Lenovo Yoga 7i 14-inch Tiger Lake Laptop Review: Core i5-1135G7 Debut
The mid-range 14-inch Lenovo Yoga 7i sits in between the low-end IdeaPad Flex 14 and high-end Yoga 9i or Yoga C900 series. It also happens to be one of the least expensive 14-inch convertibles in the market at the moment that's still certified under the stringent Intel Evo platform. If you want the latest and greatest that Intel has to offer without breaking the bank, then the Yoga 7i 14 would be a good place to start.
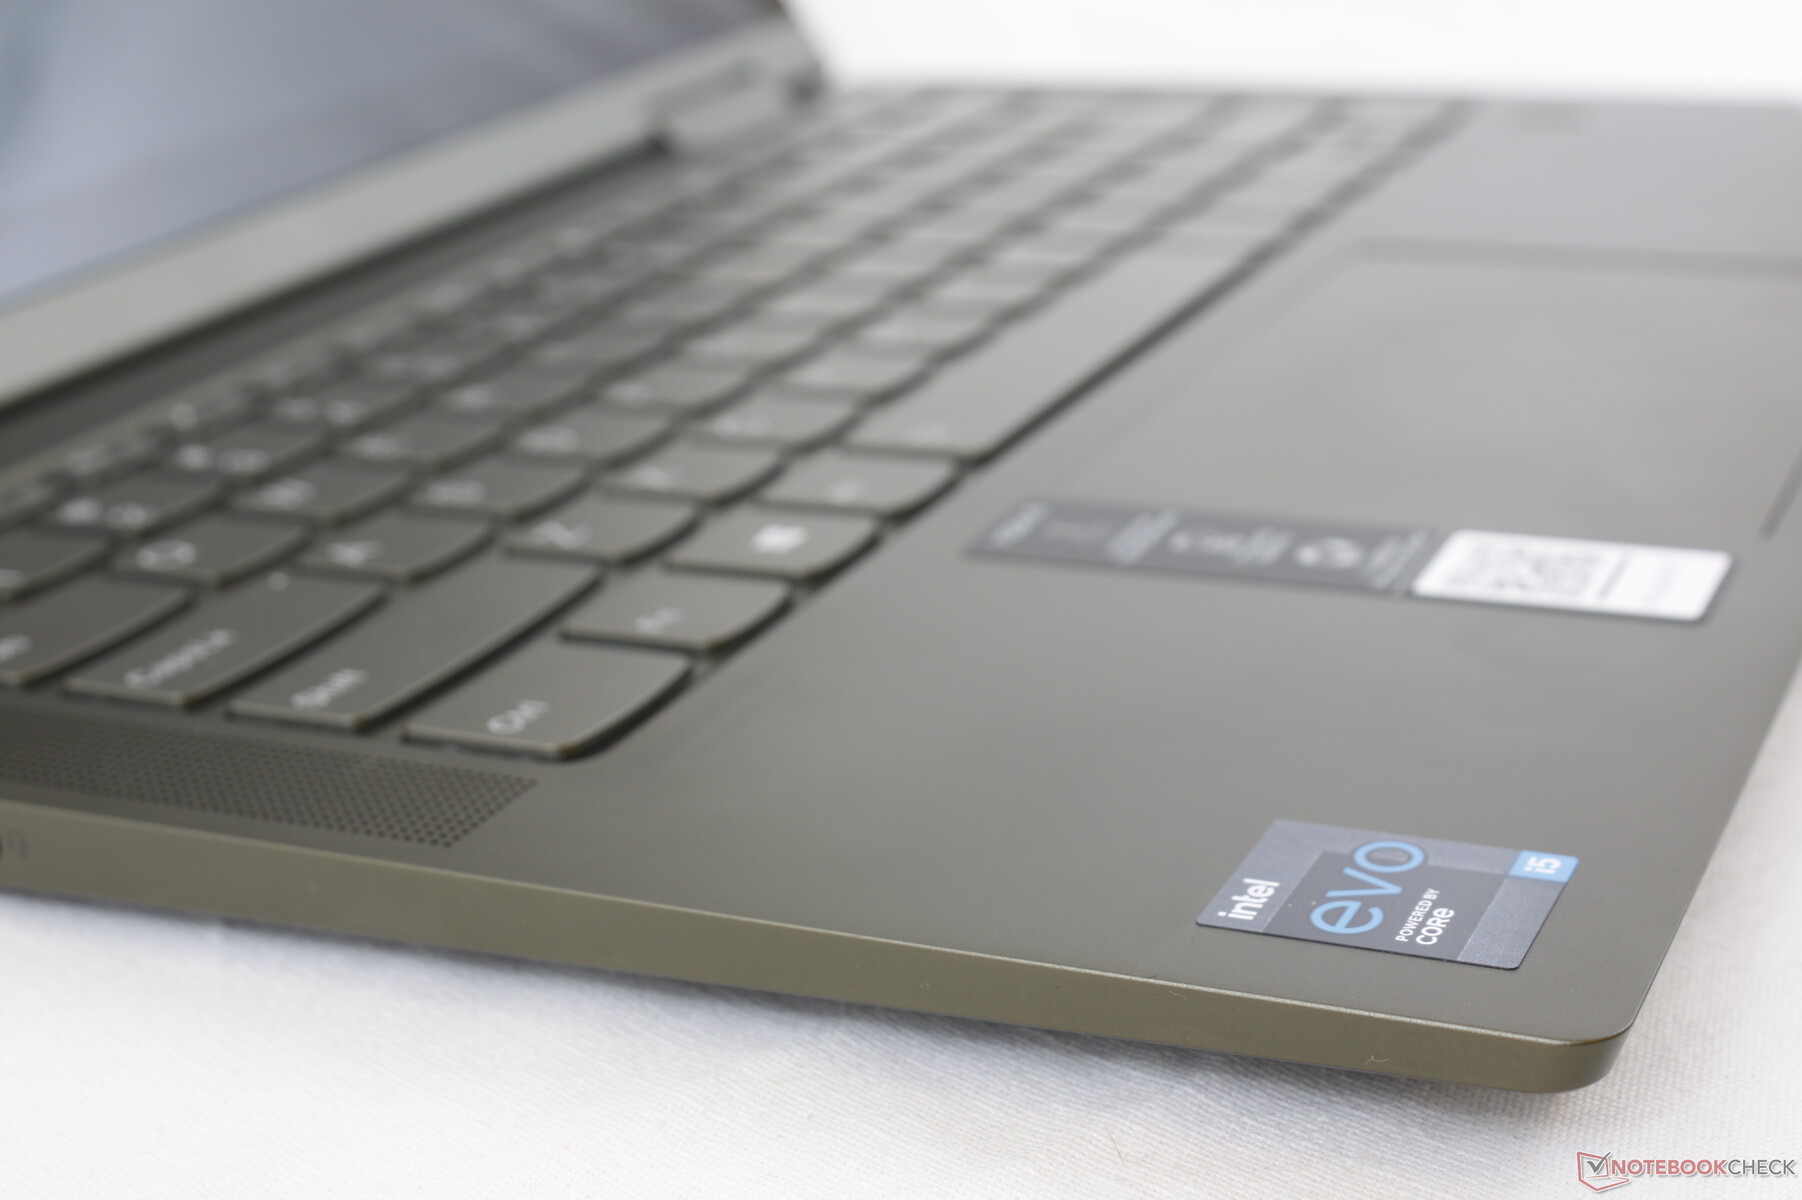
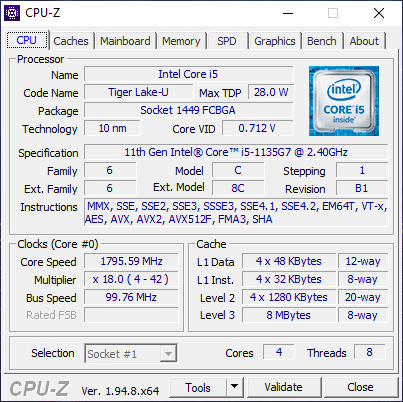
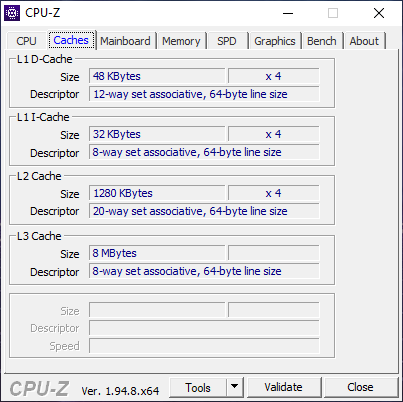
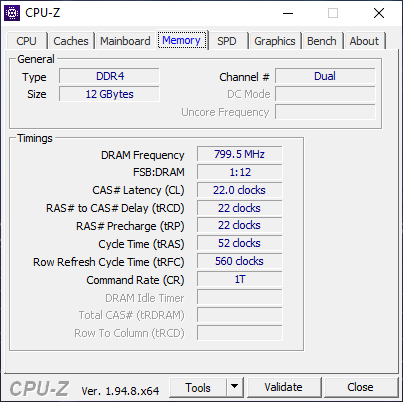
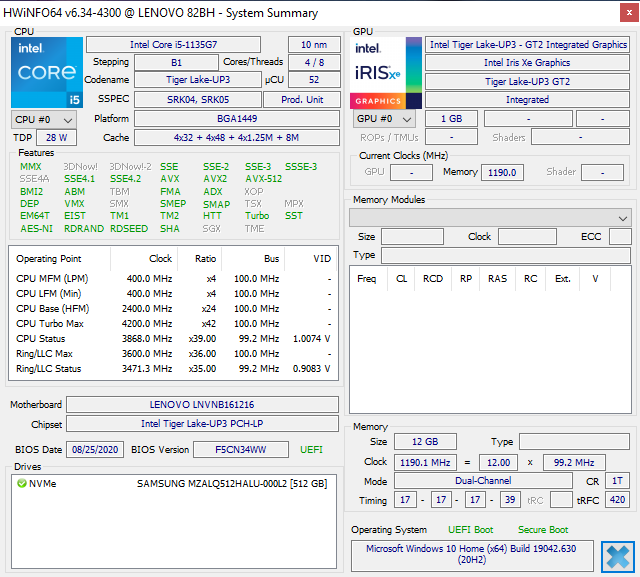
Our test unit comes configured with the Core i5-1135G7 CPU with integrated Iris Xe graphics, 1080p touchscreen, 12 GB of RAM, and a 512 GB NVMe SSD for approximately $1000 USD. Higher-end SKUs come with the faster Core i7-1165G7 CPU in addition to more RAM and storage, but the 1080p IPS display remains fixed across all configurations.
Competitors to the Yoga 7i 14 include other mid-range convertibles like the Asus ZenBook Flip 14, Acer Spin 5, HP Envy x360 13, or the Dell Inspiron 2-in-1.
More Lenovo reviews:
Rating | Date | Model | Weight | Height | Size | Resolution | Price |
|---|---|---|---|---|---|---|---|
| 85.1 % v7 (old) | 11 / 2020 | Lenovo Yoga 7 14ITL5 i5-1135G7, Iris Xe G7 80EUs | 1.5 kg | 17.7 mm | 14.00" | 1920x1080 | |
| 84.2 % v7 (old) | 09 / 2020 | Asus ZenBook 14 UX425EA i7-1165G7, Iris Xe G7 96EUs | 1.2 kg | 13.9 mm | 14.00" | 1920x1080 | |
| 84.4 % v7 (old) | 10 / 2020 | Lenovo Yoga Slim 7-14IIL05 i7-1065G7, GeForce MX350 | 1.4 kg | 14.9 mm | 14.00" | 1920x1080 | |
| 86 % v7 (old) | 07 / 2020 | Lenovo IdeaPad 5 14ARE05 R5 4500U, Vega 6 | 1.4 kg | 16.9 mm | 14.00" | 1920x1080 | |
| 85 % v7 (old) | 05 / 2020 | Asus ZenBook Flip 14 UX463FA-AI039T i5-10210U, UHD Graphics 620 | 1.4 kg | 18 mm | 14.00" | 1920x1080 | |
| 84.3 % v7 (old) | 03 / 2020 | Lenovo Yoga C740-14IML i5-10210U, UHD Graphics 620 | 1.4 kg | 16.9 mm | 14.00" | 1920x1080 |
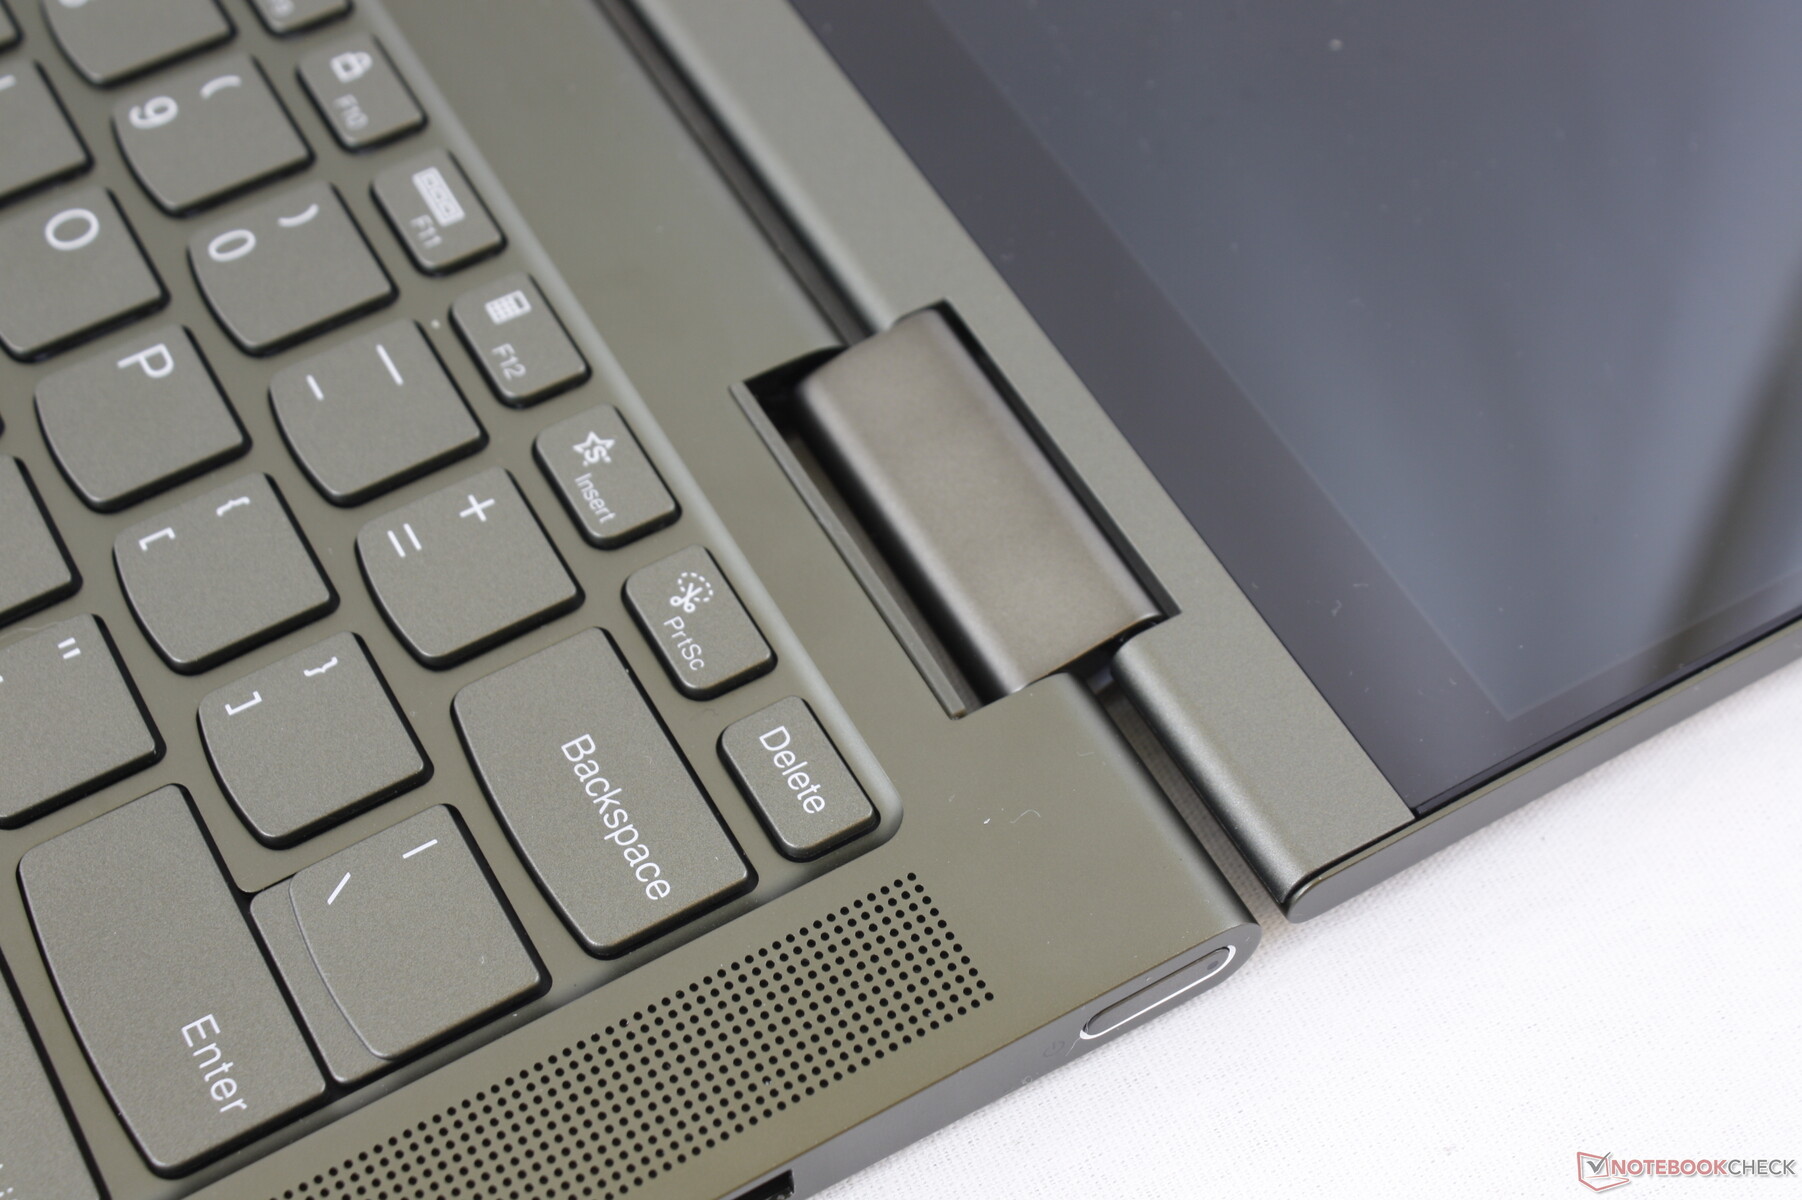
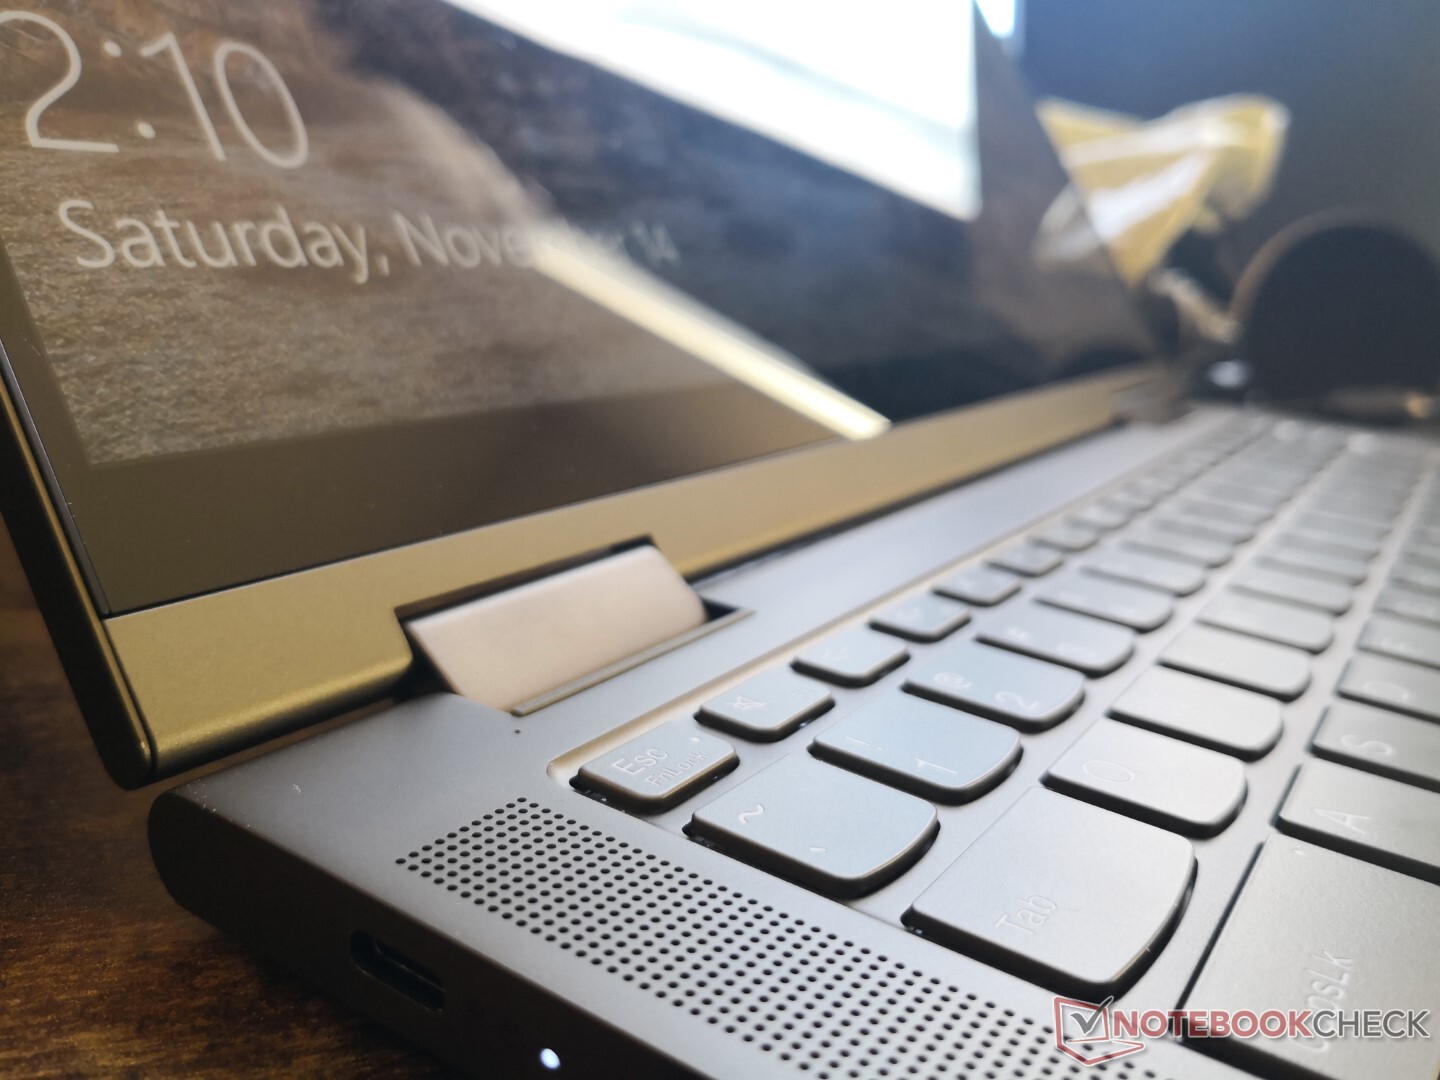
Case
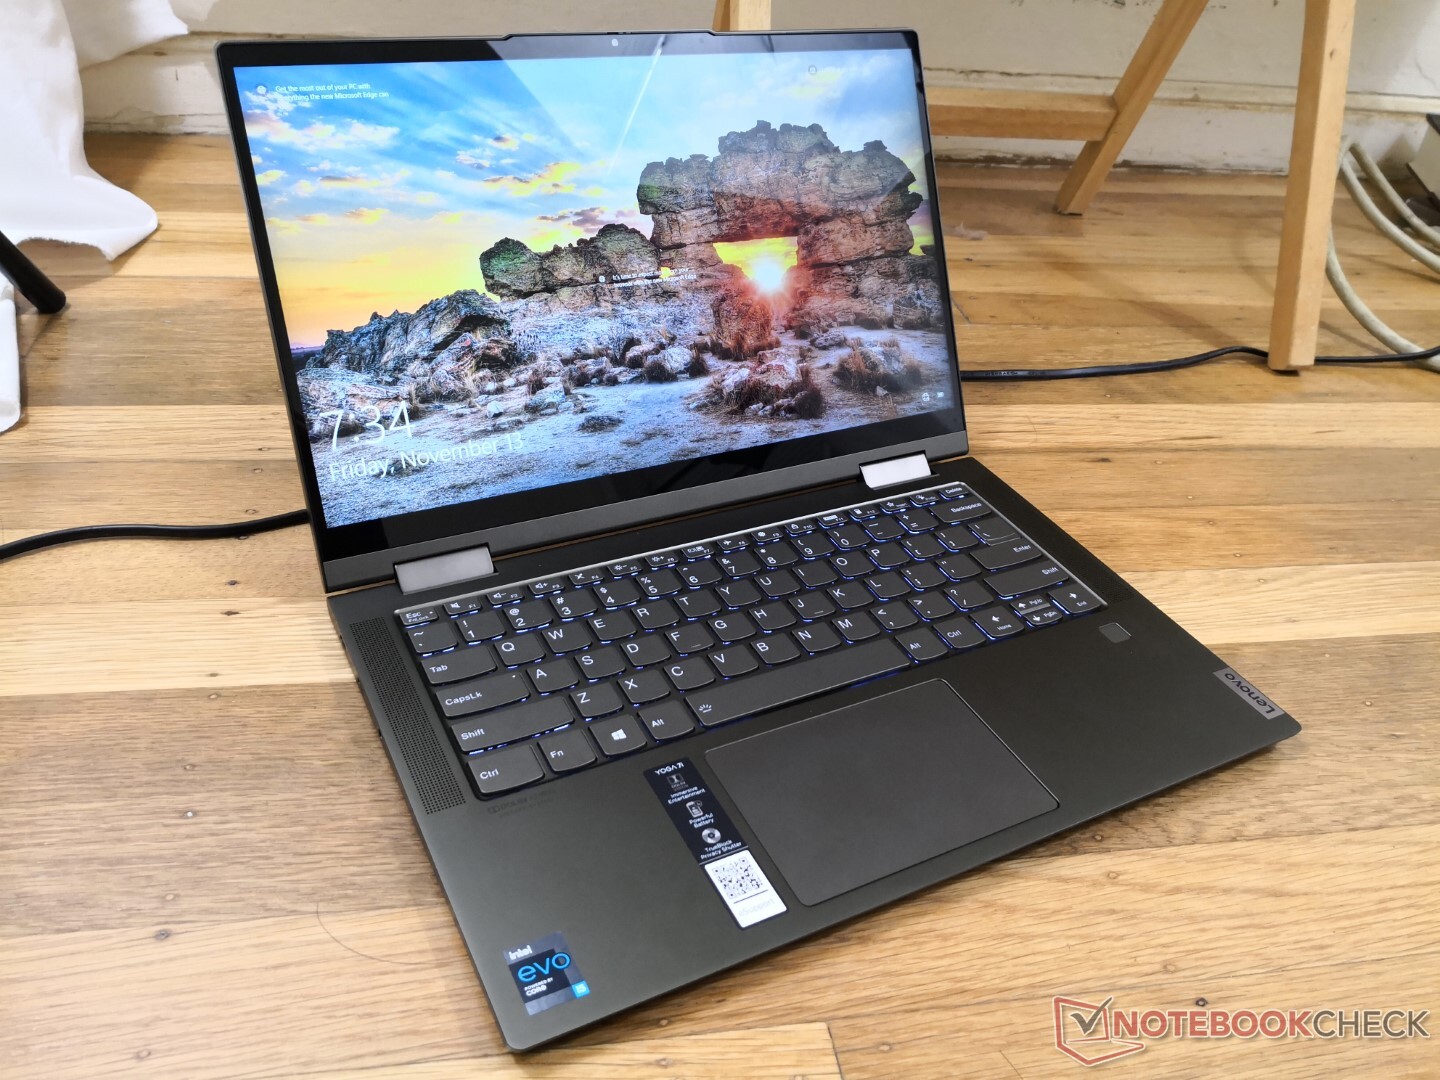
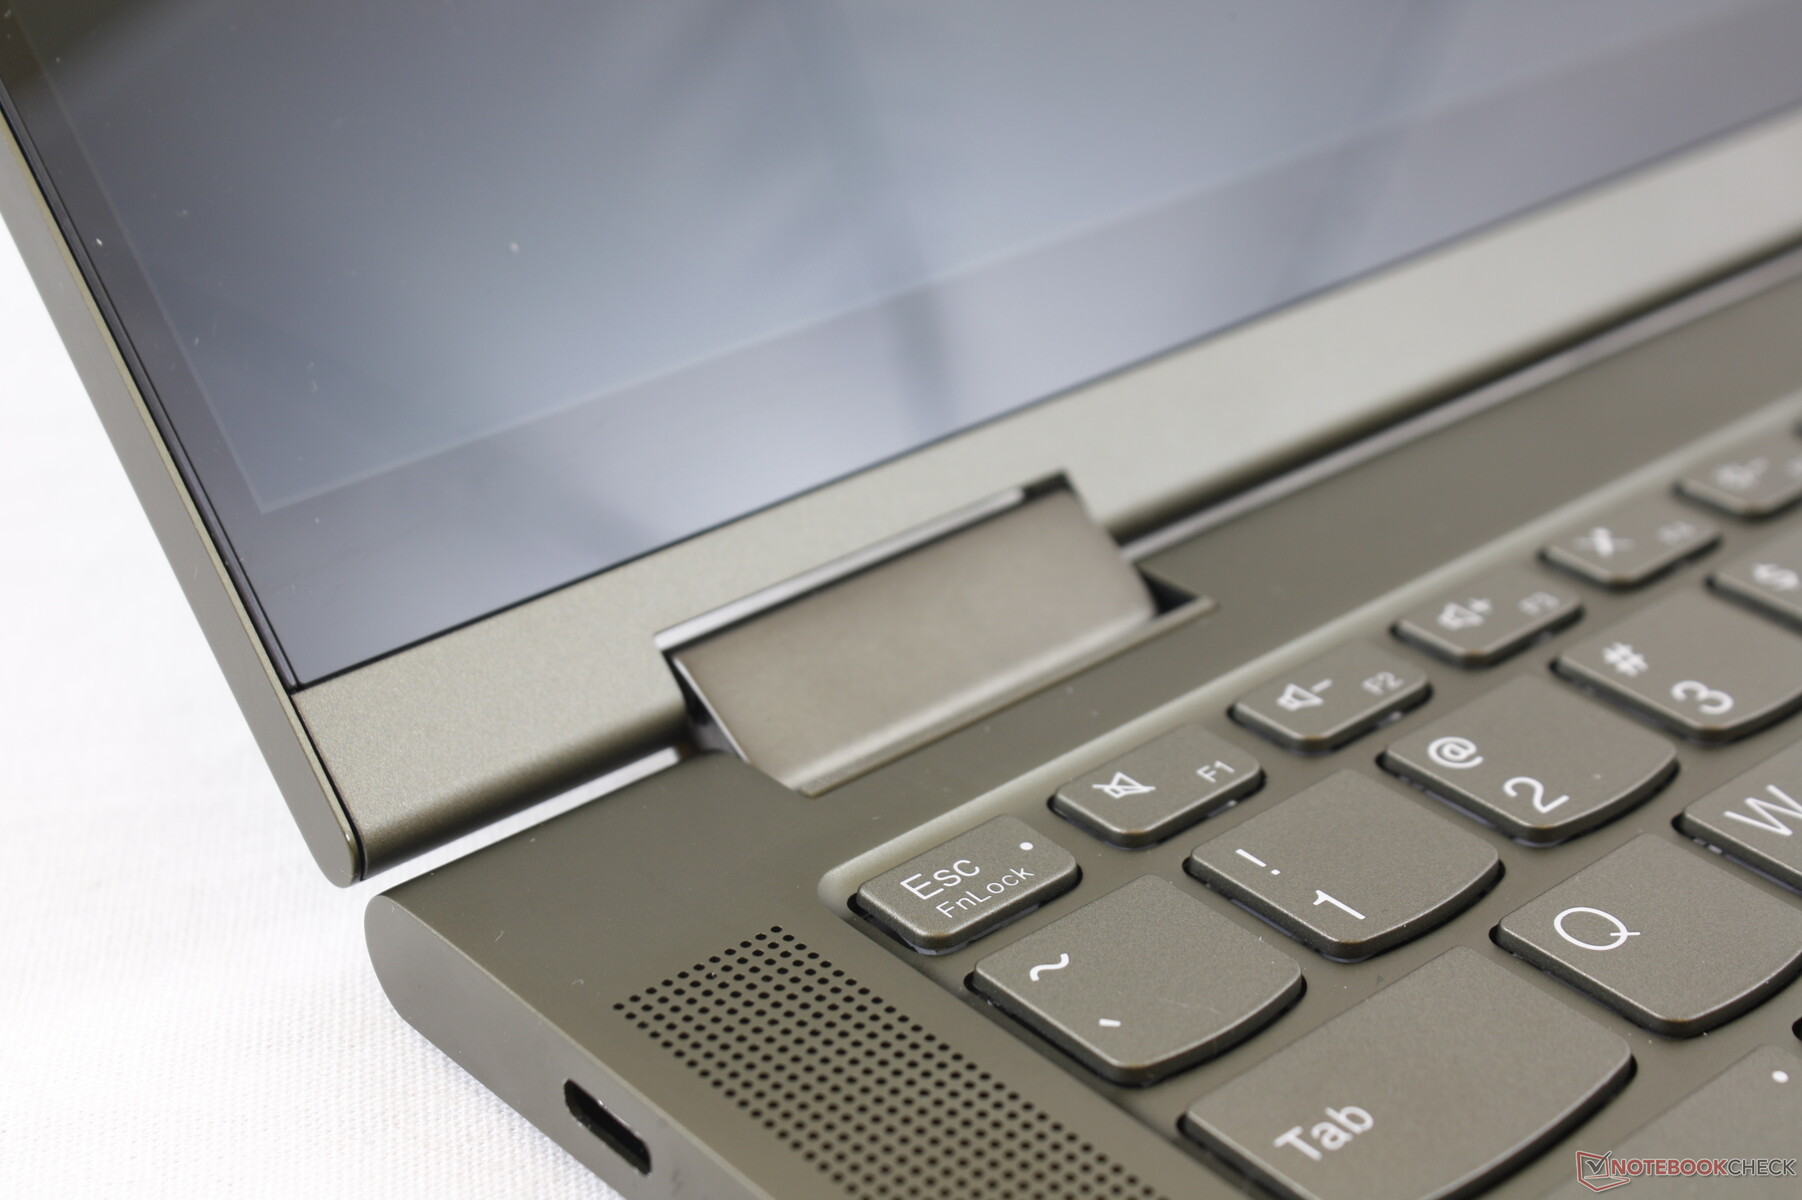
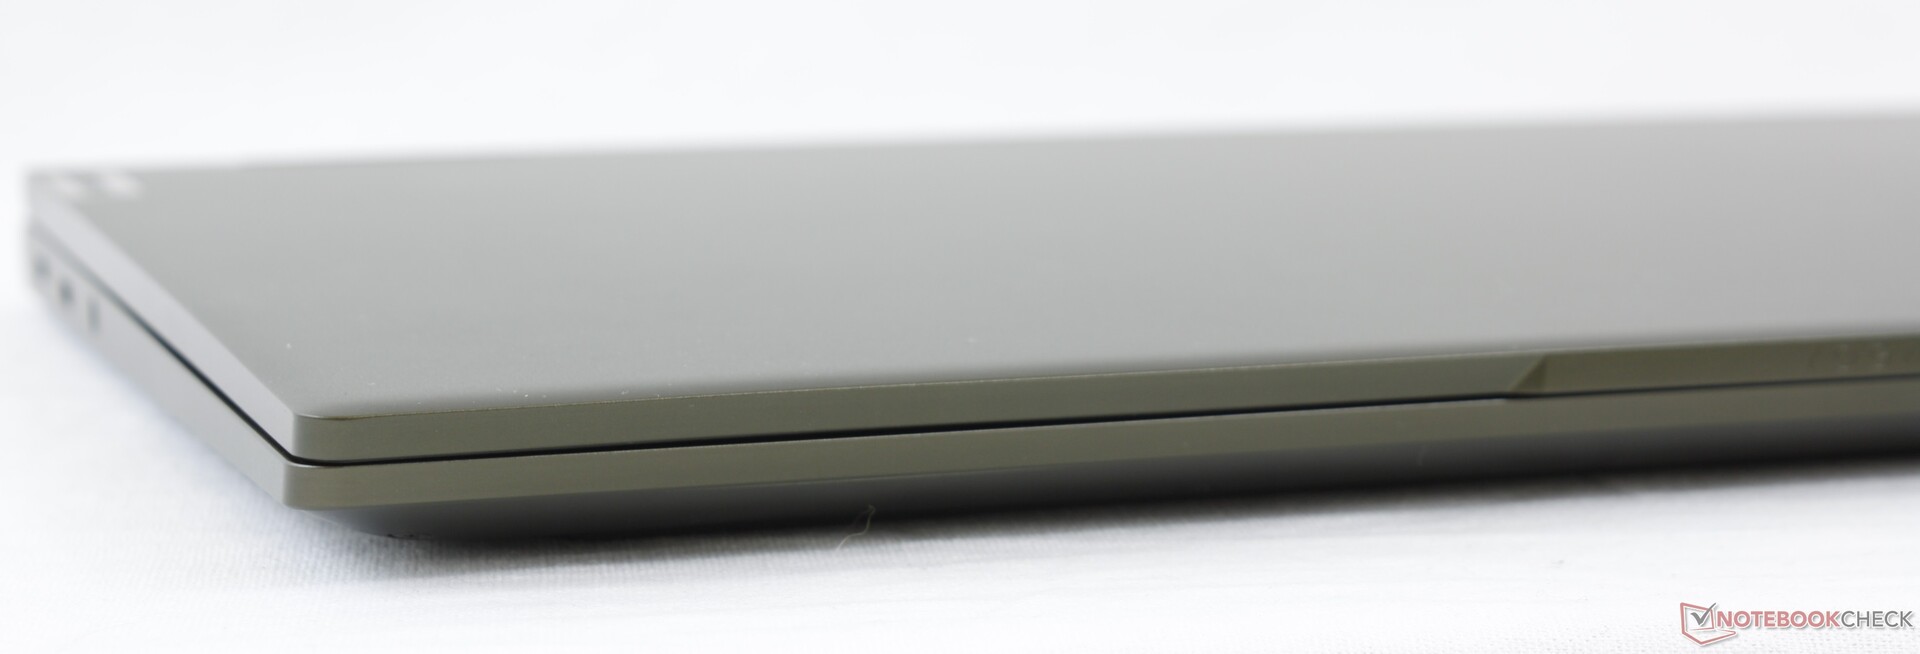
If you have a hard time telling apart all the different 14-inch Lenovo laptops, we don't blame you. The Yoga 7i 14 uses similar aluminum metal materials as the Yoga C740, Yoga Slim 7 or IdeaPad S940 for almost the same texture and visual style between them. This isn't necessarily a bad thing because we find the skeleton to be as rigid as an HP EliteBook x360 1030 G7 and less flexible than the carbon fiber-centric Thinkpad Carbon X1 each retailing for almost twice the price, but all the different Yoga model names can definitely still be a bit confusing. Attempting to twist the base or lid would result in just minor warping and creaking for excellent first impressions.
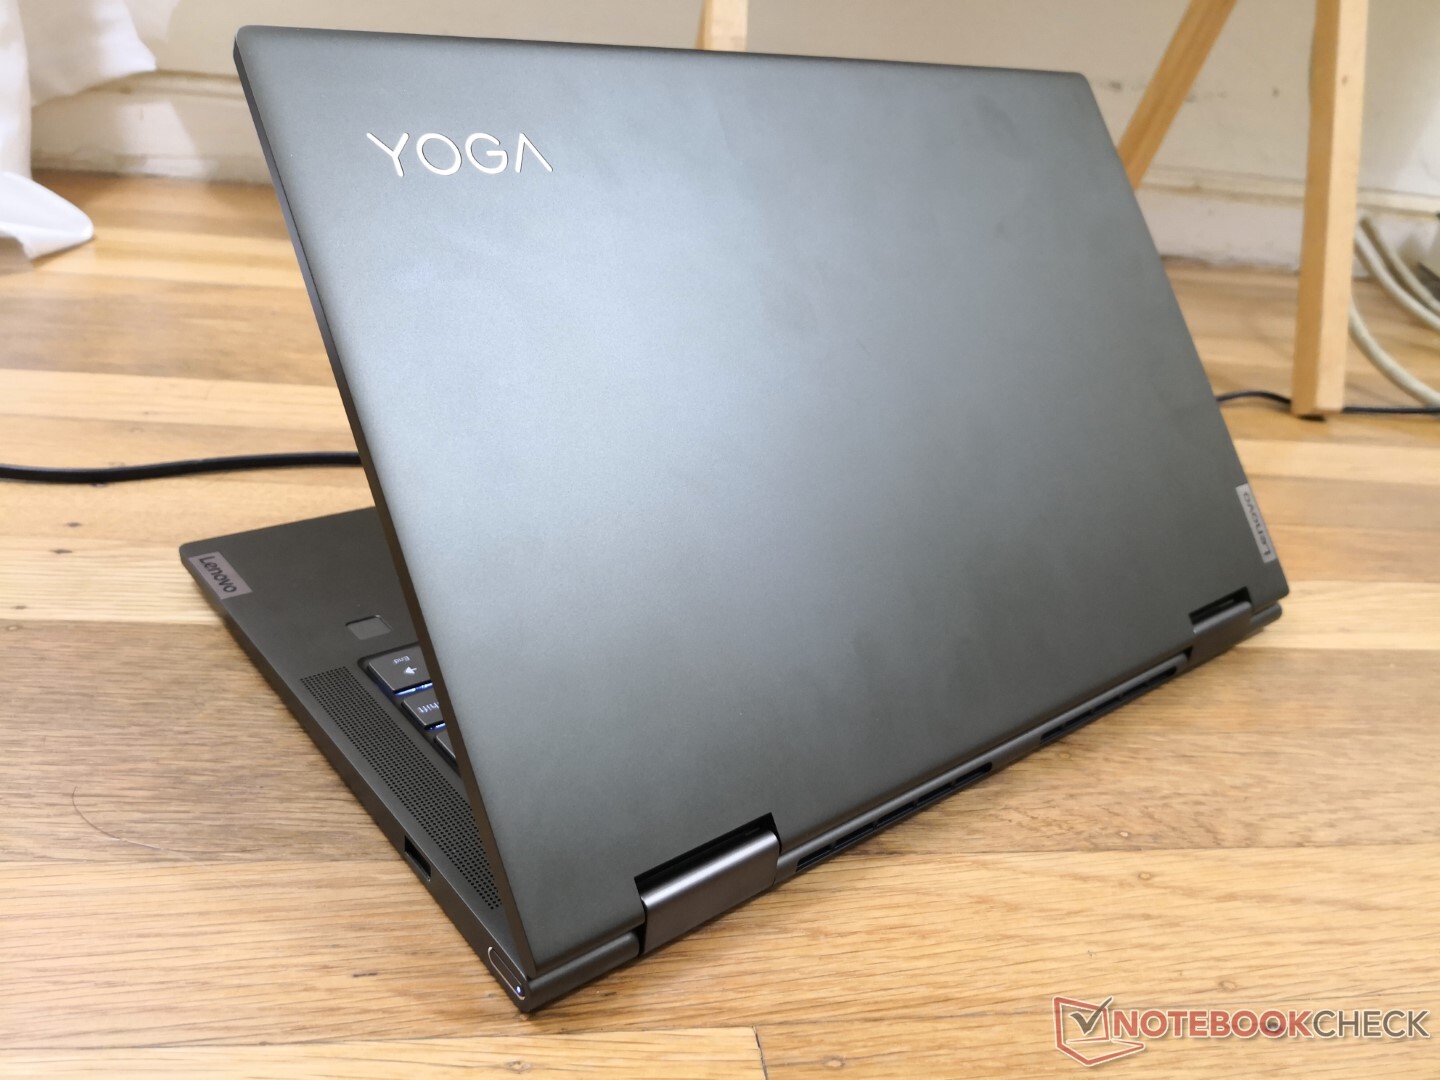
At 1.5 kg, the Lenovo is slightly heavier and larger than most others in its size class. The differences are minor on paper, but they become more noticeable over time when traveling or in tablet mode.
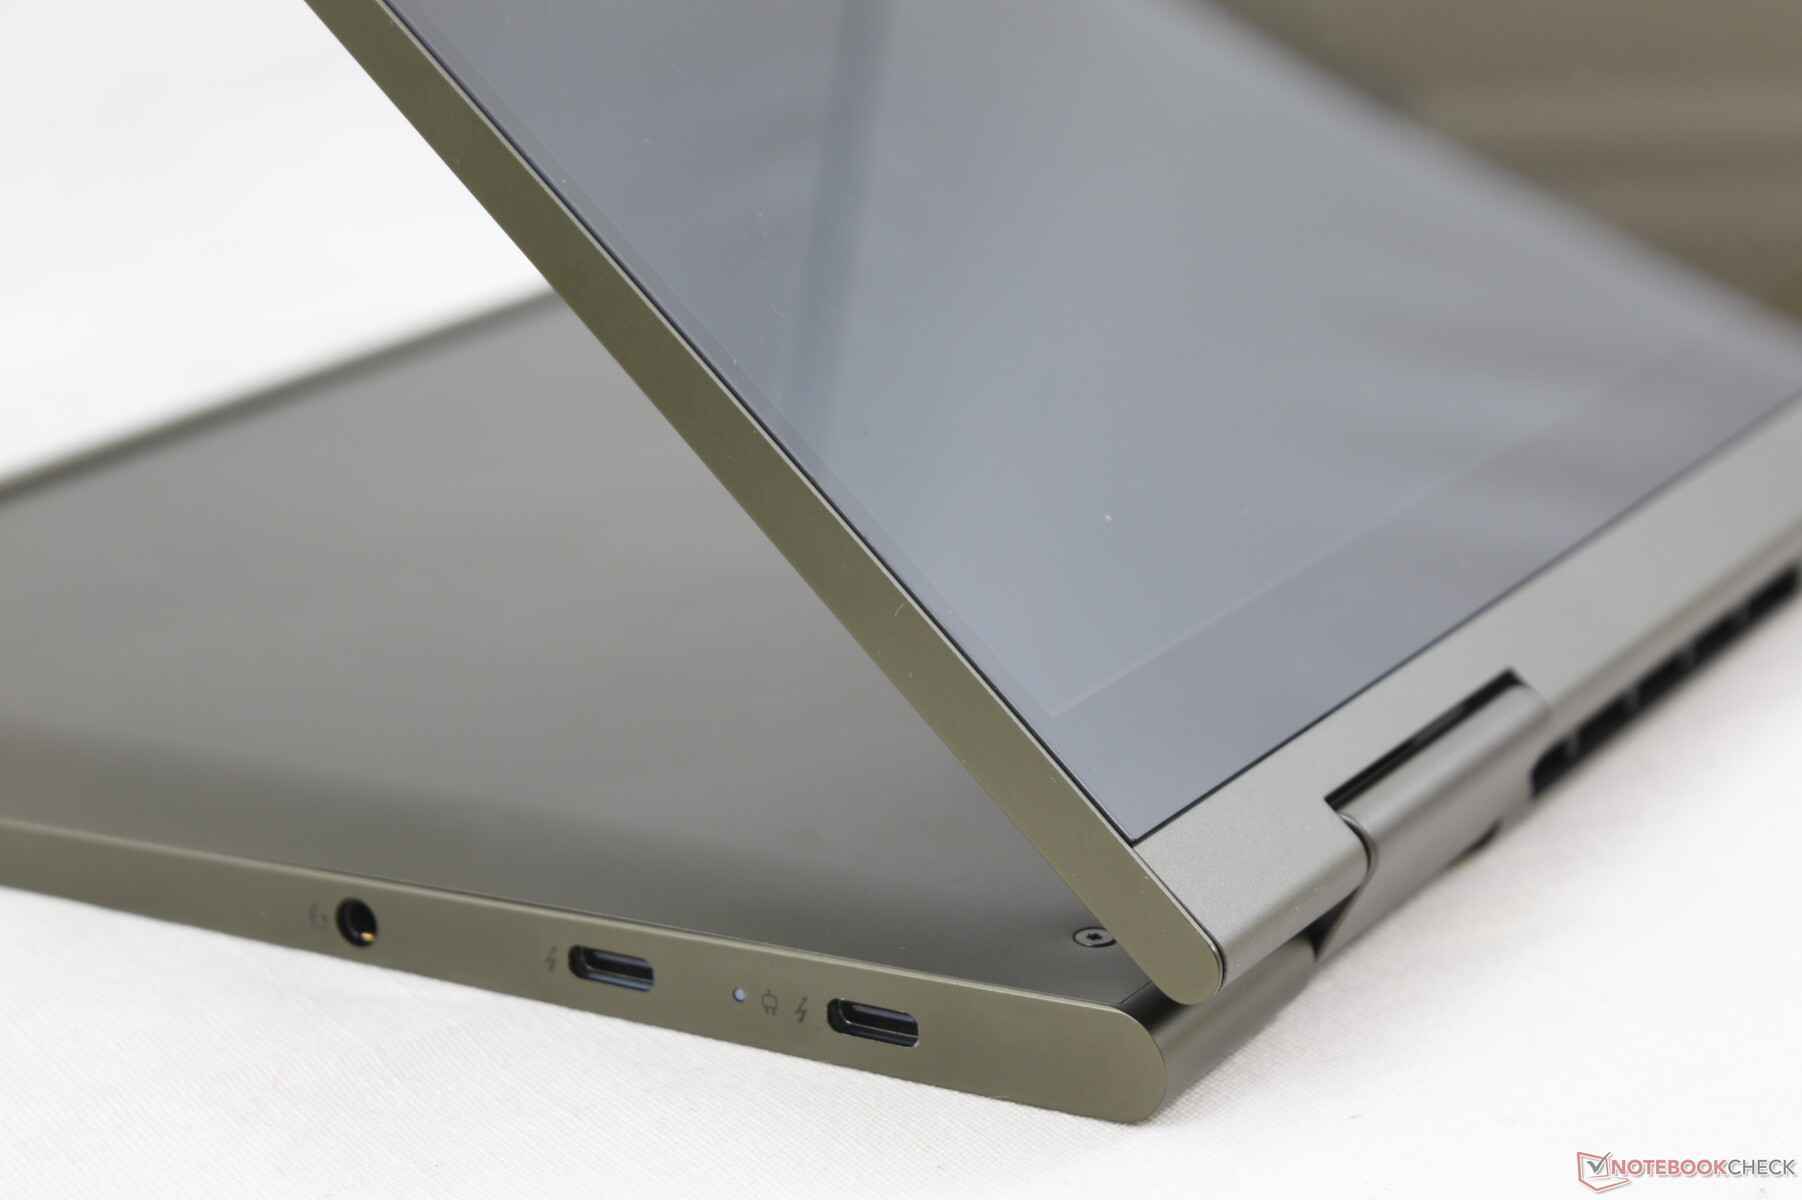
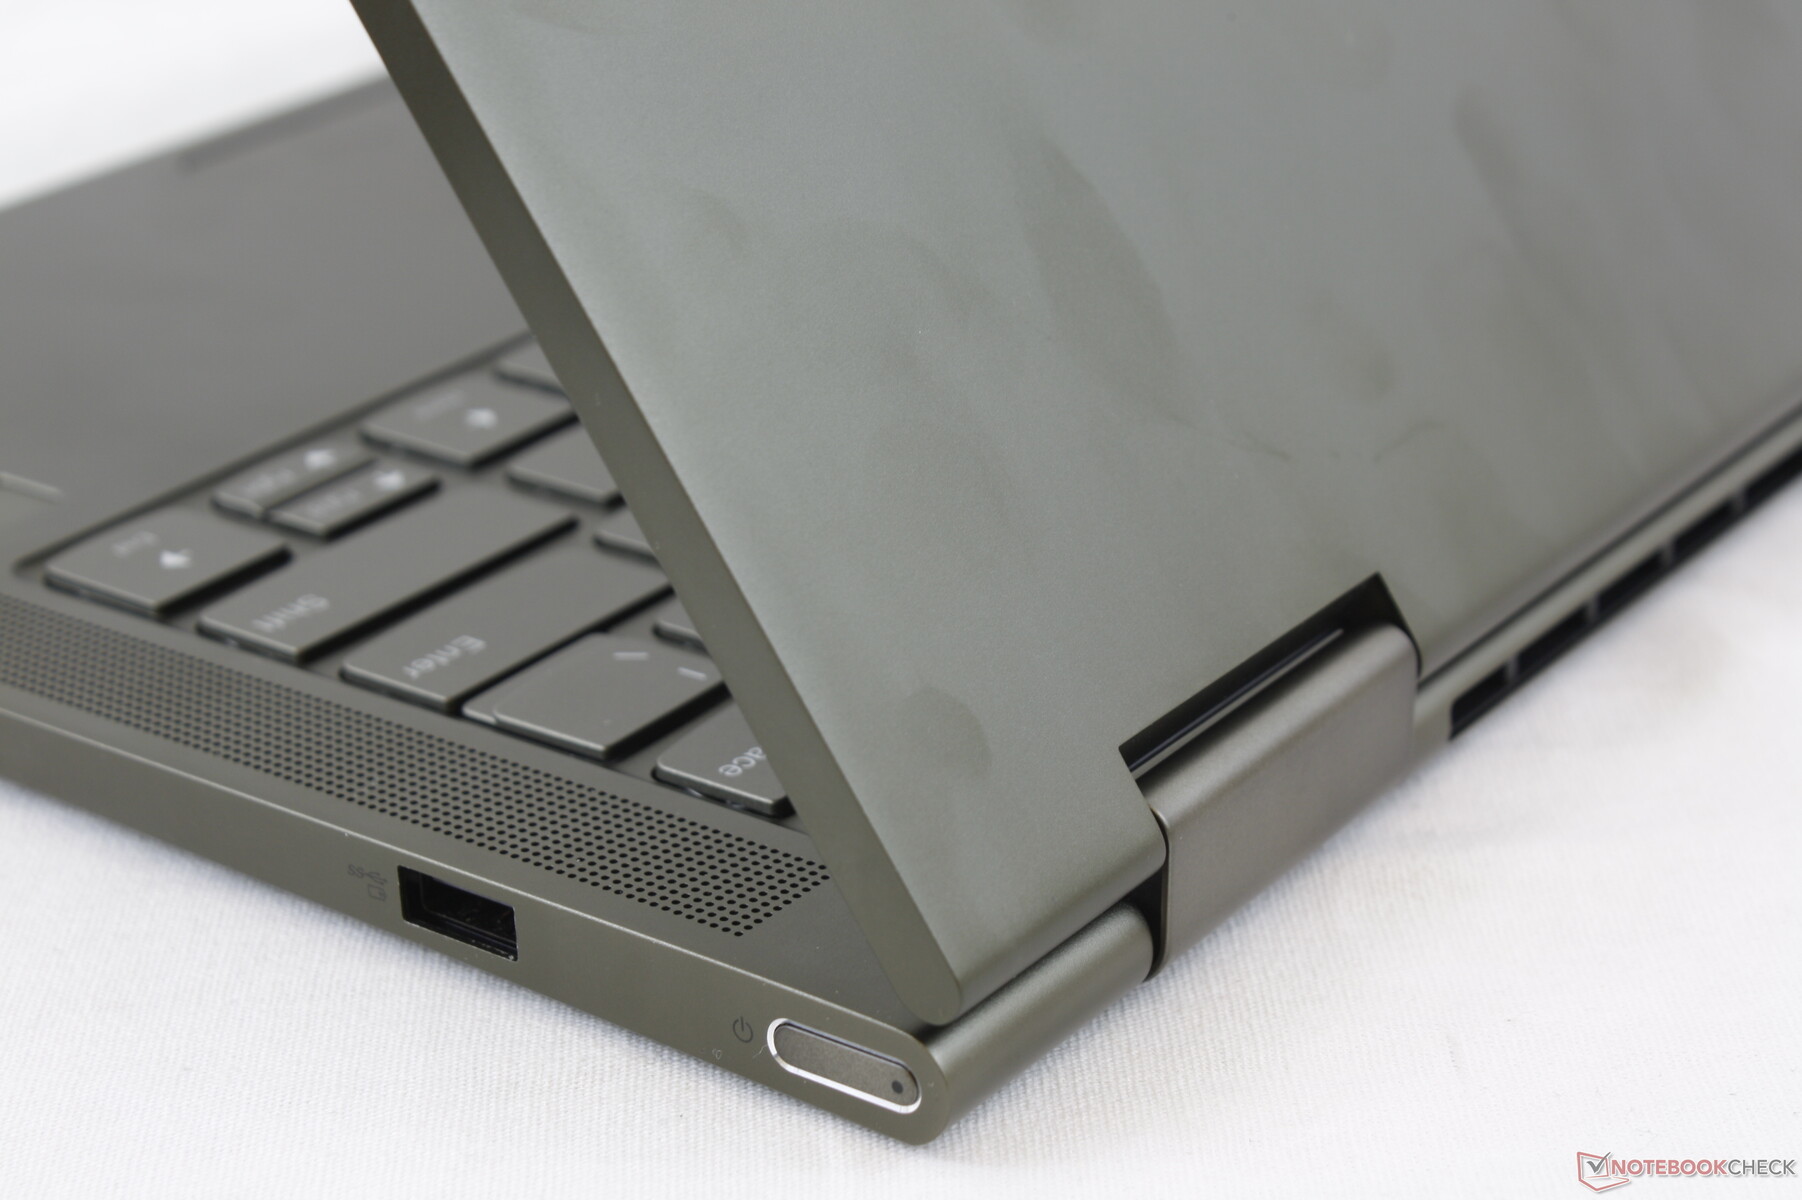
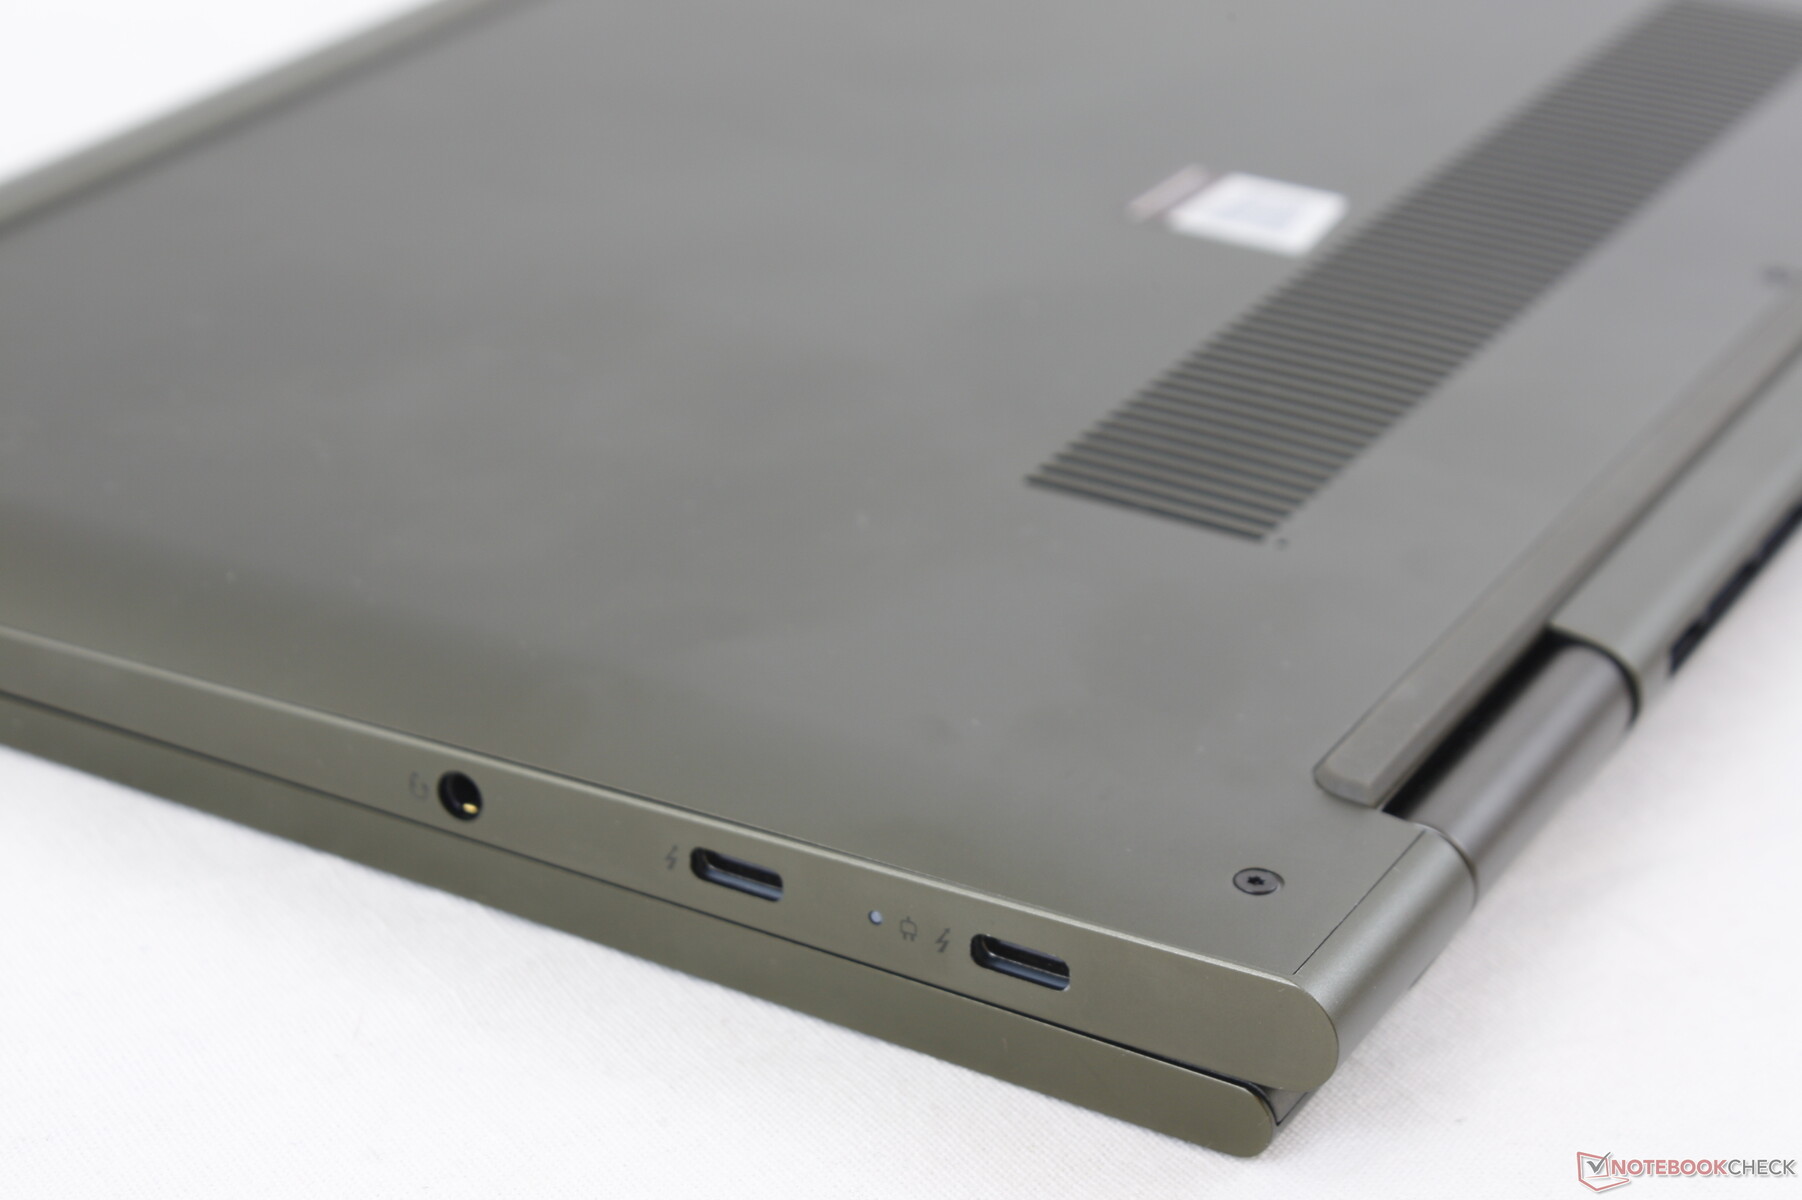
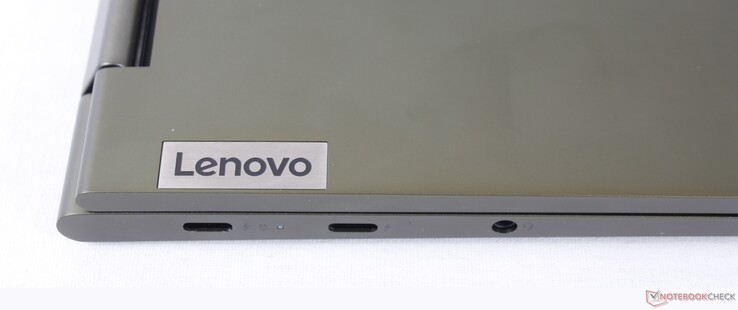
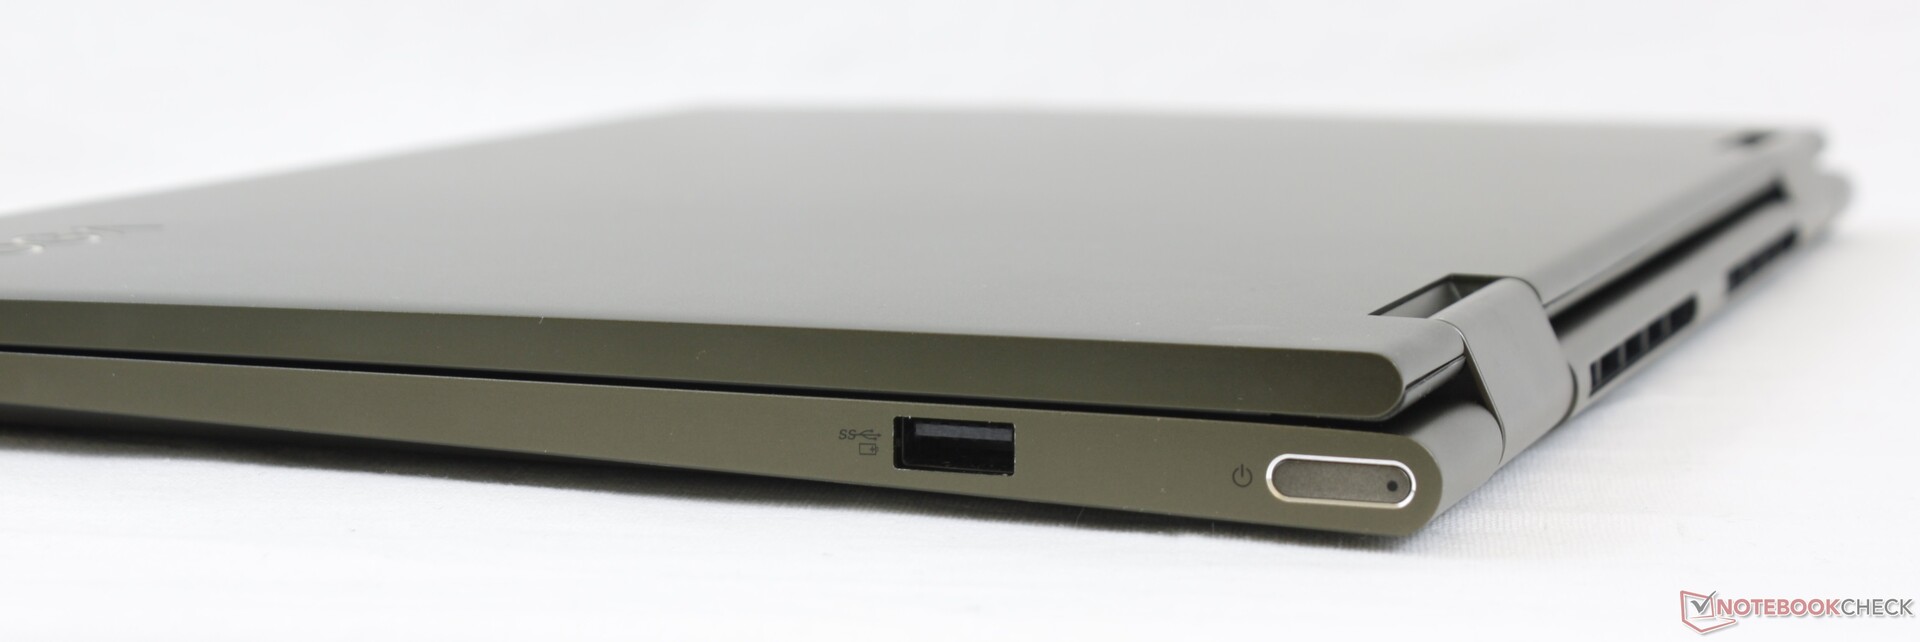
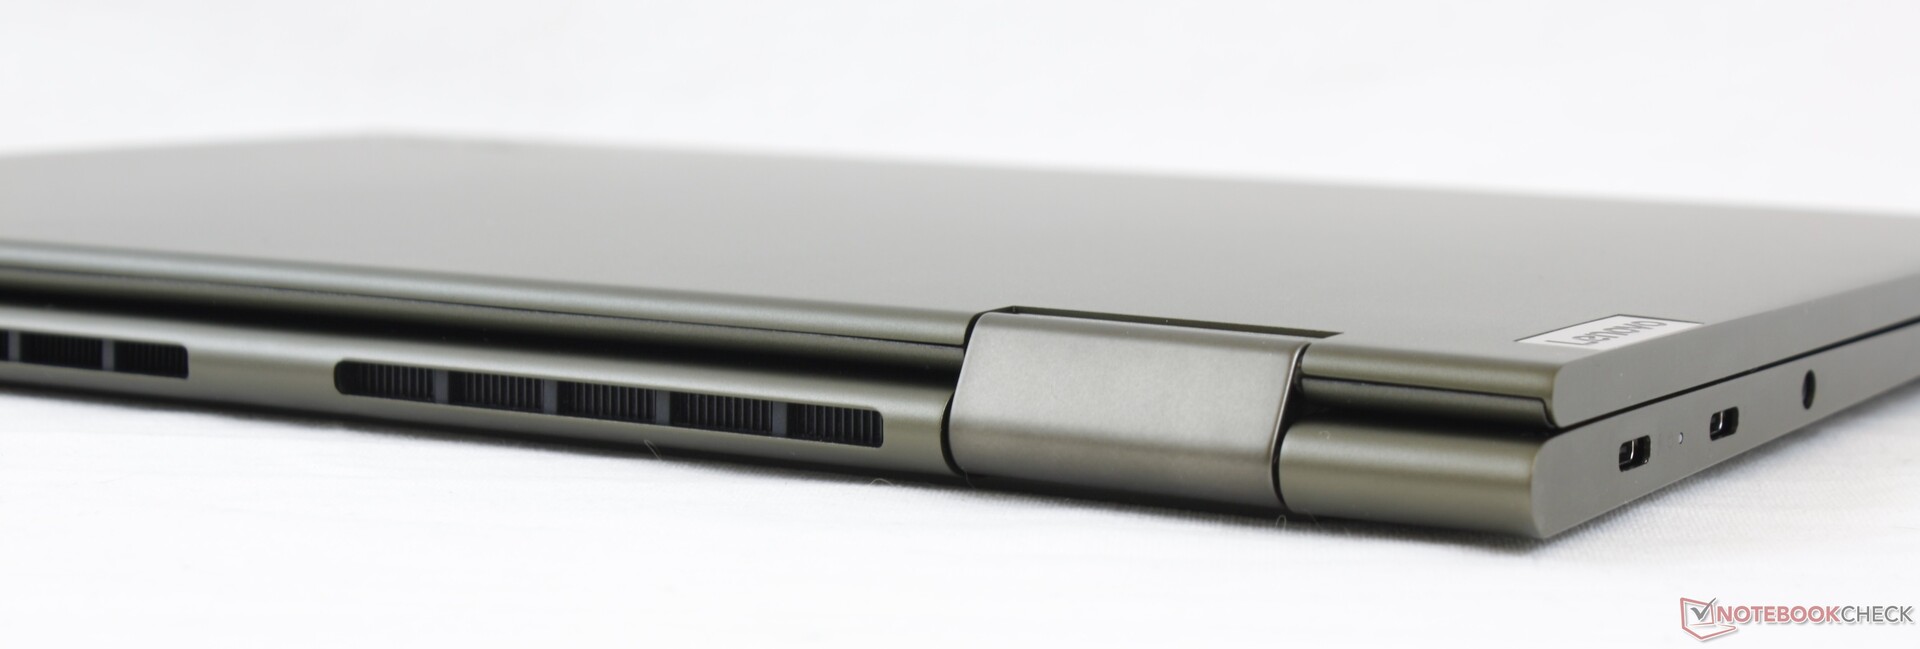
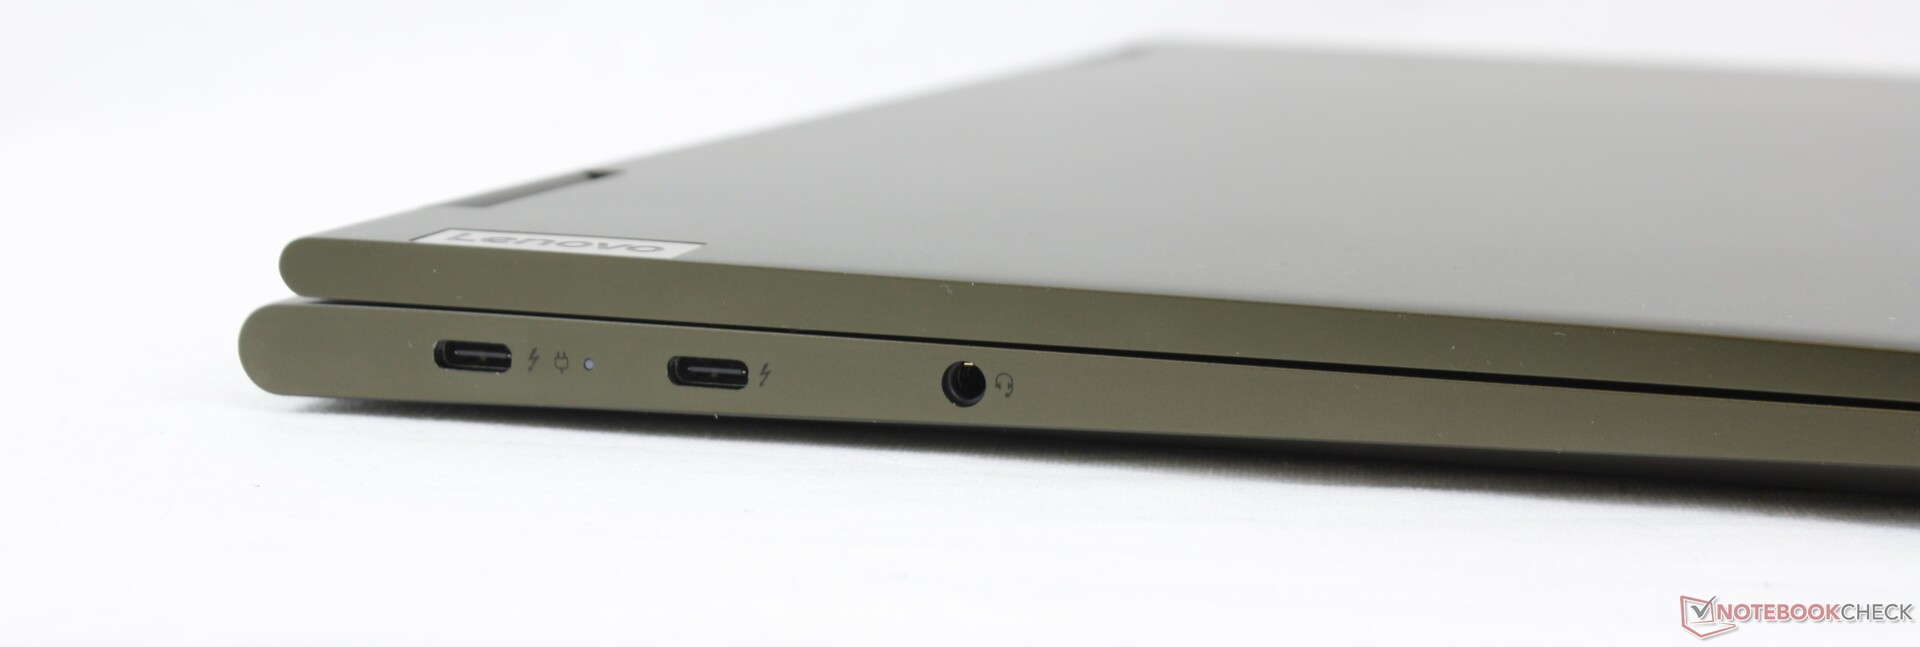
Connectivity
Port options are greater than on the IdeaPad S940 but fewer than on the Yoga Slim 7. It's becoming increasingly clear that manufacturers will be pushing Ultrabook users to USB-C especially now that Ice Lake and Tiger Lake support Thunderbolt natively.
Communication
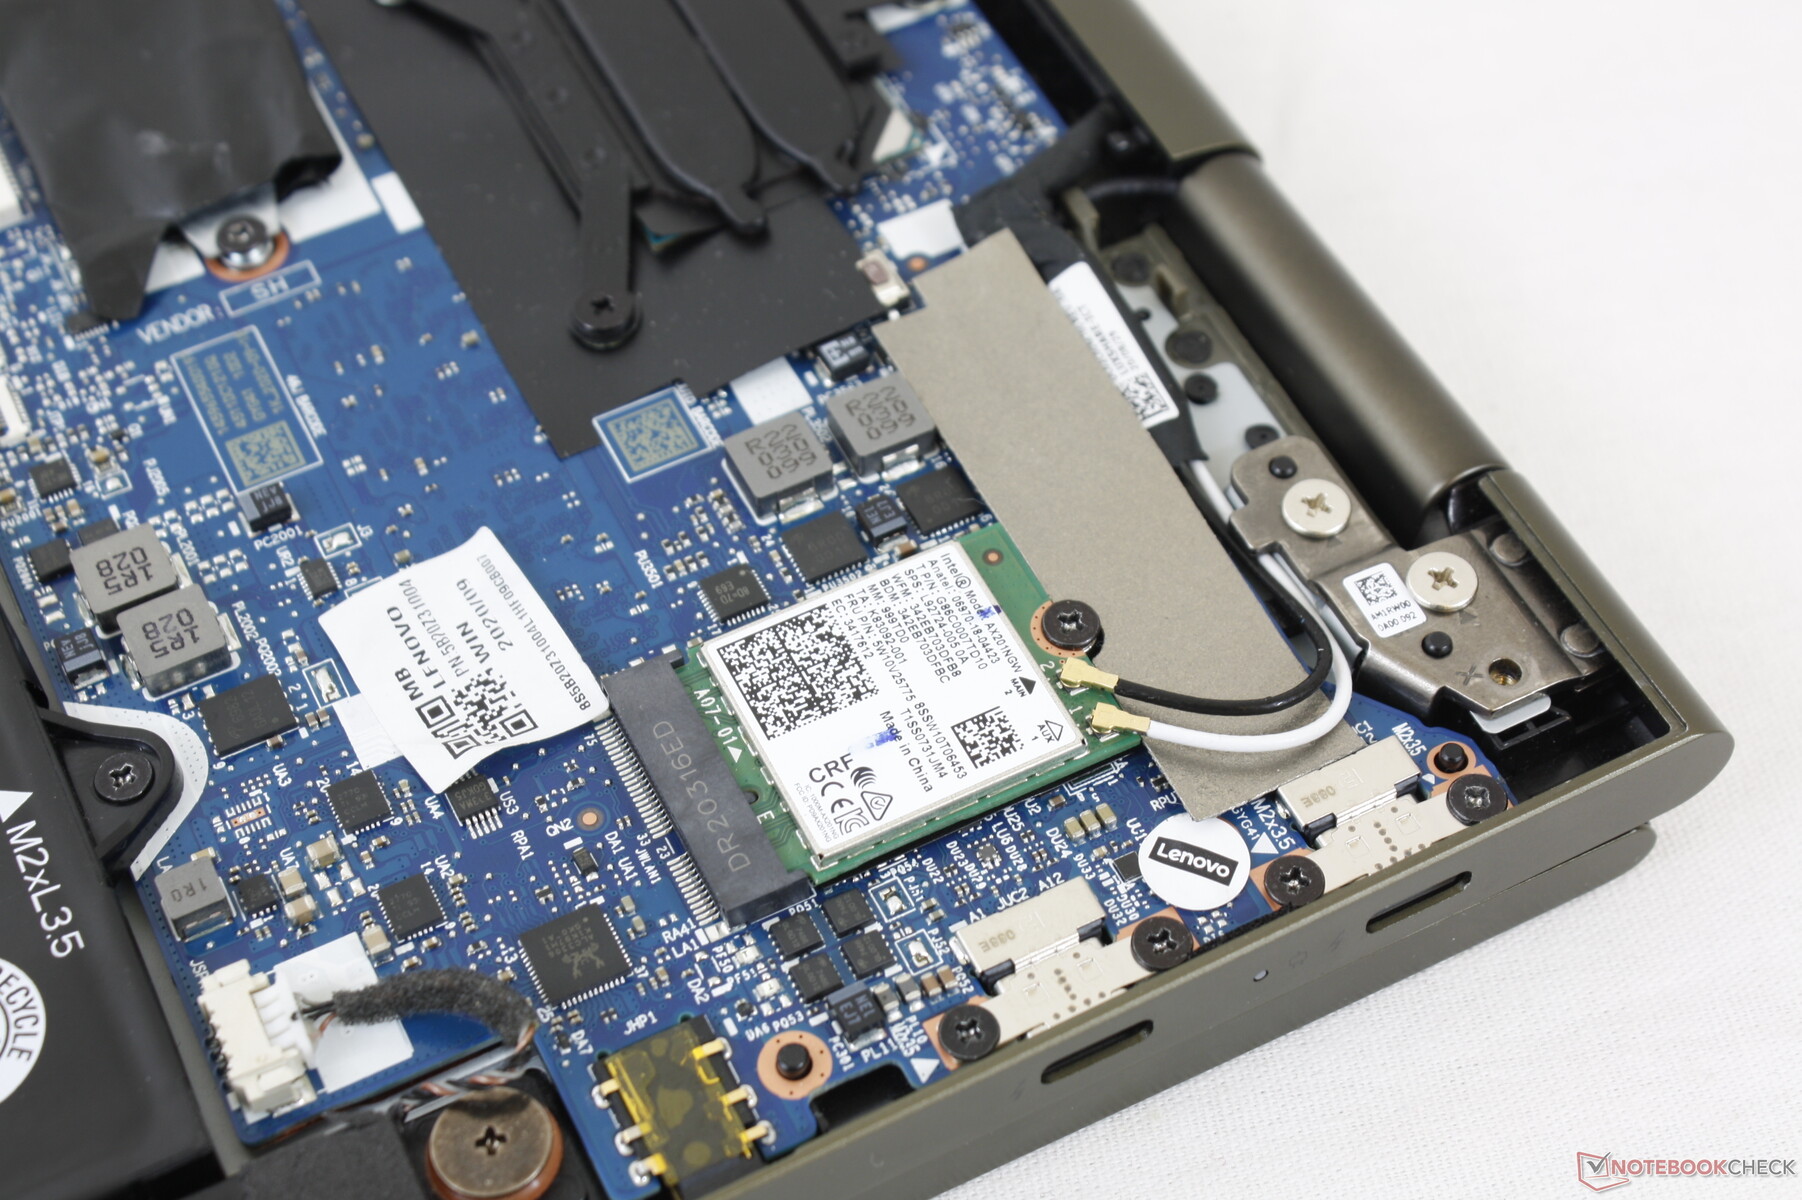
The Intel AX201 comes standard since Wi-Fi 6 is a required feature for Intel Evo certification. We experienced no connectivity issues when paired to our Netgear RAX200 test router.
Webcam


Maintenance
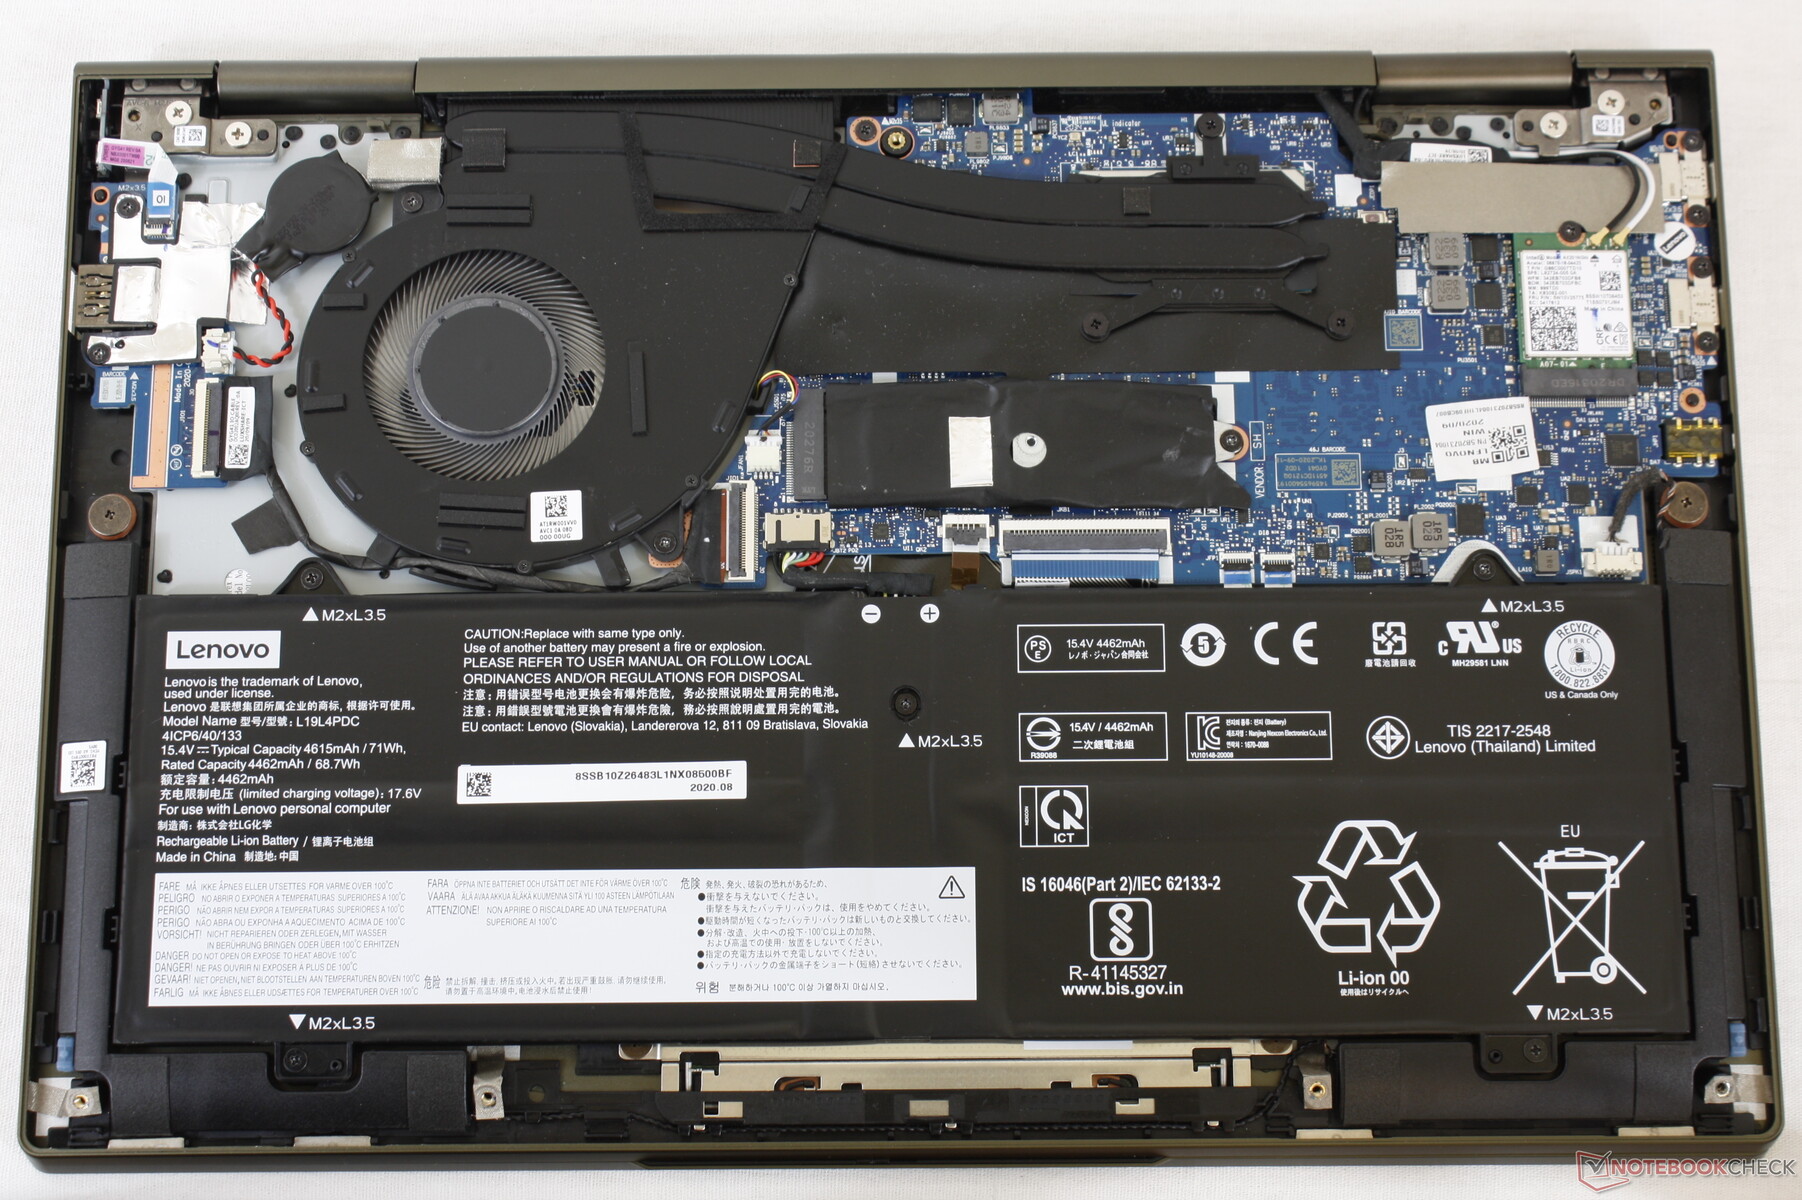
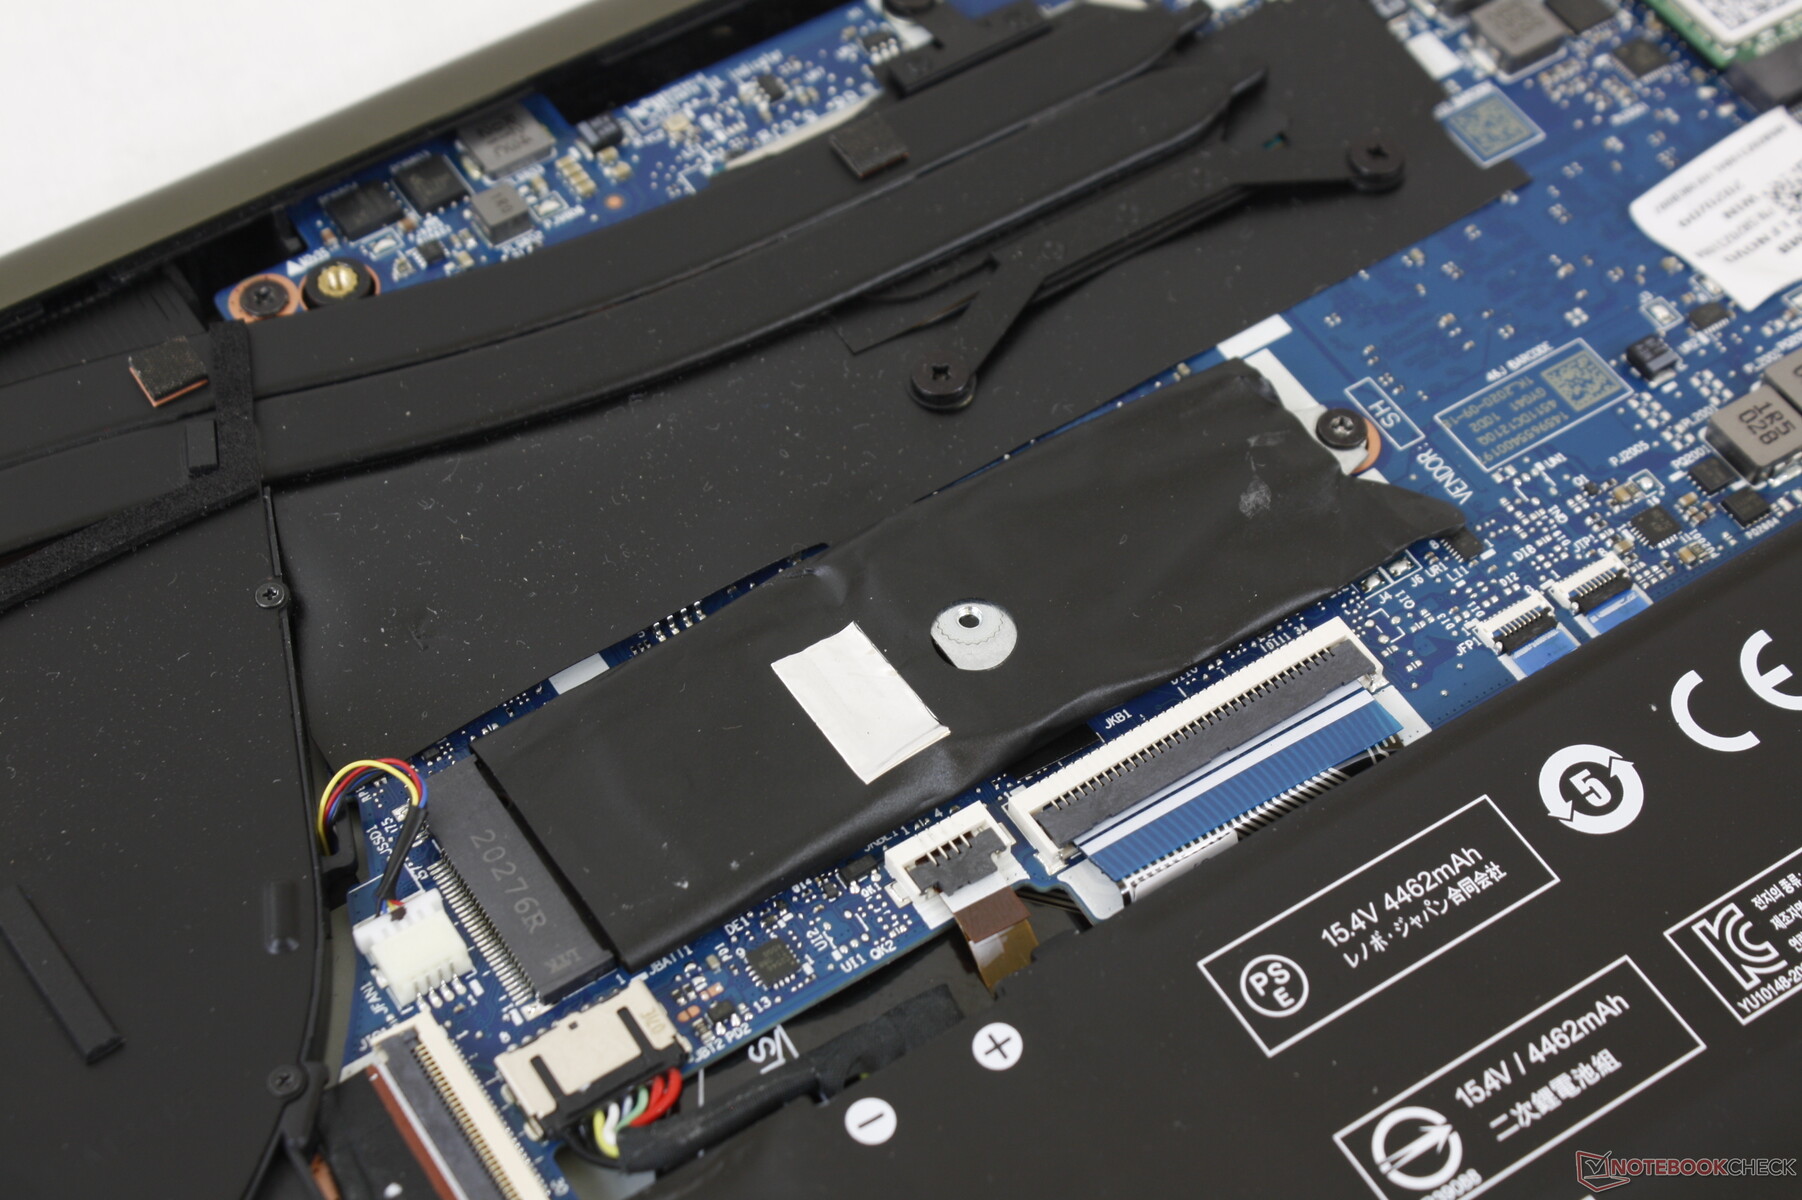
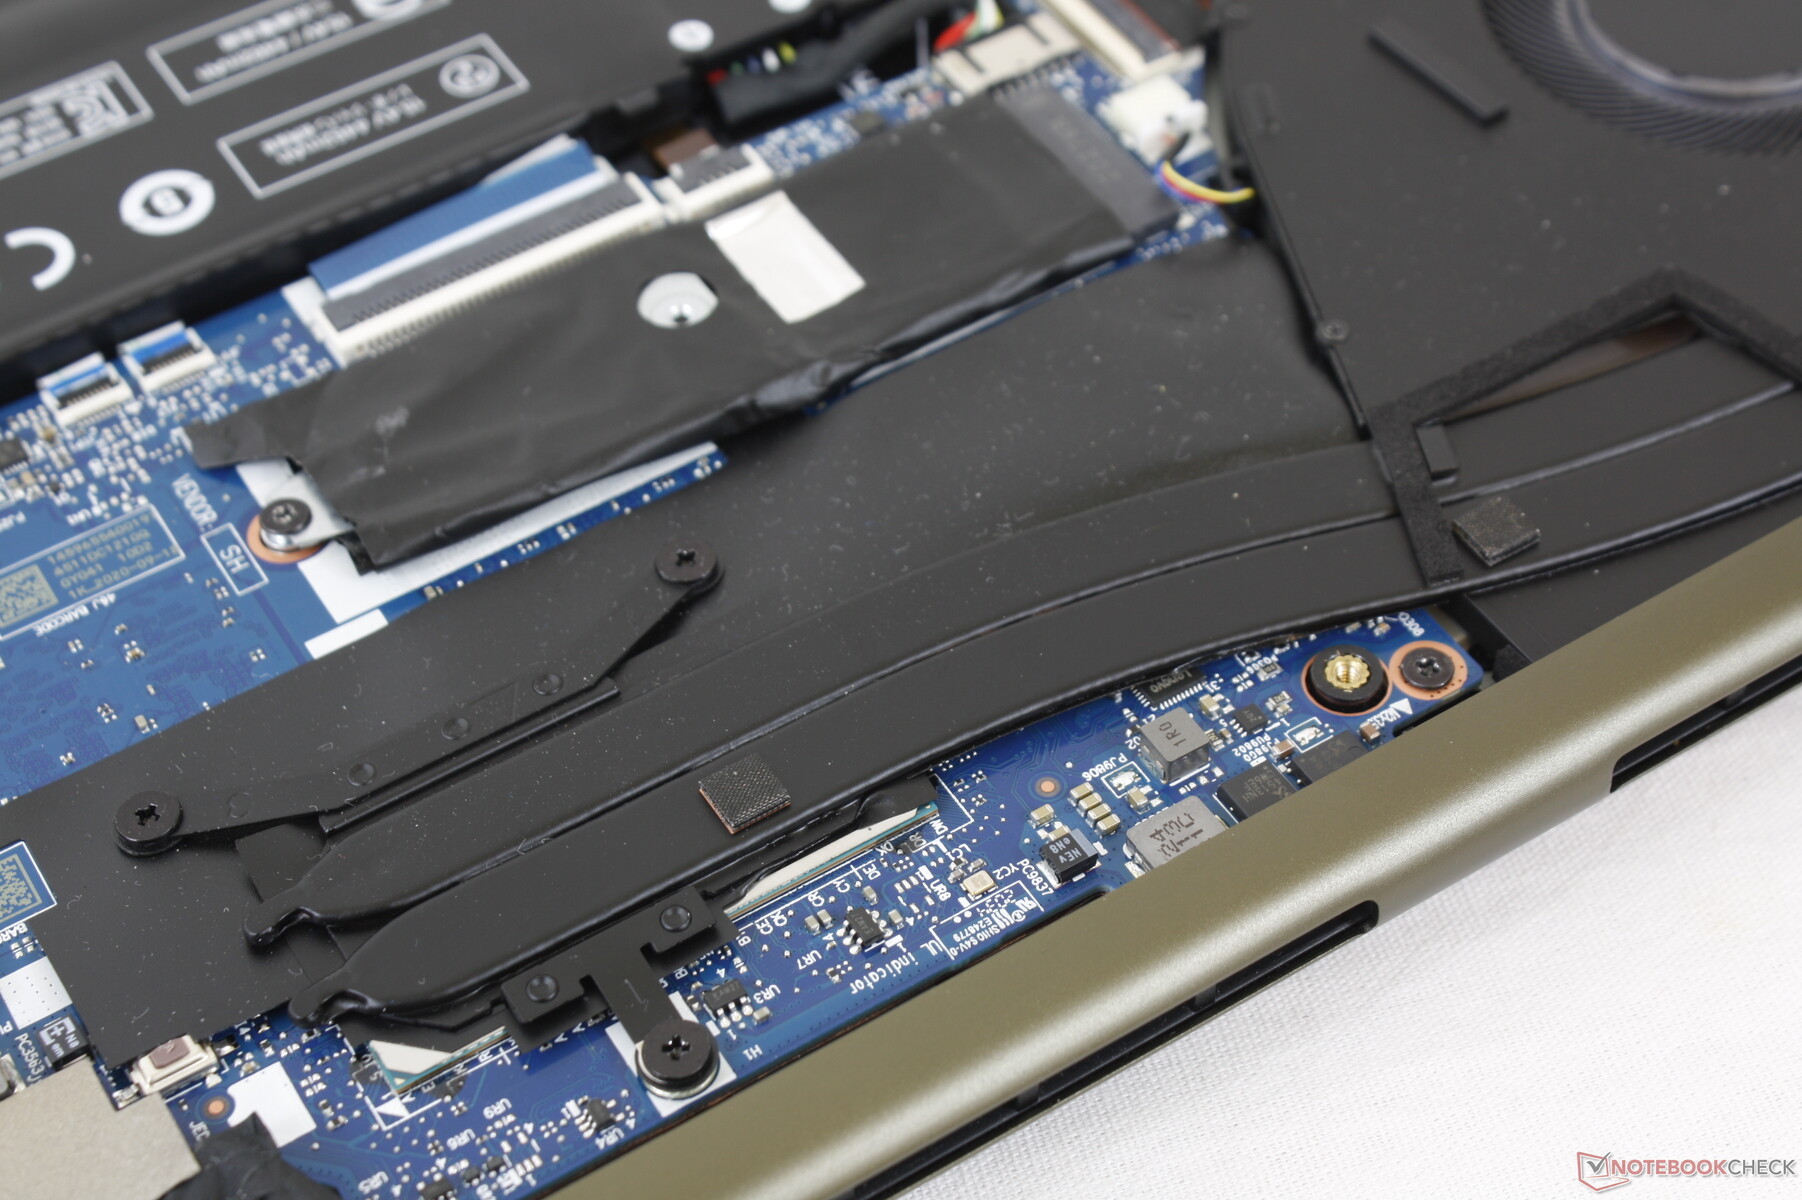
The bottom panel is secured by seven T5 Torx screws for easy servicing. The M.2 SSD, WLAN module, and batteries are removable whereas RAM is soldered.
Accessories and Warranty
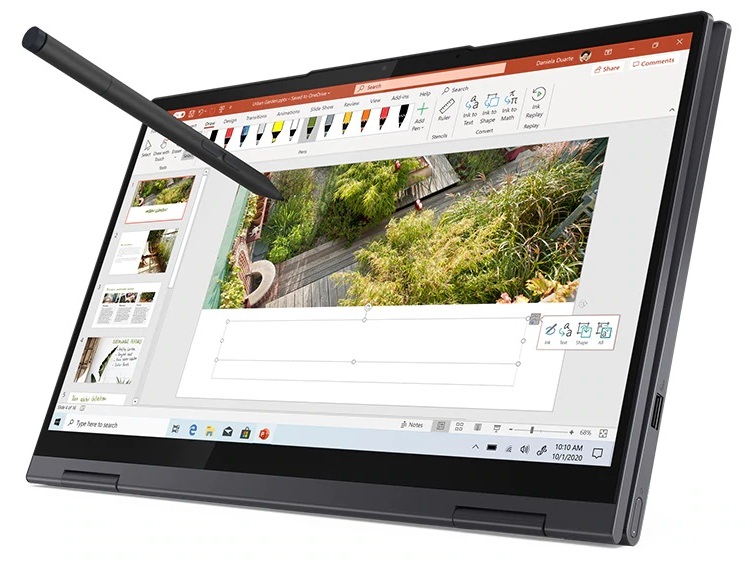
There are no extras in the box other than the paperwork and AC adapter. Users who want the active stylus will have to buy one separately. The standard one-year limited warranty applies.
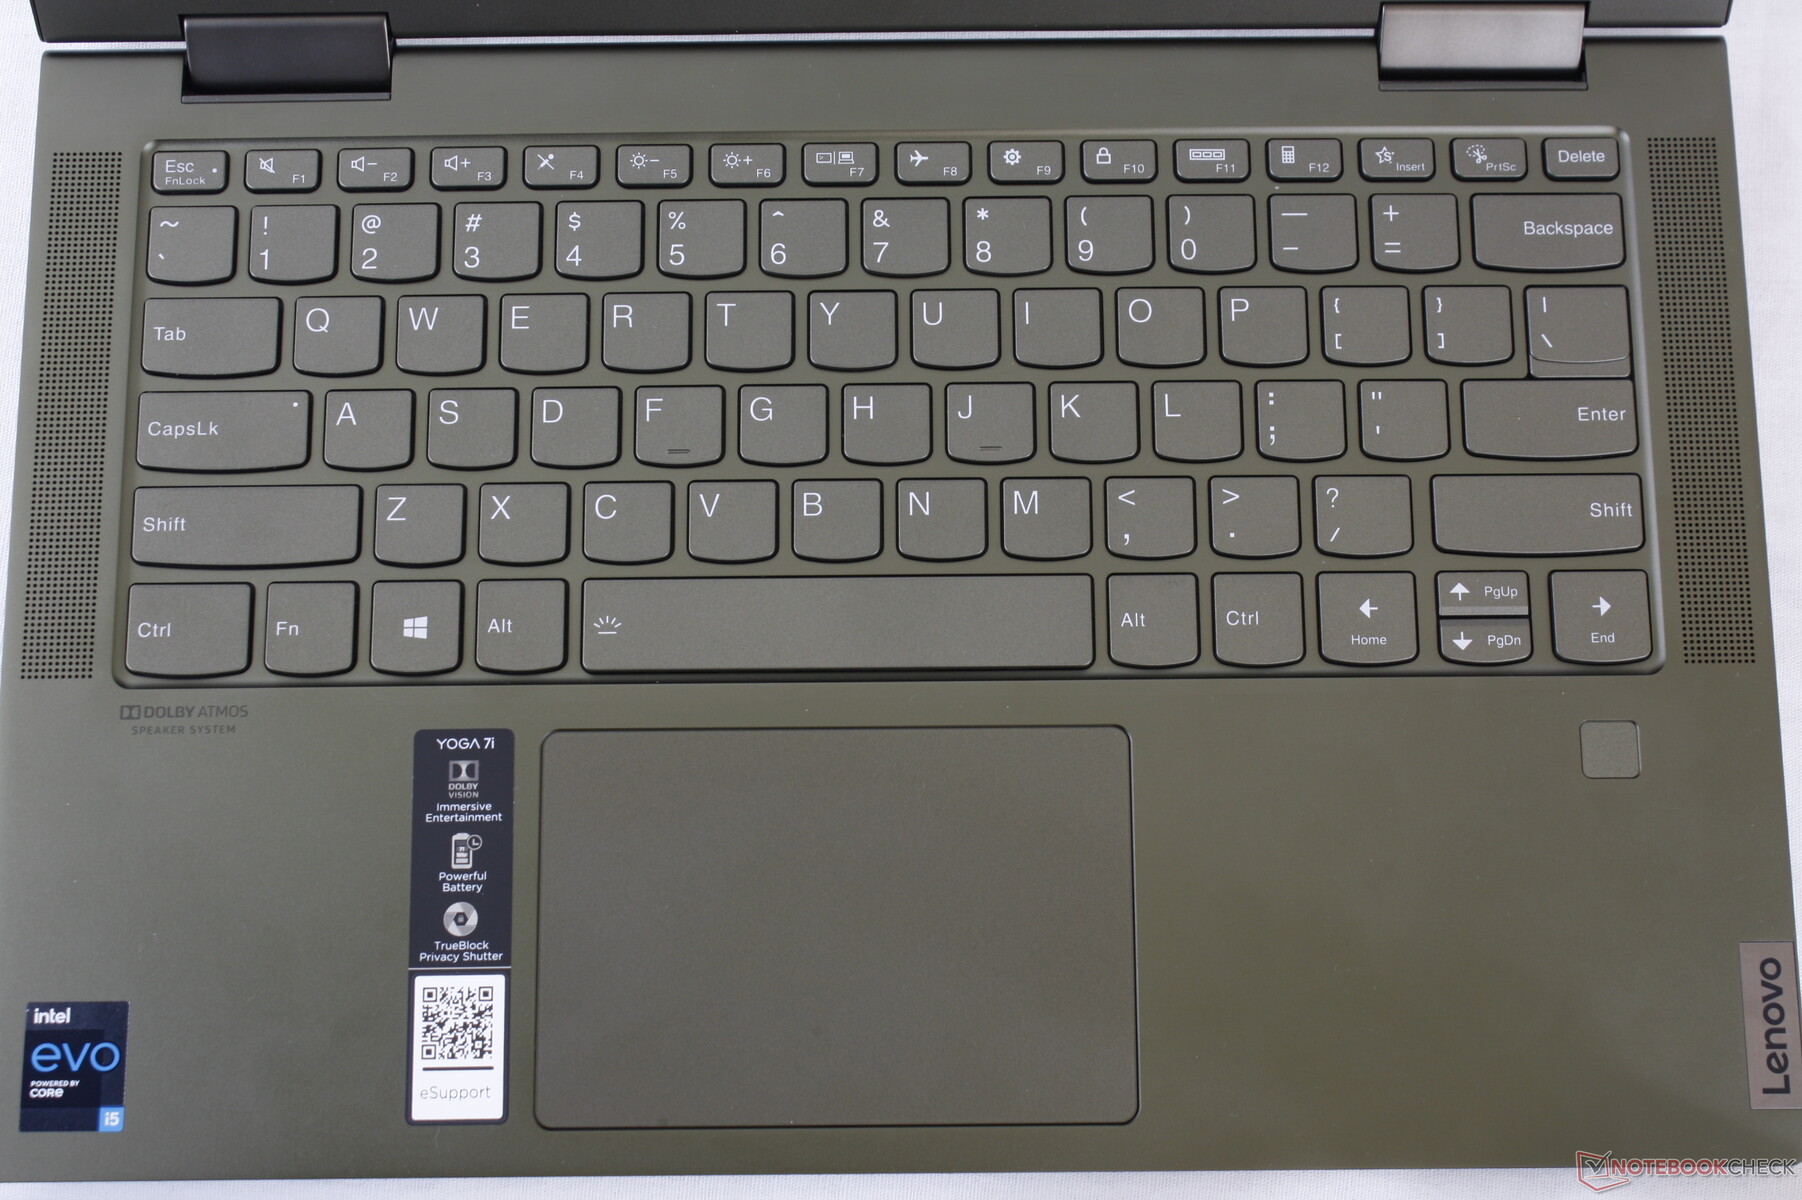
Input Devices
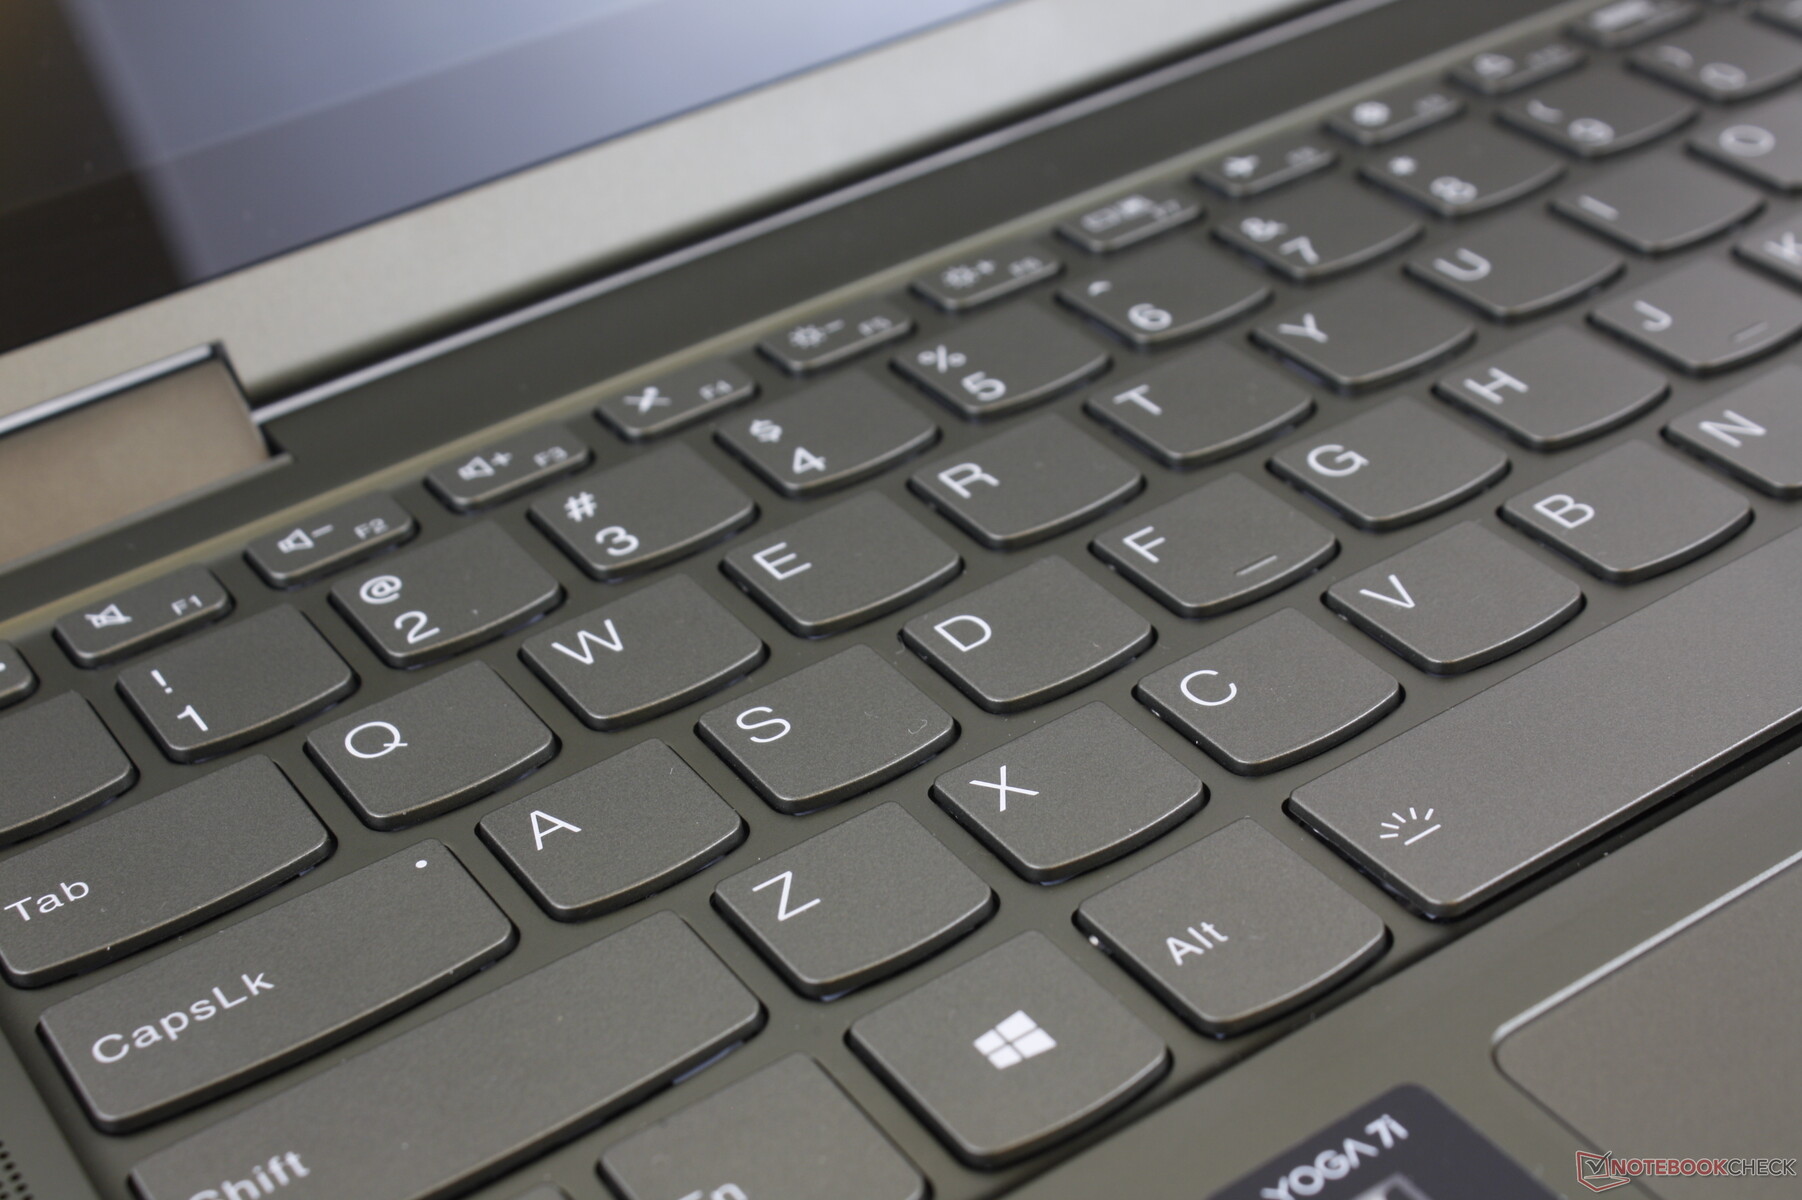
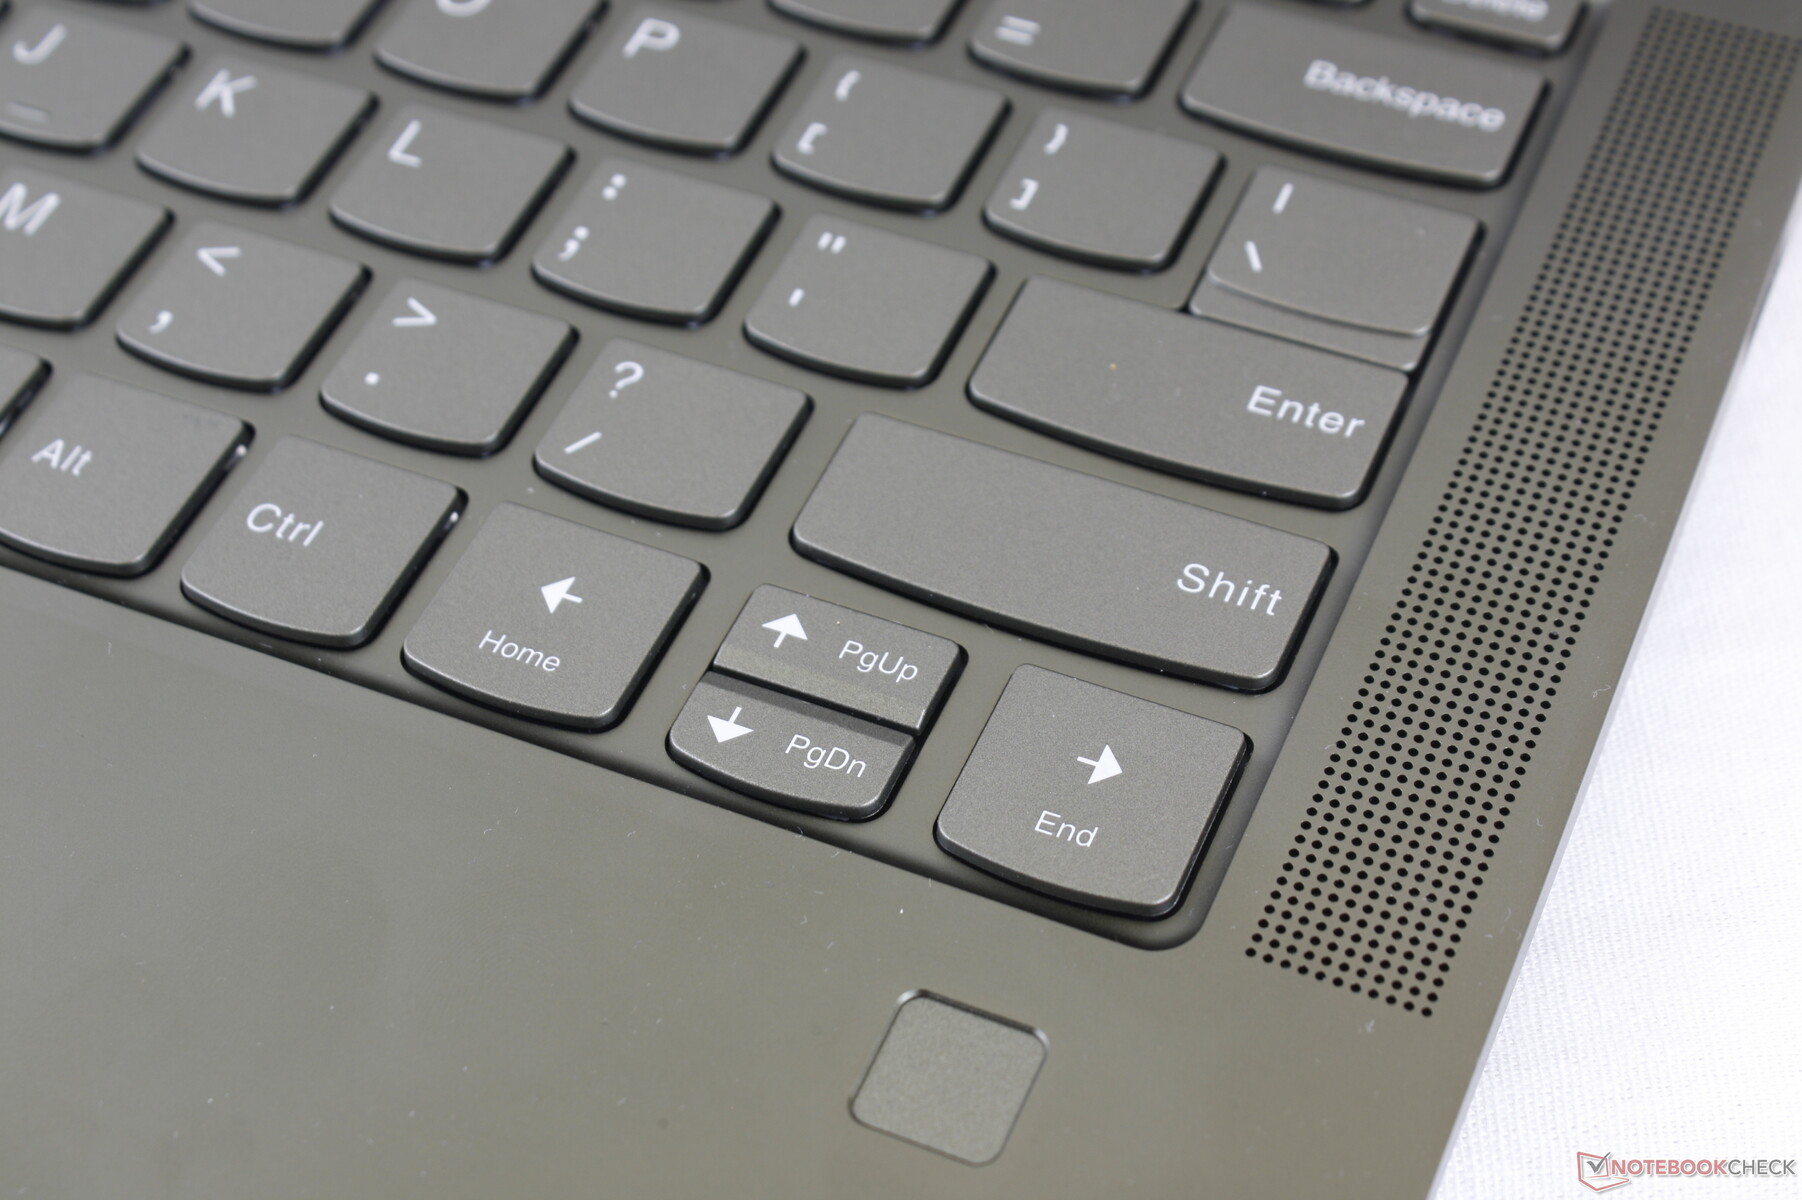
Keyboard
Keyboard size, layout, and feedback are exactly the same as on the Yoga Slim 7. Even the secondary functions on the first row of keys are not any different between them. We find key feedback to be softer and not as crisp as on the HP Spectre or EliteBook series, the XPS 13, or Lenovo's own Thinkpad series. The typing experience is more akin to a cheap IdeaPad or HP Pavilion rather than a high-end business laptop.
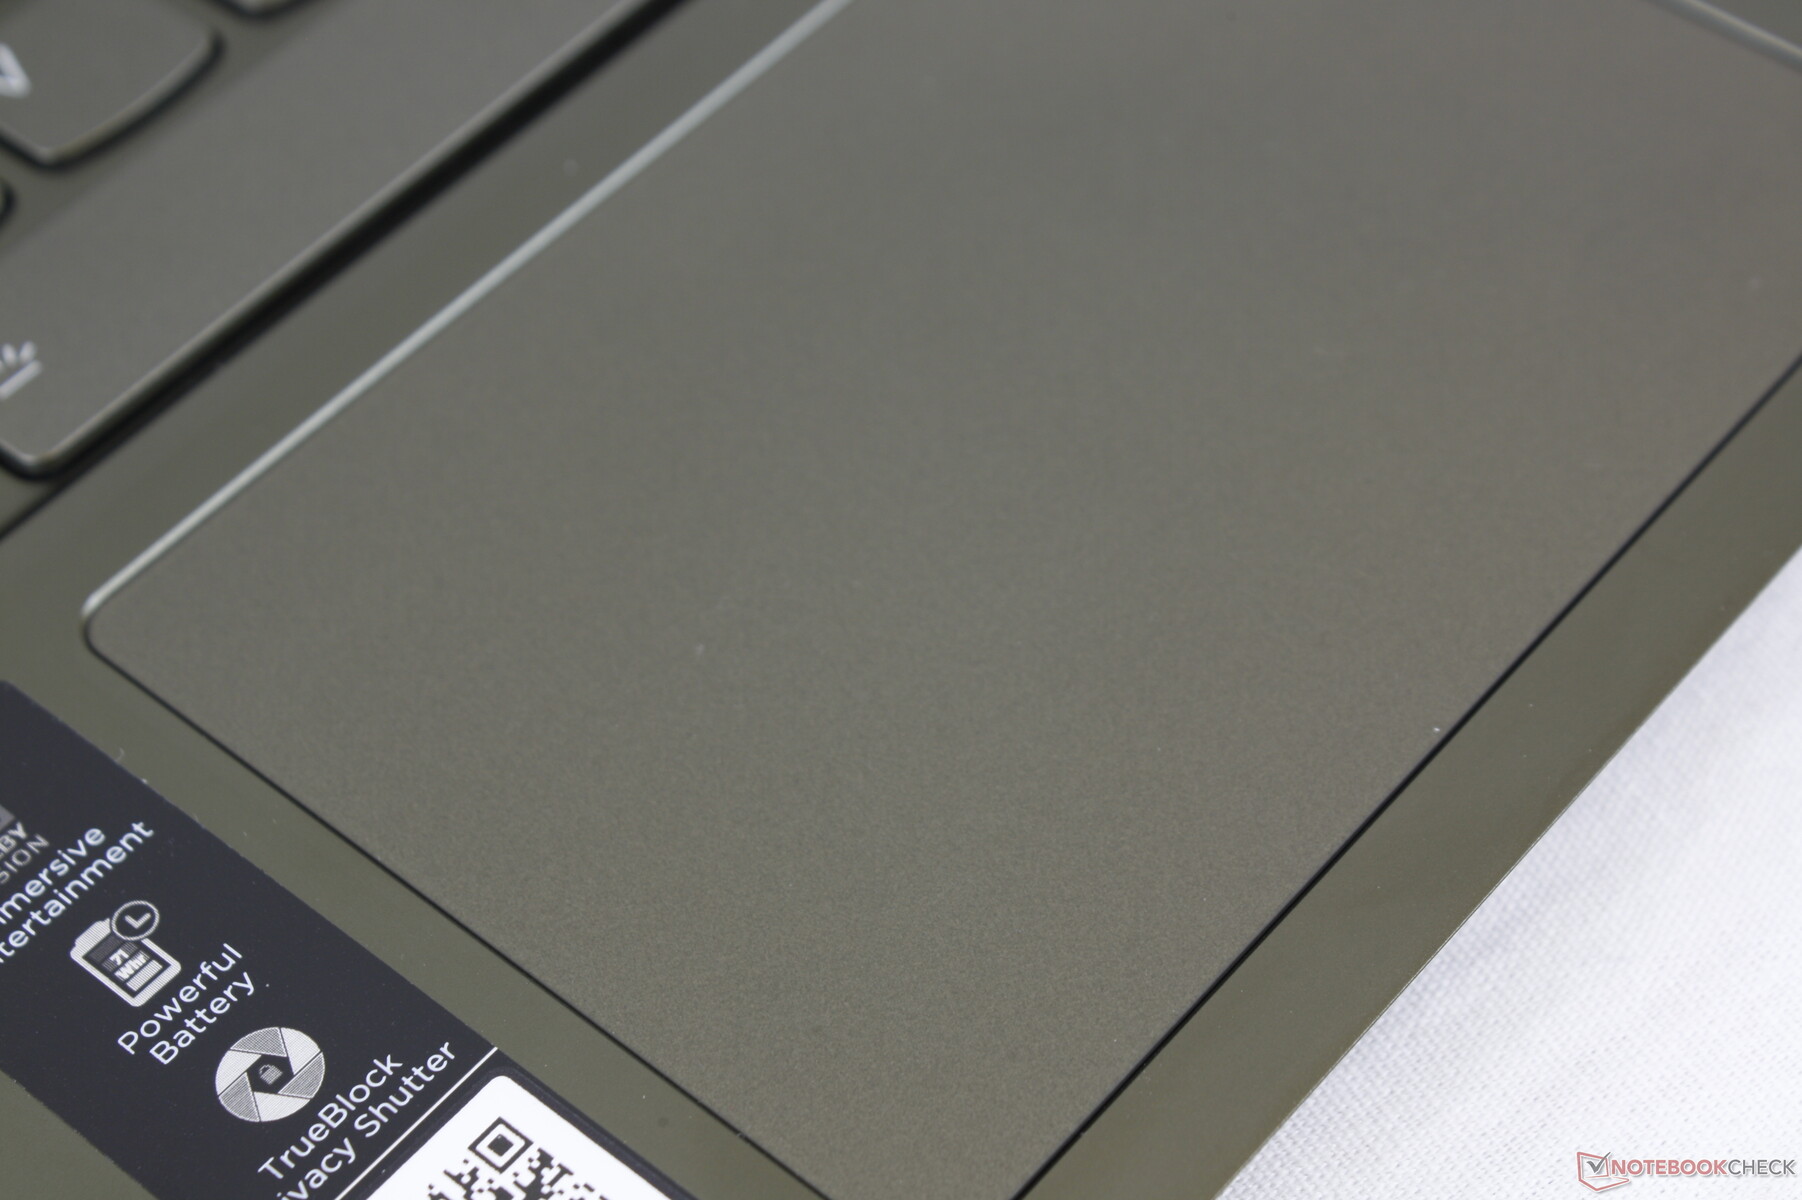
Touchpad
The Precision clickpad (10.5 x 7 cm) is larger than the clickpads on both the Yoga Slim 7 (10.5 x 6.2 cm) and IdeaPad S940 (10.5 x 5.2 cm). Its surface is completely smooth when gliding at medium to high speeds while slower speeds tend to stick a bit.
We experienced an issue on our clickpad where the mouse cursor would stop moving while gliding a finger near the top right corner of the clickpad surface. We're able to reproduce this phenomenon reliably and so it's worth double-checking immediately after purchasing.
The clickpad is loud when pressed even though feedback is weak for an odd clicking experience. Clickpads that are spongy are usually quieter, but the opposite is true on the Lenovo. We would have preferred feedback to be firmer and slightly deeper for a more satisfying click.
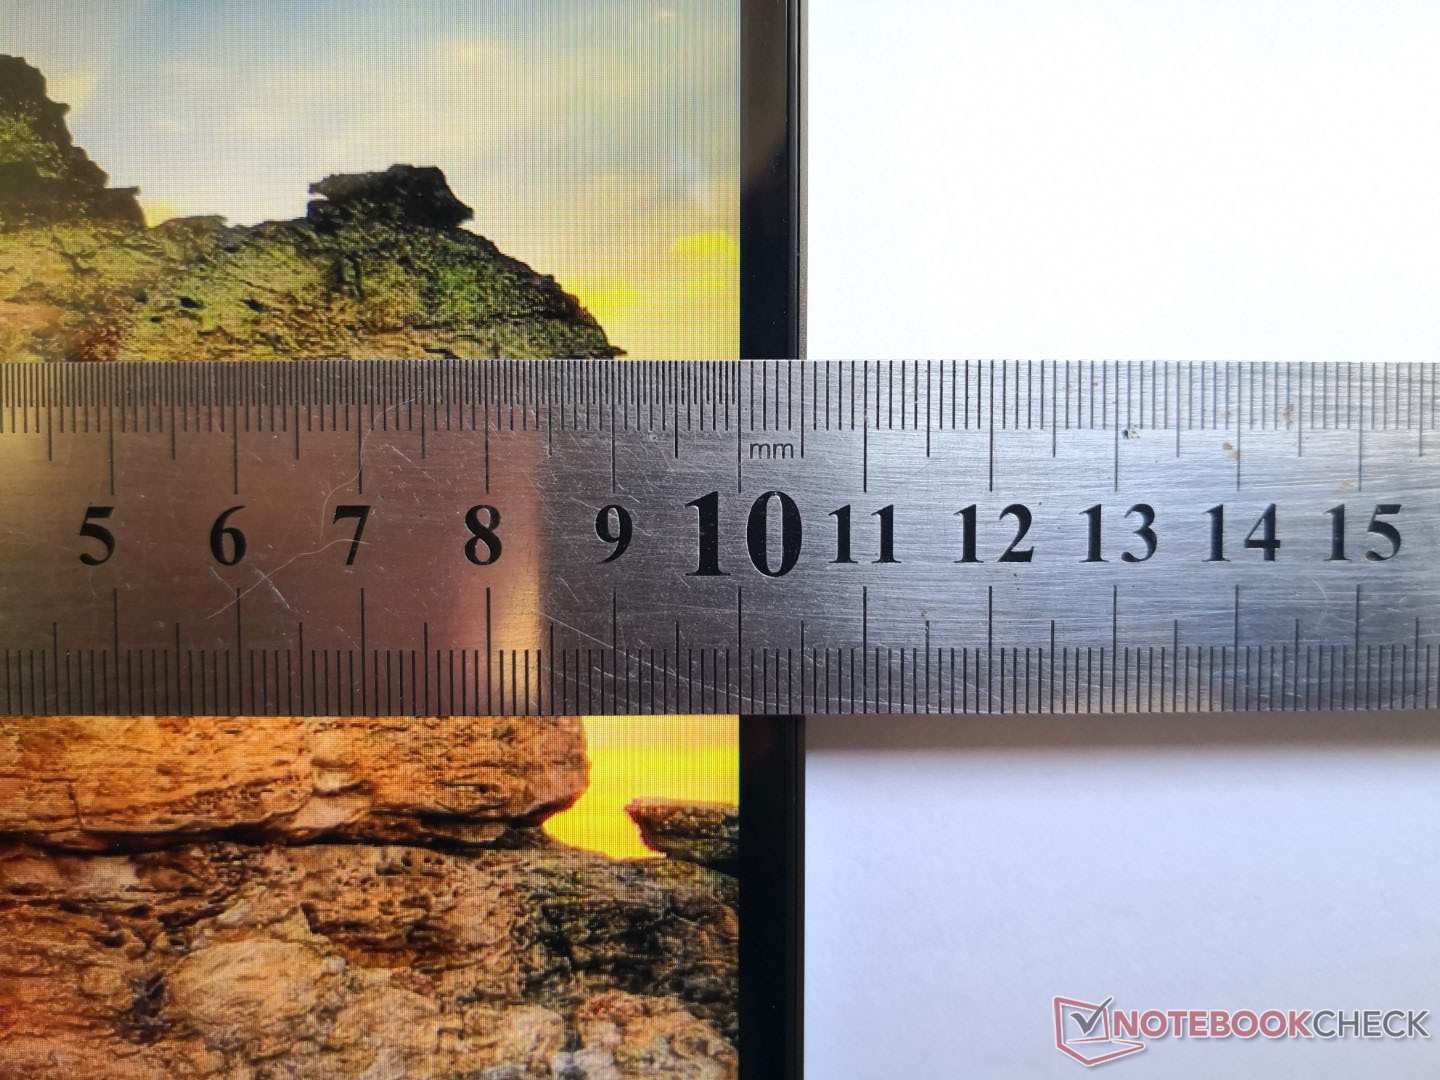
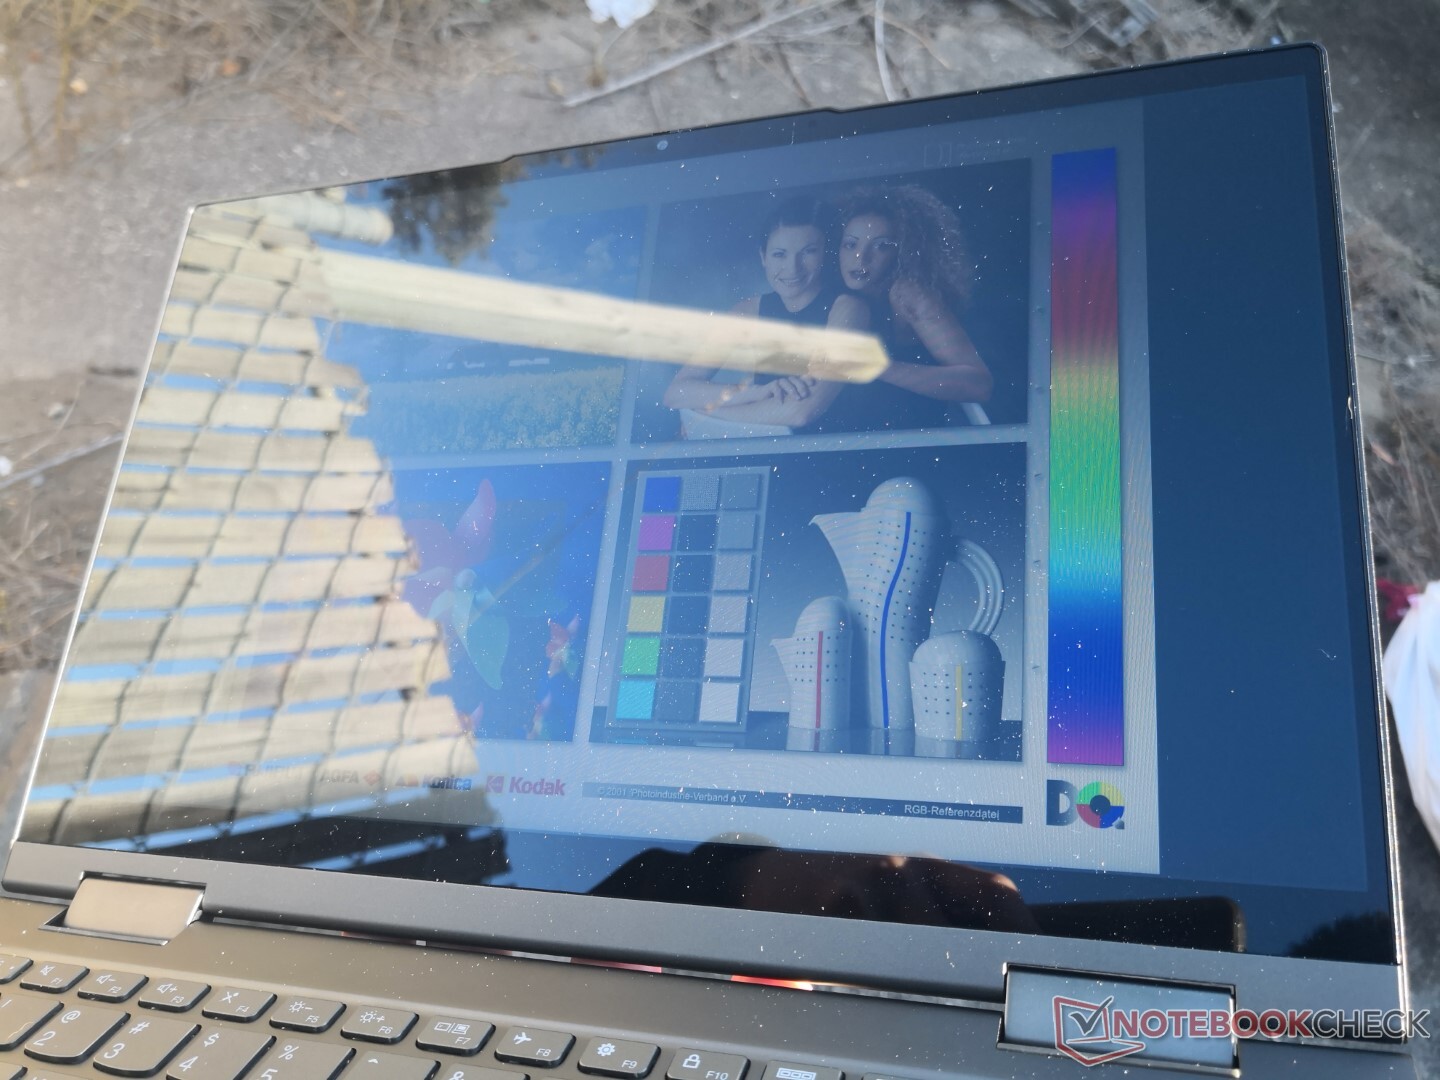
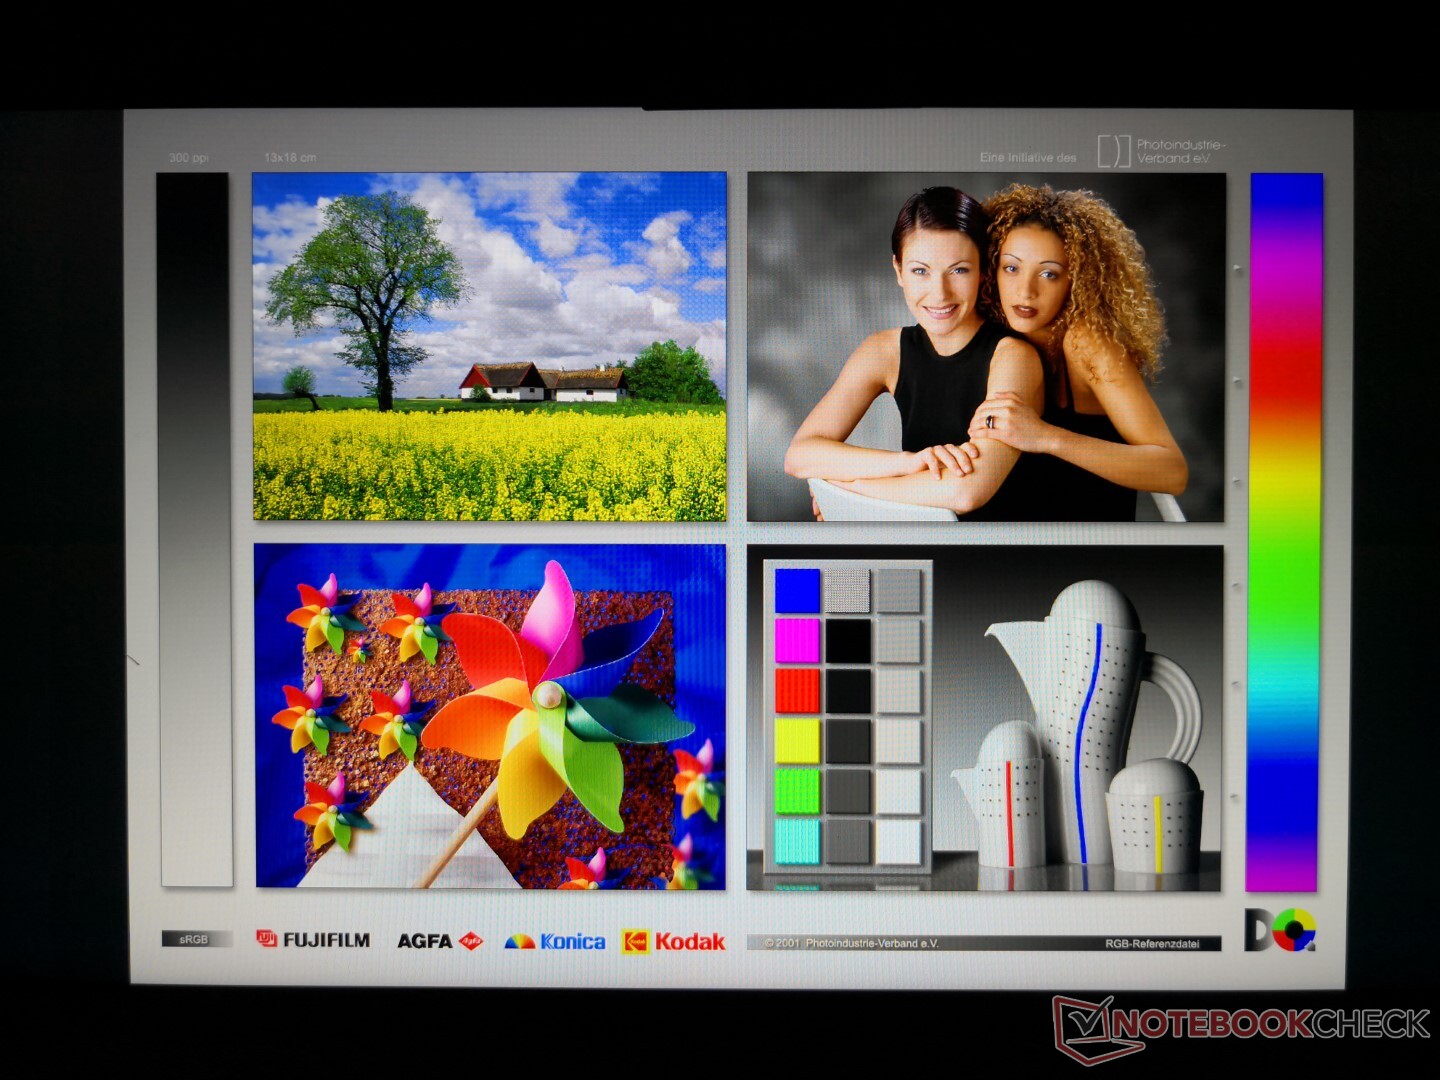
Display
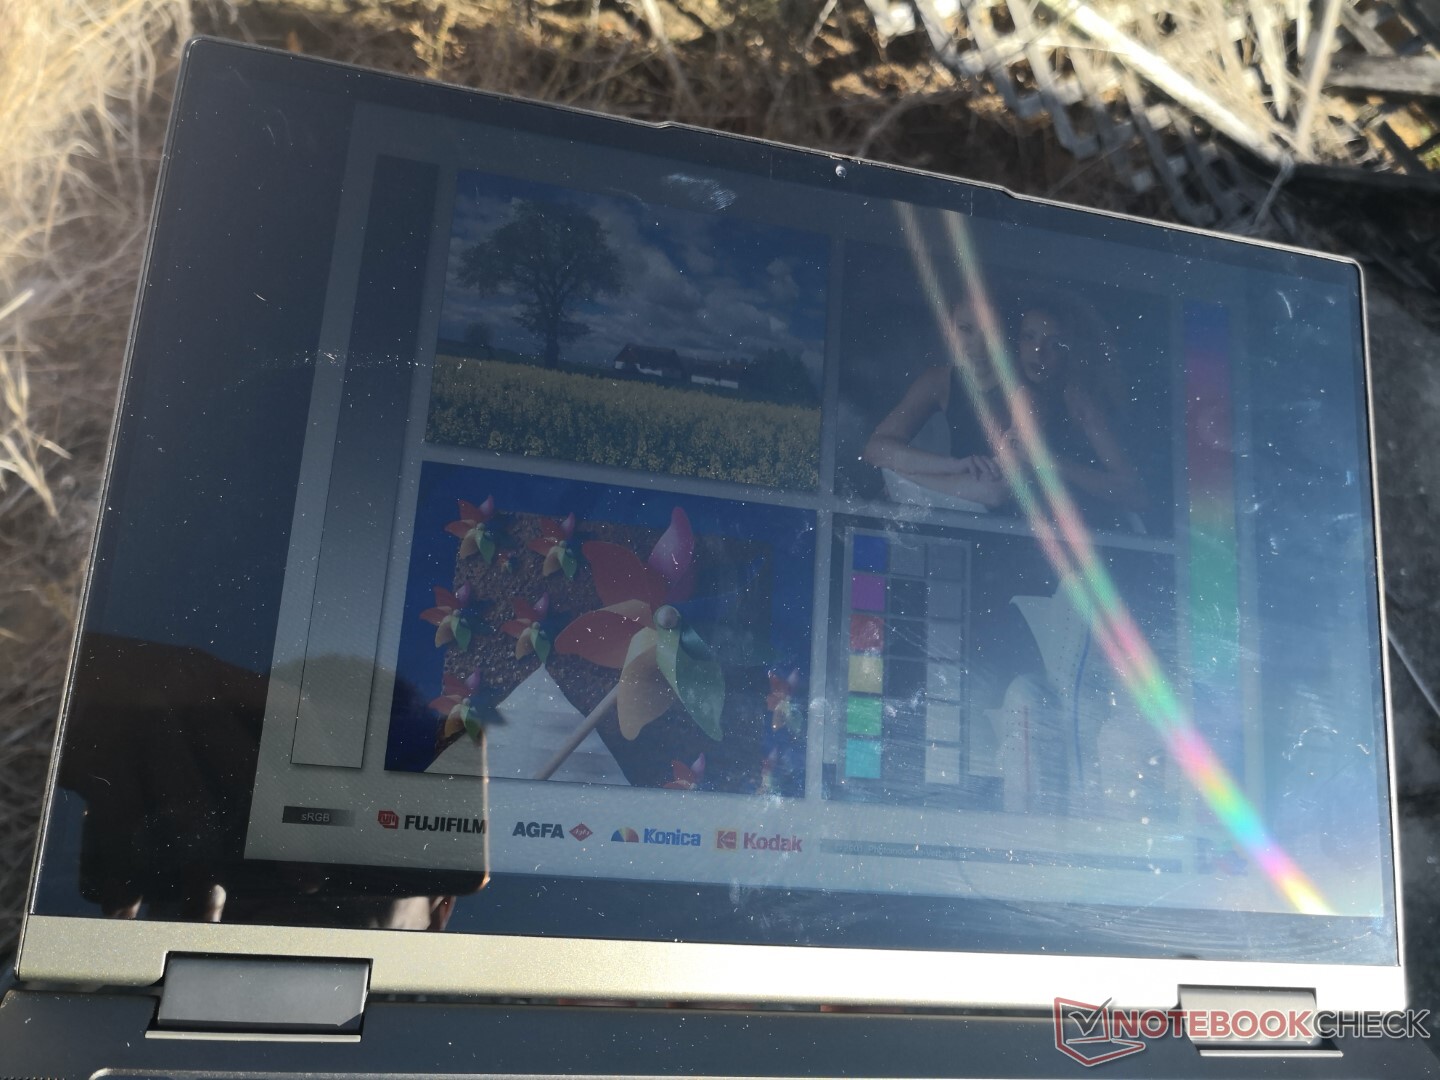
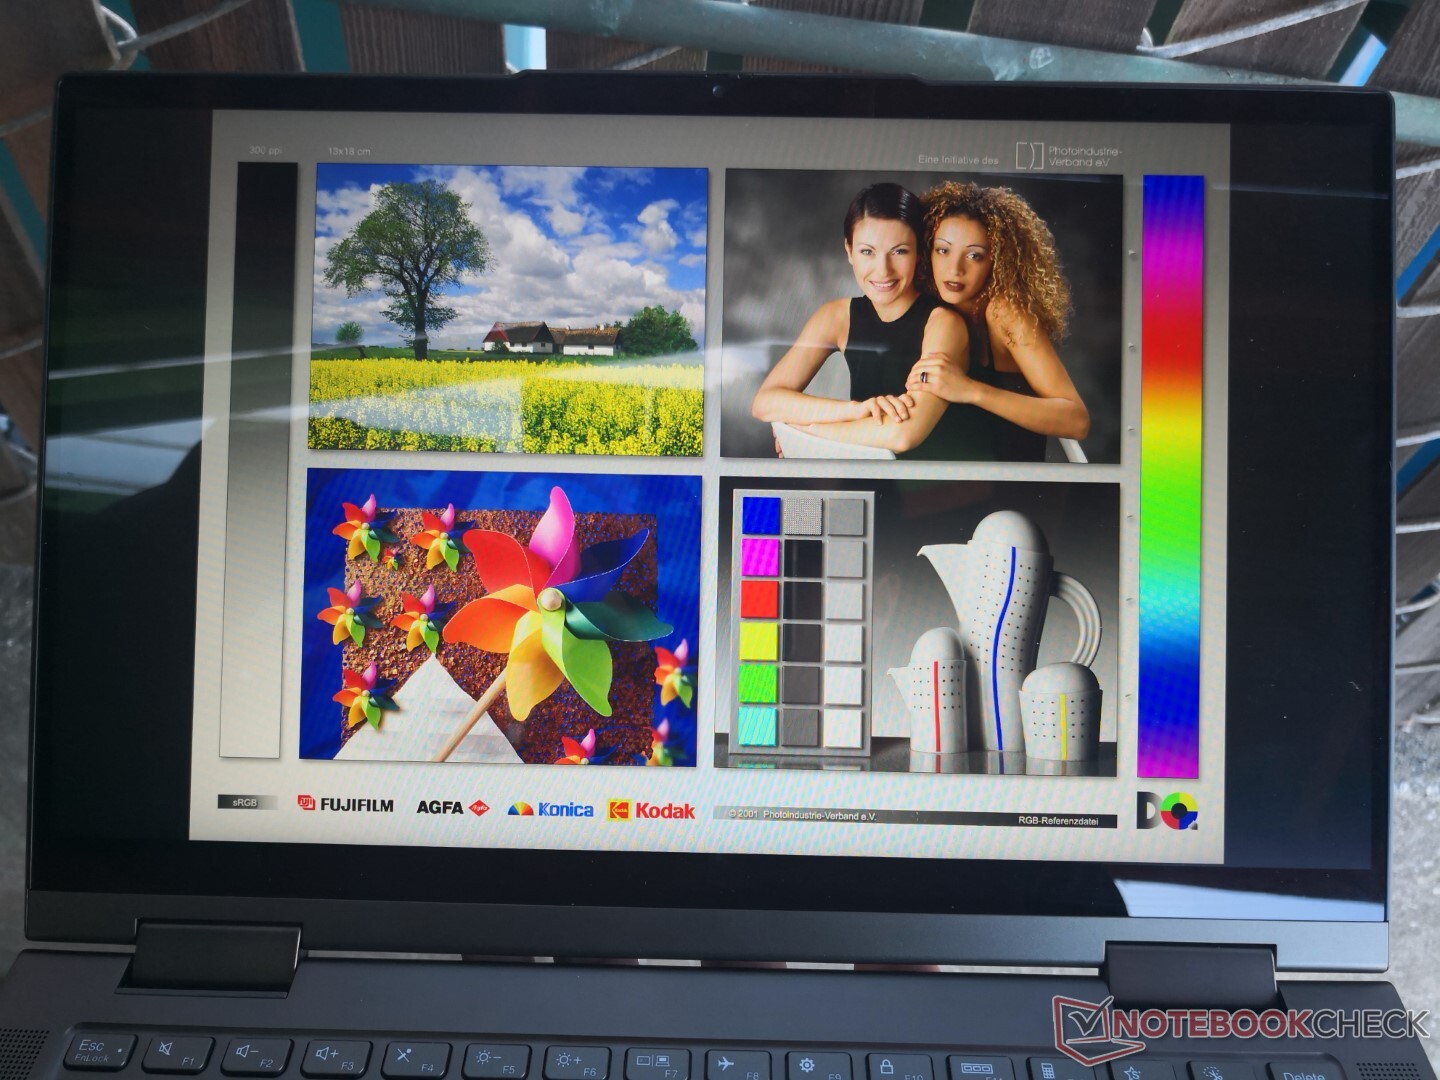
The BOE NV140FHM-N65 panel here can be found on no other laptop in our database, although the Asus ZenBook Flip 14 UX461UA uses a similar BOE NV140FHM-N62 panel. Contrast ratio is better on our Lenovo than on the aforementioned Asus by two to one while color reproduction and response times remain about the same. This is an excellent panel for browsing and amateur picture editing, but the average response times are poor for fast-moving games.

| |||||||||||||||||||||||||
Brightness Distribution: 89 %
Center on Battery: 292.3 cd/m²
Contrast: 1044:1 (Black: 0.28 cd/m²)
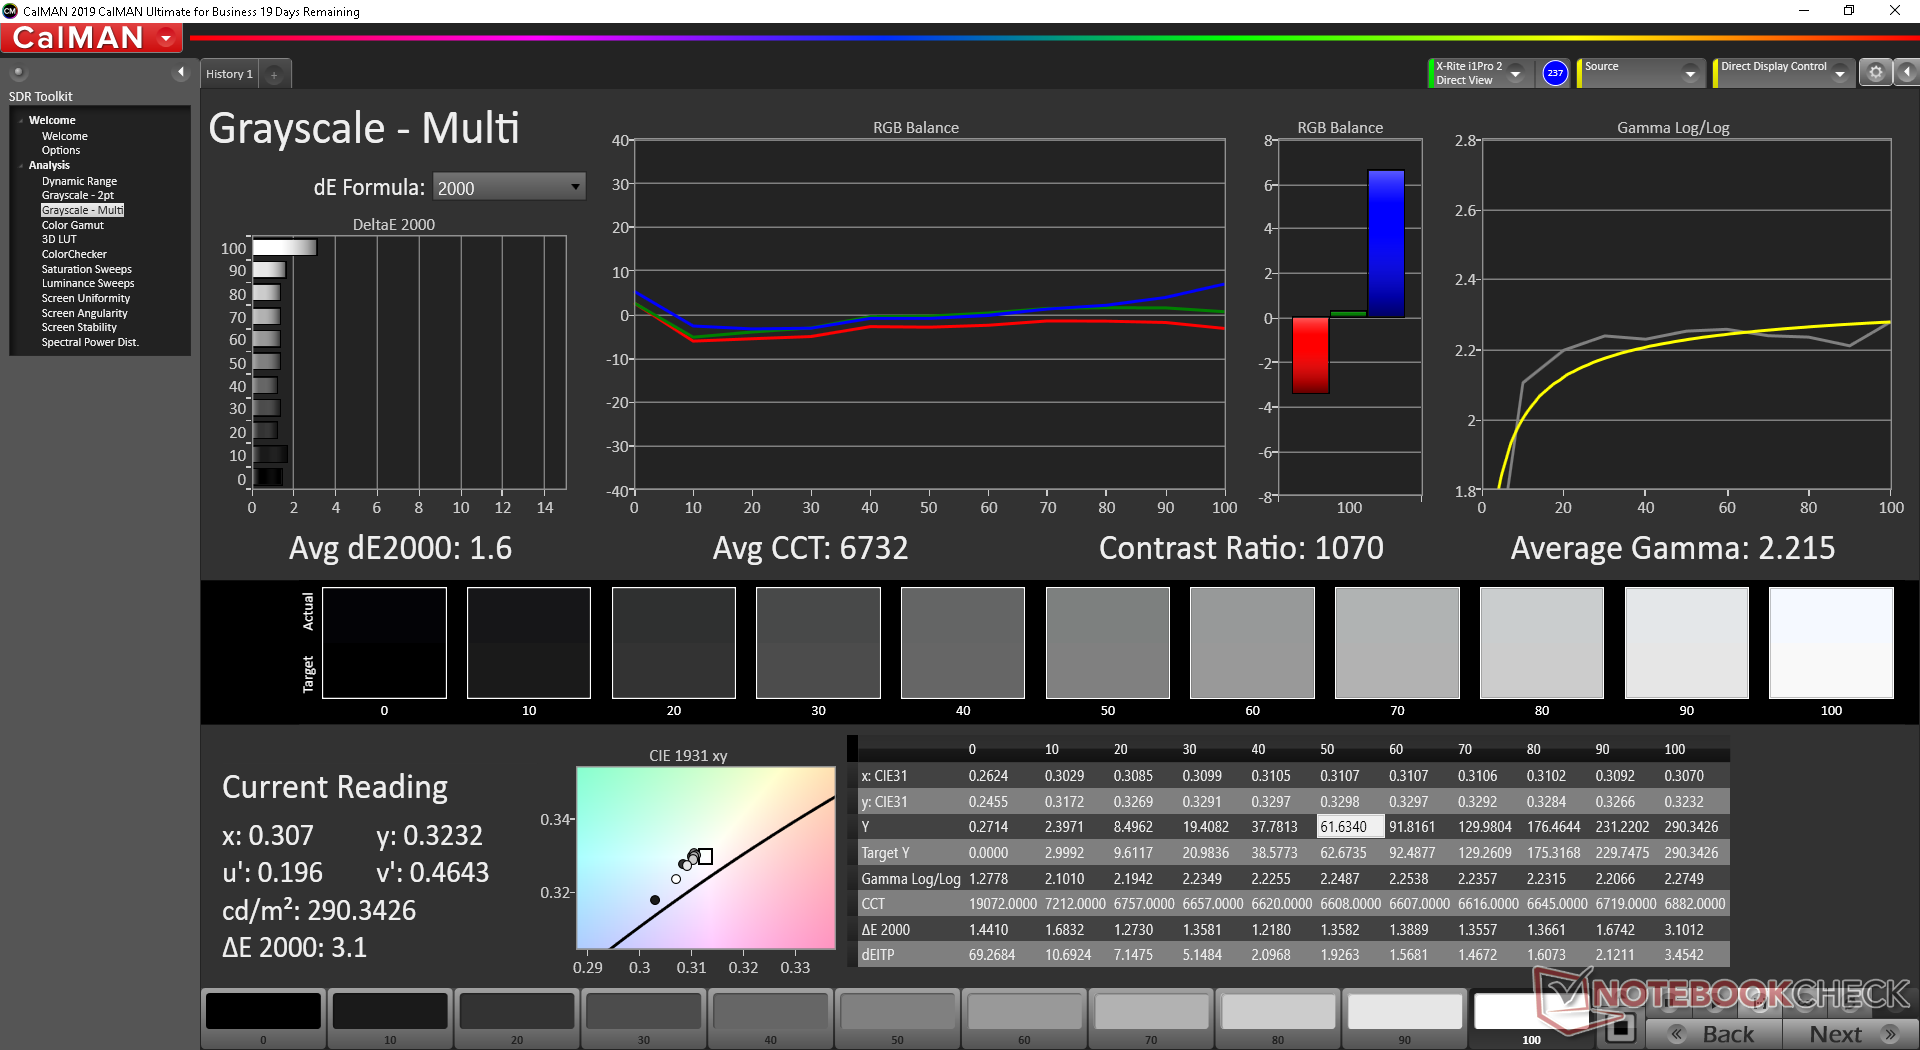
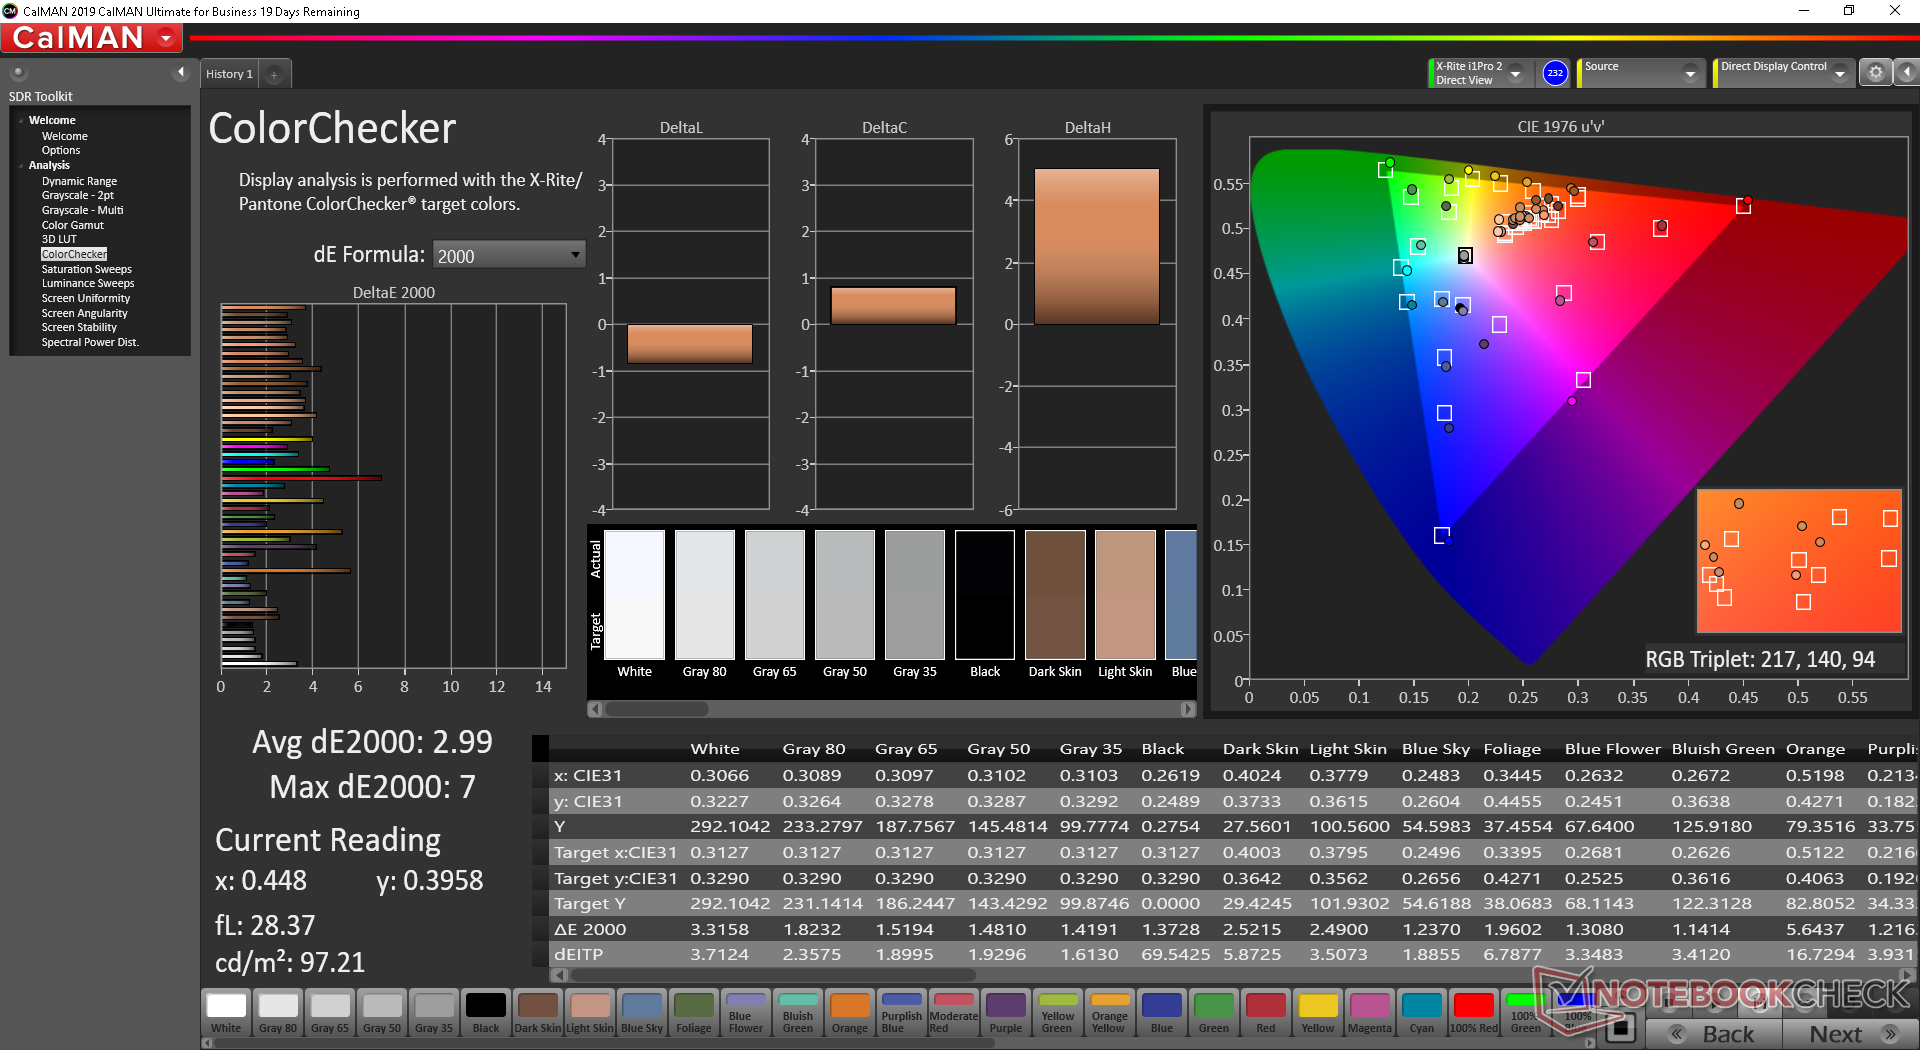
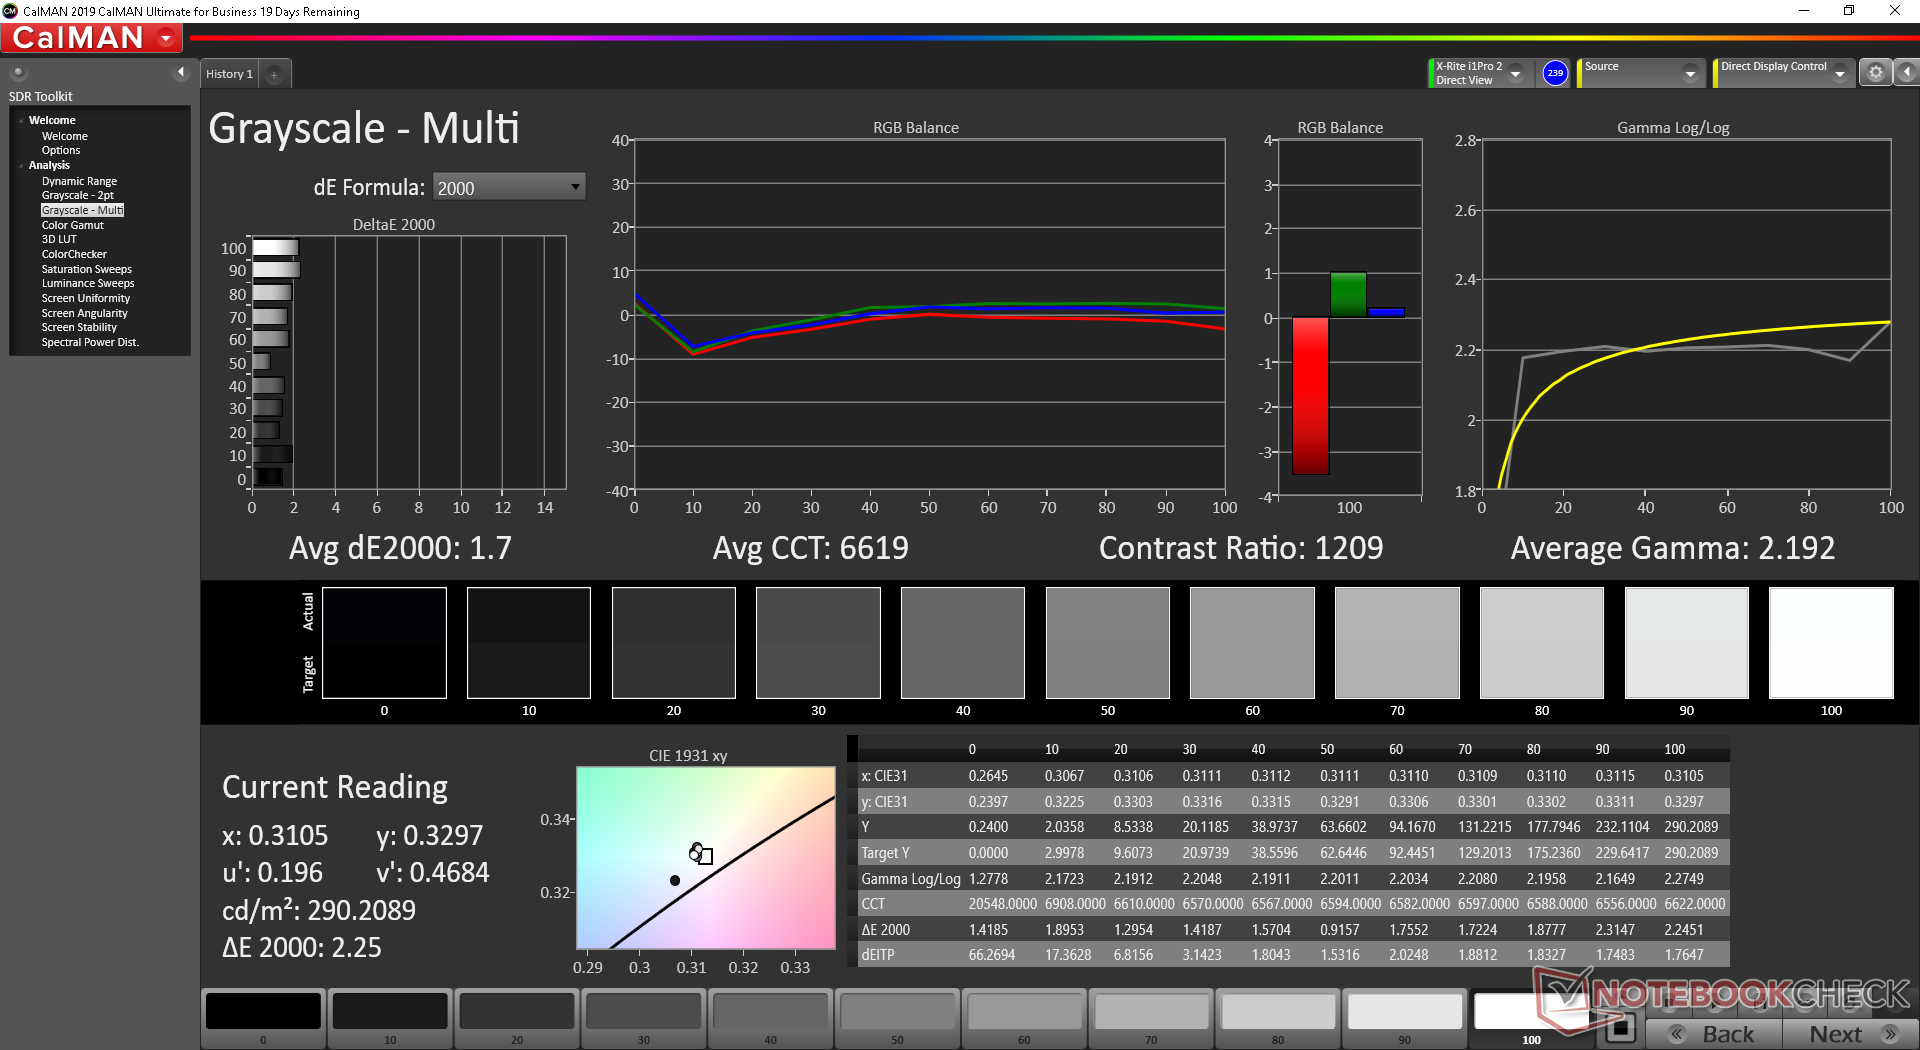
ΔE ColorChecker Calman: 2.99 | ∀{0.5-29.43 Ø4.73}
calibrated: 3.1
ΔE Greyscale Calman: 1.6 | ∀{0.09-98 Ø4.97}
91.8% sRGB (Argyll 1.6.3 3D)
60% AdobeRGB 1998 (Argyll 1.6.3 3D)
67.4% AdobeRGB 1998 (Argyll 3D)
92.2% sRGB (Argyll 3D)
70.9% Display P3 (Argyll 3D)
Gamma: 2.22
CCT: 6732 K
| Lenovo Yoga 7 14ITL5 BOE CQ NV140FHM-N65, IPS, 14", 1920x1080 | Asus ZenBook 14 UX425EA AU Optronics B140HAN06.8, IPS, 14", 1920x1080 | Lenovo Yoga Slim 7-14IIL05 N140HCG-EQ1, , 14", 1920x1080 | Lenovo IdeaPad 5 14ARE05 AU Optronics B140HAN04.E, IPS, 14", 1920x1080 | Asus ZenBook Flip 14 UX463FA-AI039T AU AUO323D, IPS, 14", 1920x1080 | Lenovo Yoga C740-14IML CMN N140HCE-ET2, IPS, 14", 1920x1080 | |
|---|---|---|---|---|---|---|
| Display | 3% | 1% | -43% | -10% | 2% | |
| Display P3 Coverage (%) | 70.9 | 68.6 -3% | 66.4 -6% | 37.23 -47% | 60.1 -15% | 67.9 -4% |
| sRGB Coverage (%) | 92.2 | 98.3 7% | 98.8 7% | 55.9 -39% | 85.5 -7% | 98.3 7% |
| AdobeRGB 1998 Coverage (%) | 67.4 | 69.8 4% | 68.4 1% | 38.46 -43% | 61.1 -9% | 70.1 4% |
| Response Times | 9% | -5% | 17% | 23% | 12% | |
| Response Time Grey 50% / Grey 80% * (ms) | 43.2 ? | 49.6 ? -15% | 51.2 ? -19% | 41 ? 5% | 36 ? 17% | 35.6 ? 18% |
| Response Time Black / White * (ms) | 38.8 ? | 26.4 ? 32% | 35.2 ? 9% | 28 ? 28% | 28 ? 28% | 36.8 ? 5% |
| PWM Frequency (Hz) | 27030 ? | |||||
| Screen | 14% | 12% | -34% | -10% | -21% | |
| Brightness middle (cd/m²) | 292.3 | 375.1 28% | 289 -1% | 360 23% | 280 -4% | 329.9 13% |
| Brightness (cd/m²) | 280 | 371 33% | 286 2% | 317 13% | 286 2% | 315 13% |
| Brightness Distribution (%) | 89 | 91 2% | 92 3% | 82 -8% | 78 -12% | 90 1% |
| Black Level * (cd/m²) | 0.28 | 0.34 -21% | 0.17 39% | 0.41 -46% | 0.208 26% | 0.29 -4% |
| Contrast (:1) | 1044 | 1103 6% | 1700 63% | 878 -16% | 1346 29% | 1138 9% |
| Colorchecker dE 2000 * | 2.99 | 1.79 40% | 2.5 16% | 4.75 -59% | 3.97 -33% | 3.68 -23% |
| Colorchecker dE 2000 max. * | 7 | 3.05 56% | 4.7 33% | 7.4 -6% | 8.29 -18% | 8.64 -23% |
| Colorchecker dE 2000 calibrated * | 3.1 | 1.79 42% | 0.6 81% | 4.86 -57% | 3.42 -10% | 1.03 67% |
| Greyscale dE 2000 * | 1.6 | 2.3 -44% | 3.4 -113% | 3.75 -134% | 2.83 -77% | 6.4 -300% |
| Gamma | 2.22 99% | 2.29 96% | 1.98 111% | 2.32 95% | 2.34 94% | 2.17 101% |
| CCT | 6732 97% | 6405 101% | 7005 93% | 6543 99% | 6556 99% | 6195 105% |
| Color Space (Percent of AdobeRGB 1998) (%) | 60 | 63.9 7% | 62.6 4% | 36 -40% | 56 -7% | 63.6 6% |
| Color Space (Percent of sRGB) (%) | 91.8 | 98.8 8% | 98.9 8% | 56 -39% | 85 -7% | 98.4 7% |
| Total Average (Program / Settings) | 9% /
11% | 3% /
8% | -20% /
-29% | 1% /
-6% | -2% /
-13% |
* ... smaller is better
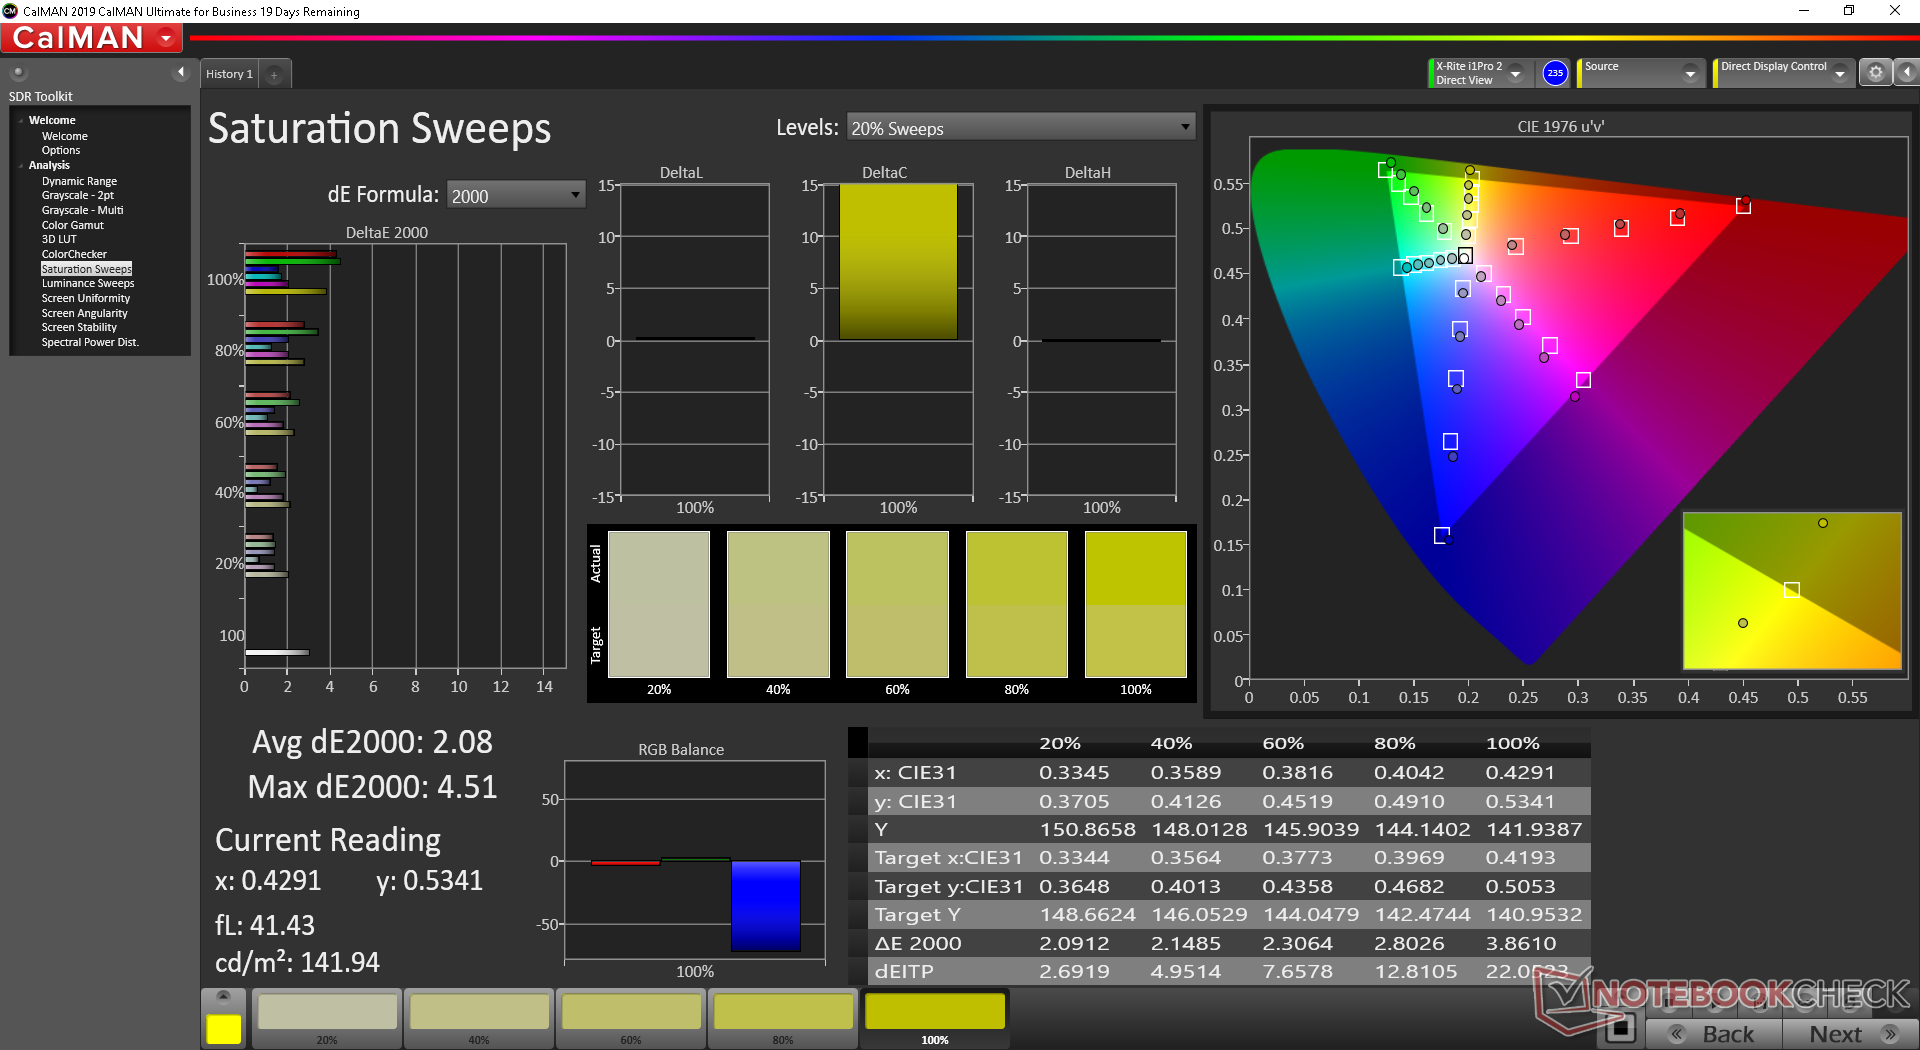
Color space covers approximately 90 percent and 60 percent of sRGB and AdobeRGB, respectively, to be similar to most other mid-range to high-end Ultrabooks. No other options are available.
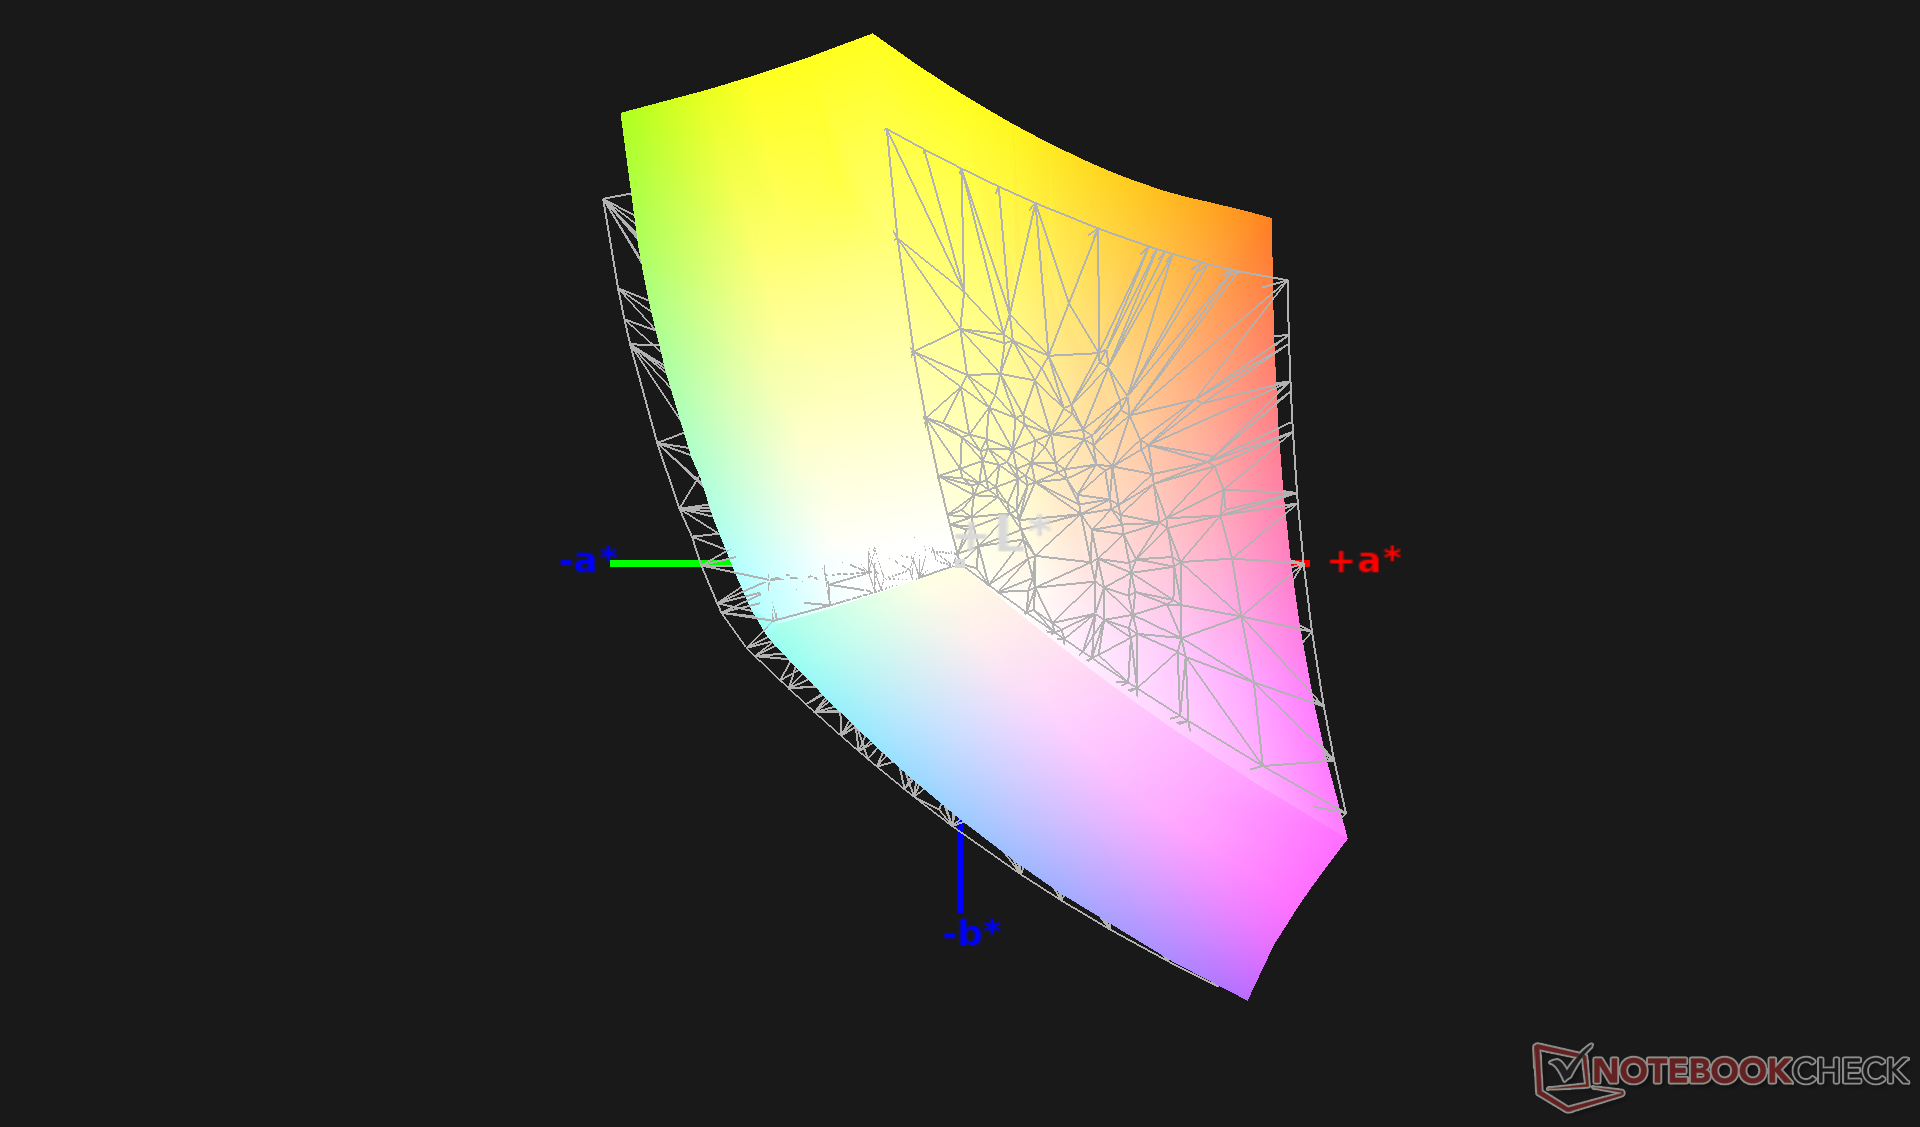
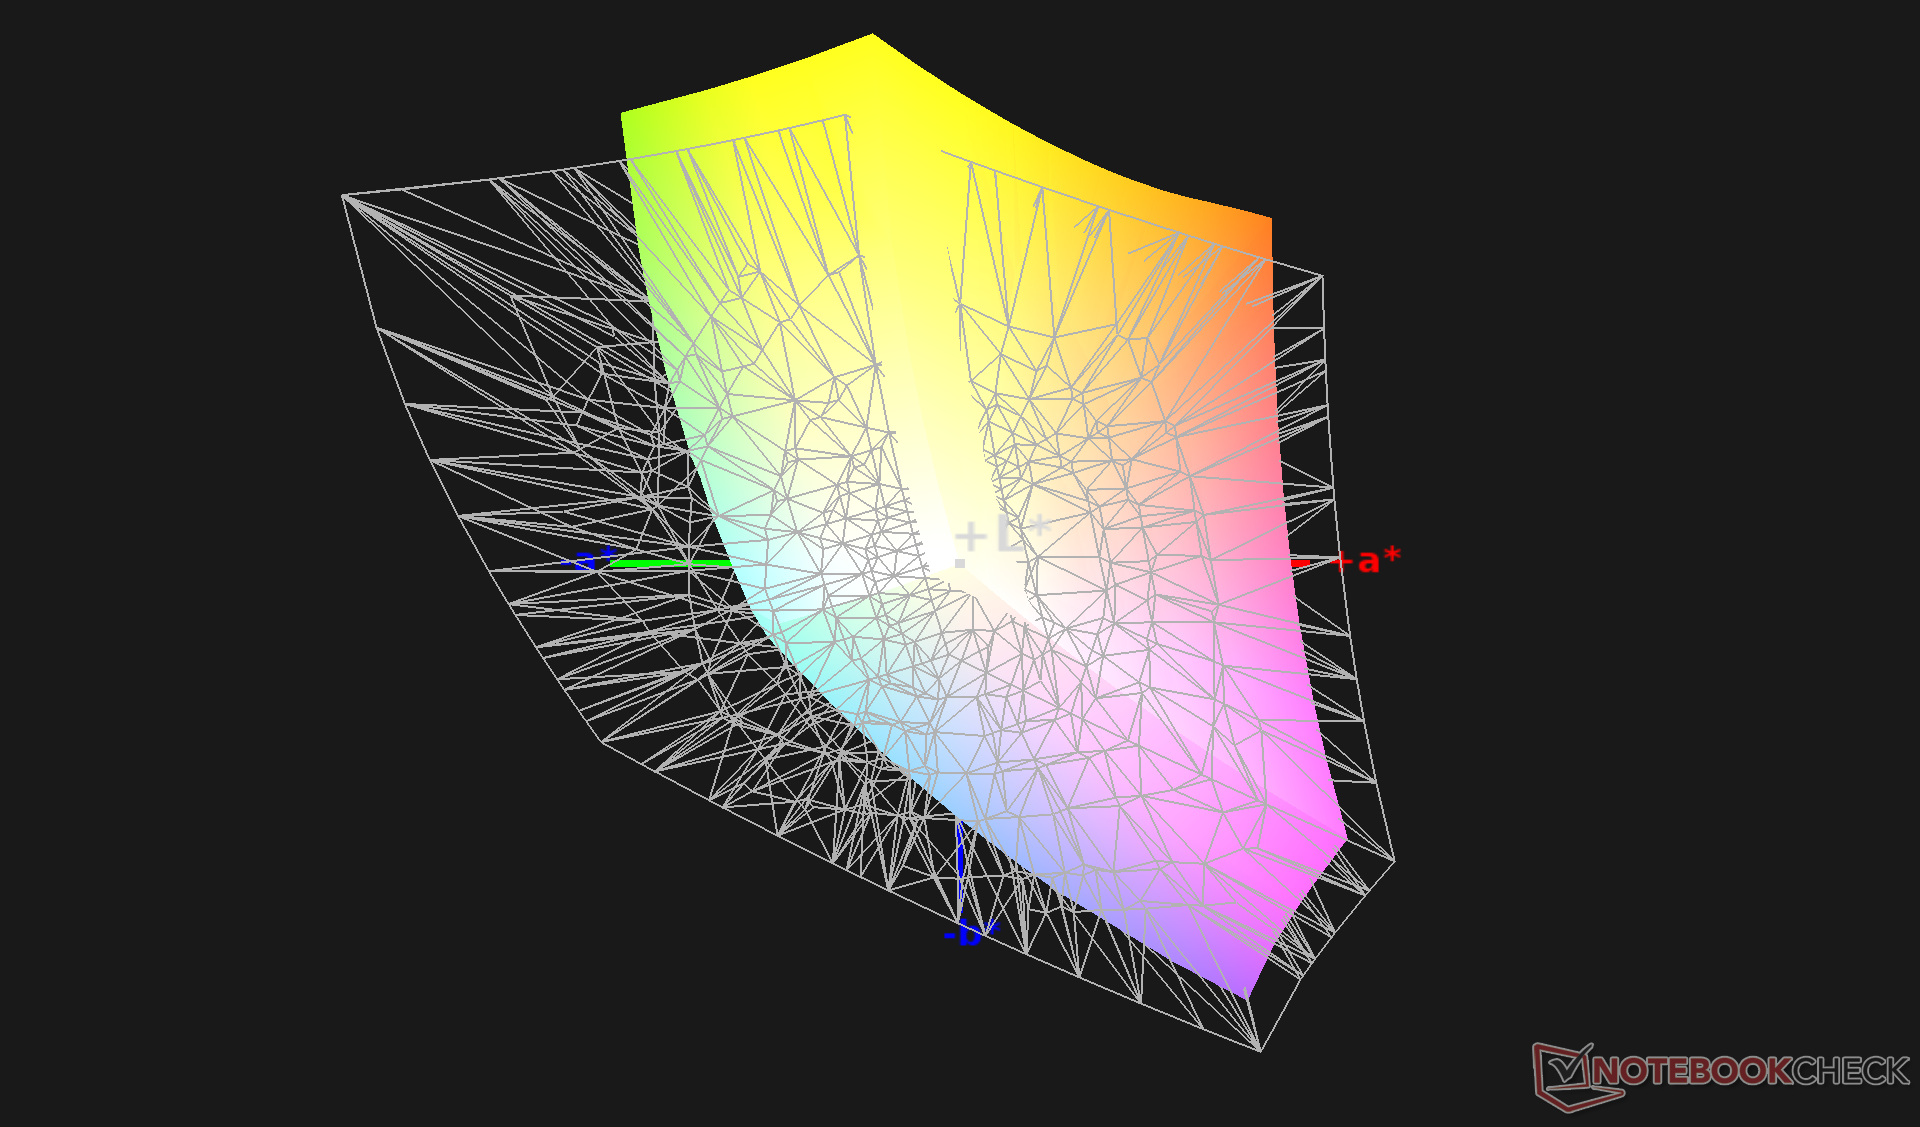
To our surprise, the laptop is well-calibrated out of the box with average grayscale and ColorChecker DeltaE values of just 1.6 and 2.99, respectively. Our attempt to calibrate the panel even further with an X-Rite colorimeter would not yield better results.
Display Response Times
| ↔ Response Time Black to White | ||
|---|---|---|
| 38.8 ms ... rise ↗ and fall ↘ combined | ↗ 21.6 ms rise | 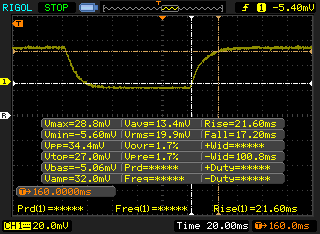 |
| ↘ 17.2 ms fall | ||
| The screen shows slow response rates in our tests and will be unsatisfactory for gamers. In comparison, all tested devices range from 0.1 (minimum) to 240 (maximum) ms. » 96 % of all devices are better. This means that the measured response time is worse than the average of all tested devices (19.9 ms). | ||
| ↔ Response Time 50% Grey to 80% Grey | ||
| 43.2 ms ... rise ↗ and fall ↘ combined | ↗ 22.4 ms rise | 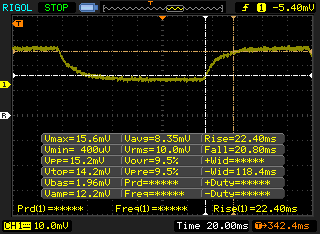 |
| ↘ 20.8 ms fall | ||
| The screen shows slow response rates in our tests and will be unsatisfactory for gamers. In comparison, all tested devices range from 0.165 (minimum) to 636 (maximum) ms. » 72 % of all devices are better. This means that the measured response time is worse than the average of all tested devices (31.1 ms). | ||
Screen Flickering / PWM (Pulse-Width Modulation)
| Screen flickering / PWM not detected | 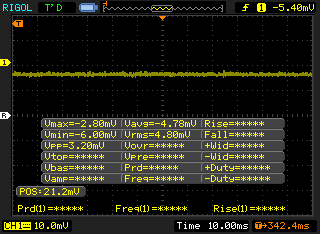 | ||
In comparison: 52 % of all tested devices do not use PWM to dim the display. If PWM was detected, an average of 7798 (minimum: 5 - maximum: 343500) Hz was measured. | |||
Outdoor visibility is average for its category. Alternatives like the Dell XPS 13 or HP EliteBook x360 1040 offer brighter displays at up to 400 nits or even 1000 nits for the latter, but they are more expensive as well.
Performance
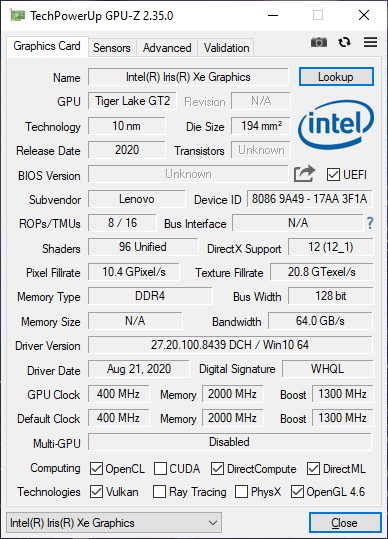
users can configure between the 11th gen Core i5-1135G7 or Core i7-1165G7 each with the same integrated Iris Xe GPU. Discrete GPUs and AMD options are not available for this specific chassis. Keep in mind that RAM is not user-upgradeable and so owners should choose their configurations carefully.
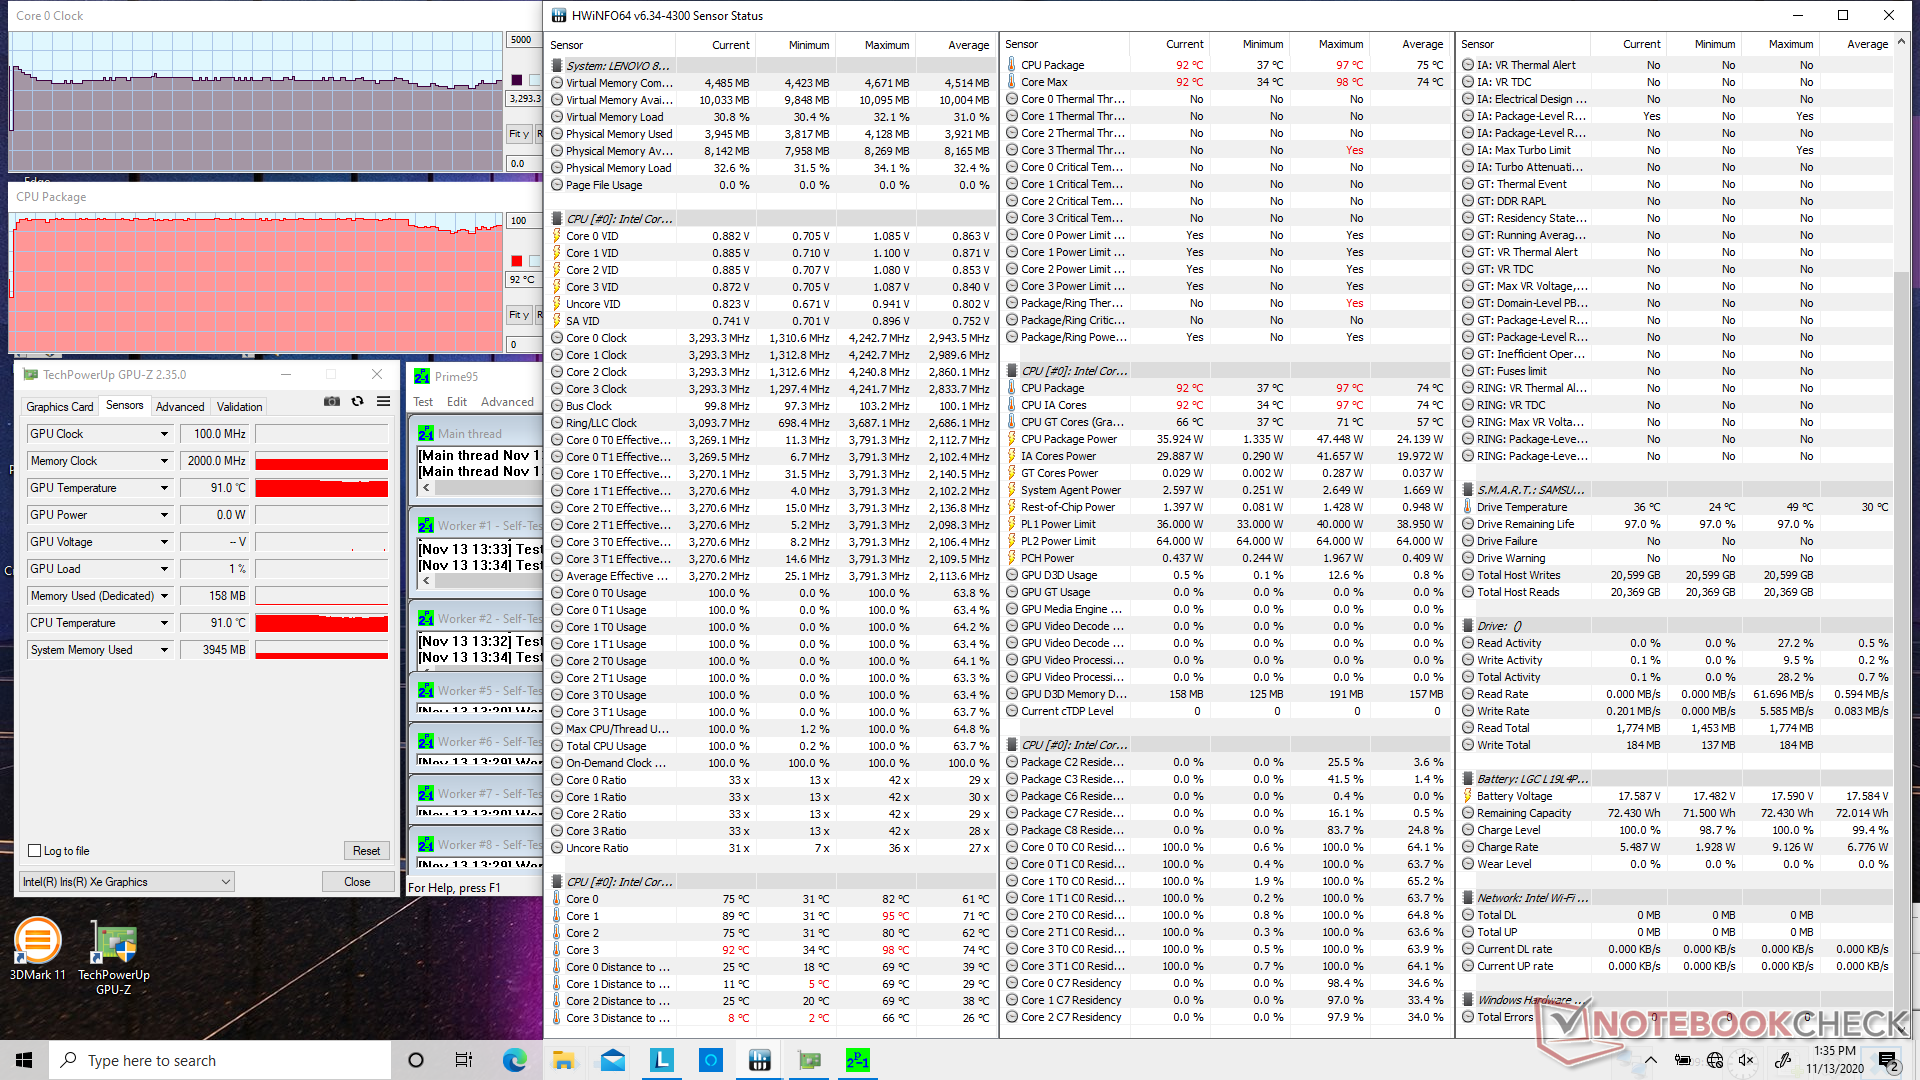
Our unit was set to Extreme Performance mode prior to running any performance benchmarks below for the highest possible scores. We recommend owners become familiar with the pre-installed Lenovo Vantage software as key system settings are found here.
Processor
CPU performance is excellent with results that are within just a few percentage points of the Core i5-1135G7 sample that Intel provided for us earlier in the year. In other words, the processor in our consumer-ready Lenovo laptop is performing as initially advertised by the chipmaker. Results are just as fast or sometimes even faster than the Core i7-1165G7 in the Asus ZenBook 14 and with one of the fastest single-thread performance results for any ULV CPU currently in the market. Multi-thread performance is approximately 25 to 30 percent faster than the Core i7-1065G7 in the Yoga Slim 7, but the Intel chip is still outpaced by the less expensive hexa-core Ryzen 5 4500U or competing octa-core Ryzen 7 4700U.
See our dedicated page on the Core i5-1135G7 for more technical information and benchmarks.
Cinebench R15: CPU Multi 64Bit | CPU Single 64Bit
Blender: v2.79 BMW27 CPU
7-Zip 18.03: 7z b 4 -mmt1 | 7z b 4
Geekbench 5.5: Single-Core | Multi-Core
HWBOT x265 Benchmark v2.2: 4k Preset
LibreOffice : 20 Documents To PDF
R Benchmark 2.5: Overall mean
| LibreOffice / 20 Documents To PDF | |
| Asus ZenBook 14 UX434FL-DB77 | |
| Lenovo IdeaPad 5 14ARE05 | |
| Lenovo Yoga Slim 7-14ARE | |
| Asus VivoBook Flip 14 TM420IA | |
| Asus VivoBook S14 S433FL | |
| Lenovo Yoga Slim 7-14IIL05 | |
| Average Intel Core i5-1135G7 (44.2 - 62.9, n=60) | |
| Lenovo Yoga 7 14ITL5 | |
| Asus ZenBook 14 UX425EA | |
| R Benchmark 2.5 / Overall mean | |
| Asus ZenBook 14 UX434FL-DB77 | |
| Lenovo Yoga Slim 7-14IIL05 | |
| Average Intel Core i5-1135G7 (0.619 - 0.727, n=59) | |
| Lenovo IdeaPad 5 14ARE05 | |
| Asus VivoBook S14 S433FL | |
| Lenovo Yoga 7 14ITL5 | |
| Lenovo Yoga Slim 7-14ARE | |
| Asus VivoBook Flip 14 TM420IA | |
| Asus ZenBook 14 UX425EA | |
* ... smaller is better
System Performance
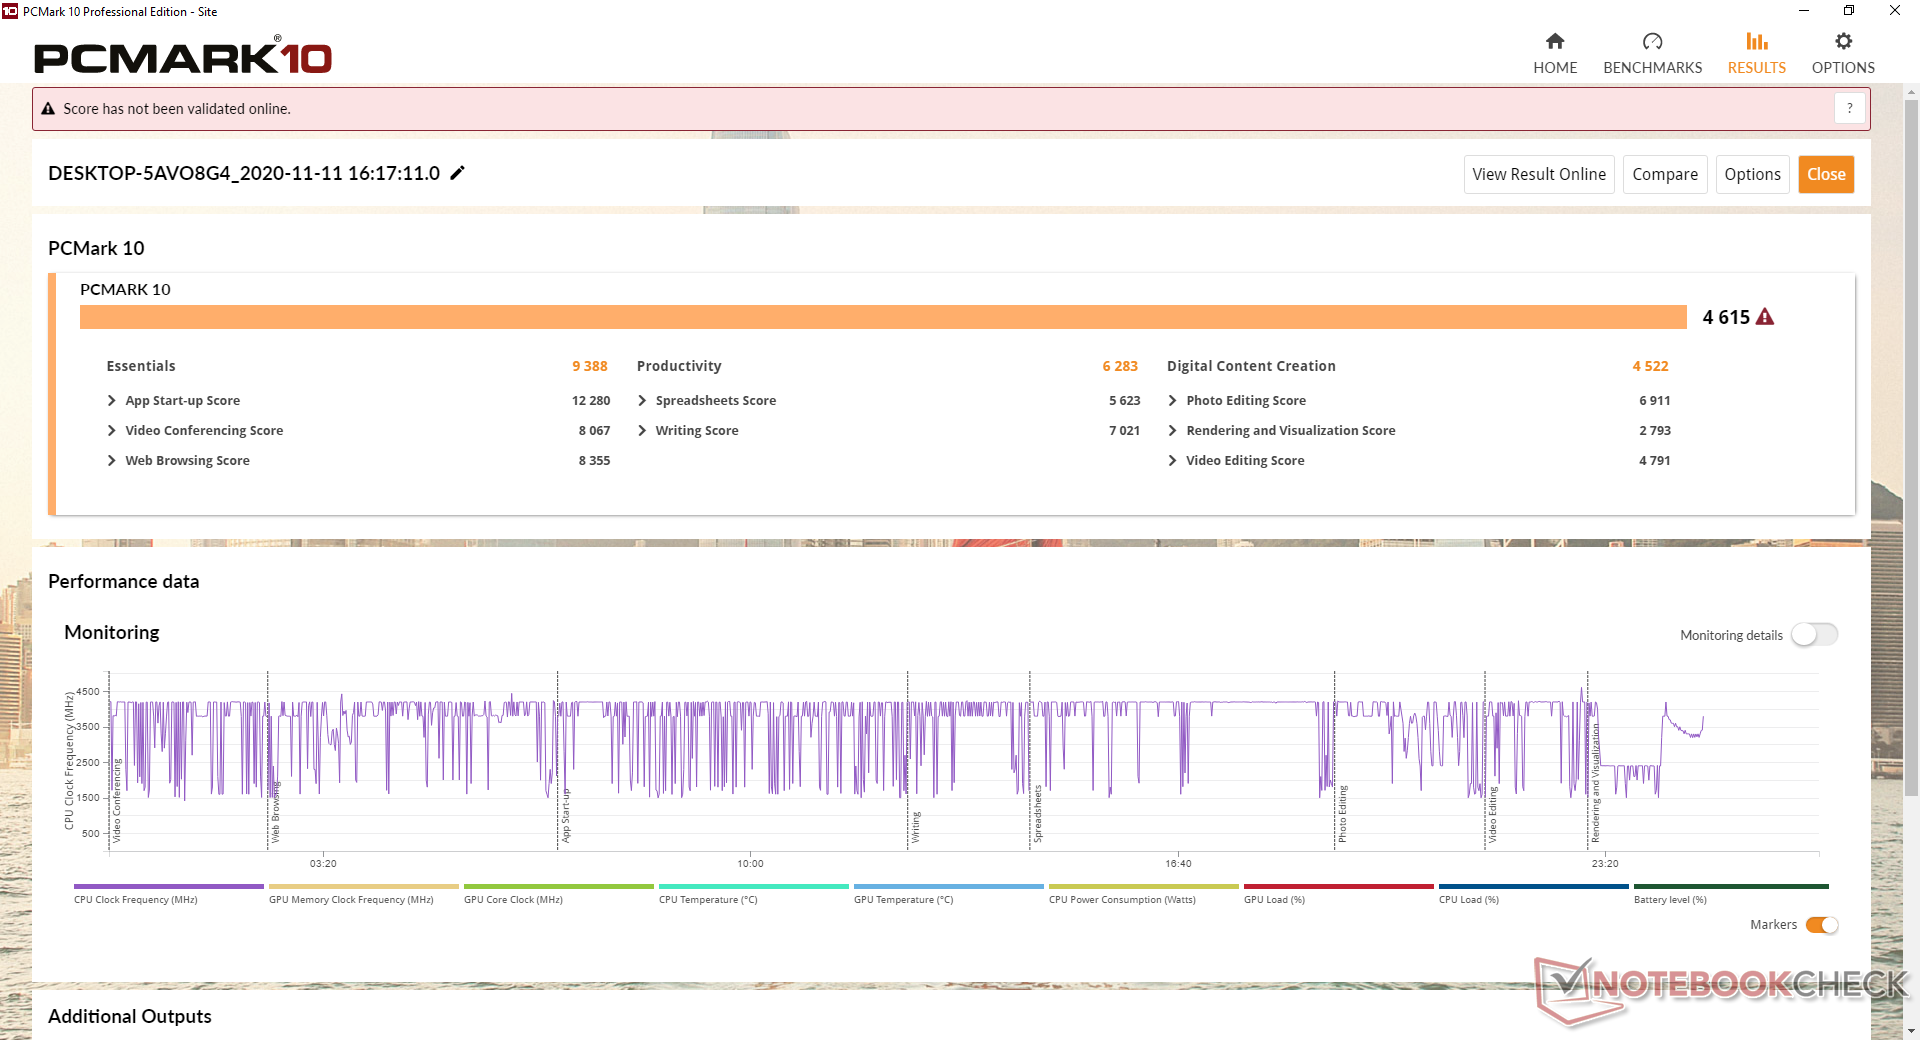
PCMark results are a few percentage points behind the Asus ZenBook 14 with the faster Core i7-1165G7. The differences are minor enough that our Tiger Lake Core i5 system won't feel any slower than a Tiger Lake Core i7 during day-to-day workloads like web browsing.
We didn't experience any software or hardware issues during our time with the test unit.
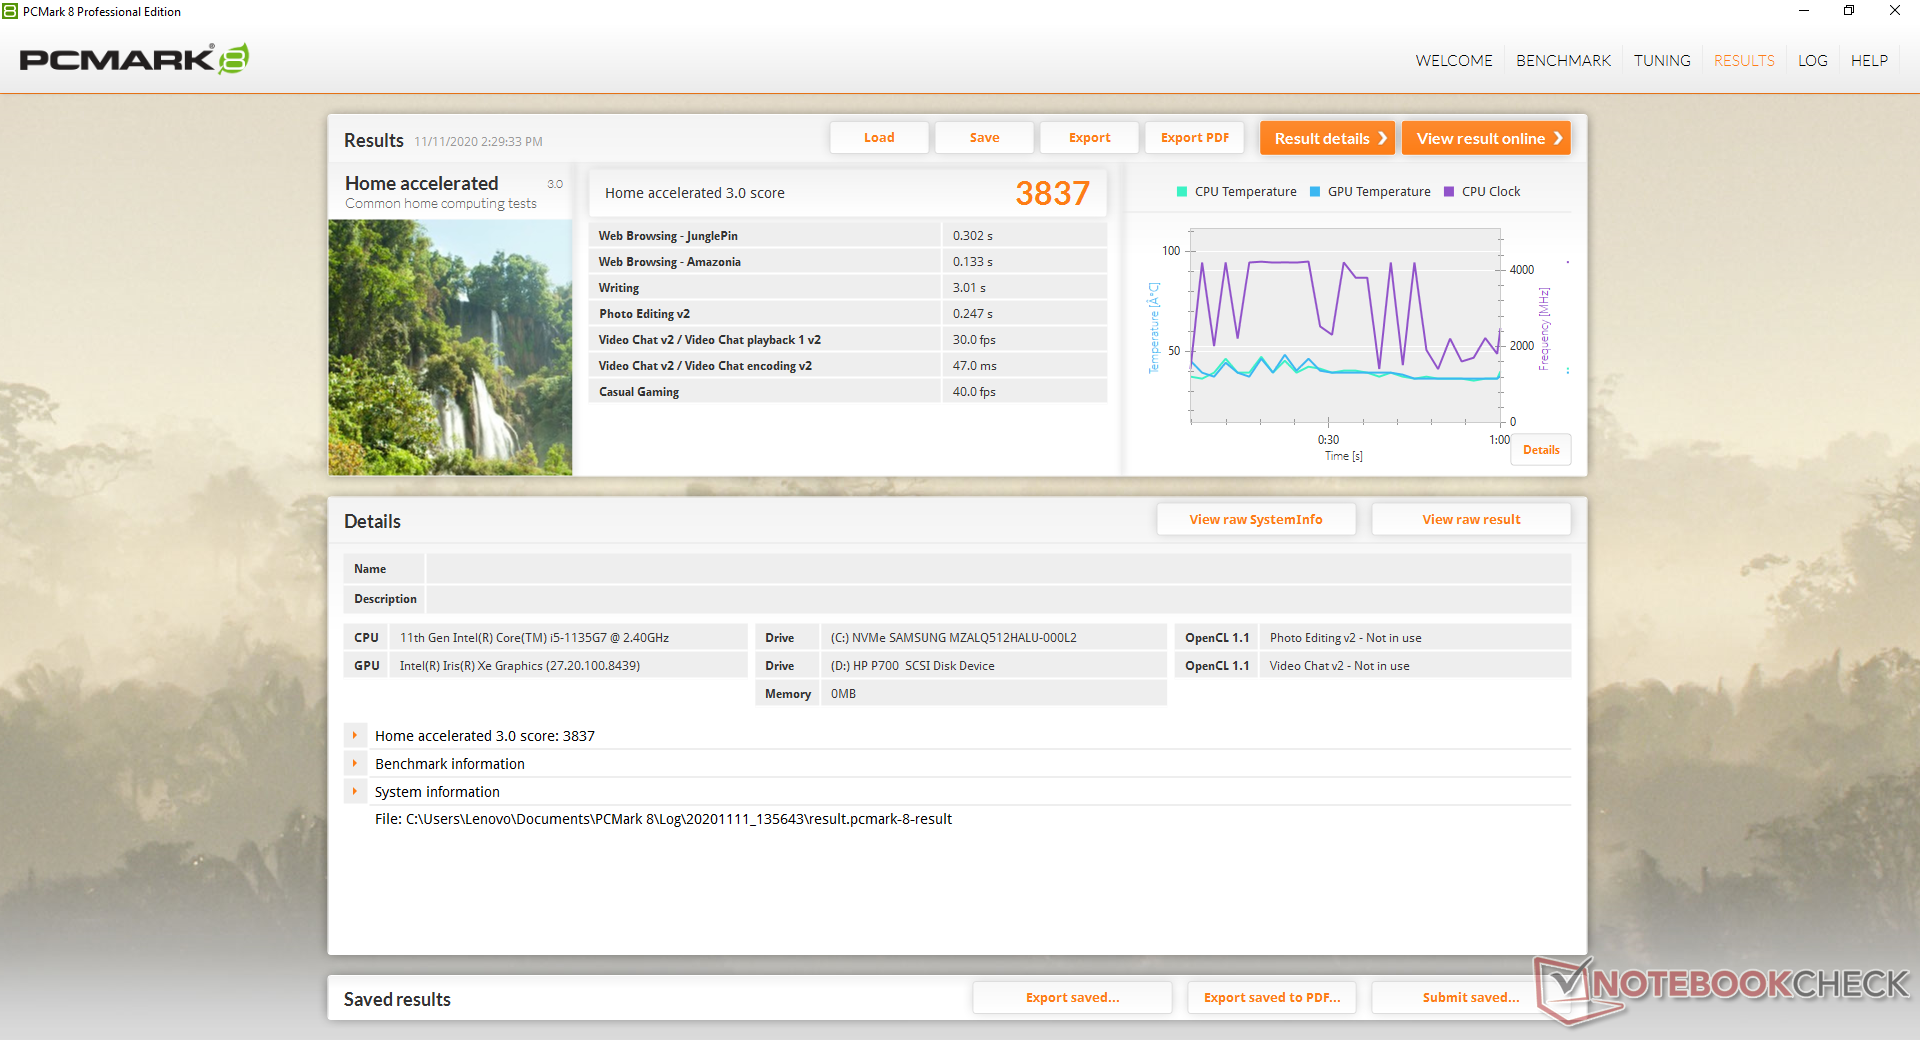
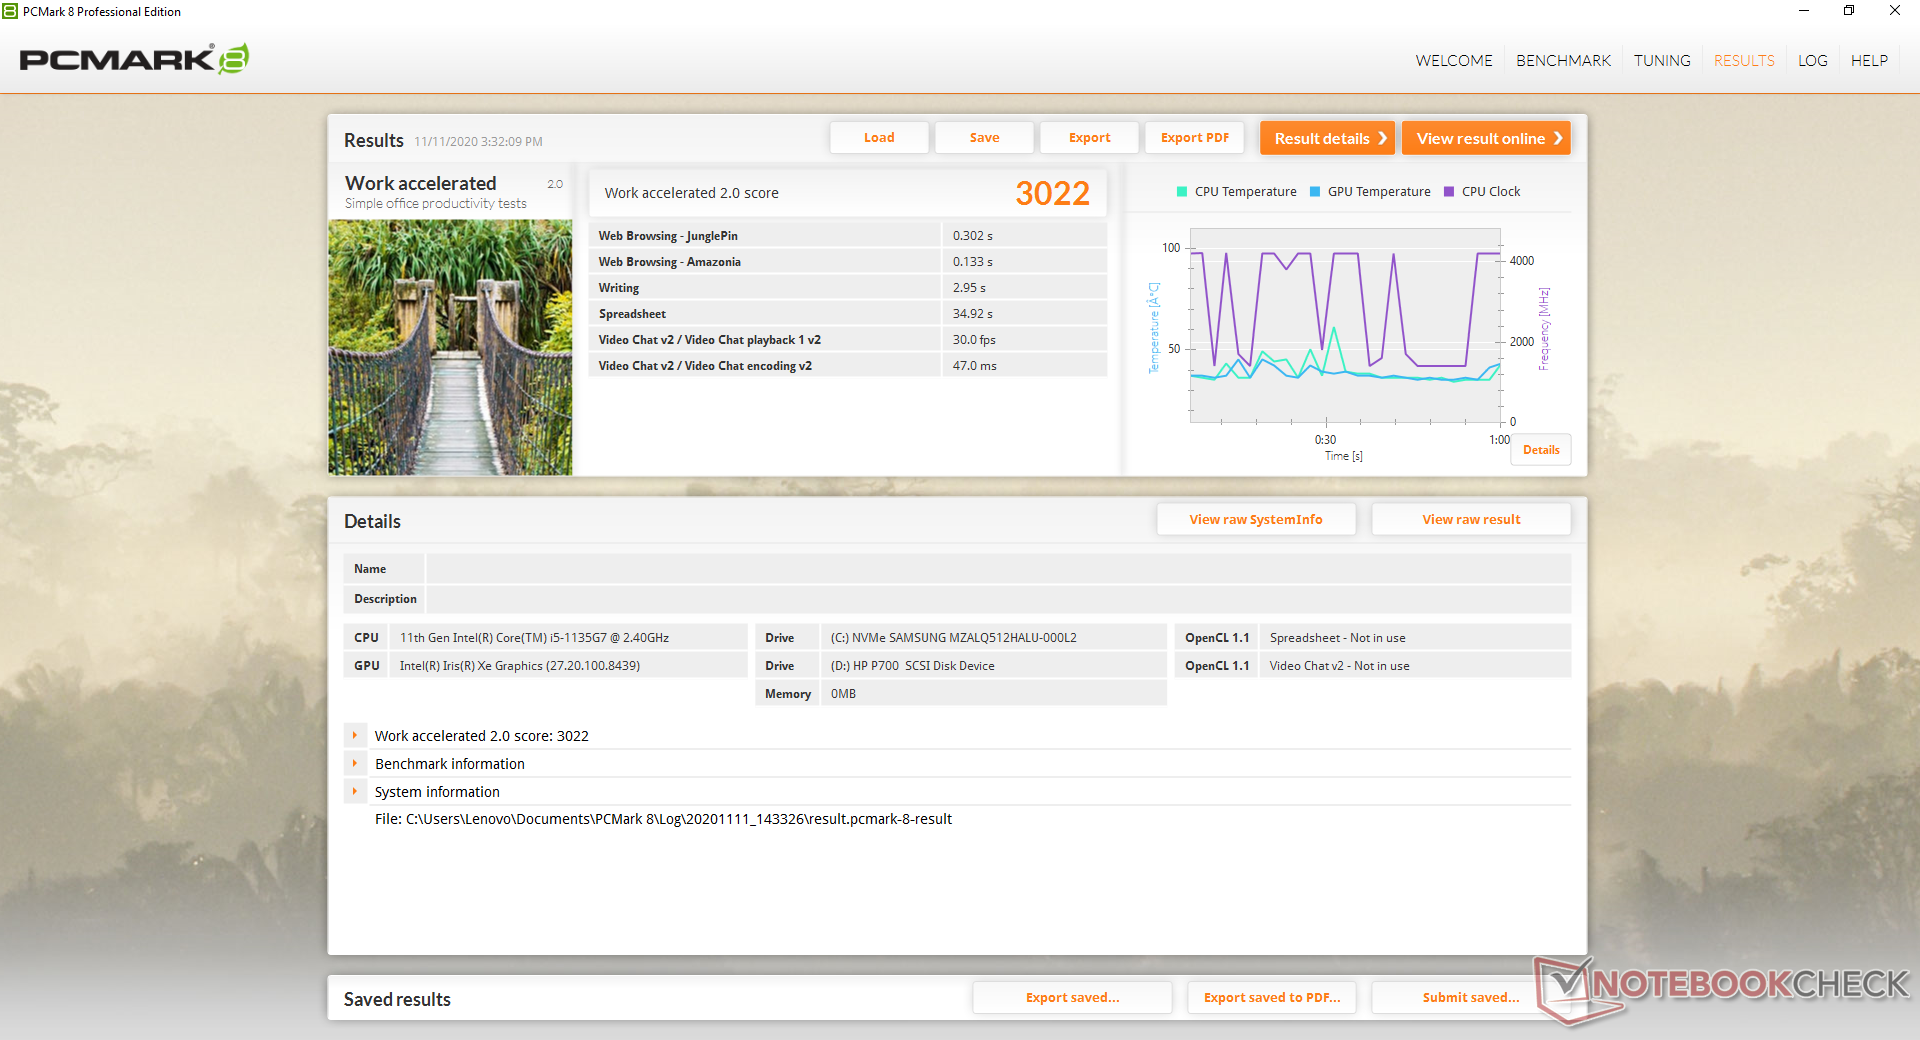
| PCMark 8 Home Score Accelerated v2 | 3837 points | |
| PCMark 8 Work Score Accelerated v2 | 3022 points | |
| PCMark 10 Score | 4615 points | |
Help | ||
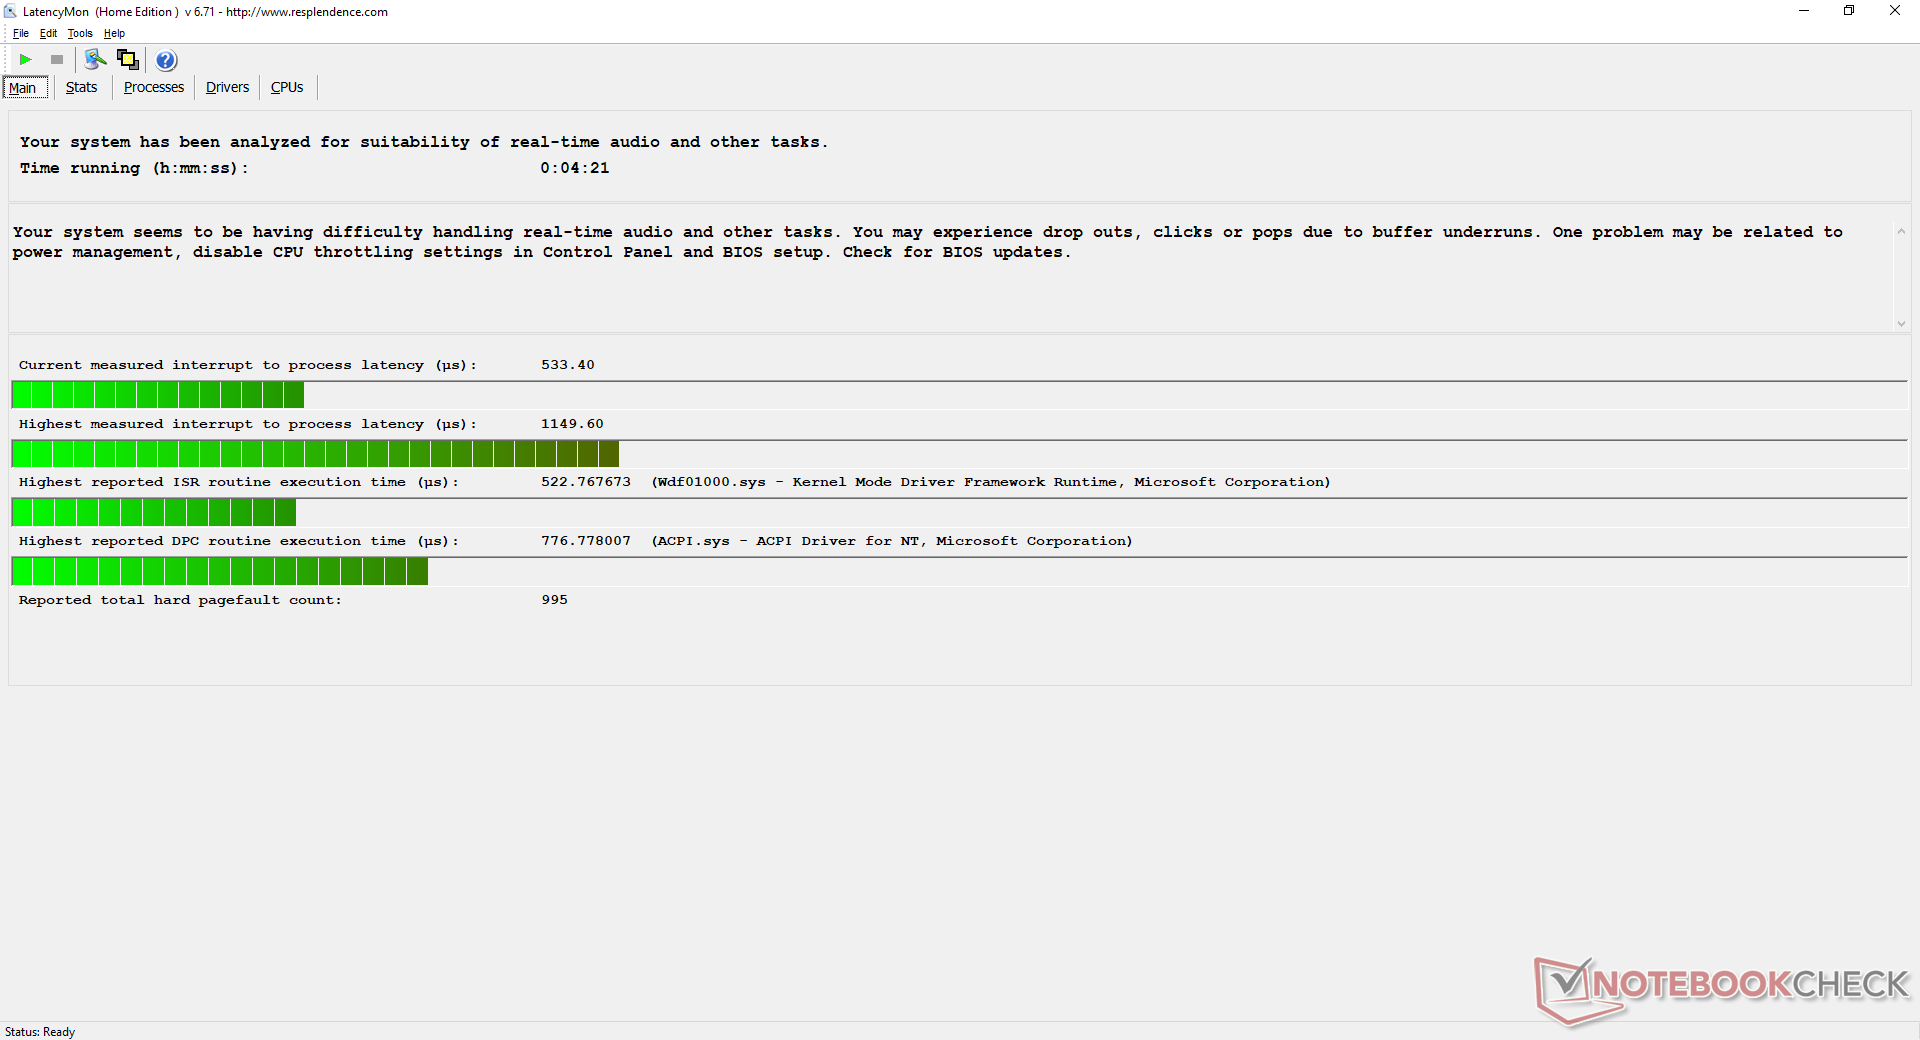
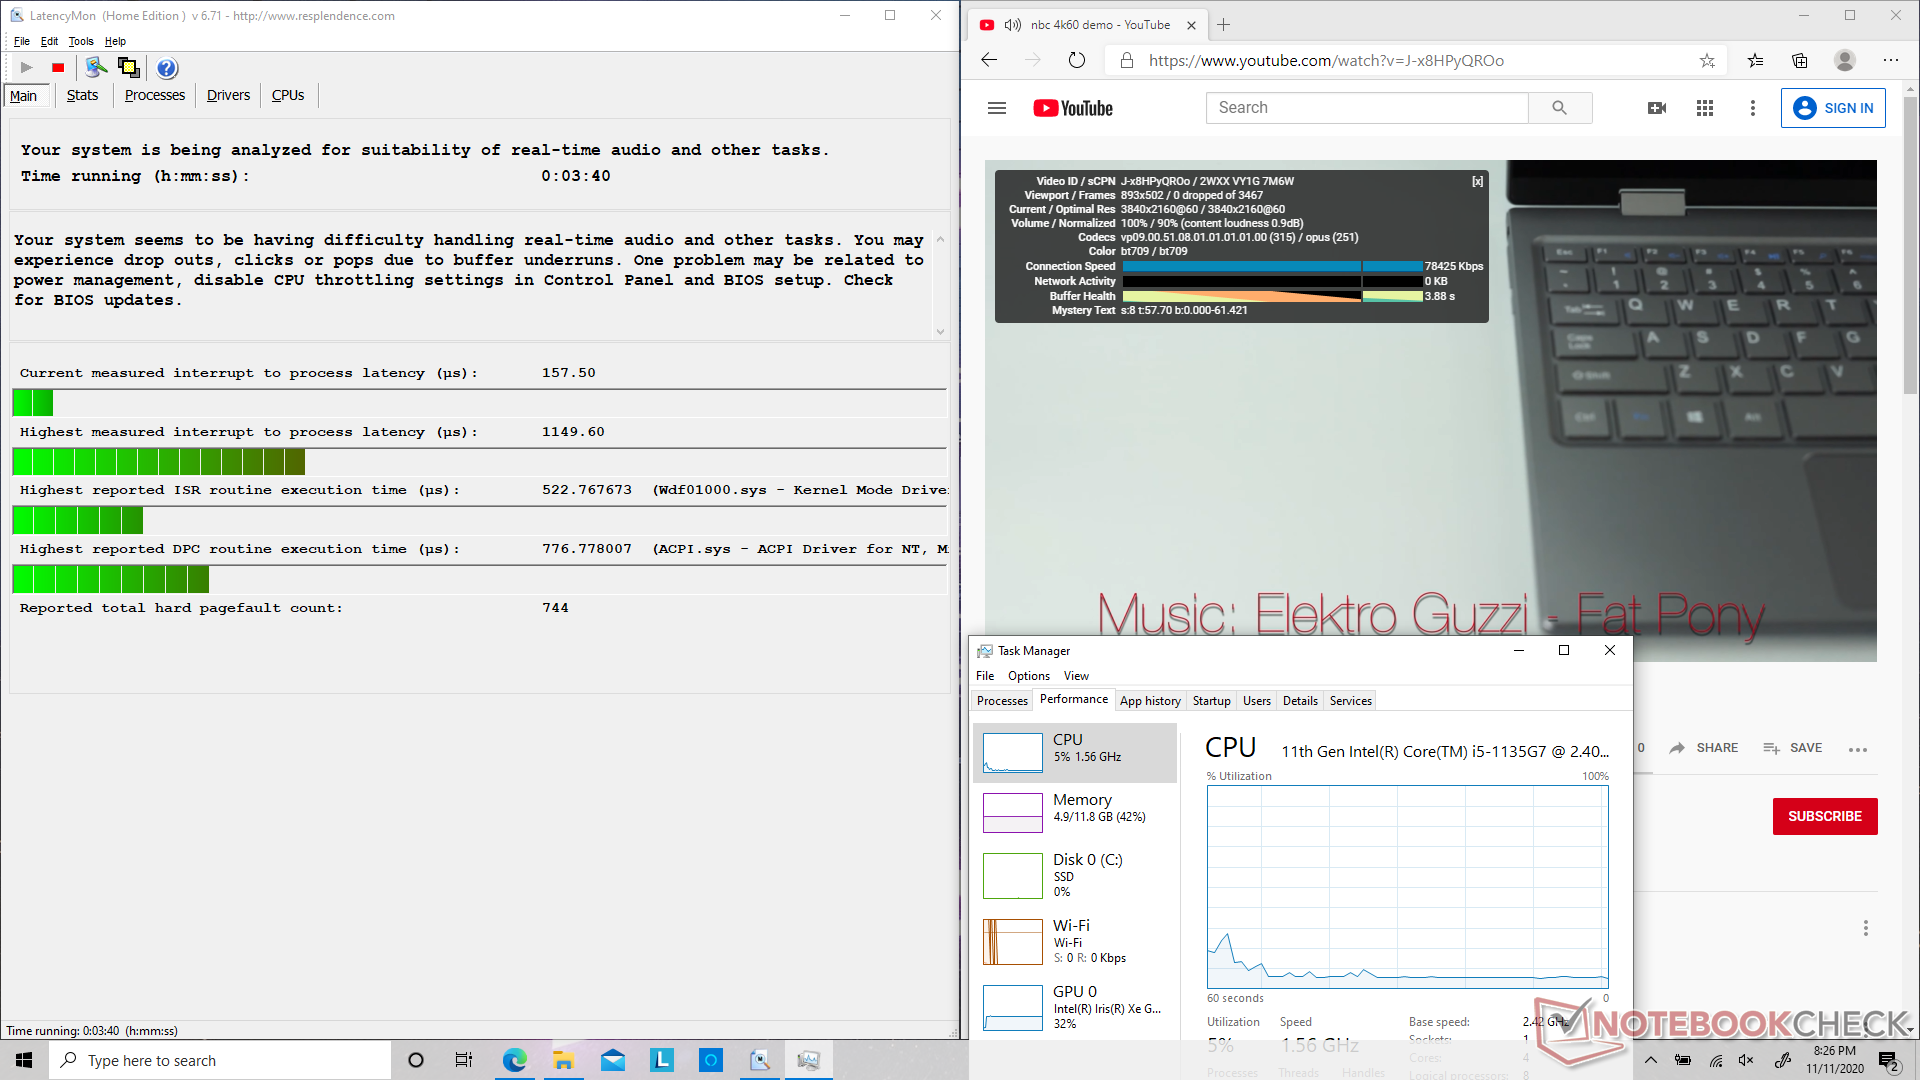
DPC Latency
LatencyMon shows minor DPC latency issues related to the Windows ACPI driver. 4K UHD video playback at 60 FPS is otherwise smooth and with no dropped frames during our minute-long YouTube test. GPU utilization would remain steady at about 32 percent compared to ~50 percent on Ultrabooks with the slower UHD Graphics 620.
| DPC Latencies / LatencyMon - interrupt to process latency (max), Web, Youtube, Prime95 | |
| Asus ZenBook 14 UX425EA | |
| Lenovo Yoga 7 14ITL5 | |
| Lenovo Yoga Slim 7-14IIL05 | |
| Asus ZenBook Flip 14 UX463FA-AI039T | |
| Lenovo IdeaPad 5 14ARE05 | |
* ... smaller is better
Storage Devices
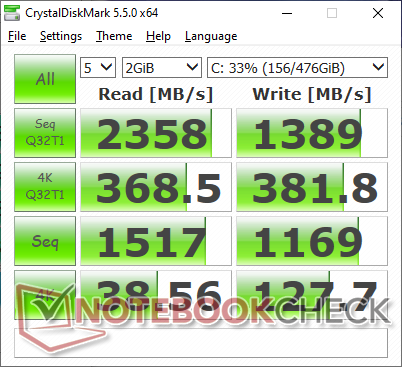
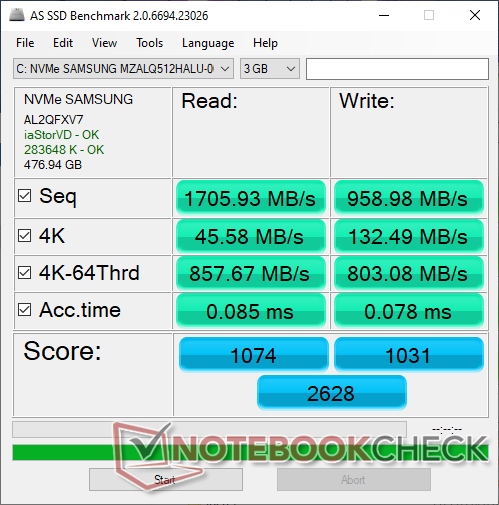
Our unit comes configured with the mid-range Samsung PM991 for theoretical sequential read and write rates of 2200 MB/s and 1200 MB/s, respectively. Running DiskSpd in a loop shows that the system is able to approach this maximum over time as shown by the graph below. Lenovo uses this same SSD for a number of other laptops as well including for the IdeaPad 5 14ARE05.
See our table of HDDs and SSDs for more technical information and benchmarks.
| Lenovo Yoga 7 14ITL5 Samsung PM991 MZALQ512HALU | Asus ZenBook 14 UX425EA Intel SSD 660p 1TB SSDPEKNW010T8 | Lenovo Yoga Slim 7-14IIL05 WDC PC SN730 SDBPNTY-512G | Lenovo IdeaPad 5 14ARE05 Samsung PM991 MZALQ512HALU | Lenovo Yoga C740-14IML Samsung SSD PM981a MZVLB256HBHQ | |
|---|---|---|---|---|---|
| AS SSD | -8% | 21% | 1% | 3% | |
| Seq Read (MB/s) | 1706 | 1219 -29% | 2703 58% | 1970 15% | 1719 1% |
| Seq Write (MB/s) | 959 | 947 -1% | 1104 15% | 1268 32% | 1211 26% |
| 4K Read (MB/s) | 45.58 | 50.9 12% | 46.41 2% | 47.13 3% | 53.1 16% |
| 4K Write (MB/s) | 132.5 | 150.9 14% | 154.1 16% | 121.6 -8% | 131.4 -1% |
| 4K-64 Read (MB/s) | 858 | 587 -32% | 835 -3% | 855 0% | 508 -41% |
| 4K-64 Write (MB/s) | 803 | 862 7% | 1138 42% | 859 7% | 883 10% |
| Access Time Read * (ms) | 0.085 | 0.083 2% | 0.058 32% | 0.065 24% | 0.05 41% |
| Access Time Write * (ms) | 0.078 | 0.114 -46% | 0.028 64% | 0.032 59% | 0.085 -9% |
| Score Read (Points) | 1074 | 760 -29% | 1151 7% | 1100 2% | 733 -32% |
| Score Write (Points) | 1031 | 1108 7% | 1402 36% | 1108 7% | 1135 10% |
| Score Total (Points) | 2628 | 2260 -14% | 3073 17% | 2745 4% | 2235 -15% |
| Copy ISO MB/s (MB/s) | 1543 | 1518 -2% | 1626 5% | 982 -36% | 1636 6% |
| Copy Program MB/s (MB/s) | 582 | 549 -6% | 568 -2% | 276.2 -53% | 698 20% |
| Copy Game MB/s (MB/s) | 1148 | 1164 1% | 1151 0% | 681 -41% | 1246 9% |
| CrystalDiskMark 5.2 / 6 | 10% | 35% | 5% | 29% | |
| Write 4K (MB/s) | 127.7 | 132.3 4% | 137 7% | 102.8 -19% | 125.6 -2% |
| Read 4K (MB/s) | 38.56 | 51.7 34% | 48.71 26% | 45.48 18% | 43.46 13% |
| Write Seq (MB/s) | 1169 | 1264 8% | 1785 53% | 1255 7% | 2011 72% |
| Read Seq (MB/s) | 1517 | 1484 -2% | 2057 36% | 1434 -5% | 2046 35% |
| Write 4K Q32T1 (MB/s) | 381.8 | 478.4 25% | 436.9 14% | 441 16% | 375.8 -2% |
| Read 4K Q32T1 (MB/s) | 368.5 | 366.9 0% | 389 6% | 474.1 29% | 338.1 -8% |
| Write Seq Q32T1 (MB/s) | 1389 | 1750 26% | 2708 95% | 1456 5% | 2346 69% |
| Read Seq Q32T1 (MB/s) | 2358 | 1970 -16% | 3426 45% | 2085 -12% | 3562 51% |
| Total Average (Program / Settings) | 1% /
-2% | 28% /
26% | 3% /
2% | 16% /
12% |
* ... smaller is better

Disk Throttling: DiskSpd Read Loop, Queue Depth 8
GPU Performance
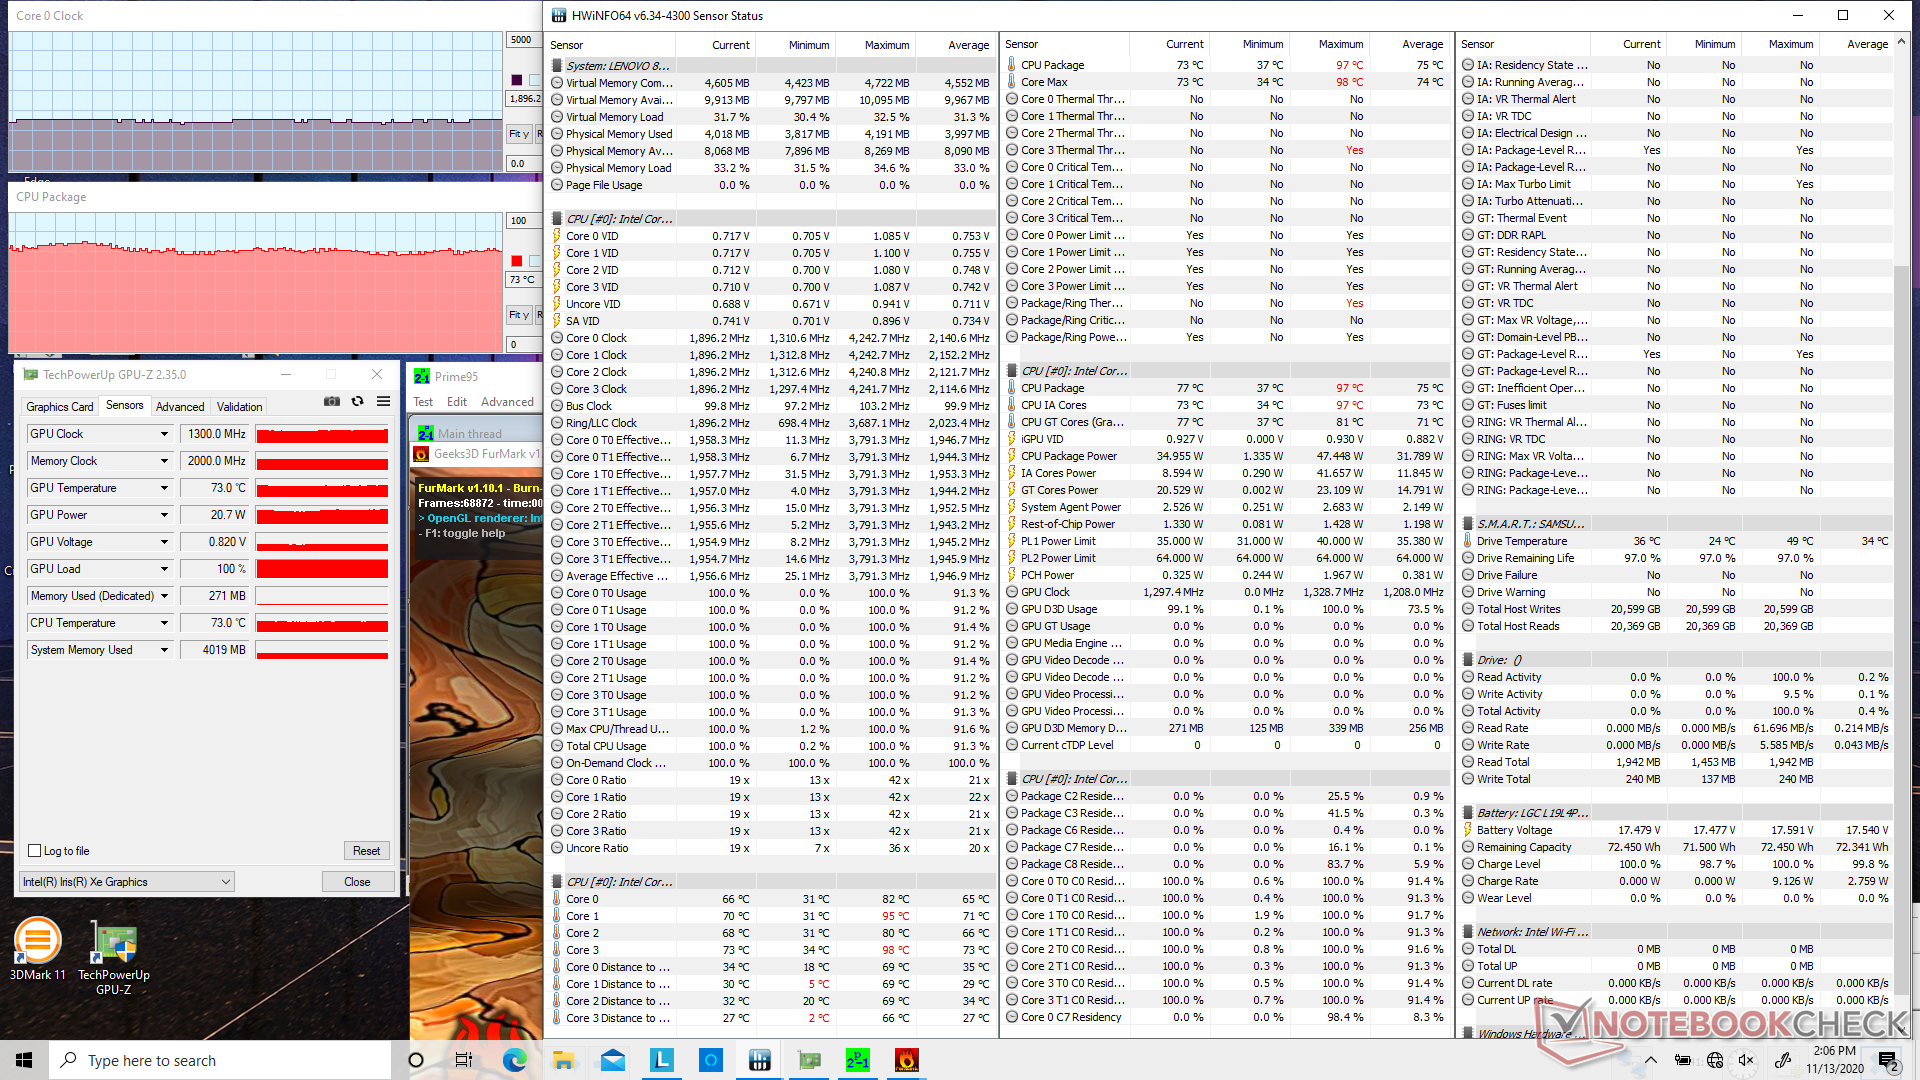
Of the dozen or so Tiger Lake laptops we've tested with the integrated Iris Xe, the one in our Lenovo Yoga 7i 14 is the slowest. 3DMark benchmarks are about 35 to 50 percent slower than the average Iris Xe in our database to be just slightly ahead of the last generation Ice Lake Iris Plus G7. Raw performance is still significantly faster than the UHD Graphics 620, but results are still disappointing overall.
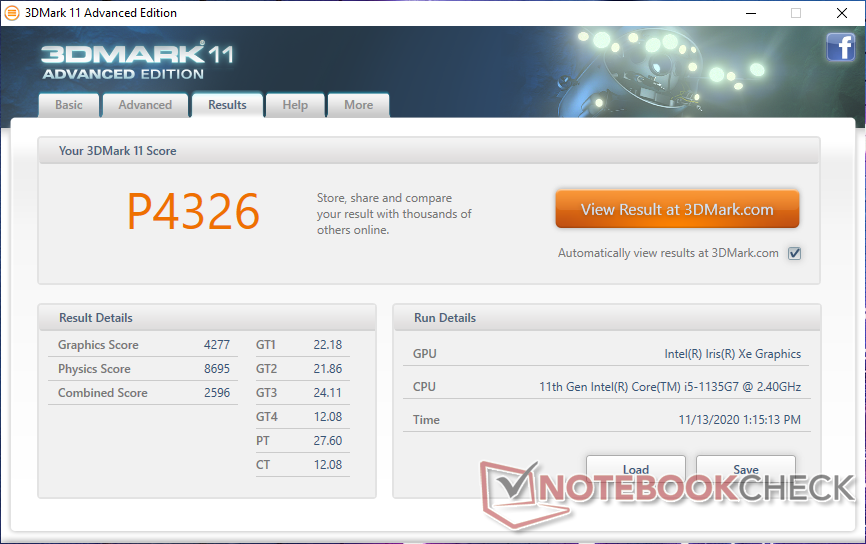
Lenovo offers three different power profiles: Extreme performance, Intelligent cooling, and Battery saving. Running 3DMark 11 on Intelligent cooling mode would result in lower overall scores than Extreme performance mode. The Physics and Graphics scores would dip from 9377 and 4558 points to 8695 and 4277 points, respectively.
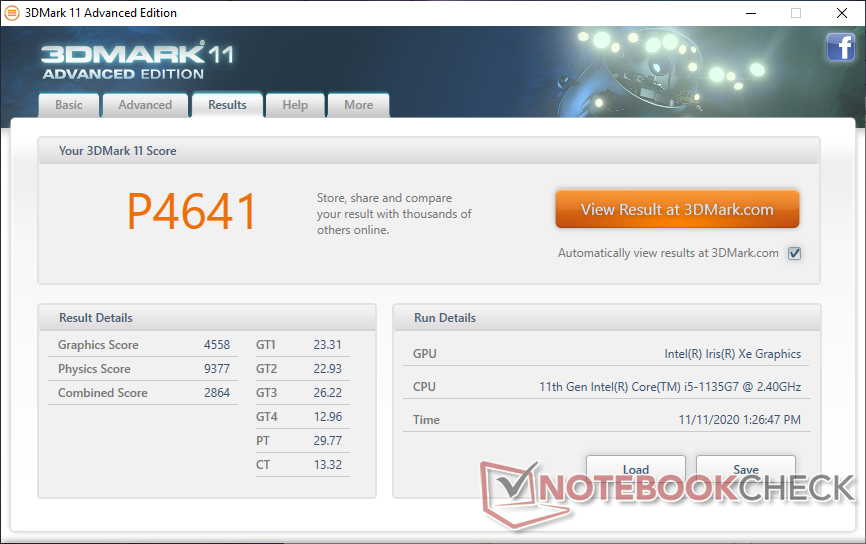
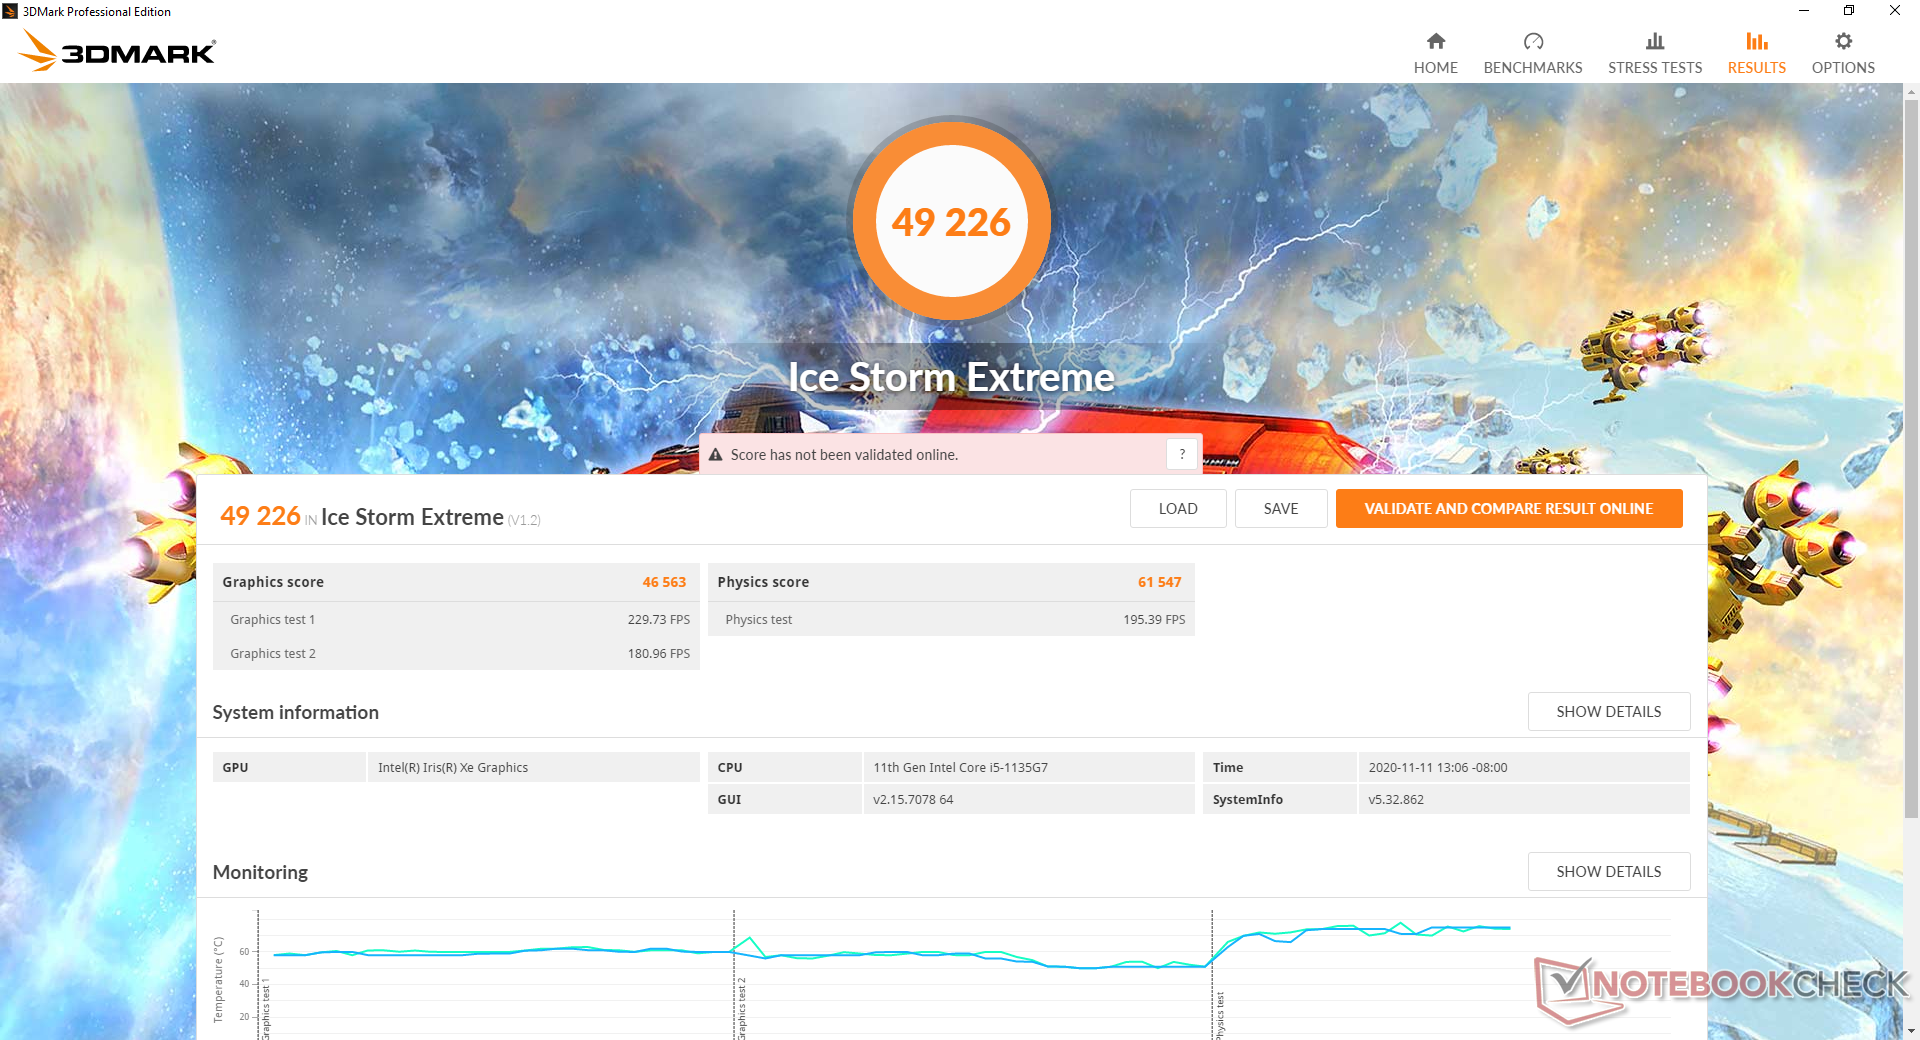
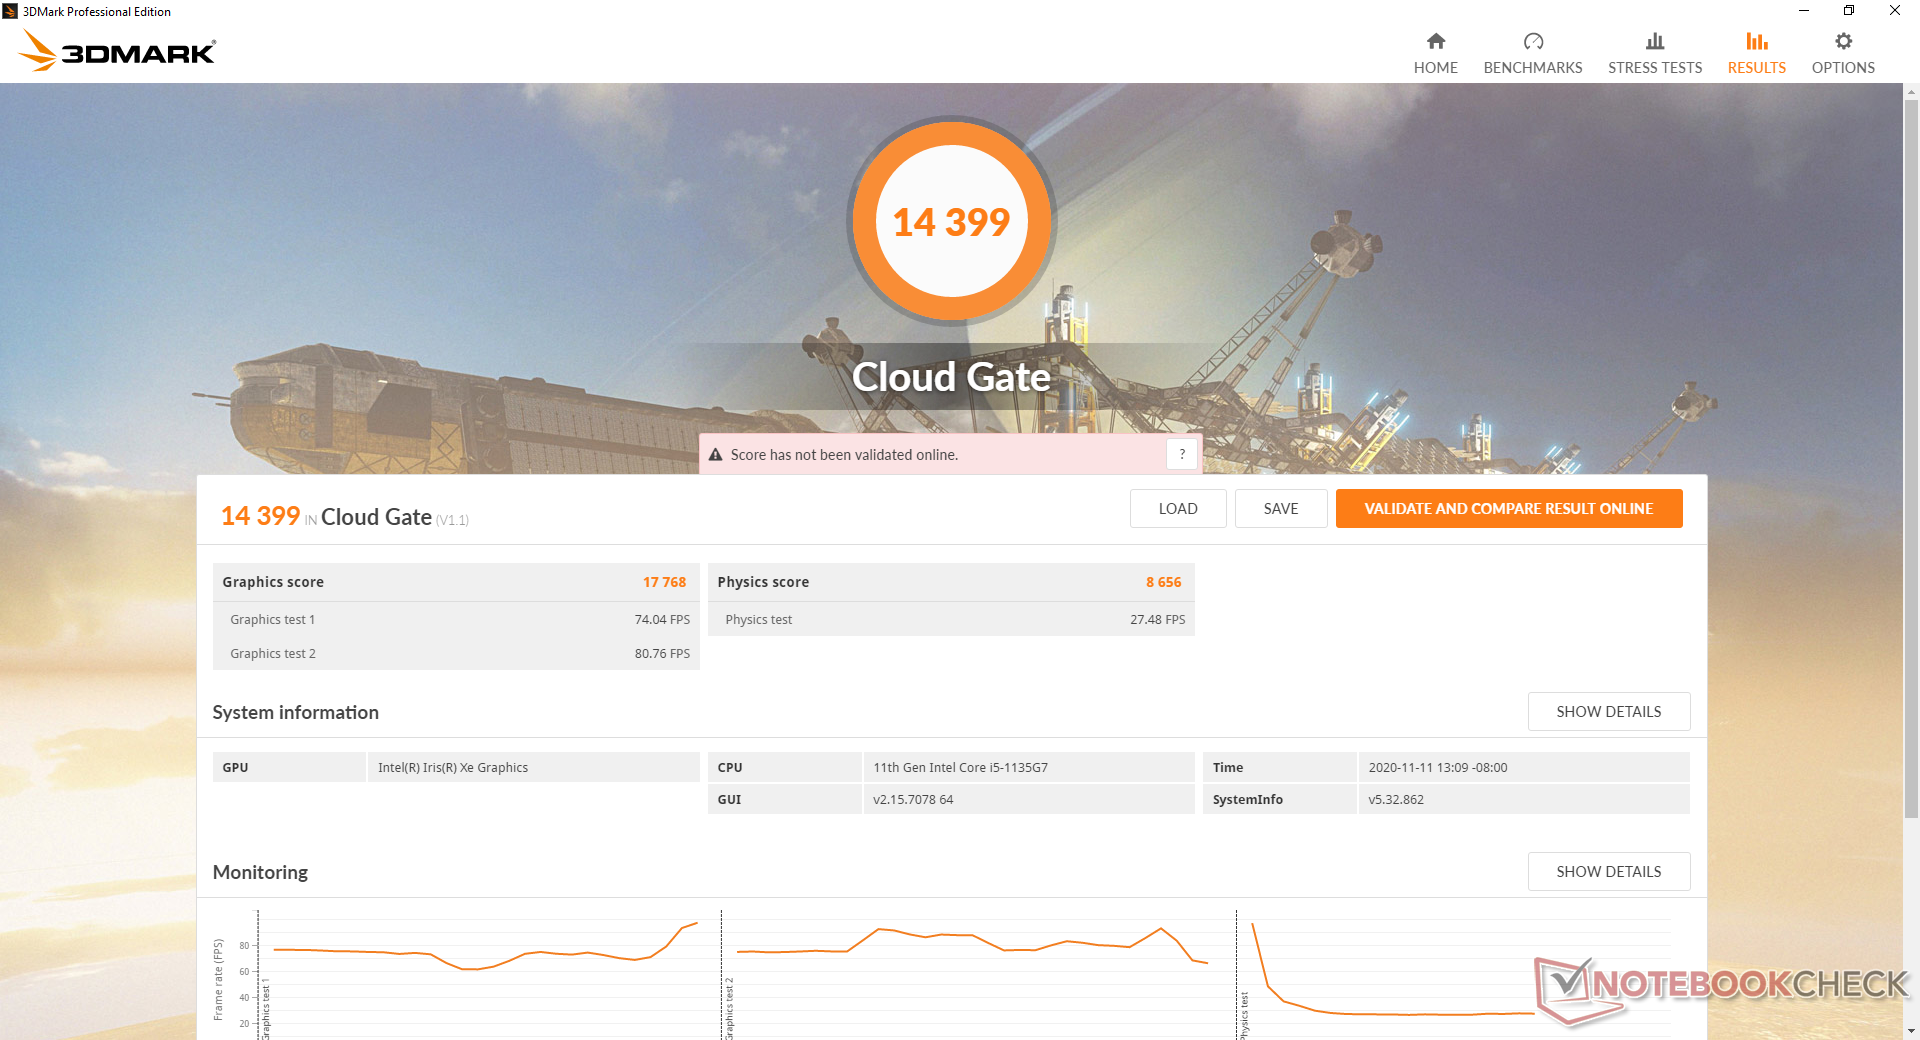
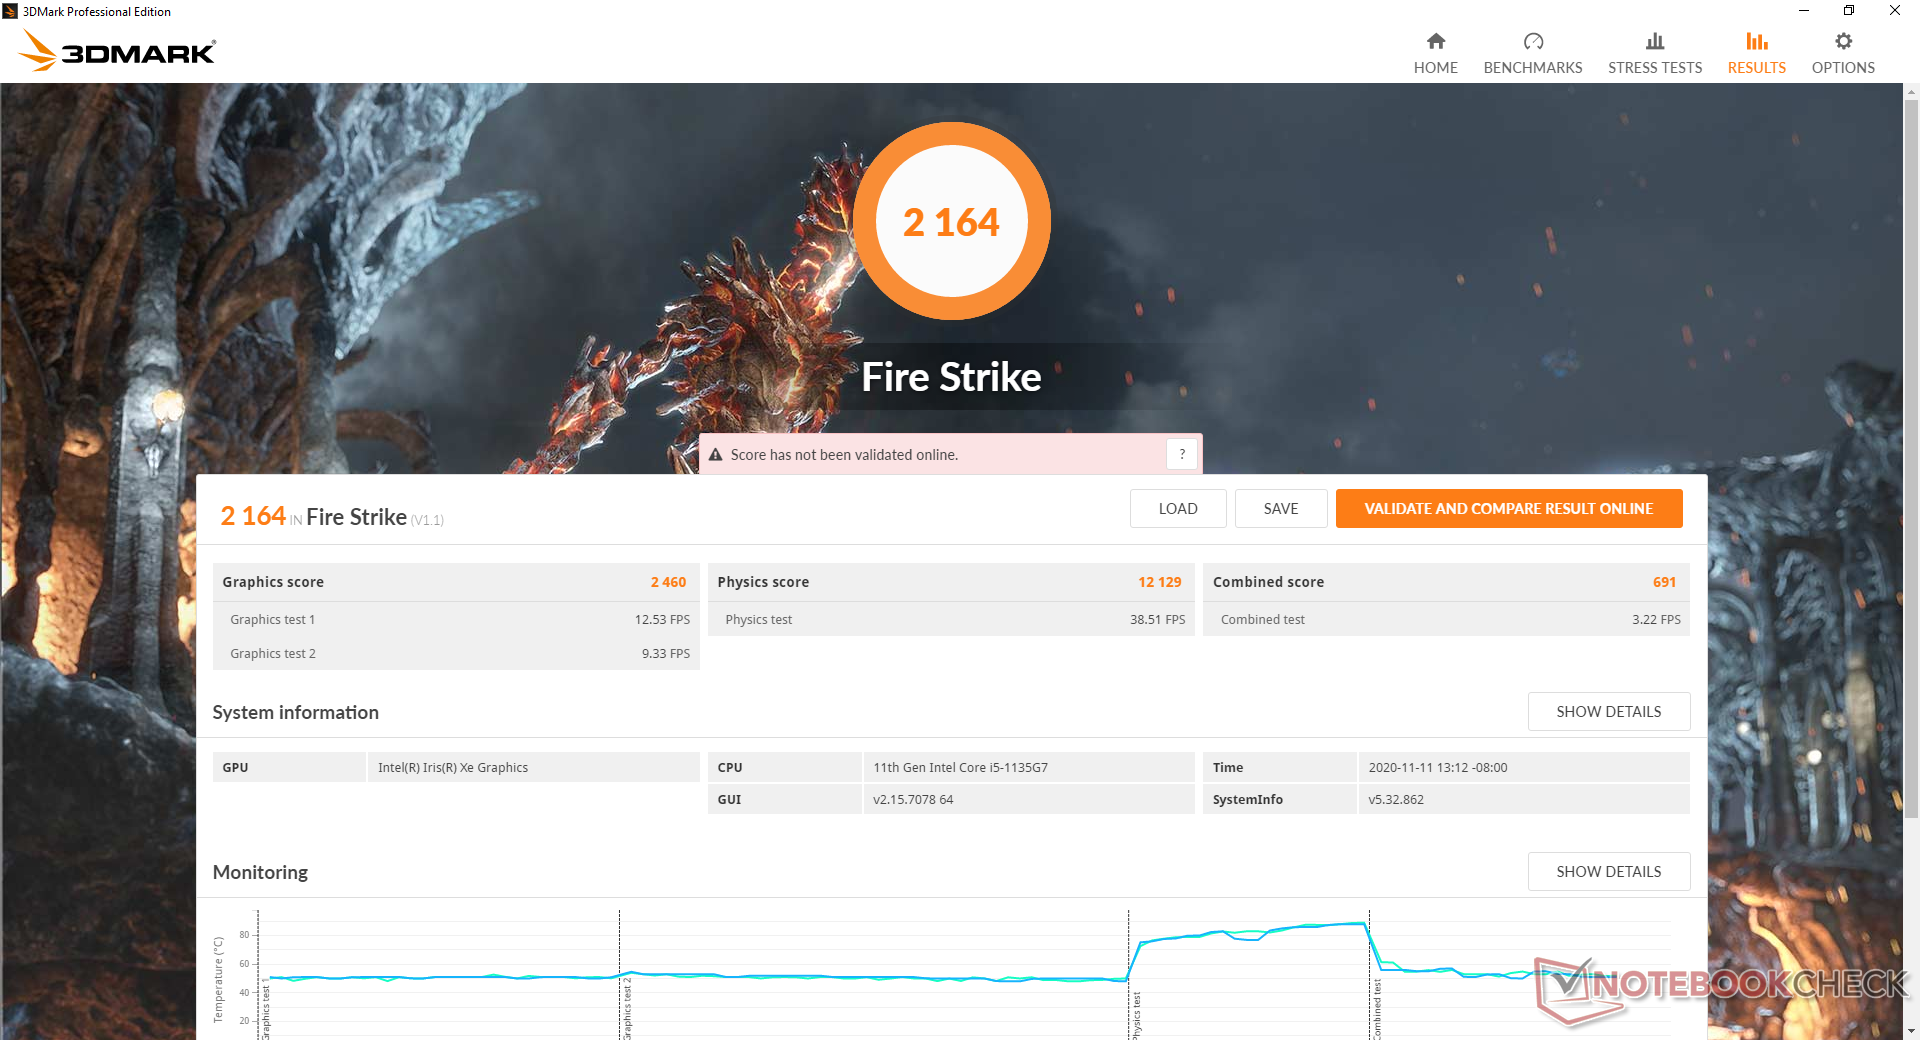
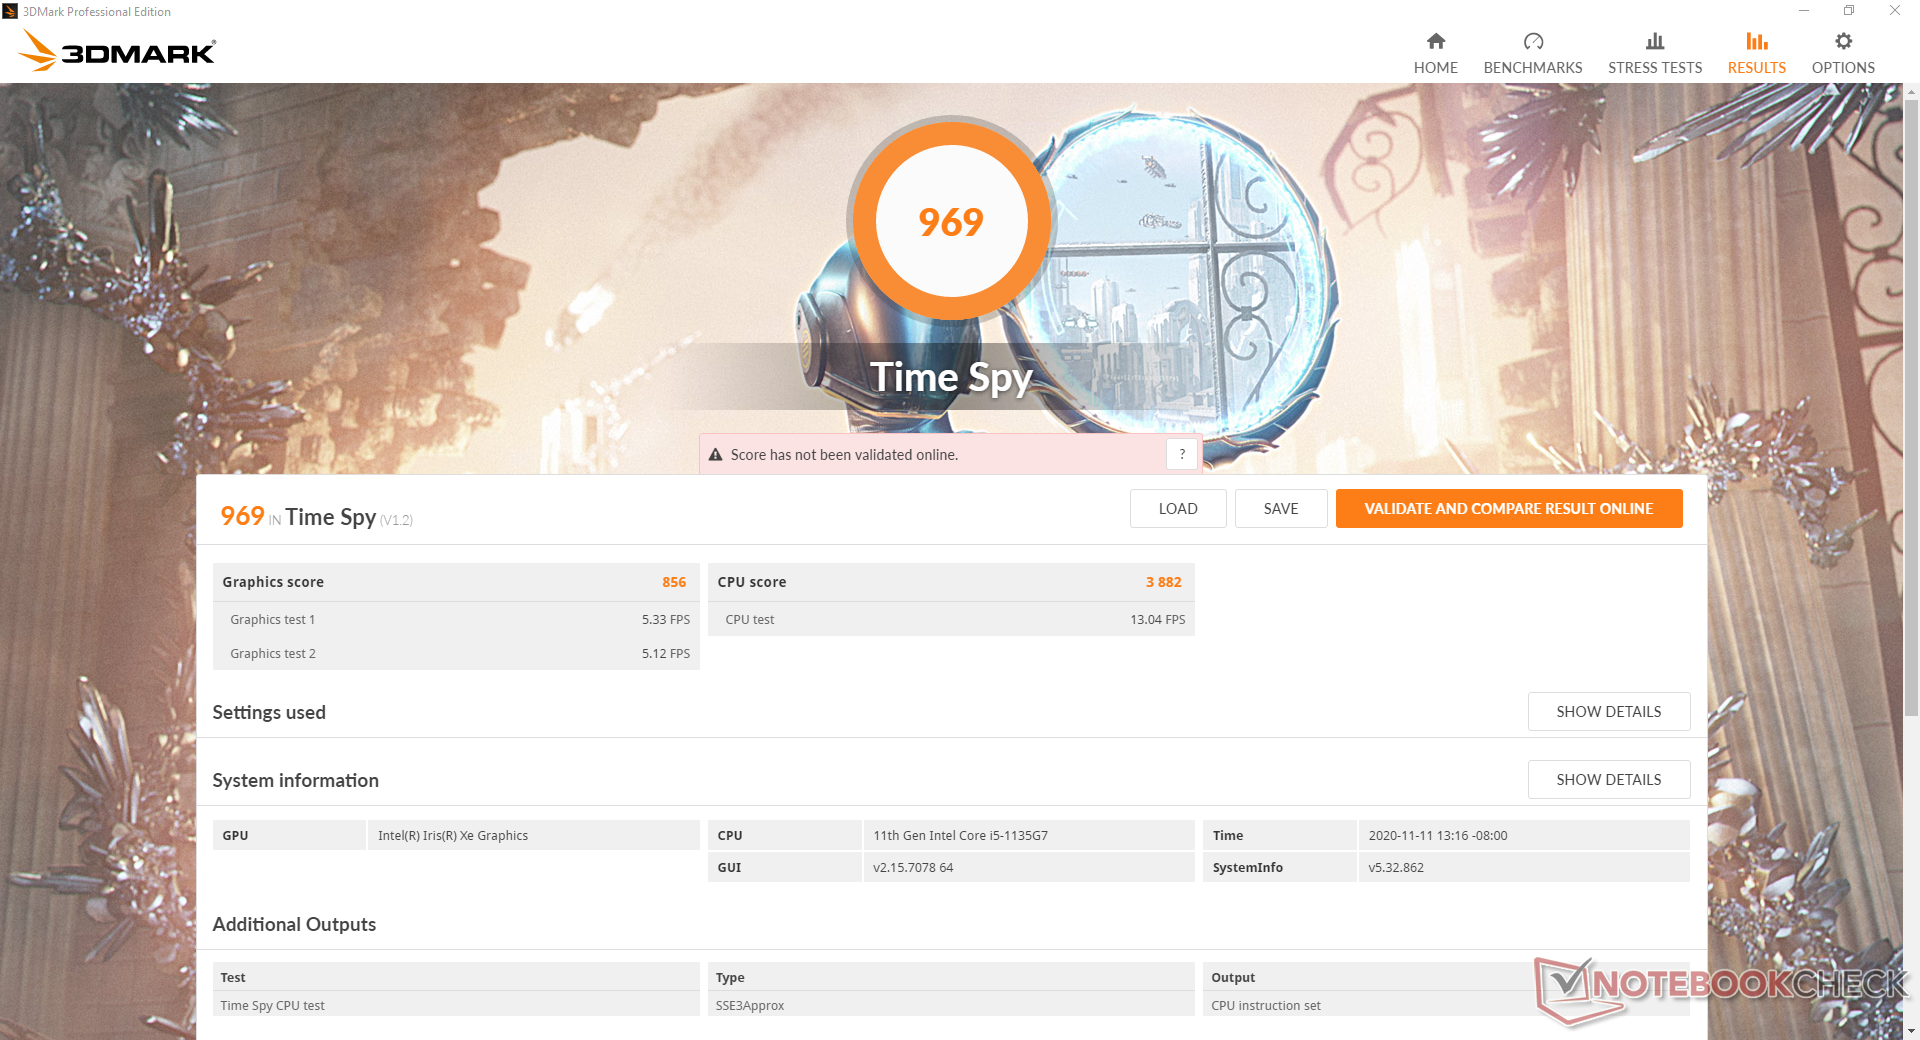
| 3DMark 11 Performance | 4641 points | |
| 3DMark Cloud Gate Standard Score | 14399 points | |
| 3DMark Fire Strike Score | 2164 points | |
| 3DMark Time Spy Score | 969 points | |
Help | ||
Gaming Performance
Actual gaming performance is disappointing as predicted by the slower-than-average 3DMark scores above. The Asus ZenBook 14 UX425EA with the same Iris Xe GPU is able to run games 50 percent faster or more than on our Core i5 Lenovo.
See our dedicated page on the Iris Xe for more benchmarks and comparisons.
| low | med. | high | ultra | |
|---|---|---|---|---|
| GTA V (2015) | 59.5 | 45.9 | 9.99 | 4.35 |
| The Witcher 3 (2015) | 51.4 | 29.2 | 12.8 | 7 |
| Dota 2 Reborn (2015) | 76.2 | 51.8 | 30.7 | 28.5 |
| Final Fantasy XV Benchmark (2018) | 24.3 | 12.7 | 10.5 | |
| X-Plane 11.11 (2018) | 47.1 | 34.3 | 31.2 | |
| Strange Brigade (2018) | 48.8 | 17.6 | 15.3 | 15.6 |
Emissions
System Noise
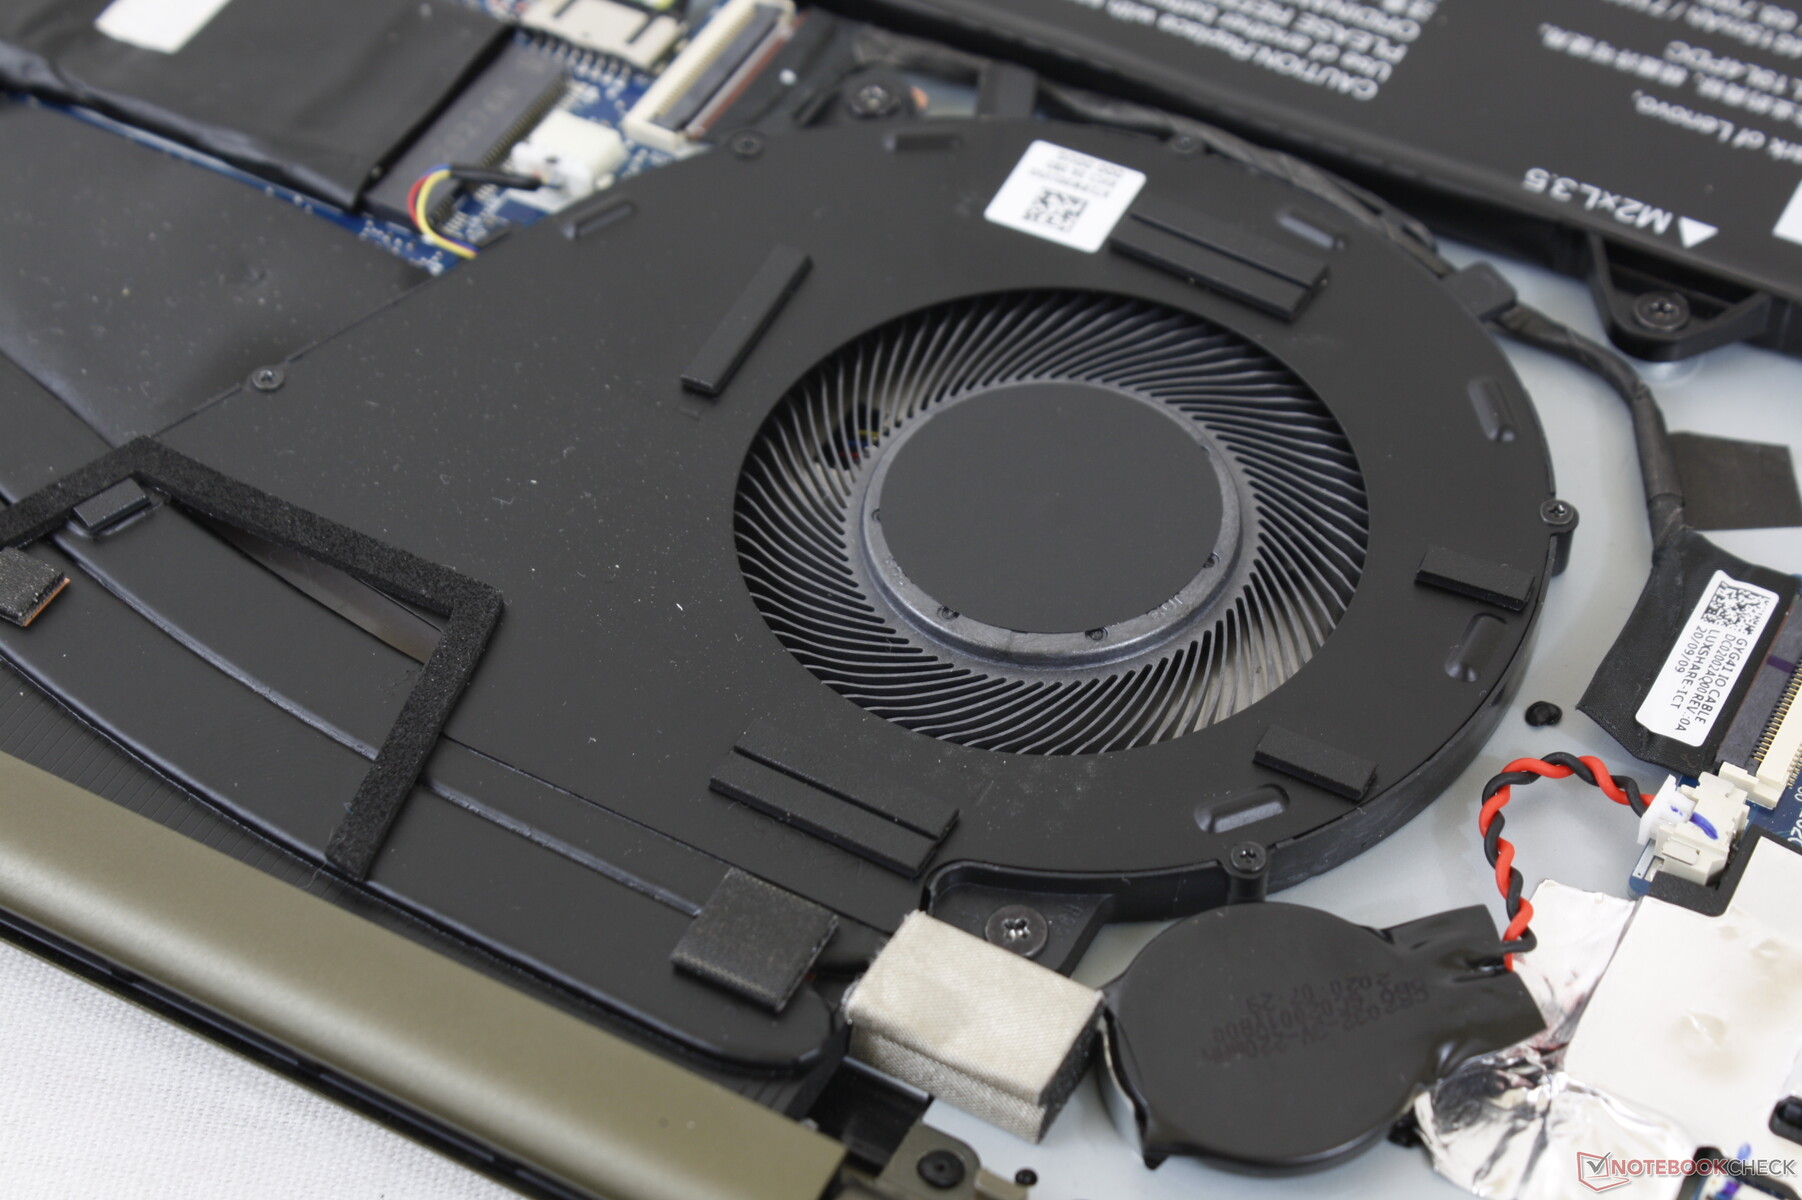
Unlike the Yoga Slim 7 14 which uses two smaller internal fans, the Yoga 7i 14 incorporates just one large 50 mm fan for generally lower RPMs and lower frequencies. The result is a system that runs noticeably quieter during low to medium loads like web browsing or even the first one or two minutes of high loads like gaming. It would range between silent (27.4 dB(A)) up to only 29.1 dB(A) when running the first benchmark scene of 3DMark 06. It wasn't until we ran Witcher 3 would fan noise increase appreciably to 36 dB(A) to be more noticeable in an office environment.
If at 100 percent CPU utilization on Extreme Performance mode, fan noise would top out at 46 dB(A) to be louder than most 14-inch convertibles. Loud fan noise is therefore unavoidable for those who wish to squeeze as much performance as possible from the CPU.
| Lenovo Yoga 7 14ITL5 Iris Xe G7 80EUs, i5-1135G7, Samsung PM991 MZALQ512HALU | Asus ZenBook 14 UX425EA Iris Xe G7 96EUs, i7-1165G7, Intel SSD 660p 1TB SSDPEKNW010T8 | Lenovo Yoga Slim 7-14IIL05 GeForce MX350, i7-1065G7, WDC PC SN730 SDBPNTY-512G | Asus ZenBook Flip 14 UX463FA-AI039T UHD Graphics 620, i5-10210U, Kingston RBUSNS8154P3512GJ1 | Lenovo Yoga C740-14IML UHD Graphics 620, i5-10210U, Samsung SSD PM981a MZVLB256HBHQ | |
|---|---|---|---|---|---|
| Noise | -7% | -10% | 0% | -2% | |
| off / environment * (dB) | 27.4 | 29.8 -9% | 29.3 -7% | 30.1 -10% | 29 -6% |
| Idle Minimum * (dB) | 27.4 | 29.9 -9% | 29.3 -7% | 30.1 -10% | 29 -6% |
| Idle Average * (dB) | 29 | 31 -7% | 29.3 -1% | 30.1 -4% | 29 -0% |
| Idle Maximum * (dB) | 29.1 | 31 -7% | 30.5 -5% | 30.1 -3% | 29.7 -2% |
| Load Average * (dB) | 29.1 | 35.6 -22% | 41.5 -43% | 30.1 -3% | 32.6 -12% |
| Witcher 3 ultra * (dB) | 36.1 | 37.4 -4% | 41.5 -15% | ||
| Load Maximum * (dB) | 46.3 | 40.8 12% | 41.5 10% | 32.02 31% | 39 16% |
* ... smaller is better
Noise level
| Idle |
| 27.4 / 29 / 29.1 dB(A) |
| Load |
| 29.1 / 46.3 dB(A) |
 | ||
30 dB silent 40 dB(A) audible 50 dB(A) loud |
||
min: | ||
Temperature
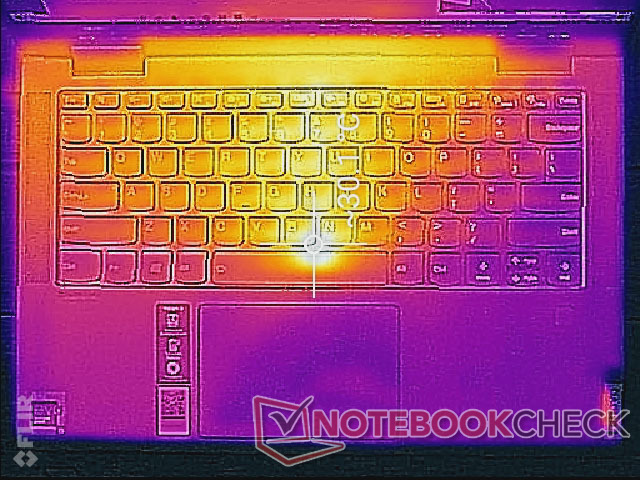
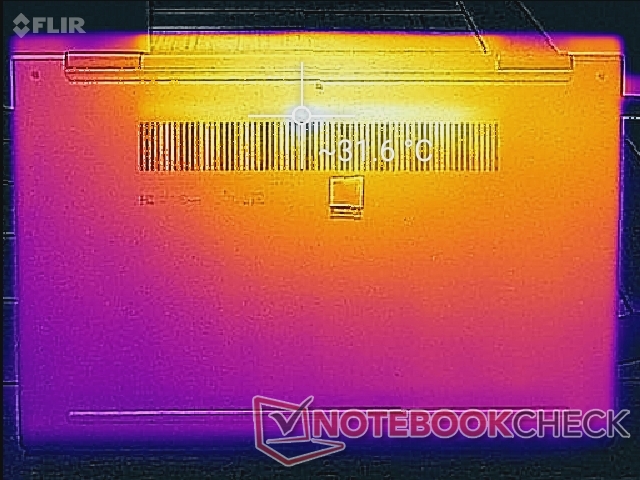
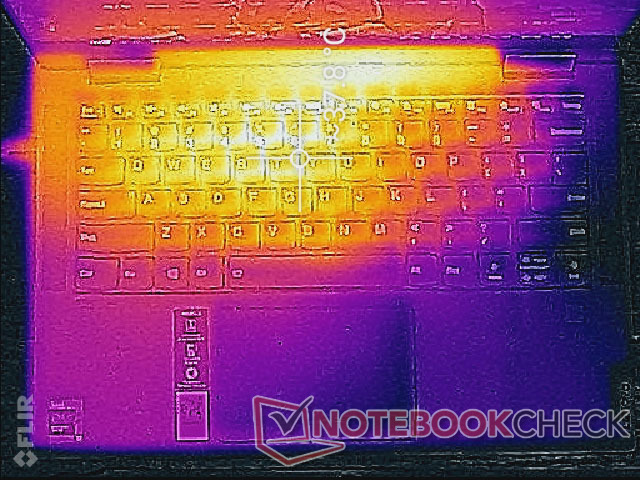
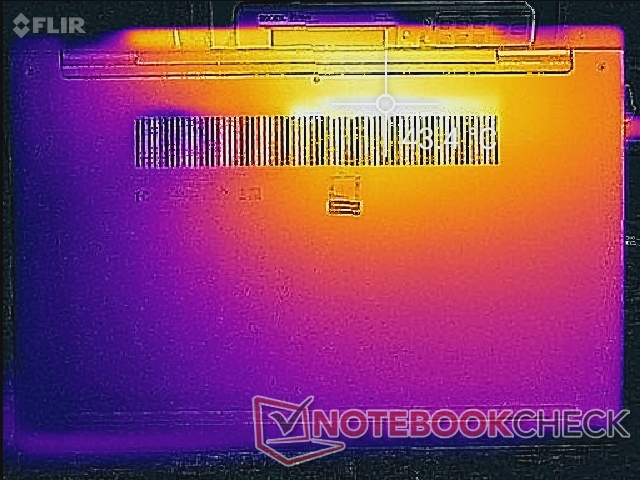
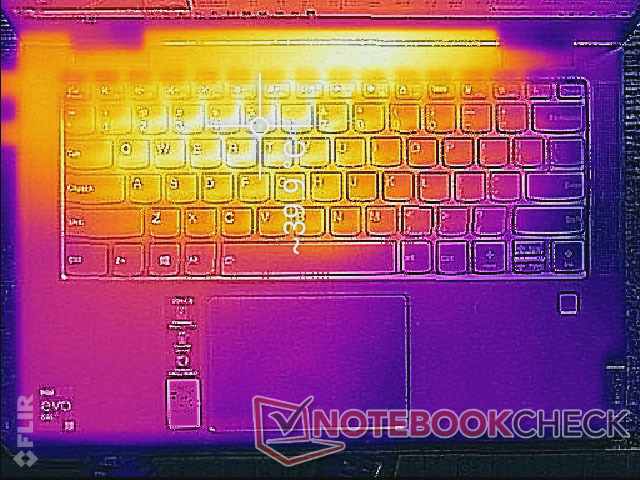
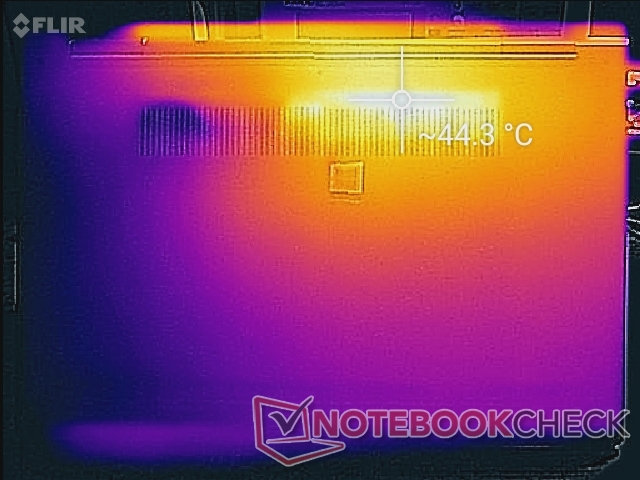
Surface temperature can become as warm as 40 C to 44 C near the center of the keyboard when running high loads for extended periods. Interestingly, these results are almost the same as what we recorded on the Yoga Slim 7 with the more powerful GeForce MX350 GPU. Expect warm keyboard keys if gaming, but the warmth isn't bothersome otherwise.
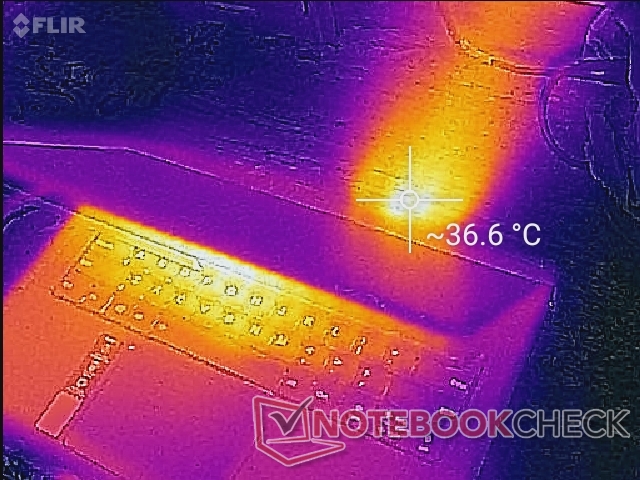
(±) The maximum temperature on the upper side is 40 °C / 104 F, compared to the average of 35.4 °C / 96 F, ranging from 19.6 to 60 °C for the class Convertible.
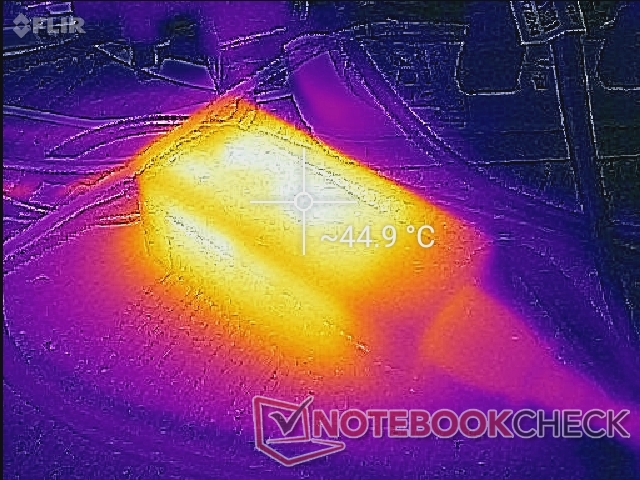
(±) The bottom heats up to a maximum of 44.2 °C / 112 F, compared to the average of 36.9 °C / 98 F
(+) In idle usage, the average temperature for the upper side is 24.6 °C / 76 F, compared to the device average of 30.3 °C / 87 F.
(+) Playing The Witcher 3, the average temperature for the upper side is 29.2 °C / 85 F, compared to the device average of 30.3 °C / 87 F.
(+) The palmrests and touchpad are cooler than skin temperature with a maximum of 27 °C / 80.6 F and are therefore cool to the touch.
(±) The average temperature of the palmrest area of similar devices was 28 °C / 82.4 F (+1 °C / 1.8 F).
Stress Test
When stressed with Prime95, the CPU would boost to 3.8 GHz and 96 C for the first few seconds before dropping to 3 GHz and 88 C thereafter. Clock rates and temperature may cycle ever-so-slightly after a few more minutes, but never to such a degree as observed on the XPS 13. Running Witcher 3 would result in a stable CPU temperature of 61 C compared to 86 C on the AMD-powered Yoga Slim 7.
Running on battery power will impact performance even if on Extreme Performance mode. A 3Dmark 11 test on batteries would return Physics and Graphics scores of 8669 and 4131 points, respectively, compared to 9377 and 4558 points when on mains.
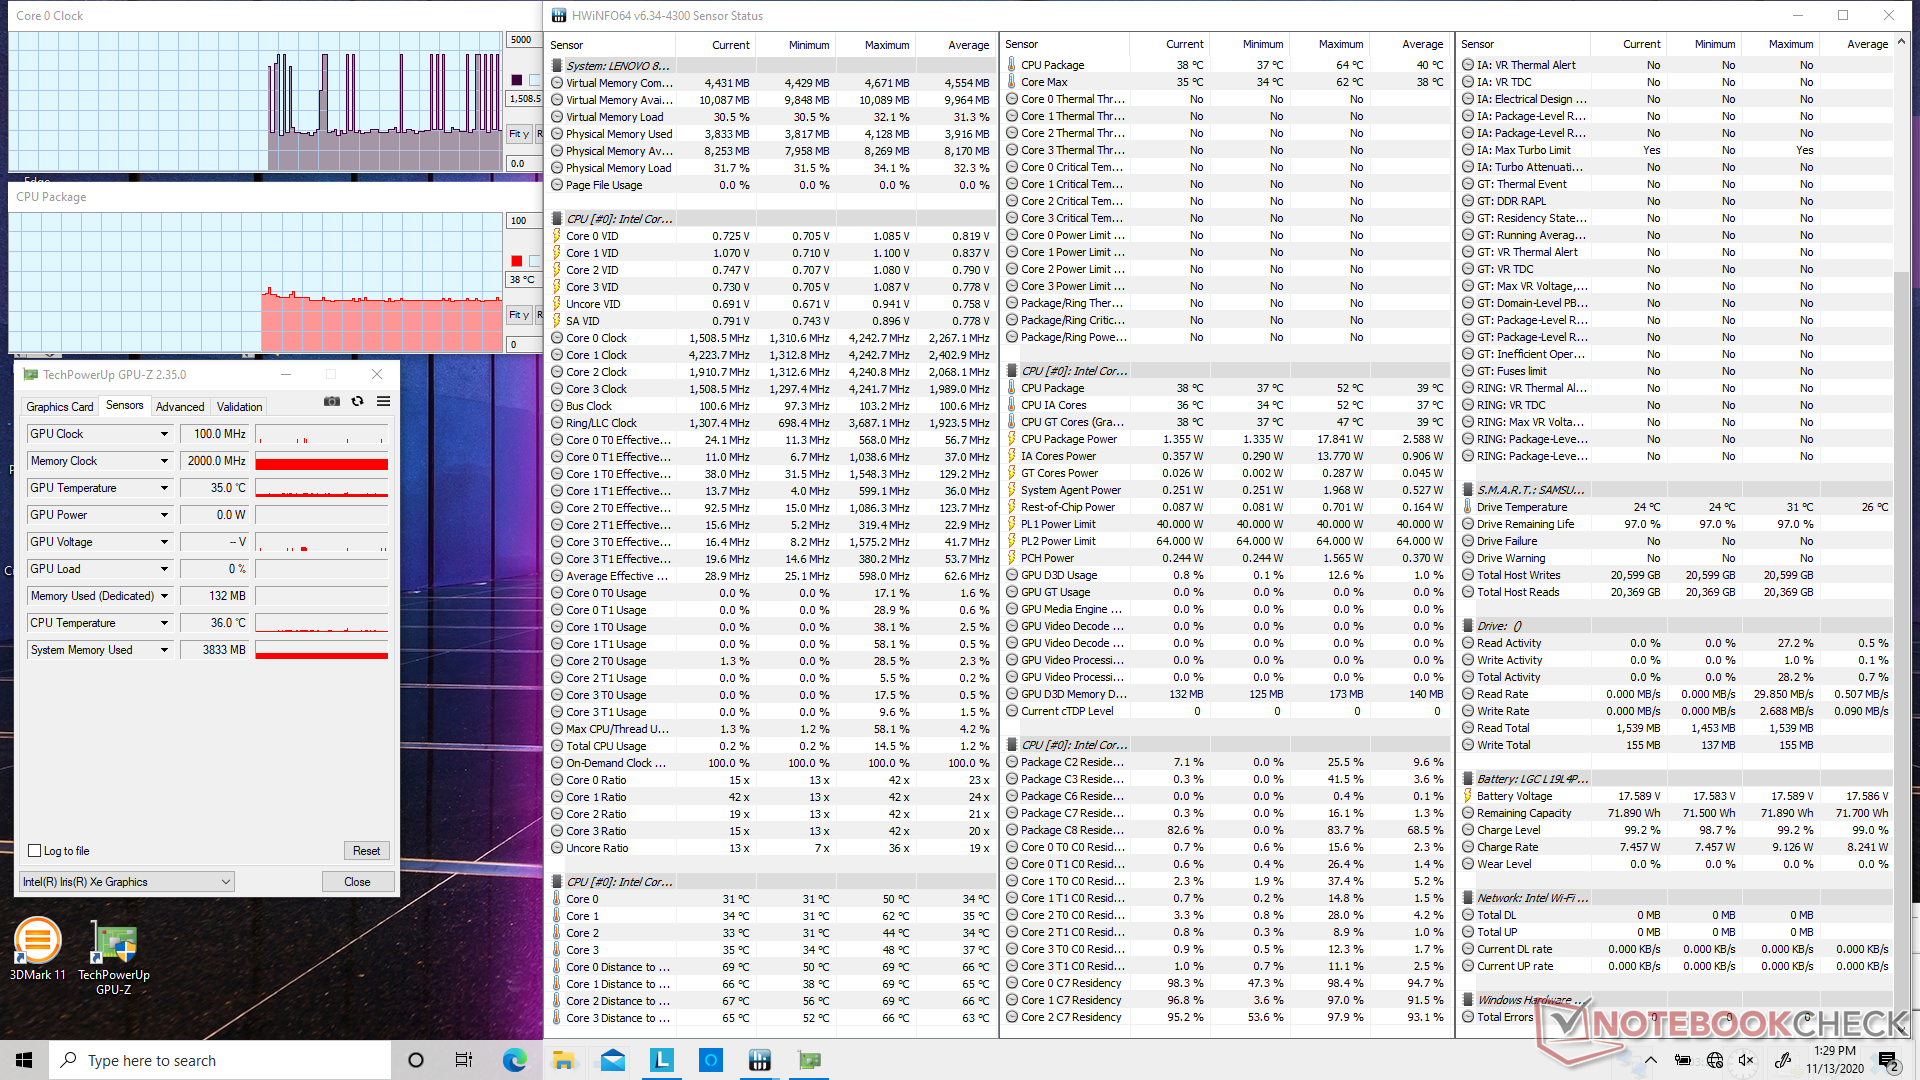
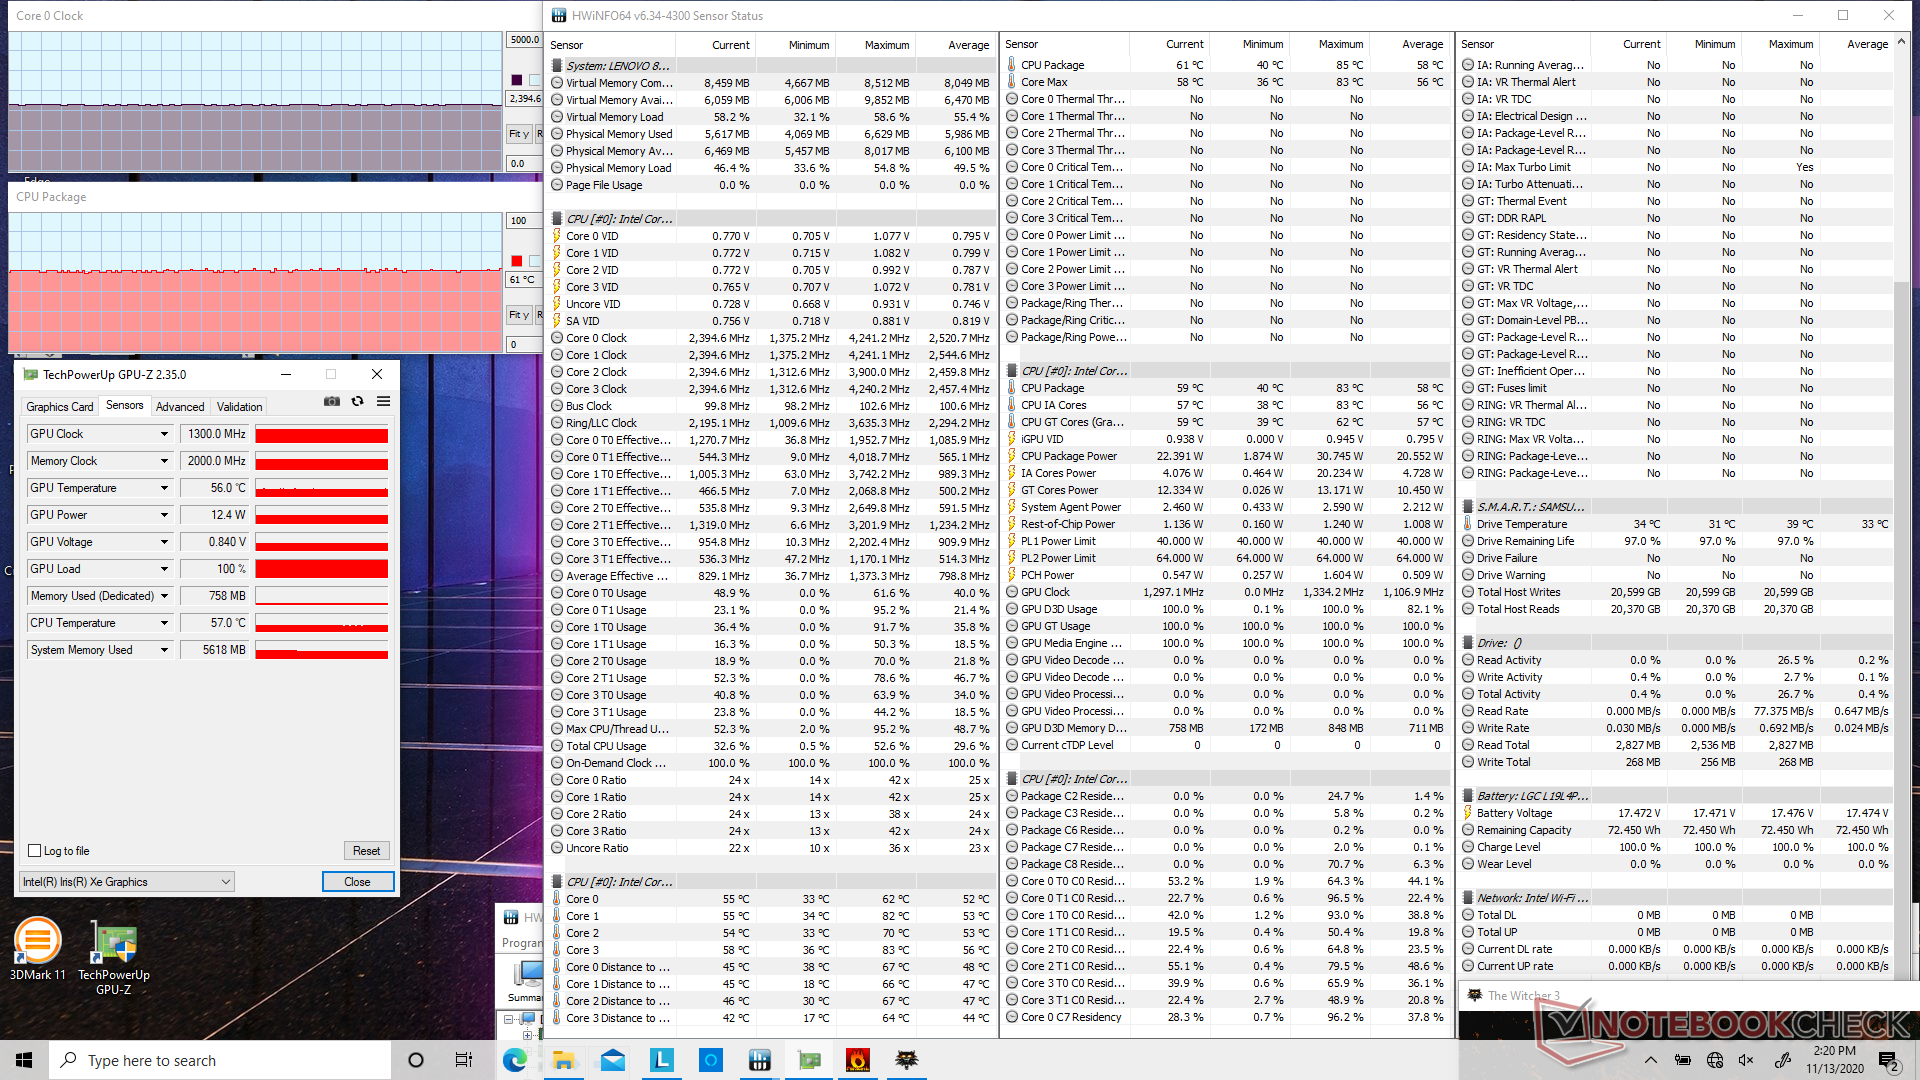
| CPU Clock (GHz) | GPU Clock (MHz) | Average CPU Temperature (°C) | |
| System Idle | -- | -- | 38 |
| Prime95 Stress | 3.0 | -- | 88 |
| Prime95 + FurMark Stress | 1.8 - 1.9 | ~1300 | 73 |
| Witcher 3 Stress | 2.4 | 1300 | 61 |
Speakers


Lenovo Yoga 7 14ITL5 audio analysis
(+) | speakers can play relatively loud (85.5 dB)
Bass 100 - 315 Hz
(±) | reduced bass - on average 12.8% lower than median
(±) | linearity of bass is average (7% delta to prev. frequency)
Mids 400 - 2000 Hz
(+) | balanced mids - only 3.7% away from median
(+) | mids are linear (3.9% delta to prev. frequency)
Highs 2 - 16 kHz
(+) | balanced highs - only 3.4% away from median
(+) | highs are linear (3.4% delta to prev. frequency)
Overall 100 - 16.000 Hz
(+) | overall sound is linear (12.2% difference to median)
Compared to same class
» 12% of all tested devices in this class were better, 4% similar, 84% worse
» The best had a delta of 6%, average was 20%, worst was 57%
Compared to all devices tested
» 10% of all tested devices were better, 2% similar, 88% worse
» The best had a delta of 4%, average was 24%, worst was 134%
Apple MacBook 12 (Early 2016) 1.1 GHz audio analysis
(+) | speakers can play relatively loud (83.6 dB)
Bass 100 - 315 Hz
(±) | reduced bass - on average 11.3% lower than median
(±) | linearity of bass is average (14.2% delta to prev. frequency)
Mids 400 - 2000 Hz
(+) | balanced mids - only 2.4% away from median
(+) | mids are linear (5.5% delta to prev. frequency)
Highs 2 - 16 kHz
(+) | balanced highs - only 2% away from median
(+) | highs are linear (4.5% delta to prev. frequency)
Overall 100 - 16.000 Hz
(+) | overall sound is linear (10.2% difference to median)
Compared to same class
» 7% of all tested devices in this class were better, 2% similar, 91% worse
» The best had a delta of 5%, average was 18%, worst was 53%
Compared to all devices tested
» 5% of all tested devices were better, 1% similar, 94% worse
» The best had a delta of 4%, average was 24%, worst was 134%
Energy Management
Power Consumption
Idling on desktop consumes between 4 W and 9 W depending on the brightness level and power profile which is similar to what we observed on on the Yoga Slim 7 powered by the GeForce MX350. Gaming would consume about 37 W compared to 54 W on the aforementioned Yoga. Perhaps most importantly, power consumption is about the same or even lower than the Asus ZenBook Flip 14 with the UHD Graphics 620 GPU even though our Lenovo is able to offer two times the graphics performance.
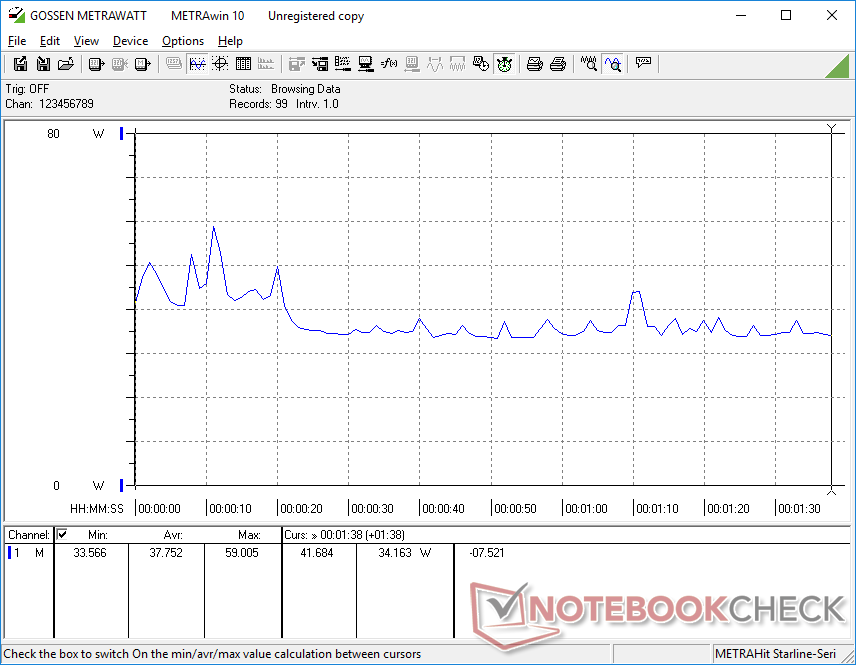
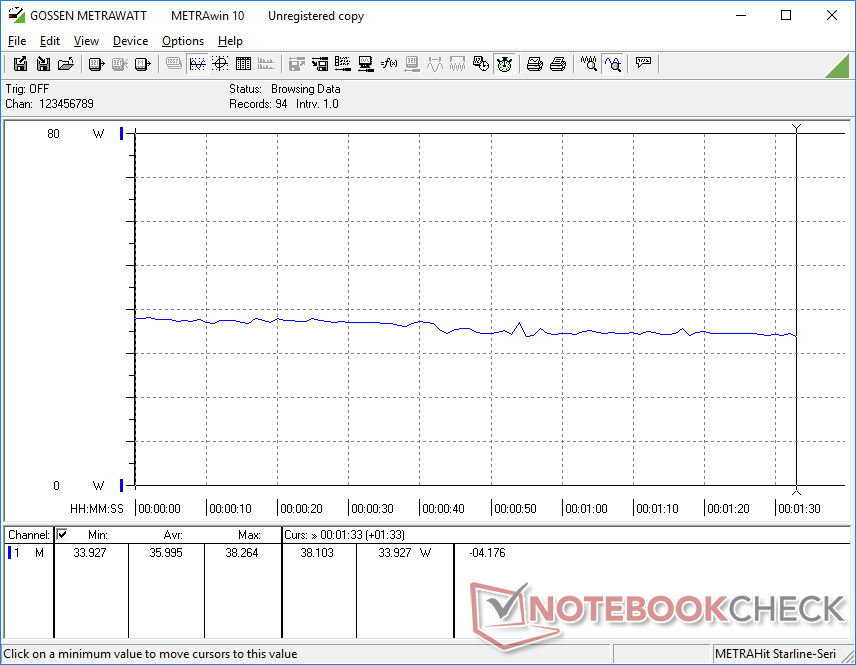
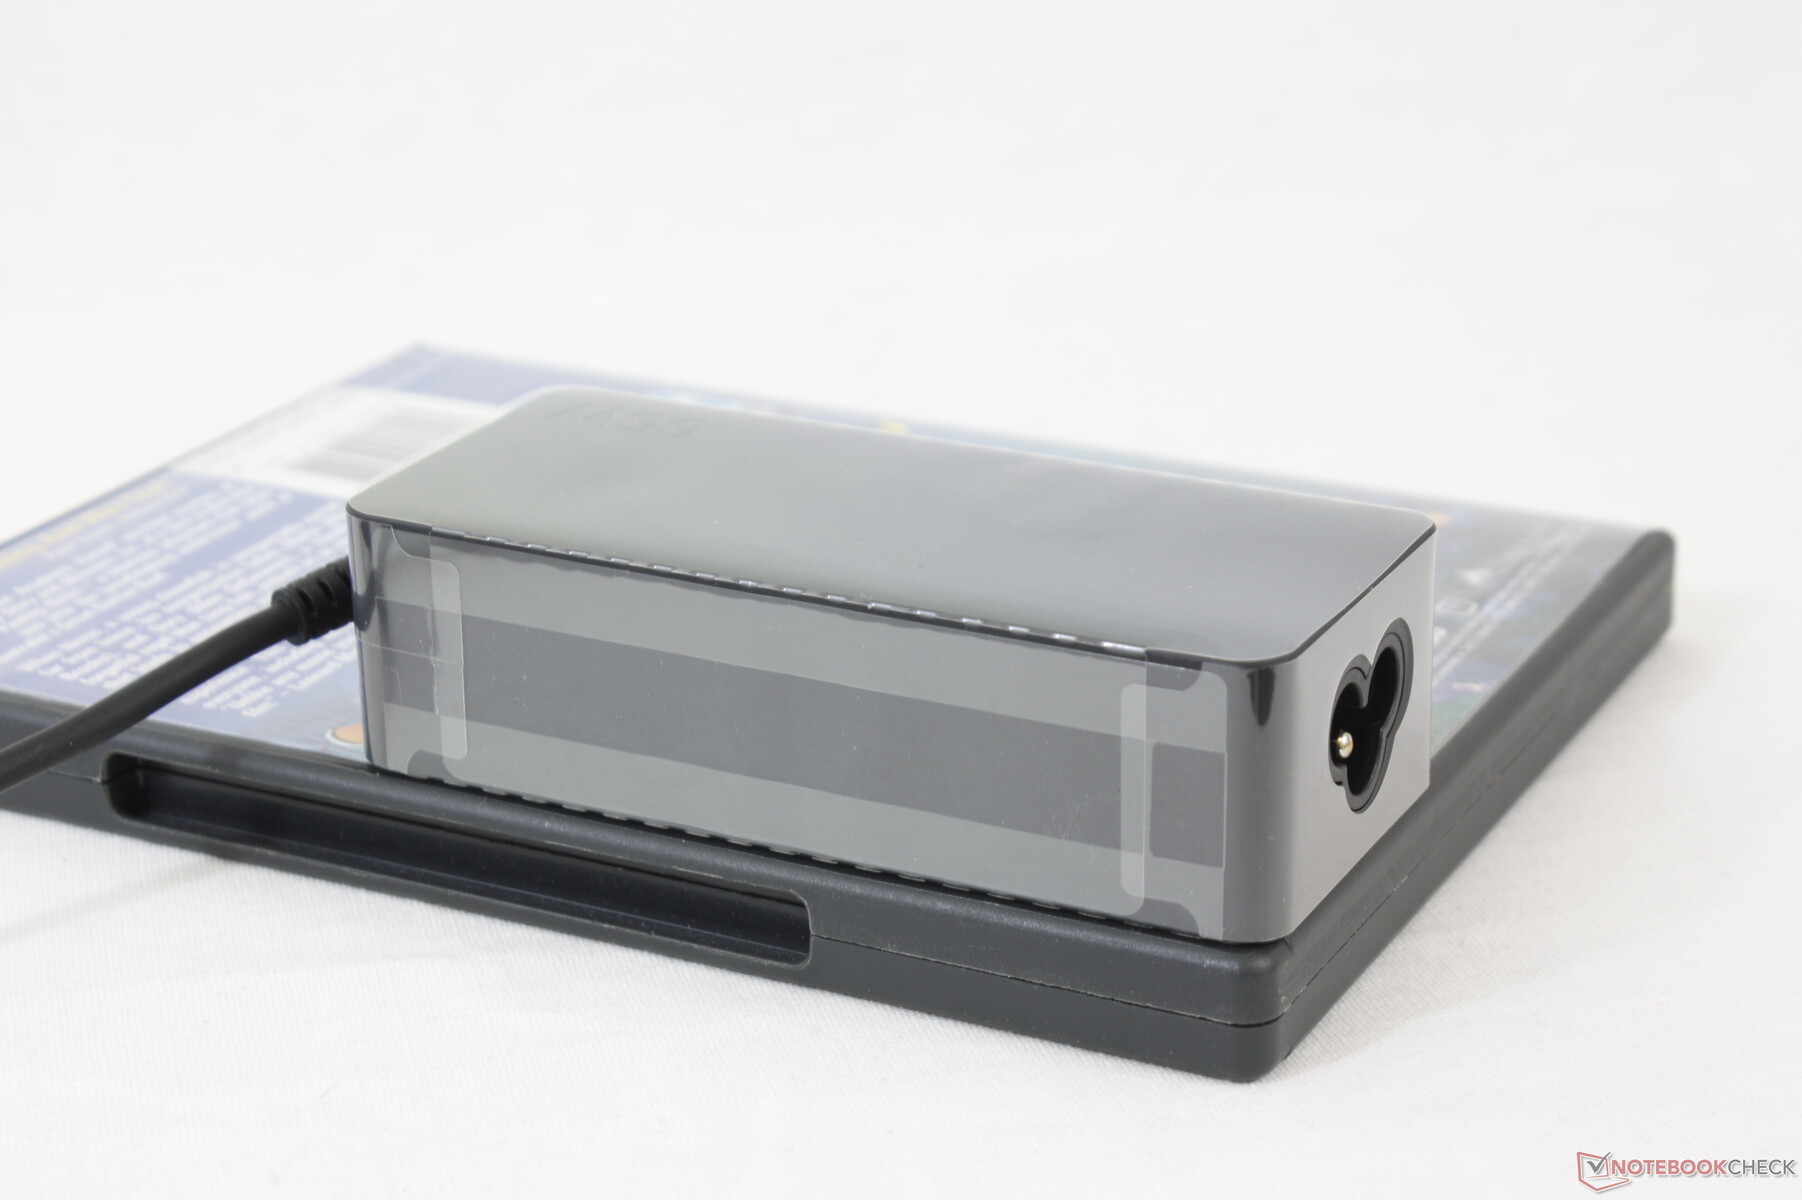
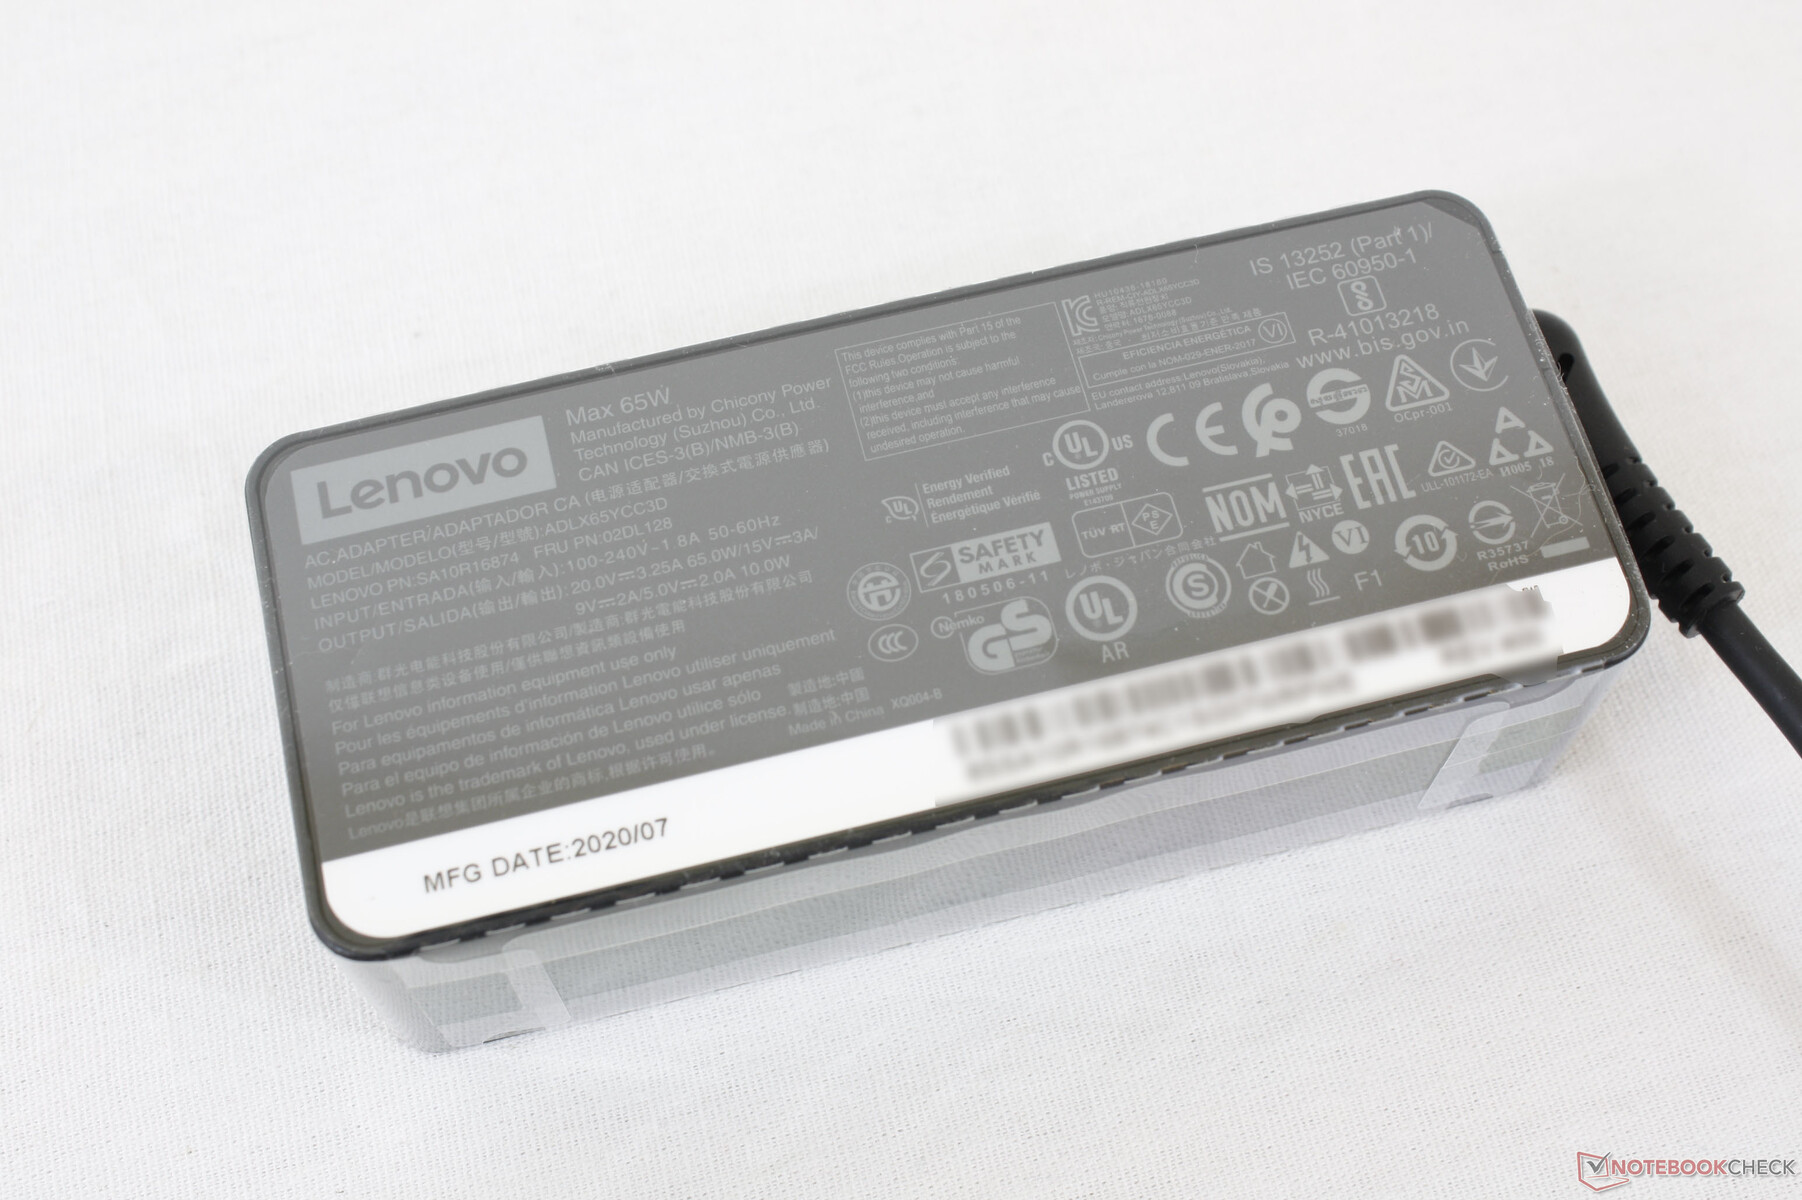
We're able to measure a temporary maximum draw of 67.3 W from the small (~11.8 x 4.8 x 3 cm) 65 W AC adapter when running Prime95. The system will still recharge albeit more slowly when under such high loads.
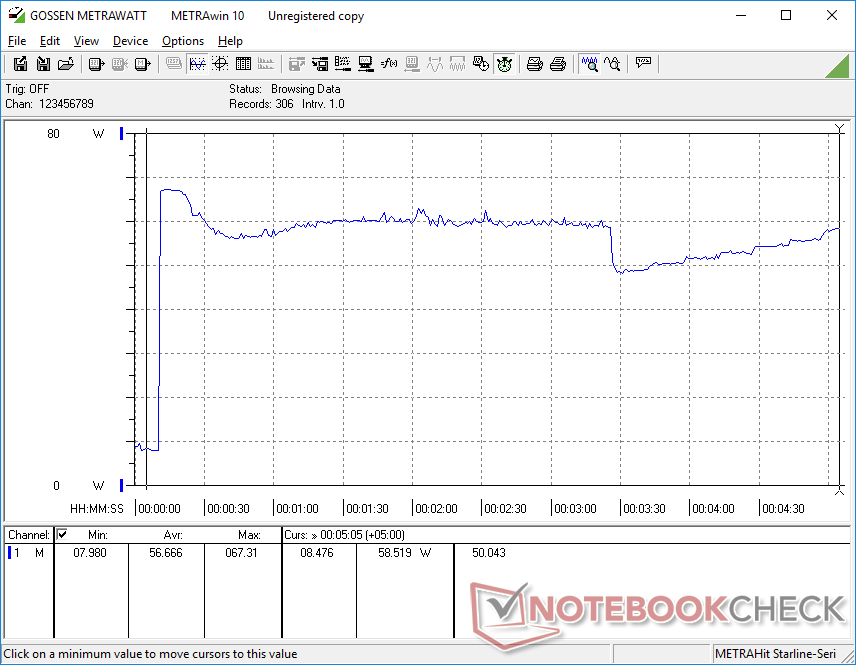
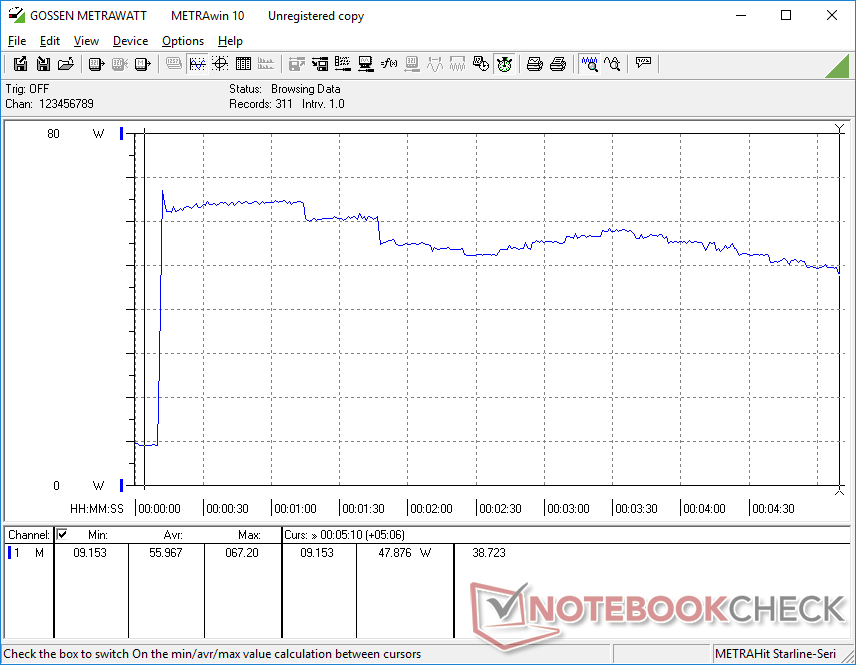
| Off / Standby | |
| Idle | |
| Load |
|
Key:
min: | |
| Lenovo Yoga 7 14ITL5 i5-1135G7, Iris Xe G7 80EUs, Samsung PM991 MZALQ512HALU, IPS, 1920x1080, 14" | Asus ZenBook 14 UX425EA i7-1165G7, Iris Xe G7 96EUs, Intel SSD 660p 1TB SSDPEKNW010T8, IPS, 1920x1080, 14" | Lenovo Yoga Slim 7-14IIL05 i7-1065G7, GeForce MX350, WDC PC SN730 SDBPNTY-512G, , 1920x1080, 14" | Lenovo IdeaPad 5 14ARE05 R5 4500U, Vega 6, Samsung PM991 MZALQ512HALU, IPS, 1920x1080, 14" | Asus ZenBook Flip 14 UX463FA-AI039T i5-10210U, UHD Graphics 620, Kingston RBUSNS8154P3512GJ1, IPS, 1920x1080, 14" | Lenovo Yoga C740-14IML i5-10210U, UHD Graphics 620, Samsung SSD PM981a MZVLB256HBHQ, IPS, 1920x1080, 14" | |
|---|---|---|---|---|---|---|
| Power Consumption | 10% | -15% | -7% | 3% | 16% | |
| Idle Minimum * (Watt) | 4 | 4.8 -20% | 3.7 7% | 4.4 -10% | 3.6 10% | 3 25% |
| Idle Average * (Watt) | 7.8 | 6.5 17% | 5.7 27% | 7.6 3% | 7.5 4% | 3.9 50% |
| Idle Maximum * (Watt) | 8.3 | 7.7 7% | 8.2 1% | 9.9 -19% | 9.4 -13% | 7.3 12% |
| Load Average * (Watt) | 37.8 | 29.6 22% | 57.1 -51% | 46 -22% | 42 -11% | 42.5 -12% |
| Witcher 3 ultra * (Watt) | 36 | 28.6 21% | 54 -50% | |||
| Load Maximum * (Watt) | 67.3 | 57.8 14% | 82.8 -23% | 59 12% | 51 24% | 65.5 3% |
* ... smaller is better
Battery Life
Runtimes are similar to the Yoga Slim 7 at about 10 hours of real-world WLAN use on a full charge. Charging from empty to full capacity takes just under 1.5 hours. Interestingly, battery capacity may change slightly between regions. Our test unit, for example, comes equipped with a 68.7 Wh internal battery even though Lenovo's product page advertises 71 Wh.
| Lenovo Yoga 7 14ITL5 i5-1135G7, Iris Xe G7 80EUs, 68.7 Wh | Asus ZenBook 14 UX425EA i7-1165G7, Iris Xe G7 96EUs, 67 Wh | Lenovo Yoga Slim 7-14IIL05 i7-1065G7, GeForce MX350, 61 Wh | Lenovo IdeaPad 5 14ARE05 R5 4500U, Vega 6, 56.5 Wh | Asus ZenBook Flip 14 UX463FA-AI039T i5-10210U, UHD Graphics 620, 50 Wh | Lenovo Yoga C740-14IML i5-10210U, UHD Graphics 620, 51 Wh | |
|---|---|---|---|---|---|---|
| Battery runtime | 48% | -1% | -2% | -24% | -9% | |
| Reader / Idle (h) | 30.9 | 25.9 -16% | 18.6 -40% | |||
| WiFi v1.3 (h) | 10.1 | 13.1 30% | 9.9 -2% | 9.9 -2% | 7.7 -24% | 9.2 -9% |
| Load (h) | 1.4 | 3.2 129% | 1.4 0% | 1.7 21% |
Pros
Cons
Verdict
One of the biggest selling points of the Yoga 7i 14 is its inclusion of two Thunderbolt 4 ports for compatibility with a wide range of external devices. Thunderbolt support is not common on convertibles in this price range as many alternatives like the HP Envy x360 13, Asus VivoBook Flip 14, Asus ZenBook Flip 14, or Dell Inspiron 14 2-in-1 offer USB-C only. If you expect to be using Thunderbolt devices frequently and don't want to pay hundreds more for such a feature, then the Yoga 7i 14 is a no brainer.
If you don't think you'll need Thunderbolt at all, however, then the Lenovo becomes a harder sell. The older Yoga C740 is cheaper while offering essentially the same chassis and keyboard and only slightly slower system performance. The Iris Xe in our Core i5-powered Yoga 7i 14 performs worse than expected relative to other Iris Xe systems we've tested thus far. The system is also a bit heavy for tablet mode and so users interested in this feature may want to consider the thinner and lighter Yoga 9i or Yoga C940 series instead.
The Lenovo yoga 7i 14 holds some nice surprises for a $1000 USD convertible including multiple Thunderbolt 4 ports, fast Core i5 CPU performance with Intel Evo certification, and a well-calibrated display. However, users are going to miss having Windows Hello or an HDMI port while both weight and graphics performance could certainly be better.
Lenovo Yoga 7 14ITL5
- 11/17/2020 v7 (old)
Allen Ngo
Price comparison
