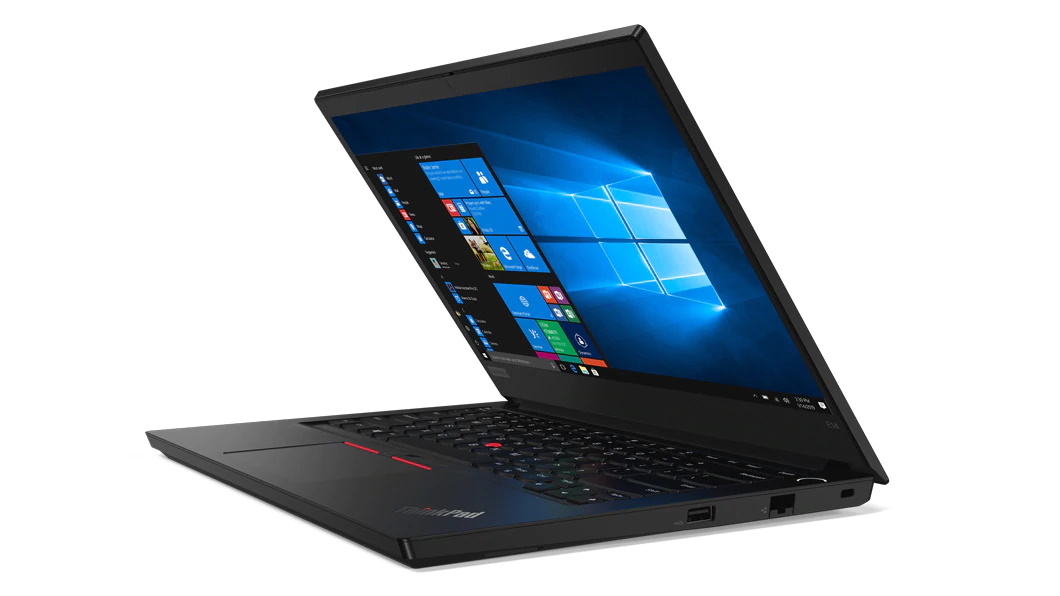
Lenovo ThinkPad E14 laptop review: Intel CPU loses against AMD Ryzen, but what else is new?
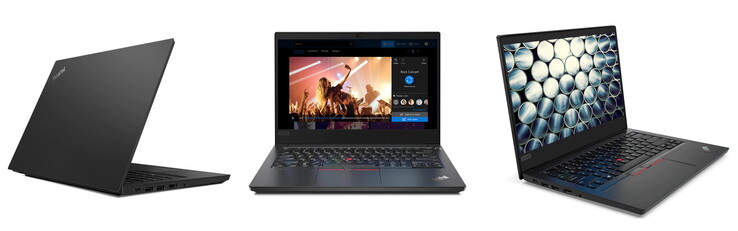
The ThinkPad E14 is the legitimate successor to the ThinkPad E490. We have already tested the E14 Gen 2 with AMD Ryzen 5 4500U and Vega 6 R4000, now we have another Gen 1 version with Intel Core i7-10510U and dedicated AMD Radeon RX 640. While Gen 2 in the pure AMD version costs 630 Euros (~$748), the Intel Gen 1 version with dedicated AMD graphics costs about 950 Euros (~$1,128). Of course, we compare both models and also look at the sister model with weaker CPU and iGPU as well as the predecessor to see what has changed since the E490. The comparison units are listed below.
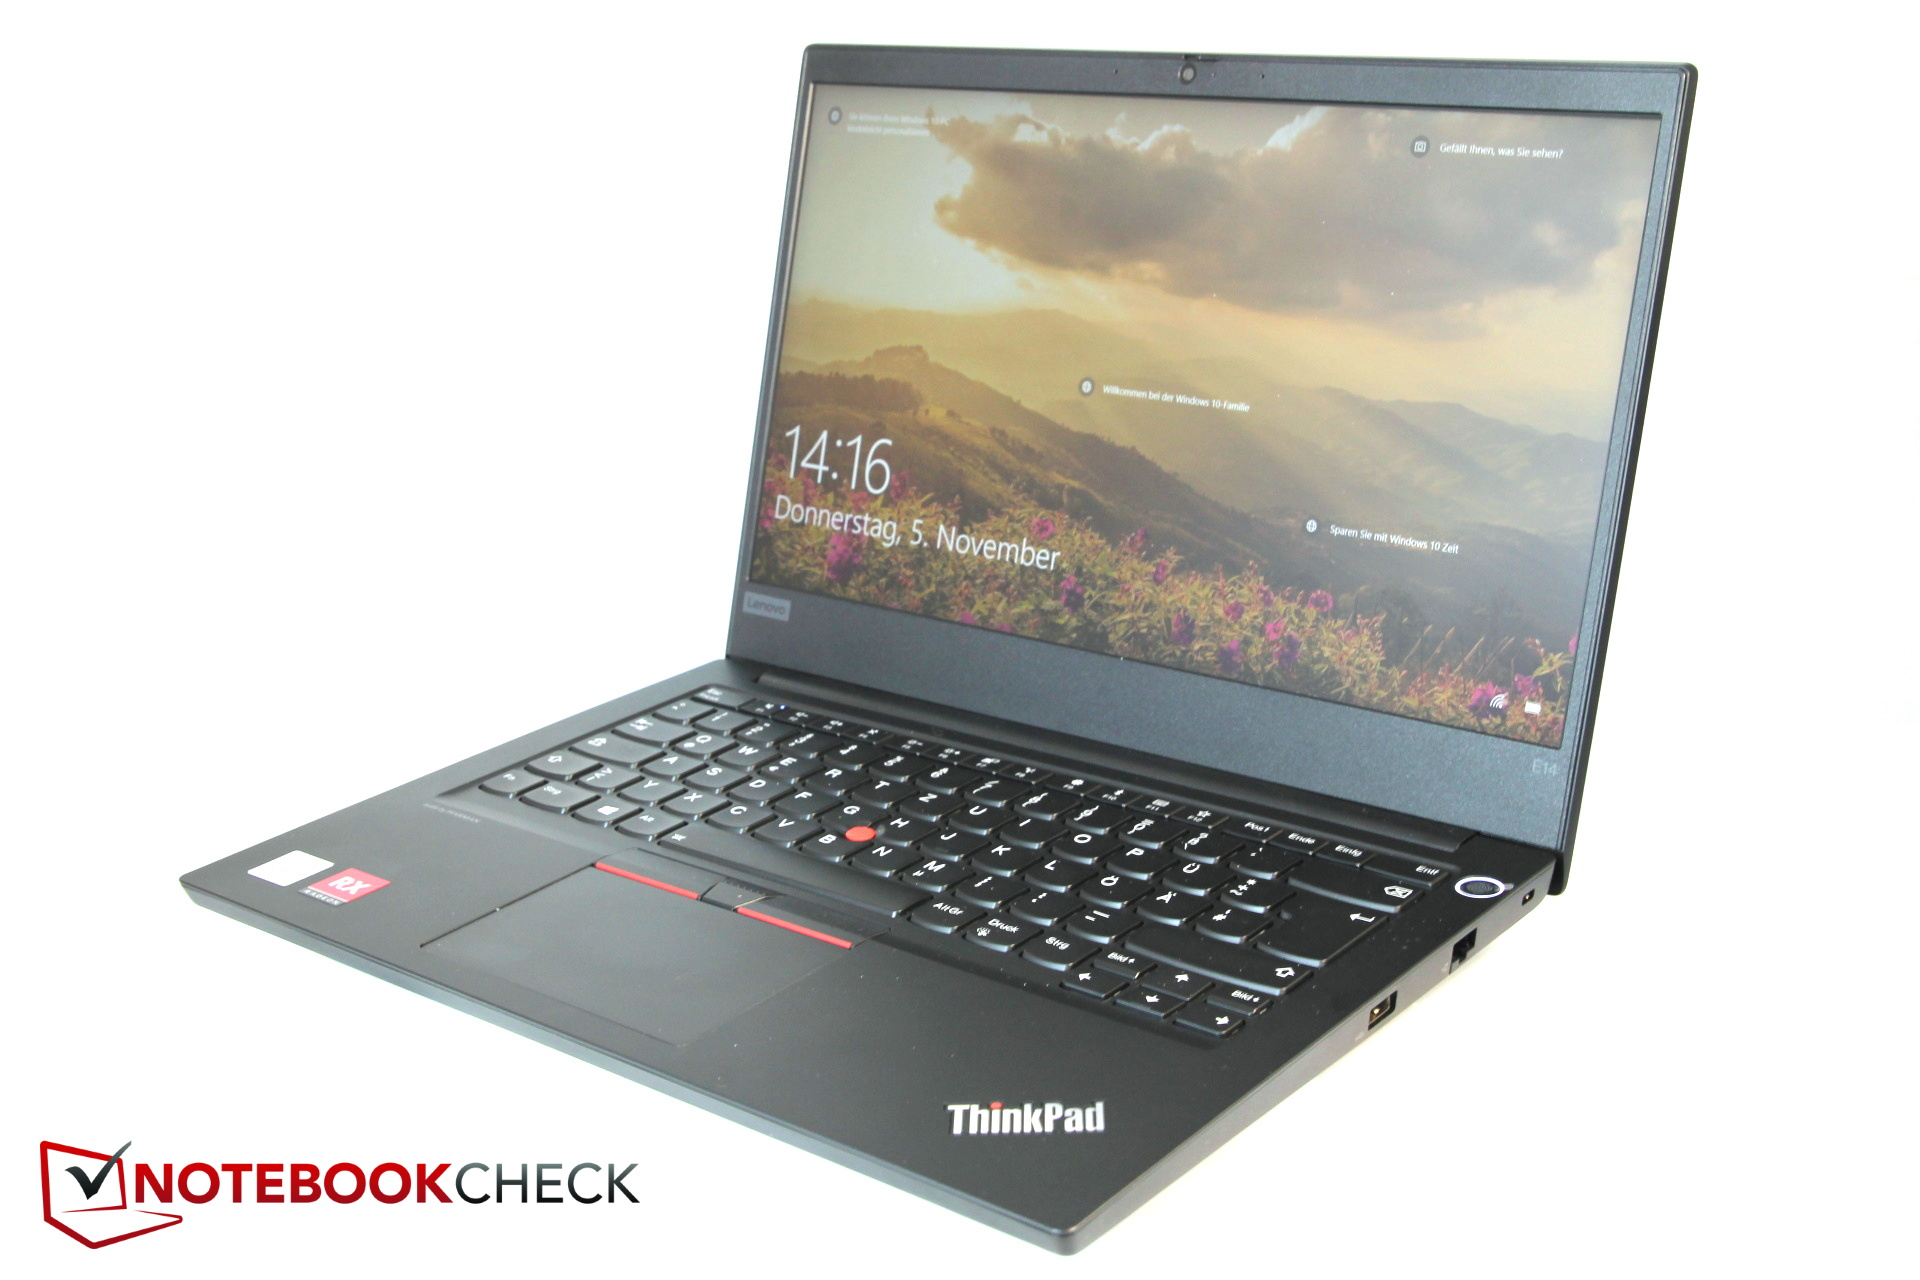
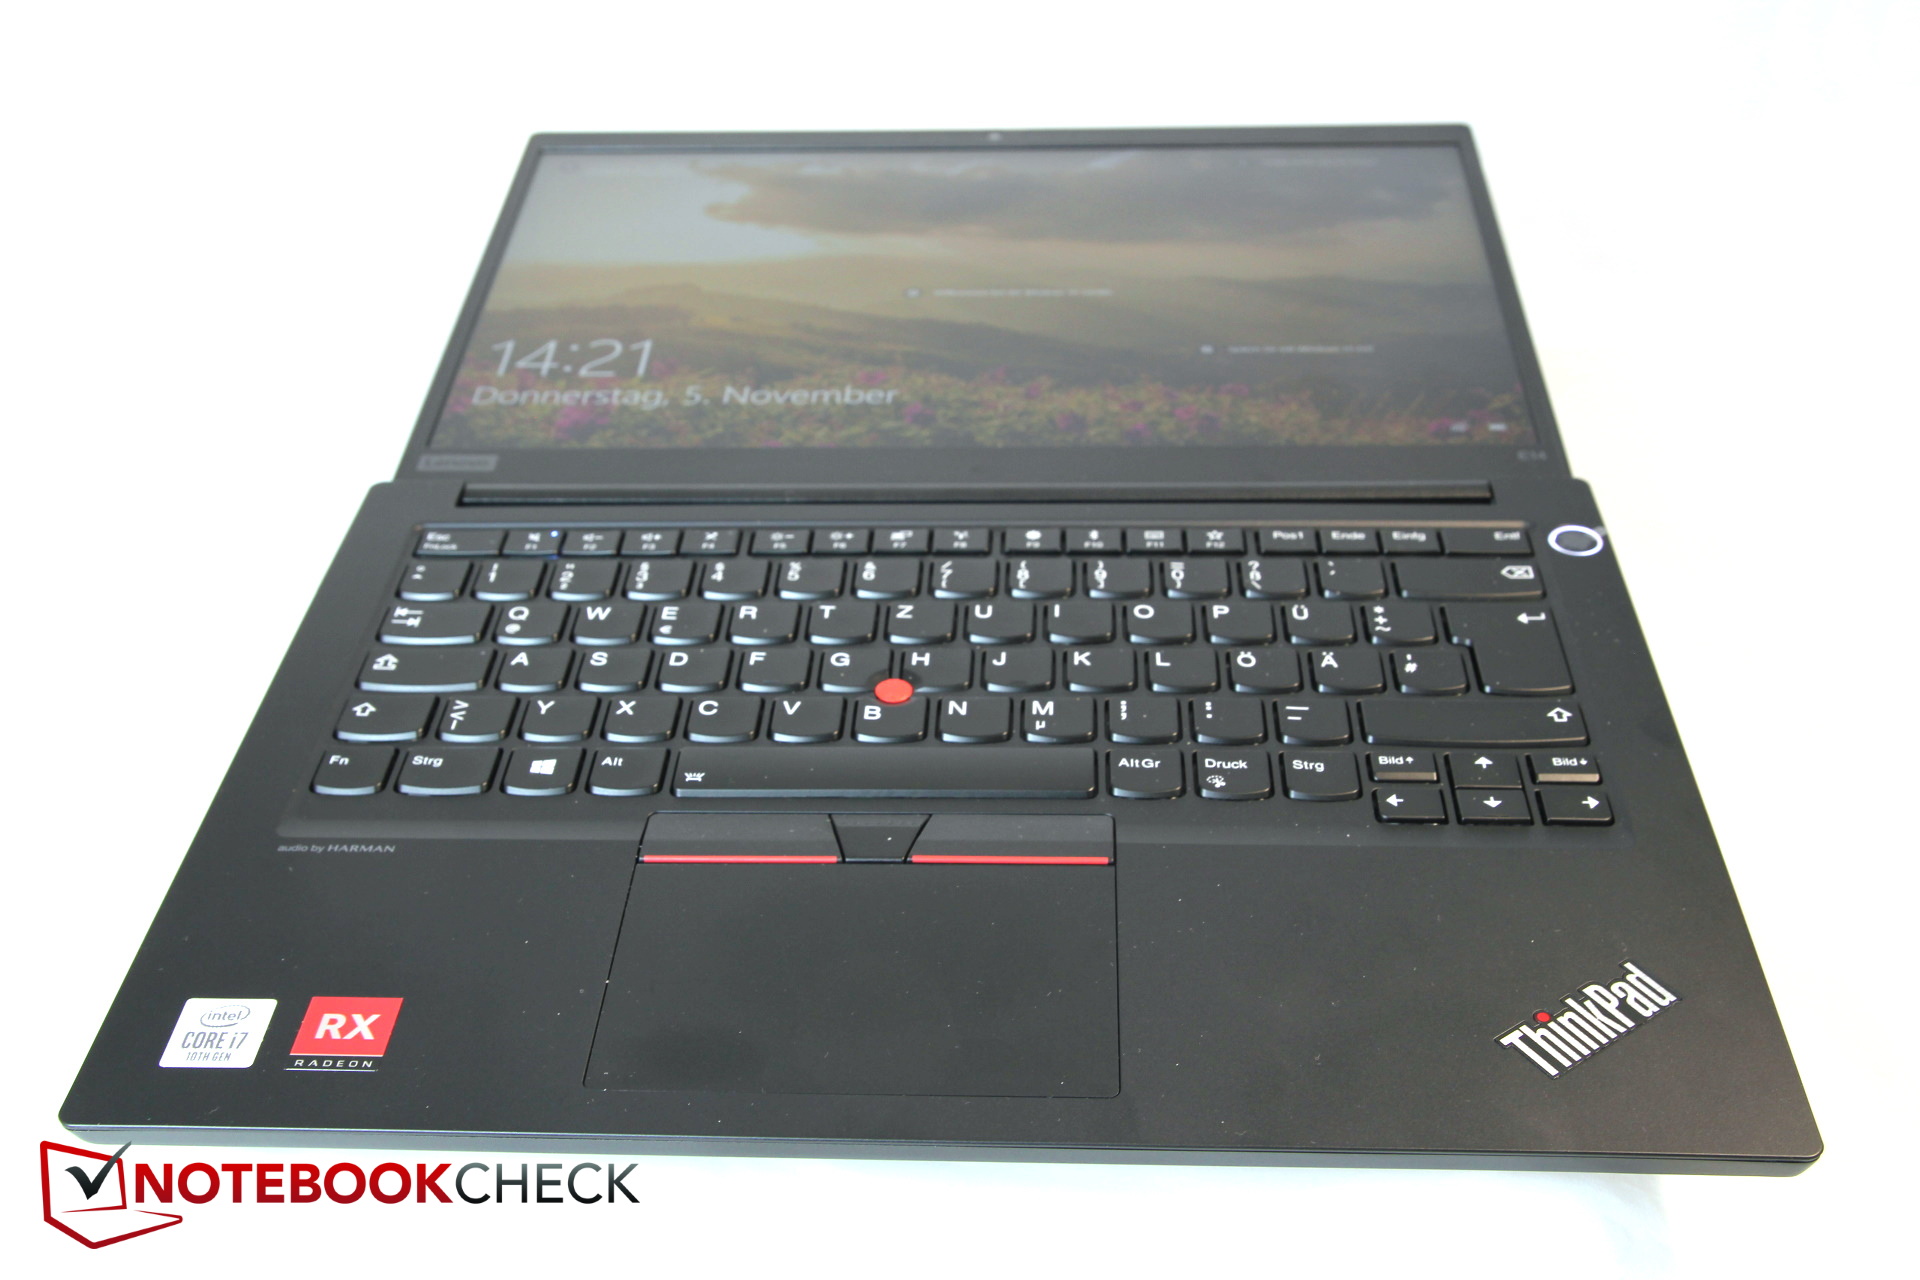
Since we've already tested the ThinkPad E14, we won't go any further into the areas of case, equipment, maintenance, input devices, display and speakers - unless of course there are differences. These features can be found in the test of the sister model.
Rating | Date | Model | Weight | Height | Size | Resolution | Price |
|---|---|---|---|---|---|---|---|
| 84.1 % v7 (old) | 11 / 2020 | Lenovo ThinkPad E14-20RA001LGE i7-10510U, Radeon RX 640 | 1.7 kg | 17.9 mm | 14.00" | 1920x1080 | |
| 85.6 % v7 (old) | 08 / 2020 | Lenovo ThinkPad E14 Gen2-20T7S00W00 R5 4500U, Vega 6 | 1.6 kg | 17.9 mm | 14.00" | 1920x1080 | |
| 84.5 % v7 (old) | 03 / 2020 | Lenovo ThinkPad E14 20RA001MGE i5-10210U, UHD Graphics 620 | 1.6 kg | 17.9 mm | 14.00" | 1920x1080 | |
| 84.6 % v7 (old) | 05 / 2020 | Lenovo ThinkPad E490-20N90004GE i7-8565U, Radeon RX 550X (Laptop) | 1.9 kg | 19.9 mm | 14.00" | 1920x1080 | |
| 80.7 % v7 (old) | 07 / 2020 | Asus VivoBook S14 S433FL i7-10510U, GeForce MX250 | 1.4 kg | 16 mm | 14.00" | 1920x1080 | |
| 80.9 % v7 (old) | 01 / 2020 | MSI Modern 14 A10RB-459US i5-10210U, GeForce MX250 | 1.2 kg | 16 mm | 14.00" | 1920x1080 |
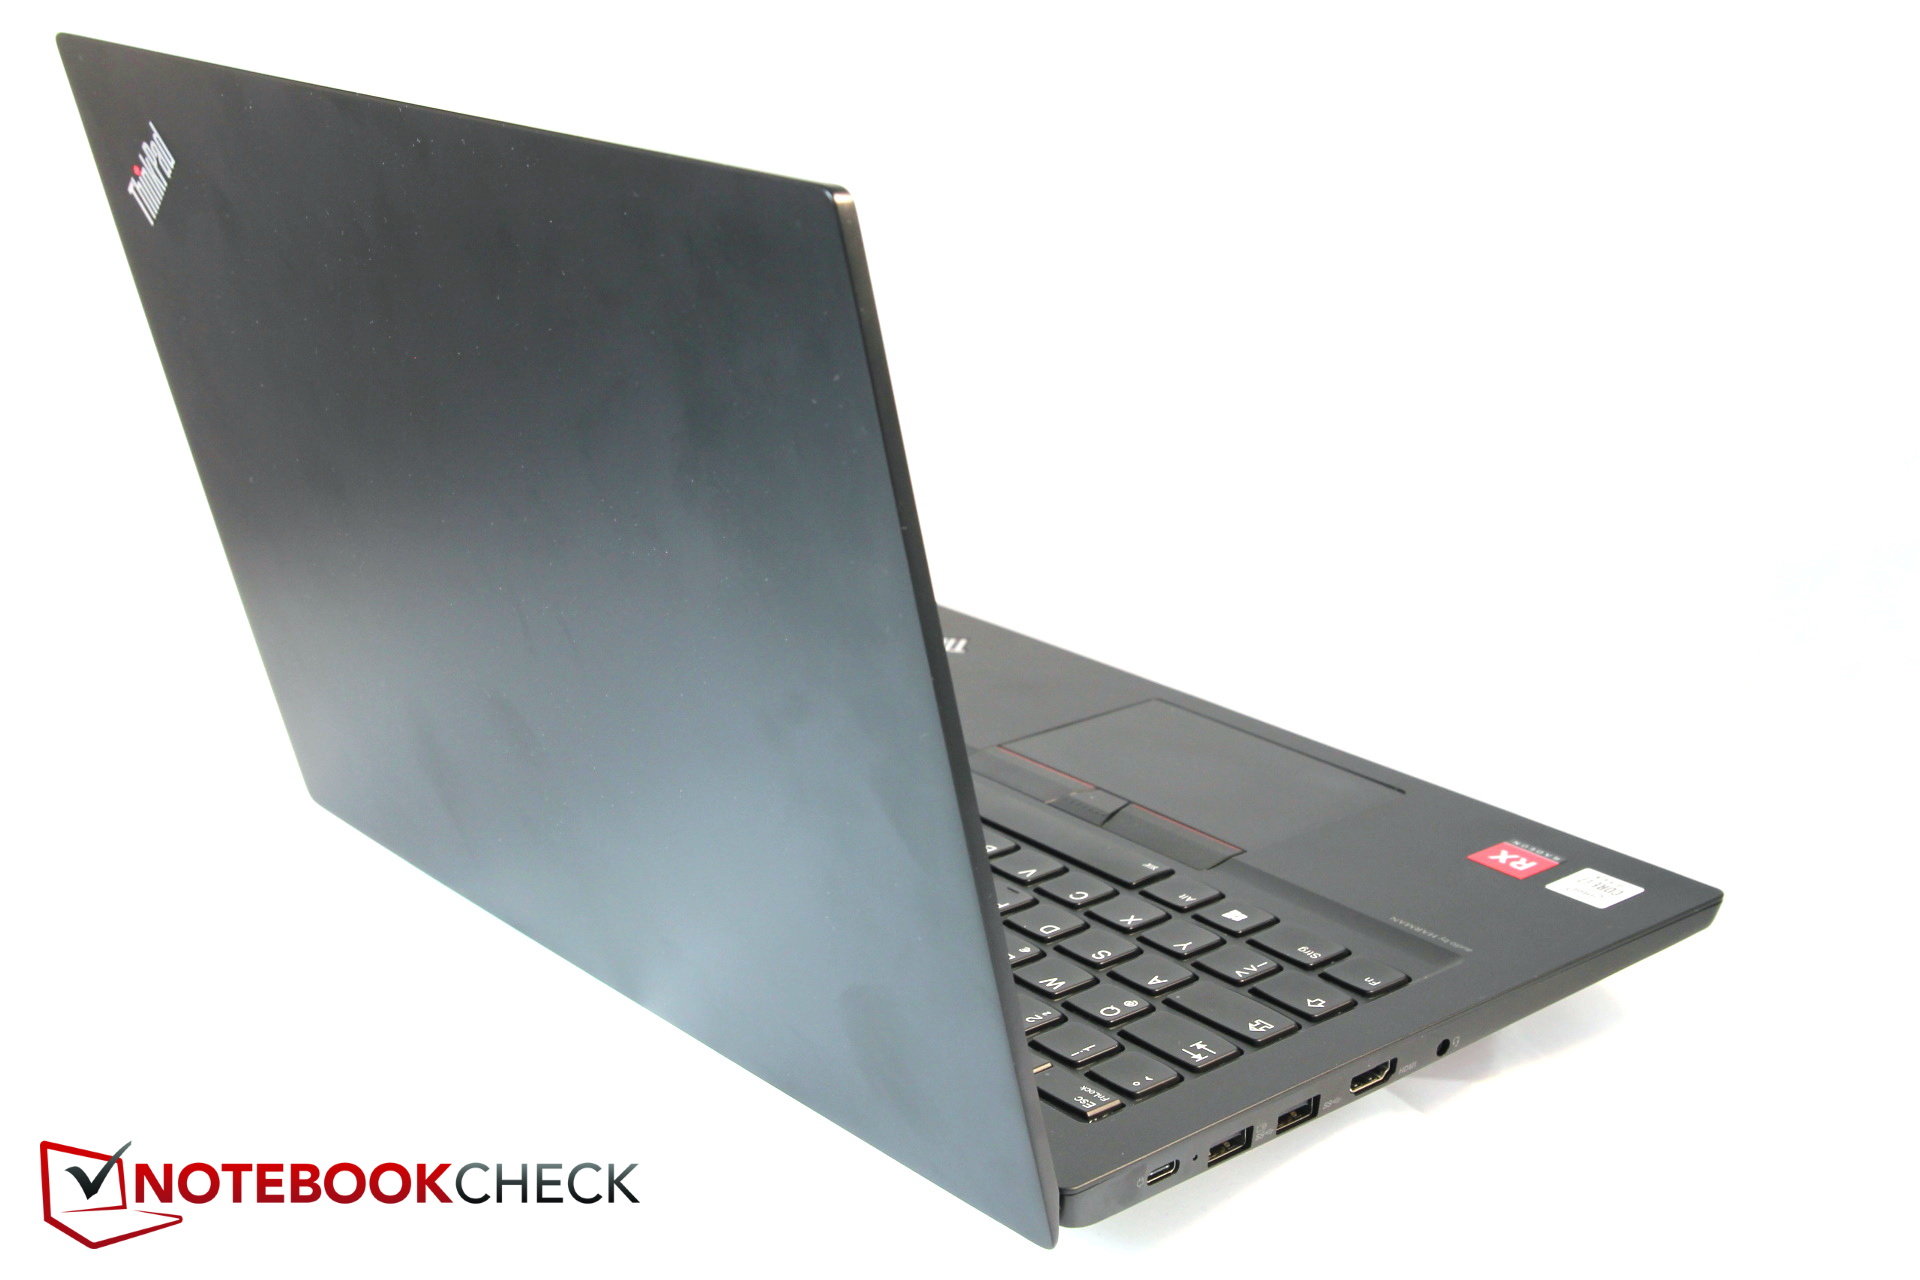
Case - Differences in material and housing thickness

Communication
In contrast to the Intel Wireless AX200 in the AMD Gen 2-E14, the nominally somewhat better Intel Wireless AX201 is used here, but the AX200 in the Gen 2 still offers about 7 to 13% faster data transmission.

Display - Still darker, but with more contrast

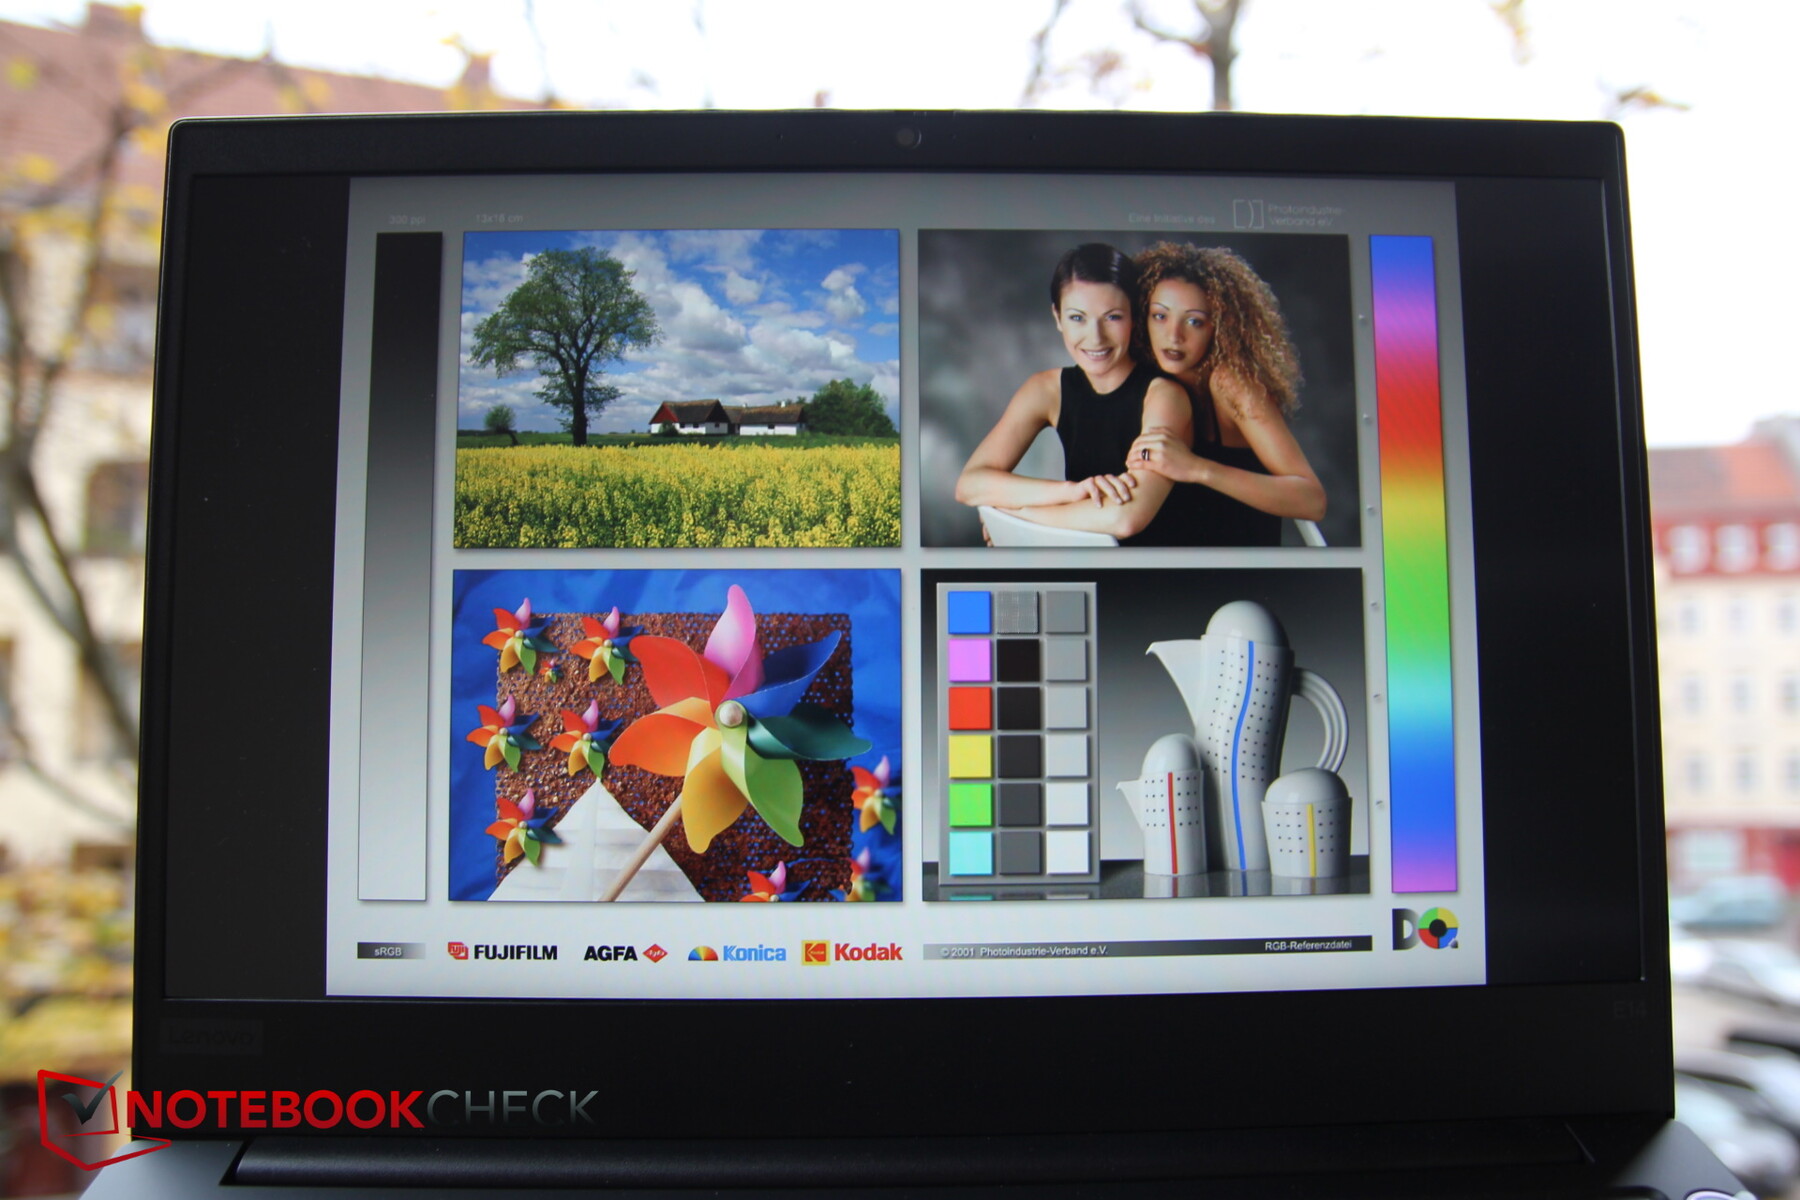
Keep your eyes open when you buy a ThinkPad: The E14 is available with either an IPS or worse TN panel. But the IPS option is not the same either. The panel here hardly does a better job than the screen we criticized in the AMD-E14. Although the black level and contrast are much higher, it is even darker. 229 nits is a weak result even for the entry level.
The screen is poorly calibrated at the factory and the color deviations are high. A separate calibration brings the colors to acceptable values. The panel from the same manufacturer in the sister model was better overall, as it is brighter with the same high contrast.
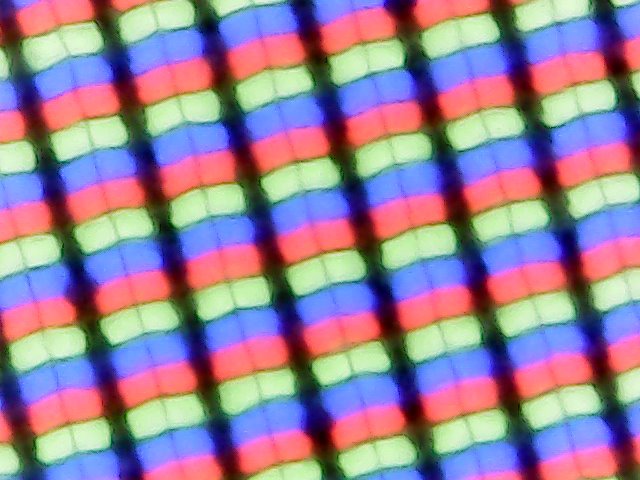
By the way, screen bleeding is almost imperceptible.
| |||||||||||||||||||||||||
Brightness Distribution: 87 %
Center on Battery: 252 cd/m²
Contrast: 1779:1 (Black: 0.14 cd/m²)
ΔE ColorChecker Calman: 6.7 | ∀{0.5-29.43 Ø4.72}
calibrated: 5
ΔE Greyscale Calman: 6.2 | ∀{0.09-98 Ø4.97}
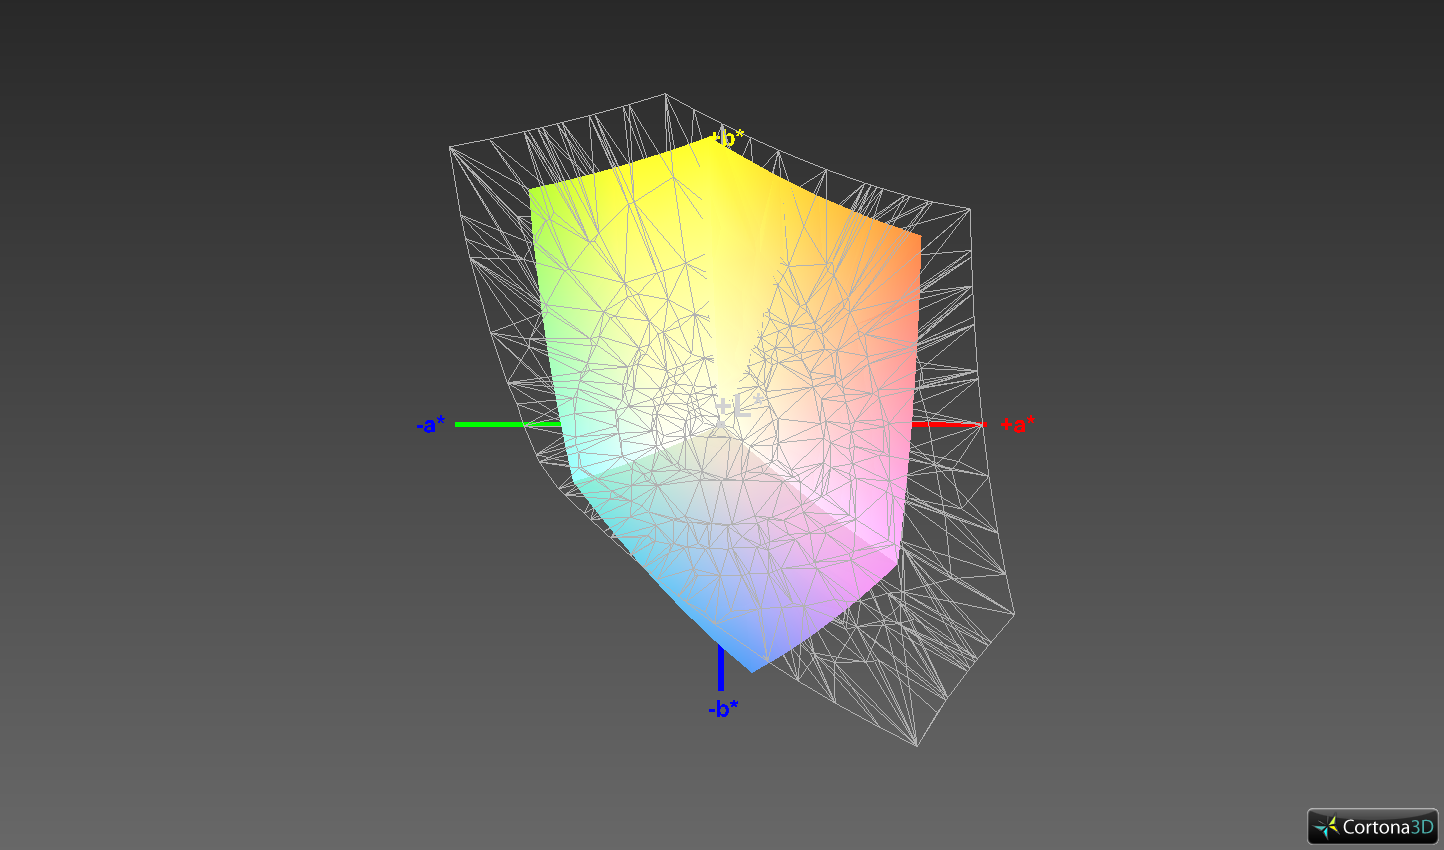
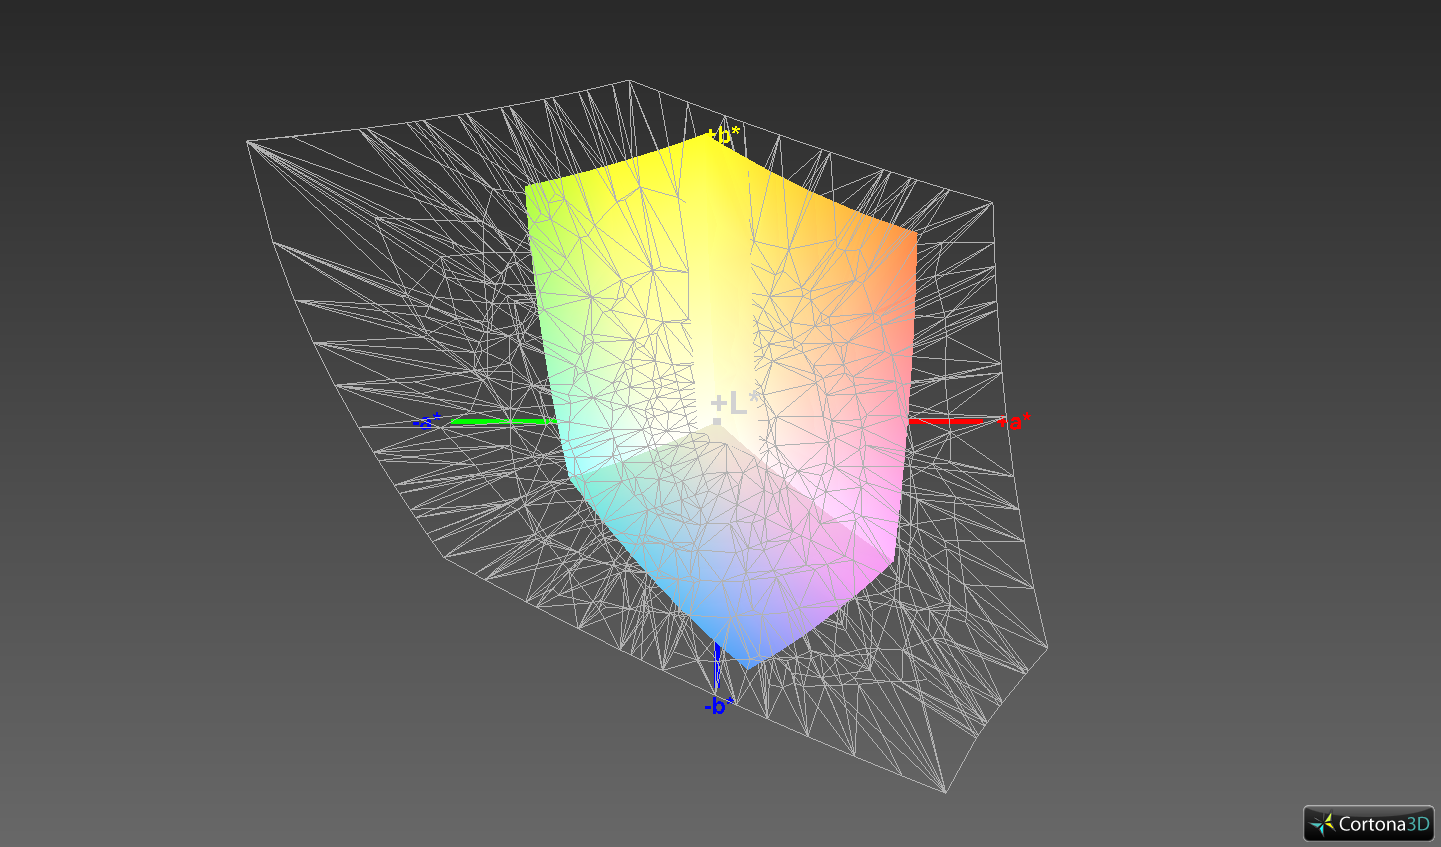
62.1% sRGB (Argyll 1.6.3 3D)
40% AdobeRGB 1998 (Argyll 1.6.3 3D)
43.52% AdobeRGB 1998 (Argyll 3D)
62.4% sRGB (Argyll 3D)
42.02% Display P3 (Argyll 3D)
Gamma: 2.16
CCT: 6256 K
| Lenovo ThinkPad E14-20RA001LGE N140HCA-EAC, IPS, 1920x1080, 14" | Lenovo ThinkPad E14 Gen2-20T7S00W00 B140HAN05.7, a-Si IPS LED, 1920x1080, 14" | Lenovo ThinkPad E14 20RA001MGE NV140FHM-N48, IPS LED, 1920x1080, 14" | Lenovo ThinkPad E490-20N90004GE B140HAN04.2, IPS, 1920x1080, 14" | Asus VivoBook S14 S433FL Chi Mei CMN14D4, IPS, 1920x1080, 14" | MSI Modern 14 A10RB-459US Chi Mei N140HCE-EN2, IPS, 1920x1080, 14" | |
|---|---|---|---|---|---|---|
| Display | -9% | -4% | -7% | -1% | 52% | |
| Display P3 Coverage (%) | 42.02 | 38.16 -9% | 40.31 -4% | 38.98 -7% | 41.55 -1% | 64.2 53% |
| sRGB Coverage (%) | 62.4 | 57.2 -8% | 60 -4% | 58.6 -6% | 62 -1% | 94.8 52% |
| AdobeRGB 1998 Coverage (%) | 43.52 | 39.42 -9% | 41.65 -4% | 40.27 -7% | 42.99 -1% | 65.4 50% |
| Response Times | -1% | -28% | -3% | 19% | -7% | |
| Response Time Grey 50% / Grey 80% * (ms) | 42 ? | 46.4 ? -10% | 52 ? -24% | 44 ? -5% | 34 ? 19% | 39.2 ? 7% |
| Response Time Black / White * (ms) | 29.6 ? | 27.2 ? 8% | 39.2 ? -32% | 30 ? -1% | 24 ? 19% | 35.6 ? -20% |
| PWM Frequency (Hz) | 1250 ? | 250 ? | 25000 ? | |||
| Screen | -3% | 9% | 6% | 1% | 35% | |
| Brightness middle (cd/m²) | 249 | 281 13% | 305 22% | 278 12% | 220 -12% | 324.1 30% |
| Brightness (cd/m²) | 229 | 264 15% | 292 28% | 257 12% | 204 -11% | 301 31% |
| Brightness Distribution (%) | 87 | 87 0% | 89 2% | 85 -2% | 68 -22% | 87 0% |
| Black Level * (cd/m²) | 0.14 | 0.25 -79% | 0.17 -21% | 0.19 -36% | 0.155 -11% | 0.22 -57% |
| Contrast (:1) | 1779 | 1124 -37% | 1794 1% | 1463 -18% | 1419 -20% | 1473 -17% |
| Colorchecker dE 2000 * | 6.7 | 5.8 13% | 5.9 12% | 5.1 24% | 5.23 22% | 1.63 76% |
| Colorchecker dE 2000 max. * | 24.5 | 22.3 9% | 18.4 25% | 19.3 21% | 21.51 12% | 4.25 83% |
| Colorchecker dE 2000 calibrated * | 5 | 4.9 2% | 4.6 8% | 4.5 10% | 4.4 12% | 1.42 72% |
| Greyscale dE 2000 * | 6.2 | 3.2 48% | 4.4 29% | 2.7 56% | 3.77 39% | 2.2 65% |
| Gamma | 2.16 102% | 2.15 102% | 2.05 107% | 2.21 100% | 2.35 94% | 2.26 97% |
| CCT | 6256 104% | 6452 101% | 6921 94% | 6685 97% | 6666 98% | 6887 94% |
| Color Space (Percent of AdobeRGB 1998) (%) | 40 | 36.2 -9% | 38.2 -4% | 37.1 -7% | 40 0% | 60.2 51% |
| Color Space (Percent of sRGB) (%) | 62.1 | 56.9 -8% | 59.6 -4% | 58.4 -6% | 62 0% | 95 53% |
| Total Average (Program / Settings) | -4% /
-4% | -8% /
2% | -1% /
3% | 6% /
3% | 27% /
33% |
* ... smaller is better
Color-space coverage can increase by a few percentage points but is still below average at 40% AdobeRGB and 62.1% sRGB.
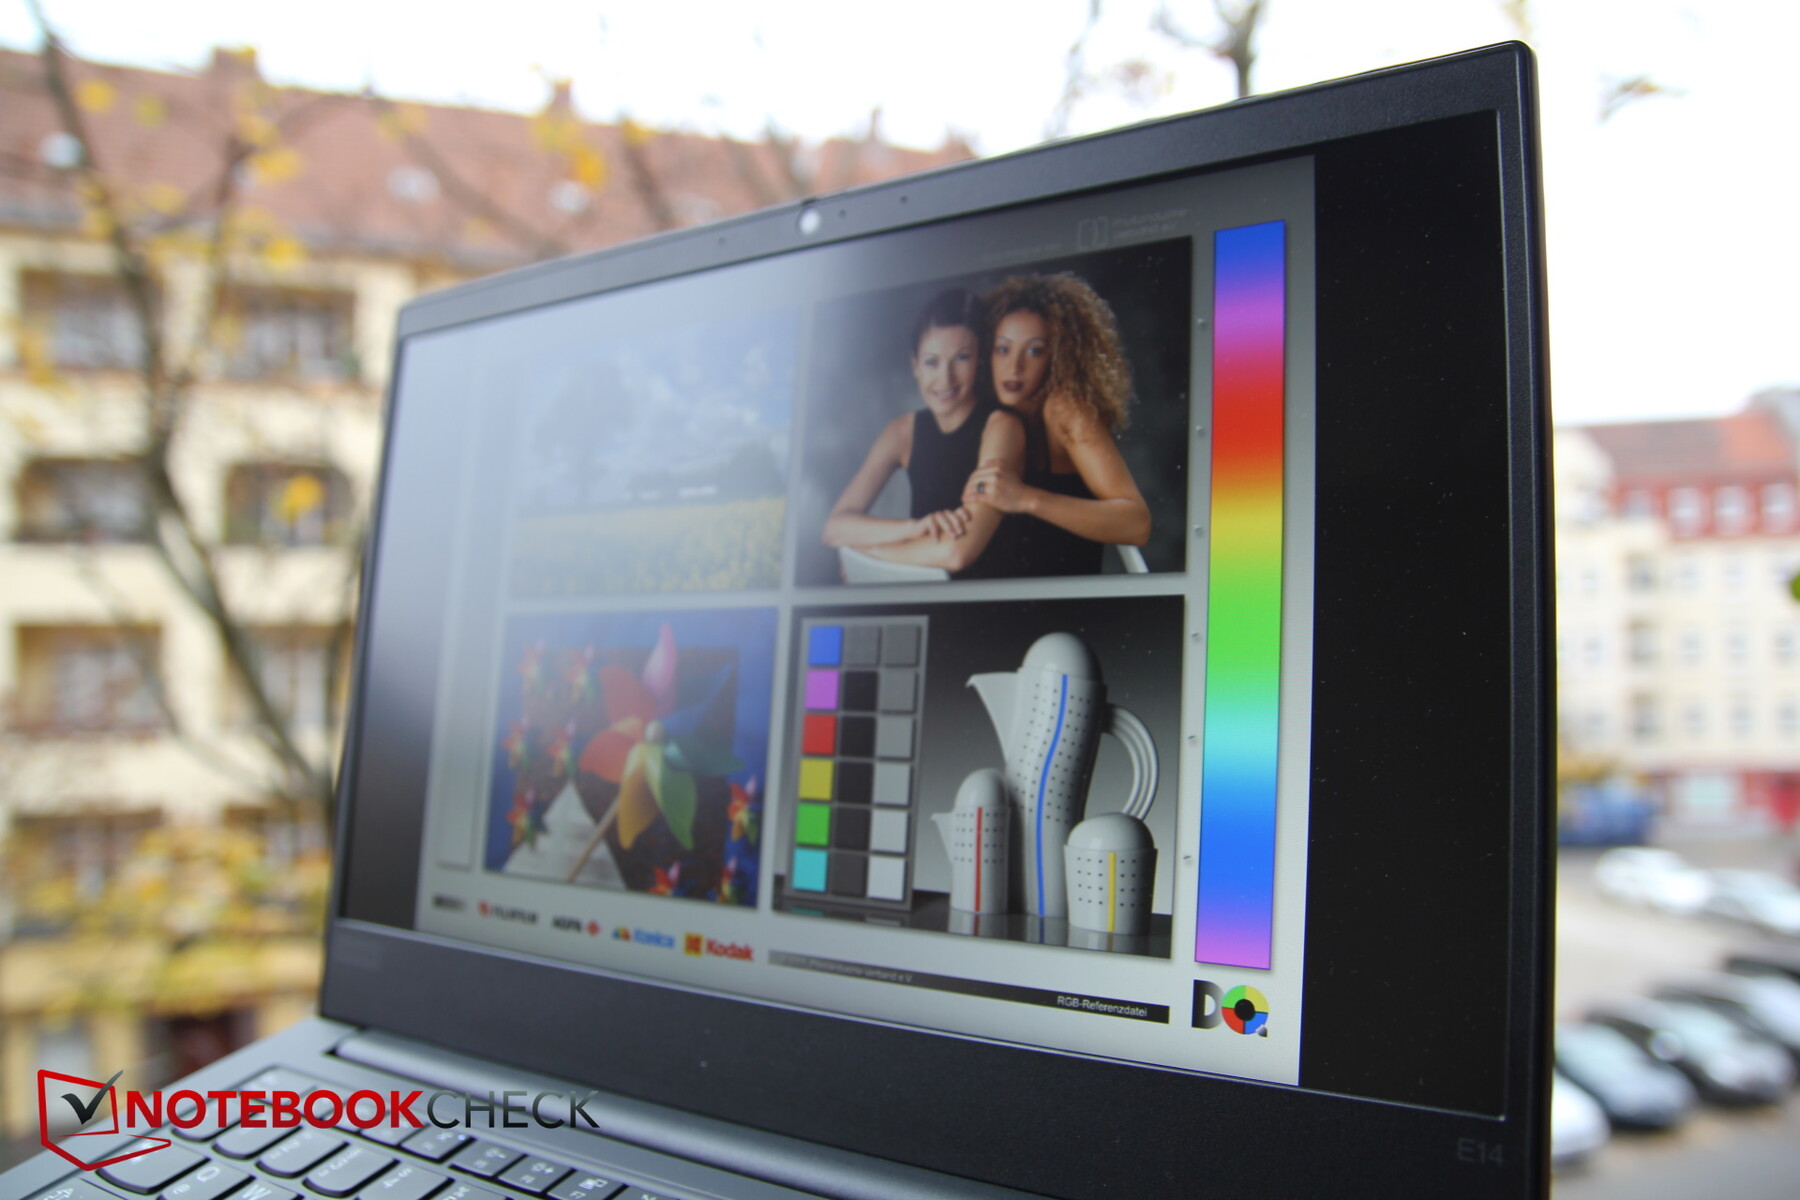
The matte surface eliminates disturbing reflections, but due to the poor brightness of less than 250 nits, the ThinkPad E14 can only be used in shaded places.
Display Response Times
| ↔ Response Time Black to White | ||
|---|---|---|
| 29.6 ms ... rise ↗ and fall ↘ combined | ↗ 15.6 ms rise | 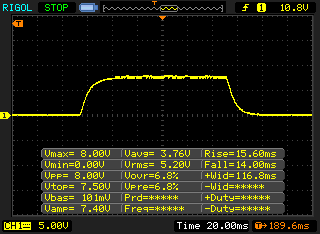 |
| ↘ 14 ms fall | ||
| The screen shows relatively slow response rates in our tests and may be too slow for gamers. In comparison, all tested devices range from 0.1 (minimum) to 240 (maximum) ms. » 79 % of all devices are better. This means that the measured response time is worse than the average of all tested devices (19.8 ms). | ||
| ↔ Response Time 50% Grey to 80% Grey | ||
| 42 ms ... rise ↗ and fall ↘ combined | ↗ 21.6 ms rise | 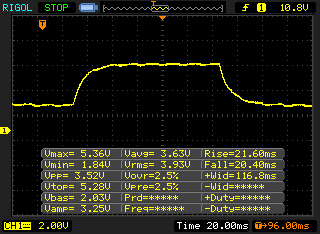 |
| ↘ 20.4 ms fall | ||
| The screen shows slow response rates in our tests and will be unsatisfactory for gamers. In comparison, all tested devices range from 0.165 (minimum) to 636 (maximum) ms. » 67 % of all devices are better. This means that the measured response time is worse than the average of all tested devices (31 ms). | ||
Screen Flickering / PWM (Pulse-Width Modulation)
| Screen flickering / PWM not detected | 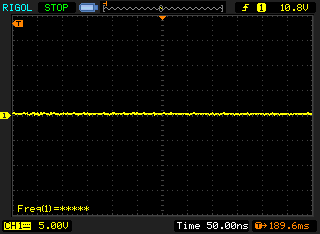 | ||
In comparison: 52 % of all tested devices do not use PWM to dim the display. If PWM was detected, an average of 7747 (minimum: 5 - maximum: 343500) Hz was measured. | |||
The viewing-angle stability is quite good, which is typical for IPS panels. However, a bit of brightness is lost when looking at the display from the sides at an angle.
Performance - Intel in E14 clearly behind AMD
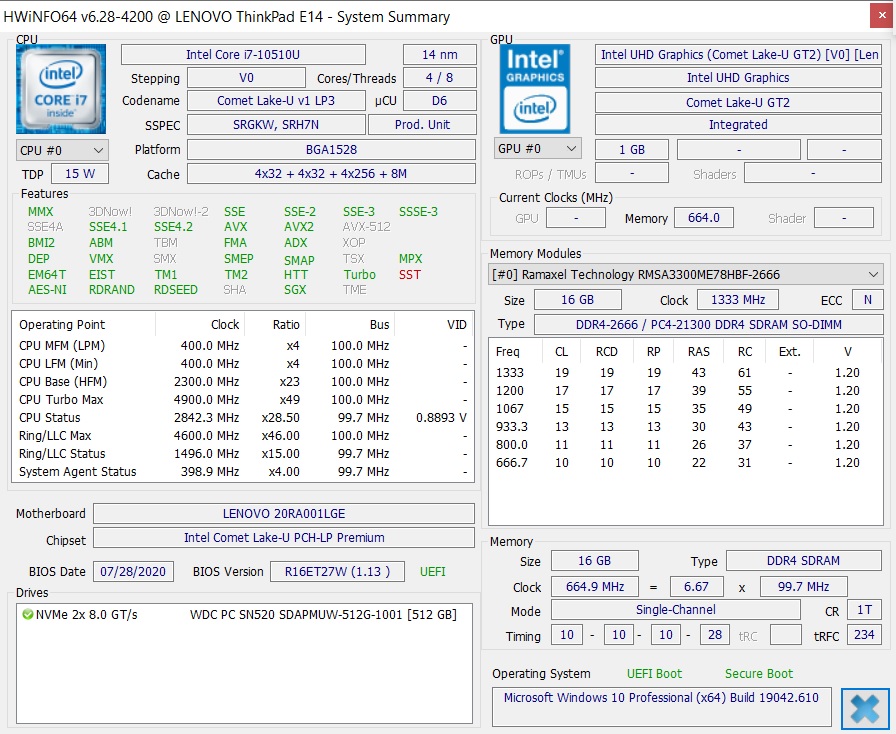
The ThinkPad has a Comet Lake Intel Core i7-10510U CPU. It has 16 GB RAM at its side, and graphically more-demanding tasks are handled by the AMD Radeon RX 640. The equipment turns the ThinkPad into an office laptop with all-round potential, so occasional image-editing or video-editing tasks or even light gaming are possible.
Processor
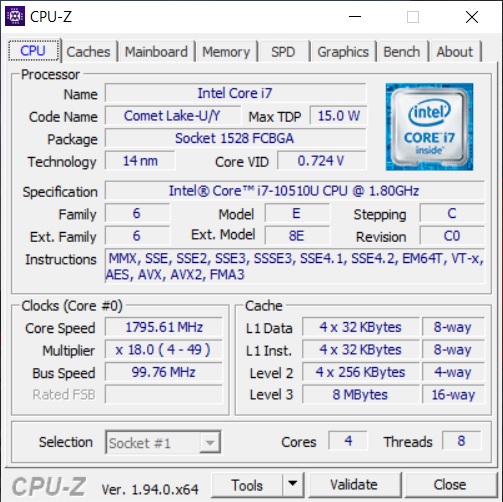
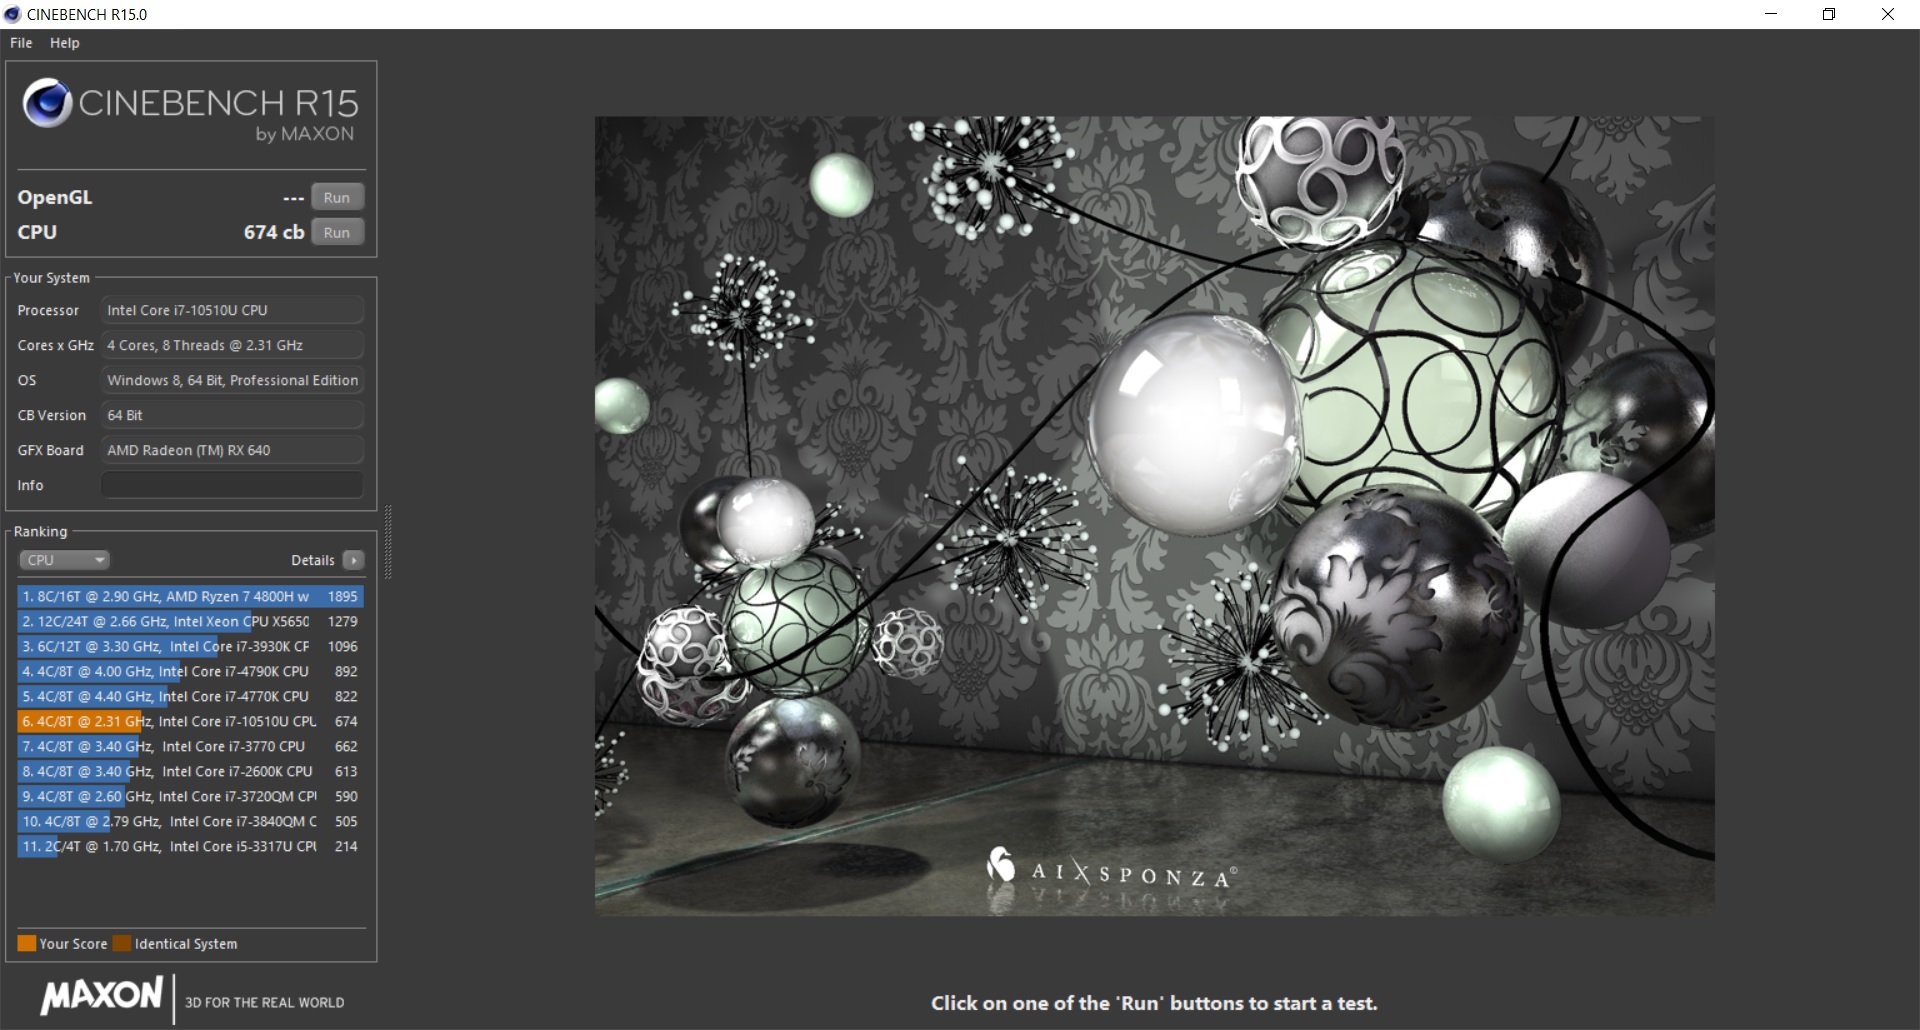
The Intel Core i7-10510U is built into our test unit. Its four cores (8 threads) clock between 1.8 and 4.8 GHz. The potentially weaker Intel Core i5-10210U is also available as an option.
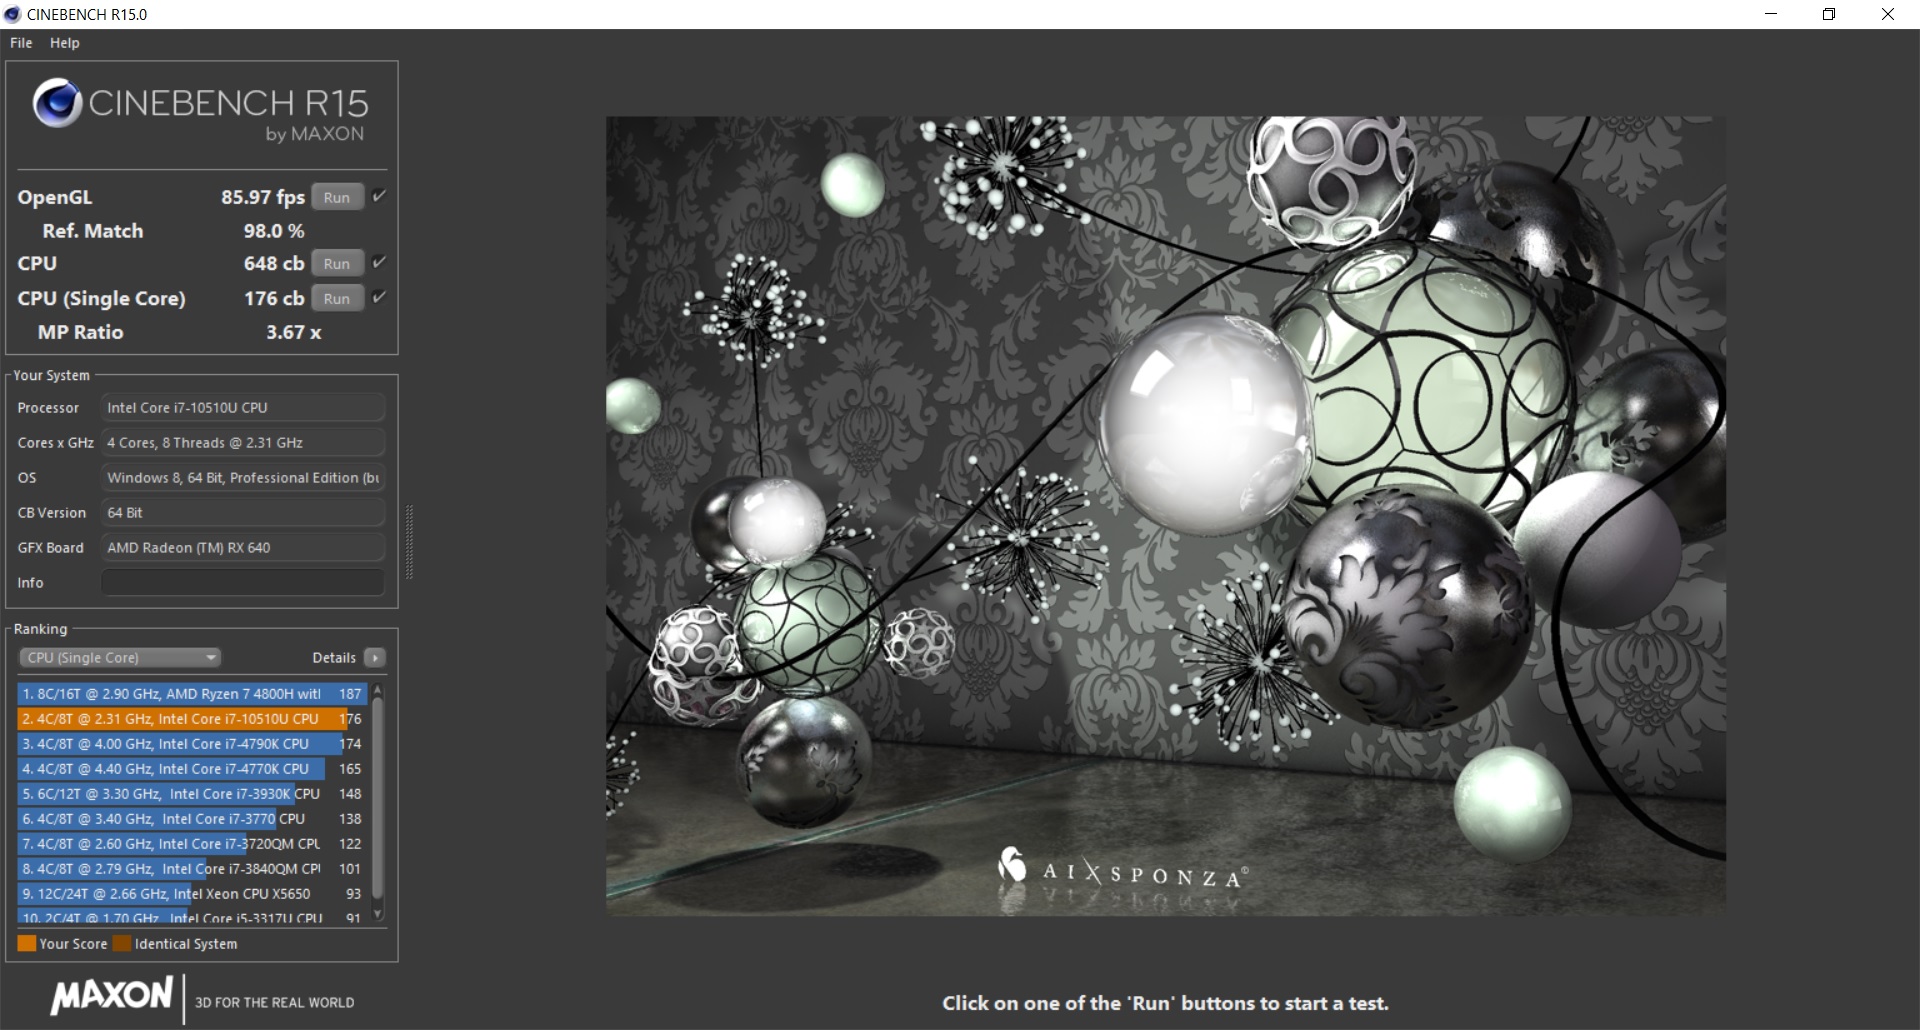
In the Cinebench loop, the performance drops by 8 to 10% after the first pass and then fluctuates around this value. The Asus VivoBook with the same CPU is on a similar performance level, but the Ryzen 5 4500U in the AMD-E14 is about 40 to 50% faster in the multithread test. Even the older E490 with Whiskey Lake CPU is minimally faster (2-5%). Nevertheless, the CPU performance is in line with expectations.
But during the Cinebench multi-loop a strange picture emerges: The TDP regularly jumps up to 25 W for a few seconds but is throttled down to 15 W most of the time. Similarly, the fans also regularly start up briefly, as do the clock rates (from 2.5 to 3.2 GHz). The 15 W level is regularly held for 30 seconds, then it is ramped up to 25 W for about 5 seconds, then down to 15 W again. The drivers do not seem to be optimized here.
The ThinkPad E14 does not lose any performance in battery mode.
Cinebench R15: CPU Single 64Bit | CPU Multi 64Bit
Blender: v2.79 BMW27 CPU
7-Zip 18.03: 7z b 4 -mmt1 | 7z b 4
Geekbench 5.5: Single-Core | Multi-Core
HWBOT x265 Benchmark v2.2: 4k Preset
LibreOffice : 20 Documents To PDF
R Benchmark 2.5: Overall mean
| Cinebench R20 / CPU (Single Core) | |
| Average of class Office (345 - 816, n=73, last 2 years) | |
| Lenovo ThinkPad E14 Gen2-20T7S00W00 | |
| Asus VivoBook S14 S433FL | |
| Lenovo ThinkPad E14-20RA001LGE | |
| Average Intel Core i7-10510U (362 - 497, n=37) | |
| MSI Modern 14 A10RB-459US | |
| Lenovo ThinkPad E14 20RA001MGE | |
| Lenovo ThinkPad E490-20N90004GE | |
| Cinebench R20 / CPU (Multi Core) | |
| Average of class Office (648 - 8840, n=73, last 2 years) | |
| Lenovo ThinkPad E14 Gen2-20T7S00W00 | |
| Asus VivoBook S14 S433FL | |
| Lenovo ThinkPad E490-20N90004GE | |
| Lenovo ThinkPad E14-20RA001LGE | |
| Average Intel Core i7-10510U (1015 - 1897, n=38) | |
| Lenovo ThinkPad E14 20RA001MGE | |
| MSI Modern 14 A10RB-459US | |
| Cinebench R15 / CPU Single 64Bit | |
| Average of class Office (99.5 - 313, n=75, last 2 years) | |
| Lenovo ThinkPad E14-20RA001LGE | |
| Average Intel Core i7-10510U (113 - 202, n=42) | |
| Asus VivoBook S14 S433FL | |
| Lenovo ThinkPad E14 Gen2-20T7S00W00 | |
| Lenovo ThinkPad E490-20N90004GE | |
| MSI Modern 14 A10RB-459US | |
| Lenovo ThinkPad E14 20RA001MGE | |
| Cinebench R15 / CPU Multi 64Bit | |
| Average of class Office (250 - 3380, n=75, last 2 years) | |
| Lenovo ThinkPad E14 Gen2-20T7S00W00 | |
| Average Intel Core i7-10510U (482 - 856, n=45) | |
| Asus VivoBook S14 S433FL | |
| Lenovo ThinkPad E490-20N90004GE | |
| Lenovo ThinkPad E14-20RA001LGE | |
| MSI Modern 14 A10RB-459US | |
| Lenovo ThinkPad E14 20RA001MGE | |
| Blender / v2.79 BMW27 CPU | |
| Lenovo ThinkPad E490-20N90004GE | |
| Lenovo ThinkPad E14 20RA001MGE | |
| Average Intel Core i7-10510U (628 - 1051, n=31) | |
| Asus VivoBook S14 S433FL | |
| Lenovo ThinkPad E14-20RA001LGE | |
| Lenovo ThinkPad E14 Gen2-20T7S00W00 | |
| Average of class Office (158 - 1940, n=74, last 2 years) | |
| 7-Zip 18.03 / 7z b 4 -mmt1 | |
| Average of class Office (3387 - 6469, n=75, last 2 years) | |
| Asus VivoBook S14 S433FL | |
| Average Intel Core i7-10510U (3747 - 4981, n=31) | |
| Lenovo ThinkPad E14-20RA001LGE | |
| Lenovo ThinkPad E14 Gen2-20T7S00W00 | |
| Lenovo ThinkPad E14 20RA001MGE | |
| Lenovo ThinkPad E490-20N90004GE | |
| 7-Zip 18.03 / 7z b 4 | |
| Average of class Office (7098 - 76886, n=75, last 2 years) | |
| Lenovo ThinkPad E14 Gen2-20T7S00W00 | |
| Average Intel Core i7-10510U (12196 - 21298, n=31) | |
| Lenovo ThinkPad E14-20RA001LGE | |
| Lenovo ThinkPad E14 20RA001MGE | |
| Asus VivoBook S14 S433FL | |
| Lenovo ThinkPad E490-20N90004GE | |
| Geekbench 5.5 / Single-Core | |
| Average of class Office (811 - 2148, n=71, last 2 years) | |
| Asus VivoBook S14 S433FL | |
| Average Intel Core i7-10510U (977 - 1287, n=31) | |
| Lenovo ThinkPad E14-20RA001LGE | |
| Lenovo ThinkPad E490-20N90004GE | |
| Lenovo ThinkPad E14 Gen2-20T7S00W00 | |
| Lenovo ThinkPad E14 20RA001MGE | |
| Geekbench 5.5 / Multi-Core | |
| Average of class Office (1483 - 16999, n=71, last 2 years) | |
| Lenovo ThinkPad E14 Gen2-20T7S00W00 | |
| Asus VivoBook S14 S433FL | |
| Average Intel Core i7-10510U (2474 - 4484, n=31) | |
| Lenovo ThinkPad E490-20N90004GE | |
| Lenovo ThinkPad E14-20RA001LGE | |
| Lenovo ThinkPad E14 20RA001MGE | |
| HWBOT x265 Benchmark v2.2 / 4k Preset | |
| Average of class Office (2.21 - 26, n=74, last 2 years) | |
| Lenovo ThinkPad E14 Gen2-20T7S00W00 | |
| Lenovo ThinkPad E14-20RA001LGE | |
| Average Intel Core i7-10510U (3.41 - 6.04, n=31) | |
| Asus VivoBook S14 S433FL | |
| Lenovo ThinkPad E14 20RA001MGE | |
| Lenovo ThinkPad E490-20N90004GE | |
| LibreOffice / 20 Documents To PDF | |
| Lenovo ThinkPad E14 Gen2-20T7S00W00 | |
| Average Intel Core i7-10510U (50.7 - 77.8, n=27) | |
| Average of class Office (39.9 - 102.3, n=74, last 2 years) | |
| Asus VivoBook S14 S433FL | |
| Lenovo ThinkPad E14-20RA001LGE | |
| R Benchmark 2.5 / Overall mean | |
| Lenovo ThinkPad E14 20RA001MGE | |
| Lenovo ThinkPad E14-20RA001LGE | |
| Lenovo ThinkPad E490-20N90004GE | |
| Average Intel Core i7-10510U (0.637 - 0.81, n=28) | |
| Asus VivoBook S14 S433FL | |
| Lenovo ThinkPad E14 Gen2-20T7S00W00 | |
| Average of class Office (0.4047 - 0.888, n=74, last 2 years) | |
* ... smaller is better
System Performance
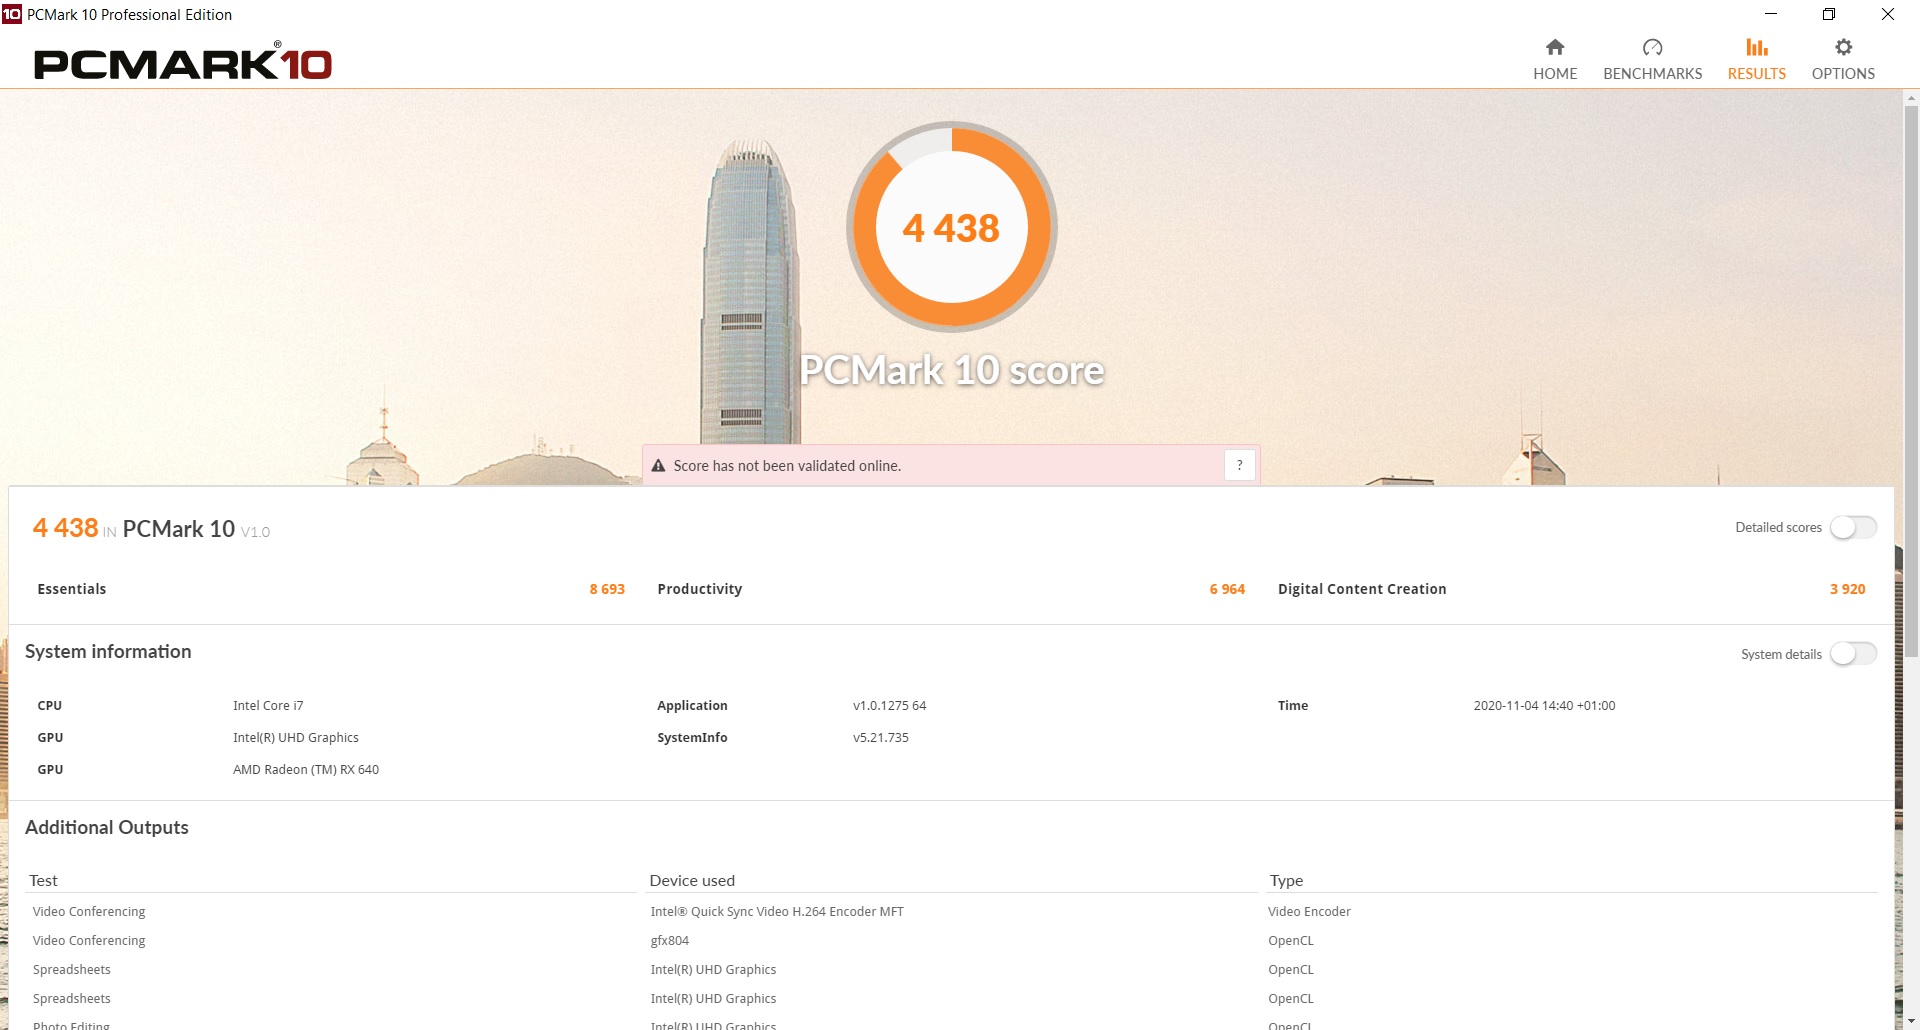
In the PCMark tests, all the comparison devices are quite close together. Overall, the AMD Ryzen version is probably a bit faster, but even the older E490 is at least equal in most tests. The performance of our test unit is at least half of what we expected, but could be about 5% better. No unusual delays are noticeable in everyday work.
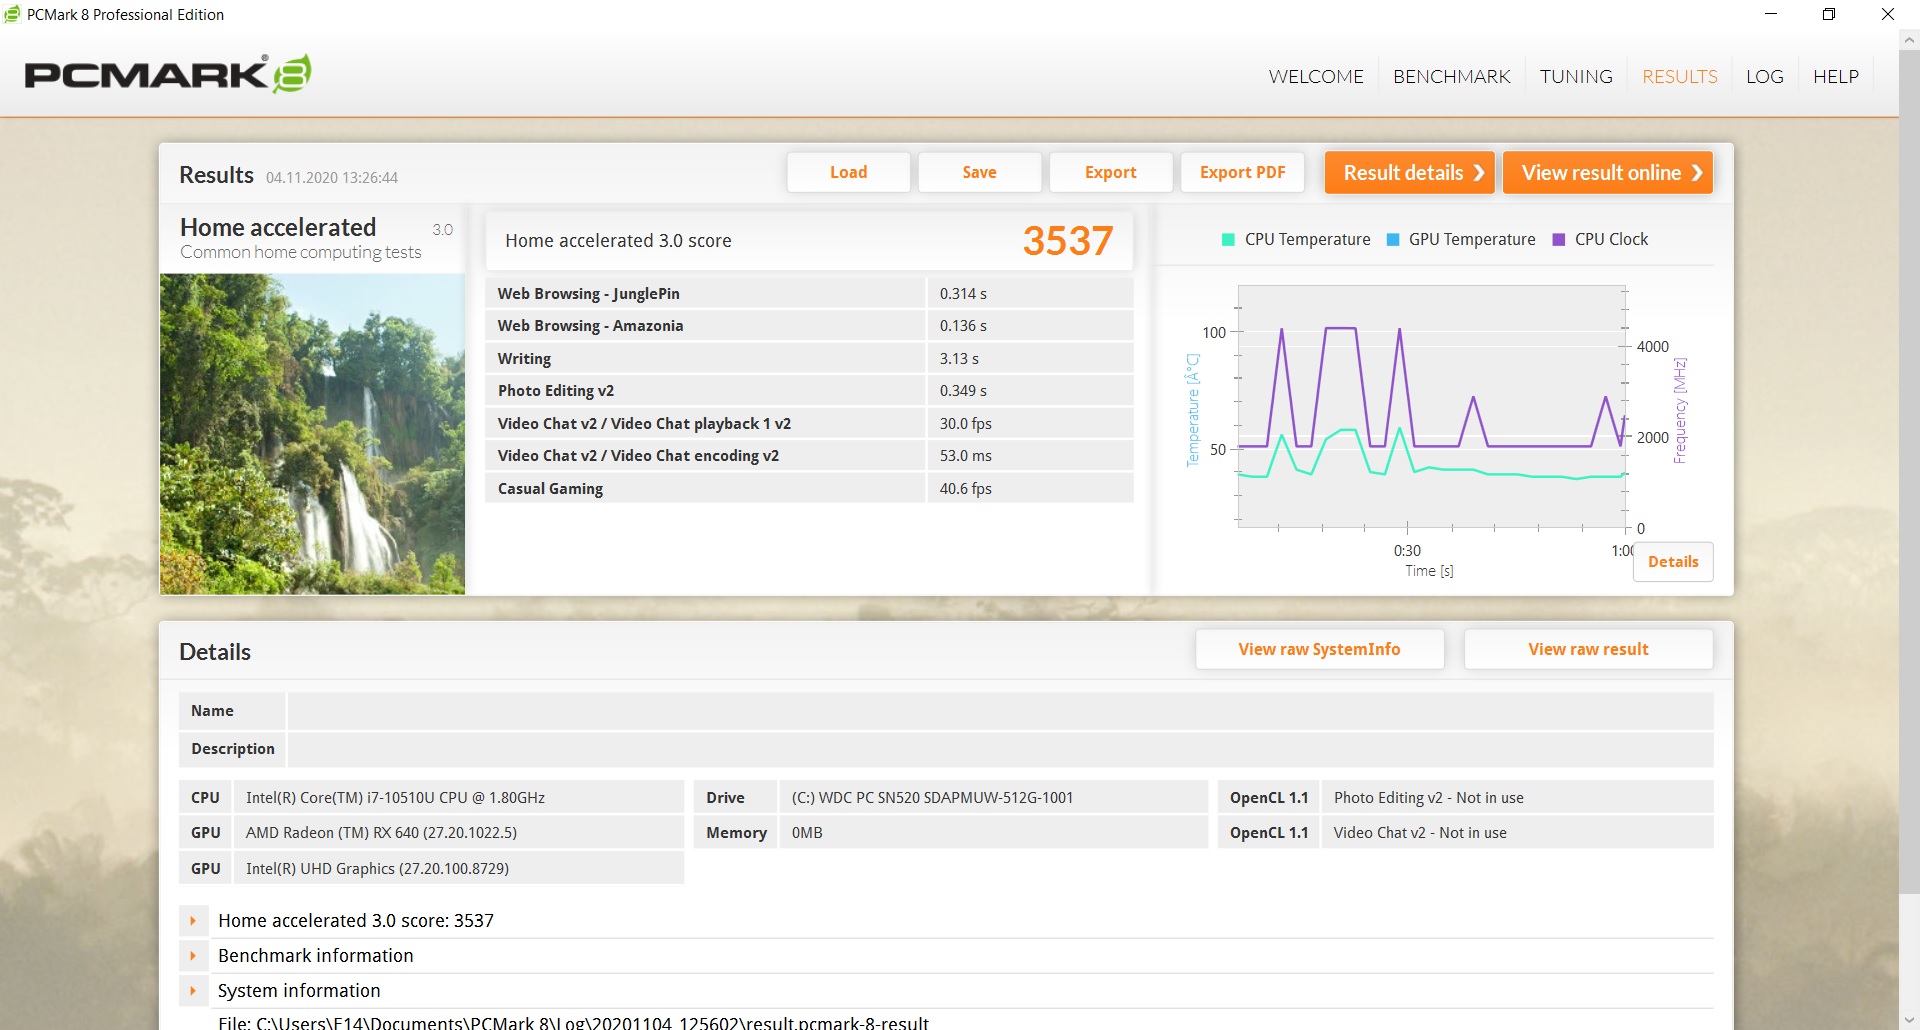

| PCMark 8 Home Score Accelerated v2 | 3537 points | |
| PCMark 8 Work Score Accelerated v2 | 4927 points | |
| PCMark 10 Score | 4438 points | |
Help | ||
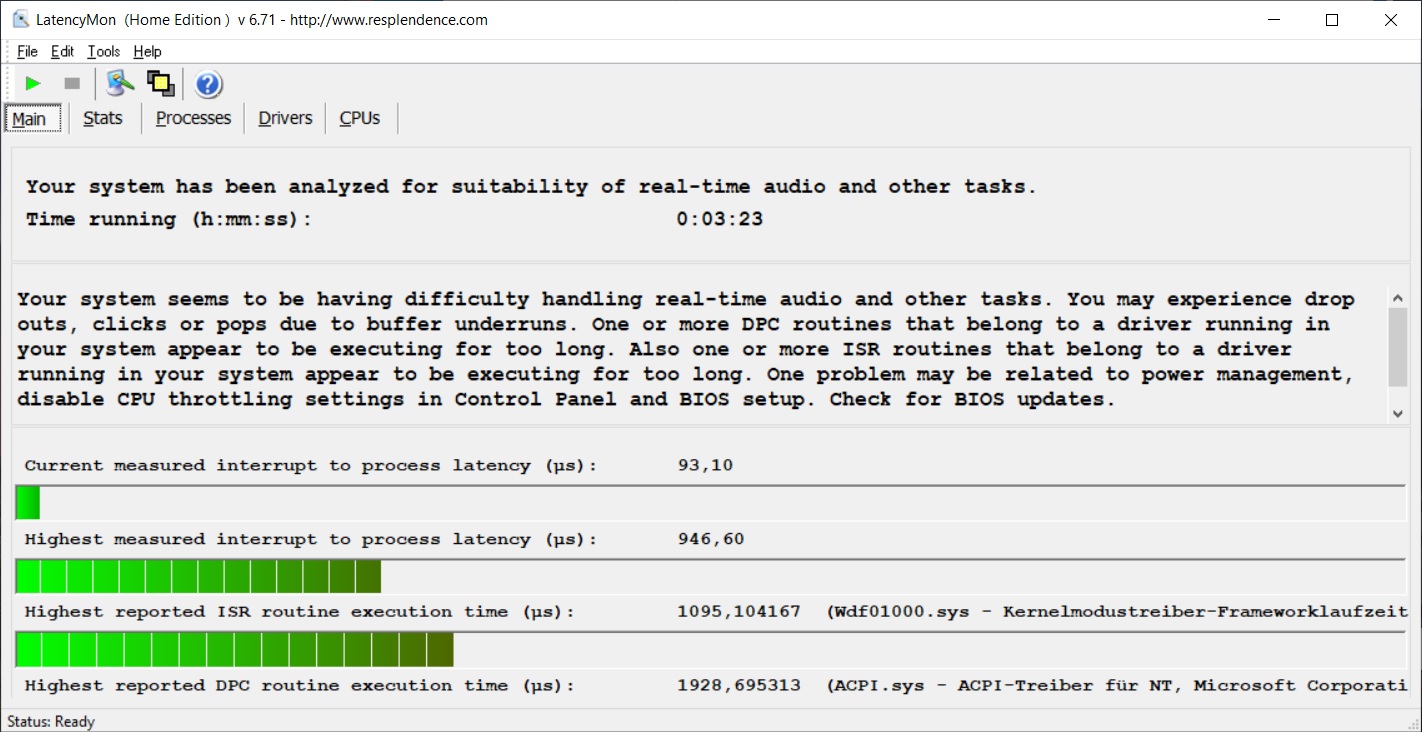
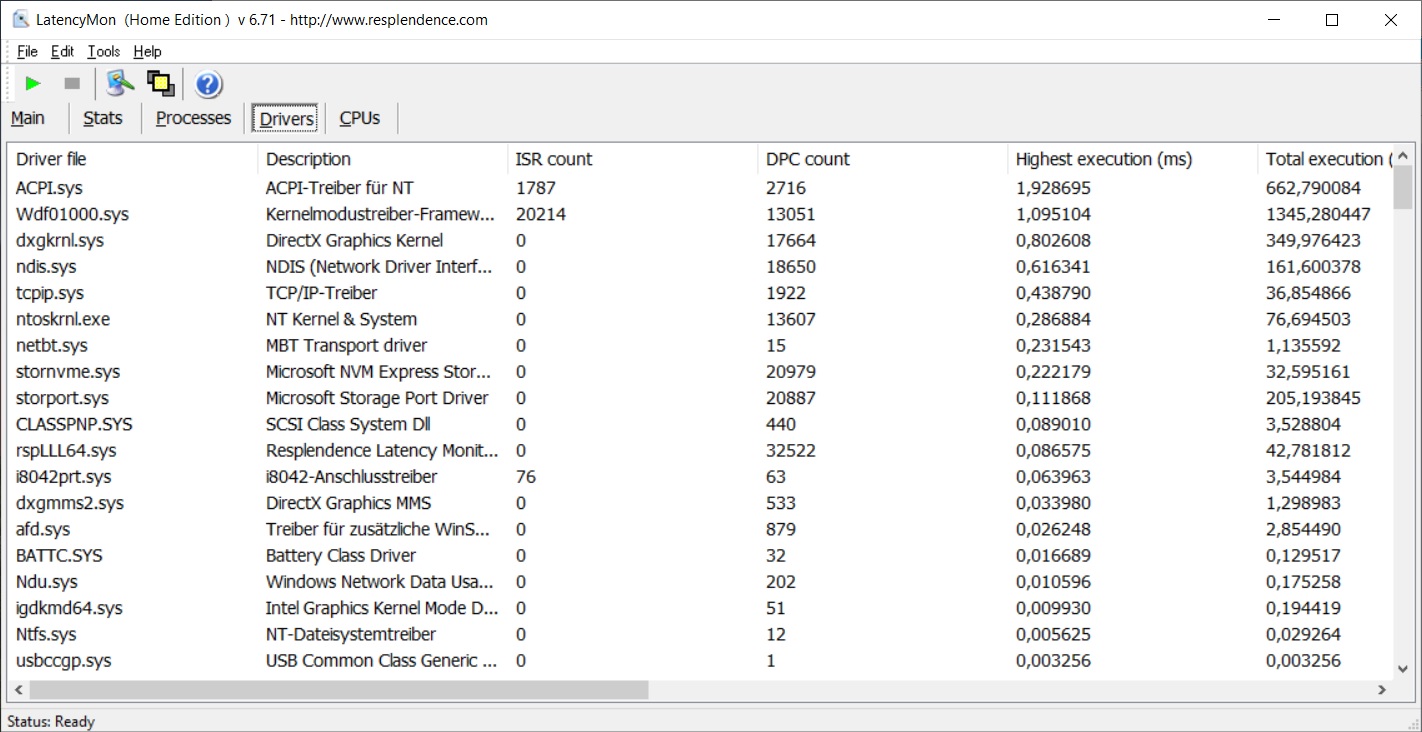
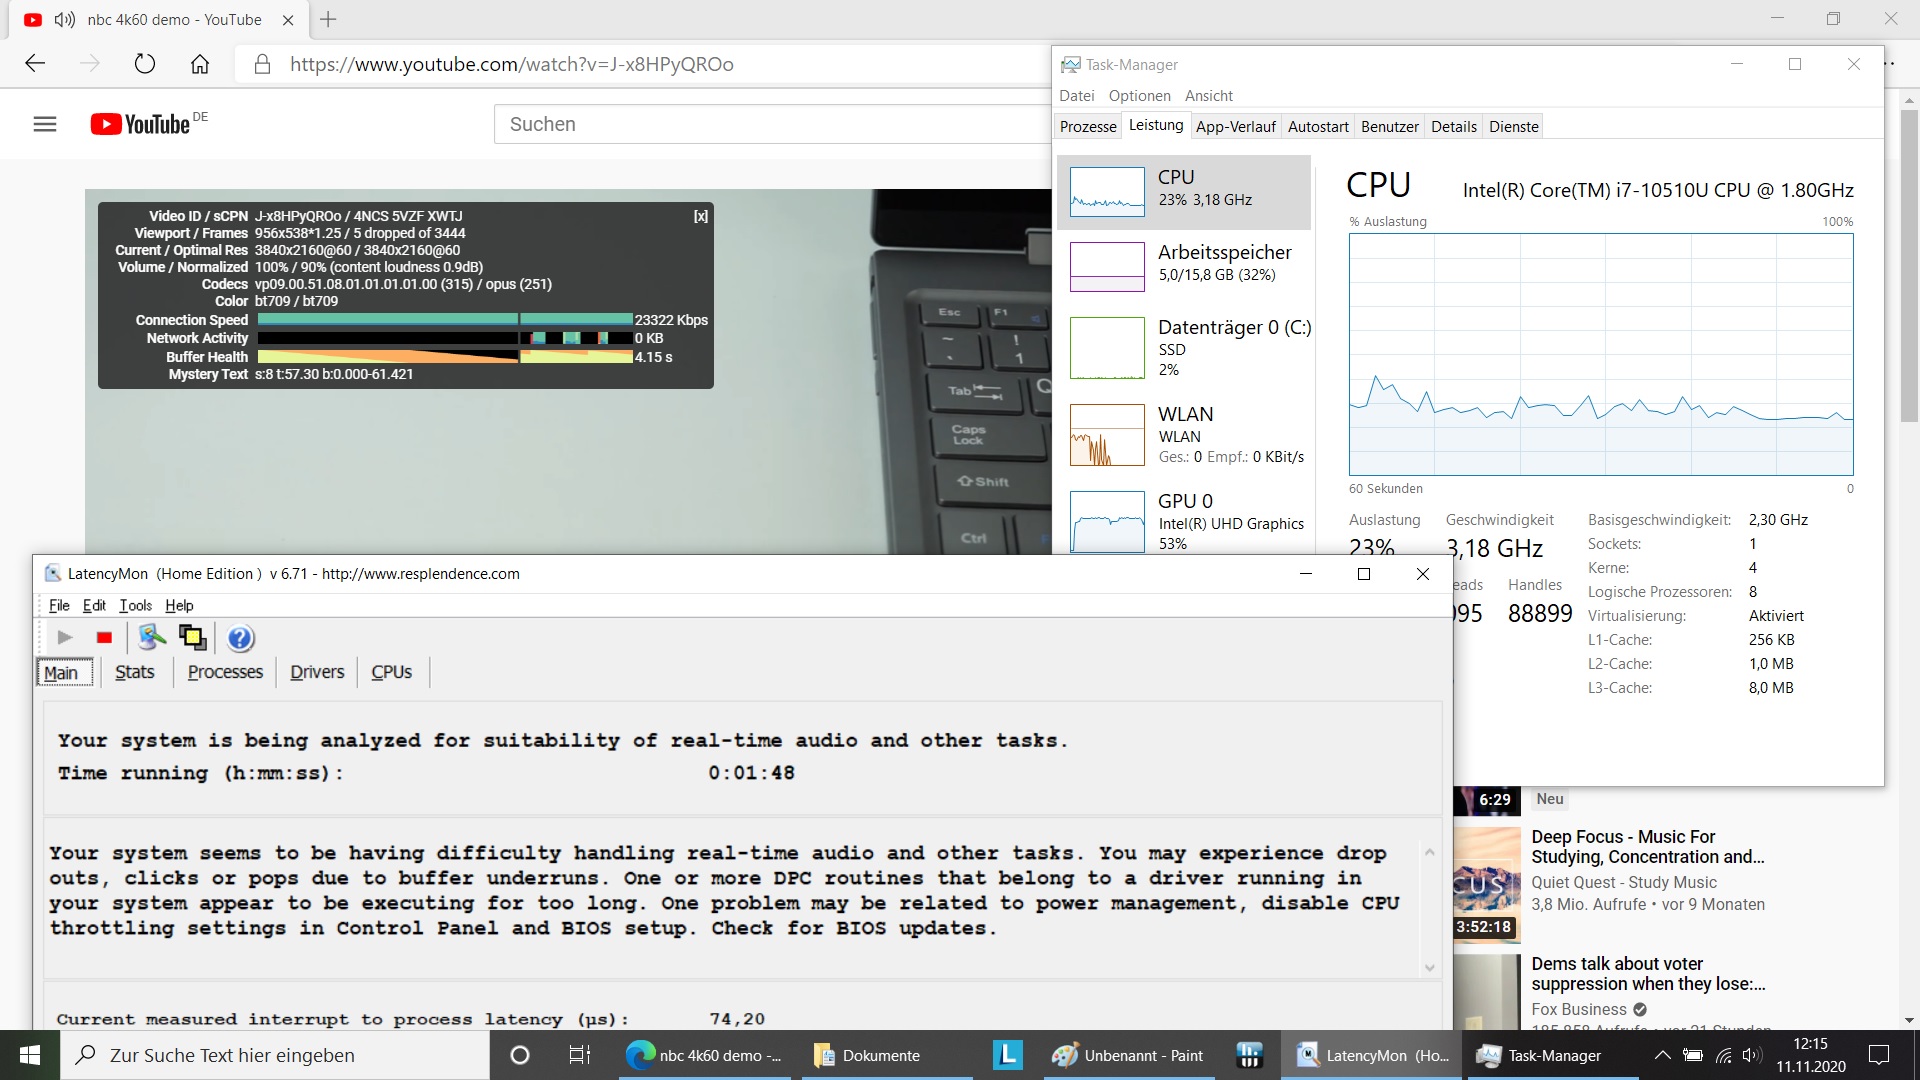
DPC latencies
Opening several browser tabs didn't cause any problems, but playing our 4K/60 Hz YouTube video did. Especially the ACPI driver and the kernel mode driver caused problems, and there were five dropped frames during video playback.
| DPC Latencies / LatencyMon - interrupt to process latency (max), Web, Youtube, Prime95 | |
| Lenovo ThinkPad E14-20RA001LGE | |
| Lenovo ThinkPad E14 Gen2-20T7S00W00 | |
| Asus VivoBook S14 S433FL | |
* ... smaller is better
Mass Storage
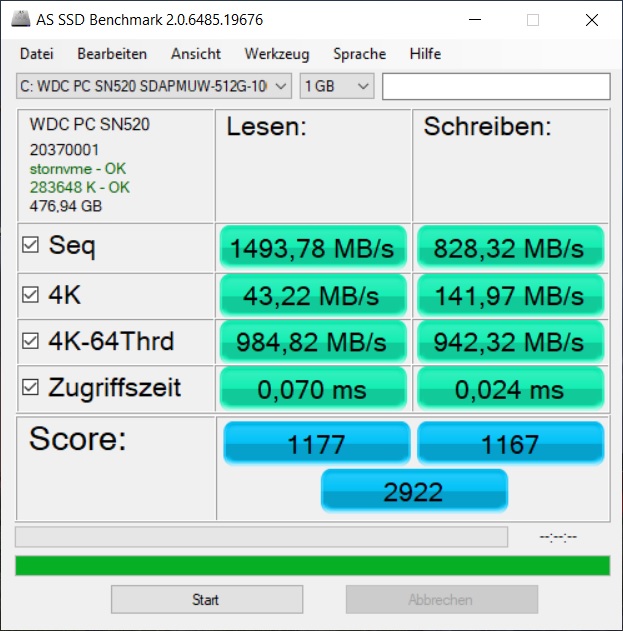
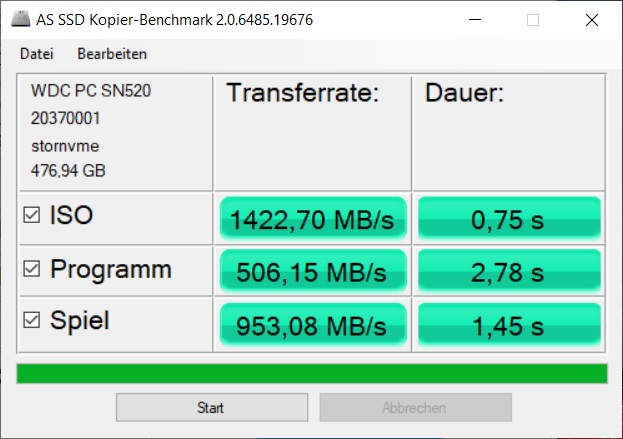
Lenovo installs a 512 GB SSD from Western Digital. Whether the same model is always used is unclear; in the configurator, only the size of the SSD can be selected (256 or 512 GB), information on the model is missing. The SSD of our test unit achieves decent transfer values. In our SSD/HDD list it occupies 88th position, so there are definitely faster models.
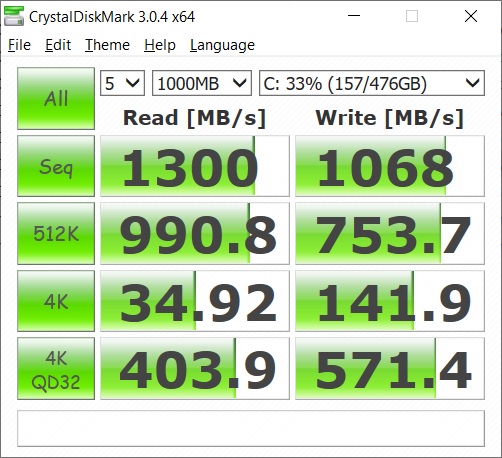
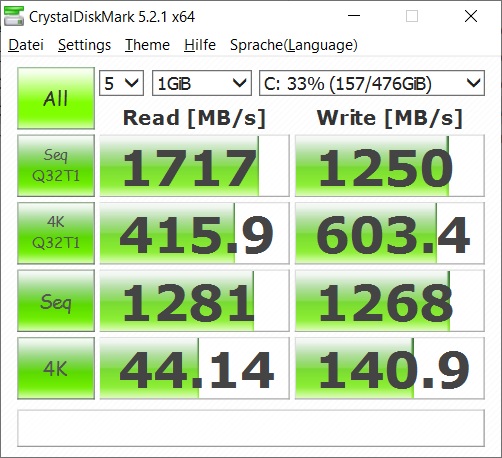
| Lenovo ThinkPad E14-20RA001LGE WDC PC SN520 SDAPMUW-512 | Lenovo ThinkPad E14 Gen2-20T7S00W00 Toshiba BG4 KBG40ZNT512G | Lenovo ThinkPad E14 20RA001MGE SK hynix BC501 HFM512GDHTNG-8310A | Lenovo ThinkPad E490-20N90004GE Toshiba KBG30ZMT512G | Asus VivoBook S14 S433FL Intel Optane Memory H10 with Solid State Storage 32GB + 512GB HBRPEKNX0202A(L/H) | MSI Modern 14 A10RB-459US Kingston RBUSNS8154P3512GJ | Average WDC PC SN520 SDAPMUW-512 | |
|---|---|---|---|---|---|---|---|
| CrystalDiskMark 5.2 / 6 | 1% | -11% | -29% | 21% | -16% | -8% | |
| Write 4K (MB/s) | 140.9 | 102.3 -27% | 121.9 -13% | 91.9 -35% | 124.9 -11% | 107.7 -24% | 115.1 ? -18% |
| Read 4K (MB/s) | 44.14 | 32.12 -27% | 42.66 -3% | 47.87 8% | 147.9 235% | 39.73 -10% | 41.4 ? -6% |
| Write Seq (MB/s) | 1268 | 1518 20% | 628 -50% | 624 -51% | 753 -41% | 926 -27% | 1208 ? -5% |
| Read Seq (MB/s) | 1281 | 1501 17% | 1193 -7% | 840 -34% | 1223 -5% | 1014 -21% | 1121 ? -12% |
| Write 4K Q32T1 (MB/s) | 603 | 356.4 -41% | 590 -2% | 162.6 -73% | 369.2 -39% | 343.6 -43% | 421 ? -30% |
| Read 4K Q32T1 (MB/s) | 415.9 | 459.6 11% | 414.5 0% | 381.6 -8% | 358.1 -14% | 499.1 20% | 393 ? -6% |
| Write Seq Q32T1 (MB/s) | 1250 | 1507 21% | 866 -31% | 818 -35% | 1057 -15% | 1033 -17% | 1388 ? 11% |
| Read Seq Q32T1 (MB/s) | 1717 | 2327 36% | 2078 21% | 1614 -6% | 2738 59% | 1604 -7% | 1697 ? -1% |
| AS SSD | -61% | -8% | -95% | -40% | -61% | -2% | |
| Seq Read (MB/s) | 1493 | 2007 34% | 1731 16% | 1323 -11% | 957 -36% | 1061 -29% | 1287 ? -14% |
| Seq Write (MB/s) | 828 | 1118 35% | 538 -35% | 746 -10% | 353.1 -57% | 953 15% | 1170 ? 41% |
| 4K Read (MB/s) | 43.22 | 46.95 9% | 43.19 0% | 50.6 17% | 62.4 44% | 35.59 -18% | 40.2 ? -7% |
| 4K Write (MB/s) | 142 | 124 -13% | 127.3 -10% | 115.7 -19% | 122.8 -14% | 87 -39% | 104.3 ? -27% |
| 4K-64 Read (MB/s) | 985 | 1221 24% | 869 -12% | 916 -7% | 386.2 -61% | 769 -22% | 1003 ? 2% |
| 4K-64 Write (MB/s) | 942 | 774 -18% | 871 -8% | 312.6 -67% | 605 -36% | 733 -22% | 1066 ? 13% |
| Access Time Read * (ms) | 0.07 | 0.108 -54% | 0.045 36% | 0.127 -81% | 0.107 -53% | 0.084 -20% | 0.07767 ? -11% |
| Access Time Write * (ms) | 0.024 | 0.195 -713% | 0.03 -25% | 0.211 -779% | 0.046 -92% | 0.136 -467% | 0.033 ? -38% |
| Score Read (Points) | 1177 | 1468 25% | 1085 -8% | 1099 -7% | 544 -54% | 911 -23% | 1172 ? 0% |
| Score Write (Points) | 1167 | 1009 -14% | 852 -27% | 503 -57% | 763 -35% | 916 -22% | 1287 ? 10% |
| Score Total (Points) | 2922 | 3191 9% | 2442 -16% | 2147 -27% | 1581 -46% | 2294 -21% | 3059 ? 5% |
| Copy ISO MB/s (MB/s) | 1181 | 1032 | 956 | 954 ? | |||
| Copy Program MB/s (MB/s) | 410.5 | 443.5 | 496.5 | 371 ? | |||
| Copy Game MB/s (MB/s) | 835 | 507 | 872 | 745 ? | |||
| Total Average (Program / Settings) | -30% /
-35% | -10% /
-9% | -62% /
-67% | -10% /
-14% | -39% /
-42% | -5% /
-5% |
* ... smaller is better

Continuous read: DiskSpd Read Loop, Queue Depth 8
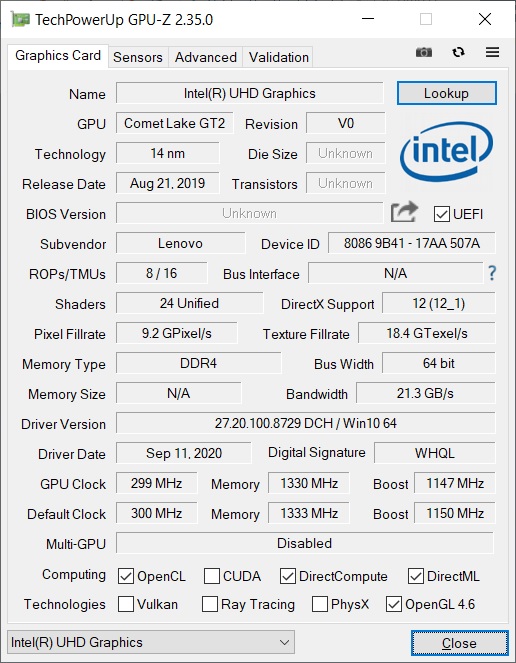
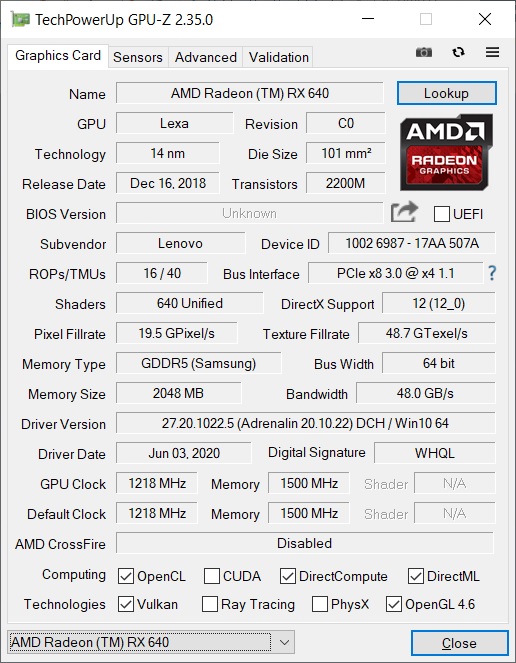
Graphics card
The Intel UHD Graphics 620 integrated in the CPU has already collected some dust on it and is supported in the E14 by the AMD Radeon RX 640, which is roughly comparable to a GeForce MX150 or MX250. It won't be able to handle demanding games, but occasional gaming is possible with strong limitations. Above all, it is useful for (en)coding tasks, so you should have a more fluent experience in image and video-editing.
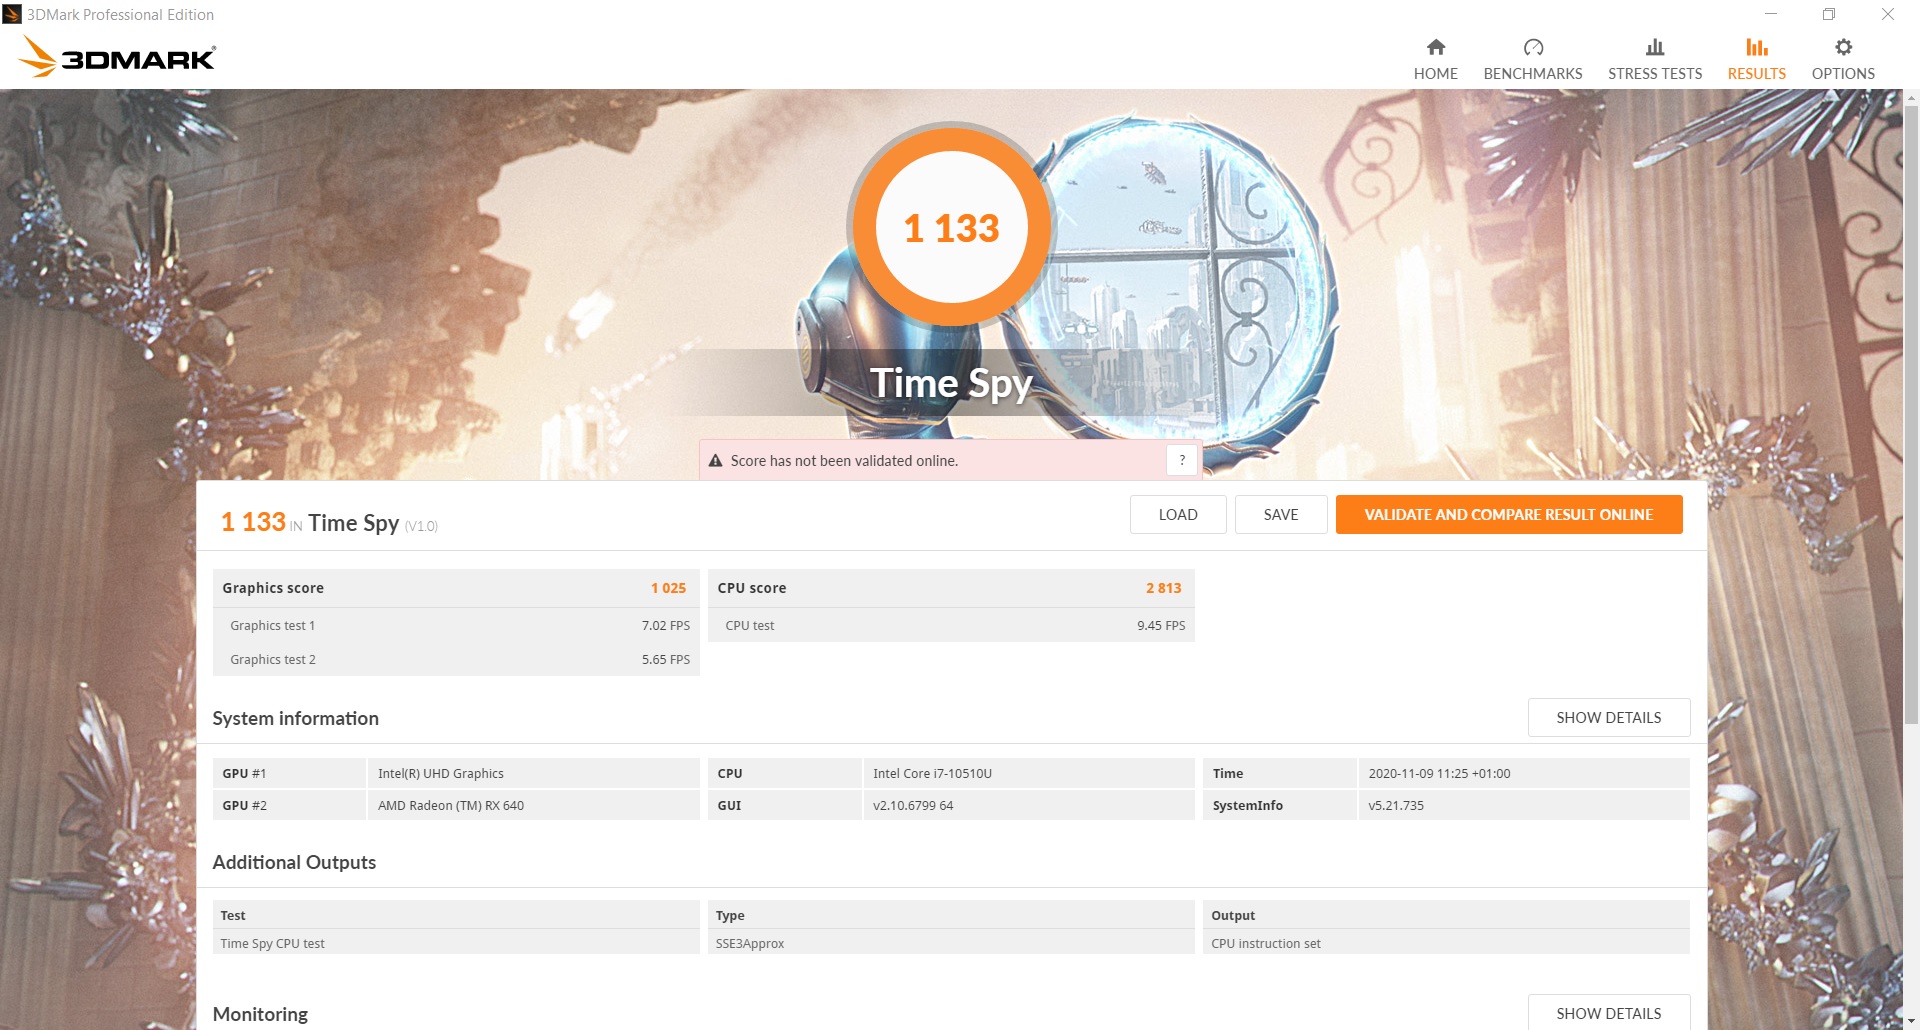
In the 3DMark tests, the Intel E14 with its dedicated GPU is for the first time clearly ahead of the Ryzen E14 with integrated GPU. Our test model is about 20% faster in the synthetic 3D benchmarks. But the old E490 with Intel Core i7-8565U and AMD Radeon RX 550X is just as fast. The competition with the MX250 is about as fast, and there might be slight advantages for the Nvidia card. The E14 passes the 3DMark stress test with 97.9%, so its performance remains relatively stable.
Away from the power outlet, the laptop loses about a third of its 3D performance in 3DMark 11.
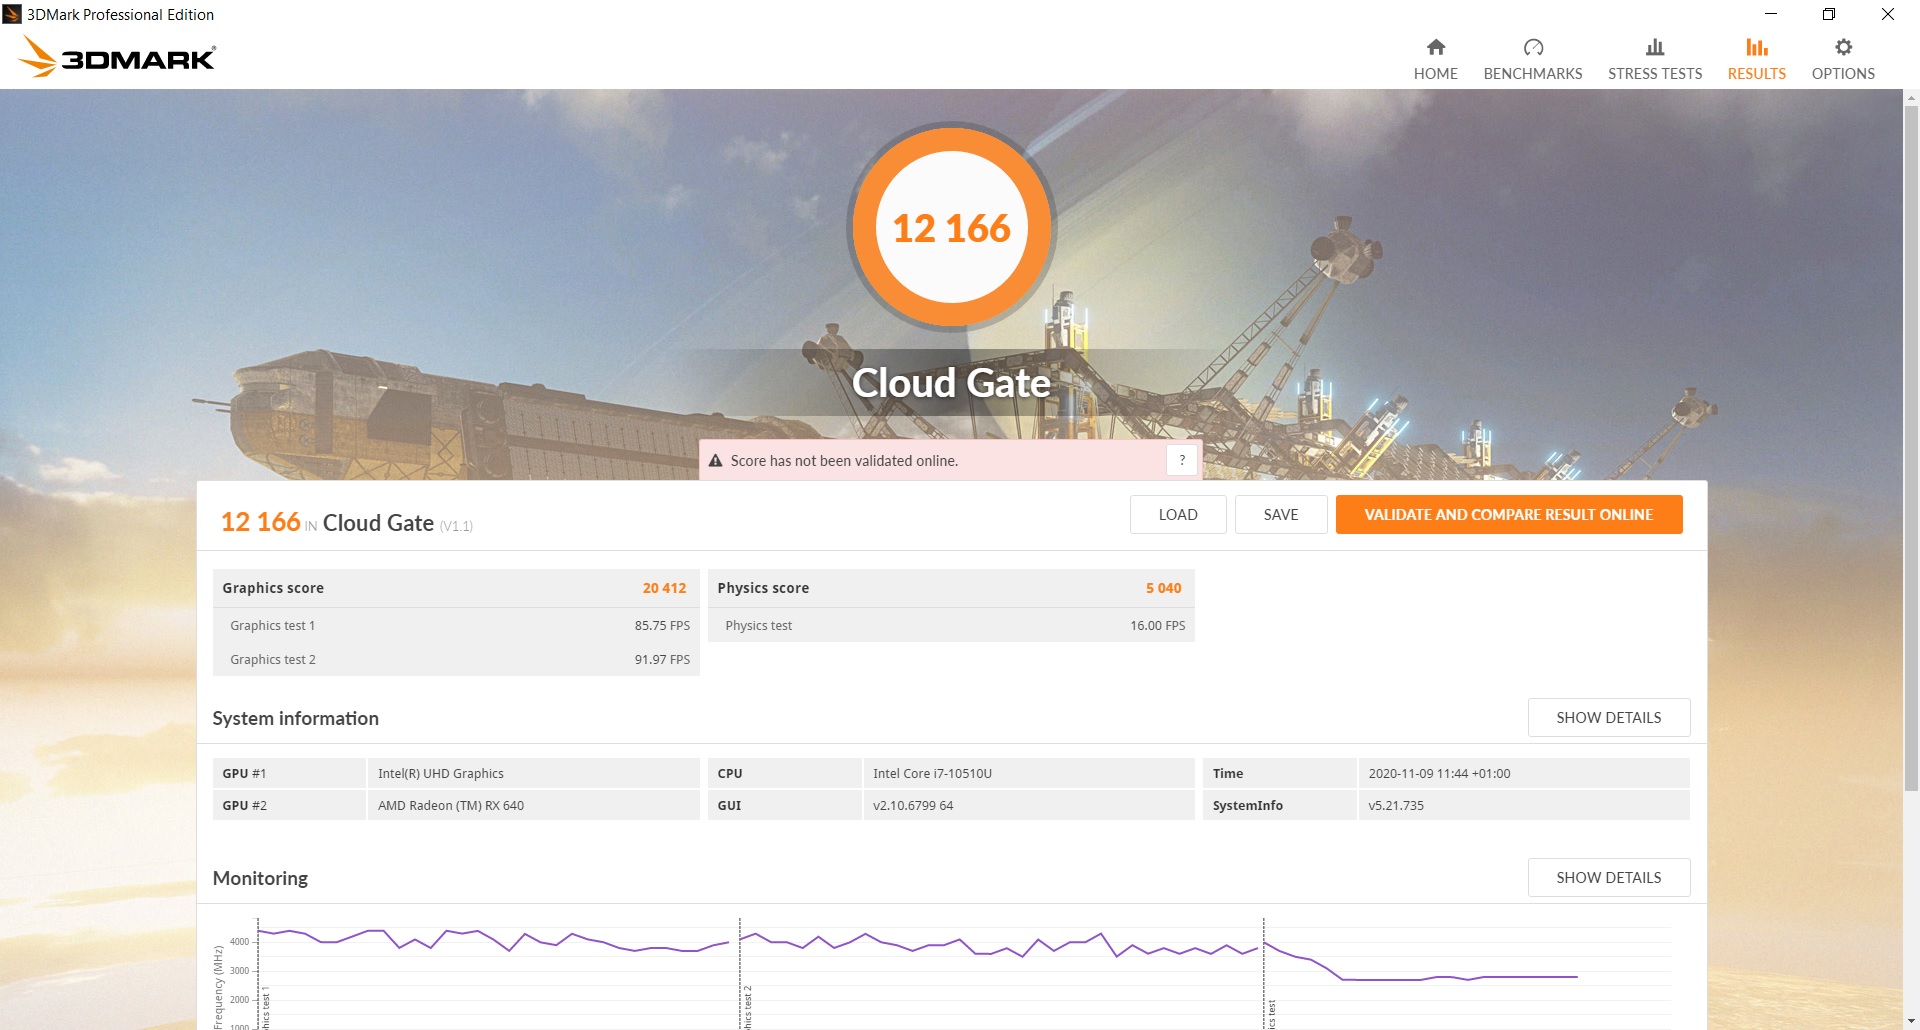
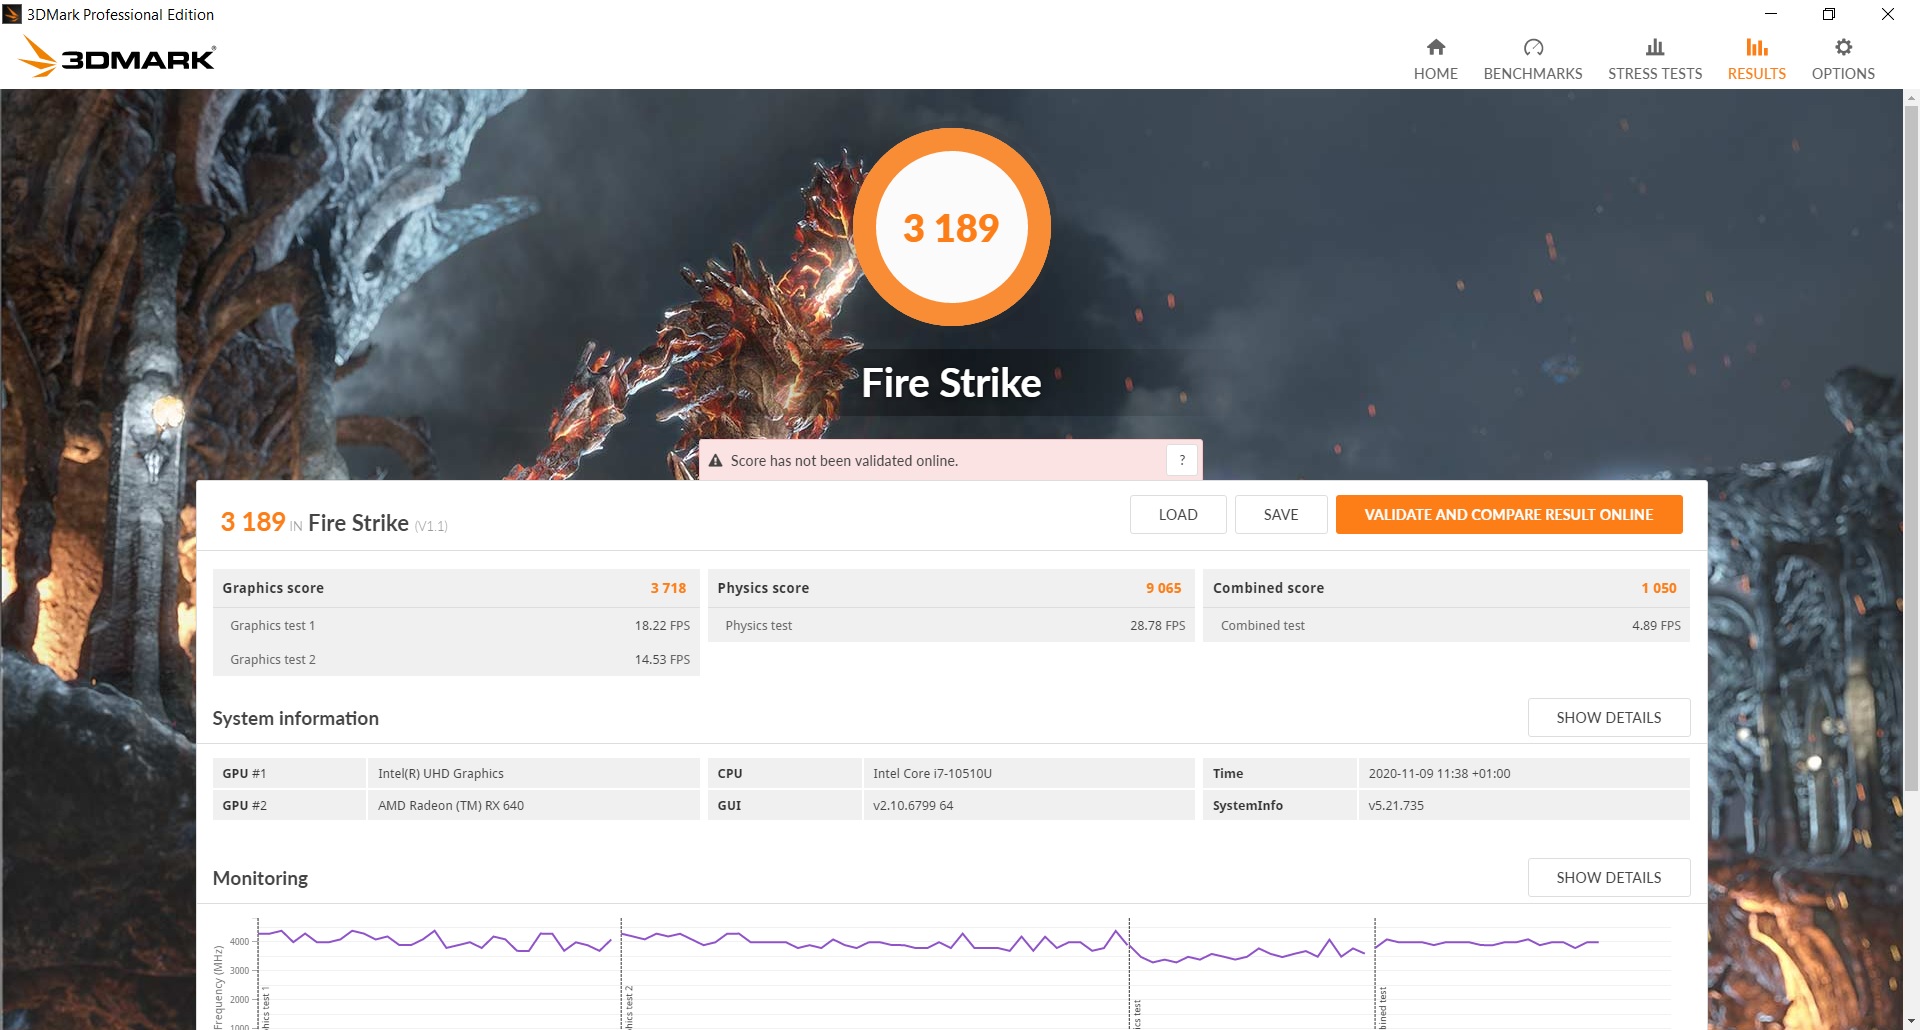
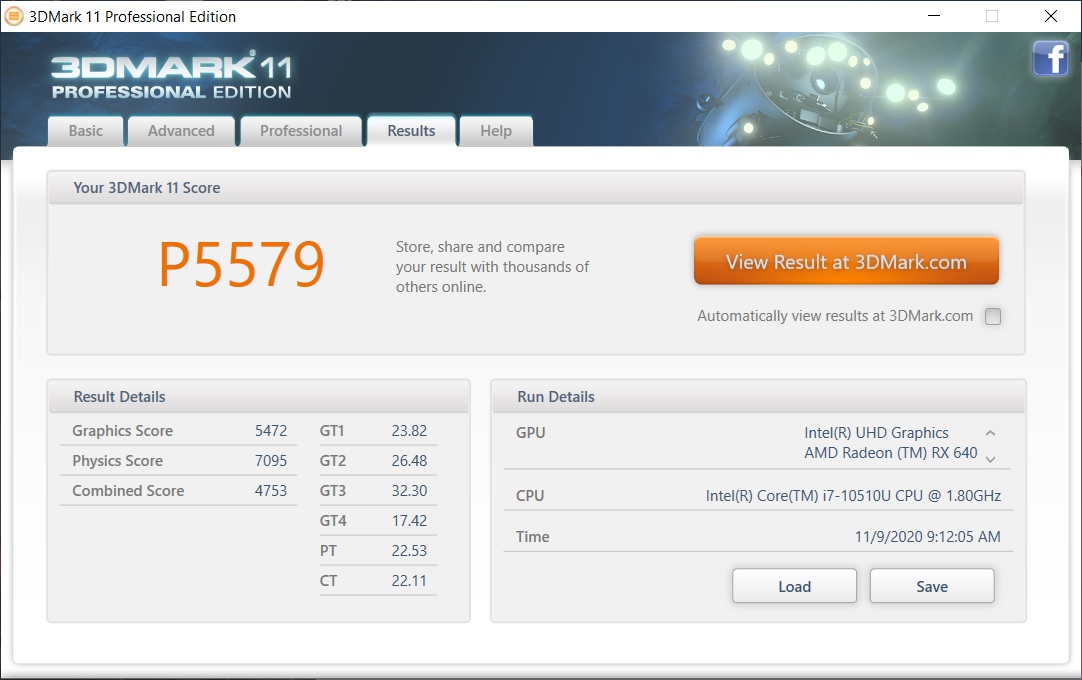

| 3DMark 11 Performance | 5579 points | |
| 3DMark Cloud Gate Standard Score | 12166 points | |
| 3DMark Fire Strike Score | 3189 points | |
| 3DMark Time Spy Score | 1133 points | |
Help | ||
Gaming Performance
The Witcher 3 can be played in medium resolution (1366x720) and details, but it is not enough for FullHD. The same applies to Rise of the Tomb Raider, with less-demanding titles like Dota 2 Reborn also available in 1080p. The competition with the MX250 is similar, but the higher the resolution and details, the greater the gap in favor of Nvidia GPUs. The Ryzen E14 with integrated RX Vega 6 is about 20% slower.
| The Witcher 3 | |
| 1024x768 Low Graphics & Postprocessing | |
| Average of class Office (32.2 - 135, n=3, last 2 years) | |
| MSI Modern 14 A10RB-459US | |
| Lenovo ThinkPad E14-20RA001LGE | |
| Average AMD Radeon RX 640 (63.2 - 65.5, n=2) | |
| Lenovo ThinkPad E490-20N90004GE | |
| Lenovo ThinkPad E14 Gen2-20T7S00W00 | |
| 1366x768 Medium Graphics & Postprocessing | |
| Average of class Office (44.7 - 90.4, n=3, last 2 years) | |
| Lenovo ThinkPad E14-20RA001LGE | |
| Lenovo ThinkPad E490-20N90004GE | |
| Average AMD Radeon RX 640 (38.4 - 39.4, n=2) | |
| MSI Modern 14 A10RB-459US | |
| Asus VivoBook S14 S433FL | |
| 1920x1080 High Graphics & Postprocessing (Nvidia HairWorks Off) | |
| Average of class Office (23.7 - 53.4, n=3, last 2 years) | |
| MSI Modern 14 A10RB-459US | |
| Asus VivoBook S14 S433FL | |
| Lenovo ThinkPad E490-20N90004GE | |
| Lenovo ThinkPad E14-20RA001LGE | |
| Average AMD Radeon RX 640 (19.7 - 19.9, n=2) | |
| Lenovo ThinkPad E14 Gen2-20T7S00W00 | |
| Rise of the Tomb Raider | |
| 1024x768 Lowest Preset | |
| Lenovo ThinkPad E490-20N90004GE | |
| Average AMD Radeon RX 640 (61.6 - 64.7, n=2) | |
| Lenovo ThinkPad E14-20RA001LGE | |
| Lenovo ThinkPad E14 20RA001MGE | |
| 1366x768 Medium Preset AF:2x | |
| Lenovo ThinkPad E14-20RA001LGE | |
| Lenovo ThinkPad E490-20N90004GE | |
| Average AMD Radeon RX 640 (28.6 - 42.7, n=2) | |
| 1920x1080 High Preset AA:FX AF:4x | |
| Lenovo ThinkPad E14-20RA001LGE | |
| Average AMD Radeon RX 640 (19.8 - 21.1, n=2) | |
| Lenovo ThinkPad E490-20N90004GE | |
| Shadow of the Tomb Raider | |
| 1280x720 Lowest Preset | |
| Average of class Office (16 - 105, n=2, last 2 years) | |
| MSI Modern 14 A10RB-459US | |
| Lenovo ThinkPad E14-20RA001LGE | |
| Average AMD Radeon RX 640 (42 - 56, n=2) | |
| Lenovo ThinkPad E14 Gen2-20T7S00W00 | |
| 1920x1080 Lowest Preset | |
| Average of class Office (n=1last 2 years) | |
| Lenovo ThinkPad E14-20RA001LGE | |
| Average AMD Radeon RX 640 (n=1) | |
| low | med. | high | ultra | |
|---|---|---|---|---|
| The Witcher 3 (2015) | 65.5 | 39.4 | 19.9 | |
| Dota 2 Reborn (2015) | 113 | 93 | 53.4 | 50.3 |
| Rise of the Tomb Raider (2016) | 61.6 | 42.7 | 21.1 | |
| X-Plane 11.11 (2018) | 45.5 | 32.8 | 30.1 | |
| Shadow of the Tomb Raider (2018) | 56 |
Emissions - Average Lenovo ThinkPad
Noise emissions
The fans are almost always active in "Best Performance" mode, even in idle, for example during a Steam download of a game, although no other loads were applied. Here it helps to adjust the power status to "Better performance" or "More battery efficiency", and then the fans are much quieter or turn off completely.
Under heavier load, the ThinkPad E14 stays a bit quieter than the competition with the MX250, but overall it gets a bit louder than the Ryzen E14. The sister model with iGPU and Core i5 is a lot quieter. For an office laptop, it is not really quiet under load, but not disturbingly loud either. Given the dedicated GPU, the volume is okay.
Noise level
| Idle |
| 29.7 / 29.7 / 32.8 dB(A) |
| Load |
| 35.5 / 35.5 dB(A) |
 | ||
30 dB silent 40 dB(A) audible 50 dB(A) loud |
||
min: | ||
| Lenovo ThinkPad E14-20RA001LGE Radeon RX 640, i7-10510U, WDC PC SN520 SDAPMUW-512 | Lenovo ThinkPad E14 Gen2-20T7S00W00 Vega 6, R5 4500U, Toshiba BG4 KBG40ZNT512G | Lenovo ThinkPad E14 20RA001MGE UHD Graphics 620, i5-10210U, SK hynix BC501 HFM512GDHTNG-8310A | Lenovo ThinkPad E490-20N90004GE Radeon RX 550X (Laptop), i7-8565U, Toshiba KBG30ZMT512G | Asus VivoBook S14 S433FL GeForce MX250, i7-10510U, Intel Optane Memory H10 with Solid State Storage 32GB + 512GB HBRPEKNX0202A(L/H) | MSI Modern 14 A10RB-459US GeForce MX250, i5-10210U, Kingston RBUSNS8154P3512GJ | |
|---|---|---|---|---|---|---|
| Noise | 6% | 8% | 4% | -9% | 0% | |
| off / environment * (dB) | 29.7 | 29.1 2% | 29.2 2% | 29.3 1% | 30.7 -3% | 28.7 3% |
| Idle Minimum * (dB) | 29.7 | 29.1 2% | 29.2 2% | 29.3 1% | 31 -4% | 29.5 1% |
| Idle Average * (dB) | 29.7 | 29.1 2% | 29.2 2% | 29.3 1% | 31 -4% | 29.5 1% |
| Idle Maximum * (dB) | 32.8 | 29.1 11% | 29.2 11% | 29.3 11% | 31.3 5% | 29.5 10% |
| Load Average * (dB) | 35.5 | 31.7 11% | 29.5 17% | 34.2 4% | 43.4 -22% | 33.4 6% |
| Witcher 3 ultra * (dB) | 35.5 | 34.2 4% | 42.8 -21% | 37.9 -7% | ||
| Load Maximum * (dB) | 35.5 | 32.7 8% | 29.9 16% | 34.2 4% | 41.5 -17% | 40.5 -14% |
* ... smaller is better
Temperature
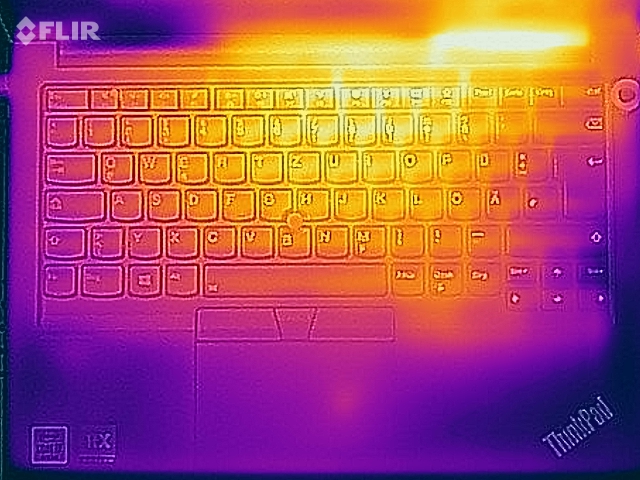
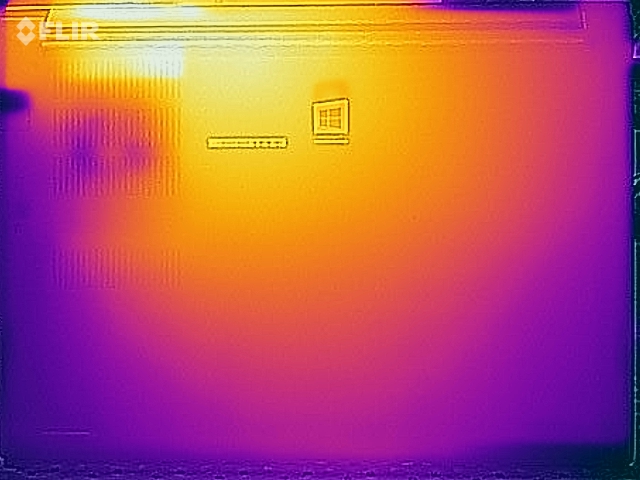
Our test model warms up under load a bit more than its Ryzen counterpart, but still a lot has changed compared to the E490, because the latter became much hotter. Towards the screen it can still get up to 50 °C, and even on the bottom, so balancing on the thighs is no longer recommended. The palm-rests remain comparatively cool, and everything is in the pleasant range in idle anyway.
(-) The maximum temperature on the upper side is 49.6 °C / 121 F, compared to the average of 34.3 °C / 94 F, ranging from 21.2 to 62.5 °C for the class Office.
(-) The bottom heats up to a maximum of 50.2 °C / 122 F, compared to the average of 36.8 °C / 98 F
(+) In idle usage, the average temperature for the upper side is 24.6 °C / 76 F, compared to the device average of 29.5 °C / 85 F.
(+) The palmrests and touchpad are reaching skin temperature as a maximum (34.2 °C / 93.6 F) and are therefore not hot.
(-) The average temperature of the palmrest area of similar devices was 27.5 °C / 81.5 F (-6.7 °C / -12.1 F).
| Lenovo ThinkPad E14-20RA001LGE Radeon RX 640, i7-10510U, WDC PC SN520 SDAPMUW-512 | Lenovo ThinkPad E14 Gen2-20T7S00W00 Vega 6, R5 4500U, Toshiba BG4 KBG40ZNT512G | Lenovo ThinkPad E14 20RA001MGE UHD Graphics 620, i5-10210U, SK hynix BC501 HFM512GDHTNG-8310A | Lenovo ThinkPad E490-20N90004GE Radeon RX 550X (Laptop), i7-8565U, Toshiba KBG30ZMT512G | Asus VivoBook S14 S433FL GeForce MX250, i7-10510U, Intel Optane Memory H10 with Solid State Storage 32GB + 512GB HBRPEKNX0202A(L/H) | MSI Modern 14 A10RB-459US GeForce MX250, i5-10210U, Kingston RBUSNS8154P3512GJ | |
|---|---|---|---|---|---|---|
| Heat | 2% | 11% | -12% | 3% | -1% | |
| Maximum Upper Side * (°C) | 49.6 | 47.1 5% | 41.7 16% | 53.1 -7% | 43 13% | 47.6 4% |
| Maximum Bottom * (°C) | 50.2 | 48.1 4% | 40.3 20% | 63.8 -27% | 44.8 11% | 58.2 -16% |
| Idle Upper Side * (°C) | 25.1 | 25.3 -1% | 24.2 4% | 25.4 -1% | 26.2 -4% | 21.8 13% |
| Idle Bottom * (°C) | 25.3 | 25.8 -2% | 24.4 4% | 28.1 -11% | 27 -7% | 26.2 -4% |
* ... smaller is better
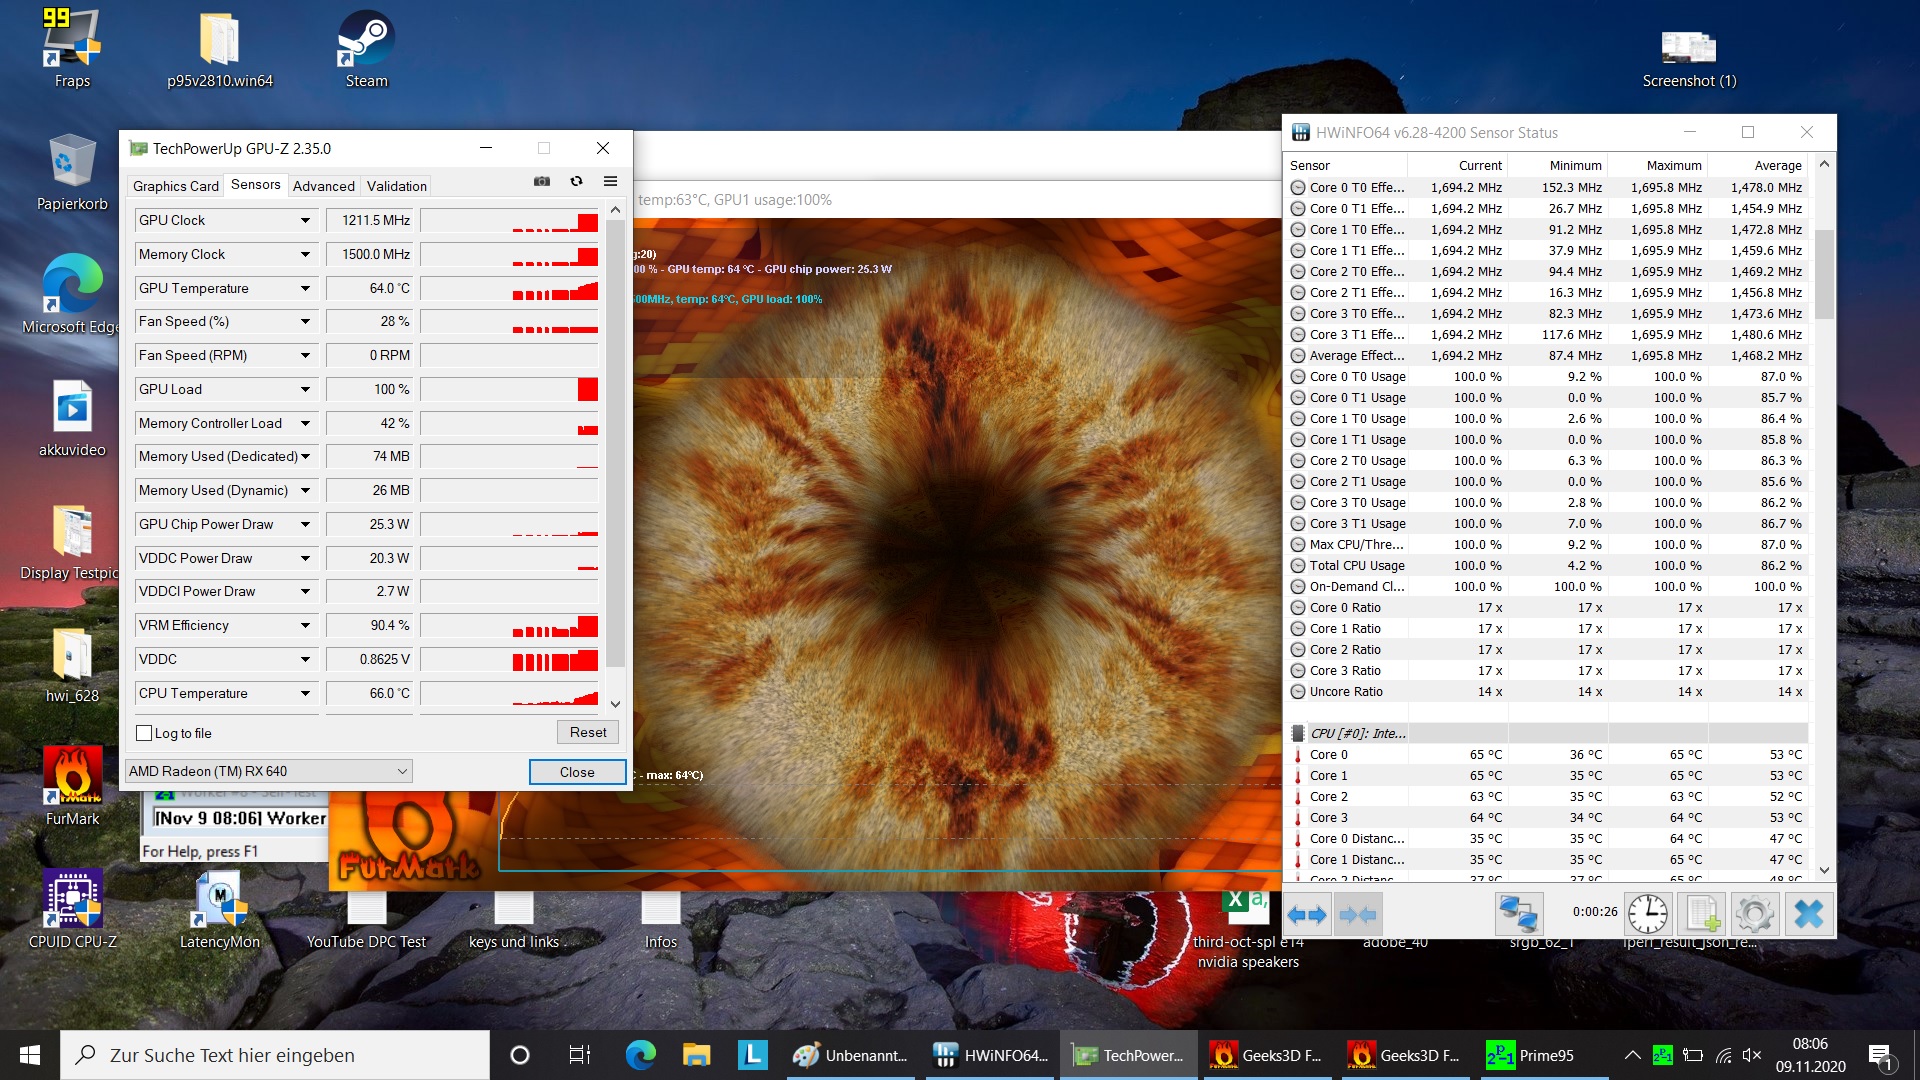
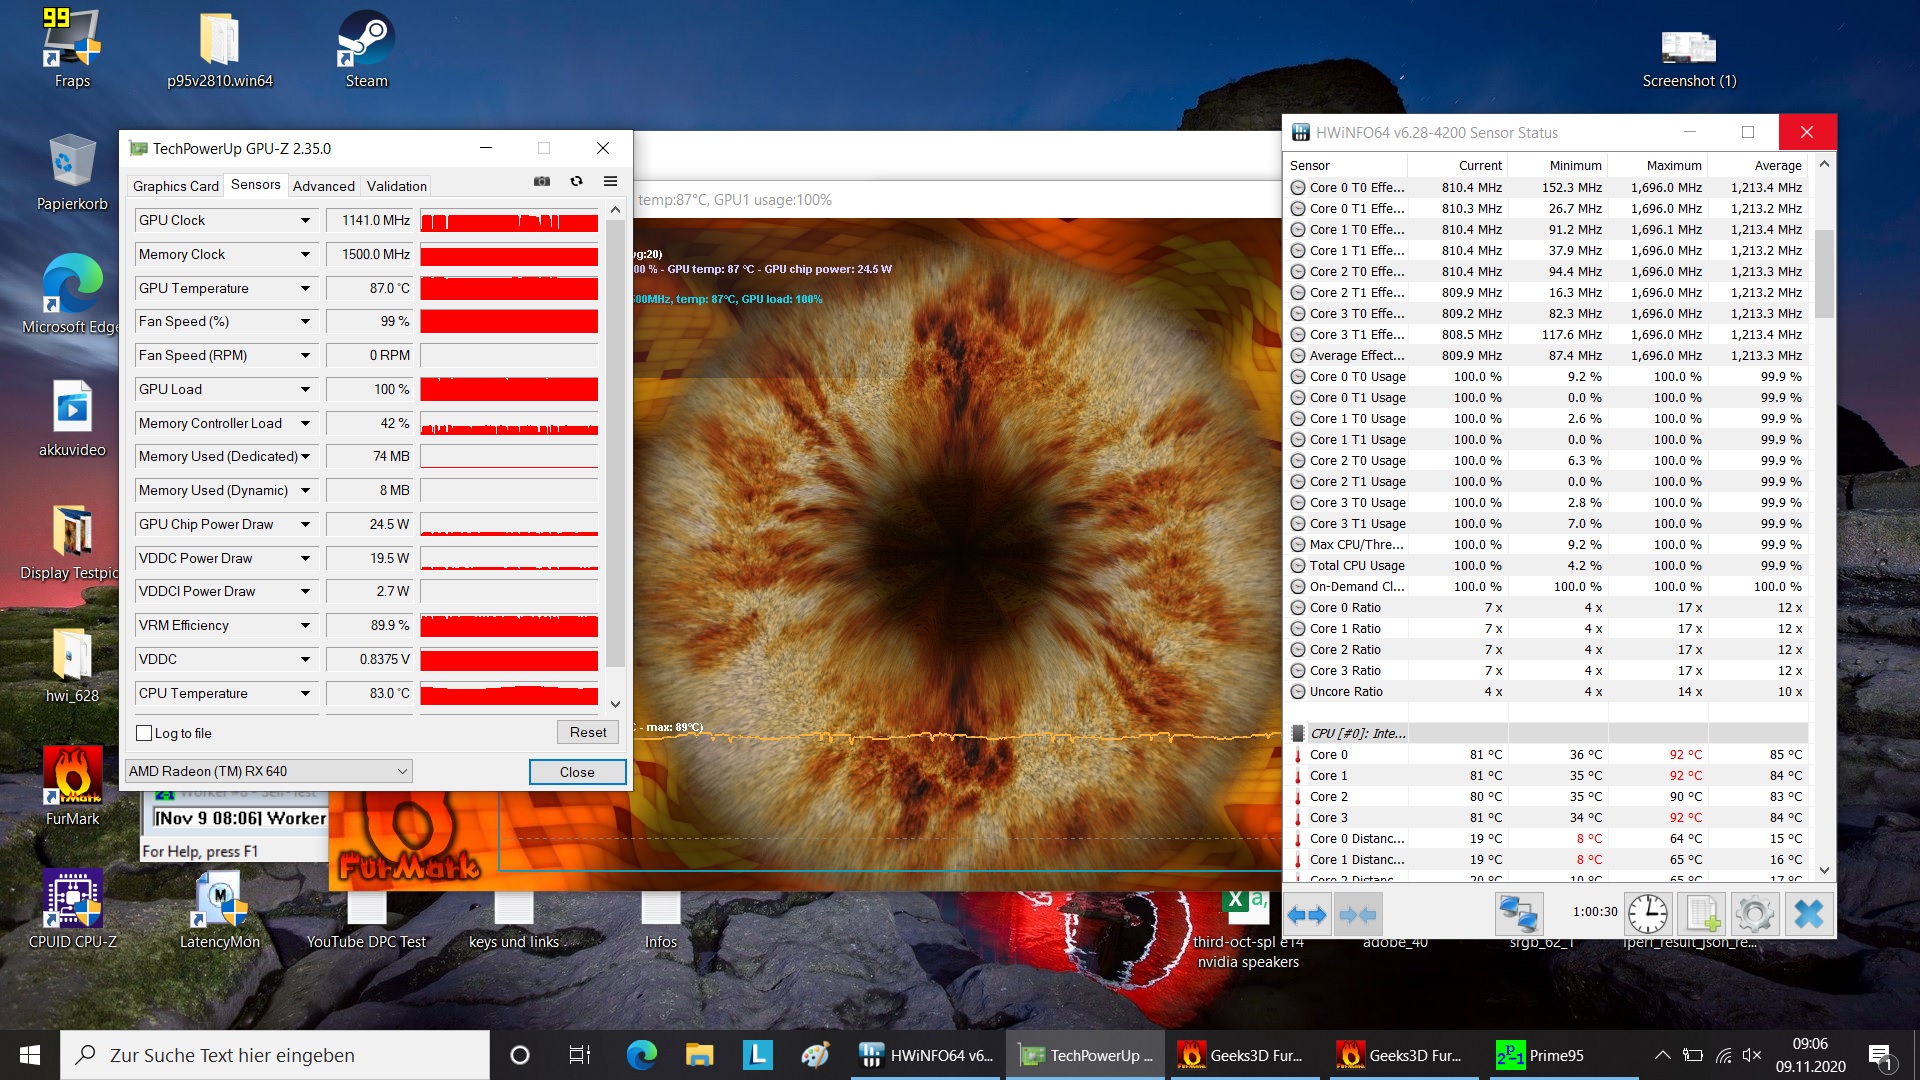
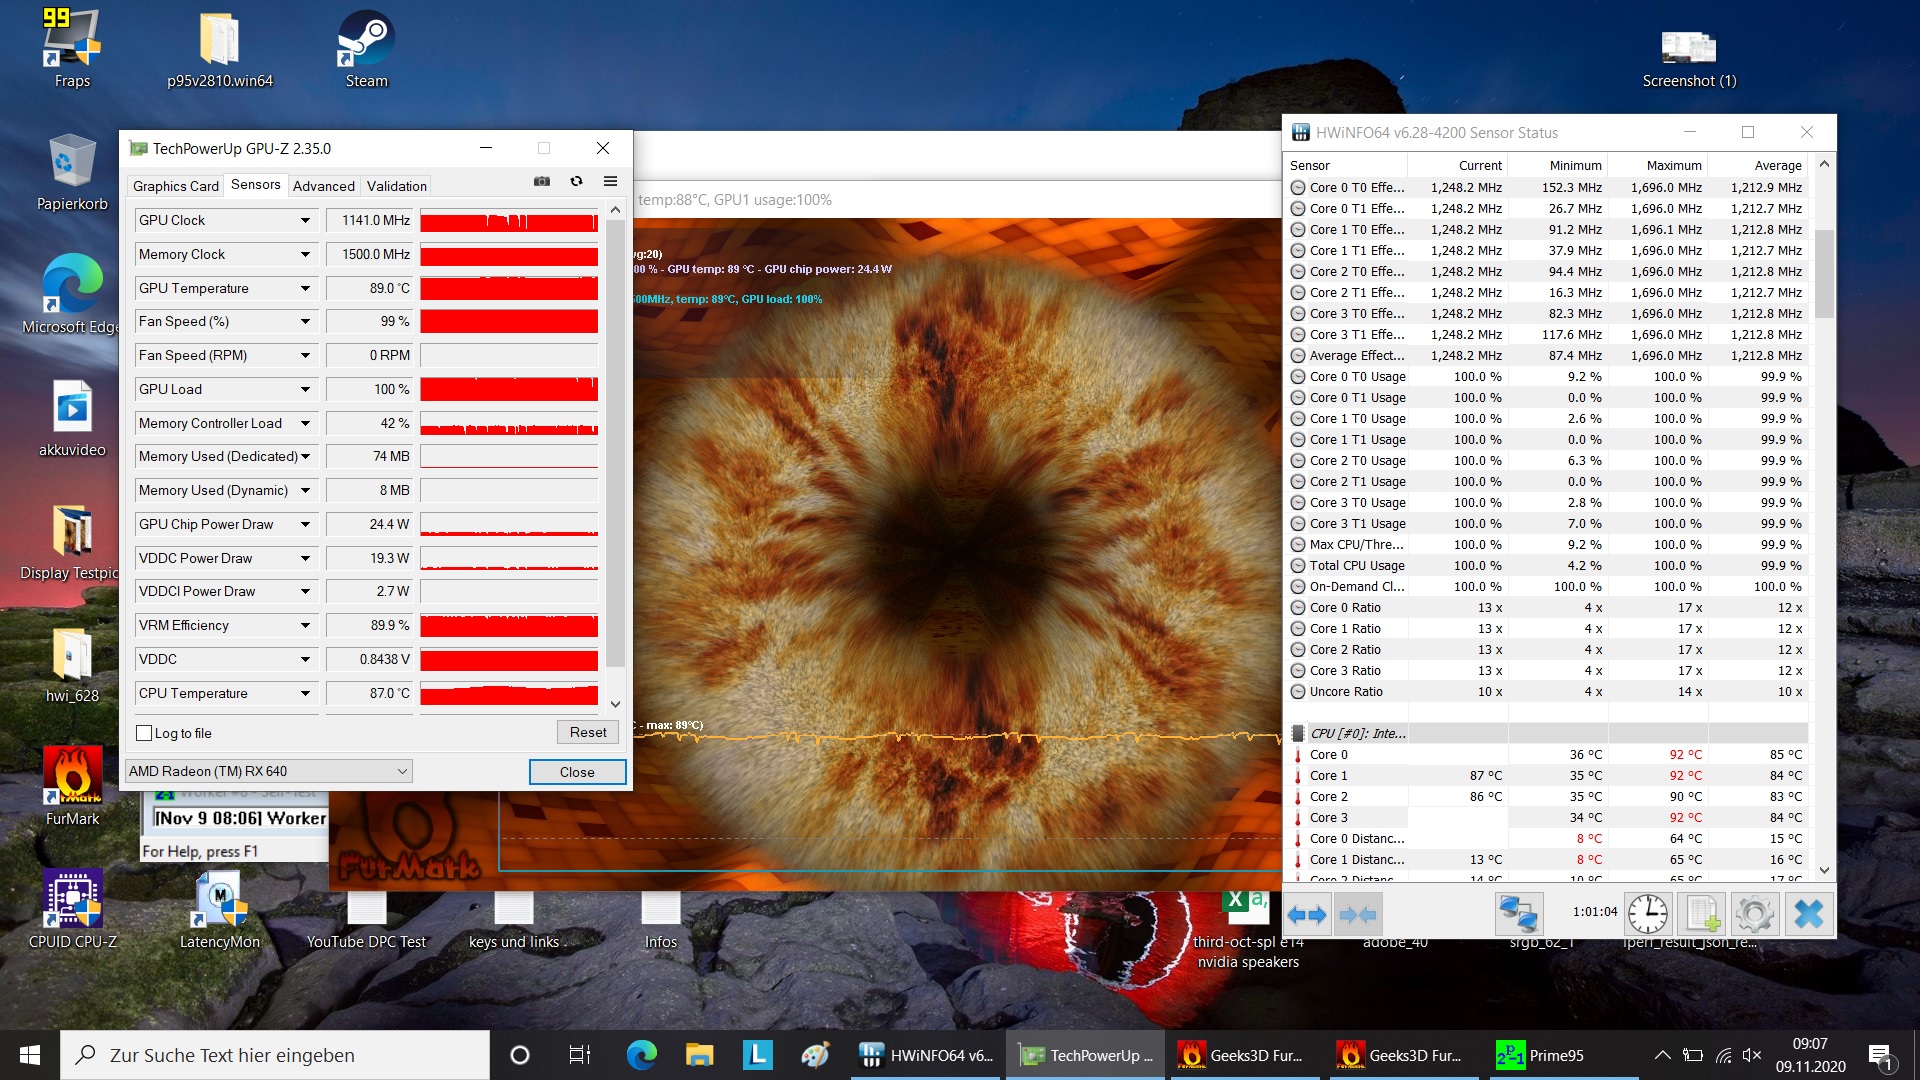
Even at the beginning of our stress test, the clock rates of 1.7 GHz are already below the base clock of 1.8 GHz. For 10 to 20 minutes this clock rate is held, and then it goes further down. After one hour, the clock rates jump back and forth quite wildly between 800 MHz and 1.3 GHz, with core temperatures fluctuating in parallel between 80 °C and 87 °C. Here, the cooling system may not be well optimized. The GPU clock drops only by about 80 MHz in the same period.
Speakers
The simple stereo loudspeakers in the laptop will not appeal to audiophiles, as is often the case. They play a bit too quiet and of course lack bass. In addition to HDMI and USB-C, the combined jack port is ideal for the connection of external devices.
Lenovo ThinkPad E14-20RA001LGE audio analysis
(±) | speaker loudness is average but good (73 dB)
Bass 100 - 315 Hz
(-) | nearly no bass - on average 16.7% lower than median
(-) | bass is not linear (15.1% delta to prev. frequency)
Mids 400 - 2000 Hz
(±) | higher mids - on average 7.2% higher than median
(±) | linearity of mids is average (7.3% delta to prev. frequency)
Highs 2 - 16 kHz
(±) | reduced highs - on average 5.5% lower than median
(±) | linearity of highs is average (10.5% delta to prev. frequency)
Overall 100 - 16.000 Hz
(±) | linearity of overall sound is average (29.6% difference to median)
Compared to same class
» 90% of all tested devices in this class were better, 3% similar, 7% worse
» The best had a delta of 7%, average was 21%, worst was 53%
Compared to all devices tested
» 88% of all tested devices were better, 3% similar, 10% worse
» The best had a delta of 4%, average was 23%, worst was 134%
Apple MacBook 12 (Early 2016) 1.1 GHz audio analysis
(+) | speakers can play relatively loud (83.6 dB)
Bass 100 - 315 Hz
(±) | reduced bass - on average 11.3% lower than median
(±) | linearity of bass is average (14.2% delta to prev. frequency)
Mids 400 - 2000 Hz
(+) | balanced mids - only 2.4% away from median
(+) | mids are linear (5.5% delta to prev. frequency)
Highs 2 - 16 kHz
(+) | balanced highs - only 2% away from median
(+) | highs are linear (4.5% delta to prev. frequency)
Overall 100 - 16.000 Hz
(+) | overall sound is linear (10.2% difference to median)
Compared to same class
» 7% of all tested devices in this class were better, 2% similar, 90% worse
» The best had a delta of 5%, average was 18%, worst was 53%
Compared to all devices tested
» 5% of all tested devices were better, 1% similar, 94% worse
» The best had a delta of 4%, average was 23%, worst was 134%
Power Management - Jumpy Intel ThinkPad
Energy consumption
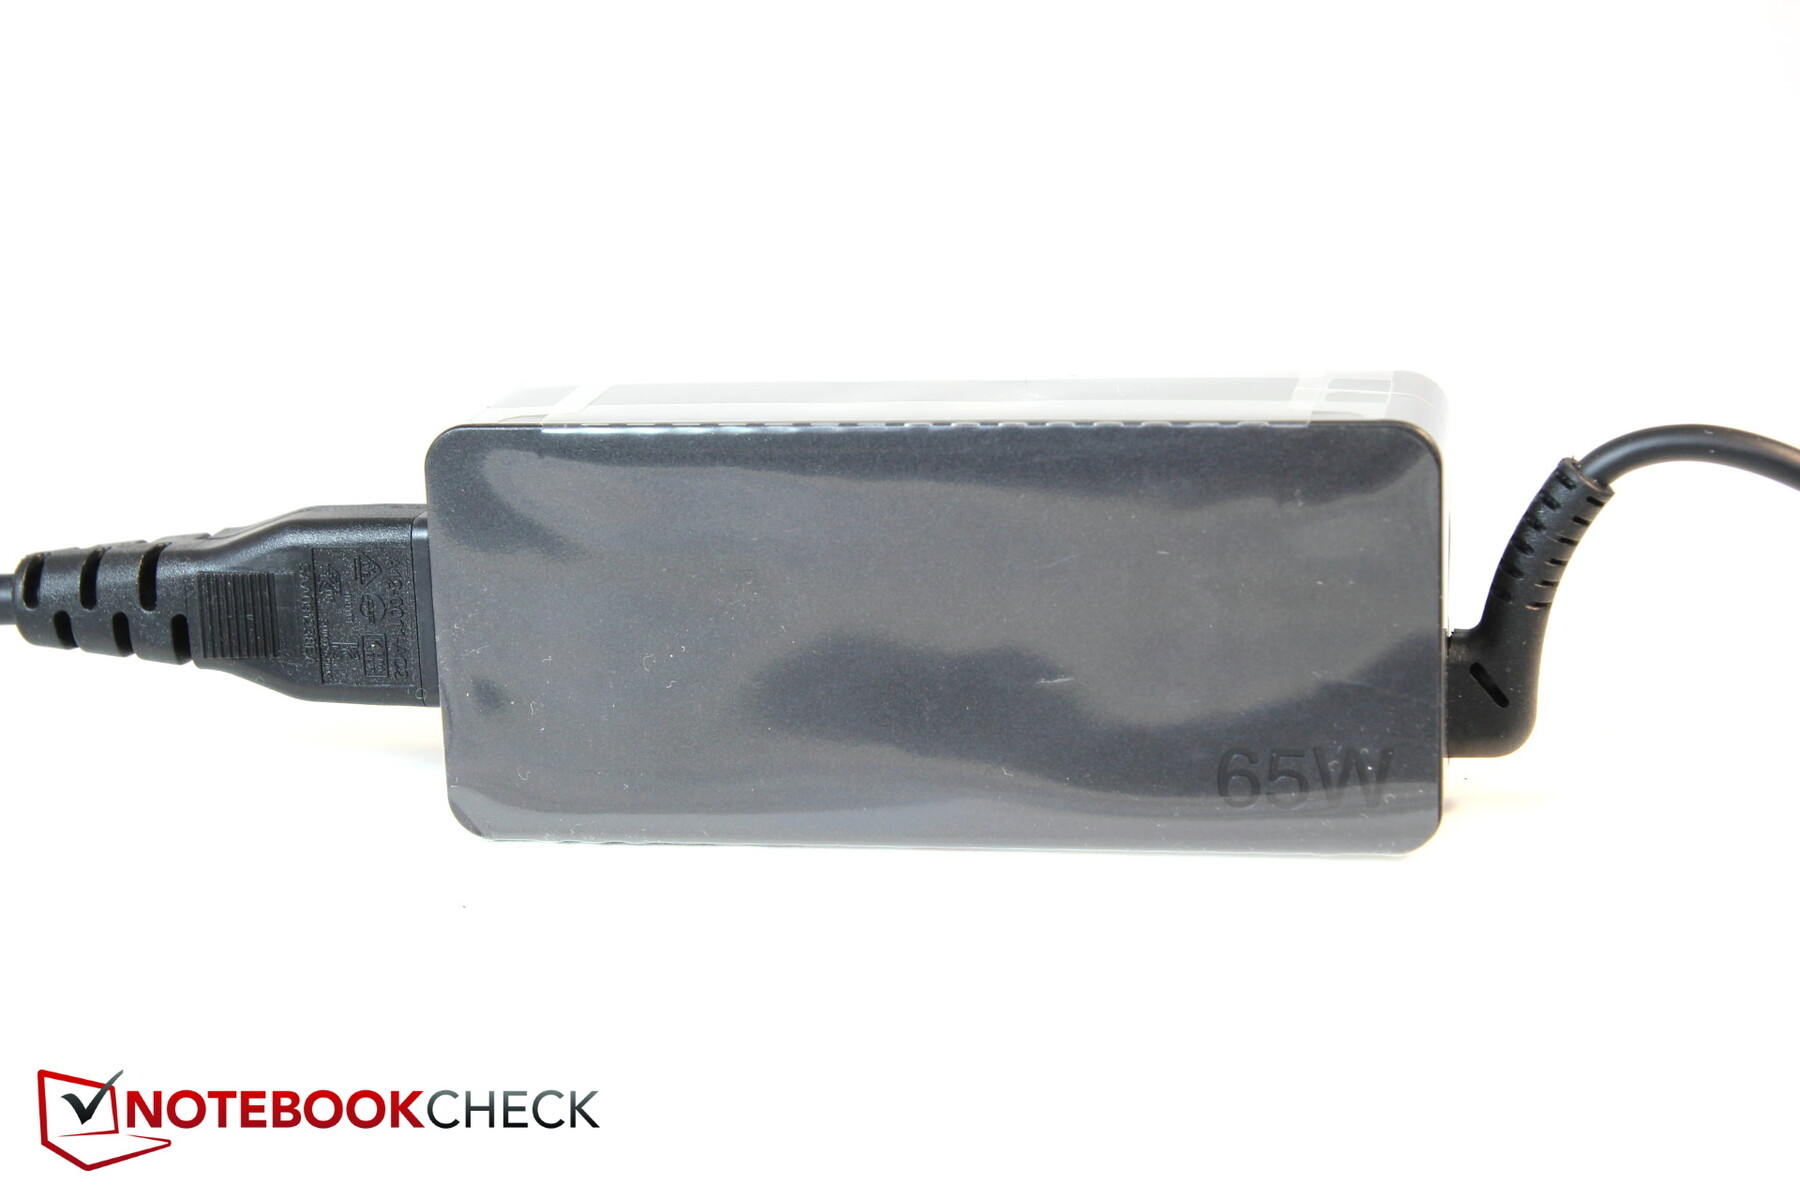
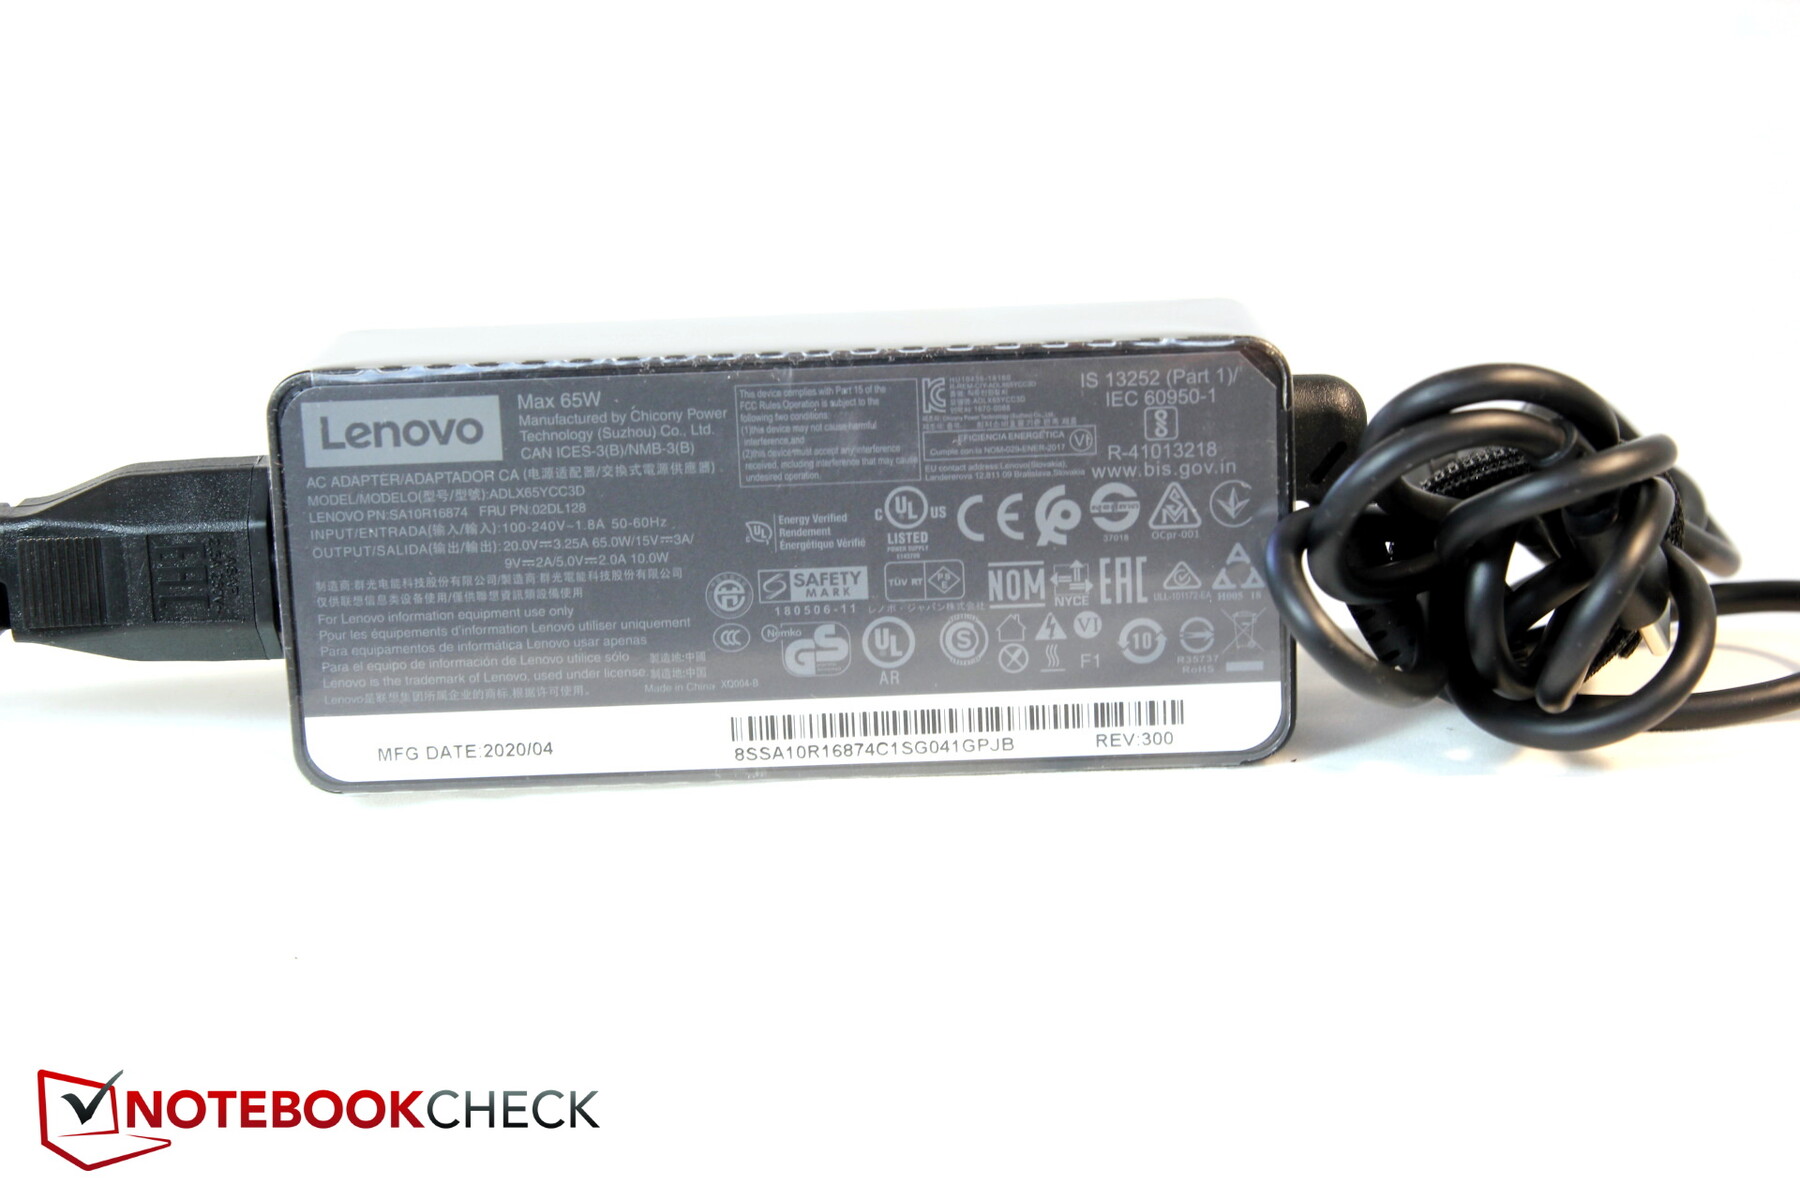
The Intel system is somewhat more economical in idle than the AMD variant. But under stress this trend turns around, which is probably mainly due to the dedicated GPU. We measure a jump between 63 and 52 W, so the 65 W power supply should be sufficient; after all, the consumption under The Witcher 3 Ultra is 54 W.
| Off / Standby | |
| Idle | |
| Load |
|
Key:
min: | |
| Lenovo ThinkPad E14-20RA001LGE i7-10510U, Radeon RX 640, WDC PC SN520 SDAPMUW-512, IPS, 1920x1080, 14" | Lenovo ThinkPad E14 Gen2-20T7S00W00 R5 4500U, Vega 6, Toshiba BG4 KBG40ZNT512G, a-Si IPS LED, 1920x1080, 14" | Lenovo ThinkPad E14 20RA001MGE i5-10210U, UHD Graphics 620, SK hynix BC501 HFM512GDHTNG-8310A, IPS LED, 1920x1080, 14" | Lenovo ThinkPad E490-20N90004GE i7-8565U, Radeon RX 550X (Laptop), Toshiba KBG30ZMT512G, IPS, 1920x1080, 14" | Asus VivoBook S14 S433FL i7-10510U, GeForce MX250, Intel Optane Memory H10 with Solid State Storage 32GB + 512GB HBRPEKNX0202A(L/H), IPS, 1920x1080, 14" | MSI Modern 14 A10RB-459US i5-10210U, GeForce MX250, Kingston RBUSNS8154P3512GJ, IPS, 1920x1080, 14" | Average AMD Radeon RX 640 | Average of class Office | |
|---|---|---|---|---|---|---|---|---|
| Power Consumption | -4% | 16% | -40% | 13% | -3% | 1% | -4% | |
| Idle Minimum * (Watt) | 3.3 | 4.6 -39% | 3.01 9% | 6.8 -106% | 2.4 27% | 4.2 -27% | 3.25 ? 2% | 4.28 ? -30% |
| Idle Average * (Watt) | 6.2 | 7.6 -23% | 6.32 -2% | 9.4 -52% | 4.2 32% | 5.9 5% | 6.5 ? -5% | 7.31 ? -18% |
| Idle Maximum * (Watt) | 8.4 | 9.7 -15% | 8.78 -5% | 12.4 -48% | 7.8 7% | 7.2 14% | 8.95 ? -7% | 8.58 ? -2% |
| Load Average * (Watt) | 59.2 | 39.1 34% | 32.5 45% | 57.2 3% | 57 4% | 63.4 -7% | 51.6 ? 13% | 43.7 ? 26% |
| Witcher 3 ultra * (Watt) | 54 | 52 4% | 53.5 1% | |||||
| Load Maximum * (Watt) | 66.5 | 50.3 24% | 45.5 32% | 63.1 5% | 64 4% | 67.4 -1% | 66.5 ? -0% | 64.4 ? 3% |
* ... smaller is better
Battery life
The ThinkPad lasts about eight hours in the WLAN test, which is about the same as the Ryzen model. The times are also very similar for video viewing, at around 8.7 hours. The battery life of the Ryzen-E14 device only drops unusually sharply in the load test: while our test unit reaches a normal 1.5 hours, the Ryzen-E14 runs out after only 55 minutes. The runtimes are appropriate for the class and battery size.
| Lenovo ThinkPad E14-20RA001LGE i7-10510U, Radeon RX 640, 45 Wh | Lenovo ThinkPad E14 Gen2-20T7S00W00 R5 4500U, Vega 6, 45 Wh | Lenovo ThinkPad E14 20RA001MGE i5-10210U, UHD Graphics 620, 45 Wh | Lenovo ThinkPad E490-20N90004GE i7-8565U, Radeon RX 550X (Laptop), 45 Wh | Asus VivoBook S14 S433FL i7-10510U, GeForce MX250, 50 Wh | MSI Modern 14 A10RB-459US i5-10210U, GeForce MX250, 50 Wh | Average of class Office | |
|---|---|---|---|---|---|---|---|
| Battery runtime | -11% | 12% | -2% | 6% | 13% | 53% | |
| H.264 (h) | 8.7 | 9.1 5% | 10.3 18% | 8.2 -6% | 15.5 ? 78% | ||
| WiFi v1.3 (h) | 8.1 | 8.3 2% | 8.5 5% | 7 -14% | 8.6 6% | 8.6 6% | 13 ? 60% |
| Load (h) | 1.5 | 0.9 -40% | 1.7 13% | 1.7 13% | 1.8 20% | 1.808 ? 21% | |
| Reader / Idle (h) | 14.4 | 16.4 | 24.5 ? |
Pros
Cons
Verdict - A neat ThinkPad, but superfluous

The ThinkPad E14 with Intel CPU is a good but also quite spartan all-rounder. The good keyboard and the TouchPad speak for it, which is why a ThinkPad is always good for work.
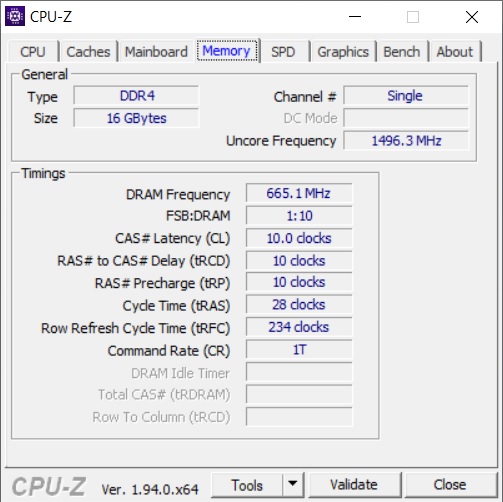
However, the Gen-2-Ryzen version of the ThinkPad E14 has the same advantages. Actually, there are hardly any reasons to buy the Gen-1 Intel version now, quite the contrary: The AMD processor in the Gen 2 is up to 50% faster on the road, the RAM runs, unlike here, in dual-channel mode, and it also stays a bit quieter and cooler and is 300 Euros (~$356) cheaper!
At most, the dedicated graphics, which generates about 20% more performance in corresponding applications, speaks for the Intel variant. Whether the 20% more 3D performance is worth the more than 300-Euro (~$356) surcharge is highly doubtful, if only because of the many other disadvantages compared to the newer AMD variant. The ThinkPad E14 with Ryzen 5 is clearly the better package!
The ThinkPad E14 is a good work computer with all-round potential. However, there is already the E14 Gen 2 with AMD Ryzen CPU, and that is superior in almost all areas! If you do not need the dedicated GPU, which is about 20% faster, you should go for the Ryzen version, otherwise you will have to wait for the Intel Gen 2 with Tiger Lake.
Lenovo ThinkPad E14-20RA001LGE
- 11/11/2020 v7 (old)
Christian Hintze
Price comparison

