MSI Modern 14 A10RB Laptop Review: Lighter than it Looks
(February 3, 2020 update: MSI Modern 14 SKUs with the Core i7-10710U exist, but they are not available in the United States at the time of writing.)
Not to be confused with the higher-end MSI Prestige 14, the MSI Modern 14 is the more affordable version aimed at content creators and business users on tighter budgets. It foregoes most of the advanced features of the Prestige 14 like GTX graphics, 4K UHD panels, and Thunderbolt 3 support in favor of a lighter system that typical office workers can appreciate.
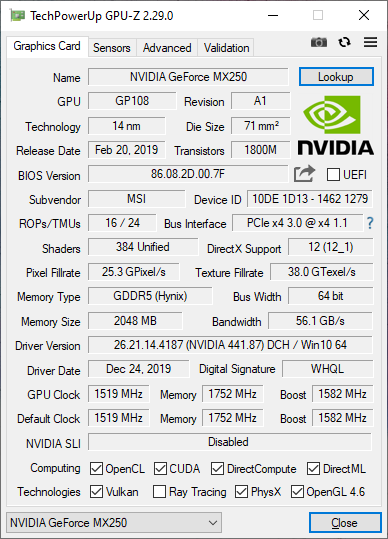
Current SKUs are fixed at the Core i5-10210U CPU and 1080p matte display. Upgradeable options are limited to the GPU (Intel UHD Graphics 620 or GeForce MX250), NVMe SSD, and DDR4 RAM up to 32 GB. The configuration tested here can be found on Xotic PC for $900 USD.
The MSI Modern 14 competes with both Ultrabooks and business-centric laptops like the Microsoft Surface Laptop series, Apple MacBook Pro series, Dell Latitude 7400, and the Lenovo ThinkPad P43s.
More MSI reviews:
Rating | Date | Model | Weight | Height | Size | Resolution | Price |
|---|---|---|---|---|---|---|---|
| 80.9 % v7 (old) | 01 / 2020 | MSI Modern 14 A10RB-459US i5-10210U, GeForce MX250 | 1.2 kg | 16 mm | 14.00" | 1920x1080 | |
| 88.2 % v7 (old) | 10 / 2019 | Lenovo Yoga C940-14IIL i7-1065G7, Iris Plus Graphics G7 (Ice Lake 64 EU) | 1.4 kg | 14.95 mm | 14.00" | 1920x1080 | |
| 89.7 % v7 (old) | 12 / 2019 | Apple MacBook Pro 16 2019 i9 5500M i9-9880H, Radeon Pro 5500M | 2 kg | 16.2 mm | 16.00" | 3072x1920 | |
| 83.7 % v7 (old) | 09 / 2019 | Asus VivoBook 14 X403FA i5-8265U, UHD Graphics 620 | 1.3 kg | 16.5 mm | 14.00" | 1920x1080 | |
| 90.1 % v7 (old) | 07 / 2019 | Lenovo ThinkPad X1 Carbon 2019-20QE000VGE i7-8665U, UHD Graphics 620 | 1.1 kg | 14.9 mm | 14.00" | 2560x1440 |
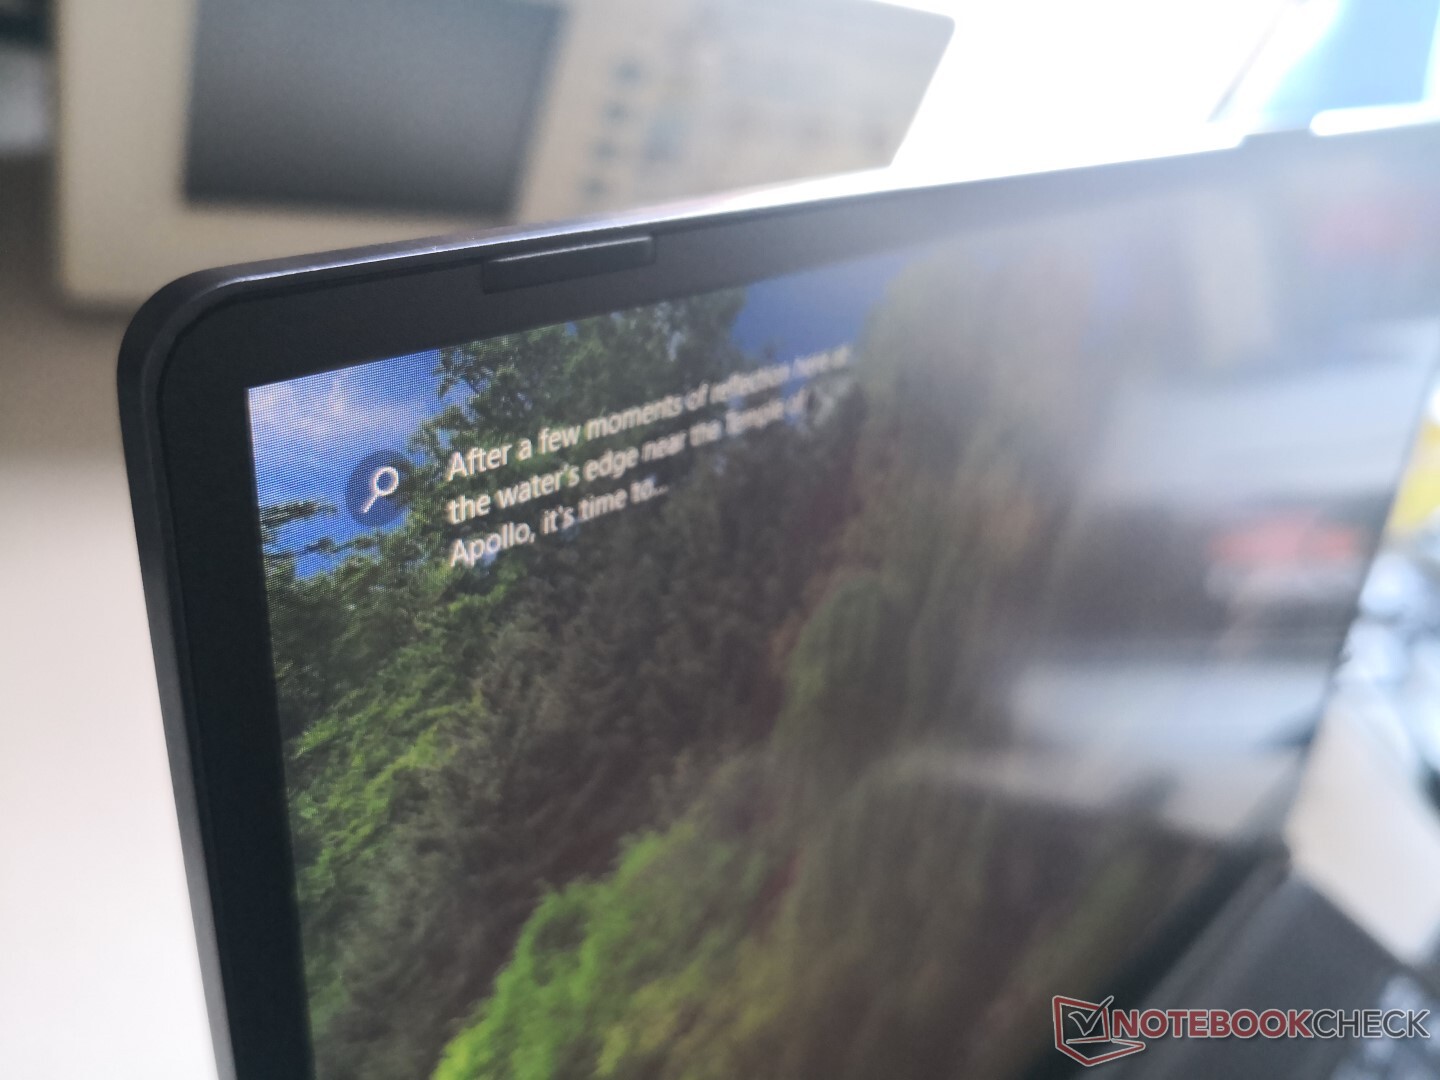
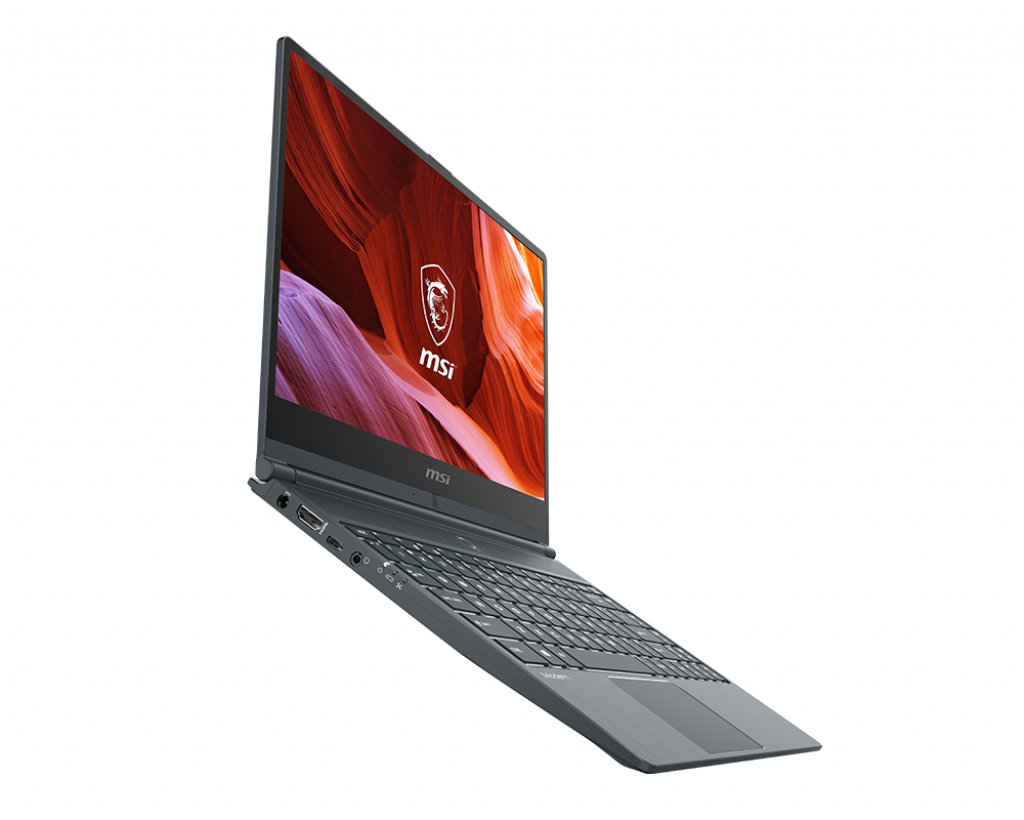
Case
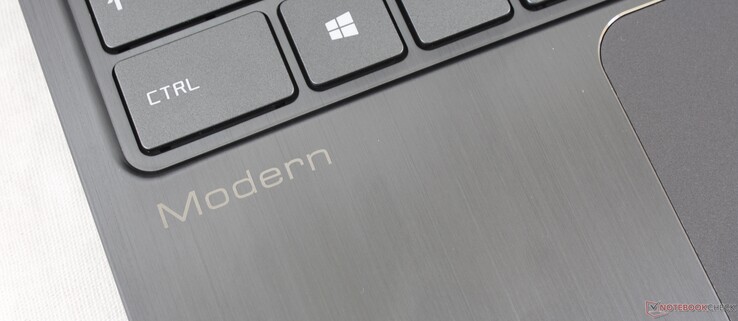
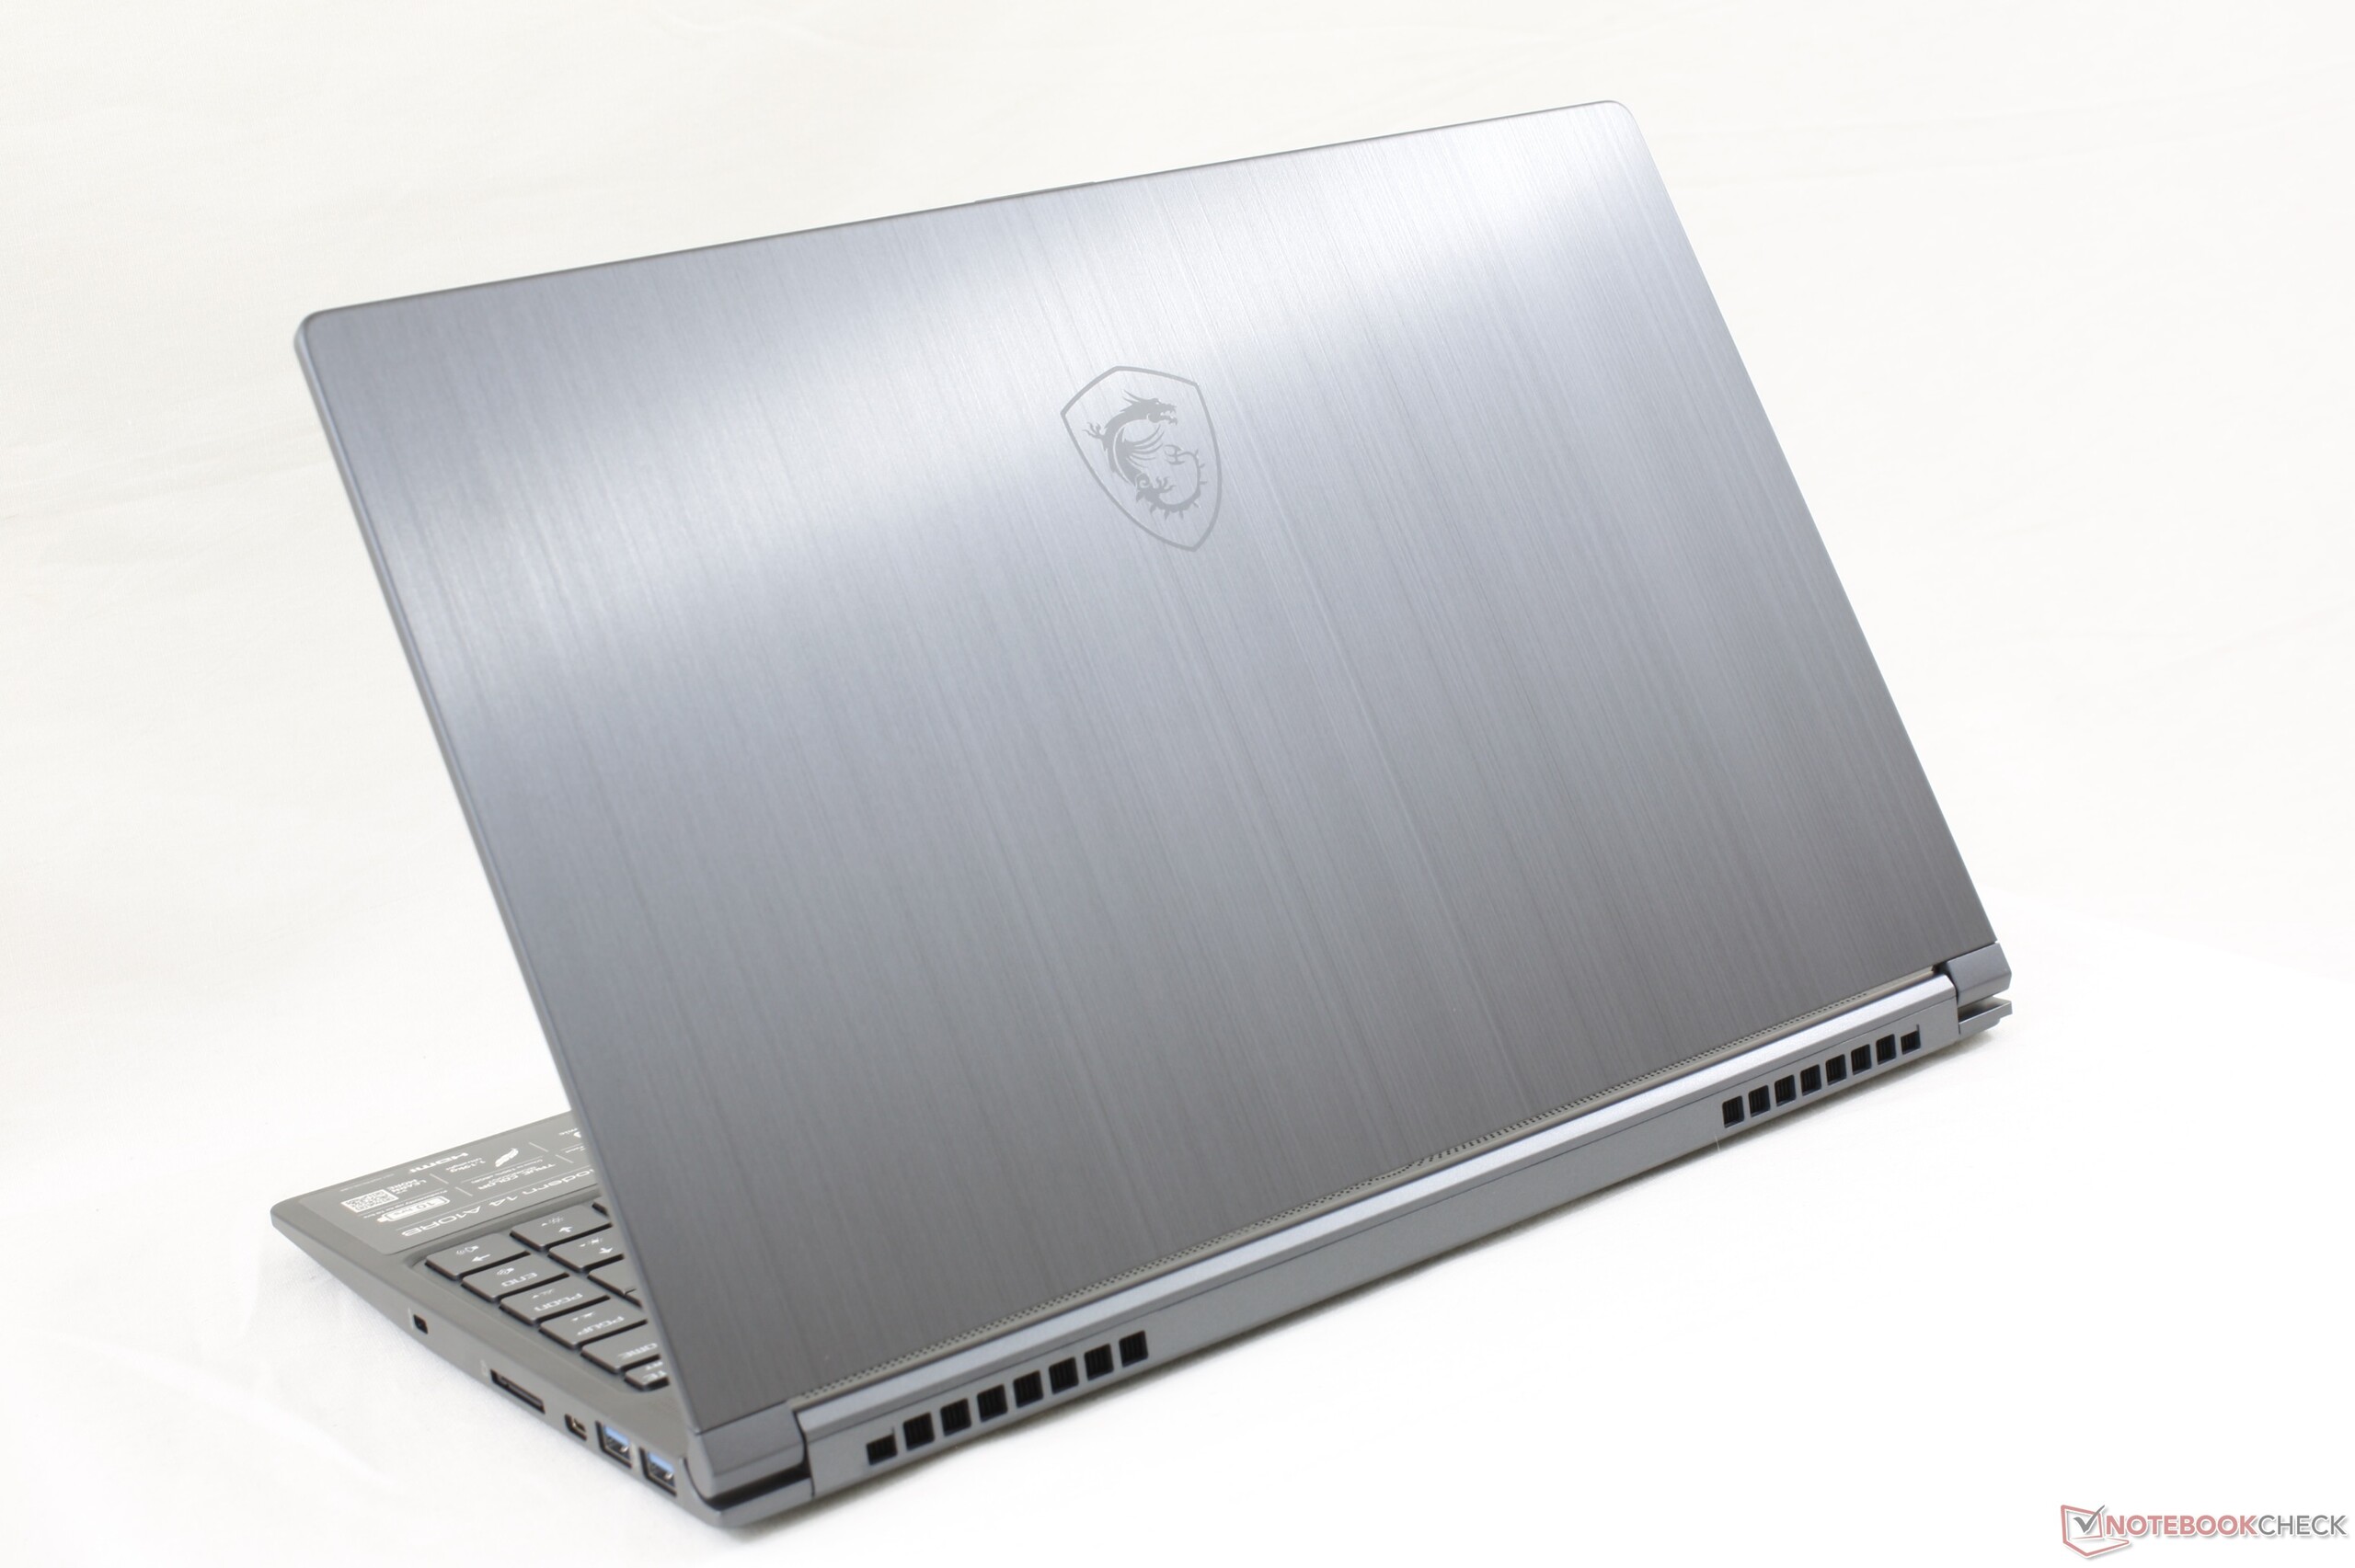
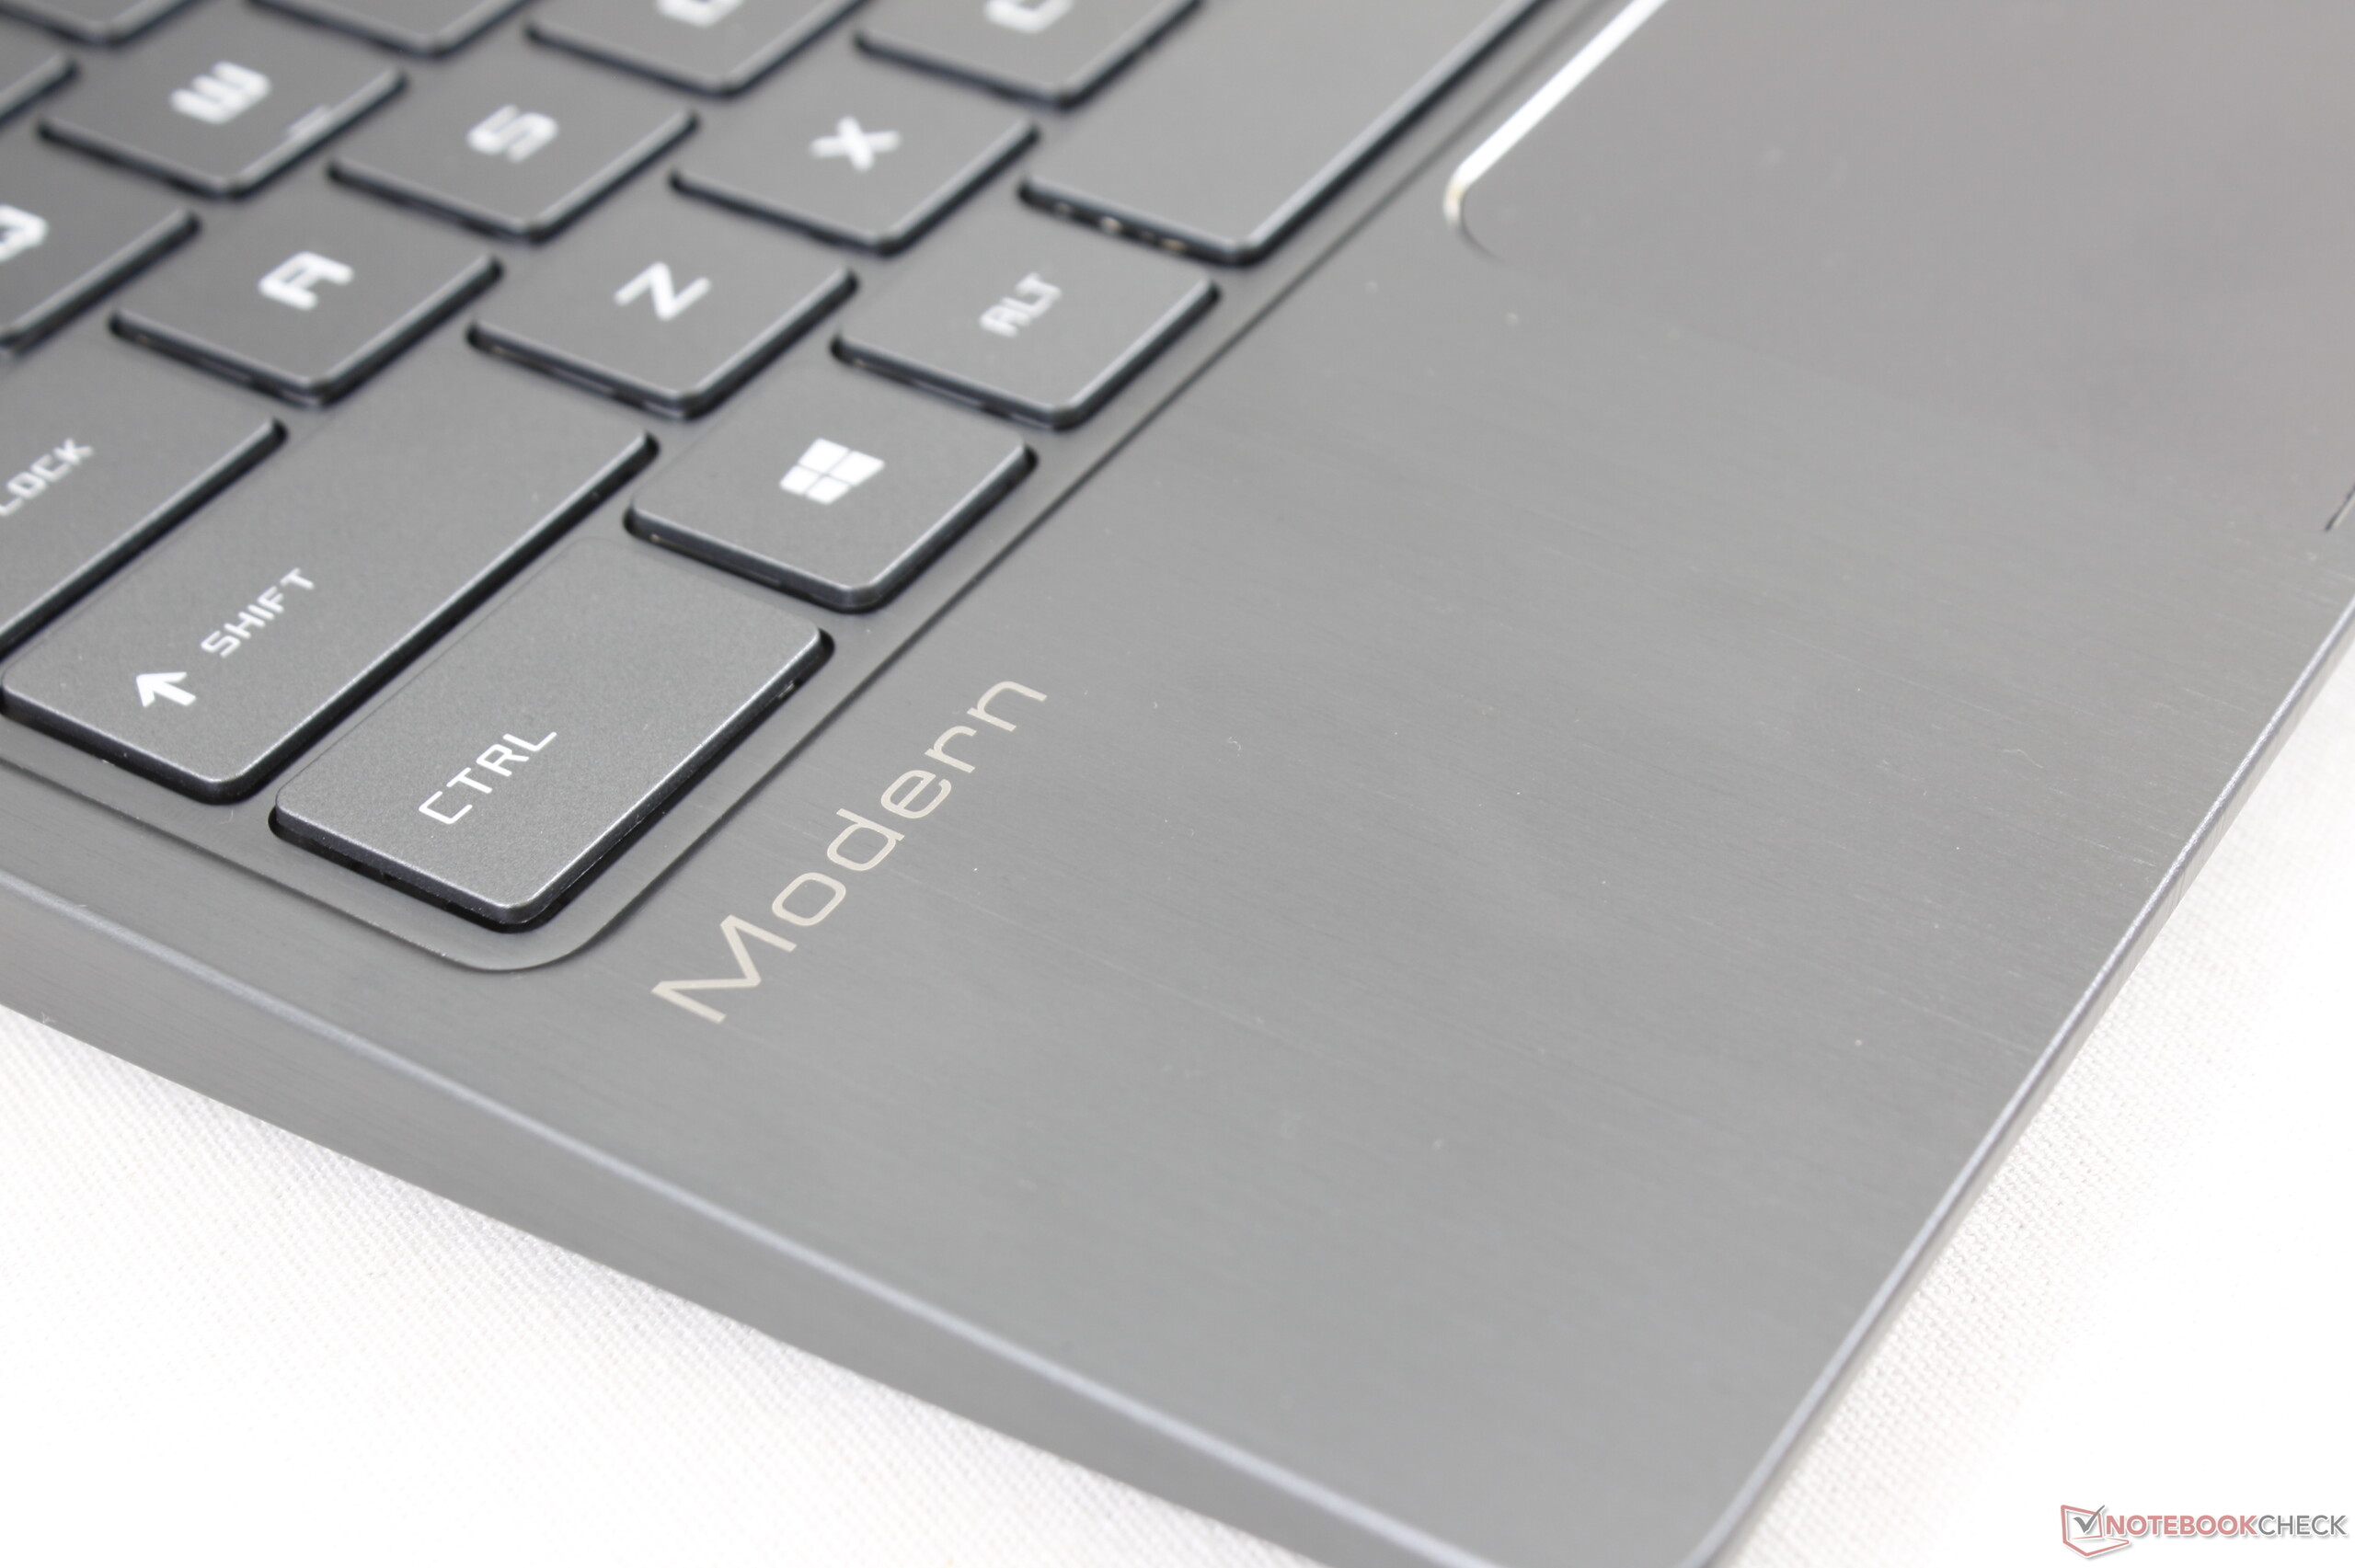
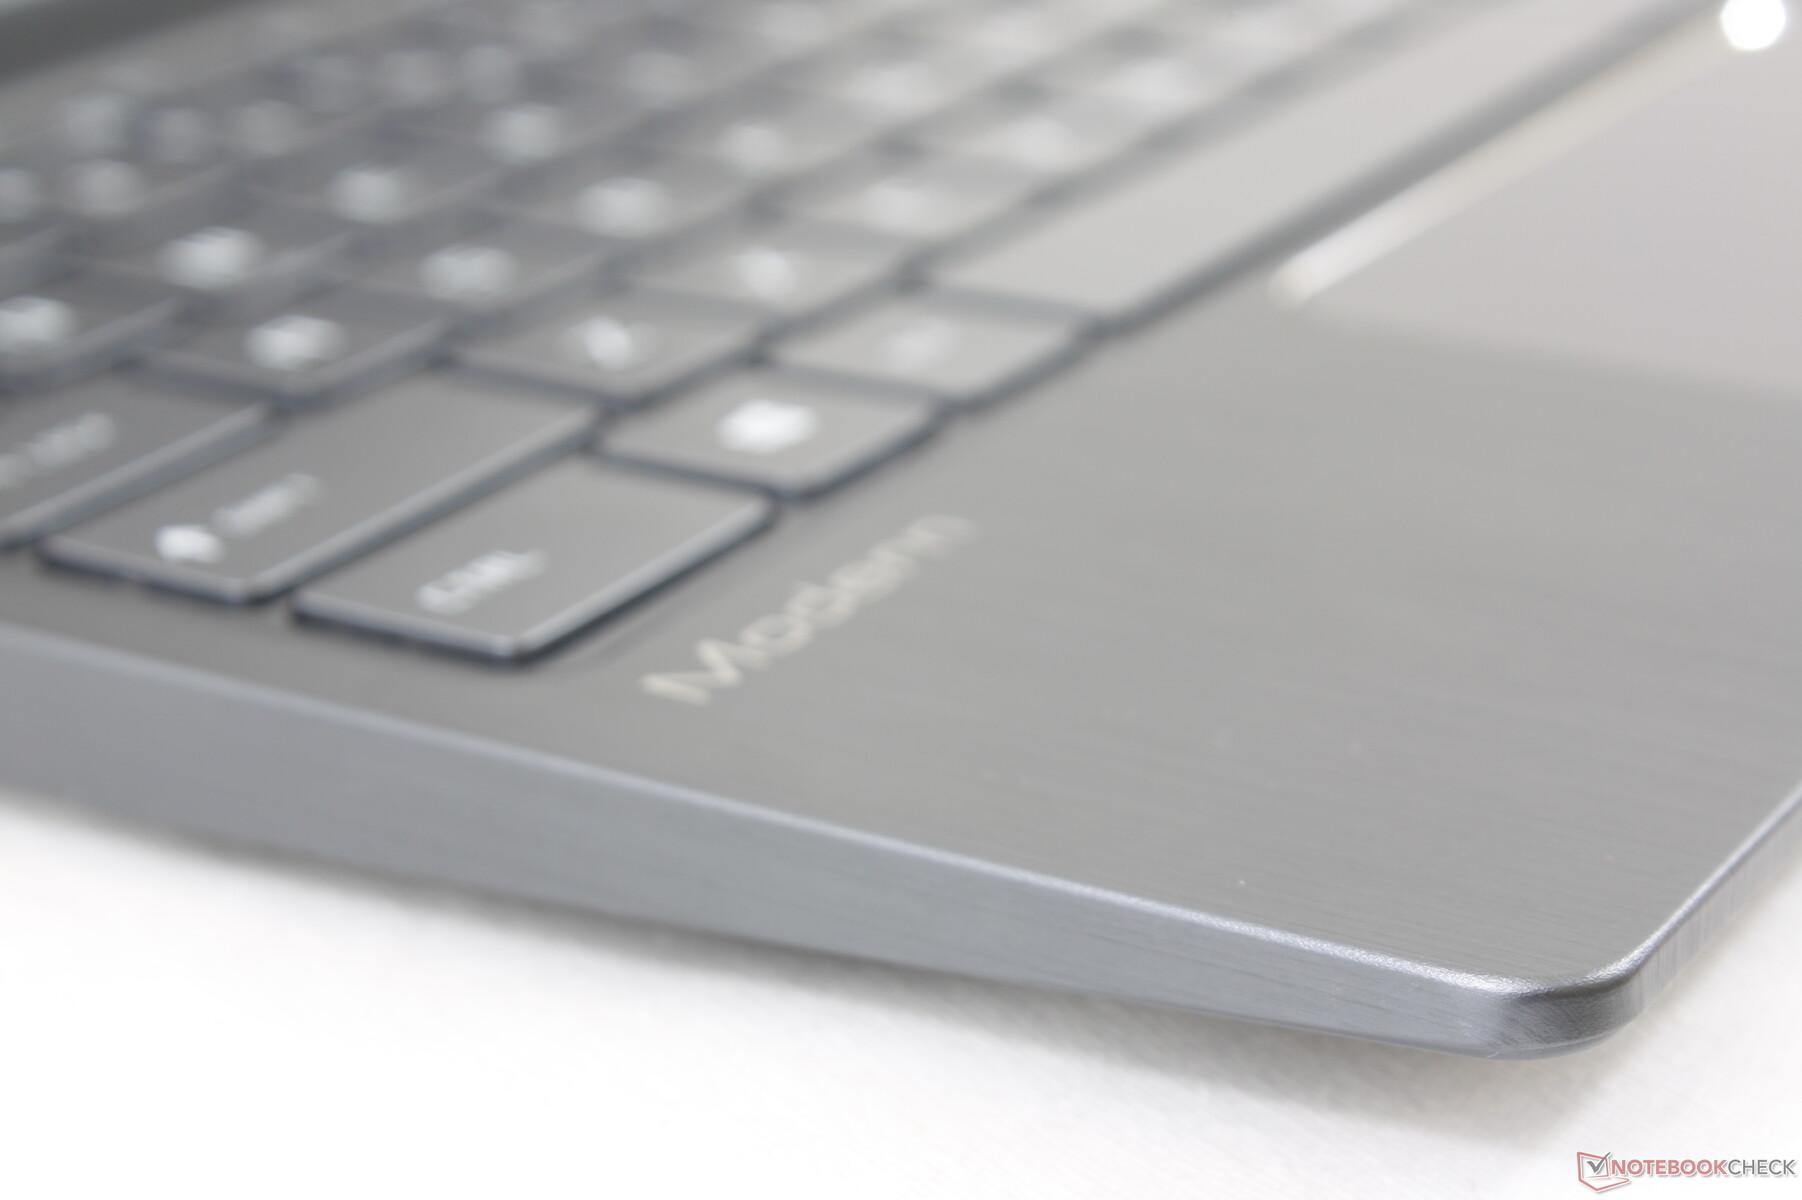
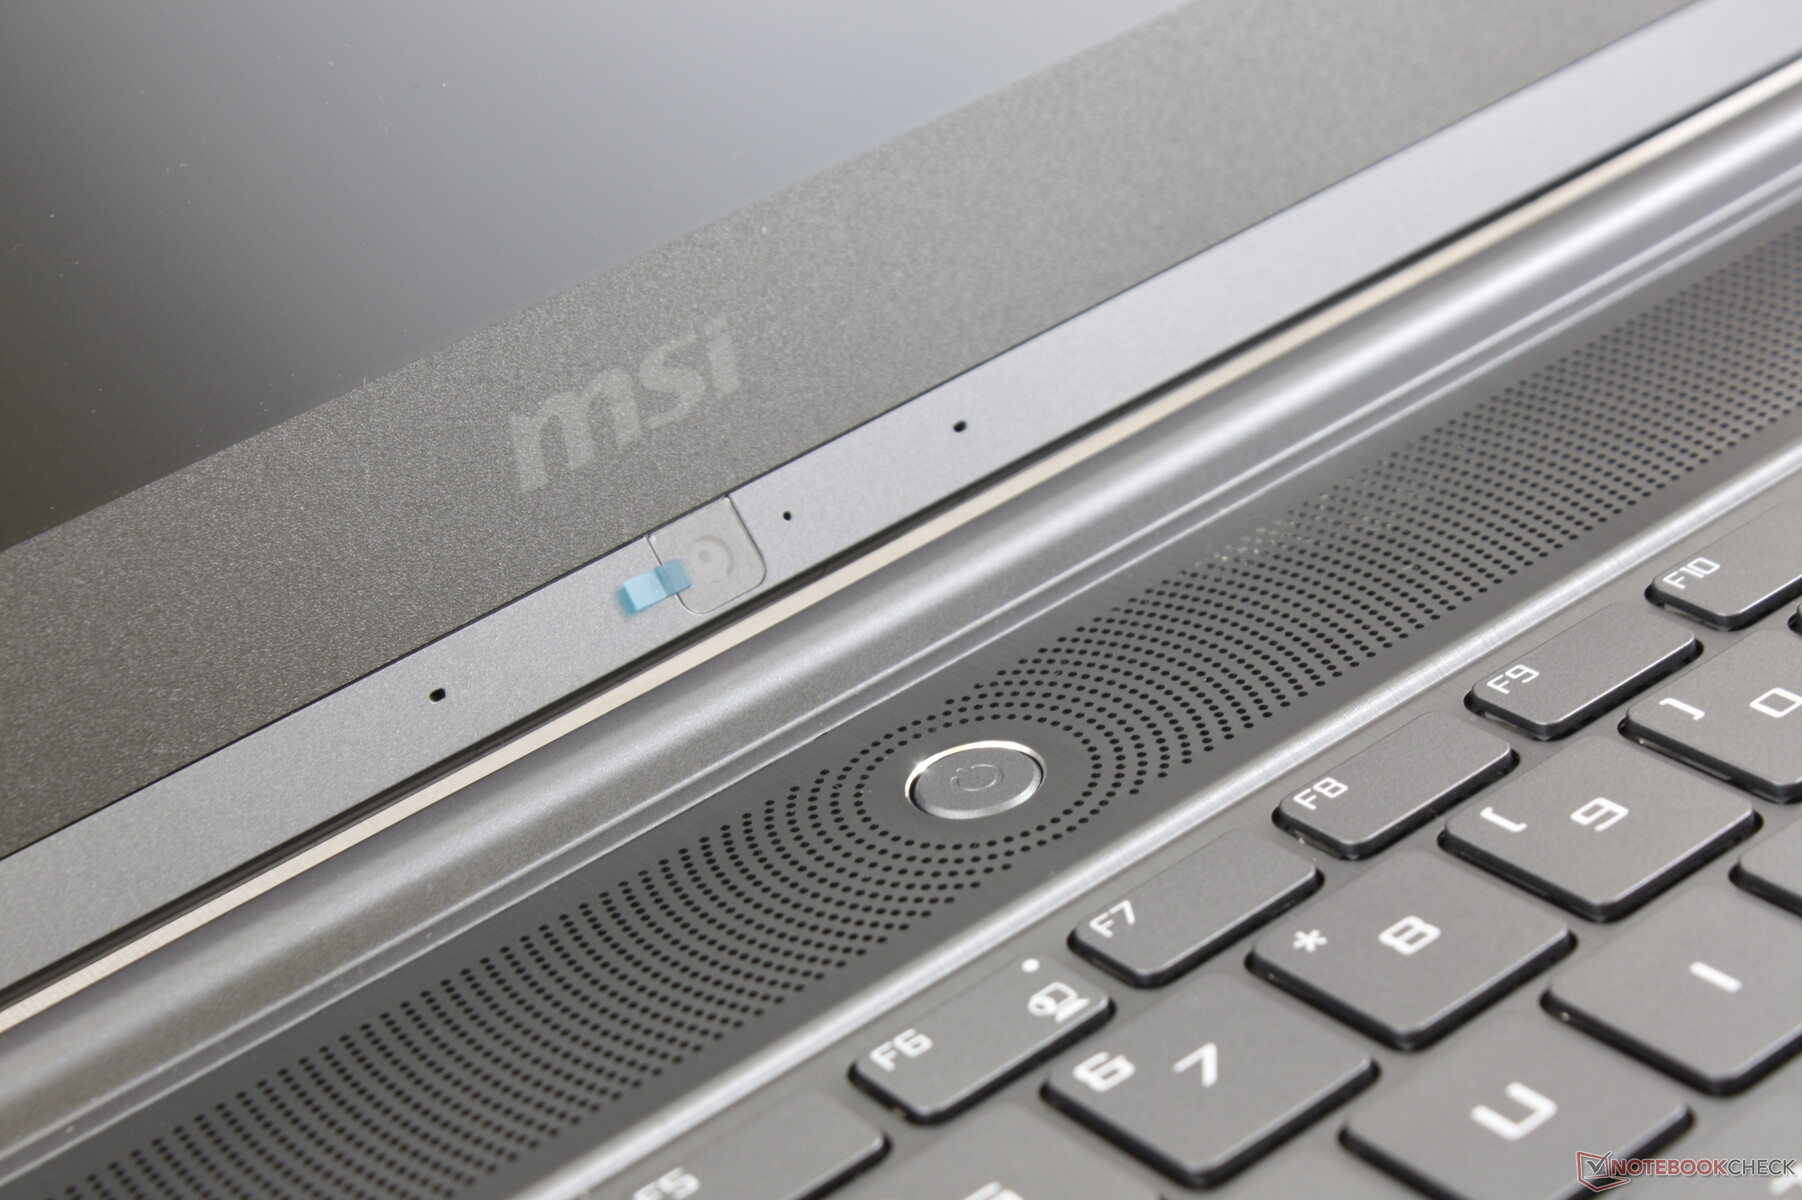
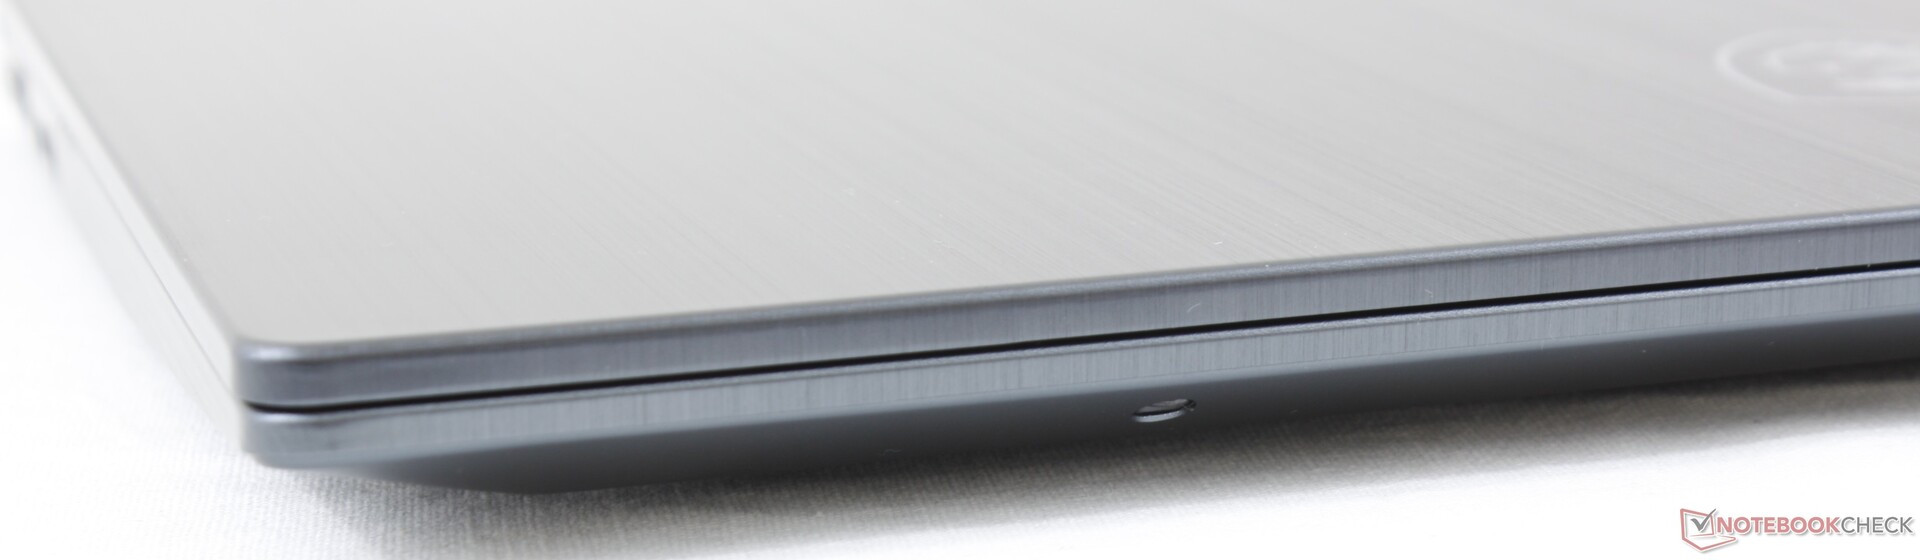
One of MSI's strengths is creating a visually appealing laptop. It's clear that the Modern 14 takes more than a few cues from the super-thin MSI GS series of gaming laptops as they share similar brushed aluminum surfaces and textures. When compared to the usual dull office laptop, the Modern 14 is definitely more stylish and attractive.
Unfortunately, visual appeal has come at the cost of chassis rigidity. The base exhibits some creaking when attempting to twist its sides and the overall skeleton doesn't give a sense of sturdiness. Alternatives like the XPS 13, Spectre 13, EliteBook 1040, Surface Laptop, MacBook Pro, and even most office laptops like the Dell Latitude 5000 or 7000 series are built stronger and can take more of a beating.
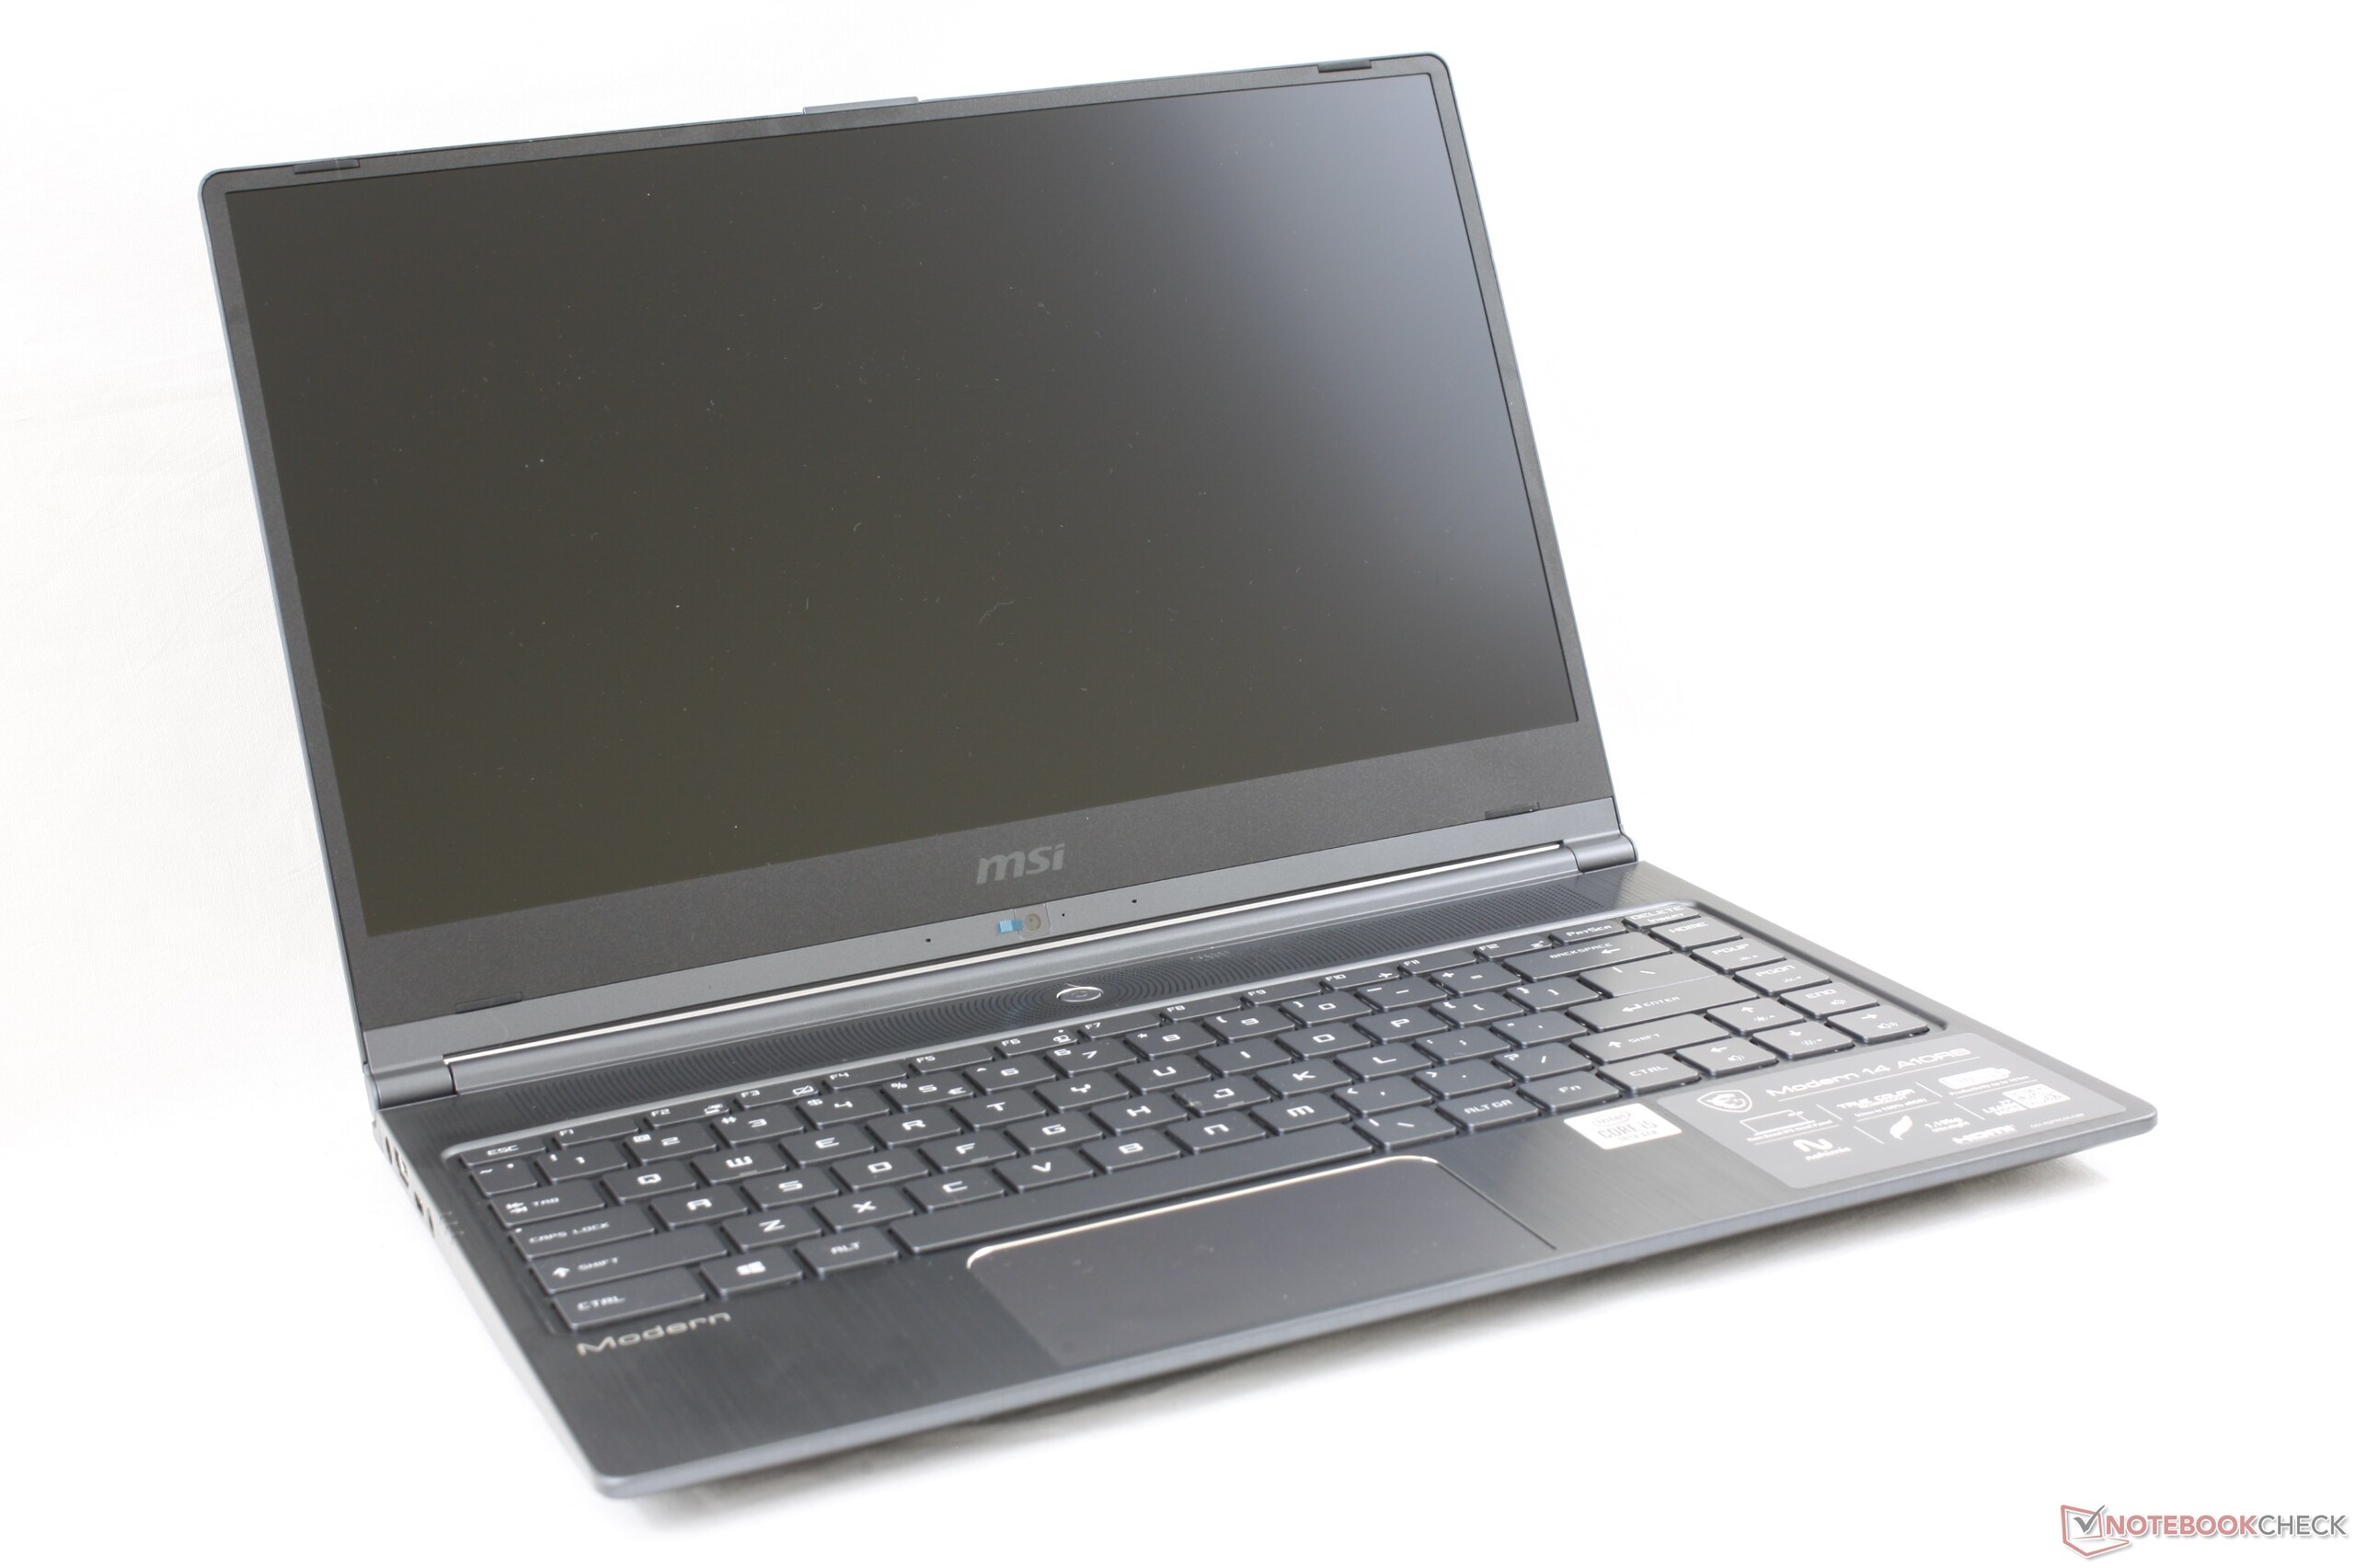
Perhaps as a direct result of the thin skeleton and flexible surfaces, the Modern 14 is much lighter than many alternatives at just 1.2 kg. Its weight is nearly identical to the 13.3-inch Dell XPS 13 while providing a larger 14-inch screen size. The pricier Yoga C940-14 and Prestige 14 are each slightly heavier and smaller in every dimension.

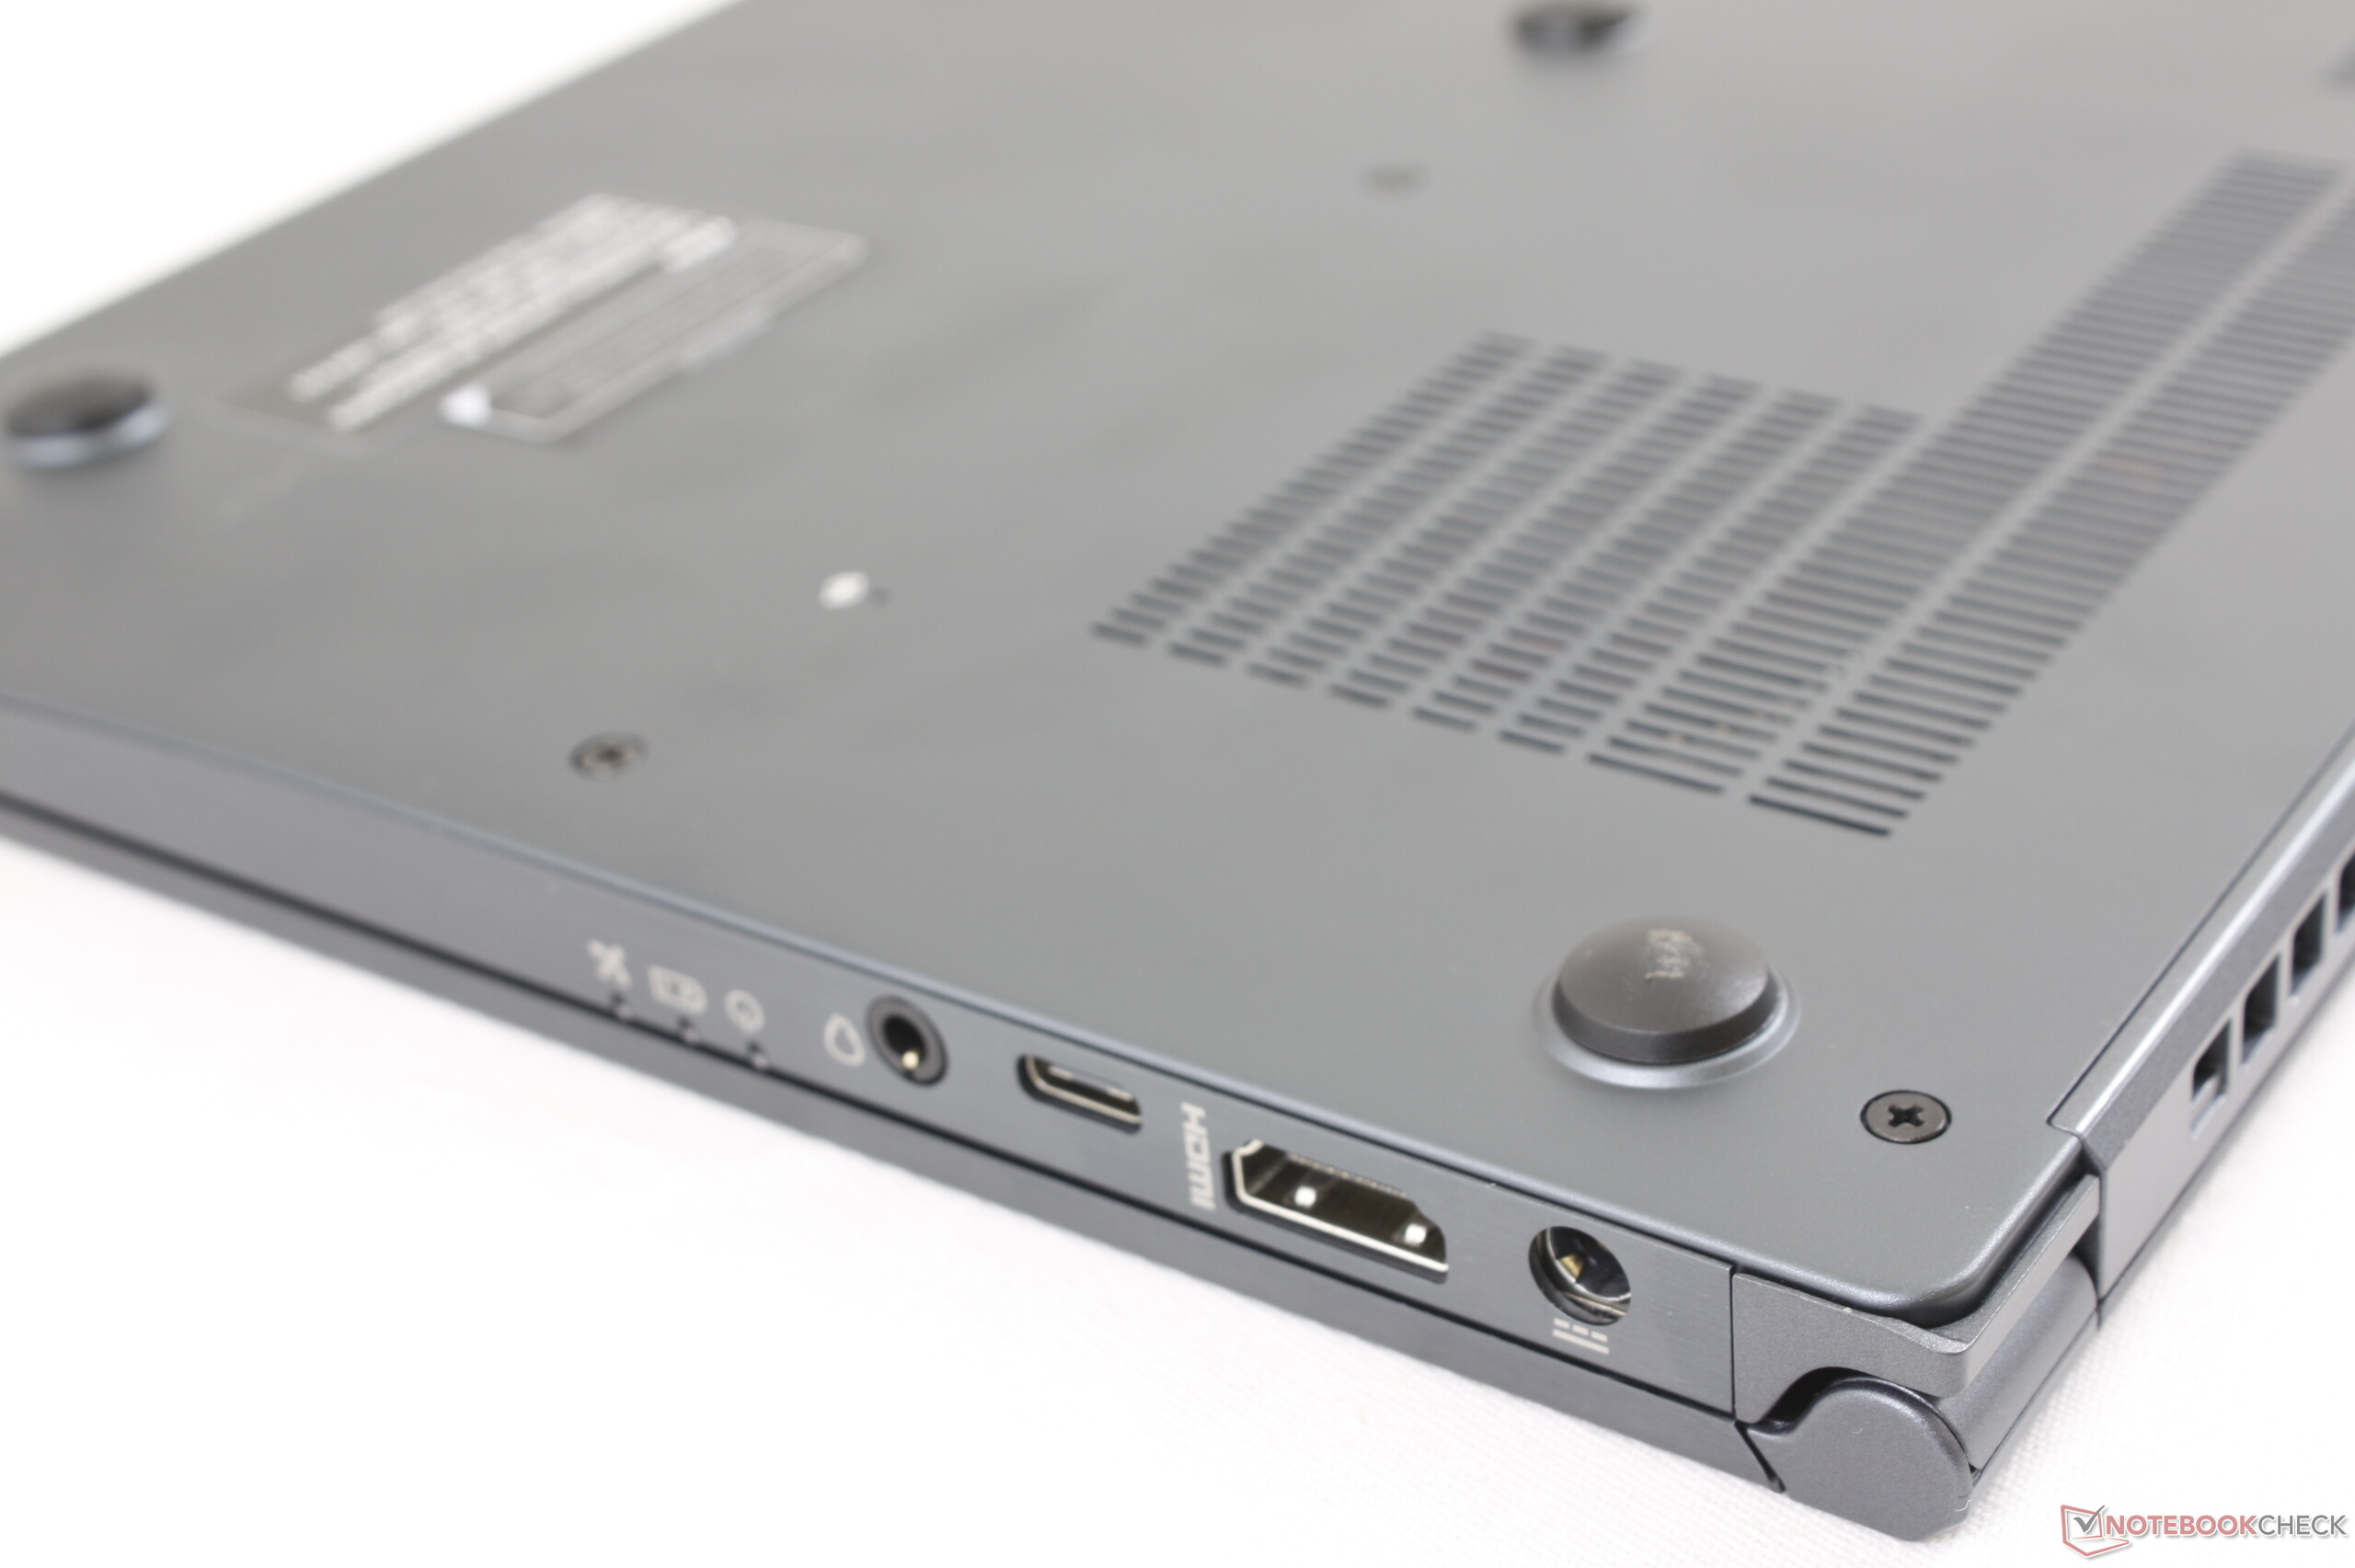
Connectivity
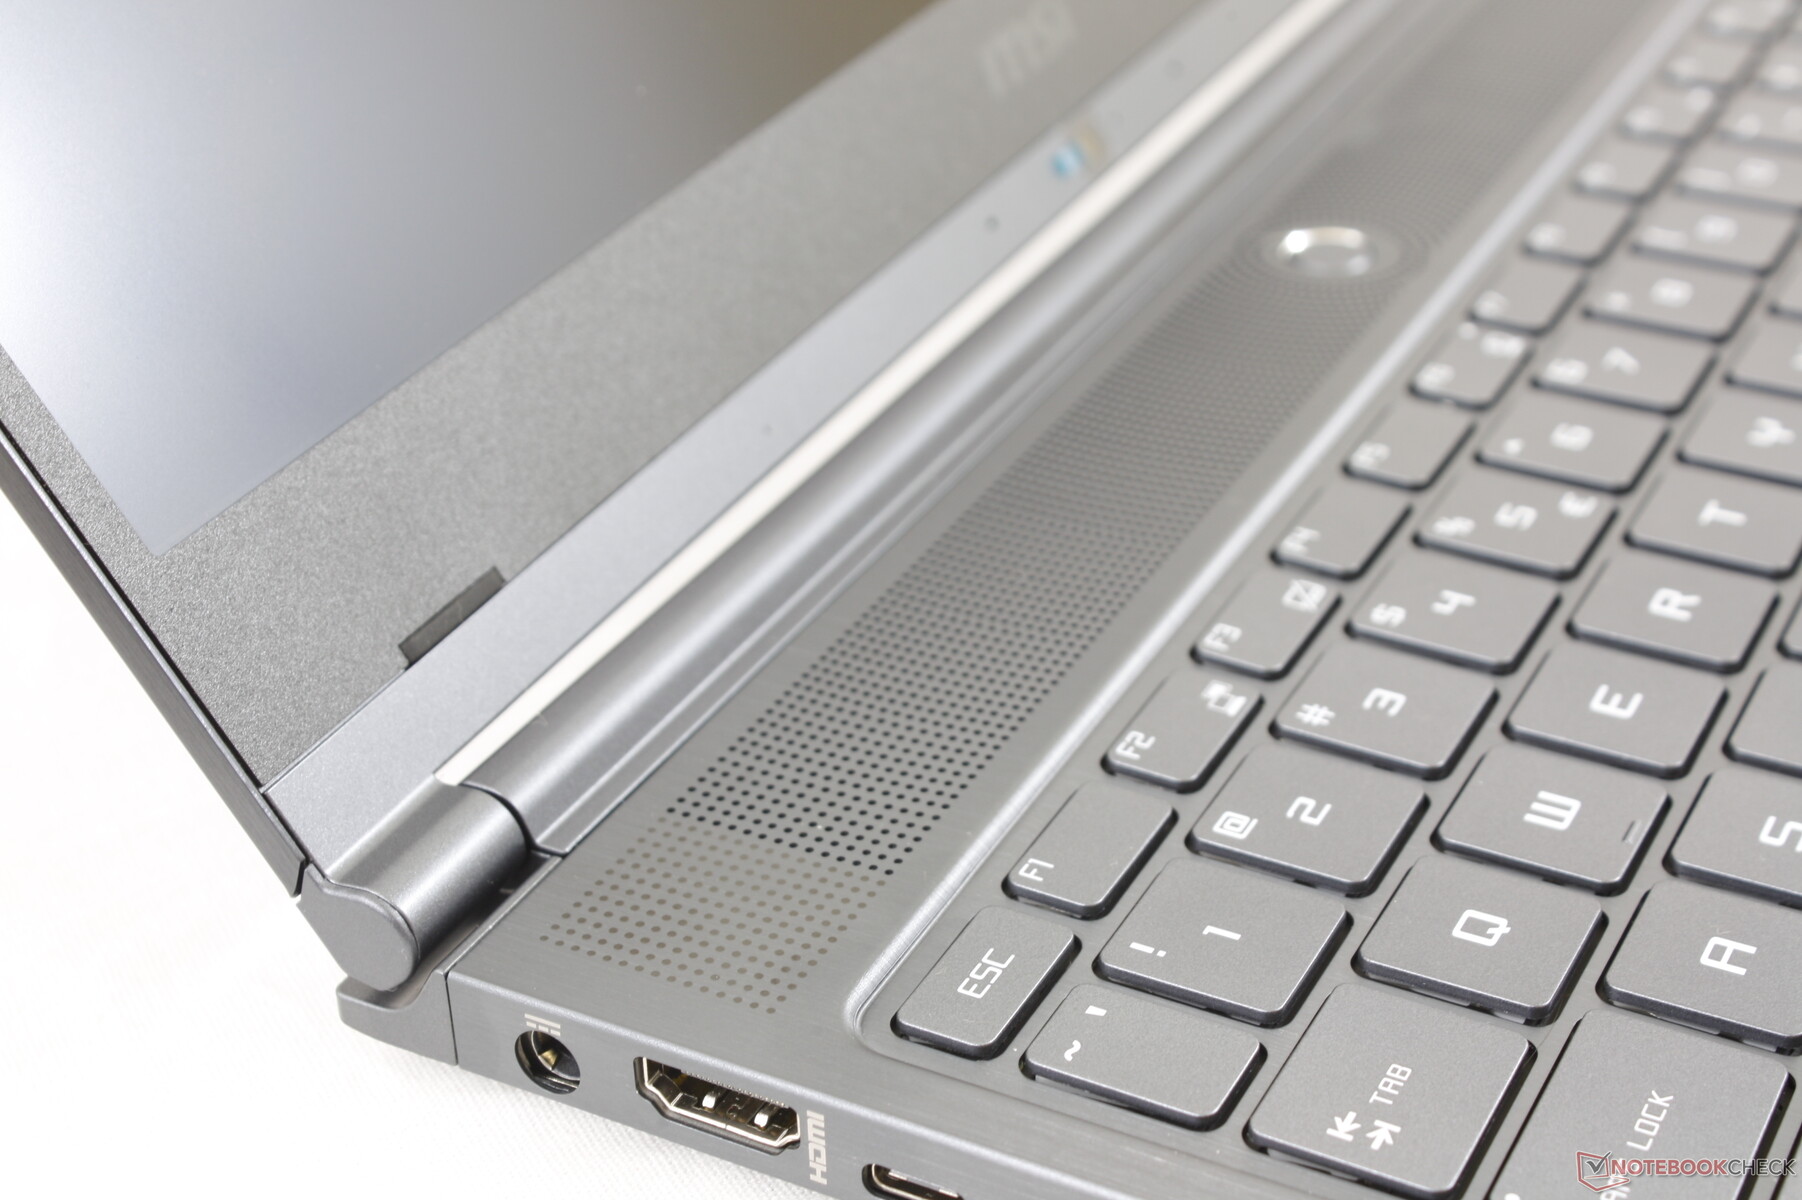
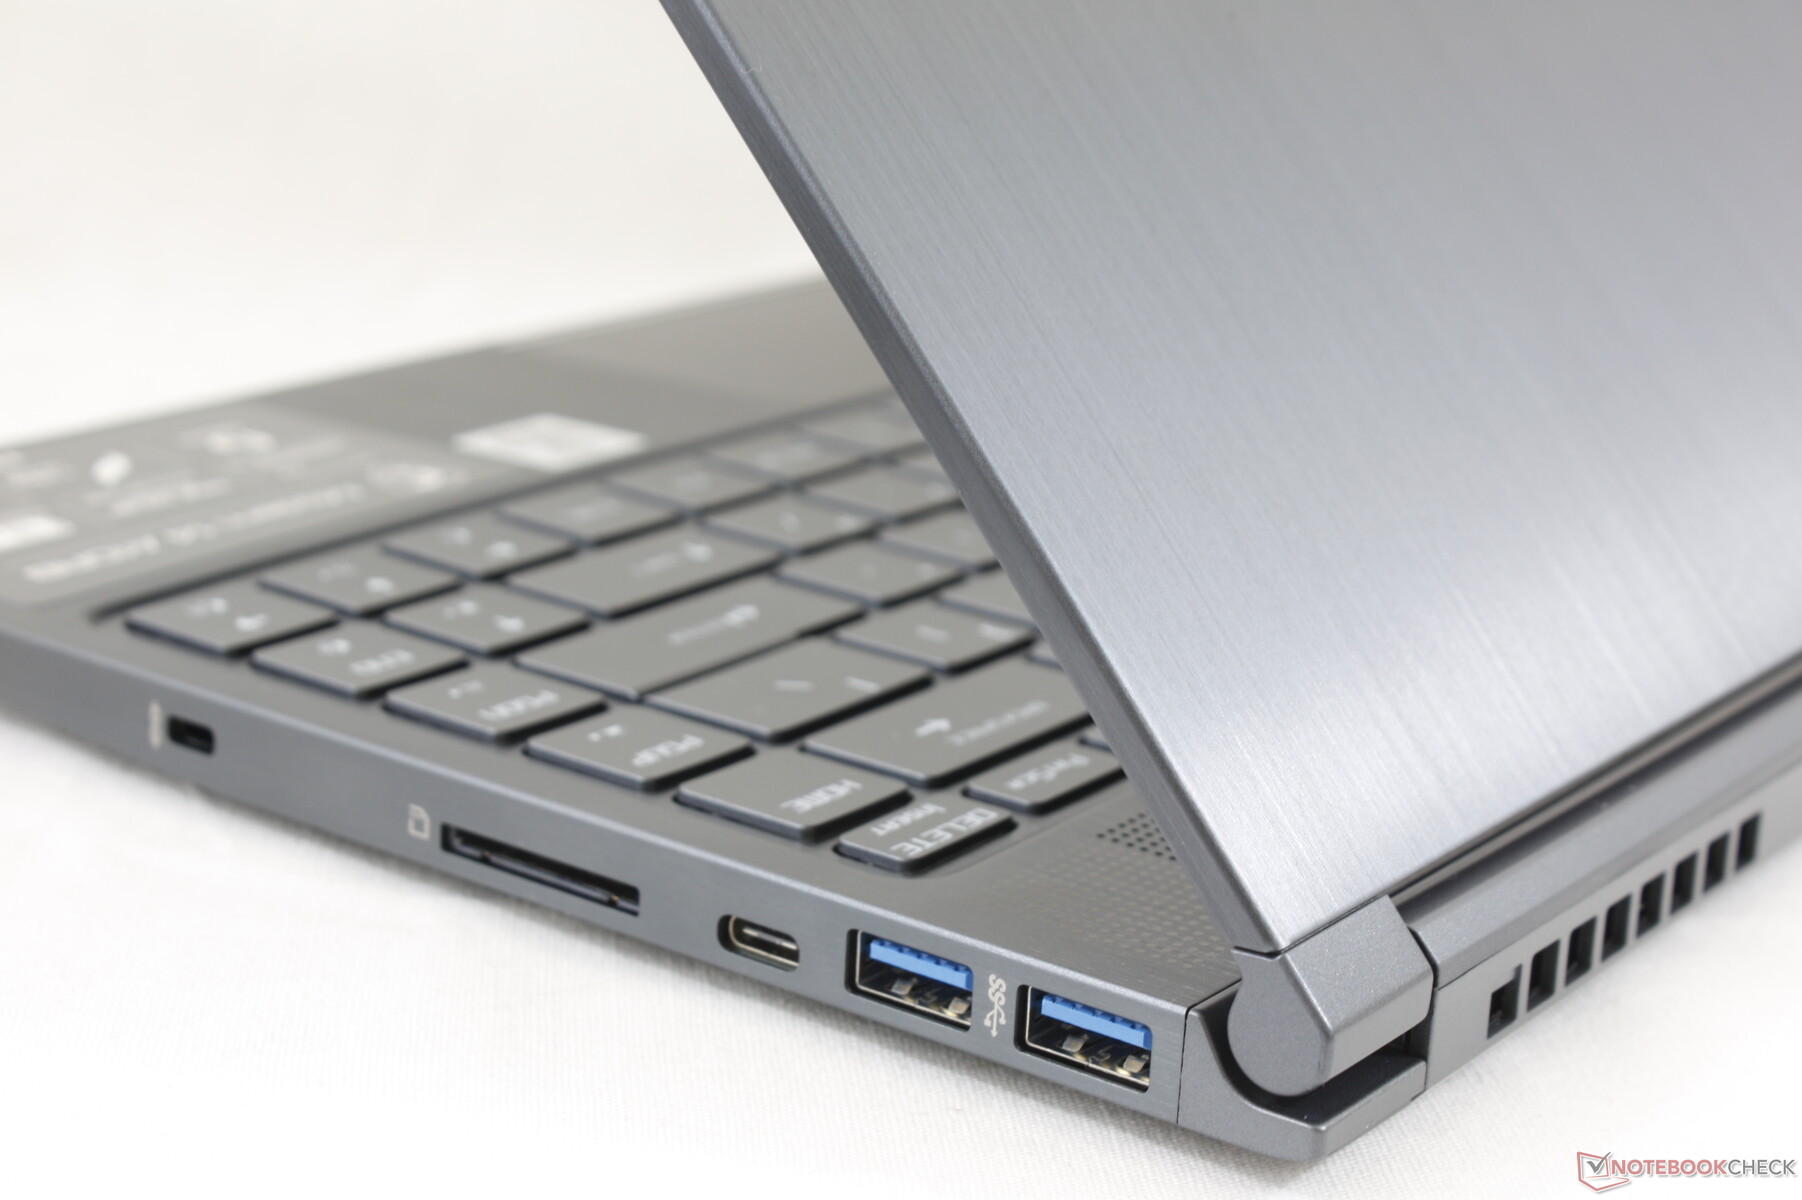
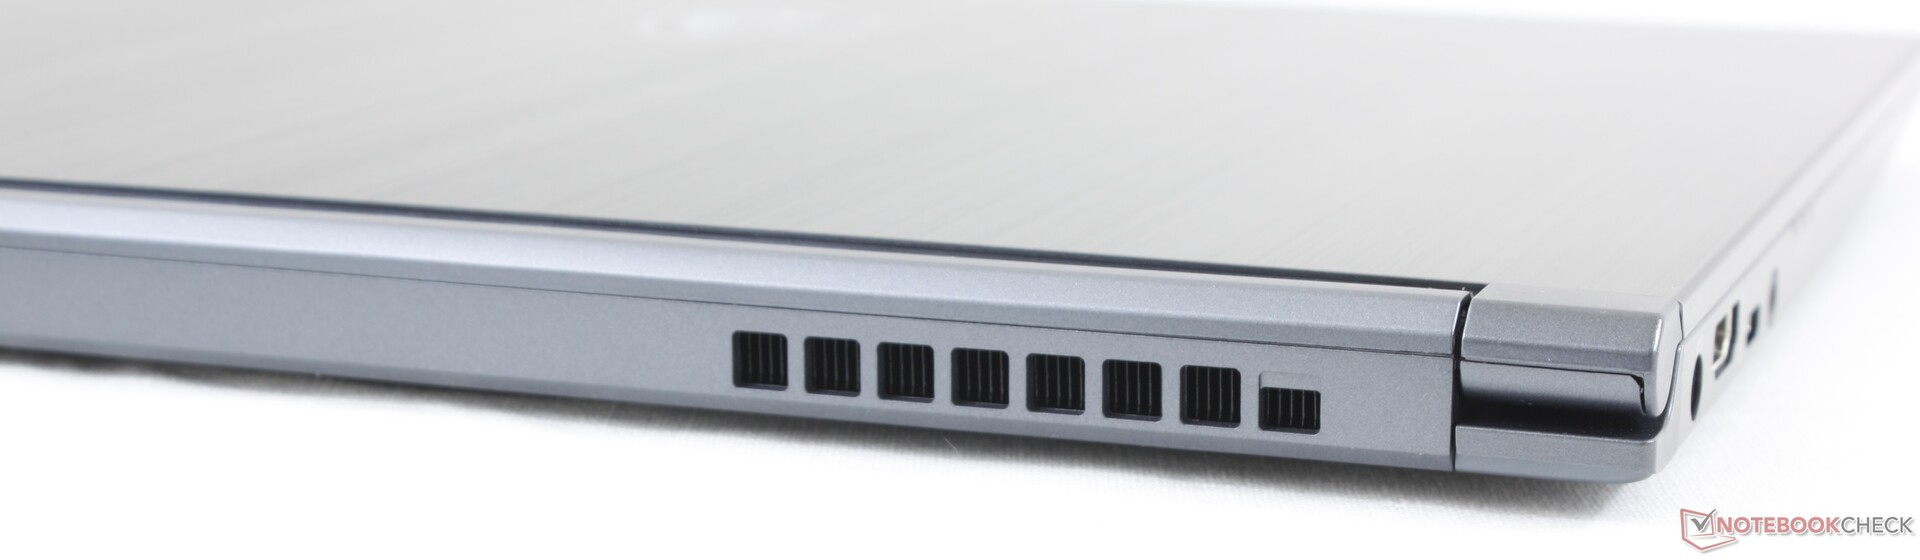
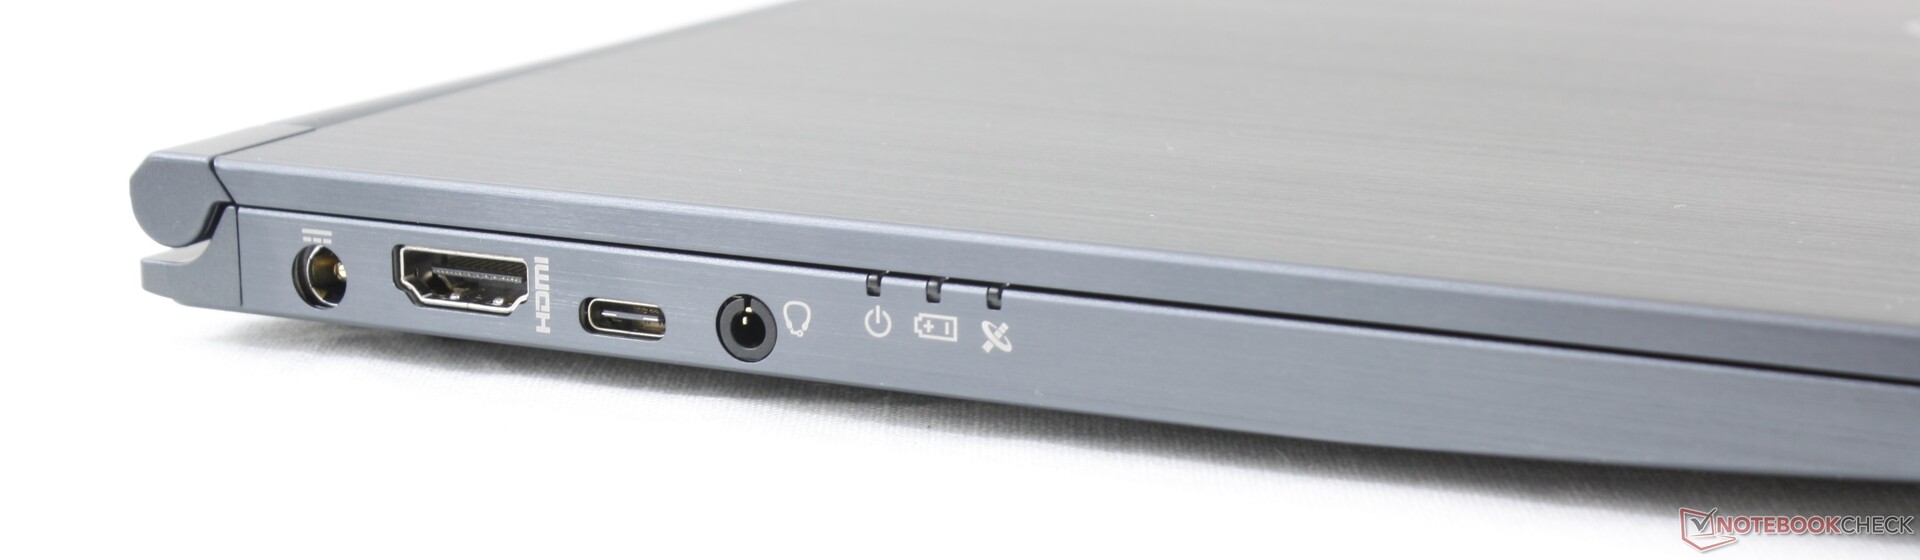
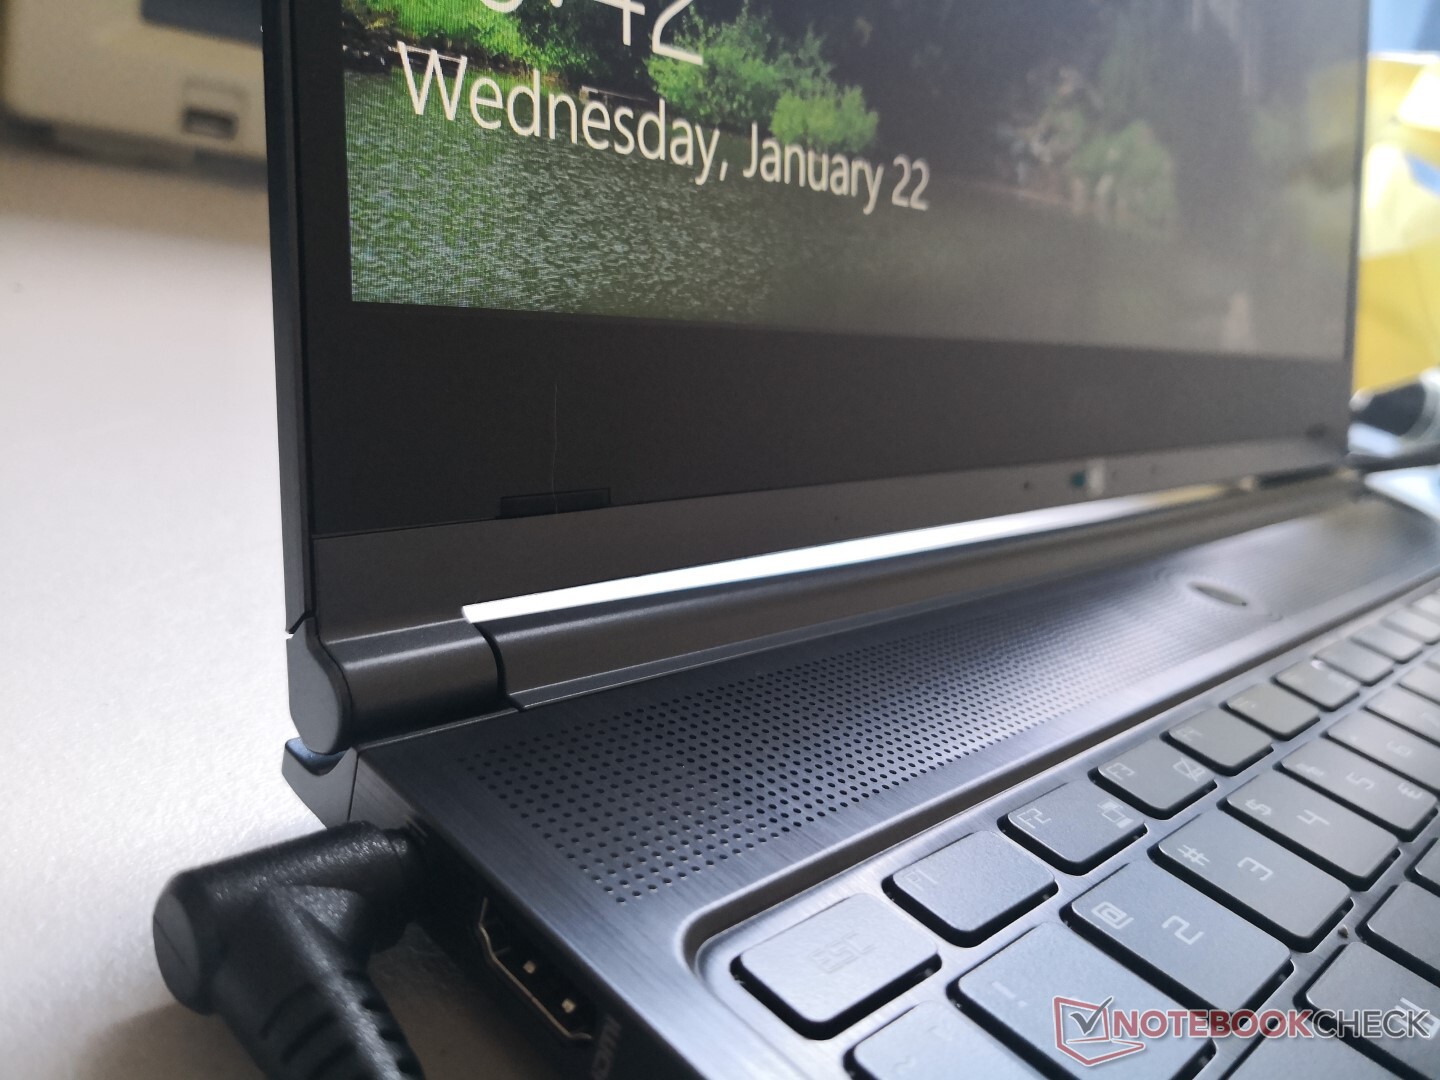
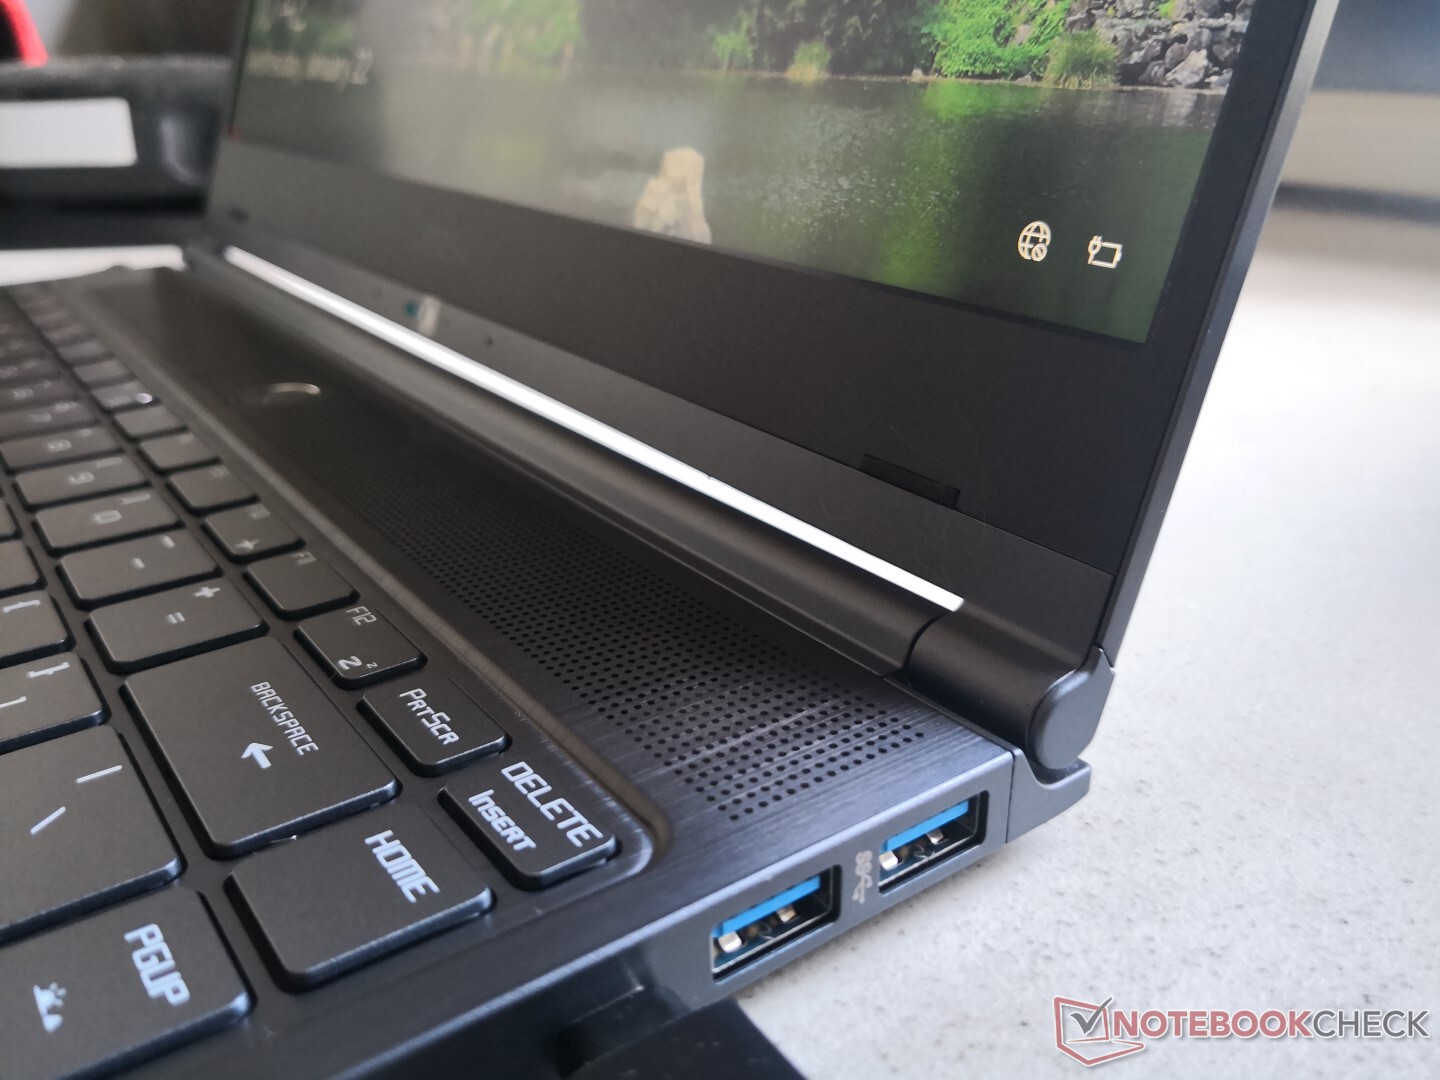
MSI didn't skimp on port selection despite the thin profile and light weight. Users will have more options here than on the XPS 13 or HP Spectre 13 including full-size HDMI and multiple USB Type-A ports. The main drawback is that the USB Type-C port does not support Thunderbolt 3 unlike on the Prestige 14. Port positioning is also good but not perfect; we would have preferred to see USB Type-A ports on both sides while the HDMI port feels cramped next to the AC adapter port.
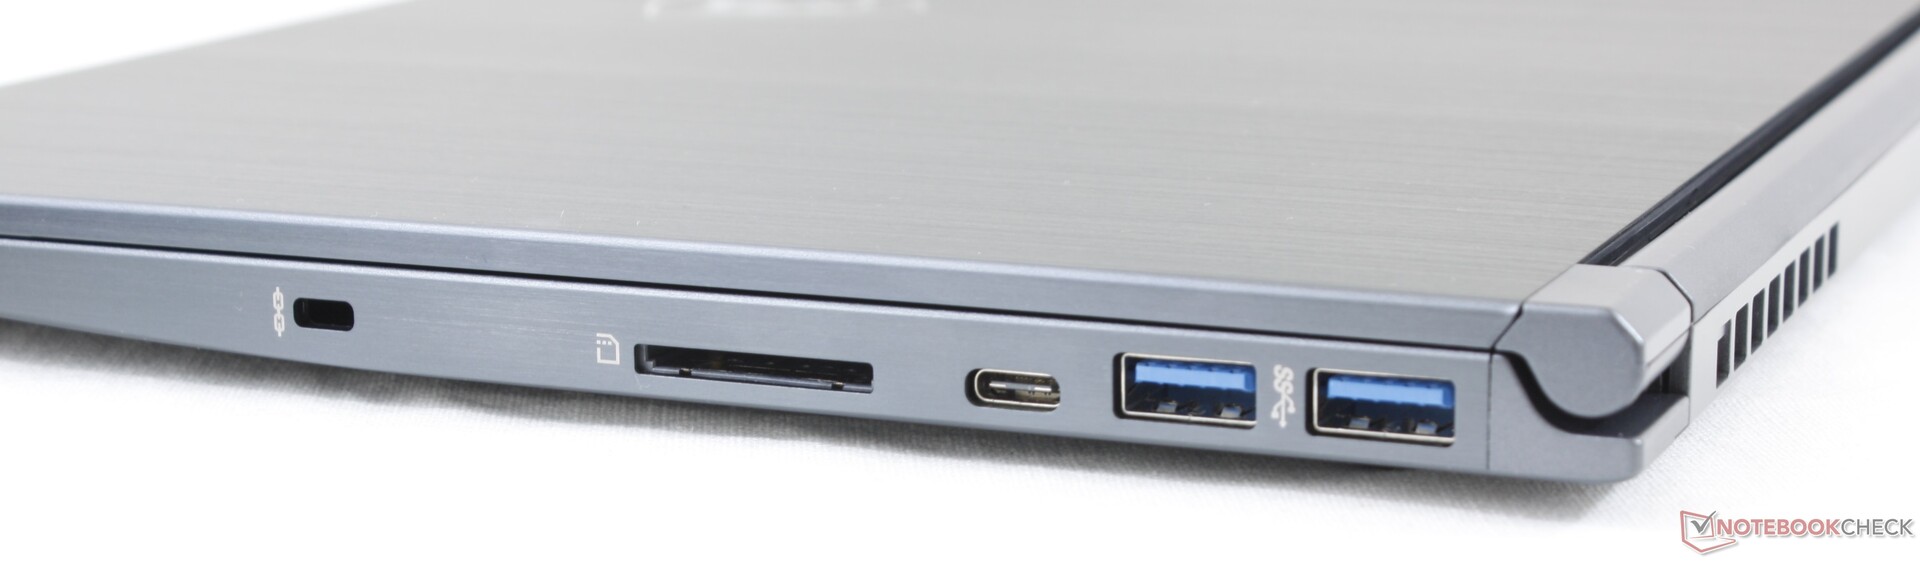
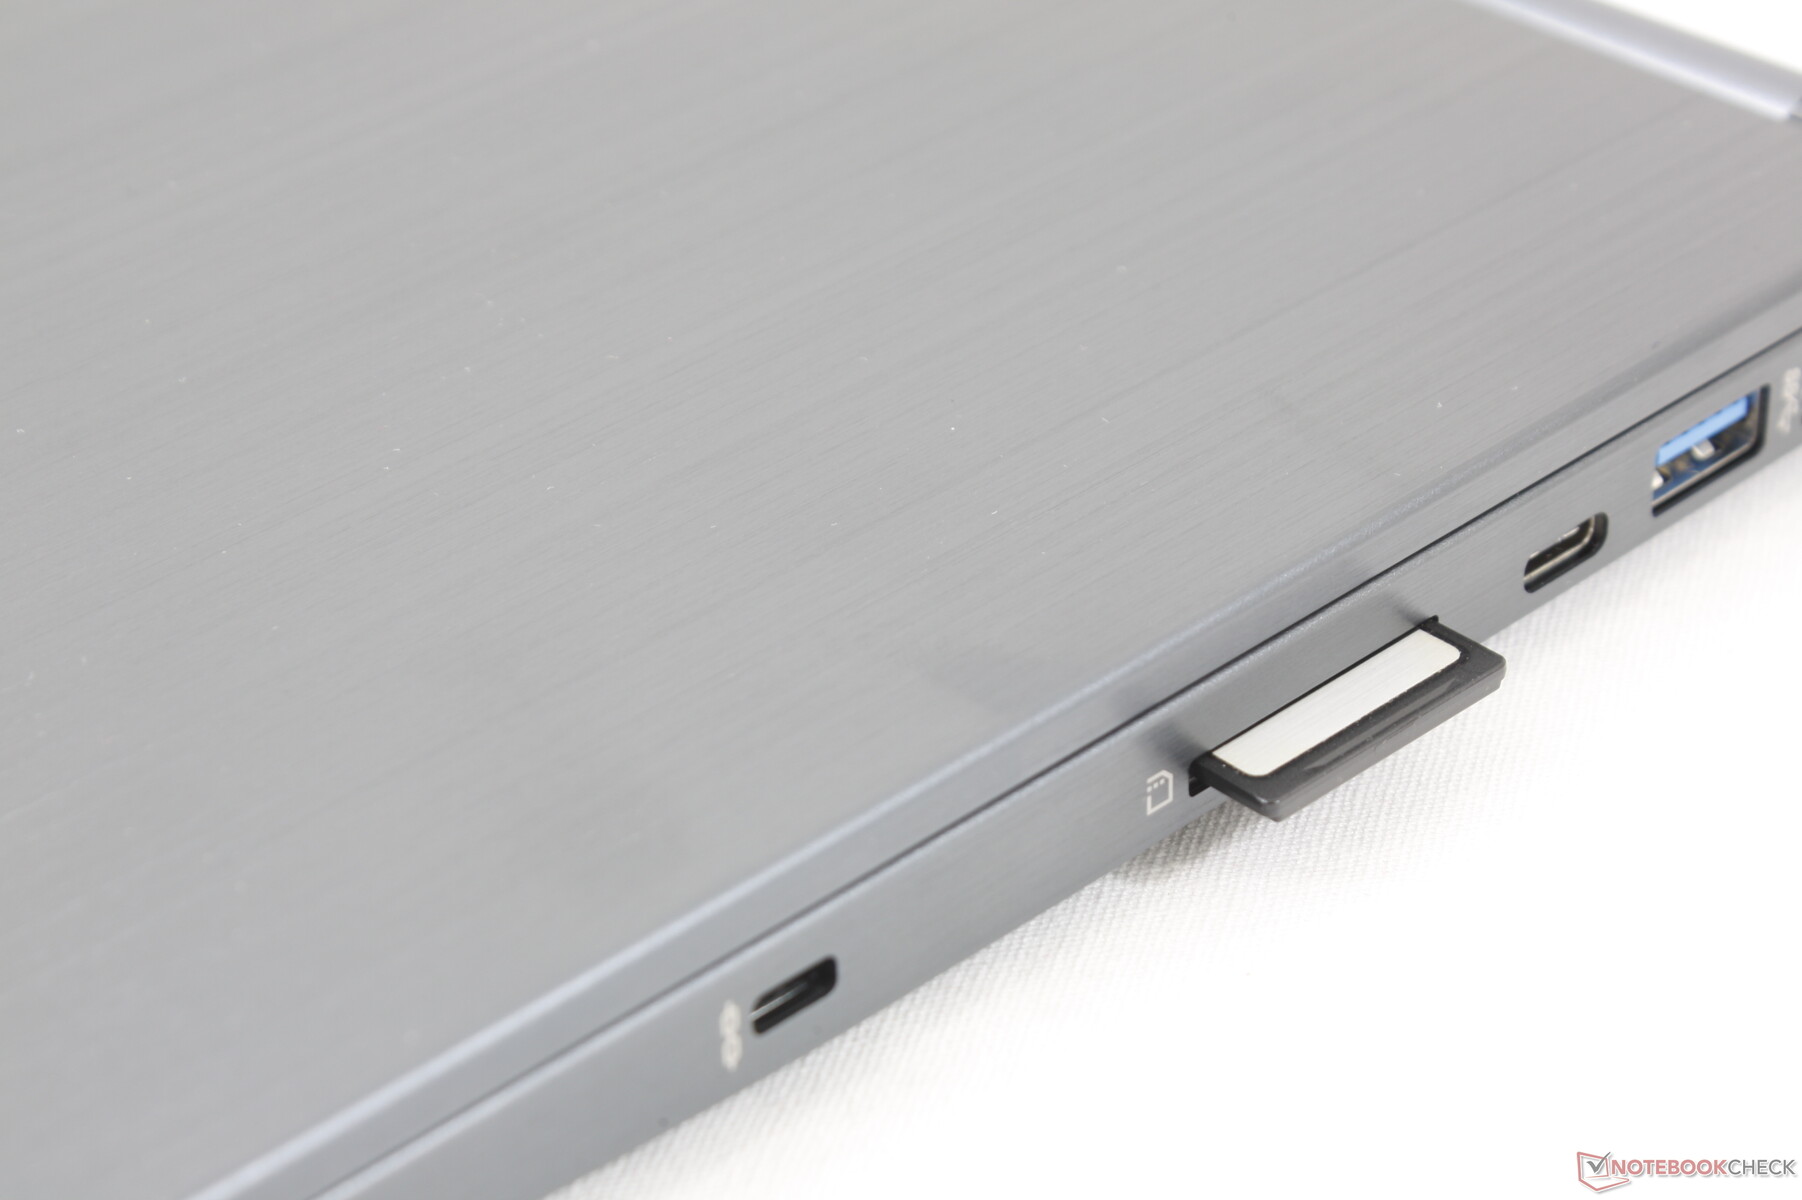
SD Card Reader
While we can appreciate the fact that the system integrates a full-size spring-loaded SD card reader, transfer rates are unfortunately very slow. Moving 1 GB worth of pictures from our UHS-II test card takes about 36 seconds compared to just 7 seconds on the Prestige 15 or XPS 15.
| SD Card Reader | |
| average JPG Copy Test (av. of 3 runs) | |
| Dell XPS 15 7590 9980HK GTX 1650 (Toshiba Exceria Pro SDXC 64 GB UHS-II) | |
| Asus ZenBook 15 UX534FT-DB77 (Toshiba Exceria Pro SDXC 64 GB UHS-II) | |
| MSI Modern 14 A10RB-459US (Toshiba Exceria Pro SDXC 64 GB UHS-II) | |
| maximum AS SSD Seq Read Test (1GB) | |
| Dell XPS 15 7590 9980HK GTX 1650 (Toshiba Exceria Pro SDXC 64 GB UHS-II) | |
| Asus ZenBook 15 UX534FT-DB77 (Toshiba Exceria Pro SDXC 64 GB UHS-II) | |
| MSI Modern 14 A10RB-459US (Toshiba Exceria Pro SDXC 64 GB UHS-II) | |
Communication
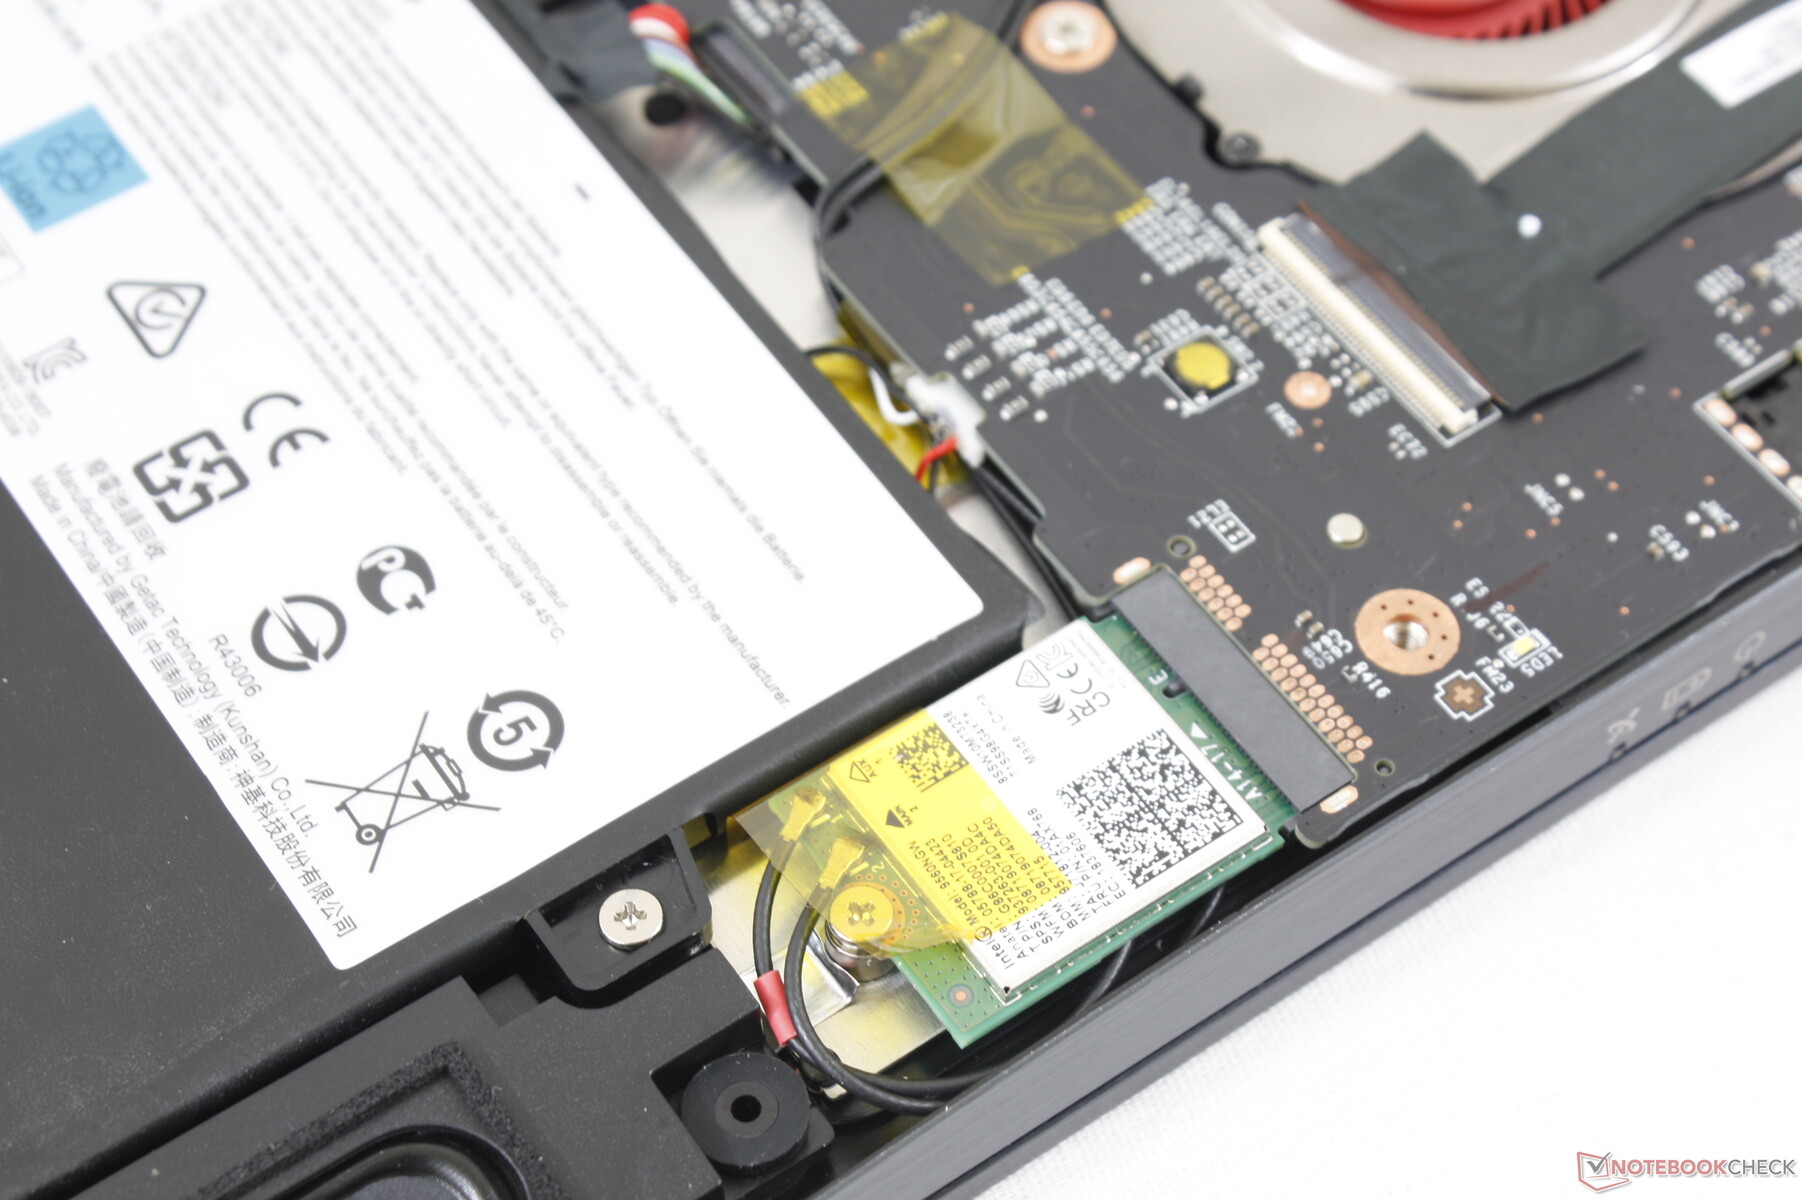
An Intel 9560 is included for Wi-Fi 5 connectivity in contrast to the Wi-Fi 6 compatible Intel AX200 in the pricier Prestige 15. We experienced no connectivity issues during our time with the test unit.
| Networking | |
| iperf3 transmit AX12 | |
| MSI Prestige 15 A10SC | |
| Asus ZenBook 15 UX534FT-DB77 | |
| iperf3 receive AX12 | |
| MSI Prestige 15 A10SC | |
| Asus ZenBook 15 UX534FT-DB77 | |
Maintenance
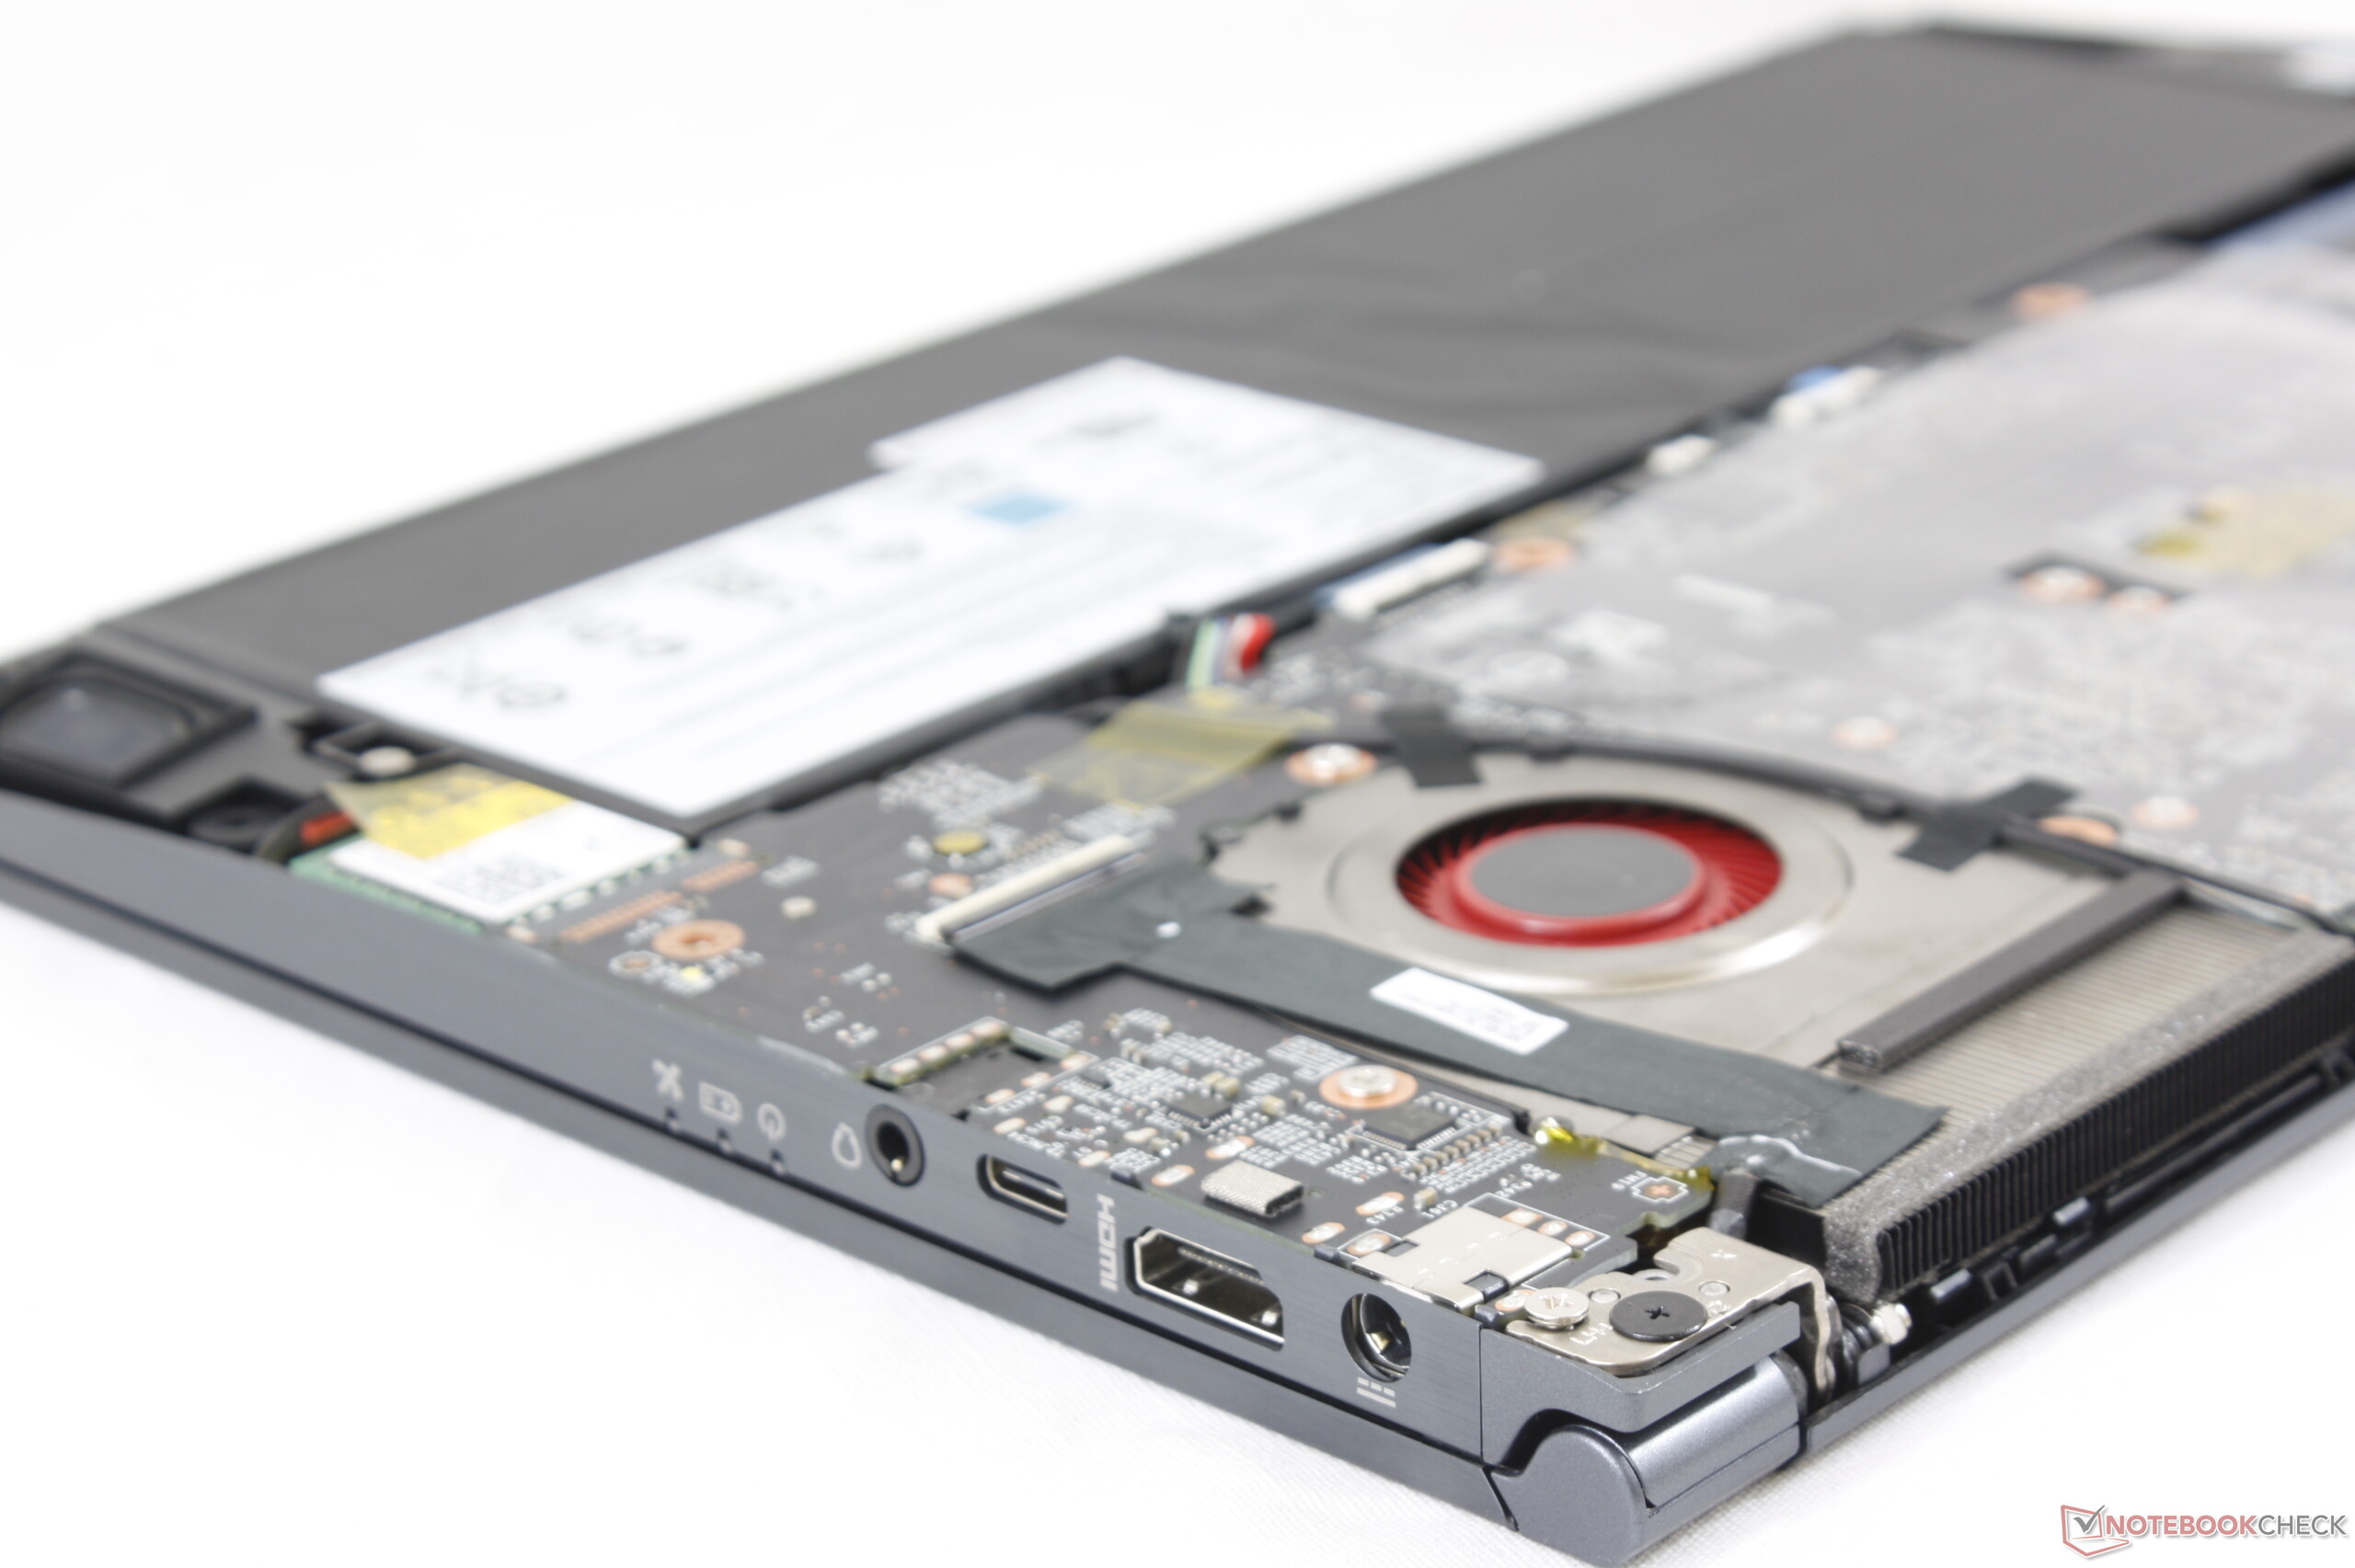
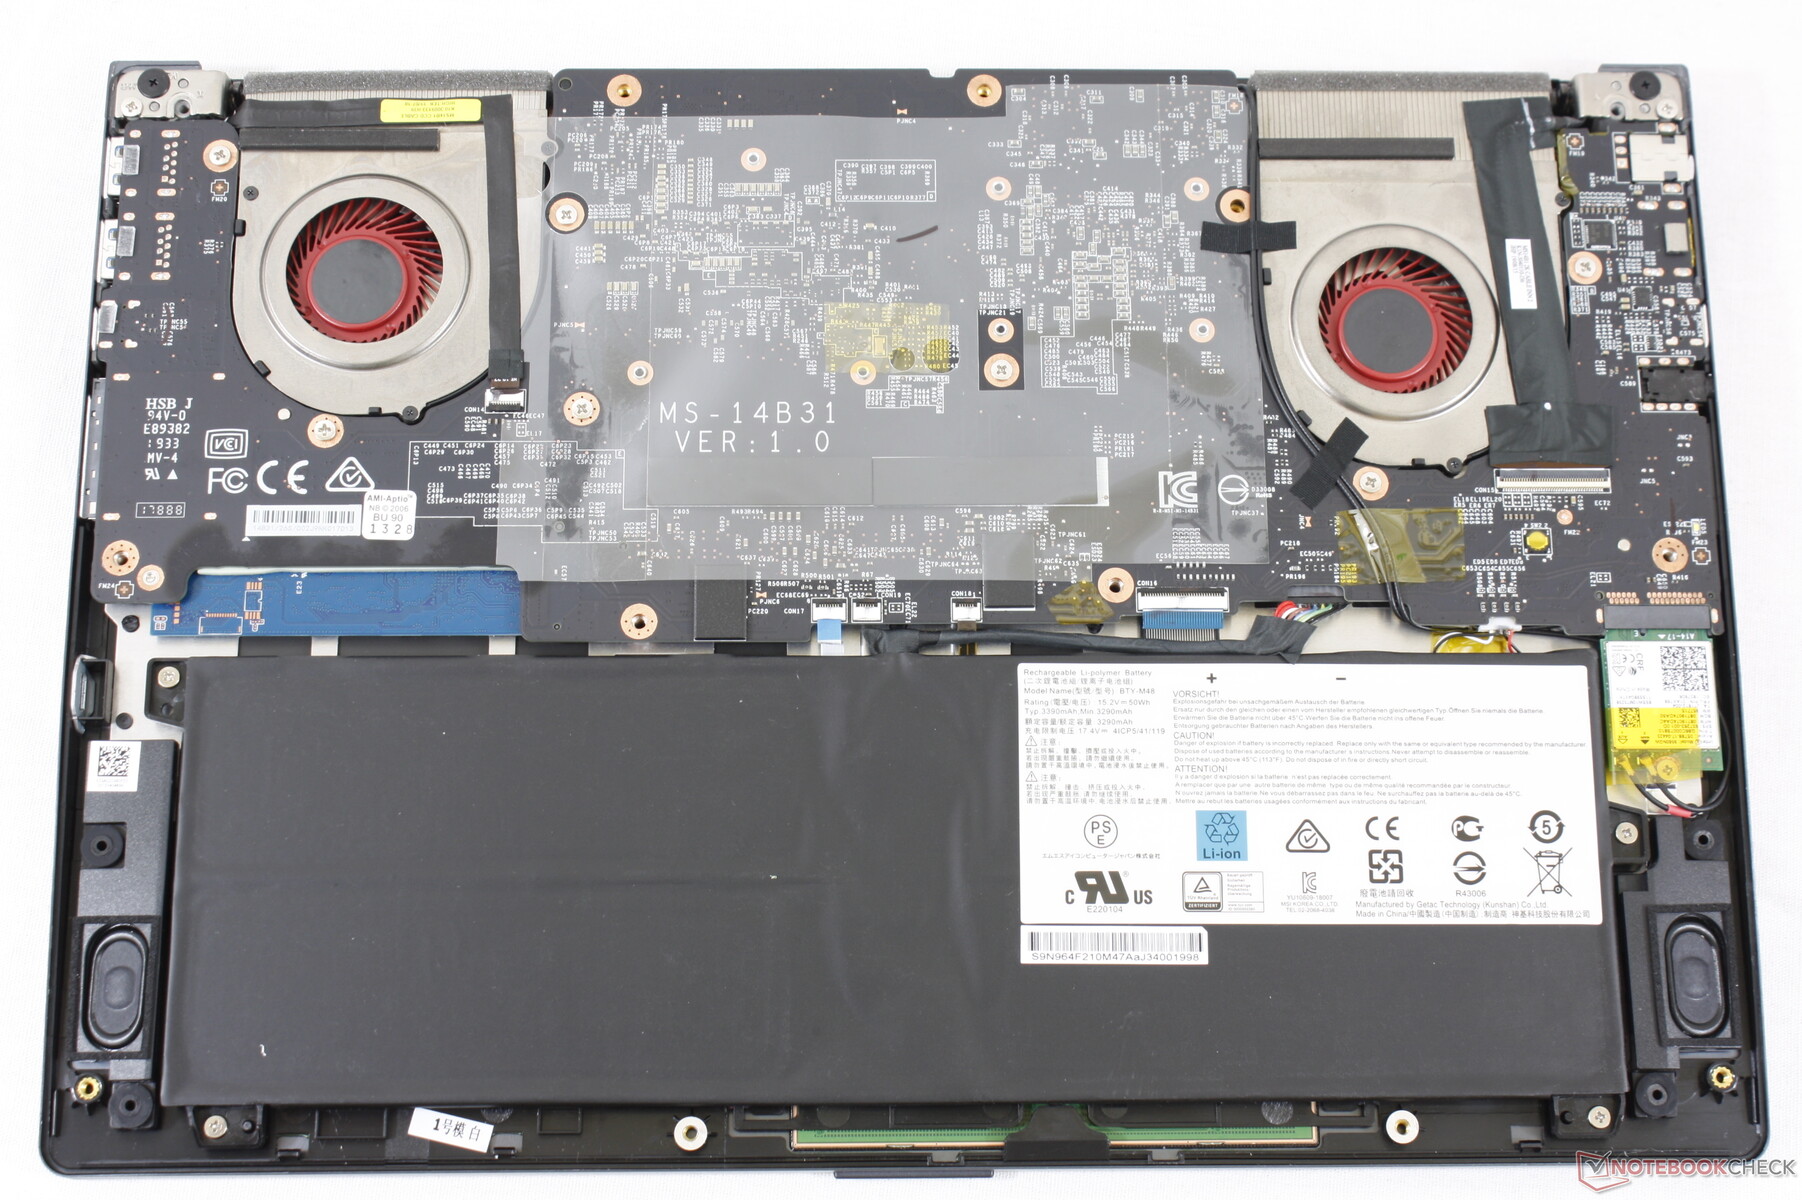
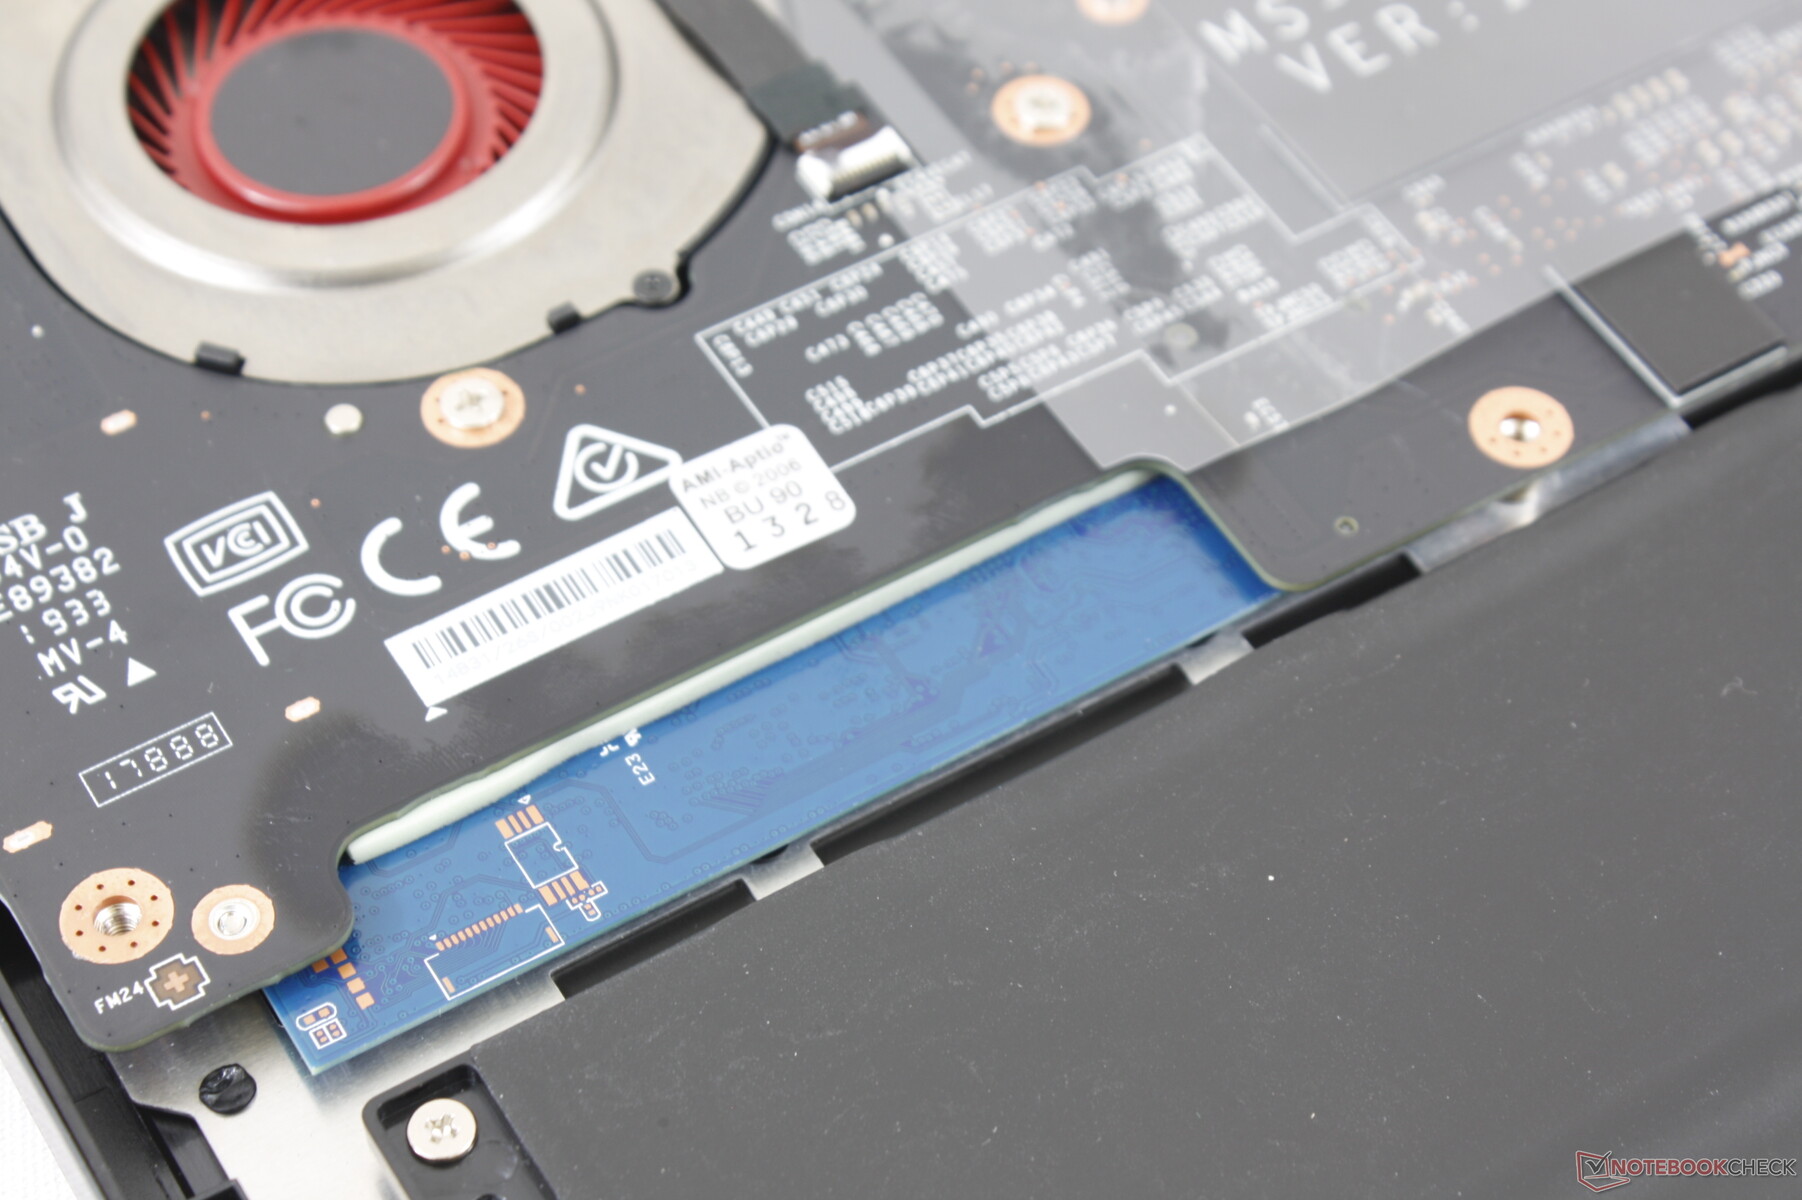
The bottom panel pops out relatively easily with just a standard Philips screwdriver. Note, however, that a 'Factory Seal' sticker must be broken and further servicing beyond the M.2 WLAN module or battery pack will require additional disassembly. Core components like RAM and M.2 storage are inconveniently on the other side of the motherboard not unlike on the MSI GS65 or GS75.
Accessories and Warranty
Included extras are a faux leather carrying sleeve and a USB Type-A to RJ-45 adapter. It's uncommon to see these for free on mid-range laptops and so they are a welcomed sight.
The standard one-year limited warranty applies with one year of accidental damage protection for those who register their new laptops within 30 days of purchase.
Input Devices
Keyboard
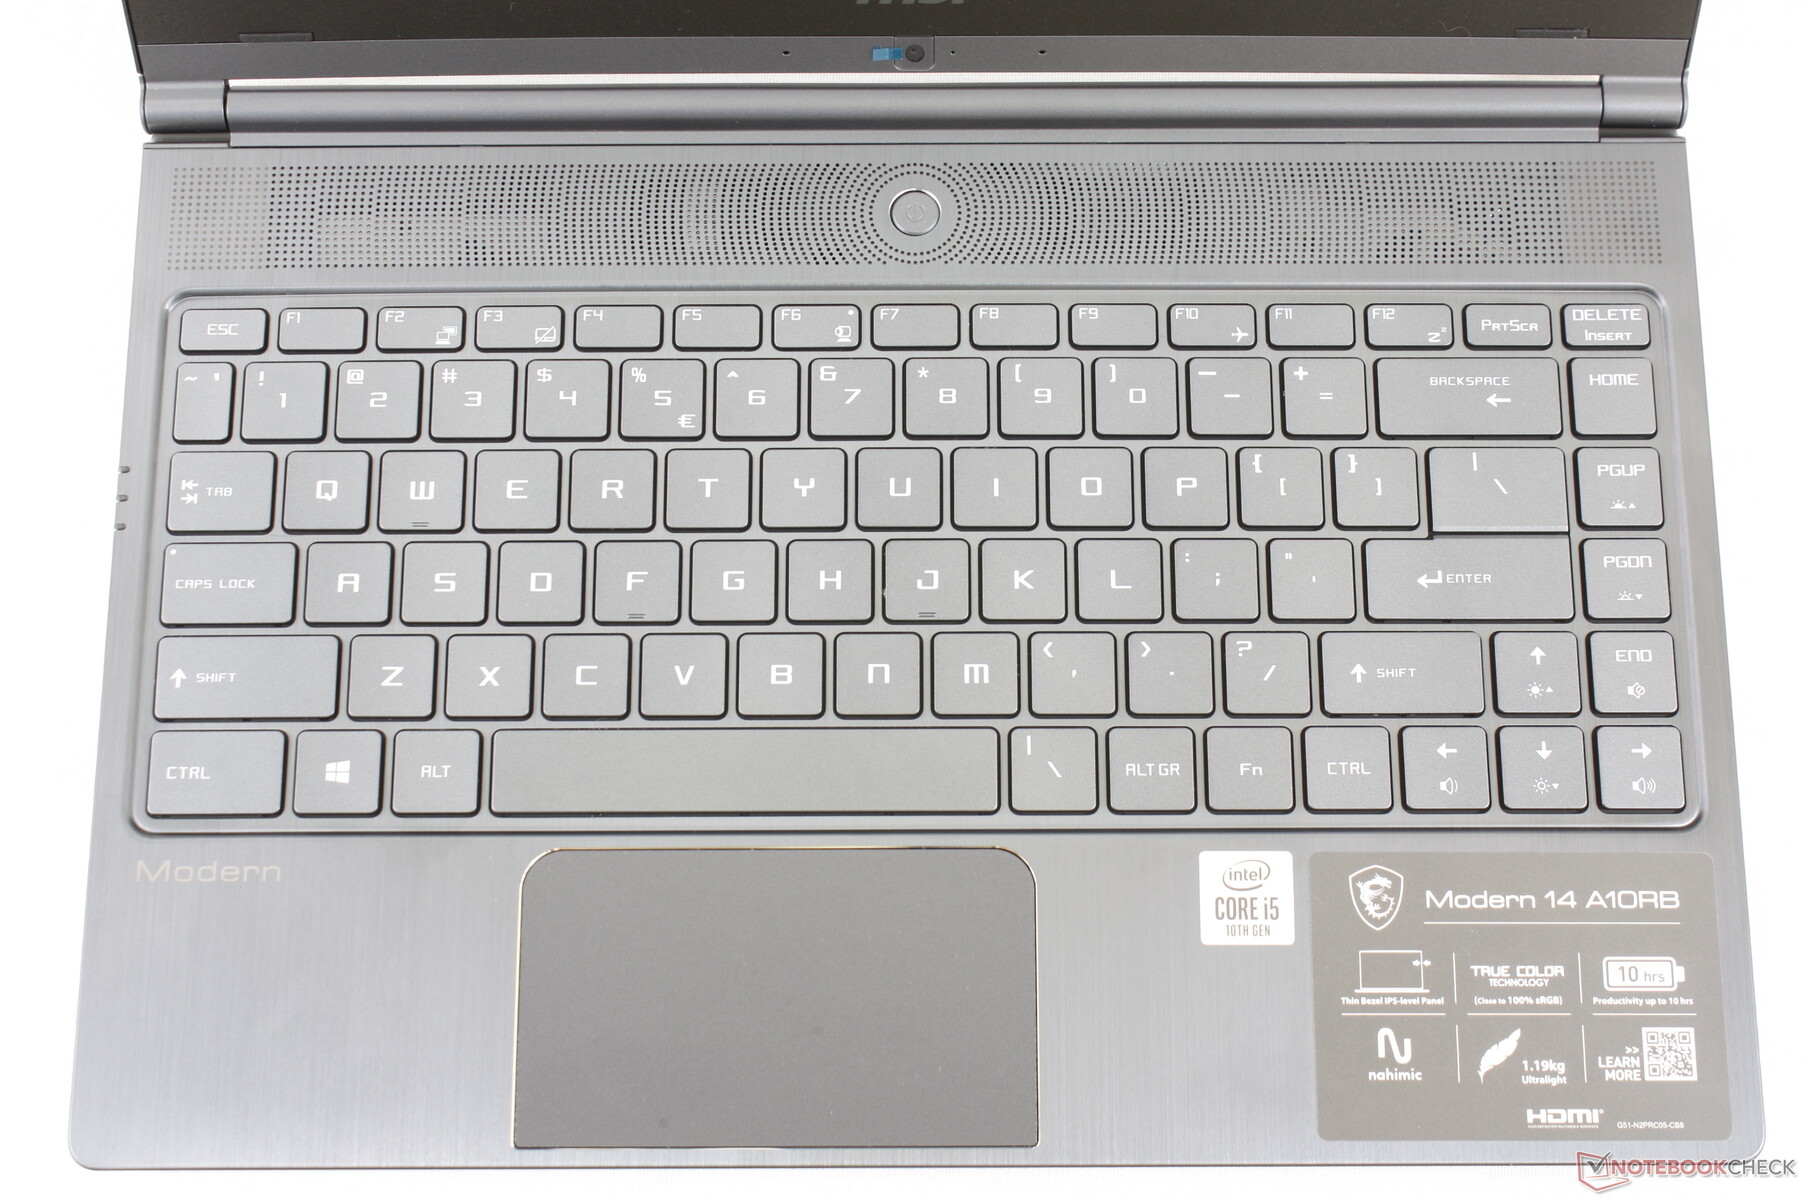
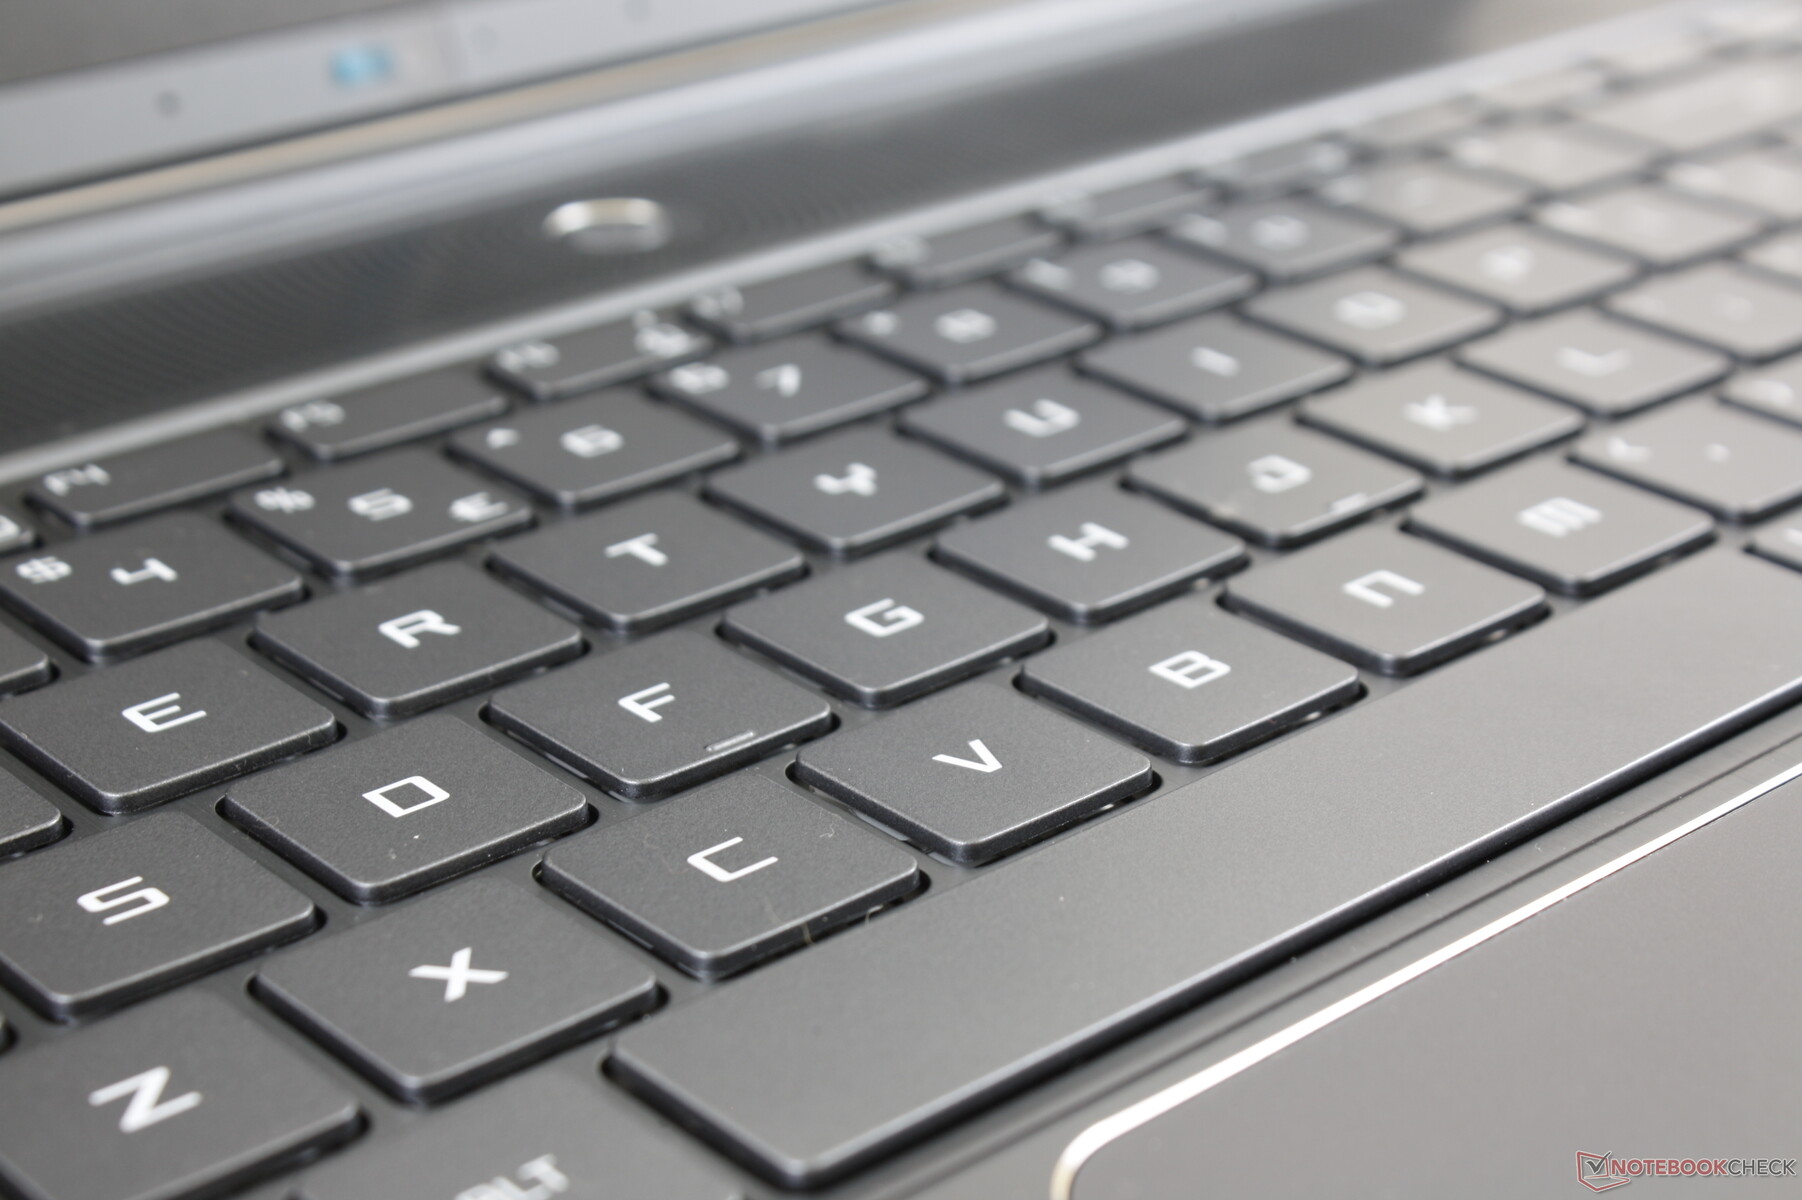
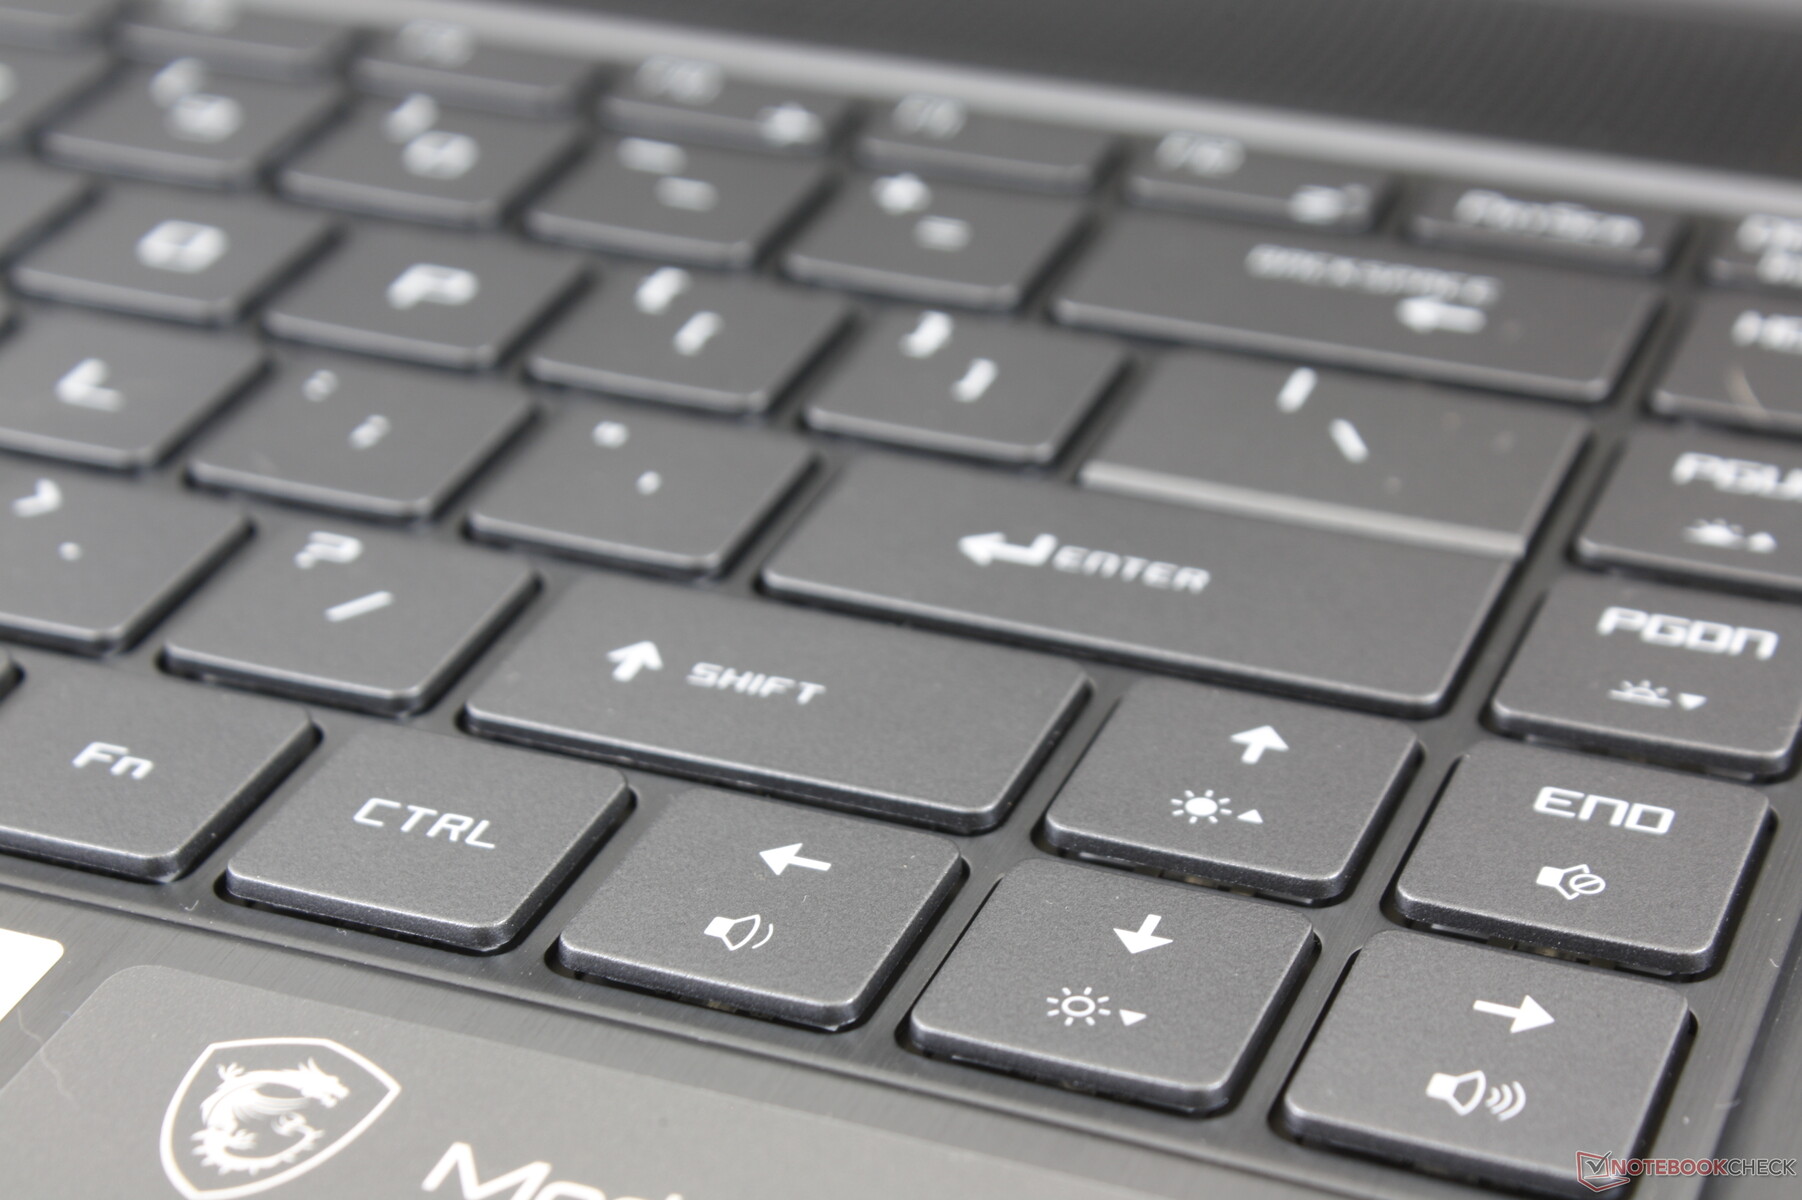
As expected, the Modern 14 doesn't integrate the SteelSteries keyboard as found on most MSI G Series gaming laptops. However, we wish MSI had considered it because the keyboard on the Modern 14 feels spongier, shallower, and less satisfying to type on. Most Ultrabooks and business laptops like the Microsoft Surface Laptop 3 15, Lenovo ThinkPad T series, or Dell Latitude series offer crisper keys than the MSI we have here. If you're already accustomed to the soft key feedback of most lower-end laptops like the Asus VivoBook 14 or Lenovo IdeaPad, however, then typing on the Modern 14 won't feel all that different.
Touchpad
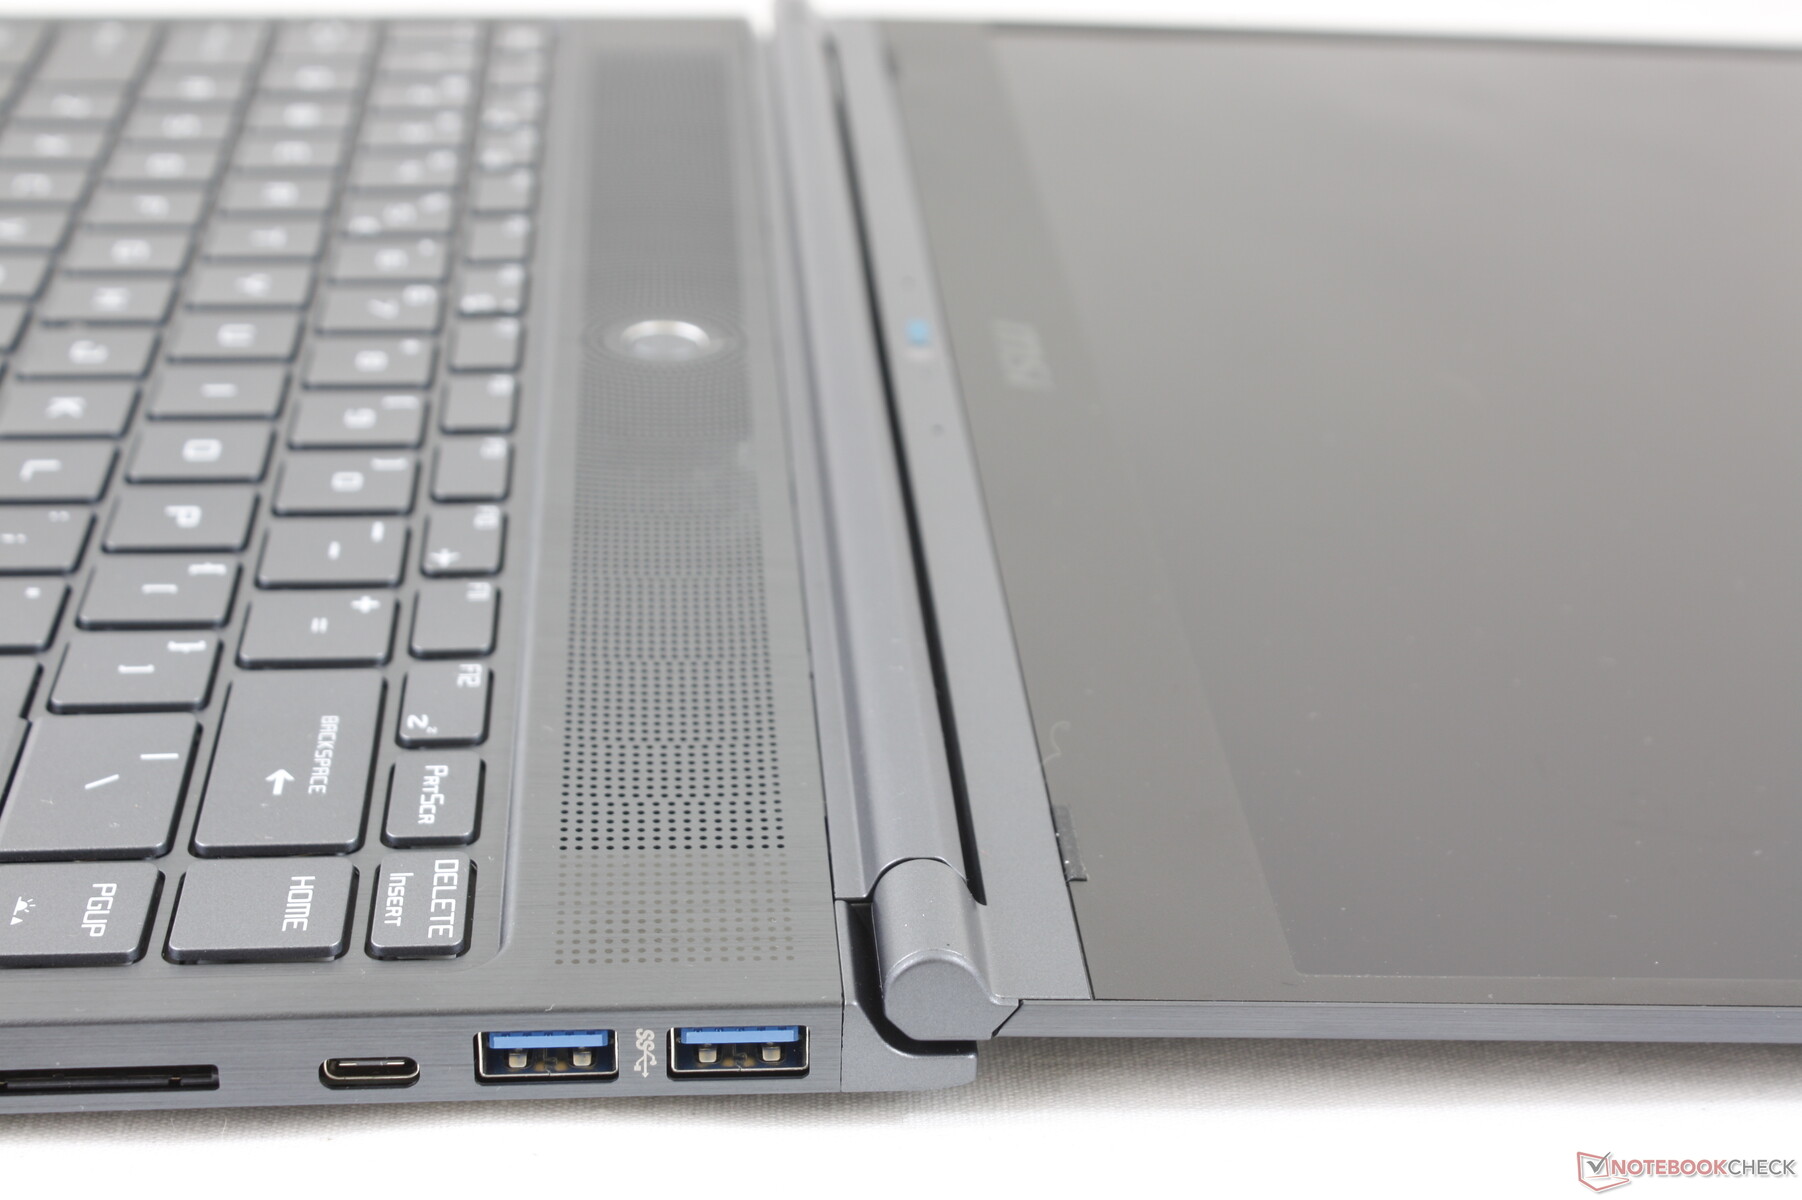
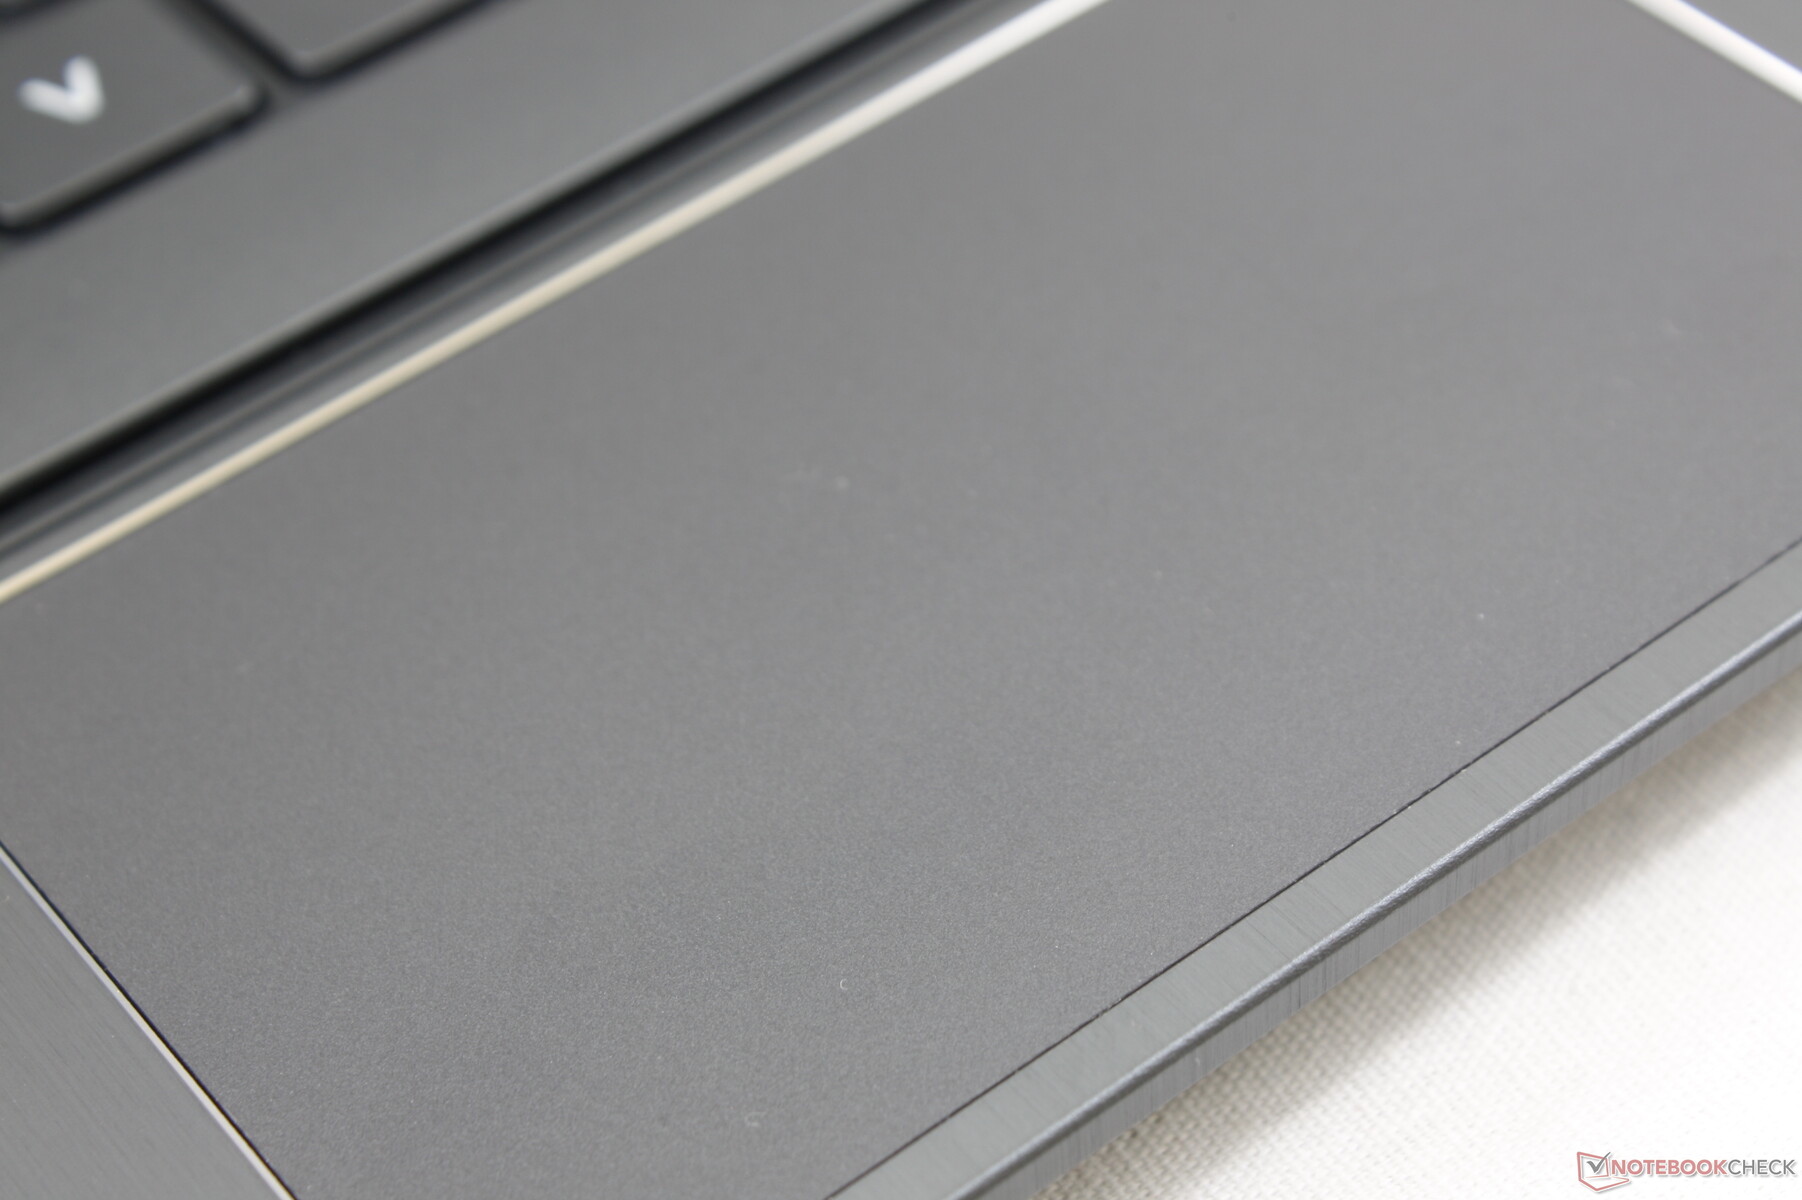
The clickpad (~10 x 5.7 cm) is smaller and narrower than the clickpad on the XPS 13 7390 2-in-1 (~11.3 x 6.8 cm). Vertical movements and two-finger gestures feel cramped as a result. Cursor control is otherwise smooth with minimal sticking when gliding slowly across the surface.
The integrated mouse keys are shallow with relatively weak feedback. It works reliably enough for short periods, but an external mouse will feel more ergonomic and less tiring to click.
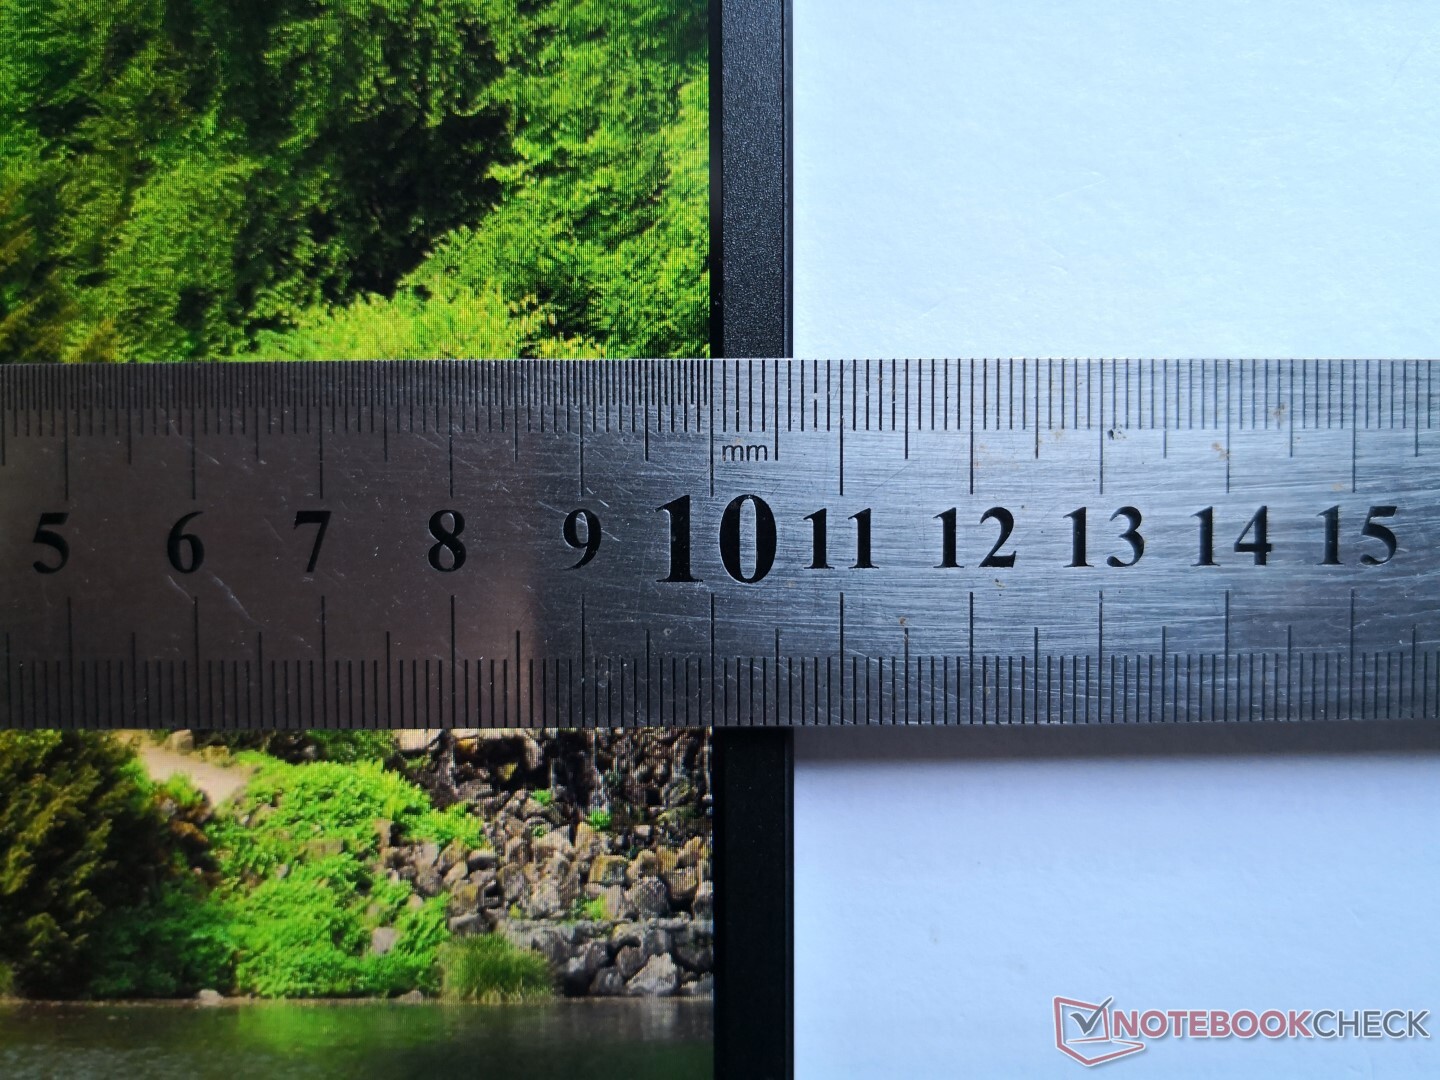
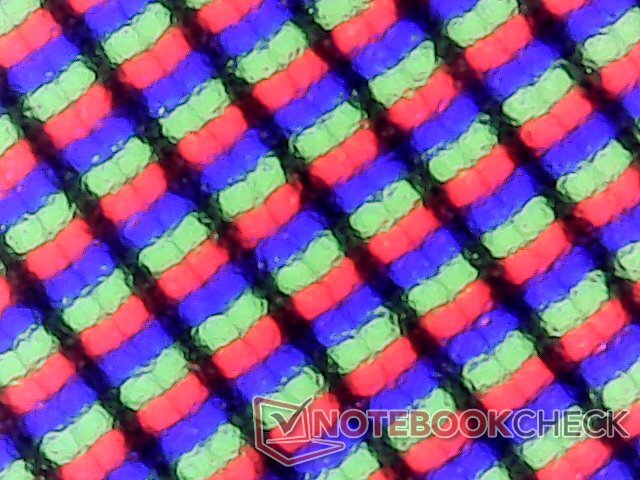
Display
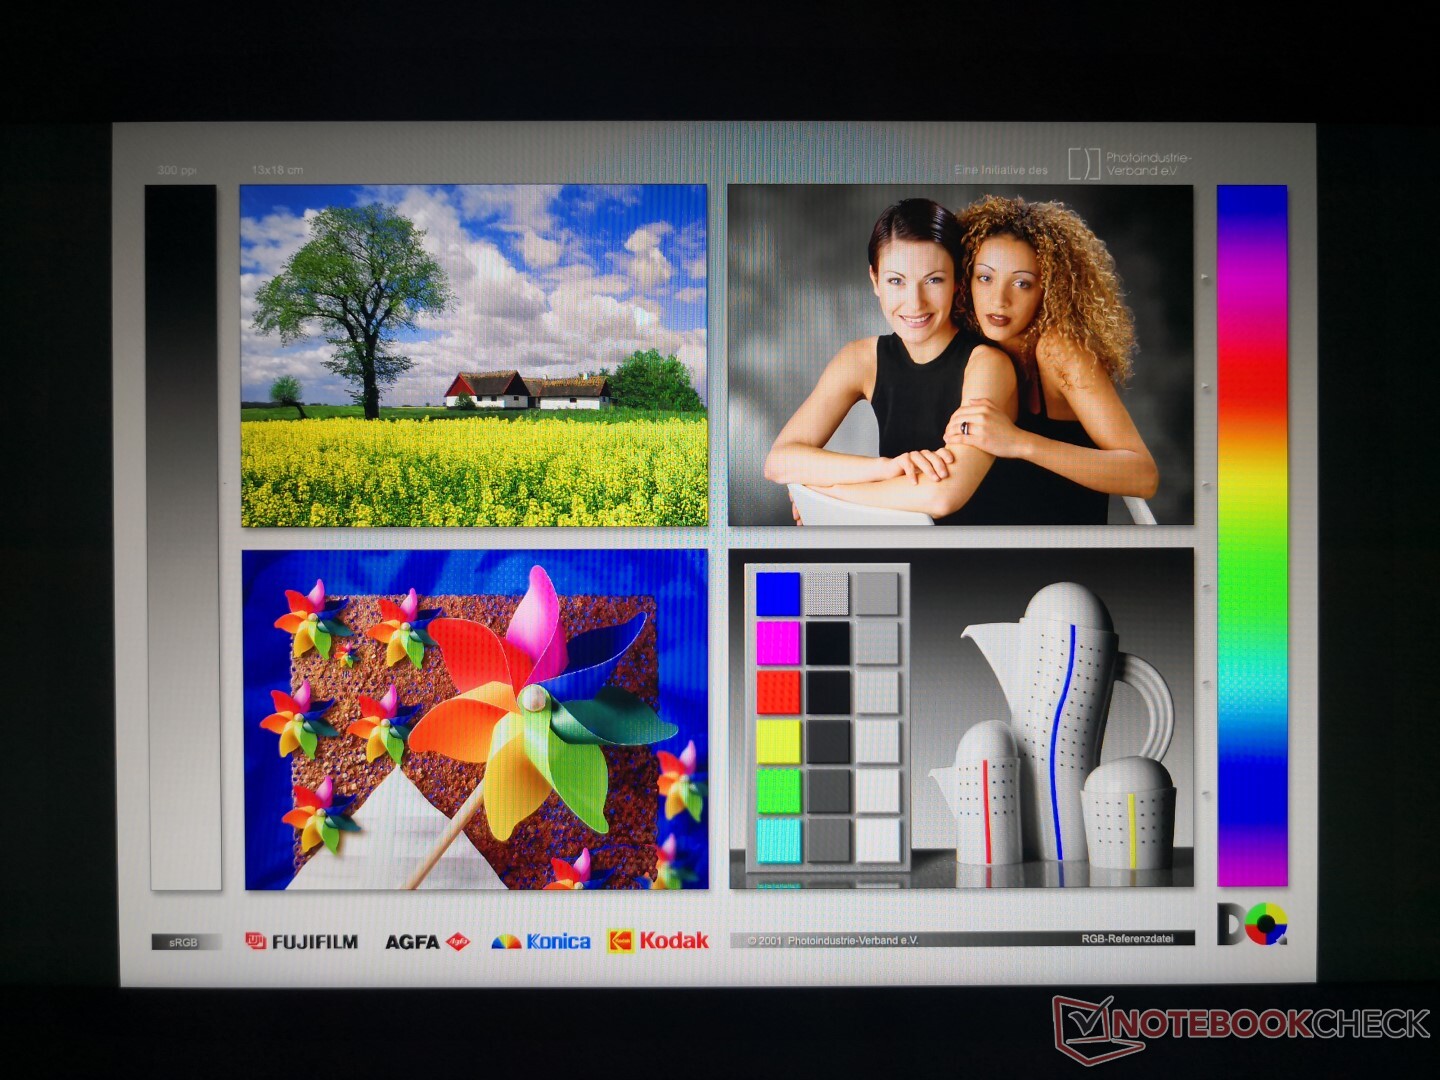
The Modern 14 uses the same Chi Mei N140HCE-EN2 1080p IPS panel as found on the Acer Swift 3 SF314 and the older MSI PS42. Thus, innate characteristics like contrast ratio and the relatively slow response times are nearly the same between them. Note that the display is about 43 percent dimmer than the pricier Prestige 14 which uses a 4K UHD from AU Optronics panel instead.
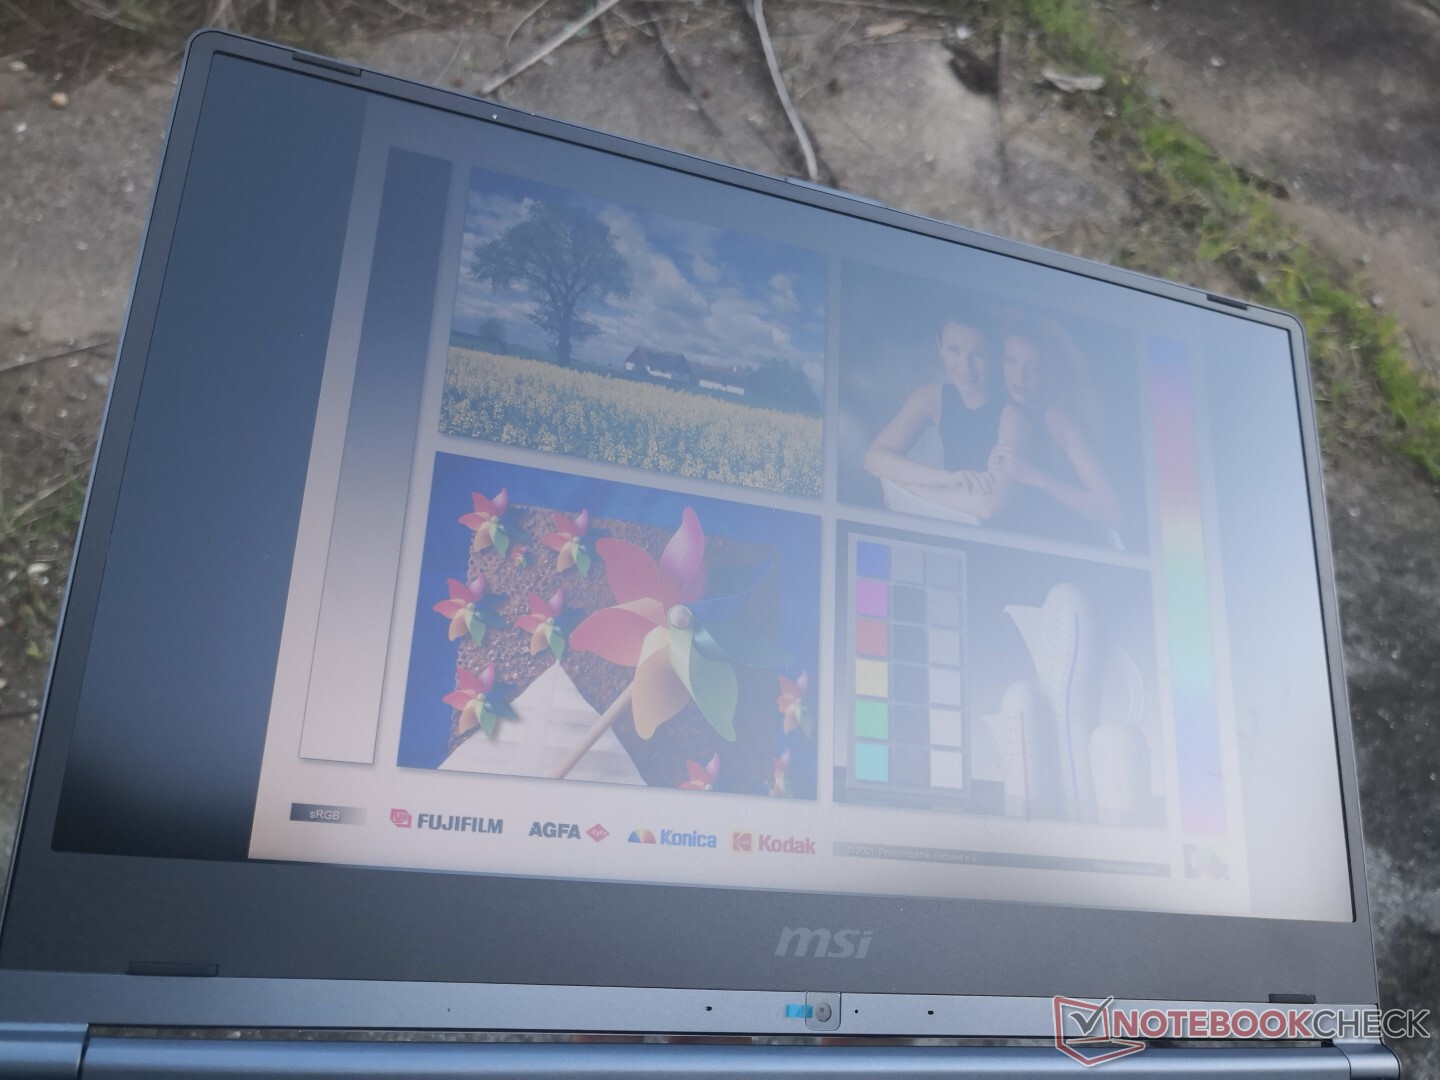
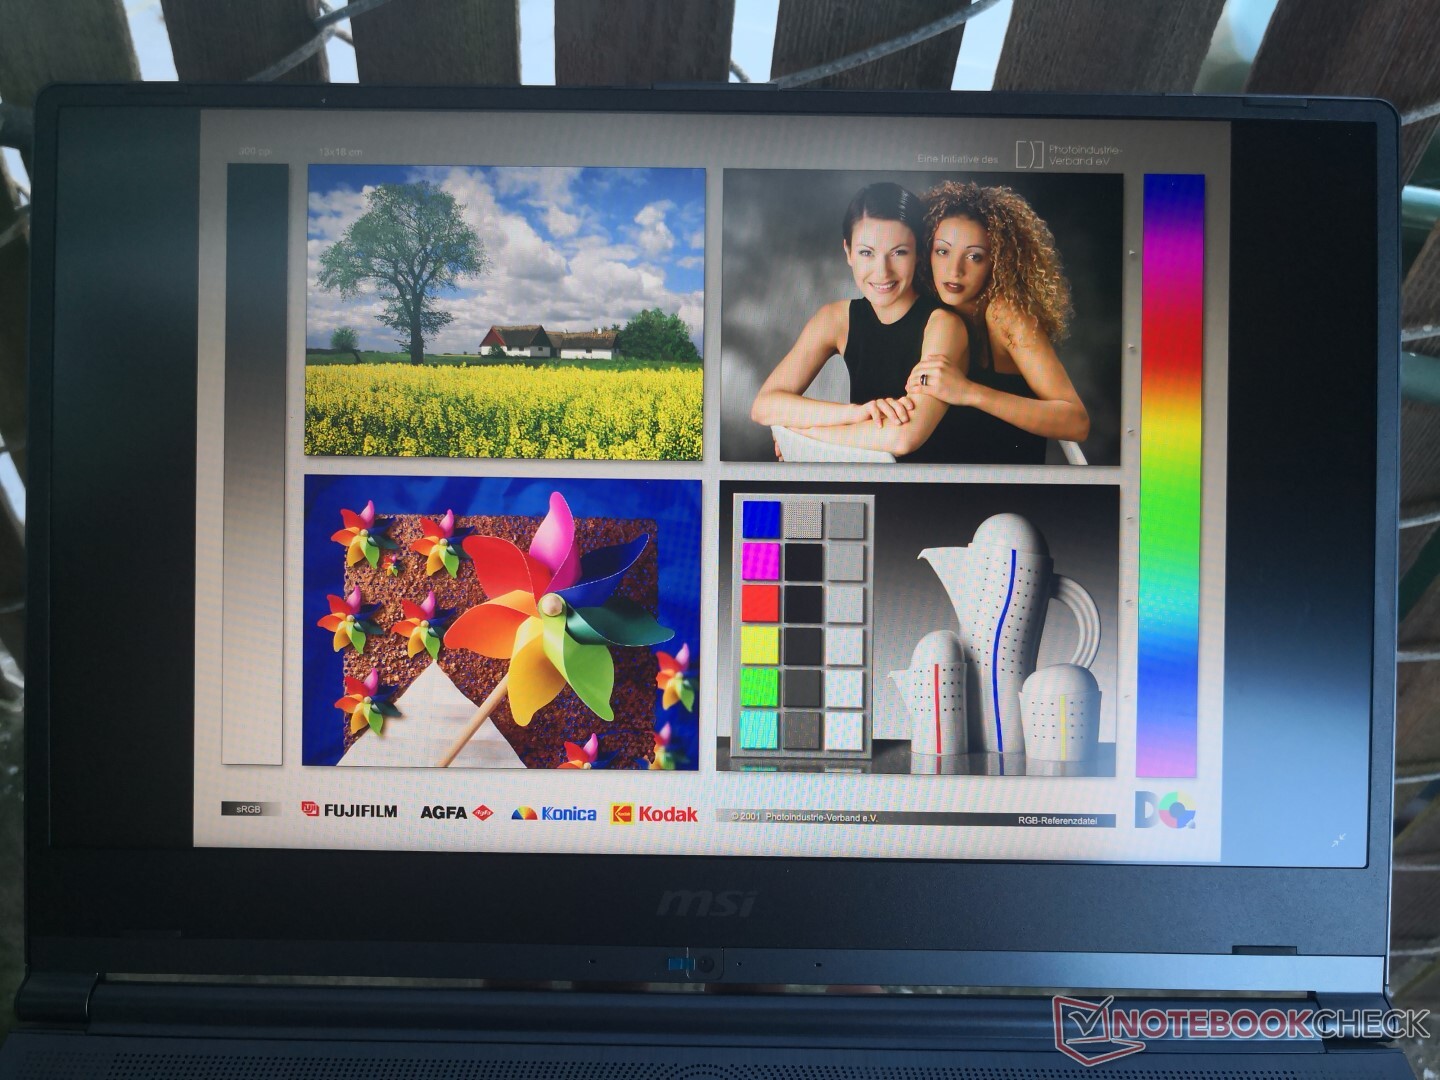
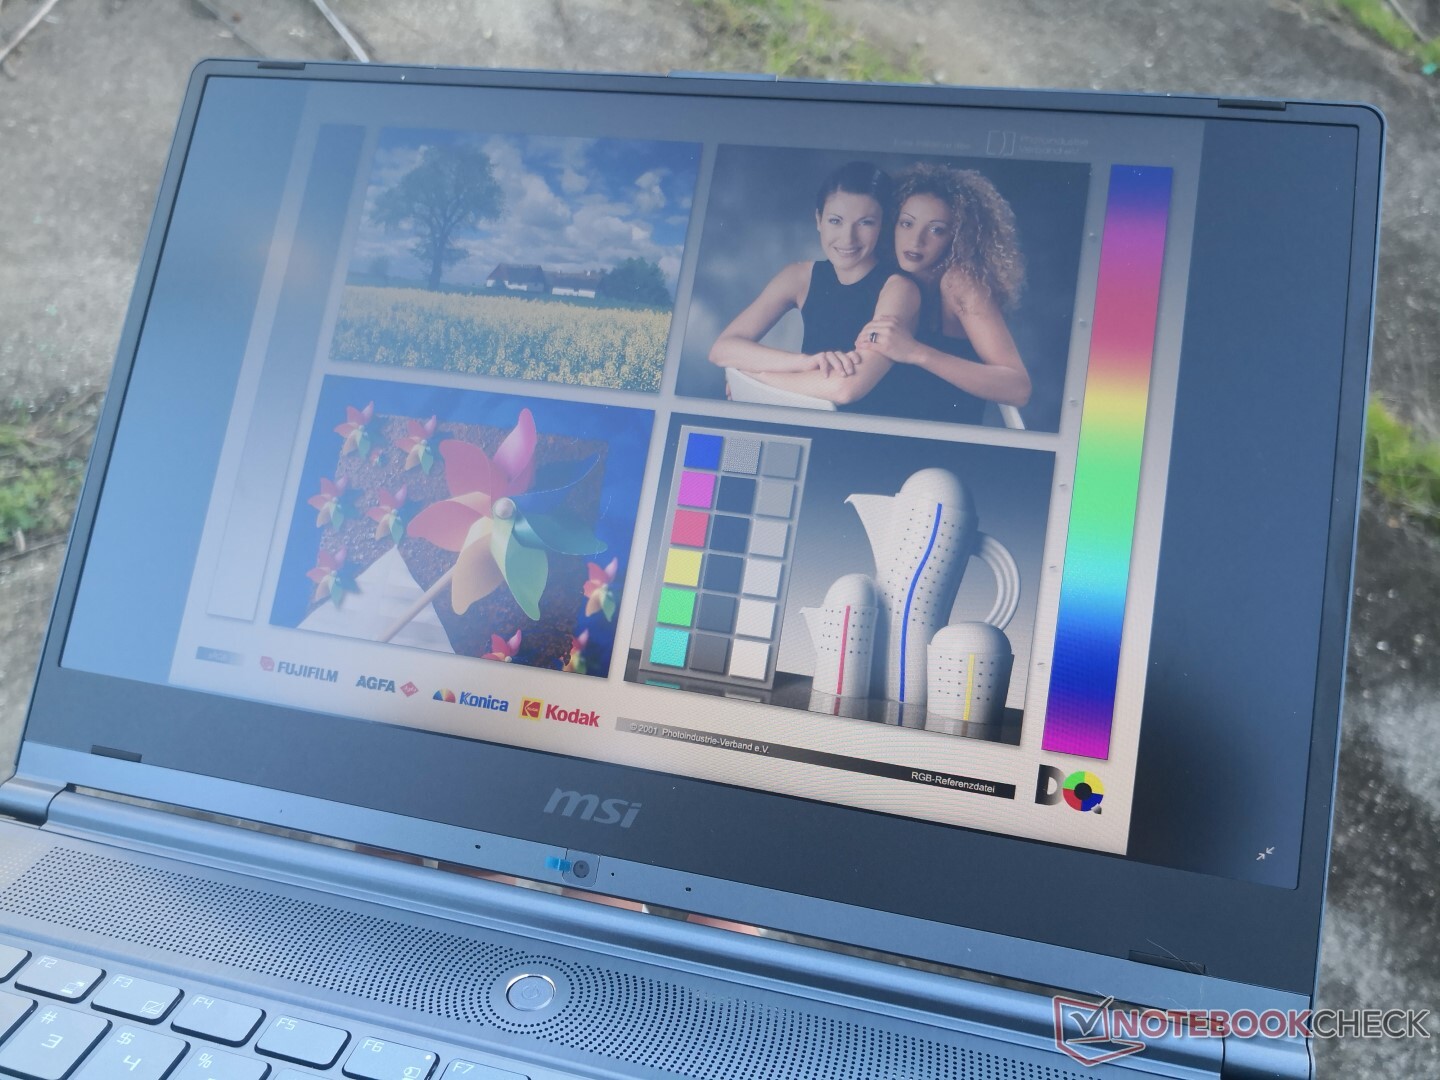
Subjectively, text and images appear nearly as crisp as on a glossy display with only a minor layer of graininess common amongst most matte panels.

| |||||||||||||||||||||||||
Brightness Distribution: 87 %
Center on Battery: 324.1 cd/m²
Contrast: 1473:1 (Black: 0.22 cd/m²)
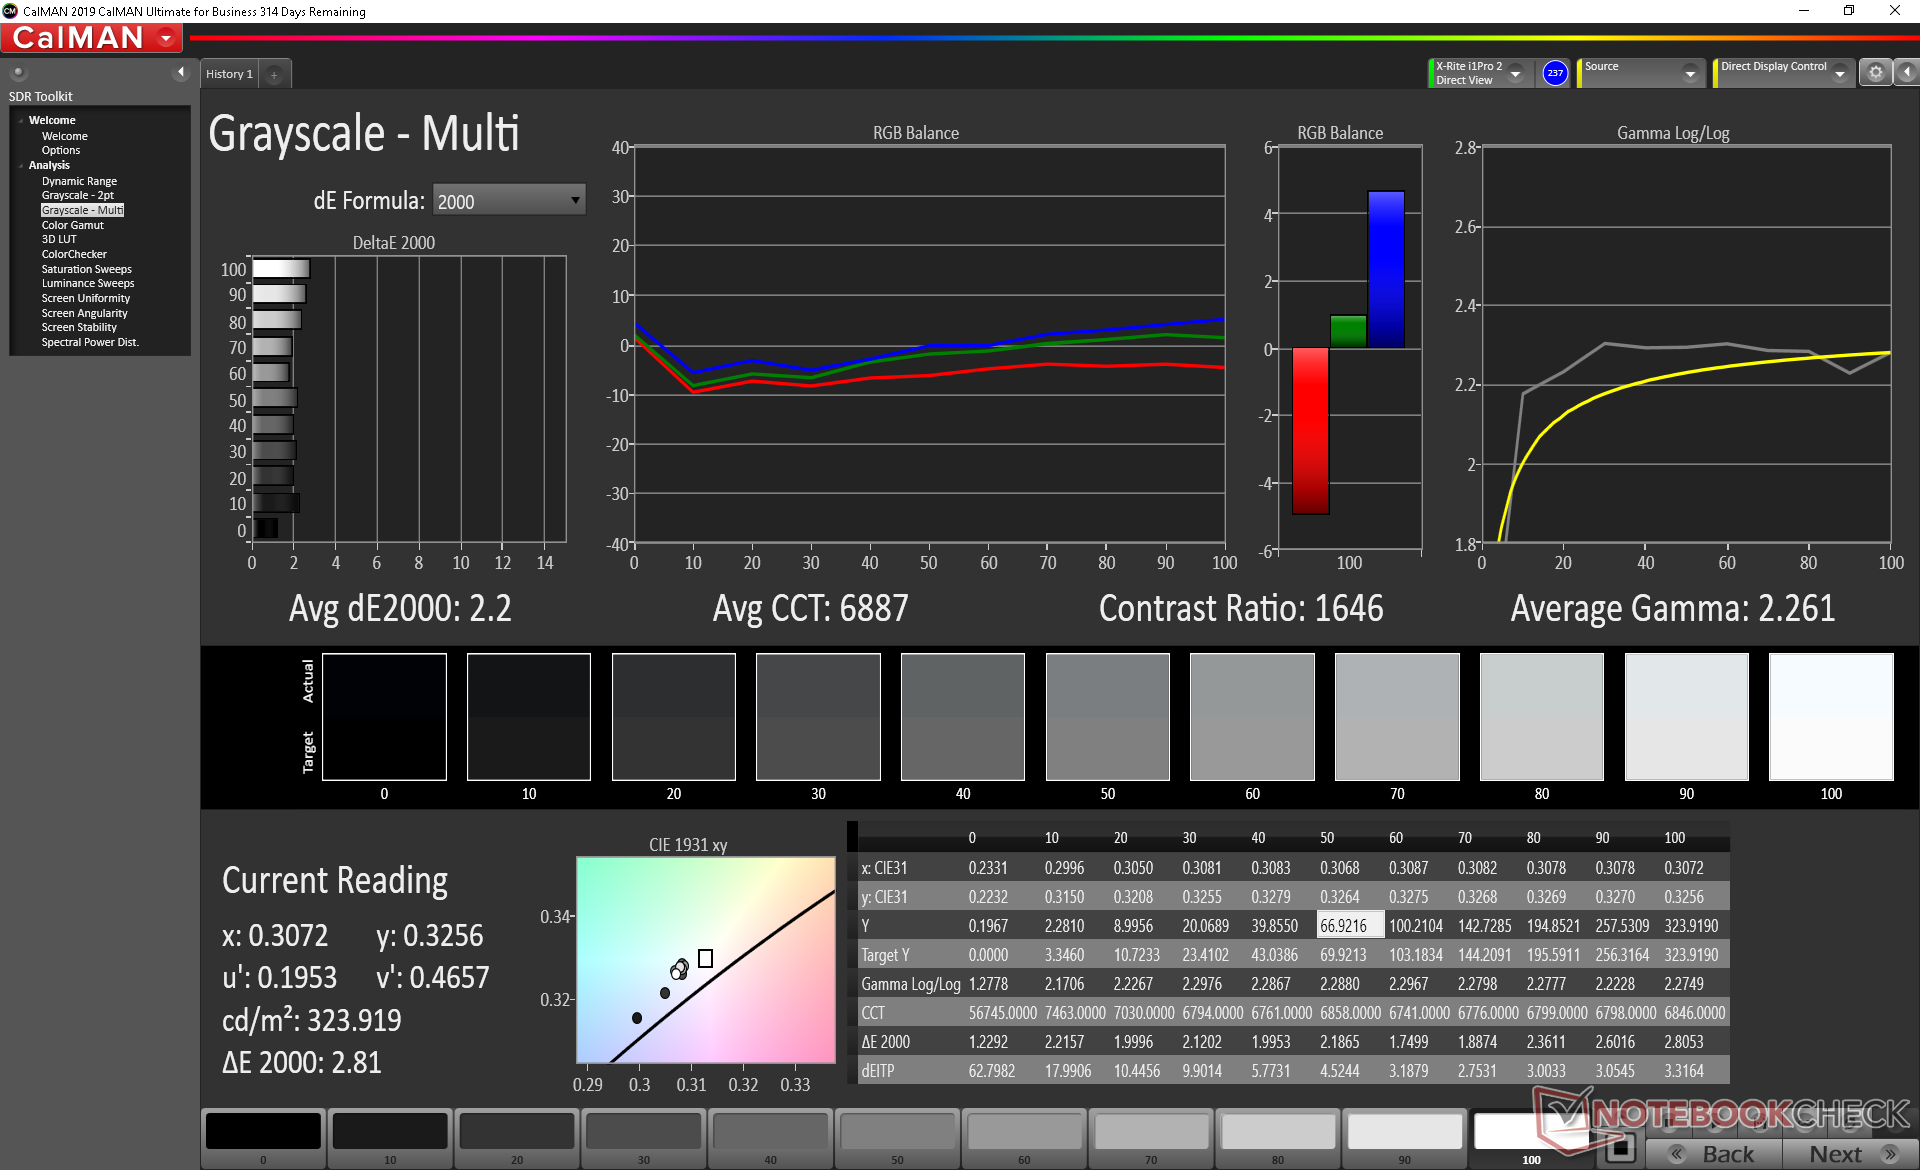
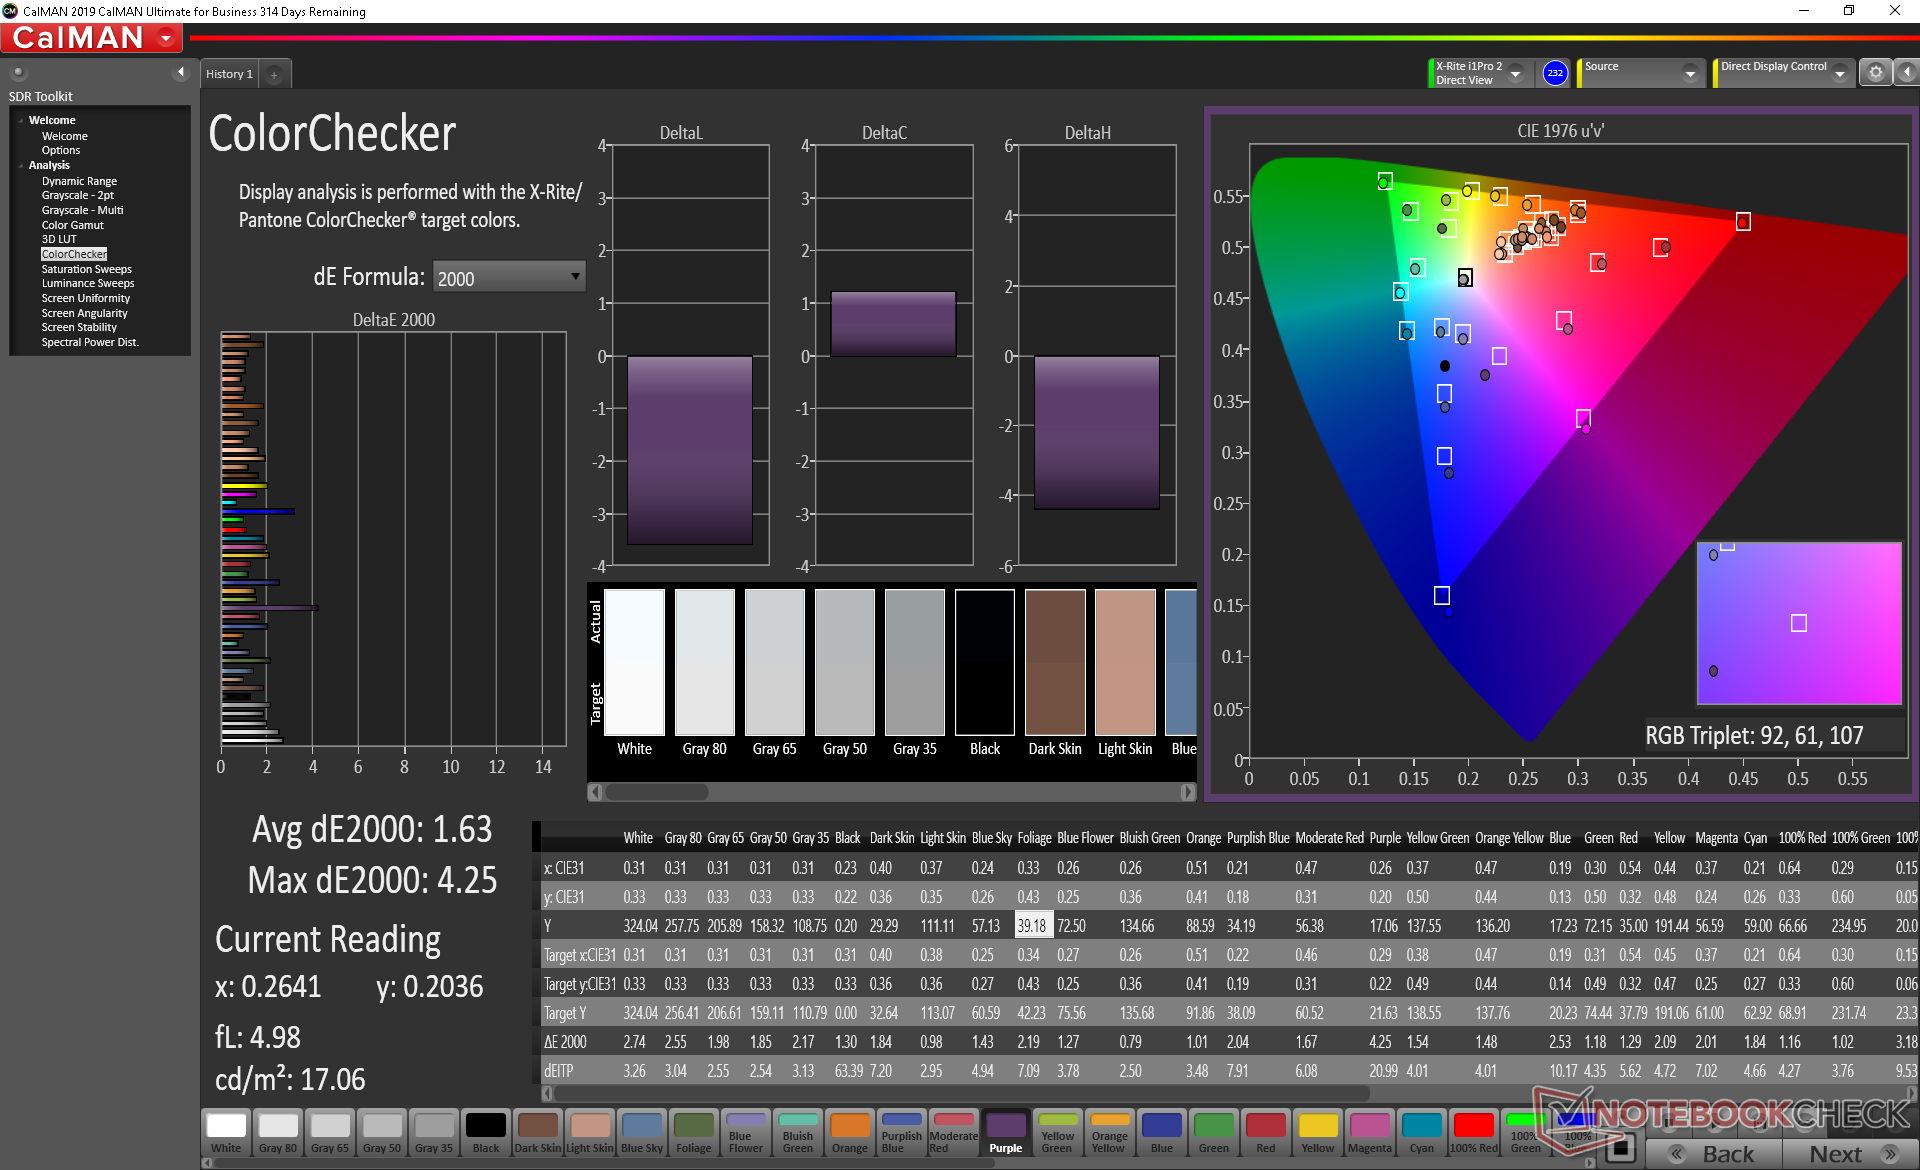
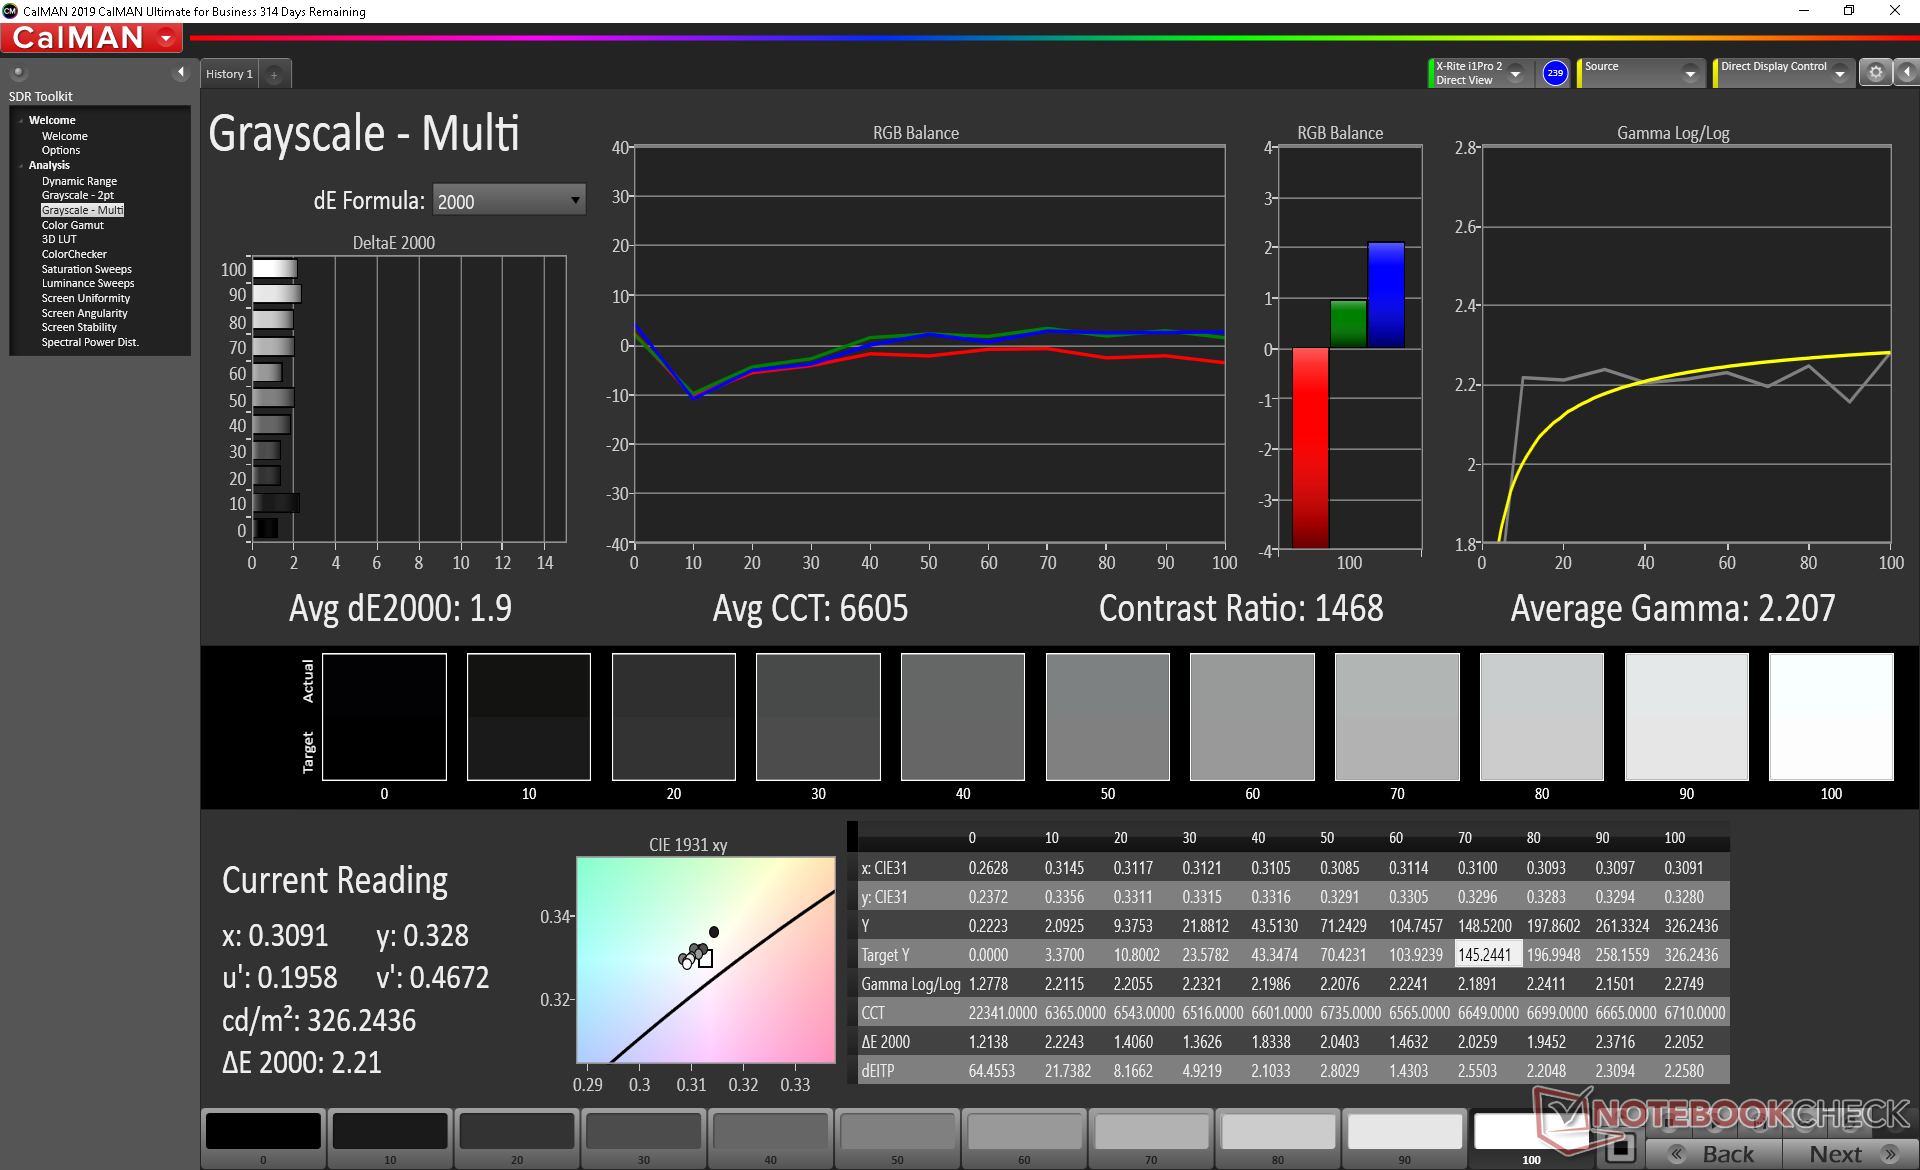
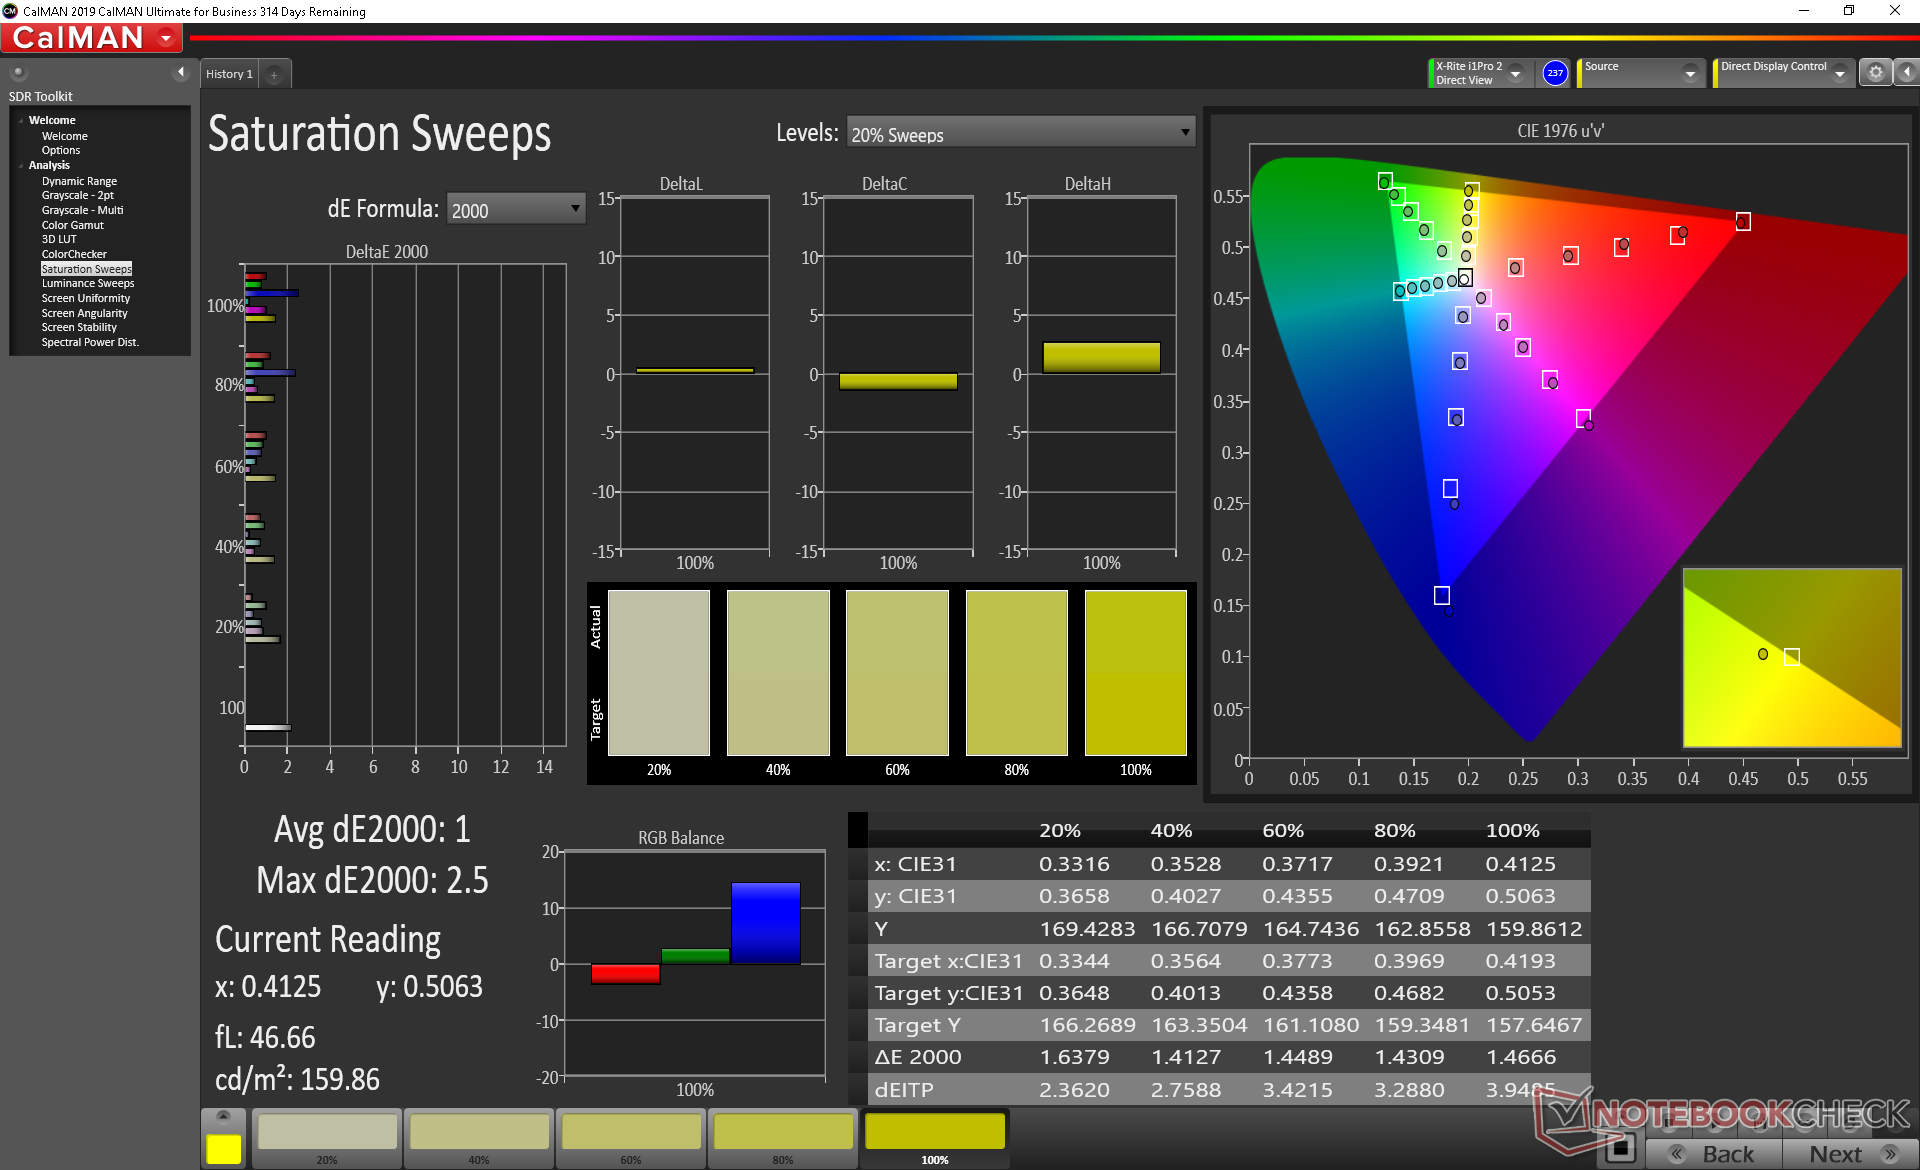
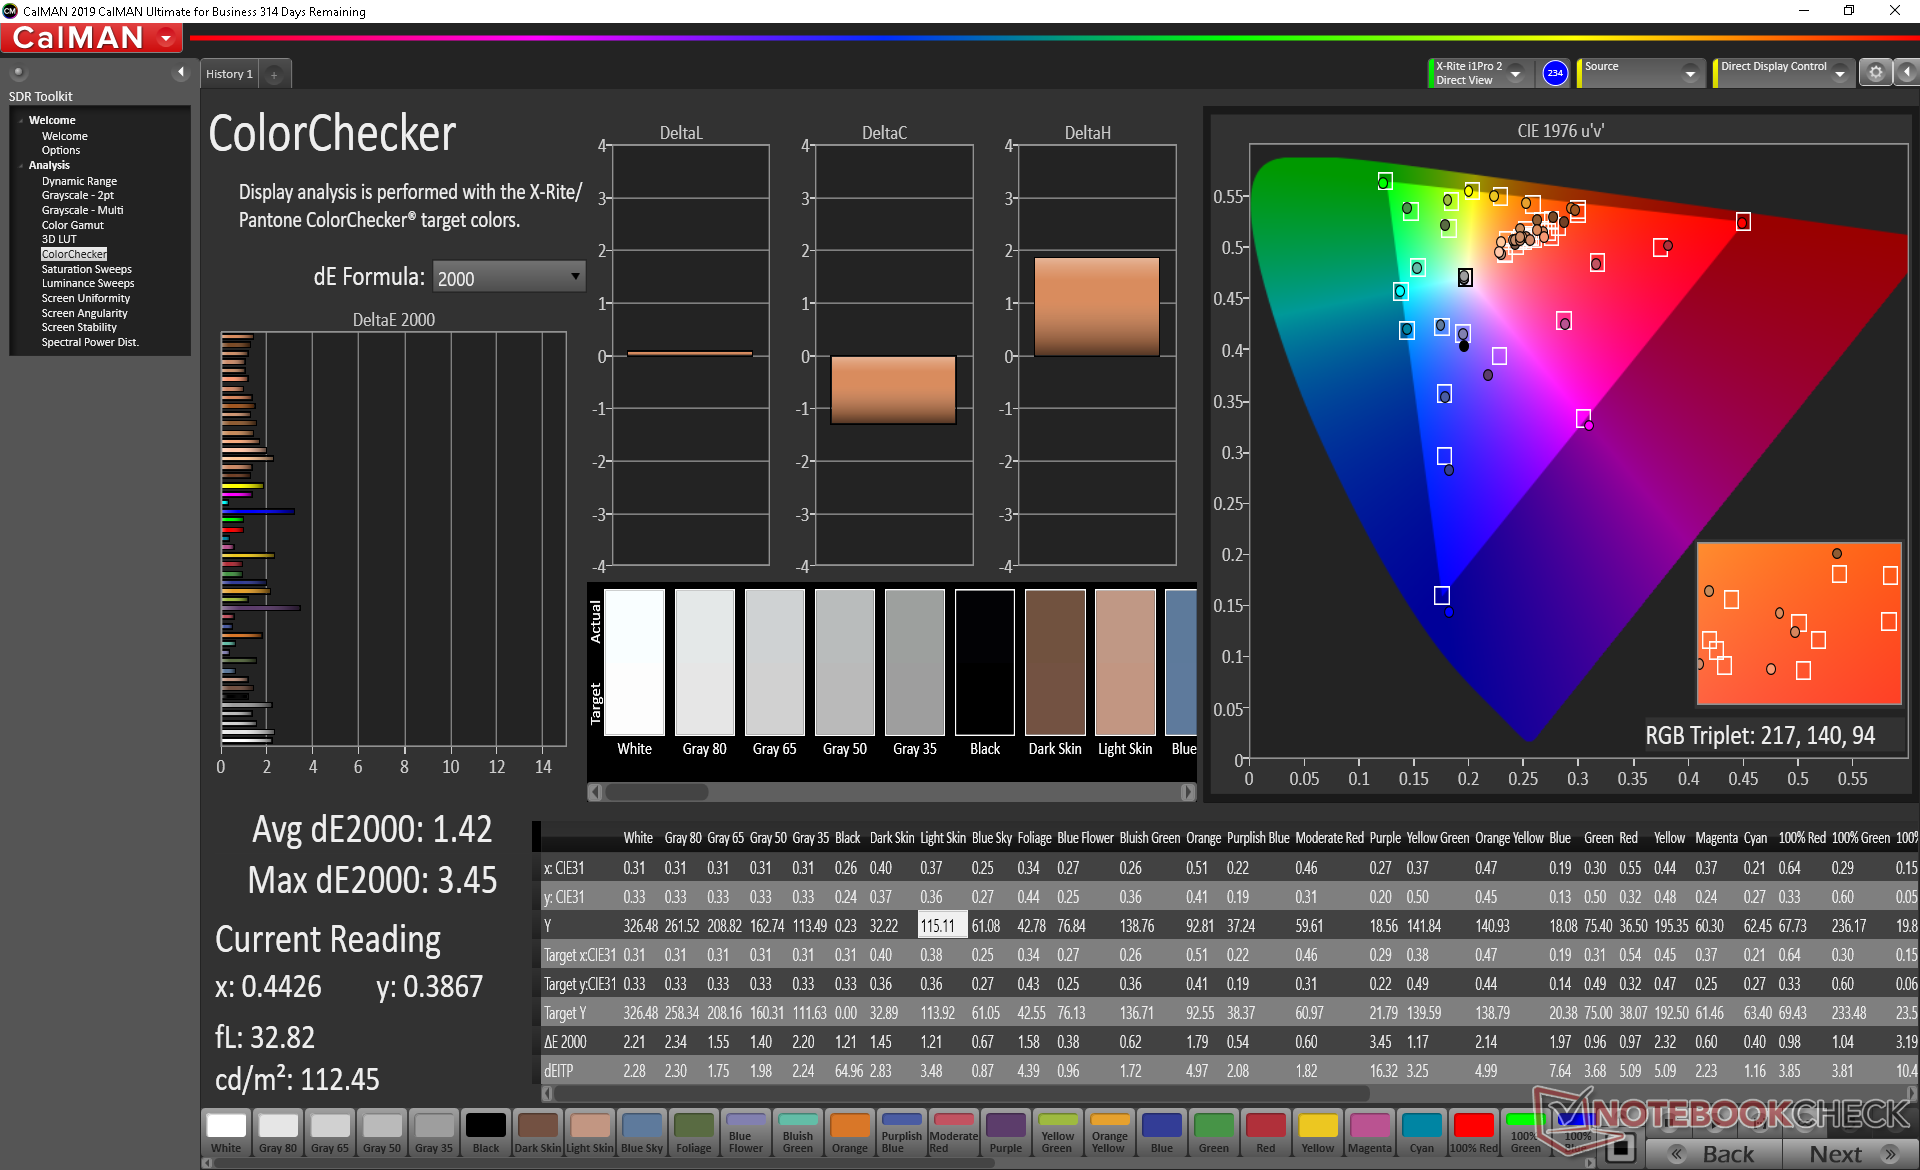
ΔE ColorChecker Calman: 1.63 | ∀{0.5-29.43 Ø4.73}
calibrated: 1.42
ΔE Greyscale Calman: 2.2 | ∀{0.09-98 Ø4.97}
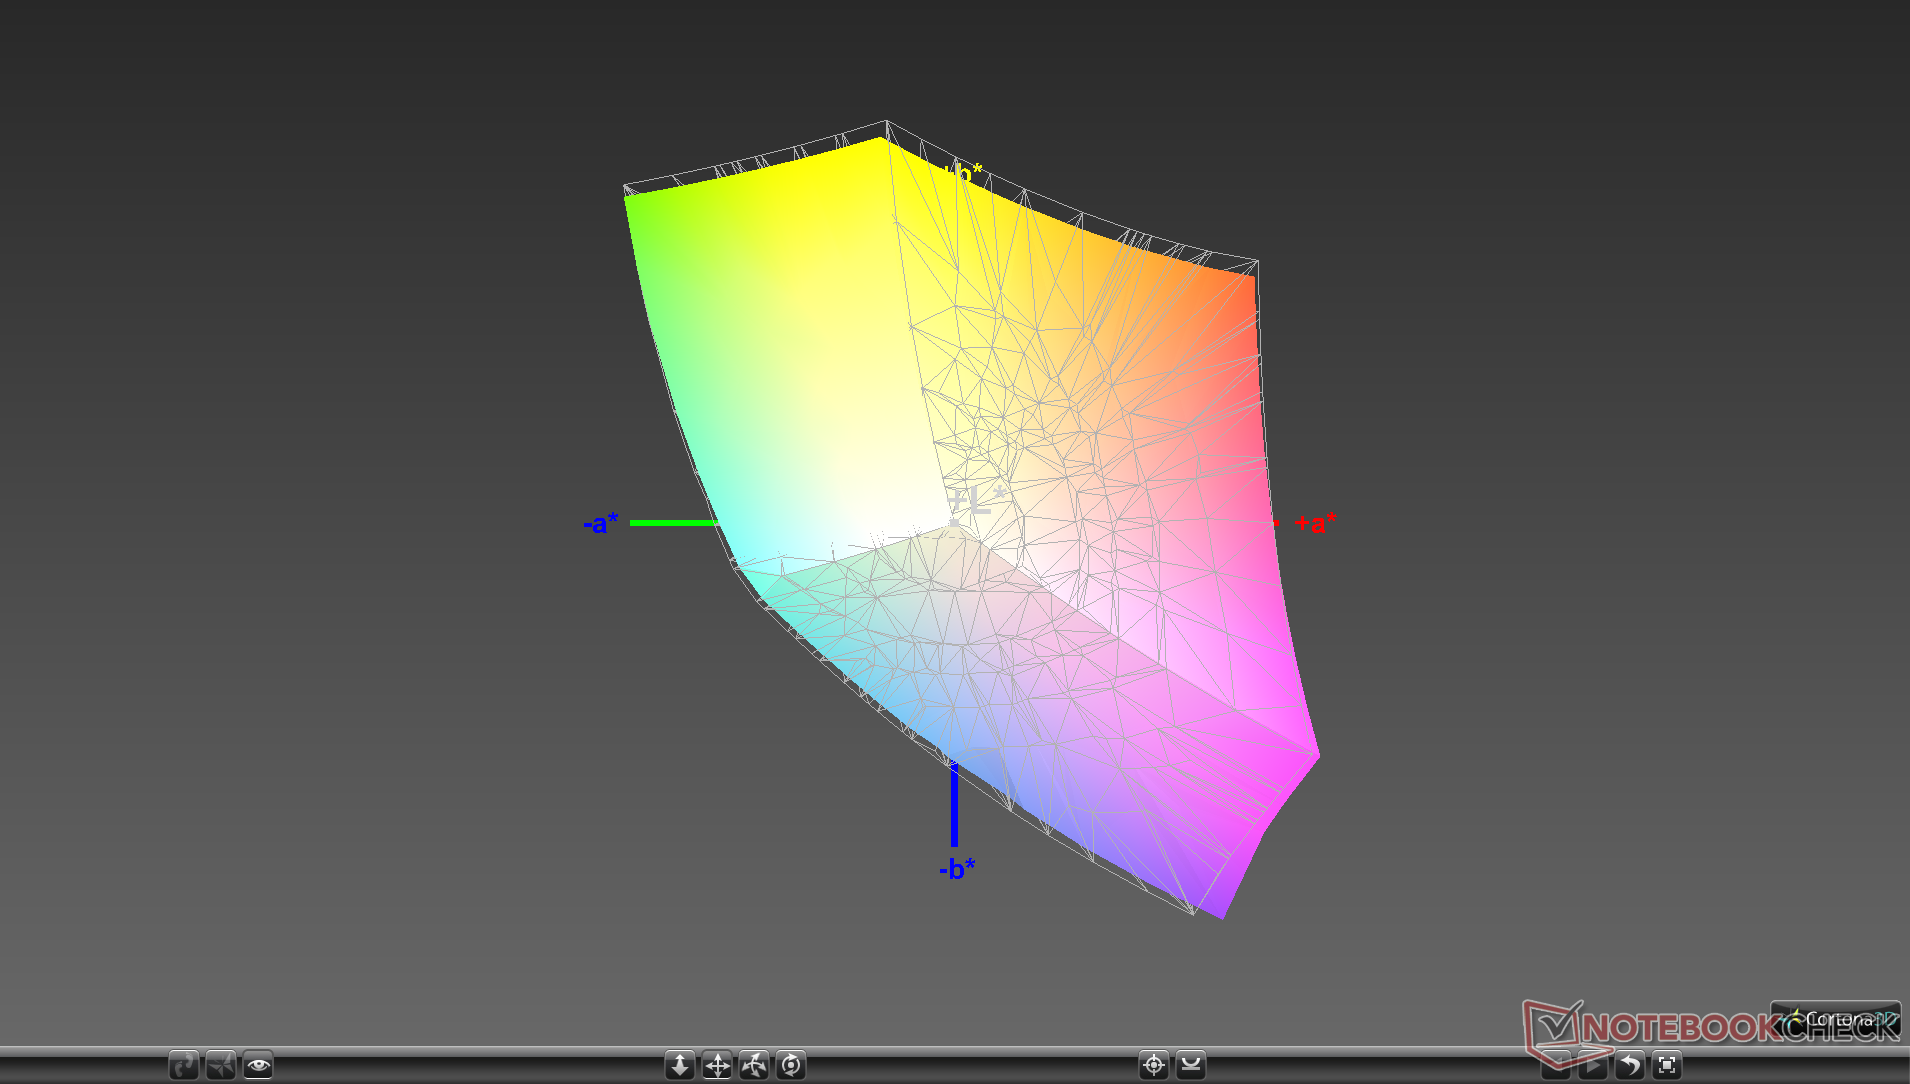
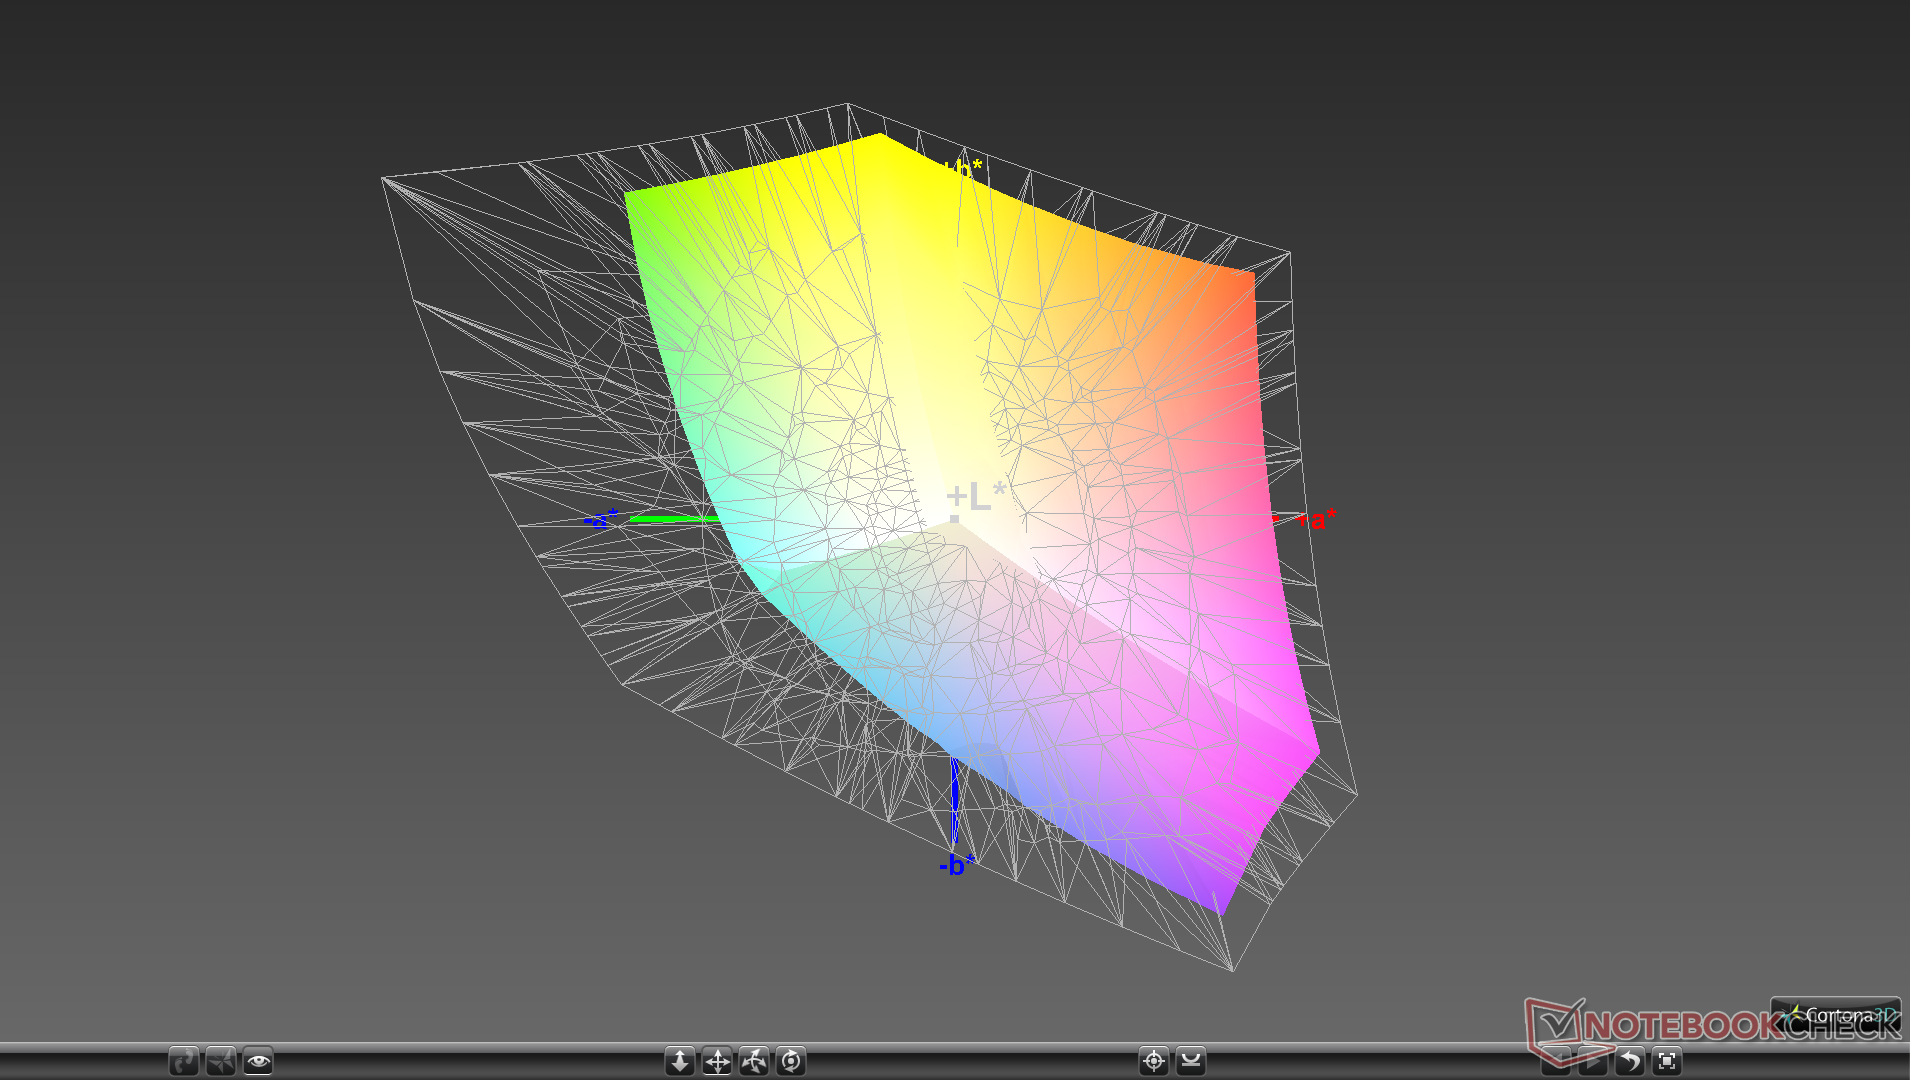
95% sRGB (Argyll 1.6.3 3D)
60.2% AdobeRGB 1998 (Argyll 1.6.3 3D)
65.4% AdobeRGB 1998 (Argyll 3D)
94.8% sRGB (Argyll 3D)
64.2% Display P3 (Argyll 3D)
Gamma: 2.26
CCT: 6887 K
| MSI Modern 14 A10RB-459US Chi Mei N140HCE-EN2, IPS, 14", 1920x1080 | MSI Prestige 14 i7-10710U AUO123B, , 14", 3840x2160 | Asus ZenBook 15 UX534FT-DB77 BOE NV156FHM-N63, IPS, 15.6", 1920x1080 | Lenovo Yoga C940-14IIL LP140WF9-SPE2, IPS LED, 14", 1920x1080 | Dell XPS 15 7590 9980HK GTX 1650 Samsung 156WR04, SDCA029, OLED, 15.6", 3840x2160 | Apple MacBook Pro 16 2019 i9 5500M APPA044, IPS, 16", 3072x1920 | |
|---|---|---|---|---|---|---|
| Display | 26% | -2% | 3% | 27% | ||
| Display P3 Coverage (%) | 64.2 | 81.5 27% | 66.6 4% | 66 3% | 88.1 37% | |
| sRGB Coverage (%) | 94.8 | 99 4% | 87.7 -7% | 97.9 3% | 99.6 5% | |
| AdobeRGB 1998 Coverage (%) | 65.4 | 95.4 46% | 64.1 -2% | 67.3 3% | 91.8 40% | |
| Response Times | 1% | -6% | 94% | -16% | ||
| Response Time Grey 50% / Grey 80% * (ms) | 39.2 ? | 41.2 ? -5% | 49.6 ? -27% | 2.3 ? 94% | 52.4 ? -34% | |
| Response Time Black / White * (ms) | 35.6 ? | 33.2 ? 7% | 30 ? 16% | 2.4 ? 93% | 34.9 ? 2% | |
| PWM Frequency (Hz) | 25000 ? | 59.5 ? | 131700 | |||
| Screen | -5% | -70% | -9% | -45% | 6% | |
| Brightness middle (cd/m²) | 324.1 | 568 75% | 312.6 -4% | 384 18% | 421.2 30% | 519 60% |
| Brightness (cd/m²) | 301 | 513 70% | 290 -4% | 363 21% | 417 39% | 477 58% |
| Brightness Distribution (%) | 87 | 87 0% | 85 -2% | 90 3% | 94 8% | 86 -1% |
| Black Level * (cd/m²) | 0.22 | 0.28 -27% | 0.31 -41% | 0.17 23% | 0.39 -77% | |
| Contrast (:1) | 1473 | 2029 38% | 1008 -32% | 2259 53% | 1331 -10% | |
| Colorchecker dE 2000 * | 1.63 | 3.18 -95% | 5.78 -255% | 3.5 -115% | 6.06 -272% | 2.28 -40% |
| Colorchecker dE 2000 max. * | 4.25 | 7.01 -65% | 8.86 -108% | 5.5 -29% | 11.89 -180% | 6.54 -54% |
| Colorchecker dE 2000 calibrated * | 1.42 | 1.14 20% | 3.78 -166% | 1 30% | 0.86 39% | |
| Greyscale dE 2000 * | 2.2 | 4.79 -118% | 5.4 -145% | 4.6 -109% | 2.8 -27% | 0.9 59% |
| Gamma | 2.26 97% | 2.49 88% | 2.21 100% | 2.32 95% | 2.15 102% | 2145 0% |
| CCT | 6887 94% | 6488 100% | 7864 83% | 6884 94% | 6235 104% | 6572 99% |
| Color Space (Percent of AdobeRGB 1998) (%) | 60.2 | 85 41% | 57.1 -5% | 62 3% | 81 35% | 78 30% |
| Color Space (Percent of sRGB) (%) | 95 | 99 4% | 87.4 -8% | 97.7 3% | 99.6 5% | |
| Total Average (Program / Settings) | 11% /
1% | -24% /
-48% | -4% /
-6% | 25% /
-7% | -5% /
3% |
* ... smaller is better
Color space encompasses approximately 95 percent and 60 percent of the sRGB and AdobeRGB standards, respectively, to be indicative of a mid-range panel. Users looking for deeper colors should consider the pricier Prestige 14 and its 4K UHD option.
The panel is well-calibrated out of the box with average grayscale and color DeltaE values of just 2.2 and 1.44, respectively. Color temperature is ever-so-slightly on the cool side which we were able to fix with our own X-Rite calibration. The included MSI True Color software makes one-click color adjustments easy for content creators.

Display Response Times
| ↔ Response Time Black to White | ||
|---|---|---|
| 35.6 ms ... rise ↗ and fall ↘ combined | ↗ 21.2 ms rise | 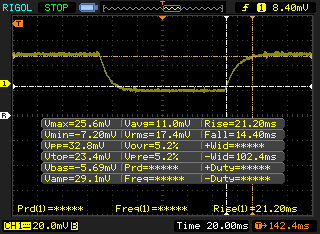 |
| ↘ 14.4 ms fall | ||
| The screen shows slow response rates in our tests and will be unsatisfactory for gamers. In comparison, all tested devices range from 0.1 (minimum) to 240 (maximum) ms. » 93 % of all devices are better. This means that the measured response time is worse than the average of all tested devices (19.9 ms). | ||
| ↔ Response Time 50% Grey to 80% Grey | ||
| 39.2 ms ... rise ↗ and fall ↘ combined | ↗ 20.8 ms rise | 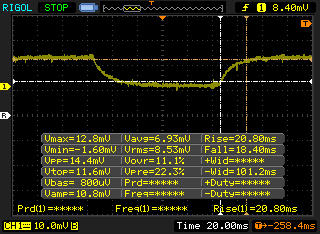 |
| ↘ 18.4 ms fall | ||
| The screen shows slow response rates in our tests and will be unsatisfactory for gamers. In comparison, all tested devices range from 0.165 (minimum) to 636 (maximum) ms. » 60 % of all devices are better. This means that the measured response time is worse than the average of all tested devices (31.1 ms). | ||
Screen Flickering / PWM (Pulse-Width Modulation)
| Screen flickering / PWM detected | 25000 Hz | ≤ 28 % brightness setting | 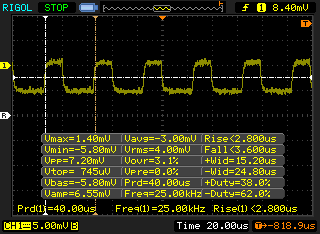 |
The display backlight flickers at 25000 Hz (worst case, e.g., utilizing PWM) Flickering detected at a brightness setting of 28 % and below. There should be no flickering or PWM above this brightness setting. The frequency of 25000 Hz is quite high, so most users sensitive to PWM should not notice any flickering. In comparison: 52 % of all tested devices do not use PWM to dim the display. If PWM was detected, an average of 7791 (minimum: 5 - maximum: 343500) Hz was measured. | |||
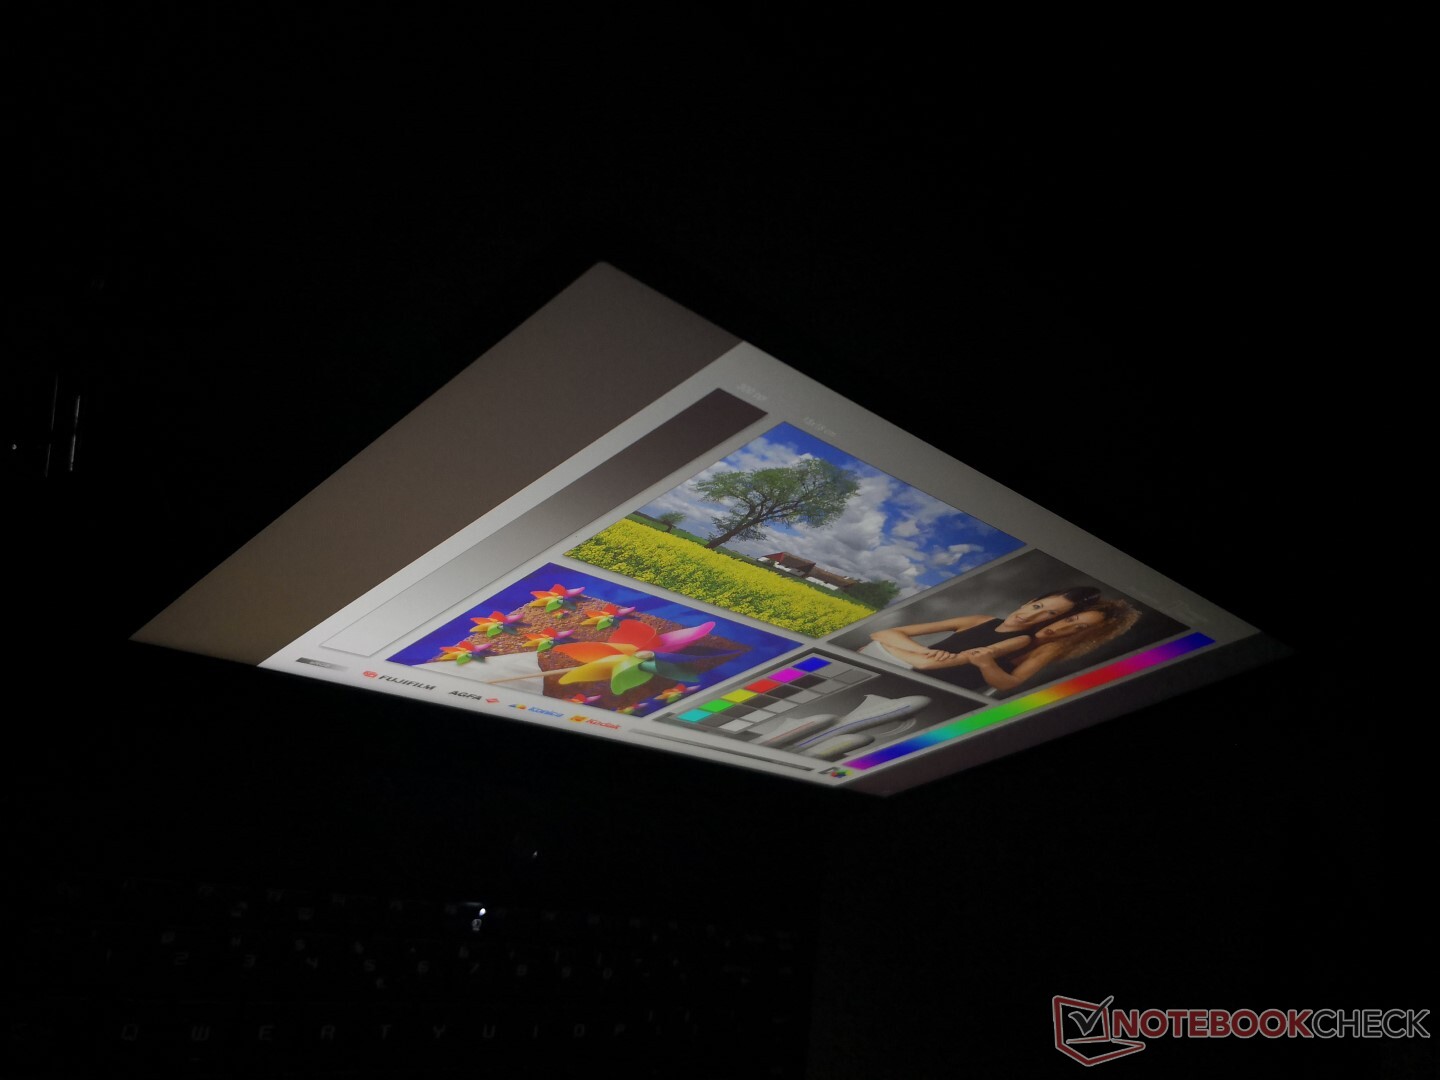
Outdoor visibility is about average for an Ultrabook. Pricier flagship alternatives like the MacBook Pro 15 or XPS 15 have brighter displays for better visibility when outdoors, but at least glare is minimal on the matte MSI display. Viewing angles are excellent to better exploit the 180-degree hinges. Colors and contrast degrade only if viewing from extreme angles not unlike other IPS displays.
Performance
The 10th gen Core i5 CPU and GeForce MX250 GPU target office users who want more graphical power than the typical Intel UMA-only Ultrabook while being just as thin and light. Laptops with more powerful GTX options tend to be heavier and larger in the 15-inch range with the Razer Blade Stealth and MSI Prestige 14 being major exceptions.
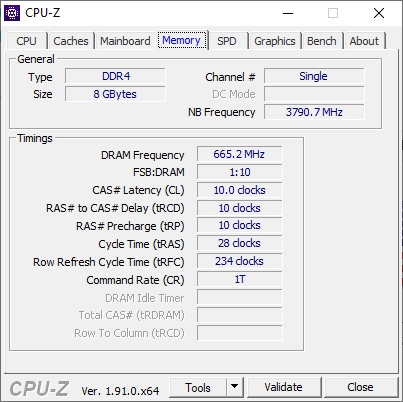
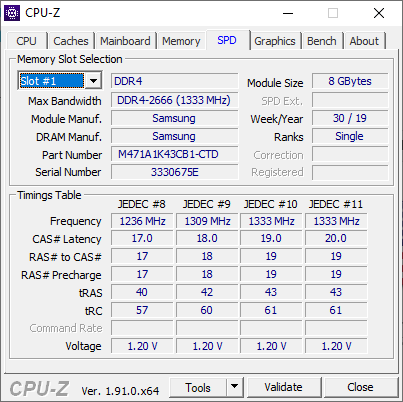
RAM can be configured from 8 GB single-channel up to 32 GB single-channel via one SODIMM slot. We recommend configuring with at least 16 GB especially since RAM upgrades are difficult on this particular chassis.
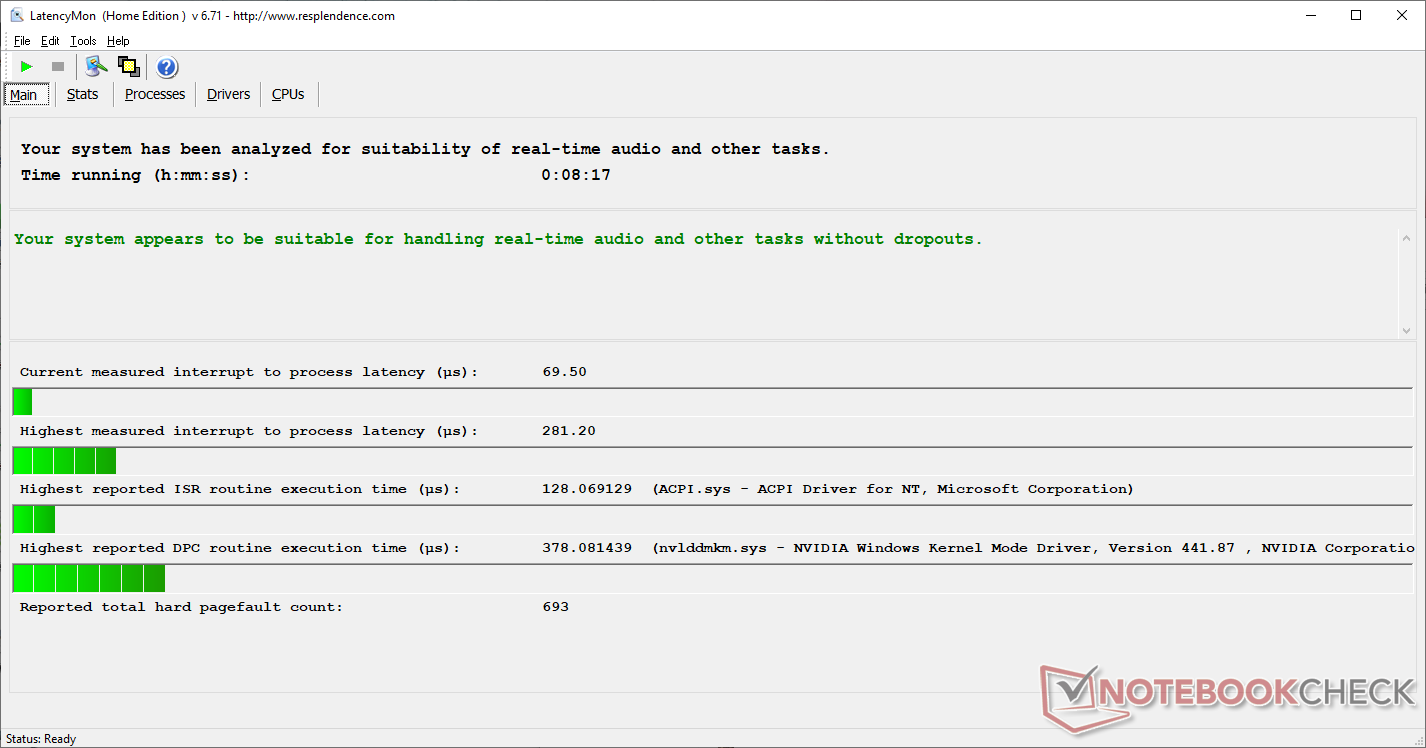
Nvidia Optimus is included for automatic graphics switching. LatencyMon shows no DPC latency issues even when wireless is enabled.
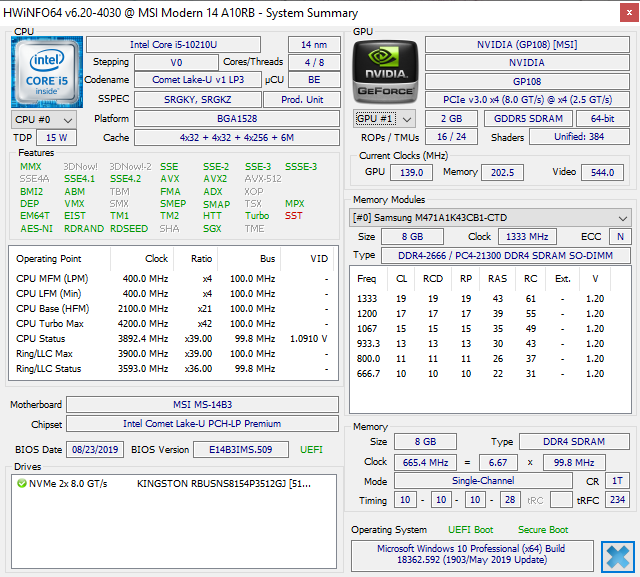
Processor
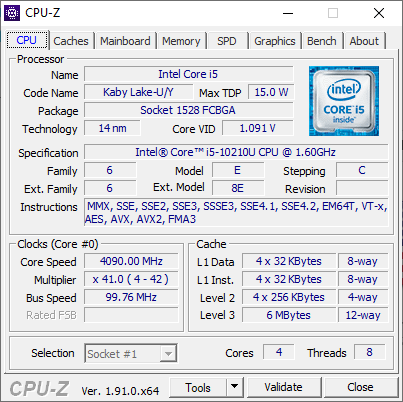
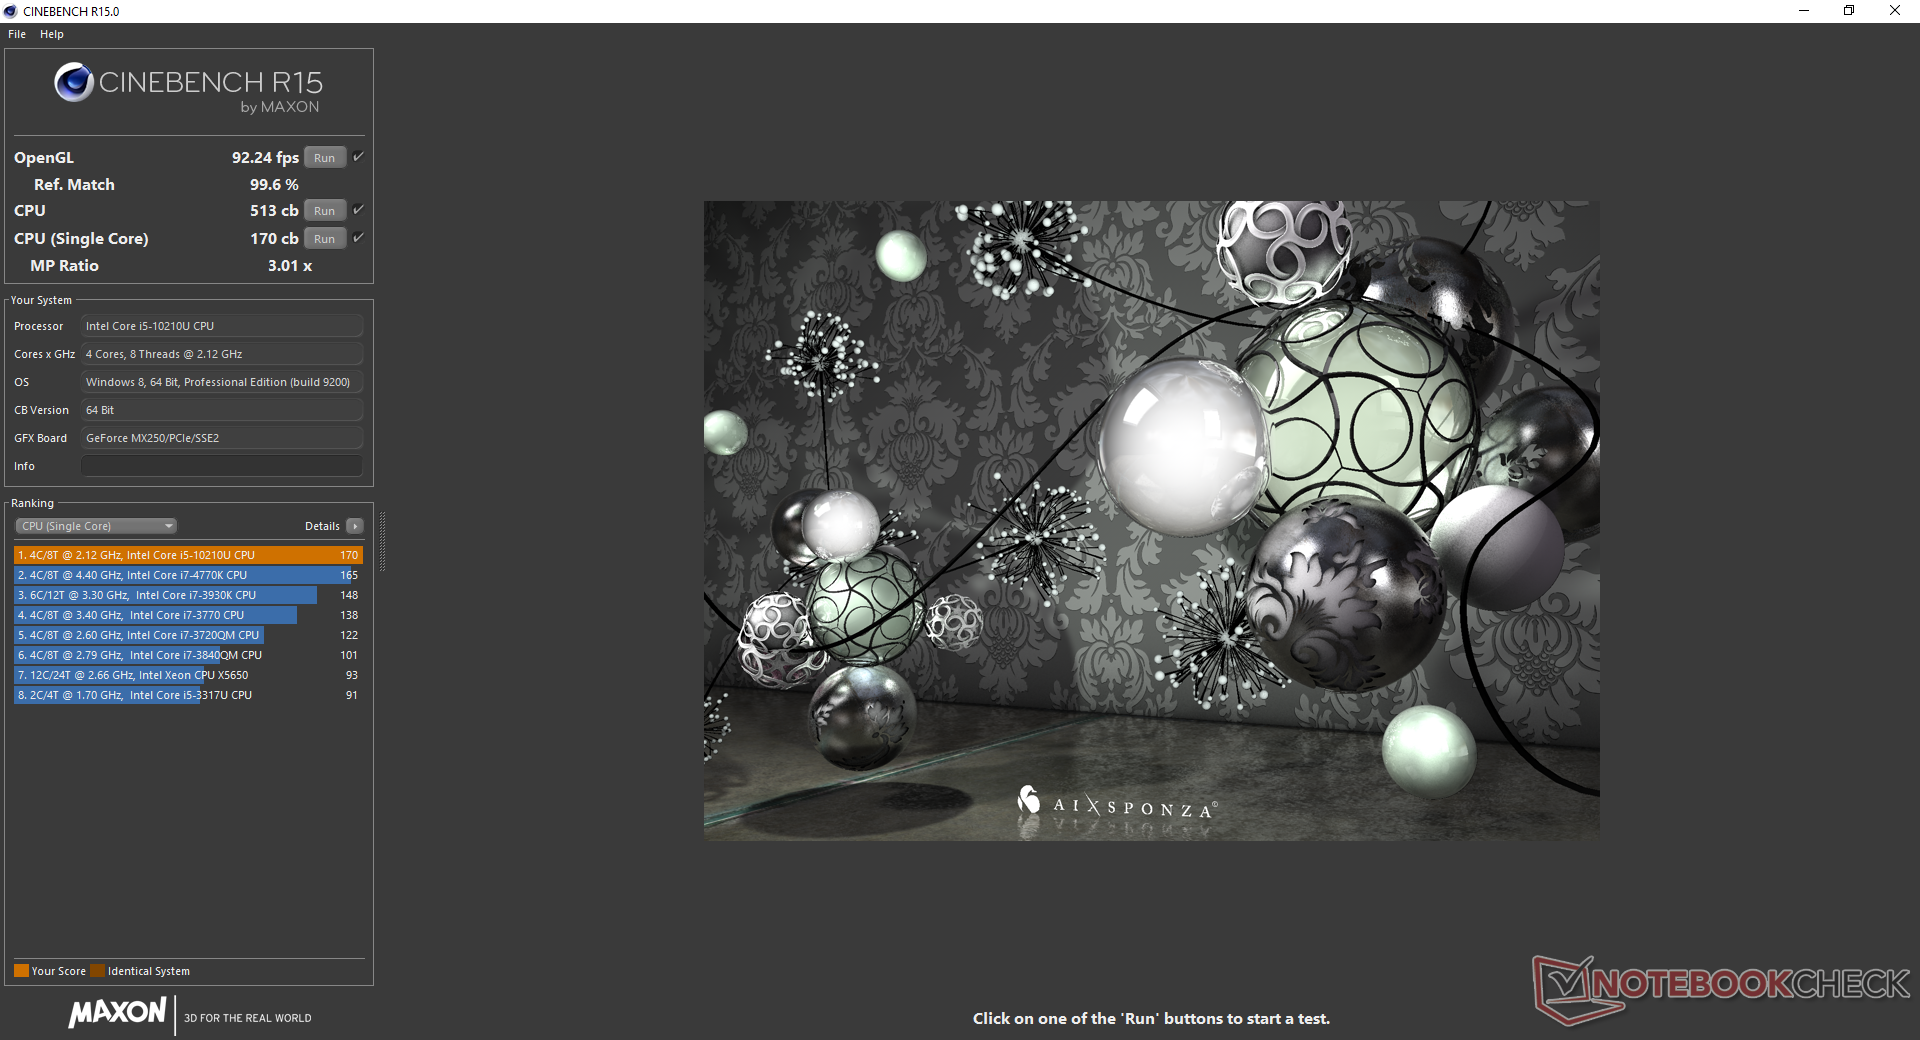
The Comet Lake-U Core i5-10210U in our MSI is about 20 percent slower than the average Core i5-10210U in our database according to CineBench R15 Multi-Thread. Thus, raw performance is barely any better than the two-year old Core i7-8550U or even the Core i5-8265U that it directly replaces. In fact, even the Ryzen 5 3500U in the Walmart Motile laptop can outperform our MSI by about 20 percent. The disappointing results can be attributed to the limited Turbo Boost sustainability of the Modern 14 as detailed in our Stress Test section below.
See our dedicated page on the Core i5-10210U for more technical information and benchmarks.
| wPrime 2.10 - 1024m | |
| Microsoft Surface Laptop 3 15 Ryzen 5 3580U | |
| Average Intel Core i5-10210U (n=1) | |
| Dell XPS 13 7390 Core i7-10710U | |
* ... smaller is better
System Performance
PCMark results are generally comparable to a Core i7-1065G7 laptop save for the Essentials benchmark where the CPU performance advantages of Ice Lake come into play. We experienced no software or hardware issues during our time with the test unit.
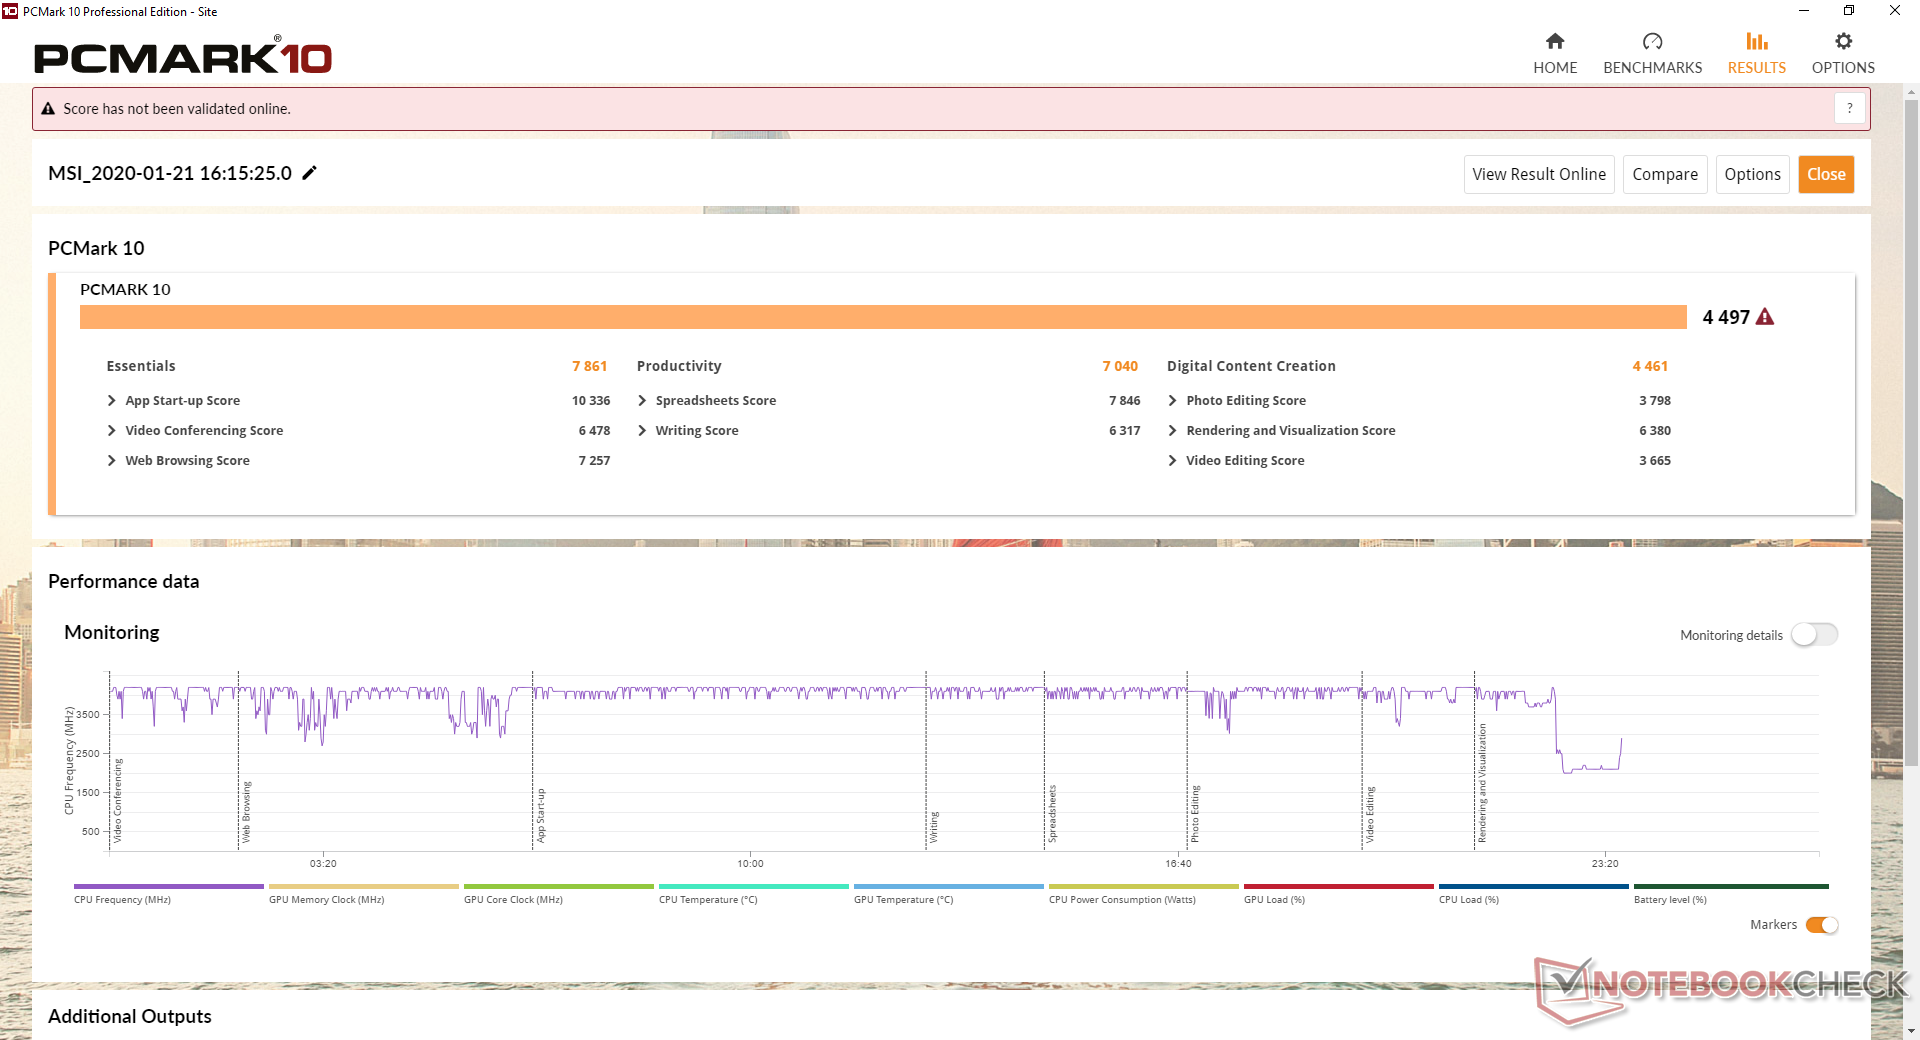
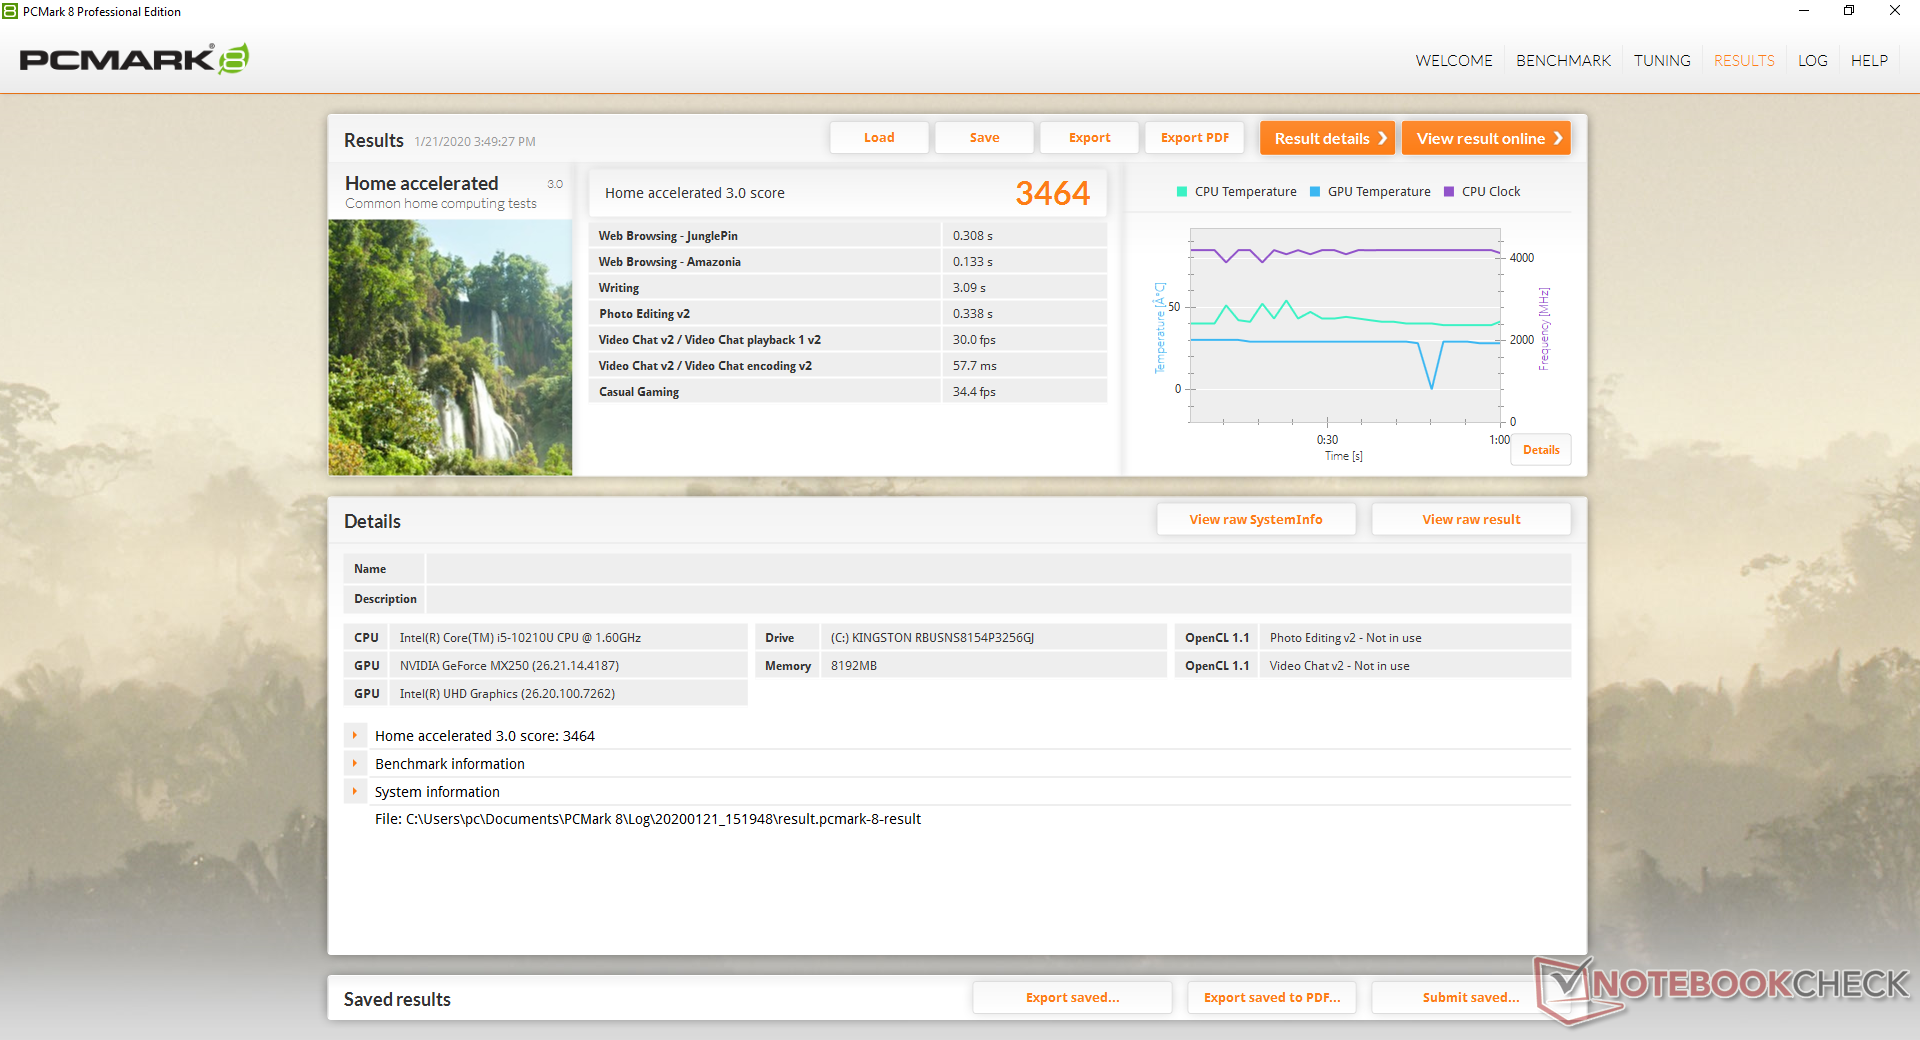
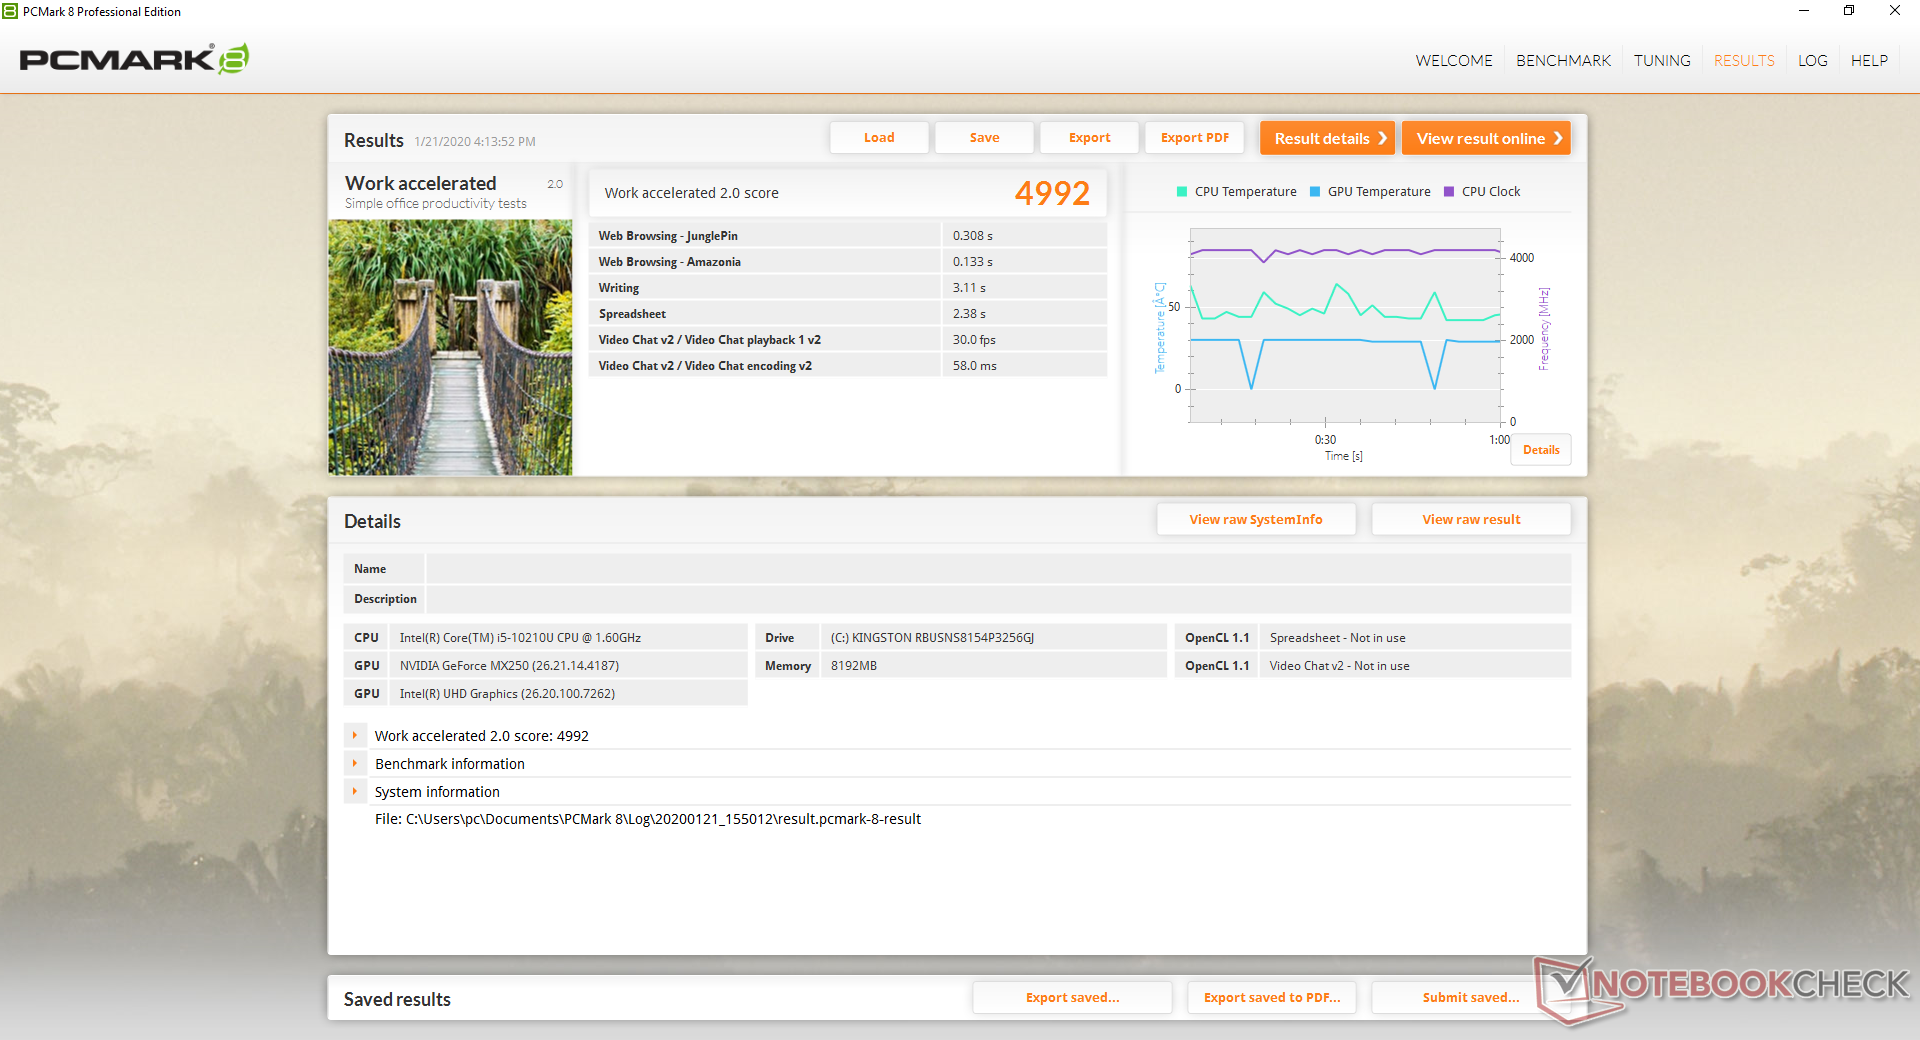
| PCMark 8 Home Score Accelerated v2 | 3464 points | |
| PCMark 8 Work Score Accelerated v2 | 4992 points | |
| PCMark 10 Score | 4497 points | |
Help | ||
Storage Devices
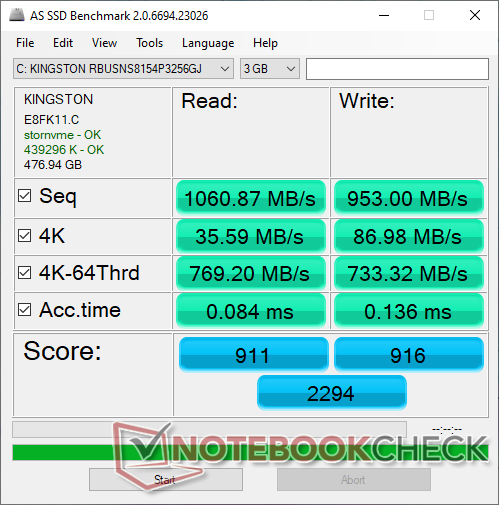
Our test unit comes with a 512 GB Kingston RBUSNS8154P3512GJ M.2 SSD, but expect drives from other OEMs depending on the laptop reseller. Sequential read and write rates average about 1000 MB/s each to suggest an entry-level NVMe SSD. The Samsung PM981, Toshiba XG6, and Apple AP1024 all outperform our Kingston by over 2x in some cases.
See our table of HDDs and SSDs for more benchmark comparisons.
| MSI Modern 14 A10RB-459US Kingston RBUSNS8154P3512GJ | Asus ZenBook 15 UX534FT-DB77 Samsung SSD PM981 MZVLB1T0HALR | Lenovo Yoga C940-14IIL Samsung SSD PM981 MZVLB512HAJQ | Dell XPS 15 7590 9980HK GTX 1650 Toshiba XG6 KXG60ZNV1T02 | Apple MacBook Pro 16 2019 i9 5500M Apple SSD AP1024 7171 | |
|---|---|---|---|---|---|
| AS SSD | 51% | 64% | 73% | 57% | |
| Seq Read (MB/s) | 1061 | 1887 78% | 2525 138% | 1723 62% | 2531 139% |
| Seq Write (MB/s) | 953 | 1432 50% | 1253 31% | 1386 45% | 2289 140% |
| 4K Read (MB/s) | 35.59 | 52.3 47% | 59.1 66% | 43.25 22% | 15.85 -55% |
| 4K Write (MB/s) | 87 | 146 68% | 134.1 54% | 98.3 13% | 39.88 -54% |
| 4K-64 Read (MB/s) | 769 | 969 26% | 1010 31% | 1078 40% | 1267 65% |
| 4K-64 Write (MB/s) | 733 | 1375 88% | 1461 99% | 1456 99% | 1749 139% |
| Access Time Read * (ms) | 0.084 | 0.034 60% | 0.052 38% | 0.05 40% | 0.122 -45% |
| Access Time Write * (ms) | 0.136 | 0.075 45% | 0.029 79% | 0.039 71% | 0.095 30% |
| Score Read (Points) | 911 | 1210 33% | 1322 45% | 1294 42% | 1536 69% |
| Score Write (Points) | 916 | 1664 82% | 1721 88% | 1693 85% | 2018 120% |
| Score Total (Points) | 2294 | 3483 52% | 3670 60% | 3638 59% | 4317 88% |
| Copy ISO MB/s (MB/s) | 956 | 1375 44% | 2016 111% | 3182 233% | 1995 109% |
| Copy Program MB/s (MB/s) | 496.5 | 468 -6% | 542 9% | 984 98% | 584 18% |
| Copy Game MB/s (MB/s) | 872 | 1287 48% | 1278 47% | 1824 109% | 1135 30% |
| CrystalDiskMark 5.2 / 6 | 68% | 66% | 58% | 49% | |
| Write 4K (MB/s) | 107.7 | 141.6 31% | 128.4 19% | 104.3 -3% | 55.5 -48% |
| Read 4K (MB/s) | 39.73 | 45.28 14% | 46.37 17% | 45.23 14% | 16.21 -59% |
| Write Seq (MB/s) | 926 | 1975 113% | 1863 101% | 1729 87% | 1959 112% |
| Read Seq (MB/s) | 1014 | 2272 124% | 2340 131% | 1861 84% | 1763 74% |
| Write 4K Q32T1 (MB/s) | 343.6 | 458.6 33% | 451.1 31% | 509 48% | 398.5 16% |
| Read 4K Q32T1 (MB/s) | 499.1 | 391.4 -22% | 415.3 -17% | 388.5 -22% | 648 30% |
| Write Seq Q32T1 (MB/s) | 1033 | 2393 132% | 2985 189% | 2813 172% | 2727 164% |
| Read Seq Q32T1 (MB/s) | 1604 | 3464 116% | 2565 60% | 2906 81% | 3242 102% |
| Write 4K Q8T8 (MB/s) | 451.4 | ||||
| Read 4K Q8T8 (MB/s) | 1004 | ||||
| Total Average (Program / Settings) | 60% /
57% | 65% /
65% | 66% /
67% | 53% /
54% |
* ... smaller is better

GPU Performance
3DMark results are nearly identical to the Razer Blade Stealth with the older 25 W GeForce MX150 while being about 35 percent faster than the 10 W GeForce MX150. The GeForce MX250 is essentially a rebadged MX150 and so users shouldn't expect any significant performance gains between them. Meanwhile, the MX230 is about 30 to 35 percent slower than our MX250.
The gaming capabilities of the Modern 14 are decent for undemanding titles like DOTA 2 or Fortnite even though the system is not catered towards gamers. Nonetheless, be prepared for noticeable ghosting because of the slow black-white response times. Idling on Witcher 3 shows no recurring drops in frame rates to suggest no interrupting background activity or throttling behavior when gaming.
See our dedicated page on the GeForce MX250 for more technical information and benchmark comparisons.
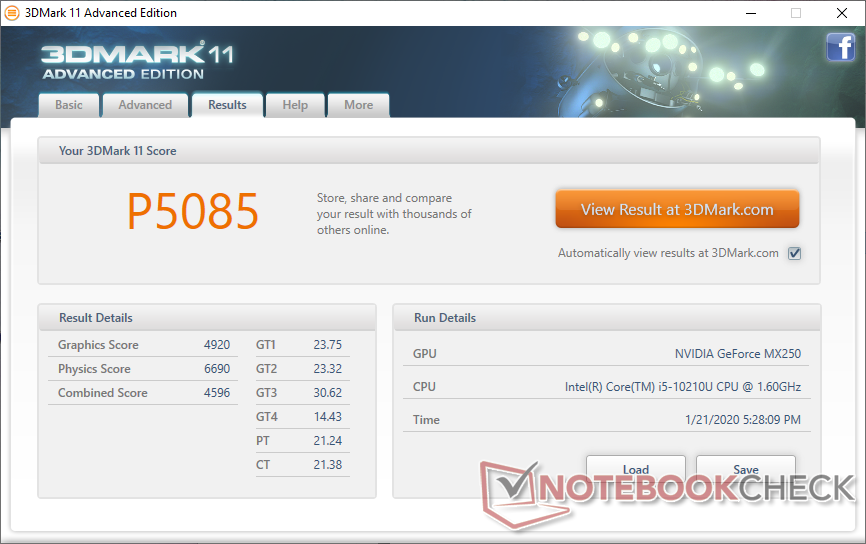
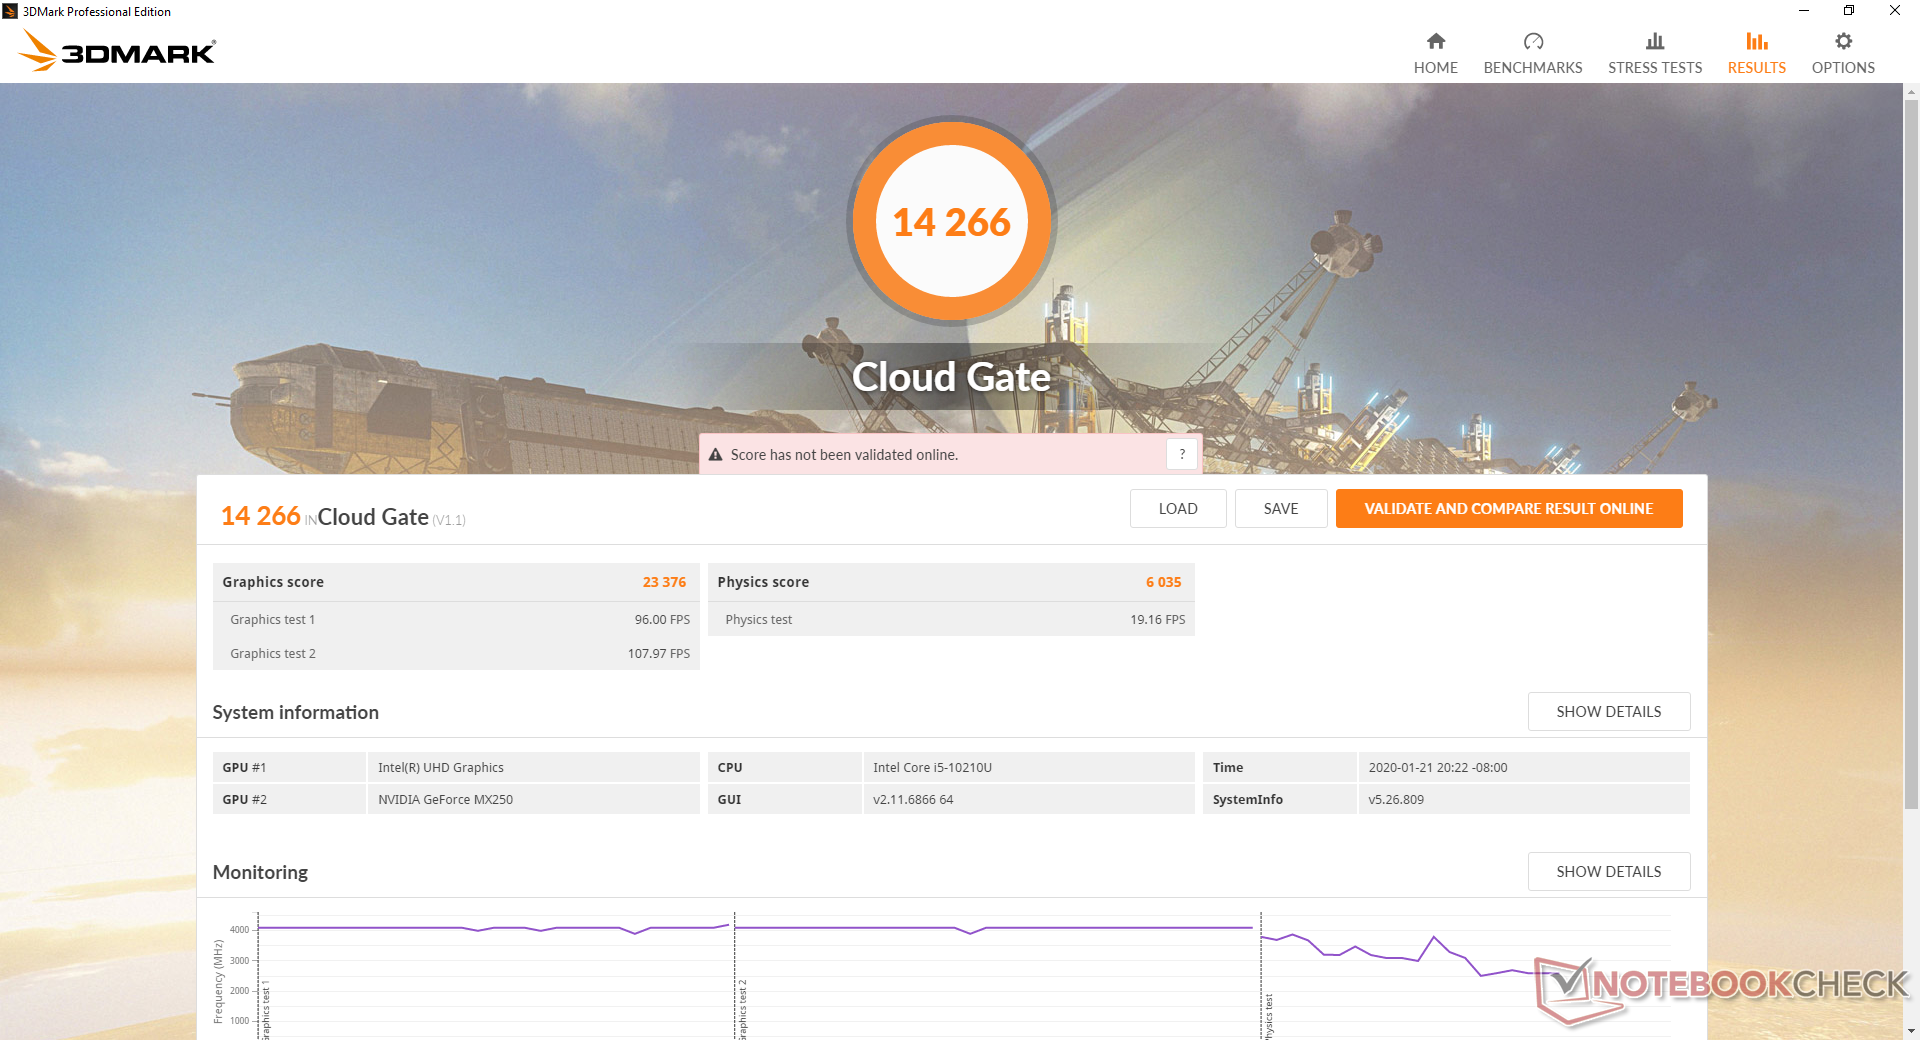
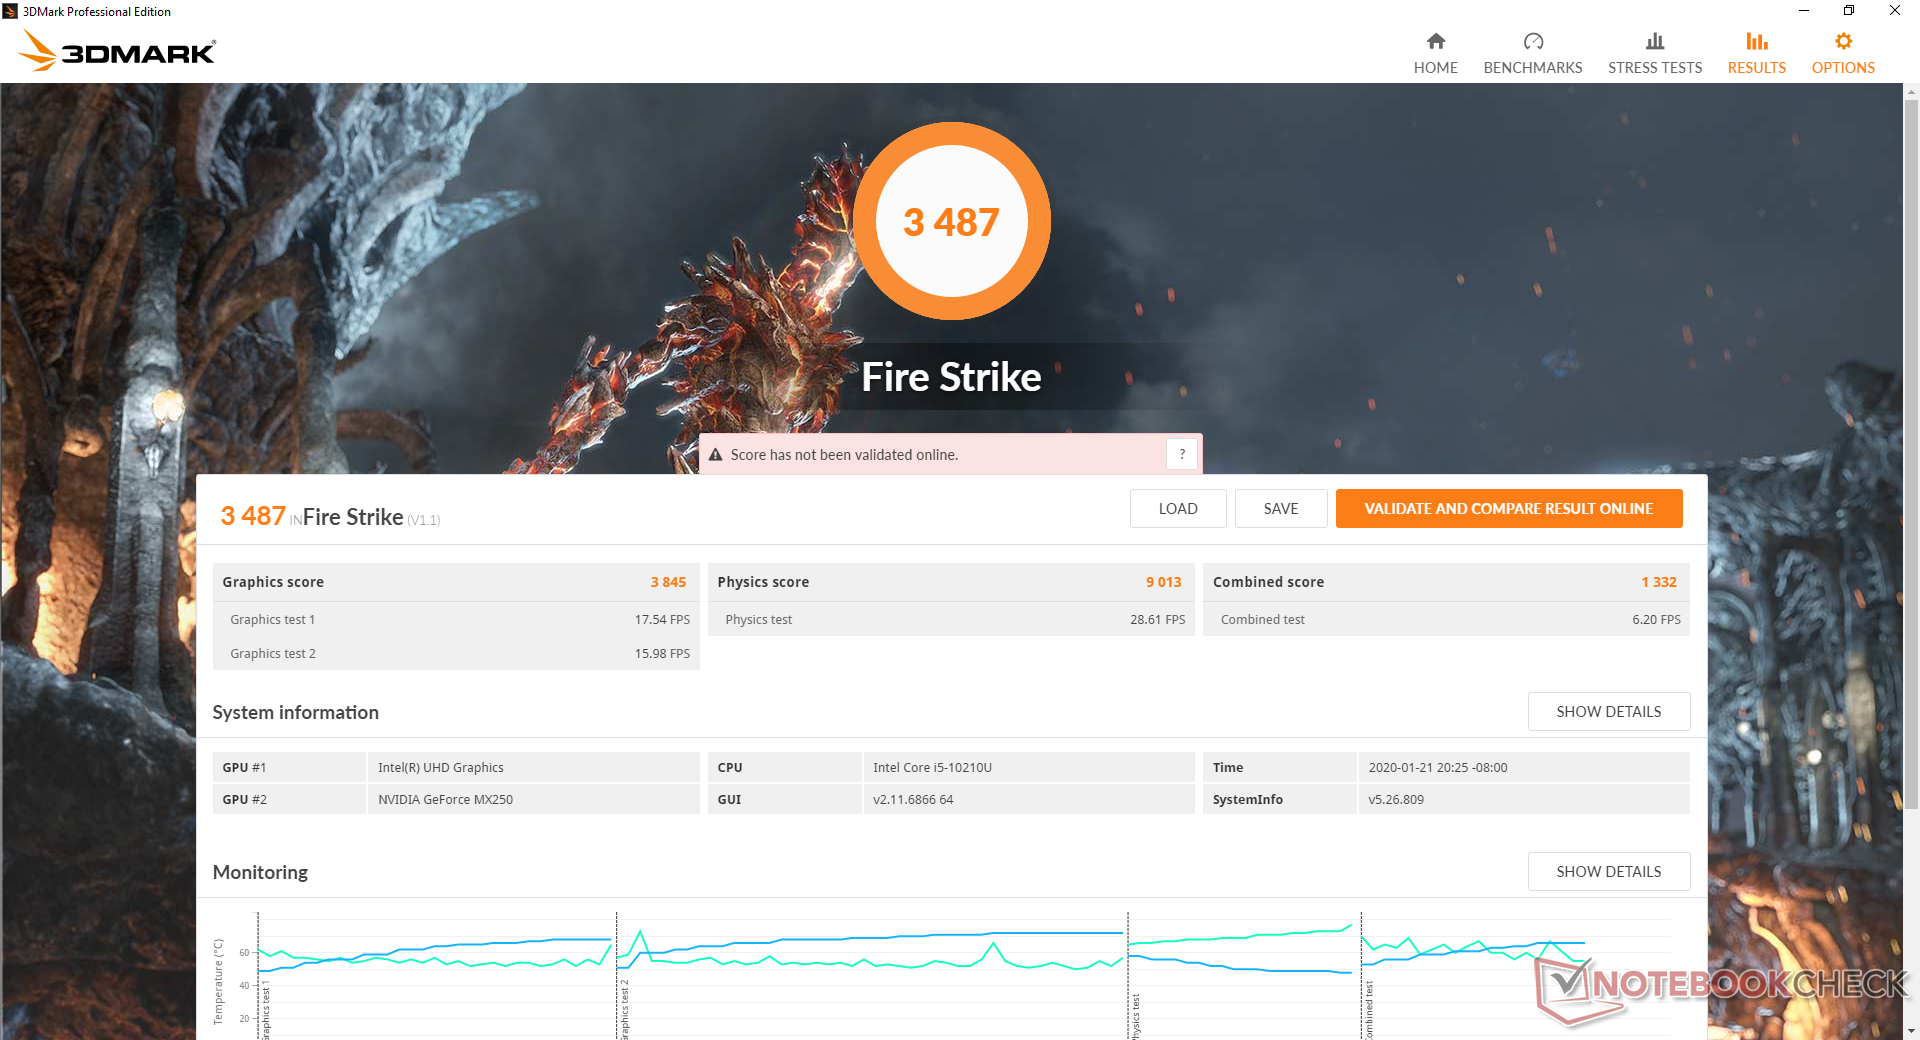
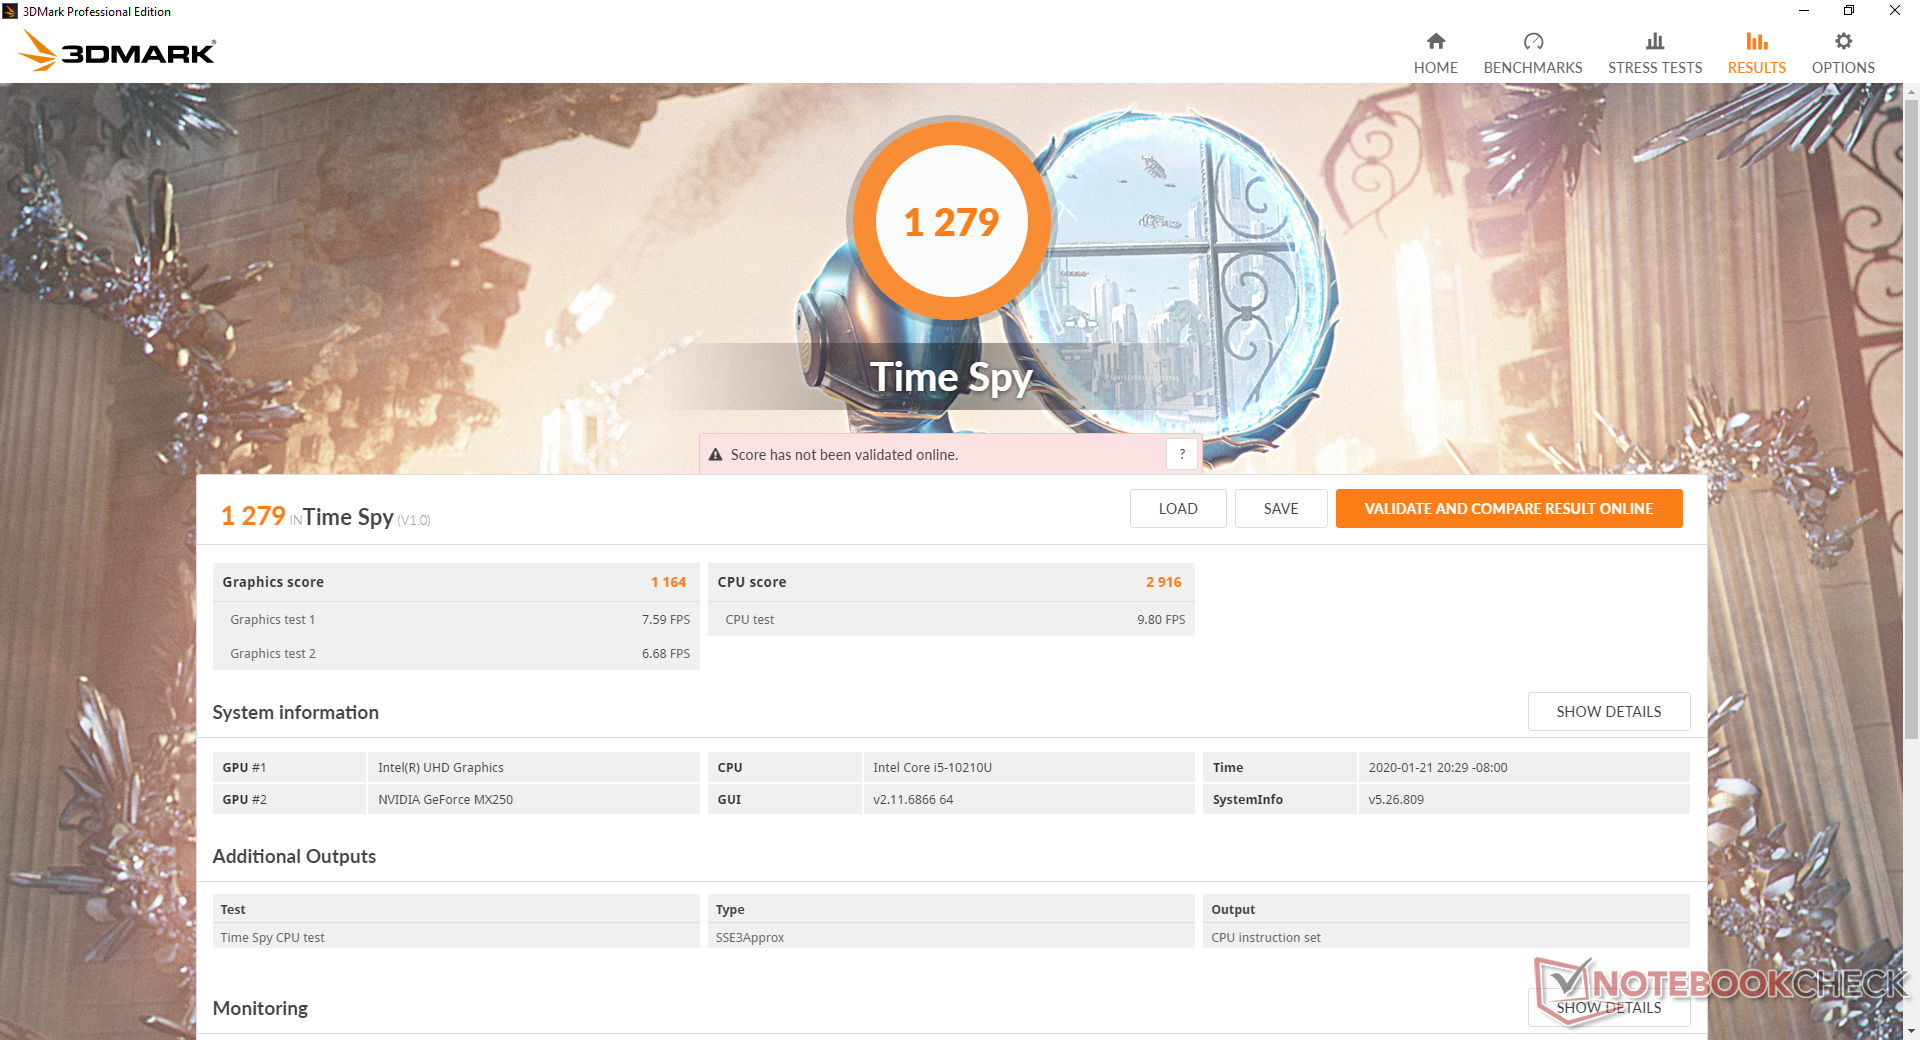
| 3DMark 11 Performance | 5085 points | |
| 3DMark Cloud Gate Standard Score | 14266 points | |
| 3DMark Fire Strike Score | 3487 points | |
| 3DMark Time Spy Score | 1279 points | |
Help | ||
| low | med. | high | ultra | |
|---|---|---|---|---|
| BioShock Infinite (2013) | 189.7 | 117.5 | 100.5 | 37.8 |
| The Witcher 3 (2015) | 68.1 | 38 | 21.5 | 11.7 |
| Shadow of the Tomb Raider (2018) | 56 | 19 | 12 |
Emissions
System Noise
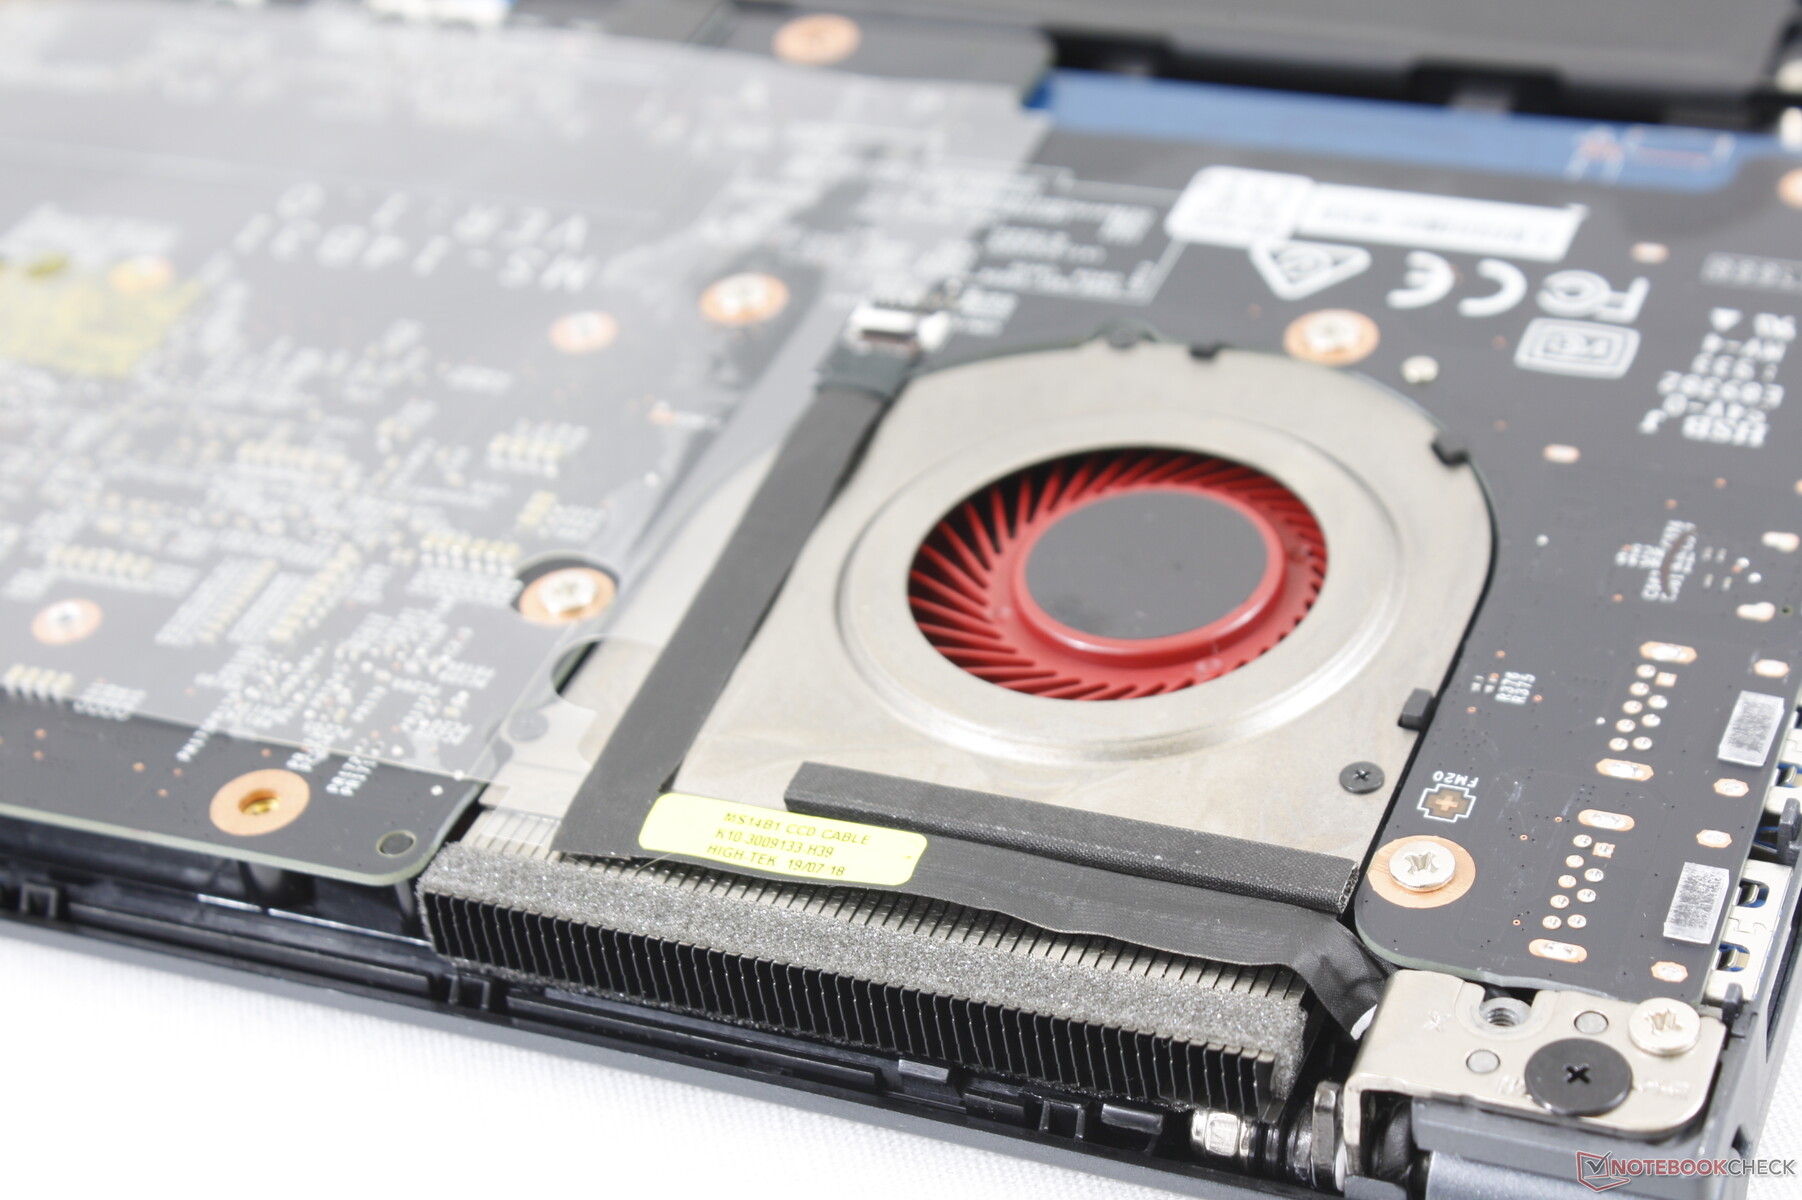
The cooling solution consists of twin fans and three heat pipes between them. The GPU and CPU do not share any heat pipes unlike on most other laptops meaning that if one processor is being stressed, the temperature of the other processor will not be significantly affected.
Fan noise is always present at about 29.5 dB(A) against a background of 28.7 dB(A) when connected to the AC adapter. Setting the system to Silent mode or High Performance mode via MSI Creator Center would not change the minimum fan noise. Only when the laptop is disconnected from the outlet will the fans fully stop.
Running higher loads like 3DMark 06 will induce a fan noise of about 33.4 dB(A) to be not unlike what we recorded on the Lenovo ThinkPad P43s or Ice Lake-powered Yoga C940 when under similar conditions. Pulsing behavior is kept to a minimum. If gaming, fan noise can be up to 40.5 dB(A). The Modern 14 is a quiet system overall with a slightly higher noise ceiling than most Ultrabooks when under high processing stress.
We can notice no electronic noise or coil whine from our test unit.

| MSI Modern 14 A10RB-459US GeForce MX250, i5-10210U, Kingston RBUSNS8154P3512GJ | Asus ZenBook 15 UX534FT-DB77 GeForce GTX 1650 Max-Q, i7-8565U, Samsung SSD PM981 MZVLB1T0HALR | Lenovo Yoga C940-14IIL Iris Plus Graphics G7 (Ice Lake 64 EU), i7-1065G7, Samsung SSD PM981 MZVLB512HAJQ | Apple MacBook Pro 16 2019 i9 5500M Radeon Pro 5500M, i9-9880H, Apple SSD AP1024 7171 | Lenovo ThinkPad P43s-20RH001FGE Quadro P520, i7-8565U, WDC PC SN720 SDAQNTW-256G | Lenovo ThinkPad X1 Carbon 2019-20QE000VGE UHD Graphics 620, i7-8665U, WDC PC SN720 SDAQNTW-512G | |
|---|---|---|---|---|---|---|
| Noise | 1% | 3% | -10% | 3% | 6% | |
| off / environment * (dB) | 28.7 | 28.4 1% | 29.3 -2% | 29.8 -4% | 29.2 -2% | 28.4 1% |
| Idle Minimum * (dB) | 29.5 | 28.4 4% | 29.3 1% | 29.9 -1% | 29.2 1% | 28.4 4% |
| Idle Average * (dB) | 29.5 | 28.4 4% | 29.3 1% | 29.9 -1% | 29.2 1% | 28.4 4% |
| Idle Maximum * (dB) | 29.5 | 28.4 4% | 29.3 1% | 29.9 -1% | 29.2 1% | 28.6 3% |
| Load Average * (dB) | 33.4 | 33.9 -1% | 33.3 -0% | 43 -29% | 33.3 -0% | 31.5 6% |
| Witcher 3 ultra * (dB) | 37.9 | 39.8 -5% | 45.4 -20% | |||
| Load Maximum * (dB) | 40.5 | 40.2 1% | 33.3 18% | 46.1 -14% | 33.3 18% | 33.1 18% |
* ... smaller is better
Noise level
| Idle |
| 29.5 / 29.5 / 29.5 dB(A) |
| Load |
| 33.4 / 40.5 dB(A) |
 | ||
30 dB silent 40 dB(A) audible 50 dB(A) loud |
||
min: | ||
Temperature
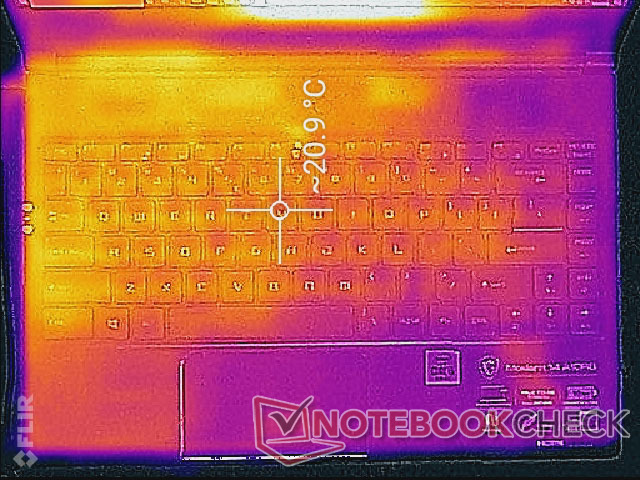
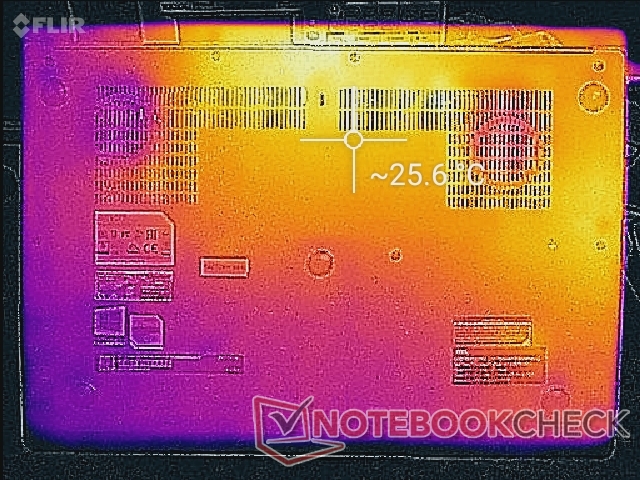
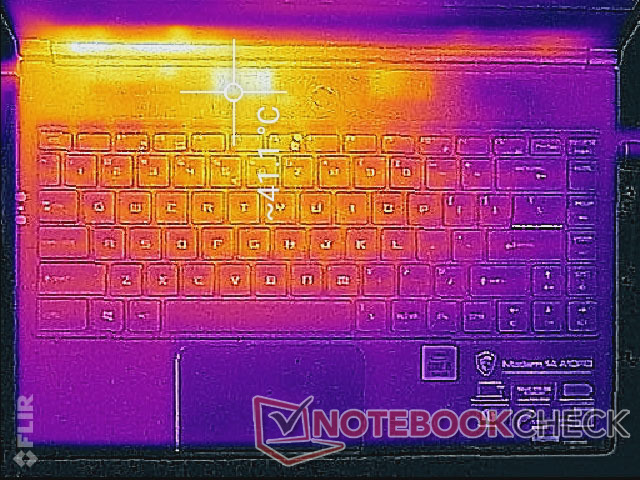
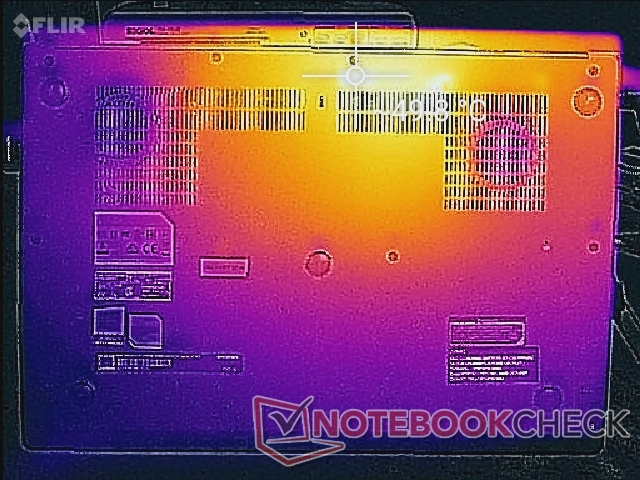
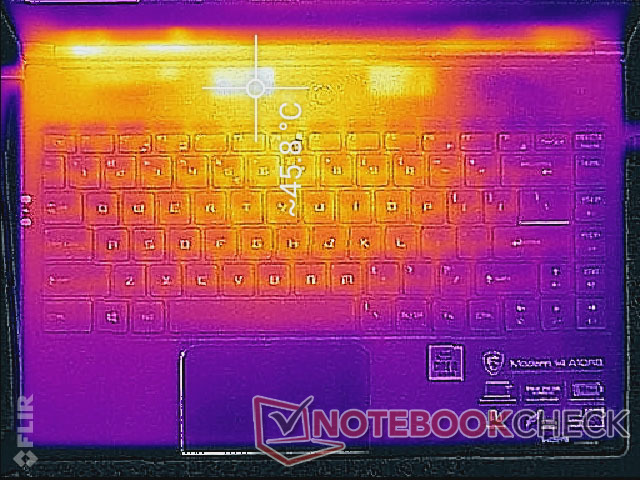
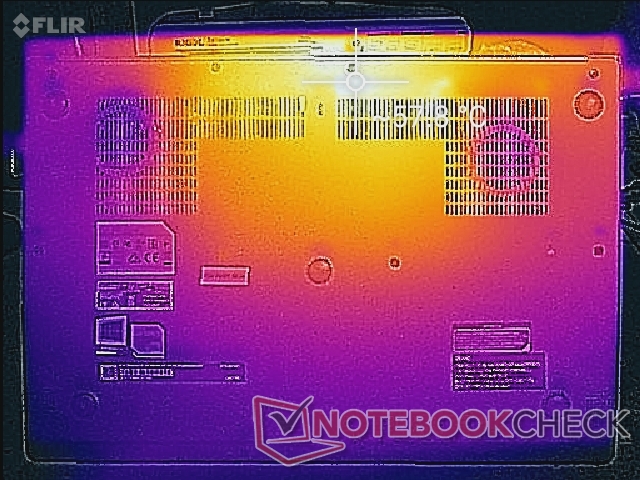
Surface temperatures when idling are flat on both sides with the rear being slightly warmer by a few degrees C. If gaming, hot spots can become as warm as 41 C up to 57 C. These spots are thankfully toward the rear of the chassis where fingers and palms are unlikely to touch as shown by our temperature maps below. In comparison, hot spots on the Ice Lake-powered Lenovo Yoga C940-14 are slightly cooler at up to 45 C when under similar stressful conditions. The palm rests and keyboard keys of the MSI never become uncomfortably warm to type on.
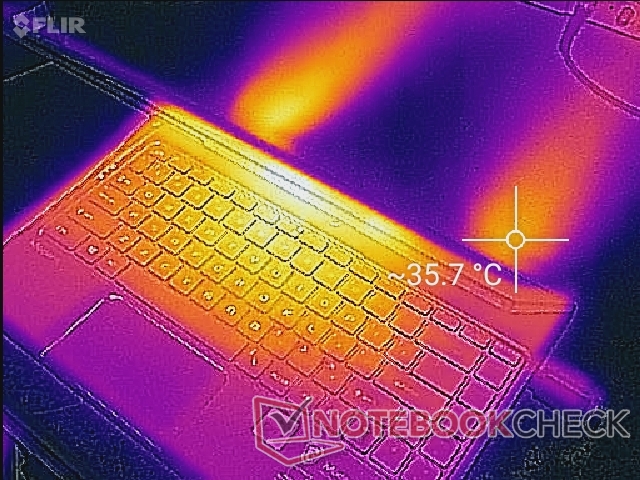
(-) The maximum temperature on the upper side is 47.6 °C / 118 F, compared to the average of 34.3 °C / 94 F, ranging from 21.2 to 62.5 °C for the class Office.
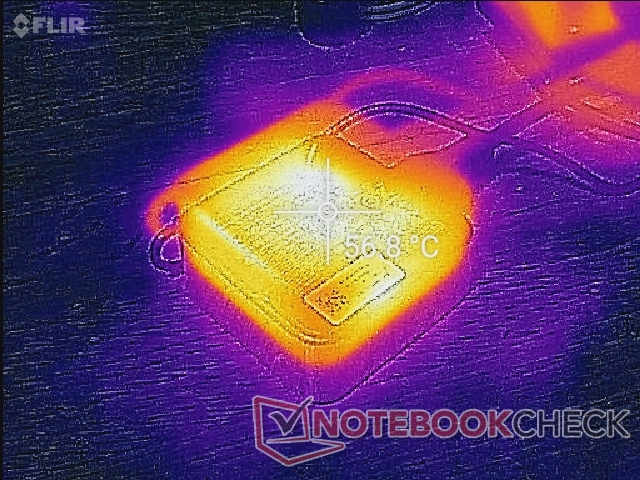
(-) The bottom heats up to a maximum of 58.2 °C / 137 F, compared to the average of 36.8 °C / 98 F
(+) In idle usage, the average temperature for the upper side is 20.7 °C / 69 F, compared to the device average of 29.5 °C / 85 F.
(+) Playing The Witcher 3, the average temperature for the upper side is 29.1 °C / 84 F, compared to the device average of 29.5 °C / 85 F.
(+) The palmrests and touchpad are cooler than skin temperature with a maximum of 26.8 °C / 80.2 F and are therefore cool to the touch.
(±) The average temperature of the palmrest area of similar devices was 27.5 °C / 81.5 F (+0.7 °C / 1.3 F).
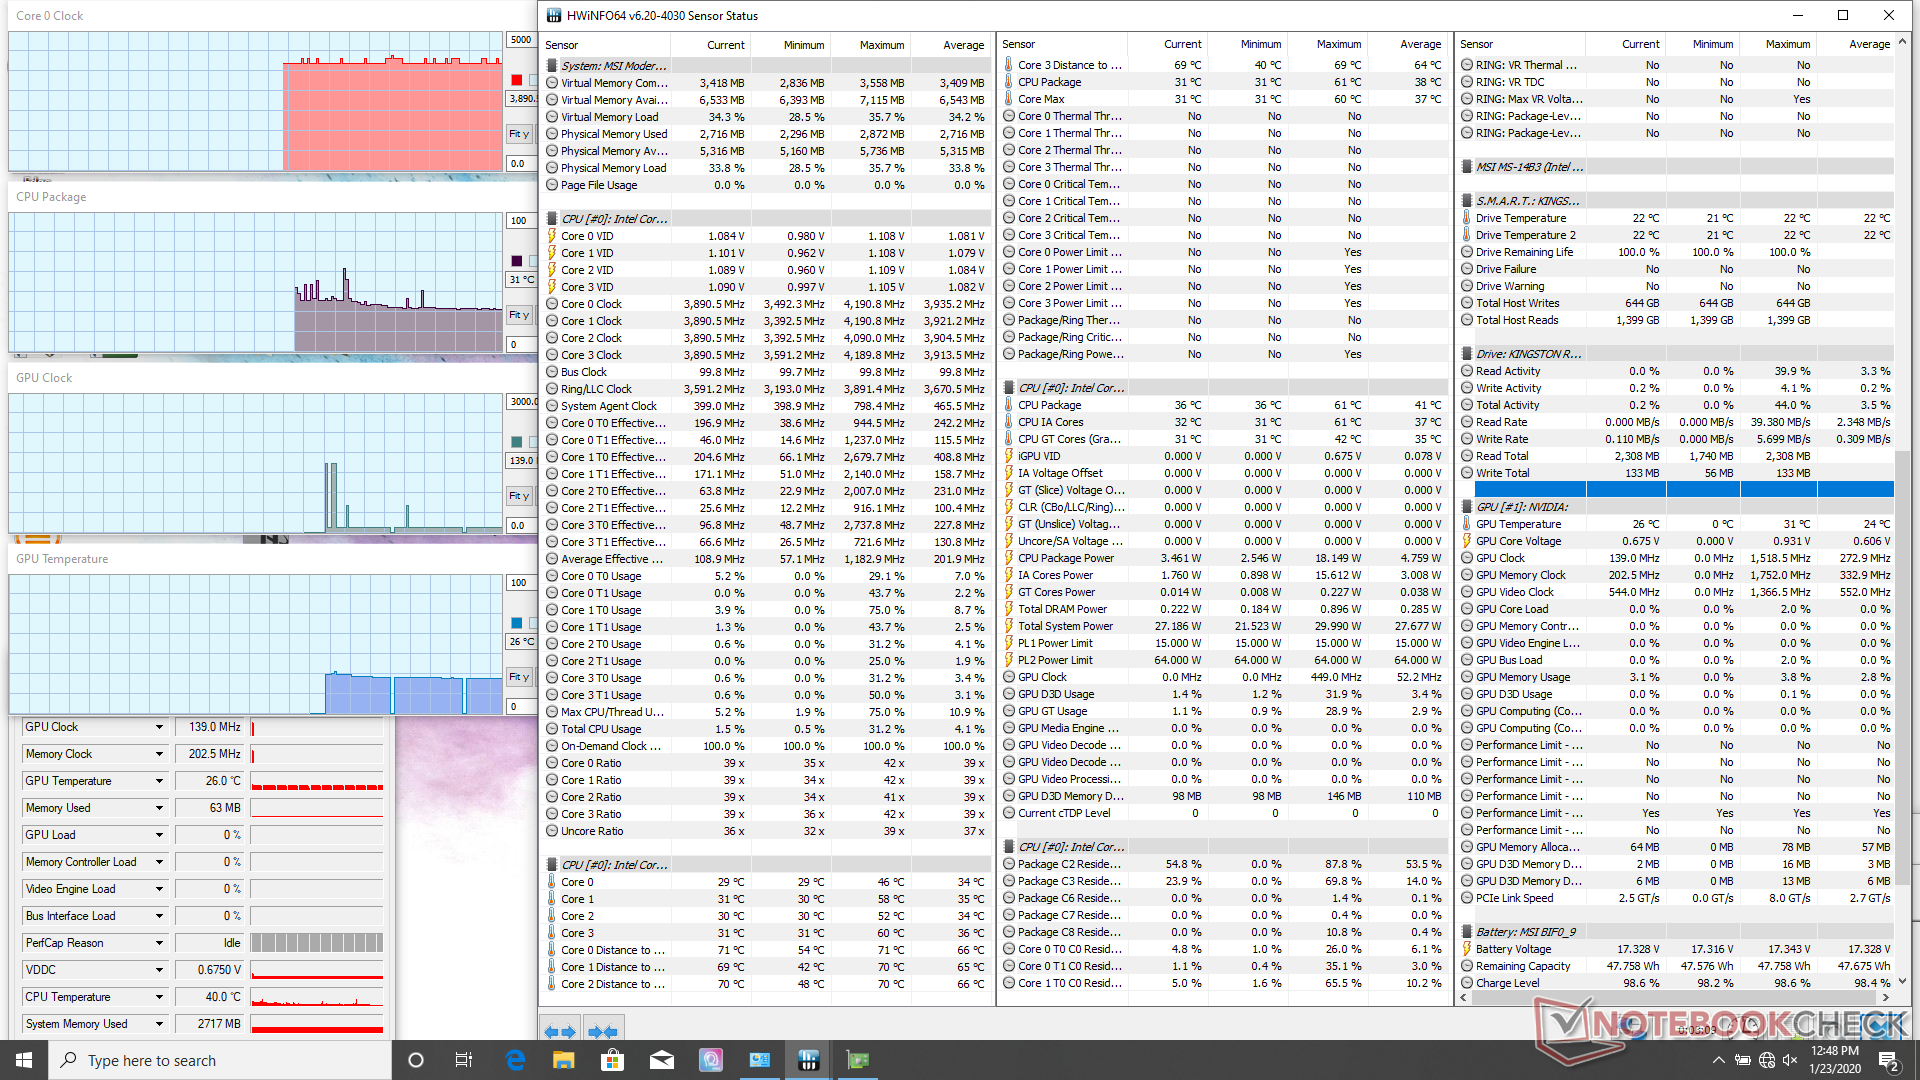
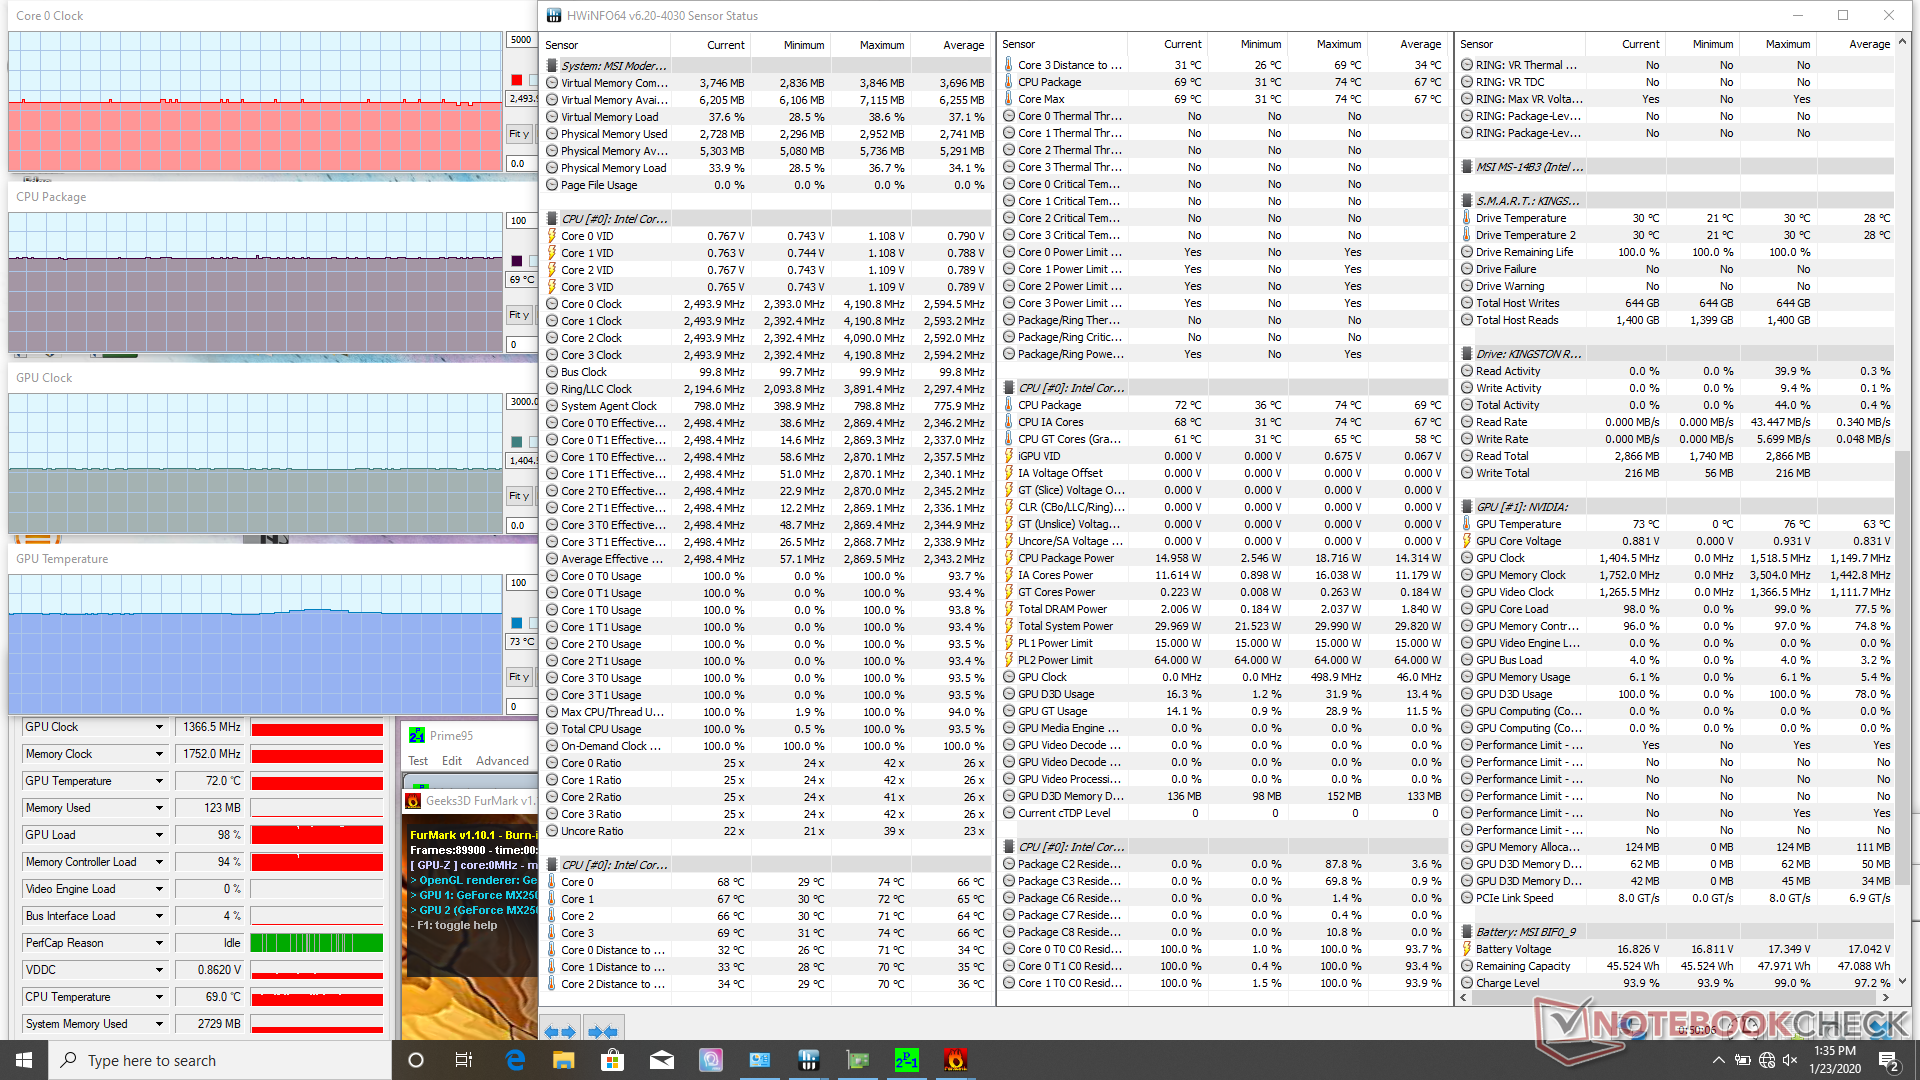
Stress Test
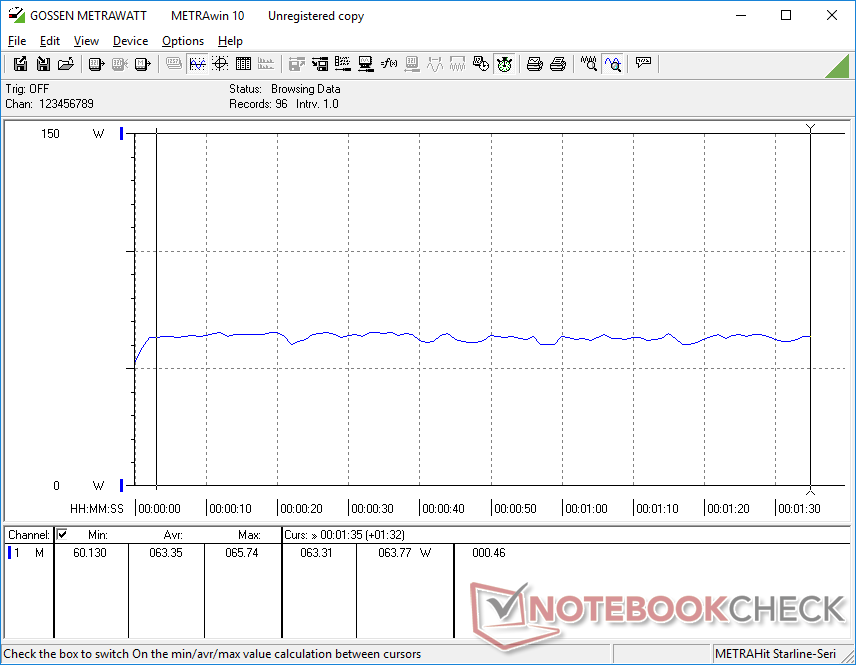
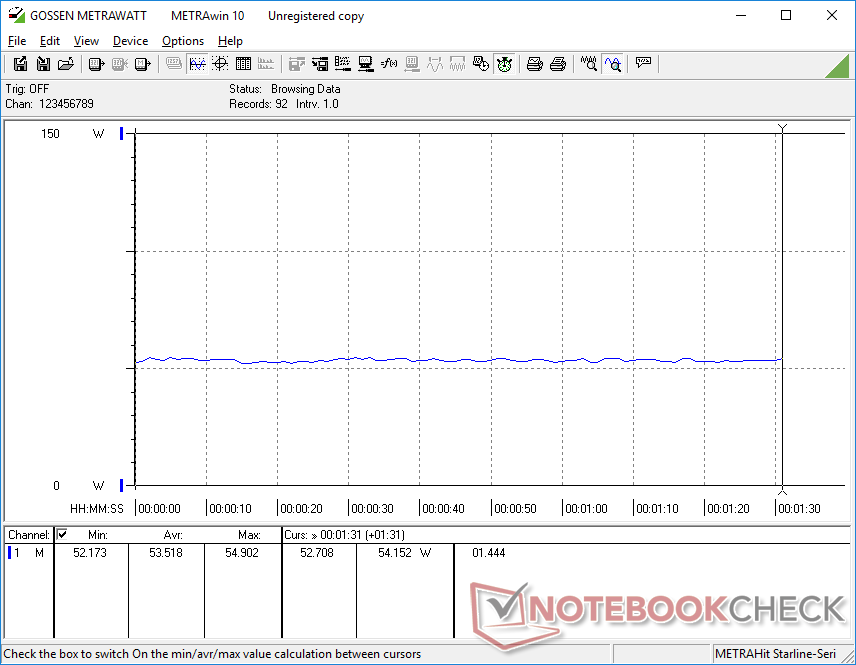
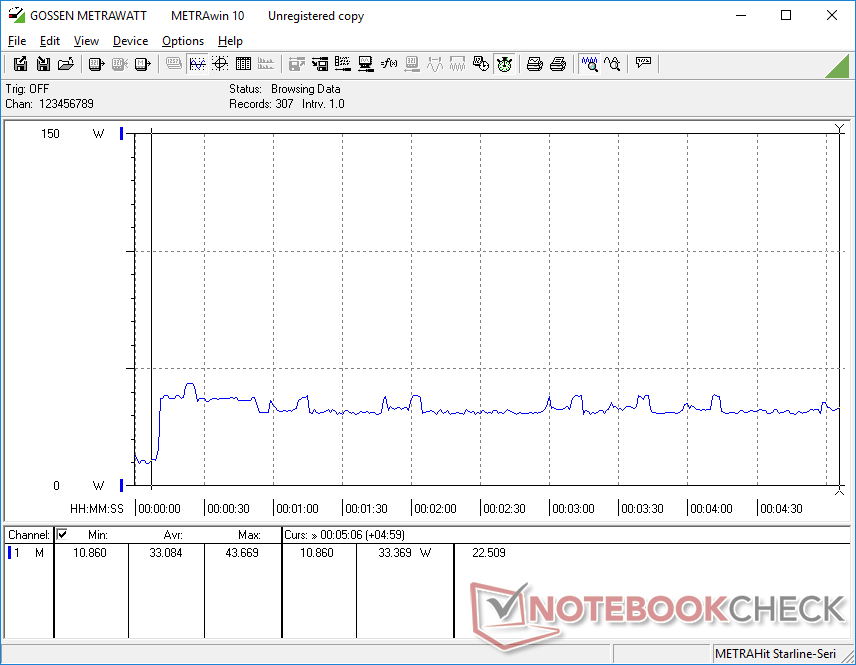
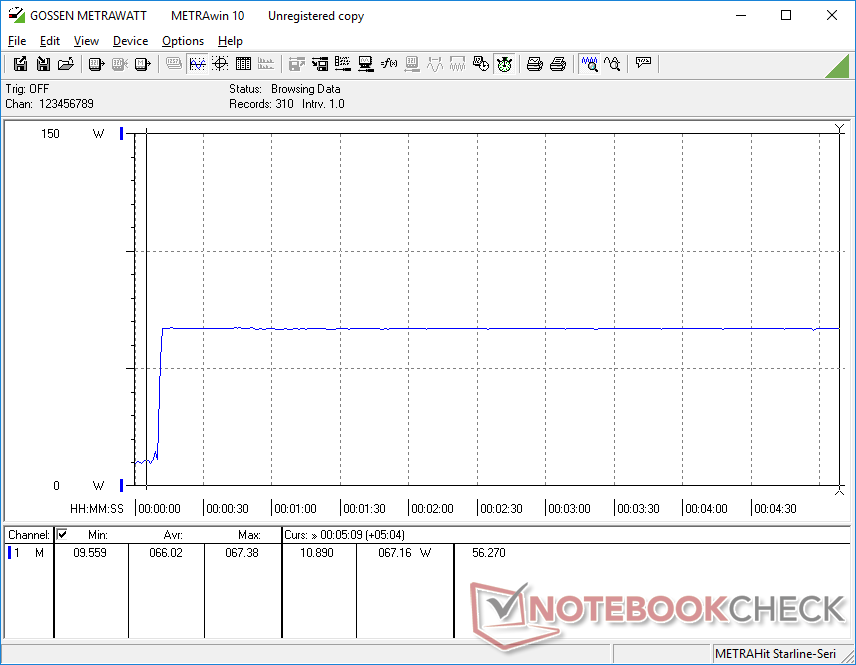
We stress the laptop in order to identify for any potential throttling or stability issues. When running Prime95, the CPU would boost to the 2.7 GHz to 3 GHz range for the first 40 seconds or so until reaching a core temperature of 70 C. Thereafter, clock rates drop to the 2.3 to 2.5 GHz range in order to maintain a core temperature of 71 C. These results are in line with what we observed in our CineBench R15 Multi-Thread loop test above and power consumption readings below.
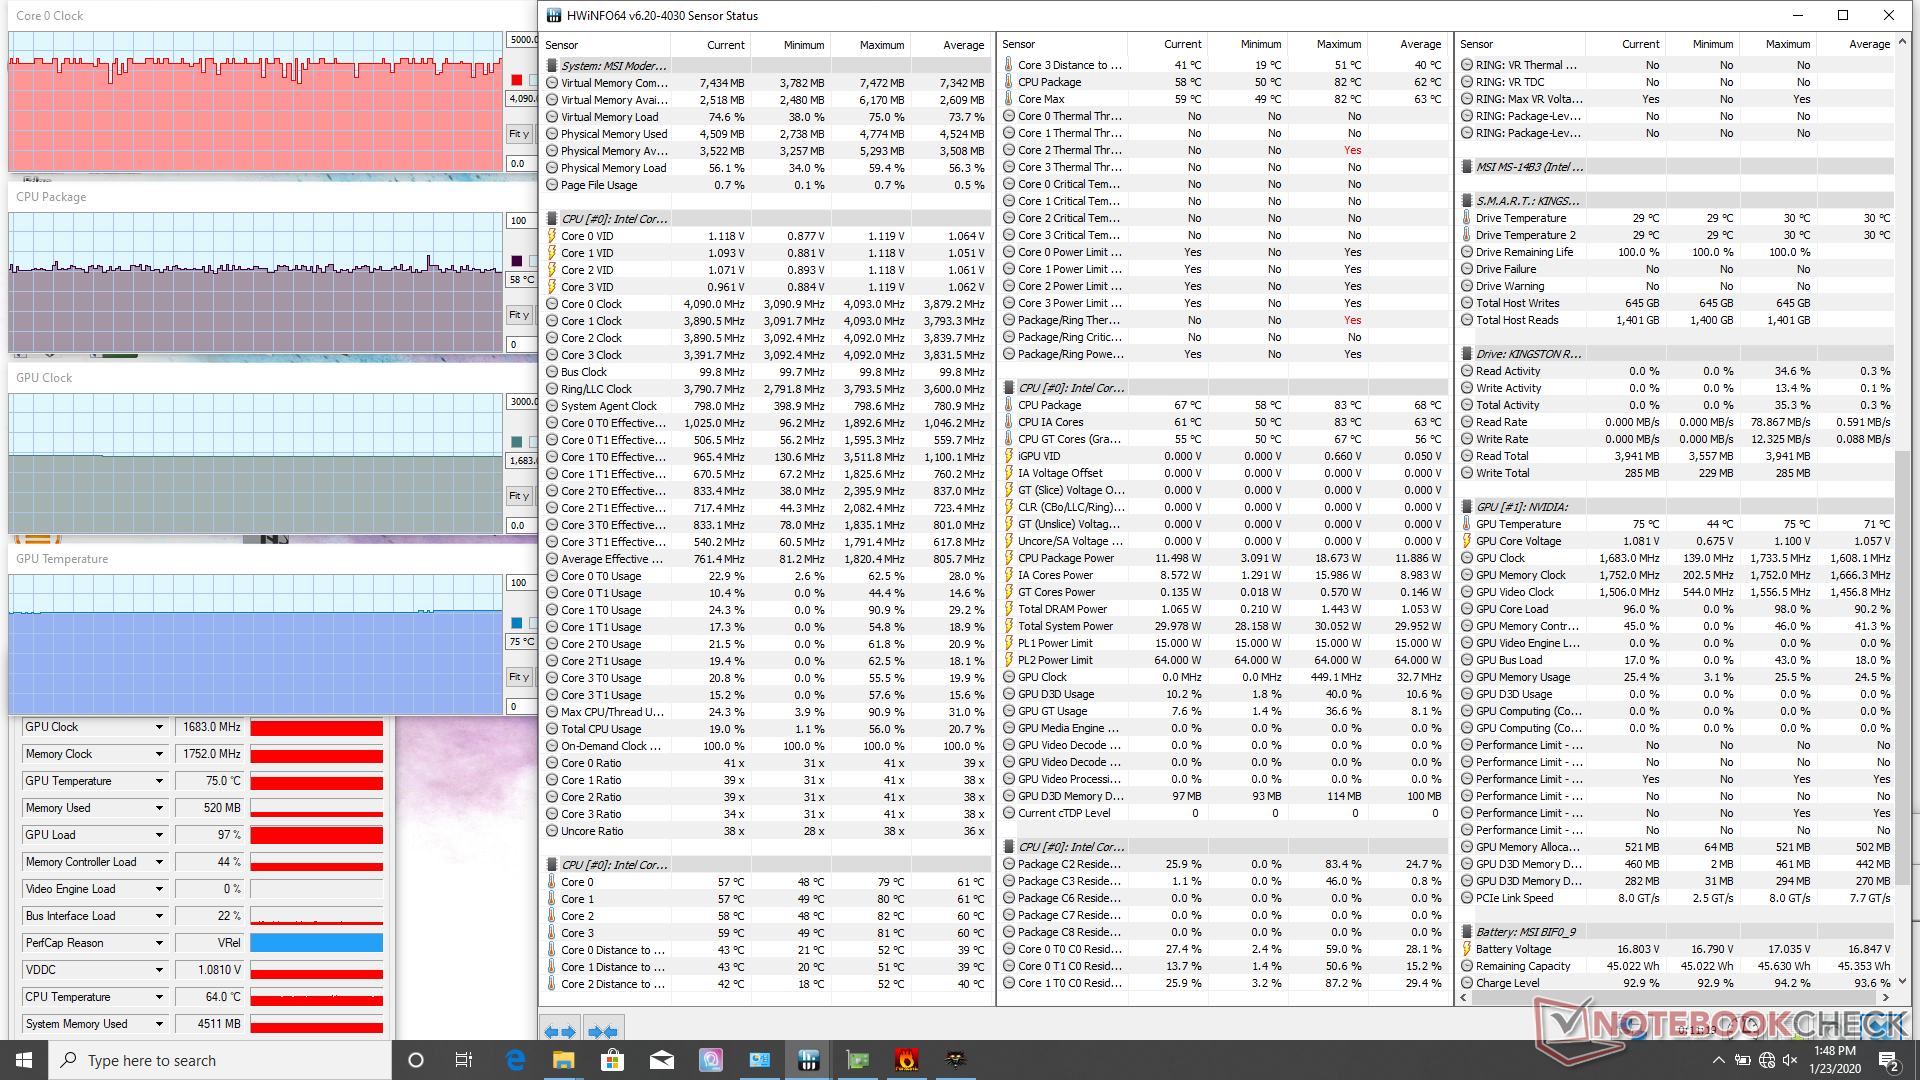
Running Witcher 3 is more representative of real-world stressful loads. CPU and GPU temperatures would stabilize at 58 C and 75 C, respectively, compared to the 75 C and 91 C maximum on the 2019 HP Spectre x360 15 equipped with the same GeForce MX250 GPU. Core temperatures are relatively cool meaning that the below average CPU performance may be attributed to maintaining comfortable surface temperatures instead.
Running on battery will limit performance. A 3DMark 11 test on batteries returns Physics and Graphics scores of 6502 and 4345 points, respectively, compared to 6690 and 4920 points when on mains.

| CPU Clock (GHz) | GPU Clock (MHz) | Average CPU Temperature (°C) | Average GPU Temperature (°C) | |
| System Idle | -- | -- | 31 | 26 |
| Prime95 Stress | 2.3 - 2.5 | -- | 72 | 29 |
| Prime95 + FurMark Stress | 2.3 - 2.6 | 1404 | 69 | 73 |
| Witcher 3 Stress | ~4.0 | 1683 | ~58 | 75 |
Speakers
MSI has set high standards for itself in regards to audio quality with their powerful speakers in most G Series gaming laptops. The speakers in the Modern 14, however, are more typical of a cheap to mid-range laptop. Bass is weaker than expected with roll-off beginning at around 1000 Hz compared to 250 Hz or 500 Hz on many multimedia laptops like the HP Spectre x360 15. The speakers work well enough for voice calls and small conference rooms, but you'll want earphones for music and video playback. High volume settings will introduce no static or vibrations.


MSI Modern 14 A10RB-459US audio analysis
(+) | speakers can play relatively loud (84.8 dB)
Bass 100 - 315 Hz
(-) | nearly no bass - on average 25.7% lower than median
(±) | linearity of bass is average (11.6% delta to prev. frequency)
Mids 400 - 2000 Hz
(±) | higher mids - on average 8.2% higher than median
(±) | linearity of mids is average (10.7% delta to prev. frequency)
Highs 2 - 16 kHz
(+) | balanced highs - only 3.2% away from median
(±) | linearity of highs is average (7.9% delta to prev. frequency)
Overall 100 - 16.000 Hz
(-) | overall sound is not linear (30.8% difference to median)
Compared to same class
» 92% of all tested devices in this class were better, 3% similar, 5% worse
» The best had a delta of 7%, average was 21%, worst was 53%
Compared to all devices tested
» 89% of all tested devices were better, 3% similar, 8% worse
» The best had a delta of 4%, average was 24%, worst was 134%
Apple MacBook 12 (Early 2016) 1.1 GHz audio analysis
(+) | speakers can play relatively loud (83.6 dB)
Bass 100 - 315 Hz
(±) | reduced bass - on average 11.3% lower than median
(±) | linearity of bass is average (14.2% delta to prev. frequency)
Mids 400 - 2000 Hz
(+) | balanced mids - only 2.4% away from median
(+) | mids are linear (5.5% delta to prev. frequency)
Highs 2 - 16 kHz
(+) | balanced highs - only 2% away from median
(+) | highs are linear (4.5% delta to prev. frequency)
Overall 100 - 16.000 Hz
(+) | overall sound is linear (10.2% difference to median)
Compared to same class
» 7% of all tested devices in this class were better, 2% similar, 91% worse
» The best had a delta of 5%, average was 18%, worst was 53%
Compared to all devices tested
» 5% of all tested devices were better, 1% similar, 94% worse
» The best had a delta of 4%, average was 24%, worst was 134%
Energy Management
Power Consumption
Idling on desktop demands between 4 W and 8 W depending on the brightness level and power profile to be more efficient than most other Ultrabooks. If gaming, expect consumption to range between 53 W and 63 W. Note that the GTX 1650 Max-Q in the Asus ZenBook 15 can offer 110 to 170 percent faster graphics performance for a mere 19 percent increase in power consumption.
We're able to record a maximum consumption of 67.4 W from the small (~6.6 x 6.6 x 3 cm) 65 W AC adapter when running both Prime95 and FurMark simultaneously. The Modern 14 is able to maintain this rate even after five full minutes which is uncommon on thin and light laptops.
| Off / Standby | |
| Idle | |
| Load |
|
Key:
min: | |
| MSI Modern 14 A10RB-459US i5-10210U, GeForce MX250, Kingston RBUSNS8154P3512GJ, IPS, 1920x1080, 14" | Asus ZenBook 15 UX534FT-DB77 i7-8565U, GeForce GTX 1650 Max-Q, Samsung SSD PM981 MZVLB1T0HALR, IPS, 1920x1080, 15.6" | Lenovo Yoga C940-14IIL i7-1065G7, Iris Plus Graphics G7 (Ice Lake 64 EU), Samsung SSD PM981 MZVLB512HAJQ, IPS LED, 1920x1080, 14" | Dell XPS 15 7590 9980HK GTX 1650 i9-9980HK, GeForce GTX 1650 Mobile, Toshiba XG6 KXG60ZNV1T02, OLED, 3840x2160, 15.6" | Apple MacBook Pro 16 2019 i9 5500M i9-9880H, Radeon Pro 5500M, Apple SSD AP1024 7171, IPS, 3072x1920, 16" | Lenovo ThinkPad X1 Carbon 2019-20QE000VGE i7-8665U, UHD Graphics 620, WDC PC SN720 SDAQNTW-512G, IPS, 2560x1440, 14" | |
|---|---|---|---|---|---|---|
| Power Consumption | -79% | 2% | -90% | -70% | 7% | |
| Idle Minimum * (Watt) | 4.2 | 5 -19% | 3.2 24% | 6.2 -48% | 3.7 12% | 3 29% |
| Idle Average * (Watt) | 5.9 | 13.2 -124% | 7 -19% | 9.6 -63% | 12.1 -105% | 6.3 -7% |
| Idle Maximum * (Watt) | 7.2 | 24 -233% | 8.9 -24% | 21.2 -194% | 17 -136% | 8.9 -24% |
| Load Average * (Watt) | 63.4 | 70 -10% | 47.6 25% | 104.3 -65% | 91.5 -44% | 40.8 36% |
| Witcher 3 ultra * (Watt) | 53.5 | 63.3 -18% | 91.7 -71% | 103 -93% | ||
| Load Maximum * (Watt) | 67.4 | 114 -69% | 63.1 6% | 135.3 -101% | 102.3 -52% | 67.5 -0% |
* ... smaller is better
Battery Life

Battery capacity is smaller than most 15.6-inch laptops due to the smaller screen size of the Modern 14. Runtimes are still comparable to most Ultrabooks at about 8.5 hours of real-world WLAN use. Charging from empty to full capacity takes about 2 hours.
We tried connecting a USB Type-C charger, but the laptop does not support USB Type-C charging.
| MSI Modern 14 A10RB-459US i5-10210U, GeForce MX250, 50 Wh | Lenovo ThinkPad X1 Carbon 2018-20KGS5DU00 i5-8550U, UHD Graphics 620, 57 Wh | Asus ZenBook 15 UX534FT-DB77 i7-8565U, GeForce GTX 1650 Max-Q, 71 Wh | Lenovo Yoga C940-14IIL i7-1065G7, Iris Plus Graphics G7 (Ice Lake 64 EU), 60 Wh | Dell XPS 15 7590 9980HK GTX 1650 i9-9980HK, GeForce GTX 1650 Mobile, 97 Wh | Apple MacBook Pro 16 2019 i9 5500M i9-9880H, Radeon Pro 5500M, 99.8 Wh | |
|---|---|---|---|---|---|---|
| Battery runtime | 5% | 30% | -8% | 22% | -2% | |
| Reader / Idle (h) | 16.4 | 21.5 31% | 15.2 -7% | |||
| WiFi v1.3 (h) | 8.6 | 9 5% | 8.4 -2% | 10.6 23% | 7.8 -9% | 12 40% |
| Load (h) | 1.8 | 2.9 61% | 1.1 -39% | 3.3 83% | 1 -44% | |
| Witcher 3 ultra (h) | 0.9 |
Pros
Cons
Verdict

After dabbing in gaming laptops and professional laptops for so long, MSI is now ready to crack the affordable subnotebook office market with the Modern 14. The best characteristics of the Modern 14 are mostly visual; the 14-inch display is well-calibrated and ready to go while the travel-friendly weight, healthy port selection, and optional GeForce MX250 graphics all directly benefit the target audience.
The main disadvantages of the Modern 14 are chassis rigidity, upgradeability, single-channel RAM, and keyboard feedback. Surfaces flex and creak more than most office laptops from Dell, Lenovo, or HP while common upgrades like RAM or storage are made more difficult. Keyboard keys are on the soft side and could have benefited from crisper feedback to better serve typists.
Other drawbacks include the "nose cam" webcam, no fingerprint reader or Thunderbolt 3 support, 8 GB of single-channel RAM, and average CPU performance from the Core i5-10210U. For less than $900, however, it's a fair price so long as you know the strengths and weaknesses of the system.
This isn't your dad's office laptop. The MSI Modern 14 targets younger office users and content creators with its visually attractive design and very light weight when compared to the mid-range office solutions from Dell, HP, or Lenovo.
MSI Modern 14 A10RB-459US
- 01/27/2020 v7 (old)
Allen Ngo
Price comparison
