MSI WE75 9TK Workstation Review: Core i7 with Quadro RTX Power
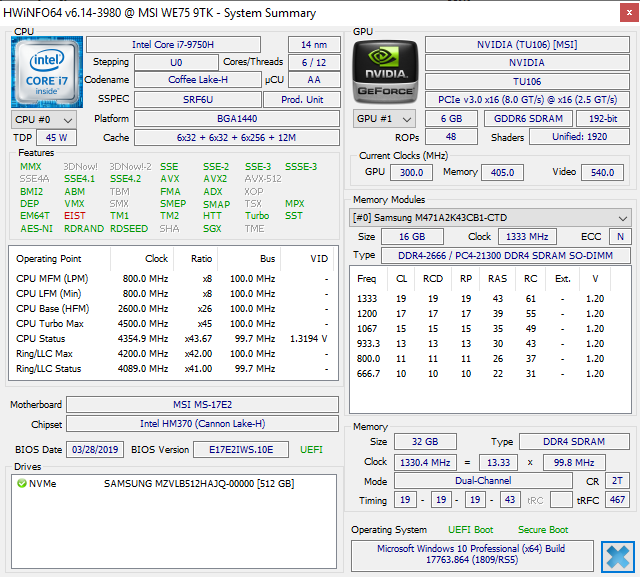
Take the MSI GE75, swap out the GeForce GPU for a Quadro GPU, and you have the MSI WE75. Of course, there are a few more differences that we'll go over below, but most MSI mobile workstations follow this formula. The WE75 we have here today comes equipped with the Core i7-9750H CPU, Quadro RTX 3000 GPU, 32 GB of DDR4 RAM, and 1080p 60 Hz display for about $2400 USD. While there are other SKUs with Core i9, Xeon, or Quadro T2000 options, there are curiously no other display options or higher GPUs available.
The WE75 competes directly with other performance 17.3-inch workstations like the Dell Precision 7730, Fujitsu Celsius H980, Eurocom Tornado F7W, Lenovo ThinkPad P73, or the HP ZBook 17. It succeeds the two-year old WE72.
We recommend checking out our existing reviews on the GE75 since the WE75 shares the same physical features, ports, keyboard, and more.
Rating | Date | Model | Weight | Height | Size | Resolution | Price |
|---|---|---|---|---|---|---|---|
| 84.8 % v7 (old) | 11 / 2019 | MSI WE75 9TK i7-9750H, Quadro RTX 3000 (Laptop) | 2.6 kg | 27.5 mm | 17.30" | 1920x1080 |
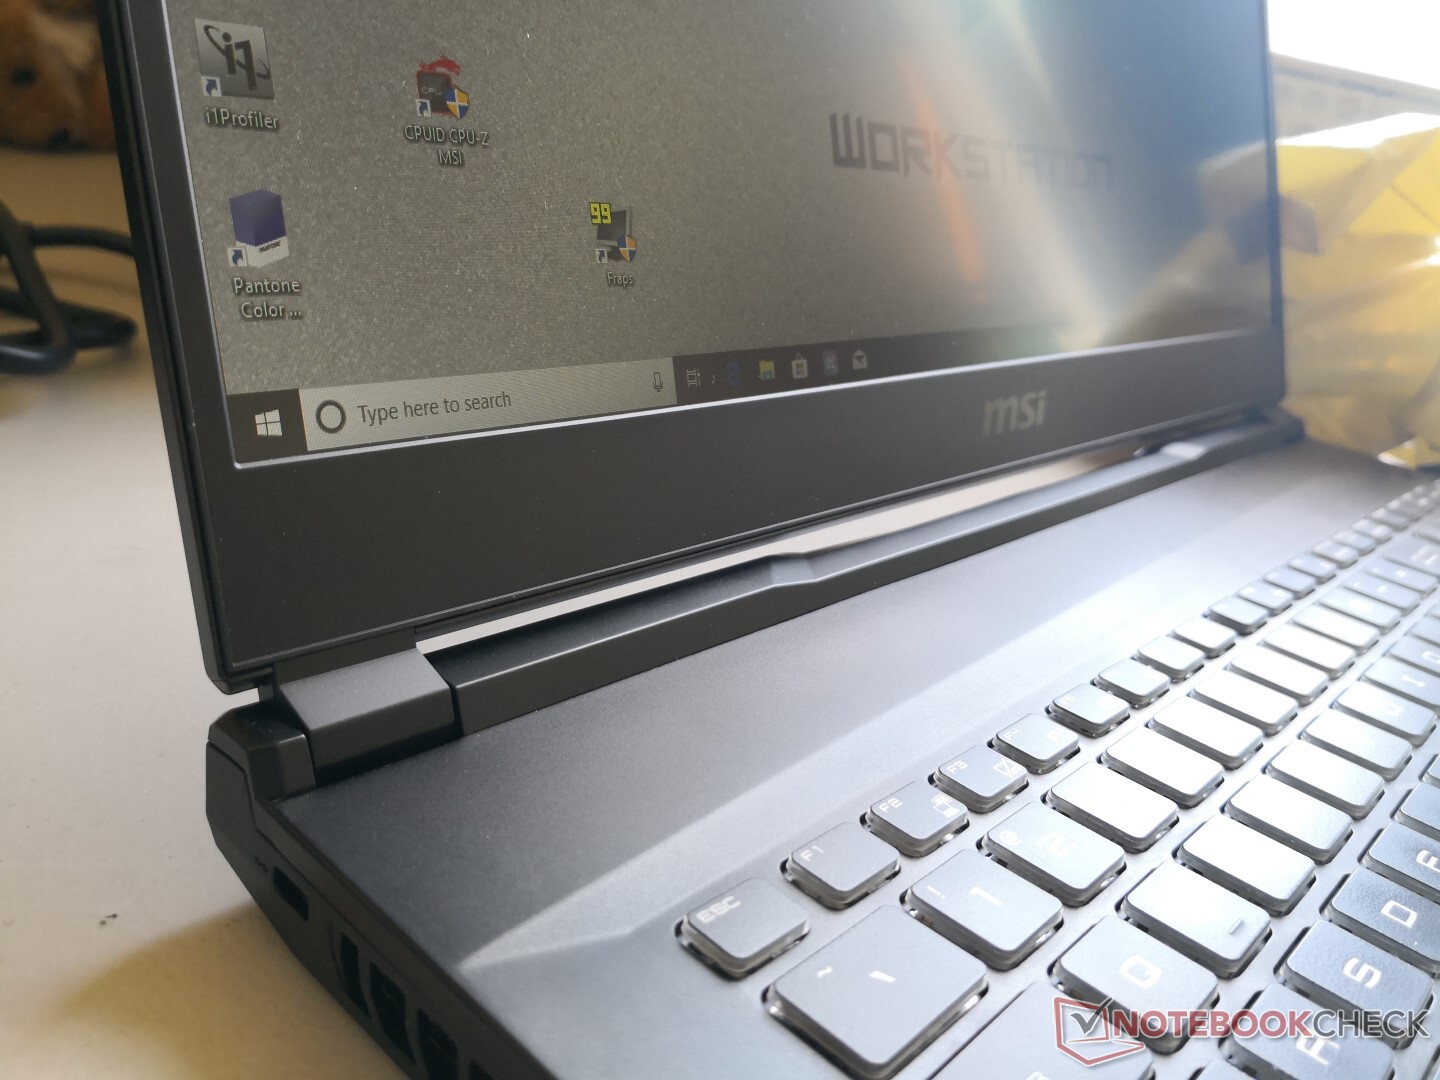
Case
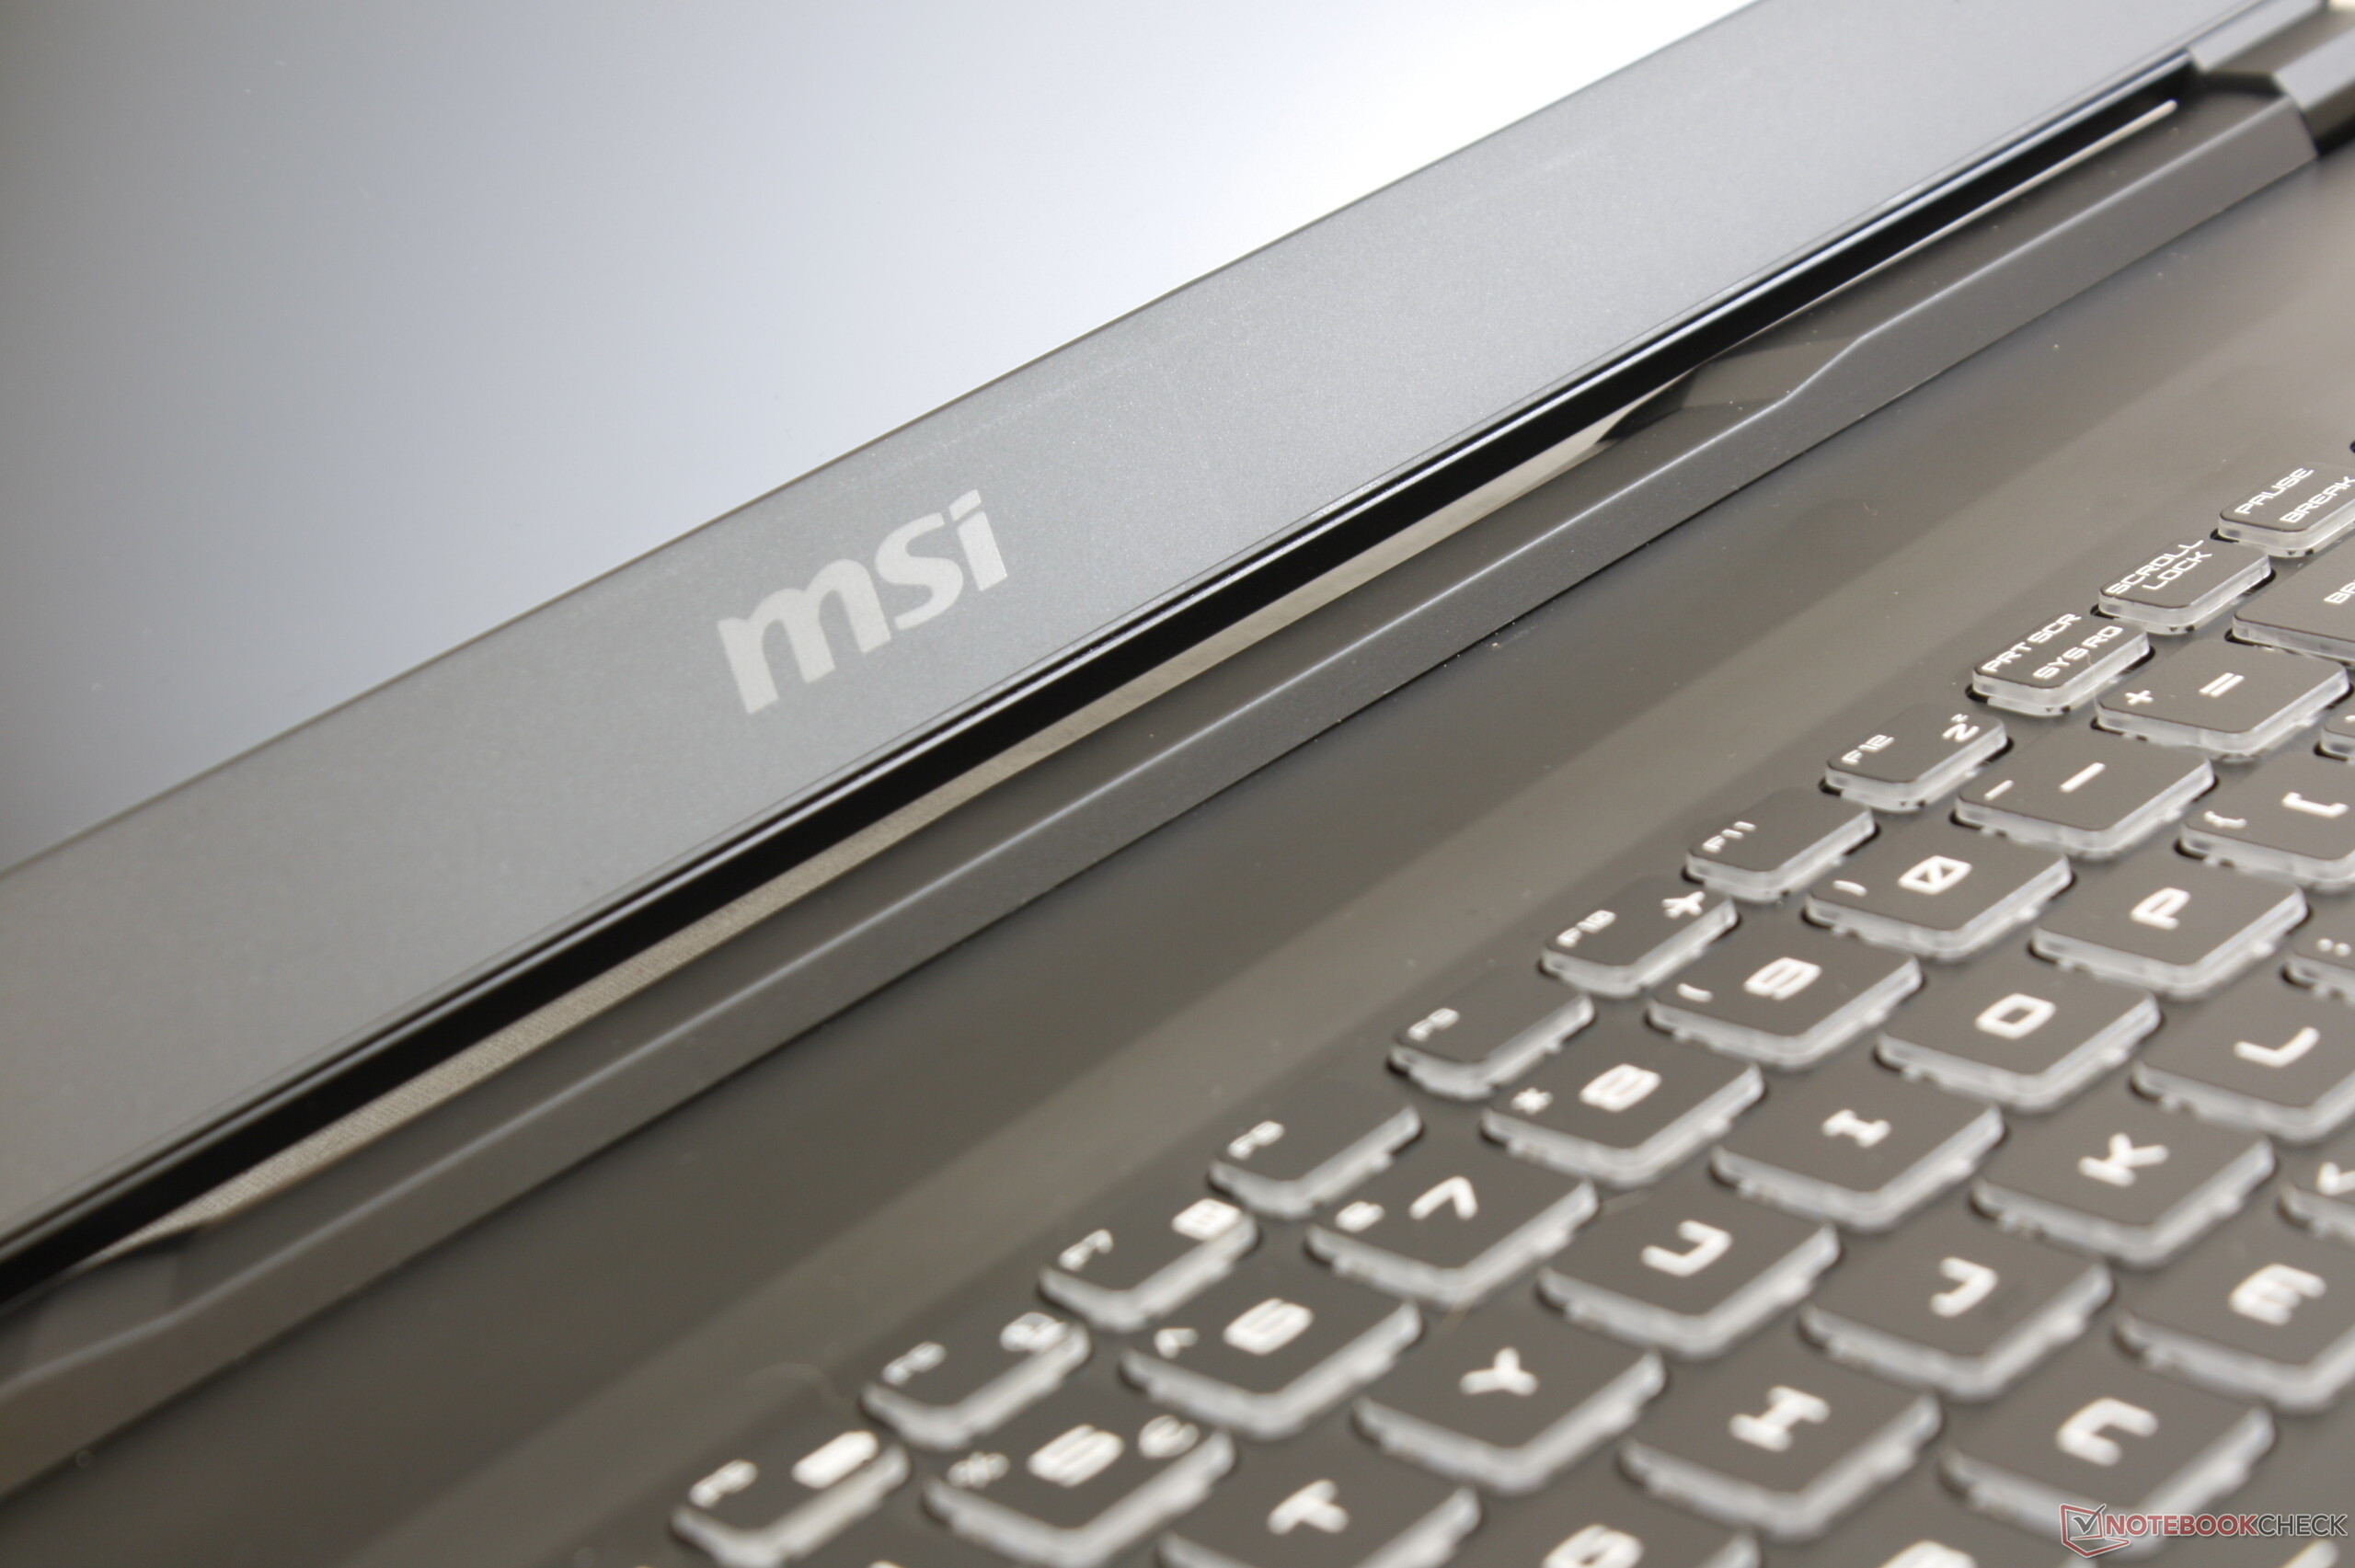
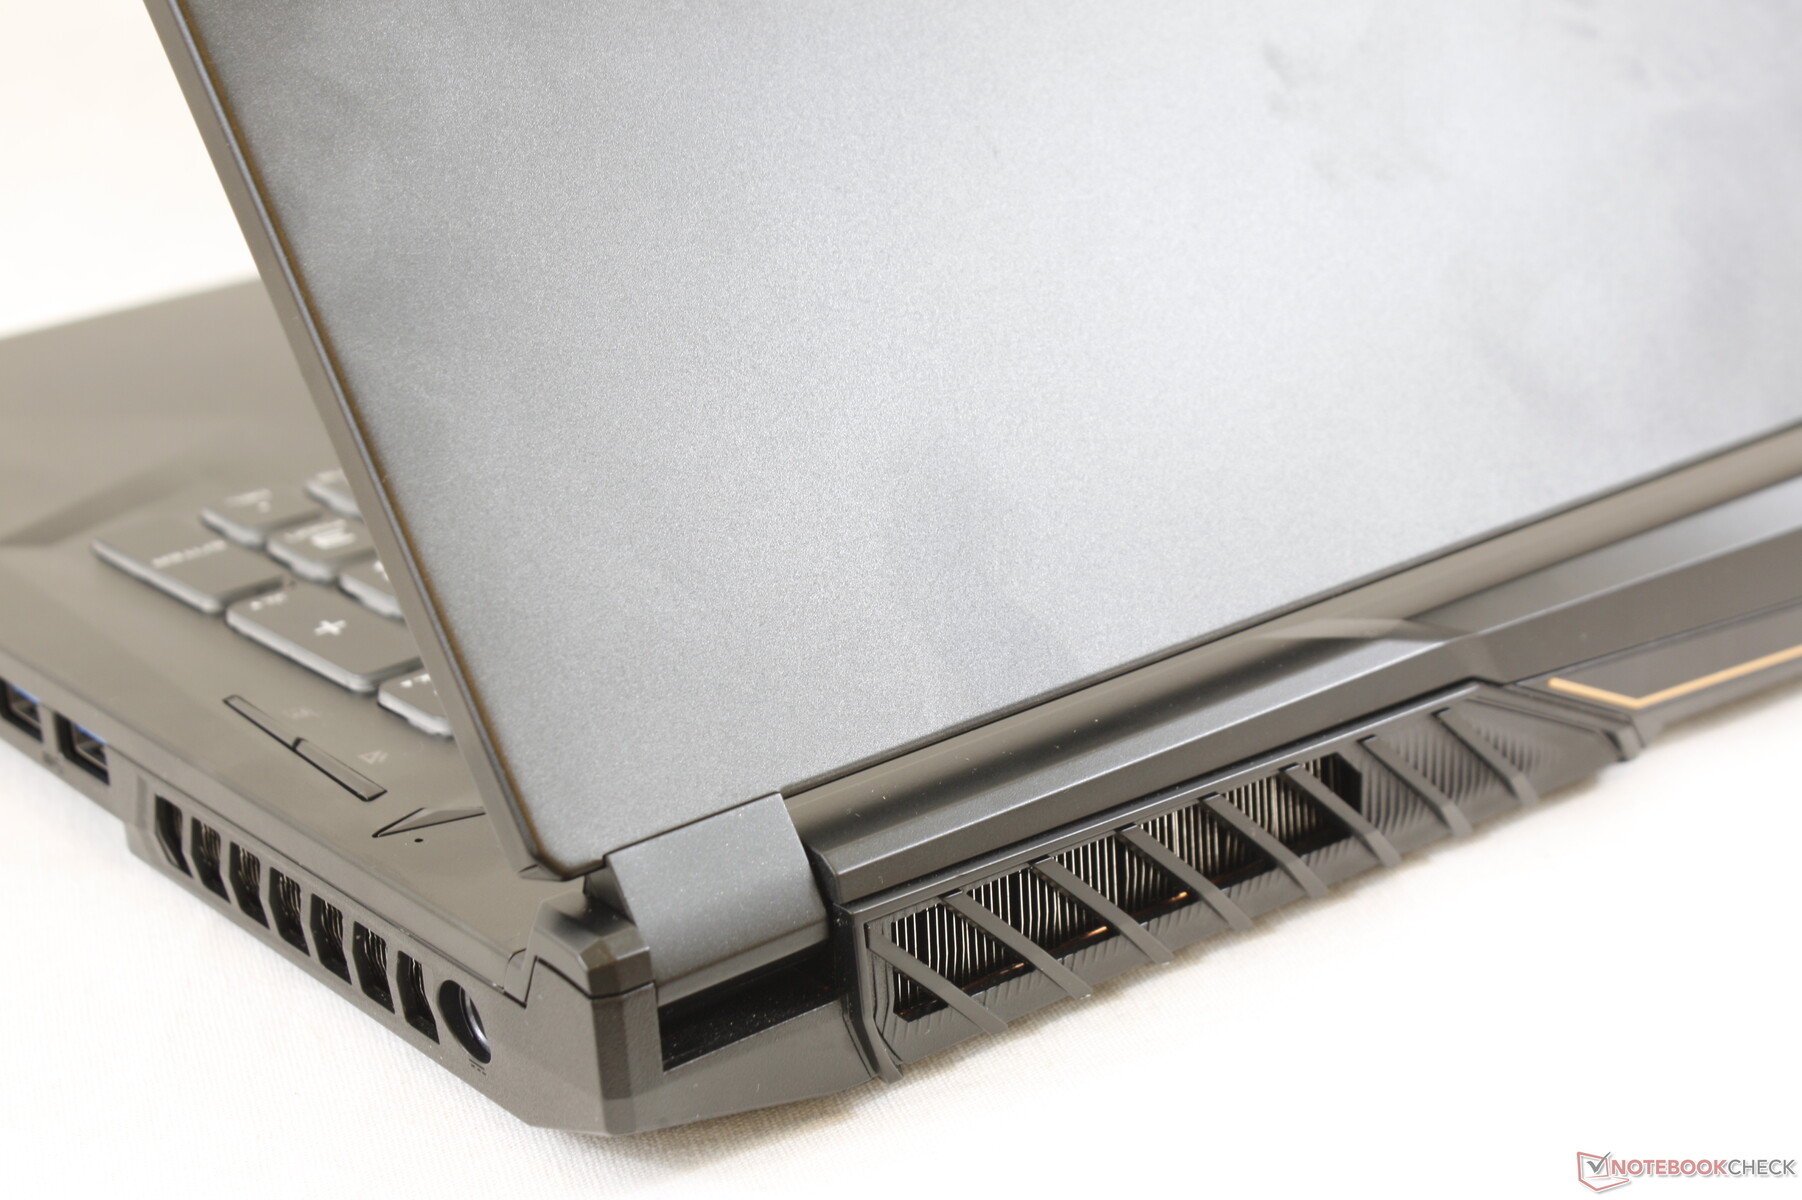
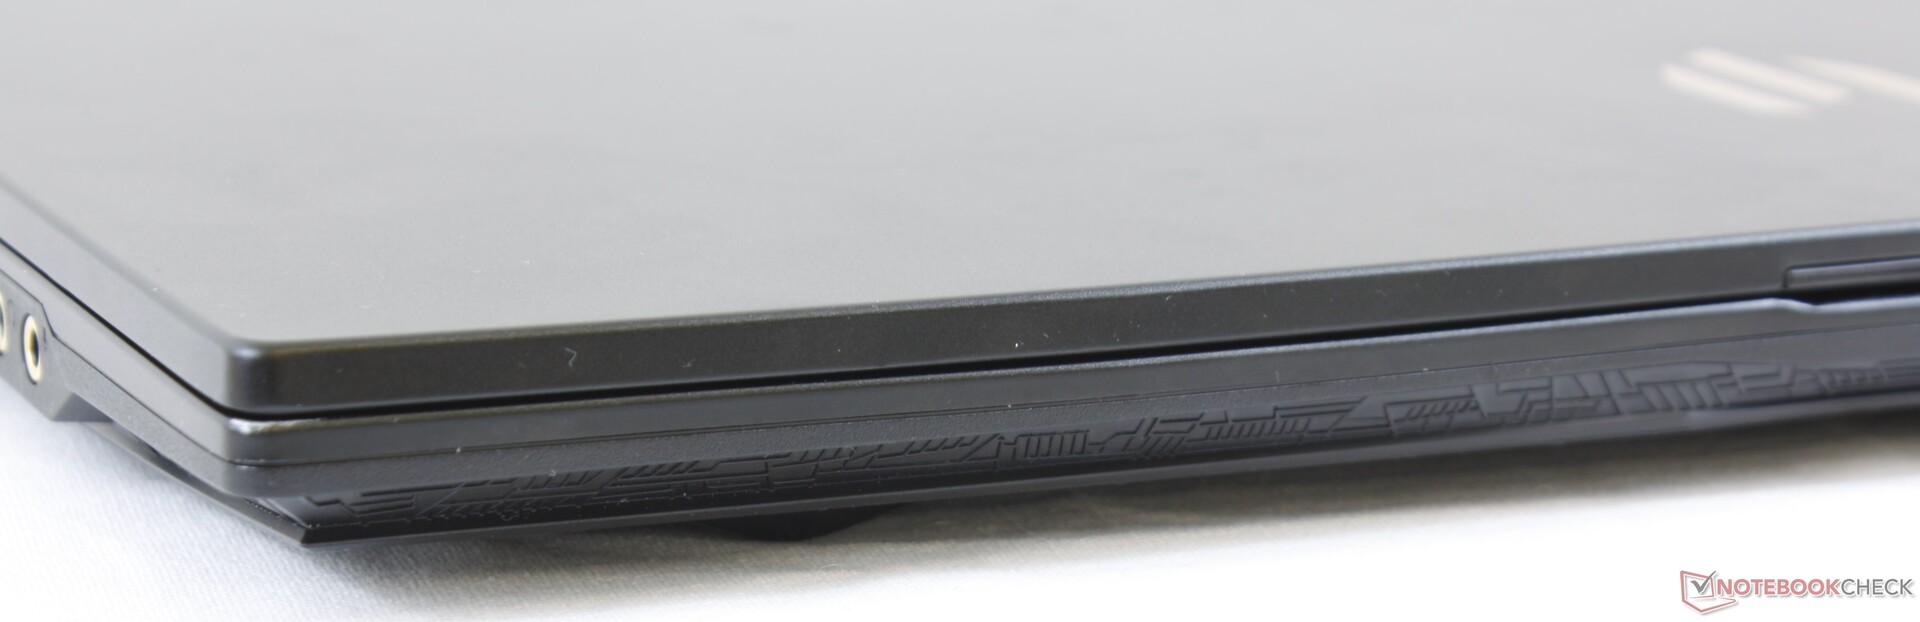
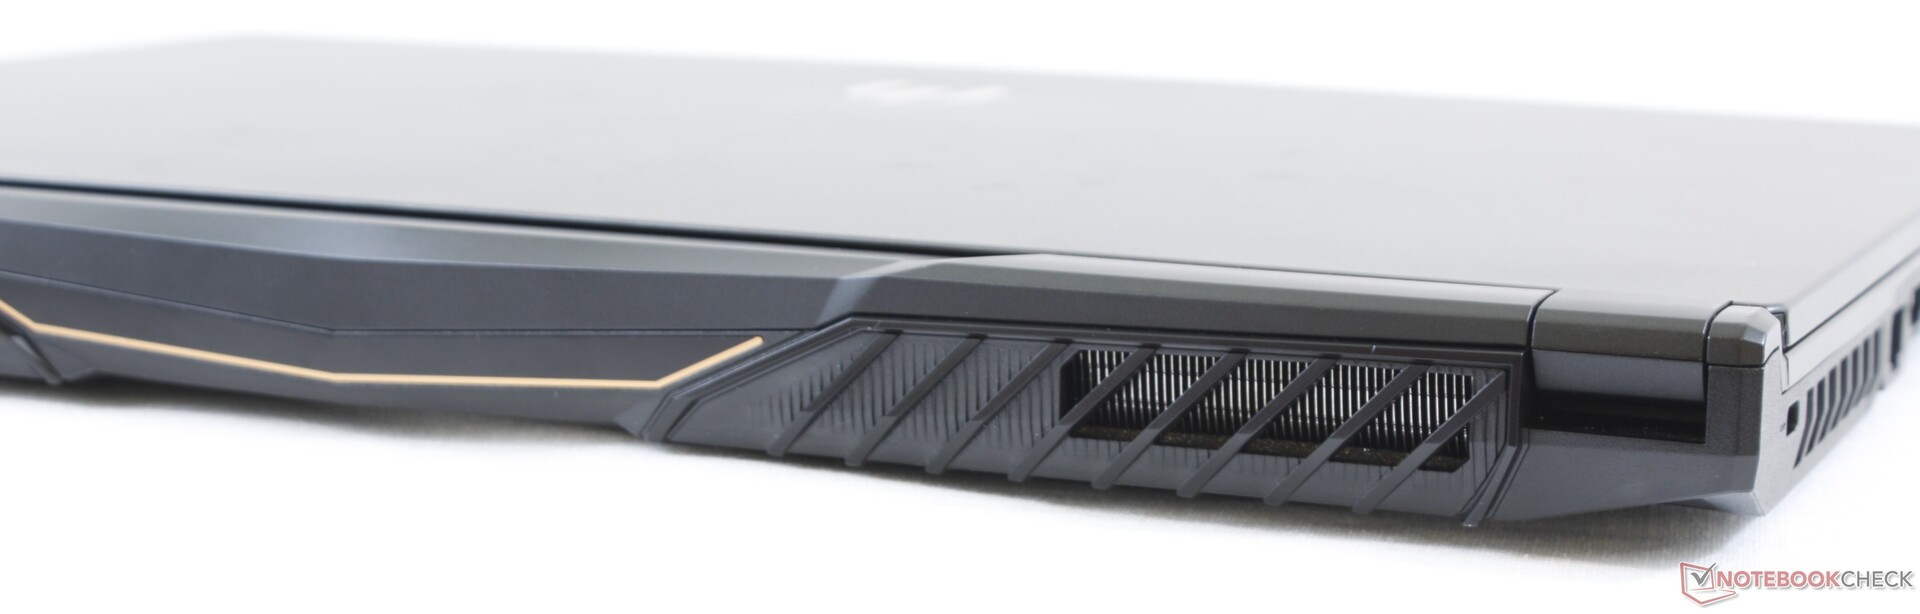
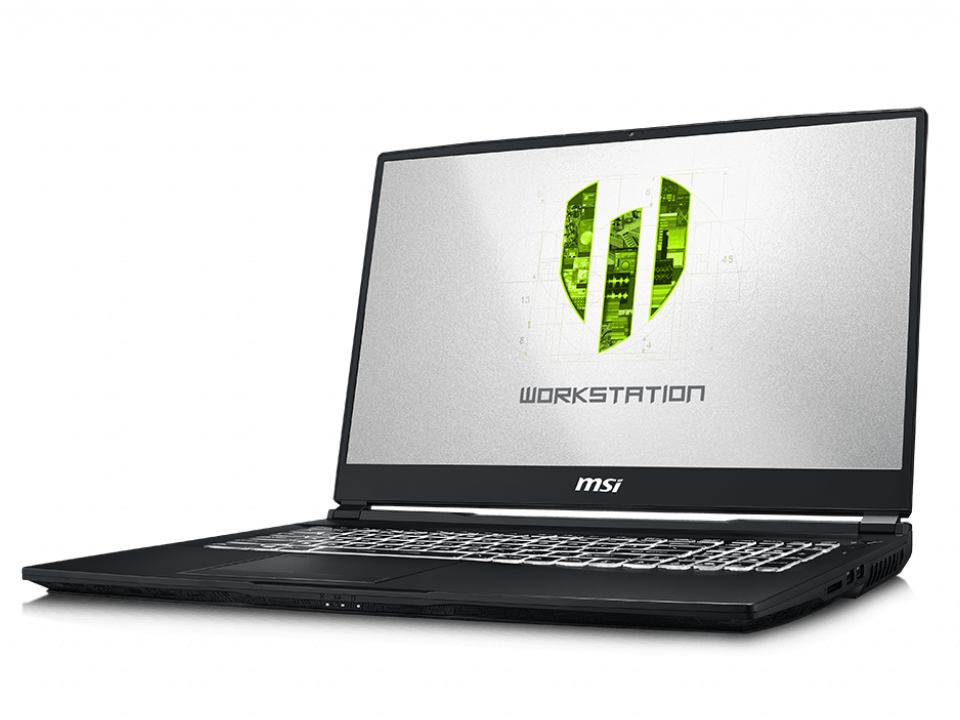
Our comments on the GE75 apply here since the WE75 utilizes the same chassis design. The red "gamer-y" trims have been removed and the dragon G series logo has been replaced with MSI's golden W series logo instead. The WE75 is one of the more aesthetically pleasing mobile workstations especially since this particular category is full of "square" and boxy designs. After all, most traditional workstations aren't scrupulously designed to be showy.
As nice as it may look, the lid is more flexible than we would like. The Razer Blade Pro Studio, ThinkPad P73, HP ZBook 17, and Dell Precision 7730 all have the upper-hand in this regard.
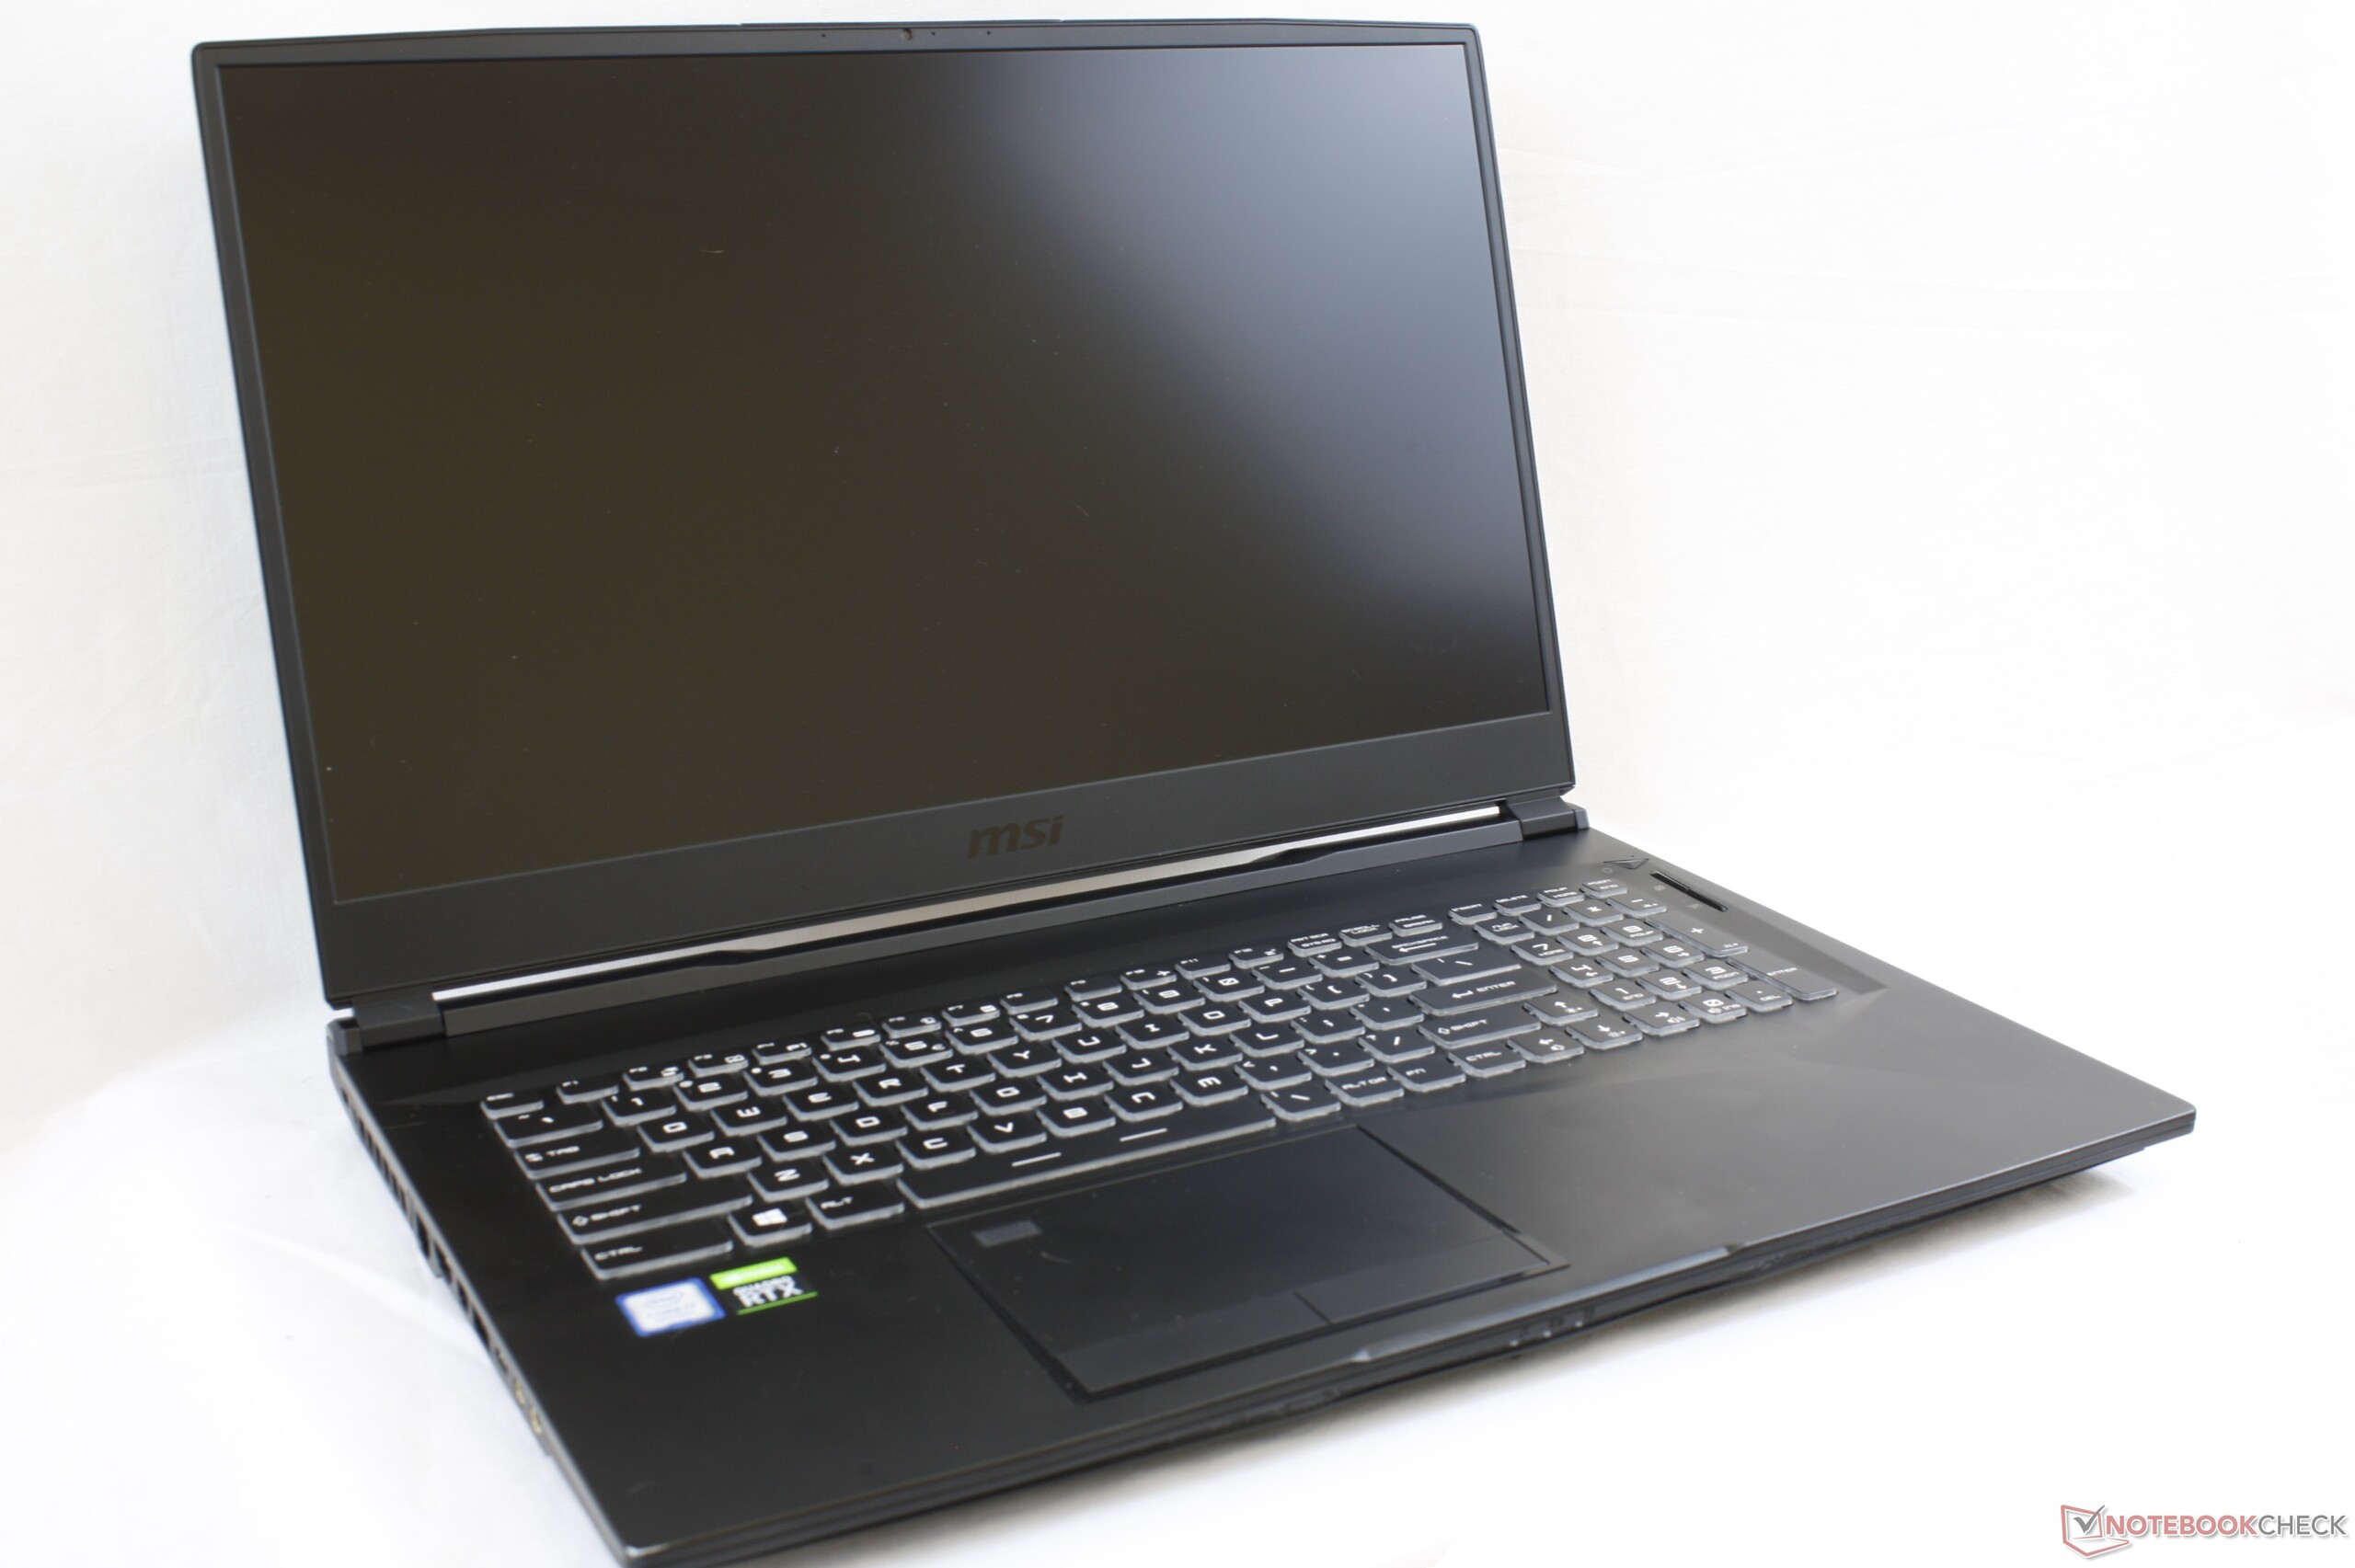
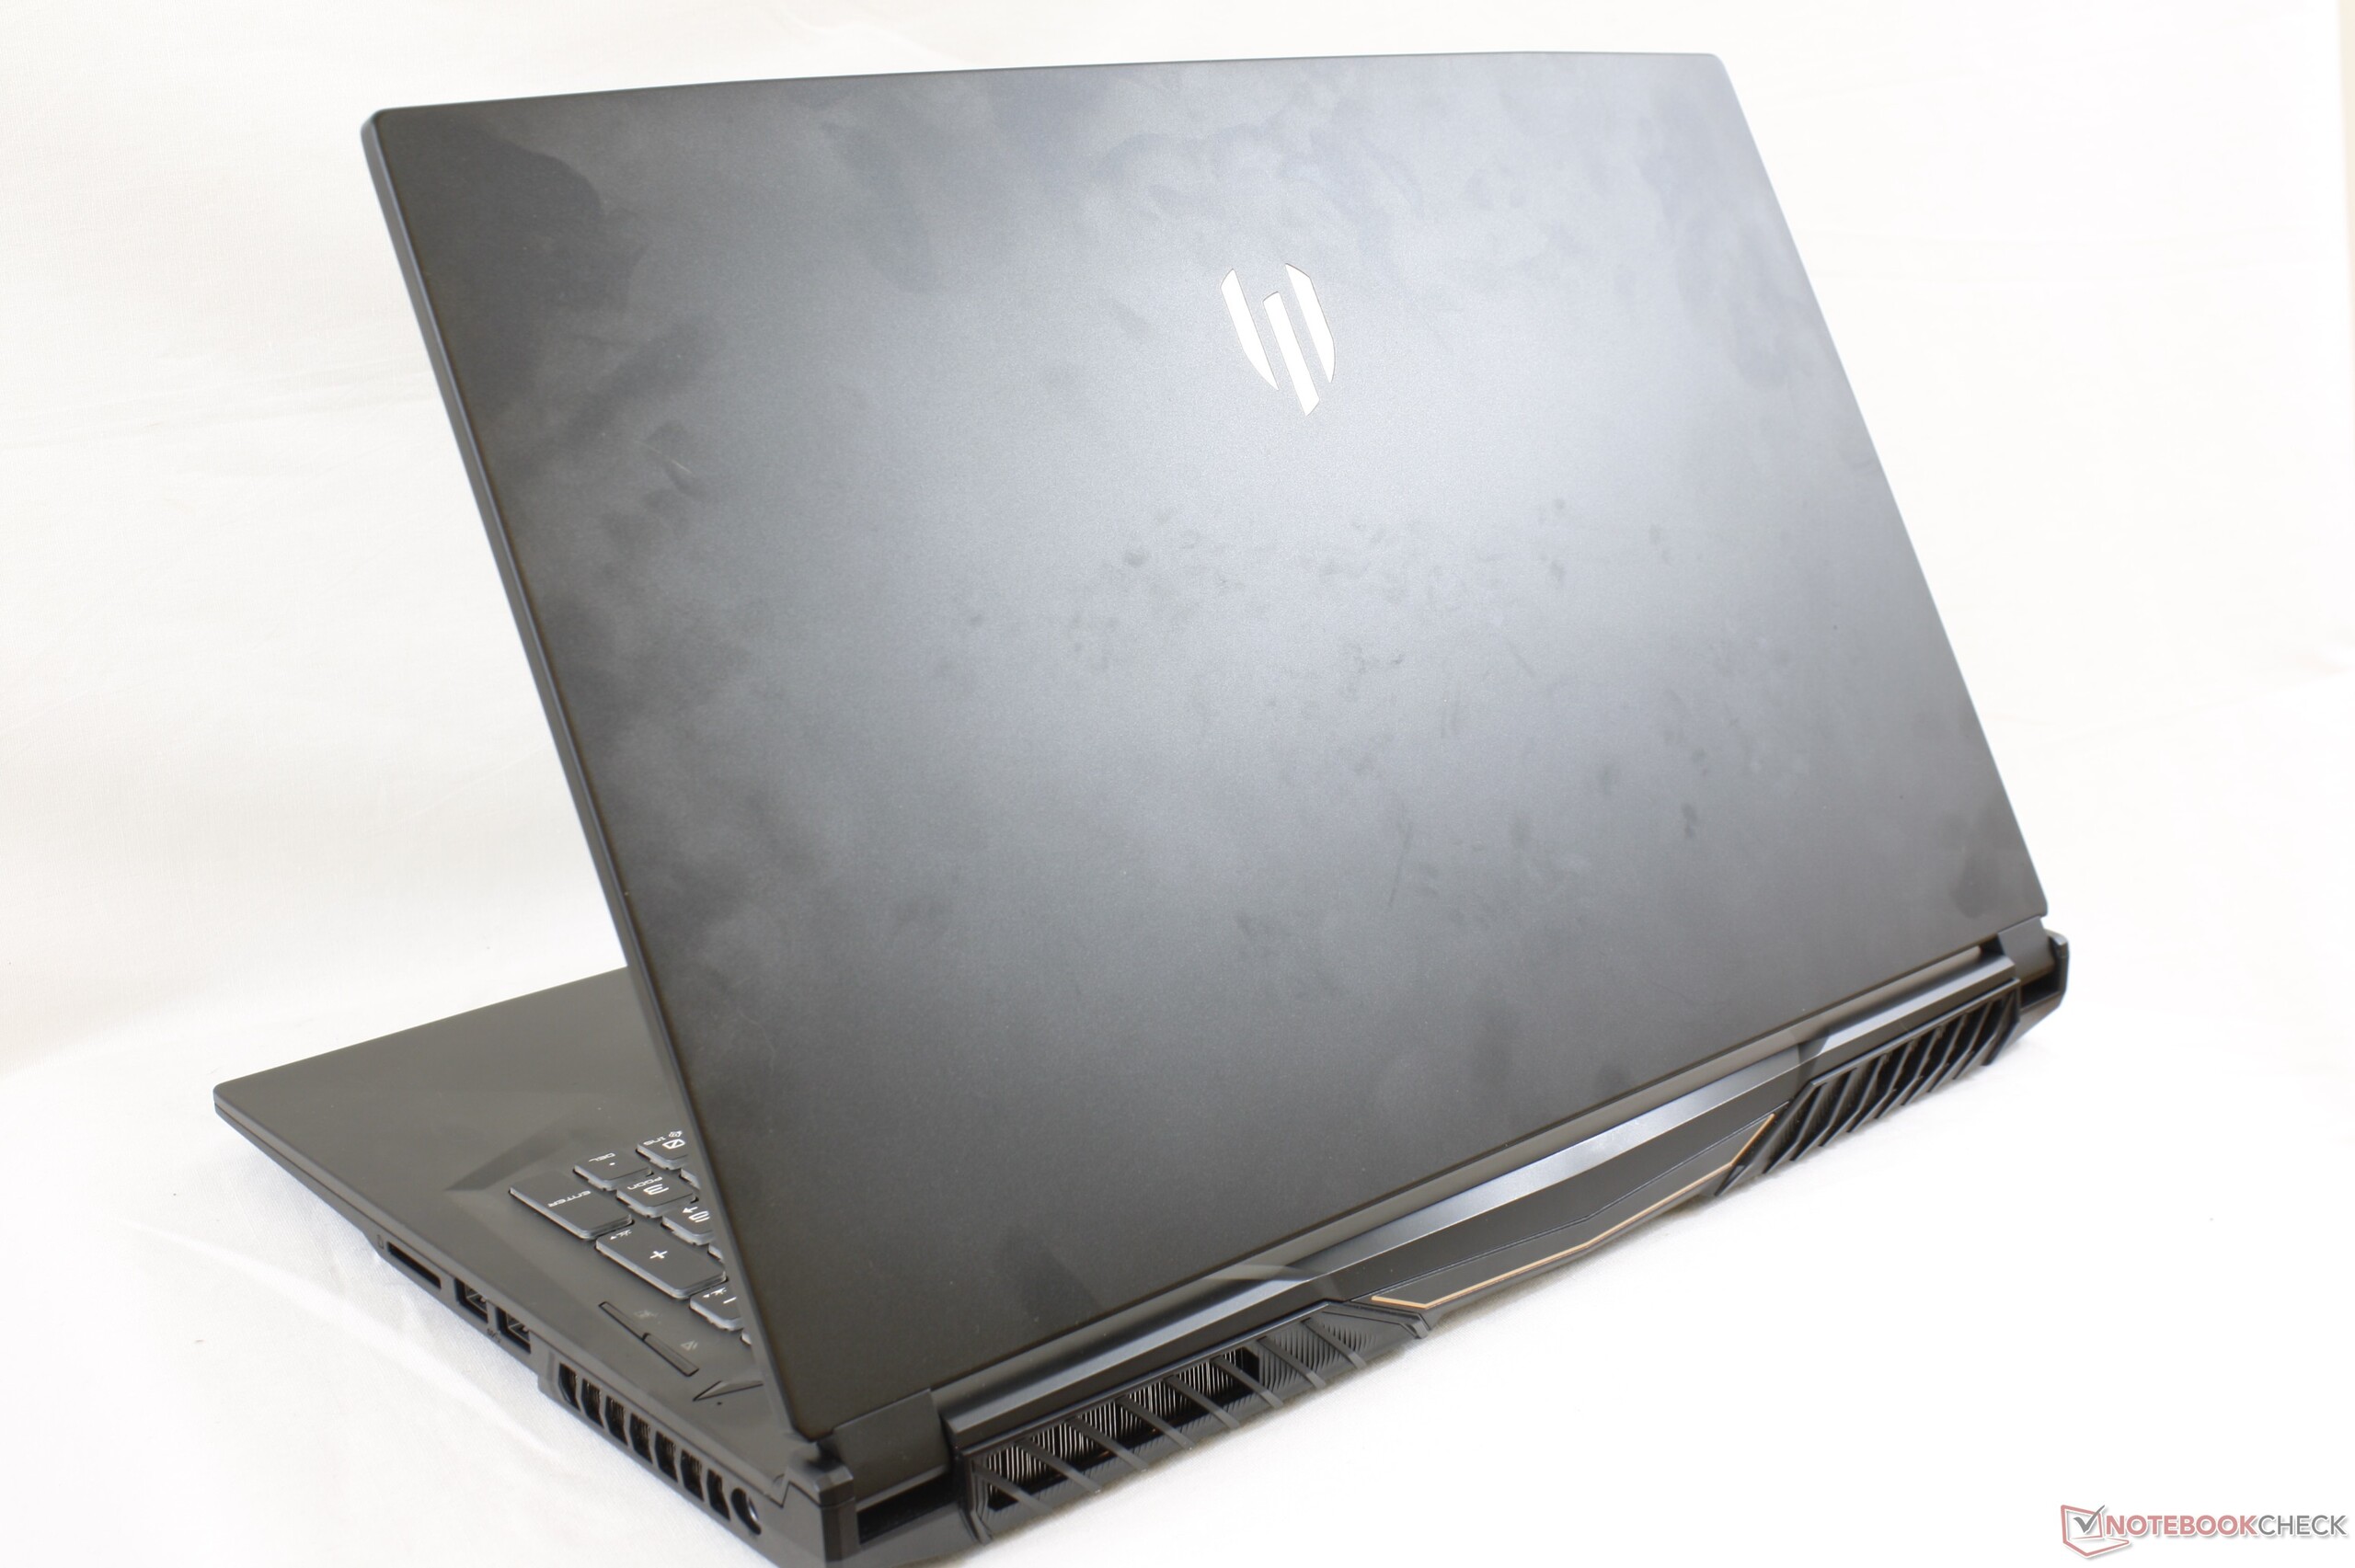
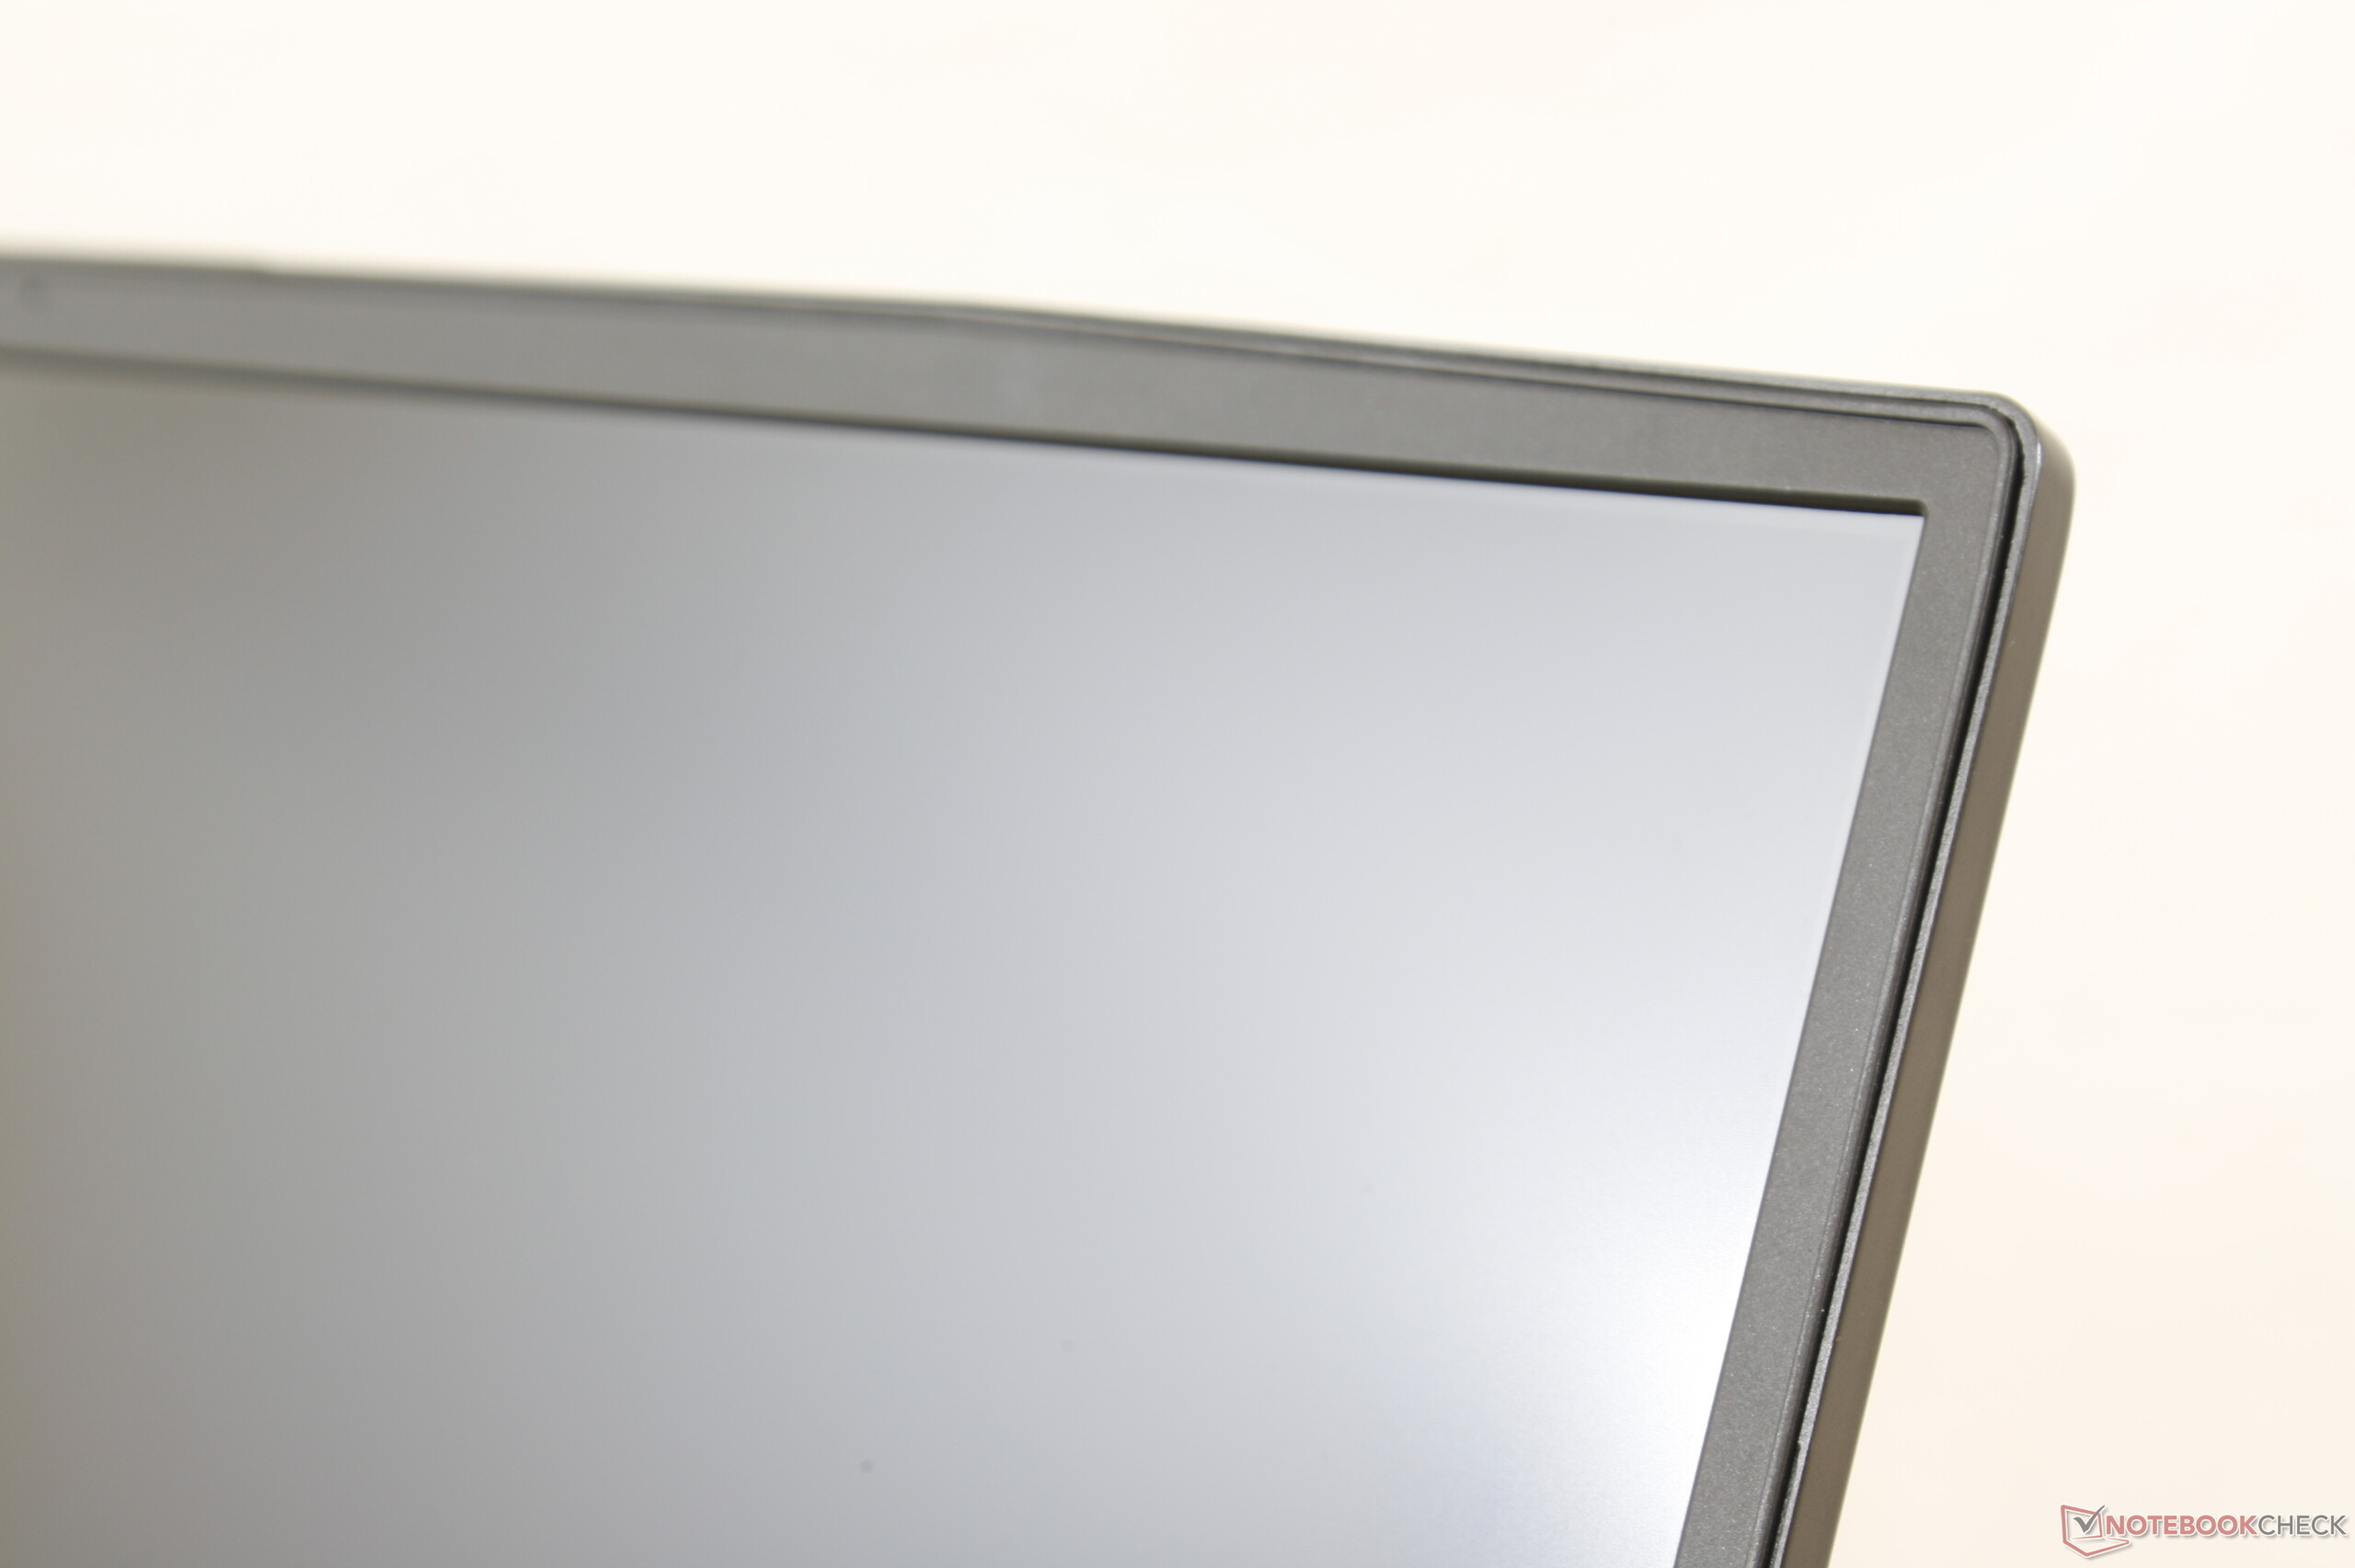
The WE75 is 13 percent smaller than the last generation WE72 due largely to the narrower bezels. It's also 300 grams lighter to be lighter than even the Razer Blade Pro 17.


Connectivity
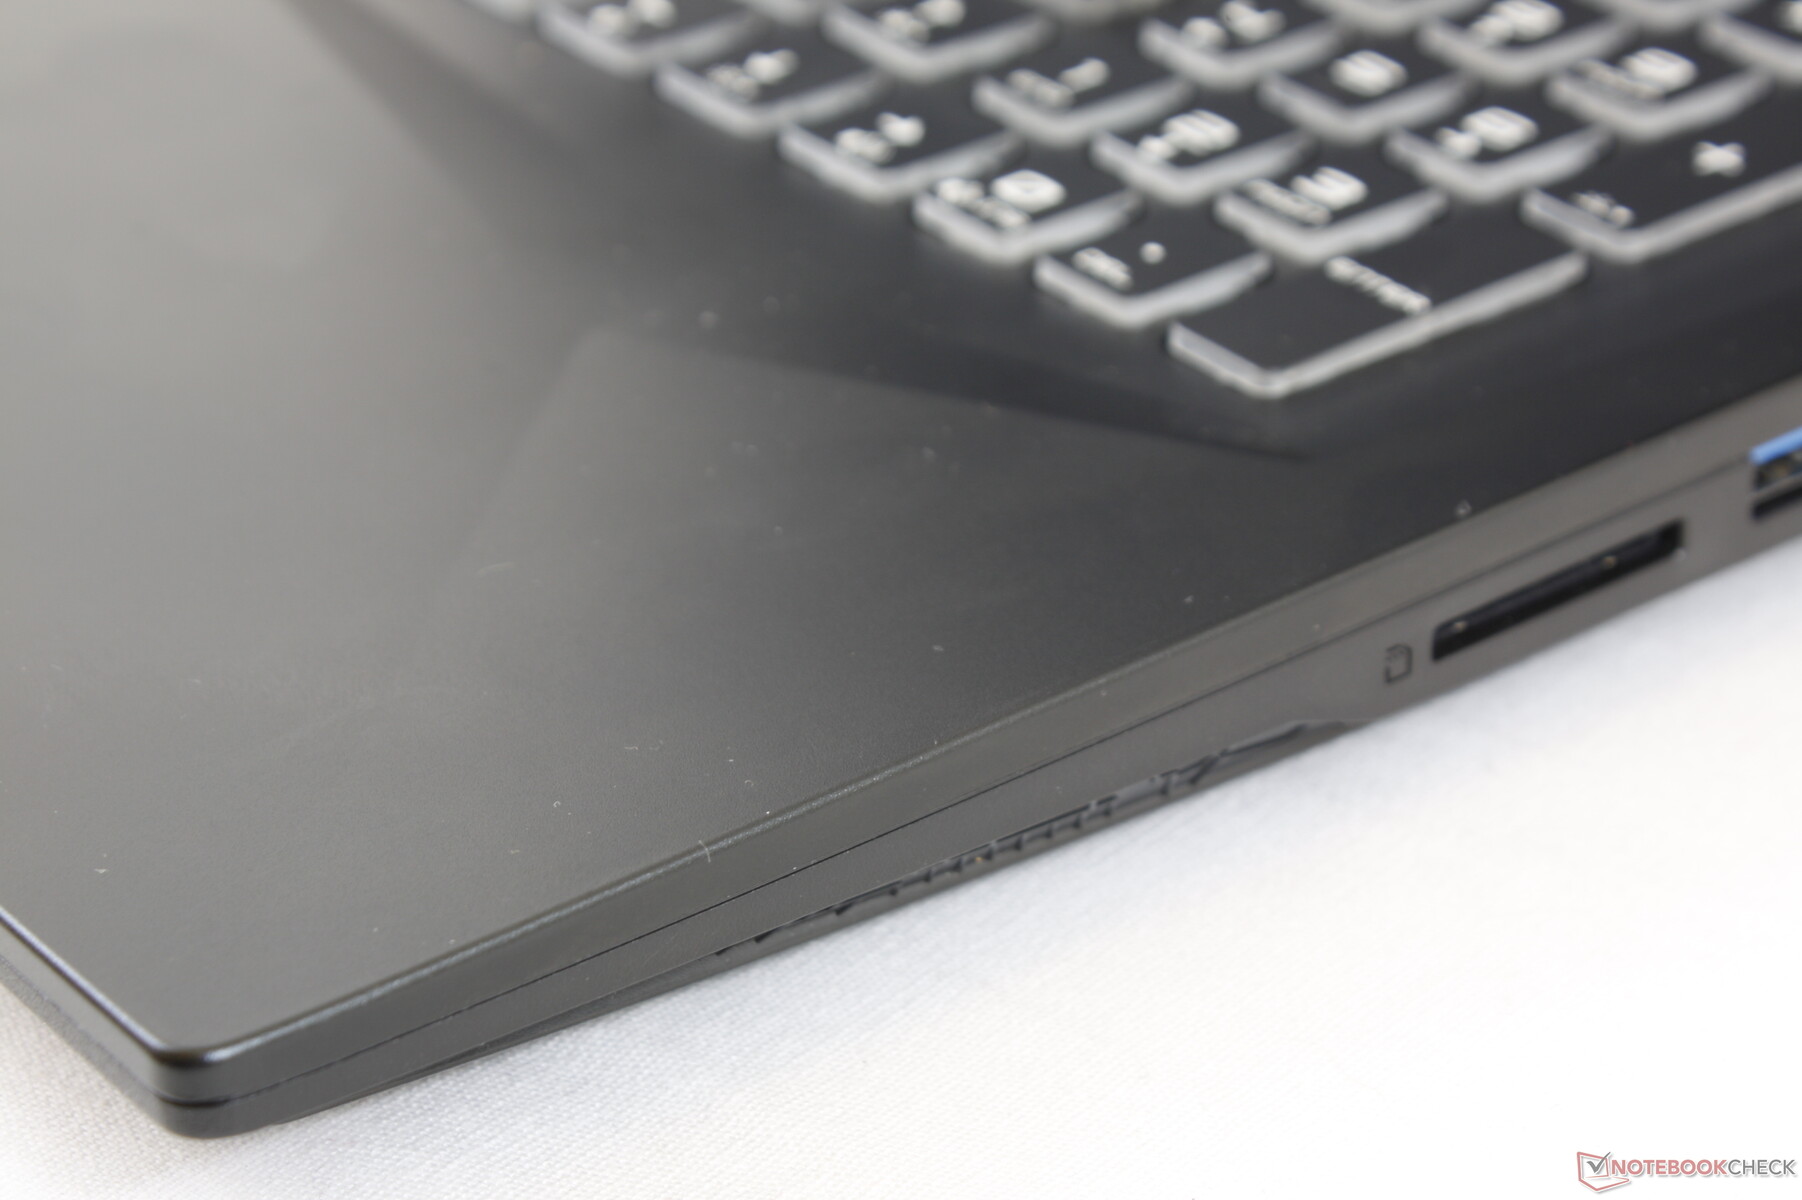
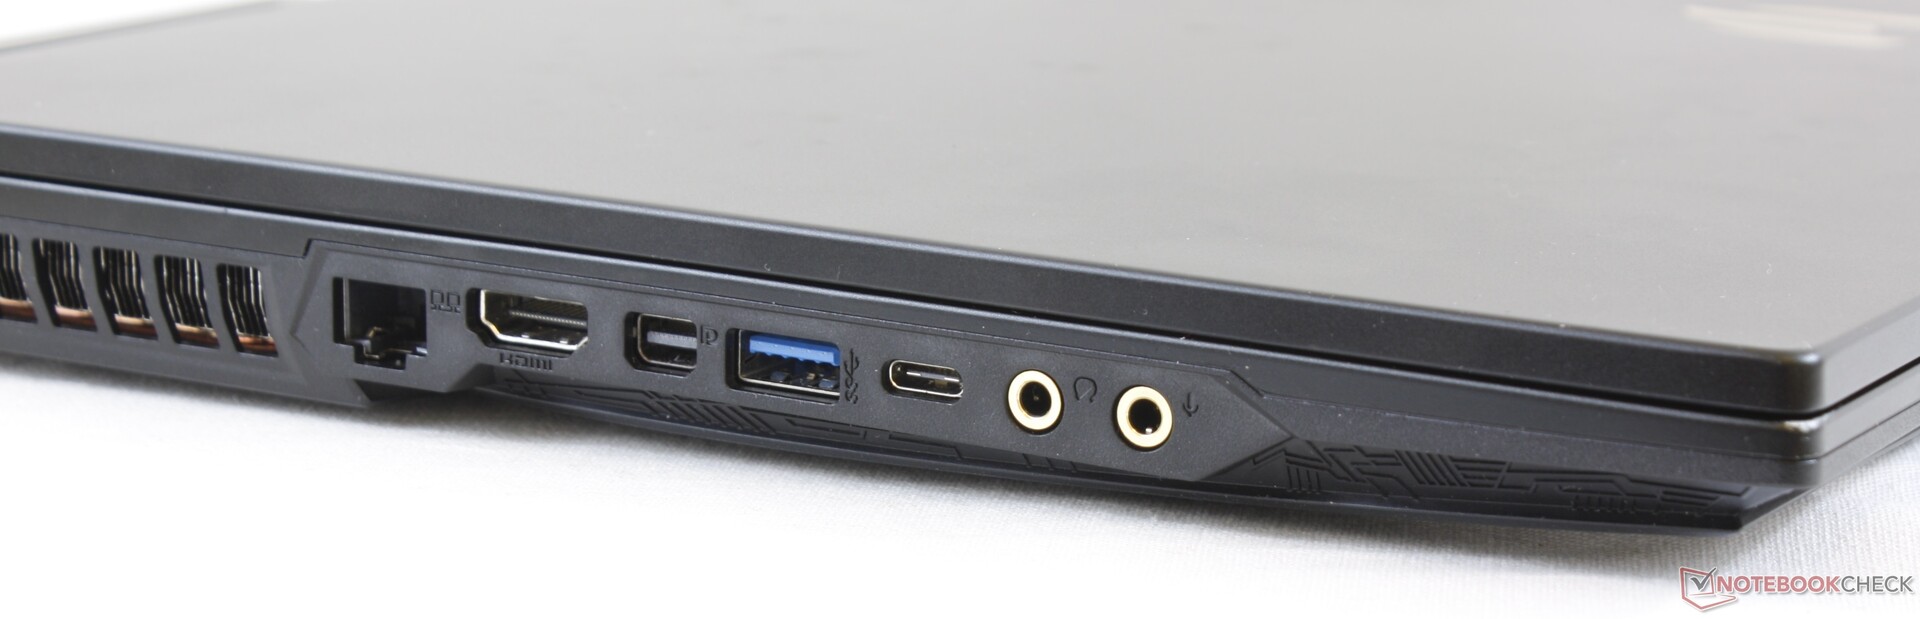
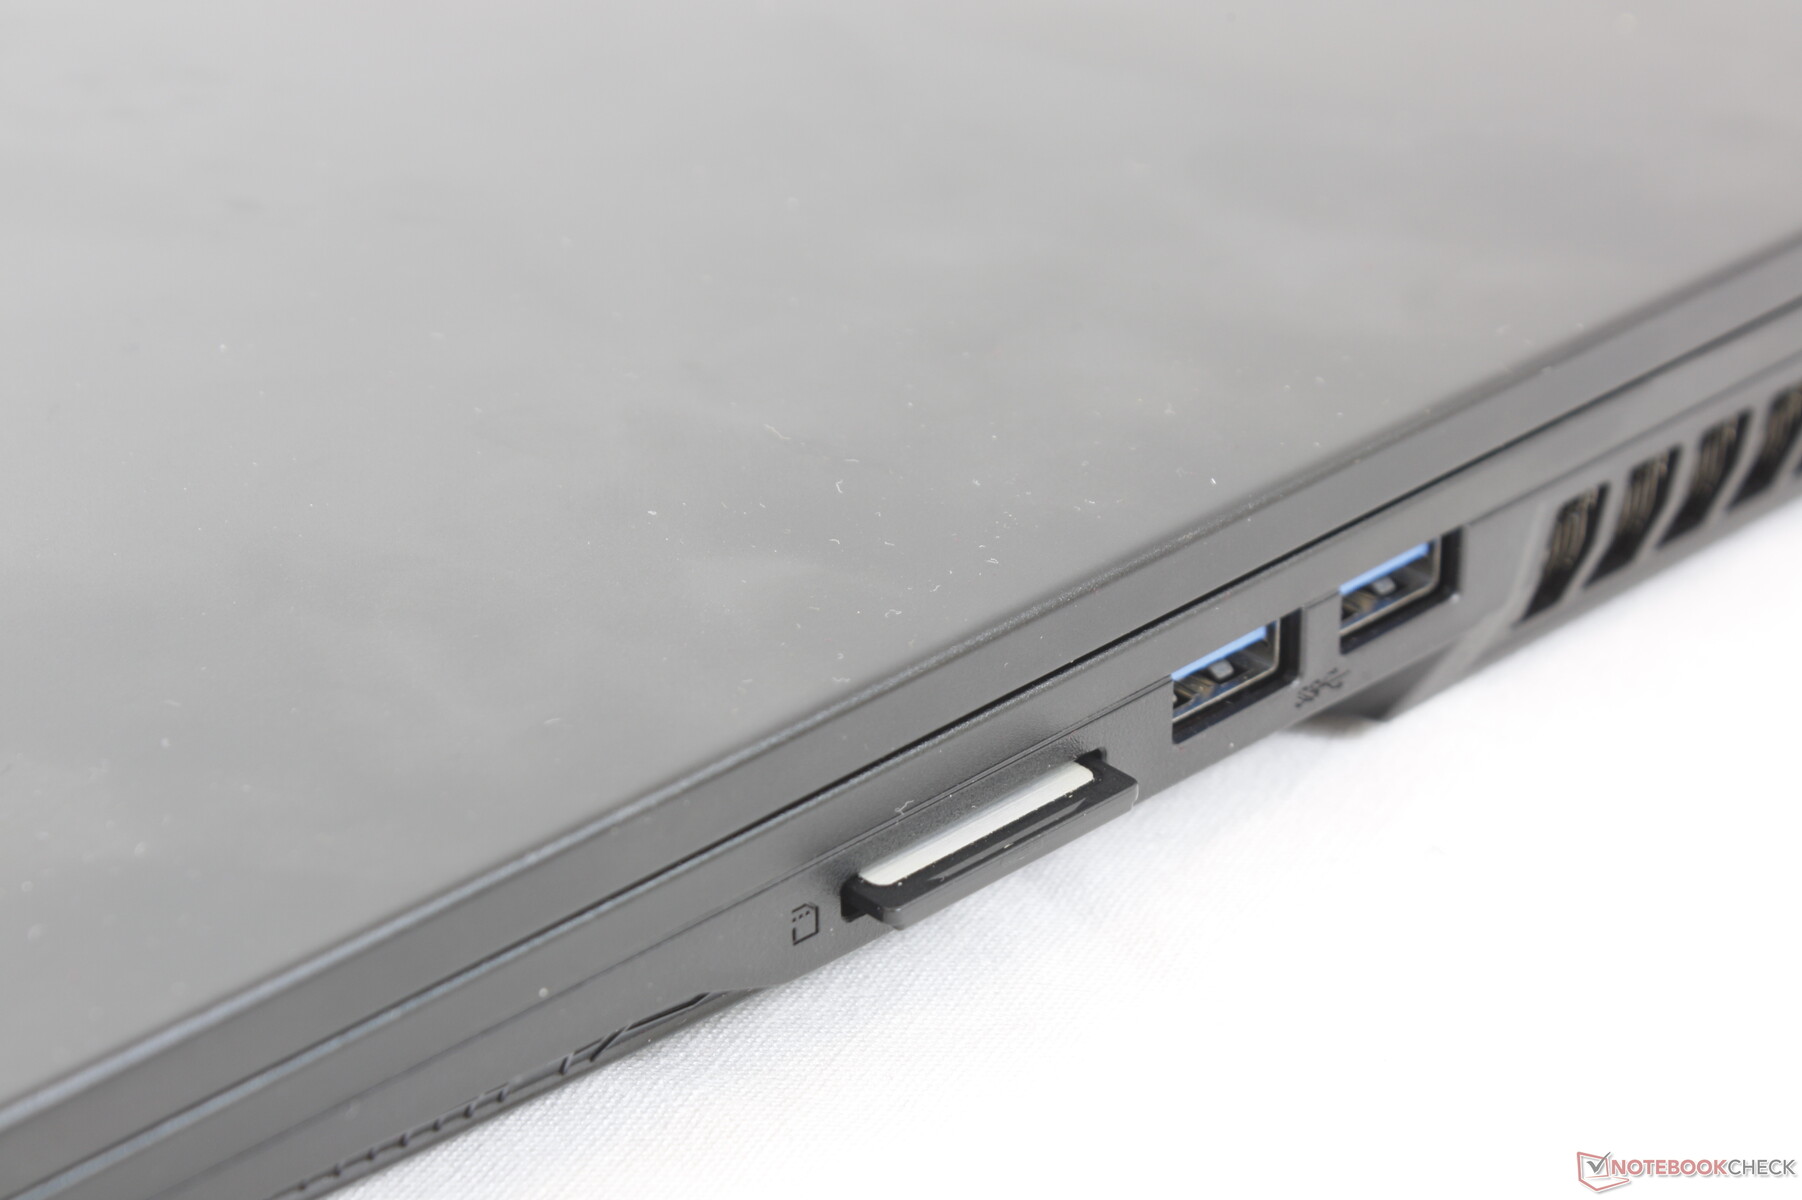
Port options are plentiful even if port positioning is a mixed bag. The ports along the left edge, for example, feel crowded and tightly packed. There are also no Smart Card options that many competing models from the ThinkPad P series or HP ZBook series tend to carry. Thunderbolt 3 is not supported.
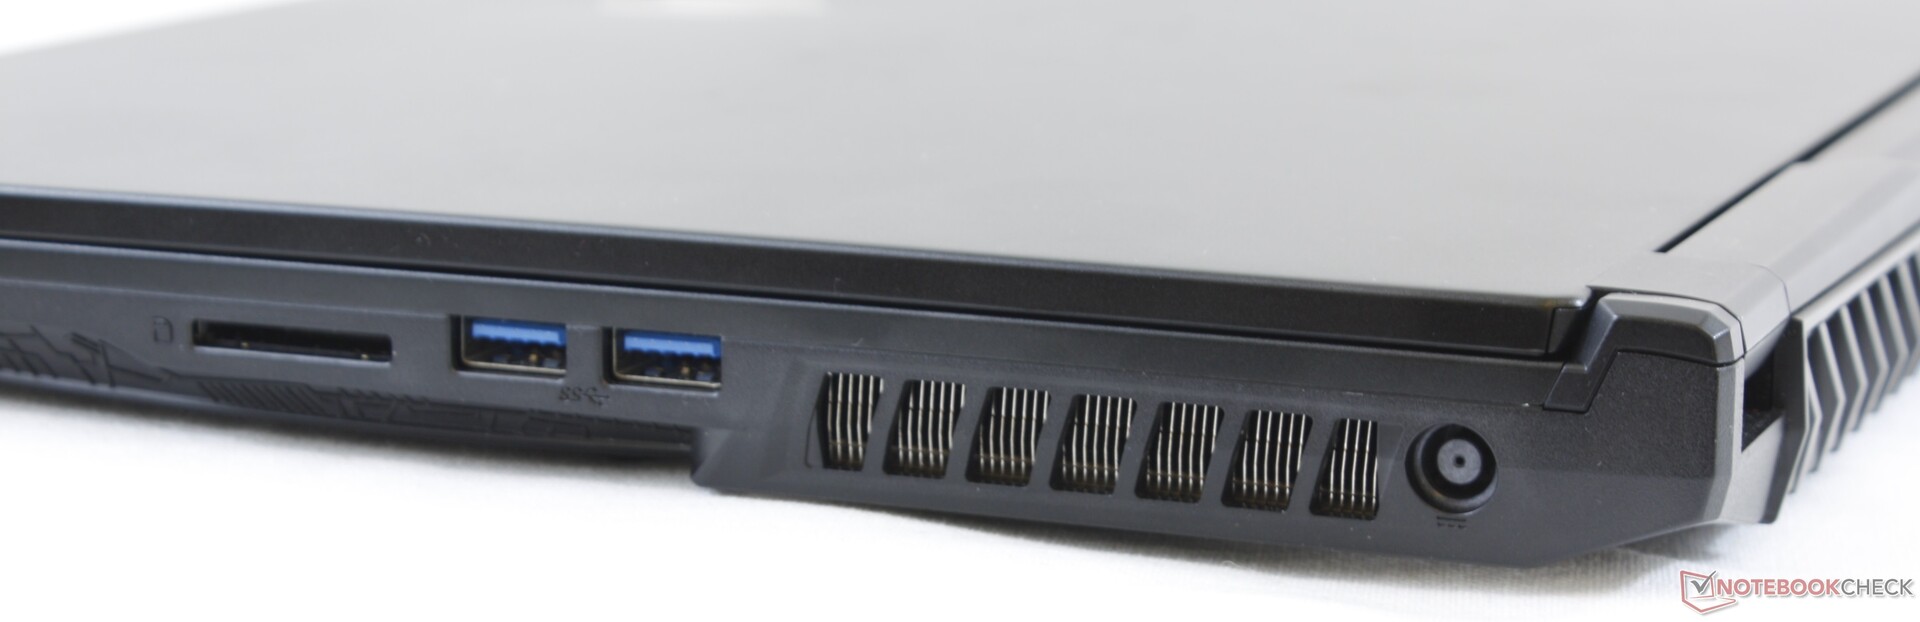
SD Card Reader
The spring-loaded card reader is disappointingly slow especially for a mobile workstation in this price range. Transferring 1 GB worth of pictures from our UHS-II test card to desktop takes about 40 seconds compared to less than 8 seconds on the Dell XPS 15.
| SD Card Reader | |
| average JPG Copy Test (av. of 3 runs) | |
| Lenovo ThinkPad P73-20QR002DGE (Toshiba Exceria Pro SDXC 64 GB UHS-II) | |
| HP ZBook 17 G5-2ZC48EA (Toshiba Exceria Pro SDXC 64 GB UHS-II) | |
| Razer Blade Pro 17 RTX 2080 Max-Q (Toshiba Exceria Pro SDXC 64 GB UHS-II) | |
| MSI WE75 9TK (Toshiba Exceria Pro SDXC 64 GB UHS-II) | |
| MSI GE75 8SG Raider (Toshiba Exceria Pro SDXC 64 GB UHS-II) | |
| MSI WE72 7RJ (Toshiba Exceria Pro SDXC 64 GB UHS-II) | |
| maximum AS SSD Seq Read Test (1GB) | |
| Lenovo ThinkPad P73-20QR002DGE (Toshiba Exceria Pro SDXC 64 GB UHS-II) | |
| Razer Blade Pro 17 RTX 2080 Max-Q (Toshiba Exceria Pro SDXC 64 GB UHS-II) | |
| HP ZBook 17 G5-2ZC48EA (Toshiba Exceria Pro SDXC 64 GB UHS-II) | |
| MSI WE75 9TK (Toshiba Exceria Pro SDXC 64 GB UHS-II) | |
| MSI GE75 8SG Raider (Toshiba Exceria Pro SDXC 64 GB UHS-II) | |
| MSI WE72 7RJ (Toshiba Exceria Pro SDXC 64 GB UHS-II) | |
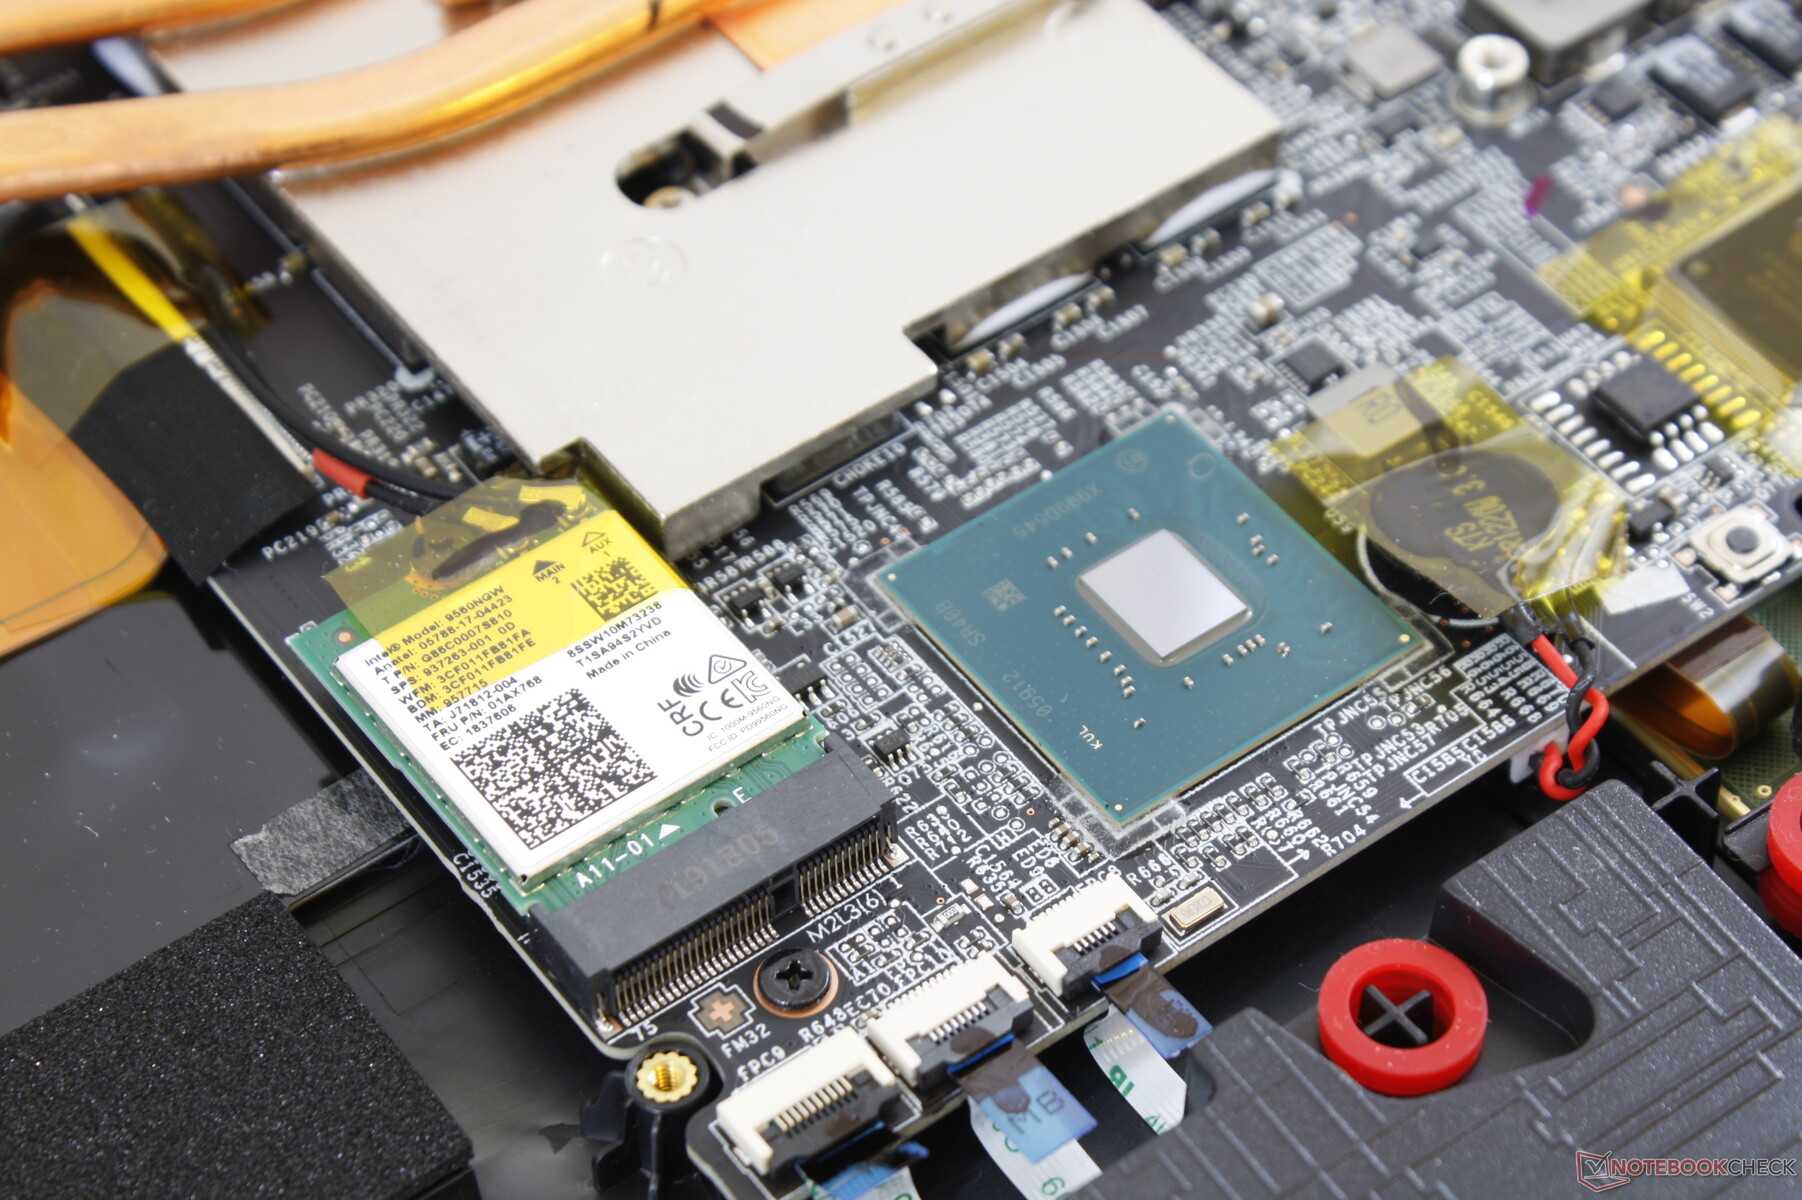
Communication
An Intel 9560 Wi-Fi 5 module is included in contrast to the Intel AX200 or Killer 1650 Wi-Fi 6 modules on most newer gaming laptops and Ultrabooks. We experienced no connectivity issues during our time with the unit.
| Networking | |
| iperf3 transmit AX12 | |
| MSI GT76 Titan DT 9SG | |
| Razer Blade Pro 17 RTX 2080 Max-Q | |
| HP ZBook 17 G5-2ZC48EA | |
| Lenovo ThinkPad P73-20QR002DGE | |
| MSI WE72 7RJ | |
| iperf3 receive AX12 | |
| MSI GT76 Titan DT 9SG | |
| Razer Blade Pro 17 RTX 2080 Max-Q | |
| HP ZBook 17 G5-2ZC48EA | |
| Lenovo ThinkPad P73-20QR002DGE | |
| MSI WE72 7RJ | |
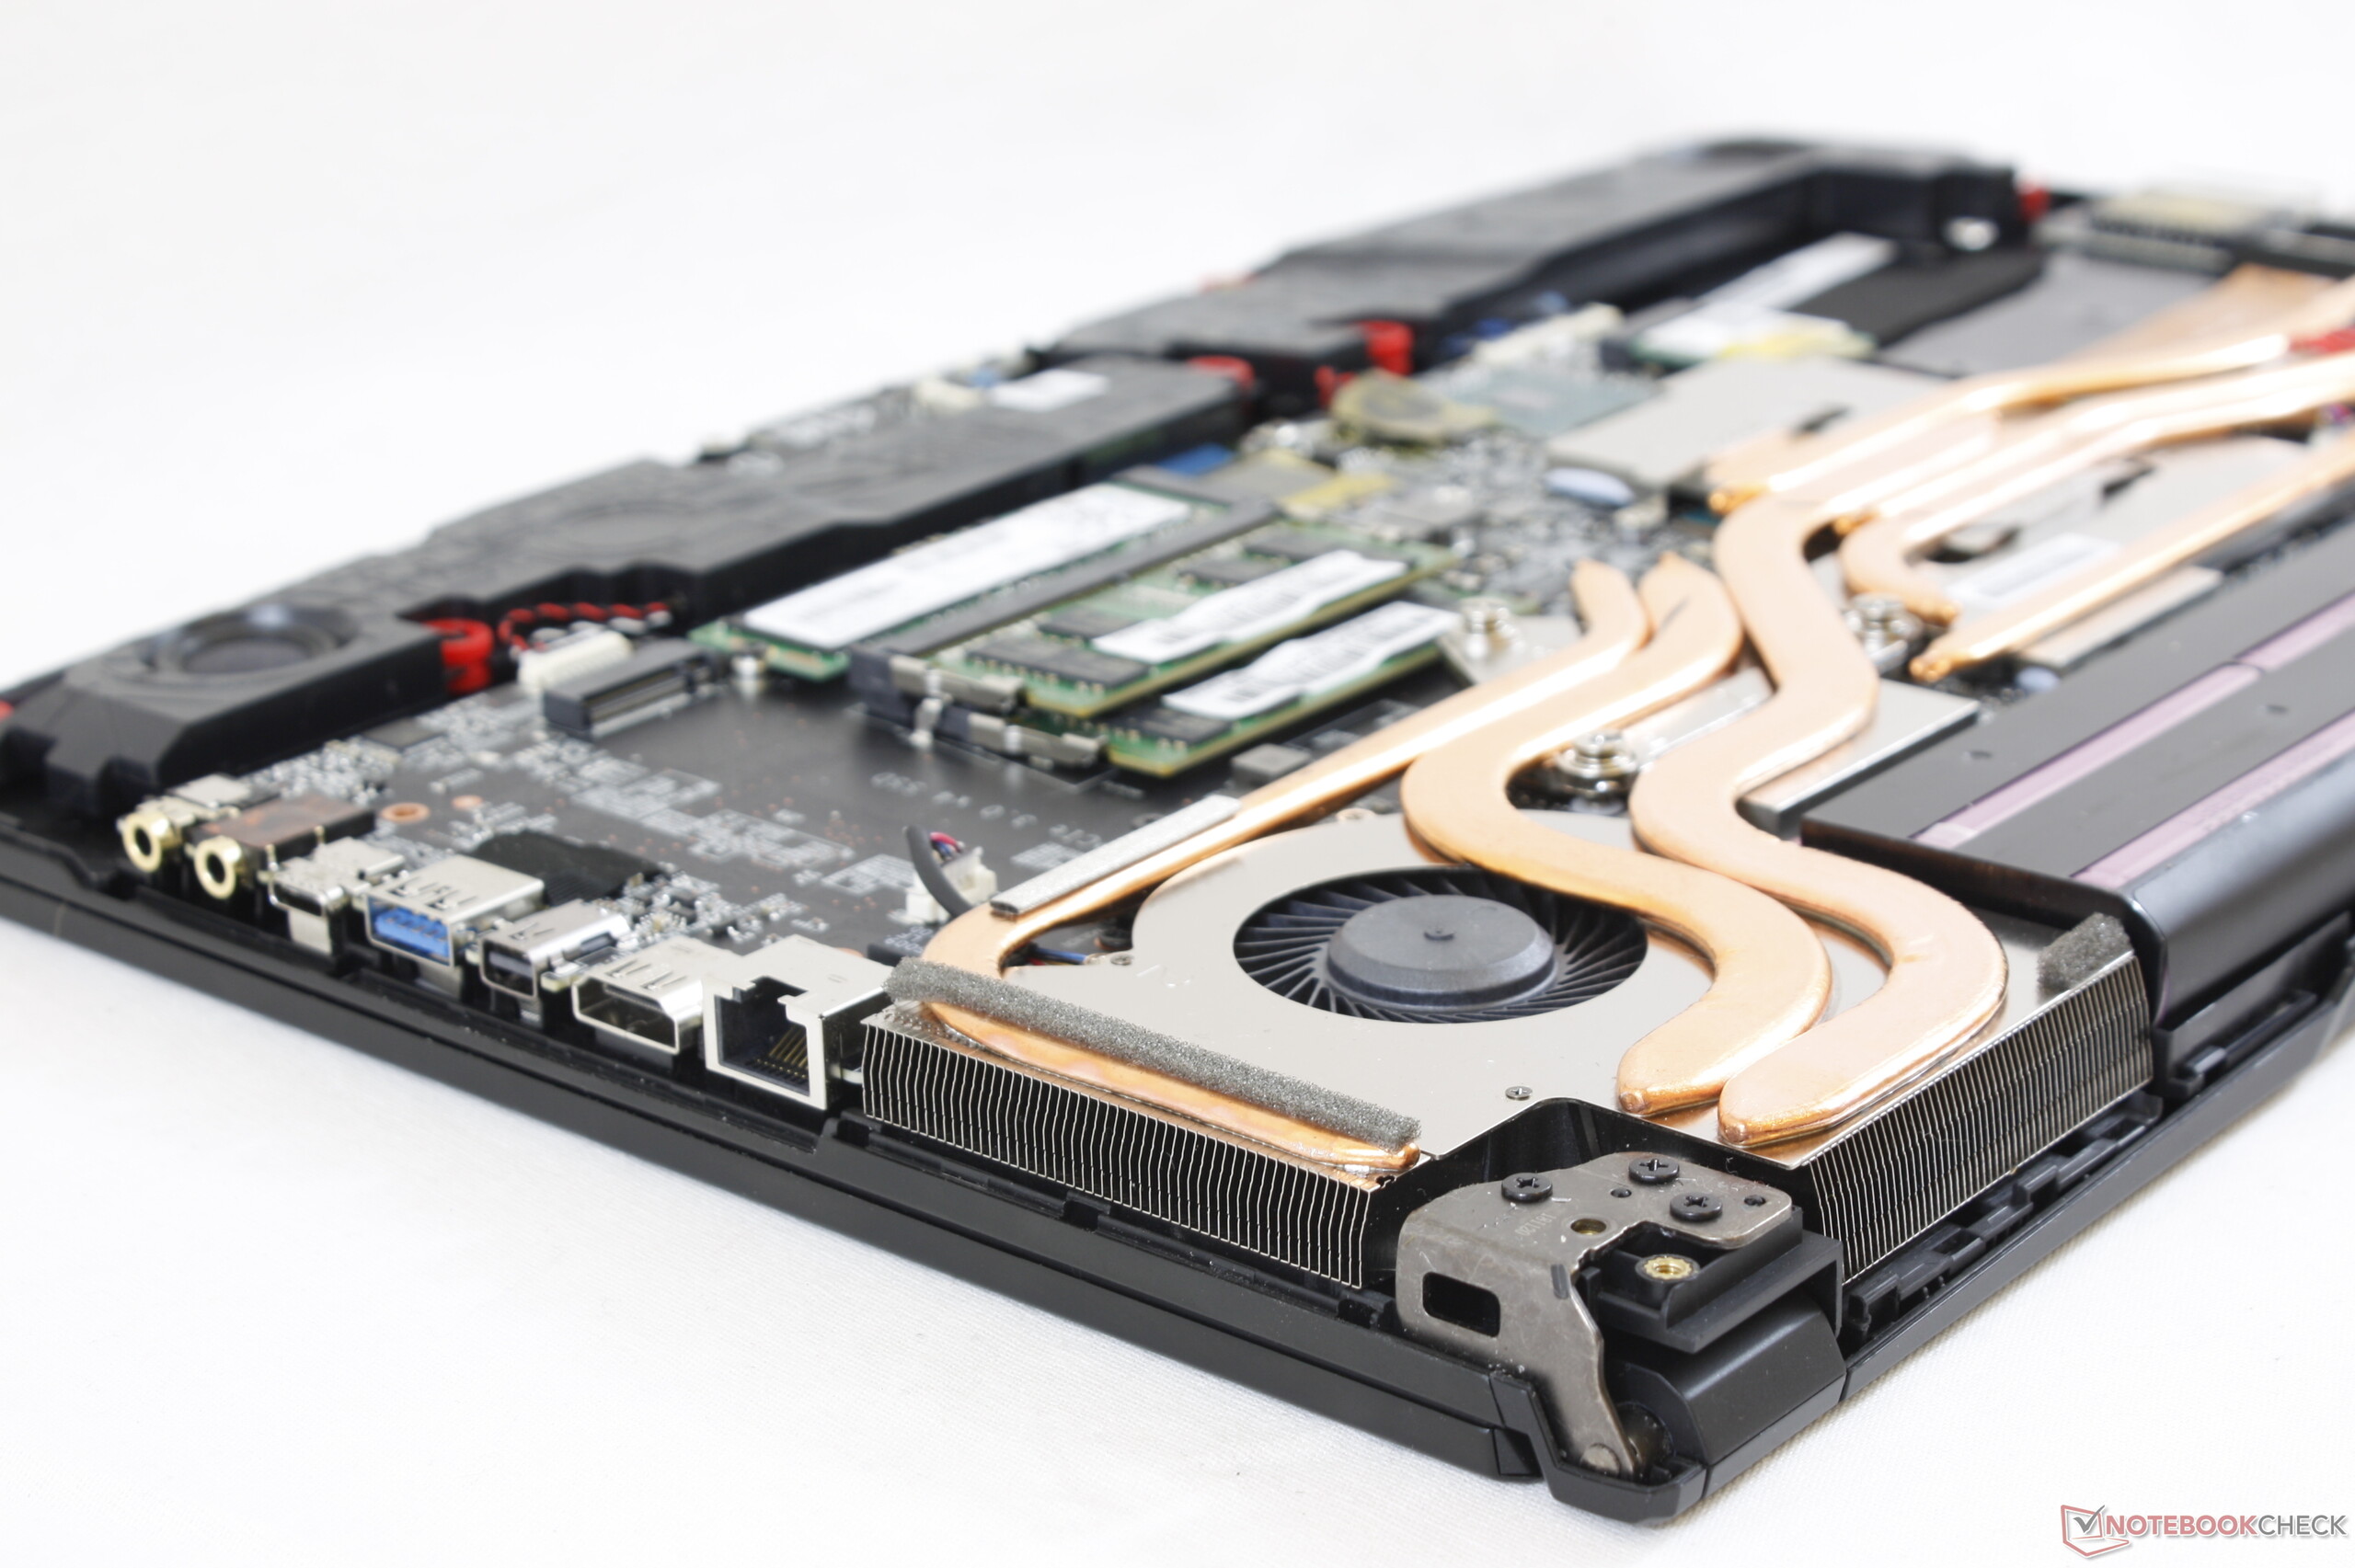
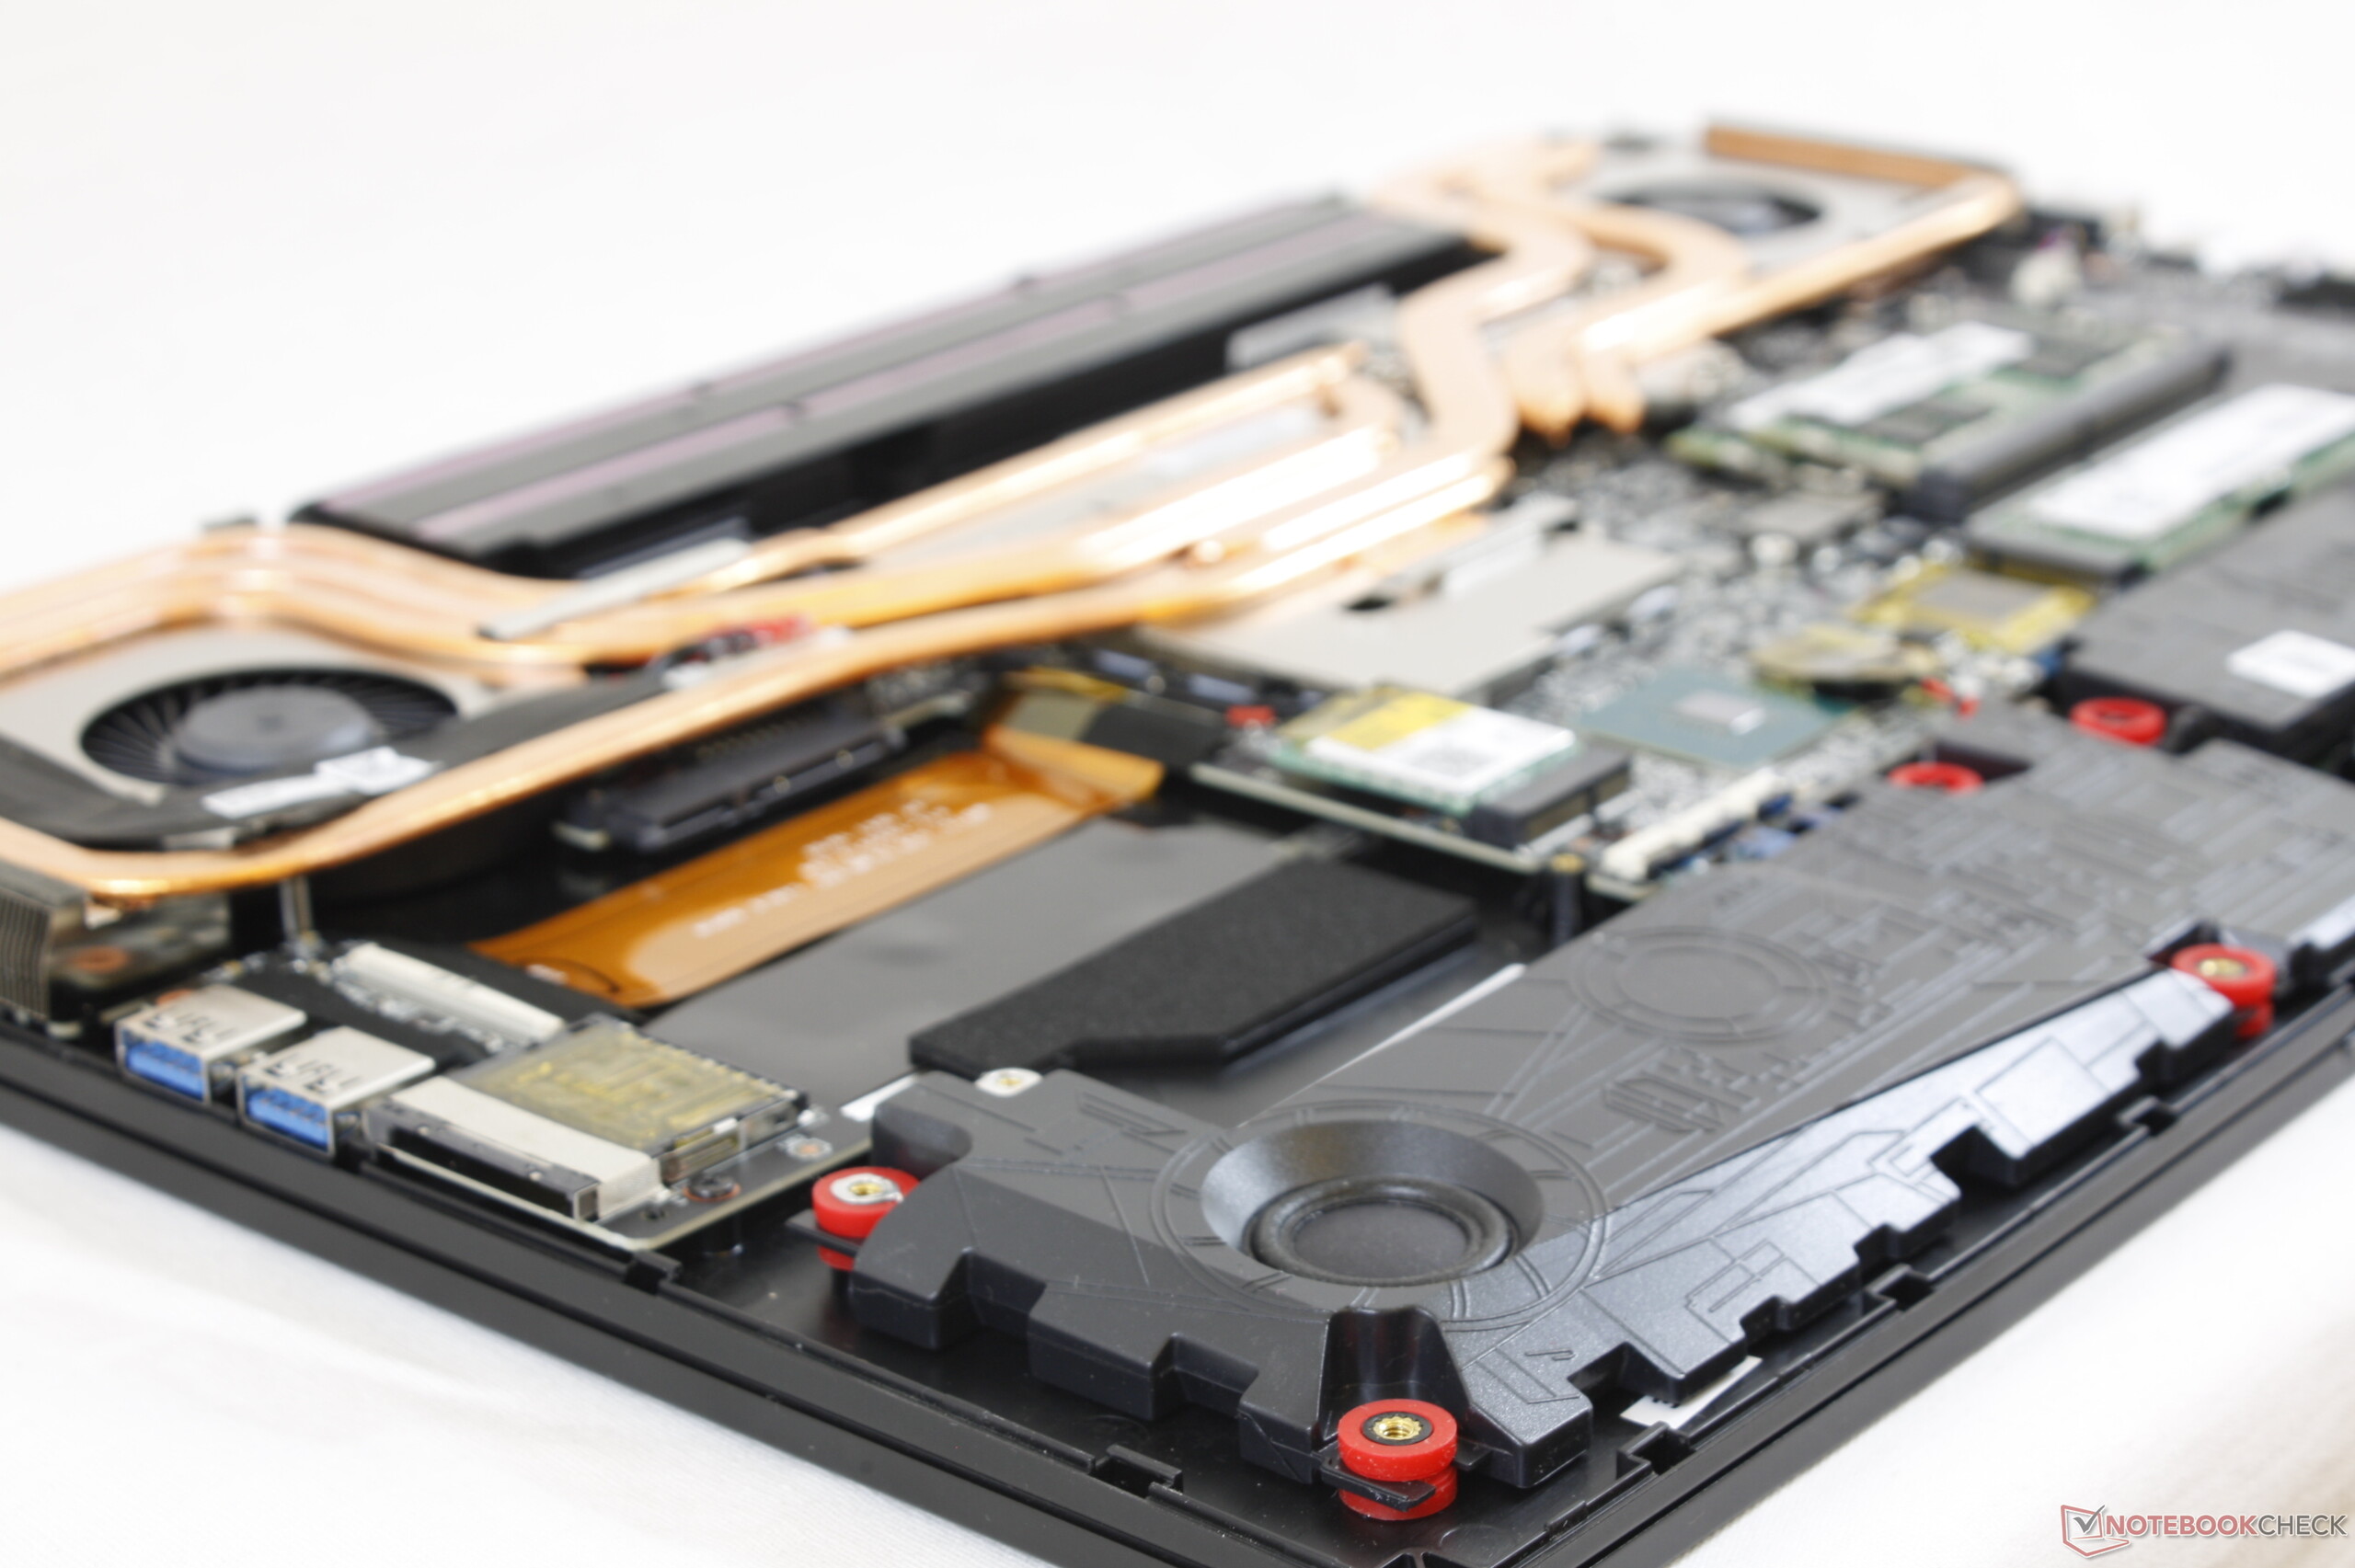
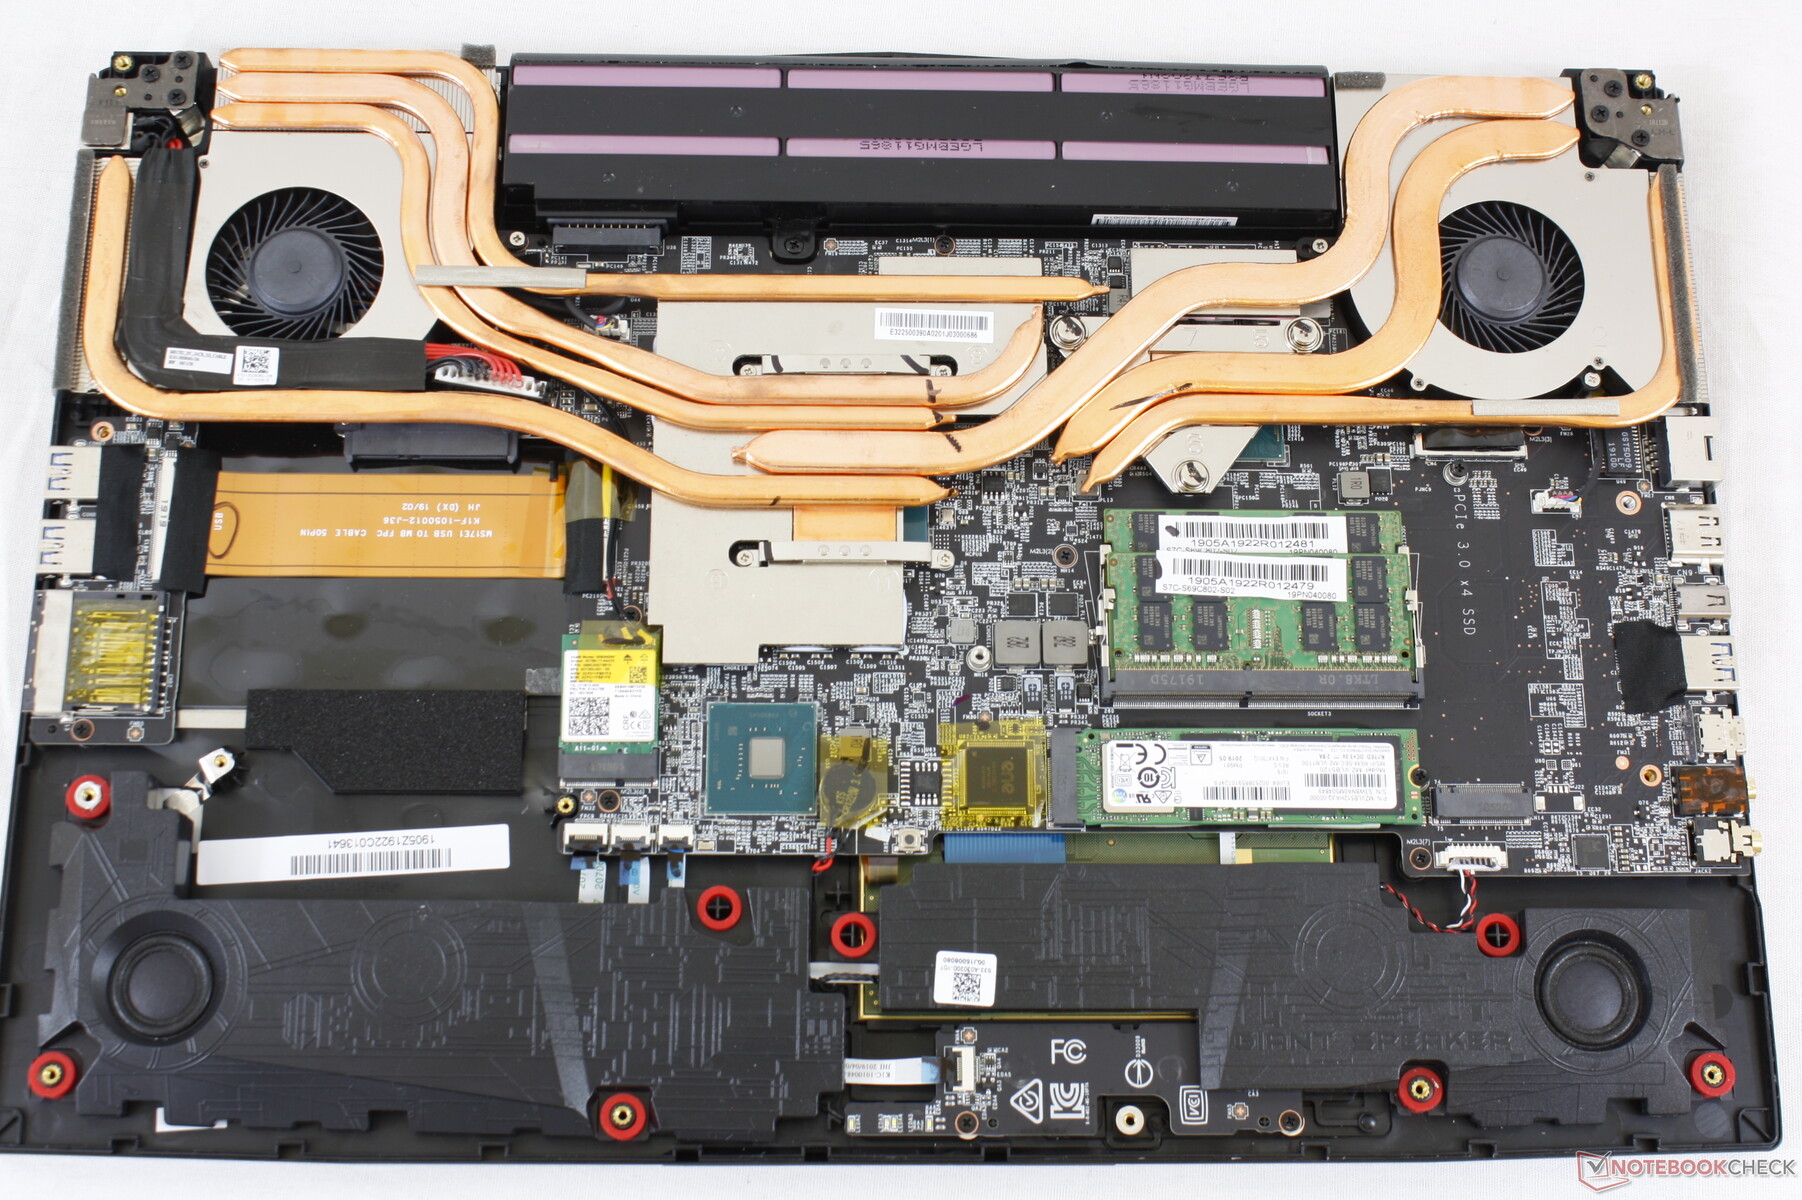
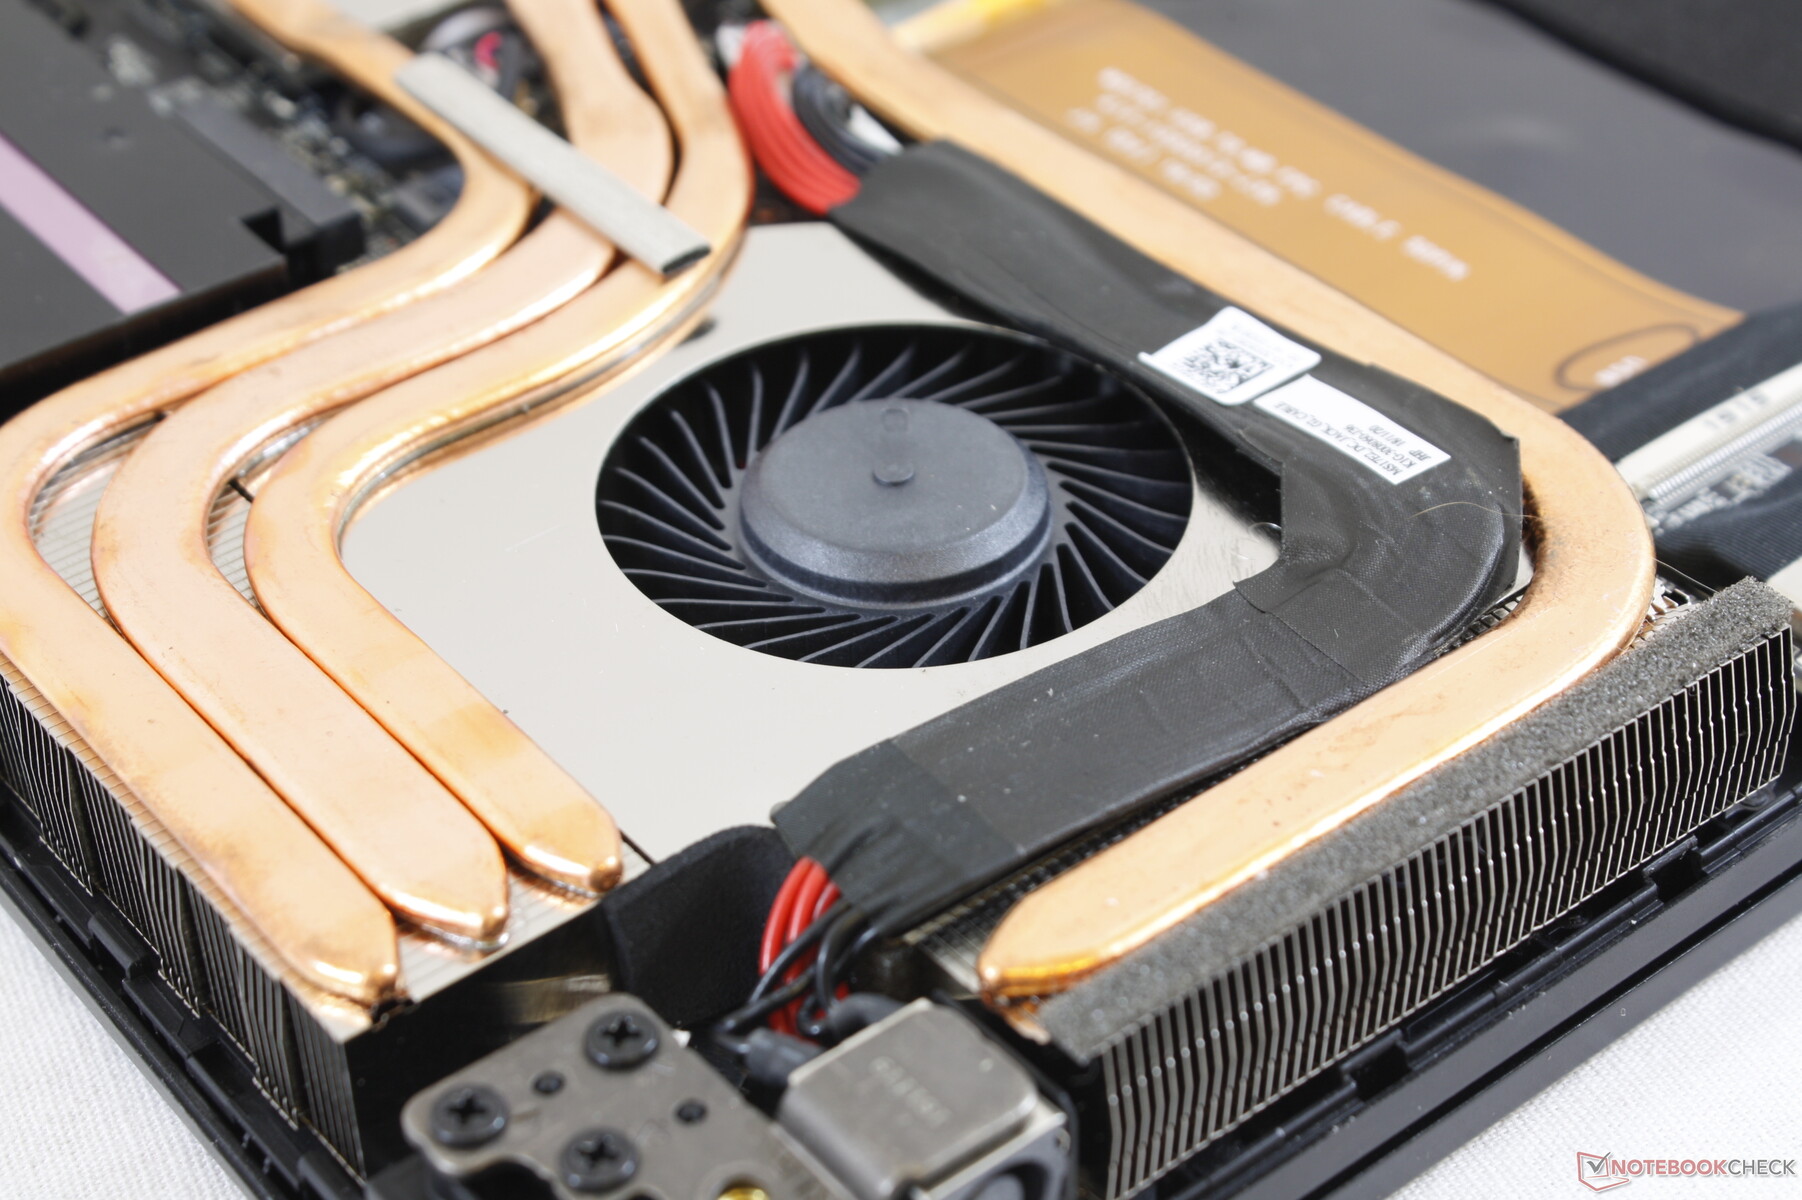
Maintenance
Servicing requires a Philips screwdriver and a sharp edge. Take care when detaching the bottom panel along the sides as the edges can get caught on the ports. A factory seal sticker must be broken before the panel can be removed.
Accessories and Warranty
There are no extras in the box other than the usual paper manuals. The standard one-year limited warranty applies.
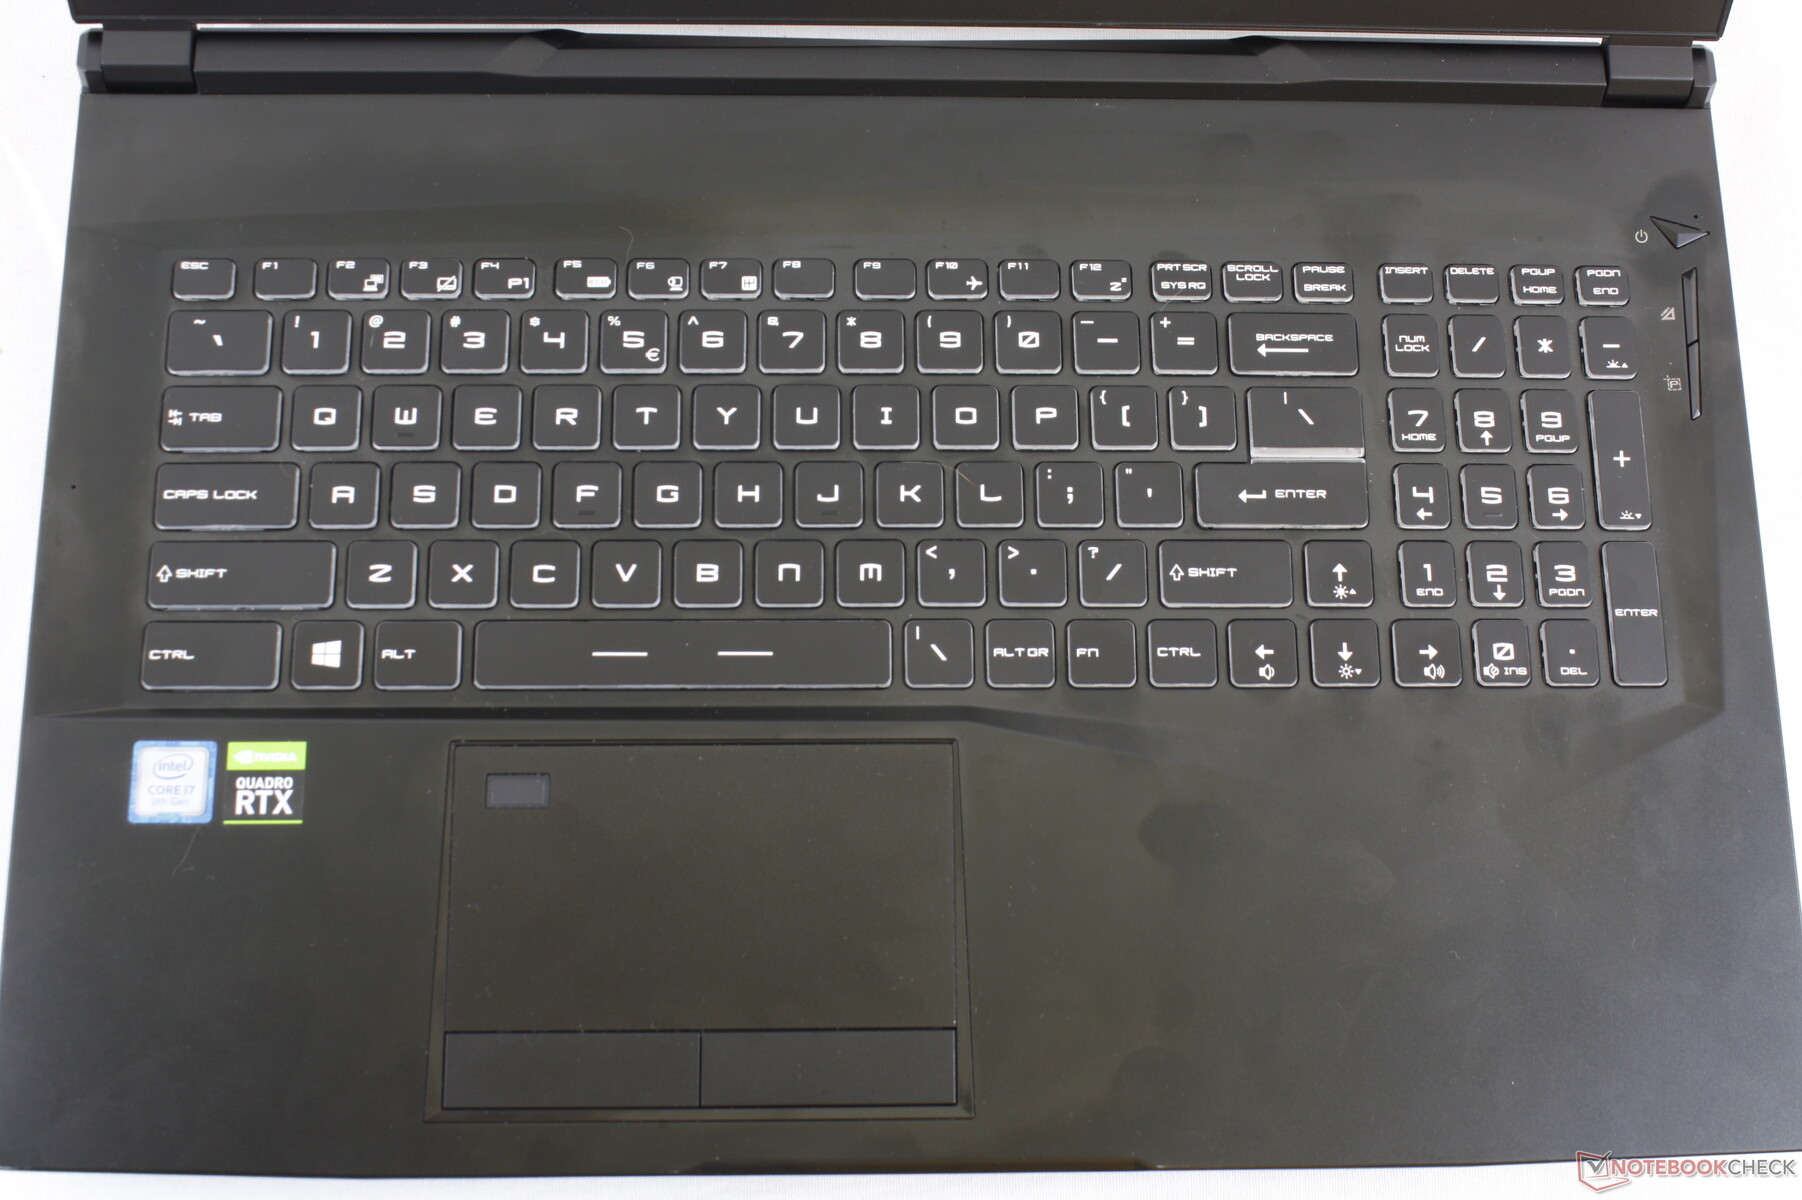
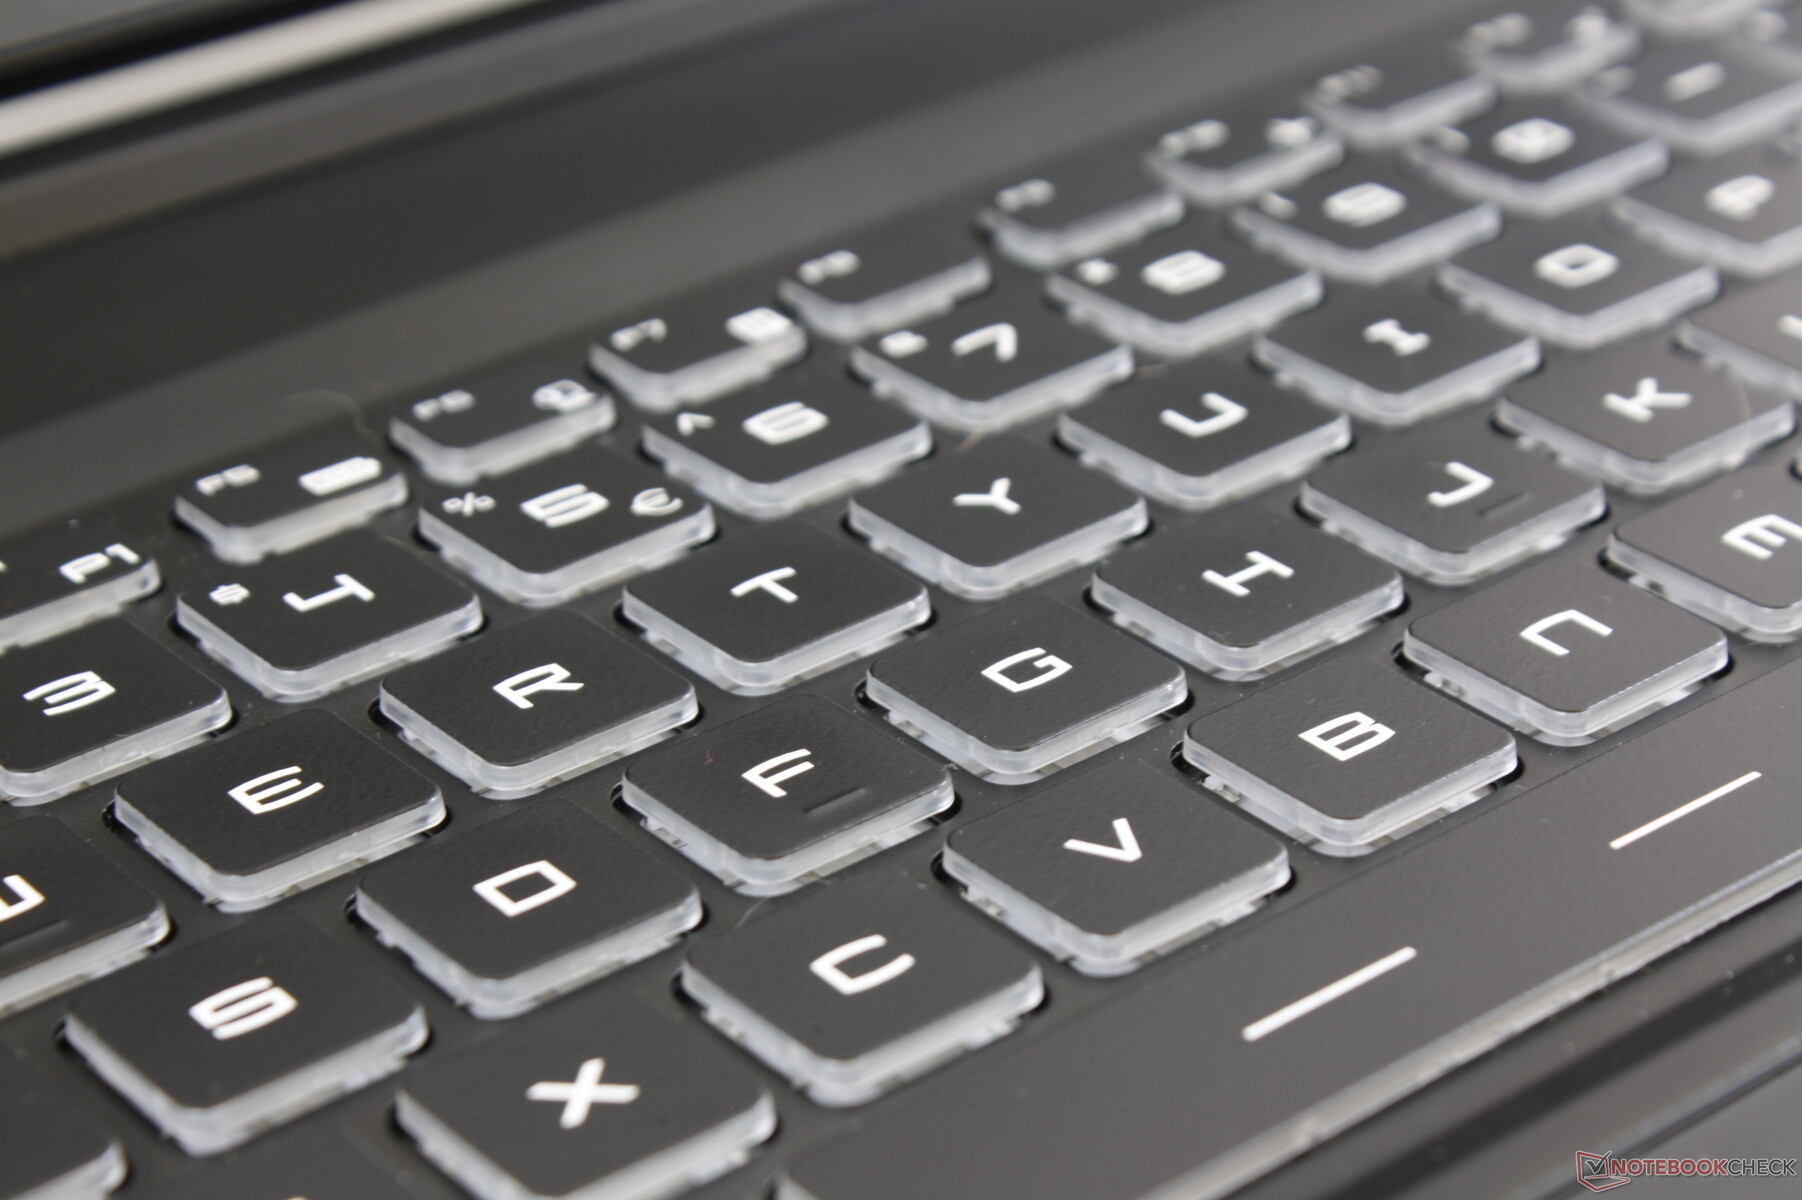
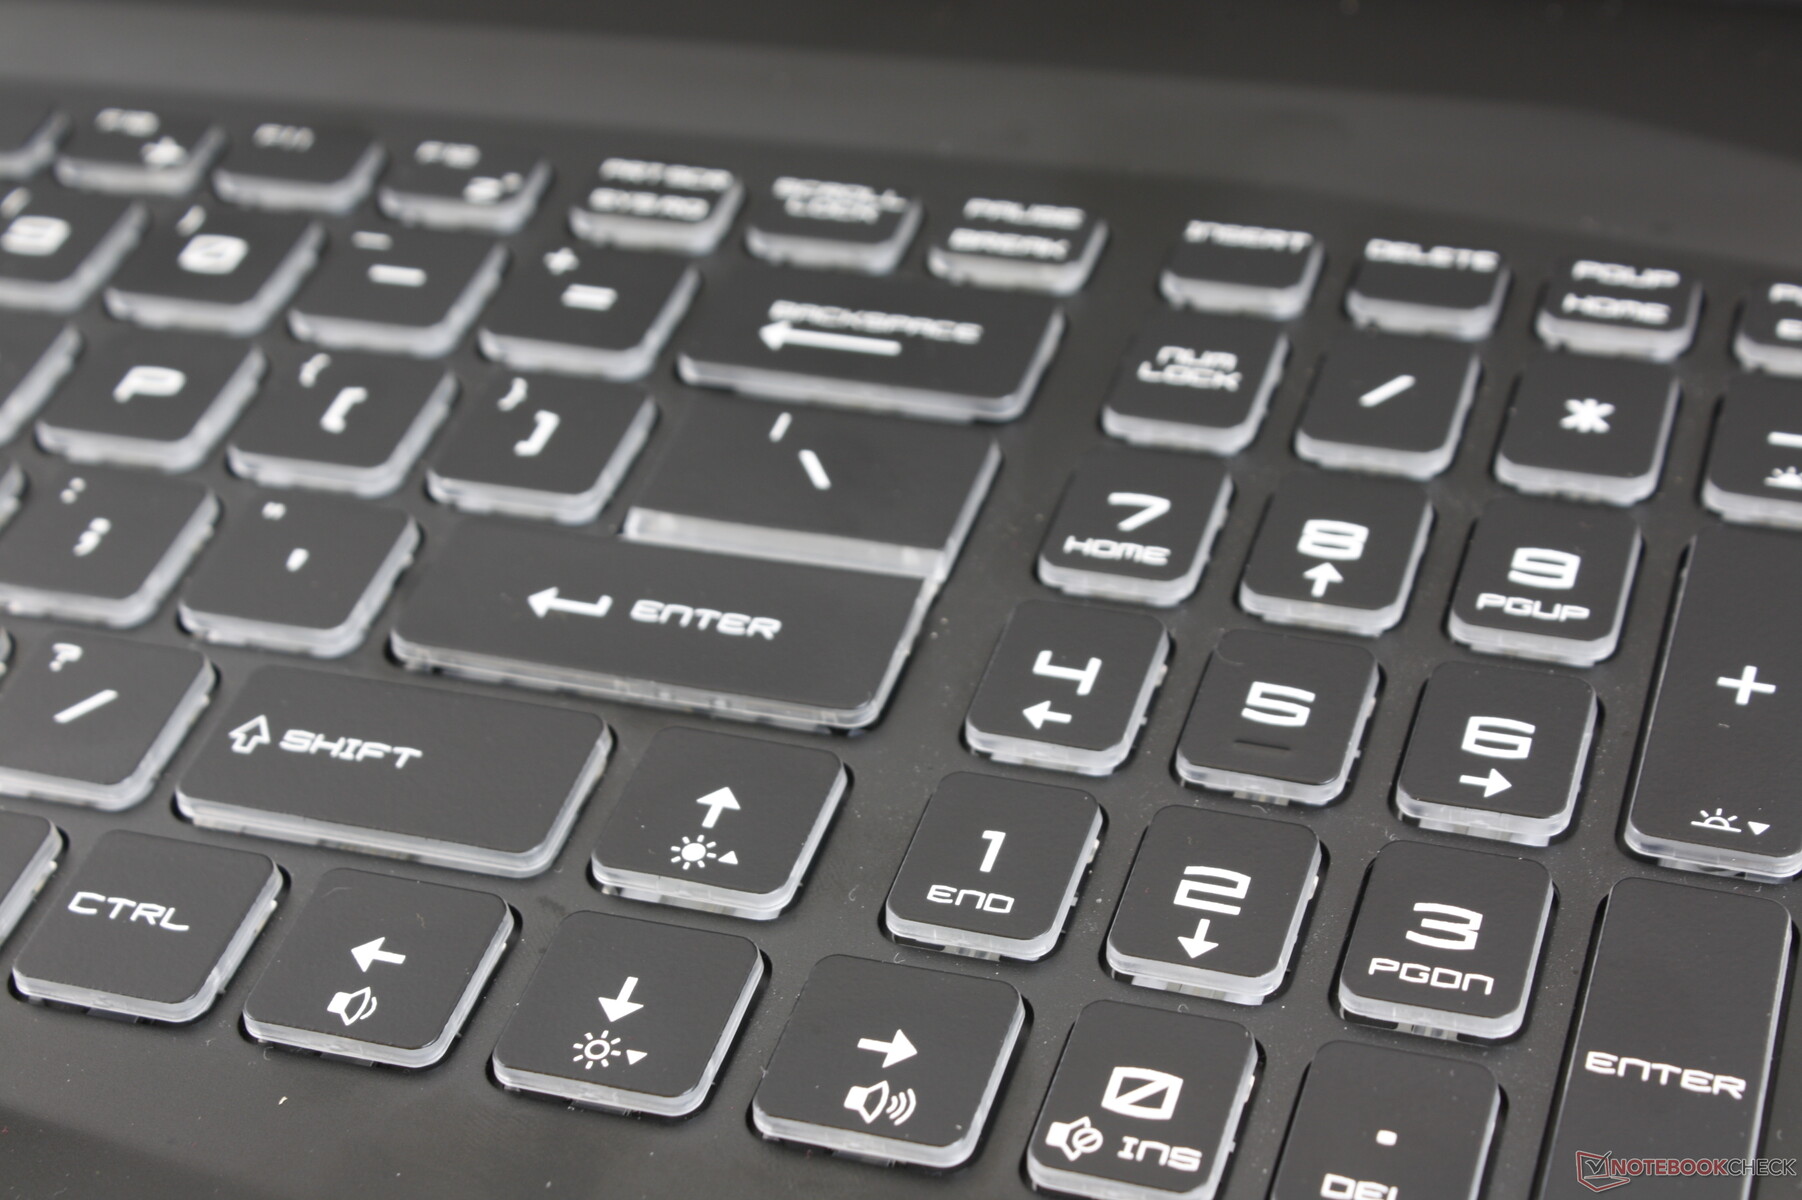
Input Devices
Keyboard and Touchpad
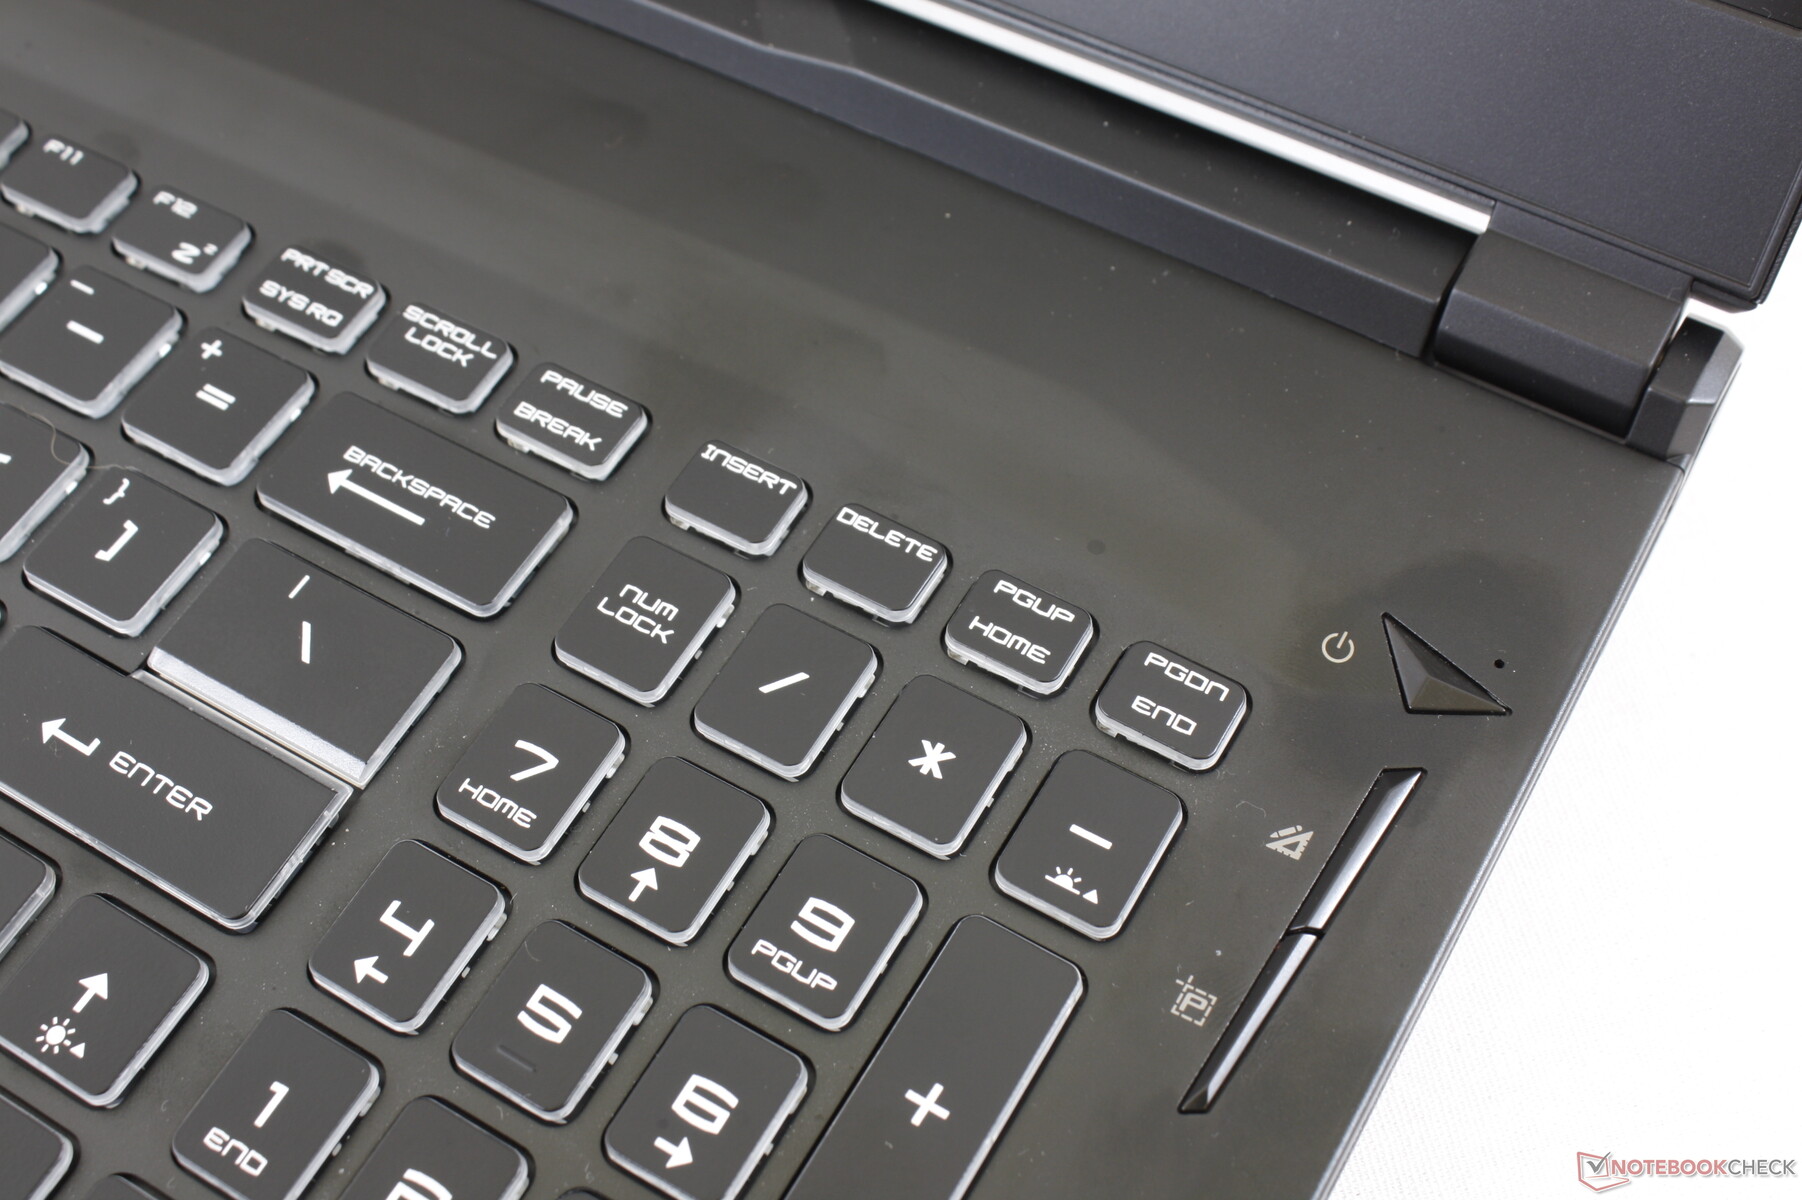
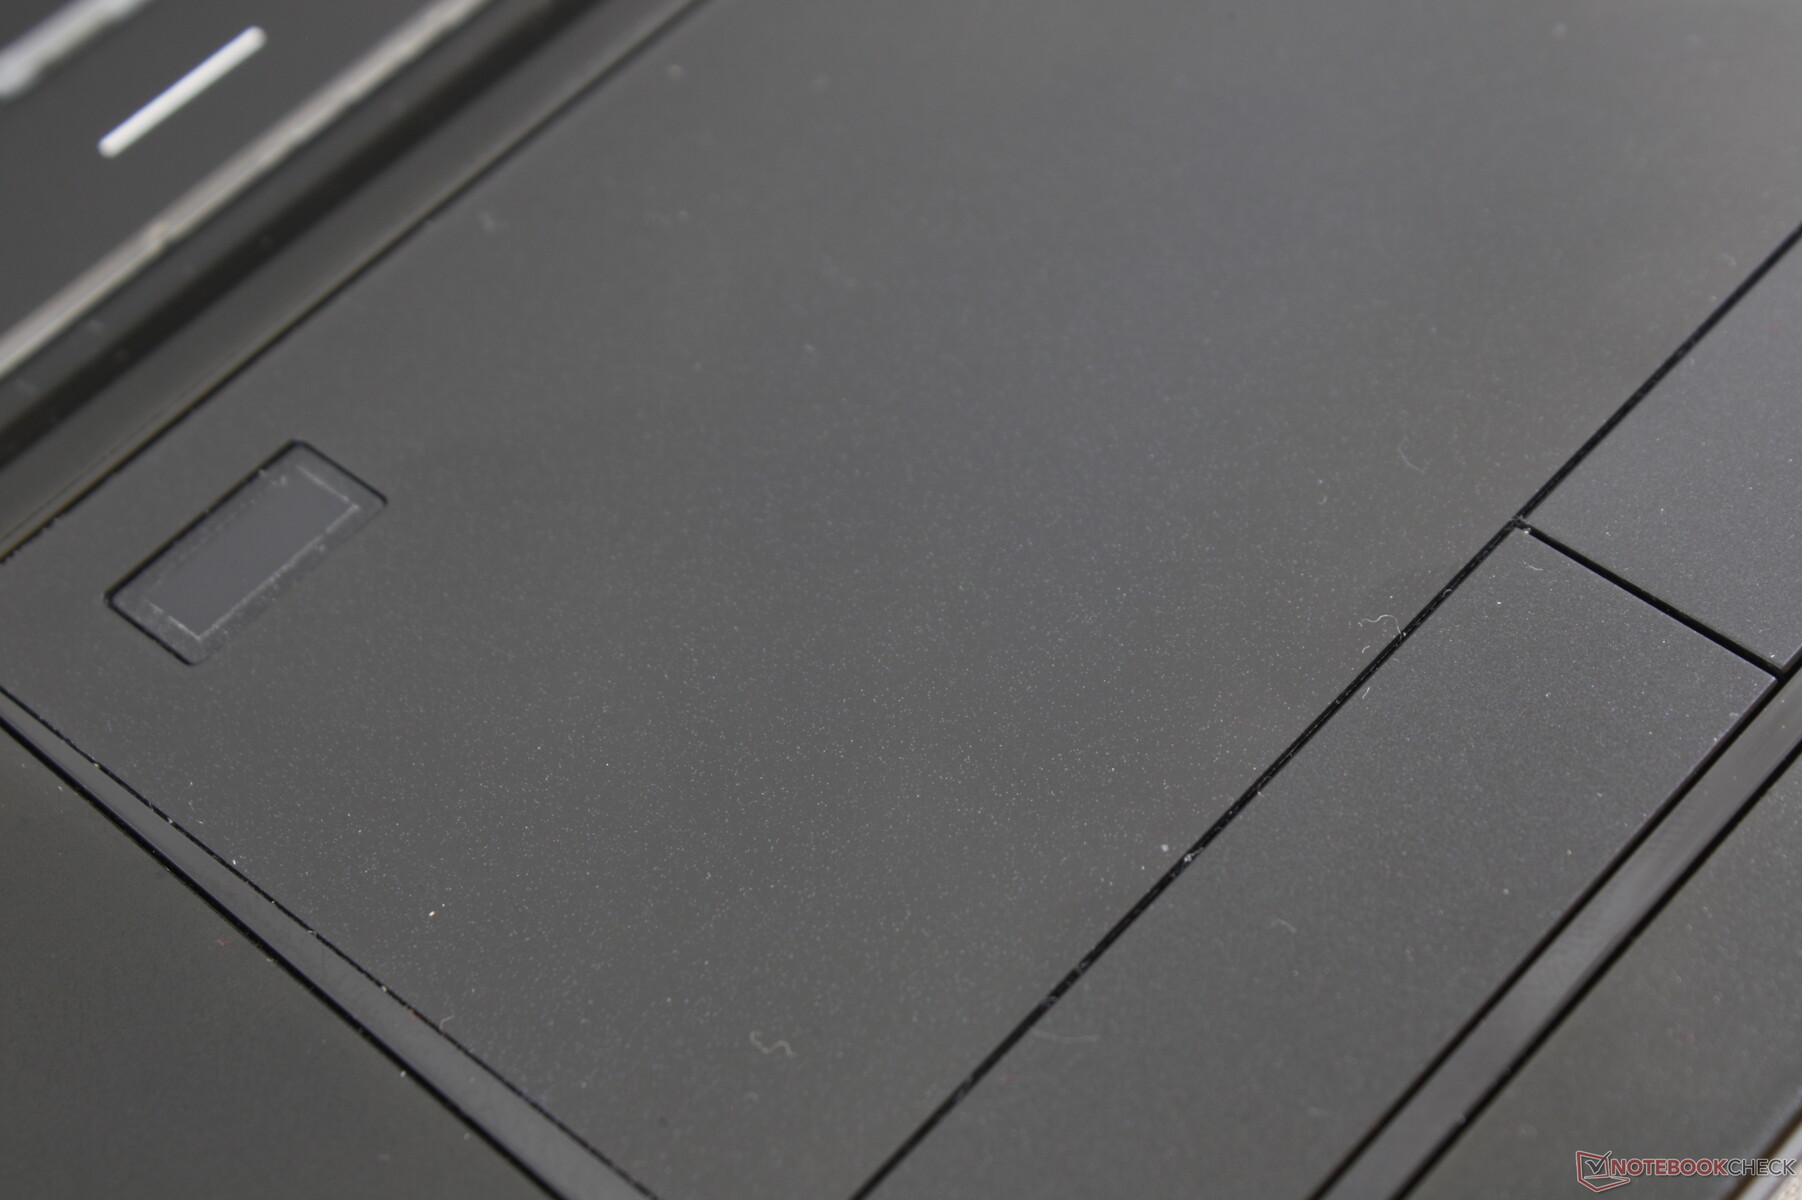
The keyboard and touchpad (~11 x 6.3 cm) are identical to the ones on the GE75 and so we refer to our existing review here. Nonetheless, there are some superficial differences on the WE75. The per-key RGB keyboard backlight is now a more office-friendly single-zone white color while the red rims around the touchpad have been removed. A fingerprint reader can now be found on the corner of the touchpad.
We encountered a touchpad bug on our test unit. When gliding a finger slowly on the surface at a constant speed, the cursor would frequently pause for a split second before deciding to move again. This unintended behavior makes precision clicks frustrating to do without an external mouse. Attempting to update the Synaptics driver through MSI's own Driver and App Center software results in Windows certification errors.
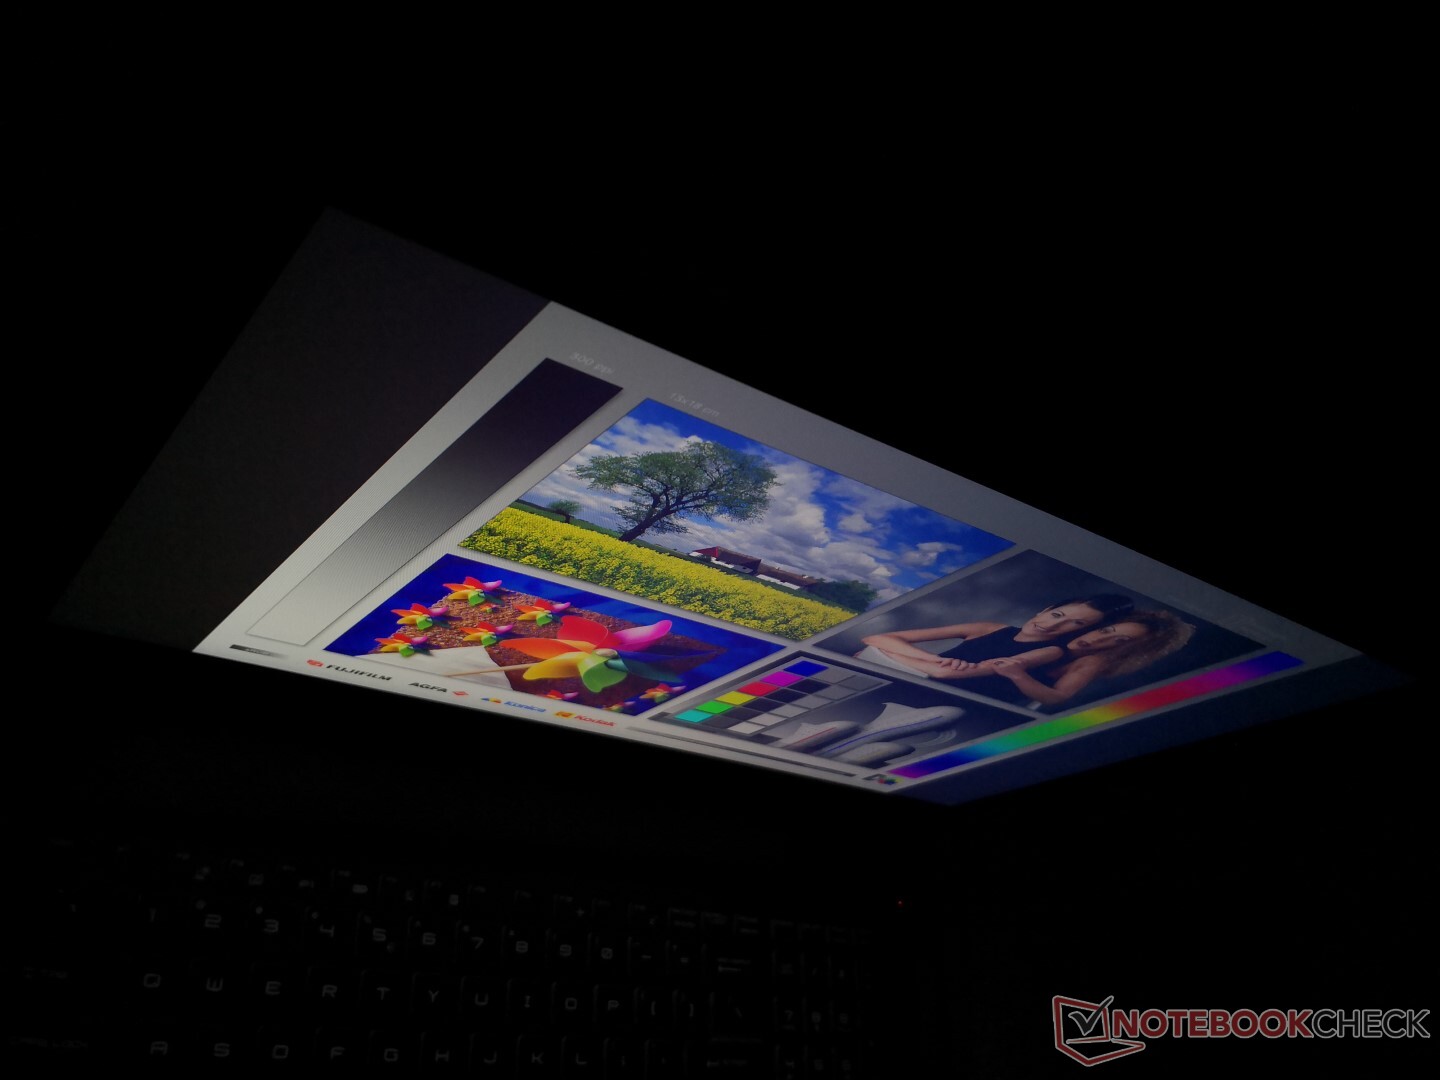
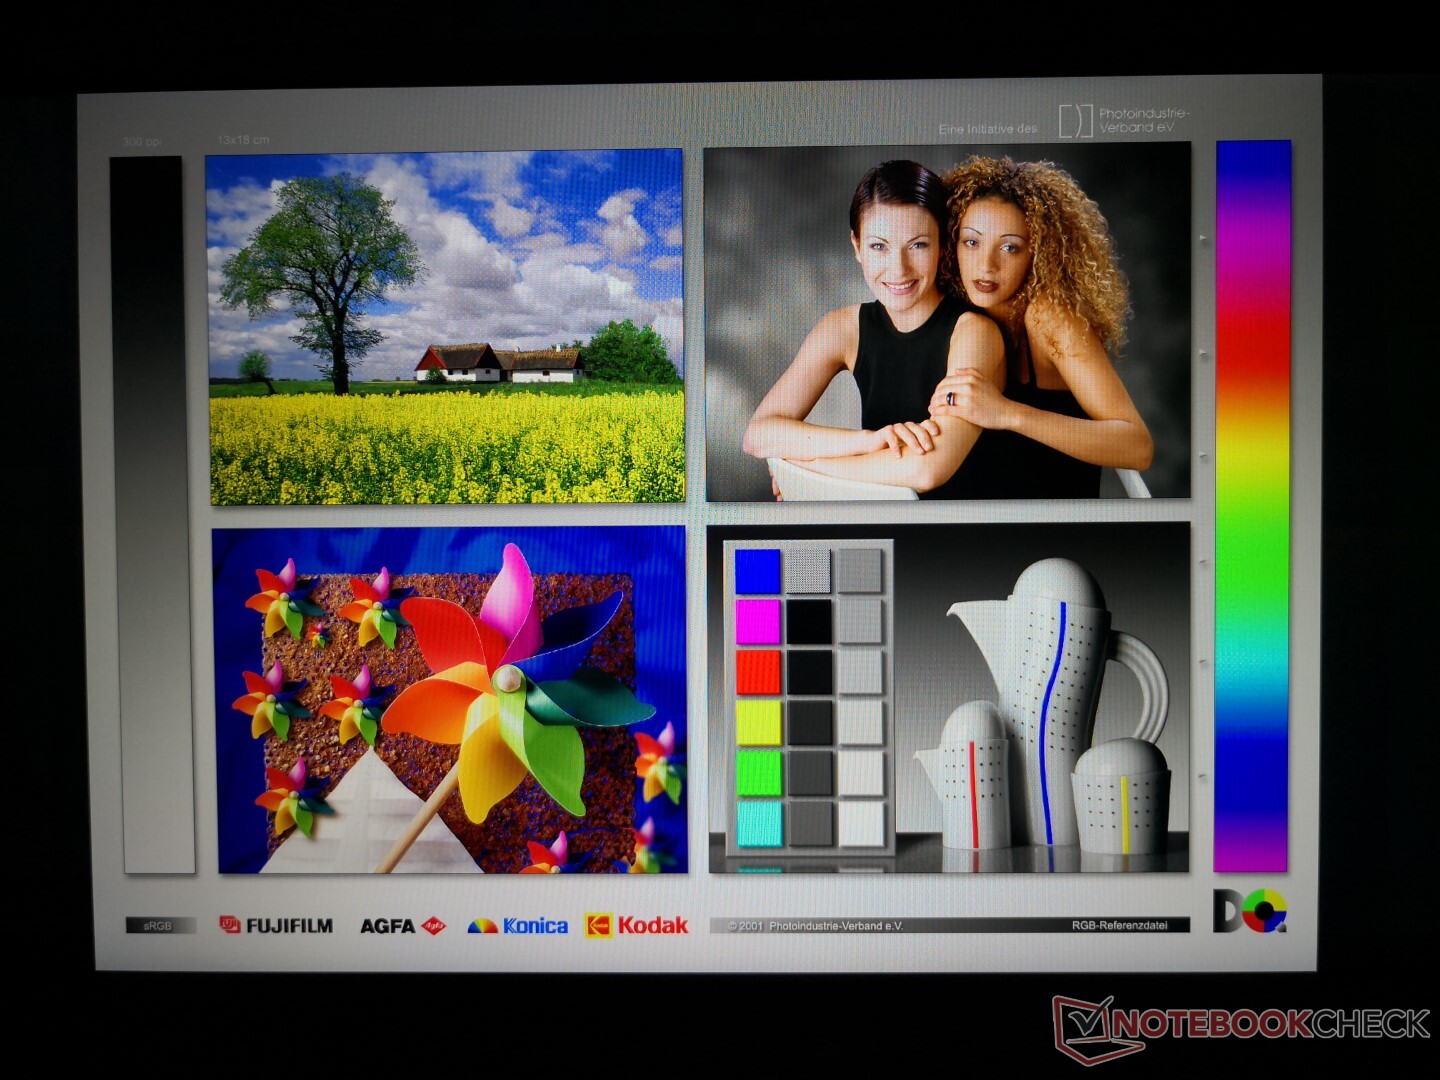
Display
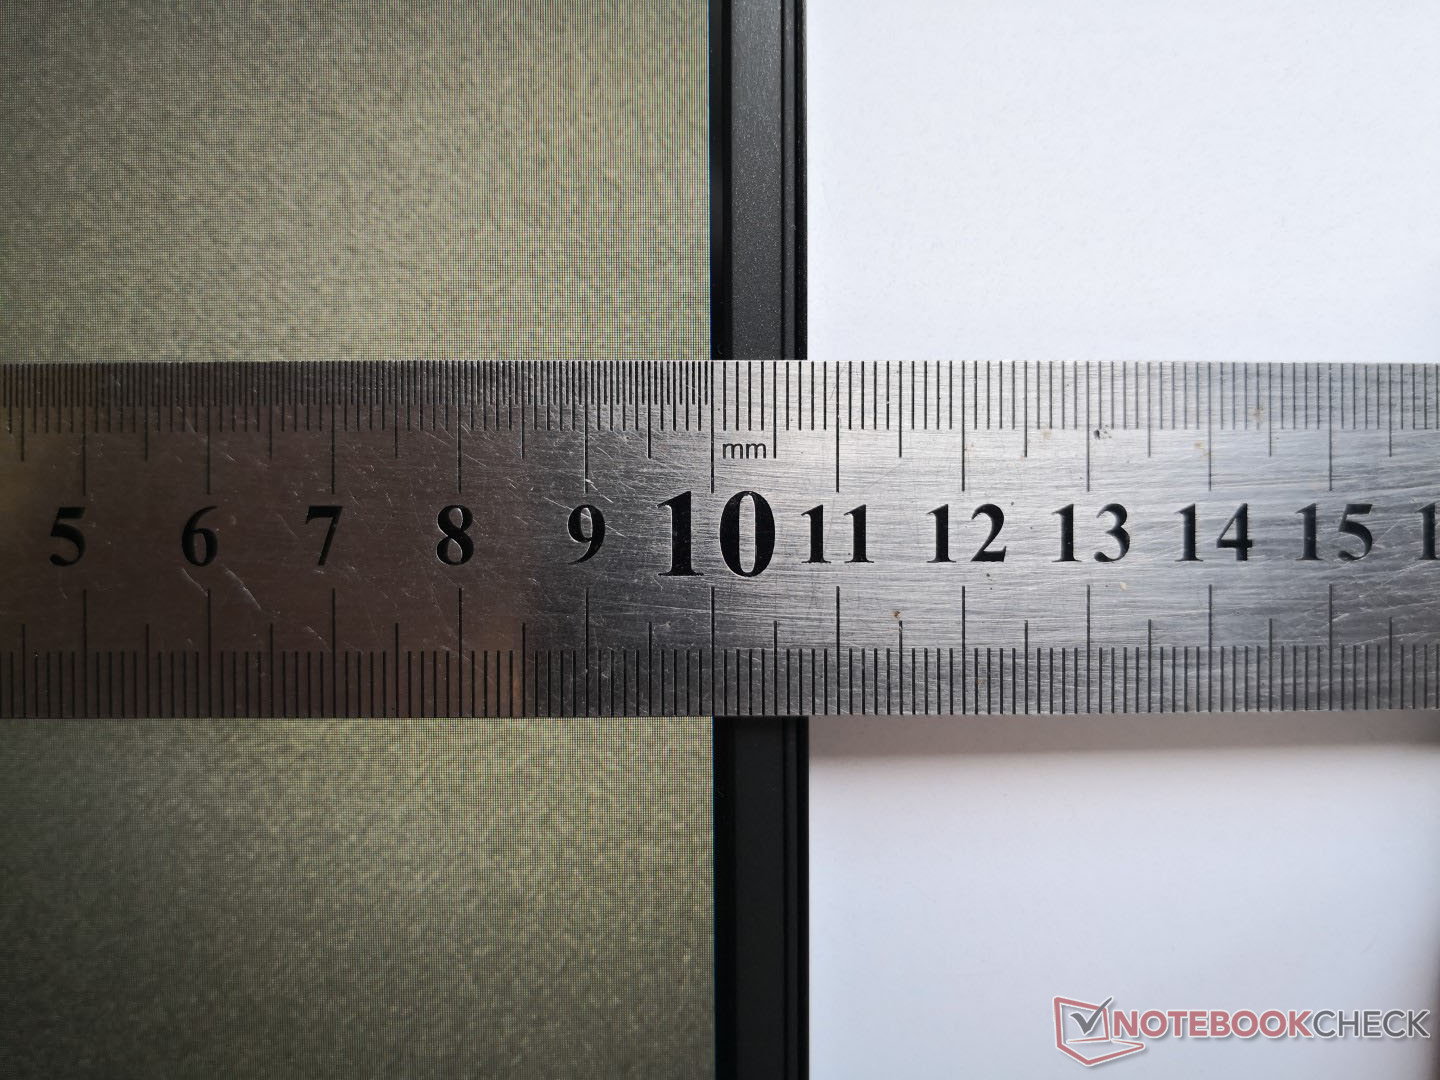
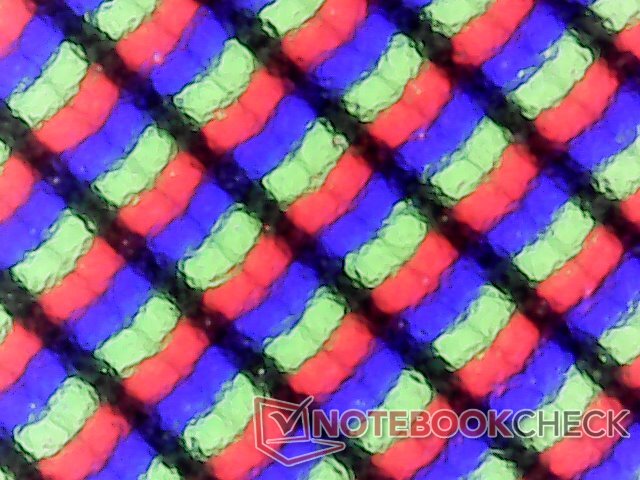
It's both odd and disappointing to not see any other panel options available other than the mid-range 1080p 60 Hz panel on our WE75 unit. This particular AU Optronics B173HAN04.2 IPS panel can also be found on the MSI GF75 and Asus TUF FX705DT budget gaming laptops and it lacks both the fast response times and fast 144 Hz refresh rates of the more advanced panels like on the Razer Blade Pro 17 or even MSI's own GE75. On the plus side, the display doesn't suffer from any noticeable graininess issues despite the matte overlay, but we can't shake off the feeling that MSI could have done more to offer a better viewing experience on the WE75.
| |||||||||||||||||||||||||
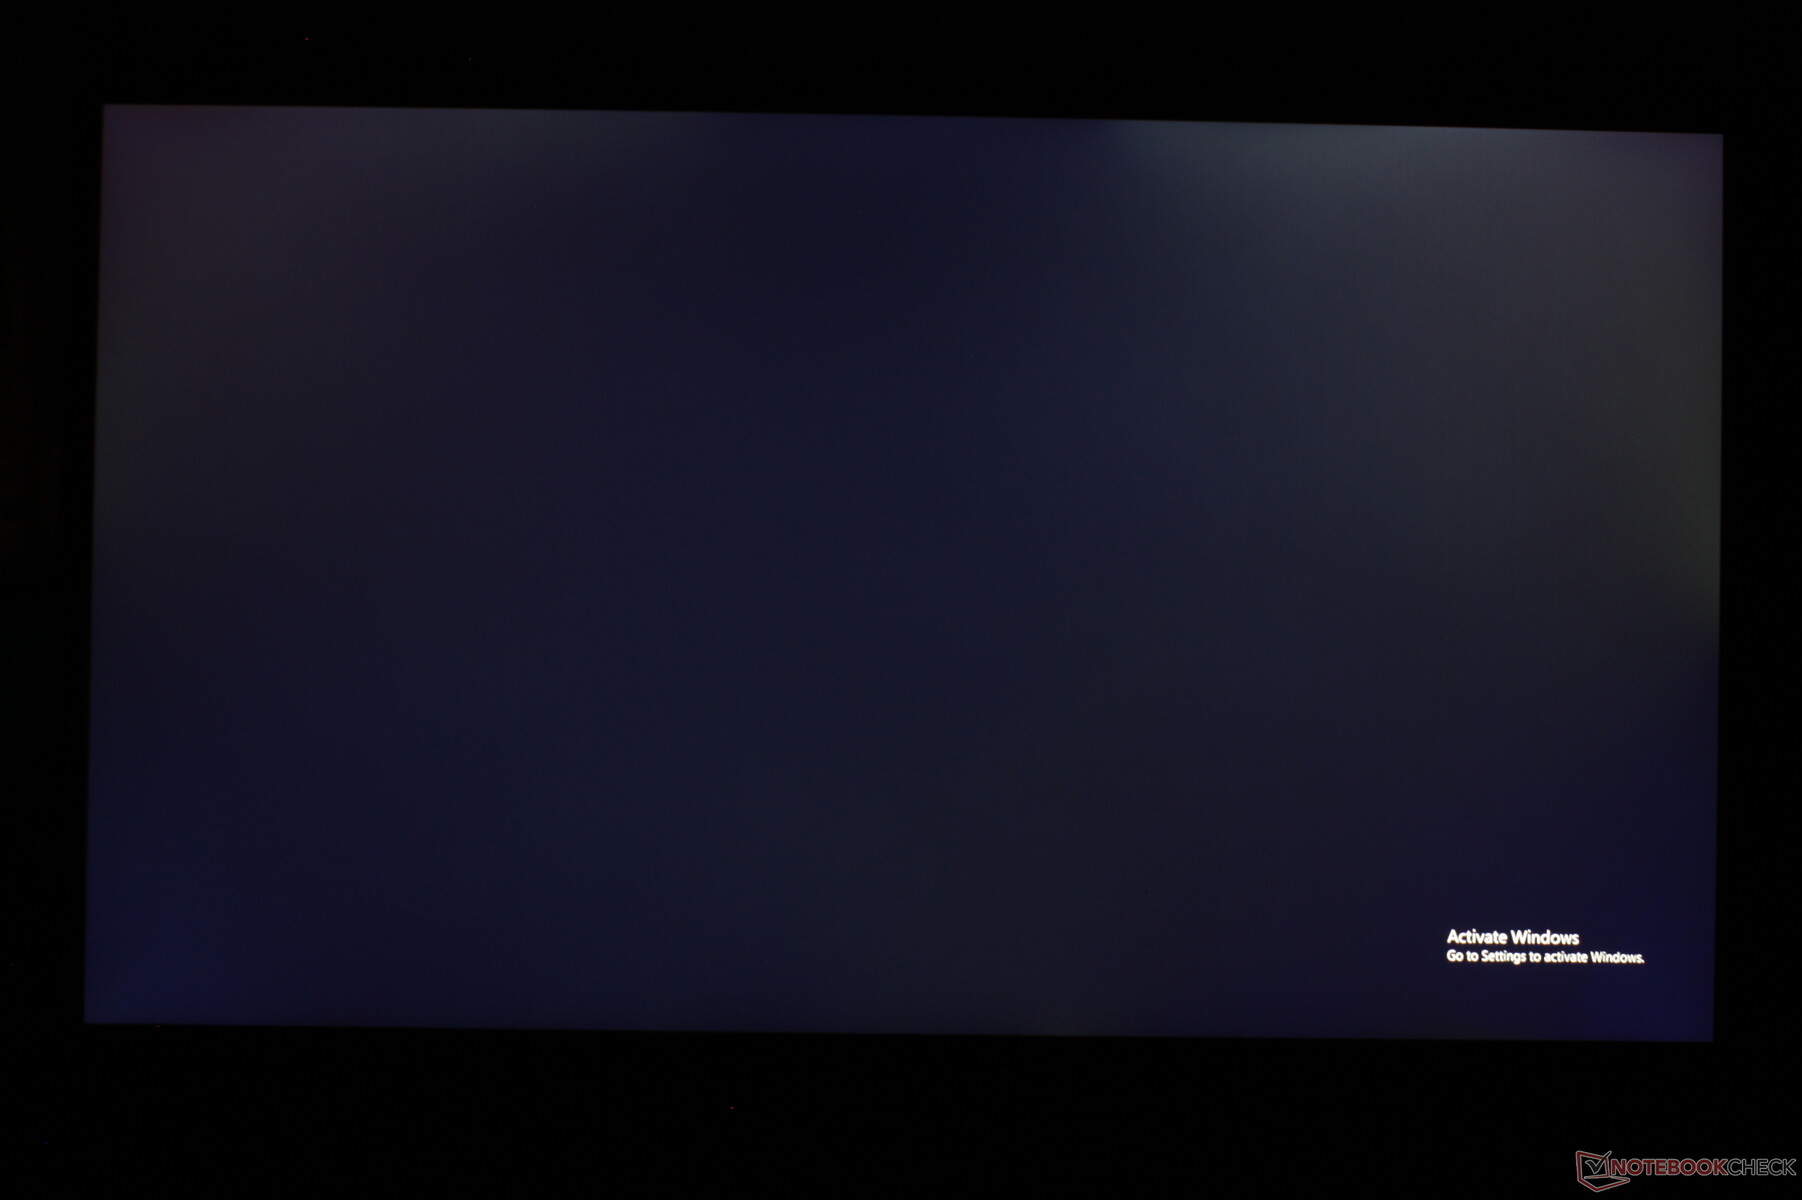
Brightness Distribution: 89 %
Center on Battery: 287.3 cd/m²
Contrast: 1105:1 (Black: 0.26 cd/m²)
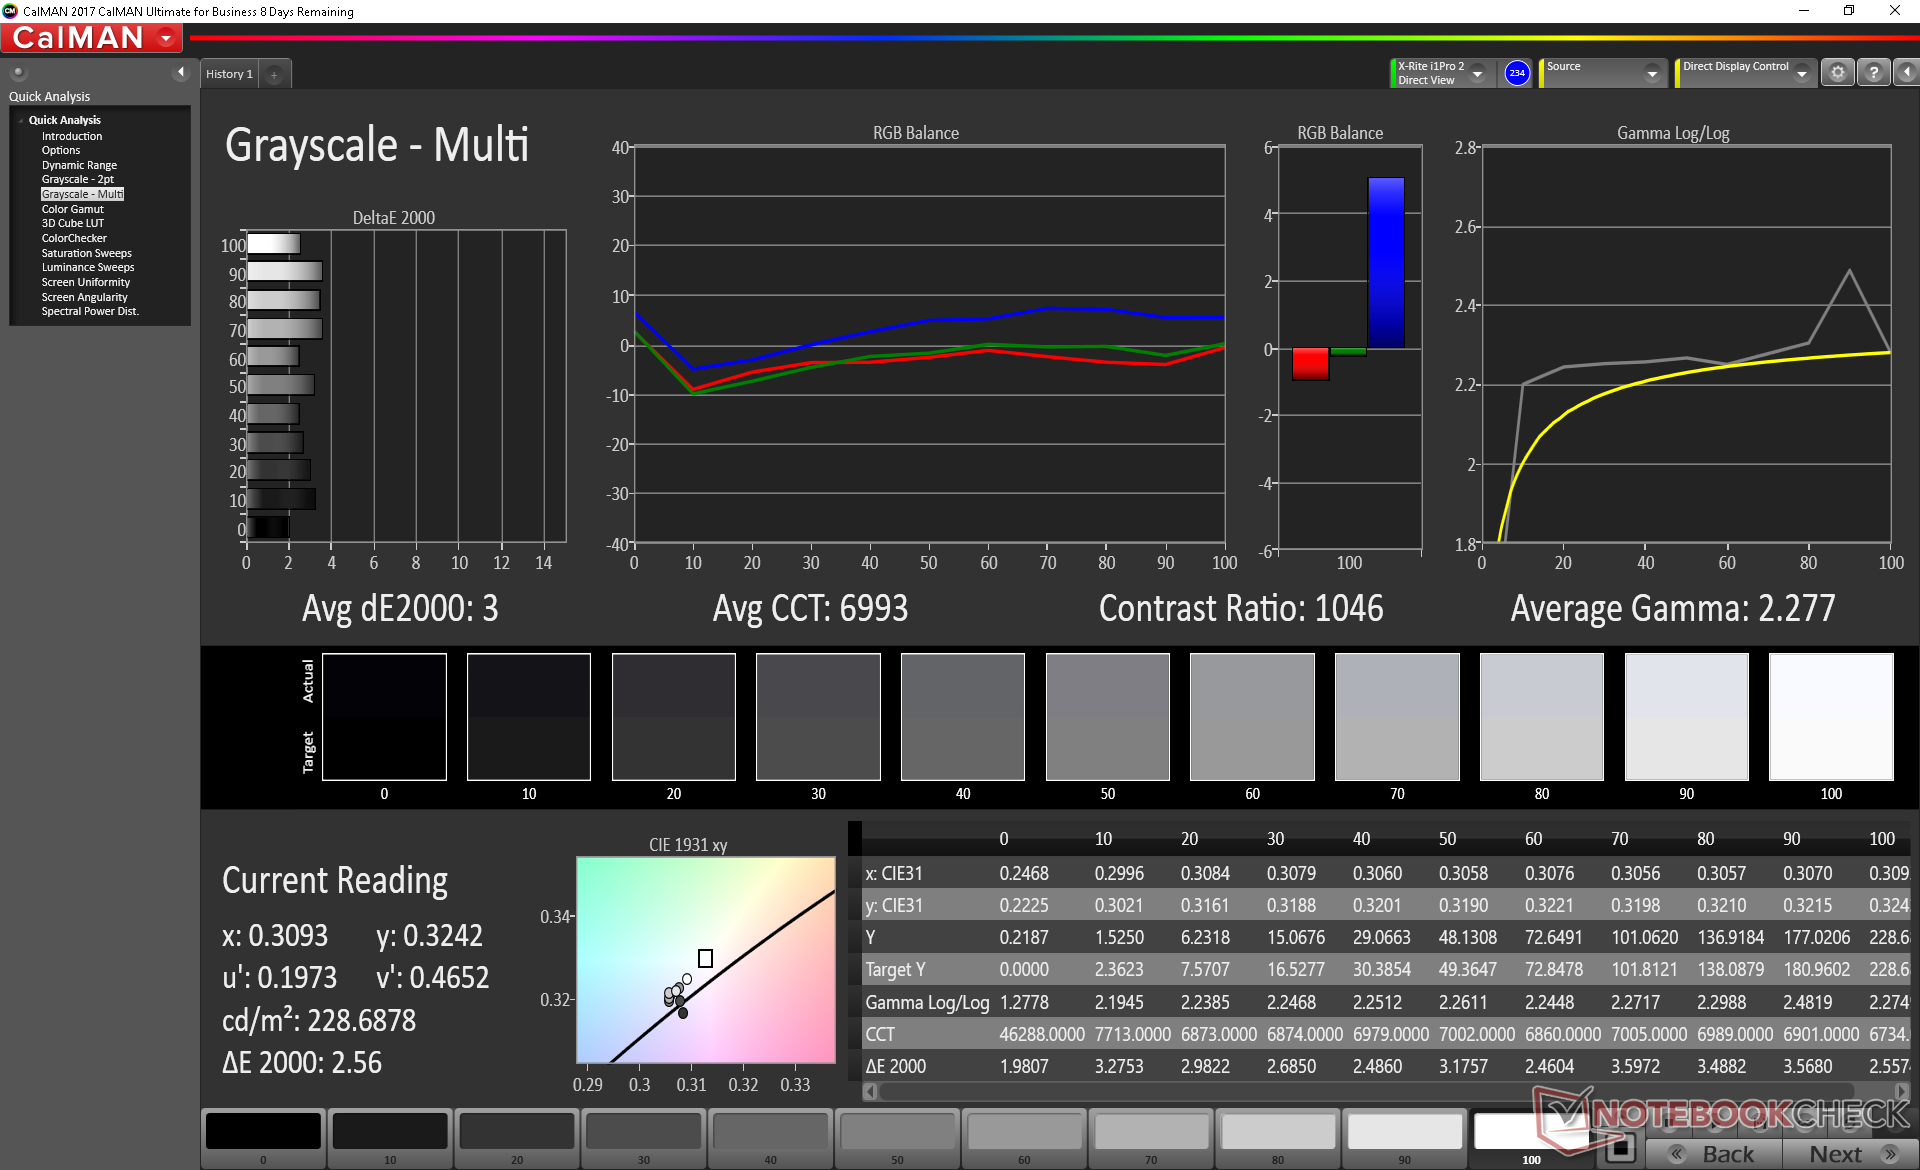
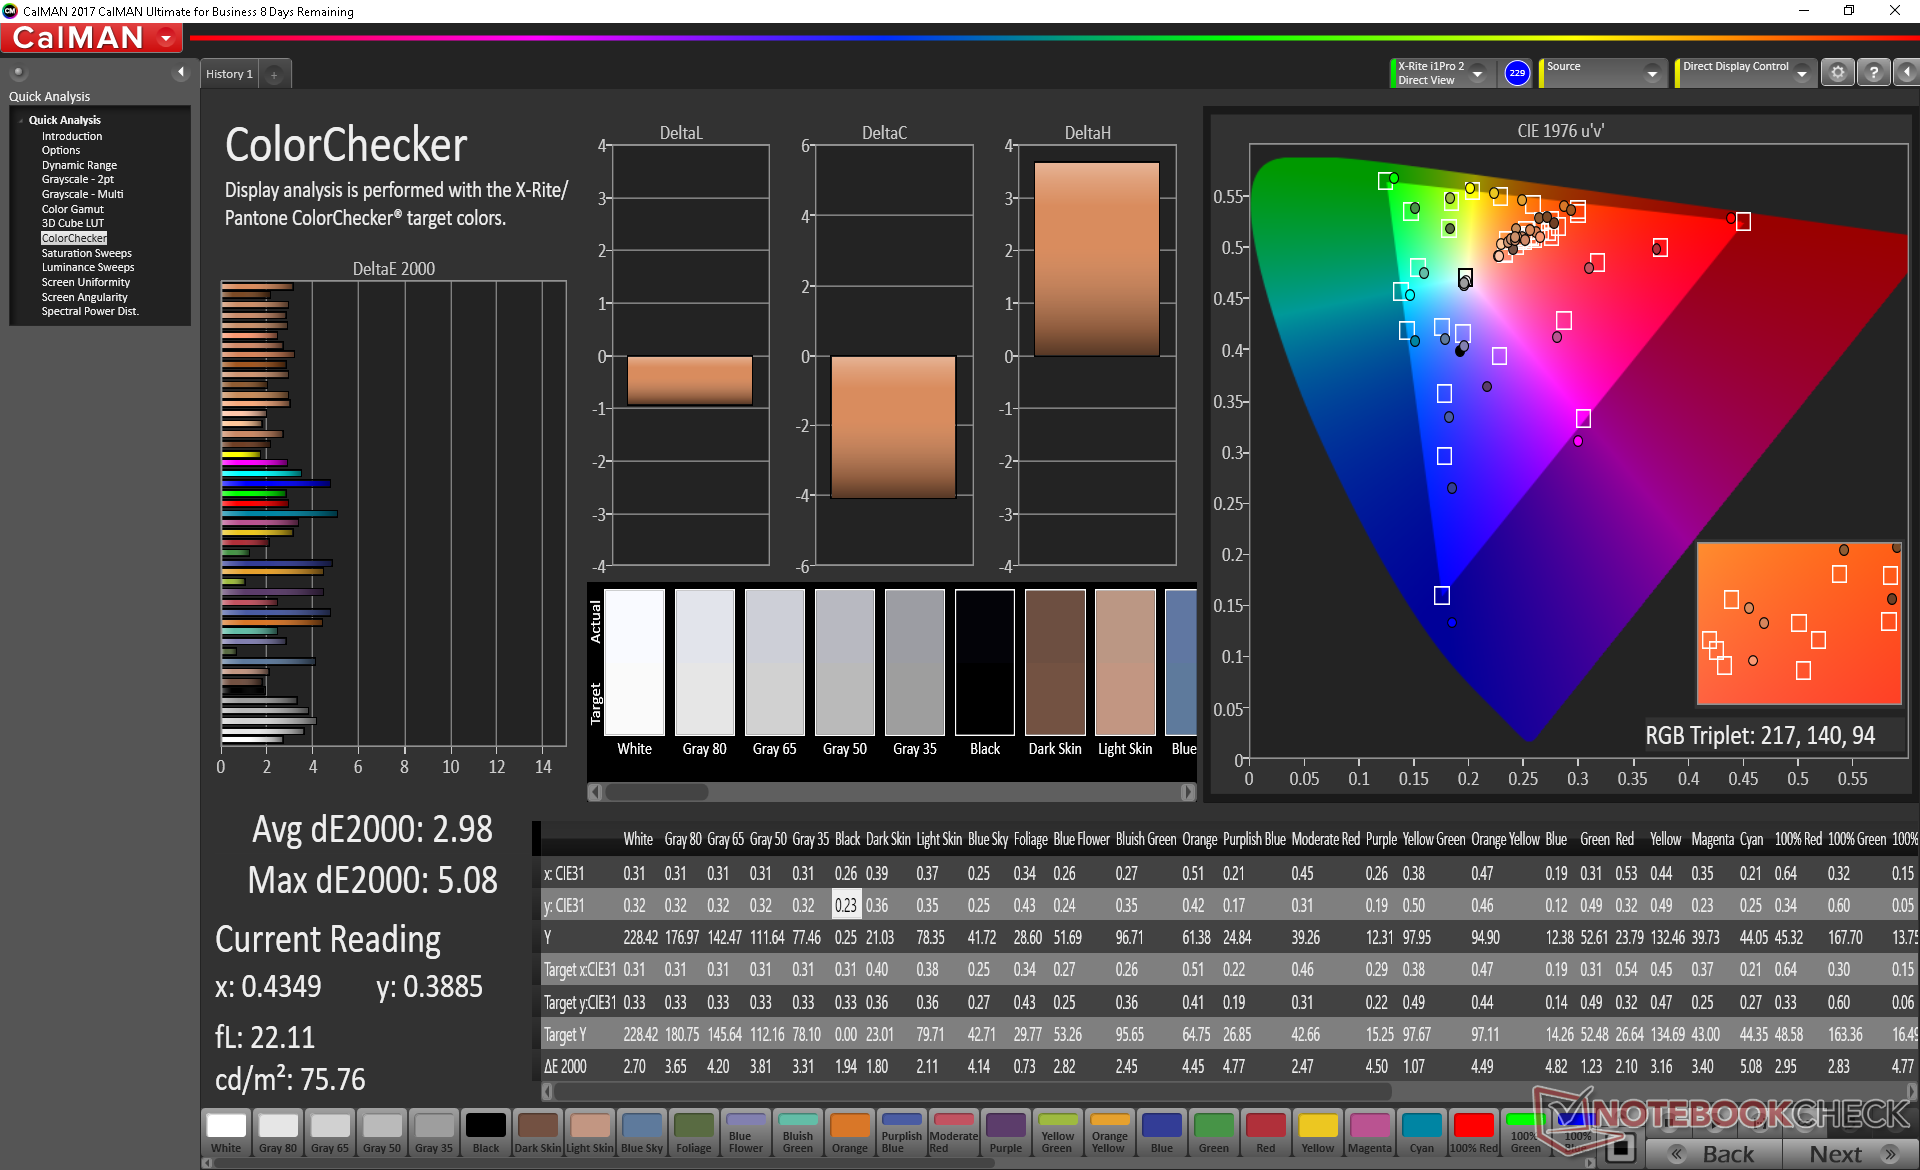
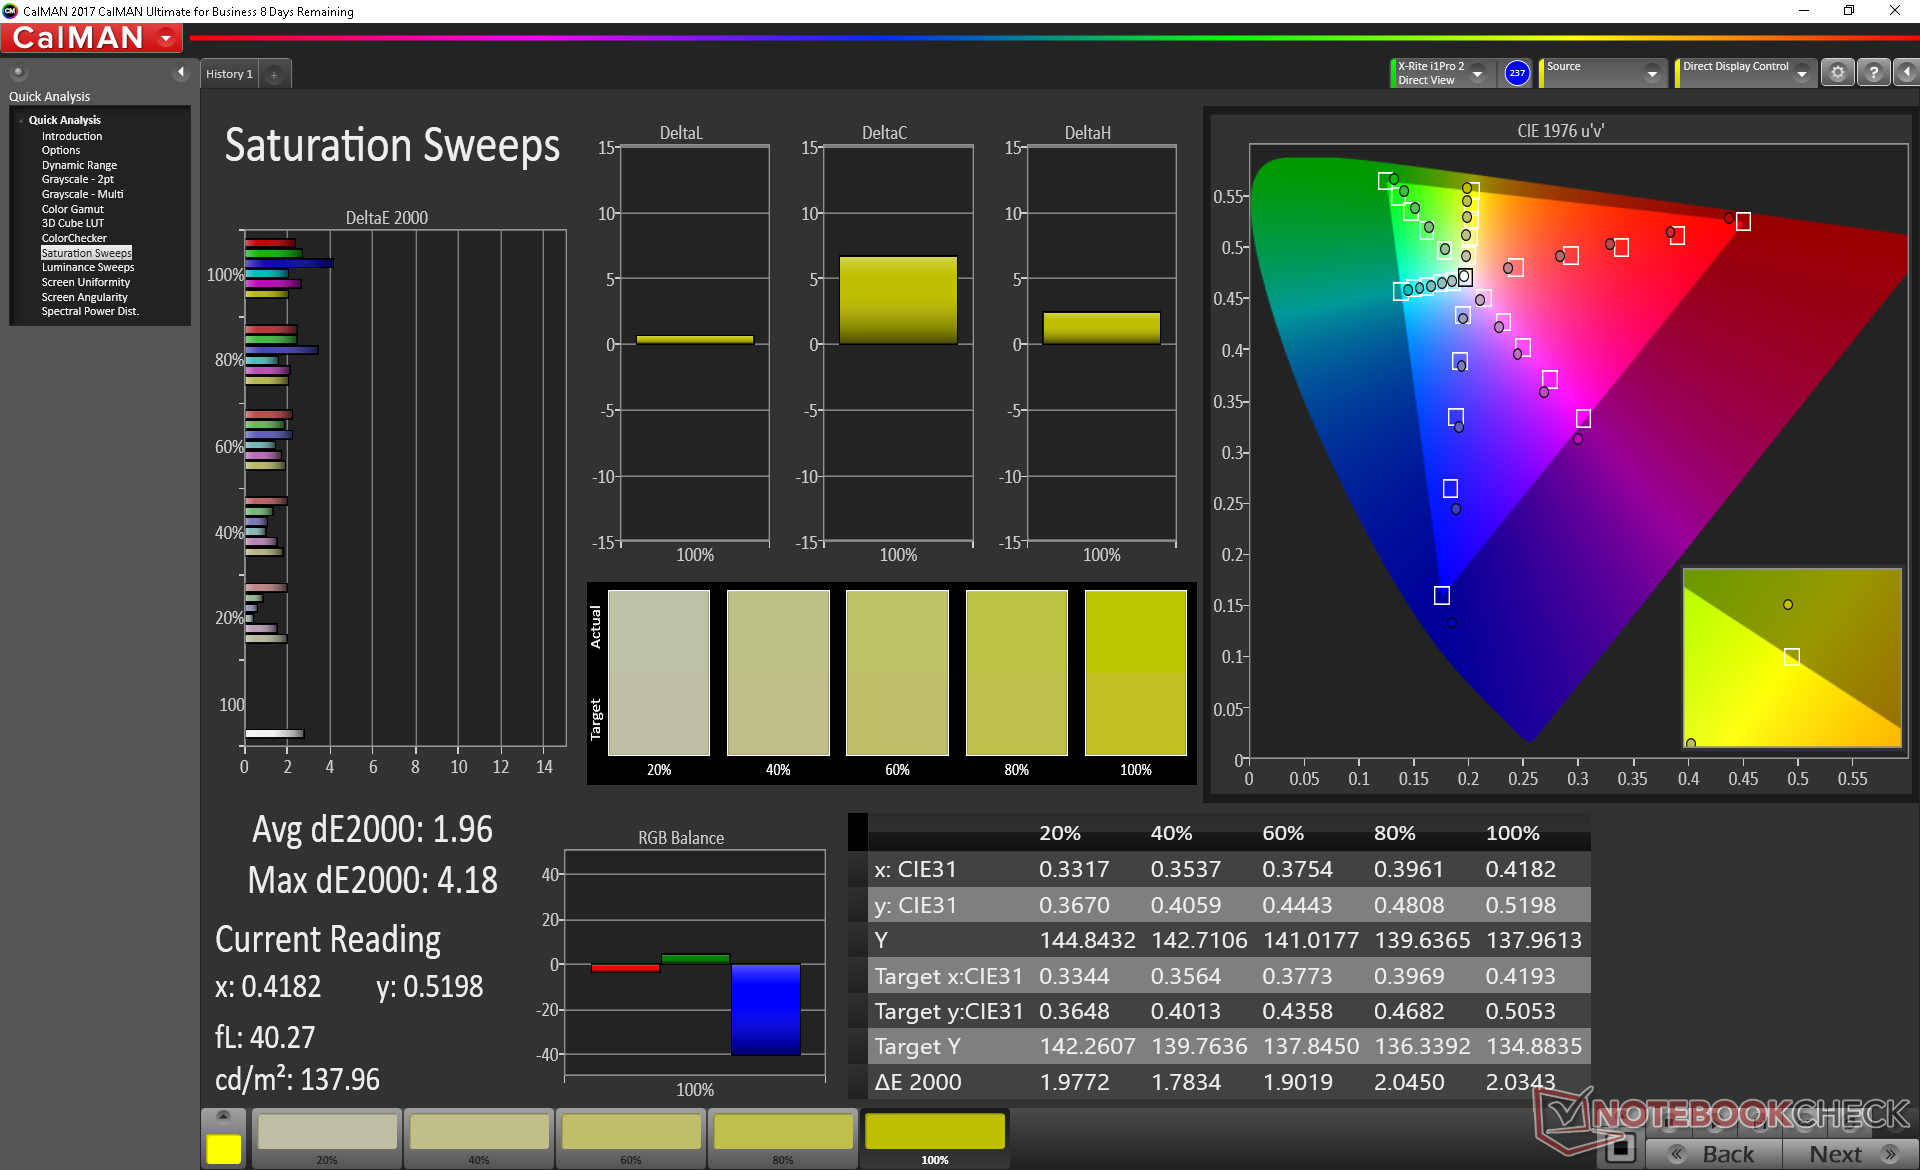
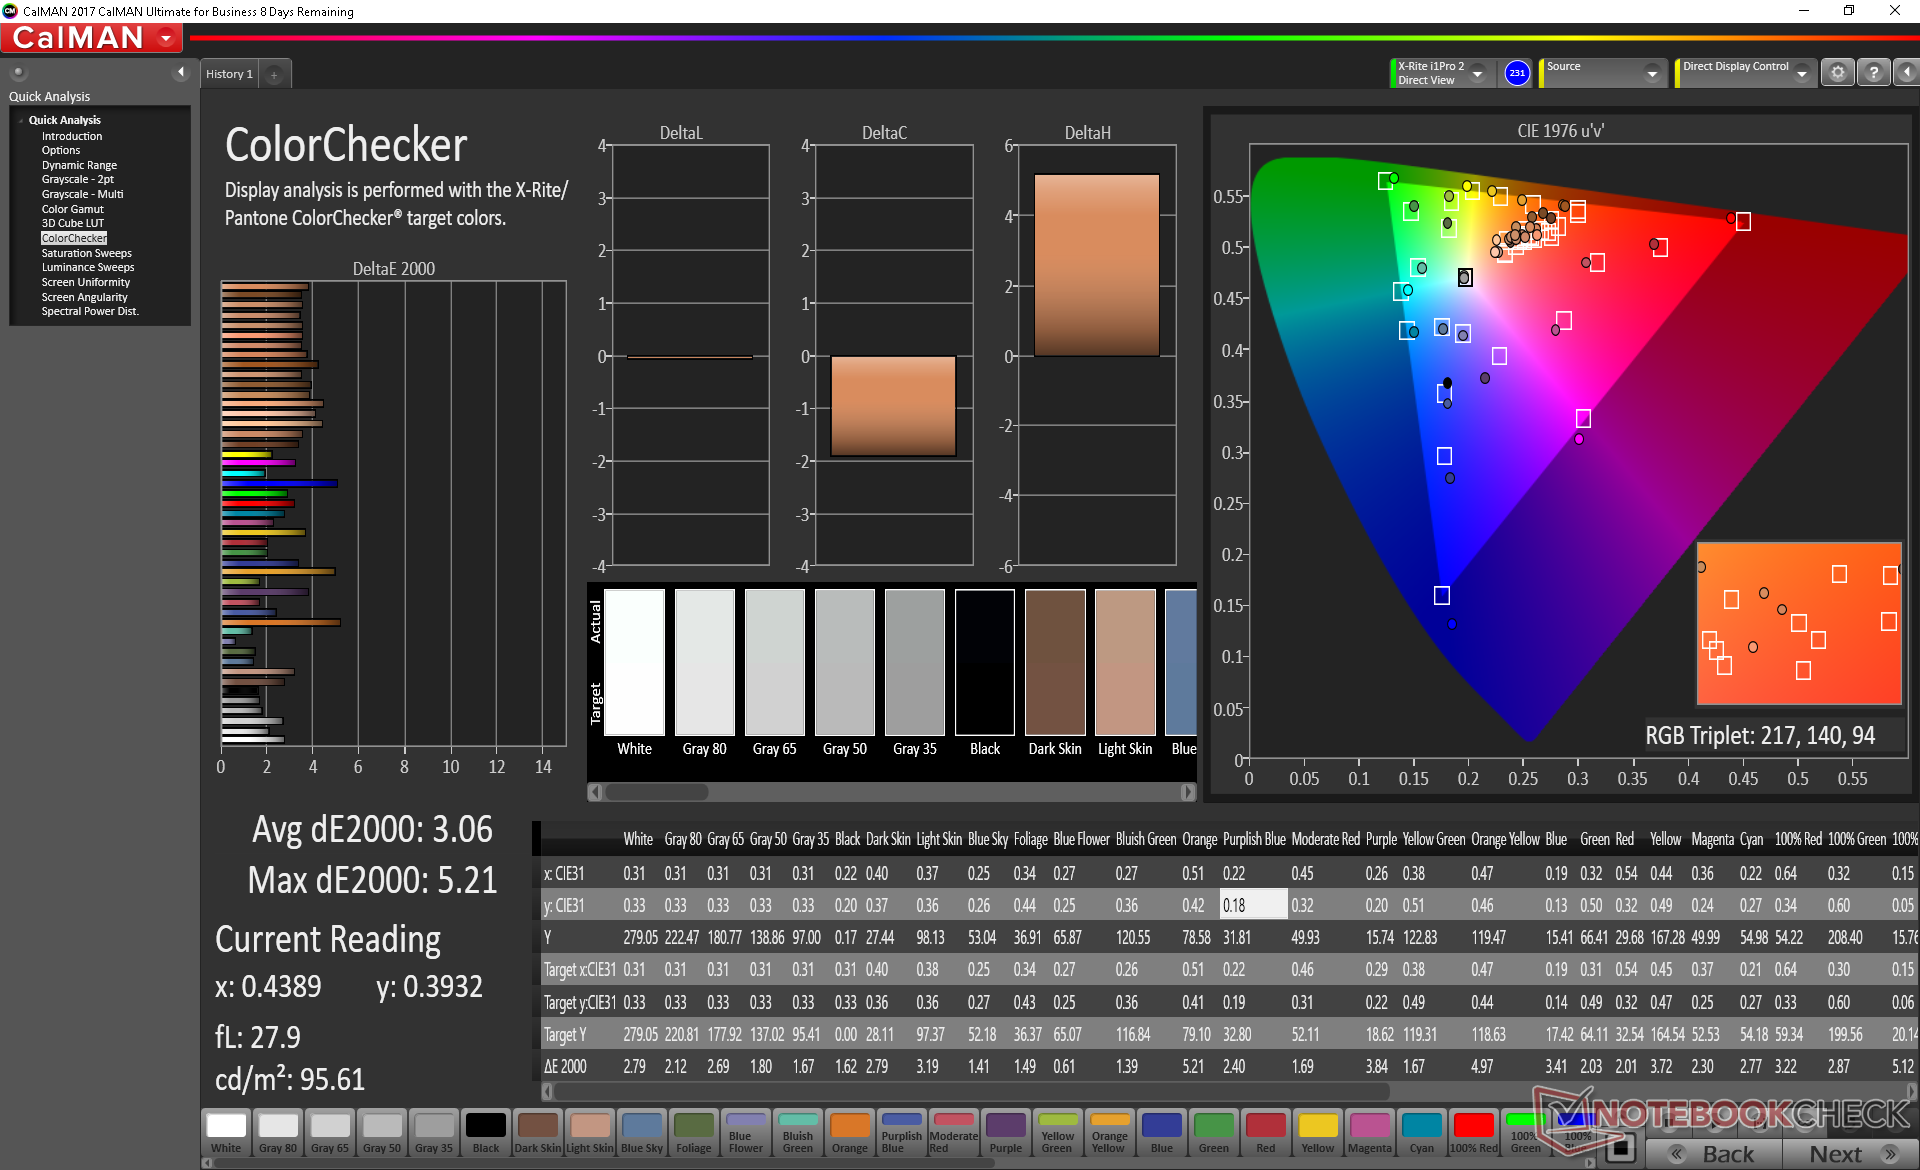
ΔE ColorChecker Calman: 2.98 | ∀{0.5-29.43 Ø4.71}
calibrated: 3.06
ΔE Greyscale Calman: 3 | ∀{0.09-98 Ø4.96}
89.5% sRGB (Argyll 1.6.3 3D)
58.1% AdobeRGB 1998 (Argyll 1.6.3 3D)
64.3% AdobeRGB 1998 (Argyll 3D)
89.9% sRGB (Argyll 3D)
63.2% Display P3 (Argyll 3D)
Gamma: 2.28
CCT: 6993 K
| MSI WE75 9TK AU Optronics B173HAN04.2, IPS, 17.3", 1920x1080 | Razer Blade Pro 17 RTX 2080 Max-Q AU Optronics B173HAN04.0, IPS, 17.3", 1920x1080 | MSI WE72 7RJ LP173WF4-SPF1, IPS, 17.3", 1920x1080 | HP ZBook 17 G5-2ZC48EA AUO B173HW01 V0, , 17.3", 1920x1080 | Lenovo ThinkPad P73-20QR002DGE N173HCE-E31, IPS LED, 17.3", 1920x1080 | MSI GT76 Titan DT 9SG Chi Mei N173HCE-G33 (CMN175C), IPS, 17.3", 1920x1080 | |
|---|---|---|---|---|---|---|
| Display | -3% | -0% | 3% | 6% | 1% | |
| Display P3 Coverage (%) | 63.2 | 60.6 -4% | 67.4 7% | 66.3 5% | 67.5 7% | 62.3 -1% |
| sRGB Coverage (%) | 89.9 | 89 -1% | 85.3 -5% | 89.9 0% | 94.2 5% | 93.4 4% |
| AdobeRGB 1998 Coverage (%) | 64.3 | 62.1 -3% | 62.4 -3% | 67.8 5% | 64.3 0% | |
| Response Times | 74% | -16% | -15% | -10% | 71% | |
| Response Time Grey 50% / Grey 80% * (ms) | 30.8 ? | 6.8 ? 78% | 45.2 ? -47% | 42.4 ? -38% | 40 ? -30% | 8 ? 74% |
| Response Time Black / White * (ms) | 31.2 ? | 9.6 ? 69% | 26.4 ? 15% | 28.4 ? 9% | 28 ? 10% | 10 ? 68% |
| PWM Frequency (Hz) | 25000 ? | 26040 ? | ||||
| Screen | 0% | -38% | -13% | -16% | 18% | |
| Brightness middle (cd/m²) | 287.3 | 299.3 4% | 302 5% | 335 17% | 333 16% | 396 38% |
| Brightness (cd/m²) | 280 | 294 5% | 306 9% | 326 16% | 310 11% | 373 33% |
| Brightness Distribution (%) | 89 | 94 6% | 93 4% | 92 3% | 83 -7% | 89 0% |
| Black Level * (cd/m²) | 0.26 | 0.29 -12% | 0.31 -19% | 0.22 15% | 0.39 -50% | 0.33 -27% |
| Contrast (:1) | 1105 | 1032 -7% | 974 -12% | 1523 38% | 854 -23% | 1200 9% |
| Colorchecker dE 2000 * | 2.98 | 2.55 14% | 6.2 -108% | 4.7 -58% | 4.4 -48% | 2.04 32% |
| Colorchecker dE 2000 max. * | 5.08 | 4.73 7% | 10.6 -109% | 8.7 -71% | 7.5 -48% | 3.85 24% |
| Colorchecker dE 2000 calibrated * | 3.06 | 2.9 5% | 2.7 12% | 2 35% | 0.82 73% | |
| Greyscale dE 2000 * | 3 | 3.5 -17% | 7.3 -143% | 6.5 -117% | 5.1 -70% | 2.83 6% |
| Gamma | 2.28 96% | 2.28 96% | 2.08 106% | 2.23 99% | 2.39 92% | 2.49 88% |
| CCT | 6993 93% | 7101 92% | 7020 93% | 6108 106% | 7061 92% | 7113 91% |
| Color Space (Percent of AdobeRGB 1998) (%) | 58.1 | 57 -2% | 56 -4% | 58.7 1% | 61.1 5% | 59 2% |
| Color Space (Percent of sRGB) (%) | 89.5 | 88.7 -1% | 85.2 -5% | 89.7 0% | 94 5% | 94 5% |
| Total Average (Program / Settings) | 24% /
9% | -18% /
-28% | -8% /
-11% | -7% /
-11% | 30% /
21% |
* ... smaller is better
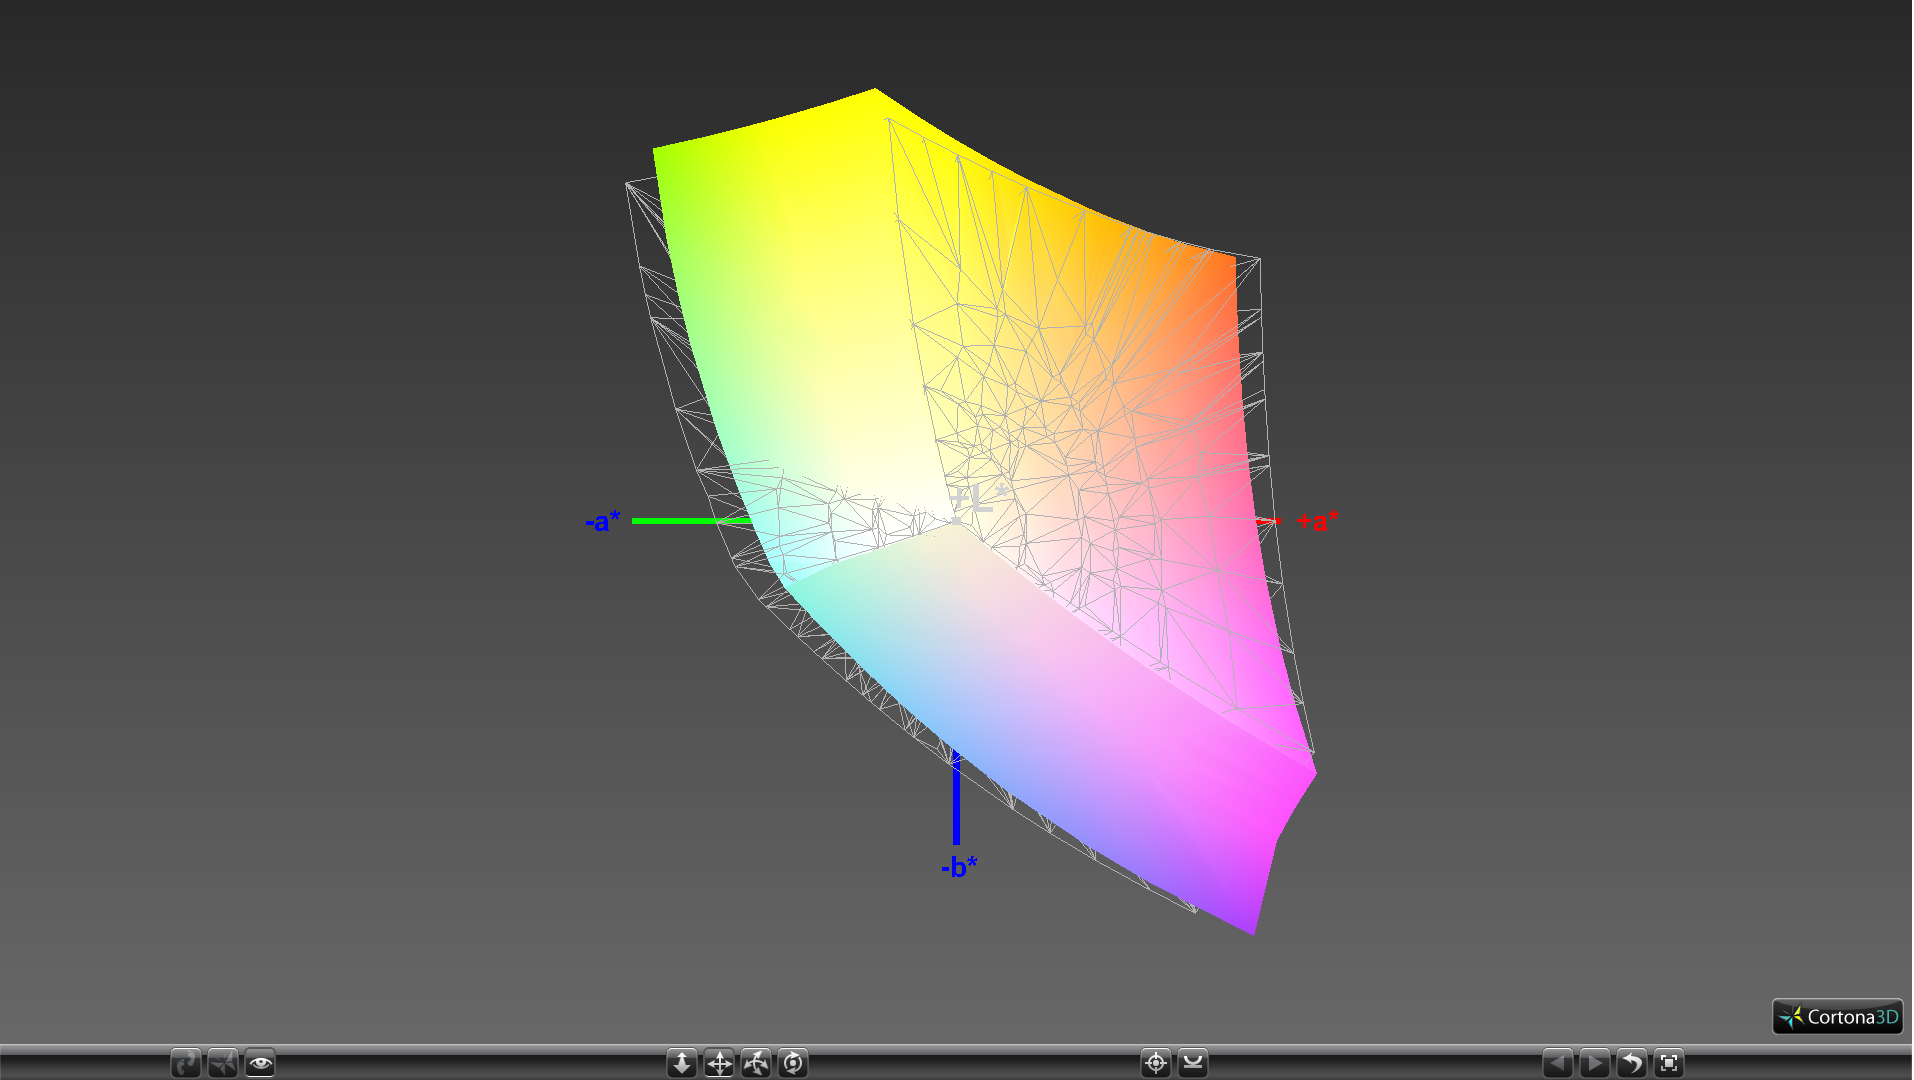
Color space hasn't improved very much from the WE72 at approximately 90 percent and 58 percent of AdobeRGB and sRGB, respectively. Full AdobeRGB is offered on laptops with 4K UHD IGZO or OLED panels like the Razer Blade Pro 17 or Asus ZenBook Pro series.
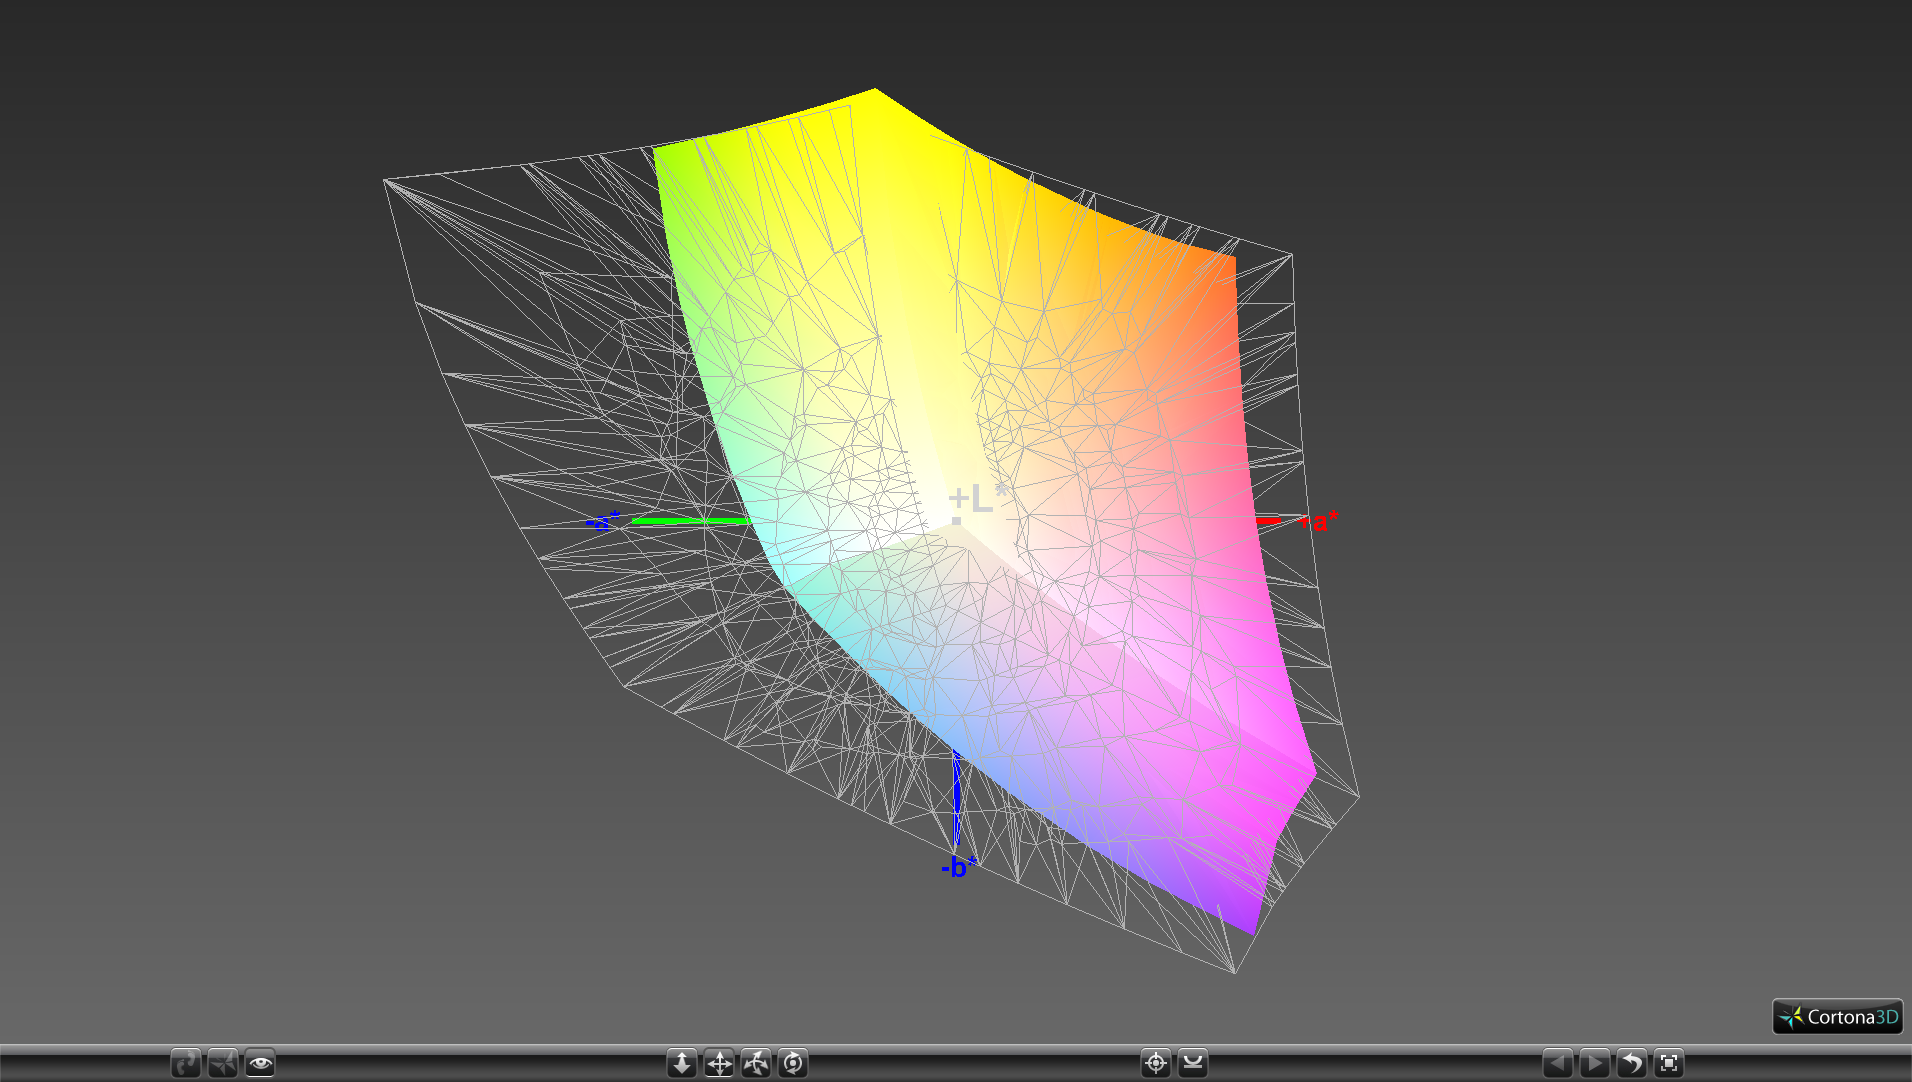
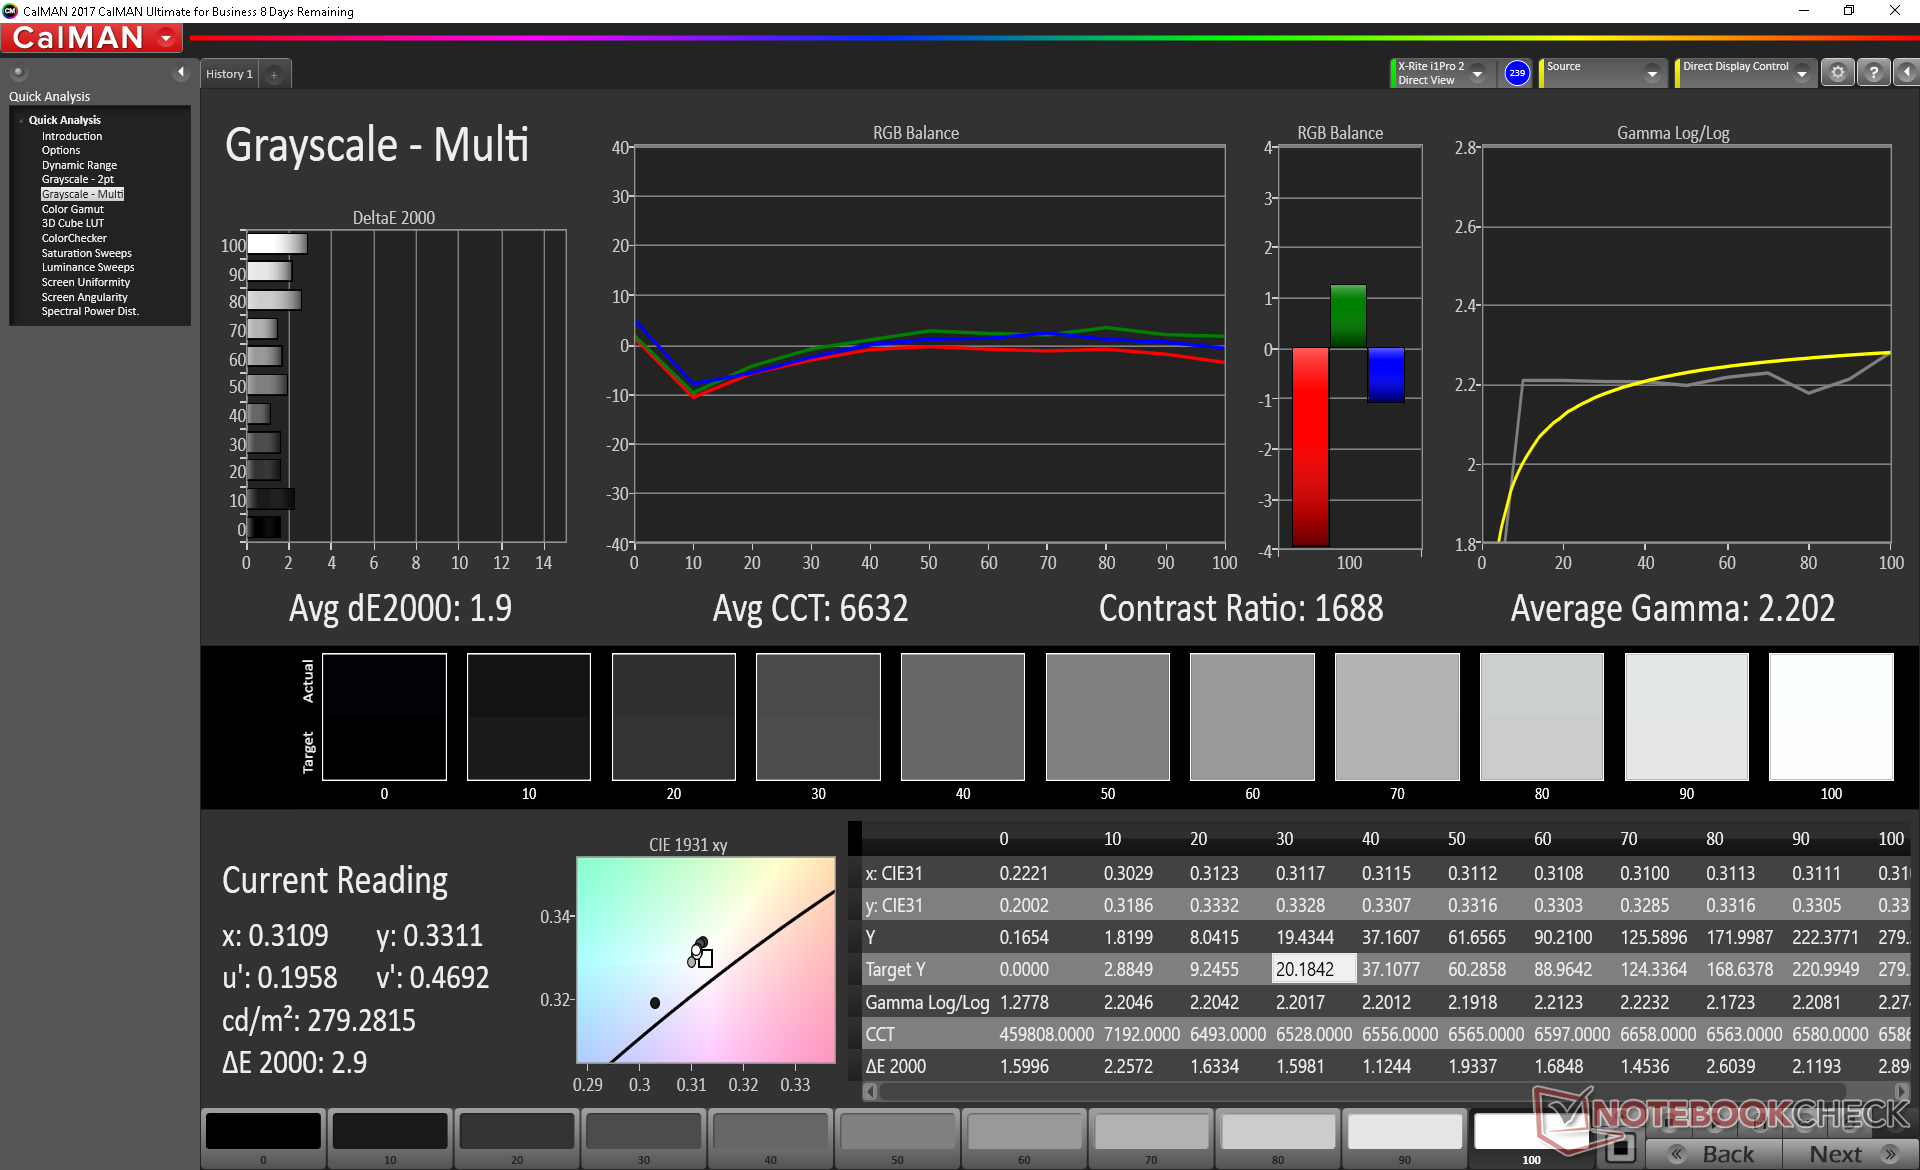
The display is well-calibrated out of the box with average DeltaE values of <3. Color temperature is slightly on the cooler side, but our calibration attempt addresses this for slightly more accurate colors at lower saturation levels.

Display Response Times
| ↔ Response Time Black to White | ||
|---|---|---|
| 31.2 ms ... rise ↗ and fall ↘ combined | ↗ 18.8 ms rise | 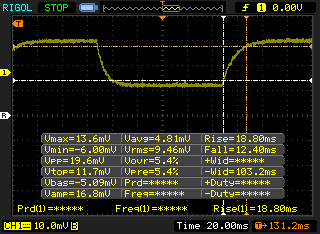 |
| ↘ 12.4 ms fall | ||
| The screen shows slow response rates in our tests and will be unsatisfactory for gamers. In comparison, all tested devices range from 0.1 (minimum) to 240 (maximum) ms. » 84 % of all devices are better. This means that the measured response time is worse than the average of all tested devices (19.8 ms). | ||
| ↔ Response Time 50% Grey to 80% Grey | ||
| 30.8 ms ... rise ↗ and fall ↘ combined | ↗ 14.4 ms rise | 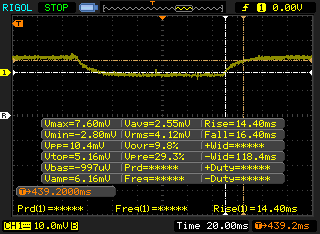 |
| ↘ 16.4 ms fall | ||
| The screen shows slow response rates in our tests and will be unsatisfactory for gamers. In comparison, all tested devices range from 0.165 (minimum) to 636 (maximum) ms. » 41 % of all devices are better. This means that the measured response time is similar to the average of all tested devices (30.9 ms). | ||
Screen Flickering / PWM (Pulse-Width Modulation)
| Screen flickering / PWM not detected | 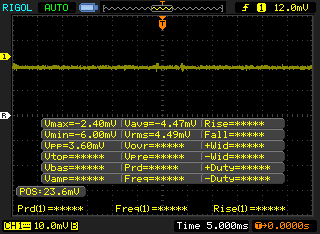 | ||
In comparison: 52 % of all tested devices do not use PWM to dim the display. If PWM was detected, an average of 7741 (minimum: 5 - maximum: 343500) Hz was measured. | |||
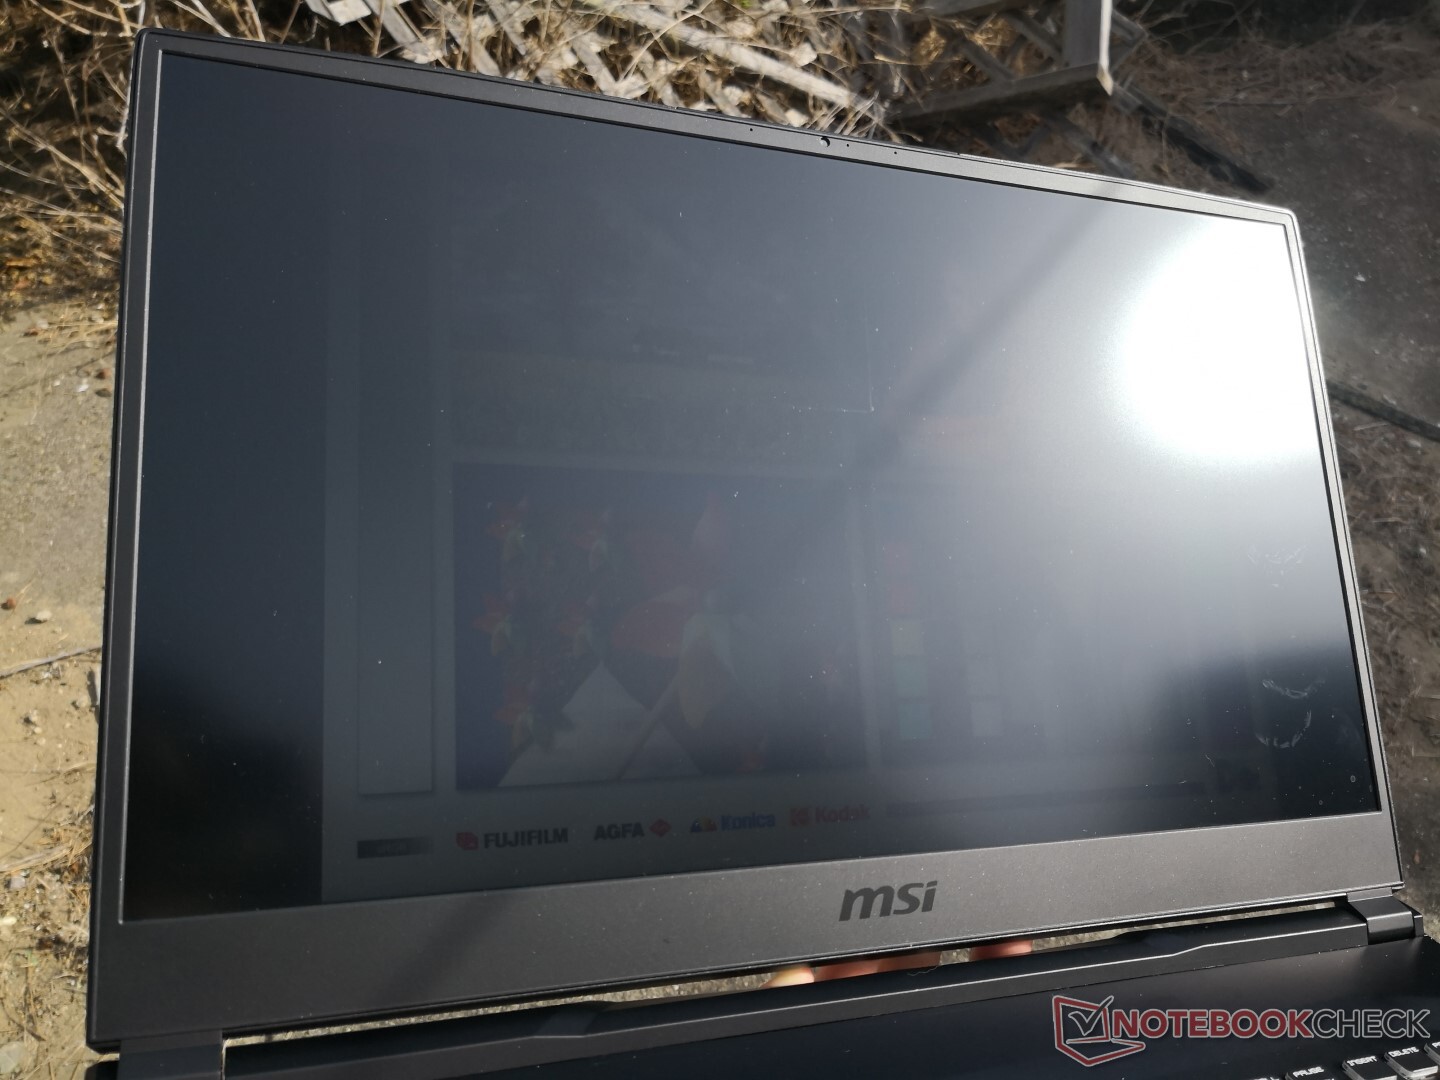
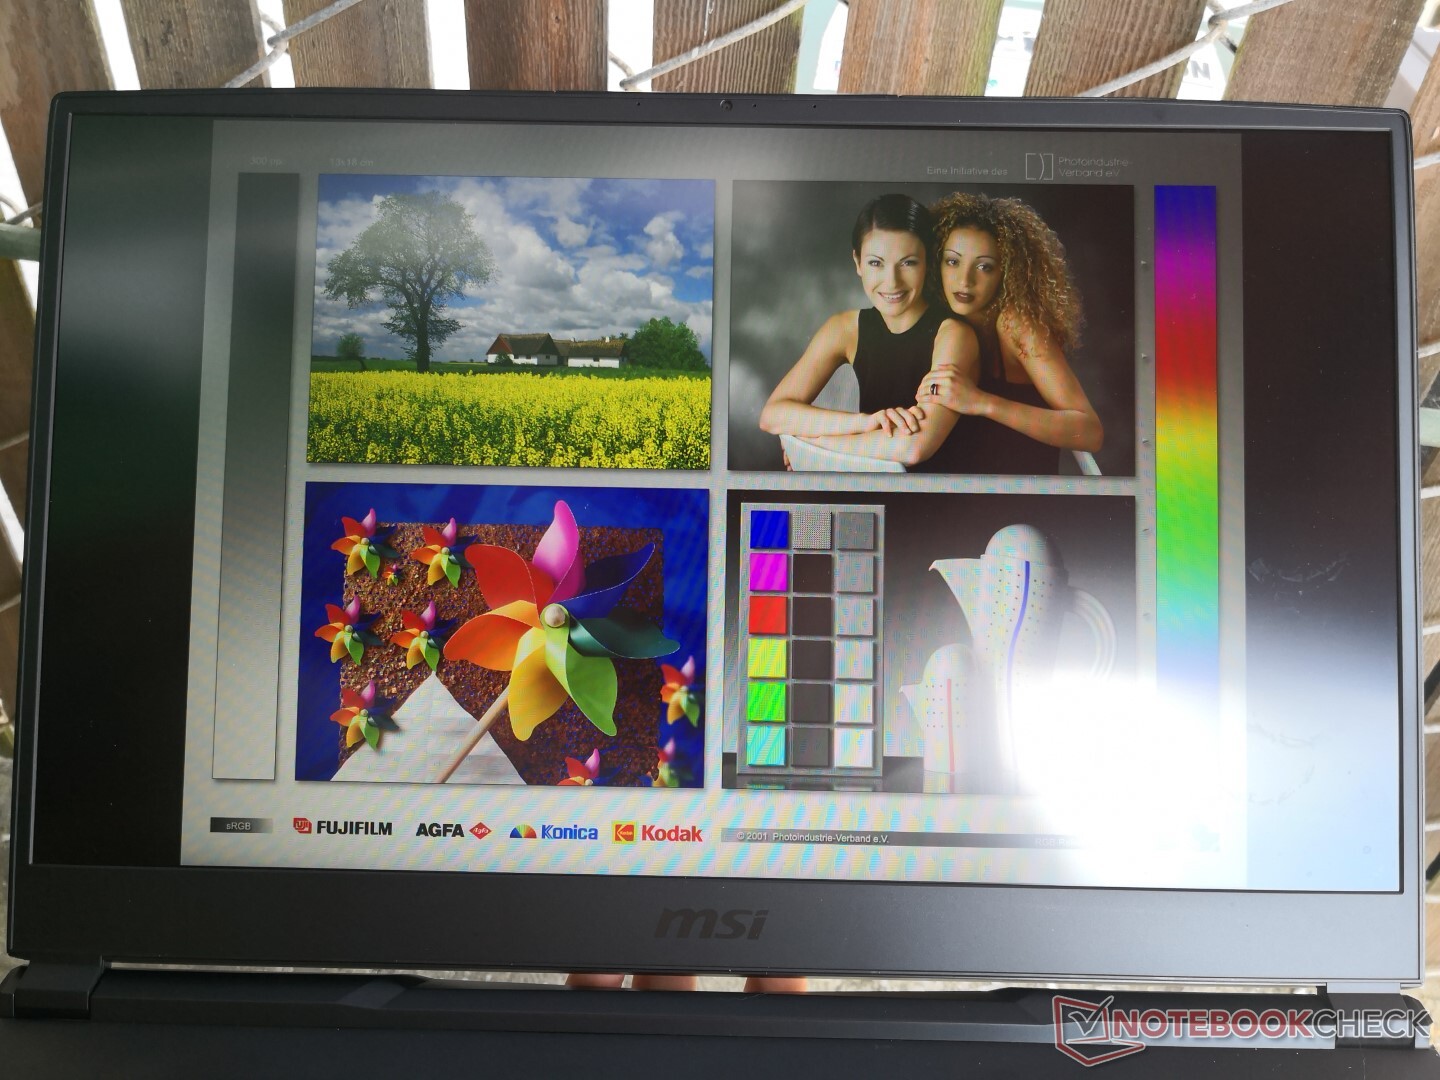
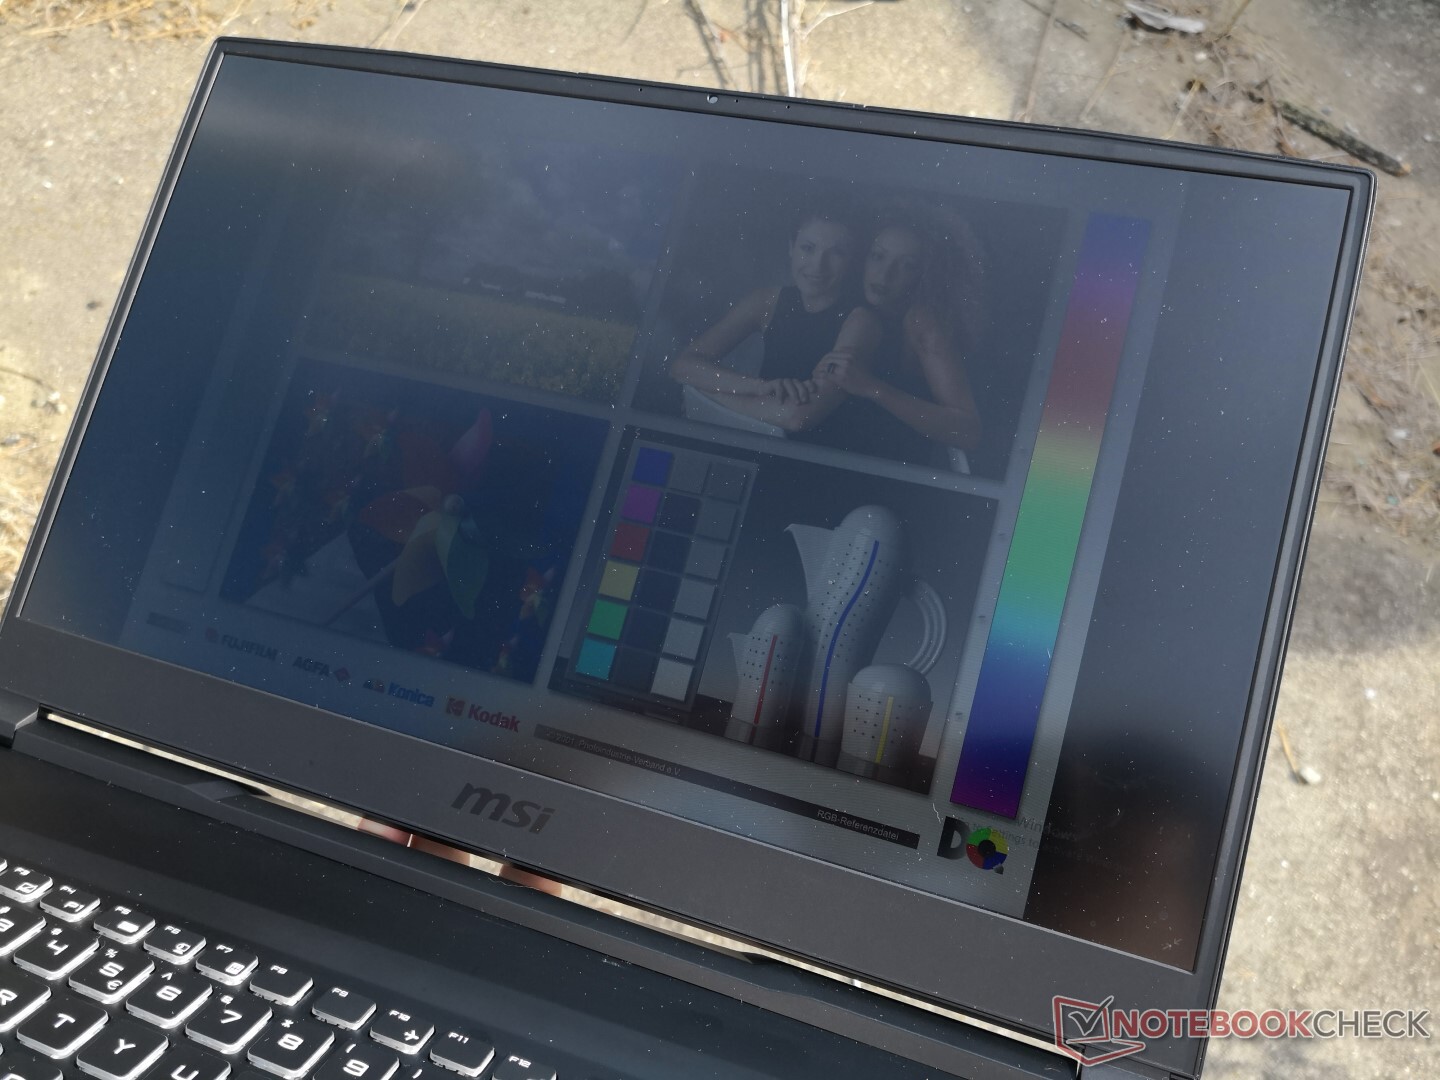
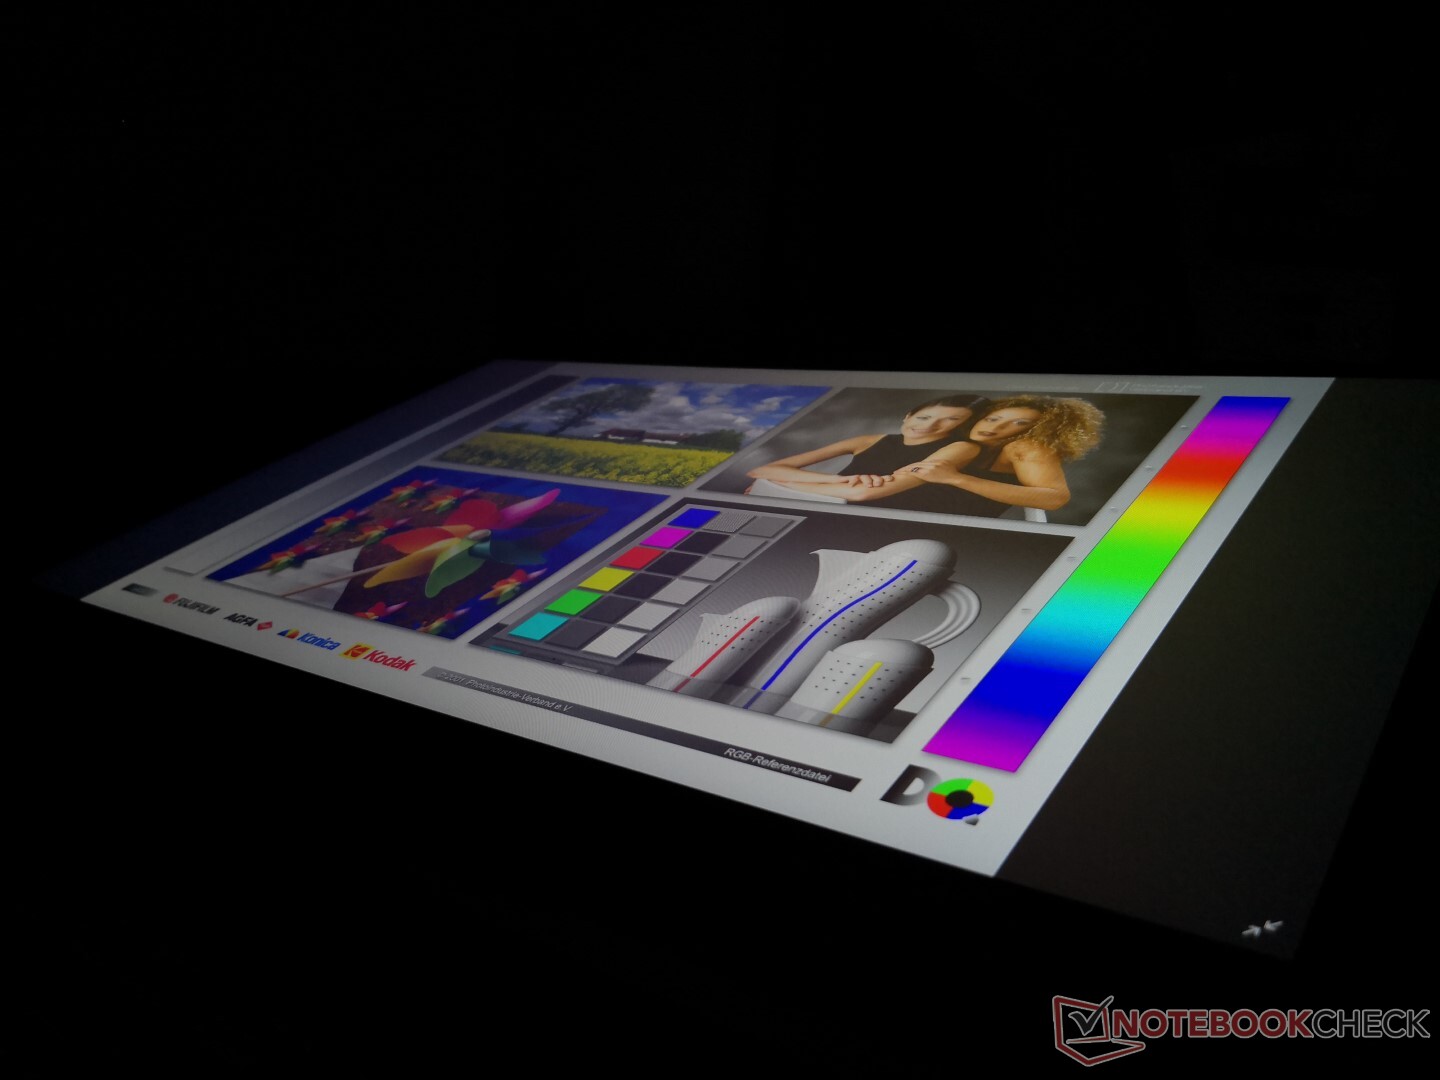
Outdoor visibility is similar to most 17.3-inch gaming laptops where the 300-nit backlight is common. Viewing angles are otherwise excellent with changes in colors and contrast occurring only if viewing from extreme angles.
Performance
The Core i7-9750H and Quadro RTX 3000 are aimed at performance workstation users. If you want even faster Quadro RTX 5000 graphics, however, you'll have to go with the MSI WS series instead. A slower Quadro T2000 option is available which omits any RTX features while the Xeon E-2176M option allows for ECC RAM.
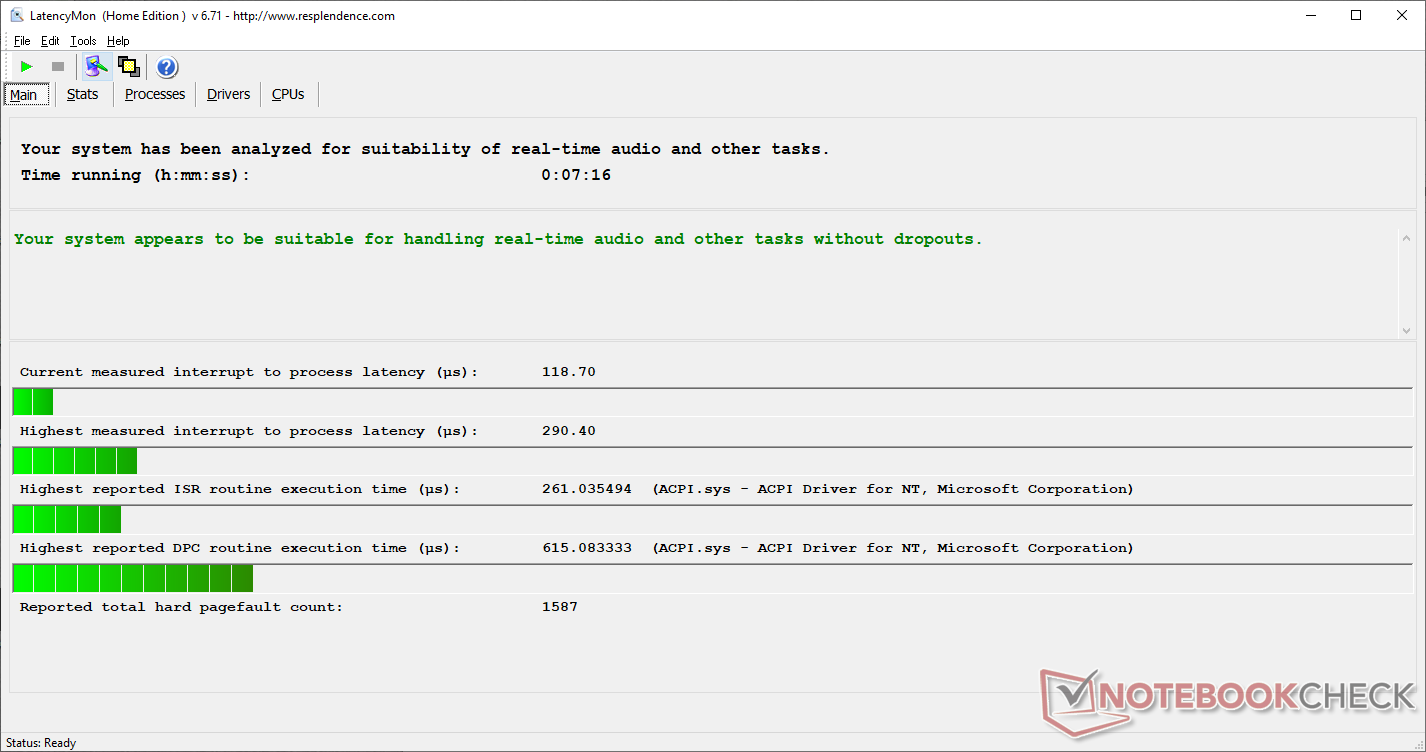
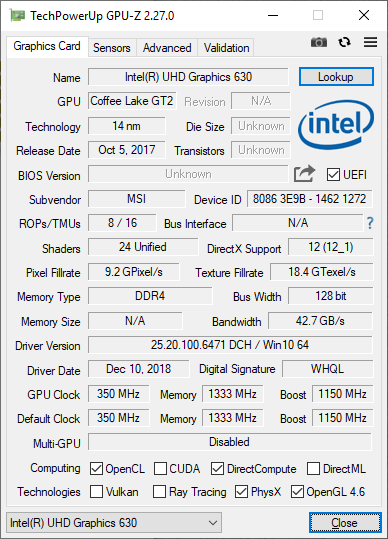
Nvidia Optimus comes standard for automatic graphics switching. LatencyMon shows no recurring DPC latency issues even when wireless is enabled.
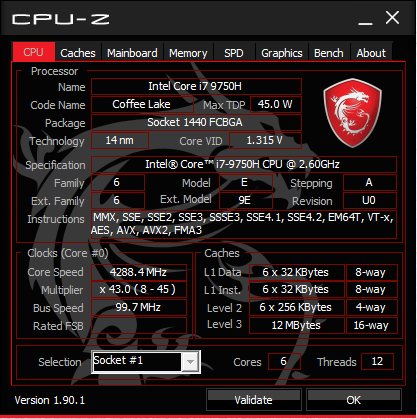
Processor
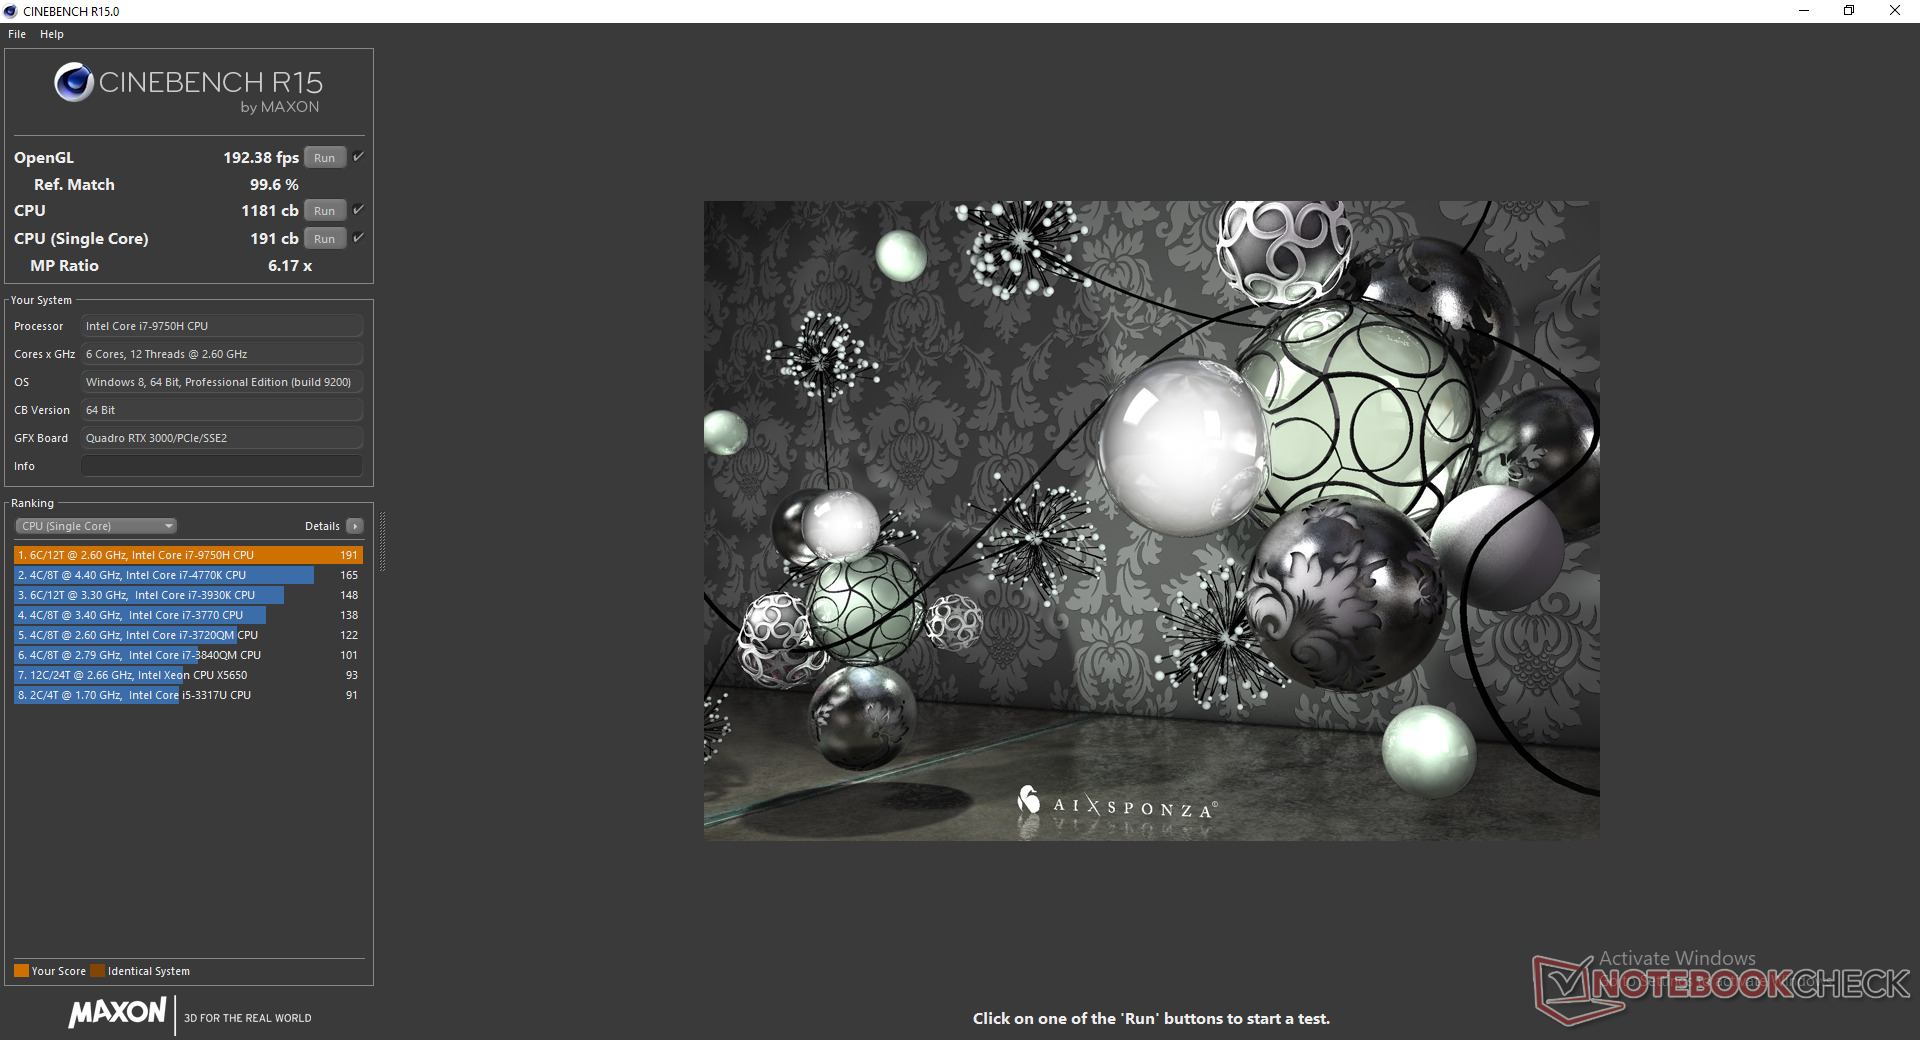
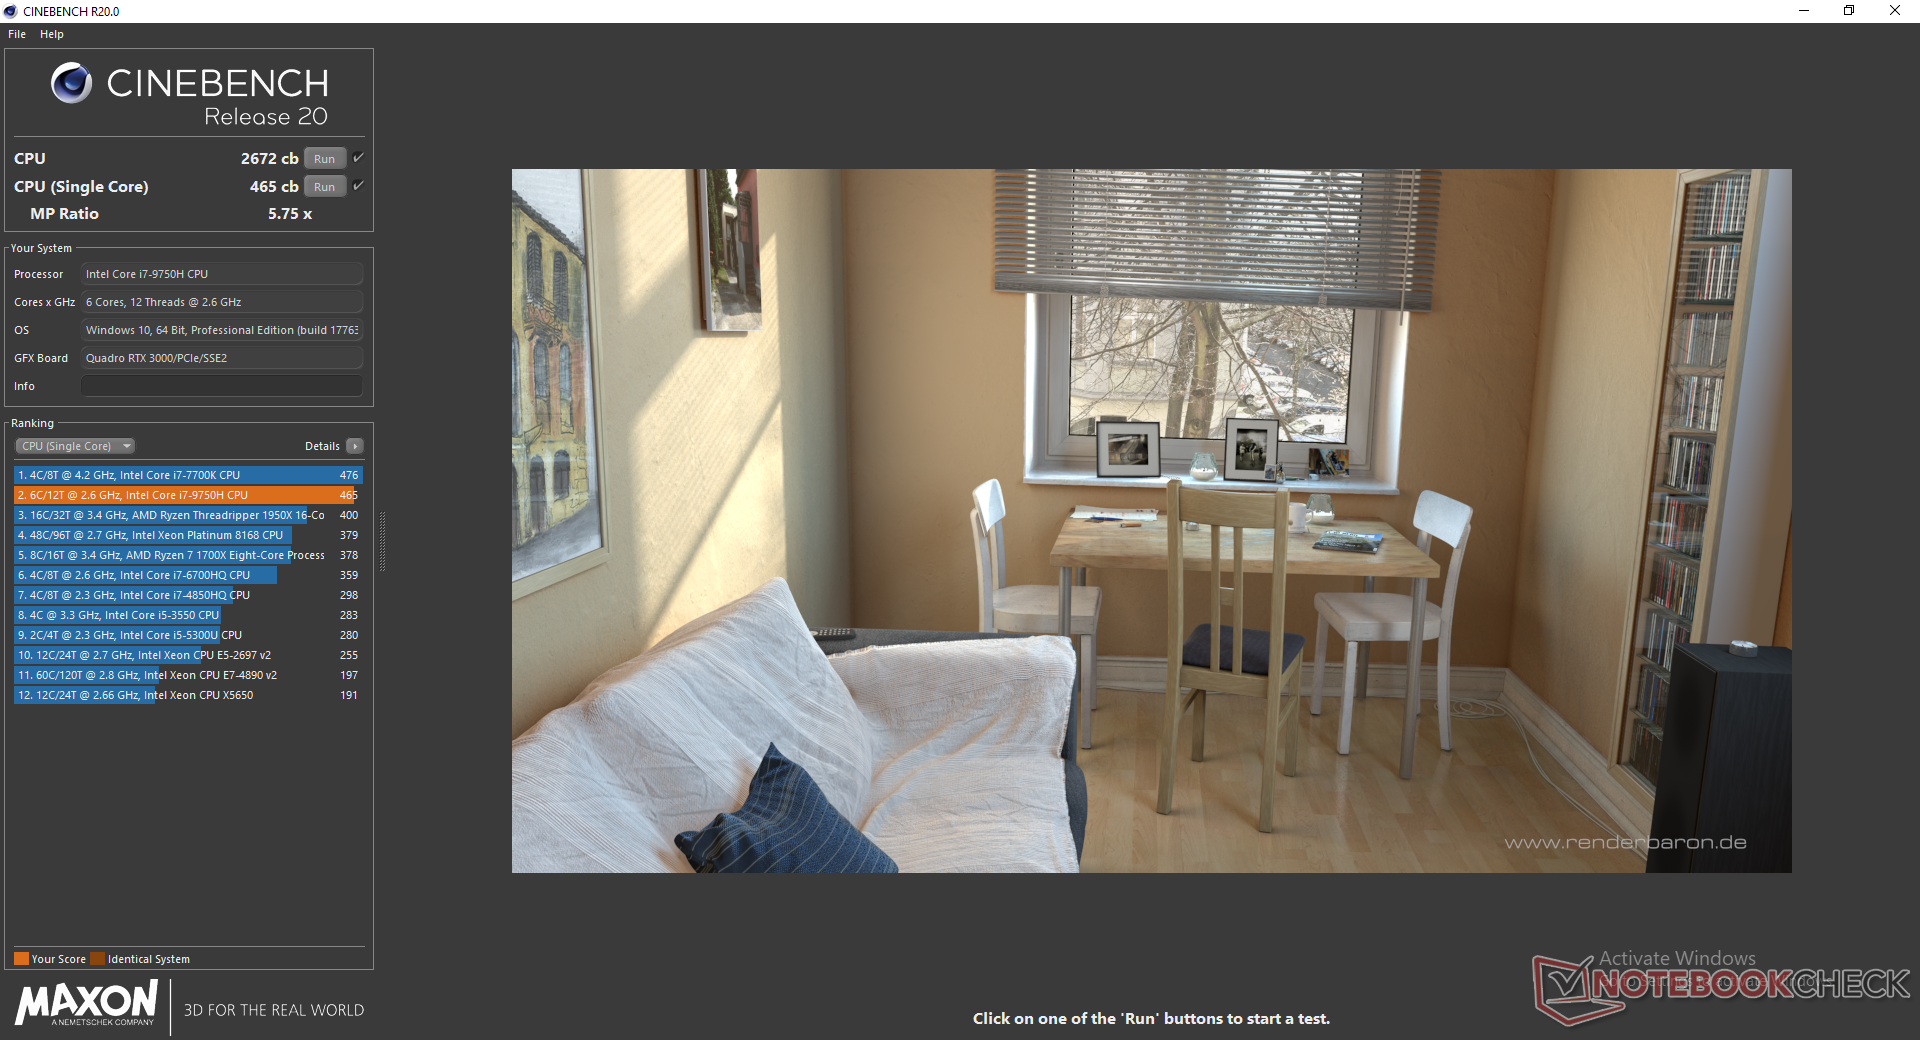
The Core i7-9750H performs excellently on the WE75 with good Turbo Boost sustainability and no major throttling issues. Nonetheless, overall processor performance is not all that much of an improvement over last year's Core i7-8750H. The Xeon E-2176M option will offer a similar level of performance while upgrading to the octa-core Core i9-9880H can bring a more substantial performance boost by up to 40 percent.
See our dedicated page on the Core i7-9750H for more technical information and benchmark comparisons.
System Performance
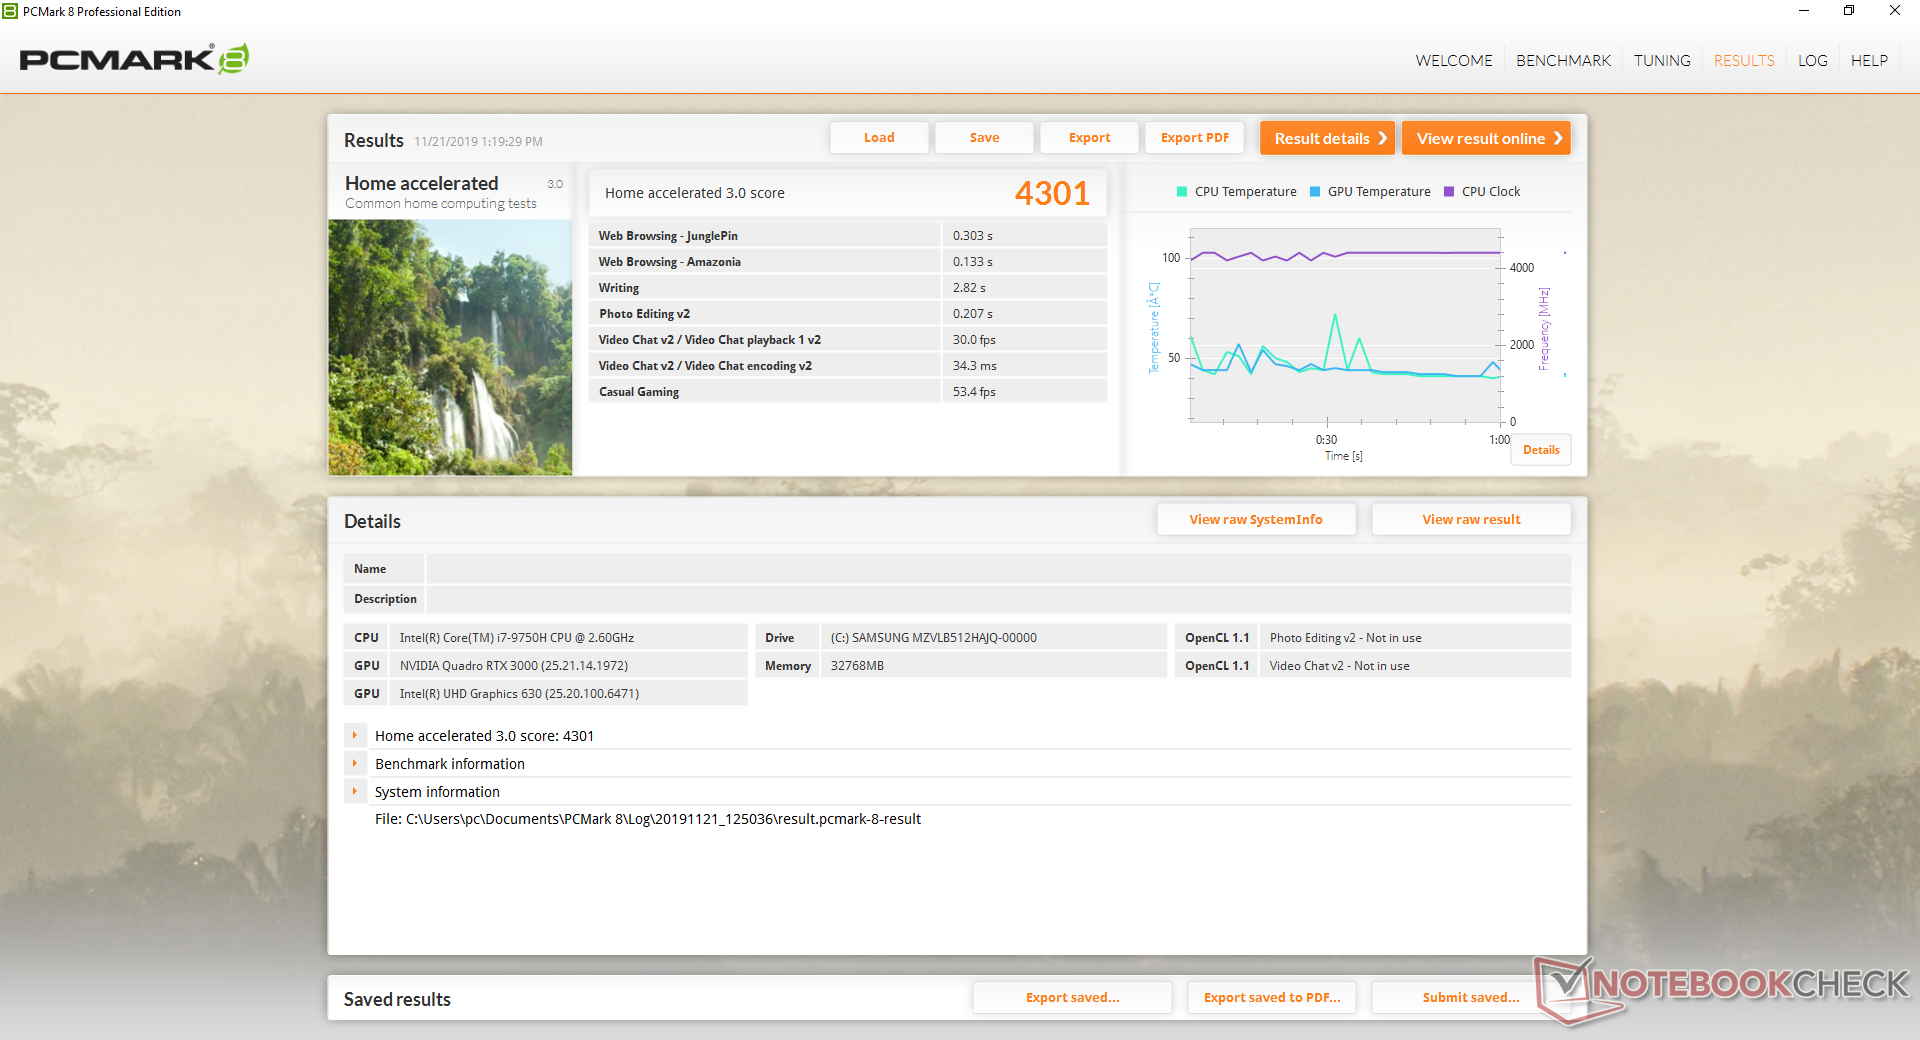
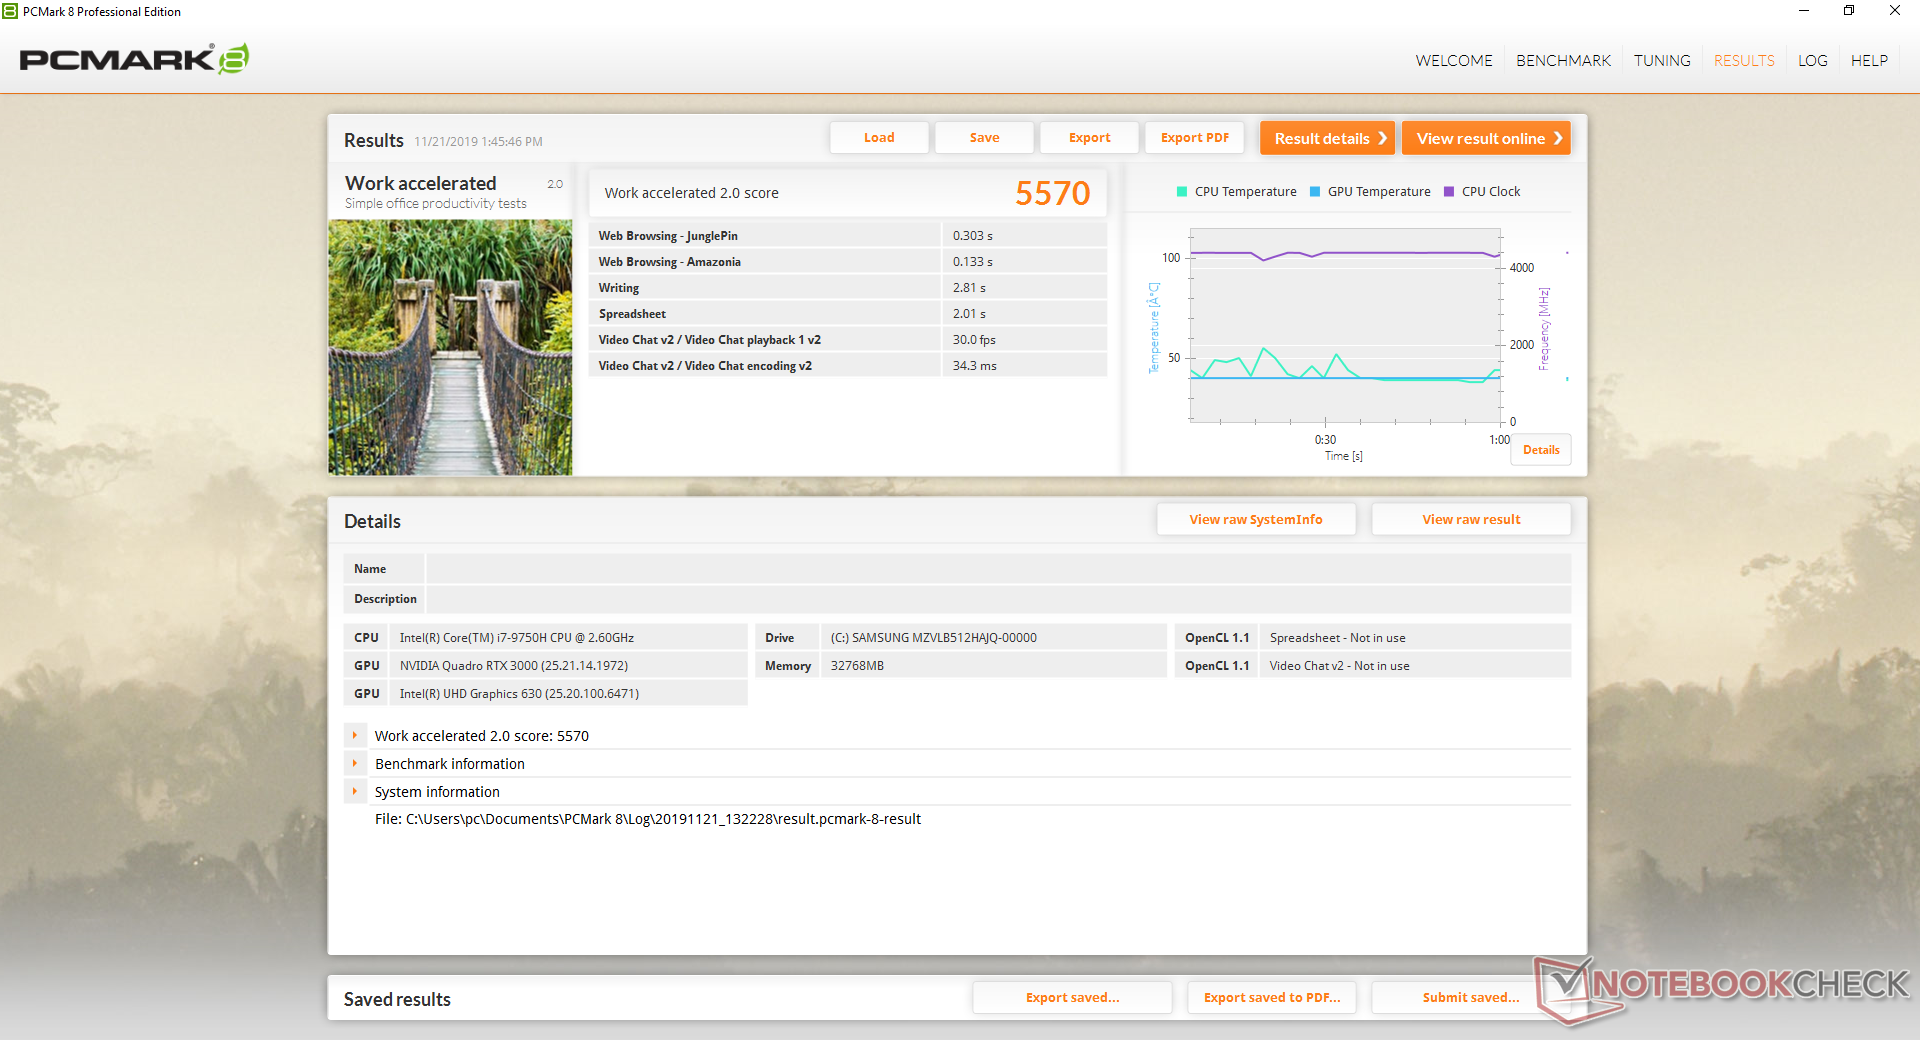
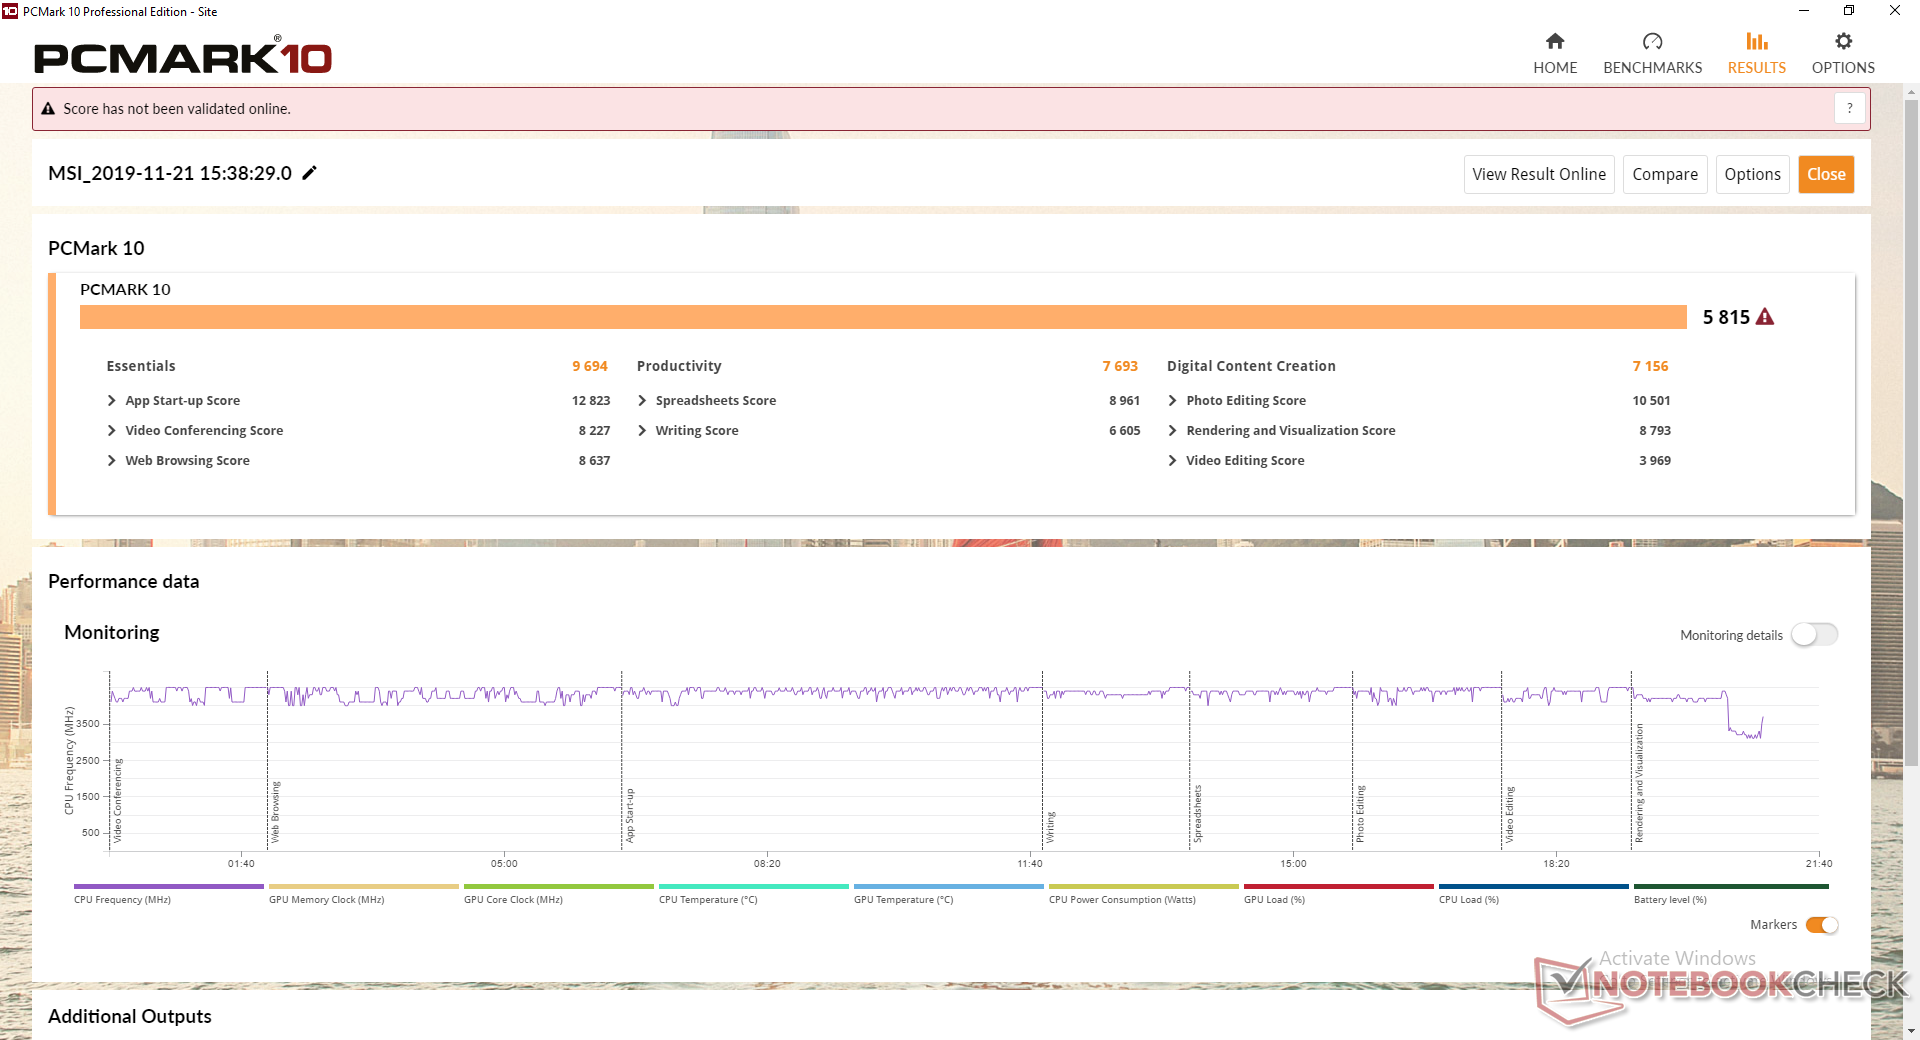
PCMark benchmarks rank our system within single-digit percentage points of the Lenovo ThinkPad P73 equipped with the same Quadro RTX 3000 GPU and Samsung PM981 SSD. We experienced no software or hardware issues during our time with the unit. However, be prepared for some inevitable MSI pop-ups when booting up and connecting online.
| PCMark 8 | |
| Home Score Accelerated v2 | |
| Razer Blade Pro 17 RTX 2080 Max-Q | |
| HP ZBook 17 G5-2ZC48EA | |
| MSI WE75 9TK | |
| MSI WE72 7RJ | |
| Lenovo ThinkPad P73-20QR002DGE | |
| Work Score Accelerated v2 | |
| Razer Blade Pro 17 RTX 2080 Max-Q | |
| MSI WE75 9TK | |
| Lenovo ThinkPad P73-20QR002DGE | |
| HP ZBook 17 G5-2ZC48EA | |
| MSI WE72 7RJ | |
| PCMark 8 Home Score Accelerated v2 | 4301 points | |
| PCMark 8 Work Score Accelerated v2 | 5570 points | |
| PCMark 10 Score | 5815 points | |
Help | ||
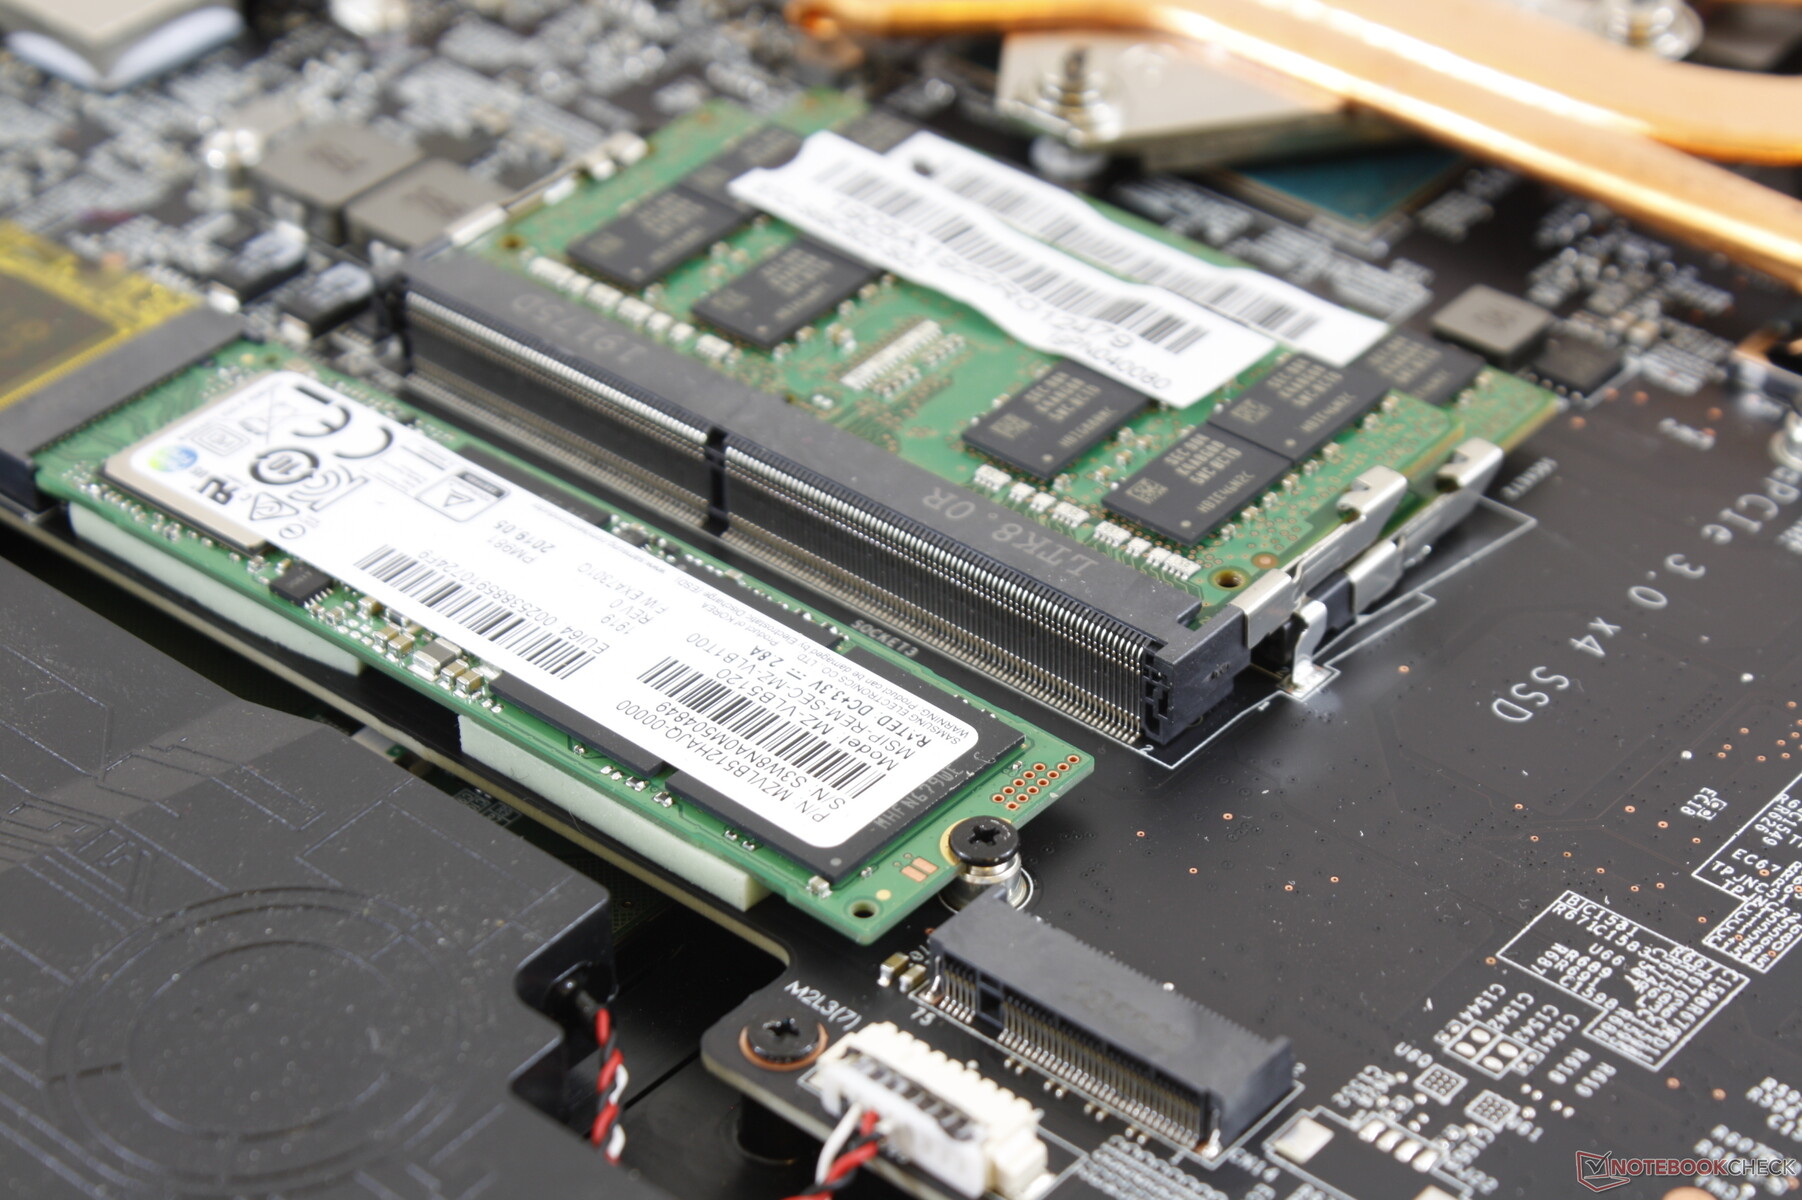
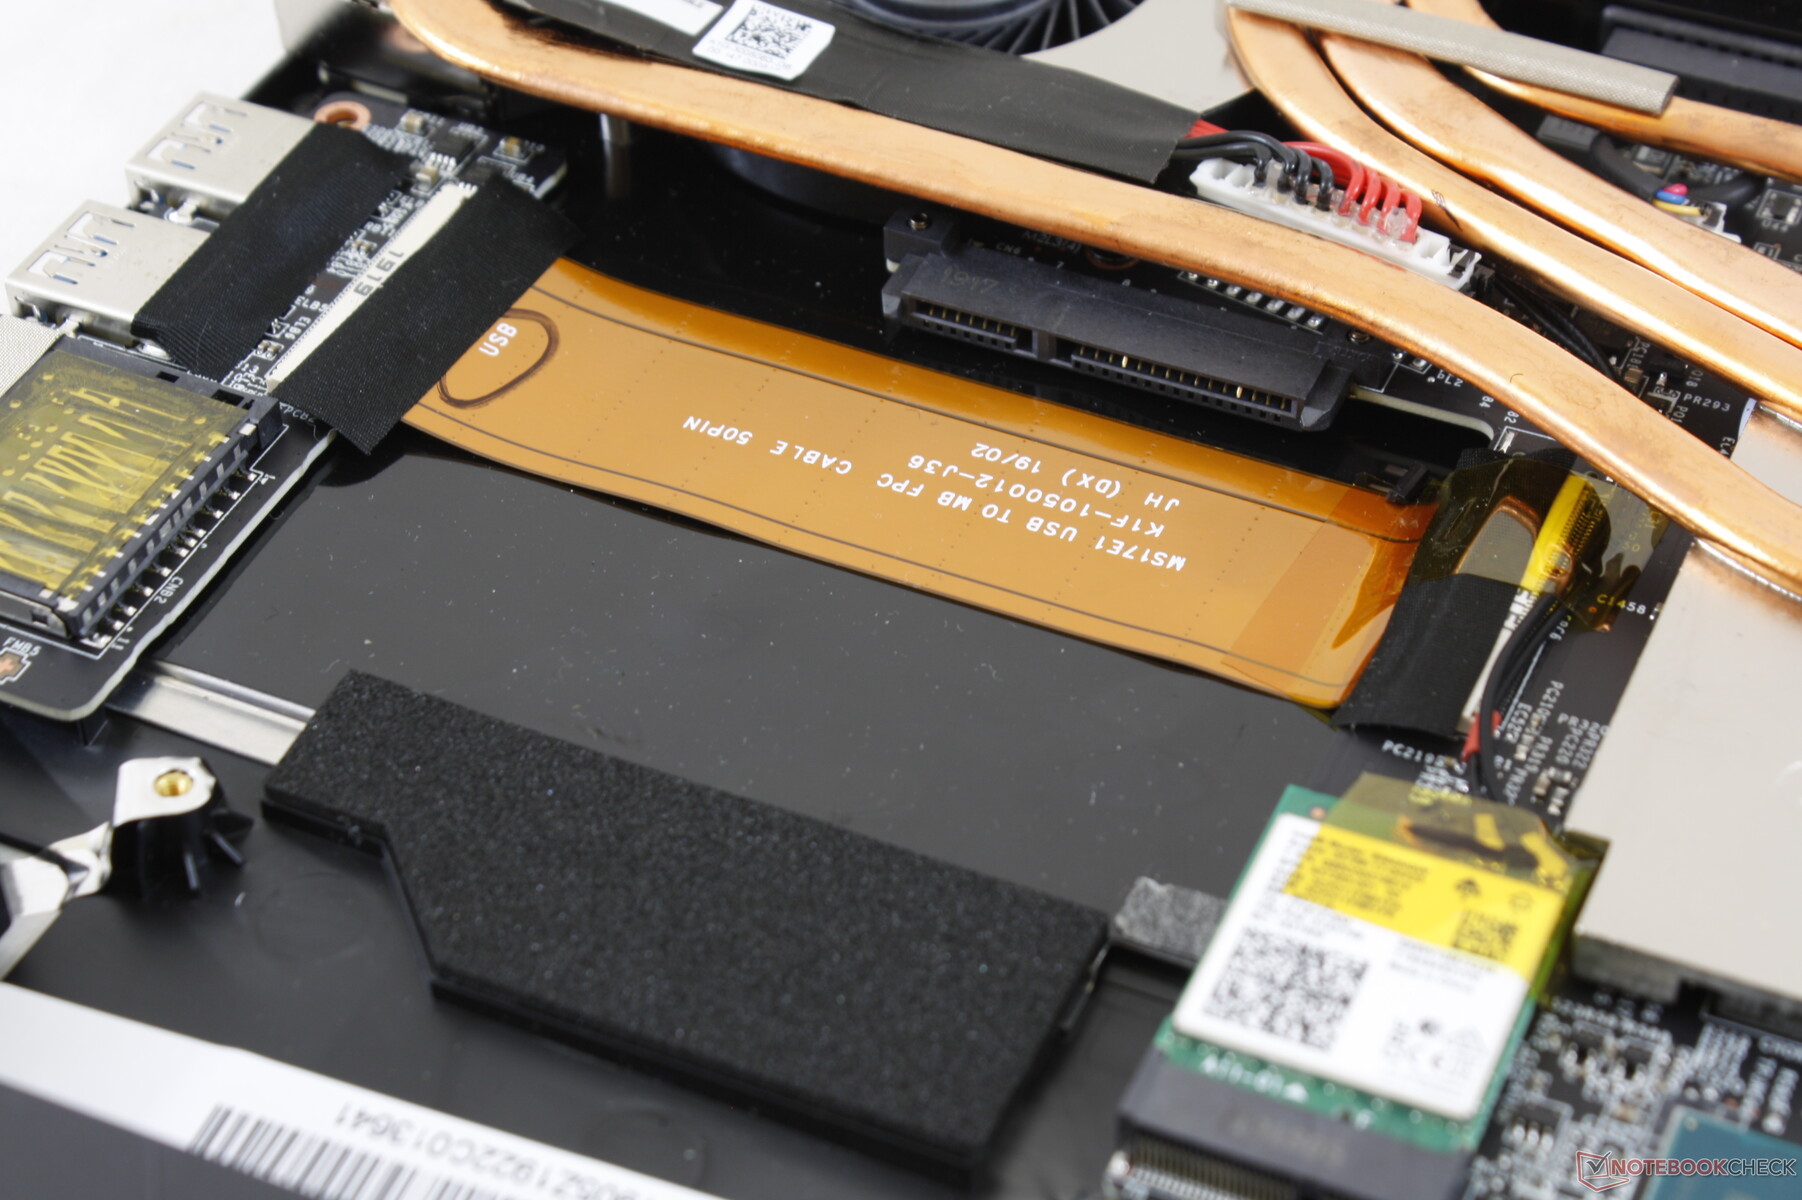
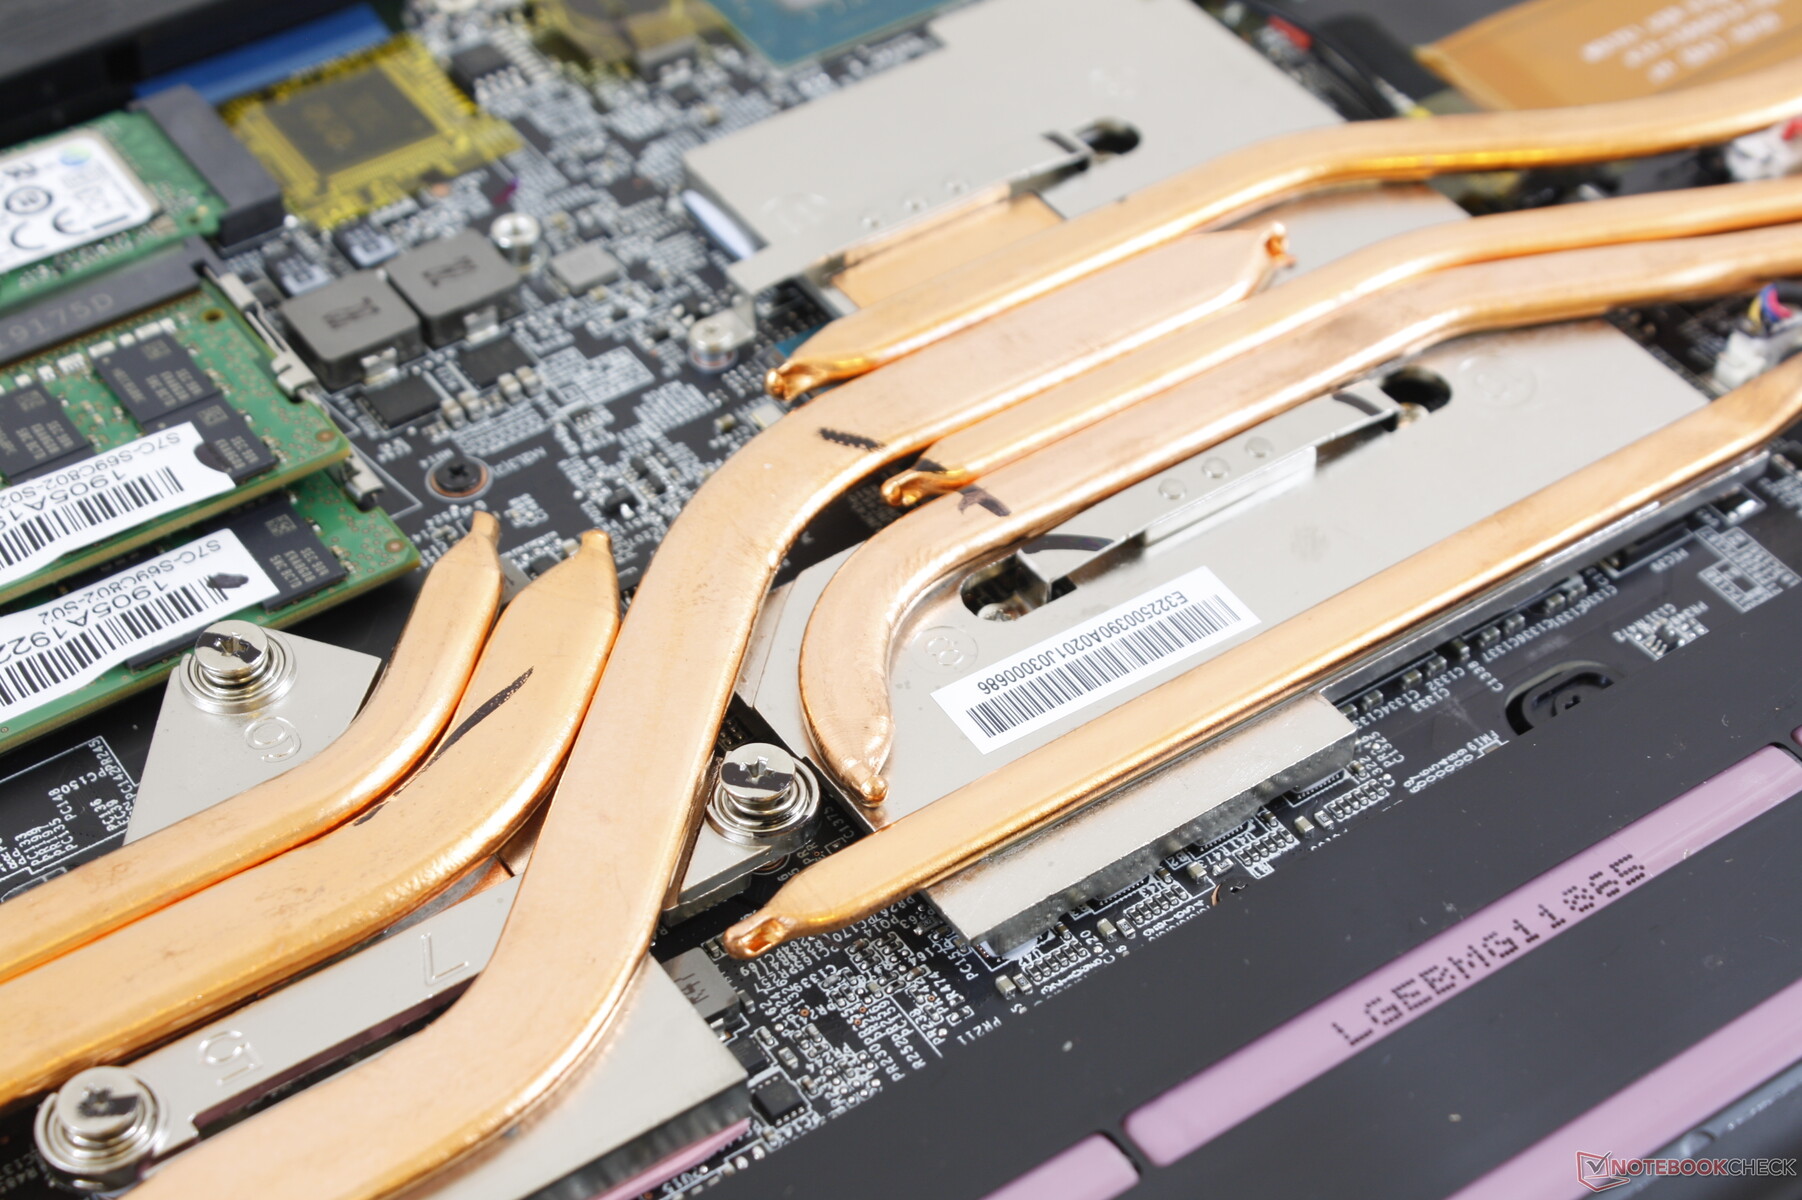
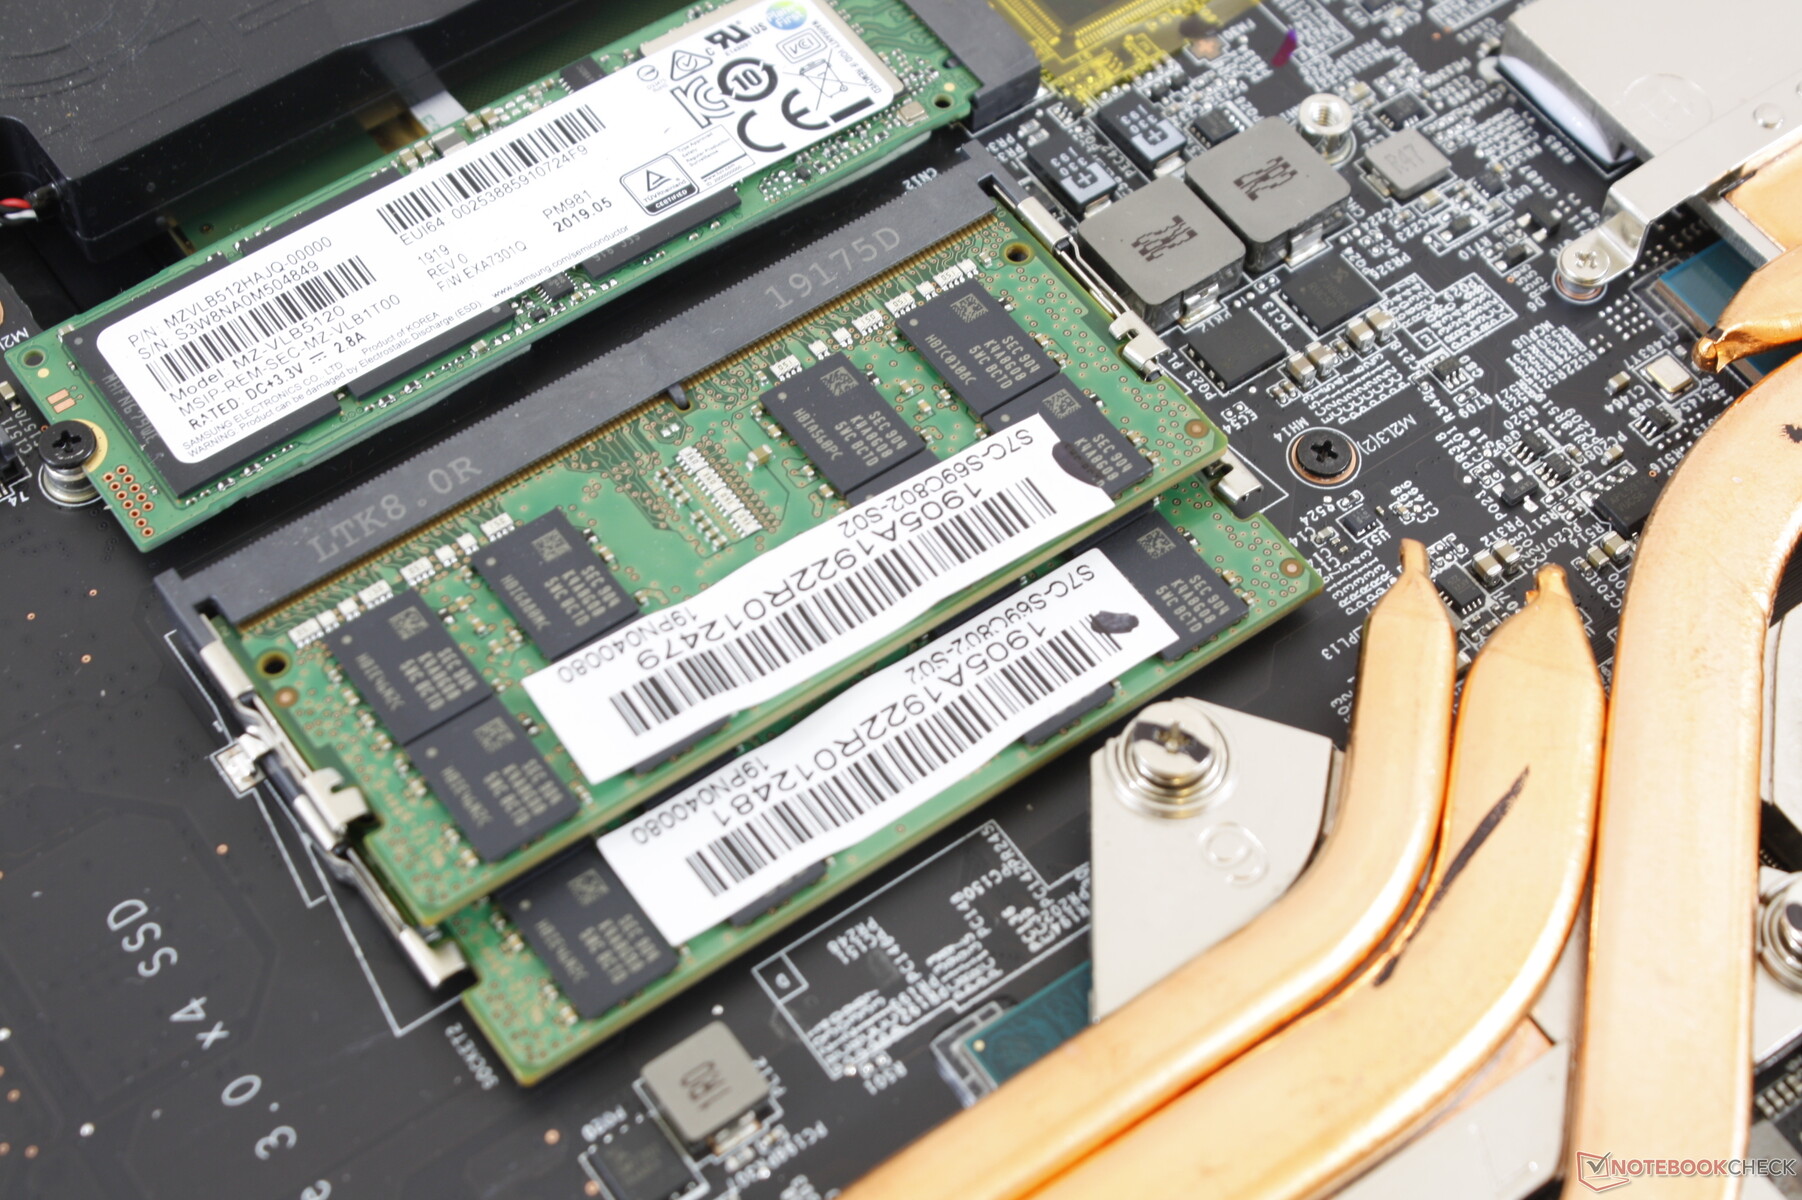
Storage Devices
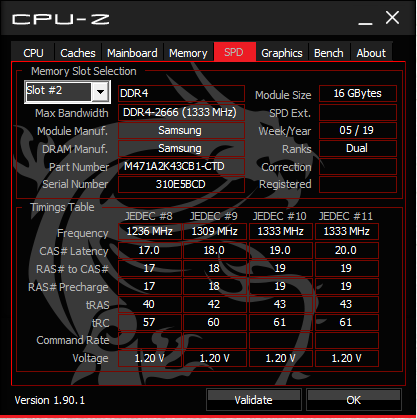
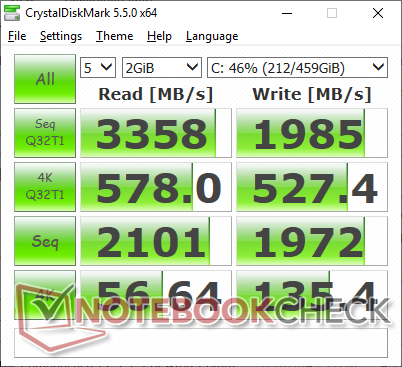
Two M.2 2280 slots and a 2.5-inch SATA III bay are available for expansion. Much like on the Razer Blade Pro and our last MSI GE75 unit, this WE75 uses a Samsung PM981 NVMe SSD for fast read and write performances. Users will likely receive different drives depending on the reseller or store.
See our table of HDDs and SSDs for more benchmark comparisons.
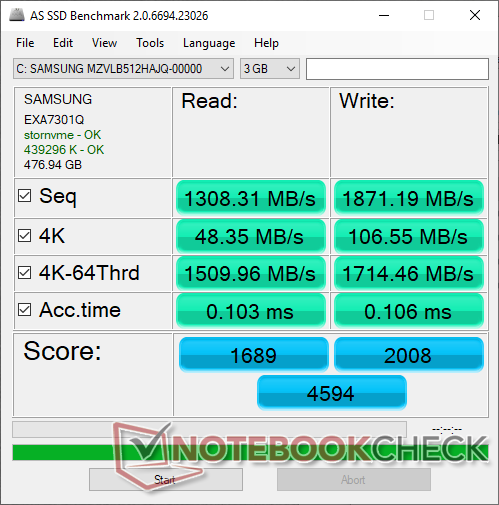
| MSI WE75 9TK Samsung SSD PM981 MZVLB512HAJQ | Razer Blade Pro 17 RTX 2080 Max-Q Samsung SSD PM981 MZVLB512HAJQ | MSI GT76 Titan DT 9SG 2x Samsung PM961 MZVLW256HEHP (RAID 0) | MSI WE72 7RJ Samsung SM961 MZVPW256 m.2 PCI-e | Lenovo ThinkPad P73-20QR002DGE Intel SSD Pro 7600p SSDPEKKF512G8L | |
|---|---|---|---|---|---|
| AS SSD | -1% | 11% | 2% | 2% | |
| Seq Read (MB/s) | 1308 | 1831 40% | 2646 102% | 2586 98% | 2693 106% |
| Seq Write (MB/s) | 1871 | 1744 -7% | 2214 18% | 1441 -23% | 1542 -18% |
| 4K Read (MB/s) | 48.35 | 45.16 -7% | 30.42 -37% | 53 10% | 62.6 29% |
| 4K Write (MB/s) | 106.6 | 107.1 0% | 95.9 -10% | 148.1 39% | 149.5 40% |
| 4K-64 Read (MB/s) | 1510 | 1240 -18% | 1609 7% | 1517 0% | 871 -42% |
| 4K-64 Write (MB/s) | 1715 | 1695 -1% | 1573 -8% | 826 -52% | 1006 -41% |
| Access Time Read * (ms) | 0.103 | 0.064 38% | 0.128 -24% | 0.041 60% | 0.058 44% |
| Access Time Write * (ms) | 0.106 | 0.037 65% | 0.039 63% | 0.026 75% | 0.067 37% |
| Score Read (Points) | 1689 | 1468 -13% | 1904 13% | 1829 8% | 1203 -29% |
| Score Write (Points) | 2008 | 1977 -2% | 1890 -6% | 1118 -44% | 1309 -35% |
| Score Total (Points) | 4594 | 4197 -9% | 4740 3% | 3831 -17% | 3088 -33% |
| Copy ISO MB/s (MB/s) | 2343 | 2086 -11% | 1600 -32% | 1716 -27% | |
| Copy Program MB/s (MB/s) | 526 | 425.5 -19% | 290 -45% | 542 3% | |
| Copy Game MB/s (MB/s) | 1506 | 555 -63% | 863 -43% | 1375 -9% |
* ... smaller is better

GPU Performance
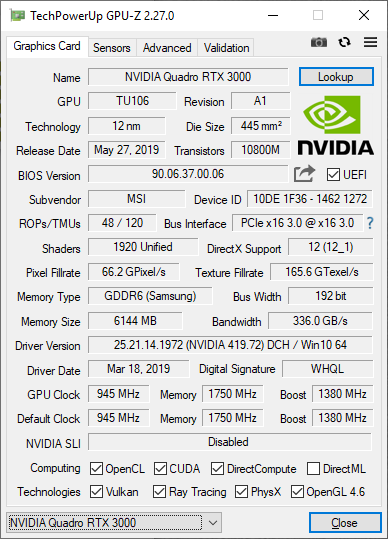
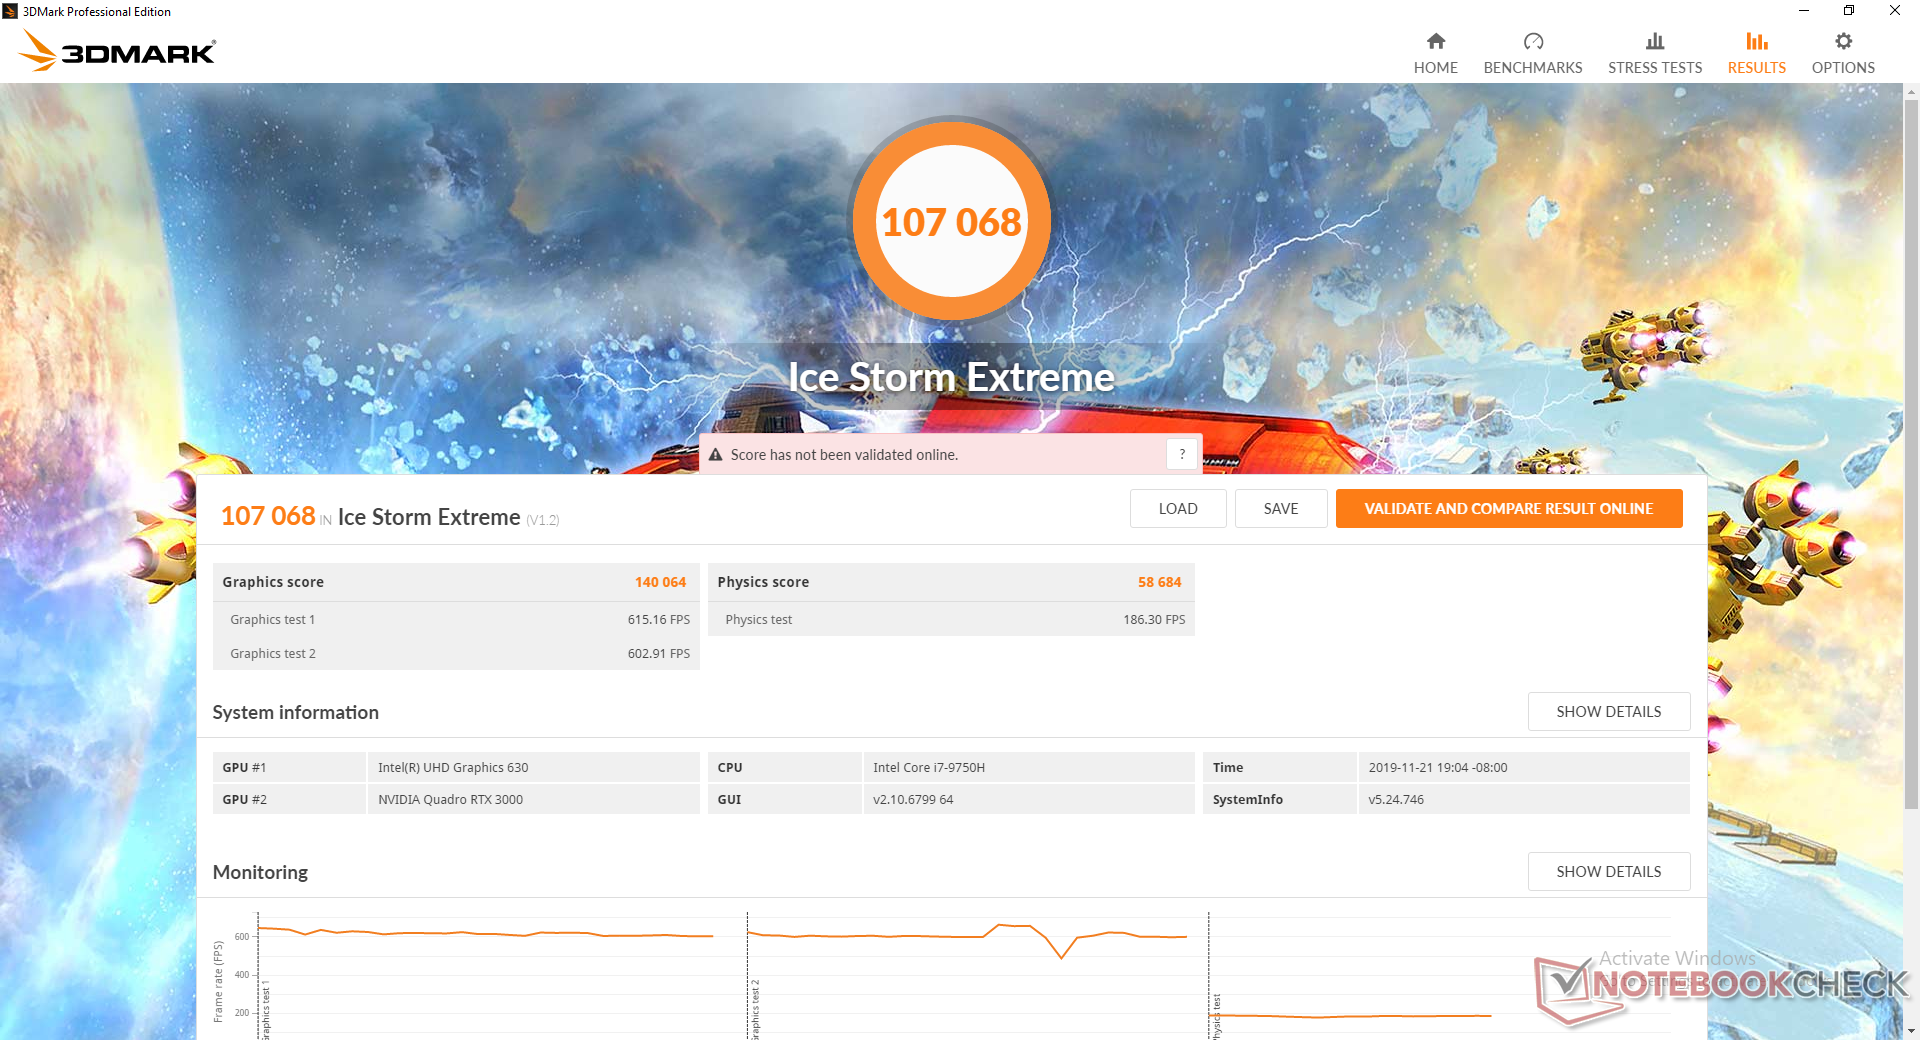
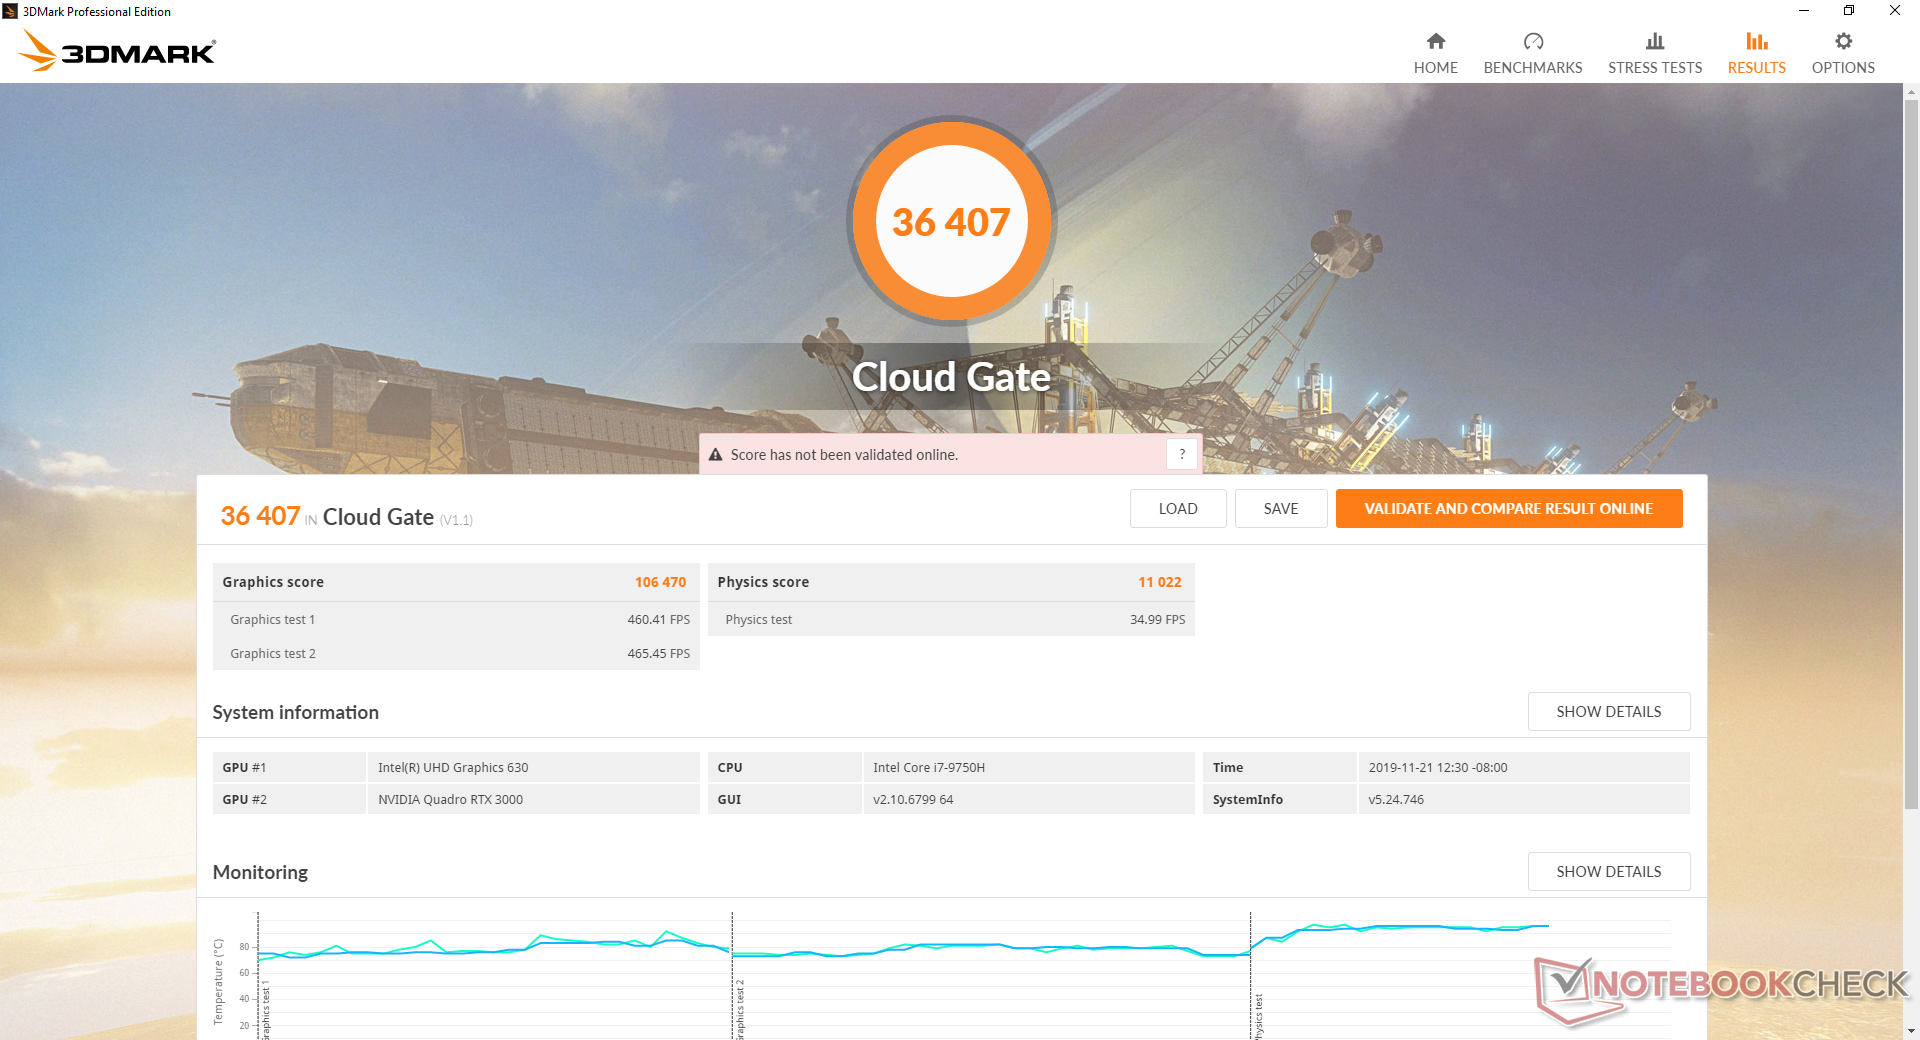
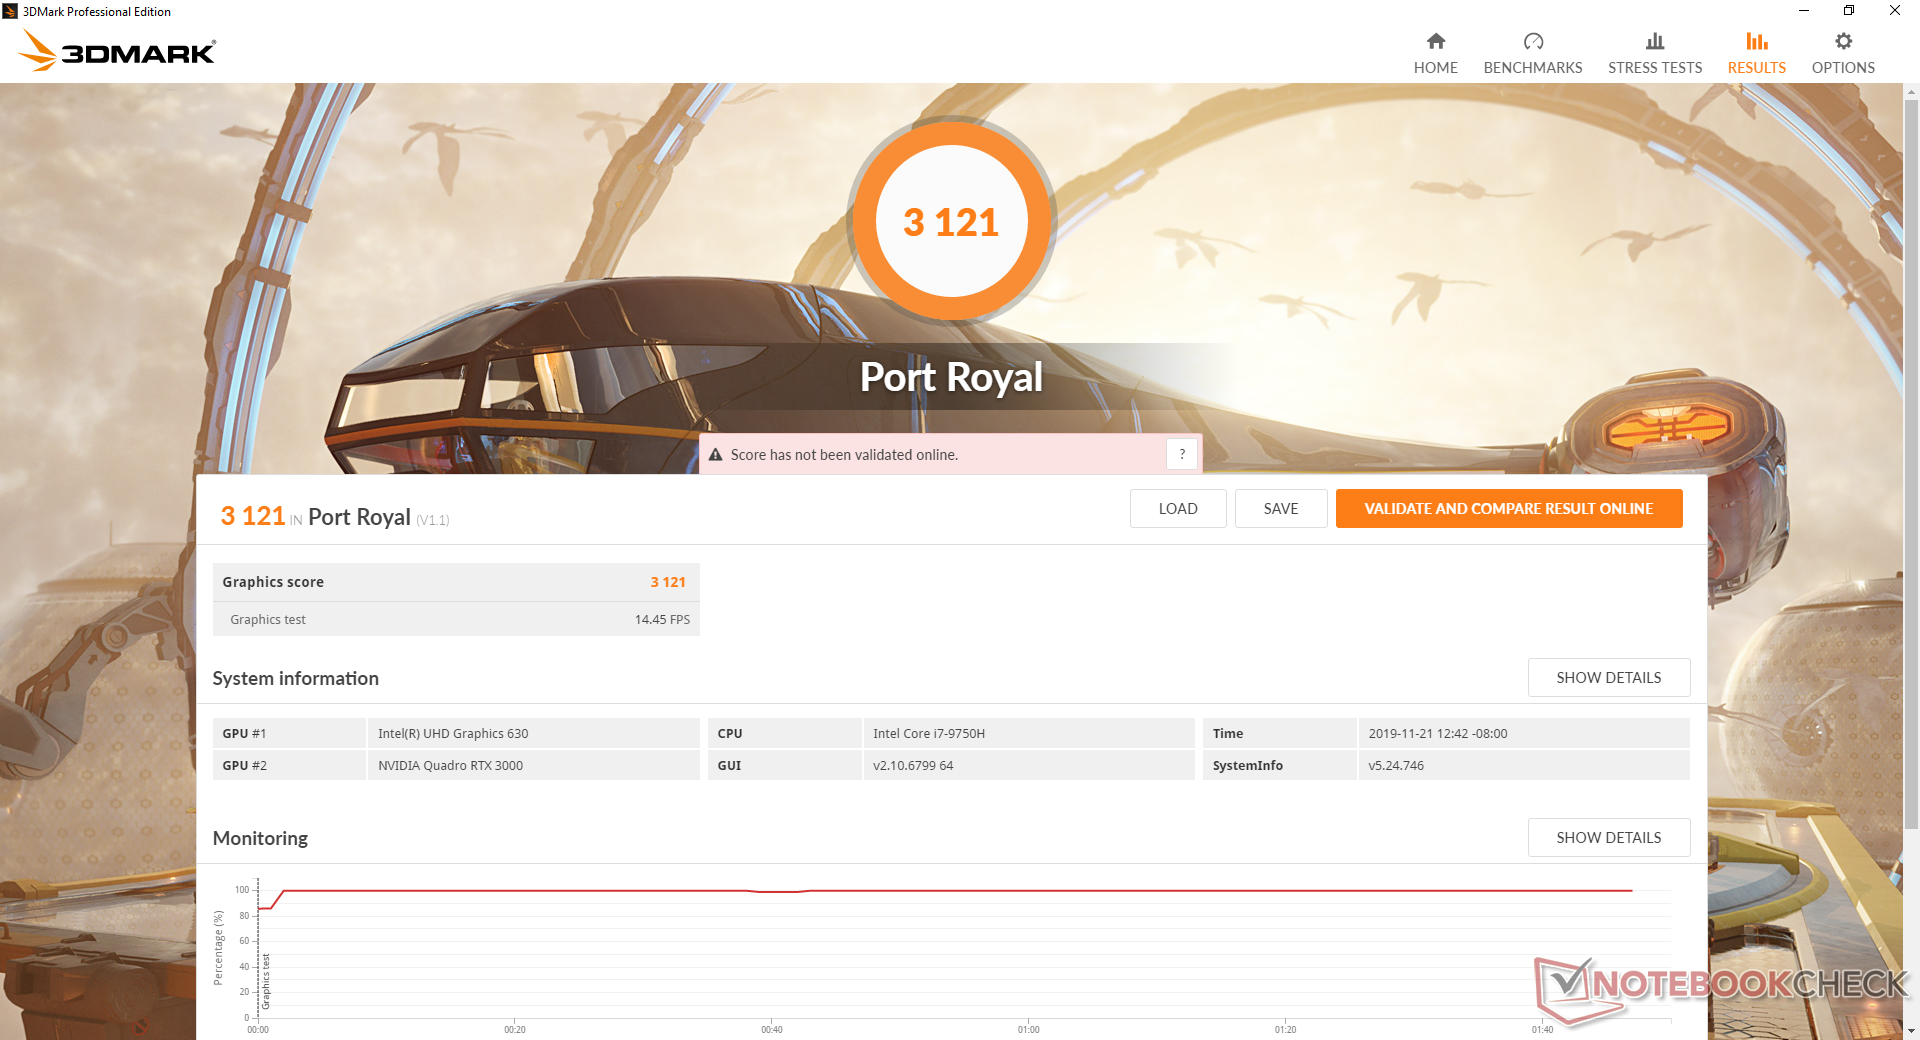
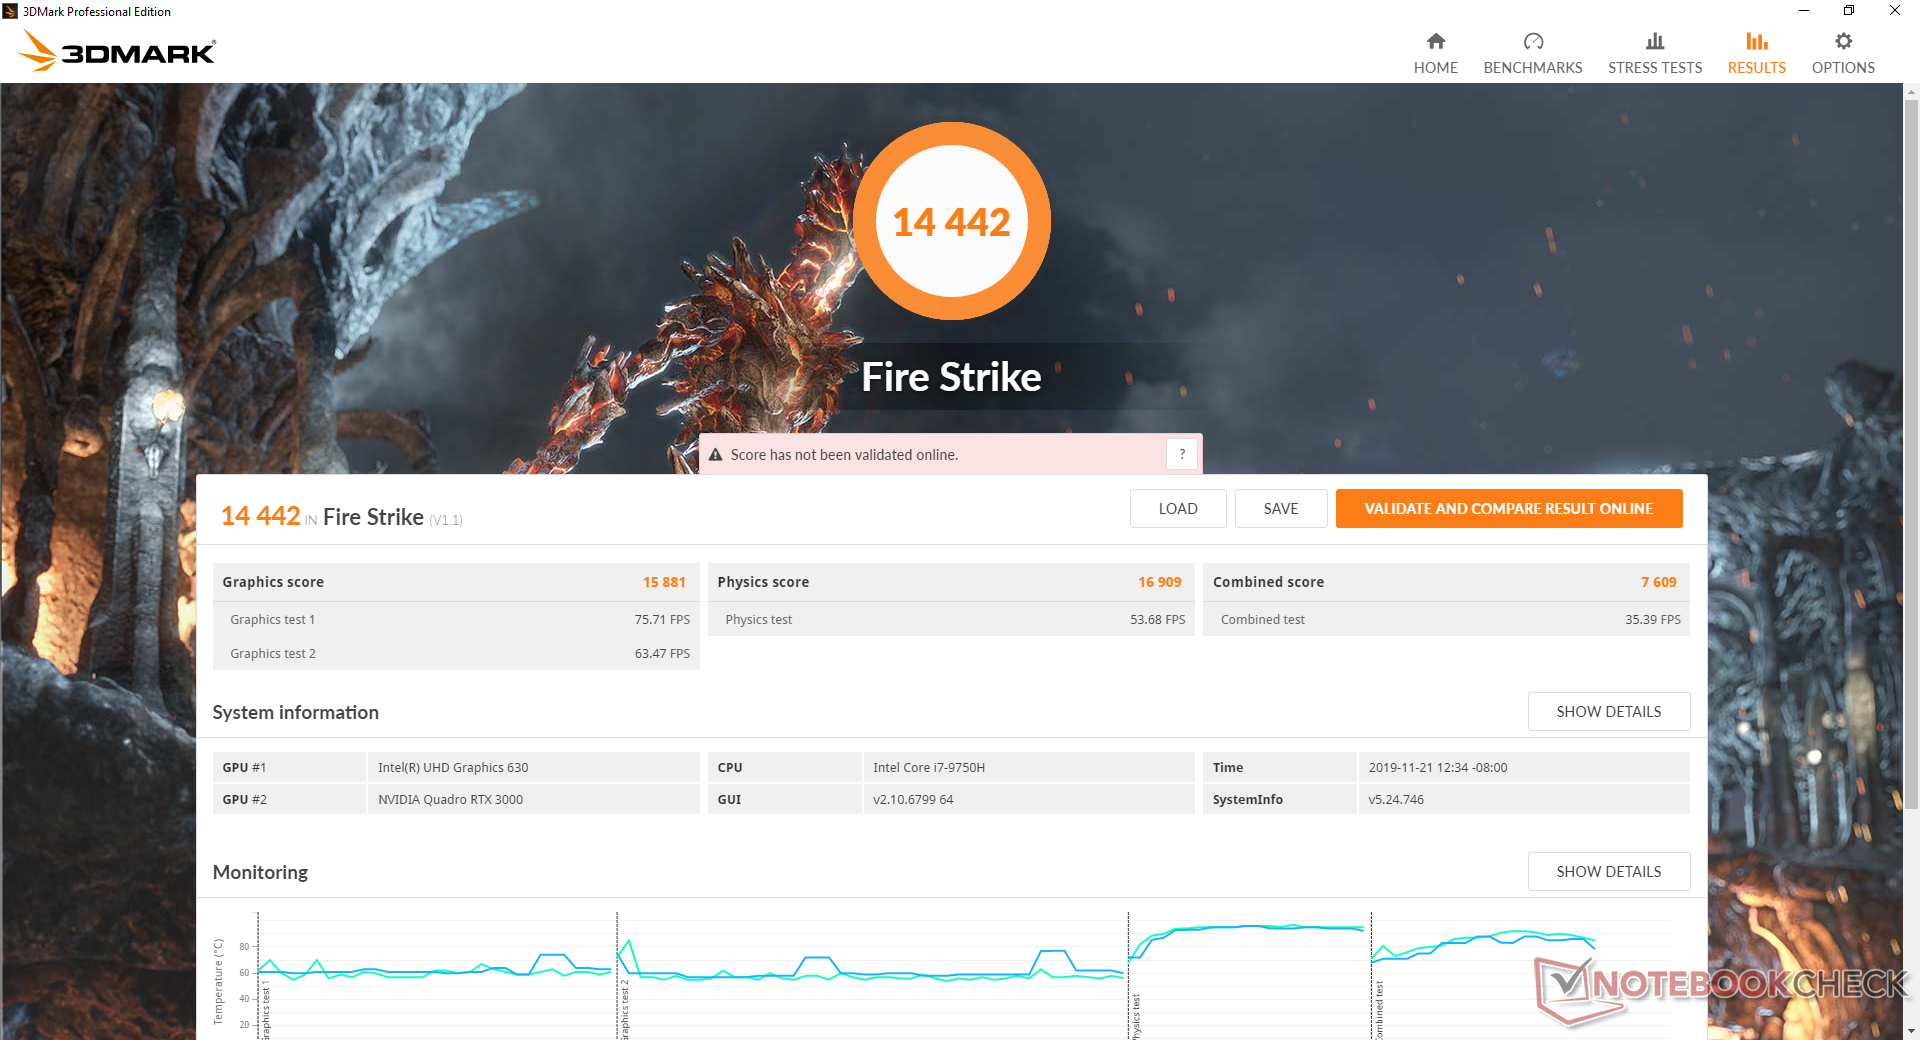
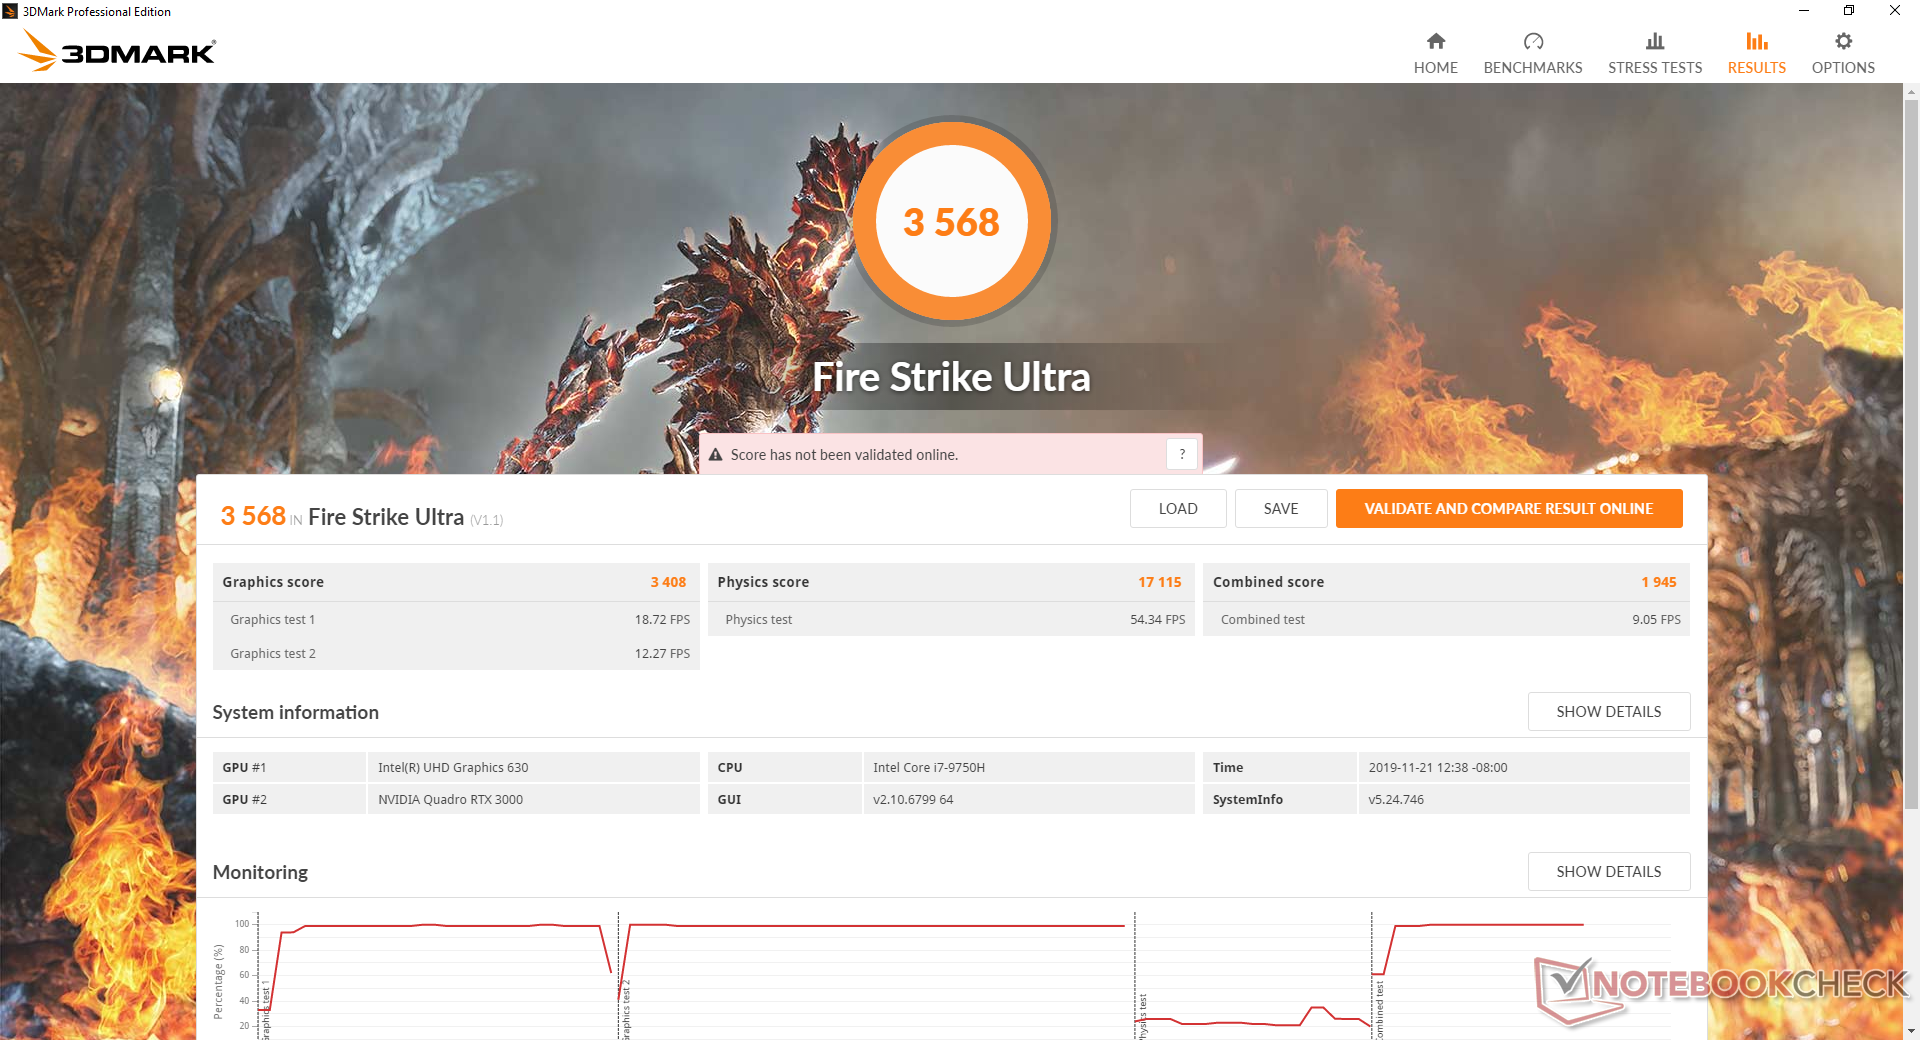
The mobile Quadro RTX 3000 is most similar to the mobile GeForce RTX 2060; both GPUs have the same number of ROPs, TMUs, and unified shaders. 3DMark and gaming results between them are therefore very close to one another. Of course, CAD-related workloads will favor the Quadro card as shown by our SpecViewPerf numbers. Upgrading from the Quadro T2000 will being a raw performance boost of roughly 90 percent.
See our dedicated page on the Quadro RTX 3000 for more technical information and benchmark comparisons.
| 3DMark 11 Performance | 18138 points | |
| 3DMark Cloud Gate Standard Score | 36407 points | |
| 3DMark Fire Strike Score | 14442 points | |
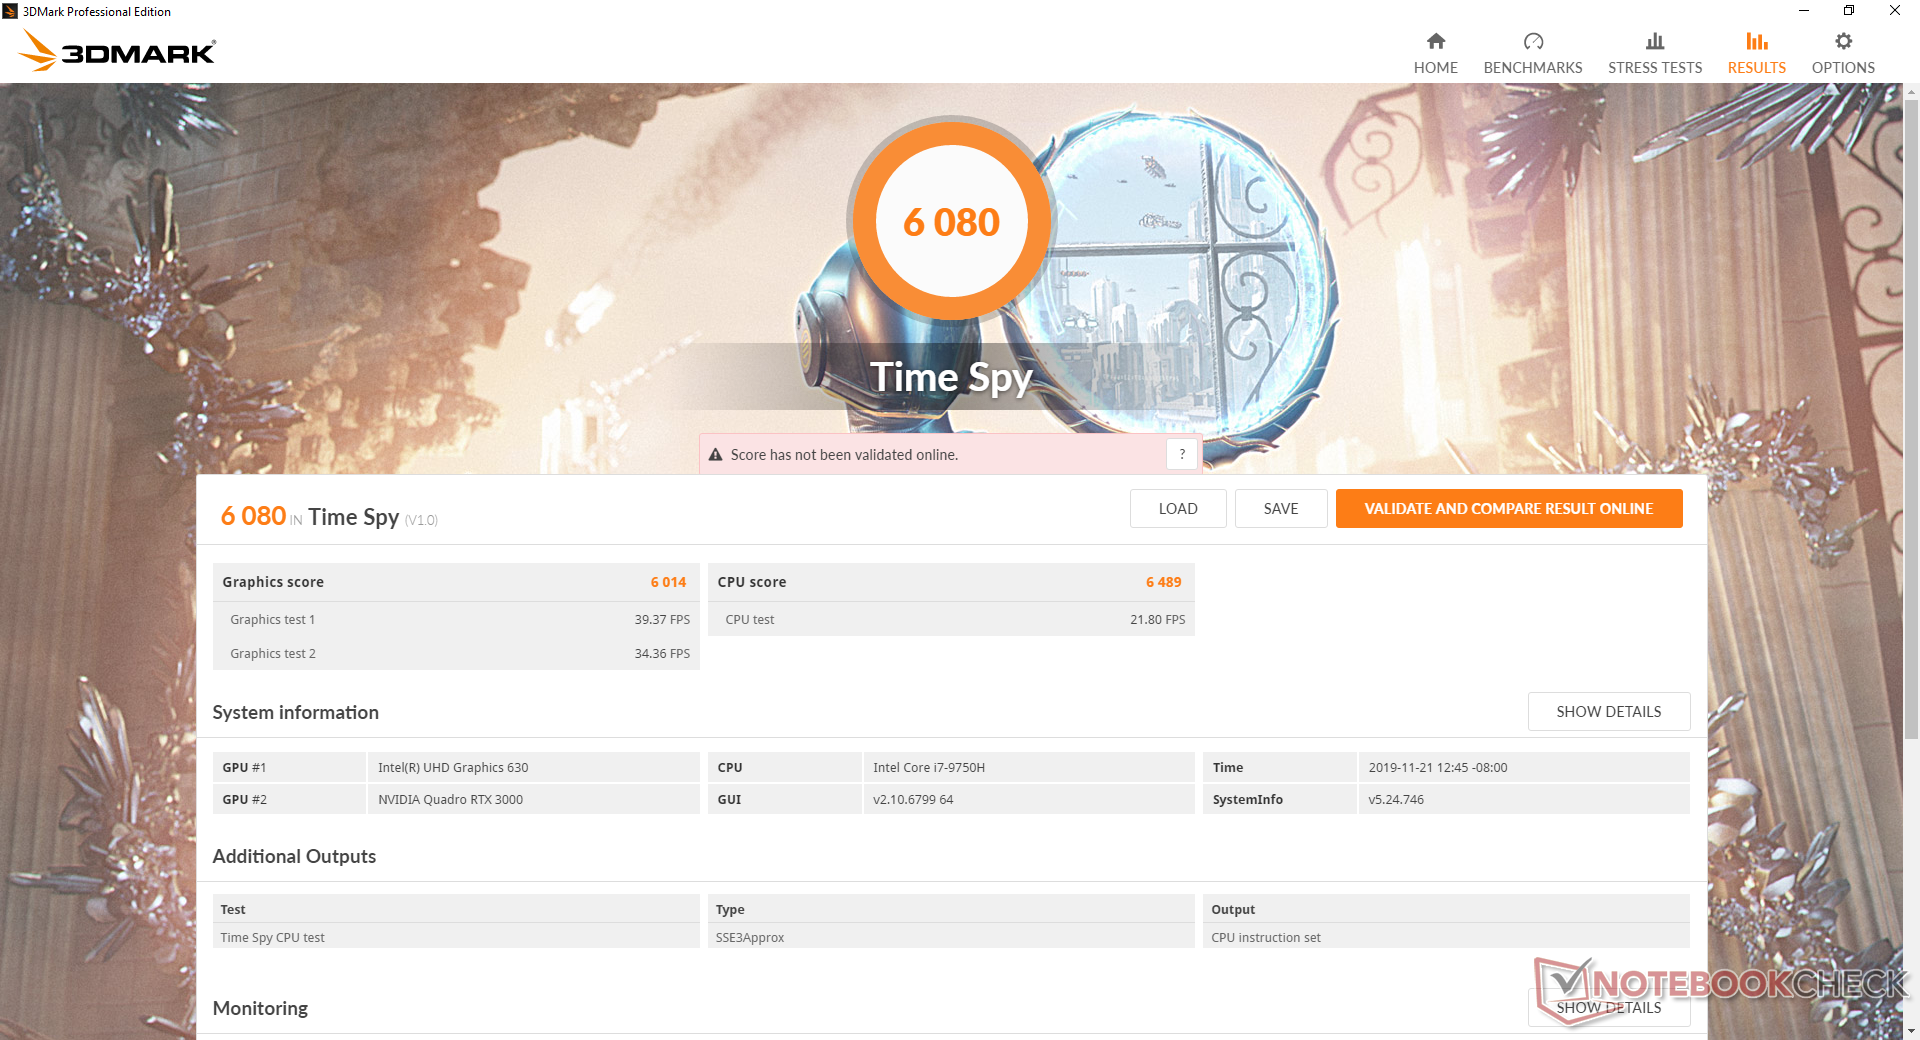
| 3DMark Time Spy Score | 6080 points | |
Help | ||
| low | med. | high | ultra | |
|---|---|---|---|---|
| BioShock Infinite (2013) | 325.9 | 288.2 | 266.8 | 148.4 |
| The Witcher 3 (2015) | 303.2 | 202.8 | 117 | 59 |
| Shadow of the Tomb Raider (2018) | 135 | 100 | 88 | 79 |
Emissions
System Noise
The fans will idle during low loads for a nearly silent experience. We say "nearly" because our particular unit exhibits slight coil whine or electronic noise. Launching heavier applications like 3DMark will bump fan noise up to just 32 dB(A) to still be quieter than most gaming laptops when under similar conditions. The system is notable for its lethargic fan behavior to keep noise as low as possible before needing to ramp up.
Running Witcher 3 will slowly bump up fan noise until it stabilizes at 44.7 dB(A). If the CPU and GPU are at maximum utilization, fan noise will max out at 51.9 dB(A). Enabling Cooler Boost (a.k.a. maximum fan mode) will cause the fans to jump to 56.5 dB(A) which isn't really necessary unless if cooler temperatures are desired. Our Stress Test section below will show that Cooler Boost mode entails no significant performance boosts relative to the much louder increase in fan noise.
| MSI WE75 9TK Quadro RTX 3000 (Laptop), i7-9750H, Samsung SSD PM981 MZVLB512HAJQ | Razer Blade Pro 17 RTX 2080 Max-Q GeForce RTX 2080 Max-Q, i7-9750H, Samsung SSD PM981 MZVLB512HAJQ | MSI GT76 Titan DT 9SG GeForce RTX 2080 Mobile, i9-9900K, 2x Samsung PM961 MZVLW256HEHP (RAID 0) | MSI WE72 7RJ Quadro M2200, i7-7700HQ, Samsung SM961 MZVPW256 m.2 PCI-e | HP ZBook 17 G5-2ZC48EA Quadro P3200, i7-8850H, Toshiba XG5 KXG50ZNV256G | Lenovo ThinkPad P73-20QR002DGE Quadro RTX 3000 (Laptop), i7-9850H, Intel SSD Pro 7600p SSDPEKKF512G8L | |
|---|---|---|---|---|---|---|
| Noise | -4% | -21% | -13% | 3% | 11% | |
| off / environment * (dB) | 28.5 | 28.2 1% | 30 -5% | 29.3 -3% | 28.7 -1% | 29.3 -3% |
| Idle Minimum * (dB) | 29 | 28.2 3% | 33 -14% | 36.3 -25% | 28.7 1% | 29.3 -1% |
| Idle Average * (dB) | 29 | 28.2 3% | 34 -17% | 36.3 -25% | 28.7 1% | 29.3 -1% |
| Idle Maximum * (dB) | 31.5 | 30.8 2% | 44 -40% | 36.6 -16% | 30.9 2% | 29.3 7% |
| Load Average * (dB) | 32 | 42 -31% | 47 -47% | 40.4 -26% | 37.3 -17% | 30.2 6% |
| Witcher 3 ultra * (dB) | 44.7 | 51 -14% | 53 -19% | 41.1 8% | 30.7 31% | |
| Load Maximum * (dB) | 56.5 | 53 6% | 59 -4% | 46.6 18% | 41.4 27% | 33.1 41% |
* ... smaller is better
Noise level
| Idle |
| 29 / 29 / 31.5 dB(A) |
| Load |
| 32 / 56.5 dB(A) |
 | ||
30 dB silent 40 dB(A) audible 50 dB(A) loud |
||
min: | ||
Temperature
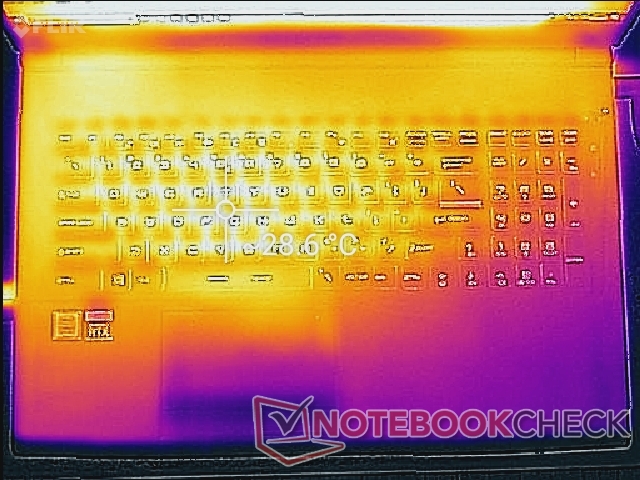
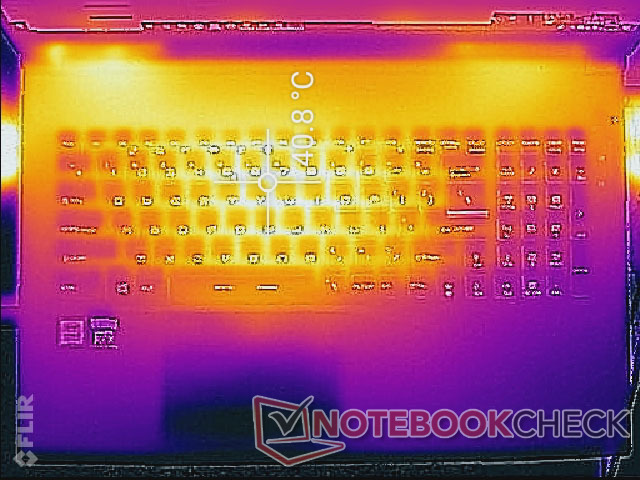
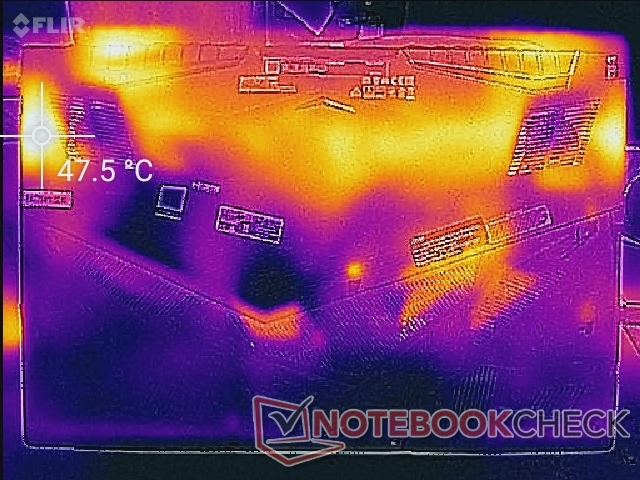
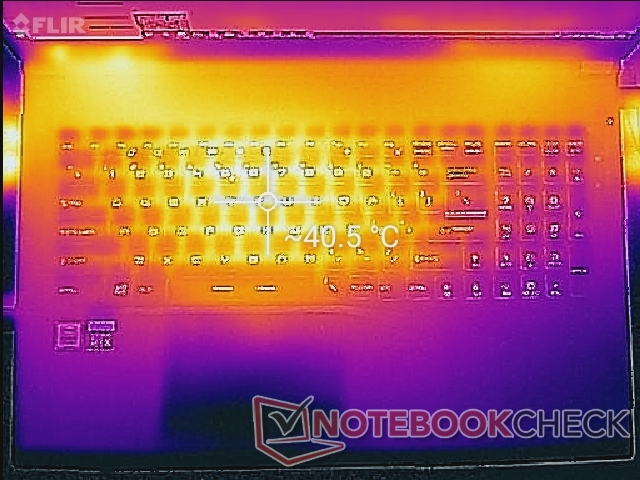
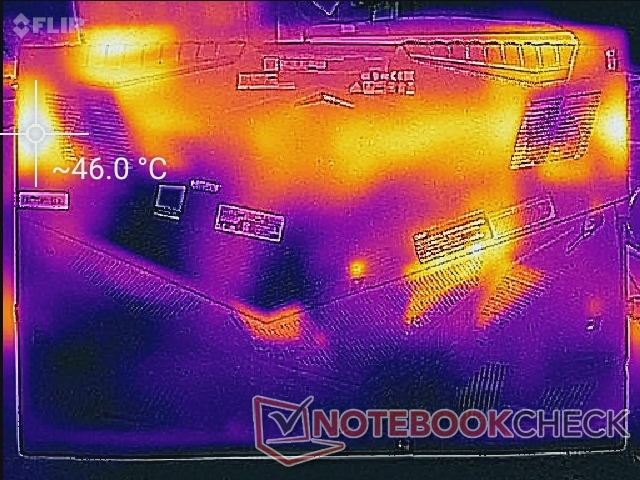
Surface temperatures are warmest toward the center of the keyboard at almost 41 C when under extreme processing loads. In contrast, the hot spots on most other laptops are on top of the first row of keyboard keys where users are less likely to touch. Average temperatures are still cooler than many other 17.3-inch workstations including the Dell Precision 7730. The palm rests, touchpad, and NumPad keys remain cool no matter the processing load.
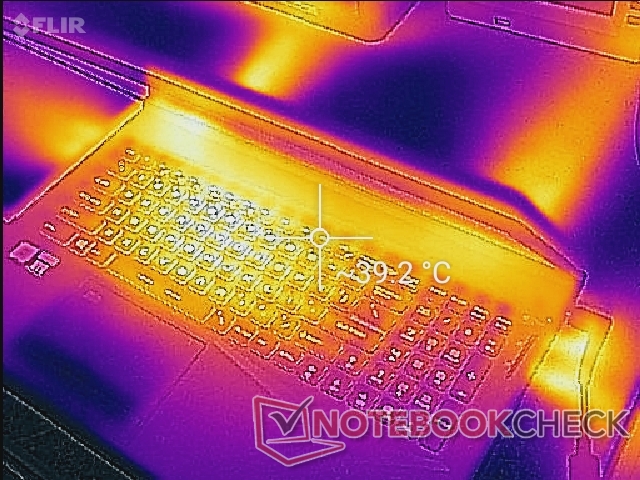
(±) The maximum temperature on the upper side is 40.6 °C / 105 F, compared to the average of 38.2 °C / 101 F, ranging from 22.2 to 69.8 °C for the class Workstation.
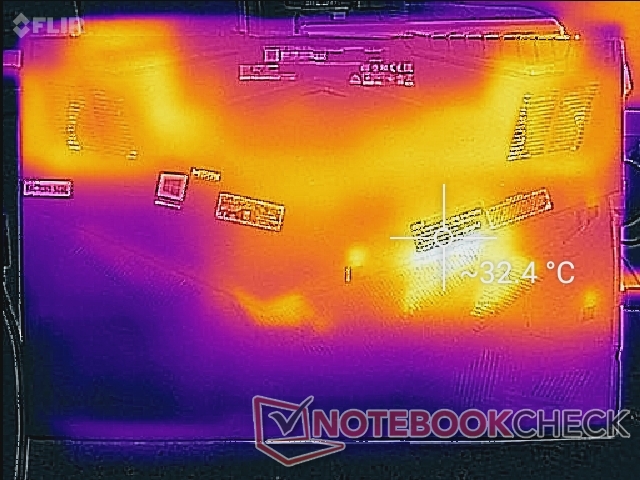
(-) The bottom heats up to a maximum of 46 °C / 115 F, compared to the average of 41.1 °C / 106 F
(+) In idle usage, the average temperature for the upper side is 27.5 °C / 82 F, compared to the device average of 32 °C / 90 F.
(±) Playing The Witcher 3, the average temperature for the upper side is 35.1 °C / 95 F, compared to the device average of 32 °C / 90 F.
(+) The palmrests and touchpad are cooler than skin temperature with a maximum of 29.4 °C / 84.9 F and are therefore cool to the touch.
(±) The average temperature of the palmrest area of similar devices was 27.8 °C / 82 F (-1.6 °C / -2.9 F).
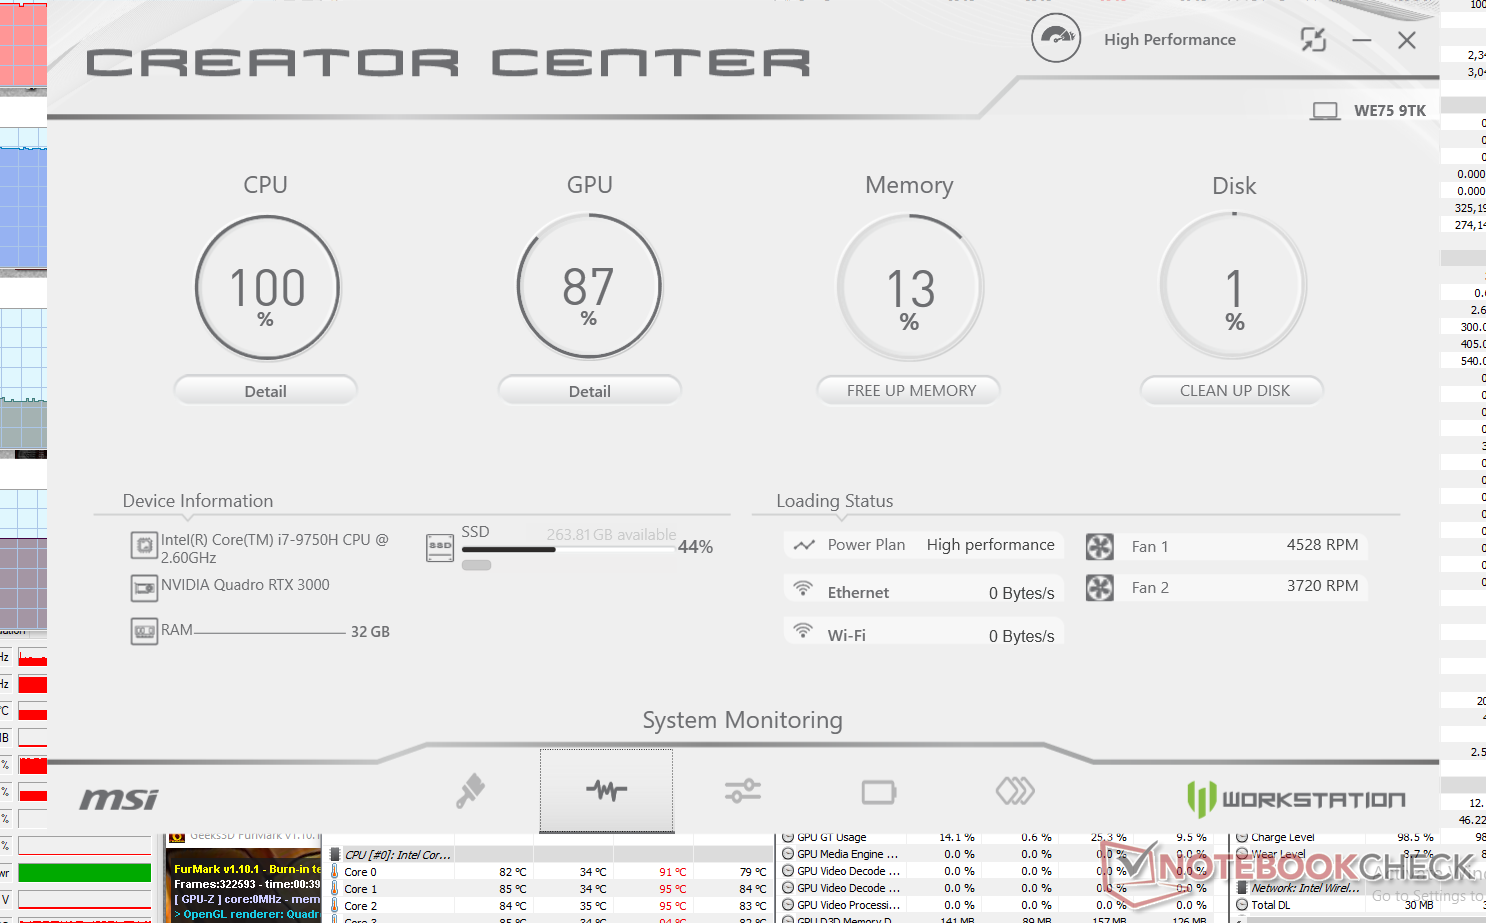
Stress Test
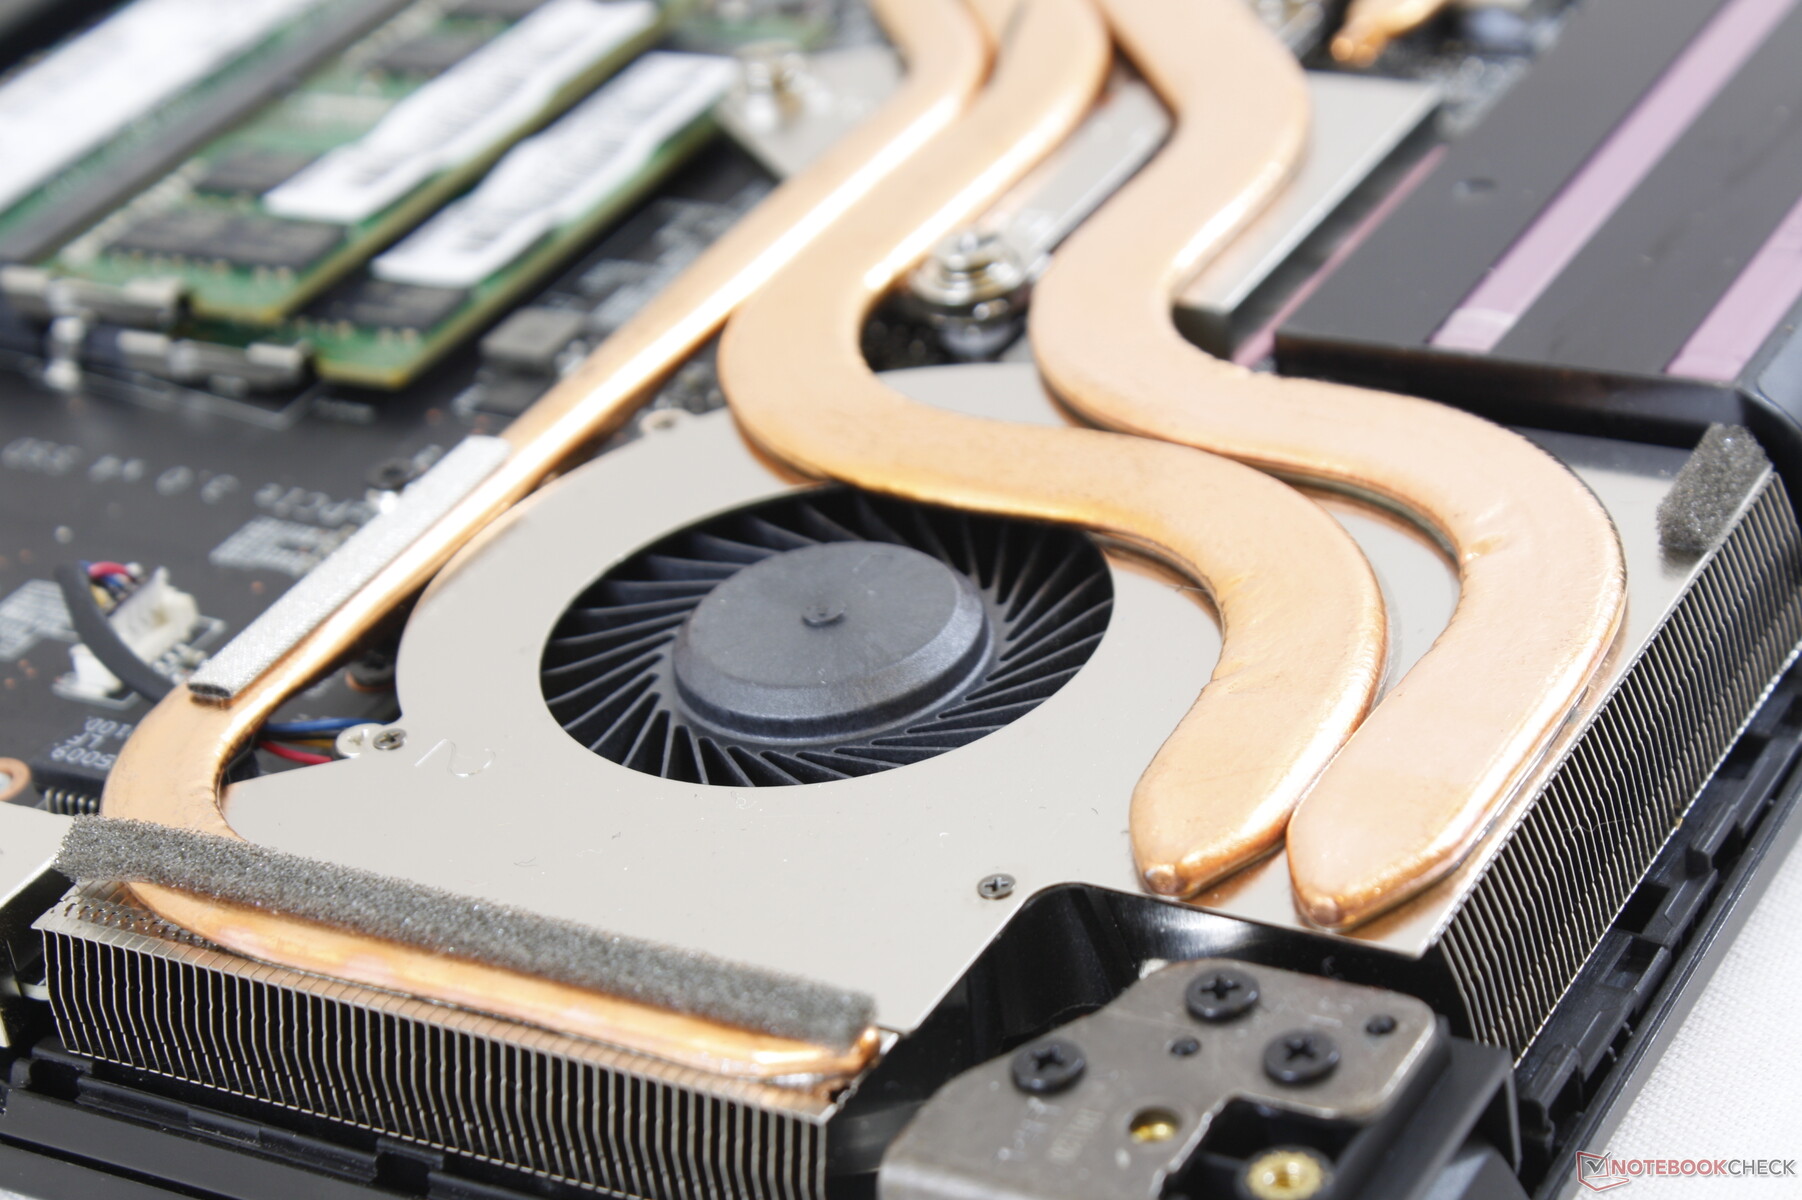
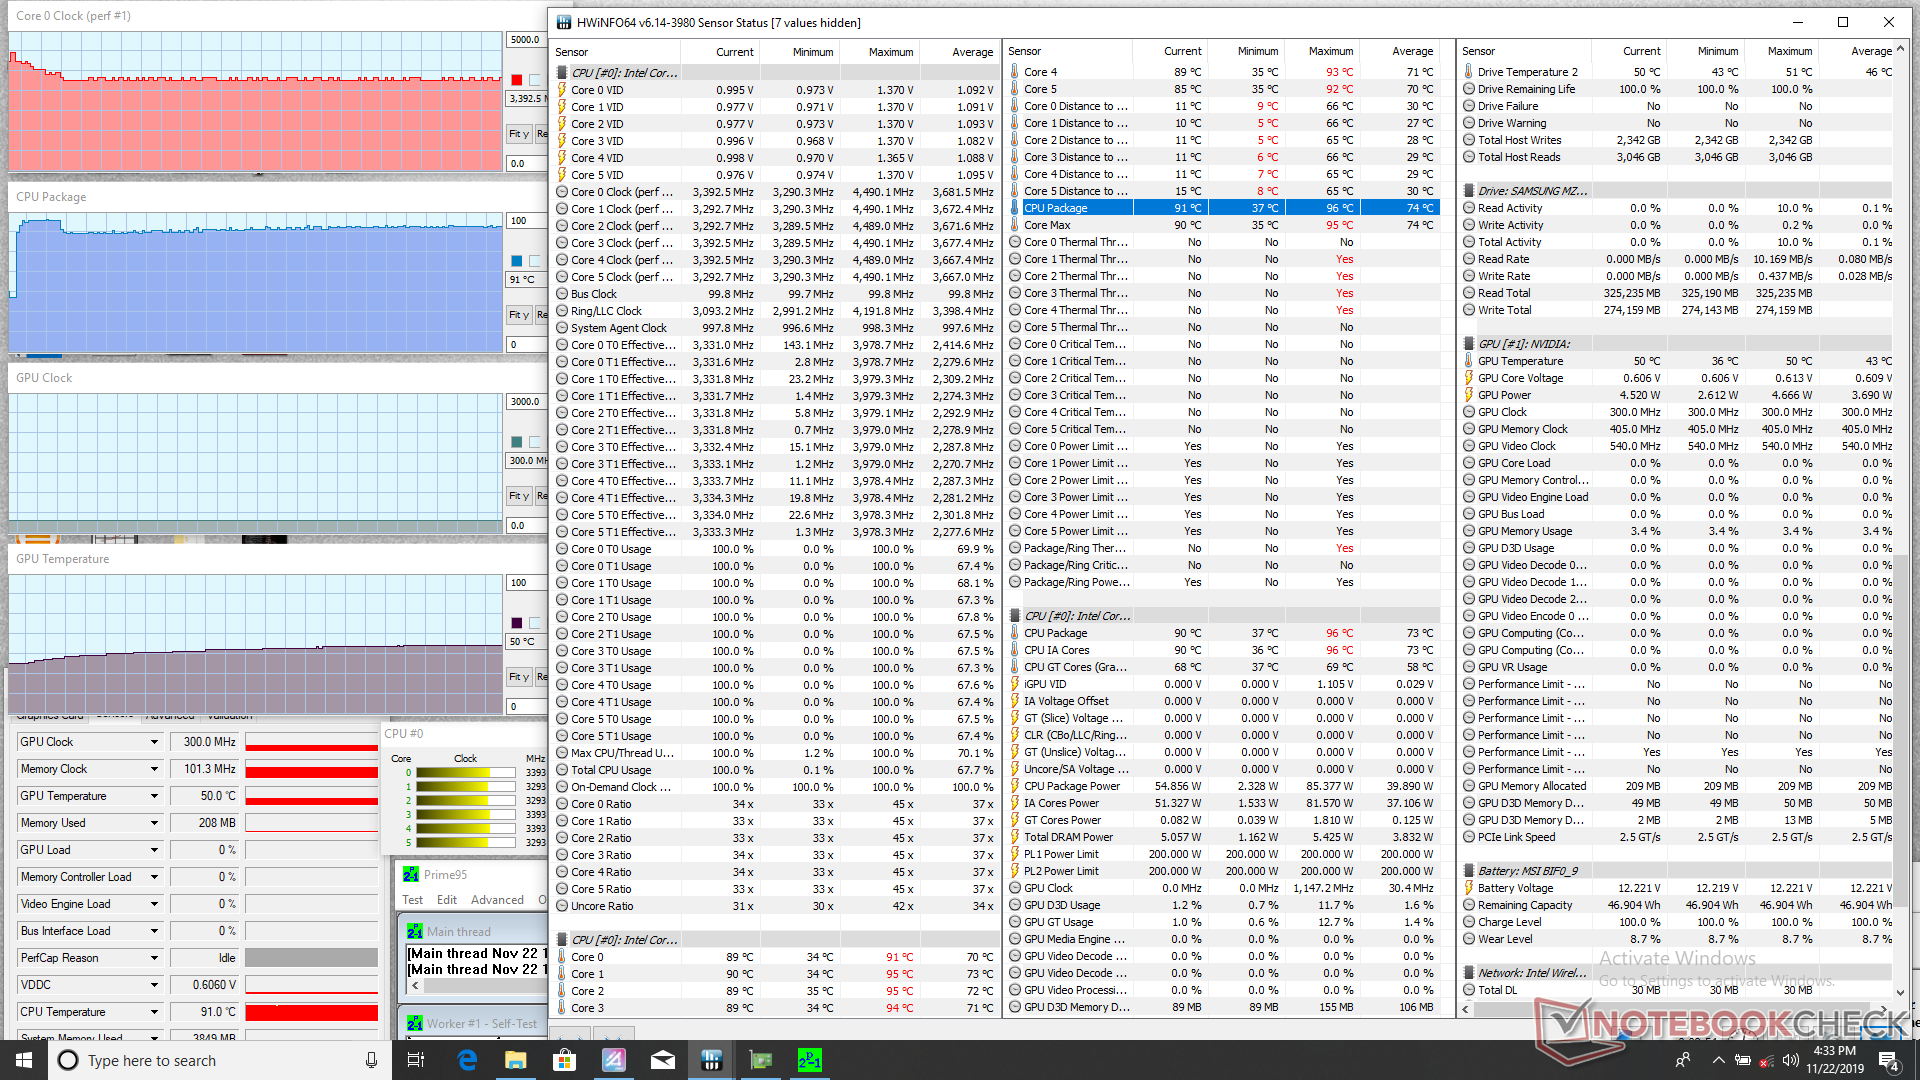
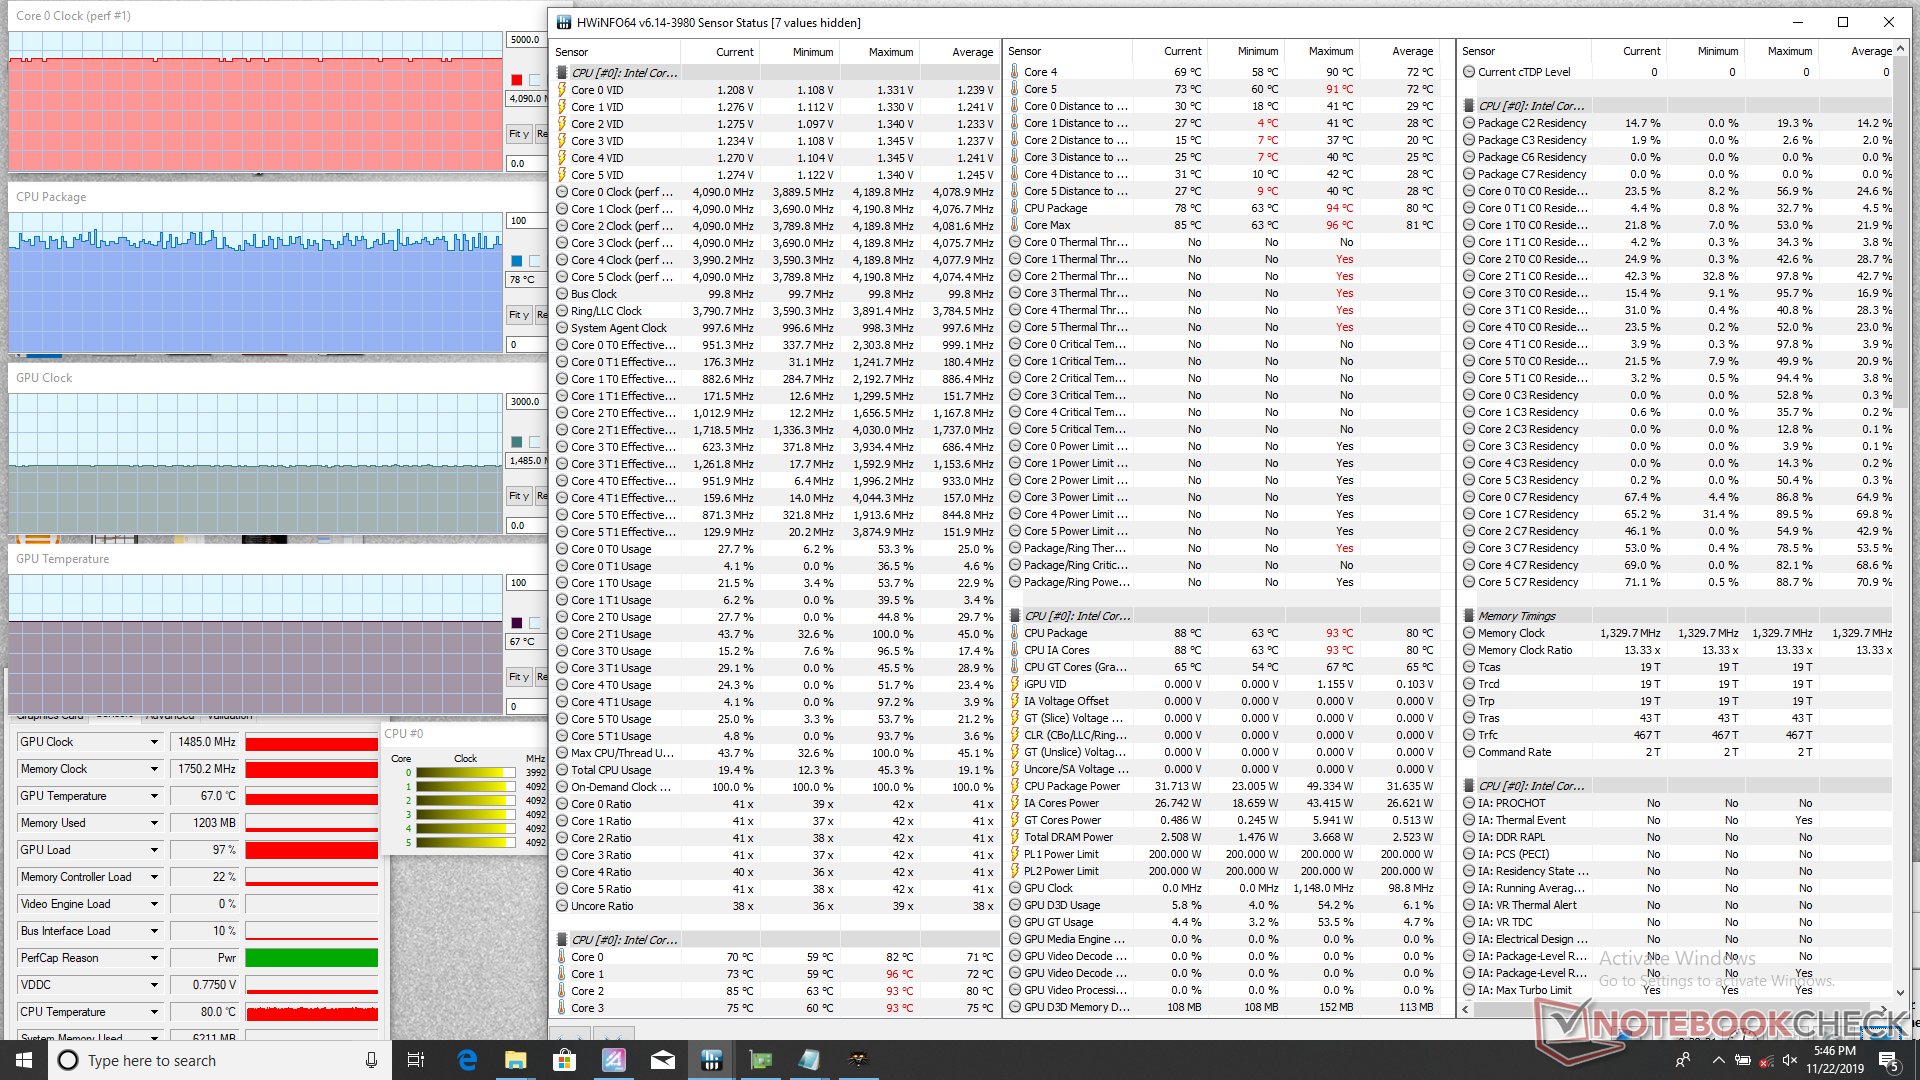
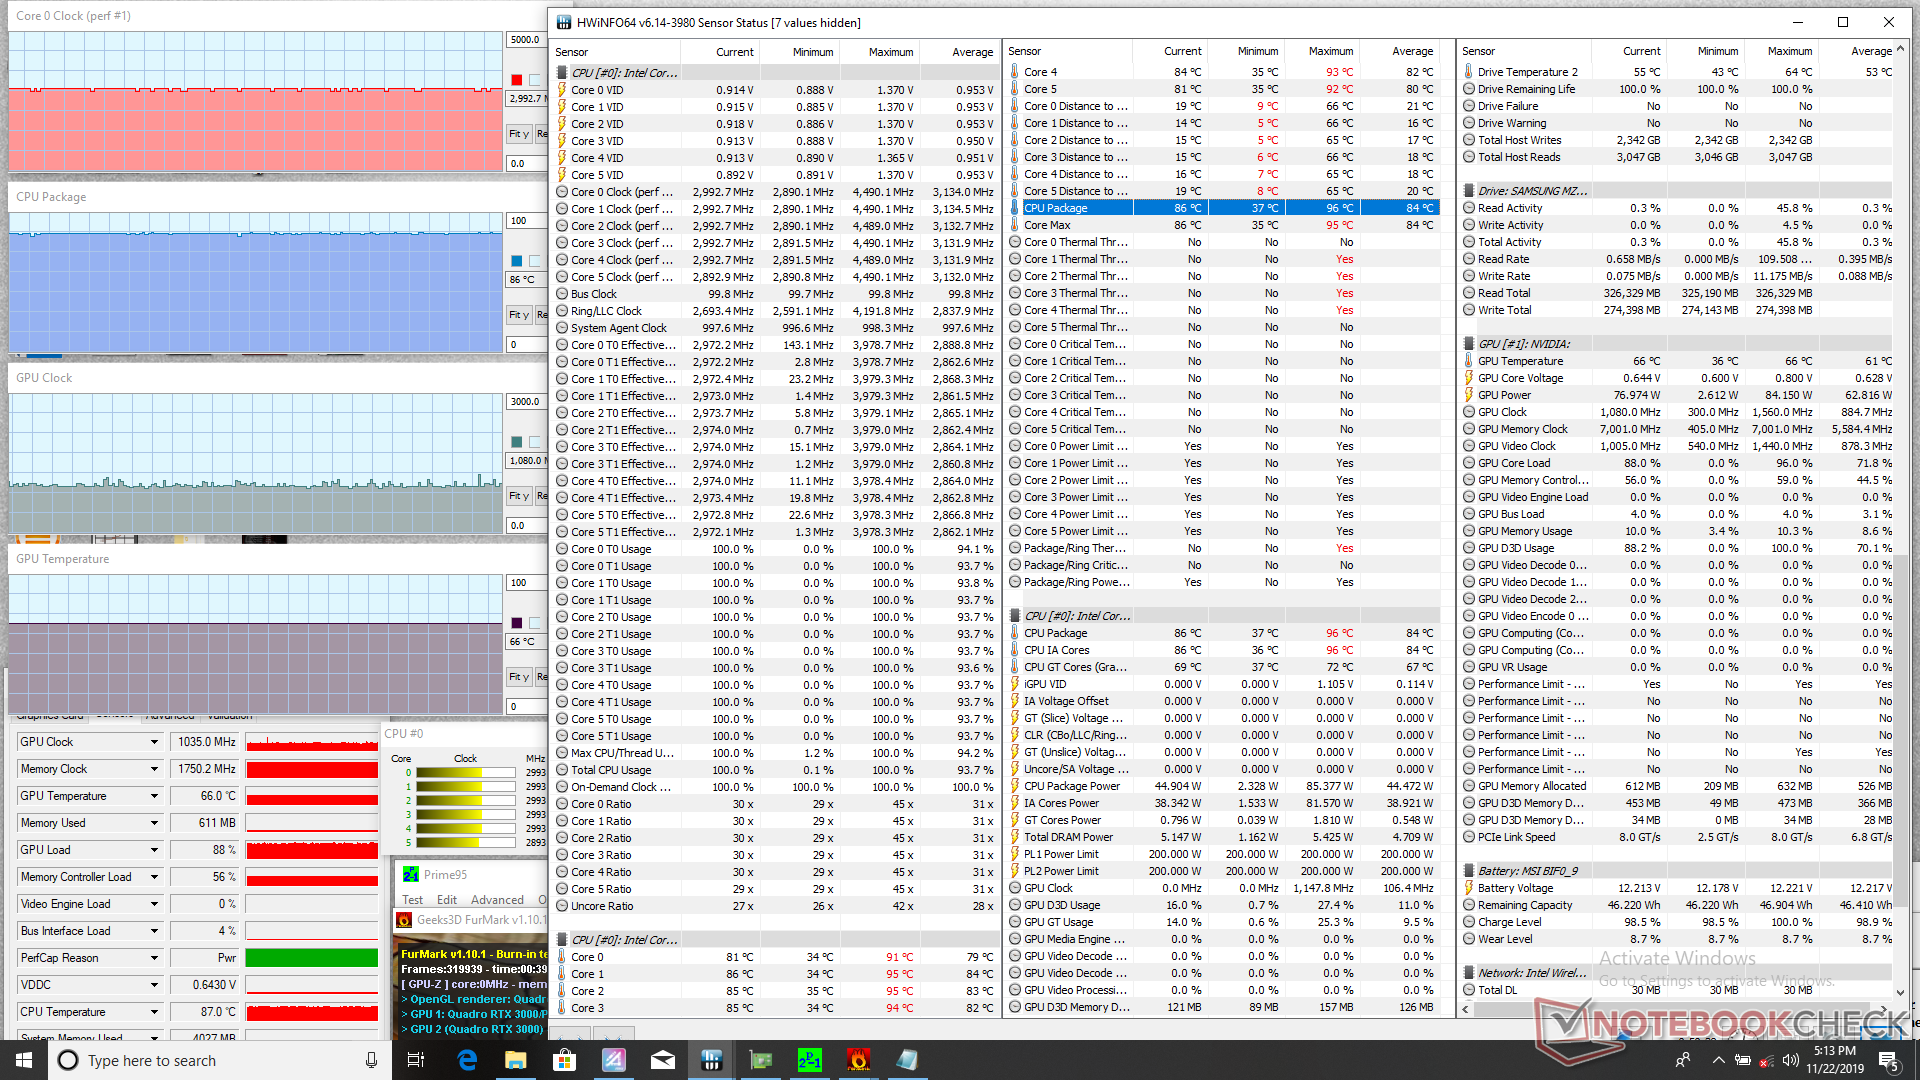
We stress the laptop with synthetic loads to identify for any potential throttling issues. The system was set to High Performance mode with the fan on Auto prior to testing. When running Prime95, the CPU would boost up to 4 GHz for the first 5 seconds until core temperature reached 95 C. Thereafter, clock rates would drop to the 3.3 to 3.4 GHz range in order to maintain a slightly cooler core temperature of 91 C. This is significantly warmer than on the Razer Blade Pro 17 (91 C vs. 65 C) when both systems are subjected to similar Prime95 conditions. Running both Prime95 and FurMark simultaneously will cause CPU and GPU temperatures to stabilize at 86 C and 66 C, respectively, with a consistent CPU Turbo Boost of about +300 to +400 MHz.
Running Prime95 on Cooler Booster mode would drop the CPU temperature from 91 C to 81 C. Clock rates, however, remain the same to suggest that Cooler Boost mode should be used mainly for reducing temperatures.
Running on battery power will limit performance significantly. A Time Spy run on batteries returns Physics and Graphics scores of 3846 and 1814 points, respectively, compared to 6489 and 6014 points when on mains.
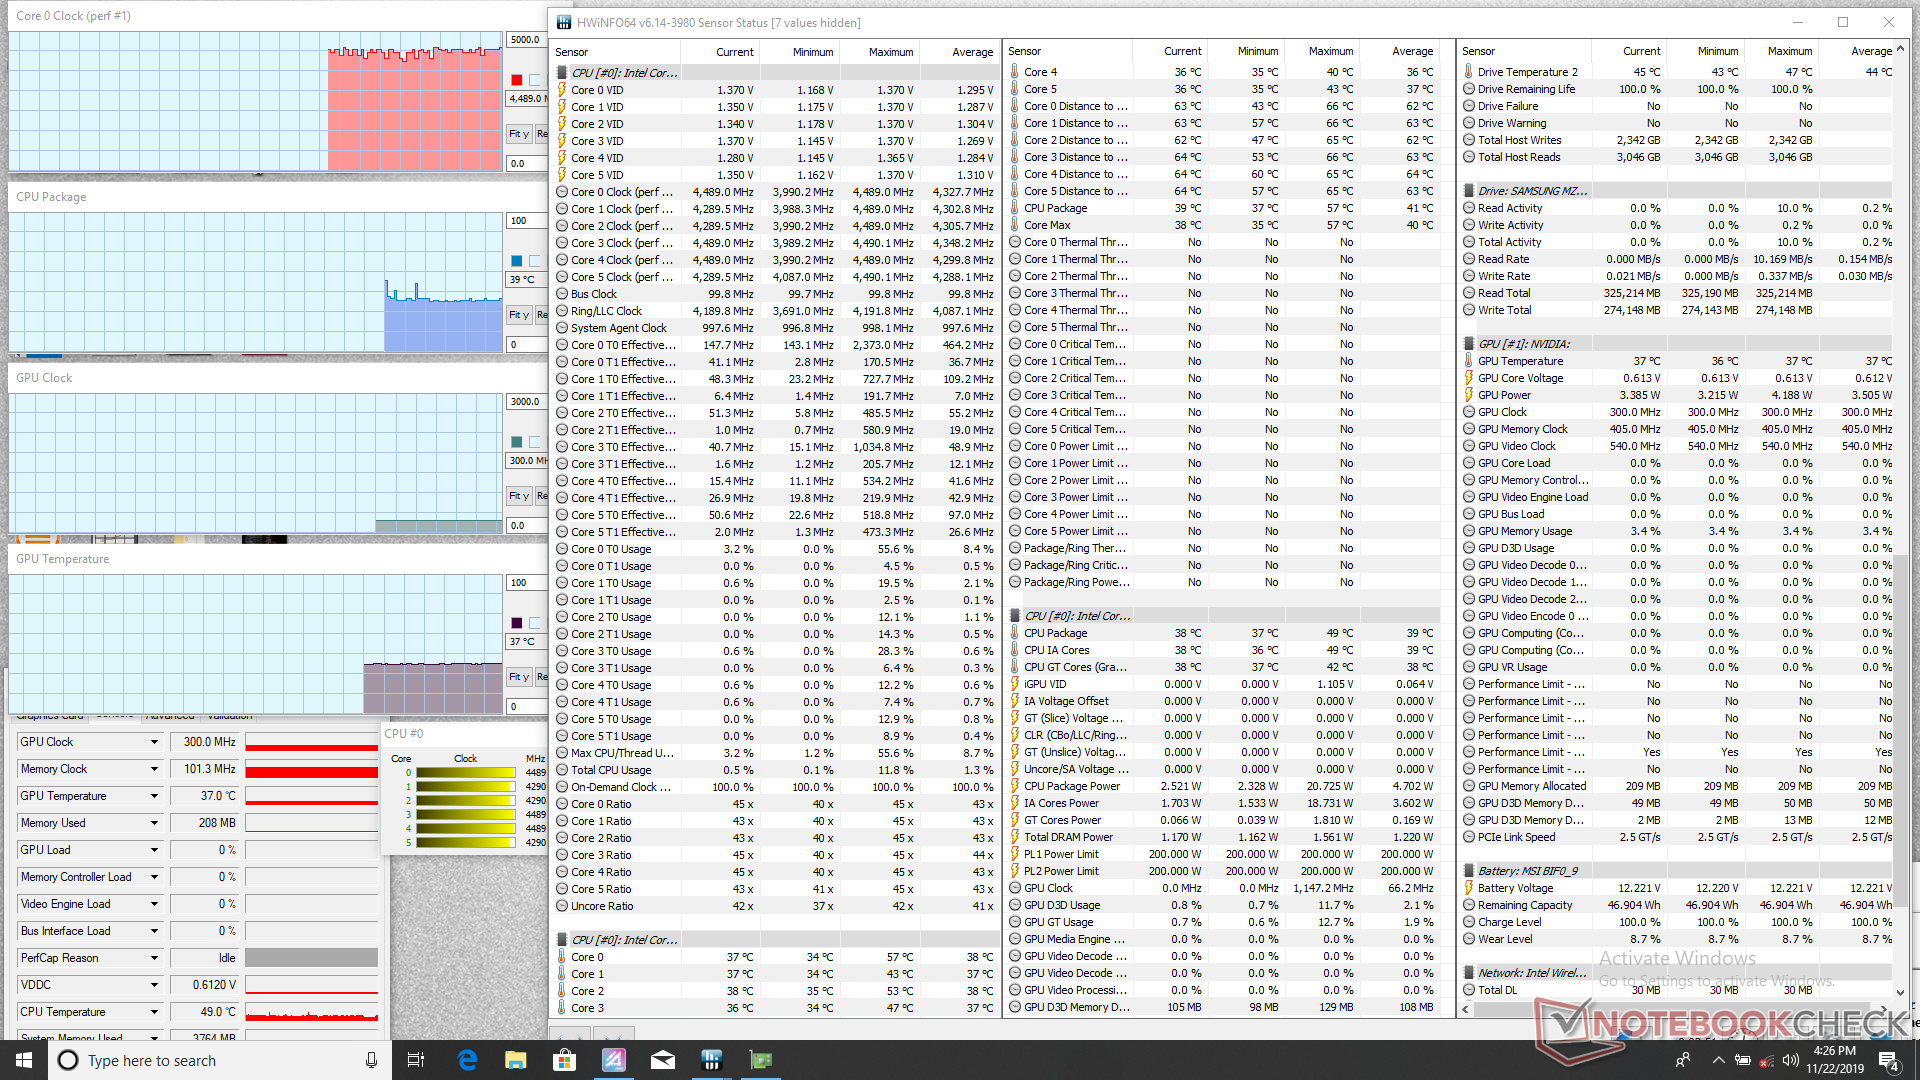
| CPU Clock (GHz) | GPU Clock (MHz) | Average CPU Temperature (°C) | Average GPU Temperature (°C) | |
| System Idle | -- | -- | 39 | 37 |
| Prime95 Stress | 3.3 - 3.4 | -- | 91 | 50 |
| Prime95 + FurMark Stress | 2.9 - 3.0 | ~1080 | 86 | 66 |
| Witcher 3 Stress | 4.1 | 1485 | ~78 | 67 |
Speakers
MSI has halved the number of speakers from the GE75 to the WE75. Still, the stereo 3 W speakers on the WE75 are better at multimedia playback than most mobile workstations since audio quality is typically not priority in this category. Our microphone measurements show roll-off beginning at about 500 Hz much like on the GE75, but the drop is steeper on the WE75. Maximum volume is a bit quieter here as well. Louder volume settings will not introduce any static or vibrations on the palm rests.


MSI WE75 9TK audio analysis
(+) | speakers can play relatively loud (85.1 dB)
Bass 100 - 315 Hz
(-) | nearly no bass - on average 25.4% lower than median
(±) | linearity of bass is average (10.8% delta to prev. frequency)
Mids 400 - 2000 Hz
(+) | balanced mids - only 2.1% away from median
(±) | linearity of mids is average (8.4% delta to prev. frequency)
Highs 2 - 16 kHz
(+) | balanced highs - only 2.7% away from median
(+) | highs are linear (5.8% delta to prev. frequency)
Overall 100 - 16.000 Hz
(±) | linearity of overall sound is average (19.8% difference to median)
Compared to same class
» 71% of all tested devices in this class were better, 4% similar, 25% worse
» The best had a delta of 7%, average was 17%, worst was 35%
Compared to all devices tested
» 51% of all tested devices were better, 7% similar, 42% worse
» The best had a delta of 4%, average was 23%, worst was 134%
Apple MacBook 12 (Early 2016) 1.1 GHz audio analysis
(+) | speakers can play relatively loud (83.6 dB)
Bass 100 - 315 Hz
(±) | reduced bass - on average 11.3% lower than median
(±) | linearity of bass is average (14.2% delta to prev. frequency)
Mids 400 - 2000 Hz
(+) | balanced mids - only 2.4% away from median
(+) | mids are linear (5.5% delta to prev. frequency)
Highs 2 - 16 kHz
(+) | balanced highs - only 2% away from median
(+) | highs are linear (4.5% delta to prev. frequency)
Overall 100 - 16.000 Hz
(+) | overall sound is linear (10.2% difference to median)
Compared to same class
» 7% of all tested devices in this class were better, 2% similar, 90% worse
» The best had a delta of 5%, average was 18%, worst was 53%
Compared to all devices tested
» 5% of all tested devices were better, 1% similar, 94% worse
» The best had a delta of 4%, average was 23%, worst was 134%
Energy Management
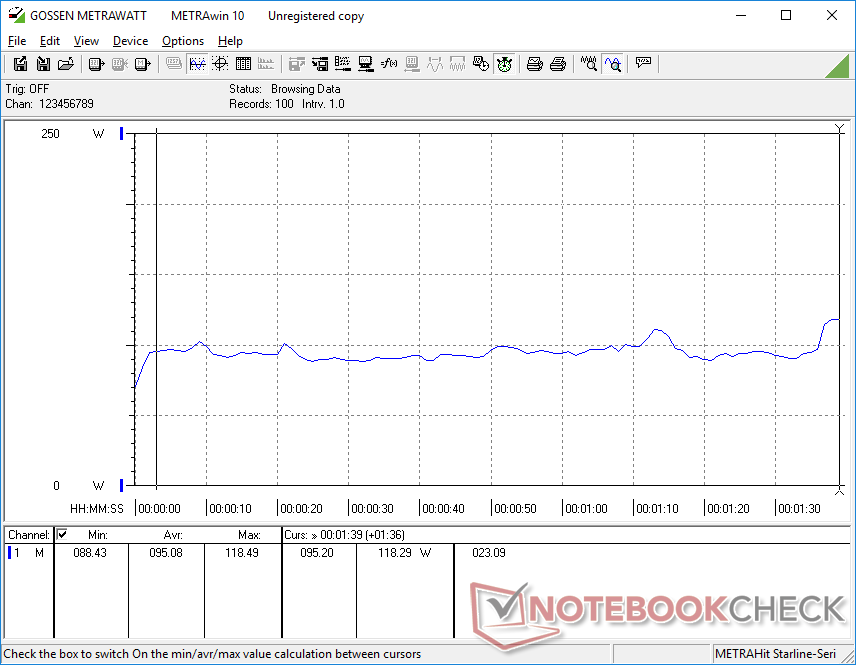
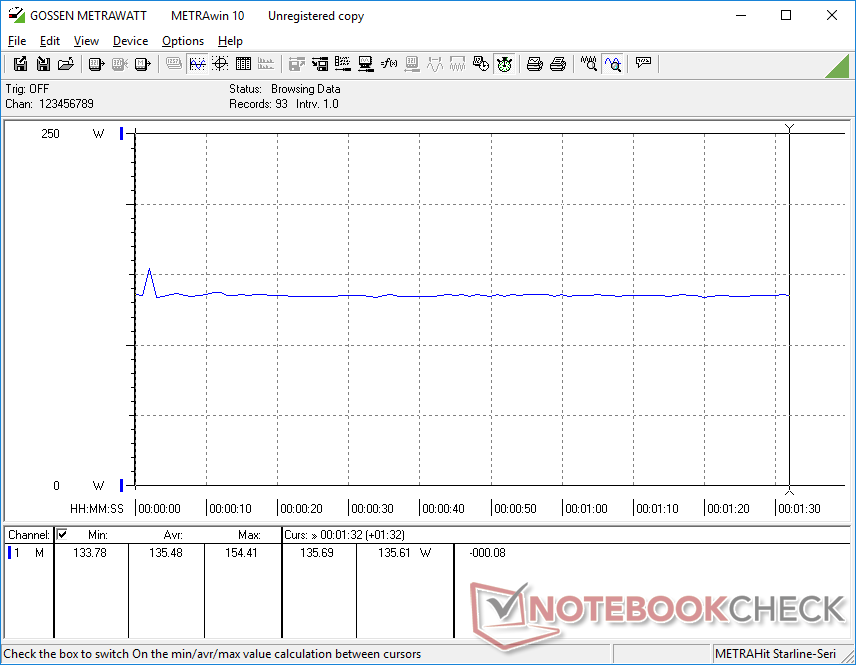
Power Consumption
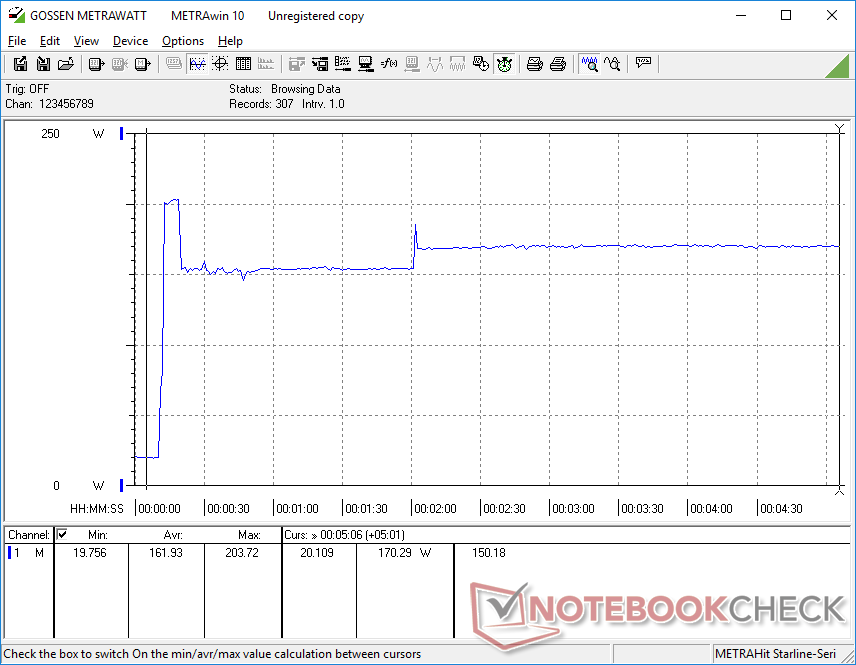
Idling on desktop will demand between 12 W and 19 W to be nearly as efficient as the competing HP ZBook 17 G5 or Lenovo ThinkPad P73. Perhaps unsurprisingly, overall results are not all that different from a RTX 2060-powered laptop like the Schenker XMG Neo 17 since the Quadro RTX 3000 is derived from the RTX 2060.
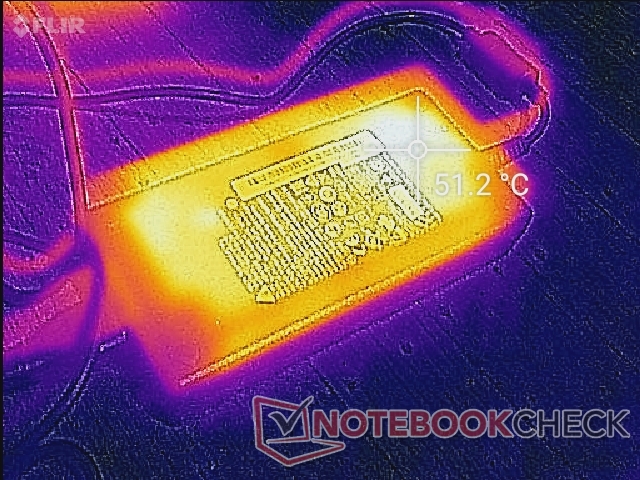
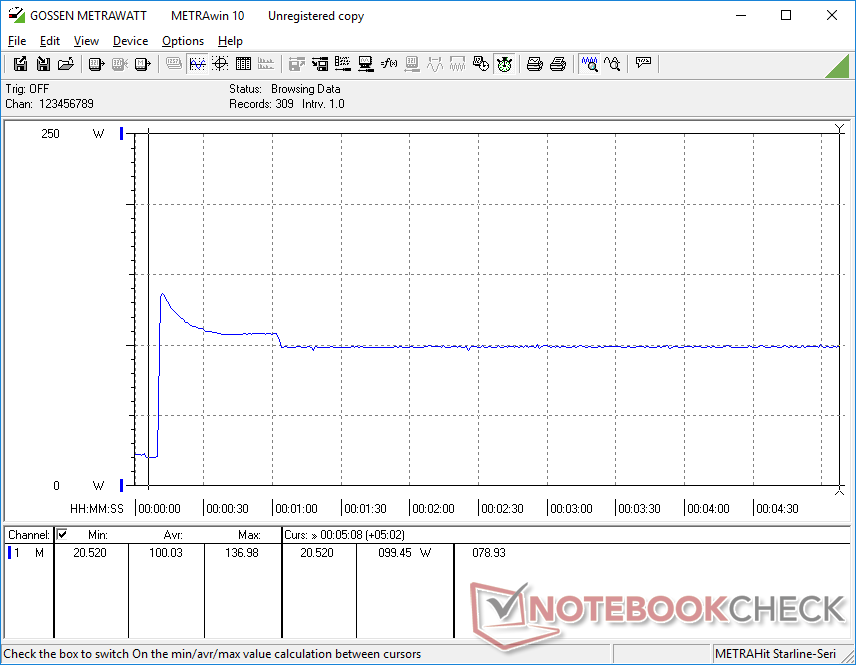
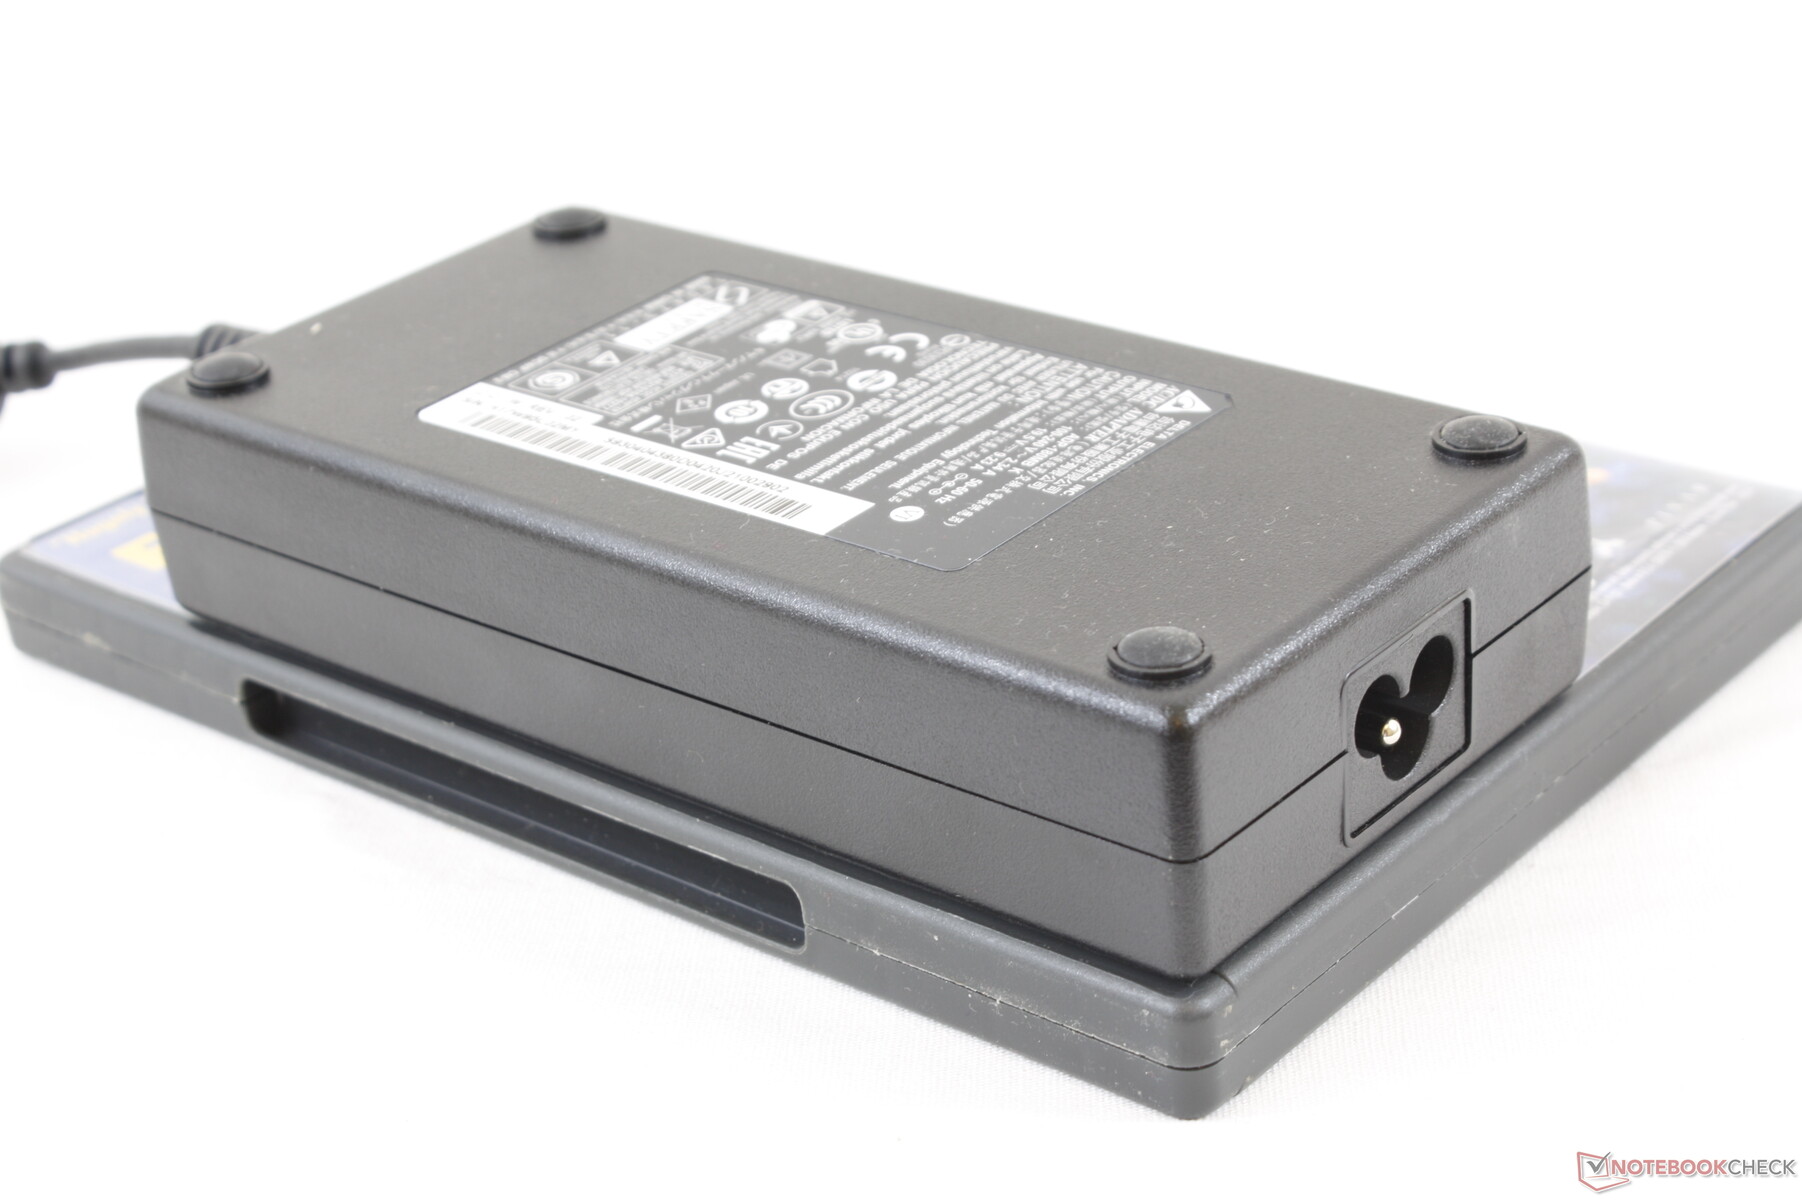
We're able to measure a maximum consumption of 203.7 W from the medium-sized (~15.5 x 7.5 x 3 cm) 180 W AC adapter when running both Prime95 and FurMark simultaneously. This maximum draw is short-lived and it eventually drops and stabilizes at 170 W instead. after just a few seconds. Charging will grind to a halt if running such extreme loads.
| Off / Standby | |
| Idle | |
| Load |
|
Key:
min: | |
| MSI WE75 9TK i7-9750H, Quadro RTX 3000 (Laptop), Samsung SSD PM981 MZVLB512HAJQ, IPS, 1920x1080, 17.3" | Razer Blade Pro 17 RTX 2080 Max-Q i7-9750H, GeForce RTX 2080 Max-Q, Samsung SSD PM981 MZVLB512HAJQ, IPS, 1920x1080, 17.3" | MSI GT76 Titan DT 9SG i9-9900K, GeForce RTX 2080 Mobile, 2x Samsung PM961 MZVLW256HEHP (RAID 0), IPS, 1920x1080, 17.3" | MSI WE72 7RJ i7-7700HQ, Quadro M2200, Samsung SM961 MZVPW256 m.2 PCI-e, IPS, 1920x1080, 17.3" | HP ZBook 17 G5-2ZC48EA i7-8850H, Quadro P3200, Toshiba XG5 KXG50ZNV256G, , 1920x1080, 17.3" | Lenovo ThinkPad P73-20QR002DGE i7-9850H, Quadro RTX 3000 (Laptop), Intel SSD Pro 7600p SSDPEKKF512G8L, IPS LED, 1920x1080, 17.3" | |
|---|---|---|---|---|---|---|
| Power Consumption | -21% | -47% | -3% | 14% | 10% | |
| Idle Minimum * (Watt) | 12.1 | 16.2 -34% | 14 -16% | 15 -24% | 9.3 23% | 8.9 26% |
| Idle Average * (Watt) | 18.4 | 20.4 -11% | 18 2% | 20.1 -9% | 14.4 22% | 12.8 30% |
| Idle Maximum * (Watt) | 18.8 | 26.1 -39% | 23 -22% | 23.8 -27% | 15.8 16% | 16.4 13% |
| Load Average * (Watt) | 95.1 | 96.5 -1% | 114 -20% | 85.6 10% | 89.2 6% | 108.4 -14% |
| Witcher 3 ultra * (Watt) | 135.5 | 182.9 -35% | 283 -109% | 123 9% | 153 -13% | |
| Load Maximum * (Watt) | 203.7 | 214.3 -5% | 443 -117% | 128 37% | 189 7% | 166 19% |
* ... smaller is better
Battery Life
The internal 65 Wh battery is relatively small for a 17.3-inch laptop albeit it's still an upgrade from the even smaller 51 Wh battery on the older WE72. WLAN runtimes have improved gen-over-gen to just under 5 hours when set to the Balanced power profile. Note that the system uses Li-Ion cells instead of a polymer unlike on most other laptops.
Charging from empty to full capacity takes about 2 hours. The system cannot be recharged via USB Type-C.
| MSI WE75 9TK i7-9750H, Quadro RTX 3000 (Laptop), 65 Wh | Razer Blade Pro 17 RTX 2080 Max-Q i7-9750H, GeForce RTX 2080 Max-Q, 70 Wh | MSI GT76 Titan DT 9SG i9-9900K, GeForce RTX 2080 Mobile, 90 Wh | MSI WE72 7RJ i7-7700HQ, Quadro M2200, 51 Wh | HP ZBook 17 G5-2ZC48EA i7-8850H, Quadro P3200, Wh | Lenovo ThinkPad P73-20QR002DGE i7-9850H, Quadro RTX 3000 (Laptop), 99 Wh | |
|---|---|---|---|---|---|---|
| Battery runtime | -6% | -15% | -43% | 105% | 84% | |
| Reader / Idle (h) | 11 | 4.9 -55% | 6.8 -38% | 4.5 -59% | 21.9 99% | |
| WiFi v1.3 (h) | 4.9 | 4.7 -4% | 5 2% | 3 -39% | 11.1 127% | |
| Load (h) | 1 | 1.4 40% | 0.9 -10% | 0.7 -30% | 2.1 110% | 1.4 40% |
Pros
Cons
Verdict
When transitioning from the MSI GE75 to the WE75, we can understand the removal of certain features. Attributes like the red trims, per-key RGB lighting, additional speakers, and 144 Hz display option aren't usually priorities for the target professional audience. One particular omission, however, has us scratching our heads.
The GE75 can be configured with the GeForce RTX 2060, 2070, or 2080 which are equivalent to the Quadro RTX 3000, 4000, and 5000, respectively. Yet, the WE75 can be configured only up to the RTX 3000 as of this writing. The chassis should be able to handle the higher Quadro RTX options especially since GPU temperatures top out at just under 70 C when fully stressed. The WE75 can be faster, but it appears that MSI may be holding these faster SKUs until a later date or reserving them to push the more powerful WT75 or WS65 series.
Aside from the above oddity in GPU SKUs, the appeal of the WE75 lies in its attractive narrow bezel design and relatively light weight for its category. It's certainly easier to carry around from one station to another when compared to traditional 17.3-inch workstations like those from Lenovo, Dell, or HP.
Both lightweight and attractive in a category full of boxy and plain designs. While the MSI WE75 offers great mid-range performance, enthusiasts will have to look at the WT75 or WS65 instead for higher-end GPU options.
MSI WE75 9TK
- 11/25/2019 v7 (old)
Allen Ngo
Price comparison
