MSI WP65 9TH Laptop Review: For Professionals on a Budget
In previous years, MSI workstations consisted wholly of rebranded and recolored gaming G series laptops. The WS63 and WT75 workstations, for example, are essentially identical to the GS63 and GT75, respectively. MSI announced at CES 2019 that it would begin investing more in original workstation chassis designs to cater better to professional users and content creators.
The 15.6-inch WP65 workstation is a product of this new approach as it carries a chassis design not fully derived from the gaming G series or the GP65. Neverthetheless, it still shares several similar physical attributes to the G series lineup including the GF63 and GF65 that we will go over in this review. The WP65 targets entry-level to mid-range professional users in the same vein as the HP ZBook 15u, Lenovo ThinkPad P52s, and the Dell Precision 3541 series. Content creators looking for more performance, features, and display options should consider the higher-end MSI Prestige series or the WS65 instead.
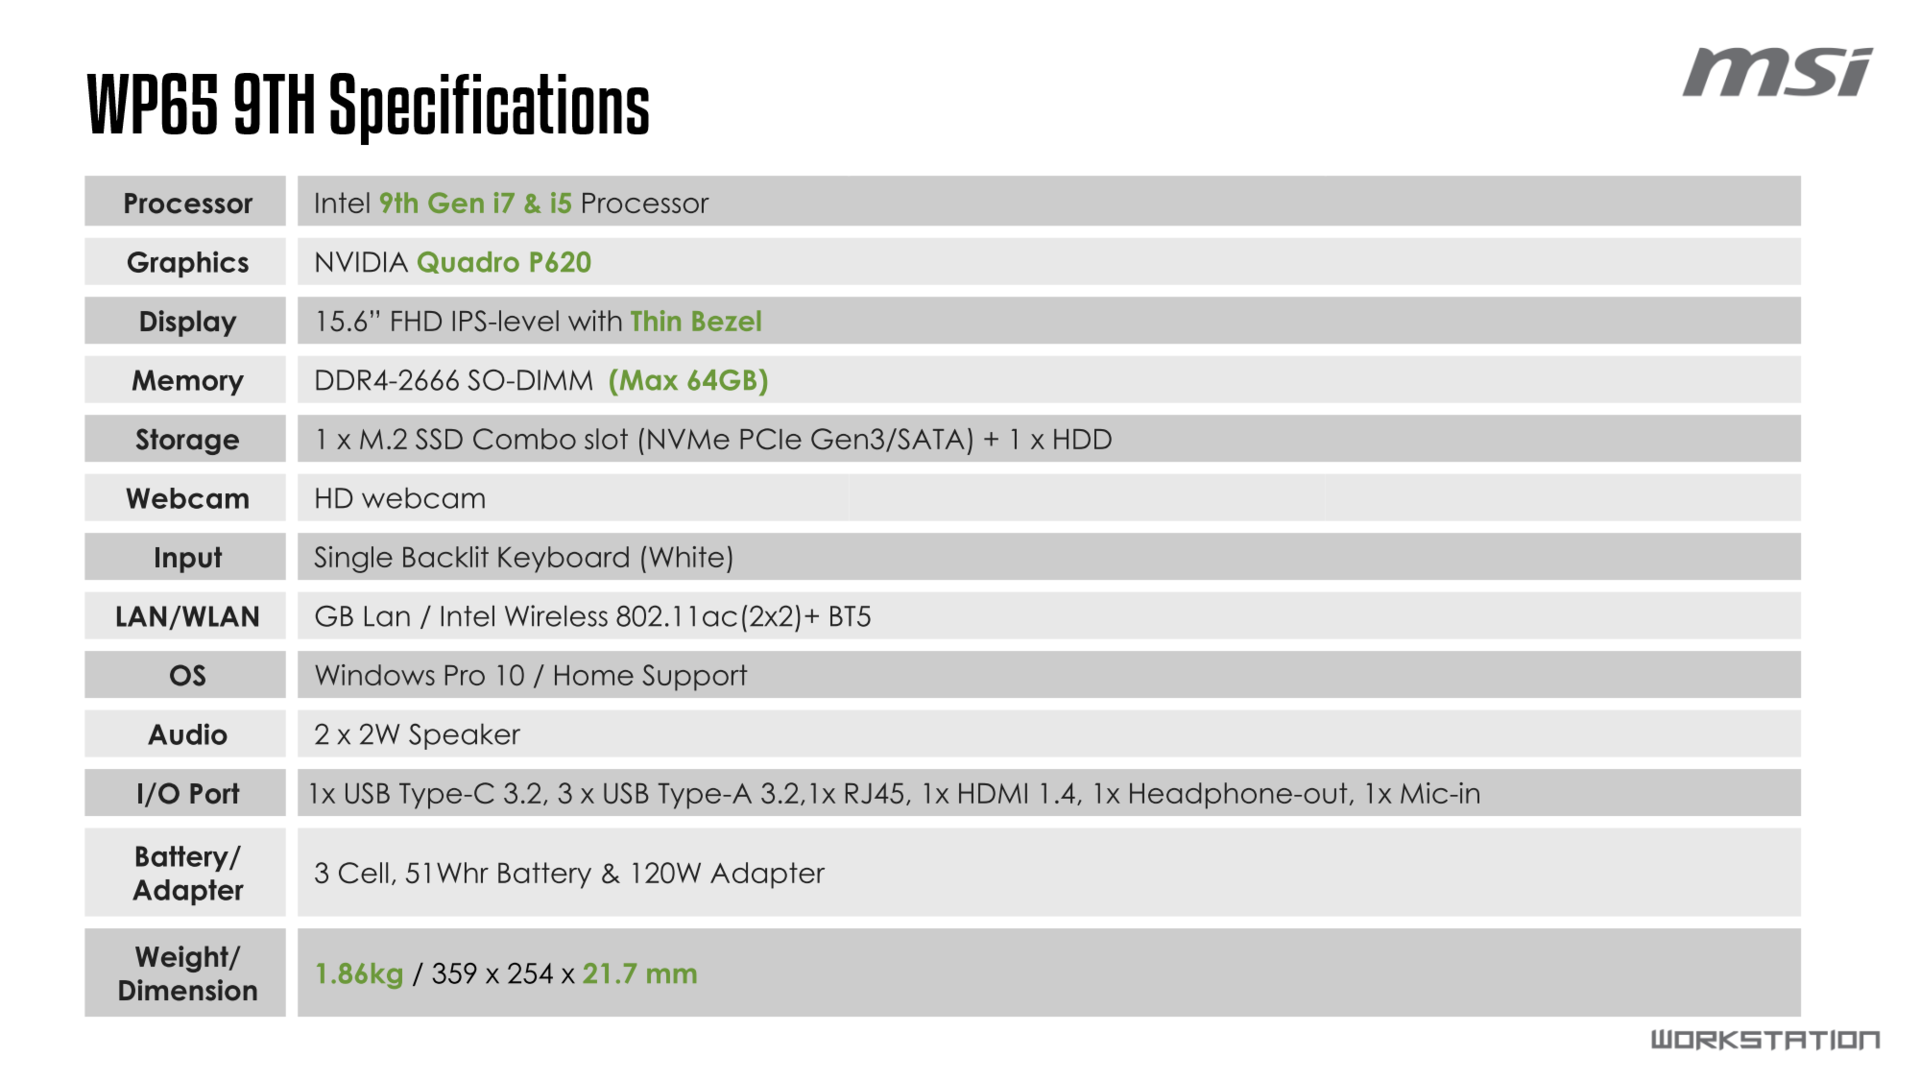
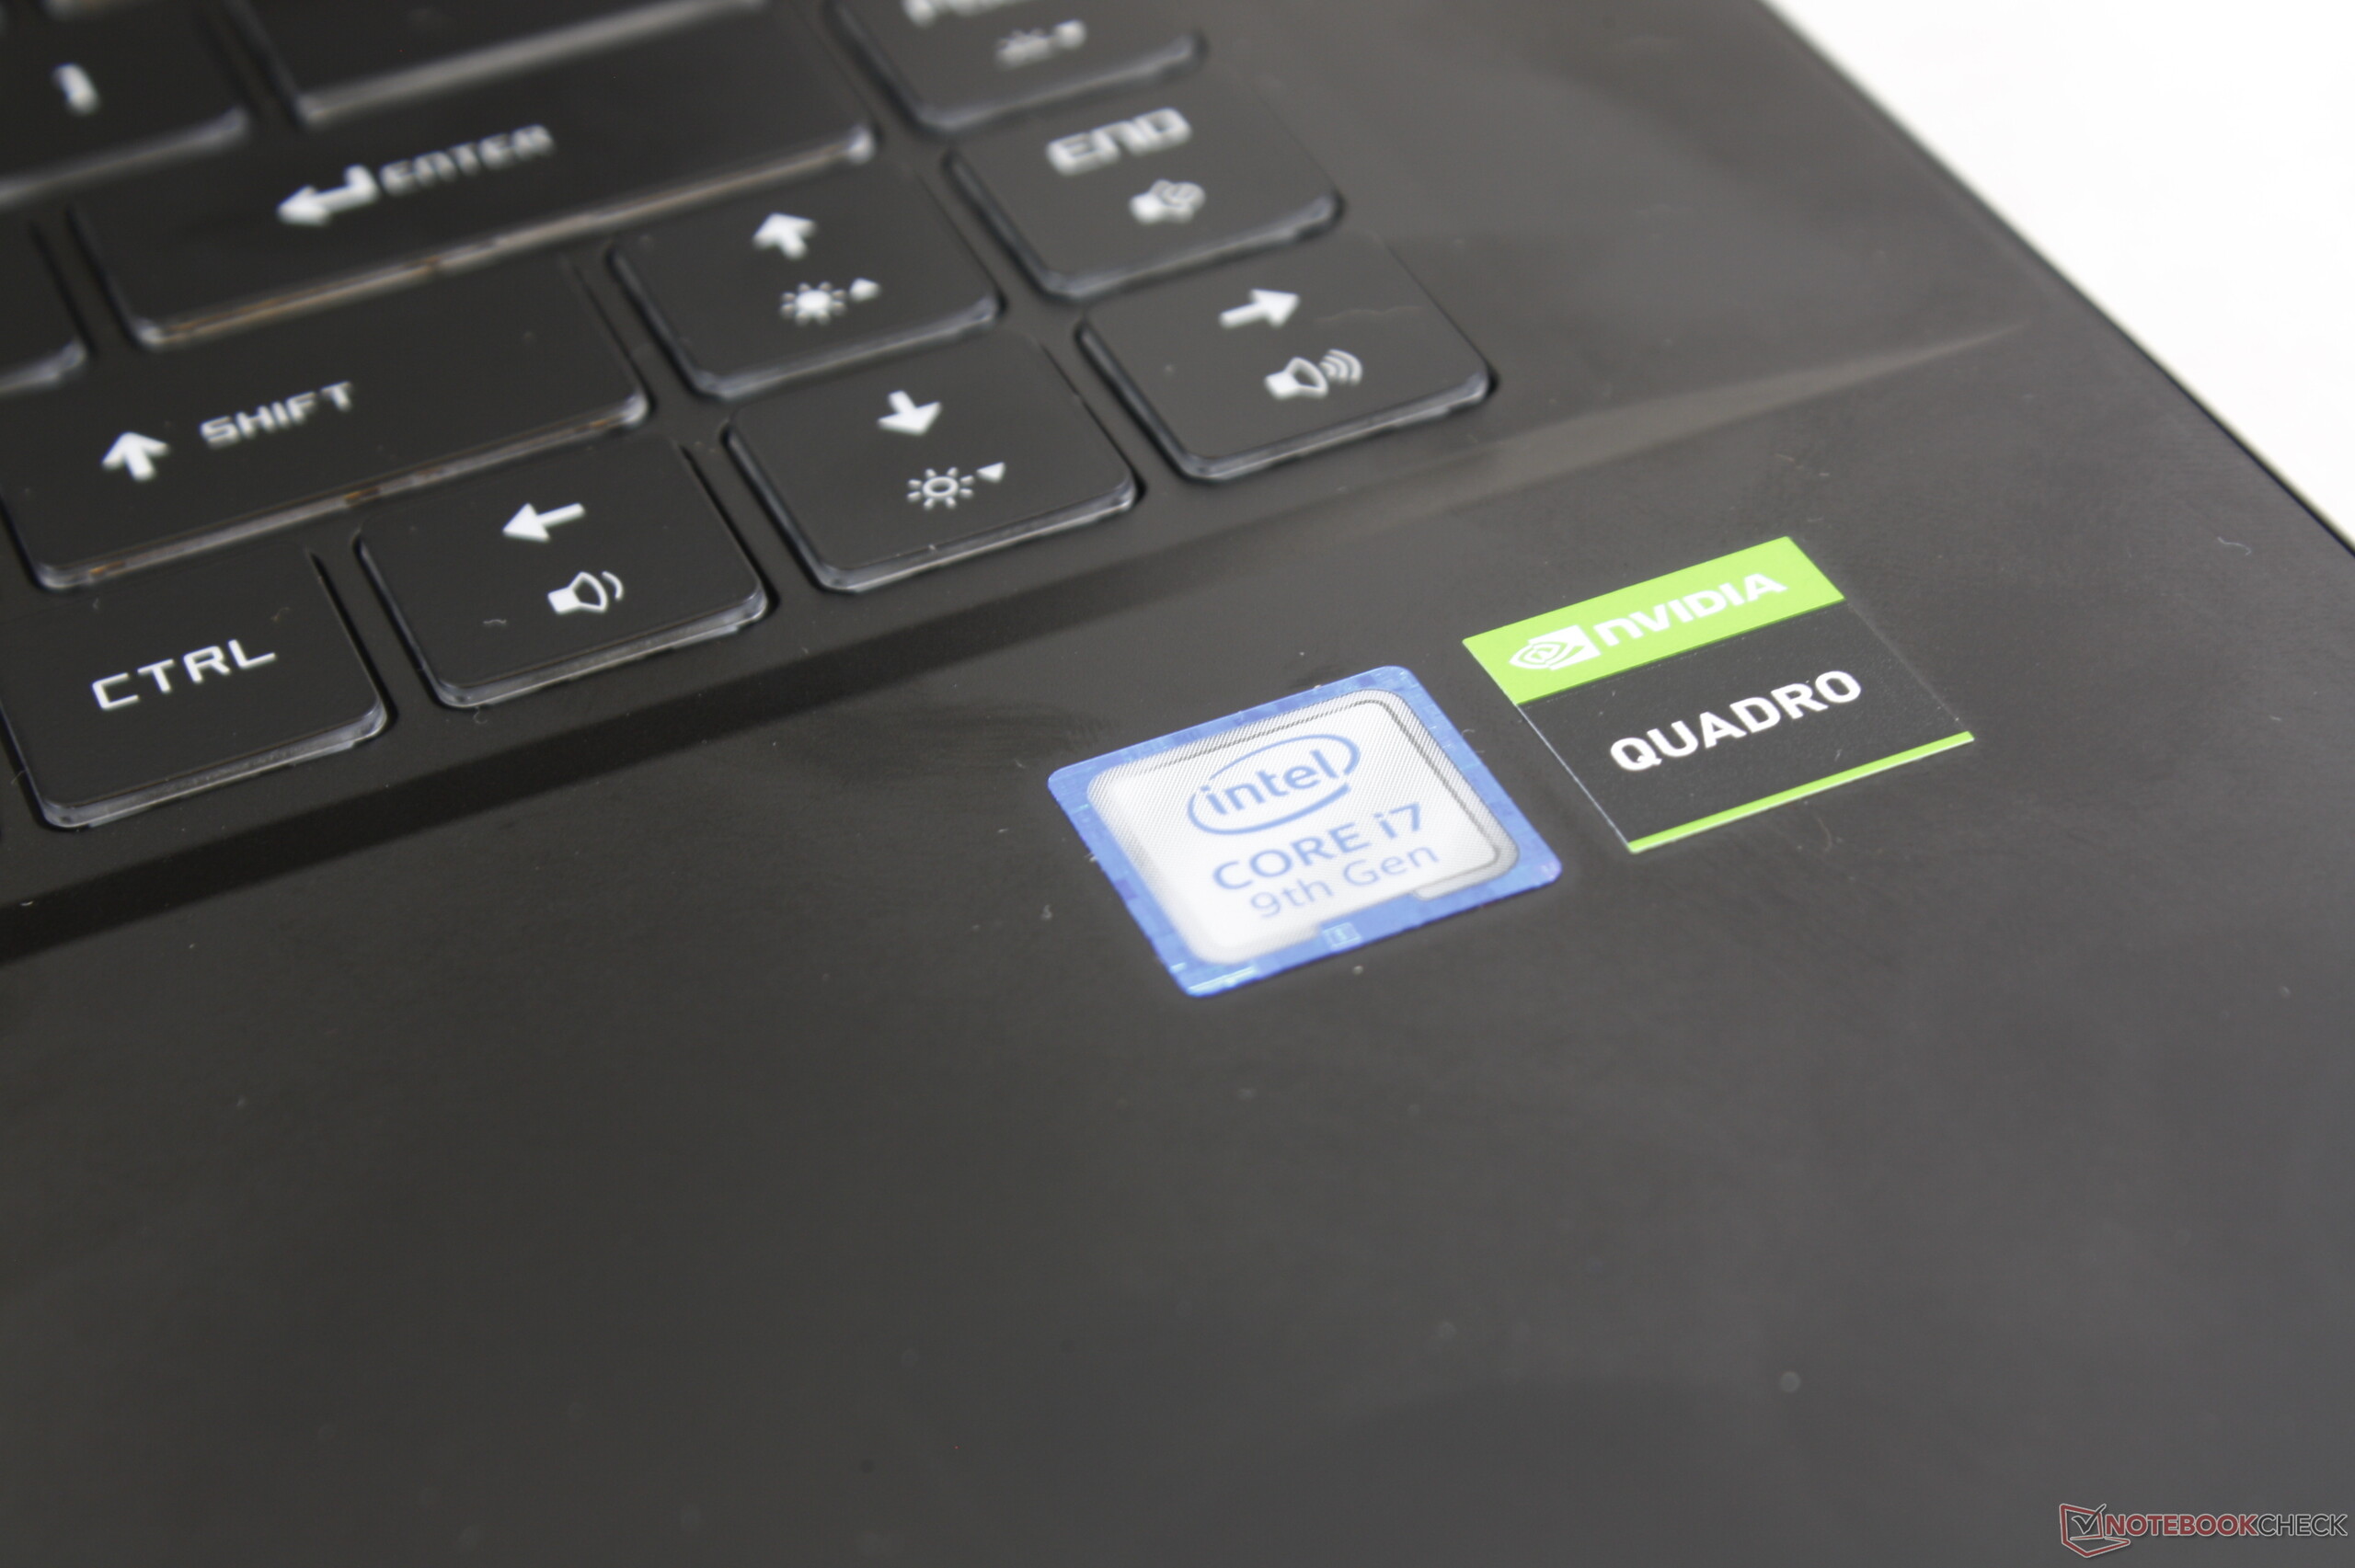
Unlike the larger WT series, the WP65 has fewer SKUs to choose from as there appears to be no other CPU, GPU, or display options outside of the Core i7-9750H, Quadro P620, or 1080p IPS, respectively. A Core i5 SKU is planned but unavailable at the time of writing. Prices start at about $1400 USD with storage and RAM sizes going up to 2 TB and 64 GB total.
More MSI reviews:
Rating | Date | Model | Weight | Height | Size | Resolution | Price |
|---|---|---|---|---|---|---|---|
| 76 % v7 (old) | 10 / 2019 | MSI WP65 i7-9750H, Quadro P620 | 1.9 kg | 21.7 mm | 15.60" | 1920x1080 | |
| 80.8 % v7 (old) | 10 / 2019 | HP ZBook 15u G6 6TP54EA i7-8565U, Radeon Pro WX 3200 | 1.6 kg | 19 mm | 15.60" | 3840x2160 | |
| 87.8 % v7 (old) | 08 / 2019 | Lenovo ThinkPad P1 2019-20QT000RGE i7-9850H, Quadro T1000 (Laptop) | 1.7 kg | 18.4 mm | 15.60" | 1920x1080 | |
| 86.9 % v7 (old) | 10 / 2018 | Dell Precision 7530 i9-8950HK, Quadro P3200 | 2.6 kg | 29.95 mm | 15.60" | 3840x2160 | |
| 83.2 % v6 (old) | 06 / 2018 | Lenovo ThinkPad P52s-20LB000HGE i5-8550U, Quadro P500 | 2.2 kg | 20.2 mm | 15.60" | 1920x1080 |
Case
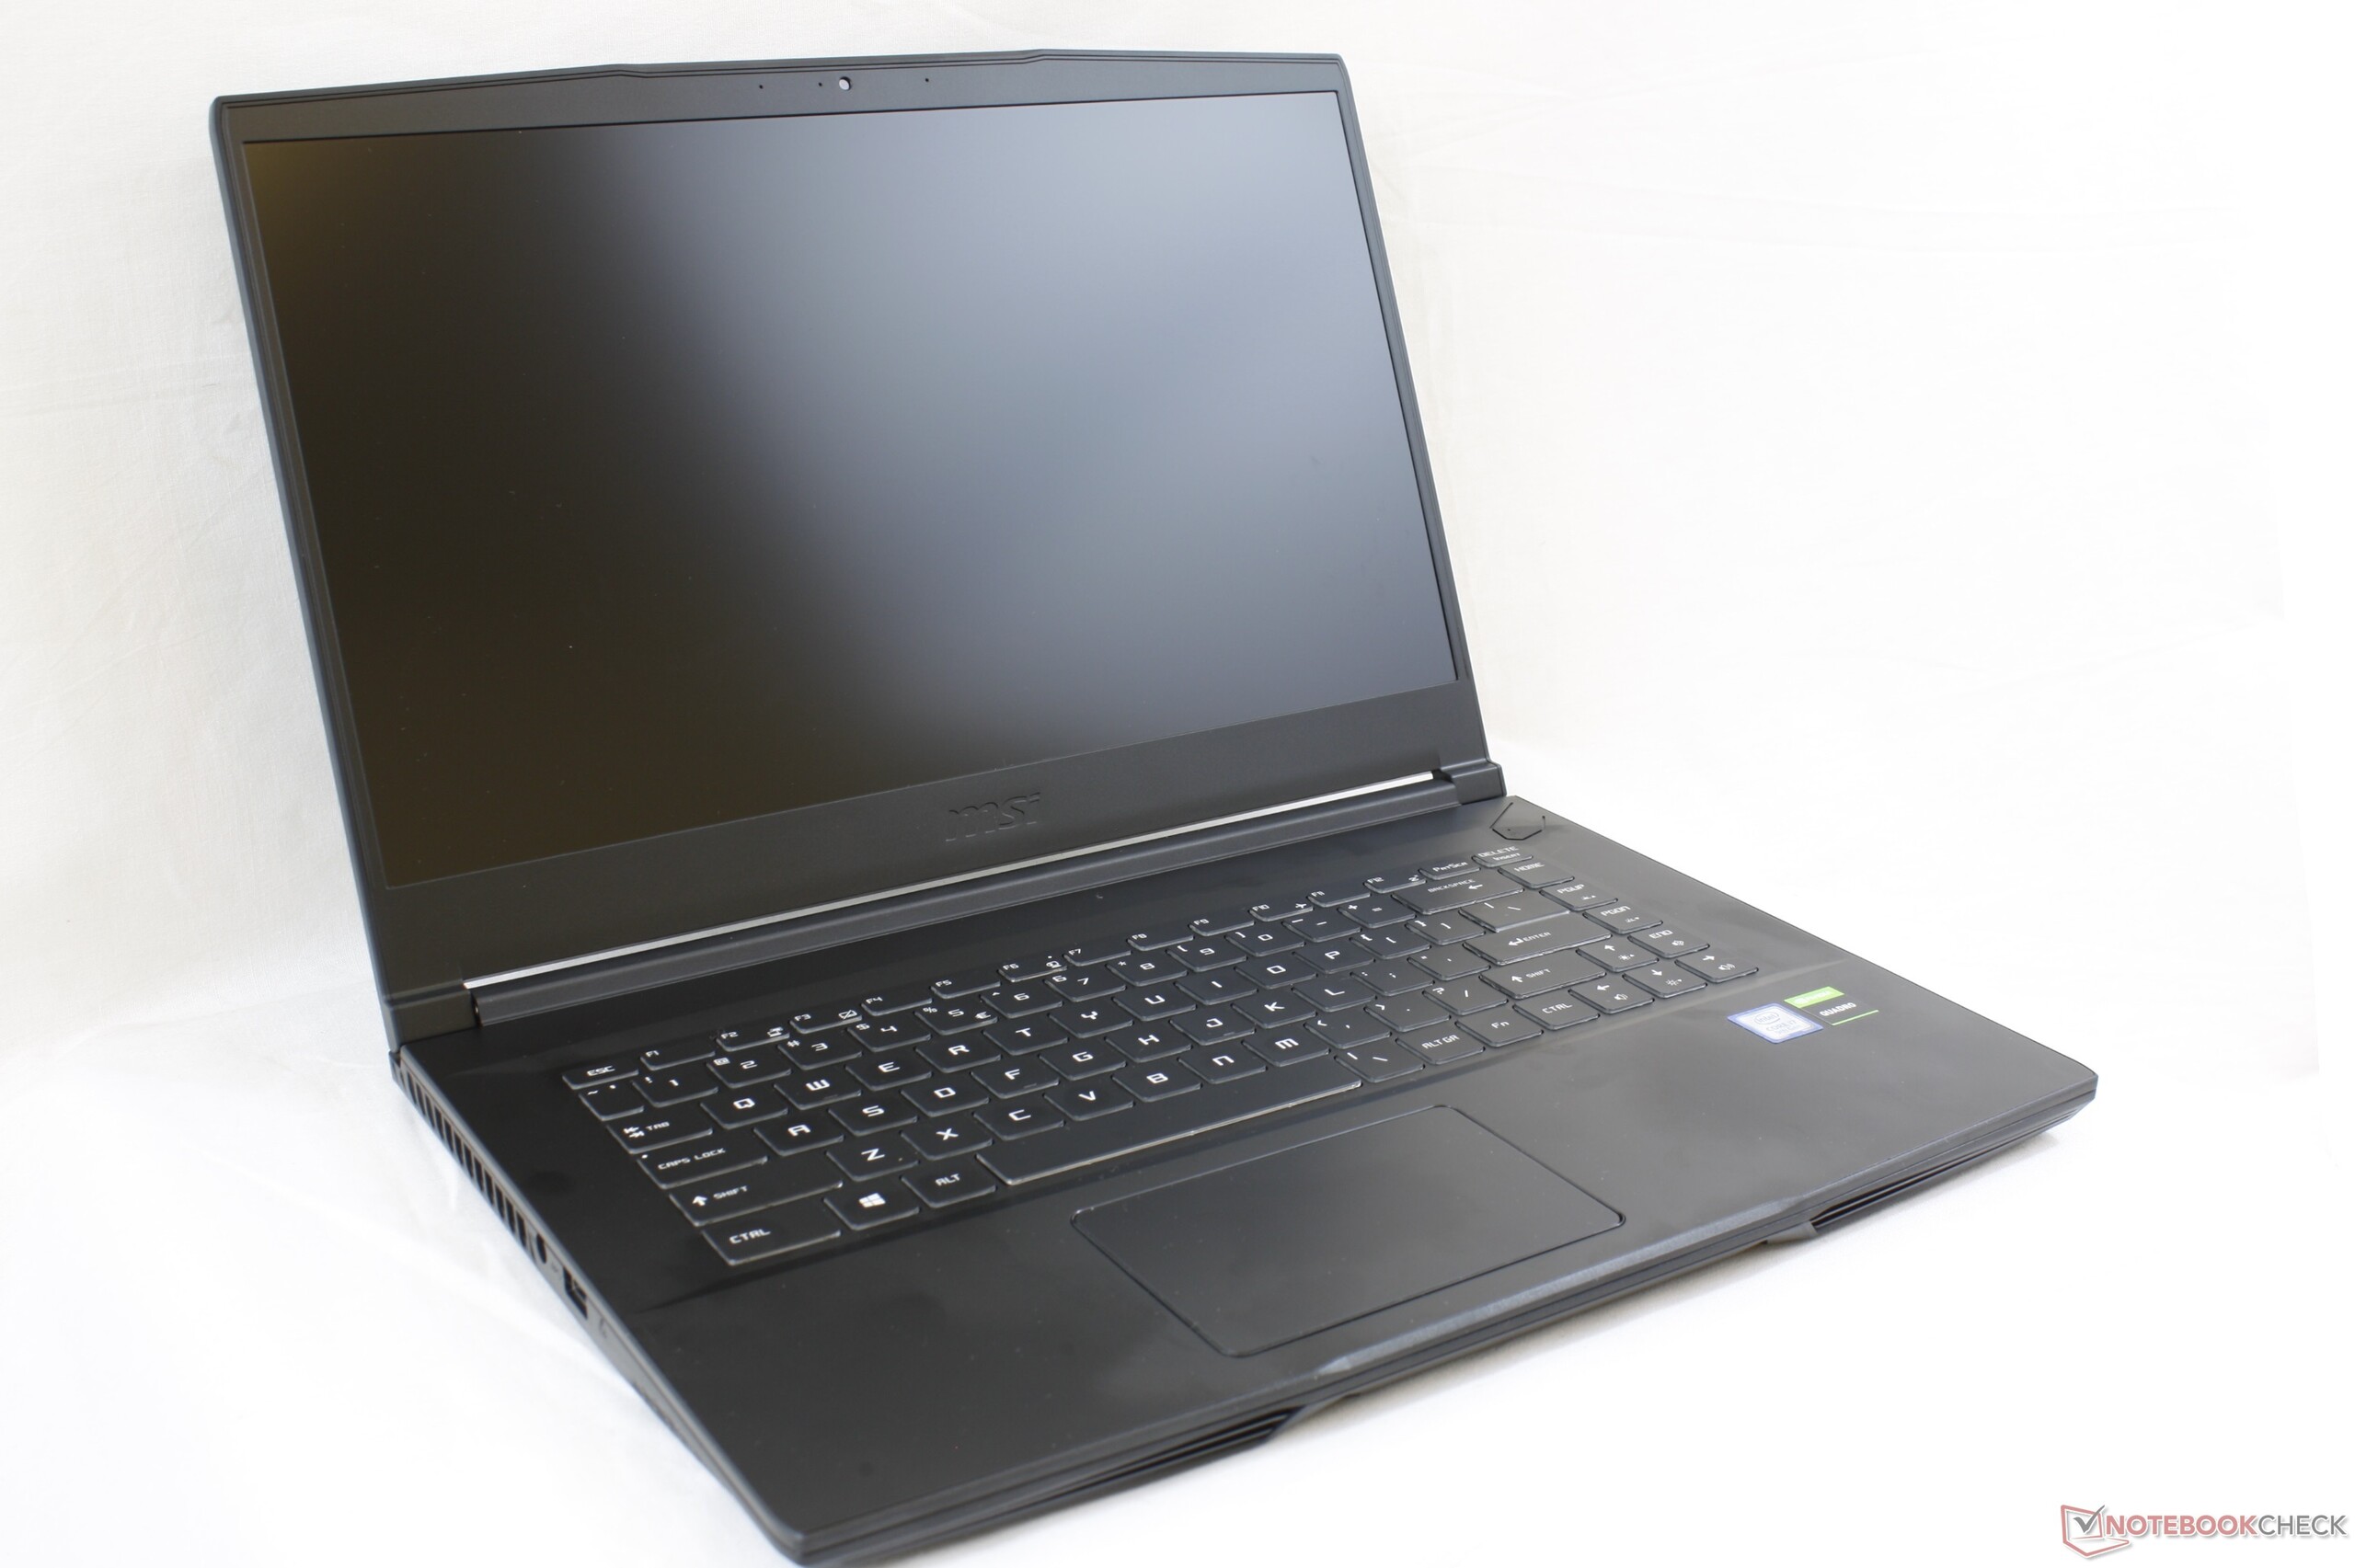
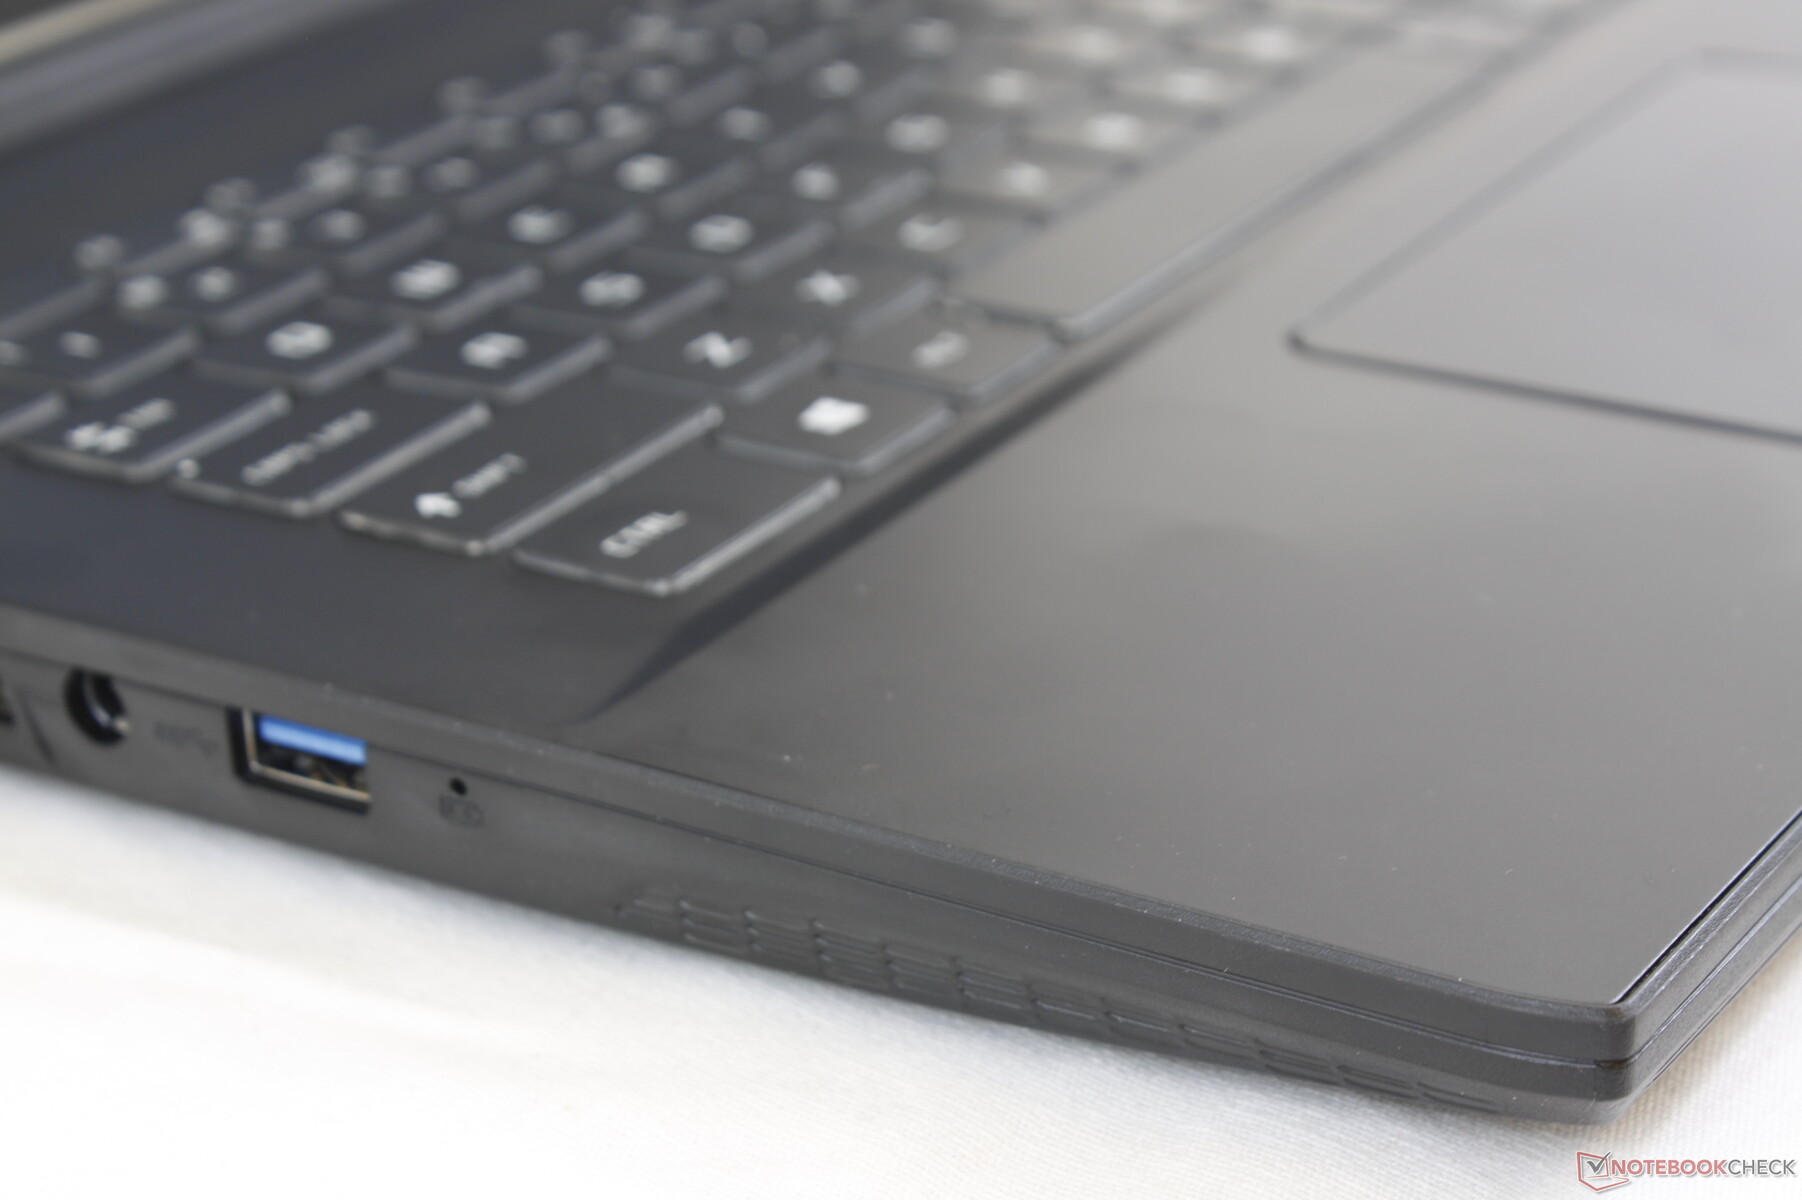
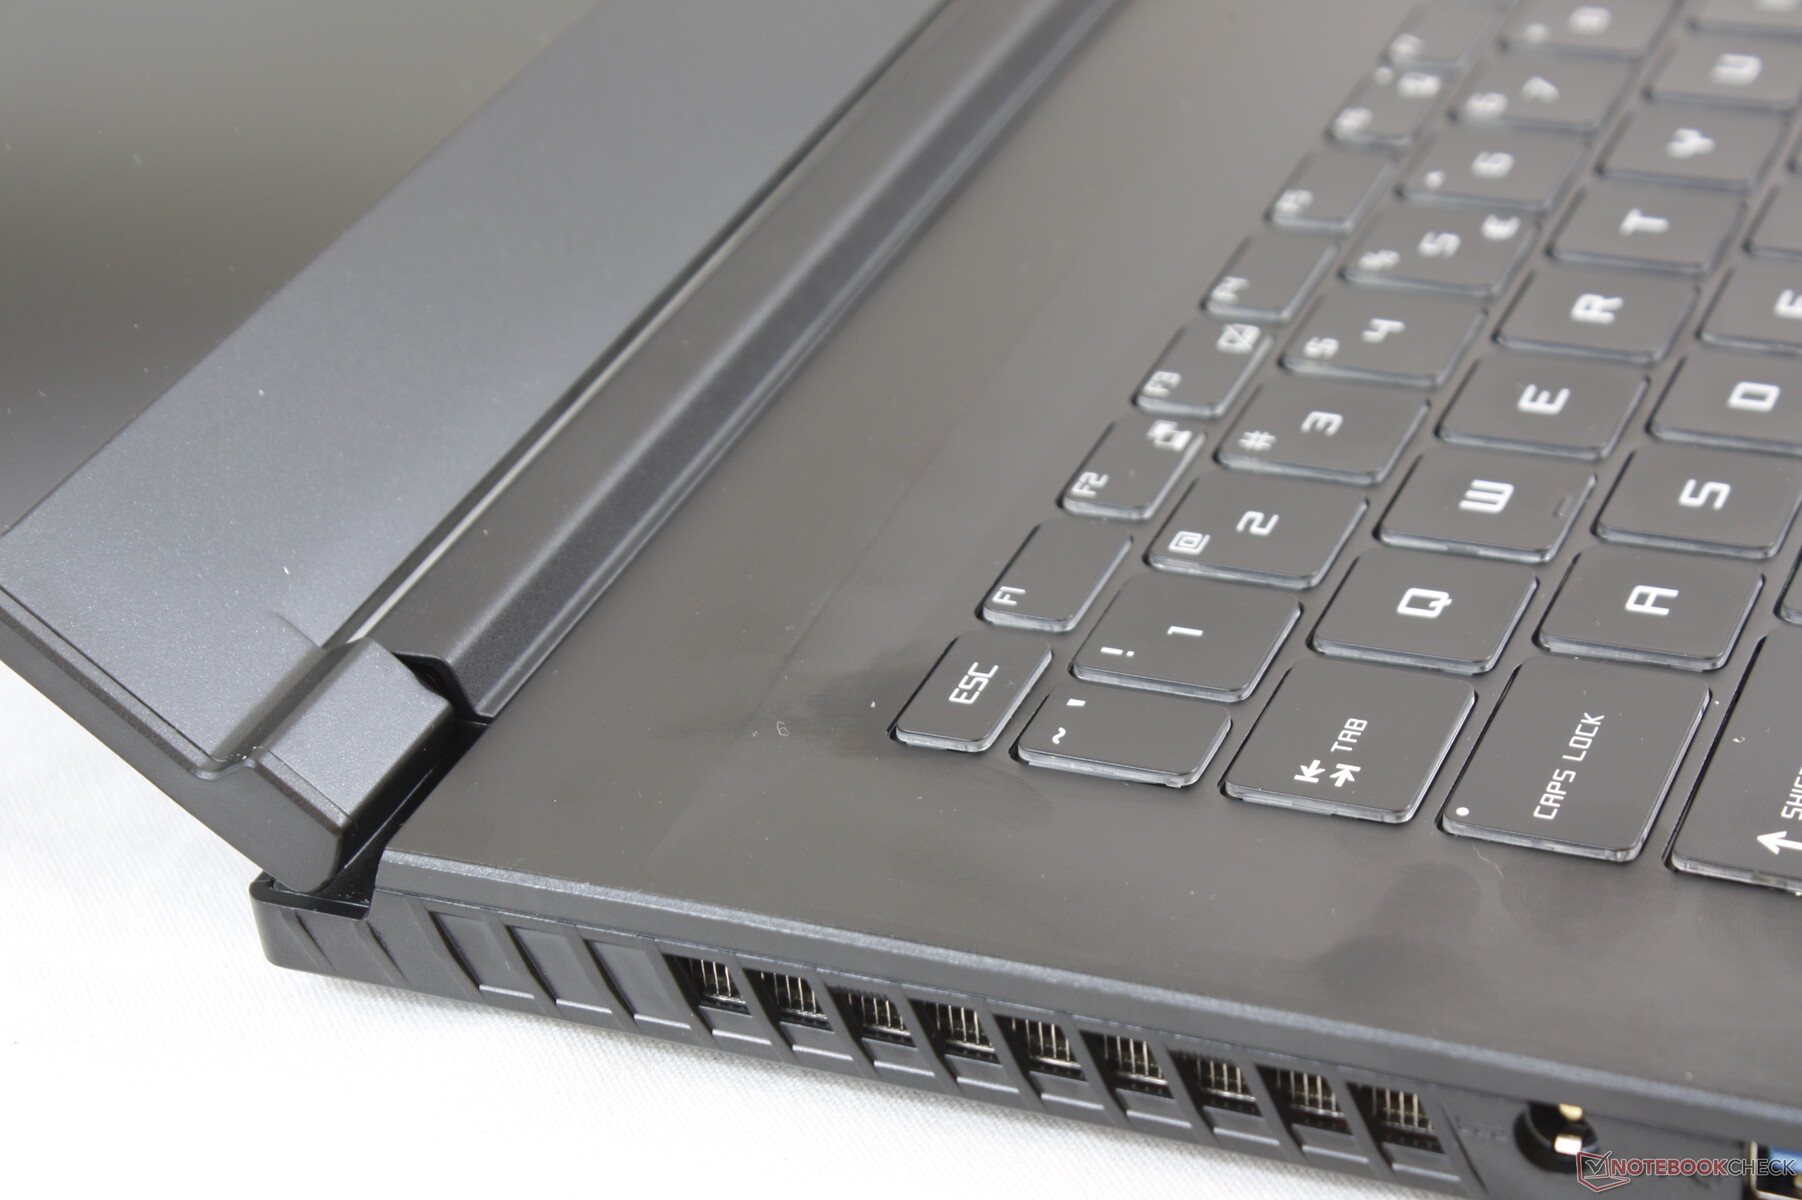
The chassis may be original, but it still utilizes similar aluminum and plastic materials to the MSI GS/GP series. Thus, the smooth matte surfaces of the outer lid and palm rests will feel very familiar if you've ever come across the GS65 or GS75. Many physical qualities of the GS65 have transferred over to the WP65 for better or worse; while the chassis is smoother and sleeker than most other workstations out there, its surfaces are more susceptible to warping and bending. The keyboard center, base, and lid all exhibit more flexing than dedicated mobile workstations like the ThinkPad P1 or a Precision 7000 model. Slight but audible creaking is present when attempting to twist the system from its corners or when opening and closing the lid.
Build quality is excellent on our test unit with no uneven gaps or crevices between materials. Keep in mind that the plastic bottom relies heavily on tight latches to make servicing more difficult than it should be.
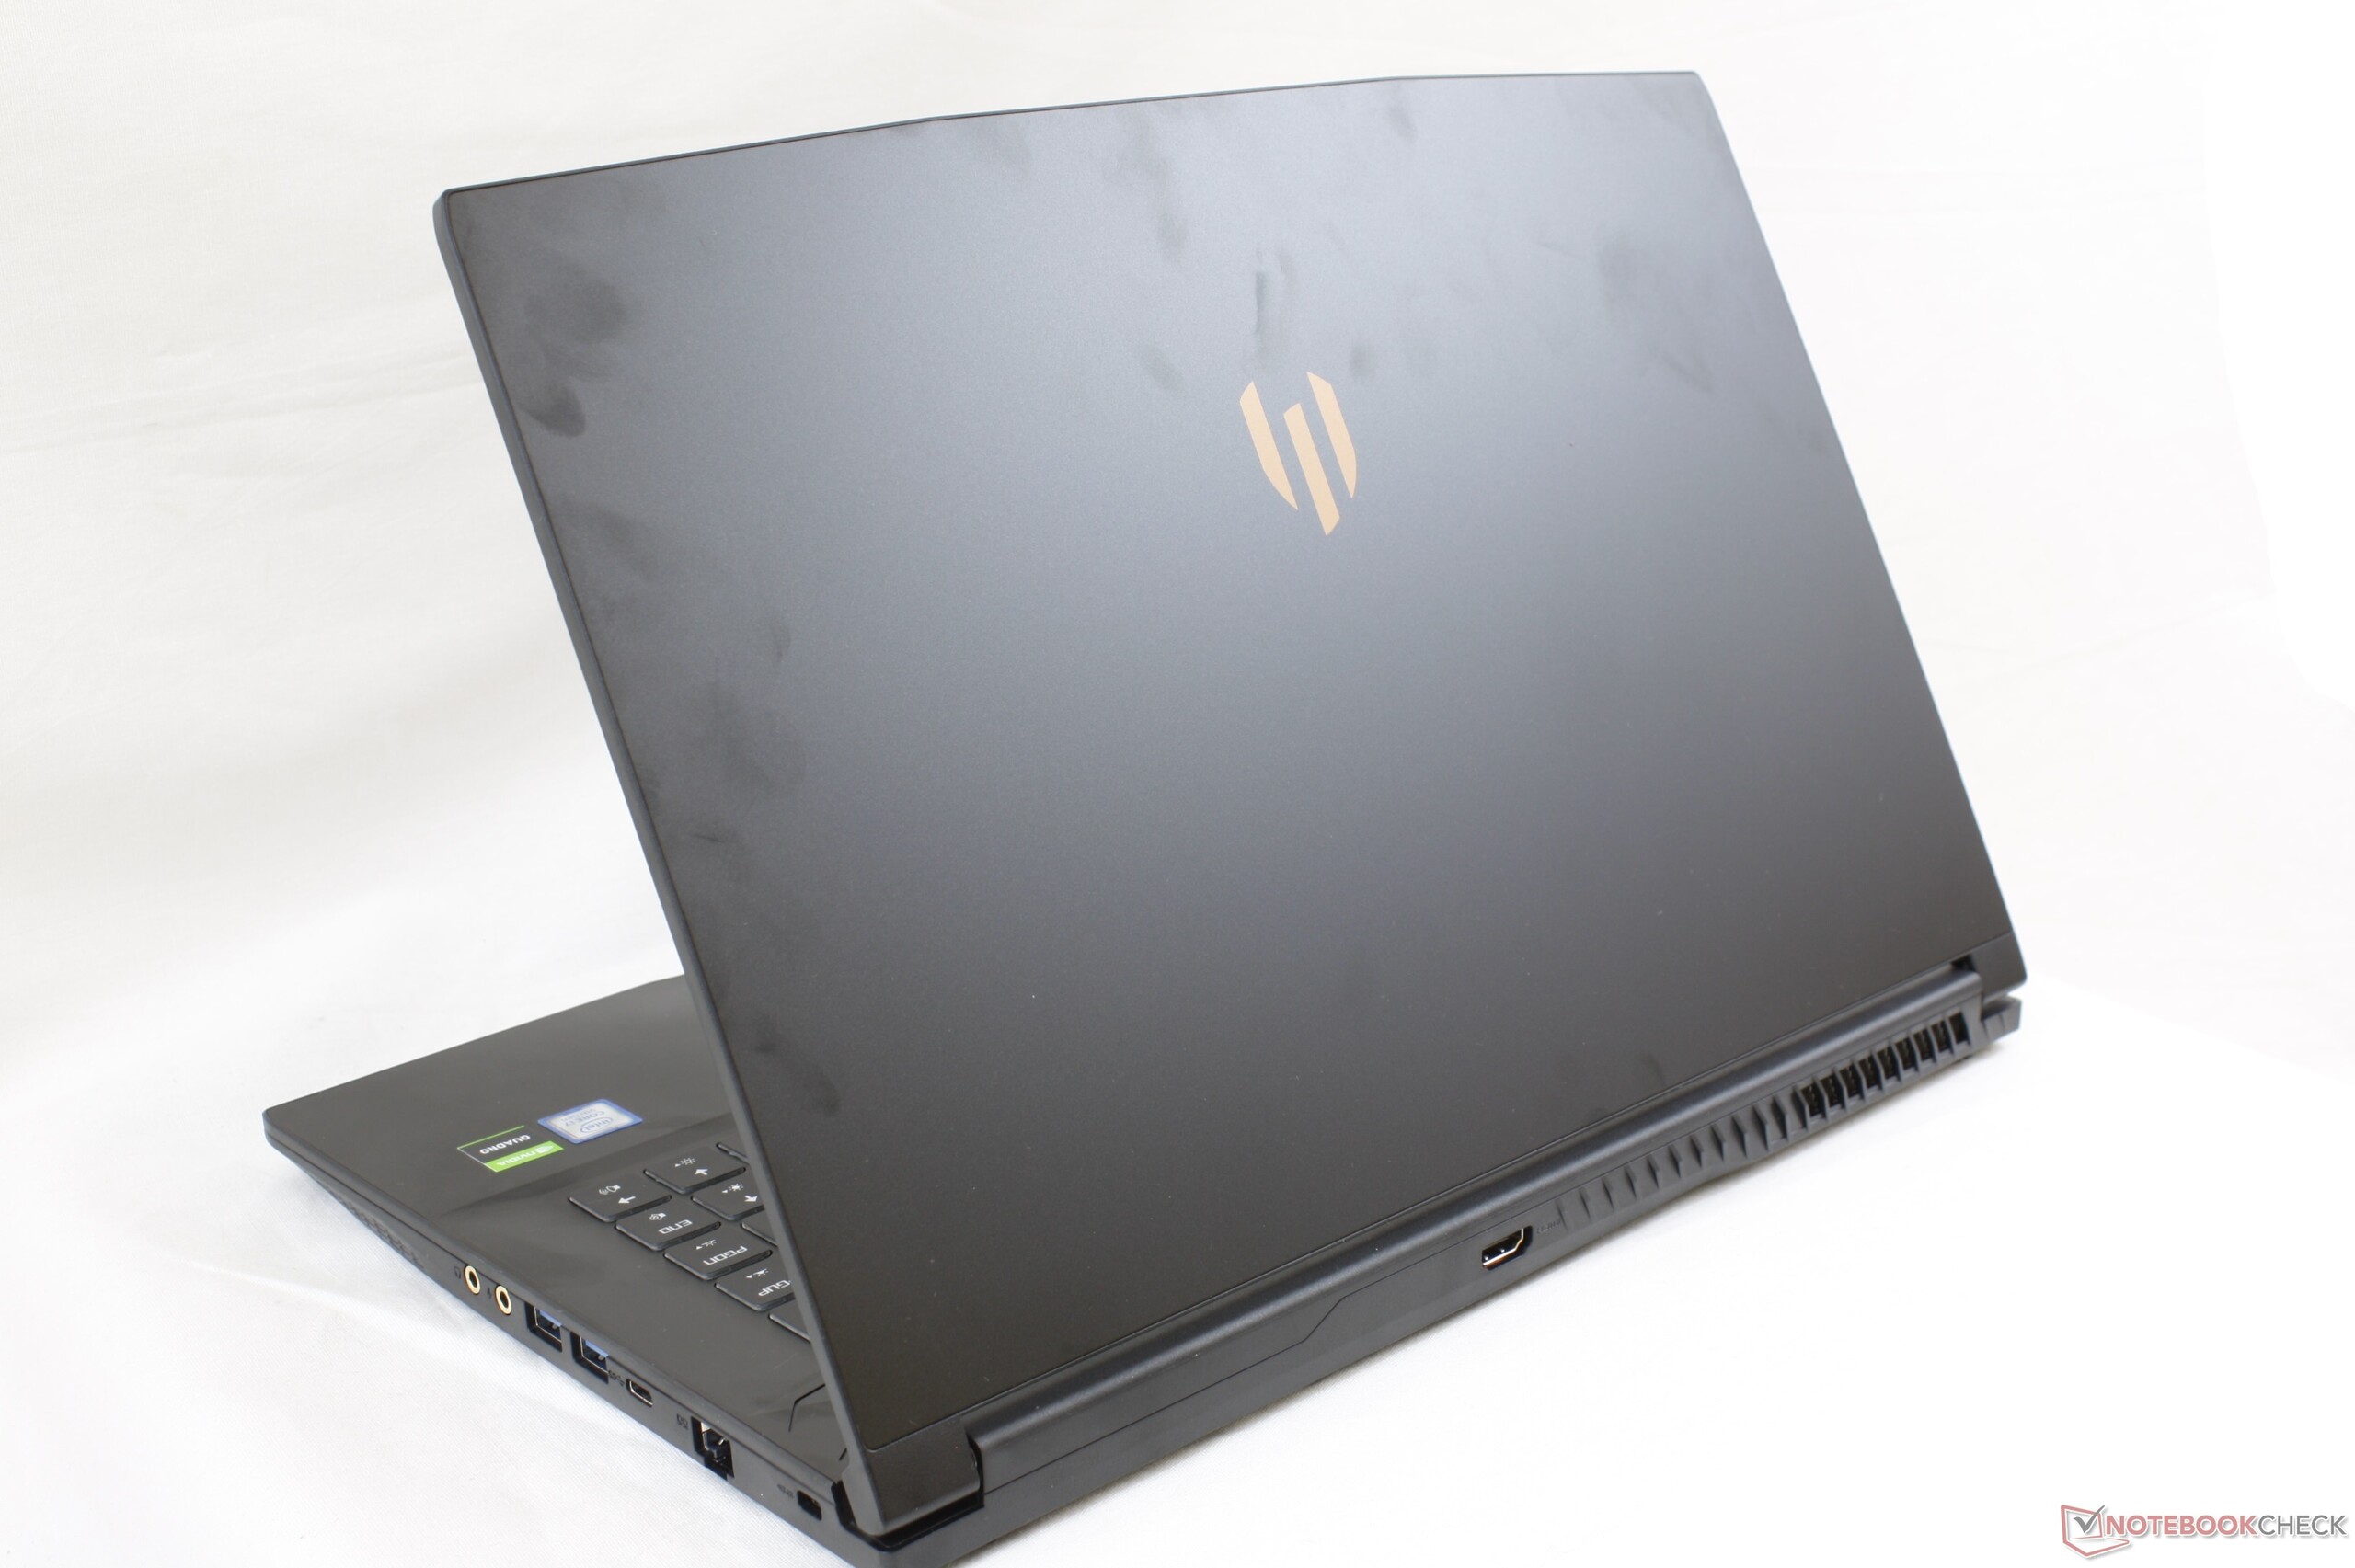
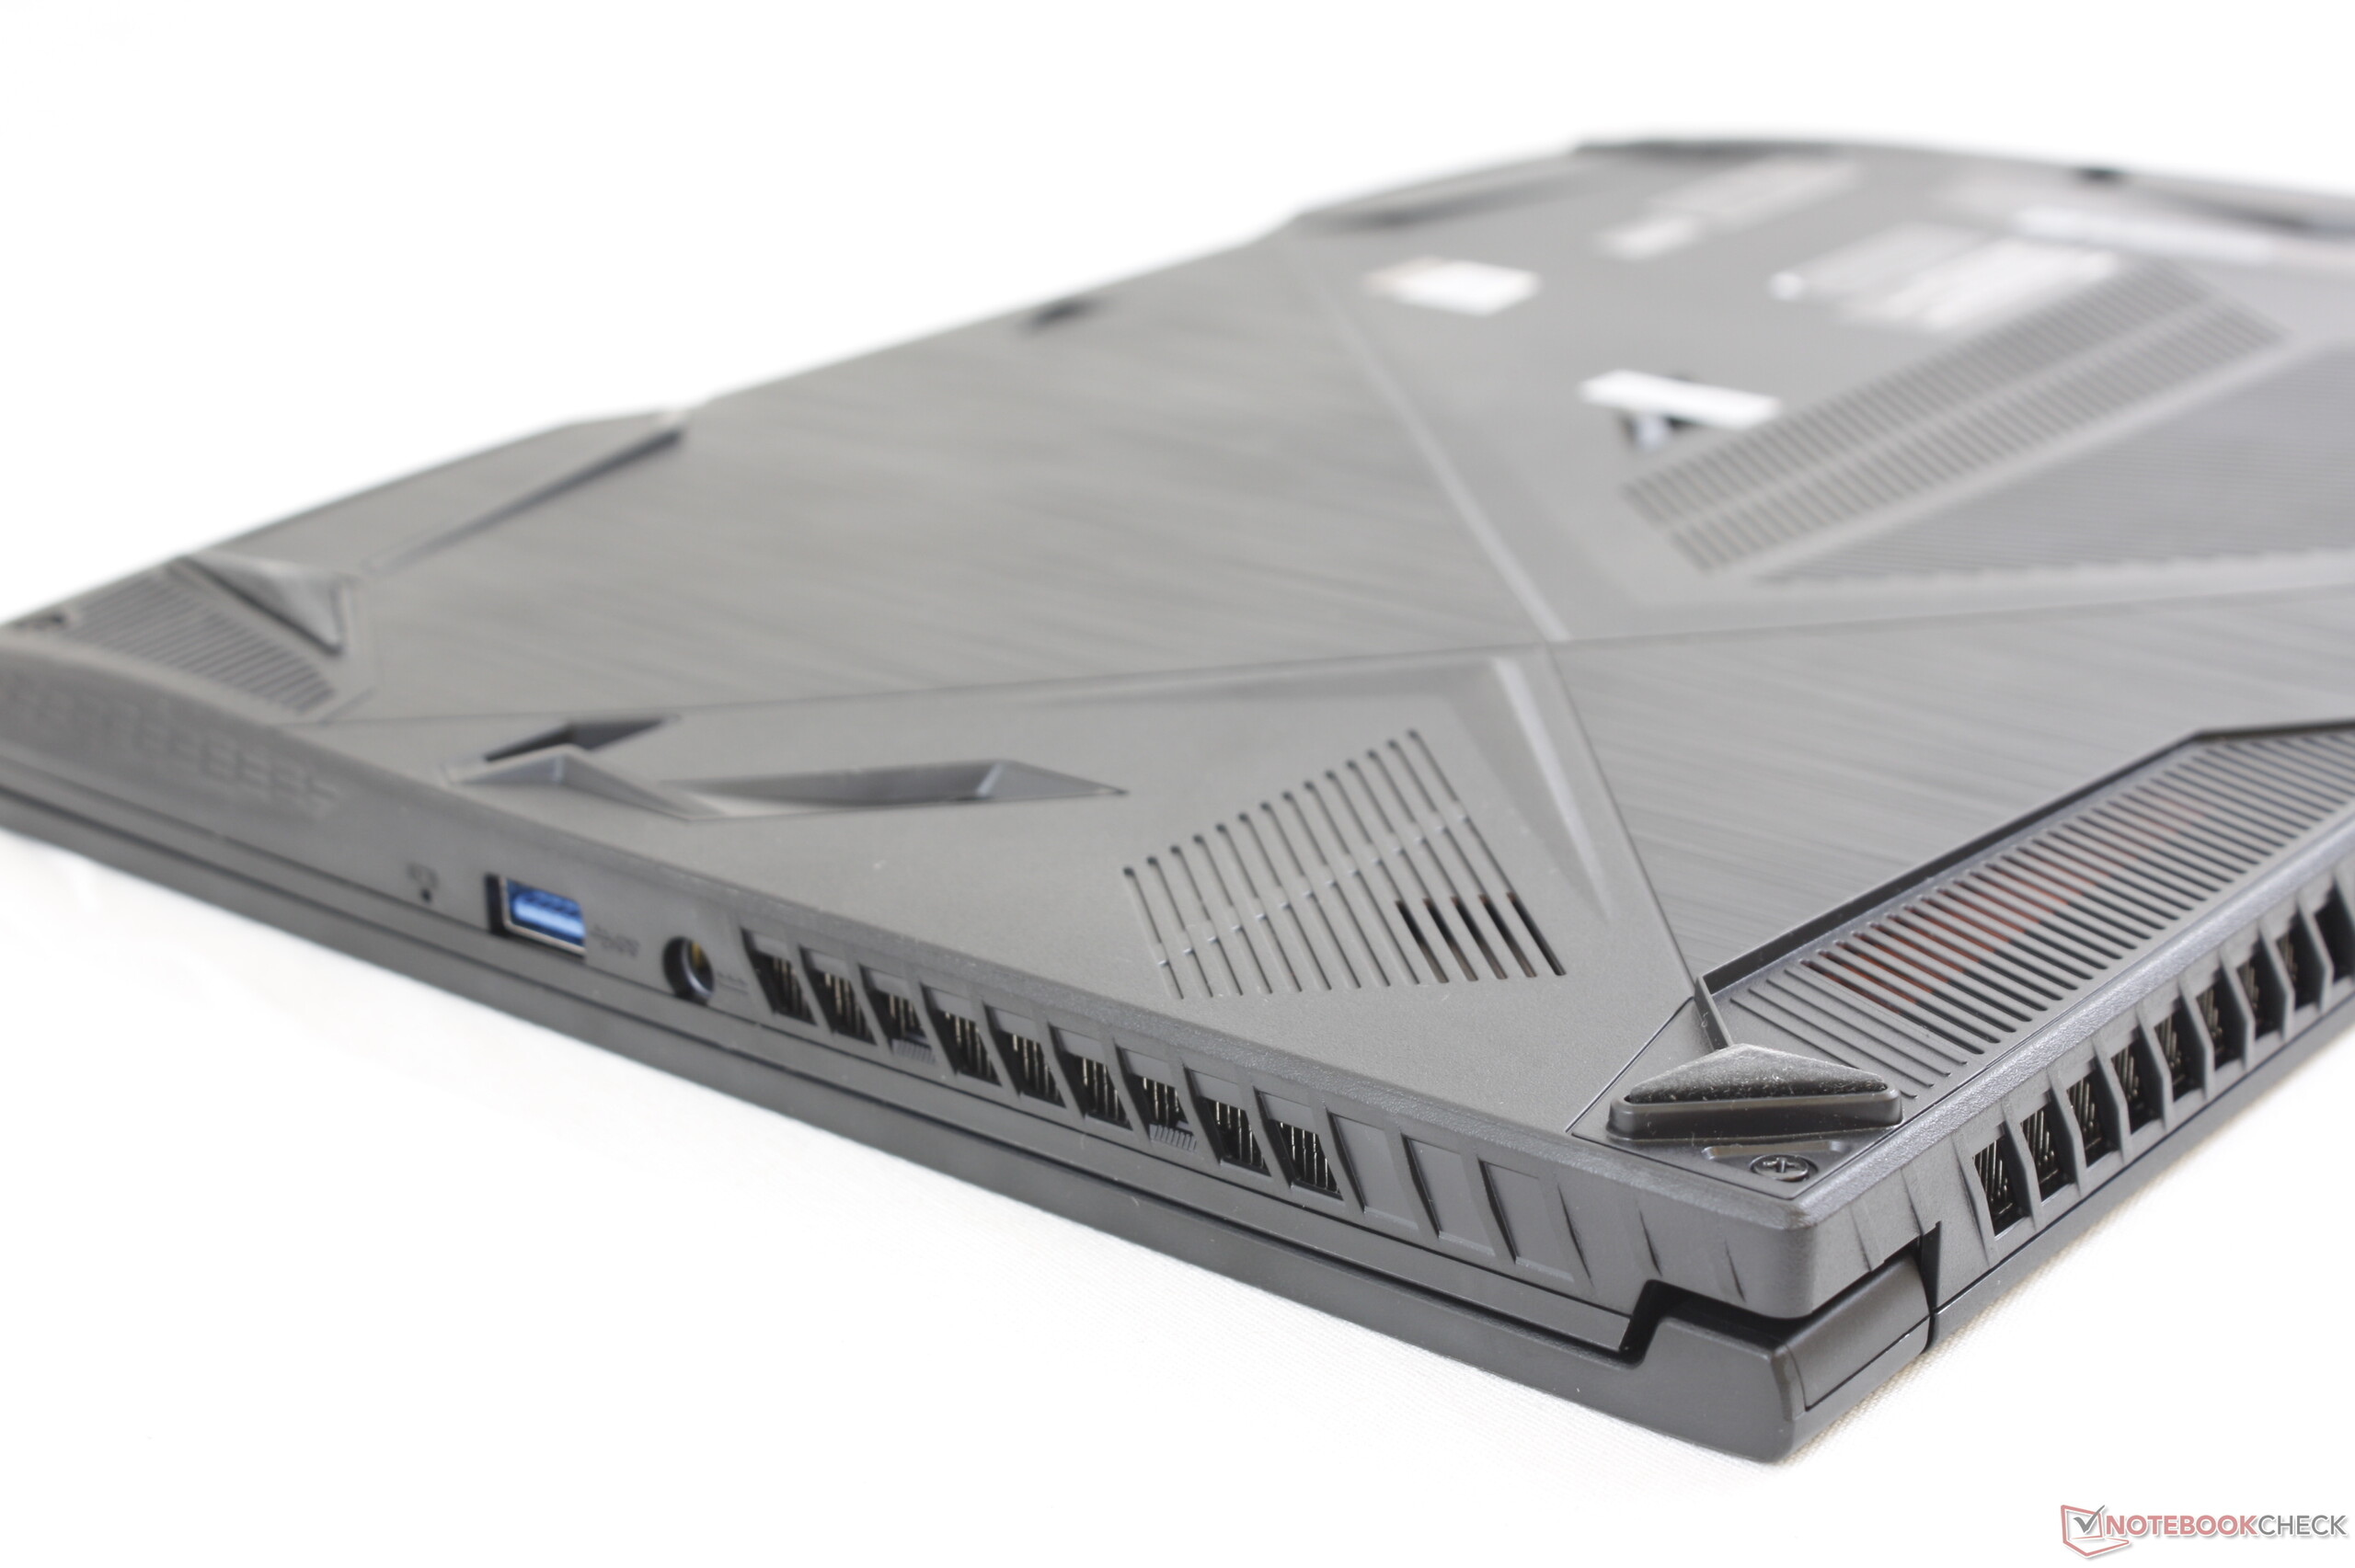
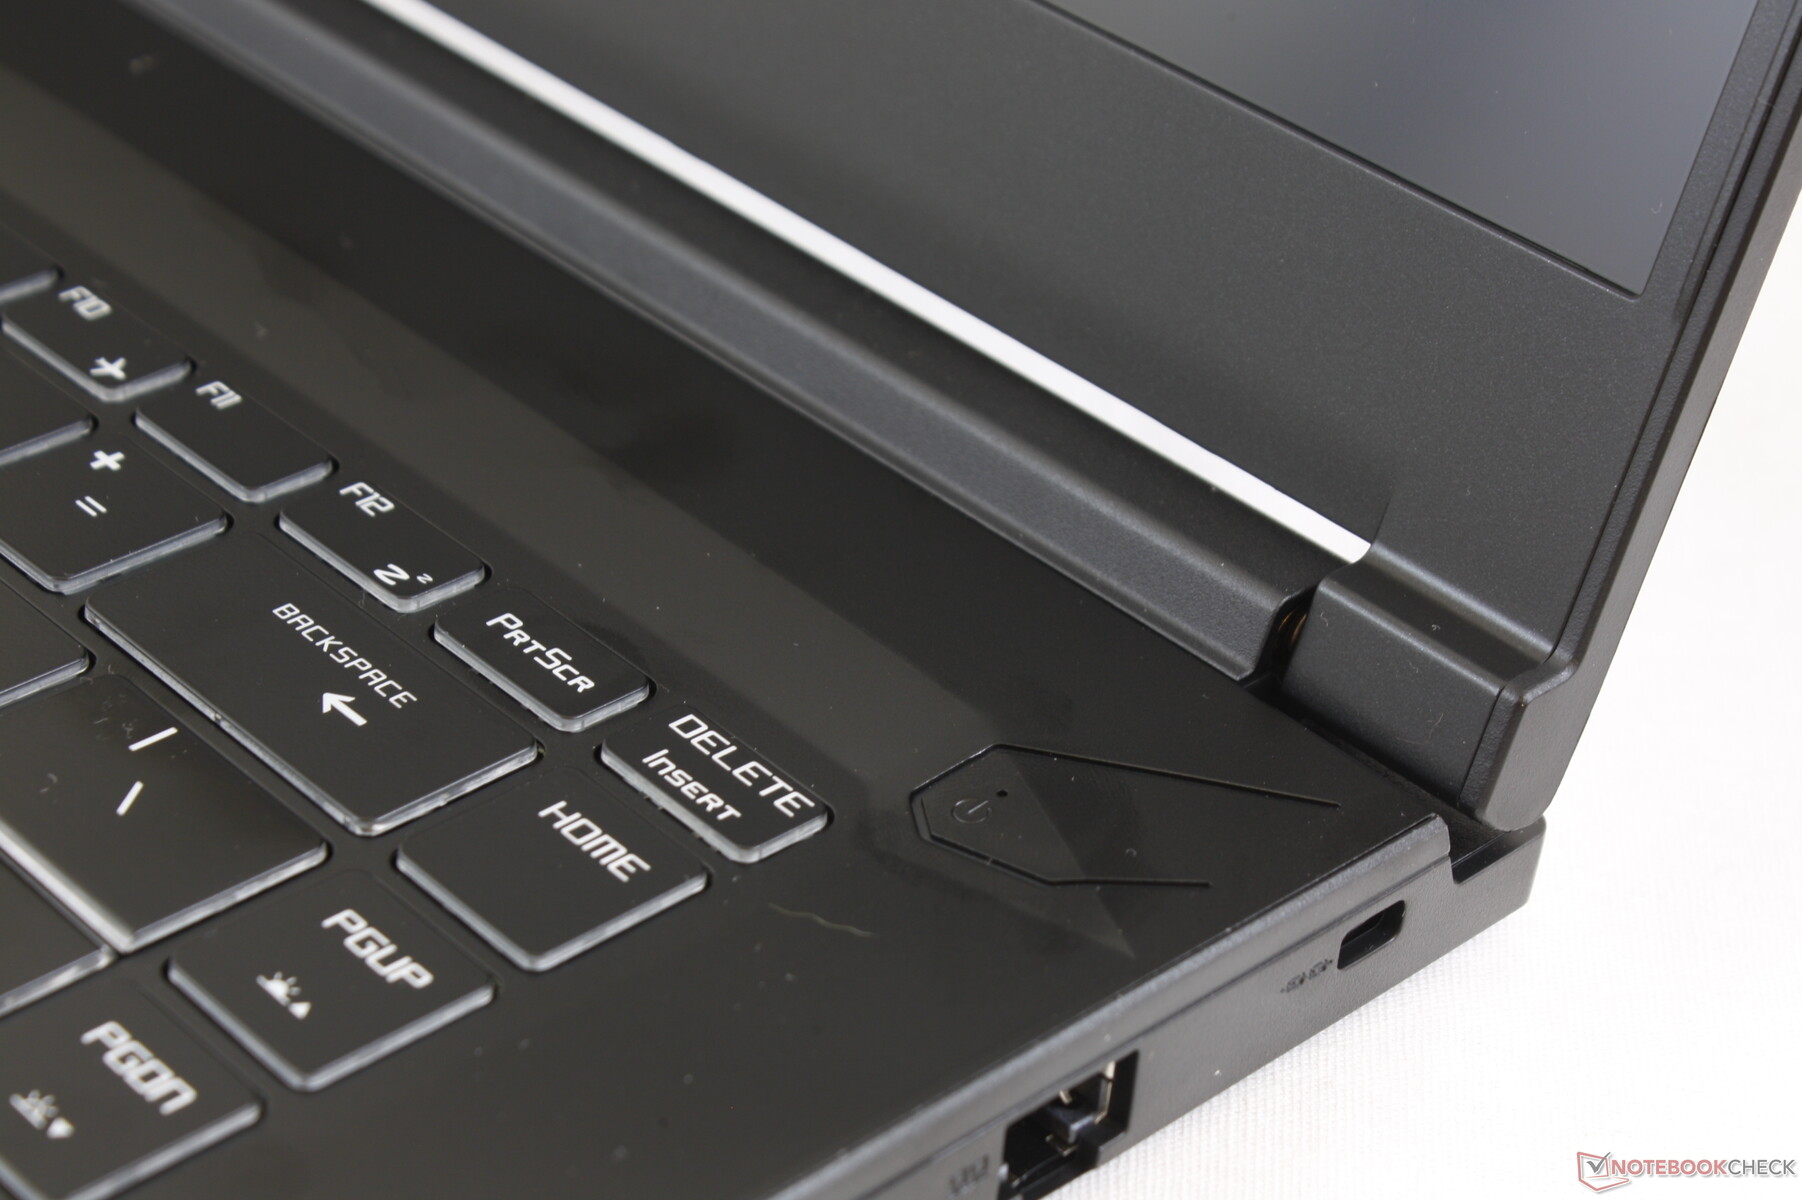
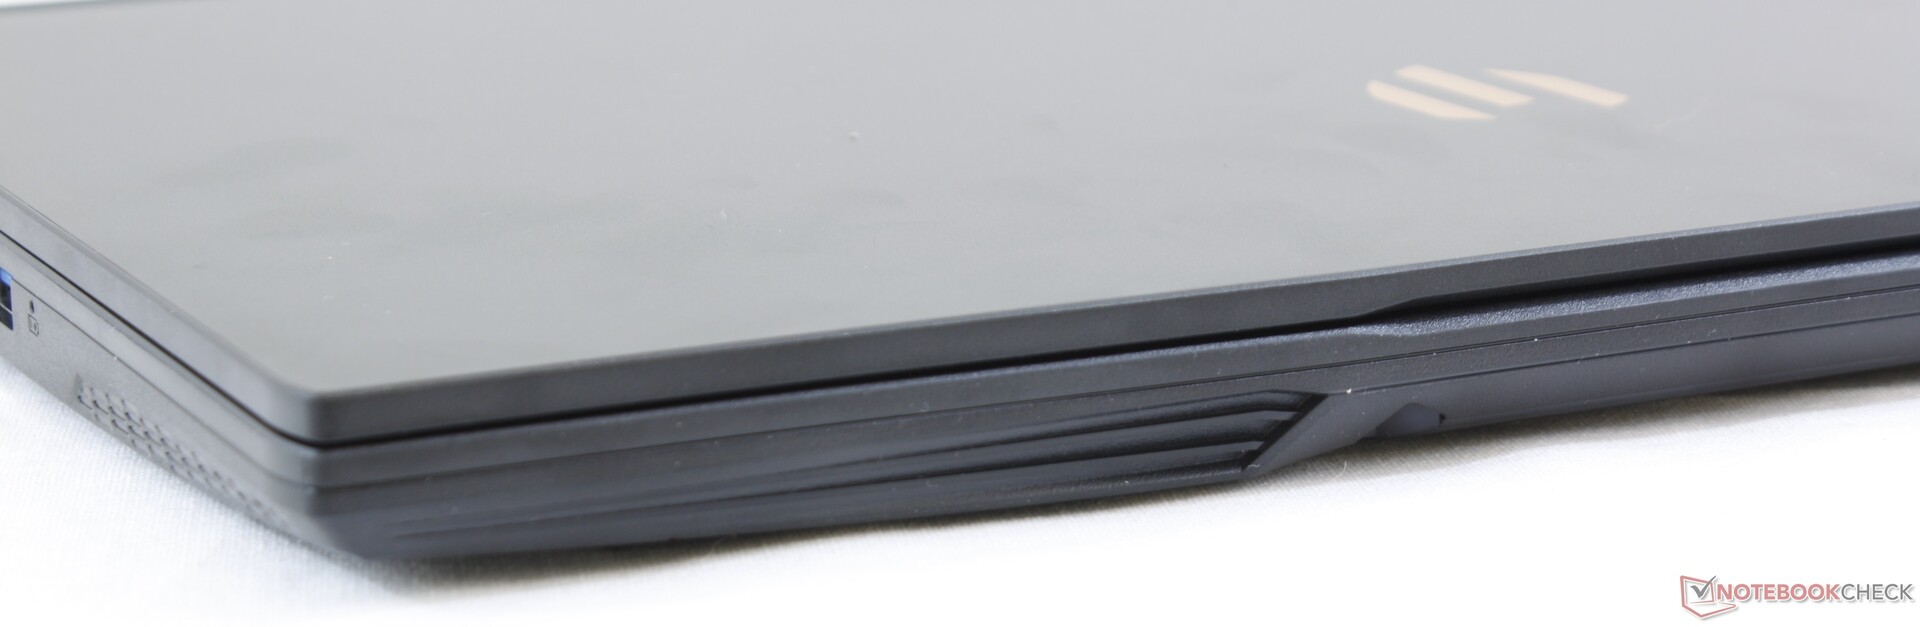
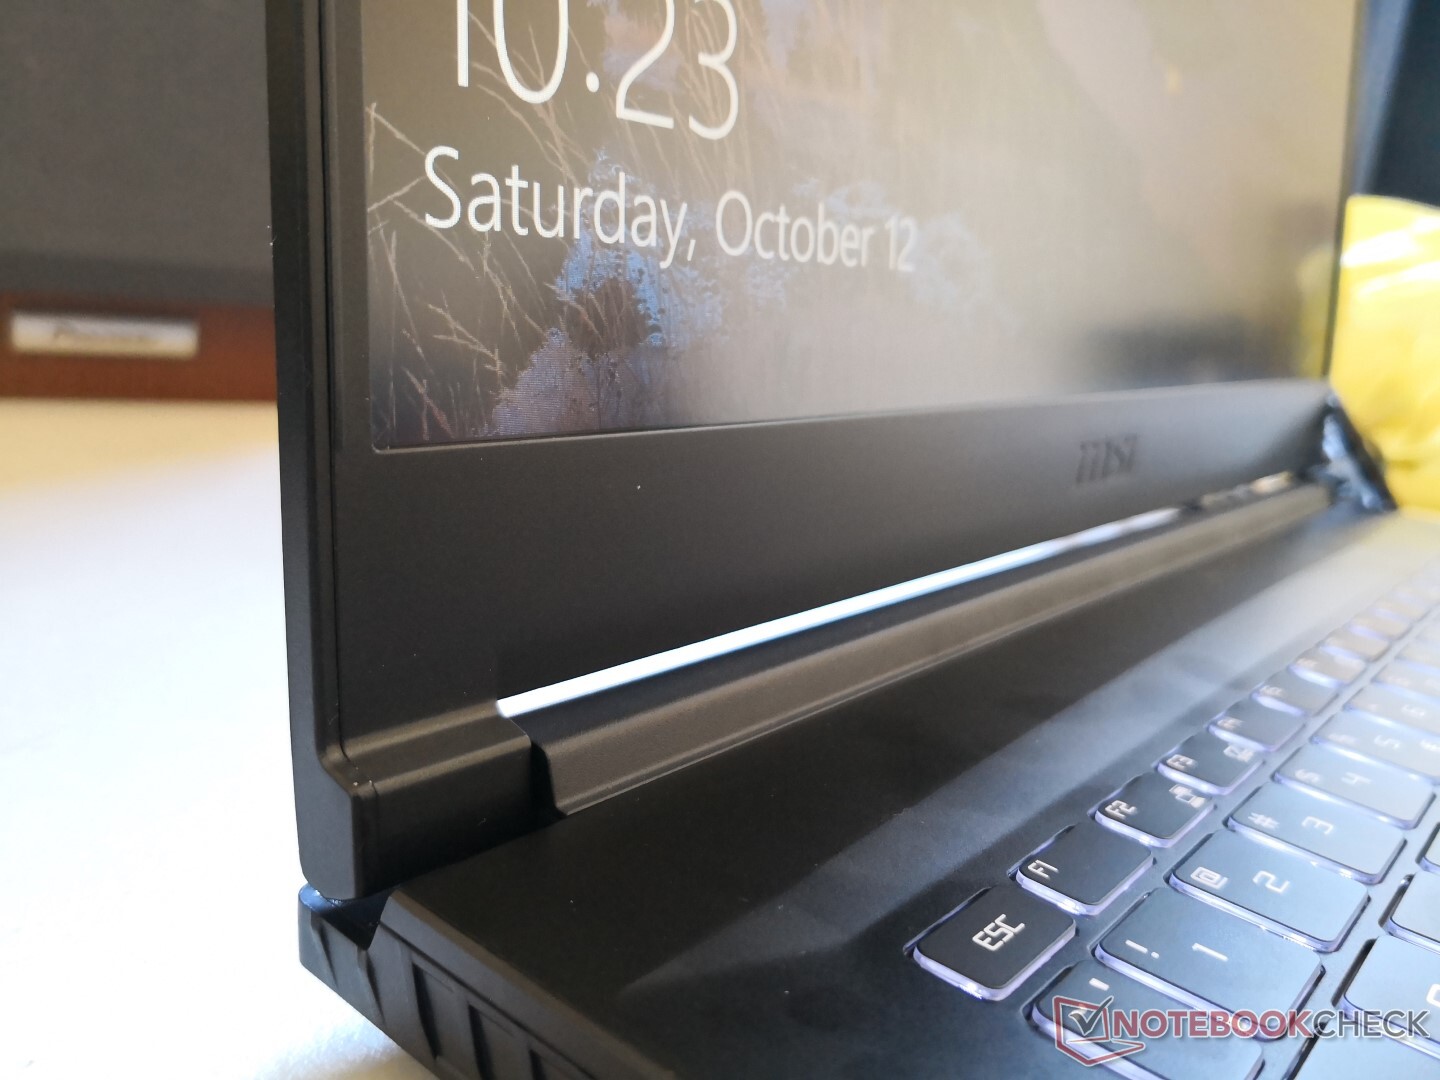
Mobile workstations are generally slow to adopt the latest trends of gaming laptops like narrow bezels. MSI, which happens to specialize in gaming laptops, have designed the WP65 to have some of the narrowest side bezels of any workstation. The system is therefore shorter in length than its closest competitors including the Lenovo ThinkPad P52s. On the other hand, it's thicker and thus boxier as well. You'll have to invest in the pricier WS65 for a thinner and lighter package.
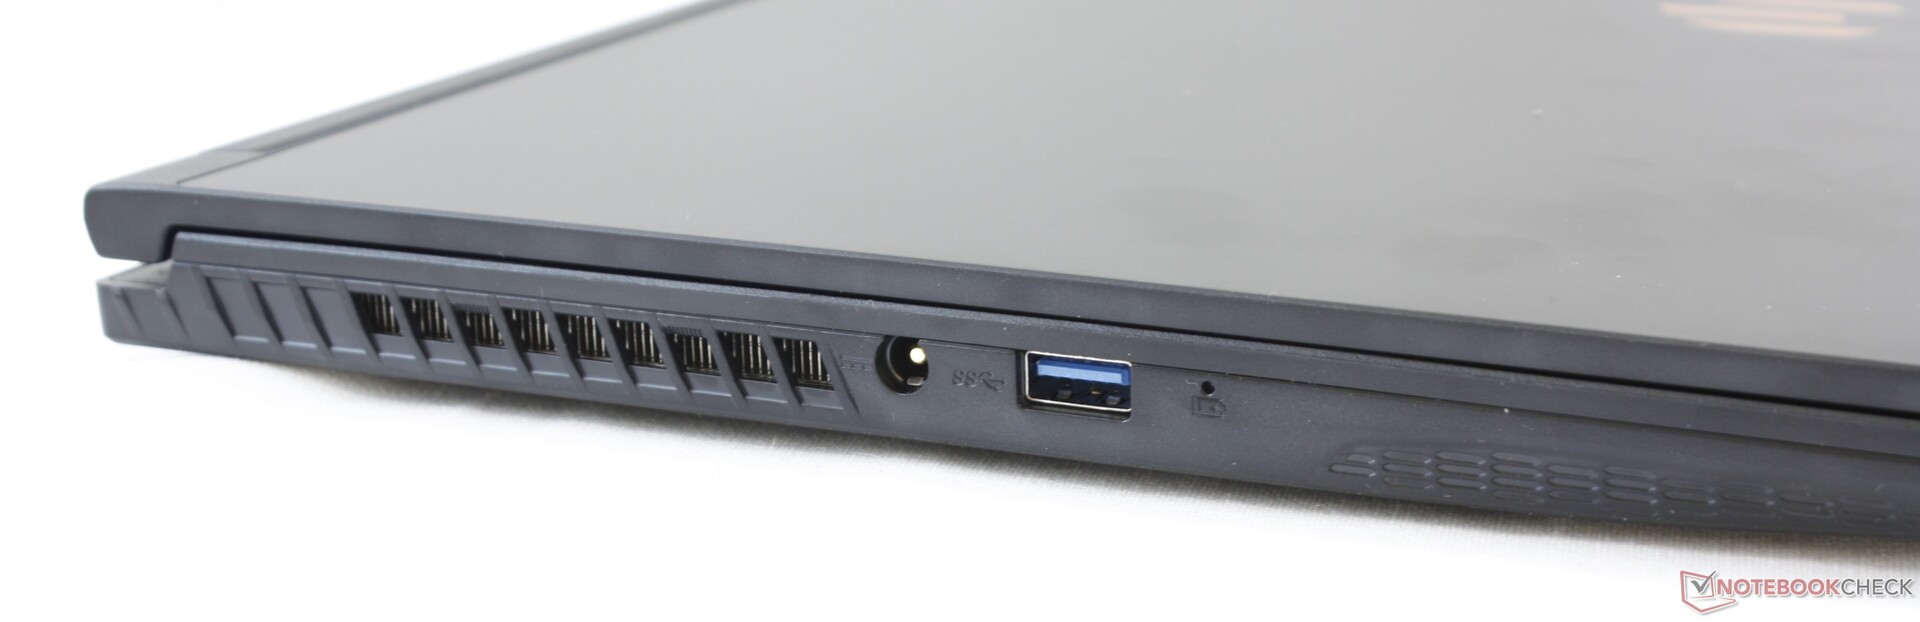
Connectivity
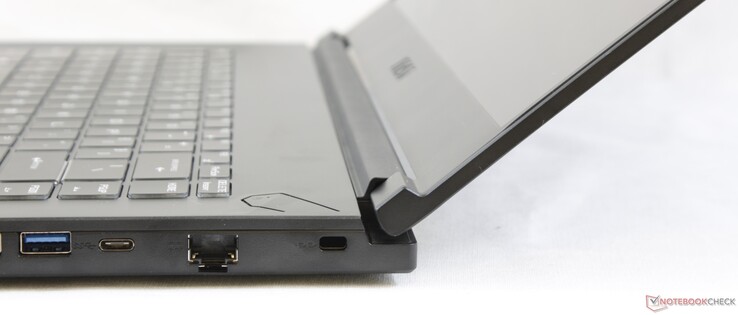
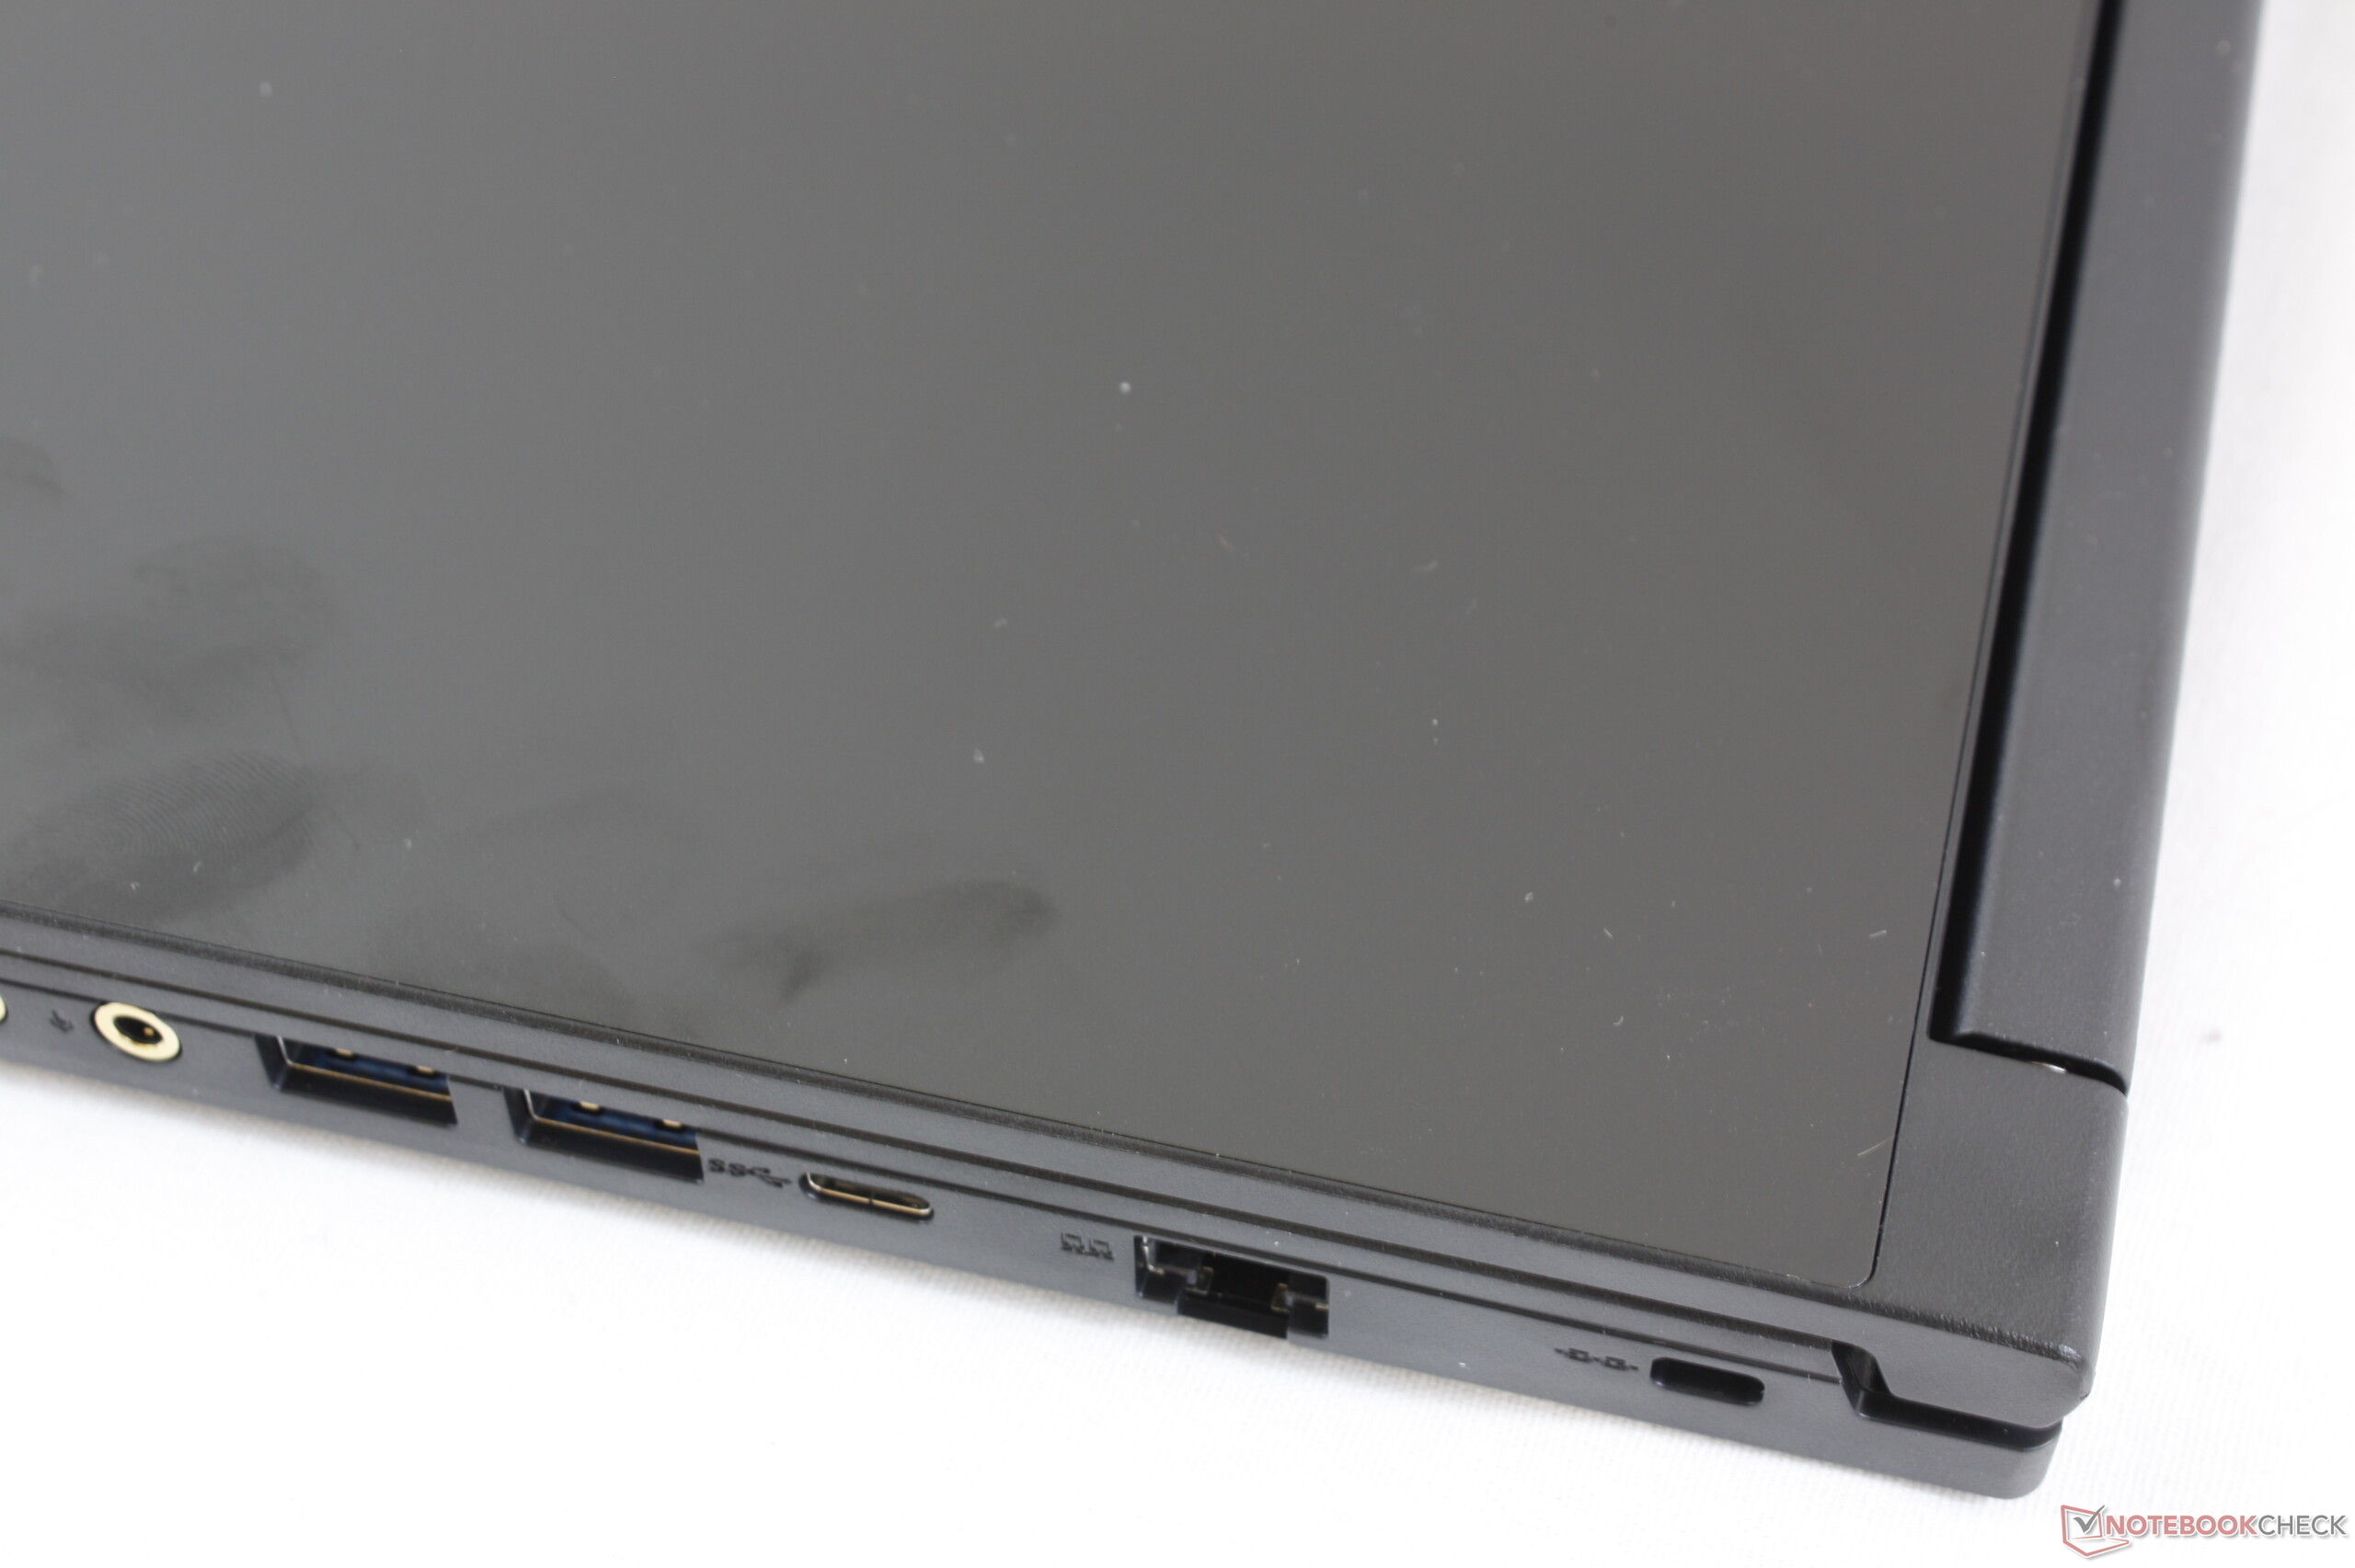
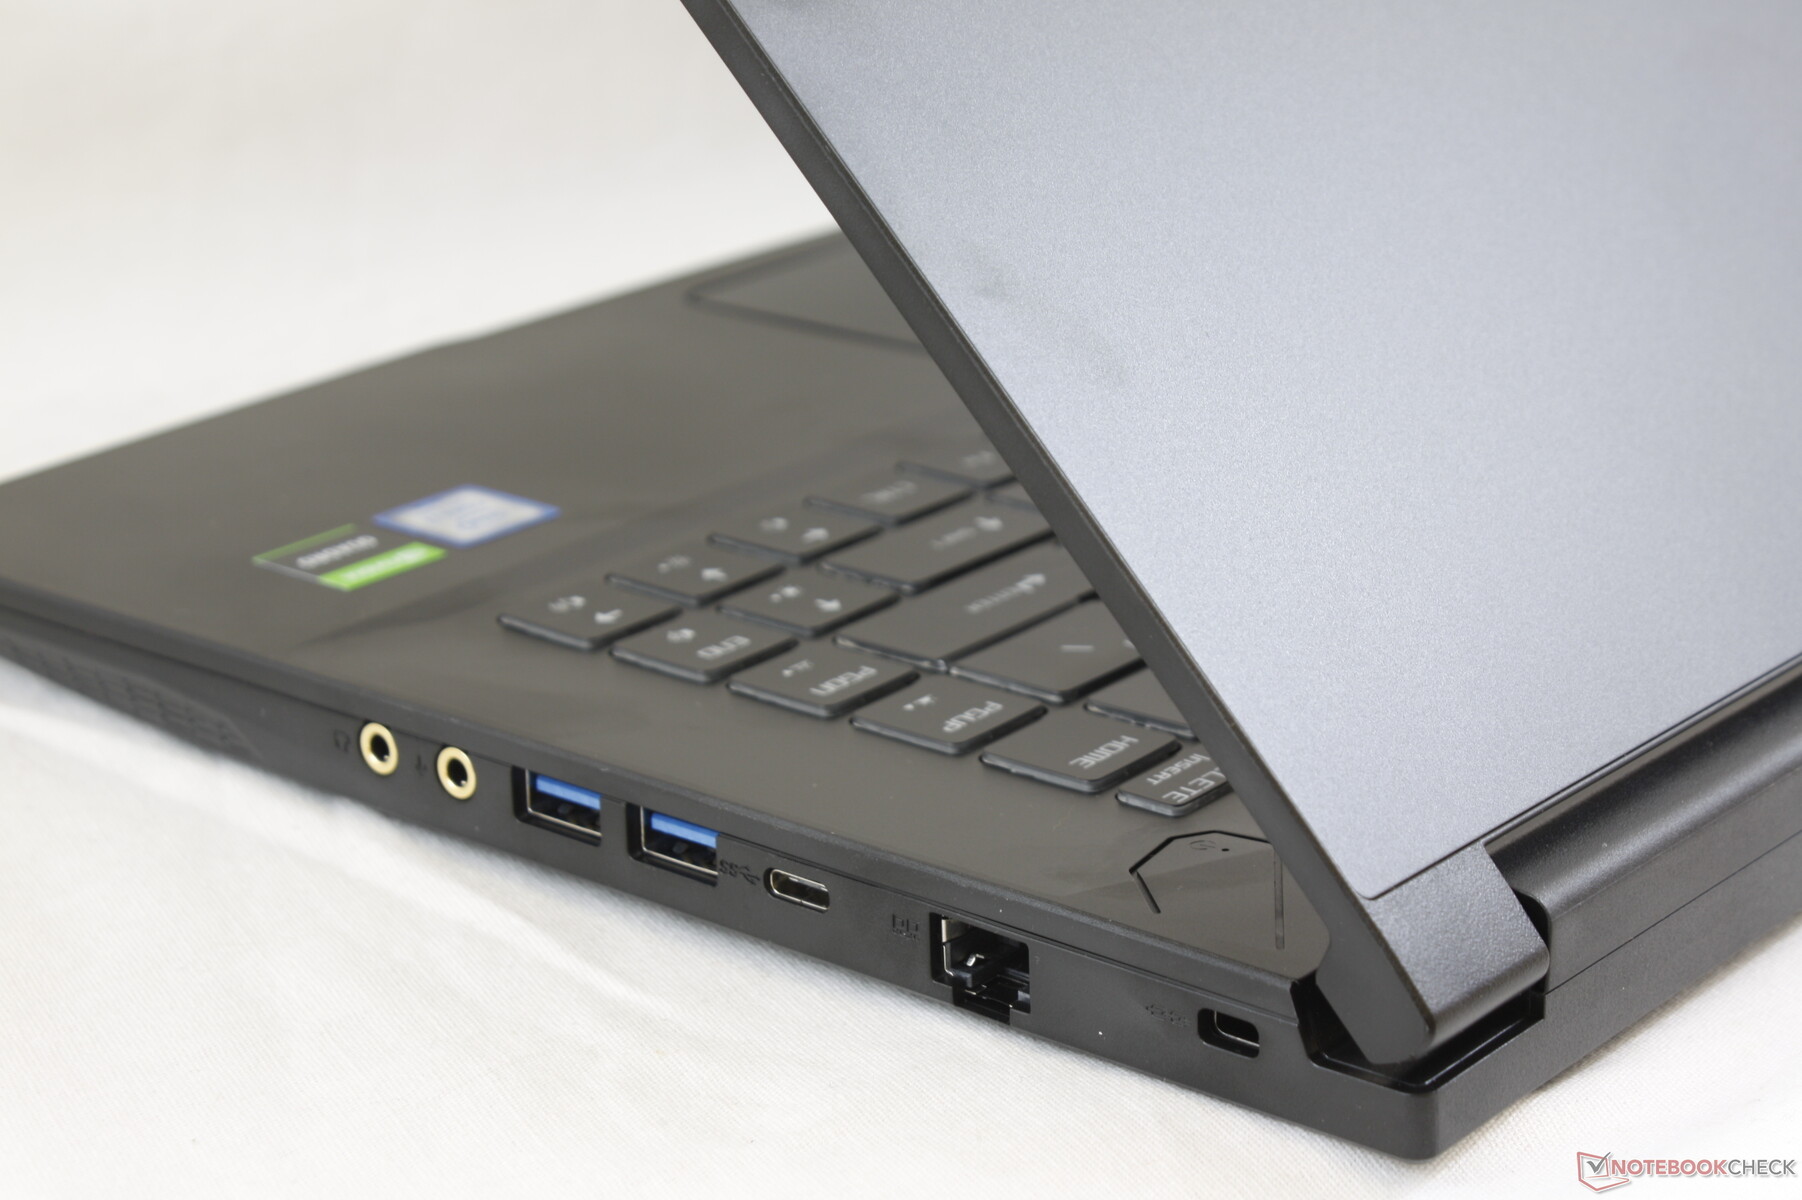
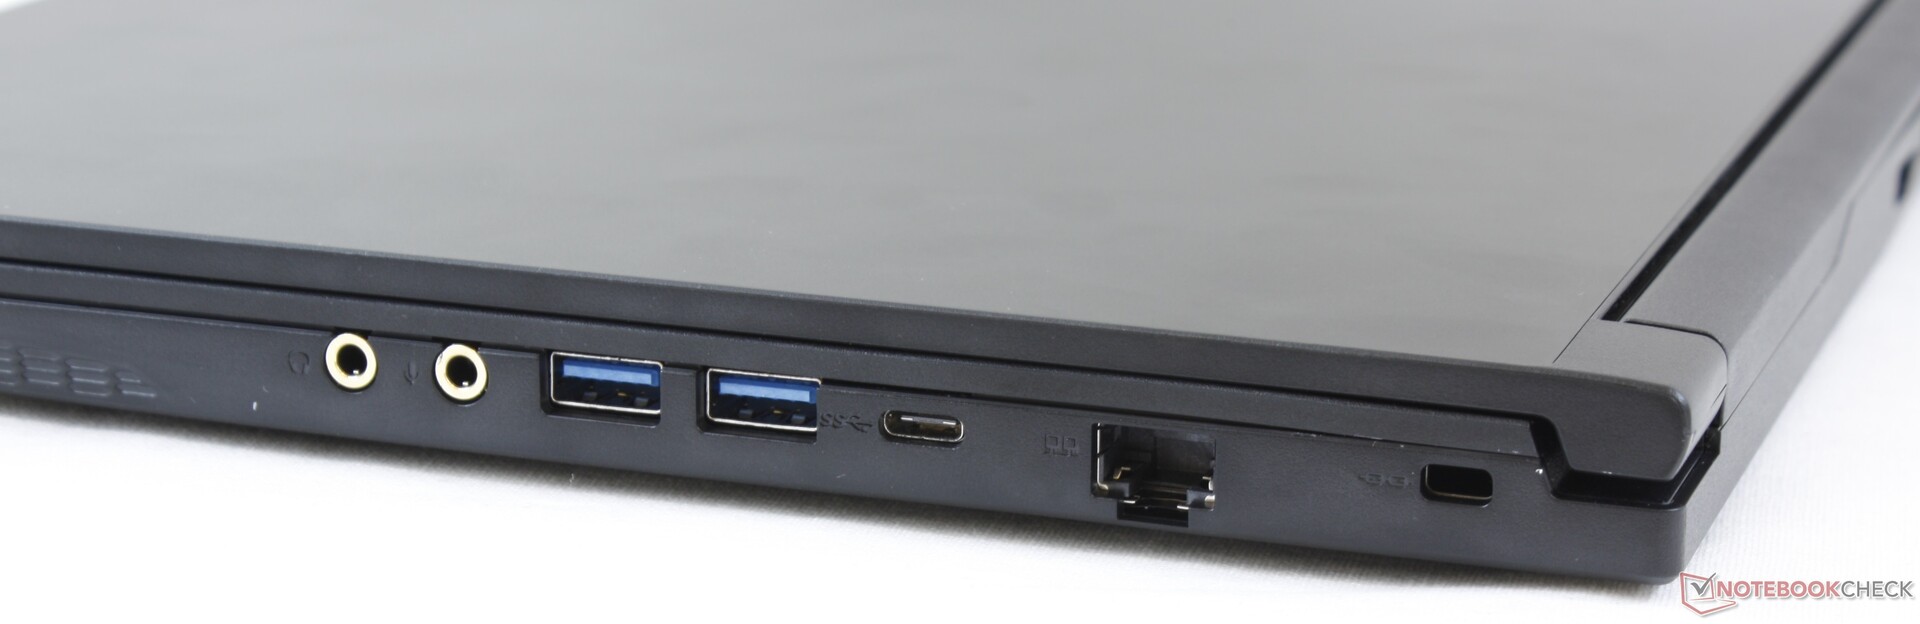
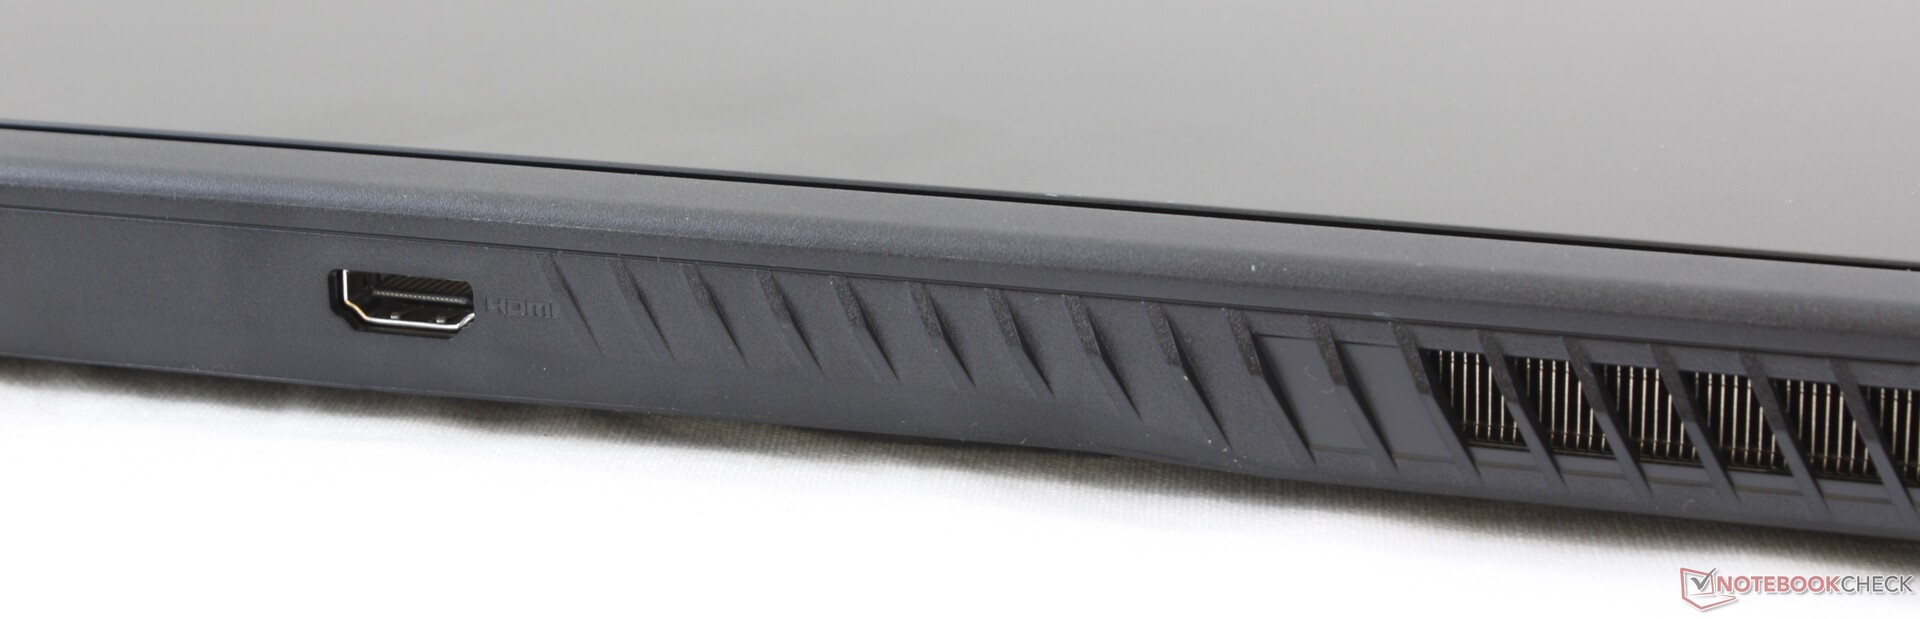
Port options are mediocre and even a little strange for a workstation. The golden headphone and microphone jacks feel carried over the GS65 series and the missing SD card reader is a bummer when considering the target audience of content creators. The ports along the right edge could have been more spread out since as they are tightly spaced.
Communication
The Intel 9560 comes standard for theoretical transfer rates of up to 1.73 Gbps and integrated Bluetooth 5.0 connectivity. Our tests on an 802.11ac network show transmit and receive rates of 339 Mbps and 540 Mbps, respectively, which are rather slow even after considering the 1 Gbps server line. We suspect that there may interference involved as we otherwise experienced no connectivity issues with the unit.
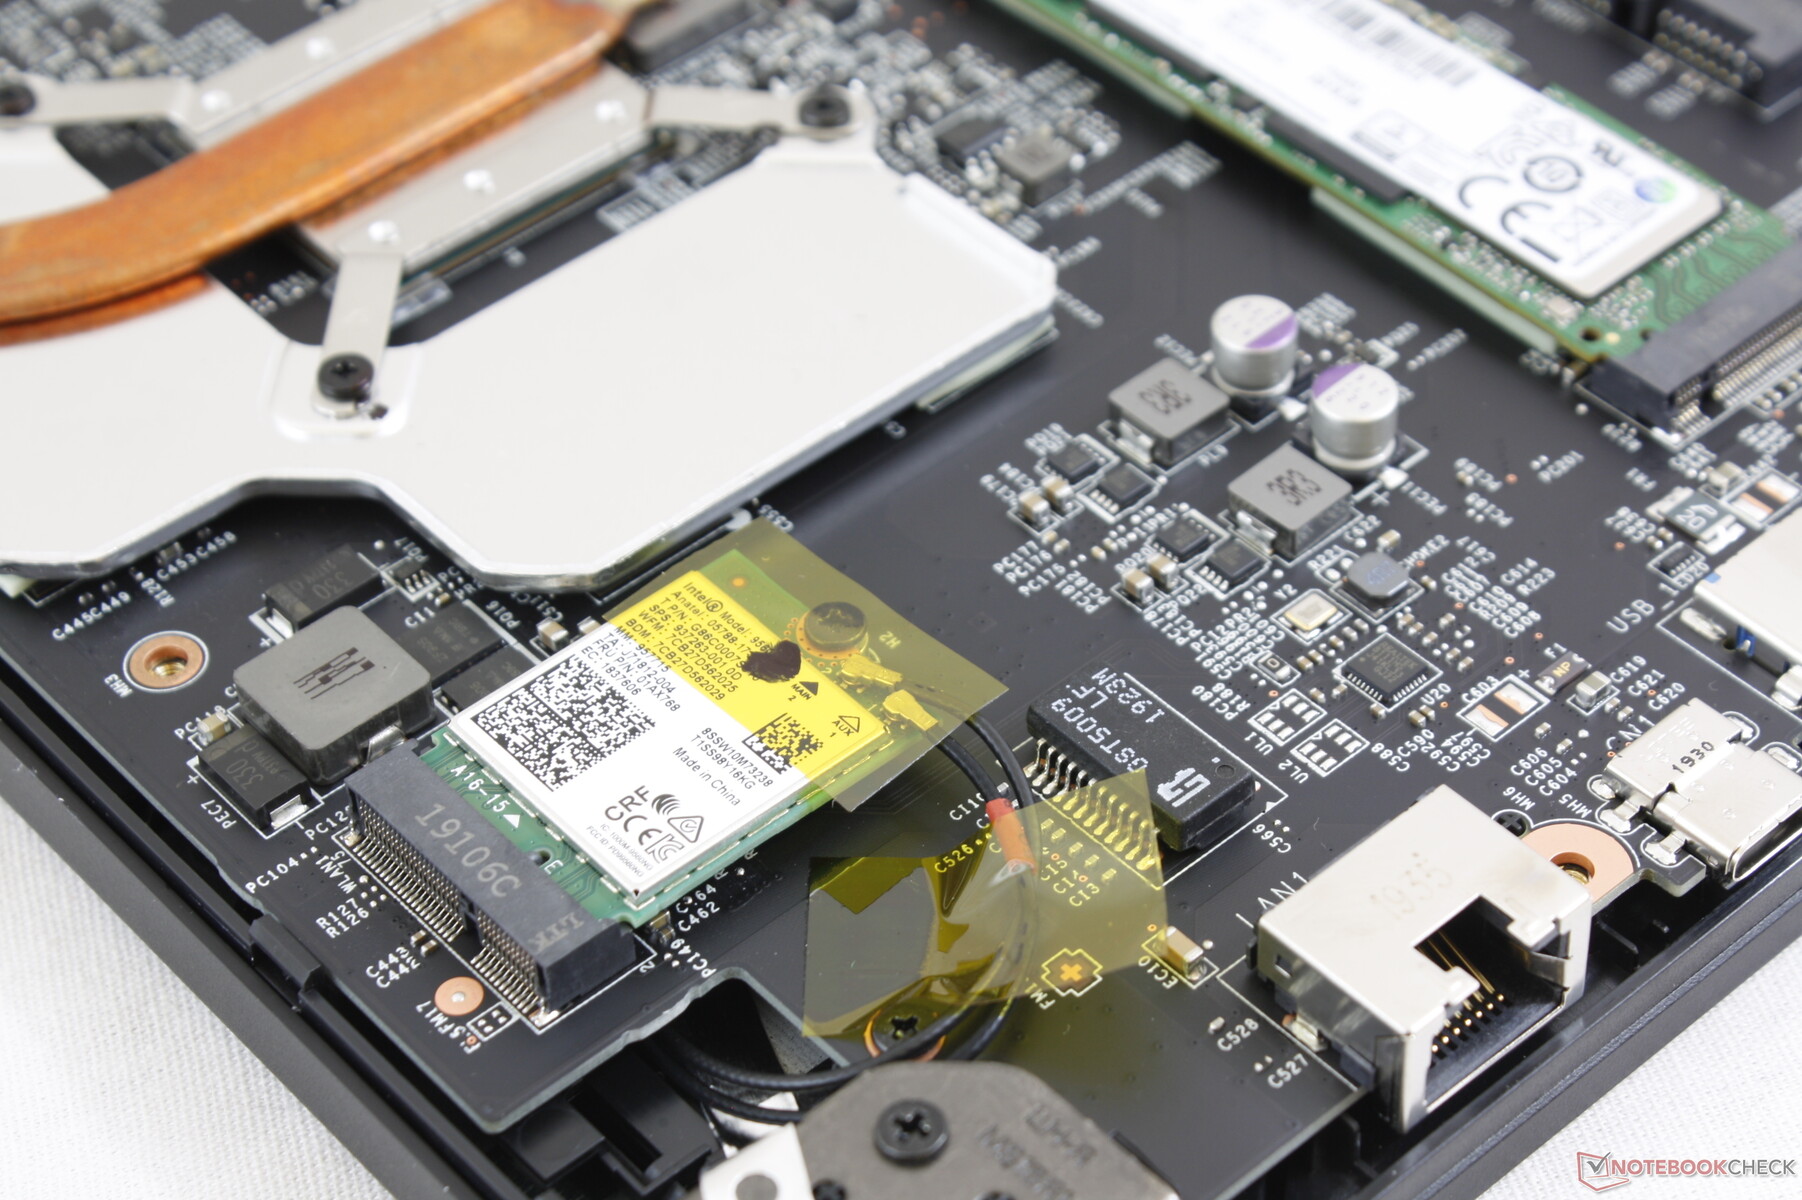
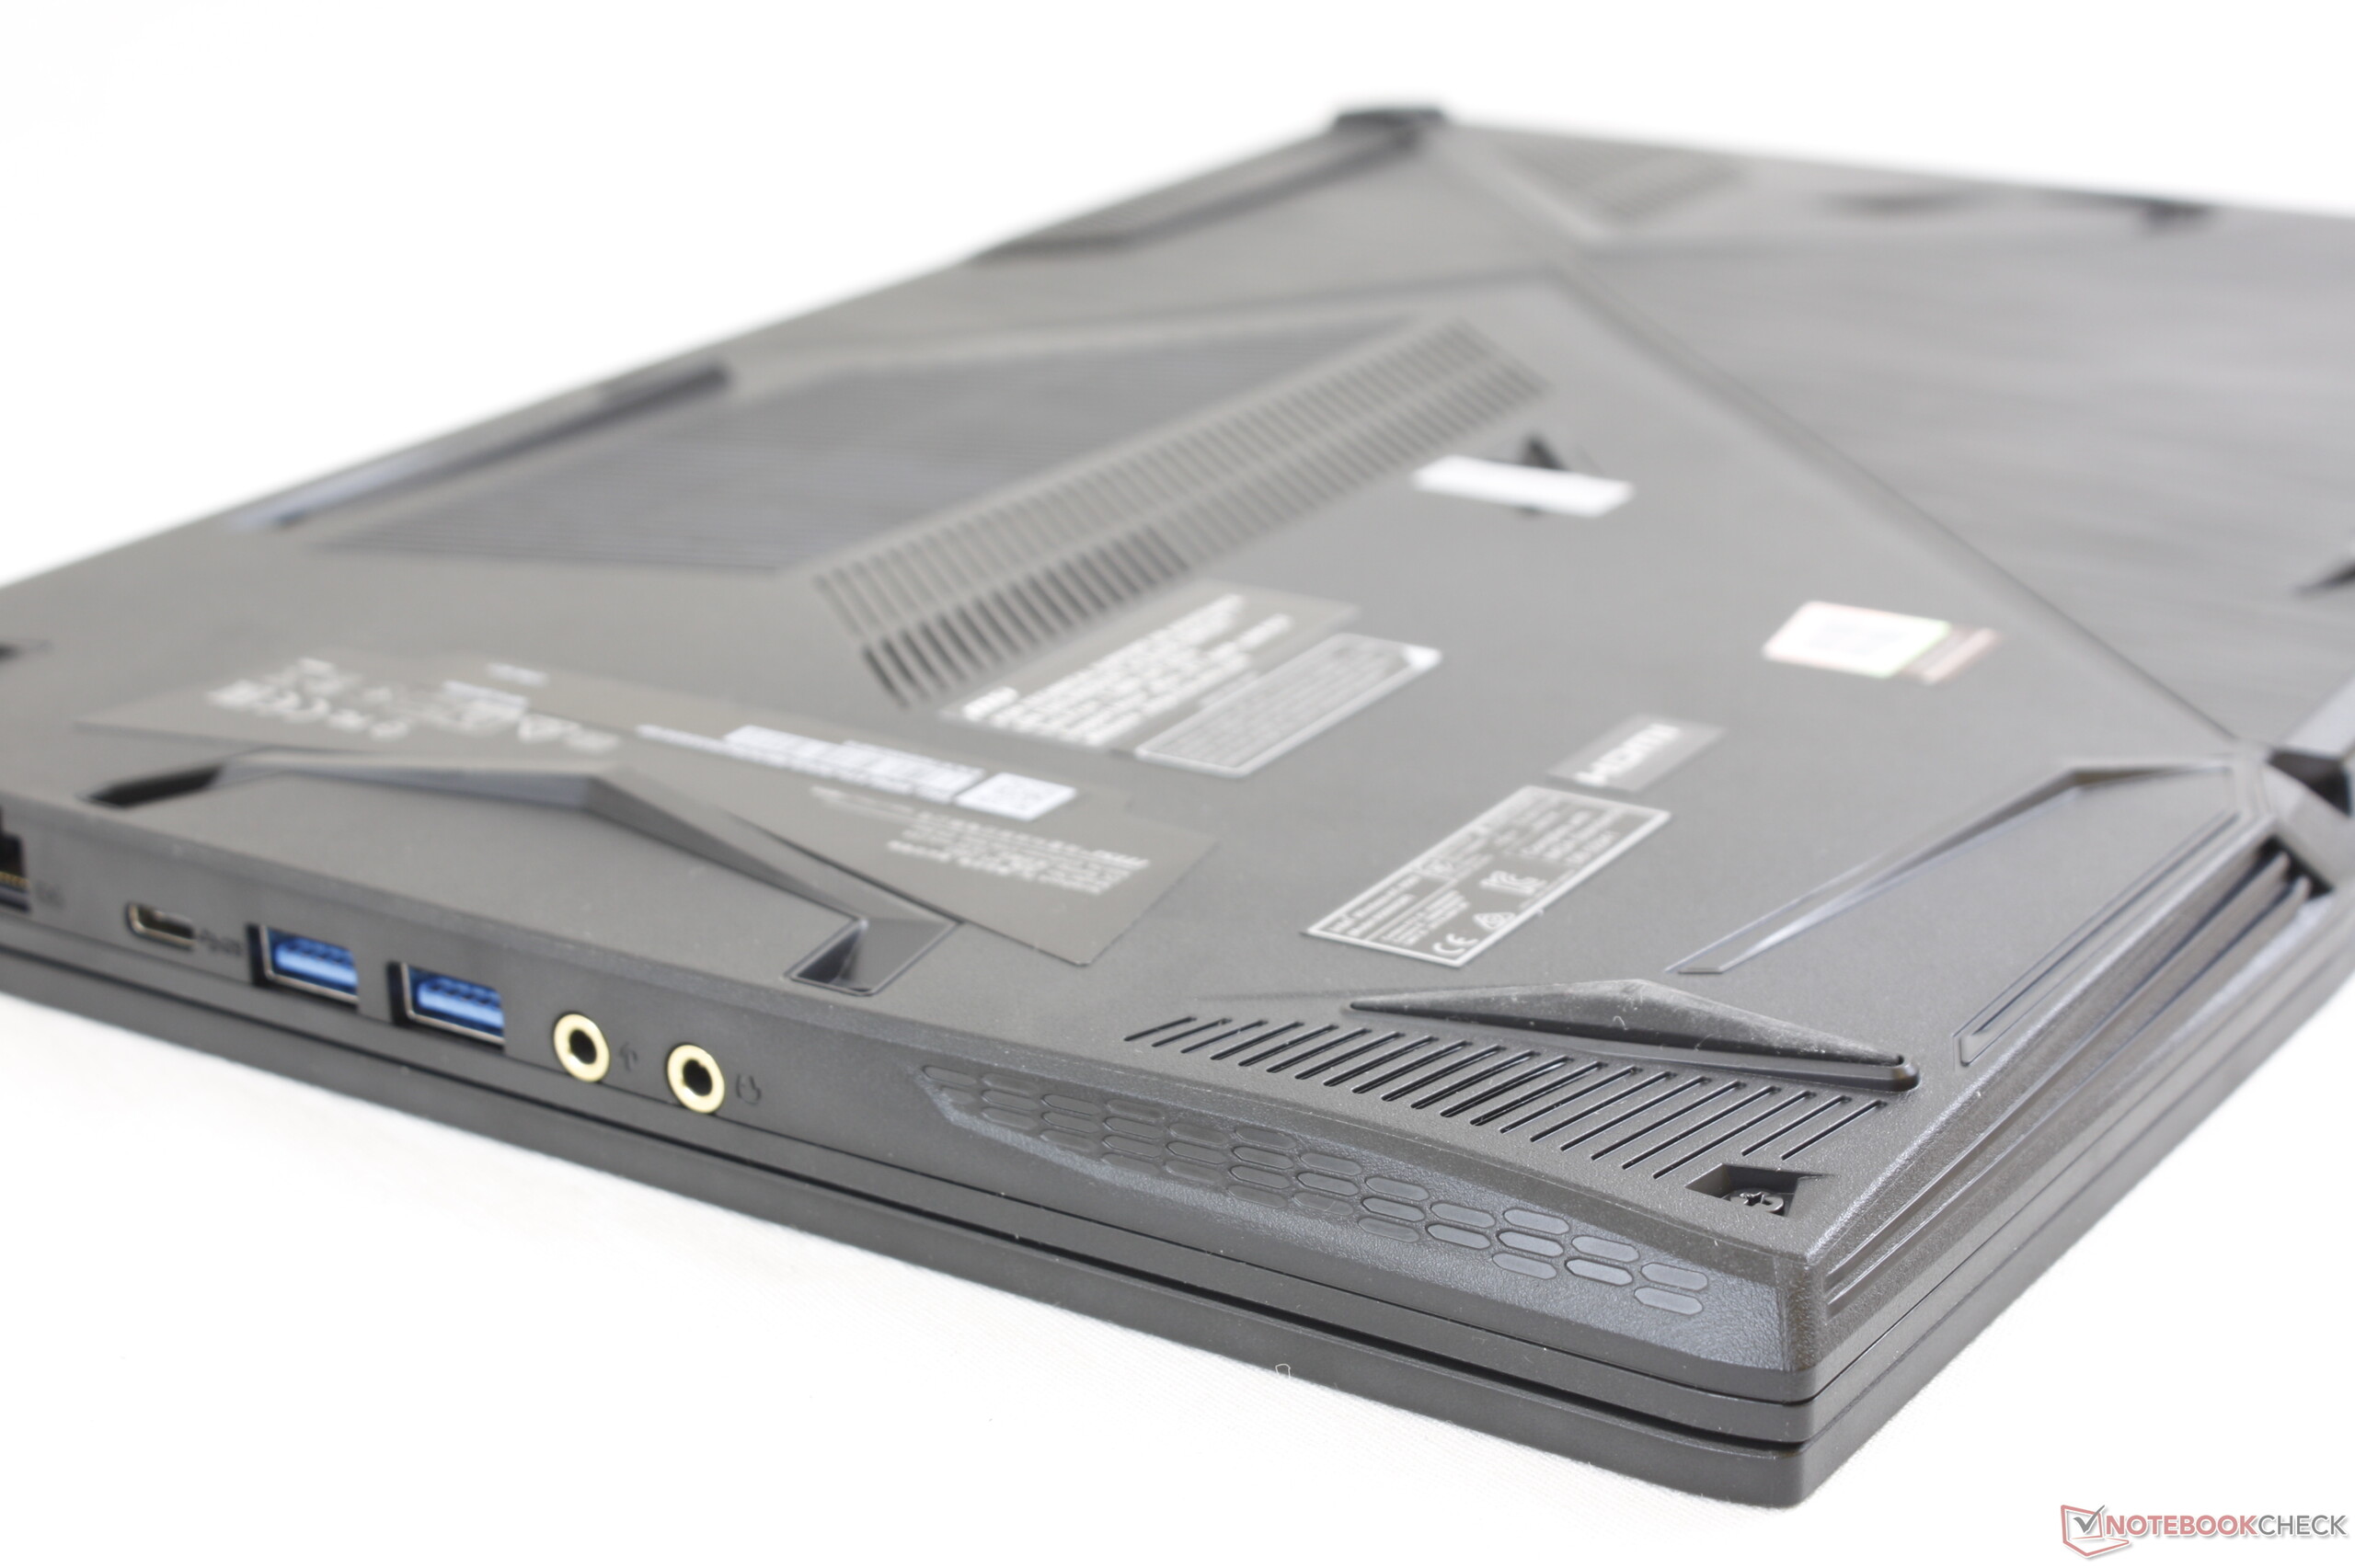
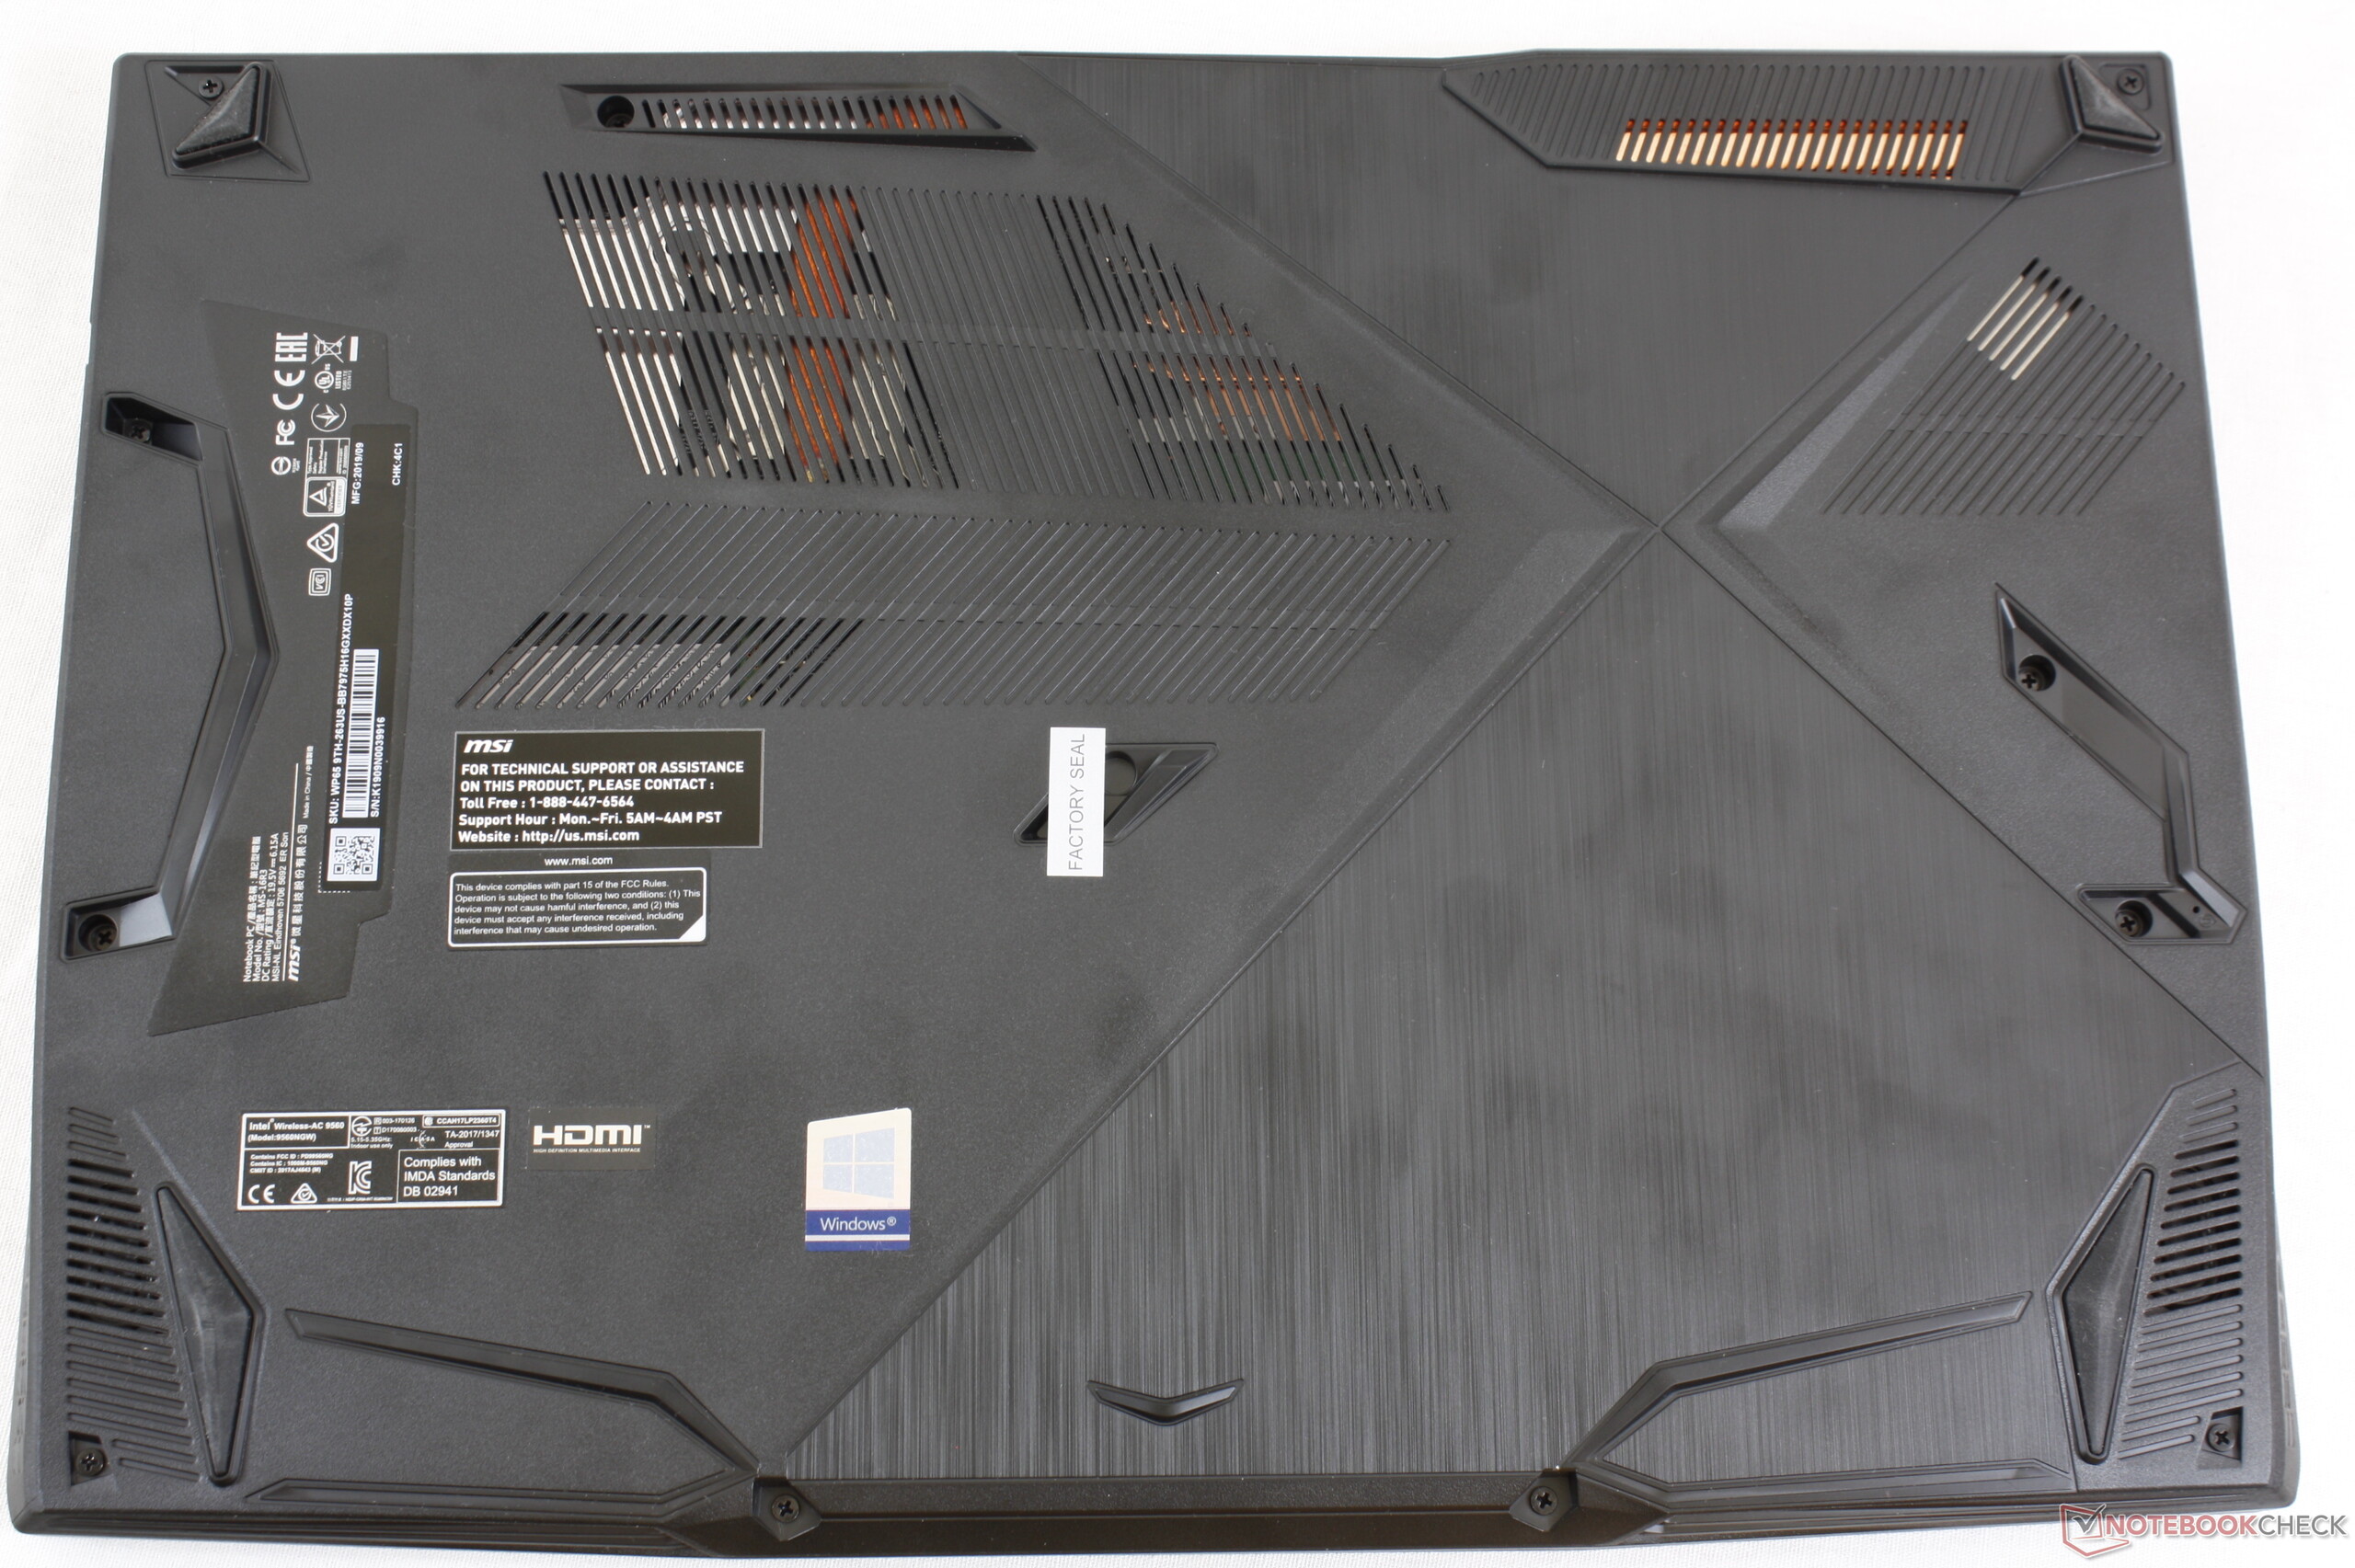
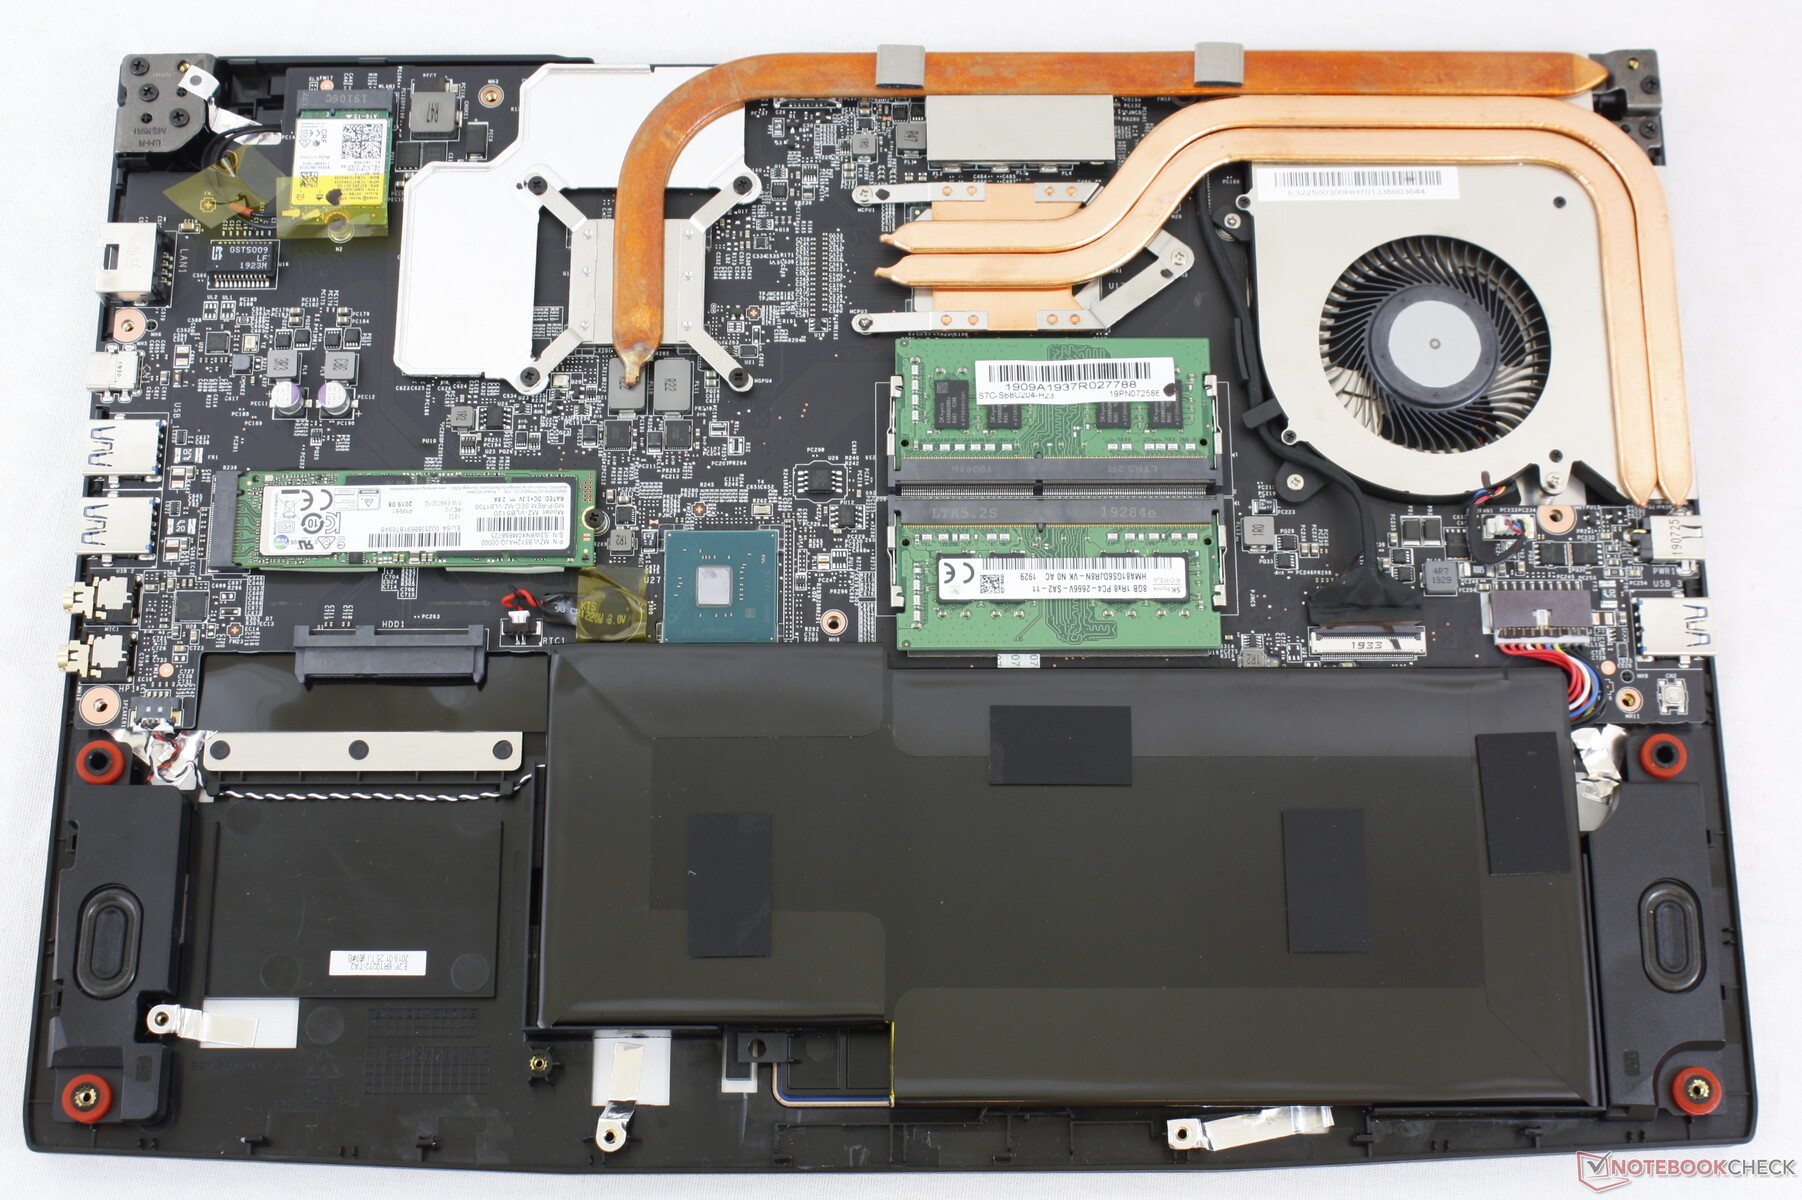
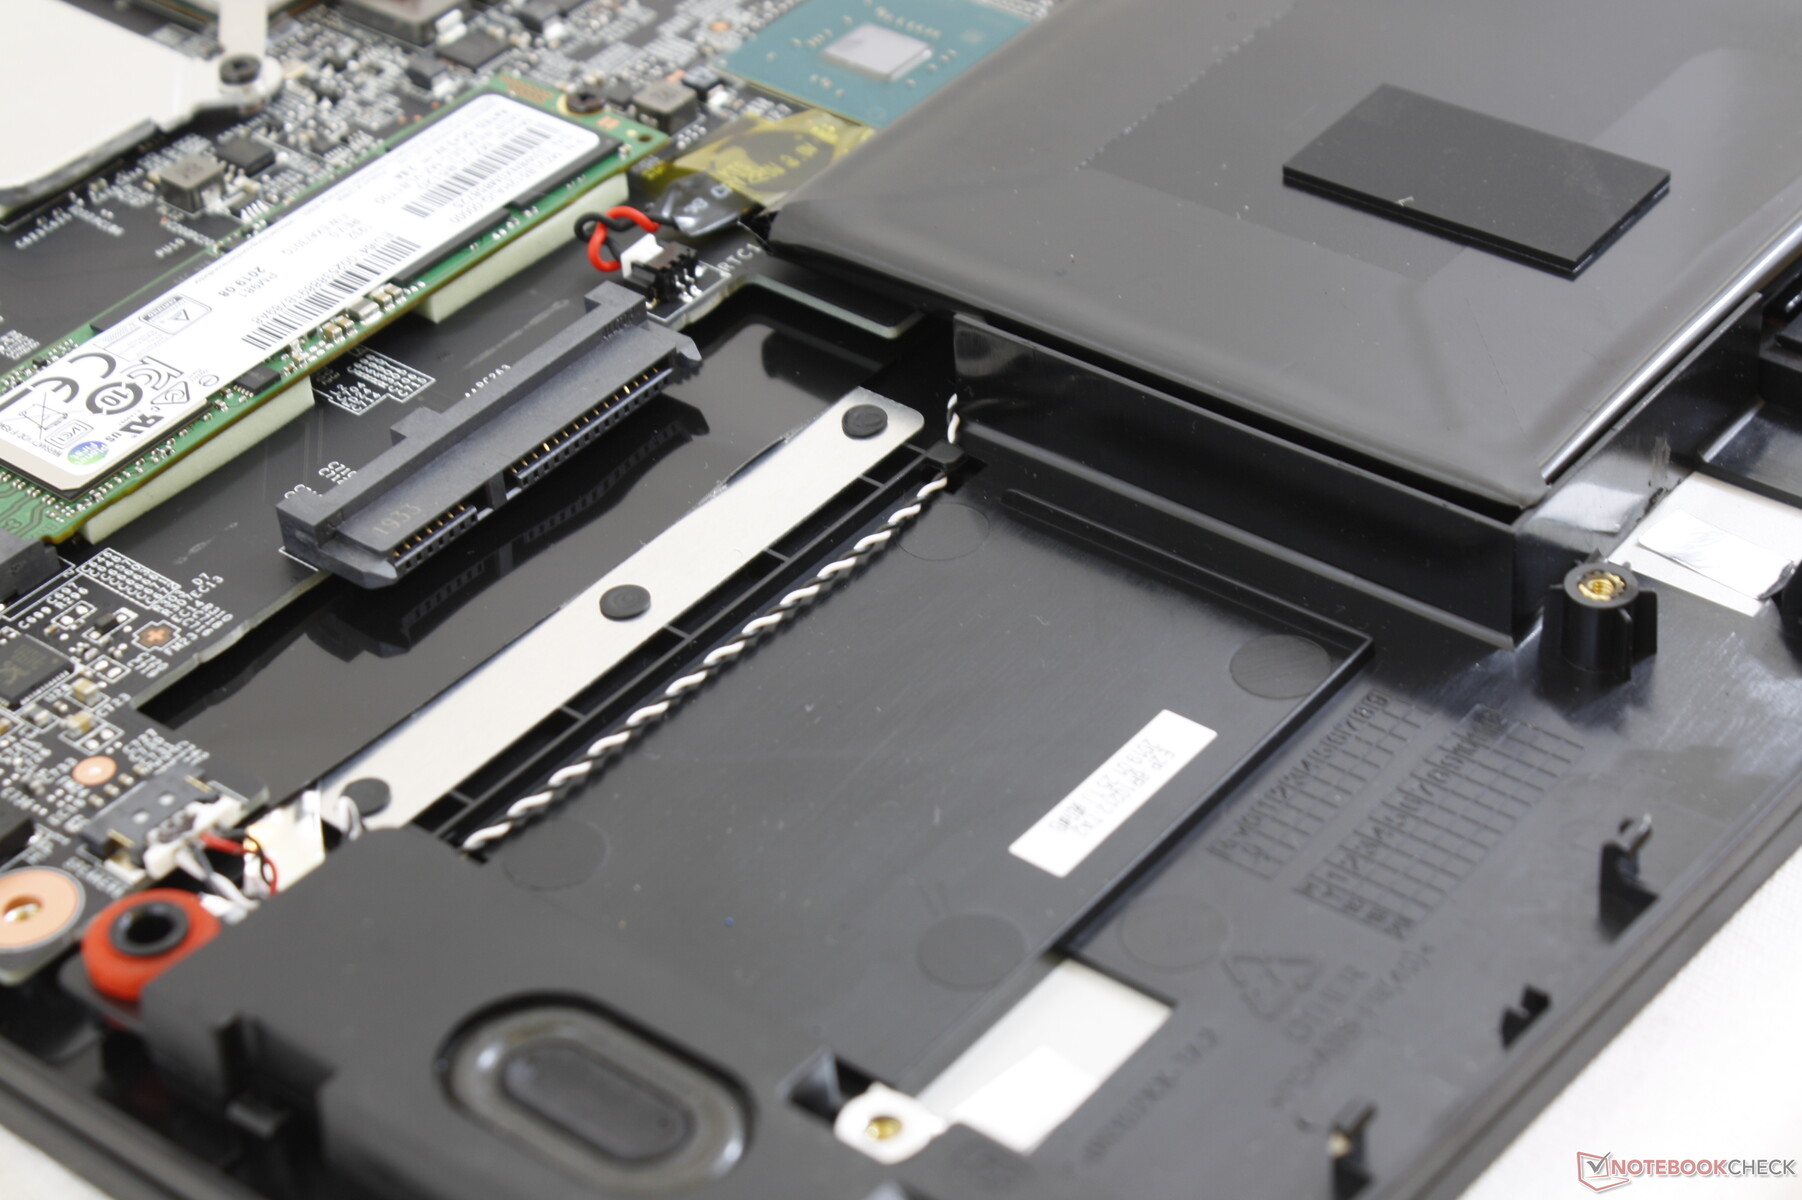
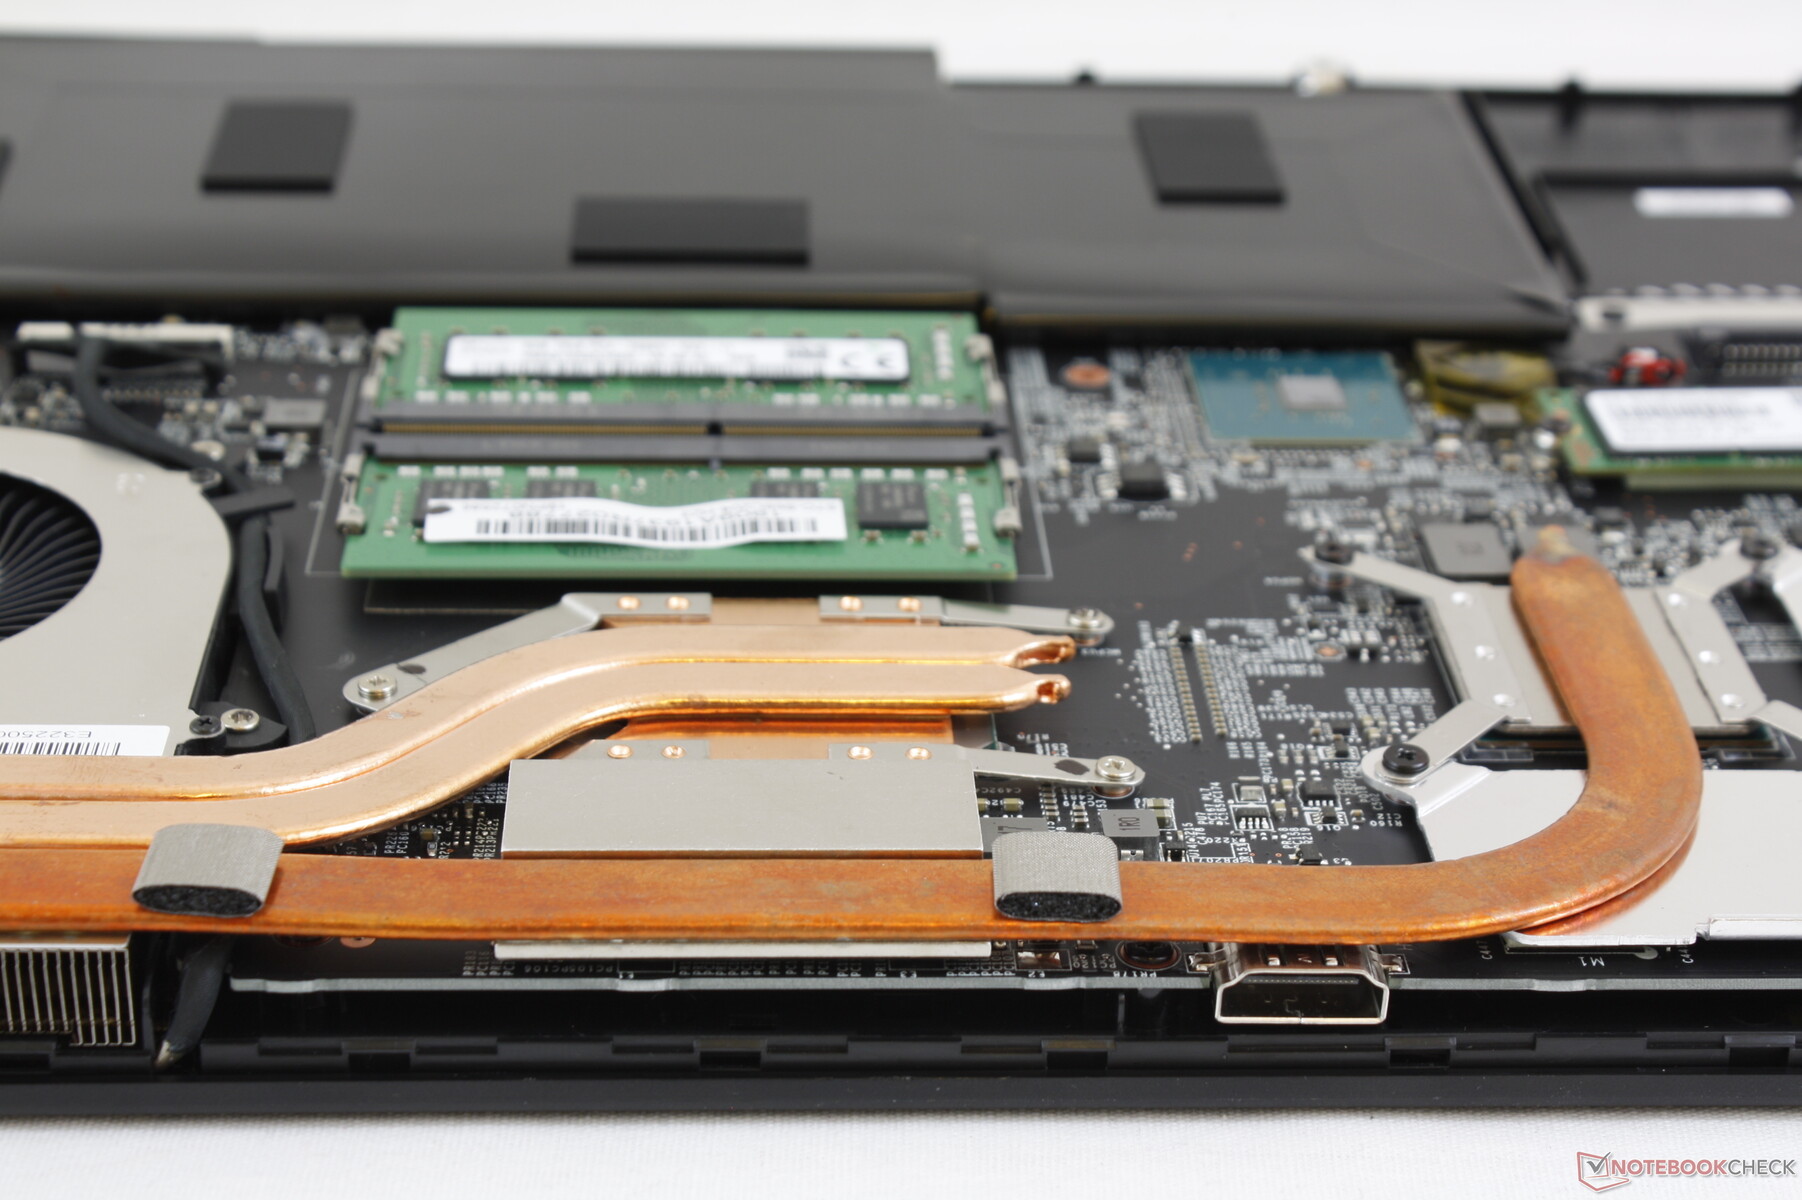
Maintenance
The bottom panel is secured by 12 Philips screws and will require a sharp edge to remove. It's particularly tricky around the right edge because the panel is tightly attached to the ports. We recommend being careful around this area and the rear latches. A factory seal sticker must be broken before the panel can be removed.
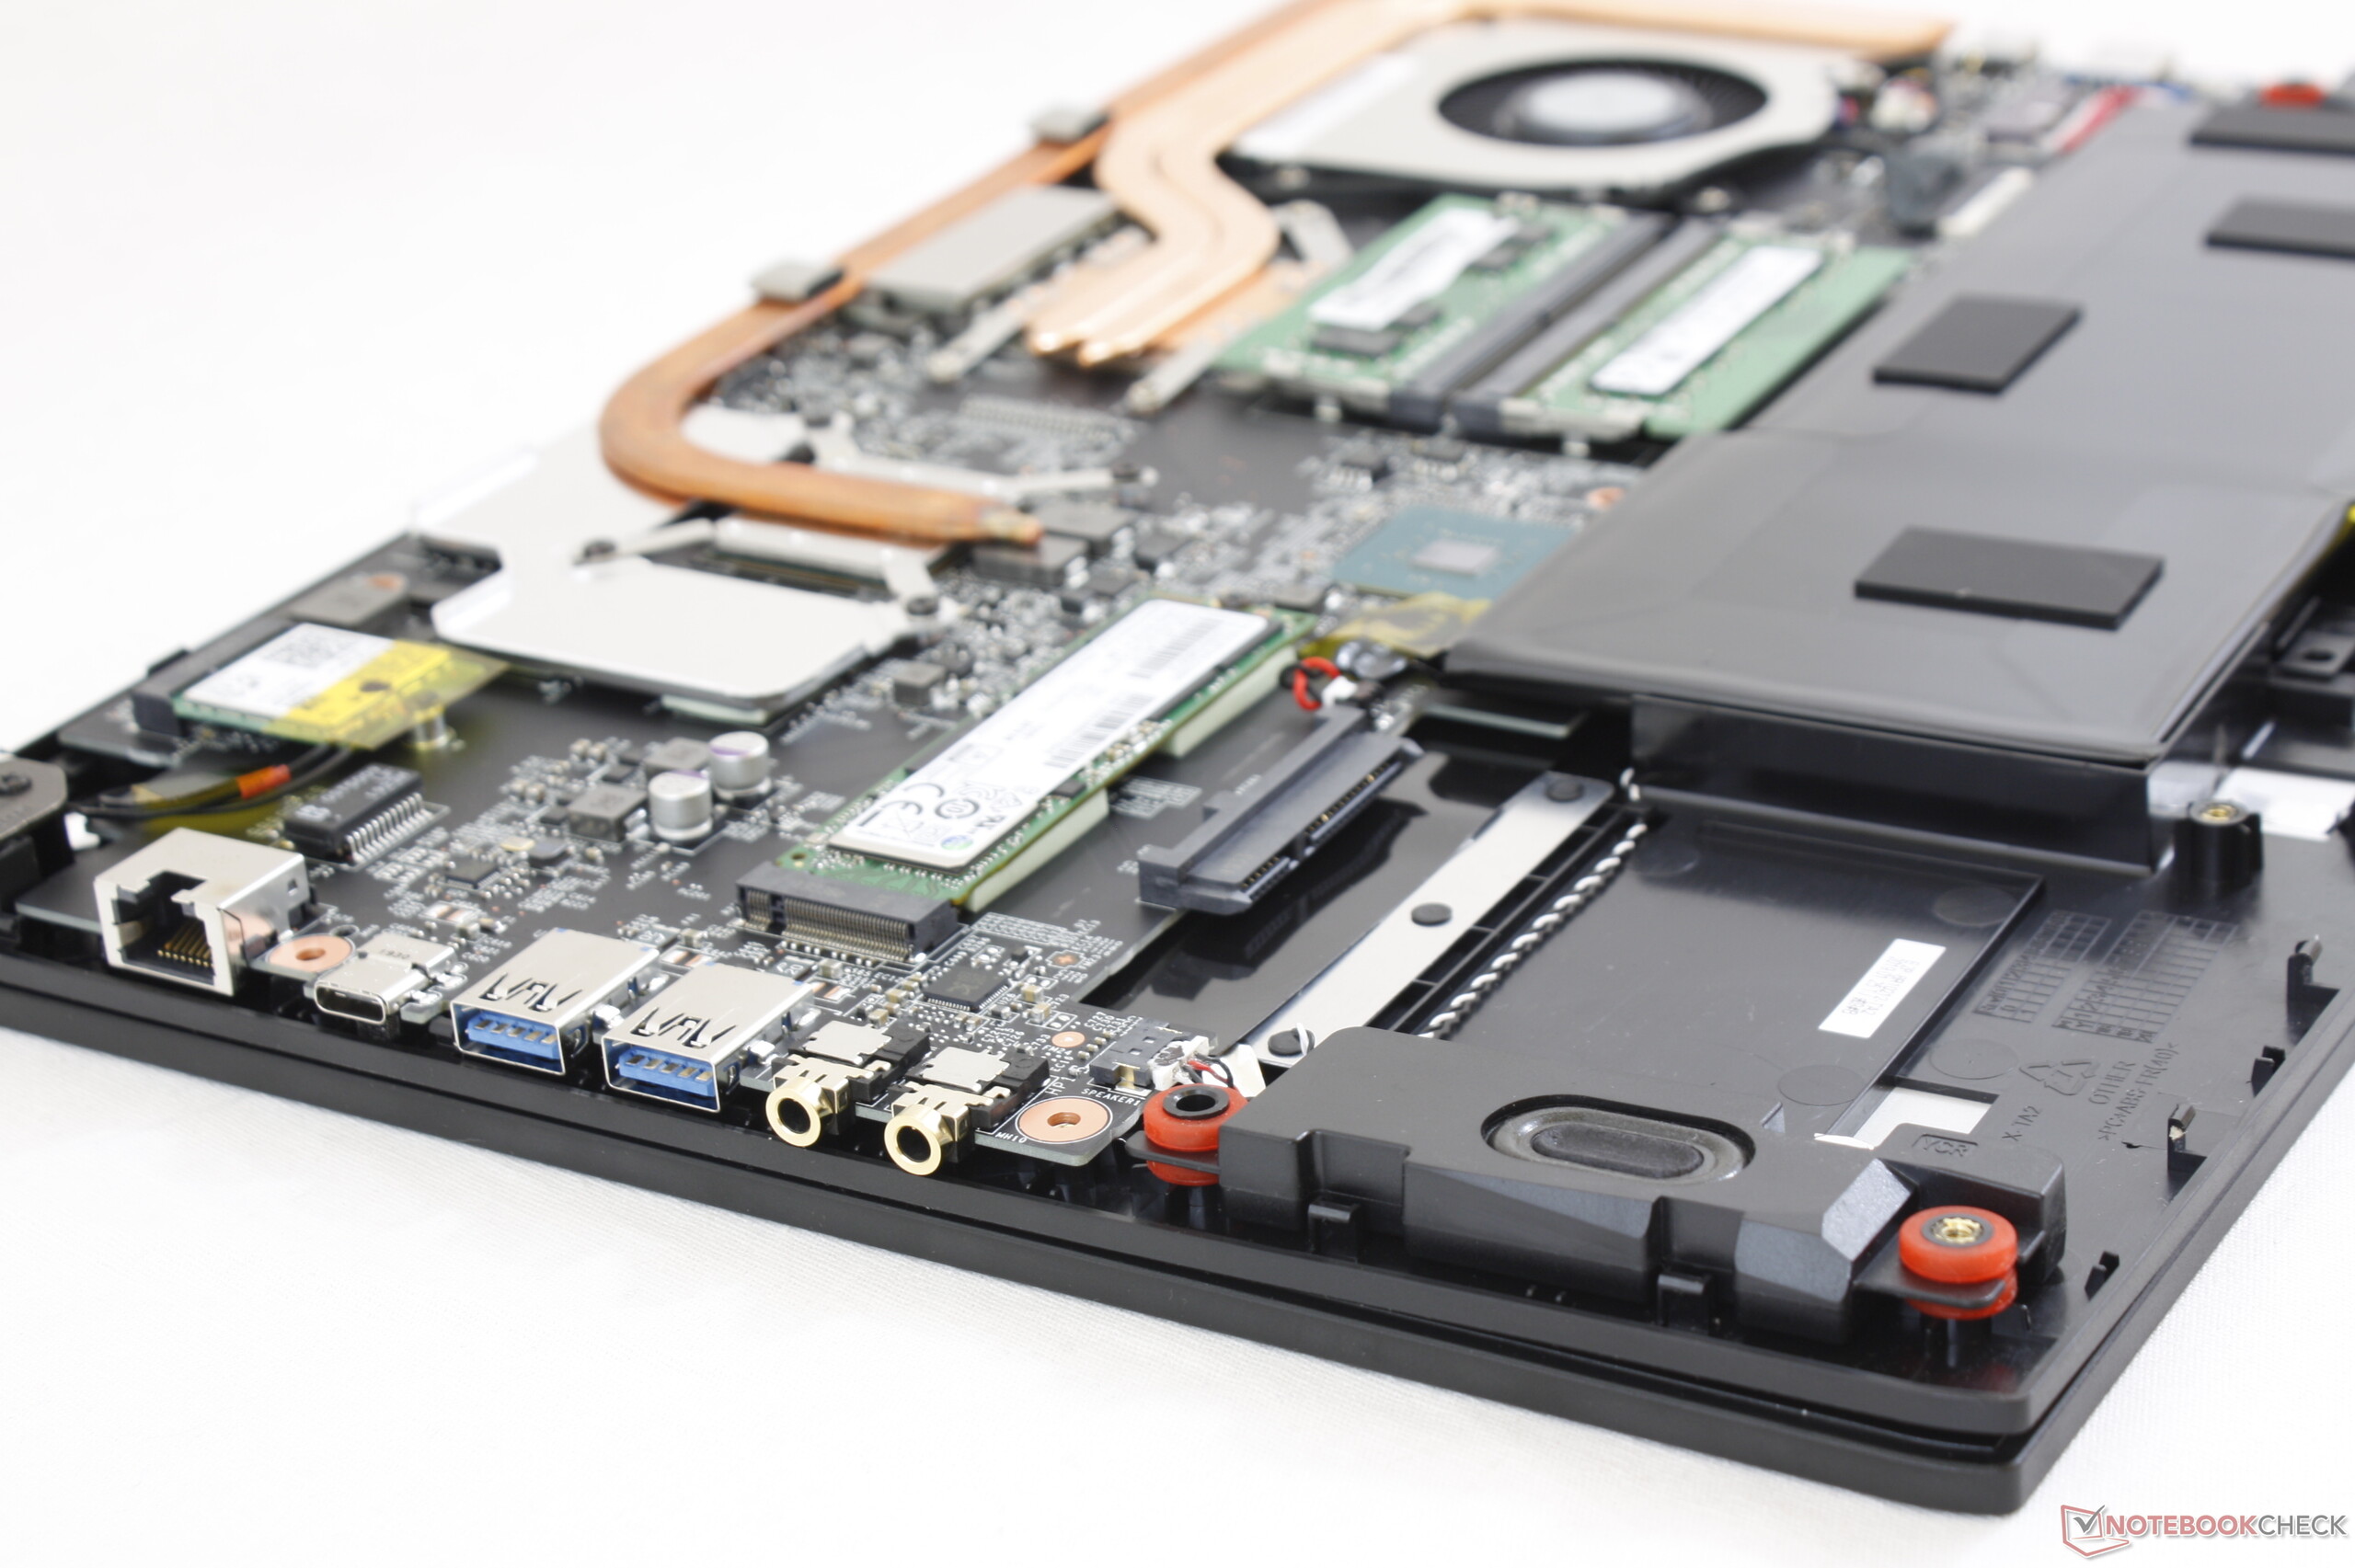
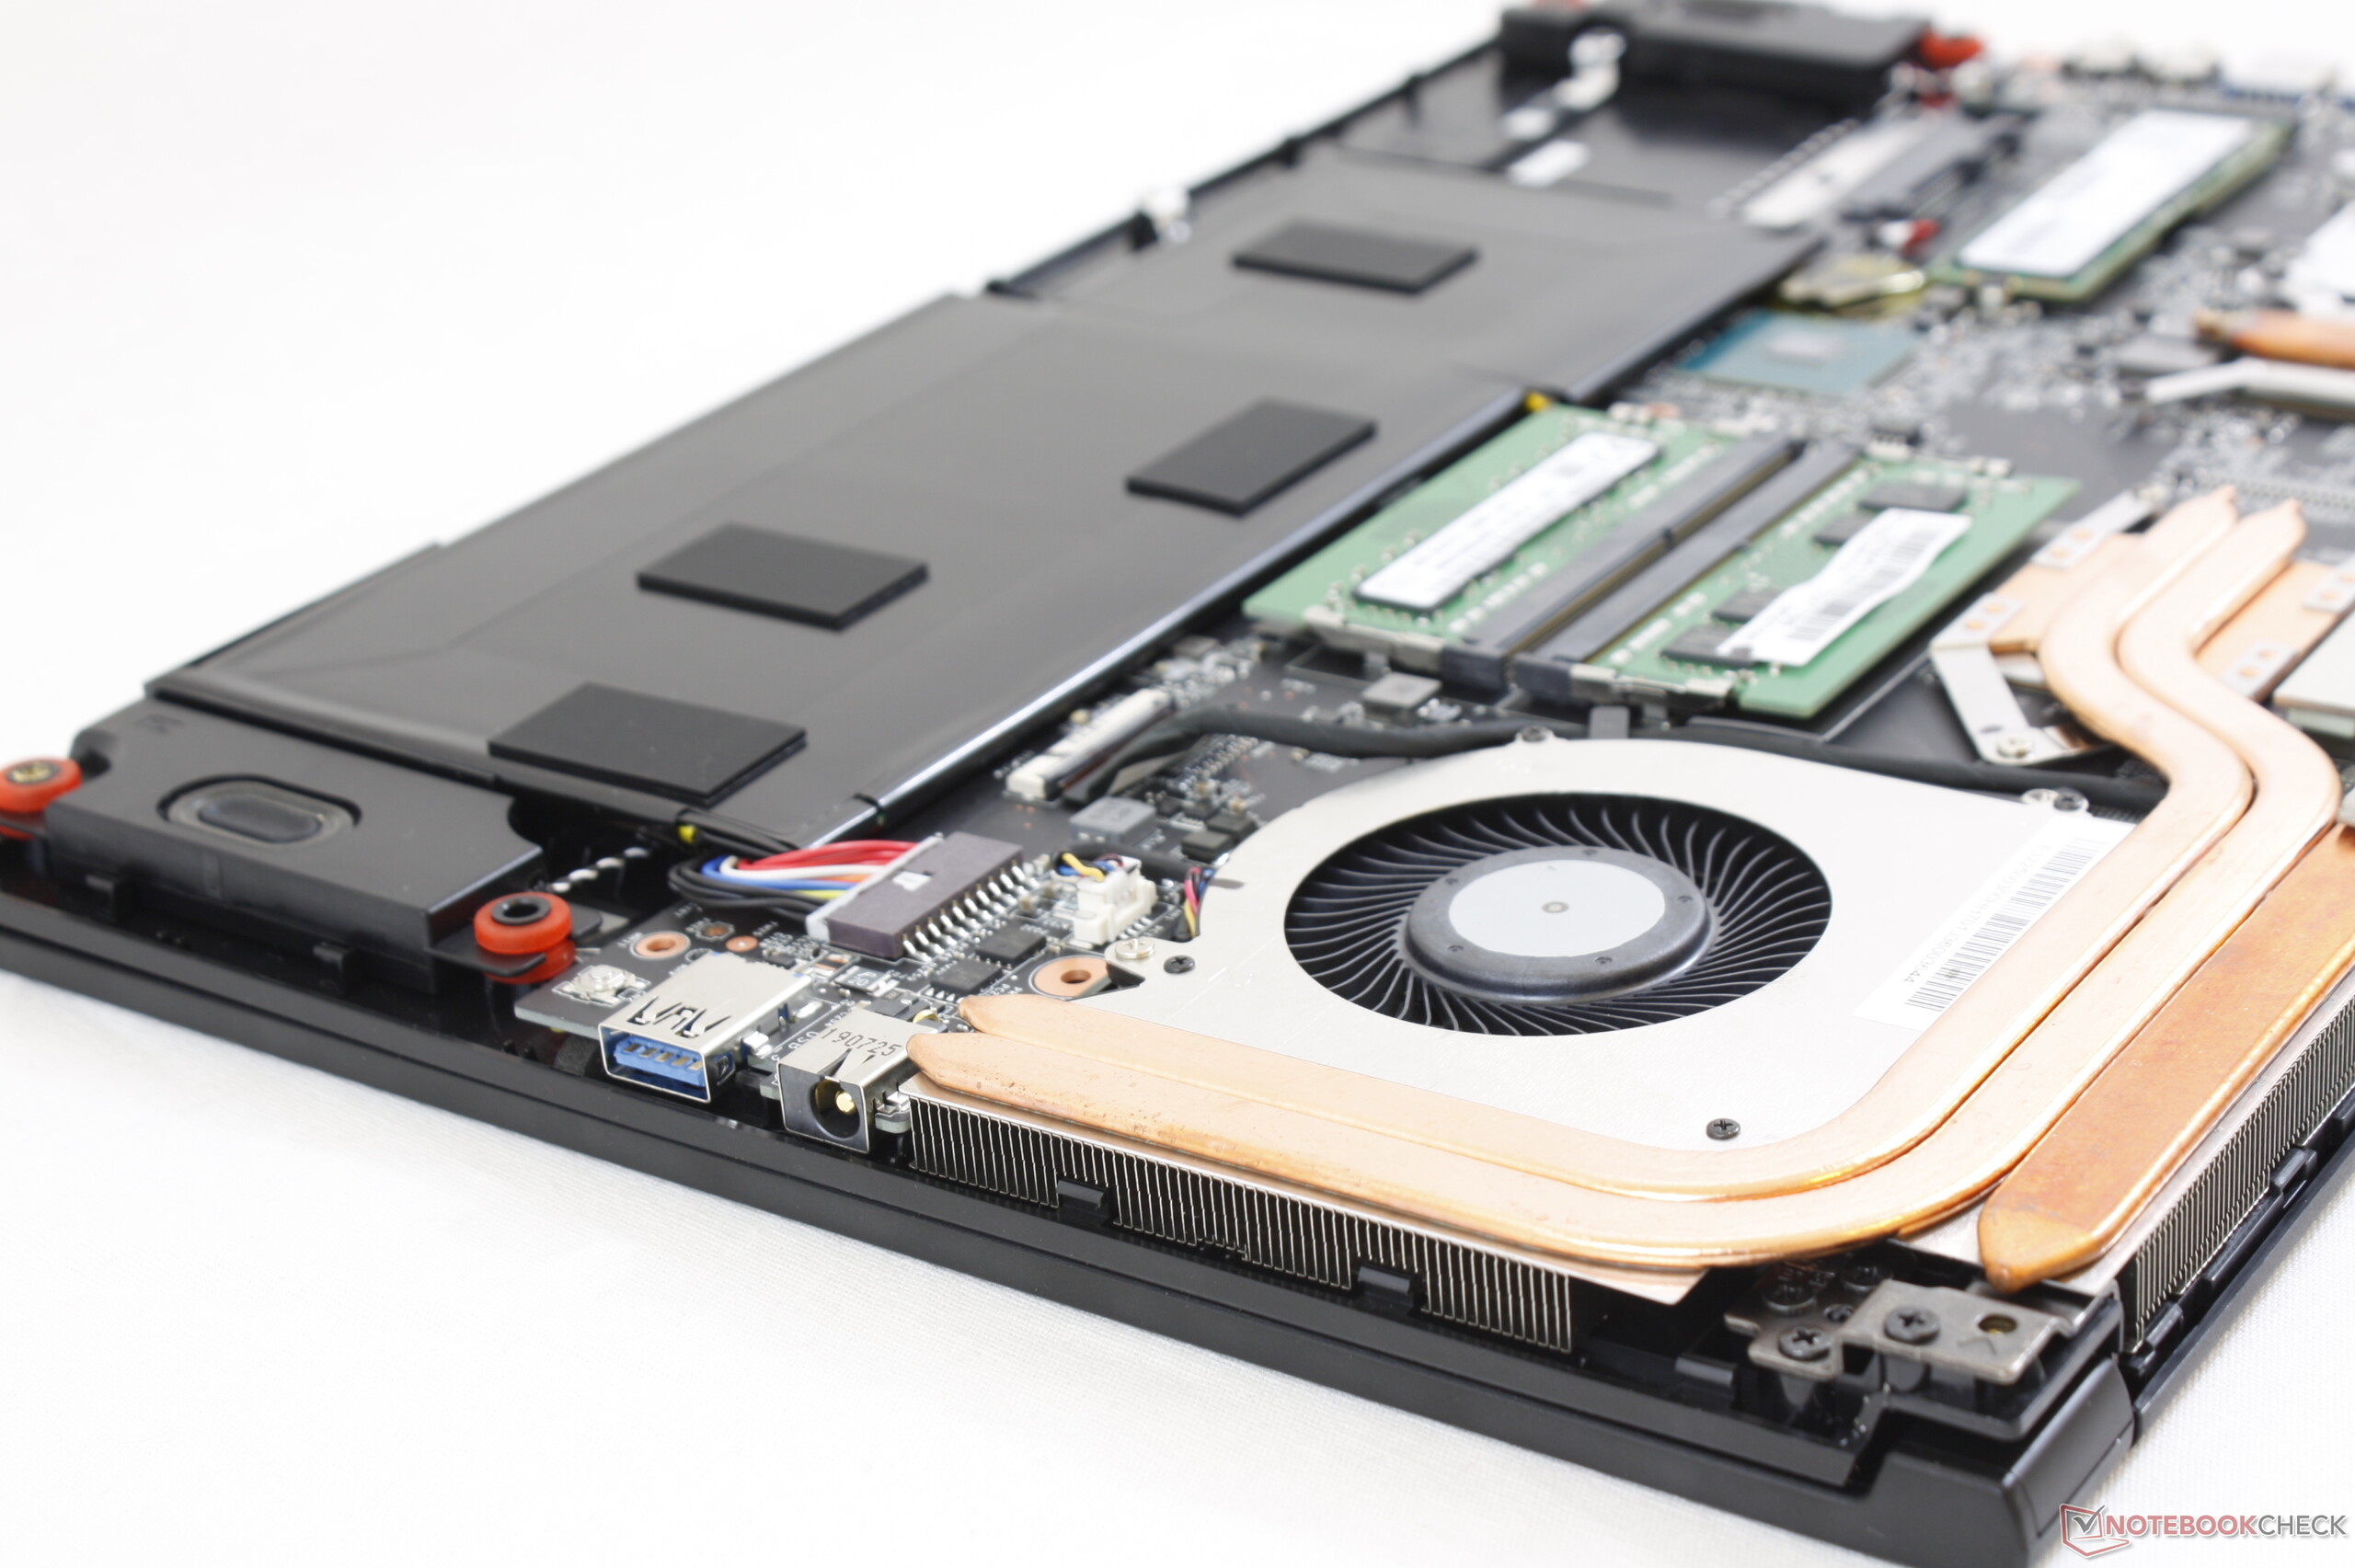
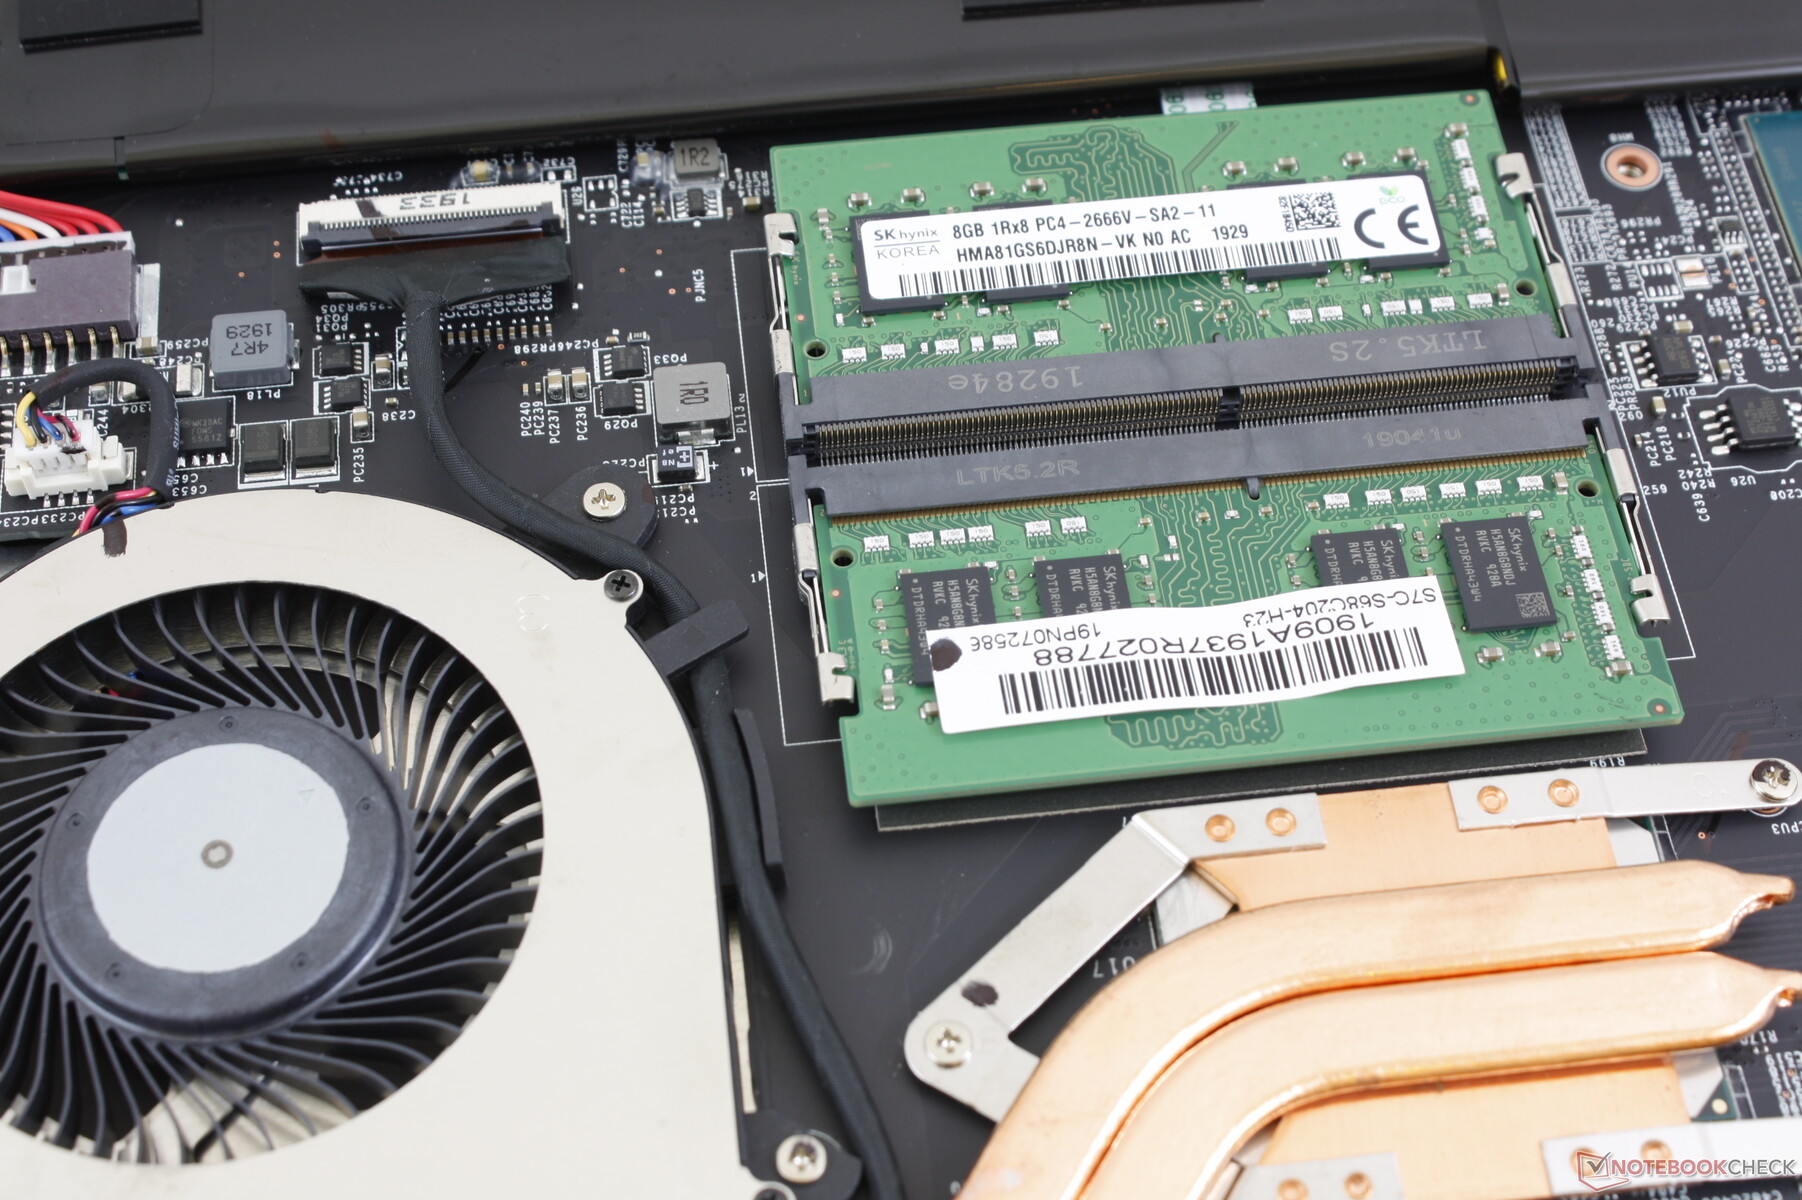
Once inside, users have direct access to core components like the dual storage bays, dual SODIMM slots, WLAN module, and the main battery.
Accessories and Warranty
Included extras are a mounting bracket and some screws for installing a secondary 2.5-inch drive. The standard limited warranty lasts for only a year with fewer extension and protection options when compared to workstations from HP, Dell, or Lenovo.
Input Devices
Keyboard
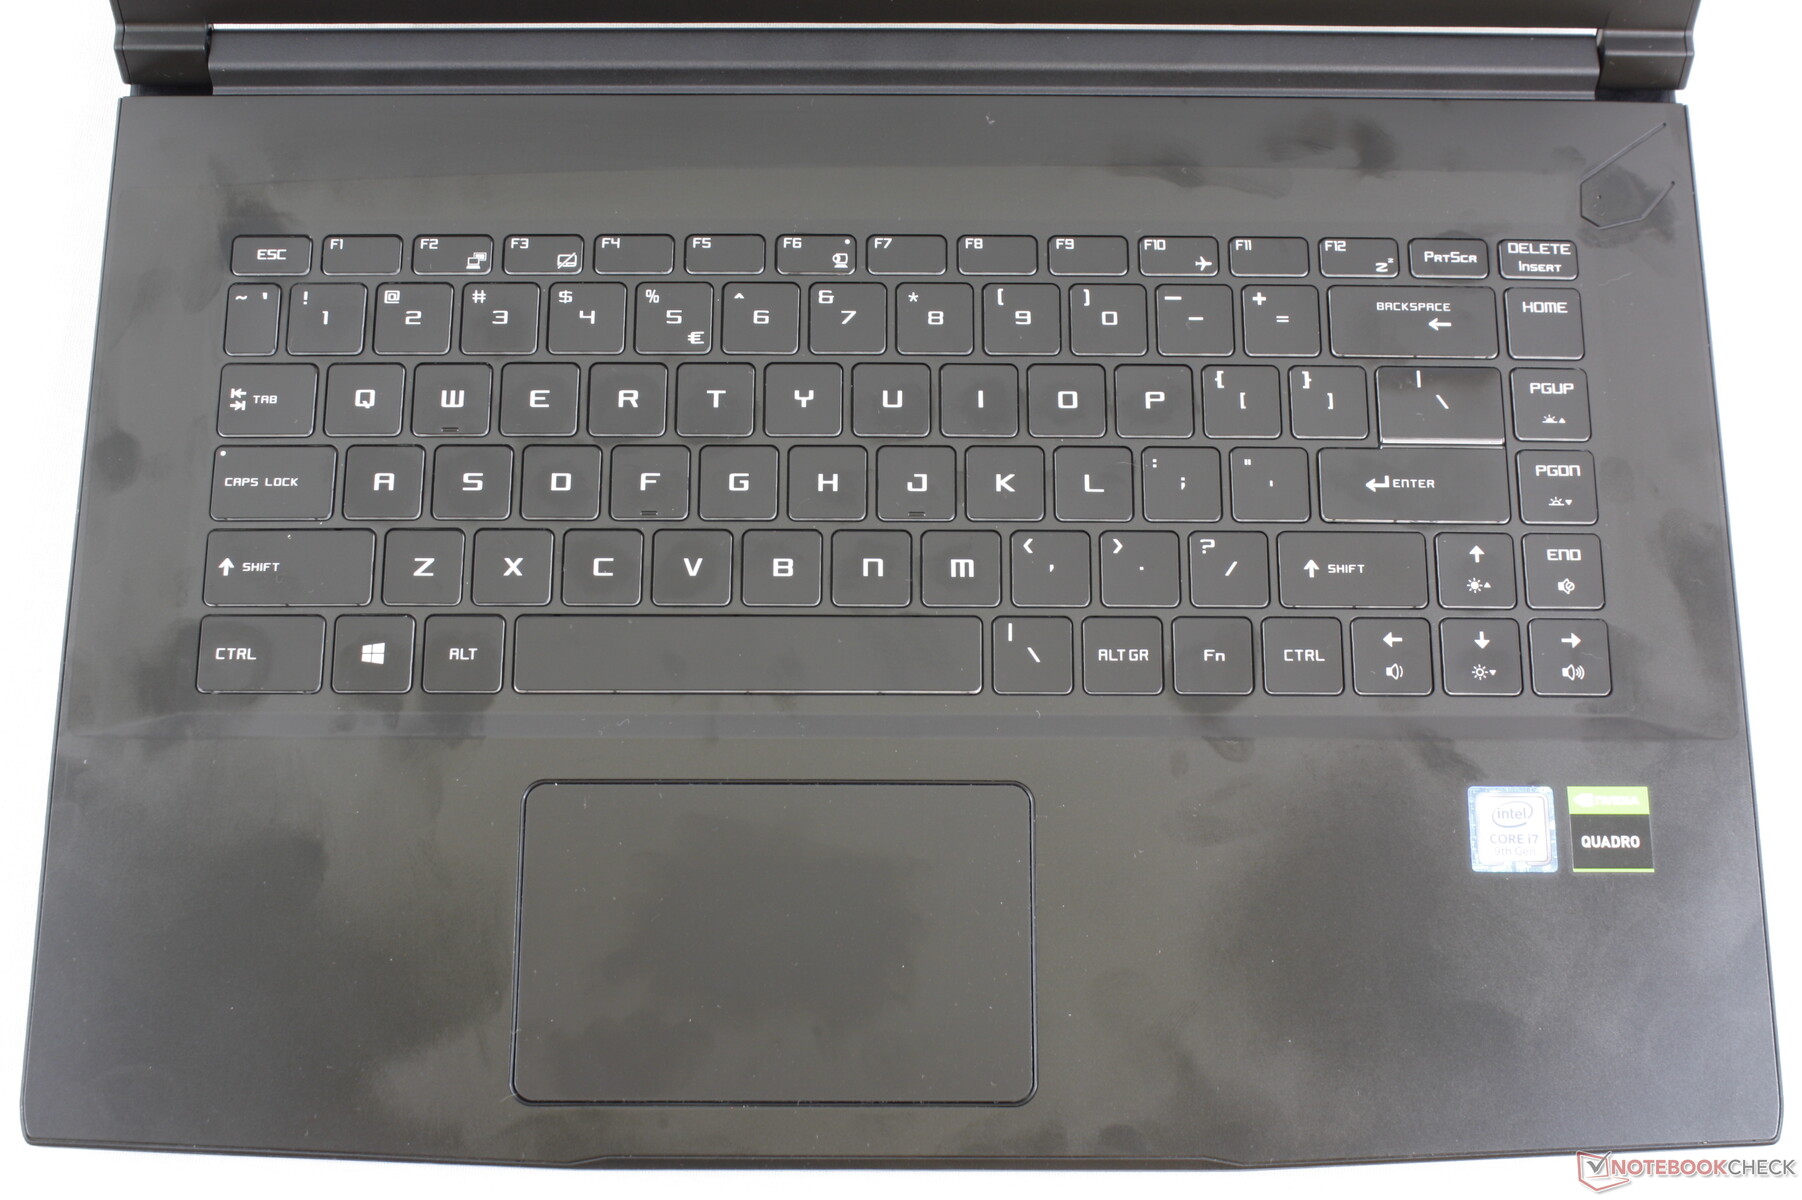
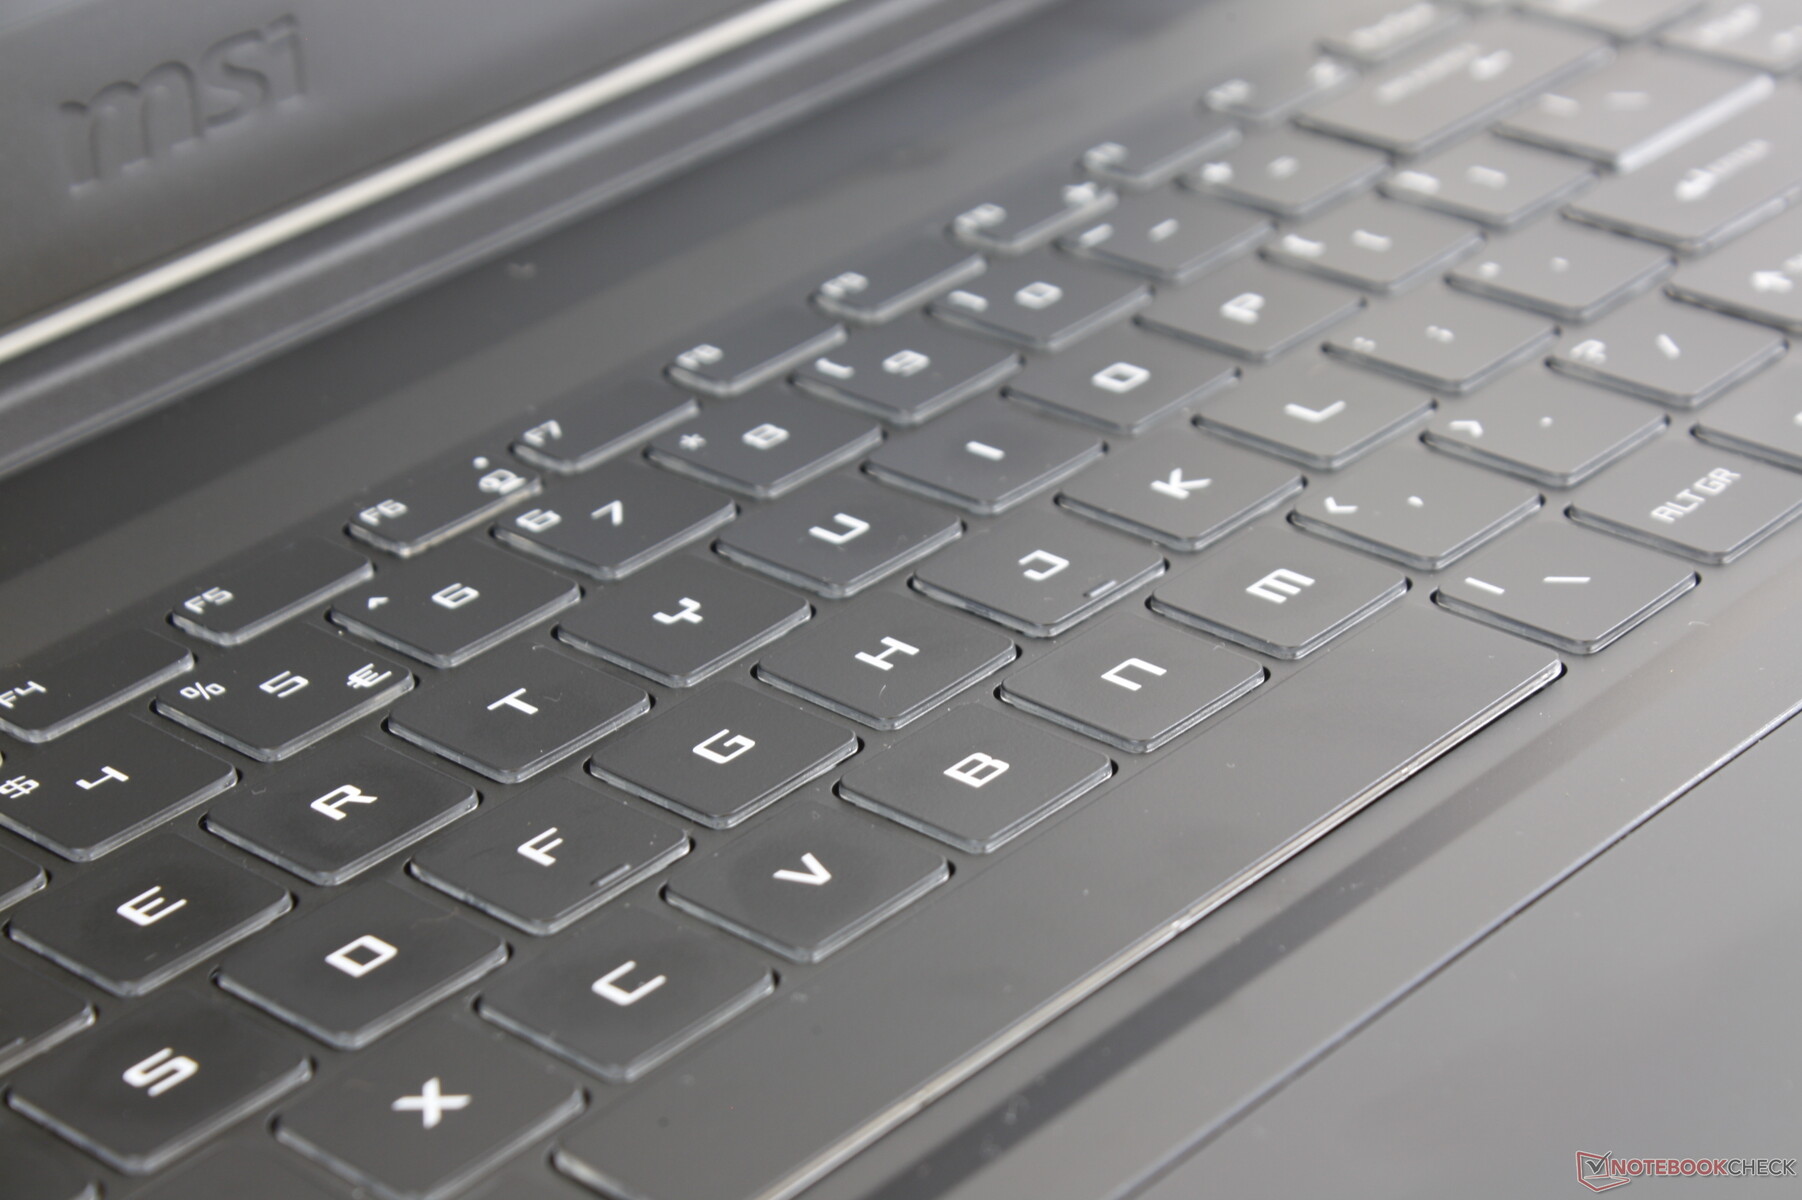
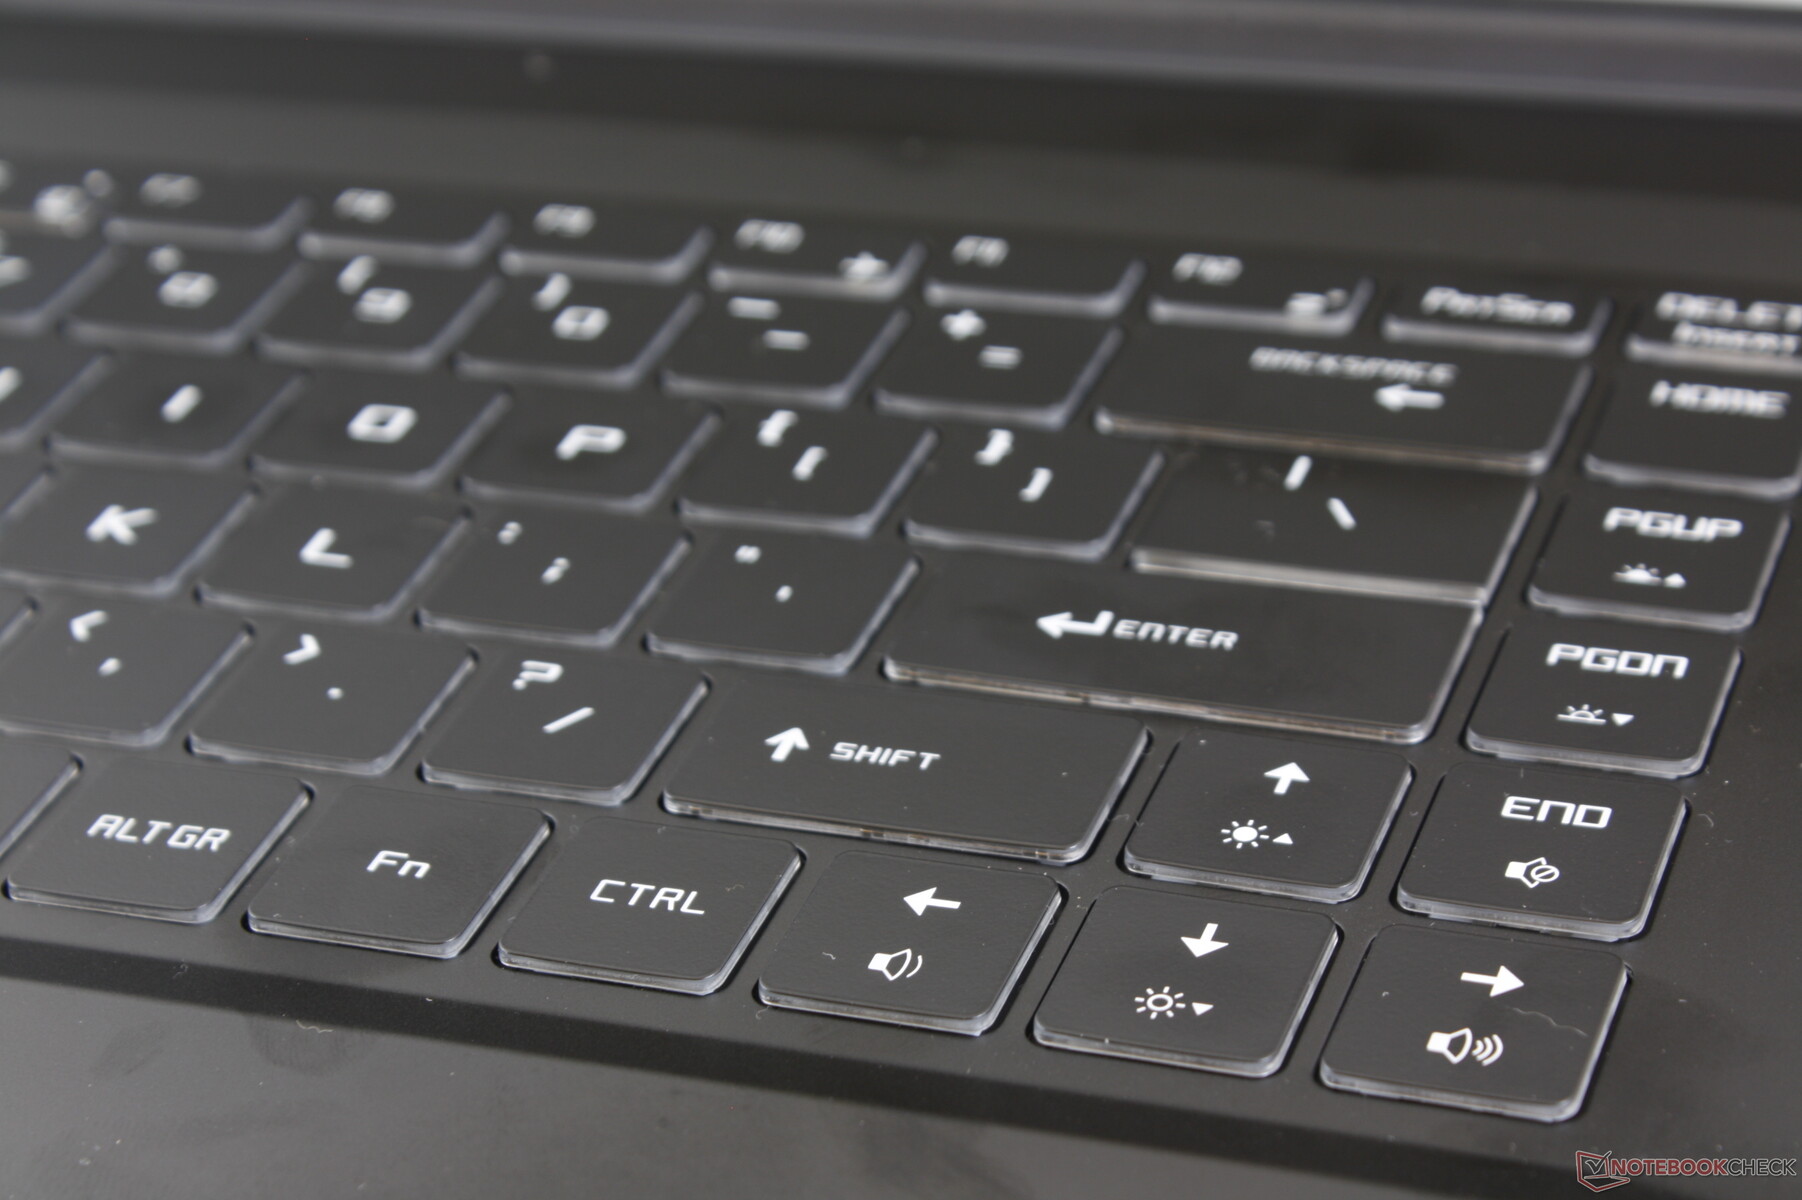
The keyboard looks the same as the one on the GS65 in terms of font and layout. Their similarities are otherwise only skin deep because the keys on the WP65 feel very different from the SteelSeries keys on most MSI G series laptops. Travel is much shallower while clatter and feedback are slightly louder and more uneven, respectively. Since the keyboard deck is flexible and not very rigid, the center keys are spongier in feedback than they should be when compared to the keys closer to the edges or corners. Other workstations like the ThinkPad P1 or Precision 7000 offer firmer keys with deeper travel whereas the typing experience on the WP65 feels more like a consumer Ultrabook.
The single-zone white backlight offers three levels of uniform illumination. All keys and symbols are lit unlike on the Gigabyte Aero 15 or some older Razer Blade systems.
Touchpad
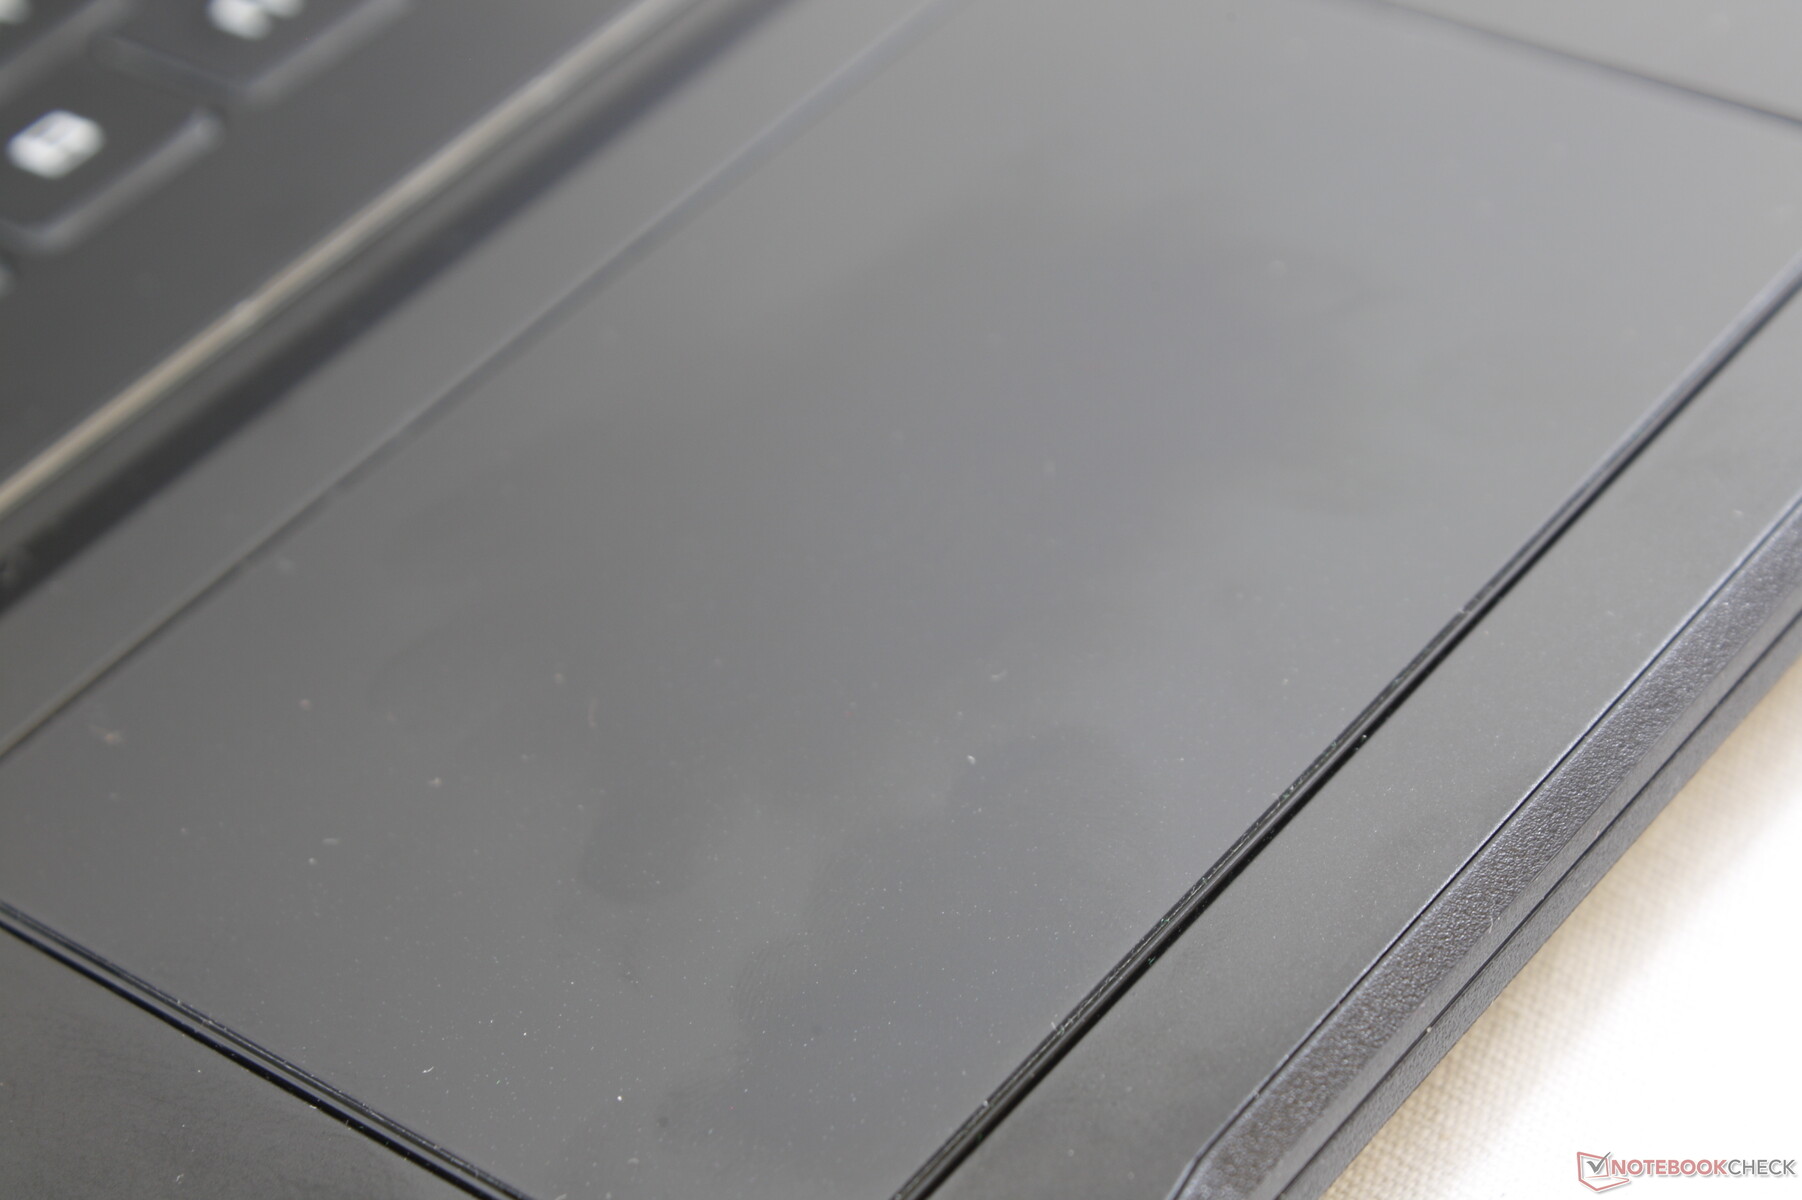
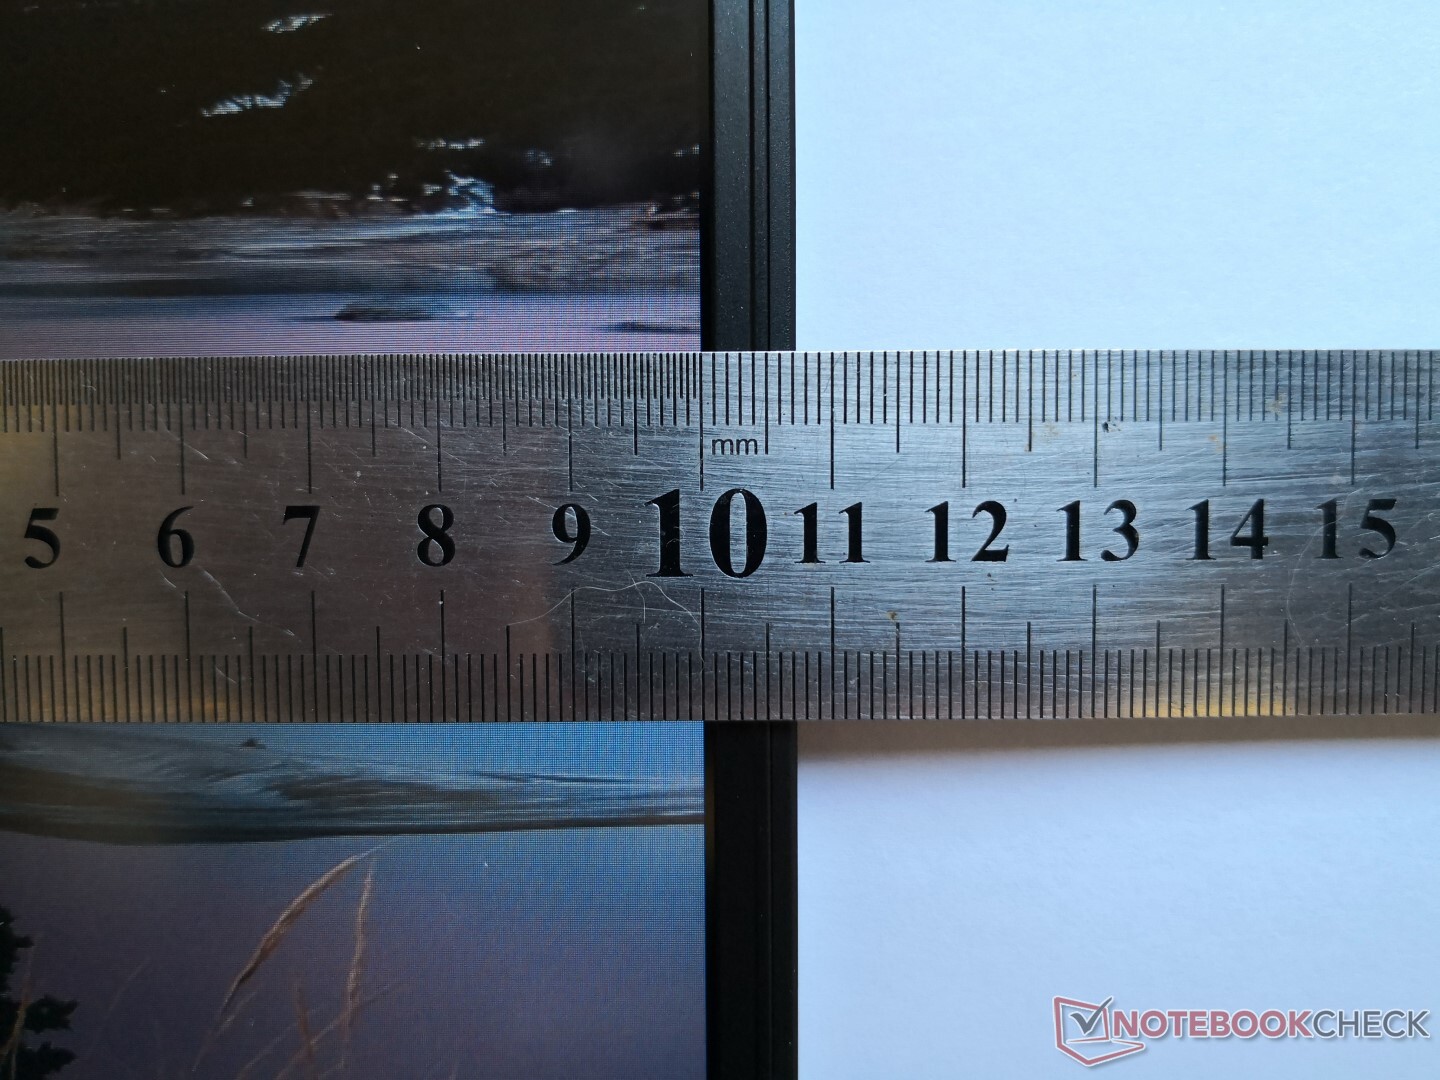
The clickpad is decent in size at about 10.5 x 6.5 cm. Other 15.6-inch laptops have roomier clickpads like the Dell XPS 15 (10.5 x 8.5 cm) or MSI's own GS65 9SG (14 x 6.5 cm). Its surface is smooth and textureless not unlike the surrounding palm rests. Thus, there is very little sticking no matter the cursor speed which can make precise clicks somewhat more difficult if moving slowly.
The integrated mouse keys have a satisfactory and audible click when pressed. Feedback, however, is on the spongy side and could have been firmer. Dedicated mouse keys like on the larger MSI GT76 series and most other workstations would have been preferable.
Display
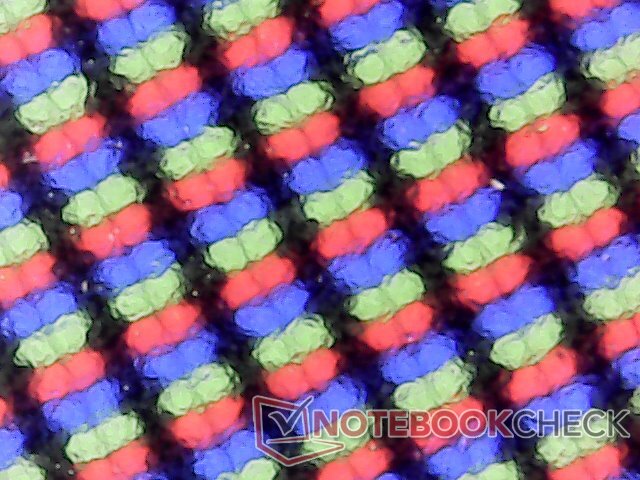
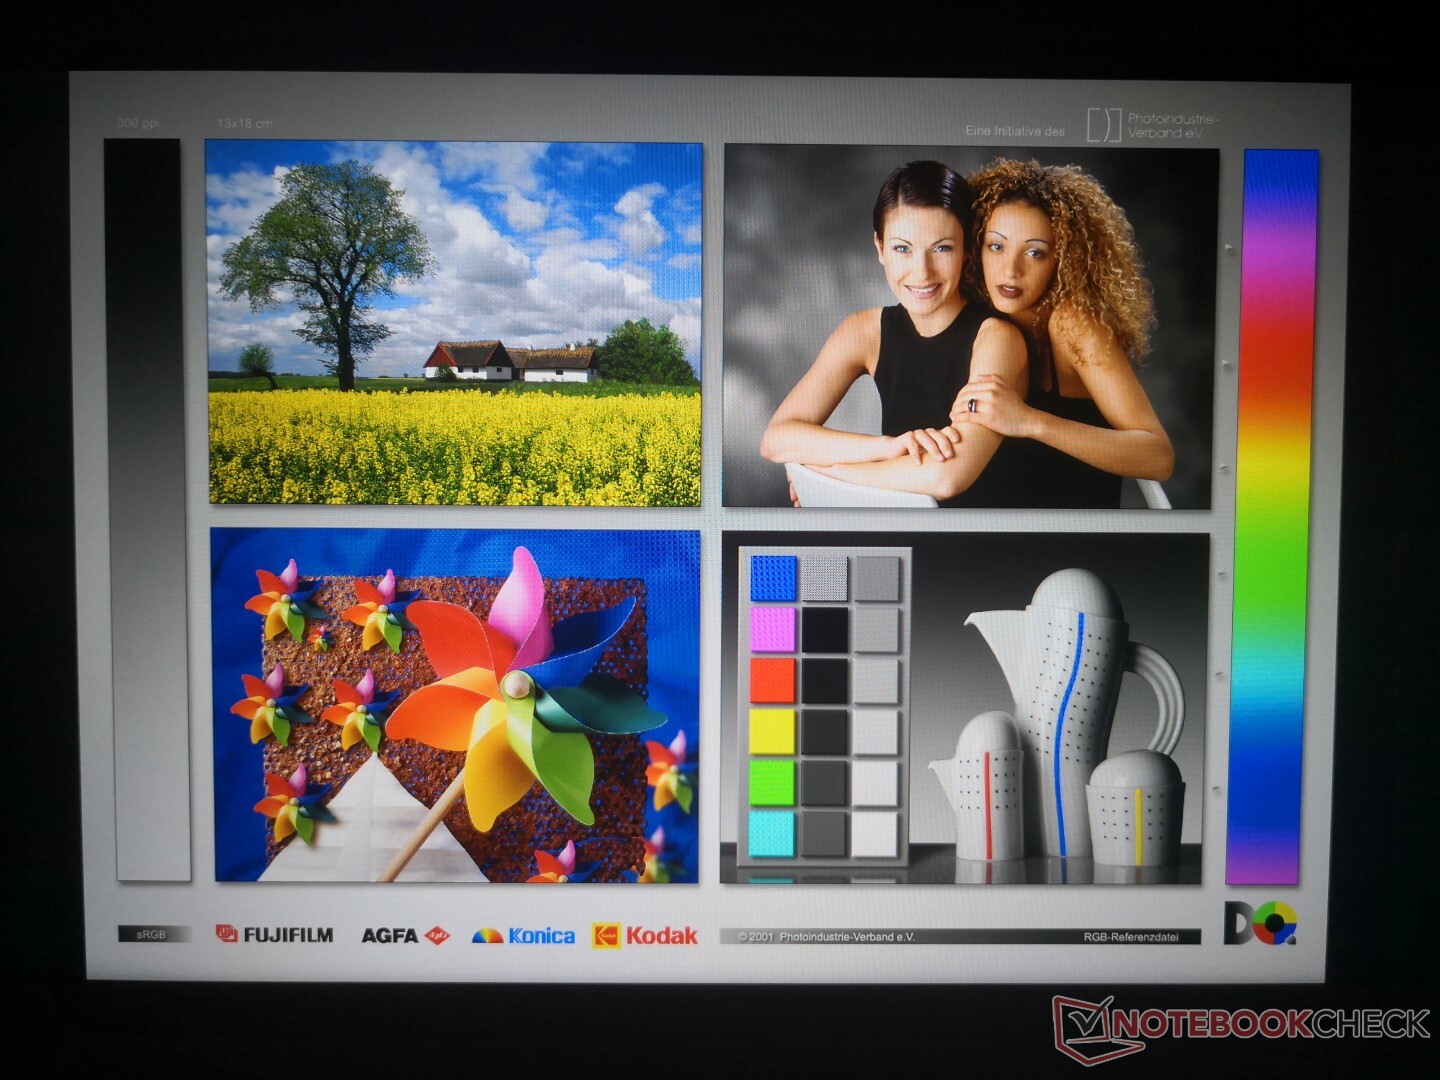
The AU Optronics B156HAN02.1 IPS panel is relatively common as this same panel can also be found on the budget-midrange Asus VivoBook S15 S510UQ, MSI GF63 8RC, or the Lenovo Legion Y530. Consequently, the WP65 offers a similar visual experience to these laptops including the average contrast ratio, average response times, and narrow color gamut to be an average display overall. MSI does not offer any 120/144/240 Hz, 3/5 ms or 4K UHD panels unlike on the gaming-centric GS65 series.
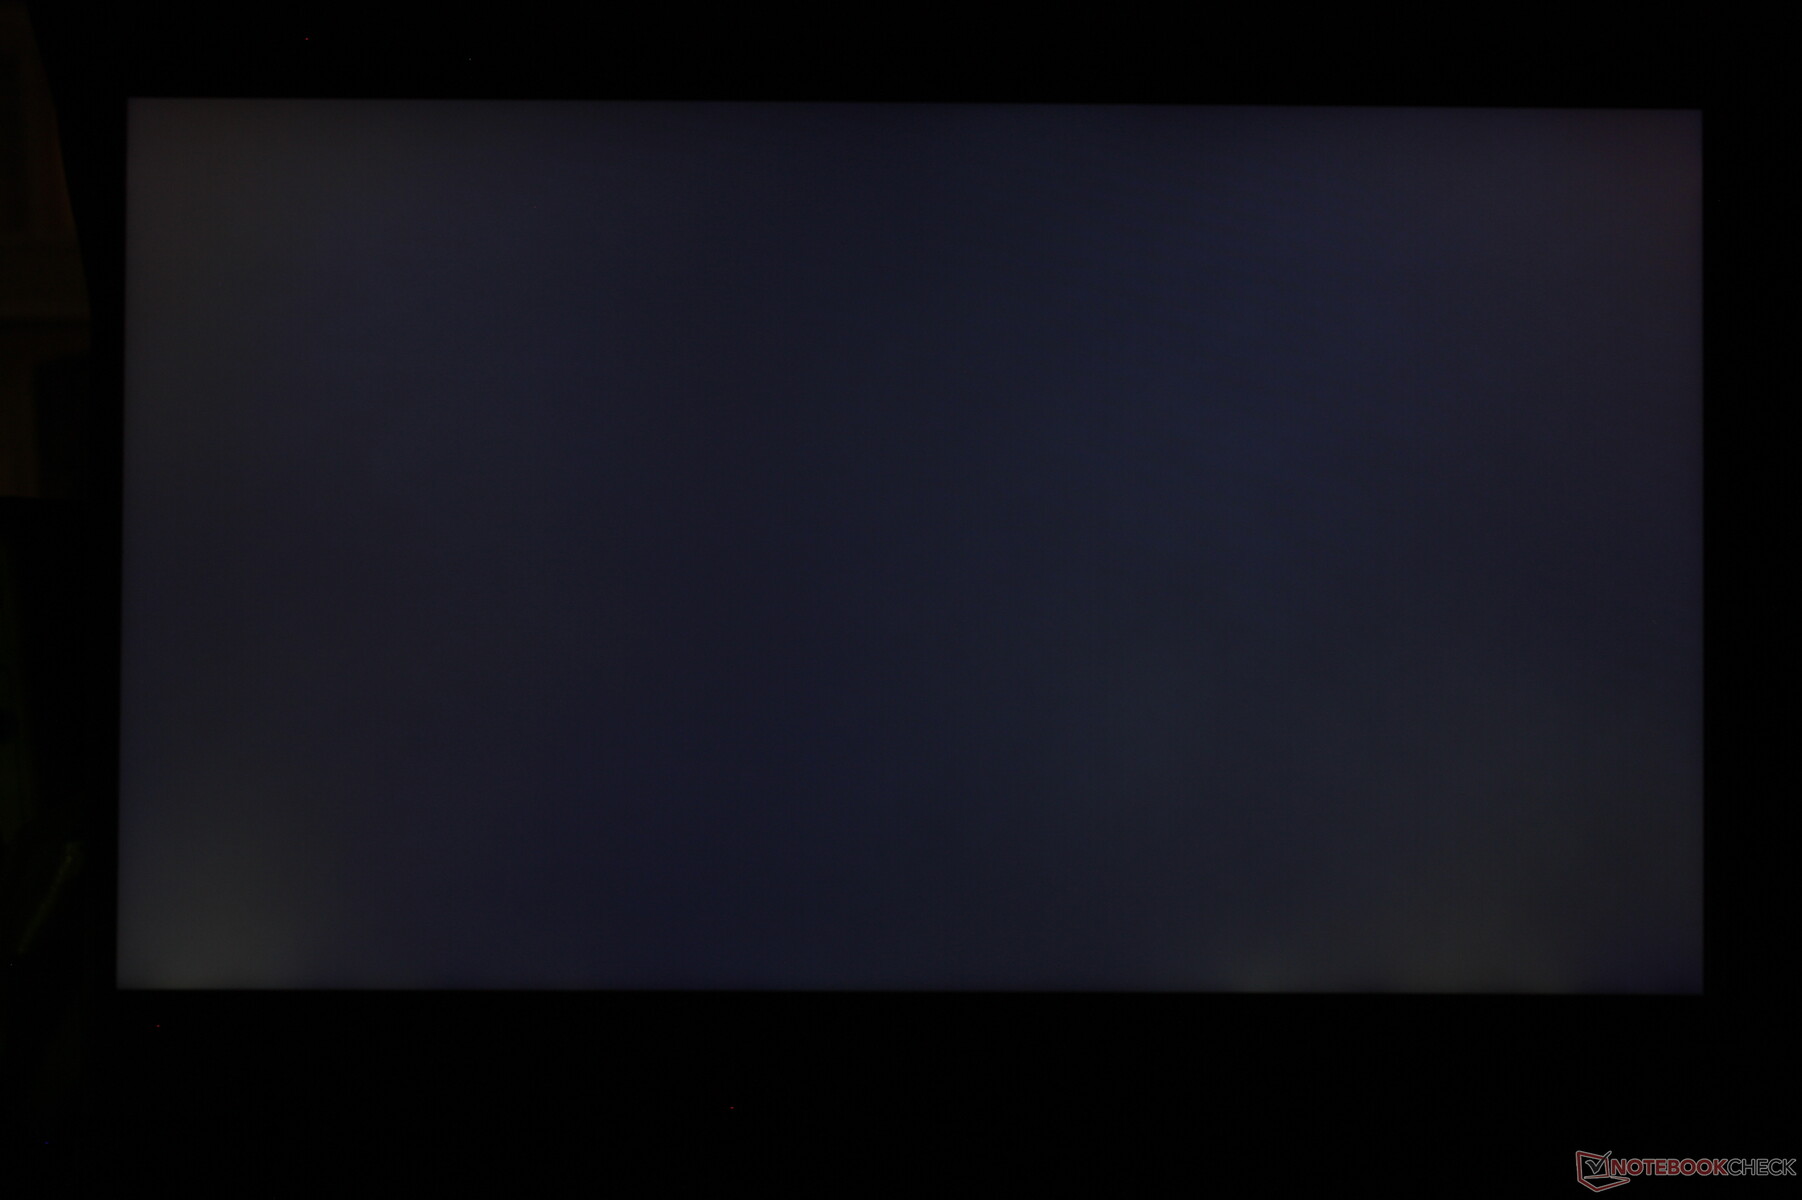
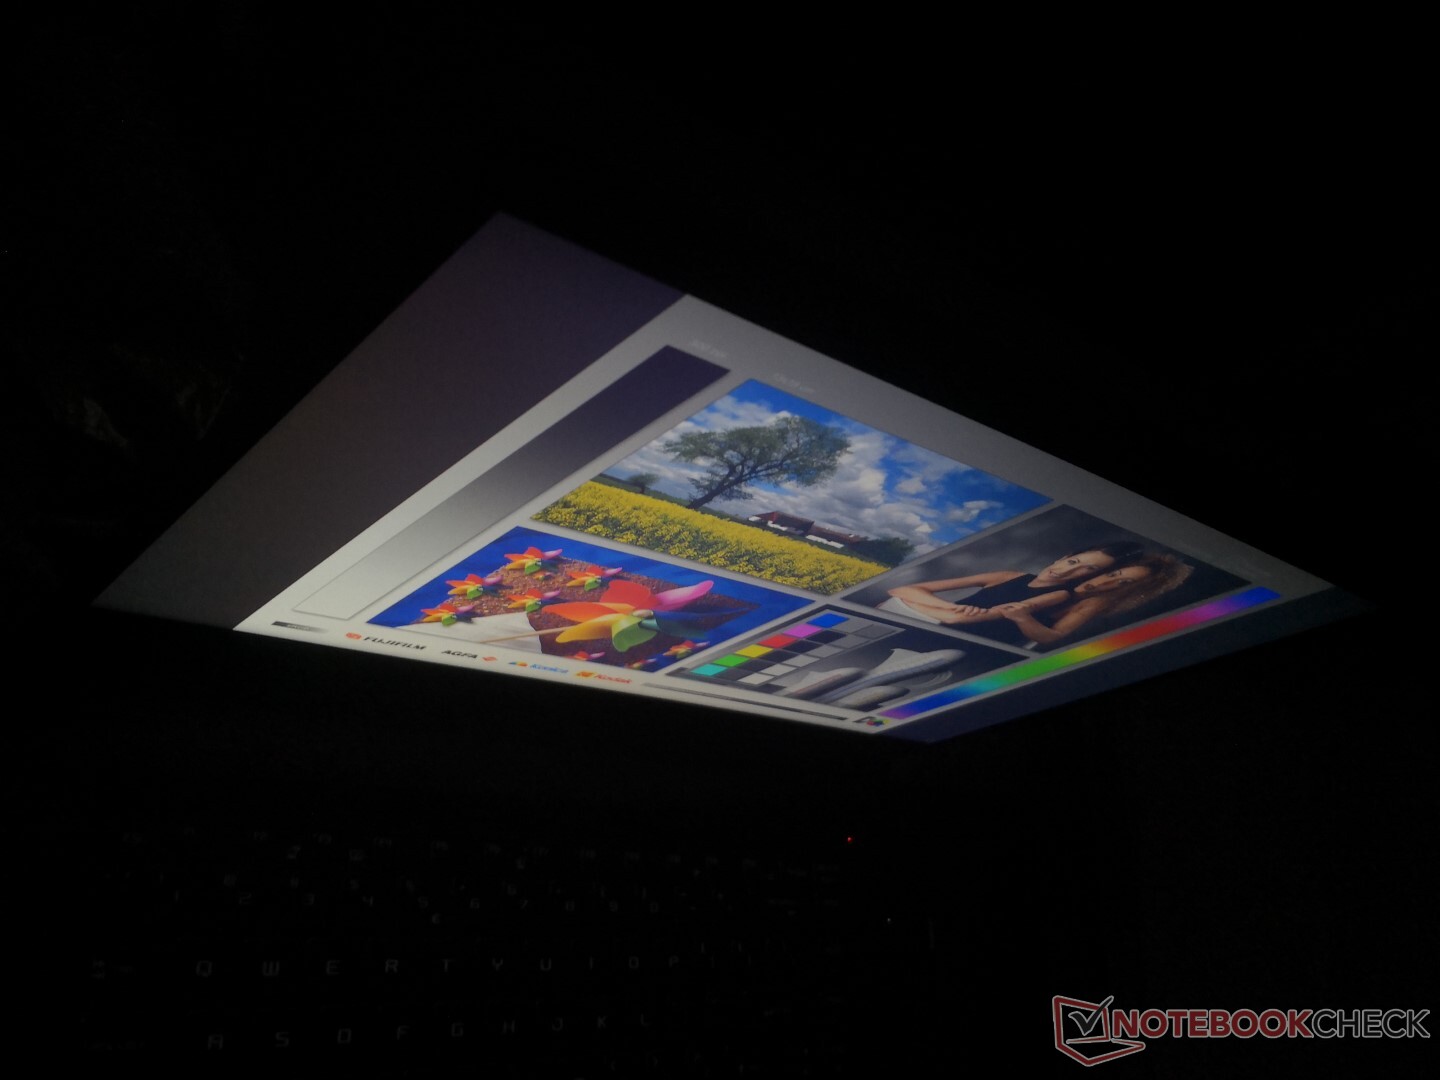
Display quality is still very good even if it can't match the higher-end workstations like the HP ZBook 15 or ThinkPad P series. Minor graininess is present as is common on most matte panels. Our unit also suffers from moderate uneven backlight bleeding along the bottom left corner of the screen as shown by the picture below.
| |||||||||||||||||||||||||
Brightness Distribution: 86 %
Center on Battery: 267.4 cd/m²
Contrast: 723:1 (Black: 0.37 cd/m²)
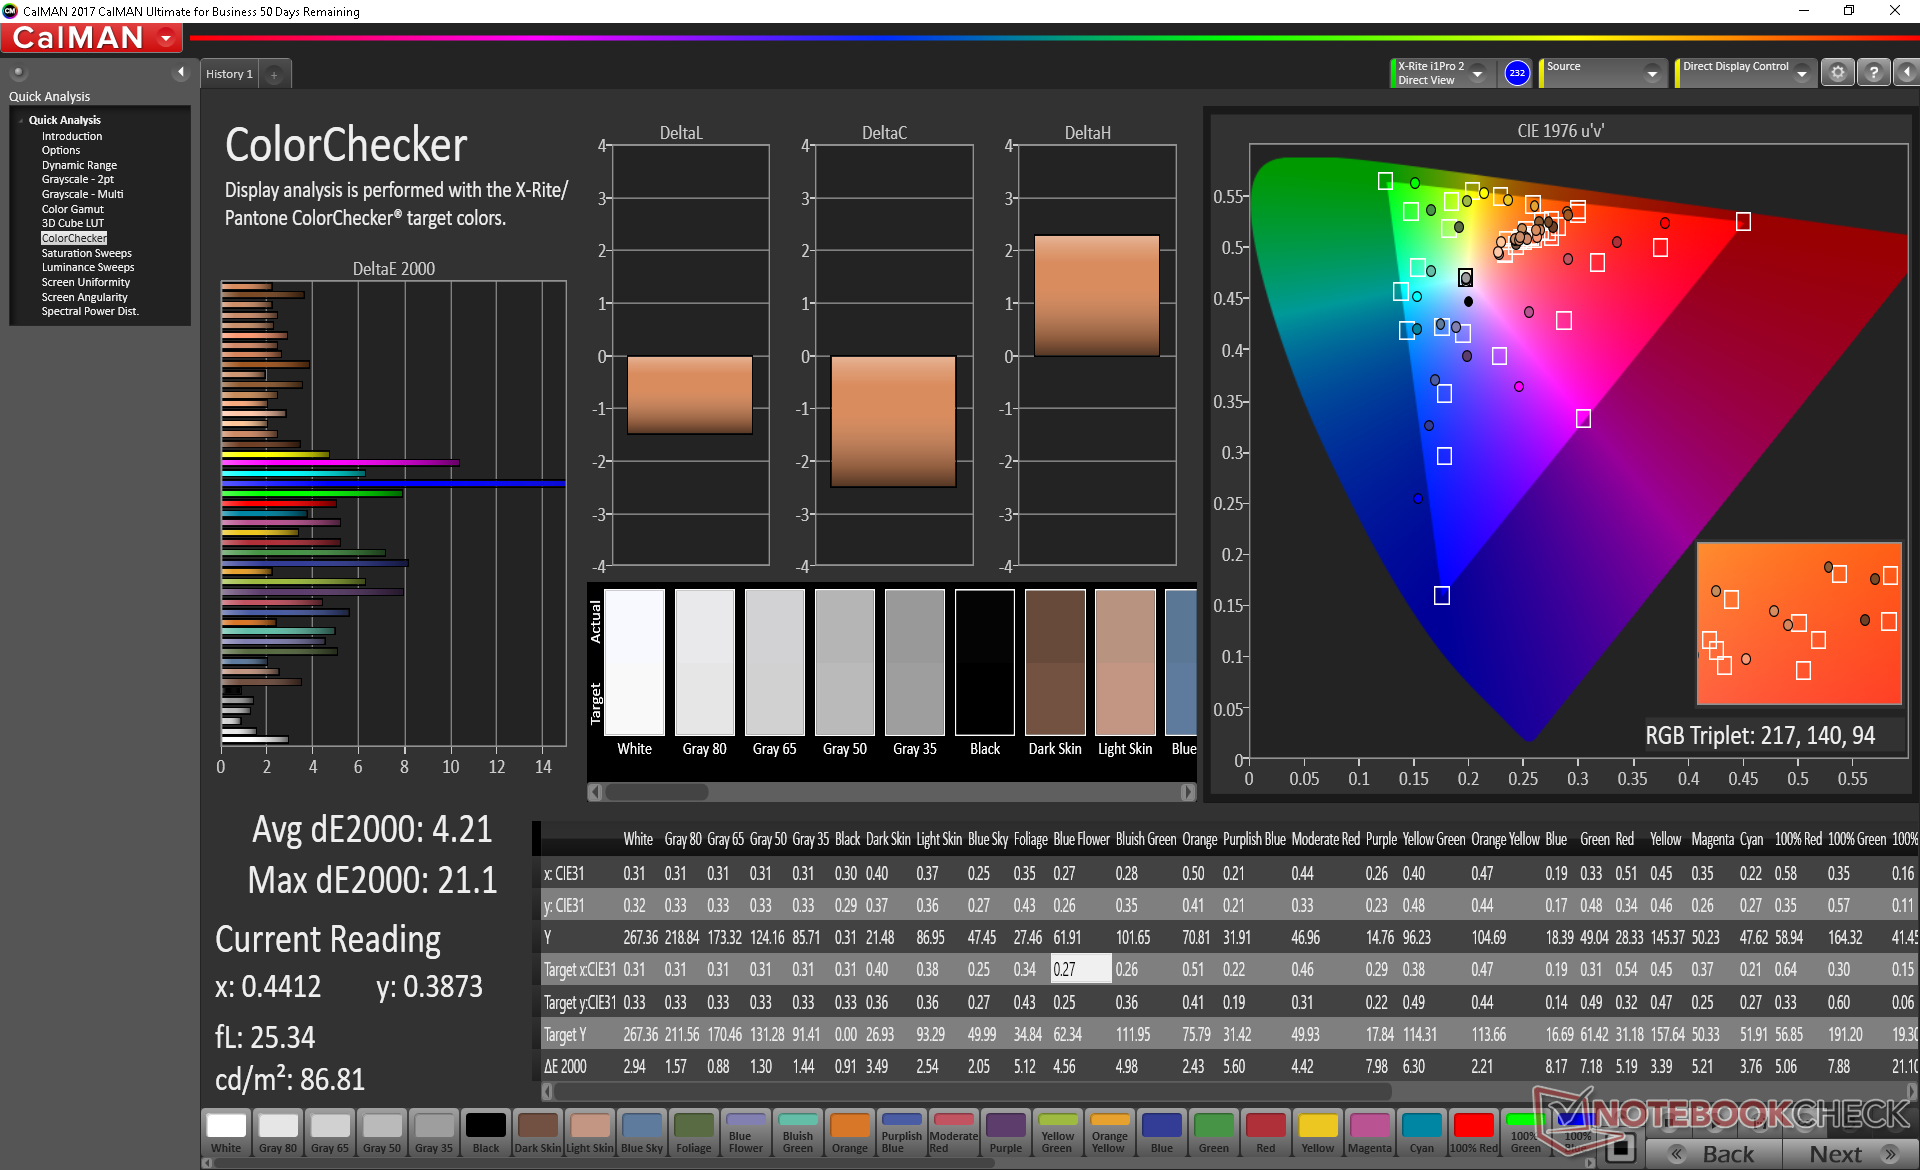
ΔE ColorChecker Calman: 4.21 | ∀{0.5-29.43 Ø4.72}
calibrated: 4.27
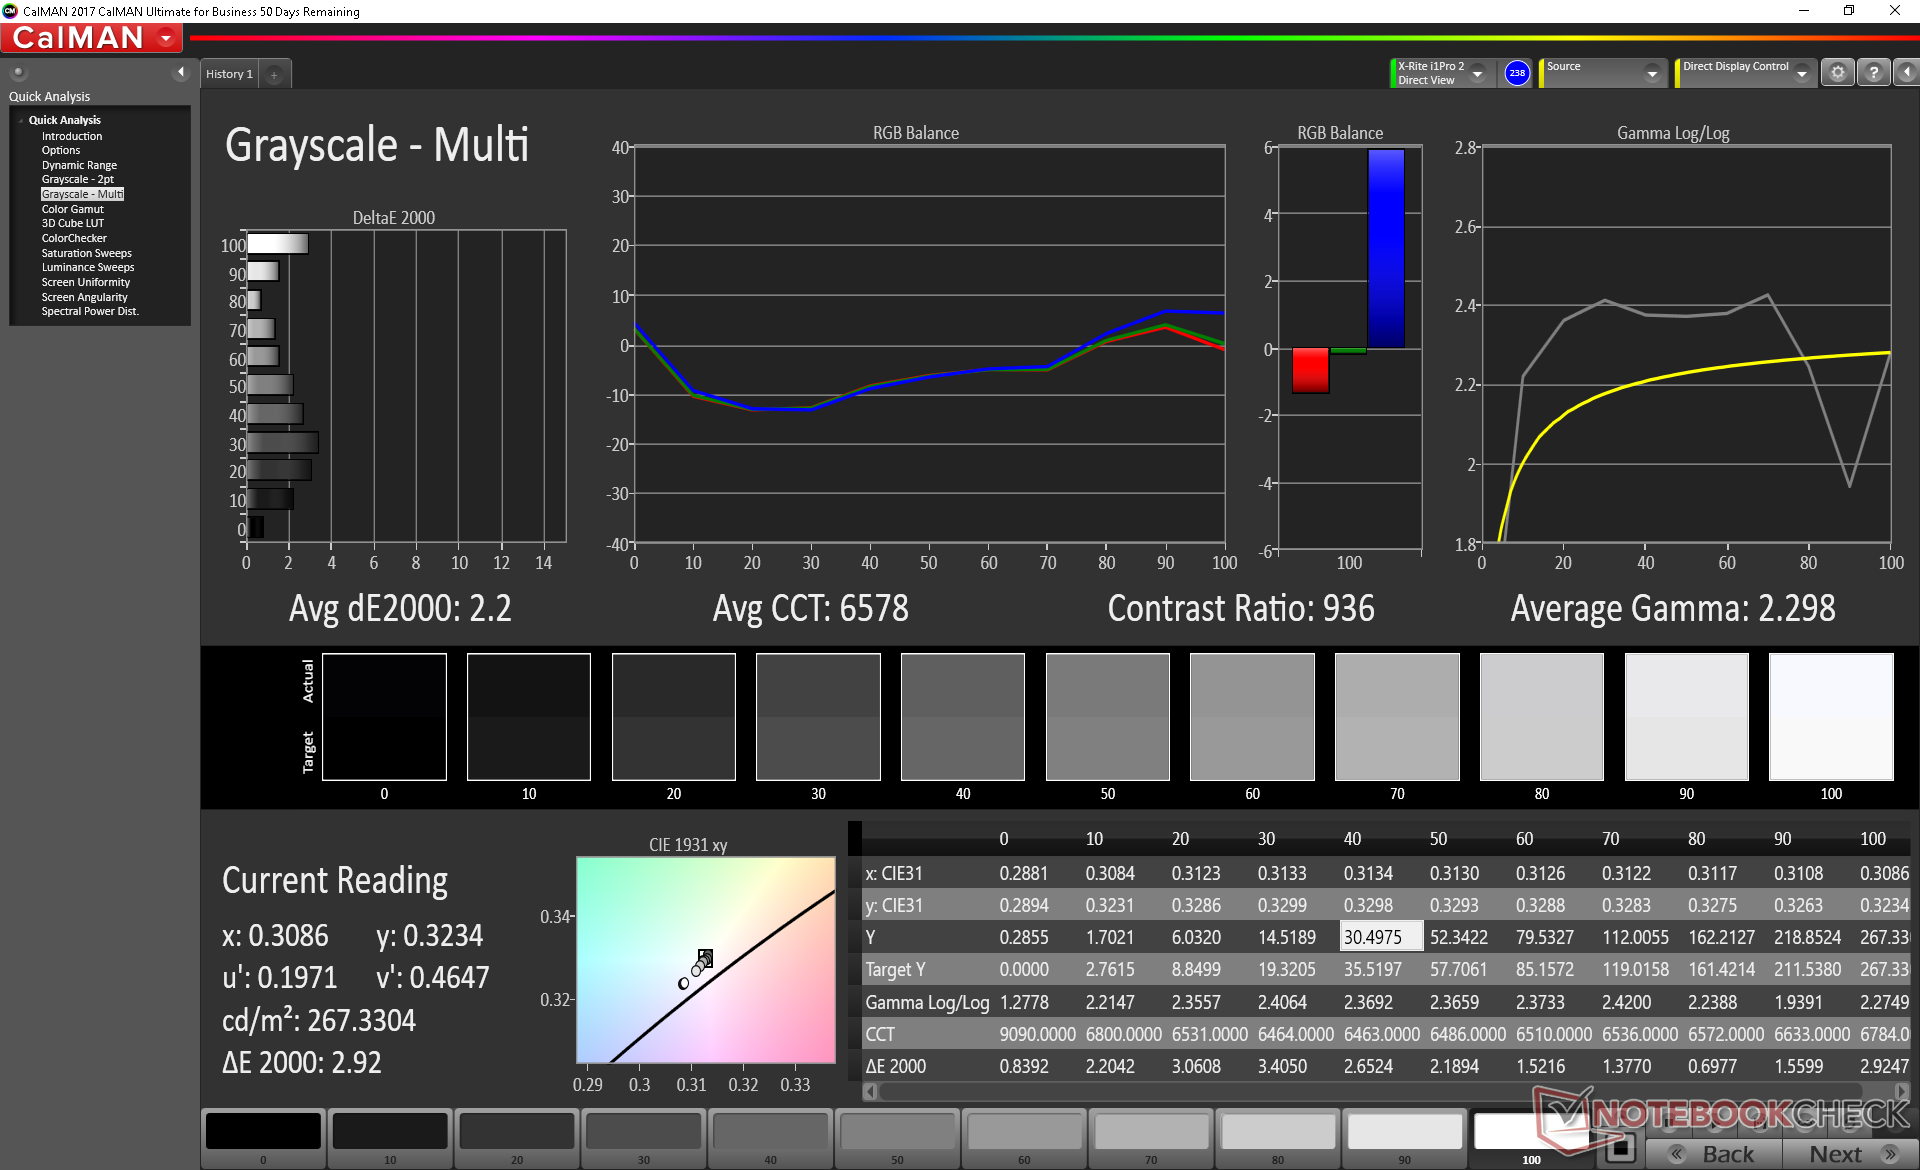
ΔE Greyscale Calman: 2.3 | ∀{0.09-98 Ø4.97}
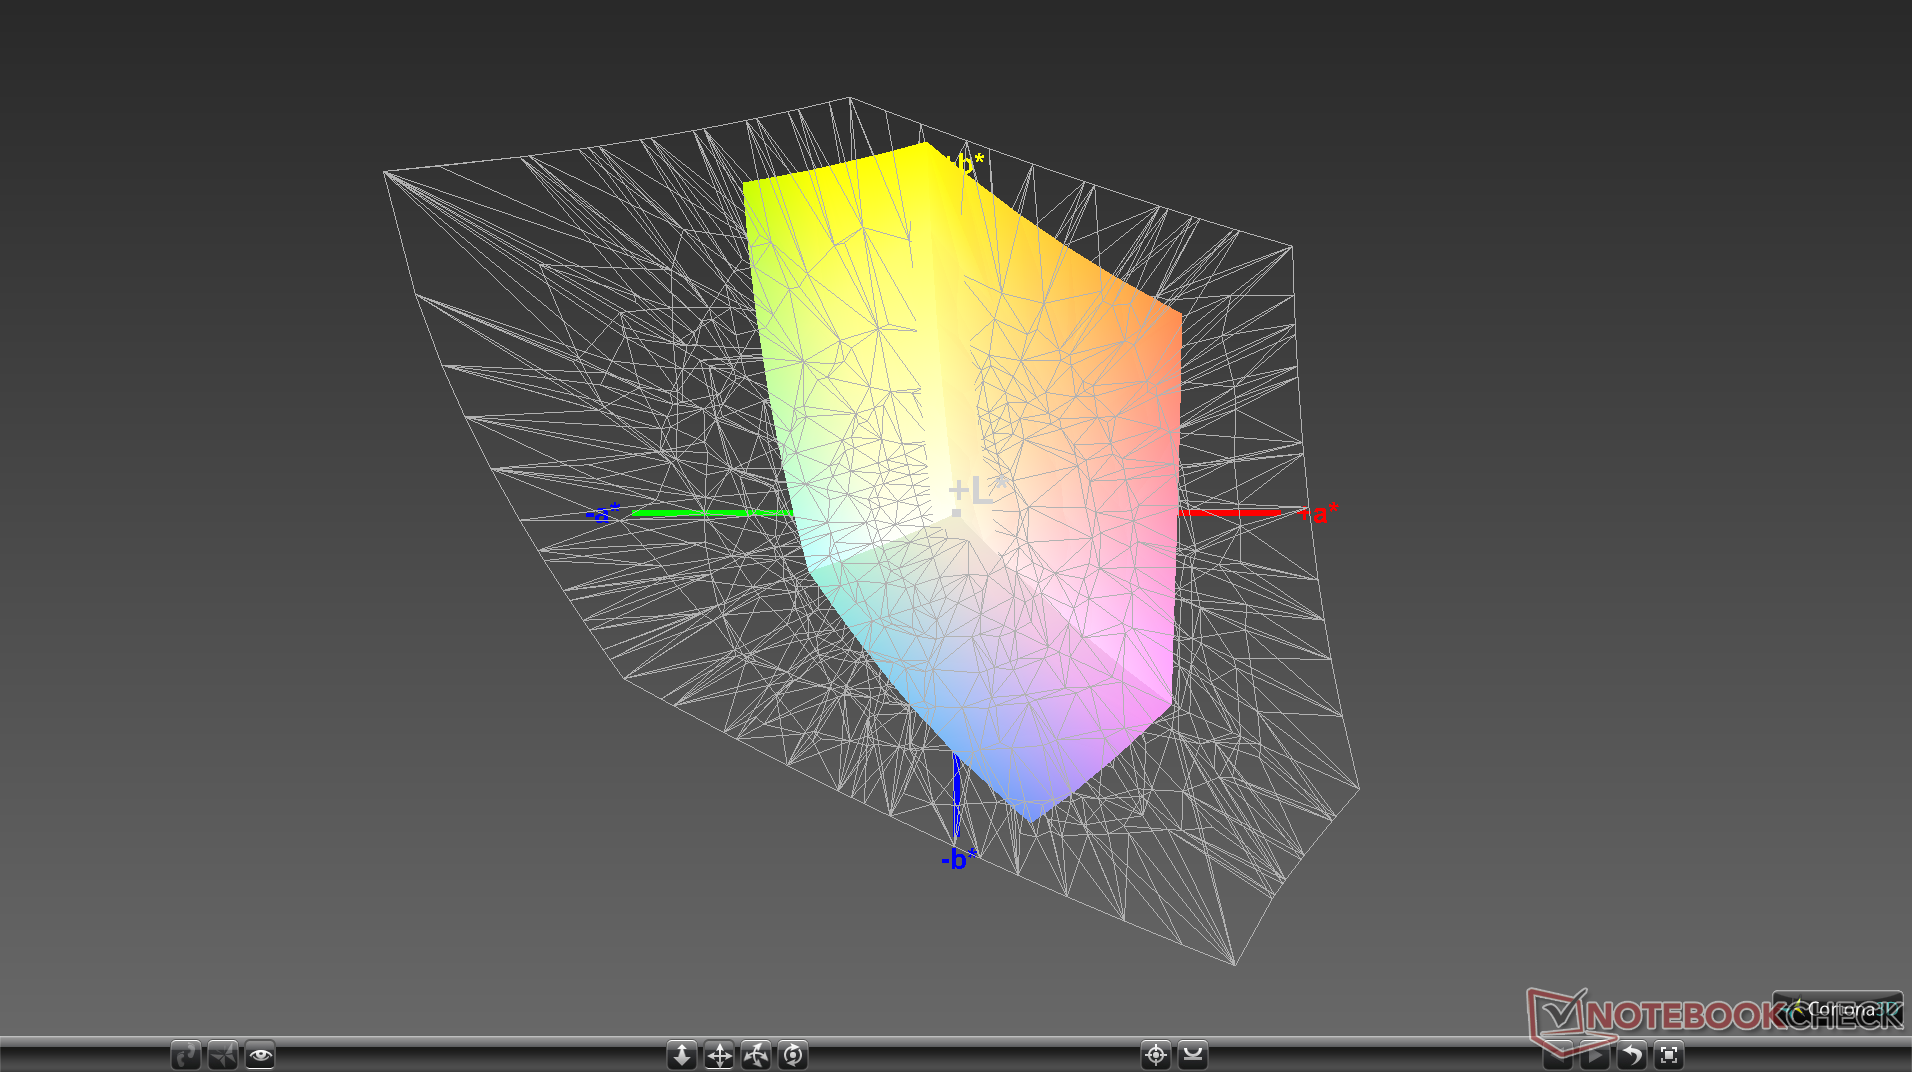
58.5% sRGB (Argyll 1.6.3 3D)
37.2% AdobeRGB 1998 (Argyll 1.6.3 3D)
40.69% AdobeRGB 1998 (Argyll 3D)
58.8% sRGB (Argyll 3D)
39.46% Display P3 (Argyll 3D)
Gamma: 2.2
CCT: 6578 K
| MSI WP65 AU Optronics B156HAN02.1, IPS, 15.6", 1920x1080 | HP ZBook 15u G6 6TP54EA AU Optronics AUO30EB, IPS, 15.6", 3840x2160 | Lenovo ThinkPad P1 2019-20QT000RGE N156HCE-GN1, IPS LED, 15.6", 1920x1080 | Dell Precision 7530 Sharp LQ156D1, IPS, 15.6", 3840x2160 | Lenovo ThinkPad P52s-20LB000HGE NV156FHM-N47, IPS LED, 15.6", 1920x1080 | MSI WS63VR 7RL-023US SAMSUNG LƒFL156FL02-101 , IPS, 15.6", 3840x2160 | |
|---|---|---|---|---|---|---|
| Display | 70% | 57% | 105% | 6% | 20% | |
| Display P3 Coverage (%) | 39.46 | 69.2 75% | 62.4 58% | 82.5 109% | 41.83 6% | 47.43 20% |
| sRGB Coverage (%) | 58.8 | 97.1 65% | 91.5 56% | 99.4 69% | 62.1 6% | 71.4 21% |
| AdobeRGB 1998 Coverage (%) | 40.69 | 69.7 71% | 63.4 56% | 96.2 136% | 43.22 6% | 49 20% |
| Response Times | -45% | 29% | 5% | -33% | -1% | |
| Response Time Grey 50% / Grey 80% * (ms) | 37.6 ? | 68.8 ? -83% | 34.4 ? 9% | 35.2 ? 6% | 47.2 ? -26% | 36.8 ? 2% |
| Response Time Black / White * (ms) | 27.6 ? | 29.6 -7% | 14 ? 49% | 26.4 ? 4% | 38.4 ? -39% | 28.4 ? -3% |
| PWM Frequency (Hz) | 26040 ? | 198.4 ? | 21550 ? | 1351 ? | ||
| Screen | 42% | 39% | 24% | 20% | -5% | |
| Brightness middle (cd/m²) | 267.4 | 451 69% | 542 103% | 292.8 9% | 291 9% | 259.4 -3% |
| Brightness (cd/m²) | 259 | 434 68% | 528 104% | 295 14% | 284 10% | 247 -5% |
| Brightness Distribution (%) | 86 | 89 3% | 84 -2% | 85 -1% | 91 6% | 85 -1% |
| Black Level * (cd/m²) | 0.37 | 0.25 32% | 0.41 -11% | 0.36 3% | 0.11 70% | 0.43 -16% |
| Contrast (:1) | 723 | 1804 150% | 1322 83% | 813 12% | 2645 266% | 603 -17% |
| Colorchecker dE 2000 * | 4.21 | 4.4 -5% | 3.5 17% | 3.48 17% | 6.7 -59% | 5.5 -31% |
| Colorchecker dE 2000 max. * | 21.1 | 6.7 68% | 7.8 63% | 6.81 68% | 20.2 4% | 12.7 40% |
| Colorchecker dE 2000 calibrated * | 4.27 | 1.8 58% | 1.3 70% | 3.13 27% | 4.5 -5% | |
| Greyscale dE 2000 * | 2.3 | 5 -117% | 4.8 -109% | 4.1 -78% | 4.5 -96% | 3.6 -57% |
| Gamma | 2.2 100% | 2.31 95% | 2.33 94% | 2.2 100% | 2.28 96% | 2.24 98% |
| CCT | 6578 99% | 7717 84% | 7690 85% | 6740 96% | 7503 87% | 7163 91% |
| Color Space (Percent of AdobeRGB 1998) (%) | 37.2 | 63 69% | 58.8 58% | 84.4 127% | 39.6 6% | 45 21% |
| Color Space (Percent of sRGB) (%) | 58.5 | 97 66% | 91.1 56% | 99.6 70% | 61.7 5% | 71 21% |
| Total Average (Program / Settings) | 22% /
36% | 42% /
41% | 45% /
37% | -2% /
11% | 5% /
1% |
* ... smaller is better
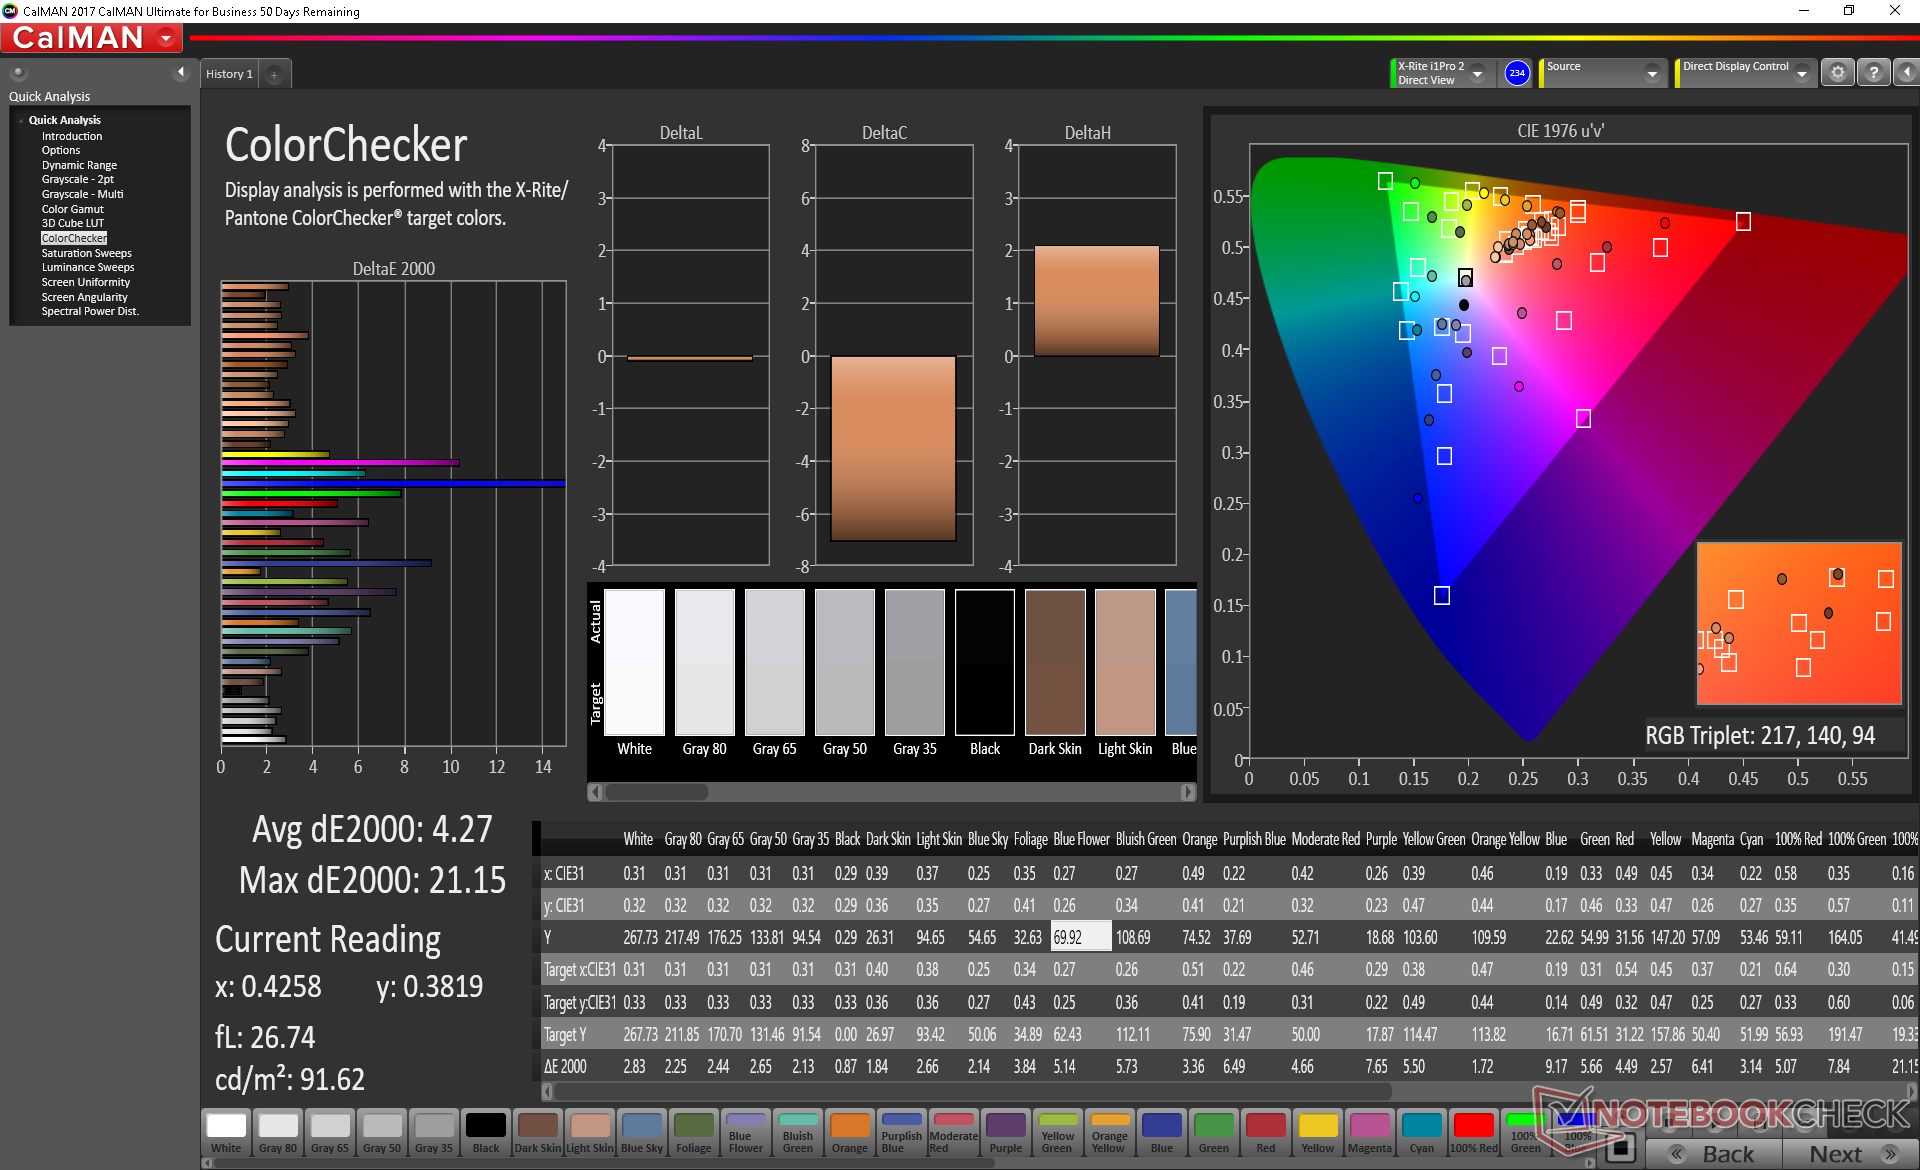
Color space is limited to just 59 percent and 37 percent of the sRGB and AdobeRGB standards, respectively. Pricier workstations like the Dell Precision 7530 or Lenovo ThinkPad P1 offer display options with deeper colors. You may want to consider the MSI Prestige series for more accurate colors fit for digital graphics work.
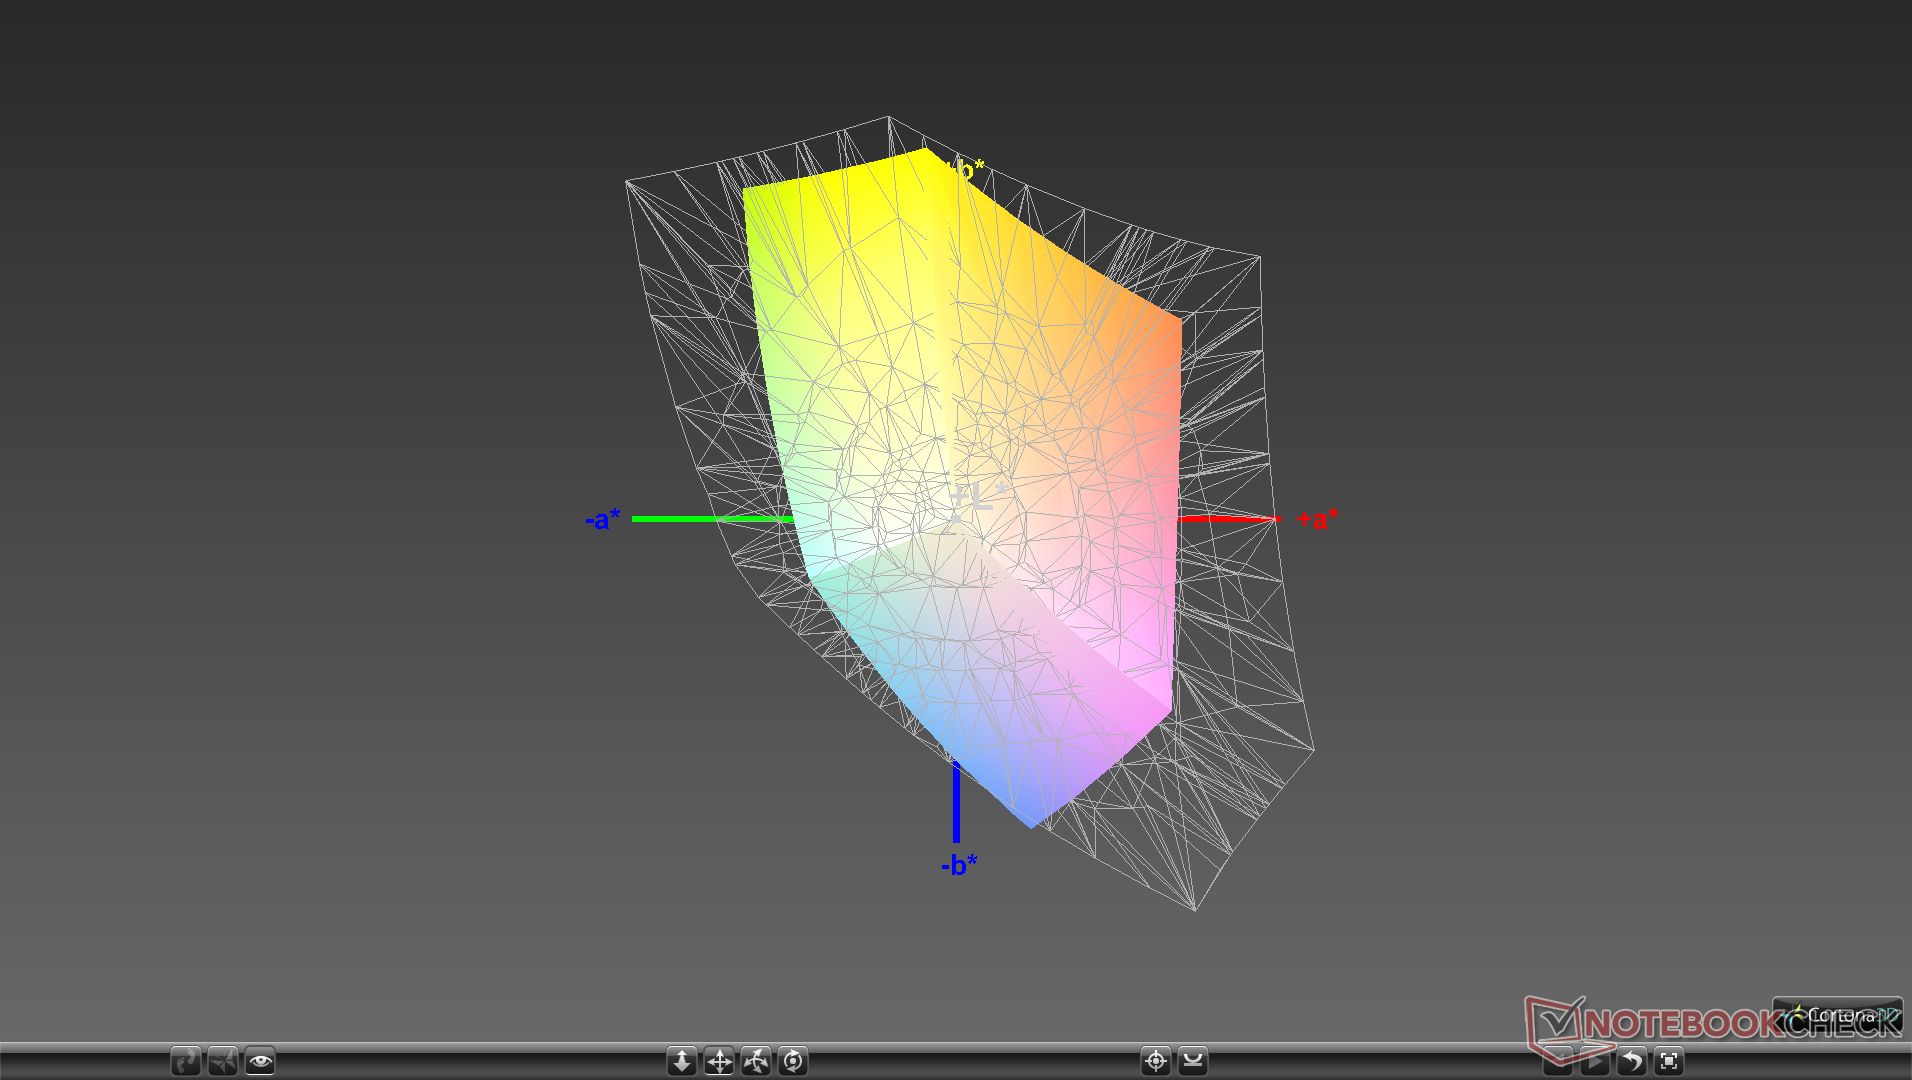
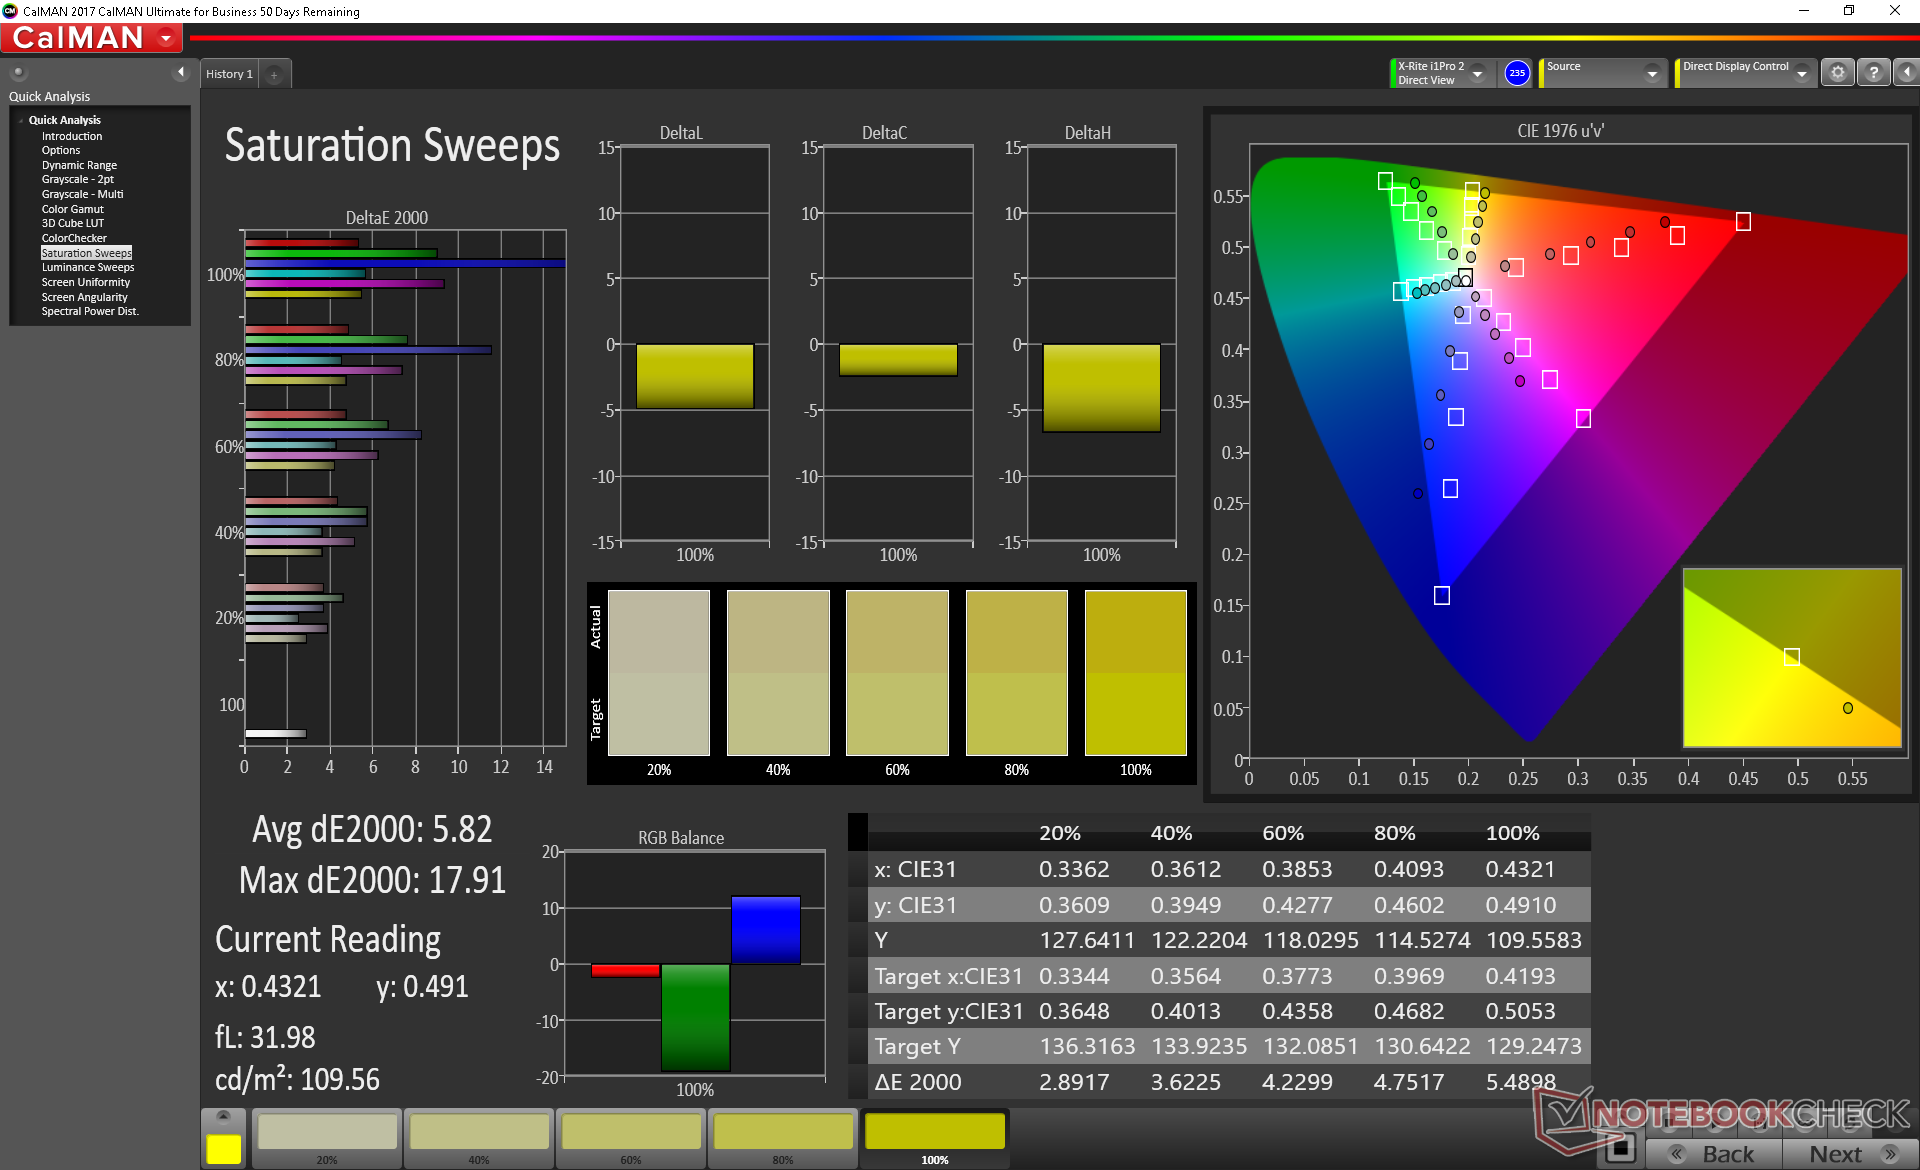
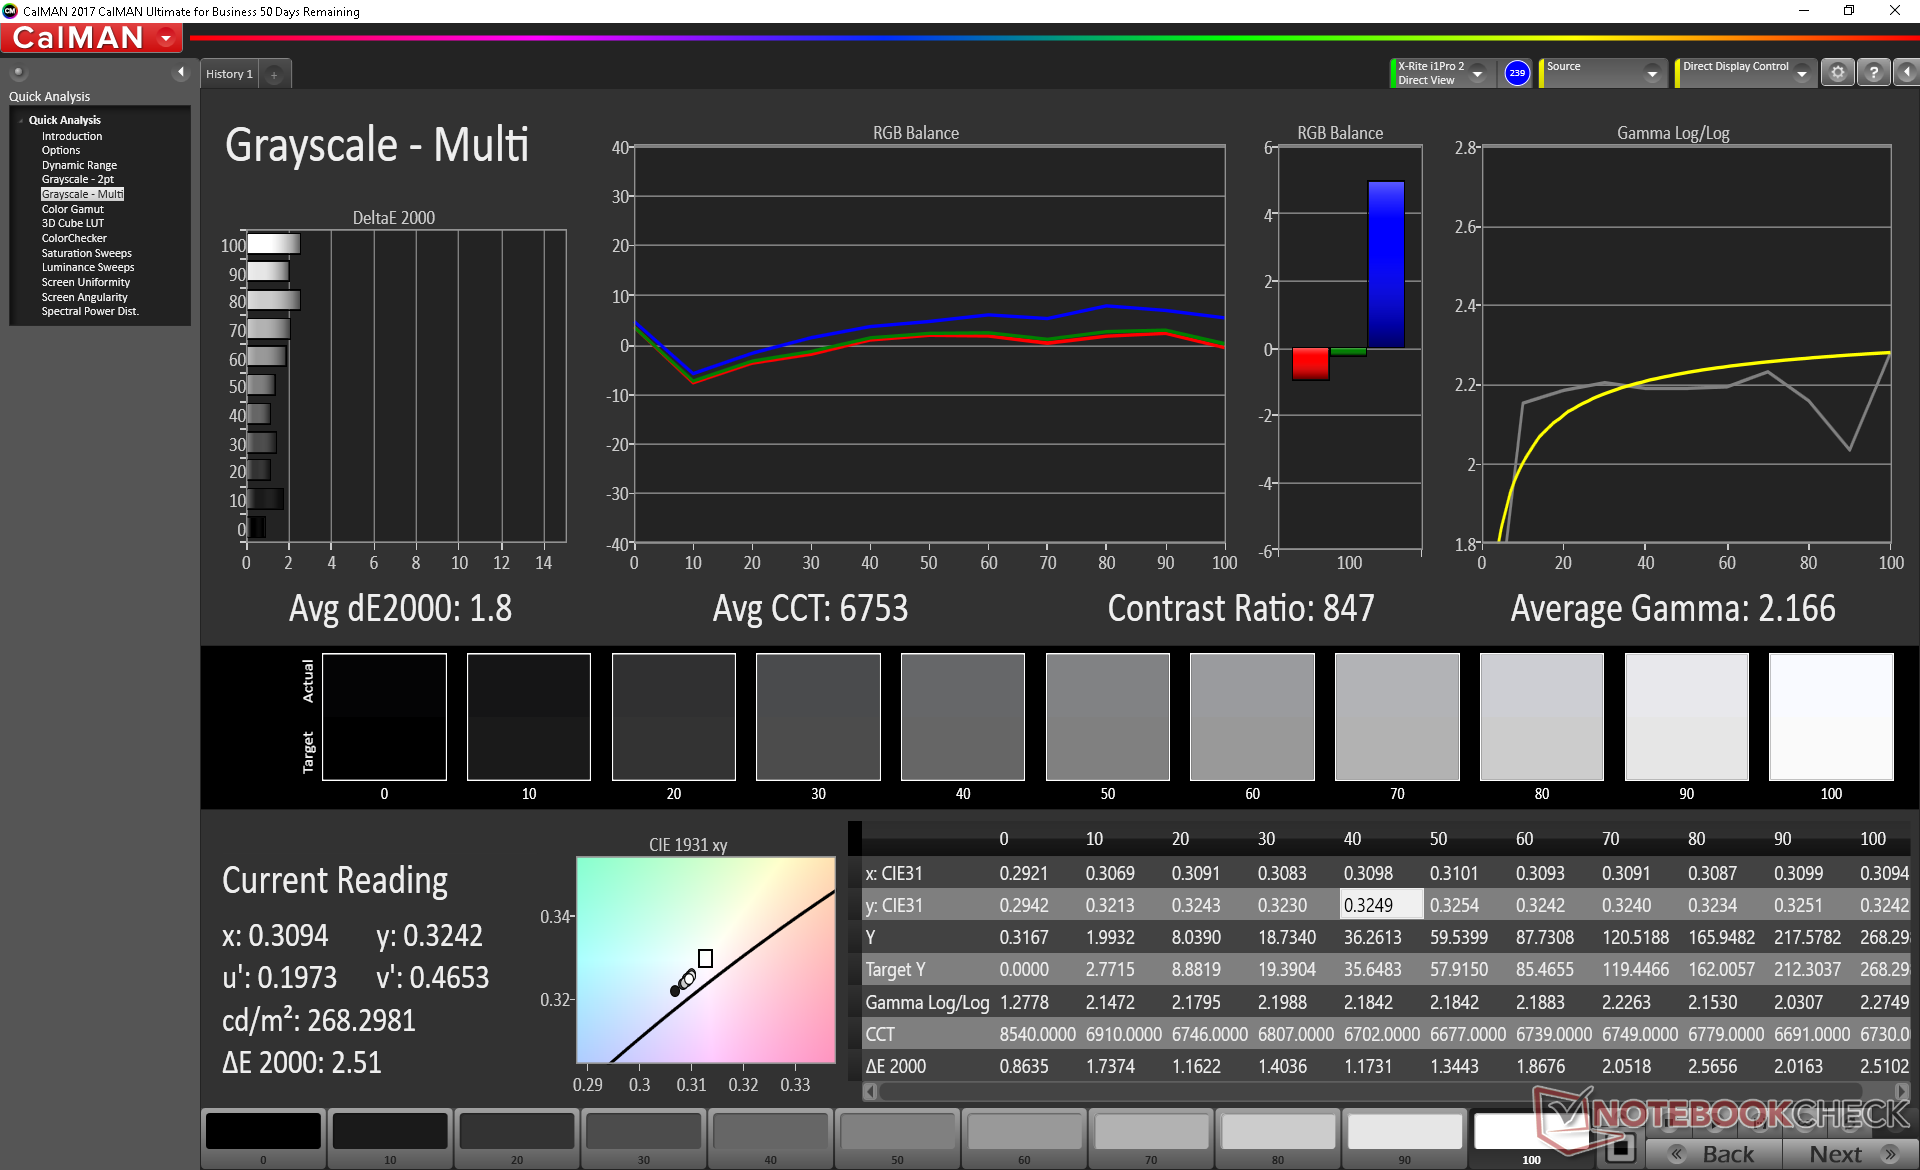
Further measurements with an X-Rite colorimeter reveal generally accurate grayscale out of the box. Attempting to calibrate the display even further improves the average DeltaE2000 only marginally from 2.2 to 1.8. Colors, however, still become increasingly inaccurate the higher the saturation level because of the limited gamut of the panel.

Display Response Times
| ↔ Response Time Black to White | ||
|---|---|---|
| 27.6 ms ... rise ↗ and fall ↘ combined | ↗ 15.2 ms rise | 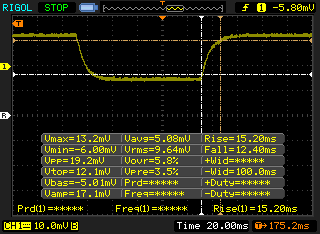 |
| ↘ 12.4 ms fall | ||
| The screen shows relatively slow response rates in our tests and may be too slow for gamers. In comparison, all tested devices range from 0.1 (minimum) to 240 (maximum) ms. » 70 % of all devices are better. This means that the measured response time is worse than the average of all tested devices (19.8 ms). | ||
| ↔ Response Time 50% Grey to 80% Grey | ||
| 37.6 ms ... rise ↗ and fall ↘ combined | ↗ 20.4 ms rise | 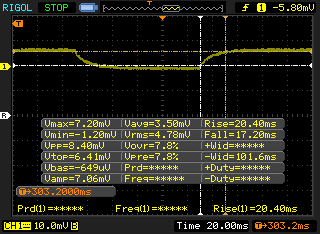 |
| ↘ 17.2 ms fall | ||
| The screen shows slow response rates in our tests and will be unsatisfactory for gamers. In comparison, all tested devices range from 0.165 (minimum) to 636 (maximum) ms. » 55 % of all devices are better. This means that the measured response time is worse than the average of all tested devices (31 ms). | ||
Screen Flickering / PWM (Pulse-Width Modulation)
| Screen flickering / PWM not detected |  | ||
In comparison: 52 % of all tested devices do not use PWM to dim the display. If PWM was detected, an average of 7747 (minimum: 5 - maximum: 343500) Hz was measured. | |||
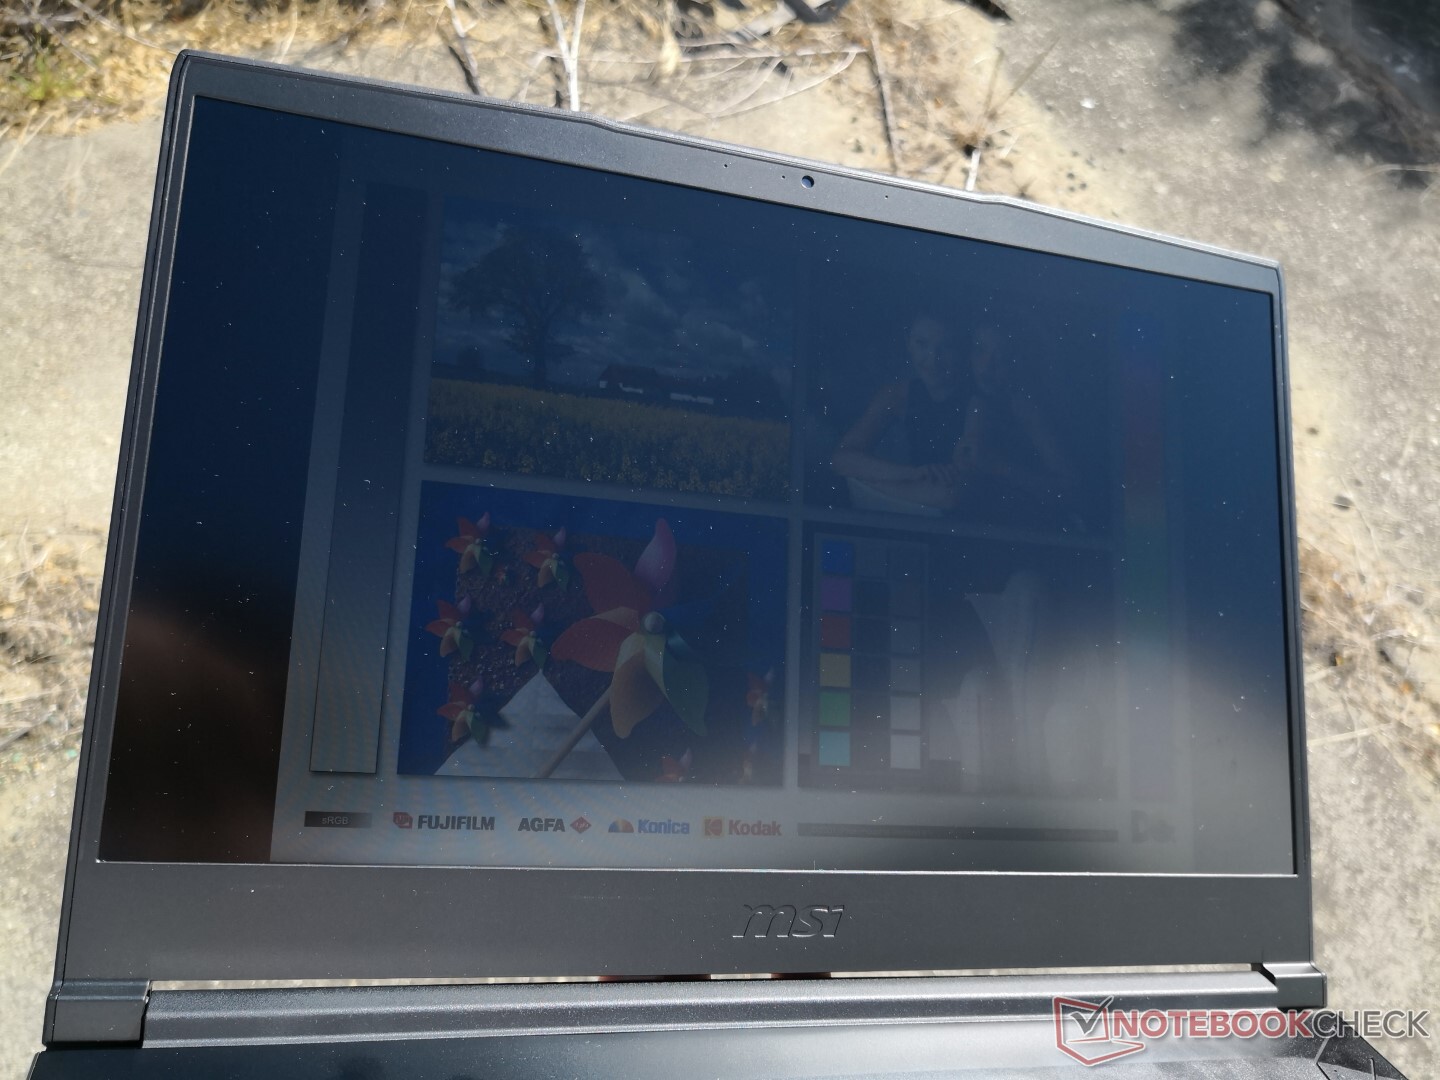
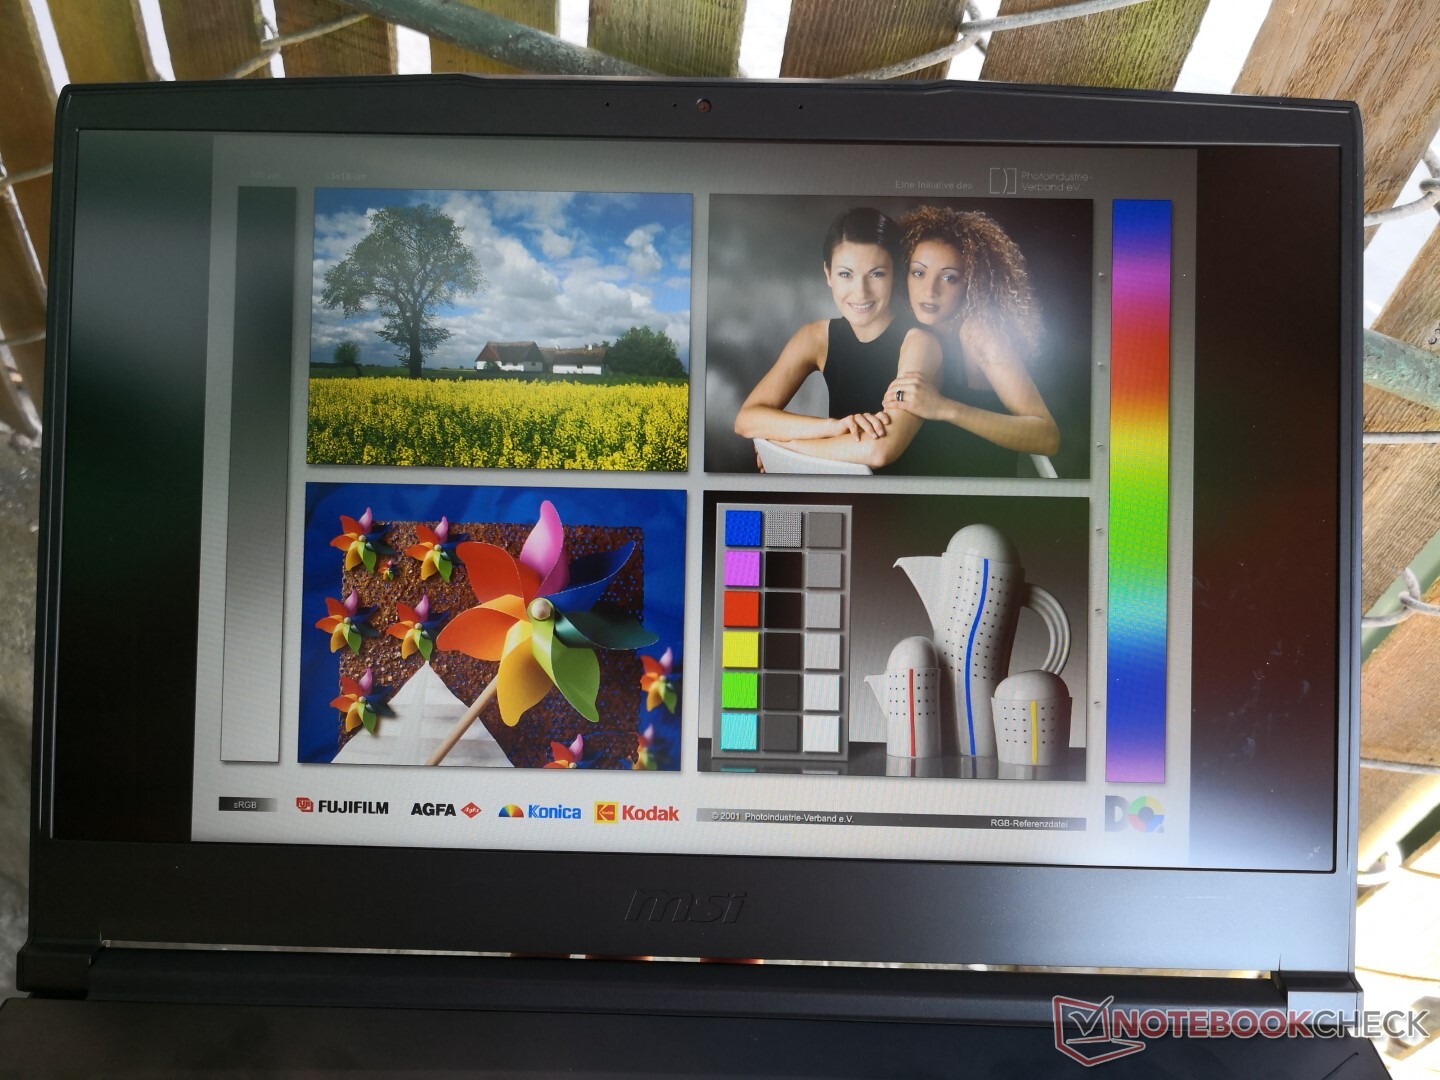
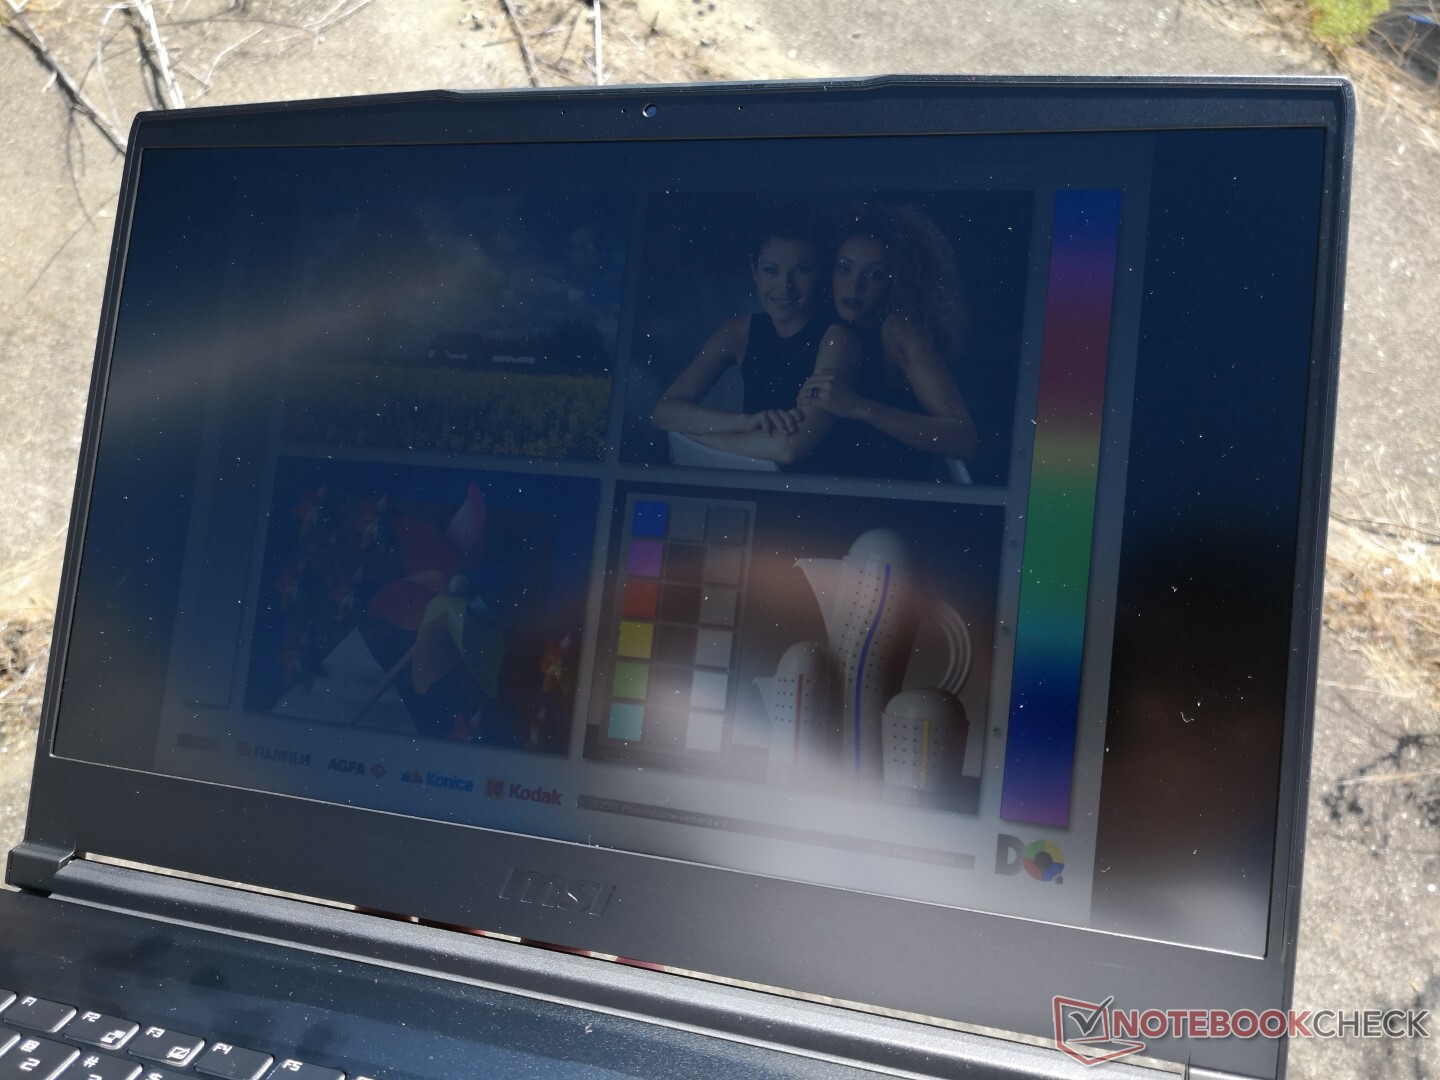
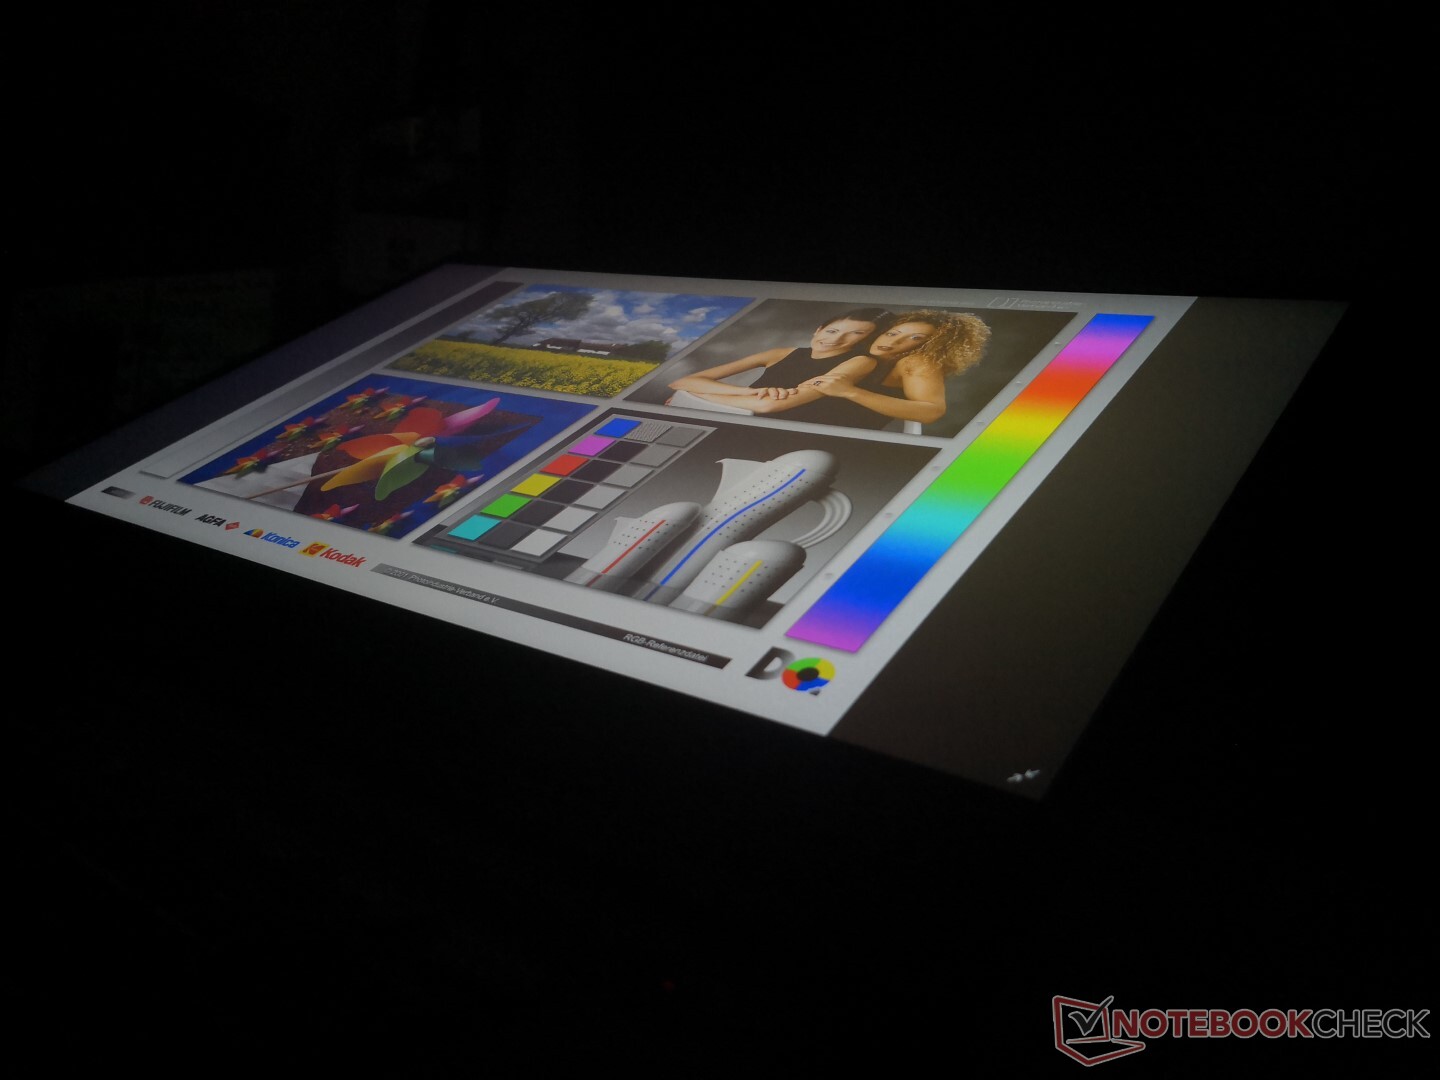
Outdoor visibility is average at best as the display was not designed to be used outdoors frequently. Sunlight overwhelms the screen and washes out colors to make glare the least of your problems. Traditional high-end Ultrabooks like the MacBook Pro 15 or Dell XPS 15 offer both brighter and more color accurate panels for a better experience when outside.
Performance
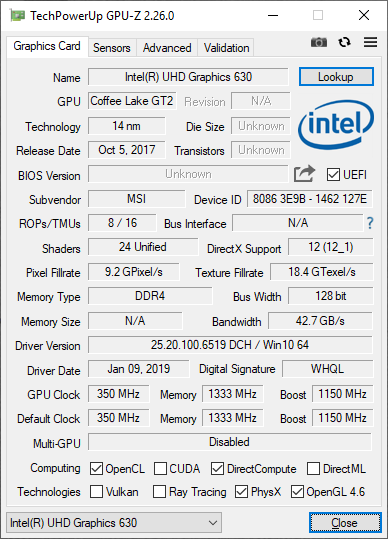
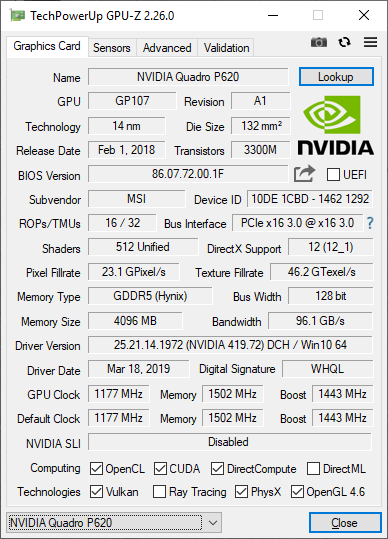
Unlike the WS or WT series, the WP65 is targeting the low-end to mid-range workstation segment where top-of-the-line Quadro graphics may not be needed. The Quadro P620 GPU replaces last year's Quadro P1000 albeit with the same underlying Pascal architecture. Optimus comes standard for graphics switching to the integrated UHD Graphics 630.
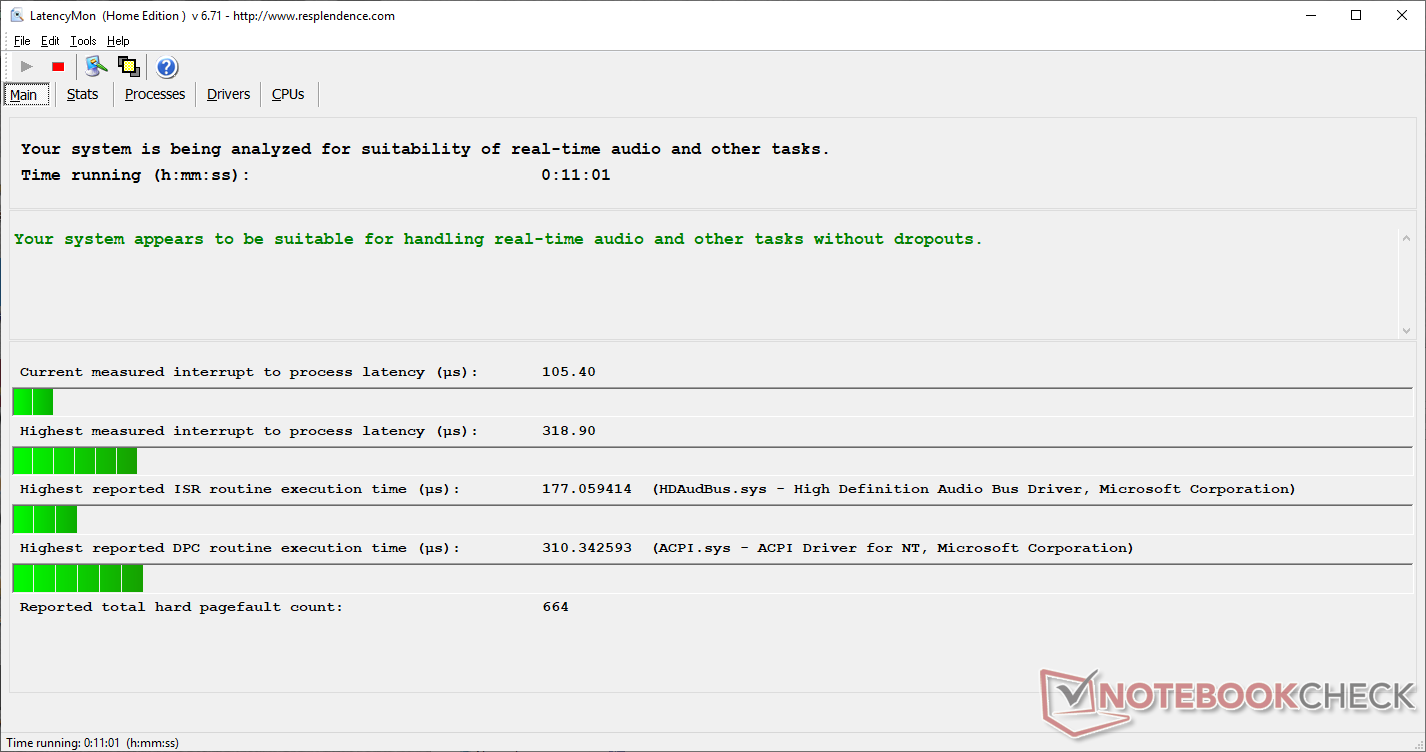
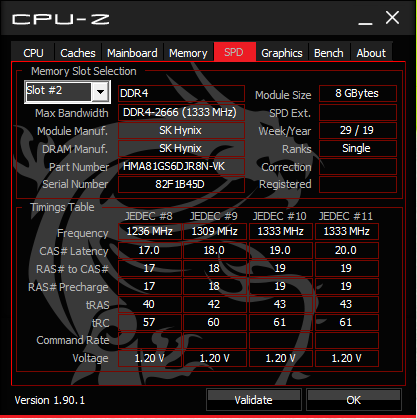
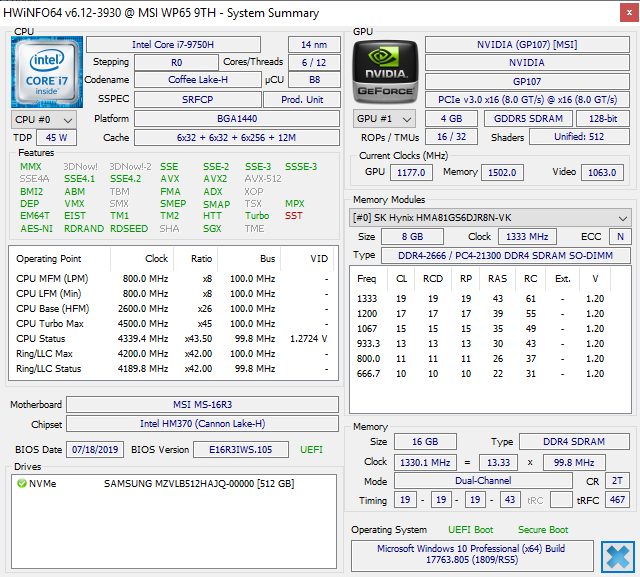
CPU options remain fixed at the Core i7-9750H meaning that there is no support for ECC RAM. Users who want Xeon E CPUs ought to look at the WT75 instead. LatencyMon shows no DPC latency issues even with wireless enabled.
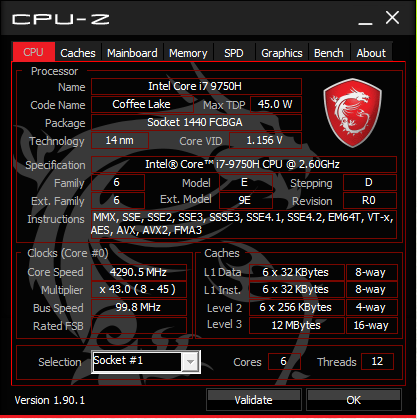
Processor
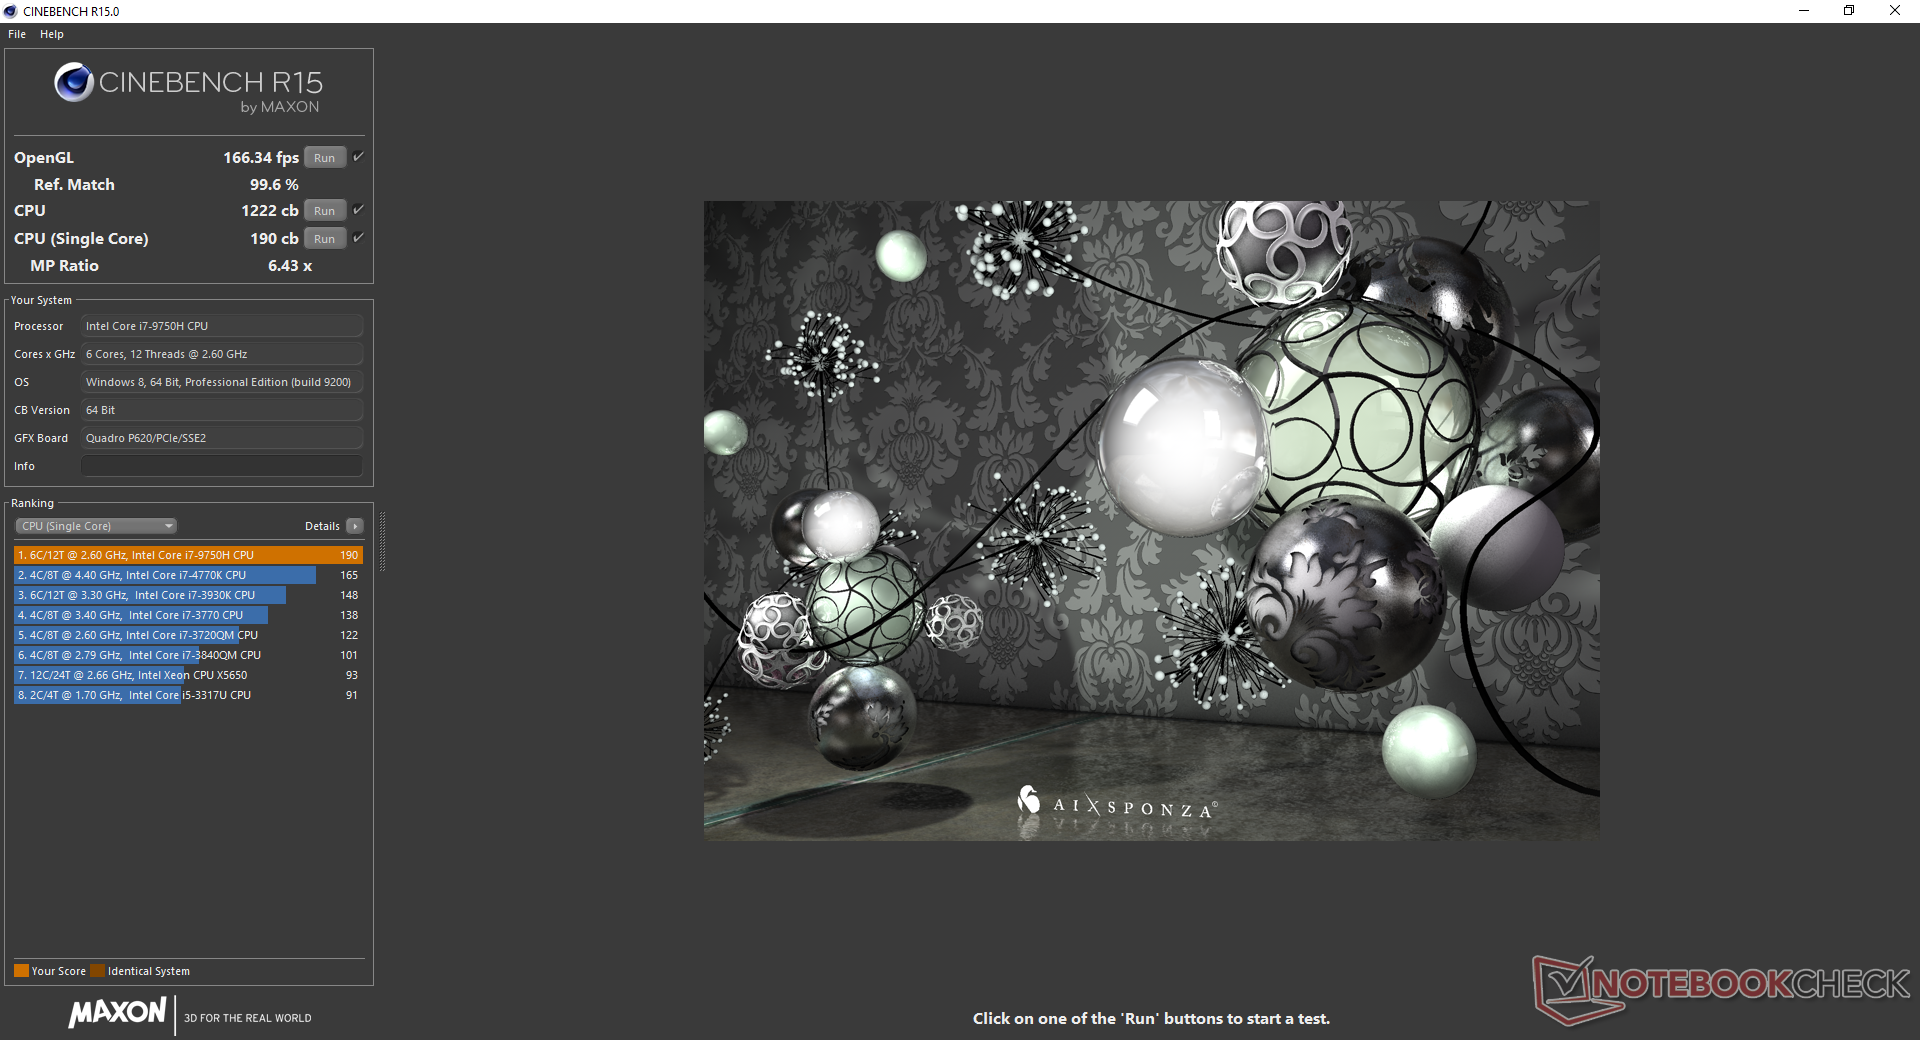
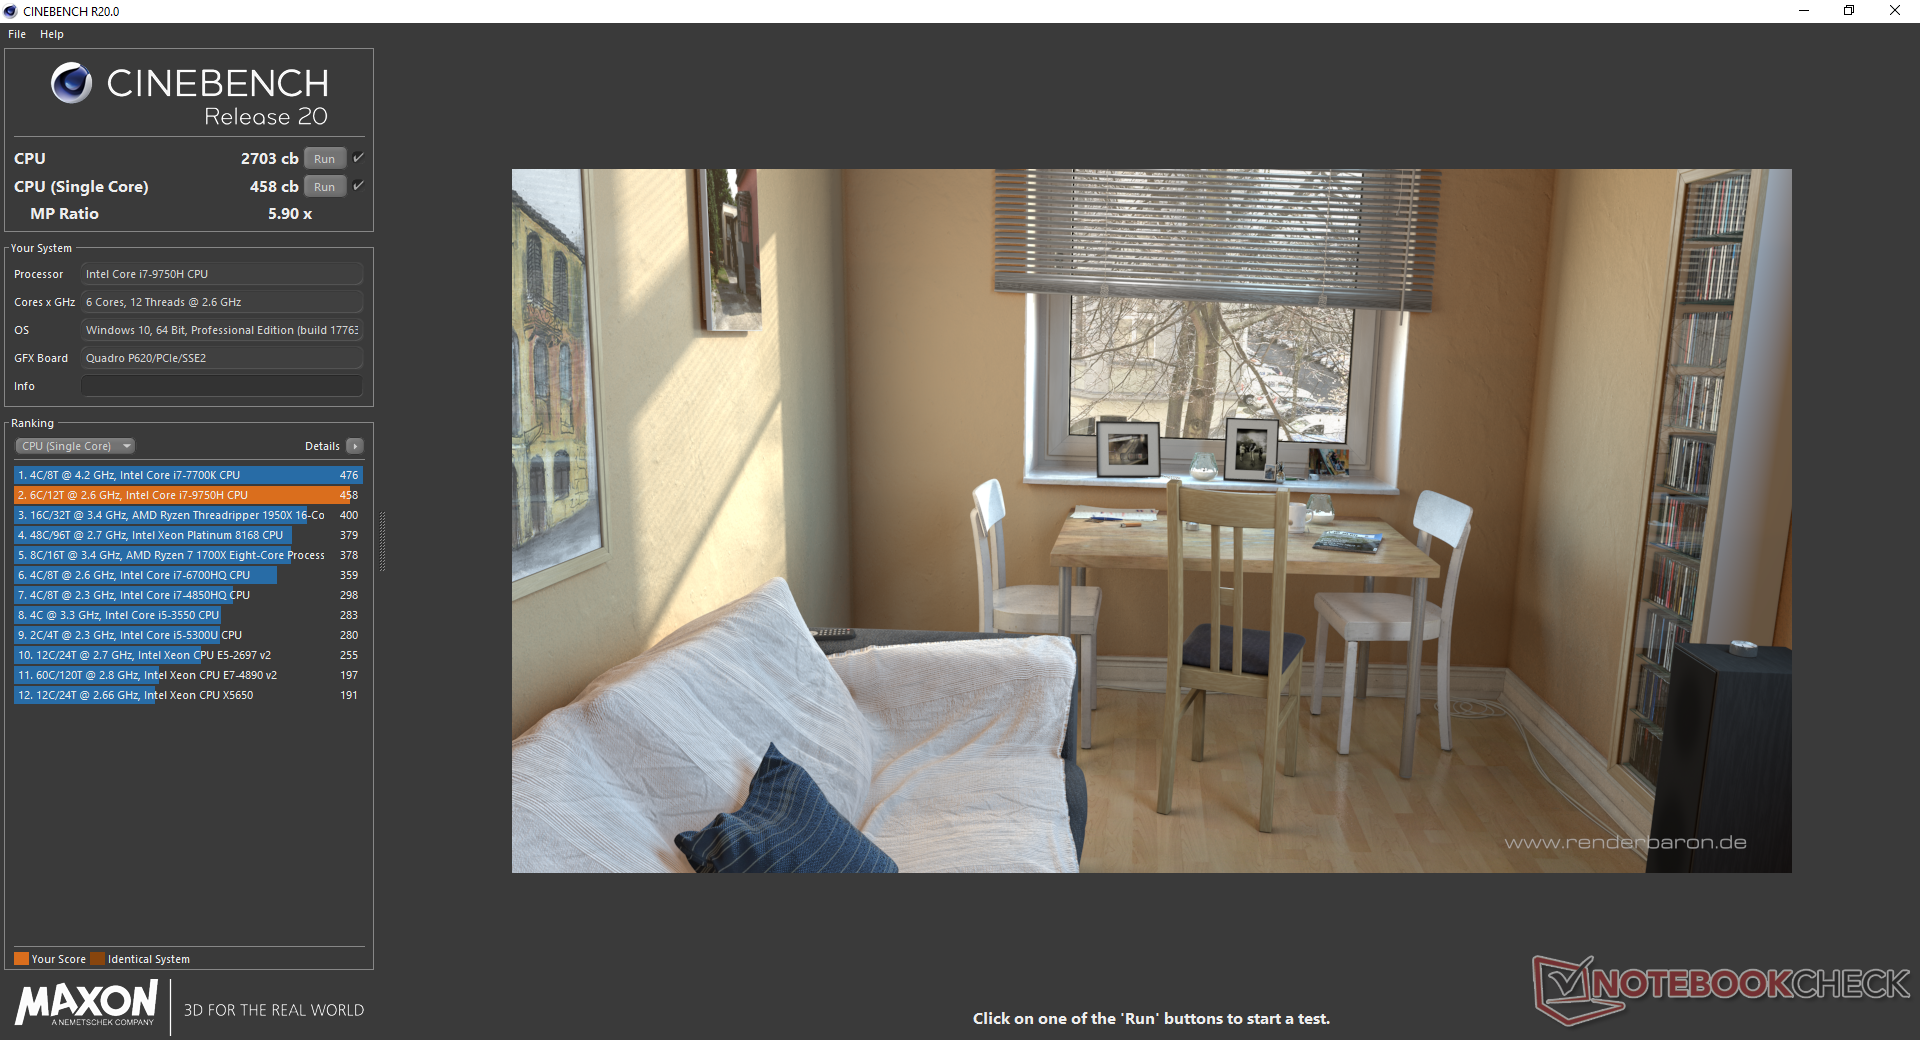
The Core i7-9750H in the MSI performs within 3 percent of the average i7-9750H in our database taken from 50 other laptops. Turbo Boost sustainability is average when running CineBench R15 Multi-Thread in a loop as shown by the graph below. The Dell G7 7590 is able to sustain higher clock rates for longer while the Razer Blade 15 Base Model is about 18 percent slower than the MSI. Raw performance is about 30 to 40 percent faster than the quad-core i5-8300H, i5-9300H, or i7-7700HQ due to the extra two physical cores while being only marginally better than the average Core i7-8750H.
See our dedicated page on the Core i7-9750H for more technical information and benchmark comparisons.
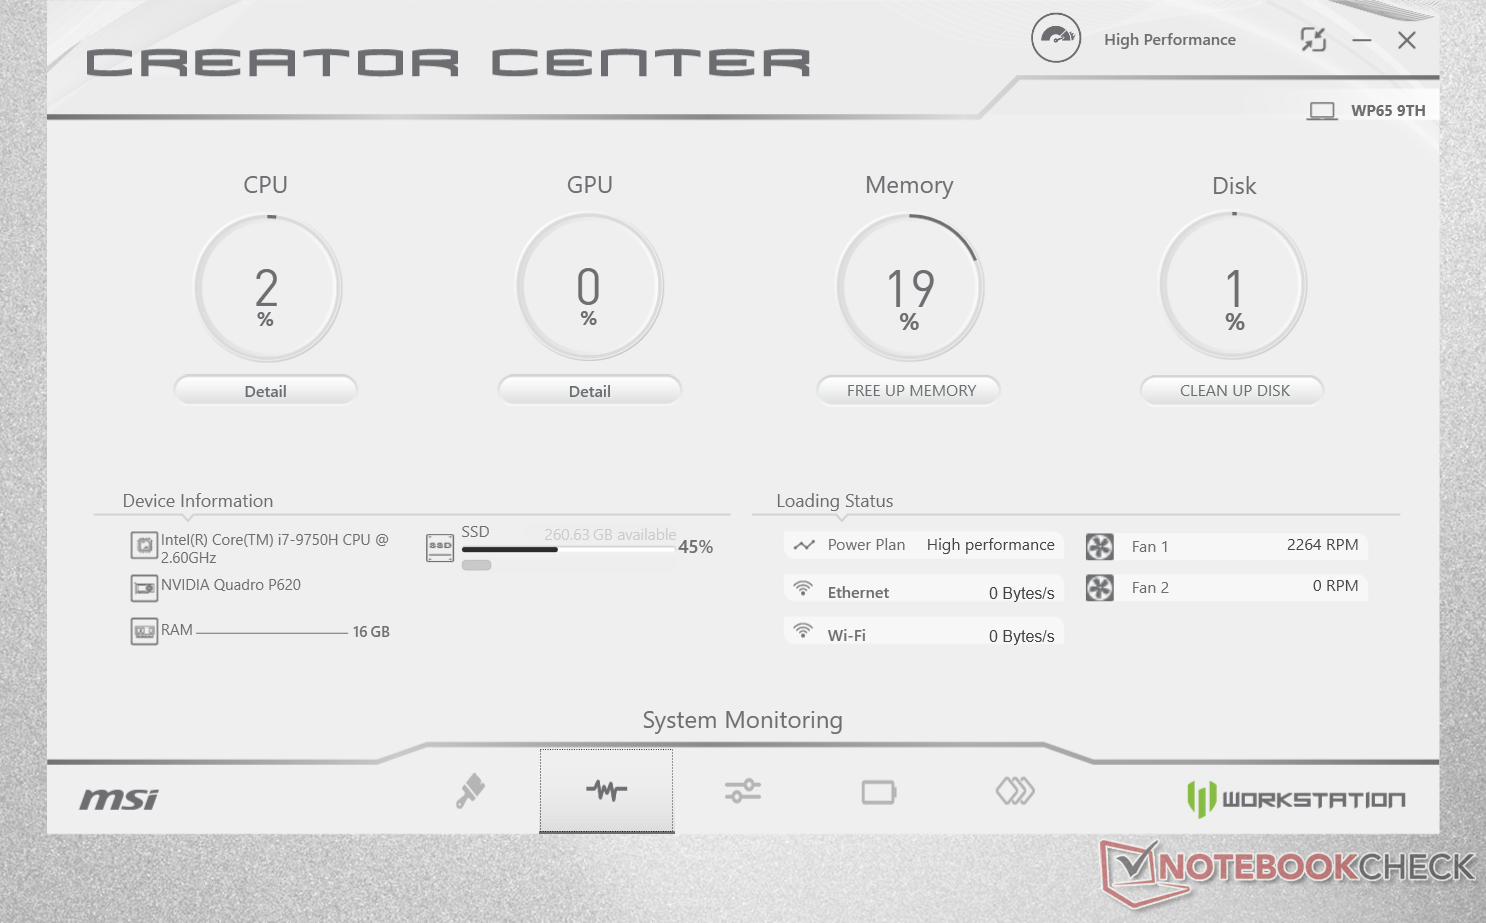
System Performance
PCMark results are better than what we recorded on the older WS63 except in Content Creation where the Quadro P4000 Max-Q outclasses the Quadro P620. We experienced no software issues during our time with the test unit. MSI pop ups, however, will occasionally appear encouraging users to register or backup their drives.
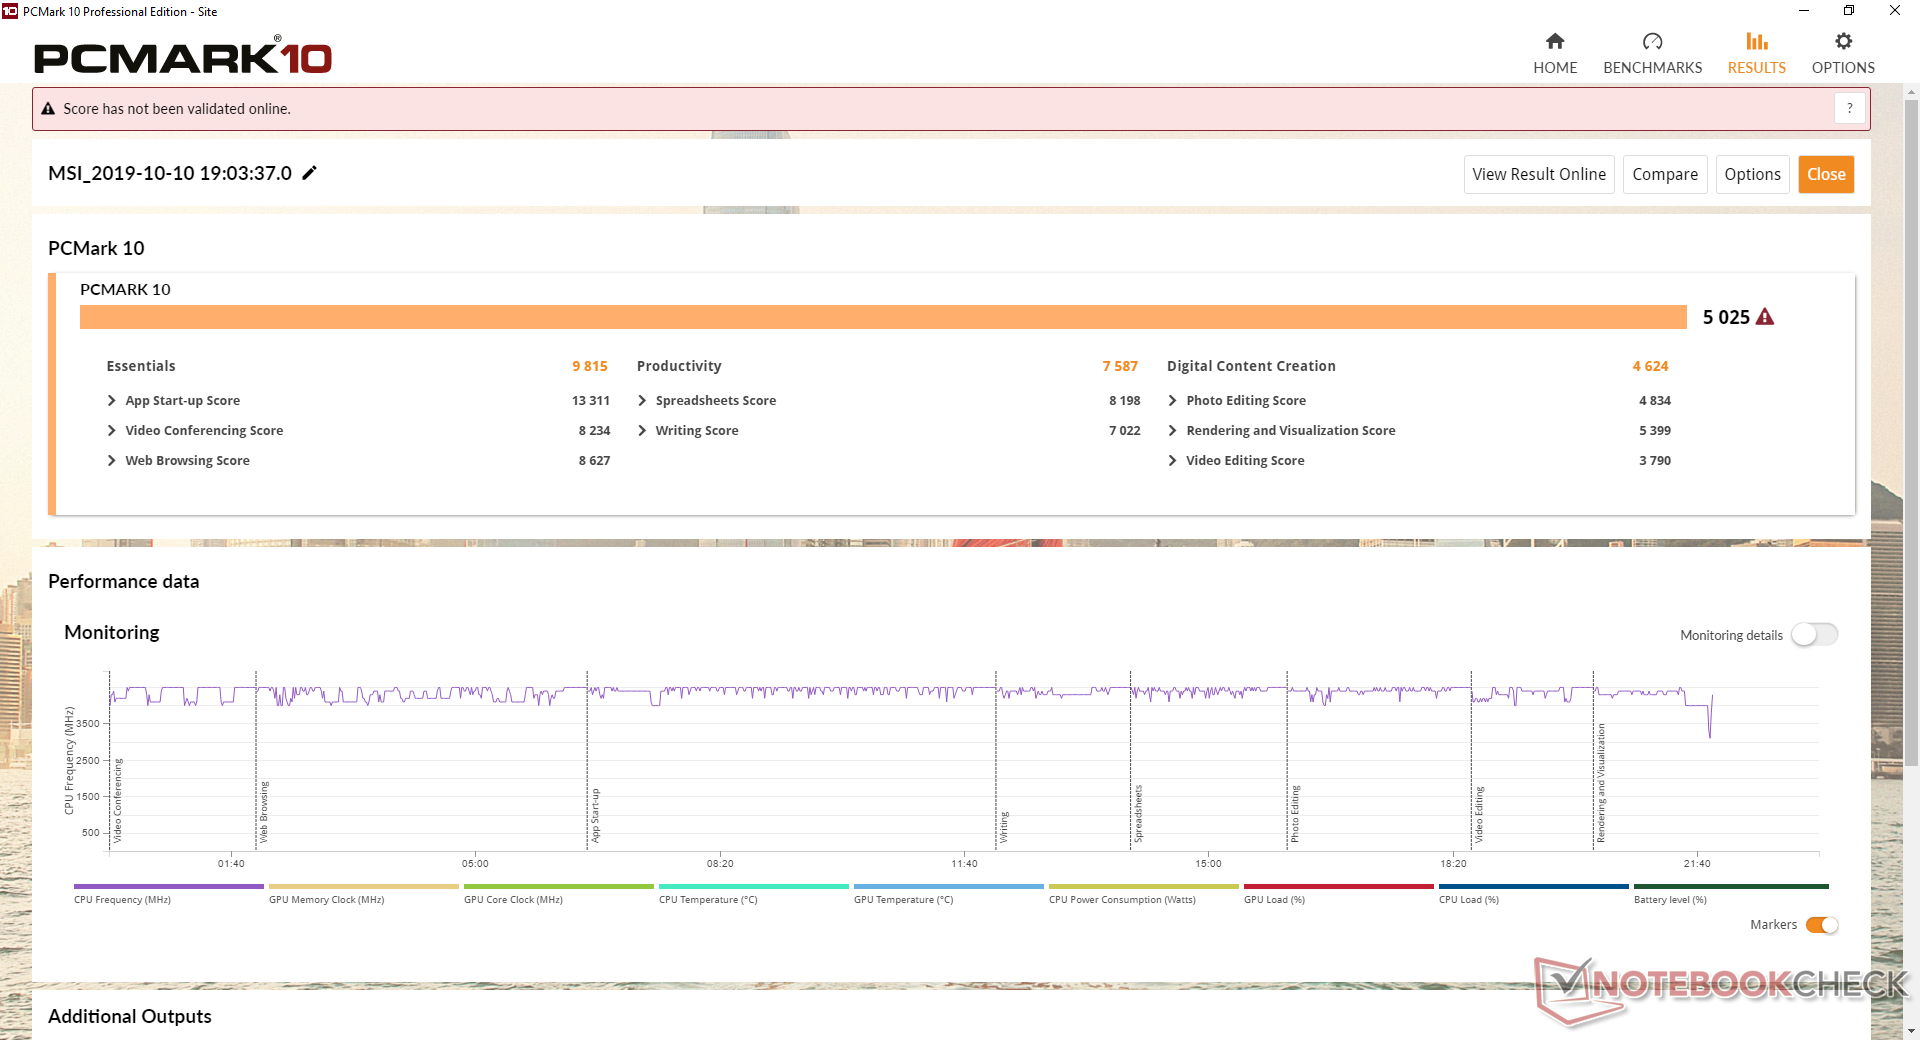
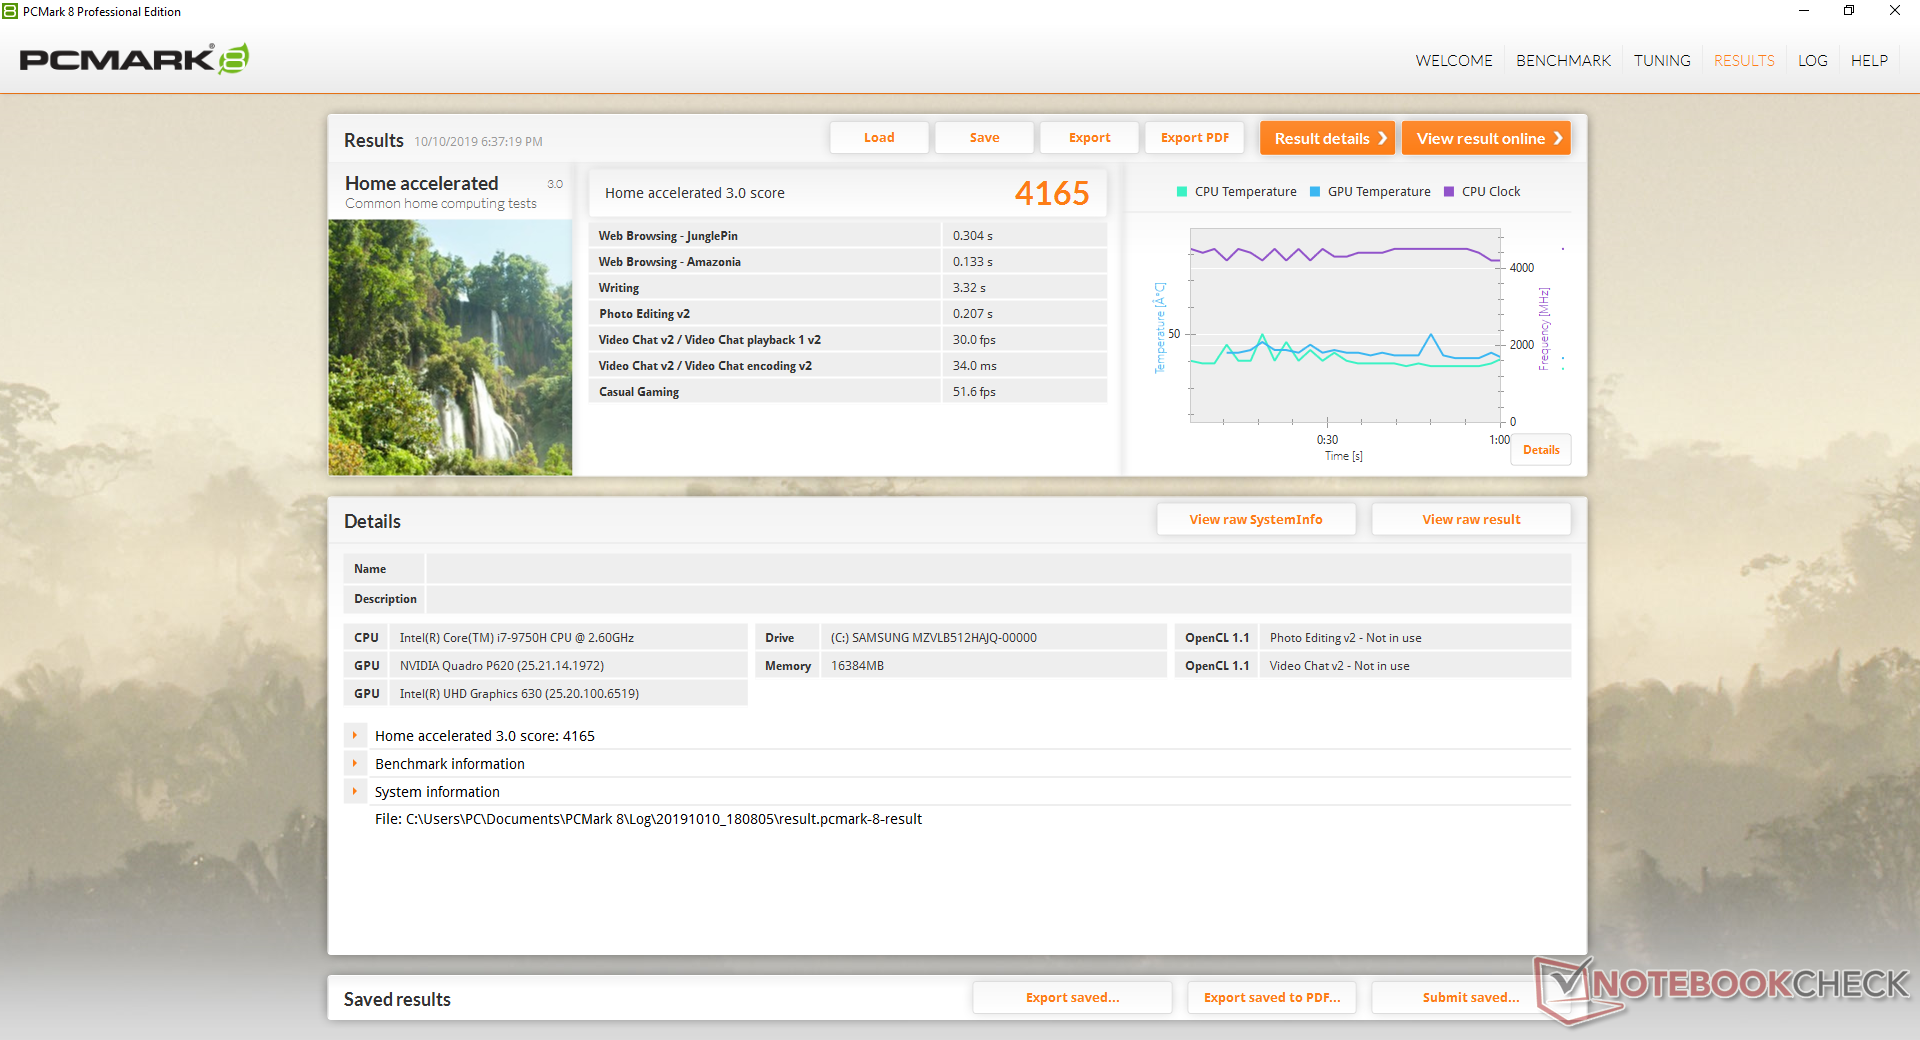
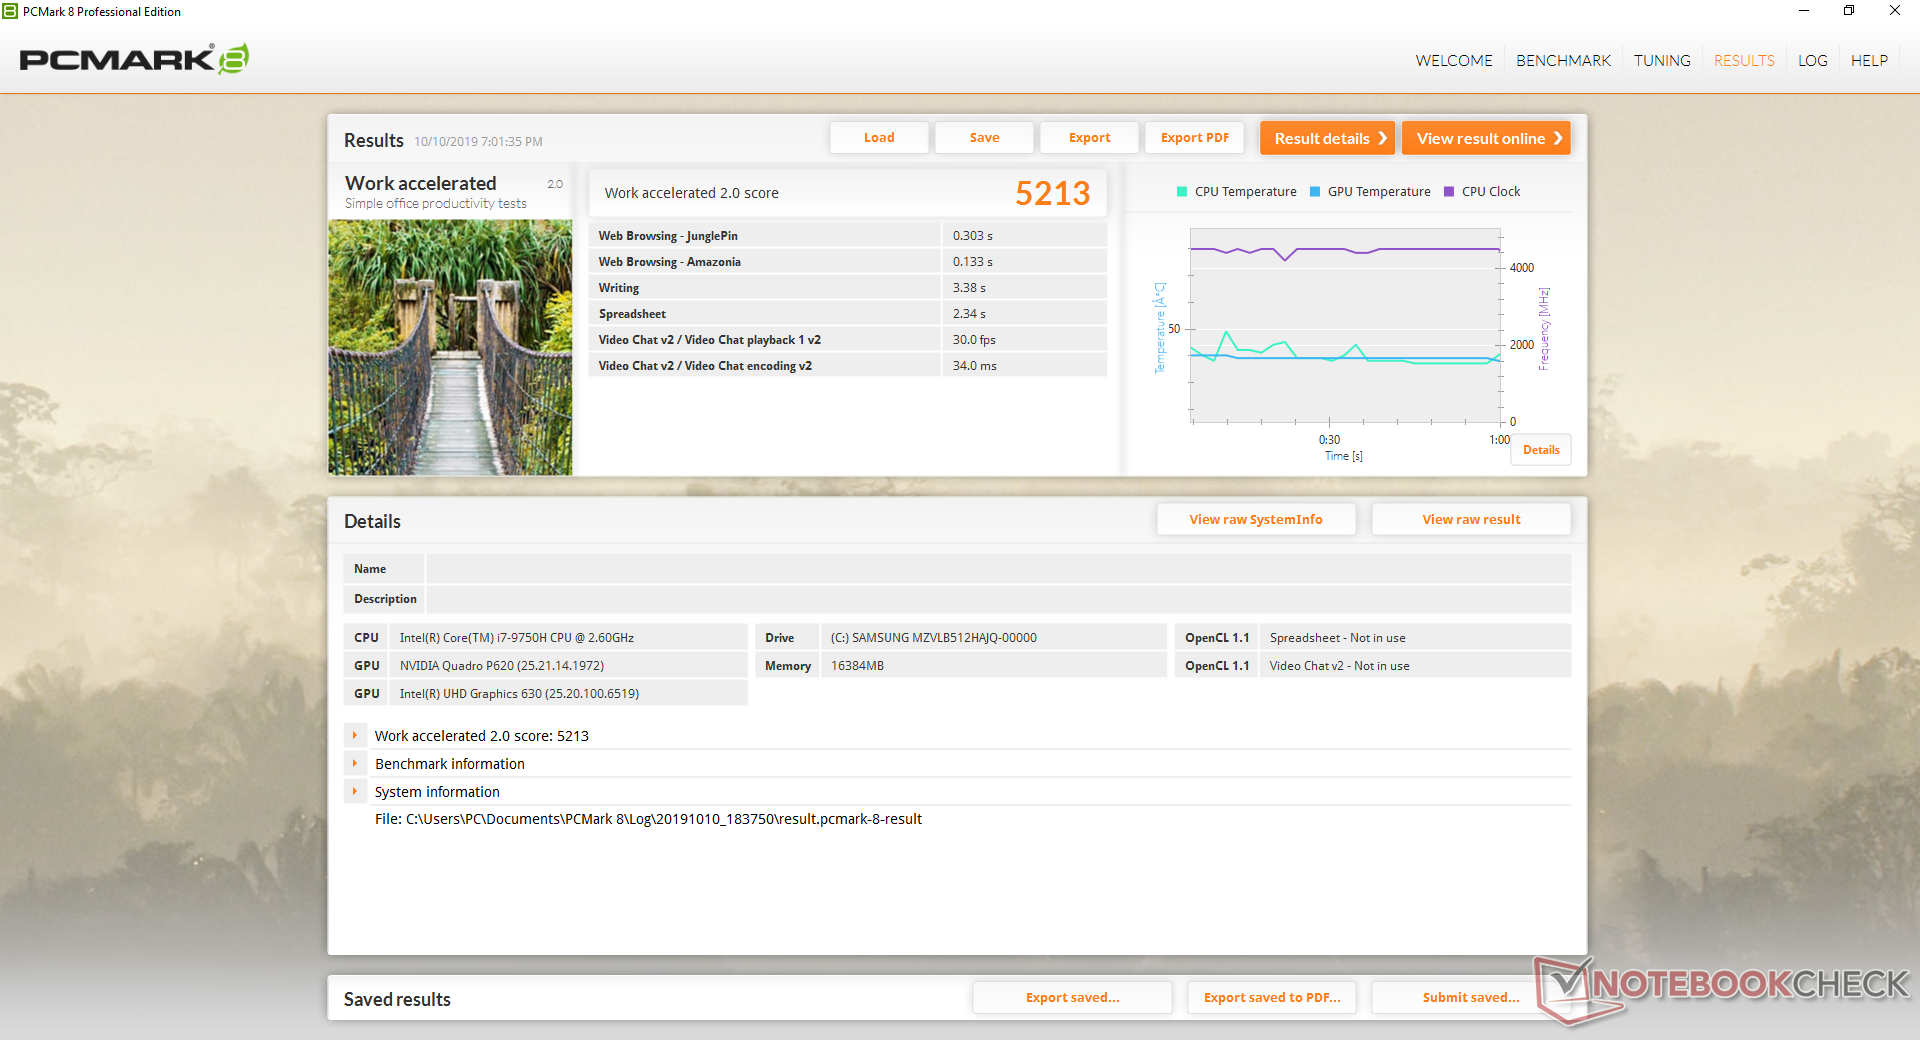
| PCMark 8 Home Score Accelerated v2 | 4165 points | |
| PCMark 8 Work Score Accelerated v2 | 5213 points | |
| PCMark 10 Score | 5025 points | |
Help | ||
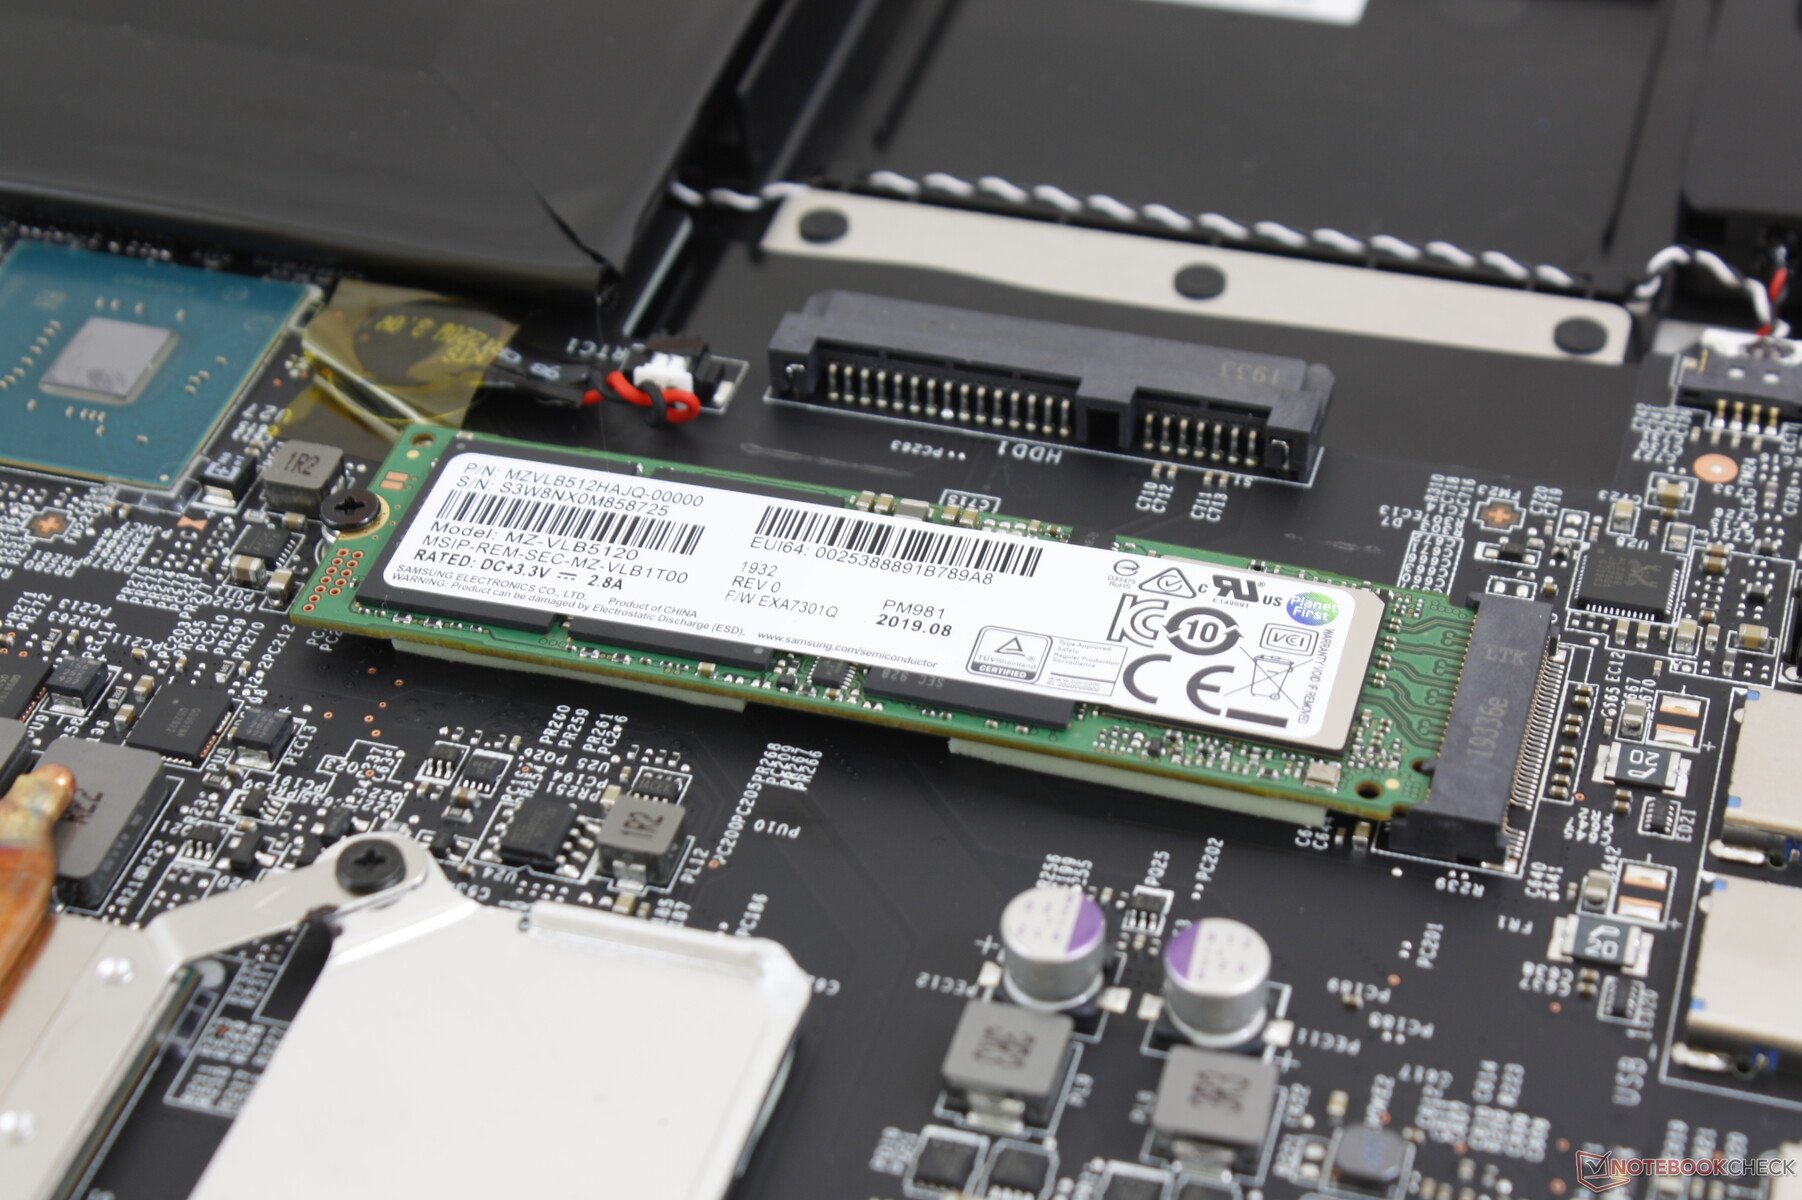
Storage Devices
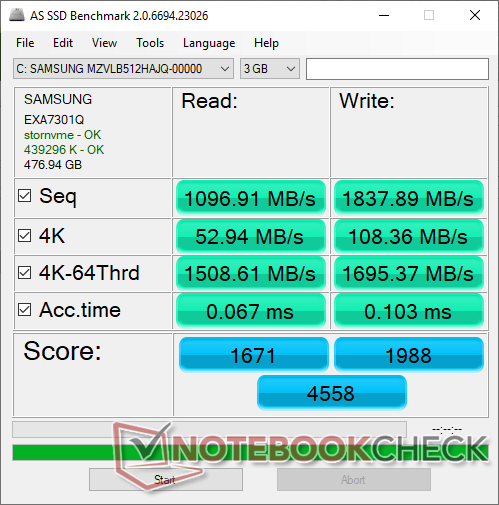
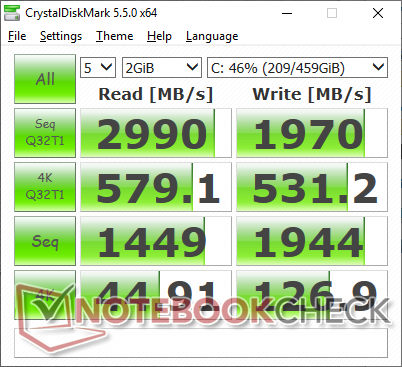
Internal storage options include an M.2 2280 PCIe x4 slot and a secondary 2.5-inch SATA III bay. Our particular test unit comes equipped with a Samsung PM981, but its sequential read rates are slower than on the HP ZBook 15u G6 with the same SSD. NVMe SSDs are known to become very warm when under high loads and so the M.2 slot in the WP65 may have benefited from a heat sink.
| MSI WP65 Samsung SSD PM981 MZVLB512HAJQ | HP ZBook 15u G6 6TP54EA Samsung SSD PM981 MZVLB512HAJQ | Lenovo ThinkPad P1 2019-20QT000RGE WDC PC SN720 SDAQNTW-512G | Dell Precision 7530 Samsung PM961 NVMe MZVLW512HMJP | Lenovo ThinkPad P52s-20LB000HGE Samsung PM961 MZVLW256HEHP | MSI WS63VR 7RL-023US Toshiba NVMe THNSN5512GPU7 | |
|---|---|---|---|---|---|---|
| AS SSD | 15% | 20% | 3% | -8% | -26% | |
| Seq Read (MB/s) | 1097 | 2083 90% | 2980 172% | 1807 65% | 1463 33% | 2133 94% |
| Seq Write (MB/s) | 1838 | 1715 -7% | 2094 14% | 1540 -16% | 1164 -37% | 1287 -30% |
| 4K Read (MB/s) | 52.9 | 55.3 5% | 45.05 -15% | 34.27 -35% | 44.98 -15% | 40.2 -24% |
| 4K Write (MB/s) | 108.4 | 137.6 27% | 155.4 43% | 103 -5% | 140 29% | 114.6 6% |
| 4K-64 Read (MB/s) | 1509 | 1211 -20% | 1291 -14% | 1304 -14% | 1312 -13% | 710 -53% |
| 4K-64 Write (MB/s) | 1695 | 1446 -15% | 1506 -11% | 1221 -28% | 612 -64% | 314 -81% |
| Access Time Read * (ms) | 0.067 | 0.039 42% | 0.064 4% | 0.055 18% | 0.065 3% | 0.128 -91% |
| Access Time Write * (ms) | 0.103 | 0.026 75% | 0.024 77% | 0.037 64% | 0.026 75% | 0.033 68% |
| Score Read (Points) | 1671 | 1474 -12% | 1634 -2% | 1519 -9% | 1504 -10% | 962 -42% |
| Score Write (Points) | 1988 | 1755 -12% | 1871 -6% | 1478 -26% | 868 -56% | 557 -72% |
| Score Total (Points) | 4558 | 3976 -13% | 4300 -6% | 3761 -17% | 3131 -31% | 1979 -57% |
| Copy ISO MB/s (MB/s) | 1800 | 2015 12% | 3015 68% | |||
| Copy Program MB/s (MB/s) | 569 | 597 5% | 519 -9% | |||
| Copy Game MB/s (MB/s) | 1409 | 1449 3% | 1172 -17% |
* ... smaller is better

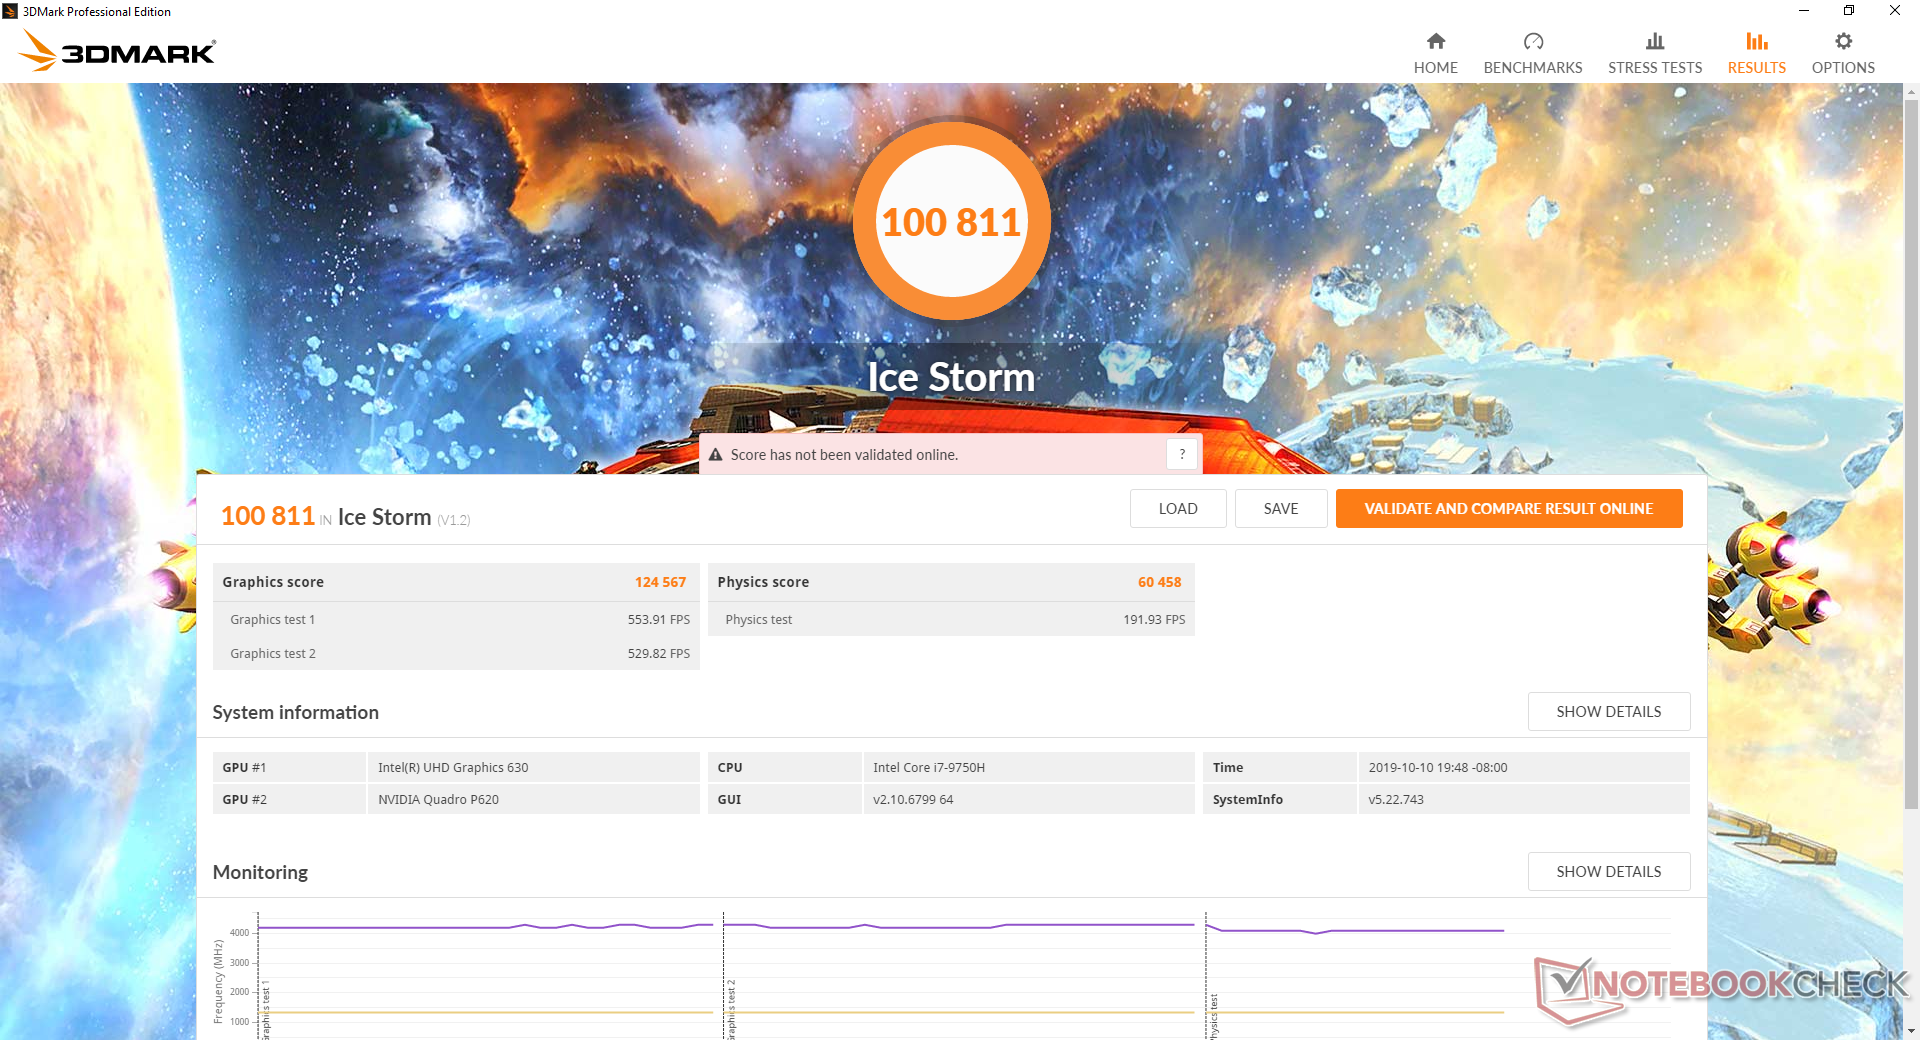
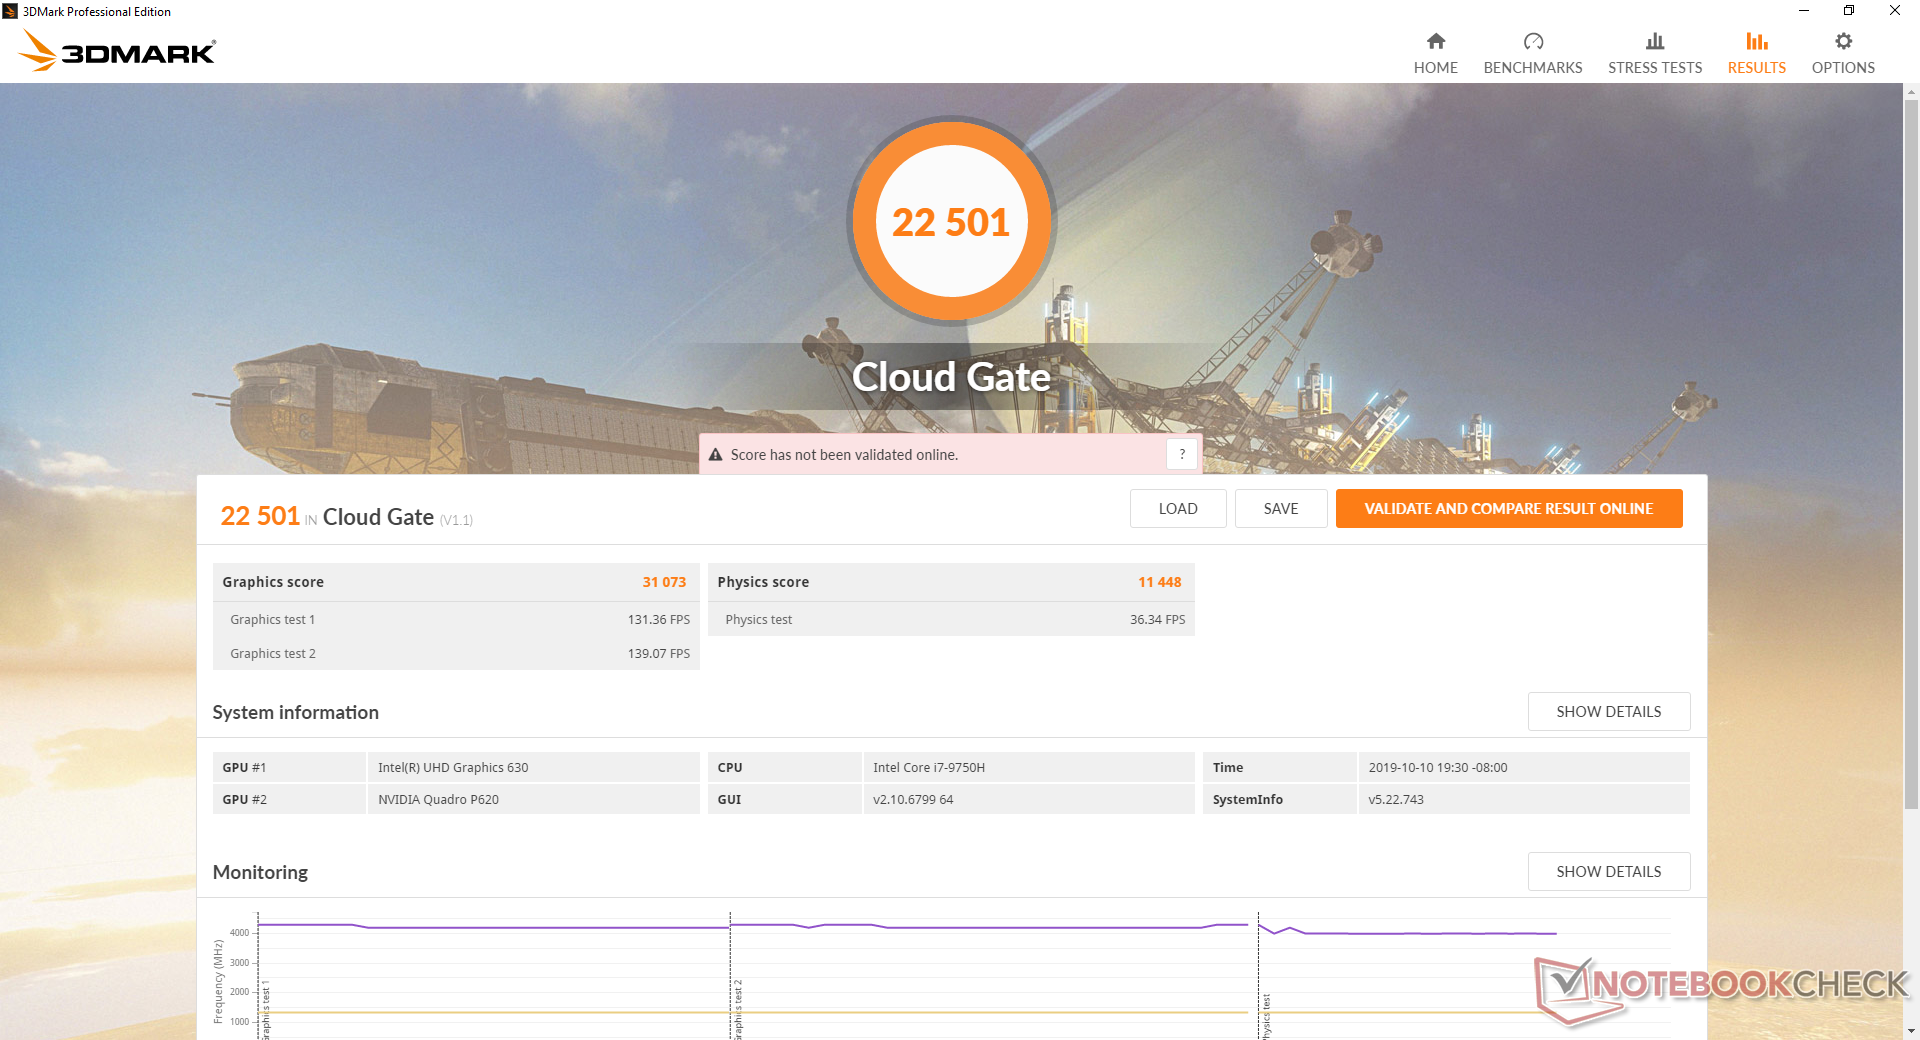
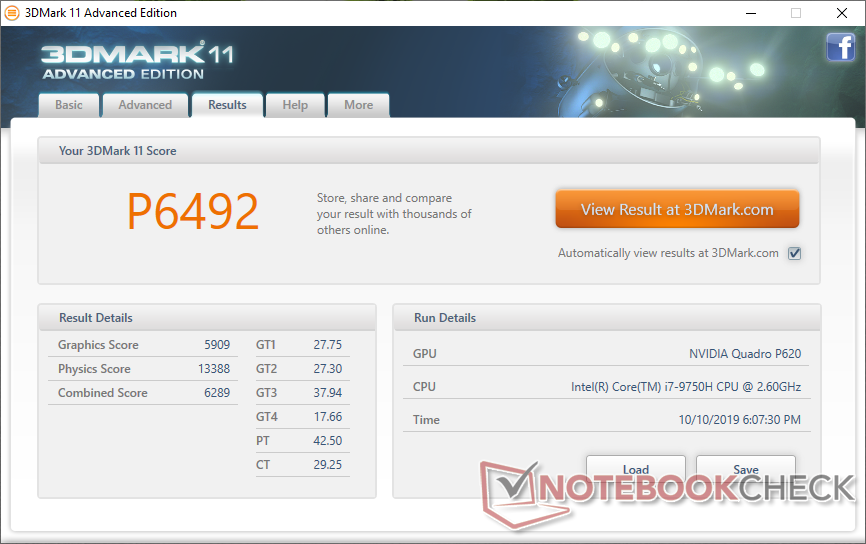
GPU Performance
Both 3DMark and Specviewperf benchmarks reveal the Quadro P620 to be within just a few percentage points of the Quadro P1000. Thus, this GPU appears to be more of a minor update and rebrand of the P1000 much like jump from the GeForce MX150 to the MX250. A closer look at their specifications show the same narrow 128-bit memory bus, 512 unified shaders, and nearly the same Boost clock rates (1442 vs. 1519 MHz) between them. This is a bit disappointing considering that the P1000 is approaching three years of age.
See our dedicated page on the Quadro P620 for more technical information and benchmark comparisons. Its gaming prowess is decent and roughly comparable to the older GeForce GTX 965M with the narrow memory bus being a major limiting factor.
| 3DMark 06 Standard Score | 34862 points | |
| 3DMark Vantage P Result | 25105 points | |
| 3DMark 11 Performance | 6492 points | |
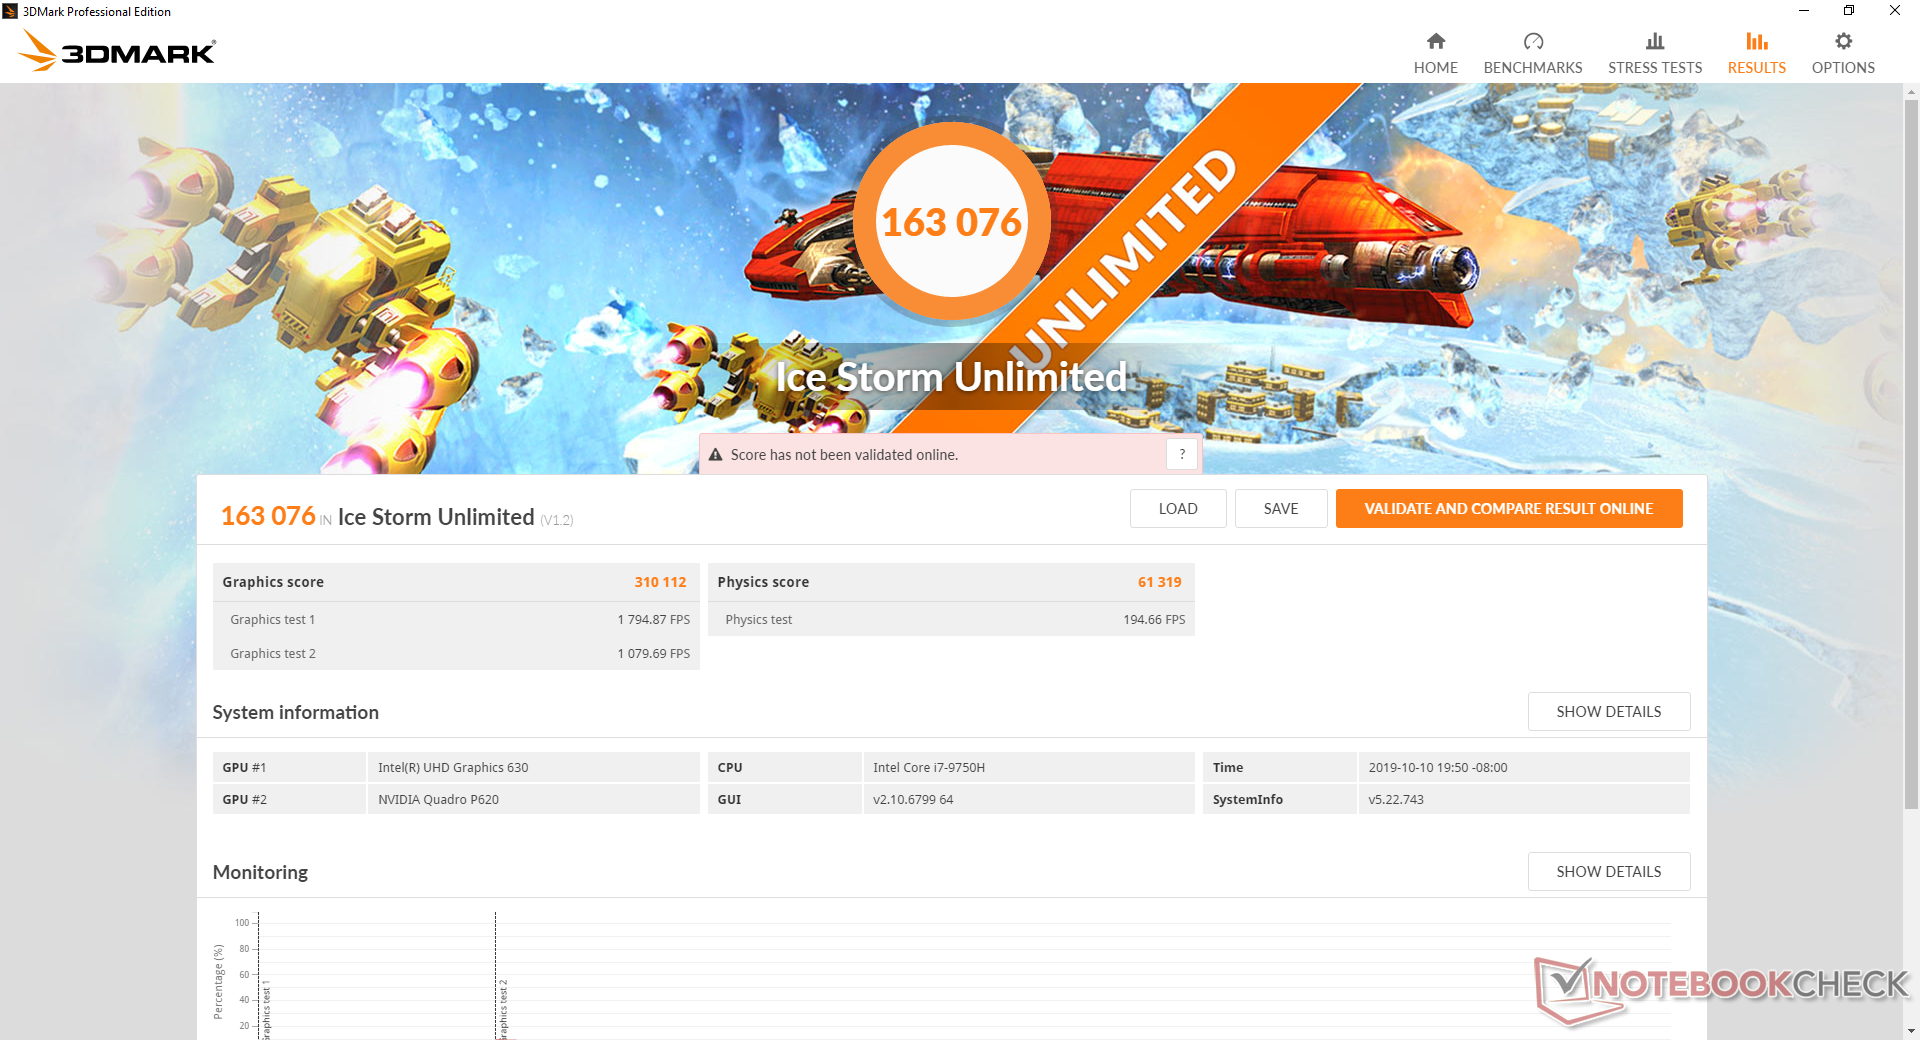
| 3DMark Ice Storm Standard Score | 100811 points | |
| 3DMark Cloud Gate Standard Score | 22501 points | |
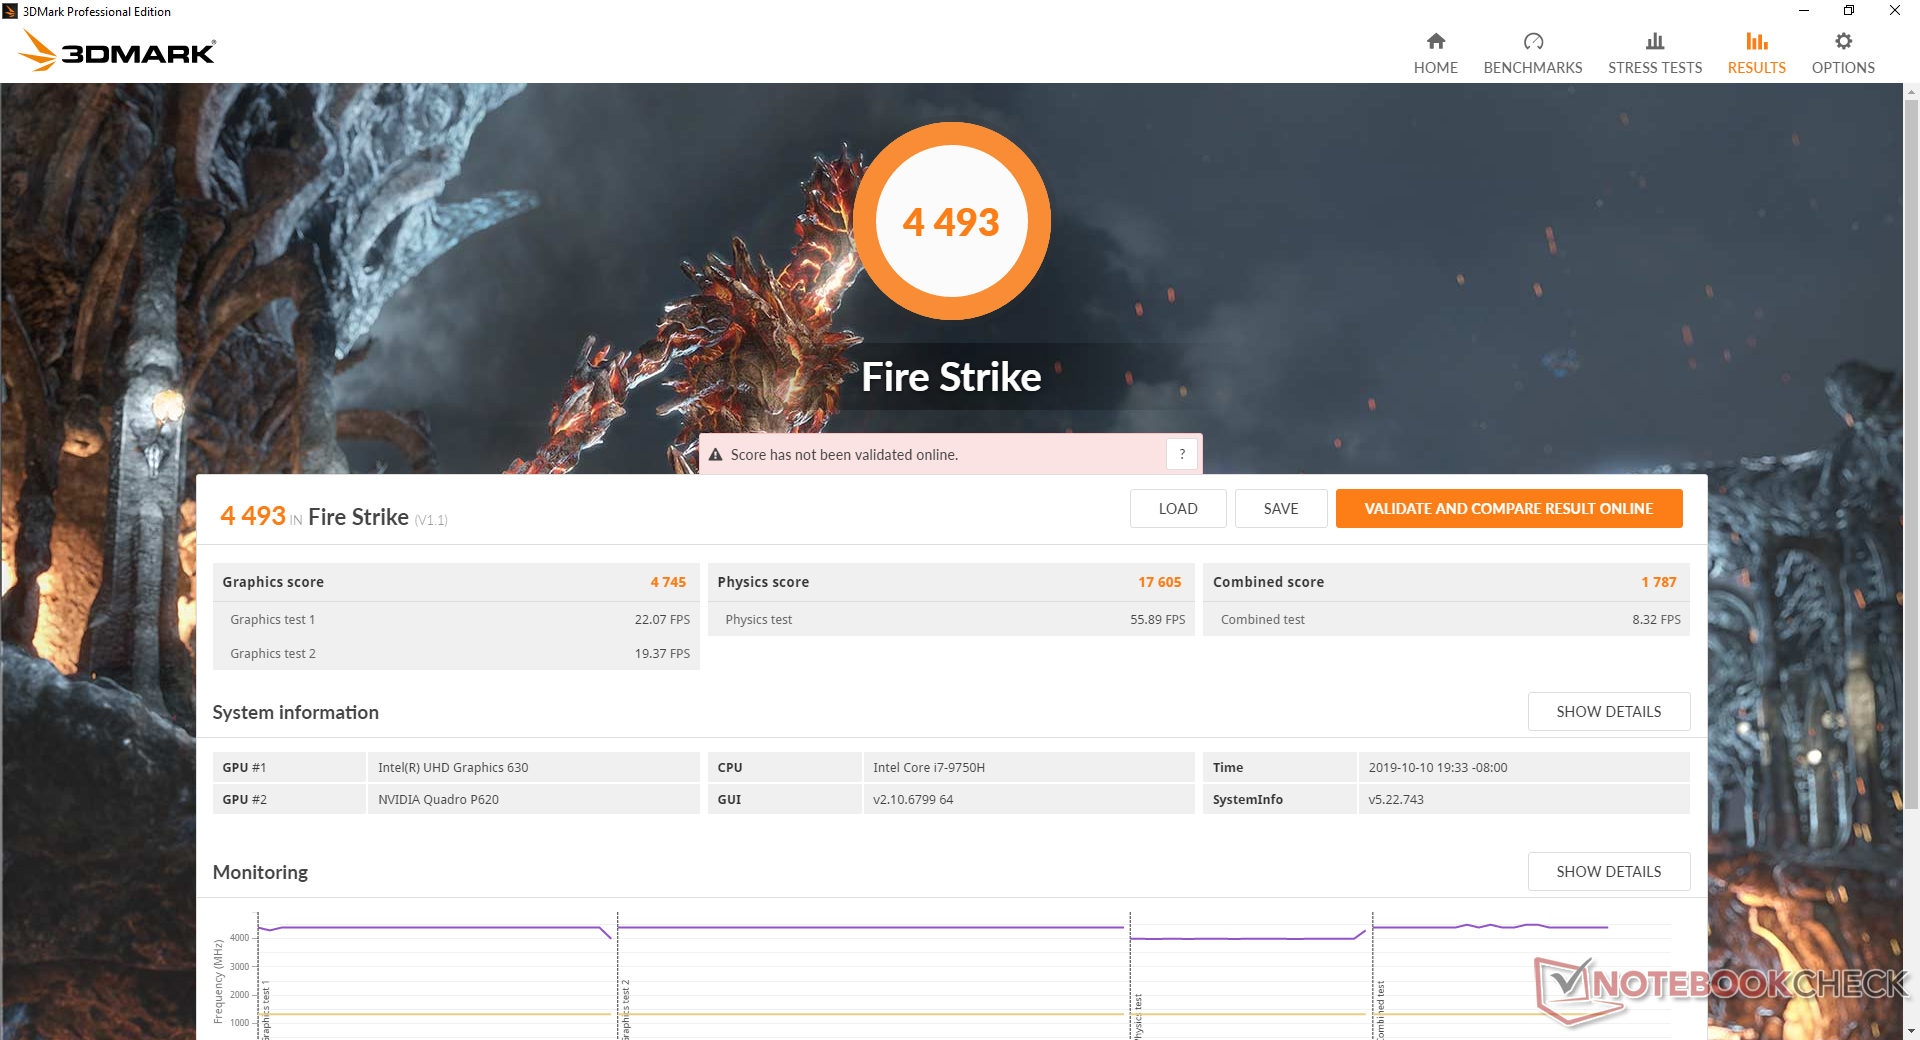
| 3DMark Fire Strike Score | 4493 points | |
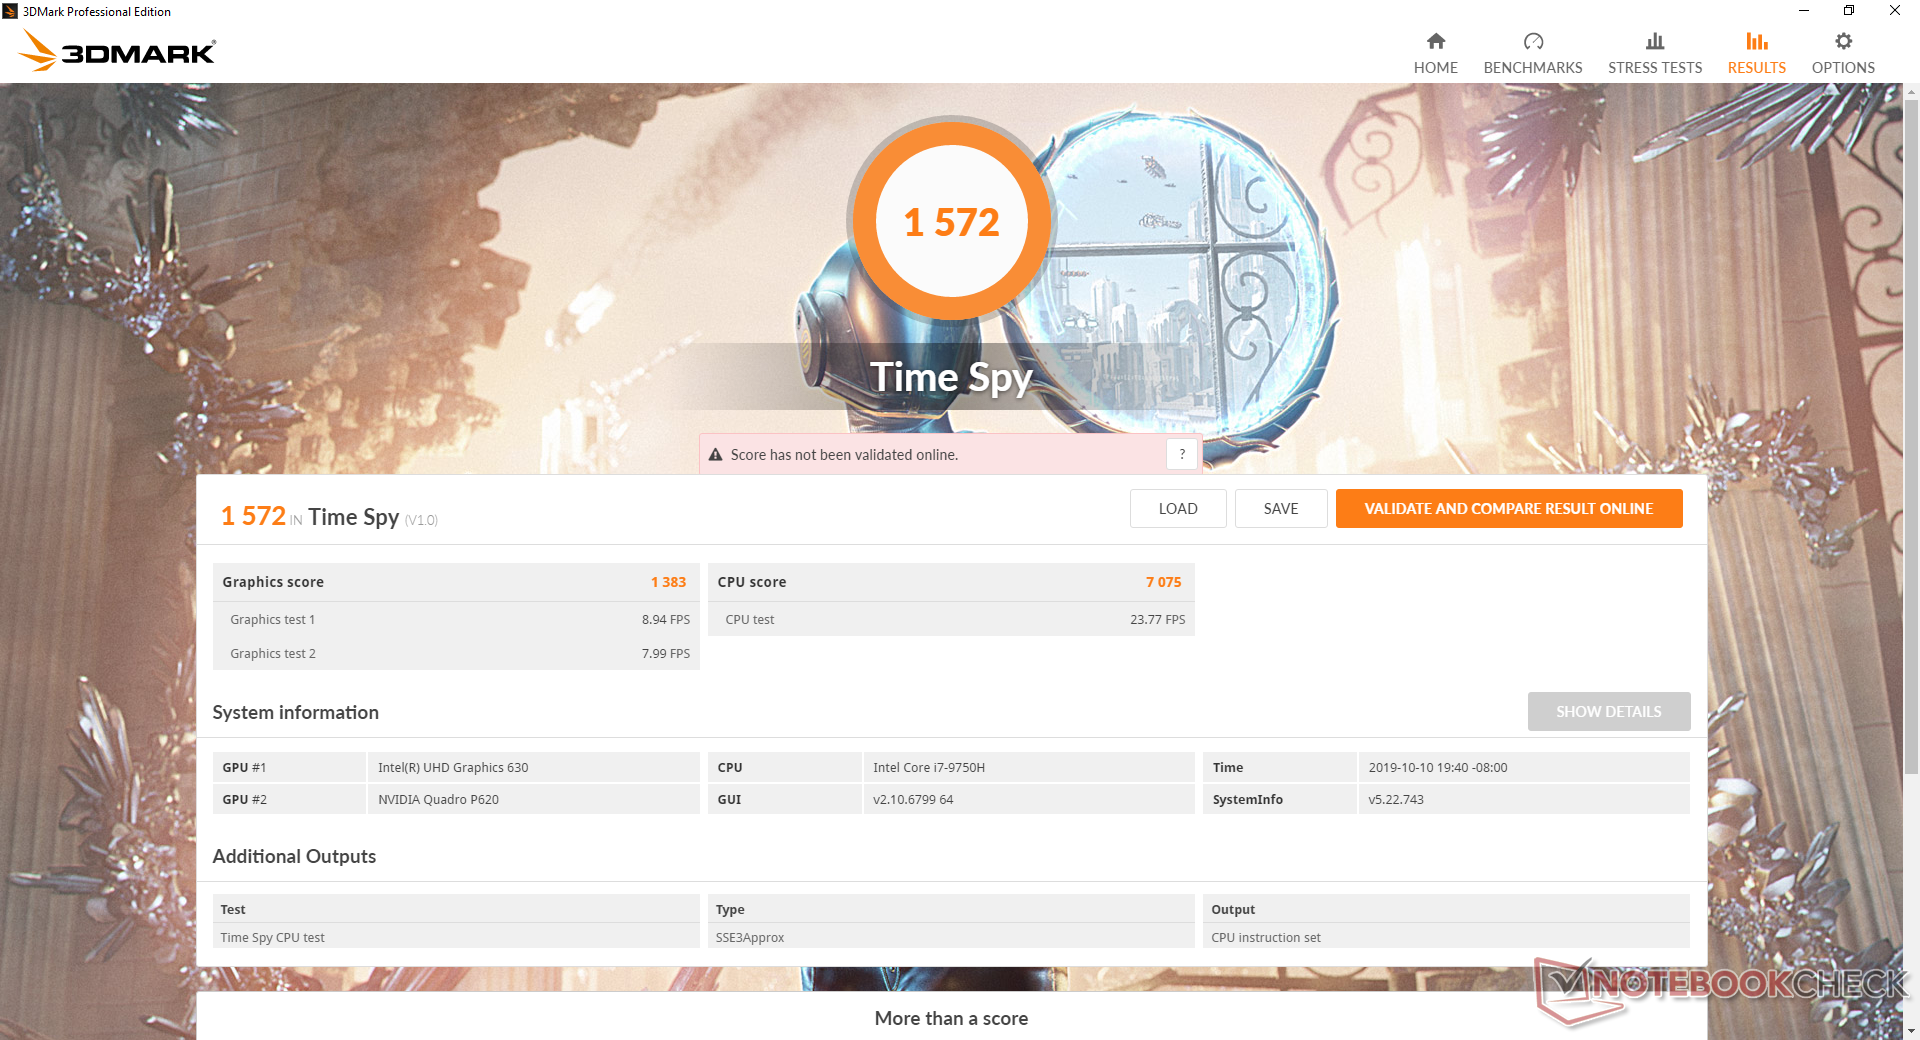
| 3DMark Time Spy Score | 1572 points | |
Help | ||
| low | med. | high | ultra | |
|---|---|---|---|---|
| Guild Wars 2 (2012) | 149.9 | 73.1 | 28.4 | |
| StarCraft II: Heart of the Swarm (2013) | 542 | 258.9 | 156.8 | 82.4 |
| BioShock Infinite (2013) | 301.7 | 160.9 | 140 | 52.8 |
| The Witcher 3 (2015) | 101 | 57.7 | 33 | 18.1 |
| Rise of the Tomb Raider (2016) | 101.9 | 62.9 | 33.7 | 26.4 |
| Ashes of the Singularity (2016) | 50.6 | 29.2 | 25.4 | |
| Doom (2016) | 96.7 | 76.3 | 44.1 | |
| Overwatch (2016) | 261.8 | 169 | 77 | |
| Prey (2017) | 144.7 | 74.8 | 56.7 | |
| Rocket League (2017) | 248.9 | 153.5 | 96.5 | |
| Middle-earth: Shadow of War (2017) | 96 | 37 | 27 | 20 |
| Destiny 2 (2017) | 100.5 | 48.6 | 37.6 | 30.1 |
| Fortnite (2018) | 183.6 | 113.2 | 41.9 | 29.3 |
| Final Fantasy XV Benchmark (2018) | 51.9 | 25.6 | 18.3 | |
| F1 2018 (2018) | 106 | 55 | 42 | 25 |
| Shadow of the Tomb Raider (2018) | 70 | 16 | 14 | 12 |
| Apex Legends (2019) | 88.4 | 35.2 | 29.1 | 26 |
| Metro Exodus (2019) | 46.6 | 21.4 | 15.5 | 12.9 |
| F1 2019 (2019) | 102 | 46 | 39 | 26 |
| Borderlands 3 (2019) | 75.8 | 29.7 | 19.3 | 14.5 |
| FIFA 20 (2019) | 166 | 117.8 | 112 | 92.4 |
Emissions
System Noise
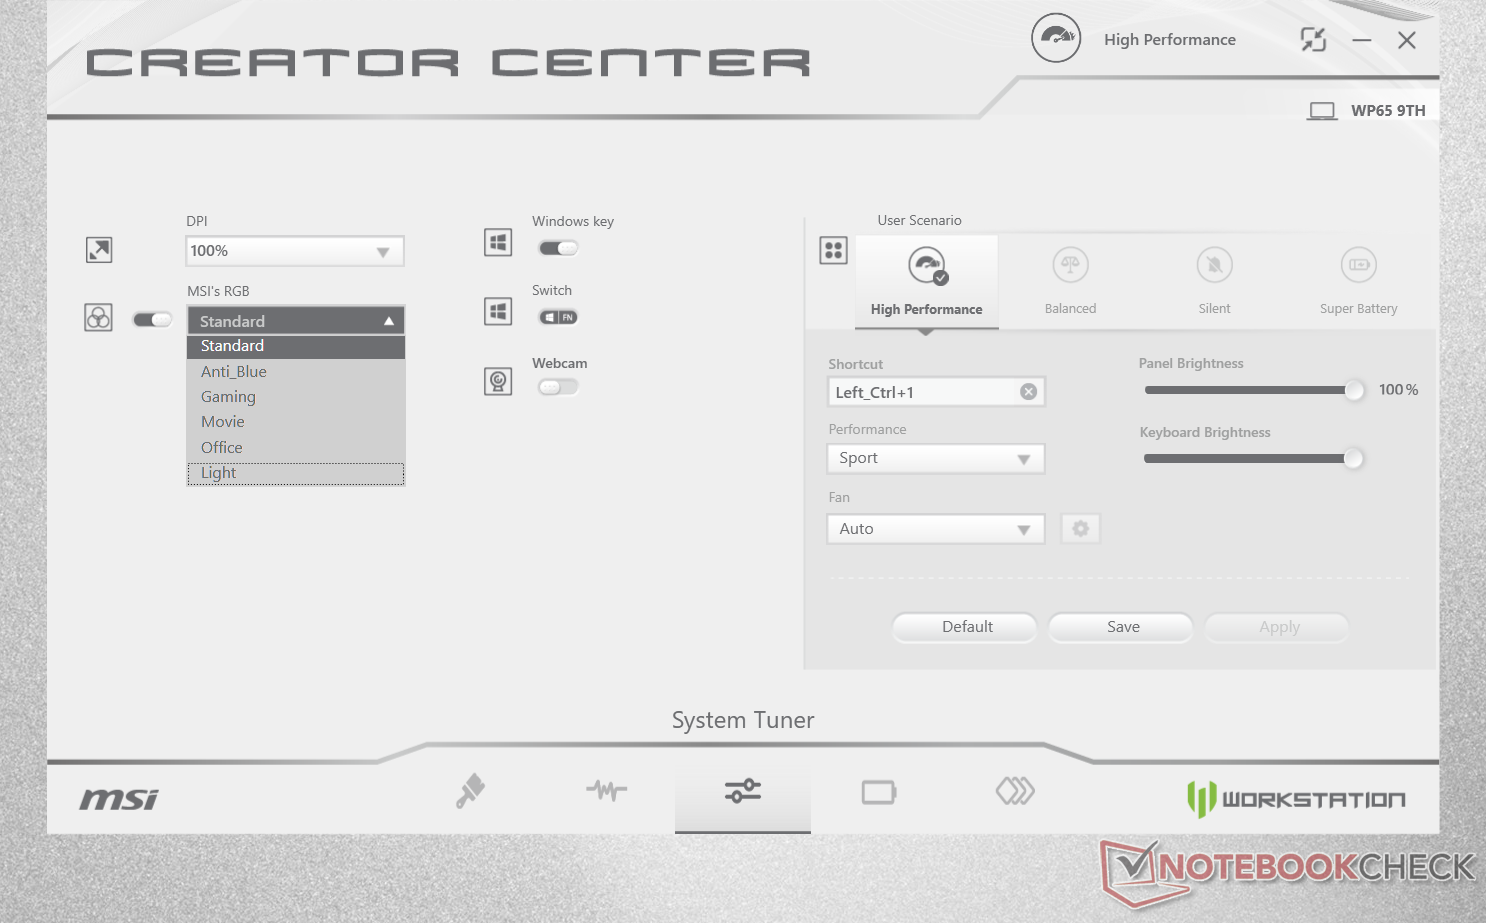
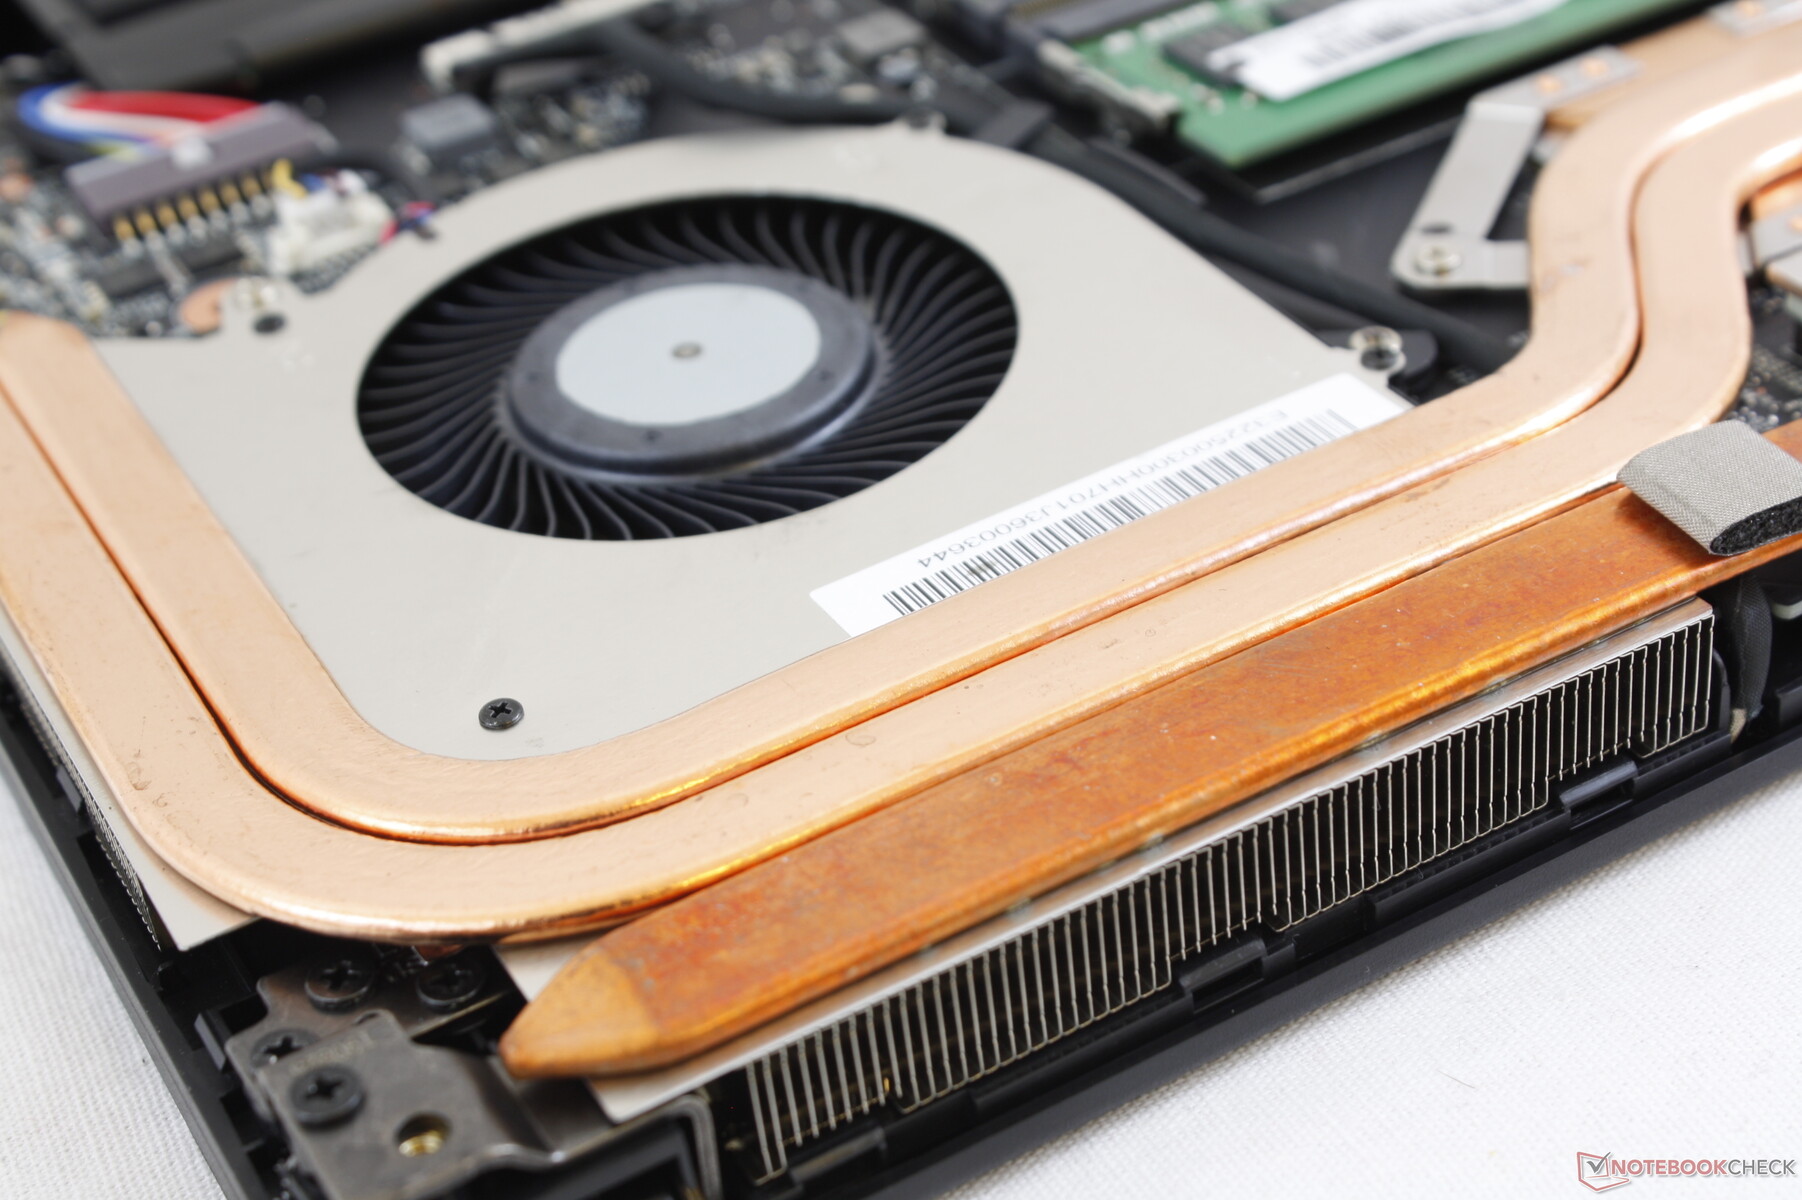
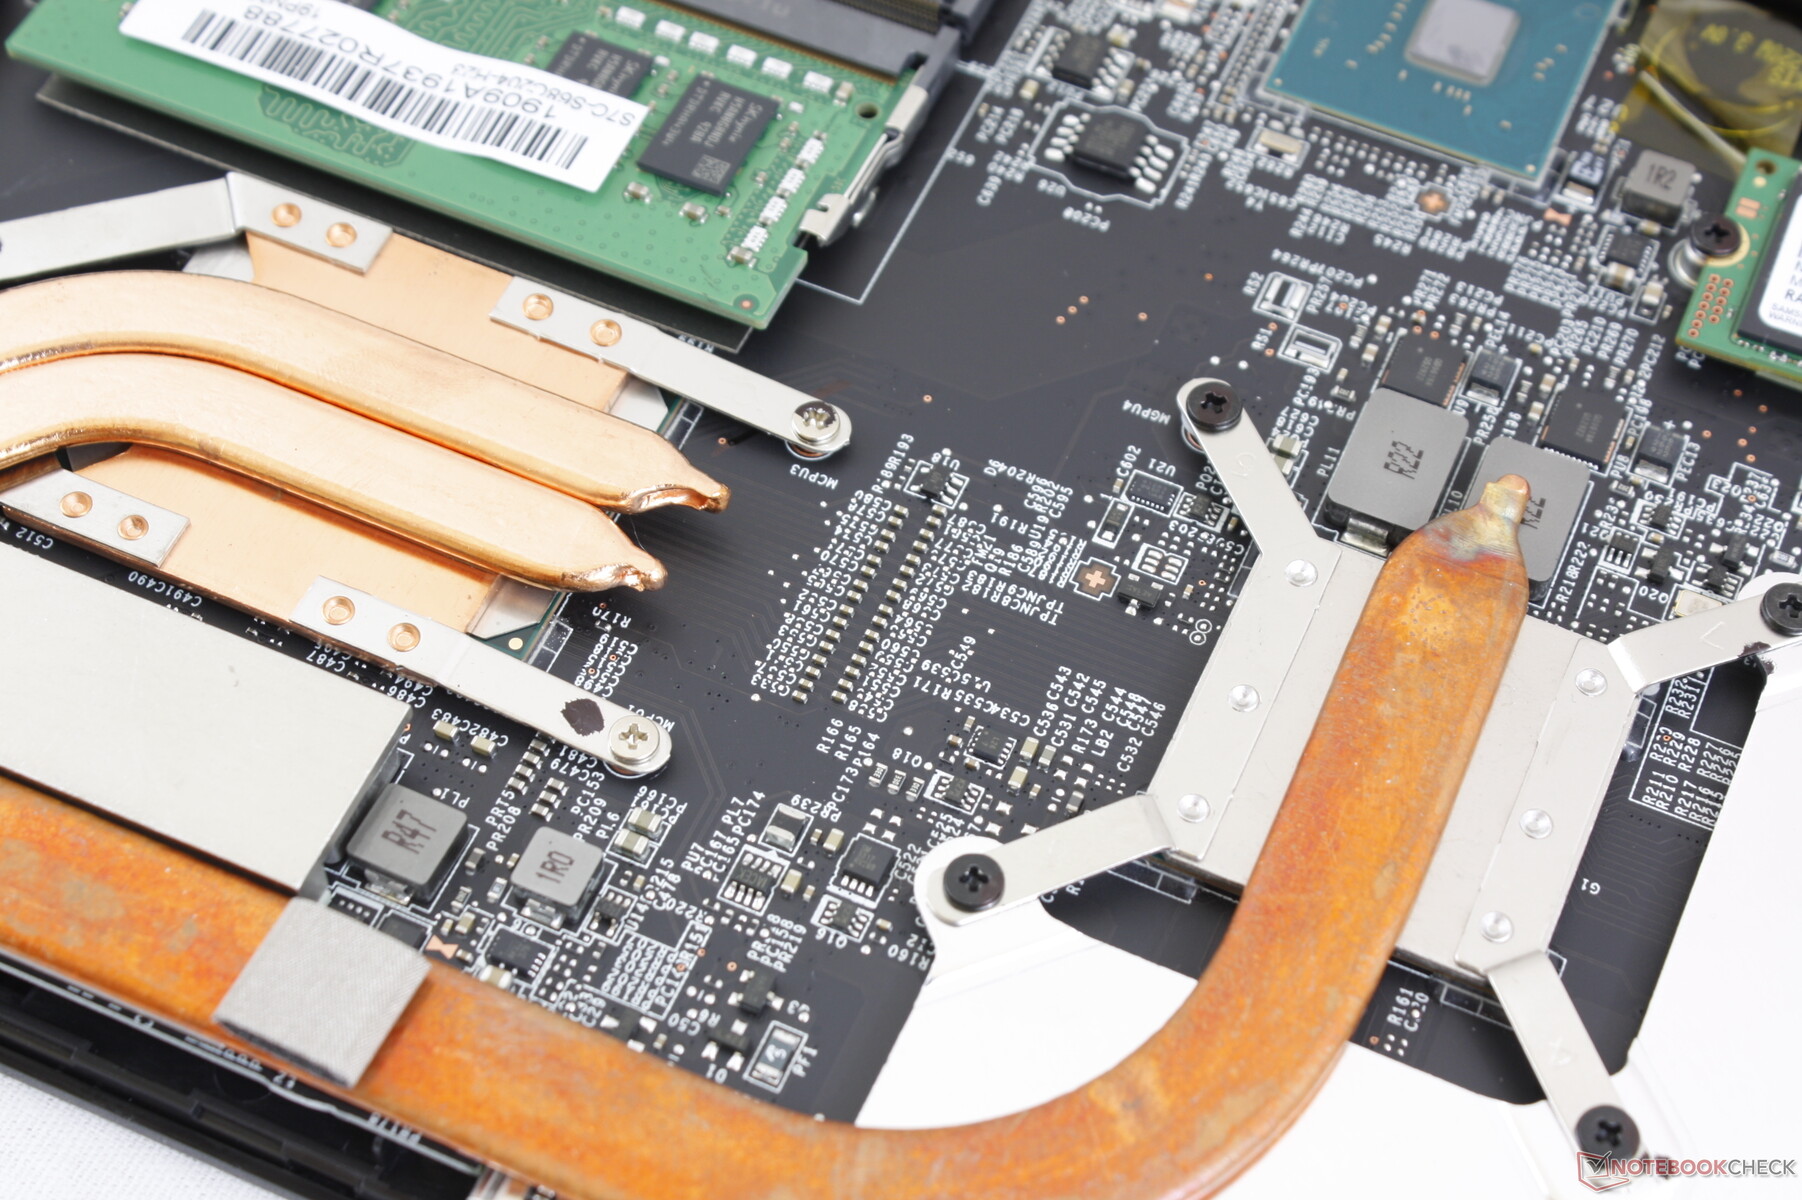
The cooling solution consists of one 60 mm fan and three copper heat pipes. The fan is always active at about 33.4 dB(A) no matter the setting to be louder than most other laptops when idling on desktop. An option to run in in complete silence would have been appreciated for undemanding loads like browsing or word processing.
Running higher loads like games will bump fan noise to just under 39 dB(A) to be louder than most Ultrabooks but still quieter than most gaming laptops when under similar conditions. Enabling Cooler Boost mode, which is MSI's version of Turbo Fan mode, will bump fan noise to a very loud and steady 59.5 dB(A). Our stress test section below will show that Cooler Boost mode improves performance only marginally relative to the extreme increase in noise.
We can notice no electronic noise or coil whine from our unit and, even if we did, it would have been overwhelmed by the constant fan noise anyway.
| MSI WP65 Quadro P620, i7-9750H, Samsung SSD PM981 MZVLB512HAJQ | HP ZBook 15u G6 6TP54EA Radeon Pro WX 3200, i7-8565U, Samsung SSD PM981 MZVLB512HAJQ | Lenovo ThinkPad P1 2019-20QT000RGE Quadro T1000 (Laptop), i7-9850H, WDC PC SN720 SDAQNTW-512G | Dell Precision 7530 Quadro P3200, i9-8950HK, Samsung PM961 NVMe MZVLW512HMJP | Lenovo ThinkPad P52s-20LB000HGE Quadro P500, i5-8550U, Samsung PM961 MZVLW256HEHP | MSI WS63VR 7RL-023US Quadro P4000 Max-Q, i7-7700HQ, Toshiba NVMe THNSN5512GPU7 | |
|---|---|---|---|---|---|---|
| Noise | 13% | 14% | 5% | 14% | 3% | |
| off / environment * (dB) | 28.7 | 29.7 -3% | 28.8 -0% | 28.3 1% | 29 -1% | 28 2% |
| Idle Minimum * (dB) | 33.4 | 29.7 11% | 28.8 14% | 28.3 15% | 29 13% | 33.2 1% |
| Idle Average * (dB) | 33.5 | 29.7 11% | 28.8 14% | 28.3 16% | 29 13% | 33.2 1% |
| Idle Maximum * (dB) | 33.5 | 30.3 10% | 28.8 14% | 30.5 9% | 31.2 7% | 33.2 1% |
| Load Average * (dB) | 37 | 32.6 12% | 36.1 2% | 34.5 7% | 32.5 12% | 41.4 -12% |
| Witcher 3 ultra * (dB) | 38.7 | 34.2 12% | 49.5 -28% | 32.5 16% | 38.4 1% | |
| Load Maximum * (dB) | 59.5 | 36.1 39% | 36.7 38% | 49.5 17% | 37.5 37% | 43.5 27% |
* ... smaller is better
Noise level
| Idle |
| 33.4 / 33.5 / 33.5 dB(A) |
| Load |
| 37 / 59.5 dB(A) |
 | ||
30 dB silent 40 dB(A) audible 50 dB(A) loud |
||
min: | ||
Temperature
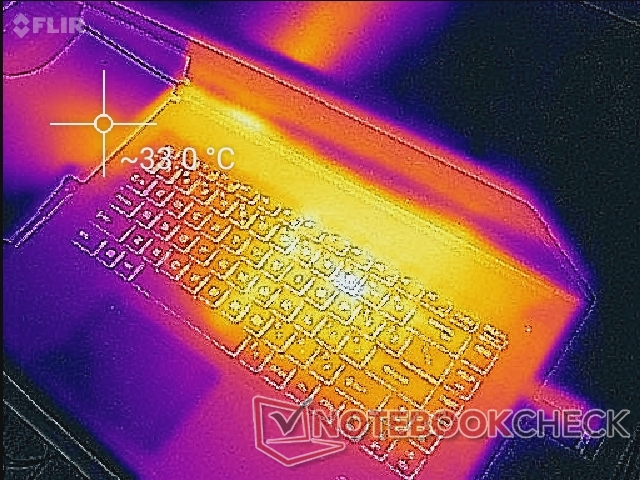
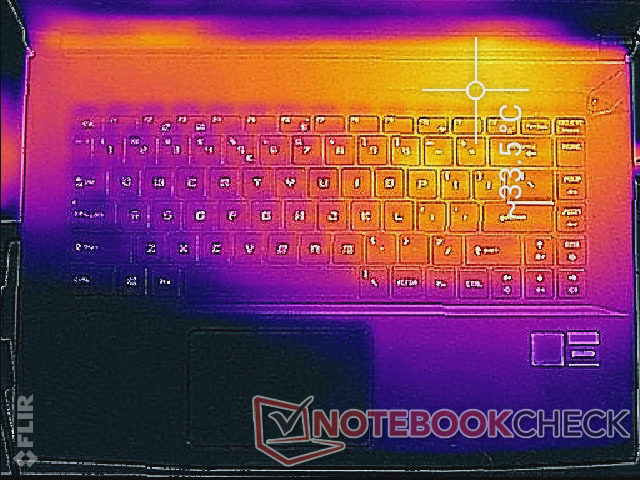
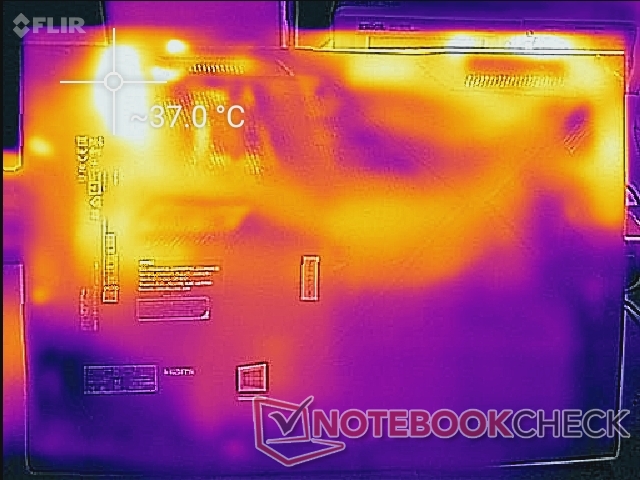
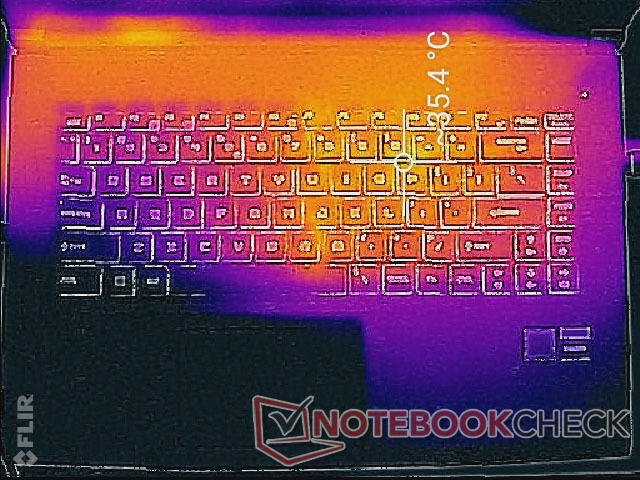
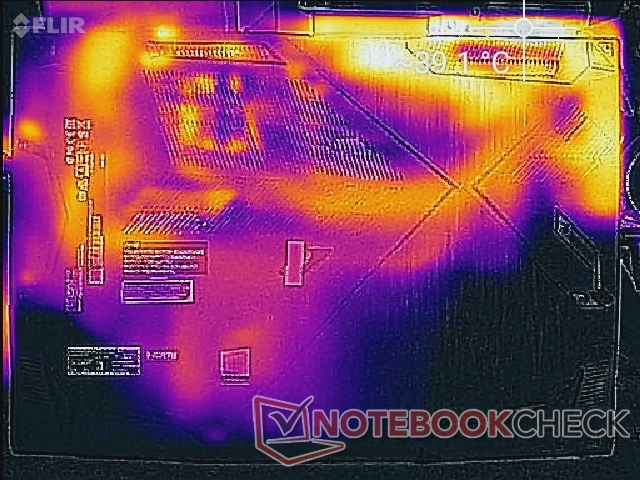
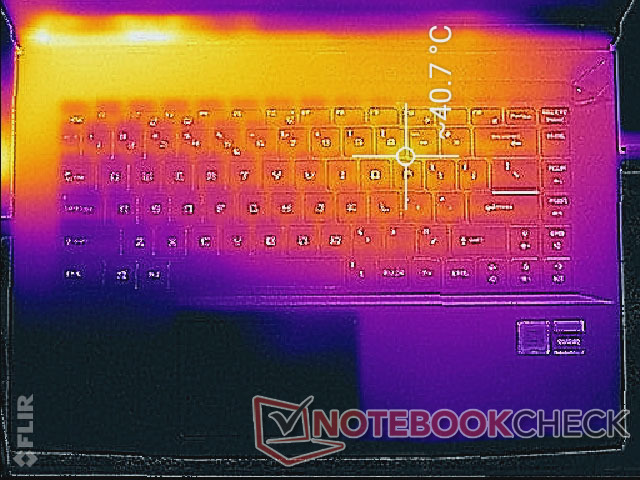
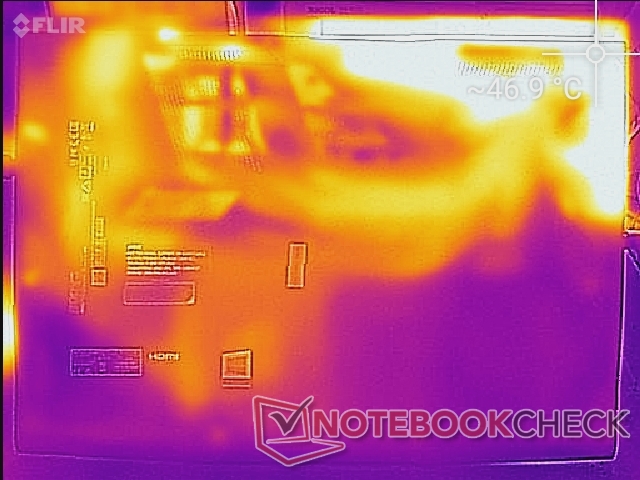
Surface temperatures when idling can be as warm as 37 C on the bottom hot spot nearest the rear as shown by our temperature maps below. This is unexpected because this hot spot is directly above the WLAN and VRAM modules instead of the CPU, GPU, or heat pipes. When gaming or running demanding loads, the hot spot shifts to the other corner of the chassis nearest the heat pipes where it can be anywhere between 40 C and 47 C. The WASD keys, clickpad, and palm rests remain relatively cool no matter the load while surfaces closer to the "P" key can become as warm as 40 C.
(±) The maximum temperature on the upper side is 42.8 °C / 109 F, compared to the average of 38.2 °C / 101 F, ranging from 22.2 to 69.8 °C for the class Workstation.
(-) The bottom heats up to a maximum of 47.4 °C / 117 F, compared to the average of 41.1 °C / 106 F
(+) In idle usage, the average temperature for the upper side is 28 °C / 82 F, compared to the device average of 32 °C / 90 F.
(+) Playing The Witcher 3, the average temperature for the upper side is 29.2 °C / 85 F, compared to the device average of 32 °C / 90 F.
(+) The palmrests and touchpad are cooler than skin temperature with a maximum of 27.4 °C / 81.3 F and are therefore cool to the touch.
(±) The average temperature of the palmrest area of similar devices was 27.8 °C / 82 F (+0.4 °C / 0.7 F).
Stress Test
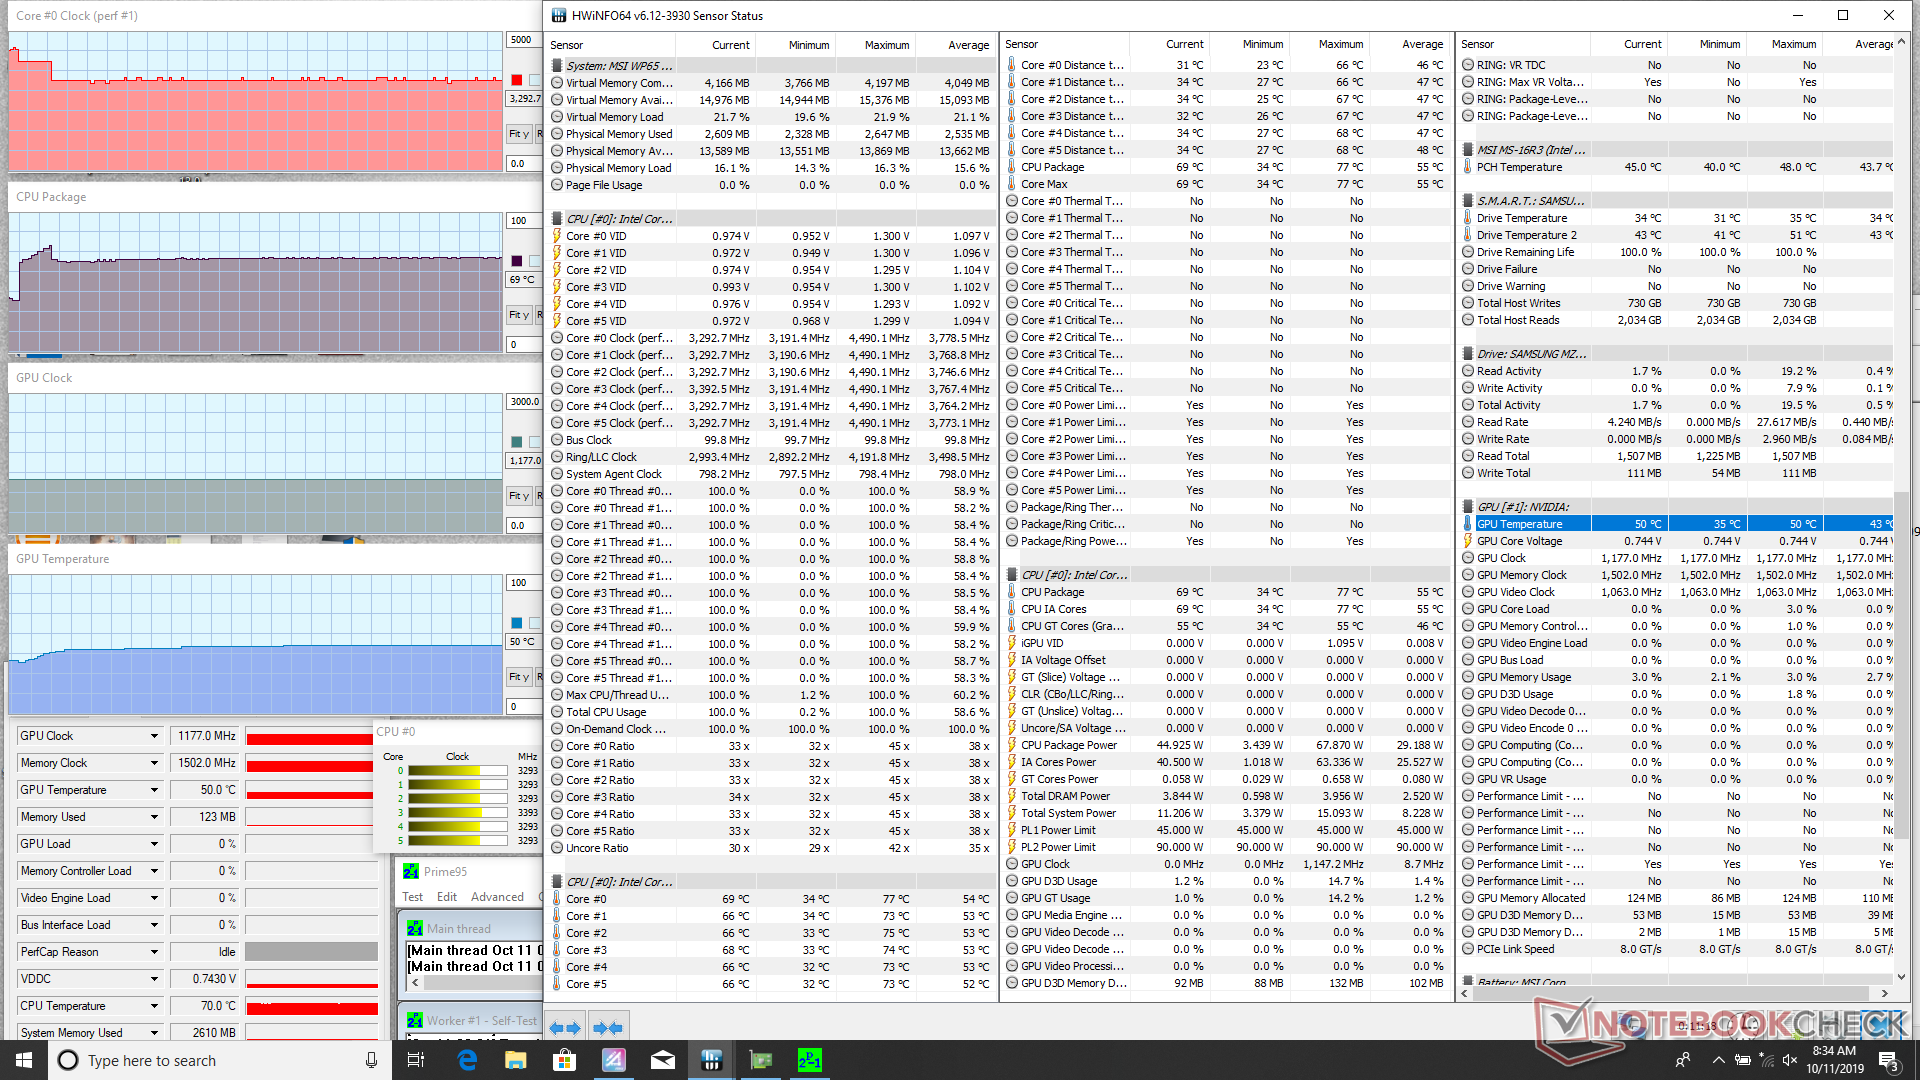
We stress the laptop with synthetic loads to identify for any potential throttling or stability issues. When running Prime95, clock rates spike to 4 GHz for about 25 seconds until hitting a core temperature of 77 C. Thereafter, clock rates drop to 3.3 GHz in order to maintain a cooler core temperature of 67 C. If Cooler Boost mode is enabled, clock rates become only 100 to 200 MHz faster while CPU temperatures becomes even cooler at just 50 C. Thus, Cooler Boost is more useful for temperature control rather than performance control.
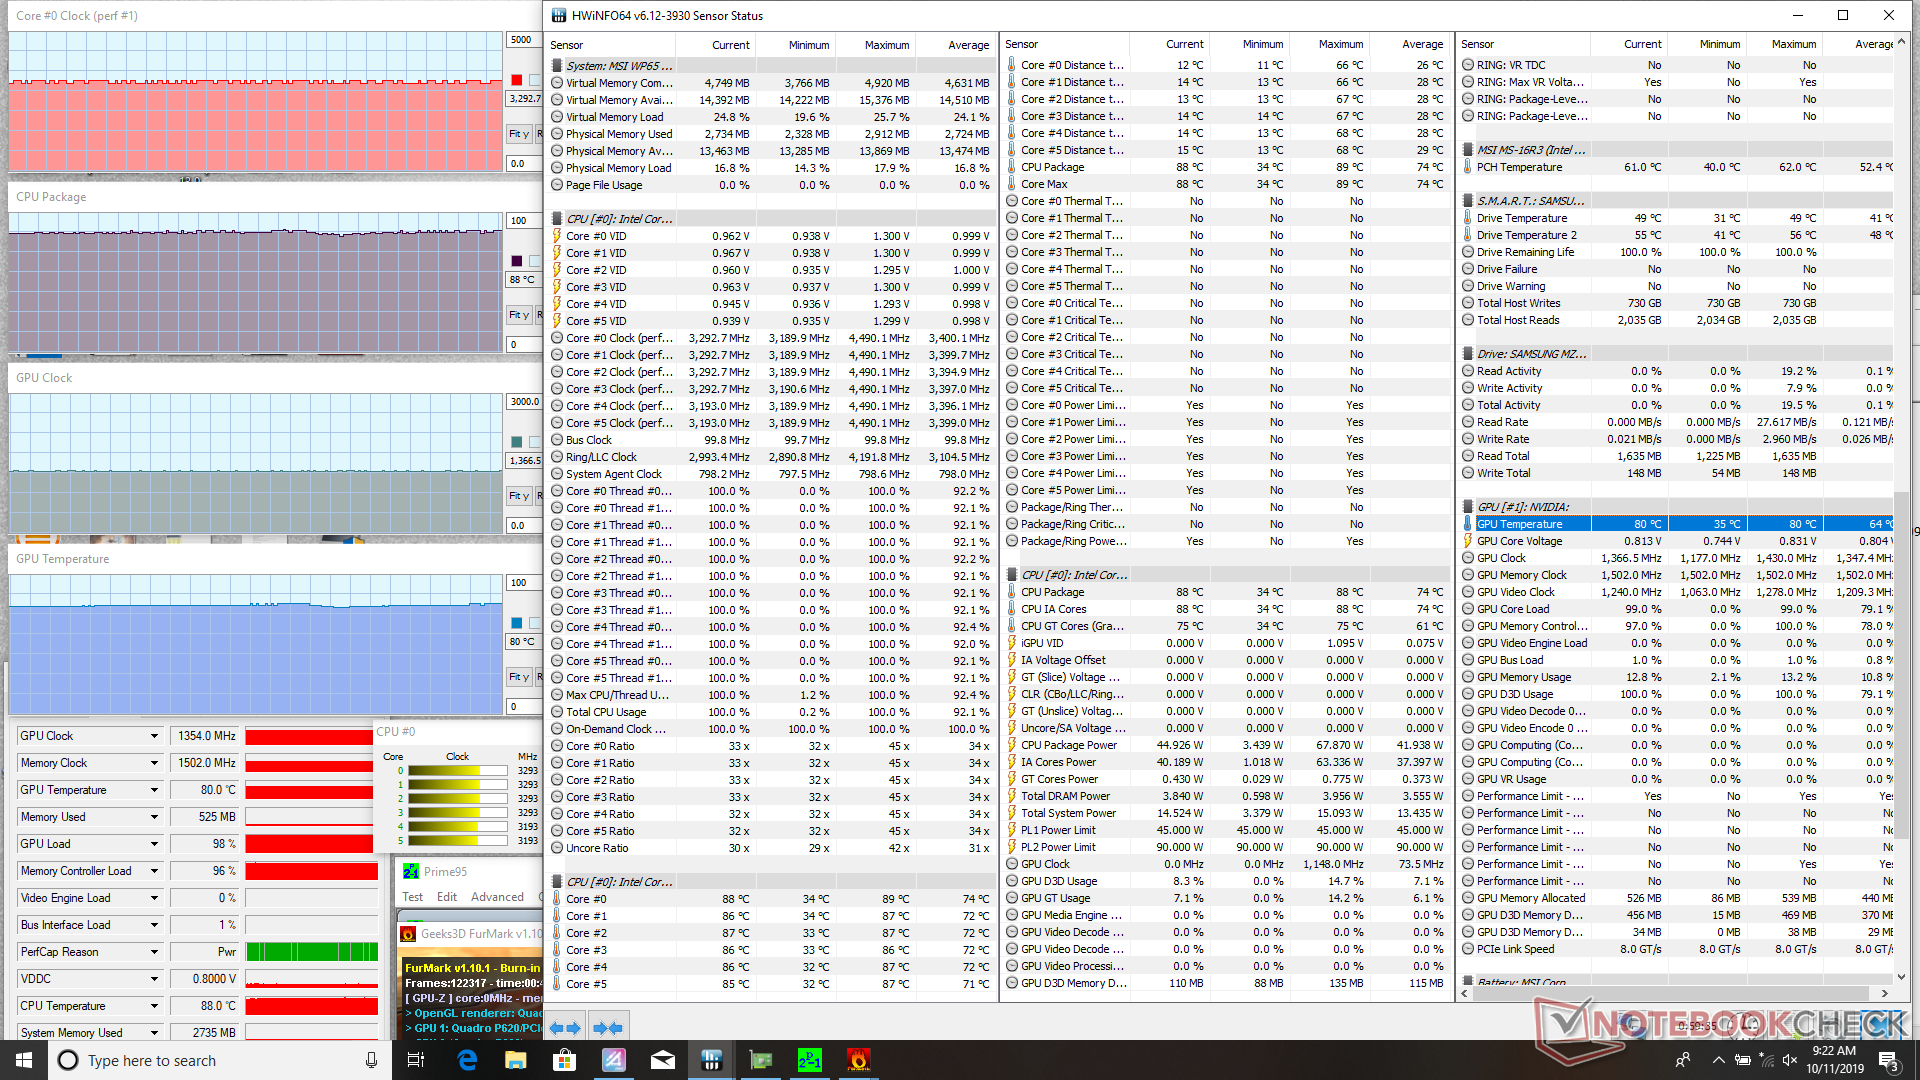
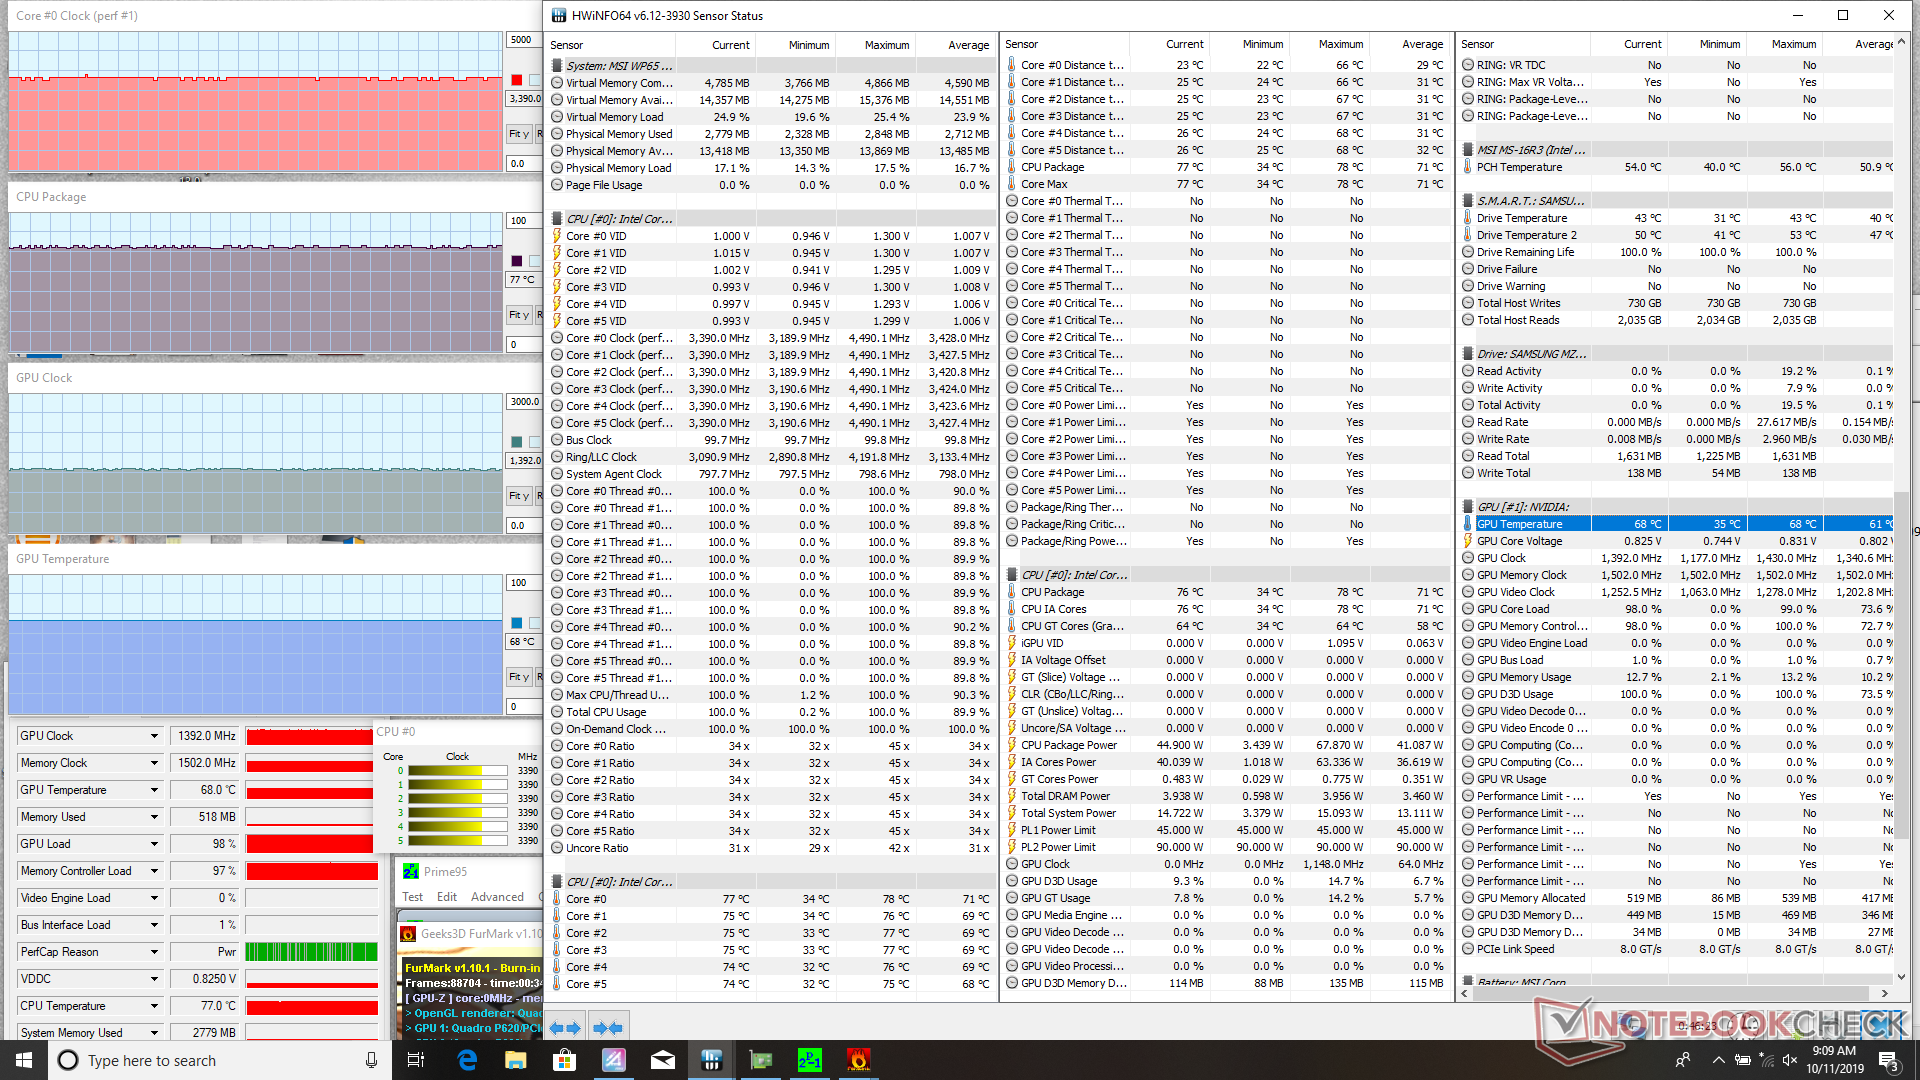
Running both Prime95 and FurMark simultaneously will cause CPU and GPU temperatures to stabilize at 88 C and 80 C, respectively, or just 77 C and 68 C when Cooler Boost is enabled.
Running on battery power will impact CPU performance more than GPU performance. A Fire Strike test on batteries returns Physics and Graphics scores of 12708 and 4612 points, respectively, compared to 17605 and 4745 points when on mains.
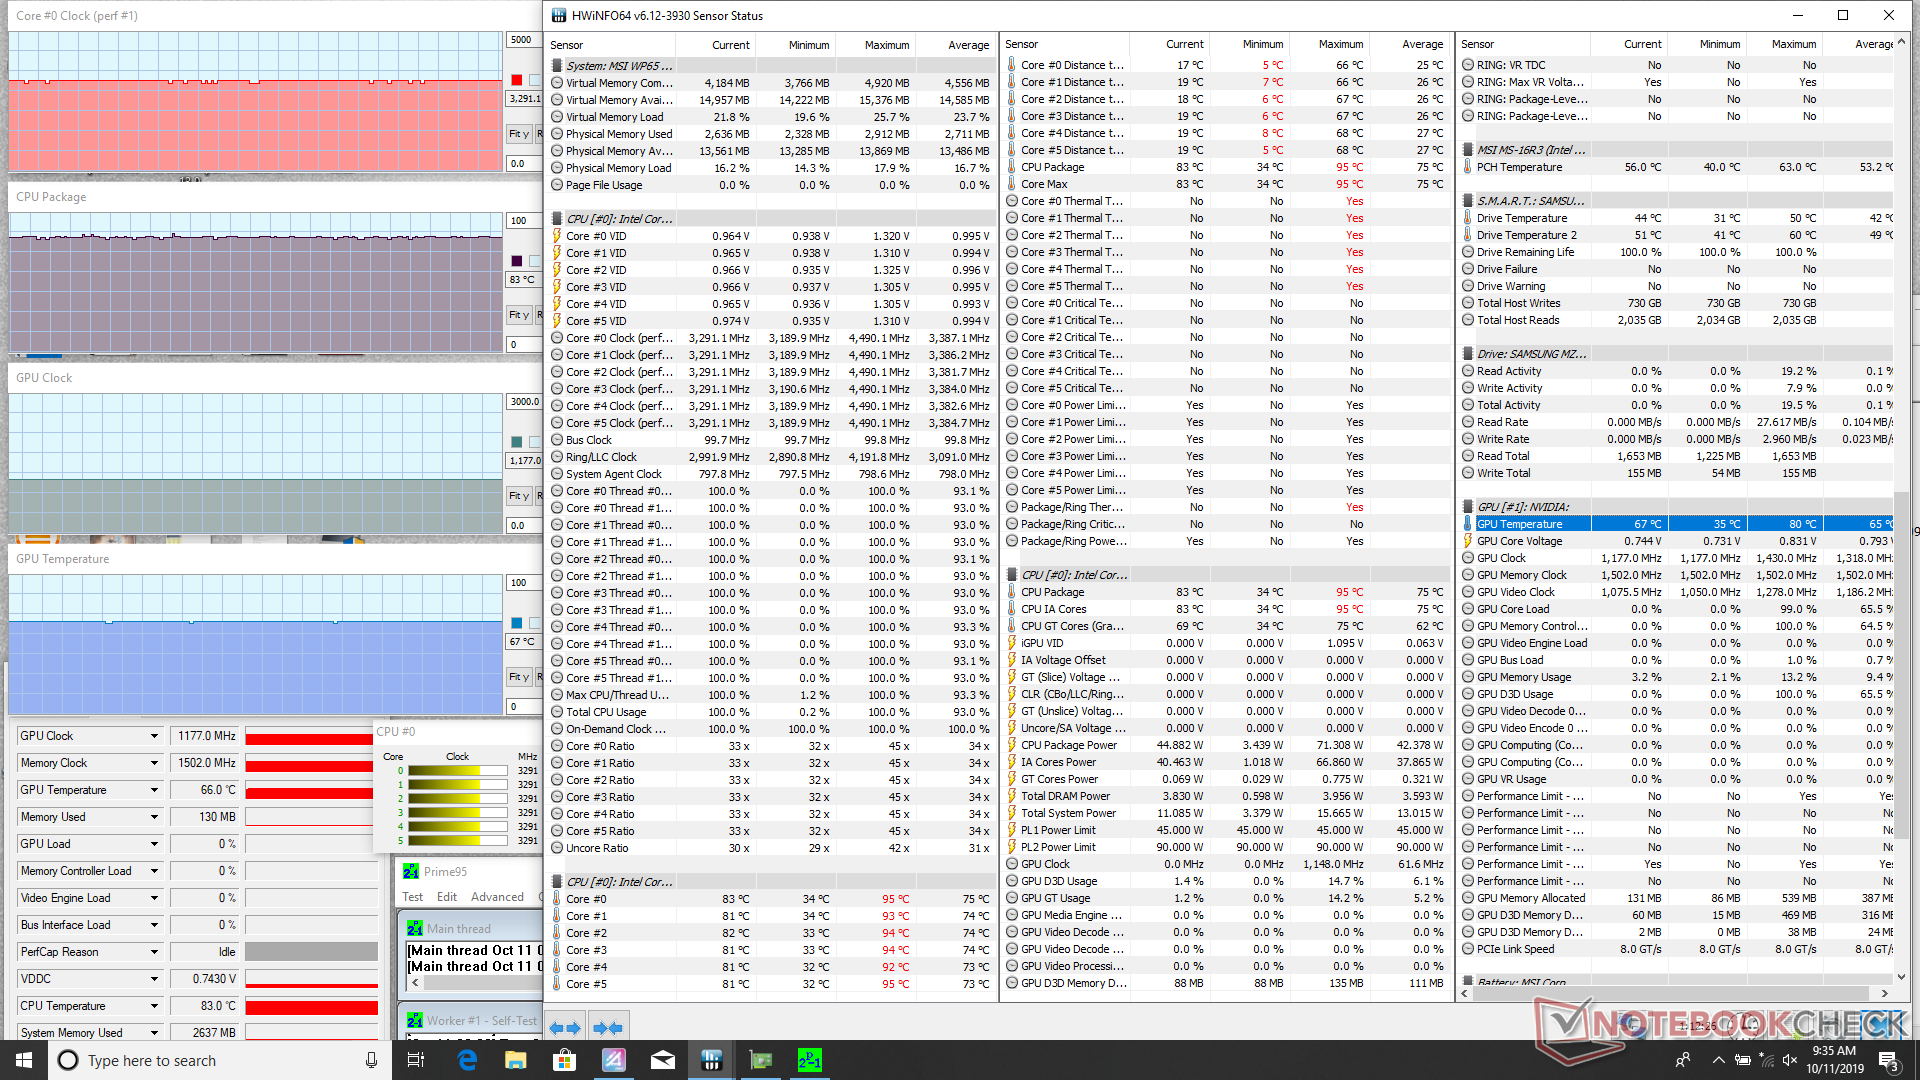
| CPU Clock (GHz) | GPU Clock (MHz) | Average CPU Temperature (°C) | Average GPU Temperature (°C) | |
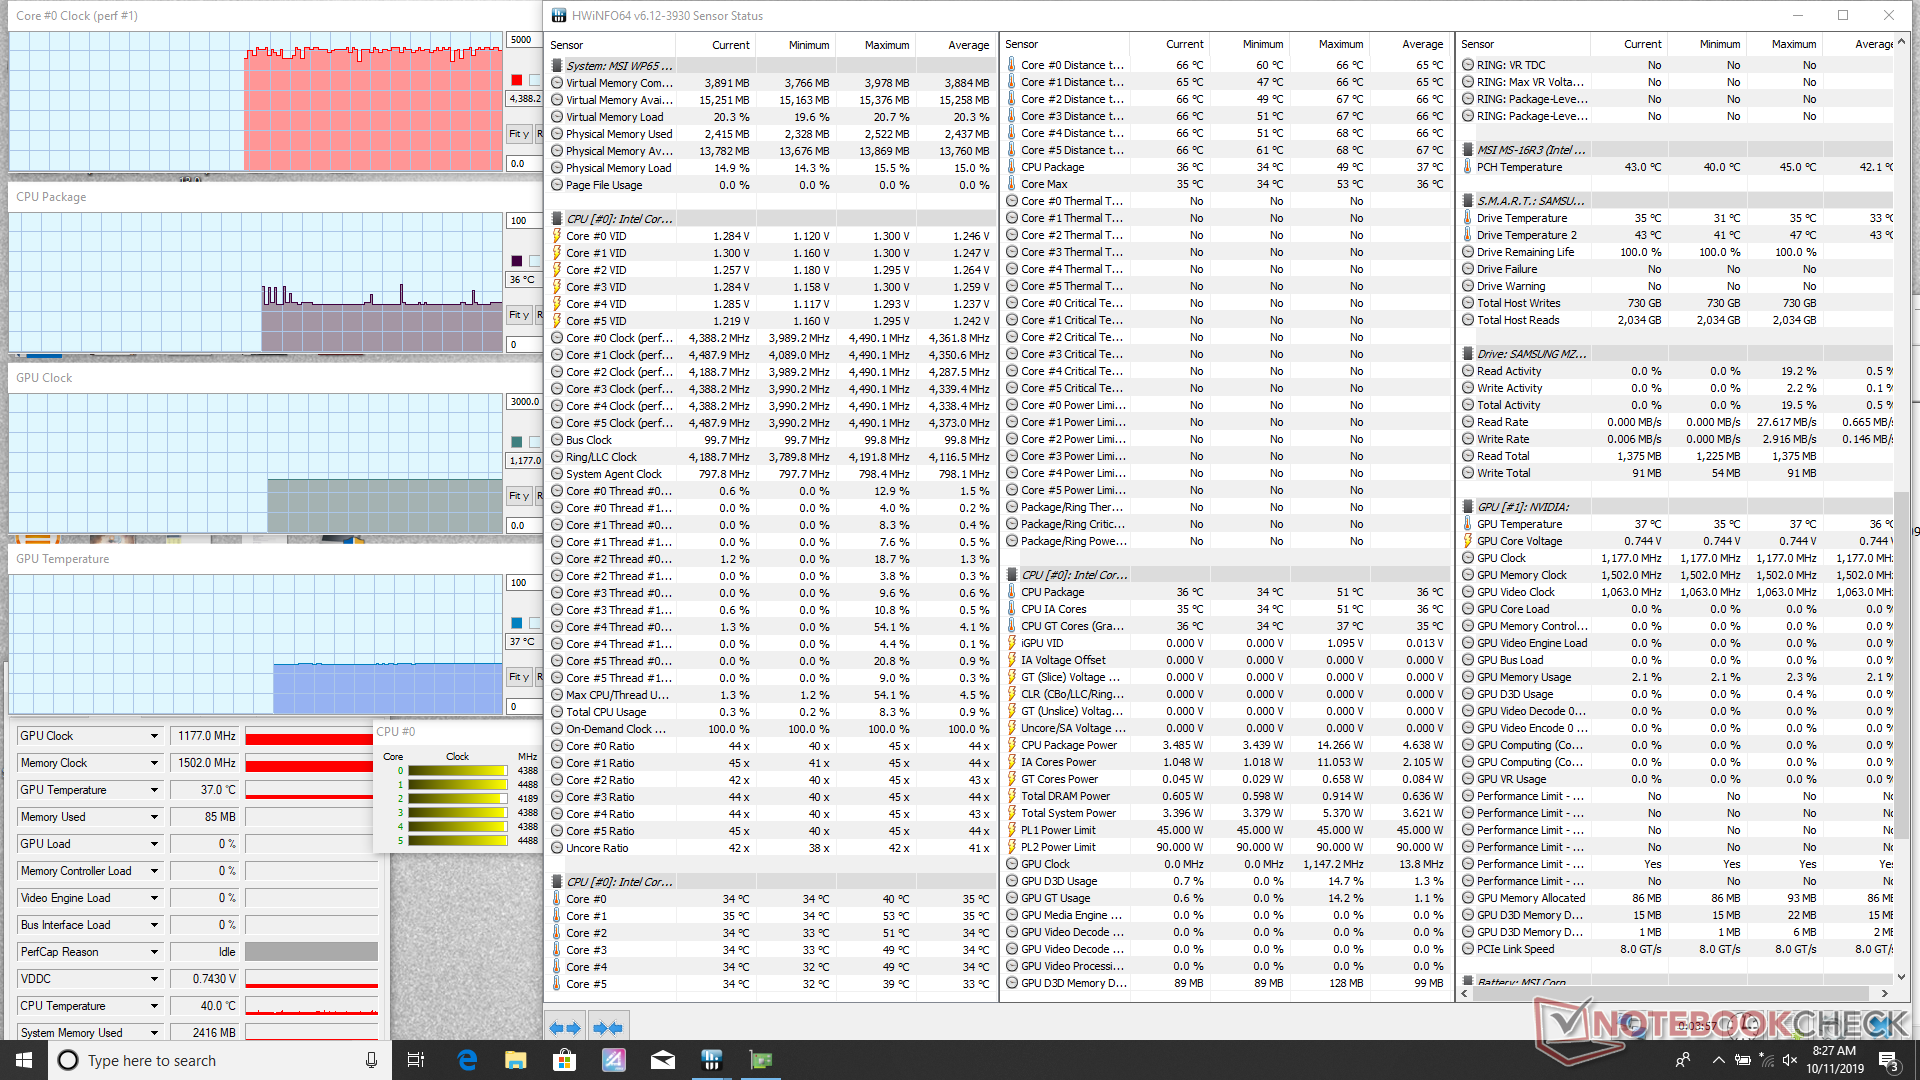
| System Idle | -- | -- | 36 | 37 |
| Prime95 Stress (Auto Fan) | 3.3 | -- | 83 | 67 |
| Prime95 + FurMark Stress (Auto Fan) | 3.2 - 3.3 | 1354 | 88 | 80 |
| Prime95 Stress (Cooler Boost) | 3.3 | -- | 69 | 50 |
| Prime95 + FurMark Stress (Cooler Boost) | 3.3 - 3.4 | 1392 | 77 | 68 |
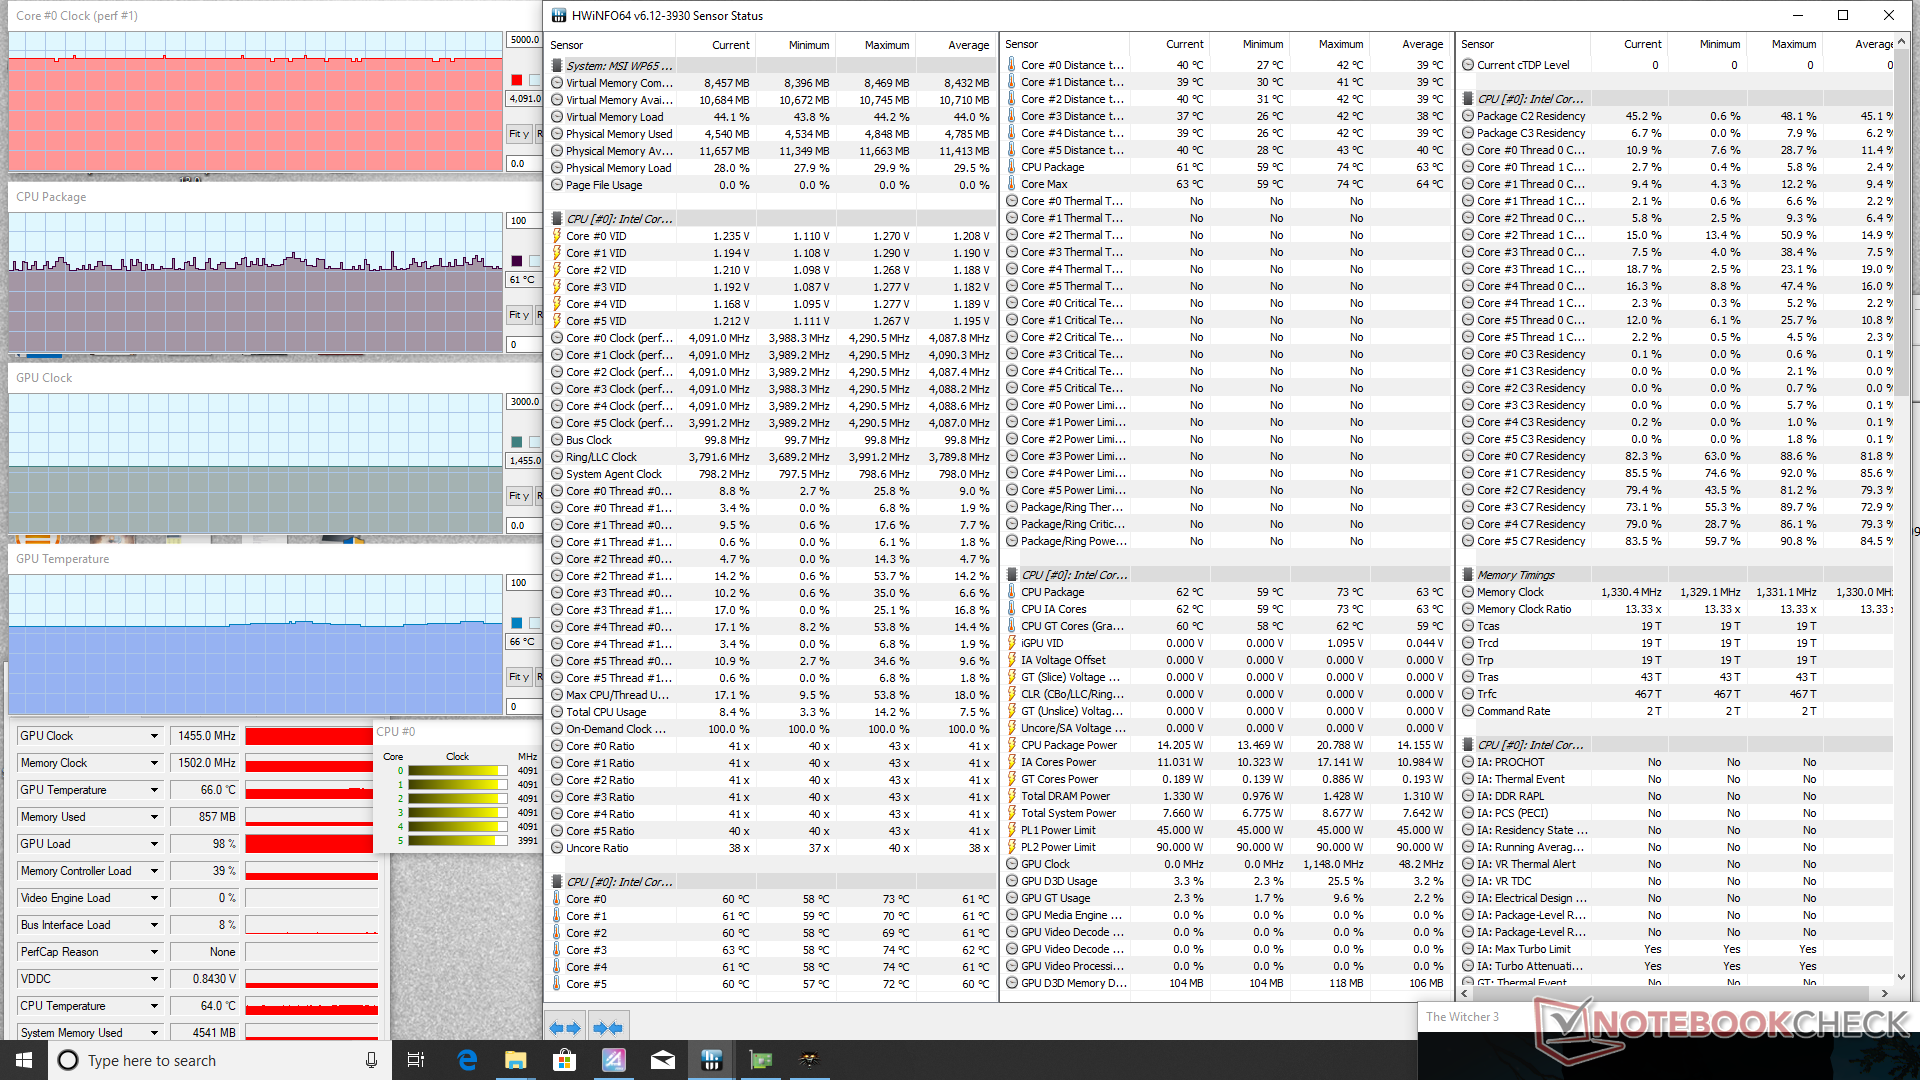
| Witcher 3 Stress (Auto Fan) | 4.0 - 4.1 | 1455 | ~61 | 66 |
Speakers
Audio quality is average with just limited bass reproduction. Maximum volume is on the low side as well at 77 dB compared to 80 dB or higher like on the similarly sized Dell G7 7590. This wasn't designed to be a primary laptop for conferencing, after all. There is fortunately no chassis rattling or static when on high volume settings.


MSI WP65 audio analysis
(±) | speaker loudness is average but good (77.1 dB)
Bass 100 - 315 Hz
(-) | nearly no bass - on average 16.5% lower than median
(±) | linearity of bass is average (14.1% delta to prev. frequency)
Mids 400 - 2000 Hz
(±) | higher mids - on average 5.4% higher than median
(±) | linearity of mids is average (12.1% delta to prev. frequency)
Highs 2 - 16 kHz
(+) | balanced highs - only 1.8% away from median
(±) | linearity of highs is average (8.7% delta to prev. frequency)
Overall 100 - 16.000 Hz
(±) | linearity of overall sound is average (26% difference to median)
Compared to same class
» 87% of all tested devices in this class were better, 6% similar, 6% worse
» The best had a delta of 7%, average was 17%, worst was 35%
Compared to all devices tested
» 80% of all tested devices were better, 4% similar, 16% worse
» The best had a delta of 4%, average was 23%, worst was 134%
Apple MacBook 12 (Early 2016) 1.1 GHz audio analysis
(+) | speakers can play relatively loud (83.6 dB)
Bass 100 - 315 Hz
(±) | reduced bass - on average 11.3% lower than median
(±) | linearity of bass is average (14.2% delta to prev. frequency)
Mids 400 - 2000 Hz
(+) | balanced mids - only 2.4% away from median
(+) | mids are linear (5.5% delta to prev. frequency)
Highs 2 - 16 kHz
(+) | balanced highs - only 2% away from median
(+) | highs are linear (4.5% delta to prev. frequency)
Overall 100 - 16.000 Hz
(+) | overall sound is linear (10.2% difference to median)
Compared to same class
» 7% of all tested devices in this class were better, 2% similar, 90% worse
» The best had a delta of 5%, average was 18%, worst was 53%
Compared to all devices tested
» 5% of all tested devices were better, 1% similar, 94% worse
» The best had a delta of 4%, average was 23%, worst was 134%
Energy Management
Power Consumption
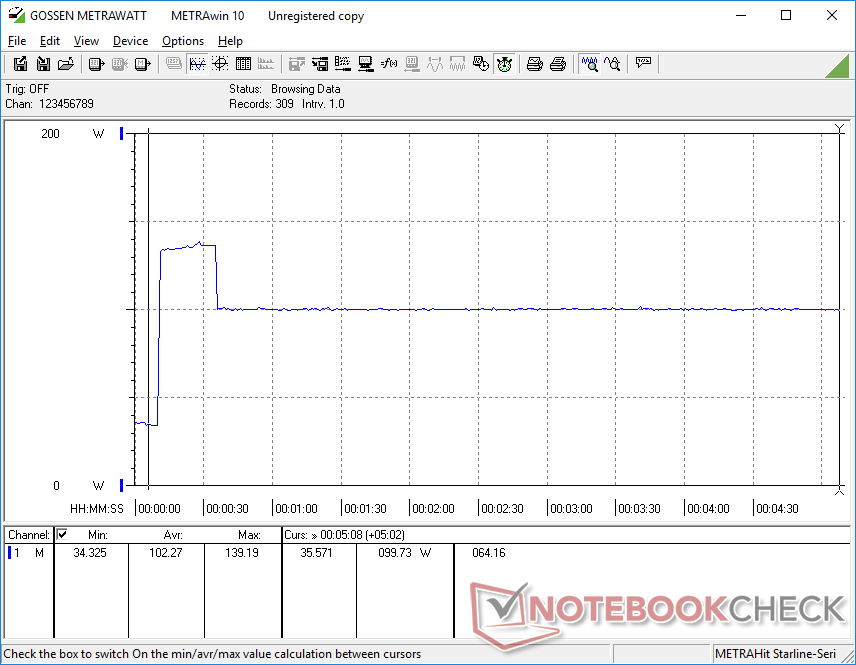
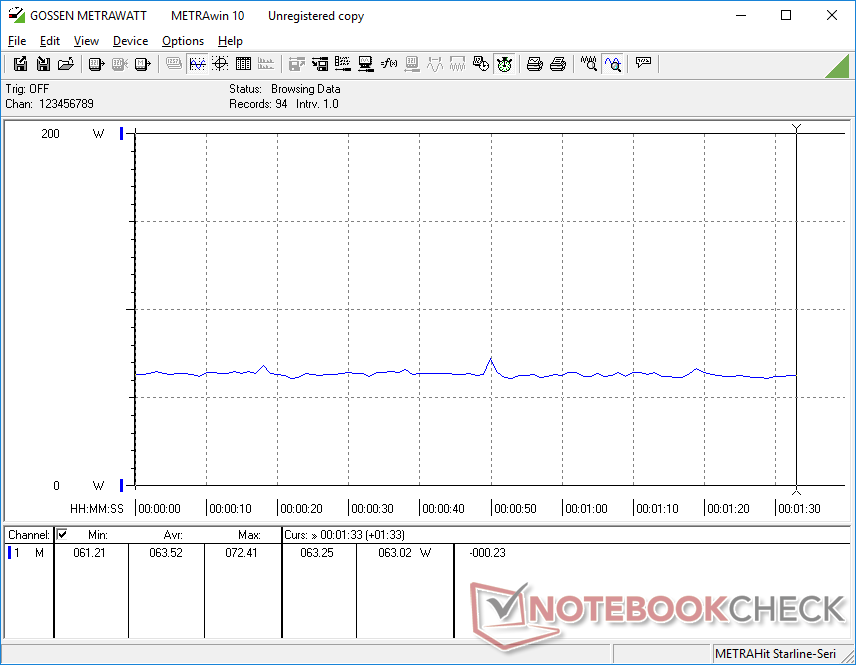
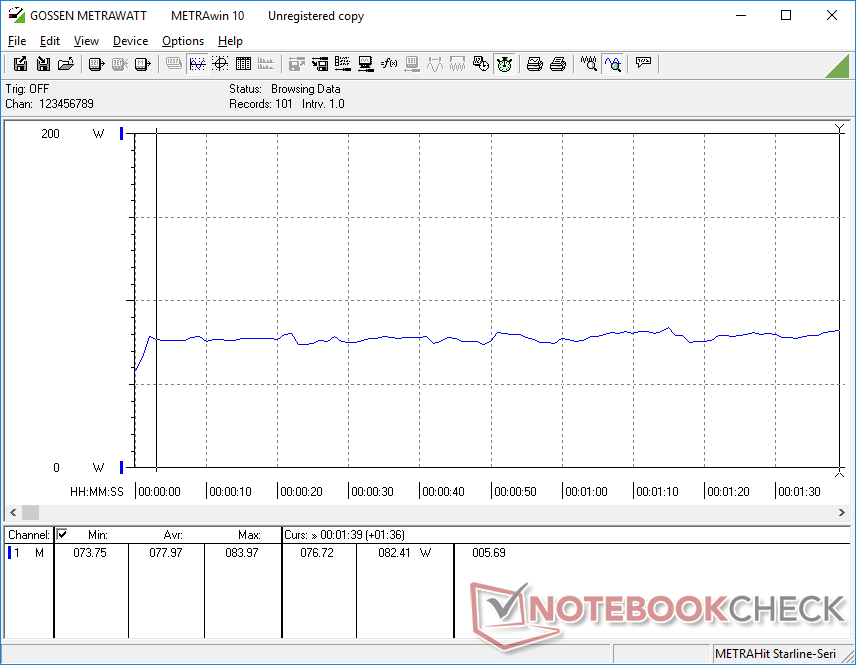
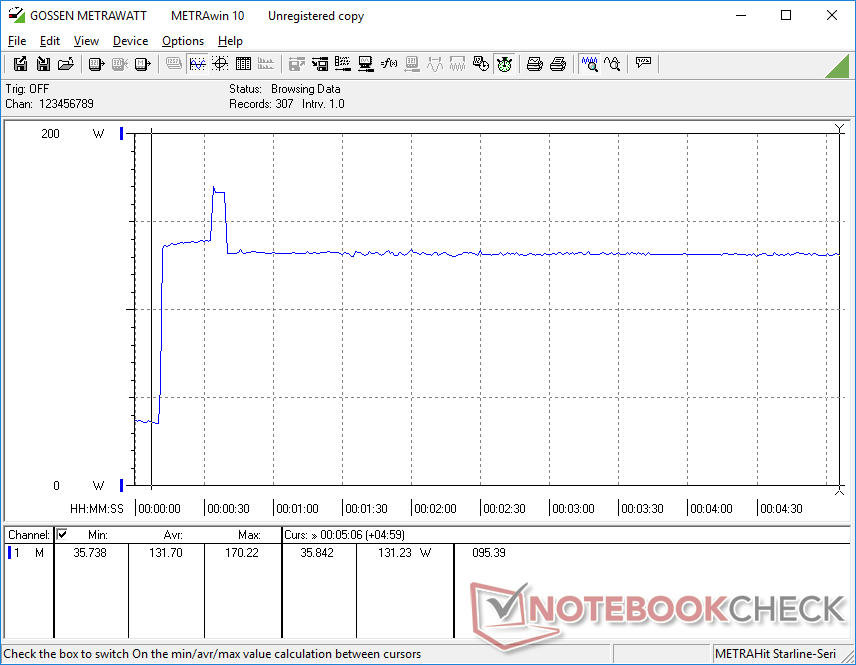
Idling on desktop demands between 6 W and 31 W depending on the power settings and system brightness. Running the system on High Performance mode with Cooler Boost enabled will induce an idling power consumption closer to the upper 31 W range. When under medium or gaming loads, consumption becomes close to what we recorded on the Lenovo ThinkPad P52 equipped with the older Quadro P1000 GPU.
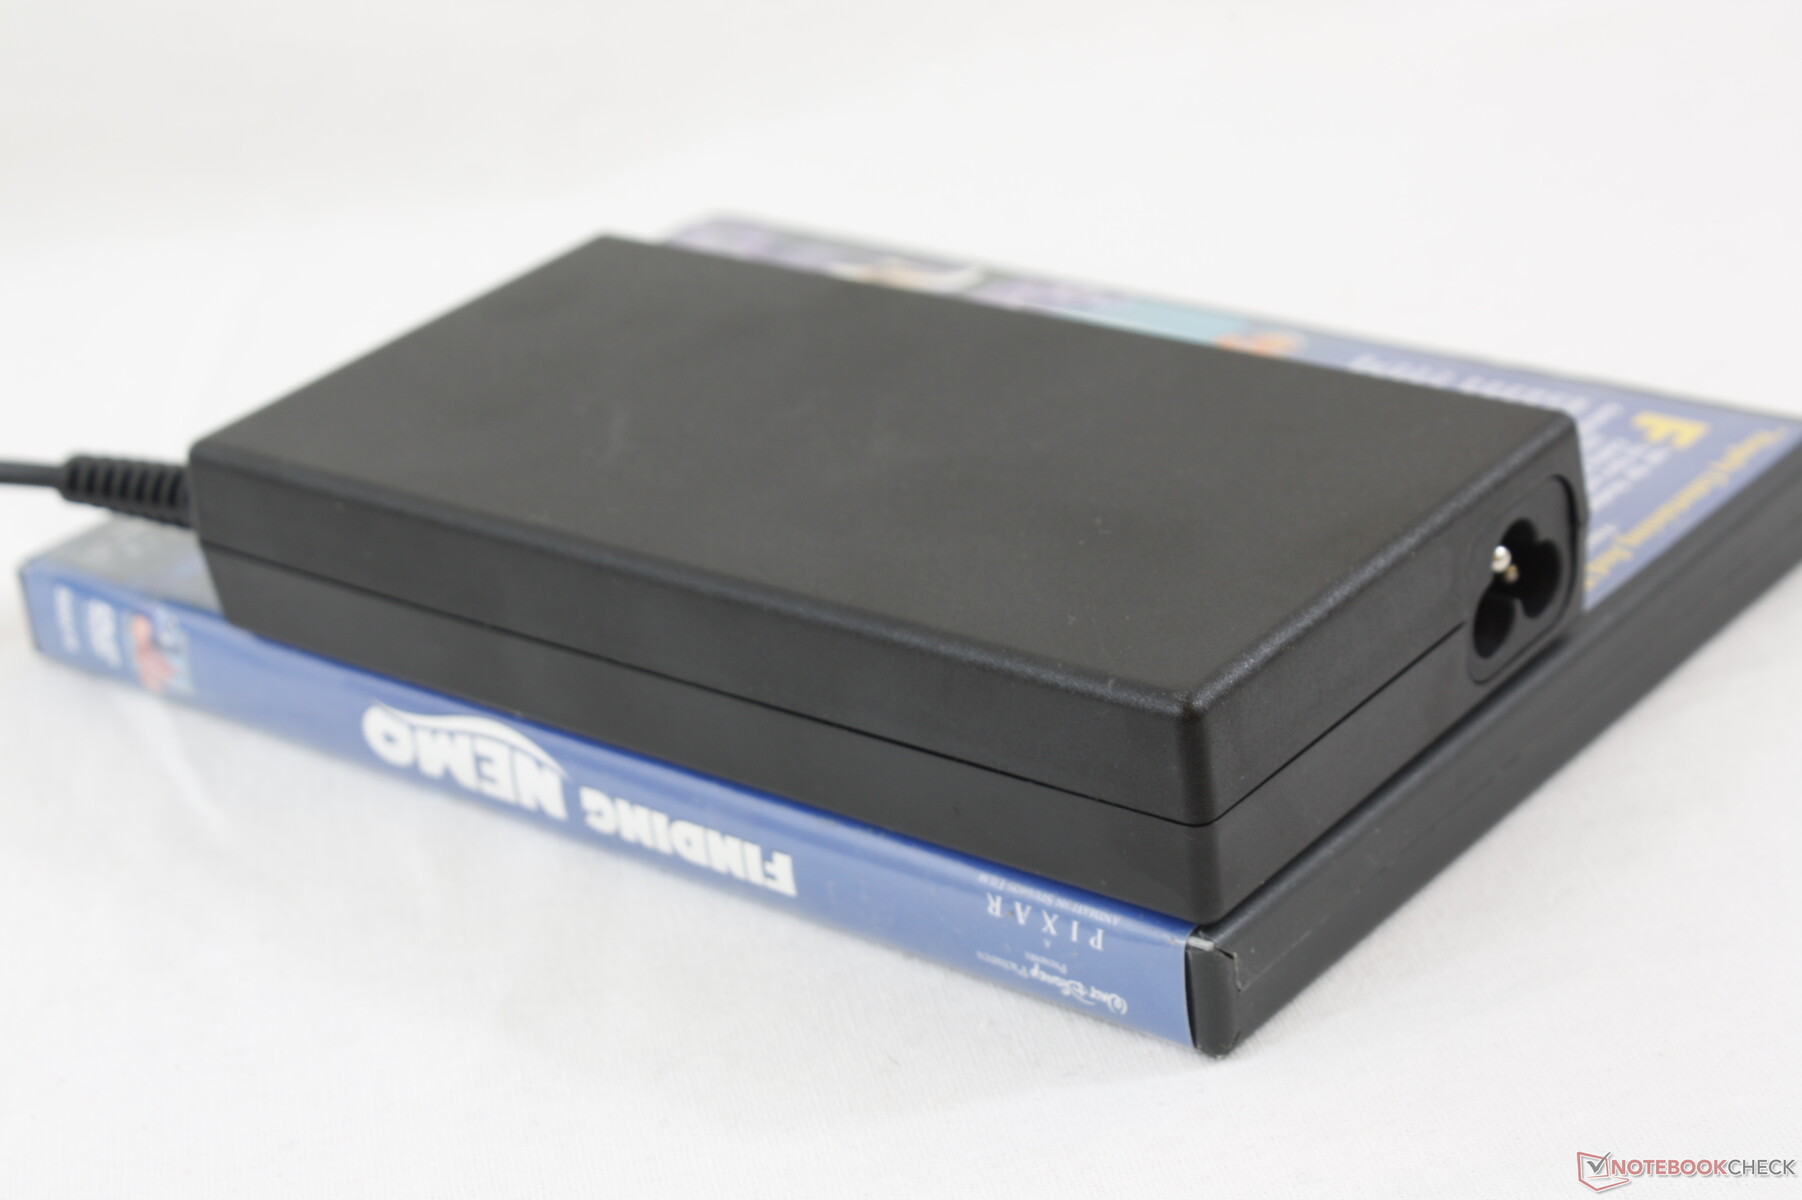
We're able to record a maximum draw of 170.2 W from the medium-sized (~14.7 x 7.5 x 2.7 cm) 120 W AC adapter. Even when running Prime95 only, consumption can be as high as 139 W as shown by the graphs below. The system will not recharge at a decent rate if both the CPU and GPU are at 100 percent utilization. It's clear that MSI should have shipped a more capable 150 W or greater AC adapter with the WP65 for users who intend to stress the CPU or GPU.
| Off / Standby | |
| Idle | |
| Load |
|
Key:
min: | |
| MSI WP65 i7-9750H, Quadro P620, Samsung SSD PM981 MZVLB512HAJQ, IPS, 1920x1080, 15.6" | HP ZBook 15u G6 6TP54EA i7-8565U, Radeon Pro WX 3200, Samsung SSD PM981 MZVLB512HAJQ, IPS, 3840x2160, 15.6" | Dell Precision 7530 i9-8950HK, Quadro P3200, Samsung PM961 NVMe MZVLW512HMJP, IPS, 3840x2160, 15.6" | Lenovo ThinkPad P52s-20LB000HGE i5-8550U, Quadro P500, Samsung PM961 MZVLW256HEHP, IPS LED, 1920x1080, 15.6" | MSI WS63VR 7RL-023US i7-7700HQ, Quadro P4000 Max-Q, Toshiba NVMe THNSN5512GPU7, IPS, 3840x2160, 15.6" | Lenovo ThinkPad P1 2019-20QT000RGE i7-9850H, Quadro T1000 (Laptop), WDC PC SN720 SDAQNTW-512G, IPS LED, 1920x1080, 15.6" | Lenovo ThinkPad P52 20MAS03N00 i7-8750H, Quadro P1000, Samsung SSD PM981 MZVLB512HAJQ, IPS LED, 1920x1080, 15.6" | |
|---|---|---|---|---|---|---|---|
| Power Consumption | 25% | -77% | 39% | -38% | -38% | 17% | |
| Idle Minimum * (Watt) | 5.6 | 5.5 2% | 15.7 -180% | 4.1 27% | 13.3 -138% | 13.7 -145% | 4.02 28% |
| Idle Average * (Watt) | 8.6 | 9.8 -14% | 20.3 -136% | 7.7 10% | 17.2 -100% | 17.5 -103% | 7.2 16% |
| Idle Maximum * (Watt) | 30.7 | 12 61% | 25.7 16% | 10.7 65% | 17.9 42% | 20.9 32% | 11.46 63% |
| Load Average * (Watt) | 78 | 59 24% | 118.9 -52% | 52 33% | 83.7 -7% | 77.2 1% | 76.3 2% |
| Witcher 3 ultra * (Watt) | 63.5 | 51 20% | 131.2 -107% | 38.8 39% | 101.9 -60% | 74 -17% | |
| Load Maximum * (Watt) | 170.2 | 70 59% | 174 -2% | 65 62% | 114.3 33% | 123.7 27% | 154 10% |
* ... smaller is better
Battery Life
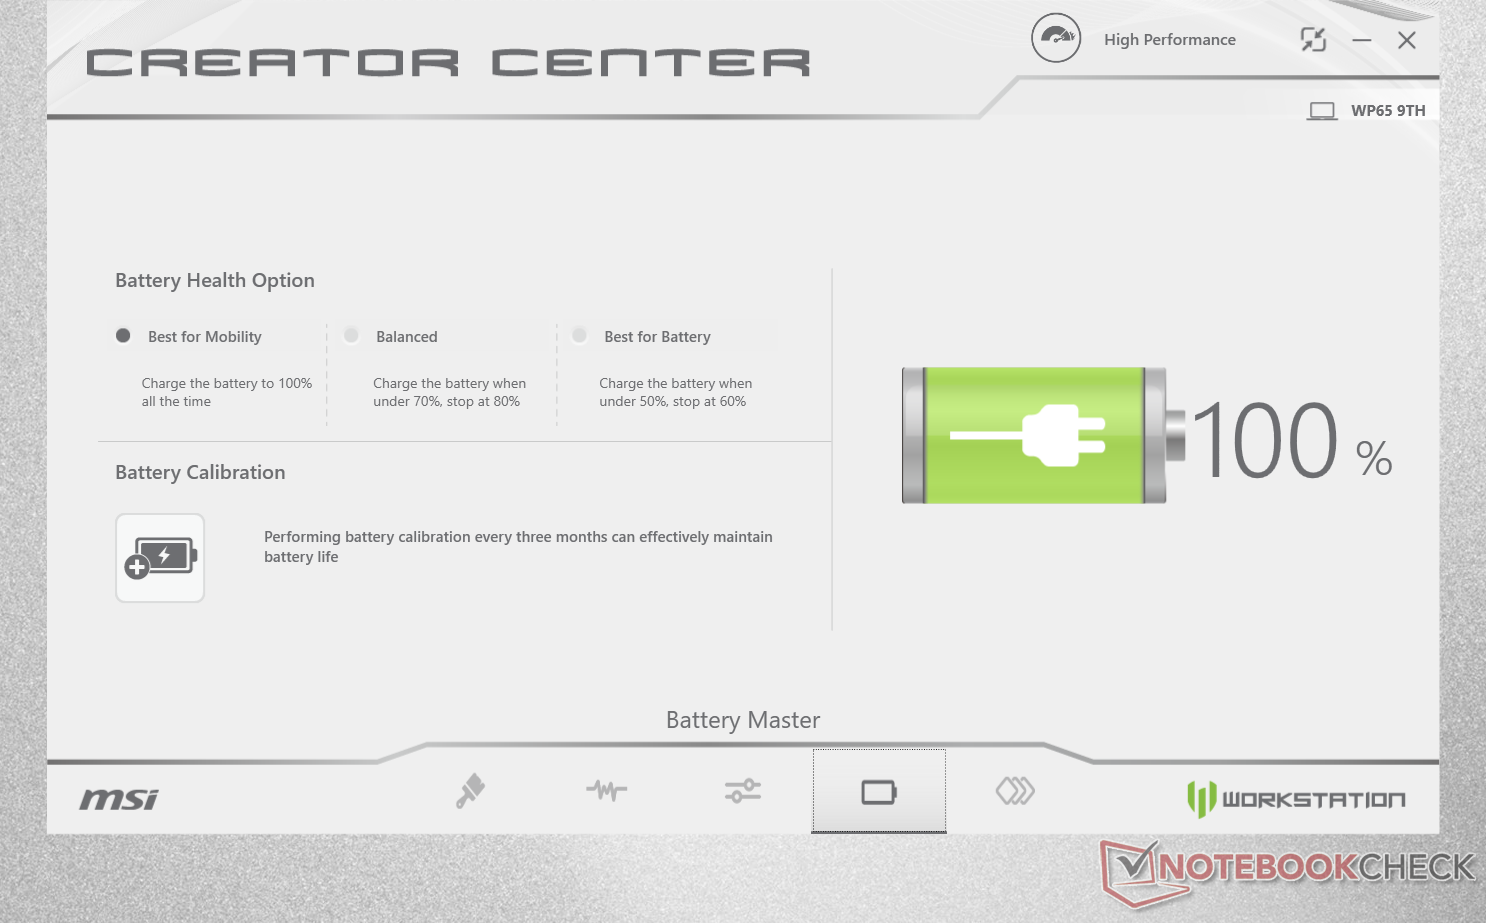
Runtimes are average for a workstation at about 6 hours of real-world WLAN use when set to the Balanced power profile and with the integrated GPU active. Battery capacity is on the small side at 51 Wh due in part to the 2.5-inch SATA III bay occupying space that would have otherwise been used for a bigger battery.
Recharging from empty to full capacity takes longer than expected at almost 2.5 hours. Most laptops take 1.5 to 2 hours to fully recharge.
| MSI WP65 i7-9750H, Quadro P620, 51 Wh | HP ZBook 15u G6 6TP54EA i7-8565U, Radeon Pro WX 3200, 56 Wh | Lenovo ThinkPad P1 2019-20QT000RGE i7-9850H, Quadro T1000 (Laptop), 80 Wh | Dell Precision 7530 i9-8950HK, Quadro P3200, 97 Wh | Lenovo ThinkPad P52s-20LB000HGE i5-8550U, Quadro P500, 104 Wh | MSI WS63VR 7RL-023US i7-7700HQ, Quadro P4000 Max-Q, 48 Wh | |
|---|---|---|---|---|---|---|
| Battery runtime | 107% | 83% | 36% | 325% | -21% | |
| Reader / Idle (h) | 10.1 | 12.4 23% | 6.4 -37% | 39.3 289% | 3.9 -61% | |
| WiFi v1.3 (h) | 6 | 6.9 15% | 8.9 48% | 4.6 -23% | 16.2 170% | 2.9 -52% |
| Load (h) | 0.6 | 2.3 283% | 1.3 117% | 1.6 167% | 3.7 517% | 0.9 50% |
Pros
Cons
Verdict
MSI is primarily known for its gaming laptops and so it's perhaps unsurprising that the WP65 workstation looks and feels like a G series laptop. It even comes with multiple gold audio jacks for microphones and headphones which is an oddity for a workstation. From the perspective of a professional, this is a double-edged sword; the WP65 is definitely more attractive and visually spirited than the typical dull entry-level Dell Precision 3000 or HP ZBook 15v, but the skin-deep advantages come at the cost of hardware features.
Dig deeper into the laptop and a long list of drawbacks begin to show. Features common to workstations like Xeon CPUs, ECC memory, full sRGB coverage, SD reader, integrated NumPad, and Smart Card or fingerprint login are all missing on the WP65. Furthermore, the chassis and its hinges are more flexible than on even the cheapest ThinkPad P or Precision 3541 workstations for a weaker first impression. The clickpad and factory seal sticker discouraging end-user servicing feel like afterthoughts derived from a consumer laptop instead of features appealing to professionals. You'd have to upgrade to MSI's higher-end WS series or the uber-powerful WT series if you want these ordinary workstation options.
Traditional budget workstations prioritize options and functionality over appearance. The MSI WP65 leans a bit too heavily on the latter and not enough on the former for a barebones experience. More SKUs and features dedicated to professionals can help it stand out more against giants like HP, Lenovo, and Dell.
MSI WP65
- 10/15/2019 v7 (old)
Allen Ngo
Price comparison
