MSI GS75 8SG Stealth (i7-8750H, RTX 2080 Max-Q) Laptop Review

MSI sells the successor to the GS73 in three different base configurations. While the GS75 8SE has to get by with a GeForce RTX 2060, the GS75 8SF comes with the GeForce RTX 2070 Max-Q. The GS75 8SG that we tested and cost about 3,800 Euros (~$4,267) comes equipped with GeForce RTX 2080 Max-Q graphics.
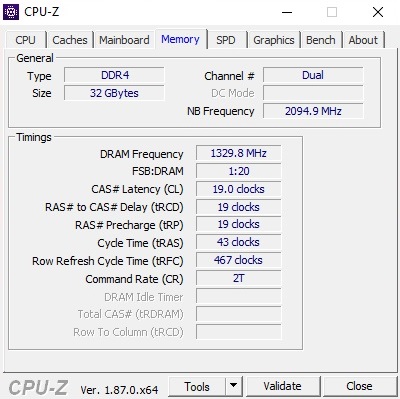
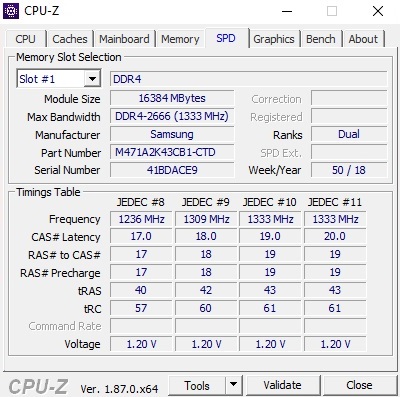
32 GB DDR4 RAM (2x 16 GB @2666 MHz) and a RAID 0 system are conveniently on board. The latter is made up of two 512 GB NVMe SSDs. A 144 Hz Full HD panel is provided as the display (as in the other models).
The GS75 is rivaled by other 17-inch laptops with a slim design and Turing GPU like the Asus Zephyrus S GX701GX, the Lenovo Legion Y740-17, the Schenker XMG Neo 17 and the MSI GE75 8SF. In this review we'll find out which device comes out on top.
Case
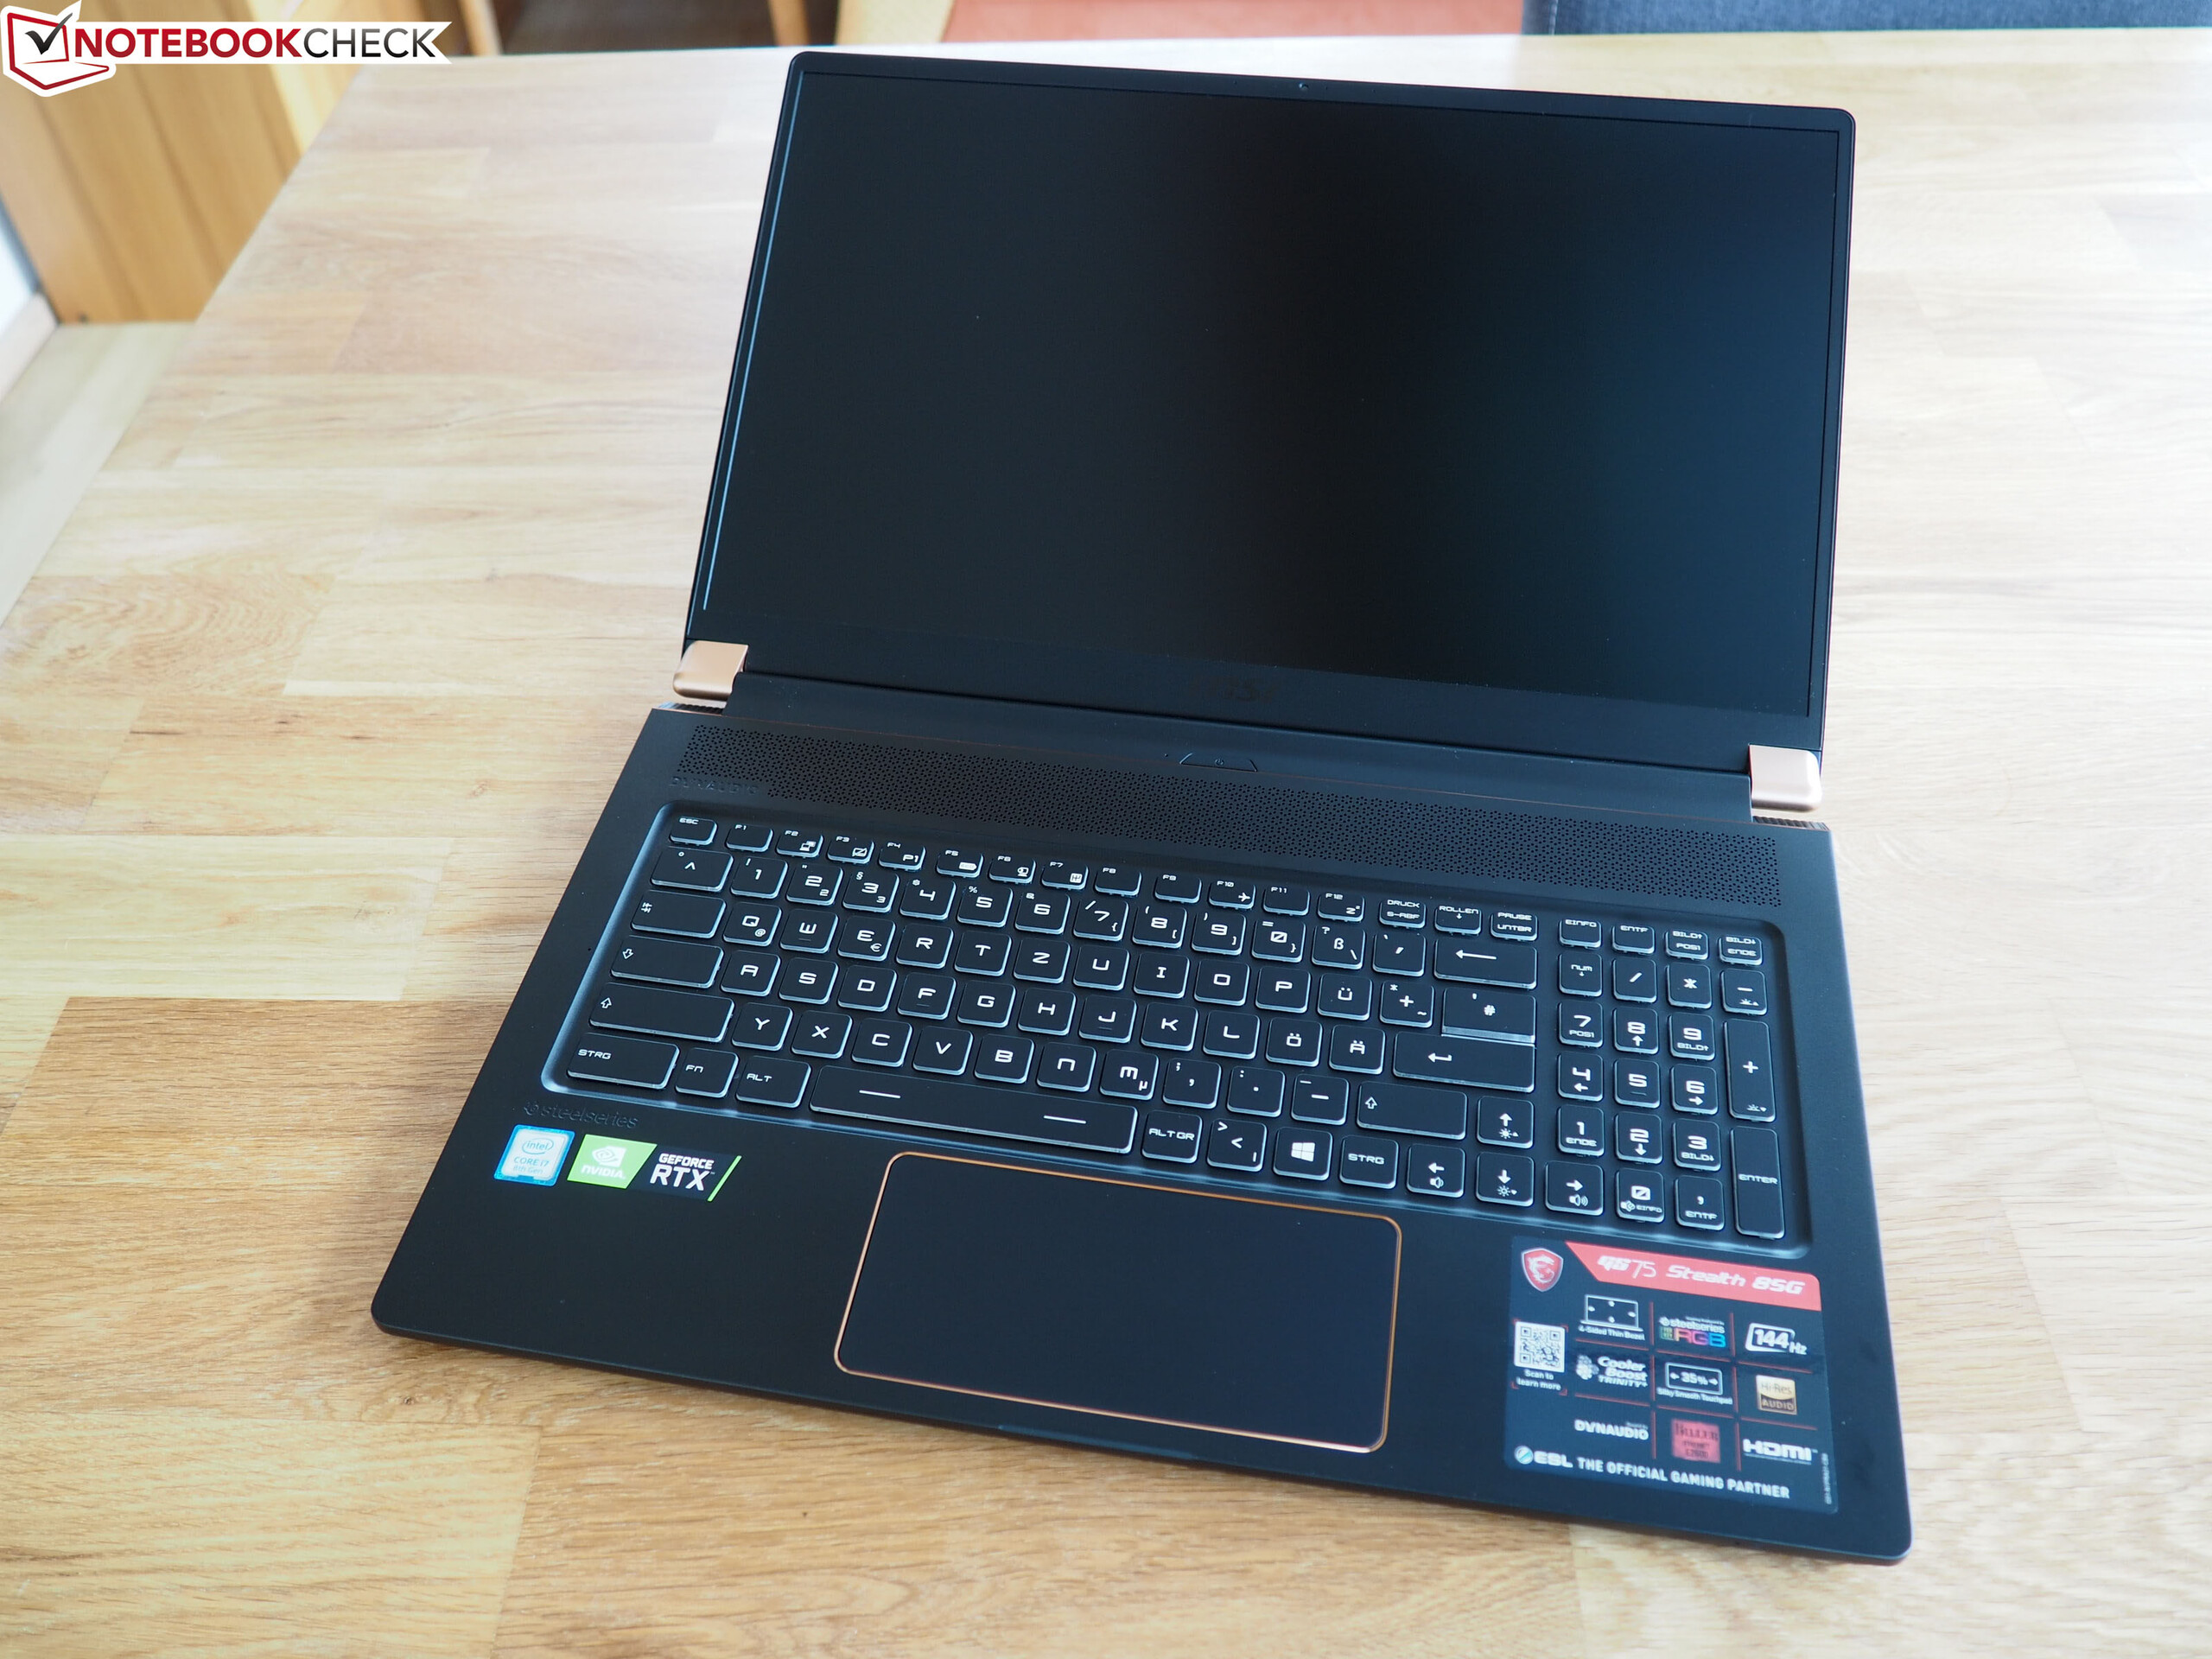
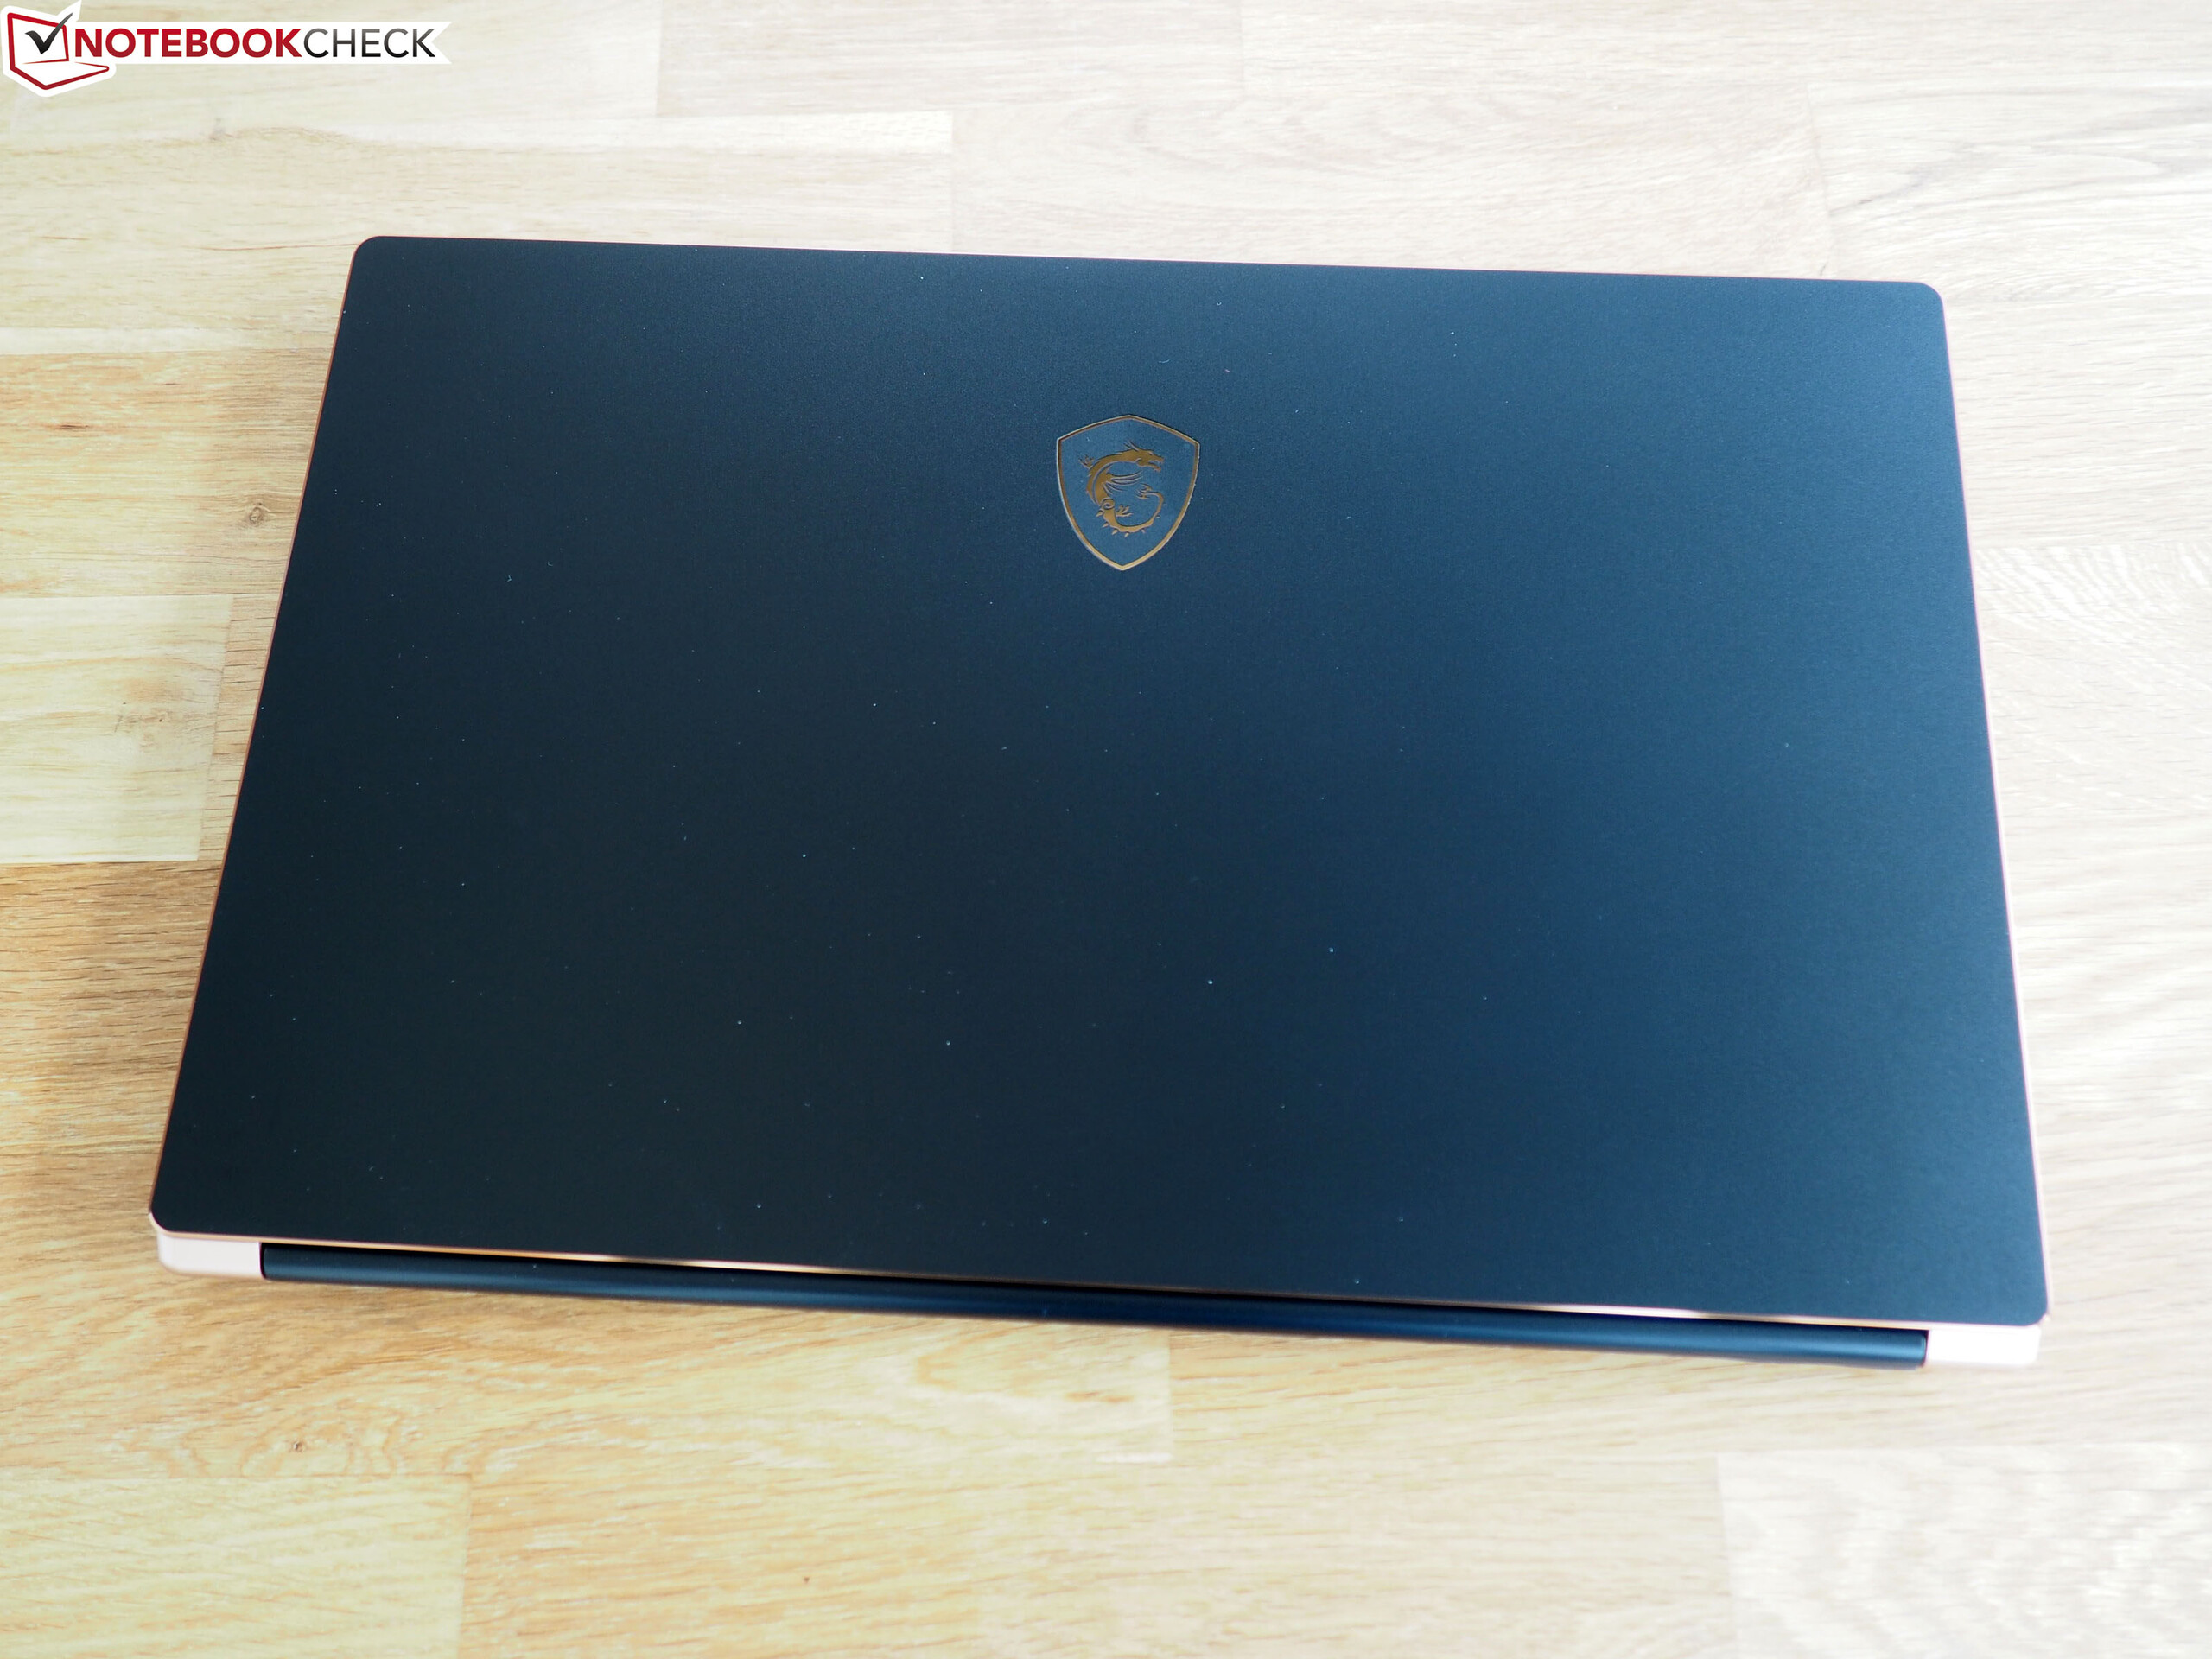
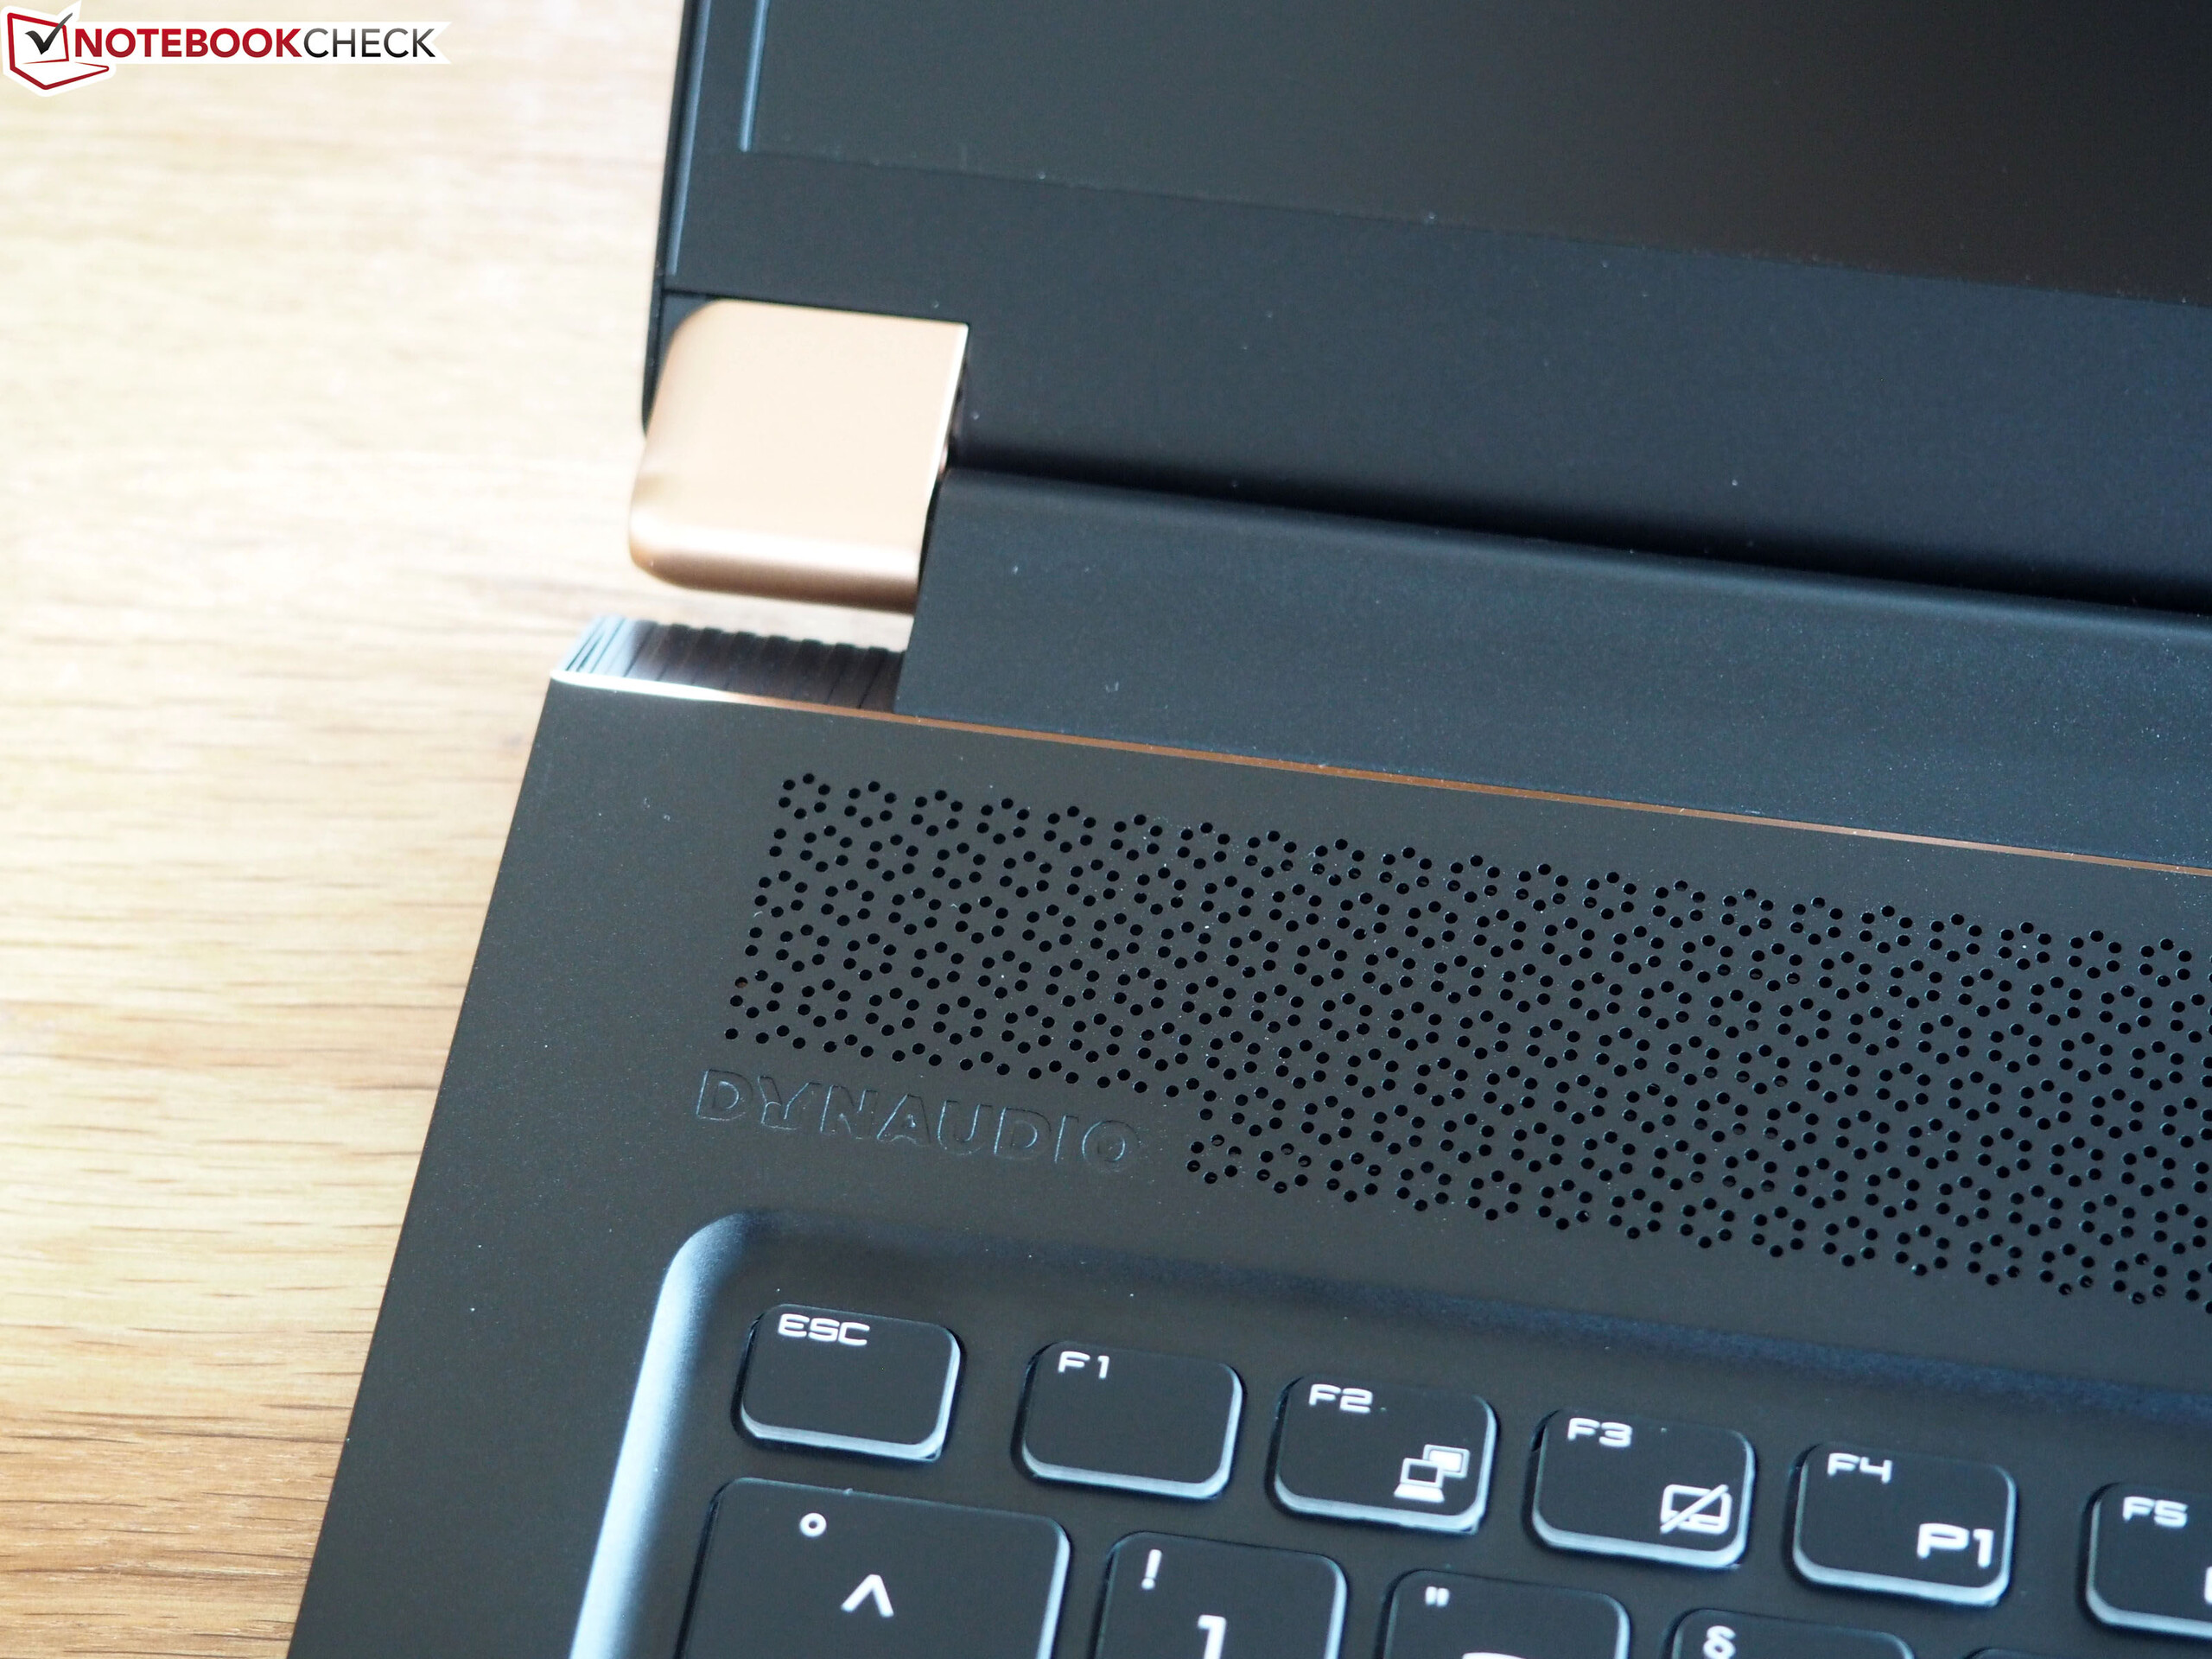
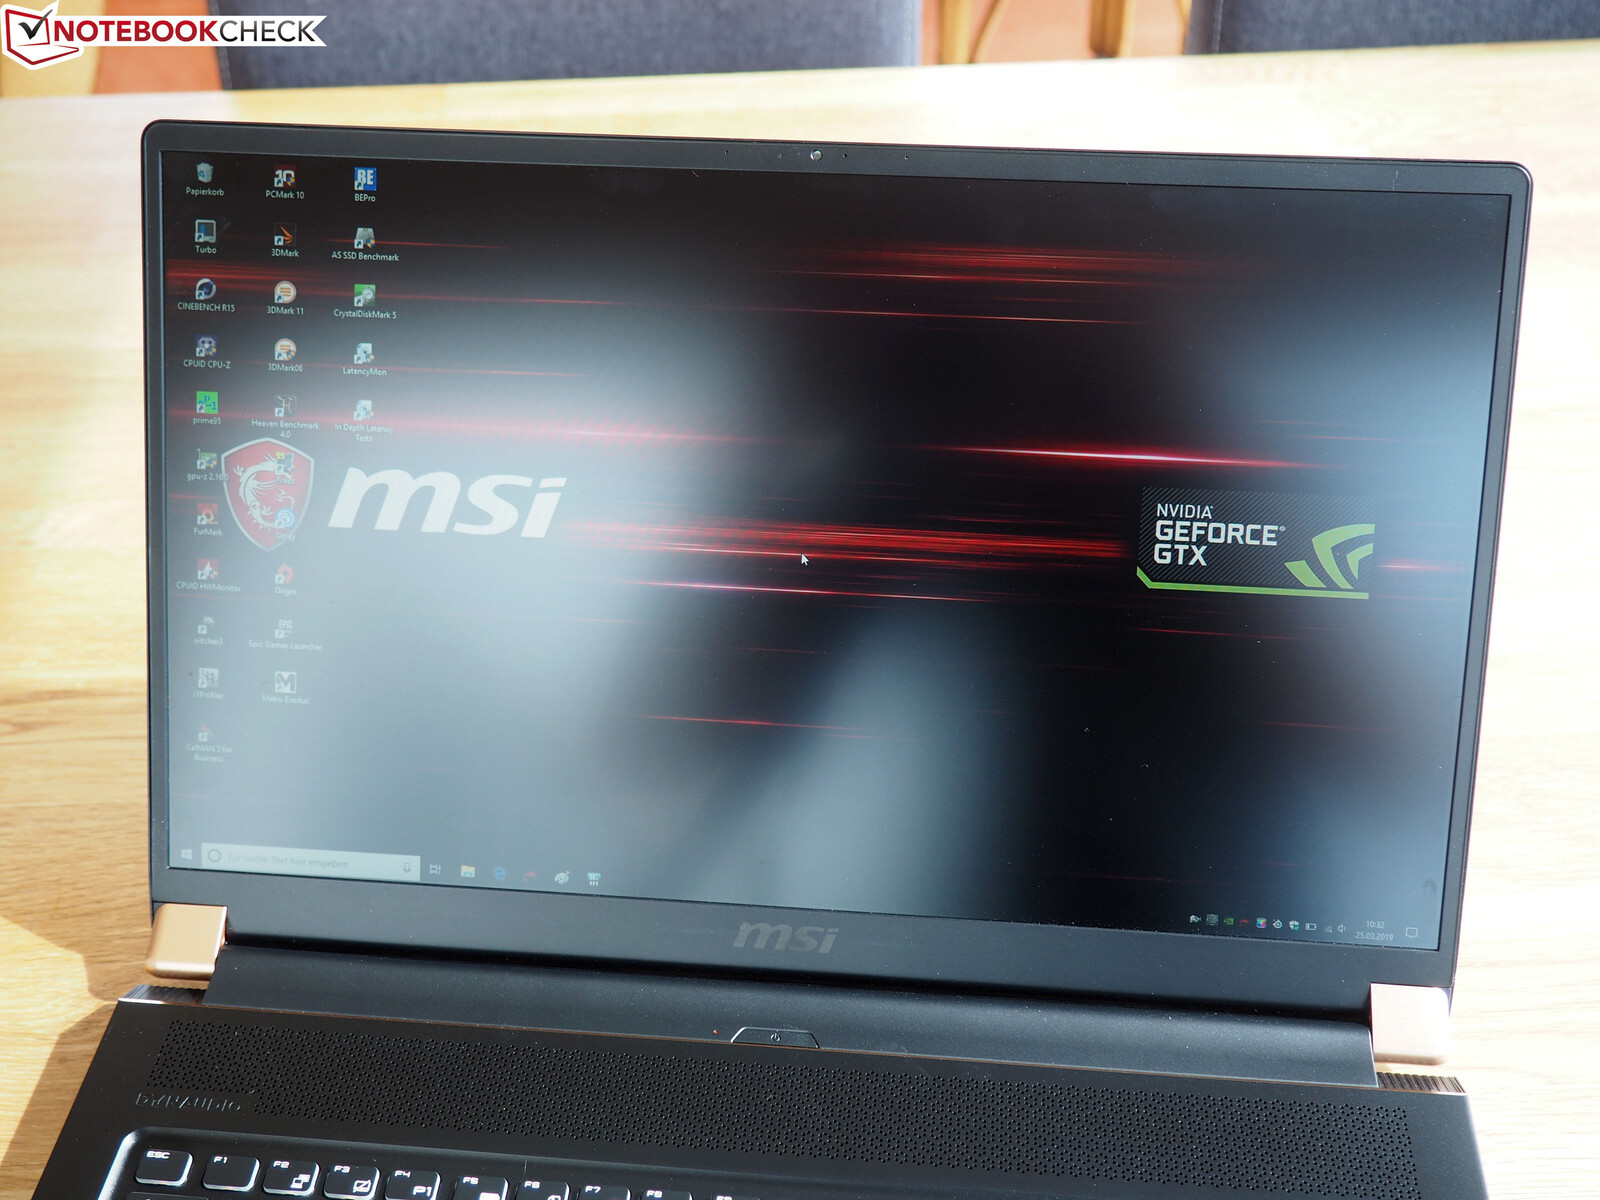
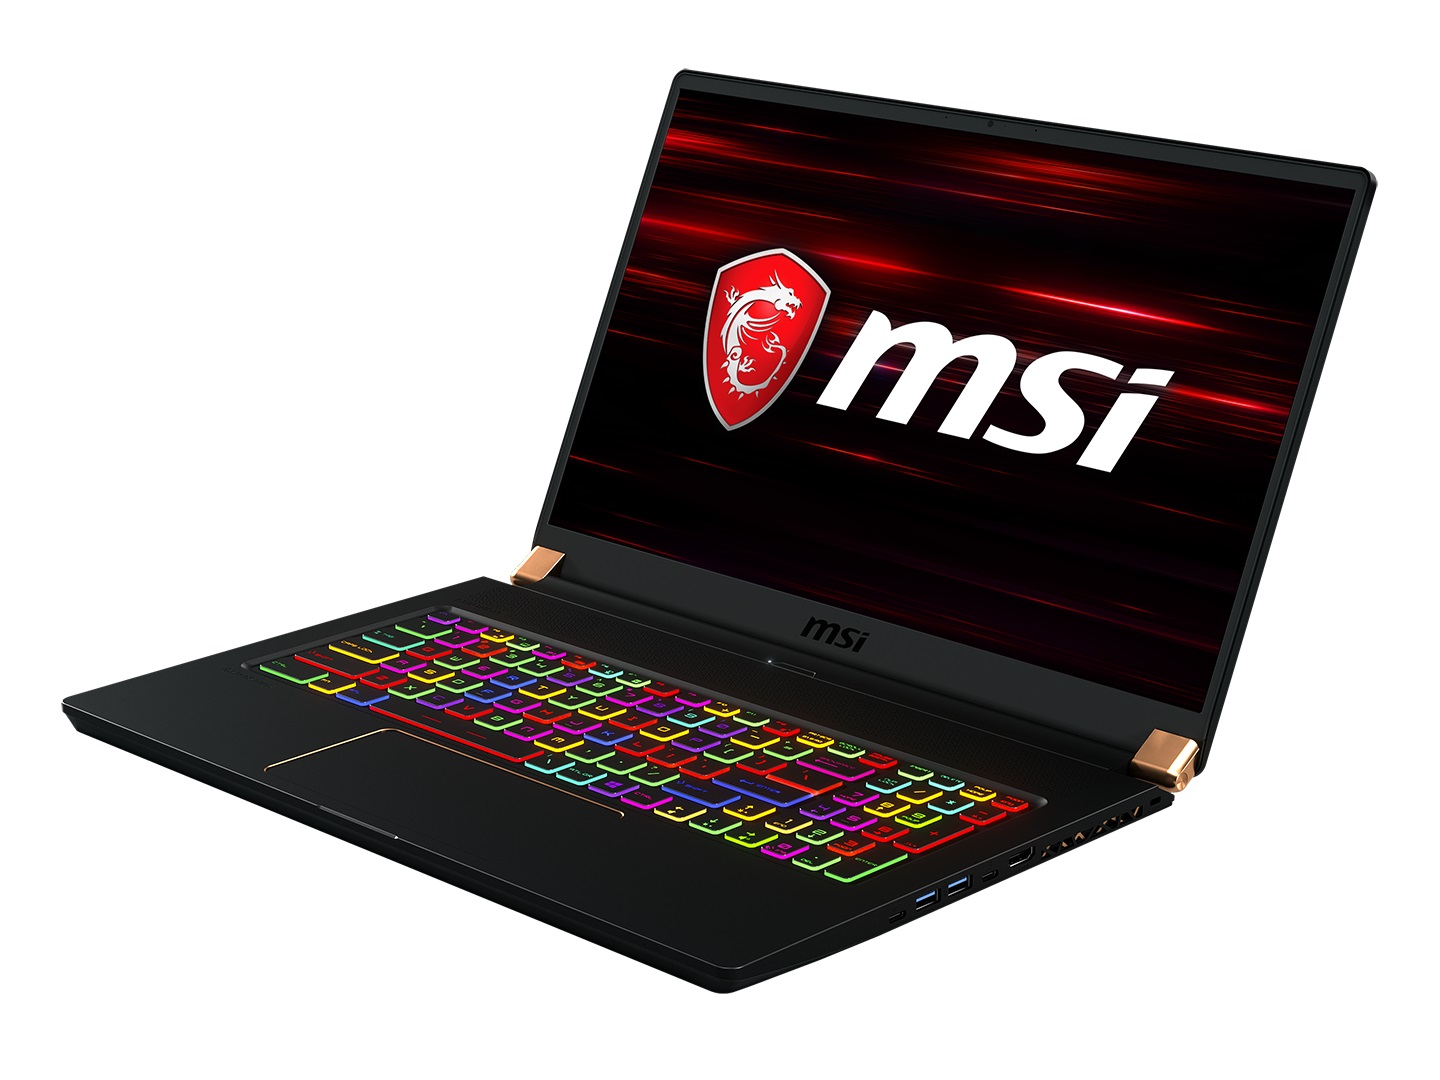
The GS75 inherits most of the strengths and weaknesses of its 15-inch brother, the GS65, which has now been available for a bit longer. On the positive side, we can mention the sleek design. The combination of metal surfaces (only the bottom side is made of plastic), short height and slim display bezels make for a stylish appearance. Thanks to the copper-colored hinges and the same-colored lid border, the 17-incher stands out from the crowd.
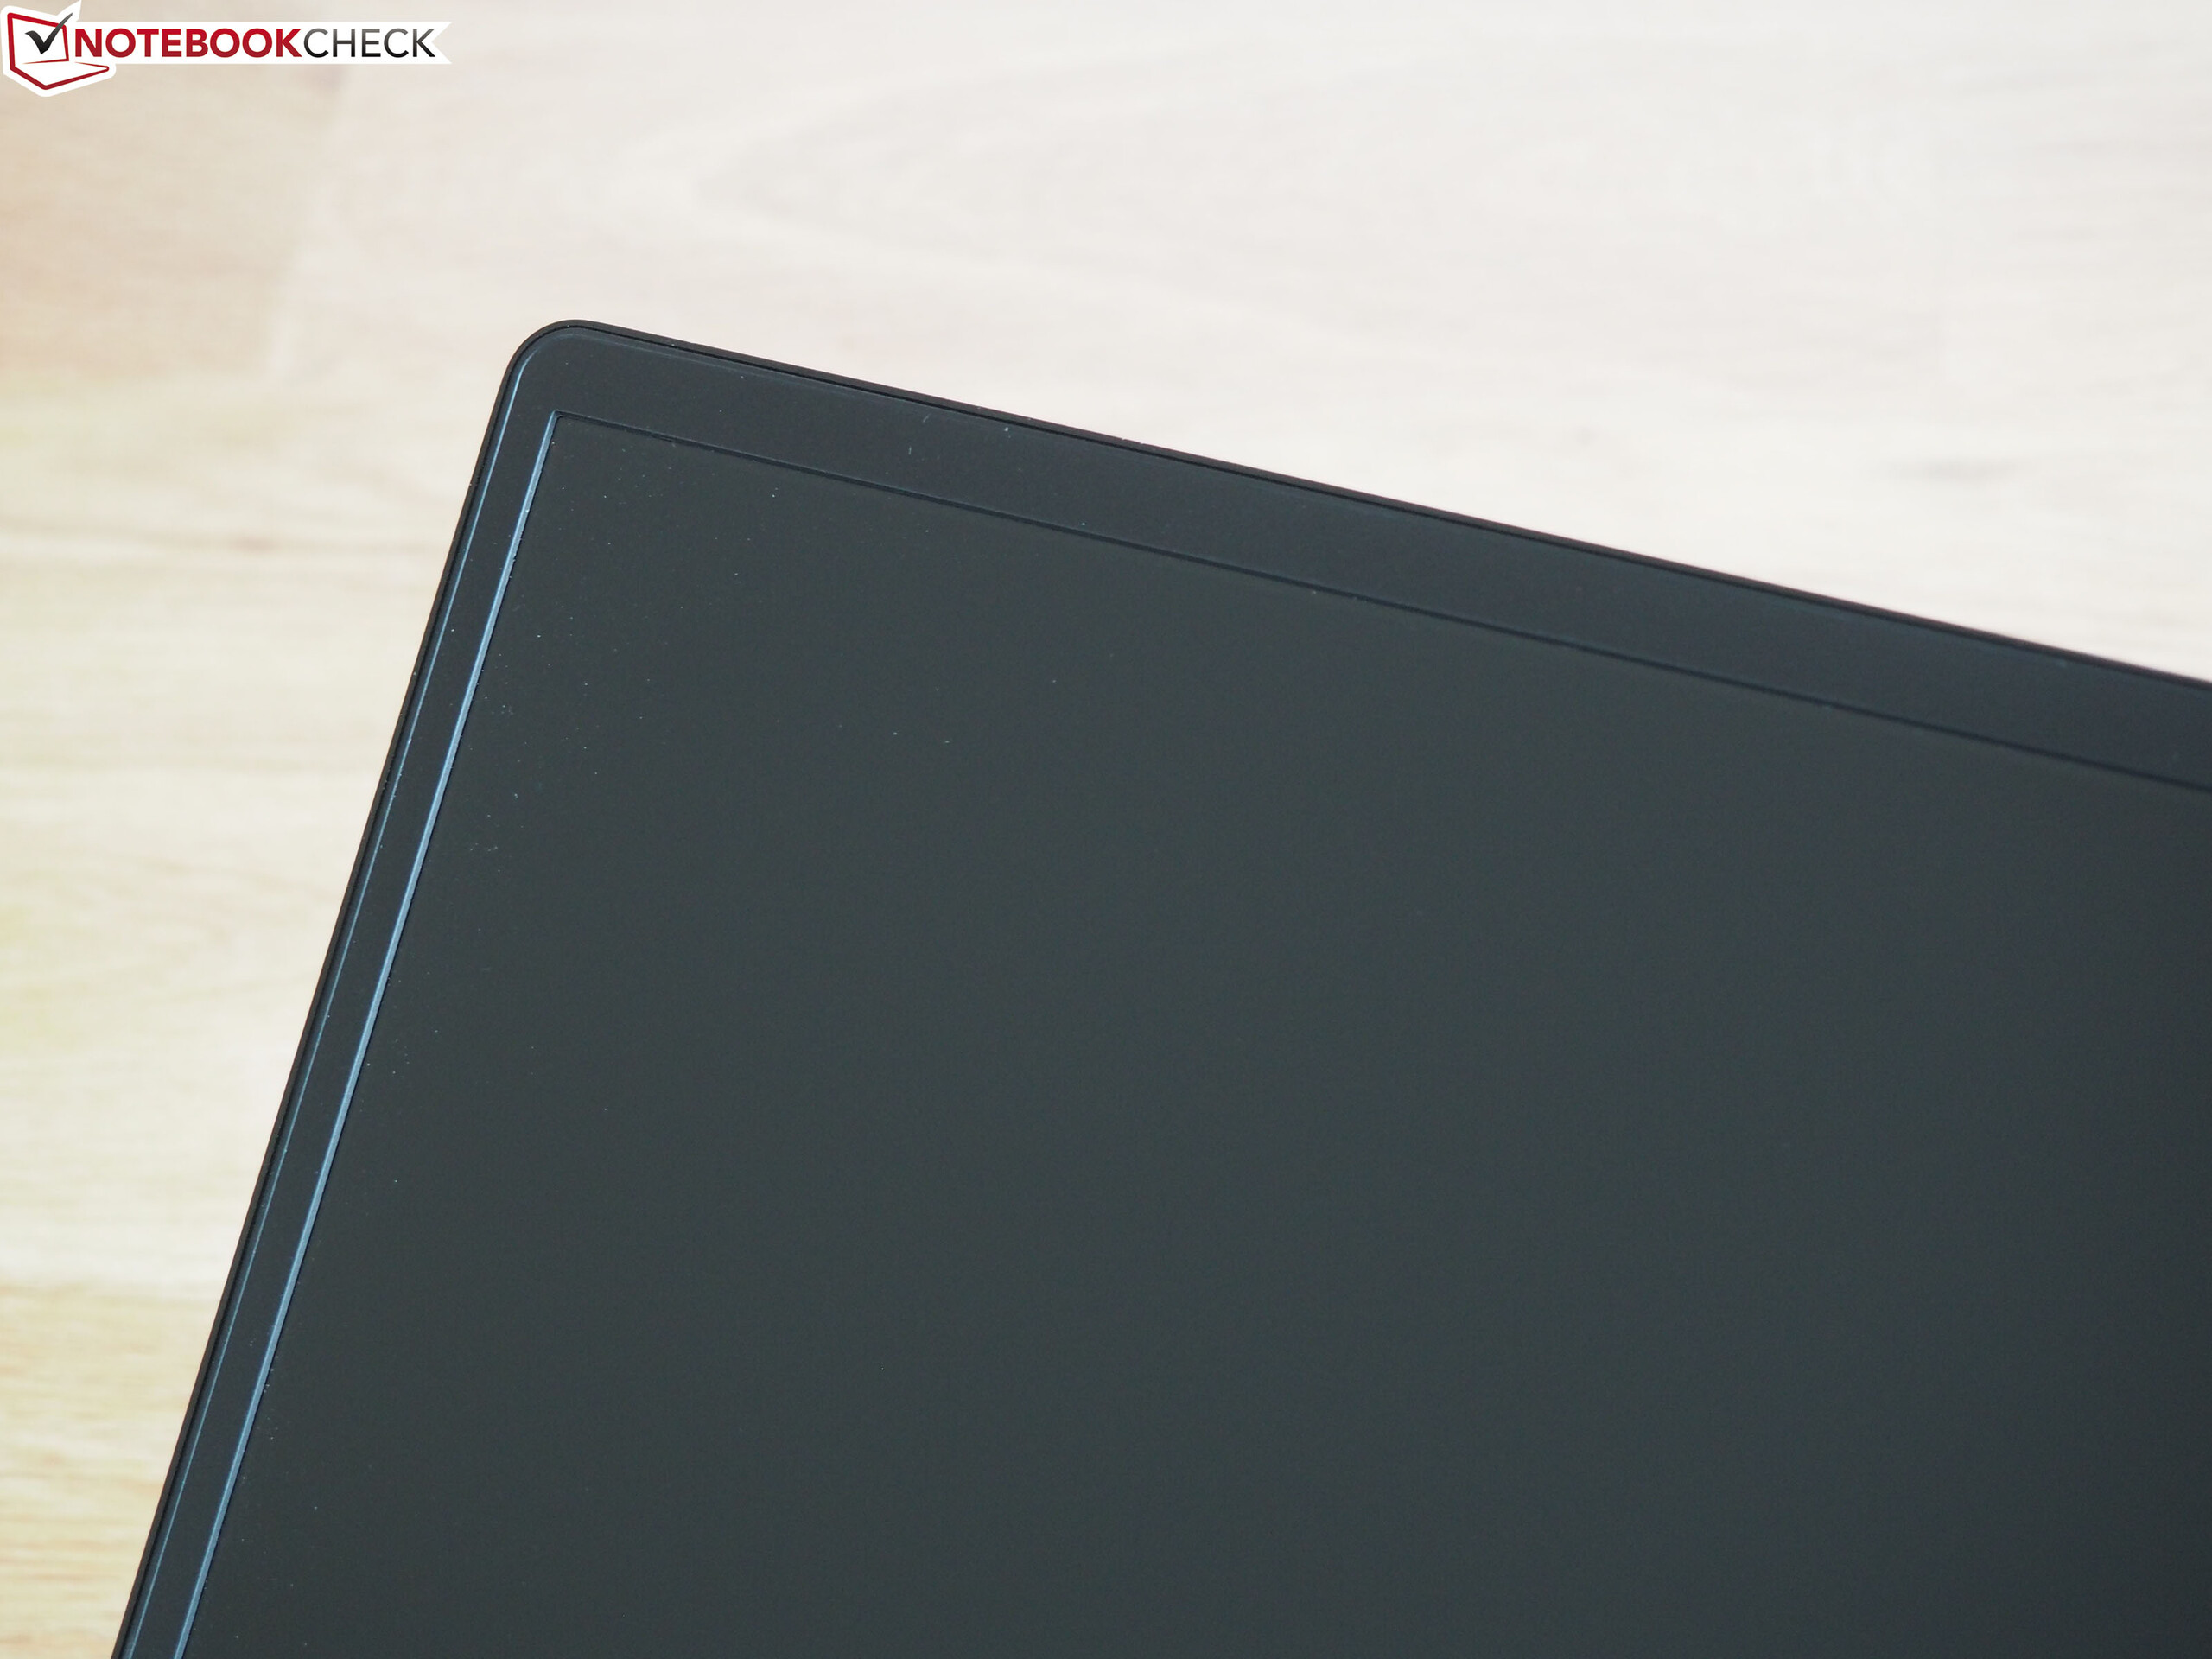
Unfortunately, the chassis wasn't completely pleasing. Analogous to the 15-inch version, the weak point is found in its stability. Under strong force, both the lid and the base unit give way and/or show a great amount of flex. Although many thin and light gaming laptops struggle with stability, the GS75 takes the bottom spot here, particularly as the case creaks in different places or produces various sounds when twisted. The workmanship and hinges are nothing special either. Even though the display can't be opened as far as on the GS65, the maximum opening angle is above-average.
One of the biggest highlights of the GS75 is its low weight. 2.3 kg is easily transported and marks the lowest value in the test field. Competitors weigh from 2.5 to 2.8 kg. In regard to the height, the GS75 comes head-to-head with the Asus GX701GX, which is likewise 19 mm thin. The Lenovo Y740 follows with 23 mm.
Connectivity
Ports
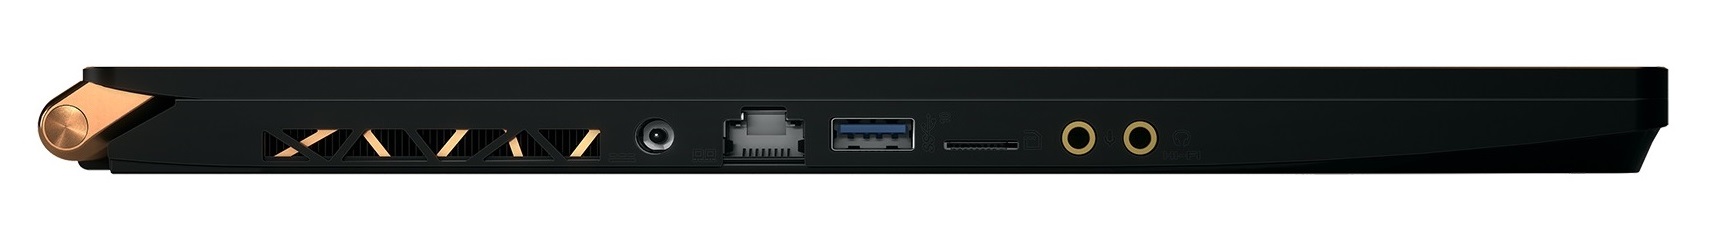
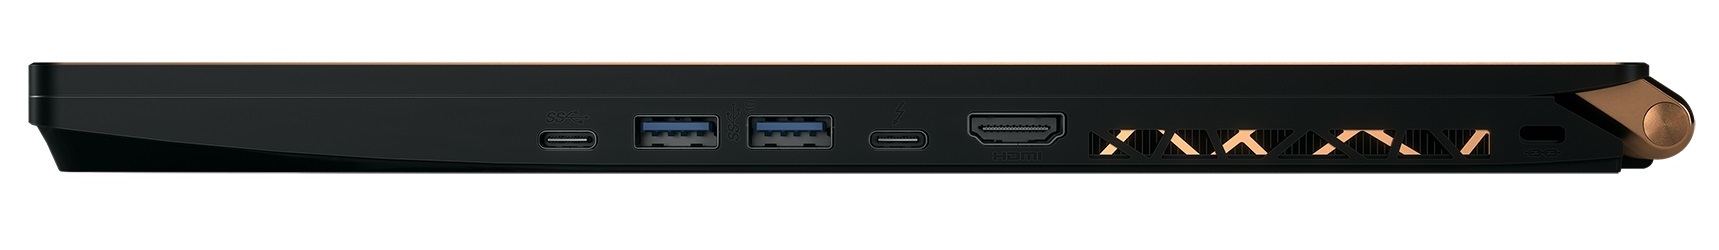
MSI doesn't miss a trick in terms of ports. As you can expect from a current gaming laptop, the 17-incher provides a Thunderbolt 3 port (to connect eGPUs, for example). Three USB 3.1 Gen 2 Type-A ports and one USB 3.0 Type-C port are also respectable. Two audio jacks for headphones and microphone are also to be found. External displays can be easily connected through the HDMI 2.0 port. Top: Despite its thin design, the GS75 houses an RJ45 LAN port. It's somehow unfortunate on the contrary that MSI didn't include a full-fledged card reader but instead only built in a variant for microSD cards. As a security feature, the GS75 provides a Kensington lock hole.
We would describe the distribution of the ports as mediocre. Due to the fan outlets being located on the sides, most ports are located quite far to the front. Depending on the amount of cable, the use of an external mouse could be hindered (keyword: movement radius).
Communication
The Wi-Fi performance is top-notch. In our range test with the reference router Linksys EA8500 (1 m distance) the GS75 took the top spot among the comparison devices when receiving data and second place when sending data. The differences are however very small, when excluding the XMG Neo 17.
| Networking | |
| iperf3 transmit AX12 | |
| MSI GE75 8SF | |
| Schenker XMG Neo 17 | |
| MSI GS75 8SG Stealth | |
| Asus Zephyrus S GX701GX | |
| Lenovo Legion Y740-17ICH | |
| iperf3 receive AX12 | |
| MSI GS75 8SG Stealth | |
| Asus Zephyrus S GX701GX | |
| Schenker XMG Neo 17 | |
| MSI GE75 8SF | |
| Lenovo Legion Y740-17ICH | |
Software
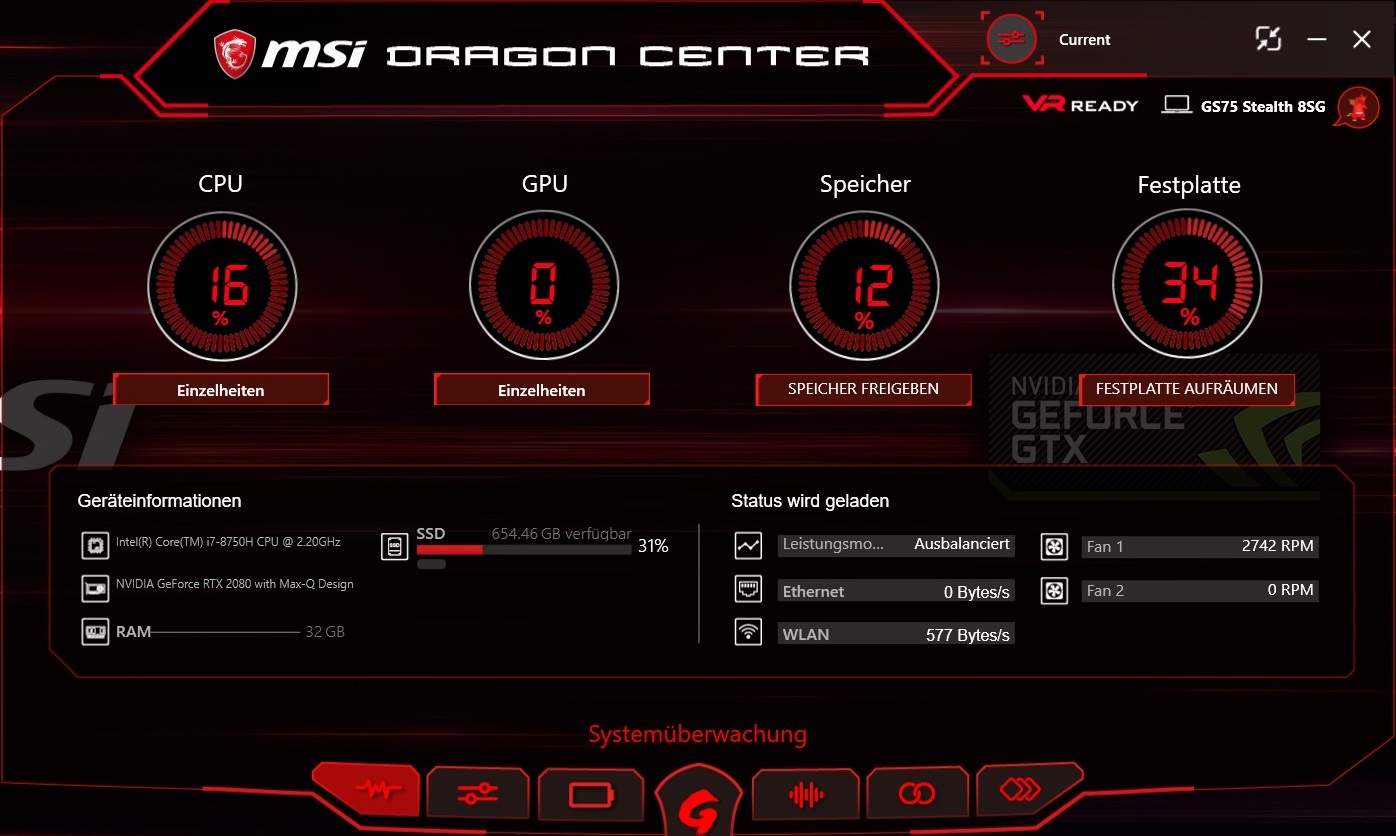
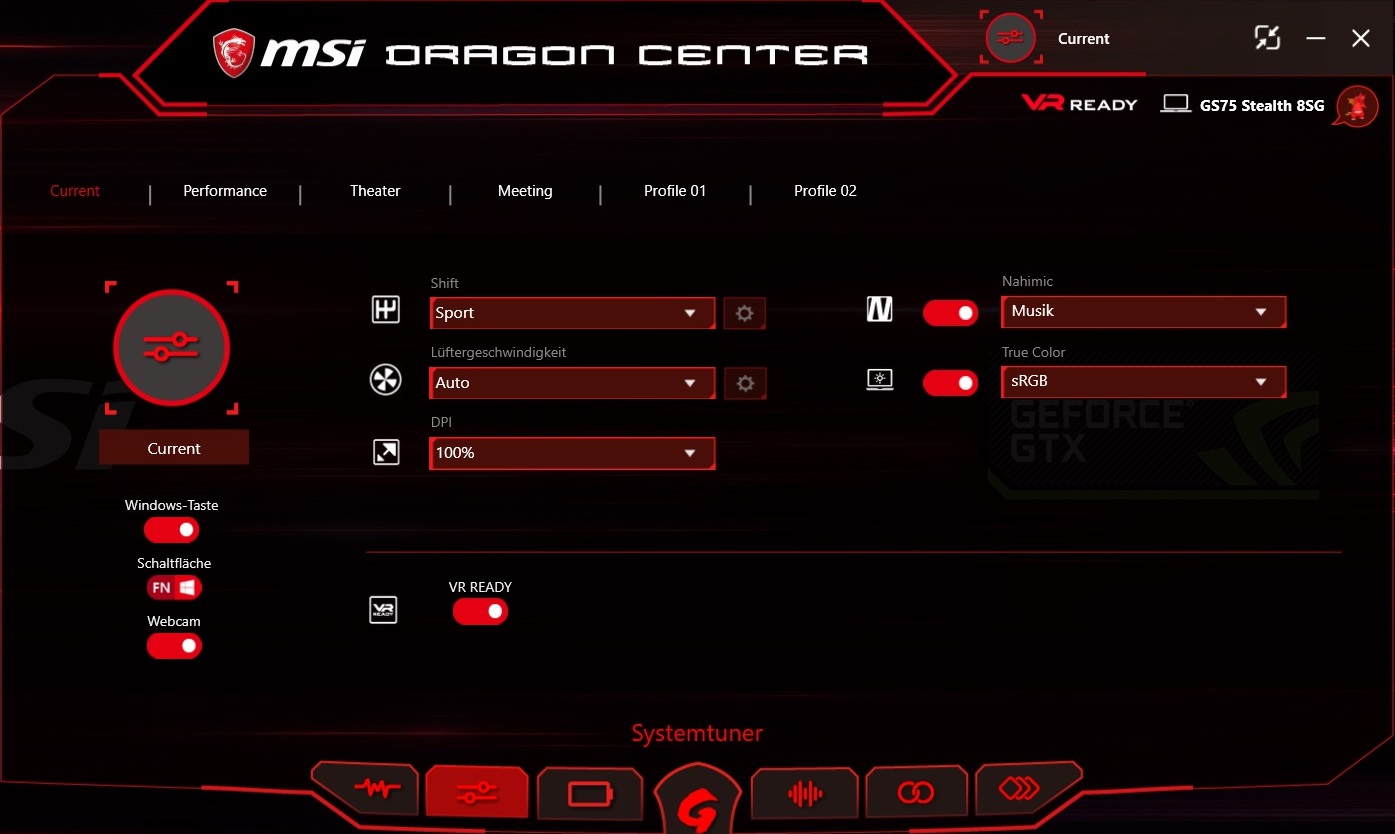
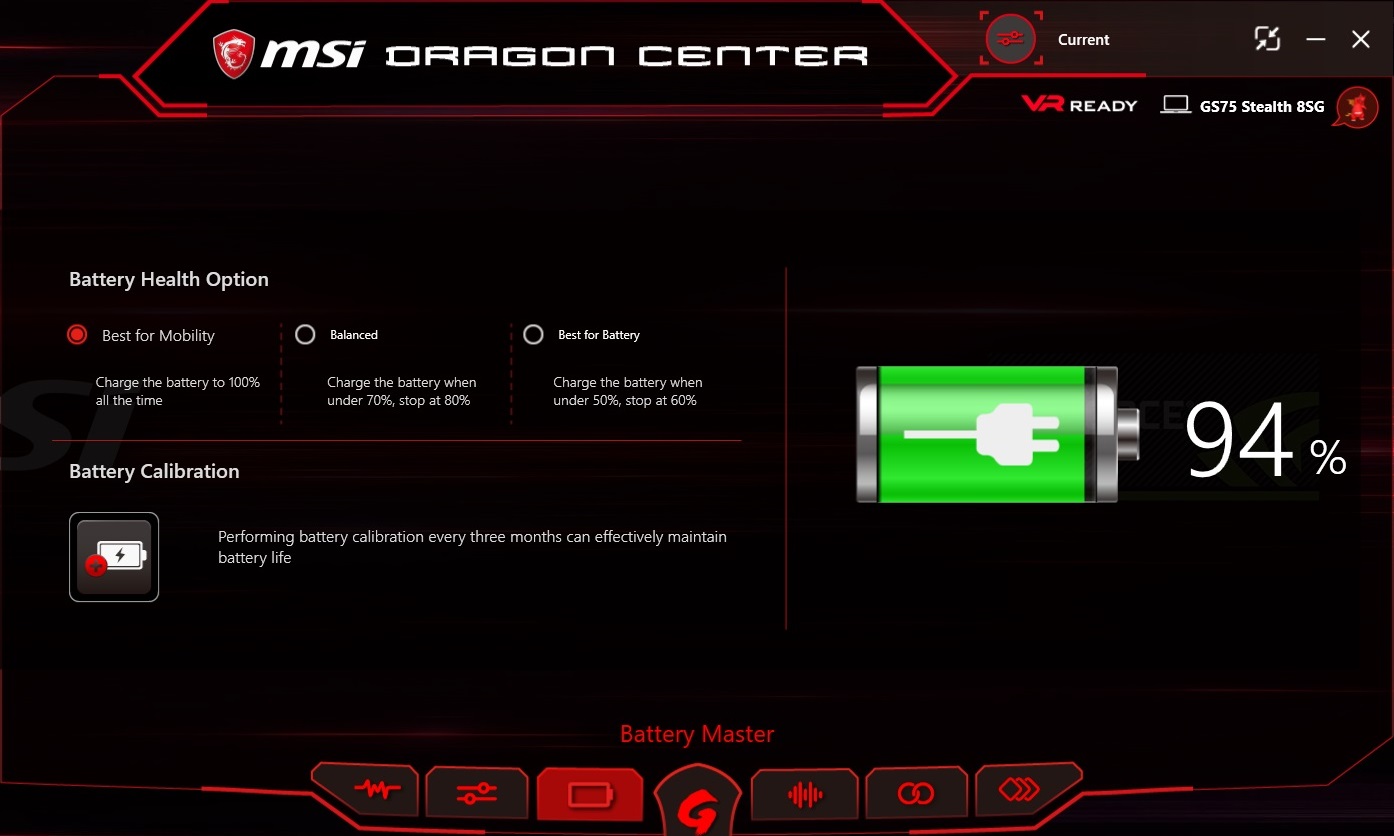
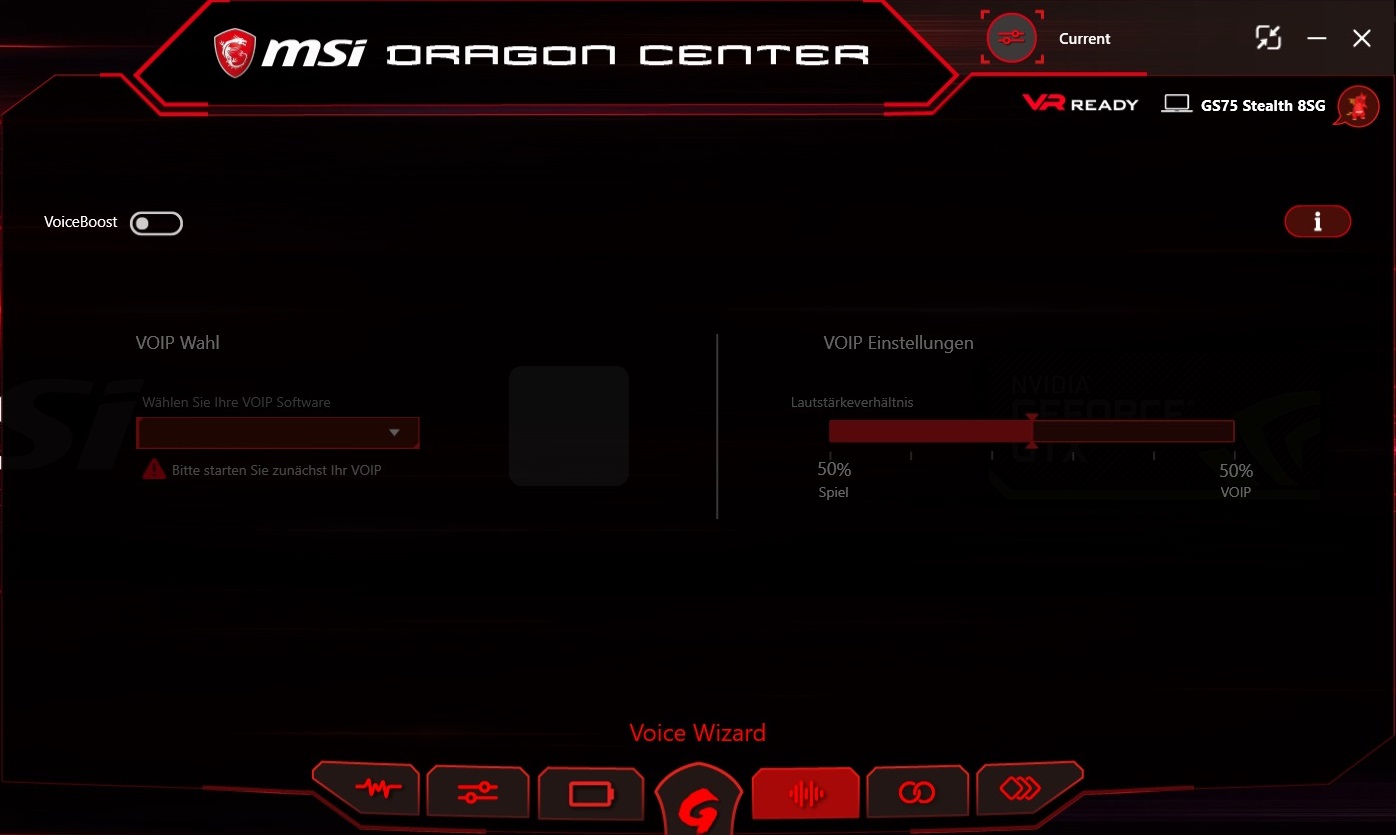
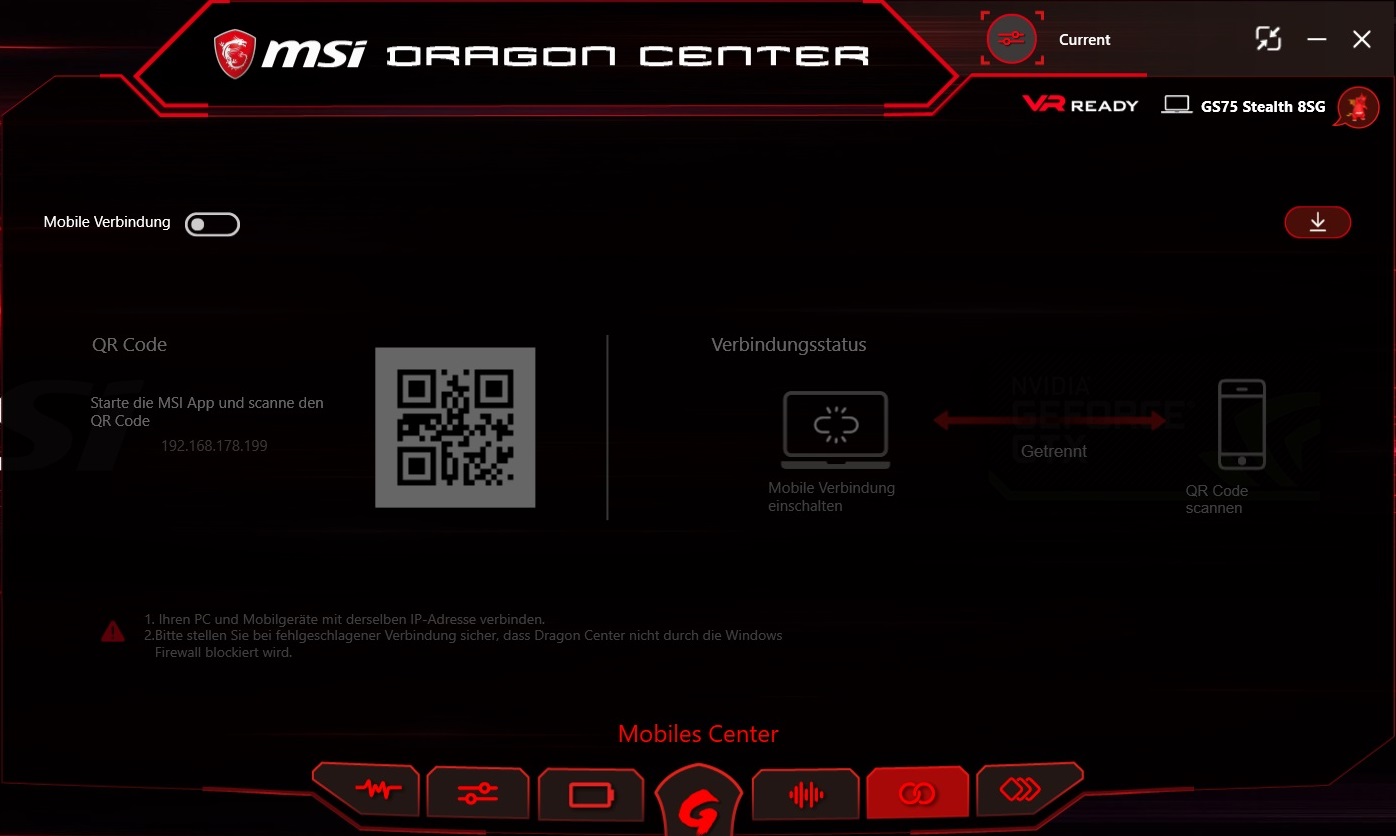
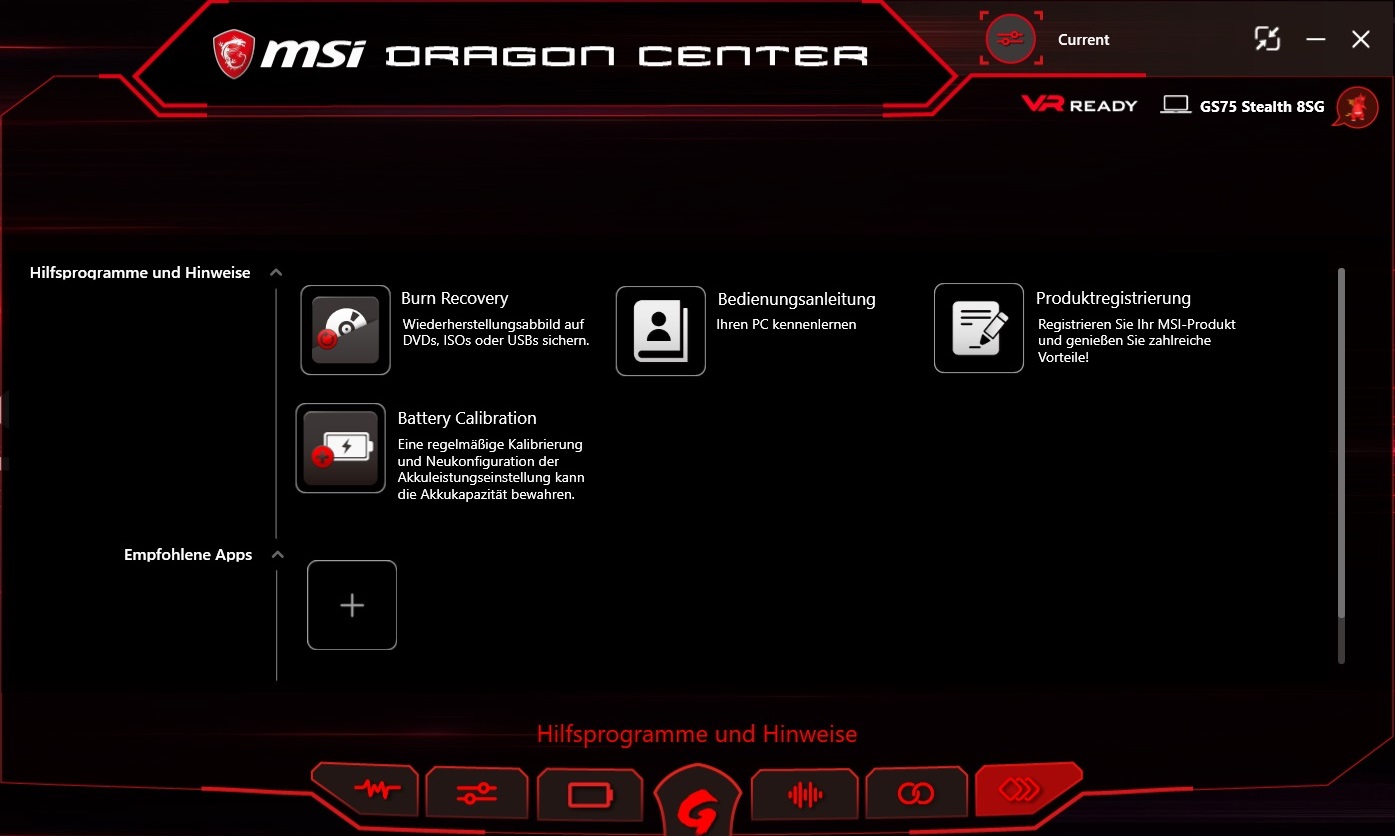
As is typical of MSI, a large software package comes preinstalled. As usual, the linchpin is the so-called Dragon Center, which combines dozens of features. The most relevant is probably the "System tuner". Here you can adjust the display and sound profiles (True Color and Nahimic), as well as the DPI settings, the performance mode (Shift) and the fan management.
All our measurements were done with the fan set to "Auto". Regarding the Shift option, the "Comfort" mode was planned actually. Since it led to very bad results in 3D usage (contrary to the pre-production device, which we had briefly in the office on the occasion of Turing's release), we had to switch to the "Sport" profile for the 3D tests. The latter had subjectively little effect on noise development, etc.
Accessories
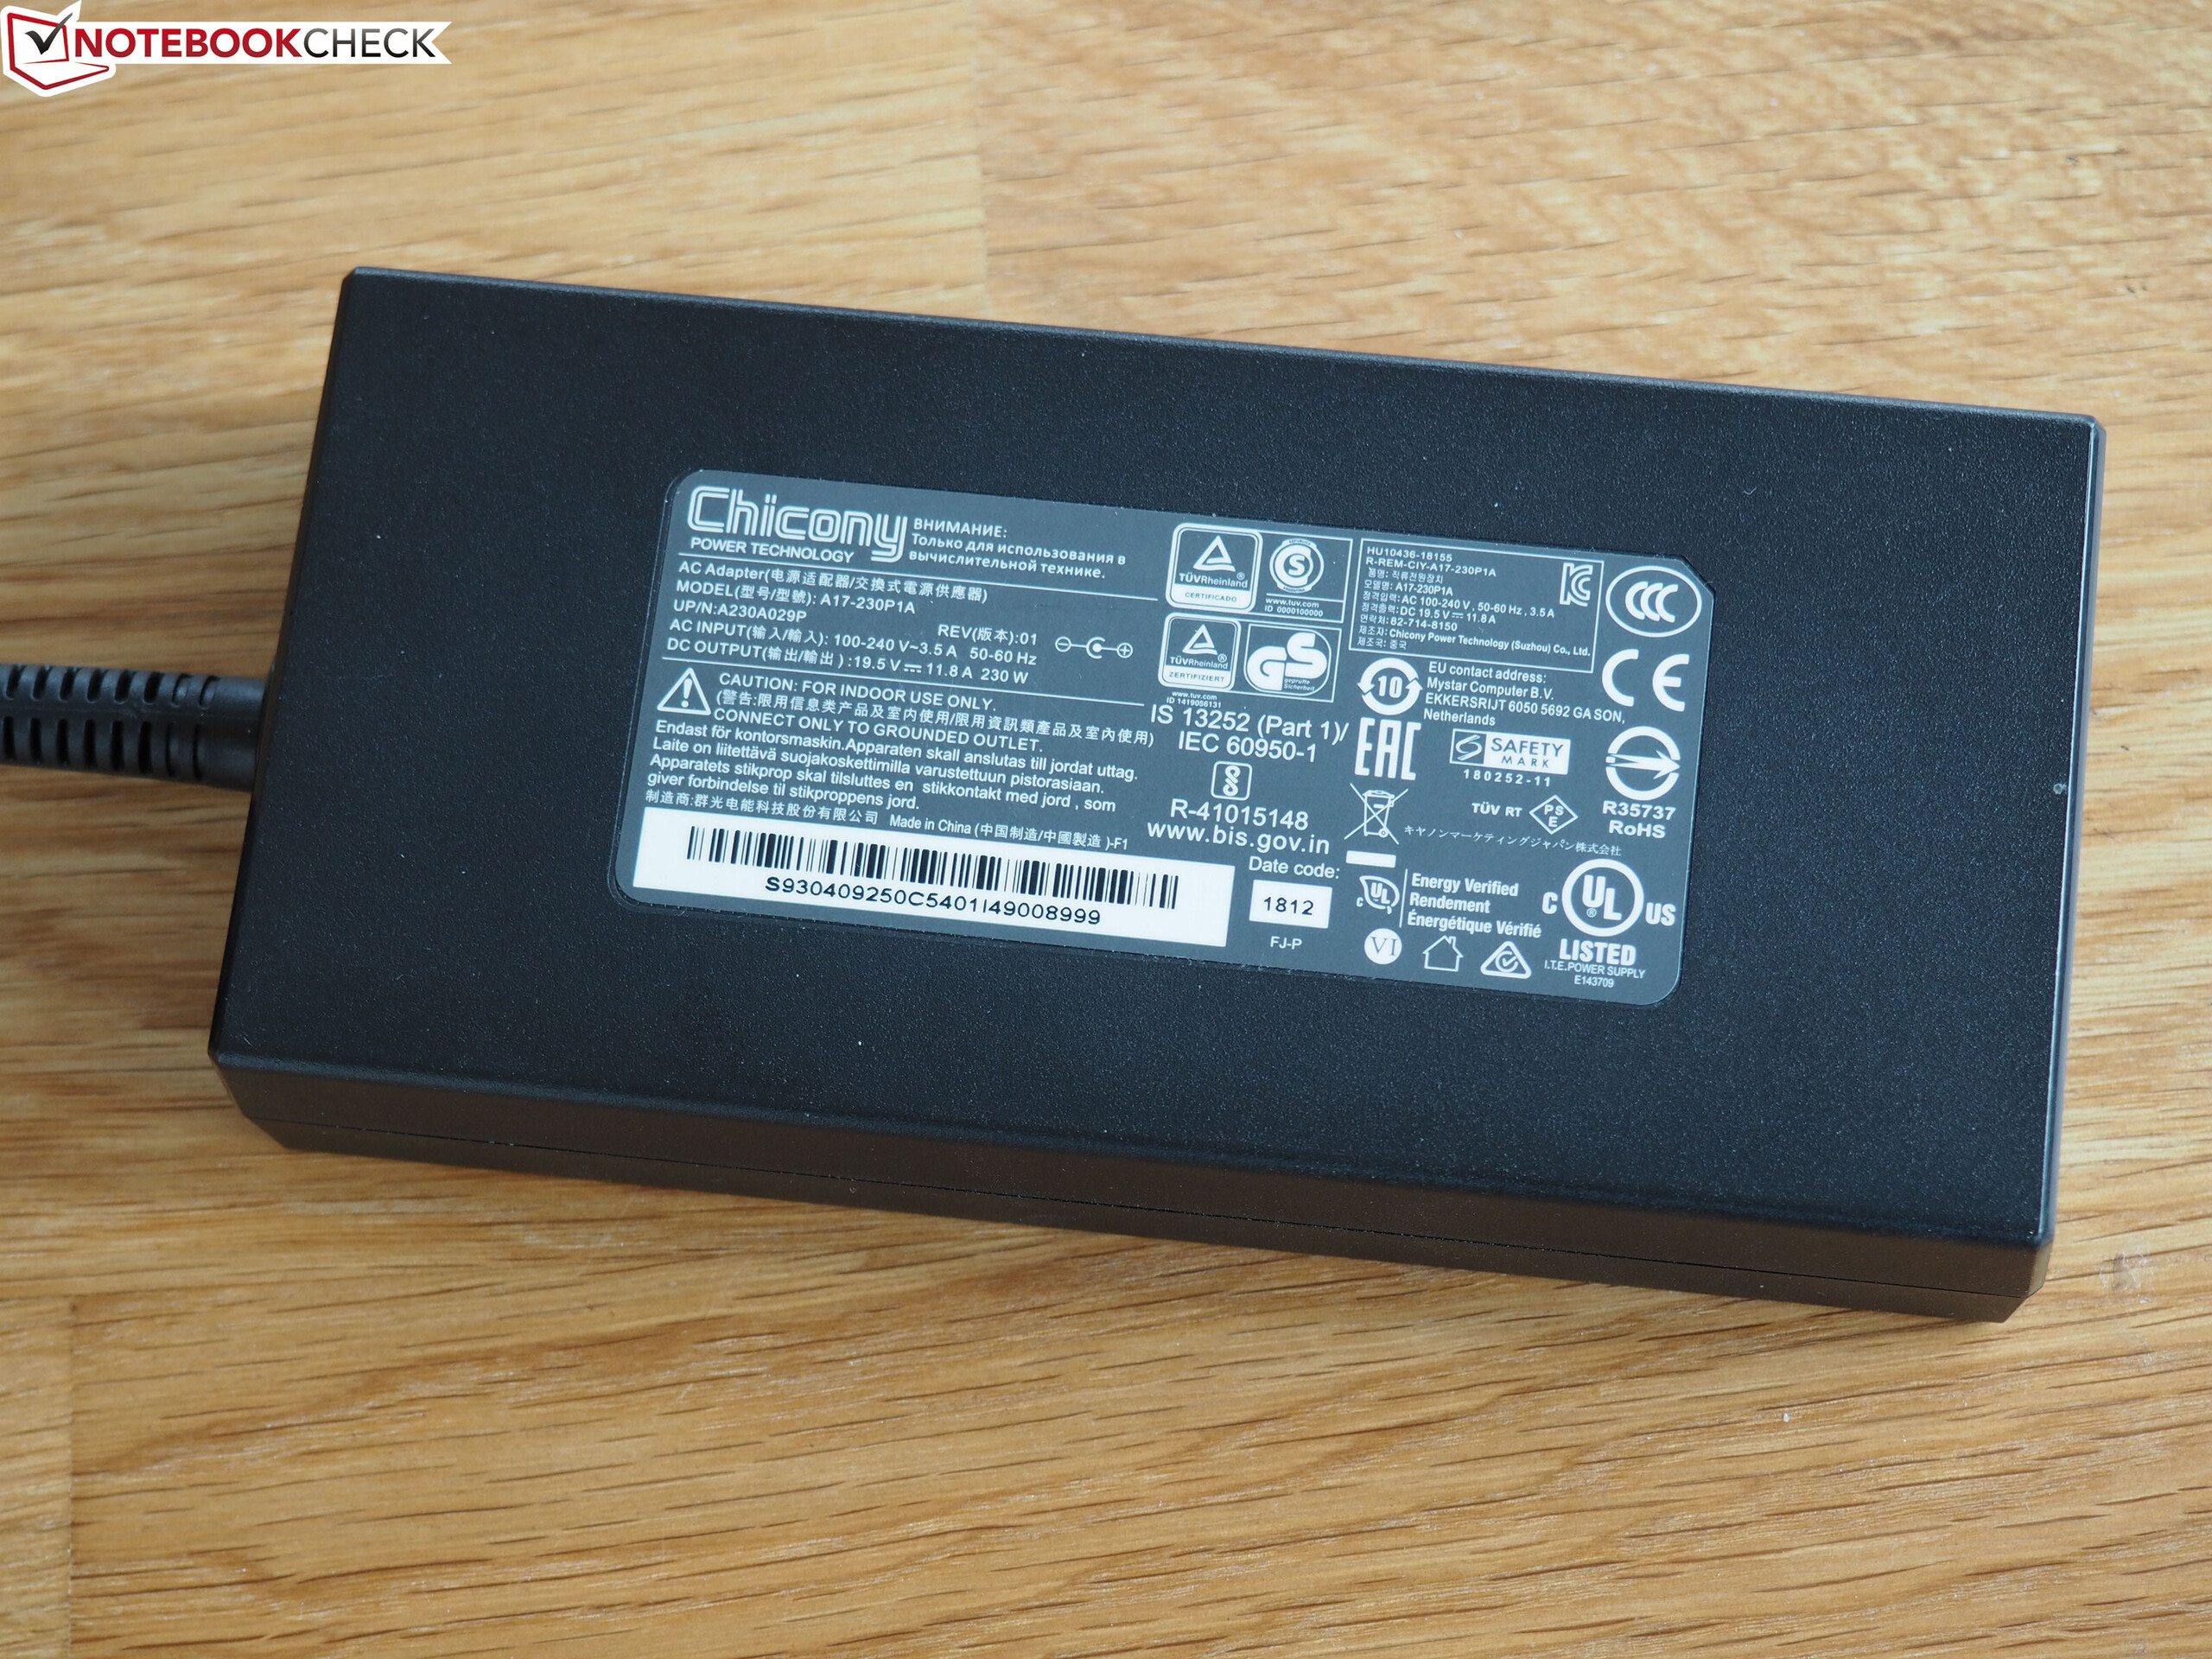
While the software features were quite ample, the delivery can be described with the word "poor". Alongside a power adapter (230 Watts), only a quick-start guide and a recovery manual were to be found in the box.
Maintenance
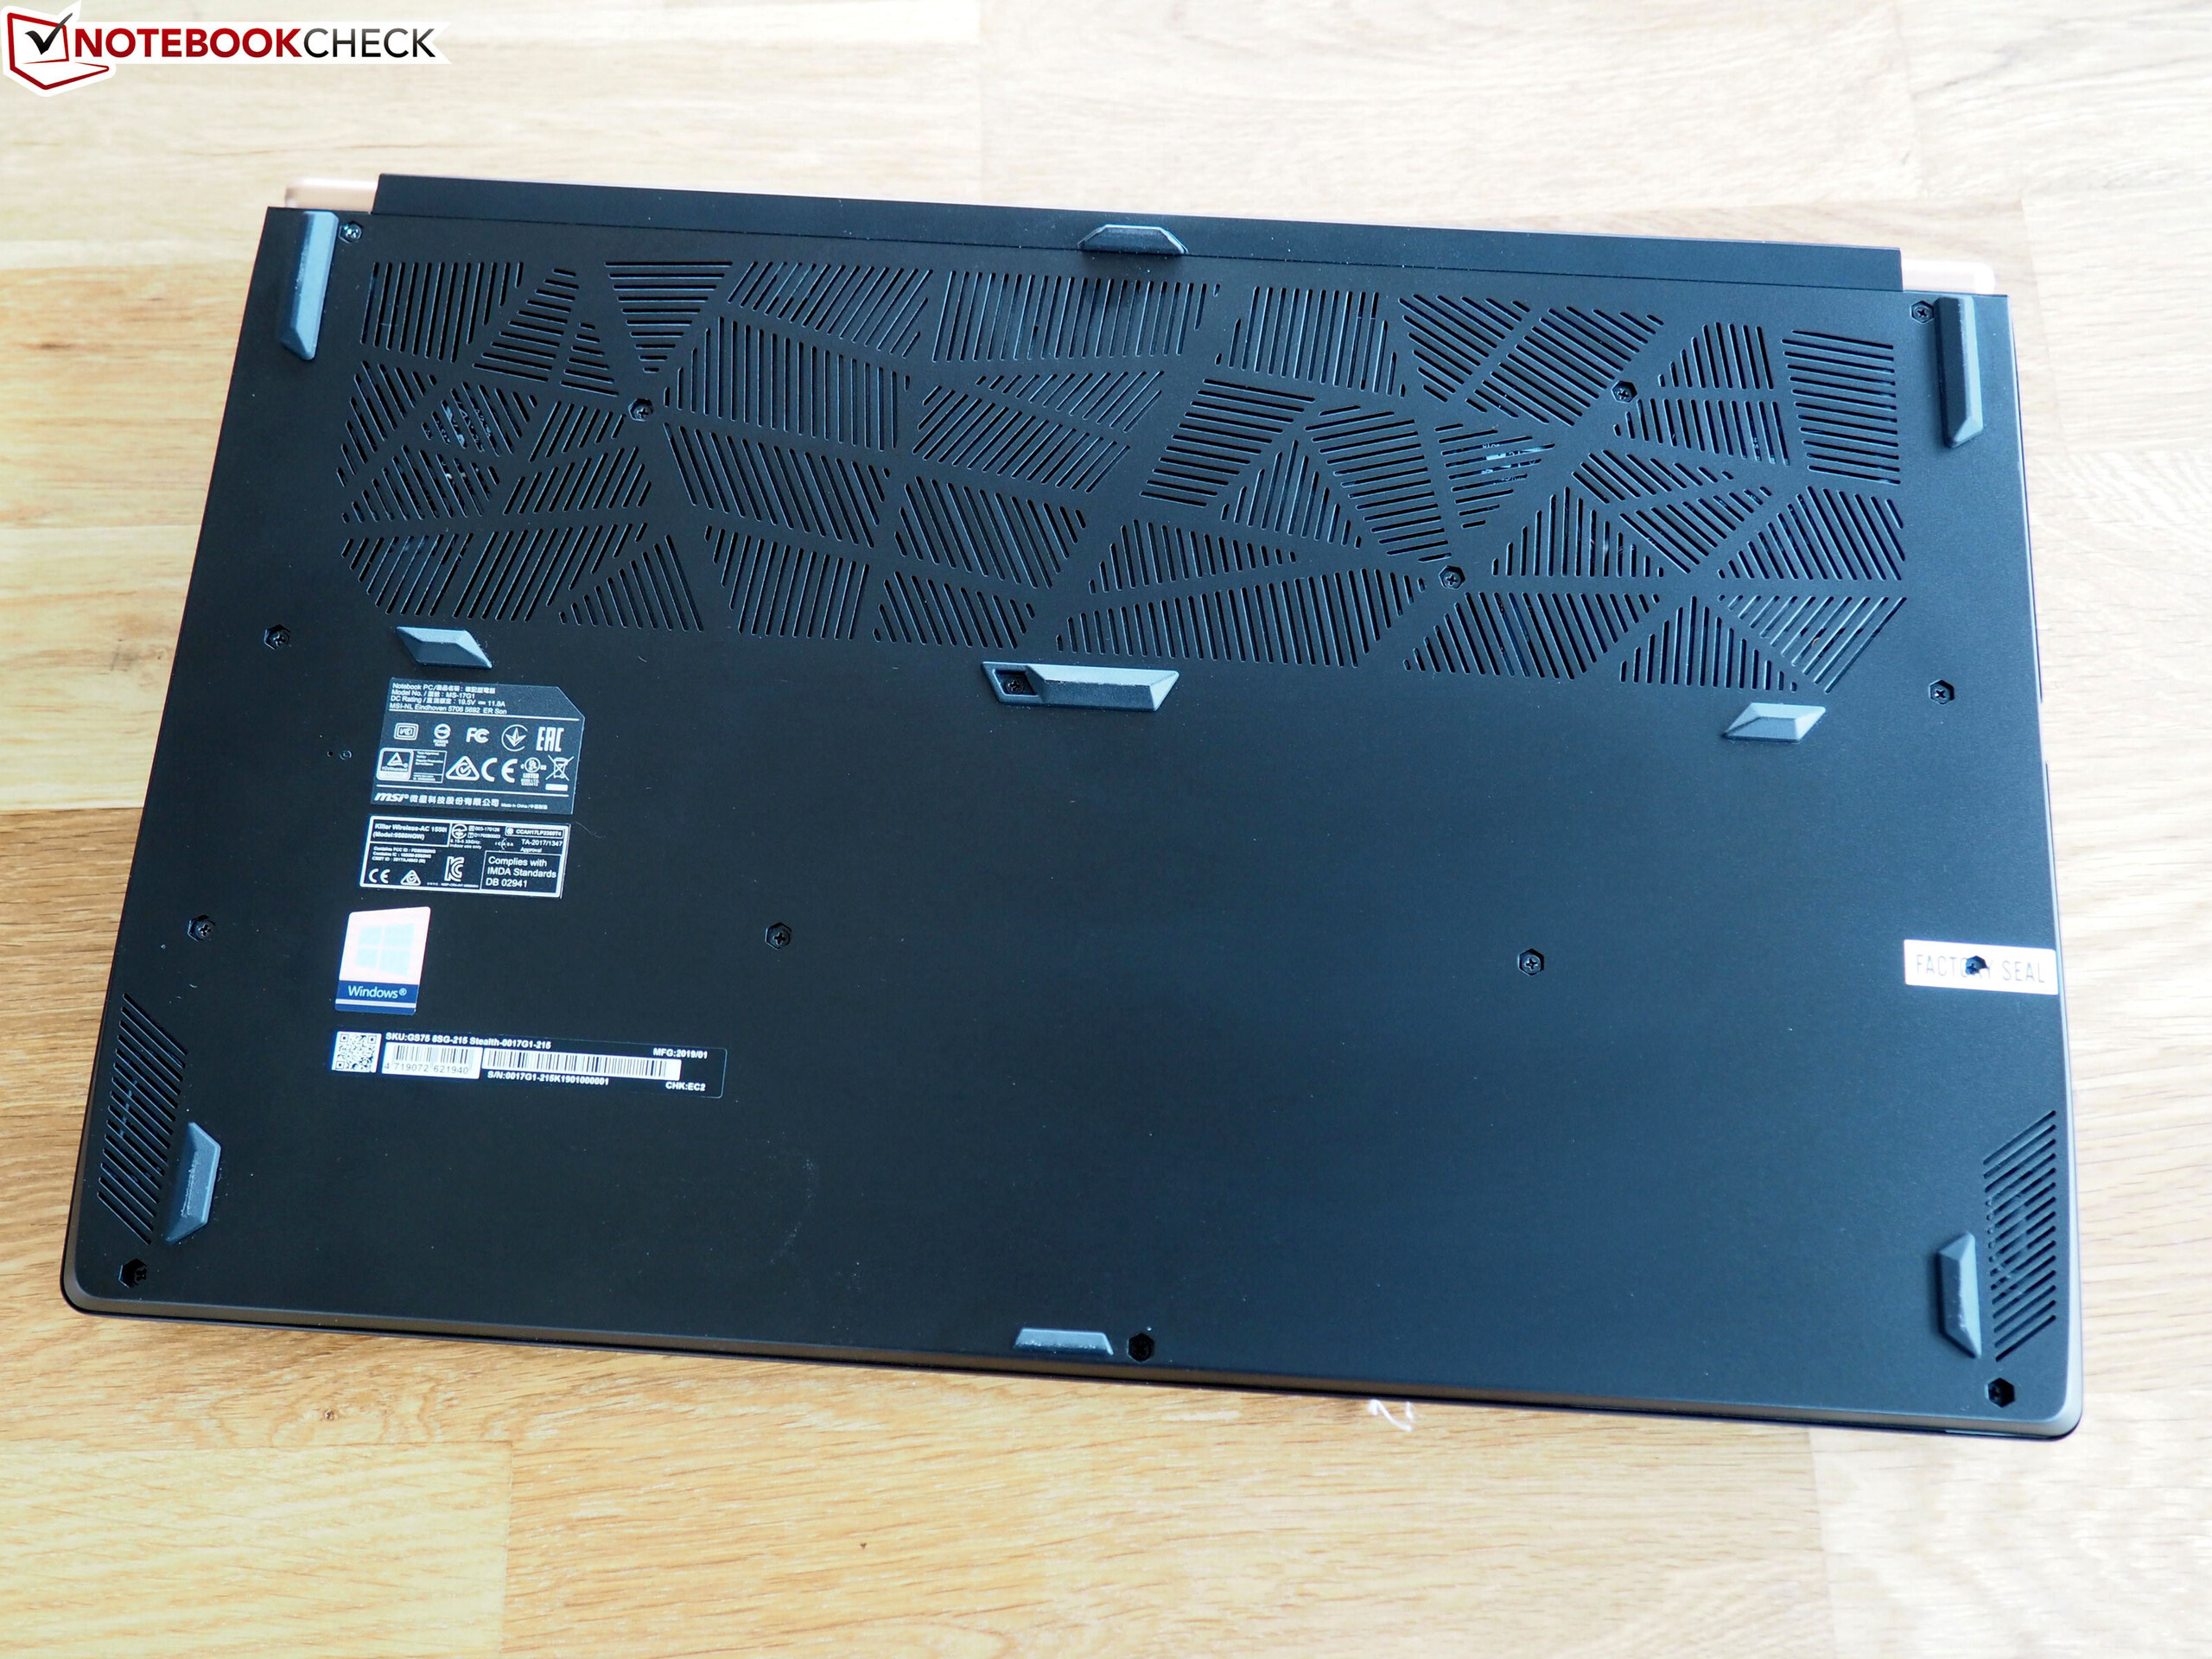
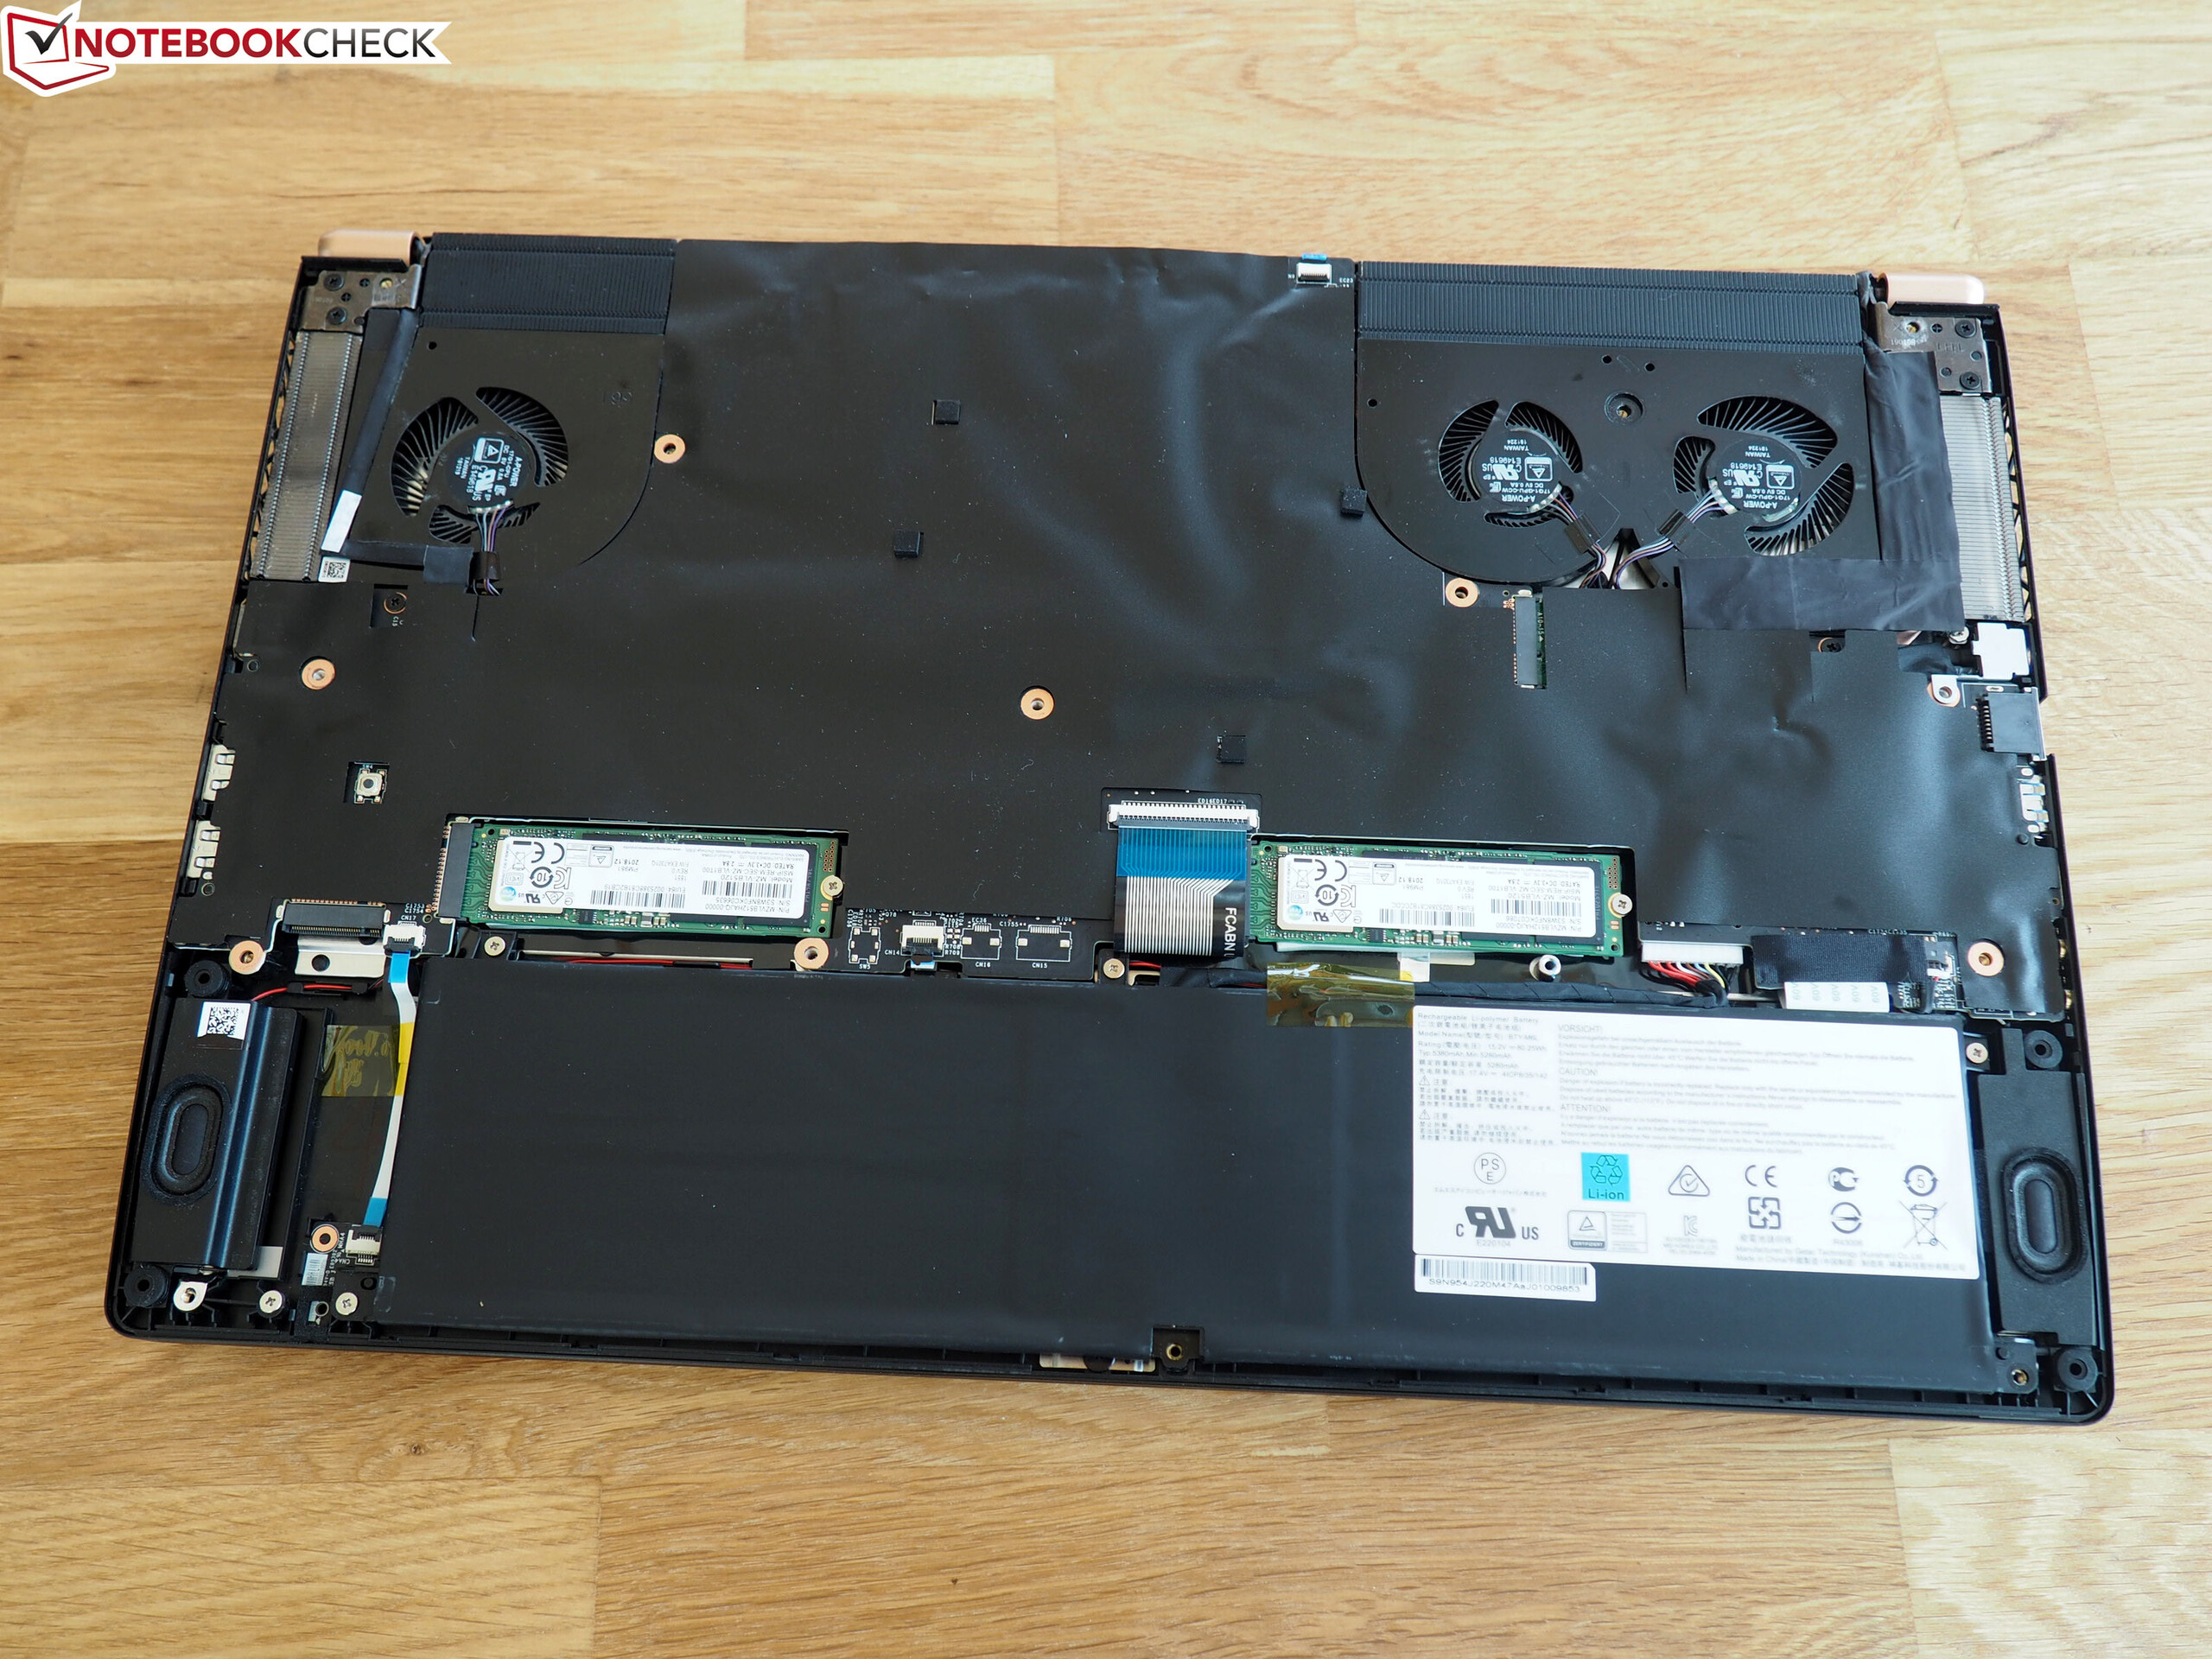
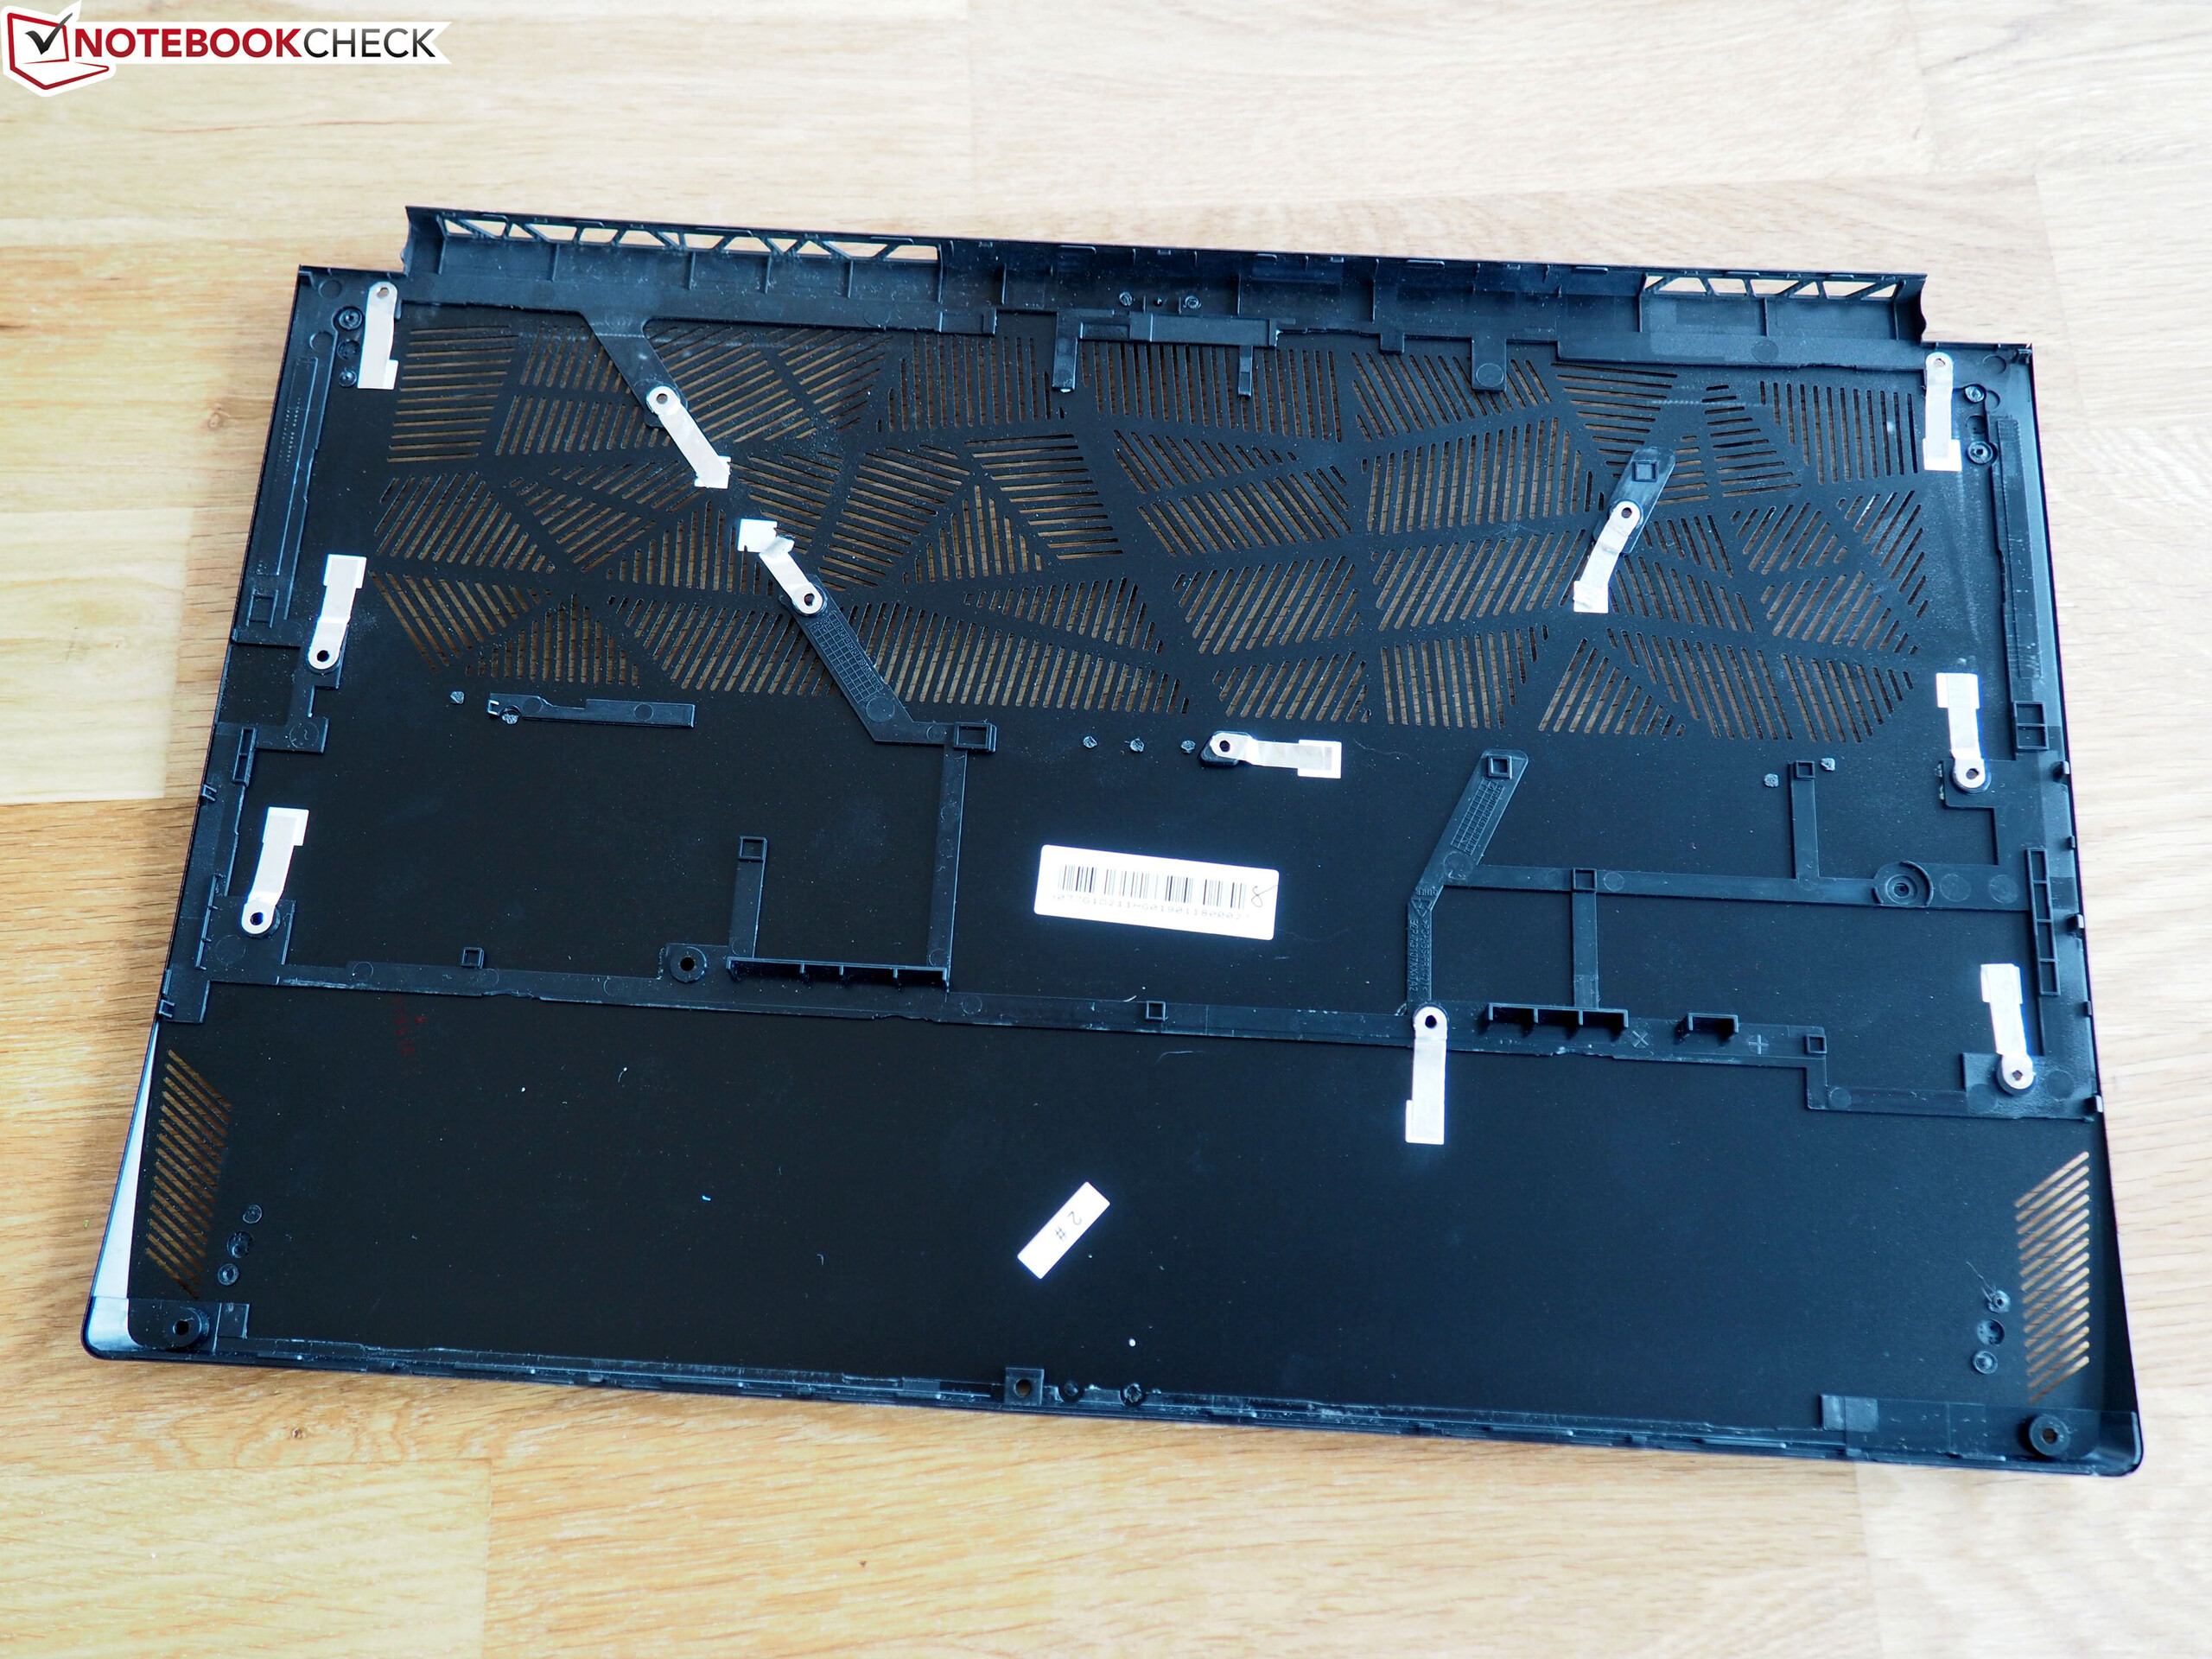
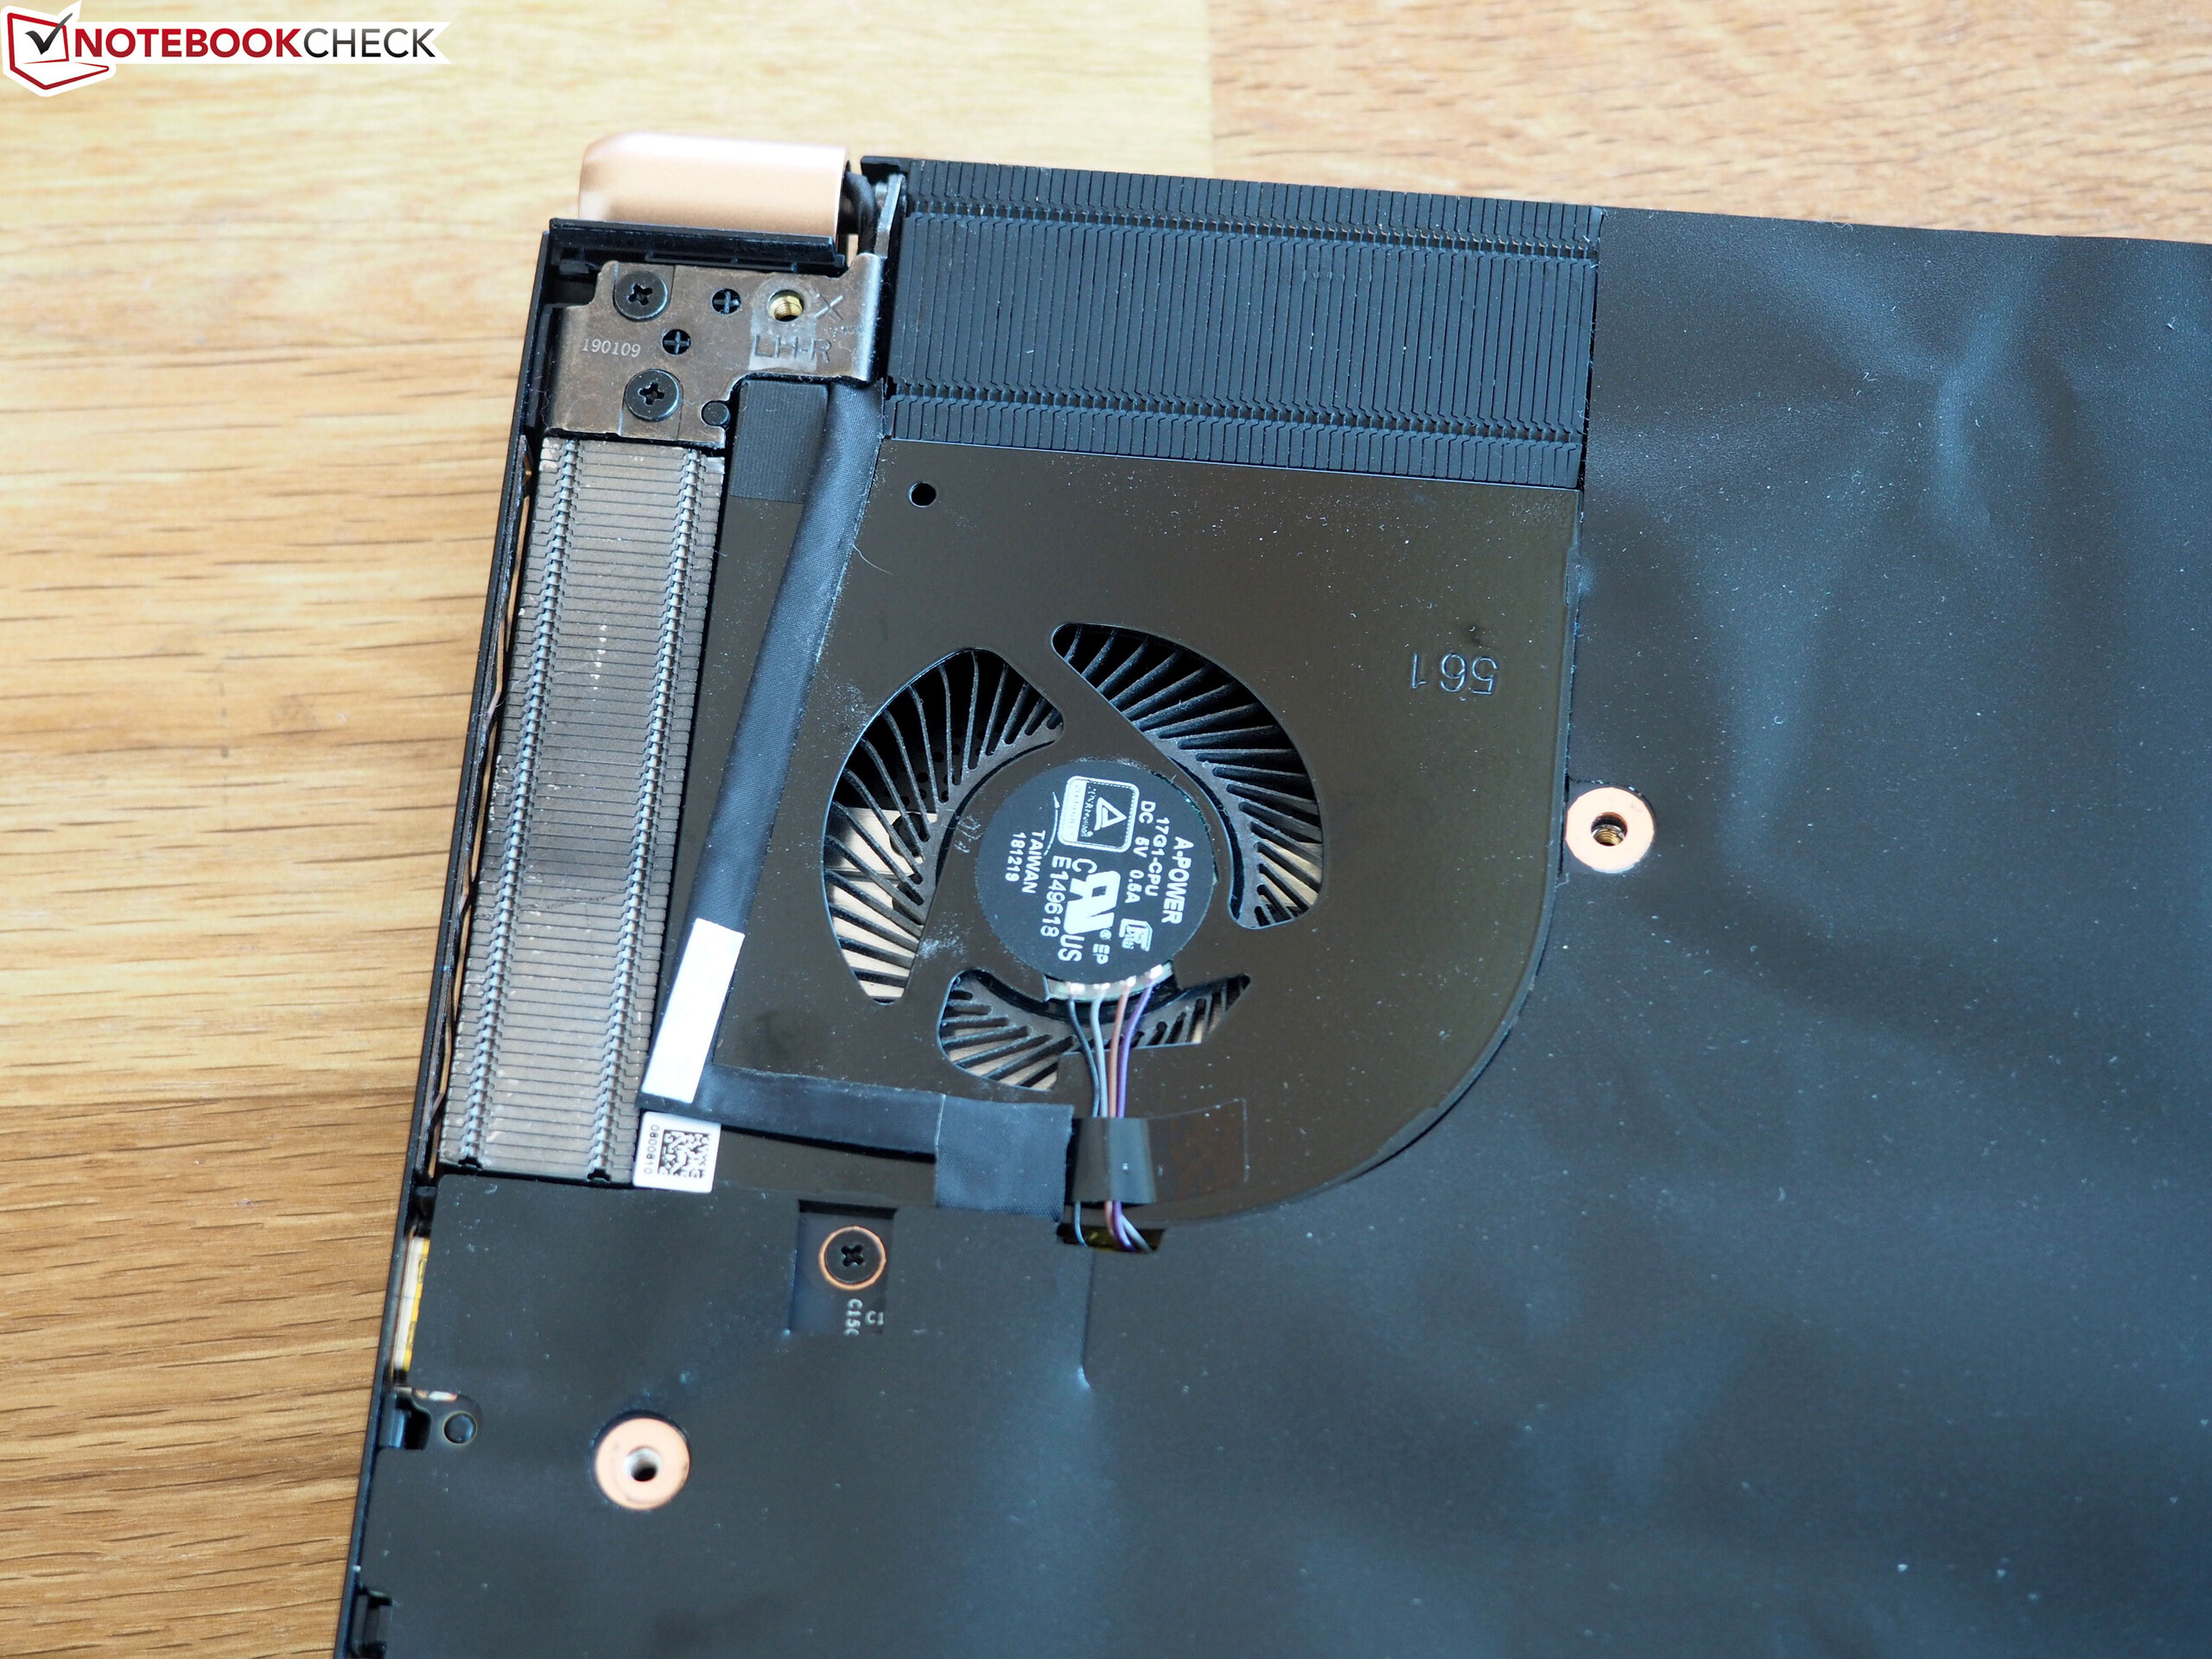
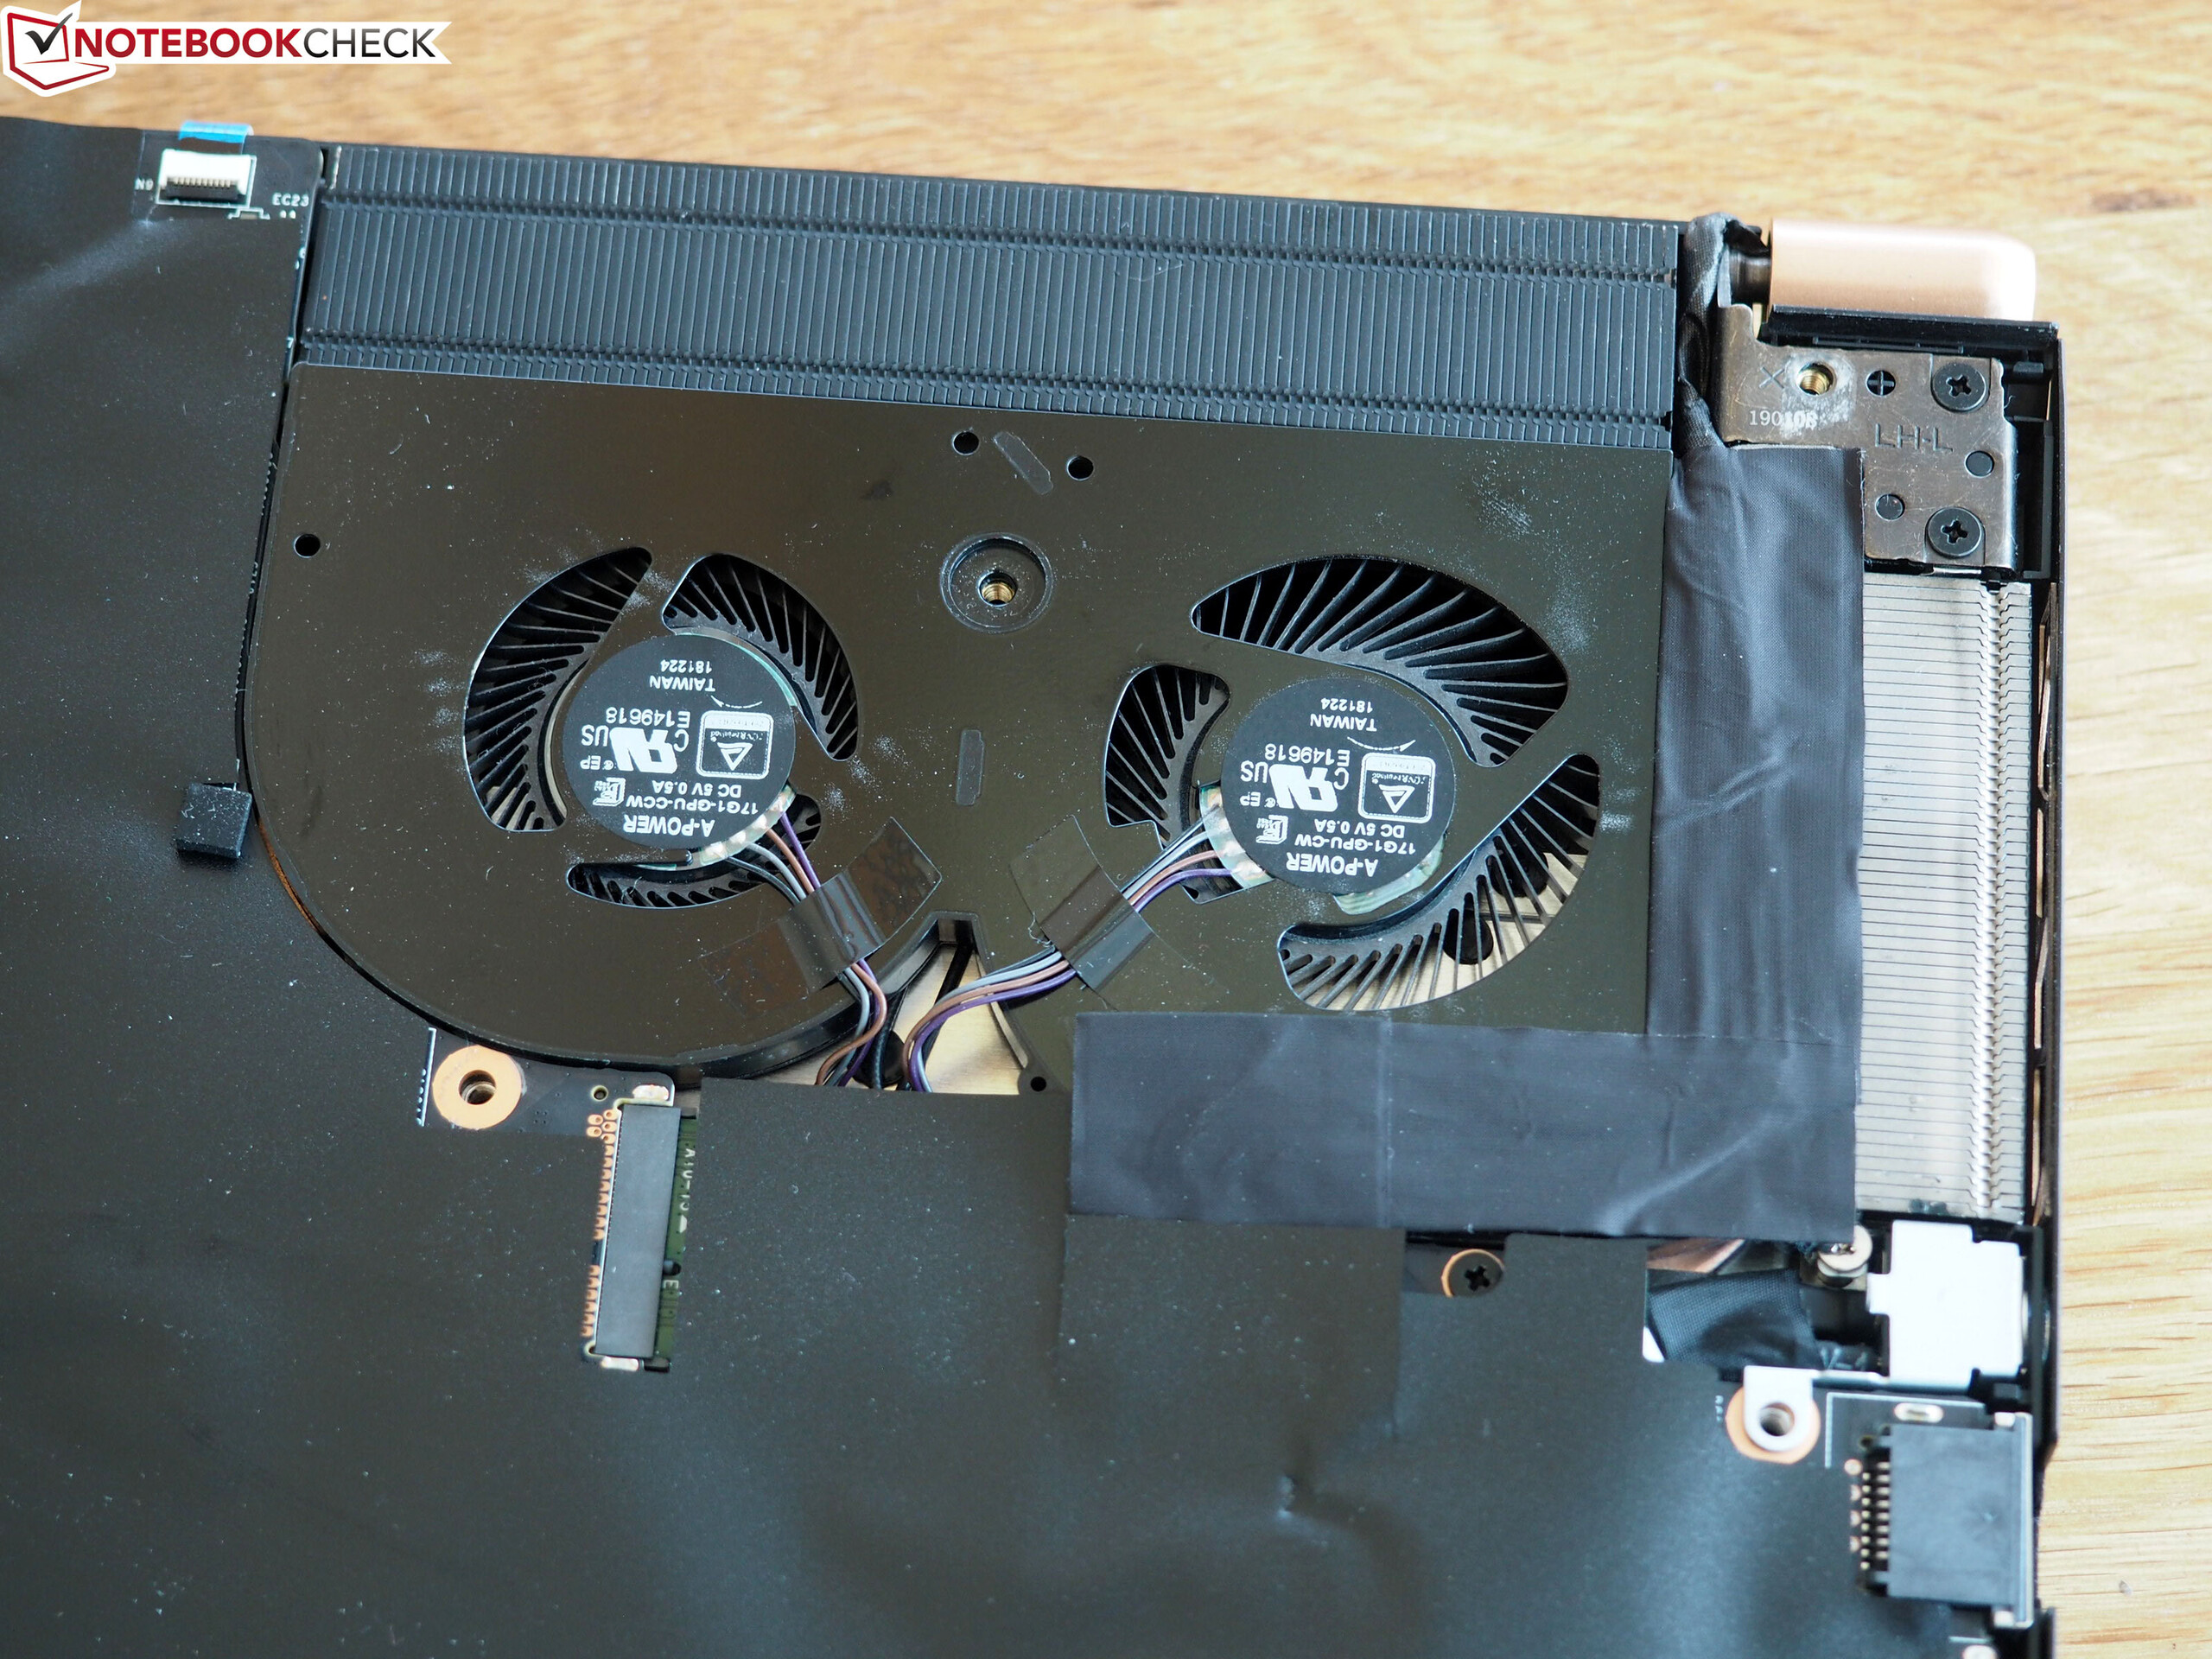
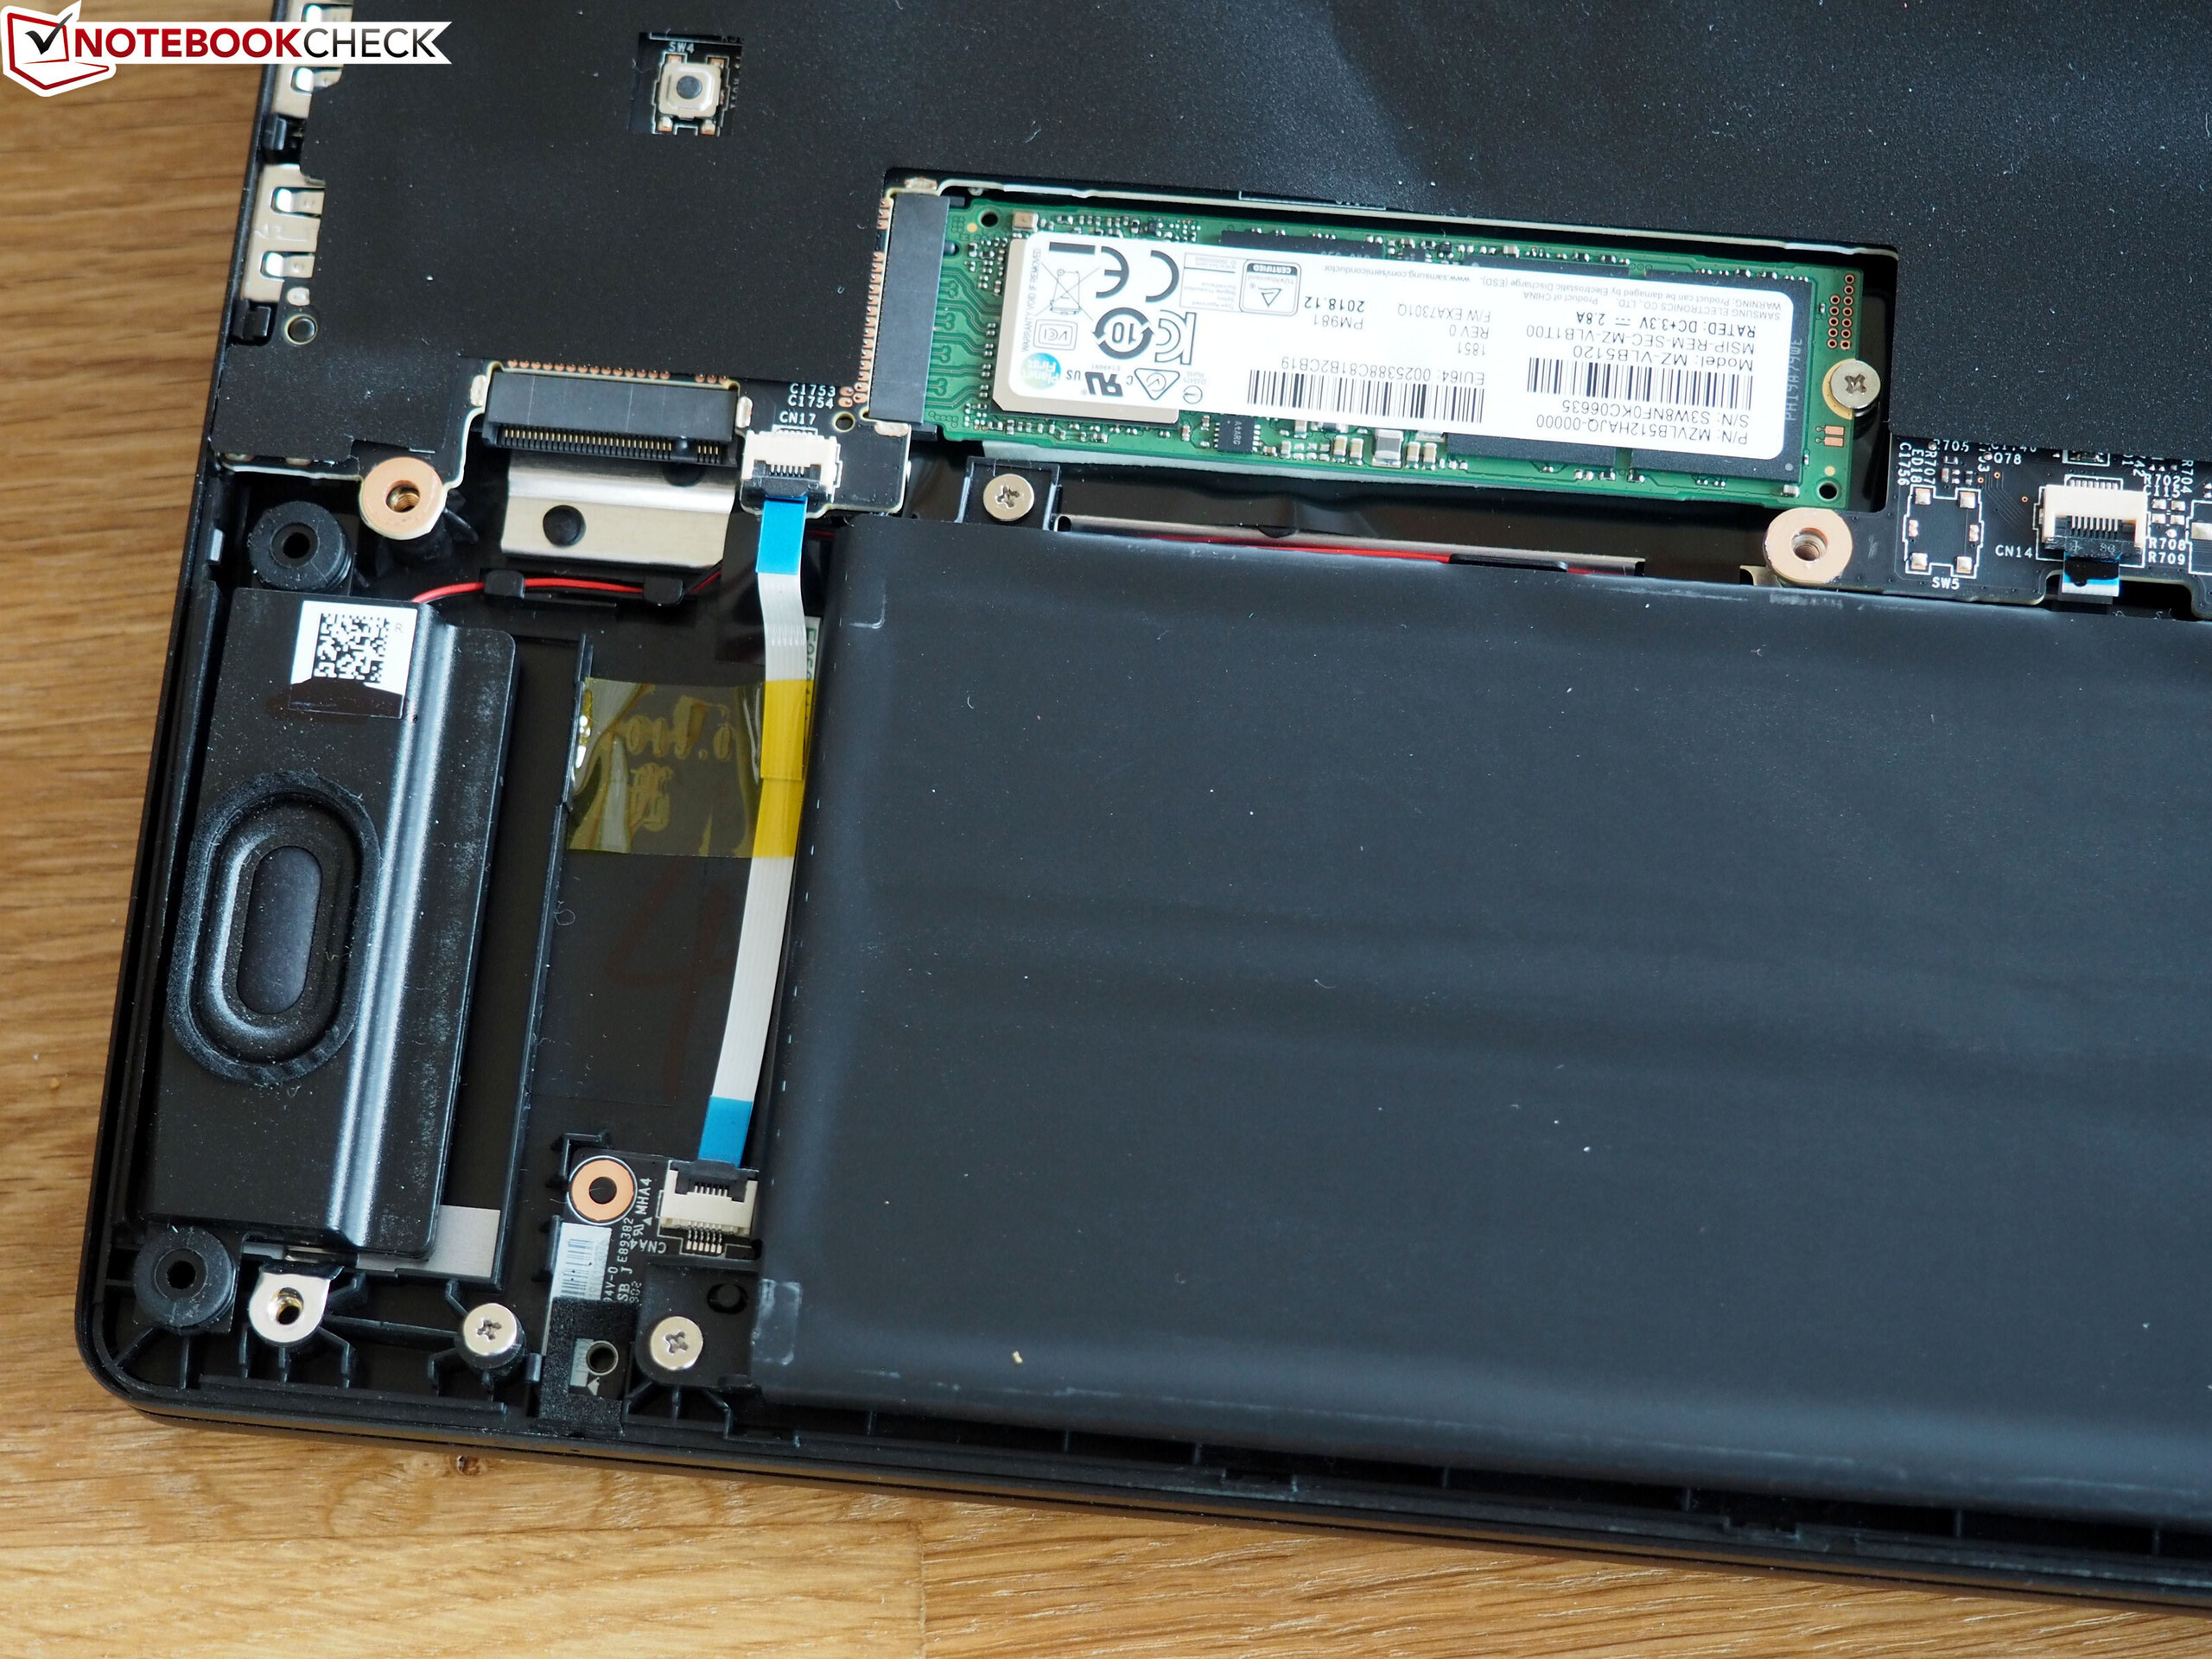
Extensive maintenance options aren't to be expected from the GS75. When the 15 Phillips screws are removed from the bottom side and the cover is popped off (tip: It's best to start at the level of the RJ45 port), there's only access to the fans, battery and storage. All remaining components are glued over with a black foil, whereby the CPU and GPU can't be upgraded.
Warranty
MSI honors a two-year warranty on the GS75. The service is of the pickup and return type.
Input devices
Keyboard
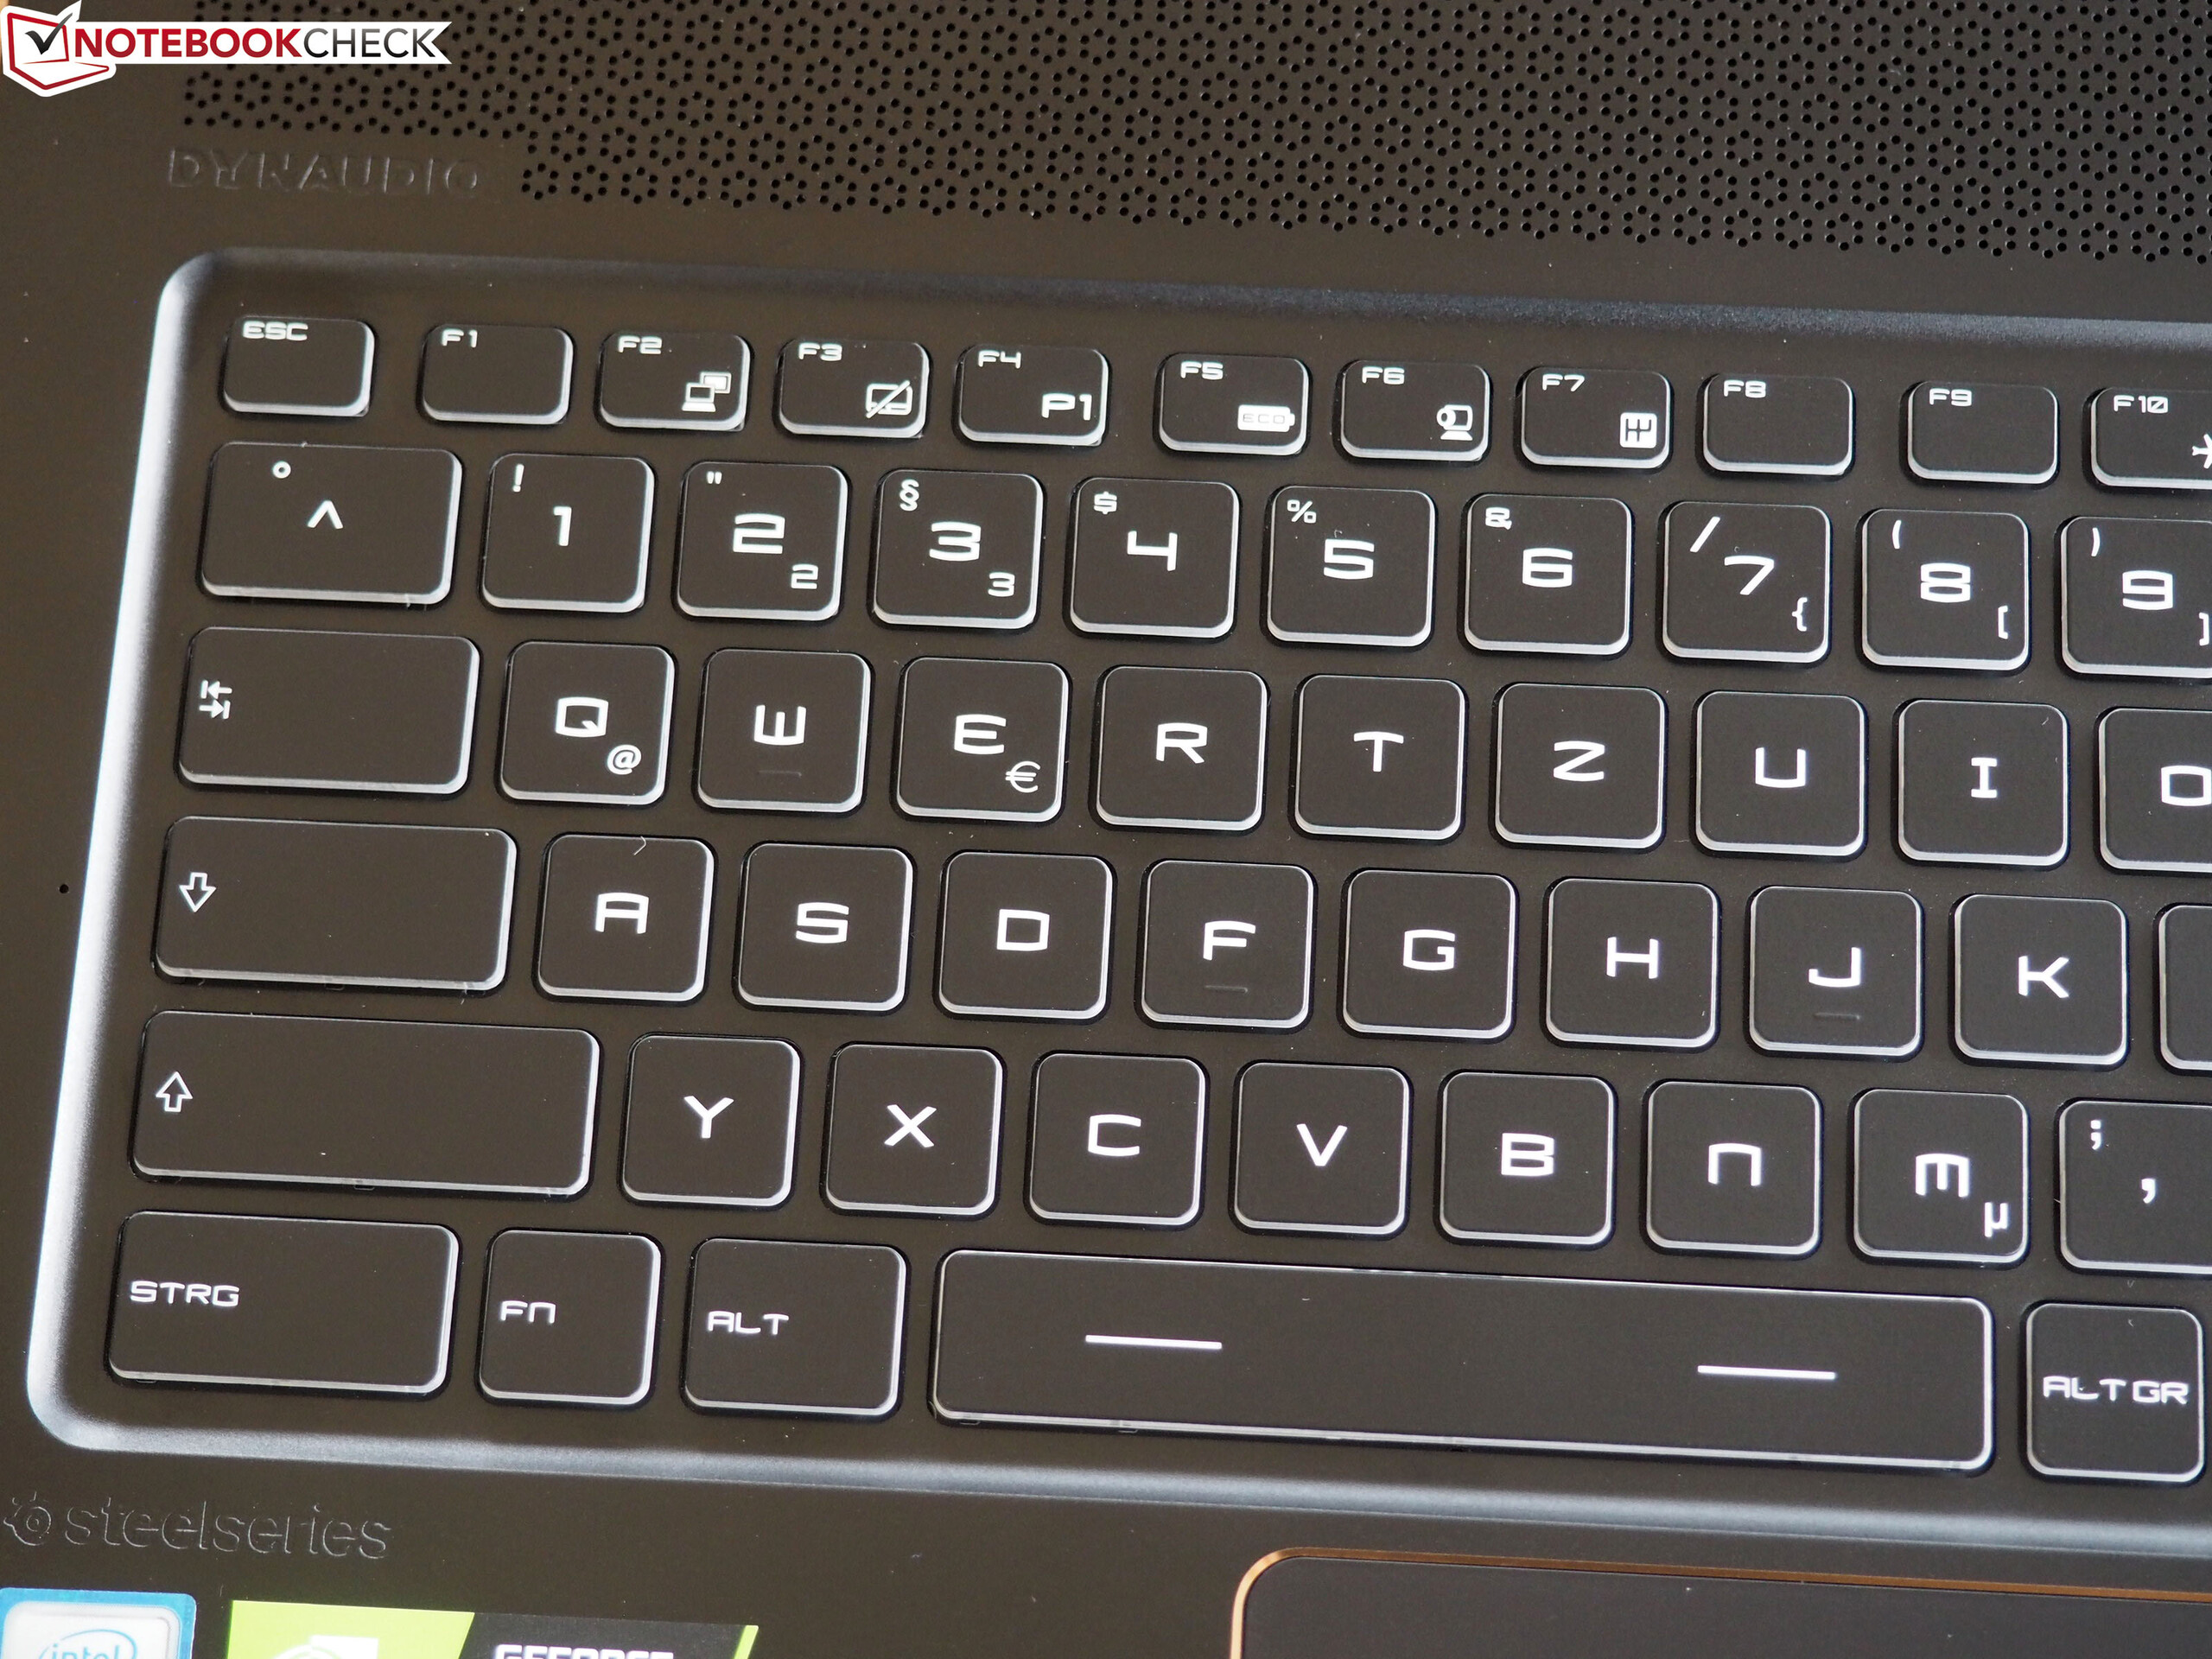
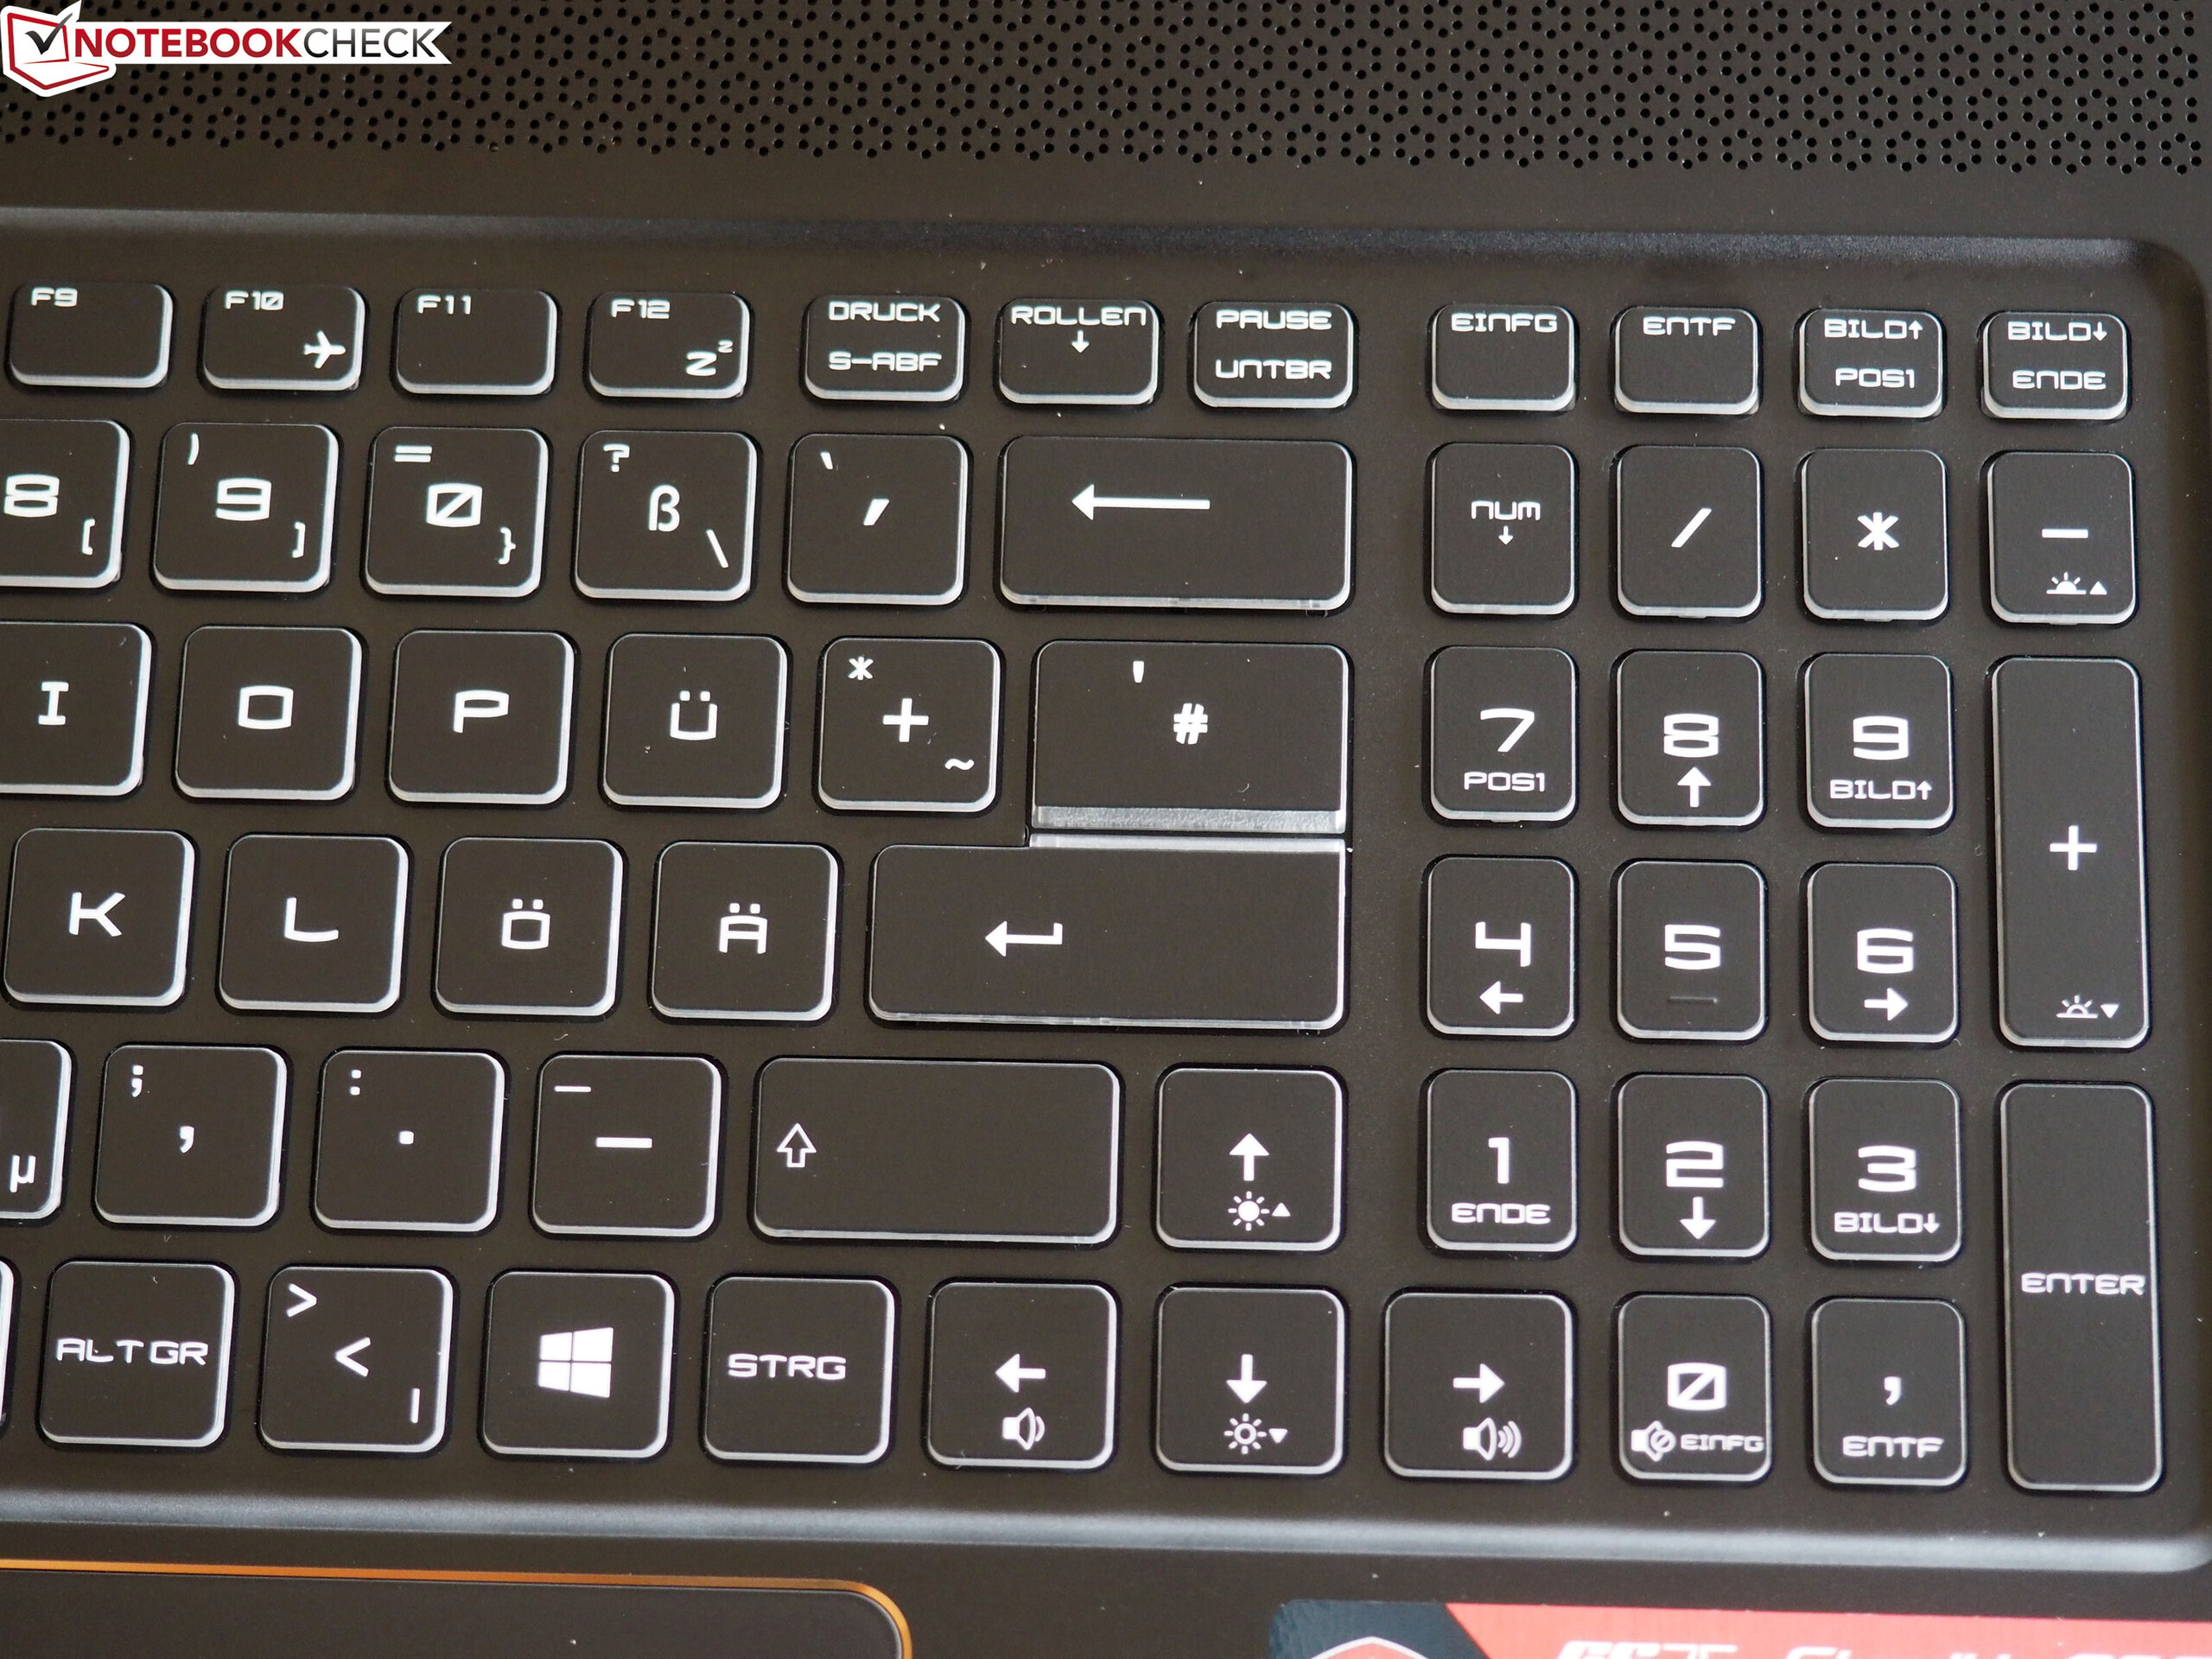
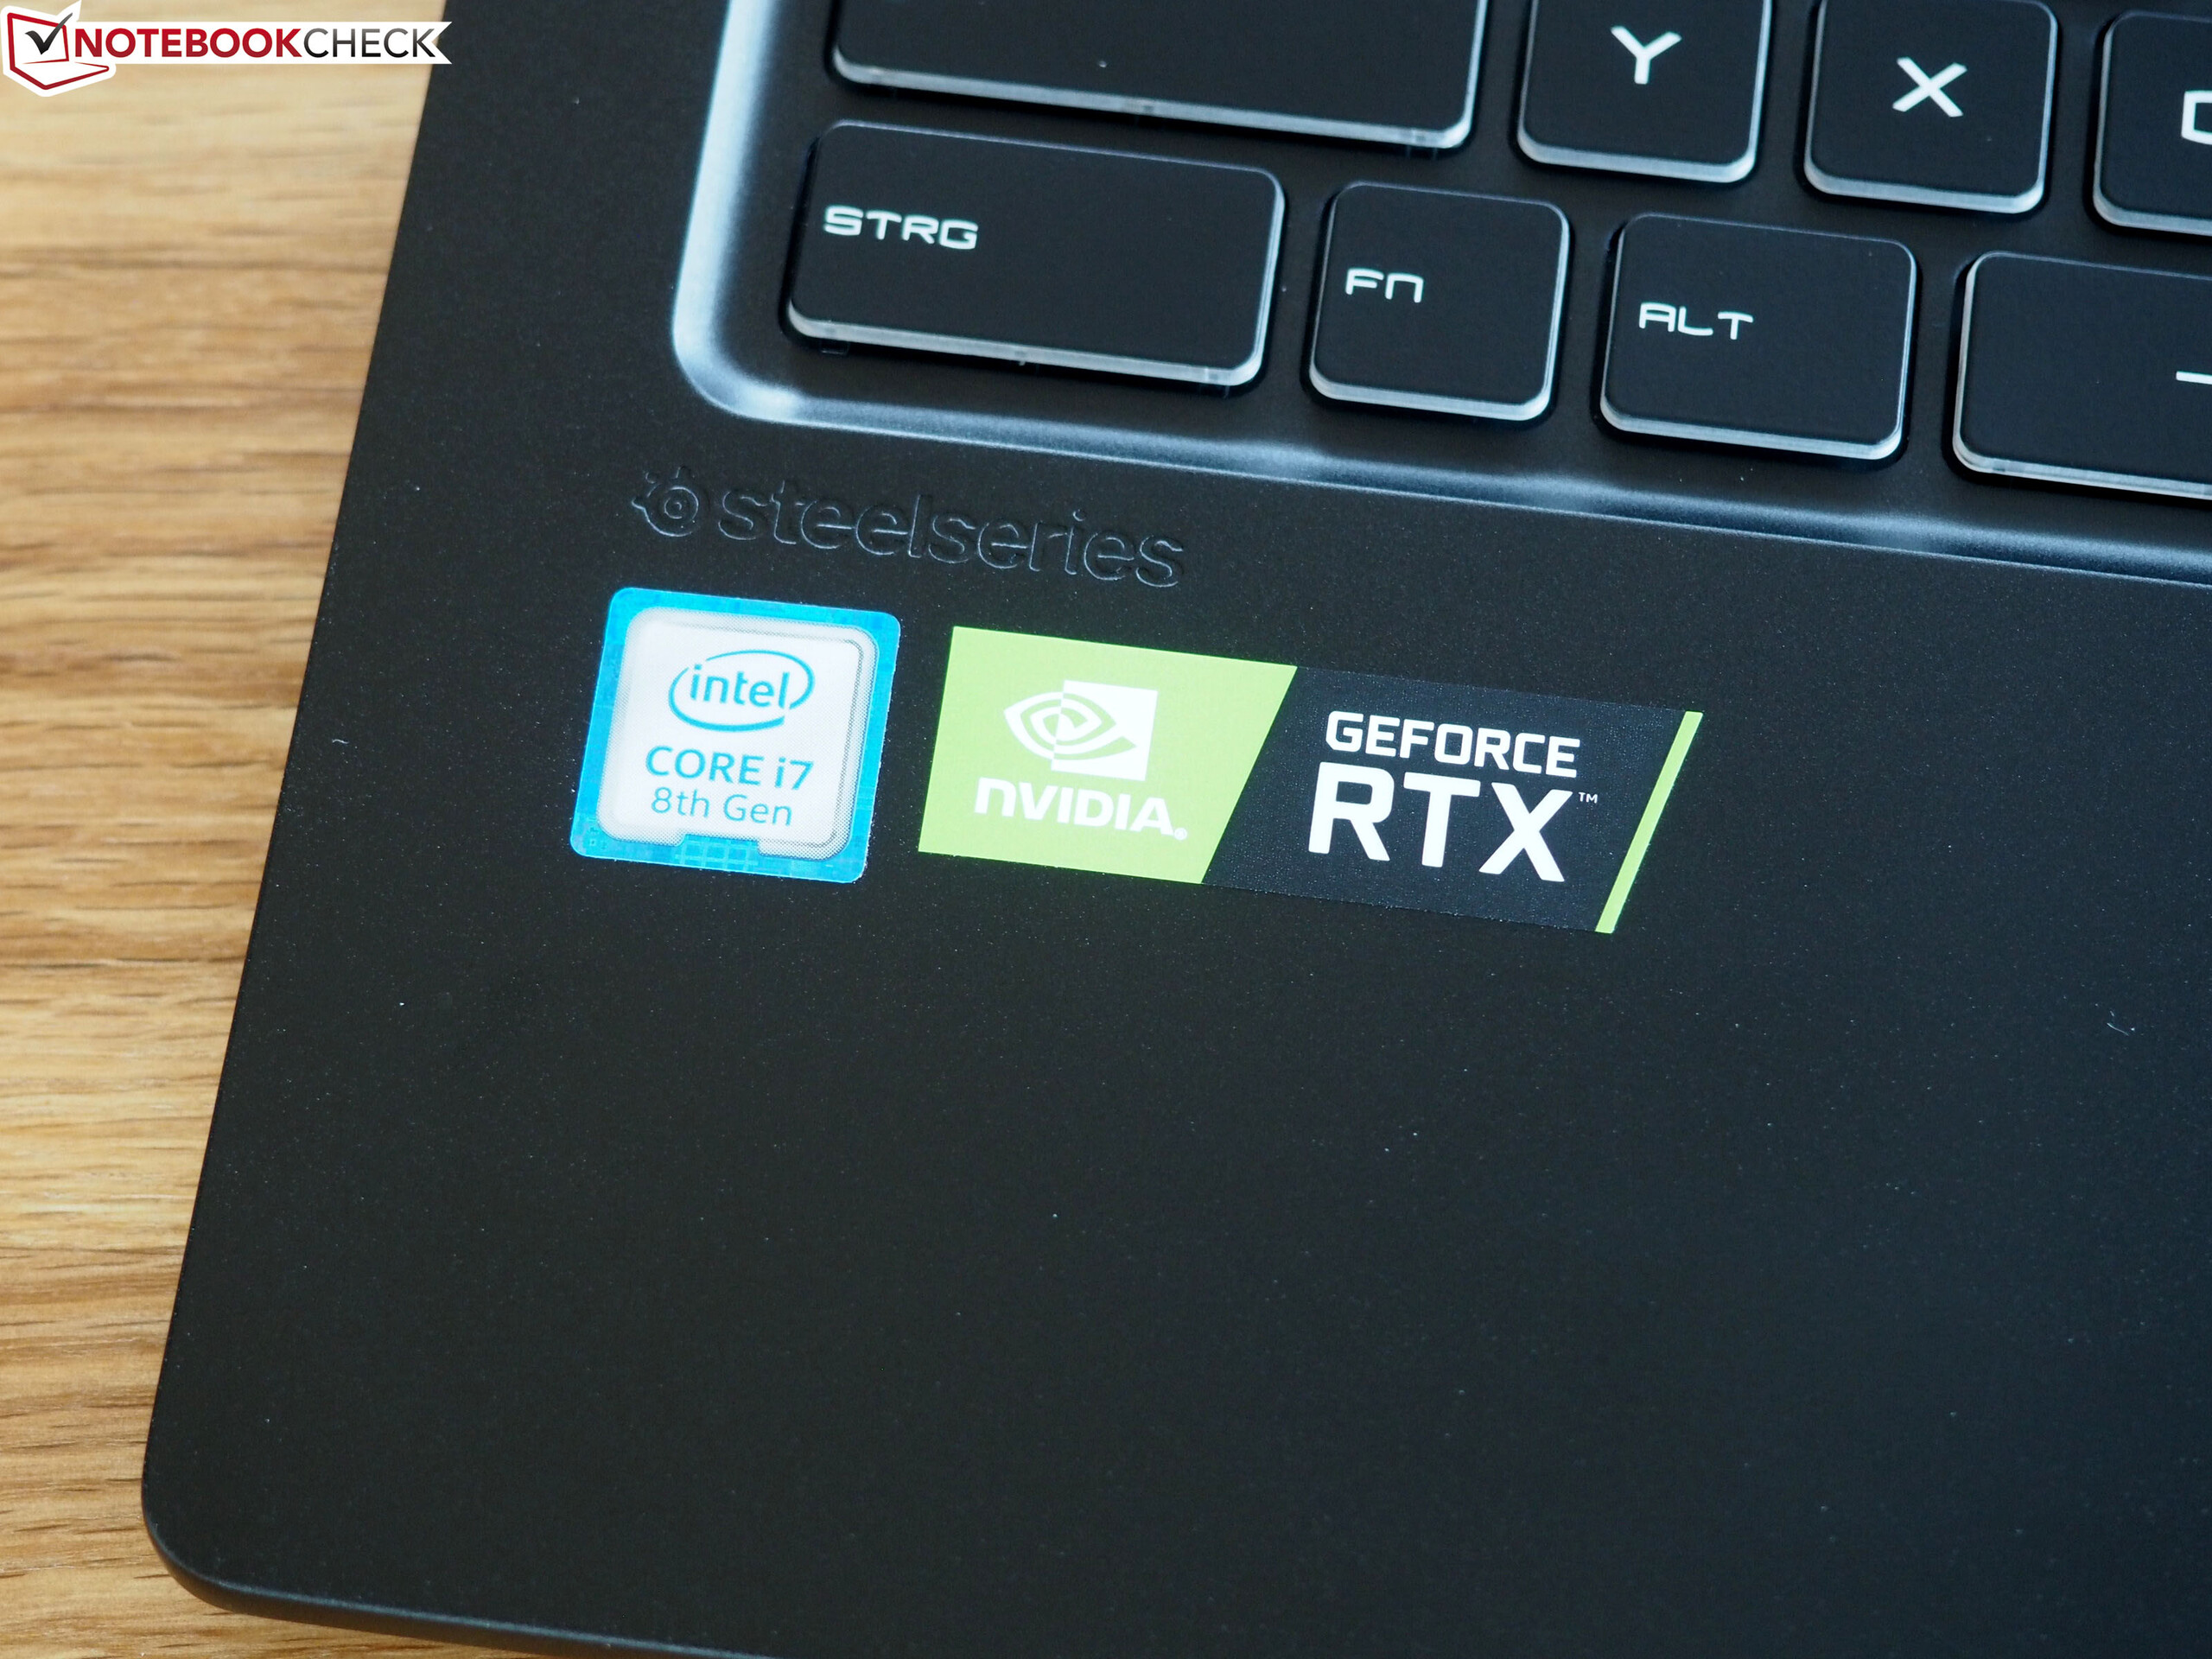
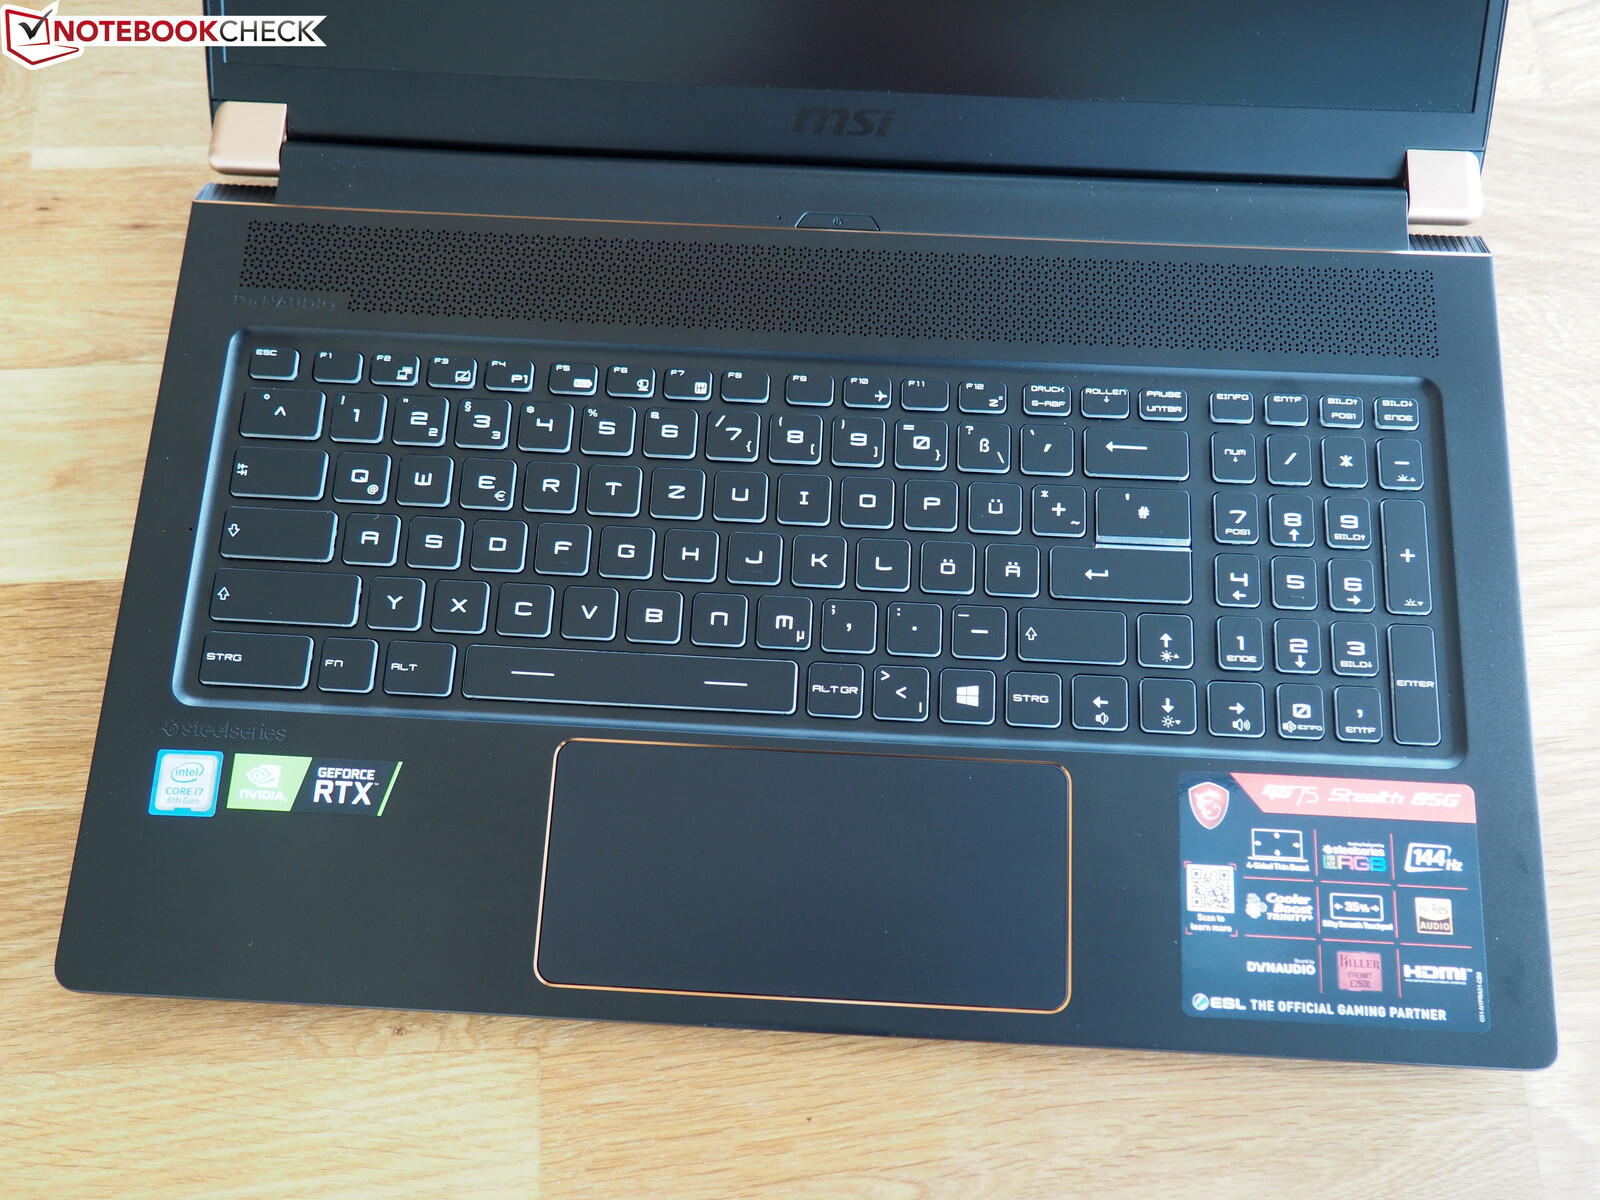
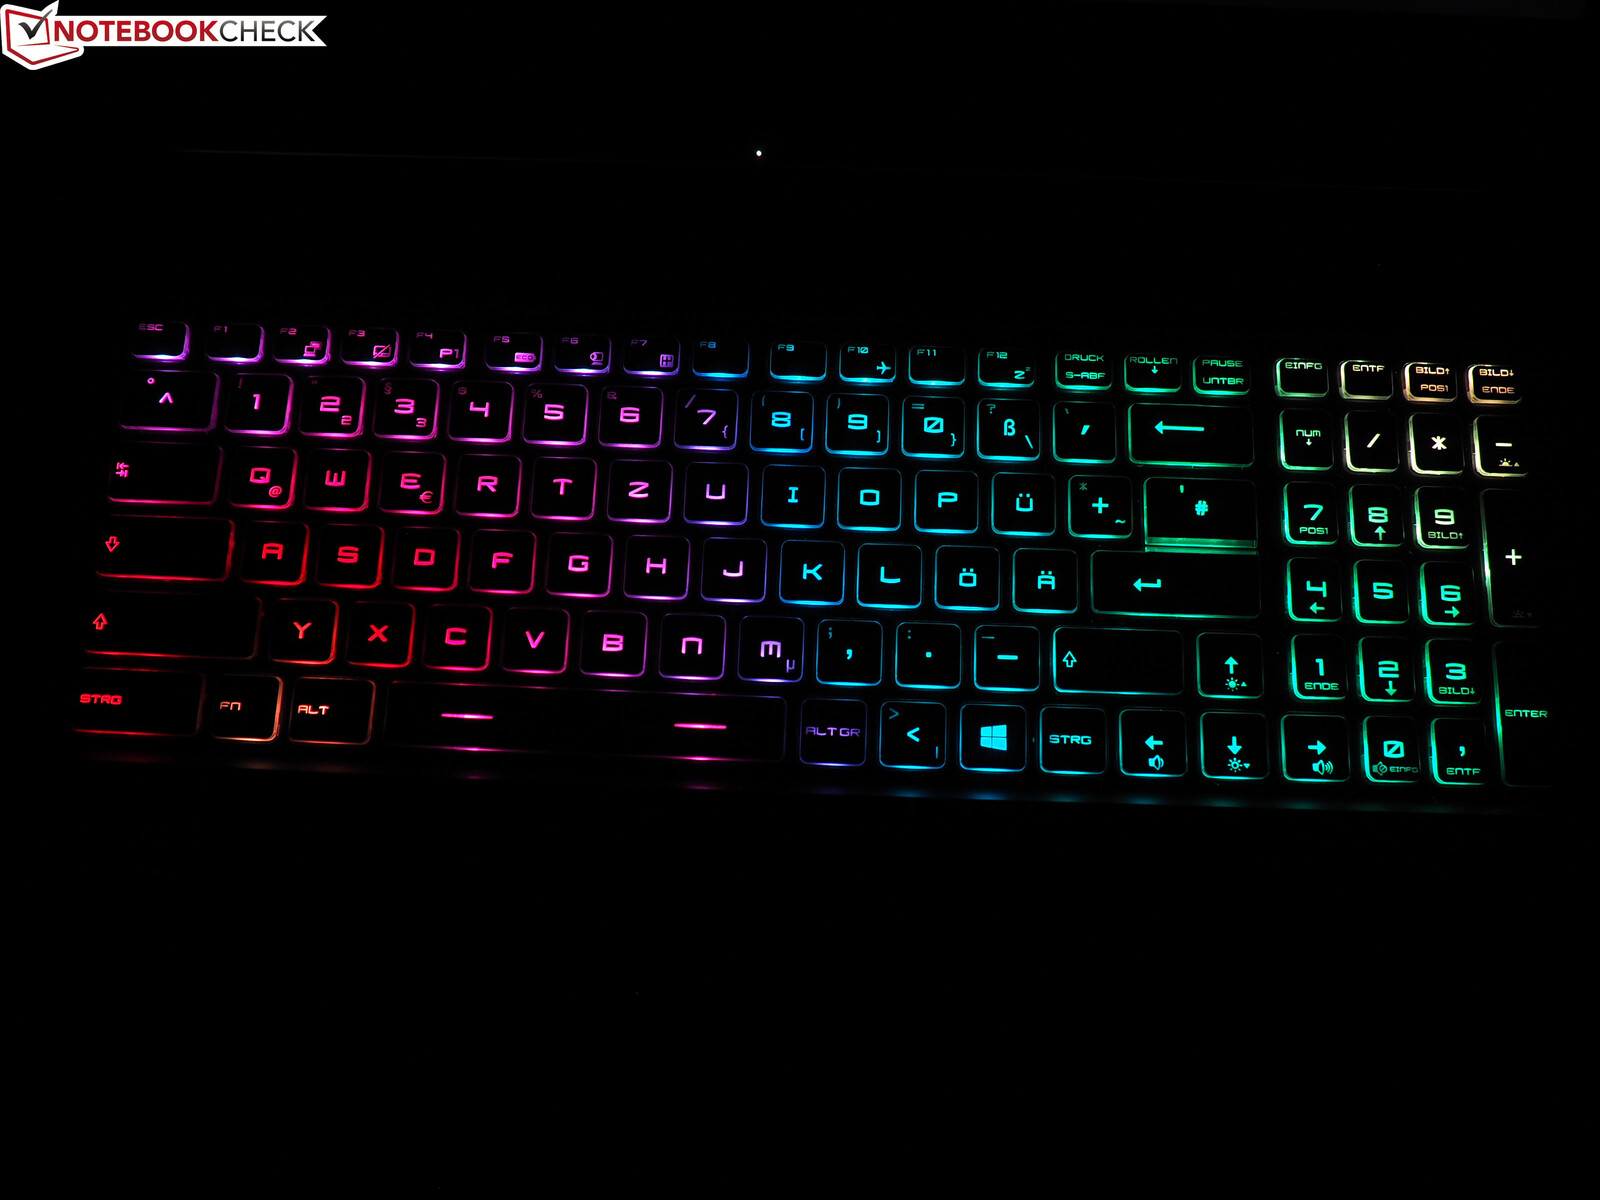
The keyboard may be instantly recognizable for many readers. No wonder, MSI has been using the tried-and-tested SteelSeries chiclet keyboard for years, which features per-key RGB backlighting and also a quite good typing feel.
However, some buyers will have to get used to the arrangement. As usual, MSI used a pretty particular layout, which differs significantly from the (German) standard in favor of better gaming control. Moreover, we would've preferred the keyboard to be placed further above. The palm rest is a bit narrow for our taste. Nevertheless, the keyboard received an overall score of "good".
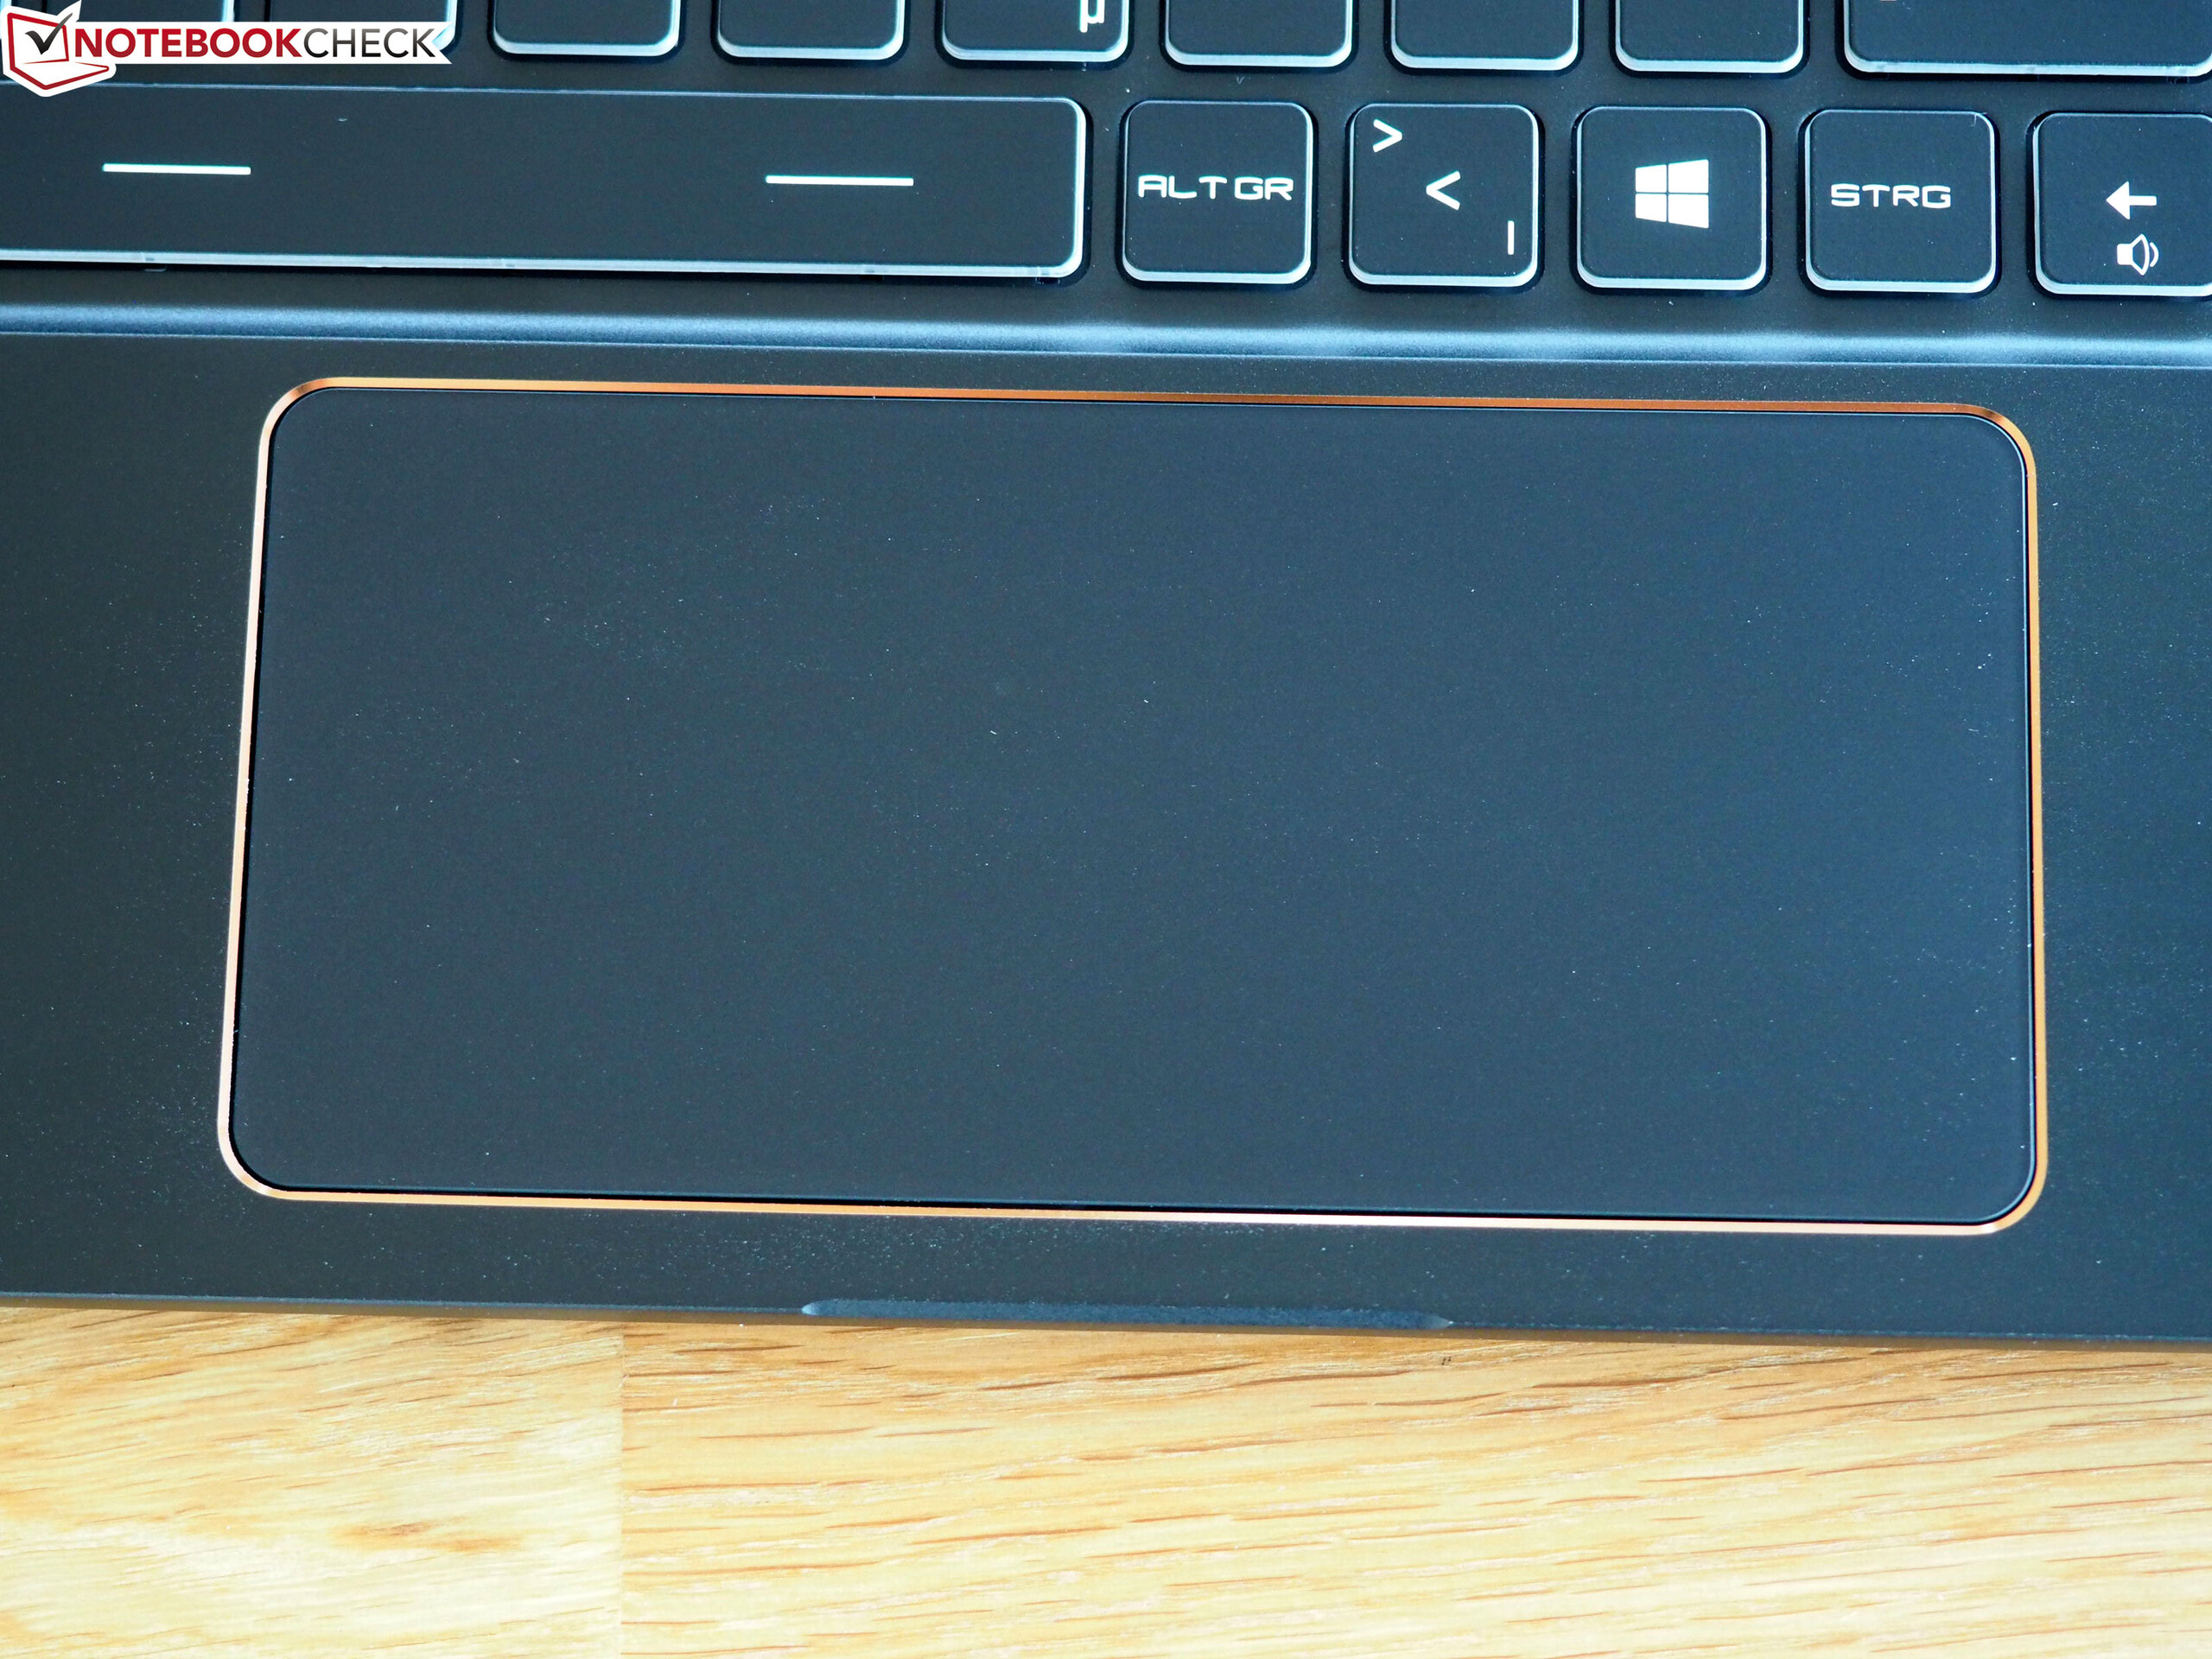
Touchpad
Regarding the touchpad, the manufacturer used an extremely wide ClickPad. 14 cm is by laptop standards an enormous amount, even in the 17-inch range. On the other hand, the height of only 6.5 cm is quite limited, which was hardly an issue for us in practice. The most annoying aspect turned out to be stability. The click areas on the left and right corners have an extremely deep travel. Unlike on the (rather quiet) keyboard, inputs are quite loud or rather rattly.
In terms of precision, there's barely anything to complain about. The multitouch gestures (zooming, scrolling, etc.) work mostly flawlessly and are easily recognized. Also nice: Thanks to the smooth surface, fingers glide fluently over the touchpad.
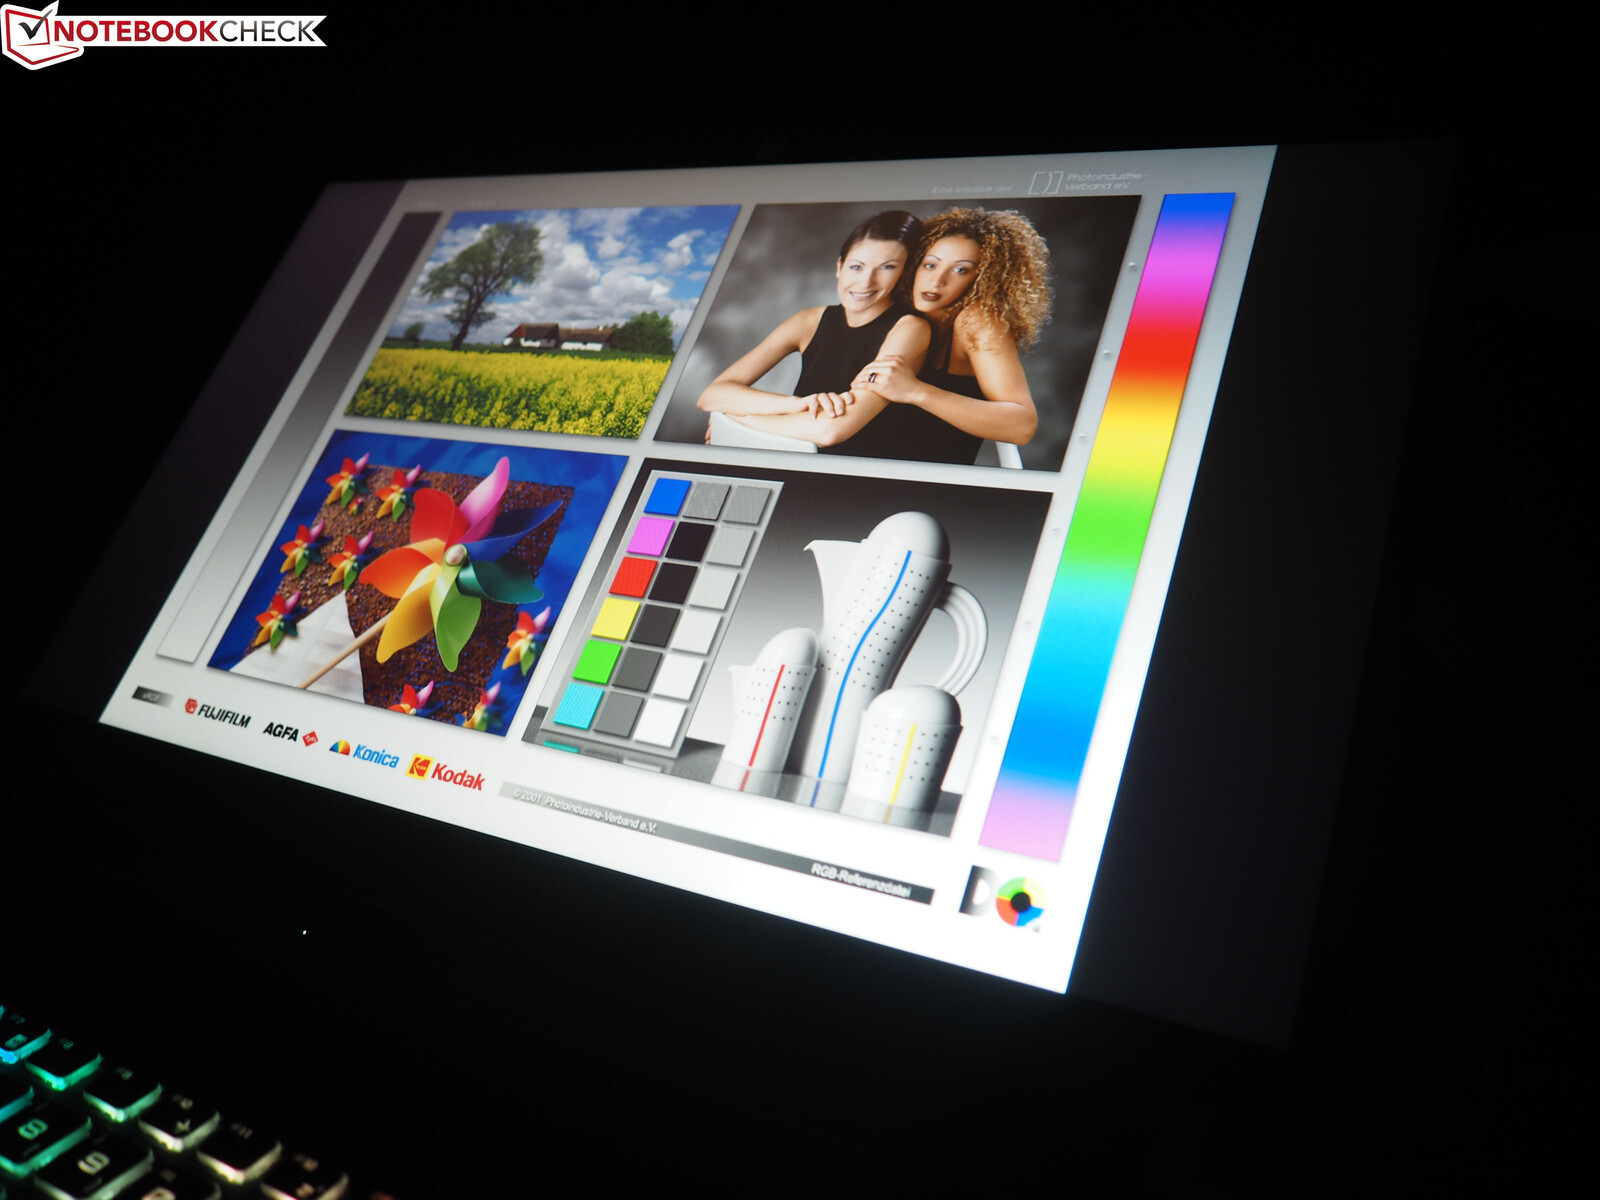
Display
Except for the missing G-Sync support, the display meets almost every standard a gamer could want for in a high-end gaming laptop in 2019. Be it the reaction time (below 10 ms) or the frequency. 144 Hz not only guarantees a buttery-smooth Windows operation, but it also affects gaming positively - at least when enough graphical power is available.
| |||||||||||||||||||||||||
Brightness Distribution: 85 %
Center on Battery: 355 cd/m²
Contrast: 1365:1 (Black: 0.26 cd/m²)
ΔE ColorChecker Calman: 1.54 | ∀{0.5-29.43 Ø4.73}
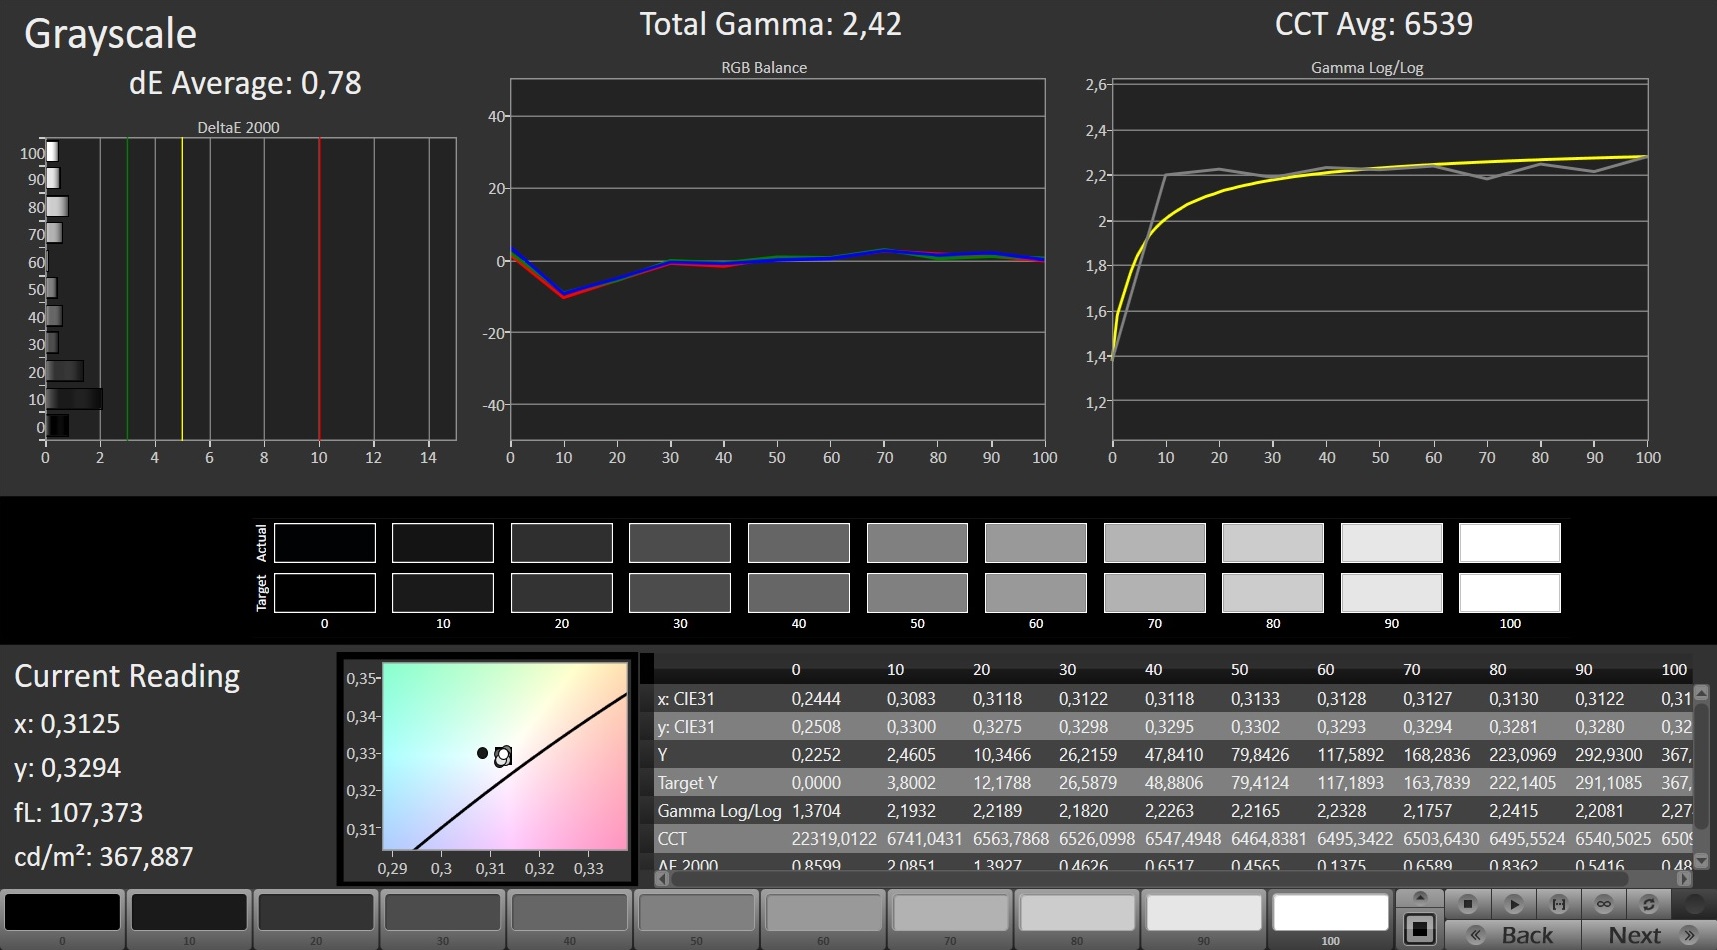
calibrated: 0.77
ΔE Greyscale Calman: 2.19 | ∀{0.09-98 Ø4.97}
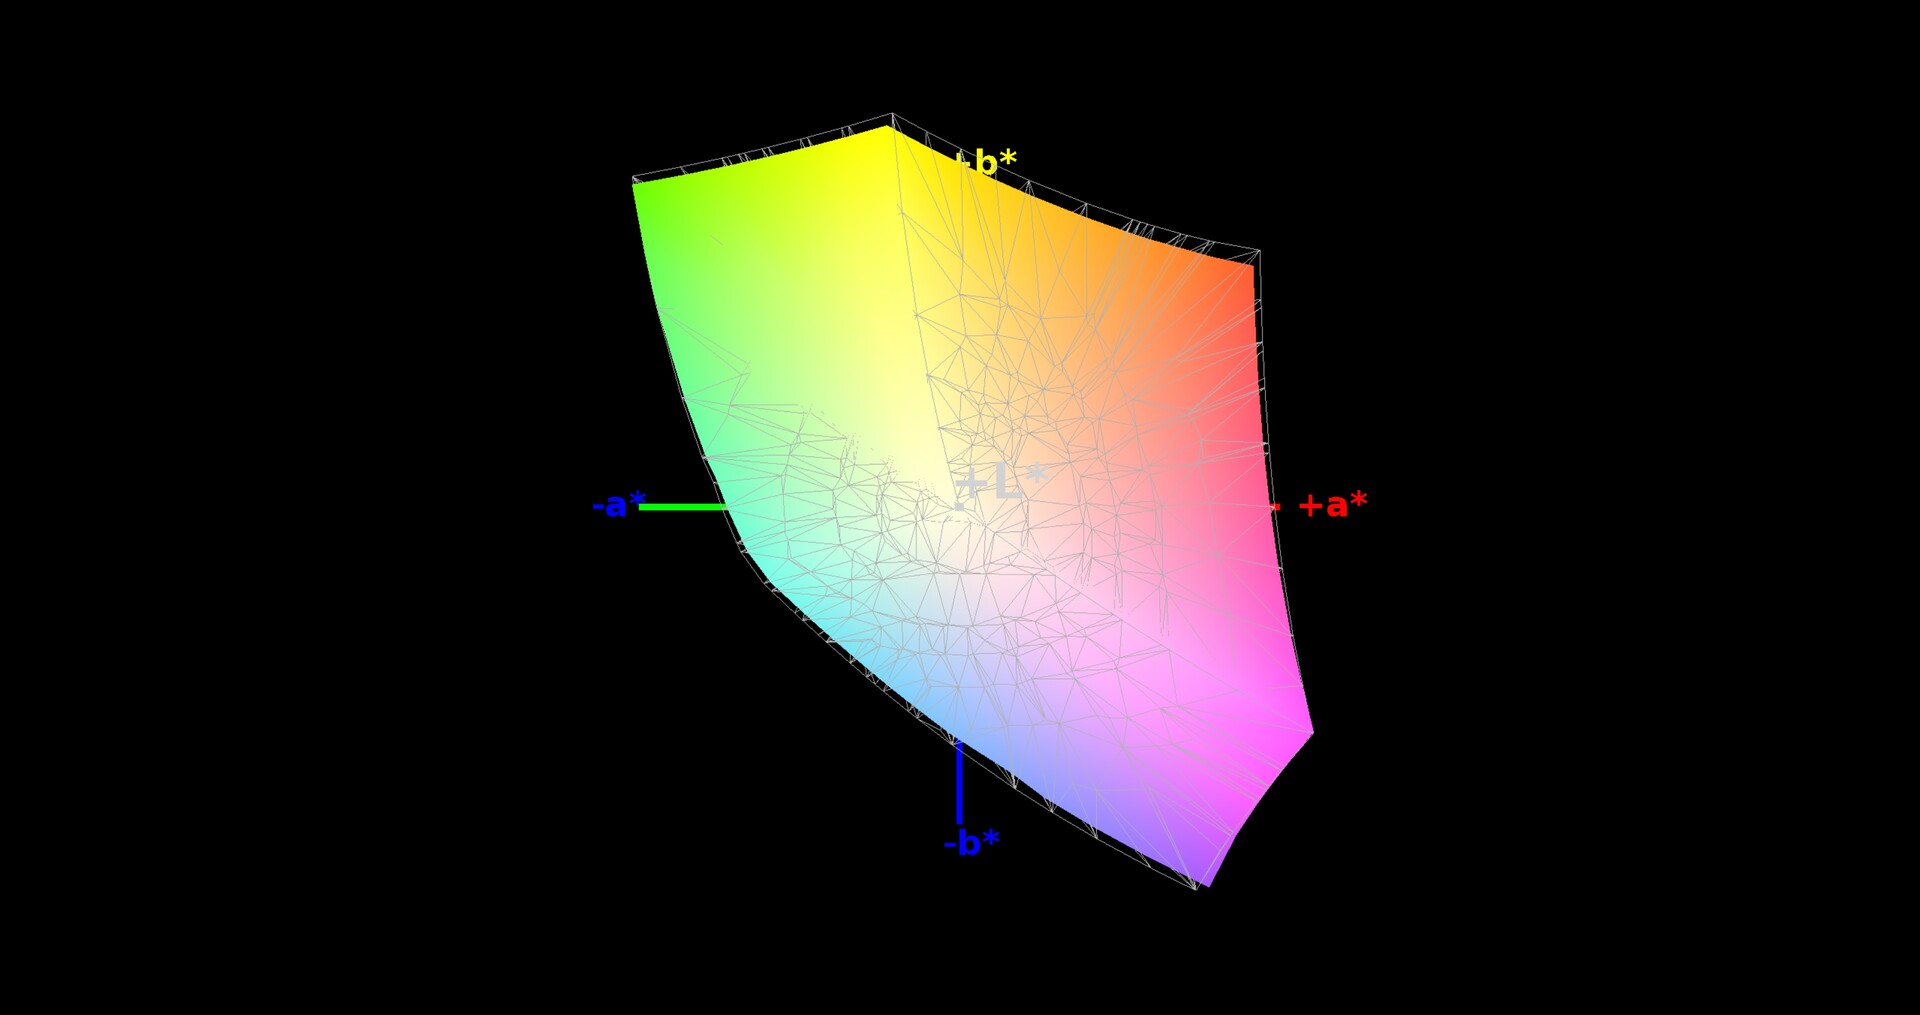
95% sRGB (Argyll 1.6.3 3D)
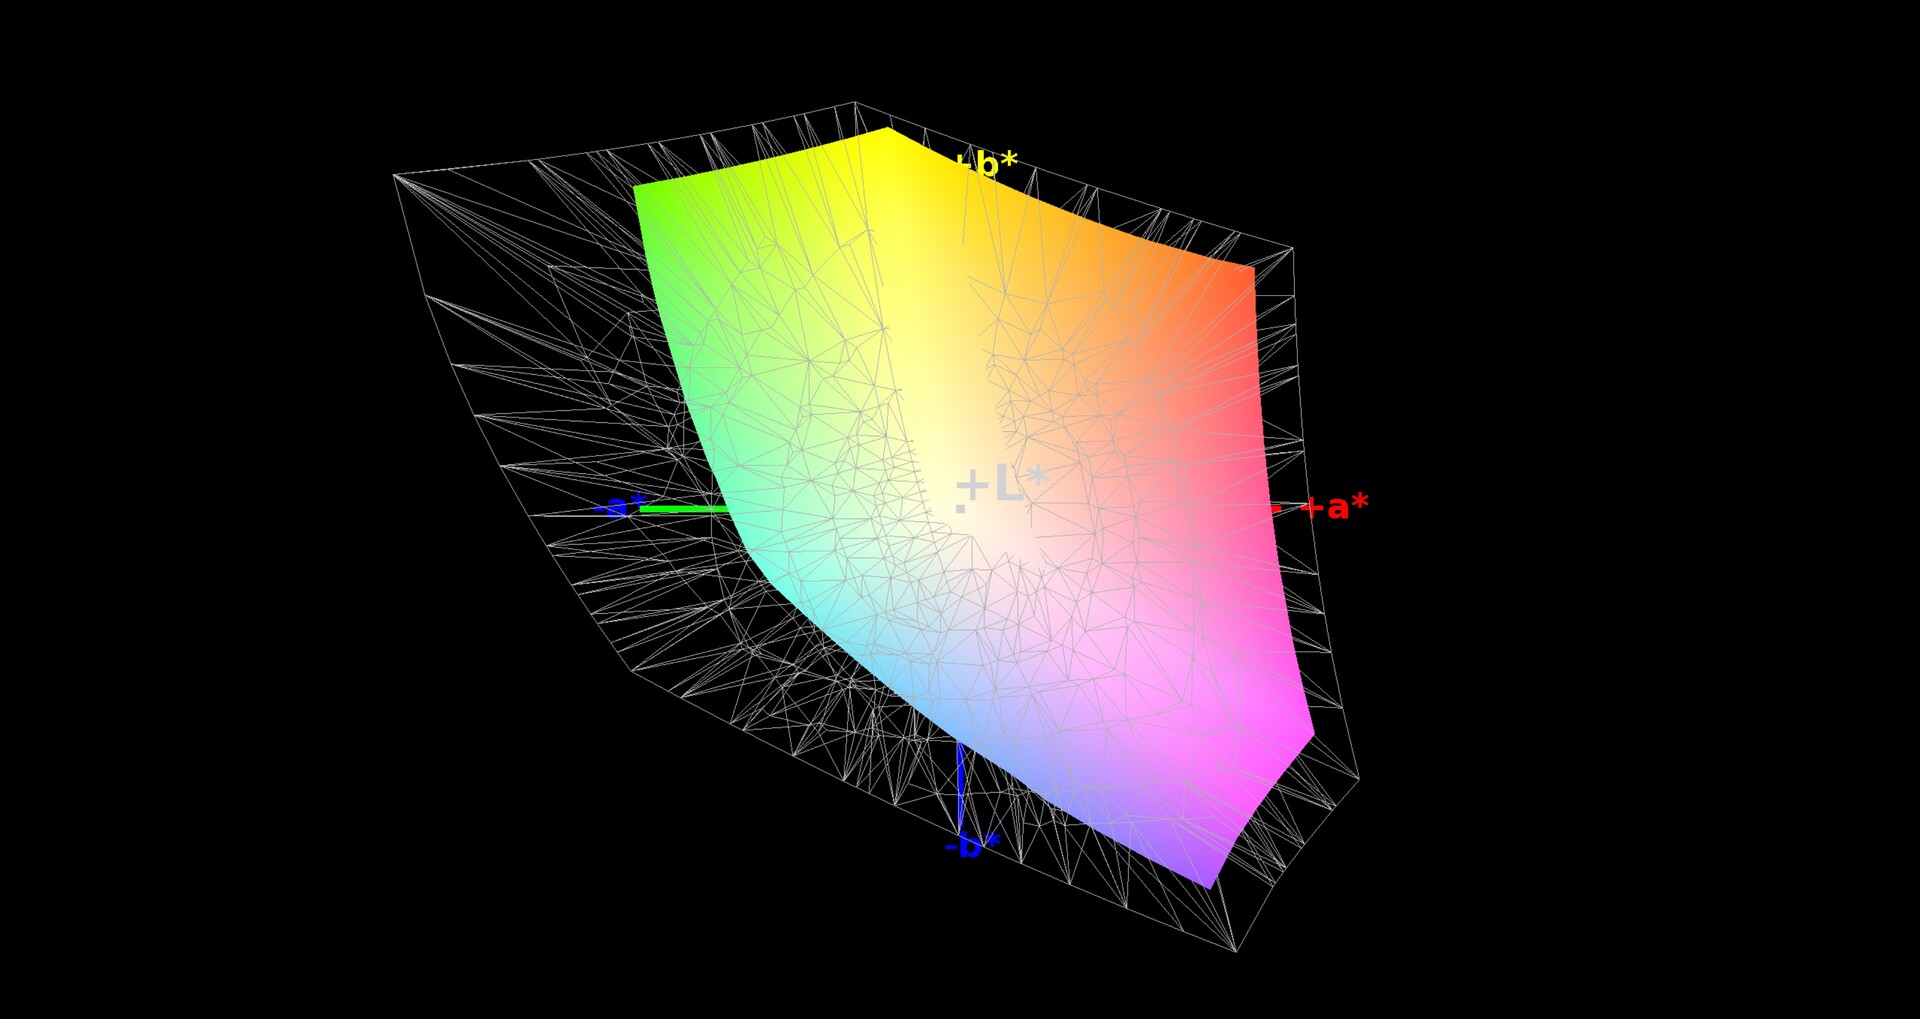
61% AdobeRGB 1998 (Argyll 1.6.3 3D)
65.5% AdobeRGB 1998 (Argyll 3D)
95.4% sRGB (Argyll 3D)
63.6% Display P3 (Argyll 3D)
Gamma: 2.42
CCT: 6893 K
| MSI GS75 8SG Stealth N173HCE-G33 (CMN175C), IPS, 1920x1080 | Asus Zephyrus S GX701GX B173HAN04.0 (AUO409D), IPS, 1920x1080 | Lenovo Legion Y740-17ICH AU Optronics B173HAN03.2, IPS, 1920x1080 | Schenker XMG Neo 17 BOEhydis NV173FHM-N44 (BOE07B6), IPS, 1920x1080 | MSI GE75 8SF Chi Mei N173HCE-G33, IPS, 1920x1080 | |
|---|---|---|---|---|---|
| Display | -4% | -2% | 1% | -1% | |
| Display P3 Coverage (%) | 63.6 | 62.9 -1% | 64 1% | 65.2 3% | 63.1 -1% |
| sRGB Coverage (%) | 95.4 | 87.8 -8% | 90.4 -5% | 92.2 -3% | 94.4 -1% |
| AdobeRGB 1998 Coverage (%) | 65.5 | 63.9 -2% | 64.8 -1% | 66.5 2% | 65.2 0% |
| Response Times | 3% | -69% | -86% | -17% | |
| Response Time Grey 50% / Grey 80% * (ms) | 7.6 ? | 7.2 ? 5% | 15.6 ? -105% | 18.8 ? -147% | 9.6 ? -26% |
| Response Time Black / White * (ms) | 9.6 ? | 9.6 ? -0% | 12.8 ? -33% | 12 ? -25% | 10.4 ? -8% |
| PWM Frequency (Hz) | 25510 ? | 971 ? | 25770 ? | ||
| Screen | -29% | -99% | -31% | -1% | |
| Brightness middle (cd/m²) | 355 | 288 -19% | 299.1 -16% | 304 -14% | 370.4 4% |
| Brightness (cd/m²) | 327 | 287 -12% | 273 -17% | 289 -12% | 348 6% |
| Brightness Distribution (%) | 85 | 91 7% | 81 -5% | 90 6% | 89 5% |
| Black Level * (cd/m²) | 0.26 | 0.2 23% | 0.27 -4% | 0.26 -0% | 0.29 -12% |
| Contrast (:1) | 1365 | 1440 5% | 1108 -19% | 1169 -14% | 1277 -6% |
| Colorchecker dE 2000 * | 1.54 | 2.33 -51% | 5.07 -229% | 2.65 -72% | 1.26 18% |
| Colorchecker dE 2000 max. * | 3 | 5.34 -78% | 10.55 -252% | 6.11 -104% | 3.02 -1% |
| Colorchecker dE 2000 calibrated * | 0.77 | 2.47 -221% | 3.31 -330% | 1.5 -95% | 1.21 -57% |
| Greyscale dE 2000 * | 2.19 | 1.19 46% | 6.8 -211% | 2.75 -26% | 1.4 36% |
| Gamma | 2.42 91% | 2.41 91% | 2.46 89% | 2.46 89% | 2.2 100% |
| CCT | 6893 94% | 6710 97% | 7805 83% | 6763 96% | 6747 96% |
| Color Space (Percent of AdobeRGB 1998) (%) | 61 | 57 -7% | 58.5 -4% | 60 -2% | 59.7 -2% |
| Color Space (Percent of sRGB) (%) | 95 | 88 -7% | 89.9 -5% | 92 -3% | 94.4 -1% |
| Total Average (Program / Settings) | -10% /
-20% | -57% /
-77% | -39% /
-32% | -6% /
-3% |
* ... smaller is better
The Full HD panel manages to make a good to very good impression in the remaining disciplines too. MSI opted for a model from Chi Mei, specifically the CMN N173HCE-G33, which is also found in the GE75, for example. Alongside the relatively high luminance (about 327 cd/m²), the ample contrast is also worth mentioning. 1365:1 could only be outperformed by the Asus GX701GX in the test field. The latter sits below the GS75 in terms of brightness, but it offers a somewhat better black level in return.
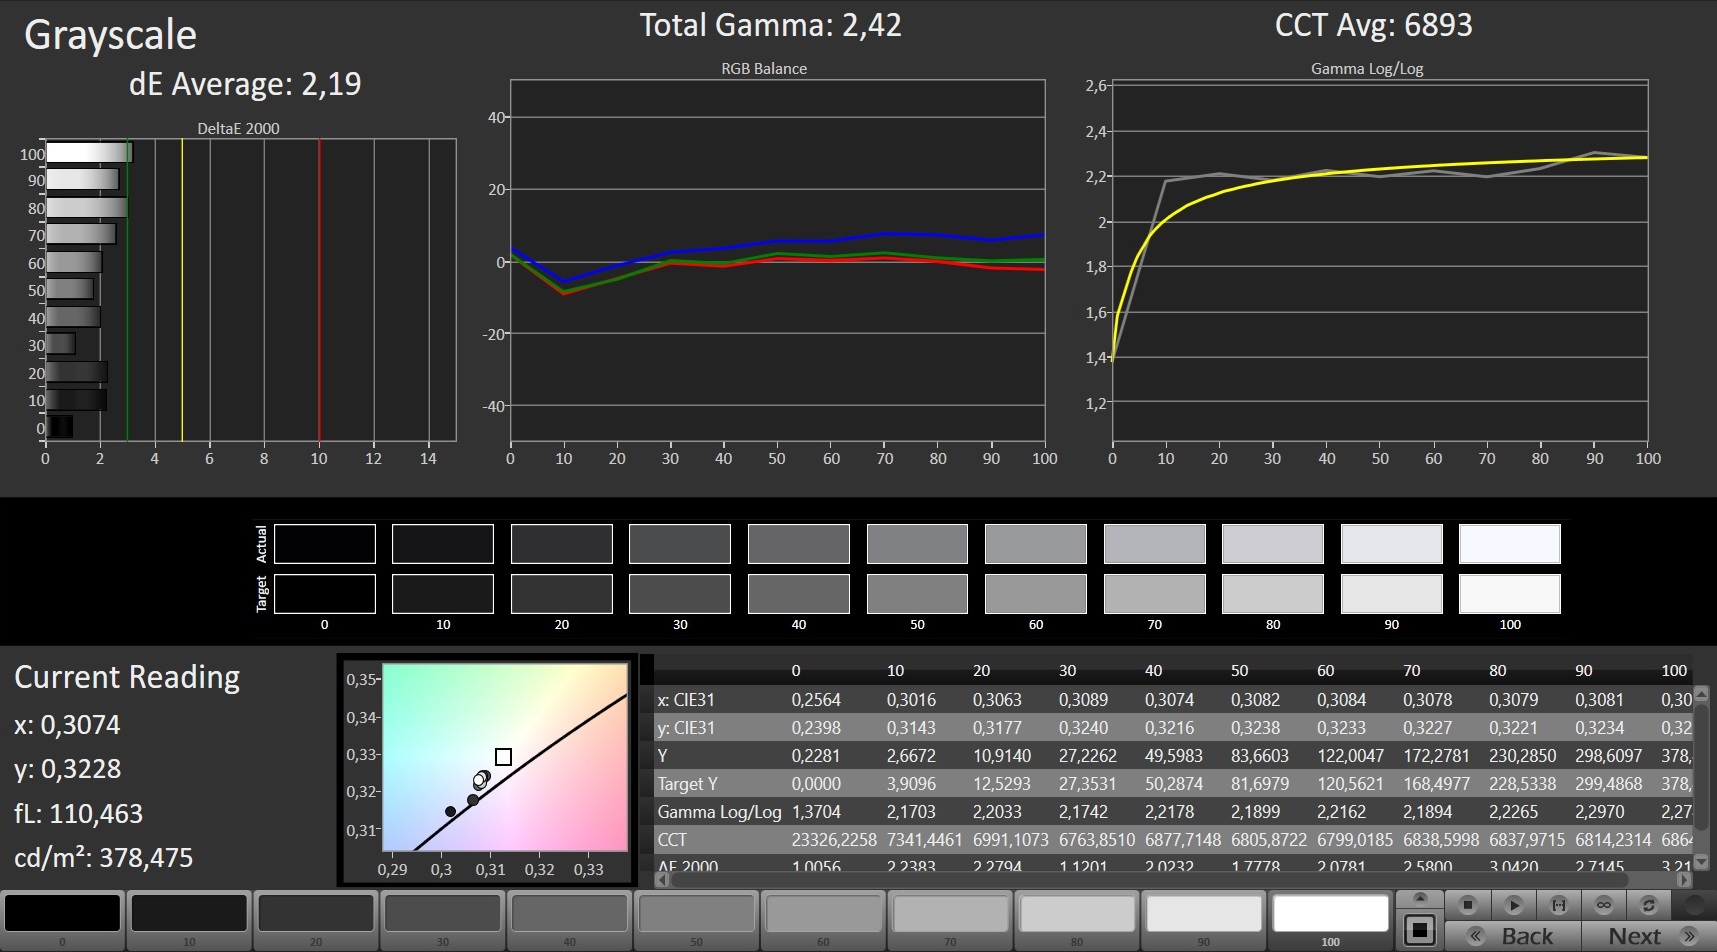
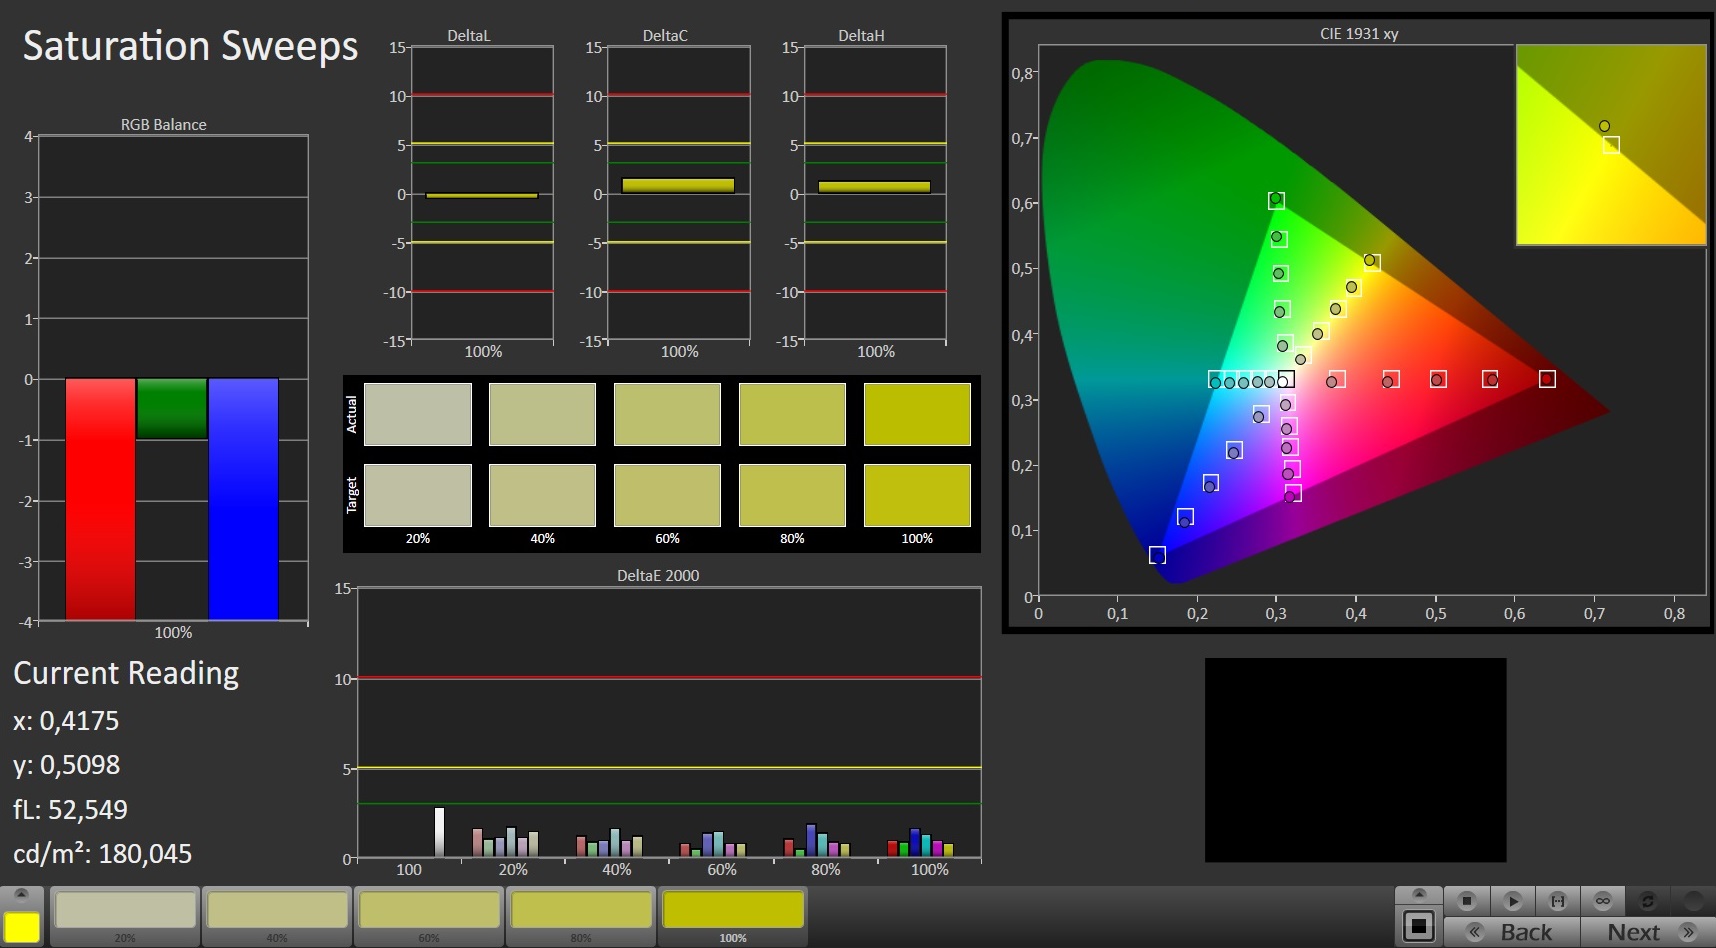
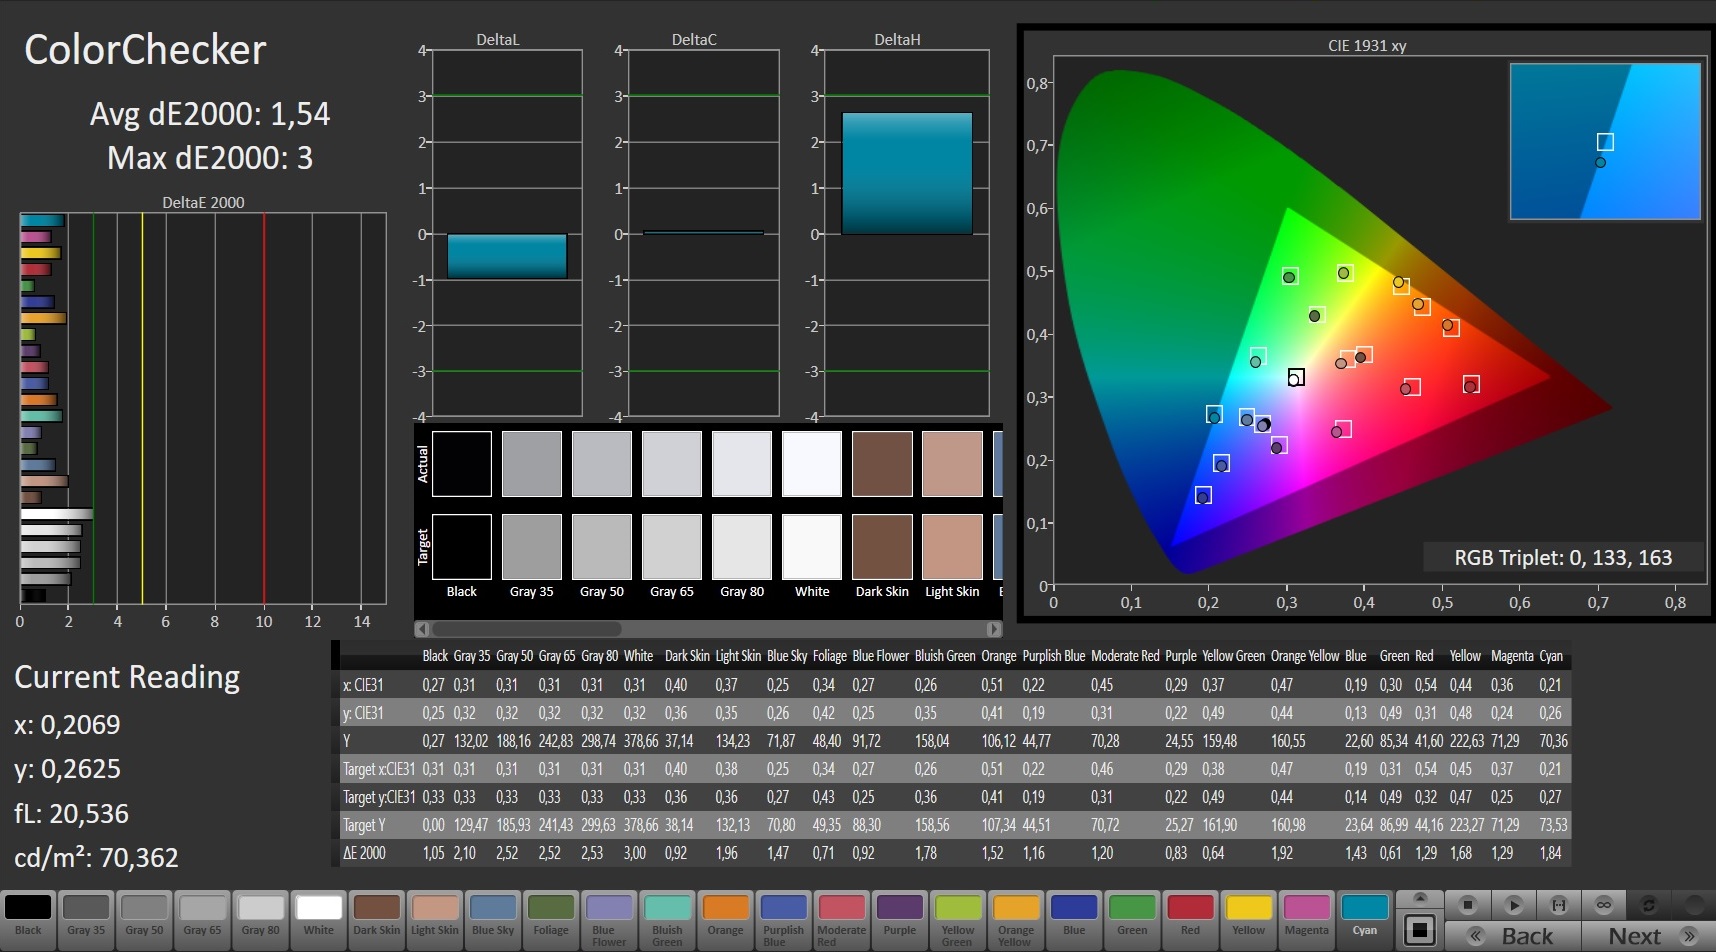

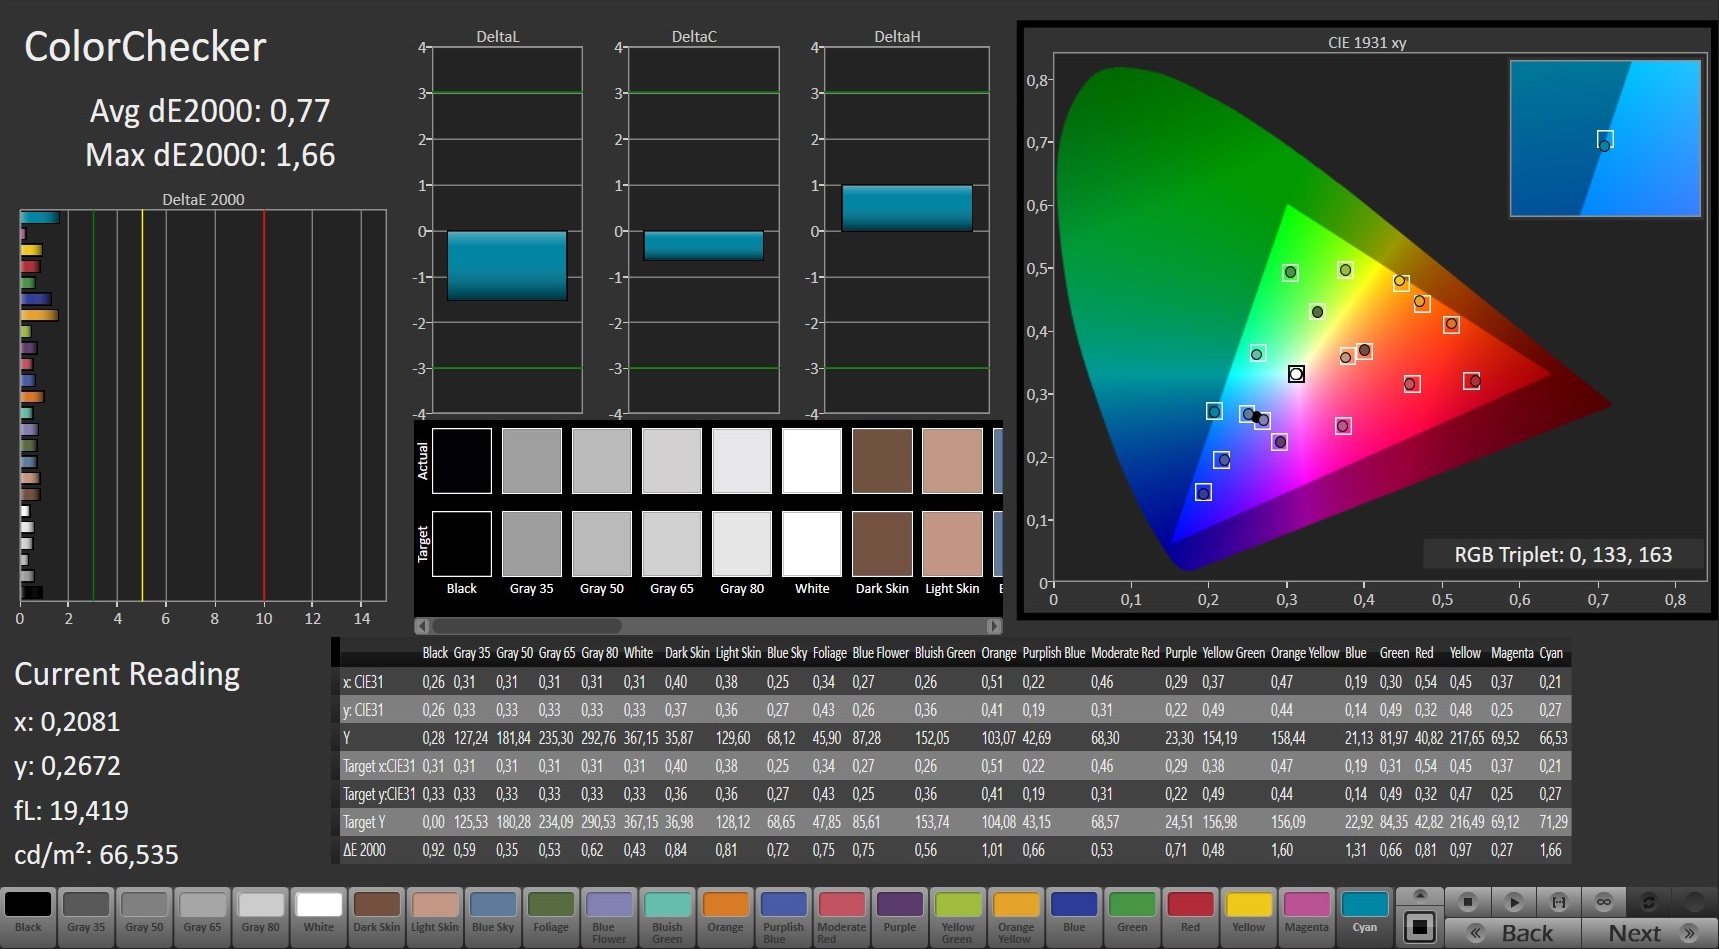
Regarding color-space, MSI comes first again. 95% of sRGB is definitely noticeable on a gaming laptop. Color accuracy is not bad either. The sRGB mode found in True Color ensures a natural-looking image without blue tints or anything of that sort, as is common in many other laptops.
Backlight bleeding is not a big deal on the GS75 either. The flickering we noticed, which occurs up to a brightness of 17%, shouldn't be an issue even to sensitive users due to its high frequency (around 25 KHz).
Display Response Times
| ↔ Response Time Black to White | ||
|---|---|---|
| 9.6 ms ... rise ↗ and fall ↘ combined | ↗ 5.2 ms rise | 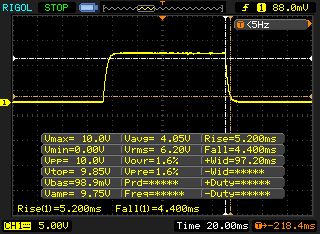 |
| ↘ 4.4 ms fall | ||
| The screen shows fast response rates in our tests and should be suited for gaming. In comparison, all tested devices range from 0.1 (minimum) to 240 (maximum) ms. » 26 % of all devices are better. This means that the measured response time is better than the average of all tested devices (19.9 ms). | ||
| ↔ Response Time 50% Grey to 80% Grey | ||
| 7.6 ms ... rise ↗ and fall ↘ combined | ↗ 3.8 ms rise | 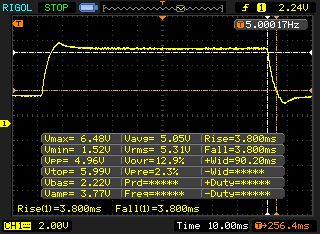 |
| ↘ 3.8 ms fall | ||
| The screen shows very fast response rates in our tests and should be very well suited for fast-paced gaming. In comparison, all tested devices range from 0.165 (minimum) to 636 (maximum) ms. » 20 % of all devices are better. This means that the measured response time is better than the average of all tested devices (31.1 ms). | ||
Screen Flickering / PWM (Pulse-Width Modulation)
| Screen flickering / PWM detected | 25510 Hz | ≤ 17 % brightness setting | 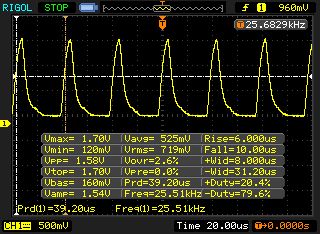 |
The display backlight flickers at 25510 Hz (worst case, e.g., utilizing PWM) Flickering detected at a brightness setting of 17 % and below. There should be no flickering or PWM above this brightness setting. The frequency of 25510 Hz is quite high, so most users sensitive to PWM should not notice any flickering. In comparison: 52 % of all tested devices do not use PWM to dim the display. If PWM was detected, an average of 7798 (minimum: 5 - maximum: 343500) Hz was measured. | |||
Performance
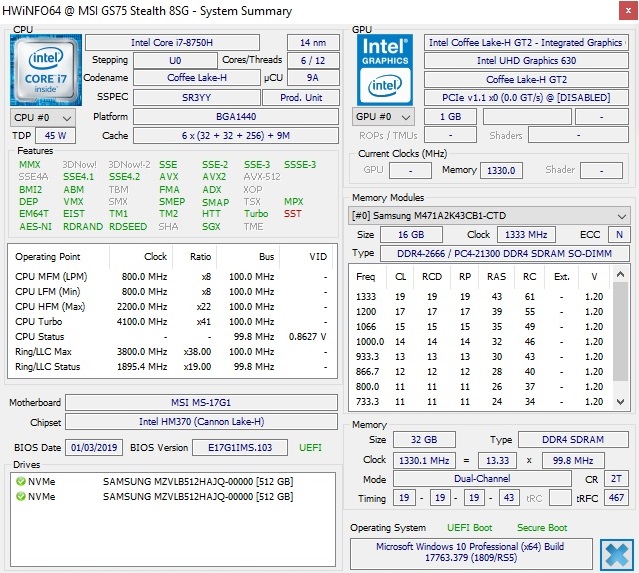
The GS75 promises to be highly future-proof in this configuration equipped with a GeForce RTX 2080 Max-Q, SSD RAID and 32 GB DDR4 RAM. The hexa-core CPU shouldn't reach its limits so quickly in the coming years either.
Processor
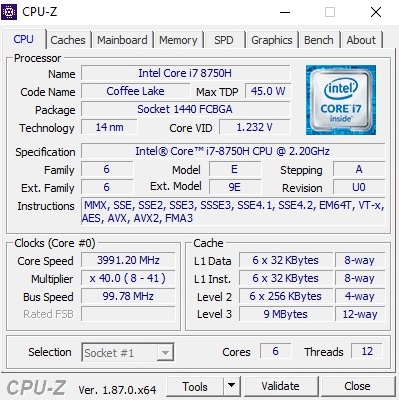
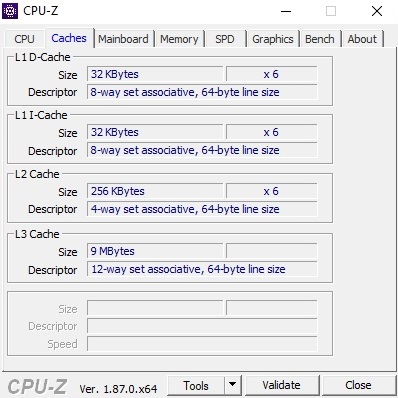
Sure enough, MSI opted for Intel's hexa-core Core i7-8750H processor, which can provide up to 12 threads in parallel through Hyper-Threading. The Coffee Lake model is specified with a TDP of 42 Watts and offers 9 MB of L3 cache.
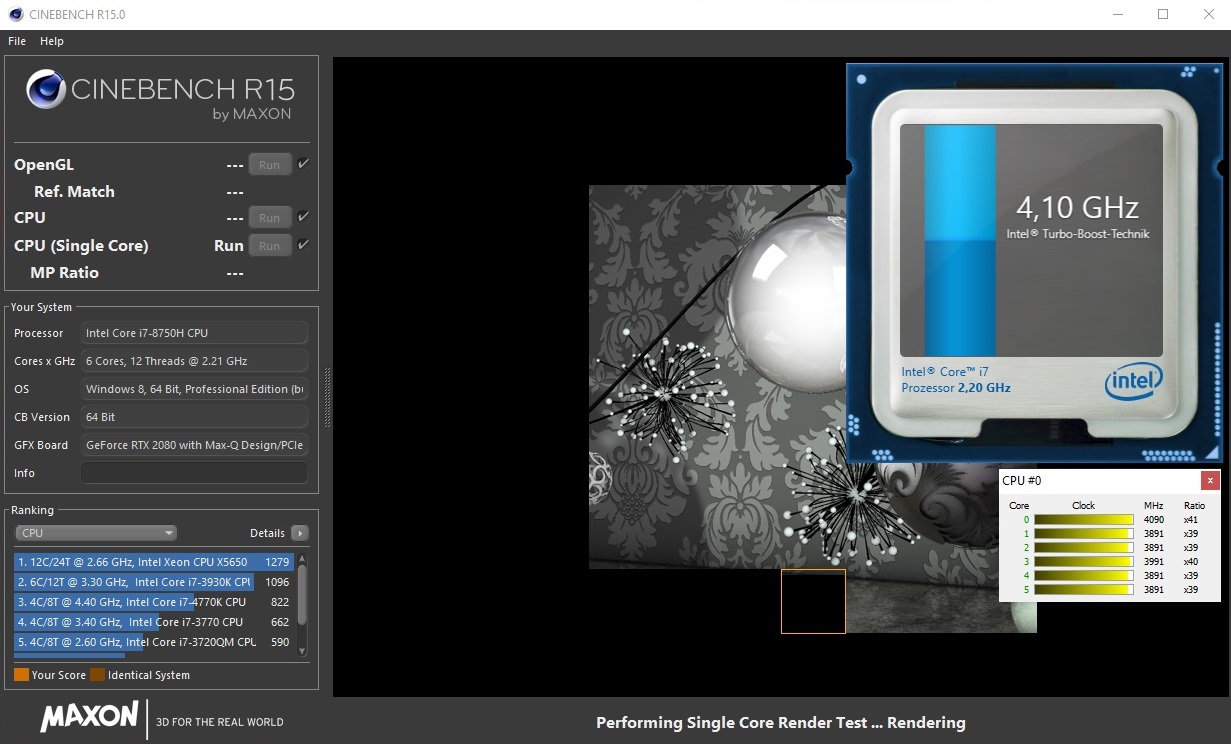
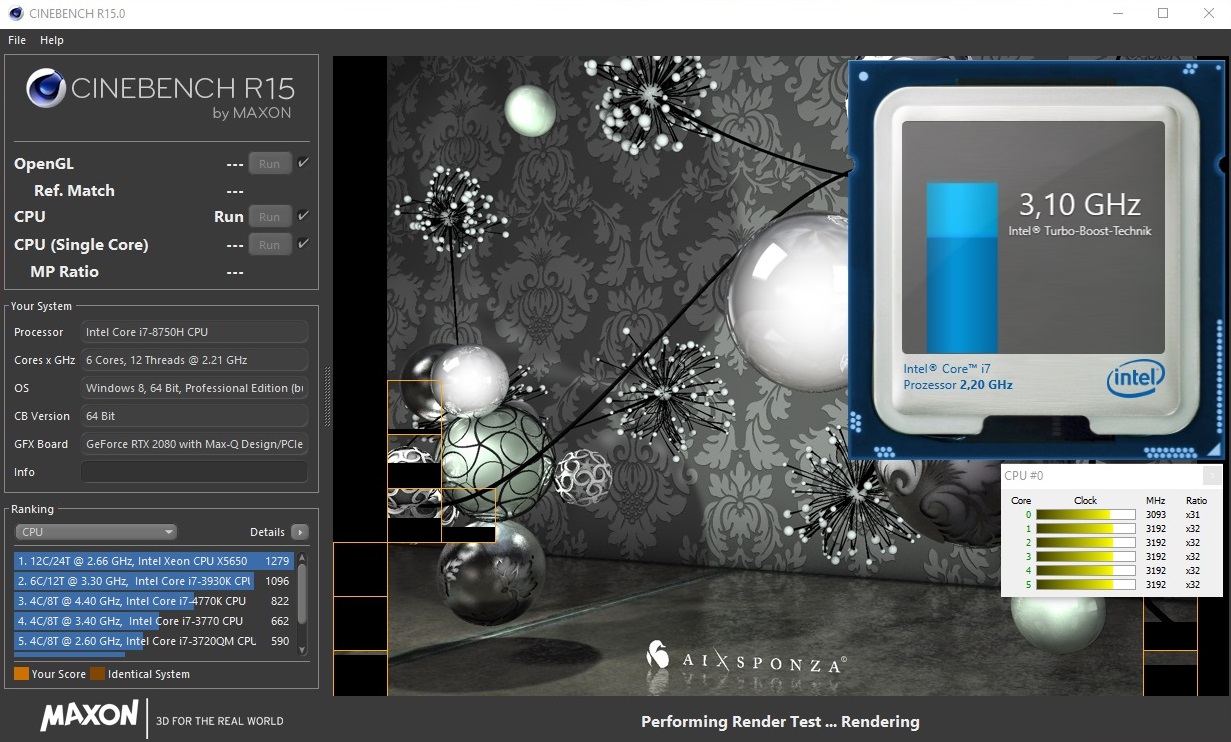
The base clock speed is marked at 2.2 GHz, whereby up to 4.1 GHz is possible through Turbo Boost. However, this value is only applicable to single-core load. When all cores are working, the maximum clock speed possible is 3.9 GHz. The GS75 achieved between 3.1 and 3.9 GHz in Cinebench's Multi-Core test, which is neither bad nor particularly good.
In our Cinebench loop, the 17-incher lagged behind the Asus GX701GX and the Lenovo Legion Y740, which are also equipped with a Core i7-8750H. As with the competitors, the overall score dropped by several percent after the second pass, but then remained at a fairly constant level.
System performance
The built-in SSD duo not only makes for short boot times and load times but also for a generally fast system. This subjective impression was backed up by the system tests. With 5605 points, the GS75 stayed well ahead on PCMark 10 and was only beaten by the Lenovo Y740.
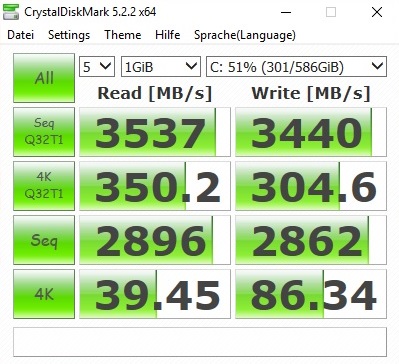
Storage solution
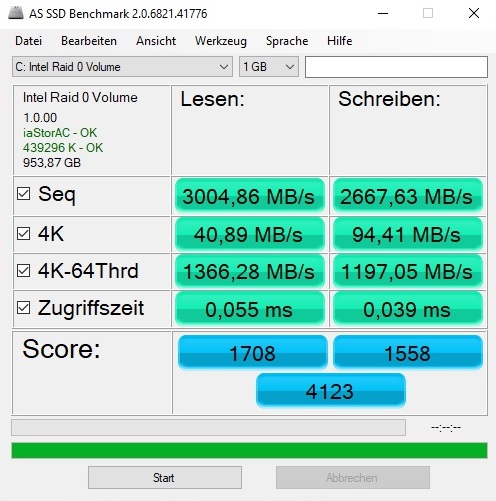
MSI combined in our review device two already quick NVMe SSDs (Samsung PM981) into an extremely fast RAID 0 arrangement, which provides a lot of storage space due to its 1 TB overall capacity. As expected, both SSDs performed excellently in benchmarks. However, the Asus GX701GX proved that a single SSD doesn't necessarily have to work slower, since its 1000 GB drive (also Samsung PM981) was usually on par.
If more storage space is required, a third M.2 slot can be found inside the case, which only supports SATA III instead of PCIe though. The GS75 doesn't have a 2.5-inch bay. MSI preferred to use this space for a larger battery - an understandable decision.
| MSI GS75 8SG Stealth 2x Samsung SSD PM981 MZVLB512HAJQ (RAID 0) | Asus Zephyrus S GX701GX Samsung SSD PM981 MZVLB1T0HALR | Lenovo Legion Y740-17ICH Samsung SSD PM981 MZVLB256HAHQ | Schenker XMG Neo 17 Samsung SSD 970 EVO Plus 1TB | MSI GE75 8SF Kingston RBUSNS8154P3256GJ1 | |
|---|---|---|---|---|---|
| AS SSD | 10% | -29% | 23% | -49% | |
| Seq Read (MB/s) | 3005 | 911 -70% | 1153 -62% | 2359 -21% | 949 -68% |
| Seq Write (MB/s) | 2668 | 2347 -12% | 1328 -50% | 2469 -7% | 823 -69% |
| 4K Read (MB/s) | 40.89 | 53 30% | 35.05 -14% | 53.5 31% | 25.36 -38% |
| 4K Write (MB/s) | 94.4 | 122.5 30% | 96 2% | 117.6 25% | 67.1 -29% |
| 4K-64 Read (MB/s) | 1366 | 1577 15% | 727 -47% | 1579 16% | 748 -45% |
| 4K-64 Write (MB/s) | 1197 | 1734 45% | 1212 1% | 2048 71% | 650 -46% |
| Score Read (Points) | 1708 | 1721 1% | 878 -49% | 1869 9% | 869 -49% |
| Score Write (Points) | 1558 | 2091 34% | 1441 -8% | 2413 55% | 799 -49% |
| Score Total (Points) | 4123 | 4771 16% | 2784 -32% | 5248 27% | 2109 -49% |

Graphics card
Since the GS75 supports Optimus for graphics switching, the computer can dynamically switch between the processor's integrated graphics chip (UHD Graphics 630 in this case) and the dedicated GeForce GPU. In order to save energy, the latter is used only for demanding 3D tasks.
| 3DMark 11 - 1280x720 Performance GPU | |
| Average of class Gaming (21841 - 80022, n=108, last 2 years) | |
| Asus Zephyrus S GX701GX | |
| MSI GS75 8SG Stealth | |
| MSI GE75 8SF | |
| Lenovo Legion Y740-17ICH | |
| Schenker XMG Neo 17 | |
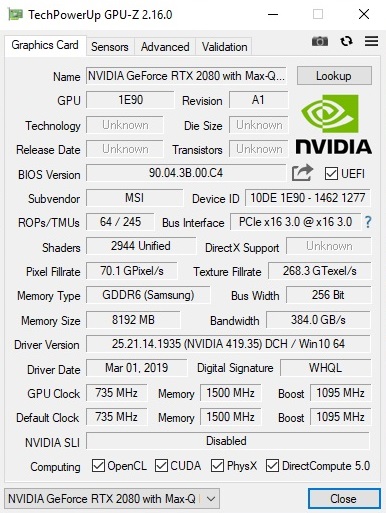
The GeForce RTX 2080 Max-Q found in the top-of-the-line model is currently the second most-powerful laptop GPU after the "normal" RTX 2080, which wasn't designed to be energy-efficient. 2944 shader units and 8 GB GDDR6 VRAM is a good match for current and upcoming games.
It should be pointed out though, that the GS75 is equipped with the 80-Watt version of the RTX 2080 Max-Q instead of the 90 W variant, which can be noted by the clock speeds (base: 735 vs. 990 MHz). This explains why there's a performance difference compared to the Asus GX701GX, which performs around 10% better across all 3D tests. The Lenovo Y740 falls back a few percent despite having an identical TDP.
| 3DMark 11 Performance | 19735 points | |
| 3DMark Fire Strike Score | 15962 points | |
| 3DMark Time Spy Score | 7180 points | |
Help | ||
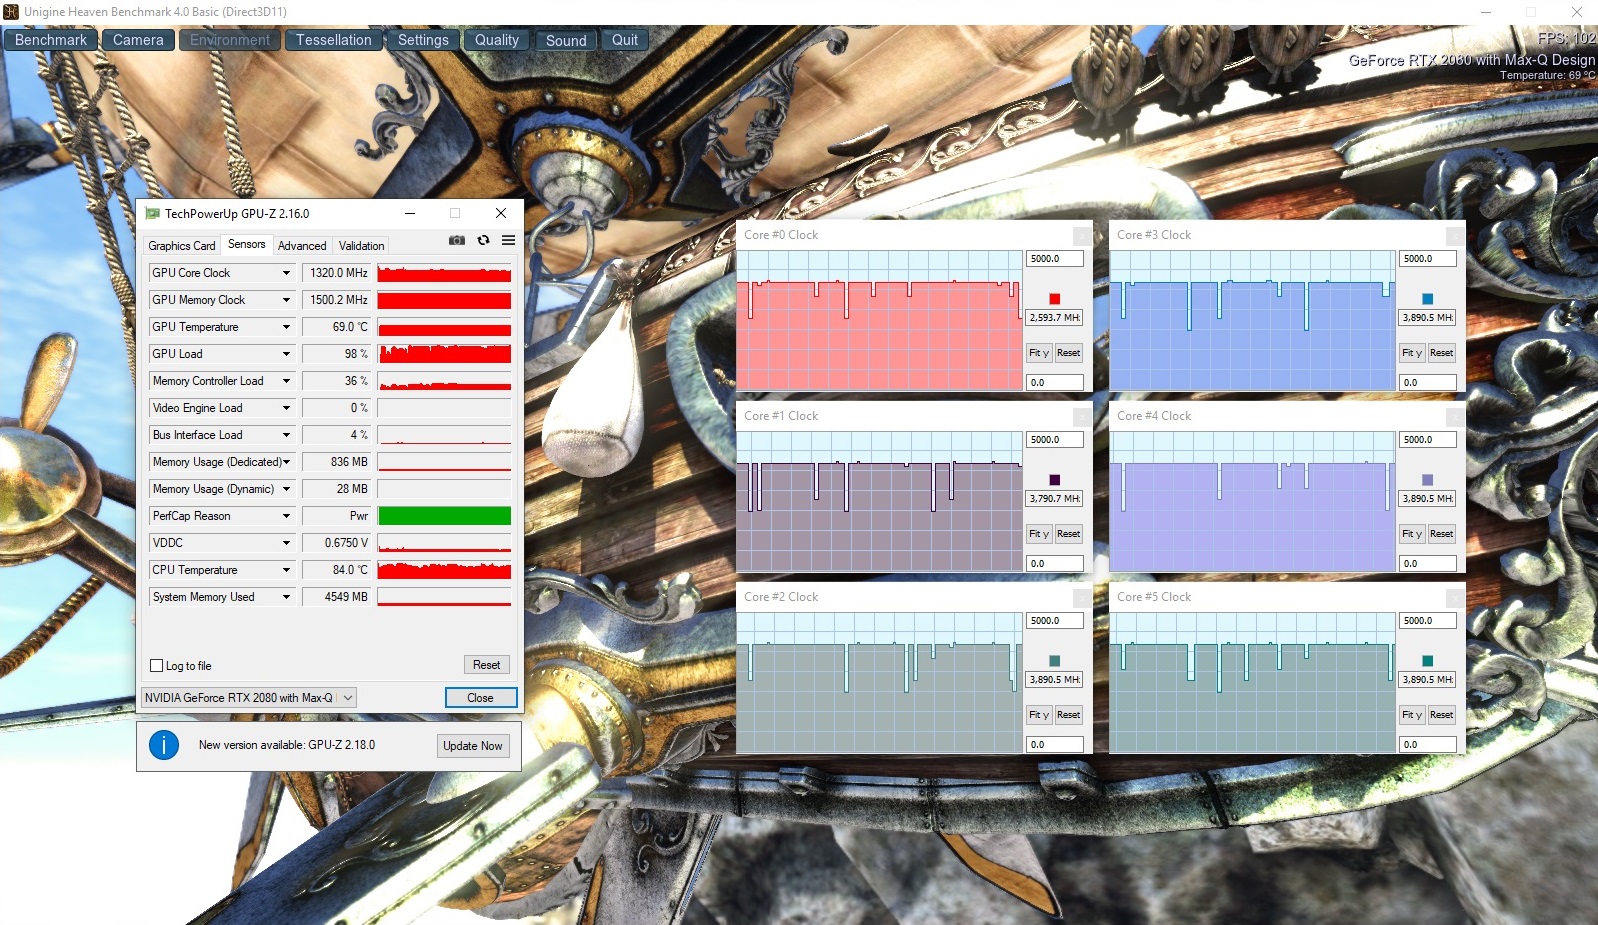
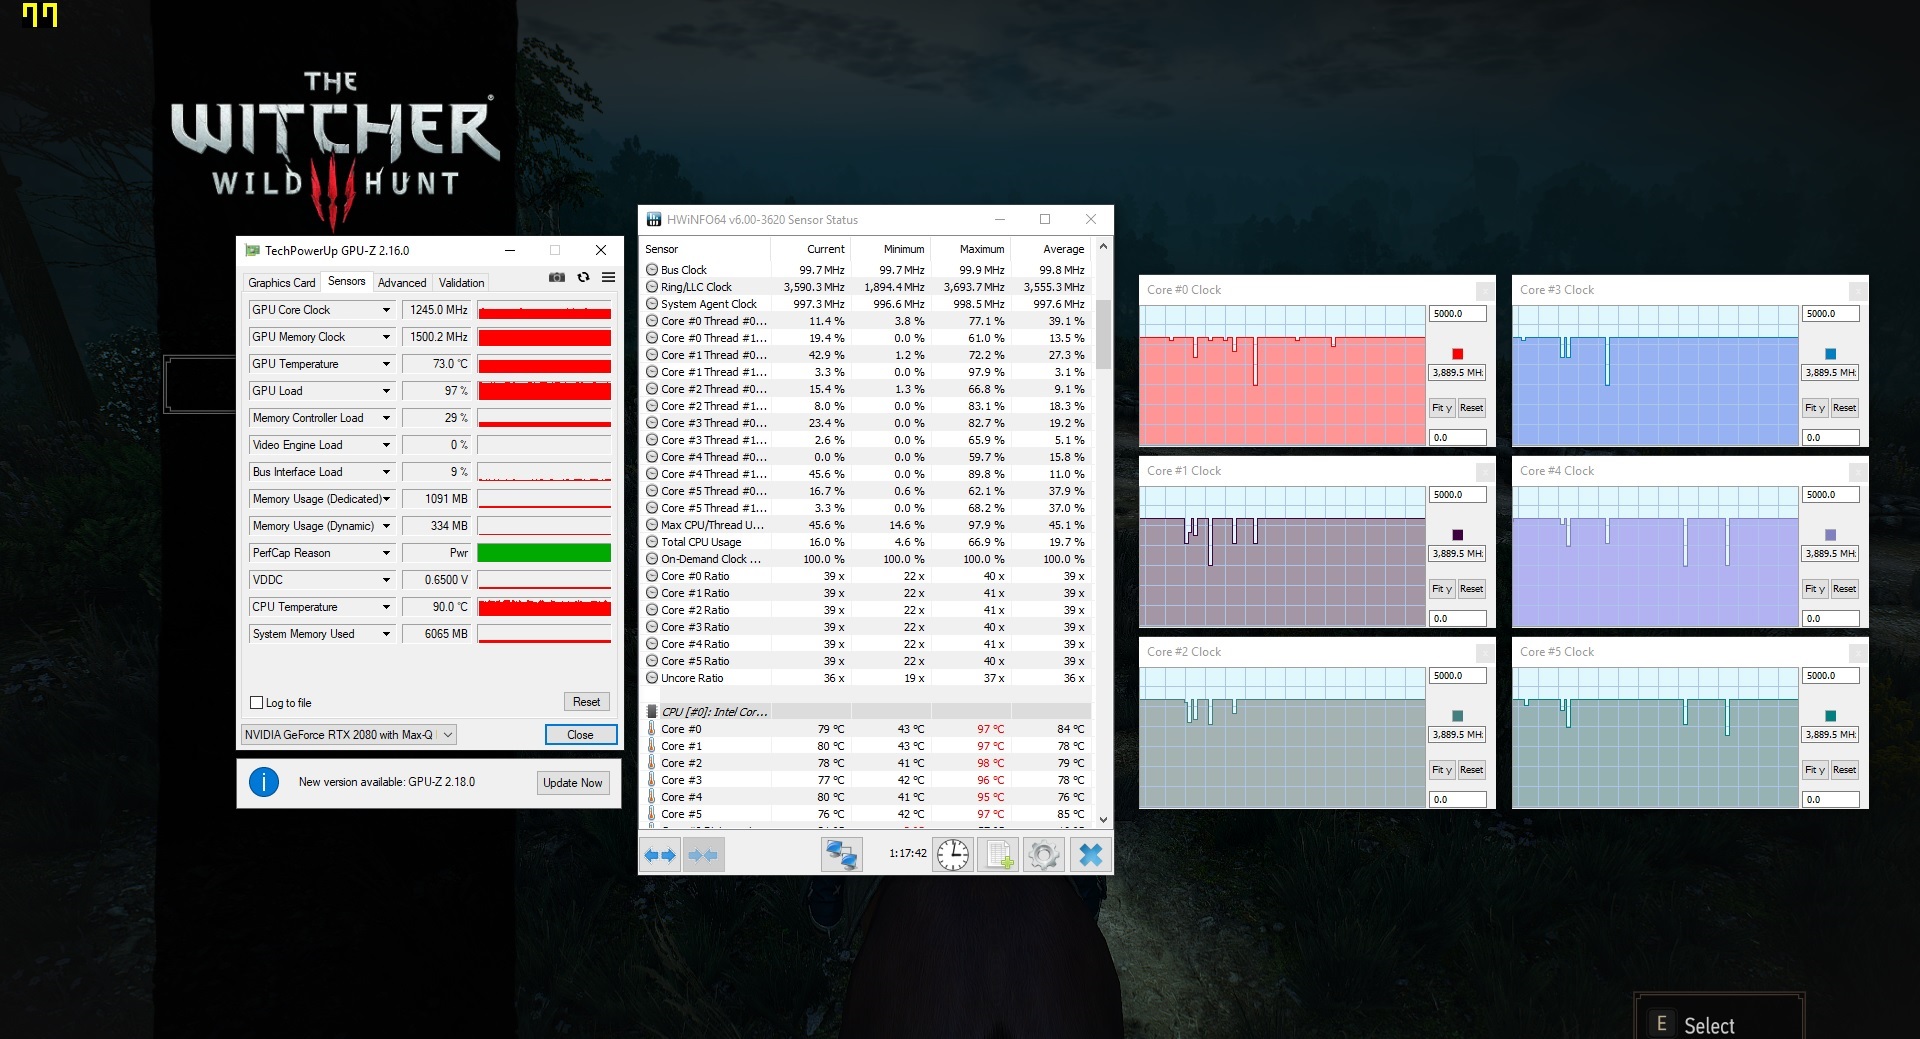
The GS75 didn't lower its guard in our endurance test with The Witcher 3 (Full HD/Ultra). The frame rate remained fairly constant and no bottom outliers were to be seen. According to the GPU-Z tool, the RTX 2080 Max-Q oscillated at around 1245 MHz with a temperature of 73 °C (ca 80 °C @CPU). On the Unigine Heaven 4.0 benchmark, we measured 1320 MHz on average.
Gaming Performance
The GeForce RTX 2080 Max-Q is capable enough to run all modern games smoothly at native resolution (1920x1080) with high to maximum details. Only on processor-intensive titles like Metro Exodus was the 60 FPS mark not always reached. In most cases though, the display's 144 Hz rate can be appreciated adequately.
| The Witcher 3 | |
| 1920x1080 Ultra Graphics & Postprocessing (HBAO+) | |
| Average of class Gaming (95 - 240, n=8, last 2 years) | |
| Asus Zephyrus S GX701GX | |
| MSI GS75 8SG Stealth | |
| Lenovo Legion Y740-17ICH | |
| Schenker XMG Neo 17 | |
| MSI GE75 8SF | |
| 3840x2160 High Graphics & Postprocessing (Nvidia HairWorks Off) | |
| Average of class Gaming (114 - 169.8, n=3, last 2 years) | |
| Asus Zephyrus S GX701GX | |
| MSI GS75 8SG Stealth | |
| Schenker XMG Neo 17 | |
QHD monitors with 2560x1440 pixels wouldn't pose much of a challenge for the RTX 2080 Max-Q. It's only in the 4K range (3840x2160 pixels) that the high-end GPU reaches its limit.
| low | med. | high | ultra | QHD | 4K | |
|---|---|---|---|---|---|---|
| The Witcher 3 (2015) | 75.4 | 50.6 | ||||
| Shadow of the Tomb Raider (2018) | 75 | 58 | 33 | |||
| Battlefield V (2018) | 112 | 91.2 | 52.4 | |||
| Apex Legends (2019) | 130 | 128 | ||||
| Far Cry New Dawn (2019) | 92 | 82 | ||||
| Metro Exodus (2019) | 66.4 | 54 | ||||
| Anthem (2019) | 86.1 | 78.9 | ||||
| Dirt Rally 2.0 (2019) | 143 | 85.1 | ||||
| The Division 2 (2019) | 93 | 77 |
Emissions
Noise emissions
MSI could make improvements in the fan control department. Even when the laptop isn't doing anything, the fans rev up in the direction of 40 dB at times. These unnecessary variations in speed will be very bothersome for sensitive users. Otherwise, the GS75 is fairly quiet when idle at 31-32 dB.
The 17-incher's performance under load is something to criticize too. 47-48 dB is quite loud for a Max-Q laptop. The Lenovo Y740 shows how to do it better by only reaching 32-46 dB during 3D usage (admittedly with slightly lower performance).
Noise level
| Idle |
| 31 / 32 / 41 dB(A) |
| Load |
| 47 / 48 dB(A) |
 | ||
30 dB silent 40 dB(A) audible 50 dB(A) loud |
||
min: | ||
| MSI GS75 8SG Stealth GeForce RTX 2080 Max-Q, i7-8750H | Asus Zephyrus S GX701GX GeForce RTX 2080 Max-Q, i7-8750H | Lenovo Legion Y740-17ICH GeForce RTX 2080 Max-Q, i7-8750H | Schenker XMG Neo 17 GeForce RTX 2070 Mobile, i7-8750H | MSI GE75 8SF GeForce RTX 2070 Mobile, i7-8750H | Average of class Gaming | |
|---|---|---|---|---|---|---|
| Noise | 3% | 10% | 5% | 0% | 12% | |
| off / environment * (dB) | 30 | 29 3% | 28.3 6% | 29 3% | 28.3 6% | 24.1 ? 20% |
| Idle Minimum * (dB) | 31 | 29 6% | 31.5 -2% | 29 6% | 33.5 -8% | 25.8 ? 17% |
| Idle Average * (dB) | 32 | 32 -0% | 31.6 1% | 32 -0% | 33.6 -5% | 27.4 ? 14% |
| Idle Maximum * (dB) | 41 | 33 20% | 31.6 23% | 33 20% | 35 15% | 30 ? 27% |
| Load Average * (dB) | 47 | 47 -0% | 32.3 31% | 42 11% | 38 19% | 43 ? 9% |
| Witcher 3 ultra * (dB) | 47 | 49 -4% | 43 9% | 49 -4% | 50 -6% | |
| Load Maximum * (dB) | 48 | 51 -6% | 45.5 5% | 49 -2% | 56.9 -19% | 54 ? -13% |
* ... smaller is better
Temperature
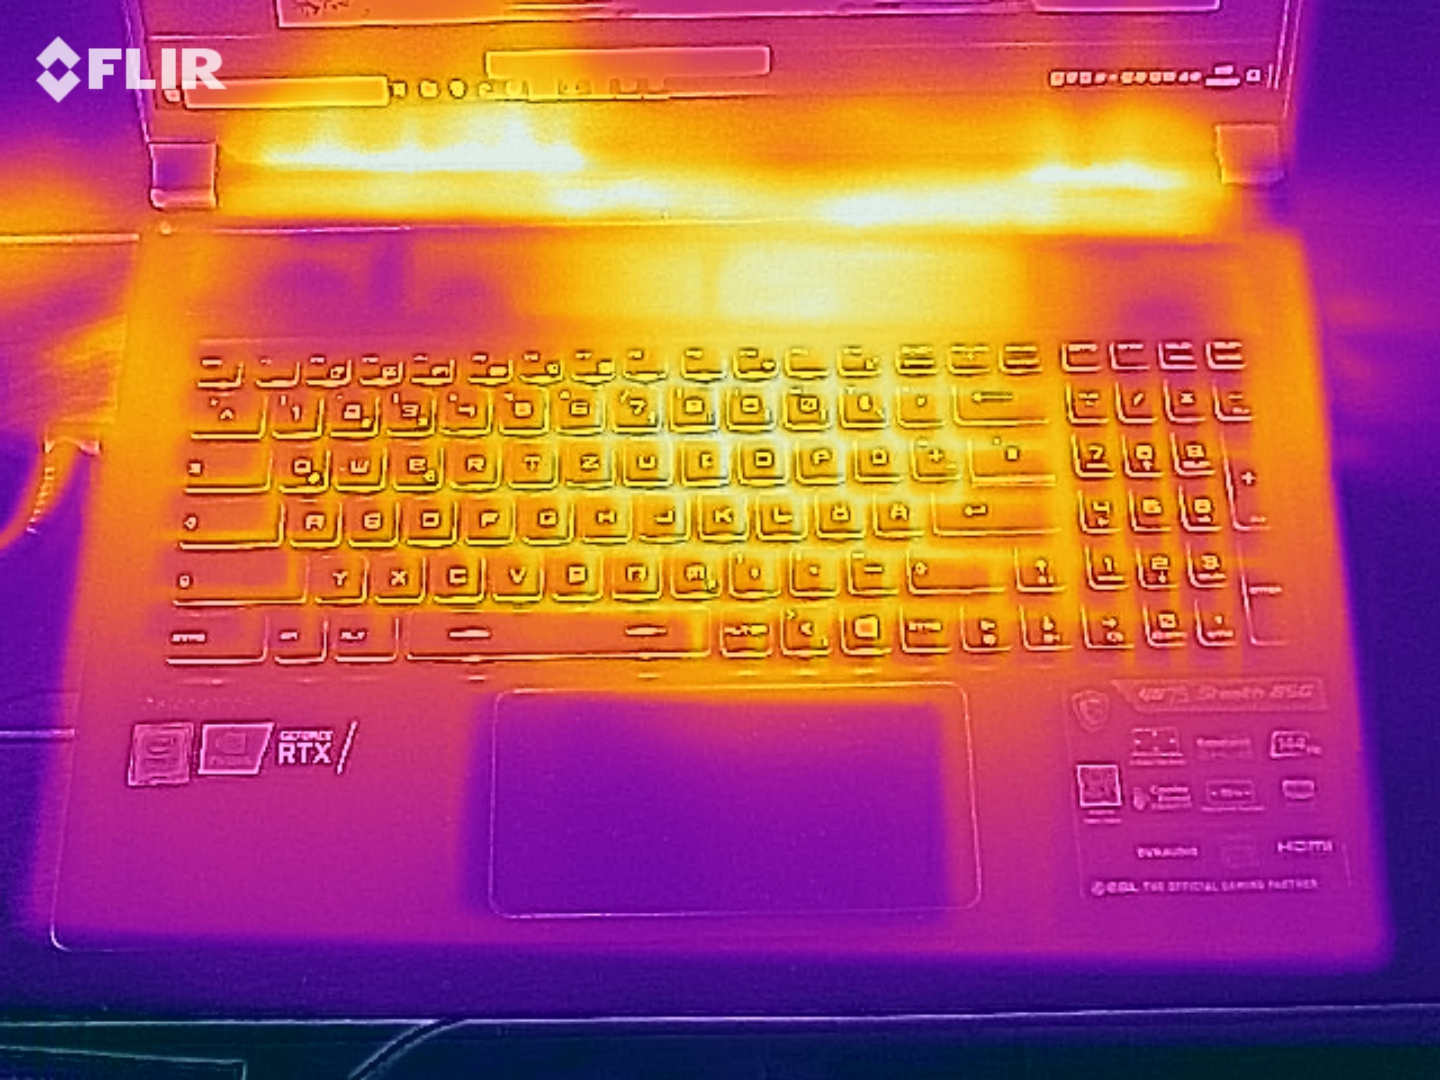
Heat development also leads to mixed feelings. While the chassis remains comfortably cool throughout the whole surface when idle, some areas become over 50 °C hot under load, which prevents gaming on your lap.
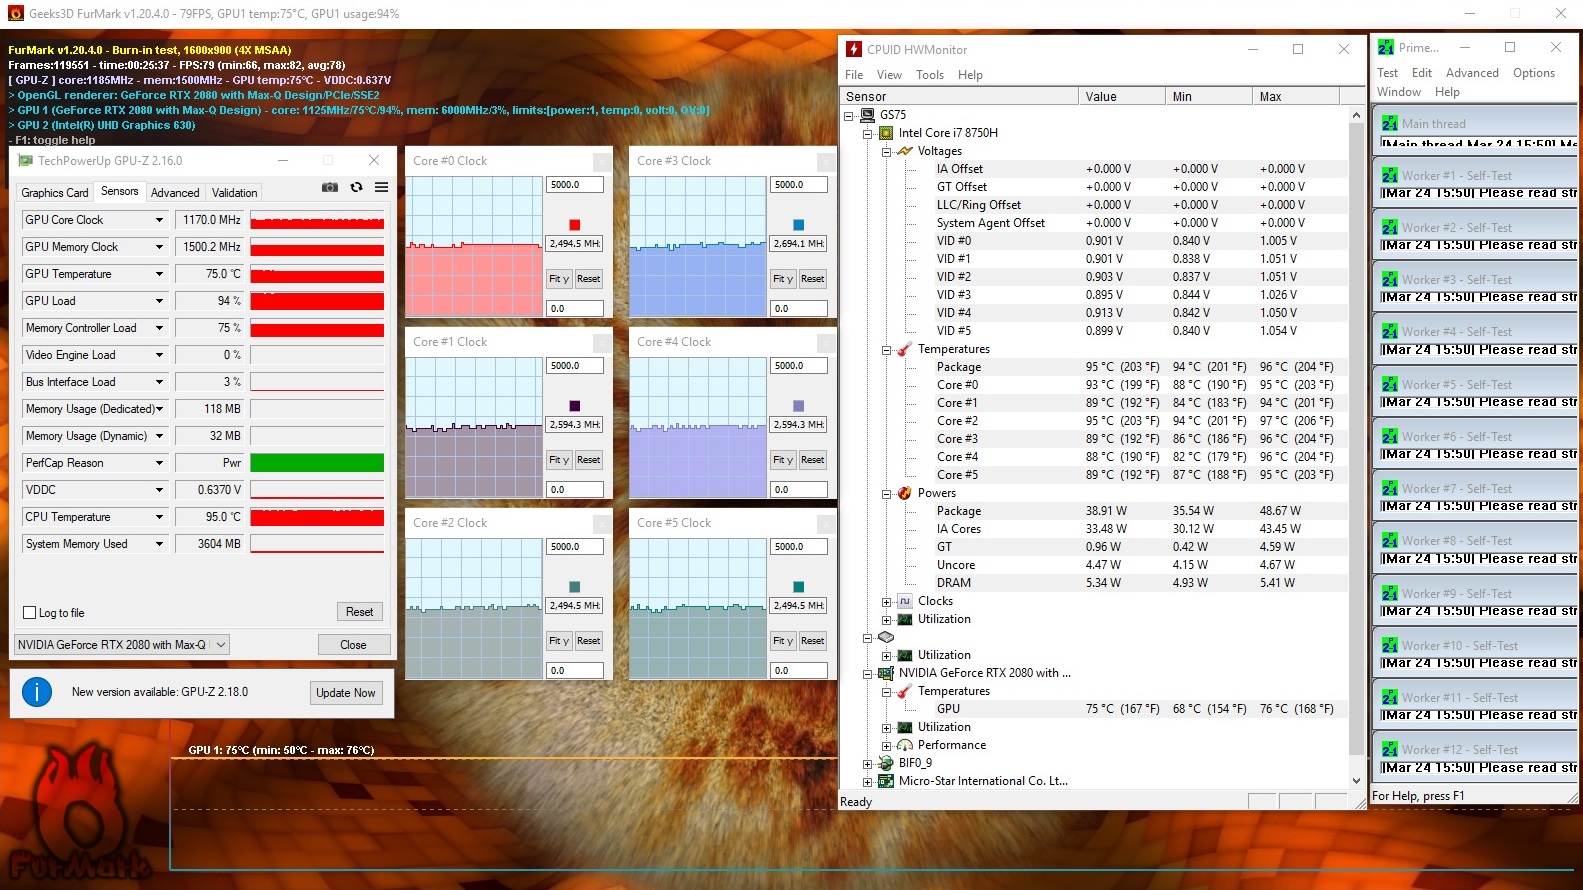
Under the hood, the CPU heats up particularly. The Core i7-8750H made itself comfortable at around 90-95 °C during our 60-minute stress test with the Furmark and Prime95 tools. On the other hand, the GeForce RTX 2080 Max-Q remained much cooler at 76 °C.
(-) The maximum temperature on the upper side is 48 °C / 118 F, compared to the average of 40.4 °C / 105 F, ranging from 21.2 to 68.8 °C for the class Gaming.
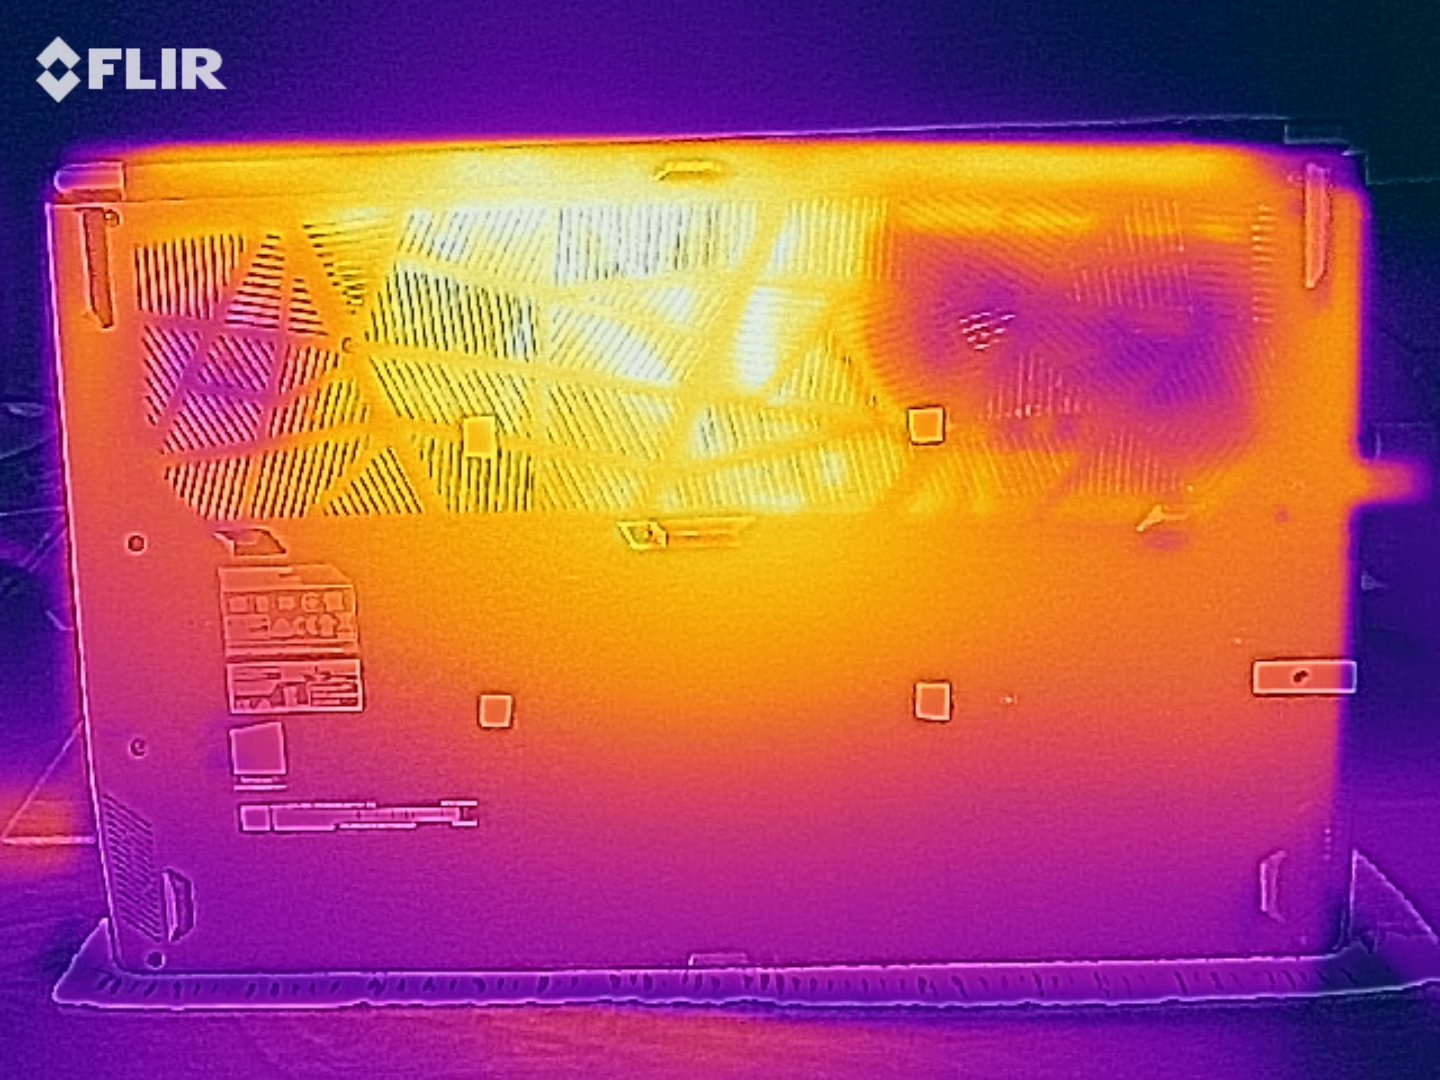
(-) The bottom heats up to a maximum of 58 °C / 136 F, compared to the average of 43.2 °C / 110 F
(+) In idle usage, the average temperature for the upper side is 25.4 °C / 78 F, compared to the device average of 33.9 °C / 93 F.
(-) Playing The Witcher 3, the average temperature for the upper side is 42.1 °C / 108 F, compared to the device average of 33.9 °C / 93 F.
(-) The palmrests and touchpad can get very hot to the touch with a maximum of 40 °C / 104 F.
(-) The average temperature of the palmrest area of similar devices was 28.8 °C / 83.8 F (-11.2 °C / -20.2 F).
| MSI GS75 8SG Stealth GeForce RTX 2080 Max-Q, i7-8750H | Asus Zephyrus S GX701GX GeForce RTX 2080 Max-Q, i7-8750H | Lenovo Legion Y740-17ICH GeForce RTX 2080 Max-Q, i7-8750H | Schenker XMG Neo 17 GeForce RTX 2070 Mobile, i7-8750H | MSI GE75 8SF GeForce RTX 2070 Mobile, i7-8750H | Average of class Gaming | |
|---|---|---|---|---|---|---|
| Heat | 1% | 4% | 0% | 9% | -2% | |
| Maximum Upper Side * (°C) | 48 | 53 -10% | 38.6 20% | 47 2% | 41.2 14% | 45.2 ? 6% |
| Maximum Bottom * (°C) | 58 | 50 14% | 43.6 25% | 56 3% | 46 21% | 48 ? 17% |
| Idle Upper Side * (°C) | 29 | 27 7% | 30.2 -4% | 28 3% | 26.2 10% | 31.1 ? -7% |
| Idle Bottom * (°C) | 28 | 30 -7% | 35 -25% | 30 -7% | 30.2 -8% | 34.2 ? -22% |
* ... smaller is better
Speakers
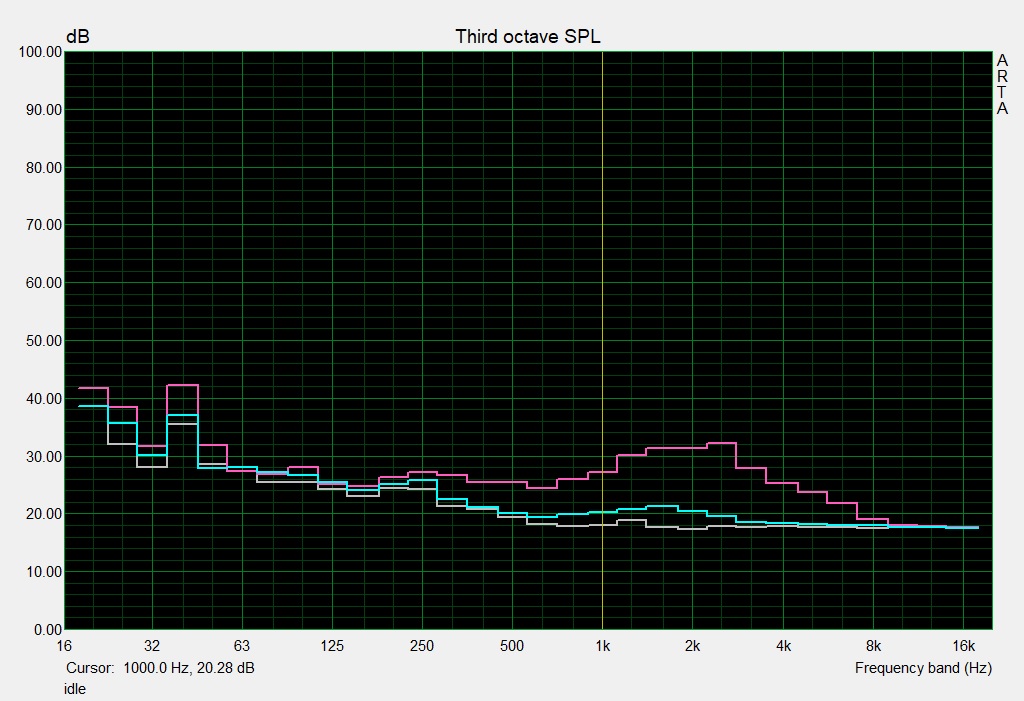
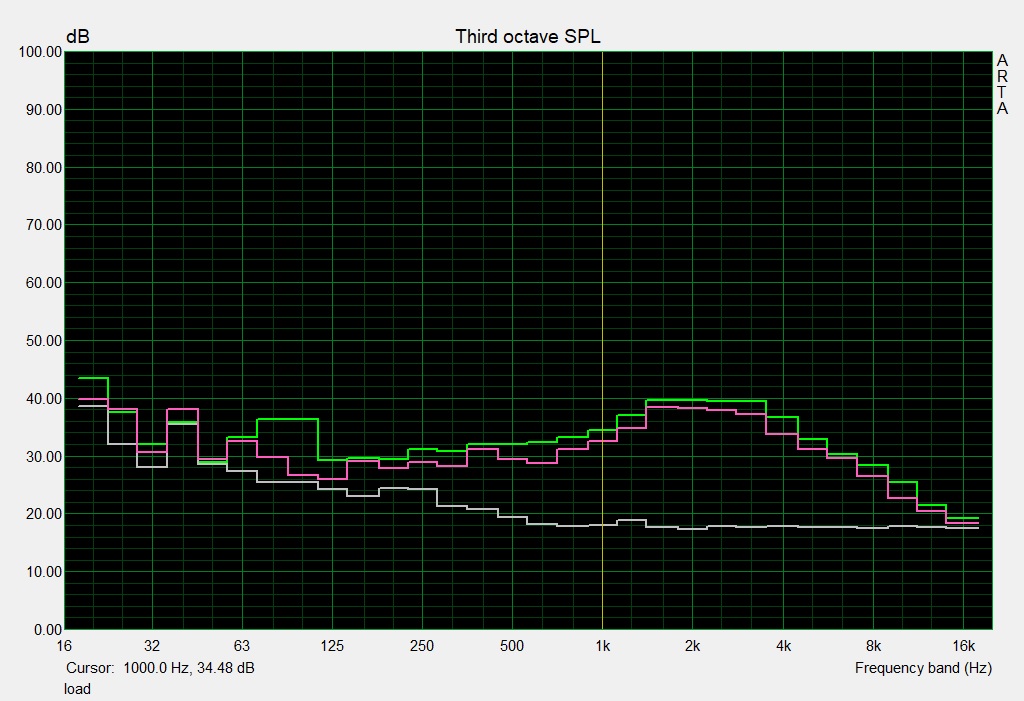
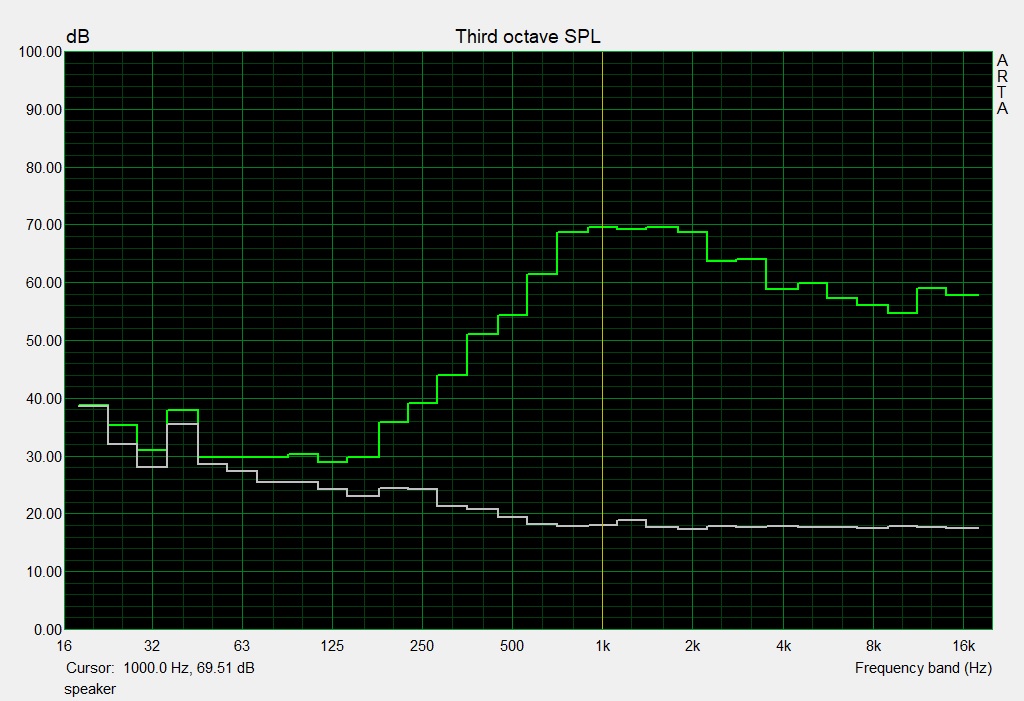
The 2.0 system integrated in the front area is unfortunately not good for the price. Sound is quite soft and tinny, so that it doesn't create a proper atmosphere for watching movies, gaming or music playback. As shown by our audio analysis, this shortcoming also affects the GS65 15-inch sibling. Deep tones are especially underrepresented. Ergo, a headset or external speakers should be used when possible.
MSI GS75 8SG Stealth audio analysis
(±) | speaker loudness is average but good (78 dB)
Bass 100 - 315 Hz
(-) | nearly no bass - on average 23.2% lower than median
(±) | linearity of bass is average (7% delta to prev. frequency)
Mids 400 - 2000 Hz
(±) | higher mids - on average 8.8% higher than median
(±) | linearity of mids is average (8.5% delta to prev. frequency)
Highs 2 - 16 kHz
(+) | balanced highs - only 2.9% away from median
(+) | highs are linear (6% delta to prev. frequency)
Overall 100 - 16.000 Hz
(±) | linearity of overall sound is average (27.3% difference to median)
Compared to same class
» 93% of all tested devices in this class were better, 1% similar, 6% worse
» The best had a delta of 6%, average was 18%, worst was 132%
Compared to all devices tested
» 83% of all tested devices were better, 4% similar, 13% worse
» The best had a delta of 4%, average was 24%, worst was 134%
MSI GS65 8RF-019DE Stealth Thin audio analysis
(±) | speaker loudness is average but good (76 dB)
Bass 100 - 315 Hz
(-) | nearly no bass - on average 16.4% lower than median
(±) | linearity of bass is average (9.7% delta to prev. frequency)
Mids 400 - 2000 Hz
(+) | balanced mids - only 4.9% away from median
(+) | mids are linear (5.6% delta to prev. frequency)
Highs 2 - 16 kHz
(+) | balanced highs - only 2.5% away from median
(±) | linearity of highs is average (7.1% delta to prev. frequency)
Overall 100 - 16.000 Hz
(±) | linearity of overall sound is average (18.5% difference to median)
Compared to same class
» 60% of all tested devices in this class were better, 8% similar, 32% worse
» The best had a delta of 6%, average was 18%, worst was 132%
Compared to all devices tested
» 41% of all tested devices were better, 8% similar, 51% worse
» The best had a delta of 4%, average was 24%, worst was 134%
Energy management
Energy consumption
When idle, energy consumption is slightly lower than on the other RTX 2080 Max-Q competitors. Thanks in big part to the graphics switching, the 17-incher requires only 13 to 23 Watts. 215 Watts was measured under load, which is backed up by a sufficiently capable power supply. In everyday gaming, 147 Watts is to be expected. This value sits well below comparably fast RTX 2070 laptops.
| Off / Standby | |
| Idle | |
| Load |
|
Key:
min: | |
| MSI GS75 8SG Stealth GeForce RTX 2080 Max-Q, i7-8750H | Asus Zephyrus S GX701GX GeForce RTX 2080 Max-Q, i7-8750H | Lenovo Legion Y740-17ICH GeForce RTX 2080 Max-Q, i7-8750H | Schenker XMG Neo 17 GeForce RTX 2070 Mobile, i7-8750H | MSI GE75 8SF GeForce RTX 2070 Mobile, i7-8750H | Average of class Gaming | |
|---|---|---|---|---|---|---|
| Power Consumption | -22% | -20% | 0% | -18% | -11% | |
| Idle Minimum * (Watt) | 13 | 19 -46% | 20.2 -55% | 13 -0% | 16.4 -26% | 13.2 ? -2% |
| Idle Average * (Watt) | 17 | 22 -29% | 27.2 -60% | 16 6% | 21.9 -29% | 18.9 ? -11% |
| Idle Maximum * (Watt) | 23 | 30 -30% | 28.7 -25% | 21 9% | 25.4 -10% | 24.3 ? -6% |
| Load Average * (Watt) | 90 | 104 -16% | 90.8 -1% | 96 -7% | 90.7 -1% | 108 ? -20% |
| Witcher 3 ultra * (Watt) | 147 | 167 -14% | 152.1 -3% | 172 -17% | 203.3 -38% | |
| Load Maximum * (Watt) | 215 | 203 6% | 165.4 23% | 191 11% | 222.9 -4% | 254 ? -18% |
* ... smaller is better
Battery life
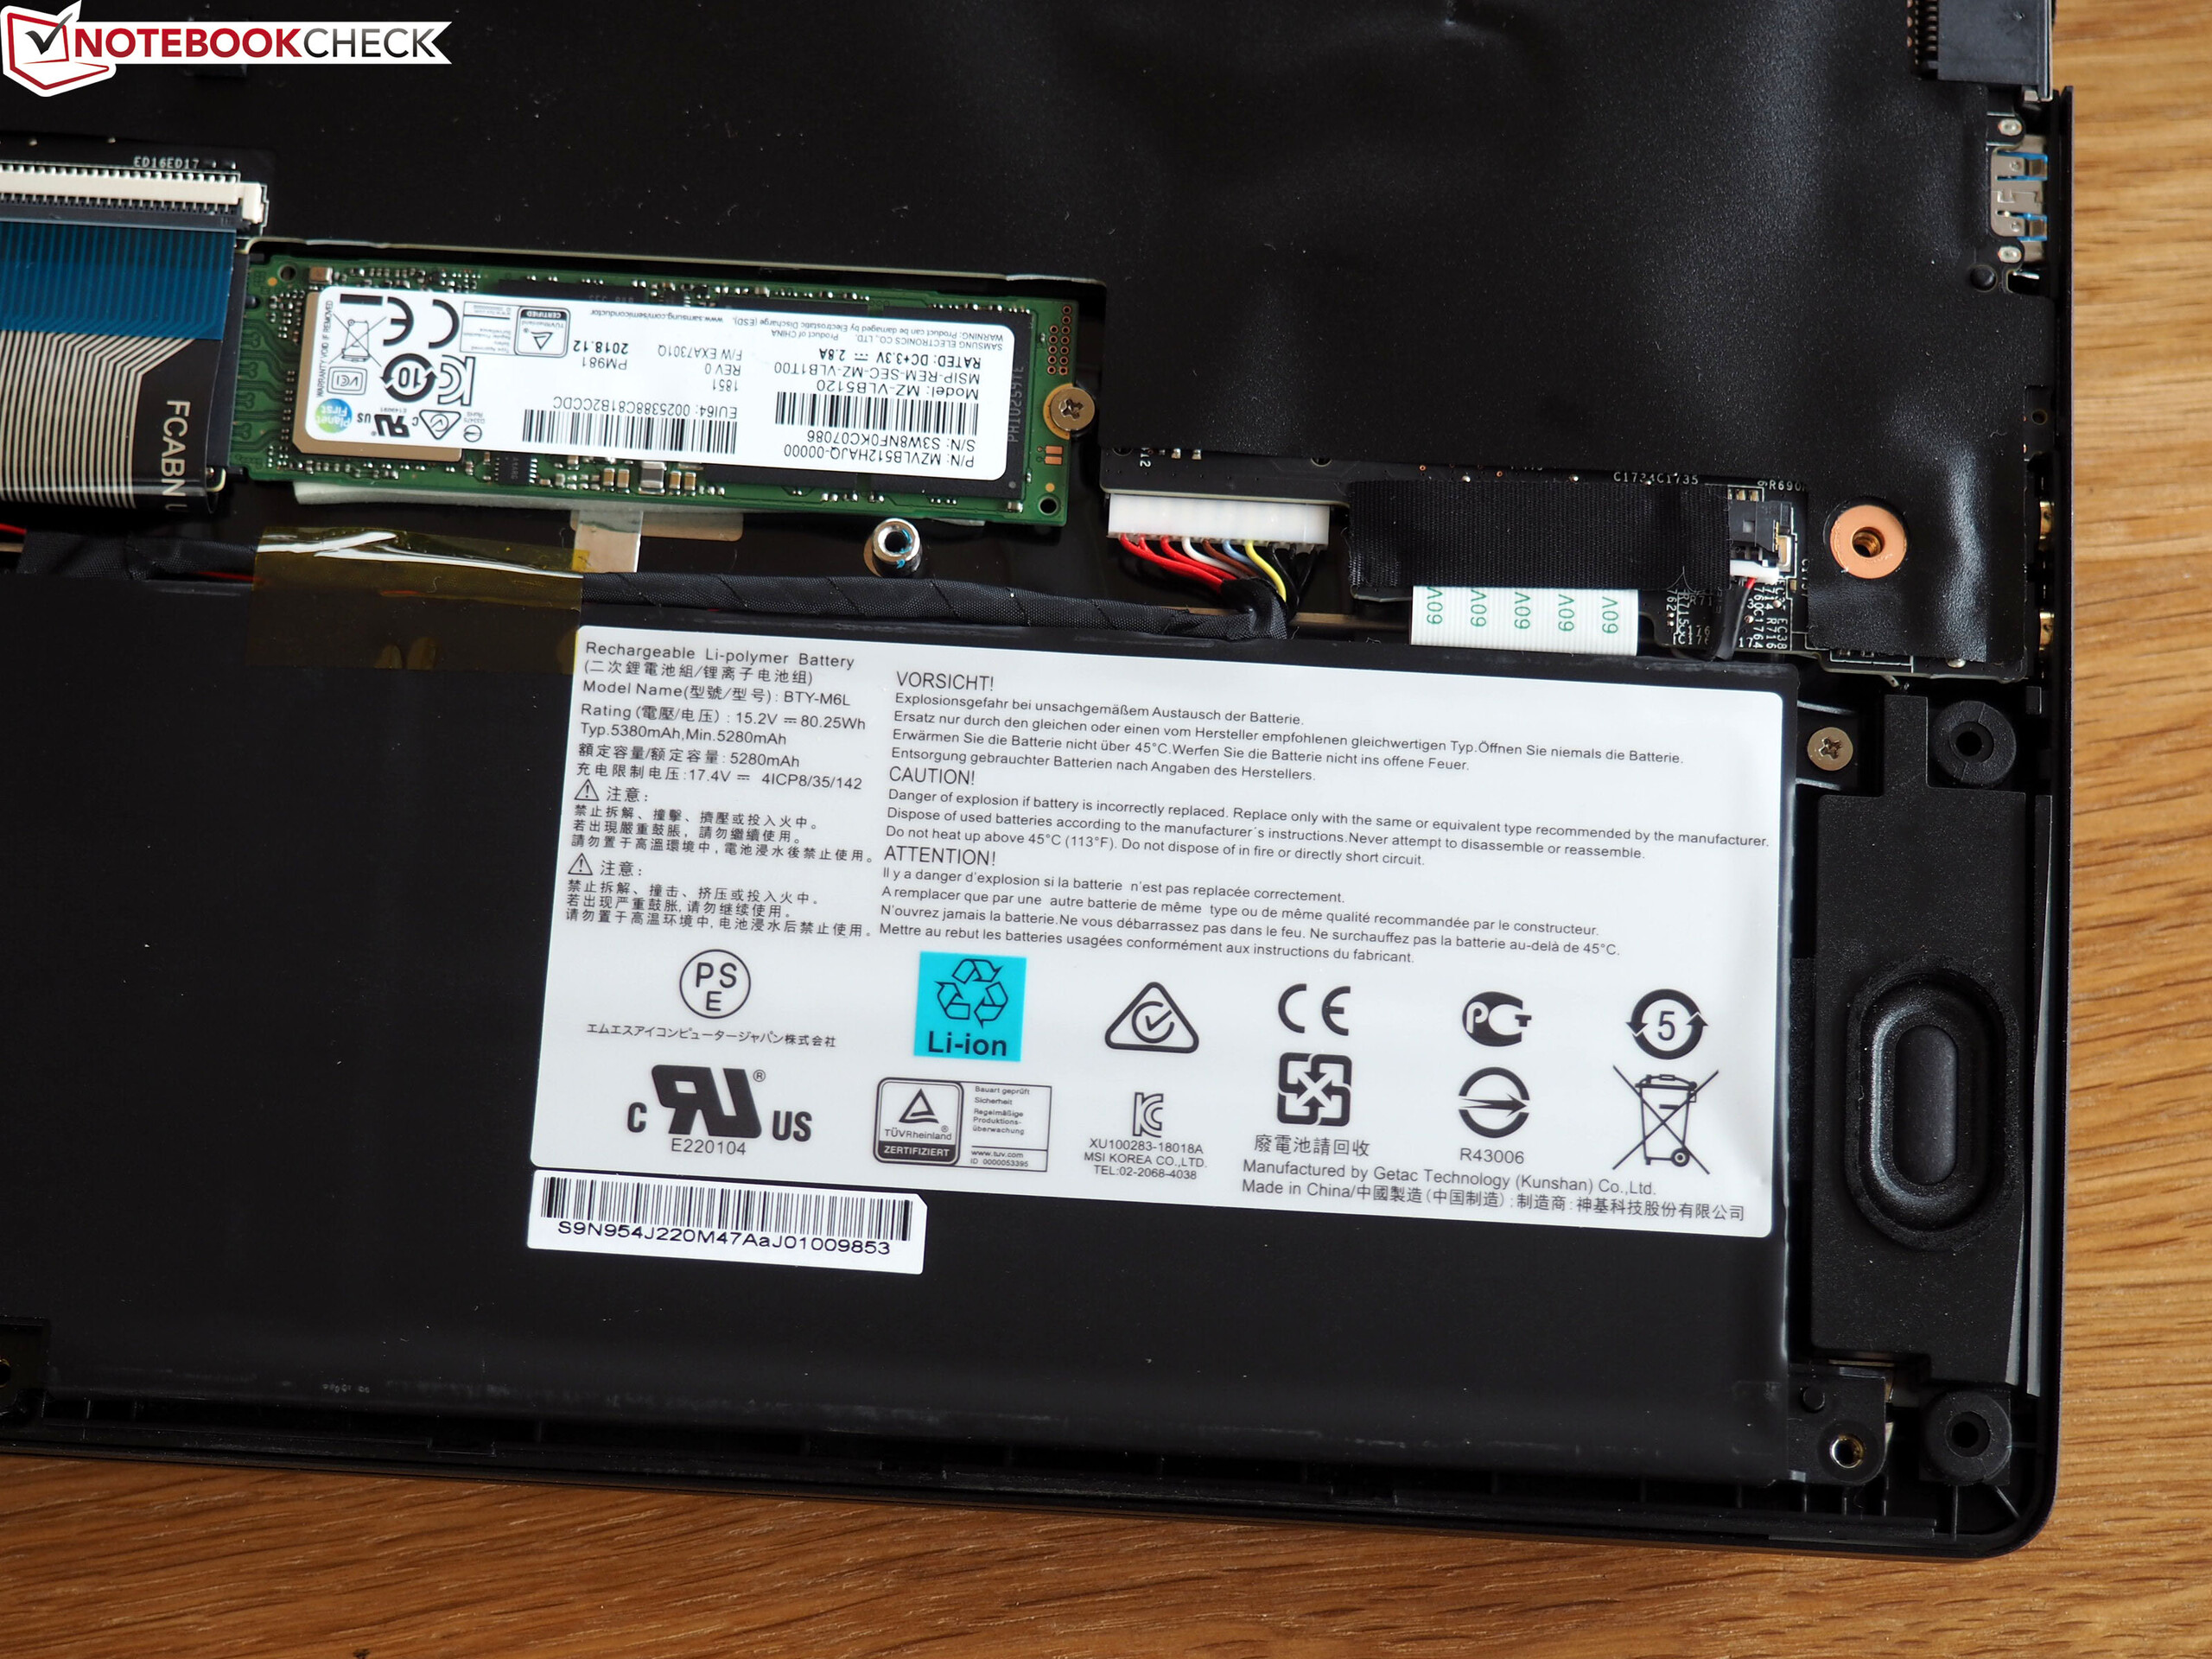
When it comes to battery life, the GS75 beats all of its contenders. In order for the 17-incher to be able to stay unplugged for as long as possible, MSI has opted for an 80 Wh battery. In comparison, the competition has only been equipped with 46 to 76 Wh. In combination with the fairly low energy consumption, the system exhibits an above-average battery runtime.
7:44 hours in idle usage at minimal brightness is respectable for a high-end laptop, as well as 5:16 hours when browsing the web on Wi-Fi and at medium brightness. On the other hand, the GS75 is hardly suitable for mobile gaming. In this case, the longest it can last is an hour. The fact that 3D performance drops to around 75% when running on battery (massive GPU throttling) is also noticeable.
| MSI GS75 8SG Stealth GeForce RTX 2080 Max-Q, i7-8750H, 80.25 Wh | Asus Zephyrus S GX701GX GeForce RTX 2080 Max-Q, i7-8750H, 76 Wh | Lenovo Legion Y740-17ICH GeForce RTX 2080 Max-Q, i7-8750H, 76 Wh | Schenker XMG Neo 17 GeForce RTX 2070 Mobile, i7-8750H, 46.74 Wh | MSI GE75 8SF GeForce RTX 2070 Mobile, i7-8750H, 65 Wh | Average of class Gaming | |
|---|---|---|---|---|---|---|
| Battery runtime | -21% | -40% | -20% | -34% | 36% | |
| Reader / Idle (h) | 7.7 | 5 -35% | 5.3 -31% | 8.71 ? 13% | ||
| WiFi v1.3 (h) | 5.3 | 3.8 -28% | 3.2 -40% | 3.7 -30% | 3.5 -34% | 7.02 ? 32% |
| Load (h) | 0.9 | 0.9 0% | 0.9 0% | 1.47 ? 63% |
Verdict
Pros
Cons
With the GS75 8SG Stealth, MSI released a mostly successful gaming laptop with slim bezels.
The combination of Core i7-8750H and GeForce RTX 2080 Max-Q tackles all current games effortlessly - at least at the native Full HD resolution. 3D content ran overall very smoothly on the fast-reacting and contrast-rich 144 Hz display, despite it lacking Nvidia's G-Sync technology.
Another strength of the 17-incher is its good mobility. Alongside the weight and height, the battery life also manages to impress. The modern ports, which include Thunderbolt 3, are also praiseworthy.
We weren't completely satisfied with the case. Although the design and quality of the materials are of a high level, the stability leaves something to be desired. In order to achieve a "very good" overall score, the manufacturer would also have to improve the sound quality and fan control.
The steep price (~3,800 Euros (~$4,267) for the top-of-the line model) will detract some interested consumers from buying. Most of the time, comparably fast laptops with an RTX 2070 GPU are significantly lower priced.
MSI GS75 8SG Stealth
- 03/27/2019 v6 (old)
Florian Glaser
Price comparison
