Asus ROG Zephyrus S GX701GX (i7-8750H, RTX 2080 Max-Q) Laptop Review

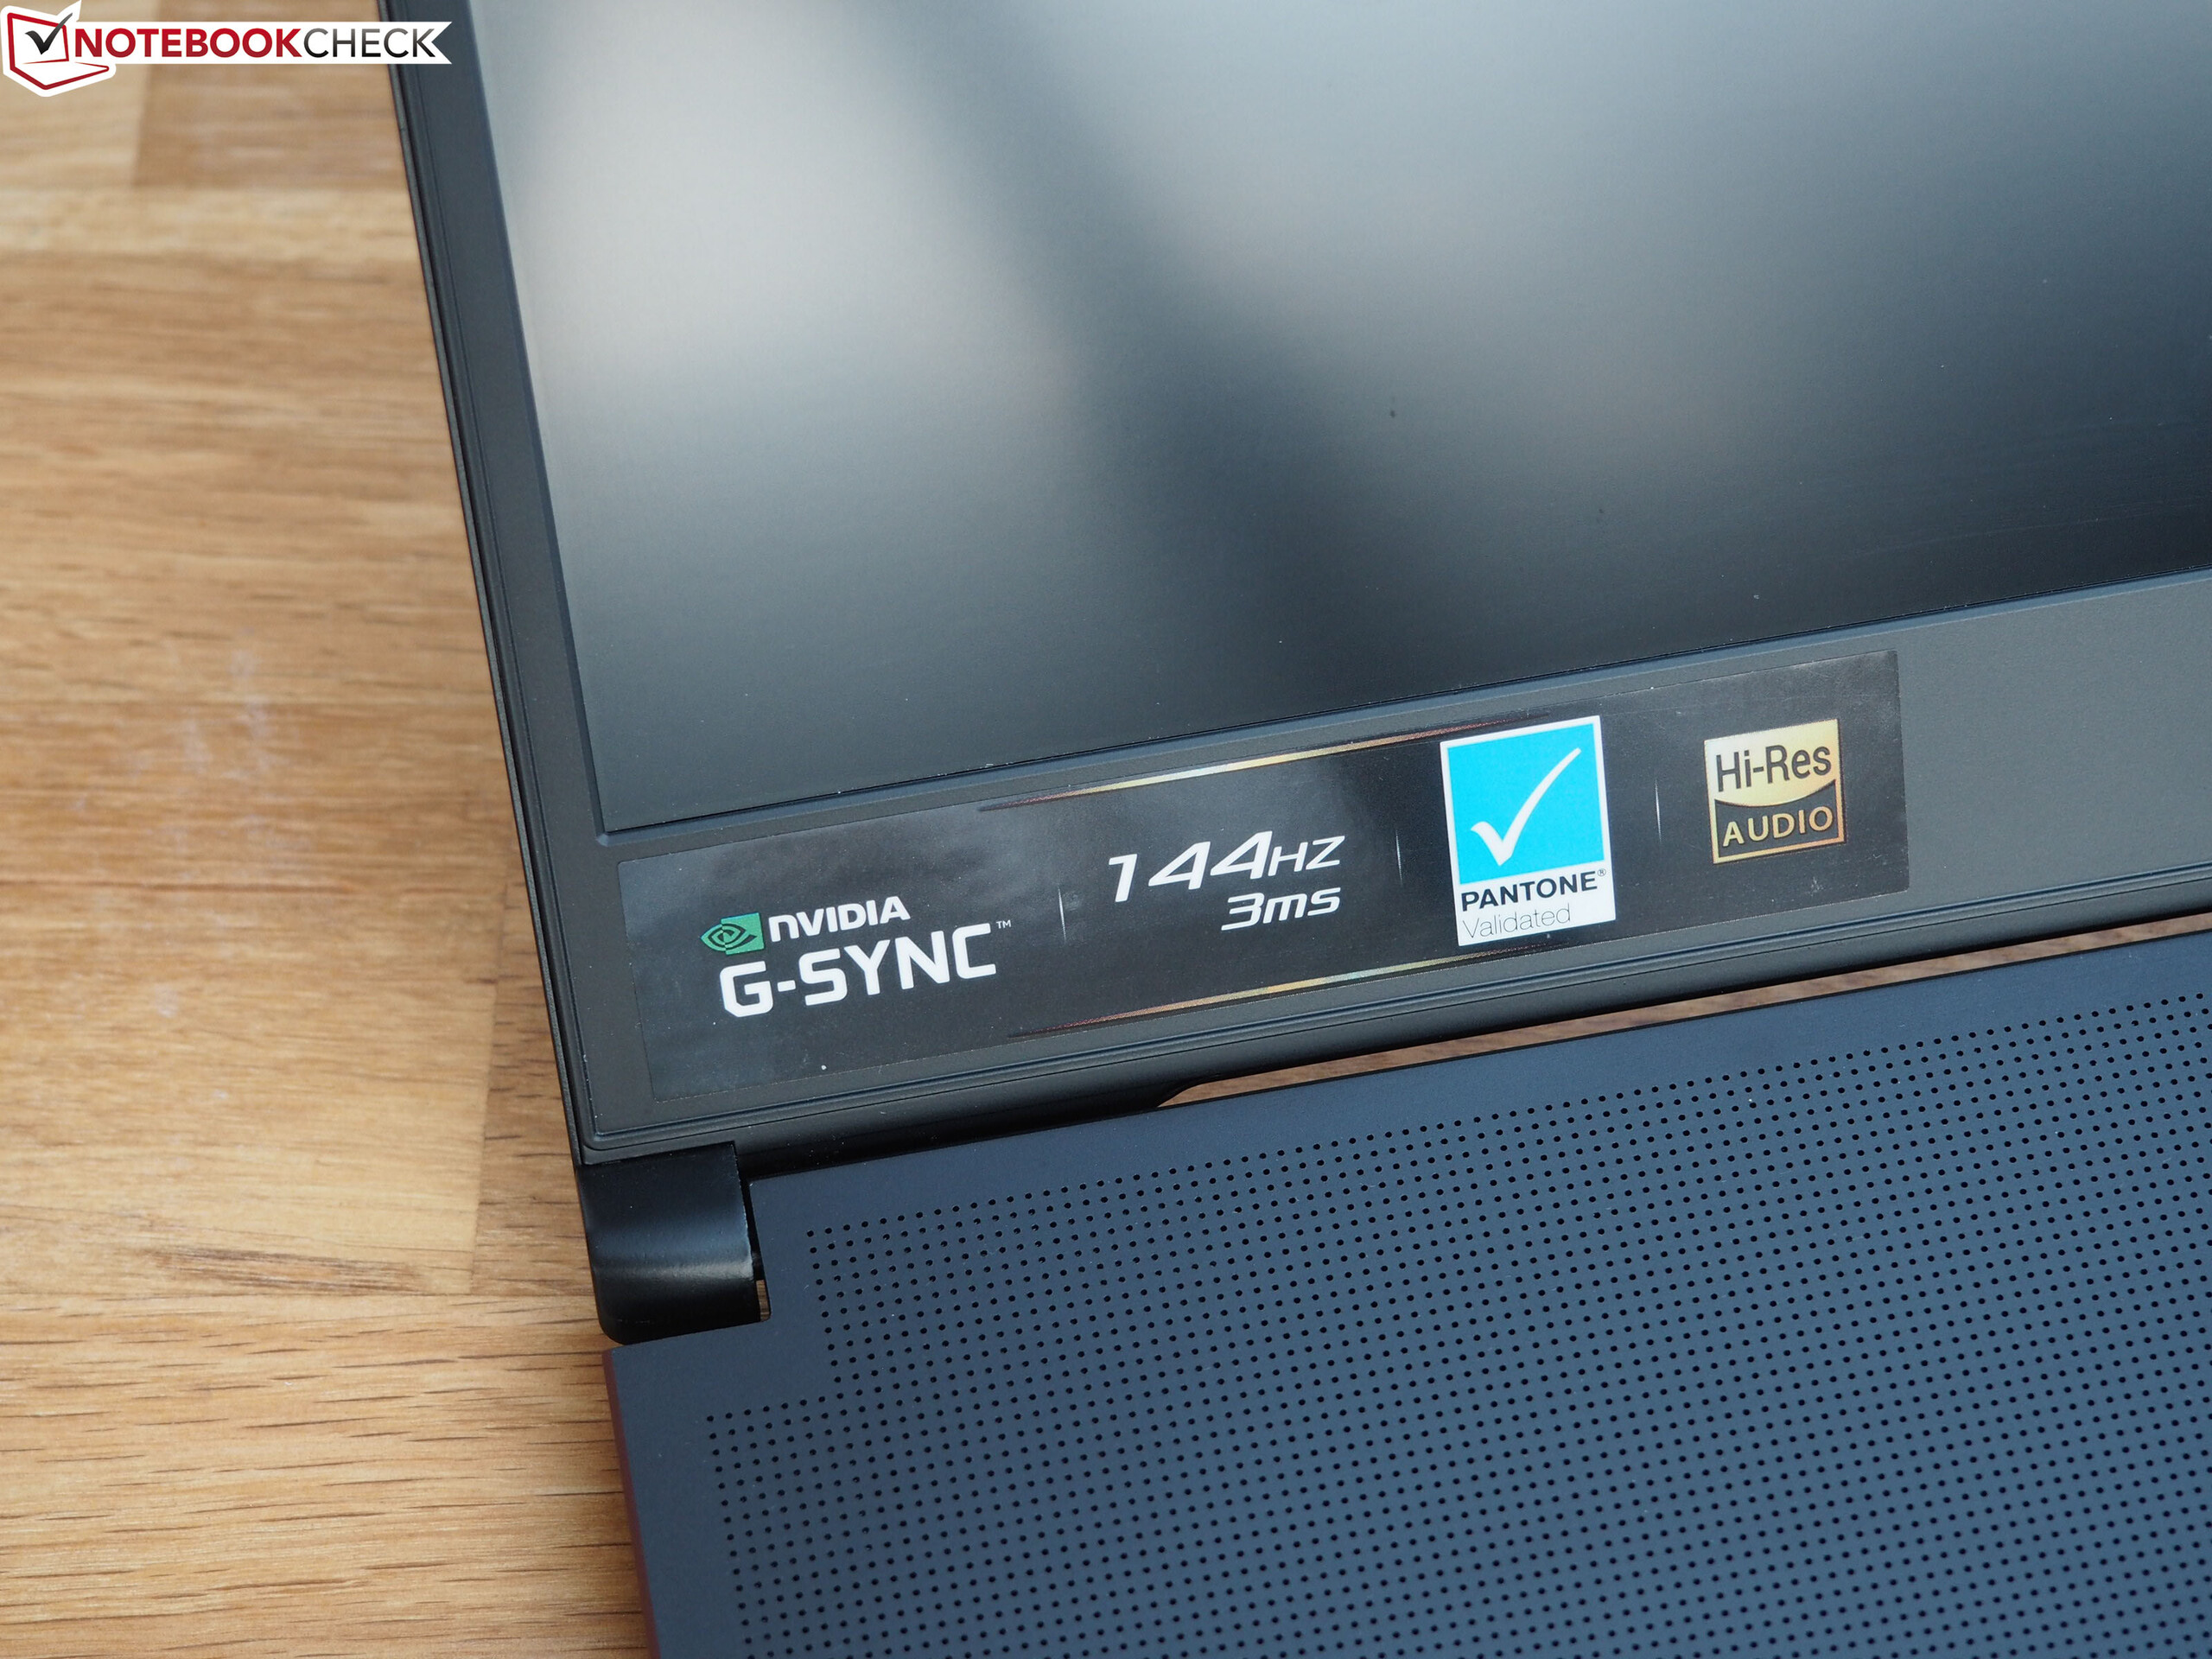
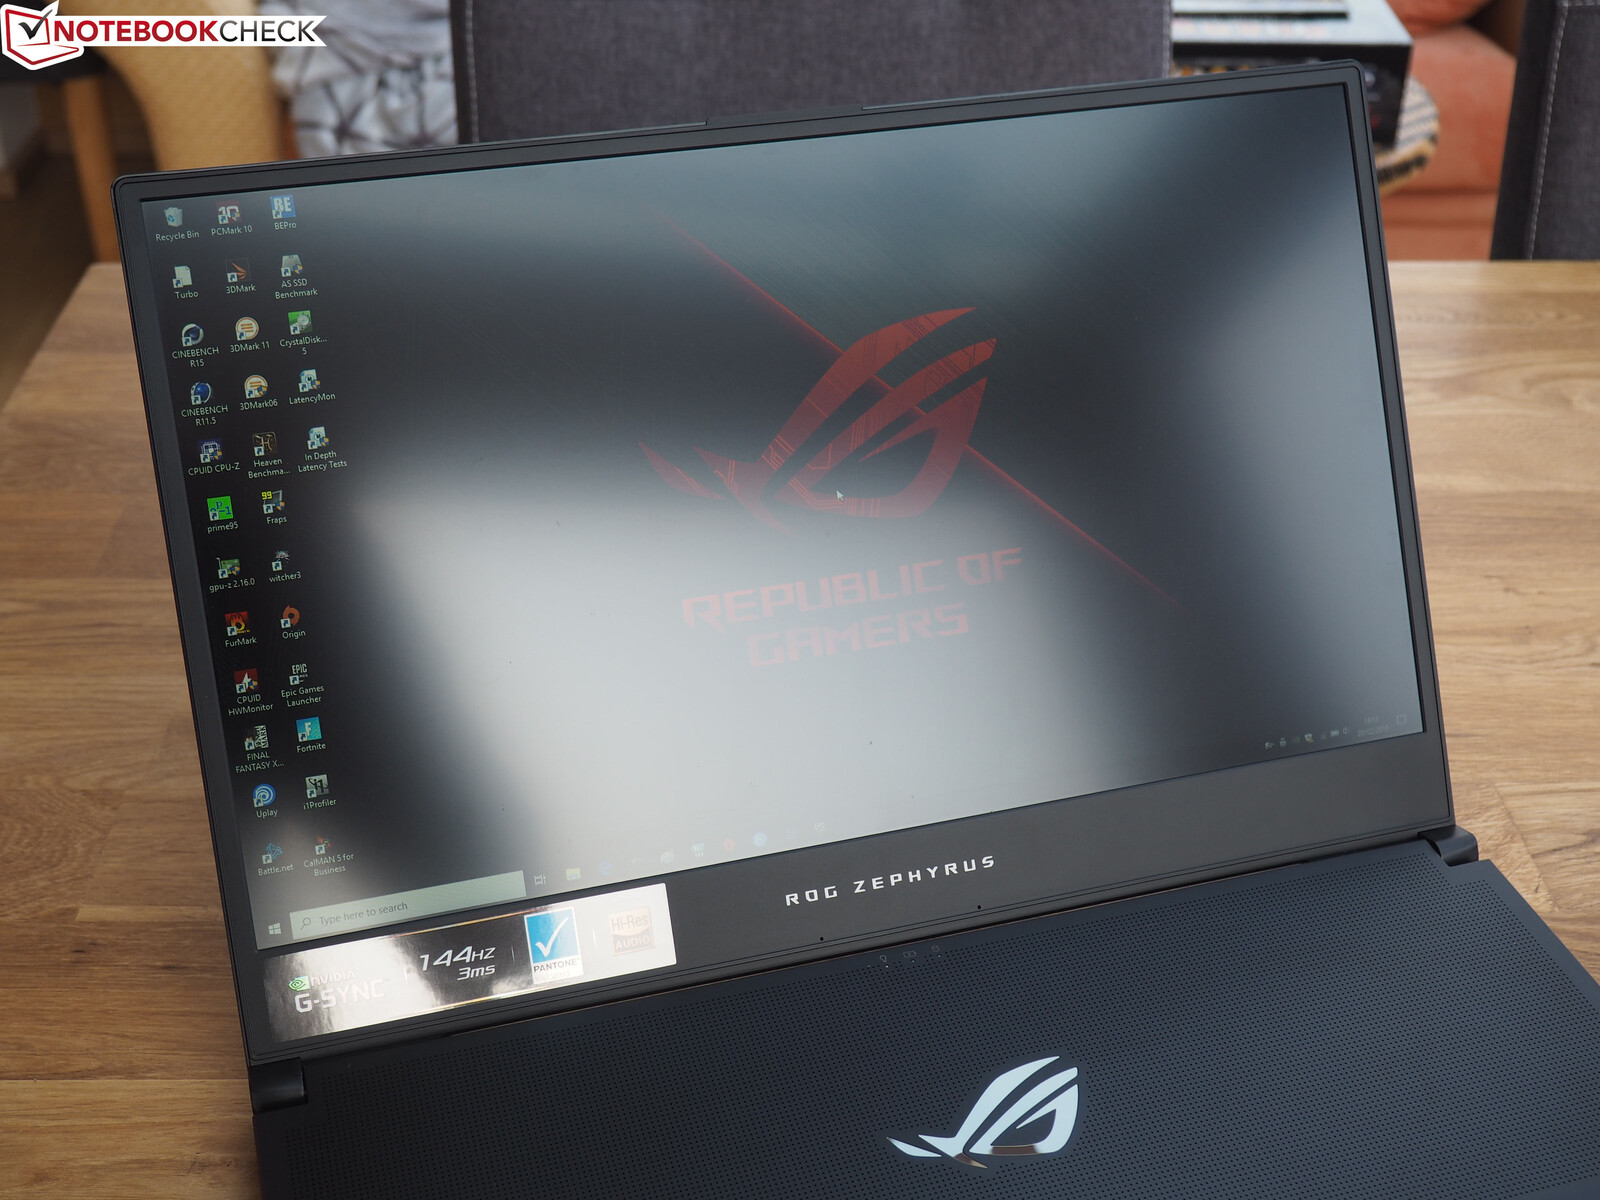
There are three different models on Asus’s website. While the GX701GV features “only” an Nvidia GeForce RTX 2060, the GX701GW comes with an RTX 2070. And then there is finally our review device that has a GeForce RTX 2080 Max-Q. Our review device is designated as the GX701GX and costs about 3200 Euros ($3634). It has a Core i7-8750H and a G-Sync-enabled, 144-Hz Full HD display with a Pantone certification.
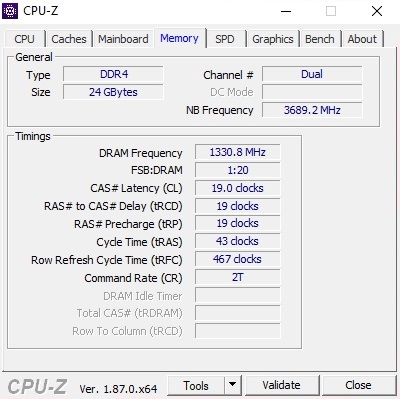
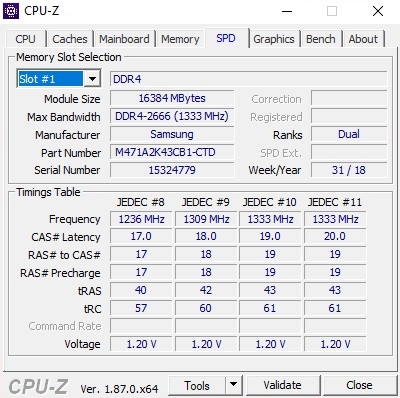
The maximum amount of RAM is limited to 24 GB, 8 GB of which is soldered to the motherboard. We reckon that this is not a particularly good decision. The same goes for the fact that the GX701 only features one M.2 slot. The biggest competitors of the ROG Zephyrus S are other slim gaming notebooks with Turing-based GPUs such as the Razer Blade 15, the Gigabyte Aero 15 and the Acer Predator Triton 500. We included the above-mentioned devices in our review for comparison purposes.
Case
The GX701 strongly resembles its 15-inch sibling, which is known as the GX531. In addition to the unusually placed input devices, the 17-inch successor inherits the innovative cooling system. To improve air circulation, both devices have a moving back cover, which cracks open a little when you open the display lid, thereby increasing the overall thickness of the device (1.9 cm/0.02 in) by a few millimeters.
The drawback of this mechanism is subpar rigidity. While the GX701 is extremely rigid when the display lid is closed, the case exhibits a whole lot more flex at several points when the display lid is open. This did not bother us in practice and only the parts of the chassis near the screen seem to be affected.
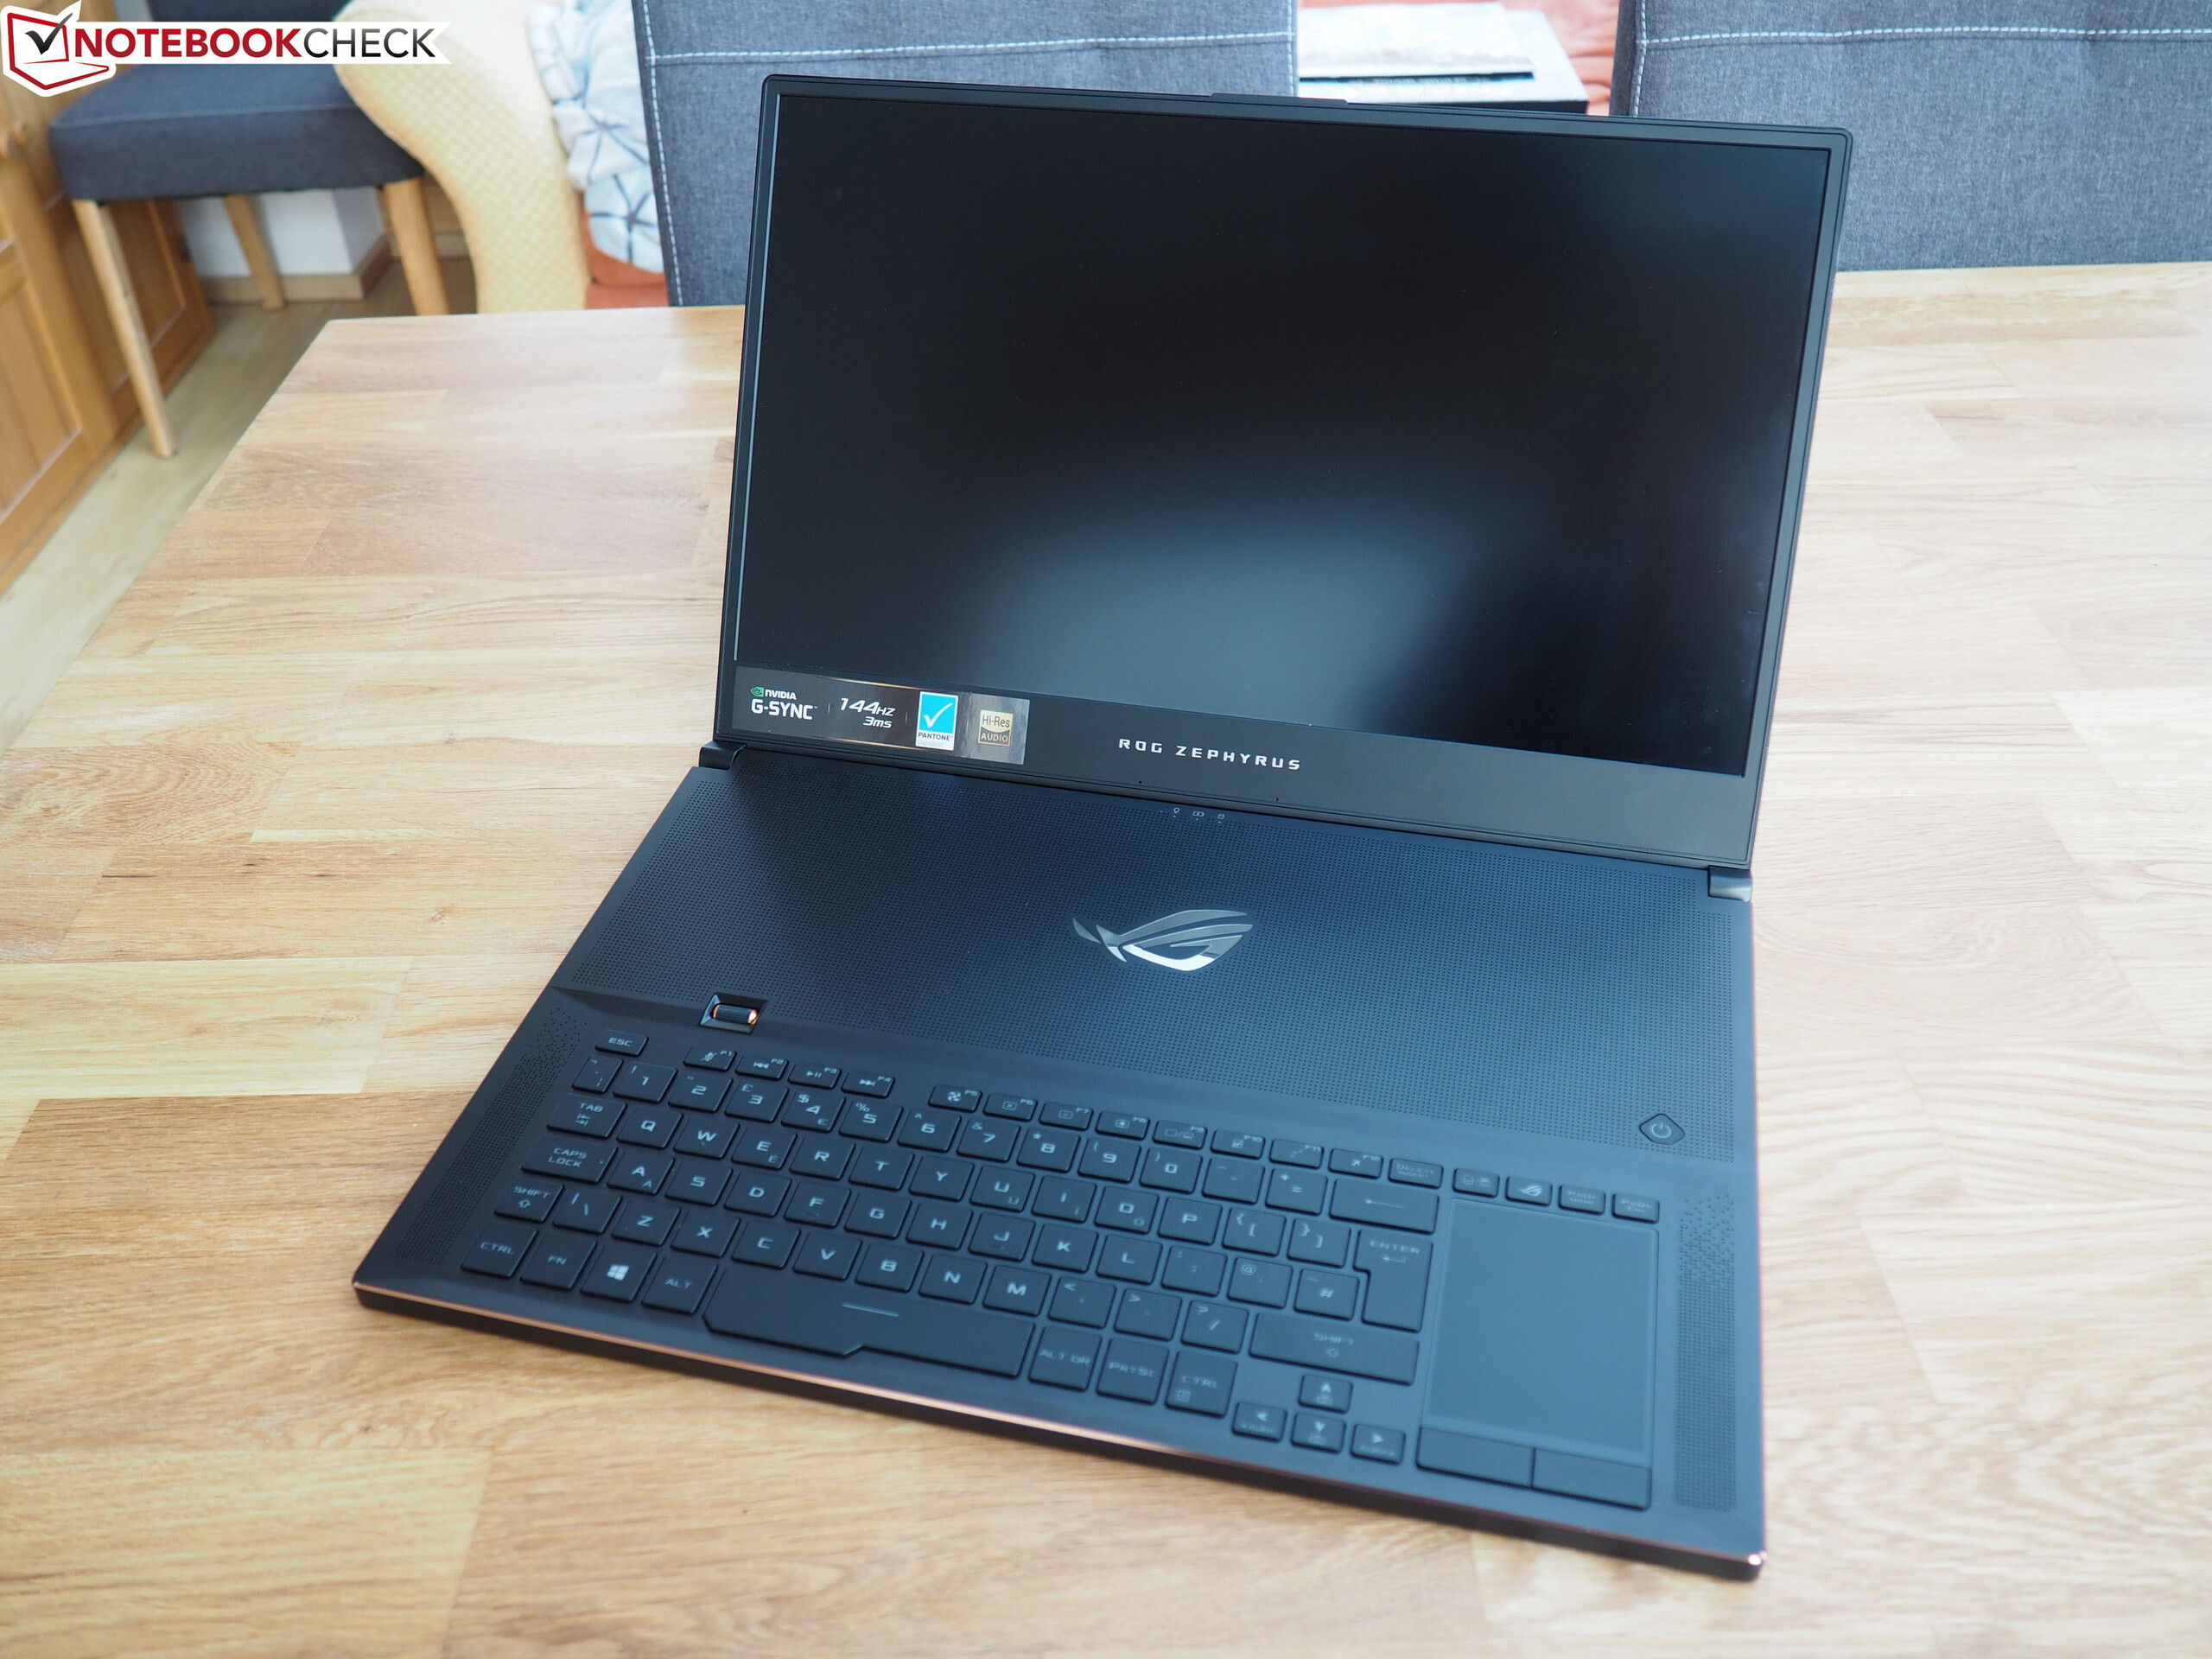
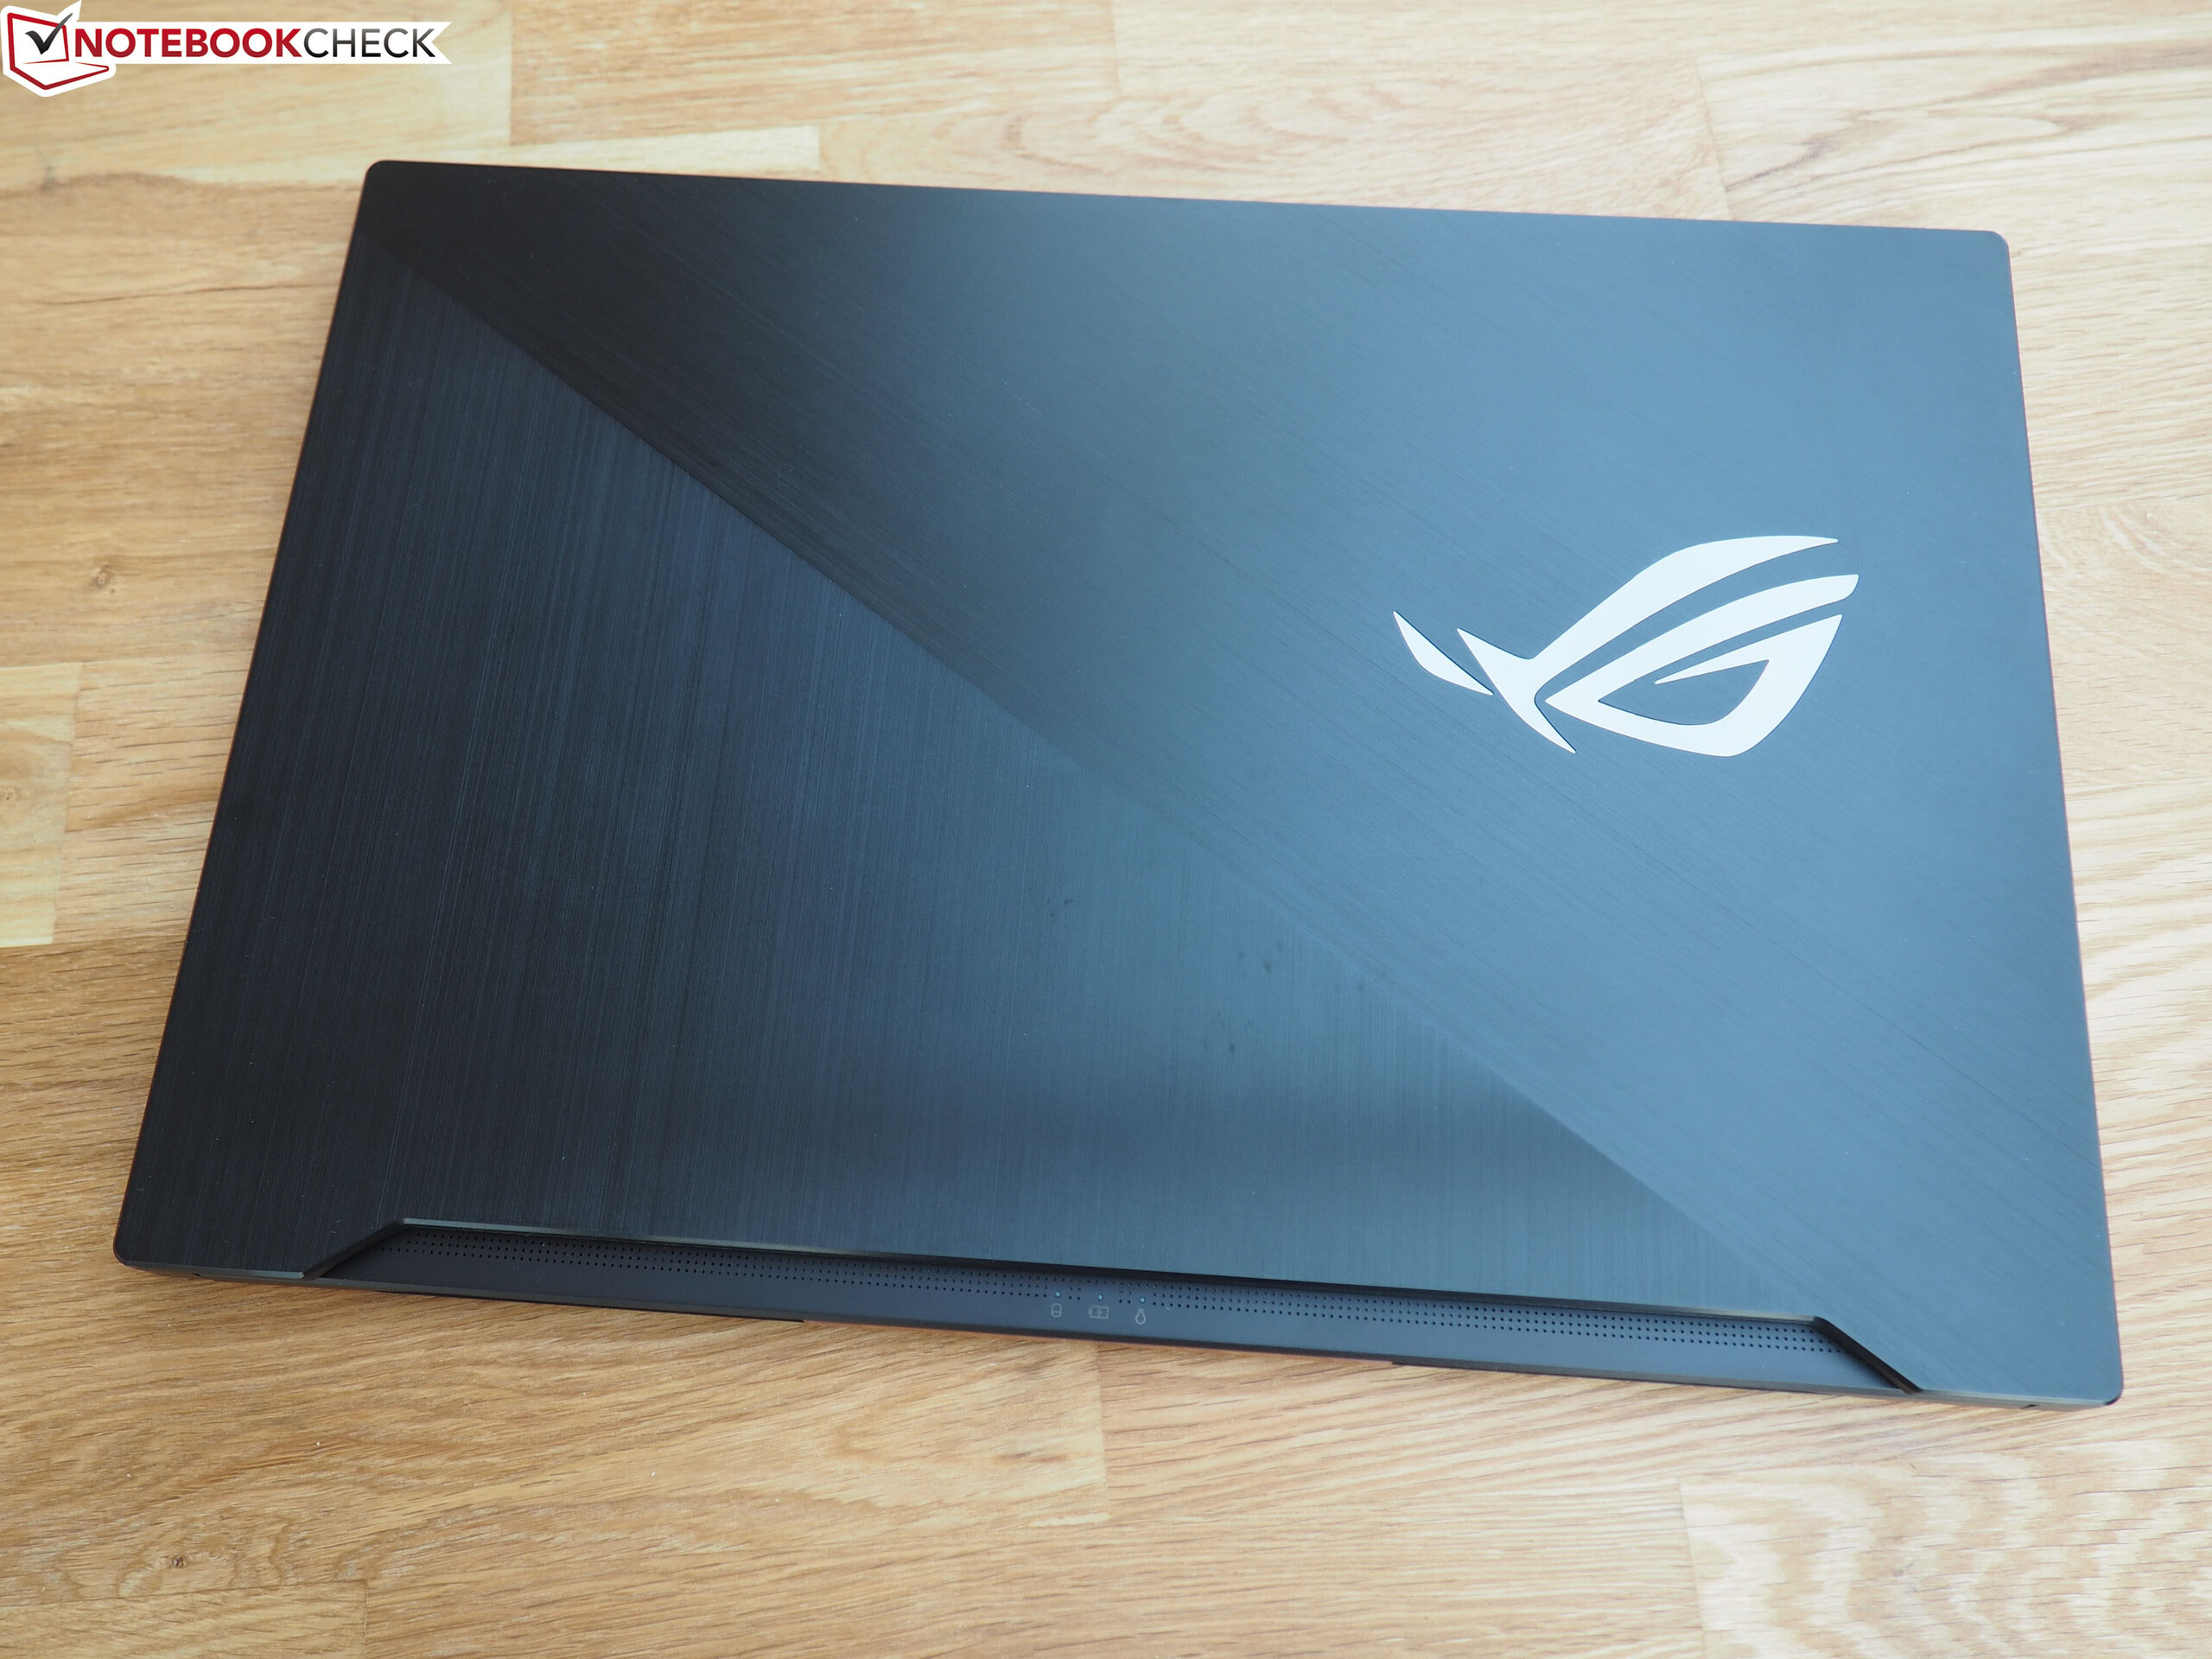

The case is very well built. The display lid, which is made of brushed metal, is just as impressive as the chassis, which is adorned with a copper stripe running along the edges. The fan grills at the back have the same color as the stripe that we mentioned in the previous sentence.
Asus could have spent some more time improving the hinges. For one thing, the opening angle is not particularly wide, and for another, the display lid closes on its own at certain angles. The GX701 scores some major points for its small dimensions. Thanks to the very thin display bezels, the notebook has a footprint of only 39.9 x 27.2 cm (15.7 x 10.7 in). This is small for a 17-inch laptop. For instance, the recently reviewed and very heavy G703GX has a footprint of 42.5 x 31.9 cm (16.7 x 12.6 in).
Connectivity
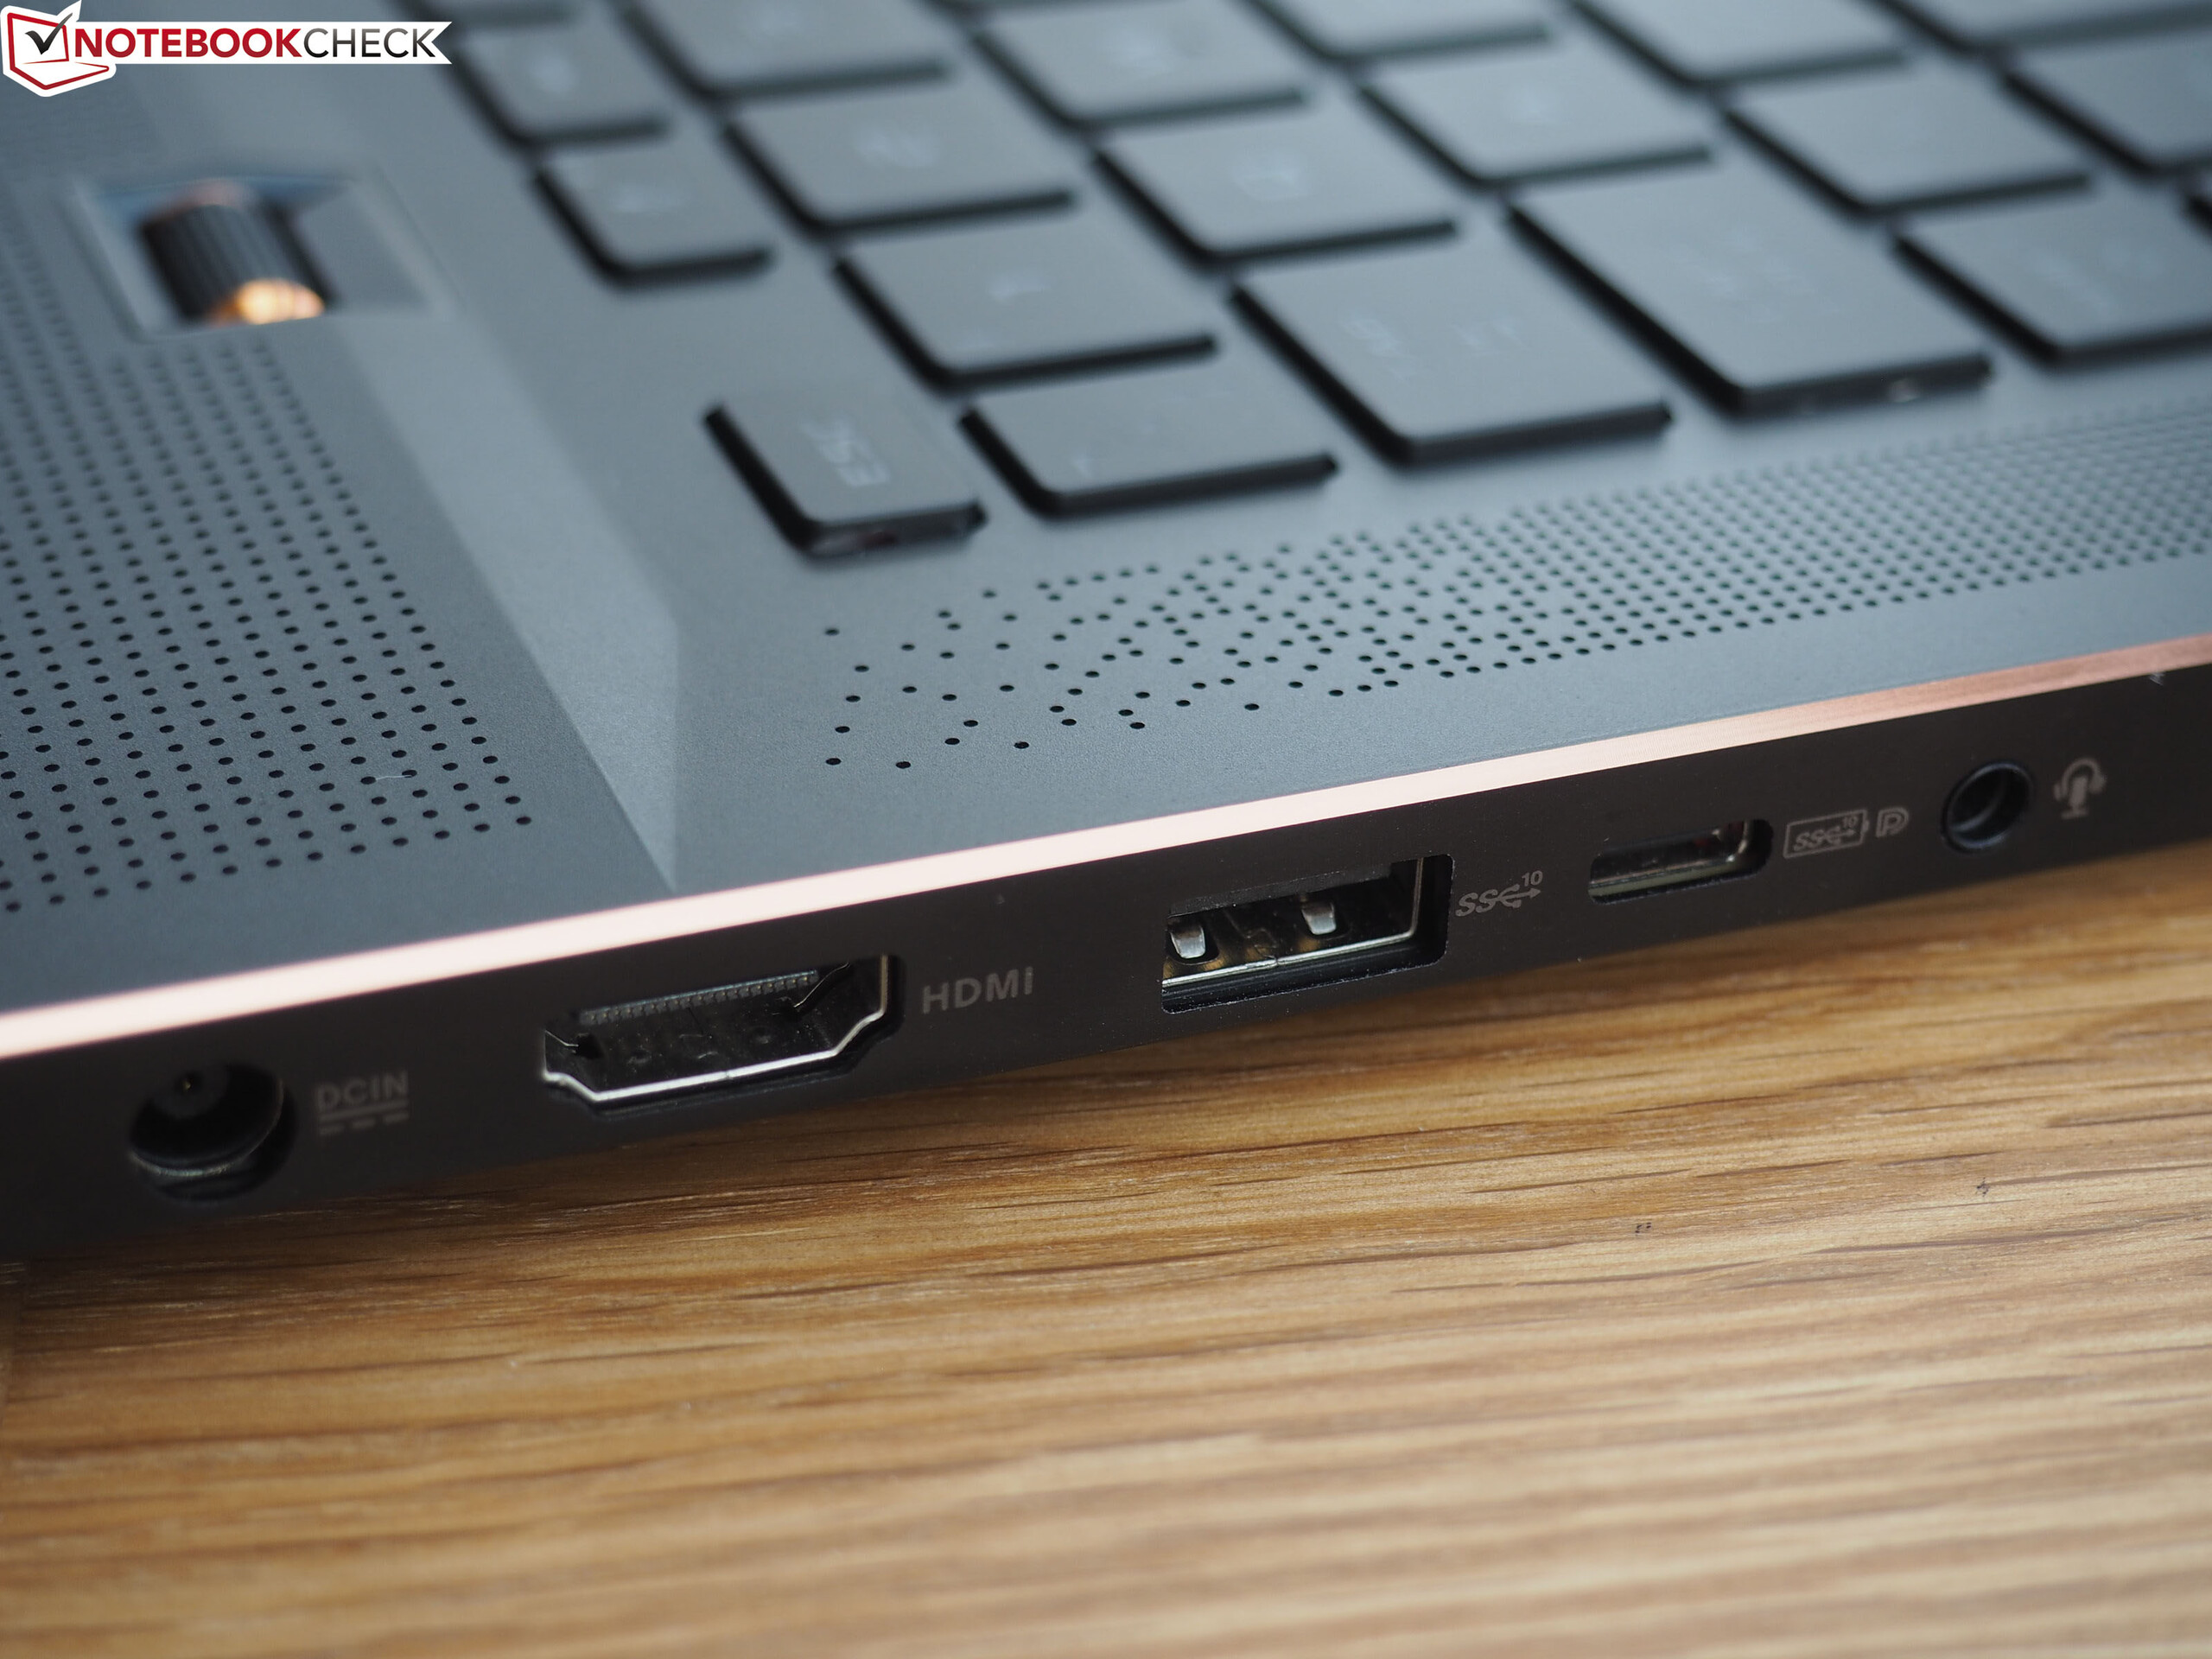
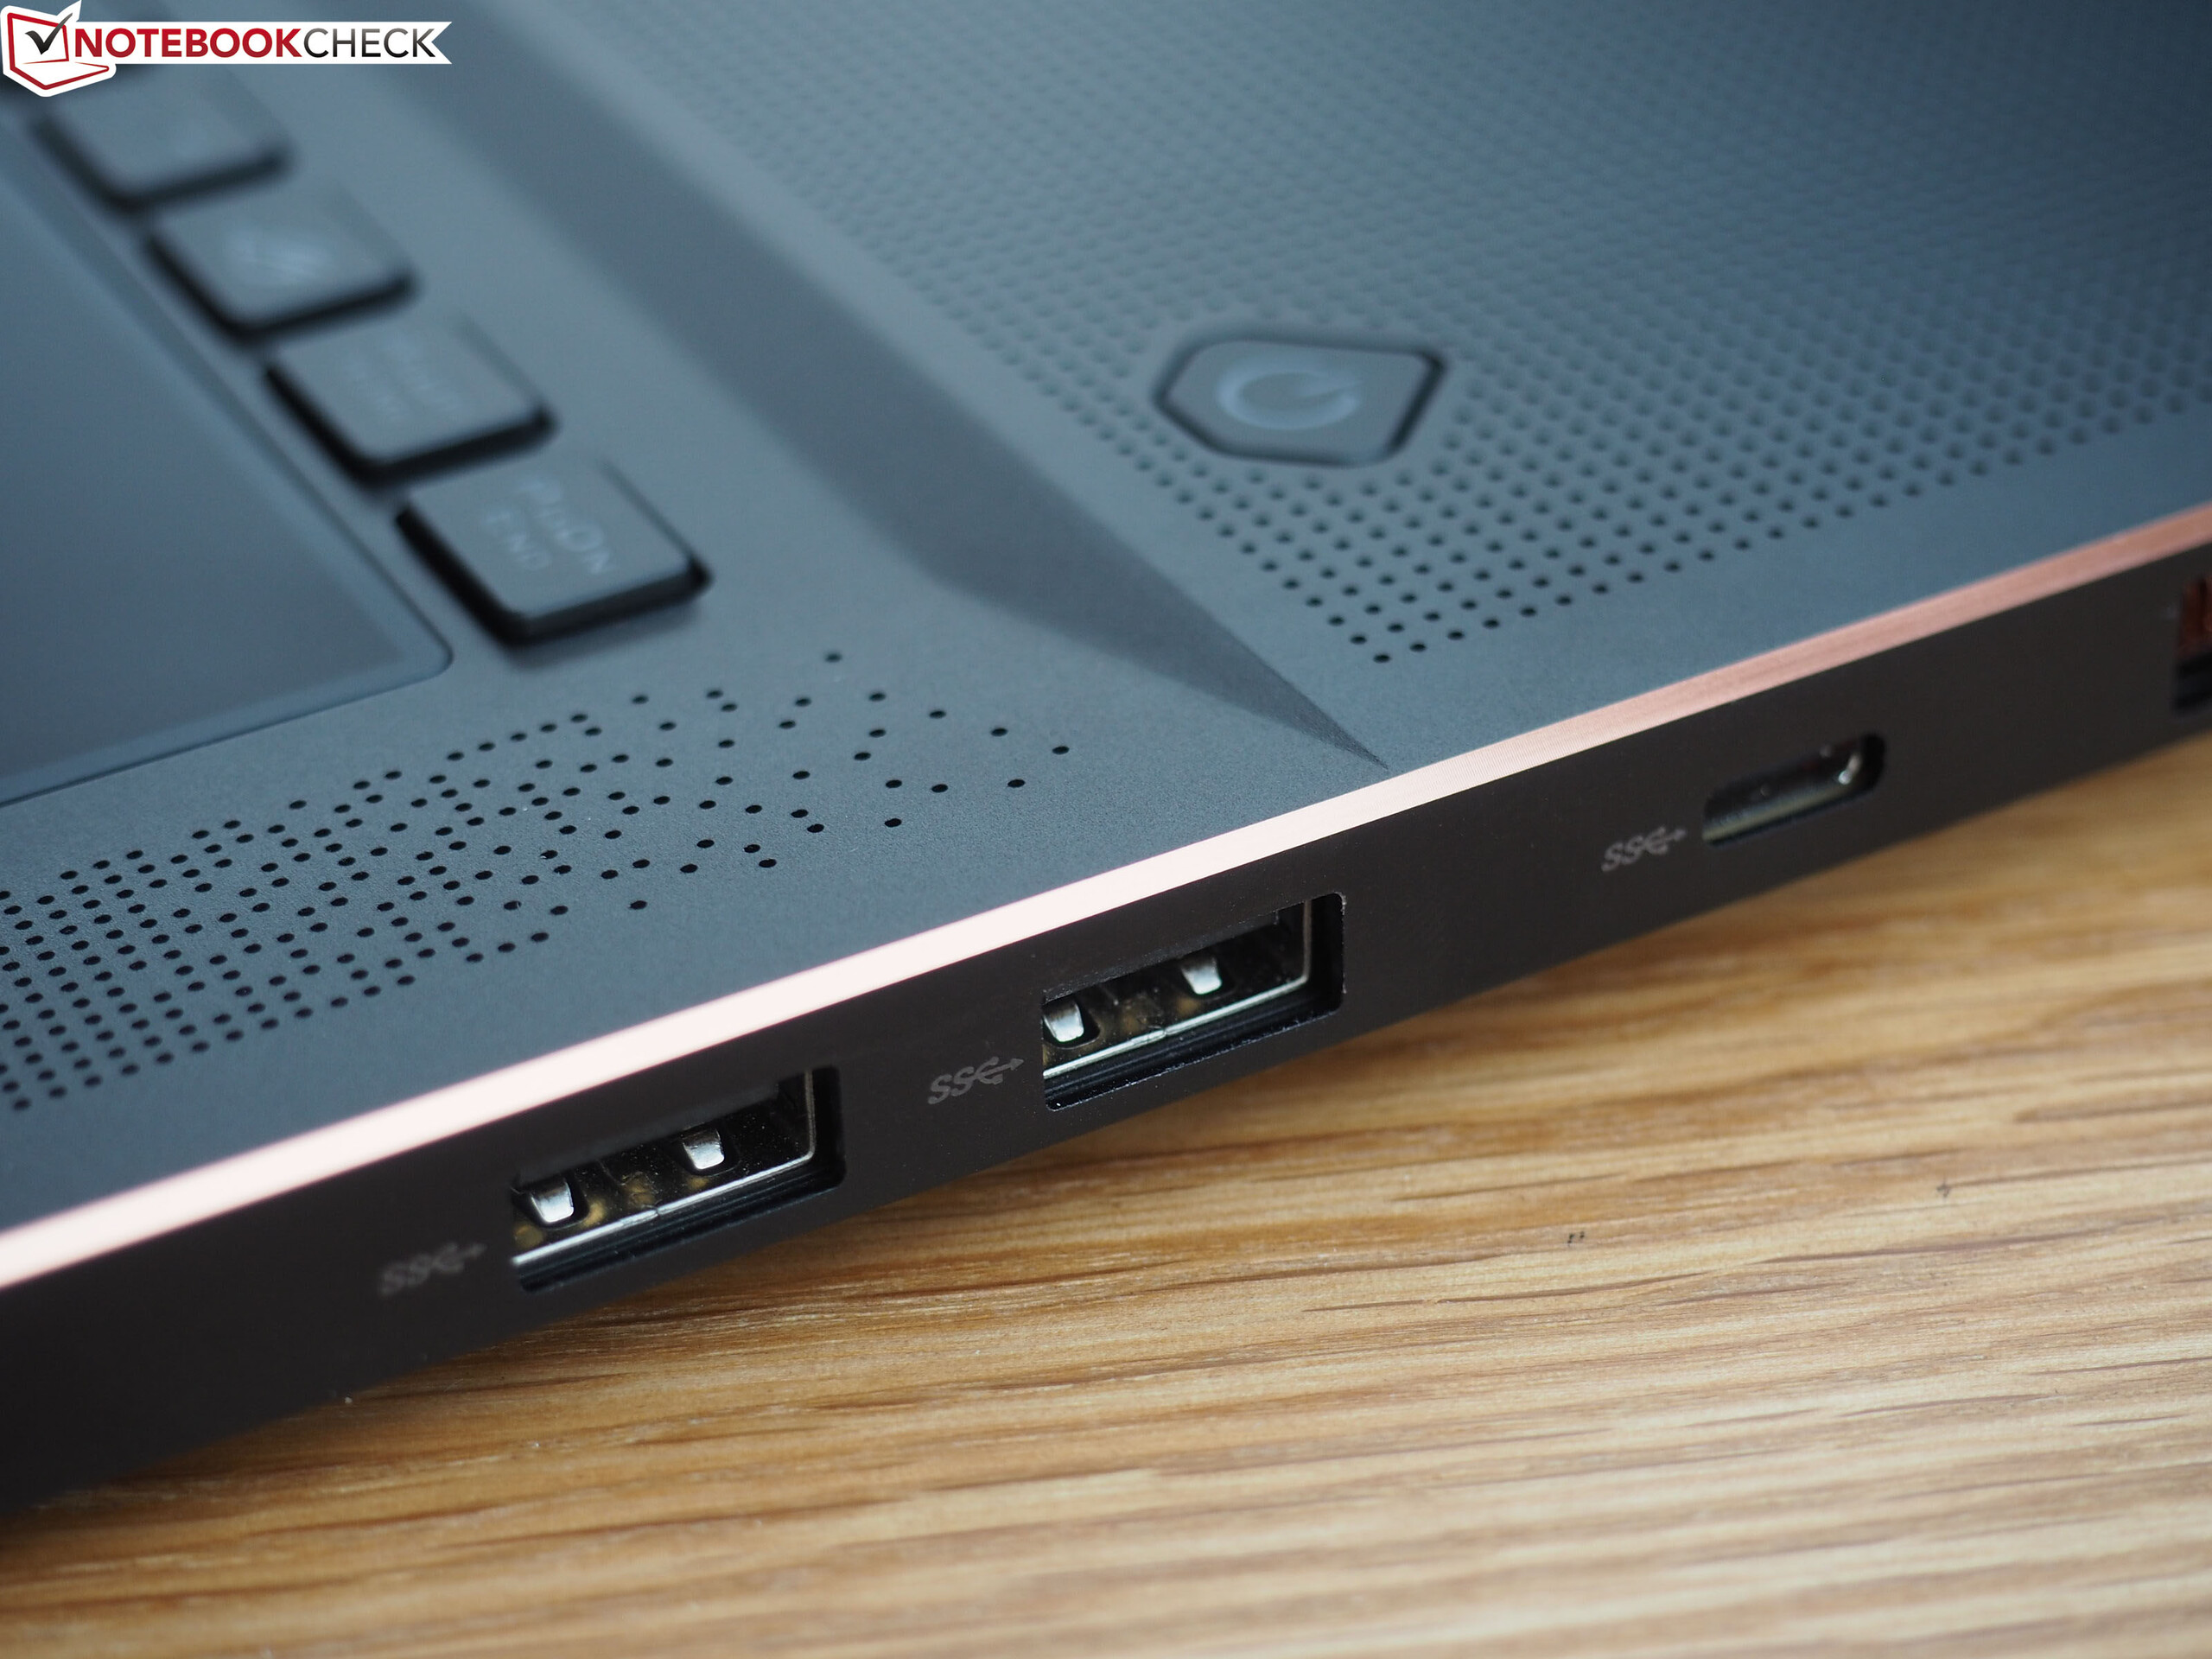
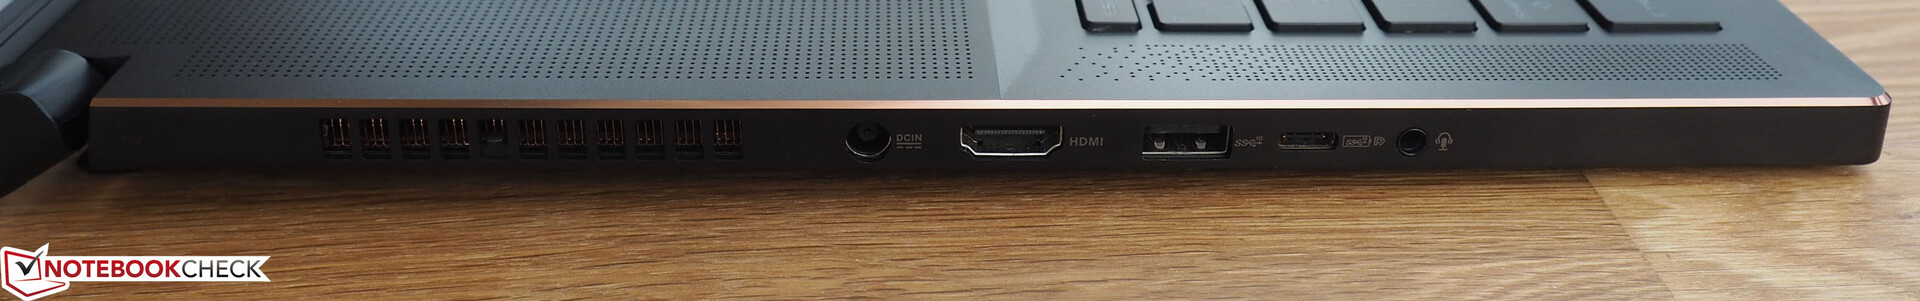
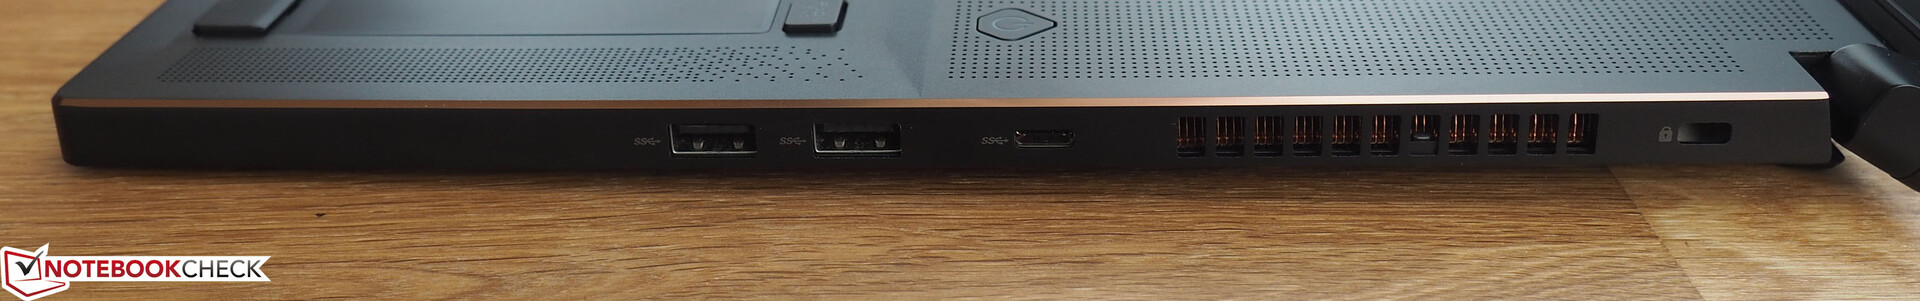
Ports
The selection of ports leaves a mixed impression. It is quite praiseworthy that the GX701 features five USB ports, three of which operate at 3.1 Gen2 speeds. However, it is a bit of a shame that the notebook does not have an SD card reader, RJ45 Gigabit LAN port and a Thunderbolt 3 port. This drawback is barely offset by an HDMI 2.0 video output (DisplayPort 1.4 via USB-C), the headphone jack and the Kensington Security Slot.
We are also not particularly happy with the positioning of the ports. Because both sides feature heat sinks, the ports are located very close to the wrist rest, which means that when you are using wired external mice, the wires are bound to get in the way.
Communication
When it comes to Wi-Fi performance, the GX701 shines. The manufacturer uses a lightning-fast Killer Wireless-AC 1550i Wi-Fi adapter, which performs just as well as the Intel Wireless-AC 9560. This Wi-Fi module is very close to the 700 Mb/s mark both when sending and receiving data (when it is one meter (~3 ft) away from our reference-grade router Linksys EA8500).
Software
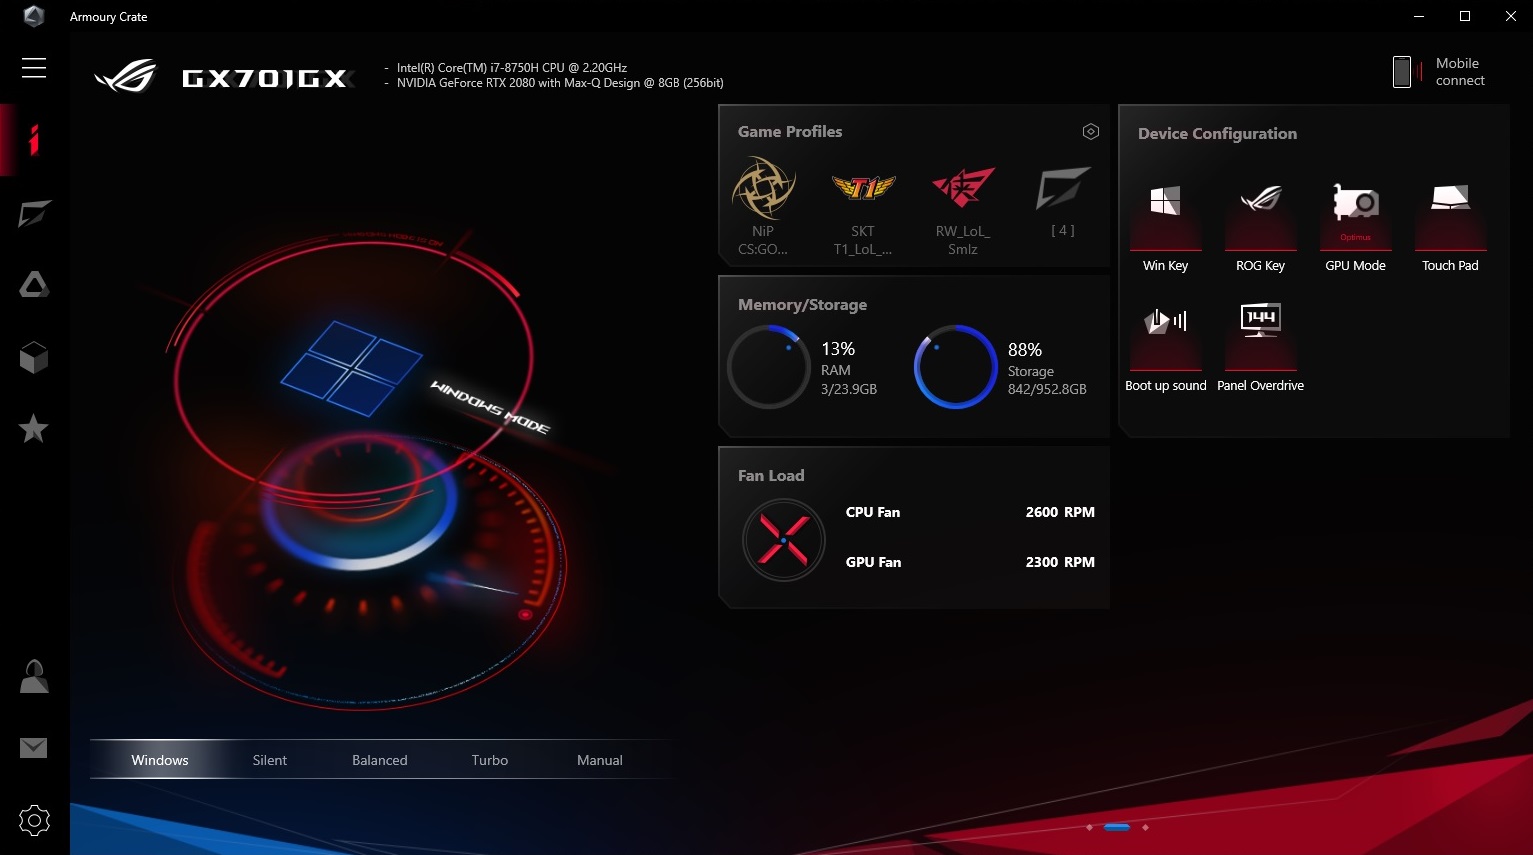
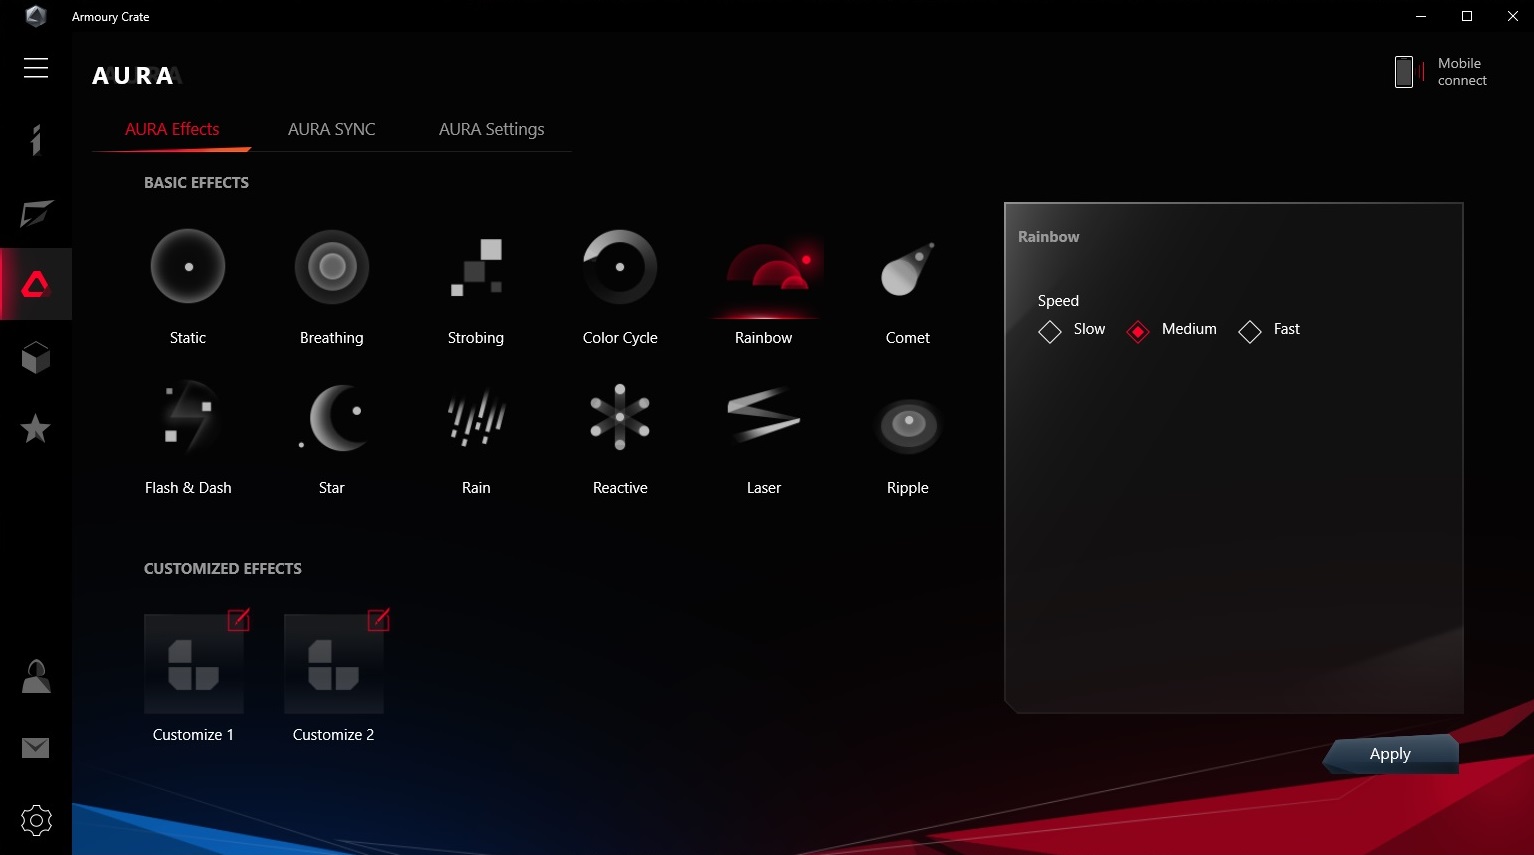
As per usual, users get a pretty nice software package from Asus. Here, the utility called “Armoury Crate” takes center stage. You can change dozens of settings through this app. The first tab is of most interest. Here, you can see the memory utilization and the fan speed. This tab also allows you to choose between a number of different power modes such as “Silent”, “Balanced” and “Turbo”. For our review, we picked the “Windows” mode, which uses the system’s power plan and is supposed to ensure a good balance between performance and system noise.
Important: You can choose between two GPU modes in “Armoury Crate”, namely Optimus (this technology enables automatic switching between a dedicated and an integrated graphics adapter) and G-Sync (anti-screen tearing technology). We would recommend the latter mode for gaming because Optimus seems to reduce the frame rate (see news). For traveling, though, the former mode is more appropriate.

Accessories
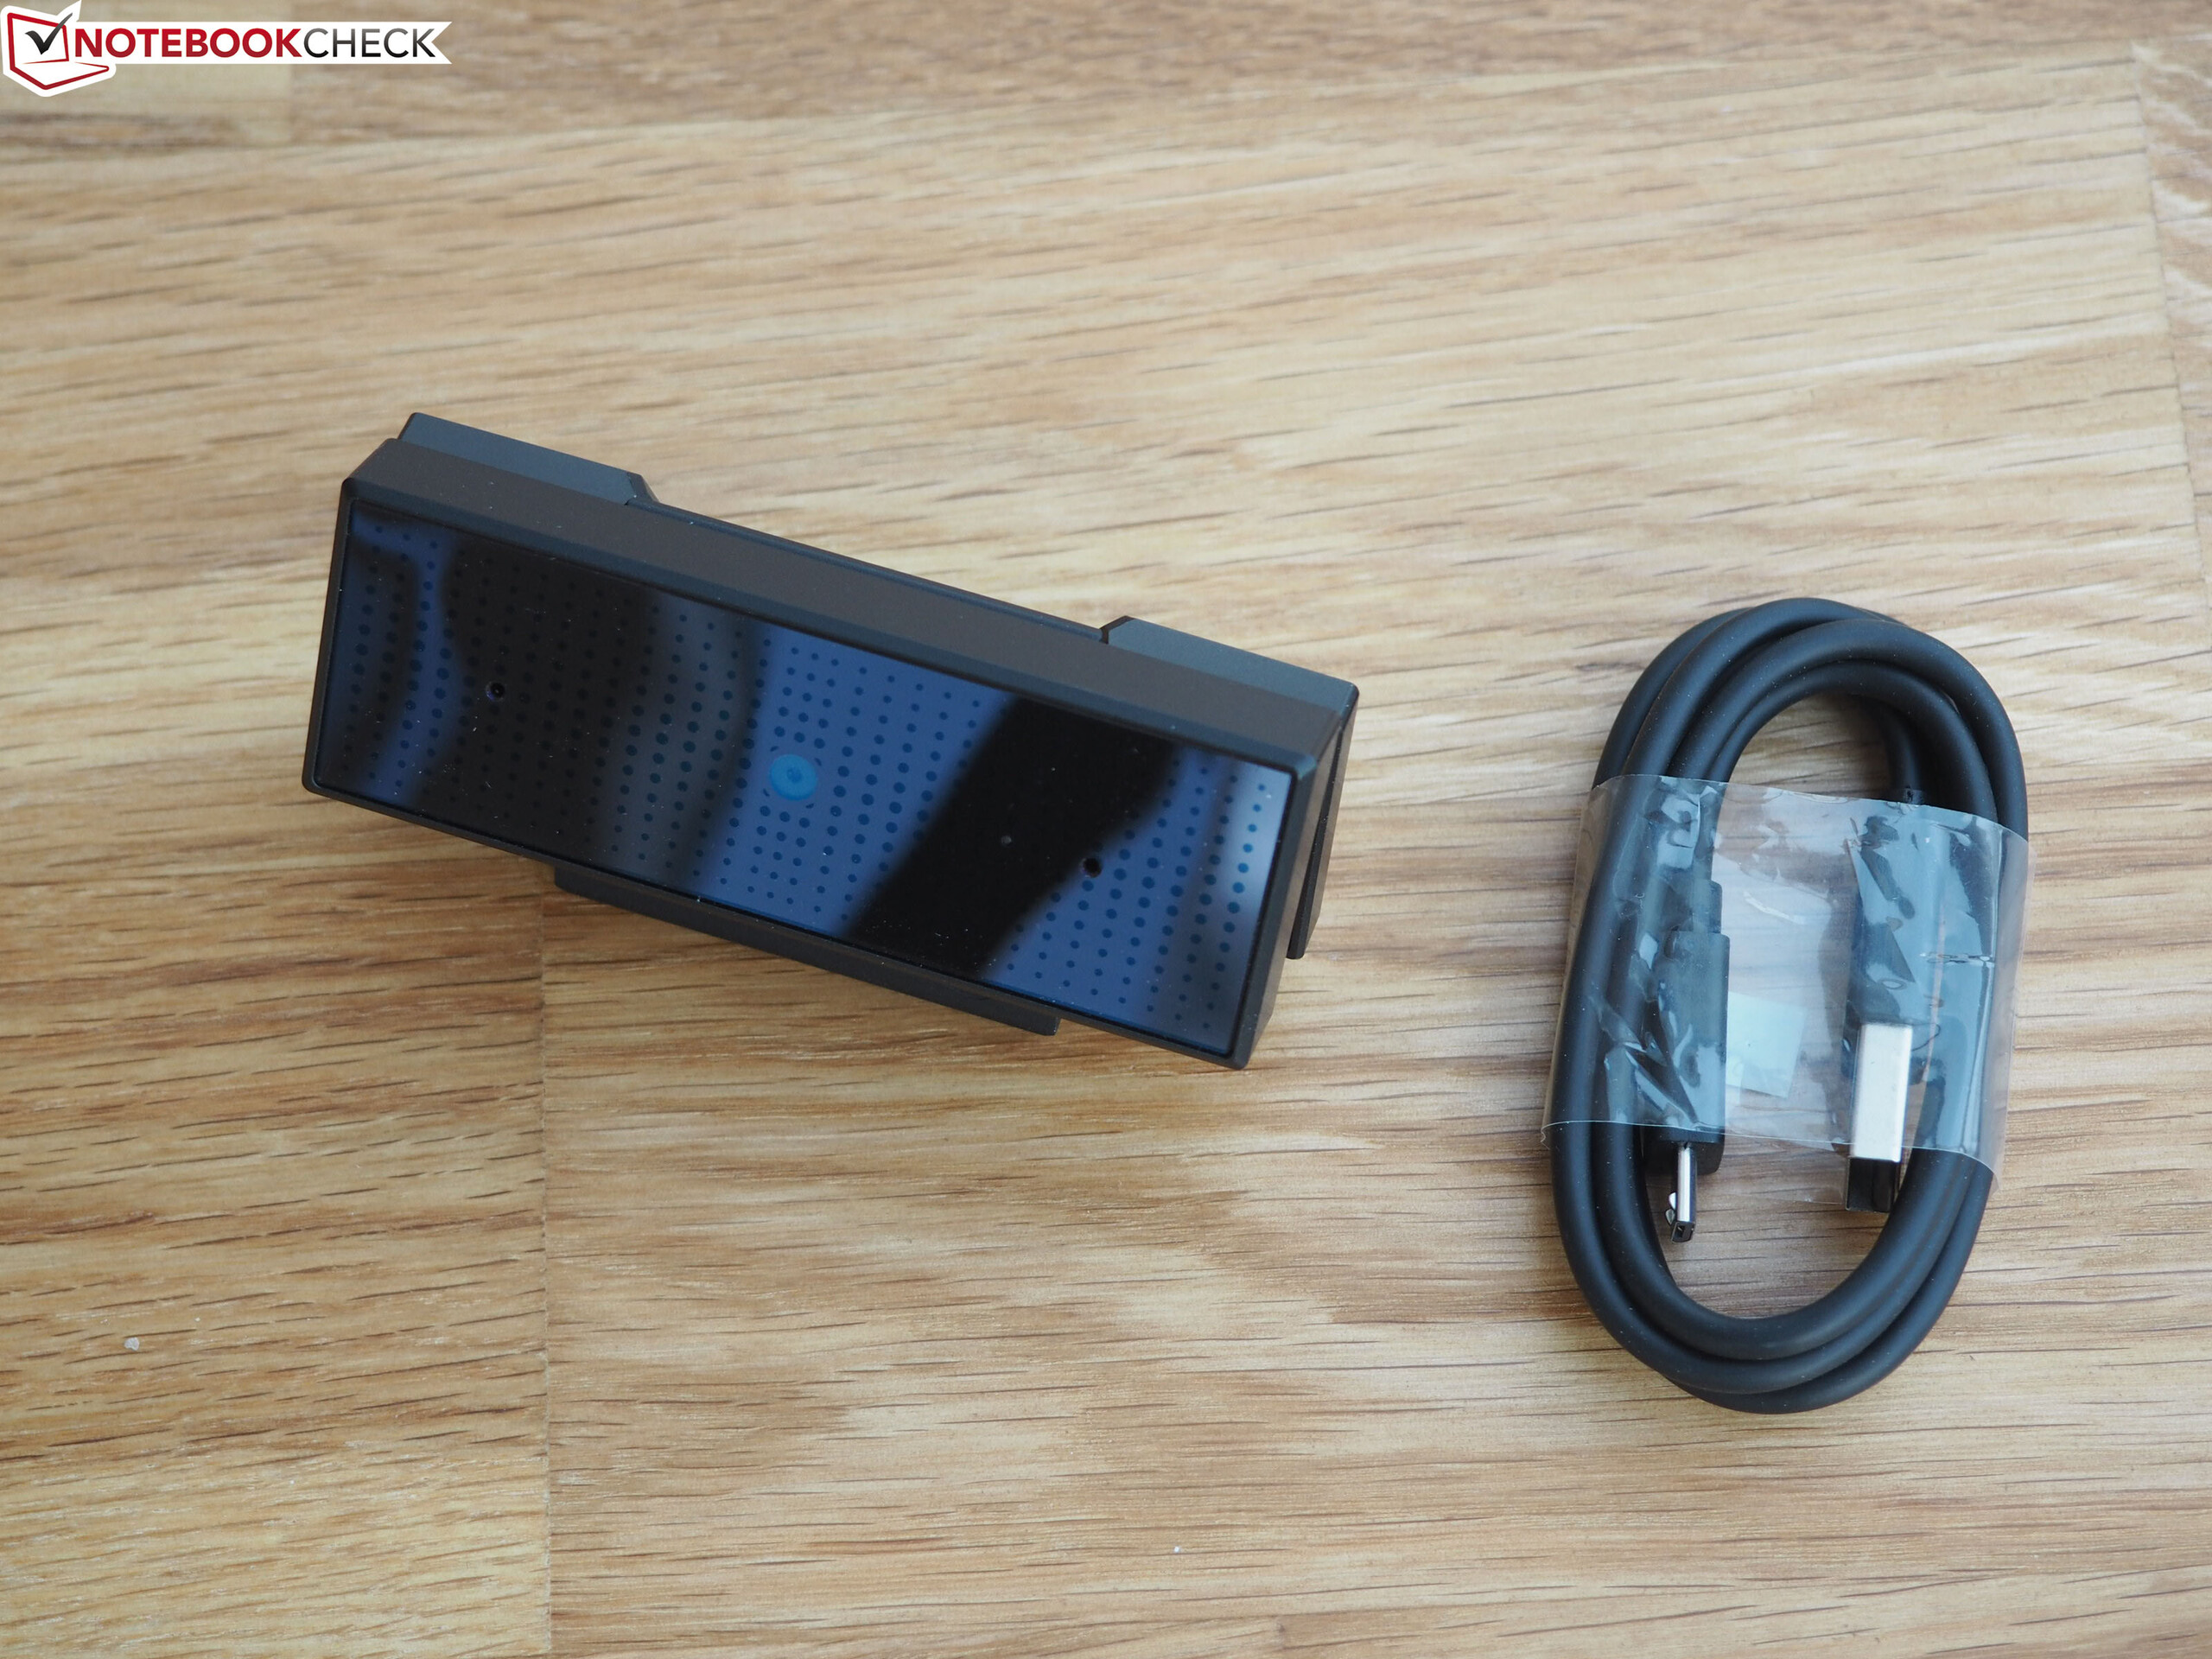
The box contains a 230-watt power adapter and (in certain regions) a small removable Full HD webcam, which can be placed either on a desk with the help of a small stand or on top of the display lid. The device itself does not feature a webcam, which is a pretty bold move on Asus’s part.
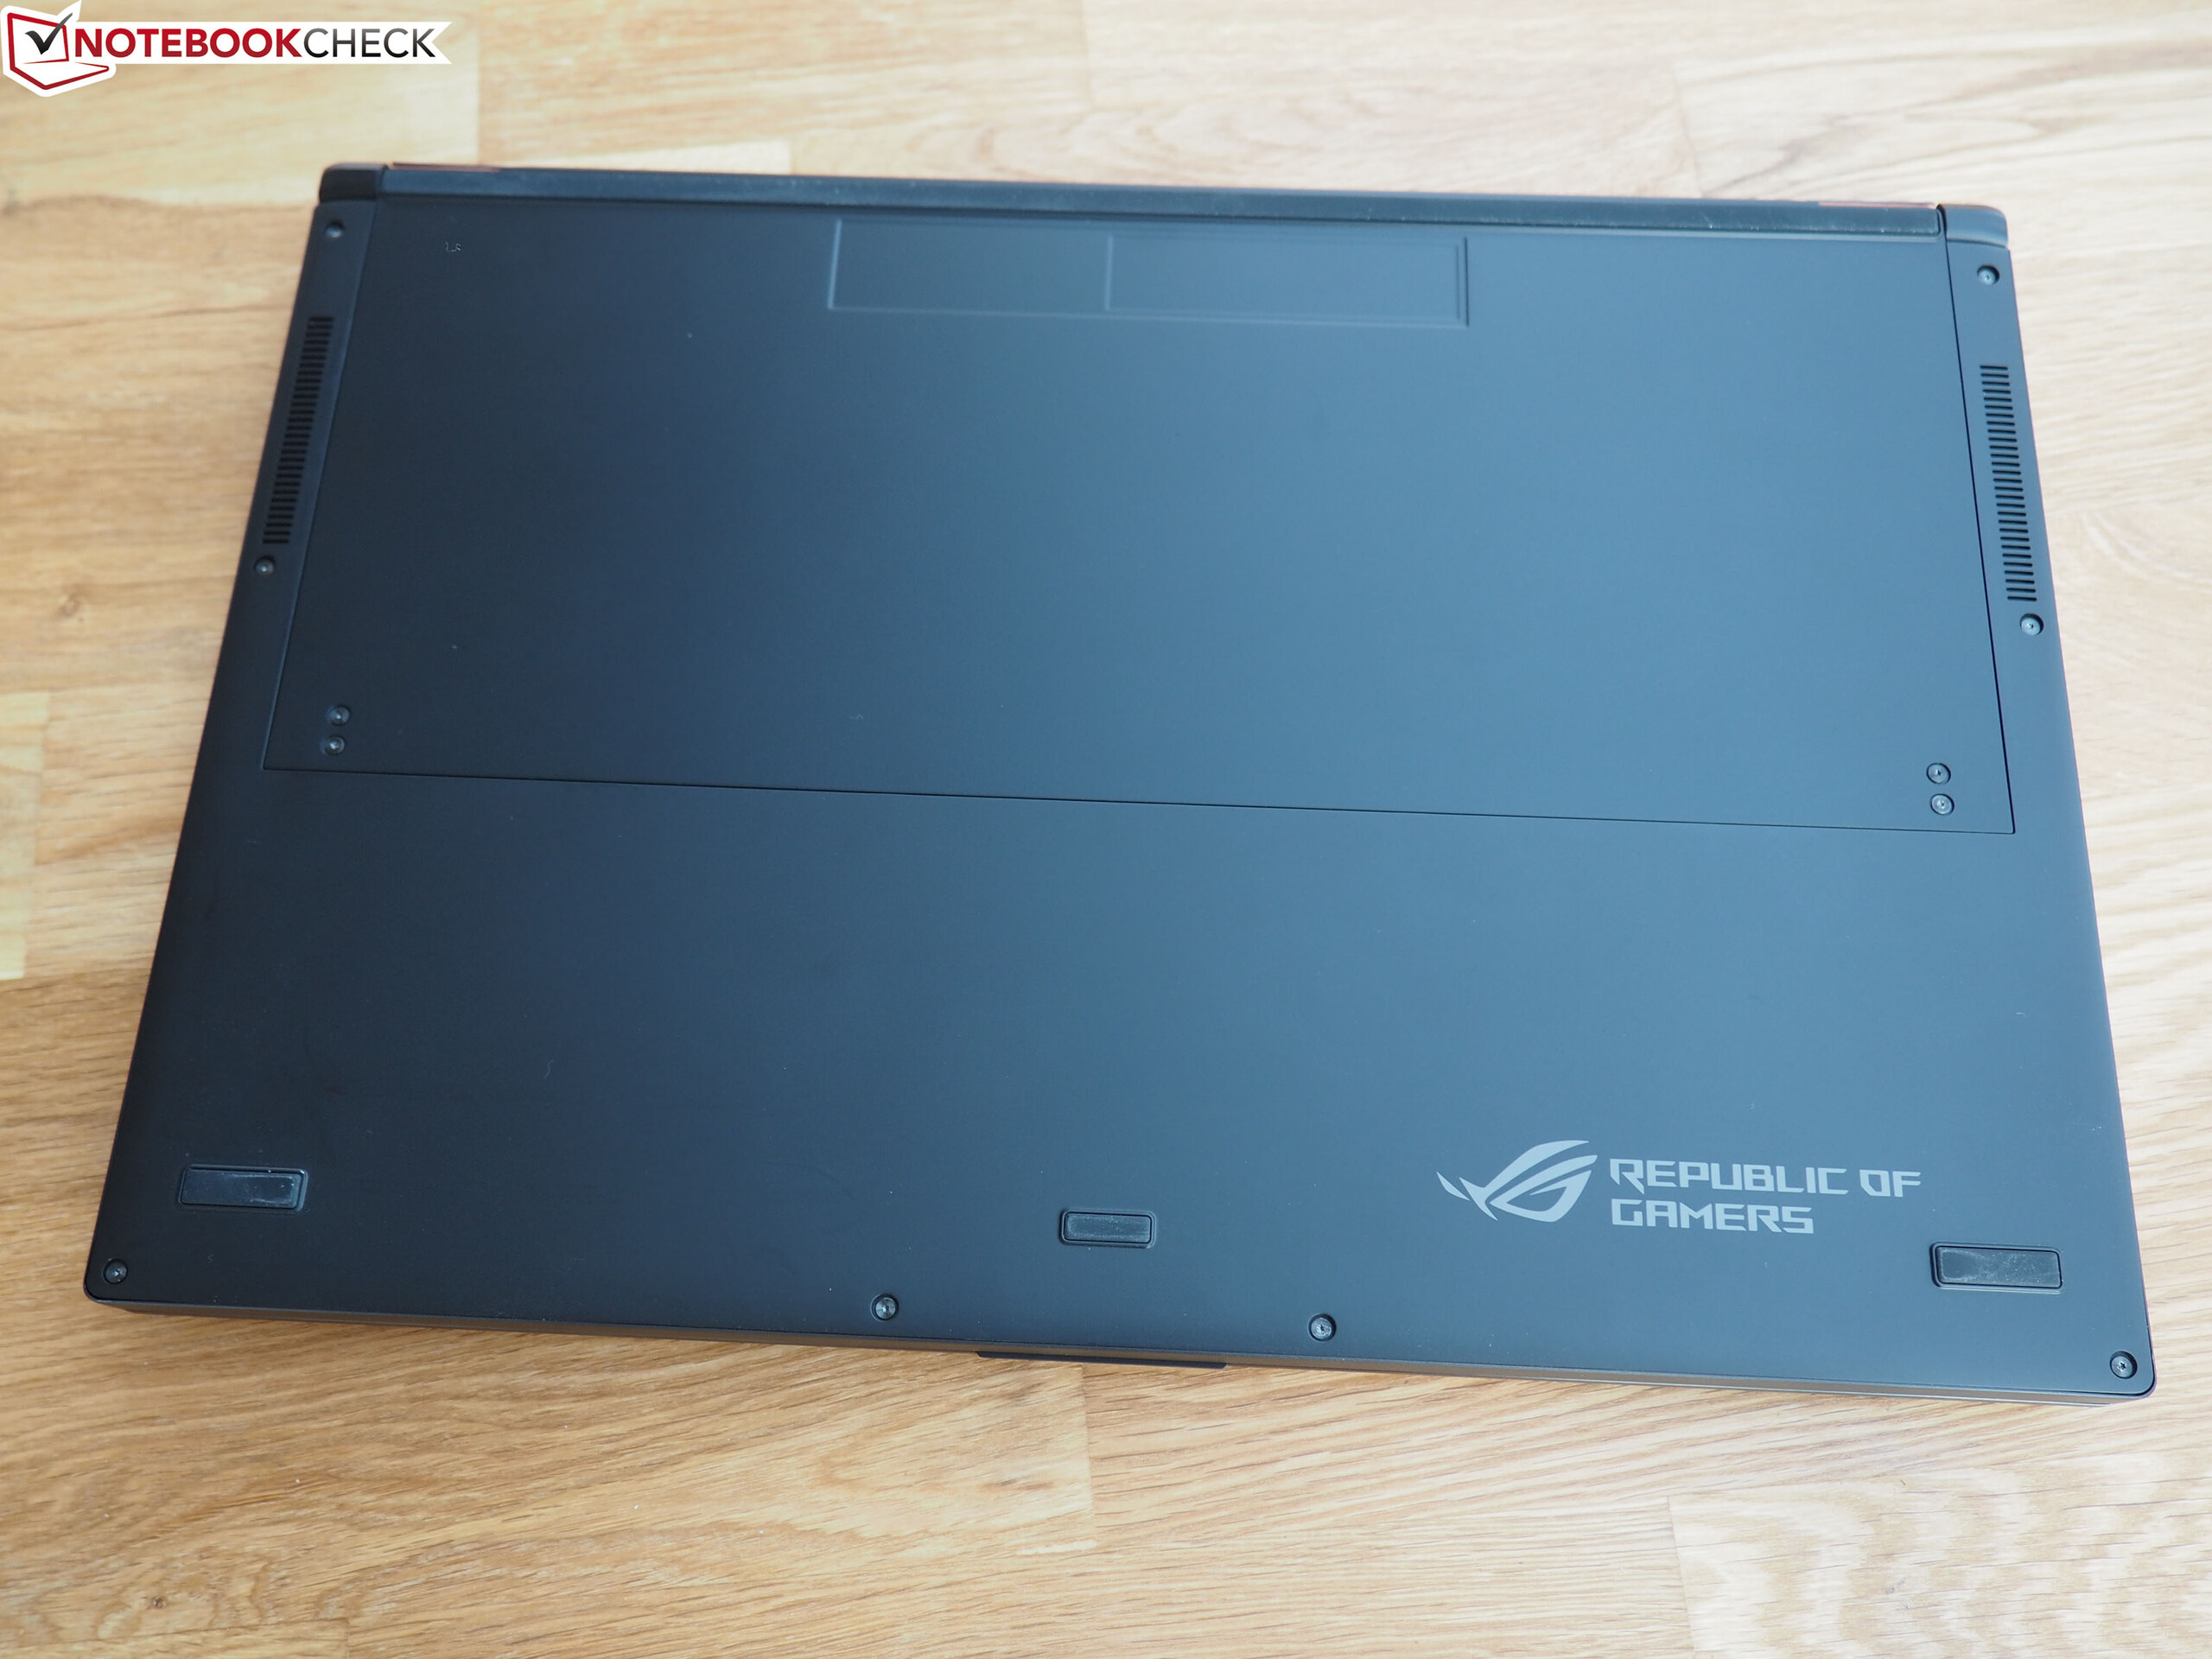
Maintenance
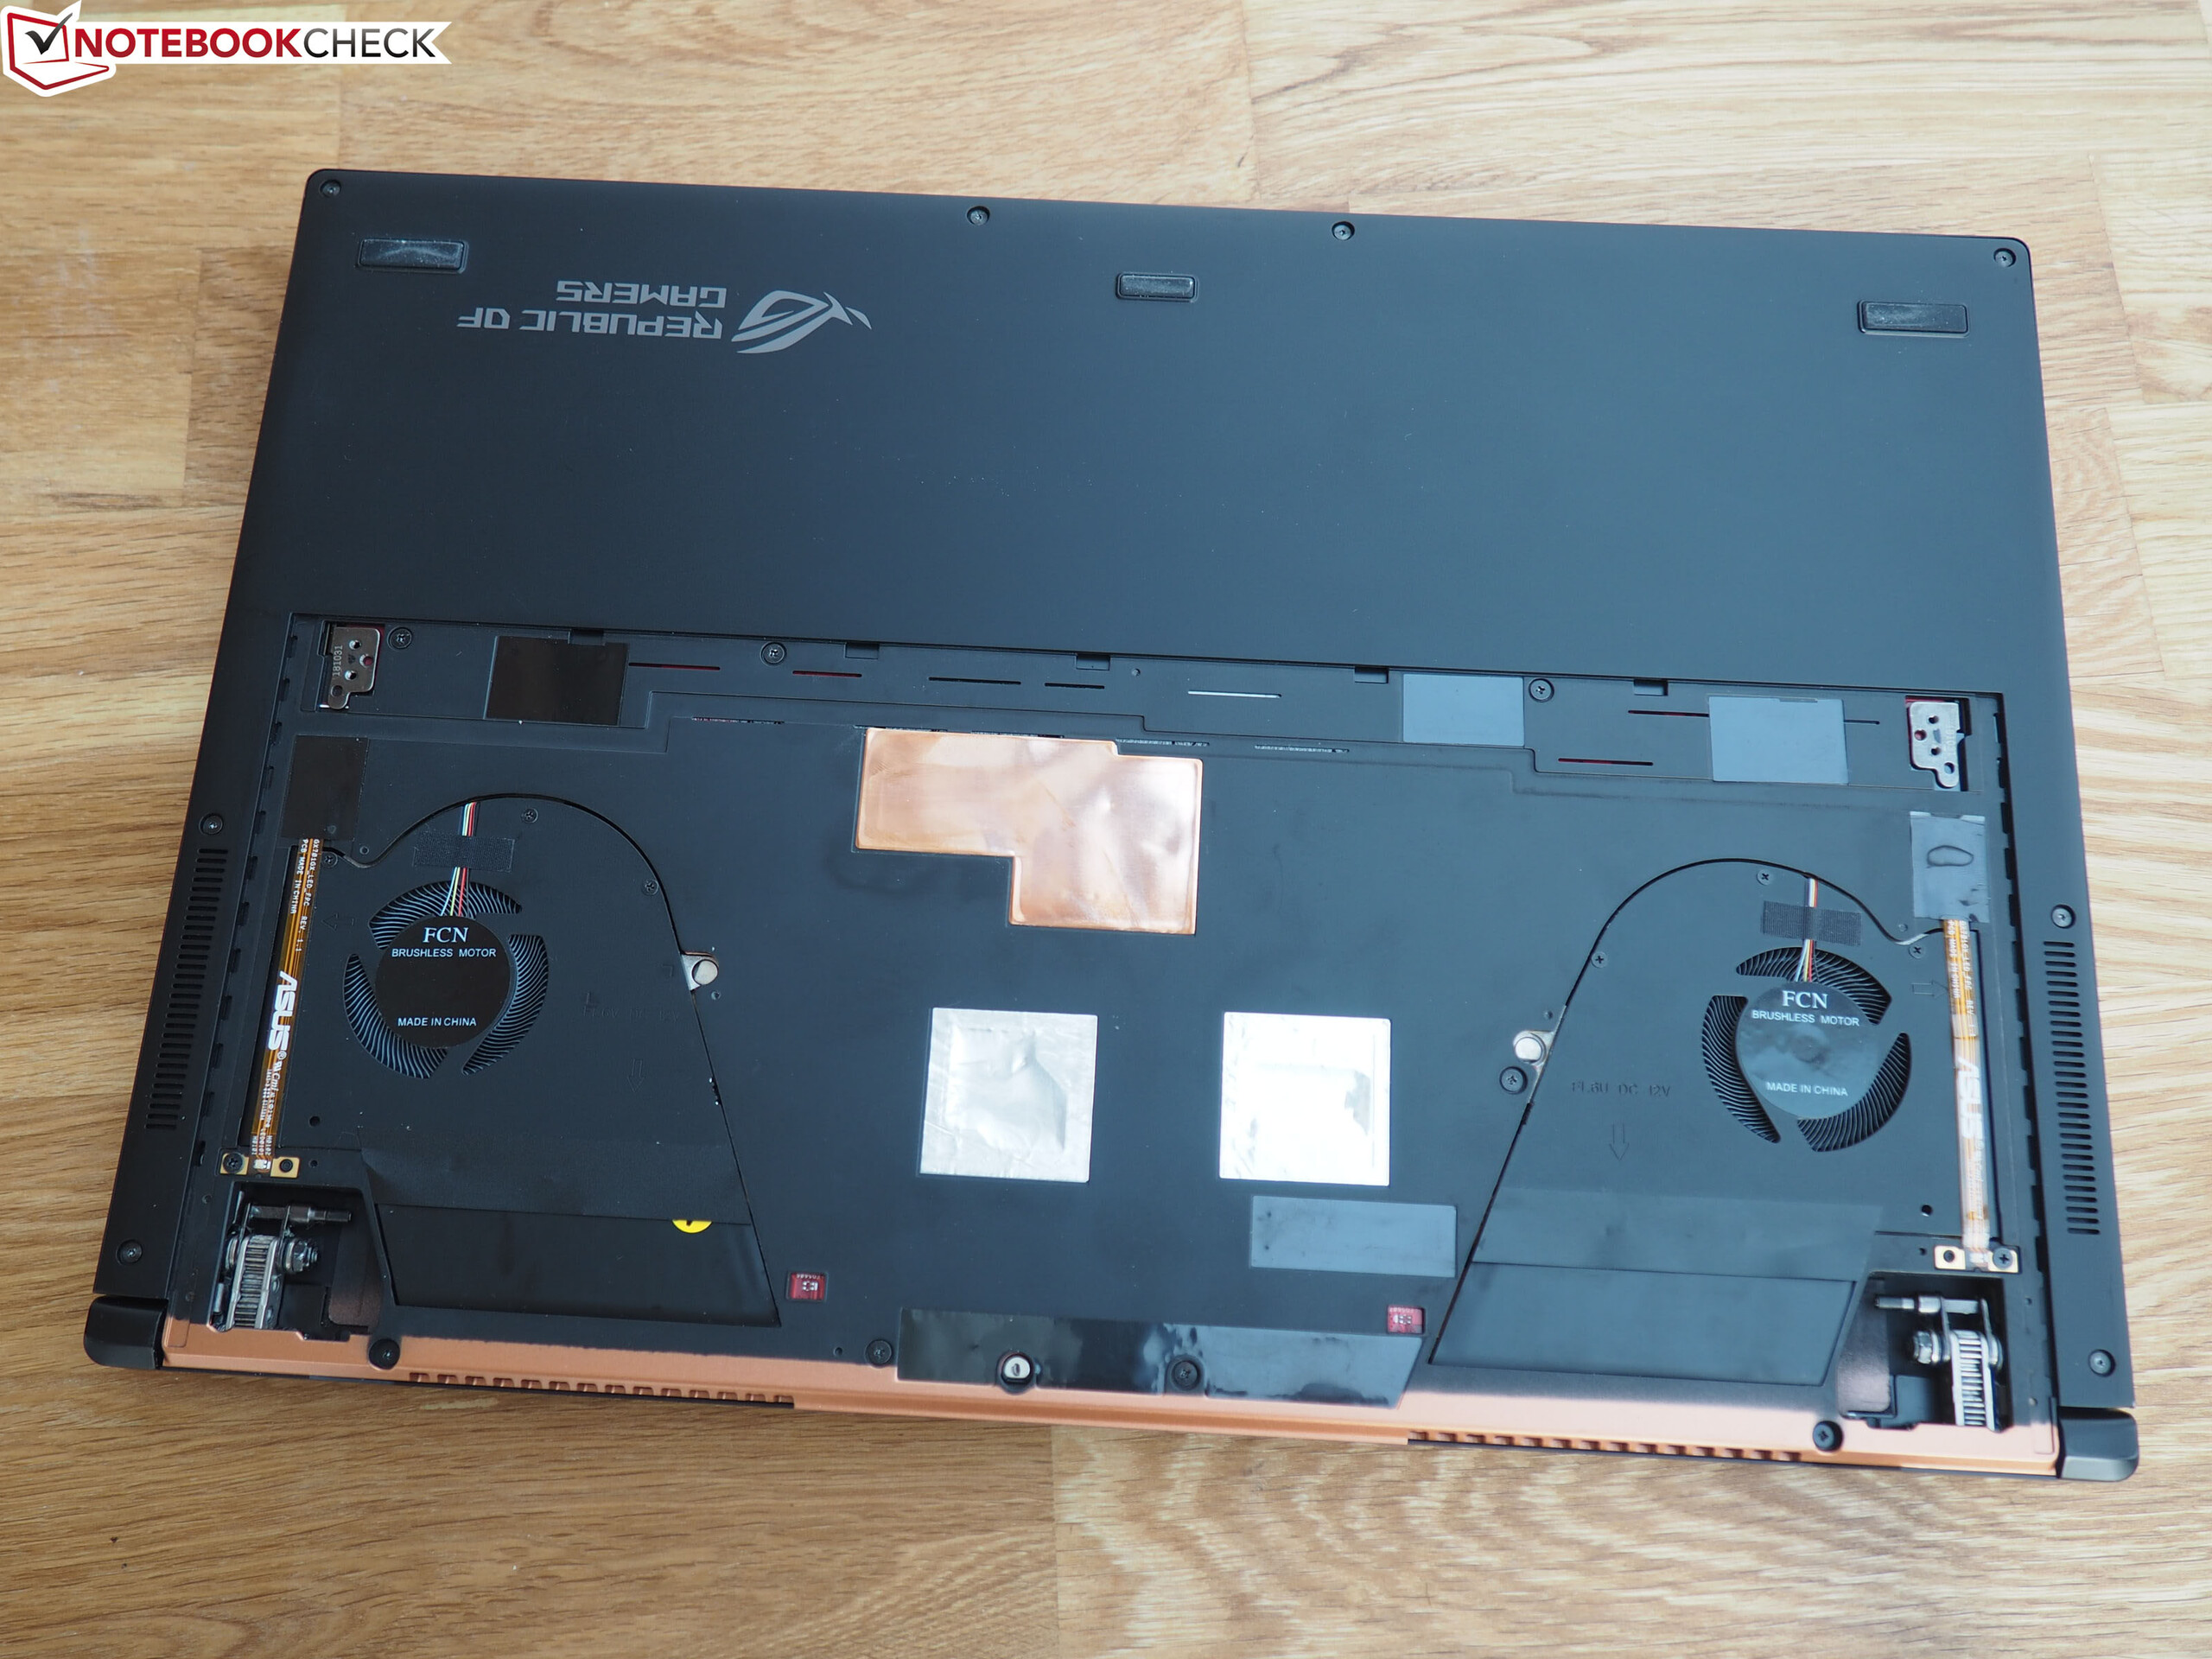
The maintenance options are very limited. Once you remove the four Torx screws keeping the bottom cover in place, you will only have access to the fans. In order to get to other internal components such as the CPU, GPU, RAM and the SSD, you will have to take the entire chassis apart, which is certain to scare off a whole lot of laymen. Here, Asus should take a lesson from the Razer Blade 15 and the Gigabyte Aero 15.
Warranty
The Asus notebook has a 24-month warranty.
Input Devices
Keyboard
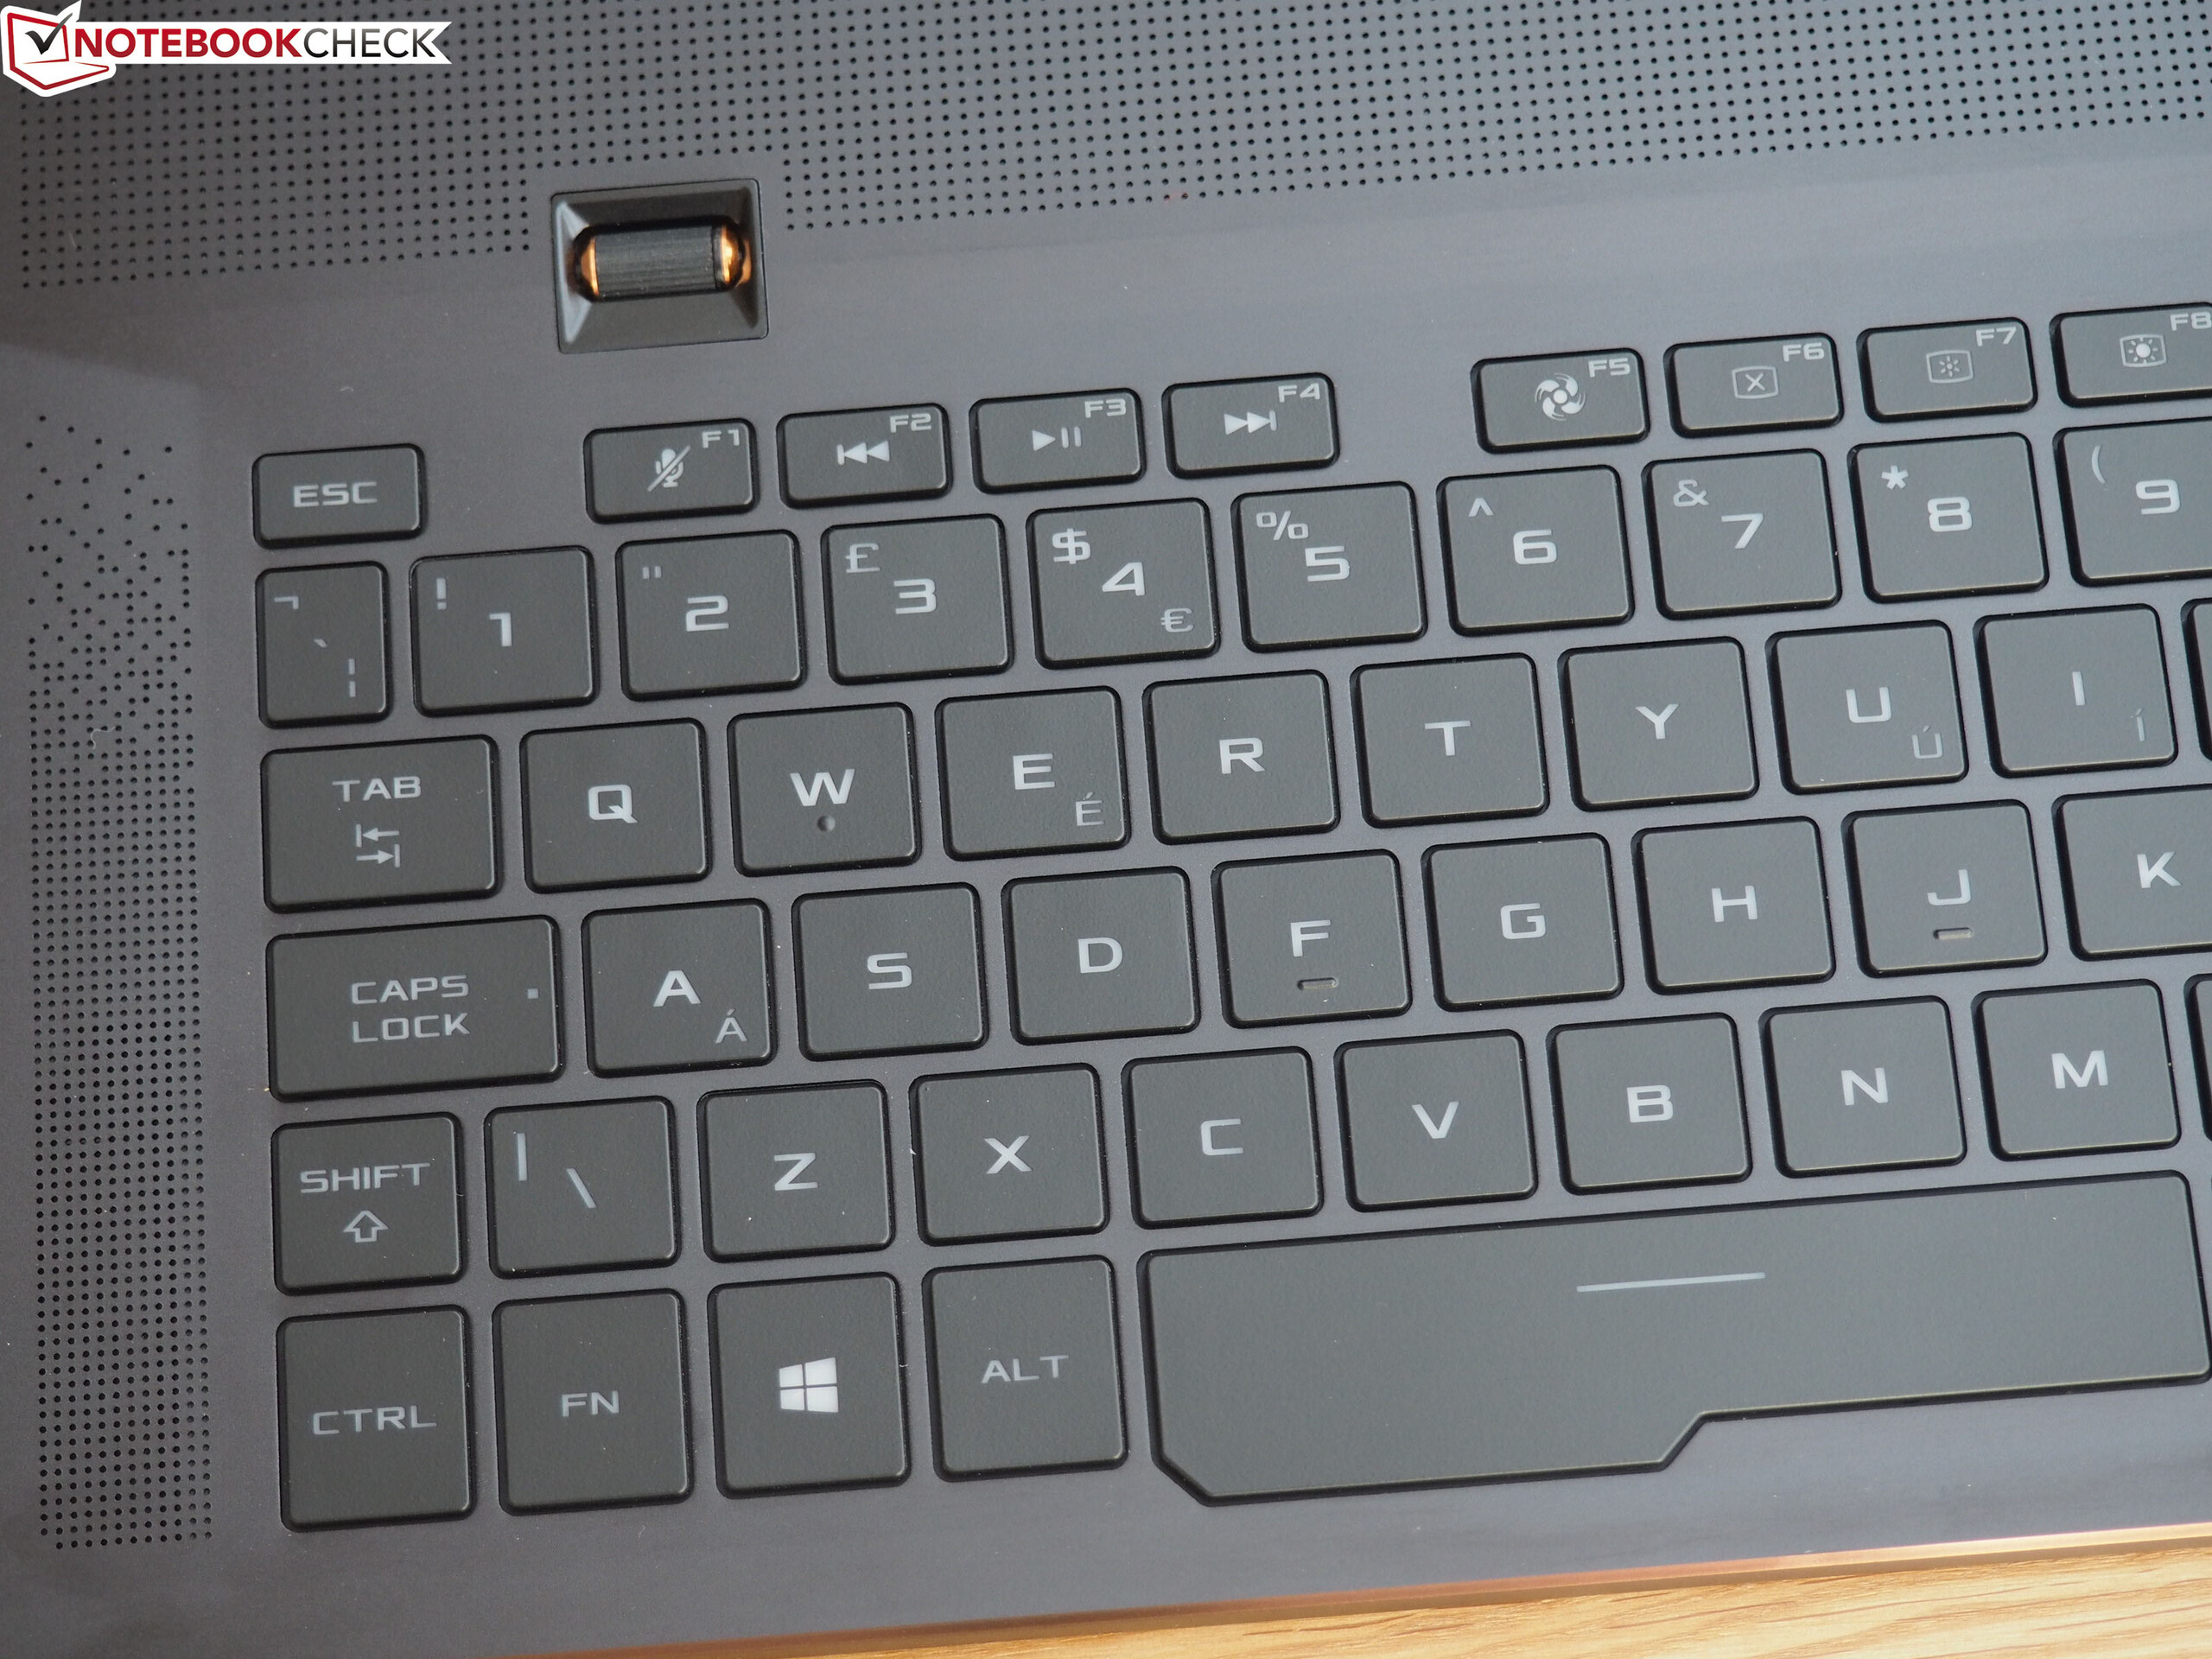
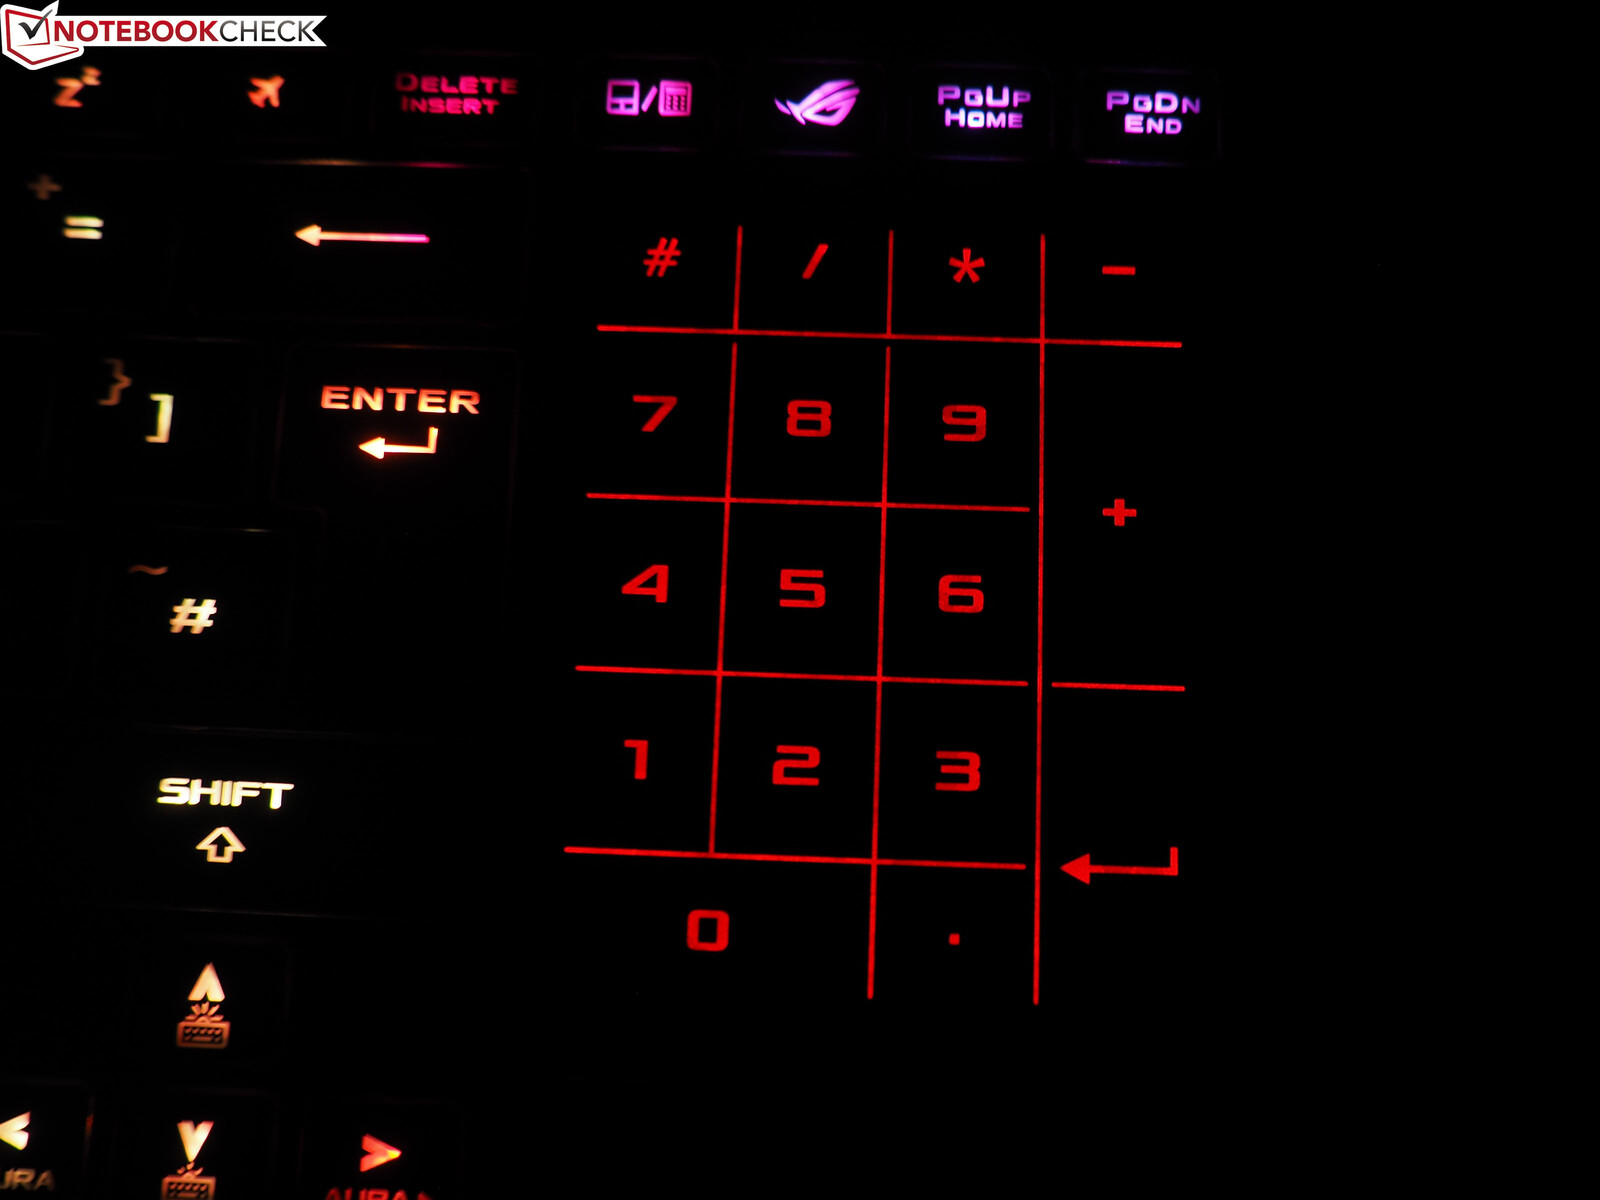
The keyboard is just okay. It is nothing to get excited about. It does not provide a lot of feedback. When compared to other gaming notebooks, the actuation point does not feel clear and the keys feel mushy. Moreover, the travel distance is relatively short. The layout is also not something you would want to write home about. The small arrow keys in particular are not fit for gaming.
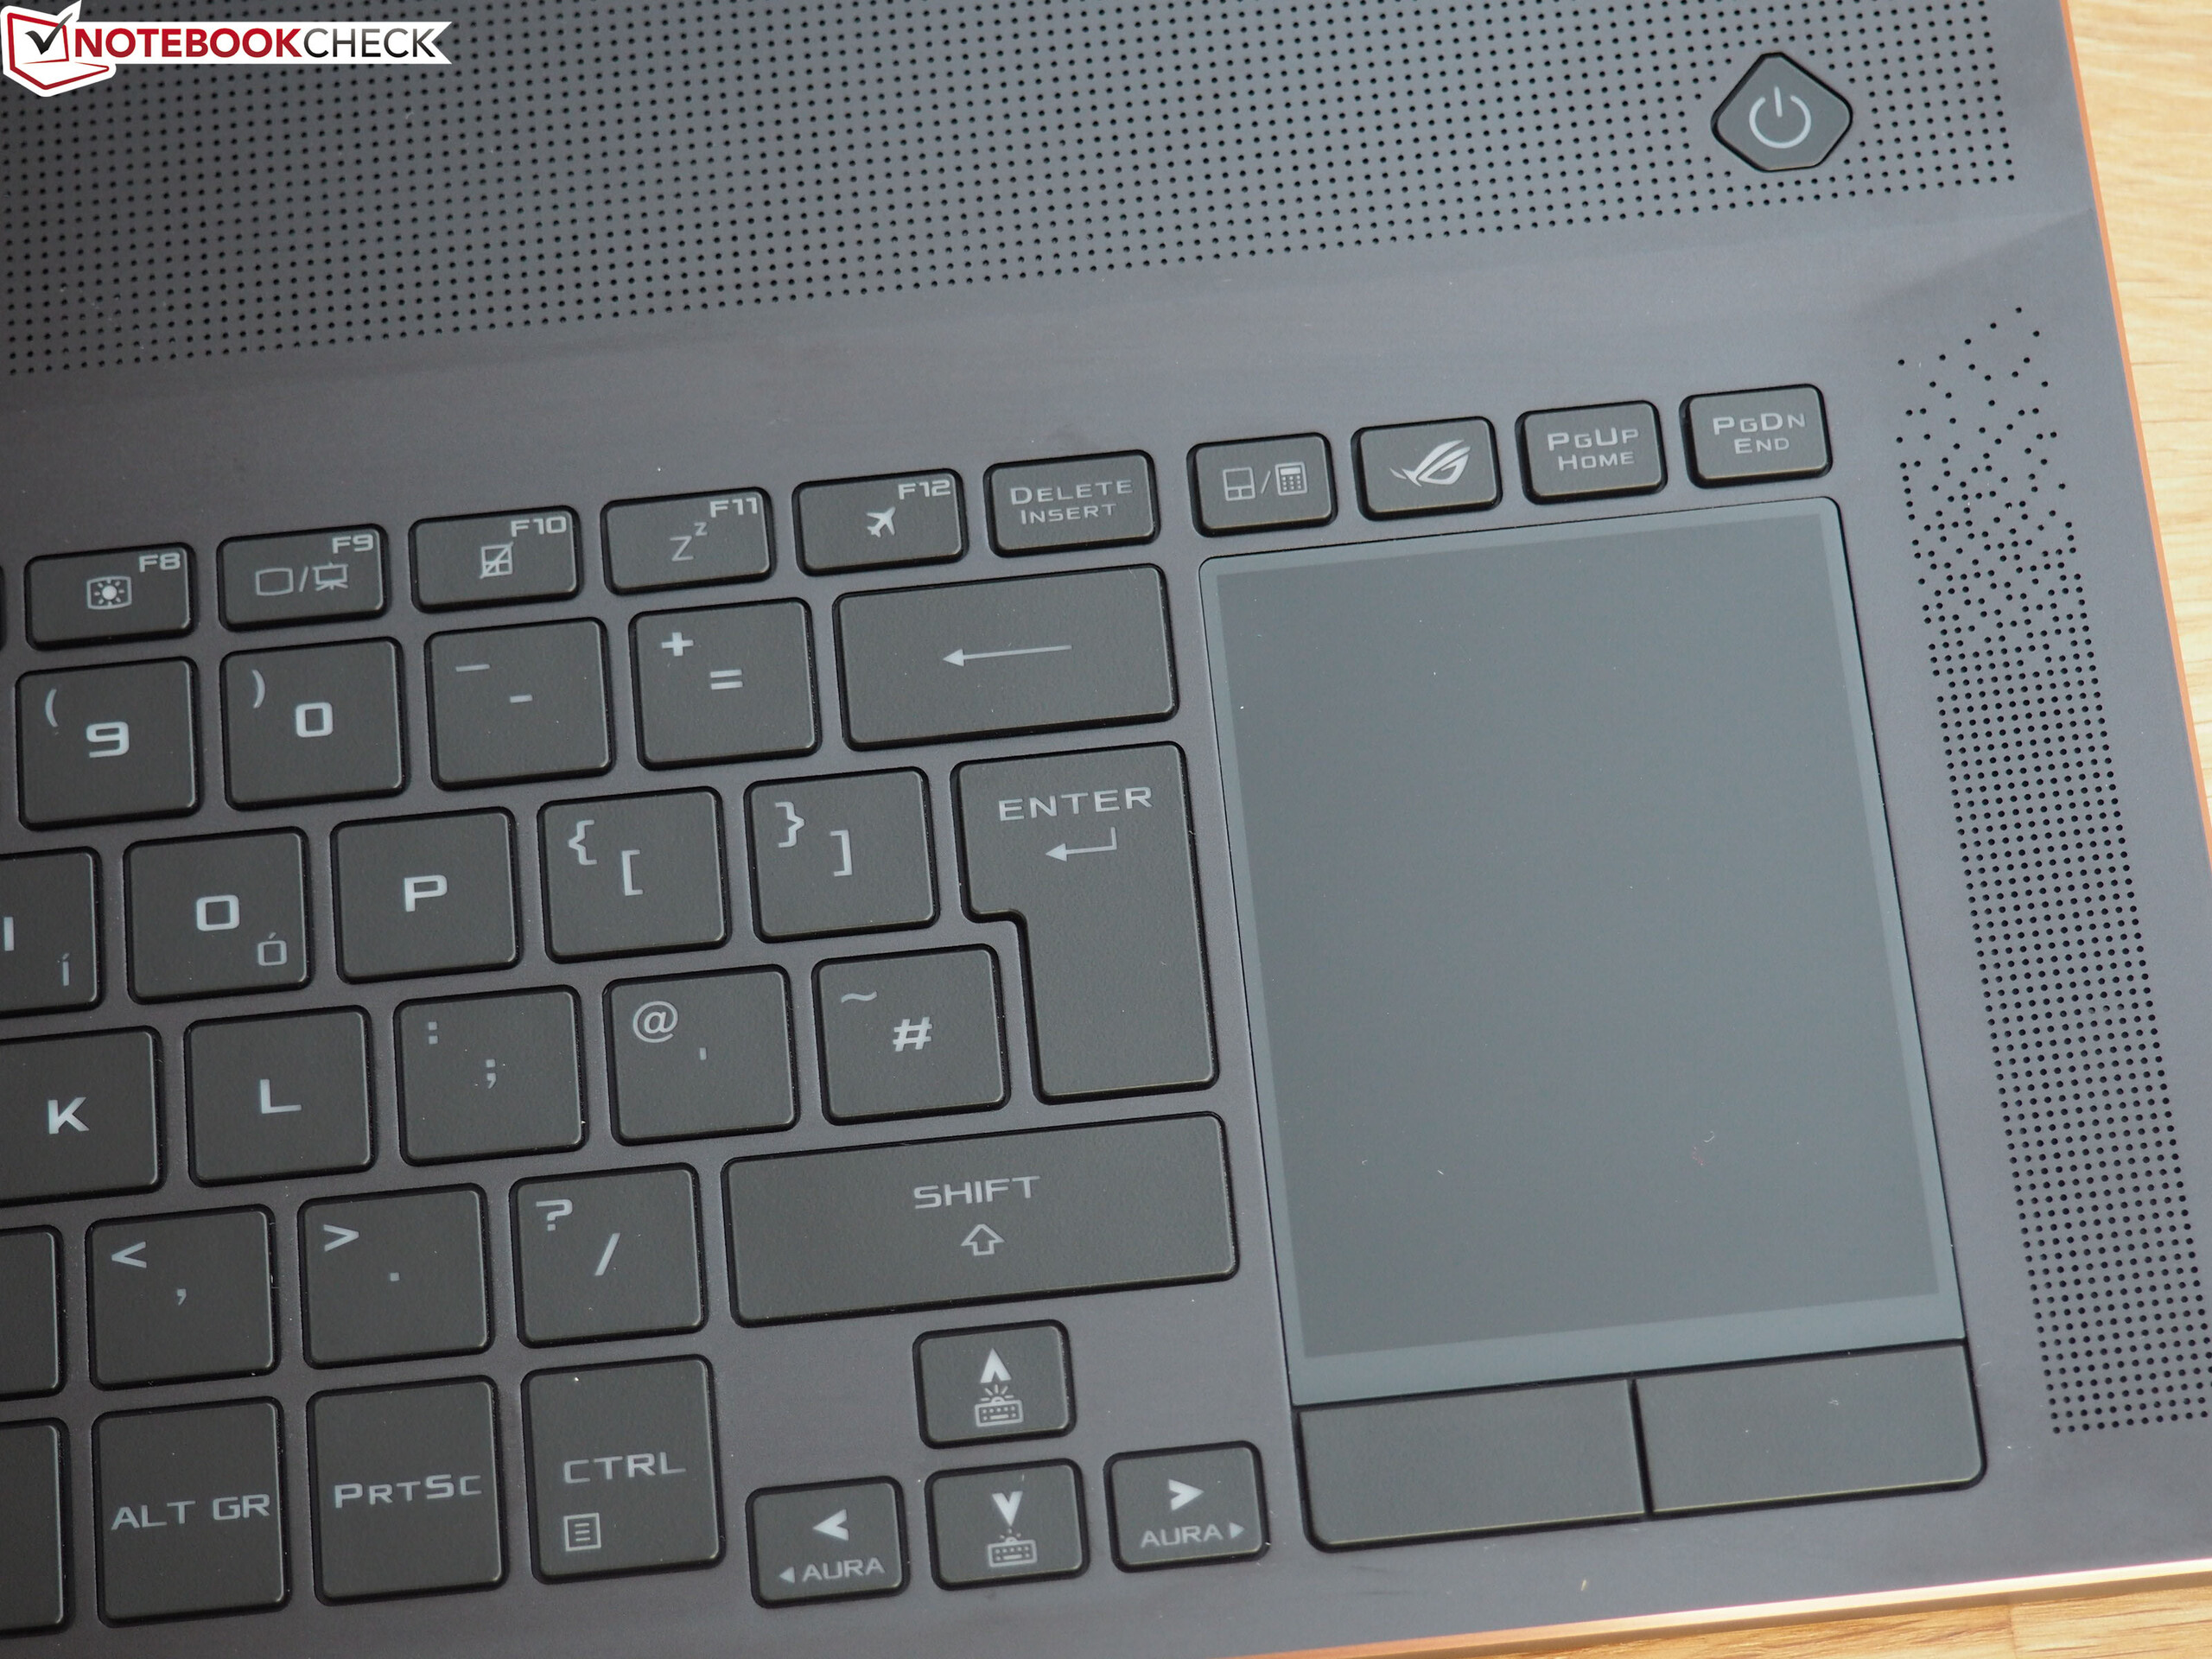
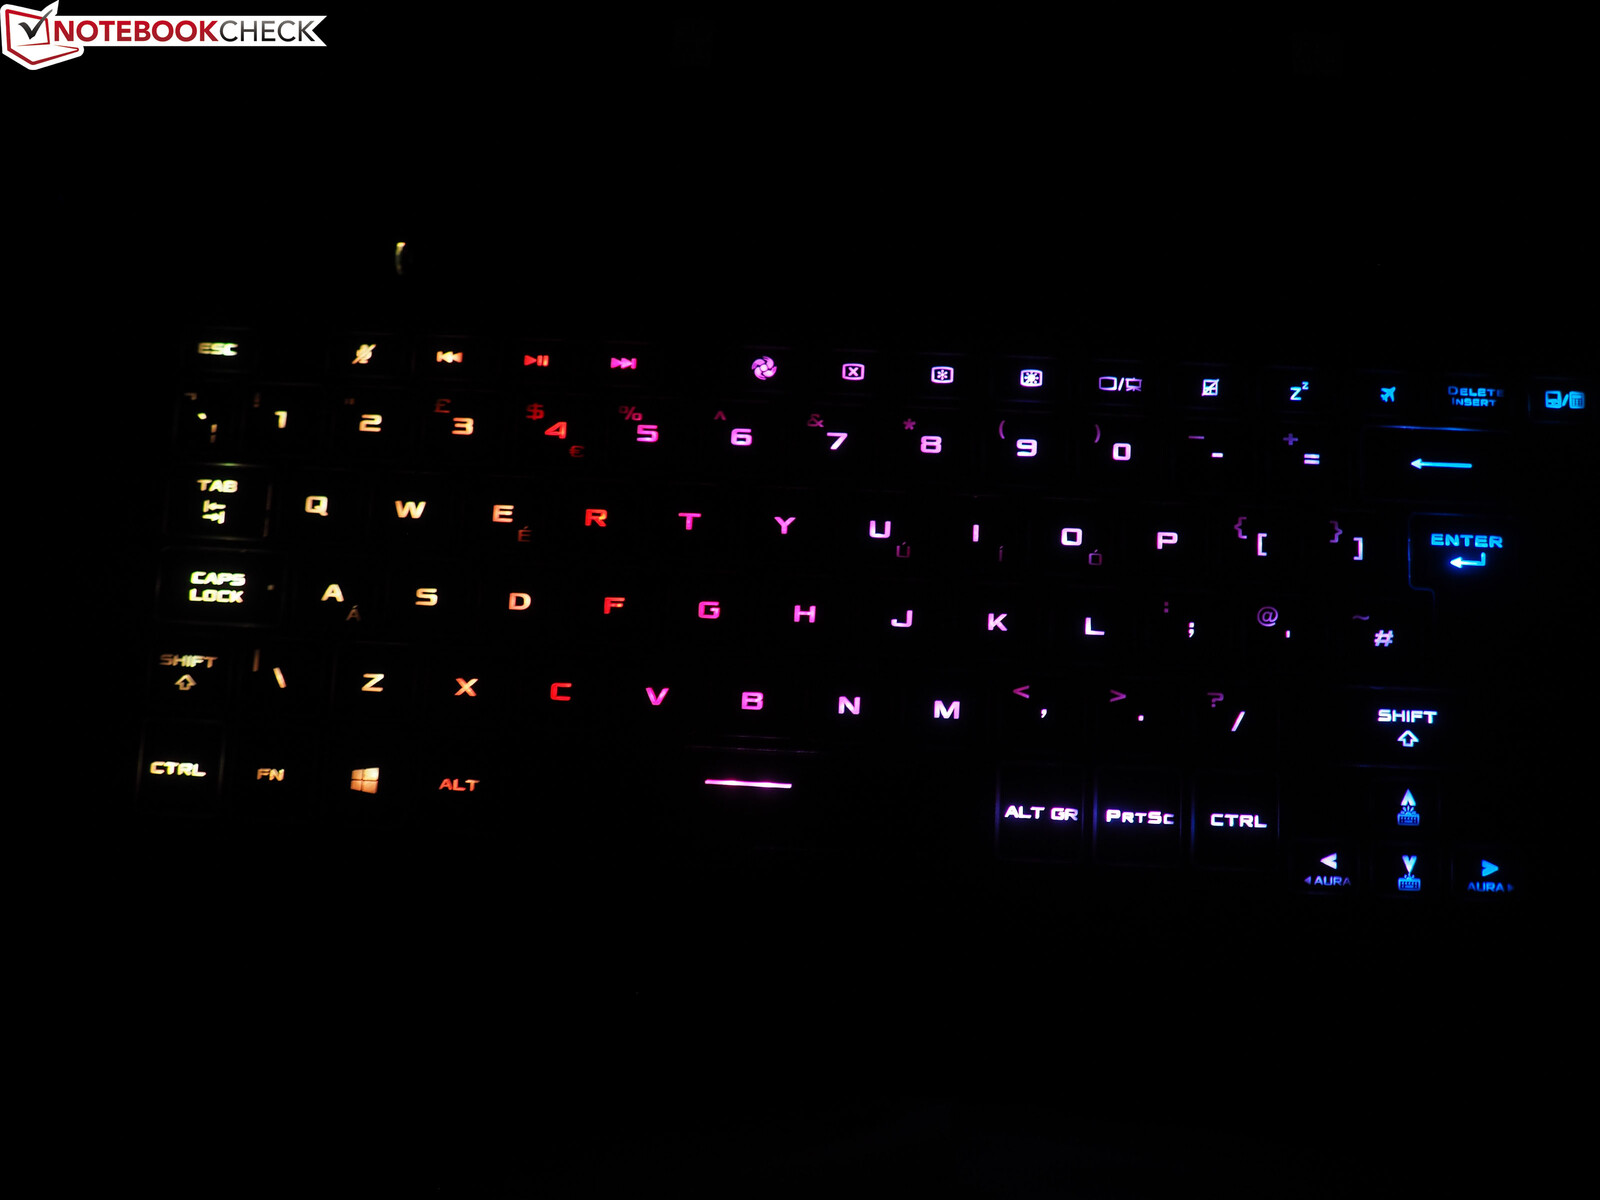
We docked a few more points because of the fact that the numbers of the function keys are not backlit. Other than that, we really liked the per-key RGB backlight. However, we wish it were more uniform. Positive: users can adjust the volume of the system with the help of a practical wheel, which is located above the keyboard.
Touchpad
The Touchpad can only be seen as a stop-gap solution. Because of its small width, you will sometimes have to reset your fingers while moving the cursor across the screen. Thanks to the smooth surface, moving fingers over the pad is easy. The Touchpad is not very accurate. It is also not suited for gestures. The main feature of the Touchpad is the built-in numeric pad, which can be enabled/disabled with the help of a special key. There is some room for improvement when it comes to the mouse buttons. Unlike the keyboard, these buttons make a very loud, clacky sound.
Display
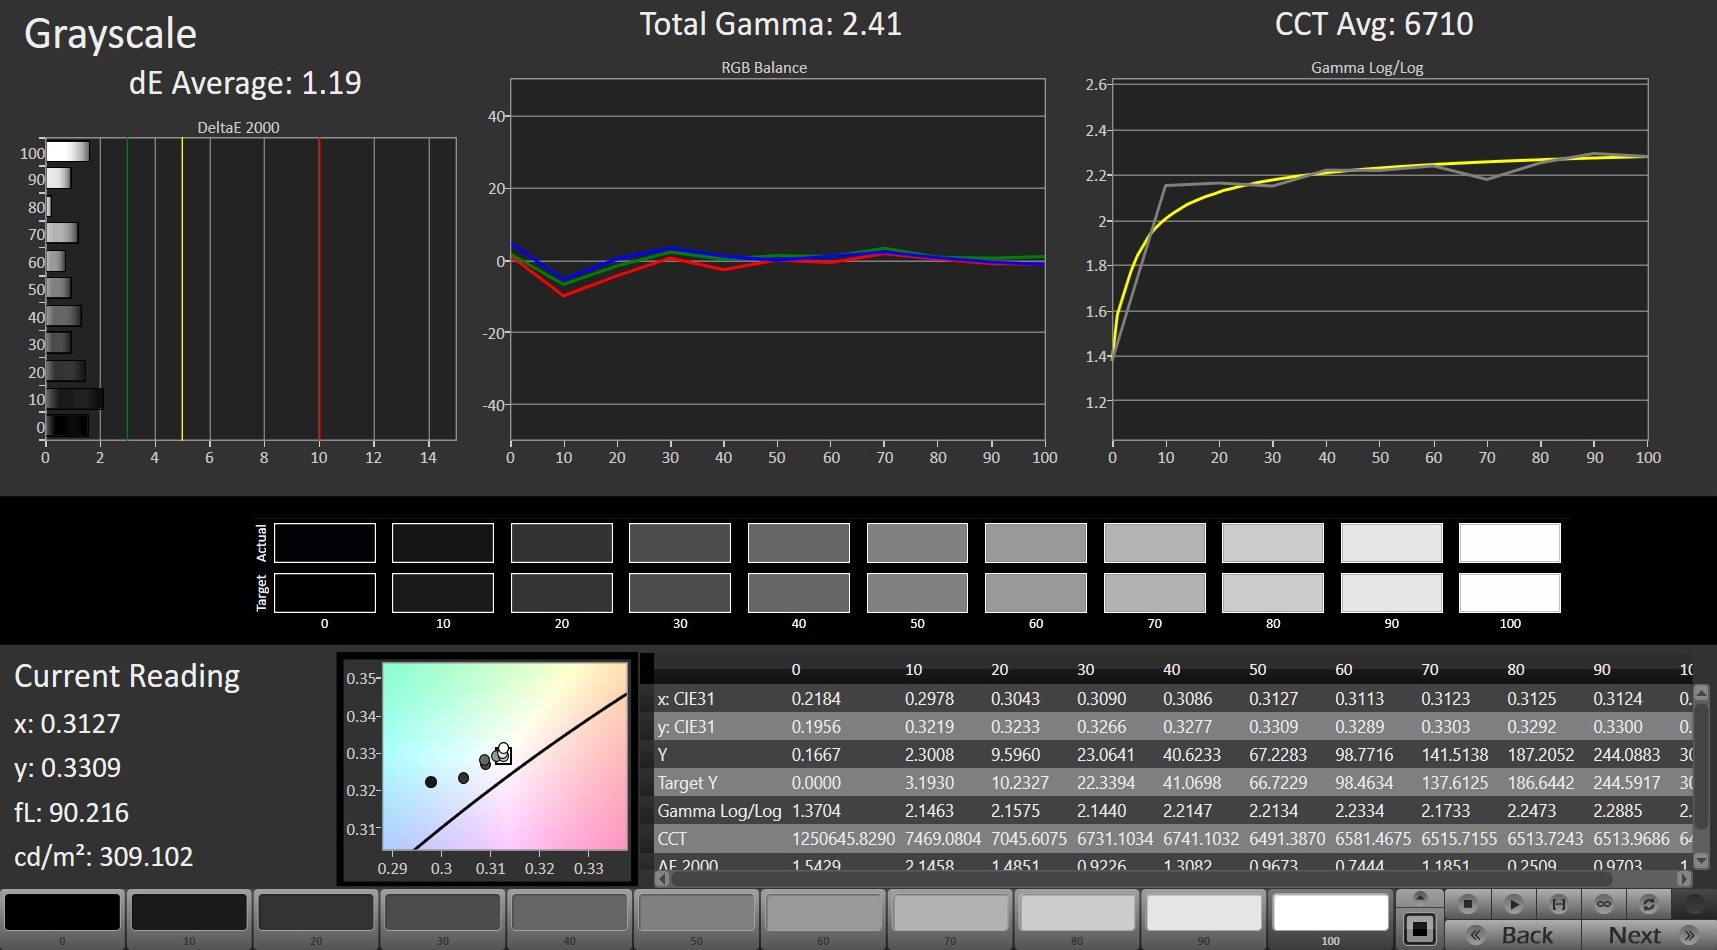
The 17.3-inch Full HD display impresses in almost all aspects.
| |||||||||||||||||||||||||
Brightness Distribution: 91 %
Center on Battery: 288 cd/m²
Contrast: 1440:1 (Black: 0.2 cd/m²)
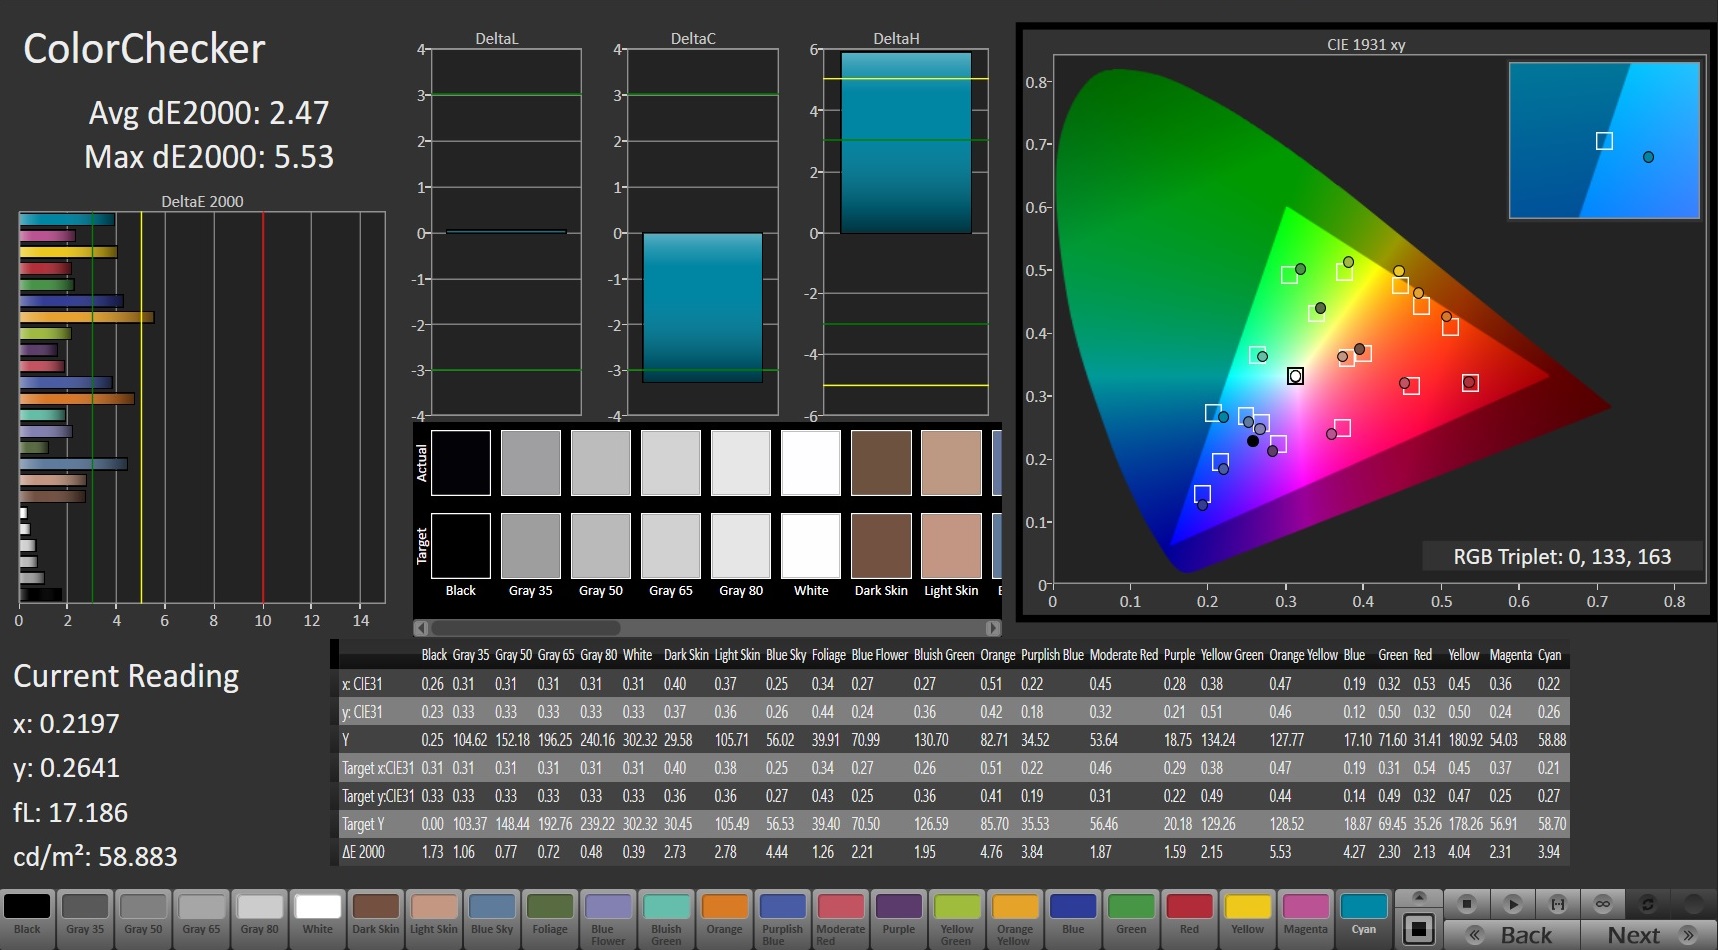
ΔE ColorChecker Calman: 2.33 | ∀{0.5-29.43 Ø4.71}
calibrated: 2.47
ΔE Greyscale Calman: 1.19 | ∀{0.09-98 Ø4.96}
88% sRGB (Argyll 1.6.3 3D)
57% AdobeRGB 1998 (Argyll 1.6.3 3D)
63.9% AdobeRGB 1998 (Argyll 3D)
87.8% sRGB (Argyll 3D)
62.9% Display P3 (Argyll 3D)
Gamma: 2.41
CCT: 6710 K
| Asus Zephyrus S GX701GX B173HAN04.0 (AUO409D), IPS, 1920x1080, 17.3" | Acer Predator Triton 500 AU Optronics B156HAN08.2 (AUO82ED), IPS, 1920x1080, 15.6" | Razer Blade 15 RTX 2070 Max-Q LG Philips LGD05C0, IPS, 1920x1080, 15.6" | Gigabyte Aero 15-X9 LGD05C0, IPS, 1920x1080, 15.6" | MSI GE75 8SG Raider CMN N173HCE-G33 (CMN175C), AHVA, 1920x1080, 17.3" | Asus ROG Strix Scar II GL704GW B173HAN04.0 (AUO409D), AHVA, 1920x1080, 17.3" | |
|---|---|---|---|---|---|---|
| Display | 3% | 5% | 3% | -1% | -0% | |
| Display P3 Coverage (%) | 62.9 | 64.2 2% | 65.3 4% | 63.5 1% | 60.6 -4% | 62.9 0% |
| sRGB Coverage (%) | 87.8 | 92.6 5% | 94.9 8% | 93.1 6% | 91.2 4% | 87.1 -1% |
| AdobeRGB 1998 Coverage (%) | 63.9 | 65.7 3% | 66.3 4% | 64.5 1% | 62.6 -2% | 63.7 0% |
| Response Times | -14% | -77% | -85% | -4% | -81% | |
| Response Time Grey 50% / Grey 80% * (ms) | 7.2 ? | 8 ? -11% | 16.8 ? -133% | 16.4 ? -128% | 8 ? -11% | 17.6 ? -144% |
| Response Time Black / White * (ms) | 9.6 ? | 11.2 ? -17% | 11.6 ? -21% | 13.6 ? -42% | 9.2 ? 4% | 11.2 ? -17% |
| PWM Frequency (Hz) | 26040 ? | |||||
| Screen | -50% | -24% | -3% | -12% | -16% | |
| Brightness middle (cd/m²) | 288 | 304 6% | 314.7 9% | 250 -13% | 363 26% | 295 2% |
| Brightness (cd/m²) | 287 | 299 4% | 312 9% | 235 -18% | 342 19% | 291 1% |
| Brightness Distribution (%) | 91 | 89 -2% | 90 -1% | 85 -7% | 86 -5% | 96 5% |
| Black Level * (cd/m²) | 0.2 | 0.27 -35% | 0.38 -90% | 0.29 -45% | 0.27 -35% | 0.24 -20% |
| Contrast (:1) | 1440 | 1126 -22% | 828 -43% | 862 -40% | 1344 -7% | 1229 -15% |
| Colorchecker dE 2000 * | 2.33 | 4.66 -100% | 2.56 -10% | 1.46 37% | 2.29 2% | 3.2 -37% |
| Colorchecker dE 2000 max. * | 5.34 | 9.65 -81% | 4.89 8% | 2.47 54% | 4.54 15% | 6.64 -24% |
| Colorchecker dE 2000 calibrated * | 2.47 | 1.72 30% | 1.71 31% | 2.45 1% | 2.52 -2% | |
| Greyscale dE 2000 * | 1.19 | 5.53 -365% | 3.4 -186% | 1.27 -7% | 3.02 -154% | 2.16 -82% |
| Gamma | 2.41 91% | 2.5 88% | 2.3 96% | 2.4 92% | 2.38 92% | 2.46 89% |
| CCT | 6710 97% | 8028 81% | 6435 101% | 6749 96% | 7048 92% | 6872 95% |
| Color Space (Percent of AdobeRGB 1998) (%) | 57 | 60 5% | 60.7 6% | 60 5% | 58 2% | 57 0% |
| Color Space (Percent of sRGB) (%) | 88 | 93 6% | 94.6 8% | 93 6% | 91 3% | 87 -1% |
| Total Average (Program / Settings) | -20% /
-36% | -32% /
-25% | -28% /
-13% | -6% /
-9% | -32% /
-21% |
* ... smaller is better
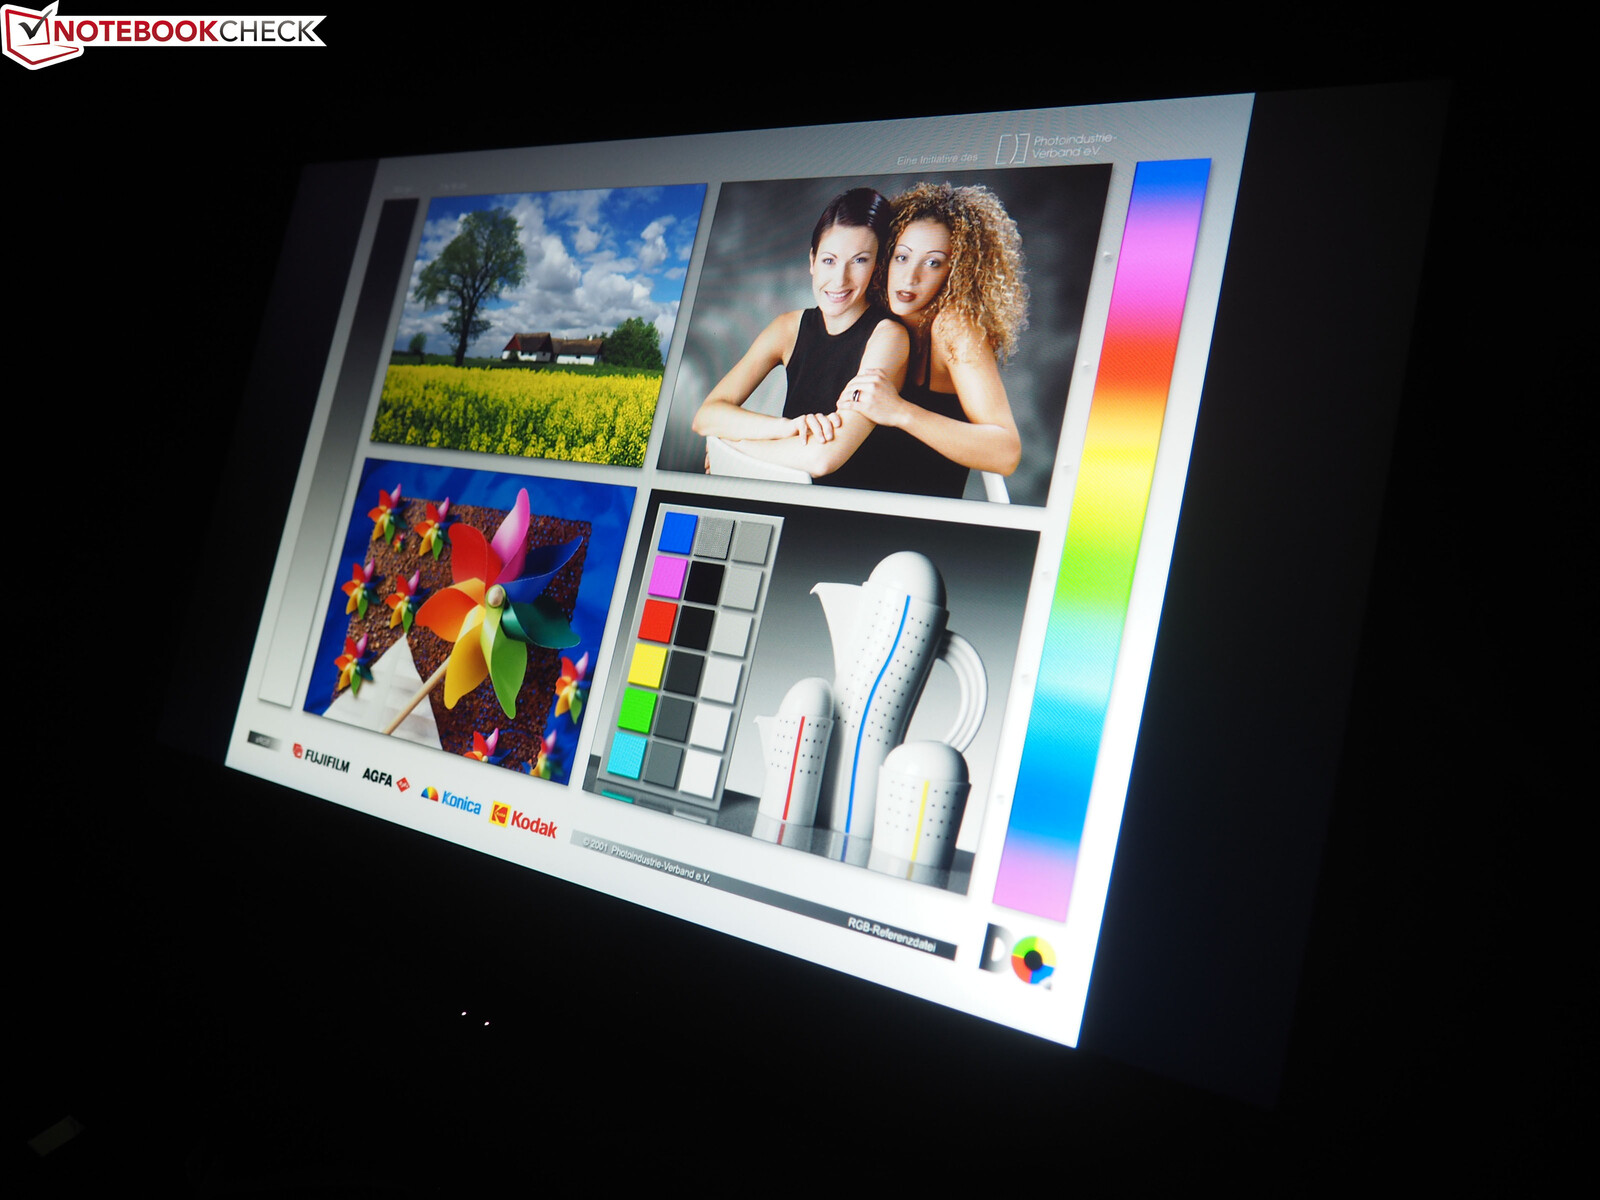
If you take the mediocre brightness (about 290 cd/m²) out of the picture, the built-in IPS panel looks very impressive. Both the black value of 0.2 cd/m² and the contrast ratio of over 1400:1 are quite respectable. The color space coverage of 88% for sRGB and 57% for AdobeRGB should be good enough for most users.

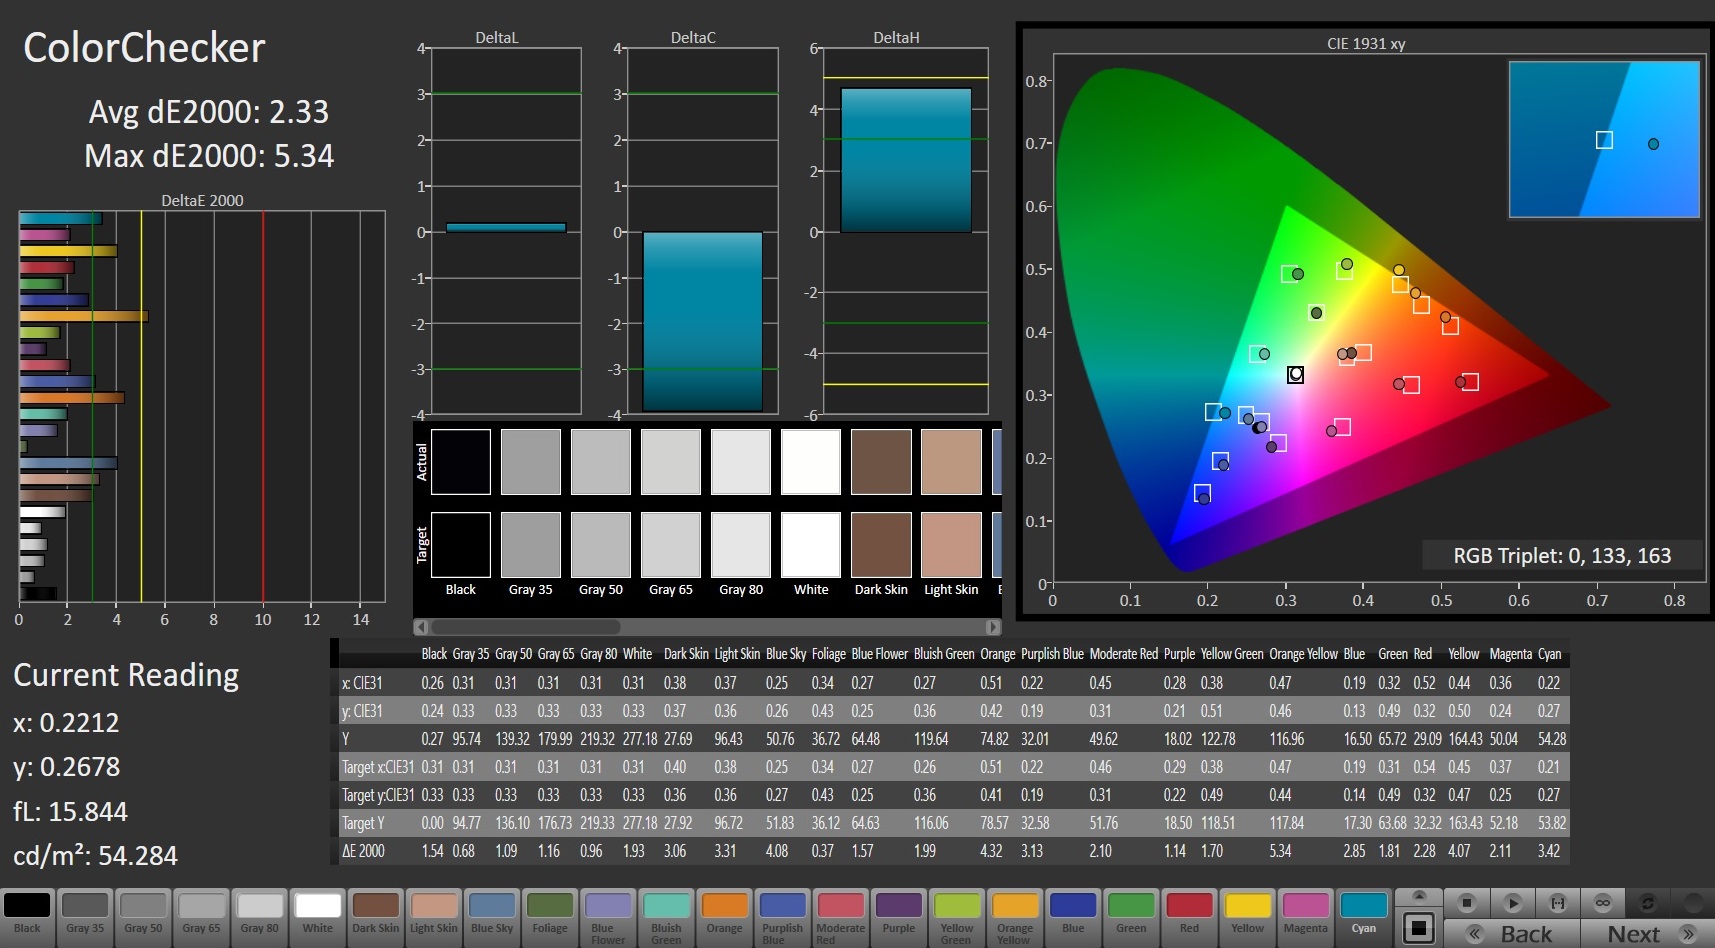
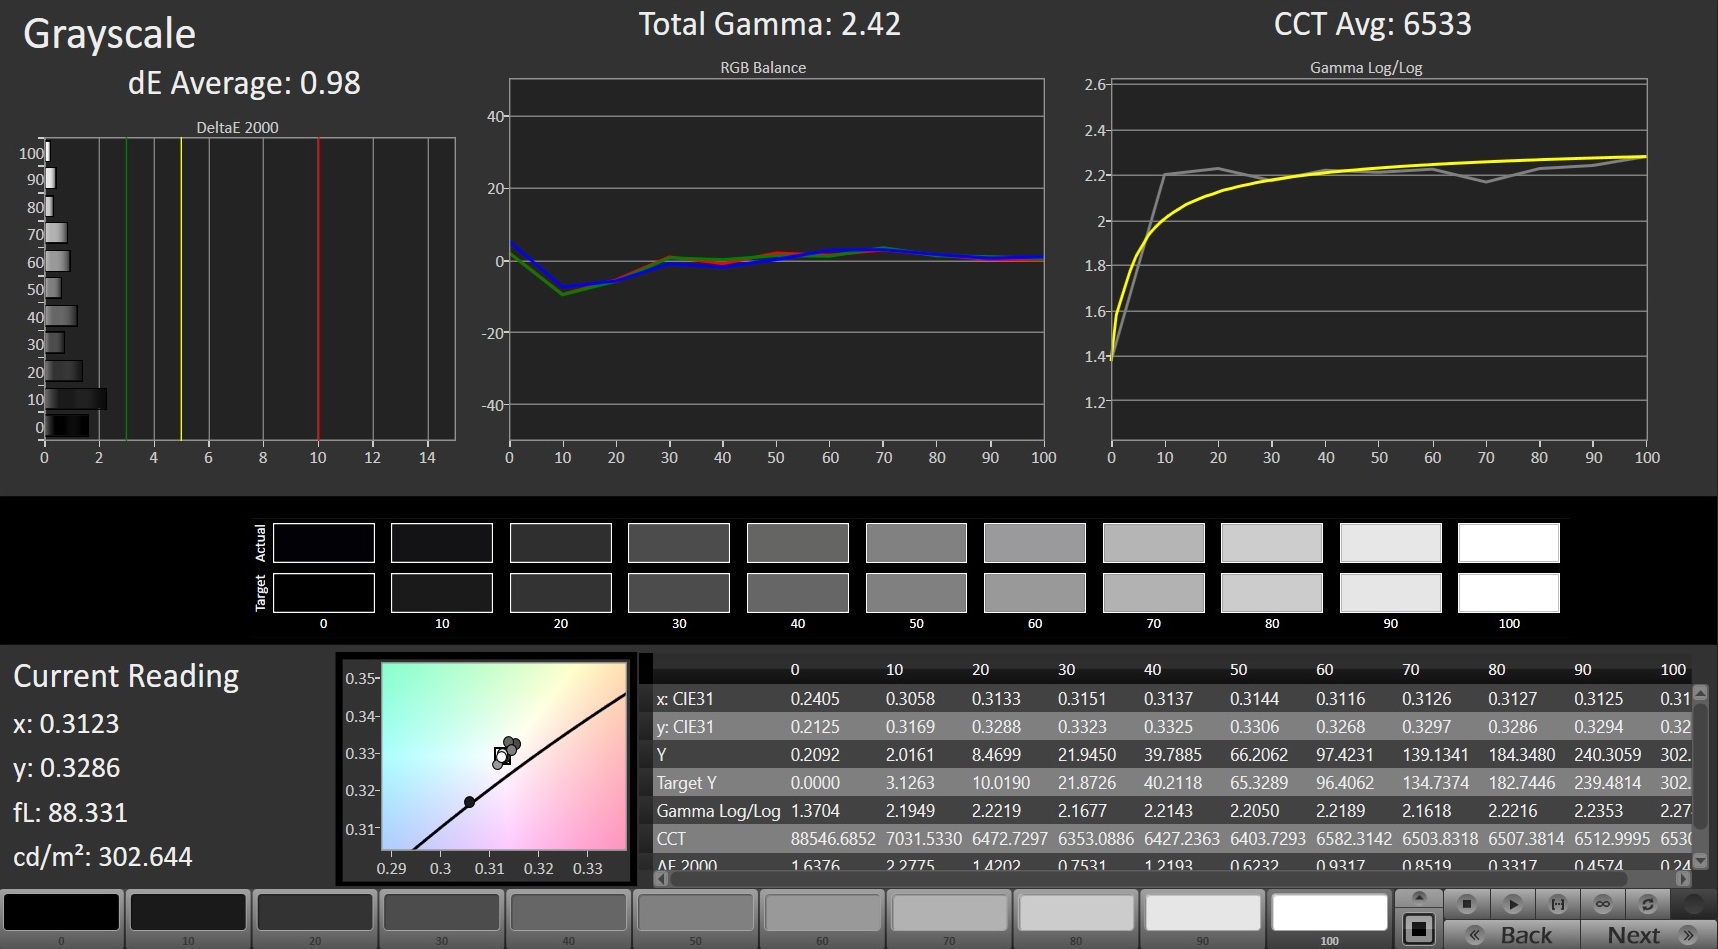
The crowning glory of the display is its color accuracy. Just like the Gigabyte Aero 15, the GX701 offers an X-Rite Pantone certification. This is why the screen displays colors very accurately and does not need to be calibrated.
The package is rounded off by fast response times and wide viewing angles. It takes the 144 Hz display less than 10 ms to switch from black to white and from gray to gray. This is good for an IPS panel. In combination with Nvidia’s G-Sync technology, the GX701 provides a very smooth presentation, when playing video games.
Display Response Times
| ↔ Response Time Black to White | ||
|---|---|---|
| 9.6 ms ... rise ↗ and fall ↘ combined | ↗ 4.4 ms rise | 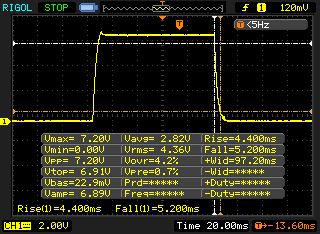 |
| ↘ 5.2 ms fall | ||
| The screen shows fast response rates in our tests and should be suited for gaming. In comparison, all tested devices range from 0.1 (minimum) to 240 (maximum) ms. » 26 % of all devices are better. This means that the measured response time is better than the average of all tested devices (19.8 ms). | ||
| ↔ Response Time 50% Grey to 80% Grey | ||
| 7.2 ms ... rise ↗ and fall ↘ combined | ↗ 3.6 ms rise | 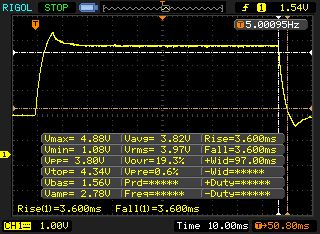 |
| ↘ 3.6 ms fall | ||
| The screen shows very fast response rates in our tests and should be very well suited for fast-paced gaming. In comparison, all tested devices range from 0.165 (minimum) to 636 (maximum) ms. » 20 % of all devices are better. This means that the measured response time is better than the average of all tested devices (31 ms). | ||
Screen Flickering / PWM (Pulse-Width Modulation)
| Screen flickering / PWM not detected | 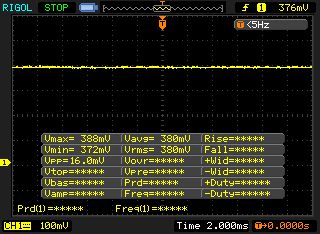 | ||
In comparison: 52 % of all tested devices do not use PWM to dim the display. If PWM was detected, an average of 7754 (minimum: 5 - maximum: 343500) Hz was measured. | |||
Performance
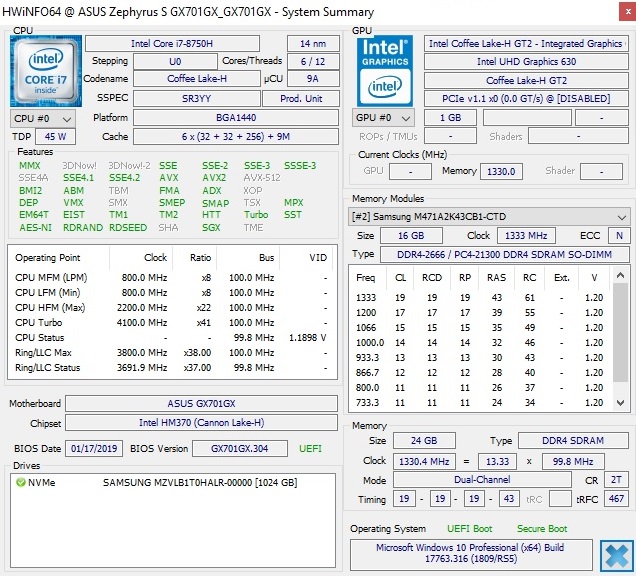
Both the hexa-core CPU and the GeForce RTX 2080 Max-Q ensure that the laptop will not become obsolete for a long time. 24 GB of RAM, which our English review device features (in Germany, 16 GB is the maximum), should also be more than enough for most users in the coming years. The 1 TB SSD is really spacious.


Processor
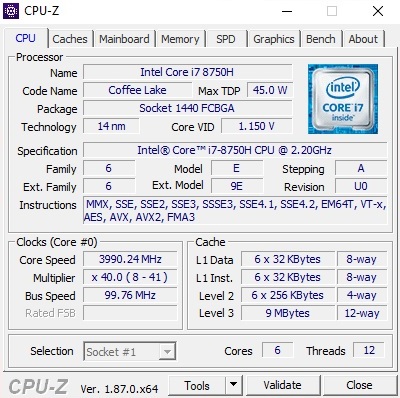
Intel’s well-liked Core i7-8750H serves as the central processing unit. The Coffee Lake-based processor is used in the vast majority of gaming notebooks and can perform almost any task without breaking a sweat.
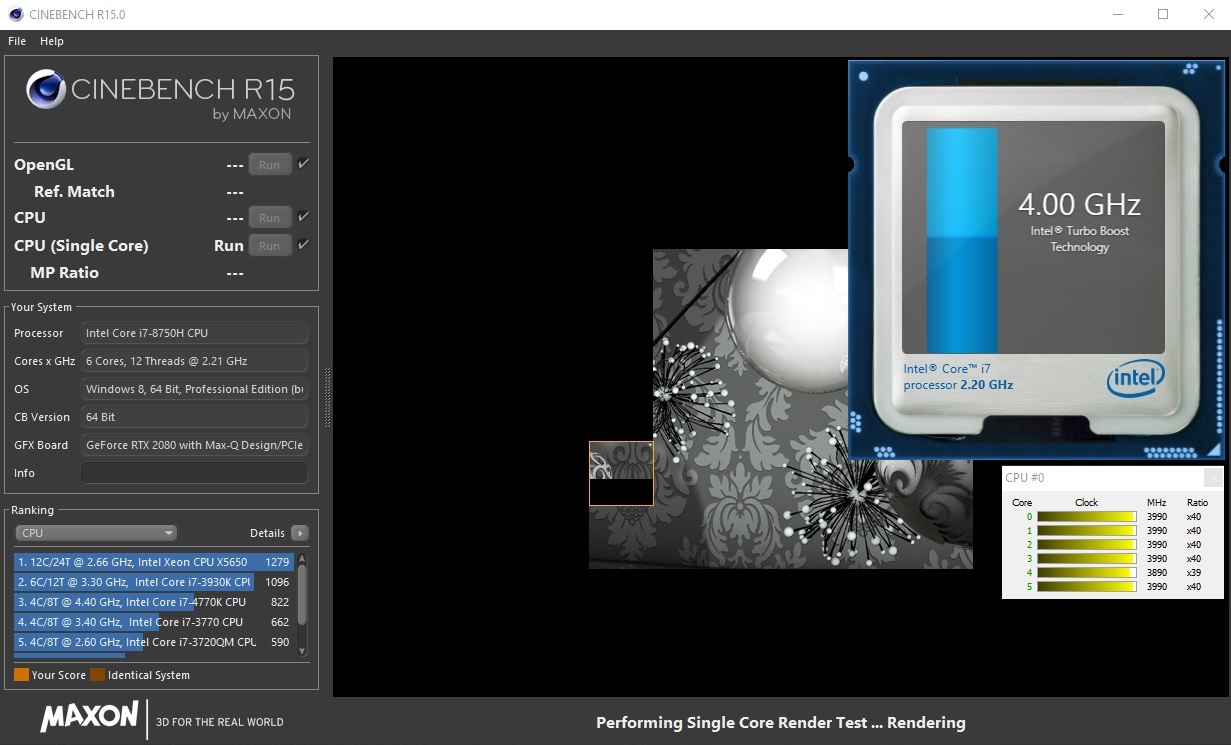
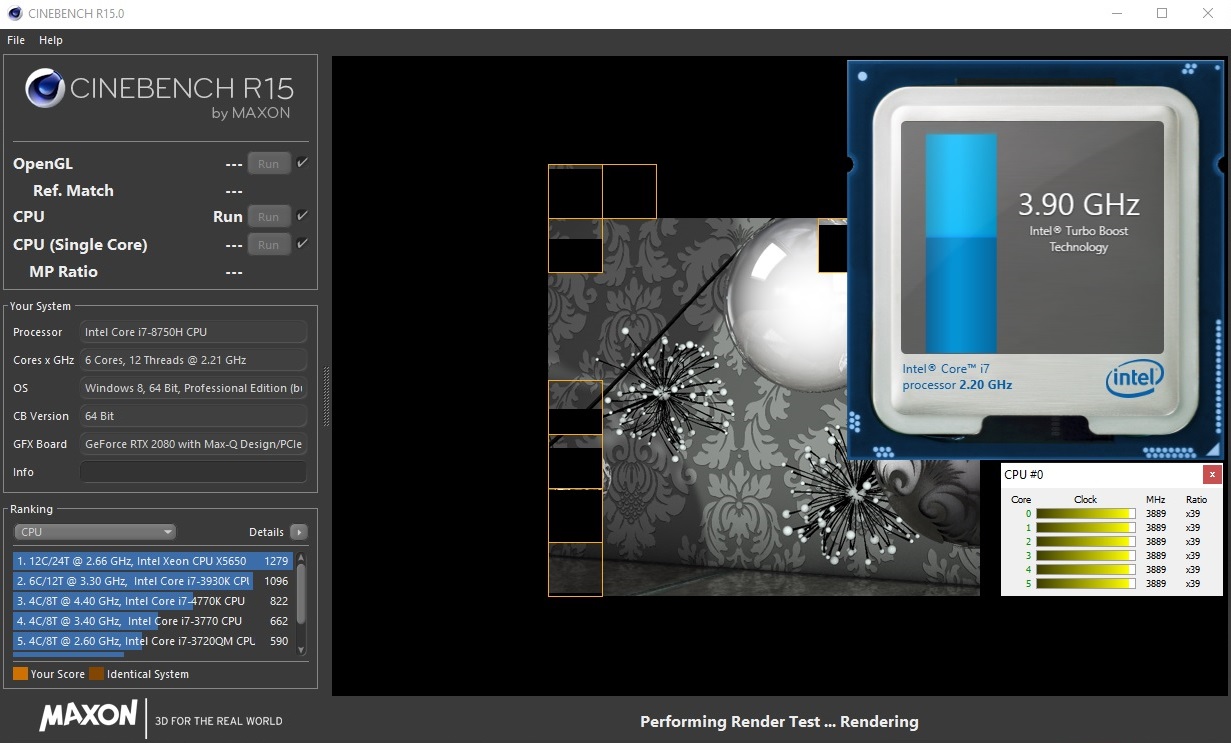
Thanks to Intel’s Turbo Boost Technology, the base clock rate of 2.2 GHz is boosted considerably under load. While in single-core applications the CPU operates at up to 4.1 GHz, under full load it runs at up to 3.9 GHz.
Most laptops can maintain their maximum boost clocks only over a short period of time. In the Cinebench loop, the clock rate fell down to 3.2 GHz after the second benchmark run, which equates to a performance drop of 10%. Here, the GX701 performs about as well as the Gigabyte Aero 15 X9. Both the Acer Triton 500 and the Razer Blade 15 in particular show that things could be much worse, because their clock rates sink much further. Asus’s own and much thicker Strix GL704 does best in the Cinebench loop.
| Cinebench R11.5 | |
| CPU Single 64Bit | |
| Average of class Gaming (3.3 - 4.16, n=9, last 2 years) | |
| Acer Predator Triton 500 | |
| Asus Zephyrus S GX701GX | |
| CPU Multi 64Bit | |
| Average of class Gaming (29.8 - 76.7, n=9, last 2 years) | |
| Asus Zephyrus S GX701GX | |
| Acer Predator Triton 500 | |
System Performance
The system performance can give the competition a run for its money. In PCMark 10, the GX701GX takes second place in our comparison chart. With 5596 points, the 17.3-inch laptop takes a spot in-between the Acer Predator Triton 500 and the Asus GL704GW. Because the OS is installed on an SSD, Windows boots up very fast and operates very smoothly.
Storage Devices
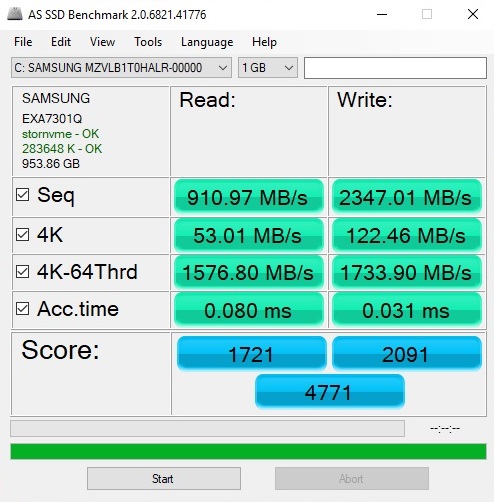
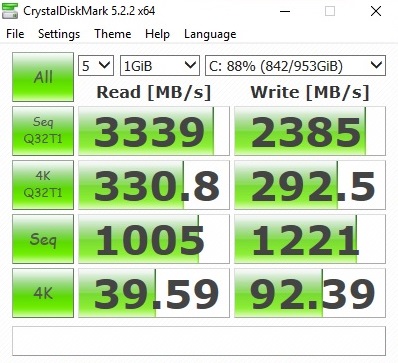
As was previously mentioned, the GX701 does not offer a 2.5-inch drive bay (the space that would otherwise be occupied by the drive bay was used to increase the battery capacity). Instead, the Asus laptop has one M.2-2280 slot. Our review model features an NVMe SSD from Samsung, which is known as the PM981 (MZVLB1T0HALR). The 1 TB SSD performs as well as other PCIe-based storage devices, that is to say, it performs incredibly well. However, the Predator Triton 500 does even better in the storage benchmarks because of its RAID 0 setup.
| Asus Zephyrus S GX701GX Samsung SSD PM981 MZVLB1T0HALR | Acer Predator Triton 500 2x WDC PC SN720 SDAPNTW-256G-1014 (RAID 0) | Razer Blade 15 RTX 2070 Max-Q Samsung SSD PM981 MZVLB512HAJQ | Gigabyte Aero 15-X9 Intel SSD 760p SSDPEKKW010T8 | MSI GE75 8SG Raider Kingston RBUSNS8154P3512GJ | Asus ROG Strix Scar II GL704GW Intel SSD 660p SSDPEKNW512G8 | |
|---|---|---|---|---|---|---|
| CrystalDiskMark 5.2 / 6 | 30% | 8% | 12% | -24% | -6% | |
| Write 4K (MB/s) | 92.4 | 93.6 1% | 93.9 2% | 97.1 5% | 73.4 -21% 73.4 -21% | 99.6 8% |
| Read 4K (MB/s) | 39.59 | 38.82 -2% | 40.56 2% | 53.7 36% | 31.97 -19% 31.93 -19% | 48.99 24% |
| Write Seq (MB/s) | 1221 | 2455 101% | 1468 20% | 1526 25% | 882 -28% | 972 -20% |
| Read Seq (MB/s) | 1005 | 2107 110% | 1540 53% | 2020 101% | 922 -8% | 1515 51% |
| Write 4K Q32T1 (MB/s) | 292.5 | 298.7 2% | 293.5 0% | 285.6 -2% | 310.1 6% 297.1 2% | 280.6 -4% |
| Read 4K Q32T1 (MB/s) | 330.8 | 338.7 2% | 346 5% | 321.8 -3% | 327.5 -1% 325.5 -2% | 327.8 -1% |
| Write Seq Q32T1 (MB/s) | 2385 | 2902 22% | 1941 -19% | 1533 -36% | 1007 -58% 929 -61% | 970 -59% |
| Read Seq Q32T1 (MB/s) | 3339 | 3536 6% | 3266 -2% | 2351 -30% | 1611 -52% 1607 -52% | 1757 -47% |
| Write 4K Q8T8 (MB/s) | 625 | |||||
| Read 4K Q8T8 (MB/s) | 818 |

Graphics Card
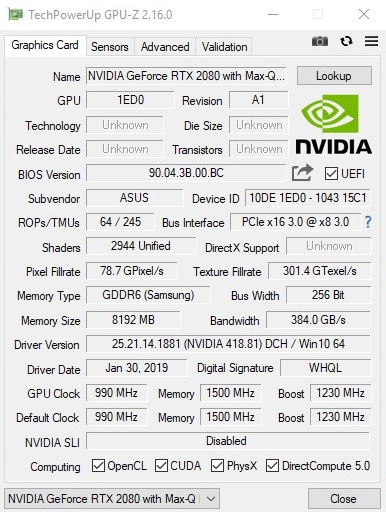
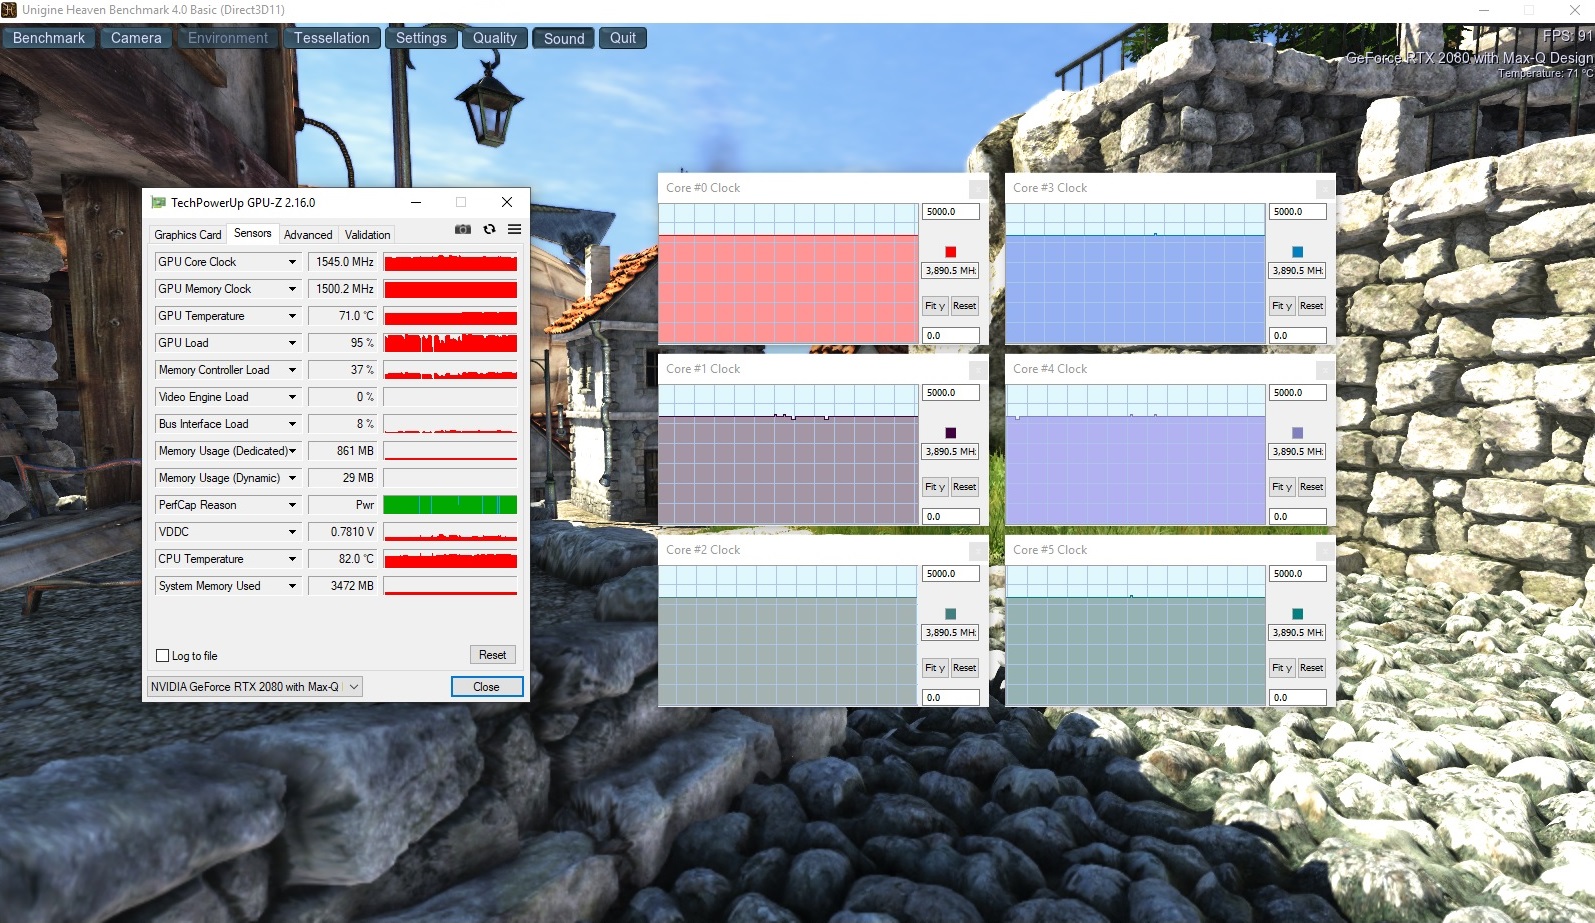
Looking at the brand-new graphics card is especially exciting. With the new Turing generation, Nvidia focuses on the very promising technology known as ray tracing. However, there are currently no games out there that truly support all functionality of the Turing GPUs. Asus chose the second most powerful Turing-based GPU (GeForce RTX 2080 Max-Q) for the GX701. The “Max-Q” bit indicates that this GPU comes with lower power consumption at the expense of performance. This is the most powerful GPU that is suited for compact devices.
The fact that Asus does not reduce the TDP any further is quite praiseworthy. While the RTX 2080 Max-Q in the Acer Triton 500 and the MSI GS75 (review is coming soon) is clocked only at 735 to 1095 MHz, this same GPU in the Asus GX701GX 990 runs at up to 1230 MHz. This is not as good as the standard RTX 2080 (1380 – 1590 MHz), but the Asus notebook still enjoys a performance advantage. According to our 3D benchmarks (see news), the Asus laptop is about 10% faster than the competition. The Triton 500 and the GS75 cannot even provide enough of a performance boost to distinguish themselves from the supposedly less powerful laptops with an RTX 2070. The RTX 2080 Max-Q in the GX701GX is about 30% faster than the RTX 2070.
| 3DMark 11 Performance | 21874 points | |
| 3DMark Ice Storm Standard Score | 161739 points | |
| 3DMark Cloud Gate Standard Score | 37830 points | |
| 3DMark Fire Strike Score | 18147 points | |
| 3DMark Time Spy Score | 8098 points | |
Help | ||
The 17-inch notebook does very well in our 60-minute gaming test with the Witcher 3. Because the GPU operates most of the time at its highest core clocks, the GPU achieves better results than what the spec sheet would suggest. Here, the RTX 2080 Max-Q ran at an average clock speed of 1455 MHz. The CPU operated at 3.9 GHz, which is also a very respectable result.
Gaming Performance
We ran a lot of gaming benchmarks to see how the various TDP ratings of the RTX 2080 Max-Q affect the performance. You can go to our GPU benchmarks page to see how the ROG Zephyrus S stacks up against the Acer Triton 500 and other competitors.
| The Witcher 3 | |
| 1920x1080 Ultra Graphics & Postprocessing (HBAO+) | |
| Average of class Gaming (104.7 - 240, n=7, last 2 years) | |
| MSI GE75 8SG Raider | |
| Asus Zephyrus S GX701GX | |
| Acer Predator Triton 500 | |
| Asus ROG Strix Scar II GL704GW | |
| Razer Blade 15 RTX 2070 Max-Q | |
| Gigabyte Aero 15-X9 | |
| 1920x1080 High Graphics & Postprocessing (Nvidia HairWorks Off) | |
| Average of class Gaming (341 - 404, n=2, last 2 years) | |
| MSI GE75 8SG Raider | |
| Asus Zephyrus S GX701GX | |
| Acer Predator Triton 500 | |
| Asus ROG Strix Scar II GL704GW | |
| Razer Blade 15 RTX 2070 Max-Q | |
| Gigabyte Aero 15-X9 | |
The RTX 2080 Max-Q can run all the latest video games at Full HD resolution on the highest settings. Because it often achieves above 60 FPS, the 144 Hz panel is well utilized. The high-end GPU also does not run into any problems with an external QHD display (2560x1440). However, the RTX 2080 Max-Q reaches its limits at 4K resolution (3840x2160). Here, several extremely demanding titles such as Kingdom Come Deliverance, Monster Hunter World and Assassin‘s Creed Odyssey struggle to hit playable frame rates.
| low | med. | high | ultra | QHD | 4K | |
|---|---|---|---|---|---|---|
| The Witcher 3 (2015) | 151 | 81.7 | 57.6 | |||
| Rainbow Six Siege (2015) | 230 | 217 | 98.2 | |||
| The Division (2016) | 127 | 100 | 51.7 | |||
| Doom (2016) | 134 | 129 | 79.3 | |||
| Overwatch (2016) | 292 | 196 | 111 | |||
| Mirror's Edge Catalyst (2016) | 135 | 123 | 50.2 | |||
| Deus Ex Mankind Divided (2016) | 107 | 63.5 | 40.6 | |||
| Battlefield 1 (2016) | 146 | 134 | 65 | |||
| Dishonored 2 (2016) | 109 | 94 | 61.1 | |||
| Resident Evil 7 (2017) | 360 | 220 | 182 | 65.1 | ||
| For Honor (2017) | 171 | 164 | 131 | 57.2 | ||
| Ghost Recon Wildlands (2017) | 105 | 98.2 | 58 | 42 | ||
| Prey (2017) | 142 | 141 | 139 | 69.5 | ||
| Rocket League (2017) | 248 | 218 | 112 | |||
| Dirt 4 (2017) | 225 | 150 | 102 | |||
| Playerunknown's Battlegrounds (PUBG) (2017) | 207 | 175 | 139 | 51.5 | ||
| Middle-earth: Shadow of War (2017) | 157 | 125 | 99 | 44 | ||
| ELEX (2017) | 117 | 115 | 99 | 68.1 | 35.7 | |
| Assassin´s Creed Origins (2017) | 82 | 80 | 69 | 61 | 39 | |
| Need for Speed Payback (2017) | 127 | 120 | 115 | 95.6 | 54.3 | |
| Star Wars Battlefront 2 (2017) | 145 | 131 | 117 | 80.9 | 42.7 | |
| Fortnite (2018) | 143 | 138 | 136 | 105 | 50.4 | |
| Final Fantasy XV Benchmark (2018) | 106 | 81.4 | 35.9 | |||
| Kingdom Come: Deliverance (2018) | 115 | 89.5 | 68.4 | 50.2 | 27.5 | |
| Far Cry 5 (2018) | 109 | 106 | 100 | 79 | 44 | |
| The Crew 2 (2018) | 60 | 60 | 60 | 60 | 39.9 | |
| Monster Hunter World (2018) | 123 | 111 | 90.9 | 58.4 | 29.7 | |
| F1 2018 (2018) | 169 | 130 | 102 | 87 | 56 | |
| Shadow of the Tomb Raider (2018) | 84 | 82 | 78 | 61 | 37 | |
| FIFA 19 (2018) | 271 | 254 | 248 | 237 | 188 | |
| Assassin´s Creed Odyssey (2018) | 87 | 76 | 59 | 48 | 32 | |
| Call of Duty Black Ops 4 (2018) | 151 | 138 | 131 | 91.4 | 41.6 | |
| Hitman 2 (2018) | 78.8 | 70.9 | 69.1 | 66 | ||
| Battlefield V (2018) | 143 | 130 | 122 | 98.2 | 57.8 | |
| Farming Simulator 19 (2018) | 161 | 141 | 131 | 113 | ||
| Darksiders III (2018) | 130 | 121 | 112 | 82.6 | 42.7 | |
| Just Cause 4 (2018) | 137 | 103 | 101 | 69.9 | 39.9 |
Emissions
System Noise
The GX701GX receives some criticism for its mediocre fan control. When idle, the 17-inch notebook is very quiet or silent most of the time. However, under load, the device becomes uncomfortably loud. Instead of controlling the RPM dynamically, the fans go between 35 and 47 dB(A) in 3DMark 06.
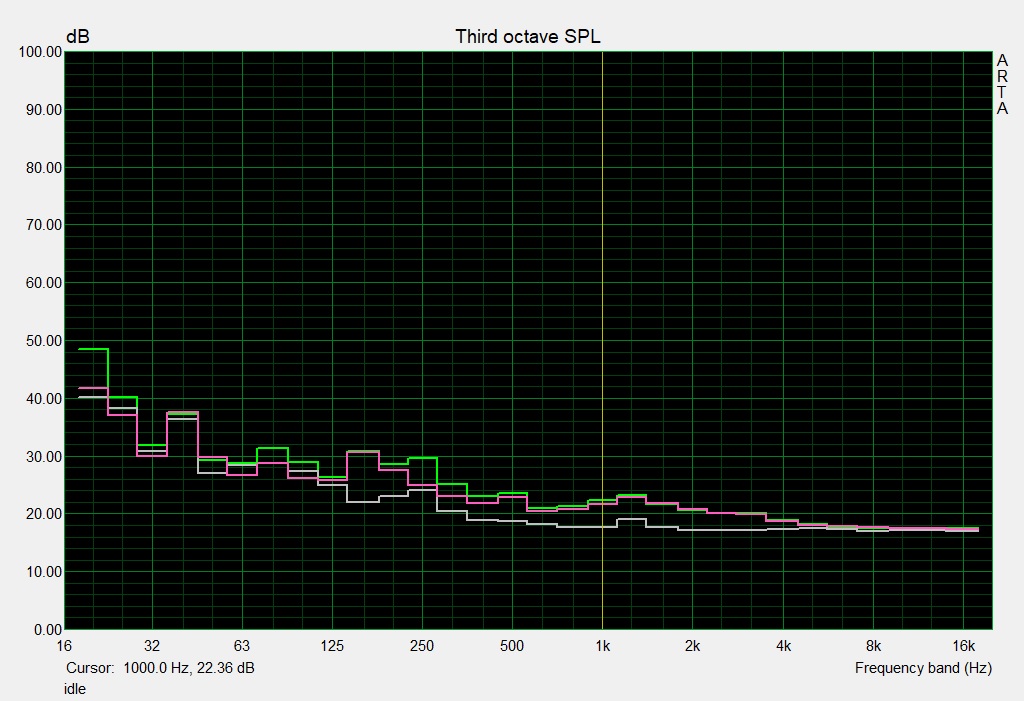

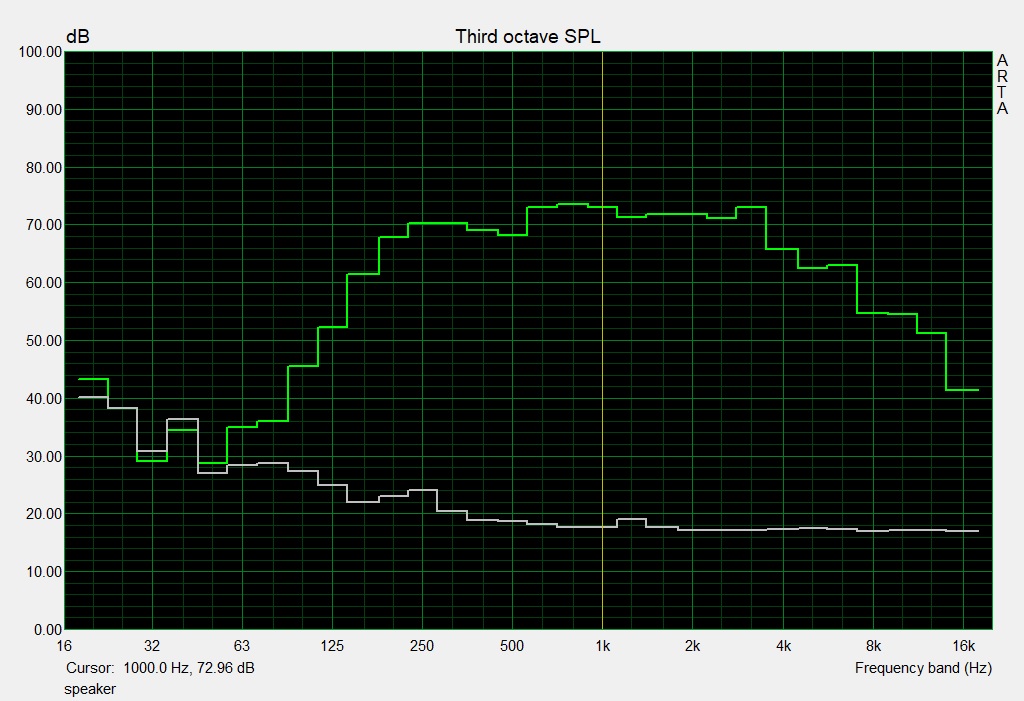
49 dB(A) in the gaming test with the Witcher 3 and 51 dB(A) in the stress test are not very good values for a Max-Q notebook. Besides, Nvidia provides specific guidelines as to how loud Max-Q notebooks can get. According to Asus, a software update that addresses these fan control issues as well as the excessive fan noise is coming soon. However, this update is not going to fix the occasional coil whine.
Noise level
| Idle |
| 29 / 32 / 33 dB(A) |
| Load |
| 47 / 51 dB(A) |
 | ||
30 dB silent 40 dB(A) audible 50 dB(A) loud |
||
min: | ||
| Asus Zephyrus S GX701GX GeForce RTX 2080 Max-Q, i7-8750H | Acer Predator Triton 500 GeForce RTX 2080 Max-Q, i7-8750H | Razer Blade 15 RTX 2070 Max-Q GeForce RTX 2070 Max-Q, i7-8750H | Gigabyte Aero 15-X9 GeForce RTX 2070 Max-Q, i7-8750H | MSI GE75 8SG Raider GeForce RTX 2080 Mobile, i7-8750H | Asus ROG Strix Scar II GL704GW GeForce RTX 2070 Mobile, i7-8750H | Average of class Gaming | |
|---|---|---|---|---|---|---|---|
| Noise | 2% | 10% | -0% | -7% | -4% | 9% | |
| off / environment * (dB) | 29 | 29 -0% | 28.8 1% | 30 -3% | 30 -3% | 29 -0% | 24.1 ? 17% |
| Idle Minimum * (dB) | 29 | 30 -3% | 28.8 1% | 32 -10% | 30 -3% | 29 -0% | 26 ? 10% |
| Idle Average * (dB) | 32 | 32 -0% | 28.8 10% | 34 -6% | 34 -6% | 32 -0% | 27.4 ? 14% |
| Idle Maximum * (dB) | 33 | 34 -3% | 29.4 11% | 36 -9% | 37 -12% | 40 -21% | 30.1 ? 9% |
| Load Average * (dB) | 47 | 44 6% | 35.7 24% | 42 11% | 52 -11% | 46 2% | 43.6 ? 7% |
| Witcher 3 ultra * (dB) | 49 | 46 6% | 42.5 13% | 44 10% | 53 -8% | 51 -4% | |
| Load Maximum * (dB) | 51 | 47 8% | 45 12% | 48 6% | 54 -6% | 52 -2% | 54.2 ? -6% |
* ... smaller is better
Temperature
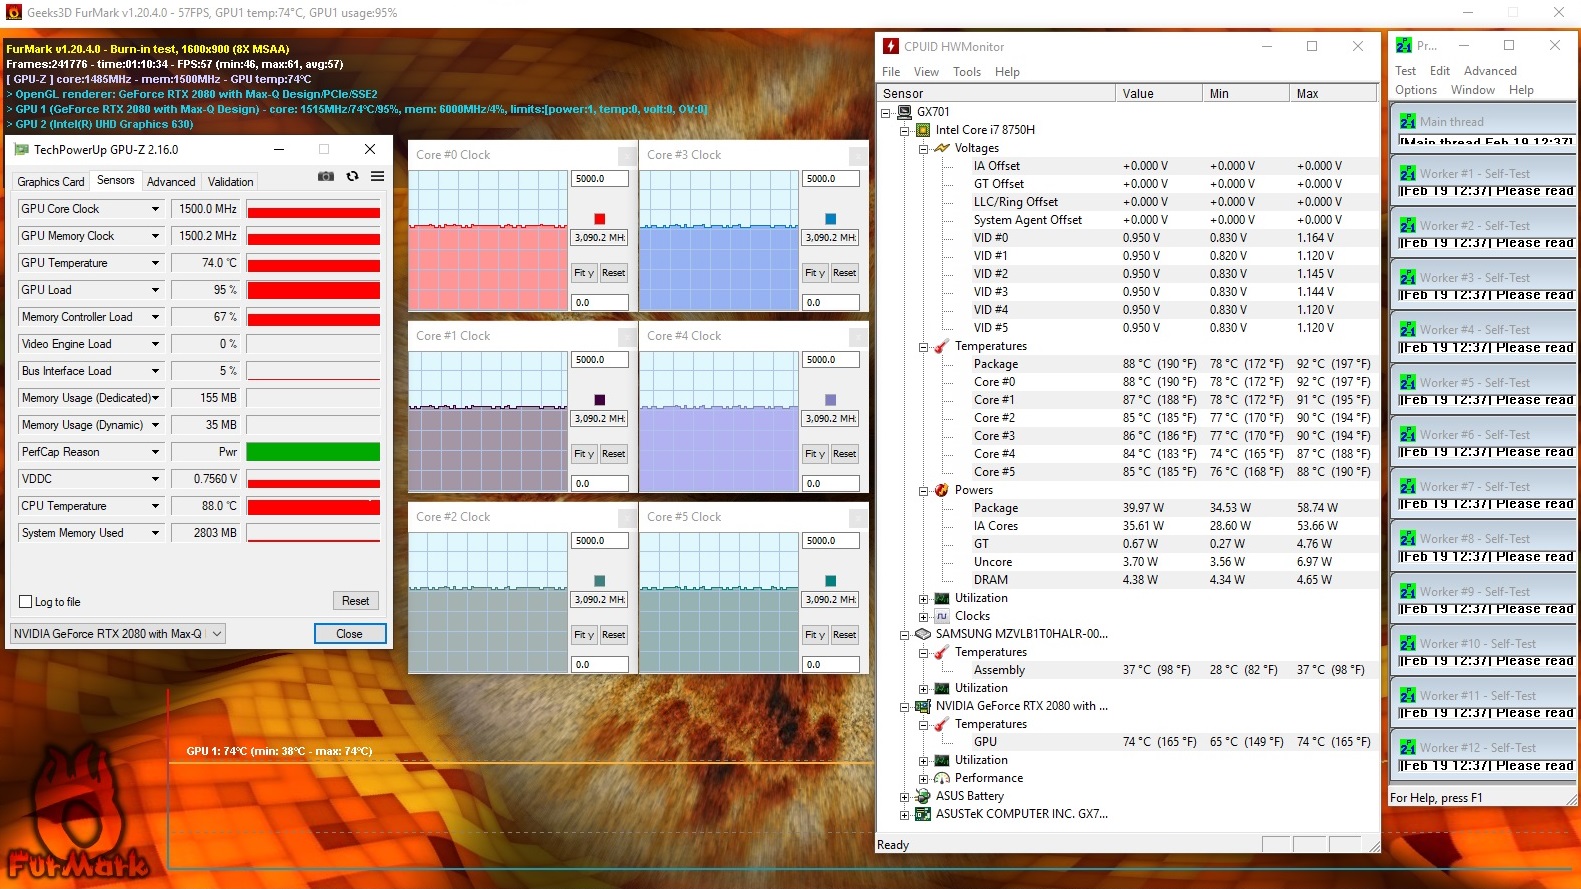
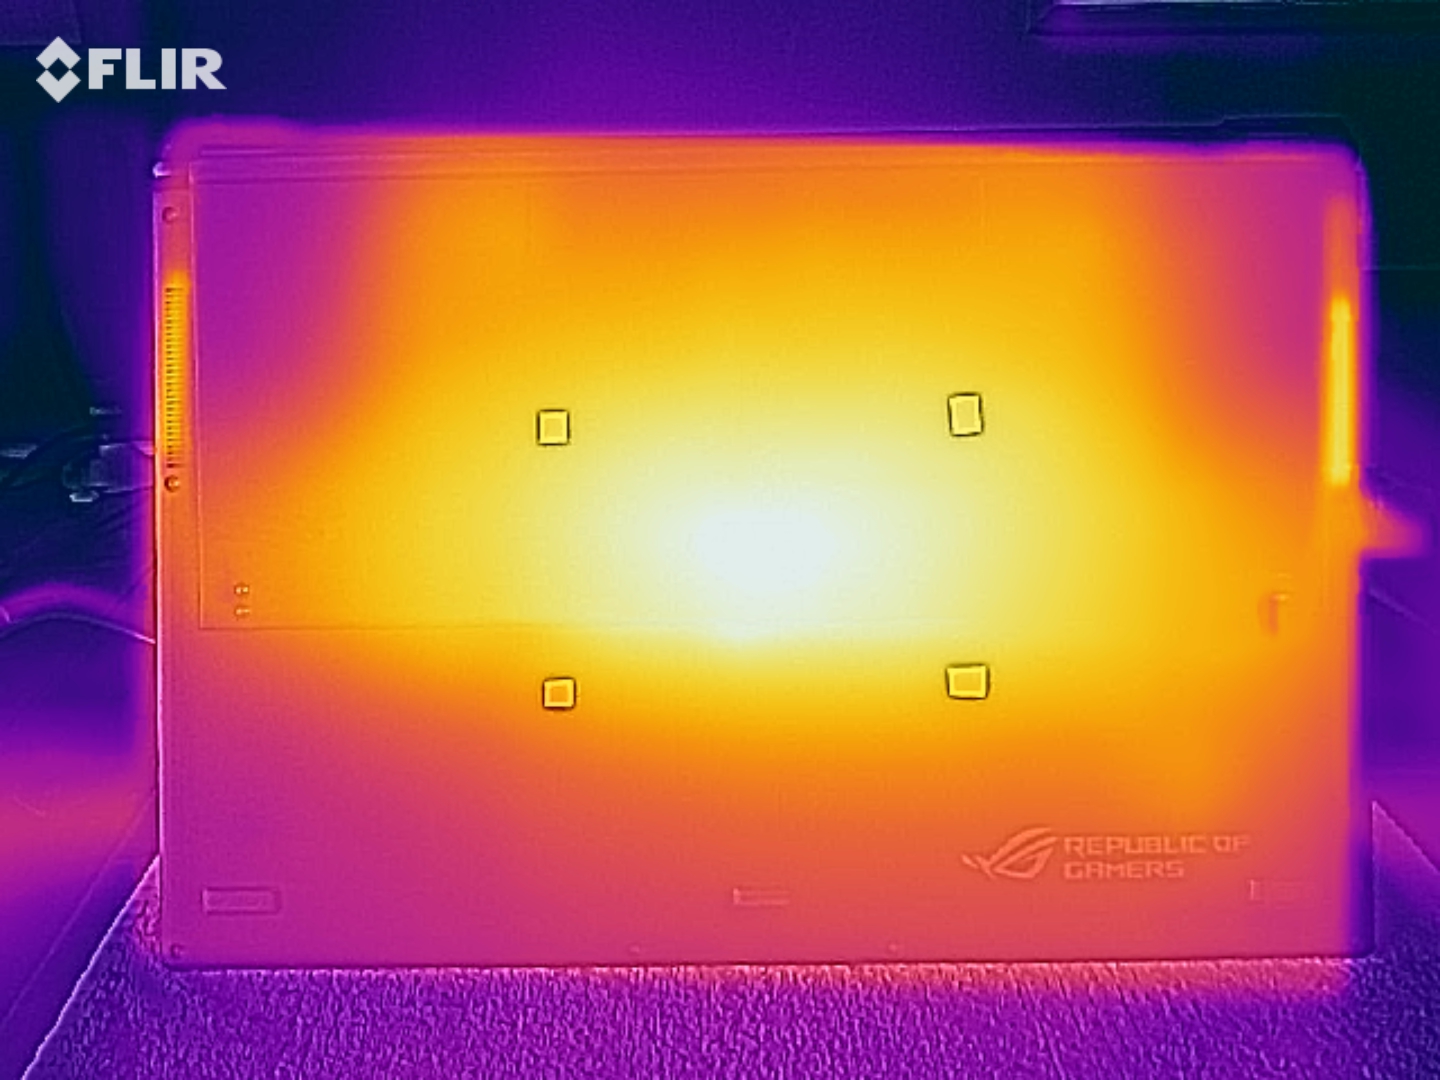
The case temperatures are typical for a slim gaming notebook. During our stress test (FurMark and Prime95 running for one hour straight), the temperatures at the top of the chassis reached 53 °C (127.4 °F) and the bottom of the chassis got up to 50 °C (122 °F). Internal components also did not overheat. The CPU hit a maximum of 92 °C (197.6 °F), which is quite high but not critical. The GeForce RTX 2080 Max-Q reached only 74 °C (165.2 °F).
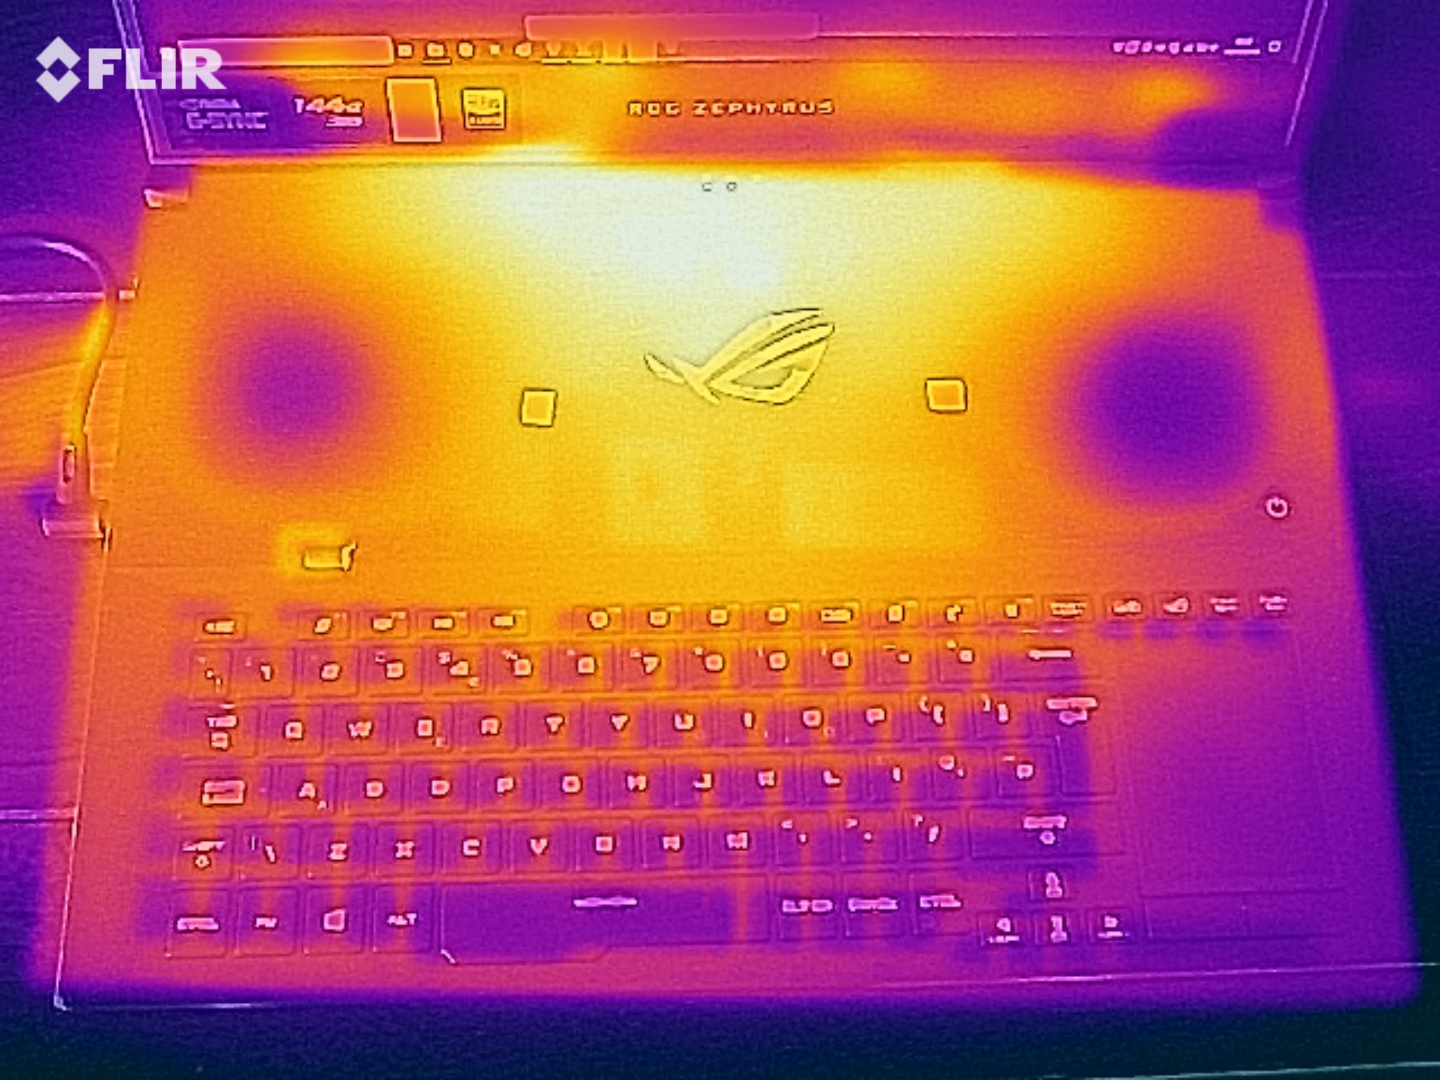
When the notebook is not used over an extended period of time, the surface temperatures are pleasantly cool. When idle, the surface temperatures fluctuate between 25 and 30 °C (77-86 °F).
(-) The maximum temperature on the upper side is 53 °C / 127 F, compared to the average of 40.4 °C / 105 F, ranging from 21.2 to 68.8 °C for the class Gaming.
(-) The bottom heats up to a maximum of 50 °C / 122 F, compared to the average of 43.2 °C / 110 F
(+) In idle usage, the average temperature for the upper side is 26.7 °C / 80 F, compared to the device average of 33.9 °C / 93 F.
(-) Playing The Witcher 3, the average temperature for the upper side is 44.6 °C / 112 F, compared to the device average of 33.9 °C / 93 F.
(±) The palmrests and touchpad can get very hot to the touch with a maximum of 38 °C / 100.4 F.
(-) The average temperature of the palmrest area of similar devices was 28.8 °C / 83.8 F (-9.2 °C / -16.6 F).
| Asus Zephyrus S GX701GX GeForce RTX 2080 Max-Q, i7-8750H | Acer Predator Triton 500 GeForce RTX 2080 Max-Q, i7-8750H | Razer Blade 15 RTX 2070 Max-Q GeForce RTX 2070 Max-Q, i7-8750H | Gigabyte Aero 15-X9 GeForce RTX 2070 Max-Q, i7-8750H | MSI GE75 8SG Raider GeForce RTX 2080 Mobile, i7-8750H | Asus ROG Strix Scar II GL704GW GeForce RTX 2070 Mobile, i7-8750H | Average of class Gaming | |
|---|---|---|---|---|---|---|---|
| Heat | -10% | 6% | -7% | 7% | -15% | -3% | |
| Maximum Upper Side * (°C) | 53 | 49 8% | 49 8% | 56 -6% | 46 13% | 59 -11% | 45.2 ? 15% |
| Maximum Bottom * (°C) | 50 | 58 -16% | 49 2% | 66 -32% | 45 10% | 54 -8% | 48.1 ? 4% |
| Idle Upper Side * (°C) | 27 | 33 -22% | 25.4 6% | 27 -0% | 27 -0% | 33 -22% | 31 ? -15% |
| Idle Bottom * (°C) | 30 | 33 -10% | 27.2 9% | 27 10% | 29 3% | 35 -17% | 34.2 ? -14% |
* ... smaller is better
Speakers
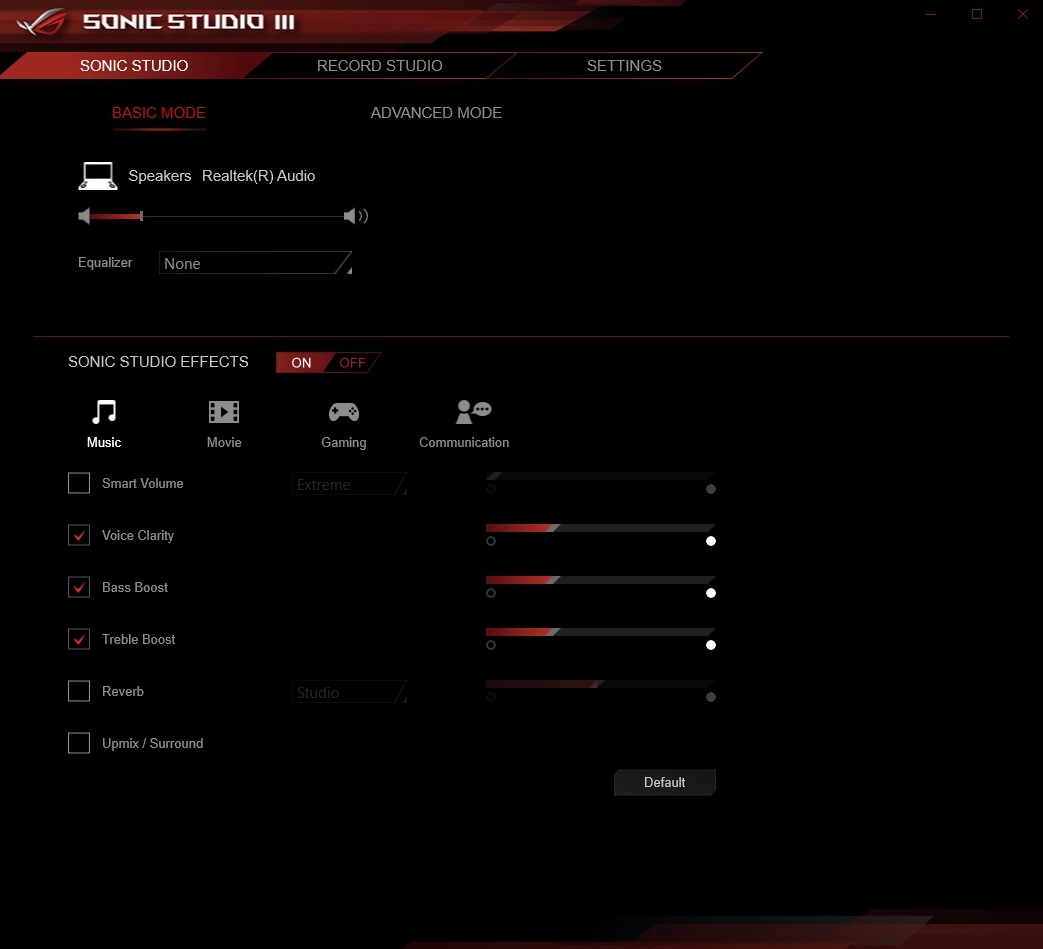
The audio quality is pretty good for such a slim notebook. Despite having no subwoofer, the ROG Zephyrus S provides more bass than the MSI GE75, which is currently being reviewed. The GX701 features two 2.5-watt speakers that support Smart AMP technology. They are located to the left and the right of the keyboard and are hidden behind a mesh. They produce an okay sound, which is afflicted by the typical weaknesses seen in laptop speakers (they sound muffled, tinny and unbalanced).
Asus Zephyrus S GX701GX audio analysis
(+) | speakers can play relatively loud (82 dB)
Bass 100 - 315 Hz
(±) | reduced bass - on average 8.3% lower than median
(±) | linearity of bass is average (11.3% delta to prev. frequency)
Mids 400 - 2000 Hz
(+) | balanced mids - only 3.3% away from median
(+) | mids are linear (2.5% delta to prev. frequency)
Highs 2 - 16 kHz
(±) | reduced highs - on average 6.9% lower than median
(+) | highs are linear (6.2% delta to prev. frequency)
Overall 100 - 16.000 Hz
(±) | linearity of overall sound is average (15.4% difference to median)
Compared to same class
» 34% of all tested devices in this class were better, 7% similar, 59% worse
» The best had a delta of 6%, average was 18%, worst was 132%
Compared to all devices tested
» 23% of all tested devices were better, 4% similar, 73% worse
» The best had a delta of 4%, average was 23%, worst was 134%
MSI GE75 8SG Raider audio analysis
(+) | speakers can play relatively loud (91 dB)
Bass 100 - 315 Hz
(-) | nearly no bass - on average 15.7% lower than median
(±) | linearity of bass is average (12.1% delta to prev. frequency)
Mids 400 - 2000 Hz
(±) | reduced mids - on average 5.1% lower than median
(+) | mids are linear (5.8% delta to prev. frequency)
Highs 2 - 16 kHz
(+) | balanced highs - only 2.7% away from median
(+) | highs are linear (3.2% delta to prev. frequency)
Overall 100 - 16.000 Hz
(+) | overall sound is linear (12.8% difference to median)
Compared to same class
» 16% of all tested devices in this class were better, 4% similar, 80% worse
» The best had a delta of 6%, average was 18%, worst was 132%
Compared to all devices tested
» 12% of all tested devices were better, 3% similar, 85% worse
» The best had a delta of 4%, average was 23%, worst was 134%
Energy Management
Energy Consumption
Thanks to Nvidia’s Optimus technology, the power draw when idle (19-30 watts) is not too high. However, the Razer Blade 15 draws even less power (10-16 watts) when idle. Under load, the GX701 consumes between 104 and 203 watts. The included 230-watt power adapter should have no trouble supplying the laptop with enough energy.
| Off / Standby | |
| Idle | |
| Load |
|
Key:
min: | |
| Asus Zephyrus S GX701GX GeForce RTX 2080 Max-Q, i7-8750H | Acer Predator Triton 500 GeForce RTX 2080 Max-Q, i7-8750H | Razer Blade 15 RTX 2070 Max-Q GeForce RTX 2070 Max-Q, i7-8750H | Gigabyte Aero 15-X9 GeForce RTX 2070 Max-Q, i7-8750H | MSI GE75 8SG Raider GeForce RTX 2080 Mobile, i7-8750H | Asus ROG Strix Scar II GL704GW GeForce RTX 2070 Mobile, i7-8750H | Average of class Gaming | |
|---|---|---|---|---|---|---|---|
| Power Consumption | 8% | 26% | 20% | 14% | -4% | 6% | |
| Idle Minimum * (Watt) | 19 | 16 16% | 10.4 45% | 16 16% | 7 63% | 19 -0% | 13 ? 32% |
| Idle Average * (Watt) | 22 | 22 -0% | 14.6 34% | 18 18% | 15 32% | 22 -0% | 19 ? 14% |
| Idle Maximum * (Watt) | 30 | 32 -7% | 16.3 46% | 23 23% | 22 27% | 29 3% | 24.6 ? 18% |
| Load Average * (Watt) | 104 | 89 14% | 88.5 15% | 88 15% | 92 12% | 102 2% | 110.7 ? -6% |
| Witcher 3 ultra * (Watt) | 167 | 147 12% | 155.4 7% | 120 28% | 207 -24% | 190 -14% | |
| Load Maximum * (Watt) | 203 | 173 15% | 182.4 10% | 167 18% | 254 -25% | 231 -14% | 259 ? -28% |
* ... smaller is better
Battery Life
While the GX531 had a 50-Wh battery, the GX701 features a 76-Wh battery. This battery is larger than the battery in the GL704 (66 Wh), but smaller than in the Acer Triton (82 Wh), the Razer Blade 15 (80 Wh) and the Gigabyte Aero 15 (94 Wh). The last two notebooks achieve the best results in our battery tests. For example, in our Wi-Fi test, in which the brightness is set to 150 cd/m², the GX701 achieves a battery runtime of about 4 hours. However, other gaming laptops can last for as long as 6.5 hours. This is why those who travel a lot should go with a competing device. Nevertheless, the battery life is still not that bad for a high-end notebook.
| Asus Zephyrus S GX701GX GeForce RTX 2080 Max-Q, i7-8750H, 76 Wh | Acer Predator Triton 500 GeForce RTX 2080 Max-Q, i7-8750H, 82 Wh | Razer Blade 15 RTX 2070 Max-Q GeForce RTX 2070 Max-Q, i7-8750H, 80 Wh | Gigabyte Aero 15-X9 GeForce RTX 2070 Max-Q, i7-8750H, 94.24 Wh | MSI GE75 8SG Raider GeForce RTX 2080 Mobile, i7-8750H, 65 Wh | Asus ROG Strix Scar II GL704GW GeForce RTX 2070 Mobile, i7-8750H, 66 Wh | Average of class Gaming | |
|---|---|---|---|---|---|---|---|
| Battery runtime | 17% | 89% | 125% | 27% | 16% | 73% | |
| Reader / Idle (h) | 5 | 5.6 12% | 11.4 128% | 9.2 84% | 7.8 56% | 6.2 24% | 8.27 ? 65% |
| WiFi v1.3 (h) | 3.8 | 3.2 -16% | 6.5 71% | 6.4 68% | 4.7 24% | 3.9 3% | 7.11 ? 87% |
| Load (h) | 0.9 | 1.4 56% | 1.5 67% | 2.9 222% | 0.9 0% | 1.1 22% | 1.502 ? 67% |
| H.264 (h) | 6.1 | 8.32 ? | |||||
| Witcher 3 ultra (h) | 0.8 | 0.9 |
Pros
Cons
Verdict
Because the choice of very thin, high-end 17.3-inch laptops is extremely limited, Asus has a trump up its sleeve with the brand-new ROG Zephyrus S GX701GX.
Sure, there are things to nitpick such as the selection of ports, fan control, maintenance options and input devices. Nevertheless, we were still pleasantly surprised by the 17-inch notebook. Users can get excited, not only about the color-accurate 144 Hz panel but also, about one of the fastest implementations of the RTX 2080 Max-Q on the market.
However, this laptop has a hefty price tag: Asus asks 3000 Euros ($3407) for the top-end model. Those who would prefer a 15-inch device should take a look at the Acer Triton 500, the Razer Blade 15 or the Gigabyte Aero 15 X9.
Asus Zephyrus S GX701GX
- 02/28/2019 v6 (old)
Florian Glaser
Price comparison
