Gigabyte Aero 15-X9 (Core i7-8750H, RTX 2070 Max-Q) Laptop Review

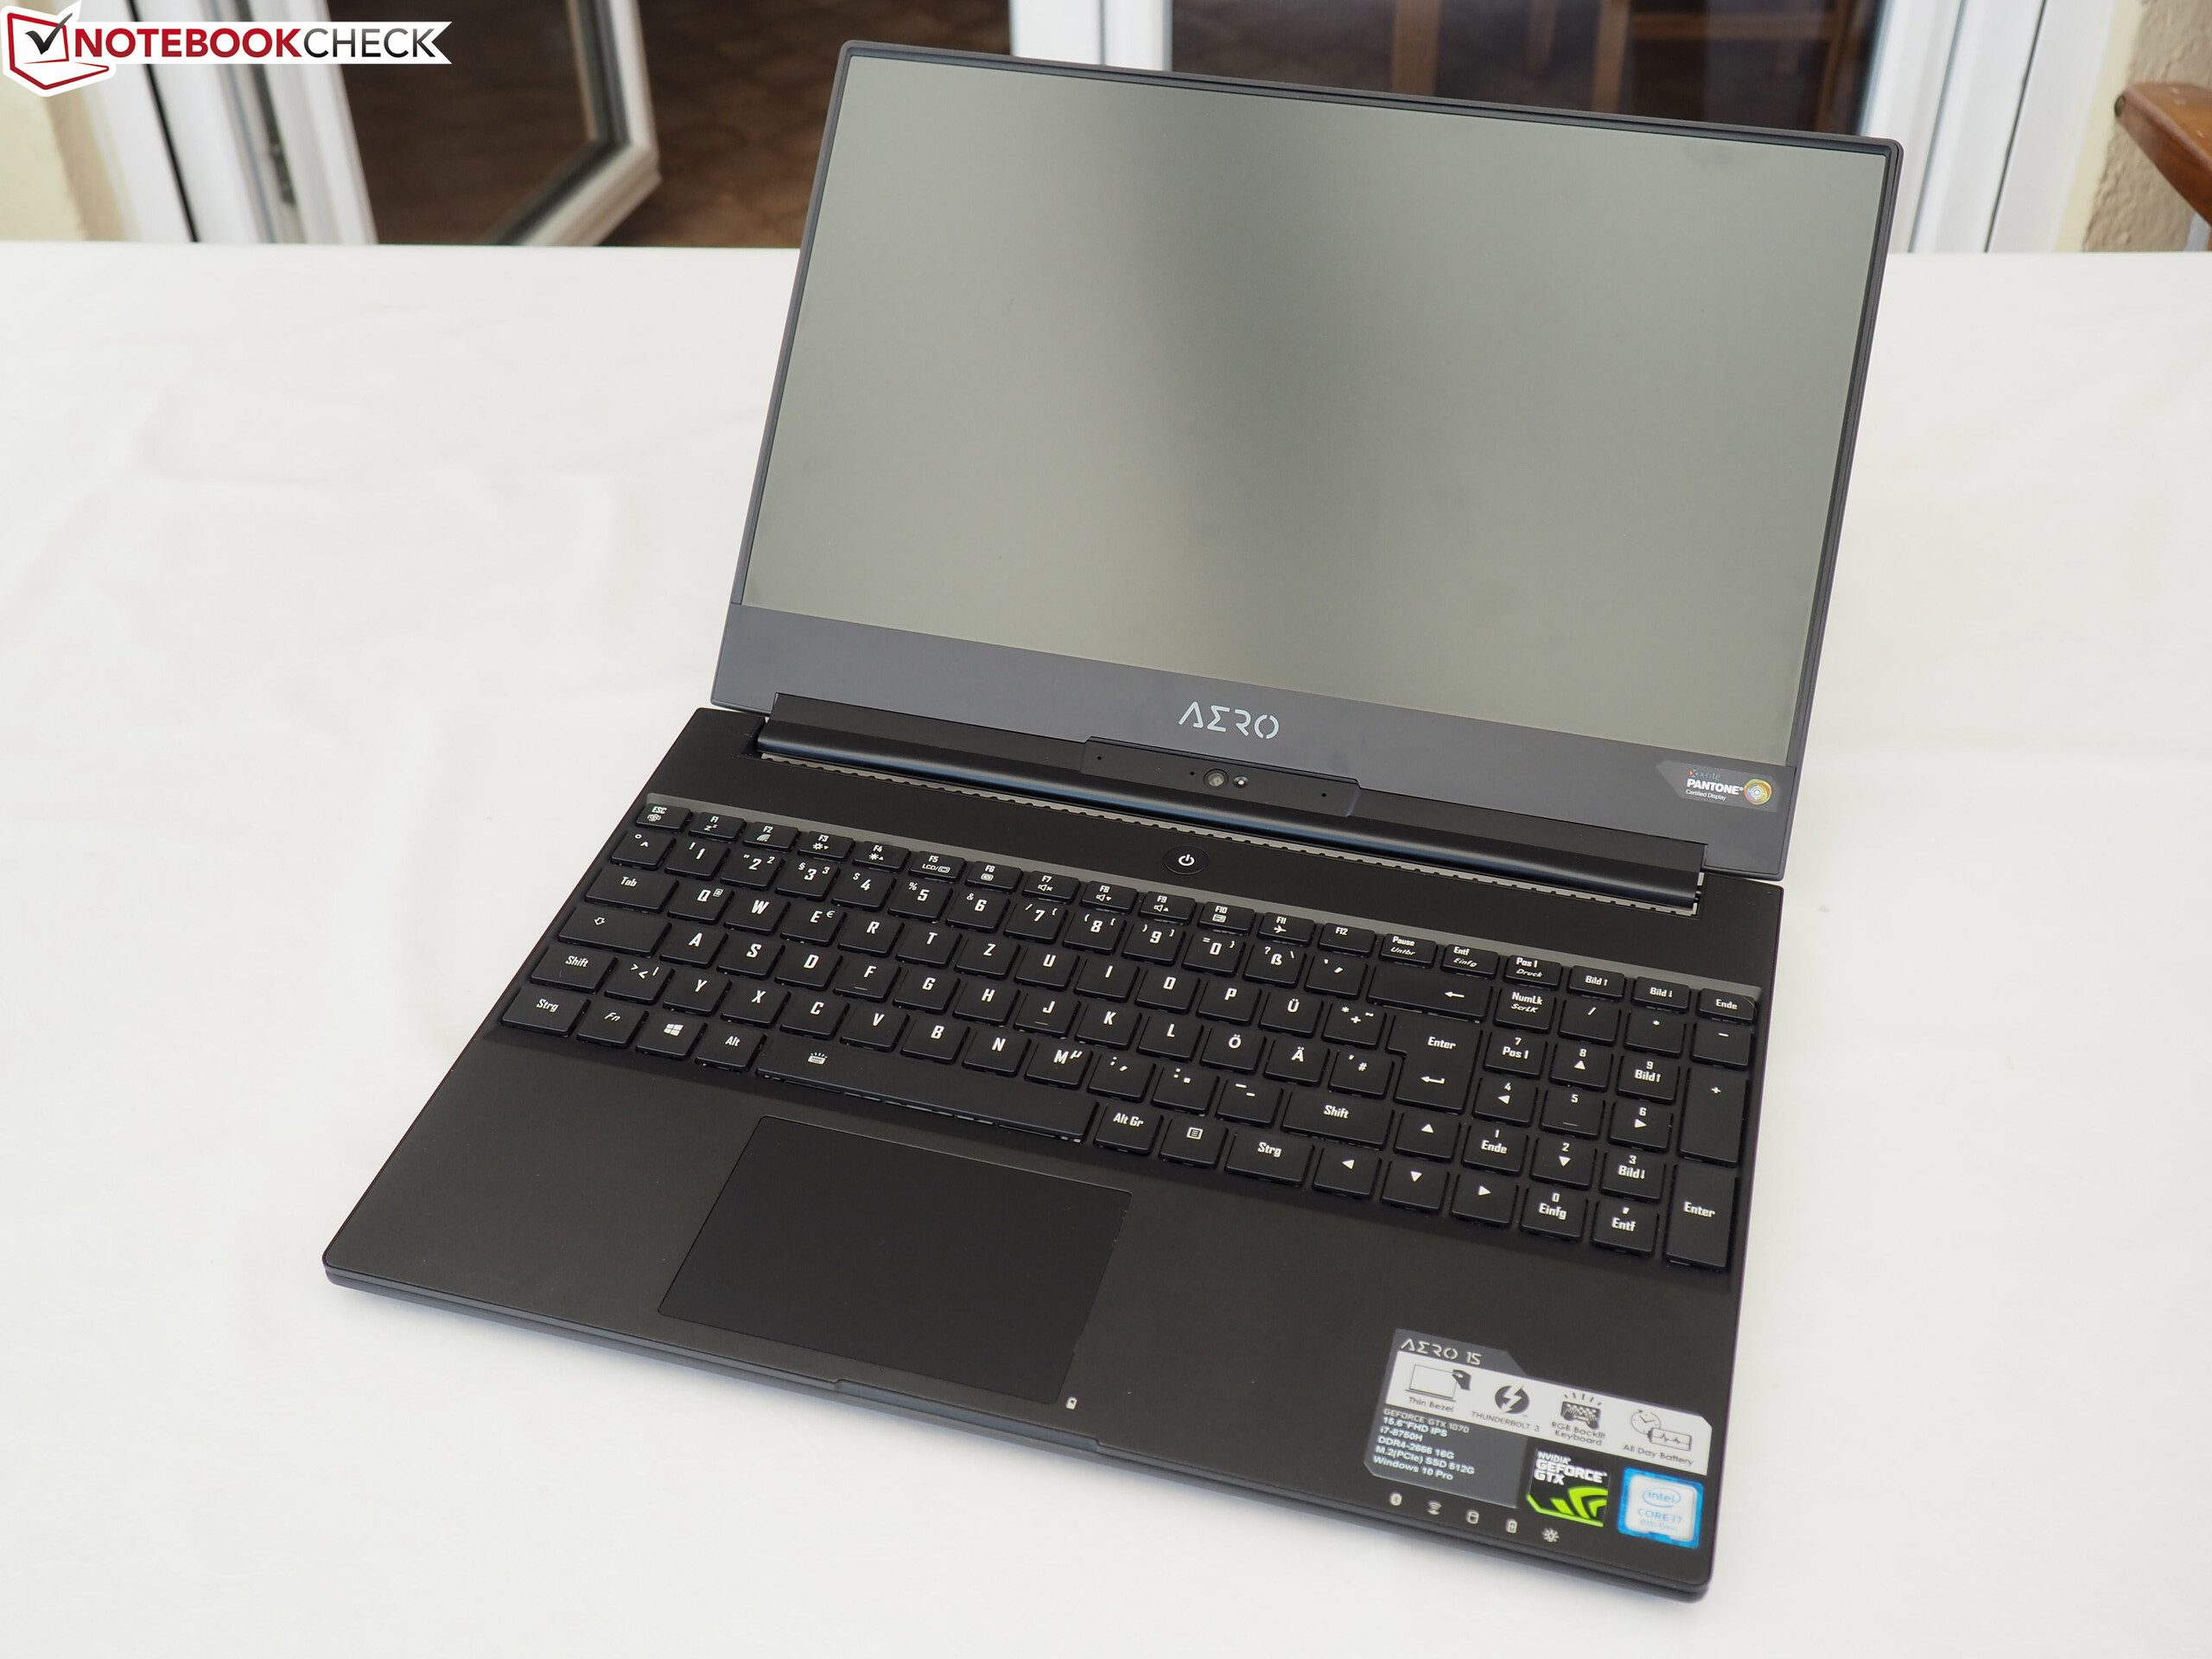
The Gigabyte Aero 15 series is made up of powerful yet compact 15.6-inch gaming laptops that have been well received in recent years. Most recently we reviewed the Aero 15X v8, which Gigabyte equipped with an Intel Core i7-8750H processor and an Nvidia GeForce GTX 1070 Max-Q GPU. Now, the company has upgraded the Aero 15 with Nvidia GeForce RTX 20 series GPUs but has kept the 15-X9 largely the same as its predecessor, including its processor. Gigabyte has equipped our review unit with the same Core i7-8750H processor that we saw with the Aero 15X v8 and an RTX 2070 Max-Q GPU. These specifications put the Aero 15-X9 in direct competition with devices like the Acer Predator Triton 500 and the Razer Blade 15, which are equipped with RTX 2080 Max-Q and RTX 2070 Max-Q GPUs, respectively. We shall also compare the Aero 15-X9 against its predecessor along with the MSI GS65 8RF Stealth Thin and the ASUS ROG Zephyrus S GX531GS. Please keep in mind that these laptops are equipped with the older and less-powerful GeForce GTX 10 series GPUs, so they will achieve lower scores in benchmarks and fewer FPS in games. They offer an insight into the differences between the GTX 10 and RTX 20 series though, which is one of the reasons why we have included them as comparison devices.
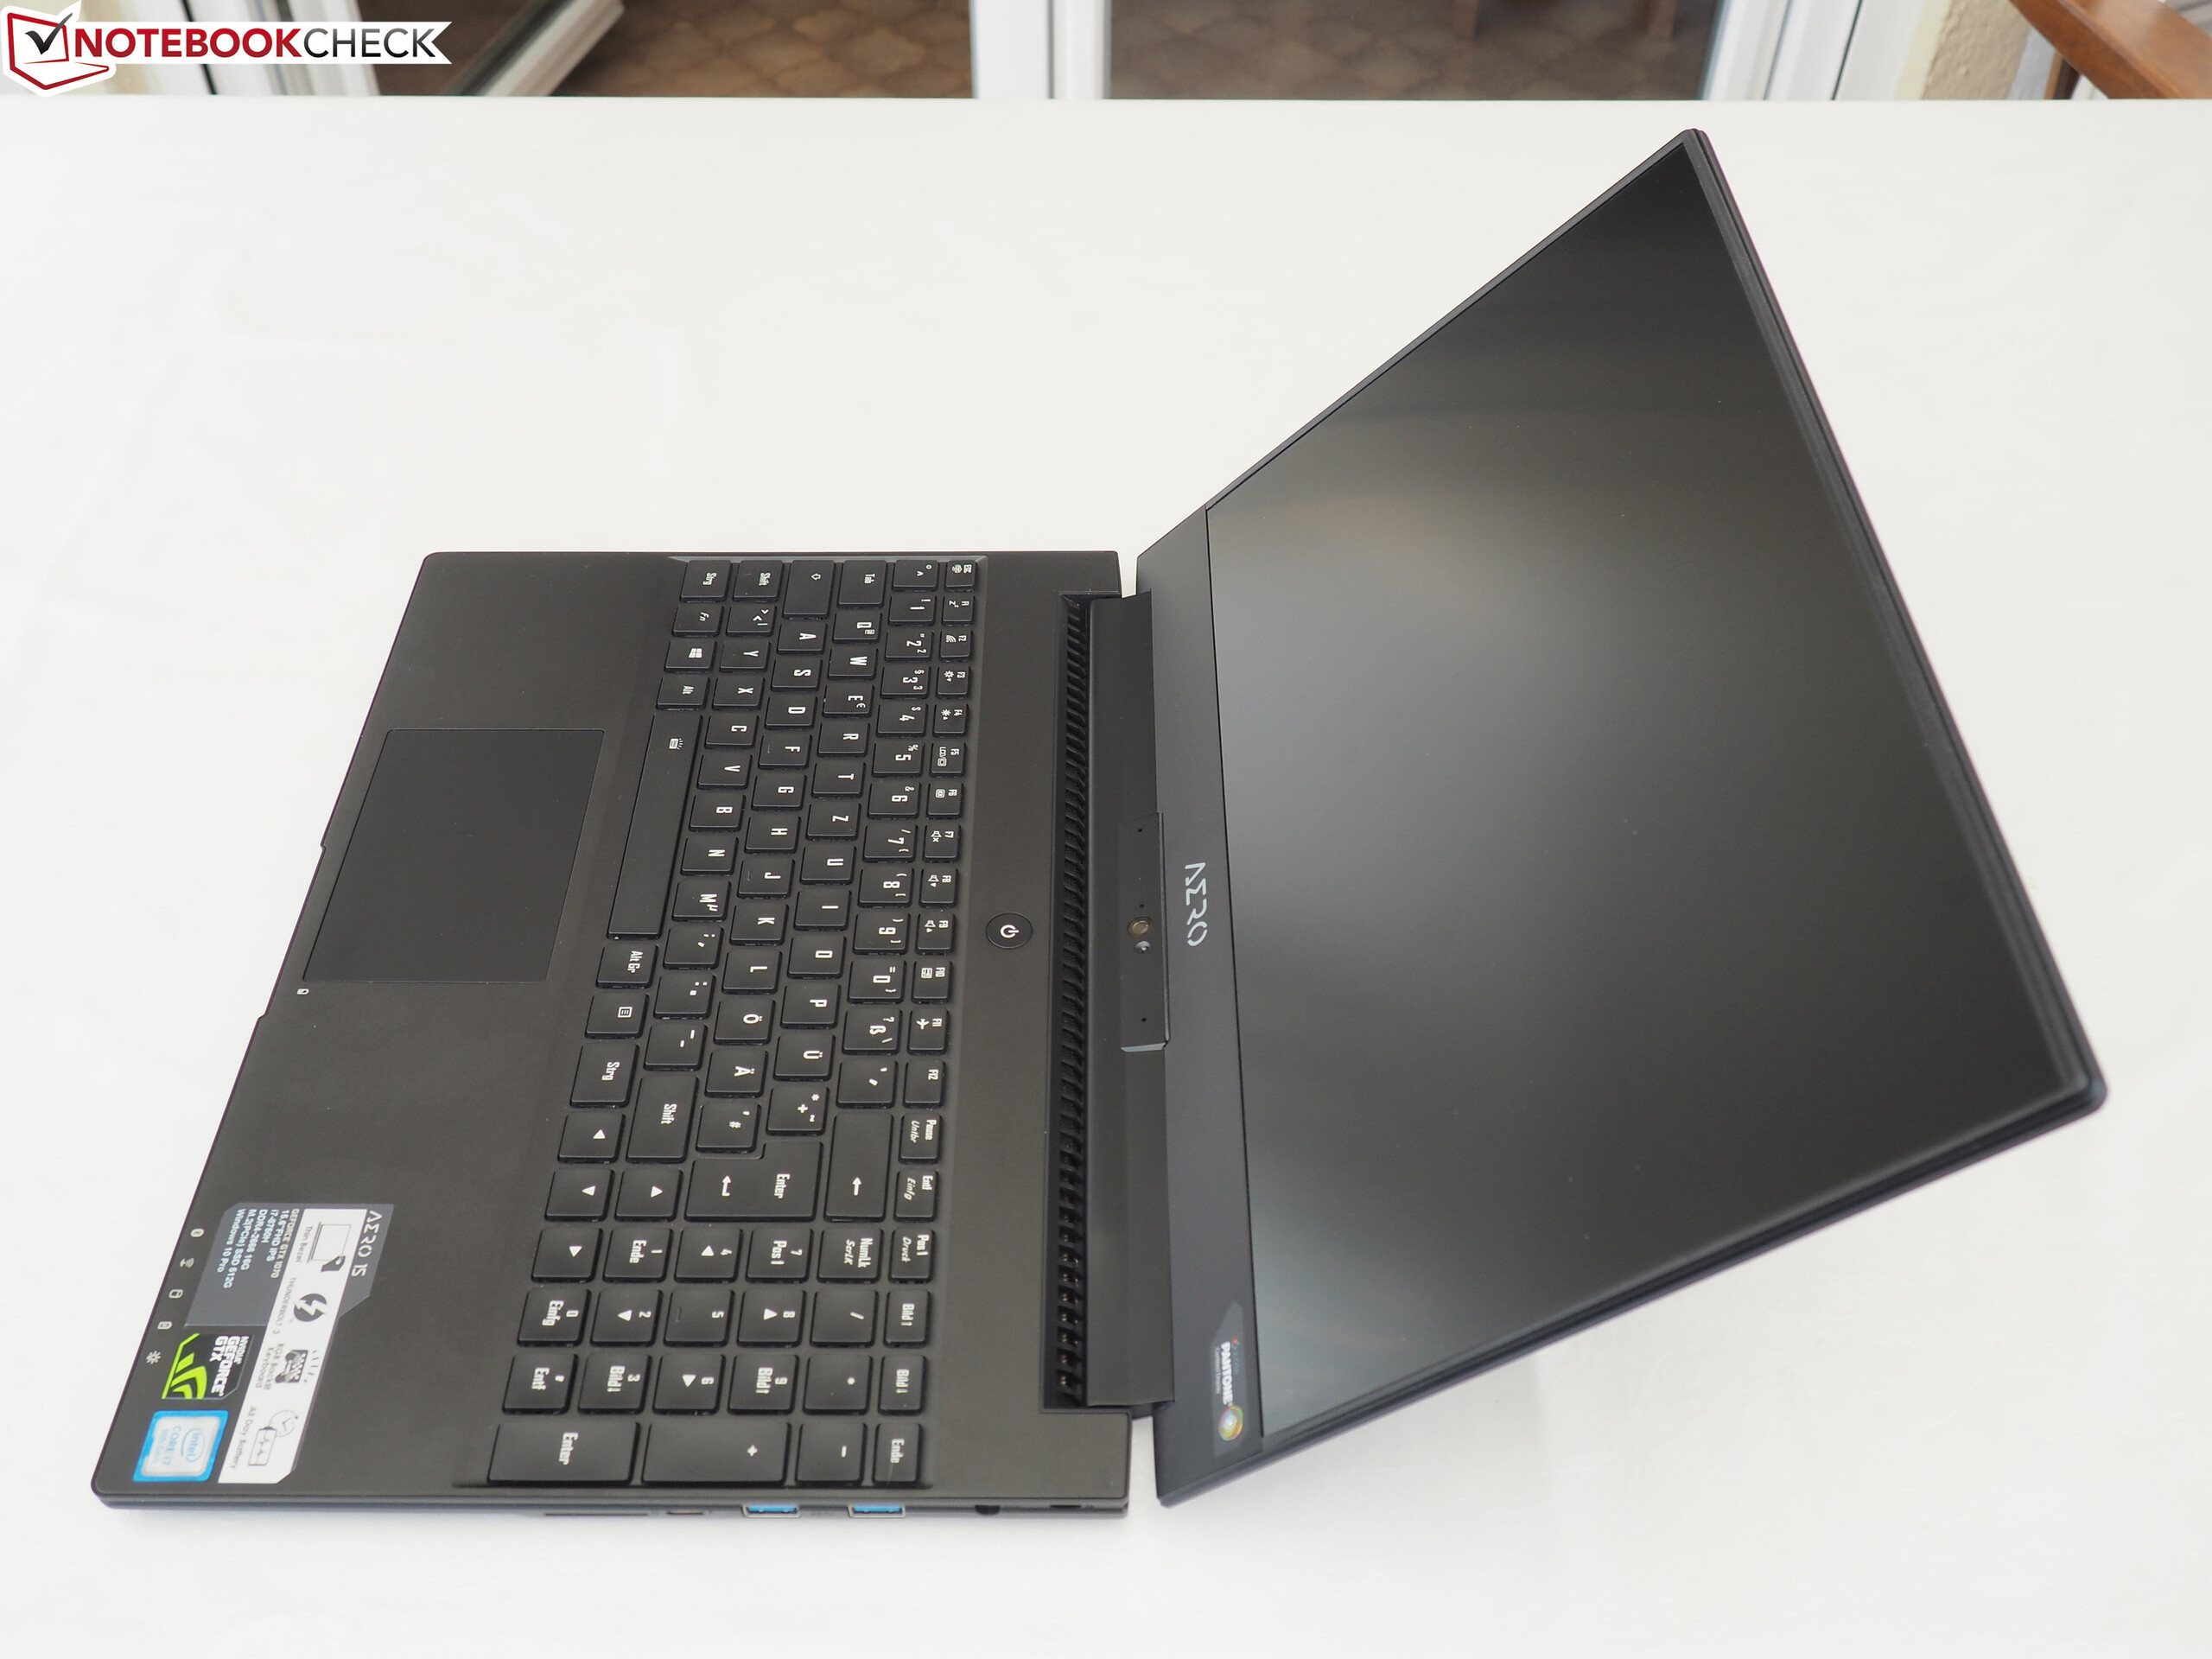
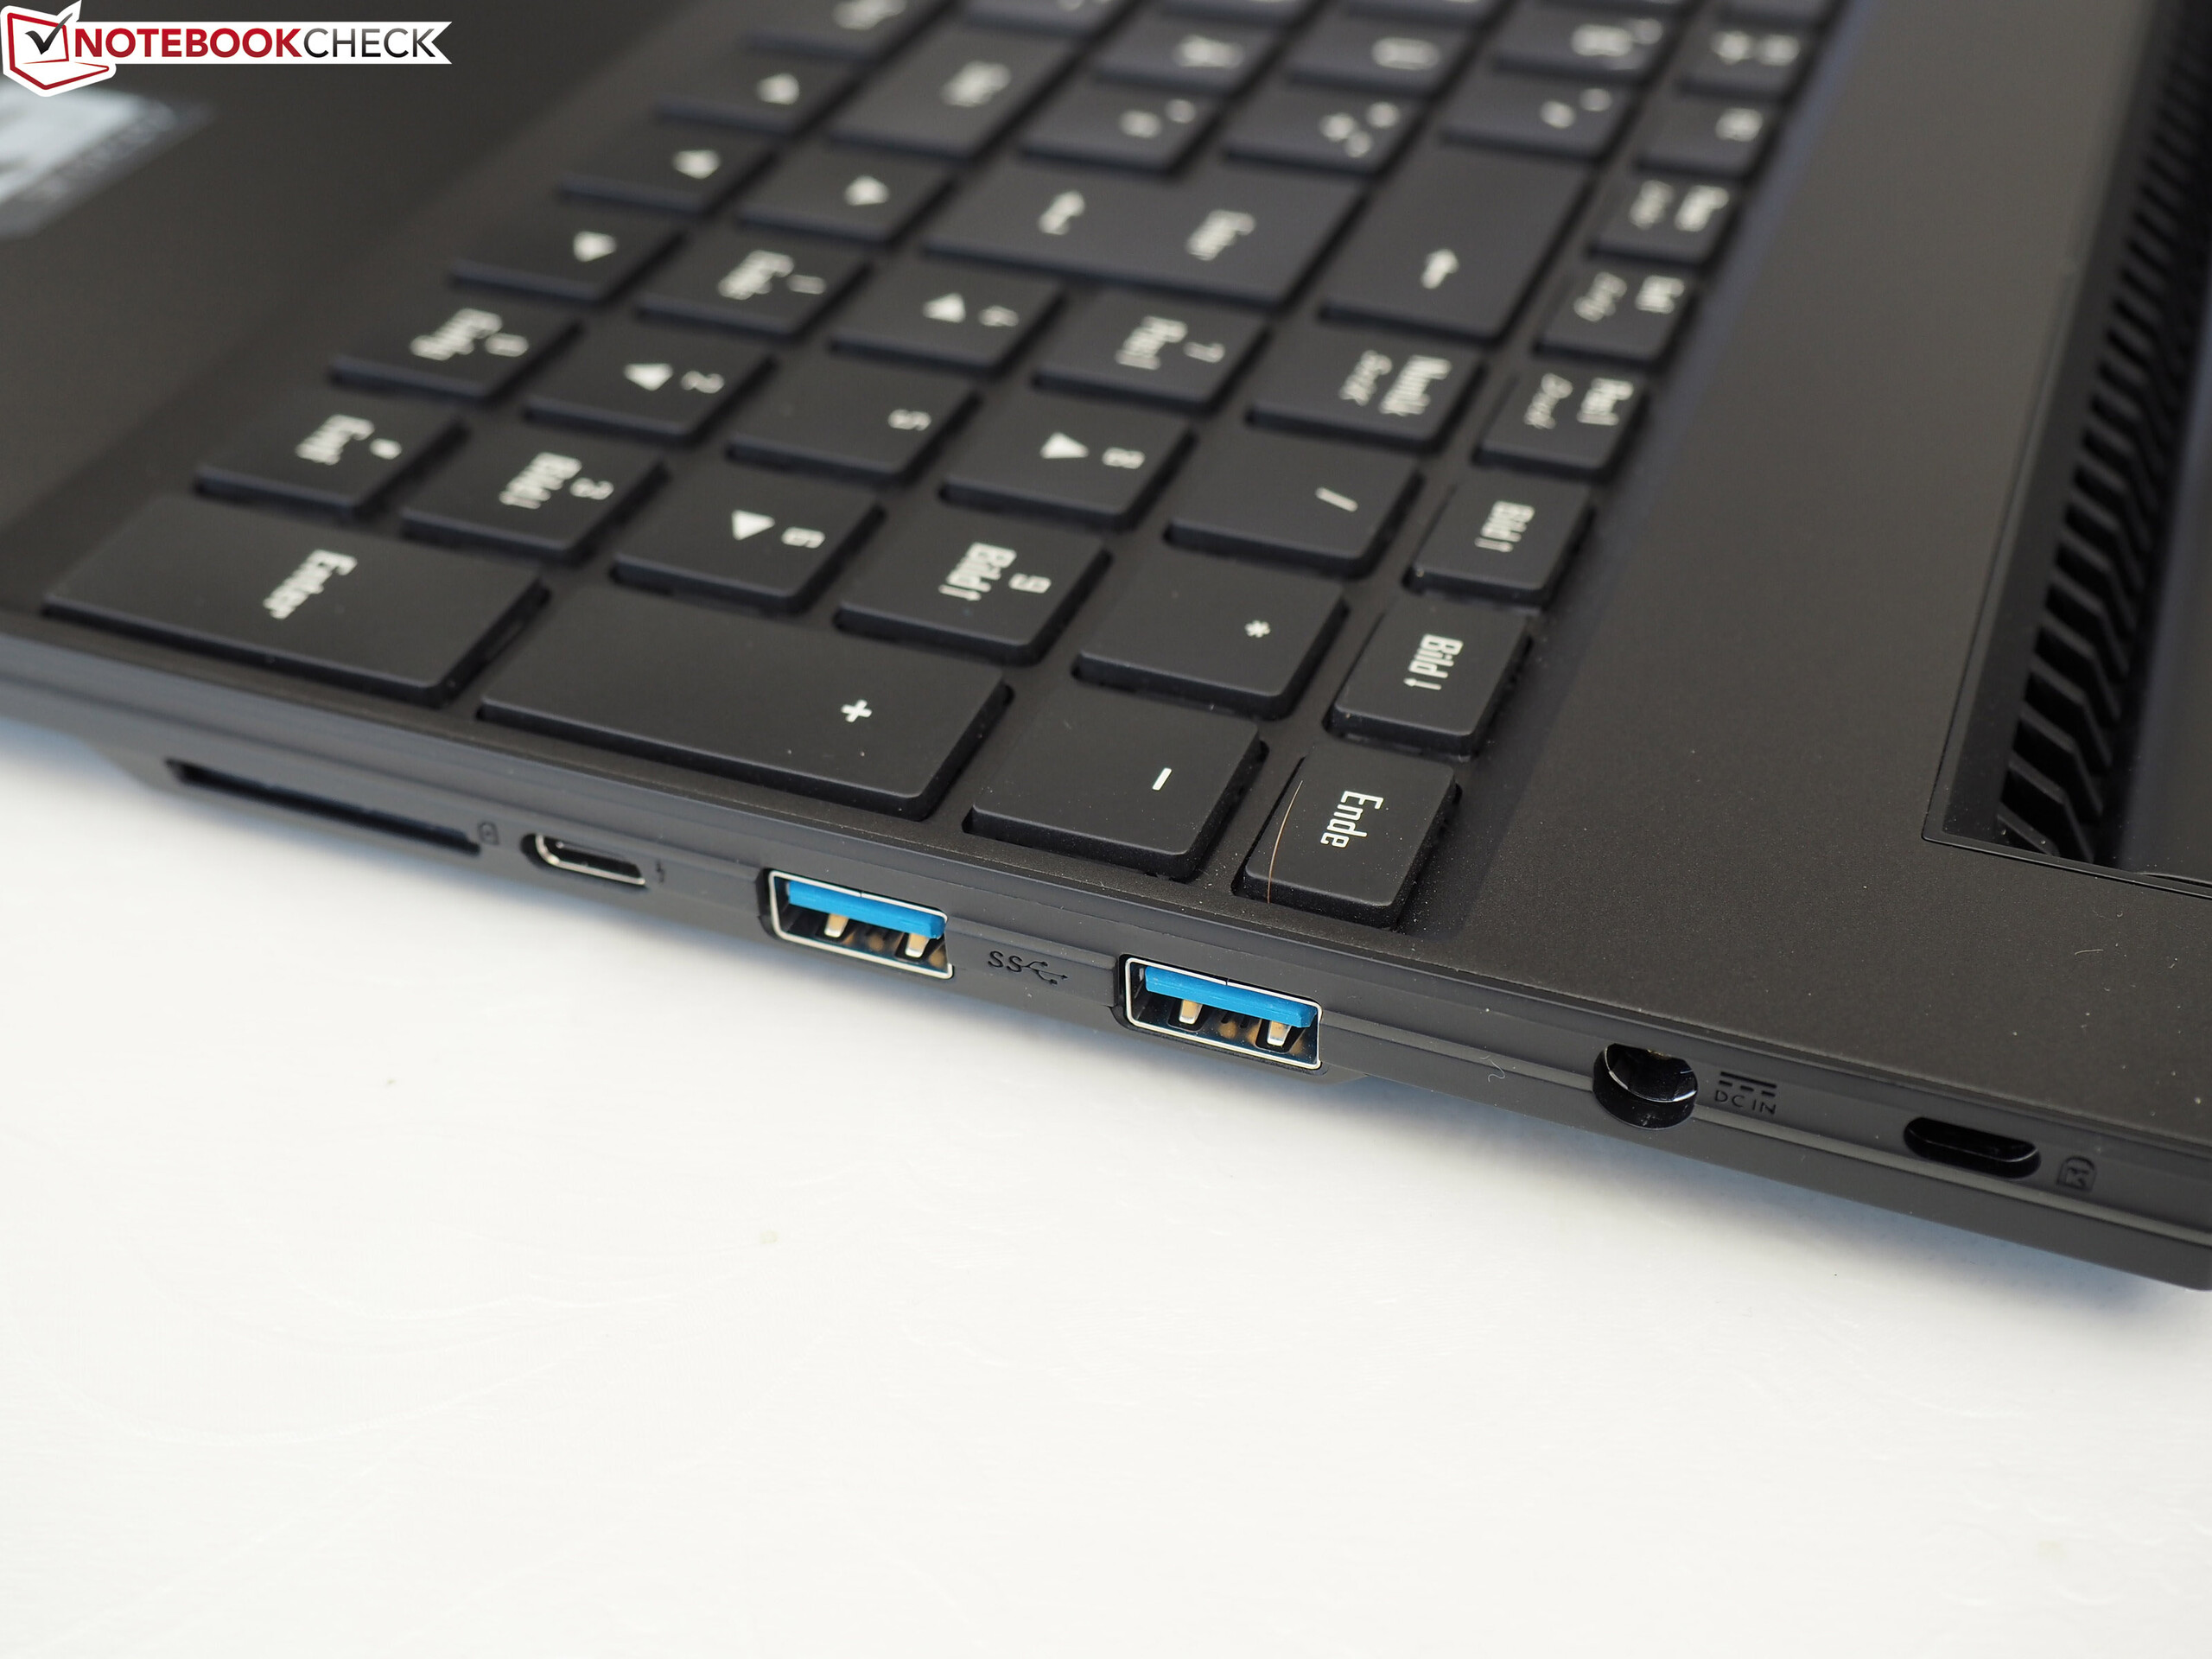
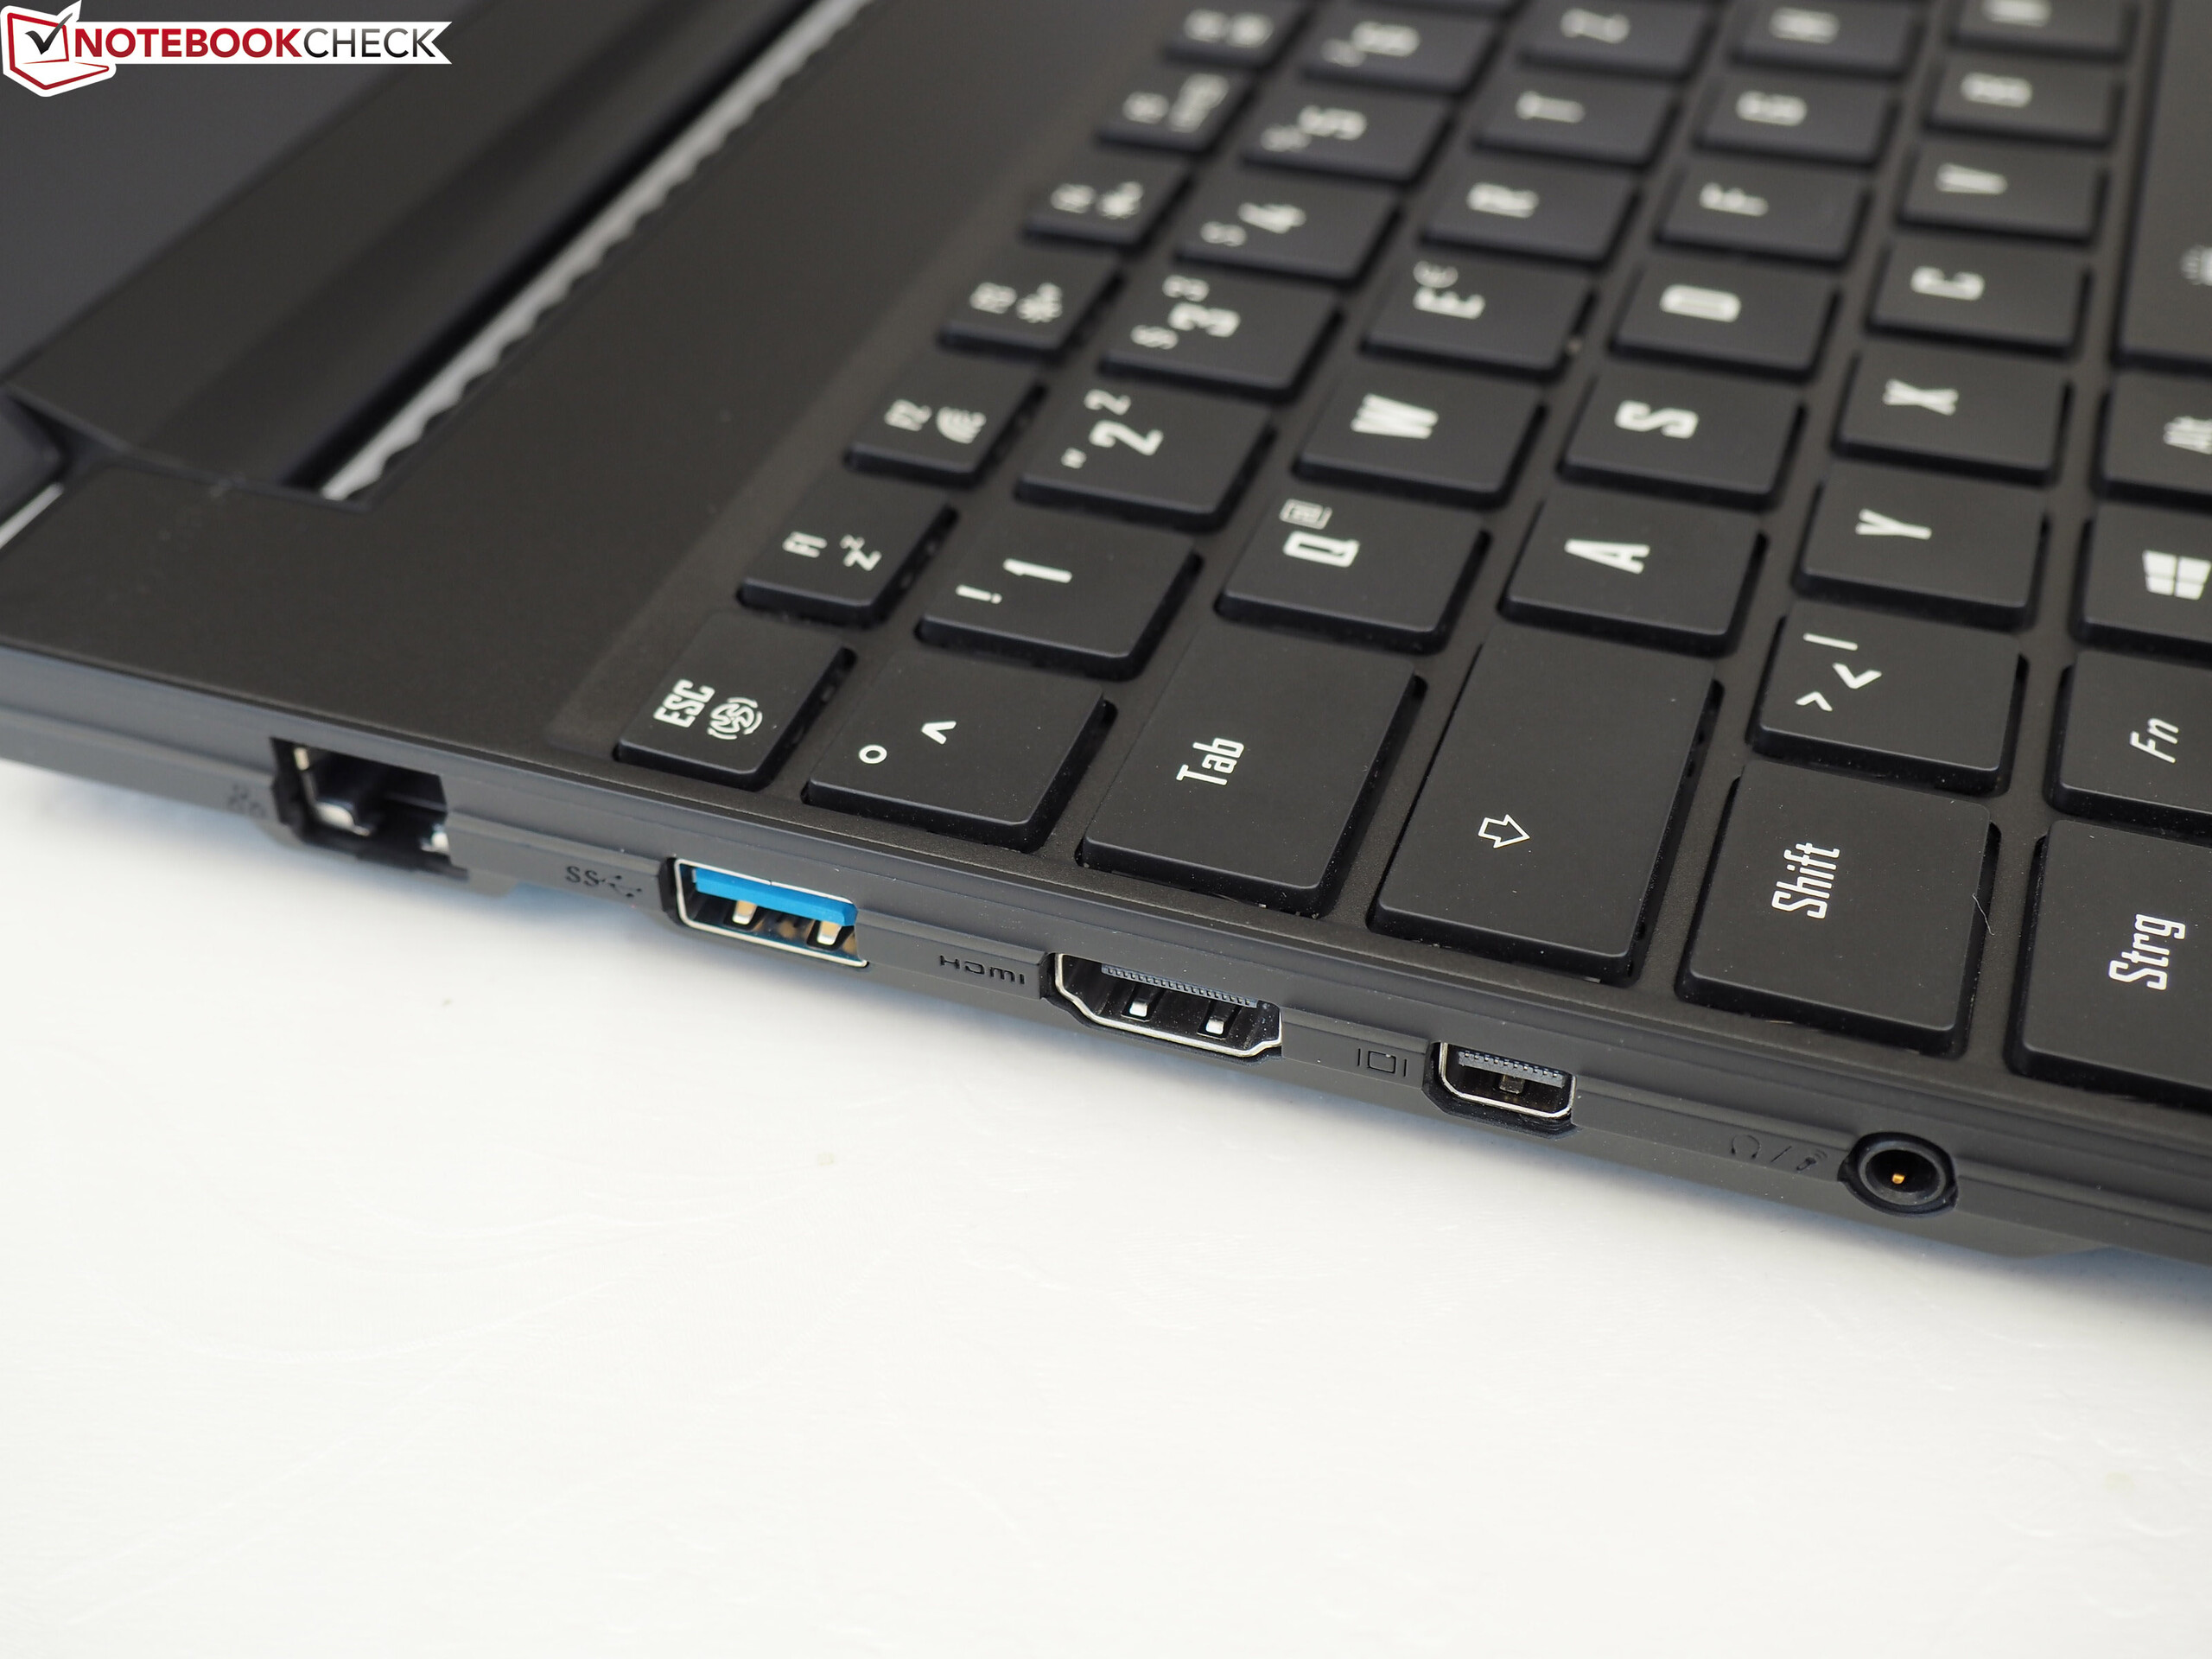
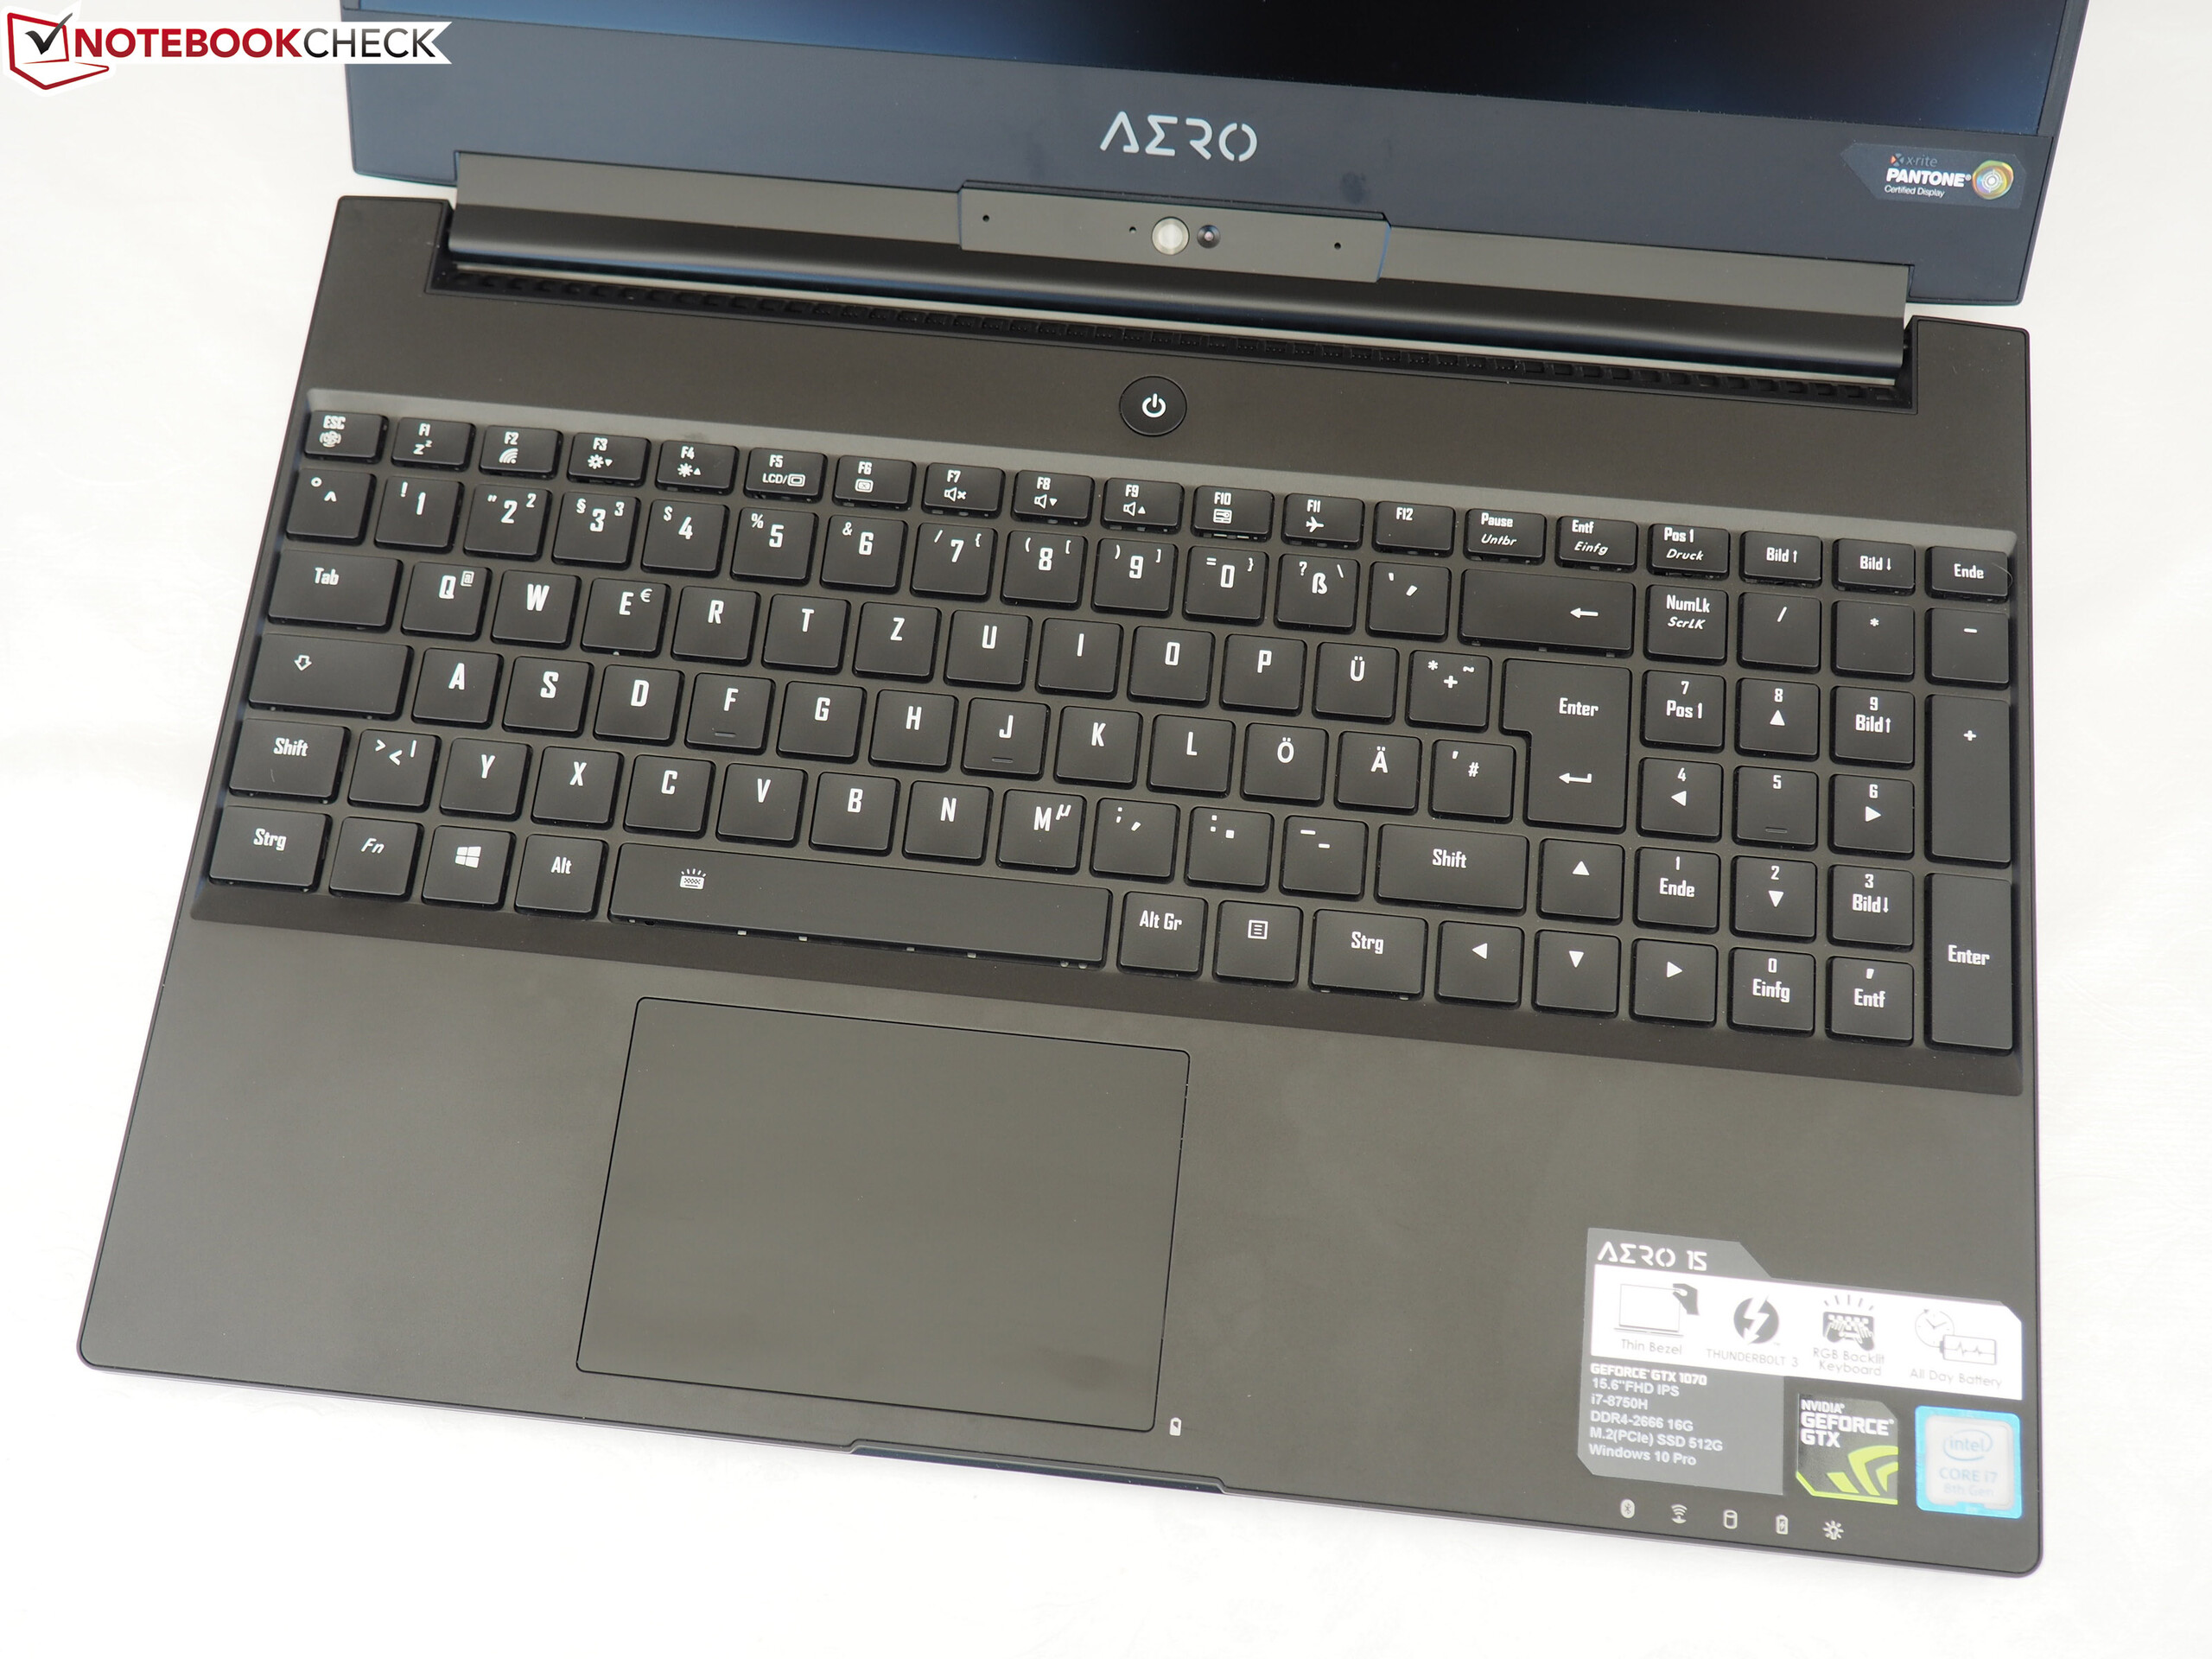
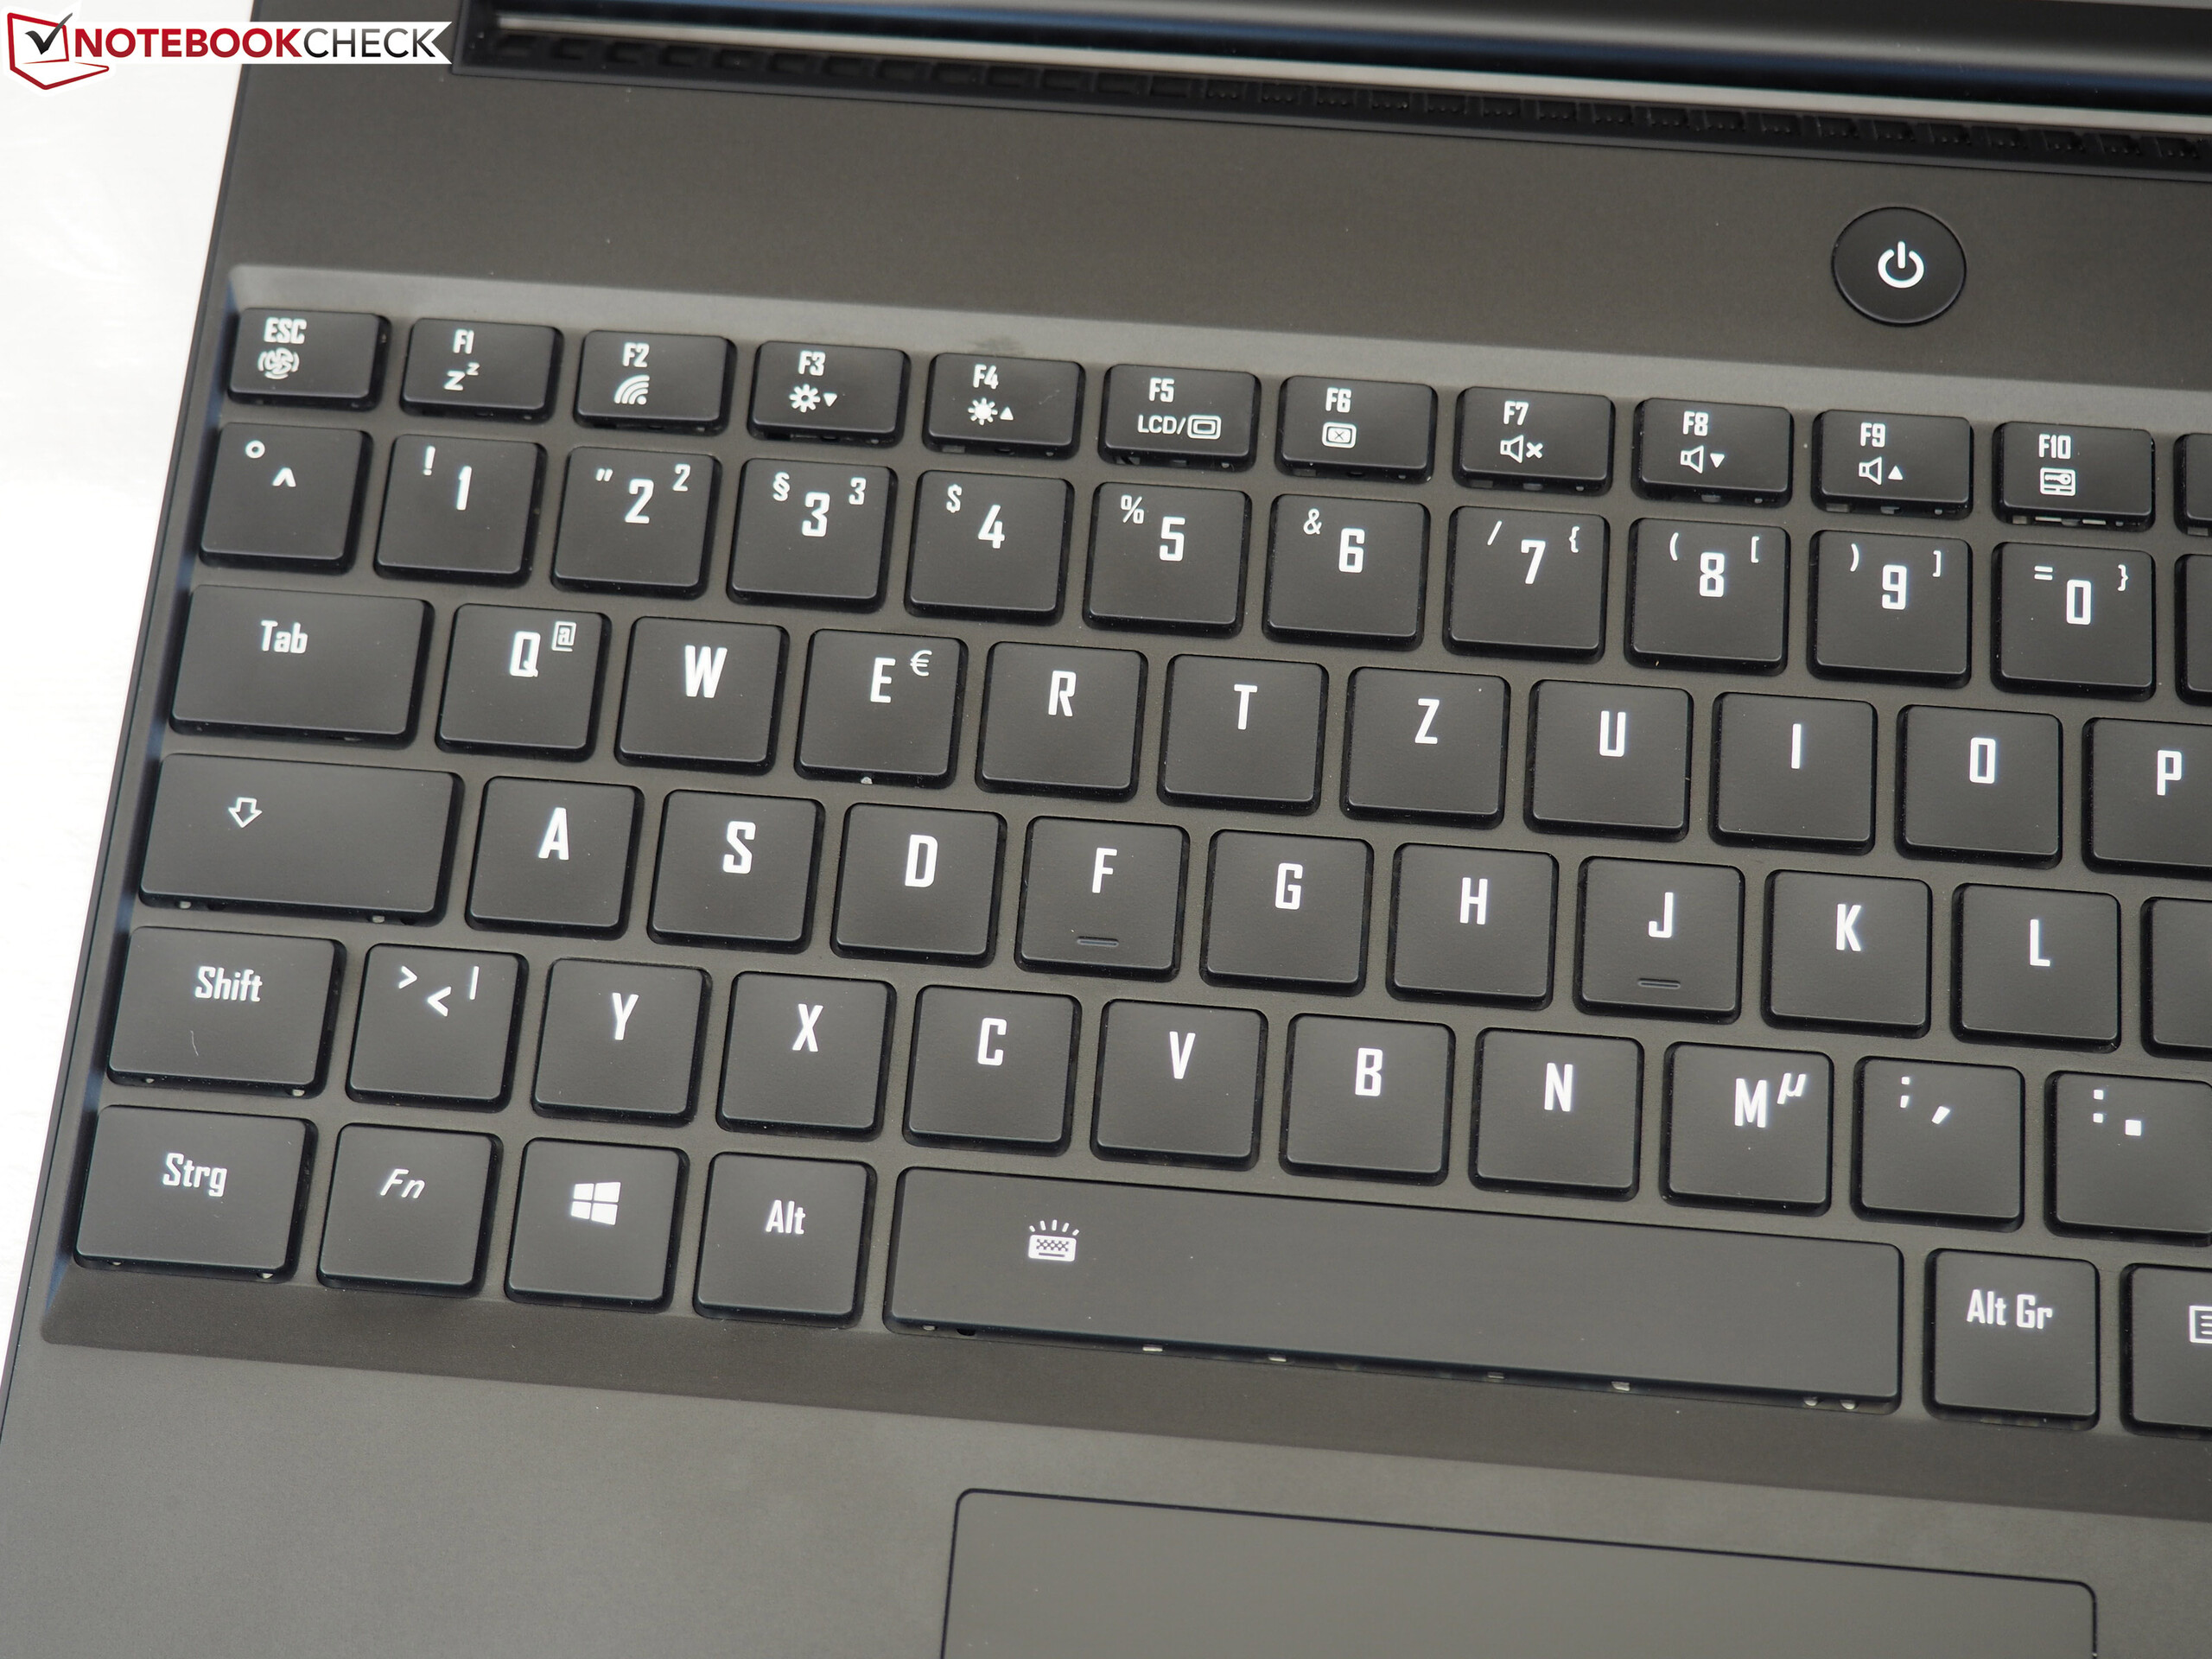
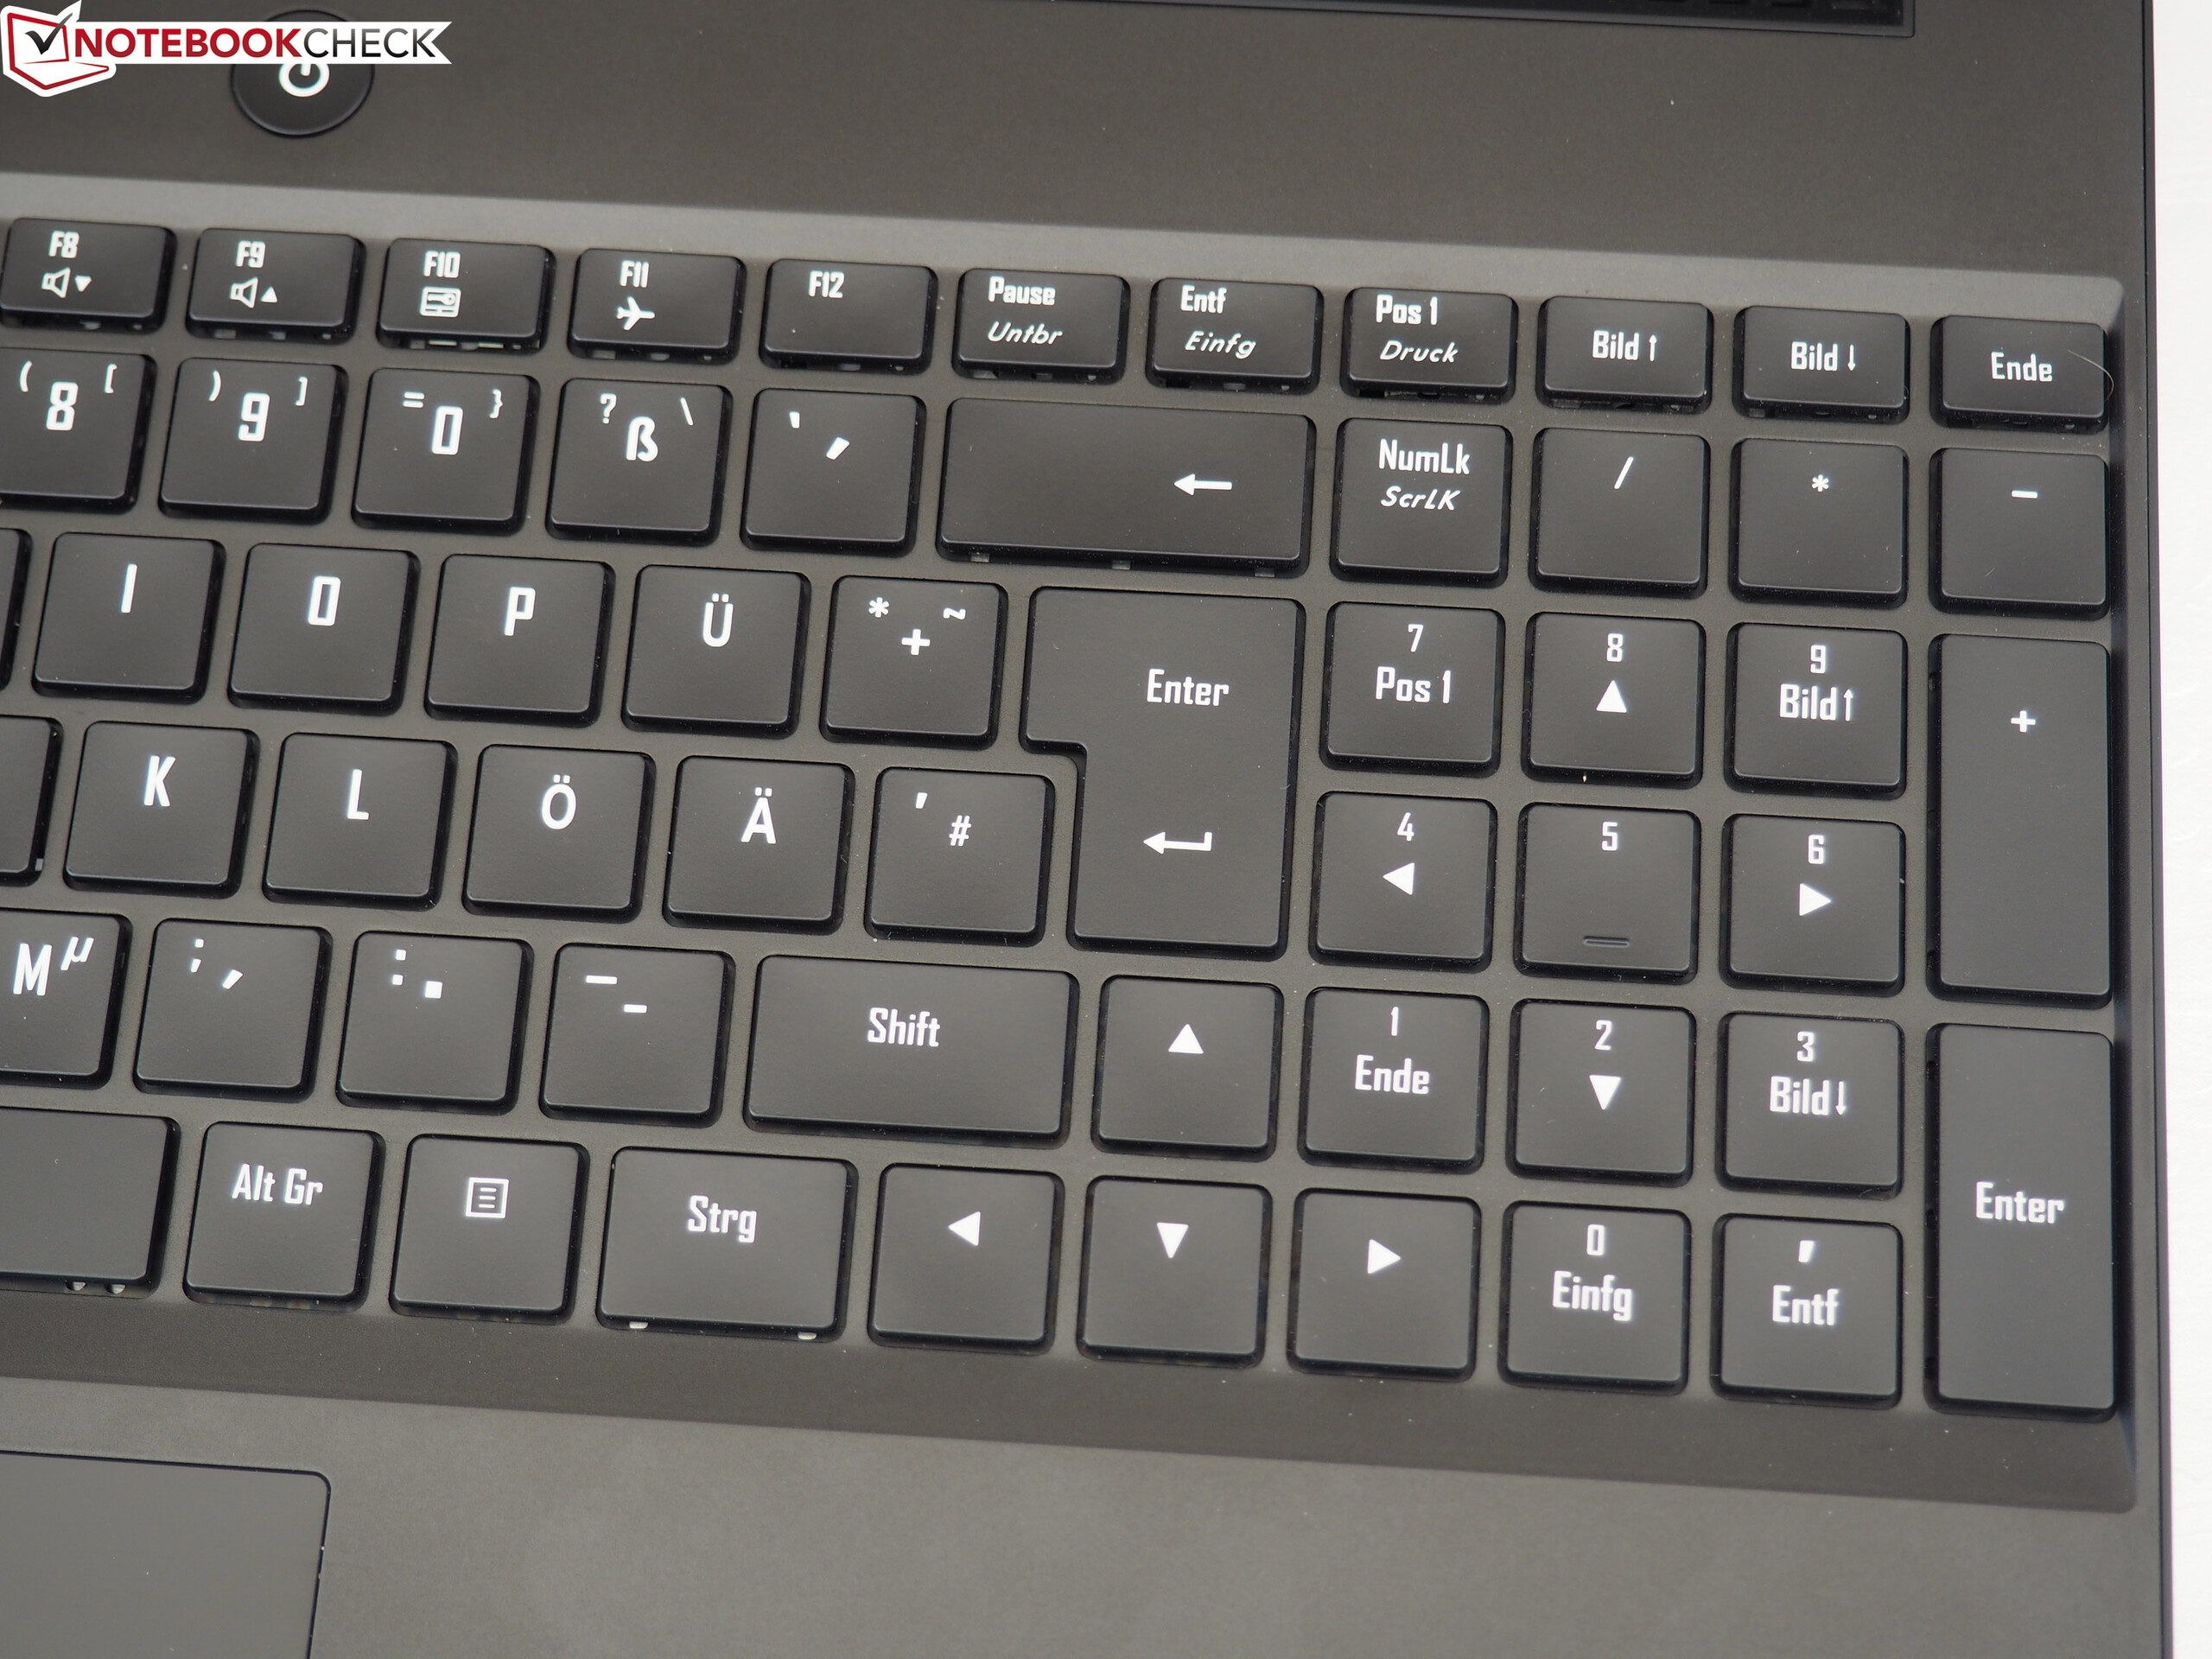
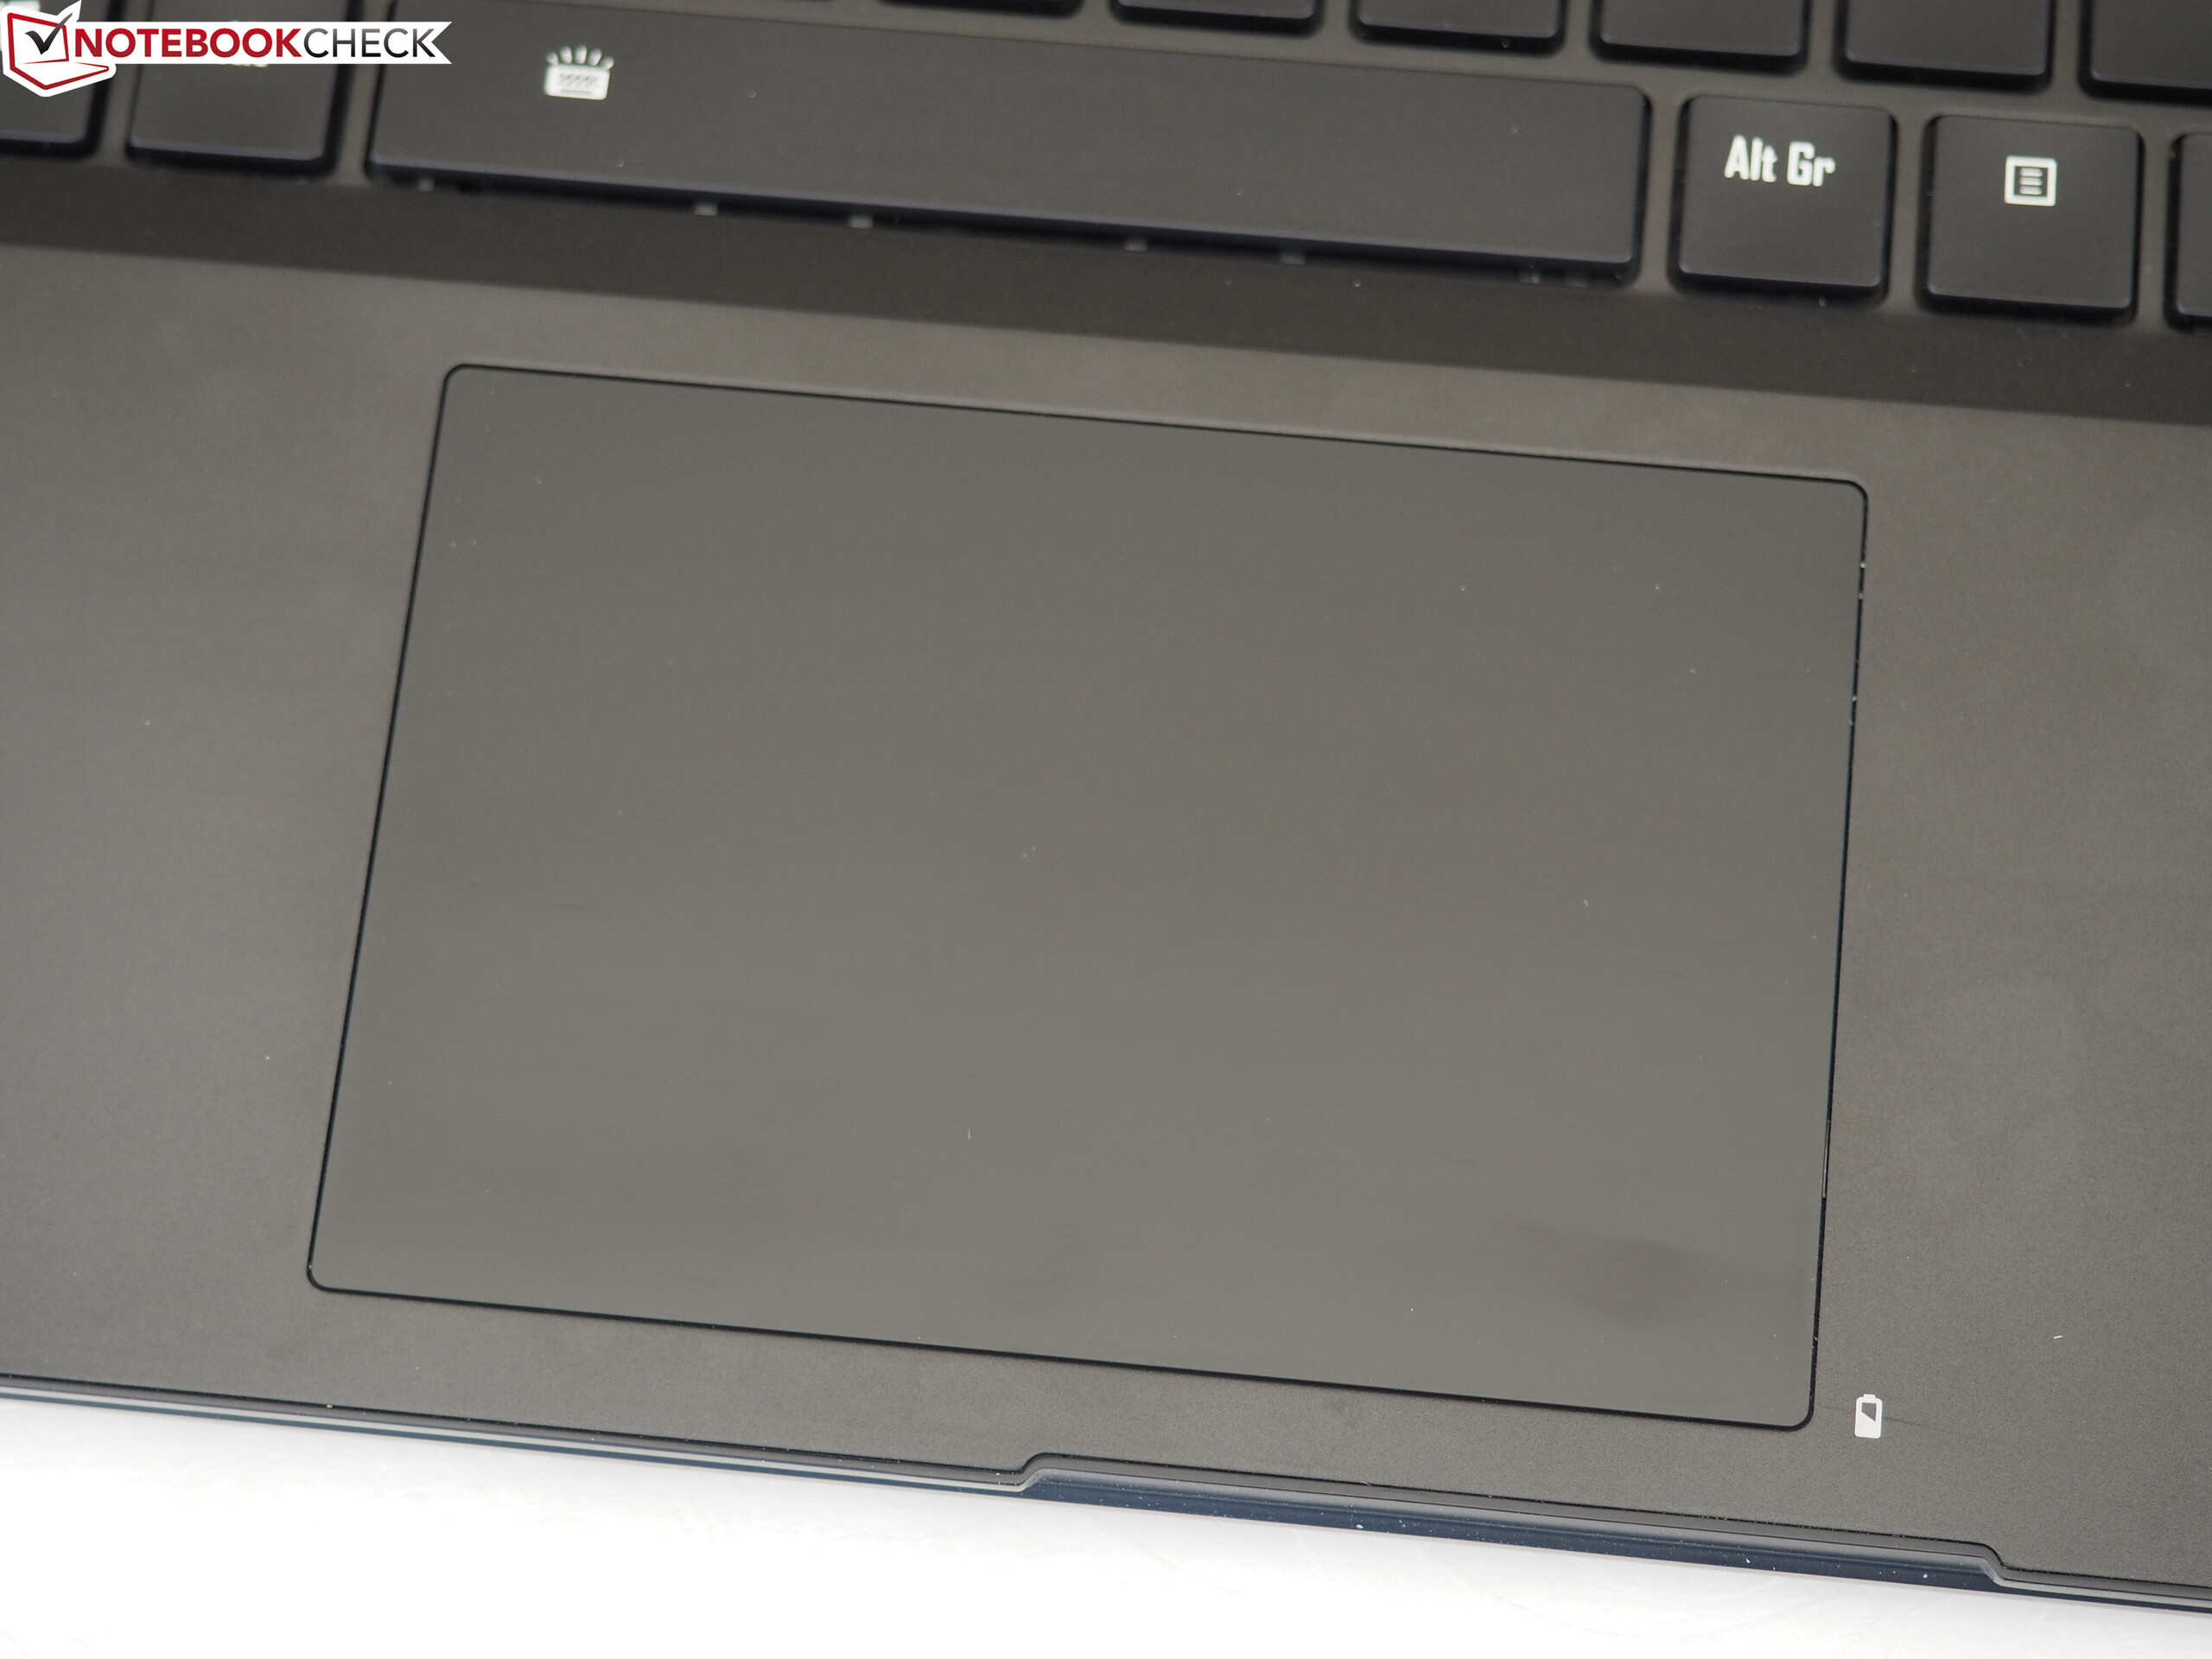
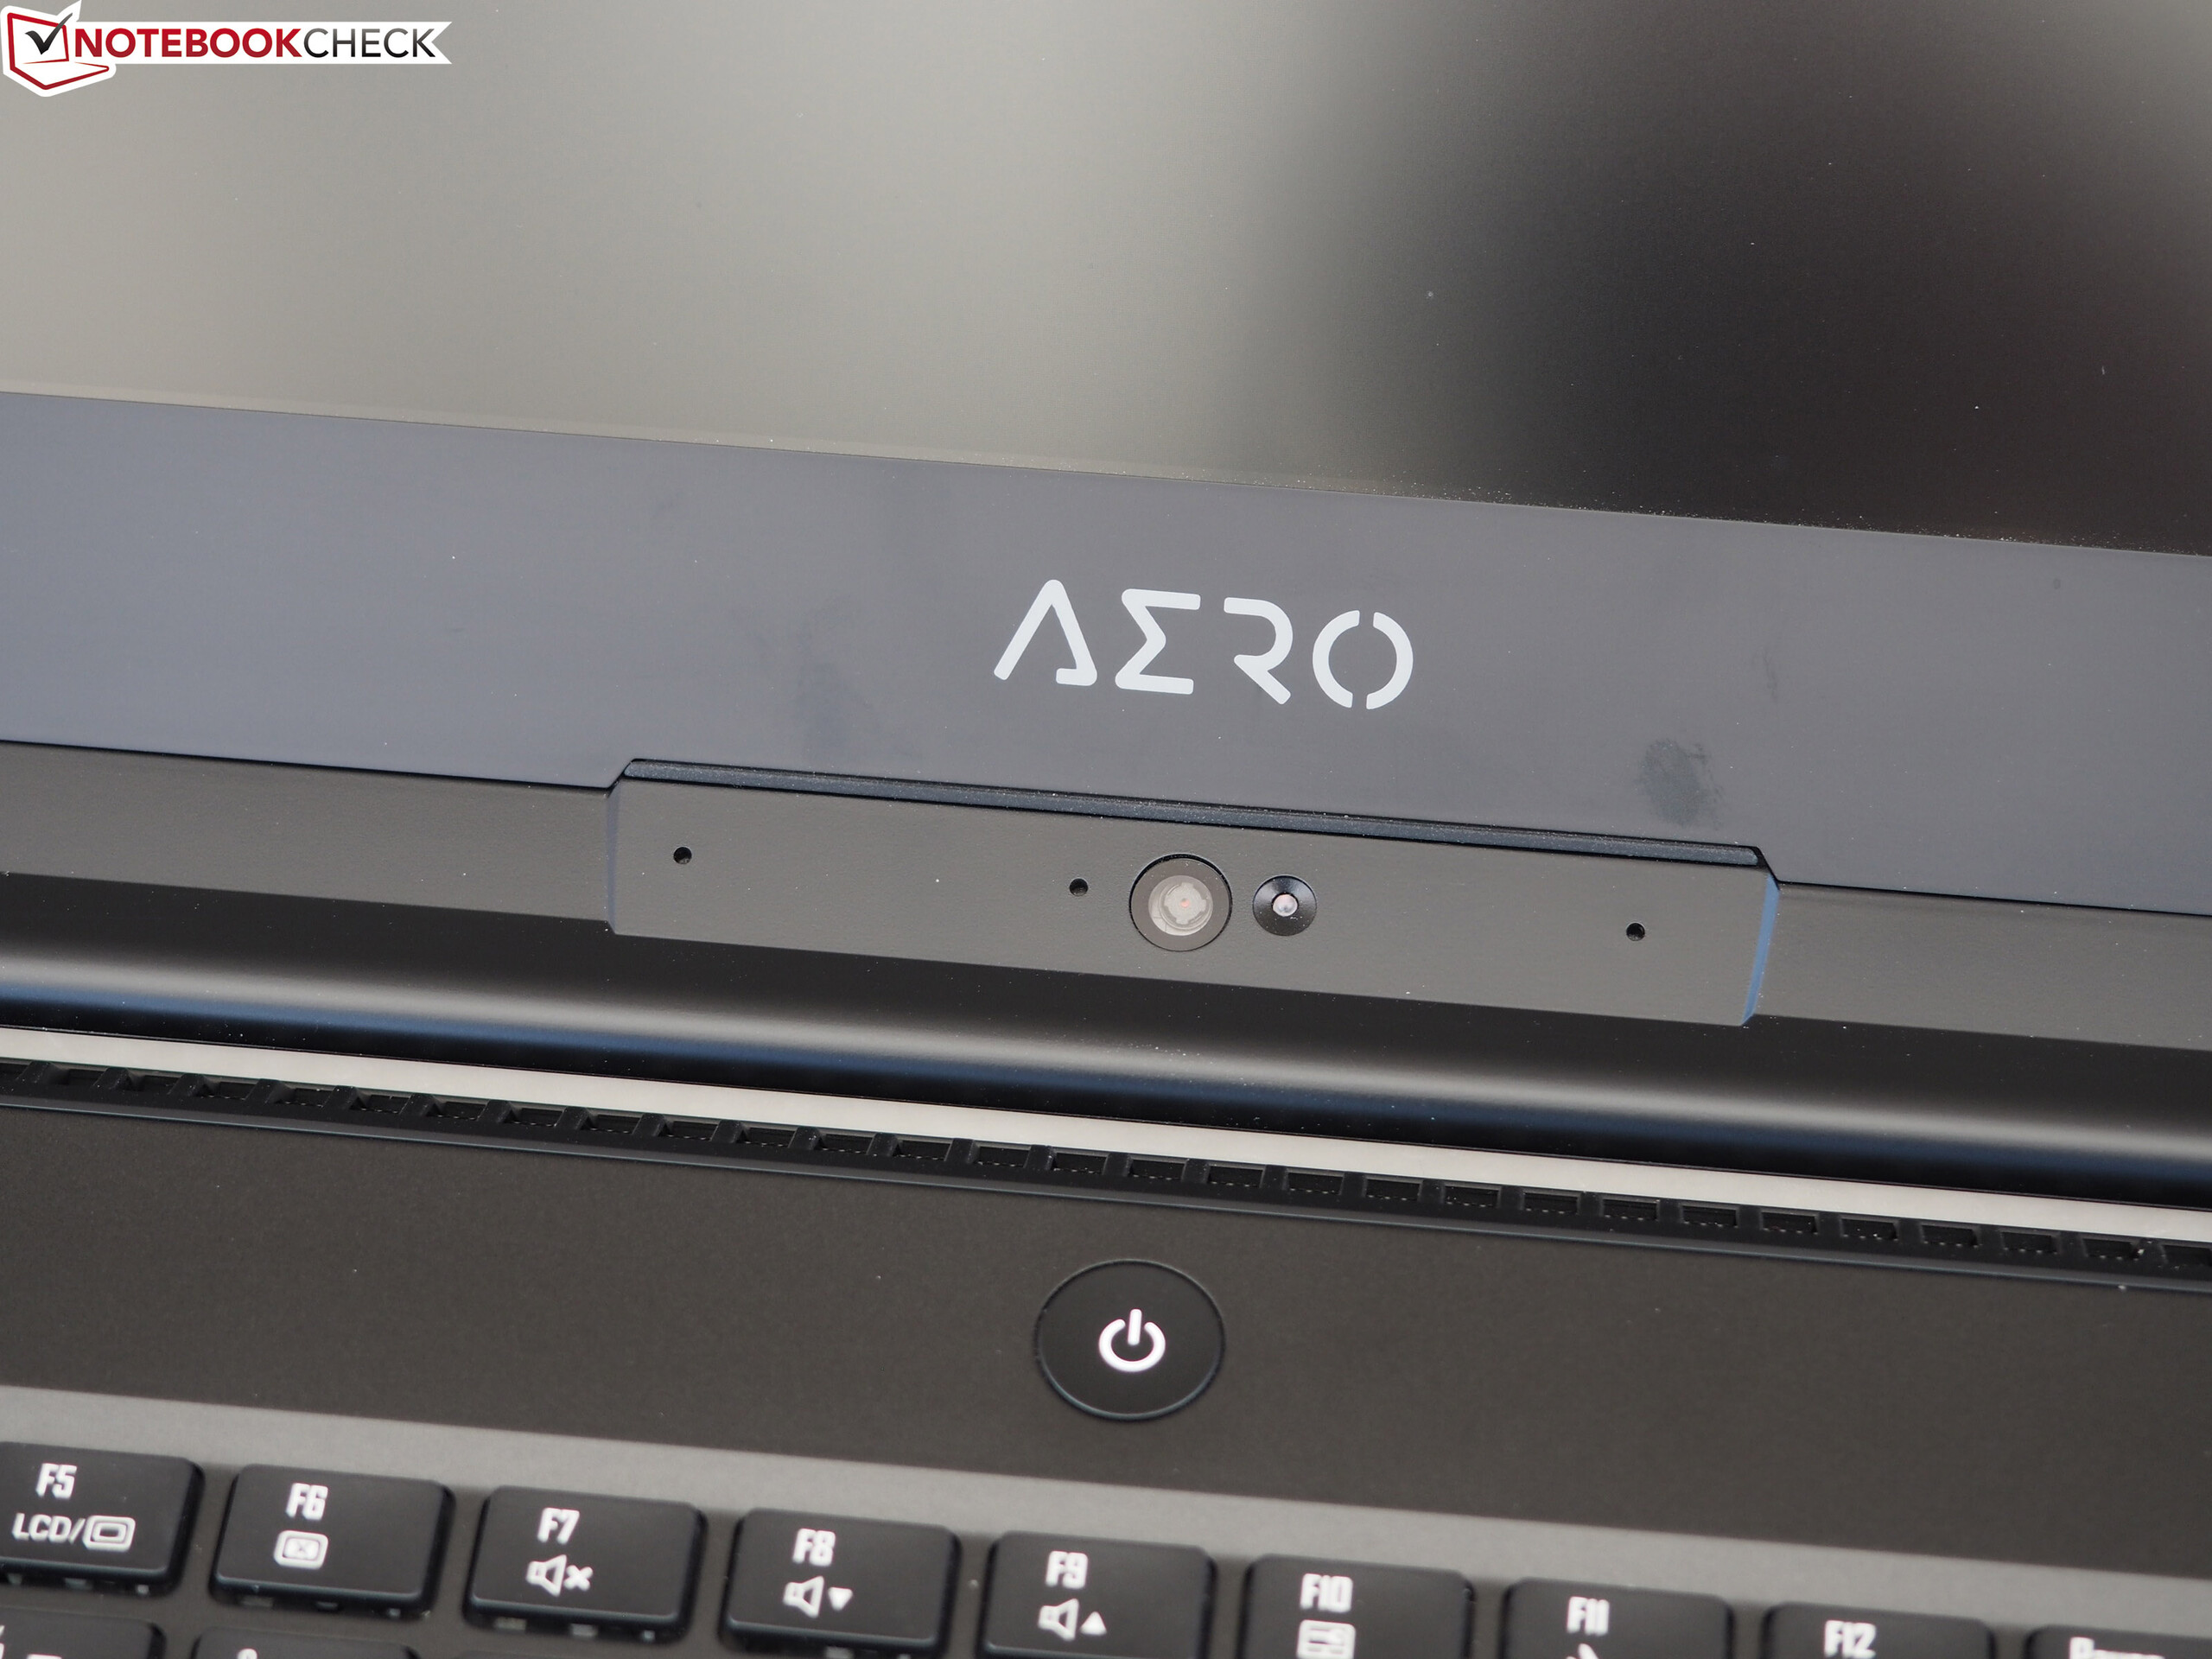
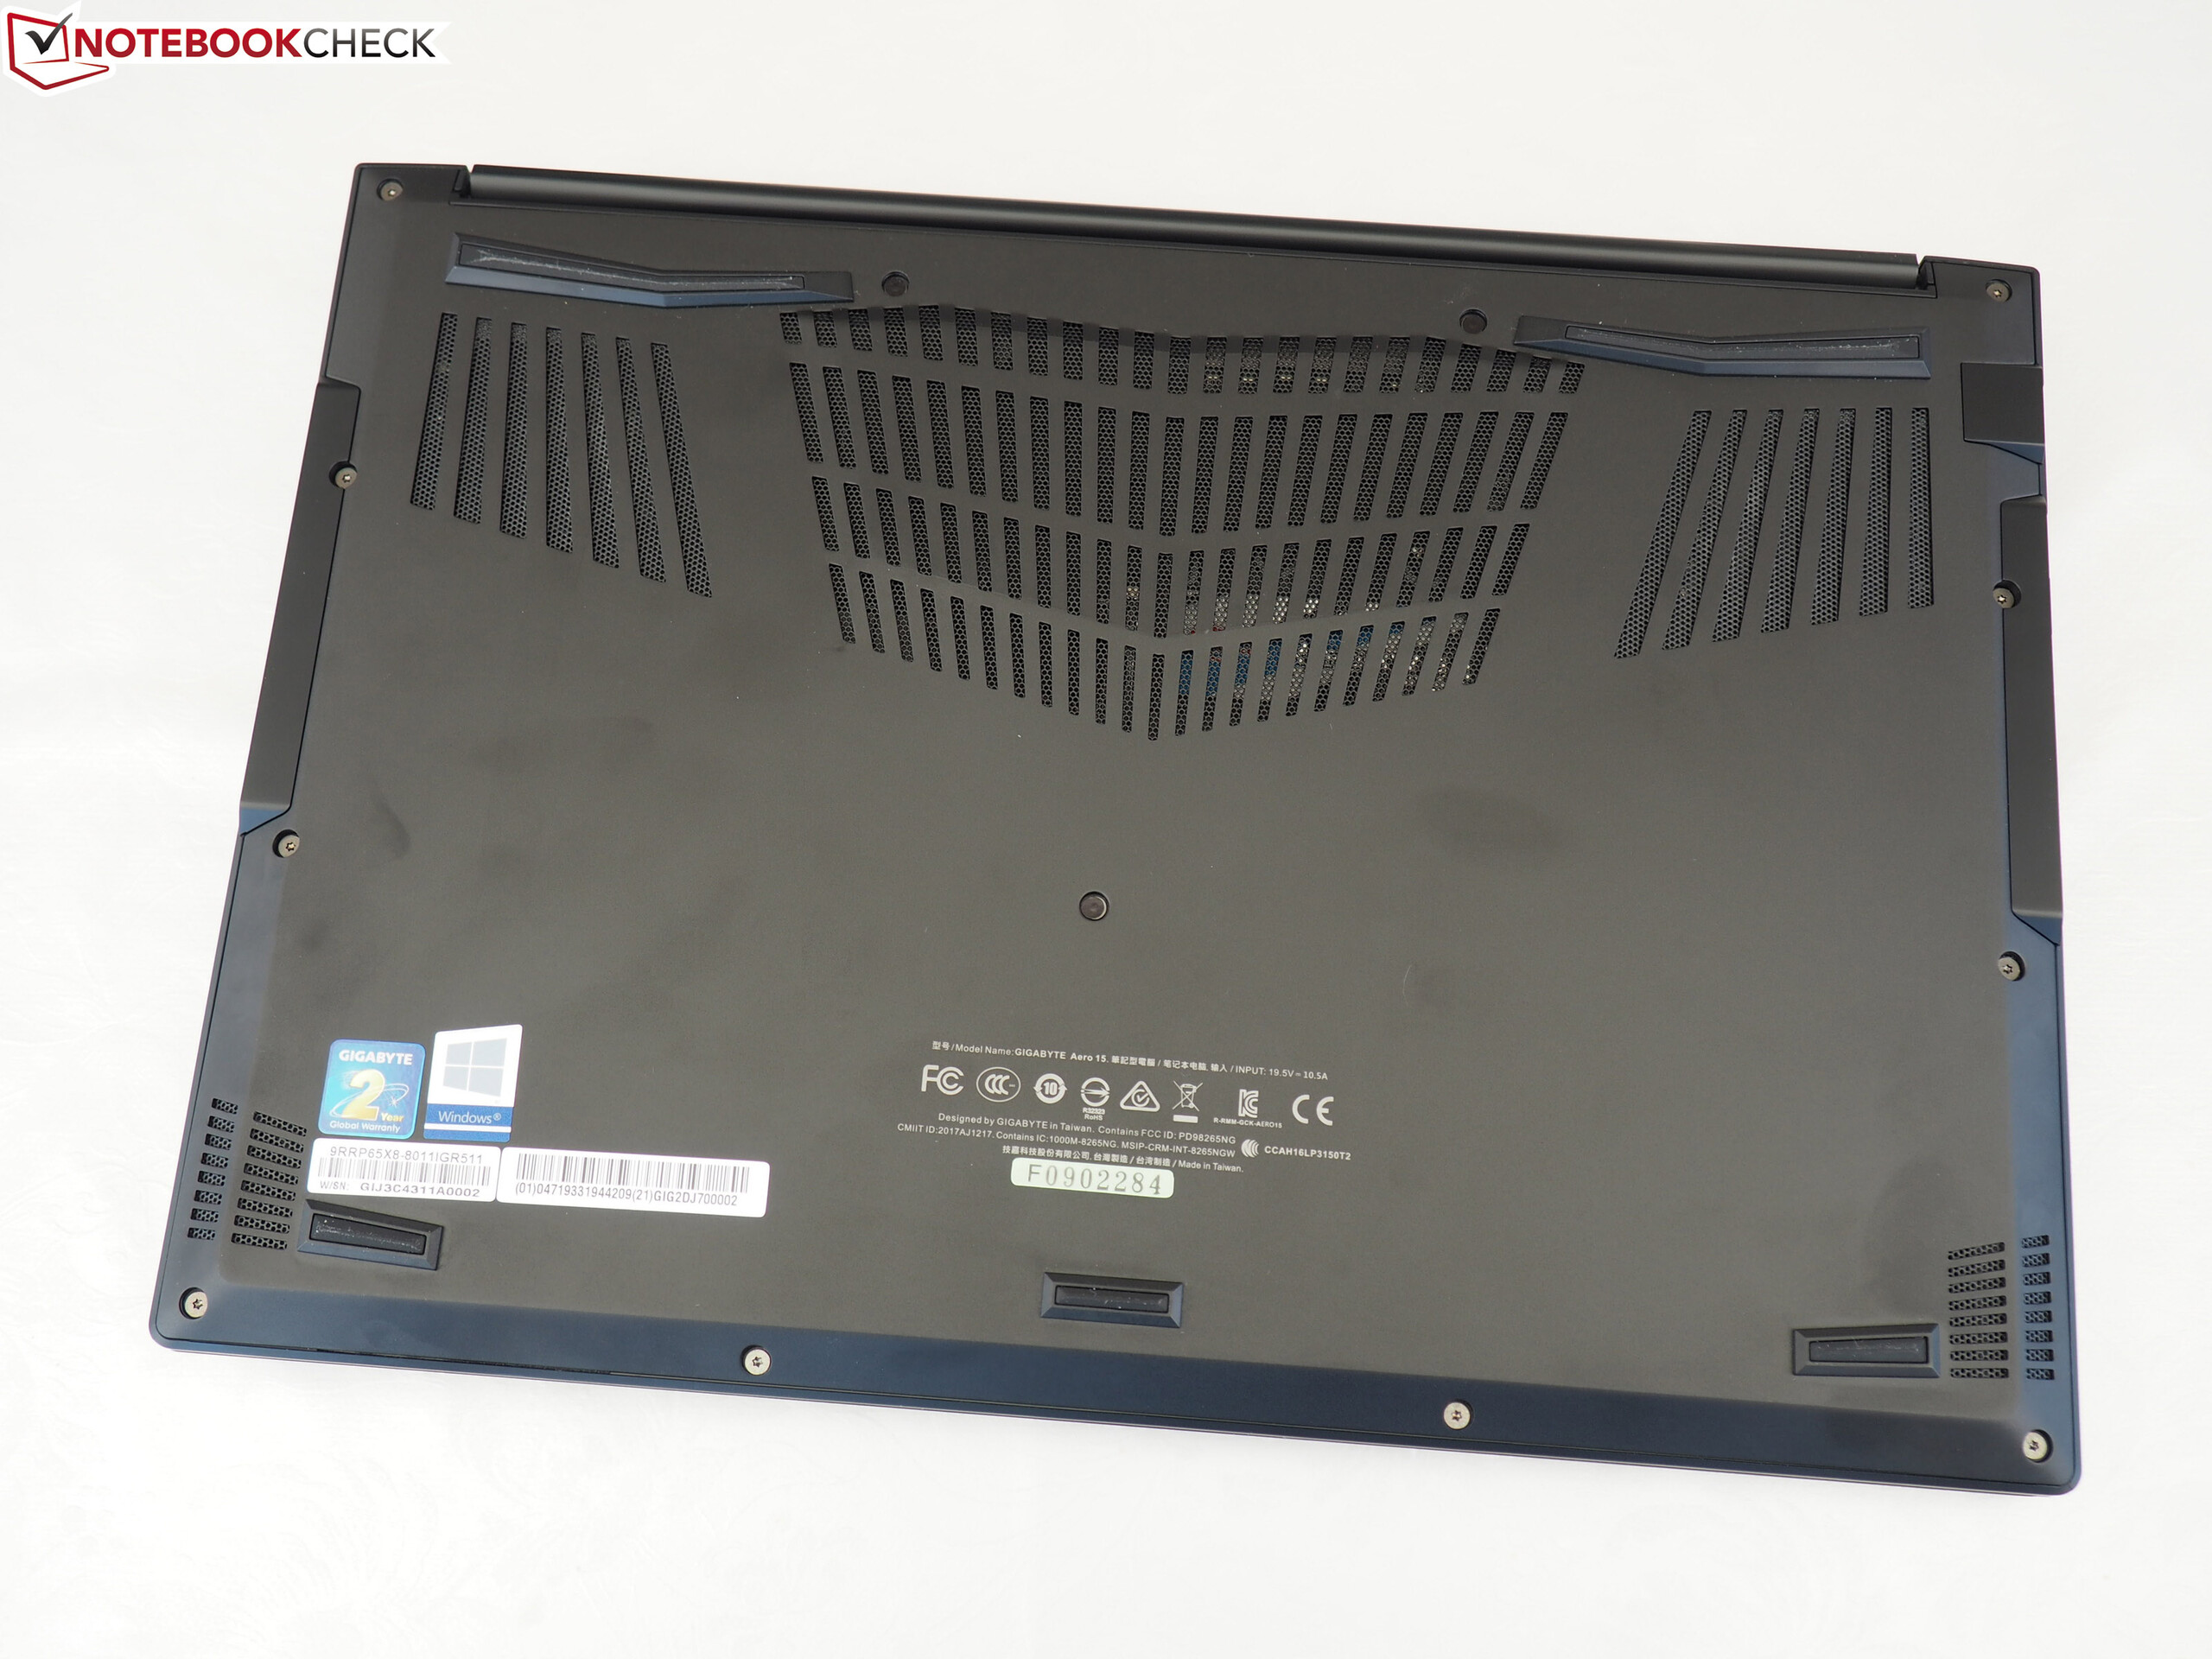
We should also point out that the Aero 15-X9 and Aero 15X v8 share the same case, connectivity, input devices and speakers, so we shall skip these and jump directly to the Display section. Please see our Aero 15X v8 review for our views on these areas.
| SD Card Reader | |
| average JPG Copy Test (av. of 3 runs) | |
| Gigabyte Aero 15-X9 (Toshiba Exceria Pro SDXC 64 GB UHS-II) | |
| Gigabyte Aero 15X v8 (Toshiba Exceria Pro SDXC 64 GB UHS-II) | |
| Average of class Gaming (20.9 - 210, n=54, last 2 years) | |
| maximum AS SSD Seq Read Test (1GB) | |
| Gigabyte Aero 15X v8 (Toshiba Exceria Pro SDXC 64 GB UHS-II) | |
| Gigabyte Aero 15-X9 (Toshiba Exceria Pro SDXC 64 GB UHS-II) | |
| Average of class Gaming (25.5 - 261, n=51, last 2 years) | |
Display
The Aero 15-X9 has a matte, 144 Hz 15.6-inch display that operates natively at 1920x1080 just like its predecessor. Gigabyte uses the same LG Philips LGD05C0 panel in both laptops, but its values differ drastically. The Aero 15X v8 that we already reviewed achieved an average maximum luminosity of 300 cd/m², which is 28% brighter than what the Aero 15-X9 achieves, according to X-Rite i1Pro 2. This also puts the latter device at the bottom of our comparison table in this regard.
Similarly, our review unit has an 862:1 contrast ratio, which is lower than all but the Razer Blade 15 of our comparison devices. We would expect at least a 1,000:1 contrast ratio for such an expensive laptop. However, we measured the display as having a 0.29 cd/m² black value, which should ensure that black tones look richer than they would on the Aero 15X v8 or the Razer Blade 15. The Aero 15-X9 also has an 85% evenly lit display, which is on par with our comparison devices.
Please keep in mind that the differences between the two LGD05C0 panels are normal. No two panels are 100% identical, but we suspect that the X-Rite Pantone calibration may reduce the theoretical maximum luminosity to a greater extent with our review unit than it does with its predecessor. We are merely speculating here, but the display in your Aero 15-X9 may have different brightness, black value and contrast ratio levels than both devices that we have tested.
| |||||||||||||||||||||||||
Brightness Distribution: 85 %
Center on Battery: 250 cd/m²
Contrast: 862:1 (Black: 0.29 cd/m²)
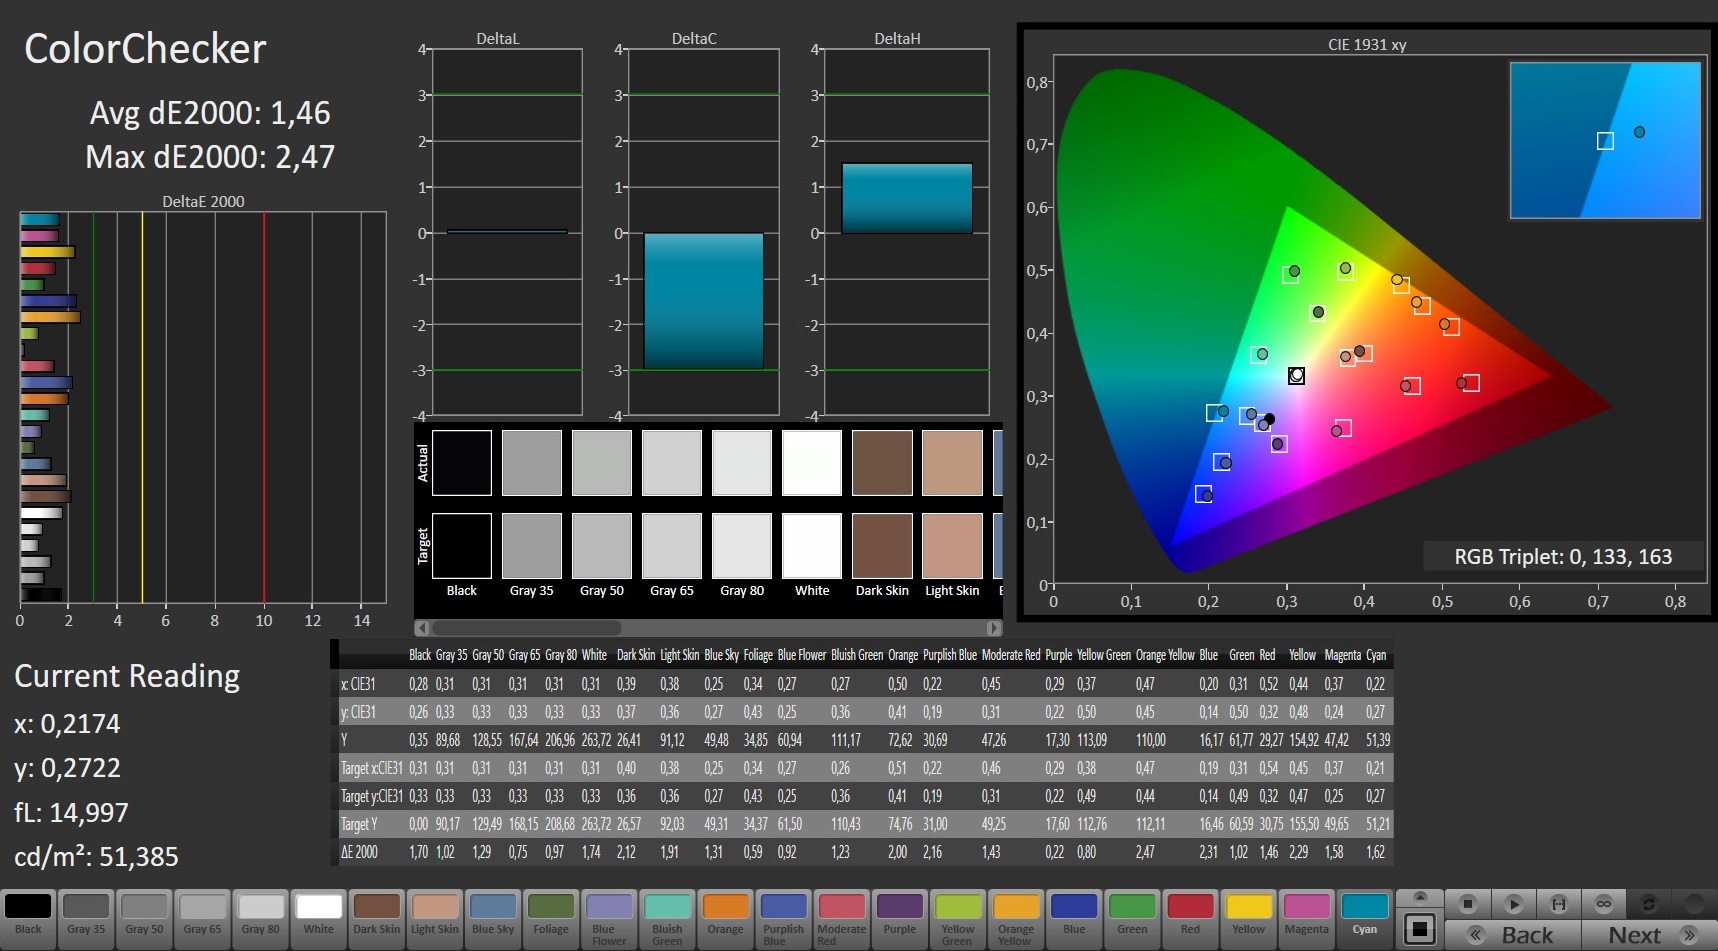
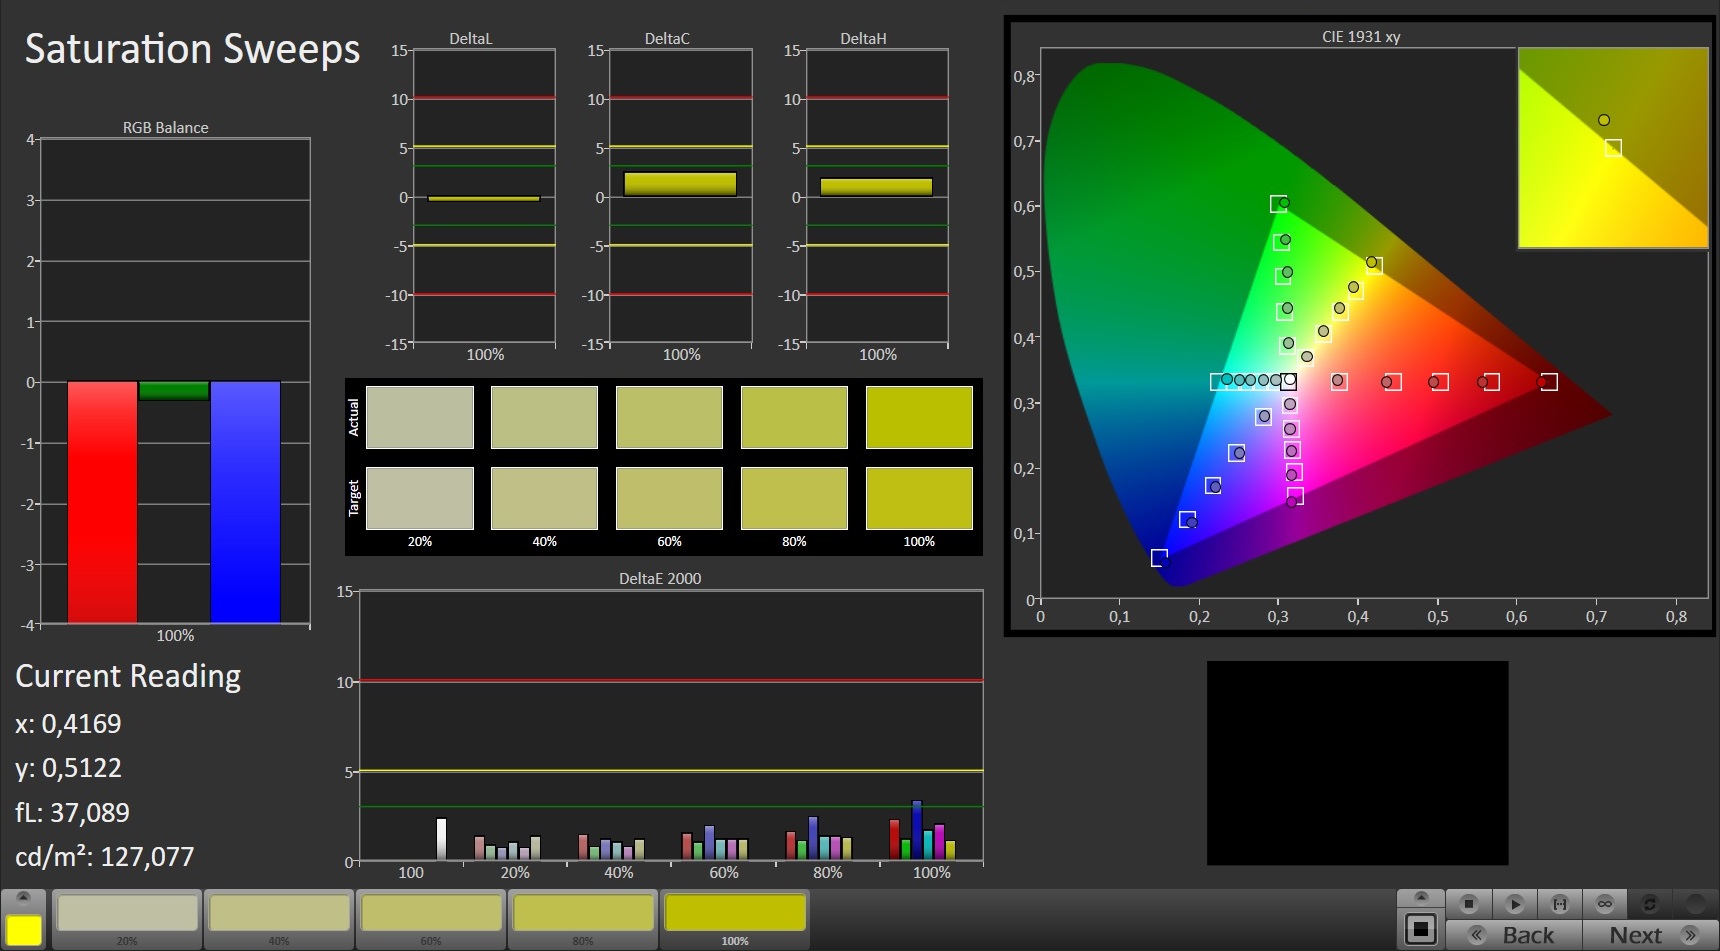
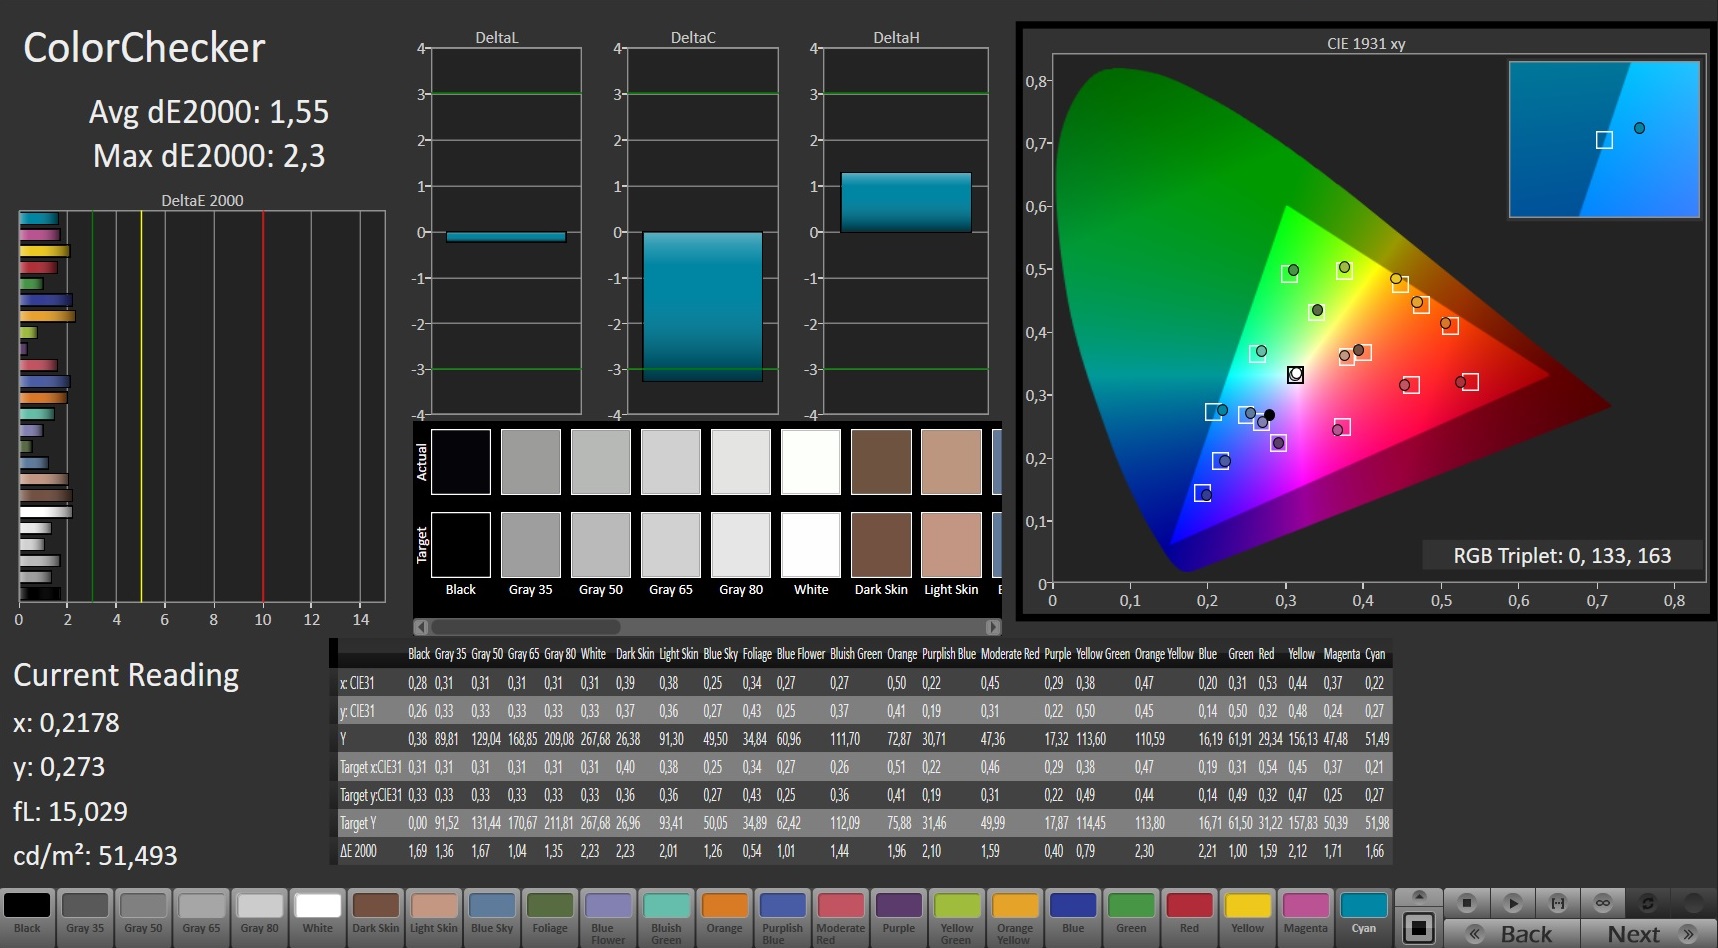
ΔE ColorChecker Calman: 1.46 | ∀{0.5-29.43 Ø4.72}
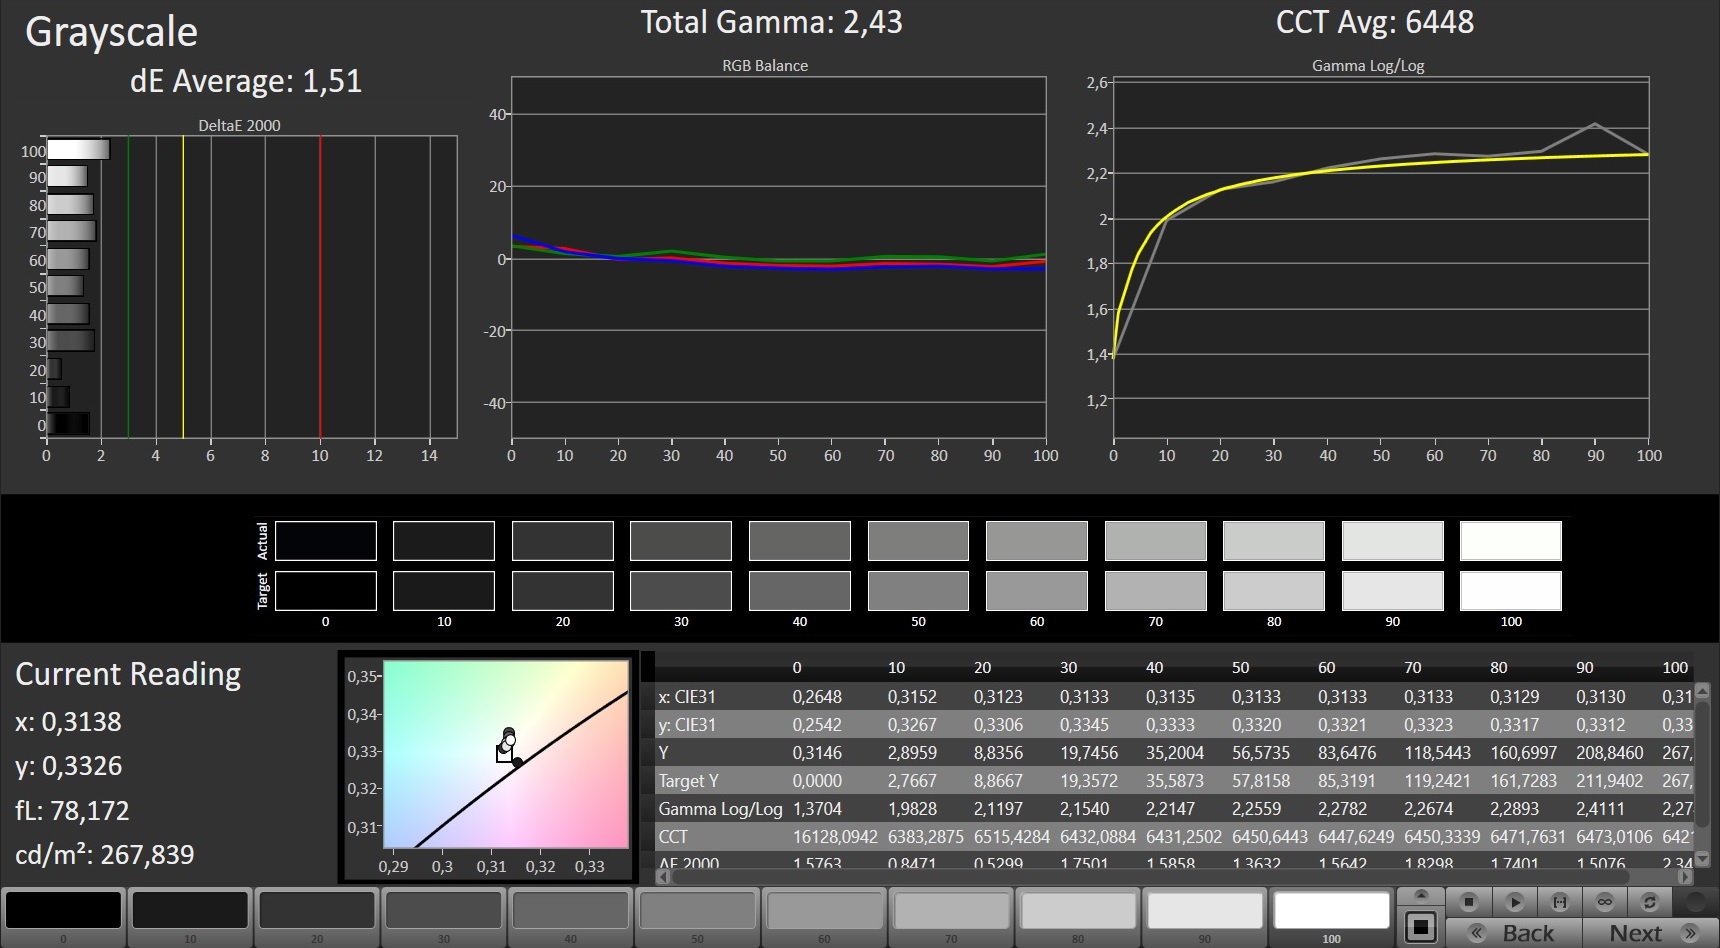
ΔE Greyscale Calman: 1.27 | ∀{0.09-98 Ø4.97}
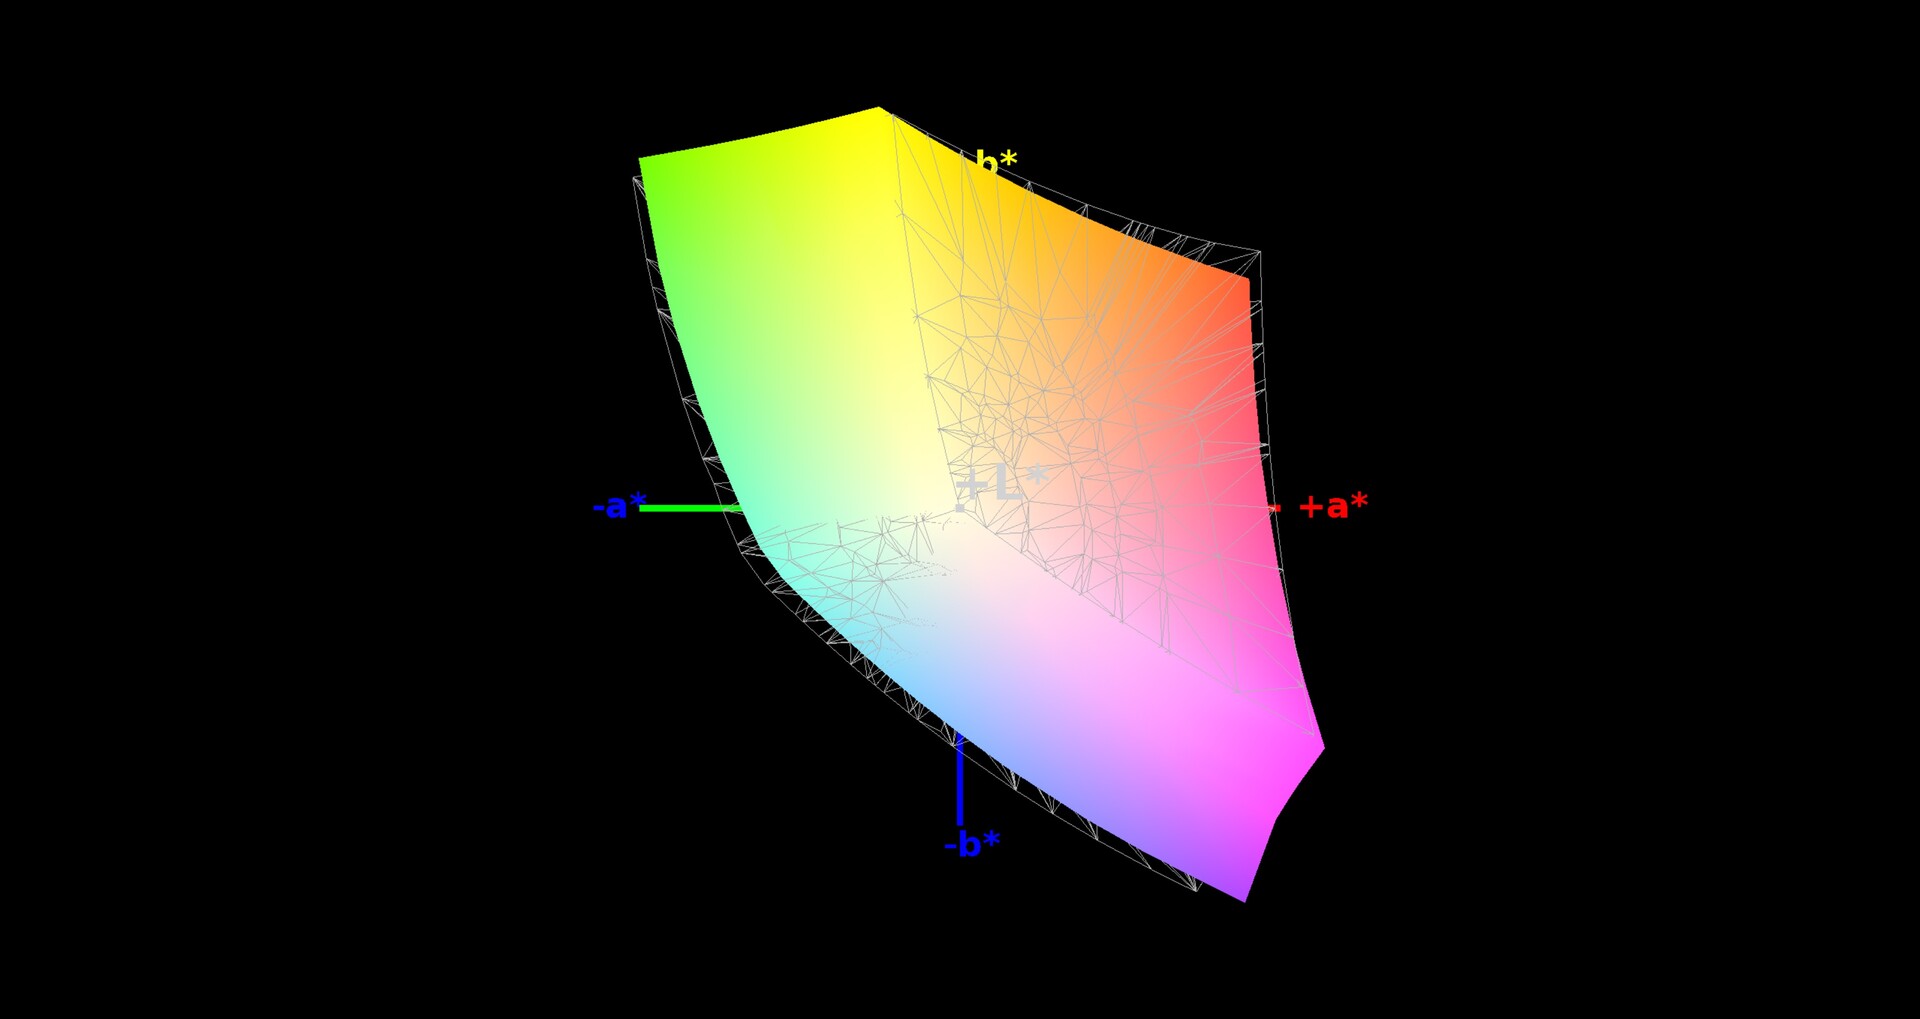
93% sRGB (Argyll 1.6.3 3D)
60% AdobeRGB 1998 (Argyll 1.6.3 3D)
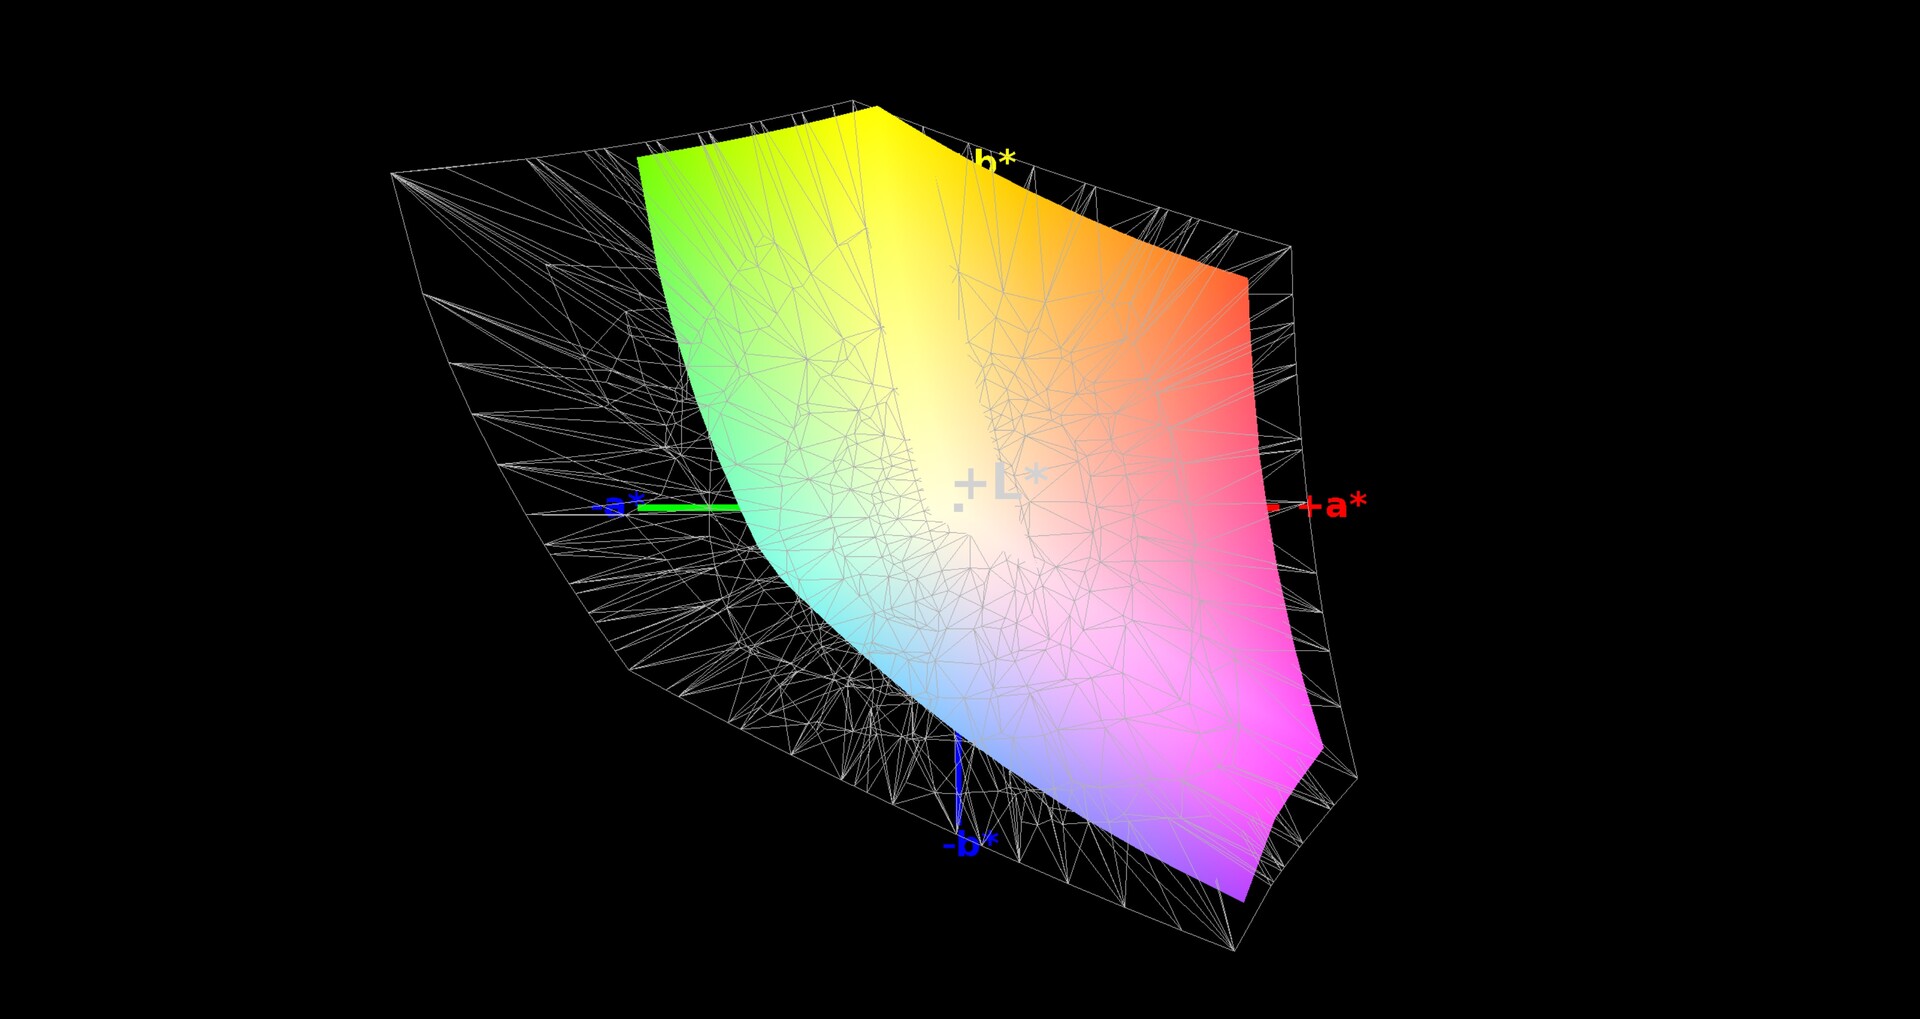
64.5% AdobeRGB 1998 (Argyll 3D)
93.1% sRGB (Argyll 3D)
63.5% Display P3 (Argyll 3D)
Gamma: 2.4
CCT: 6749 K
| Gigabyte Aero 15-X9 LGD05C0, IPS, 1920x1080 | Gigabyte Aero 15X v8 LGD05C0, IPS, 1920x1080 | Asus Zephyrus S GX531GS AU Optronics B156HAN08.2 (AUO82ED), IPS, 1920x1080 | MSI GS65 8RF-019DE Stealth Thin AU Optronics B156HAN08.0 (AUO80ED), IPS, 1920x1080 | Razer Blade 15 RTX 2070 Max-Q LG Philips LGD05C0, IPS, 1920x1080 | Acer Predator Triton 500 AU Optronics B156HAN08.2 (AUO82ED), IPS, 1920x1080 | |
|---|---|---|---|---|---|---|
| Display | 1% | 2% | 2% | 3% | 1% | |
| Display P3 Coverage (%) | 63.5 | 63.6 0% | 66.7 5% | 66.2 4% | 65.3 3% | 64.2 1% |
| sRGB Coverage (%) | 93.1 | 93.8 1% | 91.2 -2% | 92.1 -1% | 94.9 2% | 92.6 -1% |
| AdobeRGB 1998 Coverage (%) | 64.5 | 64.9 1% | 66.7 3% | 67.2 4% | 66.3 3% | 65.7 2% |
| Response Times | 8% | 41% | -1% | 7% | 35% | |
| Response Time Grey 50% / Grey 80% * (ms) | 16.4 ? | 16.8 ? -2% | 7.4 ? 55% | 17.6 ? -7% | 16.8 ? -2% | 8 ? 51% |
| Response Time Black / White * (ms) | 13.6 ? | 11.2 ? 18% | 10 ? 26% | 12.8 ? 6% | 11.6 ? 15% | 11.2 ? 18% |
| PWM Frequency (Hz) | ||||||
| Screen | 12% | -18% | -10% | -31% | -75% | |
| Brightness middle (cd/m²) | 250 | 313 25% | 294 18% | 254 2% | 314.7 26% | 304 22% |
| Brightness (cd/m²) | 235 | 300 28% | 275 17% | 262 11% | 312 33% | 299 27% |
| Brightness Distribution (%) | 85 | 78 -8% | 84 -1% | 89 5% | 90 6% | 89 5% |
| Black Level * (cd/m²) | 0.29 | 0.33 -14% | 0.24 17% | 0.22 24% | 0.38 -31% | 0.27 7% |
| Contrast (:1) | 862 | 948 10% | 1225 42% | 1155 34% | 828 -4% | 1126 31% |
| Colorchecker dE 2000 * | 1.46 | 1.29 12% | 2.57 -76% | 2.37 -62% | 2.56 -75% | 4.66 -219% |
| Colorchecker dE 2000 max. * | 2.47 | 2.04 17% | 4.88 -98% | 4.71 -91% | 4.89 -98% | 9.65 -291% |
| Greyscale dE 2000 * | 1.27 | 0.69 46% | 2.41 -90% | 1.58 -24% | 3.4 -168% | 5.53 -335% |
| Gamma | 2.4 92% | 2.43 91% | 2.5 88% | 2.48 89% | 2.3 96% | 2.5 88% |
| CCT | 6749 96% | 6550 99% | 6370 102% | 6785 96% | 6435 101% | 8028 81% |
| Color Space (Percent of AdobeRGB 1998) (%) | 60 | 60 0% | 59 -2% | 60 0% | 60.7 1% | 60 0% |
| Color Space (Percent of sRGB) (%) | 93 | 94 1% | 91 -2% | 92 -1% | 94.6 2% | 93 0% |
| Colorchecker dE 2000 calibrated * | 2.14 | 1.84 | 1.71 | 1.72 | ||
| Total Average (Program / Settings) | 7% /
9% | 8% /
-6% | -3% /
-6% | -7% /
-19% | -13% /
-45% |
* ... smaller is better


Display Response Times
| ↔ Response Time Black to White | ||
|---|---|---|
| 13.6 ms ... rise ↗ and fall ↘ combined | ↗ 8.4 ms rise | 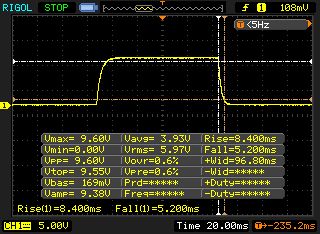 |
| ↘ 5.2 ms fall | ||
| The screen shows good response rates in our tests, but may be too slow for competitive gamers. In comparison, all tested devices range from 0.1 (minimum) to 240 (maximum) ms. » 34 % of all devices are better. This means that the measured response time is better than the average of all tested devices (19.8 ms). | ||
| ↔ Response Time 50% Grey to 80% Grey | ||
| 16.4 ms ... rise ↗ and fall ↘ combined | ↗ 8.8 ms rise | 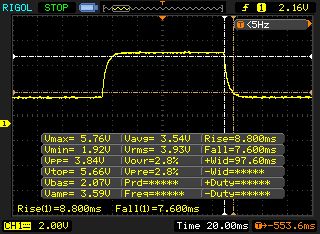 |
| ↘ 7.6 ms fall | ||
| The screen shows good response rates in our tests, but may be too slow for competitive gamers. In comparison, all tested devices range from 0.165 (minimum) to 636 (maximum) ms. » 31 % of all devices are better. This means that the measured response time is better than the average of all tested devices (31 ms). | ||
Screen Flickering / PWM (Pulse-Width Modulation)
| Screen flickering / PWM not detected | 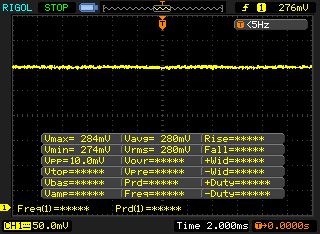 | ||
In comparison: 52 % of all tested devices do not use PWM to dim the display. If PWM was detected, an average of 7747 (minimum: 5 - maximum: 343500) Hz was measured. | |||
Performance
The Gigabyte Aero 15-X9 continues the Aero 15 series’ trademark of being a thin and light 15.6-inch gaming laptop. Our review unit handles all modern triple-A games smoothly, as it did with all programs that we ran on the device. The configuration of our test device currently retails for around 2,800 Euros (~$3,170). Gigabyte also sells the Aero 15-Y9, which features an RTX 2080 Max-Q GPU. Both models can be configured with up to 32 GB RAM, a Core i9-8950HK processor and a 60 Hz, 4K display.
Test Conditions
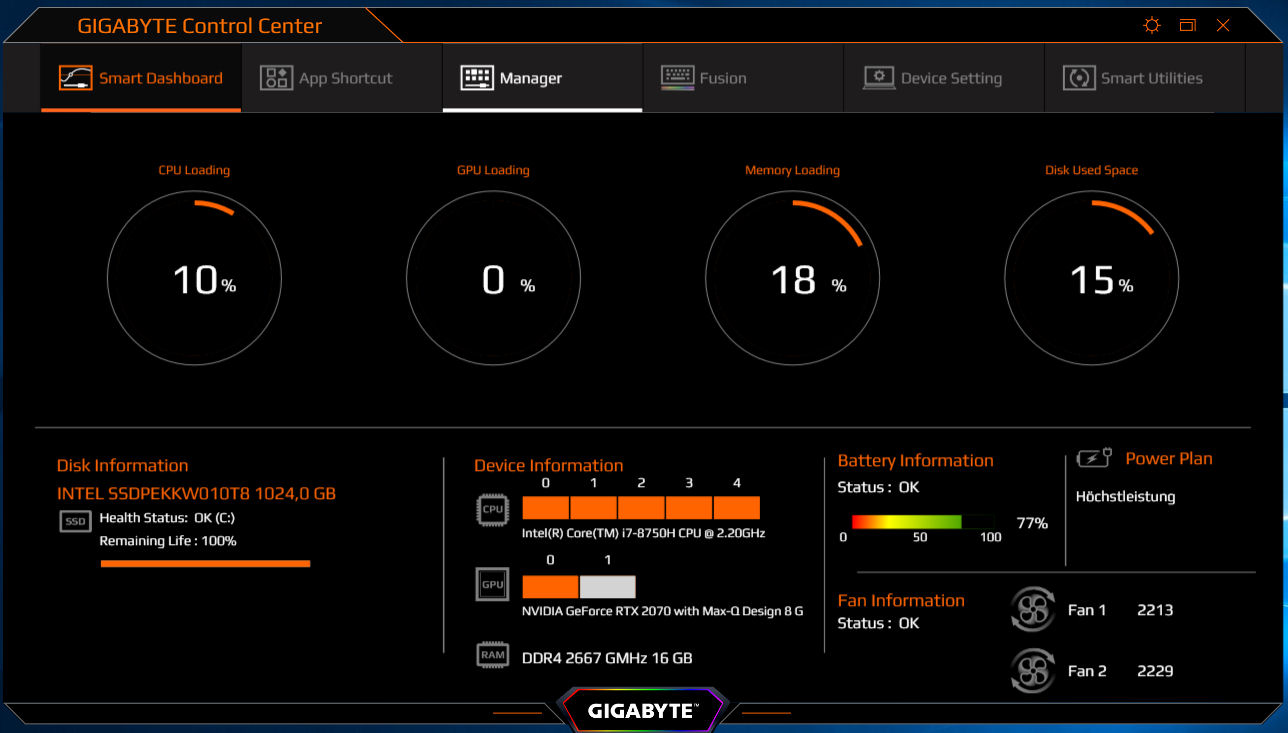
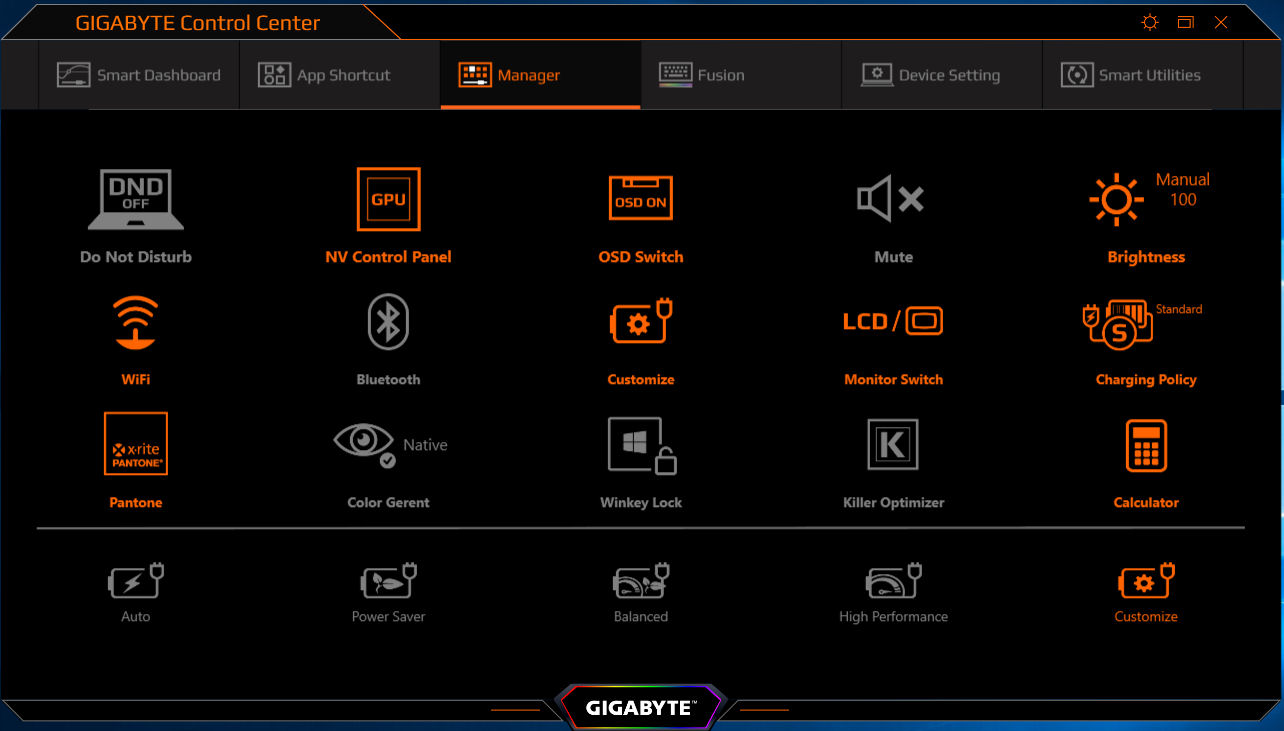
Gigabyte preinstalls its Gigabyte Control Center, which has several preset power plans among other settings to tweak the system. We disabled any Gigabyte power plans for our tests and set our review unit to the Windows 10 Balanced power mode.
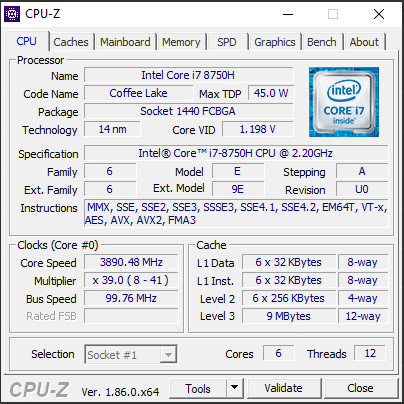
Processor
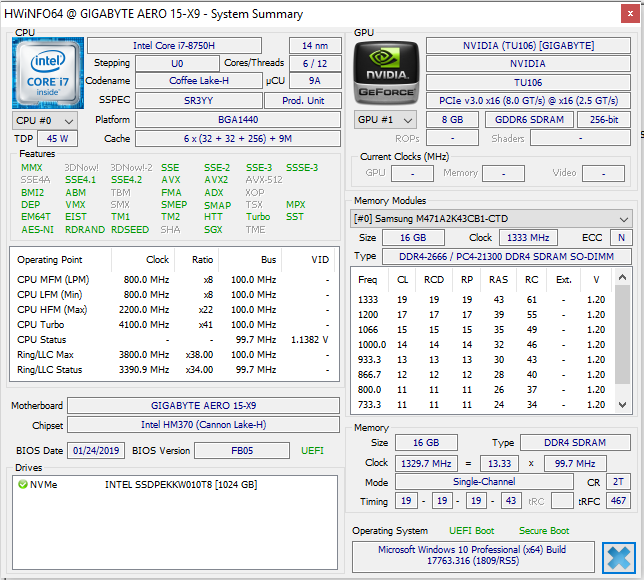
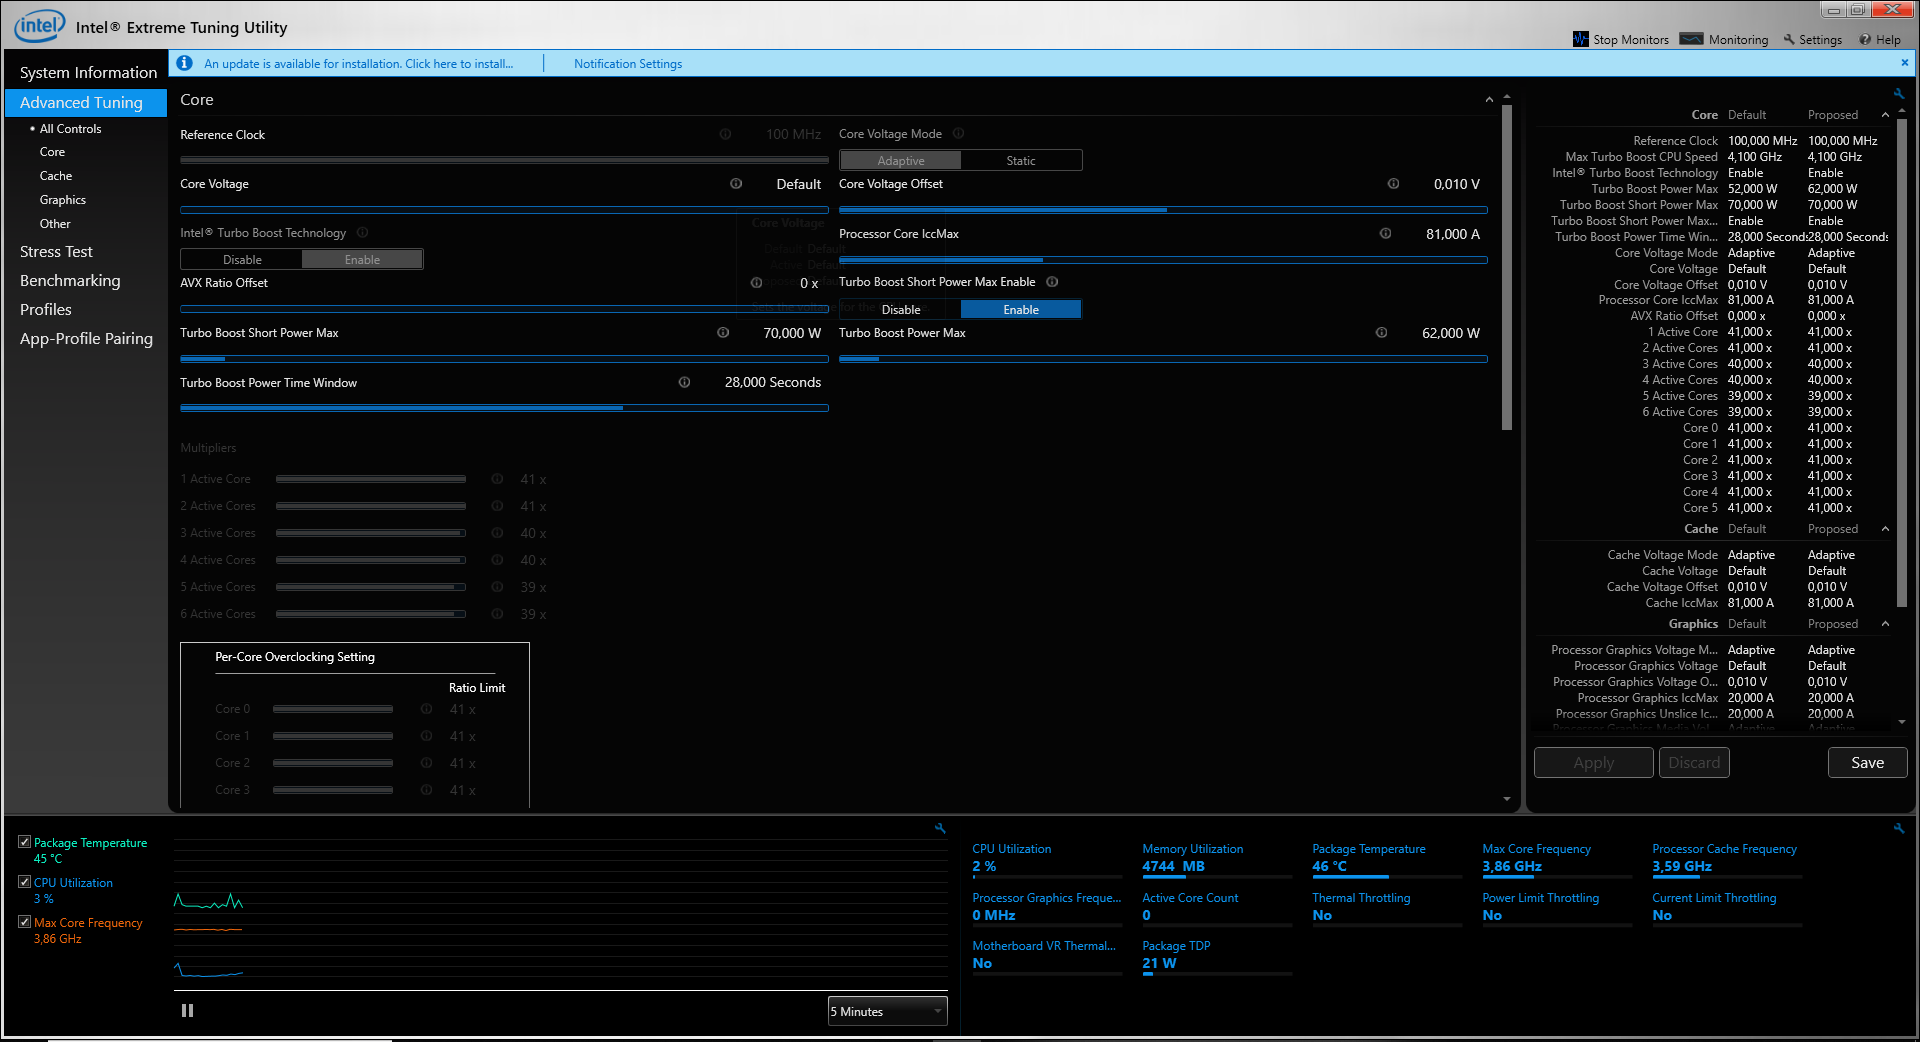
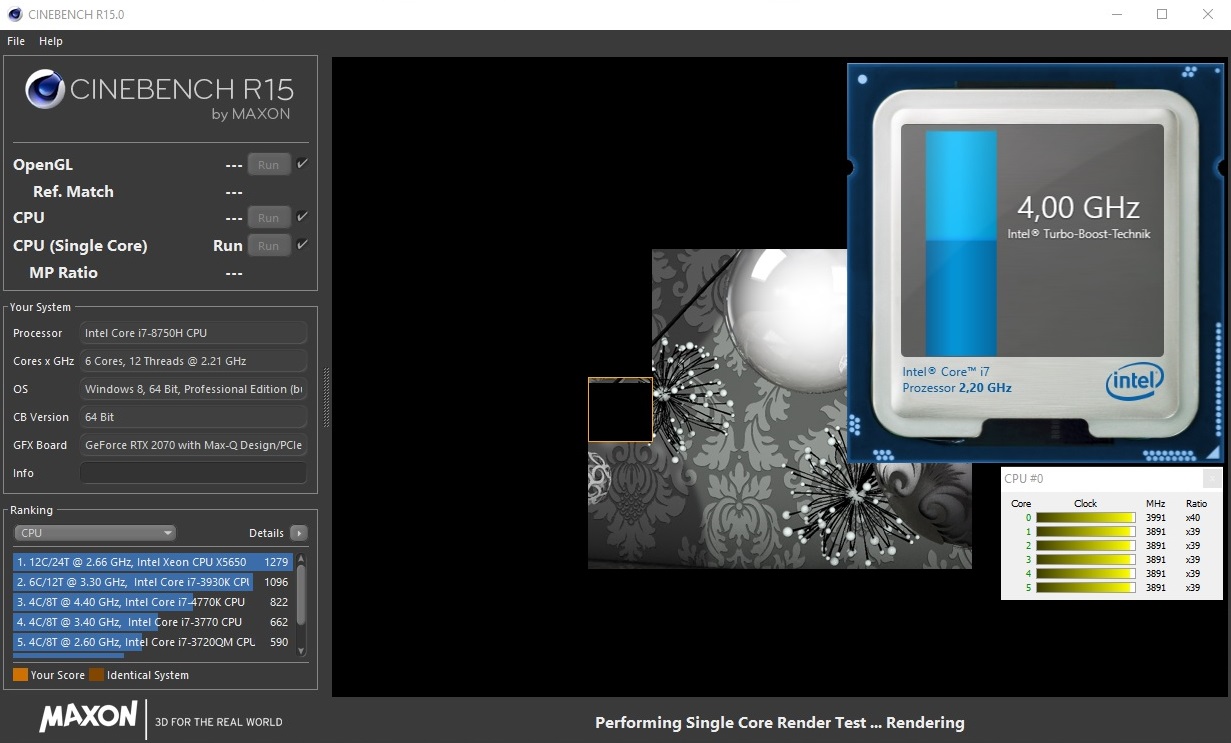
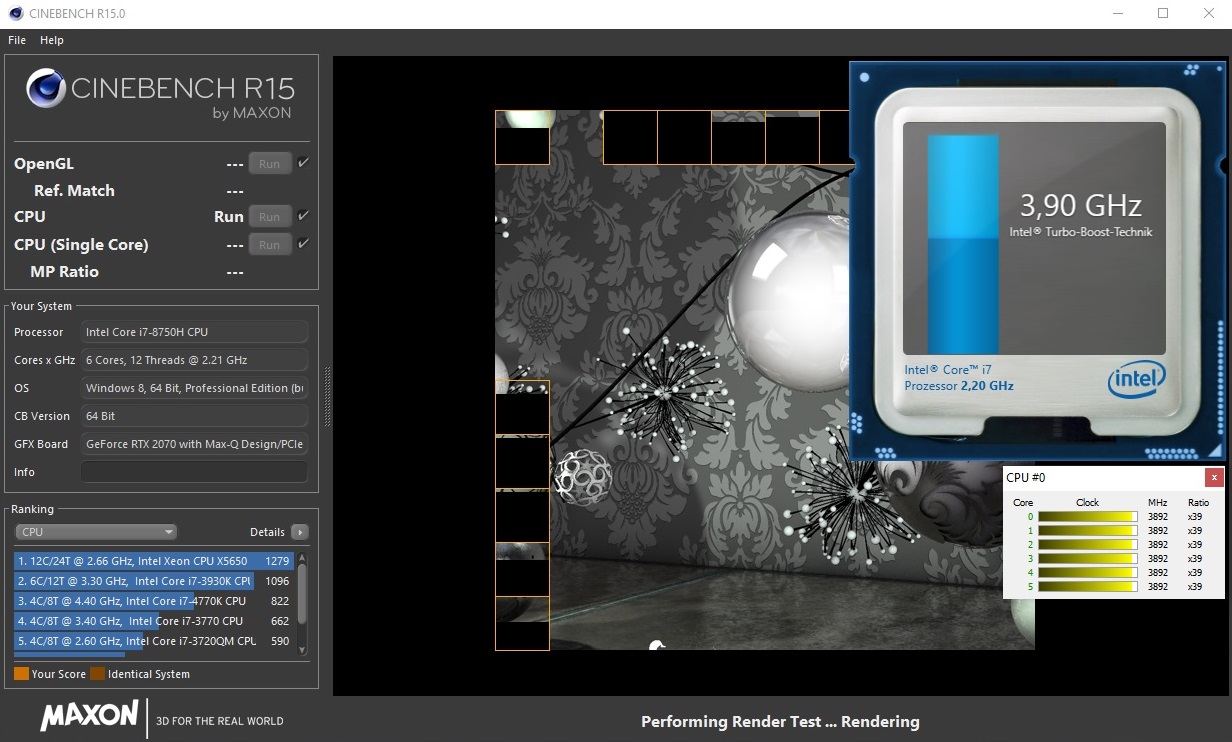
There are no surprises with our review unit’s CPU. The Core i7-8750H is a hexa-core processor from Intel’s Coffee Lake generation of CPUs. Many OEMs have equipped 15.6-inch gaming and multimedia laptops with the Core i7-8750H in the last year as it offers a good compromise between performance and power consumption. In short, the Core i7-8750H is the baseline CPU for a modern mobile gaming laptop. The Core i7-8750H has a 45 W thermal design power (TDP), but Gigabyte allows the CPU to boost to 70 W temporarily. The CPU has a 2.2 GHz base clock speed that can use Intel Turbo Boost to achieve 3.9 GHz across six cores, 4 GHz across four cores, and 4.1 GHz across one and two cores.
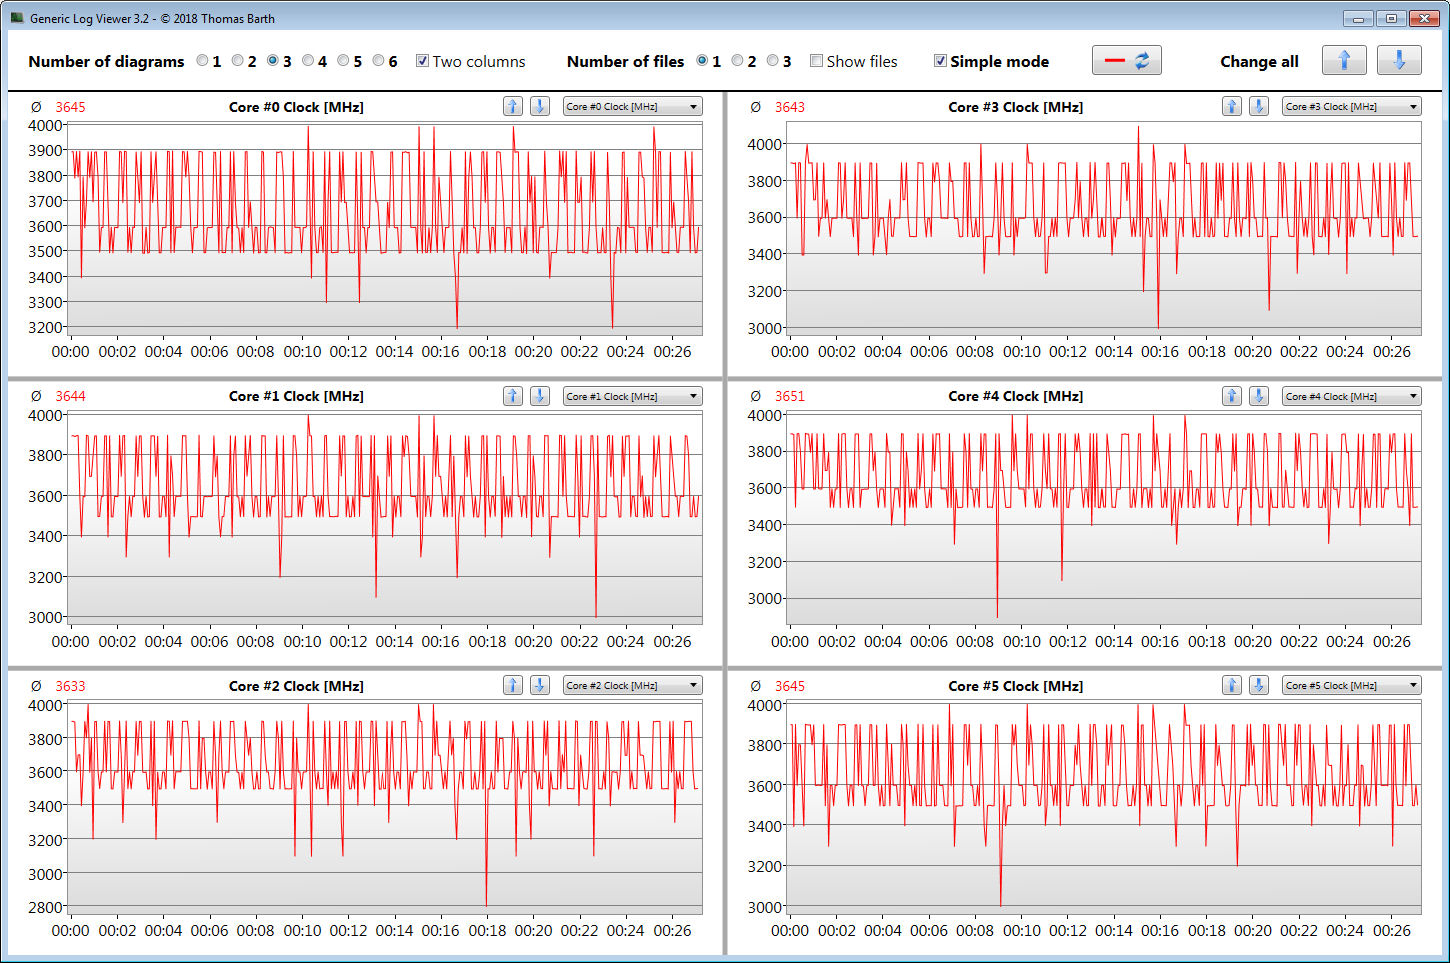
Our review unit operates at between 3.5 GHz and 3.9 GHz in Cinebench R15 Multi 64-bit, while the CPU increases to between 3.9 GHz and 4.1 GHz in single-threaded benchmarks, which both correspond with Intel’s specifications. The Aero 15-X9 downclocks the CPU to 1.7 GHz when running on battery though, which is worth keeping in mind if you planned to push the device hard when working away from a power outlet.
We also subjected our review unit to a looped CB R15 Multi 64-bit benchmark that we run for around 30 minutes to determine how well it maintains its CPU performance under sustained load. As the graph below demonstrates, the Aero 15-X9 initially scored 2% more than the Aero 15X v8, but it had throttled to 2% below its predecessor by the third benchmark pass through. Our review unit then consistently scored between 1,090 and 1,095 points for the remainder of the benchmark loop, apart from three times when it dropped to 1,087 points. By contrast, the Aero 15X v8 fluctuated widely between 1,041 and 1,117 points during the same benchmark, so Gigabyte appears to have tweaked the CPU to make it run more consistently but at the cost of absolute performance. Both Aero 15 laptops consistently outperformed our comparison devices though, which are all equipped with a Core i7-8750H processor.
| Cinebench R10 | |
| Rendering Single 32Bit | |
| Average of class Gaming (7457 - 11779, n=8, last 2 years) | |
| Gigabyte Aero 15-X9 | |
| Rendering Multiple CPUs 32Bit | |
| Average of class Gaming (42932 - 81339, n=8, last 2 years) | |
| Gigabyte Aero 15-X9 | |
| Geekbench 3 | |
| 32 Bit Multi-Core Score | |
| Gigabyte Aero 15-X9 | |
| 32 Bit Single-Core Score | |
| Gigabyte Aero 15-X9 | |
| Geekbench 4.0 | |
| 64 Bit Multi-Core Score | |
| Average of class Gaming (40469 - 76142, n=4, last 2 years) | |
| Gigabyte Aero 15-X9 | |
| 64 Bit Single-Core Score | |
| Average of class Gaming (7589 - 9053, n=4, last 2 years) | |
| Gigabyte Aero 15-X9 | |
| Geekbench 4.4 | |
| 64 Bit Multi-Core Score | |
| Average of class Gaming (89200 - 97490, n=2, last 2 years) | |
| Gigabyte Aero 15-X9 | |
| 64 Bit Single-Core Score | |
| Average of class Gaming (9335 - 9492, n=2, last 2 years) | |
| Gigabyte Aero 15-X9 | |
| Mozilla Kraken 1.1 - Total | |
| Gigabyte Aero 15-X9 (Edge 44) | |
| Razer Blade 15 RTX 2070 Max-Q (Edge 44.17763.1.0) | |
| Average of class Gaming (391 - 590, n=99, last 2 years) | |
| Octane V2 - Total Score | |
| Average of class Gaming (93292 - 139447, n=27, last 2 years) | |
| Gigabyte Aero 15-X9 (Edge 44) | |
| Razer Blade 15 RTX 2070 Max-Q (Edge 44.17763.1.0) | |
| JetStream 1.1 - 1.1 Total | |
| Average of class Gaming (549 - 647, n=3, last 2 years) | |
| Razer Blade 15 RTX 2070 Max-Q (Edge 44.17763.1.0) | |
| Gigabyte Aero 15-X9 (Edge 44) | |
* ... smaller is better
System Performance
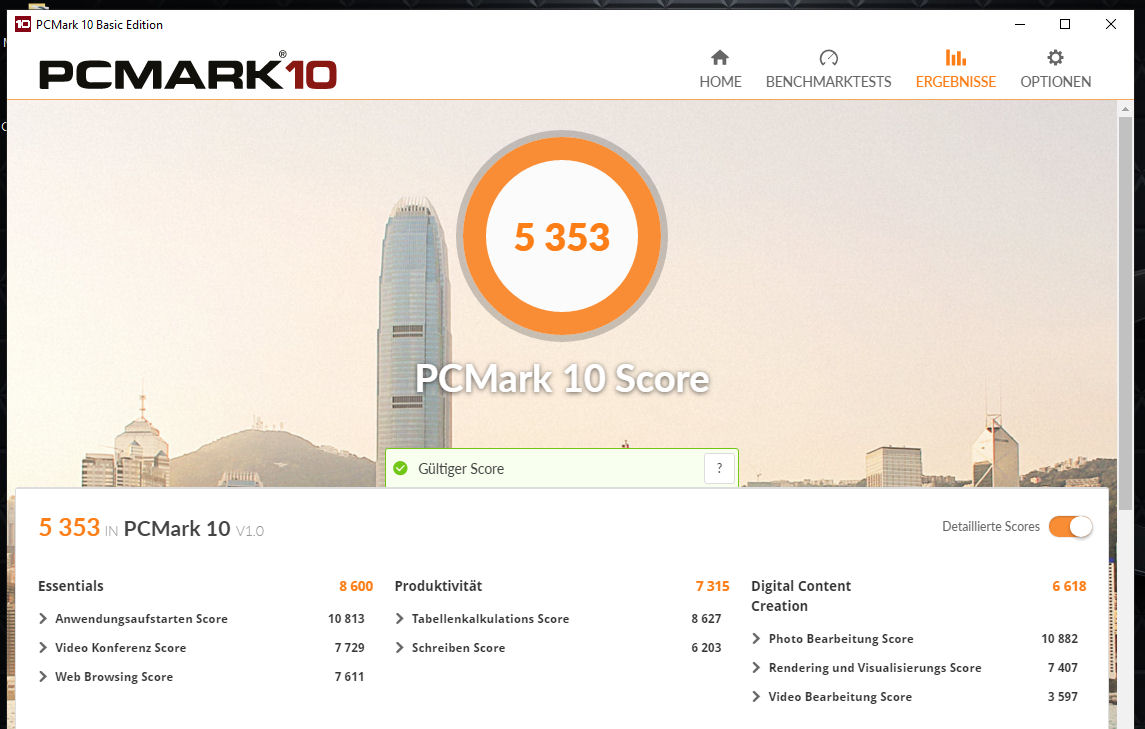
Our review unit performed smoothly throughout our tests thanks to its powerful processor and lightning-fast NVMe SSD. Synthetic benchmark results confirmed our subjective impressions, with the Aero 15-X9 just shy of the Razer Blade 15 in PCMark 10. The Acer Predator Triton 500 outscored our review unit by 10% in the same benchmark, but this is mainly because of its more-powerful GPU.
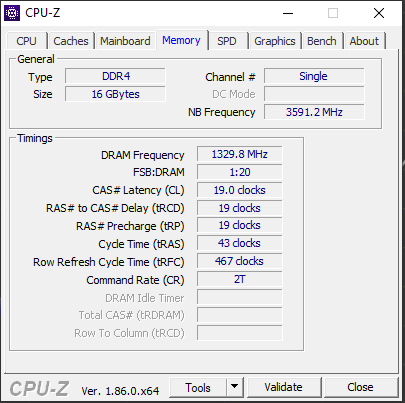
Hence, the Aero 15-X9 is not only an impressive gaming laptop but is also powerful enough for image and video-editing. There is also scope to further improve performance by adding a second SODIMM module, which would enable dual-channel mode. Making this change would generally boost performance in games and programs by a few percent.
| PCMark 7 Score | 6400 points | |
| PCMark 8 Home Score Accelerated v2 | 4338 points | |
| PCMark 8 Creative Score Accelerated v2 | 5111 points | |
| PCMark 8 Work Score Accelerated v2 | 5645 points | |
| PCMark 10 Score | 5353 points | |
Help | ||
Storage Devices
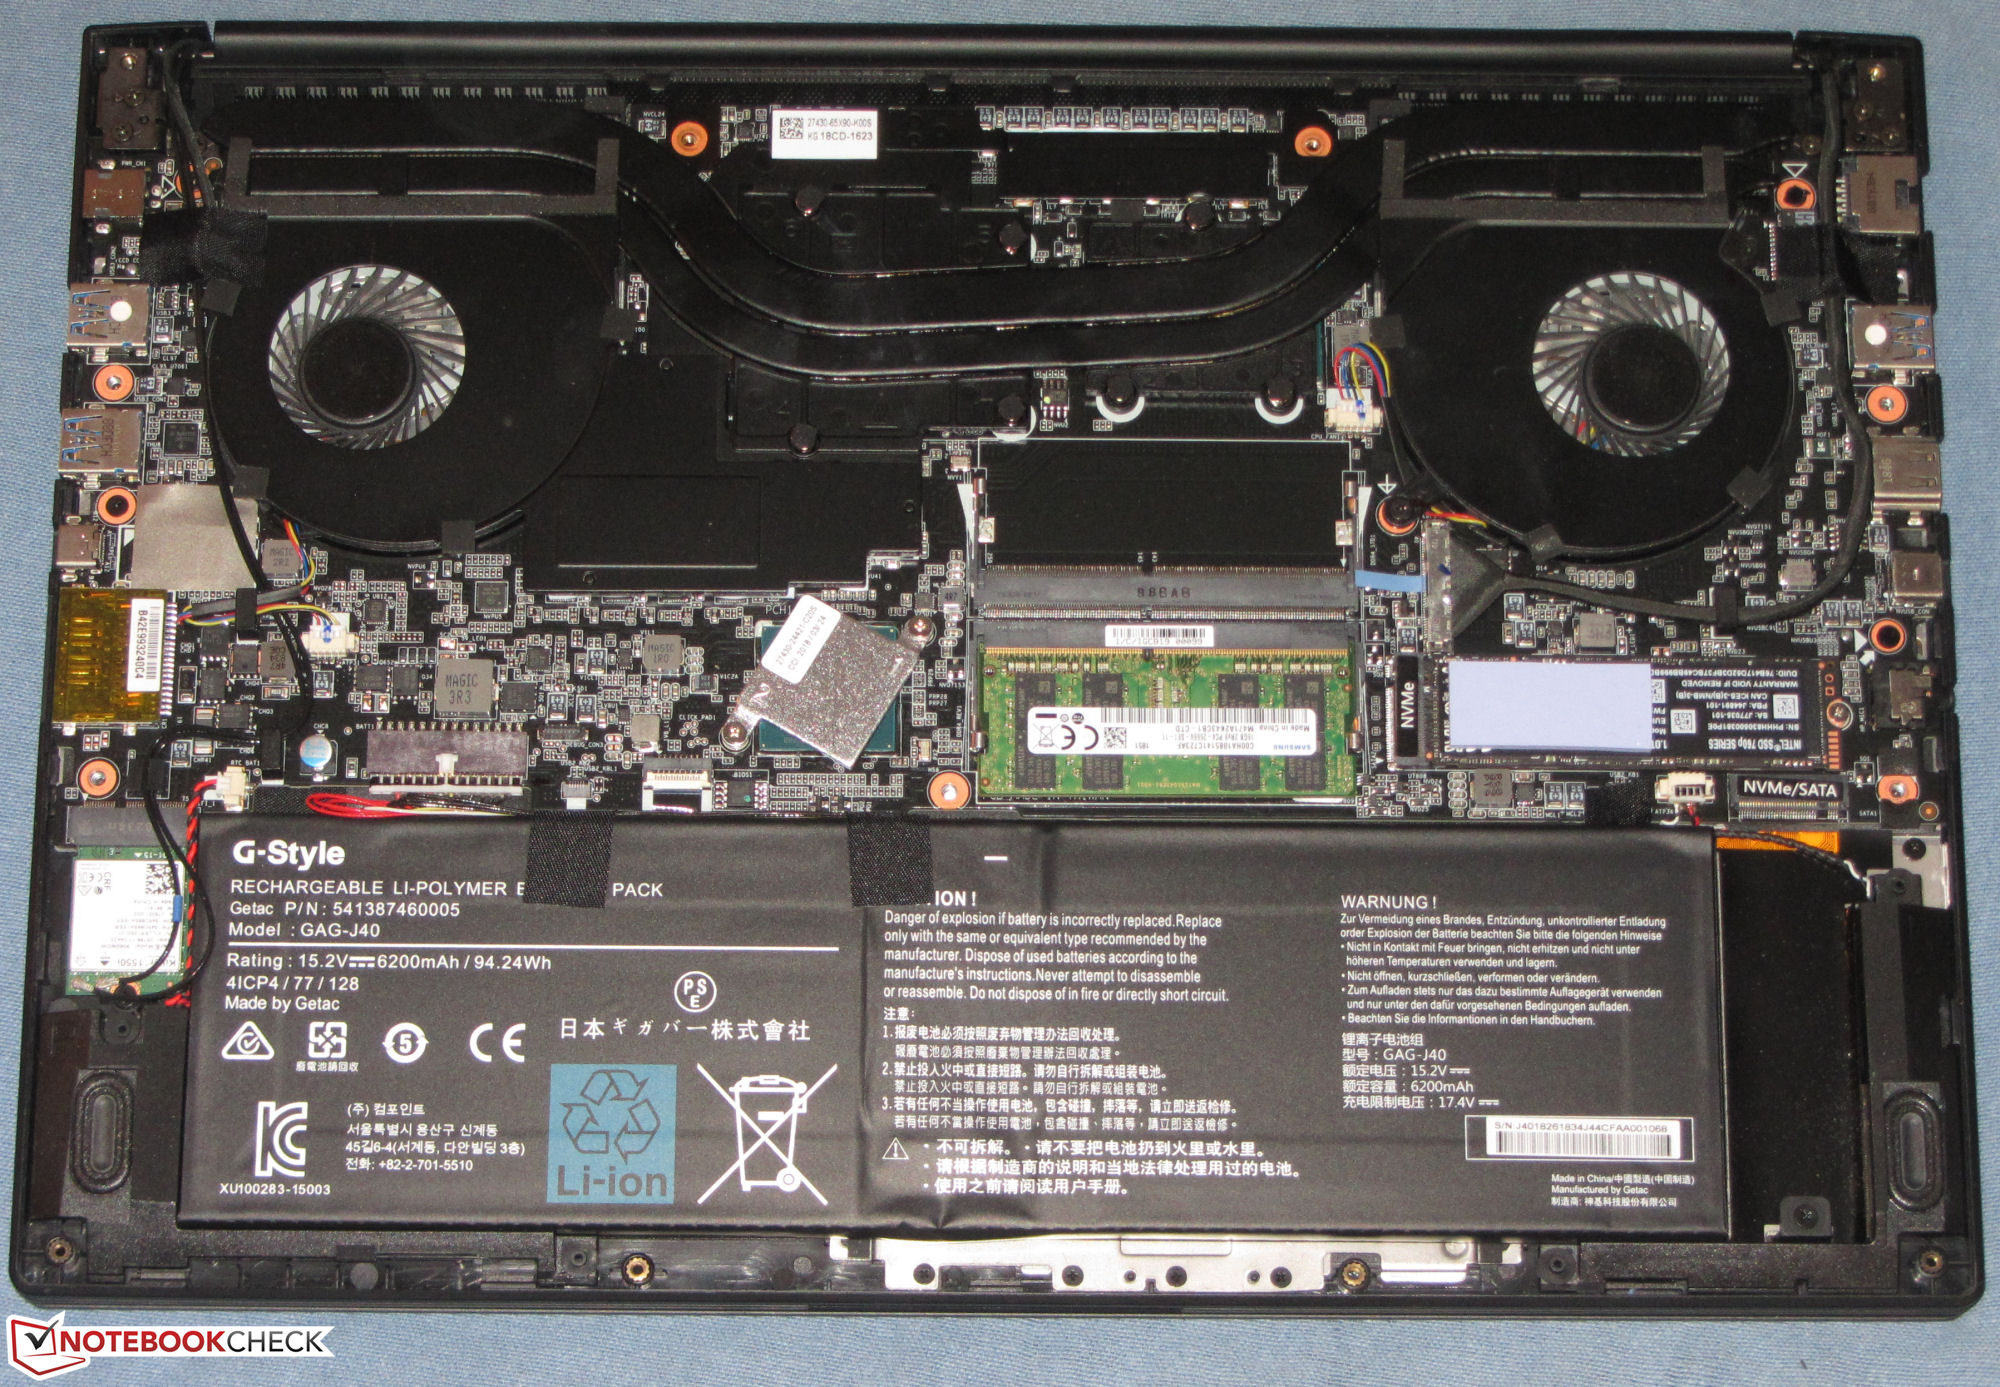
Gigabyte has equipped our review unit with an Intel 760p SSD. The 1 TB M.2 2280 drive, of which about 909 GB was free upon first boot, utilises the NVMe protocol to deliver excellent transfer speeds. The Intel 760p is on par with the Samsung PM981, which is one of the fastest consumer SSDs currently on the market.
NVMe SSDs operate on four lanes of PCI Express 3.0, which allows them to achieve significantly faster transfer speeds than their SATA III counterparts. Hence, NVMe SSDs are essential for gaming laptops, as they allow the system to load games quickly.
The Aero 15-X9 also has a second M.2 2280 slot, which works with either NVMe or SATA III SSDs. You could also run the system in RAID 0 with two NVMe SSDs for even faster transfer speeds.

| Gigabyte Aero 15-X9 Intel SSD 760p SSDPEKKW010T8 | Gigabyte Aero 15X v8 Toshiba NVMe THNSN5512GPU7 | Asus Zephyrus S GX531GS WDC PC SN520 SDAPNUW-512G | MSI GS65 8RF-019DE Stealth Thin Samsung SSD PM981 MZVLB512HAJQ | Razer Blade 15 RTX 2070 Max-Q Samsung SSD PM981 MZVLB512HAJQ | Acer Predator Triton 500 2x WDC PC SN720 SDAPNTW-256G-1014 (RAID 0) | |
|---|---|---|---|---|---|---|
| CrystalDiskMark 5.2 / 6 | -10% | -14% | 1% | 3% | 23% | |
| Write 4K (MB/s) | 97.1 | 94.4 -3% | 98.2 1% | 95.3 -2% | 93.9 -3% | 93.6 -4% |
| Read 4K (MB/s) | 53.7 | 37.65 -30% | 39.43 -27% | 40.13 -25% | 40.56 -24% | 38.82 -28% |
| Write Seq (MB/s) | 1526 | 1335 -13% | 1386 -9% | 1883 23% | 1468 -4% | 2455 61% |
| Read Seq (MB/s) | 2020 | 1404 -30% | 1100 -46% | 1322 -35% | 1540 -24% | 2107 4% |
| Write 4K Q32T1 (MB/s) | 285.6 | 268.6 -6% | 270.3 -5% | 309.9 9% | 293.5 3% | 298.7 5% |
| Read 4K Q32T1 (MB/s) | 321.8 | 332.8 3% | 340.3 6% | 353.7 10% | 346 8% | 338.7 5% |
| Write Seq Q32T1 (MB/s) | 1533 | 1375 -10% | 1454 -5% | 1919 25% | 1941 27% | 2902 89% |
| Read Seq Q32T1 (MB/s) | 2351 | 2627 12% | 1681 -28% | 2466 5% | 3266 39% | 3536 50% |
Graphics Card
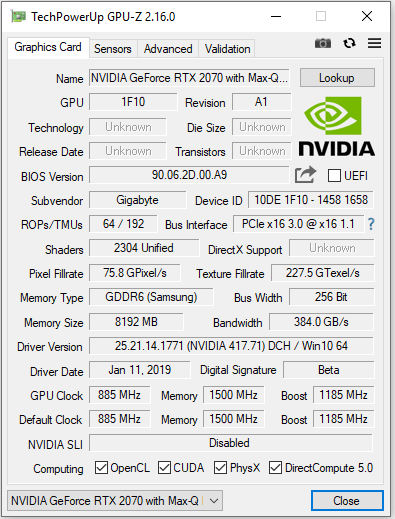
Gigabyte equips the Aero 15-X9 with an RTX 2070 Max-Q GPU, but there is an RTX 2080 Max-Q version should you need more graphics performance, which the company names the Aero 15-Y9. Max-Q GPUs are more-efficient versions of traditional mobile GPUs that are designed for thin and light laptops.
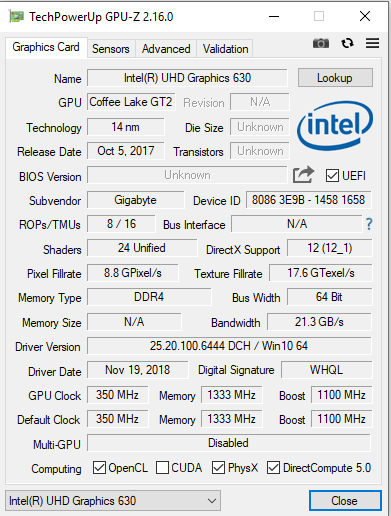
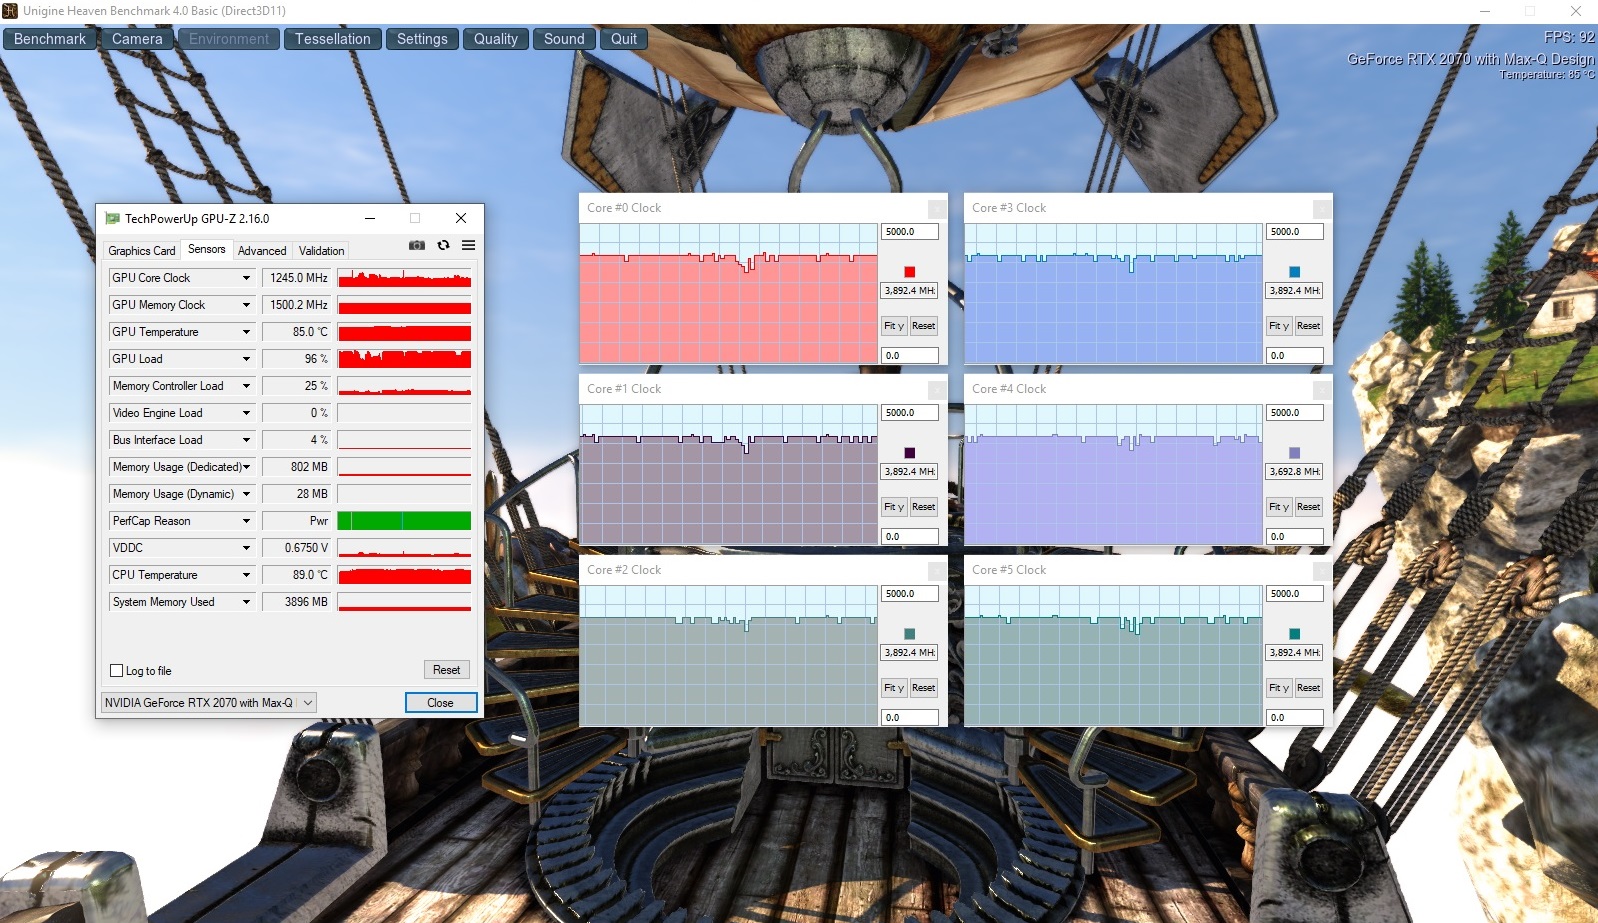
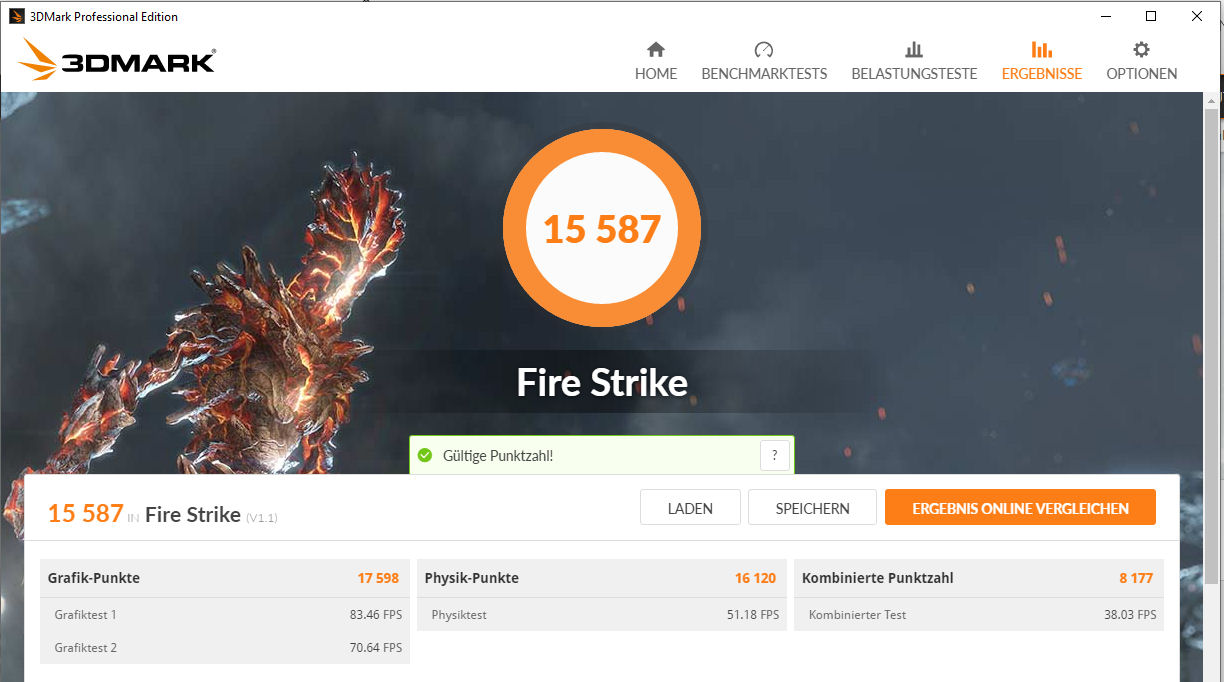
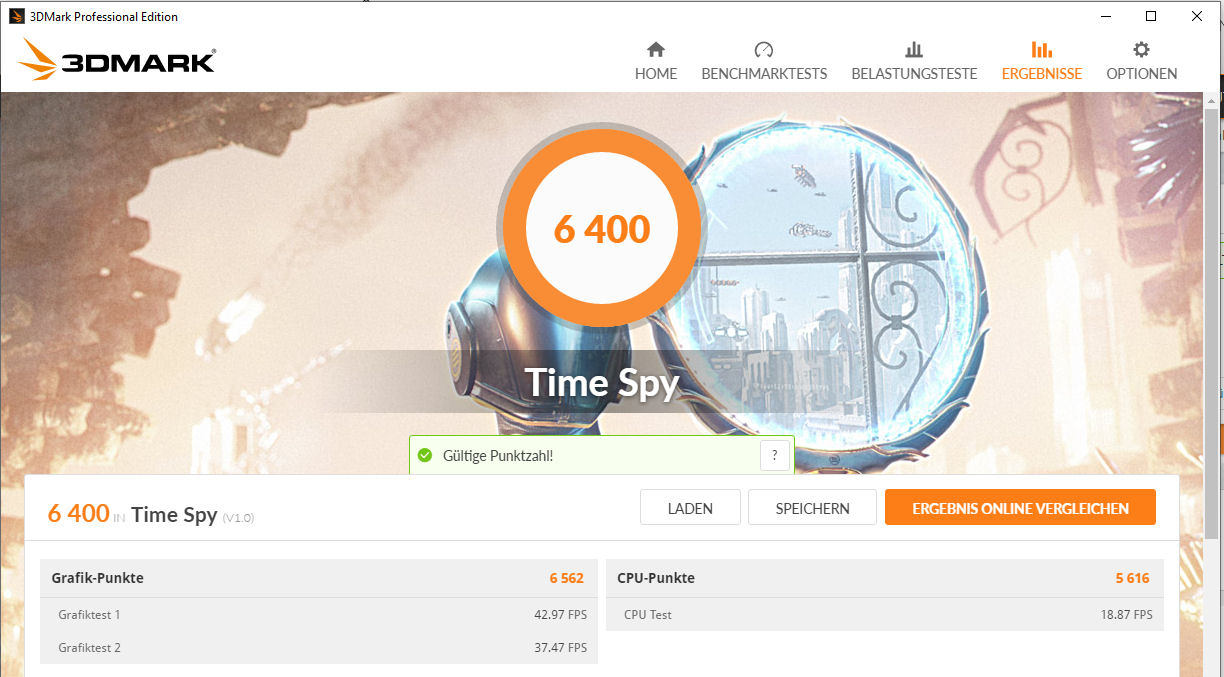
The GPU in our review unit can boost up to 1,635 MHz, but it only averaged 1,245 MHz during synthetic benchmarks. The RTX 2070 Max-Q has 8 GB of GDDR6 VRAM, which helps it achieve excellent 3DMark benchmark results. The Core i7-8750H also integrates an Intel UHD Graphics 630 GPU, which can handle simple graphics tasks. The Aero 15-X9 supports Nvidia Optimus too, which allows it to switch between GPUs when required.
| 3DMark 06 Standard Score | 34534 points | |
| 3DMark 11 Performance | 16608 points | |
| 3DMark Ice Storm Standard Score | 80496 points | |
| 3DMark Cloud Gate Standard Score | 31838 points | |
| 3DMark Fire Strike Score | 15587 points | |
| 3DMark Time Spy Score | 6400 points | |
Help | ||
| 3DMark | |
| 1920x1080 Fire Strike Graphics | |
| Average of class Gaming (12242 - 62849, n=114, last 2 years) | |
| Razer Blade 15 RTX 2070 Max-Q | |
| Gigabyte Aero 15-X9 | |
| Gigabyte Aero 15X v8 | |
| MSI GS65 8RF-019DE Stealth Thin | |
| 2560x1440 Time Spy Graphics | |
| Average of class Gaming (5012 - 26212, n=114, last 2 years) | |
| Razer Blade 15 RTX 2070 Max-Q | |
| Gigabyte Aero 15-X9 | |
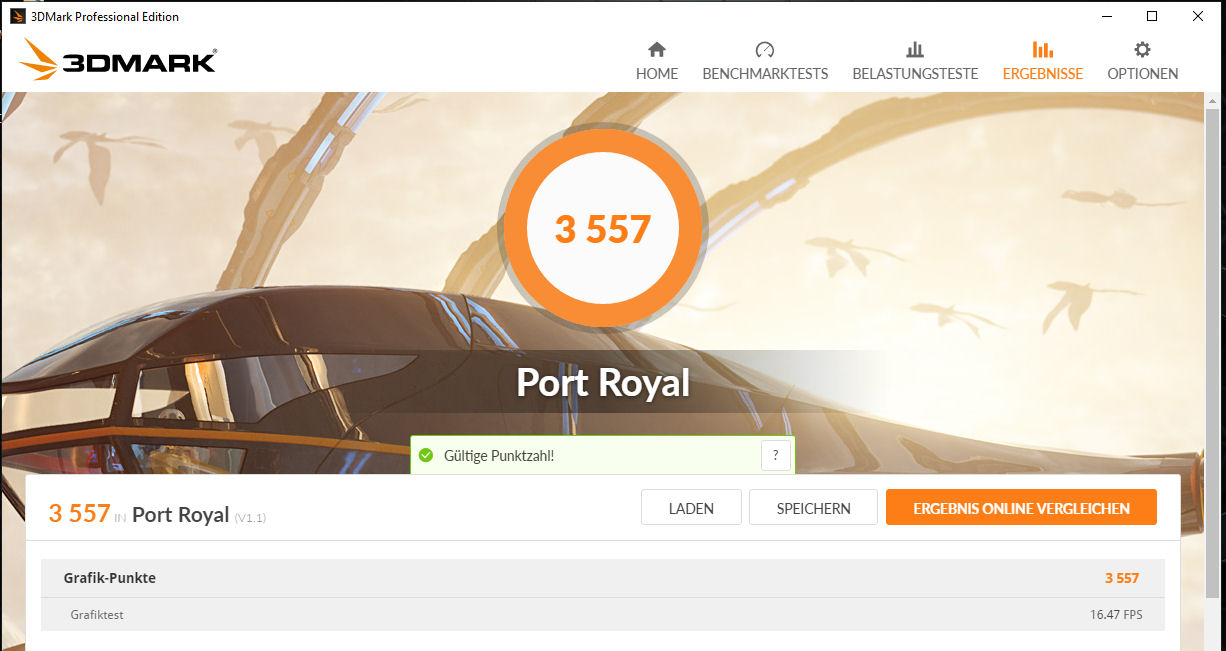
| 2560x1440 Port Royal Graphics | |
| Average of class Gaming (4395 - 17286, n=70, last 2 years) | |
| Razer Blade 15 RTX 2070 Max-Q | |
| Gigabyte Aero 15-X9 | |
Gaming Performance
Do not let the Aero 15-X9’s thin and light exterior fool you. The laptop packs enough power to render all modern triple-A games at smooth frame rates at maximum graphics in 1080p. The RTX 2070 Max-Q is also powerful enough to take advantage of our review unit’s 144 Hz display at these settings in some older games like BioShock Infinite. Dropping the graphics settings to high allows all the games we tested, apart from Ashes of the Singularity, to average more than 60 FPS. You will have to lower the graphics even further if you want to game at 4K on an external monitor though, or if you buy the 60 Hz, 4K display option.
It is worth noting that you could achieve better frame rates by adding a second SODIMM module and enabling dual-channel mode. The Razer Blade 15 runs in dual-channel mode by default and delivers around 18% higher frame rates than the Aero 15-X9, as demonstrated by the graphs below, despite having the same CPU and GPU. The Aero 15-X9 is still powerful for all modern titles in single-channel mode, but you will take better advantage of its 144 Hz display if you add a second SODIMM module.
| low | med. | high | ultra | |
|---|---|---|---|---|
| BioShock Infinite (2013) | 233.9 | 217.9 | 202.6 | 127.7 |
| GTA V (2015) | 133.1 | 123.1 | 92.9 | 54.2 |
| The Witcher 3 (2015) | 177.7 | 144.9 | 86.5 | 58.3 |
| Ashes of the Singularity (2016) | 60.2 | 53.1 | 52.6 | |
| Destiny 2 (2017) | 110.9 | 95.9 | 96.9 | 96.1 |
| X-Plane 11.11 (2018) | 84.6 | 70.2 | 61.6 | |
| Far Cry 5 (2018) | 94 | 73 | 70 | 67 |
| Darksiders III (2018) | 102.2 | 68.2 | 65.3 | 64.9 |
| The Witcher 3 - 1920x1080 Ultra Graphics & Postprocessing (HBAO+) | |
| Average of class Gaming (104.7 - 240, n=6, last 2 years) | |
| Acer Predator Triton 500 | |
| Razer Blade 15 RTX 2070 Max-Q | |
| Gigabyte Aero 15-X9 | |
| MSI GS65 8RF-019DE Stealth Thin | |
| Gigabyte Aero 15X v8 | |
| Asus Zephyrus S GX531GS | |
| BioShock Infinite - 1920x1080 Ultra Preset, DX11 (DDOF) | |
| Razer Blade 15 RTX 2070 Max-Q | |
| Gigabyte Aero 15-X9 | |
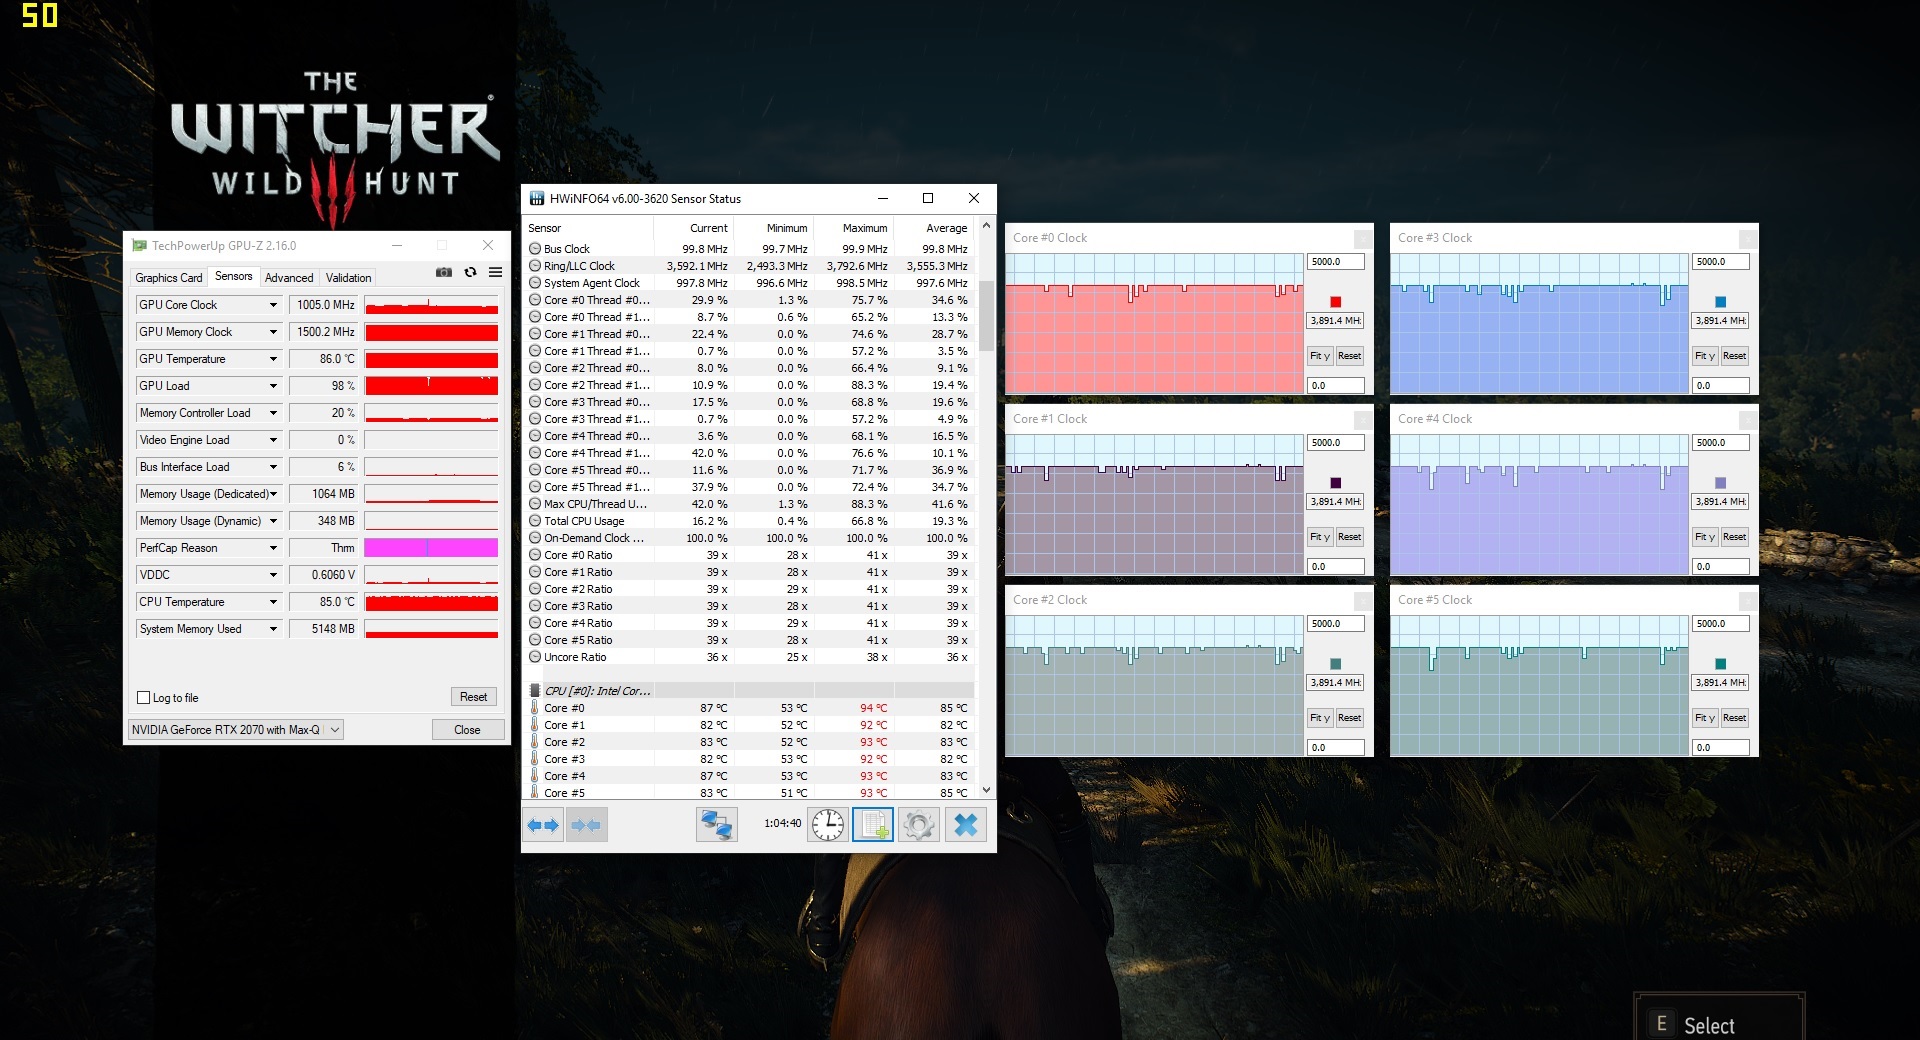
We also ran The Witcher 3 for an hour to check whether our review unit can maintain frame rates over a prolonged period. We conducted this test with the game running at 1080p and set to maximum graphics, for reference. We also do not move the game's main character, Geralt of Rivia, at all. Our review unit initially achieved a solid 60 FPS, but frame rates then slowly reduced to around 50 FPS with the occasional drops to 45 FPS. By contrast, the Razer Blade 15 only briefly dropped below 60 FPS during the same test.
Emissions
Fan Noise
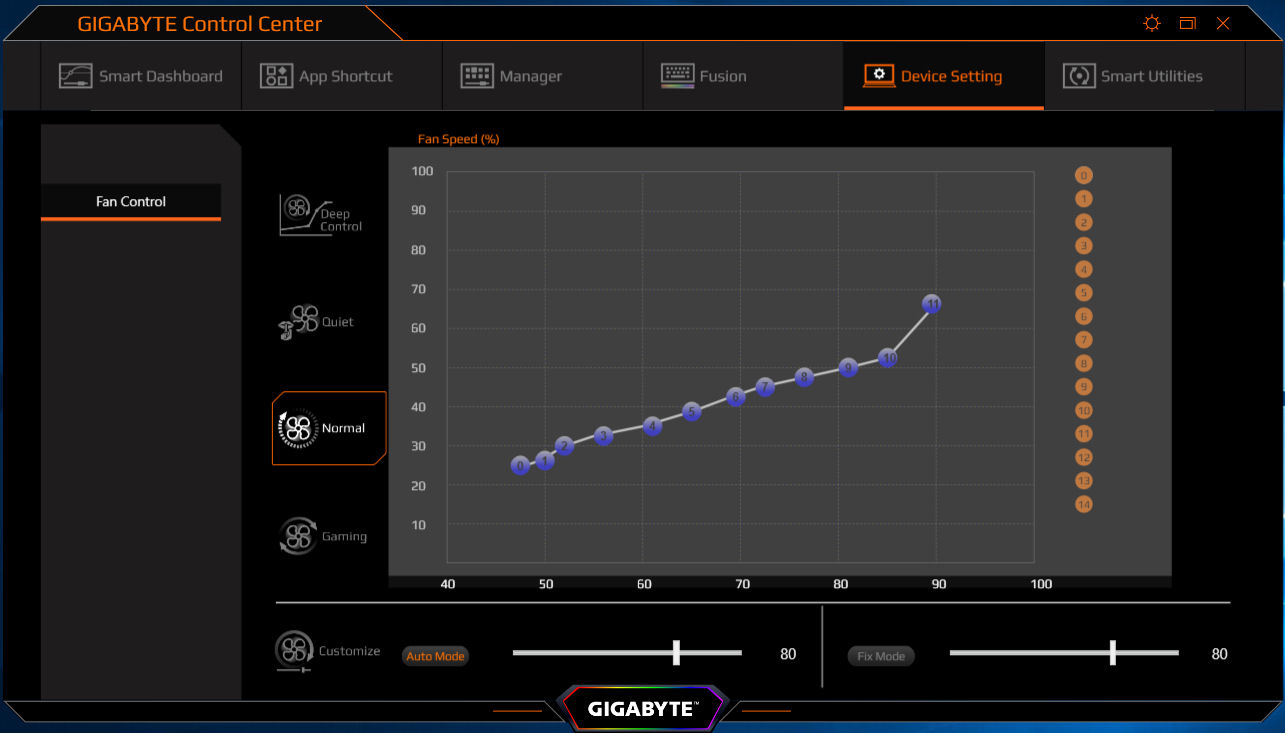
The Aero 15-X9 has two fans that constantly run at idle. The noise is not particularly disturbing, but you can set the fan control to Quiet in the Gigabyte Control Center to force the system to run silently.
Predictably, the fans get much louder when the system is operating under sustained load. Our review unit reached a maximum of 48 dB(A) during a stress test and averaged 42 dB(A) in our gaming tests. Unfortunately, one of the two fans in our test device makes a whistling sound at higher speeds, which we found intrusive and annoying.
Noise level
| Idle |
| 32 / 34 / 36 dB(A) |
| Load |
| 42 / 48 dB(A) |
 | ||
30 dB silent 40 dB(A) audible 50 dB(A) loud |
||
min: | ||
| Gigabyte Aero 15-X9 i7-8750H, GeForce RTX 2070 Max-Q | Gigabyte Aero 15X v8 i7-8750H, GeForce GTX 1070 Max-Q | Asus Zephyrus S GX531GS i7-8750H, GeForce GTX 1070 Max-Q | MSI GS65 8RF-019DE Stealth Thin i7-8750H, GeForce GTX 1070 Max-Q | Razer Blade 15 RTX 2070 Max-Q i7-8750H, GeForce RTX 2070 Max-Q | Acer Predator Triton 500 i7-8750H, GeForce RTX 2080 Max-Q | Average of class Gaming | |
|---|---|---|---|---|---|---|---|
| Noise | -4% | -7% | 5% | 10% | 2% | 10% | |
| off / environment * (dB) | 30 | 29 3% | 29 3% | 30 -0% | 28.8 4% | 29 3% | 24.1 ? 20% |
| Idle Minimum * (dB) | 32 | 30 6% | 33 -3% | 30 6% | 28.8 10% | 30 6% | 25.9 ? 19% |
| Idle Average * (dB) | 34 | 31 9% | 34 -0% | 31 9% | 28.8 15% | 32 6% | 27.4 ? 19% |
| Idle Maximum * (dB) | 36 | 35 3% | 40 -11% | 34 6% | 29.4 18% | 34 6% | 30.1 ? 16% |
| Load Average * (dB) | 42 | 49 -17% | 47 -12% | 43 -2% | 35.7 15% | 44 -5% | 43.6 ? -4% |
| Witcher 3 ultra * (dB) | 44 | 51 -16% | 51 -16% | 42 5% | 42.5 3% | 46 -5% | |
| Load Maximum * (dB) | 48 | 54 -13% | 53 -10% | 44 8% | 45 6% | 47 2% | 54.2 ? -13% |
* ... smaller is better
Temperature
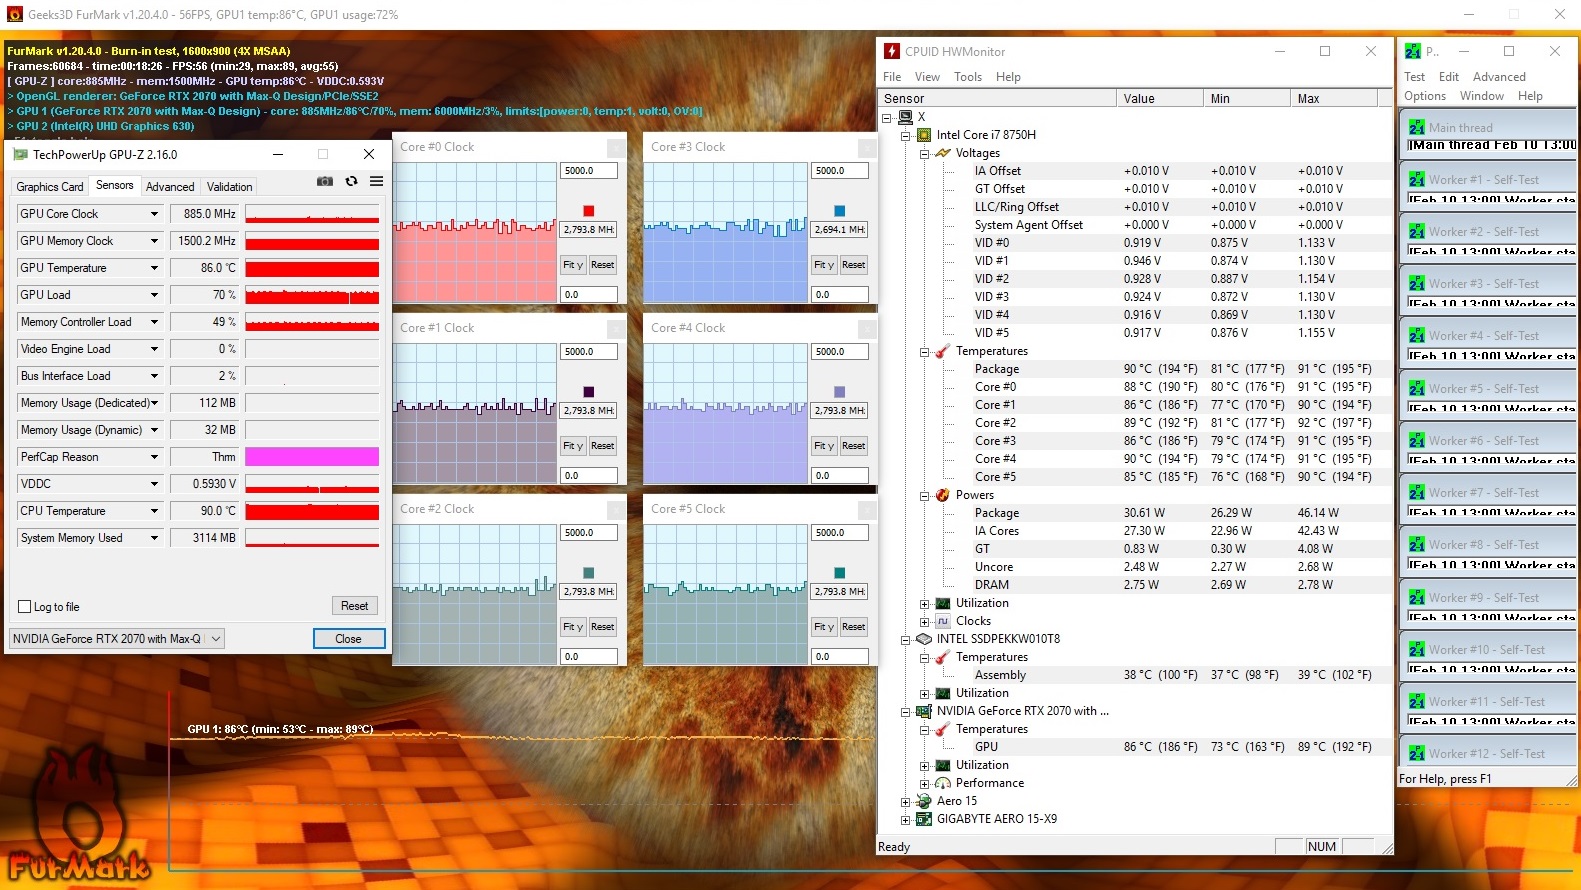
We subjected our review unit to a FurMark and Prime95 combined stress test that we ran for an hour to determine how well the Aero 15-X9 can manage its performance under sustained load. The CPU operated at between 2.7 GHz and 2.8 GHz with our test device on charge, while the CPU only clocked at 885 MHz. By contrast, both components are throttled to 1.7 GHz and 300 MHz, respectively, when the system is running on battery.
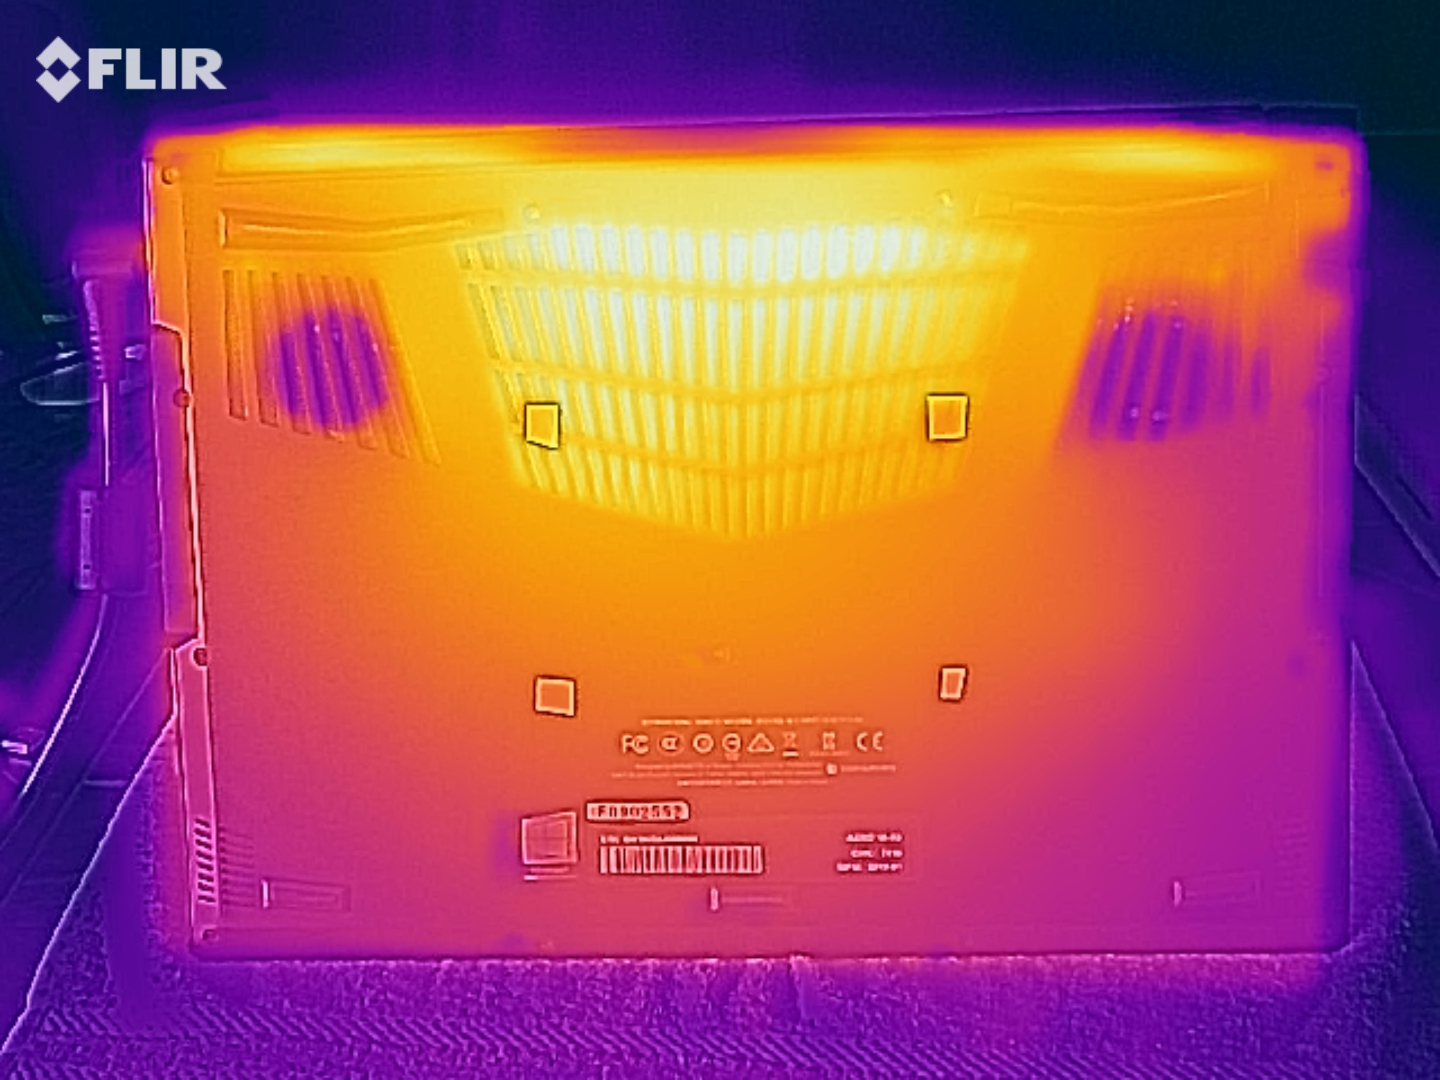
The Aero 15-X9 also gets uncomfortably hot during a stress test. Our review unit reached a maximum of 66 °C on its bottom case during our tests, while the palm rest averaged around 36 °C. In short, we would recommend placing the Aero 15-X9 on a table if you are pushing it hard, as it gets too hot to place on your lap. The device gets just as hot when gaming too. The case feels cool to the touch at idle though, so you should have no issues with using the Aero 15-X9 on your lap if you are doing some general tasks like web-browsing or word-processing.
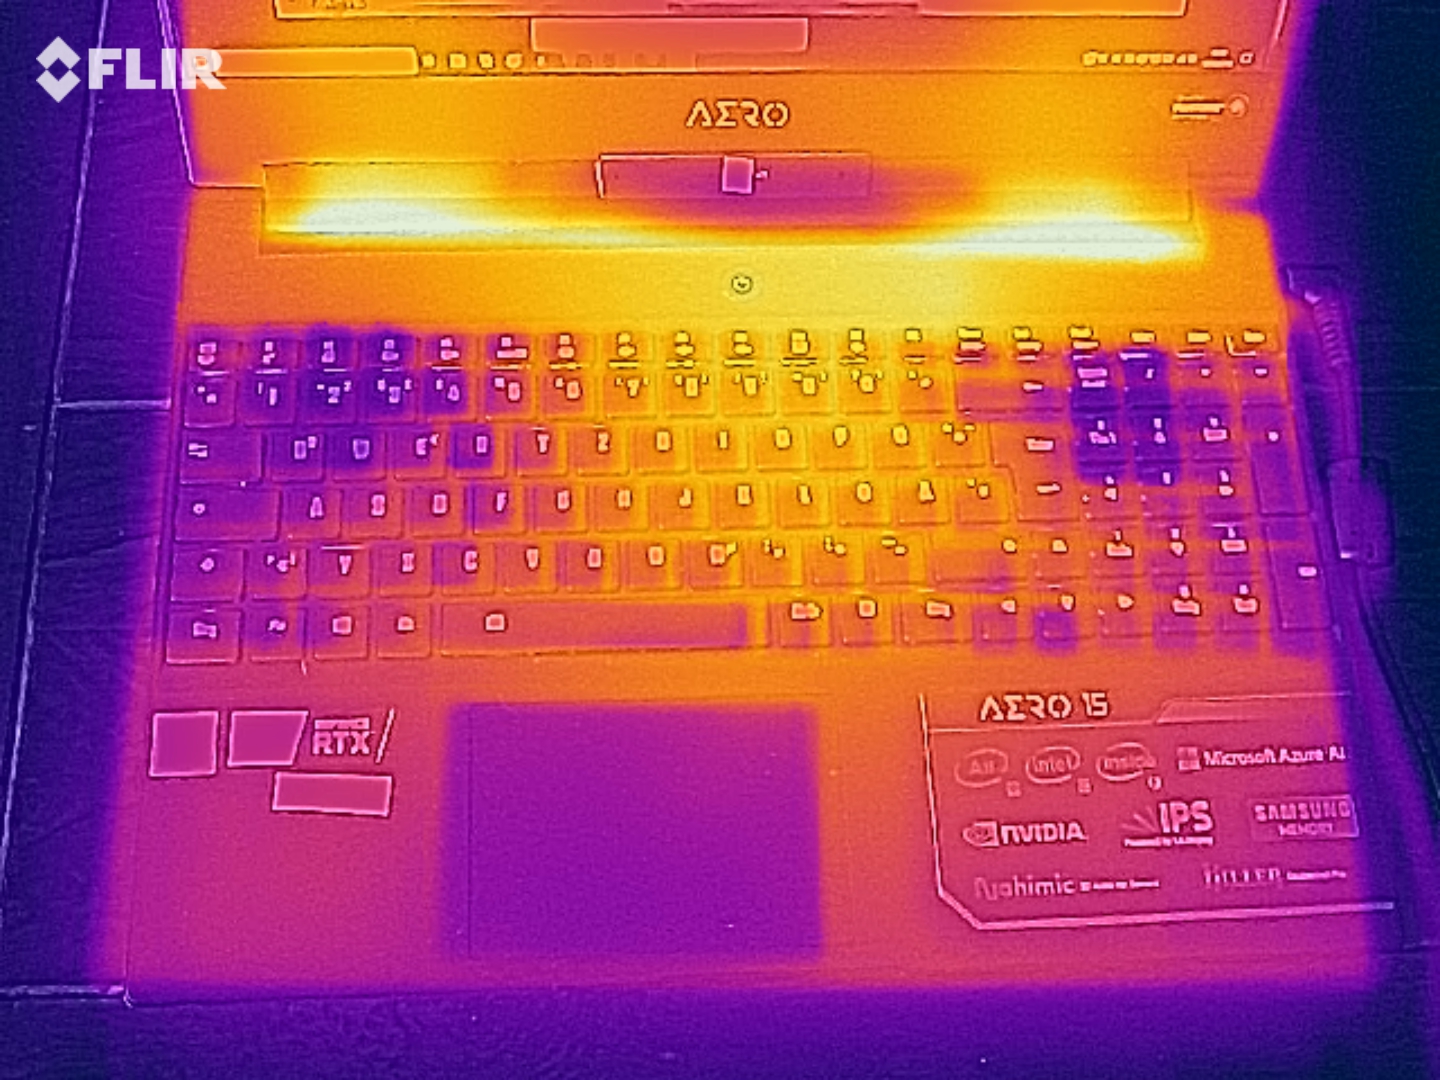
(-) The maximum temperature on the upper side is 56 °C / 133 F, compared to the average of 40.4 °C / 105 F, ranging from 21.2 to 68.8 °C for the class Gaming.
(-) The bottom heats up to a maximum of 66 °C / 151 F, compared to the average of 43.2 °C / 110 F
(+) In idle usage, the average temperature for the upper side is 25.4 °C / 78 F, compared to the device average of 33.9 °C / 93 F.
(-) Playing The Witcher 3, the average temperature for the upper side is 44.3 °C / 112 F, compared to the device average of 33.9 °C / 93 F.
(±) The palmrests and touchpad can get very hot to the touch with a maximum of 38 °C / 100.4 F.
(-) The average temperature of the palmrest area of similar devices was 28.8 °C / 83.8 F (-9.2 °C / -16.6 F).
| Gigabyte Aero 15-X9 i7-8750H, GeForce RTX 2070 Max-Q | Gigabyte Aero 15X v8 i7-8750H, GeForce GTX 1070 Max-Q | Asus Zephyrus S GX531GS i7-8750H, GeForce GTX 1070 Max-Q | MSI GS65 8RF-019DE Stealth Thin i7-8750H, GeForce GTX 1070 Max-Q | Razer Blade 15 RTX 2070 Max-Q i7-8750H, GeForce RTX 2070 Max-Q | Acer Predator Triton 500 i7-8750H, GeForce RTX 2080 Max-Q | Average of class Gaming | |
|---|---|---|---|---|---|---|---|
| Heat | 0% | -2% | 9% | 11% | -5% | 1% | |
| Maximum Upper Side * (°C) | 56 | 53 5% | 54 4% | 49 12% | 49 12% | 49 12% | 45.2 ? 19% |
| Maximum Bottom * (°C) | 66 | 65 2% | 60 9% | 63 5% | 49 26% | 58 12% | 48.2 ? 27% |
| Idle Upper Side * (°C) | 27 | 26 4% | 30 -11% | 24 11% | 25.4 6% | 33 -22% | 31 ? -15% |
| Idle Bottom * (°C) | 27 | 30 -11% | 30 -11% | 25 7% | 27.2 -1% | 33 -22% | 34.3 ? -27% |
* ... smaller is better
Speakers
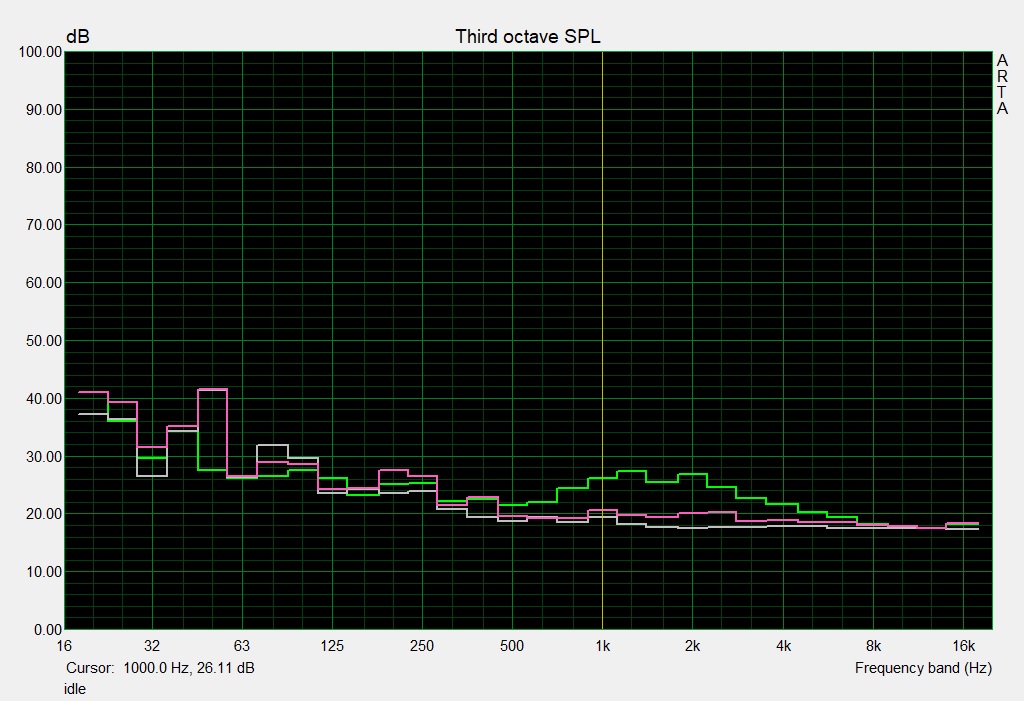
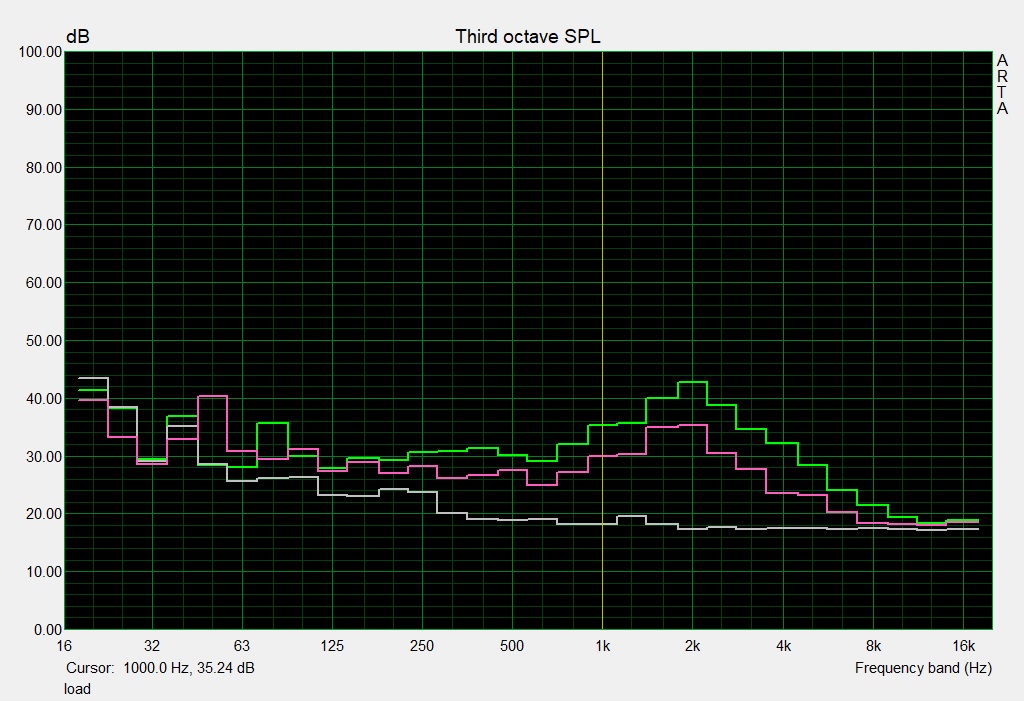
Gigabyte Aero 15-X9 audio analysis
(±) | speaker loudness is average but good (81 dB)
Bass 100 - 315 Hz
(±) | reduced bass - on average 14% lower than median
(±) | linearity of bass is average (13.7% delta to prev. frequency)
Mids 400 - 2000 Hz
(±) | higher mids - on average 6.2% higher than median
(±) | linearity of mids is average (7.9% delta to prev. frequency)
Highs 2 - 16 kHz
(+) | balanced highs - only 4.4% away from median
(±) | linearity of highs is average (9.7% delta to prev. frequency)
Overall 100 - 16.000 Hz
(±) | linearity of overall sound is average (17.5% difference to median)
Compared to same class
» 49% of all tested devices in this class were better, 12% similar, 40% worse
» The best had a delta of 6%, average was 18%, worst was 132%
Compared to all devices tested
» 34% of all tested devices were better, 8% similar, 58% worse
» The best had a delta of 4%, average was 23%, worst was 134%
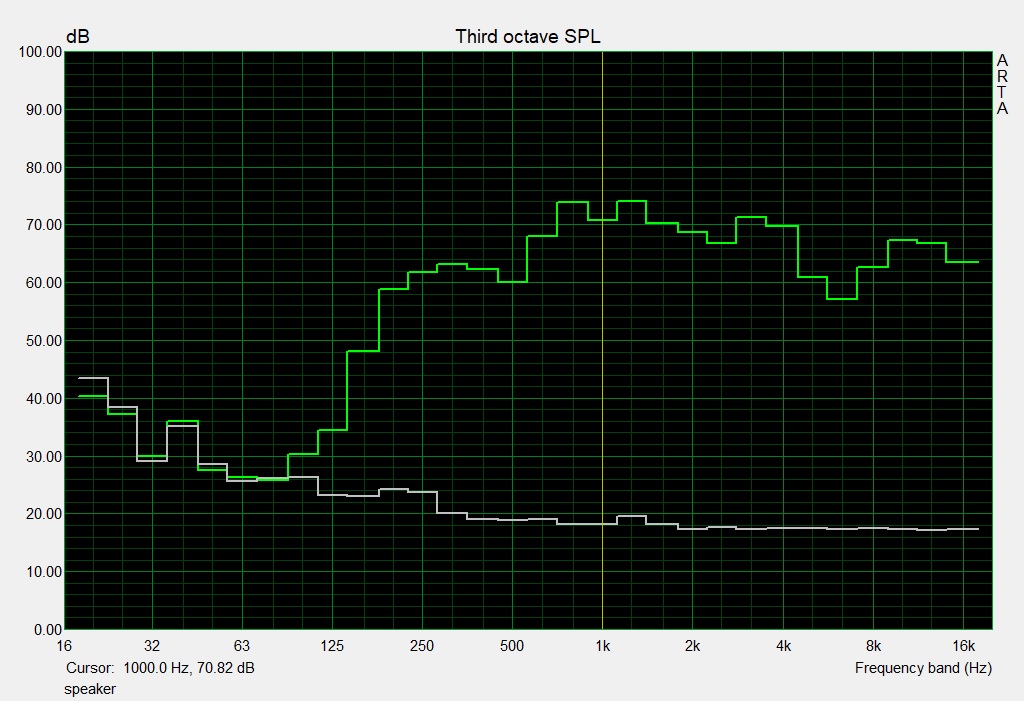
Gigabyte Aero 15X v8 audio analysis
(±) | speaker loudness is average but good (78 dB)
Bass 100 - 315 Hz
(-) | nearly no bass - on average 16.8% lower than median
(±) | linearity of bass is average (11.6% delta to prev. frequency)
Mids 400 - 2000 Hz
(+) | balanced mids - only 4.3% away from median
(+) | mids are linear (5% delta to prev. frequency)
Highs 2 - 16 kHz
(+) | balanced highs - only 3.6% away from median
(±) | linearity of highs is average (9.1% delta to prev. frequency)
Overall 100 - 16.000 Hz
(±) | linearity of overall sound is average (18.4% difference to median)
Compared to same class
» 59% of all tested devices in this class were better, 9% similar, 32% worse
» The best had a delta of 6%, average was 18%, worst was 132%
Compared to all devices tested
» 41% of all tested devices were better, 8% similar, 51% worse
» The best had a delta of 4%, average was 23%, worst was 134%
Power Management
Power Consumption
Gigabyte appears to have generally reduced power consumption with the Aero 15-X9 compared to its predecessor. Our review unit consumes a minimum of 16 W at idle, which is 2 W more than the Aero 15X v8. However, power consumption rises to a maximum of 167 W under load and averages at around 88 W, which is approximately 3.5% less than its predecessor consumed. Moreover, our review unit consumed just 120 W while playing The Witcher 3, which makes it more efficient than all our comparison devices.
In short, the Aero 15-X9 is a surprisingly power-efficient laptop given its powerful components. These results are even more impressive considering that it is equipped with a more-powerful GPU than its predecessor. Gigabyte includes a 230 W charger with the Aero 15-X9, which is powerful enough to recharge the device even if it is being pushed hard.
| Off / Standby | |
| Idle | |
| Load |
|
Key:
min: | |
| Gigabyte Aero 15-X9 i7-8750H, GeForce RTX 2070 Max-Q | Gigabyte Aero 15X v8 i7-8750H, GeForce GTX 1070 Max-Q | Asus Zephyrus S GX531GS i7-8750H, GeForce GTX 1070 Max-Q | MSI GS65 8RF-019DE Stealth Thin i7-8750H, GeForce GTX 1070 Max-Q | Razer Blade 15 RTX 2070 Max-Q i7-8750H, GeForce RTX 2070 Max-Q | Acer Predator Triton 500 i7-8750H, GeForce RTX 2080 Max-Q | Average of class Gaming | |
|---|---|---|---|---|---|---|---|
| Power Consumption | -2% | -21% | 13% | 7% | -15% | -14% | |
| Idle Minimum * (Watt) | 16 | 14 12% | 17 -6% | 7 56% | 10.4 35% | 16 -0% | 13 ? 19% |
| Idle Average * (Watt) | 18 | 18 -0% | 20 -11% | 11 39% | 14.6 19% | 22 -22% | 18.7 ? -4% |
| Idle Maximum * (Watt) | 23 | 22 4% | 29 -26% | 20 13% | 16.3 29% | 32 -39% | 24.3 ? -6% |
| Load Average * (Watt) | 88 | 91 -3% | 112 -27% | 98 -11% | 88.5 -1% | 89 -1% | 110.2 ? -25% |
| Witcher 3 ultra * (Watt) | 120 | 142 -18% | 152 -27% | 132 -10% | 155.4 -30% | 147 -23% | |
| Load Maximum * (Watt) | 167 | 173 -4% | 211 -26% | 182 -9% | 182.4 -9% | 173 -4% | 258 ? -54% |
* ... smaller is better
Battery Life
Gigabyte continues to equip the Aero 15 with a 94.24 Wh battery, but it generally achieved considerably shorter runtimes than its predecessor. We initially suspected that this could have been because of the Aero 15-X9’s more-powerful GPU, but we ruled this out when our tests determined that the system drastically downclocks the GPU when running on battery and mainly relies on the integrated GPU instead. We also tried various drivers and even installed a fresh version of Windows 10 without any preinstalled Gigabyte software, but our review unit lasted roughly just as long before it needed recharging.
The Aero 15-X9 lasted for 6:22 hours in our practical Wi-Fi battery life test, in which we run a script that simulates the load to render websites. We also set the Windows 10 power mode to Balanced and adjusted the display brightness to around 150 cd/m². Our review unit even needed recharging sooner than the Razer Blade 15 did, despite the latter having a 14.24 Wh smaller battery. Likewise, the Aero 15-X9 lasted just 6:04 hours in our H.264 video test where we run the short film Big Buck Bunny on a loop until the battery needs recharging. We also set the Windows 10 power mode to Battery Saver, the display to 150 cd/m² and the system to Flight Mode. In short, the Aero 15-X9 has disappointing battery life compared to its predecessor, but it still lasts longer than most other gaming laptops.
| Gigabyte Aero 15-X9 i7-8750H, GeForce RTX 2070 Max-Q, 94.24 Wh | Gigabyte Aero 15X v8 i7-8750H, GeForce GTX 1070 Max-Q, 94.24 Wh | Asus Zephyrus S GX531GS i7-8750H, GeForce GTX 1070 Max-Q, 50 Wh | MSI GS65 8RF-019DE Stealth Thin i7-8750H, GeForce GTX 1070 Max-Q, 82 Wh | Razer Blade 15 RTX 2070 Max-Q i7-8750H, GeForce RTX 2070 Max-Q, 80 Wh | Acer Predator Triton 500 i7-8750H, GeForce RTX 2080 Max-Q, 82 Wh | Average of class Gaming | |
|---|---|---|---|---|---|---|---|
| Battery runtime | 25% | -65% | -17% | -7% | -47% | 0% | |
| Reader / Idle (h) | 9.2 | 12.7 38% | 3.6 -61% | 8.5 -8% | 11.4 24% | 5.6 -39% | 8.71 ? -5% |
| H.264 (h) | 6.1 | 8.4 38% | 5.9 -3% | 8.64 ? 42% | |||
| WiFi v1.3 (h) | 6.4 | 8.6 34% | 2.6 -59% | 6 -6% | 6.5 2% | 3.2 -50% | 7.15 ? 12% |
| Load (h) | 2.9 | 2.6 -10% | 0.7 -76% | 1.4 -52% | 1.5 -48% | 1.4 -52% | 1.502 ? -48% |
Verdict
Pros
Cons
The Gigabyte Aero 15-X9 is an excellent gaming laptop, but it is just a slight refinement of its predecessor with a few added downsides. The Core i7-8750H processor and RTX-2070 Max-Q GPU is a winning combination that is powerful enough to handle all triple-A games at maximum graphics in 1080p. Moreover, the NVMe SSD ensures that the system runs smoothly even when it is working under sustained load. The device is easy to maintain and upgrade too, which is a bonus.
The Gigabyte Aero 15-X9 is a class-leading thin and light gaming laptop, but it is not quite as impressive as its predecessor was a year ago.
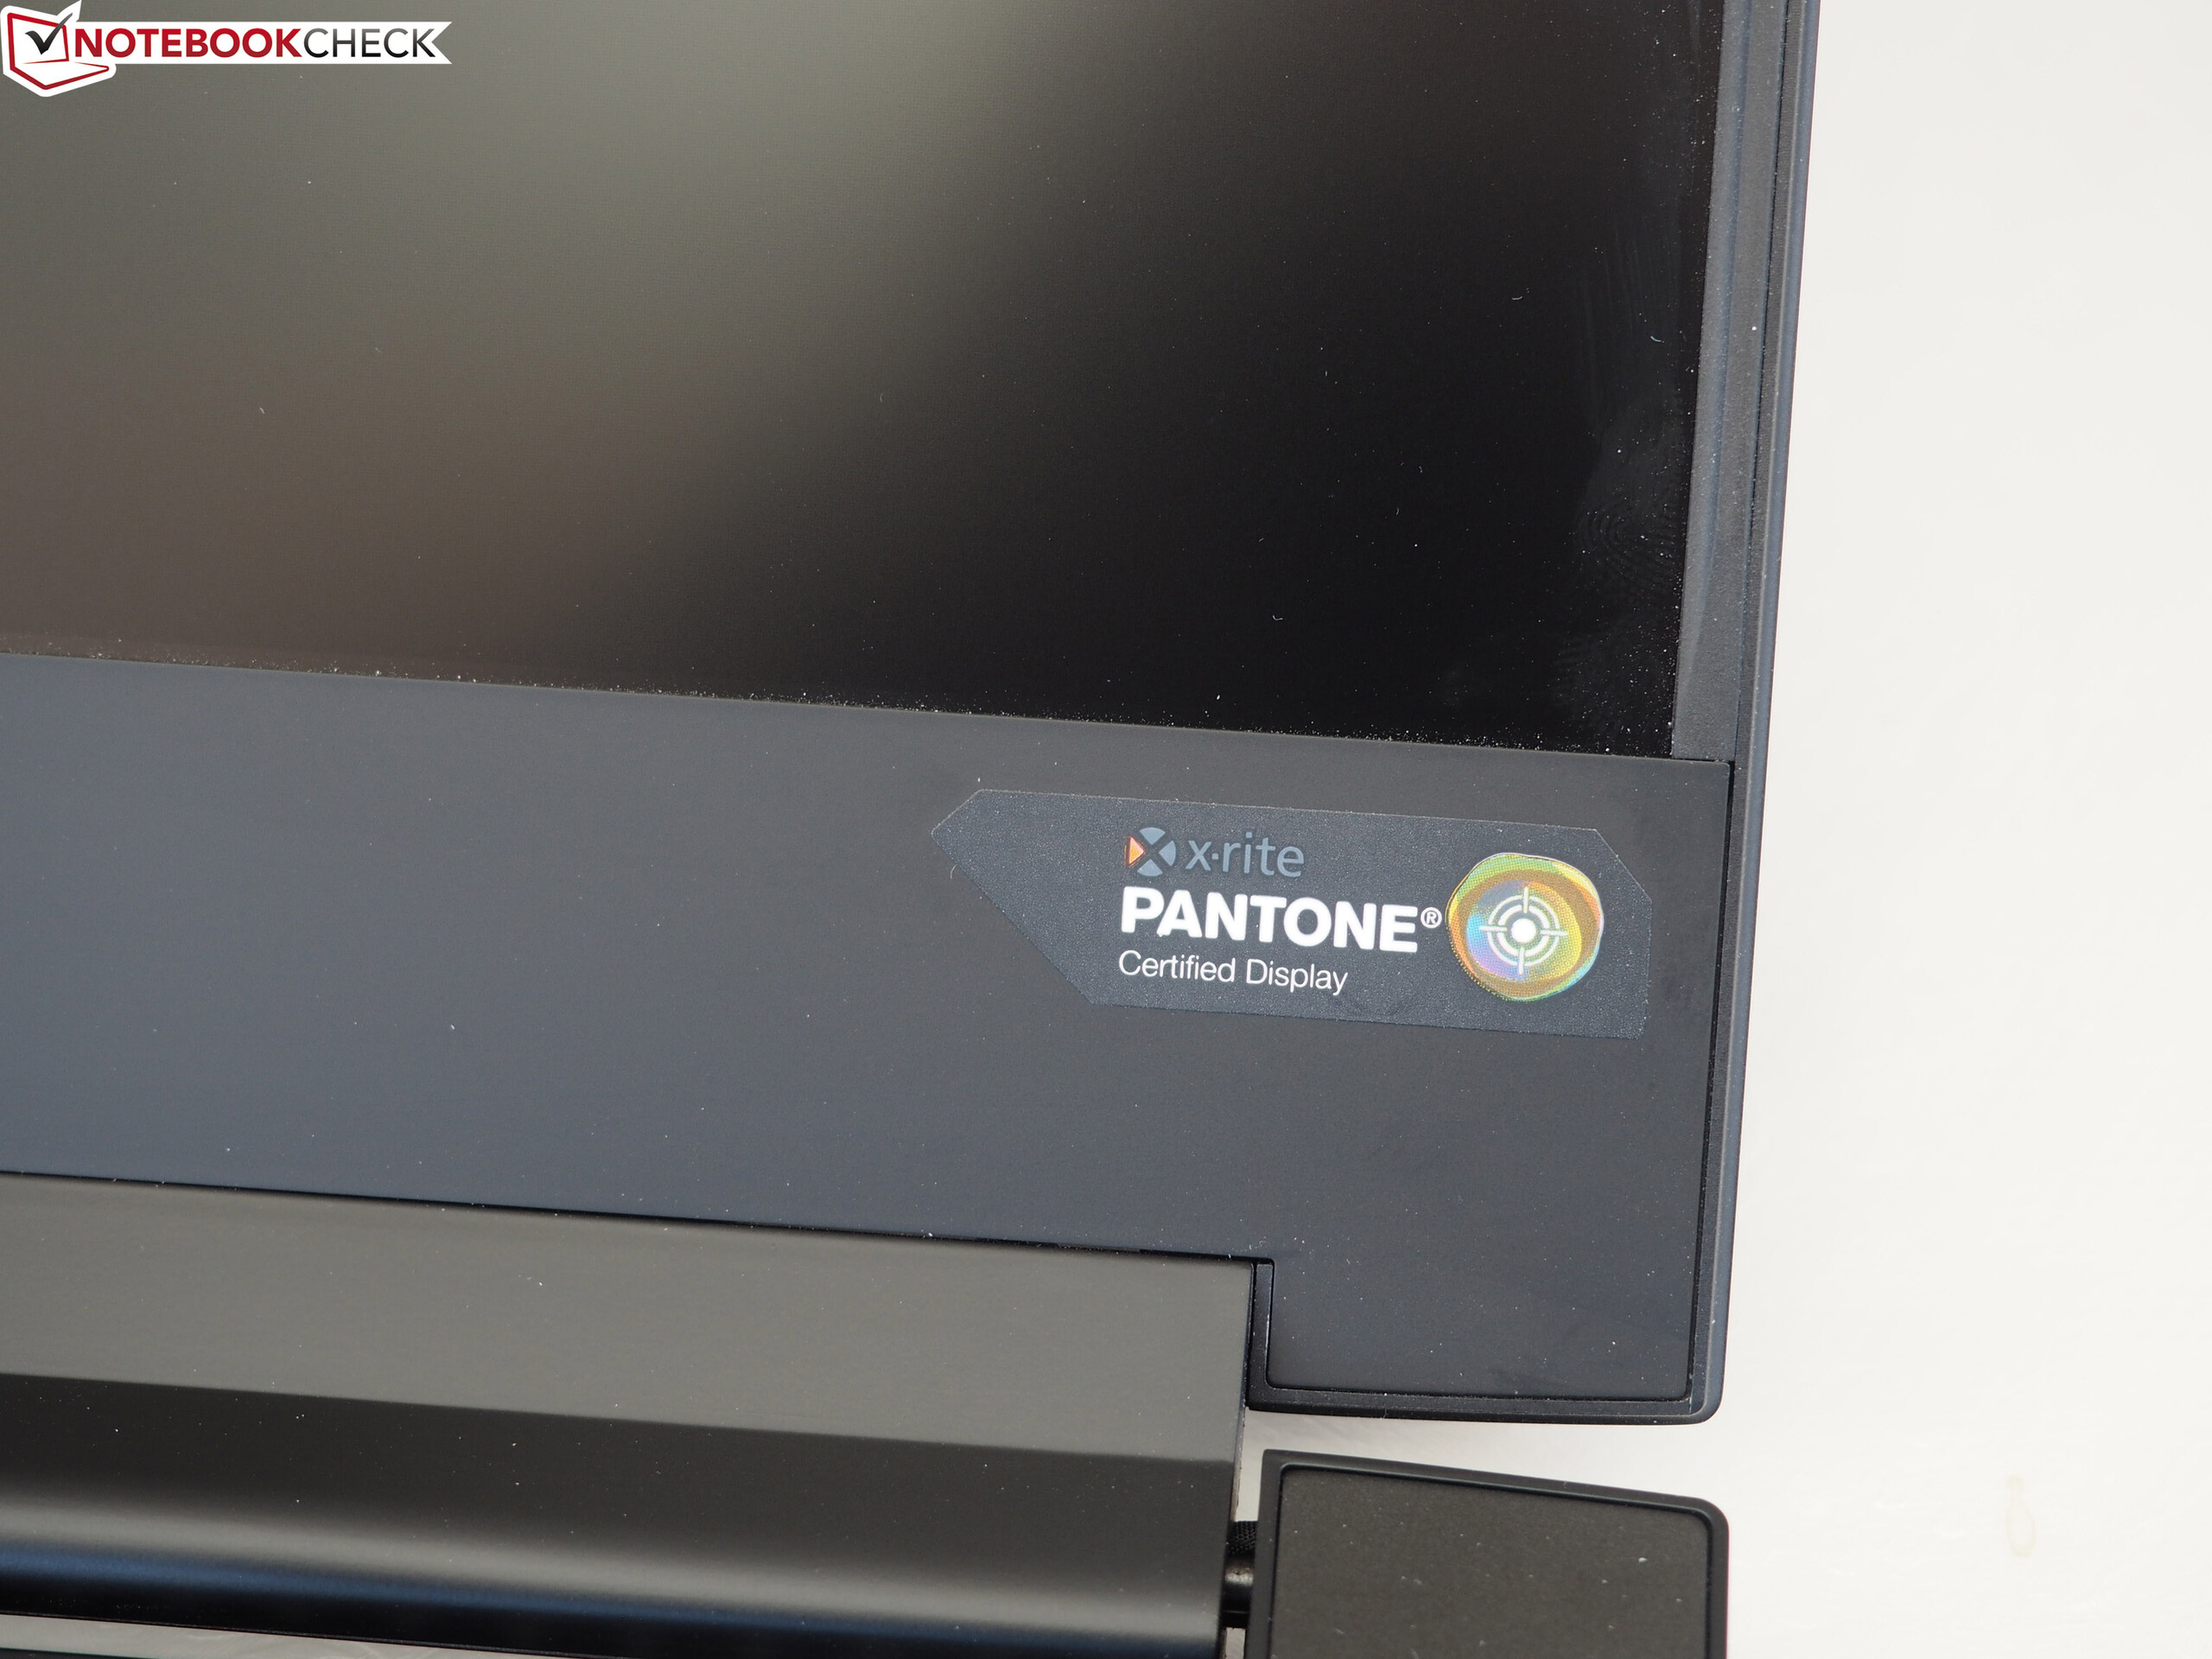
Likewise, the 144 Hz IPS screen continues to impress with its X-Rite Pantone certification, its stable viewing angles and its low response times. However, it is rather dim, which results in a poor contrast ratio.
Unfortunately, the battery life is underwhelming, considering the precedent that its predecessor set. We hope that this is a bug that Gigabyte can iron out. Furthermore, the more-powerful GPU generates more heat, which makes the device too hot to have on your lap while gaming or video-editing. The persistence with single-channel RAM bottlenecks performance too, which seems unnecessary and an easy win for Razer to remedy. Fortunately, all these issues, besides the high temperatures, are hopefully resolvable. The device also retails for several hundred US$ more than its predecessor currently and brings only minor improvements. In short, the Gigabyte Aero 15-X9 is one of the best thin and light gaming laptops that money can buy, but its high price and issues at the time of our tests mean that we cannot recommend it as highly as we did its predecessor.
Gigabyte Aero 15-X9
- 02/25/2019 v6 (old)
Sascha Mölck
Price comparison

