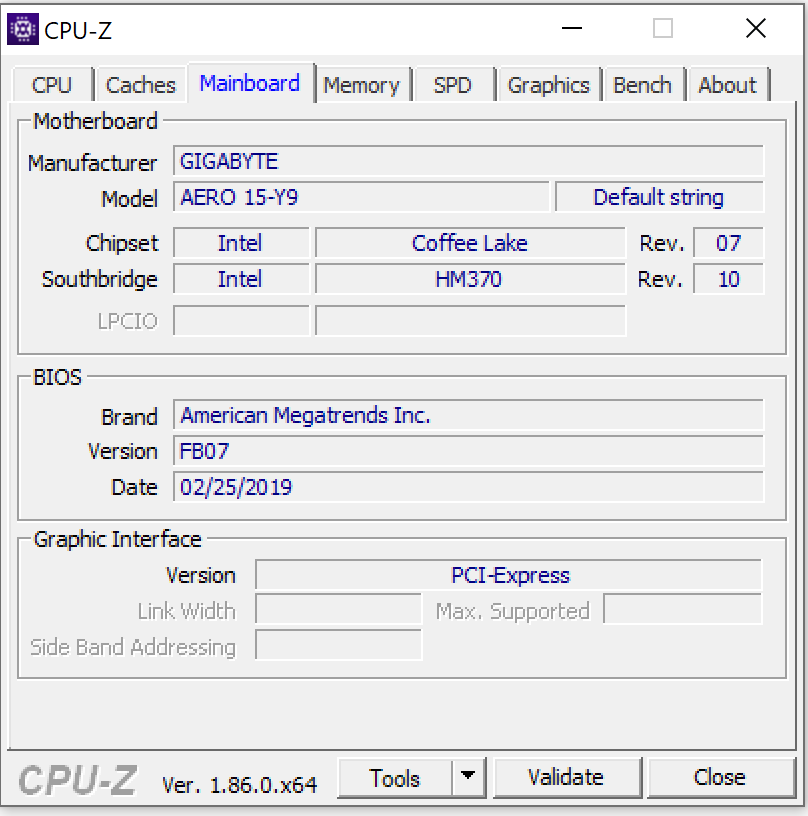
Gigabyte Aero 15-Y9 (i9-8950HK, RTX 2080 Max-Q) Laptop Review

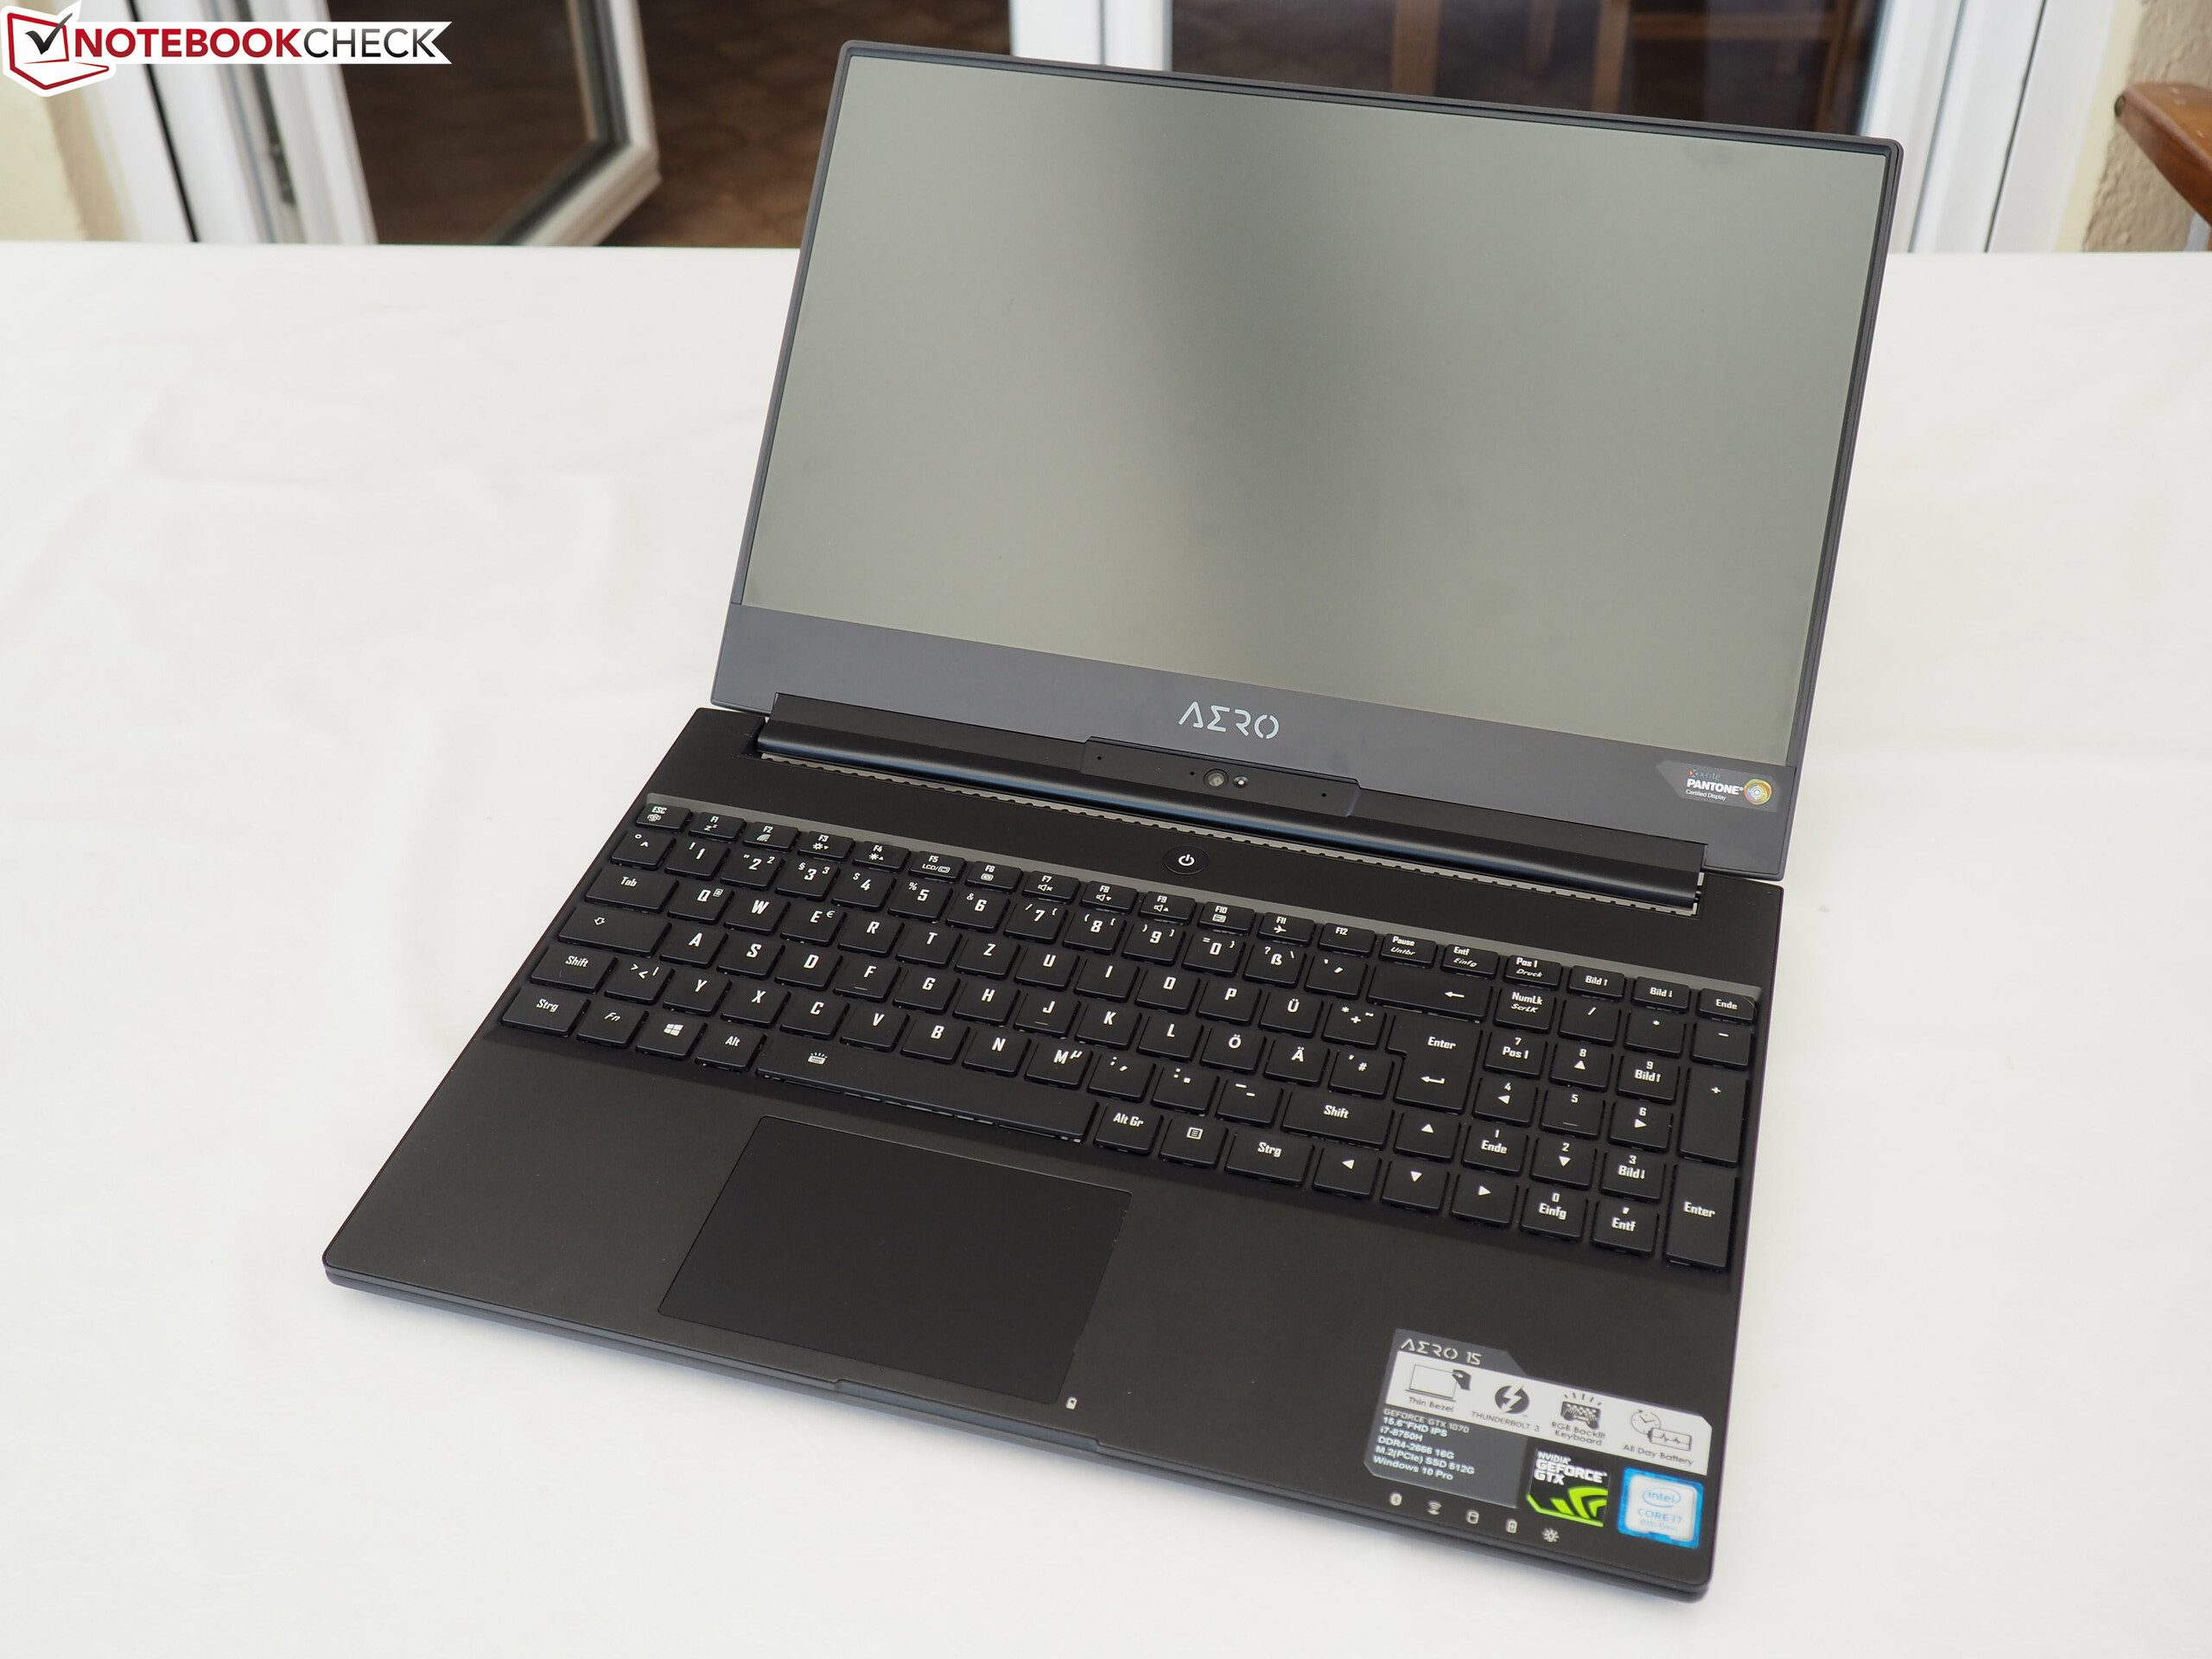
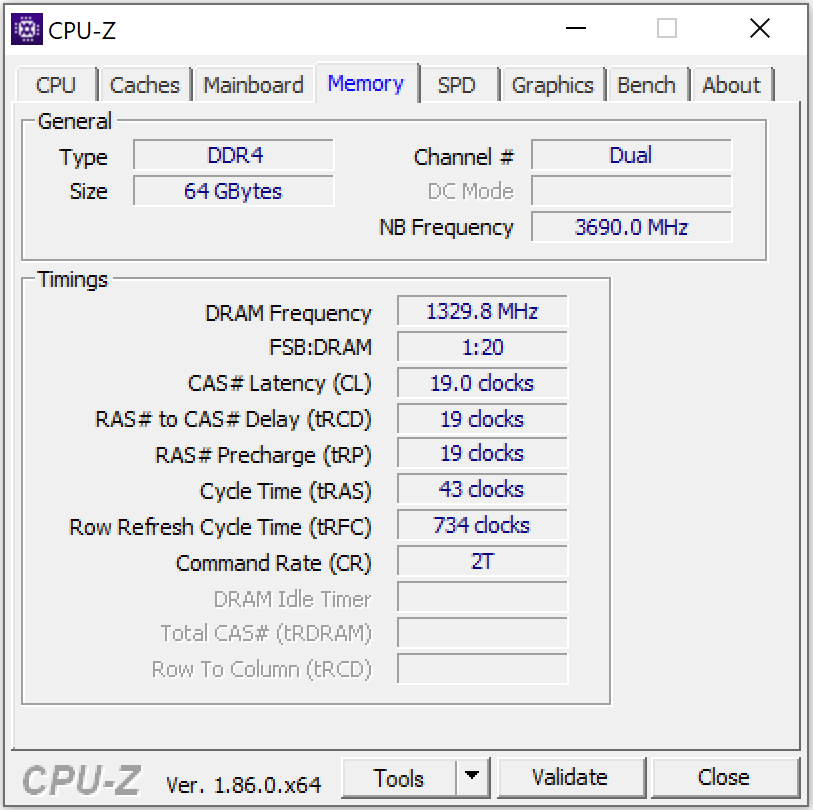
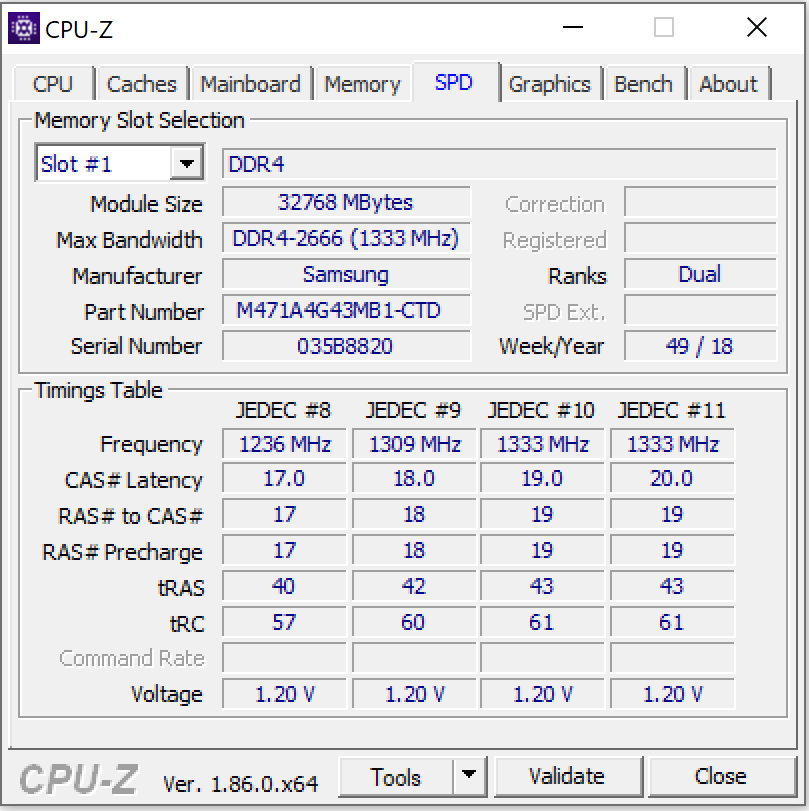
The Aero-15 range from Gigabyte is comprised of powerful, but very compact, 15.6-inch laptops. We recently reviewed another example from the range, the Aero 15-X9, which has a Core i7-8750H and a GeForce RTX 2070 Max-Q on board. The Aero 15-Y9 model sitting before us today represents the highest configuration model in the Aero-15 line-up from Gigabyte. It is therefore accordingly well-equipped: Core i9-8950HK CPU, GeForce RTX 2080 Max-Q GPU, 64 GB of RAM, 2 TB of NVMe SSD storage and a 4K screen. For this package, you'll have to fork out around 5,000 Euros (~$5,657). Competition at this end of the market includes the Acer Predator Triton 500, MSI GS65 8RF Stealth Thin, Asus Zephyrus S GX531GS and Razer Blade 15.
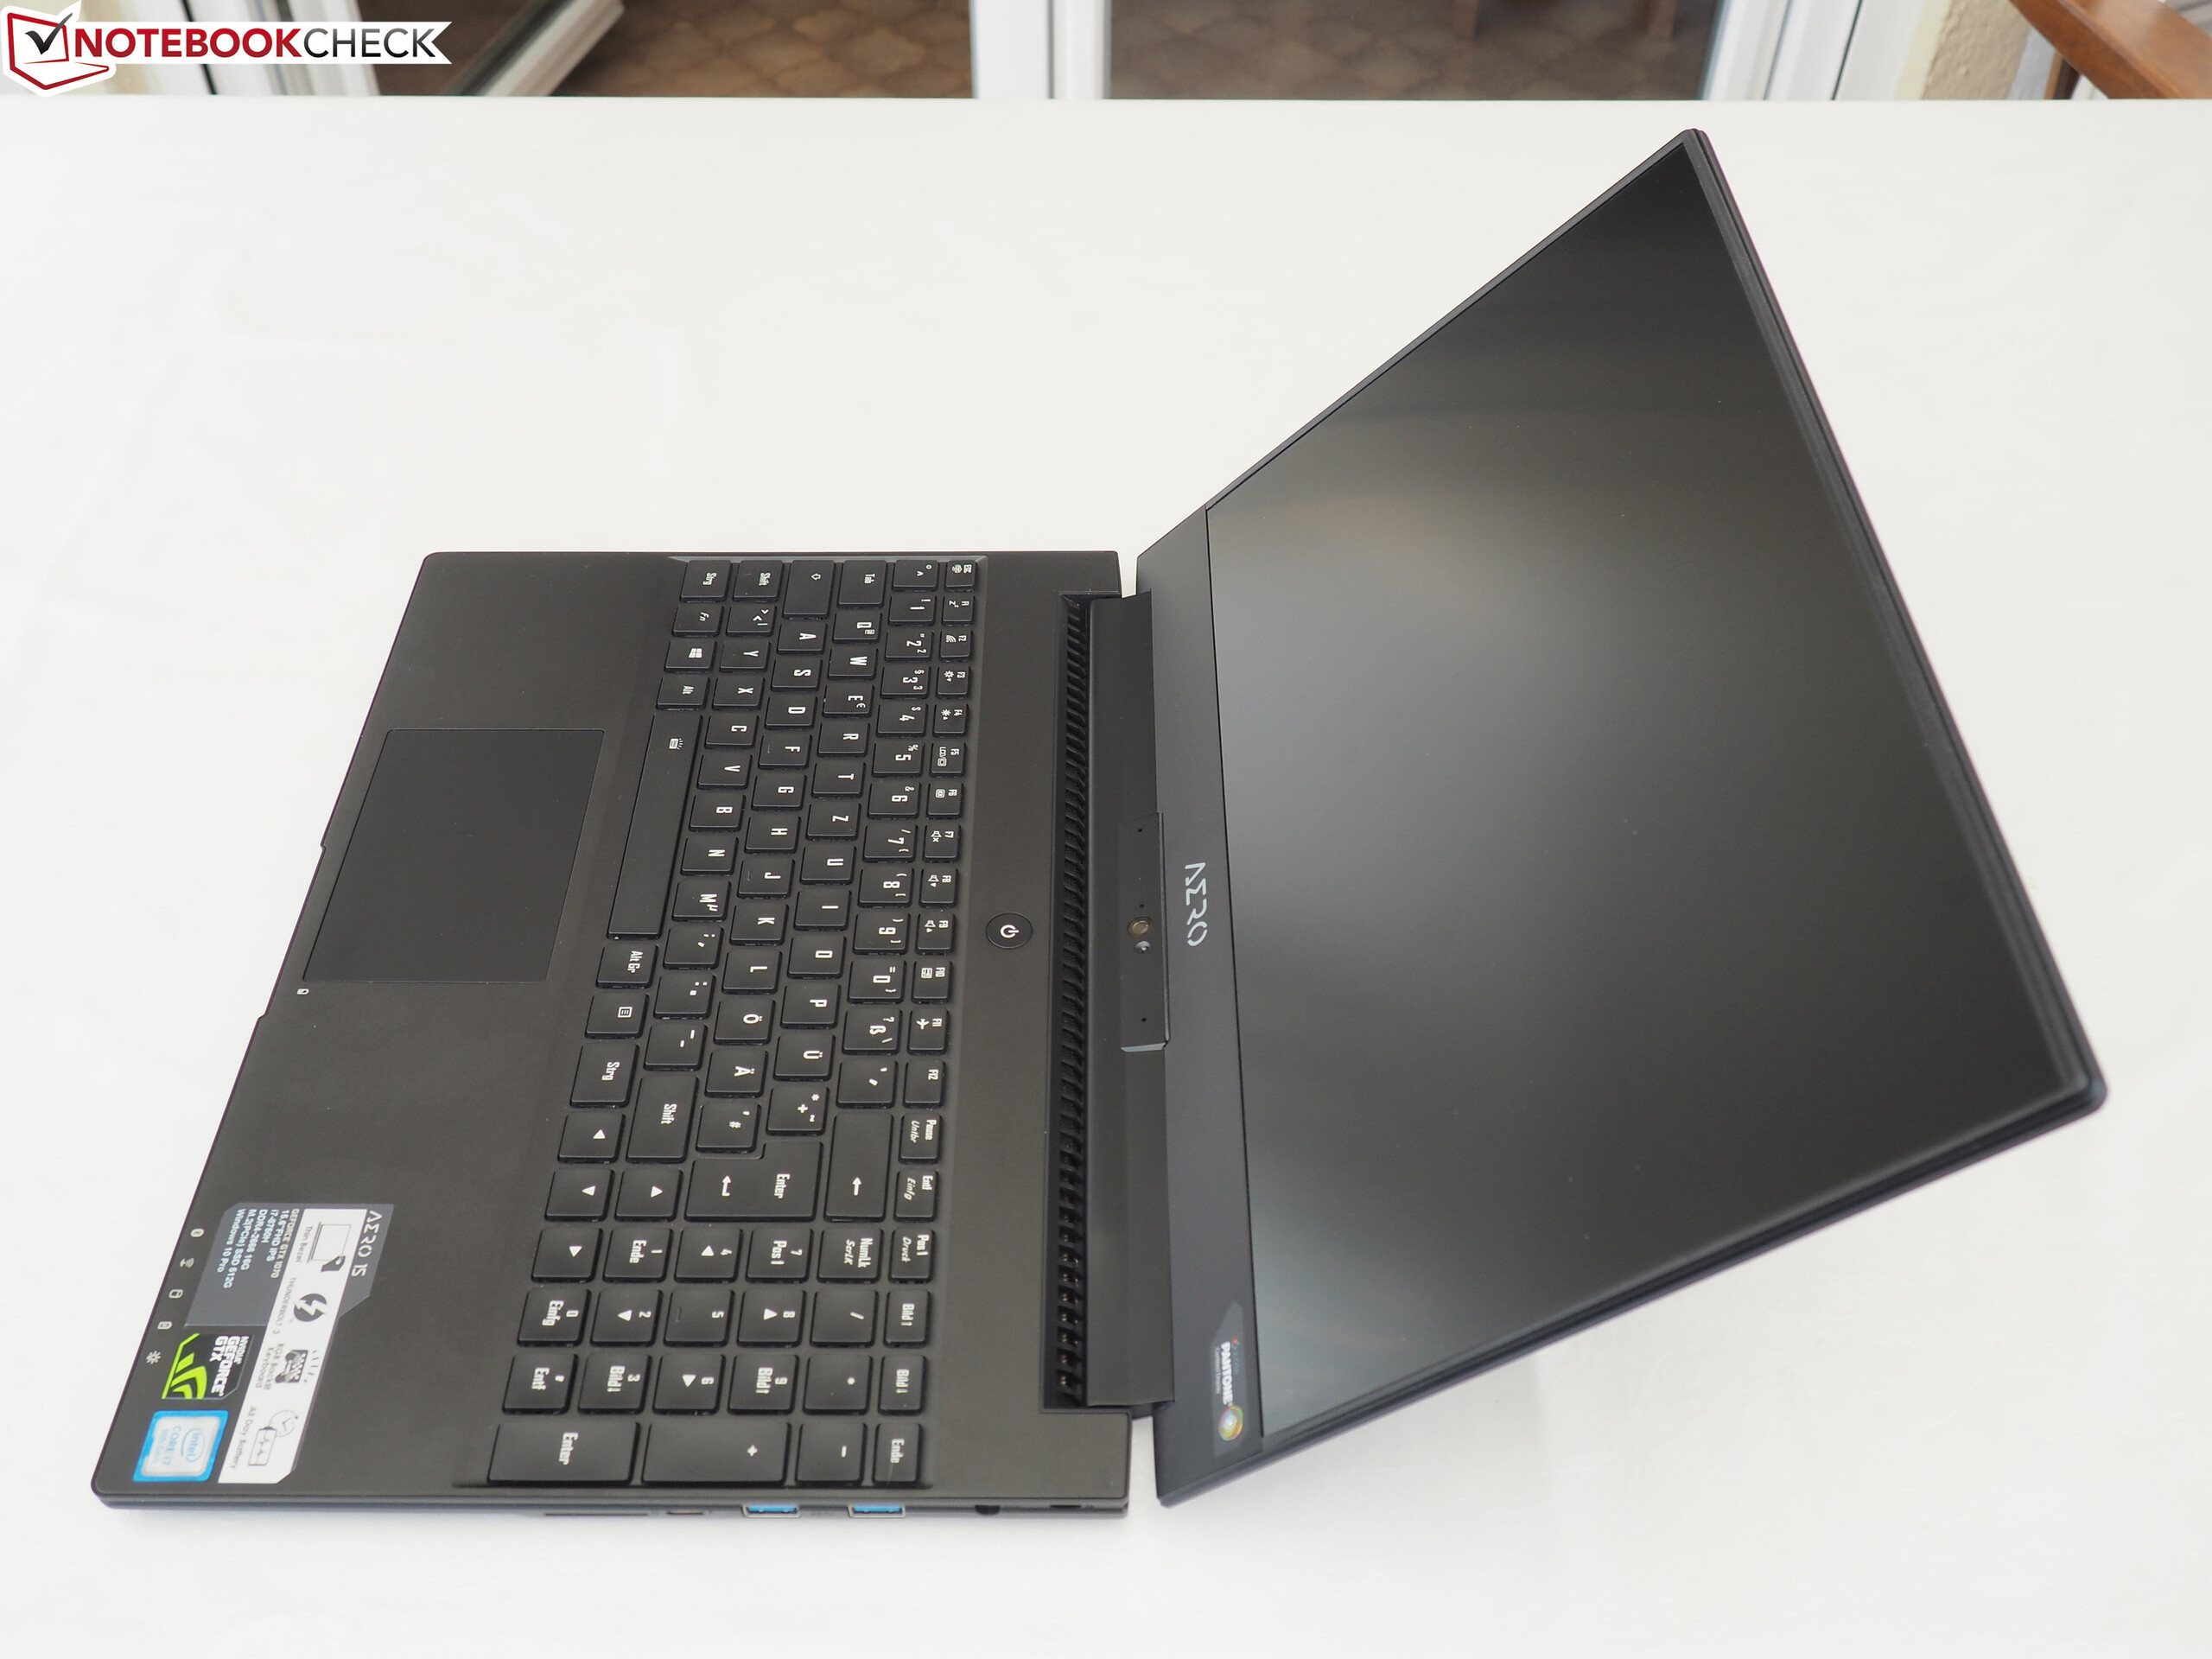
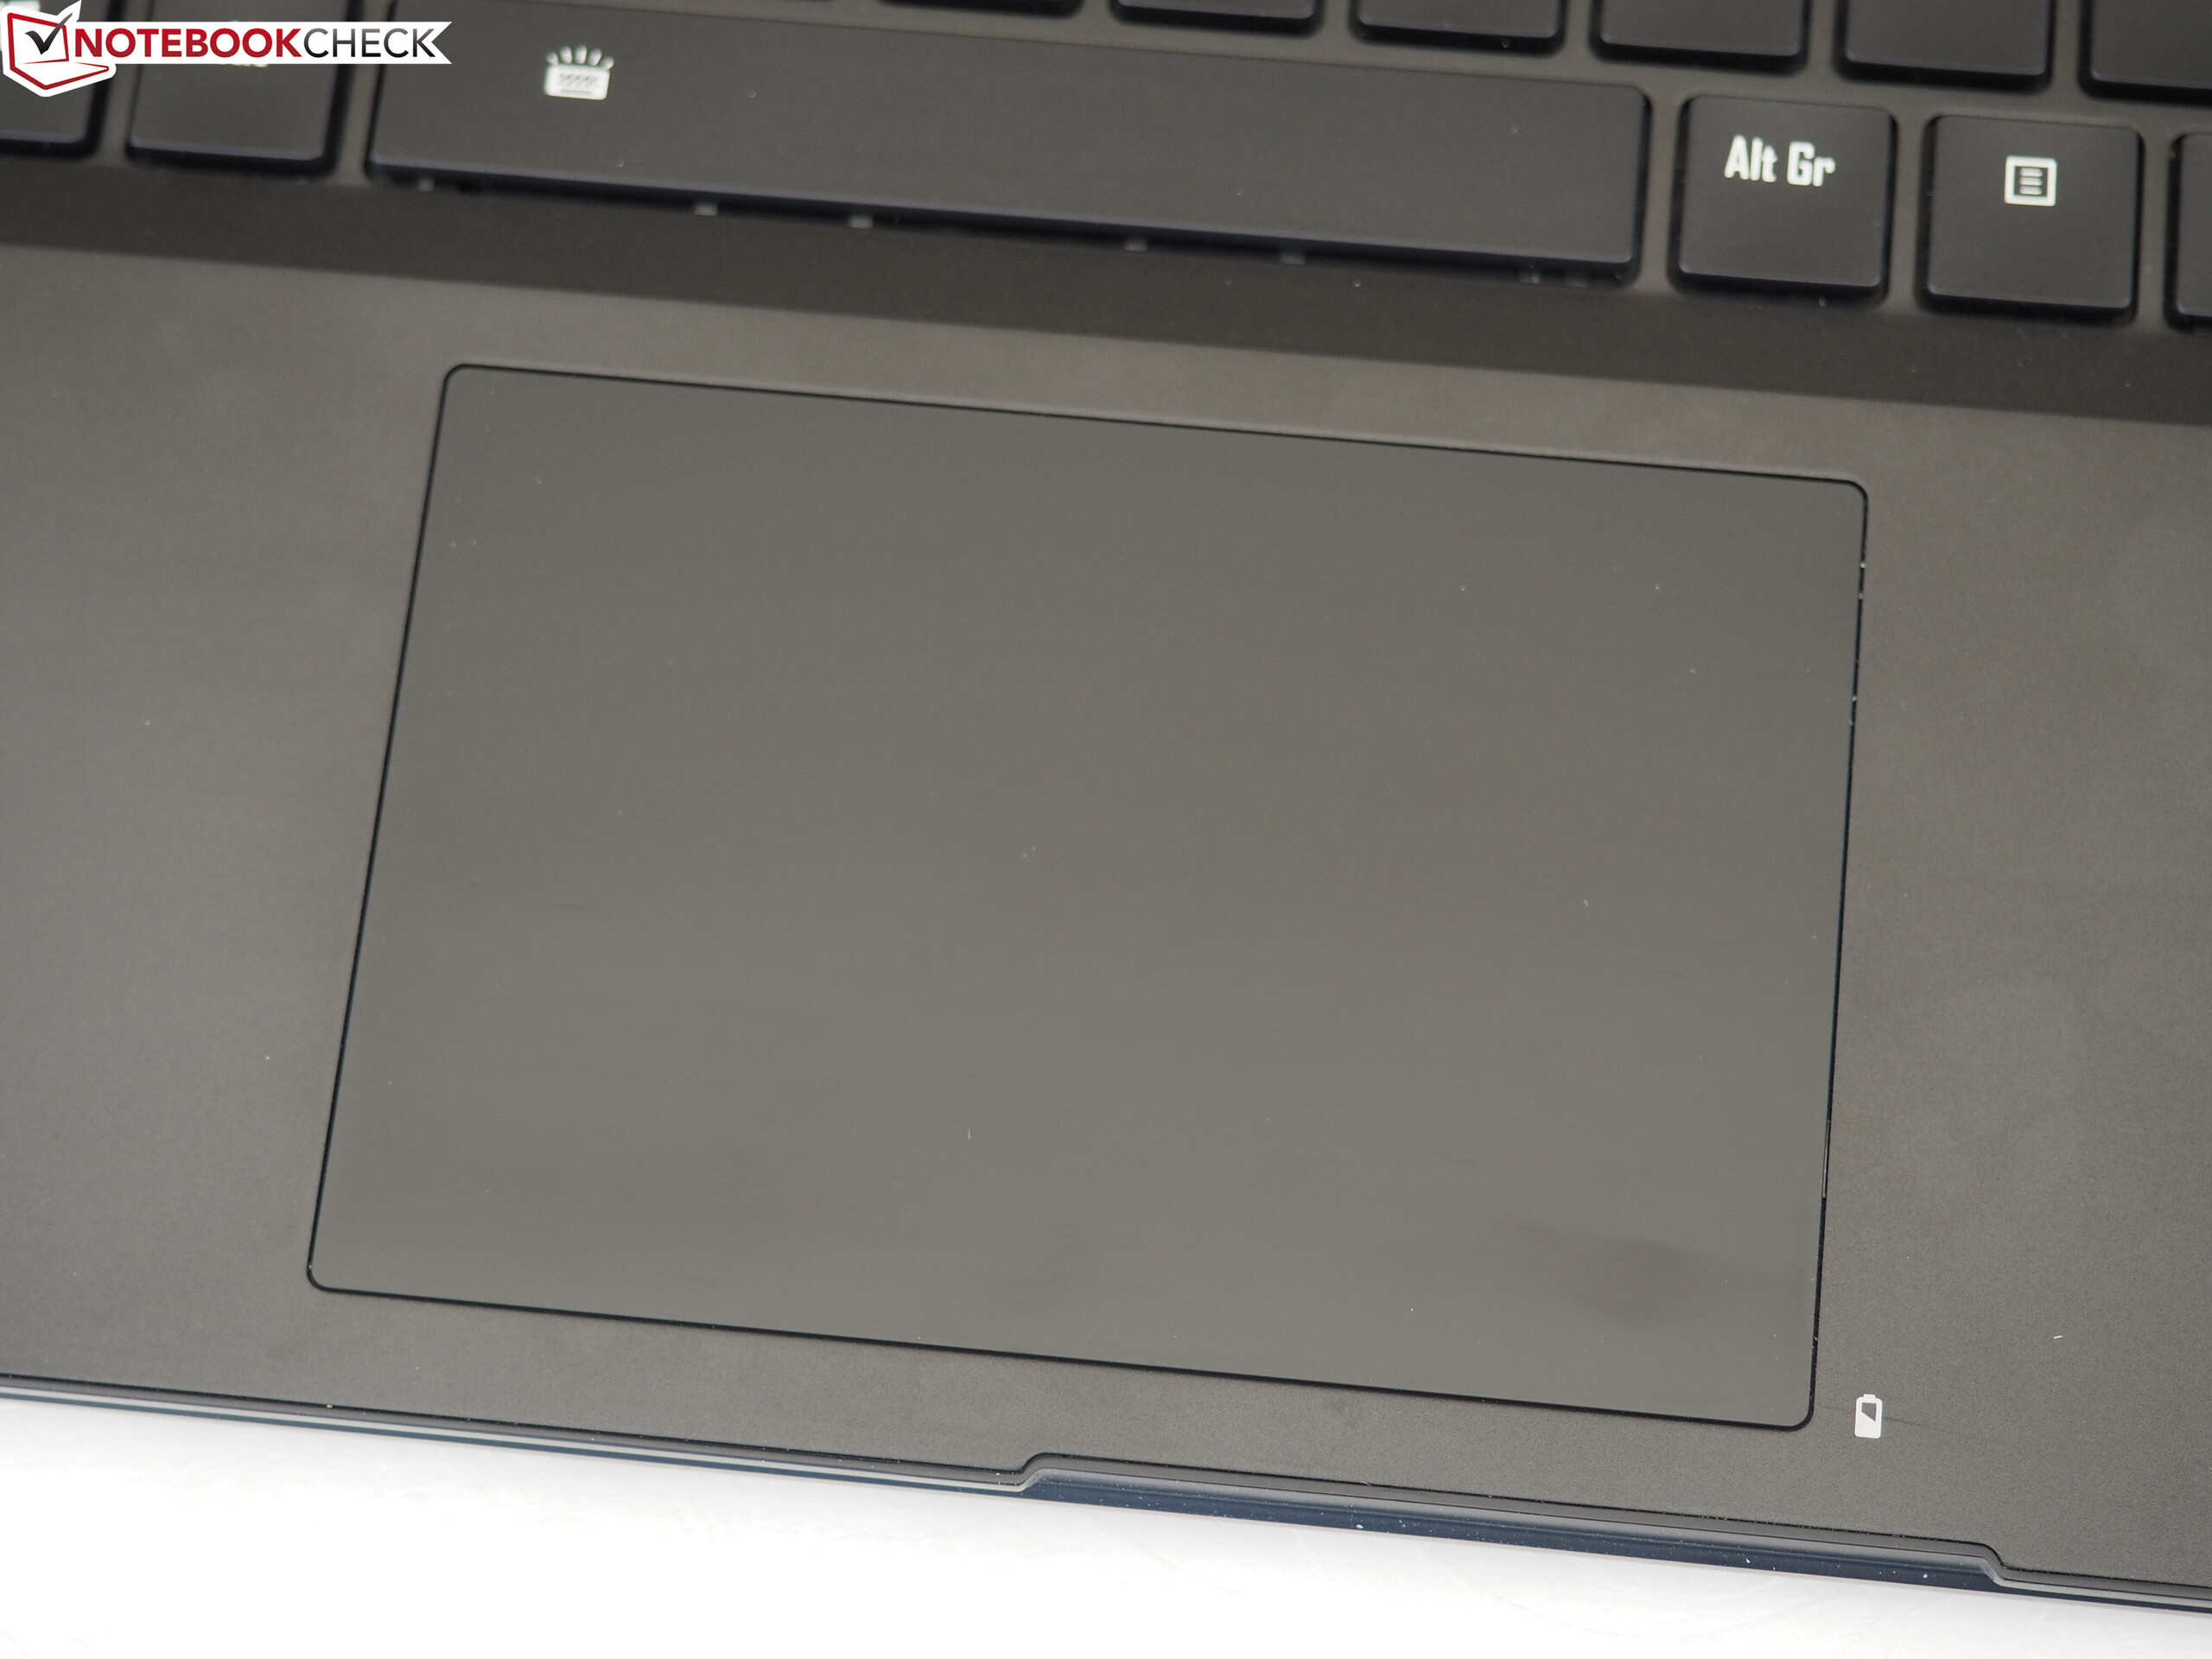
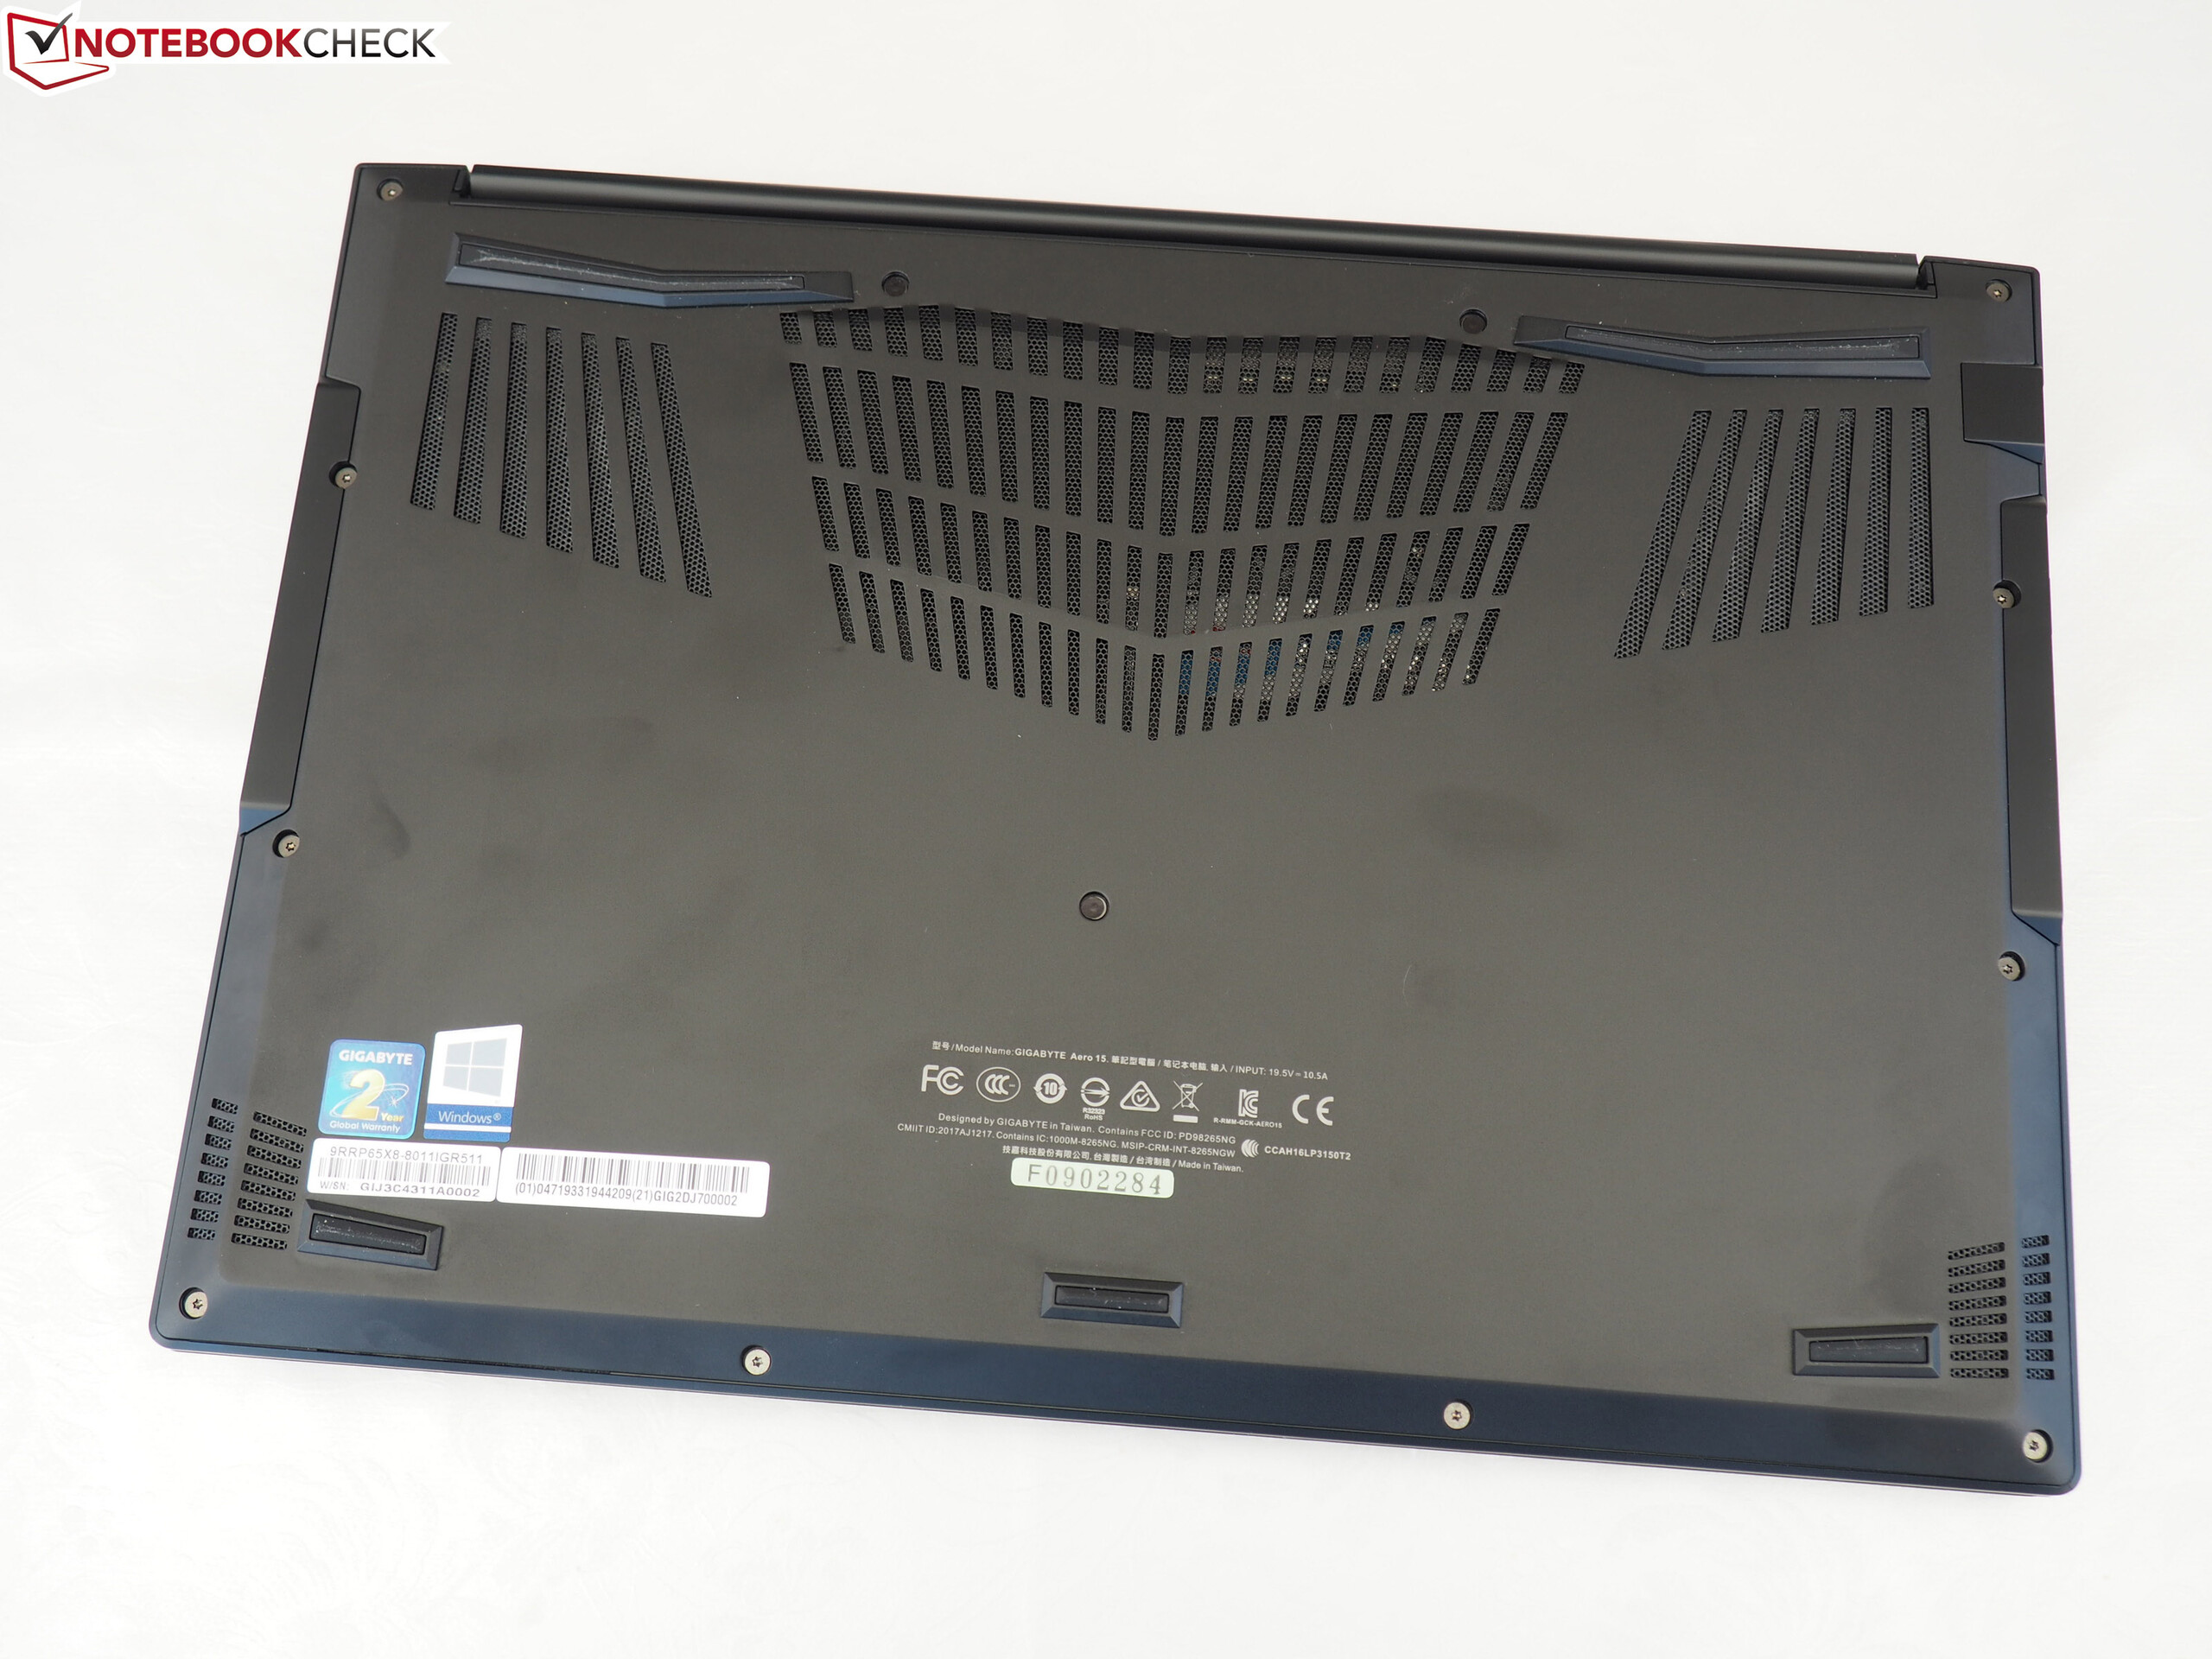
Due to the fact that apart from internal configuration, the Aero 15-Y9 and Aero 15-X9 are identical to their predecessors, we won't go into details about the case, features, input devices and speakers etc., which we covered at length in our Aero 15X V8 review.
| SD Card Reader | |
| average JPG Copy Test (av. of 3 runs) | |
| Gigabyte Aero 15-X9 (Toshiba Exceria Pro SDXC 64 GB UHS-II) | |
| Gigabyte Aero 15-Y9 (Toshiba Exceria Pro SDXC 64 GB UHS-II) | |
| Gigabyte Aero 15X v8 (Toshiba Exceria Pro SDXC 64 GB UHS-II) | |
| Average of class Gaming (20.9 - 210, n=55, last 2 years) | |
| maximum AS SSD Seq Read Test (1GB) | |
| Gigabyte Aero 15X v8 (Toshiba Exceria Pro SDXC 64 GB UHS-II) | |
| Gigabyte Aero 15-X9 (Toshiba Exceria Pro SDXC 64 GB UHS-II) | |
| Gigabyte Aero 15-Y9 (Toshiba Exceria Pro SDXC 64 GB UHS-II) | |
| Average of class Gaming (25.5 - 261, n=52, last 2 years) | |
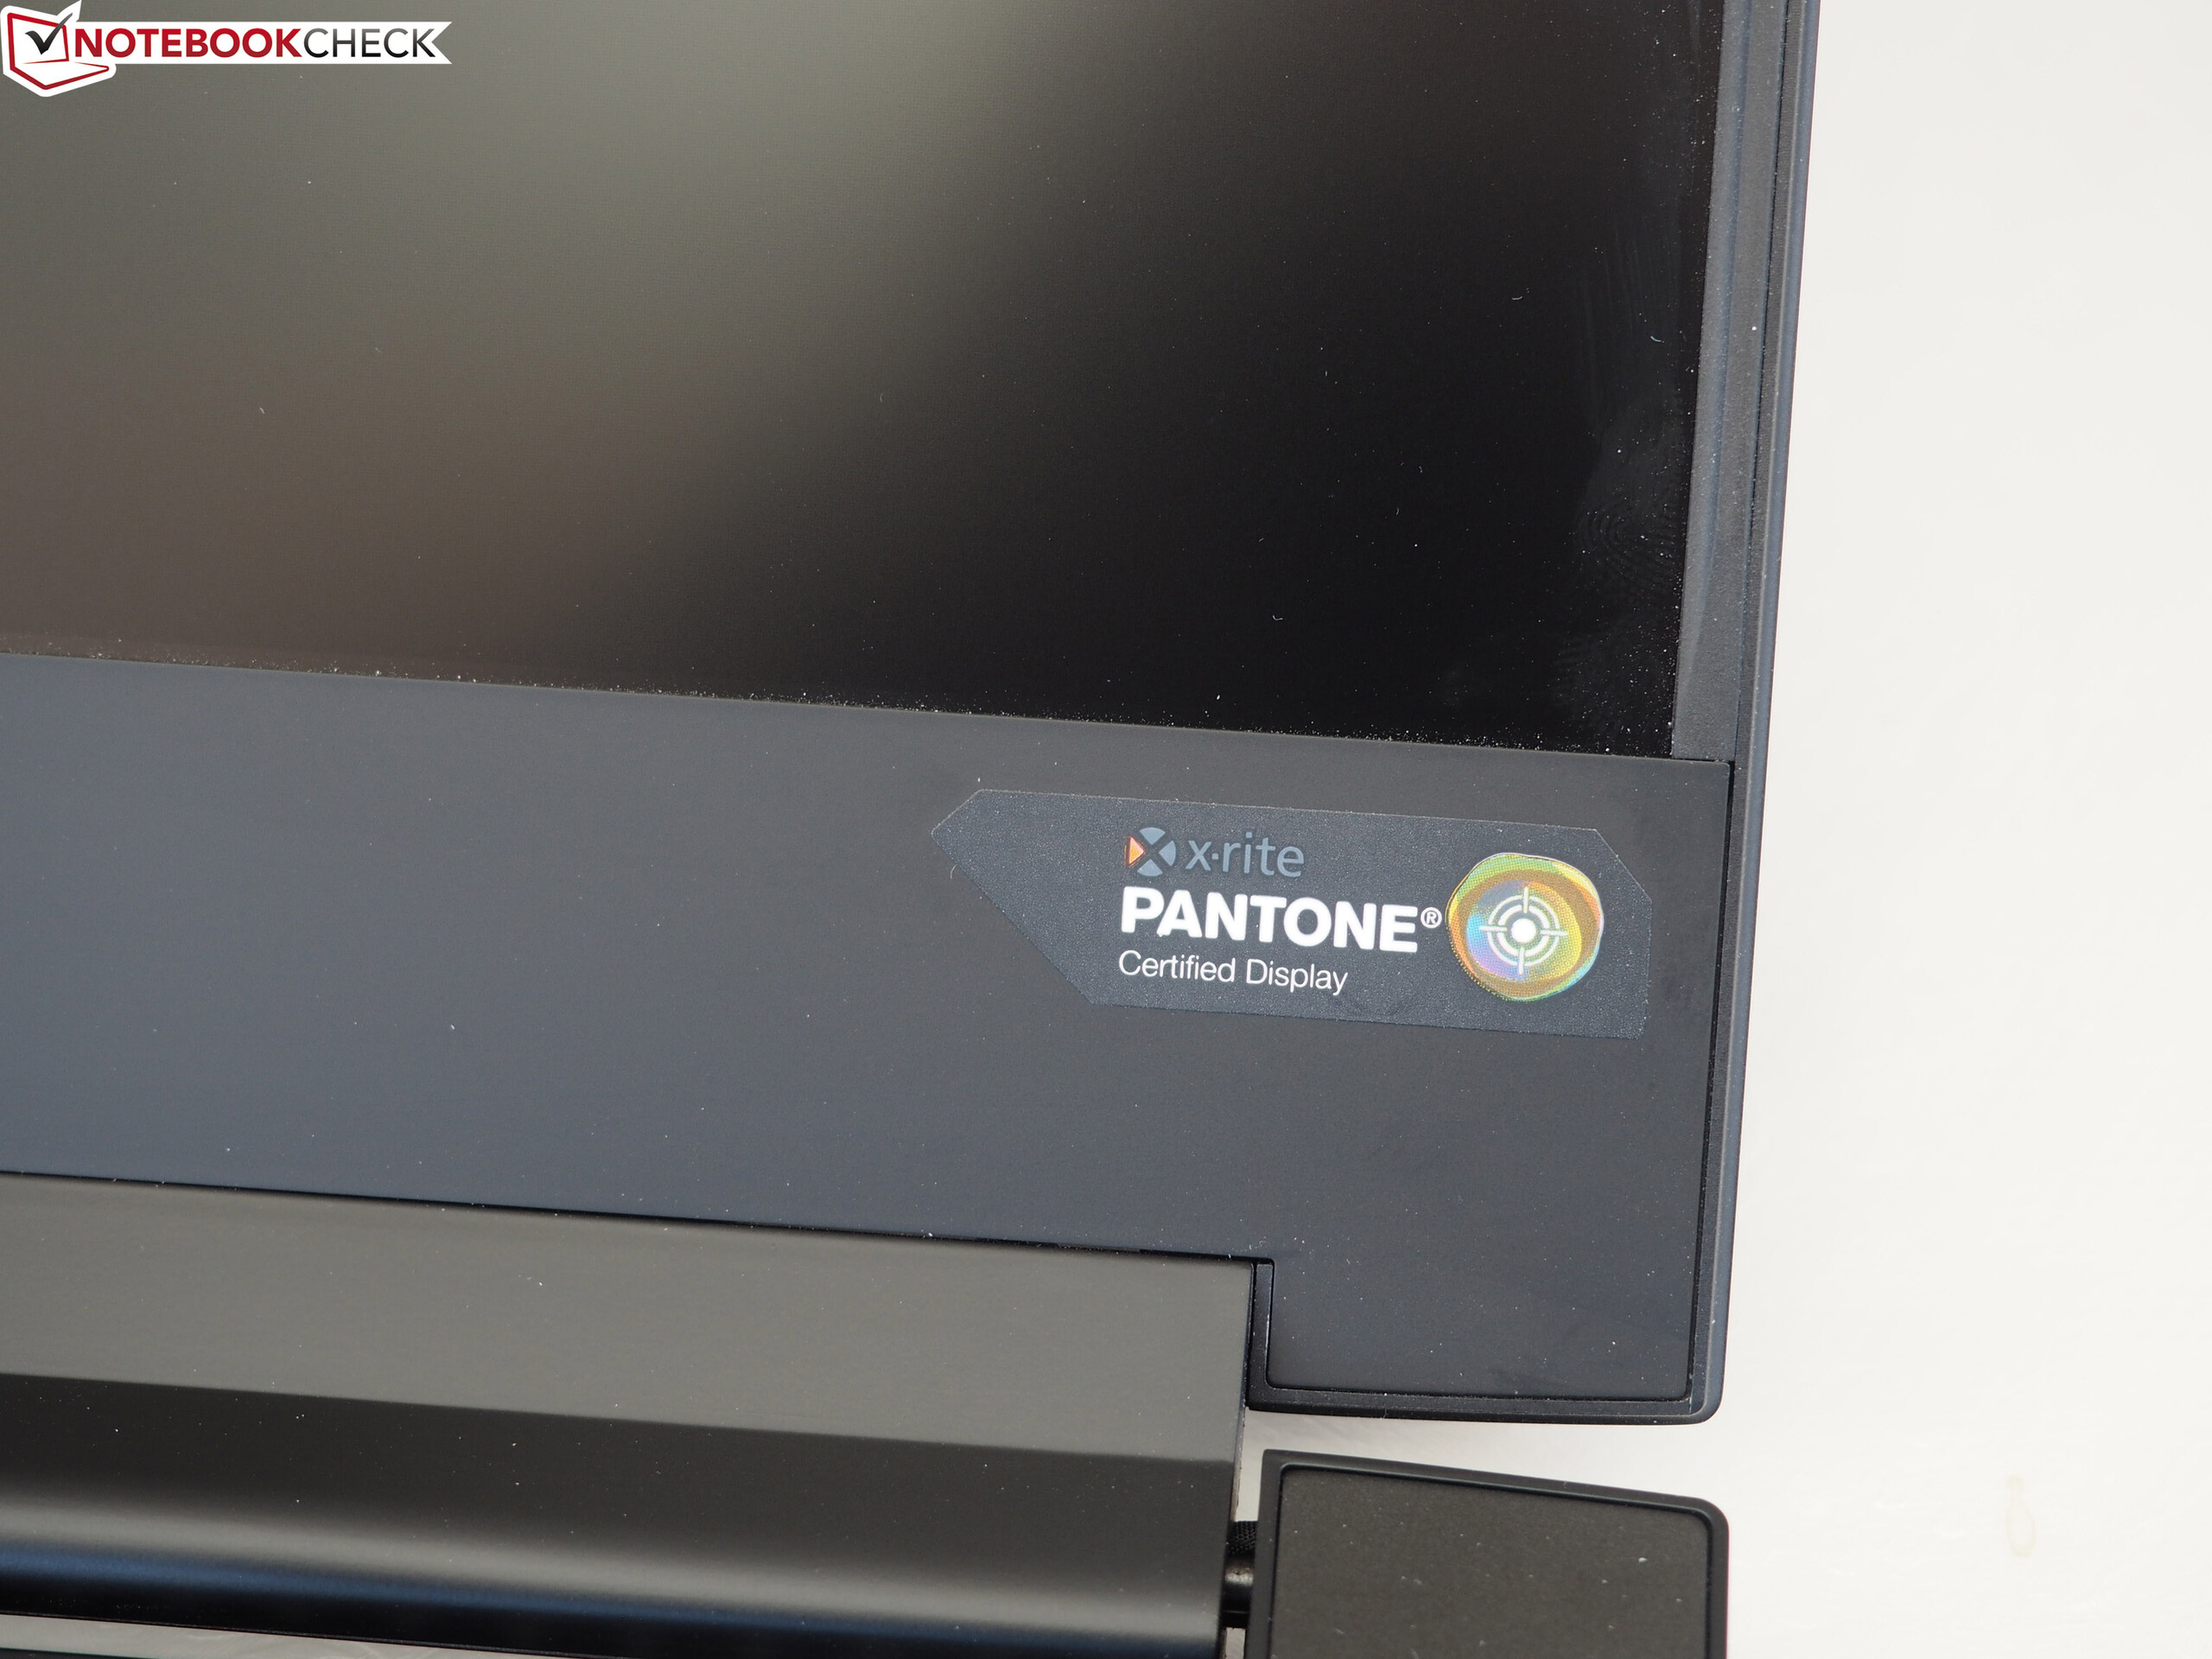
Display - 4K - IPS
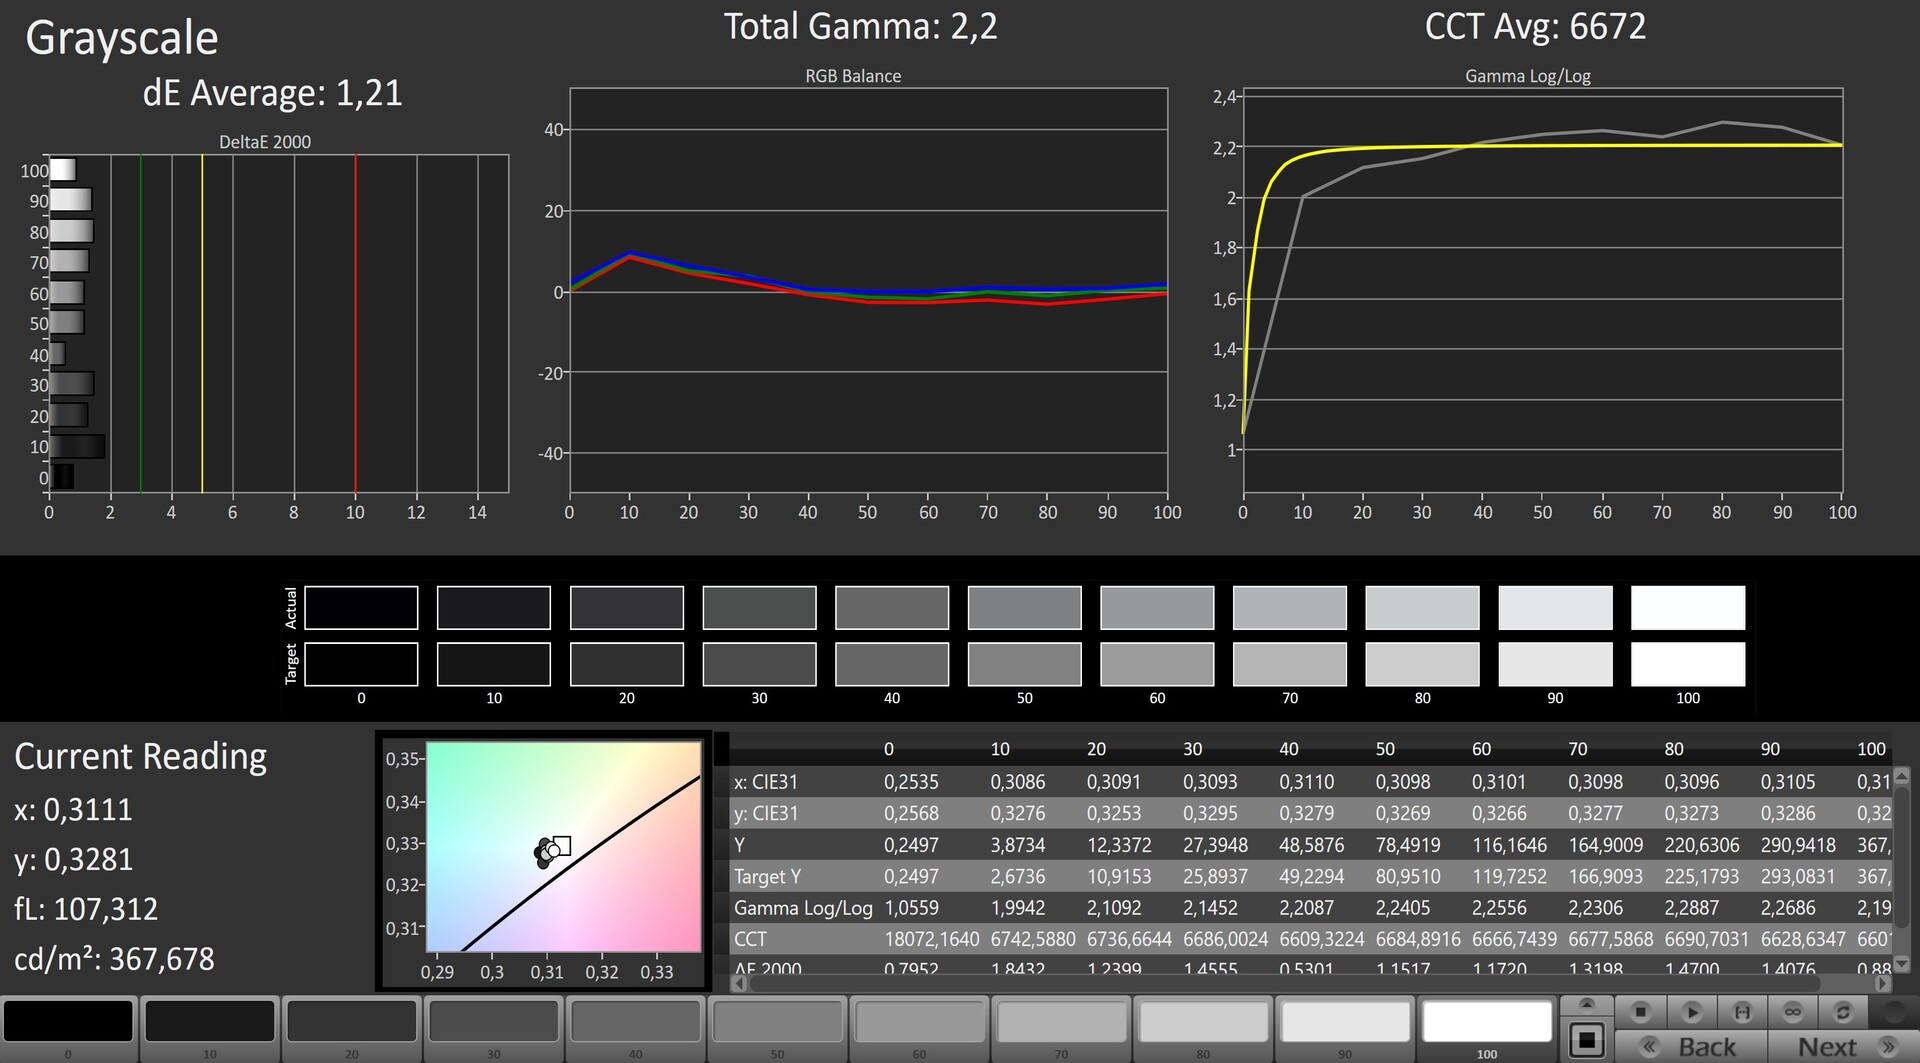
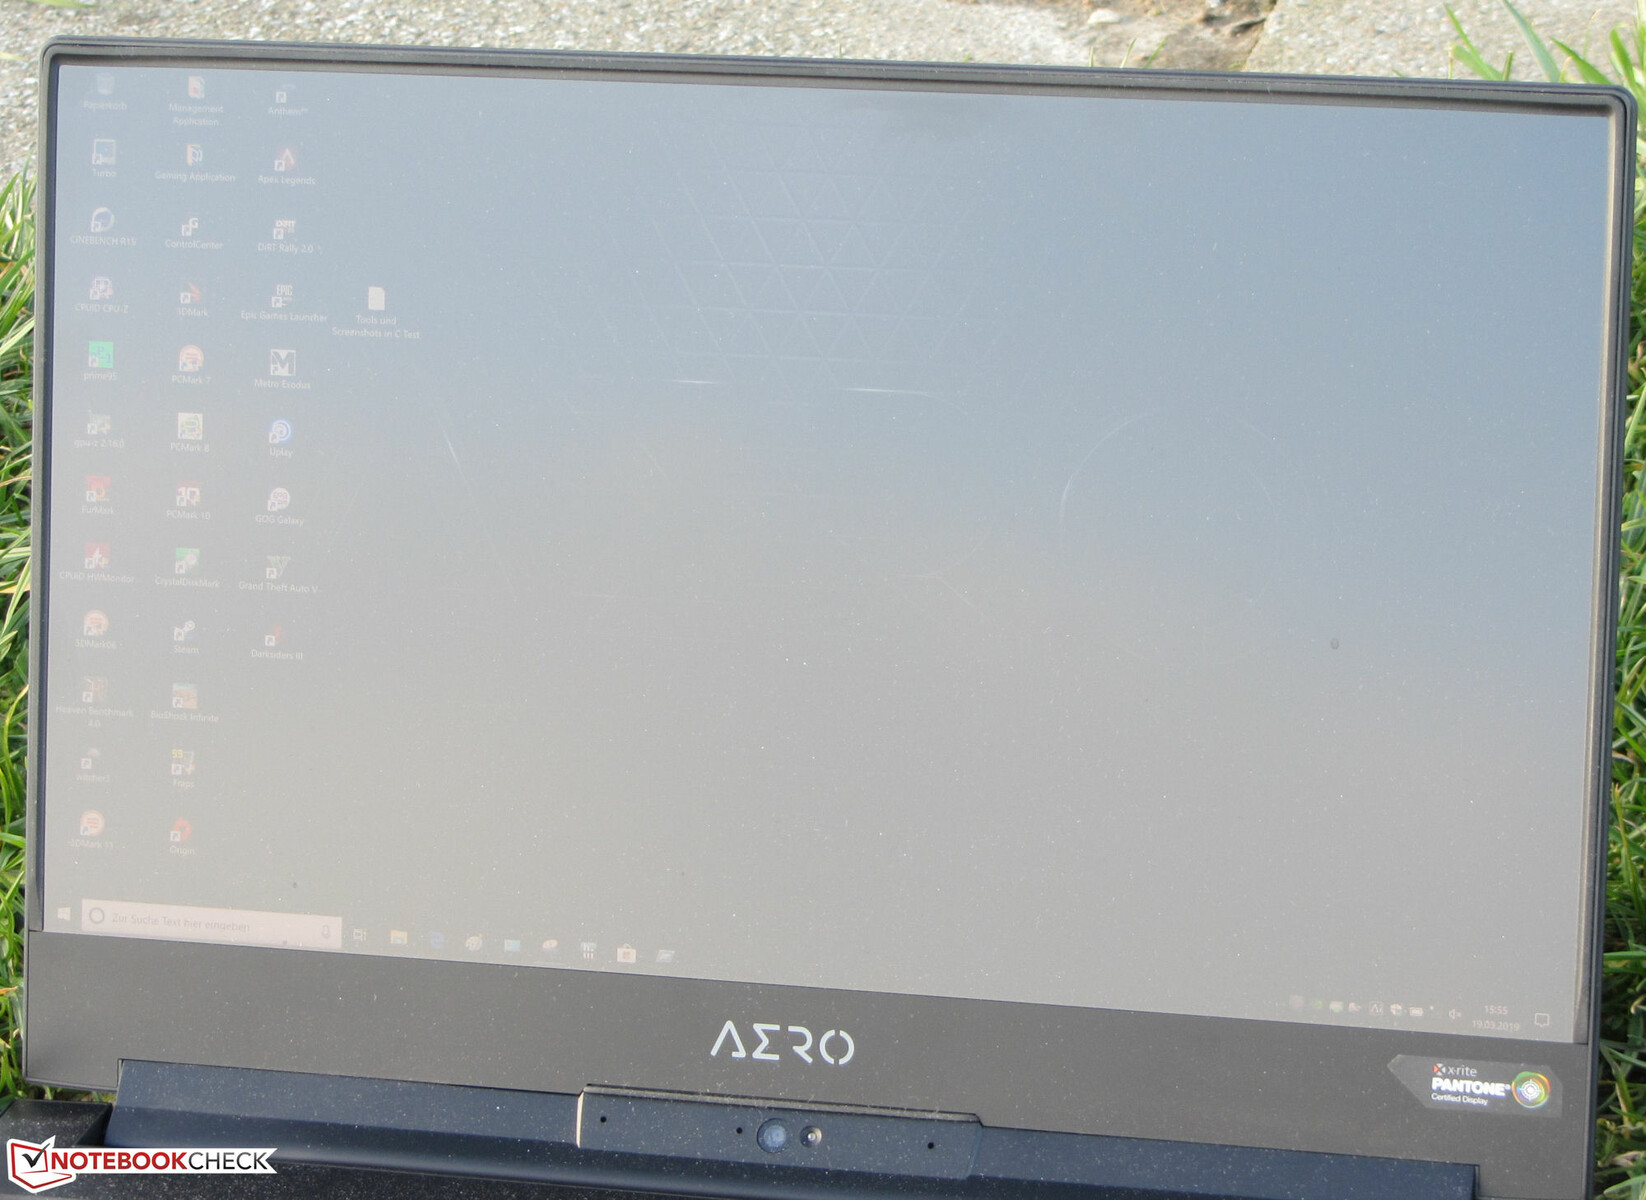
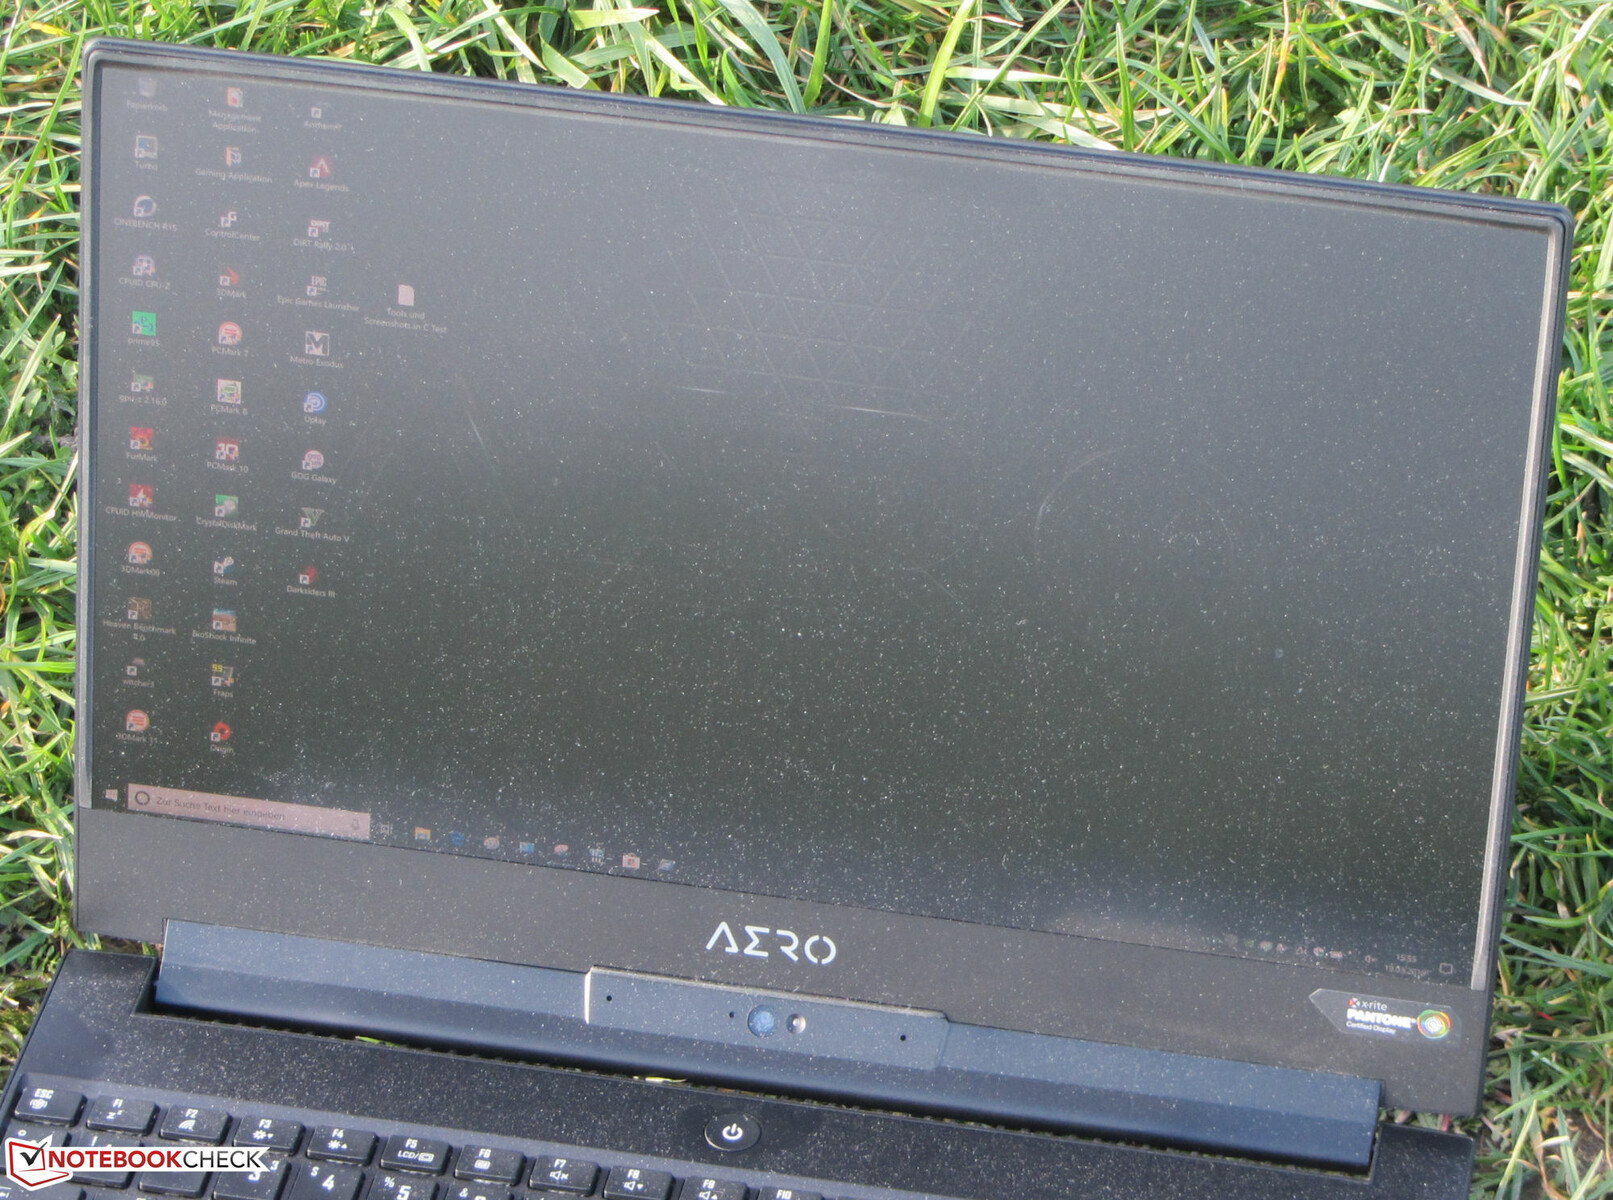
The matte 15.6-inch display of the Aero 15 has a native resolution of 3840x2,160. Brightness (337 cd/m²) and contrast (1,207:1) aim to please. Compared to the competition in our review, the Aero 15-Y9 offered the brightest panel. However, the reaction times are somewhat behind the rest of the field, which have 144 Hz panels on board. Another positive - the display exhibited no PWM flickering.
| |||||||||||||||||||||||||
Brightness Distribution: 92 %
Center on Battery: 350 cd/m²
Contrast: 1207:1 (Black: 0.29 cd/m²)
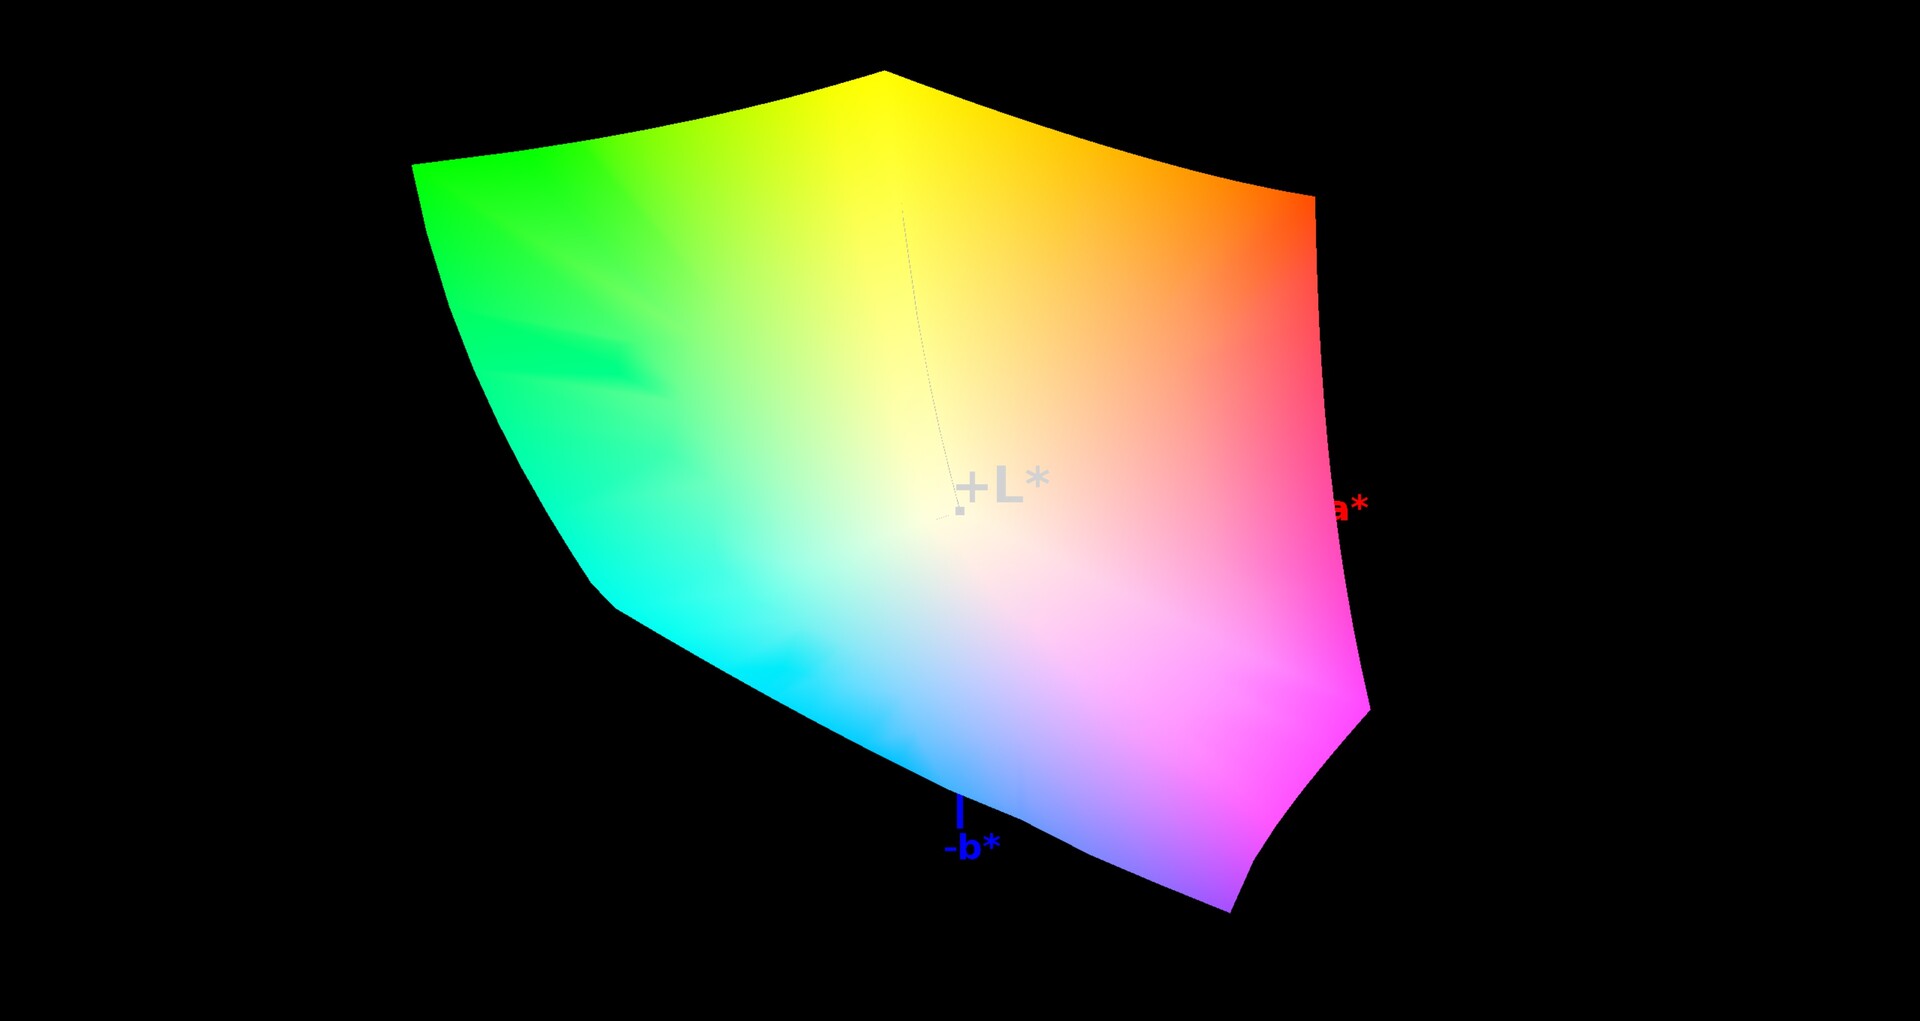
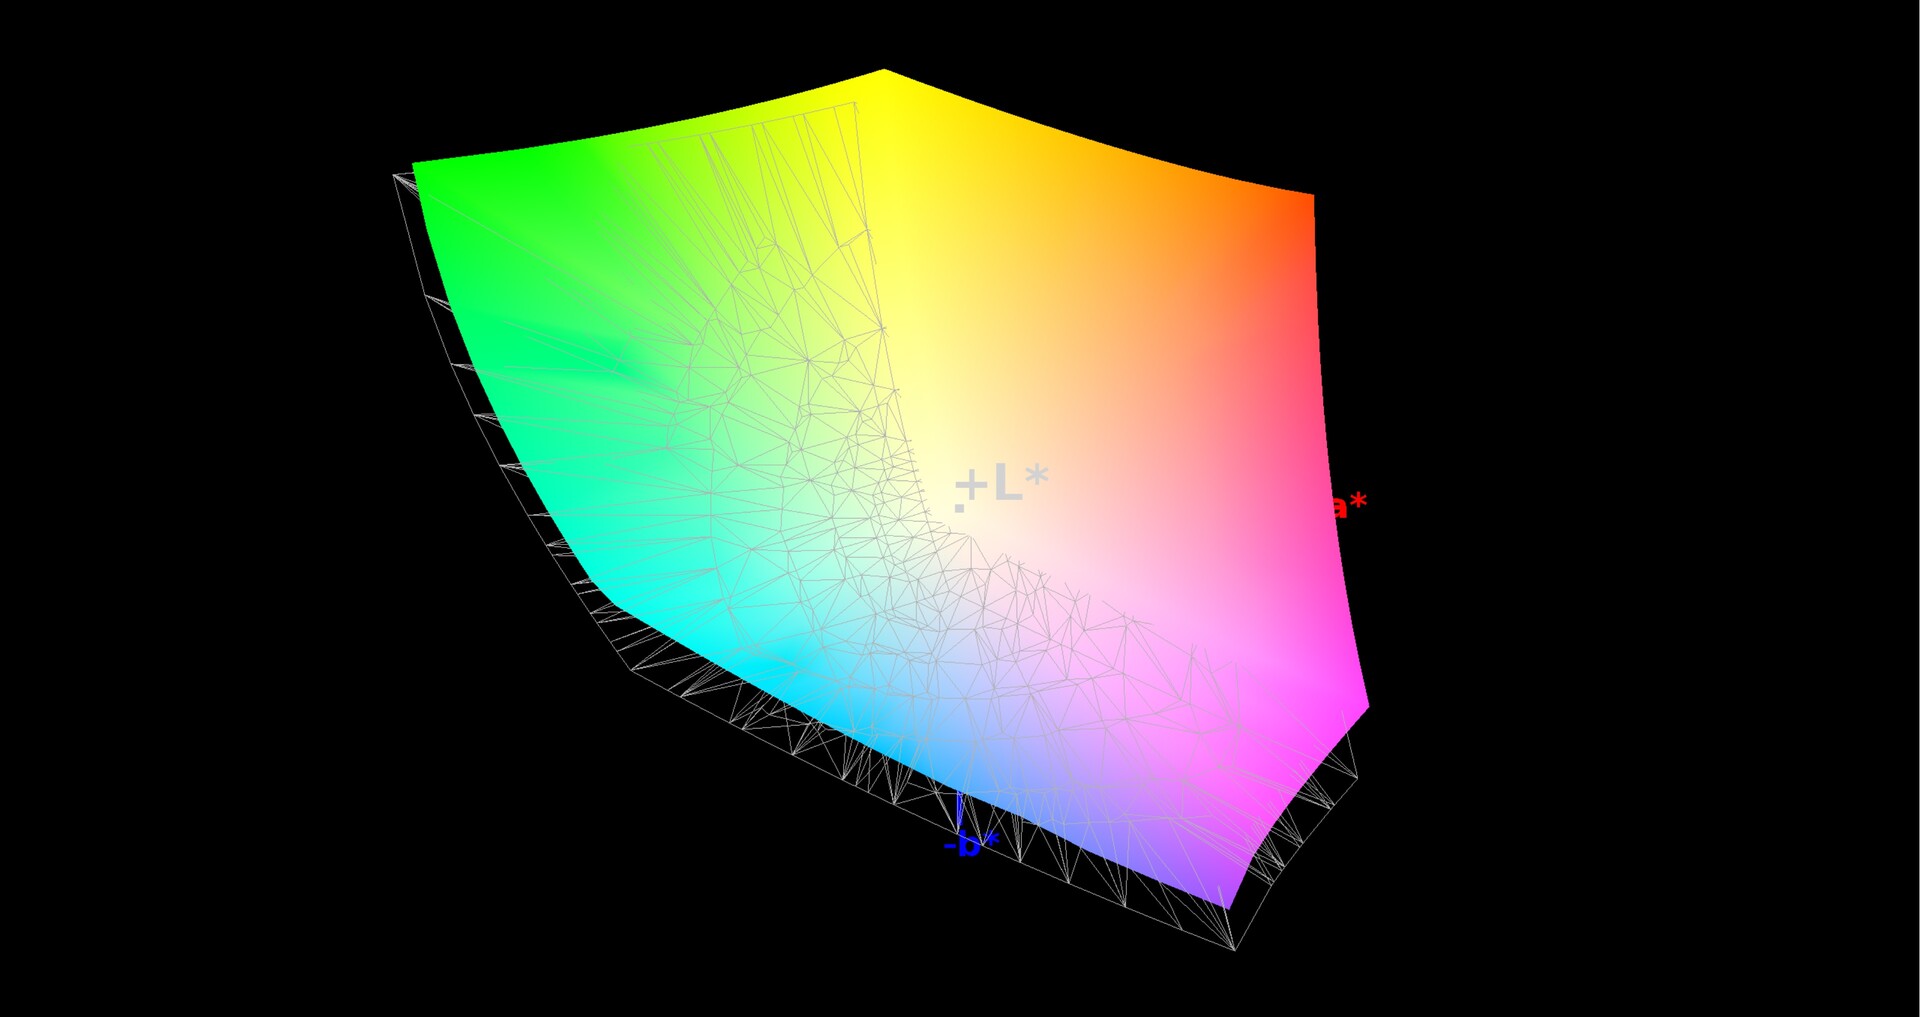
ΔE ColorChecker Calman: 0.93 | ∀{0.5-29.43 Ø4.71}
calibrated: 0.62
ΔE Greyscale Calman: 1.21 | ∀{0.09-98 Ø4.96}
100% sRGB (Argyll 1.6.3 3D)
88% AdobeRGB 1998 (Argyll 1.6.3 3D)
99.7% AdobeRGB 1998 (Argyll 3D)
100% sRGB (Argyll 3D)
86.8% Display P3 (Argyll 3D)
Gamma: 2.2
CCT: 6672 K
| Gigabyte Aero 15-Y9 AU Optronics B156ZAN03.1 (AUO31EB), IPS, 3840x2160 | Gigabyte Aero 15-X9 LGD05C0, IPS, 1920x1080 | MSI GS65 8RF-019DE Stealth Thin AU Optronics B156HAN08.0 (AUO80ED), IPS, 1920x1080 | Asus Zephyrus S GX531GS AU Optronics B156HAN08.2 (AUO82ED), IPS, 1920x1080 | Acer Predator Triton 500 AU Optronics B156HAN08.2 (AUO82ED), IPS, 1920x1080 | Razer Blade 15 RTX 2070 Max-Q LG Philips LGD05C0, IPS, 1920x1080 | |
|---|---|---|---|---|---|---|
| Display | -23% | -22% | -22% | -22% | -21% | |
| Display P3 Coverage (%) | 86.8 | 63.5 -27% | 66.2 -24% | 66.7 -23% | 64.2 -26% | 65.3 -25% |
| sRGB Coverage (%) | 100 | 93.1 -7% | 92.1 -8% | 91.2 -9% | 92.6 -7% | 94.9 -5% |
| AdobeRGB 1998 Coverage (%) | 99.7 | 64.5 -35% | 67.2 -33% | 66.7 -33% | 65.7 -34% | 66.3 -34% |
| Response Times | 63% | 64% | 77% | 74% | 66% | |
| Response Time Grey 50% / Grey 80% * (ms) | 60 ? | 16.4 ? 73% | 17.6 ? 71% | 7.4 ? 88% | 8 ? 87% | 16.8 ? 72% |
| Response Time Black / White * (ms) | 28.8 ? | 13.6 ? 53% | 12.8 ? 56% | 10 ? 65% | 11.2 ? 61% | 11.6 ? 60% |
| PWM Frequency (Hz) | ||||||
| Screen | -27% | -62% | -75% | -143% | -81% | |
| Brightness middle (cd/m²) | 350 | 250 -29% | 254 -27% | 294 -16% | 304 -13% | 314.7 -10% |
| Brightness (cd/m²) | 337 | 235 -30% | 262 -22% | 275 -18% | 299 -11% | 312 -7% |
| Brightness Distribution (%) | 92 | 85 -8% | 89 -3% | 84 -9% | 89 -3% | 90 -2% |
| Black Level * (cd/m²) | 0.29 | 0.29 -0% | 0.22 24% | 0.24 17% | 0.27 7% | 0.38 -31% |
| Contrast (:1) | 1207 | 862 -29% | 1155 -4% | 1225 1% | 1126 -7% | 828 -31% |
| Colorchecker dE 2000 * | 0.93 | 1.46 -57% | 2.37 -155% | 2.57 -176% | 4.66 -401% | 2.56 -175% |
| Colorchecker dE 2000 max. * | 1.43 | 2.47 -73% | 4.71 -229% | 4.88 -241% | 9.65 -575% | 4.89 -242% |
| Colorchecker dE 2000 calibrated * | 0.62 | 1.84 -197% | 2.14 -245% | 1.72 -177% | 1.71 -176% | |
| Greyscale dE 2000 * | 1.21 | 1.27 -5% | 1.58 -31% | 2.41 -99% | 5.53 -357% | 3.4 -181% |
| Gamma | 2.2 100% | 2.4 92% | 2.48 89% | 2.5 88% | 2.5 88% | 2.3 96% |
| CCT | 6672 97% | 6749 96% | 6785 96% | 6370 102% | 8028 81% | 6435 101% |
| Color Space (Percent of AdobeRGB 1998) (%) | 88 | 60 -32% | 60 -32% | 59 -33% | 60 -32% | 60.7 -31% |
| Color Space (Percent of sRGB) (%) | 100 | 93 -7% | 92 -8% | 91 -9% | 93 -7% | 94.6 -5% |
| Total Average (Program / Settings) | 4% /
-14% | -7% /
-39% | -7% /
-46% | -30% /
-93% | -12% /
-51% |
* ... smaller is better
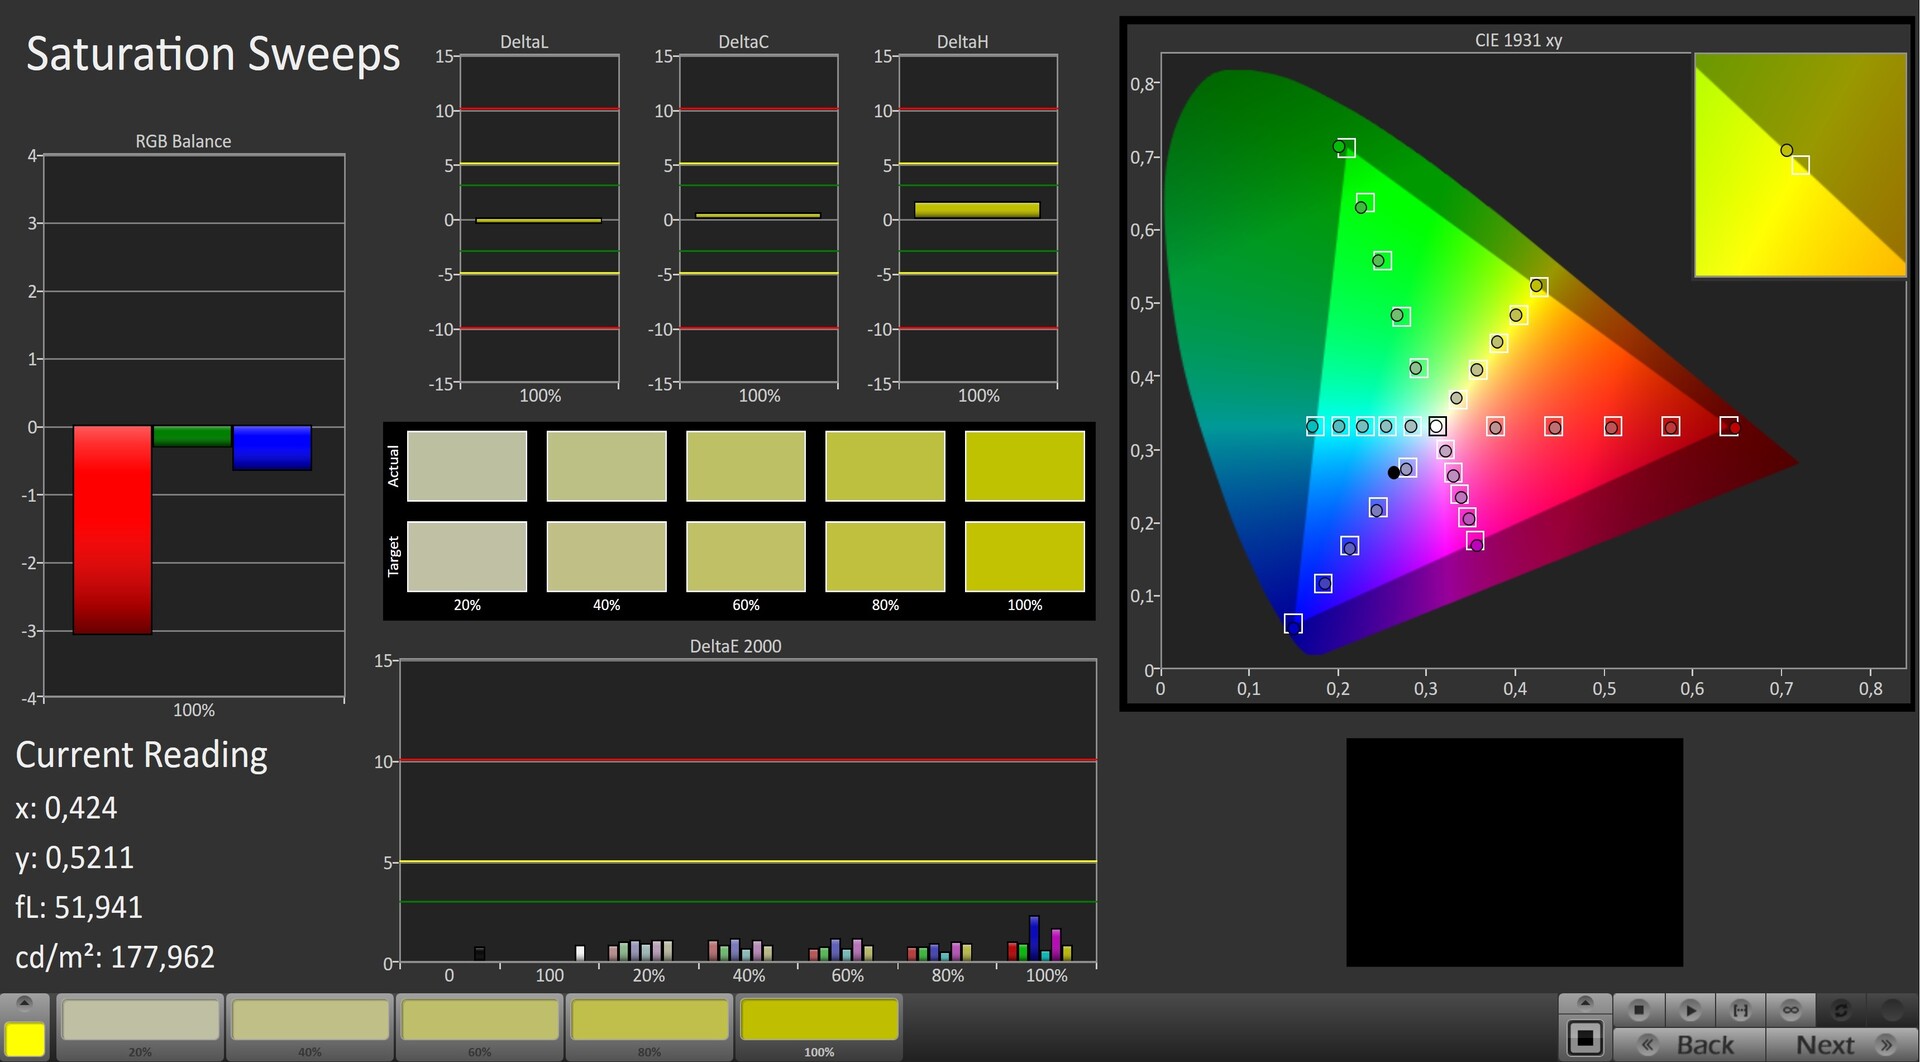
Straight out of the box, the display had very good colour accuracy with a Delta-E-2000 colour-difference value of 0.93, more than fulfilling requirements (Delta E value less than 3). The display also does not appear too "cool" or blue-tinted. Grey tones were additionally very balanced, and a calibration performed by us on the display resulted in only minimal improvements, which for the average user wouldn't be noticeable. After calibration, the colour-difference value dropped to 0.62 and the grey tones were even more balanced. In terms of colour-space coverage, the display also shines with 88% (AdobeRGB) and 100% (sRGB) scores.
With our pre-prepared ICC profile file you can apply the same settings for colour reproduction that we achieved during our calibration - but please check in advance to ensure that the same display (manufacturer and model number) is installed in your laptop, otherwise it may make things worse instead of better. It's very common practice for models in the same laptop range to be equipped with different panels from multiple manufacturers.

Display Response Times
| ↔ Response Time Black to White | ||
|---|---|---|
| 28.8 ms ... rise ↗ and fall ↘ combined | ↗ 13.2 ms rise |  |
| ↘ 15.6 ms fall | ||
| The screen shows relatively slow response rates in our tests and may be too slow for gamers. In comparison, all tested devices range from 0.1 (minimum) to 240 (maximum) ms. » 76 % of all devices are better. This means that the measured response time is worse than the average of all tested devices (19.8 ms). | ||
| ↔ Response Time 50% Grey to 80% Grey | ||
| 60 ms ... rise ↗ and fall ↘ combined | ↗ 29.2 ms rise | 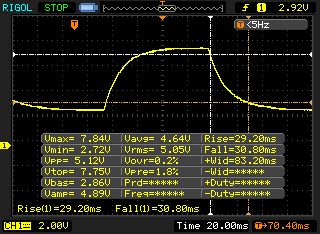 |
| ↘ 30.8 ms fall | ||
| The screen shows slow response rates in our tests and will be unsatisfactory for gamers. In comparison, all tested devices range from 0.165 (minimum) to 636 (maximum) ms. » 96 % of all devices are better. This means that the measured response time is worse than the average of all tested devices (30.9 ms). | ||
Screen Flickering / PWM (Pulse-Width Modulation)
| Screen flickering / PWM not detected | 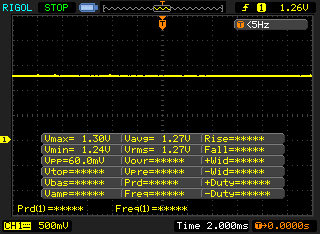 | ||
In comparison: 52 % of all tested devices do not use PWM to dim the display. If PWM was detected, an average of 7748 (minimum: 5 - maximum: 343500) Hz was measured. | |||
Gigabyte has equipped the Aero with an IPS panel with good viewing angles. As a result, the screen is visible from any position. The laptop was usable outside thanks to its bright display, as long as the sun wasn't too bright at the time.

Performance - Core i9 Power
The Gigabyte Aero 15-Y9 is a device in the family of slim, portable 15.6-inch gaming laptops and is able to provide smooth performance in (almost) every current game. In terms of other areas such as productivity, it also does not disappoint. For our review device you'll have to hand over around 5,000 Euros (~$5,657); however, other configurations are available.

Test Setup
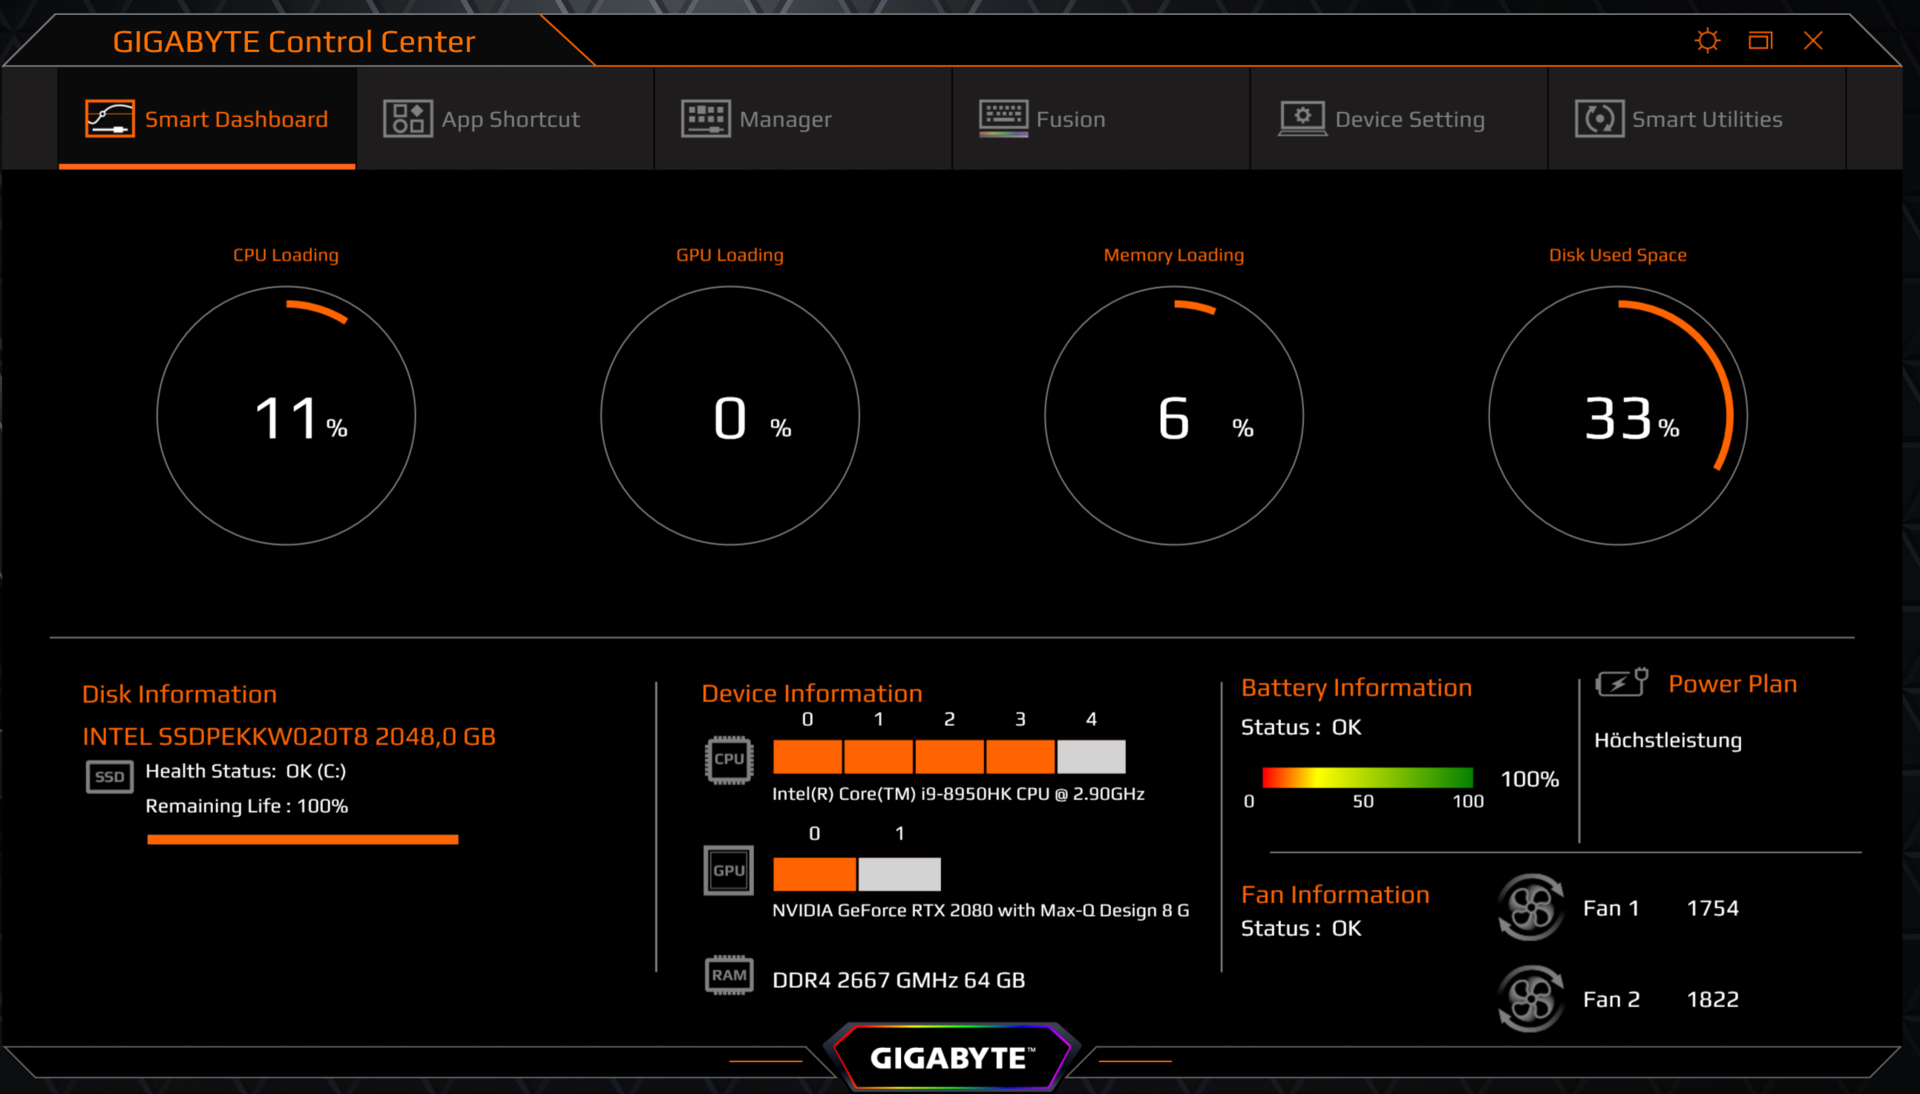
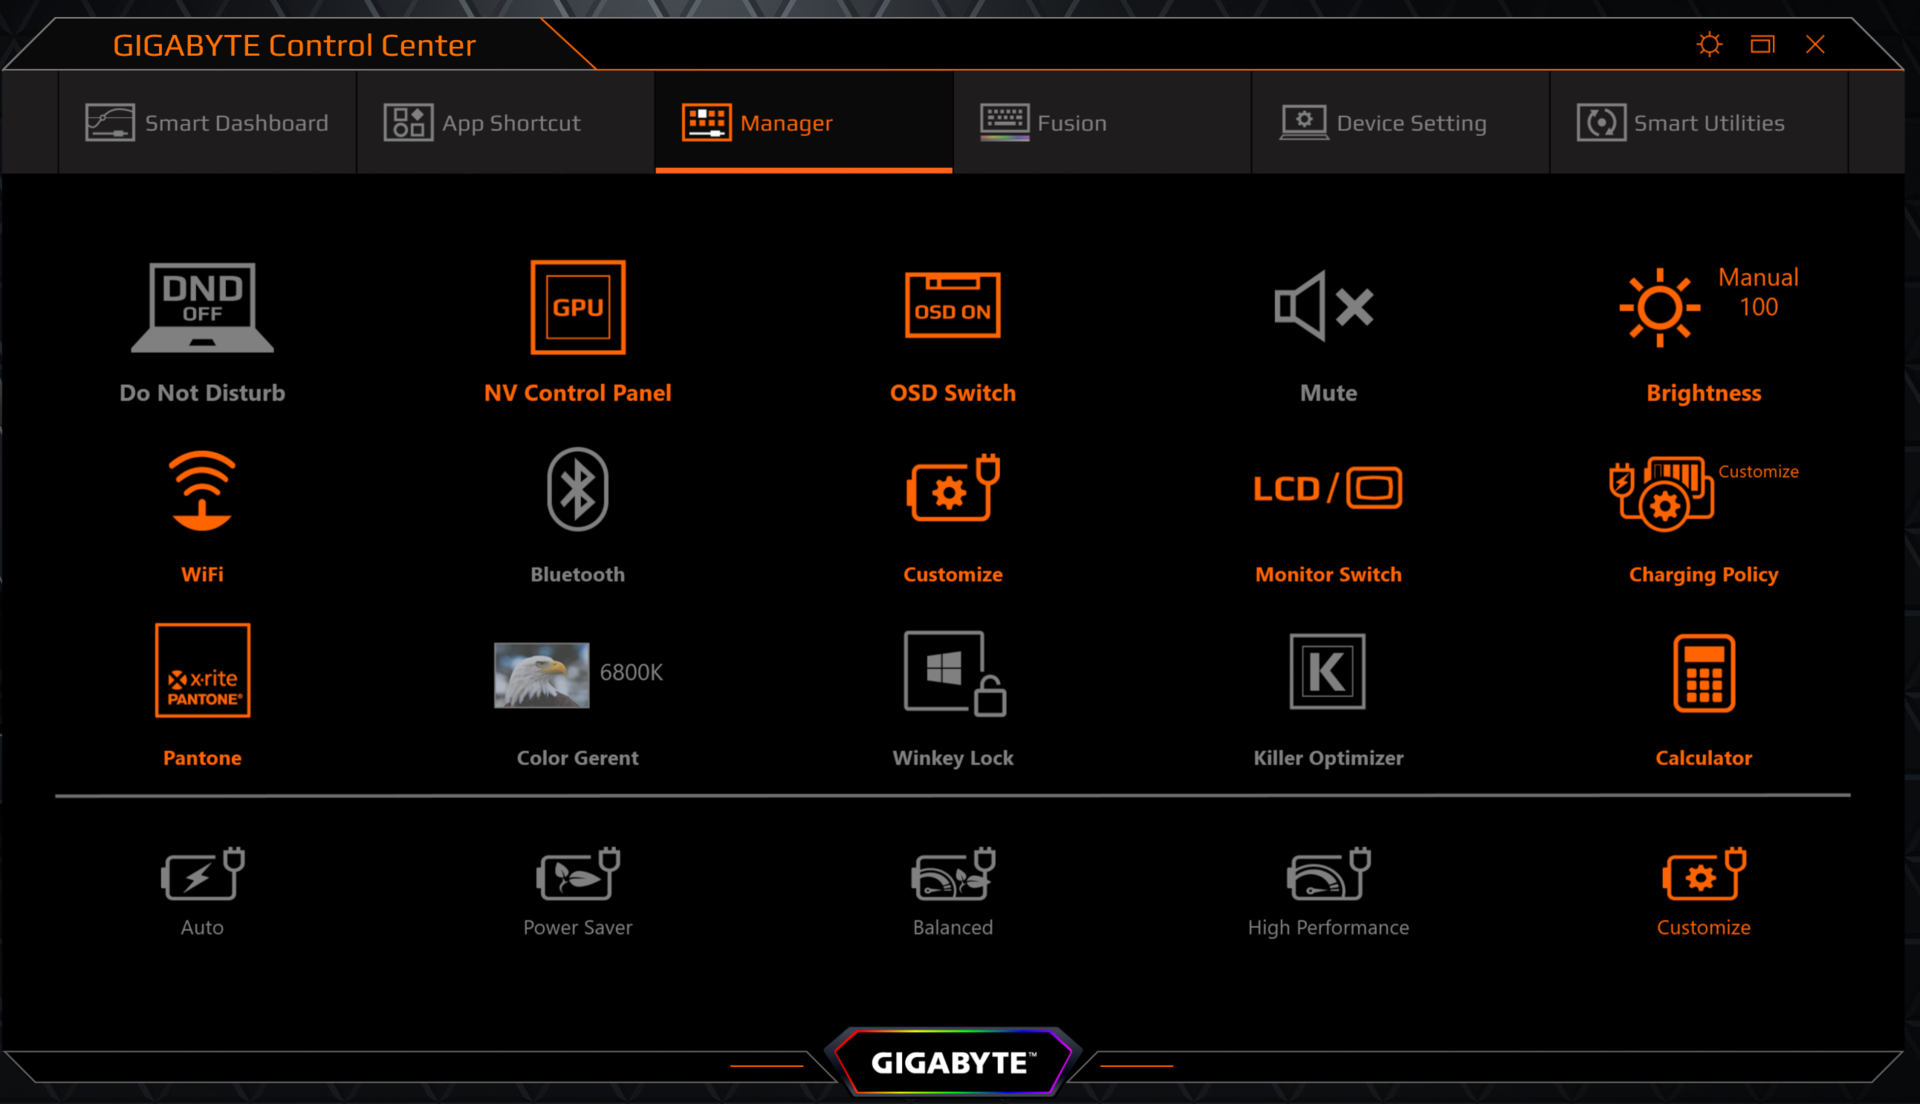
The preinstalled Gigabyte Control Center offers, amongst other things, the ability to apply an energy profile. We decided against this and selected the option "Customize" that results in Windows' own power profiles being used.
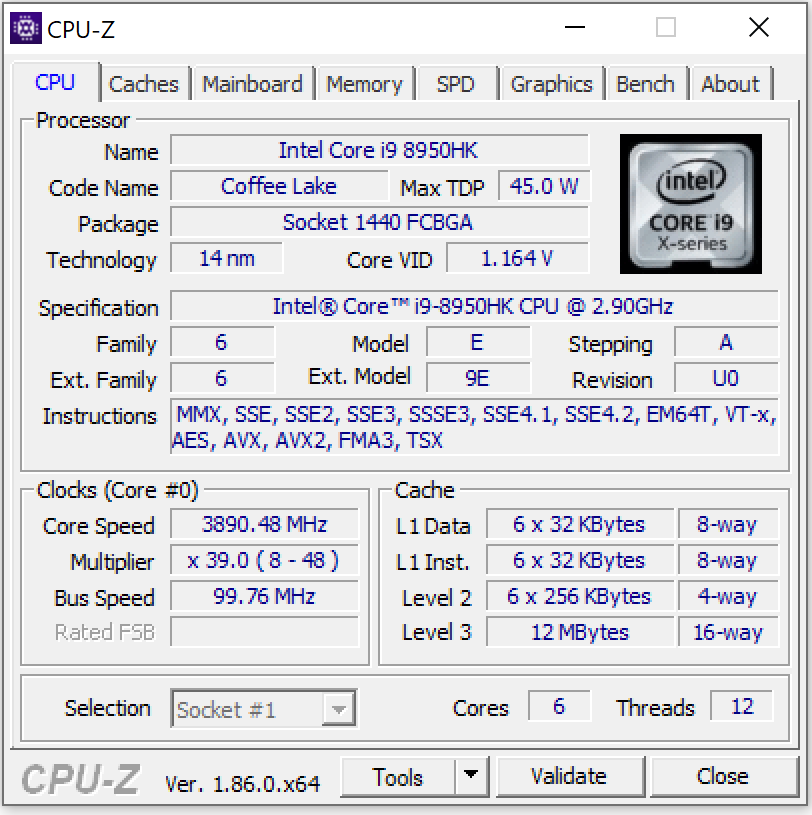
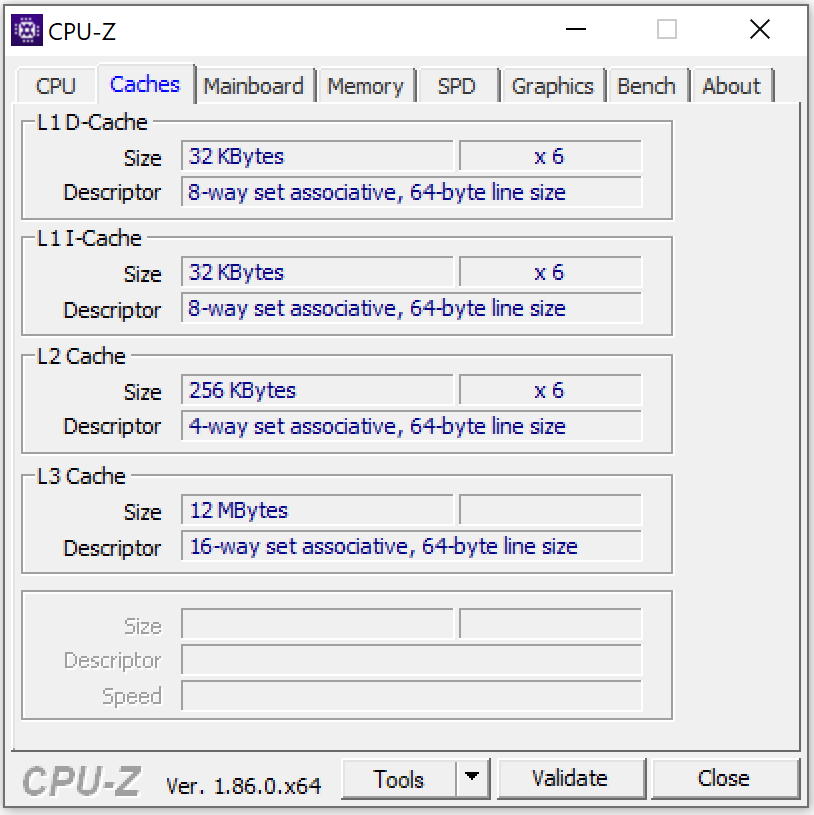
Processor
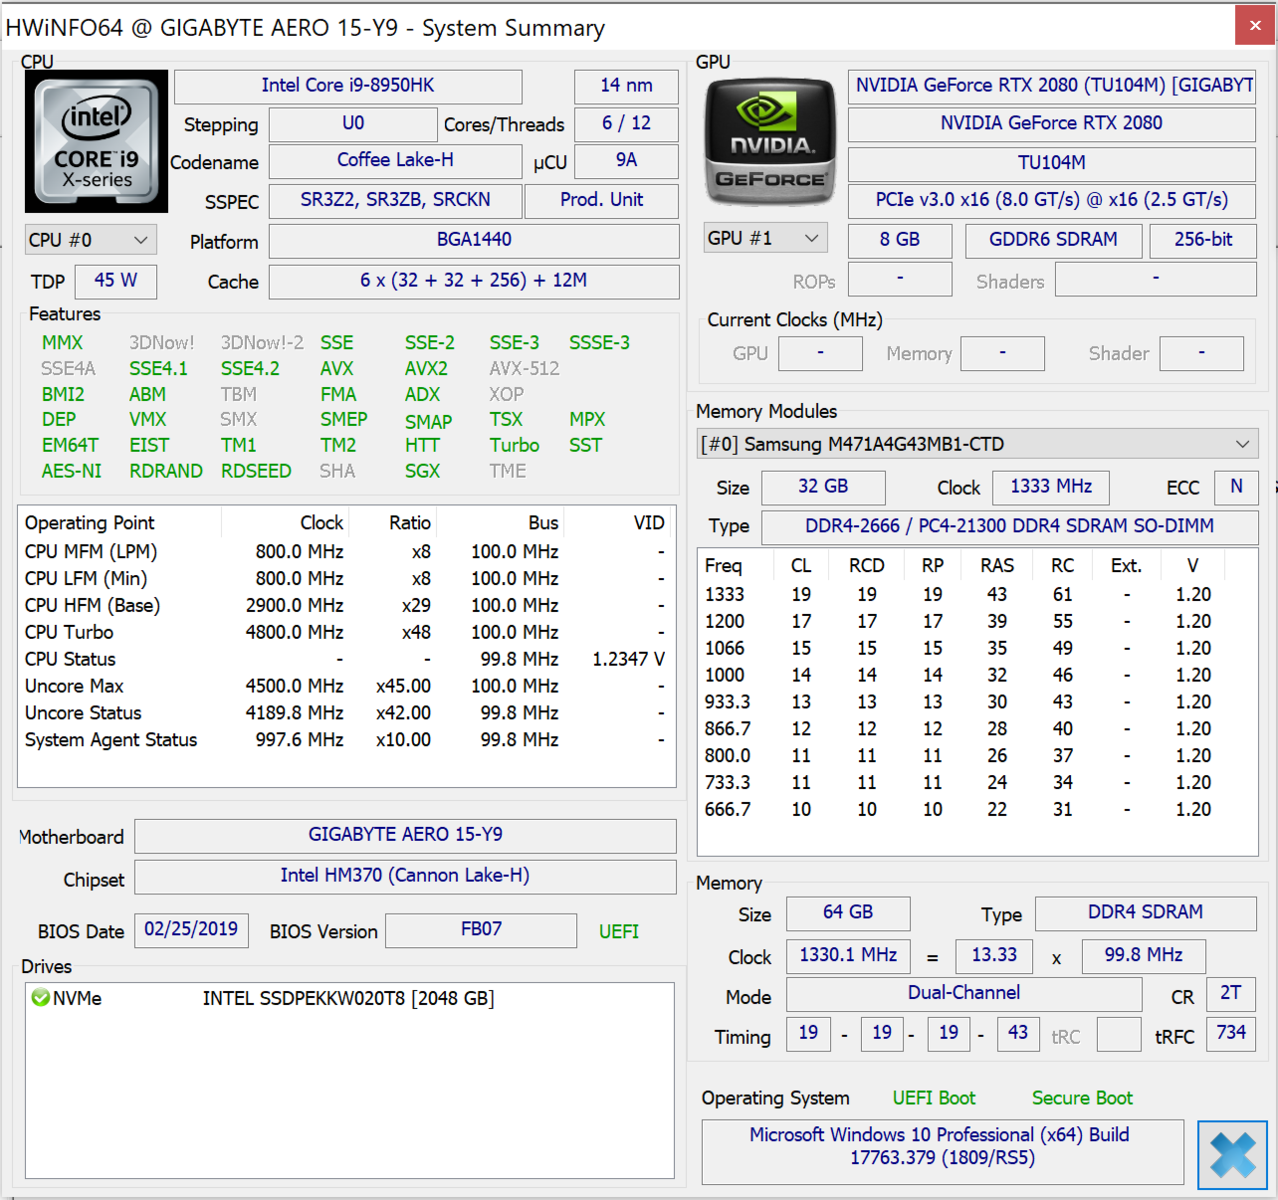
The Aero 15 is powered by a Core i9-8950HK (Coffee Lake) hexa-core processor. The CPU is soldered to the board and cannot be swapped out, so anyone who places value on being able to replace their CPU will have to turn to a much more substantial laptop such as the Schenker XMG Ultra 15.
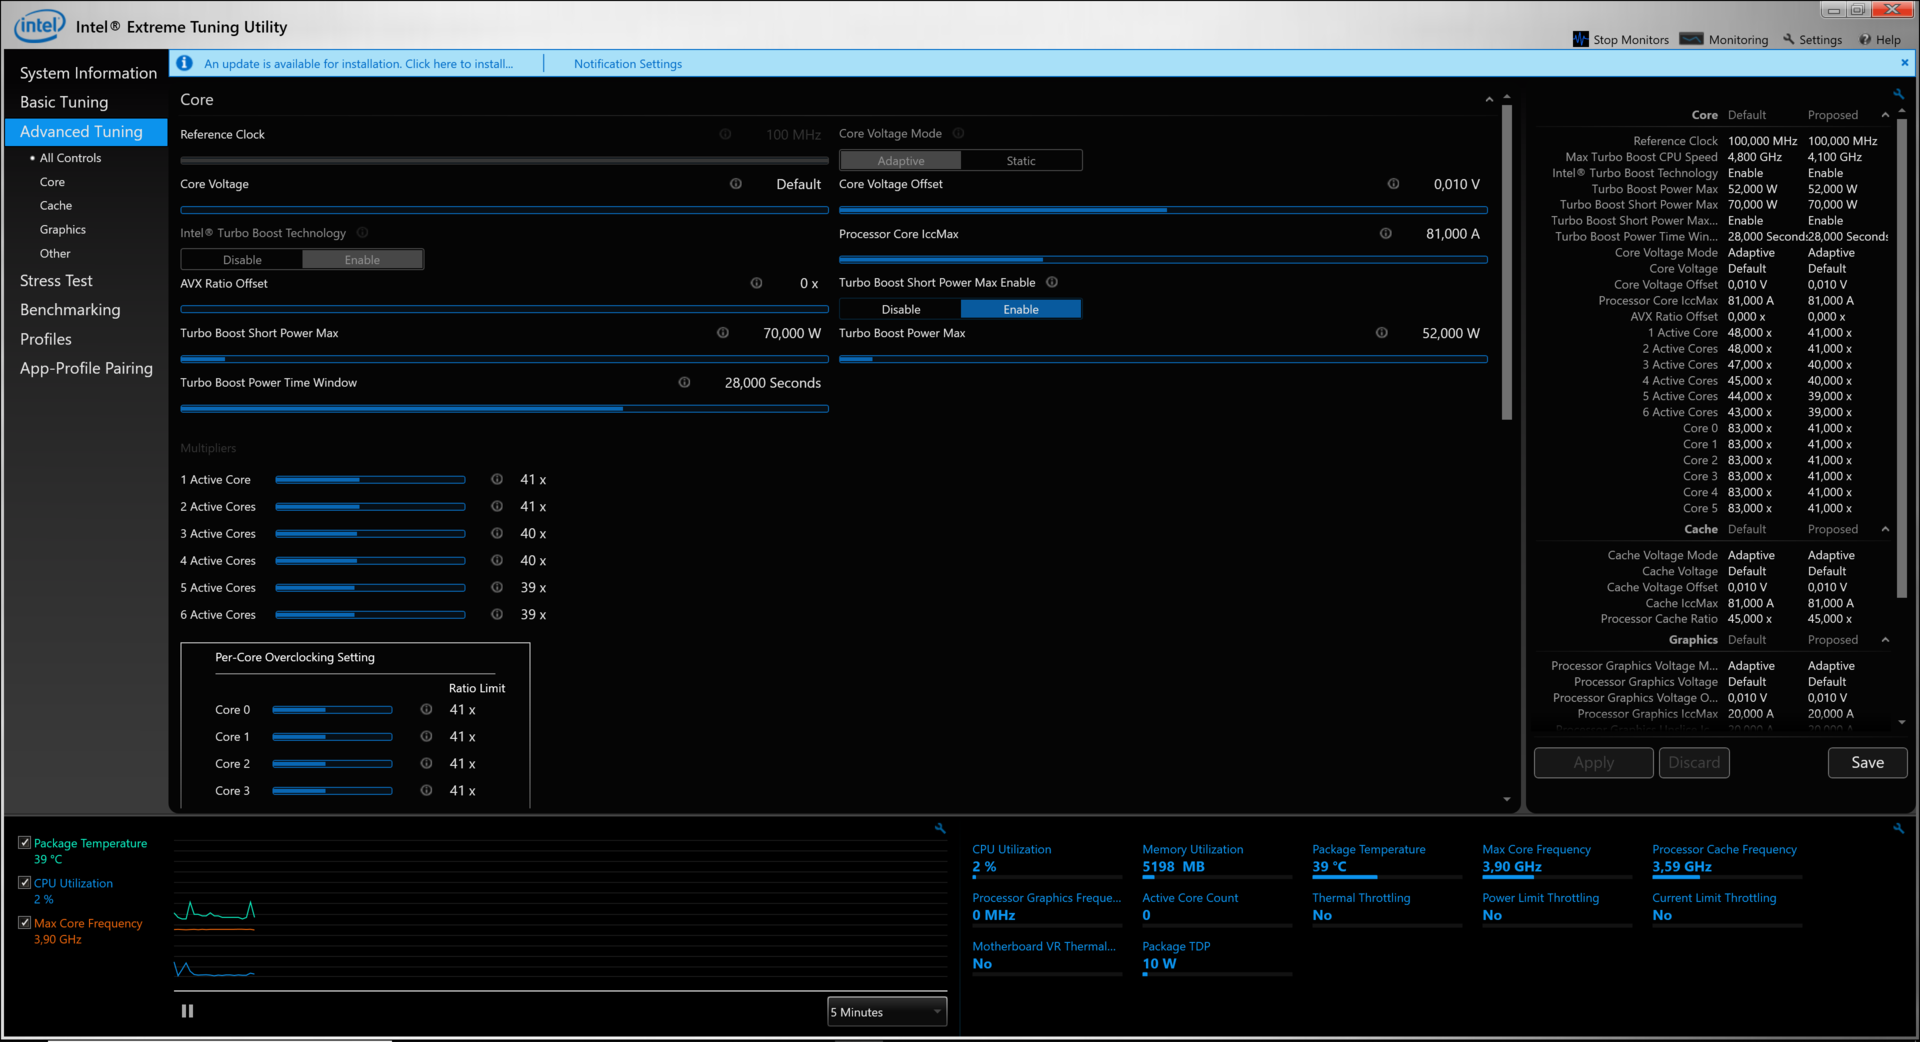
The Core i9 operates with a base frequency of 2.9 GHz, and can turbo up to 4.3 GHz (all six cores), 4.5 GHz (four cores), 4.7 GHz (two cores) or 4.8 GHz (one core). It is a mobile CPU with a TDP value of 45 watts. Hyper-Threading (two threads per core) is supported. The unlocked multiplier allows for simple overclocking of the CPU.
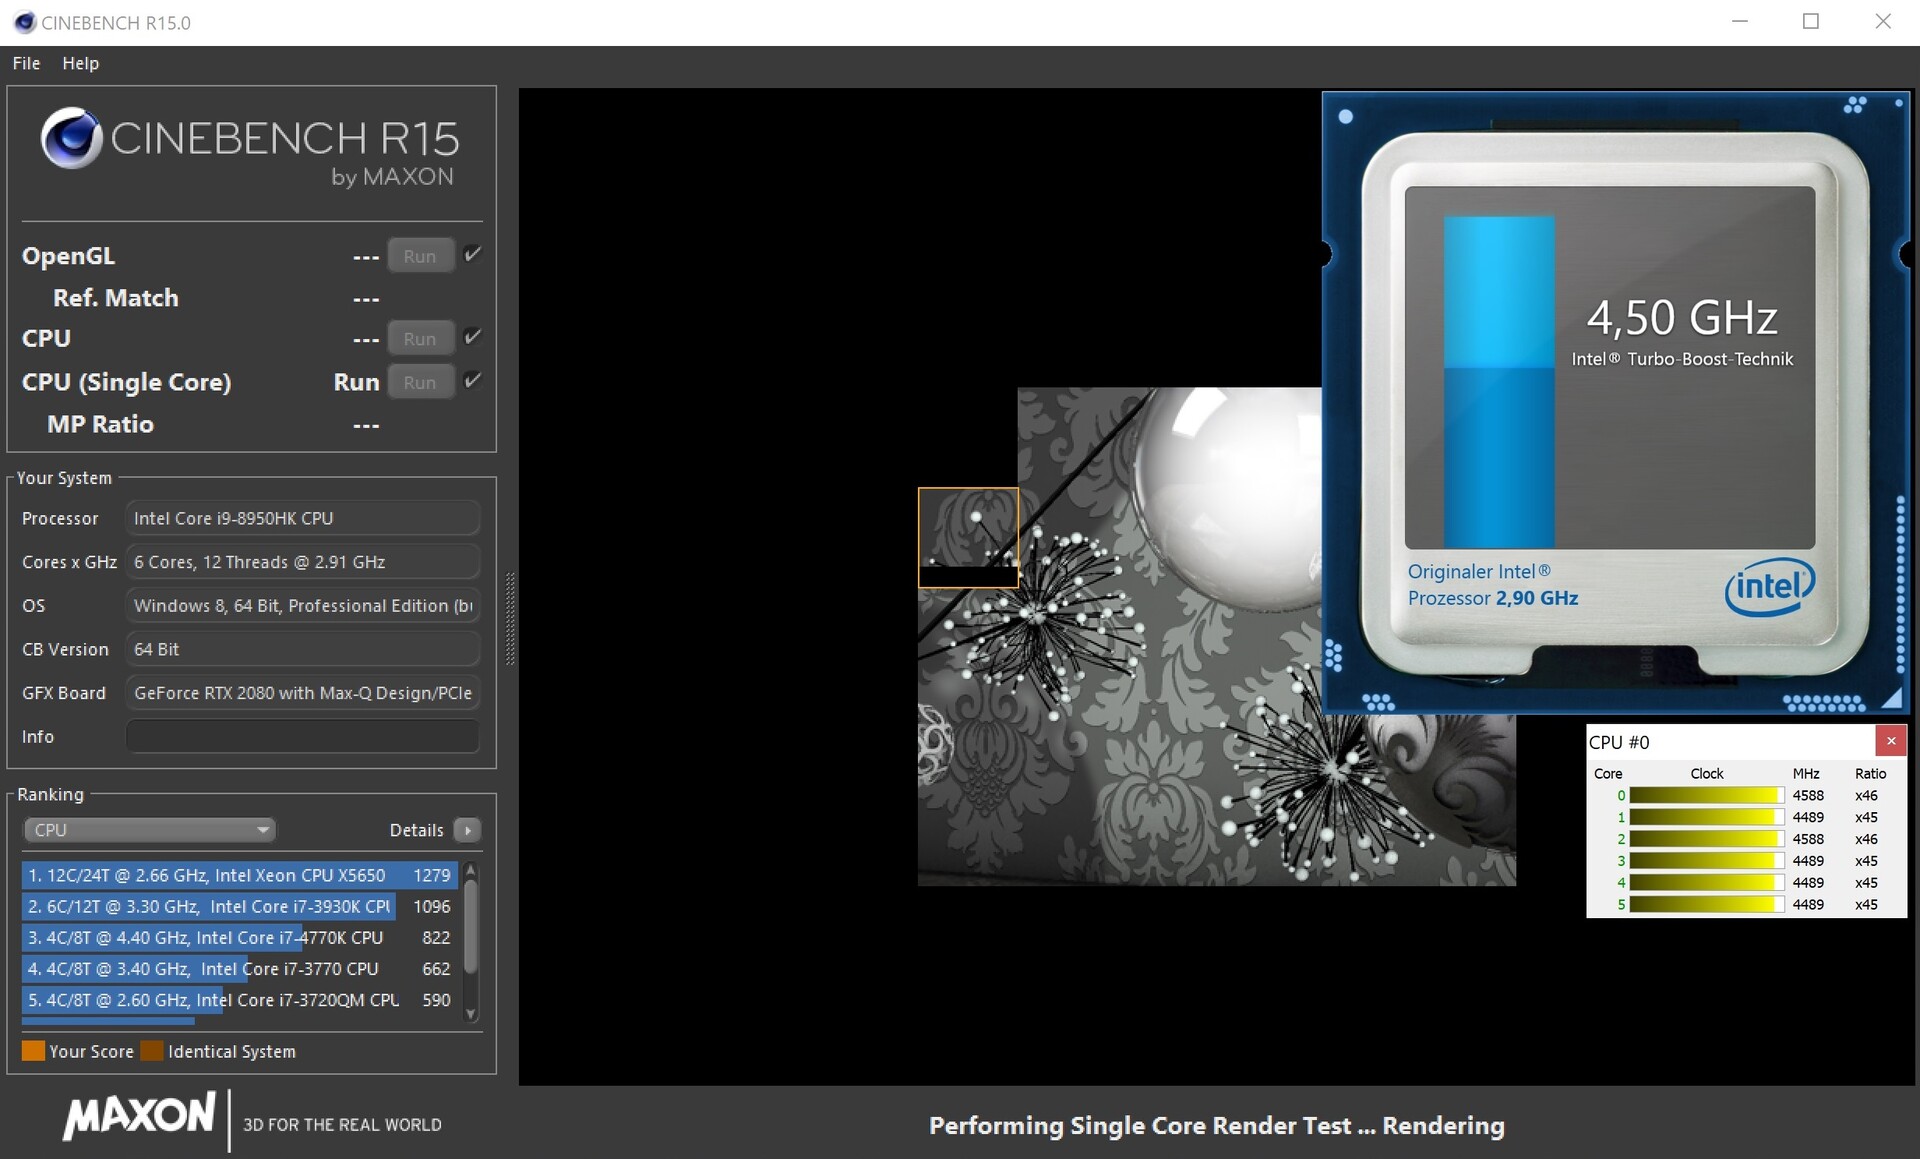
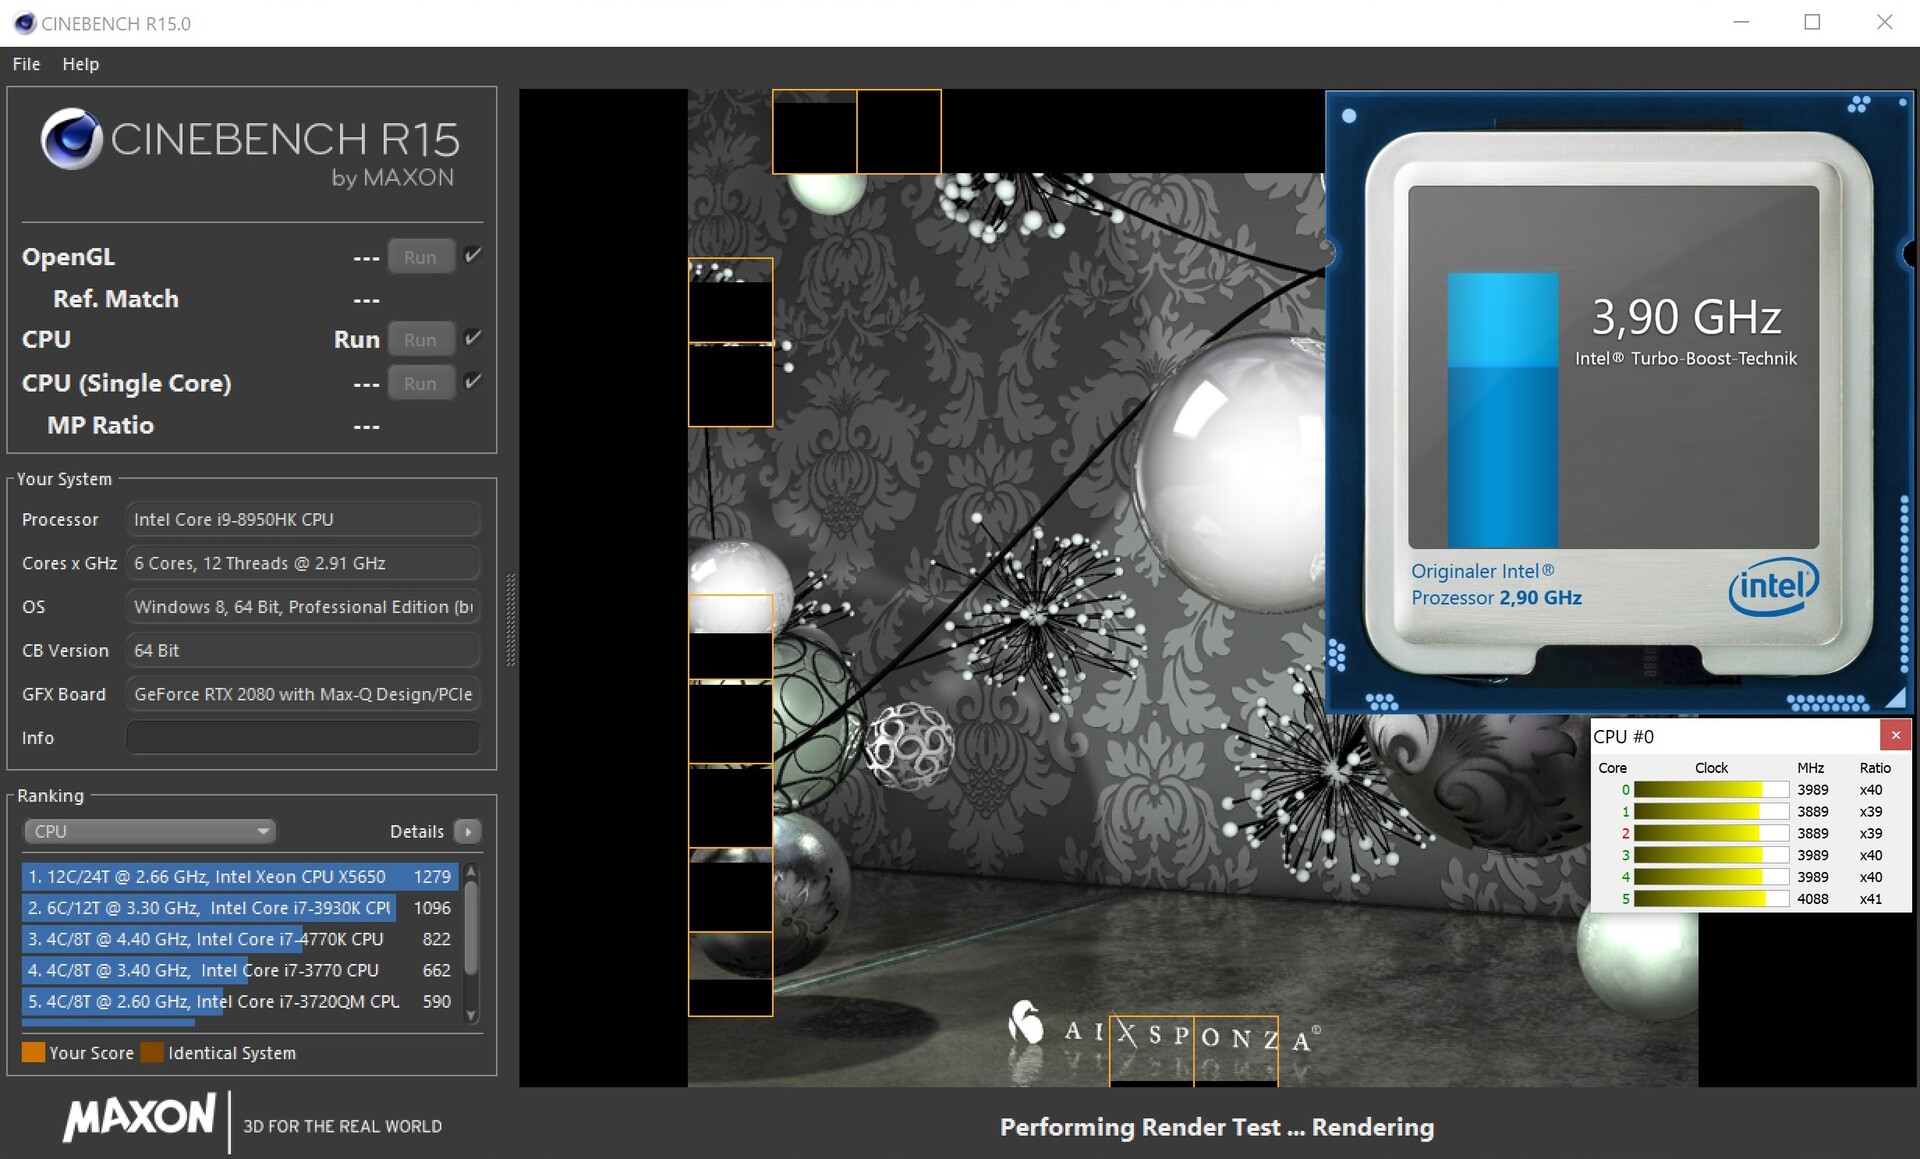
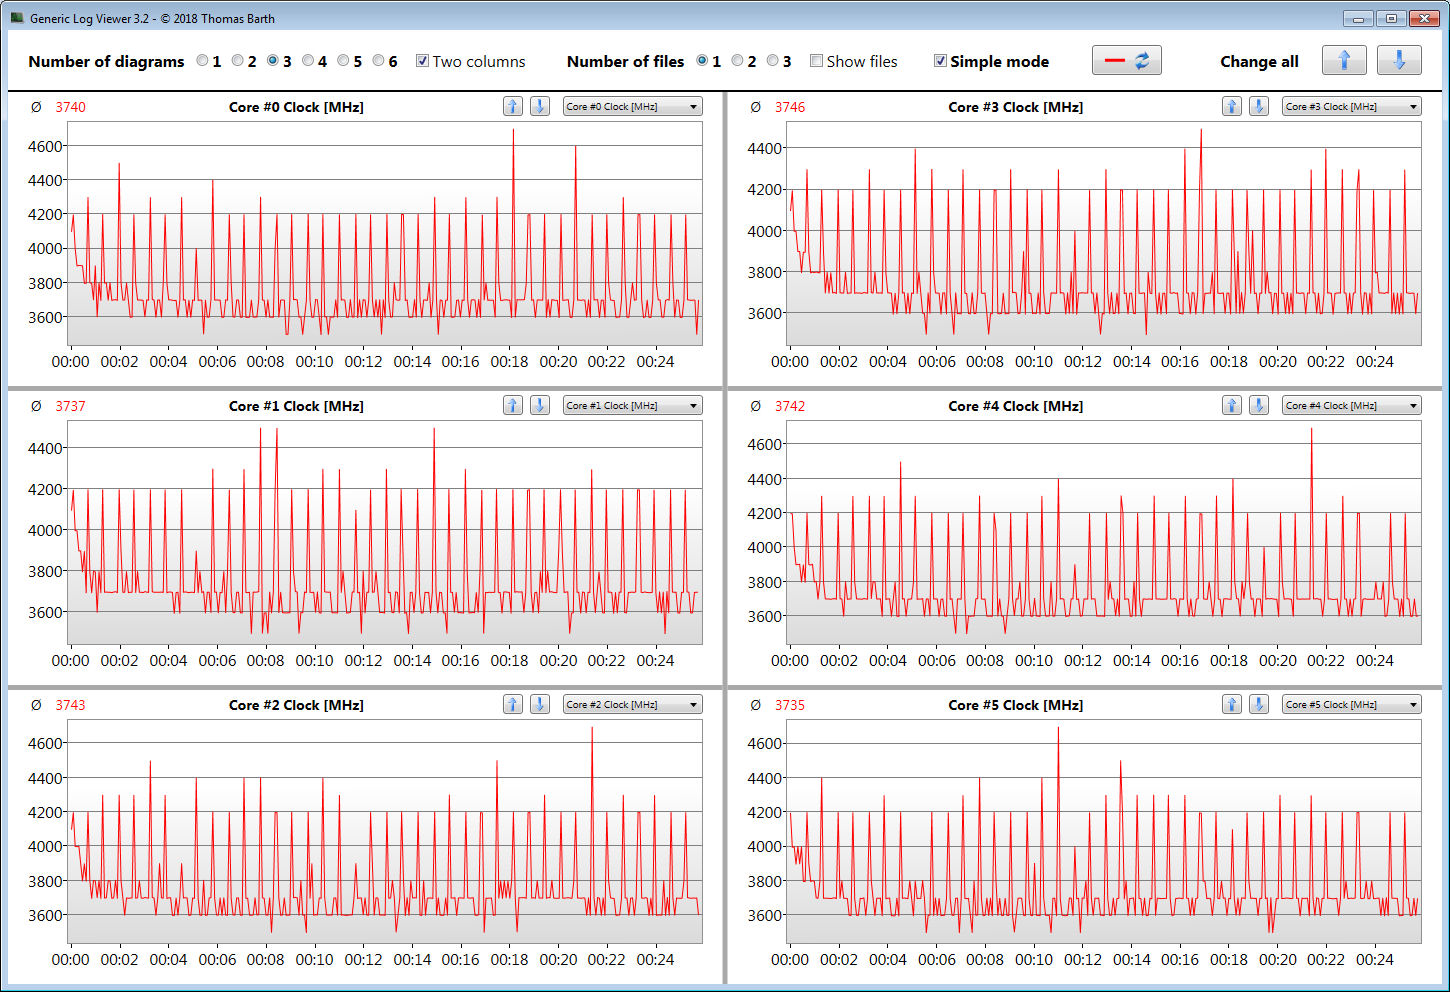
The multithread tests of Cinebench resulted in the CPU operating at around 3.7 - 4.1 GHz. The single-thread tests ran at 4.1 - 4.6 GHz. This was only valid for when on mains power; on battery, the CPU was clocked at a constant 2.3 GHz.
Whether or not the CPU turbo mode can be sustained in mains operation is tested by running the multithread test of Cinebench R15 for approximately 30 minutes in a loop. The results fall somewhat between the first and fifth runs and then stabilise at a relatively constant level between 1,140 and 1,170 points. Turbo mode did engage, but somewhat below its possible maximum.
| Cinebench R10 | |
| Rendering Single 32Bit | |
| Average of class Gaming (7457 - 12575, n=9, last 2 years) | |
| Gigabyte Aero 15-Y9 | |
| Gigabyte Aero 15-X9 | |
| Rendering Multiple CPUs 32Bit | |
| Average of class Gaming (42932 - 102066, n=9, last 2 years) | |
| Gigabyte Aero 15-Y9 | |
| Gigabyte Aero 15-X9 | |
| Cinebench R20 | |
| CPU (Single Core) | |
| Average of class Gaming (442 - 913, n=107, last 2 years) | |
| Gigabyte Aero 15-Y9 | |
| CPU (Multi Core) | |
| Average of class Gaming (4029 - 16433, n=107, last 2 years) | |
| Gigabyte Aero 15-Y9 | |
| Geekbench 3 | |
| 32 Bit Multi-Core Score | |
| Gigabyte Aero 15-Y9 | |
| Gigabyte Aero 15-X9 | |
| 32 Bit Single-Core Score | |
| Gigabyte Aero 15-Y9 | |
| Gigabyte Aero 15-X9 | |
| Geekbench 4.4 | |
| 64 Bit Multi-Core Score | |
| Average of class Gaming (89200 - 101054, n=3, last 2 years) | |
| Gigabyte Aero 15-Y9 | |
| Gigabyte Aero 15-X9 | |
| 64 Bit Single-Core Score | |
| Average of class Gaming (9335 - 9775, n=3, last 2 years) | |
| Gigabyte Aero 15-Y9 | |
| Gigabyte Aero 15-X9 | |
| Mozilla Kraken 1.1 - Total | |
| Gigabyte Aero 15-X9 (Edge 44) | |
| Razer Blade 15 RTX 2070 Max-Q (Edge 44.17763.1.0) | |
| Gigabyte Aero 15-Y9 (Edge 44) | |
| Average of class Gaming (391 - 590, n=101, last 2 years) | |
| Octane V2 - Total Score | |
| Average of class Gaming (93292 - 139447, n=27, last 2 years) | |
| Gigabyte Aero 15-Y9 (Edge 44) | |
| Gigabyte Aero 15-X9 (Edge 44) | |
| Razer Blade 15 RTX 2070 Max-Q (Edge 44.17763.1.0) | |
| JetStream 1.1 - 1.1 Total | |
| Average of class Gaming (549 - 647, n=3, last 2 years) | |
| Gigabyte Aero 15-Y9 (Edge 44) | |
| Razer Blade 15 RTX 2070 Max-Q (Edge 44.17763.1.0) | |
| Gigabyte Aero 15-X9 (Edge 44) | |
* ... smaller is better
System Performance
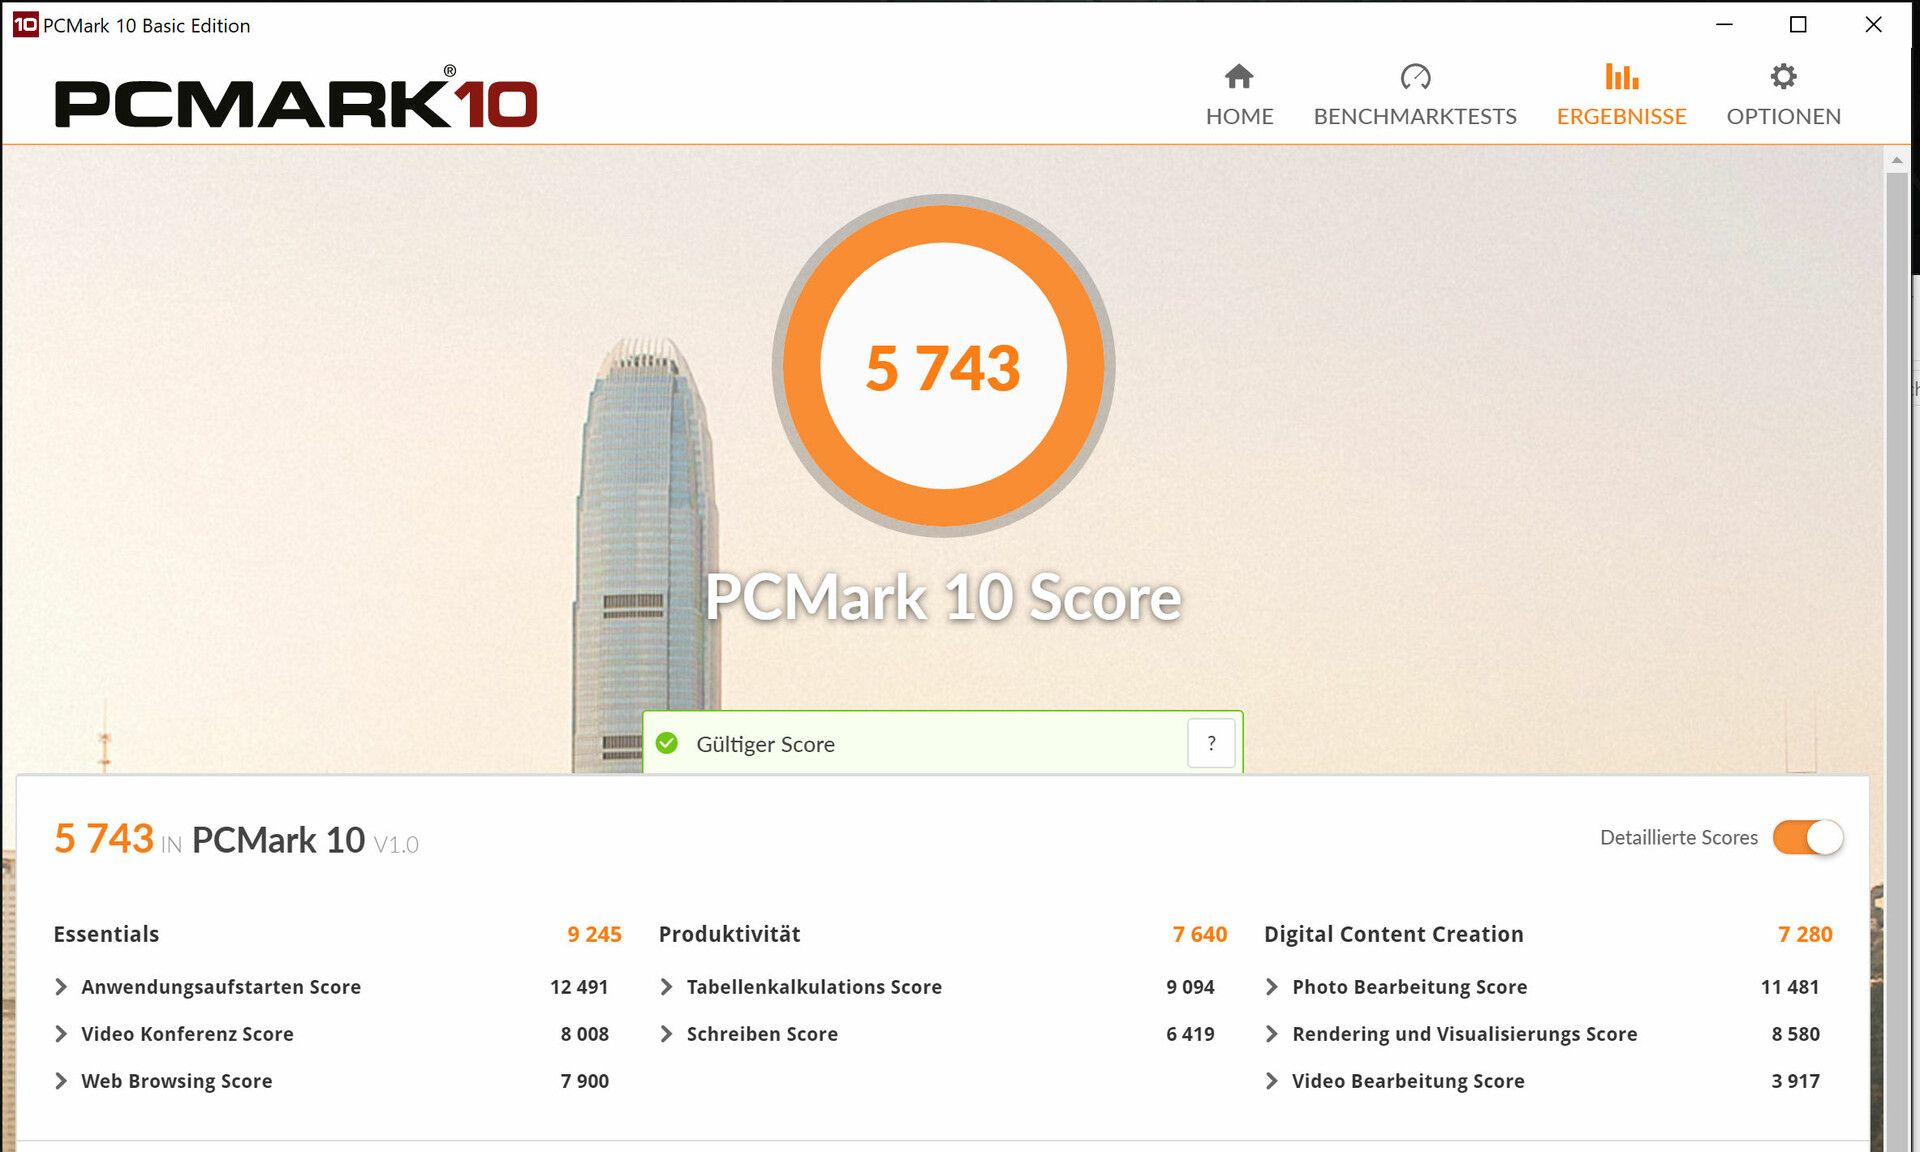
In terms of system performance, the Aero 15 can take on anything thrown at it. Thanks to very high-end hardware it not only impresses in gaming service but also with video and image-editing. In addition, it achieved very good results in the PCMark benchmarks. However, a look at our comparison table shows that despite having a more-powerful CPU and GPU combination, it comes in behind the Aero 15-X9. This is likely due to the higher screen resolution (4K vs. FHD) of the Aero 15-Y9.
| PCMark 7 Score | 6905 points | |
| PCMark 8 Home Score Accelerated v2 | 3944 points | |
| PCMark 8 Creative Score Accelerated v2 | 5164 points | |
| PCMark 8 Work Score Accelerated v2 | 4775 points | |
| PCMark 10 Score | 5743 points | |
Help | ||
Storage
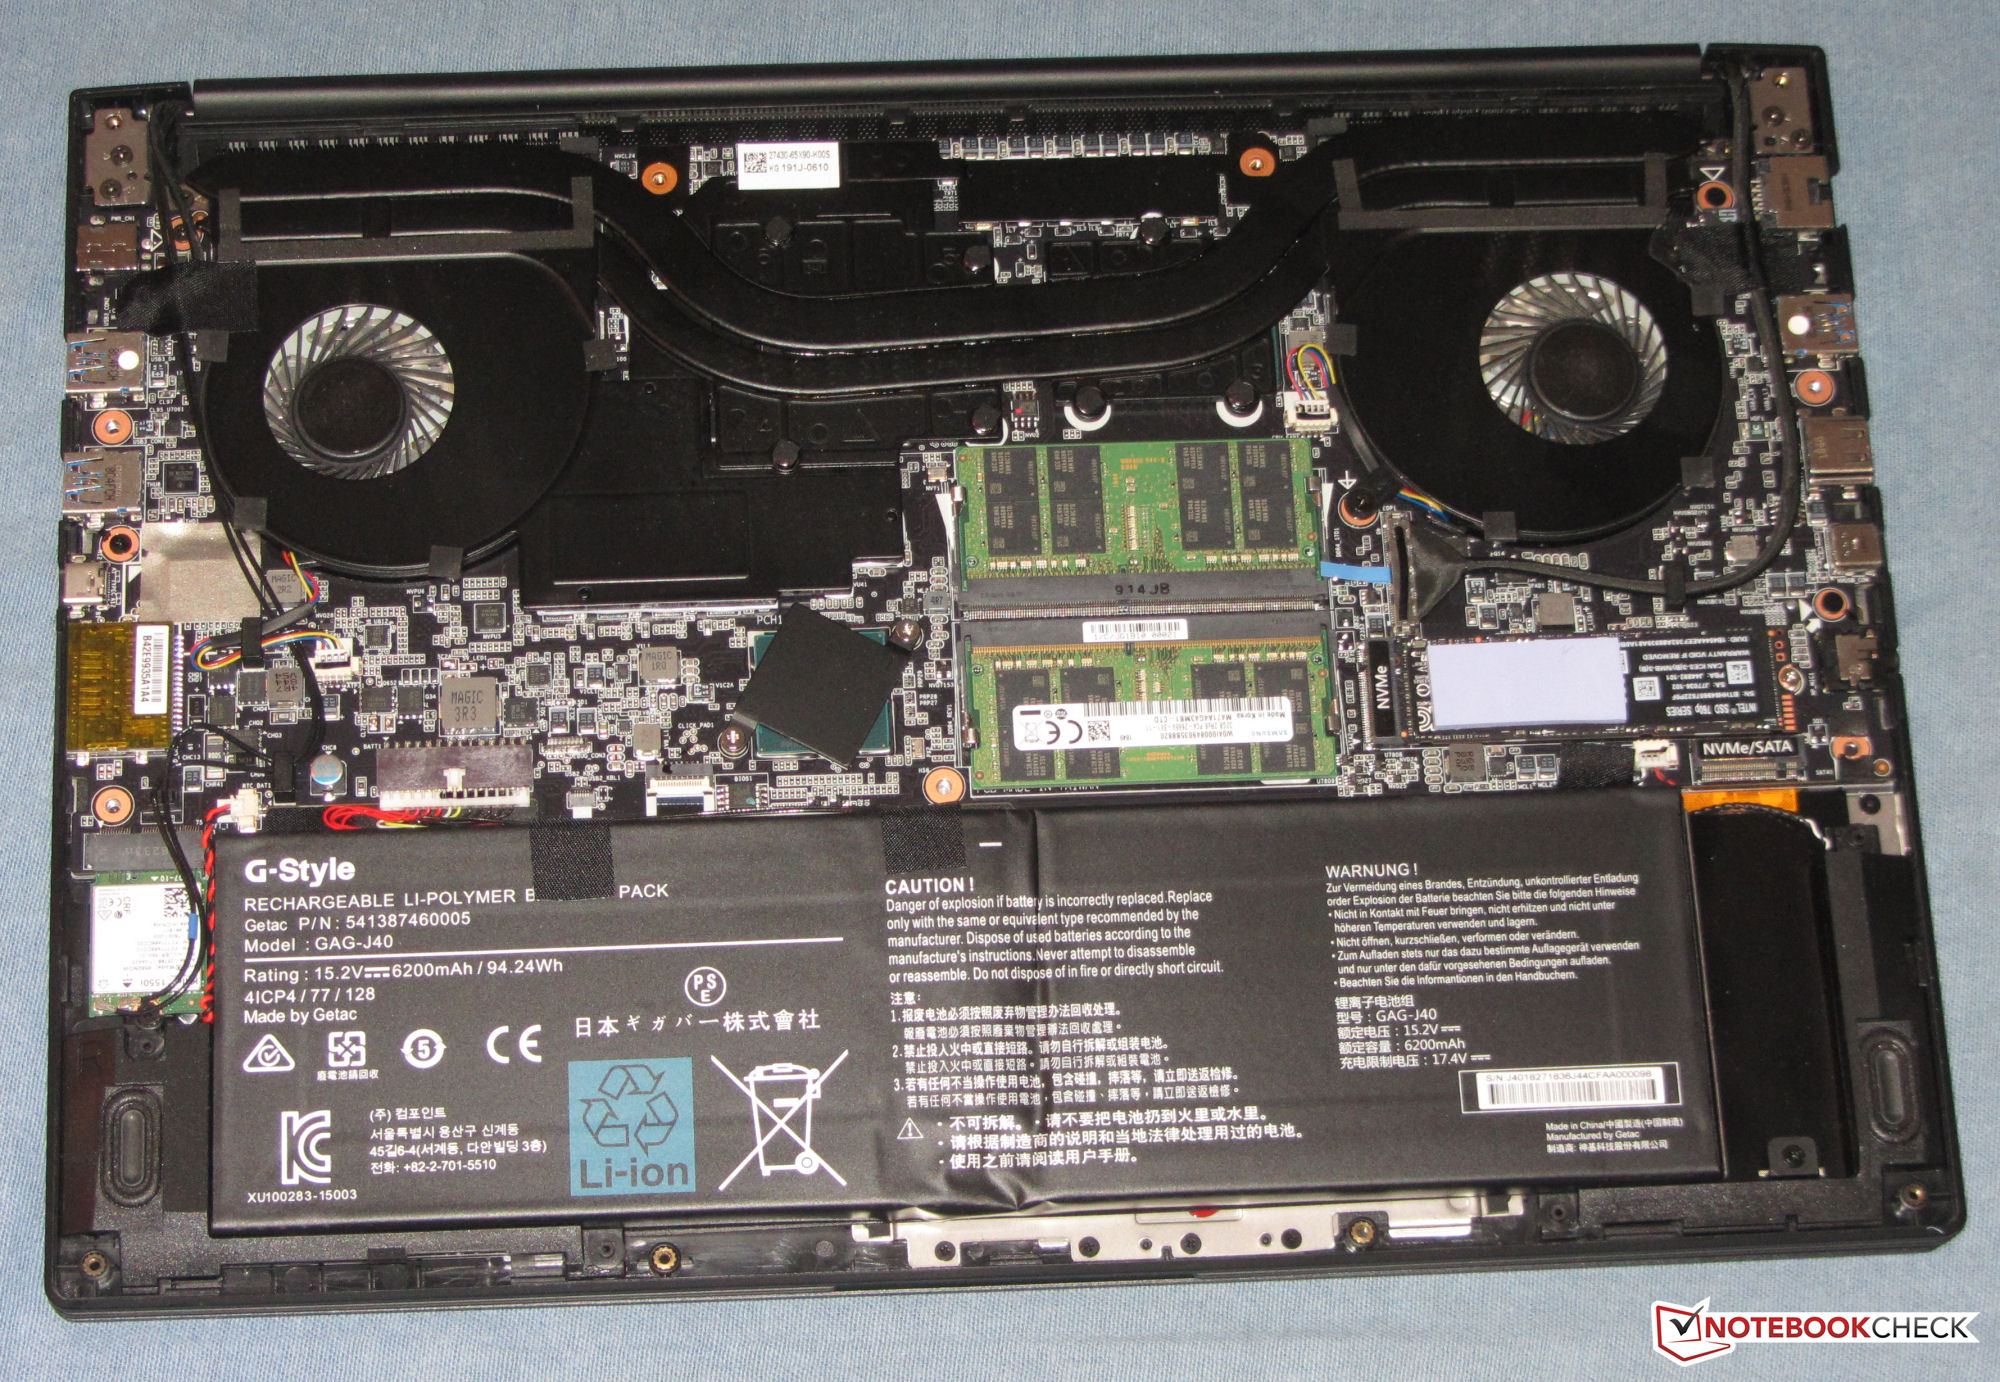
Purchasers of the Aero 15-Y9 are not likely to complain about internal storage. Gigabyte installed in our review unit a 2 TB NVMe SSD in M.2 form, which delivered exceptional transfer rates. This is thanks to it being a PCI Express 3.0 x4 device, which results in much higher transfer speeds in comparison to SATA 3 models that are limited to 600 MB/s.
Should it be necessary at some point to expand storage - no problem. The internals of the laptop offer a second M.2 2280 slot, which can take either an NVMe or SATA 3 SSD.

| Gigabyte Aero 15-Y9 Intel SSD 760p SSDPEKKW020T8 | Gigabyte Aero 15-X9 Intel SSD 760p SSDPEKKW010T8 | MSI GS65 8RF-019DE Stealth Thin Samsung SSD PM981 MZVLB512HAJQ | Asus Zephyrus S GX531GS WDC PC SN520 SDAPNUW-512G | Acer Predator Triton 500 2x WDC PC SN720 SDAPNTW-256G-1014 (RAID 0) | Razer Blade 15 RTX 2070 Max-Q Samsung SSD PM981 MZVLB512HAJQ | |
|---|---|---|---|---|---|---|
| CrystalDiskMark 5.2 / 6 | -8% | -6% | -20% | 14% | -6% | |
| Write 4K (MB/s) | 109.4 | 97.1 -11% | 95.3 -13% | 98.2 -10% | 93.6 -14% | 93.9 -14% |
| Read 4K (MB/s) | 56.6 | 53.7 -5% | 40.13 -29% | 39.43 -30% | 38.82 -31% | 40.56 -28% |
| Write Seq (MB/s) | 1508 | 1526 1% | 1883 25% | 1386 -8% | 2455 63% | 1468 -3% |
| Read Seq (MB/s) | 2427 | 2020 -17% | 1322 -46% | 1100 -55% | 2107 -13% | 1540 -37% |
| Write 4K Q32T1 (MB/s) | 307 | 285.6 -7% | 309.9 1% | 270.3 -12% | 298.7 -3% | 293.5 -4% |
| Read 4K Q32T1 (MB/s) | 351.3 | 321.8 -8% | 353.7 1% | 340.3 -3% | 338.7 -4% | 346 -2% |
| Write Seq Q32T1 (MB/s) | 1523 | 1533 1% | 1919 26% | 1454 -5% | 2902 91% | 1941 27% |
| Read Seq Q32T1 (MB/s) | 2825 | 2351 -17% | 2466 -13% | 1681 -40% | 3536 25% | 3266 16% |
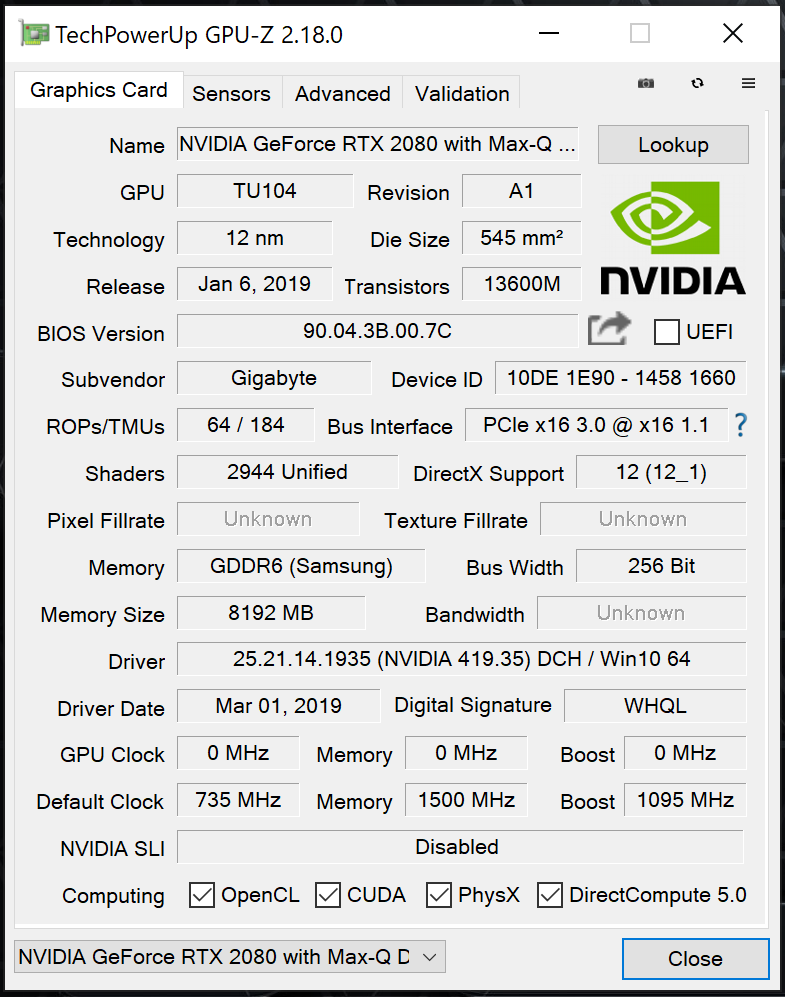
Graphics Card
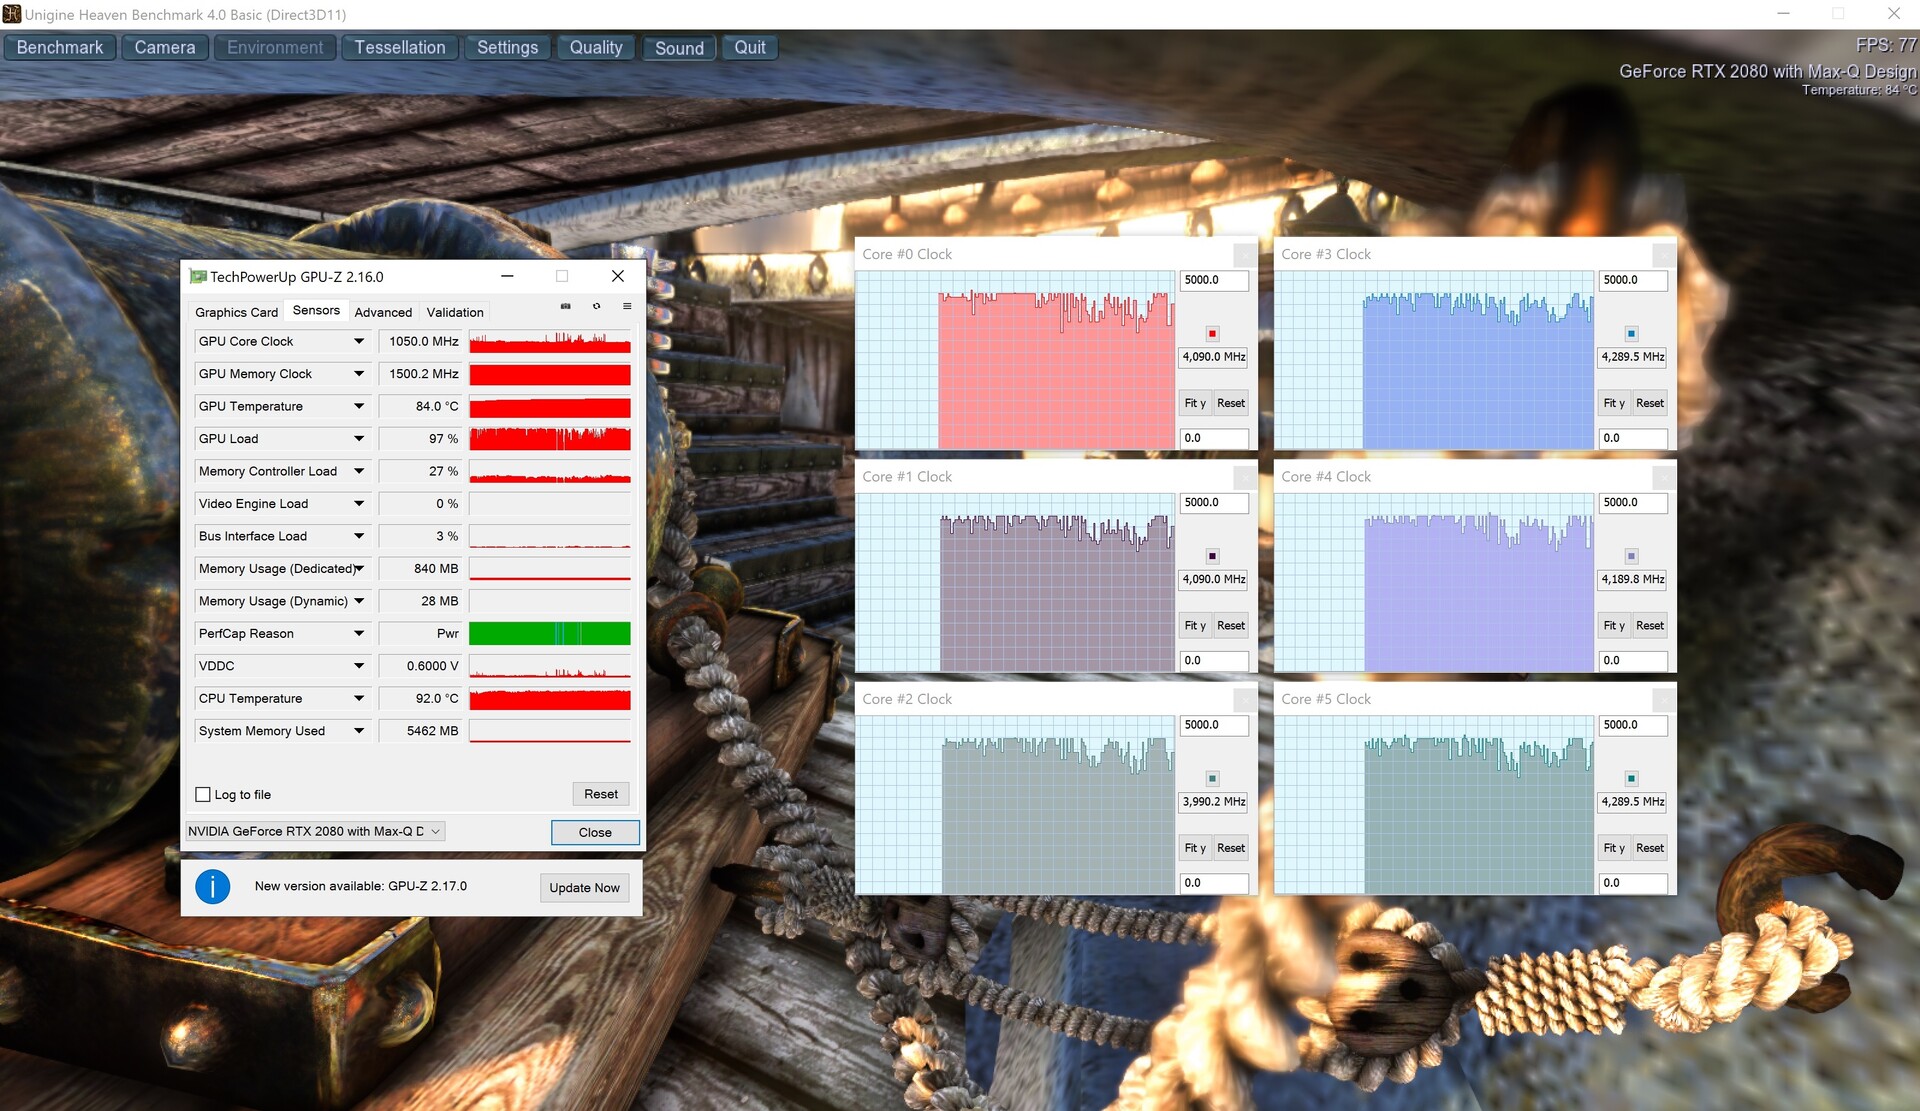
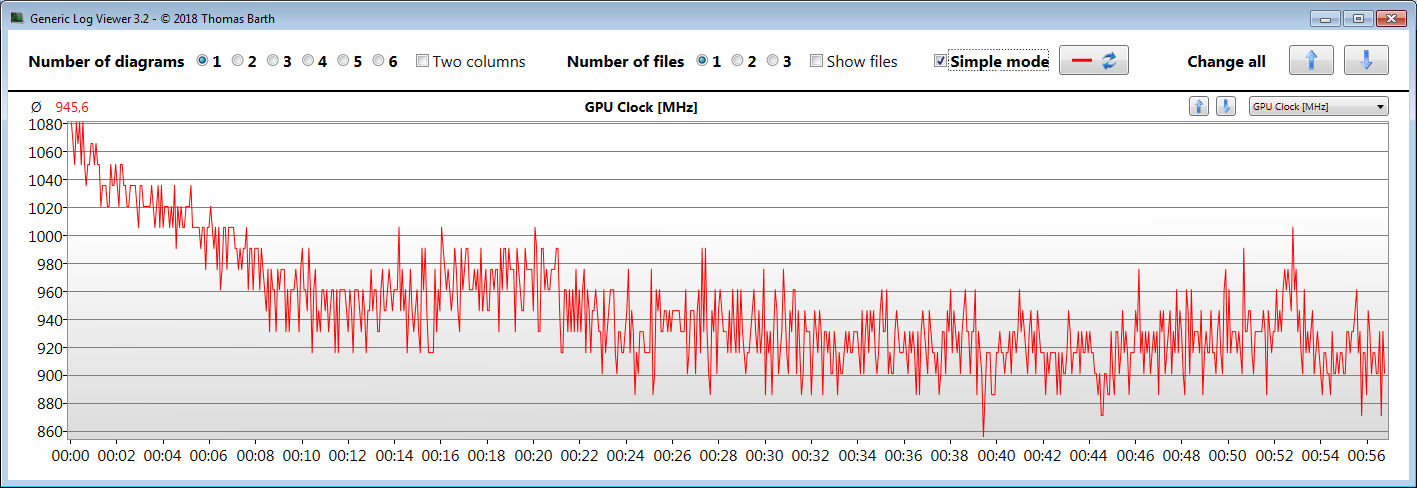
The Aero-15 Y9 is equipped with a GeForce RTX 2080 Max-Q. This variant of the RTX 2080 focuses on power and heat efficiency and is intended for thin and light laptops. Nvidia offers two variants of the adapter that are classified by TDP and therefore run at differing speeds. The 80-watt model has a core clock of 735 - 1,095 MHz, and the 90-watt model offers 990 - 1,230 MHz. The Aero is equipped with the 80-watt version.
The GPU in our review unit at one point reached a maximum core speed of 1,455 MHz, but this value cannot be achieved for long - during our benchmark testing, the average clock speed measured was 1,050 MHz. In terms of VRAM, it is equipped with 8,192 MB of fast GDDR6 RAM.
The results from 3DMark place the laptop, in comparison with previously tested RTX 2080 Max-Q devices, somewhere around the bottom of the scale. As a result, the GPU is not able to vastly differentiate itself from the Aero 15-X9 with its RTX 2070 Max-Q - in addition, the Aero 15-X9 also had a bit more to give, as the review unit we tested was equipped with RAM in single-channel mode, whereas the Aero 15-Y9 has two RAM modules (i.e. dual-channel mode) on board.
The CPU-integrated graphics adapter, an Intel UHD Graphics 630, is active, and it operates in conjunction with Nvidia's GPU-switching solution Optimus.
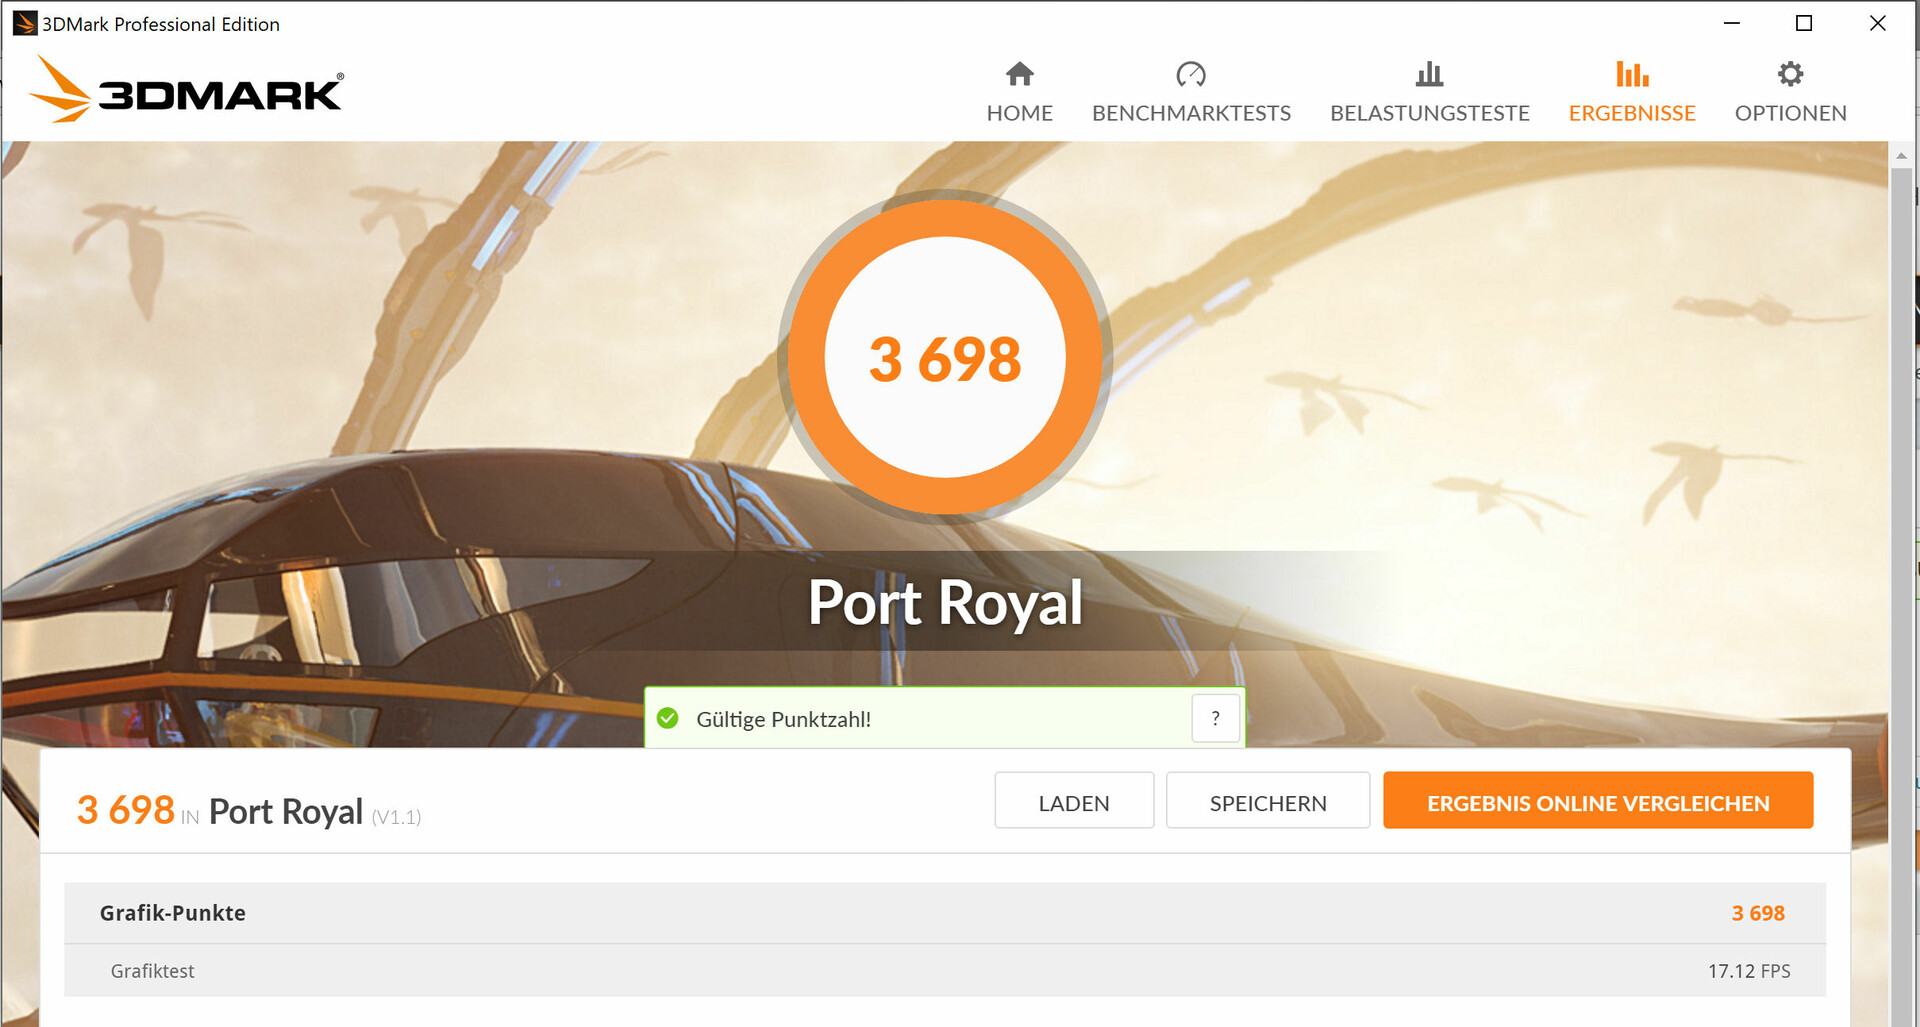
| 3DMark 06 Standard Score | 38435 points | |
| 3DMark 11 Performance | 19220 points | |
| 3DMark Ice Storm Standard Score | 66387 points | |
| 3DMark Cloud Gate Standard Score | 29945 points | |
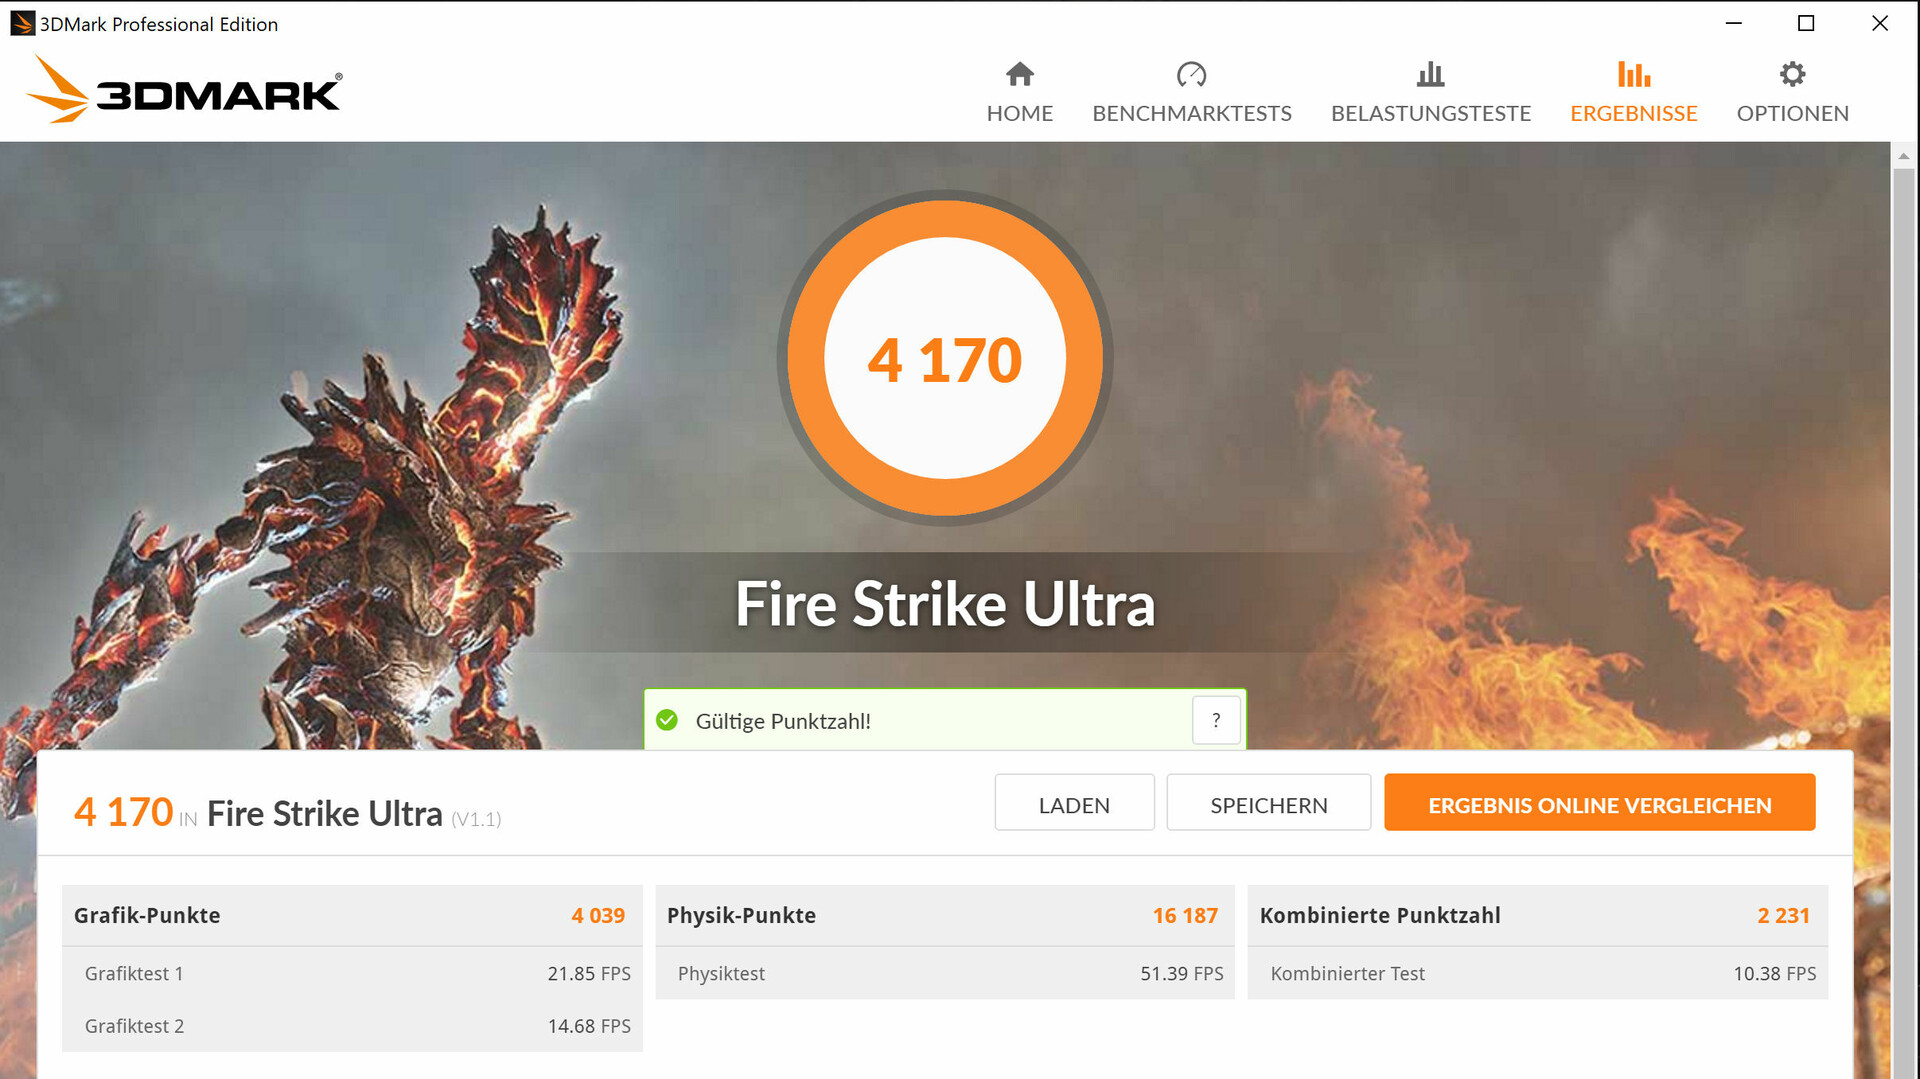
| 3DMark Fire Strike Score | 16020 points | |
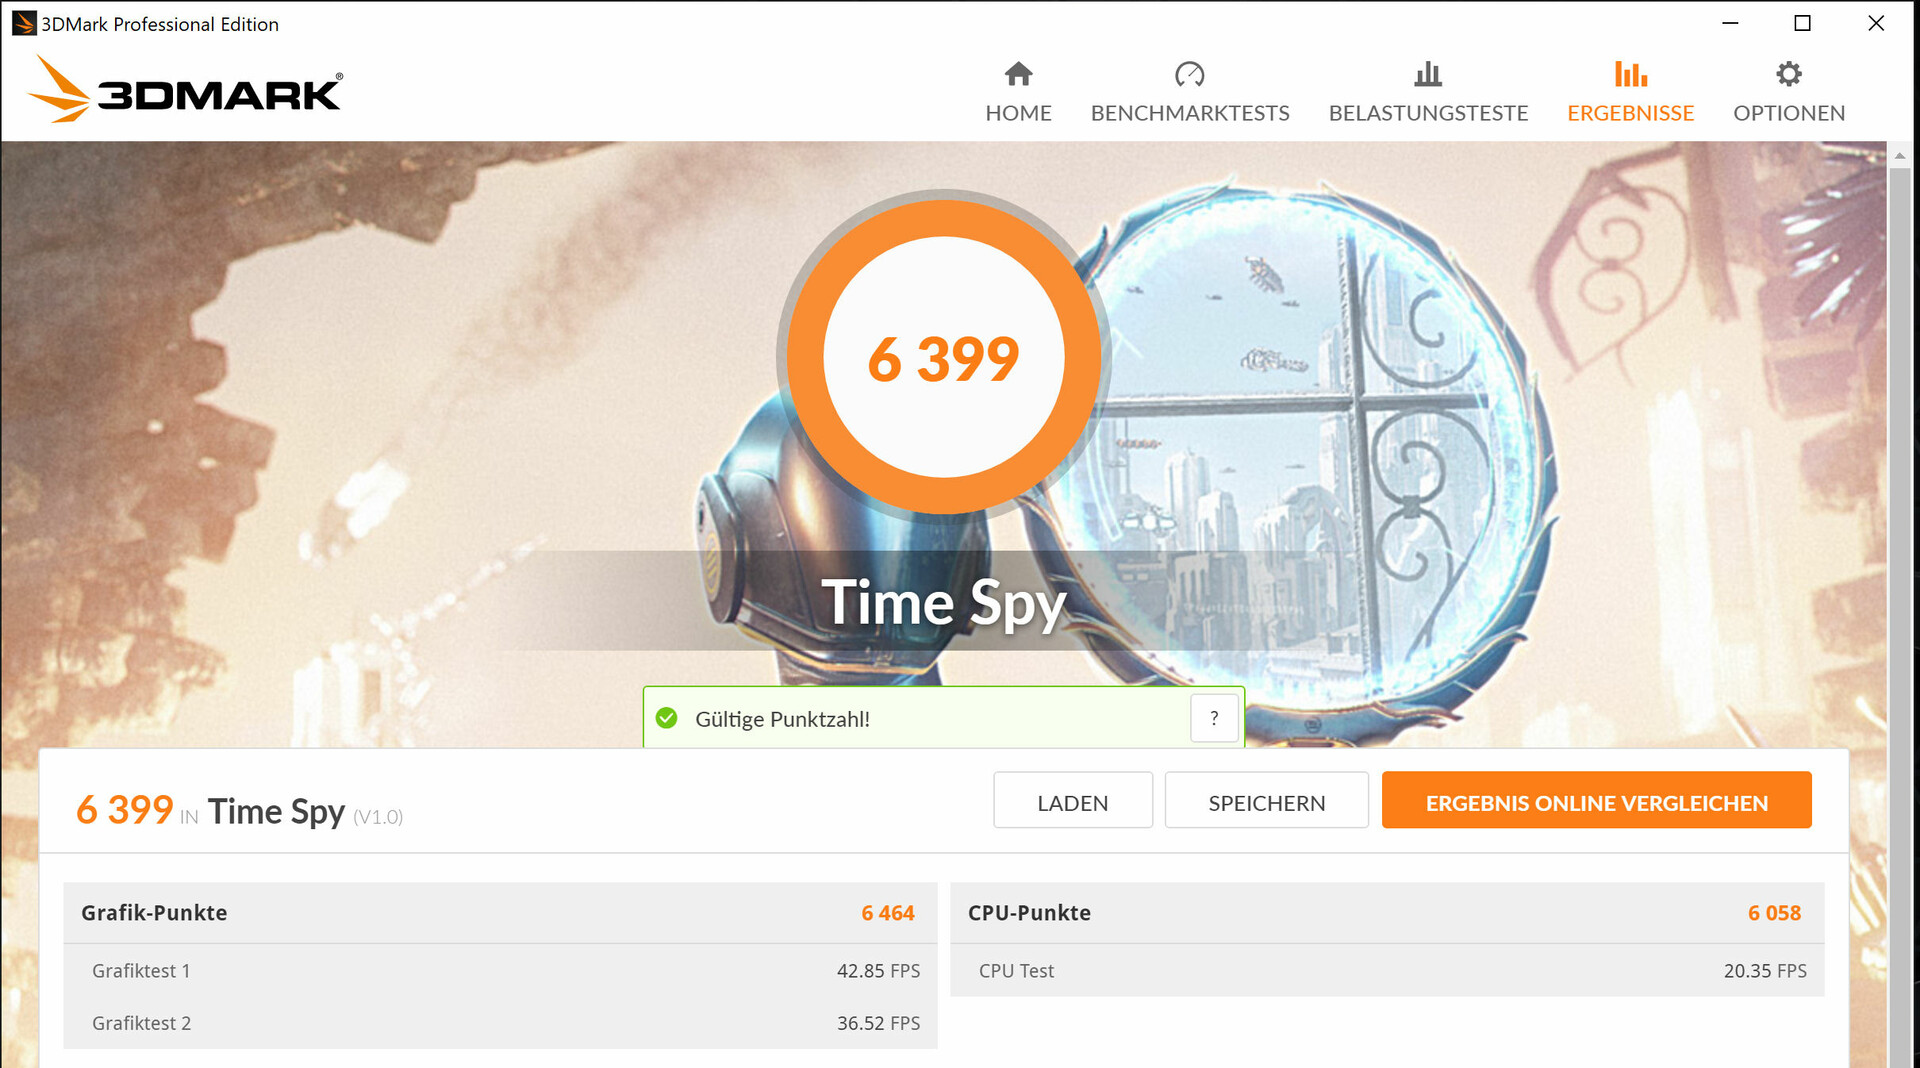
| 3DMark Time Spy Score | 6399 points | |
Help | ||
| 3DMark | |
| 1920x1080 Fire Strike Graphics | |
| Average of class Gaming (12242 - 62849, n=116, last 2 years) | |
| Razer Blade 15 RTX 2070 Max-Q | |
| Gigabyte Aero 15-Y9 | |
| Gigabyte Aero 15-X9 | |
| MSI GS65 8RF-019DE Stealth Thin | |
| 2560x1440 Time Spy Graphics | |
| Average of class Gaming (5012 - 26212, n=116, last 2 years) | |
| Razer Blade 15 RTX 2070 Max-Q | |
| Gigabyte Aero 15-X9 | |
| Gigabyte Aero 15-Y9 | |
Gaming Performance
The Aero 15 is able to play all current games fluidly. Generally this requires using FHD resolution at maximum detail settings. Many games will also allow the player to take advantage of the 4K screen; however, detail settings may have to be wound down a little.
| low | med. | high | ultra | 4K | |
|---|---|---|---|---|---|
| BioShock Infinite (2013) | 280.1 | 197.5 | 187.8 | 137.6 | |
| GTA V (2015) | 140 | 135.3 | 115.4 | 62.6 | 74 |
| The Witcher 3 (2015) | 255 | 192.7 | 117.3 | 65.7 | 39.6 |
| X-Plane 11.11 (2018) | 91 | 80.5 | 67.2 | 51.8 | |
| Far Cry 5 (2018) | 114 | 94 | 88 | 84 | 34 |
| Darksiders III (2018) | 137 | 103.5 | 94.3 | 84.8 | 29.8 |
| Apex Legends (2019) | 143.7 | 137.1 | 111.8 | 109.9 | 36 |
| Far Cry New Dawn (2019) | 101 | 88 | 82 | 74 | 36 |
| Metro Exodus (2019) | 116.7 | 77.7 | 58.2 | 47.8 | 20.9 |
| Anthem (2019) | 84.5 | 73.7 | 72.1 | 67.4 | 26.4 |
| Dirt Rally 2.0 (2019) | 157.8 | 116.1 | 101.1 | 66.3 | 31.2 |
| The Division 2 (2019) | 132 | 97 | 84 | 69 | 26 |
| The Witcher 3 - 1920x1080 Ultra Graphics & Postprocessing (HBAO+) | |
| Average of class Gaming (104.7 - 240, n=7, last 2 years) | |
| Acer Predator Triton 500 | |
| Razer Blade 15 RTX 2070 Max-Q | |
| Gigabyte Aero 15-Y9 | |
| Gigabyte Aero 15-X9 | |
| MSI GS65 8RF-019DE Stealth Thin | |
| Asus Zephyrus S GX531GS | |
| BioShock Infinite - 1920x1080 Ultra Preset, DX11 (DDOF) | |
| Razer Blade 15 RTX 2070 Max-Q | |
| Gigabyte Aero 15-Y9 | |
| Gigabyte Aero 15-X9 | |
| GTA V - 1920x1080 Highest AA:4xMSAA + FX AF:16x | |
| Average of class Gaming (48.3 - 186.9, n=94, last 2 years) | |
| Gigabyte Aero 15-Y9 | |
| Gigabyte Aero 15-X9 | |
| X-Plane 11.11 - 1920x1080 high (fps_test=3) | |
| Average of class Gaming (55.5 - 148.5, n=110, last 2 years) | |
| Gigabyte Aero 15-Y9 | |
| Gigabyte Aero 15-X9 | |
The higher frame rates achieved in comparison to the Aero 15-X9 are not overly noticeable, plus the gap could be narrowed by equipping the Aero 15-X9 with a second RAM module that would allow for dual-channel mode and an increase in frame-rate performance.
Due to the fact we no longer have the Aero 15-X9, we instead removed a RAM module from the Aero 15-X9 and repeated some of the game benchmarks in single-channel mode. Both Aero models delivered frame-rate results within spitting distance of each other. The only game that bucked this trend was Darksiders 3, which ran noticeably faster.
| Gigabyte Aero 15-Y9 Intel Core i9-8950HK, NVIDIA GeForce RTX 2080 Max-Q | Gigabyte Aero 15-X9 Intel Core i7-8750H, NVIDIA GeForce RTX 2070 Max-Q | Gigabyte Aero 15-Y9 Intel Core i9-8950HK, NVIDIA GeForce RTX 2080 Max-Q | |
|---|---|---|---|
| BioShock Infinite | |||
| 1920x1080 Ultra Preset, DX11 (DDOF) (fps) | 137.6 | 127.7 -7% | 118.9 ? -14% |
| X-Plane 11.11 | |||
| 1920x1080 high (fps_test=3) (fps) | 67.2 | 61.6 -8% | 55.8 ? -17% |
| Far Cry 5 | |||
| 1920x1080 Ultra Preset AA:T (fps) | 84 | 67 -20% | 66 ? -21% |
| Darksiders III | |||
| 1920x1080 Epic (fps) | 84.8 | 64.9 -23% | 81.4 ? -4% |
| Total Average (Program / Settings) | -15% /
-15% | -14% /
-14% |
To test whether or not the frame rate can be maintained over a longer time period, we run the game The Witcher 3 for approximately 60 minutes in FHD resolution and maximum detail settings. The game's protagonist is not moved during this test. The frame rates did drop over the test period, but remained at a playable level. No real performance drop could be determined.
Emissions - Too Hot Under Load
Noise Levels
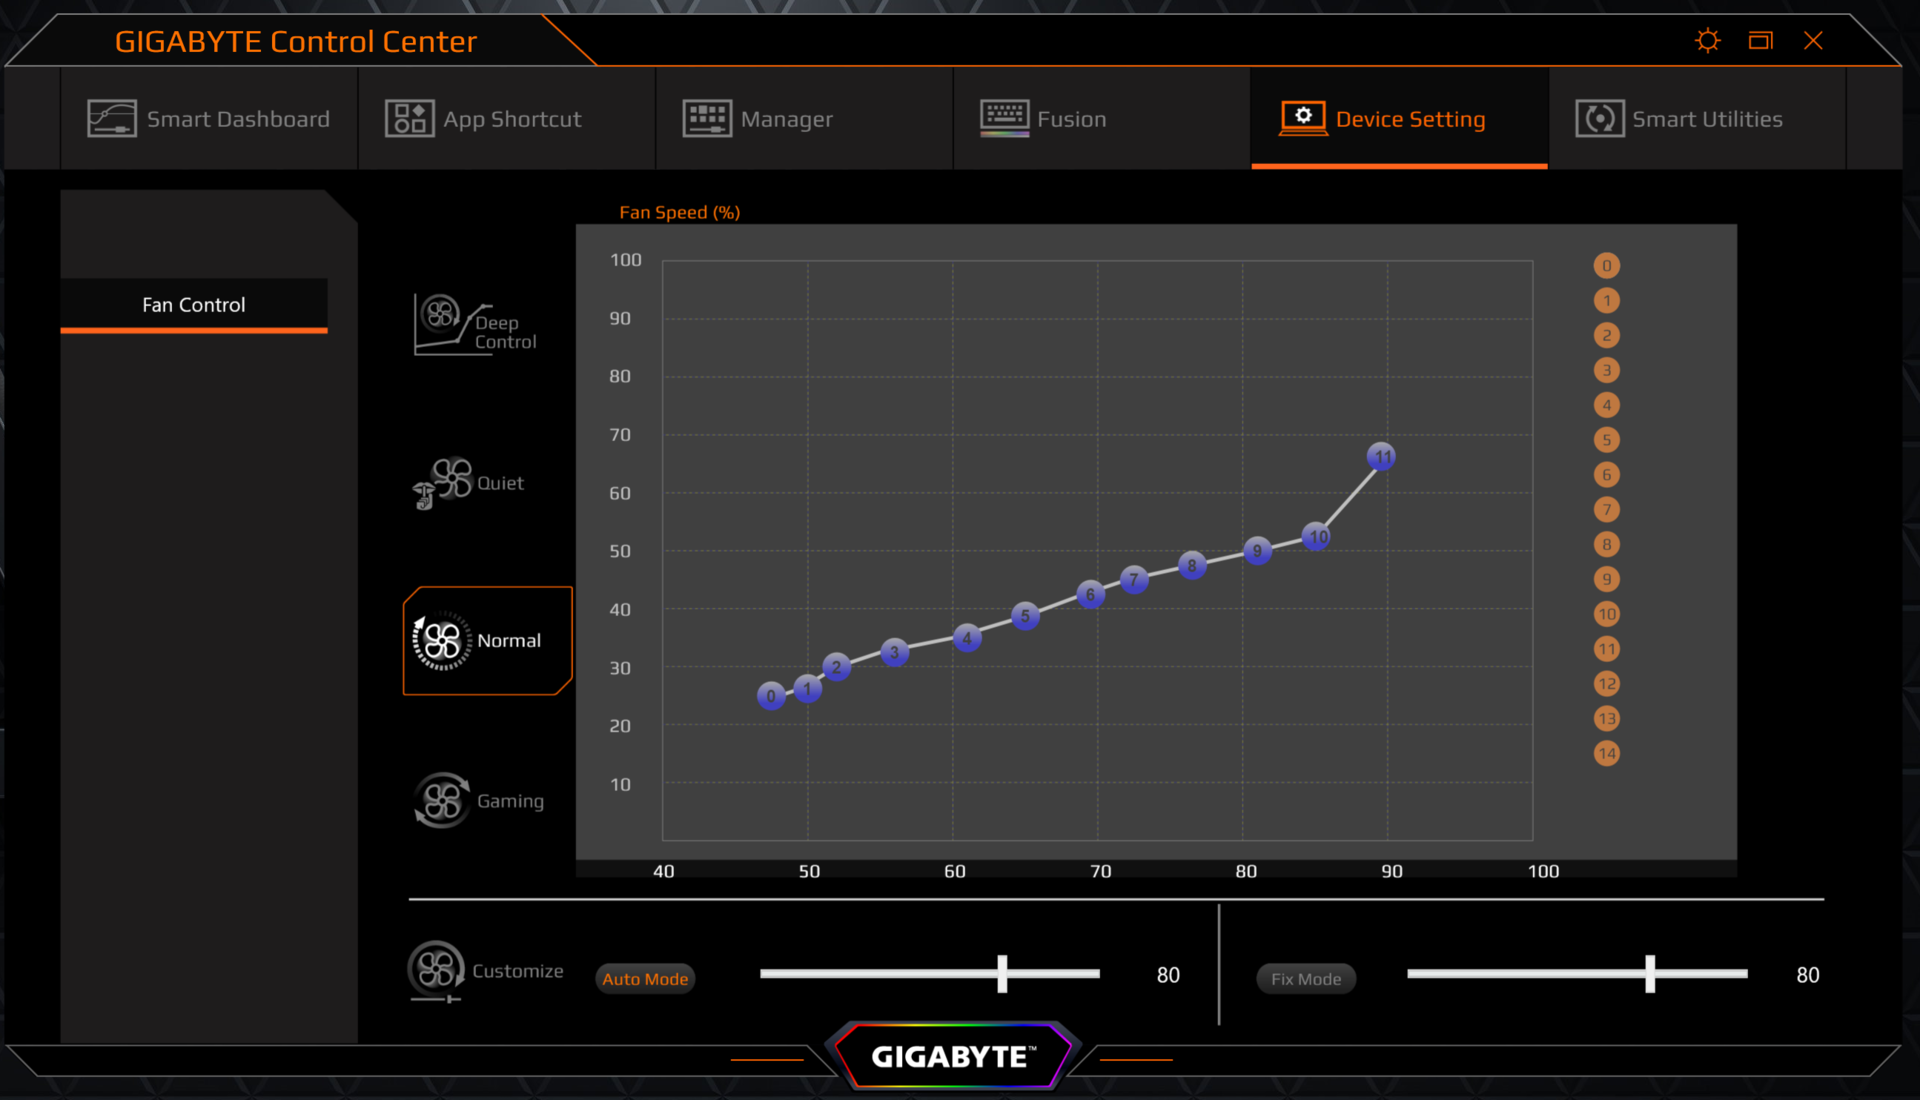
At idle and under light loads, noise levels are kept in check despite a fan that runs constantly. It is possible to run the laptop in silent mode - for this, you have to go into the Gigabyte Control Center and set the fan control to "Quiet". When under load, the fans spin up considerably. During the stress tests we measured a noise level of 45 dB(A). However, during the test it produced less noise than the lower-equipped Aero 15-X9. During gaming it was similarly loud - here we measured noise levels between 38 and 45 dB(A) (average: 44 dB(A)). For comparison, we measured average noise levels in our The Witcher 3 test of between 42 and 43 dB(A).
Noise level
| Idle |
| 31 / 33 / 36 dB(A) |
| Load |
| 44 / 45 dB(A) |
 | ||
30 dB silent 40 dB(A) audible 50 dB(A) loud |
||
min: | ||
| Gigabyte Aero 15-Y9 i9-8950HK, GeForce RTX 2080 Max-Q | Gigabyte Aero 15-X9 i7-8750H, GeForce RTX 2070 Max-Q | MSI GS65 8RF-019DE Stealth Thin i7-8750H, GeForce GTX 1070 Max-Q | Asus Zephyrus S GX531GS i7-8750H, GeForce GTX 1070 Max-Q | Acer Predator Triton 500 i7-8750H, GeForce RTX 2080 Max-Q | Razer Blade 15 RTX 2070 Max-Q i7-8750H, GeForce RTX 2070 Max-Q | Average of class Gaming | |
|---|---|---|---|---|---|---|---|
| Noise | -2% | 3% | -9% | 0% | 8% | 8% | |
| off / environment * (dB) | 29 | 30 -3% | 30 -3% | 29 -0% | 29 -0% | 28.8 1% | 24.1 ? 17% |
| Idle Minimum * (dB) | 31 | 32 -3% | 30 3% | 33 -6% | 30 3% | 28.8 7% | 26 ? 16% |
| Idle Average * (dB) | 33 | 34 -3% | 31 6% | 34 -3% | 32 3% | 28.8 13% | 27.5 ? 17% |
| Idle Maximum * (dB) | 36 | 36 -0% | 34 6% | 40 -11% | 34 6% | 29.4 18% | 30.1 ? 16% |
| Load Average * (dB) | 44 | 42 5% | 43 2% | 47 -7% | 44 -0% | 35.7 19% | 43.8 ? -0% |
| Witcher 3 ultra * (dB) | 43 | 44 -2% | 42 2% | 51 -19% | 46 -7% | 42.5 1% | |
| Load Maximum * (dB) | 45 | 48 -7% | 44 2% | 53 -18% | 47 -4% | 45 -0% | 54.3 ? -21% |
* ... smaller is better
Temperatures
Our stress test (Prime95 and FurMark running for at least one hour) saw the Aero 15 pass in both mains and battery operation but at different clock speeds. In mains operation the CPU flicked between 2 and 2.1 GHz with the GPU running at 300 MHz. The clock speed of the GPU didn't change whilst running on battery, but the CPU clock dropped to between 1.4 and 1.8 GHz.
The Aero 15-Y9 got significantly warmer during operation than the Aero 15-X9. At two points on the underside we measured temperatures just below 70° C. The temperatures were a little lower during our The Witcher 3 tests (the game ran for one hour in FHD resolution and maximum detail settings). As a result, the laptop cannot be used on one's lap whilst under full load or gaming but only during more everyday or casual use, during which the measured temperatures were not an issue. The stress test does represent an extreme scenario that wouldn't be encountered during normal usage - it is used instead to test whether or not the laptop is stable under full load.
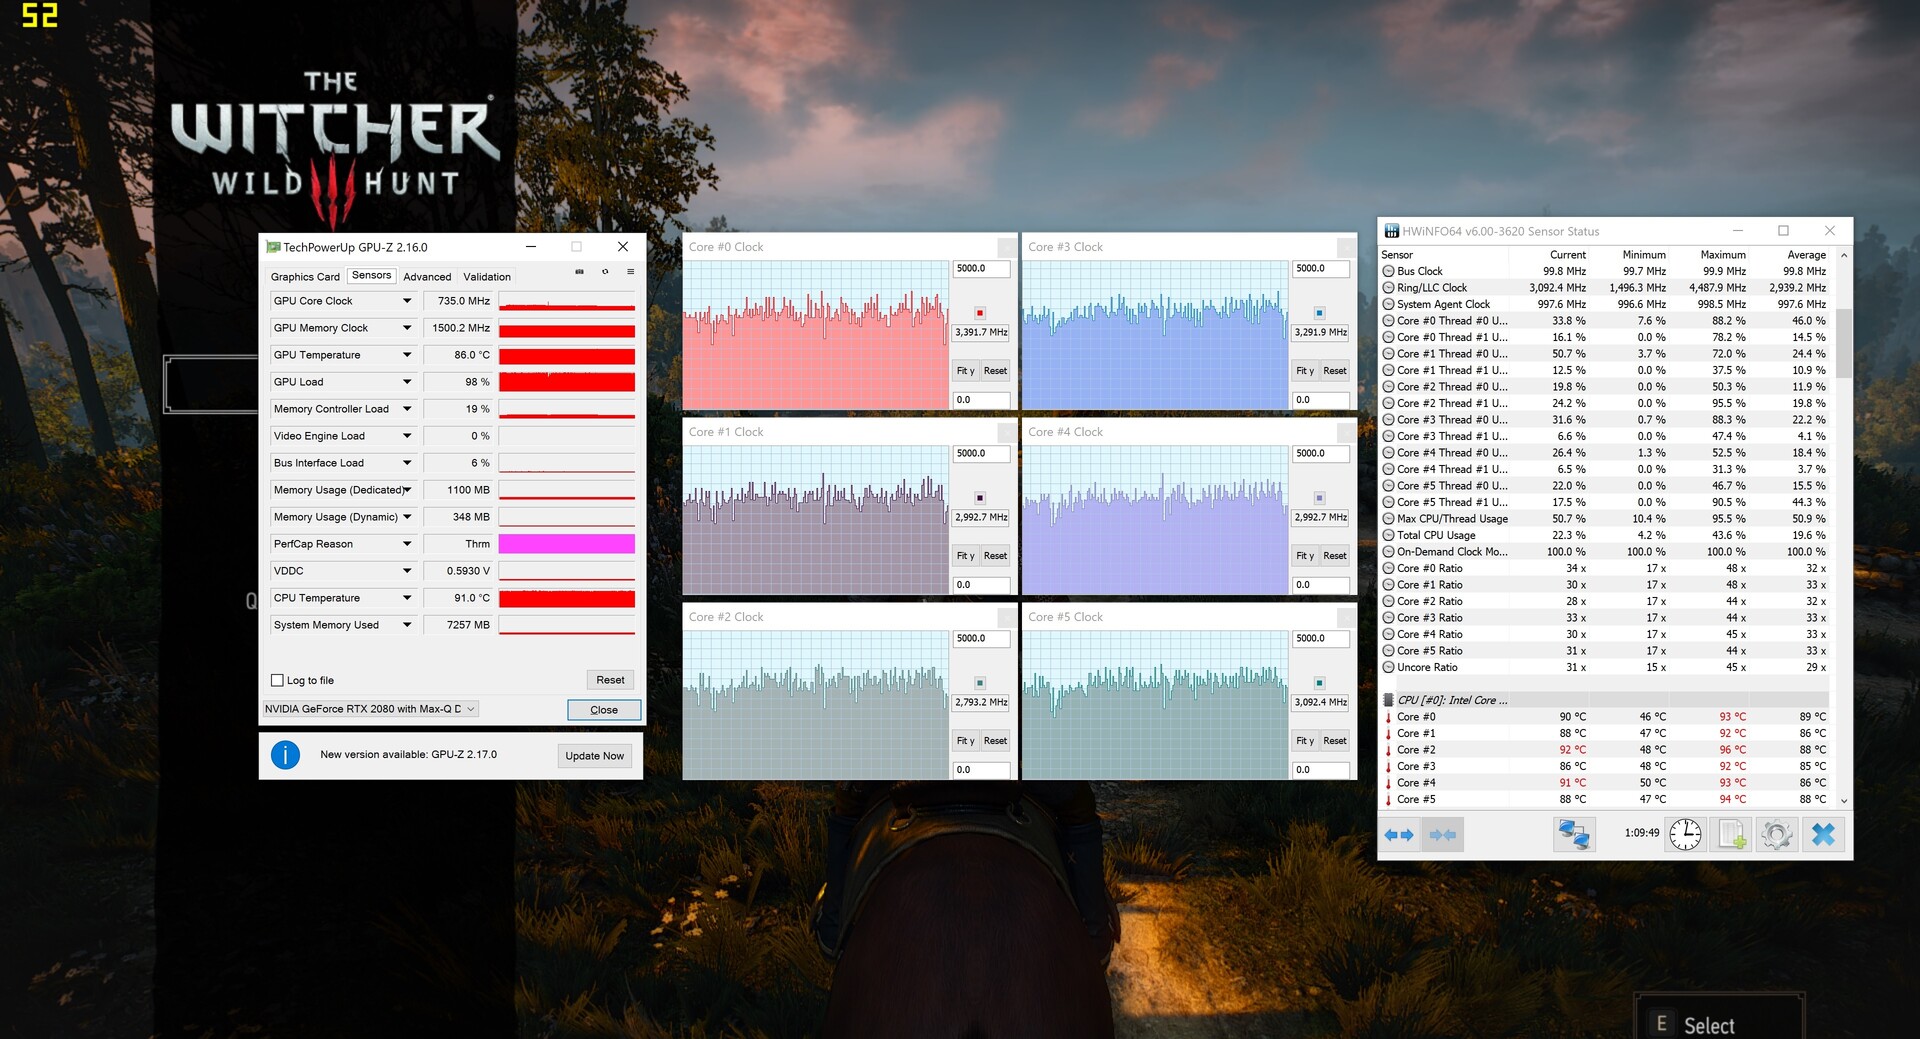
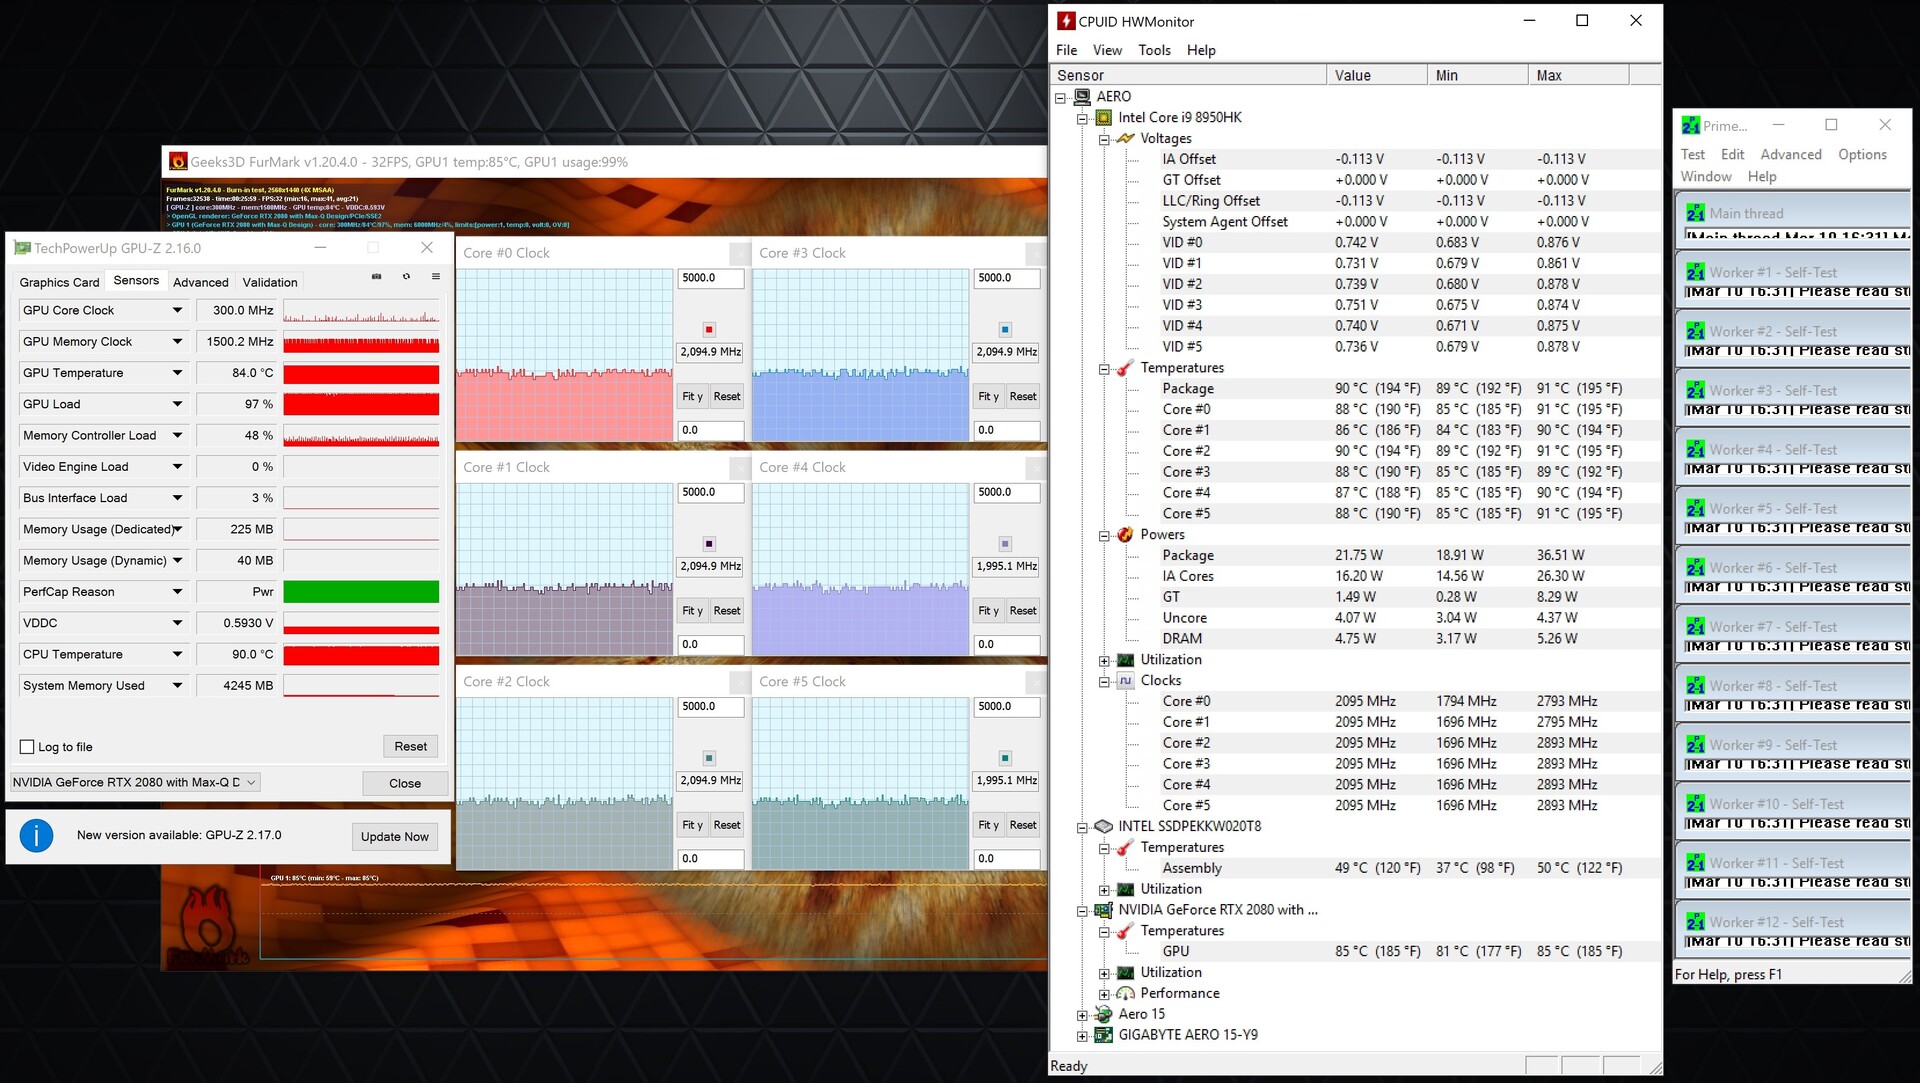
(-) The maximum temperature on the upper side is 64 °C / 147 F, compared to the average of 40.4 °C / 105 F, ranging from 21.2 to 68.8 °C for the class Gaming.
(-) The bottom heats up to a maximum of 69 °C / 156 F, compared to the average of 43.2 °C / 110 F
(+) In idle usage, the average temperature for the upper side is 26.4 °C / 80 F, compared to the device average of 33.9 °C / 93 F.
(-) Playing The Witcher 3, the average temperature for the upper side is 48.3 °C / 119 F, compared to the device average of 33.9 °C / 93 F.
(-) The palmrests and touchpad can get very hot to the touch with a maximum of 41 °C / 105.8 F.
(-) The average temperature of the palmrest area of similar devices was 28.8 °C / 83.8 F (-12.2 °C / -22 F).
| Gigabyte Aero 15-Y9 i9-8950HK, GeForce RTX 2080 Max-Q | Gigabyte Aero 15-X9 i7-8750H, GeForce RTX 2070 Max-Q | MSI GS65 8RF-019DE Stealth Thin i7-8750H, GeForce GTX 1070 Max-Q | Asus Zephyrus S GX531GS i7-8750H, GeForce GTX 1070 Max-Q | Acer Predator Triton 500 i7-8750H, GeForce RTX 2080 Max-Q | Razer Blade 15 RTX 2070 Max-Q i7-8750H, GeForce RTX 2070 Max-Q | Average of class Gaming | |
|---|---|---|---|---|---|---|---|
| Heat | 8% | 16% | 6% | 3% | 18% | 9% | |
| Maximum Upper Side * (°C) | 64 | 56 12% | 49 23% | 54 16% | 49 23% | 49 23% | 45.2 ? 29% |
| Maximum Bottom * (°C) | 69 | 66 4% | 63 9% | 60 13% | 58 16% | 49 29% | 48.2 ? 30% |
| Idle Upper Side * (°C) | 29 | 27 7% | 24 17% | 30 -3% | 33 -14% | 25.4 12% | 31 ? -7% |
| Idle Bottom * (°C) | 29 | 27 7% | 25 14% | 30 -3% | 33 -14% | 27.2 6% | 34.2 ? -18% |
* ... smaller is better
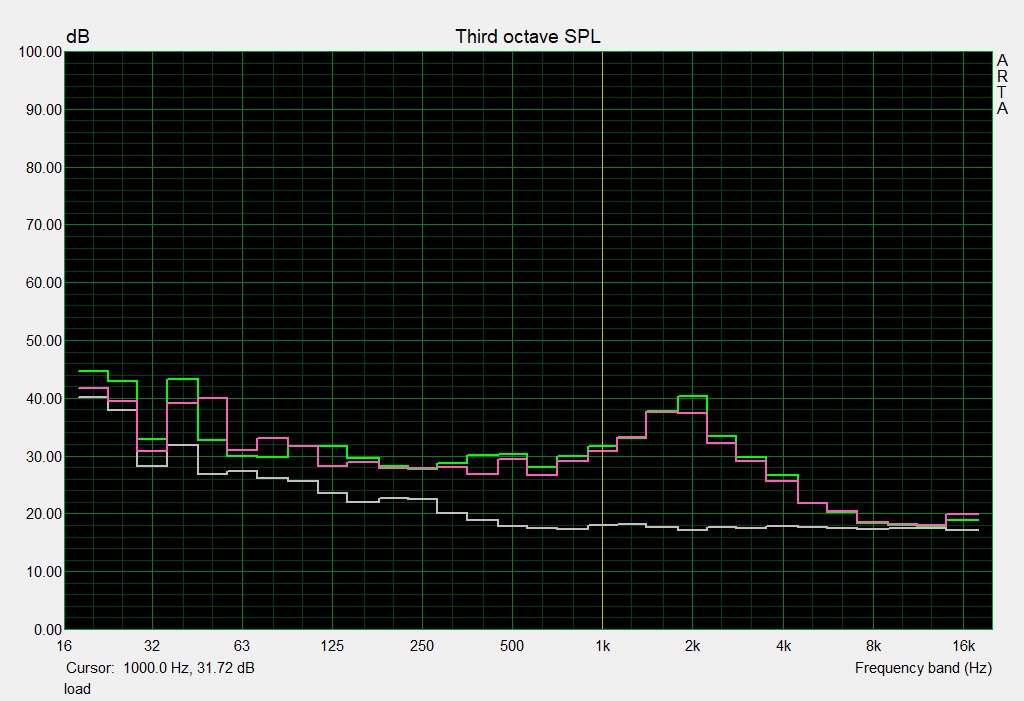
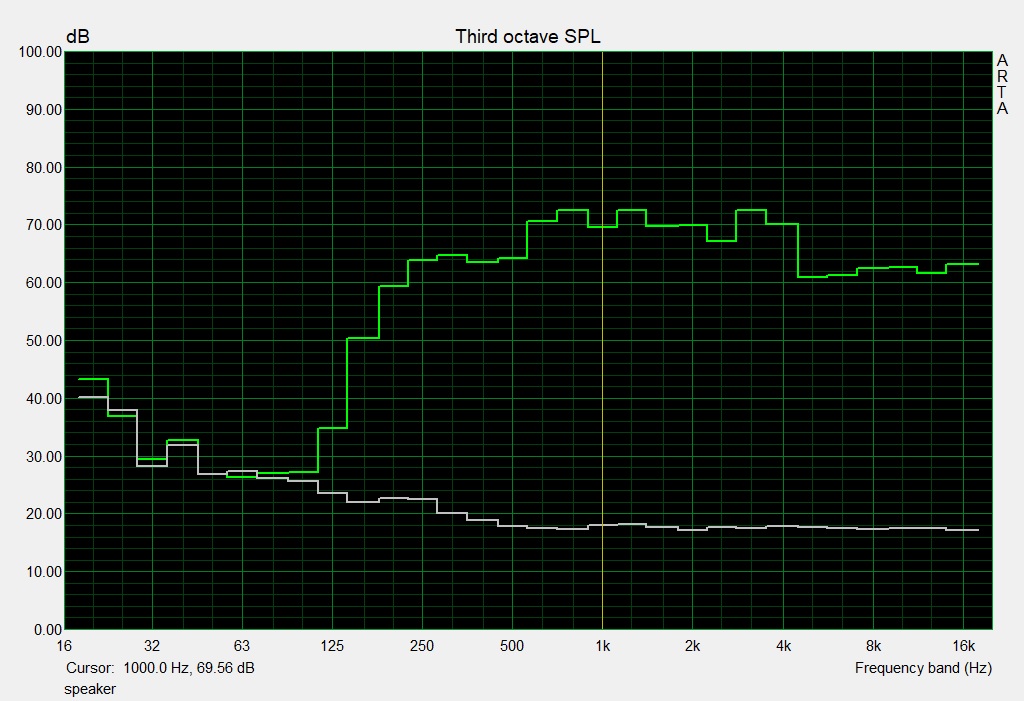
Speakers
Gigabyte Aero 15-Y9 audio analysis
(±) | speaker loudness is average but good (81 dB)
Bass 100 - 315 Hz
(±) | reduced bass - on average 14.1% lower than median
(±) | linearity of bass is average (13.7% delta to prev. frequency)
Mids 400 - 2000 Hz
(±) | higher mids - on average 5.3% higher than median
(+) | mids are linear (5.1% delta to prev. frequency)
Highs 2 - 16 kHz
(+) | balanced highs - only 3.8% away from median
(+) | highs are linear (6.5% delta to prev. frequency)
Overall 100 - 16.000 Hz
(±) | linearity of overall sound is average (16.1% difference to median)
Compared to same class
» 39% of all tested devices in this class were better, 7% similar, 54% worse
» The best had a delta of 6%, average was 18%, worst was 132%
Compared to all devices tested
» 26% of all tested devices were better, 5% similar, 69% worse
» The best had a delta of 4%, average was 23%, worst was 134%
Acer Predator Triton 500 audio analysis
(±) | speaker loudness is average but good (81 dB)
Bass 100 - 315 Hz
(±) | reduced bass - on average 13% lower than median
(±) | linearity of bass is average (12.3% delta to prev. frequency)
Mids 400 - 2000 Hz
(+) | balanced mids - only 3.8% away from median
(+) | mids are linear (5.3% delta to prev. frequency)
Highs 2 - 16 kHz
(+) | balanced highs - only 2.3% away from median
(+) | highs are linear (4.7% delta to prev. frequency)
Overall 100 - 16.000 Hz
(+) | overall sound is linear (14.5% difference to median)
Compared to same class
» 27% of all tested devices in this class were better, 7% similar, 66% worse
» The best had a delta of 6%, average was 18%, worst was 132%
Compared to all devices tested
» 19% of all tested devices were better, 4% similar, 77% worse
» The best had a delta of 4%, average was 23%, worst was 134%
Power Management - Reduced Runtime
Power Consumption
The Aero delivers no surprises in terms of power consumption. At idle, we measured a maximum consumption of 27 watts. During our stress tests this value climbed to 183 watts. During gaming the consumption was reduced and our The Witcher 3 test gave a measurement of 130 watts. The stated maximum output of the power adapter is 230 watts. In general when under load the Aero 15-Y9 burned through more power than its Aero 15-X9 sibling. This is to be expected given its more-powerful CPU and GPU combination and 4K display.
| Off / Standby | |
| Idle | |
| Load |
|
Key:
min: | |
| Gigabyte Aero 15-Y9 i9-8950HK, GeForce RTX 2080 Max-Q | Gigabyte Aero 15-X9 i7-8750H, GeForce RTX 2070 Max-Q | MSI GS65 8RF-019DE Stealth Thin i7-8750H, GeForce GTX 1070 Max-Q | Asus Zephyrus S GX531GS i7-8750H, GeForce GTX 1070 Max-Q | Acer Predator Triton 500 i7-8750H, GeForce RTX 2080 Max-Q | Razer Blade 15 RTX 2070 Max-Q i7-8750H, GeForce RTX 2070 Max-Q | Average of class Gaming | |
|---|---|---|---|---|---|---|---|
| Power Consumption | 12% | 24% | -6% | -1% | 18% | 0% | |
| Idle Minimum * (Watt) | 17 | 16 6% | 7 59% | 17 -0% | 16 6% | 10.4 39% | 13 ? 24% |
| Idle Average * (Watt) | 21 | 18 14% | 11 48% | 20 5% | 22 -5% | 14.6 30% | 19 ? 10% |
| Idle Maximum * (Watt) | 27 | 23 15% | 20 26% | 29 -7% | 32 -19% | 16.3 40% | 24.5 ? 9% |
| Load Average * (Watt) | 111 | 88 21% | 98 12% | 112 -1% | 89 20% | 88.5 20% | 111.1 ? -0% |
| Witcher 3 ultra * (Watt) | 130 | 120 8% | 132 -2% | 152 -17% | 147 -13% | 155.4 -20% | |
| Load Maximum * (Watt) | 183 | 167 9% | 182 1% | 211 -15% | 173 5% | 182.4 -0% | 260 ? -42% |
* ... smaller is better
Battery Life
The Aero 15-Y9 achieved a total runtime in our real-world WLAN test of 5:54 h. With this test we simulate load via script by loading websites. The profile "Balanced" was active and the display brightness was set to around 150 cd/m2. In our video test, the 15.6-inch device gave up after 5:32 h. In this test we ran the short film Big Buck Bunny (H.264 encoding, 1920x1080 resolution) in a loop. The profile "Energy Saver" was active, the wireless module deactivated, and the display brightness was set to 150 cd/m2.
| Gigabyte Aero 15-Y9 i9-8950HK, GeForce RTX 2080 Max-Q, 94.24 Wh | Gigabyte Aero 15-X9 i7-8750H, GeForce RTX 2070 Max-Q, 94.24 Wh | MSI GS65 8RF-019DE Stealth Thin i7-8750H, GeForce GTX 1070 Max-Q, 82 Wh | Asus Zephyrus S GX531GS i7-8750H, GeForce GTX 1070 Max-Q, 50 Wh | Acer Predator Triton 500 i7-8750H, GeForce RTX 2080 Max-Q, 82 Wh | Razer Blade 15 RTX 2070 Max-Q i7-8750H, GeForce RTX 2070 Max-Q, 80 Wh | Average of class Gaming | |
|---|---|---|---|---|---|---|---|
| Battery runtime | 8% | -11% | -63% | -43% | -3% | 5% | |
| Reader / Idle (h) | 9.4 | 9.2 -2% | 8.5 -10% | 3.6 -62% | 5.6 -40% | 11.4 21% | 8.27 ? -12% |
| H.264 (h) | 5.5 | 6.1 11% | 5.9 7% | 8.32 ? 51% | |||
| WiFi v1.3 (h) | 5.9 | 6.4 8% | 6 2% | 2.6 -56% | 3.2 -46% | 6.5 10% | 7.11 ? 21% |
| Load (h) | 2.5 | 2.9 16% | 1.4 -44% | 0.7 -72% | 1.4 -44% | 1.5 -40% | 1.502 ? -40% |
Pros
Cons
Verdict
The unit in front of us today, the Aero 15-Y9, represents the flagship model of the Aero-15 range and as expected, the manufacturer aimed to impress: Gigabyte only went into the top drawer for this config. The combination of a Core i9-8950HK CPU and GeForce RTX 2080 Max-Q GPU allows for a smooth gaming experience in FHD resolution and with medium to max detail settings on its matte 4K screen.
However, the laptop is only equipped with a Max-Q (80 W) variant of the RTX 2080.
As a result, the Aero 15-Y9 is not really able to distance itself from the RTX 2070 Max-Q-equipped Aero 15-X9. When running in the same RAM mode (single-channel / dual-channel) both devices frequently delivered similar frame rates. As a result, most potential purchasers would be better served by the cheaper RTX 2070 Max-Q version of the Aero.
The included NVMe SSD offers not only excellent transfer rates but also lots of storage space (2 TB). Internally, the laptop also features an additional slot for a second M.2 2280 SSD. No slot is available for a 2.5-inch drive in the Aero 15.
The matte 4K IPS screen impressed with good viewing angles, good brightness and contrast, and impressive colour reproduction. However, the reaction times lag clearly behind the 144 Hz panel-equipped Aero 15-X9. The battery life is also somewhat behind the Aero 15-X9. This is no surprise and to be expected with the 4K display. However, in general the battery performance was very good for a gaming laptop.
Gigabyte Aero 15-Y9
- 05/14/2020 v7 (old)
Sascha Mölck
Price comparison
