Asus ROG Zephyrus S17 Laptop Review: Slim Gigantic Gaming Notebook with 300-Hz Panel

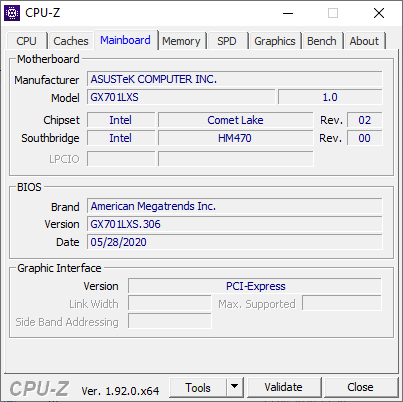
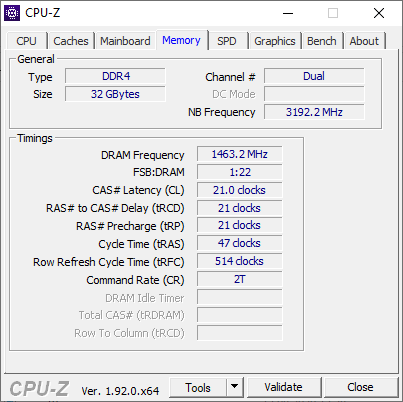
These days, gaming notebooks from Asus represent innovation. With the particularly small 14-inch Zephyrus G14 laptop, gamers can also play on the road, and with the ROG Zephyrus Duo, they can push content to an integrated second display. In contrast, the Asus Zephyrus S17 would almost look like a classic, if it weren't for the more unusual position of the keyboard. However, not only in terms of the exterior but also the insides, the 17-inch gaming laptop has a lot to offer. With the Intel Core i7-10875H and an Nvidia GeForce RTX 2080 Super Max-Q, it brings a lot of performance. In addition, there is 32 GB of RAM in dual-channel mode and a 1 TB SSD.
With this equipment, we compare the Asus ROG Zephyrus S17 with the competing devices listed below. In addition, you can also add more laptops from our database below each chart.
Rating | Date | Model | Weight | Height | Size | Resolution | Price |
|---|---|---|---|---|---|---|---|
| 82.4 % v7 (old) | 08 / 2020 | Asus Zephyrus S17 GX701LXS i7-10875H, GeForce RTX 2080 Super Max-Q | 2.6 kg | 18.7 mm | 17.30" | 1920x1080 | |
| 87.4 % v7 (old) | 06 / 2020 | Razer Blade Pro 17 RTX 2070 Max-Q 300 Hz i7-10875H, GeForce RTX 2070 Max-Q | 2.7 kg | 19.9 mm | 17.30" | 1920x1080 | |
| 83.7 % v7 (old) | 07 / 2020 | MSI GS75 10SF-609US i7-10875H, GeForce RTX 2070 Max-Q | 2.3 kg | 18.9 mm | 17.30" | 1920x1080 | |
| 84 % v7 (old) | 03 / 2020 | Lenovo Legion Y740-17IRHg-81UJ001VGE i7-9750H, GeForce RTX 2080 Max-Q | 3 kg | 25.5 mm | 17.30" | 1920x1080 | |
| 84.2 % v7 (old) | 02 / 2020 | Alienware m17 R2 P41E i9-9980HK, GeForce RTX 2080 Max-Q | 2.6 kg | 20.5 mm | 17.30" | 1920x1080 |
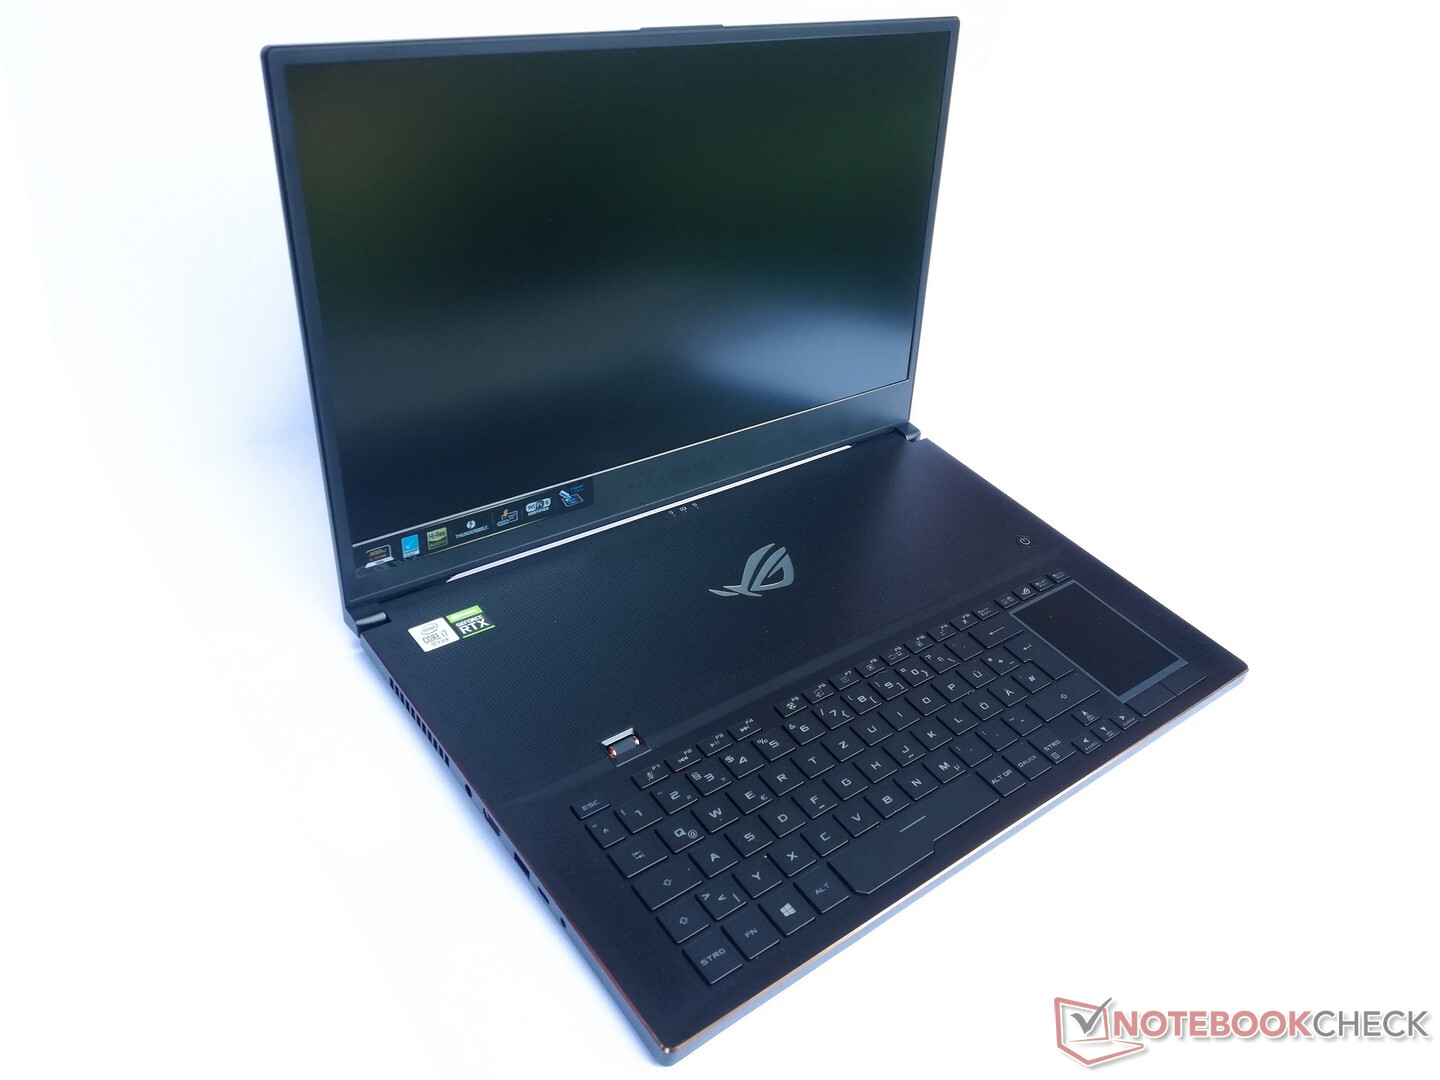
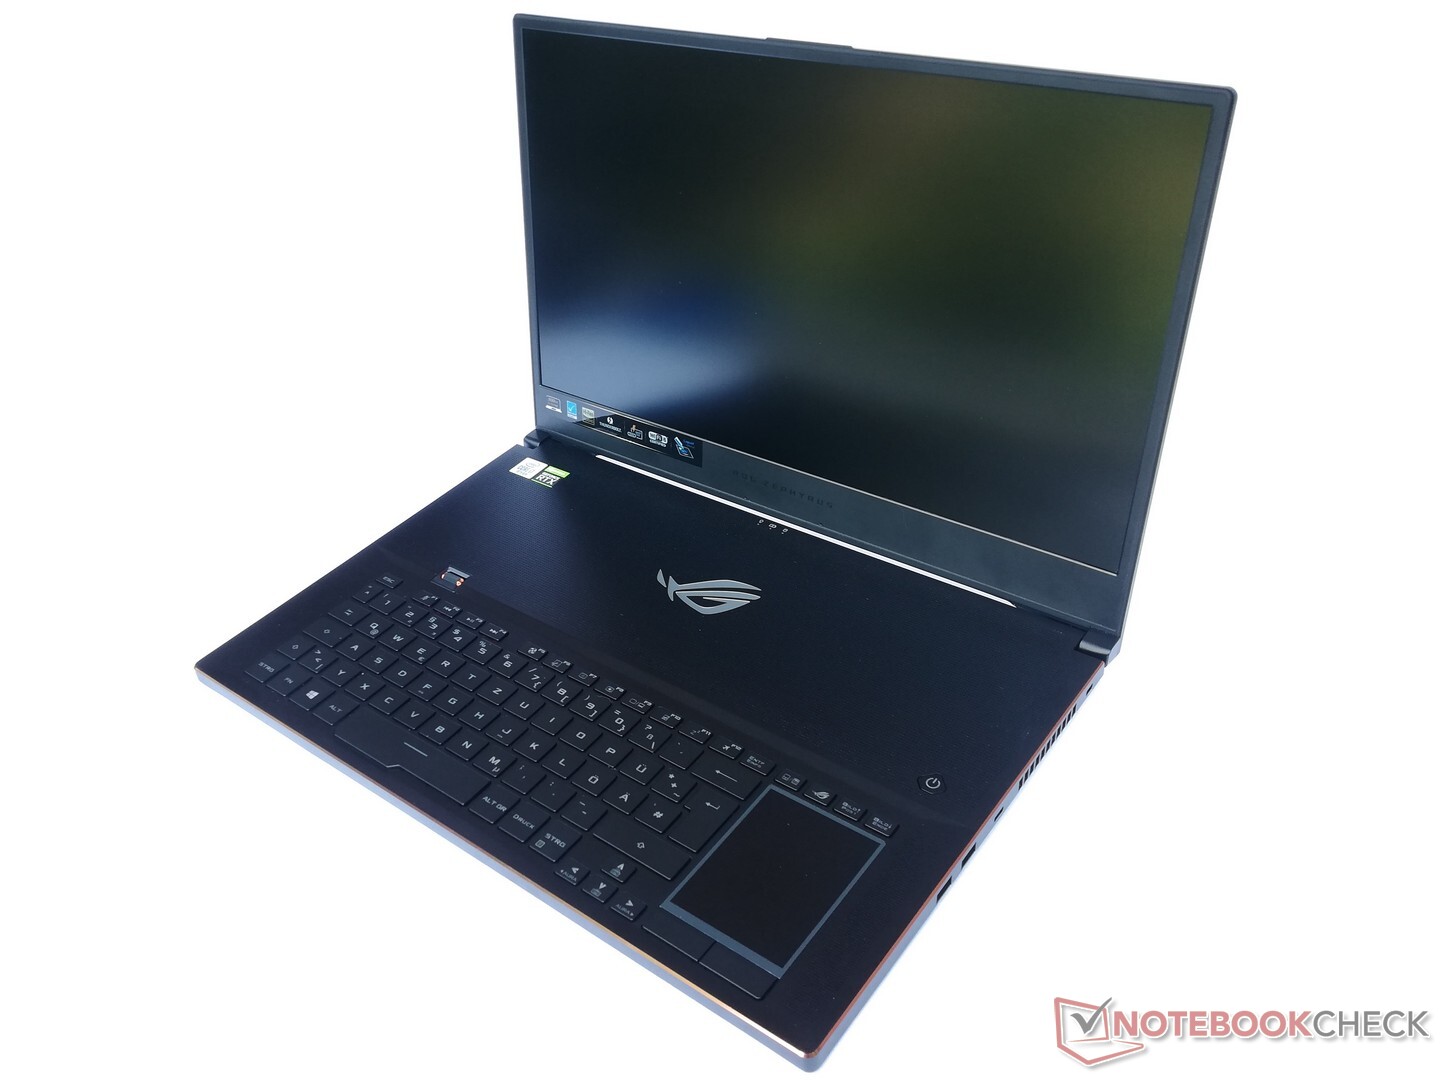
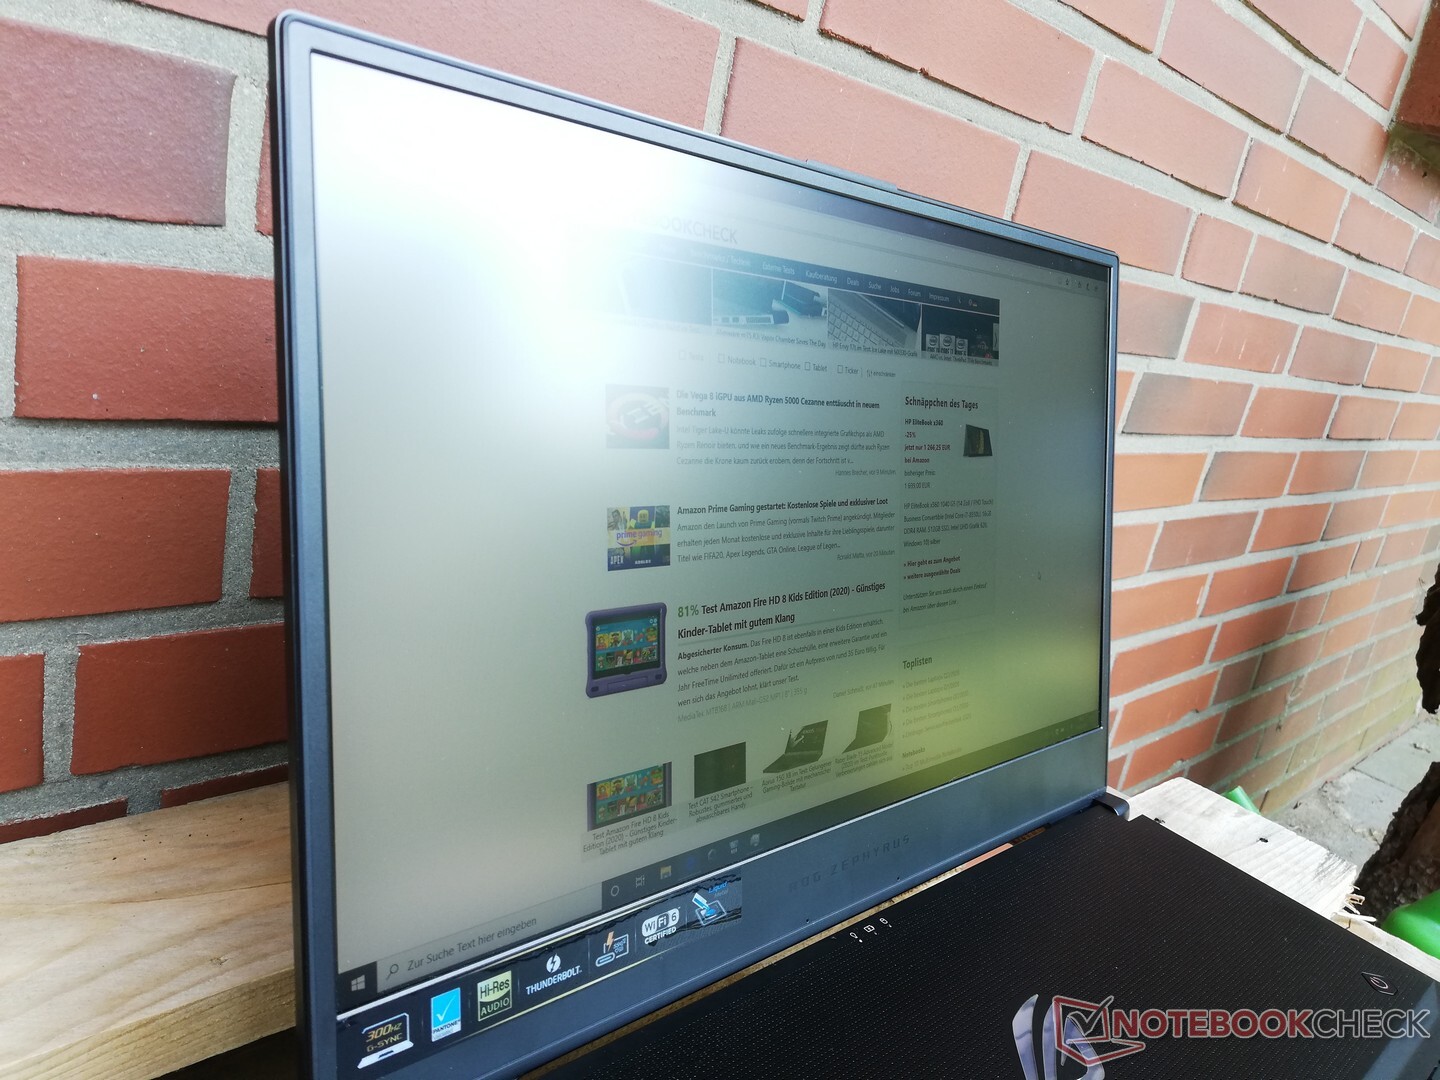
Case - A slim 17-incher
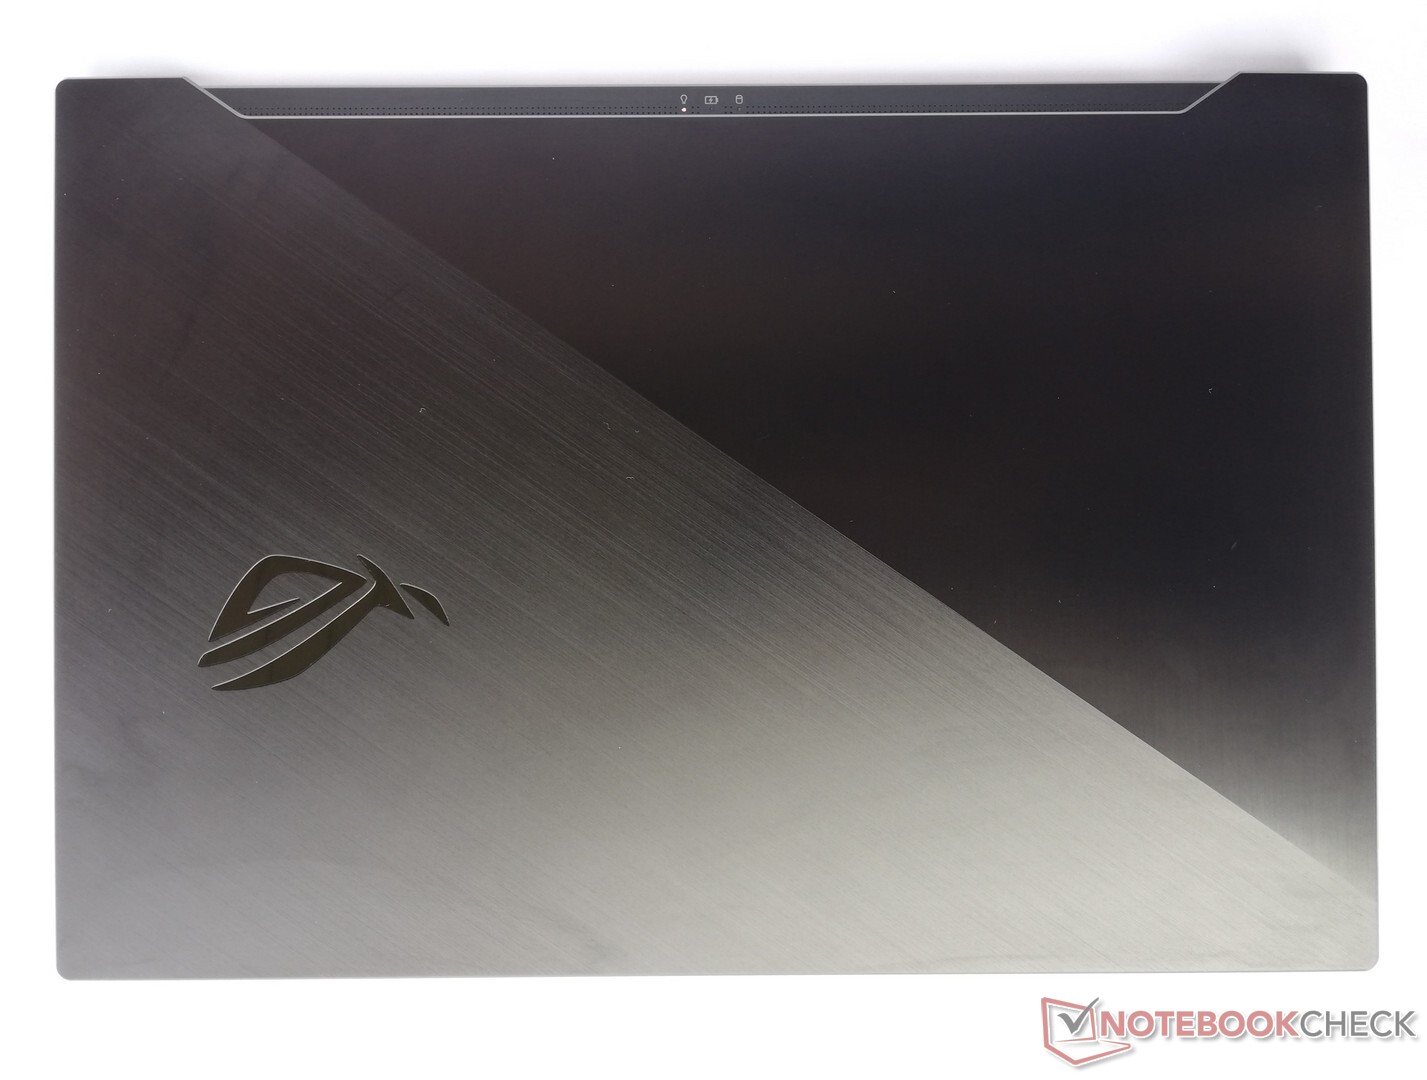
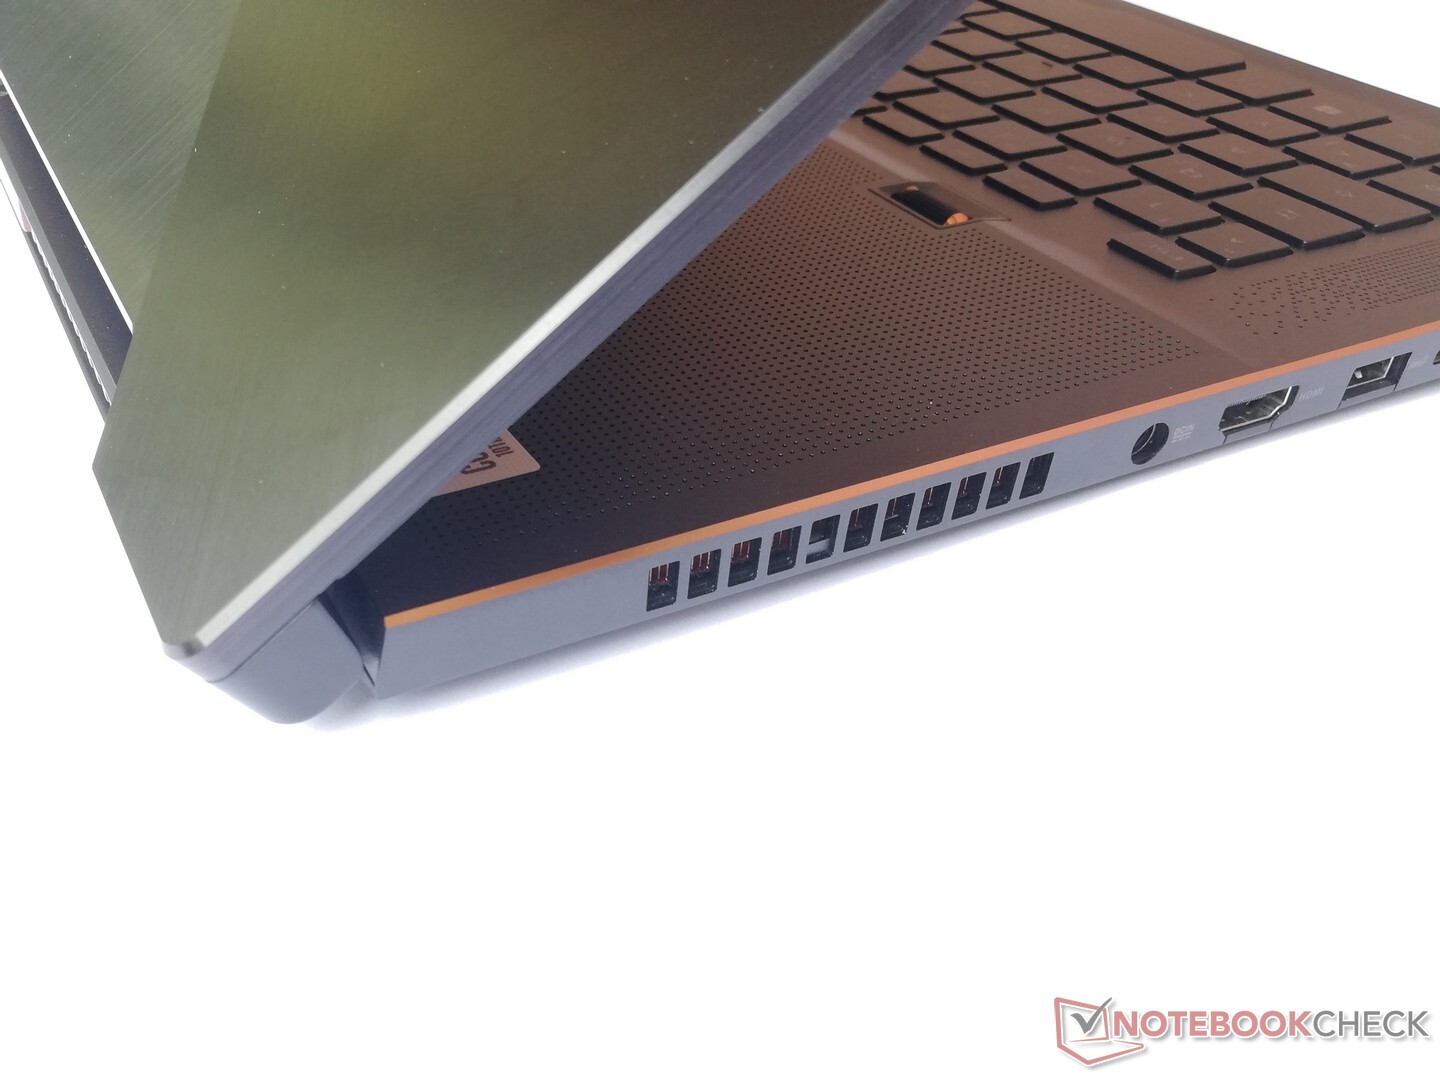
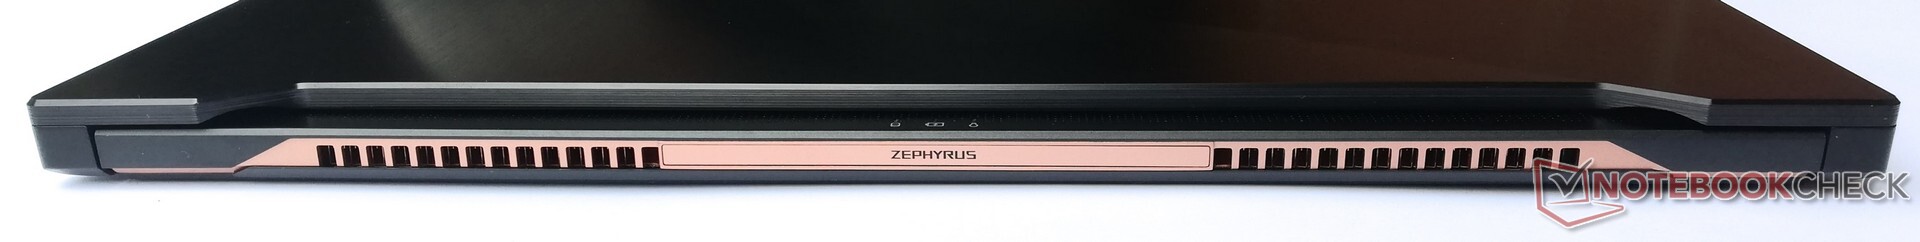
When it is closed, the Asus Zephyrus S17 appears very sturdy. The case is made of metal and shows no faults in workmanship at all, which creates a very high-quality impression. When you open up the notebook, a large gap opens at the bottom, which is supposed to optimize the air circulation. However, this also makes it more difficult to carry the laptop around with the lid opened, since the opened bottom plate appears significantly less sturdy than the rest of the Zephyrus S17. Due to this mechanism, the opening angle of the display is also limited to about 140°.
The Asus Zephyrus S17 is very large. However, when comparing it to other 17-inch devices, it becomes apparent that it has an average width and is also not as deep as the Lenovo Legion Y740, for example. On the other hand, the MSI GS75 Stealth 10SF and Razer Blade Pro 17 competitors are slightly less deep than our test unit. The weight of 2.6 kg (~5.7 lb) is also at the level of comparable notebooks.
Connection Equipment - A gaming laptop with a Thunderbolt port
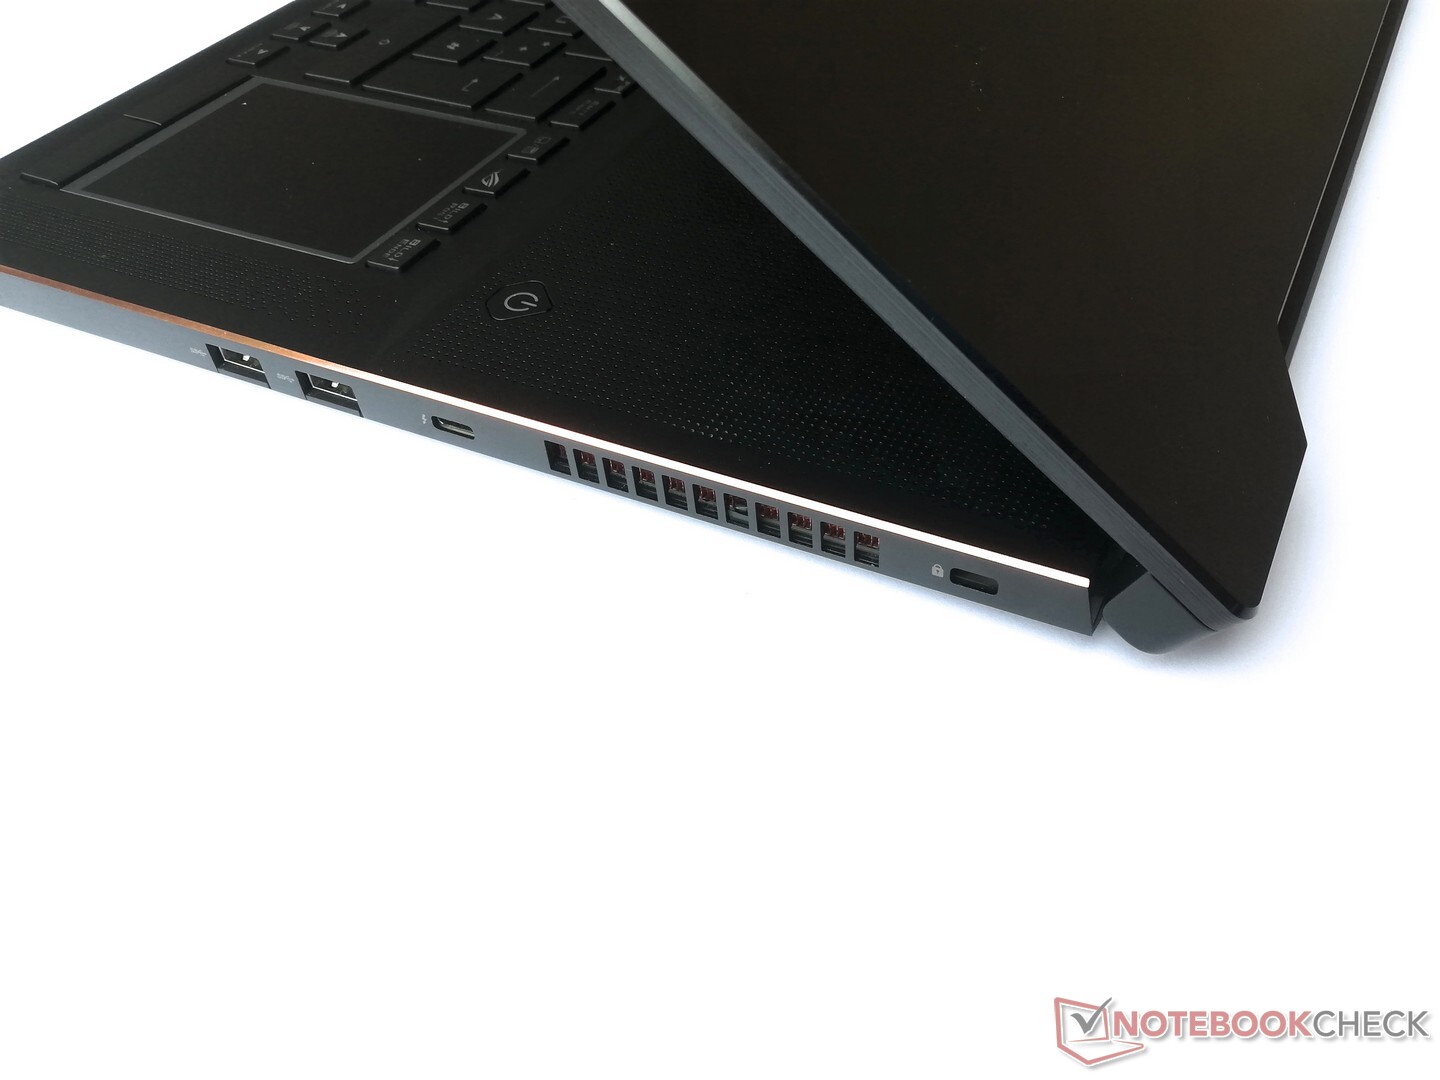
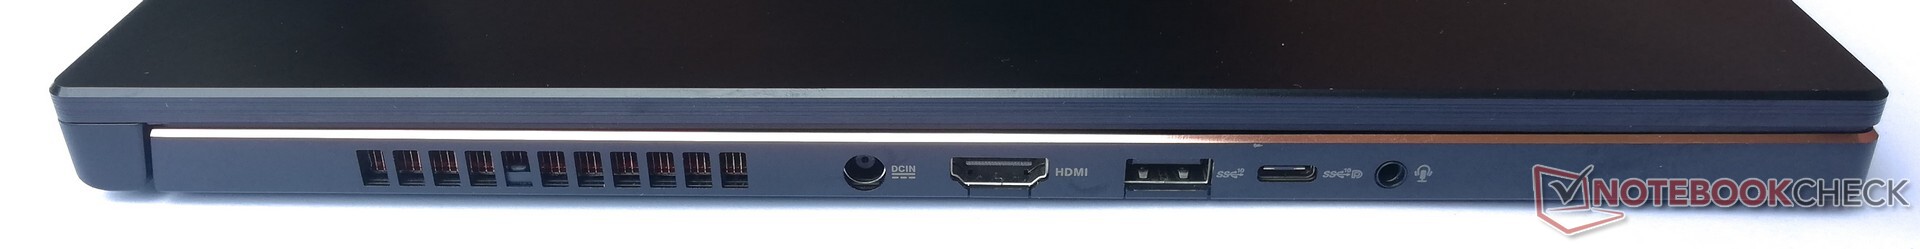
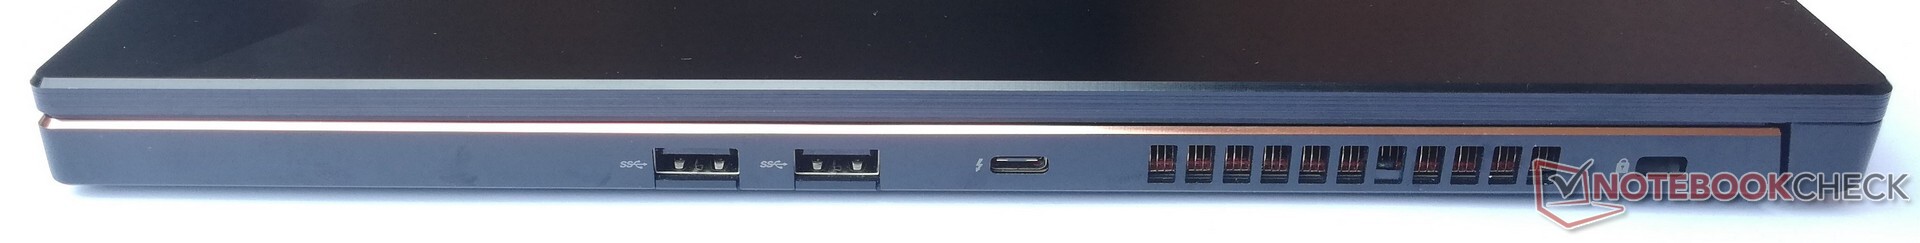
Asus forgoes a Gigabit LAN connection and a storage card reader in the Zephyrus S17. On the other hand, several USB 3.2 Gen2 ports and the Thunderbolt 3 connector give users the option to create almost any kind of connection via adapters.
Due to the large fan vents in the back area on the left and right sides, the connections have moved quite far forward toward the users. This might lead to some obstructions from plugs that are sticking out or cables when using an external mouse, for example.
Communication
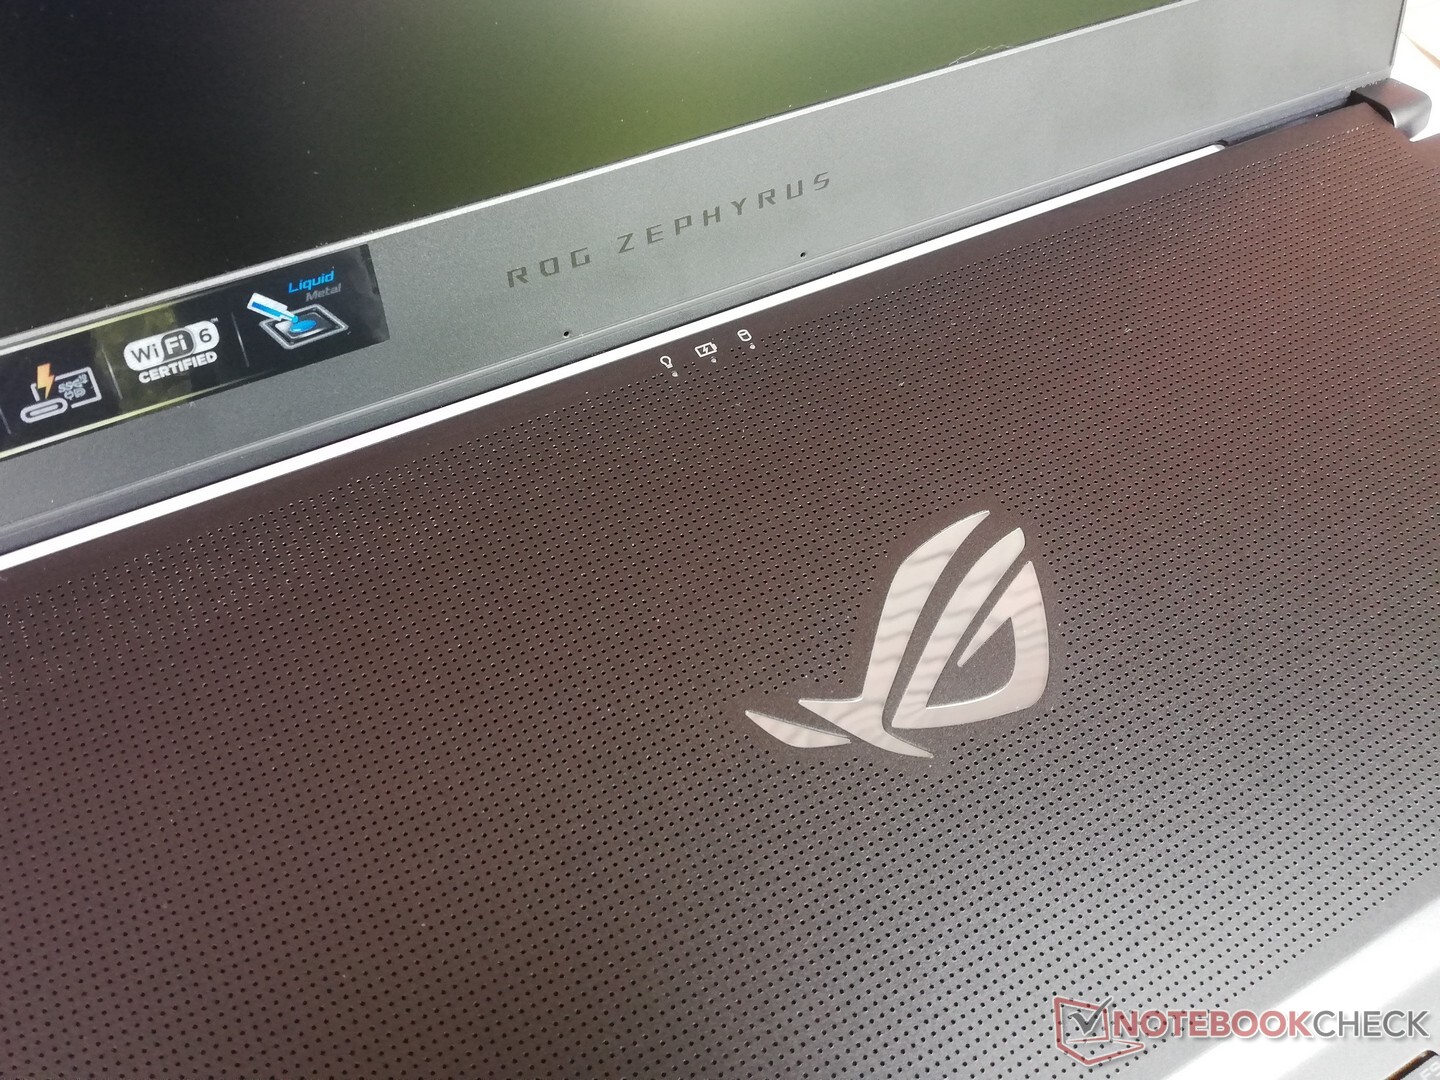
The Zephyrus S17 is able to create wireless connections via Bluetooth 5.0 and Wi-Fi 6. With the latter, it achieves speeds of up to 1260 Mb/s when receiving and 1390 Mb/s when sending data in our WLAN test. With this, the Asus gaming notebook offers a very good WLAN performance and is able to lead our test field.
Webcam
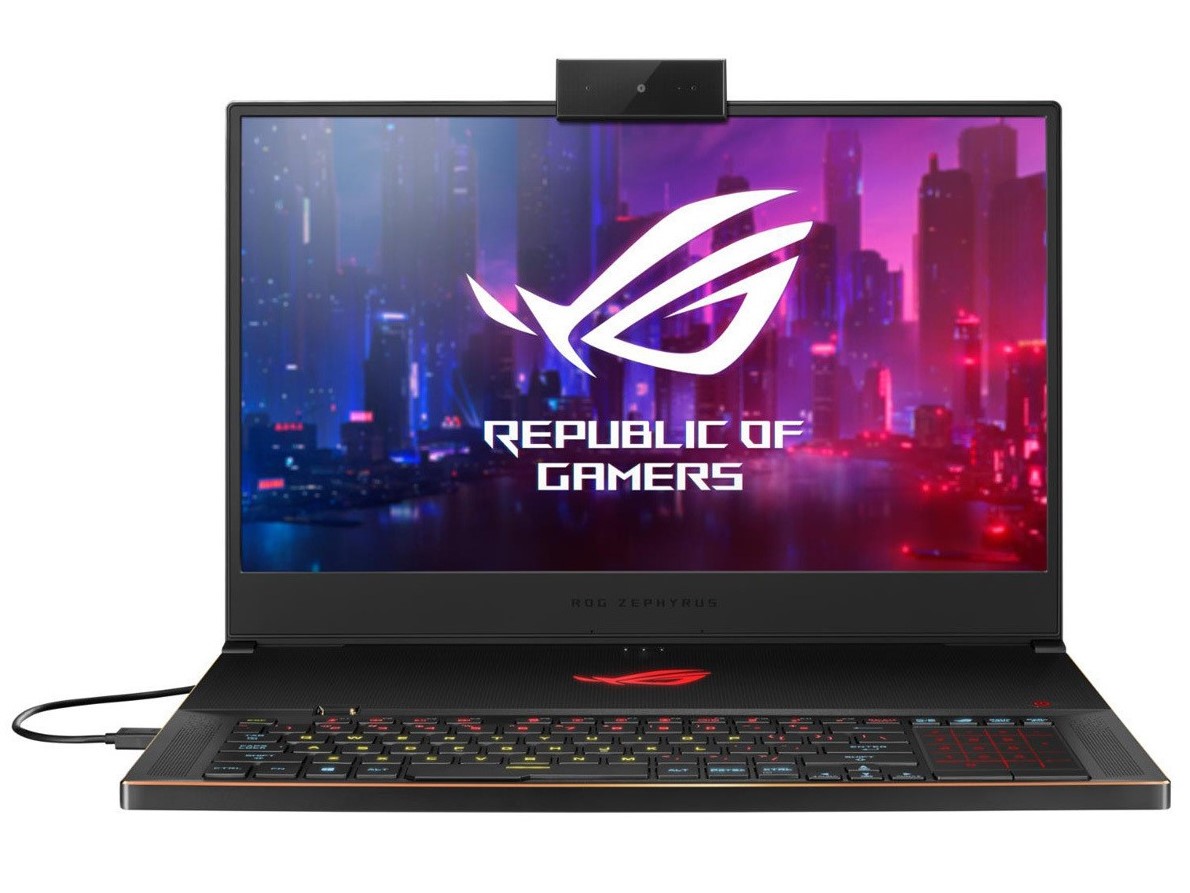
Asus has not equipped the Zephyrus S17 with a webcam but offers this as a separate accessory. The "ROG Eye" webcam, which costs about 160 Euros (~$190), can be fixed to the top of the display and can also be used as an external camera for other devices.
Accessories
In addition to the laptop itself, the box of the Asus Zephyrus S17 includes a 240-Watt power supply for gaming operation and a 65-Watt power supply with a USB Type-C connection, which can be used for regular operation or just charging the notebook. Asus also offers numerous generic accessories that are also suited for use with the Zephyrus S17.
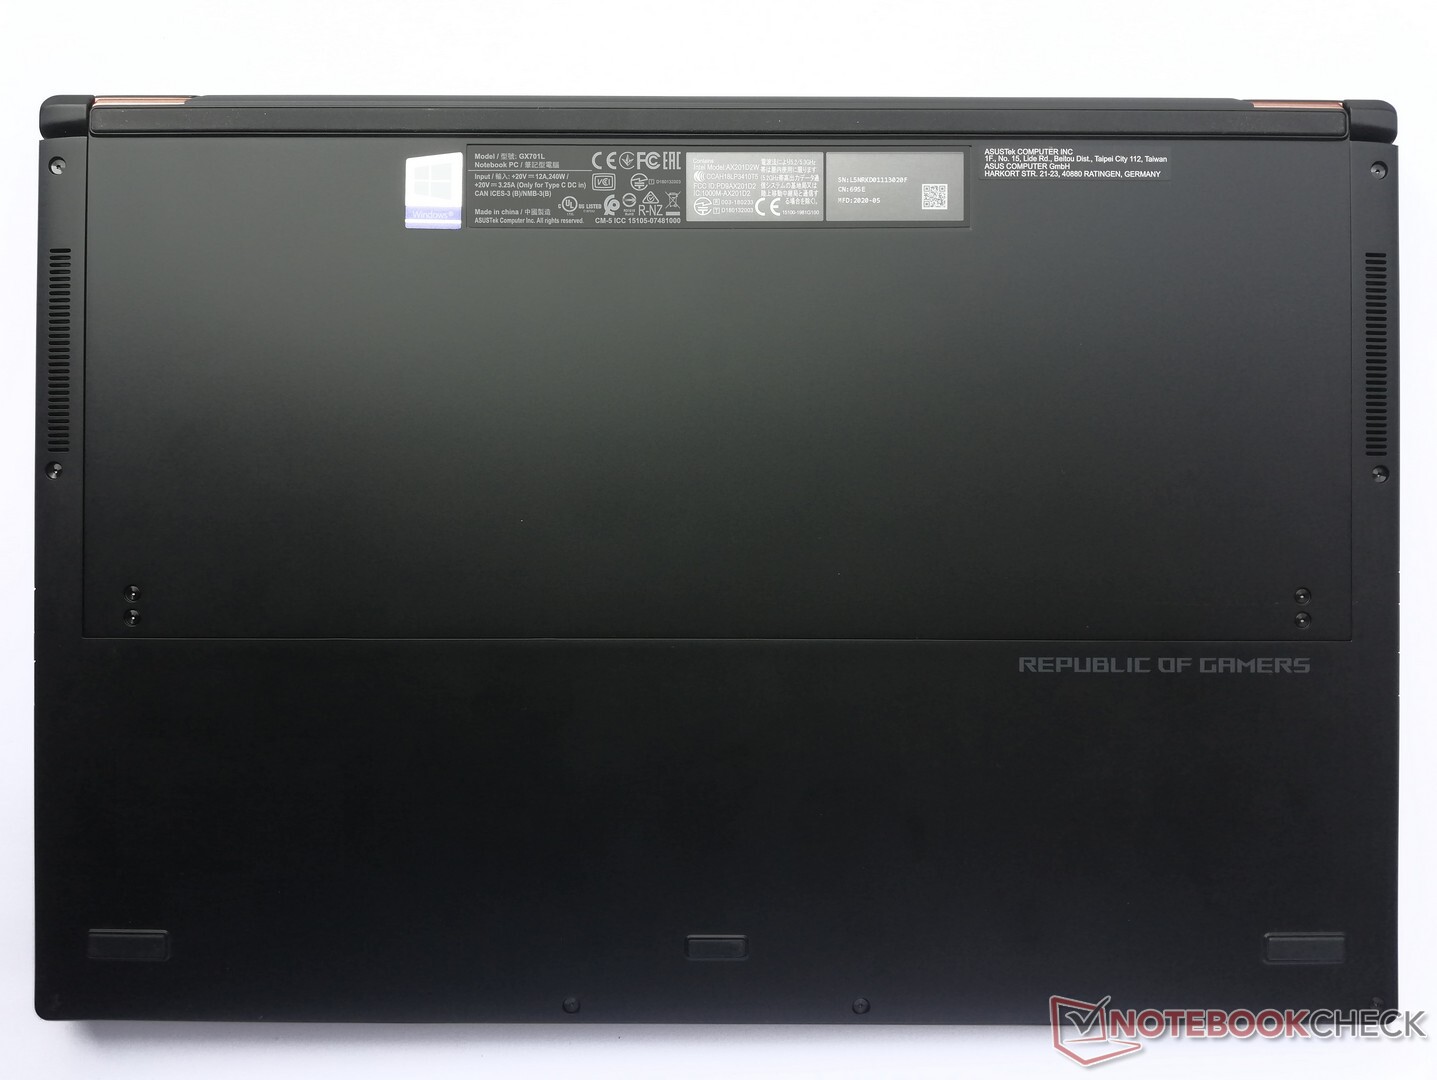
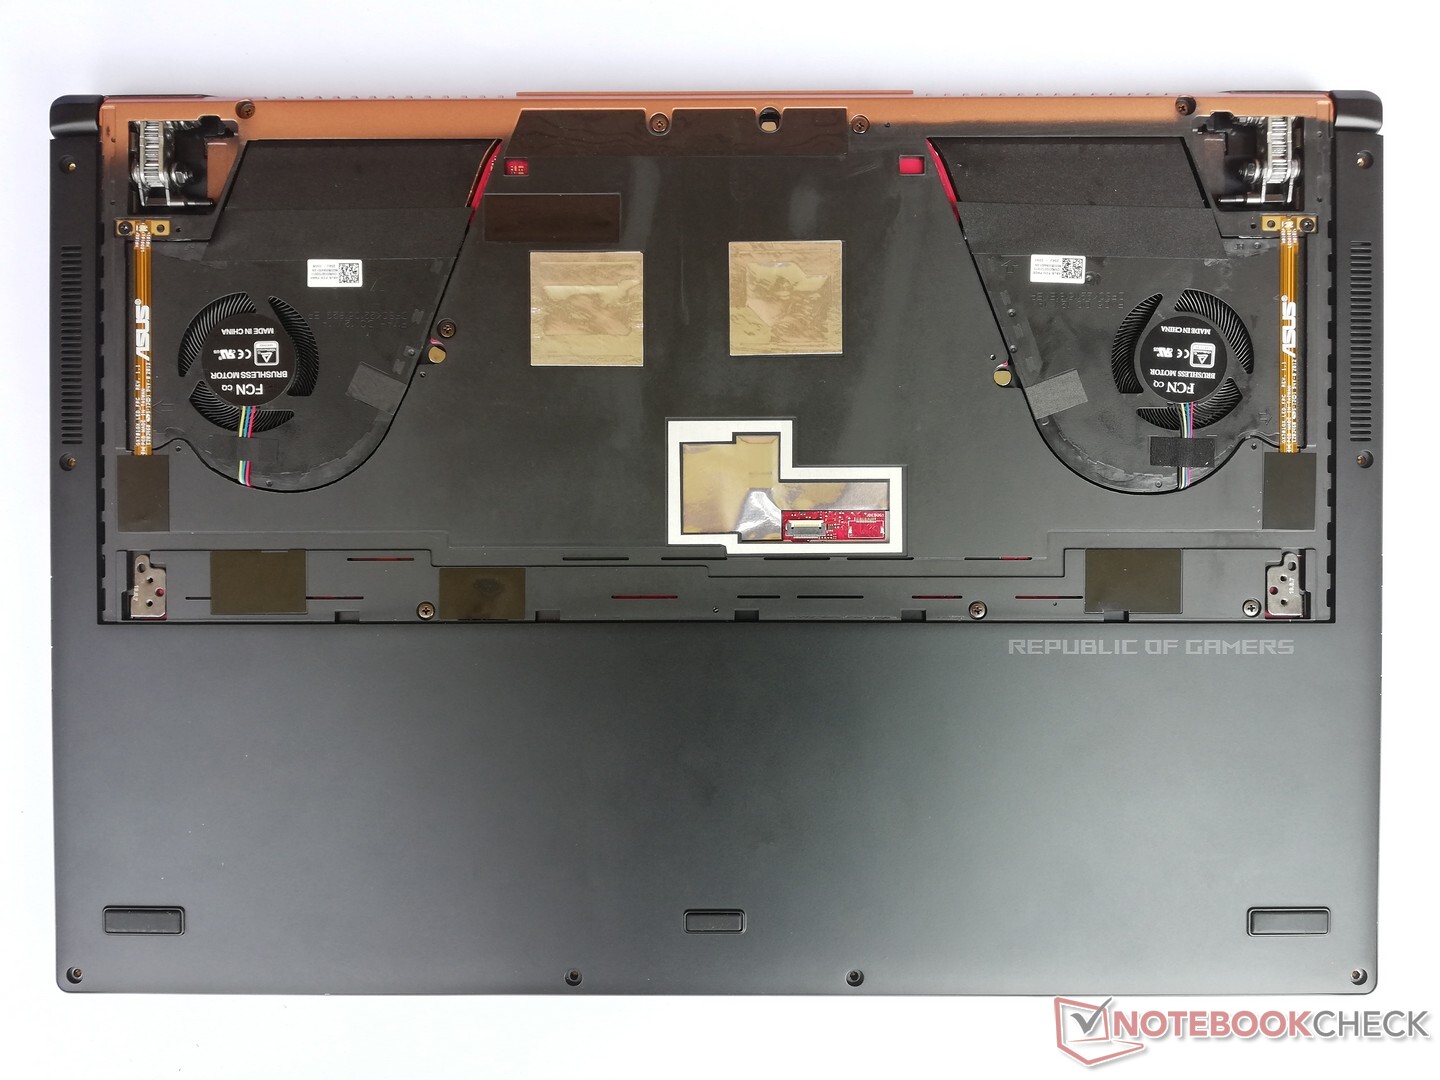
Maintenance
At the bottom of the Asus laptop are numerous screws, which can be removed by the user. After doing this, the bottom plate can be removed above the fans, but this only makes the fans accessible. In order to open the Zephyrus S14 further, a lot of experience is necessary, since the case has to be taken apart completely. To avoid damaging it, we did not do this with our test unit.
Warranty
Asus offers buyers of the Zephyrus S17 a warranty period of 24 months.
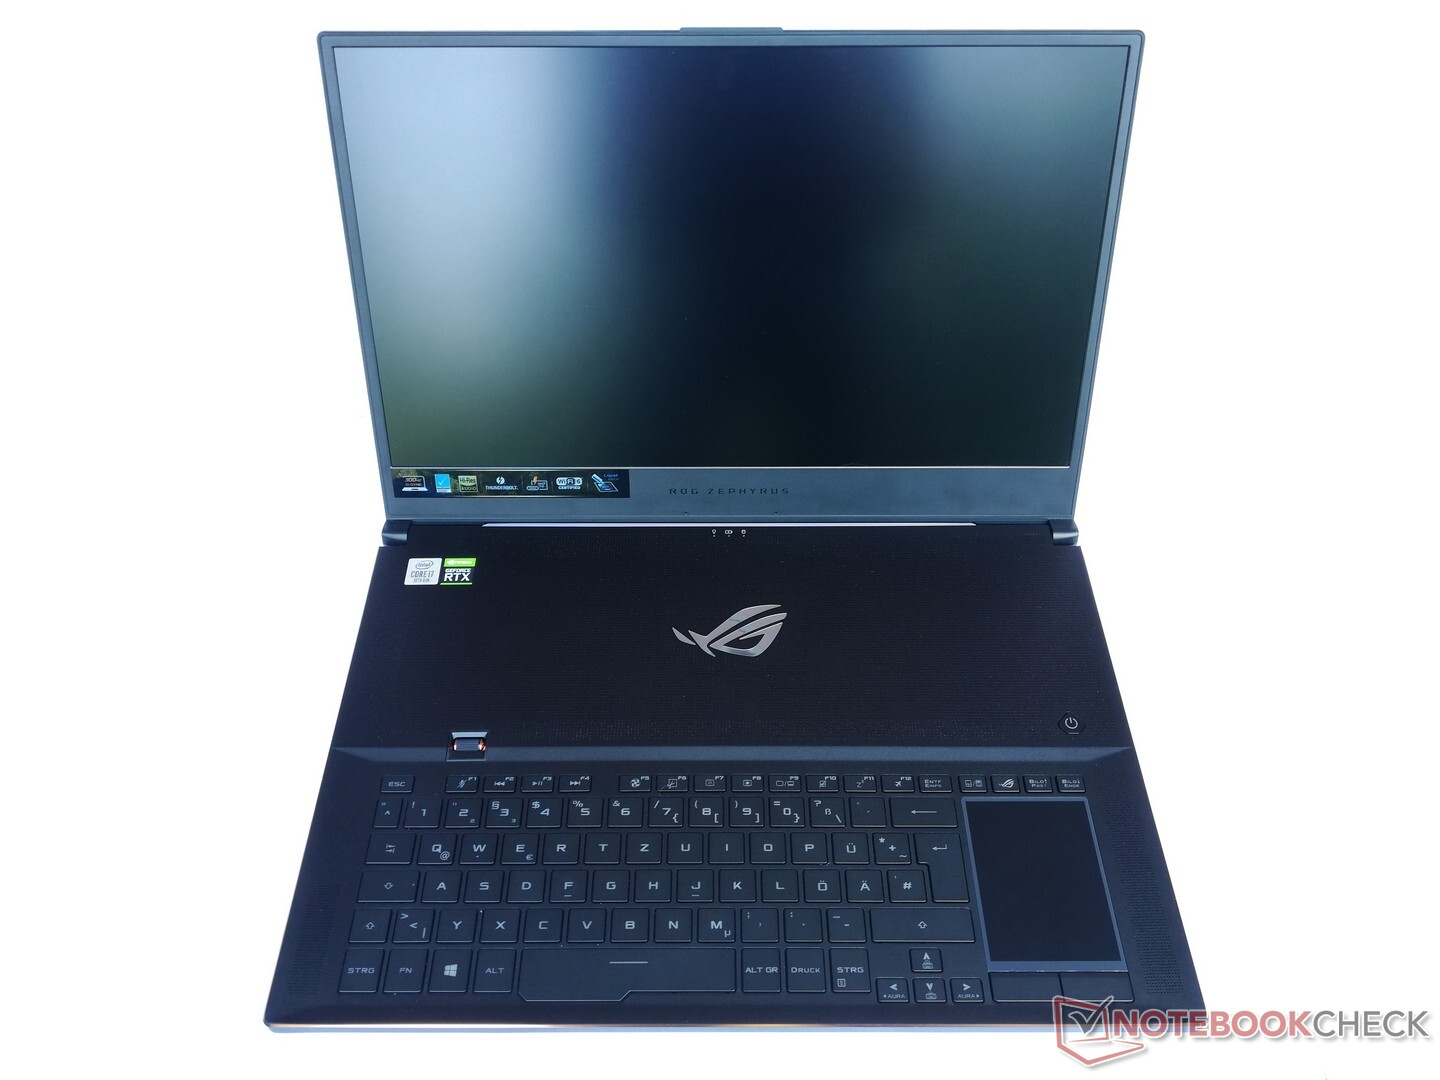
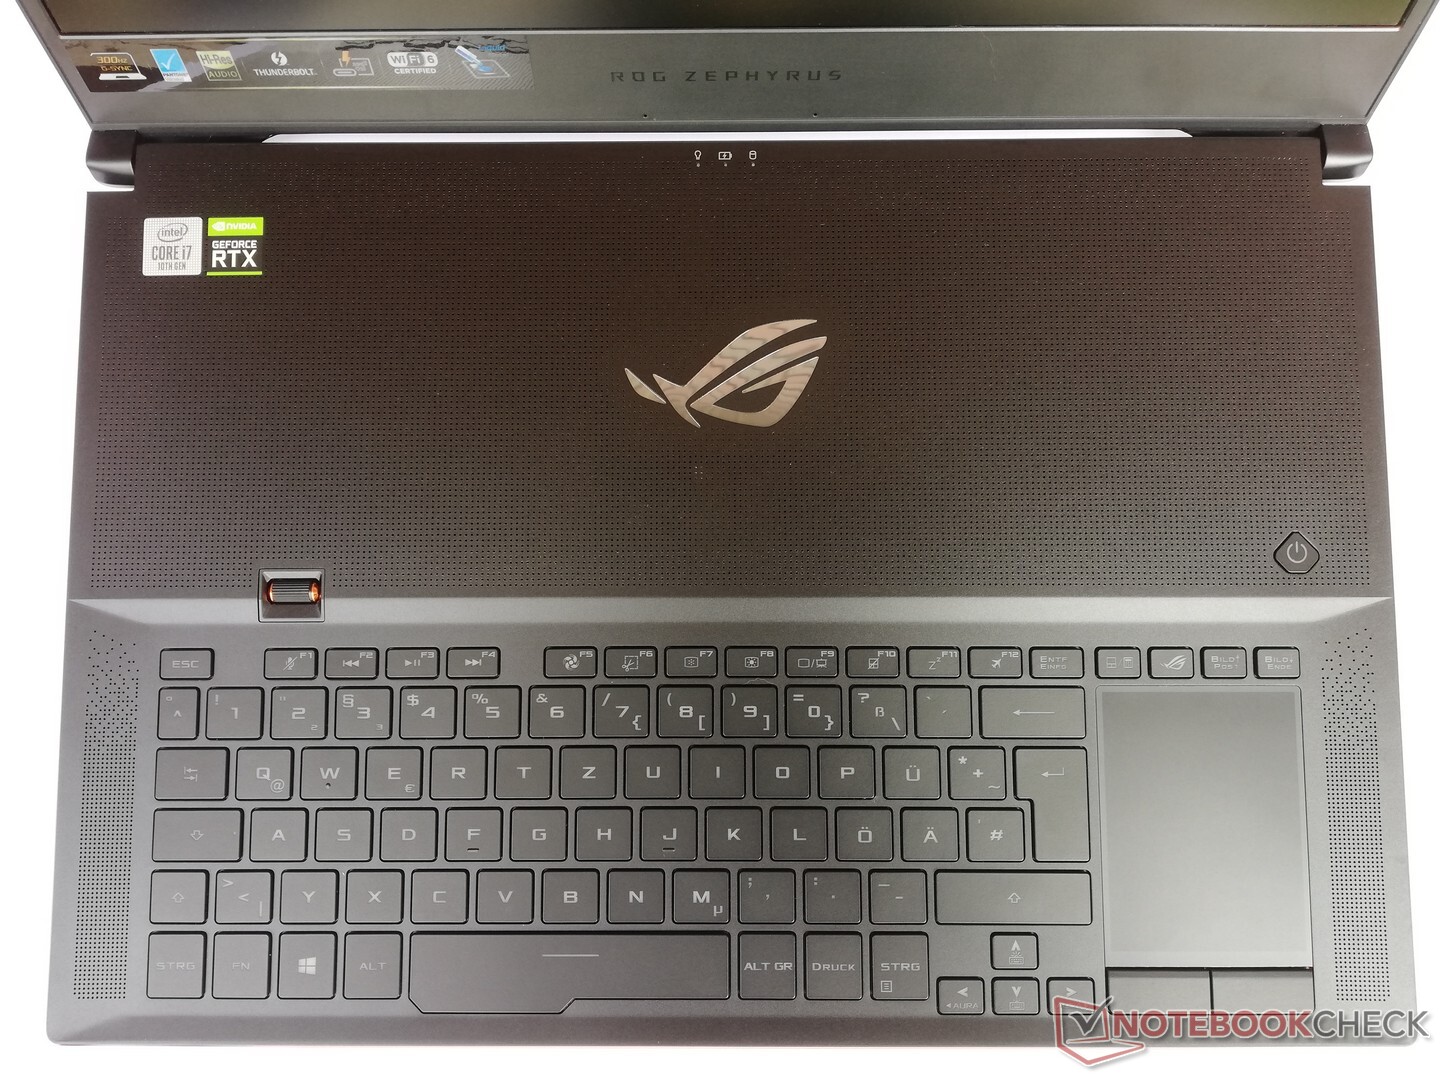
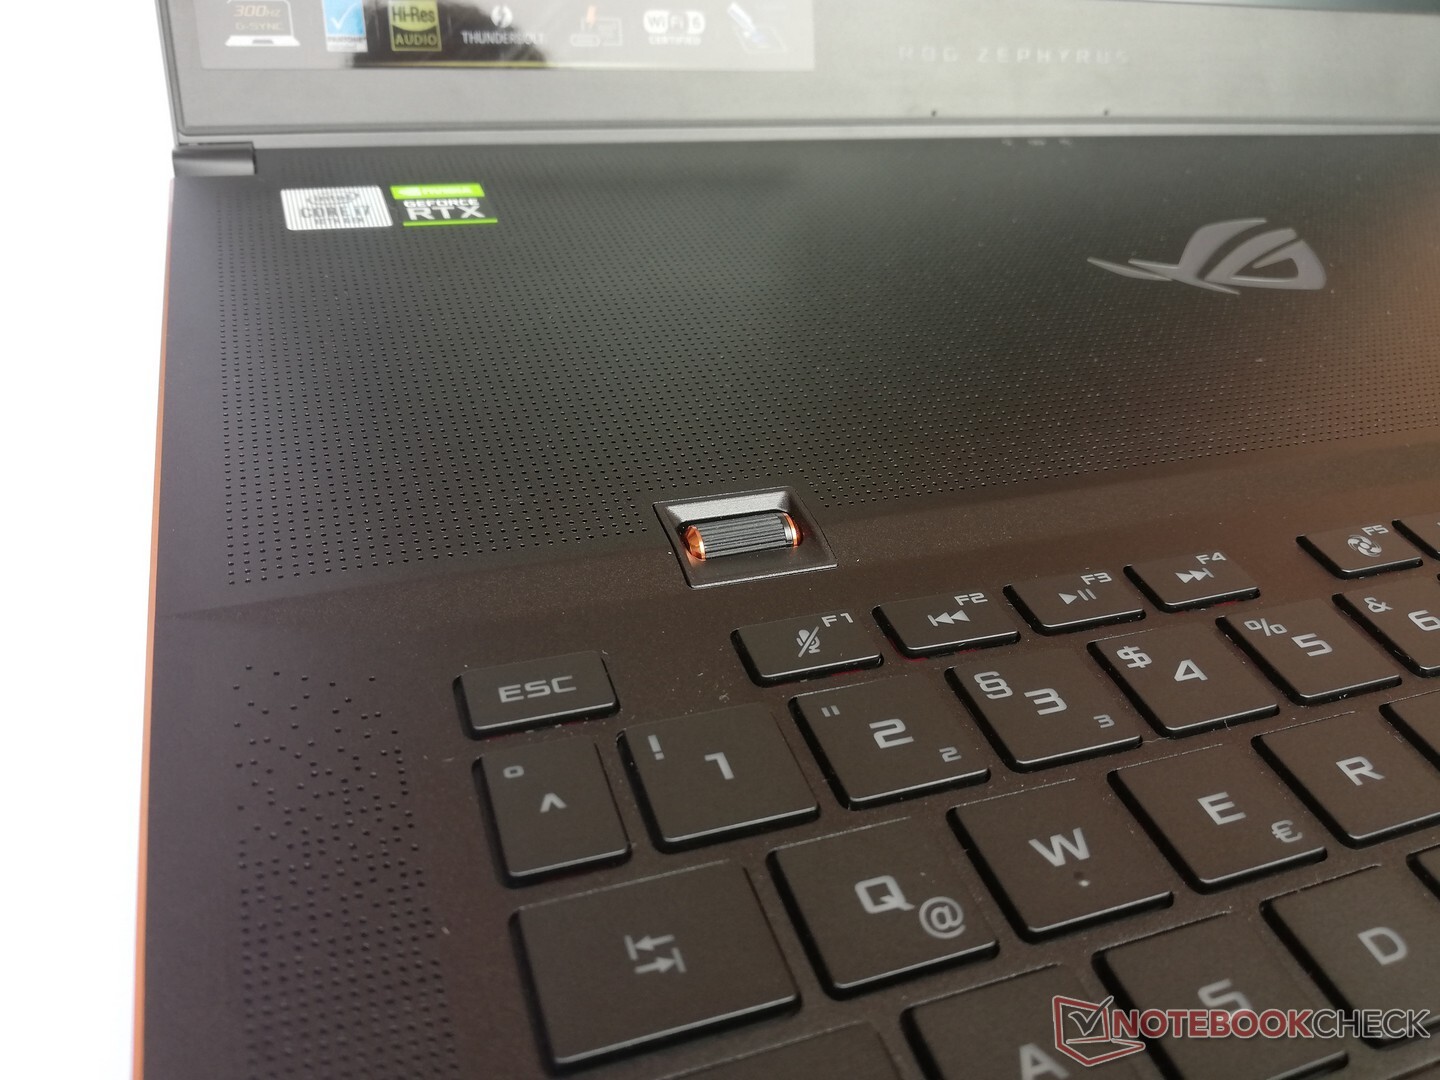
Input Devices - Keyboard moved to the front and RGB illumination
Keyboard
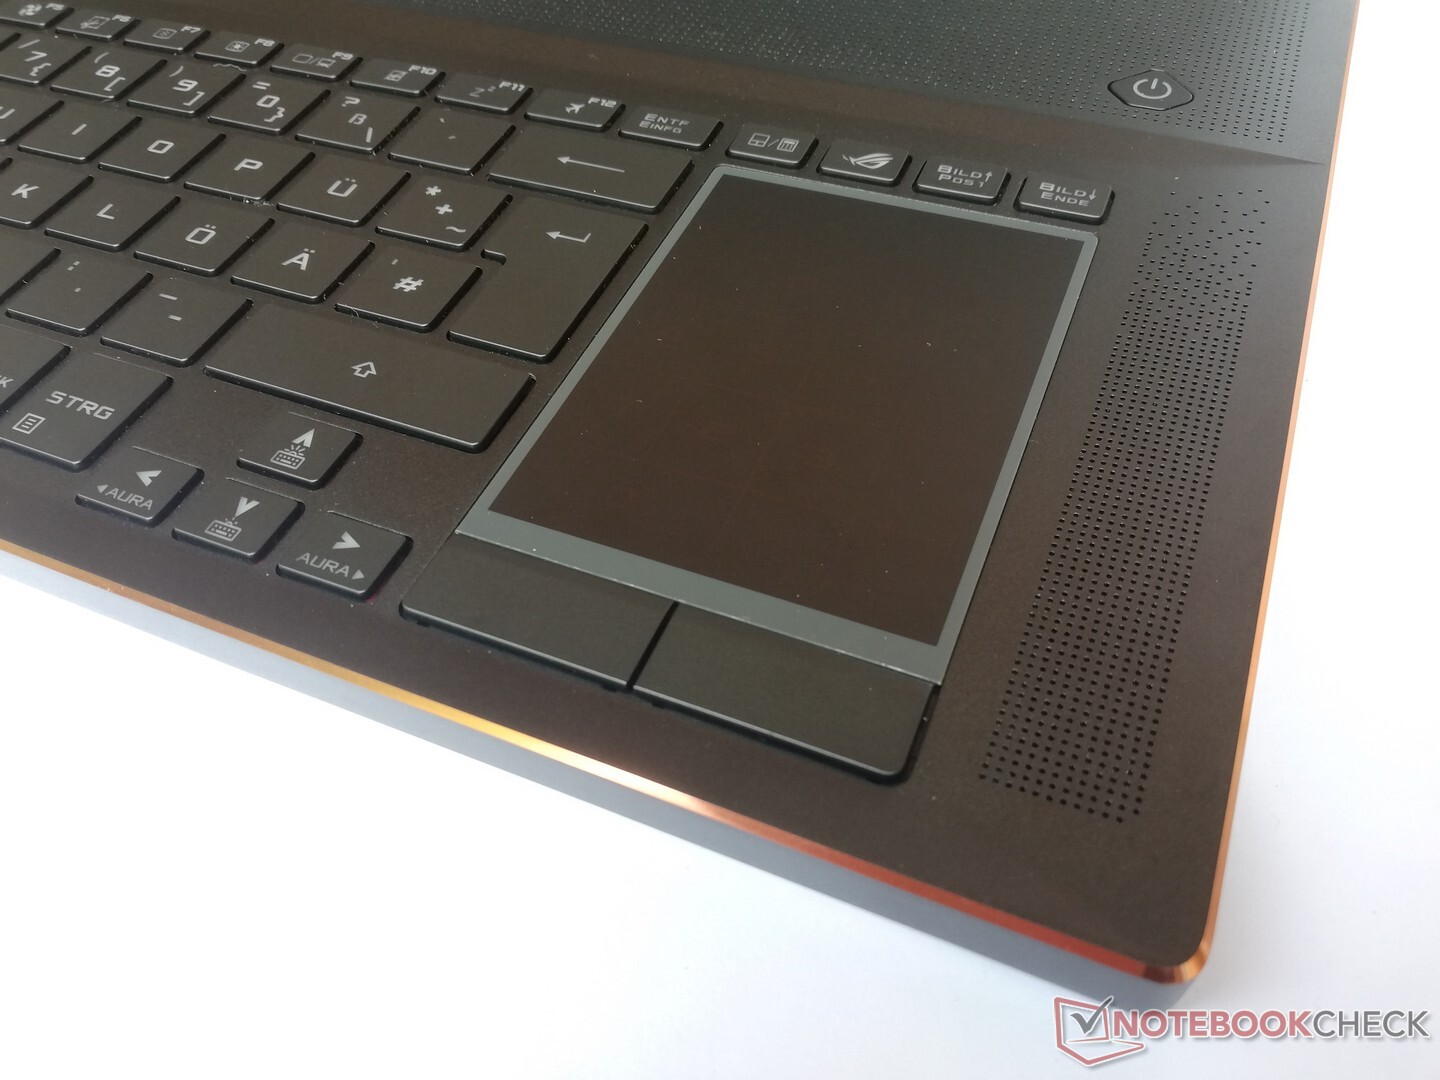
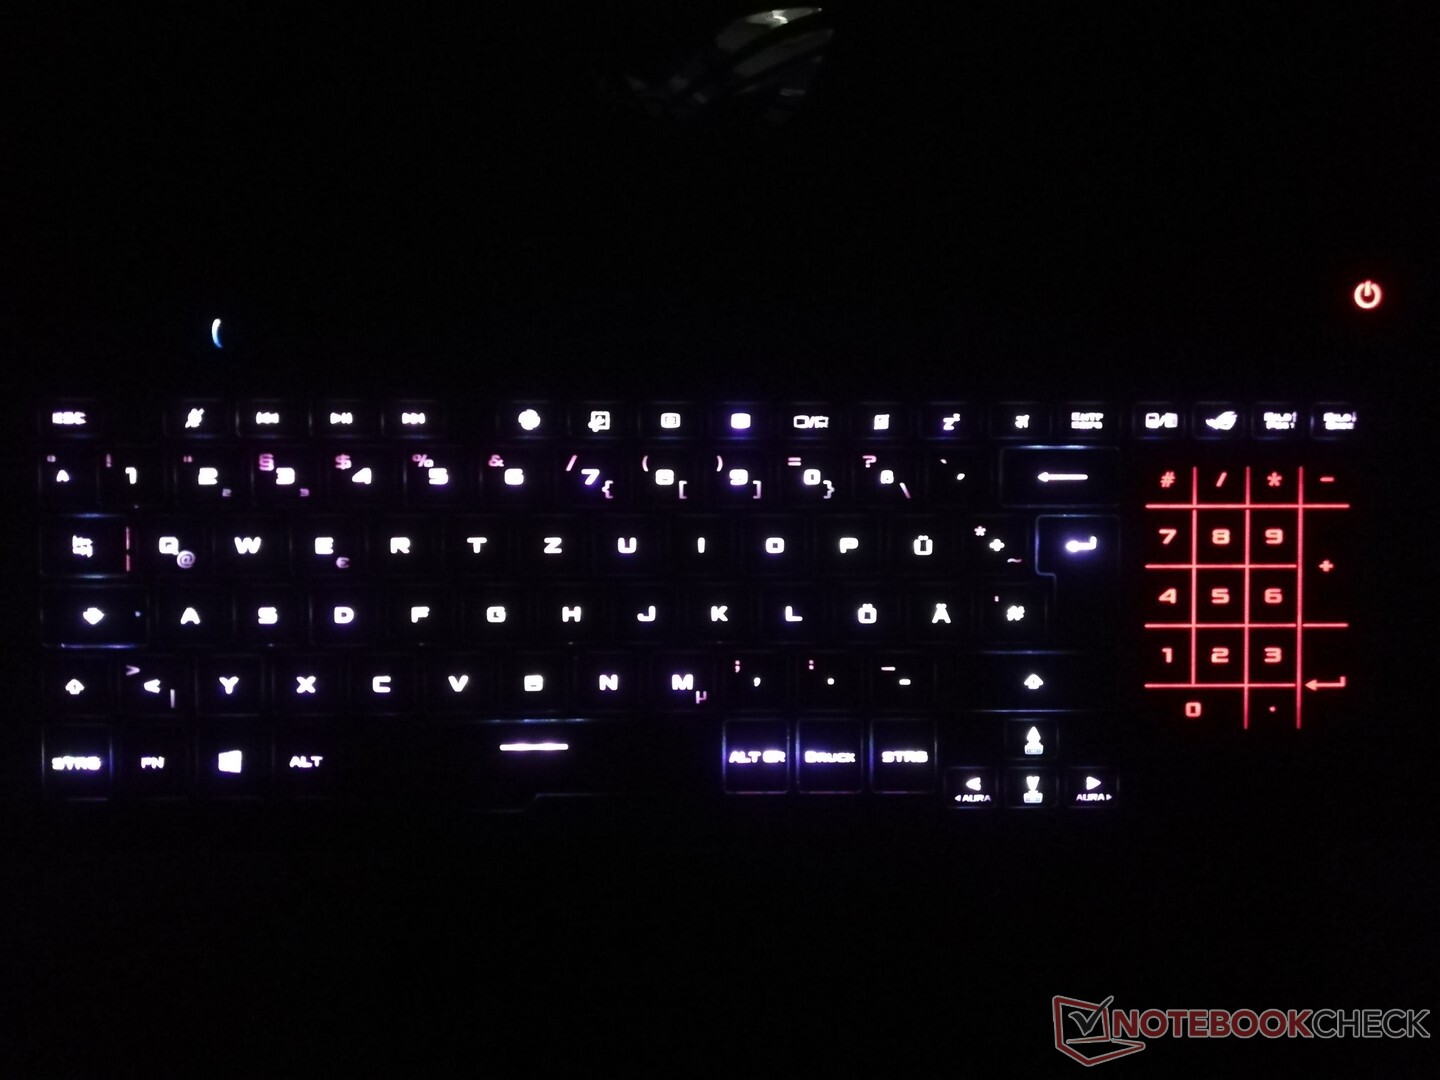
The keyboard of the Asus Zephyrus S17 offers a very shallow stroke with a clear pressure point. The rubberized key surfaces prevent fingertips from slipping, and after a little time of getting used to it, longer typing tasks succeed easily. The arrow keys turn out a little smaller, and the image position keys as well as "Home" and "End" share their keys with another function, duplicating key occupancy. In bad light conditions, users can activate the three-step keyboard illumination, which can be individually adjusted with RGB colors.
Due to the keyboard position in front, users have to get their own palm rest. However, because of the slim height of the laptop, this will not be absolutely necessary when the notebook is placed on a table.
Touchpad
As mouse replacement, there is a touchpad with separate mouse keys for users of the Zephyrus S17. It is positioned to the right of the keyboard, which is a disadvantage for left-handed people. Even though there would be sufficient space, Asus has limited itself to a slightly squeezed version that offers little space for movements to the left and right. The mouse keys respond very reliably, offering a deep stroke and clear pressure point.
Users can also display a number block on the touchpad, which can be operated fairly easily. However, while using it as the number pad, you cannot use the mouse functions of the touchpad.
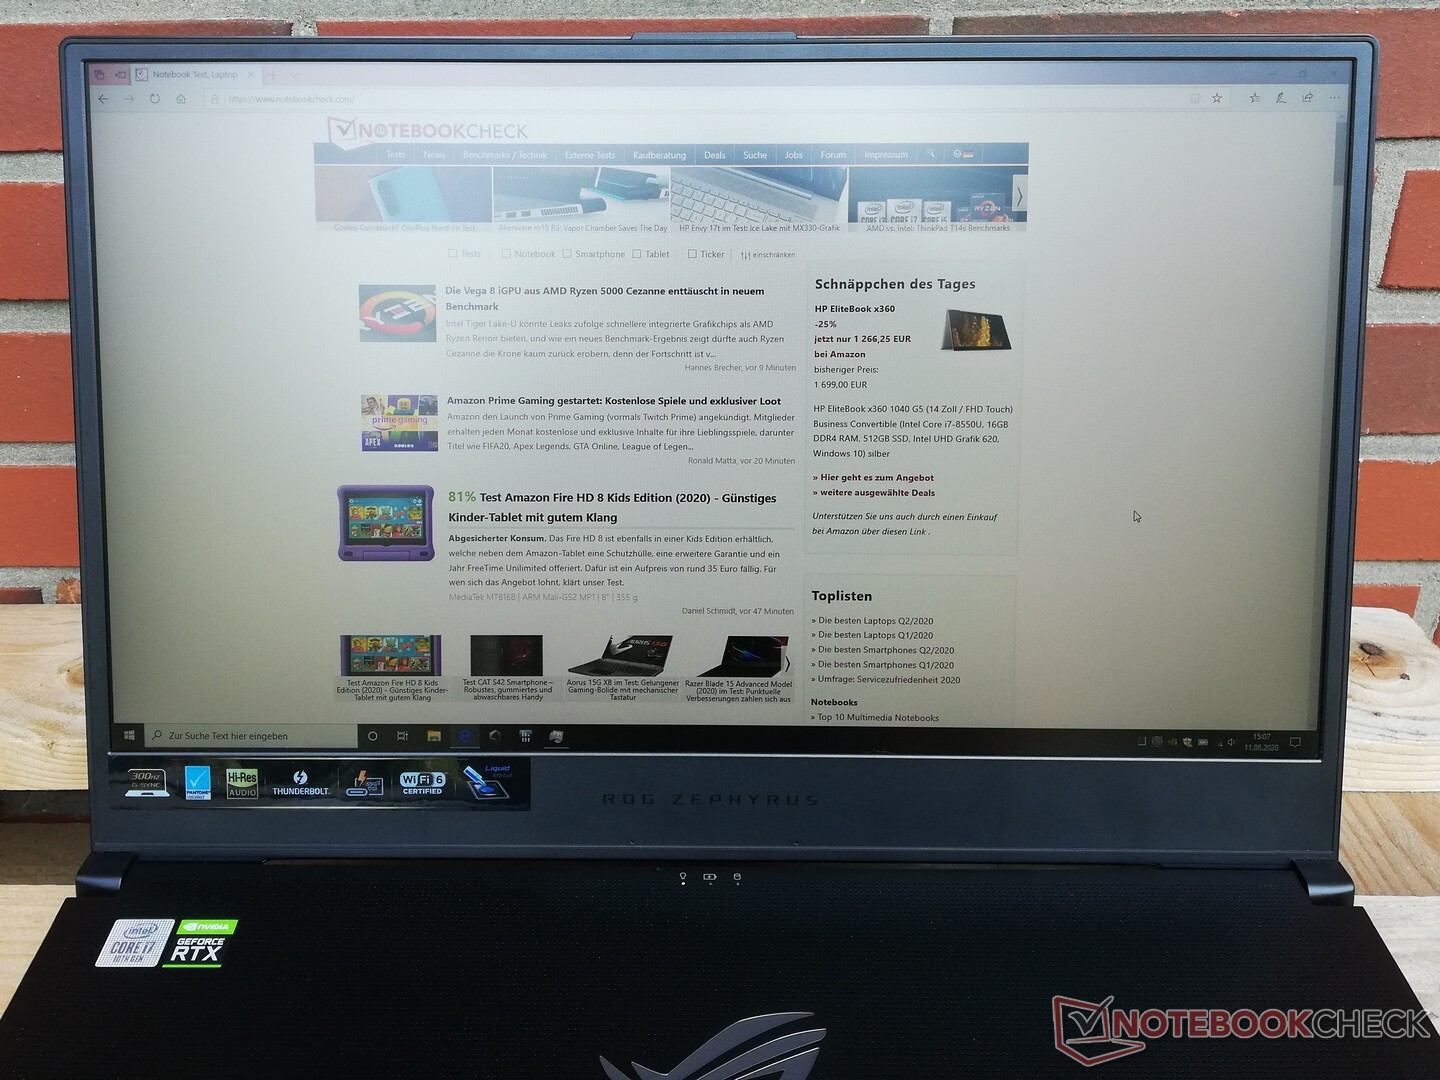
Display - 300 Hz and without PWM
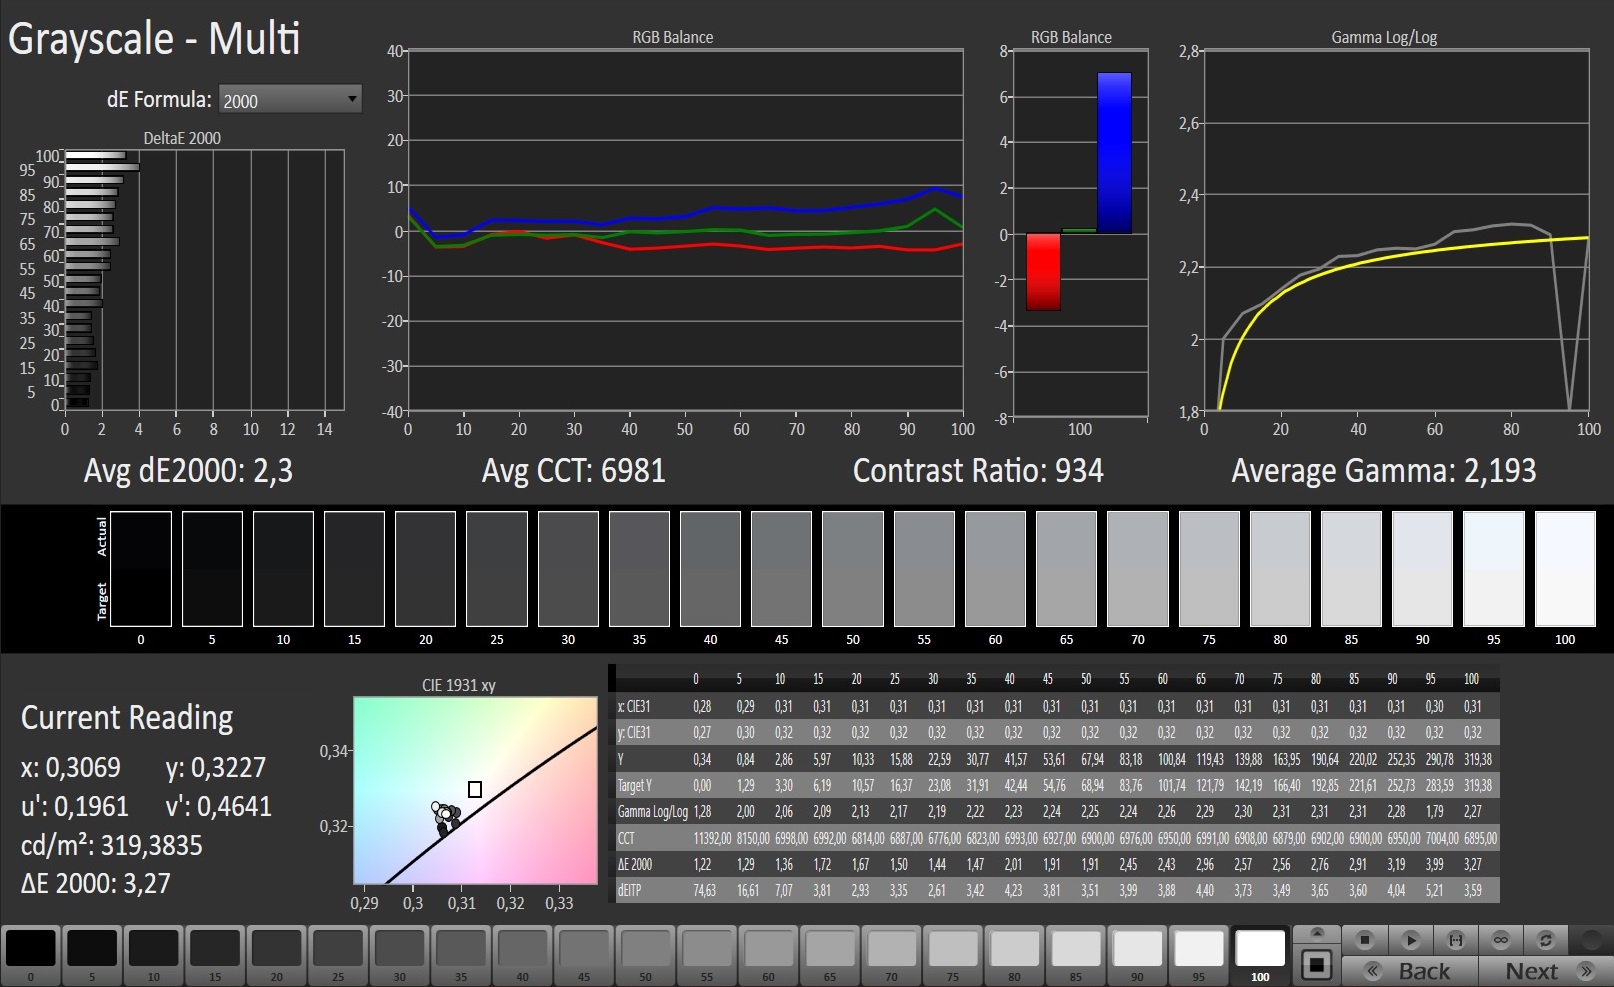
In our test configuration, the display of the Asus Zephyrus S17 consists of a 17-inch IPS panel that offers a resolution of 1920x1080 pixels and a refresh rate of 300 Hz. At 310 cd/m², the average brightness places it in the middle of our test field. The brightness does not drop further during battery operation. However, the brightness distribution is quite low at 76%. In addition to the panel used here, Asus also offers our Zephyrus S17 GX701LXS test model with a refresh rate of 144 Hz.
According to our measurements, Asus does not use PWM to control brightness, so users with sensitive eyes should not expect any problems.
| |||||||||||||||||||||||||
Brightness Distribution: 76 %
Center on Battery: 308 cd/m²
Contrast: 906:1 (Black: 0.34 cd/m²)
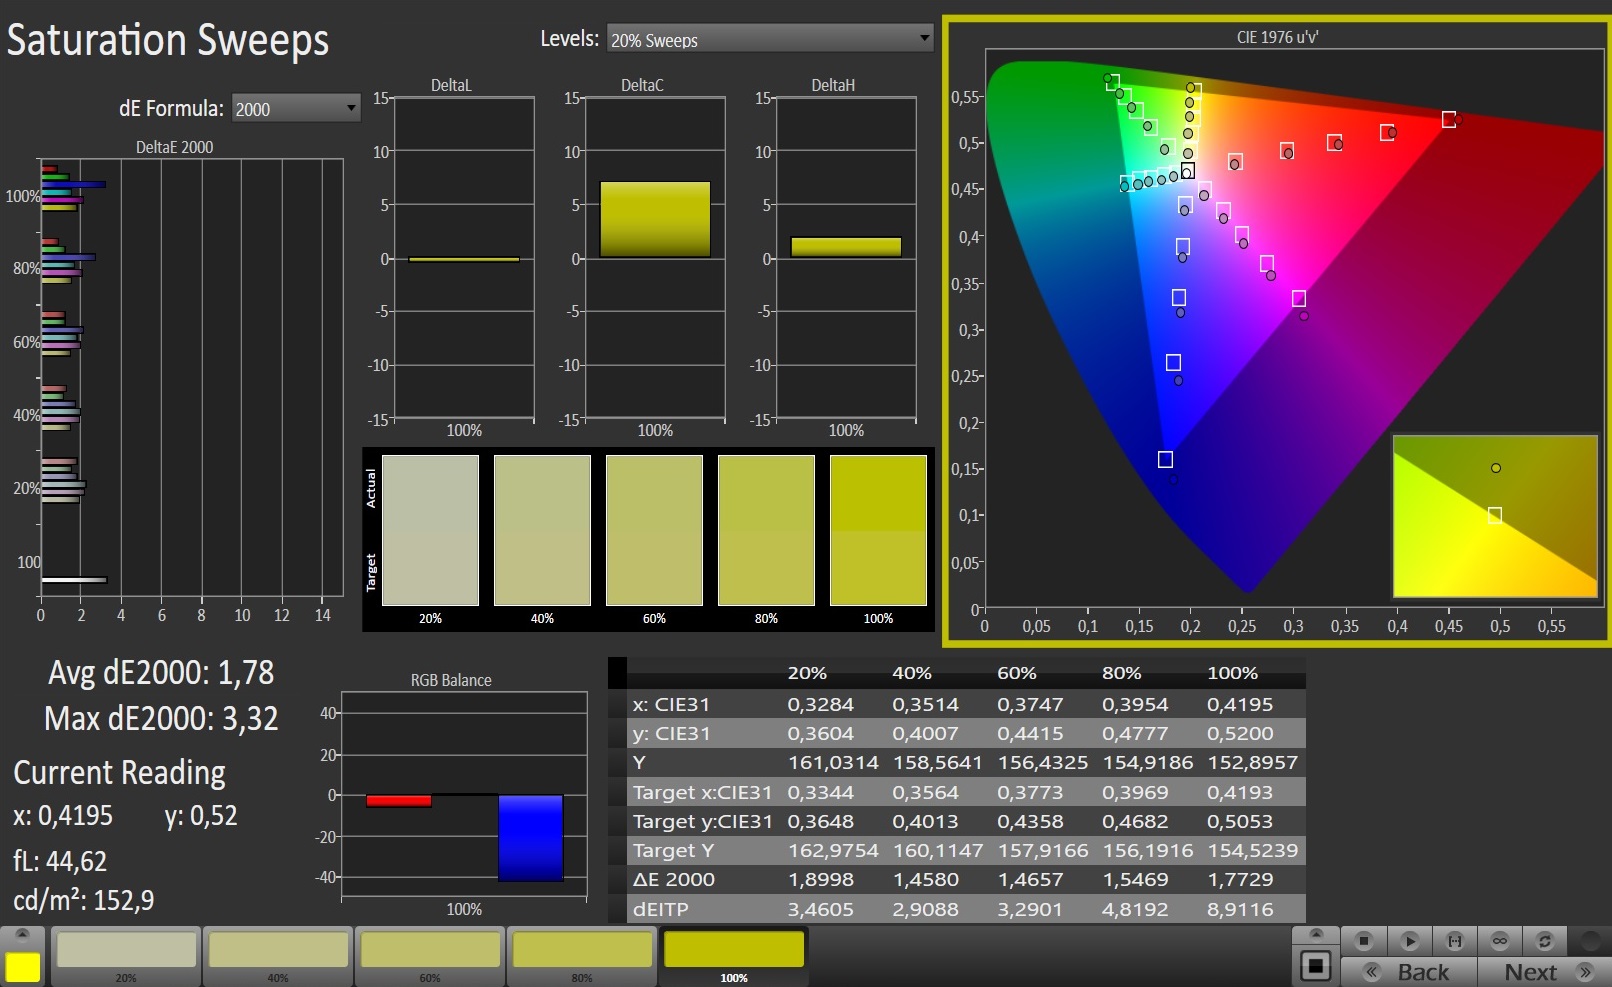
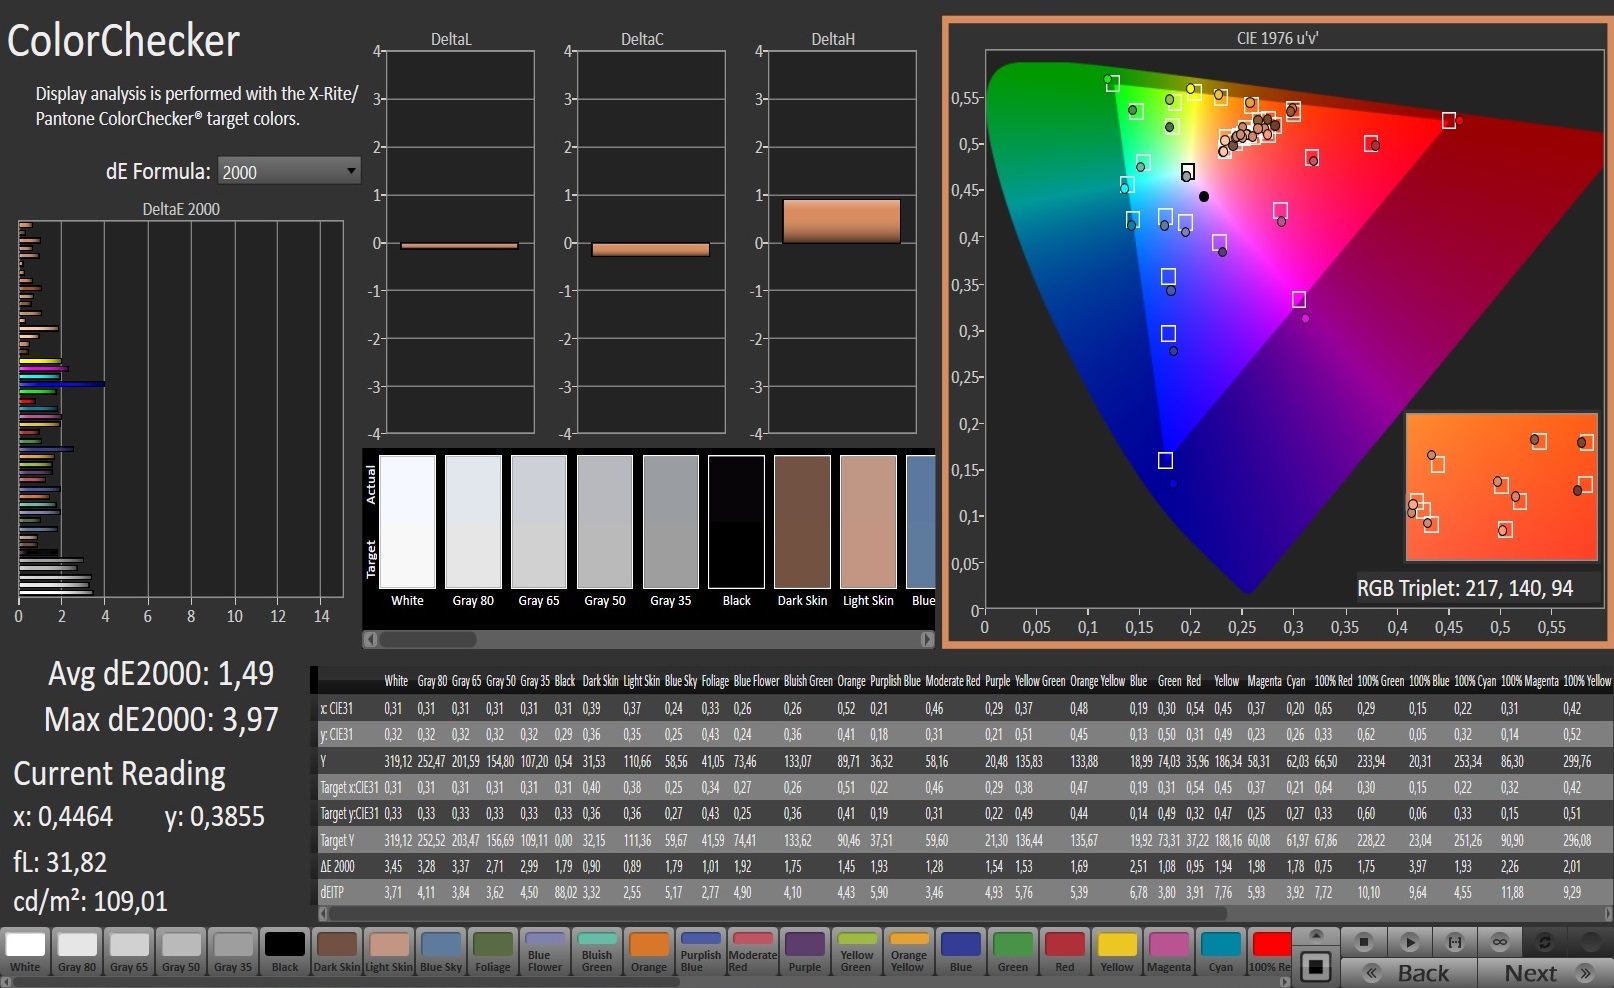
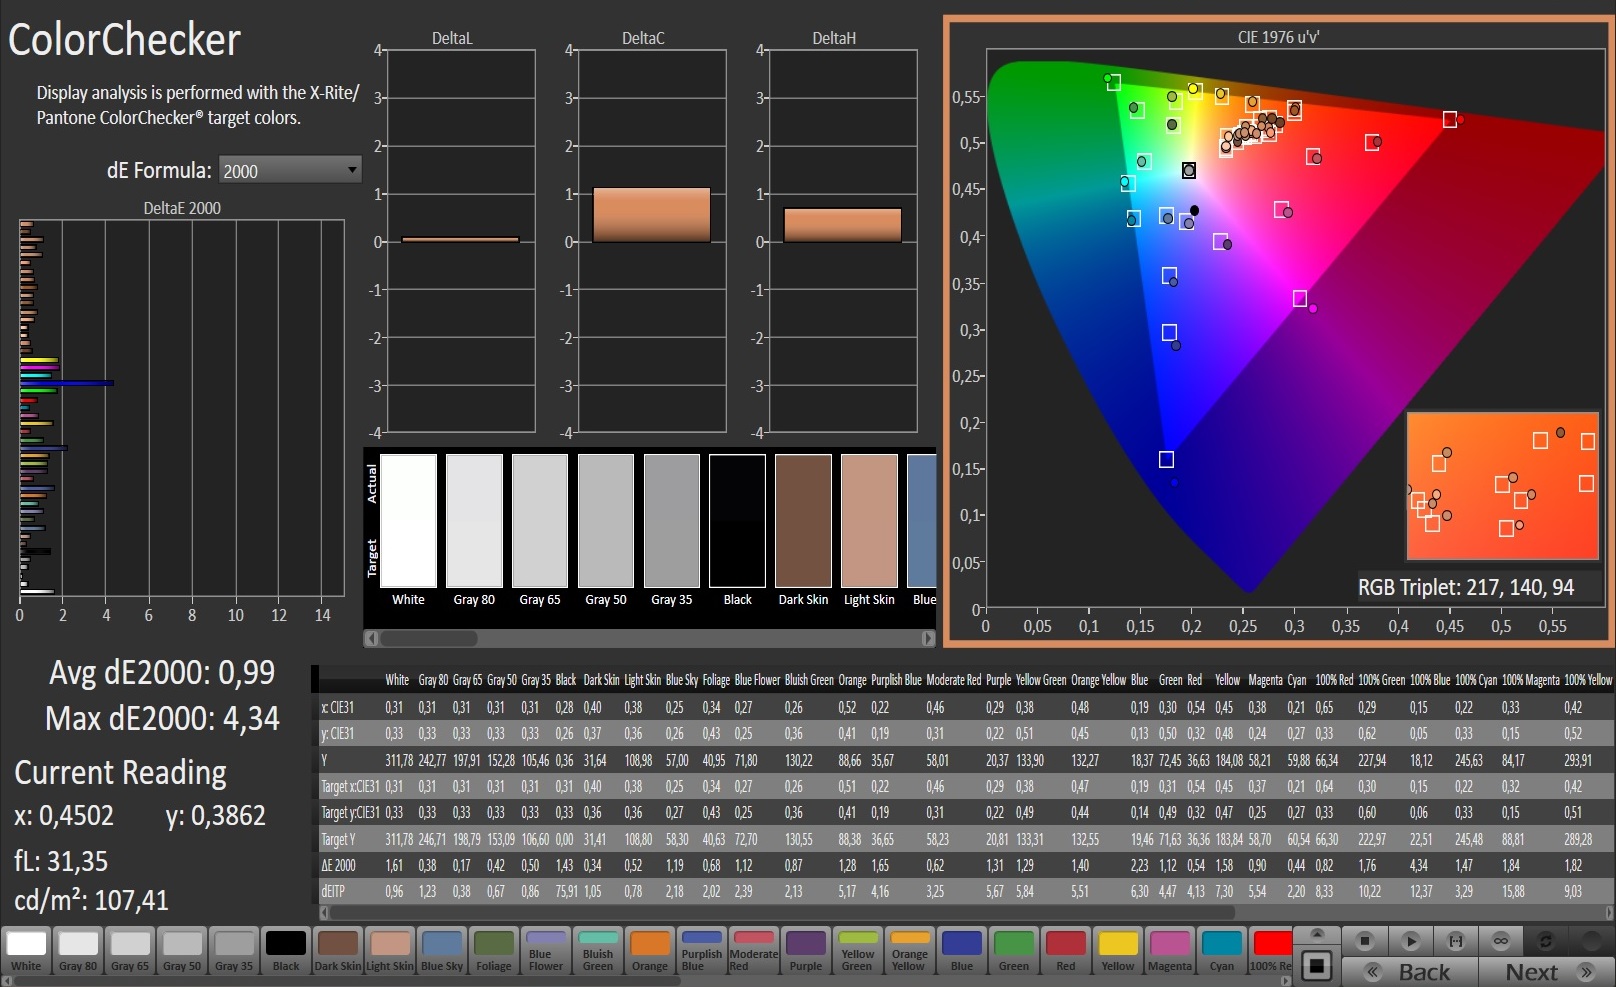
ΔE ColorChecker Calman: 1.49 | ∀{0.5-29.43 Ø4.72}
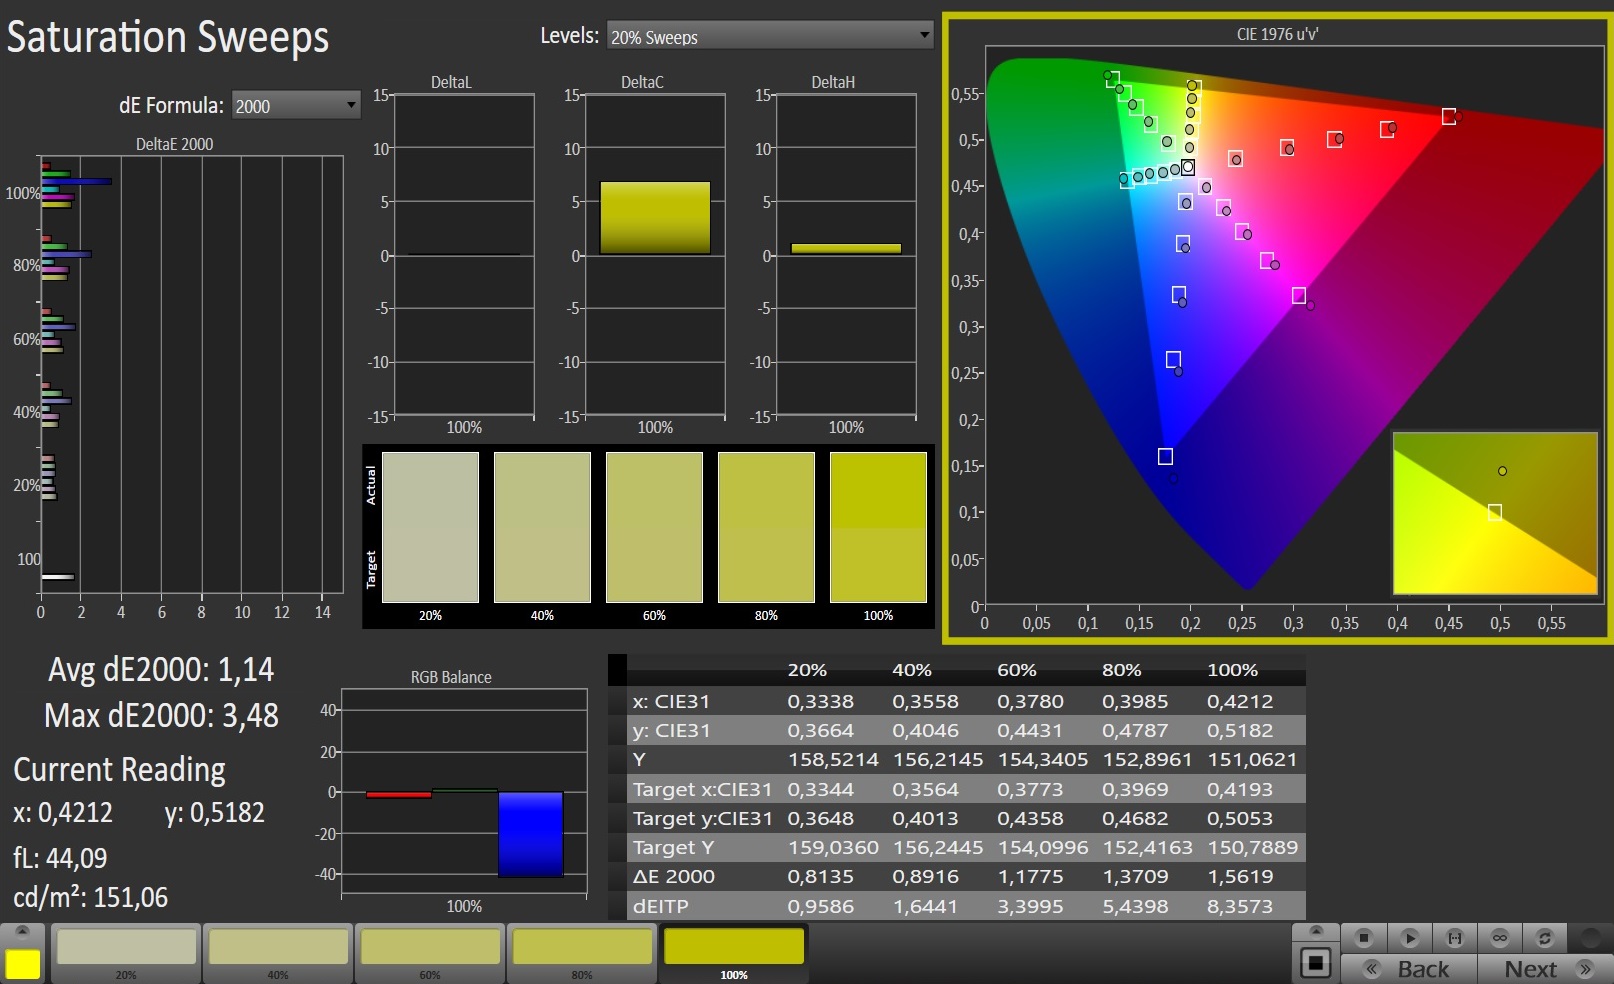
calibrated: 0.99
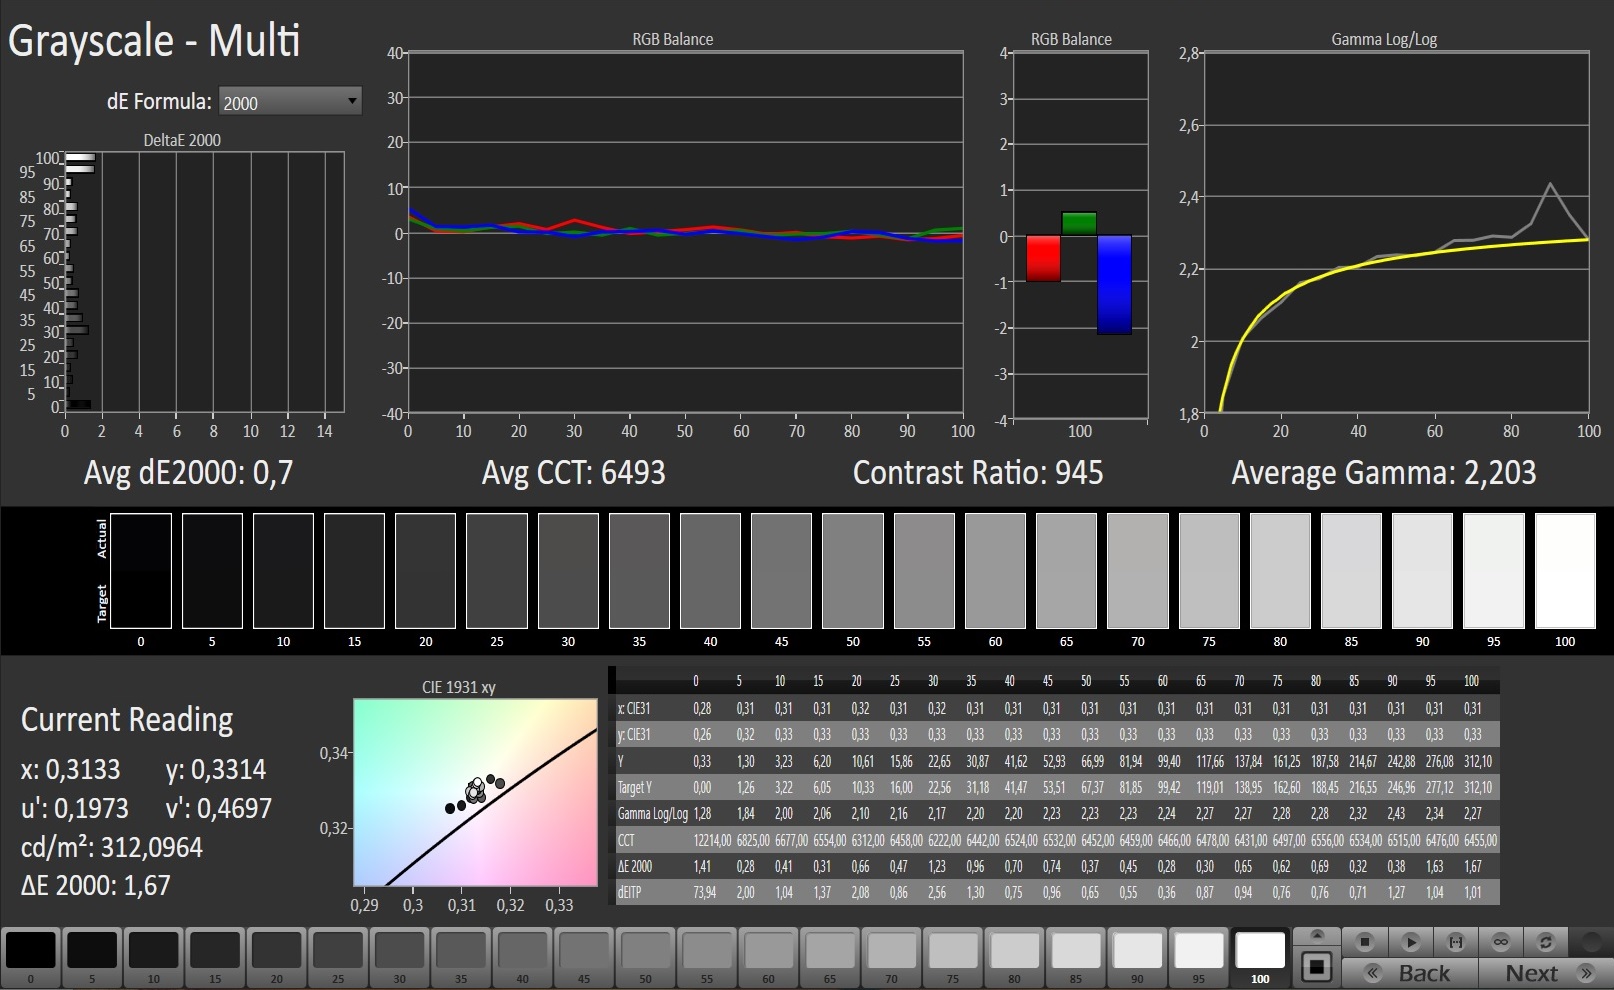
ΔE Greyscale Calman: 2.3 | ∀{0.09-98 Ø4.97}
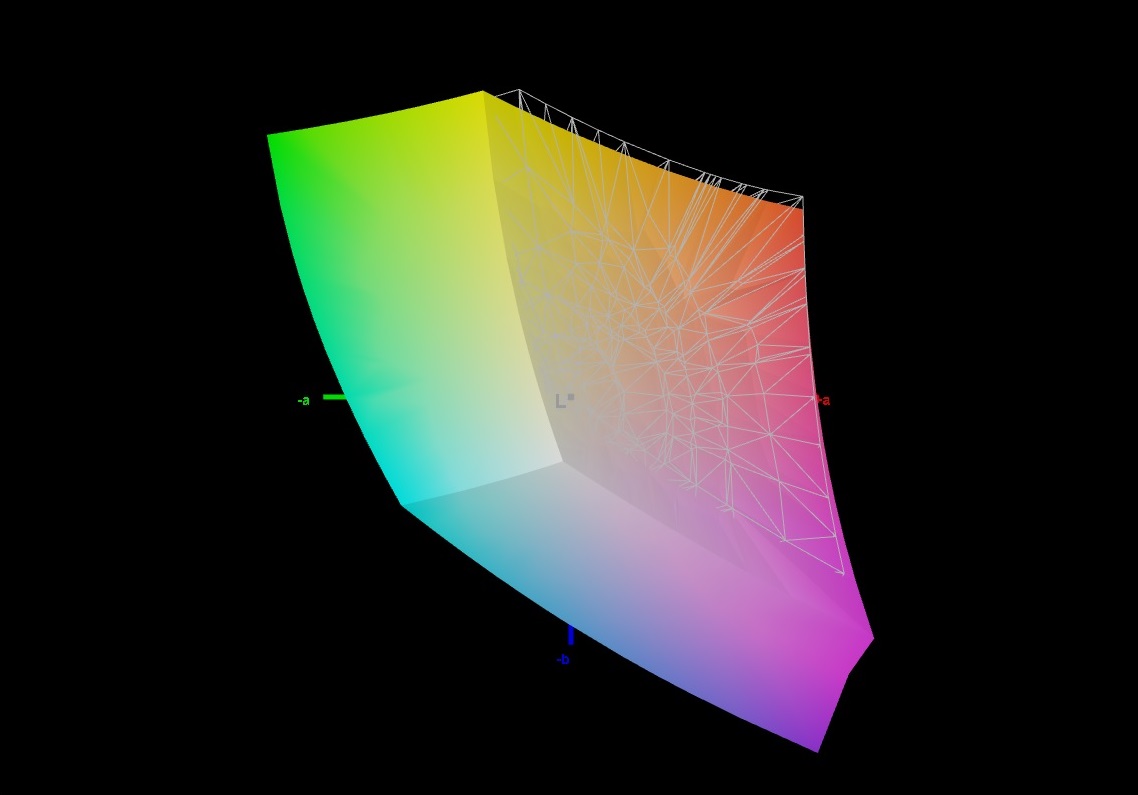
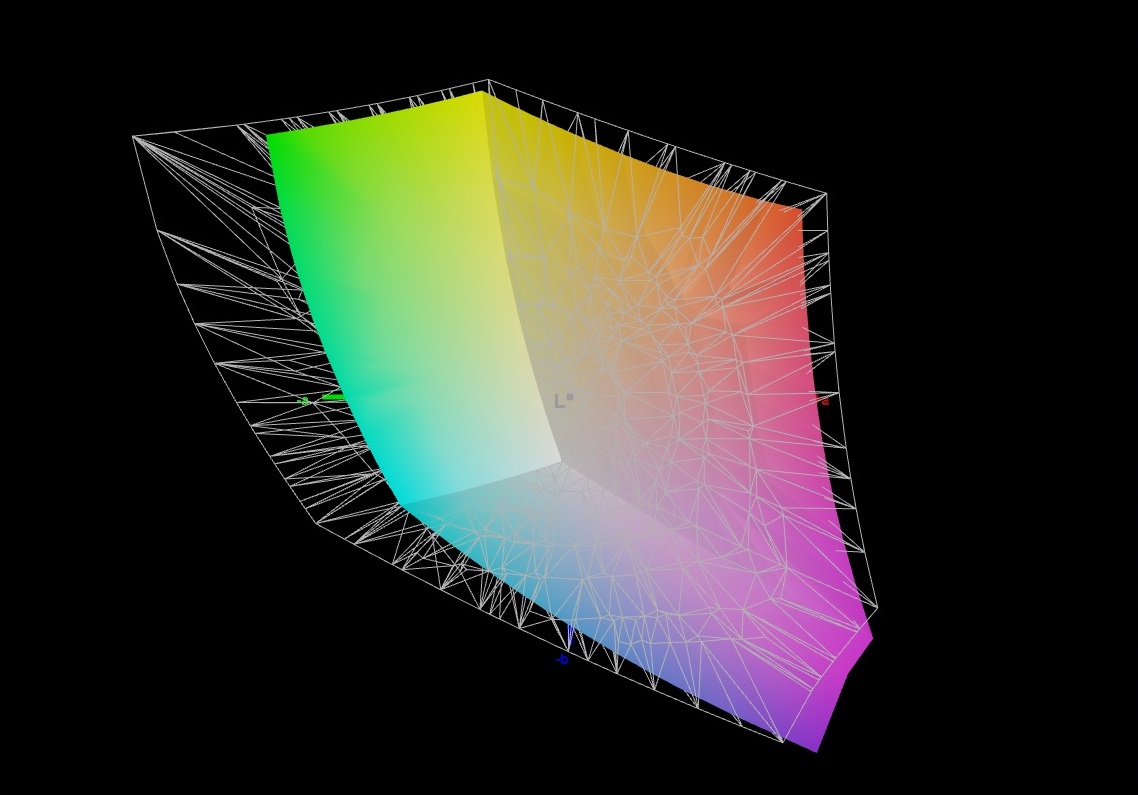
96% sRGB (Argyll 1.6.3 3D)
74% AdobeRGB 1998 (Argyll 1.6.3 3D)
73.7% AdobeRGB 1998 (Argyll 3D)
99.7% sRGB (Argyll 3D)
73.6% Display P3 (Argyll 3D)
Gamma: 2.193
CCT: 6981 K
| Asus Zephyrus S17 GX701LXS Sharp SHP14DC, IPS, 1920x1080, 17.3" | Razer Blade Pro 17 RTX 2070 Max-Q 300 Hz Sharp LQ173M1JW02, IPS, 1920x1080, 17.3" | MSI GS75 10SF-609US Sharp LQ173M1JW05, IPS, 1920x1080, 17.3" | Lenovo Legion Y740-17IRHg-81UJ001VGE AUO_B173HAN03, IPS, 1920x1080, 17.3" | Alienware m17 R2 P41E Chi Mei 173HCE, CMN175F, IPS, 1920x1080, 17.3" | |
|---|---|---|---|---|---|
| Display | -1% | 2% | -10% | -2% | |
| Display P3 Coverage (%) | 73.6 | 72.2 -2% | 75.6 3% | 63.8 -13% | 70.8 -4% |
| sRGB Coverage (%) | 99.7 | 98.5 -1% | 99.8 0% | 92.7 -7% | 98.5 -1% |
| AdobeRGB 1998 Coverage (%) | 73.7 | 73 -1% | 75.1 2% | 65.3 -11% | 72.2 -2% |
| Response Times | -16% | 9% | -129% | -140% | |
| Response Time Grey 50% / Grey 80% * (ms) | 5 ? | 5.6 ? -12% | 5 ? -0% | 16 ? -220% | 17.2 ? -244% |
| Response Time Black / White * (ms) | 8 ? | 9.6 ? -20% | 6.6 ? 17% | 11 ? -38% | 10.8 ? -35% |
| PWM Frequency (Hz) | 26320 ? | ||||
| Screen | -59% | -8% | -35% | 13% | |
| Brightness middle (cd/m²) | 308 | 328 6% | 299.4 -3% | 310 1% | 384.2 25% |
| Brightness (cd/m²) | 310 | 329 6% | 299 -4% | 281 -9% | 357 15% |
| Brightness Distribution (%) | 76 | 78 3% | 84 11% | 85 12% | 90 18% |
| Black Level * (cd/m²) | 0.34 | 0.35 -3% | 0.31 9% | 0.31 9% | 0.29 15% |
| Contrast (:1) | 906 | 937 3% | 966 7% | 1000 10% | 1325 46% |
| Colorchecker dE 2000 * | 1.49 | 4.74 -218% | 1.82 -22% | 3.86 -159% | 1.35 9% |
| Colorchecker dE 2000 max. * | 3.97 | 8.99 -126% | 3.91 2% | 7.8 -96% | 3.45 13% |
| Colorchecker dE 2000 calibrated * | 0.99 | 2.12 -114% | 1.59 -61% | 1.42 -43% | |
| Greyscale dE 2000 * | 2.3 | 6.8 -196% | 2.7 -17% | 4.48 -95% | 1.2 48% |
| Gamma | 2.193 100% | 2.2 100% | 2.18 101% | 2.5 88% | 2.23 99% |
| CCT | 6981 93% | 6446 101% | 6837 95% | 7542 86% | 6580 99% |
| Color Space (Percent of AdobeRGB 1998) (%) | 74 | 64.8 -12% | 67.1 -9% | 60 -19% | 65.5 -11% |
| Color Space (Percent of sRGB) (%) | 96 | 98.6 3% | 99.8 4% | 93 -3% | 98.5 3% |
| Total Average (Program / Settings) | -25% /
-43% | 1% /
-4% | -58% /
-43% | -43% /
-9% |
* ... smaller is better
With 96% of the sRGB and 74% of the AdobeRGB color spaces, the Zephyrus S14 offers good color-space coverage. Even though the contrast ratio turns out only mediocre at 906:1, it is at a similar level as the rest of our test field. Only the Alienware m17 R2 turns out significantly better. At 0.34 cd/m², the black value is elevated, but this also corresponds to the average in this class.
The CalMAN analysis attests the display of the Asus notebook with a very low DeltaE-2000 deviation of 1.49 (ColorChecker) already by default. This value can be further improved via calibration to 0.99. The corresponding ICC file can be downloaded from the link in the window above, to the right of the brightness distribution graphic.
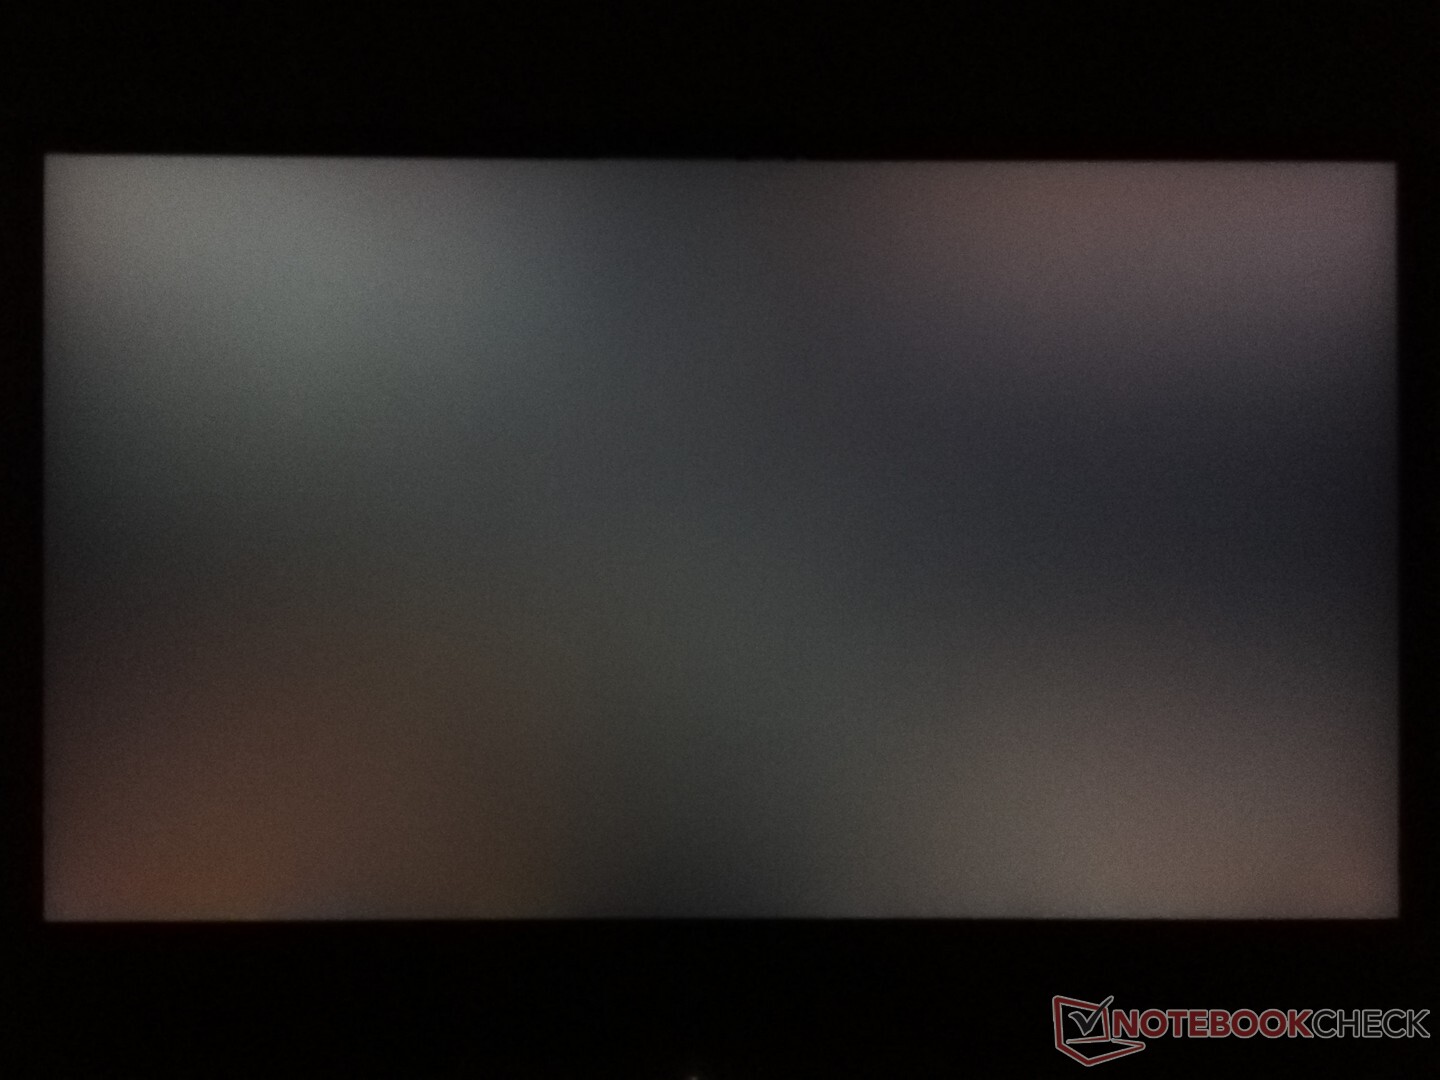
Outdoors, the use of the Zephyrus S17 is very limited. In shaded areas, the display brightness is just barely sufficient to still be able to read the image contents.
Display Response Times
| ↔ Response Time Black to White | ||
|---|---|---|
| 8 ms ... rise ↗ and fall ↘ combined | ↗ 3.6 ms rise | 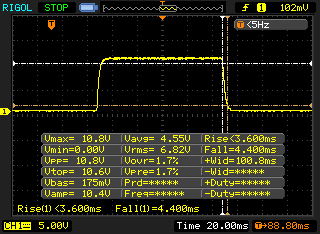 |
| ↘ 4.4 ms fall | ||
| The screen shows fast response rates in our tests and should be suited for gaming. In comparison, all tested devices range from 0.1 (minimum) to 240 (maximum) ms. » 22 % of all devices are better. This means that the measured response time is better than the average of all tested devices (19.8 ms). | ||
| ↔ Response Time 50% Grey to 80% Grey | ||
| 5 ms ... rise ↗ and fall ↘ combined | ↗ 2.2 ms rise | 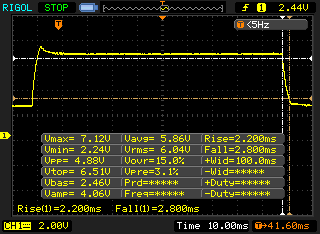 |
| ↘ 2.8 ms fall | ||
| The screen shows very fast response rates in our tests and should be very well suited for fast-paced gaming. In comparison, all tested devices range from 0.165 (minimum) to 636 (maximum) ms. » 17 % of all devices are better. This means that the measured response time is better than the average of all tested devices (31 ms). | ||
Screen Flickering / PWM (Pulse-Width Modulation)
| Screen flickering / PWM not detected | 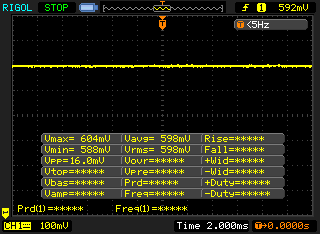 | ||
In comparison: 52 % of all tested devices do not use PWM to dim the display. If PWM was detected, an average of 7750 (minimum: 5 - maximum: 343500) Hz was measured. | |||
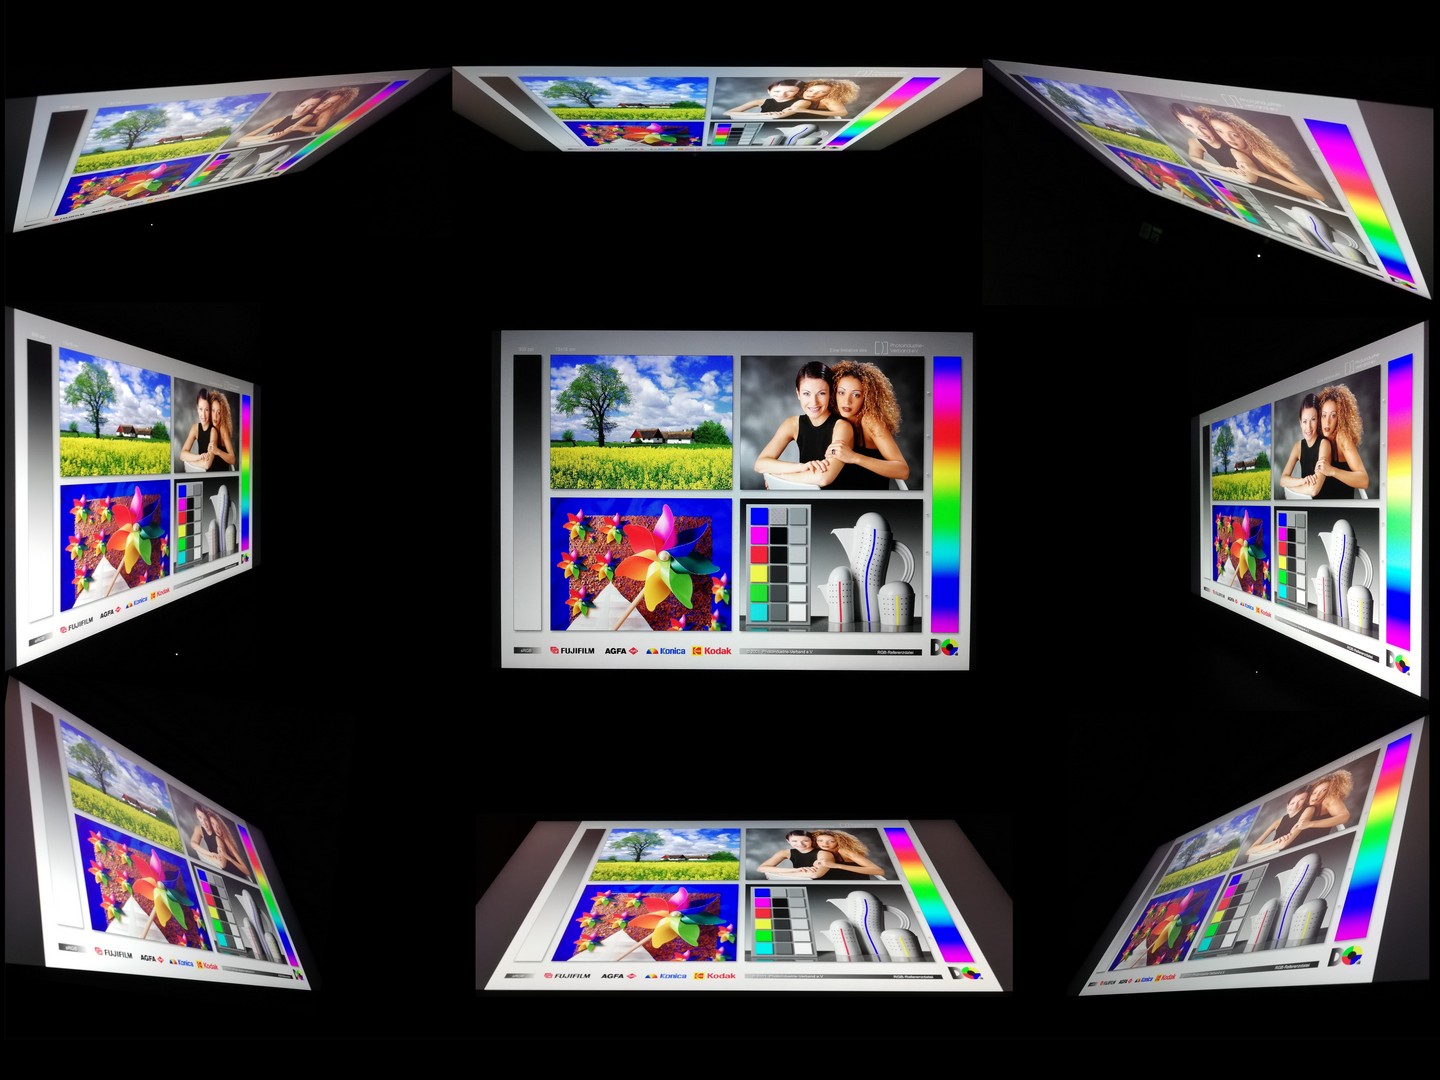
The IPS panel of the Zephyrus S17 has very stable viewing angles. The display content can be viewed from almost any angle without any color distortions.
Performance - Zephyrus S17 with a very good gaming performance
Asus clearly targets ambitious gamers with the Zephyrus S17. The Nvidia GeForce RTX 2080 Super Max-Q built into our test unit in combination with the Intel Core i7-10875H represents the maximum configuration. Users can also choose an Intel Core i7-10750H and the RTX 2070 Super and RTX 2060 GeForce cards. There are also several different working memory and storage configuration options.
All of the following benchmarks were run using the "Performance" profile and activated graphics switching.

Processor
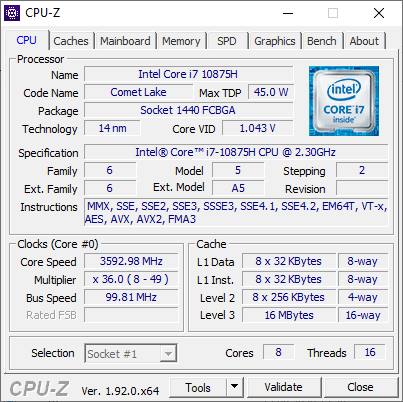
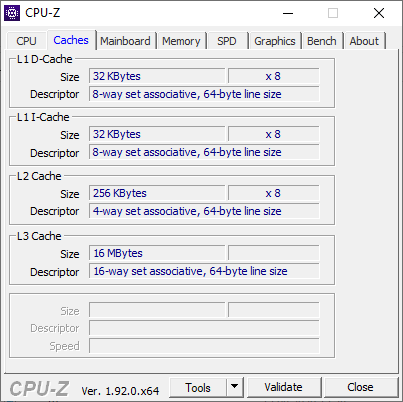
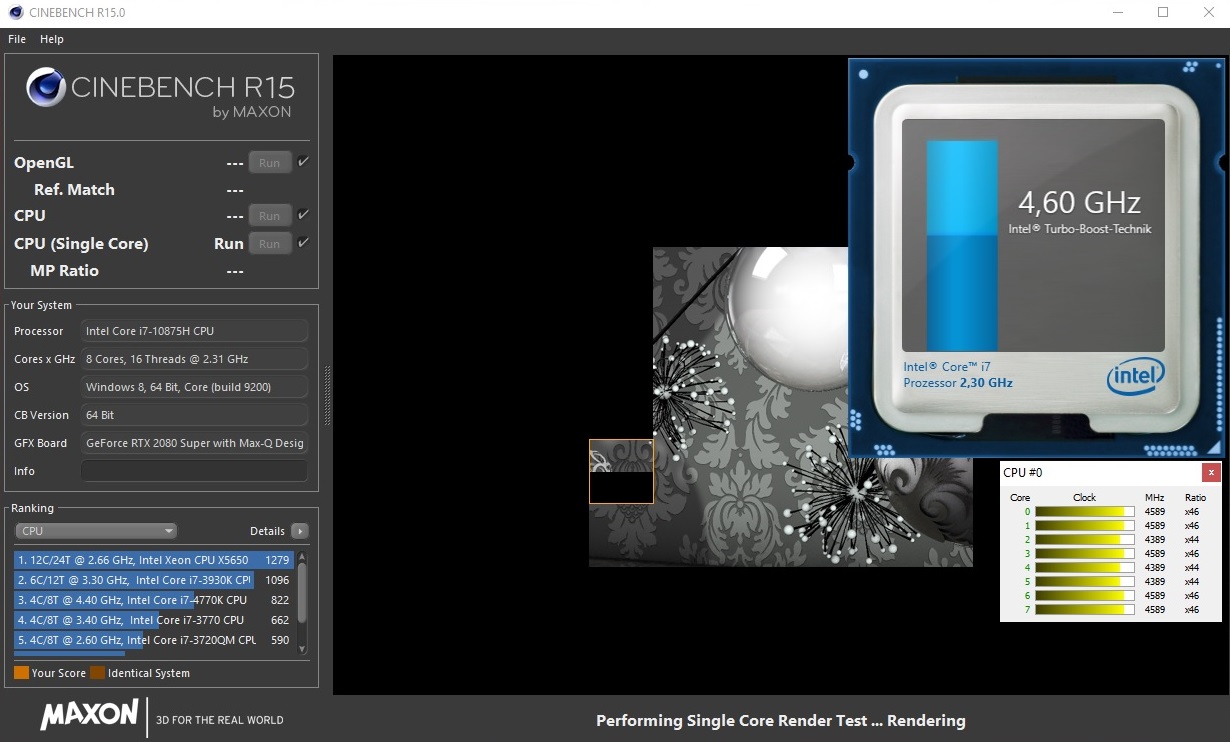
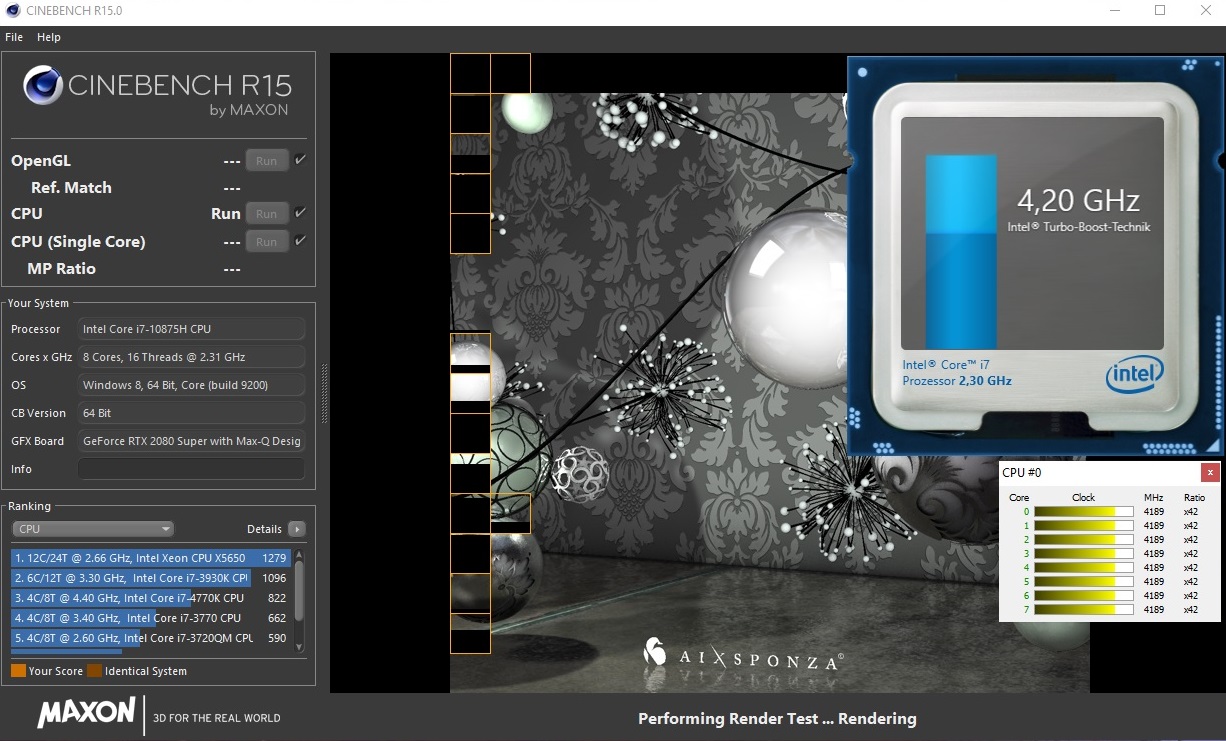
Intel's Core i7-10875H is an octa-core processor that can run up to 16 threads simultaneously. The clock speeds are between 2.3 and 5.1 GHz, with the amount of time that high clock speeds can be maintained heavily depending on the built-in cooling system. In our Cinebench R15 constant load test, the CPU in the Zephyrus S17 is able to start with a good value, but then we record a varying drop of performance, which is about 5% lower than the starting value.
In the separate disciplines of CPU performance, the results of the Intel Core i7-10875H in the Zephyrus S17 are sometimes above and sometimes below the average values that we measured for other laptops with this CPU.
* ... smaller is better
System Performance
In the system performance benchmarks, the Asus Zephyrus S17 achieves results on the level of other laptops with this equipment. We measure the largest deviation in the single "Digital Content Creation" discipline of PCMark 10, where the Asus gaming notebook ends up 11% below the average of its hardware configuration. In daily operation, the system runs very smoothly, not showing any micro-stutters or similar delays. Programs are opened quickly, and files can be accessed without any delay.
You can find out about the performance of other laptops in our tests from our CPU benchmark list.
| PCMark 8 Home Score Accelerated v2 | 4666 points | |
| PCMark 8 Work Score Accelerated v2 | 6370 points | |
| PCMark 10 Score | 5231 points | |
Help | ||
DPC Latencies
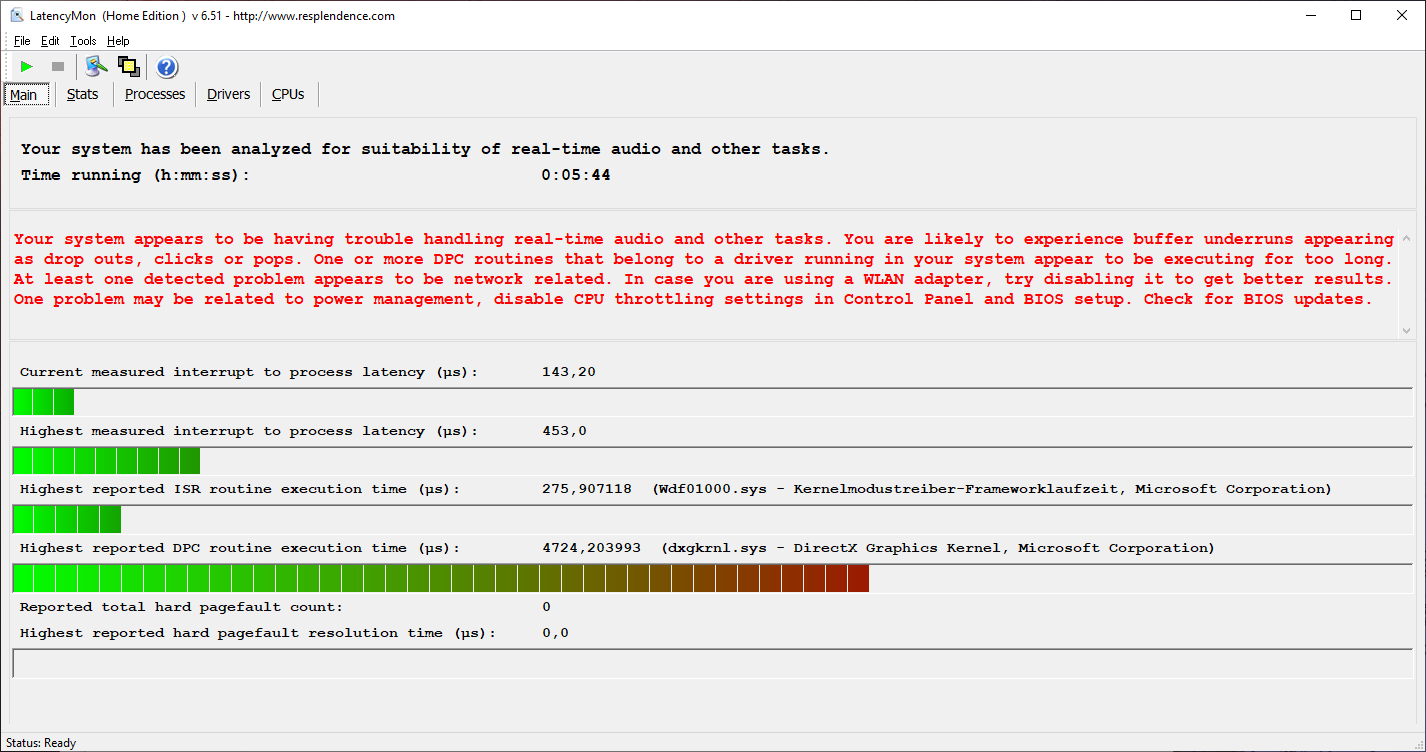
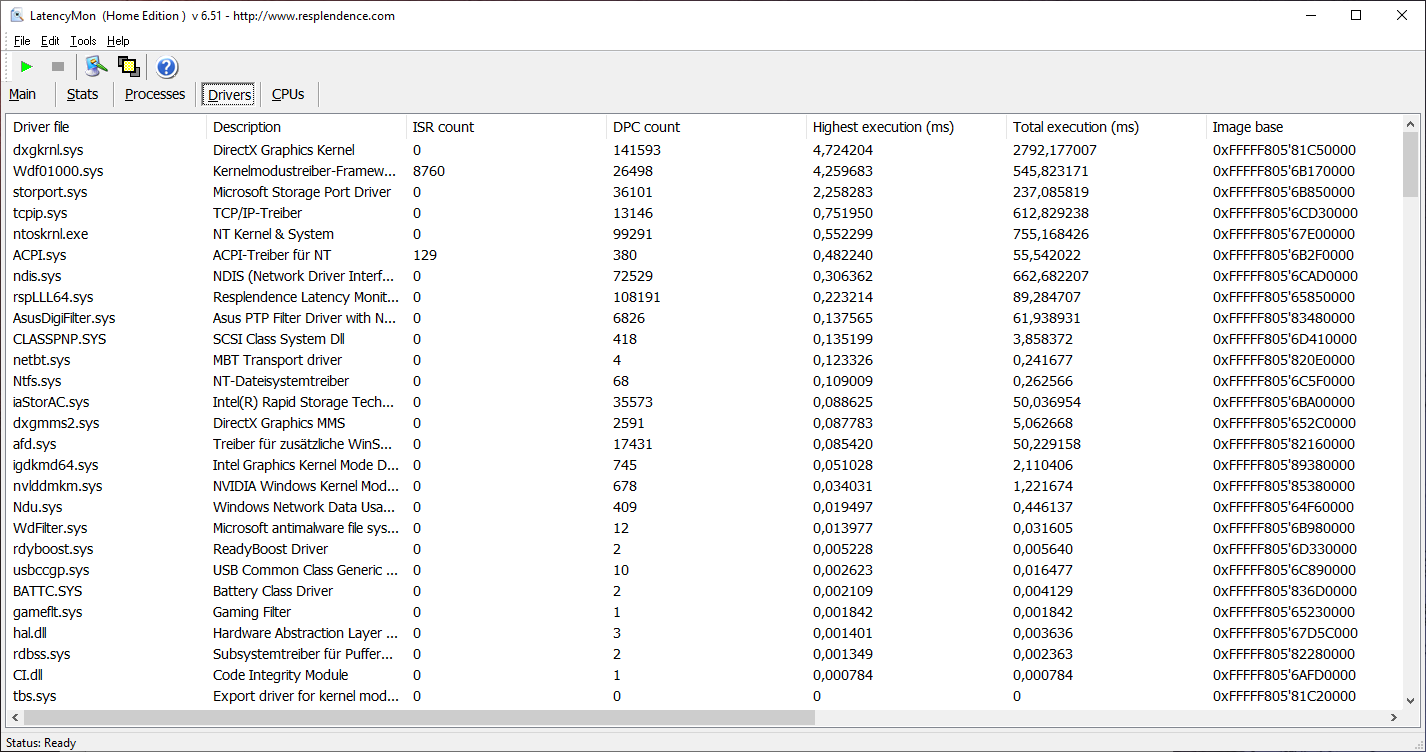
The LatencyMon test attests the Asus Zephyrus S17 with increased latencies. Therefore, there can be some interruptions in real-time applications.
| DPC Latencies / LatencyMon - interrupt to process latency (max), Web, Youtube, Prime95 | |
| Razer Blade Pro 17 RTX 2070 Max-Q 300 Hz | |
| Asus Zephyrus S17 GX701LXS | |
| MSI GS75 10SF-609US | |
* ... smaller is better
Storage Solution
Asus has equipped the Zephyrus S17 with a 1-TB SSD from Samsung, which achieves very good read and write rates in our benchmarks. Even though there are also SSD models in the competing devices that do even slightly better, users will still profit significantly from the fast read and write rates.
You can find out how this SSD fares in the comparison with other storage solutions in our HDD/SSD benchmark list.
| Asus Zephyrus S17 GX701LXS Samsung PM981a MZVLB1T0HBLR | Razer Blade Pro 17 RTX 2070 Max-Q 300 Hz Lite-On CA5-8D512 | MSI GS75 10SF-609US WDC PC SN730 SDBPNTY-512G | Lenovo Legion Y740-17IRHg-81UJ001VGE Samsung SSD PM981 MZVLB1T0HALR | Alienware m17 R2 P41E 2x SK Hynix PC601 NVMe 512 GB (RAID 0) | Average Samsung PM981a MZVLB1T0HBLR | |
|---|---|---|---|---|---|---|
| CrystalDiskMark 5.2 / 6 | 9% | 18% | 1% | 4% | 9% | |
| Write 4K (MB/s) | 120 | 119 -1% | 177.9 48% | 101.2 -16% | 110.6 -8% | 139.7 ? 16% |
| Read 4K (MB/s) | 45.24 | 51.9 15% | 47.42 5% | 44.61 -1% | 41.46 -8% | 49.9 ? 10% |
| Write Seq (MB/s) | 2090 | 2258 8% | 2707 30% | 2295 10% | 2378 14% | 2036 ? -3% |
| Read Seq (MB/s) | 2246 | 2283 2% | 2369 5% | 2174 -3% | 2114 -6% | 2014 ? -10% |
| Write 4K Q32T1 (MB/s) | 392.5 | 491 25% | 427.8 9% | 401.2 2% | 445.4 13% | 461 ? 17% |
| Read 4K Q32T1 (MB/s) | 348.4 | 540 55% | 543 56% | 475.5 36% | 509 46% | 499 ? 43% |
| Write Seq Q32T1 (MB/s) | 3015 | 2253 -25% | 2703 -10% | 2397 -20% | 2735 -9% | 2903 ? -4% |
| Read Seq Q32T1 (MB/s) | 3445 | 3172 -8% | 3387 -2% | 3337 -3% | 3206 -7% | 3479 ? 1% |
| AS SSD | -60% | -13% | 9% | -27% | 13% | |
| Seq Read (MB/s) | 2744 | 2019 -26% | 2327 -15% | 2800 2% | 1938 -29% | 2553 ? -7% |
| Seq Write (MB/s) | 1351 | 1314 -3% | 2479 83% | 2424 79% | 2094 55% | 2084 ? 54% |
| 4K Read (MB/s) | 47.24 | 46.61 -1% | 45.46 -4% | 42.77 -9% | 25.88 -45% | 53.1 ? 12% |
| 4K Write (MB/s) | 109.1 | 90.2 -17% | 157.4 44% | 94.8 -13% | 100.8 -8% | 131.2 ? 20% |
| 4K-64 Read (MB/s) | 1118 | 665 -41% | 1050 -6% | 1406 26% | 1217 9% | 1477 ? 32% |
| 4K-64 Write (MB/s) | 1926 | 813 -58% | 938 -51% | 1697 -12% | 1137 -41% | 1805 ? -6% |
| Access Time Read * (ms) | 0.064 | 0.058 9% | 0.076 -19% | 0.05 22% | 0.051 20% | 0.04983 ? 22% |
| Access Time Write * (ms) | 0.034 | 0.167 -391% | 0.071 -109% | 0.039 -15% | 0.107 -215% | 0.04222 ? -24% |
| Score Read (Points) | 1439 | 913 -37% | 1328 -8% | 1729 20% | 1437 0% | 1786 ? 24% |
| Score Write (Points) | 2170 | 1034 -52% | 1343 -38% | 2034 -6% | 1447 -33% | 2144 ? -1% |
| Score Total (Points) | 4283 | 2392 -44% | 3366 -21% | 4630 8% | 3624 -15% | 4826 ? 13% |
| Total Average (Program / Settings) | -26% /
-31% | 3% /
-0% | 5% /
6% | -12% /
-14% | 11% /
11% |
* ... smaller is better

Constant Performance Reads: DiskSpd Read Loop, Queue Depth 8
Graphics Card
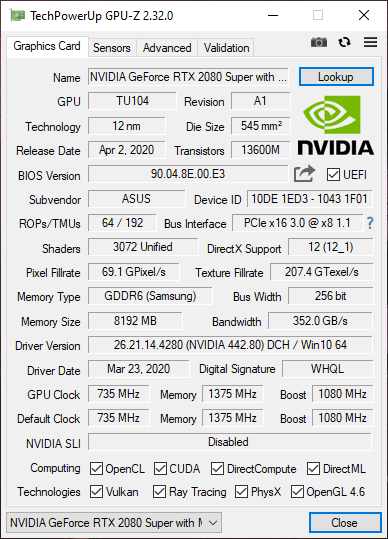
The Nvidia GeForce RTX 2080 Super Max-Q used here is currently one of the most powerful mobile graphics cards. With its Max-Q design, it is also distinguished by its energy-efficient operation, which is not the case for the non-Max-Q models. Corresponding to the performance of its graphics unit, the Zephyrus S17 achieves an above-average result in the benchmarks and is able to lead our test field with this. Only in the "Cloud Gate" 3DMark test does the Razer Blade Pro 17 score slightly better.
On our GPU benchmark page, you can find out what performance other graphics cards were able to achieve in our tests.
| 3DMark 11 Performance | 25058 points | |
| 3DMark Cloud Gate Standard Score | 45467 points | |
| 3DMark Fire Strike Score | 19929 points | |
| 3DMark Time Spy Score | 8883 points | |
Help | ||
Gaming Performance
The Asus Zephyrus S17 with the Nvidia GeForce RTX 2080 Super Max-Q is also able to bring demanding games to the screen smoothly and at high detail levels. All the games we tested ran smoothly without showing any larger drops in the frame rates. Due to the 300-Hz display, the game contents also appear comfortably smooth, but users should decide for themselves whether they can really see any subjective difference to a 240-Hz panel, for example.
Our GPU games list shows what gaming performance in other games you can expect from the graphics unit used here.
| The Witcher 3 - 1920x1080 Ultra Graphics & Postprocessing (HBAO+) | |
| Average of class Gaming (104.7 - 240, n=6, last 2 years) | |
| Average NVIDIA GeForce RTX 2080 Super Max-Q (74.3 - 96, n=11) | |
| Asus Zephyrus S17 GX701LXS | |
| Lenovo Legion Y740-17IRHg-81UJ001VGE | |
| Razer Blade Pro 17 RTX 2070 Max-Q 300 Hz | |
| Alienware m17 R2 P41E | |
| MSI GS75 10SF-609US | |
| Far Cry 5 - 1920x1080 Ultra Preset AA:T | |
| Average of class Gaming (70 - 151, n=6, last 2 years) | |
| Asus Zephyrus S17 GX701LXS | |
| Average NVIDIA GeForce RTX 2080 Super Max-Q (91 - 110, n=4) | |
| Doom Eternal - 1920x1080 Ultra Preset | |
| Asus Zephyrus S17 GX701LXS | |
| Average NVIDIA GeForce RTX 2080 Super Max-Q (140 - 177.7, n=8) | |
| Final Fantasy XV Benchmark - 1920x1080 High Quality | |
| Average of class Gaming (41 - 215, n=94, last 2 years) | |
| Average NVIDIA GeForce RTX 2080 Super Max-Q (67 - 80.8, n=2) | |
| Asus Zephyrus S17 GX701LXS | |
Our The Witcher 3 constant load test running for about one hour with the "Ultra" graphics setting shows a slight but noticeable reduction in the frame rates after about half the time. However, the system is able to recover from this until the end of the test. Users therefore do not need to expect any limitations during long gaming sessions.
| low | med. | high | ultra | |
|---|---|---|---|---|
| The Witcher 3 (2015) | 82.6 | |||
| Dota 2 Reborn (2015) | 146.6 | 135.8 | 124.2 | 117.7 |
| Final Fantasy XV Benchmark (2018) | 67 | |||
| X-Plane 11.11 (2018) | 114 | 97.6 | 82.8 | |
| Far Cry 5 (2018) | 101 | |||
| Doom Eternal (2020) | 177.7 |
Emissions - Very good speakers
Noise Emissions
Producing 45 dB(A), the fans of the Zephyrus S17 can become quite noticeable in the "Performance" profile, slightly interfering with the game play. However, due to the high performance of the Asus laptop, many games can also be played smoothly at high frame rates in the "Quiet" mode. While you can still hear the fans producing an even whirring noise in this mode, the speakers of the gaming laptop produce a sufficient volume to drown out the noise.
Noise level
| Idle |
| 32 / 35 / 43 dB(A) |
| Load |
| 44 / 45 dB(A) |
 | ||
30 dB silent 40 dB(A) audible 50 dB(A) loud |
||
min: | ||
Temperature
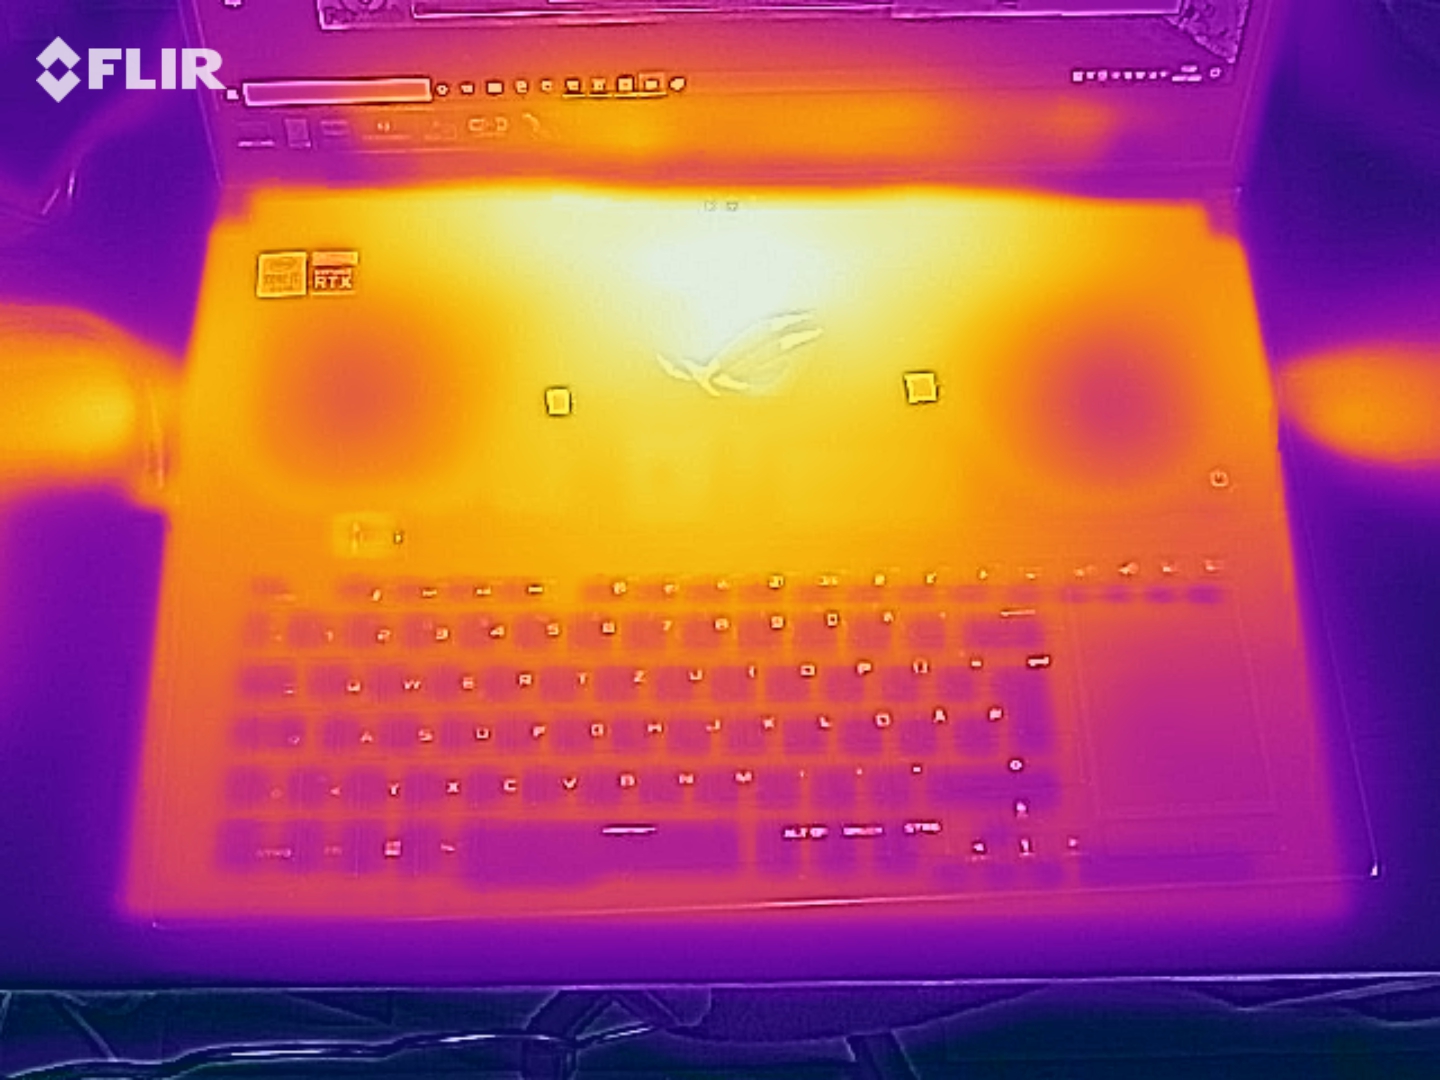
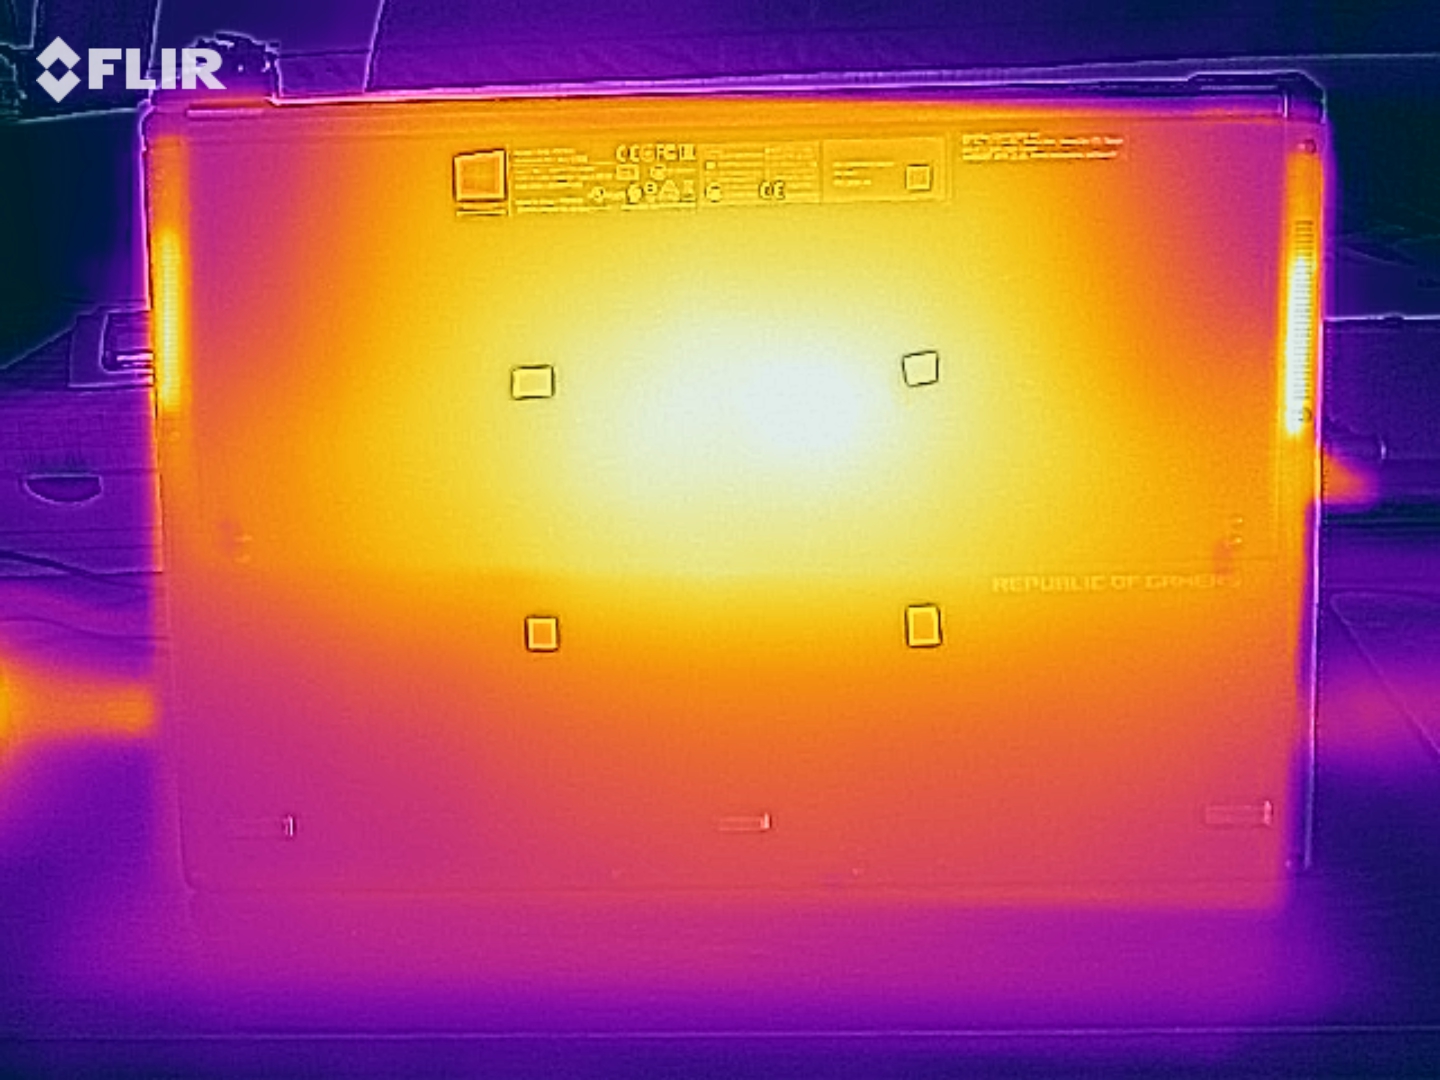
Our measurements attest the Zephyrus S17 with surface temperatures of up to 59 °C (138 °F) in our The Witcher 3 load test. But since the keyboard area always remains below the 40-°C mark (104 °F), the laptop can still be used comfortably as long as it is placed on a table, for example. We do not recommend using the notebook on your lap during gaming operation.
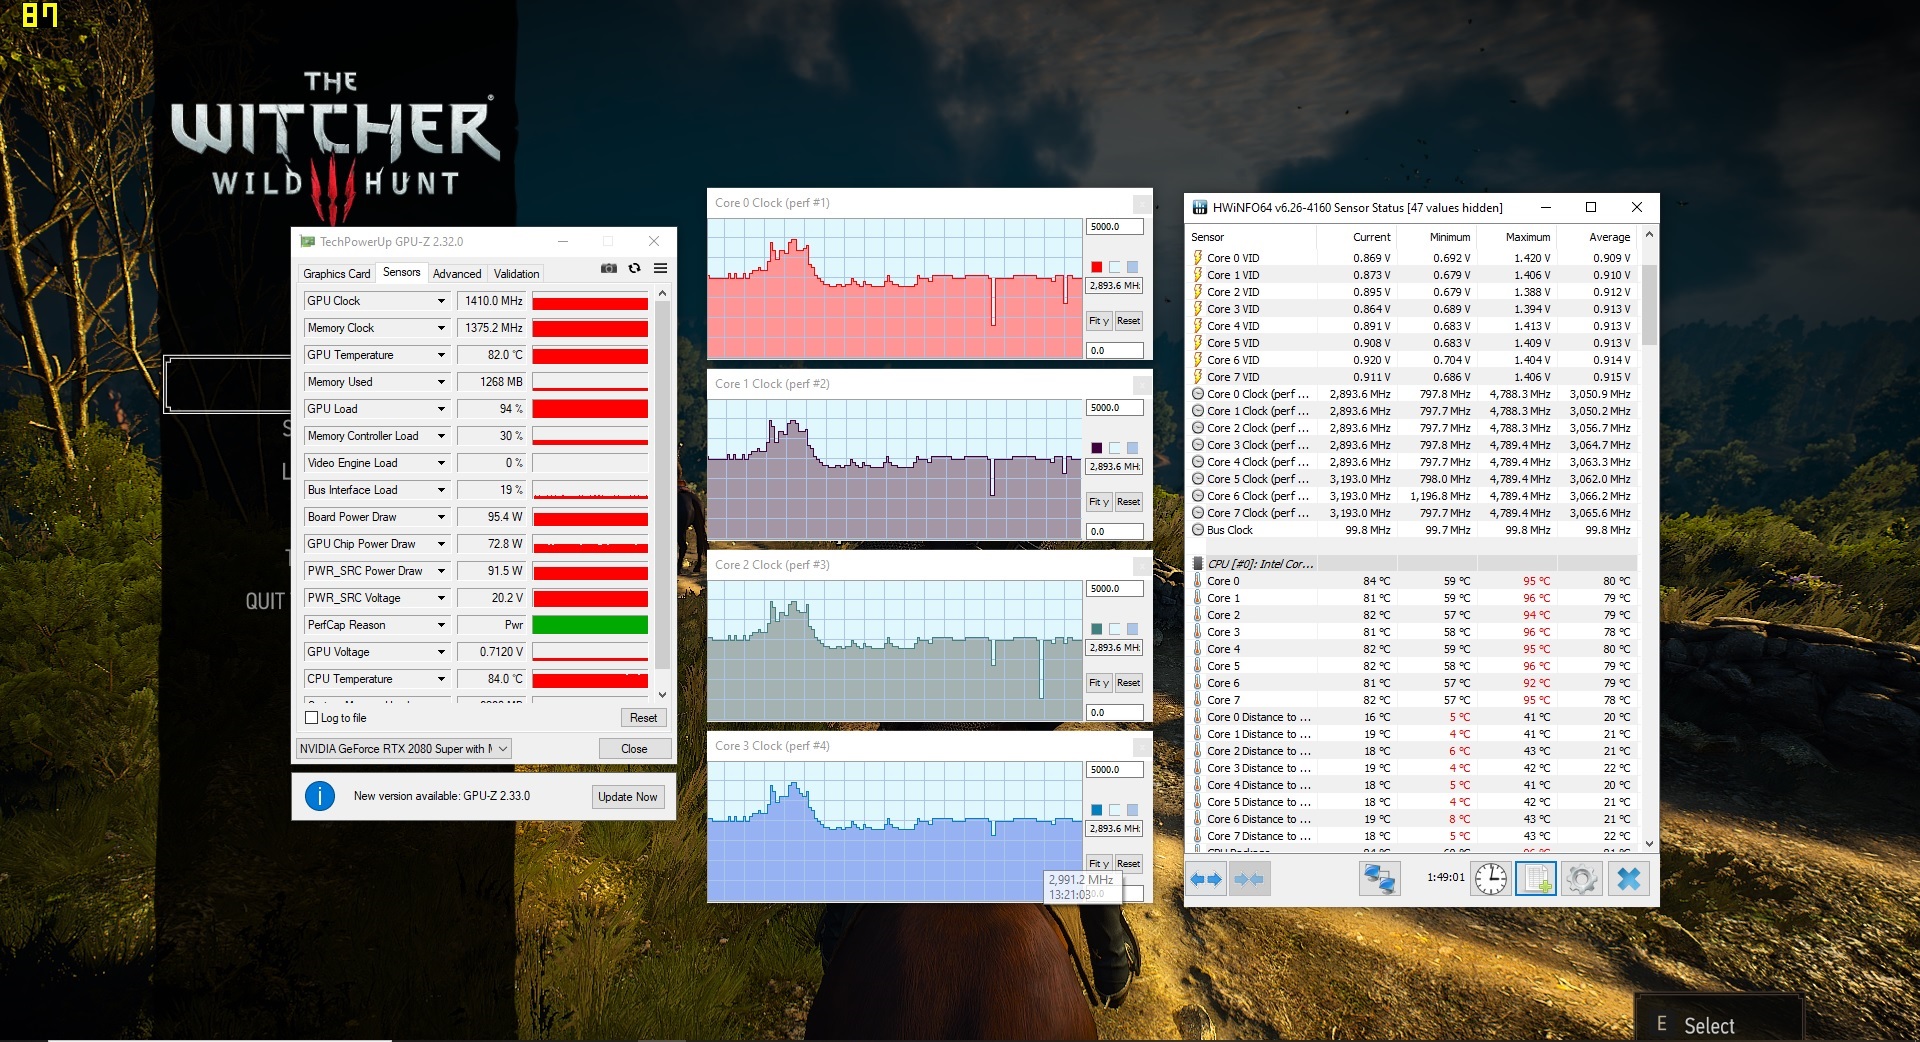
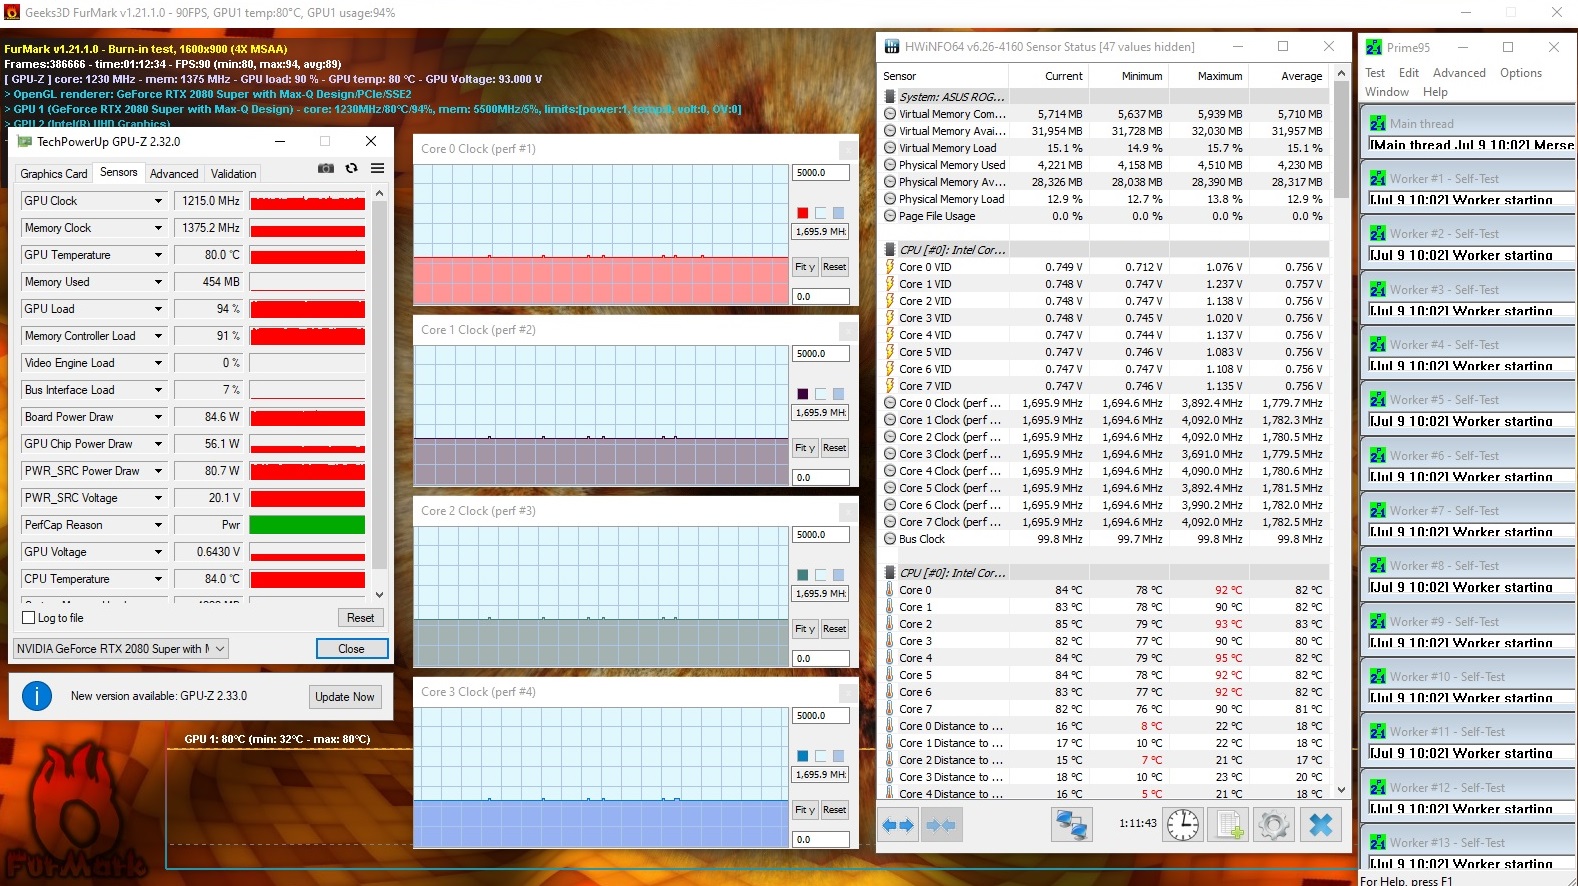
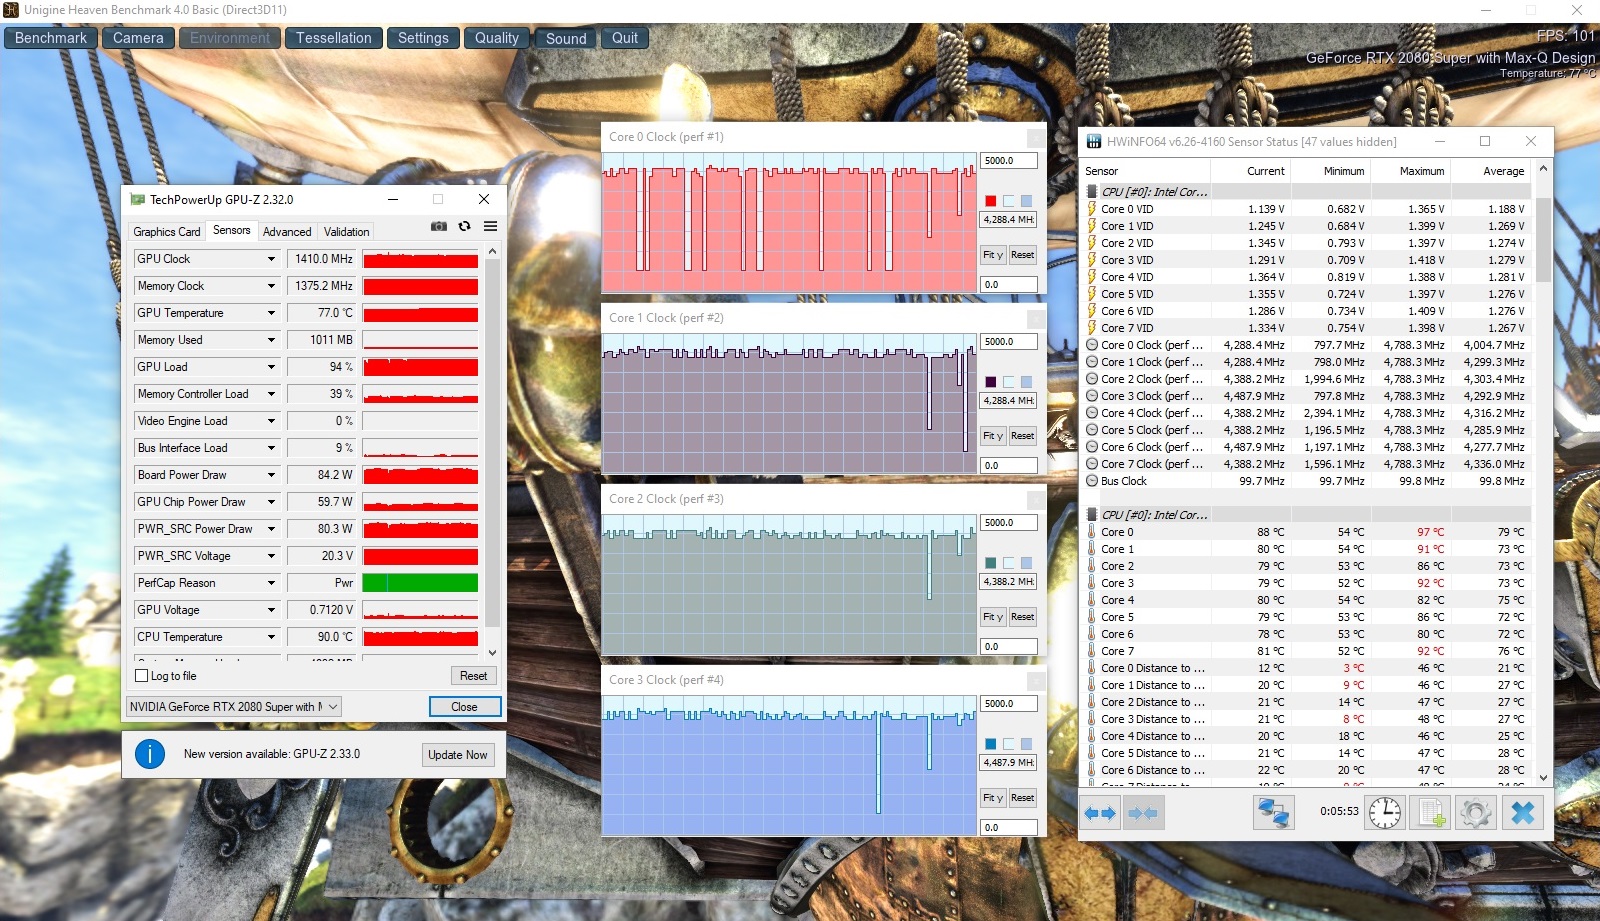
During our approximately hour-long stress test with the FurMark a Prime95 tools, the CPU temperatures rise up to 95 °C (203 °F). At the same time, the clock speed drops to about 1.7 GHz, which is significantly lower than the basic clock speed of 2.3 GHz. However, since this still allows for smooth system operation and our stress-test scenario is almost impossible to occur in practice, users should not expect any limitations due to temperatures being too high. In our The Witcher 3 test, the average CPU clock speeds of about 3 GHz were significantly higher than the basic clock speed.
(-) The maximum temperature on the upper side is 57 °C / 135 F, compared to the average of 40.4 °C / 105 F, ranging from 21.2 to 68.8 °C for the class Gaming.
(-) The bottom heats up to a maximum of 51 °C / 124 F, compared to the average of 43.2 °C / 110 F
(+) In idle usage, the average temperature for the upper side is 27.6 °C / 82 F, compared to the device average of 33.9 °C / 93 F.
(-) Playing The Witcher 3, the average temperature for the upper side is 48.6 °C / 119 F, compared to the device average of 33.9 °C / 93 F.
(-) The palmrests and touchpad can get very hot to the touch with a maximum of 40 °C / 104 F.
(-) The average temperature of the palmrest area of similar devices was 28.8 °C / 83.8 F (-11.2 °C / -20.2 F).
Speakers
The speakers of the Asus Zephyrus S17 produce a relatively high volume and a wide sound spectrum. This makes them well-suited for reproduction of media content. With their saturated sound, they also strike a good figure during gaming, so that users don't necessarily have to use headphones or external speakers.
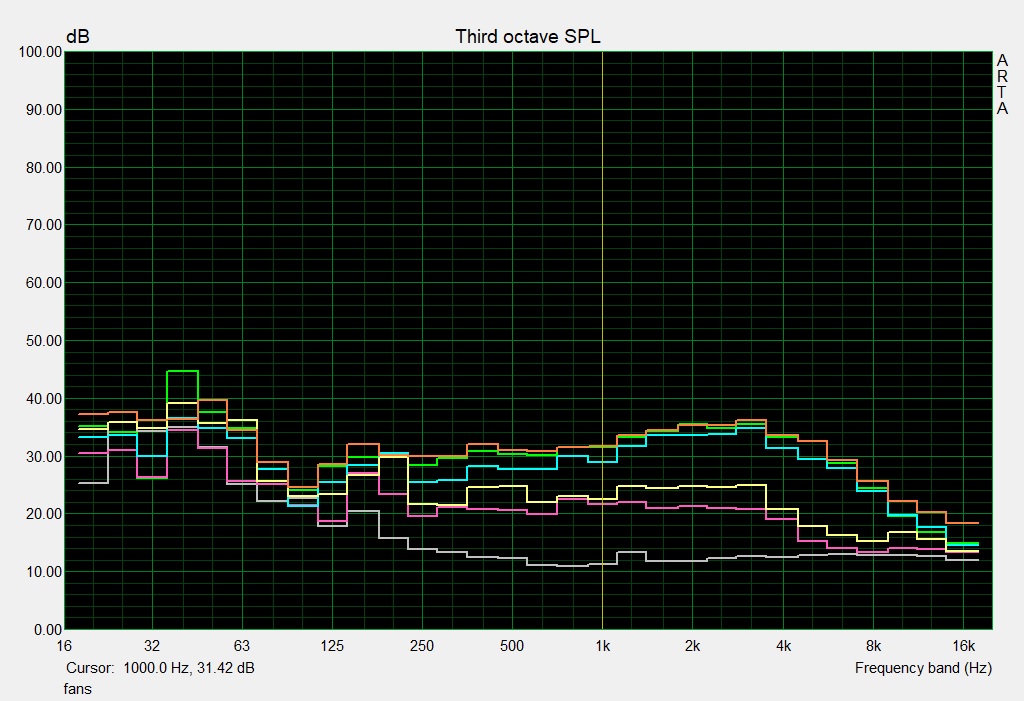
Asus Zephyrus S17 GX701LXS audio analysis
(+) | speakers can play relatively loud (82 dB)
Bass 100 - 315 Hz
(±) | reduced bass - on average 8.4% lower than median
(±) | linearity of bass is average (11.6% delta to prev. frequency)
Mids 400 - 2000 Hz
(+) | balanced mids - only 2.2% away from median
(+) | mids are linear (2.9% delta to prev. frequency)
Highs 2 - 16 kHz
(+) | balanced highs - only 4.3% away from median
(+) | highs are linear (4.3% delta to prev. frequency)
Overall 100 - 16.000 Hz
(+) | overall sound is linear (11% difference to median)
Compared to same class
» 7% of all tested devices in this class were better, 3% similar, 89% worse
» The best had a delta of 6%, average was 18%, worst was 132%
Compared to all devices tested
» 6% of all tested devices were better, 2% similar, 92% worse
» The best had a delta of 4%, average was 23%, worst was 134%
Power Management - No endurance with a mediocre battery life
Power Consumption
According to our measurements, the Zephyrus S17 has slightly lower power consumption during operation under low load than is the case for our selected competing devices. Under load, this impression reverses, and the Asus gaming notebook has slightly higher power consumption at times. The maximum value is 206 watts, which means that the included 240-Watt power supply has a sufficient size to always ensure enough power.
| Off / Standby | |
| Idle | |
| Load |
|
Key:
min: | |
| Asus Zephyrus S17 GX701LXS i7-10875H, GeForce RTX 2080 Super Max-Q | Razer Blade Pro 17 RTX 2070 Max-Q 300 Hz i7-10875H, GeForce RTX 2070 Max-Q | MSI GS75 10SF-609US i7-10875H, GeForce RTX 2070 Max-Q | Lenovo Legion Y740-17IRHg-81UJ001VGE i7-9750H, GeForce RTX 2080 Max-Q | Alienware m17 R2 P41E i9-9980HK, GeForce RTX 2080 Max-Q | Average NVIDIA GeForce RTX 2080 Super Max-Q | Average of class Gaming | |
|---|---|---|---|---|---|---|---|
| Power Consumption | -25% | -26% | -18% | -75% | -3% | -7% | |
| Idle Minimum * (Watt) | 10 | 19.6 -96% | 19.2 -92% | 15.7 -57% | 24.7 -147% | 12.9 ? -29% | 13 ? -30% |
| Idle Average * (Watt) | 16 | 21.7 -36% | 22.4 -40% | 26.3 -64% | 35.9 -124% | 17.3 ? -8% | 18.7 ? -17% |
| Idle Maximum * (Watt) | 29 | 36.1 -24% | 34.7 -20% | 28 3% | 69.6 -140% | 26.9 ? 7% | 24.3 ? 16% |
| Load Average * (Watt) | 143 | 115.6 19% | 106.7 25% | 136 5% | 141.8 1% | 123.9 ? 13% | 110.2 ? 23% |
| Witcher 3 ultra * (Watt) | 146 | 157 -8% | 160.5 -10% | 160 -10% | 185.8 -27% | ||
| Load Maximum * (Watt) | 205 | 219.9 -7% | 248.7 -21% | 177 14% | 235.4 -15% | 205 ? -0% | 258 ? -26% |
* ... smaller is better
Battery Life
In our realistic WLAN test, the Asus Zephyrus S17 lasts for barely three hours, which means that it does not last as long as the other gaming laptops in our test field.
Using the included 240-Watt power supply, the battery is completely recharged after about two hours.
| Asus Zephyrus S17 GX701LXS i7-10875H, GeForce RTX 2080 Super Max-Q, 76 Wh | Razer Blade Pro 17 RTX 2070 Max-Q 300 Hz i7-10875H, GeForce RTX 2070 Max-Q, 70 Wh | MSI GS75 10SF-609US i7-10875H, GeForce RTX 2070 Max-Q, 80.25 Wh | Lenovo Legion Y740-17IRHg-81UJ001VGE i7-9750H, GeForce RTX 2080 Max-Q, 76 Wh | Alienware m17 R2 P41E i9-9980HK, GeForce RTX 2080 Max-Q, 76 Wh | Average of class Gaming | |
|---|---|---|---|---|---|---|
| Battery runtime | 75% | 131% | -1% | 36% | 101% | |
| Reader / Idle (h) | 3.5 | 8.6 146% | 3.8 9% | 7.1 103% | 8.71 ? 149% | |
| WiFi v1.3 (h) | 2.8 | 4.9 75% | 4.9 75% | 3 7% | 4.8 71% | 7.15 ? 155% |
| Load (h) | 1.5 | 4.1 173% | 1.2 -20% | 0.5 -67% | 1.502 ? 0% |
Pros
Cons
Verdict - A modern gaming laptop with a lot of performance
After a purchase of the Zephyrus S17 GX701LXS, users don't have to worry about the hardware performance of their laptop for a long time. This is completely sufficient for current games, even allowing them to be played in the significantly less noisy "Quiet" mode, where the fans don't sound like an engine room. In our opinion, the cooling design from Asus works, and we were not negatively affected in everyday operation by the resulting re-positioning of the keyboard. However, the slight opening of the case bottom when the lid is opened creates a very unstable impression, so that we would only want to use the Zephyrus S17 on a fixed surface.
The Asus Zephyrus S17 offers plenty of performance that can also be maintained over long time periods due to the refined cooling system.
However, those who want to get the maximum performance from their Asus Zephyrus S17 will sooner or later want to use the "Turbo" mode. Particularly during 4K or VR applications, the performance requirements will be significantly higher than for the Full HD resolution games we tested here. We would worry less about the constant performance than about the noise level. When the fans rev up fully, nothing goes without headphones. But since this is nothing unusual for a gaming notebook, the Asus Zephyrus S17 still leaves a good overall impression.
Asus Zephyrus S17 GX701LXS
- 08/16/2020 v7 (old)
Mike Wobker
Price comparison

