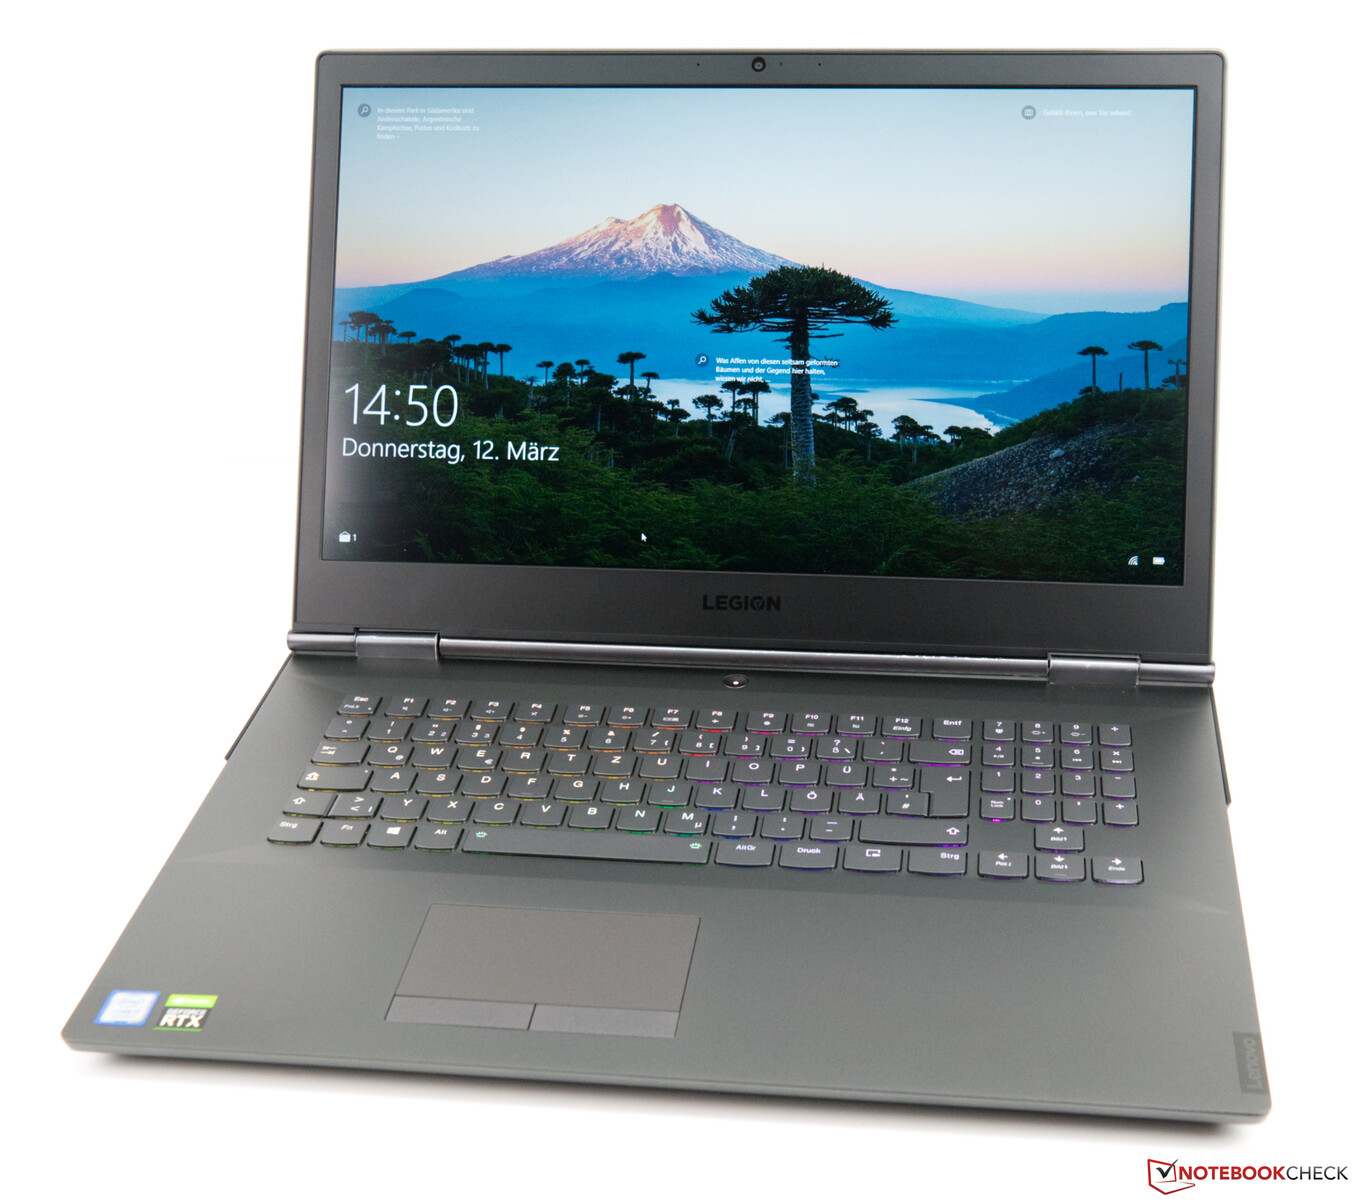
Lenovo Legion Y740-17IRHg with a GeForce RTX 2080 Max-Q in Review
Lenovo's Legion series consists of gaming laptops. Thus, its devices need to deliver a decent performance. Furthermore, the Legion family devices are visually distinct due to RGB highlights.
Prospective buyers can expect to pay around 2700 Euros (~$2965) for our test configuration. In return, the device features the Nvidia GeForce RTX 2080 Max-Q, which is the highest-end GPU option. Cheaper models are equipped with either an Nvidia GeForce RTX 2070 Max-Q or an Nvidia GeForce RTX 2060 Max-Q. Although there are more powerful processor options available, our configuration only sports an Intel Core i7-9750. The Intel Core i9-9880H, which is both slightly more expensive and slightly faster, would be the next step. The latter even has 8 cores.
The competition includes similarly equipped devices. These laptops are listed in the following table.
Rating | Date | Model | Weight | Height | Size | Resolution | Price |
|---|---|---|---|---|---|---|---|
| 84 % v7 (old) | 03 / 2020 | Lenovo Legion Y740-17IRHg-81UJ001VGE i7-9750H, GeForce RTX 2080 Max-Q | 3 kg | 25.5 mm | 17.30" | 1920x1080 | |
| 86.7 % v7 (old) | 10 / 2019 | Razer Blade Pro 17 4K UHD 120 Hz i7-9750H, GeForce RTX 2080 Max-Q | 2.8 kg | 19.9 mm | 17.30" | 3840x2160 | |
| 84.2 % v7 (old) | 02 / 2020 | Alienware m17 R2 P41E i9-9980HK, GeForce RTX 2080 Max-Q | 2.6 kg | 20.5 mm | 17.30" | 1920x1080 | |
| 81.2 % v7 (old) | 12 / 2019 | Asus ROG Zephyrus S GX701GXR i7-9750H, GeForce RTX 2080 Max-Q | 2.7 kg | 18.7 mm | 17.30" | 1920x1080 |
Case & Features - Good, but Not Perfect
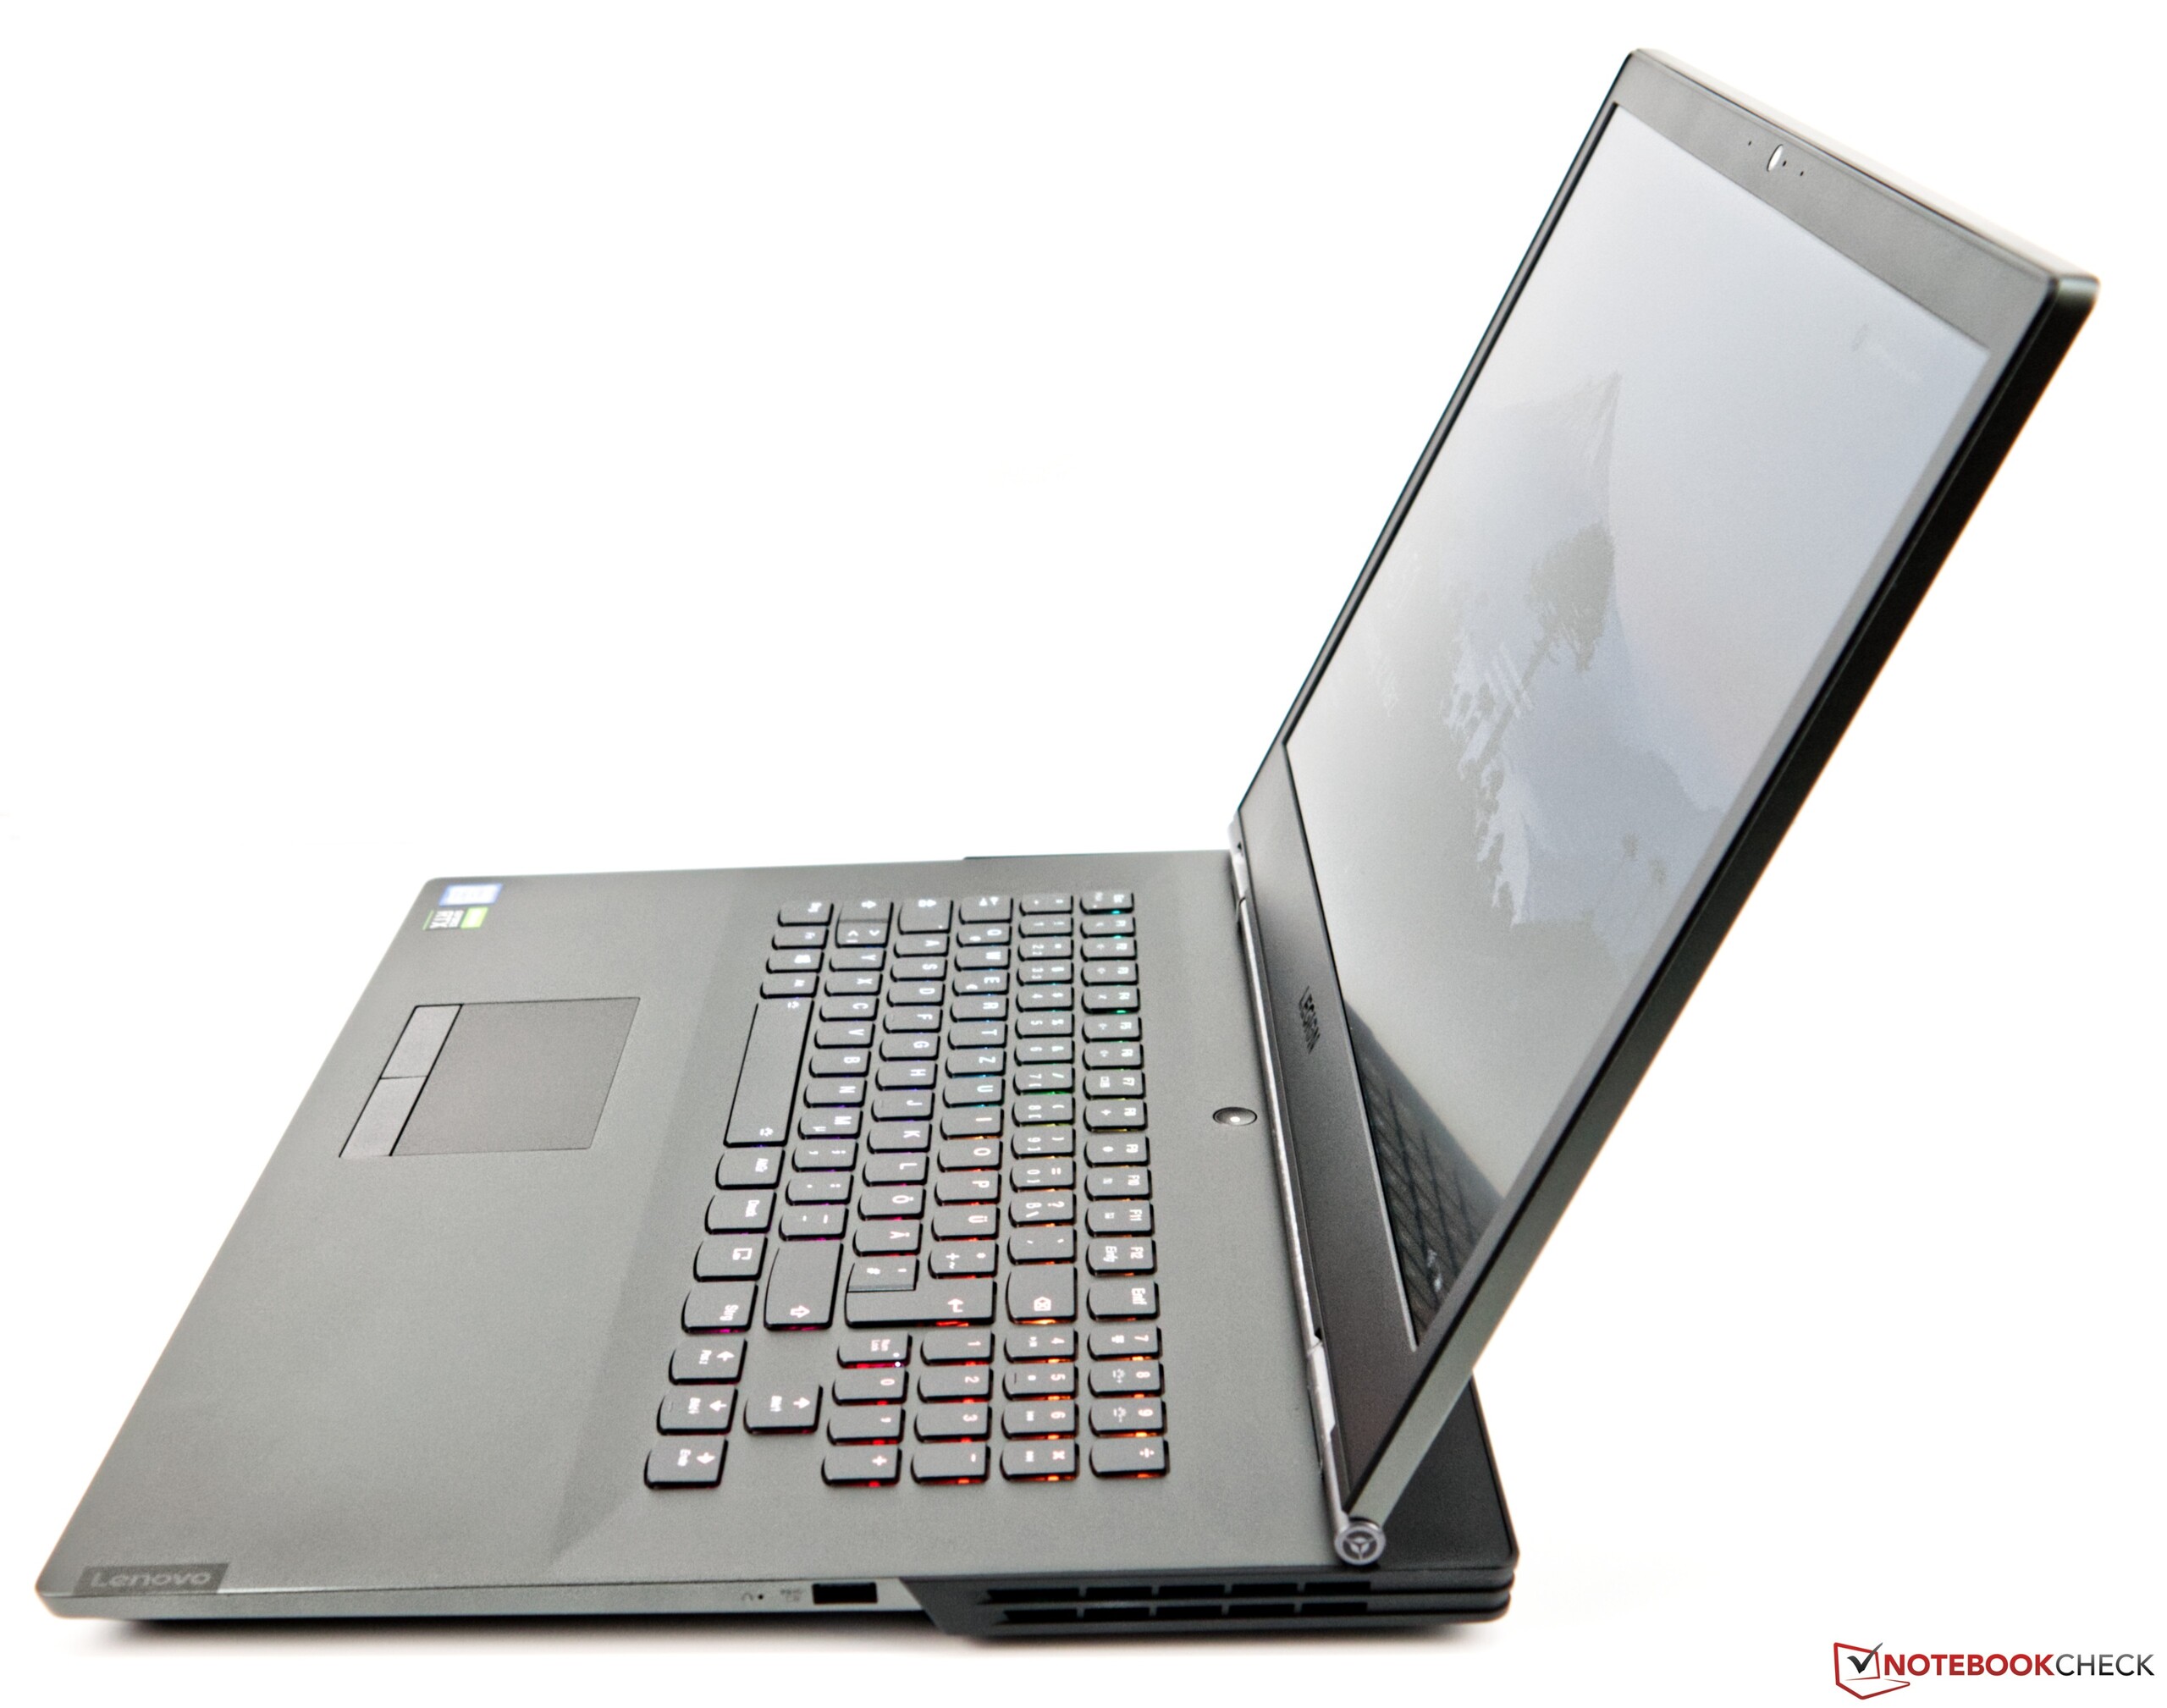
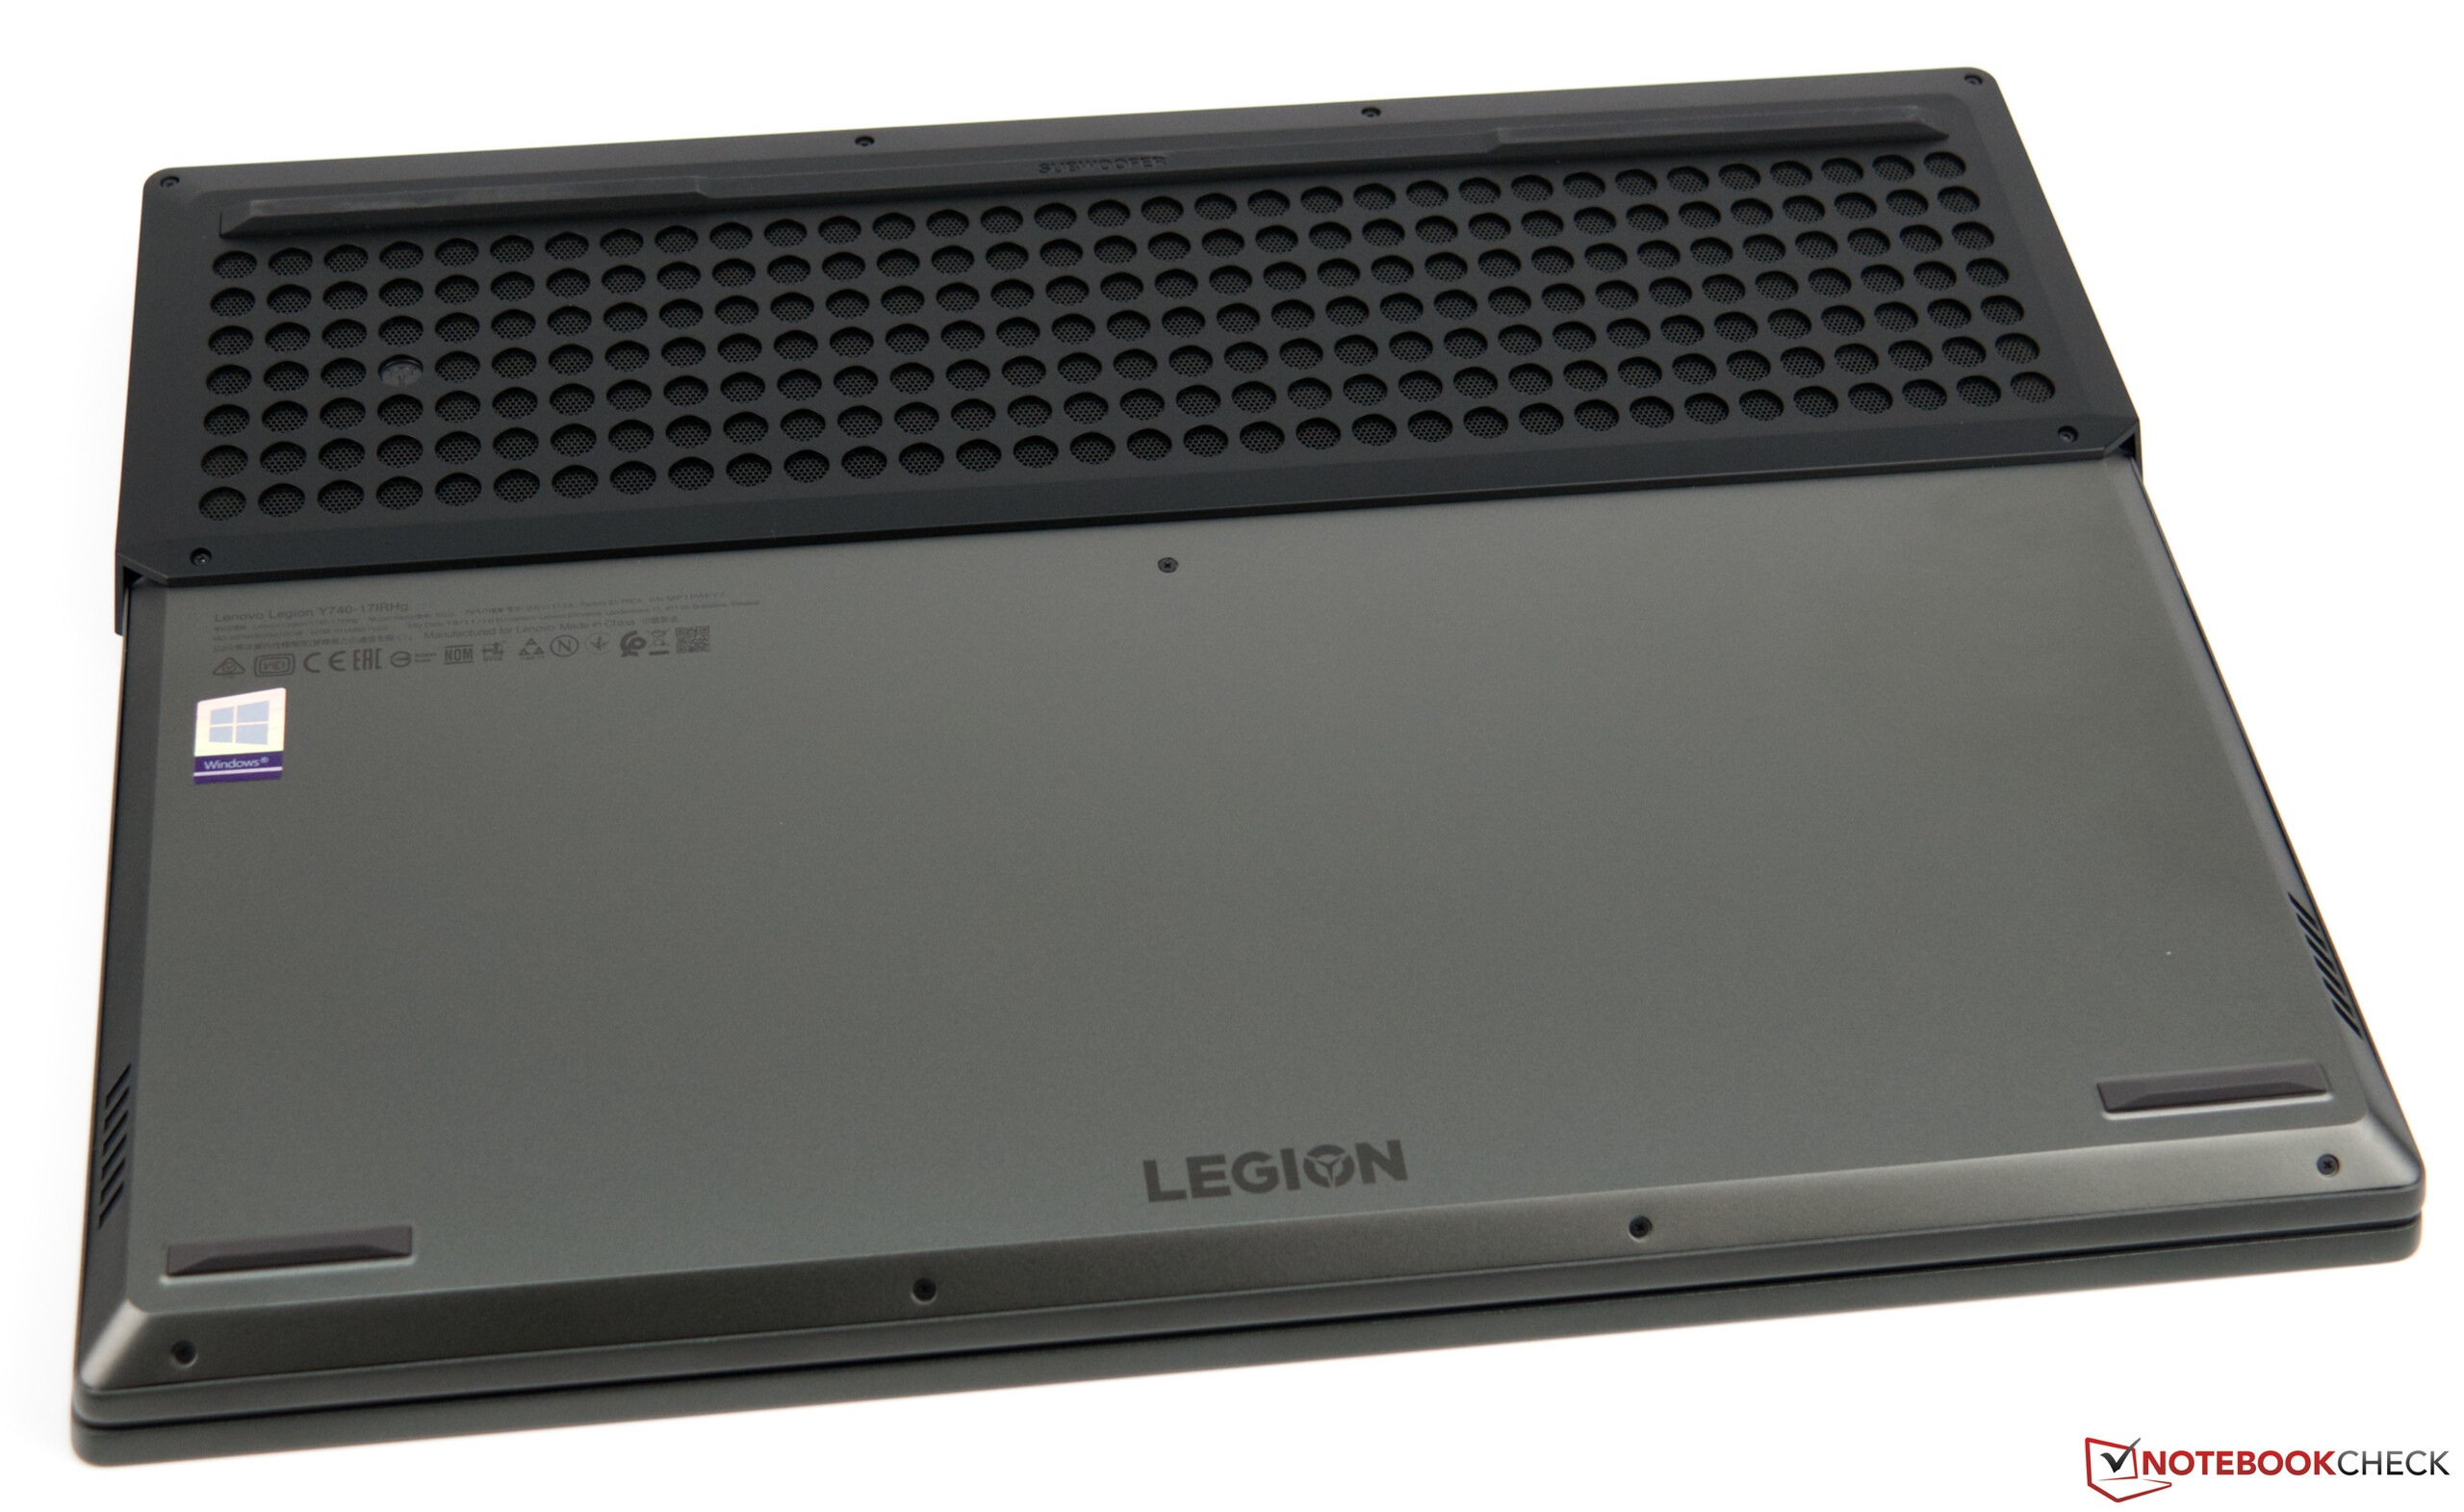
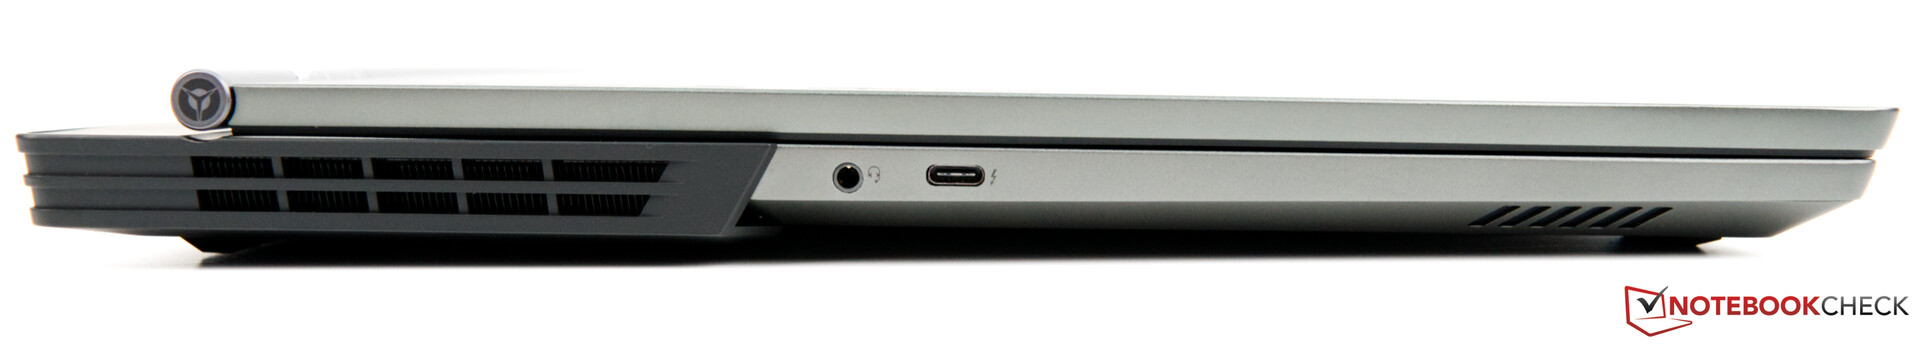
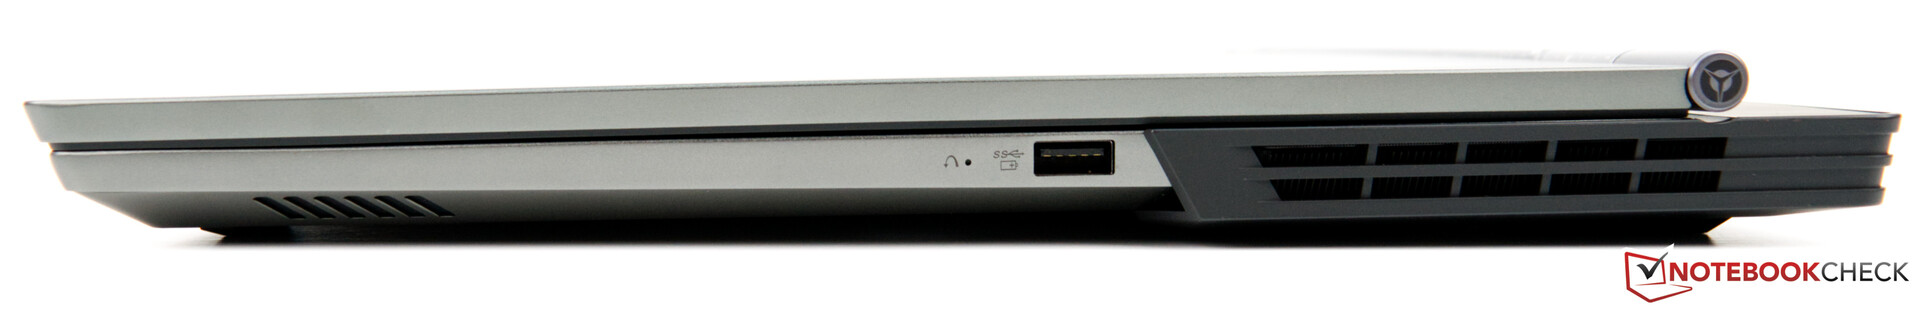
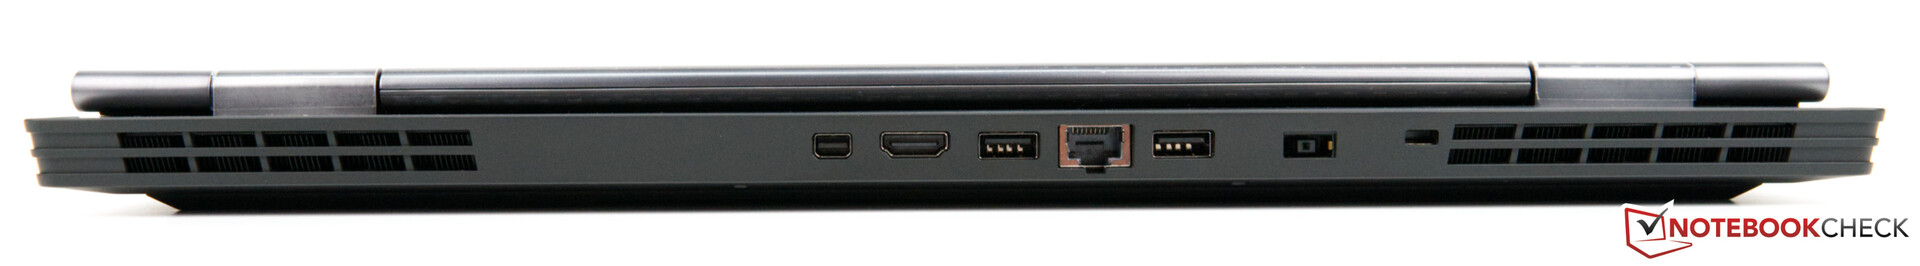
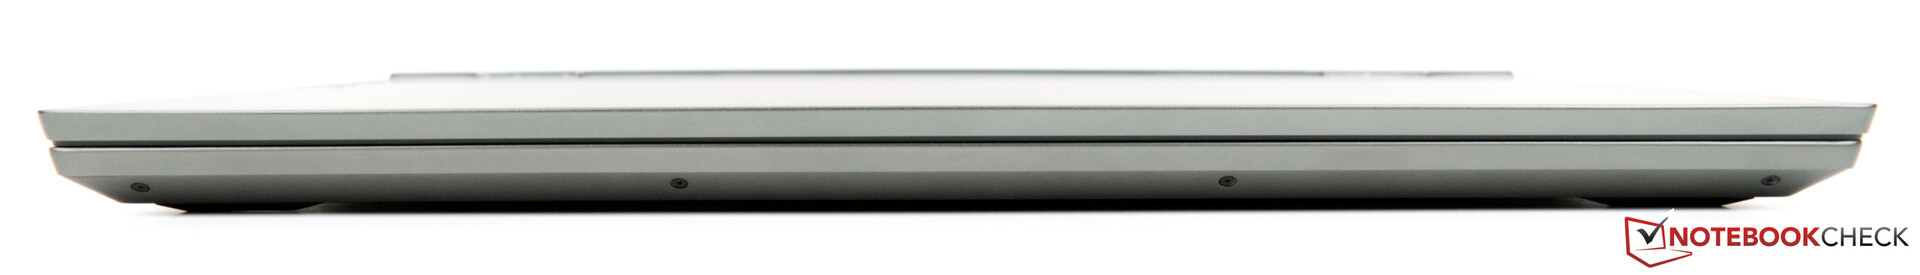
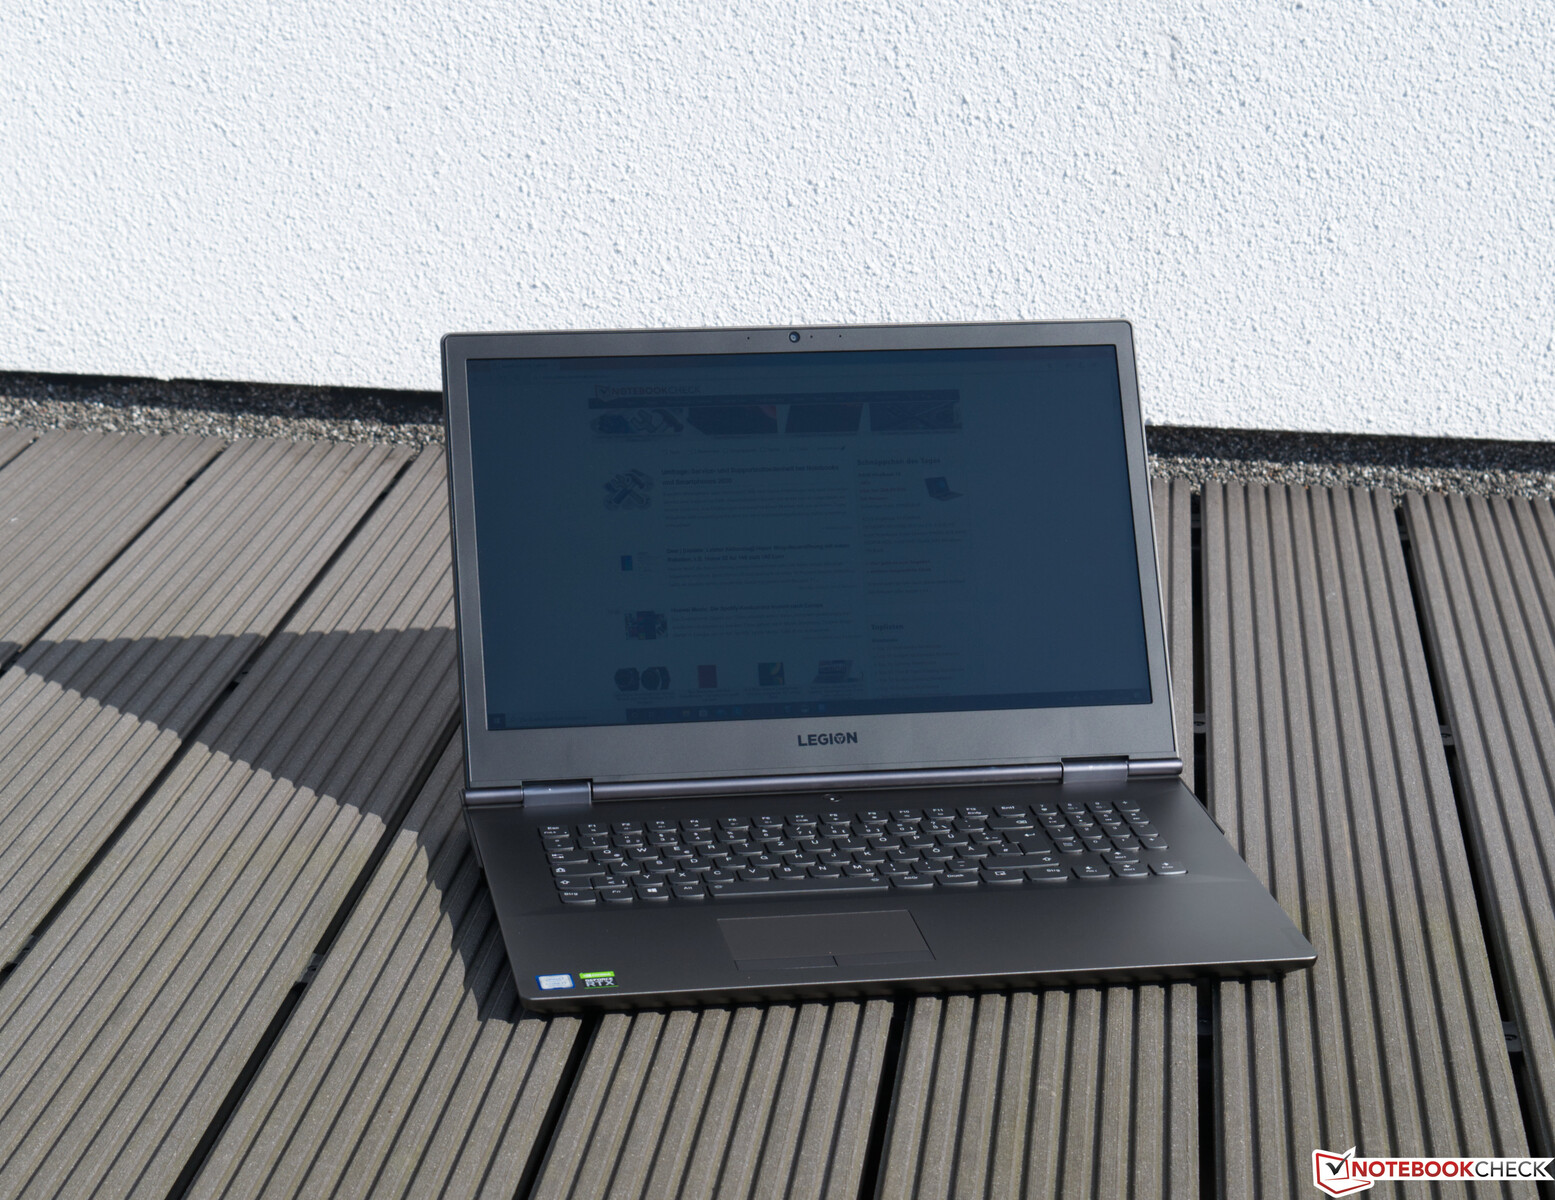
The Lenovo Legion Y740-17 stands out visually as a gaming laptop. The typical design elements of the Legion series are emphasized by RGB lighting. The choice of materials is good as well, since the manufacturer uses a lot of aluminum. As a result, the base unit and the lid are quite rigid, although the keyboard center can be observed to yield slightly under pressure. However, the extent of this remains within reason. Various design elements such as the fan grilles on the base unit and the display bezels are made of plastic. The display can be opened to a maximum angle of a generous 180 °. Even then, the two hinges reliably prevent teetering. Meanwhile, since the base is heavy enough, the display can be opened one-handed. At 3 kg (~6.5 lb), the Lenovo Legion Y740-17 is significantly heavier than its competitors. For a 17-inch device, it is still not very heavy. The port selection of the laptop is solid. Most ports can be found on the back. However, there is also one USB port on each side. We still are not too happy about the Mini DisplayPort, since a normal DisplayPort would have made more sense. We also regret the absence of a card reader.
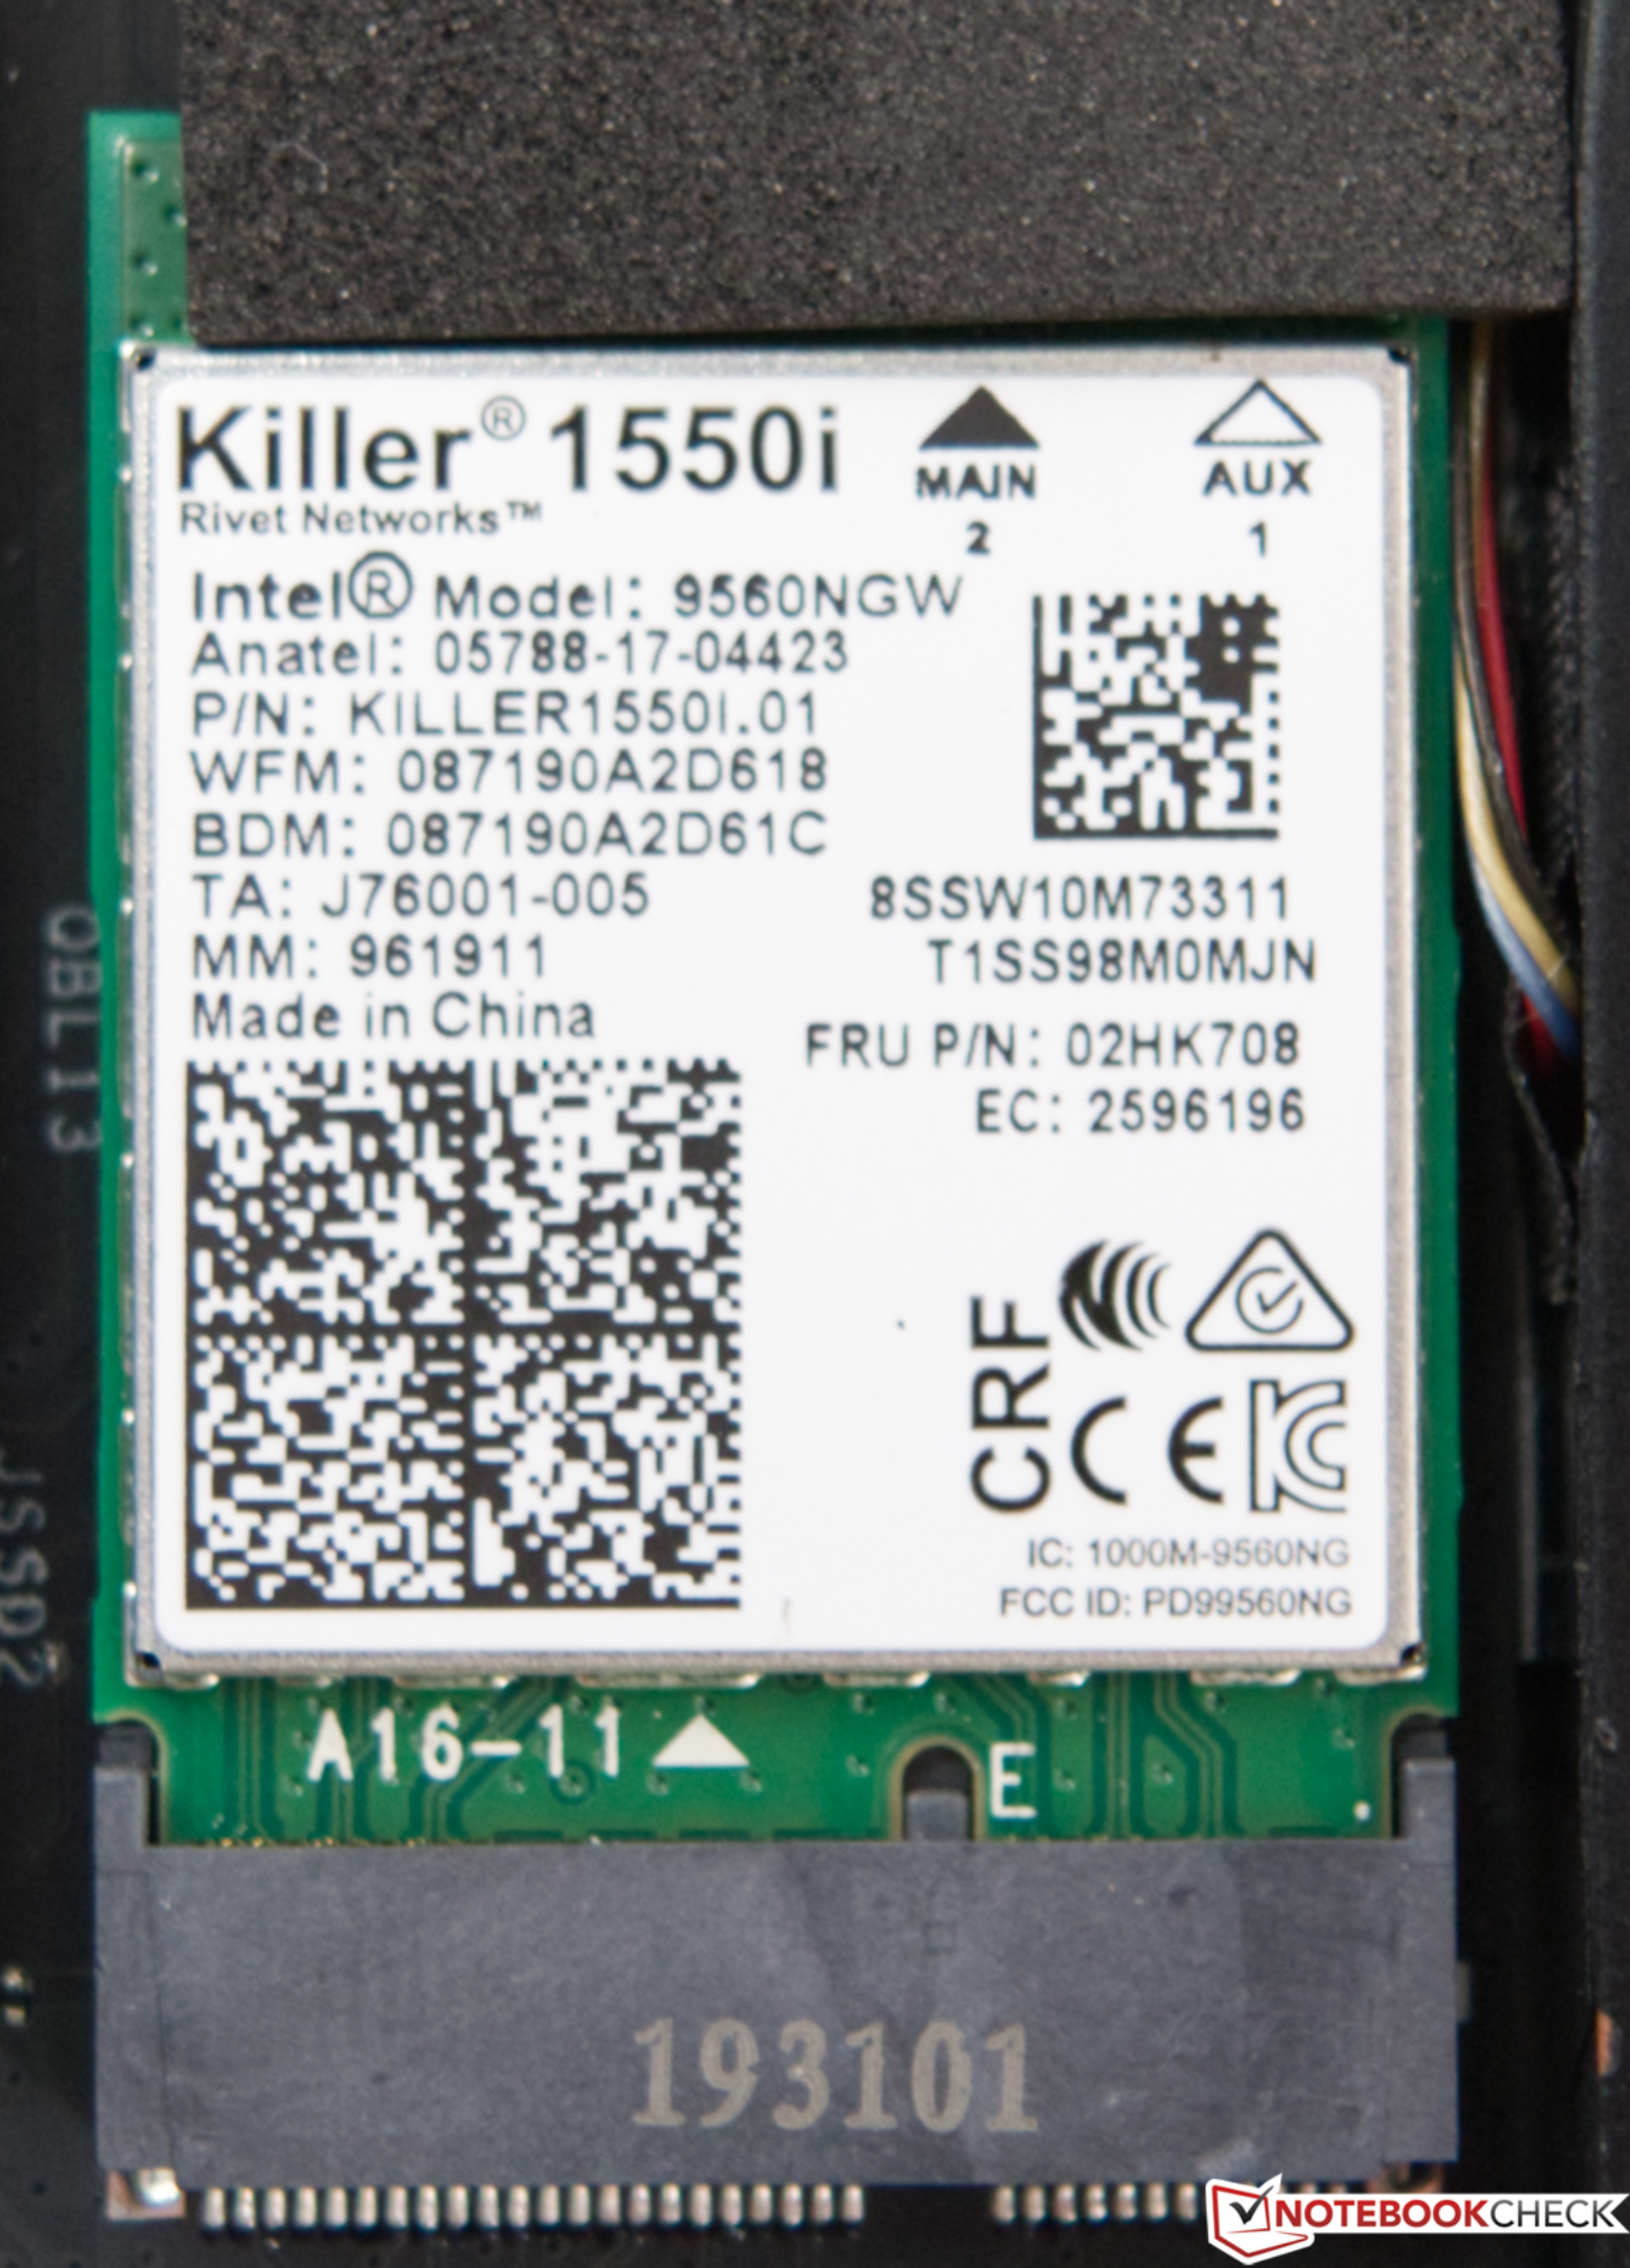
The Lenovo Legion Y740-17 is equipped with a Killer Wireless AC 1550i module. It delivers a good and stable performance in our test. However, our test device falls short of the fast Intel Wireless AC 9560, which can for example be found on the Asus ROG Zephyrus. Lastly, the Legion Y740 also comes with an RJ45 port.

Port Selection


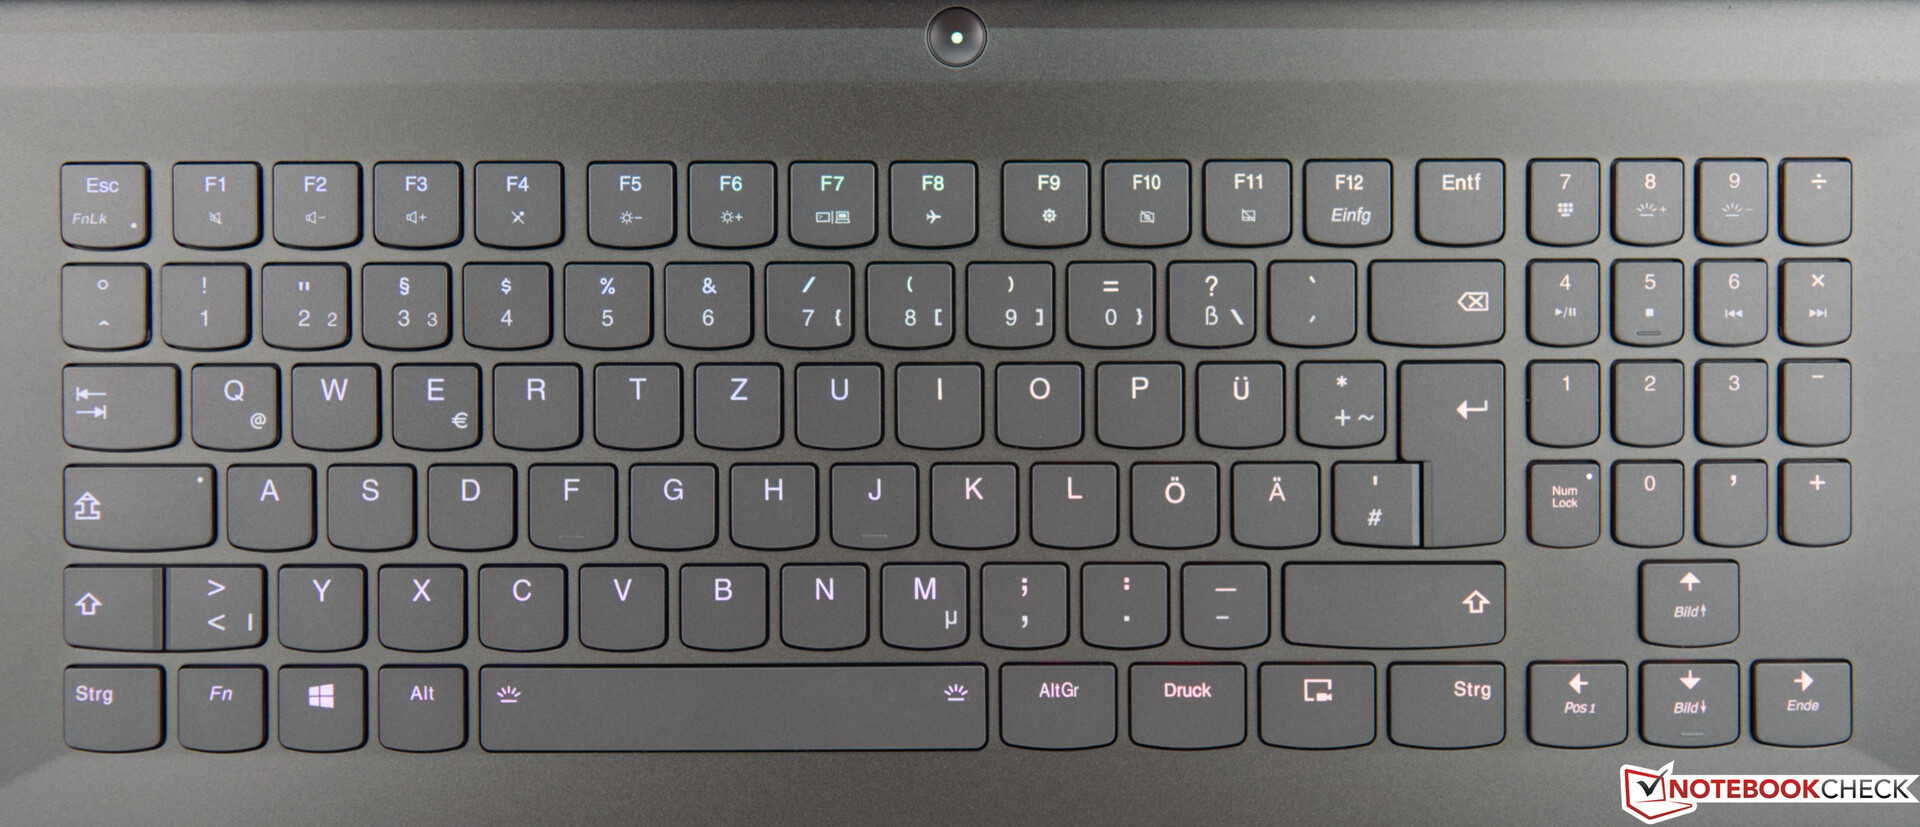
Input Devices
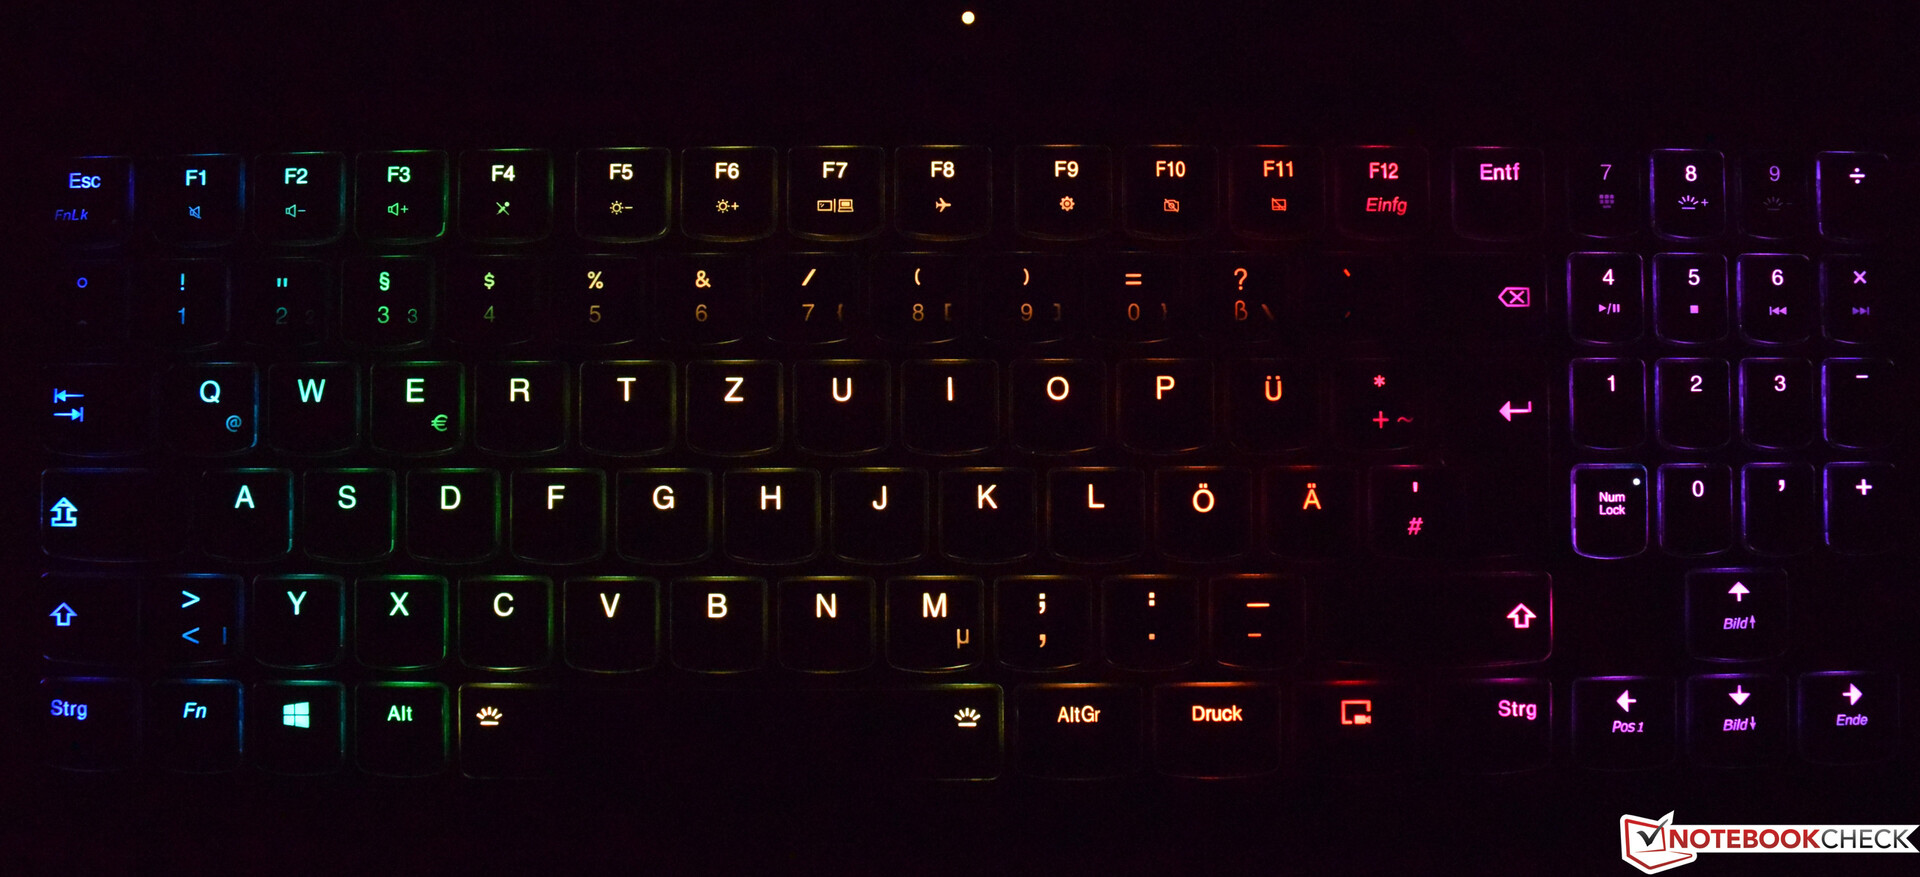
Lenovo has fitted the Legion Y740 with a 6-row chiclet keyboard with an RGB backlight. It can be controlled for example, with Corsair's iCue software, which can be used to display certain effects. The keys are comfortably sized. However, the numpad requires some getting used to, since the key layout is unusual. The keys offer shallow travel and a somewhat dull feedback with a distinct actuation point.
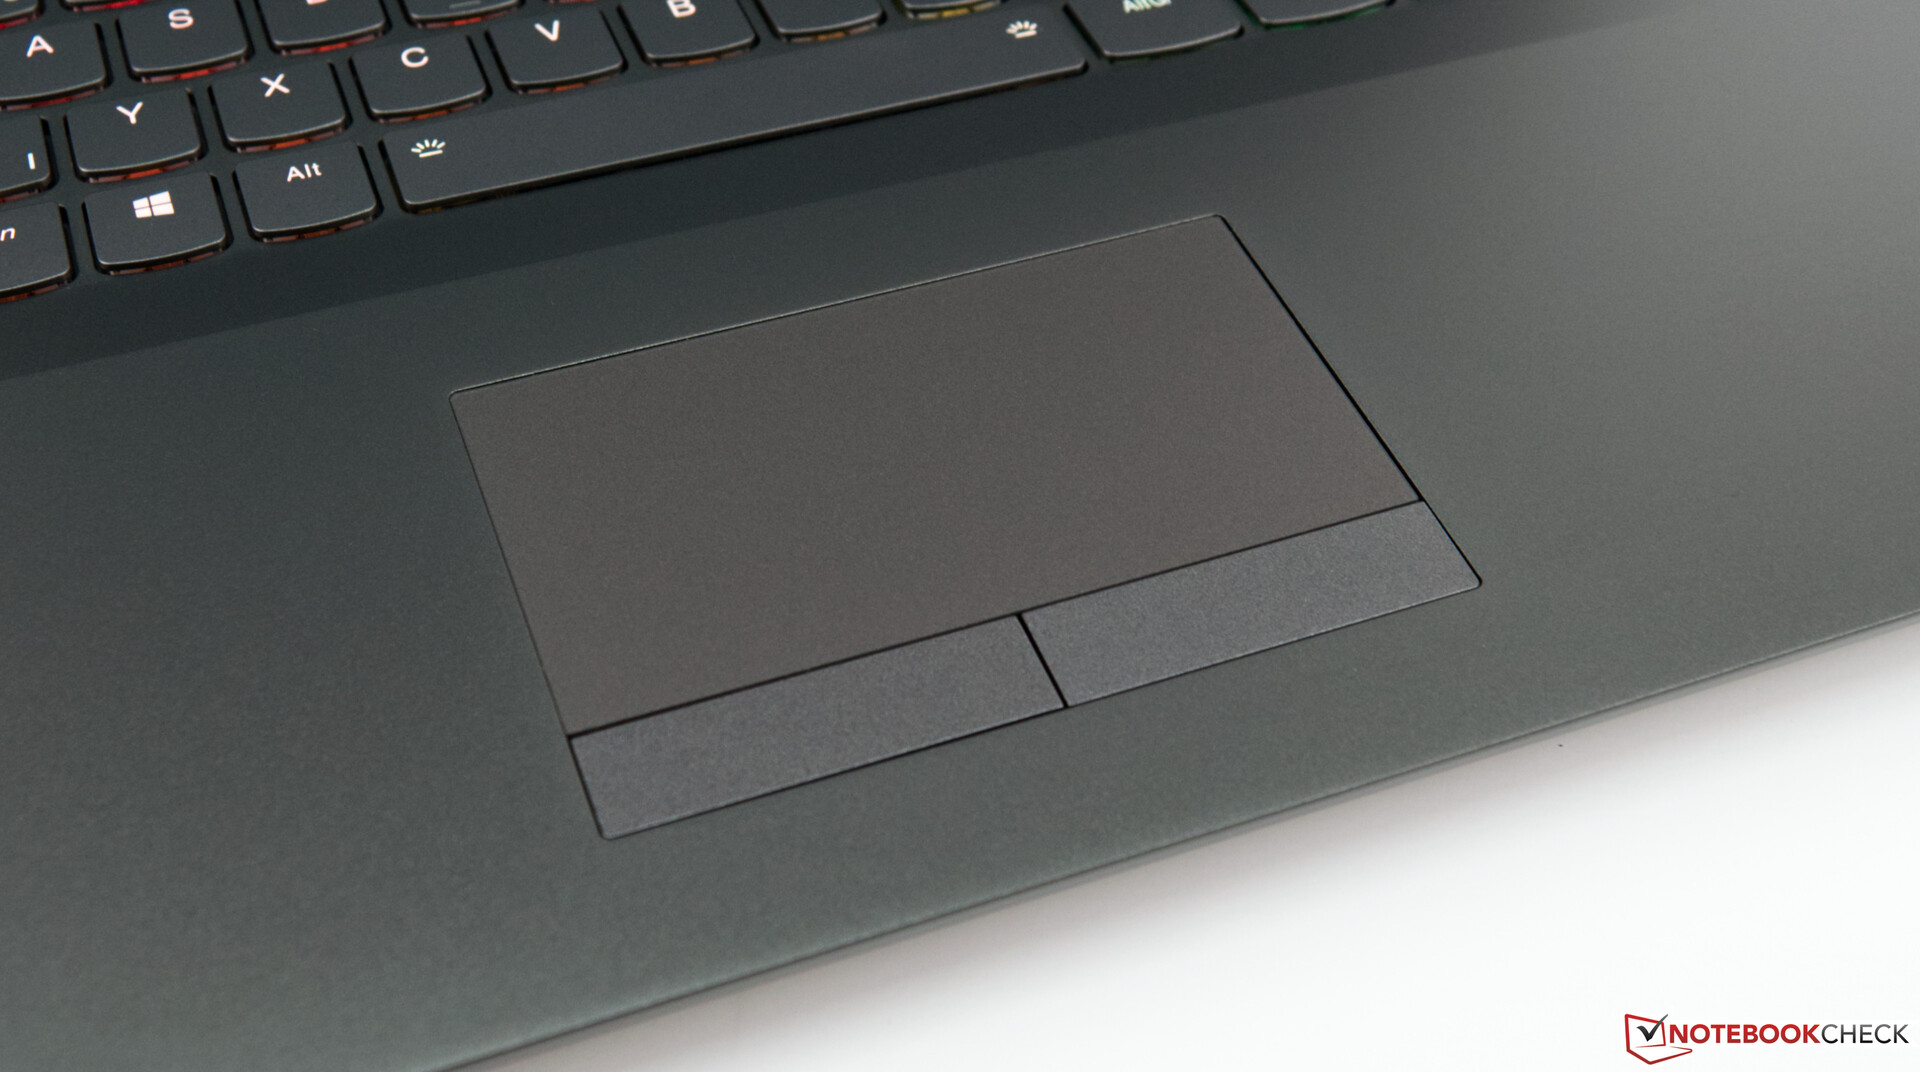
The integrated touchpad should only be used as a mouse substitute when it is absolutely necessary. While the surface is smooth and responsive all the way to the edges and corners, the surface area relative to the laptop's size is quite small. The two buttons on the bottom offer fairly deep travel. Furthermore, their clicks are rather quiet. That being said, the actuation point is still very distinct, which makes for a satisfying feedback.
Display - 144 Hz and G-Sync

Lenovo has fitted our Legion Y740 with a matte Dolby Vision panel with 144 Hz and Nvidia G-Sync. The 17-inch IPS display has a native resolution of 1920x1080 for a theoretical pixel density of 127 PPI.
According to our measurements, the installed panel does not quite reach its advertised maximum brightness. On average, we observed only 281 cd/m². However, it even exceeds the specified 300 cd/m² with 310 cd/m² in the center. The contrast ratio of 1000:1, matches our expectations for an IPS panel. Since some competing laptops offer more in terms of brightness or lower black values, they tend to be able to achieve better results.
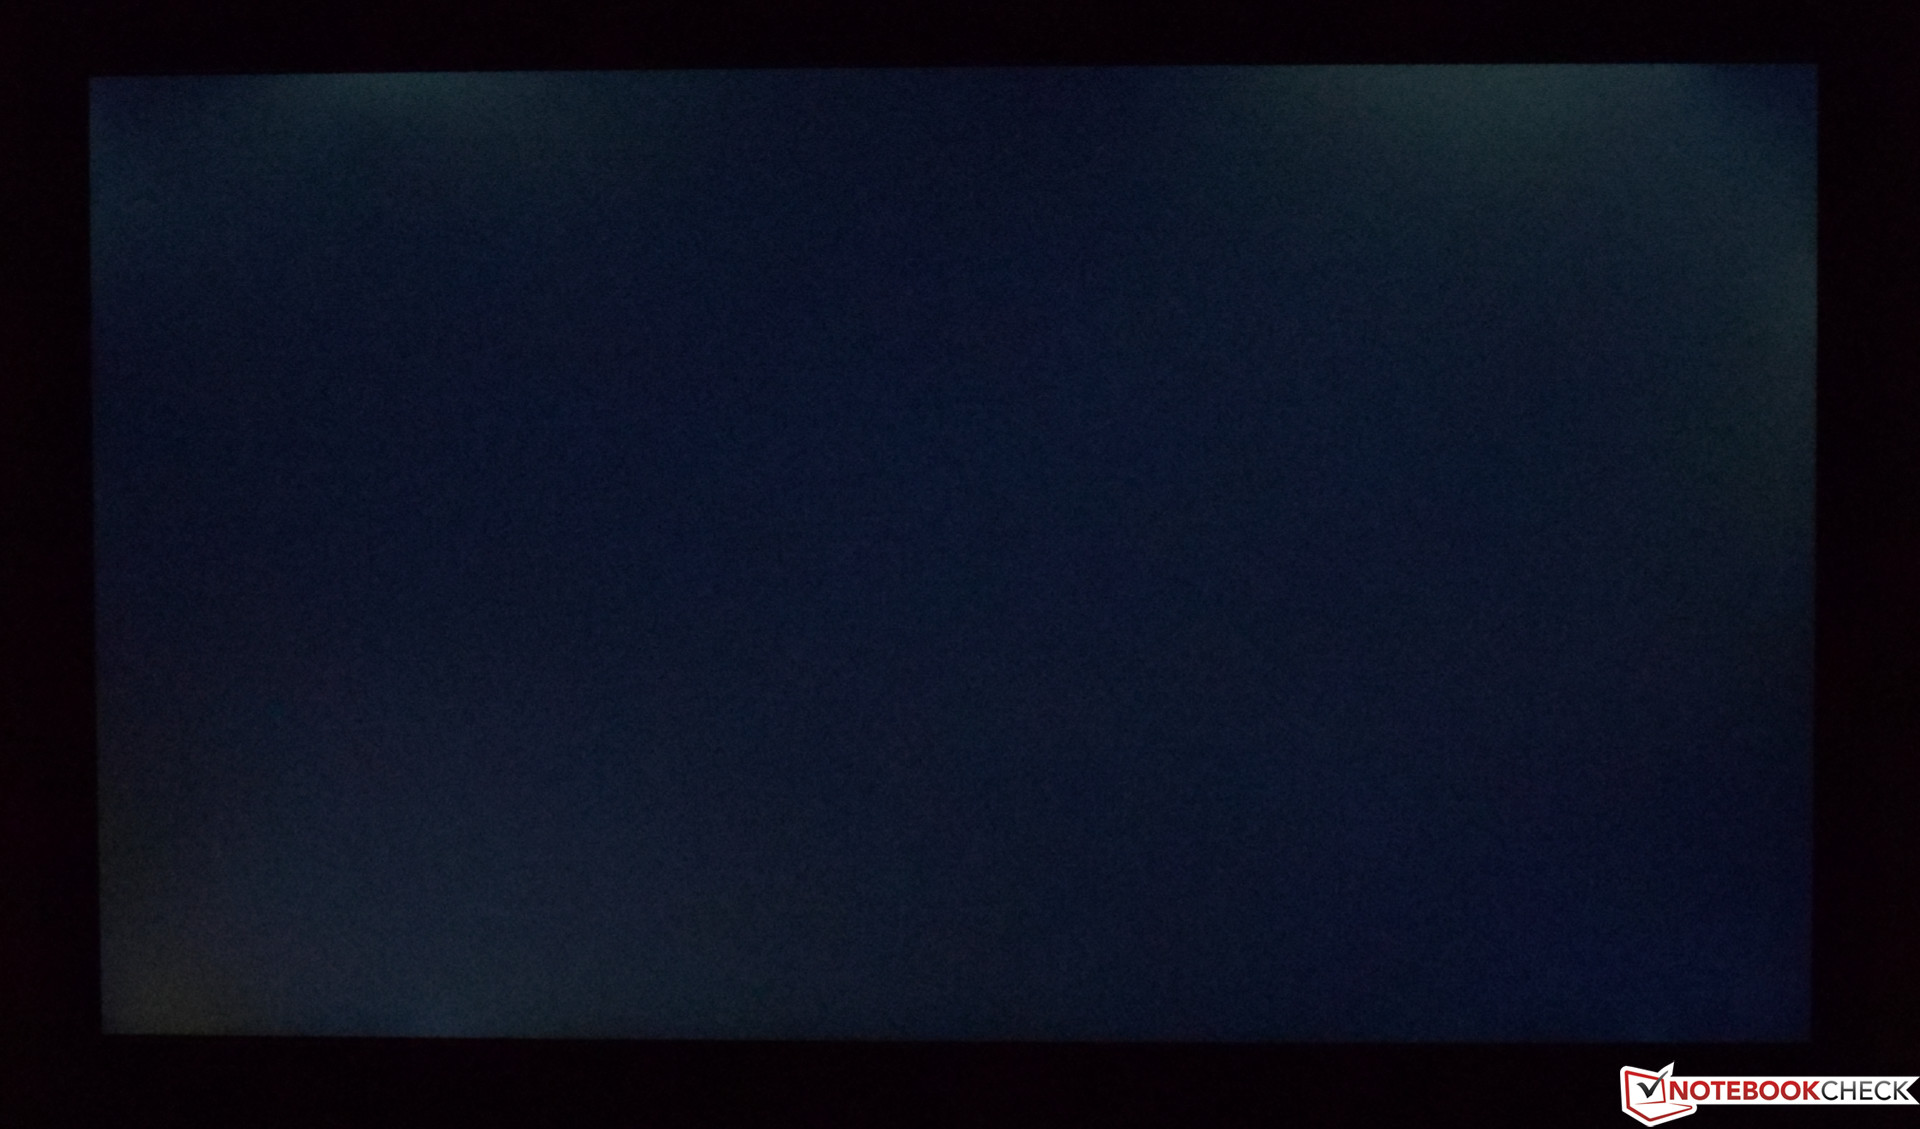
Since the Lenovo Legion Y740-17 does not use PWM to control the display's brightness, users will not have to worry about eyestrain or similar issues. However, our device suffers from some amount of backlight bleeding. In dark scenes, it is quite noticeable around the edges.
| |||||||||||||||||||||||||
Brightness Distribution: 85 %
Center on Battery: 310 cd/m²
Contrast: 1000:1 (Black: 0.31 cd/m²)
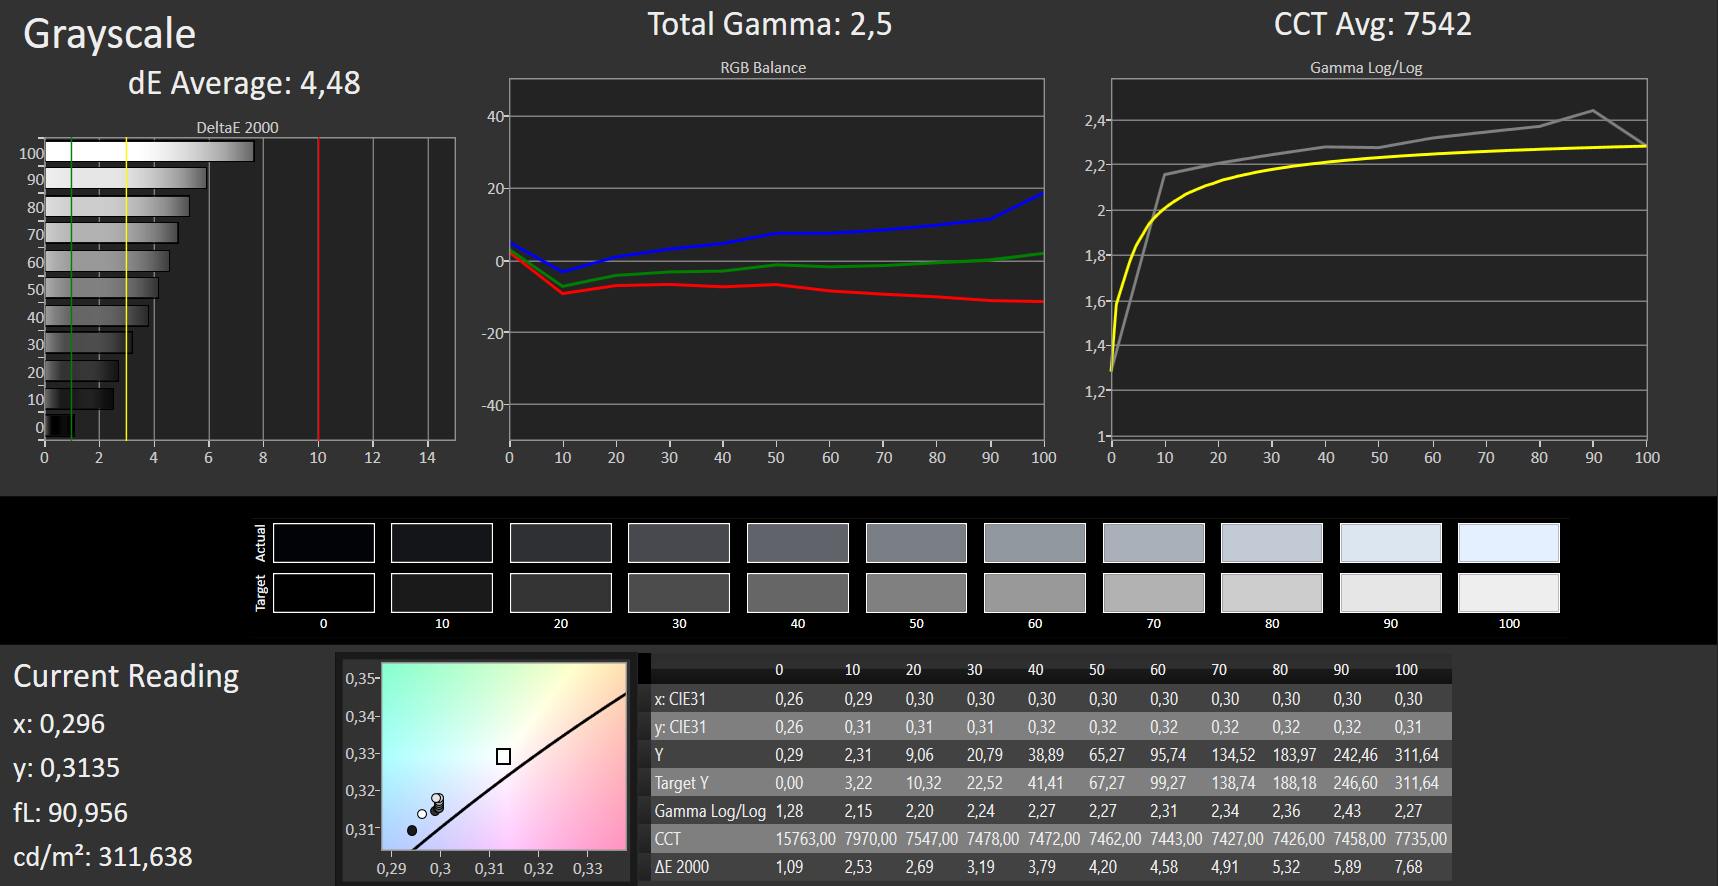
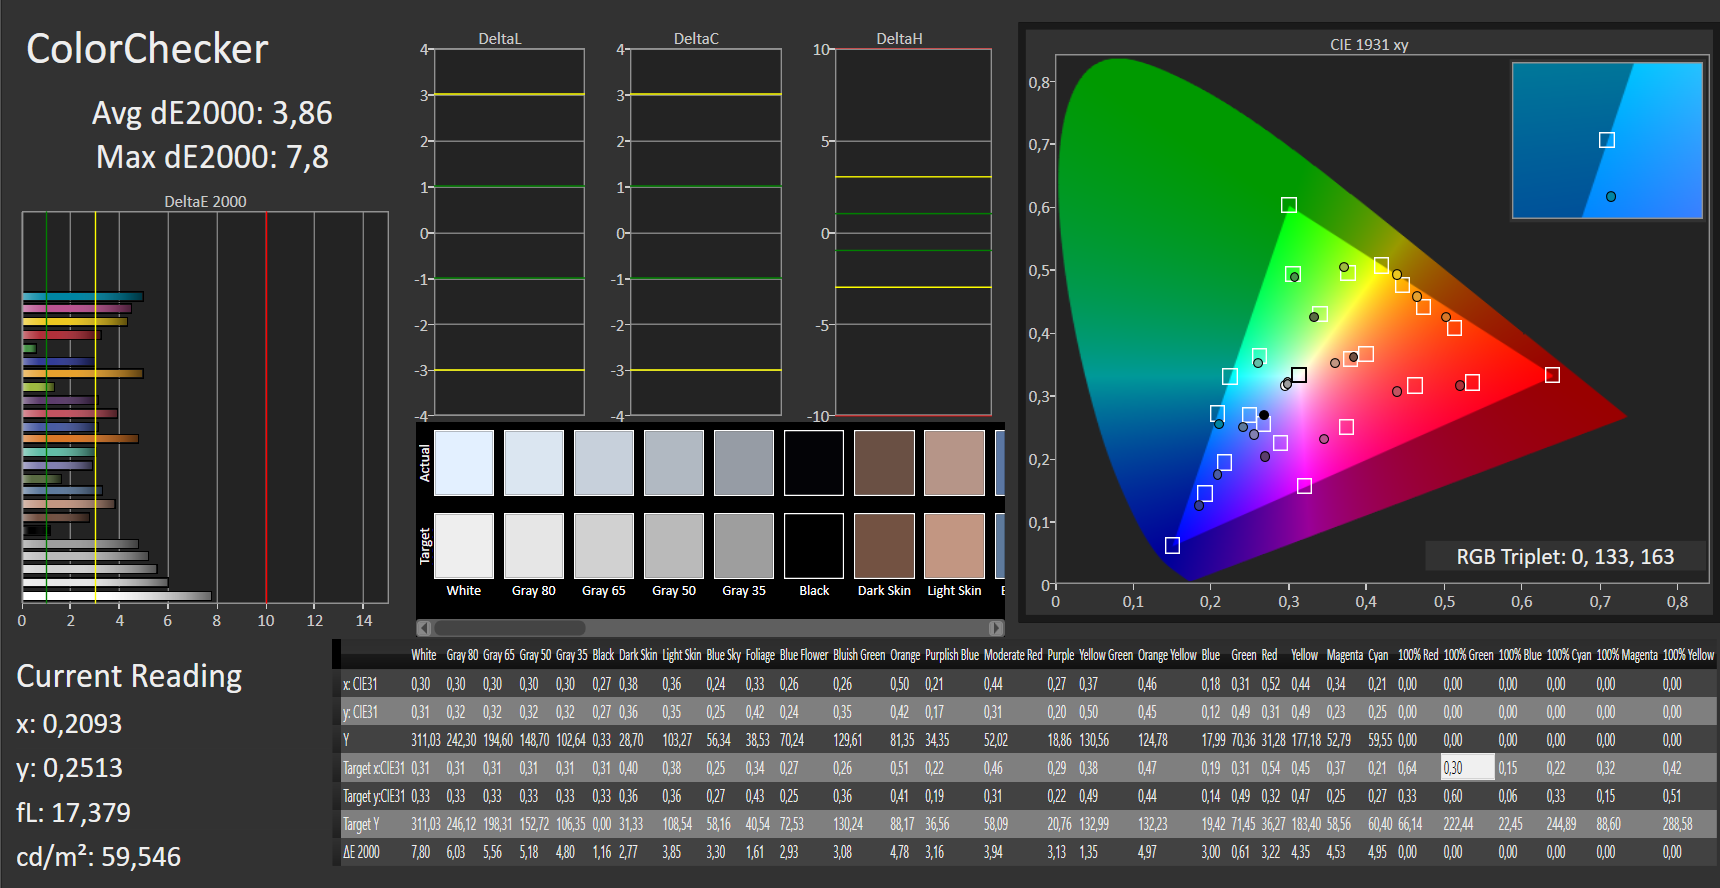
ΔE ColorChecker Calman: 3.86 | ∀{0.5-29.43 Ø4.71}
ΔE Greyscale Calman: 4.48 | ∀{0.09-98 Ø4.96}
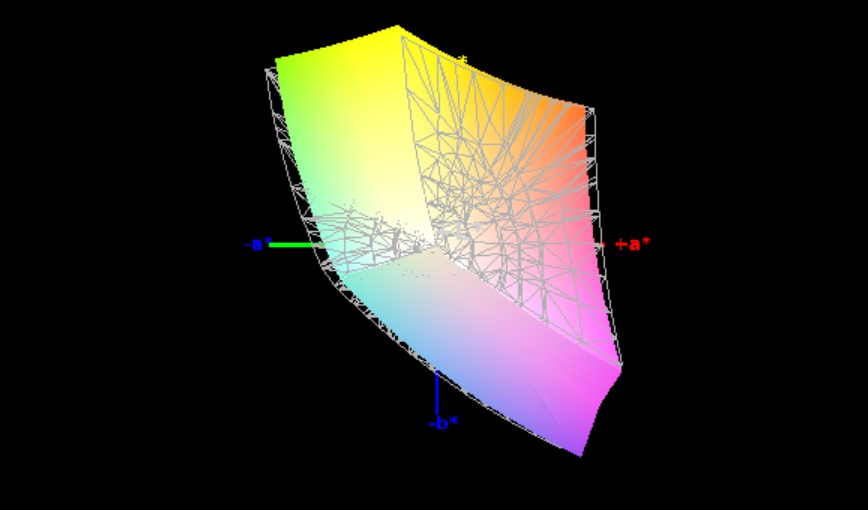
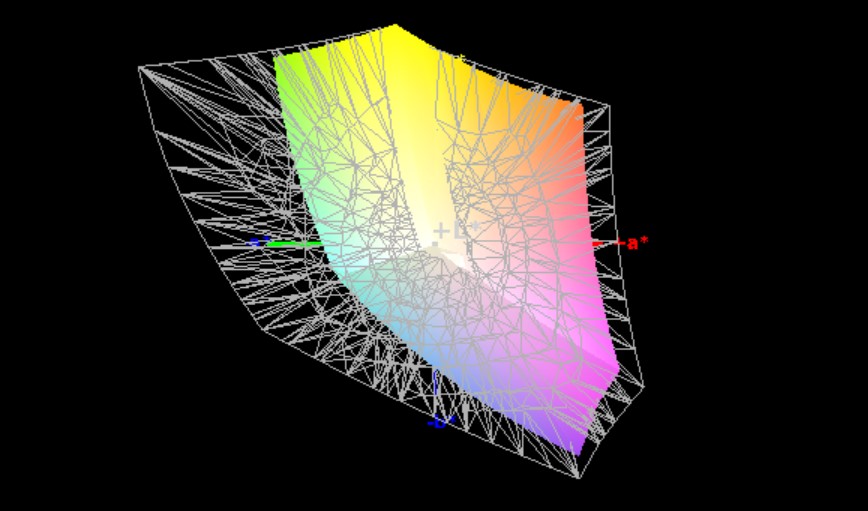
93% sRGB (Argyll 1.6.3 3D)
60% AdobeRGB 1998 (Argyll 1.6.3 3D)
65.3% AdobeRGB 1998 (Argyll 3D)
92.7% sRGB (Argyll 3D)
63.8% Display P3 (Argyll 3D)
Gamma: 2.5
CCT: 7542 K
| Lenovo Legion Y740-17IRHg-81UJ001VGE AUO_B173HAN03, IPS, 1920x1080, 17.3" | Razer Blade Pro 17 4K UHD 120 Hz AU Optronics B173ZAN03.3, IPS, 3840x2160, 17.3" | Alienware m17 R2 P41E Chi Mei 173HCE, CMN175F, IPS, 1920x1080, 17.3" | Asus ROG Zephyrus S GX701GXR AU Optronics B173HAN05.1, IPS, 1920x1080, 17.3" | |
|---|---|---|---|---|
| Display | 31% | 9% | 8% | |
| Display P3 Coverage (%) | 63.8 | 84.8 33% | 70.8 11% | 70 10% |
| sRGB Coverage (%) | 92.7 | 99.9 8% | 98.5 6% | 96.6 4% |
| AdobeRGB 1998 Coverage (%) | 65.3 | 98.6 51% | 72.2 11% | 72.3 11% |
| Response Times | 5% | -3% | 48% | |
| Response Time Grey 50% / Grey 80% * (ms) | 16 ? | 15.2 ? 5% | 17.2 ? -8% | 5.6 ? 65% |
| Response Time Black / White * (ms) | 11 ? | 10.4 ? 5% | 10.8 ? 2% | 7.6 ? 31% |
| PWM Frequency (Hz) | 26320 ? | |||
| Screen | 4% | 31% | 18% | |
| Brightness middle (cd/m²) | 310 | 346.7 12% | 384.2 24% | 288 -7% |
| Brightness (cd/m²) | 281 | 332 18% | 357 27% | 276 -2% |
| Brightness Distribution (%) | 85 | 91 7% | 90 6% | 93 9% |
| Black Level * (cd/m²) | 0.31 | 0.27 13% | 0.29 6% | 0.24 23% |
| Contrast (:1) | 1000 | 1284 28% | 1325 33% | 1200 20% |
| Colorchecker dE 2000 * | 3.86 | 5.62 -46% | 1.35 65% | 1.92 50% |
| Colorchecker dE 2000 max. * | 7.8 | 9.36 -20% | 3.45 56% | 4.57 41% |
| Greyscale dE 2000 * | 4.48 | 5.5 -23% | 1.2 73% | 3.08 31% |
| Gamma | 2.5 88% | 2.25 98% | 2.23 99% | 2.42 91% |
| CCT | 7542 86% | 6175 105% | 6580 99% | 7055 92% |
| Color Space (Percent of AdobeRGB 1998) (%) | 60 | 87.2 45% | 65.5 9% | 65 8% |
| Color Space (Percent of sRGB) (%) | 93 | 100 8% | 98.5 6% | 96 3% |
| Colorchecker dE 2000 calibrated * | 3.81 | 1.42 | 1.14 | |
| Total Average (Program / Settings) | 13% /
10% | 12% /
22% | 25% /
20% |
* ... smaller is better
Display Response Times
| ↔ Response Time Black to White | ||
|---|---|---|
| 11 ms ... rise ↗ and fall ↘ combined | ↗ 6 ms rise | 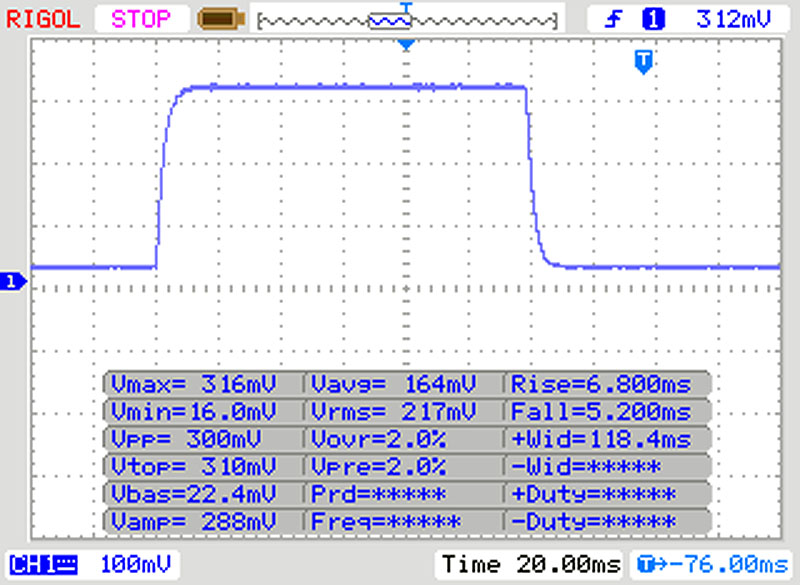 |
| ↘ 5 ms fall | ||
| The screen shows good response rates in our tests, but may be too slow for competitive gamers. In comparison, all tested devices range from 0.1 (minimum) to 240 (maximum) ms. » 30 % of all devices are better. This means that the measured response time is better than the average of all tested devices (19.8 ms). | ||
| ↔ Response Time 50% Grey to 80% Grey | ||
| 16 ms ... rise ↗ and fall ↘ combined | ↗ 8 ms rise | 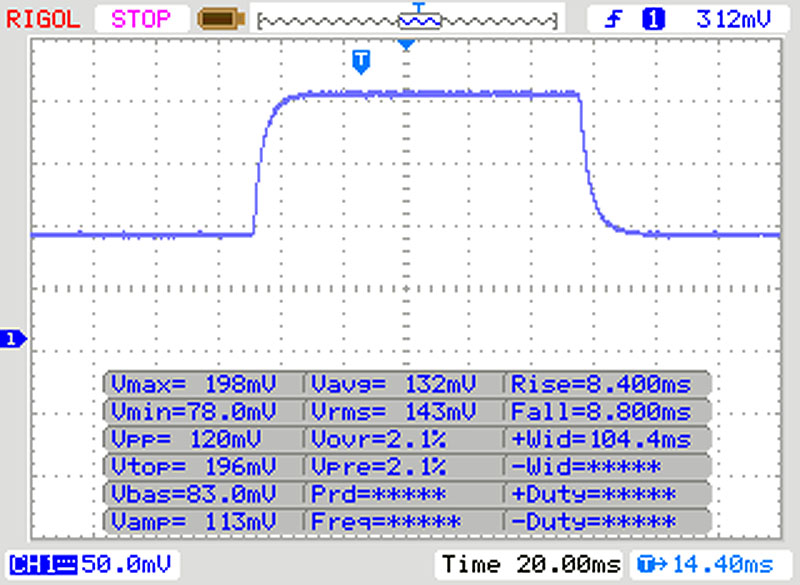 |
| ↘ 8 ms fall | ||
| The screen shows good response rates in our tests, but may be too slow for competitive gamers. In comparison, all tested devices range from 0.165 (minimum) to 636 (maximum) ms. » 30 % of all devices are better. This means that the measured response time is better than the average of all tested devices (31 ms). | ||
Screen Flickering / PWM (Pulse-Width Modulation)
| Screen flickering / PWM not detected | 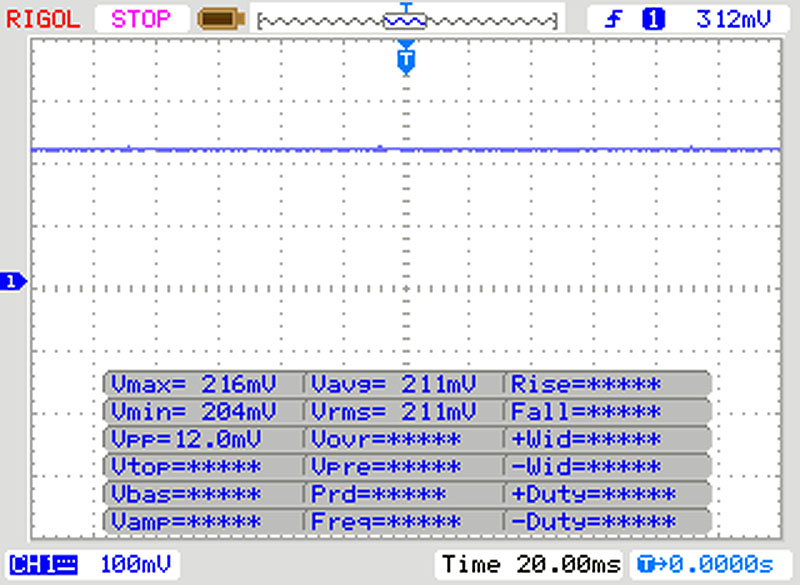 | ||
In comparison: 52 % of all tested devices do not use PWM to dim the display. If PWM was detected, an average of 7754 (minimum: 5 - maximum: 343500) Hz was measured. | |||
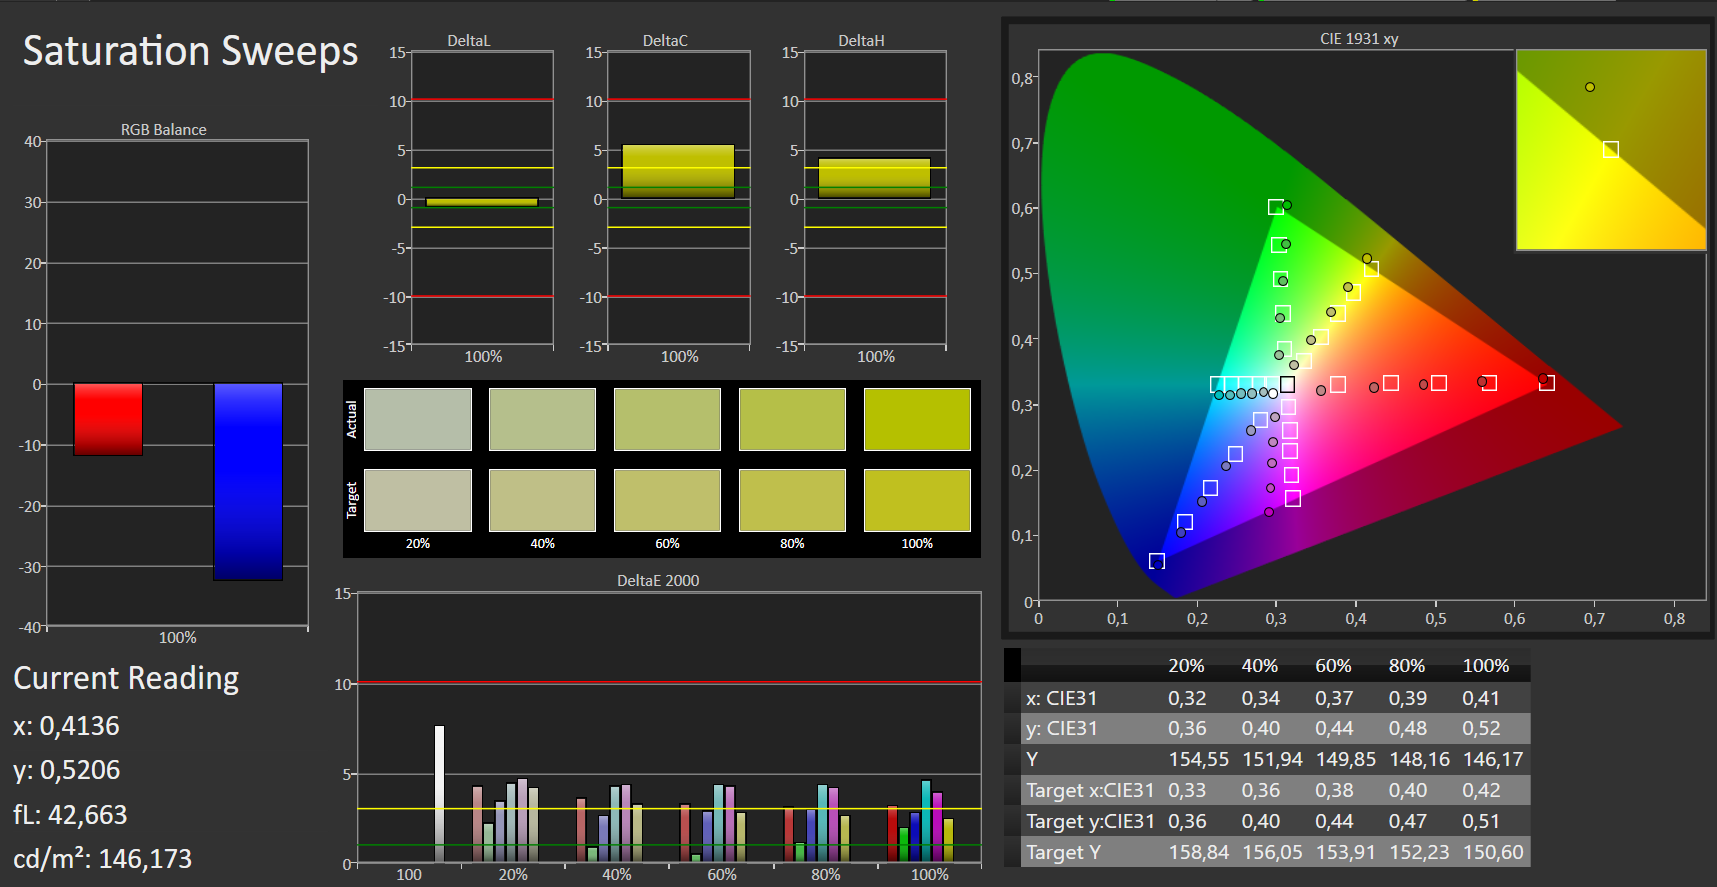
Even though almost all competitors achieve better results, display is good in all respects. Ex-factory, DeltaE-2000 grayscale and color values are only slightly higher than their sRGB reference points. At 93% and 60%, respectively, the sRGB and AdobeRGB color space coverage cannot match competitors, either. However, these values are still sufficient for semi-professional photo editing.
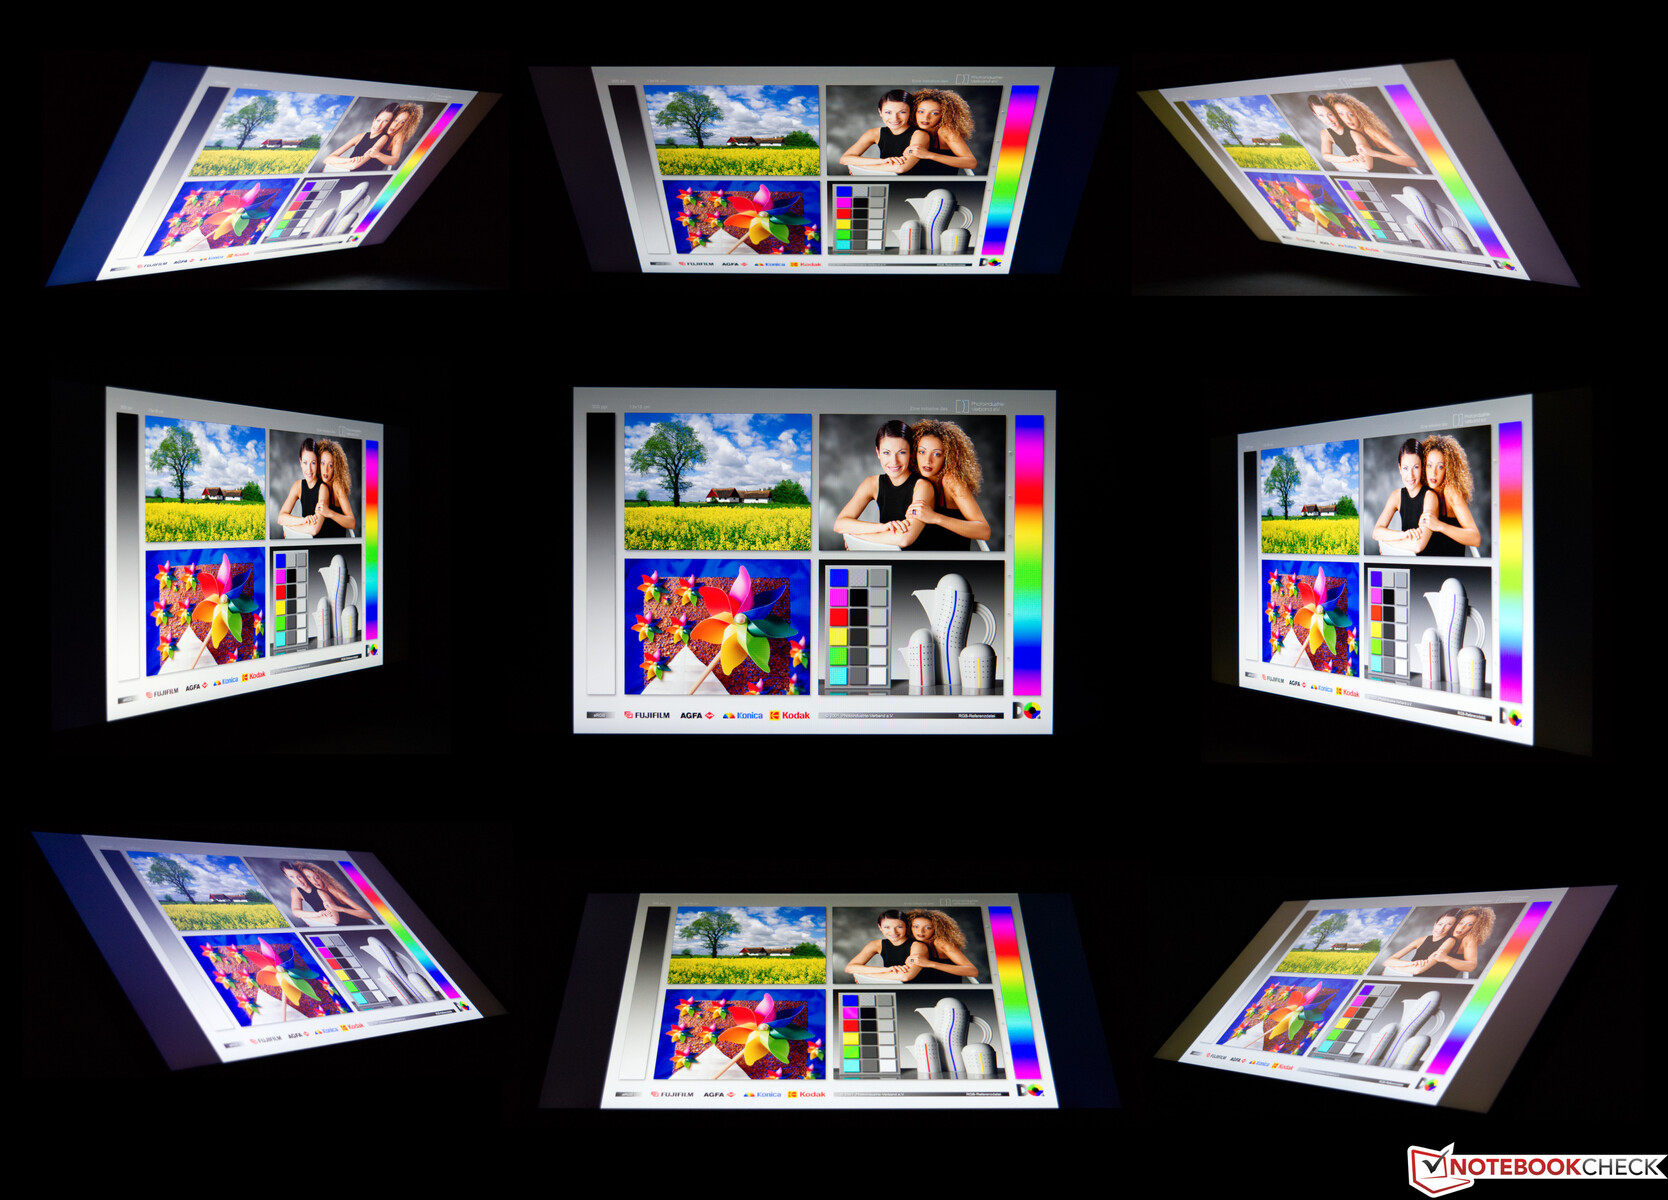
The outdoor usability of the Legion Y740-17 is limited. If outdoor use is unavoidable, users should remain in the shade. In our viewing angle test, the result we observed matches our expectations for a normal IPS panel. Only the four corner images appear to be covered by a faint veil. However, this has not proven to be distracting during normal use.

Performance - Sufficient Performance for Current Games
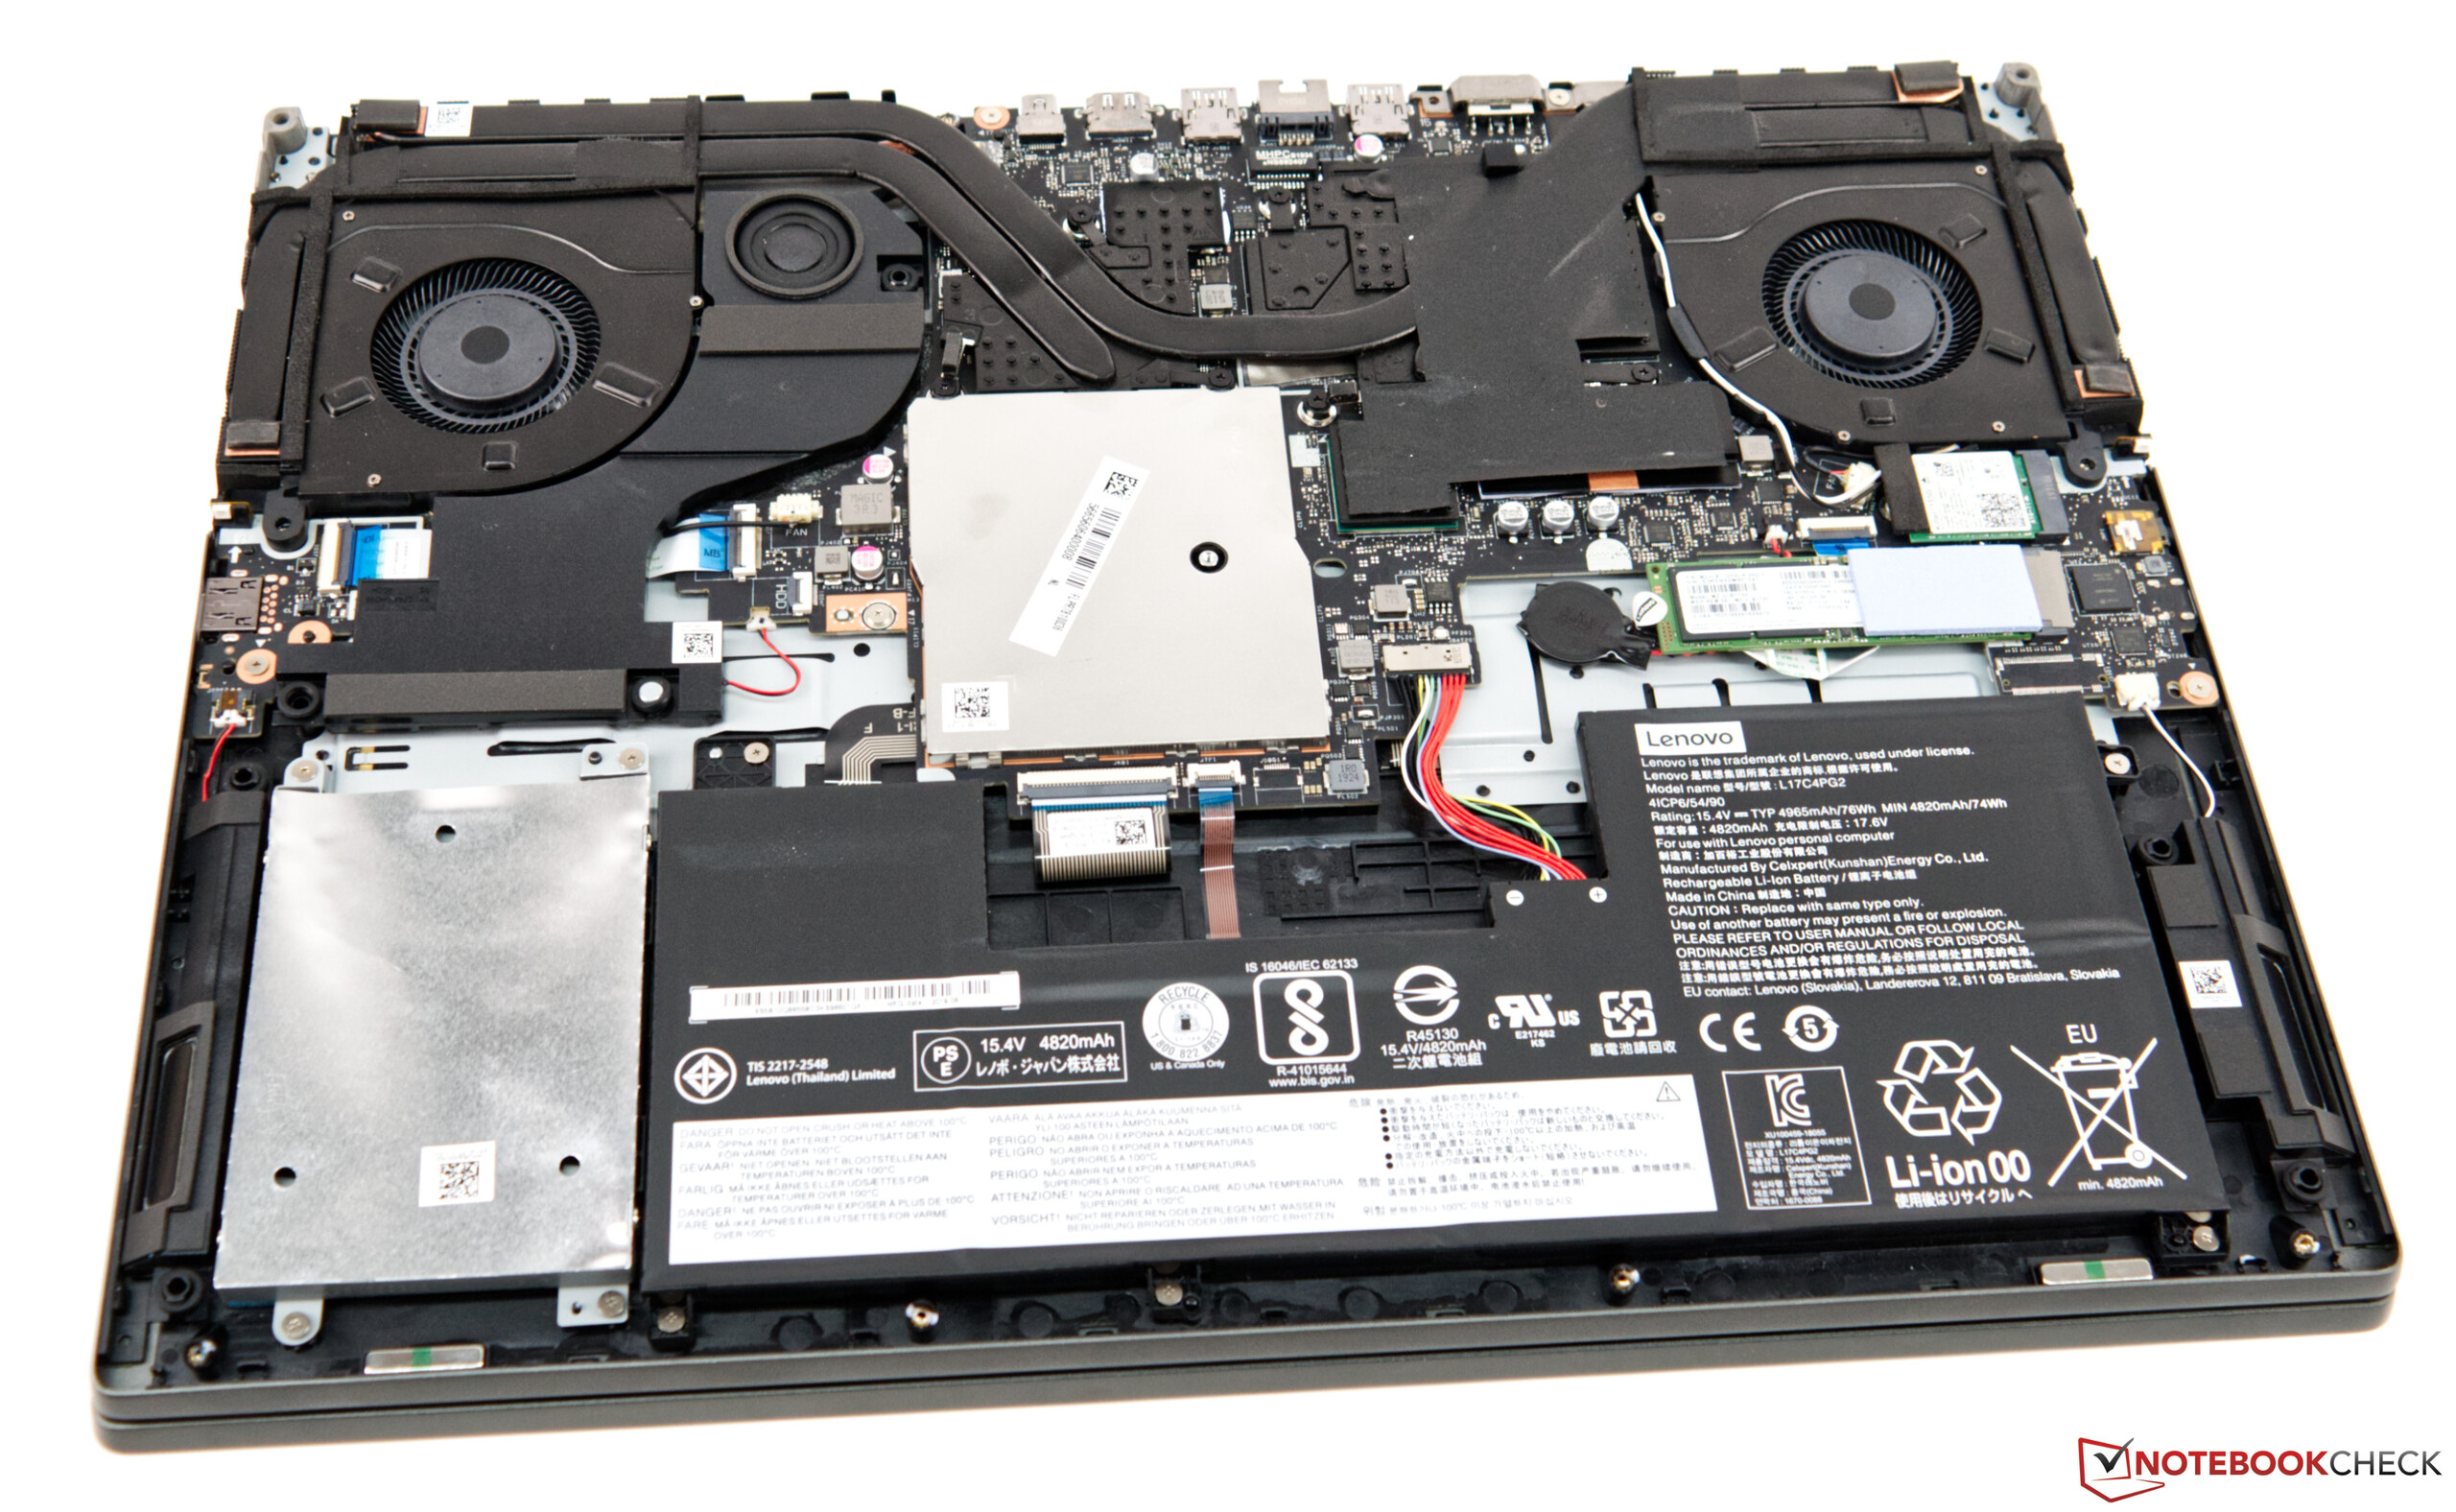
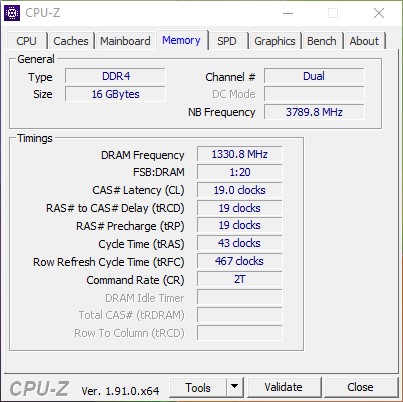
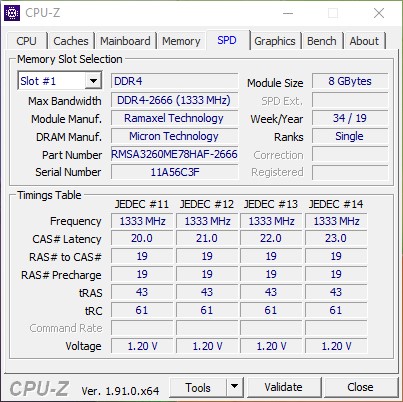
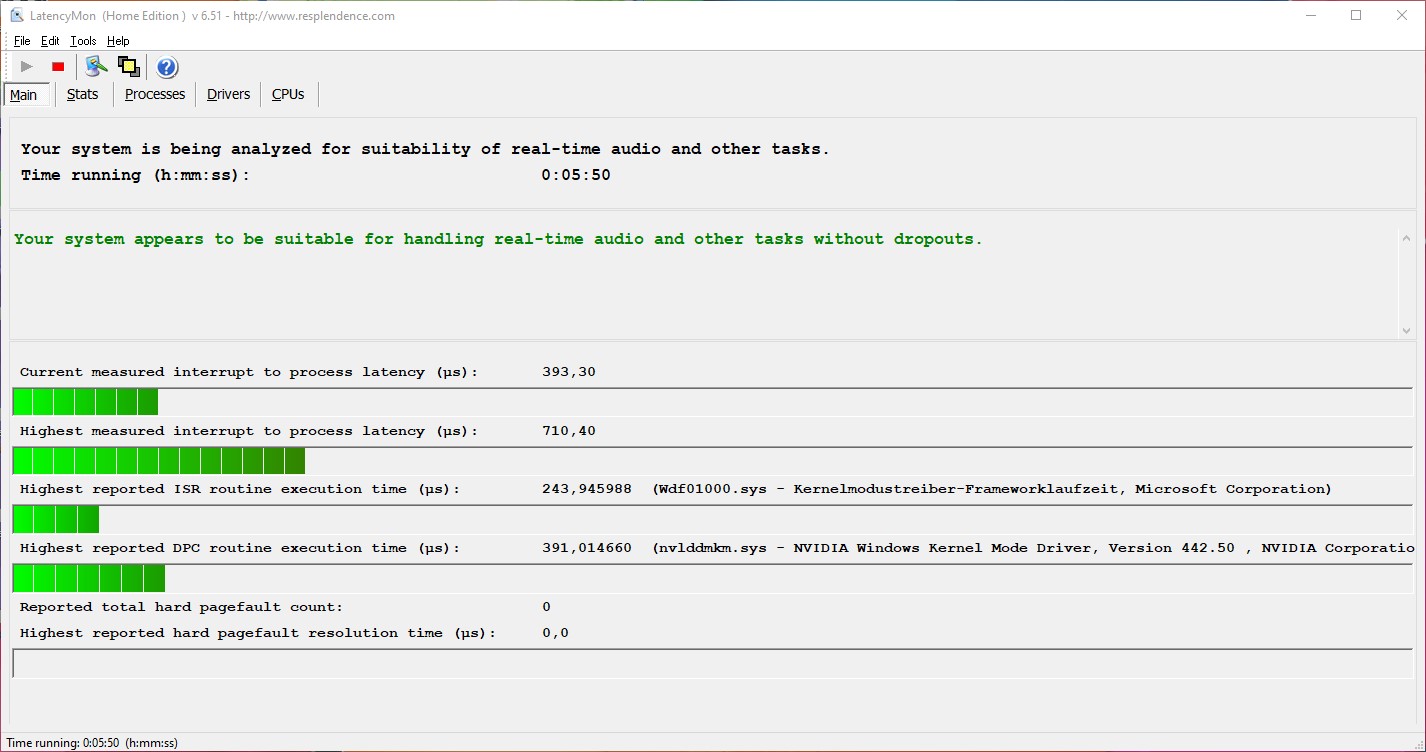
A modern gaming laptop demands the use of fast and recent hardware. Lenovo appears to have had the same idea and has equipped the laptop with an Intel Core i7-9750H and an Nvidia GeForce RTX 2080 Max-Q. With 16 GB, the RAM is sufficient as well and the storage capacity should last users a while. Thankfully, the individual components also work well together when it comes to running software. In our test, LatencyMon did not detect any problematic latencies.
Processor
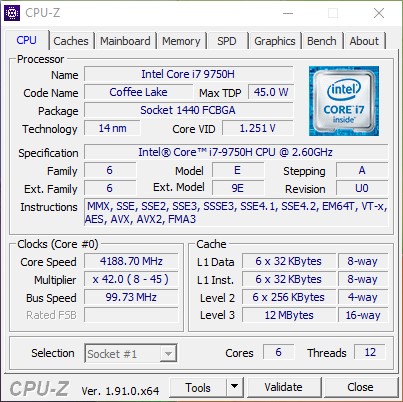
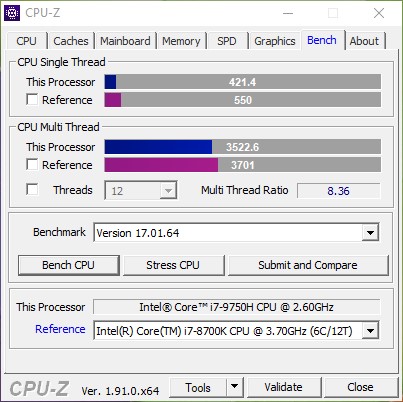
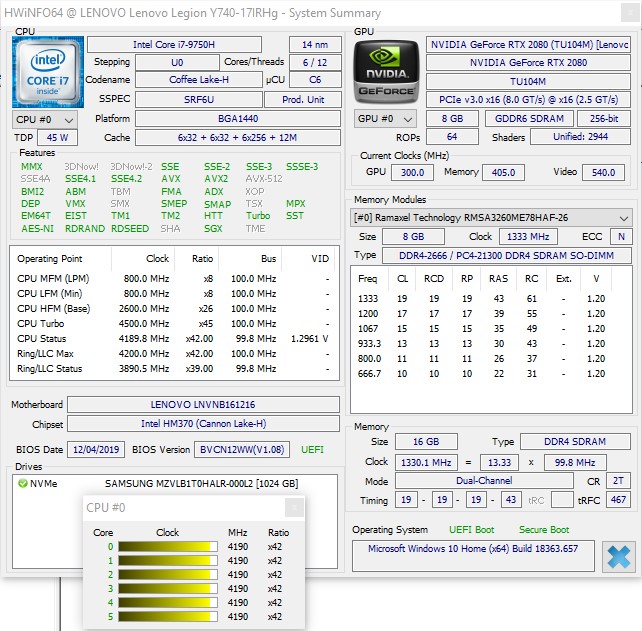
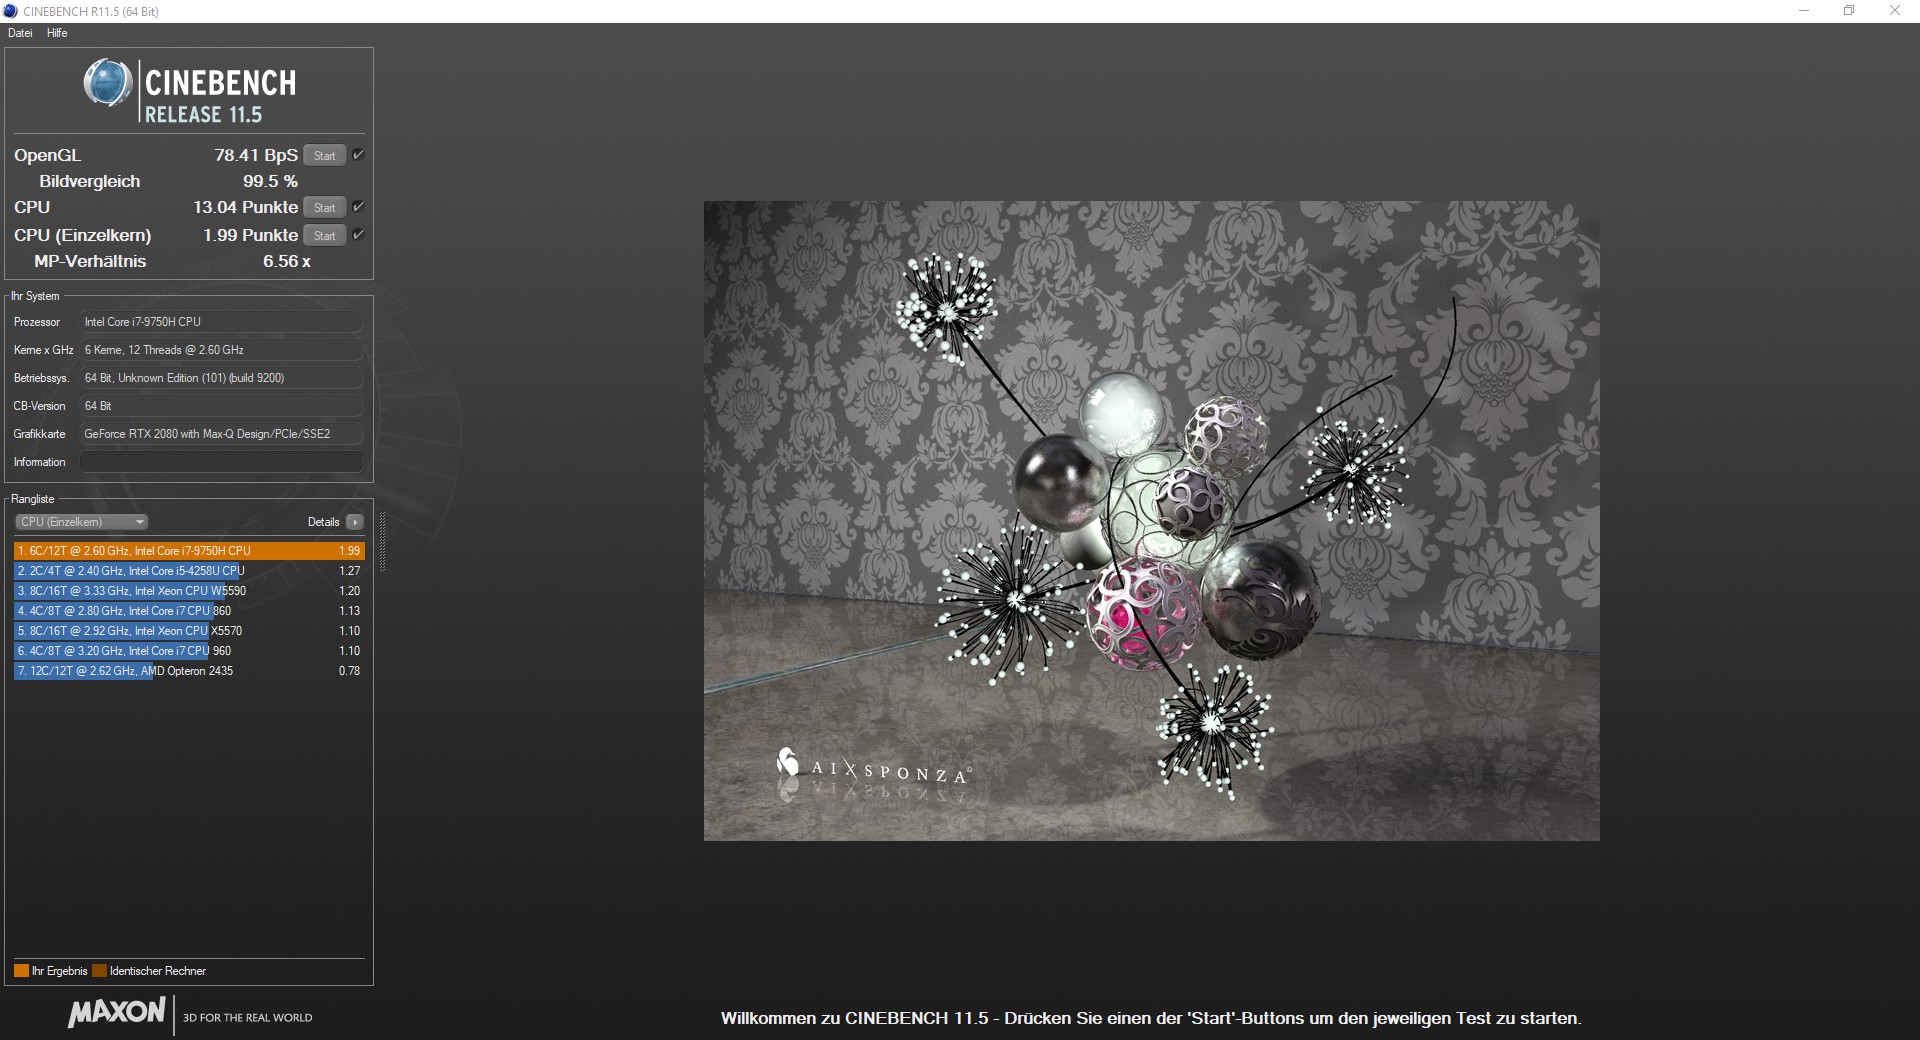
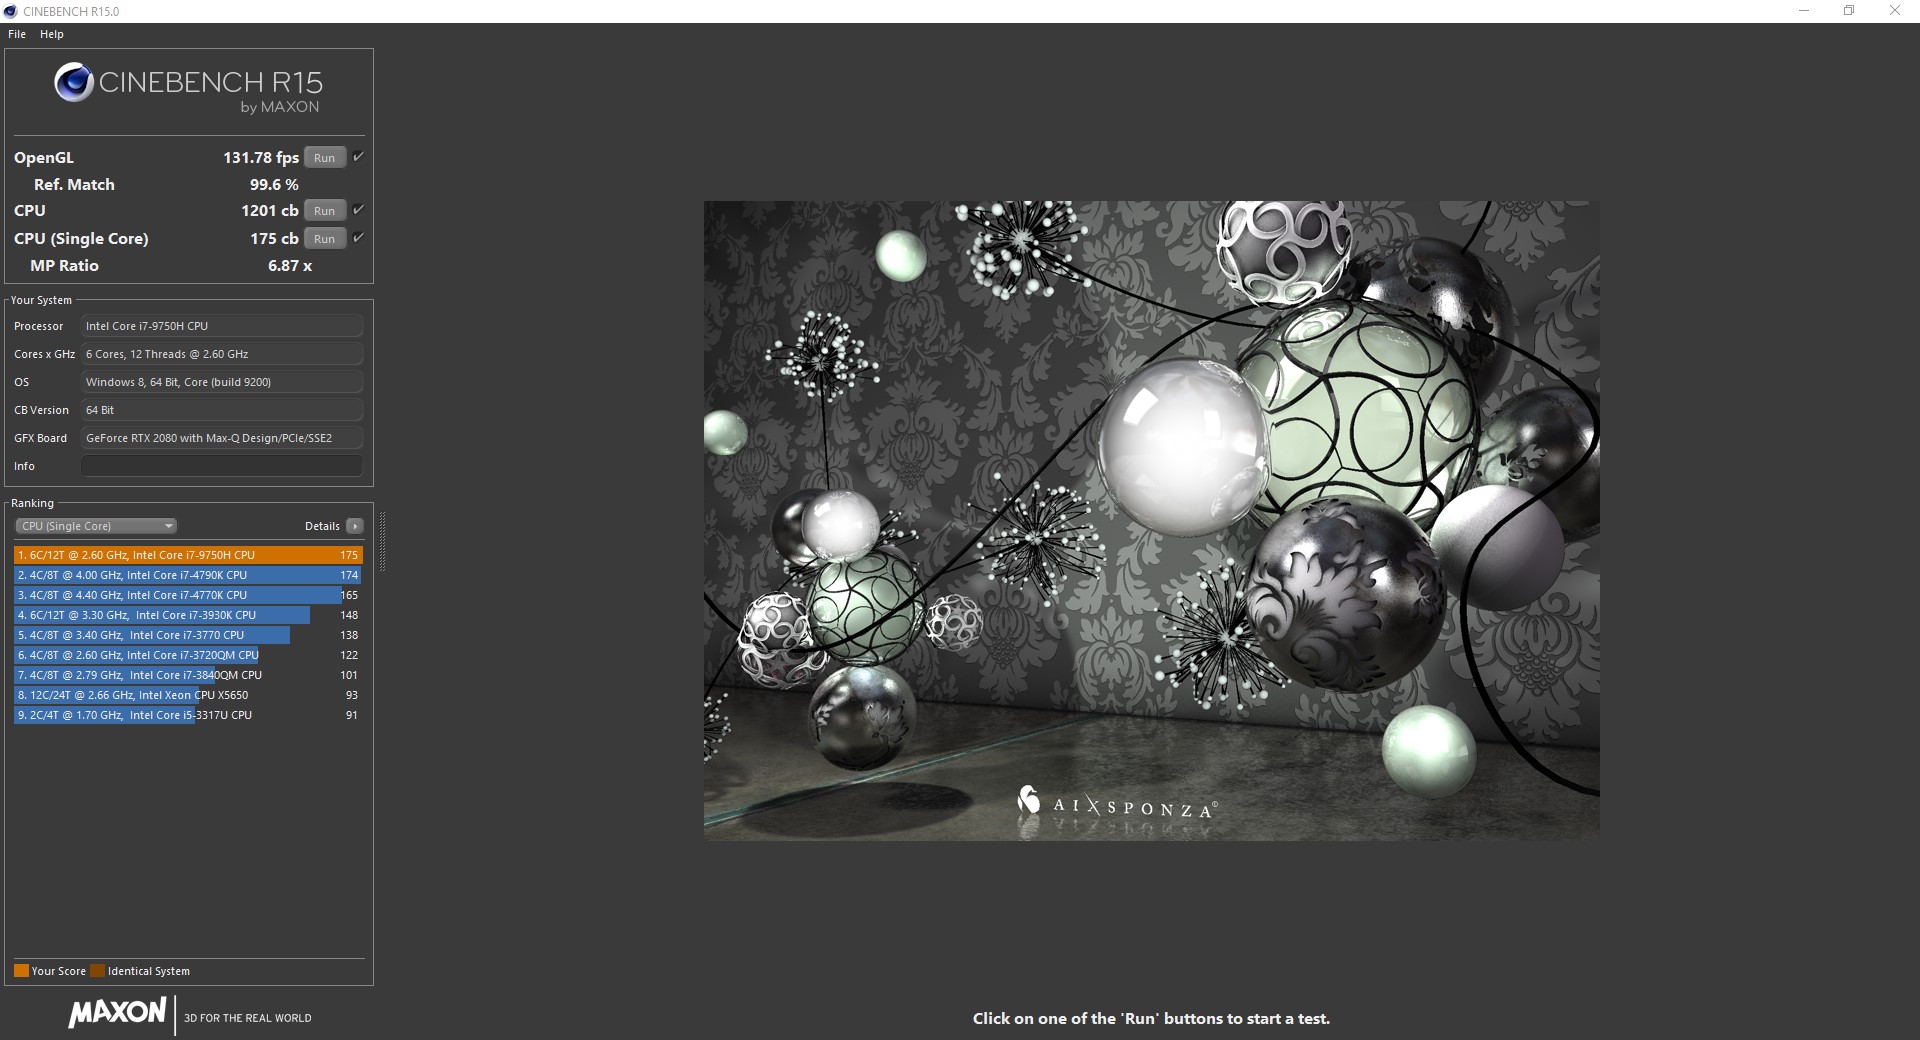
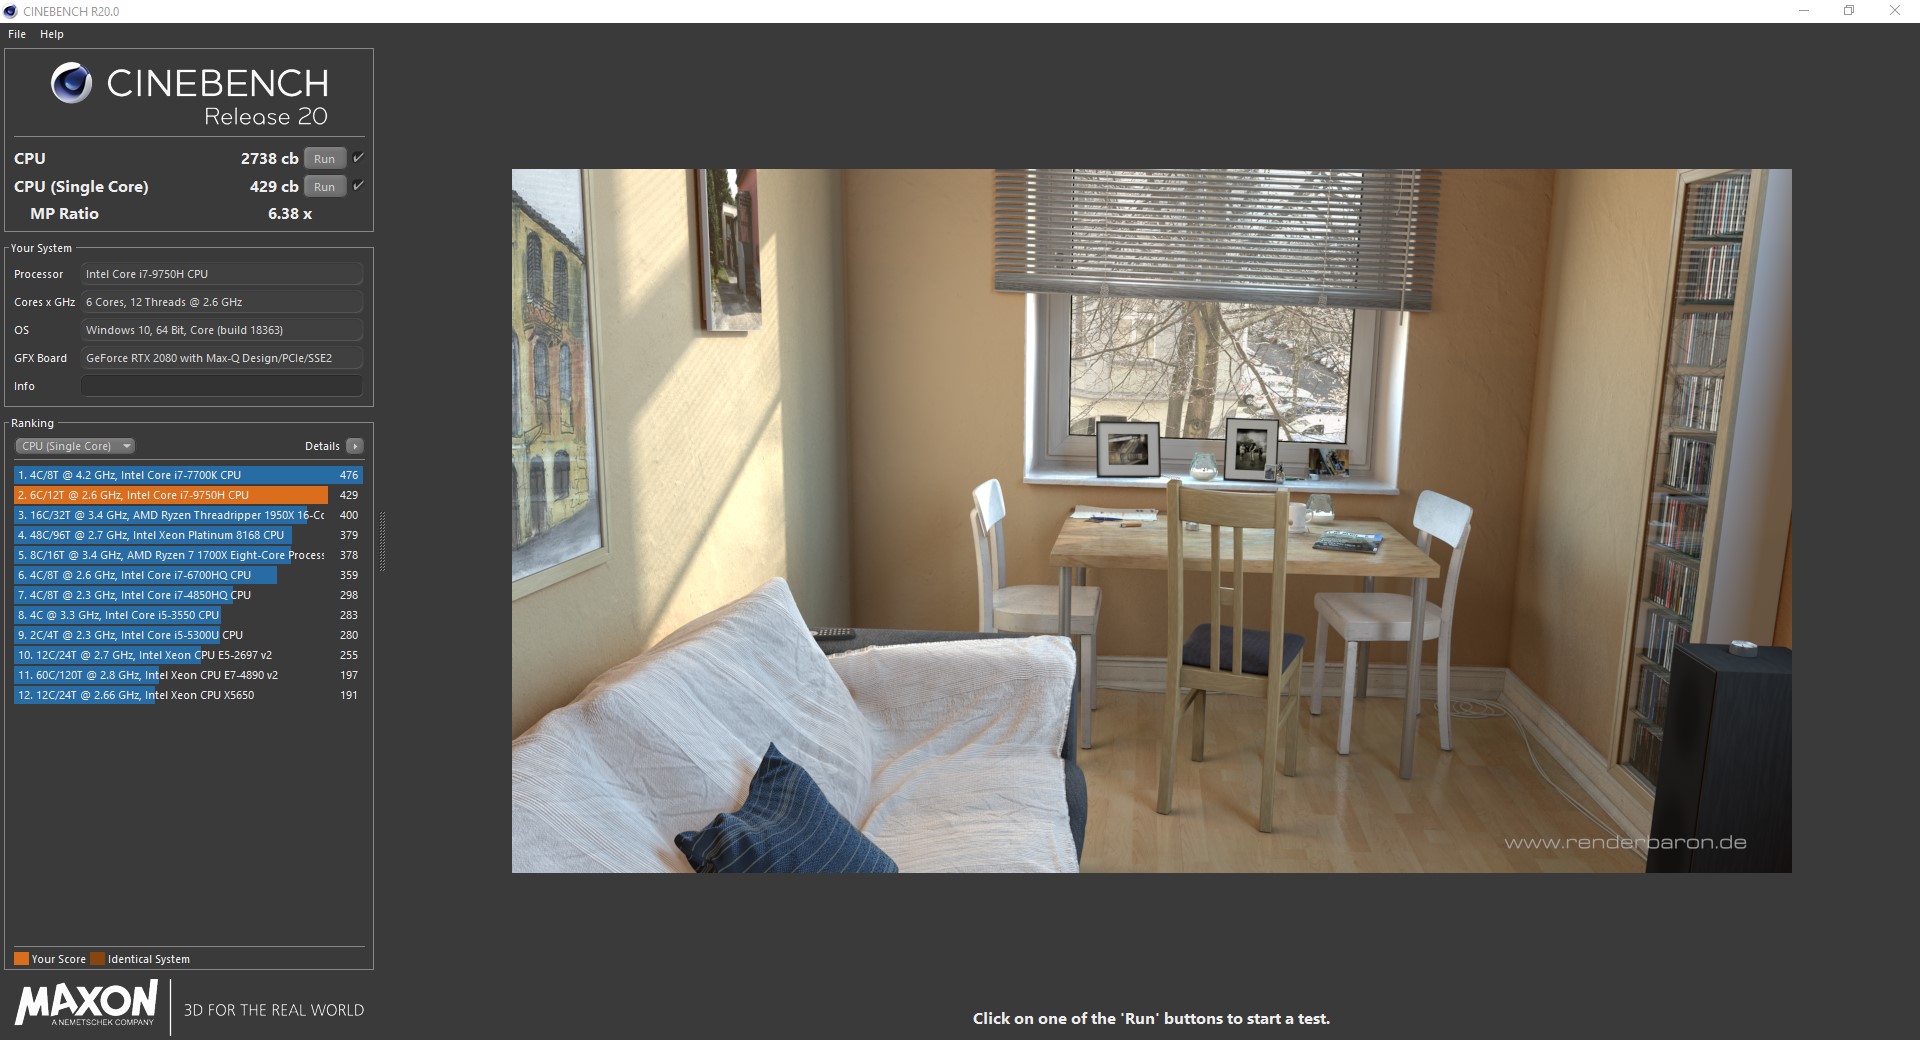
The laptop relies on an Intel Core i7-9750H with 6 physical Hyper-Threading cores for computational tasks. The CPU is able to process up to 12 threads simultaneously. In our tests, the Intel Core i7-9750H performs well. The performance of the SoC in our test sample is on a similar level as its competition. Only the Alienware m17 R2 with its faster Intel Core i9-9980HK surpasses the other devices in our comparison by a significant margin.
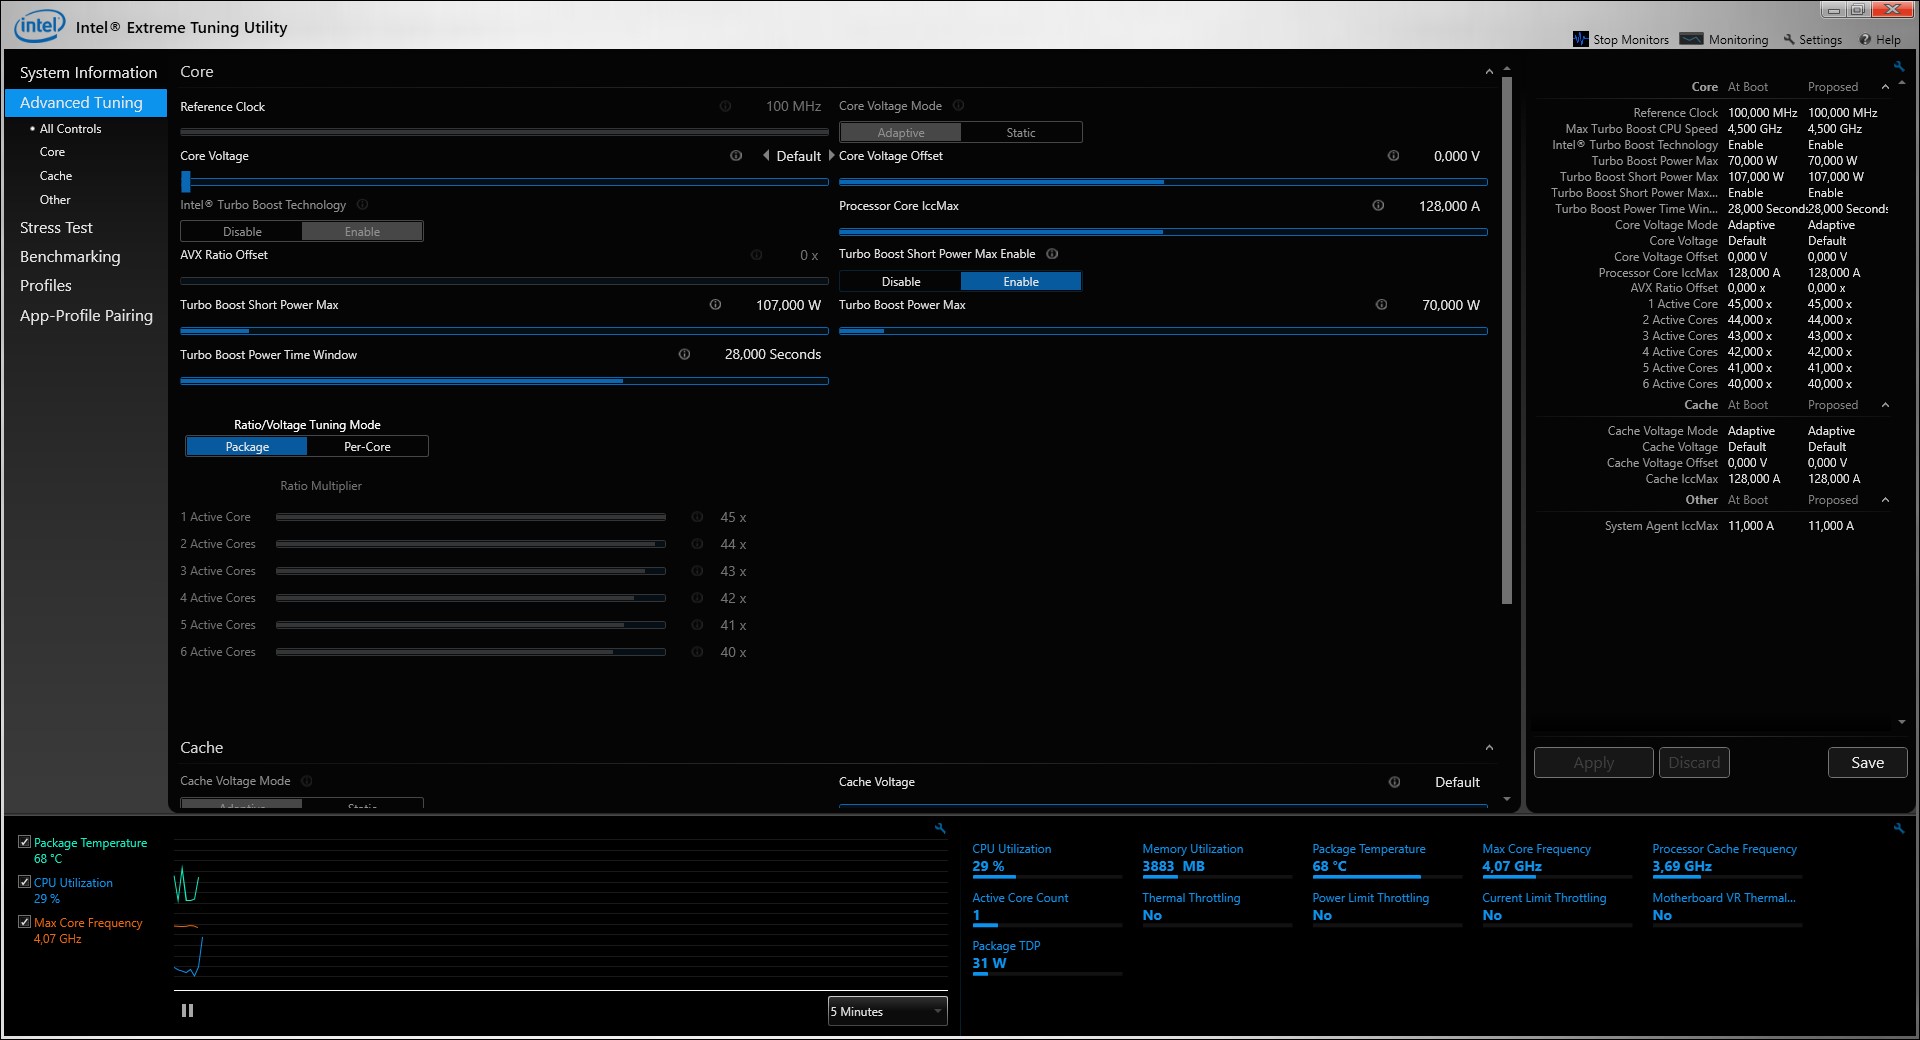
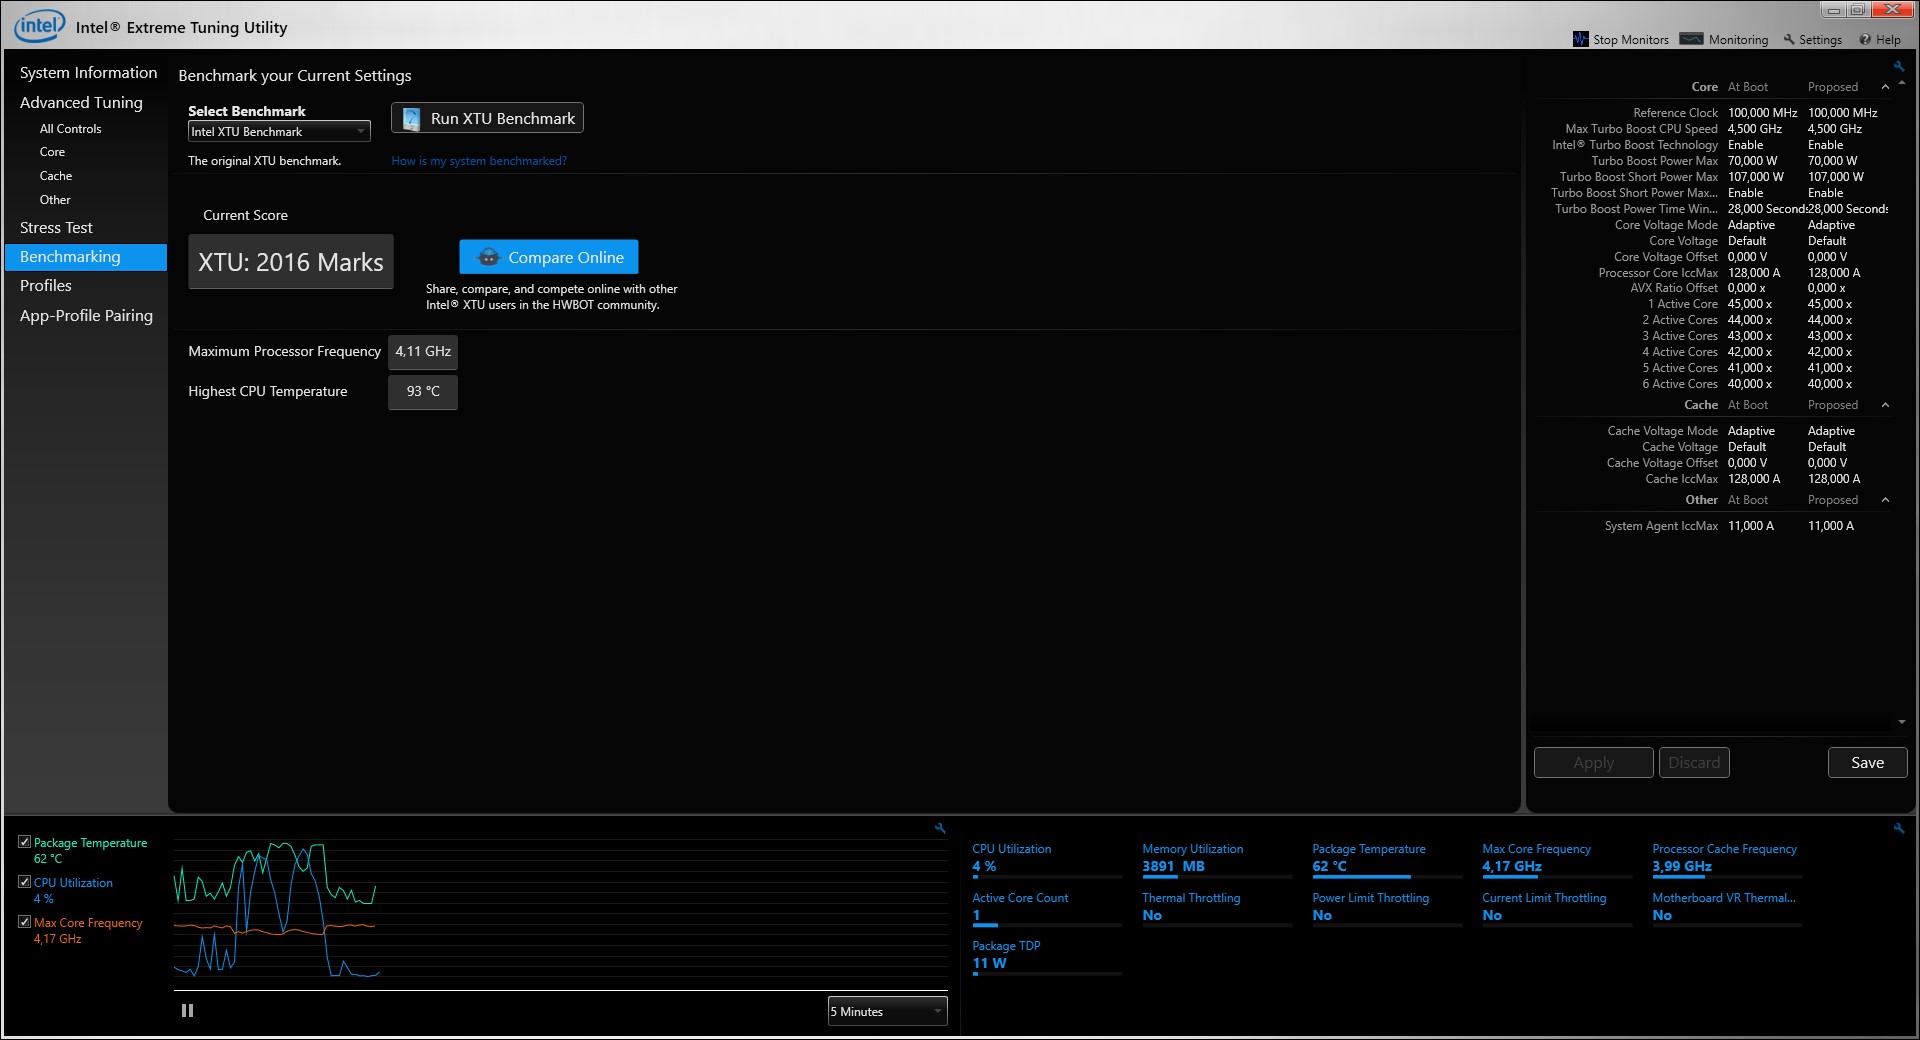
In our stress test, during which we run the Cinebench R15 multi-thread benchmark test in a loop, the Lenovo Legion Y740-17 achieves a relatively good result. The maximum boost clock speed is no longer available by the second loop, which leads to an overall performance deficit. Subsequently, the performance level stabilizes, making the Legion Y740 about as fast on average as the Razer Blade Pro 17 in its first loop.
More comparisons and benchmarks can be found in our CPU comparison table.
| 3DMark 11 - 1280x720 Performance Physics | |
| Alienware m17 R2 P41E | |
| Lenovo Legion Y740-17IRHg-81UJ001VGE | |
| Razer Blade Pro 17 4K UHD 120 Hz | |
| Average Intel Core i7-9750H (9704 - 14337, n=80) | |
| Asus ROG Zephyrus S GX701GXR | |
| Blender - v2.79 BMW27 CPU | |
| Average Intel Core i7-9750H (342 - 495, n=21) | |
| Lenovo Legion Y740-17IRHg-81UJ001VGE | |
| Geekbench 4.4 | |
| 64 Bit Single-Core Score | |
| Average Intel Core i7-9750H (4440 - 5511, n=27) | |
| Asus ROG Zephyrus S GX701GXR | |
| Lenovo Legion Y740-17IRHg-81UJ001VGE | |
| 64 Bit Multi-Core Score | |
| Lenovo Legion Y740-17IRHg-81UJ001VGE | |
| Asus ROG Zephyrus S GX701GXR | |
| Average Intel Core i7-9750H (17054 - 25043, n=27) | |
| 7-Zip 18.03 | |
| 7z b 4 | |
| Lenovo Legion Y740-17IRHg-81UJ001VGE | |
| Average Intel Core i7-9750H (28512 - 35174, n=21) | |
| 7z b 4 -mmt1 | |
| Average Intel Core i7-9750H (4580 - 5090, n=21) | |
| Lenovo Legion Y740-17IRHg-81UJ001VGE | |
* ... smaller is better
System Performance
Thanks to the powerful hardware, the system performance is very high. However, the Lenovo Legion Y740-17 does fall short in a few individual tests. Subjectively, the overall performance is still very good and working with the device is a smooth and pleasant experience.
| PCMark 8 Home Score Accelerated v2 | 5539 points | |
| PCMark 8 Creative Score Accelerated v2 | 8491 points | |
| PCMark 8 Work Score Accelerated v2 | 5949 points | |
| PCMark 10 Score | 5922 points | |
Help | ||
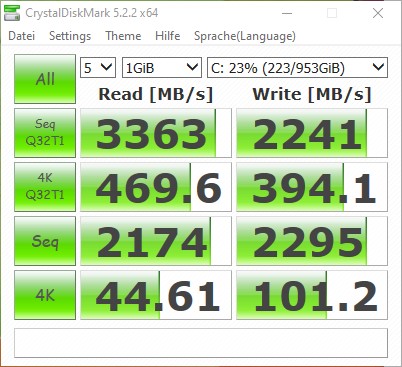
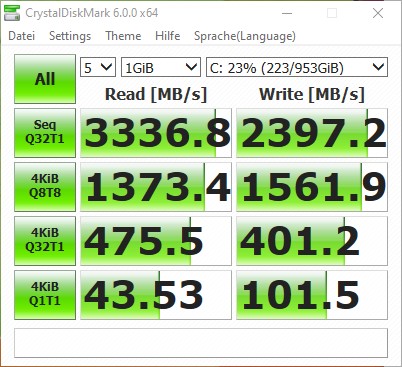
Storage Solution
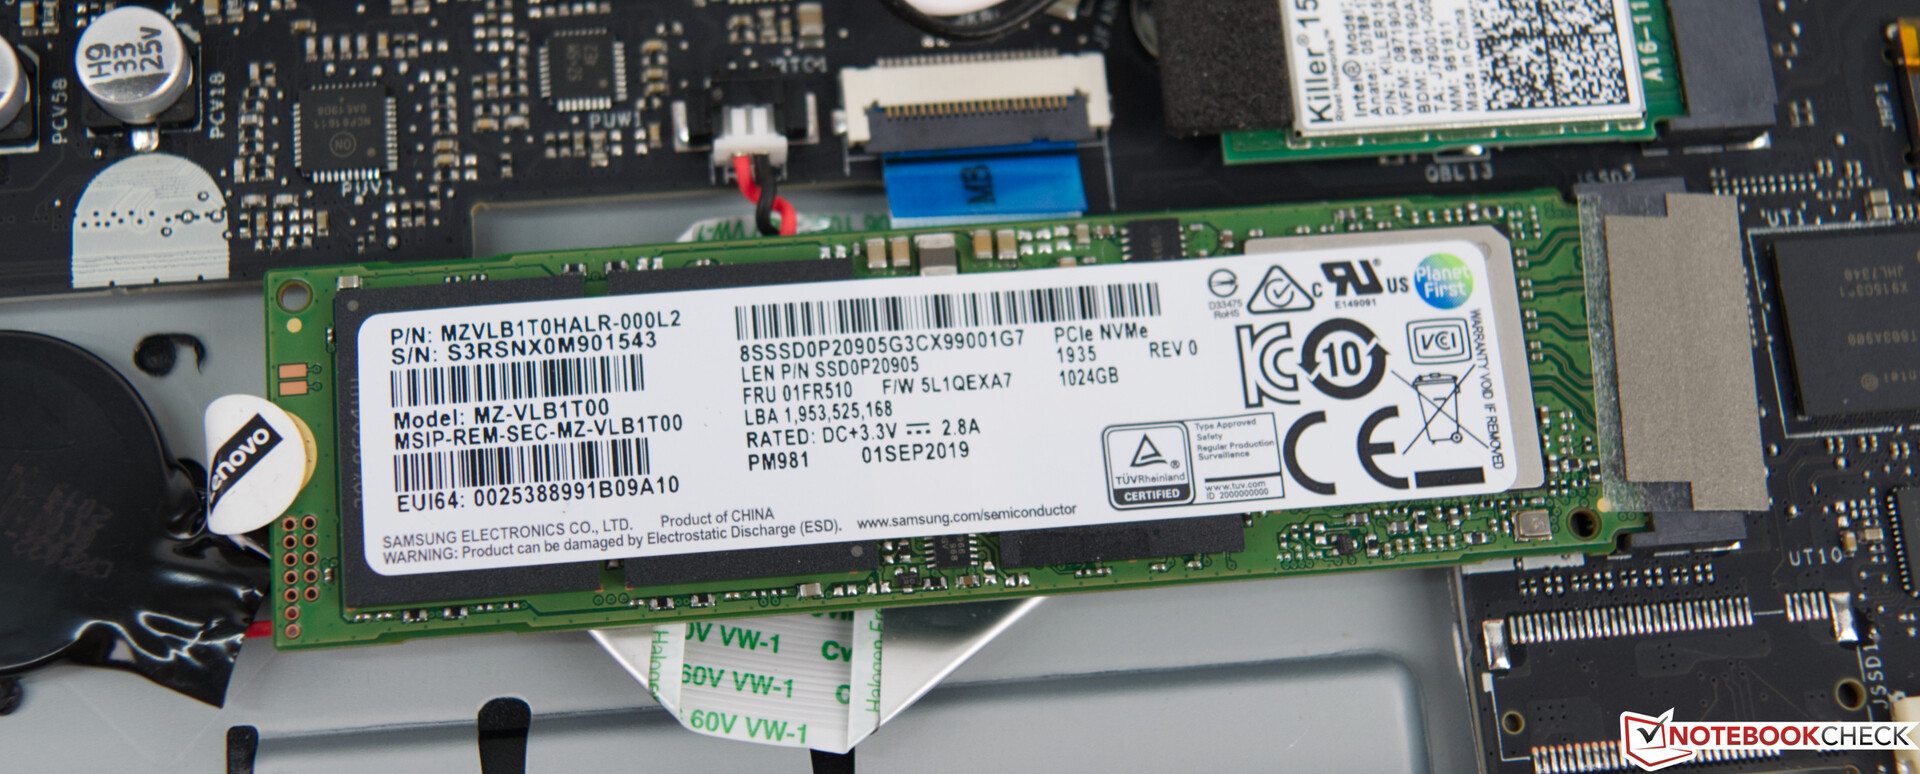
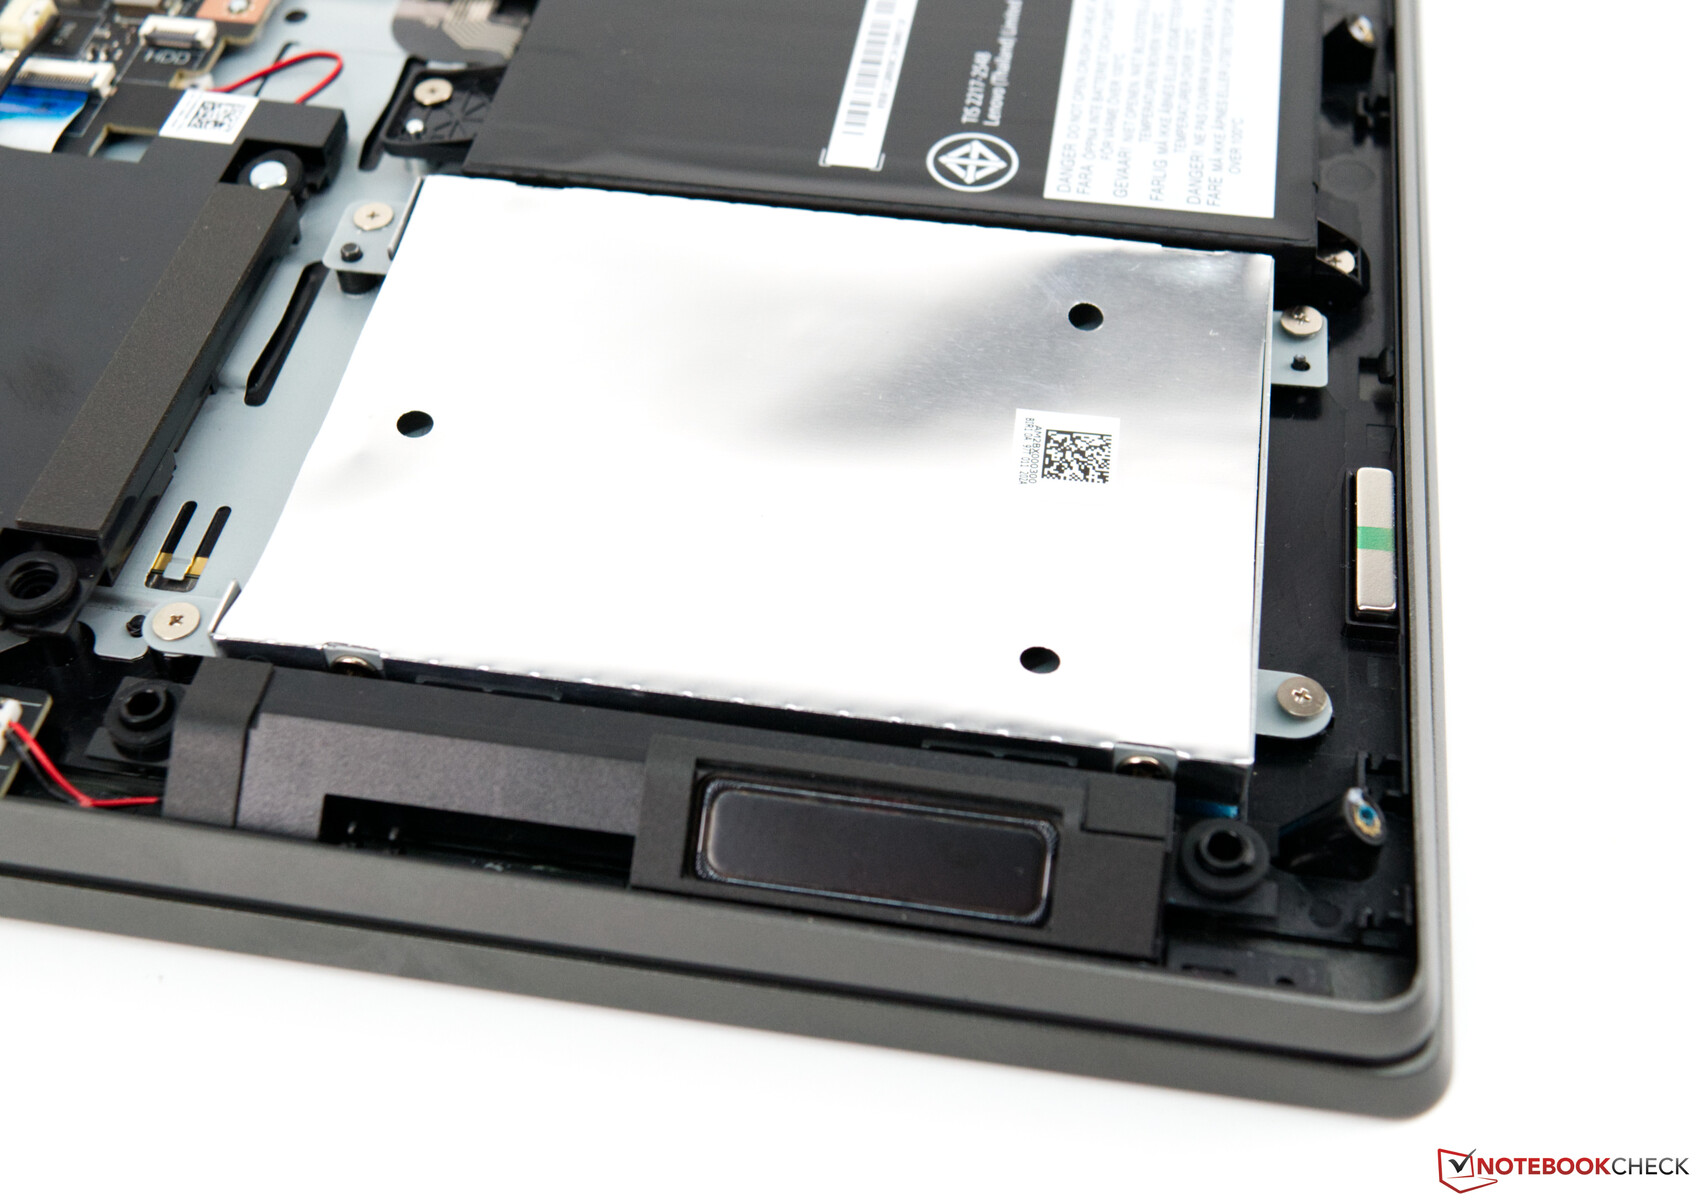
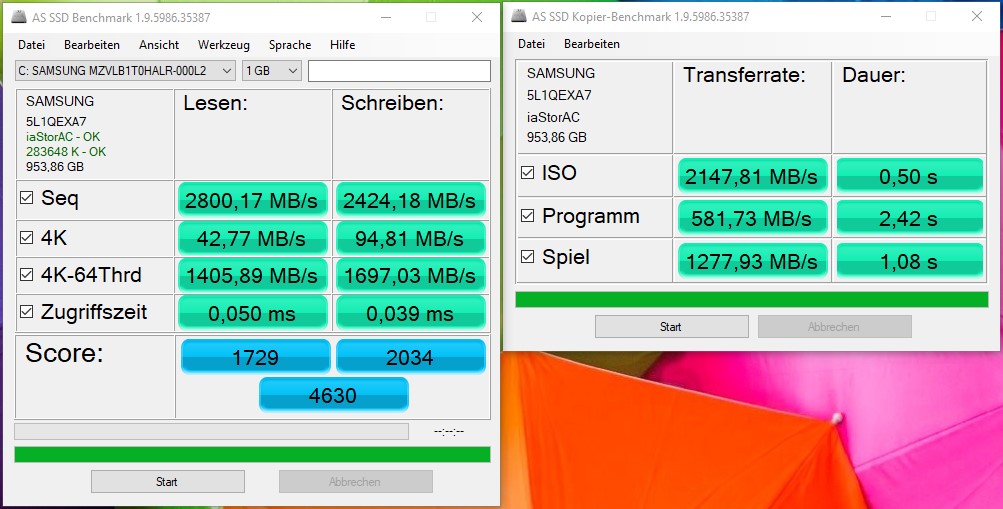
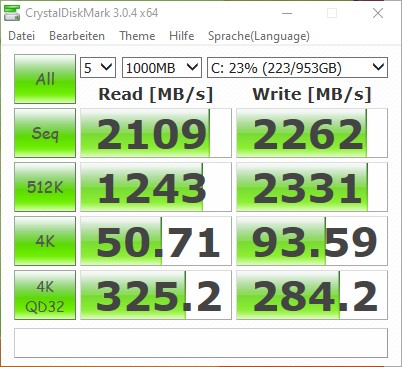
For the Legion Y740, Lenovo has opted for a fast Samsung SSD. The installed model offers 1 TB of storage space and uses the M.2 PCIe interface for transferring data. In our tests, this combination achieves convincing results in terms of absolute performance and even outperforms the competition. Users who need more storage space in the long term can install an additional 2.5-inch drive.
More comparisons and benchmarks can be found in our comparison table.
| Lenovo Legion Y740-17IRHg-81UJ001VGE Samsung SSD PM981 MZVLB1T0HALR | Razer Blade Pro 17 4K UHD 120 Hz Samsung SSD PM981 MZVLB1T0HALR | Alienware m17 R2 P41E 2x SK Hynix PC601 NVMe 512 GB (RAID 0) | Asus ROG Zephyrus S GX701GXR Samsung SSD PM981 MZVLB1T0HALR | Average Samsung SSD PM981 MZVLB1T0HALR | Average of class Gaming | |
|---|---|---|---|---|---|---|
| AS SSD | -10% | -25% | -7% | -5% | 54% | |
| Seq Read (MB/s) | 2800 | 1881 -33% | 1938 -31% | 1662 -41% | 1993 ? -29% | 5591 ? 100% |
| Seq Write (MB/s) | 2424 | 2354 -3% | 2094 -14% | 2266 -7% | 2036 ? -16% | 3972 ? 64% |
| 4K Read (MB/s) | 42.77 | 43.42 2% | 25.88 -39% | 46.86 10% | 46.4 ? 8% | 71.1 ? 66% |
| 4K Write (MB/s) | 94.8 | 104.1 10% | 100.8 6% | 101.1 7% | 109.7 ? 16% | 215 ? 127% |
| 4K-64 Read (MB/s) | 1406 | 1805 28% | 1217 -13% | 1419 1% | 1502 ? 7% | 1618 ? 15% |
| 4K-64 Write (MB/s) | 1697 | 1775 5% | 1137 -33% | 1746 3% | 1625 ? -4% | 2935 ? 73% |
| Access Time Read * (ms) | 0.05 | 0.049 2% | 0.051 -2% | 0.047 6% | 0.05158 ? -3% | 0.06364 ? -27% |
| Access Time Write * (ms) | 0.039 | 0.106 -172% | 0.107 -174% | 0.037 5% | 0.05581 ? -43% | 0.03794 ? 3% |
| Score Read (Points) | 1729 | 2037 18% | 1437 -17% | 1632 -6% | 1747 ? 1% | 2248 ? 30% |
| Score Write (Points) | 2034 | 2115 4% | 1447 -29% | 2074 2% | 1942 ? -5% | 3547 ? 74% |
| Score Total (Points) | 4630 | 5215 13% | 3624 -22% | 4576 -1% | 4588 ? -1% | 6872 ? 48% |
| Copy ISO MB/s (MB/s) | 2148 | 1877 -13% | 1926 -10% | 1398 -35% | 2280 ? 6% | 3168 ? 47% |
| Copy Program MB/s (MB/s) | 582 | 539 -7% | 626 8% | 438.9 -25% | 558 ? -4% | 981 ? 69% |
| Copy Game MB/s (MB/s) | 1278 | 1368 7% | 1533 20% | 996 -22% | 1302 ? 2% | 2112 ? 65% |
* ... smaller is better

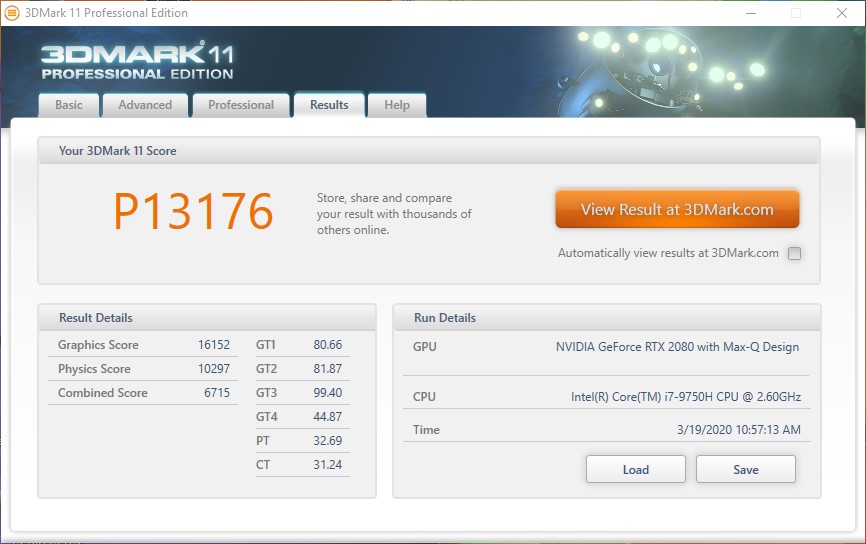
GPU Performance
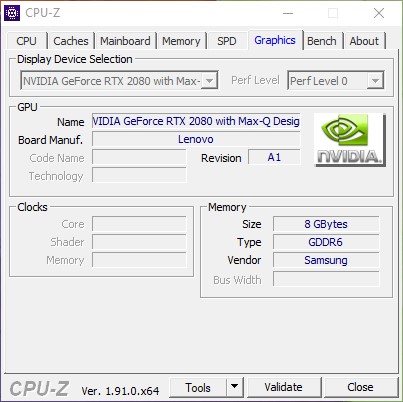
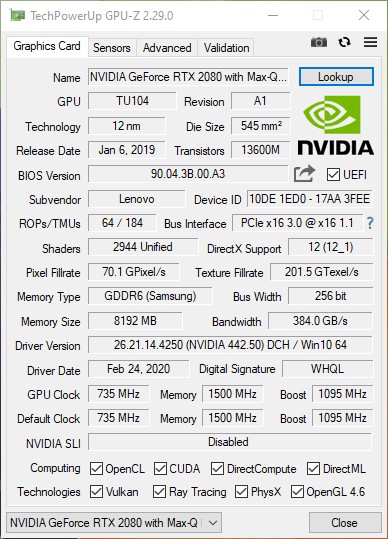
Our test device relies on Nvidia's GeForce RTX 2080 Max-Q for graphics calculations. This is the most powerful GPU model available on the Lenovo Legion Y740. In our synthetic tests, our test sample performs slightly worse than its competitors.
More comparisons and benchmarks can be found in our GPU comparison table.
| 3DMark 11 Performance | 20810 points | |
| 3DMark Ice Storm Standard Score | 181500 points | |
| 3DMark Cloud Gate Standard Score | 38493 points | |
| 3DMark Fire Strike Score | 16706 points | |
| 3DMark Fire Strike Extreme Score | 8320 points | |
| 3DMark Time Spy Score | 7475 points | |
Help | ||
Gaming Performance
When it comes to gaming, the Legion Y740's performance is average. Here, the Razer Blade Pro 17 is the laptop to beat. That being said, even modern games can be played smoothly at the native resolution and maximum quality settings. During our stress test, which consists of running "The Witcher 3" on the ultra preset, the performance drops slightly. However, users will not have to worry about unplayable frame rates.
| The Witcher 3 | |
| 1920x1080 High Graphics & Postprocessing (Nvidia HairWorks Off) | |
| Average of class Gaming (341 - 404, n=2, last 2 years) | |
| Razer Blade Pro 17 4K UHD 120 Hz | |
| Asus ROG Zephyrus S GX701GXR | |
| Alienware m17 R2 P41E | |
| Lenovo Legion Y740-17IRHg-81UJ001VGE | |
| Average NVIDIA GeForce RTX 2080 Max-Q (117.3 - 179.9, n=19) | |
| 1920x1080 Ultra Graphics & Postprocessing (HBAO+) | |
| Average of class Gaming (104.7 - 240, n=7, last 2 years) | |
| Razer Blade Pro 17 4K UHD 120 Hz | |
| Lenovo Legion Y740-17IRHg-81UJ001VGE | |
| Asus ROG Zephyrus S GX701GXR | |
| Average NVIDIA GeForce RTX 2080 Max-Q (65.7 - 92.7, n=22) | |
| Alienware m17 R2 P41E | |
| low | med. | high | ultra | |
|---|---|---|---|---|
| BioShock Infinite (2013) | 330 | 295 | 278 | 166 |
| GTA V (2015) | 171 | 166 | 144 | 77.2 |
| The Witcher 3 (2015) | 299 | 234 | 145 | 81 |
| Dota 2 Reborn (2015) | 144.9 | 132.2 | 126.4 | 119.6 |
| Rise of the Tomb Raider (2016) | 246 | 185 | 139 | 126 |
| X-Plane 11.11 (2018) | 108 | 97.4 | 81.6 | |
| Metro Exodus (2019) | 150 | 97 | 75 | 59 |
Emissions & Energy - Barely Acceptable
System Noise
Gaming laptops and noise under load often go hand in hand. The Lenovo Legion Y740 does not exactly spare users either, although 40.8 dB(A) also is not an excessively high value. That being said, the fans are very noticeable while gaming. Fortunately, the frequency of the fans is not too high.
Noise level
| Idle |
| 30.3 / 30.3 / 30.5 dB(A) |
| Load |
| 40.8 / 40.8 dB(A) |
 | ||
30 dB silent 40 dB(A) audible 50 dB(A) loud |
||
min: | ||
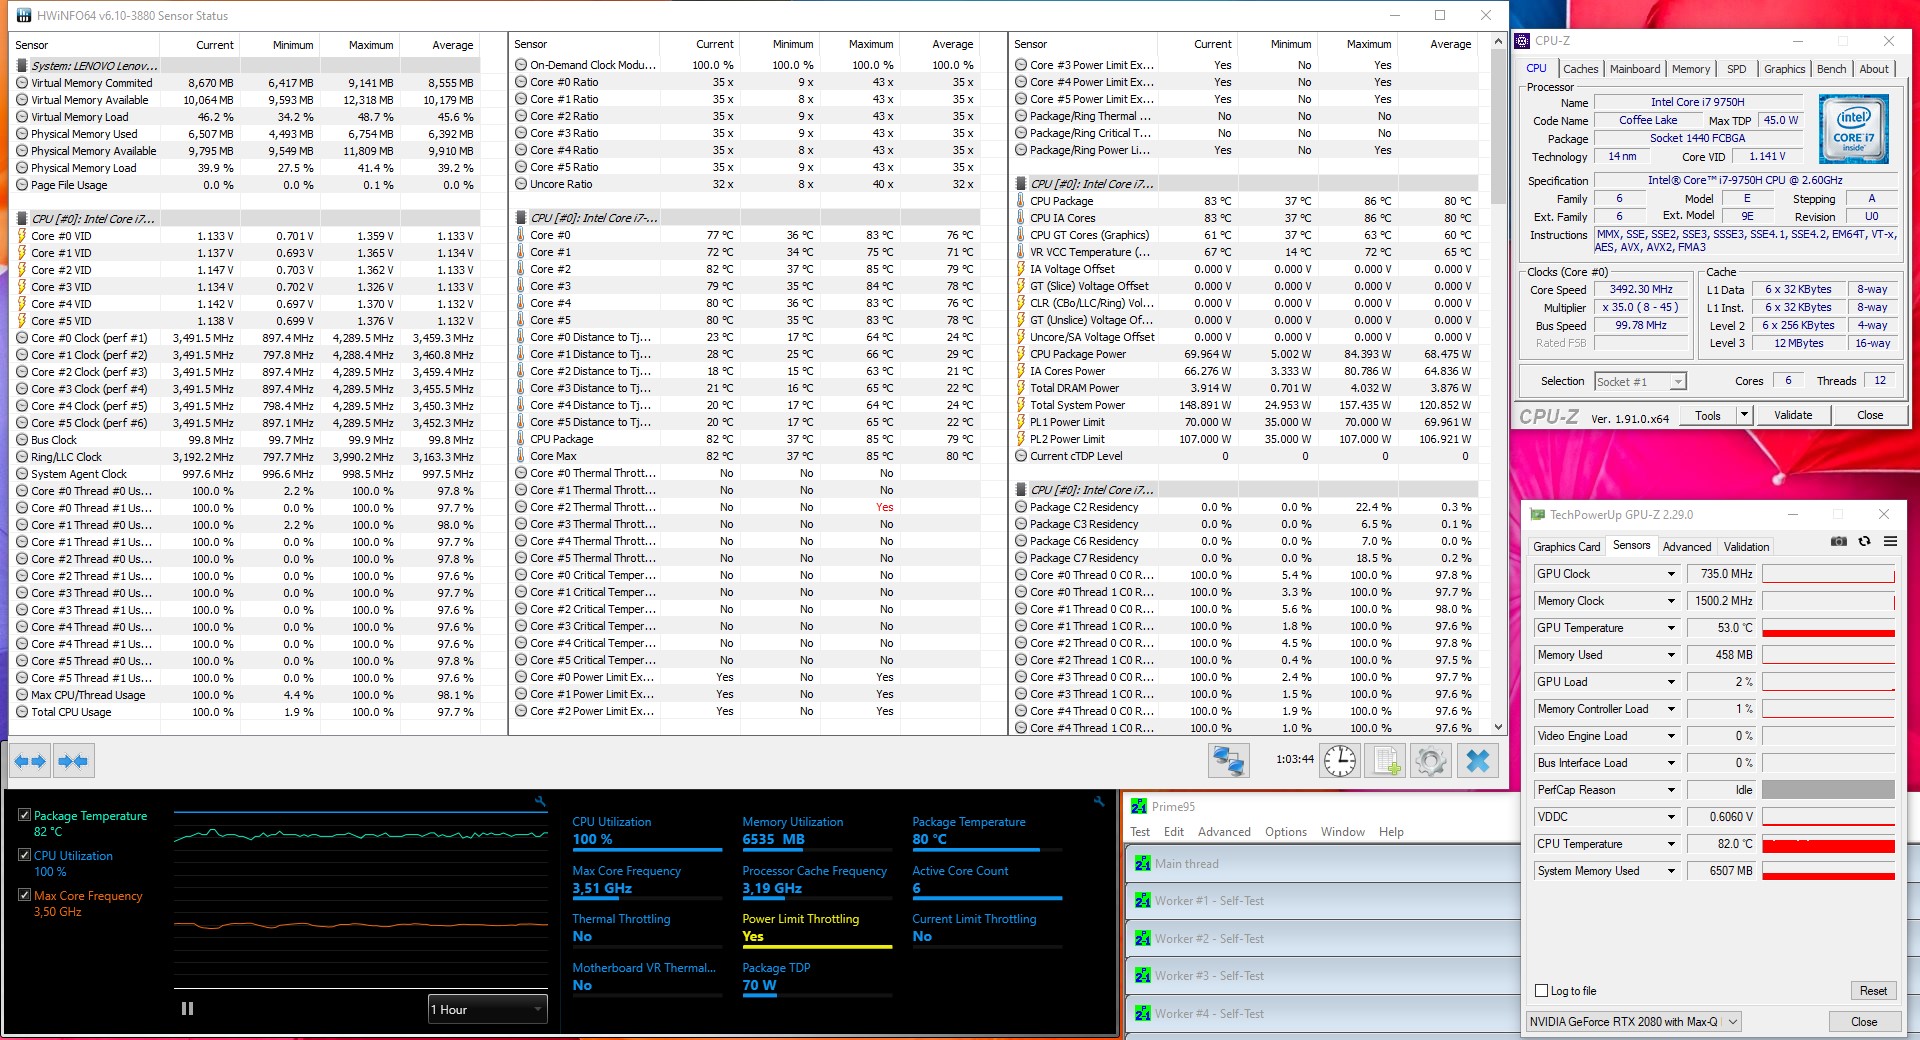
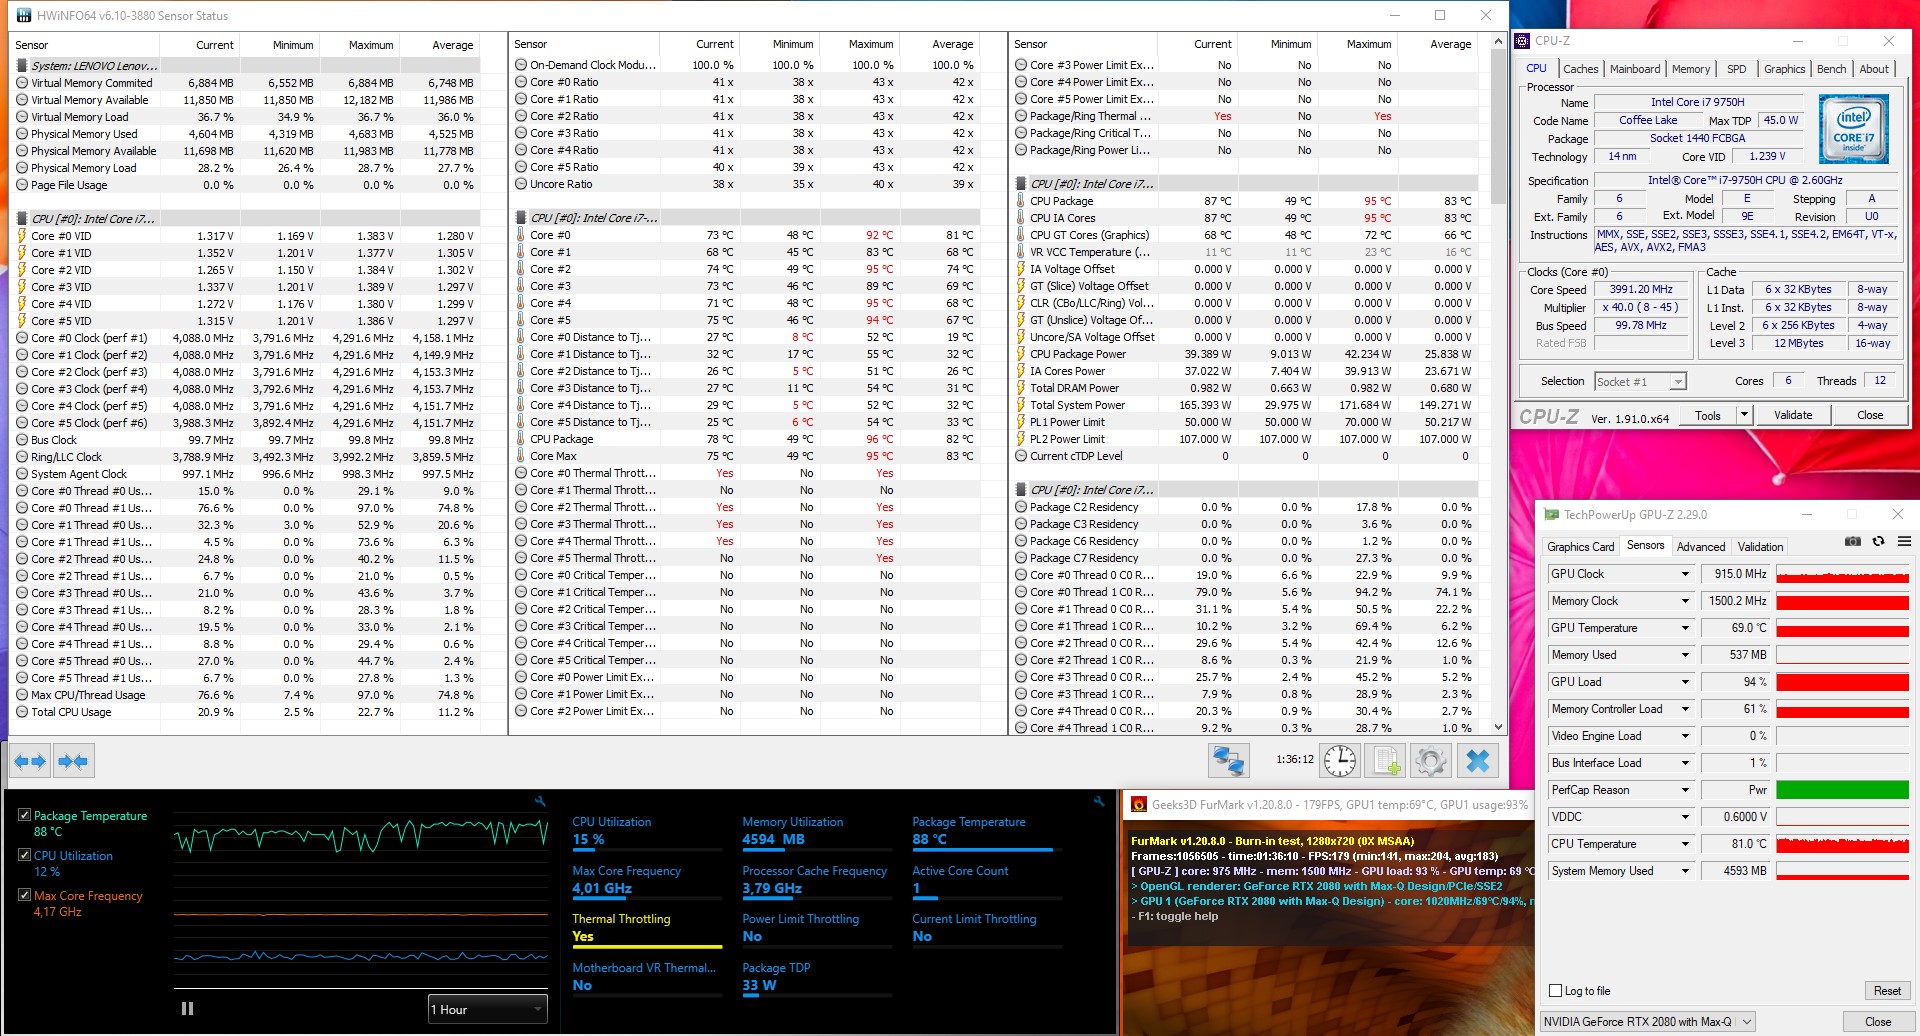
Temperature
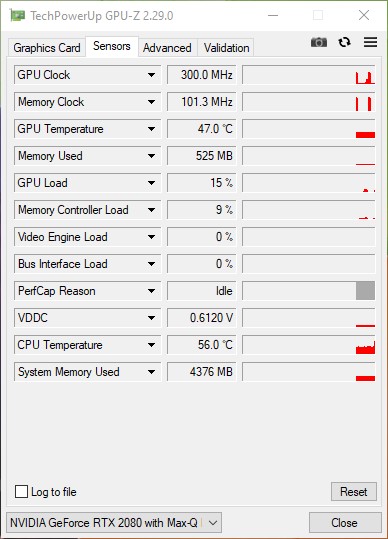
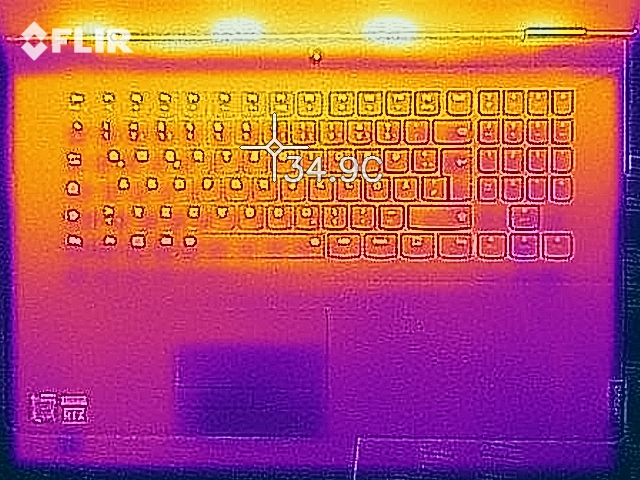
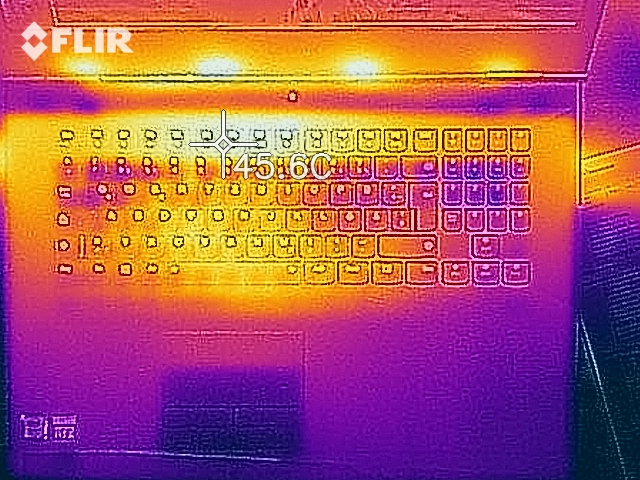
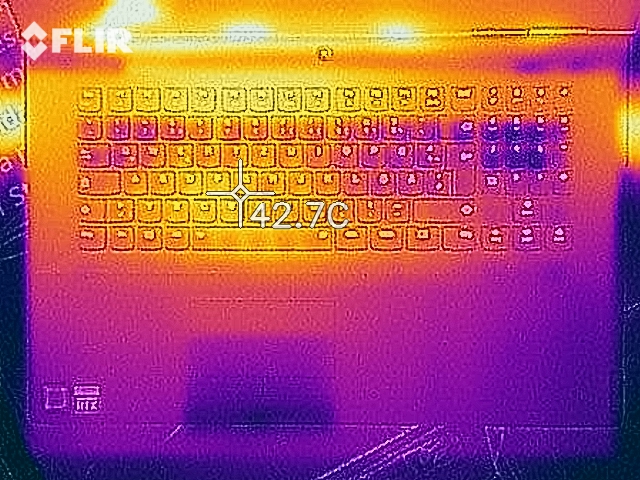
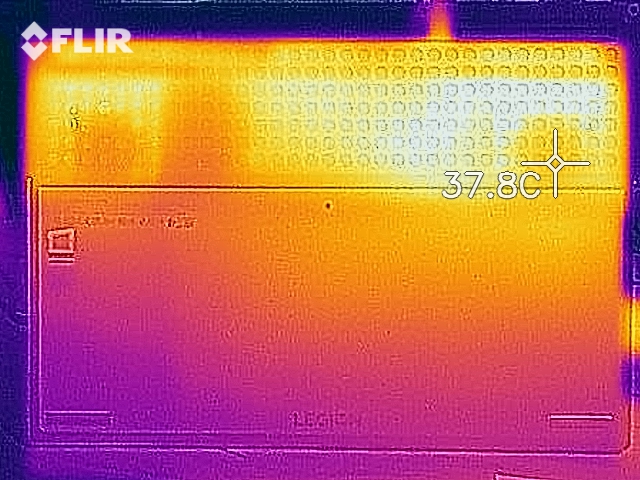
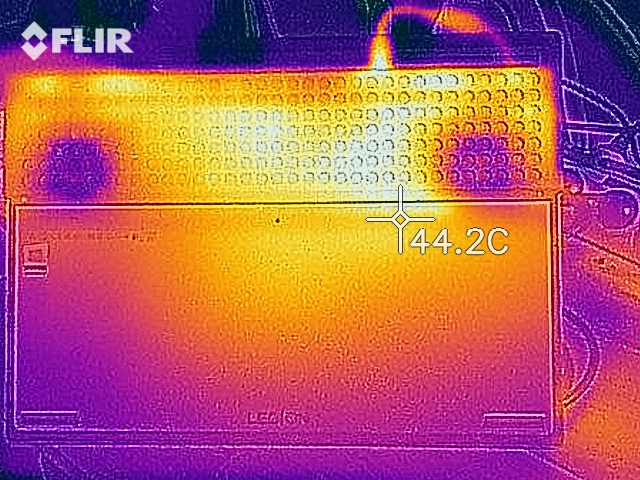
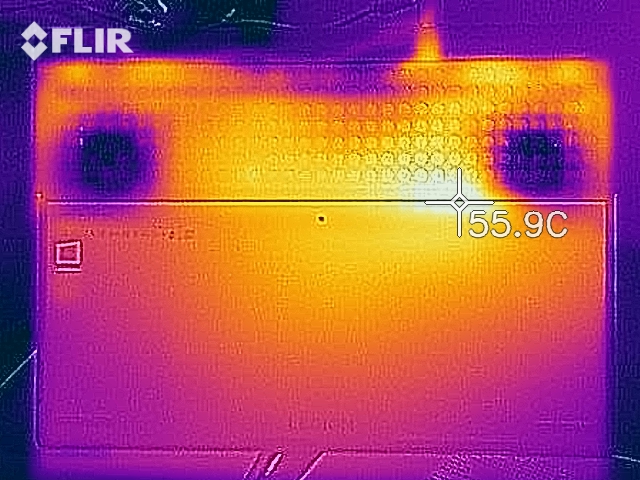
When only looking at the surface temperatures, Lenovo appears to have done a good job. Here, the surfaces are far from reaching 50 °C (122 °F) and only a few spots cross the 40 °C (104 °F) mark. The processor's core temperatures do not look quite as good. When exclusively stressing the CPU, its core temperature does not reach critical values. However, as soon as the GPU comes into play, the SoC's temperatures can reach up to 95 °C (203 °F). Meanwhile, we observed a maximum core temperature of 76 °C (~169 °F) for the Nvidia GeForce RTX 2080 Max-Q.
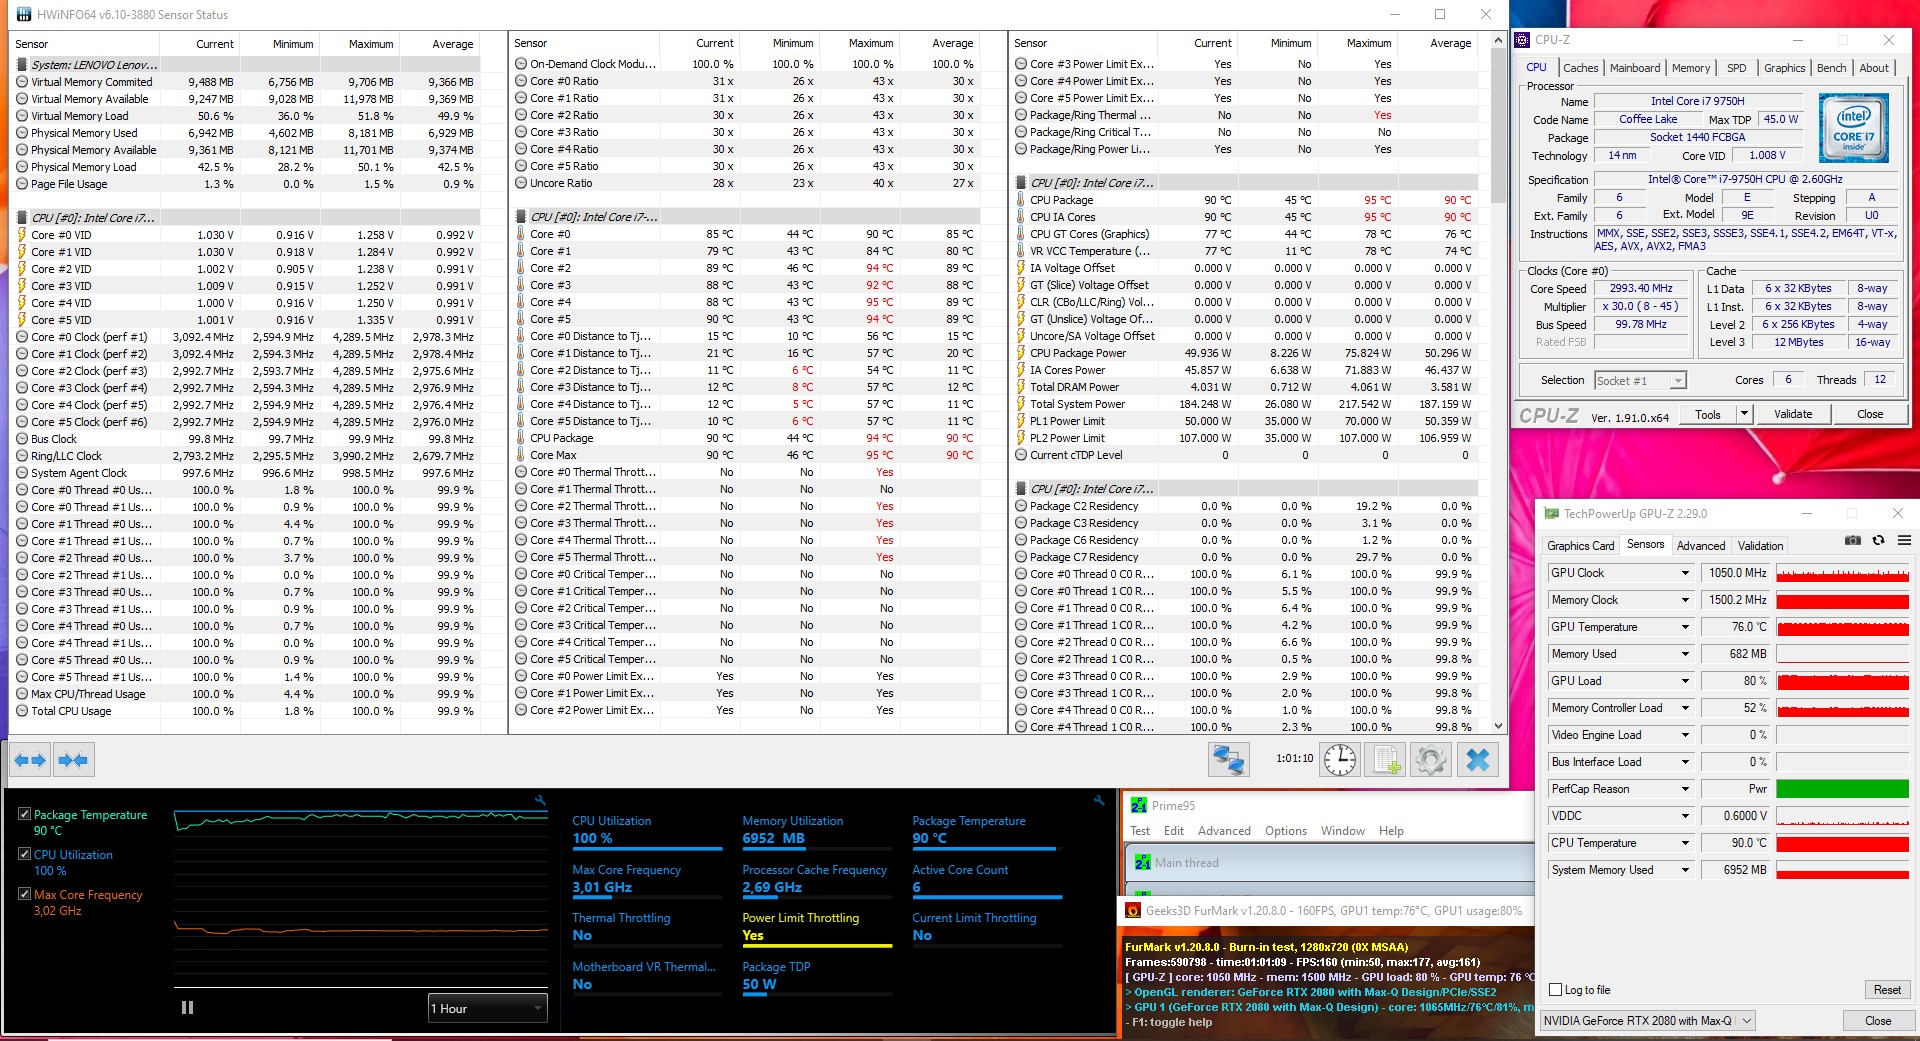
(±) The maximum temperature on the upper side is 40.7 °C / 105 F, compared to the average of 40.4 °C / 105 F, ranging from 21.2 to 68.8 °C for the class Gaming.
(±) The bottom heats up to a maximum of 42.2 °C / 108 F, compared to the average of 43.2 °C / 110 F
(+) In idle usage, the average temperature for the upper side is 28.6 °C / 83 F, compared to the device average of 33.9 °C / 93 F.
(±) Playing The Witcher 3, the average temperature for the upper side is 33.1 °C / 92 F, compared to the device average of 33.9 °C / 93 F.
(+) The palmrests and touchpad are cooler than skin temperature with a maximum of 30 °C / 86 F and are therefore cool to the touch.
(±) The average temperature of the palmrest area of similar devices was 28.8 °C / 83.8 F (-1.2 °C / -2.2 F).
Speakers
In terms of audio, there are two stereo speakers, which are complemented by a subwoofer for lower frequencies. The sound is balanced overall and at least offers some amount of bass. For an ideal audio experience however, we still recommend using a headset. The latter can be connected to the laptop via the 3.5 mm jack or USB.
Lenovo Legion Y740-17IRHg-81UJ001VGE audio analysis
(-) | not very loud speakers (69.2 dB)
Bass 100 - 315 Hz
(±) | reduced bass - on average 6.3% lower than median
(±) | linearity of bass is average (11% delta to prev. frequency)
Mids 400 - 2000 Hz
(+) | balanced mids - only 3.8% away from median
(±) | linearity of mids is average (8.3% delta to prev. frequency)
Highs 2 - 16 kHz
(+) | balanced highs - only 2.5% away from median
(±) | linearity of highs is average (7% delta to prev. frequency)
Overall 100 - 16.000 Hz
(+) | overall sound is linear (14.9% difference to median)
Compared to same class
» 30% of all tested devices in this class were better, 7% similar, 63% worse
» The best had a delta of 6%, average was 18%, worst was 132%
Compared to all devices tested
» 20% of all tested devices were better, 4% similar, 76% worse
» The best had a delta of 4%, average was 23%, worst was 134%
Asus ROG Zephyrus S GX701GXR audio analysis
(+) | speakers can play relatively loud (83 dB)
Bass 100 - 315 Hz
(±) | reduced bass - on average 10.3% lower than median
(±) | linearity of bass is average (11.1% delta to prev. frequency)
Mids 400 - 2000 Hz
(+) | balanced mids - only 2.6% away from median
(+) | mids are linear (4.3% delta to prev. frequency)
Highs 2 - 16 kHz
(+) | balanced highs - only 3.3% away from median
(+) | highs are linear (4.1% delta to prev. frequency)
Overall 100 - 16.000 Hz
(+) | overall sound is linear (12.5% difference to median)
Compared to same class
» 15% of all tested devices in this class were better, 3% similar, 81% worse
» The best had a delta of 6%, average was 18%, worst was 132%
Compared to all devices tested
» 11% of all tested devices were better, 2% similar, 87% worse
» The best had a delta of 4%, average was 23%, worst was 134%
Energy Consumption
Gaming laptops tend to consume more power than traditional workstations. While idling, the Legion Y740-17 draws only 15.7 to 28 watts. Under maximum load, the consumption increases to up to 177 W from the 230-Watt AC adapter.
| Off / Standby | |
| Idle | |
| Load |
|
Key:
min: | |
Battery Life

With its fixed 76-Wh battery, the Lenovo Legion Y740-17 lasts slightly less than 3 hours in our Wi-Fi test. Here, competitors achieve better results. Thus, our test device comes in last in this particular discipline. Fully charging the battery takes about 2:10 hours.
Note that in battery mode, the CPU and GPU performance is slightly throttled, as the benchmarks show.


Pros
Cons
Verdict - Good Value
The Lenovo Legion Y740-17 is a well-equipped and fairly reasonably priced gaming notebook. Comparable devices with similar specifications often cost more than 3000 Euros (~$3300). Instead, the Legion Y740-17 can be purchased from various online shops for around 2700 Euros (~$2965). For the price, buyers receive a visually appealing laptop with subtle, customizable RGB lighting. However, the installed components should be the main focus. The Intel Core i7-9750H is a safe choice. The six-core SoC delivers solid performance. An Nvidia GeForce RTX 2080 Max-Q was selected as the graphics card and combined with the SoC, even the latest titles run smoothly. As for the screen, it has a native Full HD resolution and a 144-Hz refresh rate as well as G-Sync shows that Lenovo has designed this device primarily with gamers in mind. Similarly, it is a good choice for light photo editing.
The Lenovo Legion Y740-17 is a solid gaming laptop that is definitely worth considering.
Overall, the Lenovo Legion Y740-17 is a good gaming machine with only minor weaknesses. For example, the battery life is slightly below average and the touchpad could have been slightly bigger. In terms of raw performance, the Lenovo Legion Y740-17 has showcased its ability to keep up with the competition in our comparison.
The port selection is nothing out of the ordinary. Still, a full size DisplayPort would have been good to see, since it would have made using special cables or adapters unnecessary.
Lenovo Legion Y740-17IRHg-81UJ001VGE
- 03/26/2020 v7 (old)
Sebastian Bade
Price comparison

