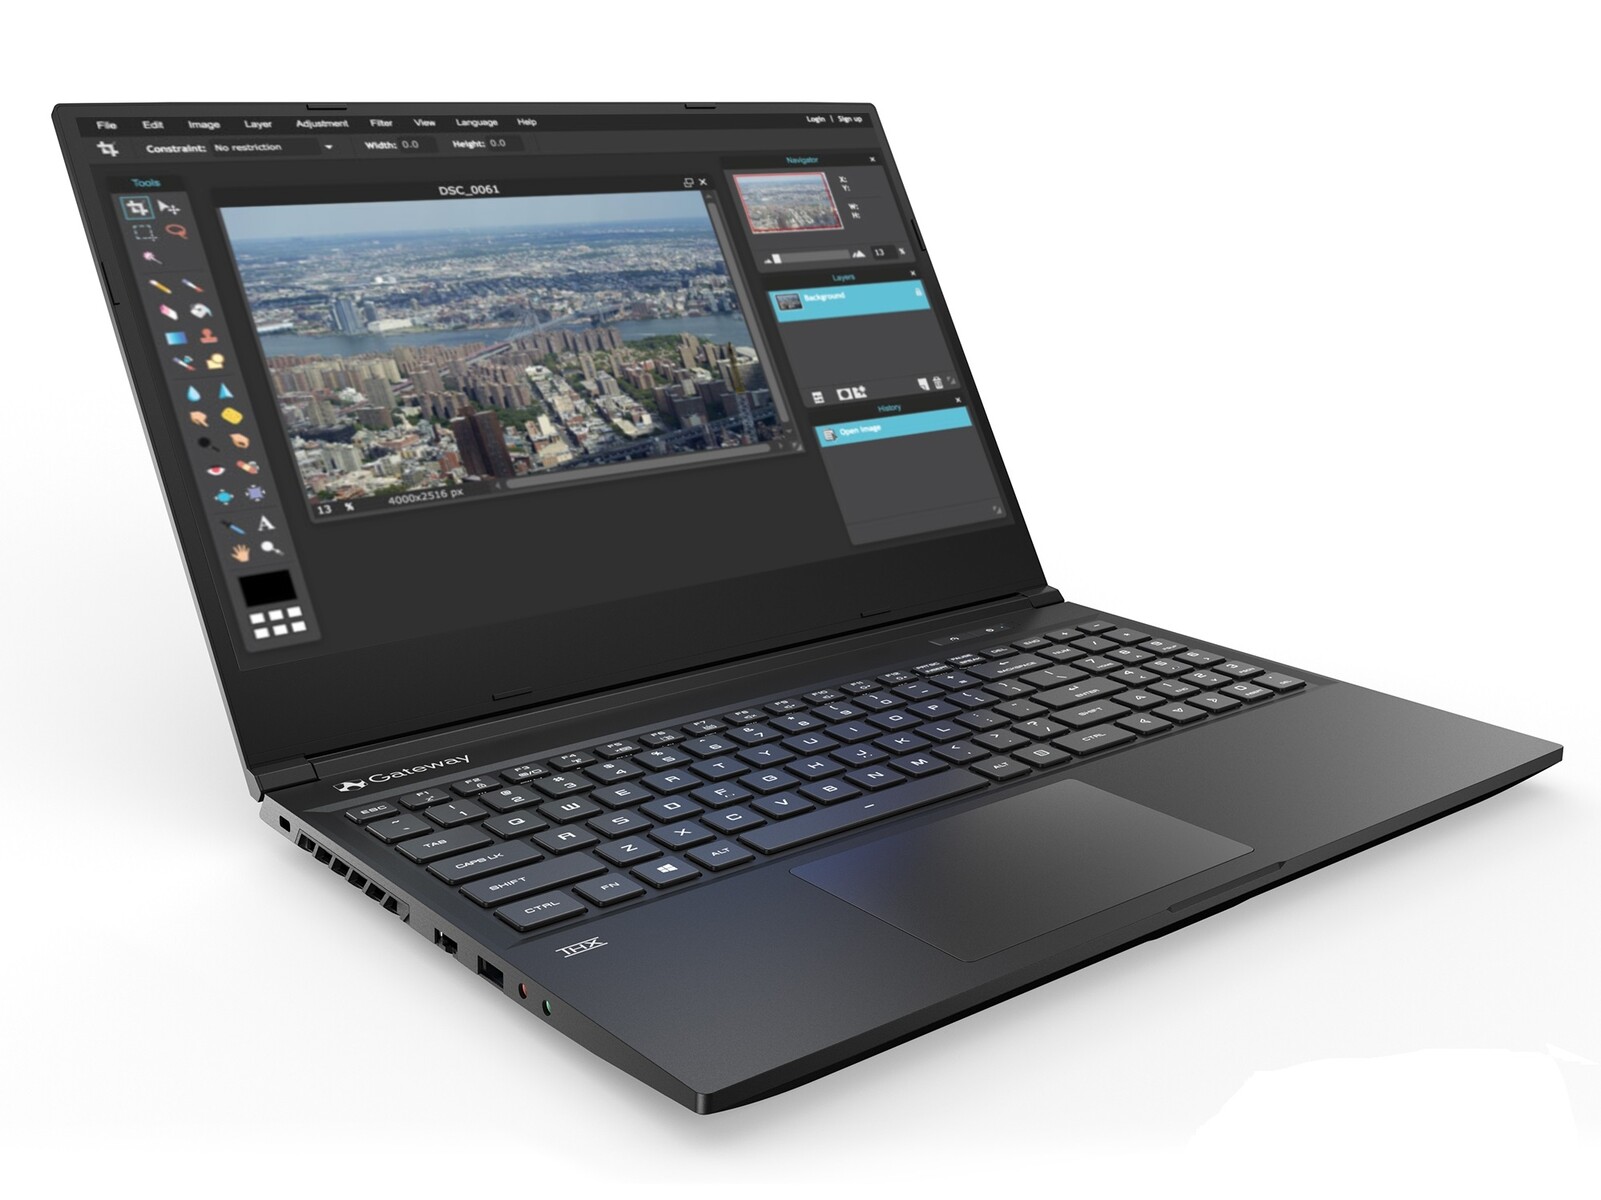
Walmart Gateway Creator Series 15 Laptop Review: GeForce RTX 2060 For Under $1000 USD
Gateway is Walmart's in-house brand name of laptops not unlike the Motile series or EVOO series. The Gateway Creator 15 is an affordable gaming laptop with its Coffee Lake-H CPU, GeForce RTX 2060 GPU, and 1080p display for just $999 USD. A second SKU with the Ryzen 5 4600H and GTX 1650 is also available for $200 to $300 less.
As we will see in this review, however, the Gateway system cuts a lot of corners in order to reach such a low price point for a gaming laptop. See our review on the Schenker XMG Core 15 for more information on the chassis and its physical features since the Gateway Creator 15 uses an identical Tongfang chassis.
Alternatives to the Gateway Creator 15 include other budget to mid-range 15.6-inch gaming laptops like the Lenovo Legion 5, HP Pavilion Gaming 15, Dell G3 15, or the MSI GL65.
Rating | Date | Model | Weight | Height | Size | Resolution | Price |
|---|---|---|---|---|---|---|---|
| 82.1 % v7 (old) | 10 / 2020 | Gateway Creator Series 15.6 GWTN156-3BK i5-10300H, GeForce RTX 2060 Mobile | 2 kg | 19.9 mm | 15.60" | 1920x1080 | |
| 82.1 % v7 (old) | 09 / 2020 | Schenker XMG Core 15 GK5NR0O R7 4800H, GeForce RTX 2060 Mobile | 2 kg | 19.9 mm | 15.60" | 1920x1080 | |
| 83.7 % v7 (old) | 10 / 2020 | Aorus 5 KB i7-10750H, GeForce RTX 2060 Mobile | 2.1 kg | 28 mm | 15.60" | 1920x1080 | |
| 81.2 % v7 (old) | 09 / 2020 | Asus ROG Zephyrus G15 GA502IU-ES76 R7 4800HS, GeForce GTX 1660 Ti Max-Q | 2.1 kg | 19.9 mm | 15.60" | 1920x1080 | |
| 82.1 % v7 (old) | 09 / 2020 | HP Omen 15-ek0456ng i5-10300H, GeForce GTX 1660 Ti Mobile | 2.1 kg | 32 mm | 15.60" | 1920x1080 | |
| 84.2 % v7 (old) | 09 / 2019 | Razer Blade 15 GTX 1660 Ti i7-9750H, GeForce GTX 1660 Ti Mobile | 2.1 kg | 19.9 mm | 15.60" | 1920x1080 |
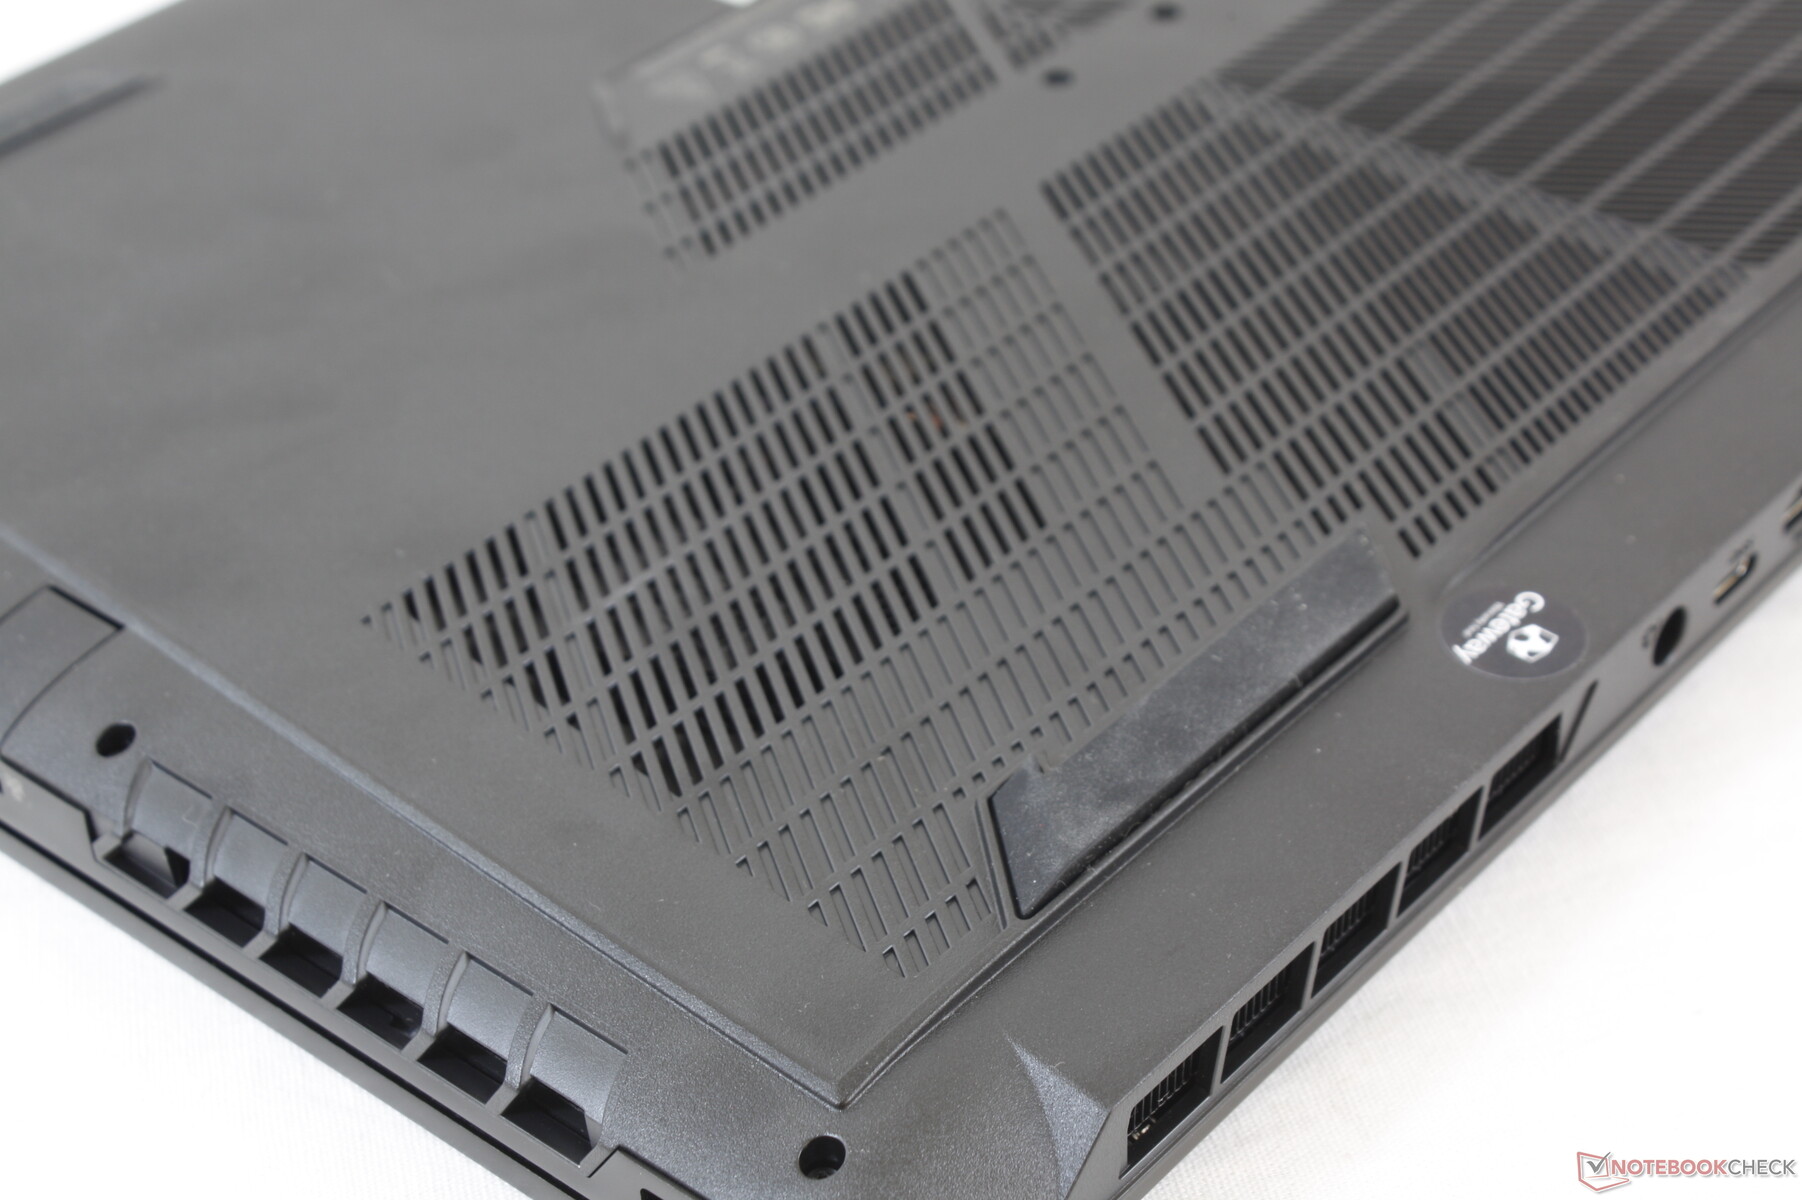
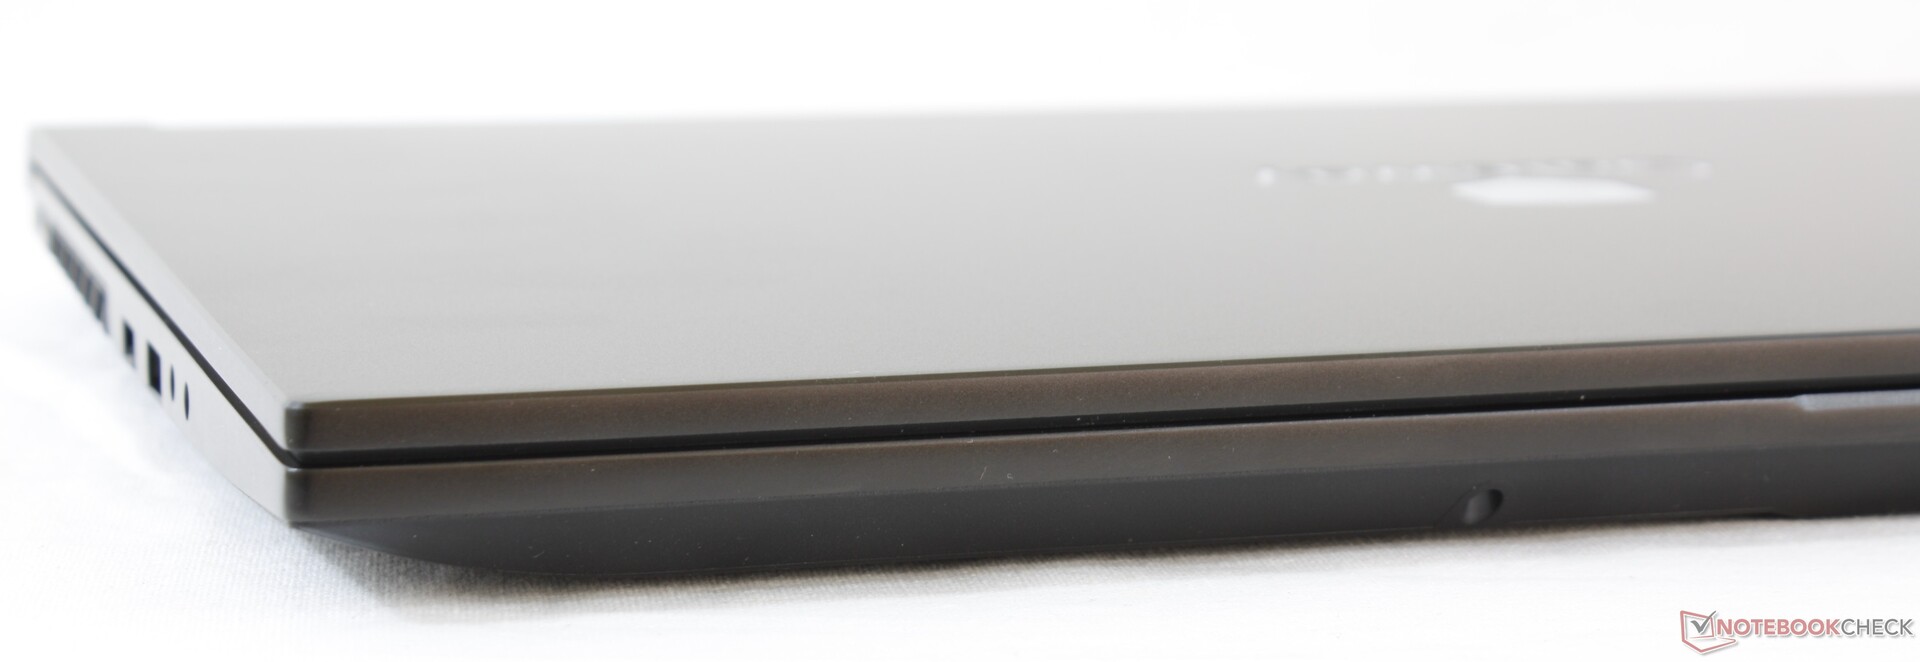
Case
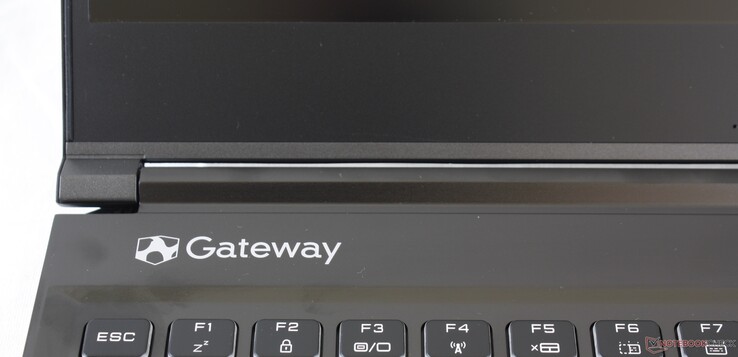
Gateway doesn't design its own laptops from the ground up. Instead, the Gateway Creator 15 uses a white label chassis from Chinese ODM Tongfang. Many resellers use this same design including Eluktronics and Schenker.
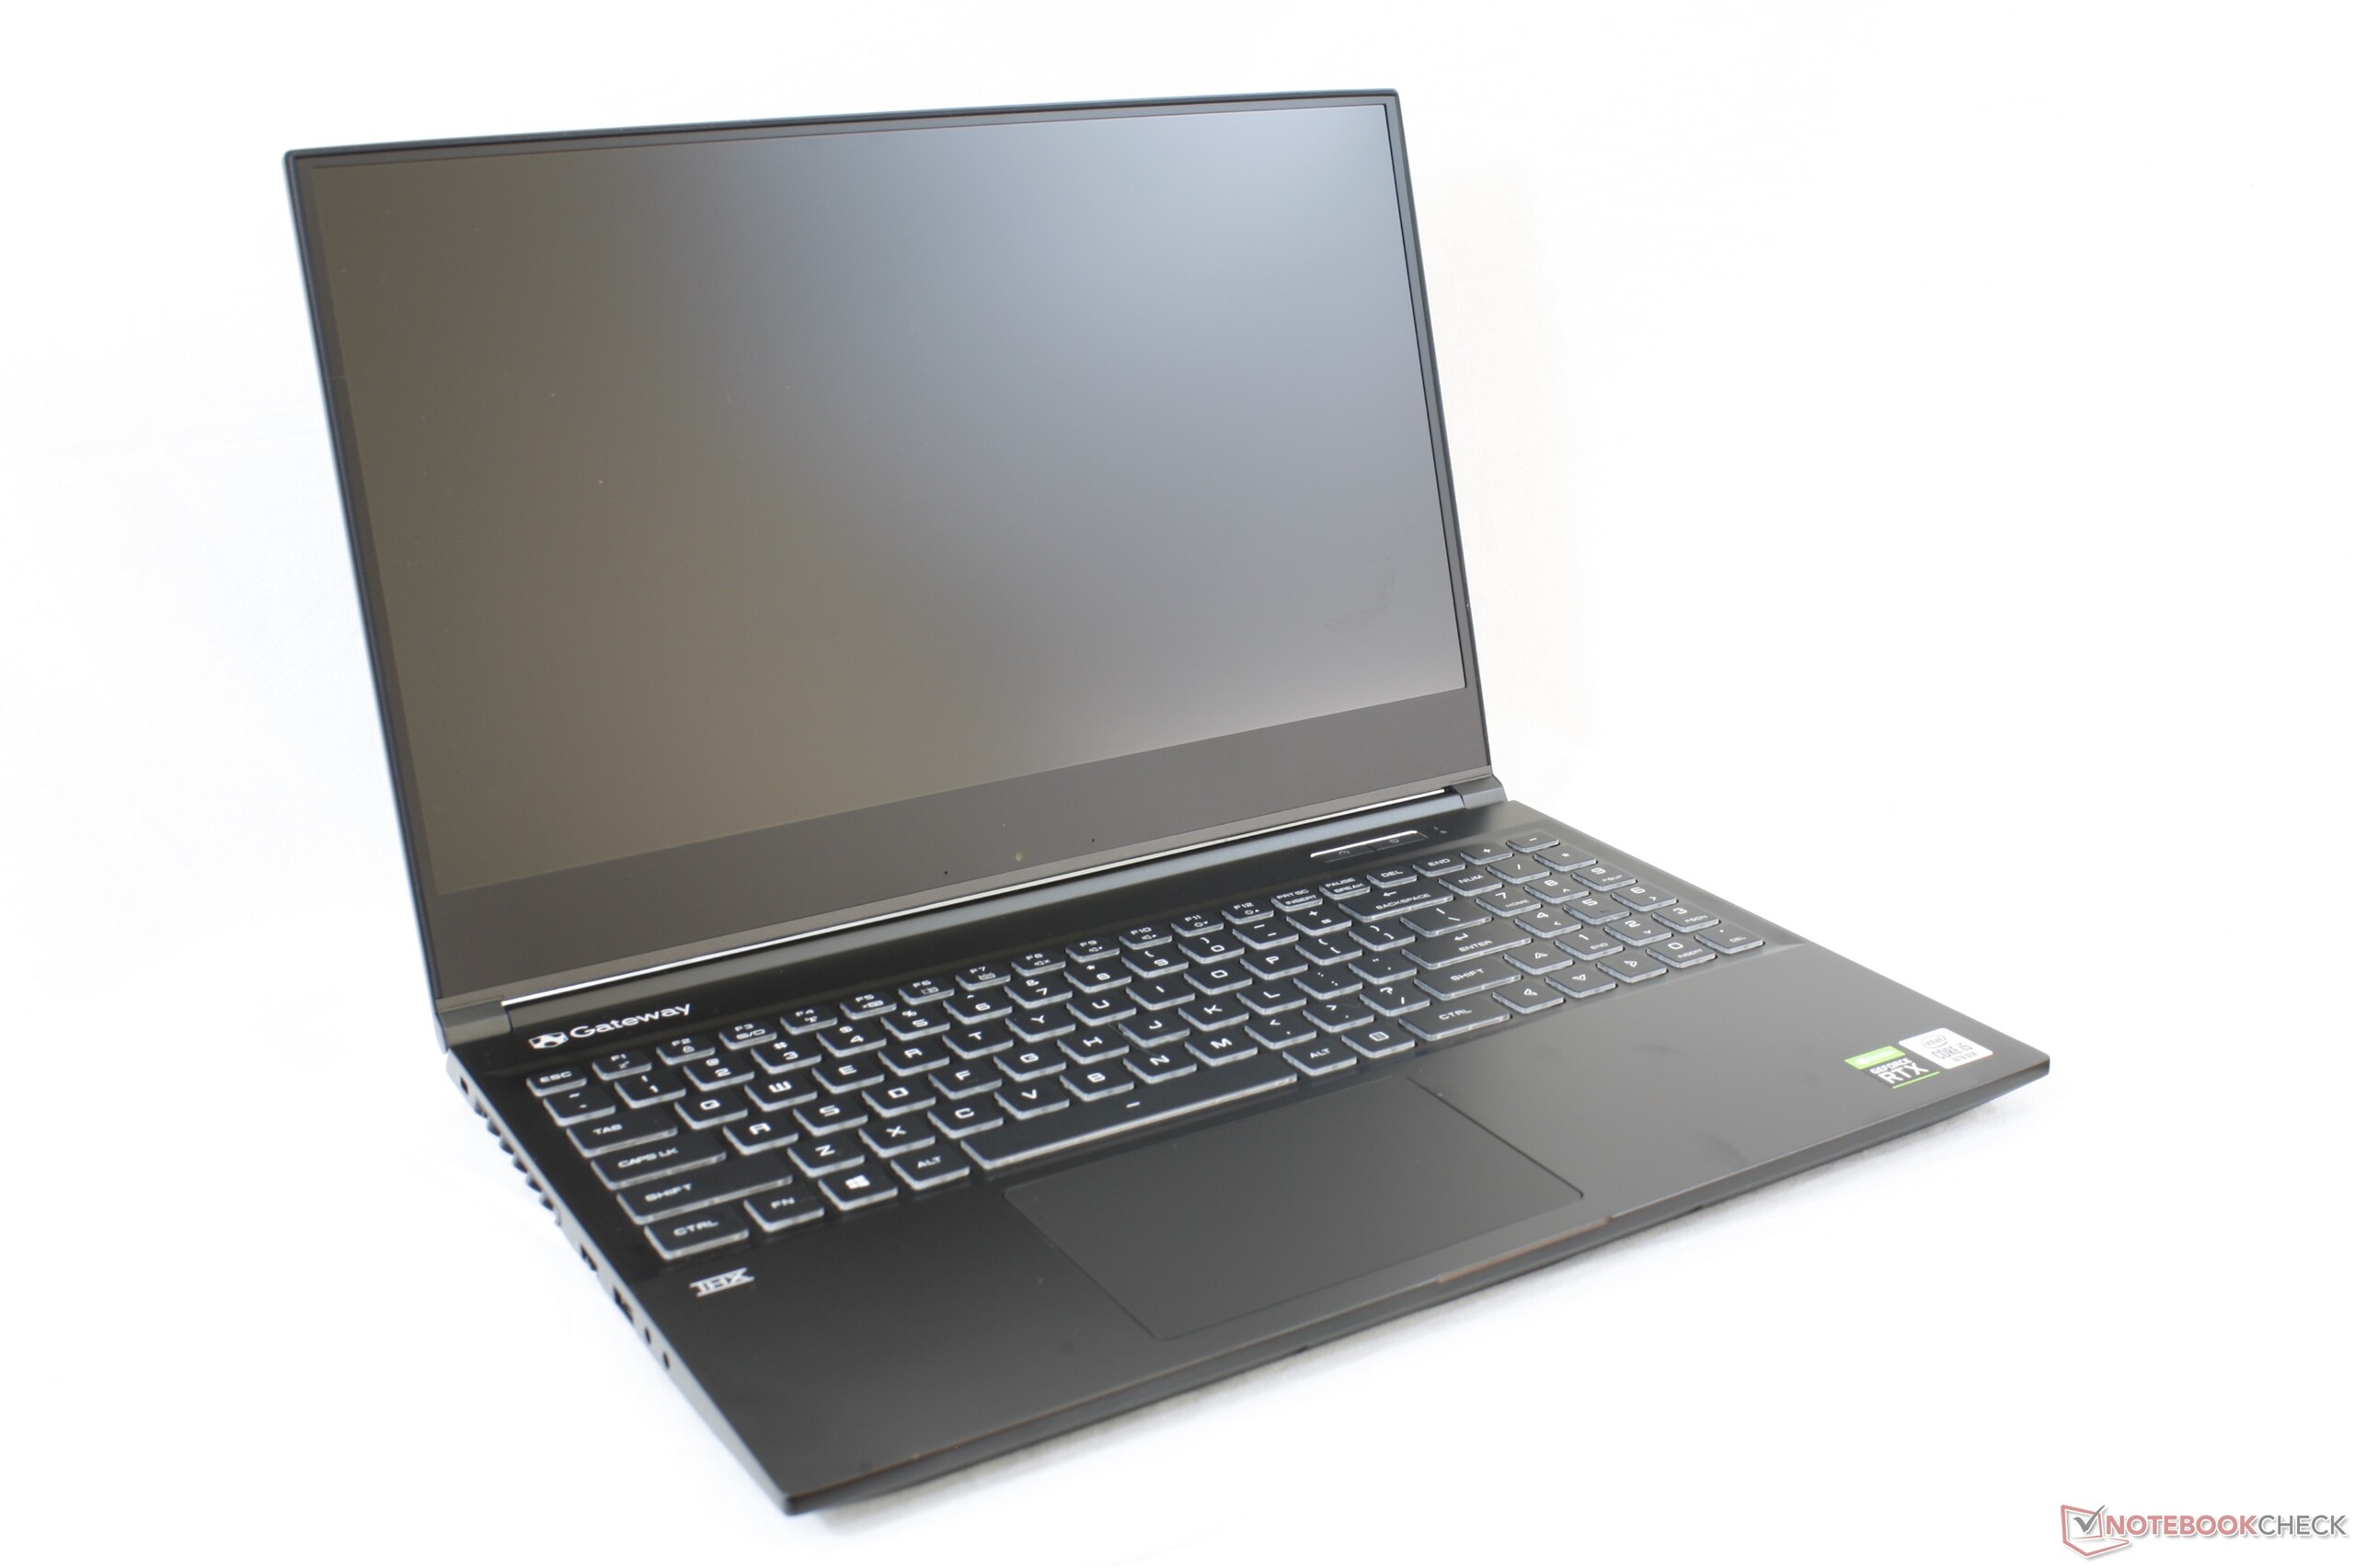
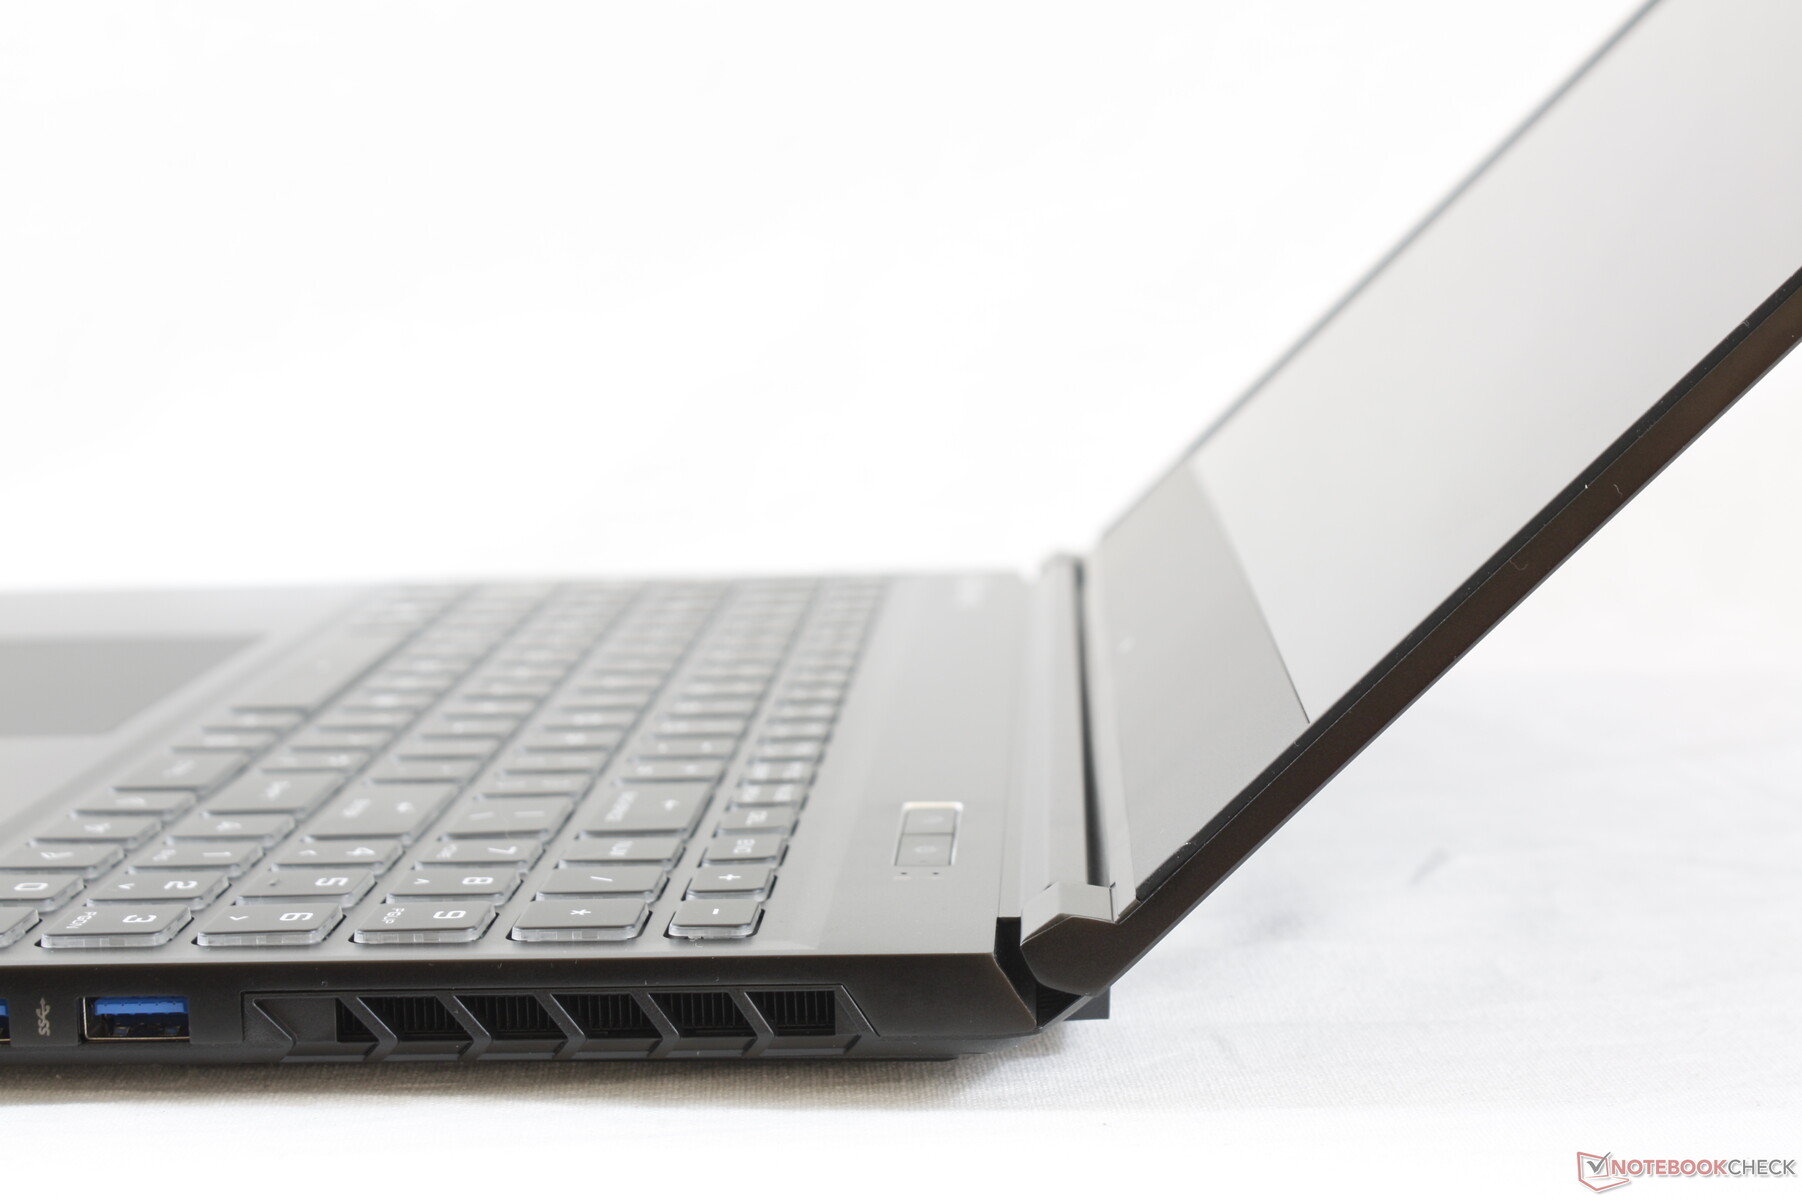
In terms of size and weight, the Gateway is slightly smaller than the Asus Zephyrus G15 GA502 while weighing about the same as most other thin 15.6-inch gaming laptops. The Razer Blade 15 is even smaller but of course more expensive.
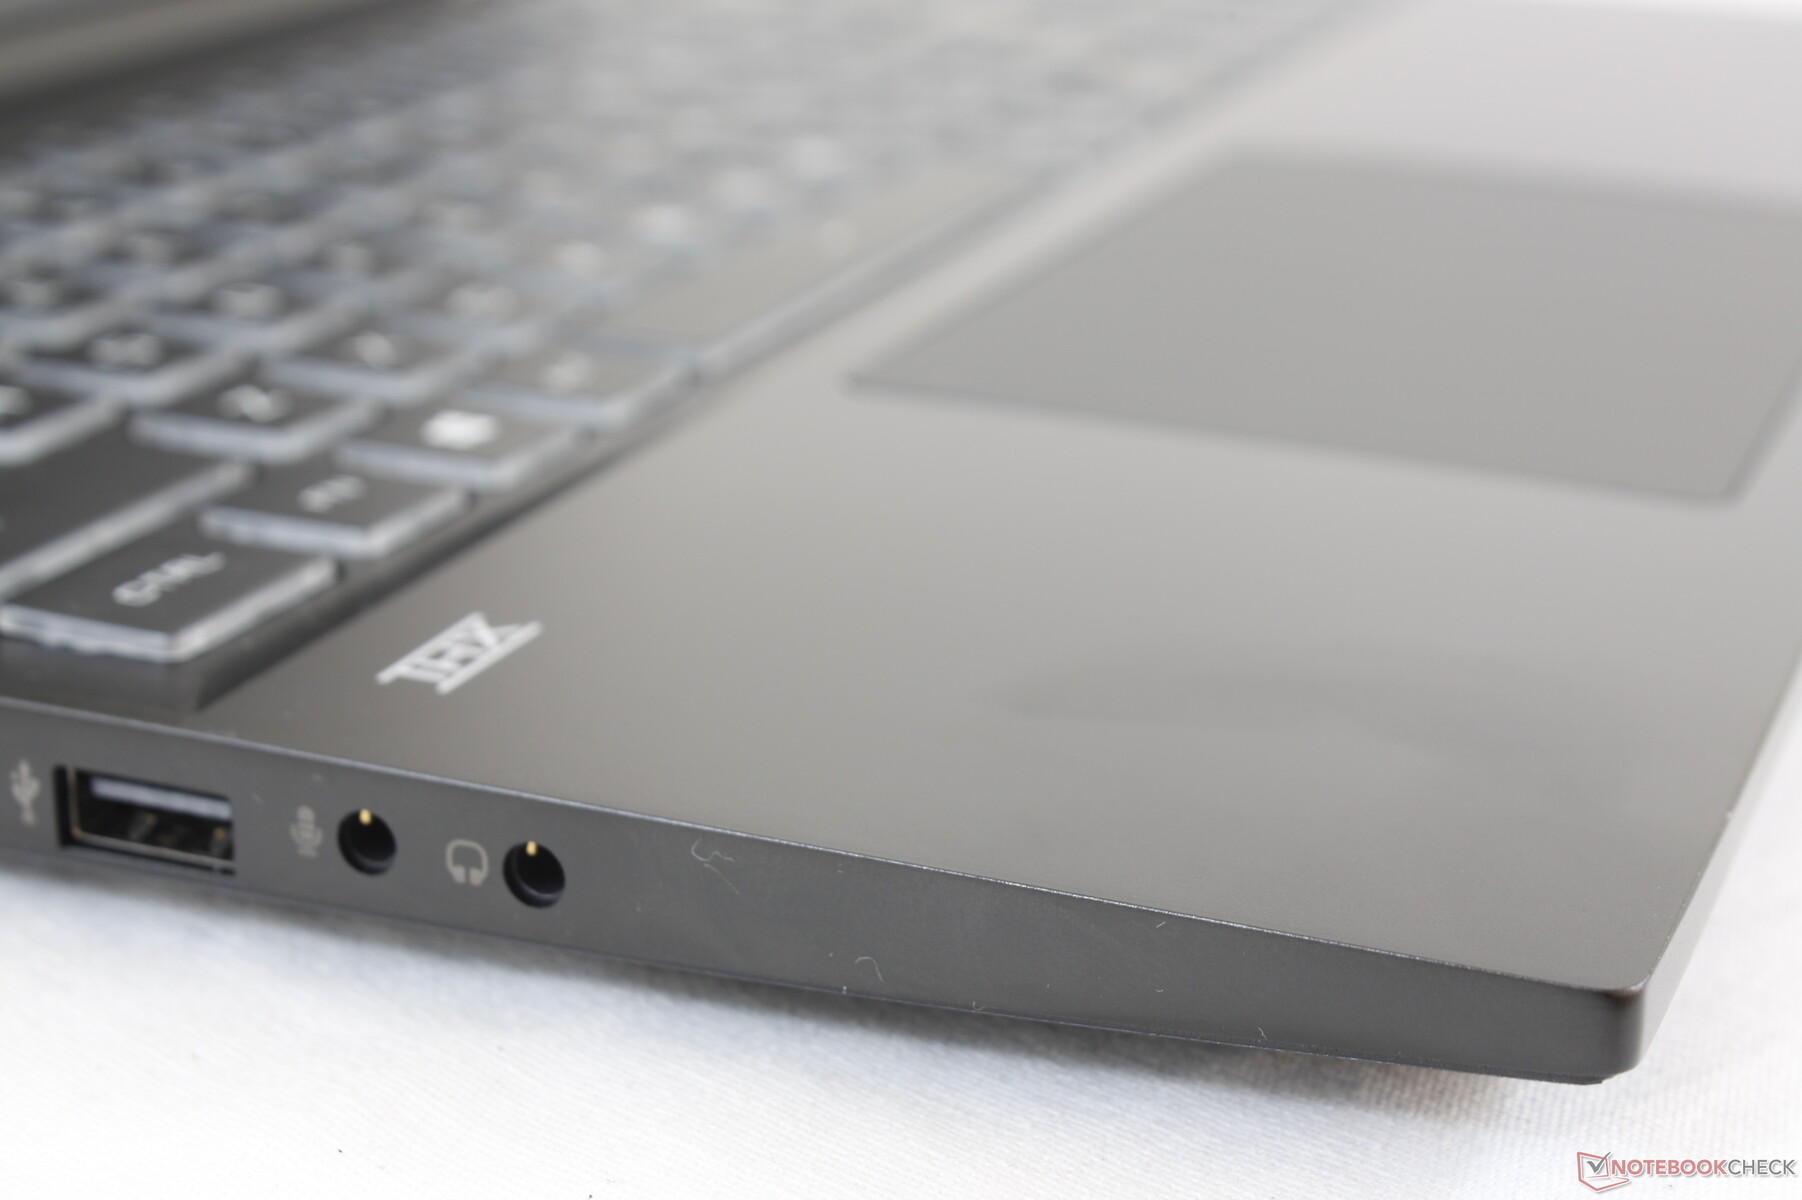
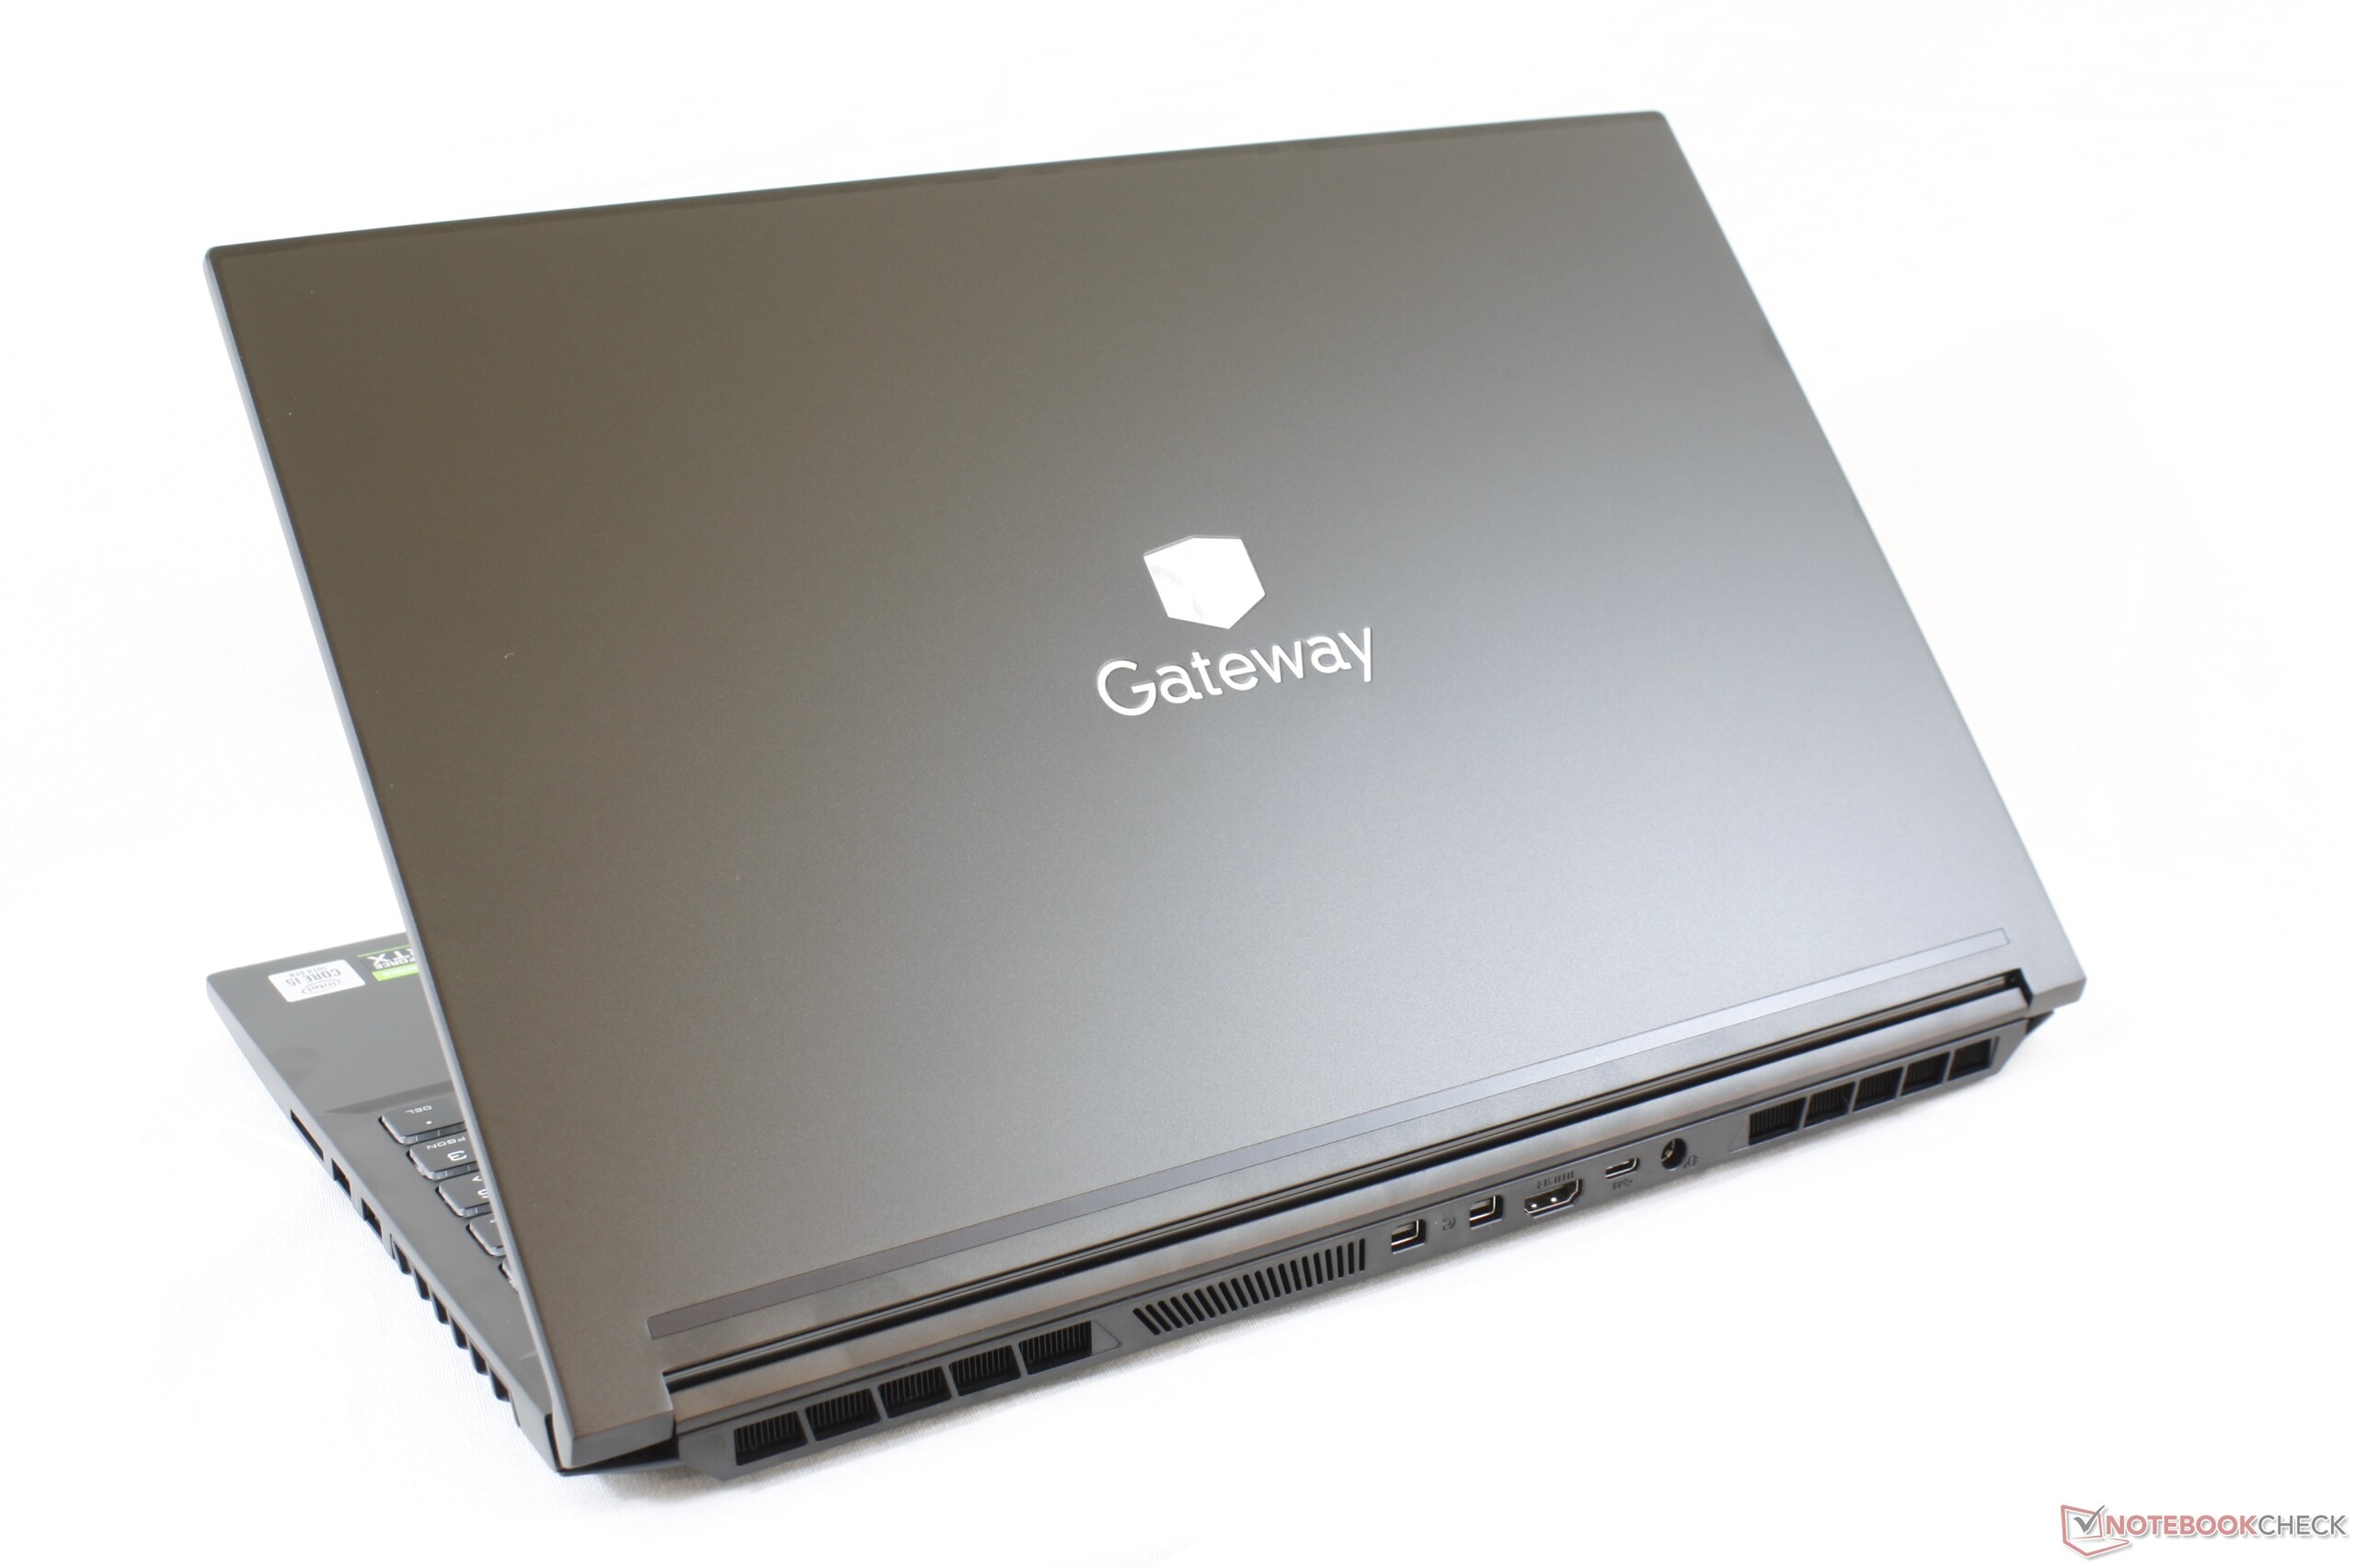
Connectivity
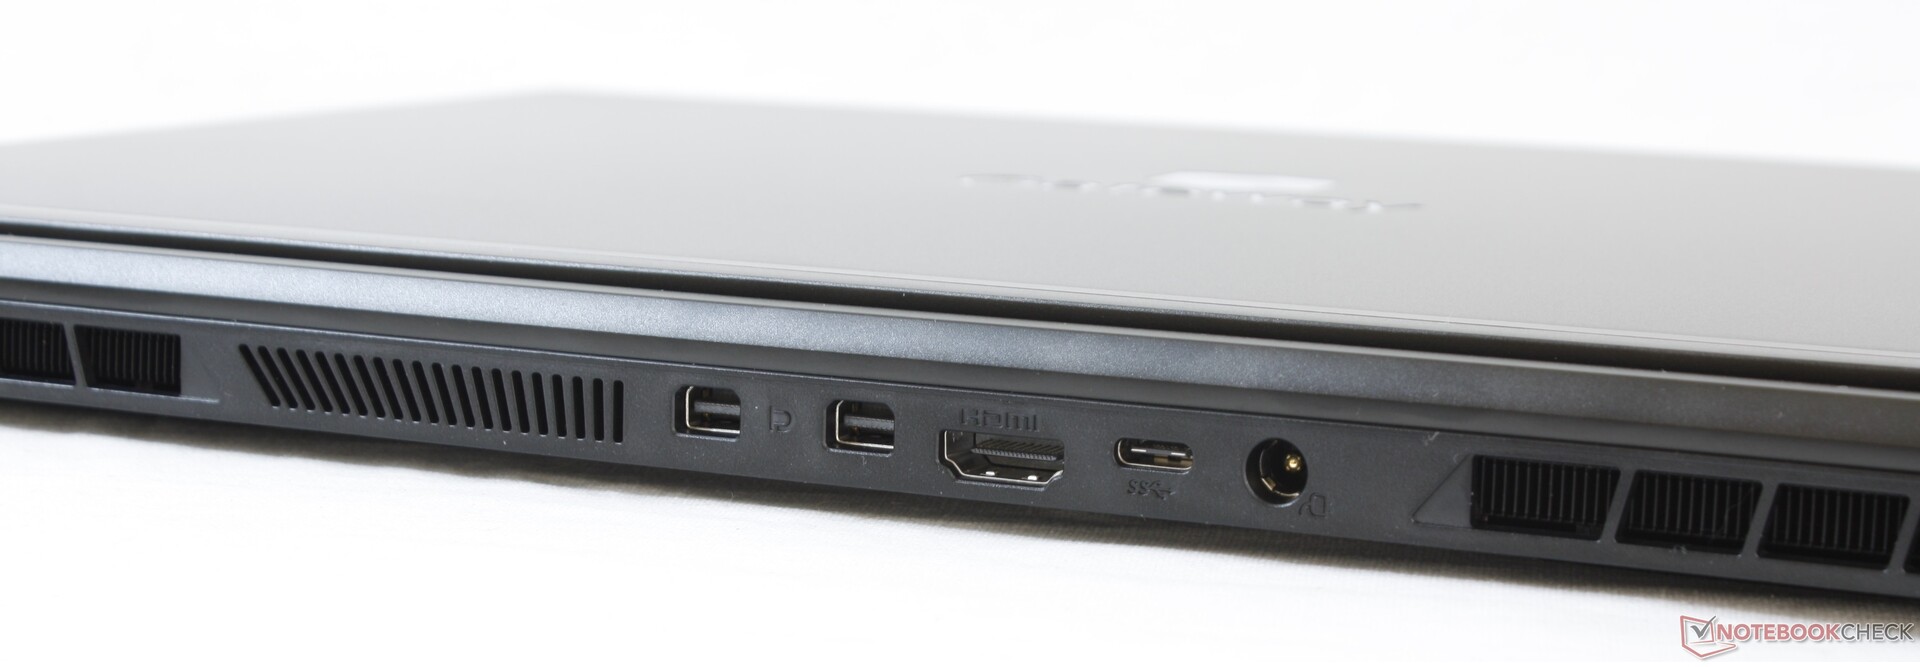
The dual Mini-DisplayPort ports are the most notable feature here when compared to other laptops. Keep in mind that the rear USB-C port does not support video-out.
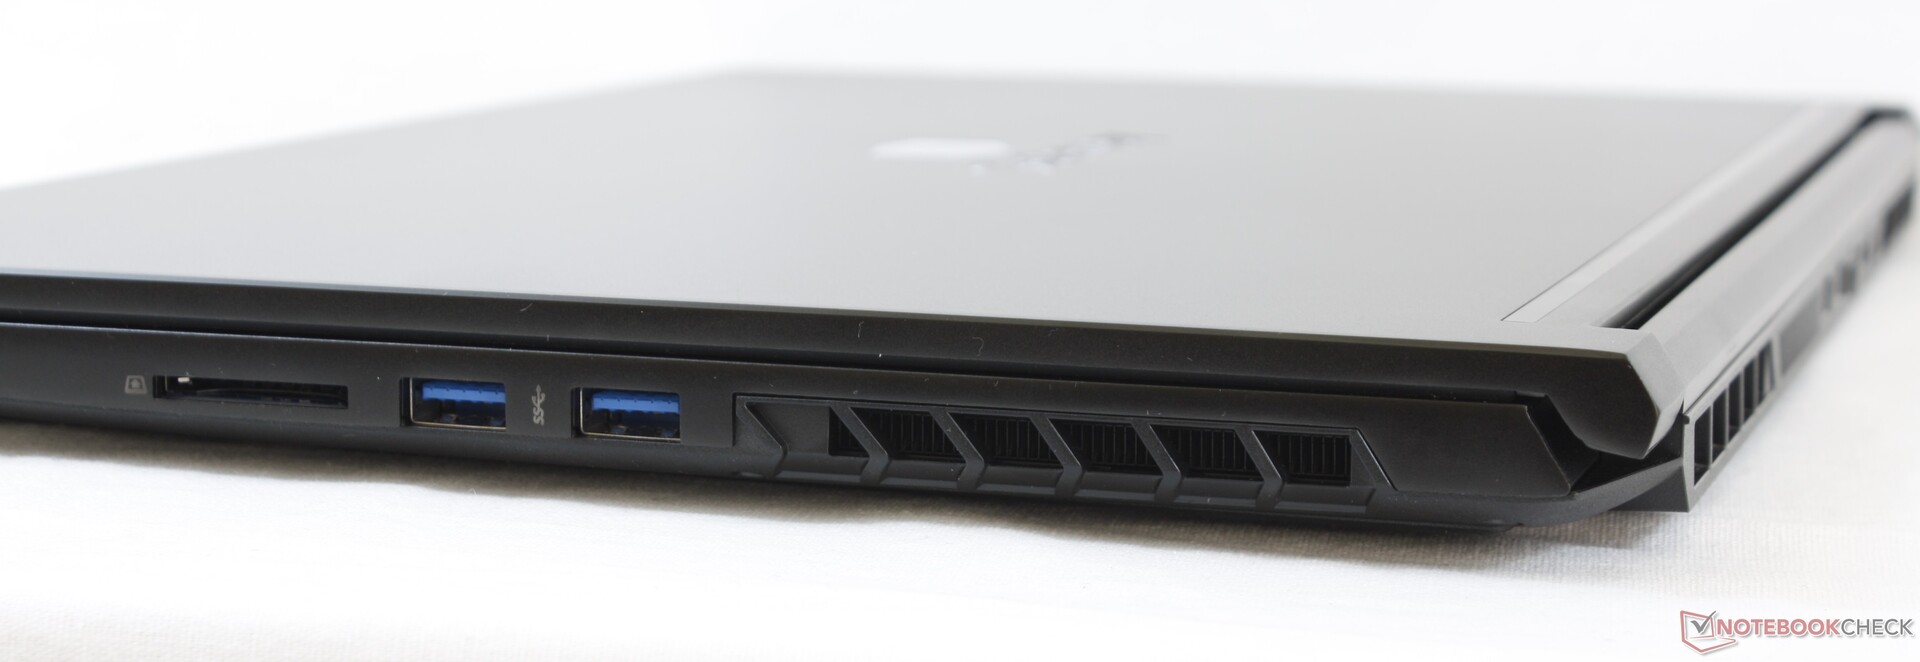

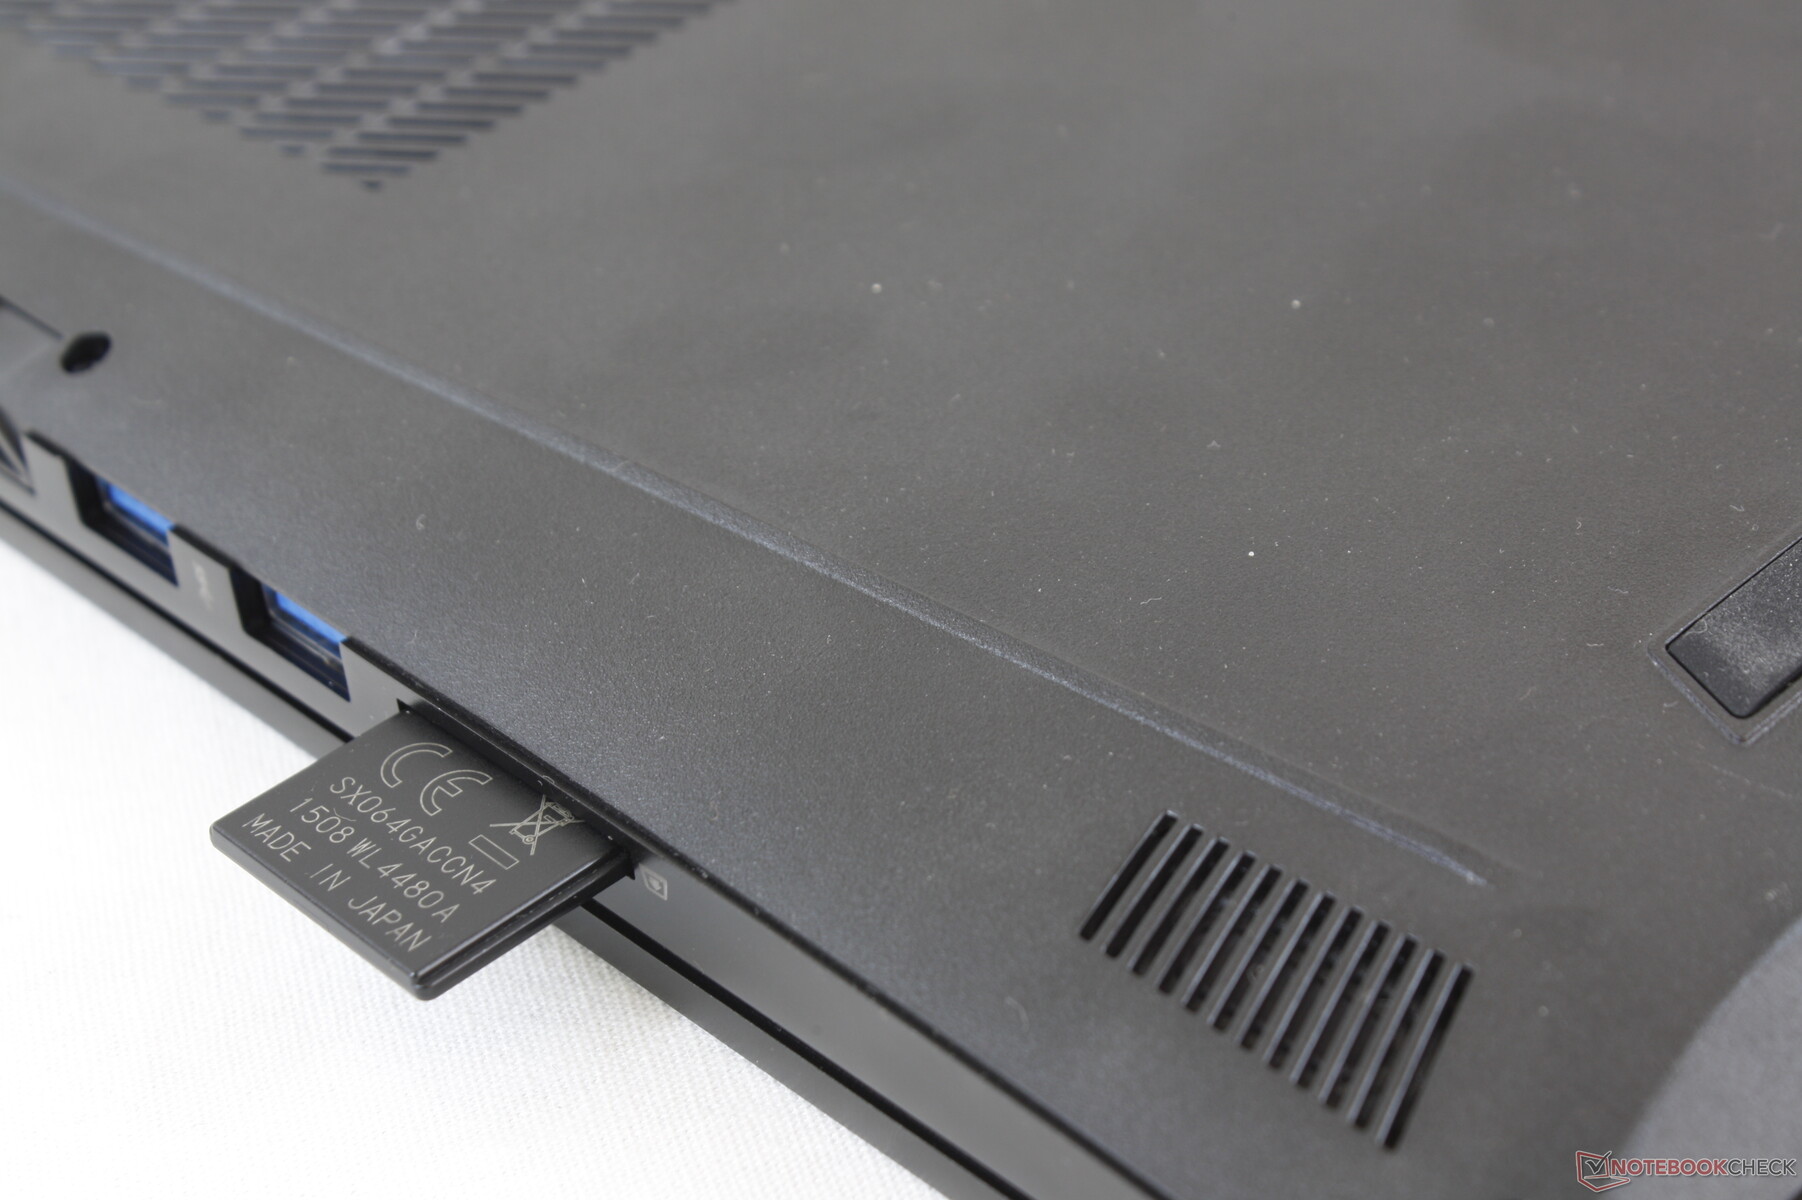
SD Card Reader
| SD Card Reader | |
| average JPG Copy Test (av. of 3 runs) | |
| Aorus 5 KB (Toshiba Exceria Pro SDXC 64 GB UHS-II) | |
| HP Omen 15-ek0456ng (Toshiba Exceria Pro SDXC 64 GB UHS-II) | |
| Schenker XMG Core 15 GK5NR0O (Toshiba Exceria Pro SDXC 64 GB UHS-II) | |
| Gateway Creator Series 15.6 GWTN156-3BK (Toshiba Exceria Pro SDXC 64 GB UHS-II) | |
| maximum AS SSD Seq Read Test (1GB) | |
| Aorus 5 KB (Toshiba Exceria Pro SDXC 64 GB UHS-II) | |
| HP Omen 15-ek0456ng (Toshiba Exceria Pro SDXC 64 GB UHS-II) | |
| Schenker XMG Core 15 GK5NR0O (Toshiba Exceria Pro SDXC 64 GB UHS-II) | |
| Gateway Creator Series 15.6 GWTN156-3BK (Toshiba Exceria Pro SDXC 64 GB UHS-II) | |
Communication
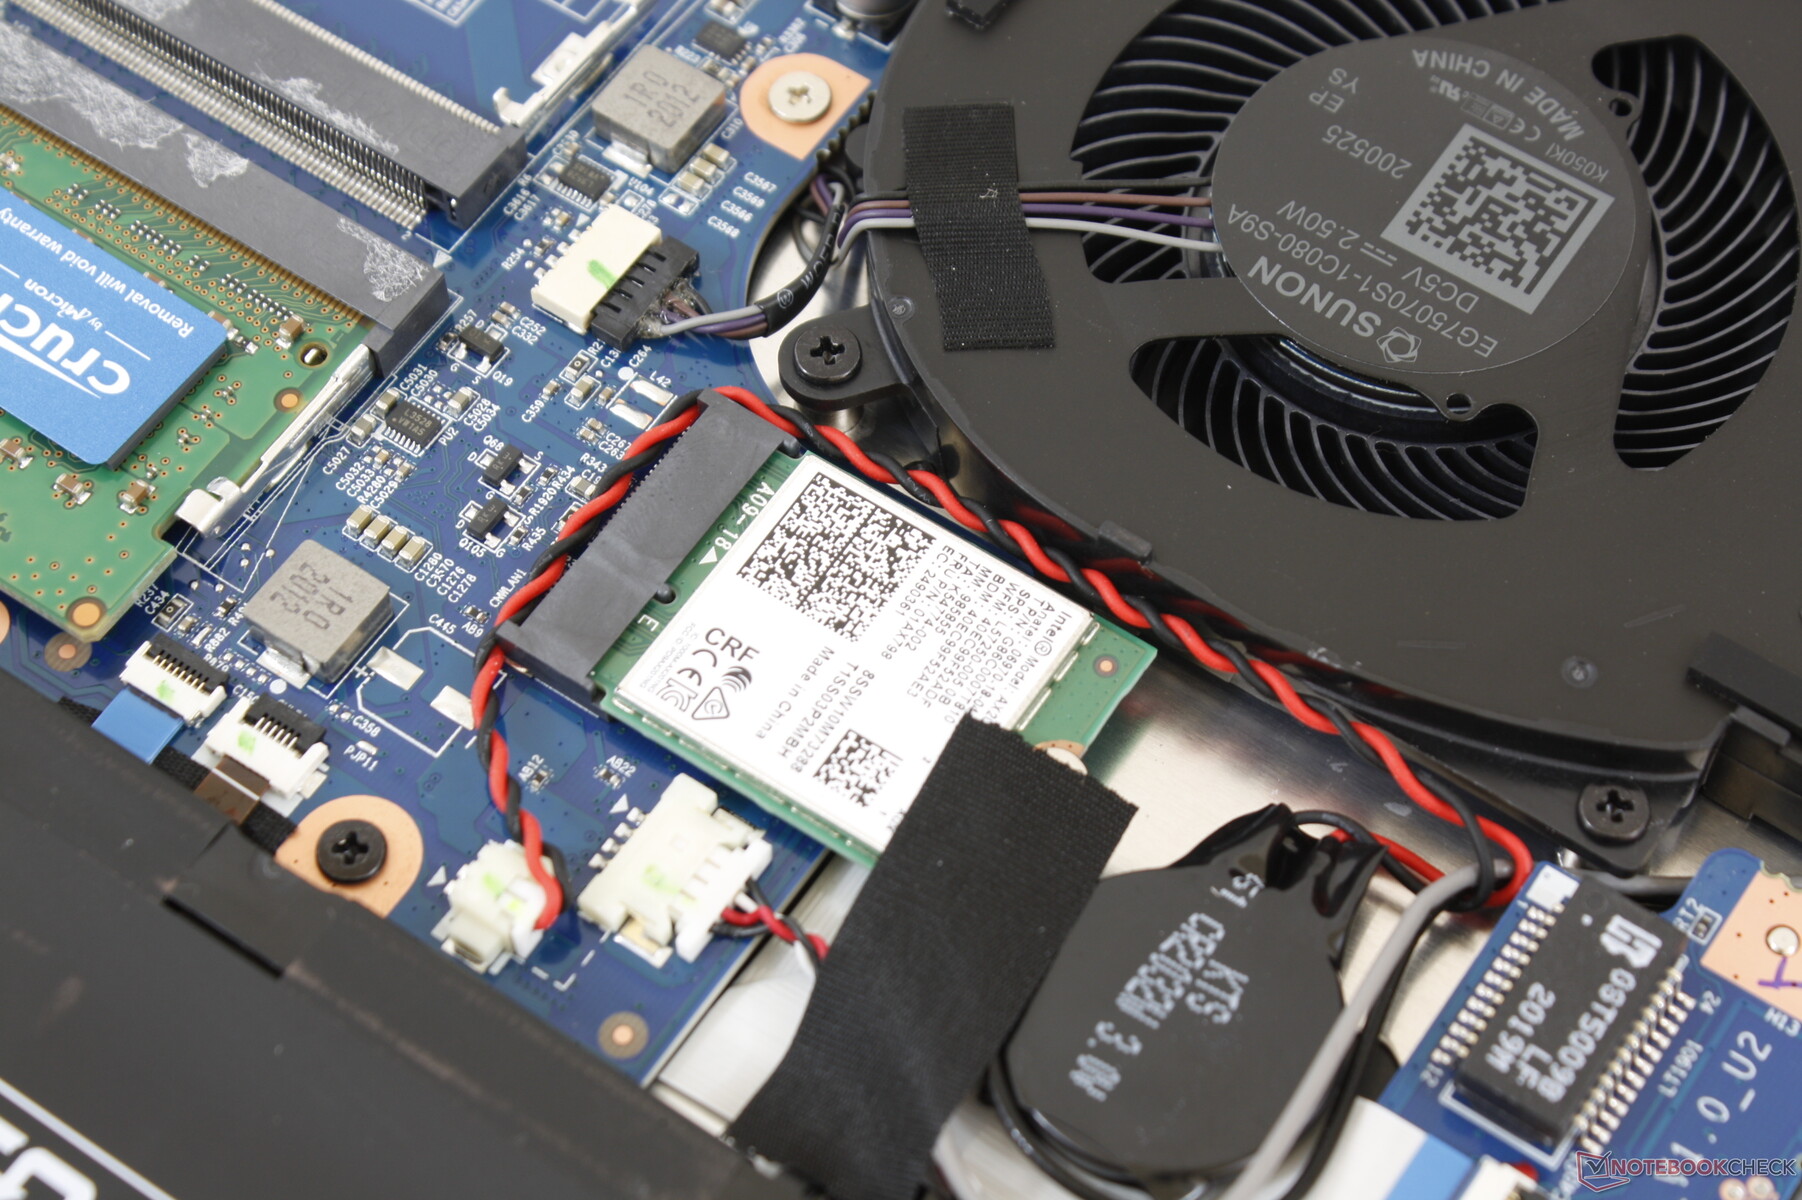
The Intel AX201 comes standard for Wi-Fi 6 and Bluetooth 5.1 connectivity. We experienced no issues when paired to our Netgear RAX200 test router.
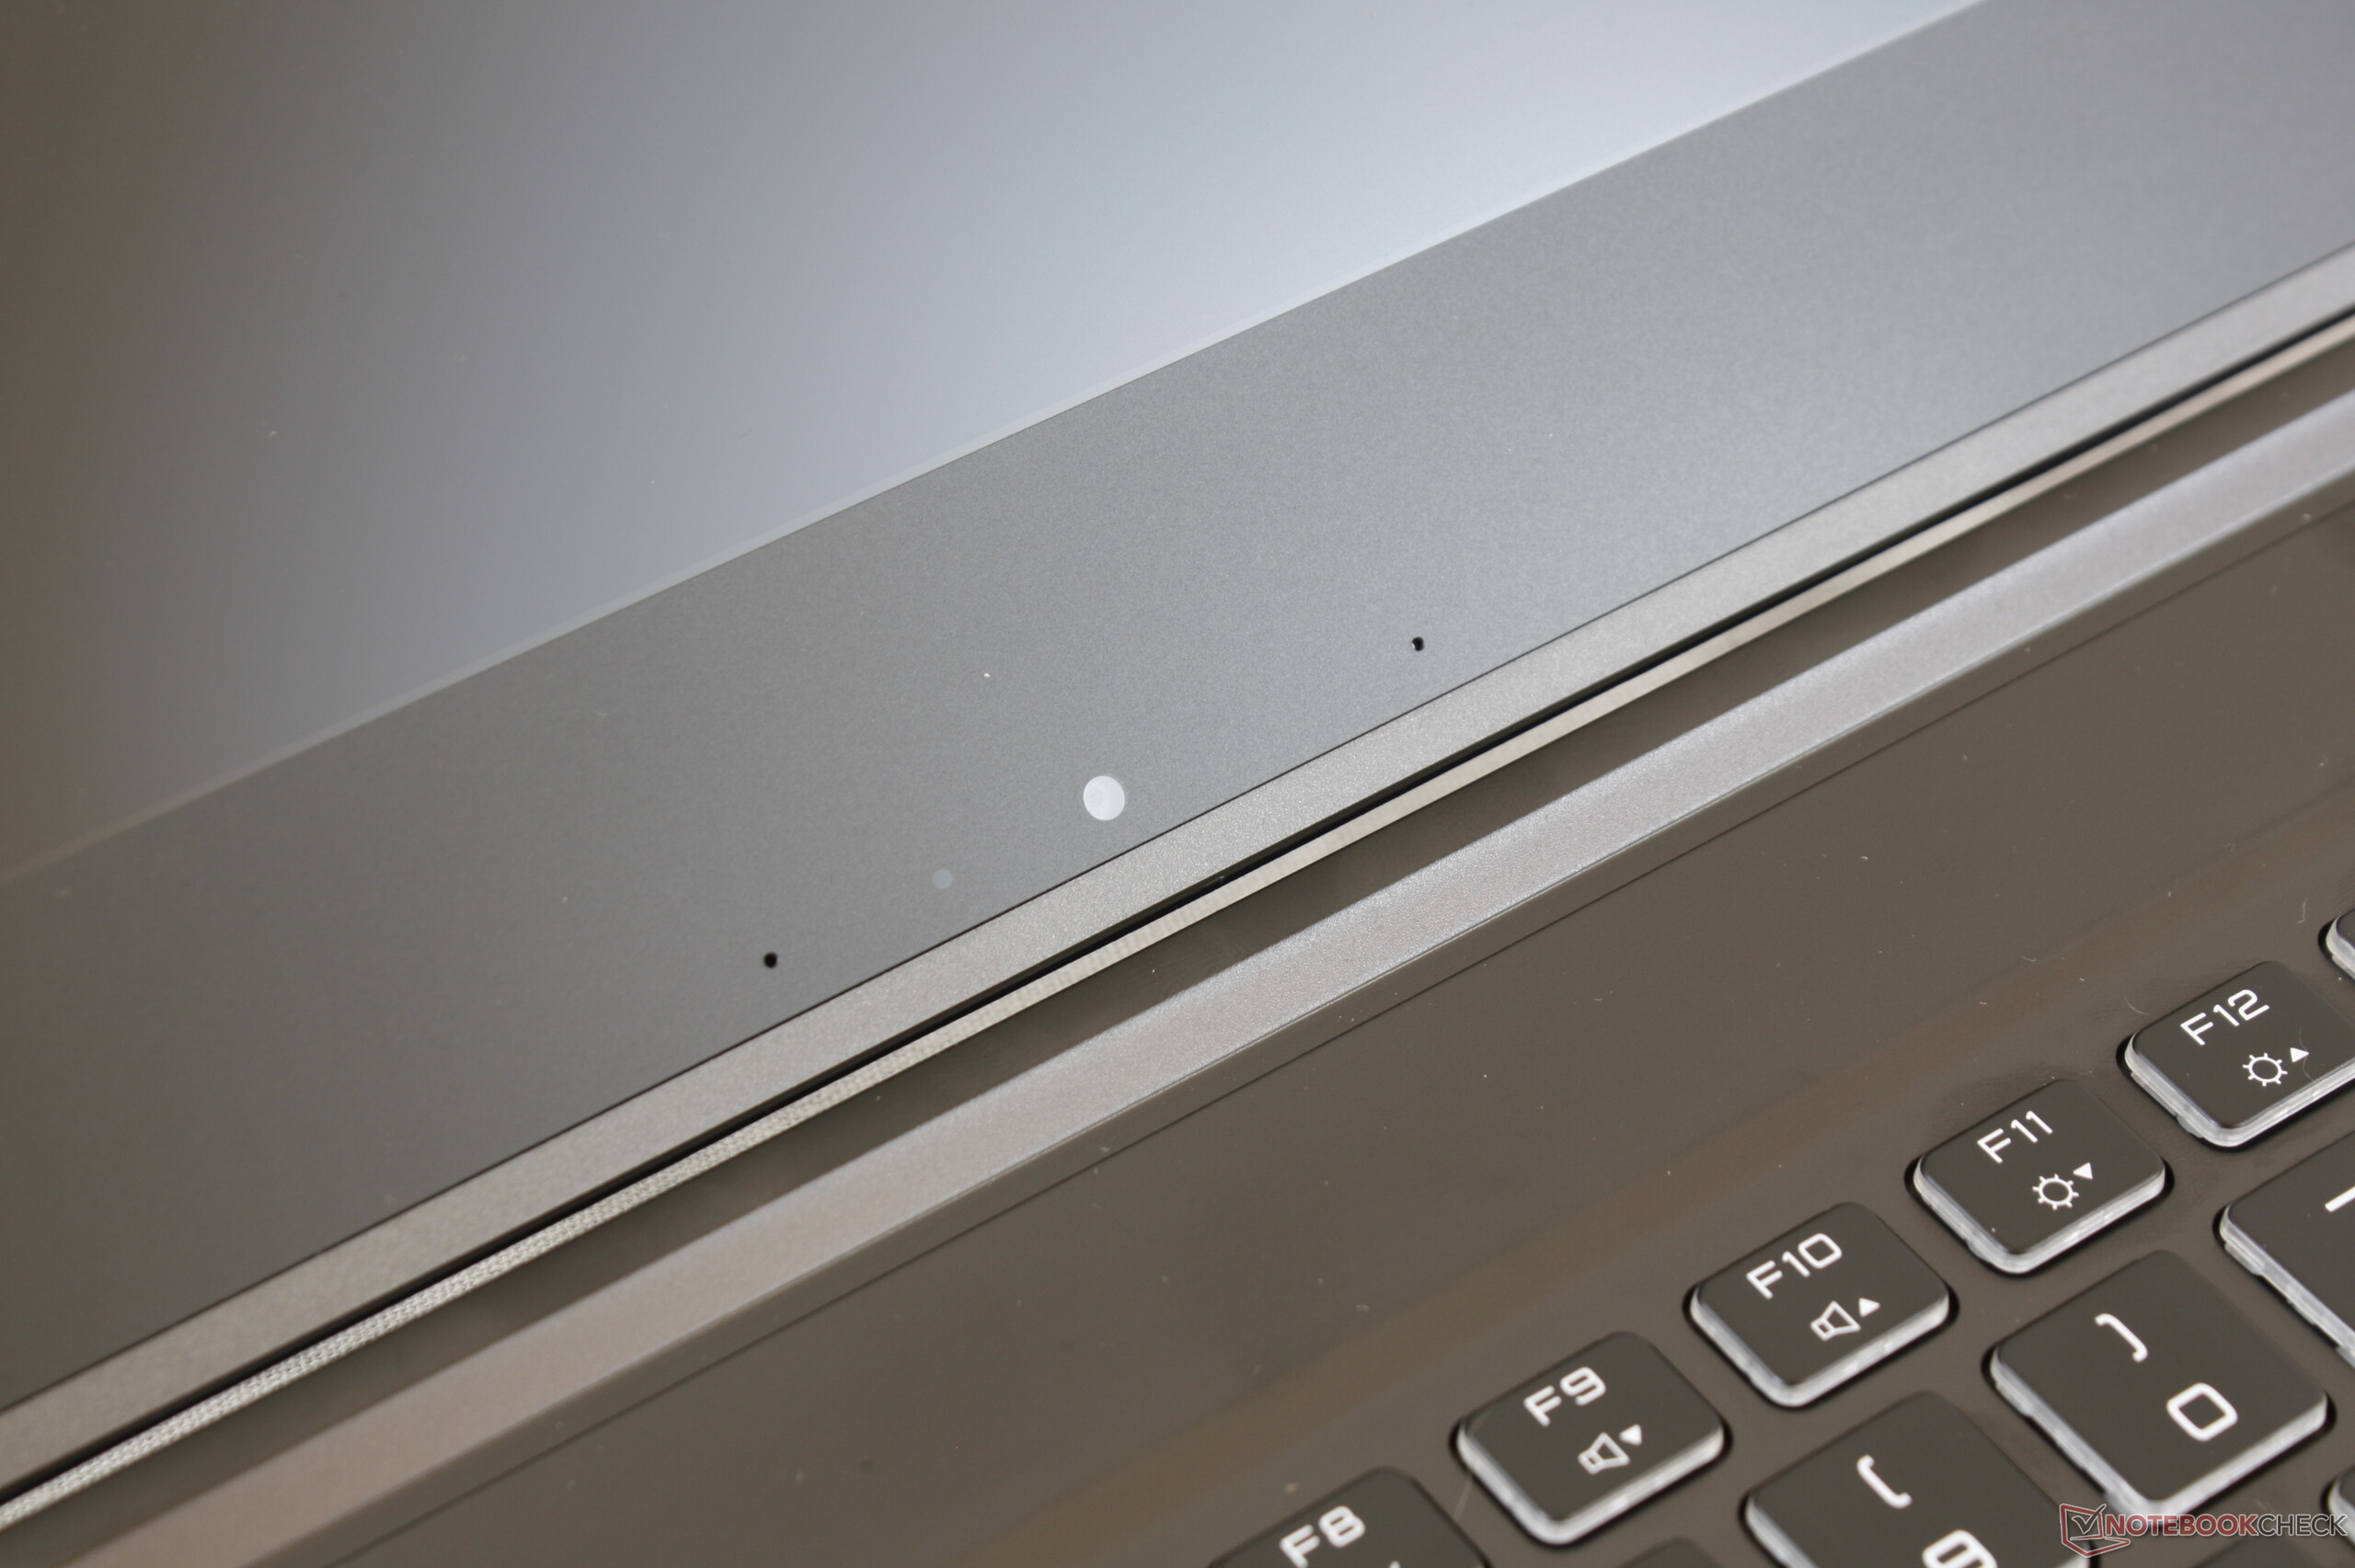
Webcam

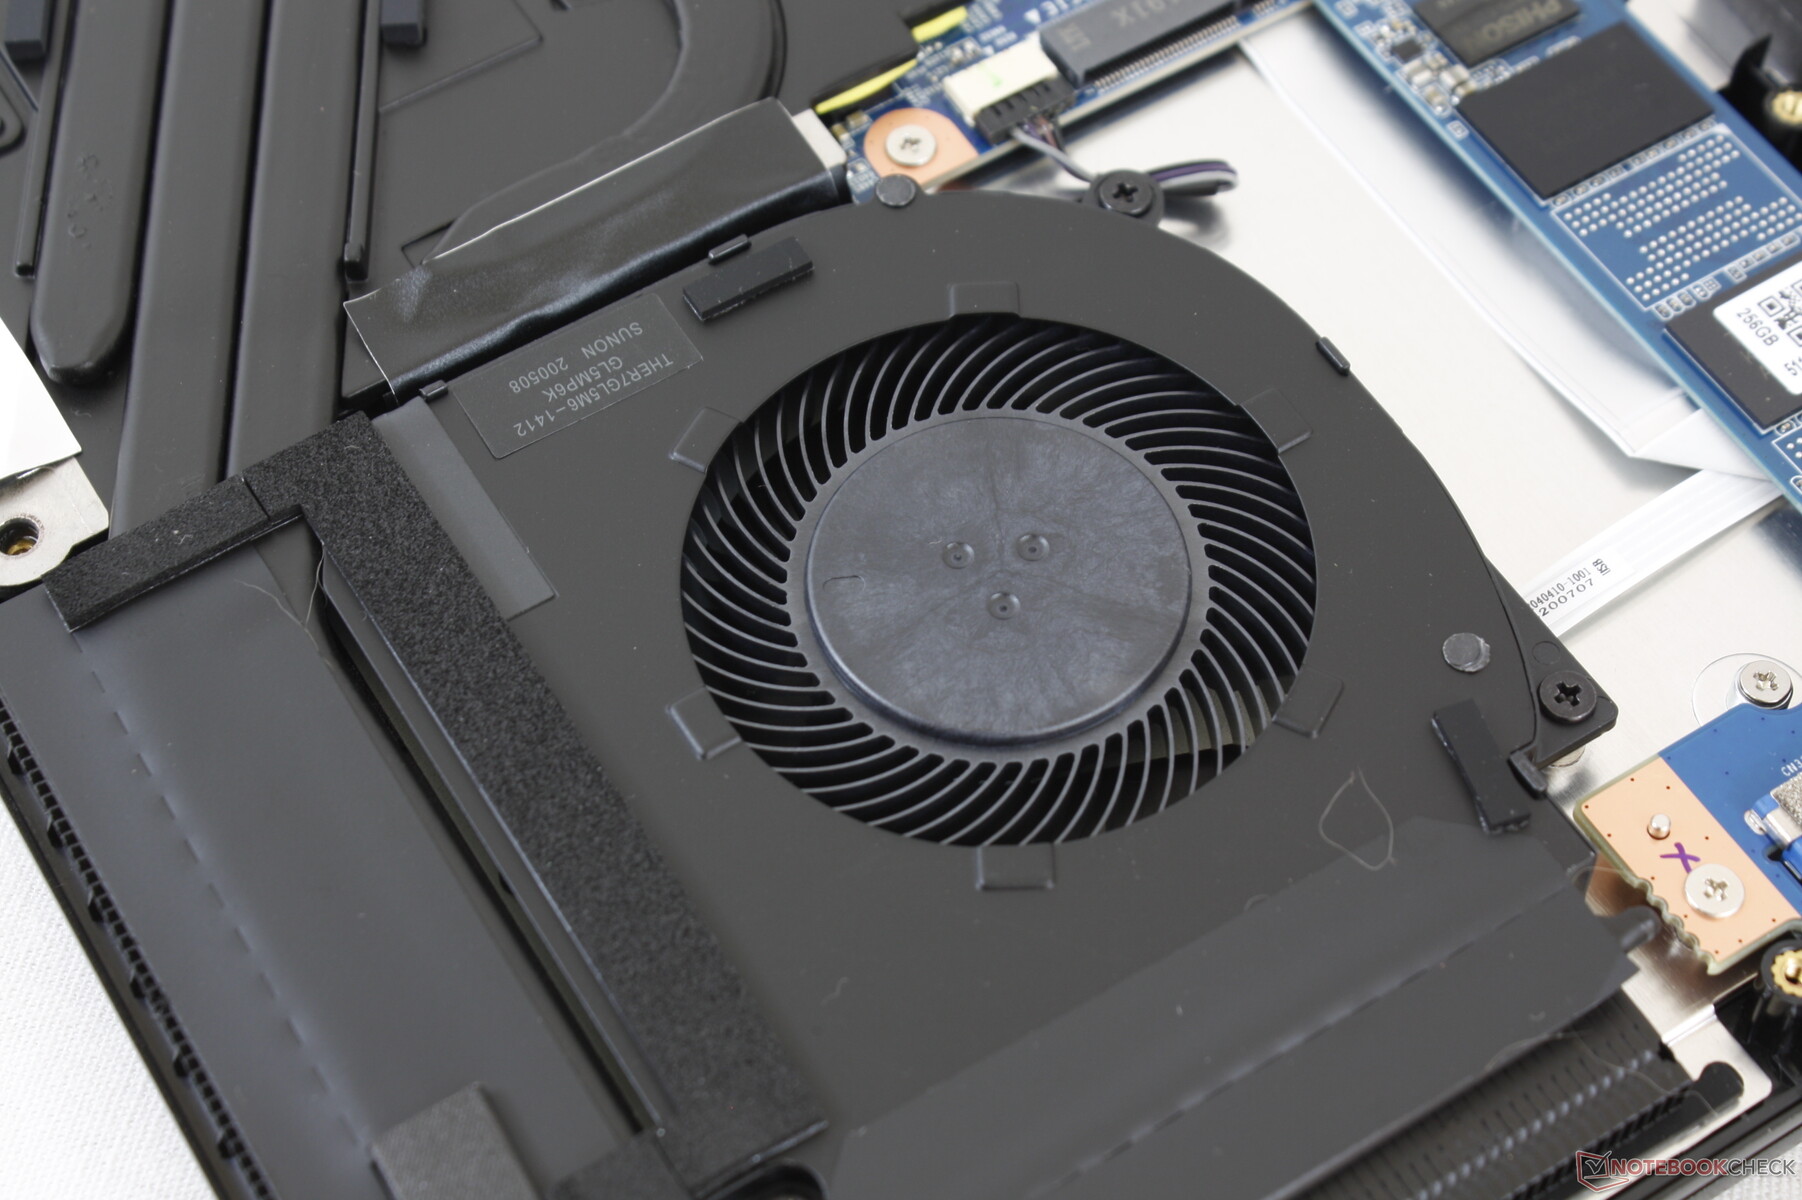
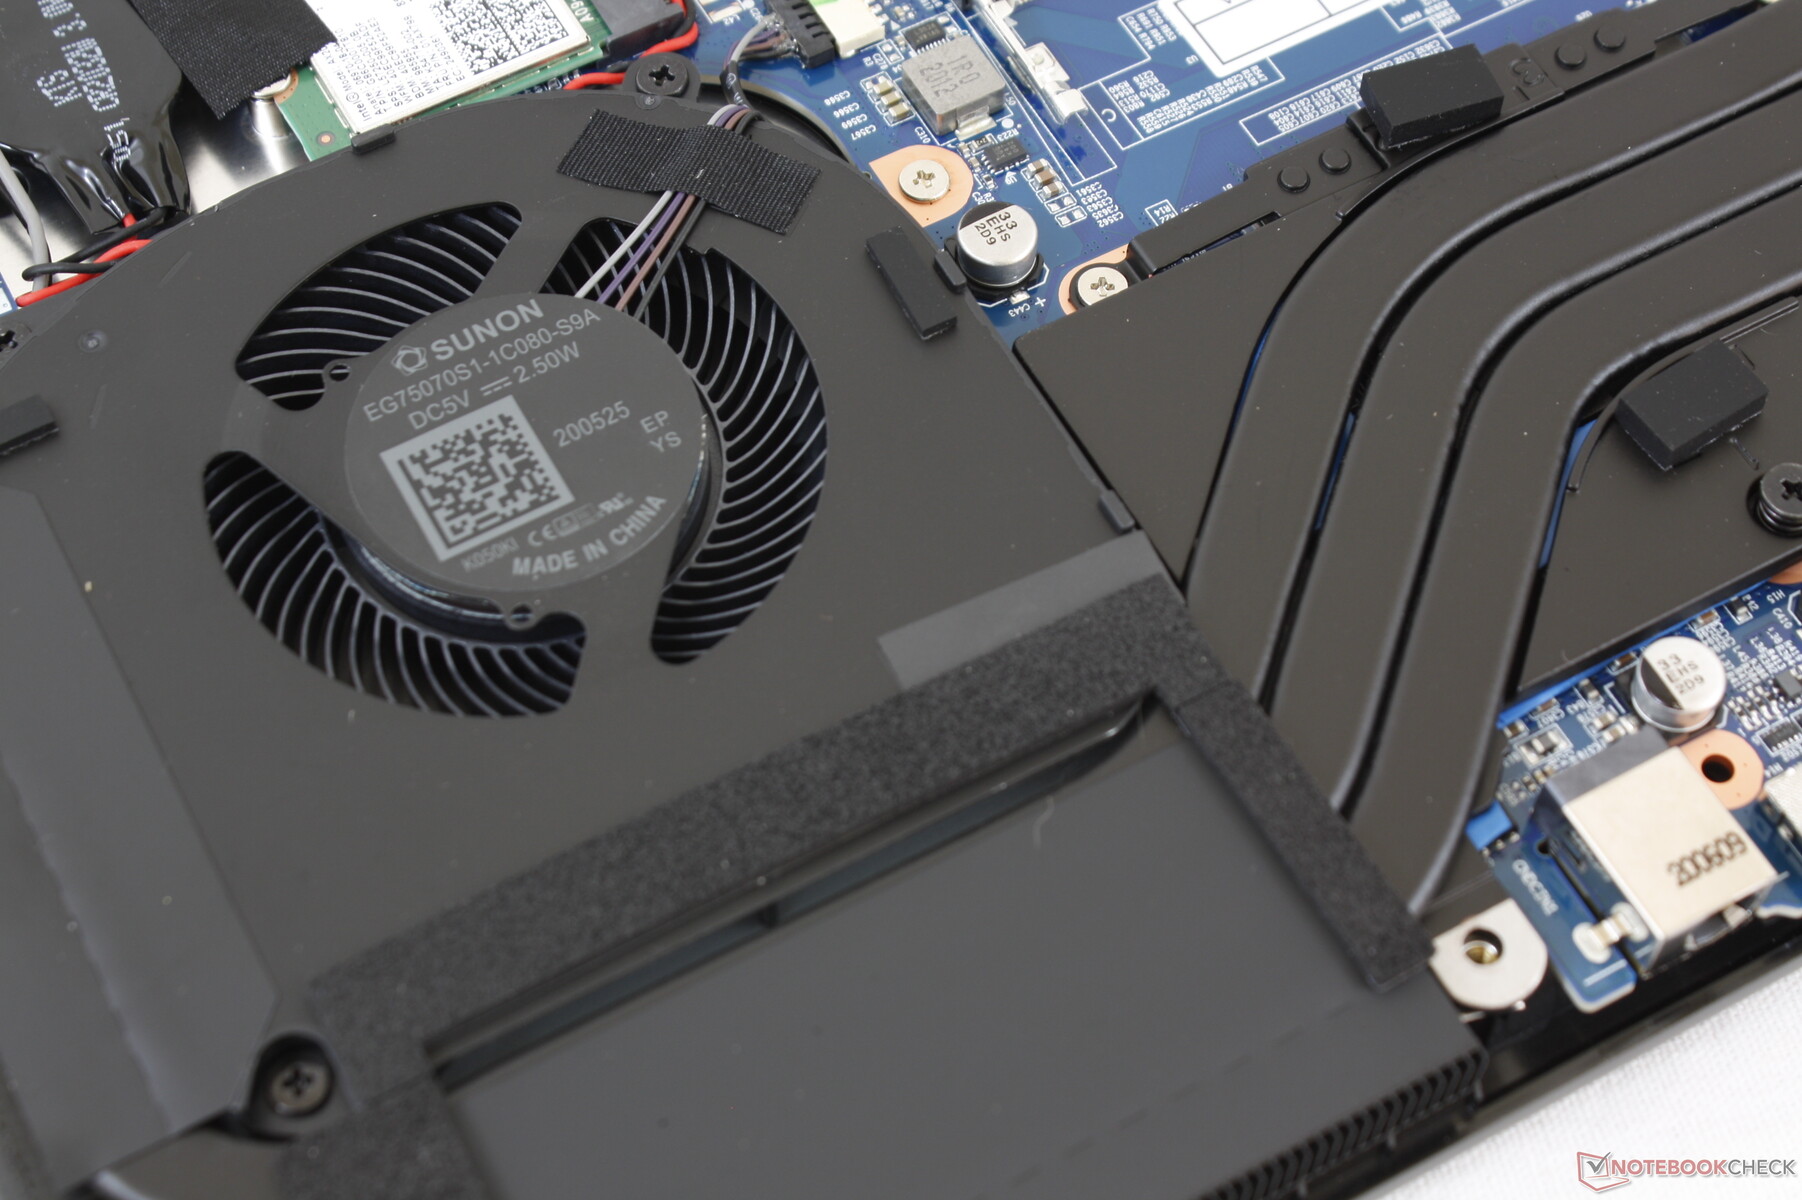
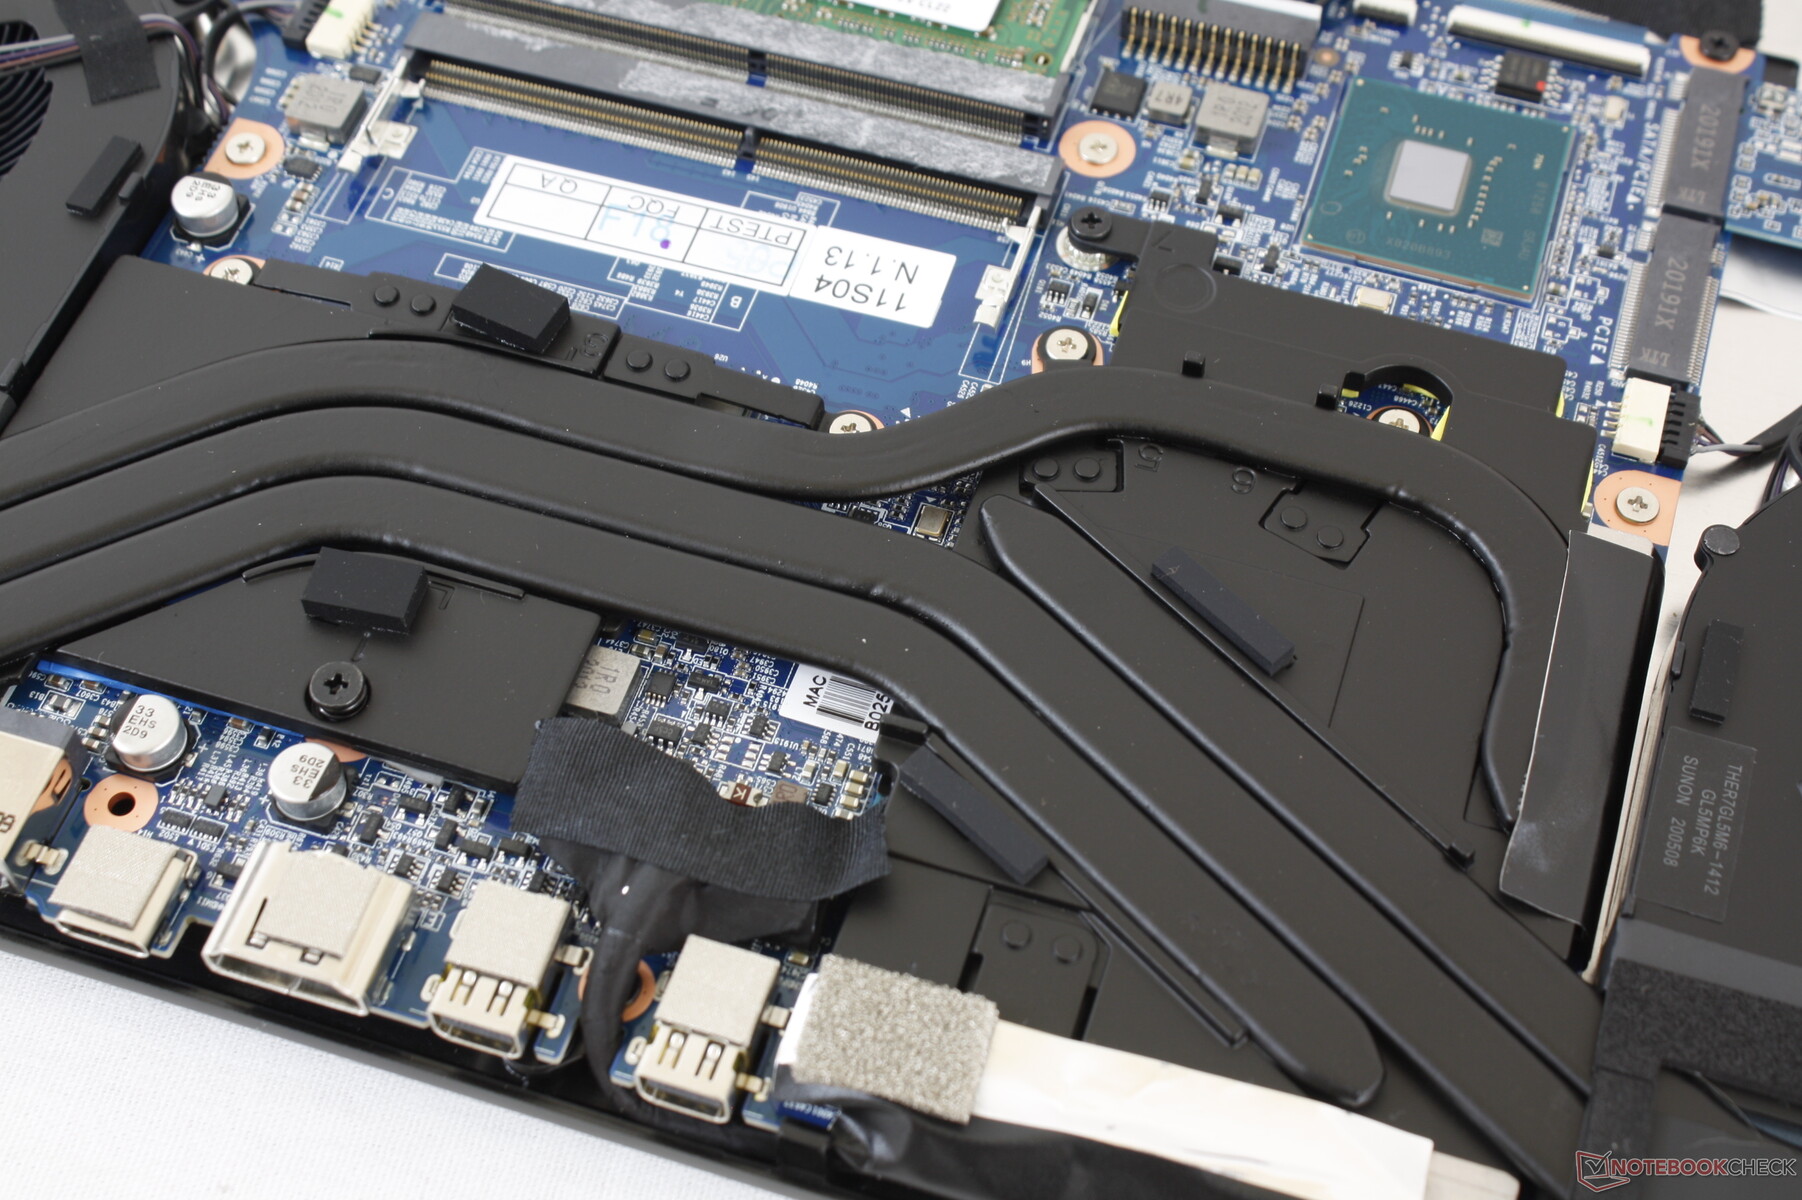
Maintenance
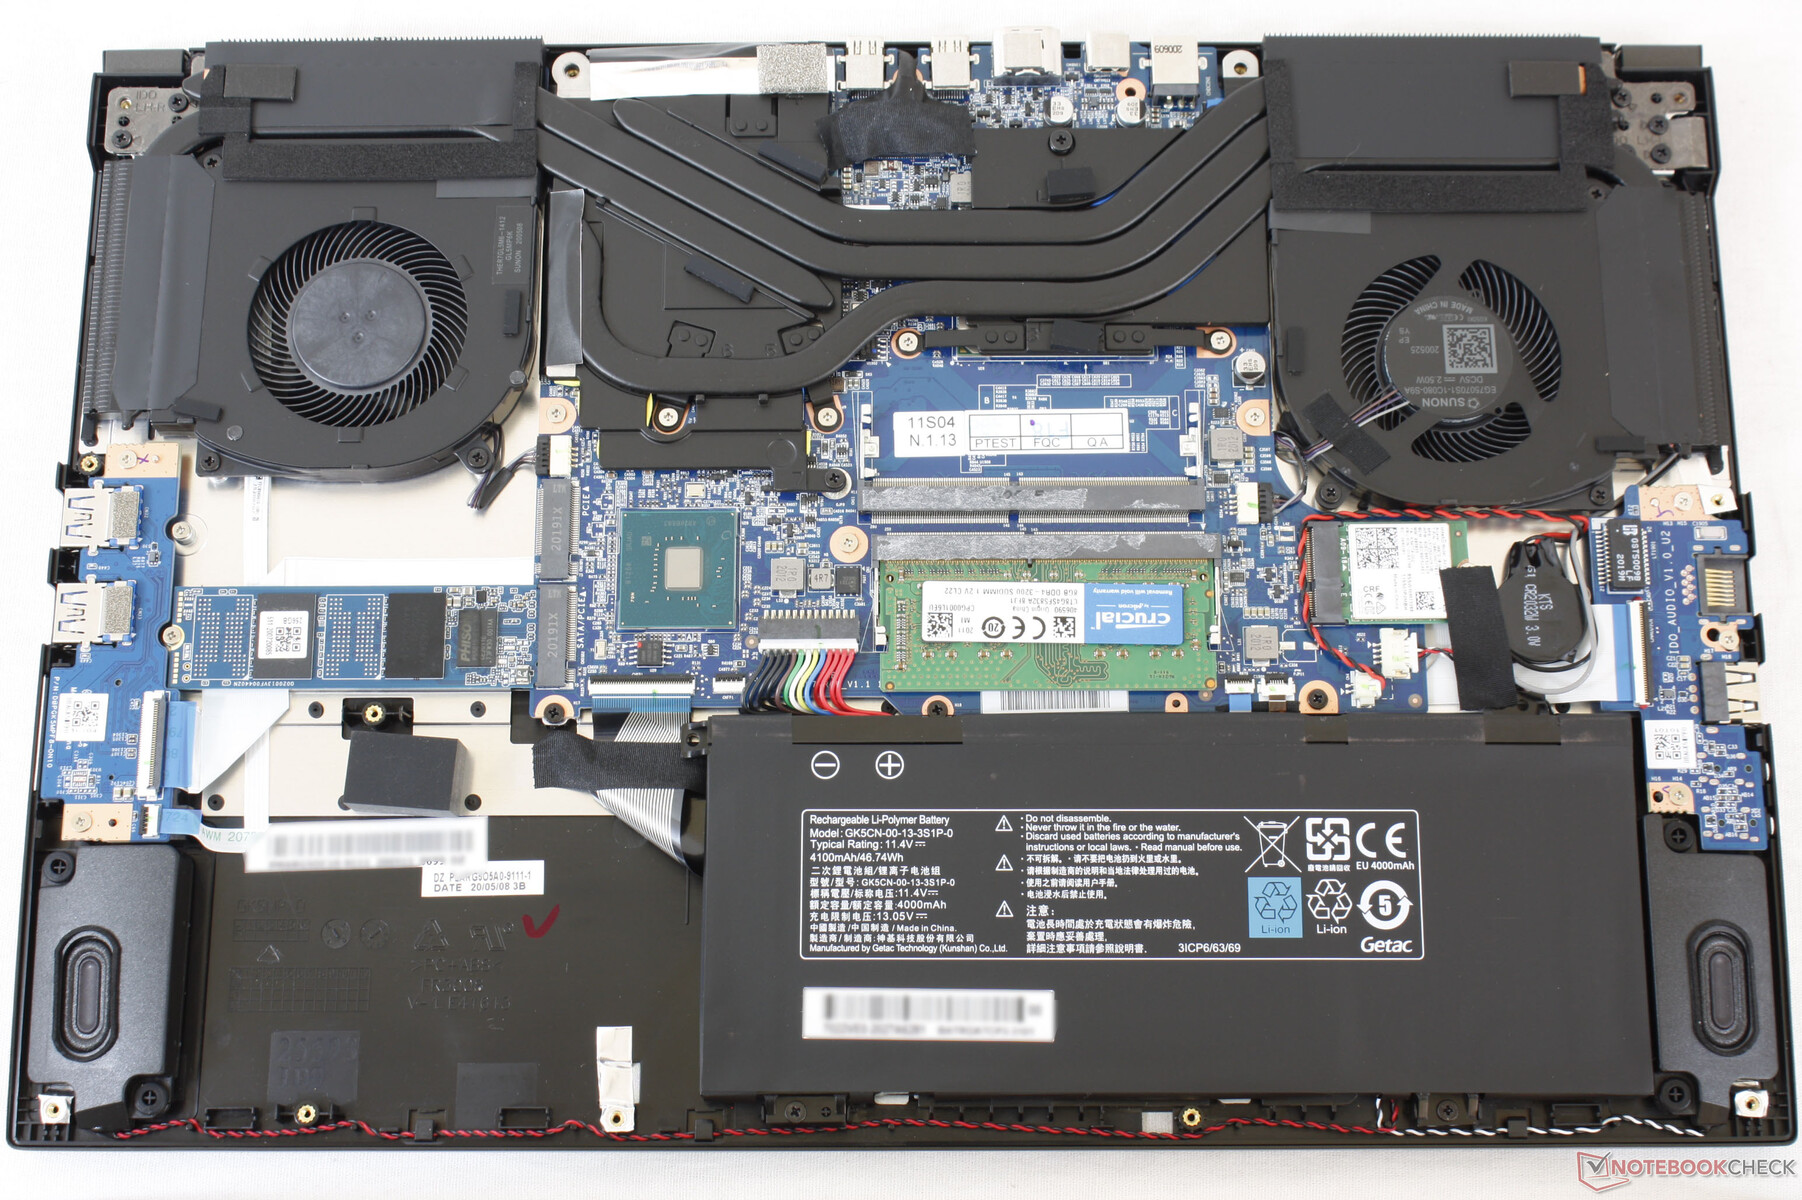
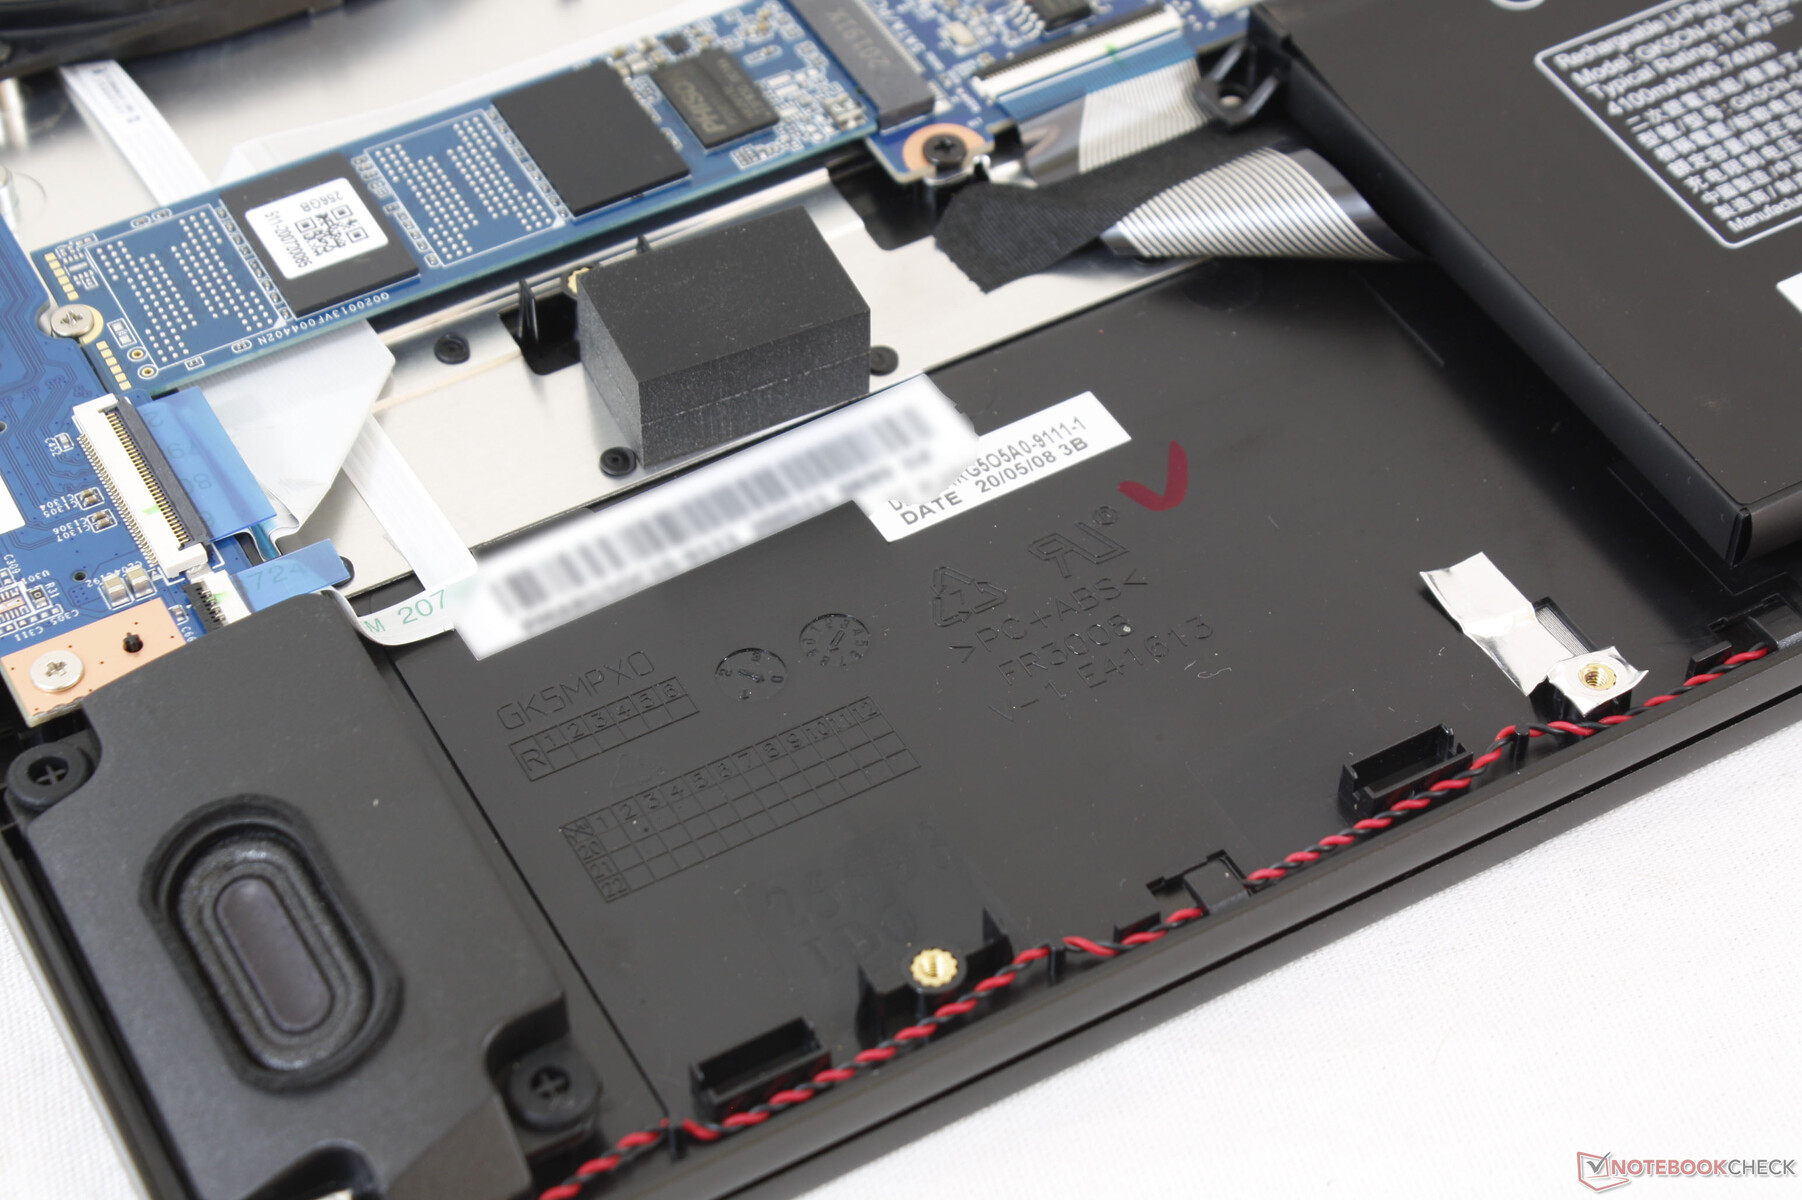
The bottom panel comes off easily with just a Philips screwdriver. Unfortunately, owners must break a warranty seal to remove the panel.
Accessories and Warranty
There are no physical extras in the box, but Walmart does throw in a free month of XBox Game Pass for PC users. The standard one-year limited warranty applies.
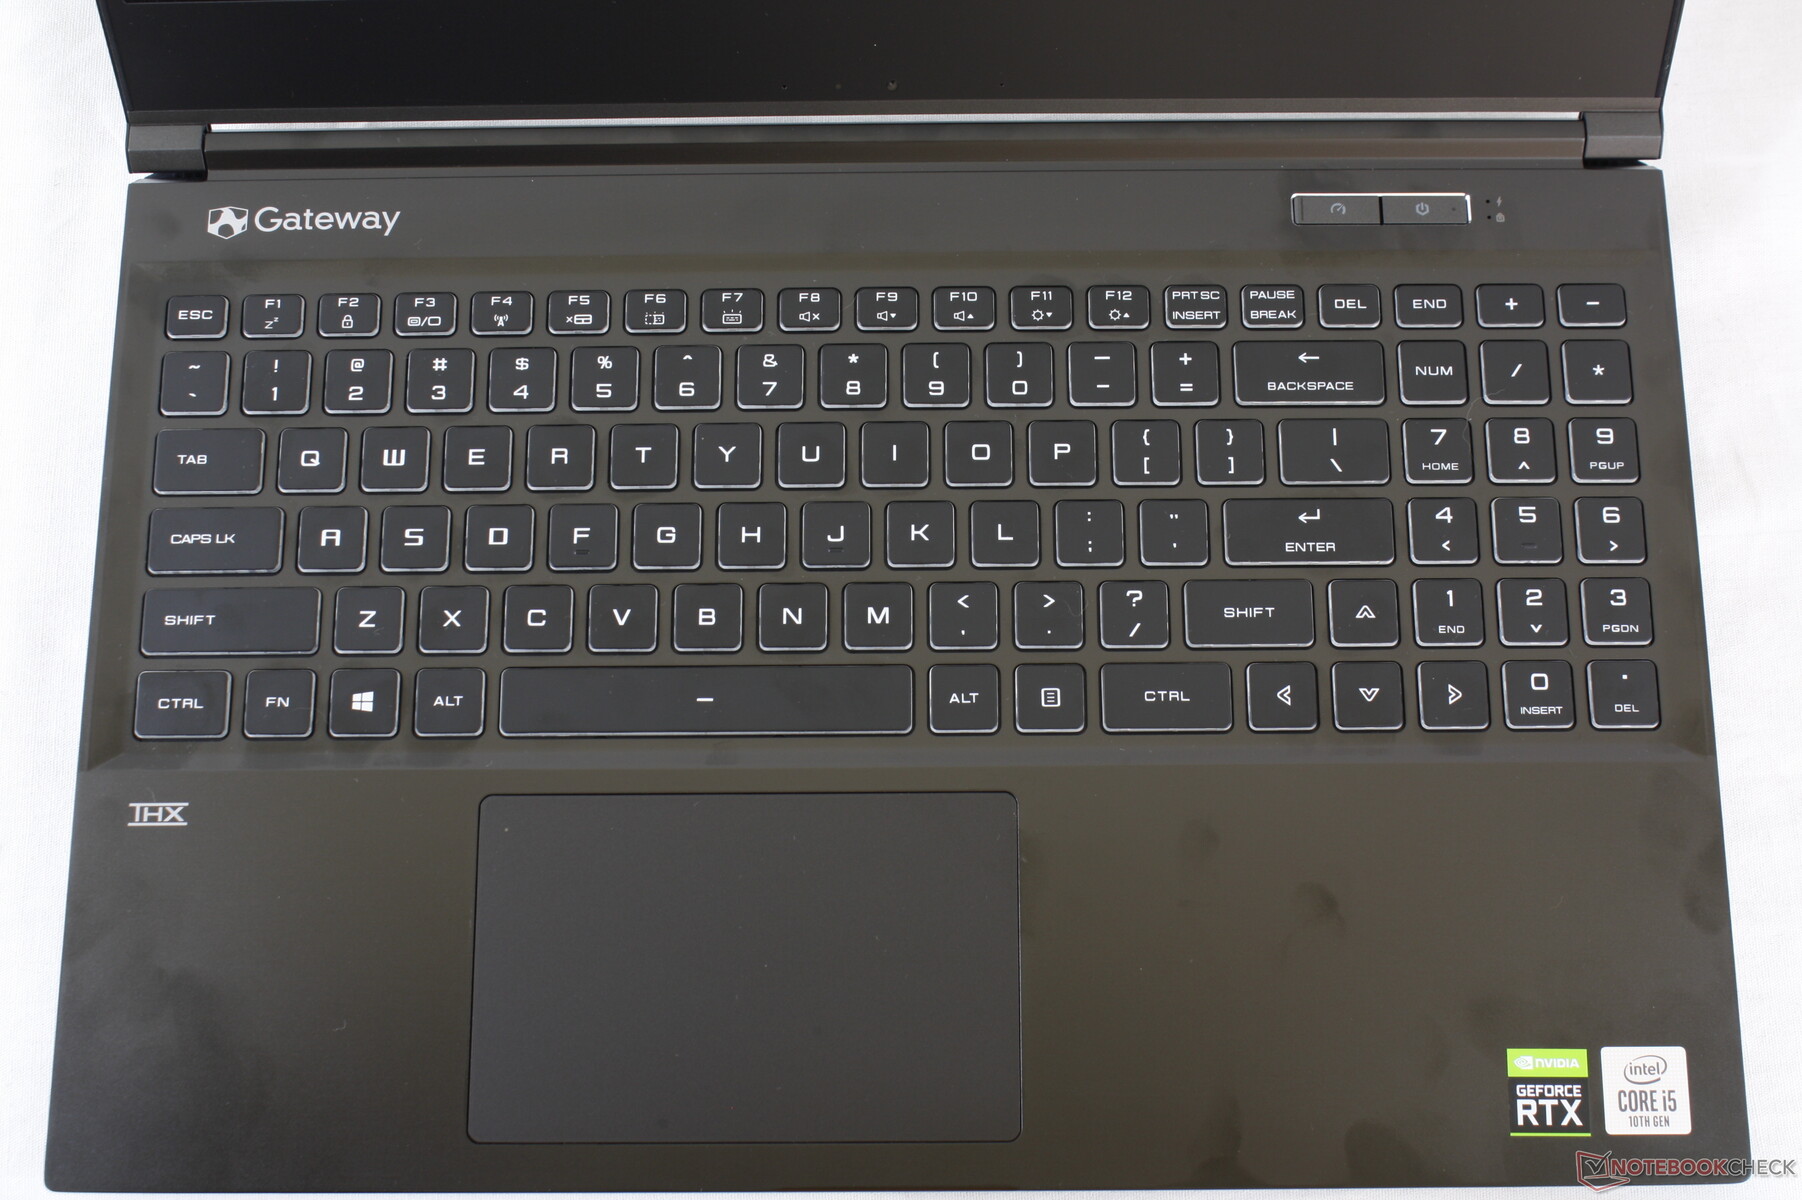
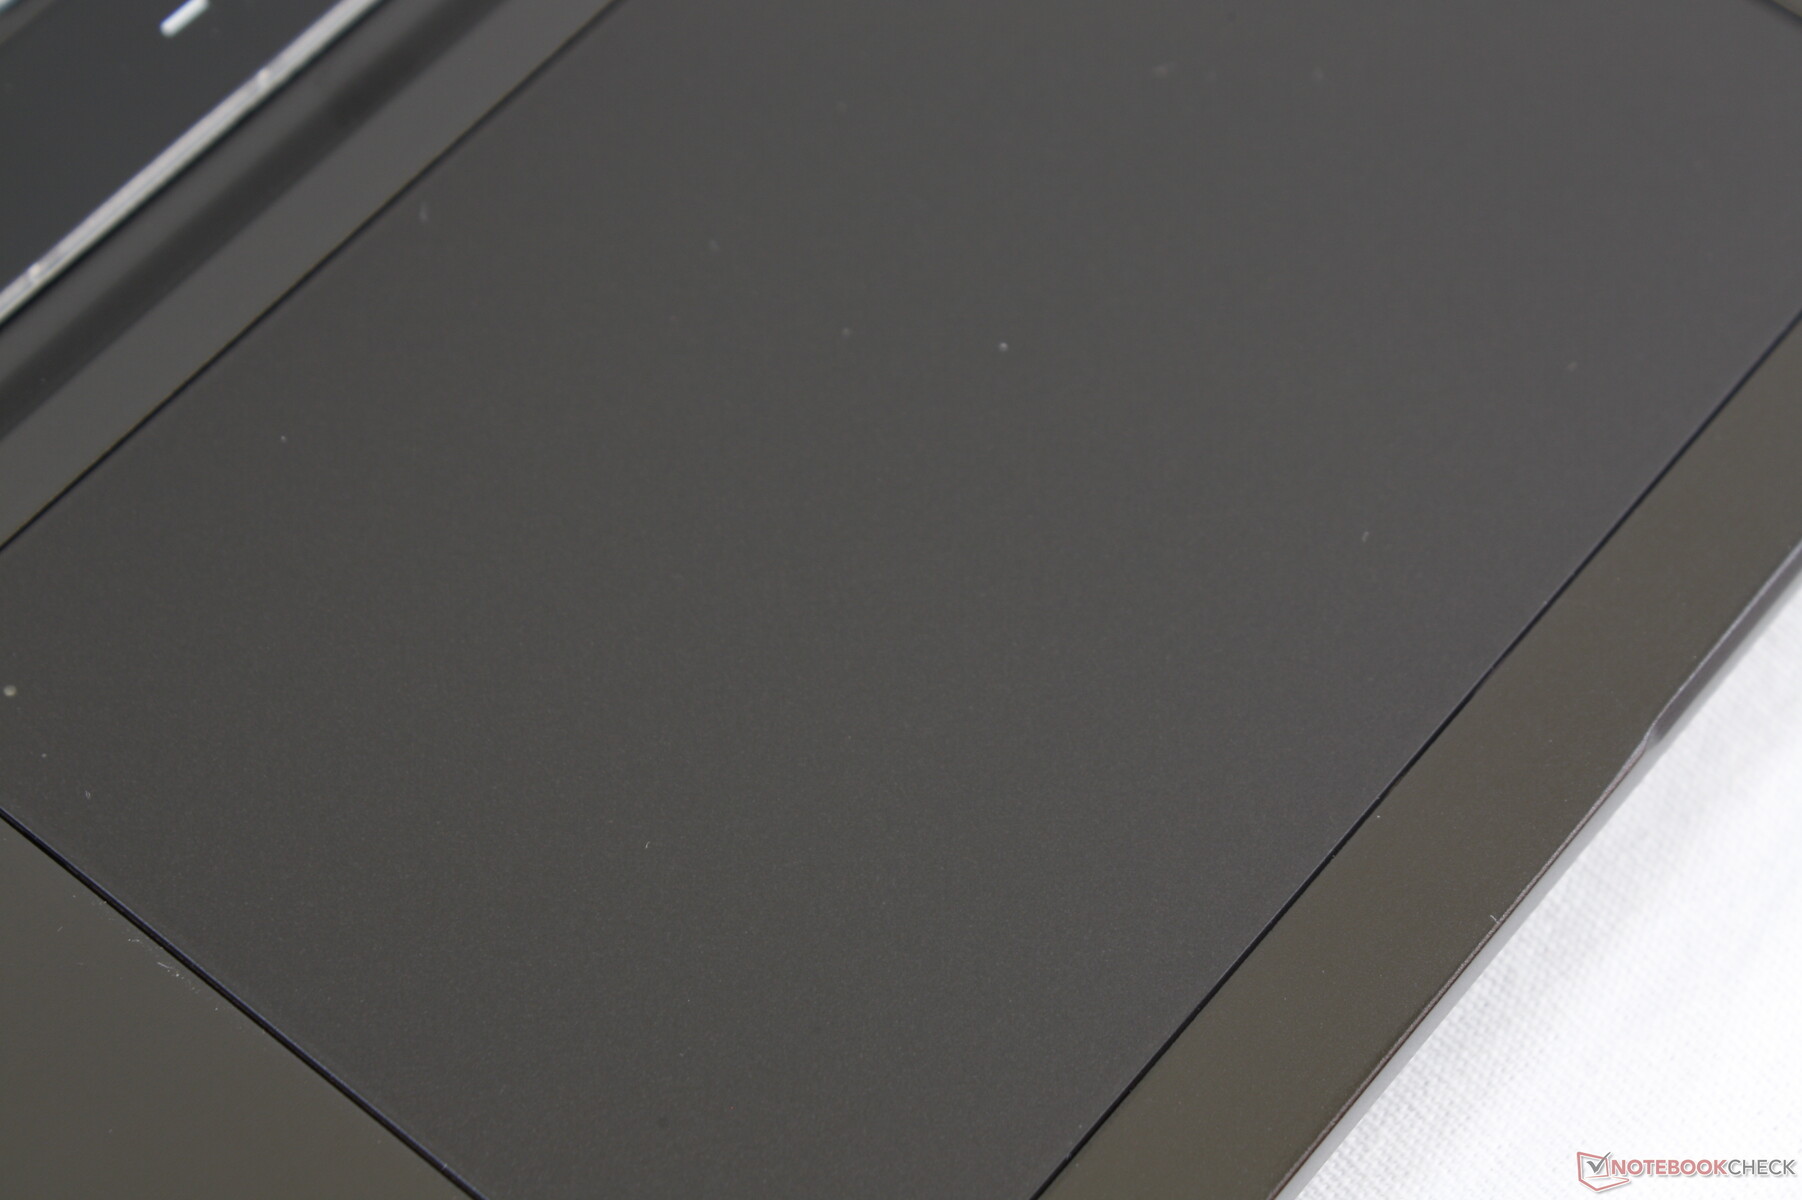
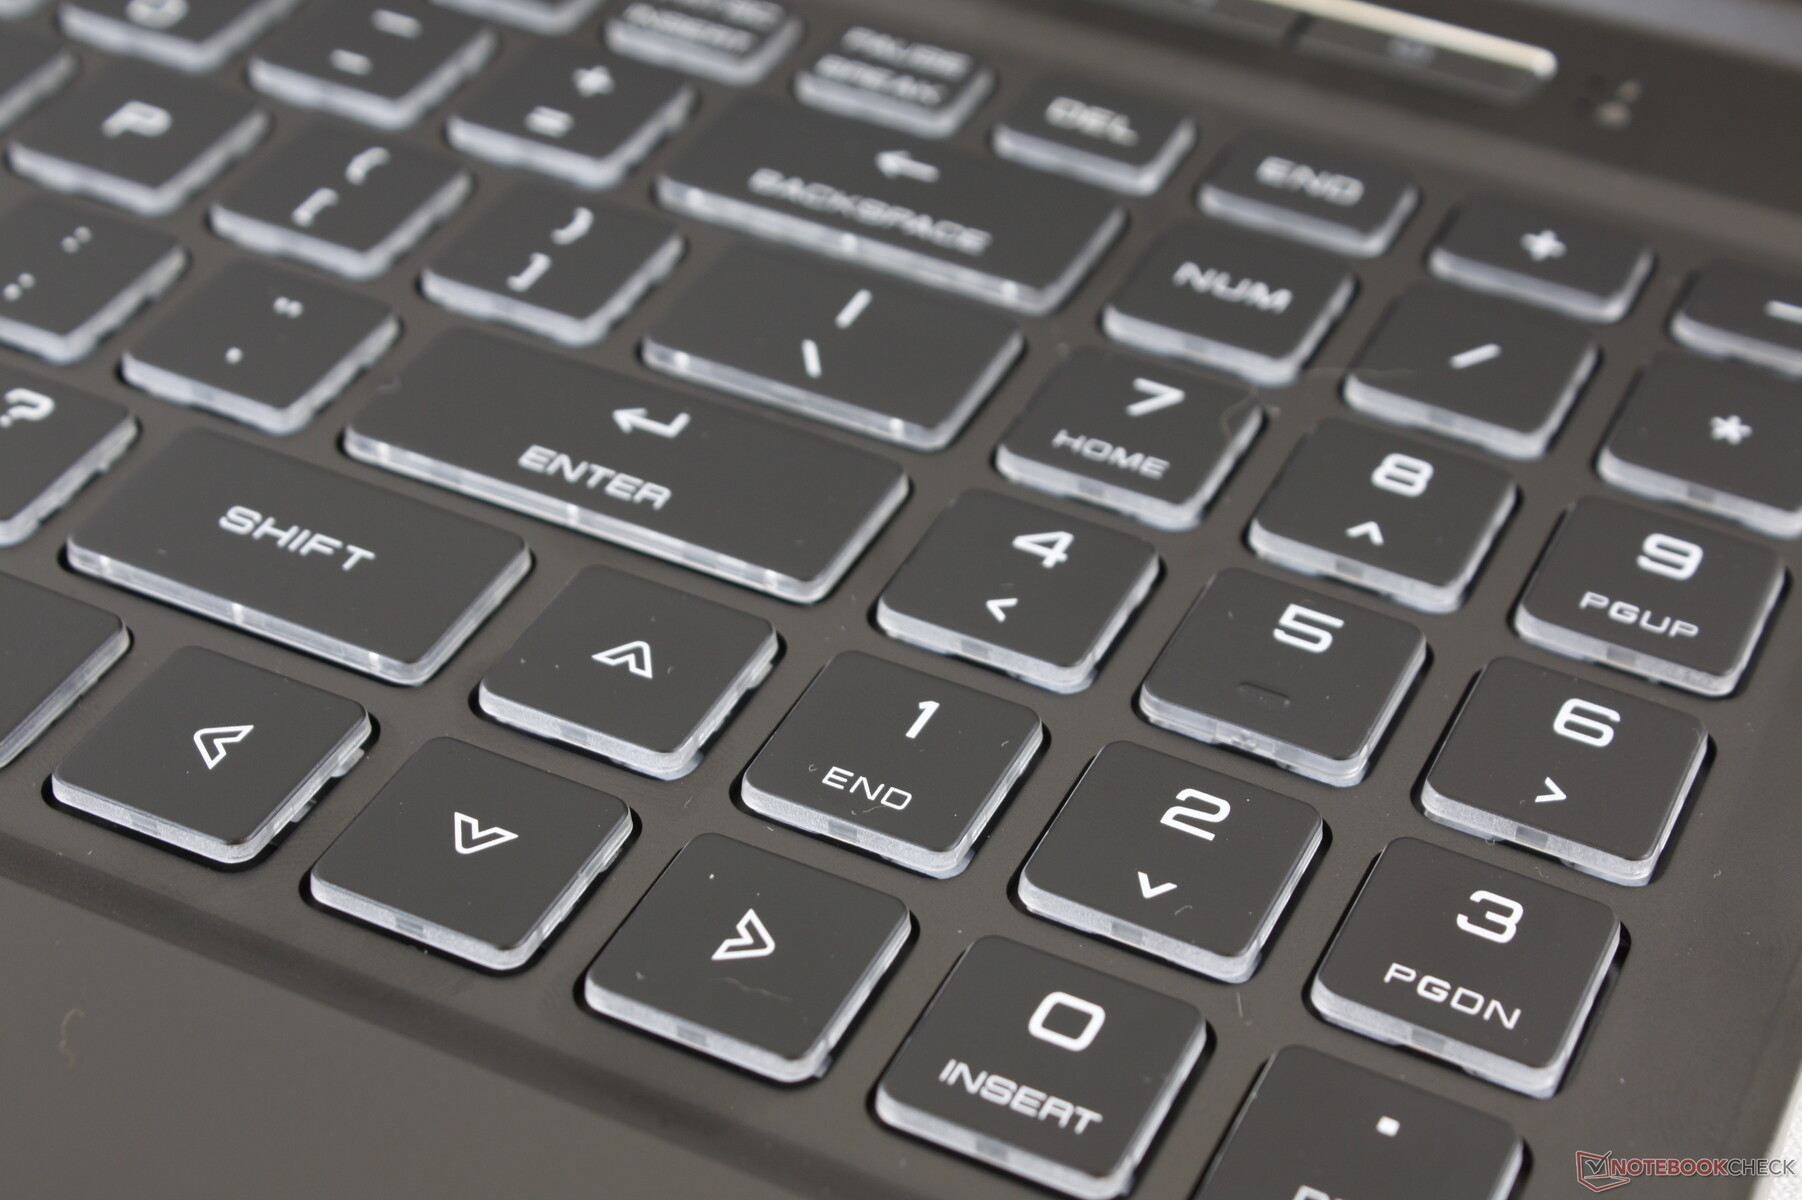
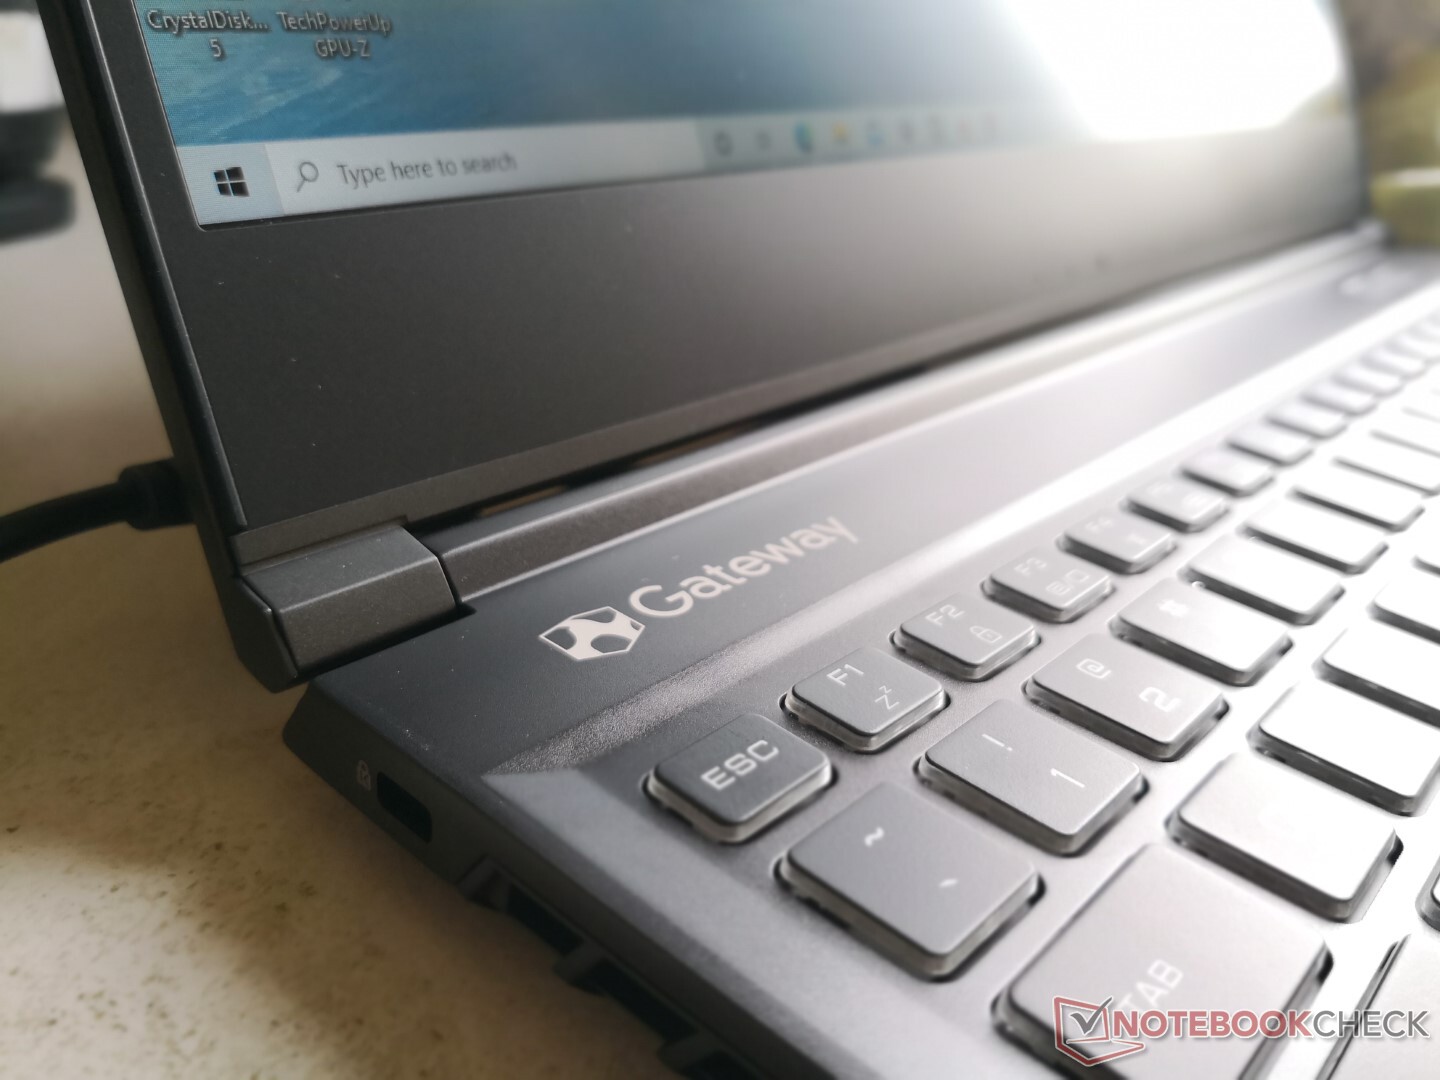
Input Devices
Keyboard
Describe the keyboard: key size, keyboard layout. Does it clatter/yield under pressure? Characteristics (silver coating, keyboard light,...), haptics, key travel, tapping,...

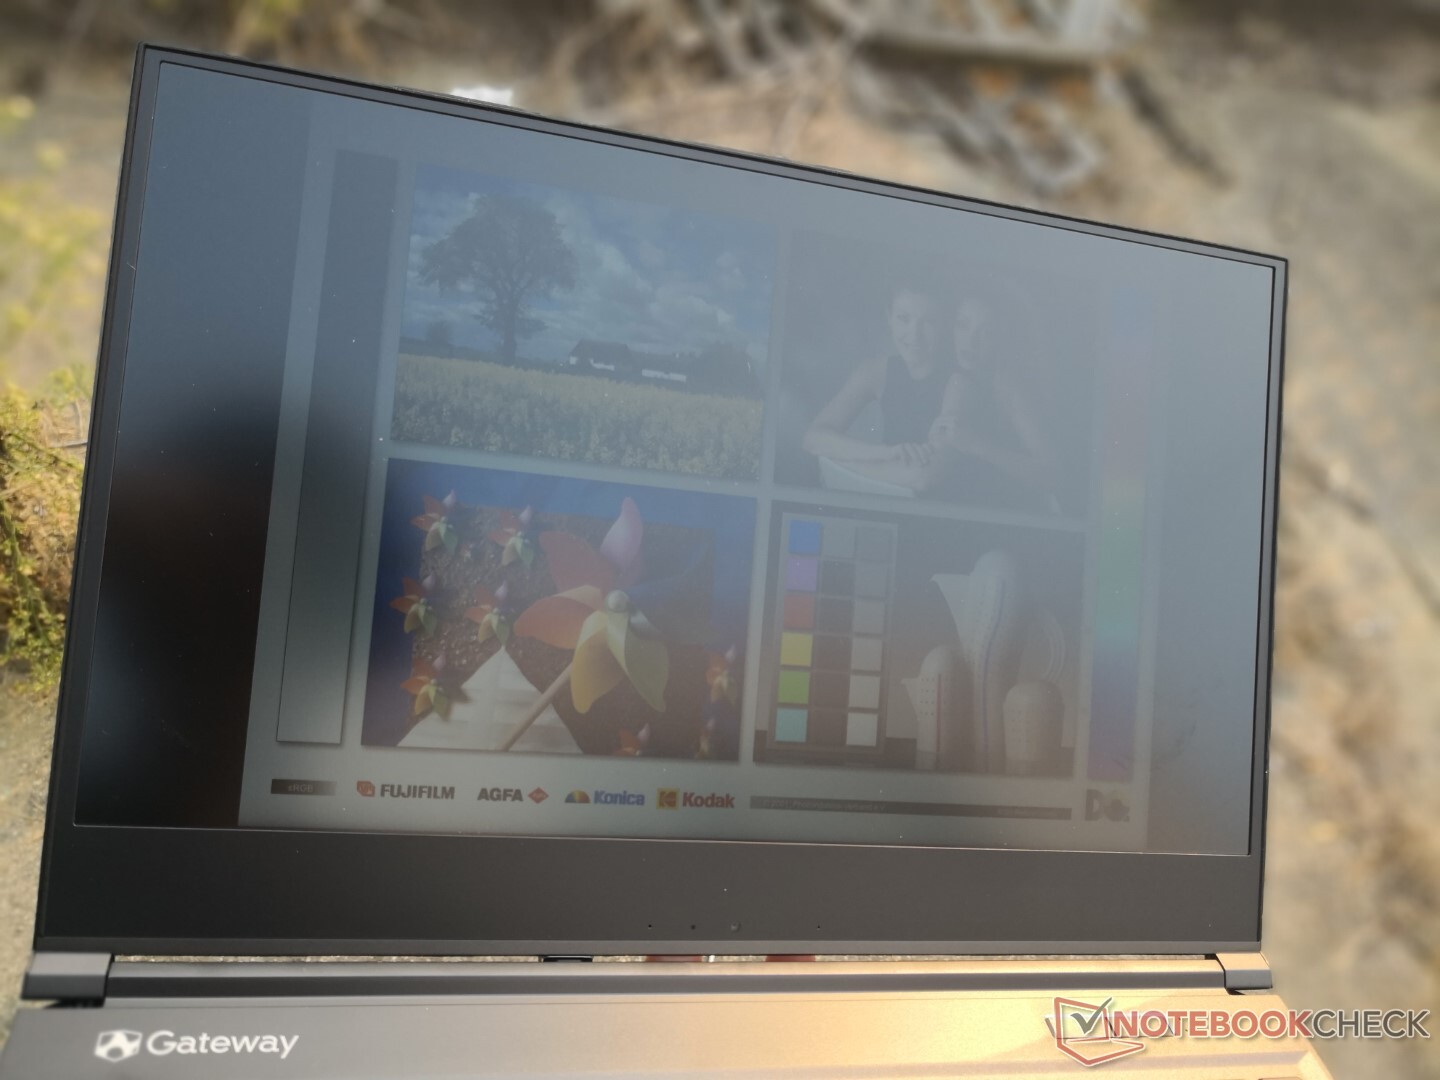
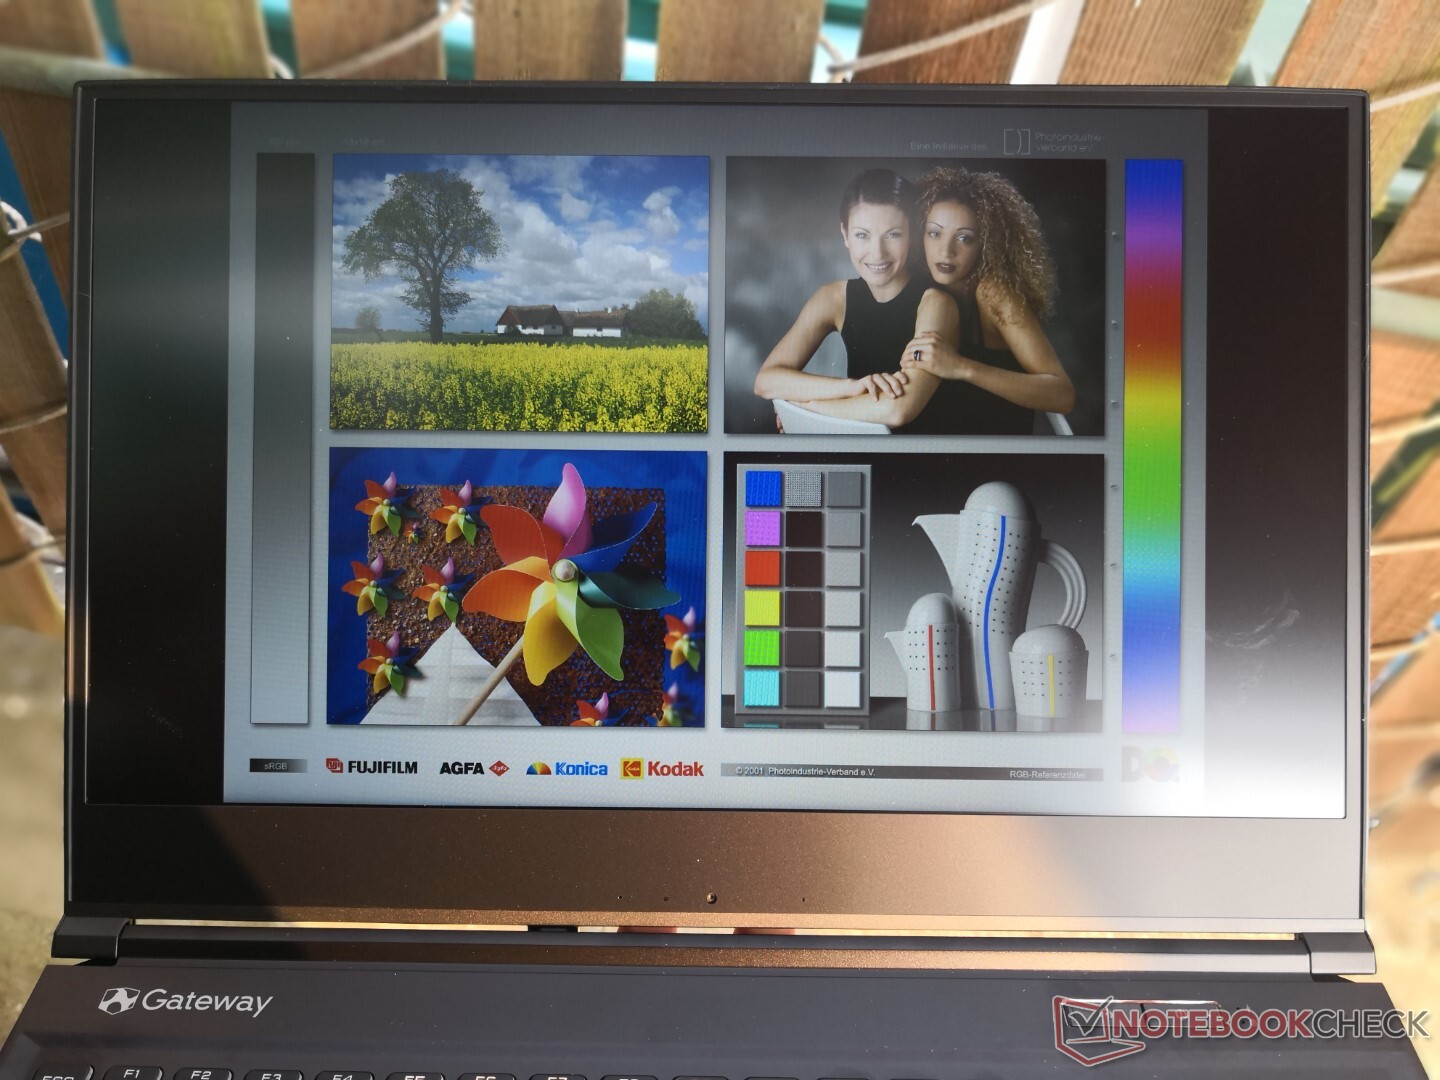
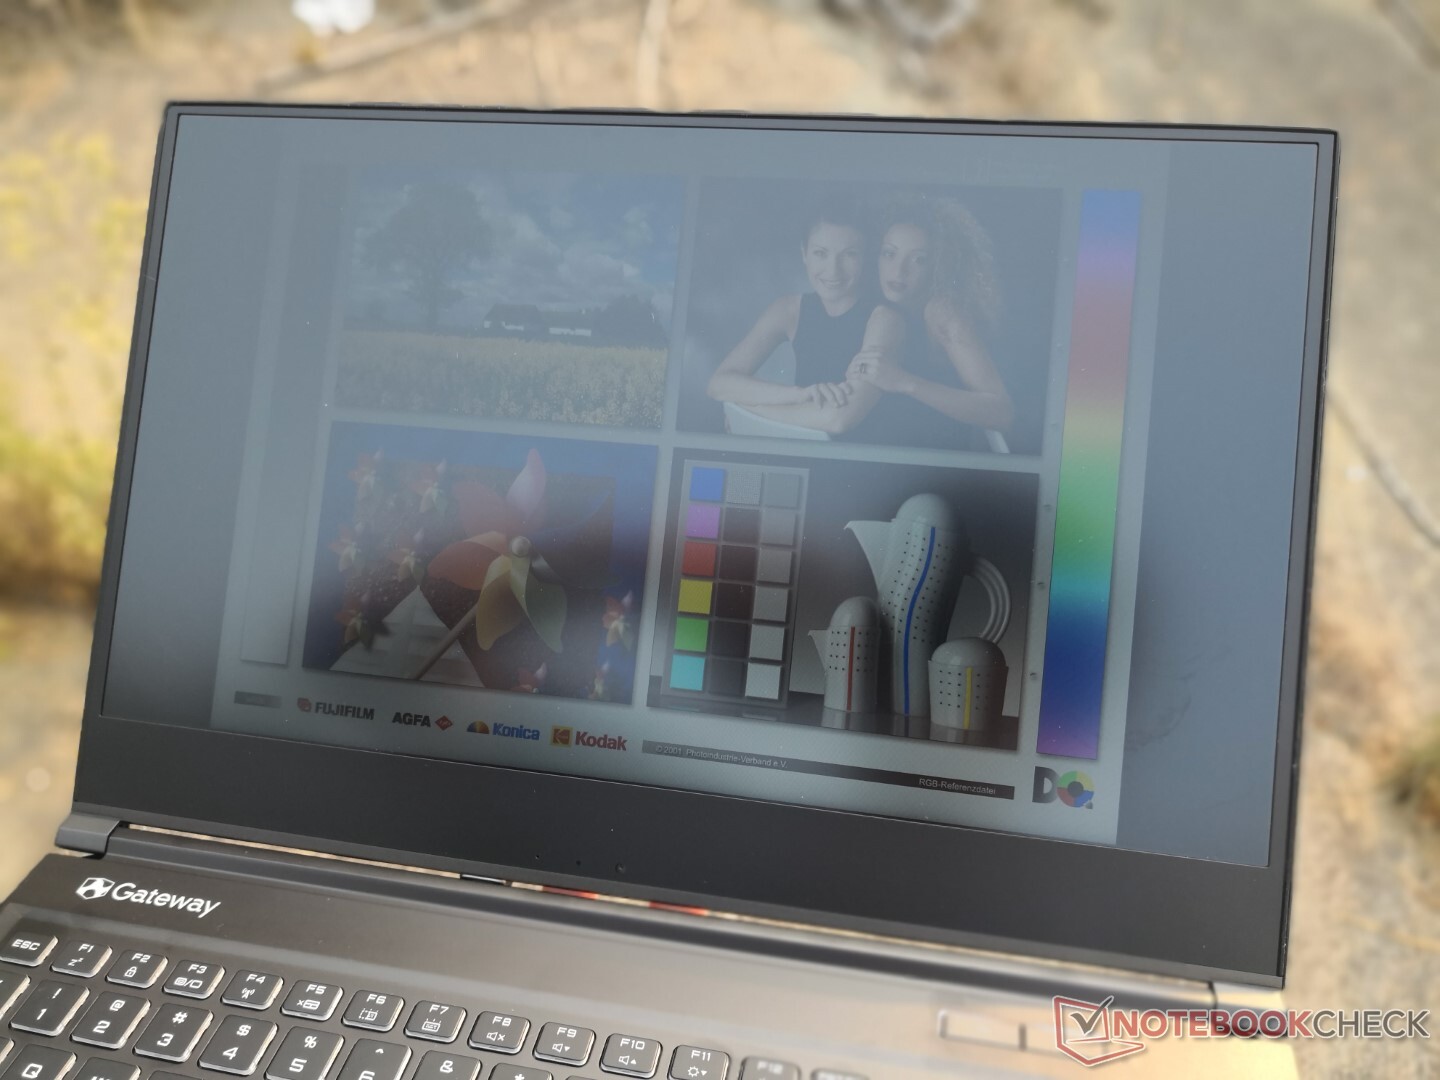
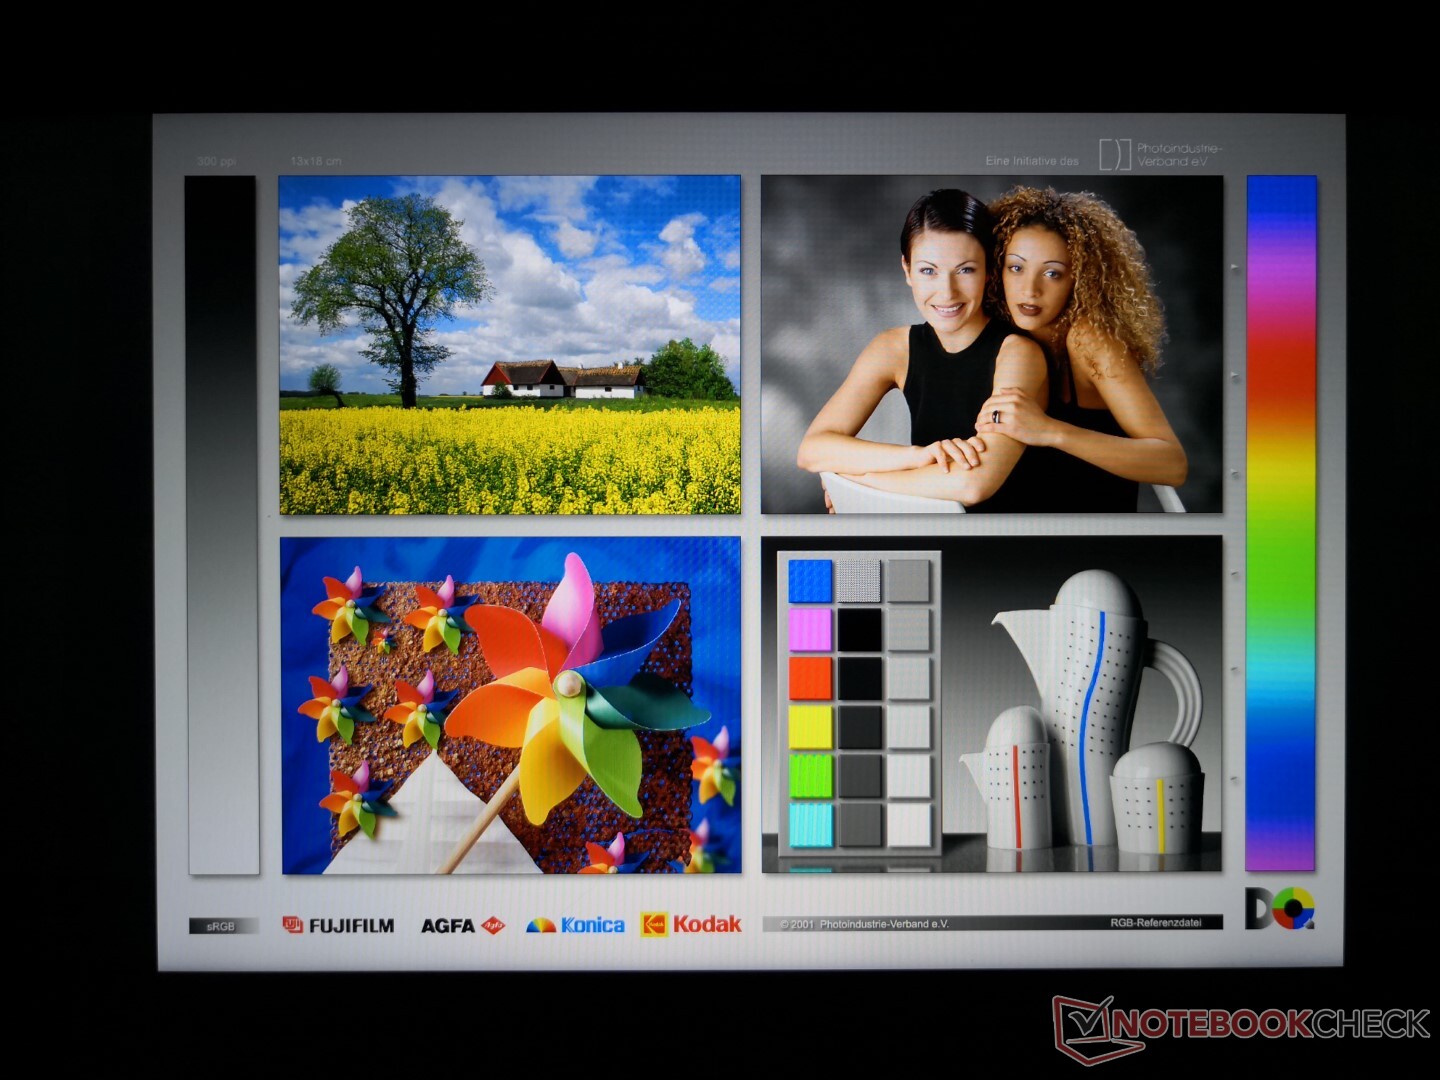
Display
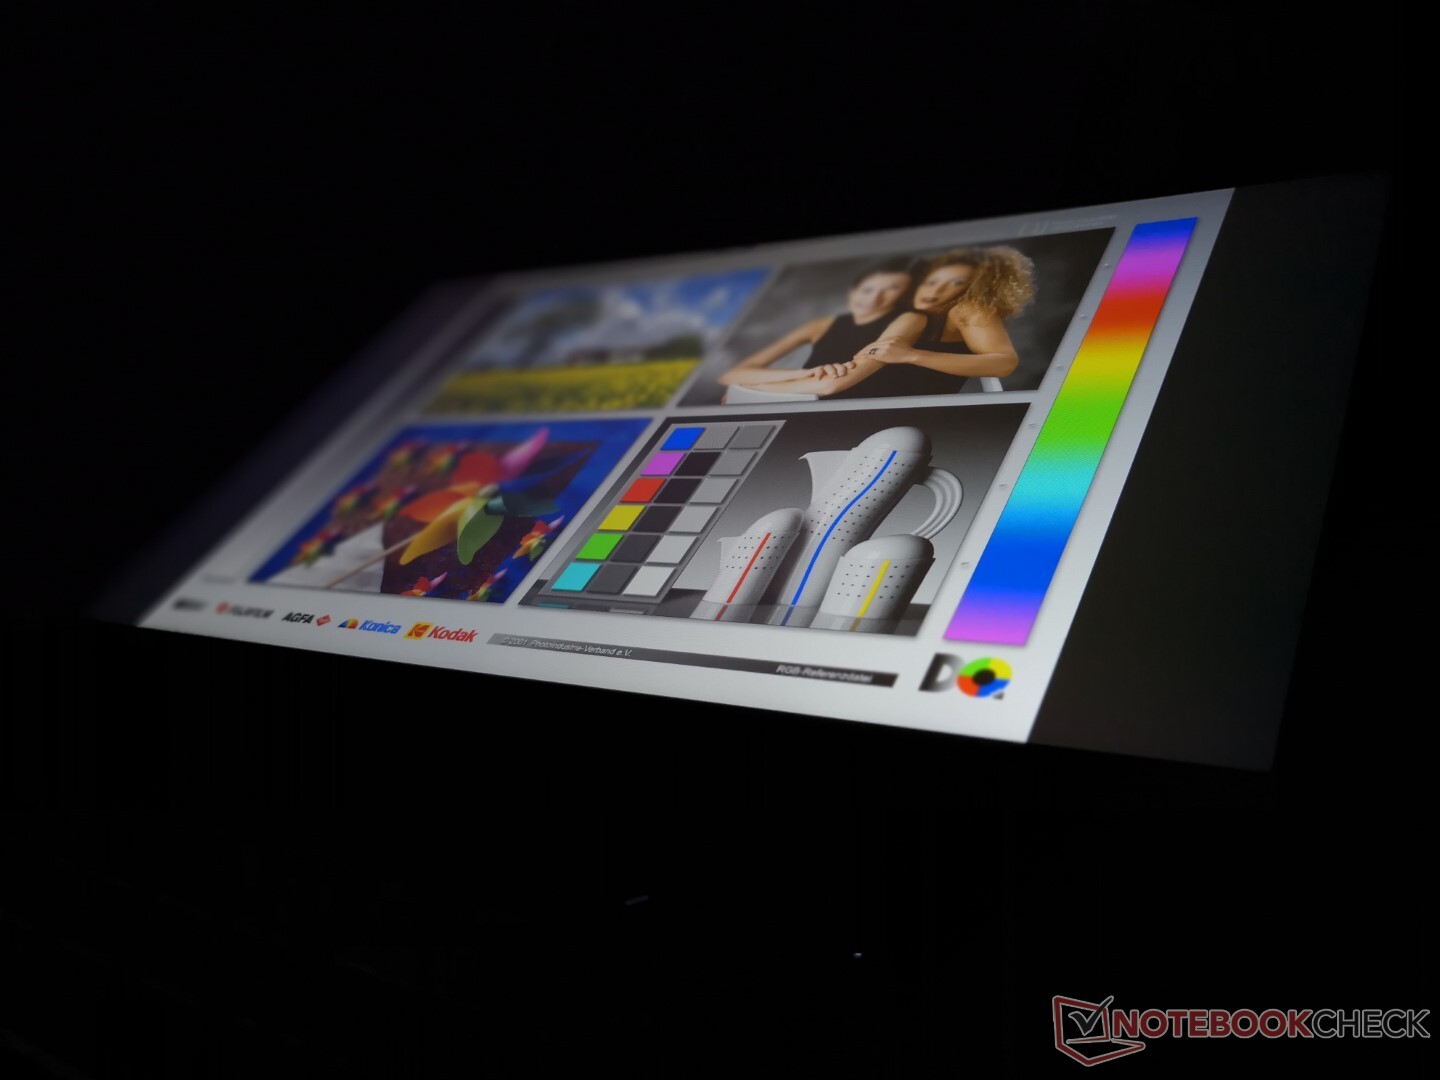
The Gateway system uses the same BOE NV156FHM-NX1 1080p IPS panel as found on the budget Lenovo IdeaPad Gaming 3i and Legion 5 gaming laptops. While brightness is average for the category, almost everything else is mediocre including contrast ratio, colors, and response times. Even subjectively, it's obvious that this is a cut corner and not a display optimized for games or content creation.


| |||||||||||||||||||||||||
Brightness Distribution: 84 %
Center on Battery: 296.3 cd/m²
Contrast: 780:1 (Black: 0.38 cd/m²)
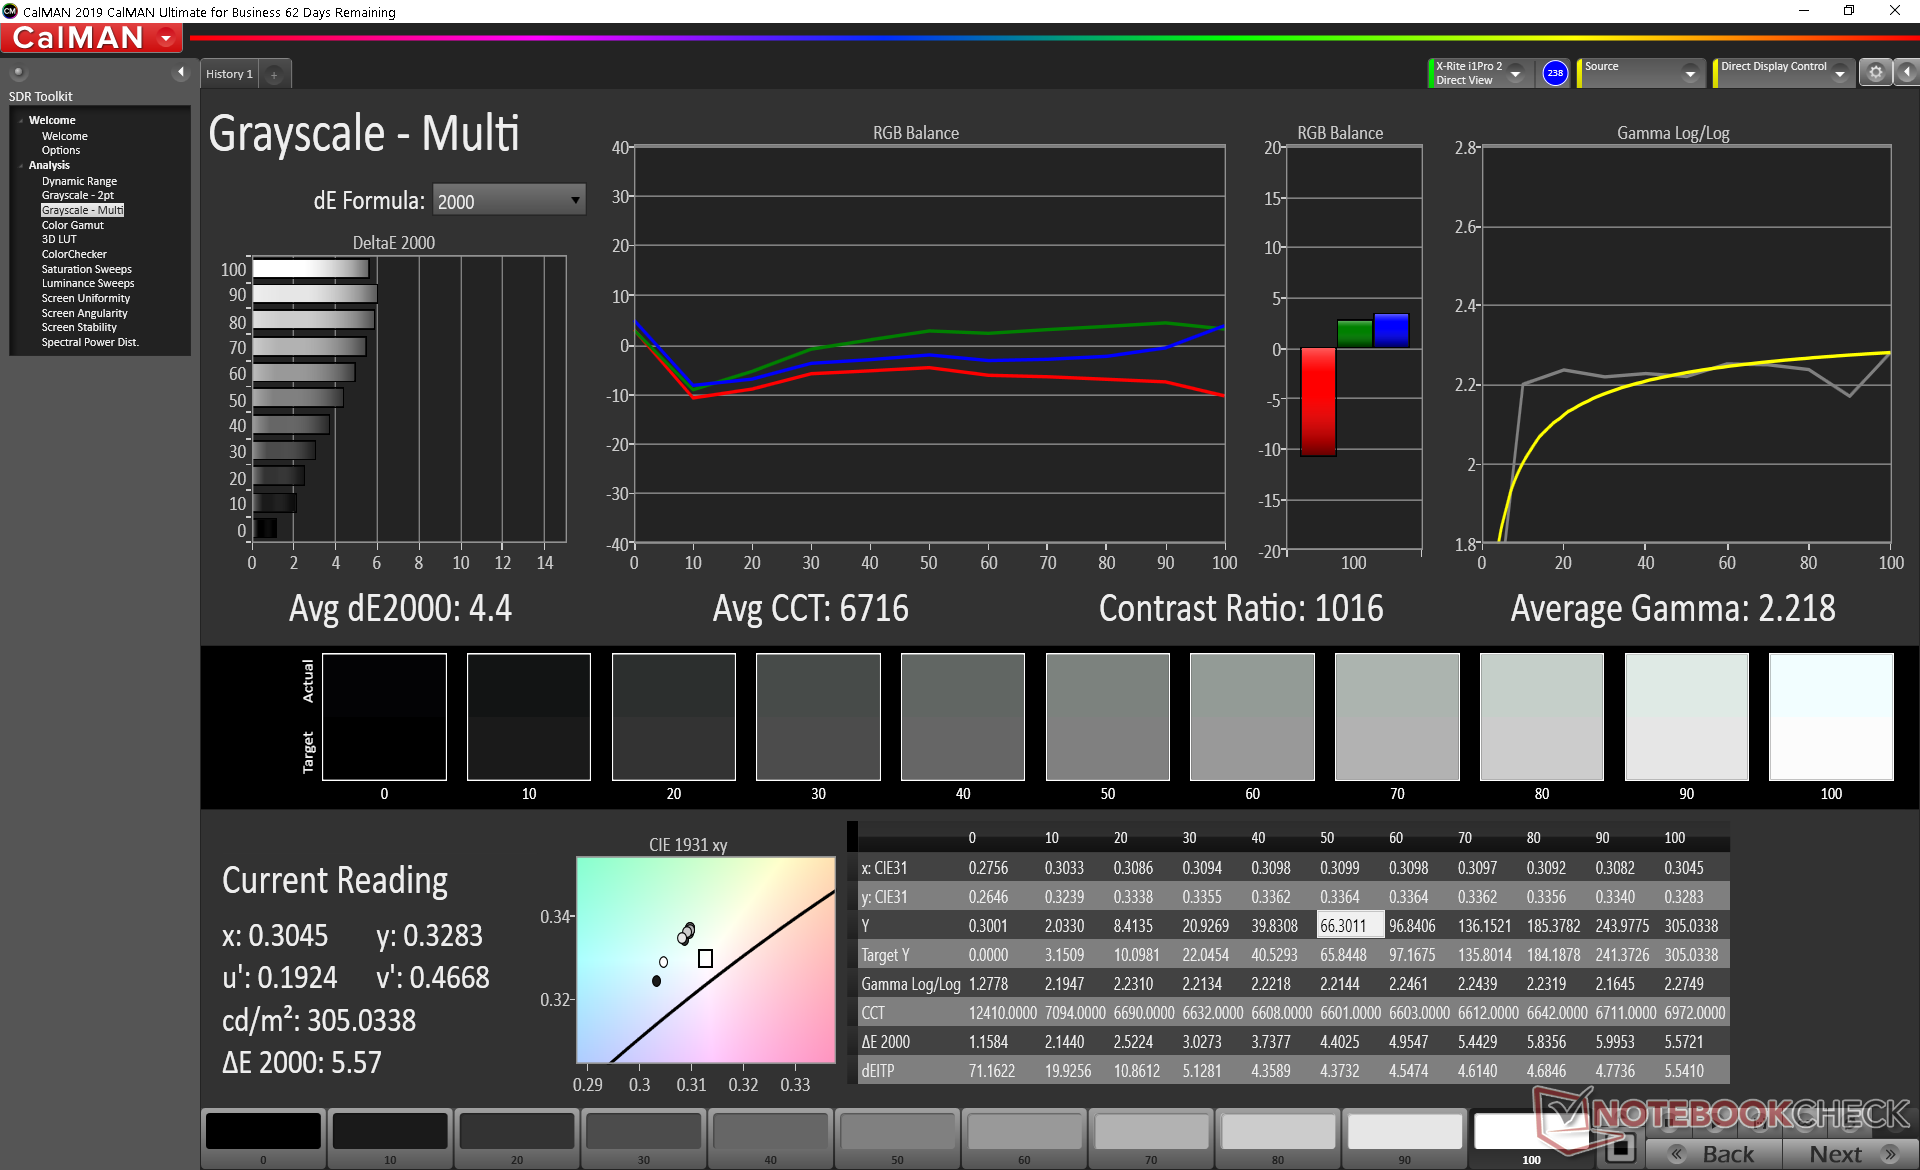
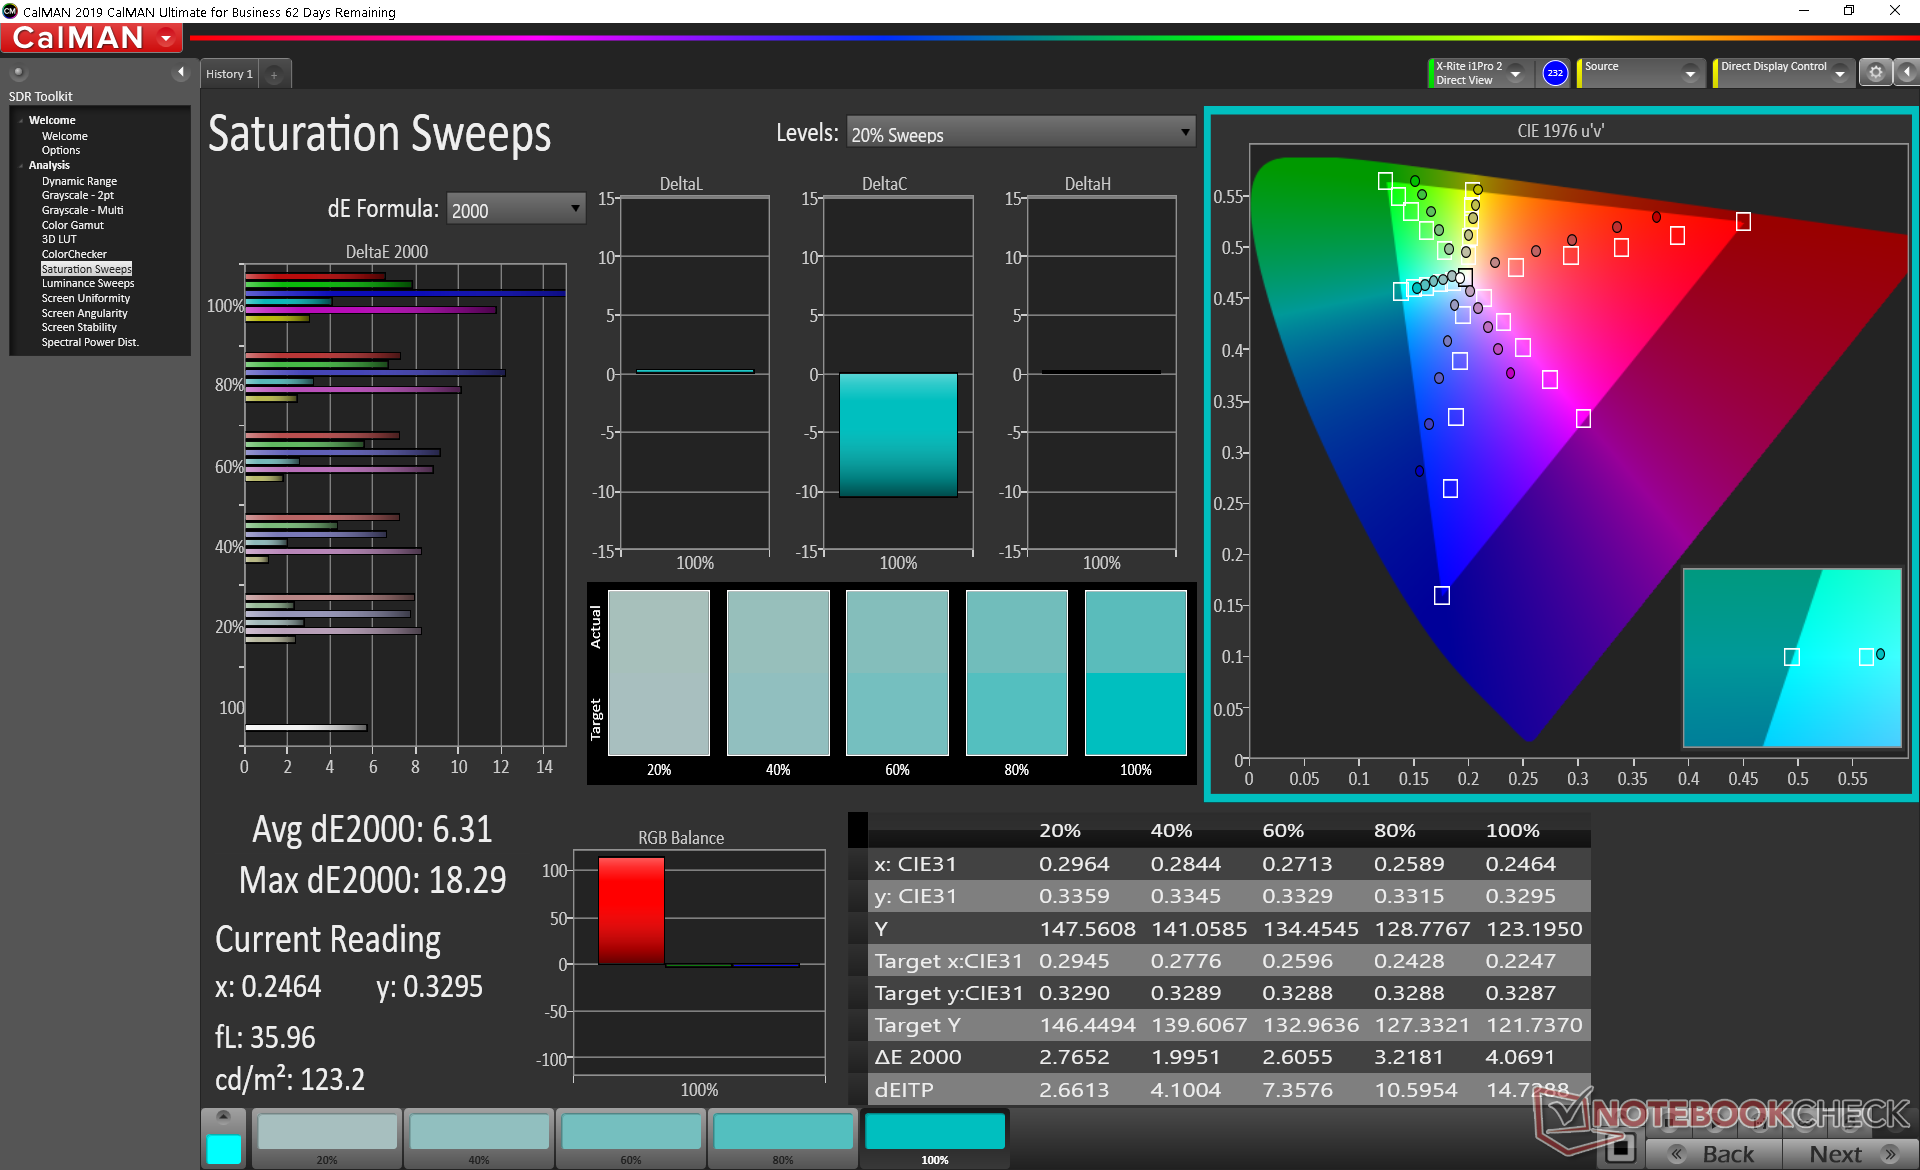
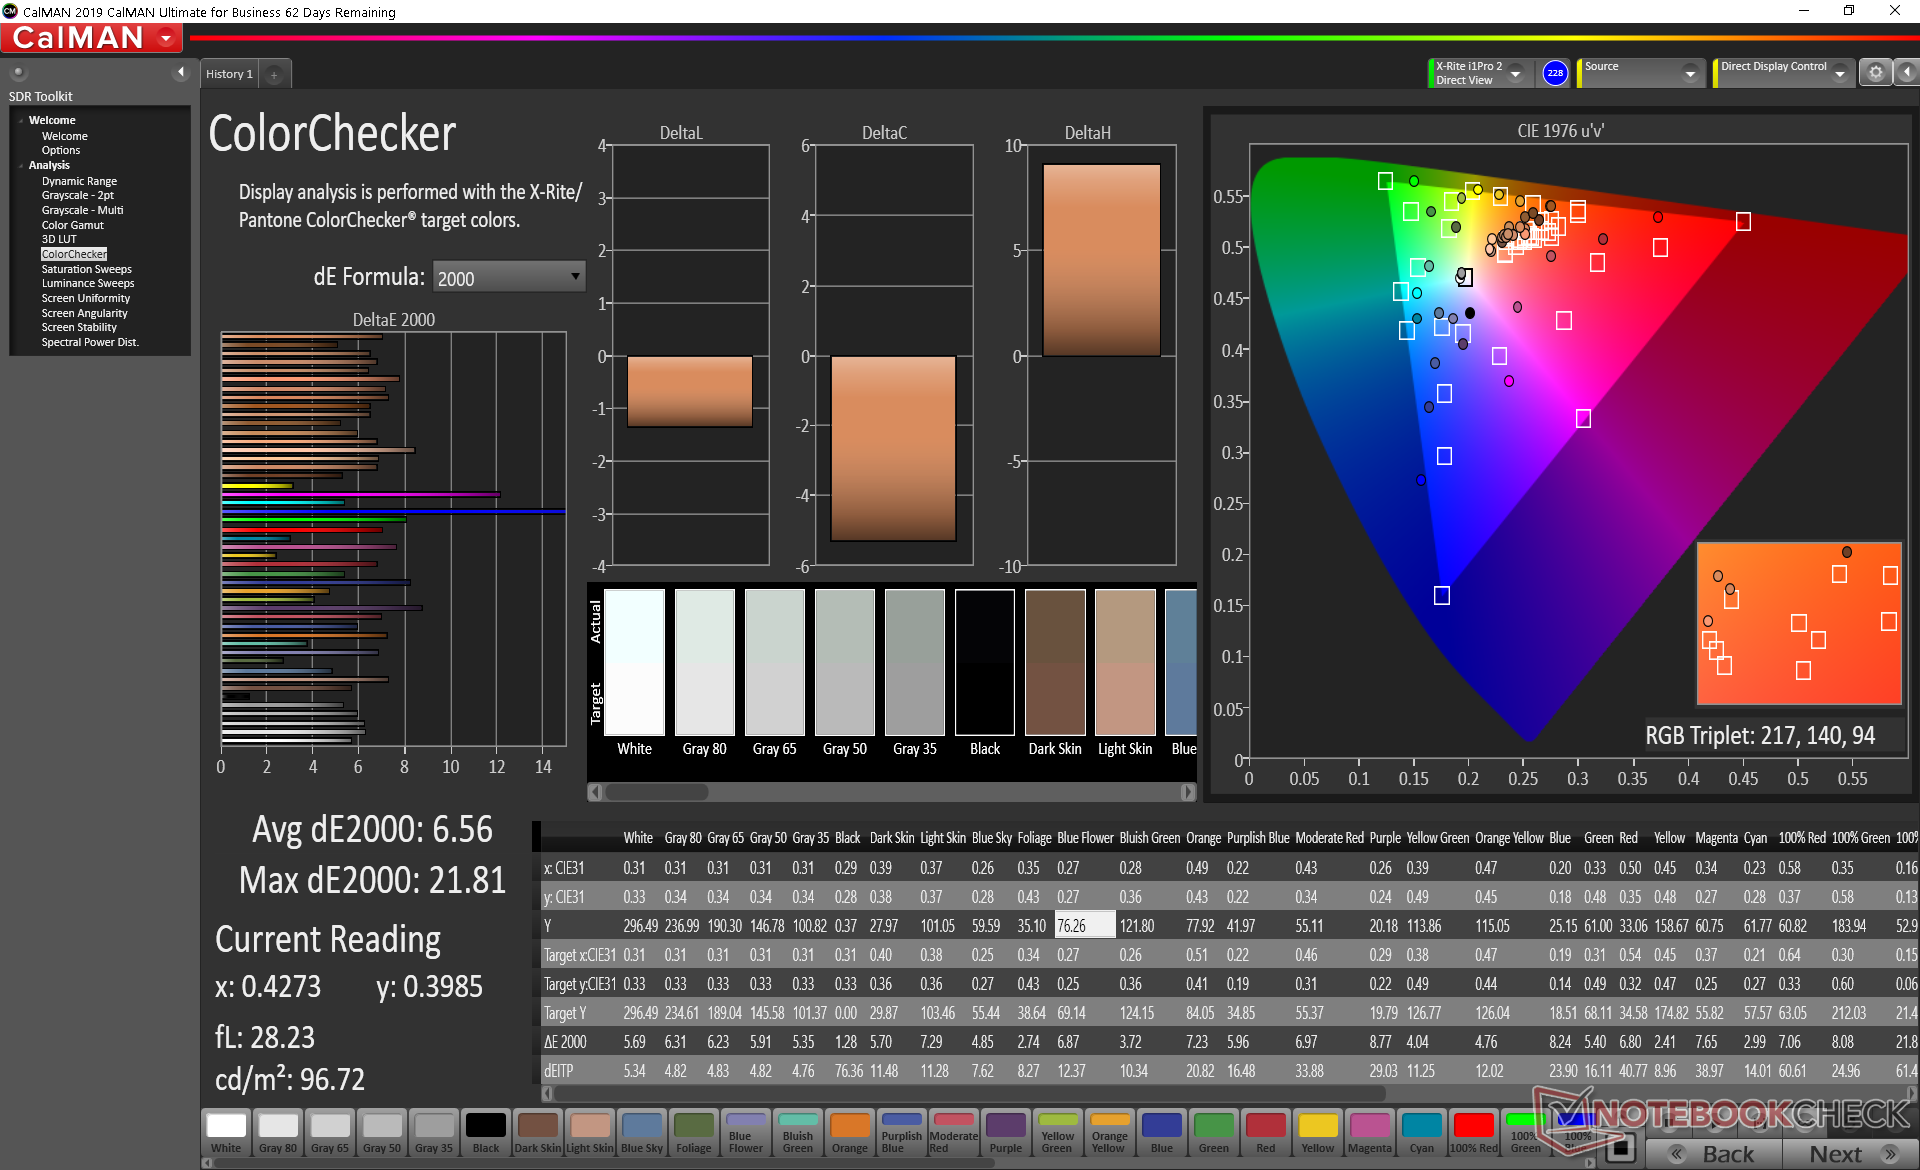
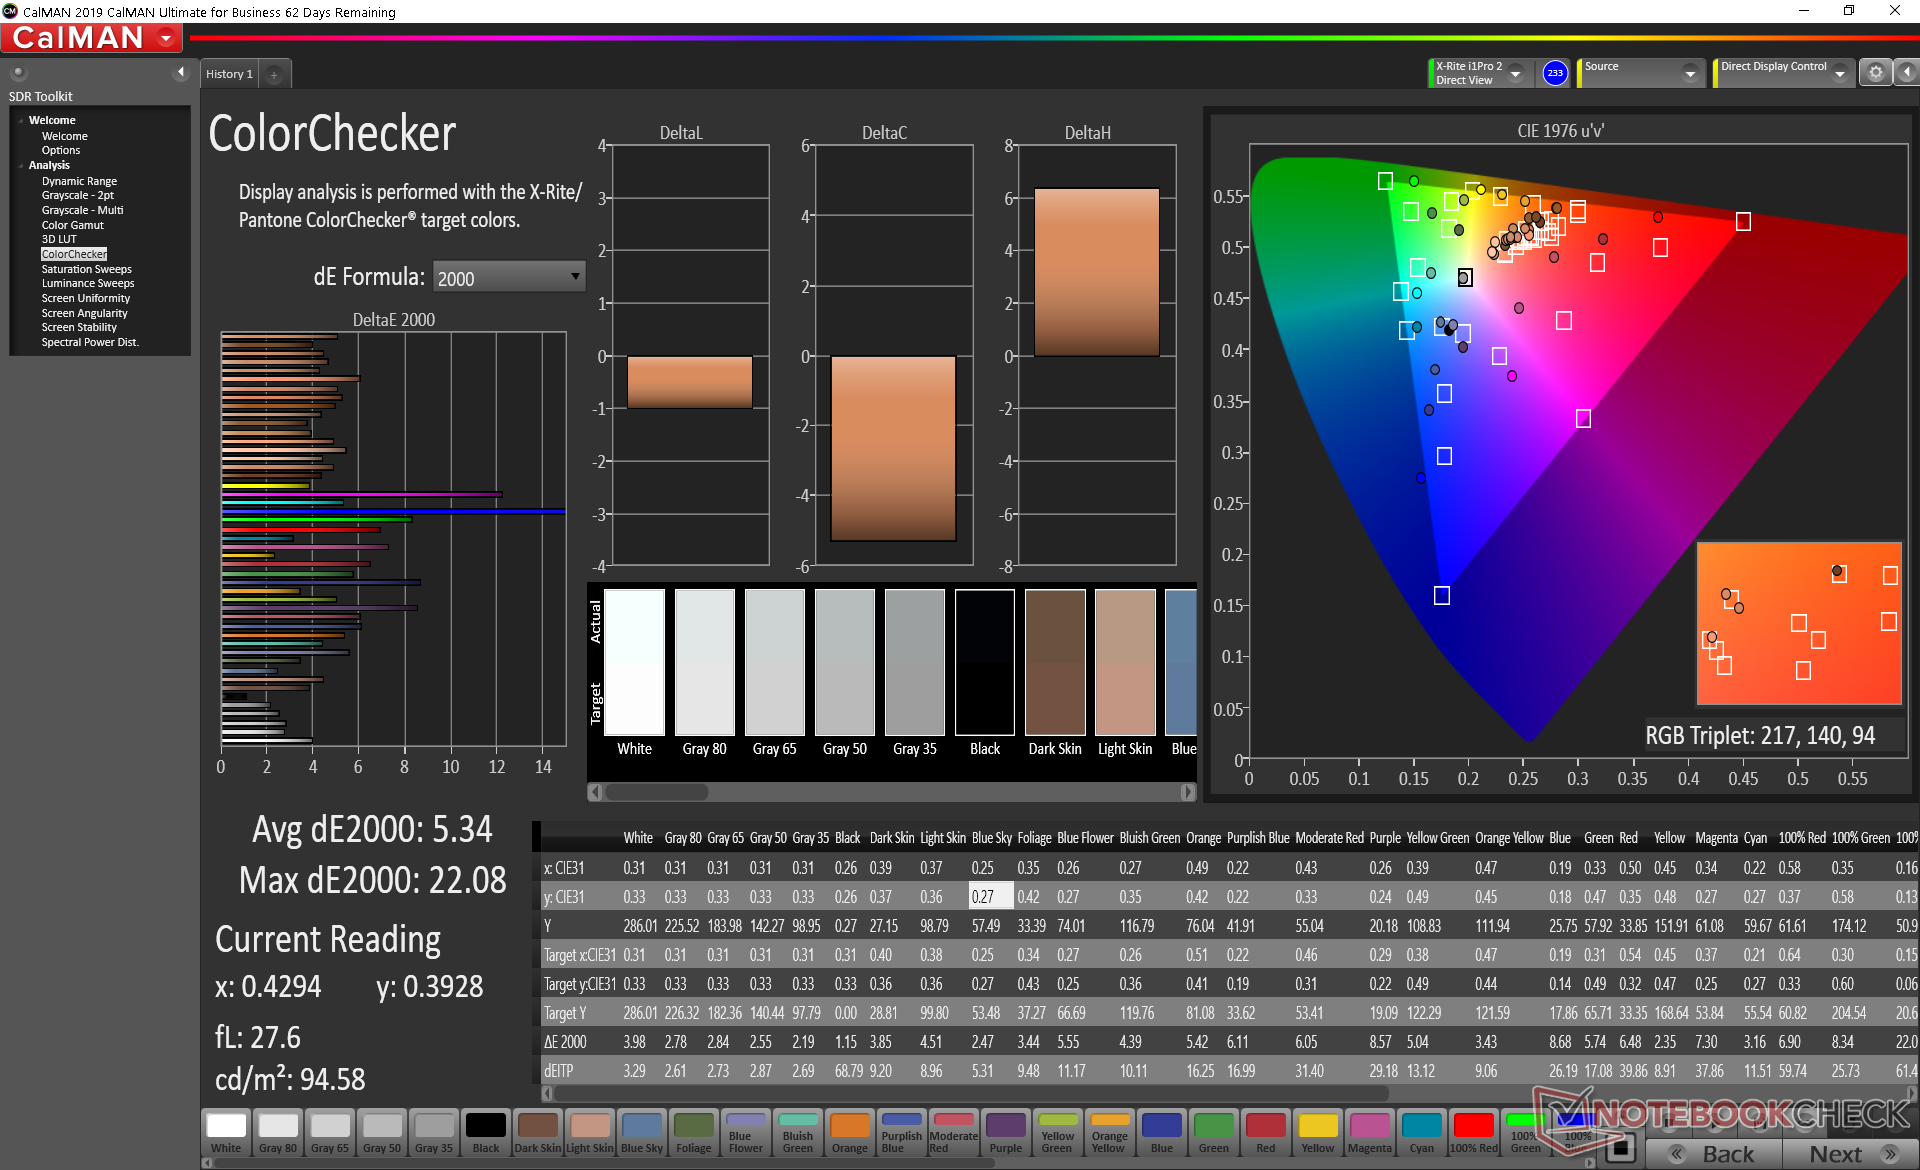
ΔE ColorChecker Calman: 6.56 | ∀{0.5-29.43 Ø4.73}
calibrated: 5.34
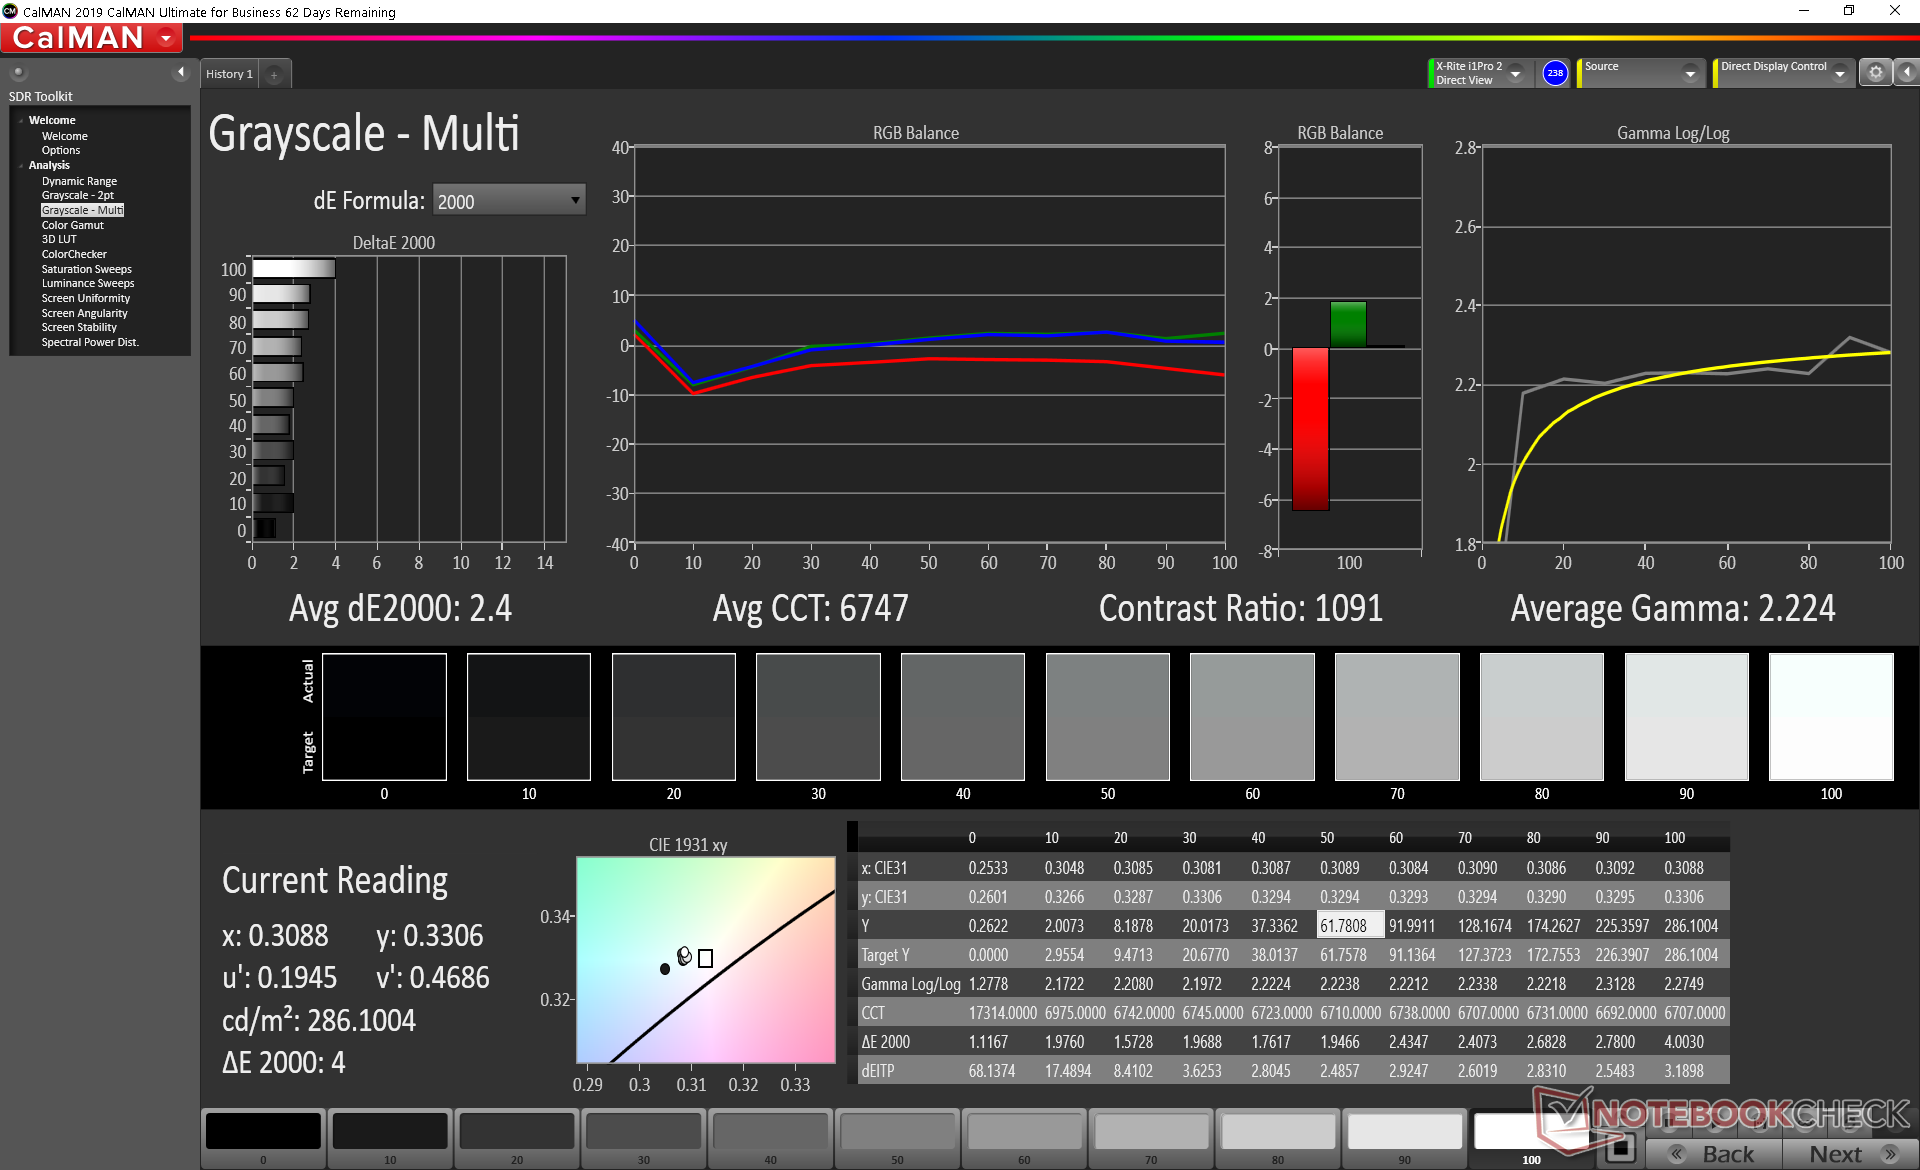
ΔE Greyscale Calman: 4.4 | ∀{0.09-98 Ø4.97}
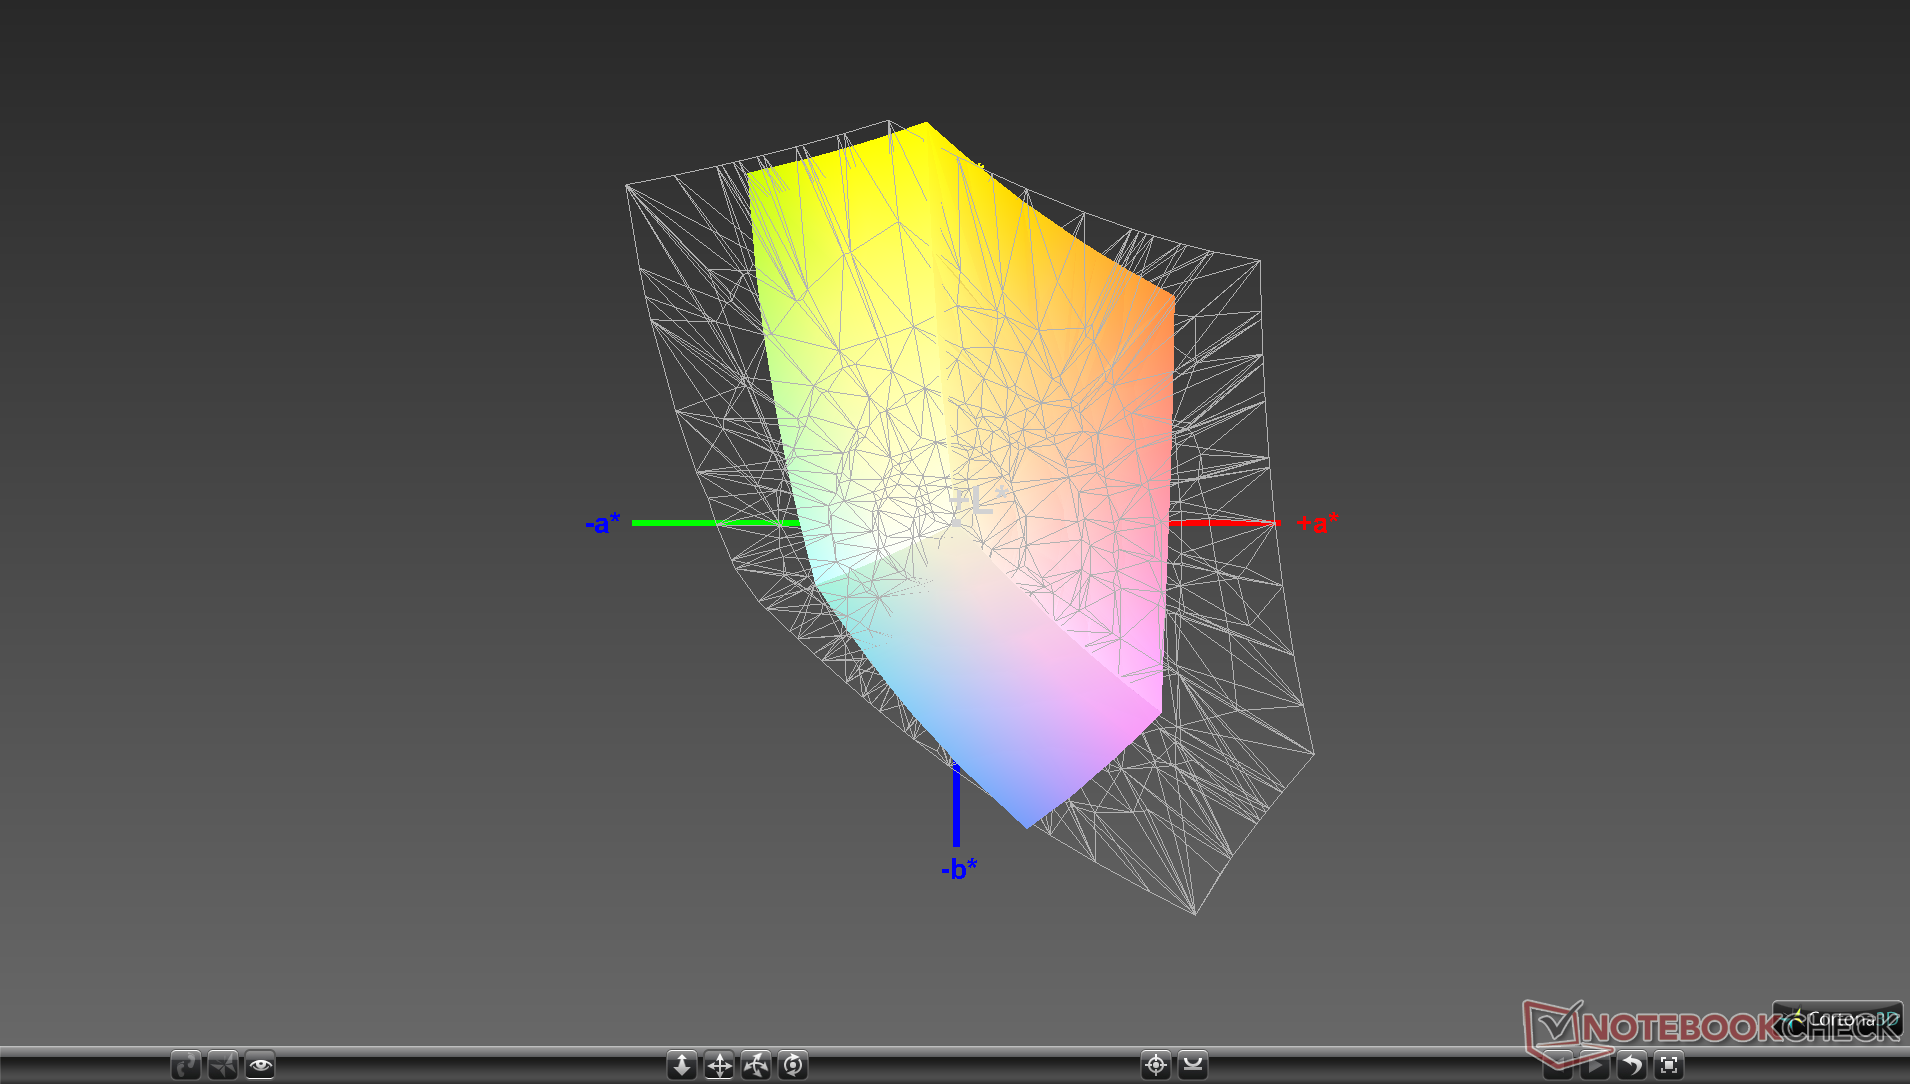
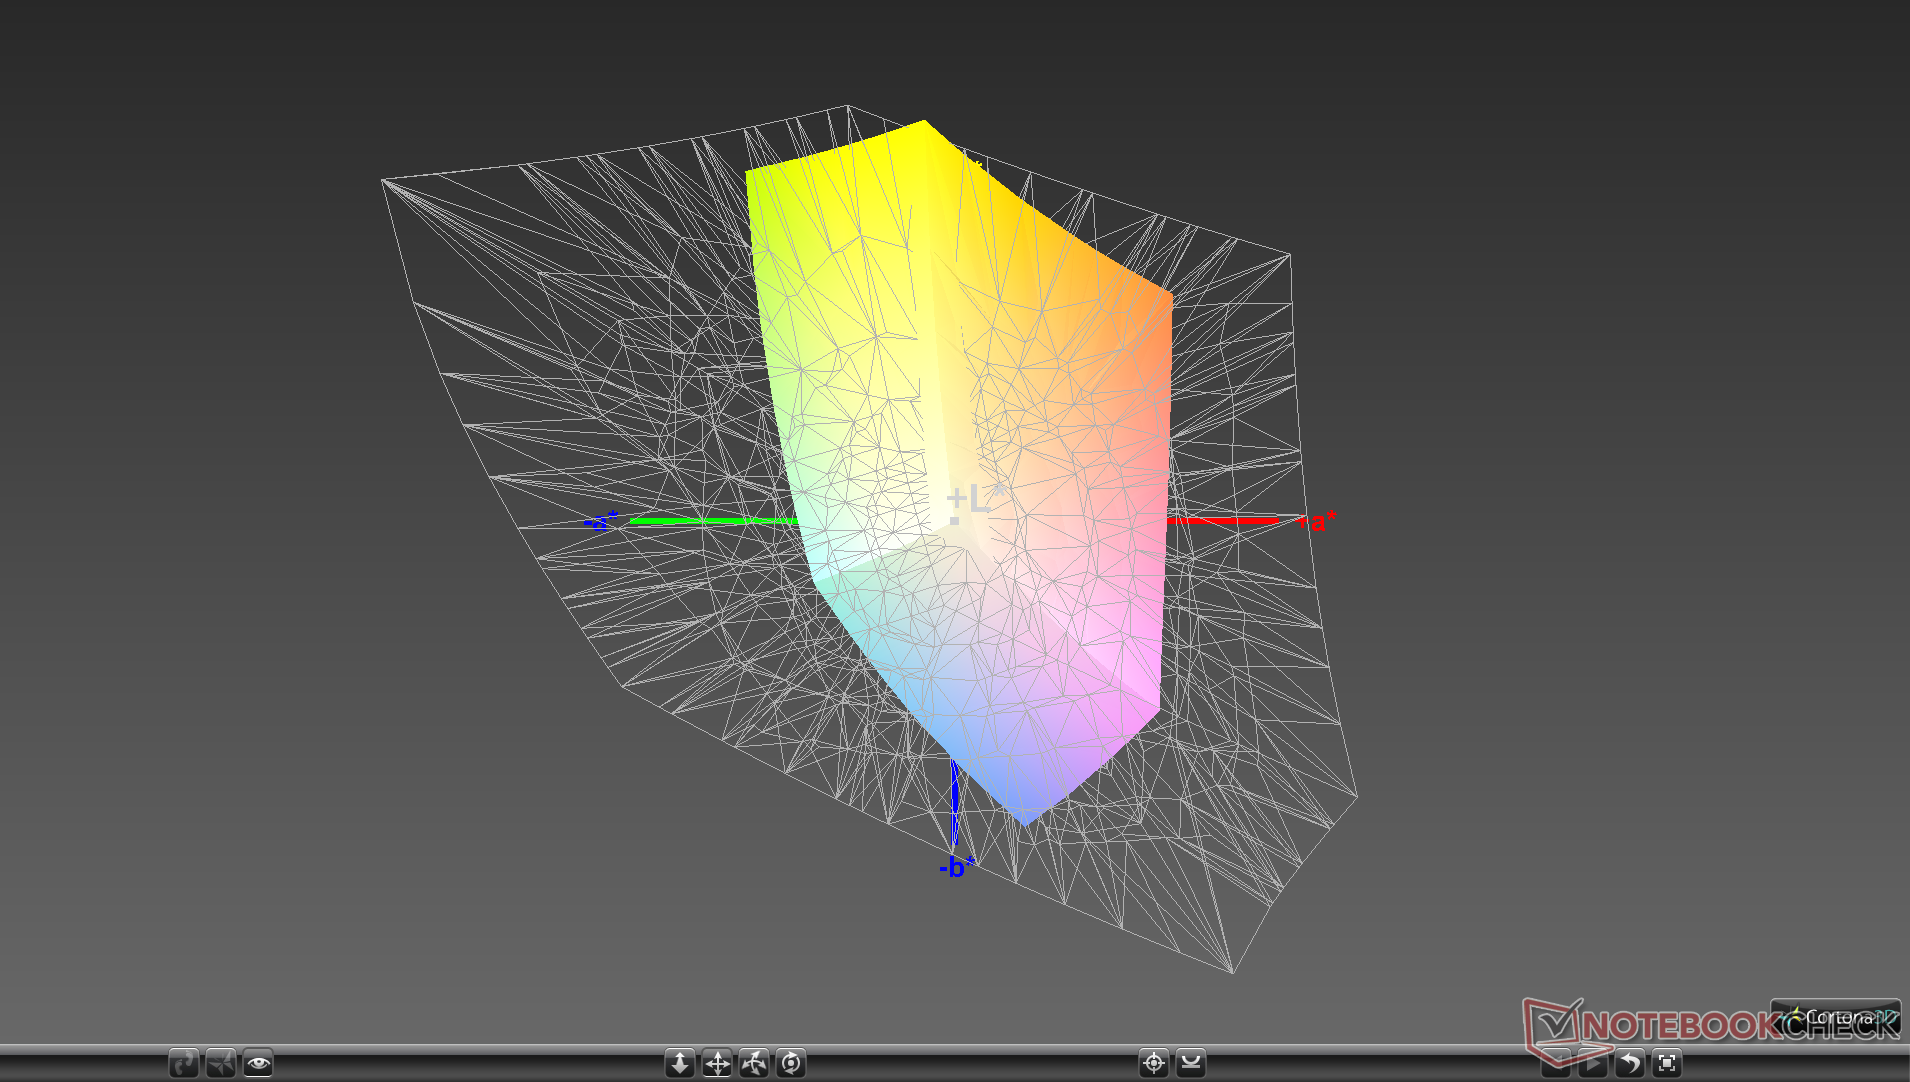
57.6% sRGB (Argyll 1.6.3 3D)
37.3% AdobeRGB 1998 (Argyll 1.6.3 3D)
41.18% AdobeRGB 1998 (Argyll 3D)
58.4% sRGB (Argyll 3D)
39.86% Display P3 (Argyll 3D)
Gamma: 2.22
CCT: 6716 K
| Gateway Creator Series 15.6 GWTN156-3BK BOE NV156FHM-NX1, IPS, 15.6", 1920x1080 | Schenker XMG Core 15 GK5NR0O LM156LF-1F02, IPS, 15.6", 1920x1080 | Aorus 5 KB LG Philips LP156WFG-SPB2 (LGD05E8), IPS, 15.6", 1920x1080 | Asus ROG Zephyrus G15 GA502IU-ES76 Panda LM156LF-2F01, IPS, 15.6", 1920x1080 | HP Omen 15-ek0456ng LGD05FE, IPS, 15.6", 1920x1080 | Razer Blade 15 GTX 1660 Ti BOE NV156FHM-N4K, IPS, 15.6", 1920x1080 | |
|---|---|---|---|---|---|---|
| Display | 66% | 58% | -1% | 61% | ||
| Display P3 Coverage (%) | 39.86 | 67.2 69% | 63.4 59% | 38.9 -2% | 65.3 64% | |
| sRGB Coverage (%) | 58.4 | 95.9 64% | 92.8 59% | 58.5 0% | 91.8 57% | |
| AdobeRGB 1998 Coverage (%) | 41.18 | 68.5 66% | 64.8 57% | 40.22 -2% | 66.5 61% | |
| Response Times | 65% | 54% | 7% | 52% | 59% | |
| Response Time Grey 50% / Grey 80% * (ms) | 38.4 ? | 9.6 ? 75% | 14.4 ? 62% | 24.4 ? 36% | 17 ? 56% | 13.6 ? 65% |
| Response Time Black / White * (ms) | 20.8 ? | 9.6 ? 54% | 11.2 ? 46% | 25.6 ? -23% | 11 ? 47% | 10 ? 52% |
| PWM Frequency (Hz) | 200 ? | |||||
| Screen | 29% | 43% | 12% | 42% | 33% | |
| Brightness middle (cd/m²) | 296.3 | 312 5% | 318 7% | 255.9 -14% | 314 6% | 312.7 6% |
| Brightness (cd/m²) | 284 | 290 2% | 298 5% | 246 -13% | 293 3% | 305 7% |
| Brightness Distribution (%) | 84 | 87 4% | 87 4% | 89 6% | 87 4% | 90 7% |
| Black Level * (cd/m²) | 0.38 | 0.2 47% | 0.3 21% | 0.22 42% | 0.22 42% | 0.27 29% |
| Contrast (:1) | 780 | 1560 100% | 1060 36% | 1163 49% | 1427 83% | 1158 48% |
| Colorchecker dE 2000 * | 6.56 | 4.84 26% | 2.49 62% | 5.15 21% | 2.51 62% | 4.57 30% |
| Colorchecker dE 2000 max. * | 21.81 | 13.85 36% | 5.06 77% | 17.11 22% | 4.42 80% | 6.81 69% |
| Colorchecker dE 2000 calibrated * | 5.34 | 1.77 67% | 1.53 71% | 4.83 10% | 1.71 68% | 2.91 46% |
| Greyscale dE 2000 * | 4.4 | 9 -105% | 1.6 64% | 4.2 5% | 3.26 26% | 4.3 2% |
| Gamma | 2.22 99% | 2.105 105% | 2.211 100% | 2.16 102% | 2.42 91% | 2.29 96% |
| CCT | 6716 97% | 8099 80% | 6714 97% | 7500 87% | 6150 106% | 7098 92% |
| Color Space (Percent of AdobeRGB 1998) (%) | 37.3 | 68 82% | 65 74% | 36.9 -1% | 59.4 59% | |
| Color Space (Percent of sRGB) (%) | 57.6 | 92 60% | 89 55% | 58 1% | 91.3 59% | |
| Total Average (Program / Settings) | 53% /
41% | 52% /
47% | 6% /
9% | 47% /
43% | 51% /
41% |
* ... smaller is better
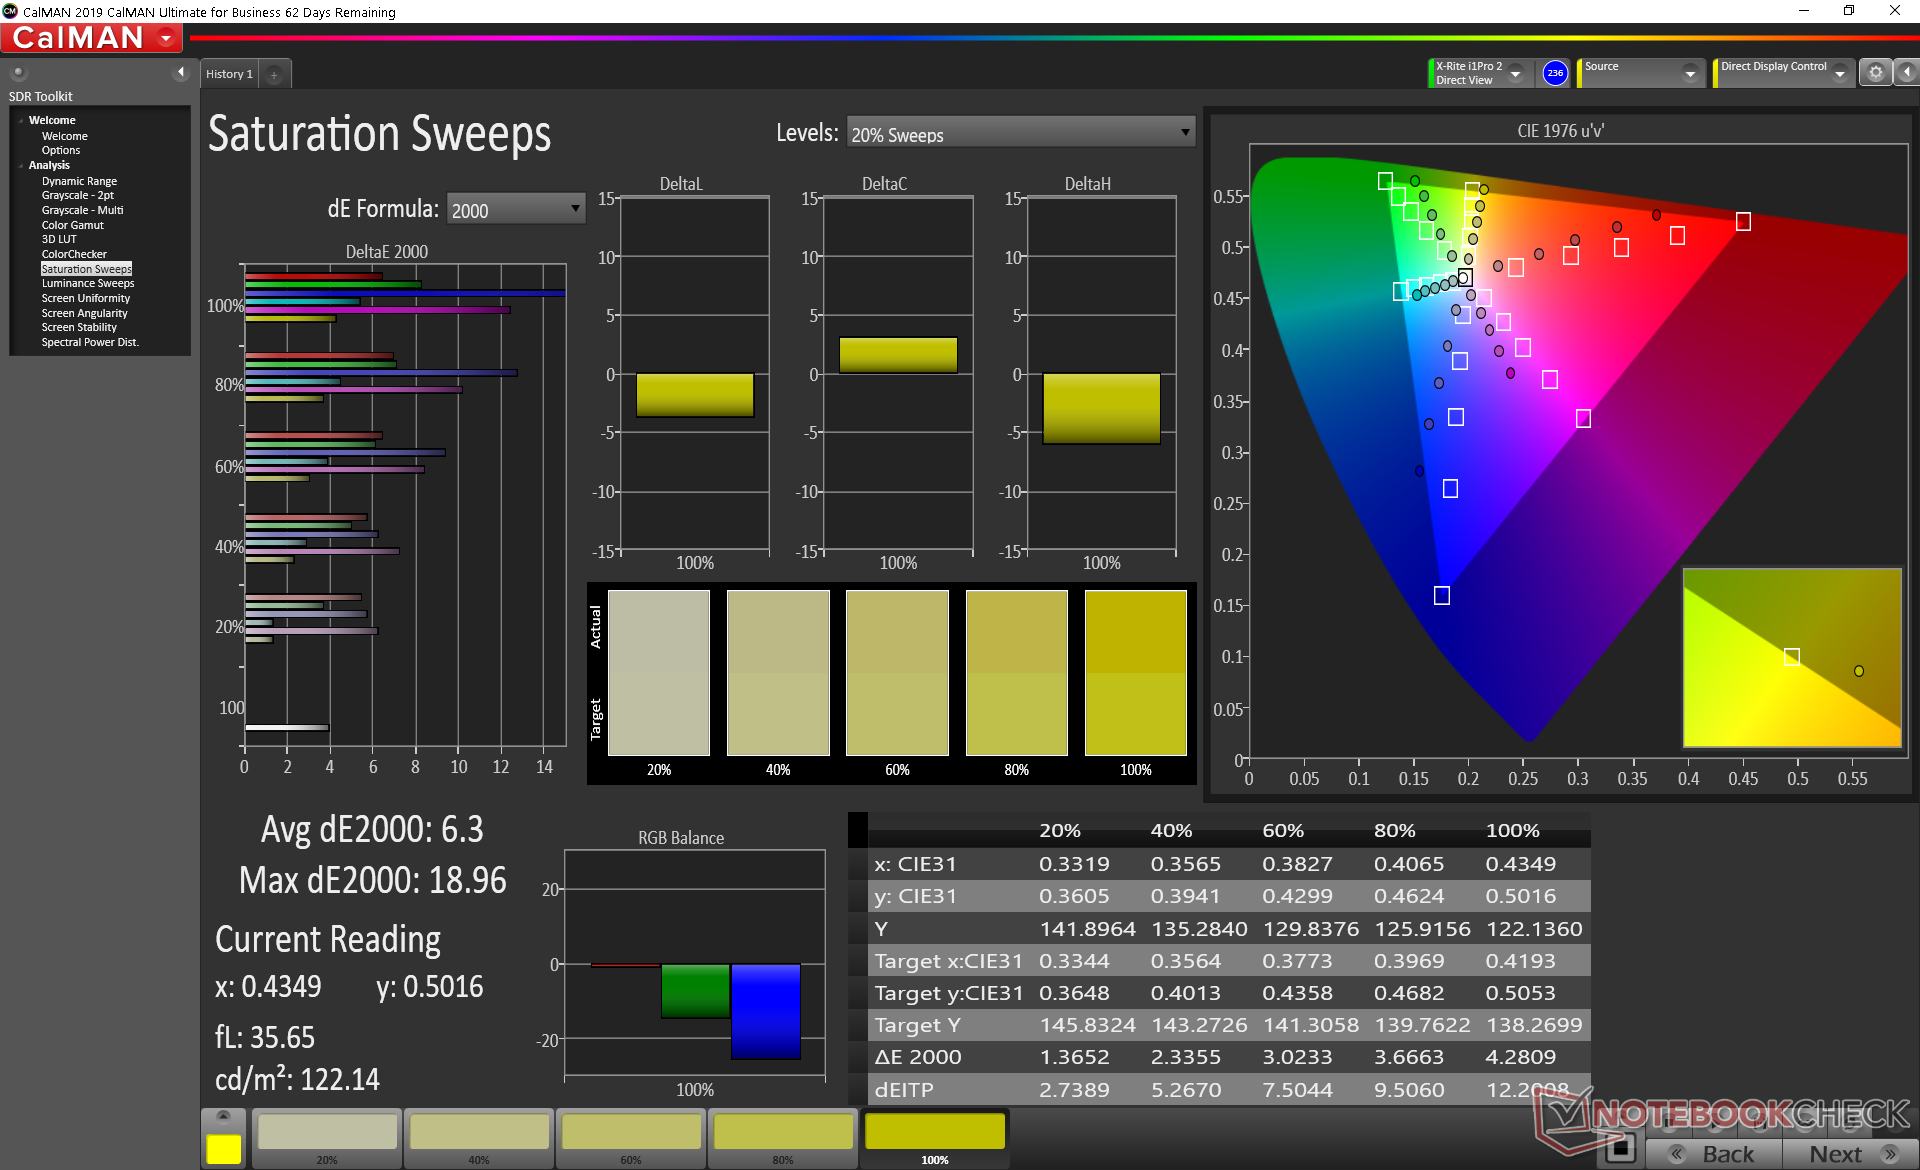
Color space is narrow at just 58 percent of sRGB when most other gaming laptops with the RTX 2060 cover at least 90 percent of sRGB.
X-Rite colorimeter measurements reveal decent grayscale and color DeltaE values of 4.4 and 6.56, respectively. These improve just marginally after calibration because of the narrow color space mentioned above. The color blue is represented least accurately of all the primary and secondary colors.
Display Response Times
| ↔ Response Time Black to White | ||
|---|---|---|
| 20.8 ms ... rise ↗ and fall ↘ combined | ↗ 10.8 ms rise | 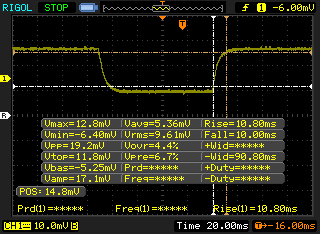 |
| ↘ 10 ms fall | ||
| The screen shows good response rates in our tests, but may be too slow for competitive gamers. In comparison, all tested devices range from 0.1 (minimum) to 240 (maximum) ms. » 46 % of all devices are better. This means that the measured response time is similar to the average of all tested devices (19.9 ms). | ||
| ↔ Response Time 50% Grey to 80% Grey | ||
| 38.4 ms ... rise ↗ and fall ↘ combined | ↗ 18.8 ms rise | 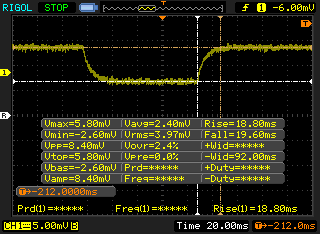 |
| ↘ 19.6 ms fall | ||
| The screen shows slow response rates in our tests and will be unsatisfactory for gamers. In comparison, all tested devices range from 0.165 (minimum) to 636 (maximum) ms. » 57 % of all devices are better. This means that the measured response time is worse than the average of all tested devices (31.1 ms). | ||
Screen Flickering / PWM (Pulse-Width Modulation)
| Screen flickering / PWM not detected | 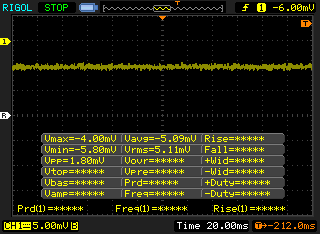 | ||
In comparison: 52 % of all tested devices do not use PWM to dim the display. If PWM was detected, an average of 7798 (minimum: 5 - maximum: 343500) Hz was measured. | |||
Performance
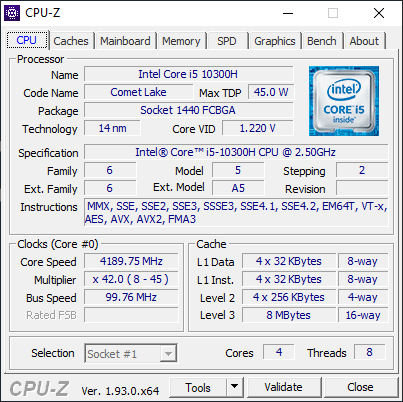
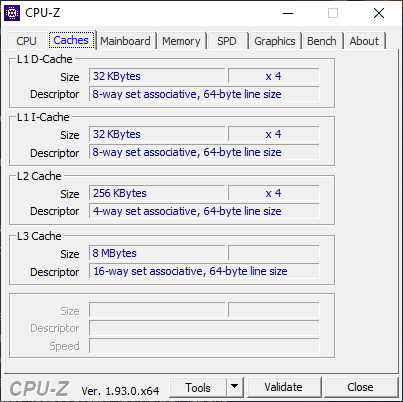
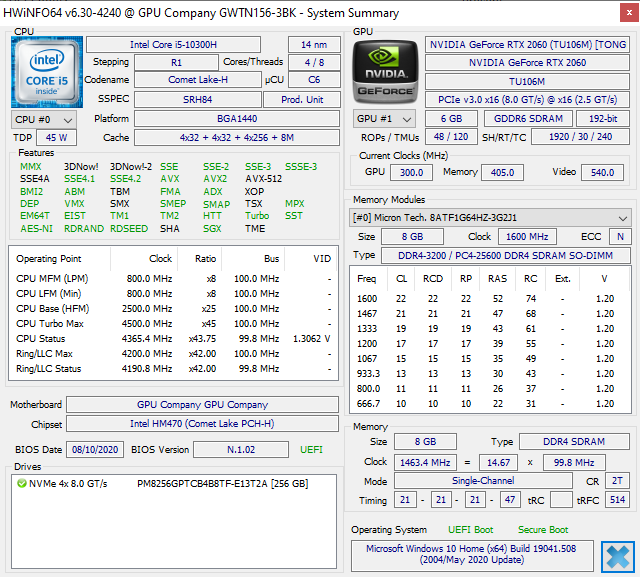
A Core i5-10300H comes standard instead of the more common Core i7-10750H in order to keep prices in check. Though Walmart offers a faster Ryzen 5 4600H CPU option, that particular SKU comes only with the slower GeForce GTX 1650 GPU. In other words, opting for the Intel SKU will give you a slower CPU but a faster GPU while the AMD option will you a faster CPU but a slower GPU.
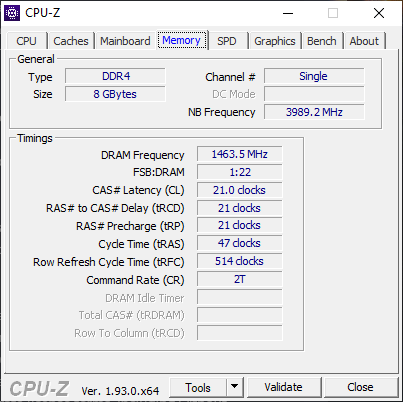
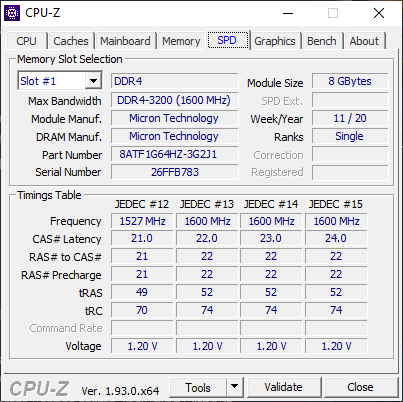
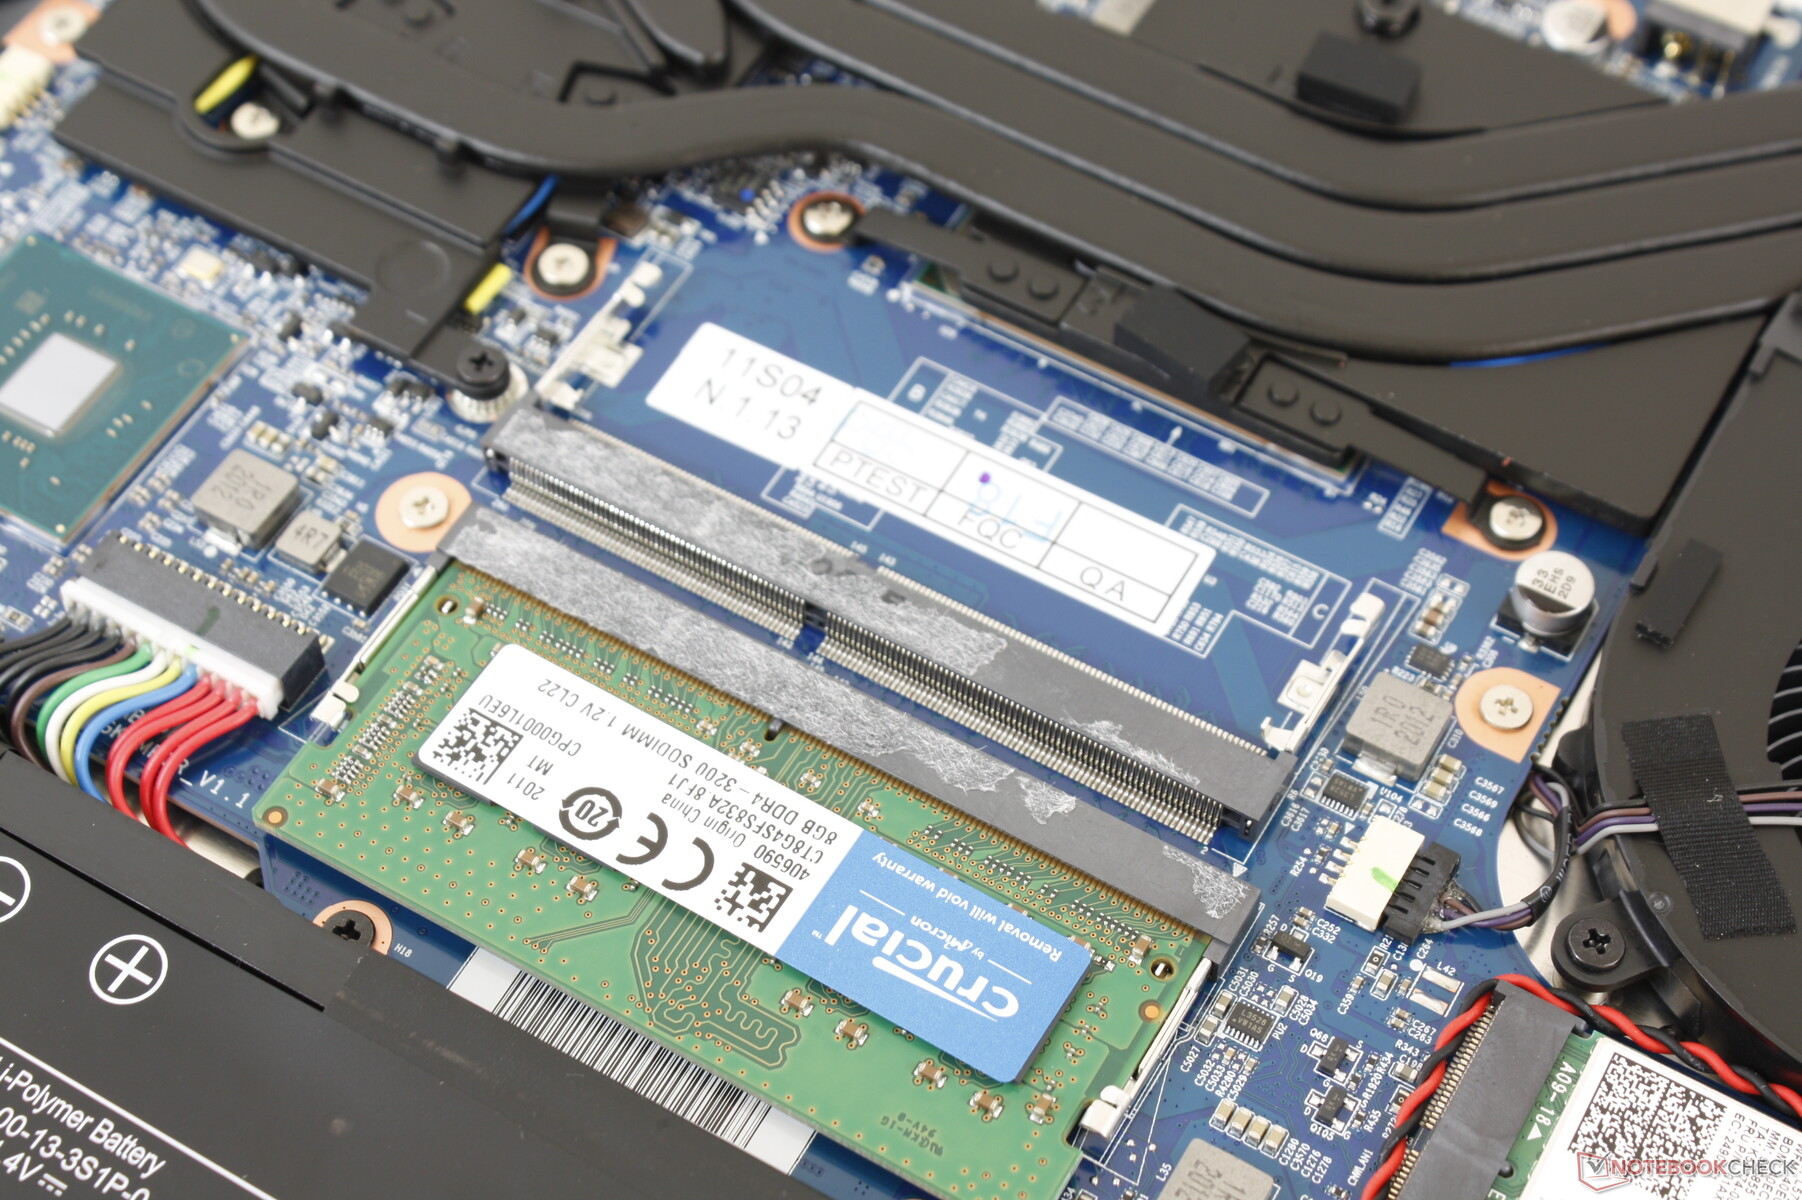
System RAM is just 8 GB of single-channel DDR4-3200 which is expandable up to 32 GB dual-channel.
Processor
CPU performance is where we expect it to be relative to the average Core i5-10300H in our database. Multi-core performance is slower than the Ryzen 5 4600H, Core i7-9750H, and Core i7-10750H since the i5-10300H has fewer cores and threads.
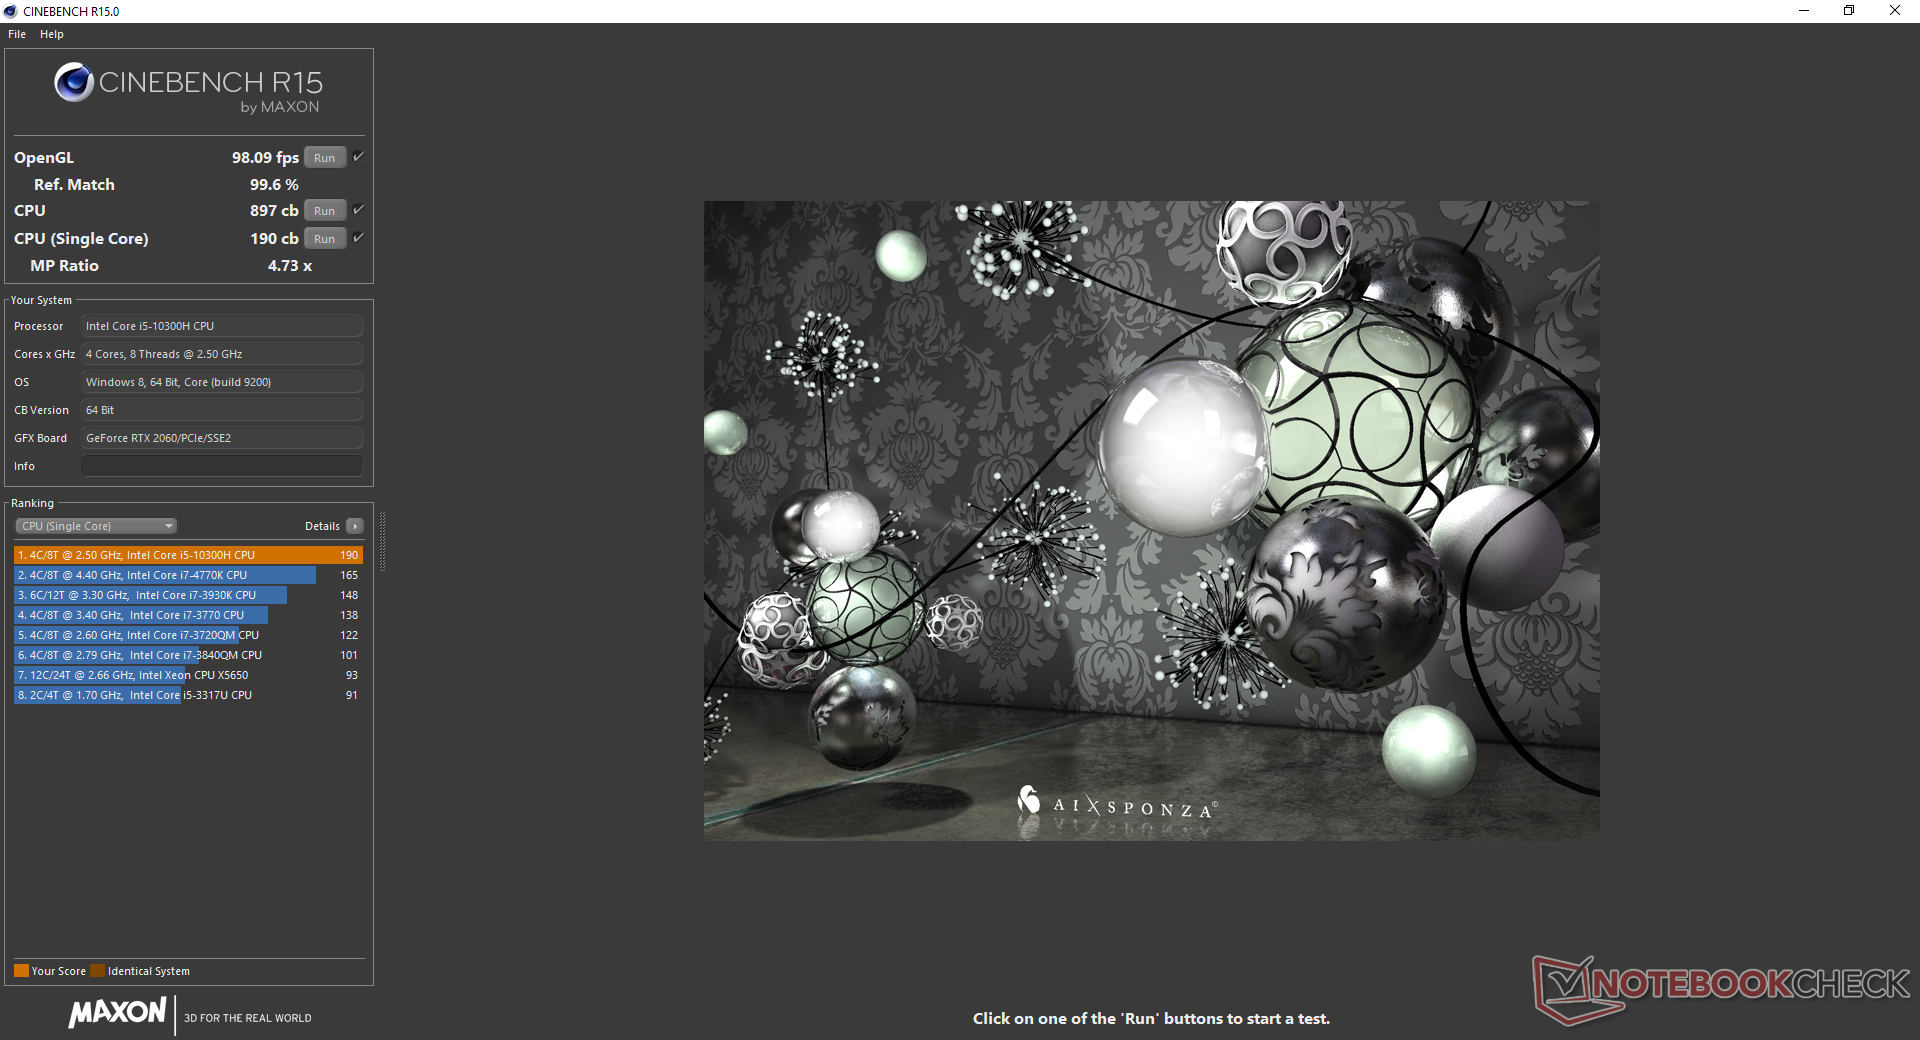
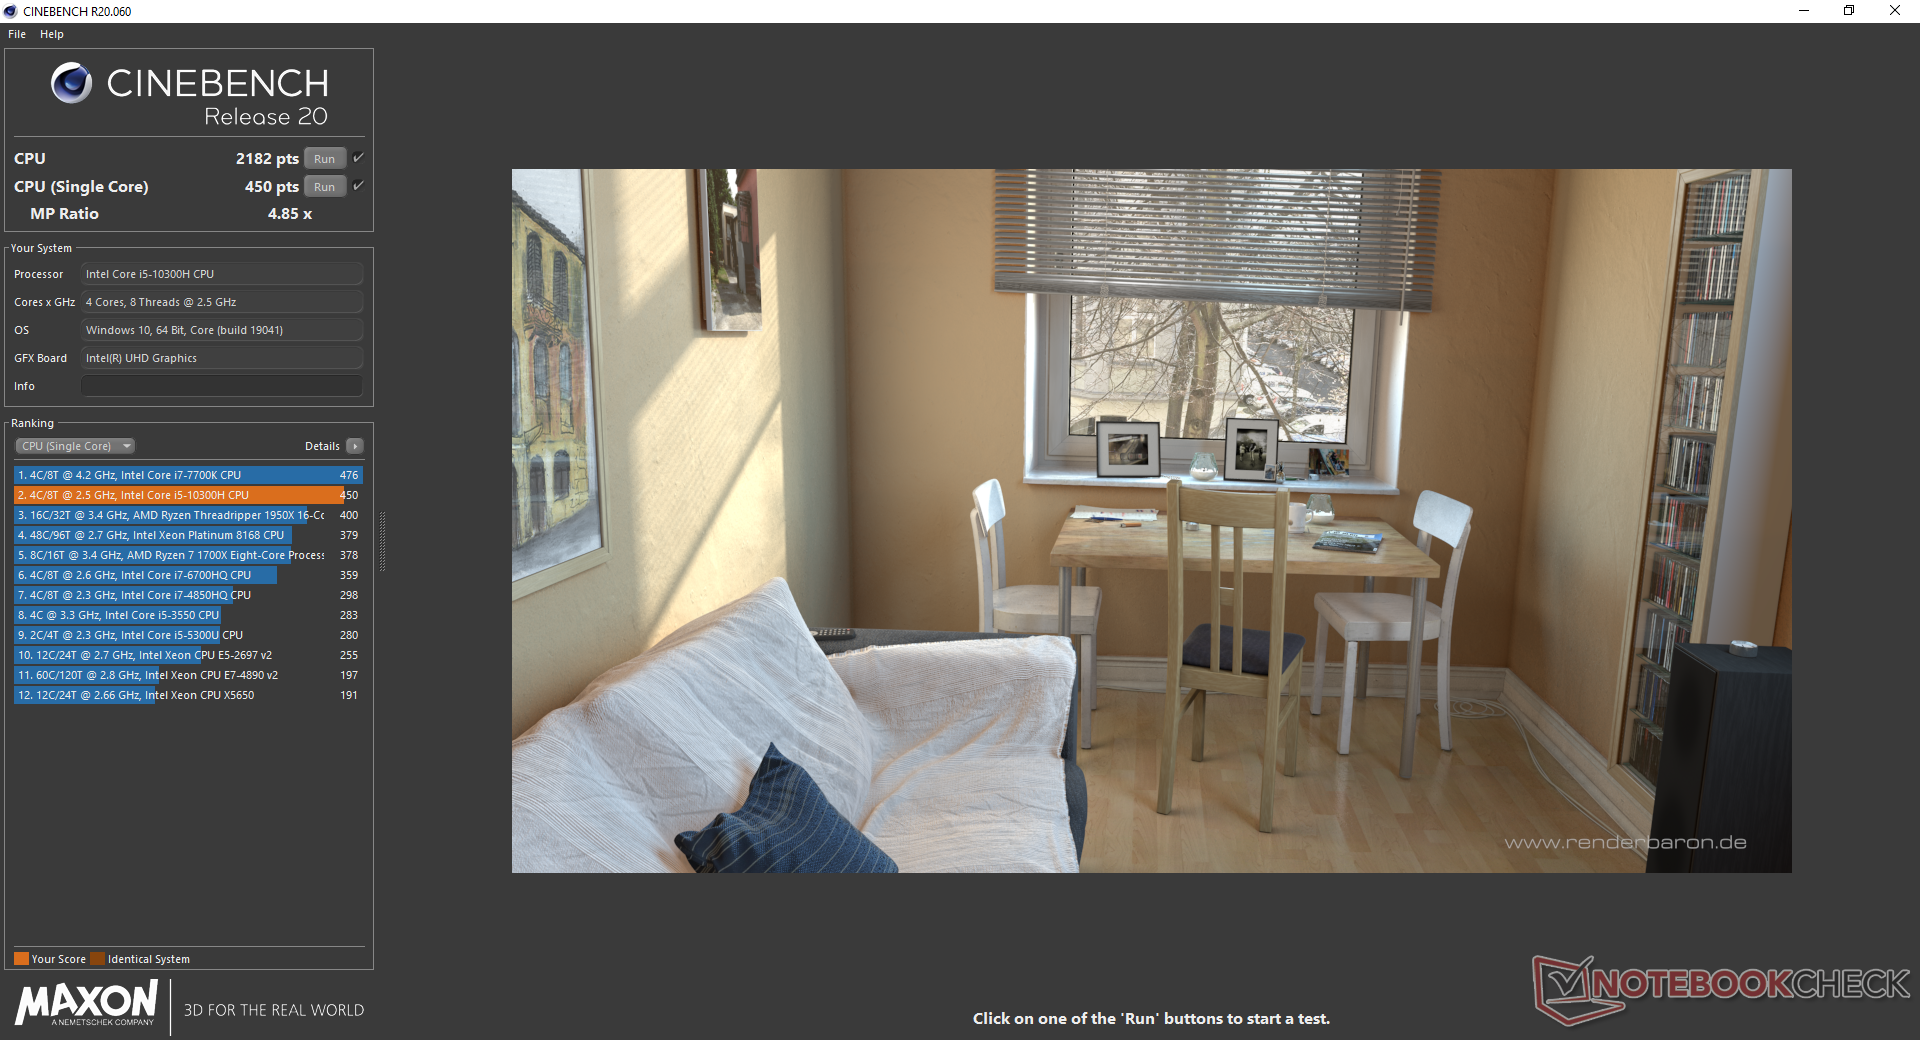
Cinebench R15: CPU Multi 64Bit | CPU Single 64Bit
Blender: v2.79 BMW27 CPU
7-Zip 18.03: 7z b 4 -mmt1 | 7z b 4
Geekbench 5.5: Single-Core | Multi-Core
HWBOT x265 Benchmark v2.2: 4k Preset
LibreOffice : 20 Documents To PDF
R Benchmark 2.5: Overall mean
| Cinebench R20 / CPU (Multi Core) | |
| Schenker XMG Core 15 GK5NR0O | |
| Asus Zephyrus S15 GX502L | |
| MSI GE66 Raider 10SFS | |
| Acer Nitro 5 AN515-44-R5FT | |
| Asus ROG Zephyrus M15 GU502L | |
| Schenker XMG Pro 15 | |
| Gateway Creator Series 15.6 GWTN156-3BK | |
| Average Intel Core i5-10300H (1397 - 2240, n=15) | |
| MSI GF63 Thin 9SC | |
| MSI Alpha 15 A3DDK-034 | |
| Cinebench R20 / CPU (Single Core) | |
| MSI GE66 Raider 10SFS | |
| Schenker XMG Core 15 GK5NR0O | |
| Asus Zephyrus S15 GX502L | |
| Asus ROG Zephyrus M15 GU502L | |
| Average Intel Core i5-10300H (312 - 470, n=15) | |
| Gateway Creator Series 15.6 GWTN156-3BK | |
| Acer Nitro 5 AN515-44-R5FT | |
| Schenker XMG Pro 15 | |
| MSI GF63 Thin 9SC | |
| MSI Alpha 15 A3DDK-034 | |
| Cinebench R15 / CPU Multi 64Bit | |
| Schenker XMG Core 15 GK5NR0O | |
| MSI GE66 Raider 10SFS | |
| Asus Zephyrus S15 GX502L | |
| Acer Nitro 5 AN515-44-R5FT | |
| Asus ROG Zephyrus M15 GU502L | |
| Schenker XMG Pro 15 | |
| Gateway Creator Series 15.6 GWTN156-3BK | |
| Average Intel Core i5-10300H (536 - 921, n=17) | |
| MSI GF63 Thin 9SC | |
| MSI Alpha 15 A3DDK-034 | |
| Cinebench R15 / CPU Single 64Bit | |
| MSI GE66 Raider 10SFS | |
| Asus Zephyrus S15 GX502L | |
| Asus ROG Zephyrus M15 GU502L | |
| Schenker XMG Core 15 GK5NR0O | |
| Acer Nitro 5 AN515-44-R5FT | |
| Gateway Creator Series 15.6 GWTN156-3BK | |
| Schenker XMG Pro 15 | |
| Average Intel Core i5-10300H (108 - 194, n=17) | |
| MSI GF63 Thin 9SC | |
| MSI Alpha 15 A3DDK-034 | |
| Blender / v2.79 BMW27 CPU | |
| Average Intel Core i5-10300H (479 - 555, n=14) | |
| Gateway Creator Series 15.6 GWTN156-3BK | |
| Schenker XMG Pro 15 | |
| Asus ROG Zephyrus M15 GU502L | |
| Acer Nitro 5 AN515-44-R5FT | |
| MSI GE66 Raider 10SFS | |
| Asus Zephyrus S15 GX502L | |
| Schenker XMG Core 15 GK5NR0O | |
| 7-Zip 18.03 / 7z b 4 -mmt1 | |
| MSI GE66 Raider 10SFS | |
| Asus Zephyrus S15 GX502L | |
| Asus ROG Zephyrus M15 GU502L | |
| Average Intel Core i5-10300H (2945 - 4956, n=14) | |
| Schenker XMG Core 15 GK5NR0O | |
| Schenker XMG Pro 15 | |
| Gateway Creator Series 15.6 GWTN156-3BK | |
| Acer Nitro 5 AN515-44-R5FT | |
| 7-Zip 18.03 / 7z b 4 | |
| Schenker XMG Core 15 GK5NR0O | |
| Asus Zephyrus S15 GX502L | |
| MSI GE66 Raider 10SFS | |
| Asus ROG Zephyrus M15 GU502L | |
| Acer Nitro 5 AN515-44-R5FT | |
| Schenker XMG Pro 15 | |
| Average Intel Core i5-10300H (15146 - 24841, n=14) | |
| Gateway Creator Series 15.6 GWTN156-3BK | |
| Geekbench 5.5 / Single-Core | |
| MSI GE66 Raider 10SFS | |
| Asus Zephyrus S15 GX502L | |
| Asus ROG Zephyrus M15 GU502L | |
| Schenker XMG Core 15 GK5NR0O | |
| Average Intel Core i5-10300H (703 - 1241, n=16) | |
| Schenker XMG Pro 15 | |
| Acer Nitro 5 AN515-44-R5FT | |
| Gateway Creator Series 15.6 GWTN156-3BK | |
| MSI Alpha 15 A3DDK-034 | |
| Geekbench 5.5 / Multi-Core | |
| MSI GE66 Raider 10SFS | |
| Asus Zephyrus S15 GX502L | |
| Schenker XMG Core 15 GK5NR0O | |
| Asus ROG Zephyrus M15 GU502L | |
| Schenker XMG Pro 15 | |
| Acer Nitro 5 AN515-44-R5FT | |
| Average Intel Core i5-10300H (2783 - 4728, n=16) | |
| Gateway Creator Series 15.6 GWTN156-3BK | |
| MSI Alpha 15 A3DDK-034 | |
| HWBOT x265 Benchmark v2.2 / 4k Preset | |
| Asus Zephyrus S15 GX502L | |
| MSI GE66 Raider 10SFS | |
| Schenker XMG Core 15 GK5NR0O | |
| Asus ROG Zephyrus M15 GU502L | |
| Acer Nitro 5 AN515-44-R5FT | |
| Schenker XMG Pro 15 | |
| Average Intel Core i5-10300H (6.13 - 7.78, n=14) | |
| Gateway Creator Series 15.6 GWTN156-3BK | |
| LibreOffice / 20 Documents To PDF | |
| Acer Nitro 5 AN515-44-R5FT | |
| Schenker XMG Core 15 GK5NR0O | |
| Average Intel Core i5-10300H (23.9 - 94, n=14) | |
| Asus ROG Zephyrus M15 GU502L | |
| Gateway Creator Series 15.6 GWTN156-3BK | |
| MSI GE66 Raider 10SFS | |
| Asus Zephyrus S15 GX502L | |
| R Benchmark 2.5 / Overall mean | |
| Gateway Creator Series 15.6 GWTN156-3BK | |
| Average Intel Core i5-10300H (0.625 - 1.088, n=14) | |
| Schenker XMG Pro 15 | |
| Asus ROG Zephyrus M15 GU502L | |
| Acer Nitro 5 AN515-44-R5FT | |
| Asus Zephyrus S15 GX502L | |
| Schenker XMG Core 15 GK5NR0O | |
| MSI GE66 Raider 10SFS | |
* ... smaller is better
System Performance
PCMark results are lower than many Core i7 gaming laptops due to the Core i5 CPU, 8 GB of single-channel RAM, and entry-level NVMe SSD. Even so, the differences are mostly small.
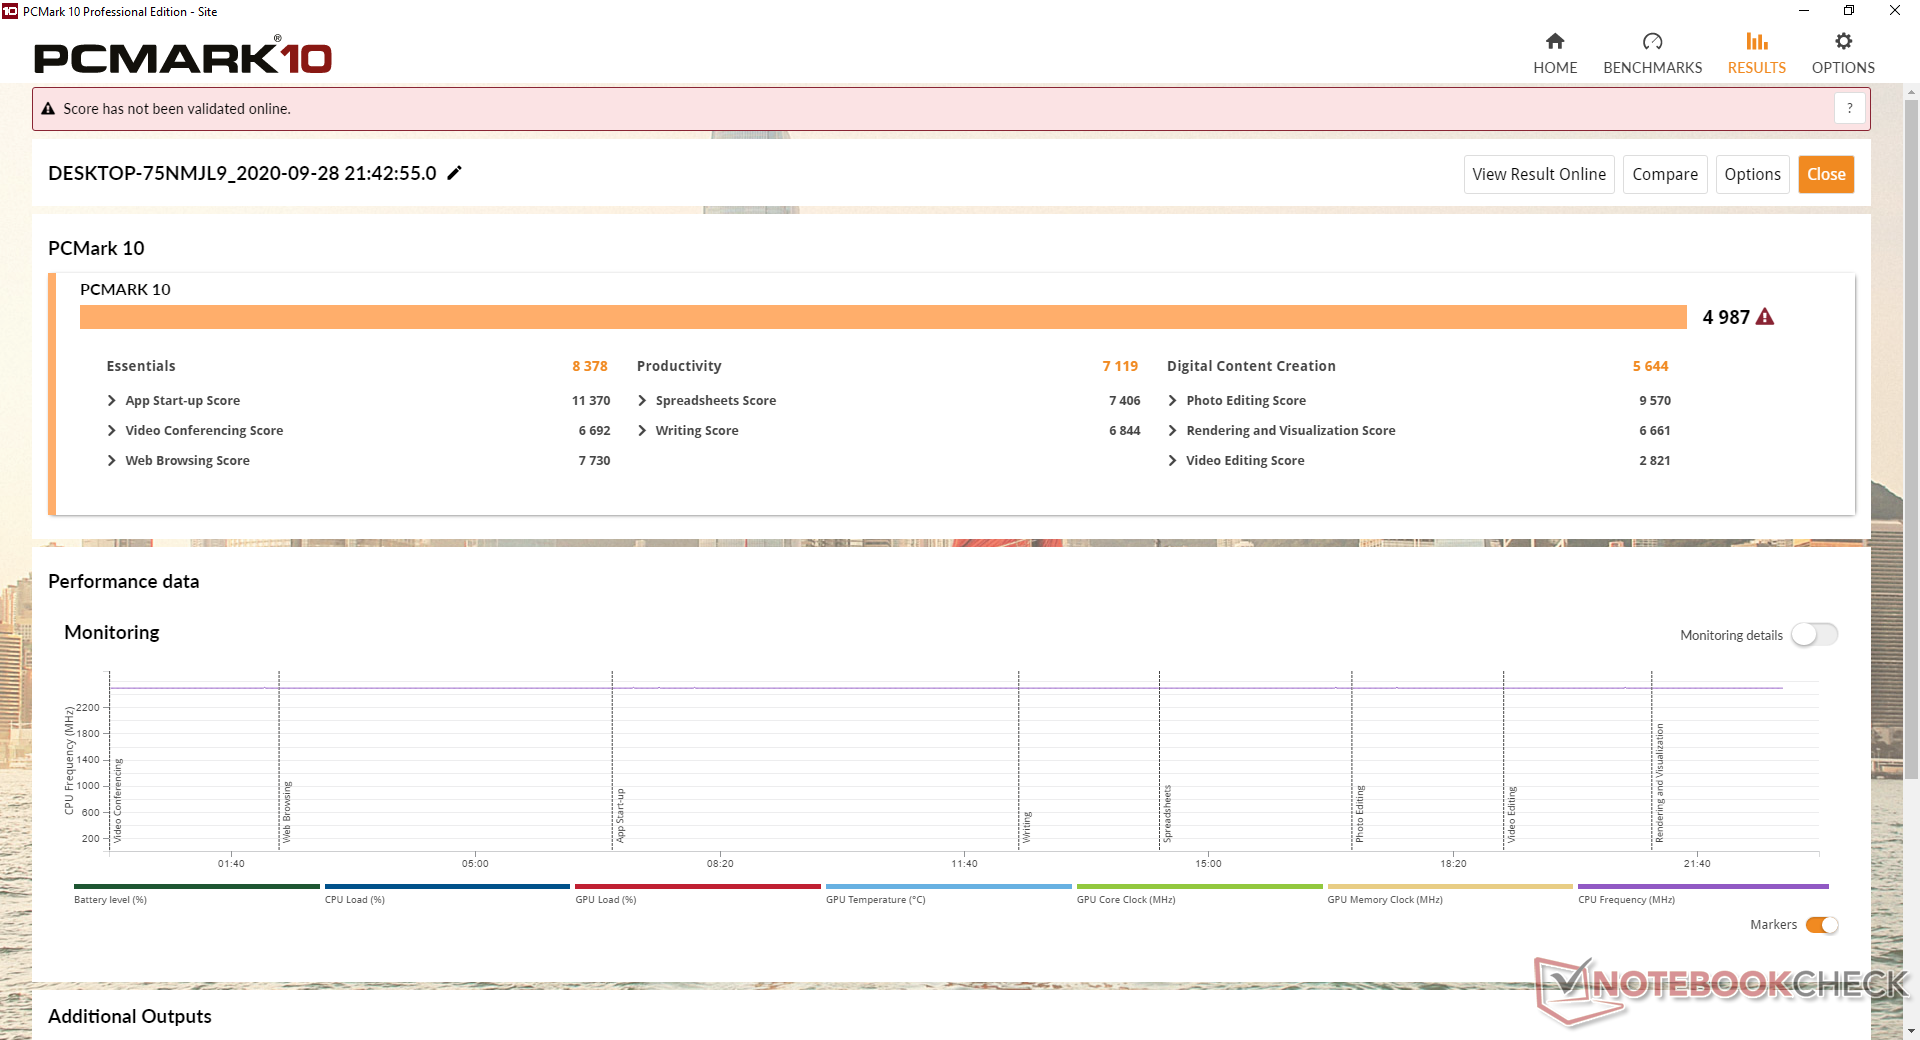
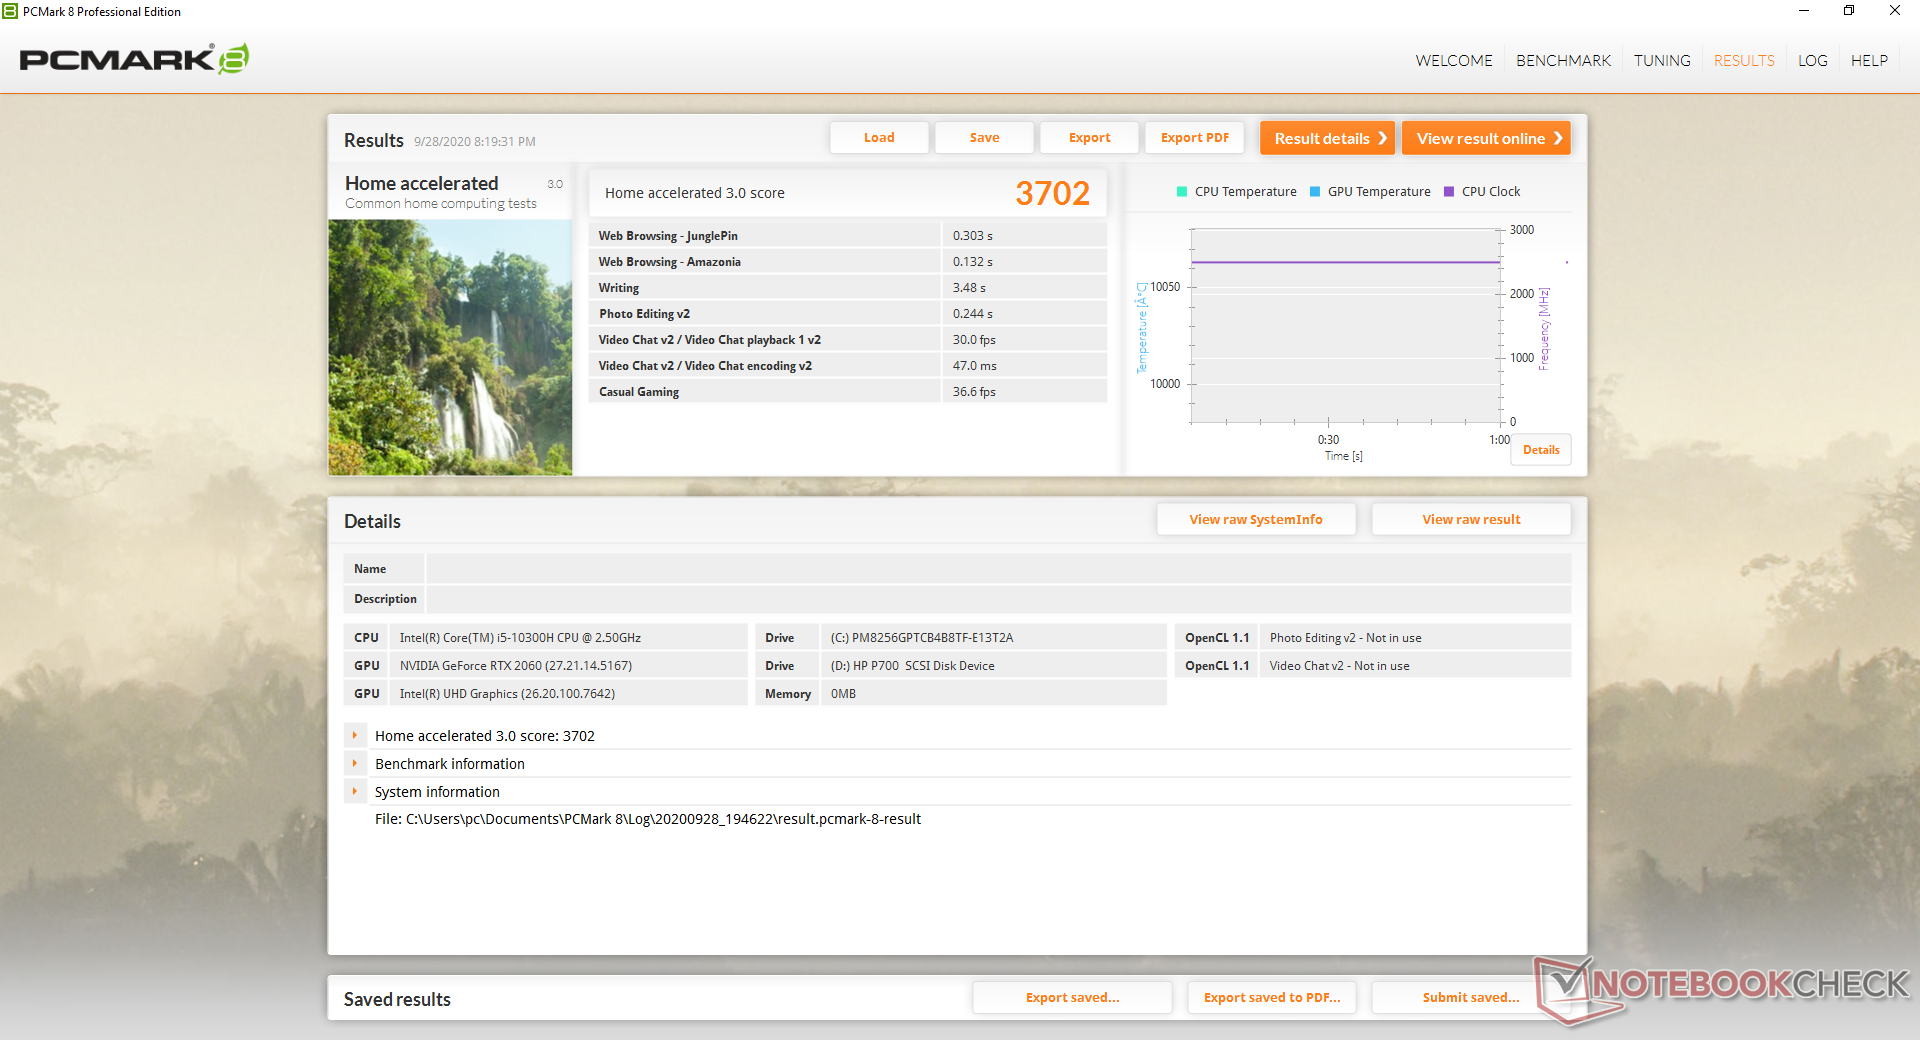
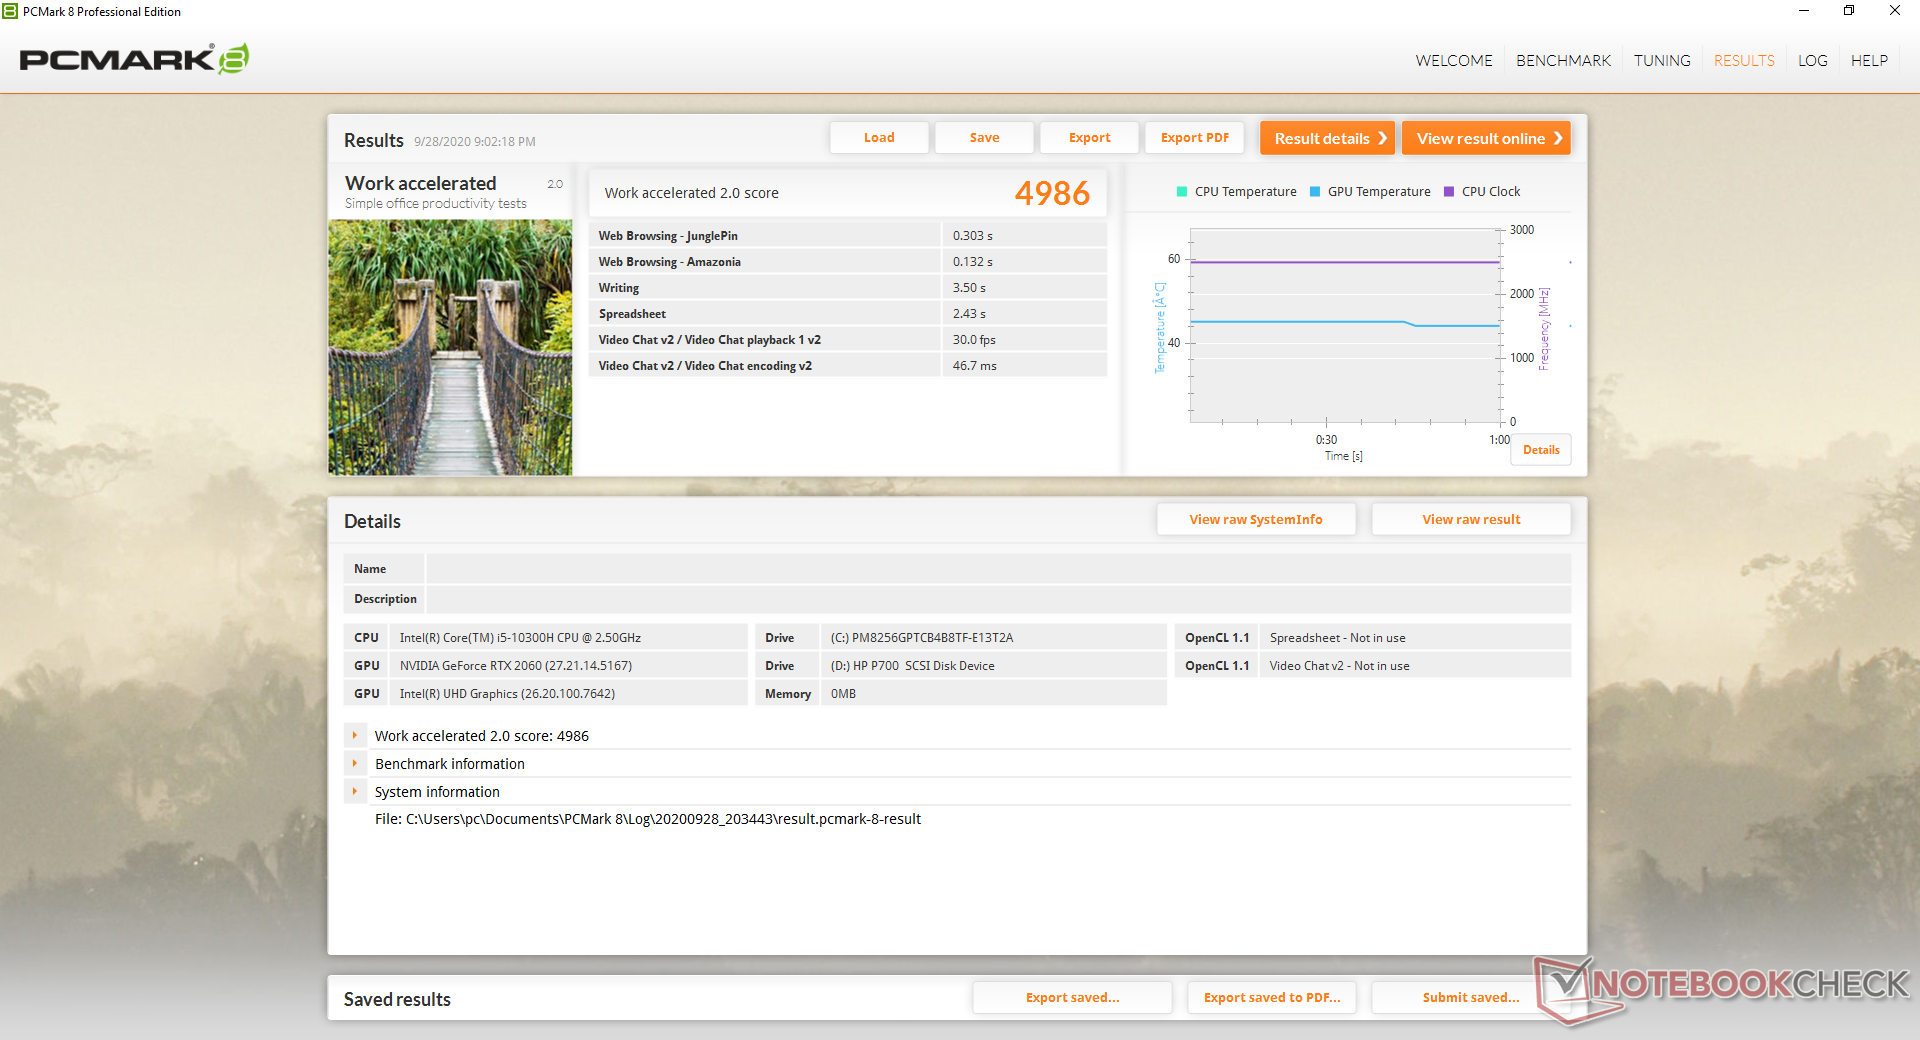
| PCMark 8 Home Score Accelerated v2 | 3702 points | |
| PCMark 8 Work Score Accelerated v2 | 4986 points | |
| PCMark 10 Score | 4987 points | |
Help | ||
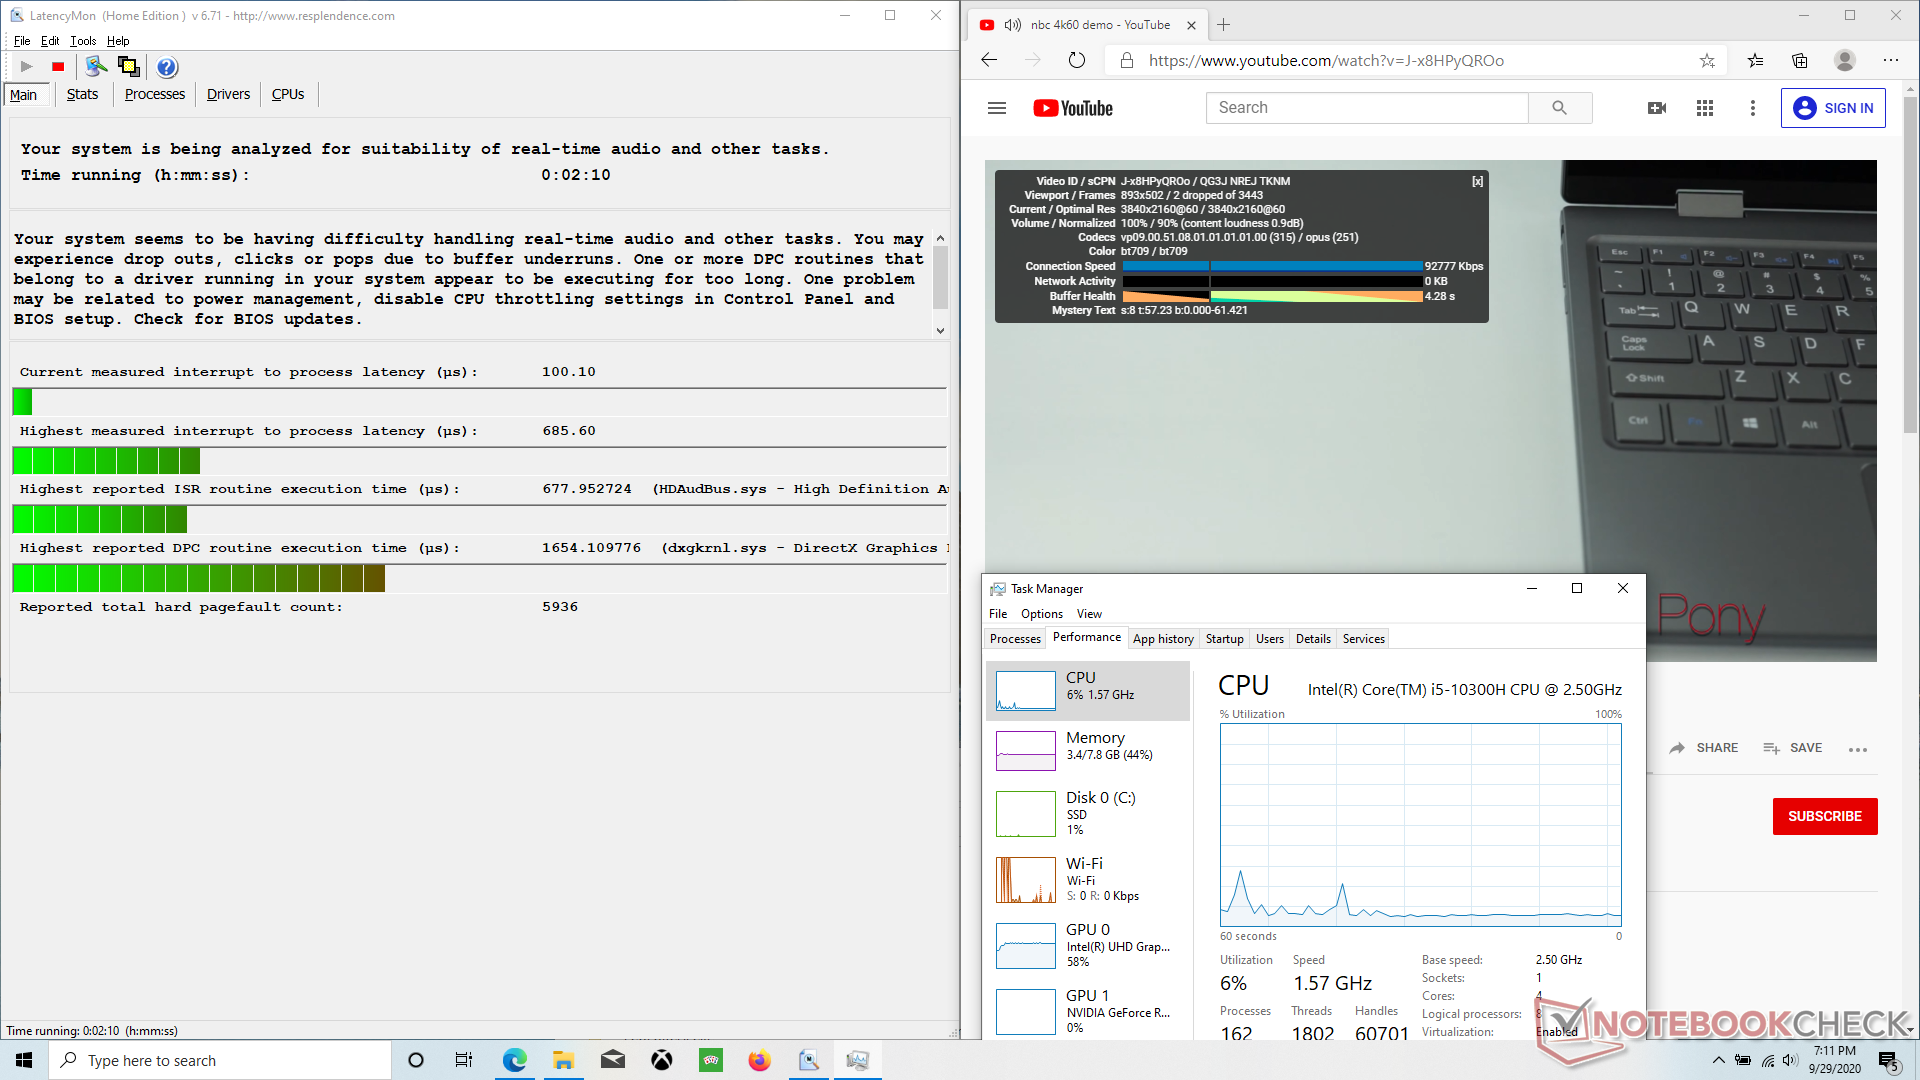
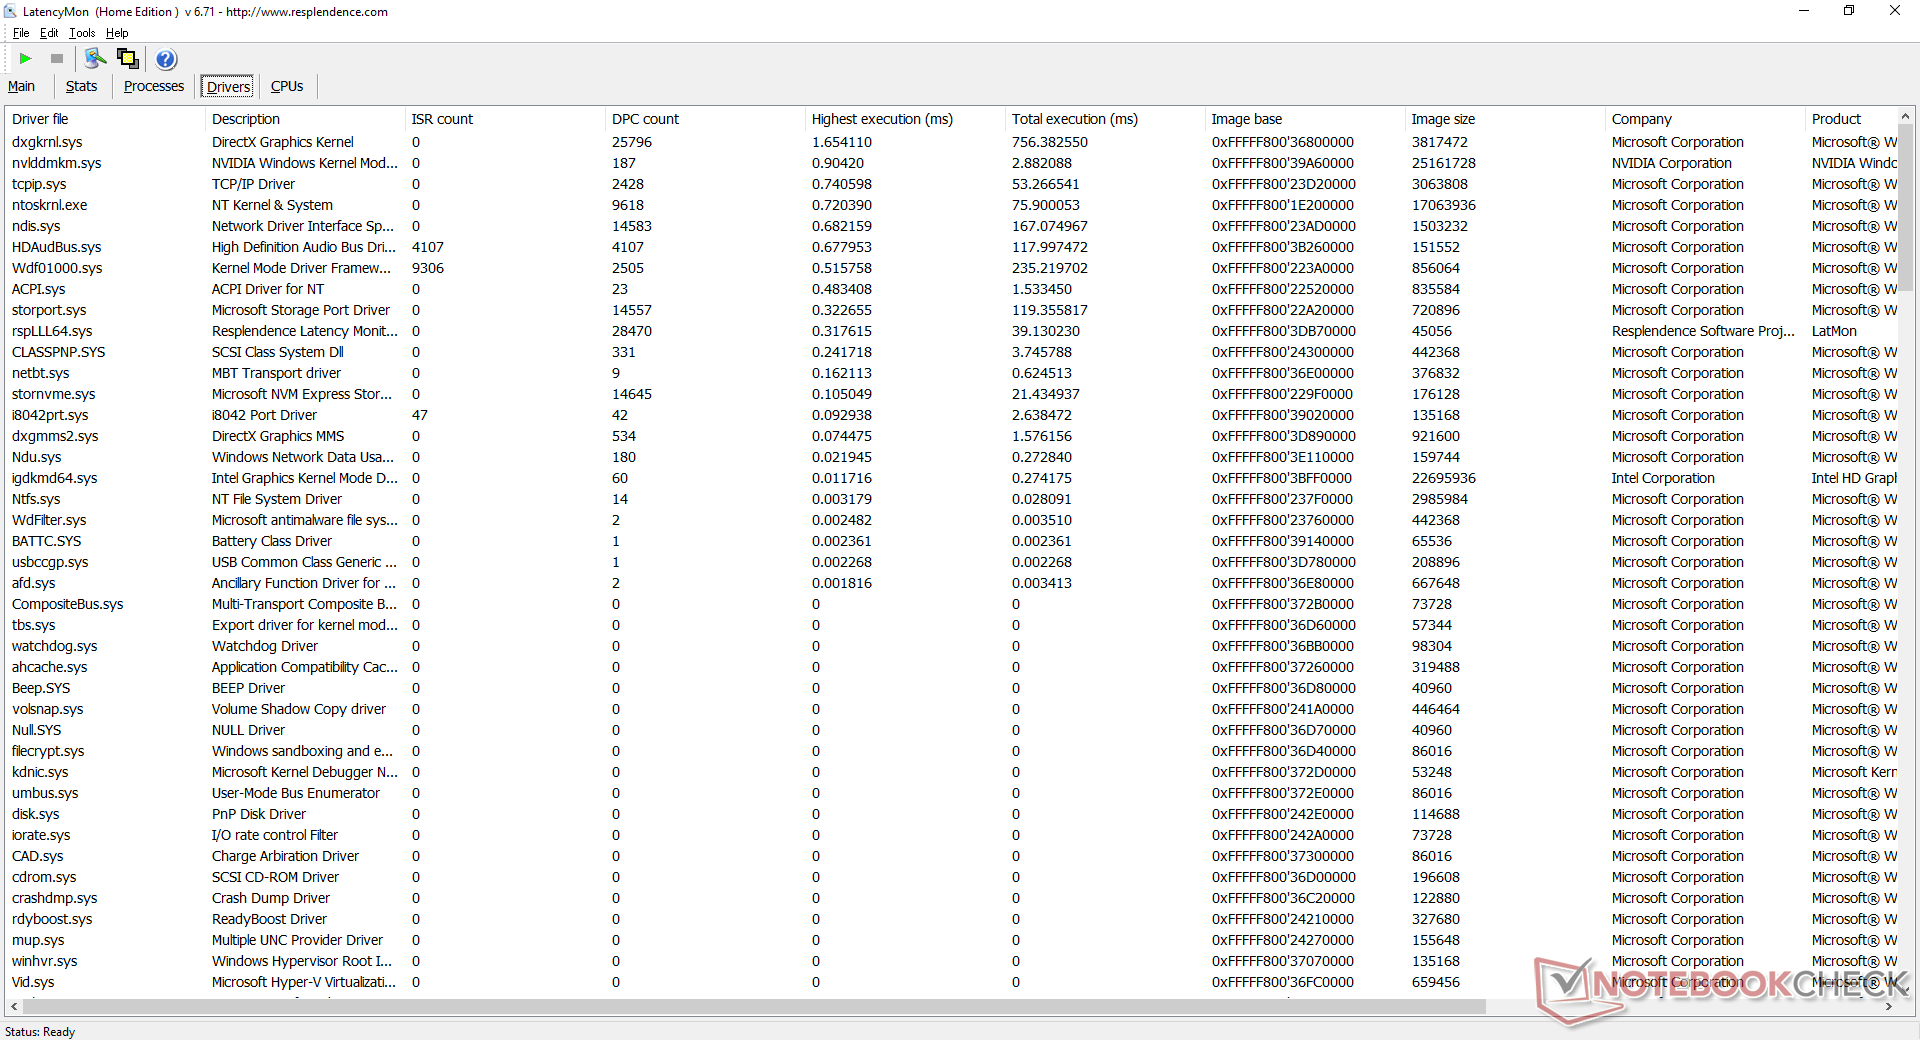
DPC Latency
LatencyMon shows DPC latency issues when opening multiple tabs on our homepage. 4K UHD video playback at 60 FPS is otherwise smooth with just two dropped frames during our minute-long YouTube test.
| DPC Latencies / LatencyMon - interrupt to process latency (max), Web, Youtube, Prime95 | |
| HP Omen 15-ek0456ng | |
| Schenker XMG Core 15 GK5NR0O | |
| Gateway Creator Series 15.6 GWTN156-3BK | |
| Aorus 5 KB | |
| Asus ROG Zephyrus G15 GA502IU-ES76 | |
* ... smaller is better
Storage Devices
The 256 GB capacity is small especially for a laptop catered towards gamers and content creators. Additionally, the system uses a slower NVMe SSD from Phison instead of pricier Samsung or Intel solutions.
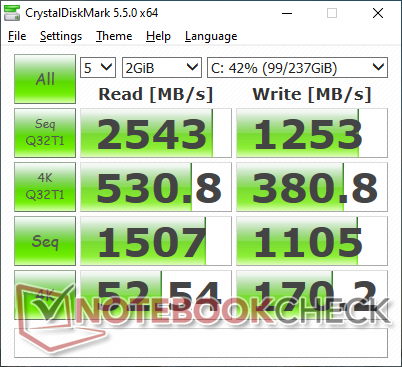
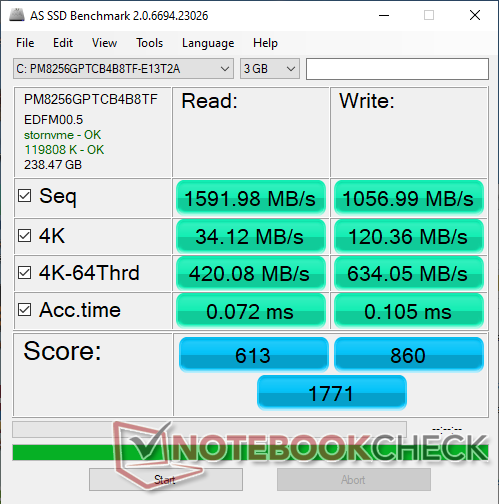

| Gateway Creator Series 15.6 GWTN156-3BK Phison PS5013 PM8256GPTCB4B8TF | Schenker XMG Core 15 GK5NR0O Samsung SSD 970 EVO Plus 500GB | Asus ROG Zephyrus G15 GA502IU-ES76 Intel SSD 660p 1TB SSDPEKNW010T8 | Razer Blade 15 GTX 1660 Ti Samsung SSD PM981 MZVLB256HAHQ | Dell G3 15 3500-G4DG2 SK Hynix BC511 HFM512GDJTNI | |
|---|---|---|---|---|---|
| AS SSD | 114% | 23% | 42% | 16% | |
| Seq Read (MB/s) | 1592 | 2836 78% | 1197 -25% | 1829 15% | 1305 -18% |
| Seq Write (MB/s) | 1057 | 2452 132% | 1637 55% | 1315 24% | 767 -27% |
| 4K Read (MB/s) | 34.12 | 60.4 77% | 56.3 65% | 51.3 50% | 41.84 23% |
| 4K Write (MB/s) | 120.4 | 190.5 58% | 159 32% | 106 -12% | 90.1 -25% |
| 4K-64 Read (MB/s) | 410.1 | 1283 213% | 583 42% | 917 124% | 773 88% |
| 4K-64 Write (MB/s) | 634 | 2298 262% | 838 32% | 1212 91% | 711 12% |
| Access Time Read * (ms) | 0.072 | 0.034 53% | 0.062 14% | 0.063 12% | 0.09 -25% |
| Access Time Write * (ms) | 0.105 | 0.02 81% | 0.128 -22% | 0.104 1% | 0.04 62% |
| Score Read (Points) | 613 | 1627 165% | 759 24% | 1152 88% | 945 54% |
| Score Write (Points) | 860 | 2734 218% | 1160 35% | 1450 69% | 878 2% |
| Score Total (Points) | 1771 | 5184 193% | 2350 33% | 3177 79% | 2290 29% |
| Copy ISO MB/s (MB/s) | 1255 | 2039 62% | 1376 10% | 1539 23% | |
| Copy Program MB/s (MB/s) | 508 | 438 -14% | 568 12% | 513 1% | |
| Copy Game MB/s (MB/s) | 986 | 1137 15% | 1180 20% | 1150 17% | |
| CrystalDiskMark 5.2 / 6 | 70% | 17% | 8% | -18% | |
| Write 4K (MB/s) | 170.2 | 233 37% | 189.6 11% | 135 -21% | 99.6 -41% |
| Read 4K (MB/s) | 52.5 | 54.5 4% | 61.7 18% | 41.1 -22% | 38.8 -26% |
| Write Seq (MB/s) | 1105 | 3050 176% | 1730 57% | 1427 29% | 1117 1% |
| Read Seq (MB/s) | 1507 | 3042 102% | 1620 7% | 1494 -1% | 1030 -32% |
| Write 4K Q32T1 (MB/s) | 380.8 | 520 37% | 474.2 25% | 494.9 30% | 445.2 17% |
| Read 4K Q32T1 (MB/s) | 531 | 546 3% | 528 -1% | 578 9% | 331.8 -38% |
| Write Seq Q32T1 (MB/s) | 1253 | 3241 159% | 1795 43% | 1417 13% | 1102 -12% |
| Read Seq Q32T1 (MB/s) | 2543 | 3538 39% | 1880 -26% | 3251 28% | 2227 -12% |
| Total Average (Program / Settings) | 92% /
98% | 20% /
21% | 25% /
29% | -1% /
2% |
* ... smaller is better

Disk Throttling: DiskSpd Read Loop, Queue Depth 8
GPU Performance
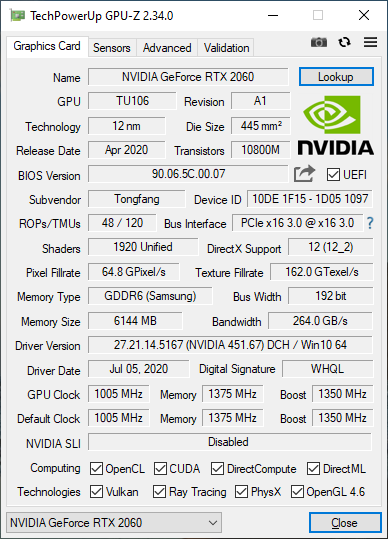
The mobile GeForce RTX 2060 is still one hell of a GPU even if it may be 15 to 25 percent slower than the desktop RTX 2060. Performance deficits from the limited 8 GB of system RAM and Core i5 CPU is minor to moderate when running most games that are GPU bound.
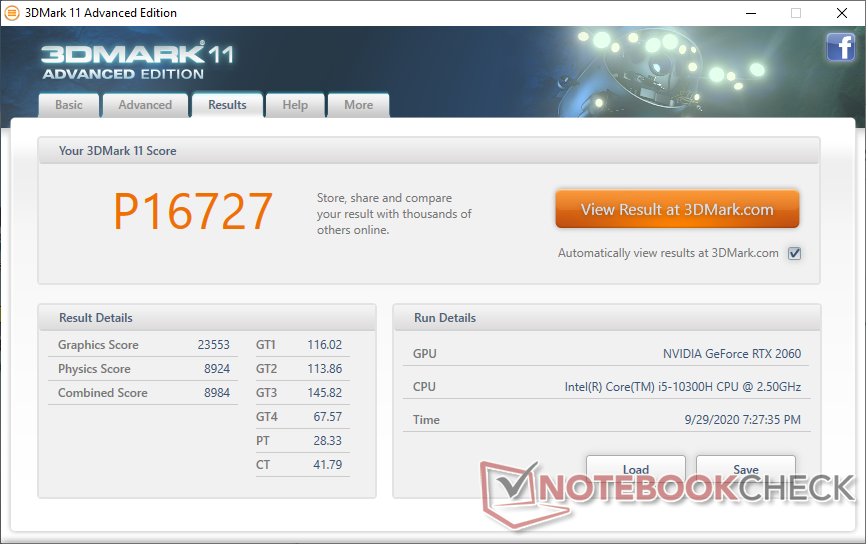
| 3DMark 11 Performance | 16727 points | |
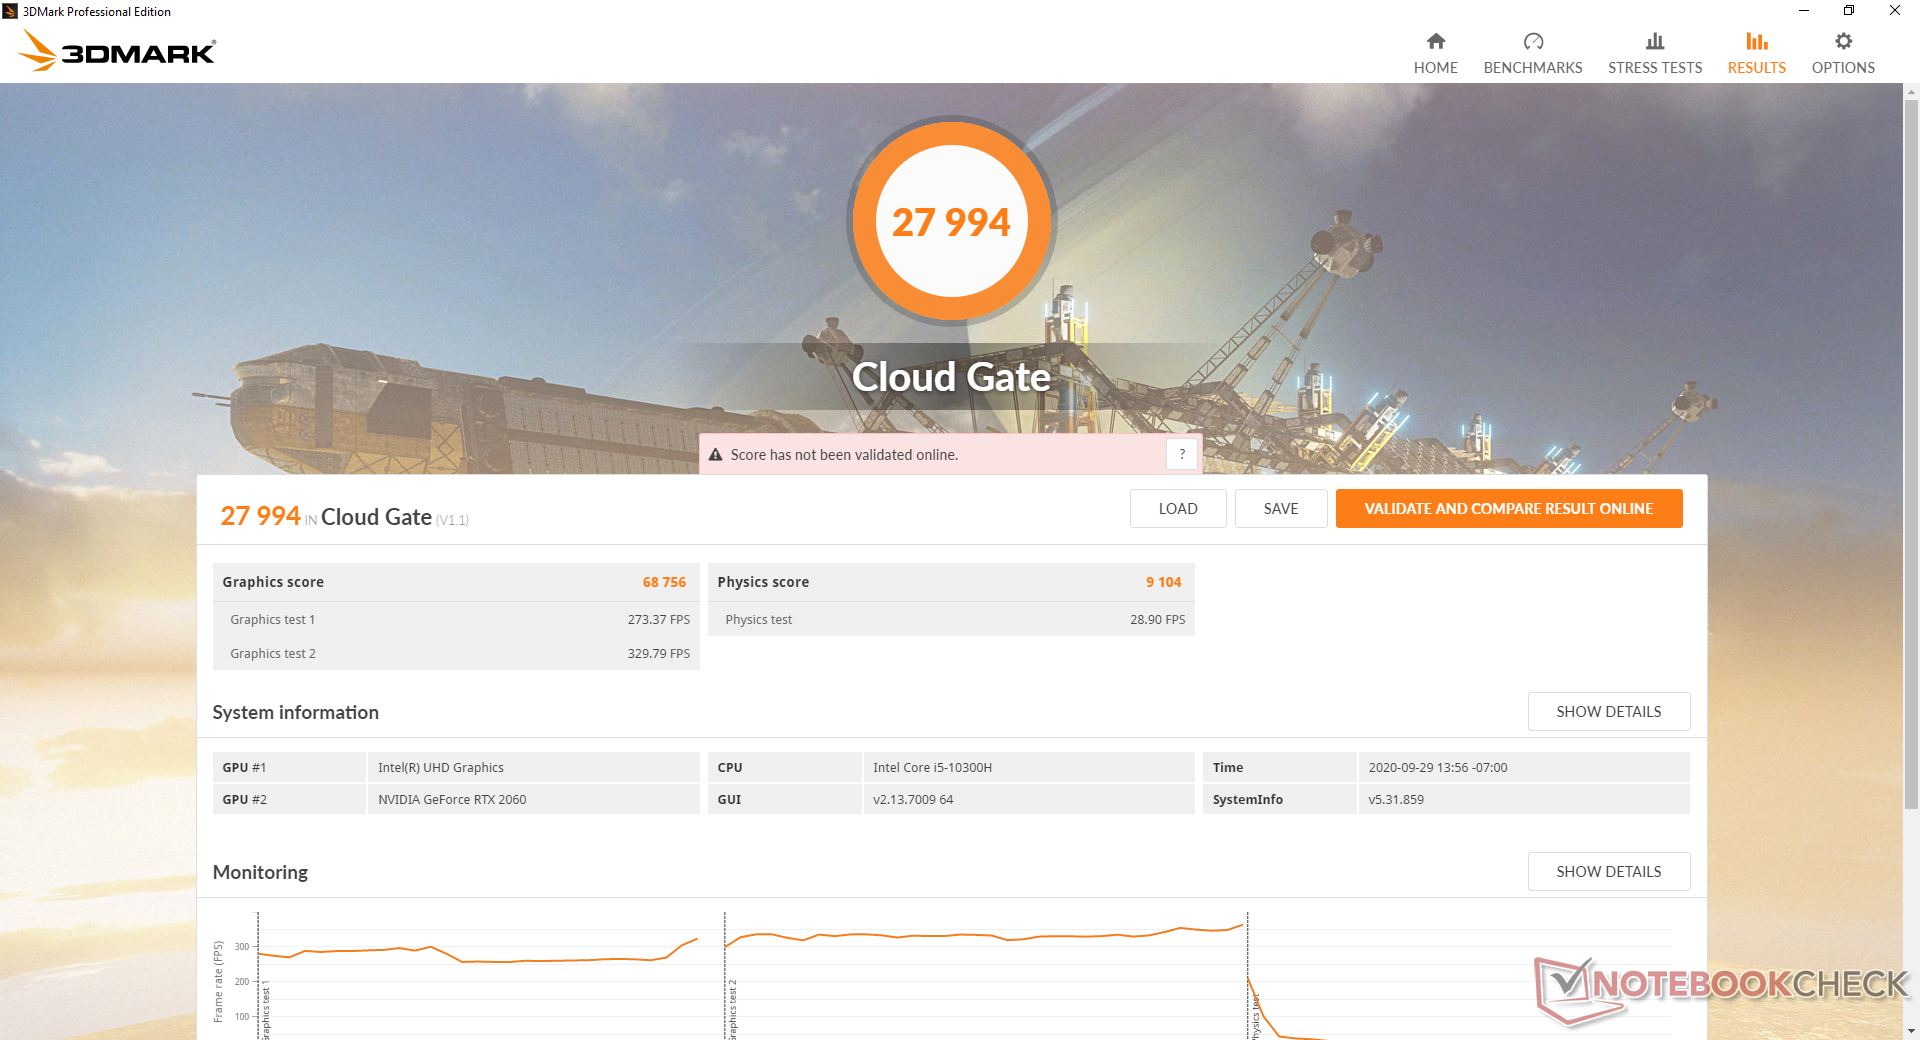
| 3DMark Cloud Gate Standard Score | 27994 points | |
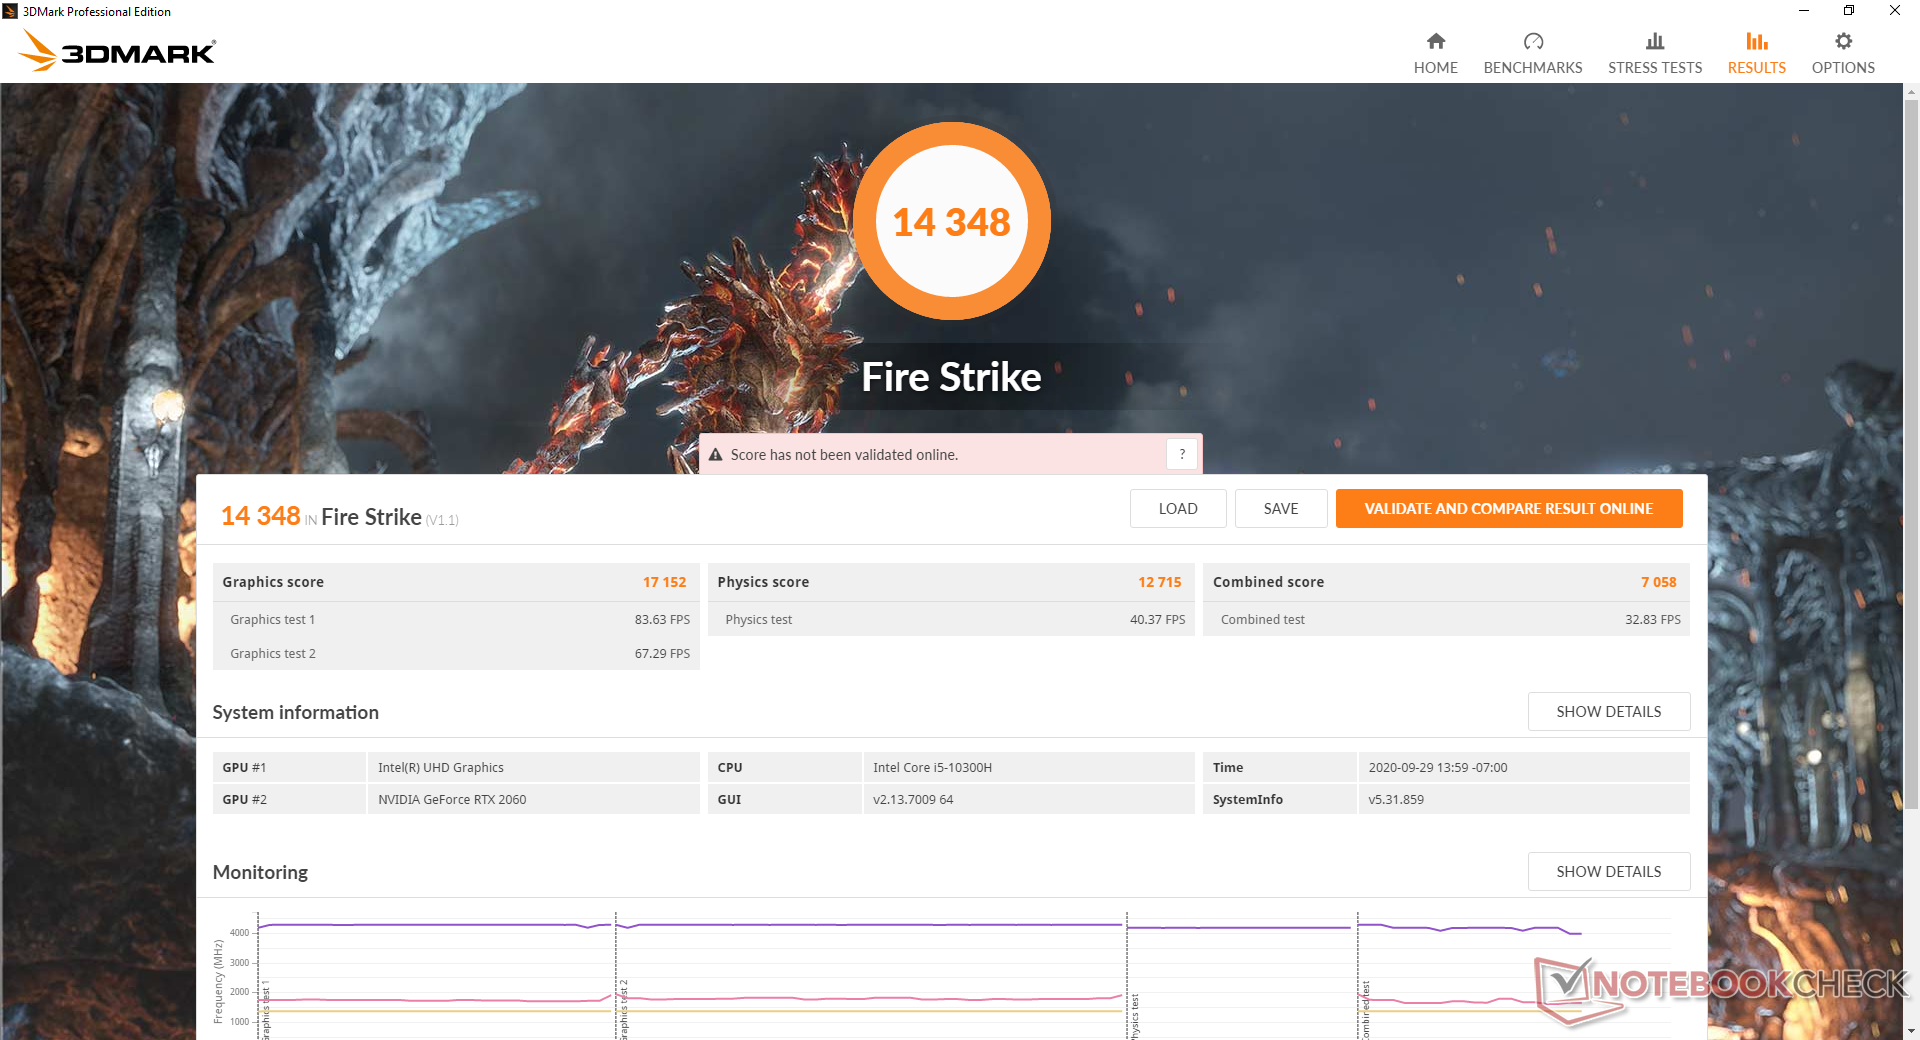
| 3DMark Fire Strike Score | 14348 points | |
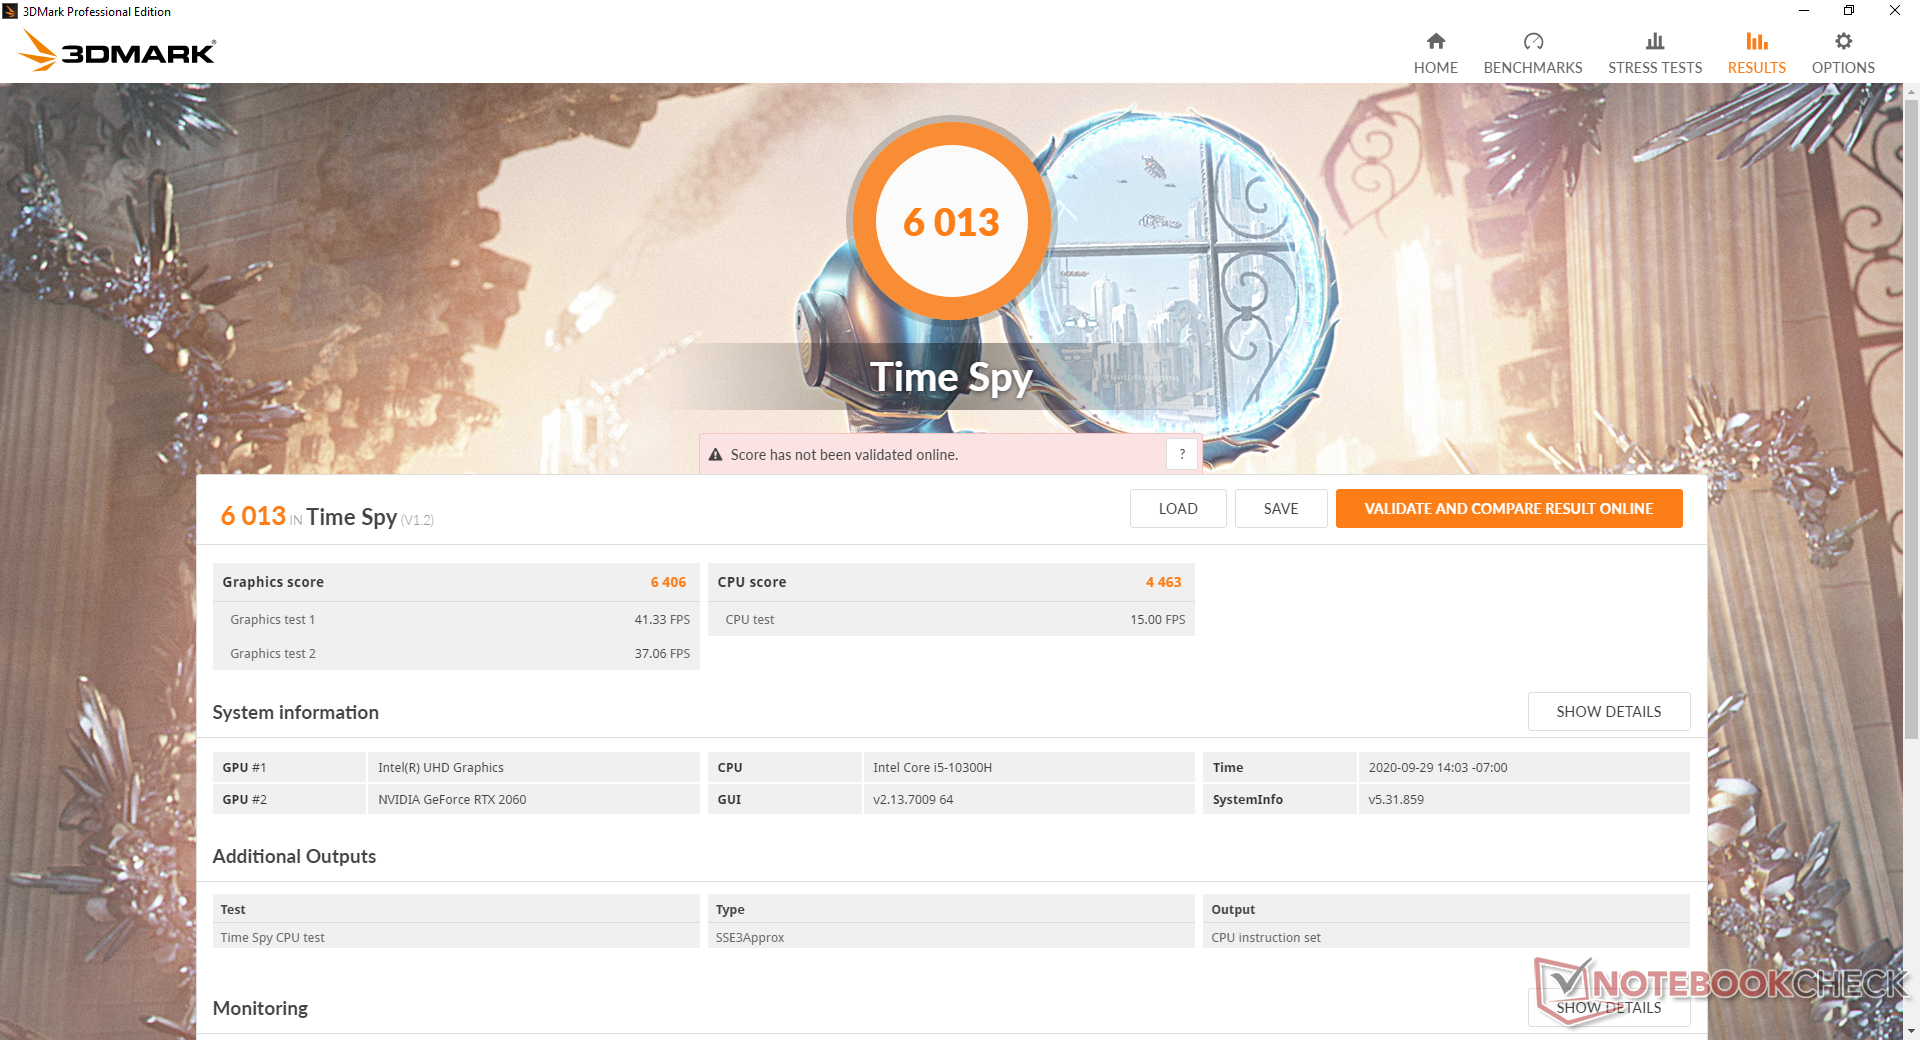
| 3DMark Time Spy Score | 6013 points | |
Help | ||
| low | med. | high | ultra | |
|---|---|---|---|---|
| GTA V (2015) | 153 | 133 | 94.5 | 60 |
| The Witcher 3 (2015) | 194 | 159.1 | 111 | 63.2 |
| Dota 2 Reborn (2015) | 117 | 107 | 93.3 | 88.3 |
| Final Fantasy XV Benchmark (2018) | 98.4 | 74 | 60 | |
| X-Plane 11.11 (2018) | 75.8 | 63.5 | 56 | |
| Strange Brigade (2018) | 236 | 149 | 122 | 104 |
Emissions
System Noise
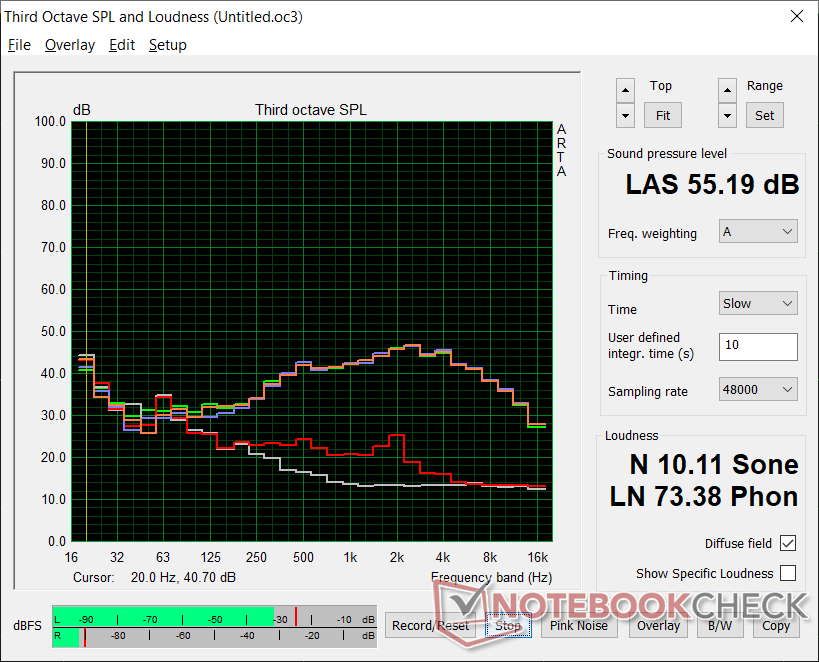
Fan noise is intimately tied to the pre-installed Gateway Control Center. Three modes are available: Office Mode, Game Mode, and Turbo Mode. Fans are quiet on Office Mode at up to 32 dB(A) against a background of 26.5 dB(A) when browsing the web or streaming video. When on Game Mode or Turbo Mode, however, the fans will become very noisy very quickly at over 55 dB(A) when gaming. There is almost no difference between Game Mode and Turbo Mode and so you may as well run the system on Turbo Mode when playing games.
| Gateway Creator Series 15.6 GWTN156-3BK GeForce RTX 2060 Mobile, i5-10300H, Phison PS5013 PM8256GPTCB4B8TF | Schenker XMG Core 15 GK5NR0O GeForce RTX 2060 Mobile, R7 4800H, Samsung SSD 970 EVO Plus 500GB | Aorus 5 KB GeForce RTX 2060 Mobile, i7-10750H, ADATA XPG SX8200 Pro (ASX8200PNP-512GT) | Asus ROG Zephyrus G15 GA502IU-ES76 GeForce GTX 1660 Ti Max-Q, R7 4800HS, Intel SSD 660p 1TB SSDPEKNW010T8 | HP Omen 15-ek0456ng GeForce GTX 1660 Ti Mobile, i5-10300H, Toshiba XG6 KXG60ZNV512G | Razer Blade 15 GTX 1660 Ti GeForce GTX 1660 Ti Mobile, i7-9750H, Samsung SSD PM981 MZVLB256HAHQ | |
|---|---|---|---|---|---|---|
| Noise | 6% | 0% | 6% | 2% | 2% | |
| off / environment * (dB) | 26.5 | 25 6% | 25 6% | 26.3 1% | 27 -2% | 28.5 -8% |
| Idle Minimum * (dB) | 26.5 | 26 2% | 26 2% | 26.7 -1% | 32.4 -22% | 30.3 -14% |
| Idle Average * (dB) | 26.5 | 30 -13% | 30 -13% | 26.7 -1% | 32.4 -22% | 30.5 -15% |
| Idle Maximum * (dB) | 32.4 | 32 1% | 34 -5% | 31.9 2% | 32.4 -0% | 30.5 6% |
| Load Average * (dB) | 55.4 | 46 17% | 53 4% | 38.9 30% | 32.5 41% | 41 26% |
| Witcher 3 ultra * (dB) | 55.3 | 48 13% | 51 8% | 51 8% | 47.2 15% | 48 13% |
| Load Maximum * (dB) | 55.3 | 48 13% | 56 -1% | 54.9 1% | 51.9 6% | 51.9 6% |
* ... smaller is better
Noise level
| Idle |
| 26.5 / 26.5 / 32.4 dB(A) |
| Load |
| 55.4 / 55.3 dB(A) |
 | ||
30 dB silent 40 dB(A) audible 50 dB(A) loud |
||
min: | ||
Temperature
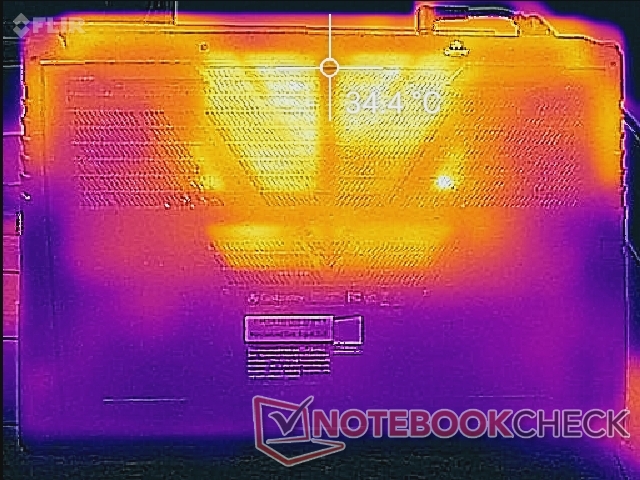
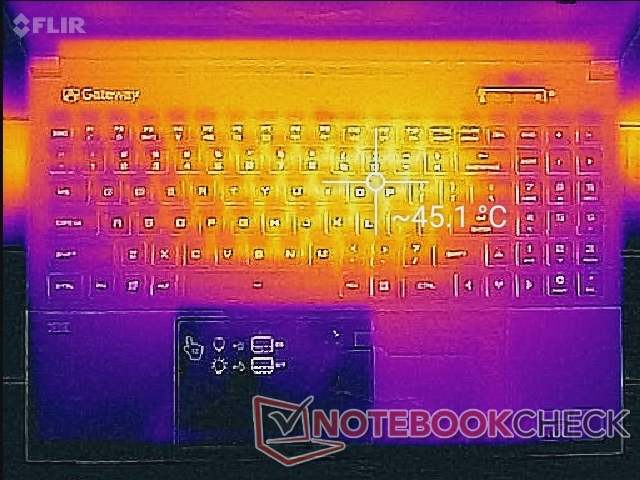
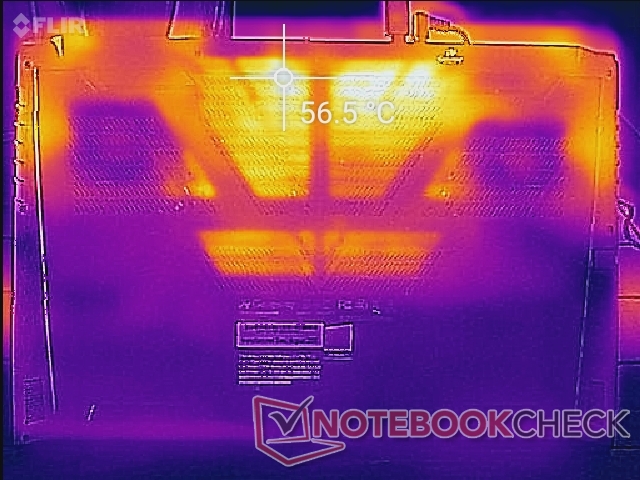
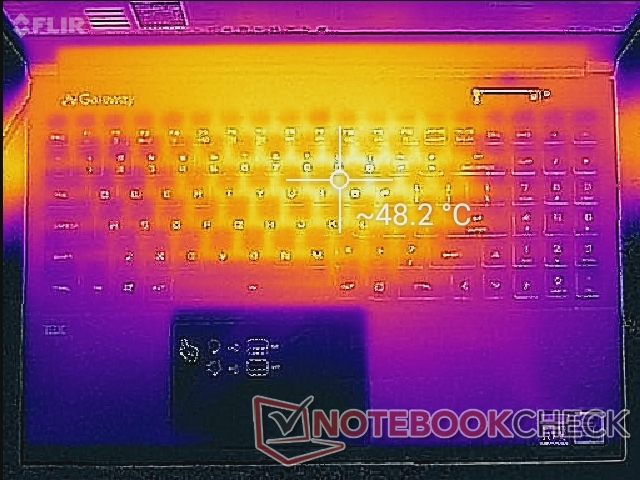
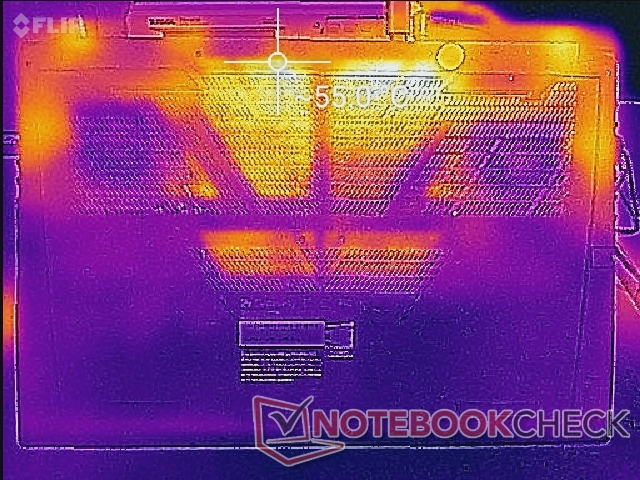
Surface temperature development is largely symmetrical with hot spots reaching over 48 C near the center of the keyboard when gaming. Results are slightly cooler than what we observed on the Asus Zephyrus GA502.
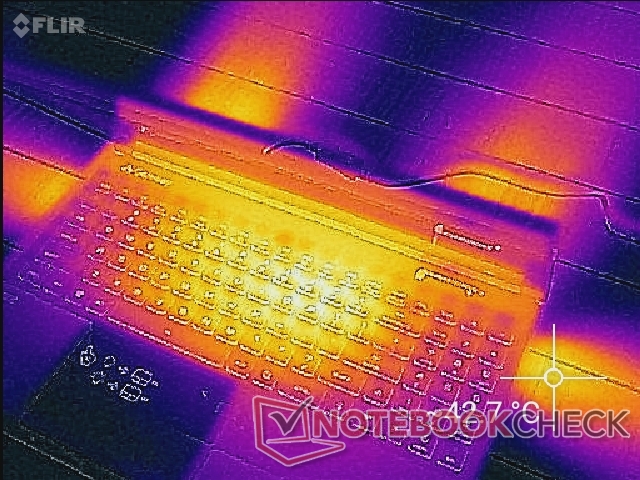
(-) The maximum temperature on the upper side is 48.2 °C / 119 F, compared to the average of 40.4 °C / 105 F, ranging from 21.2 to 68.8 °C for the class Gaming.
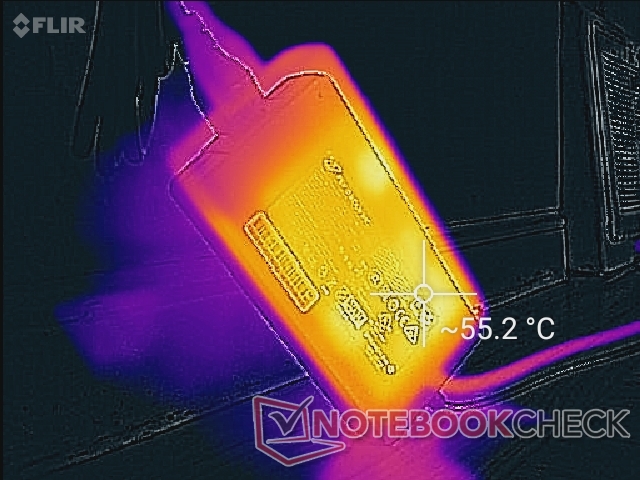
(-) The bottom heats up to a maximum of 59.8 °C / 140 F, compared to the average of 43.2 °C / 110 F
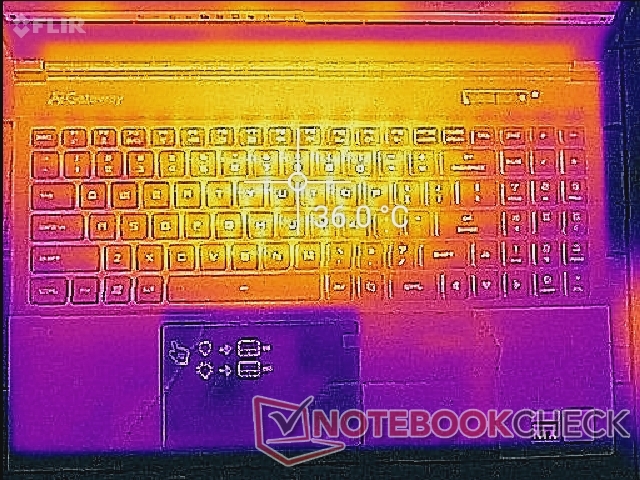
(±) In idle usage, the average temperature for the upper side is 33.1 °C / 92 F, compared to the device average of 33.9 °C / 93 F.
(±) Playing The Witcher 3, the average temperature for the upper side is 33.5 °C / 92 F, compared to the device average of 33.9 °C / 93 F.
(+) The palmrests and touchpad are cooler than skin temperature with a maximum of 31.2 °C / 88.2 F and are therefore cool to the touch.
(-) The average temperature of the palmrest area of similar devices was 28.8 °C / 83.8 F (-2.4 °C / -4.4 F).
Stress Test
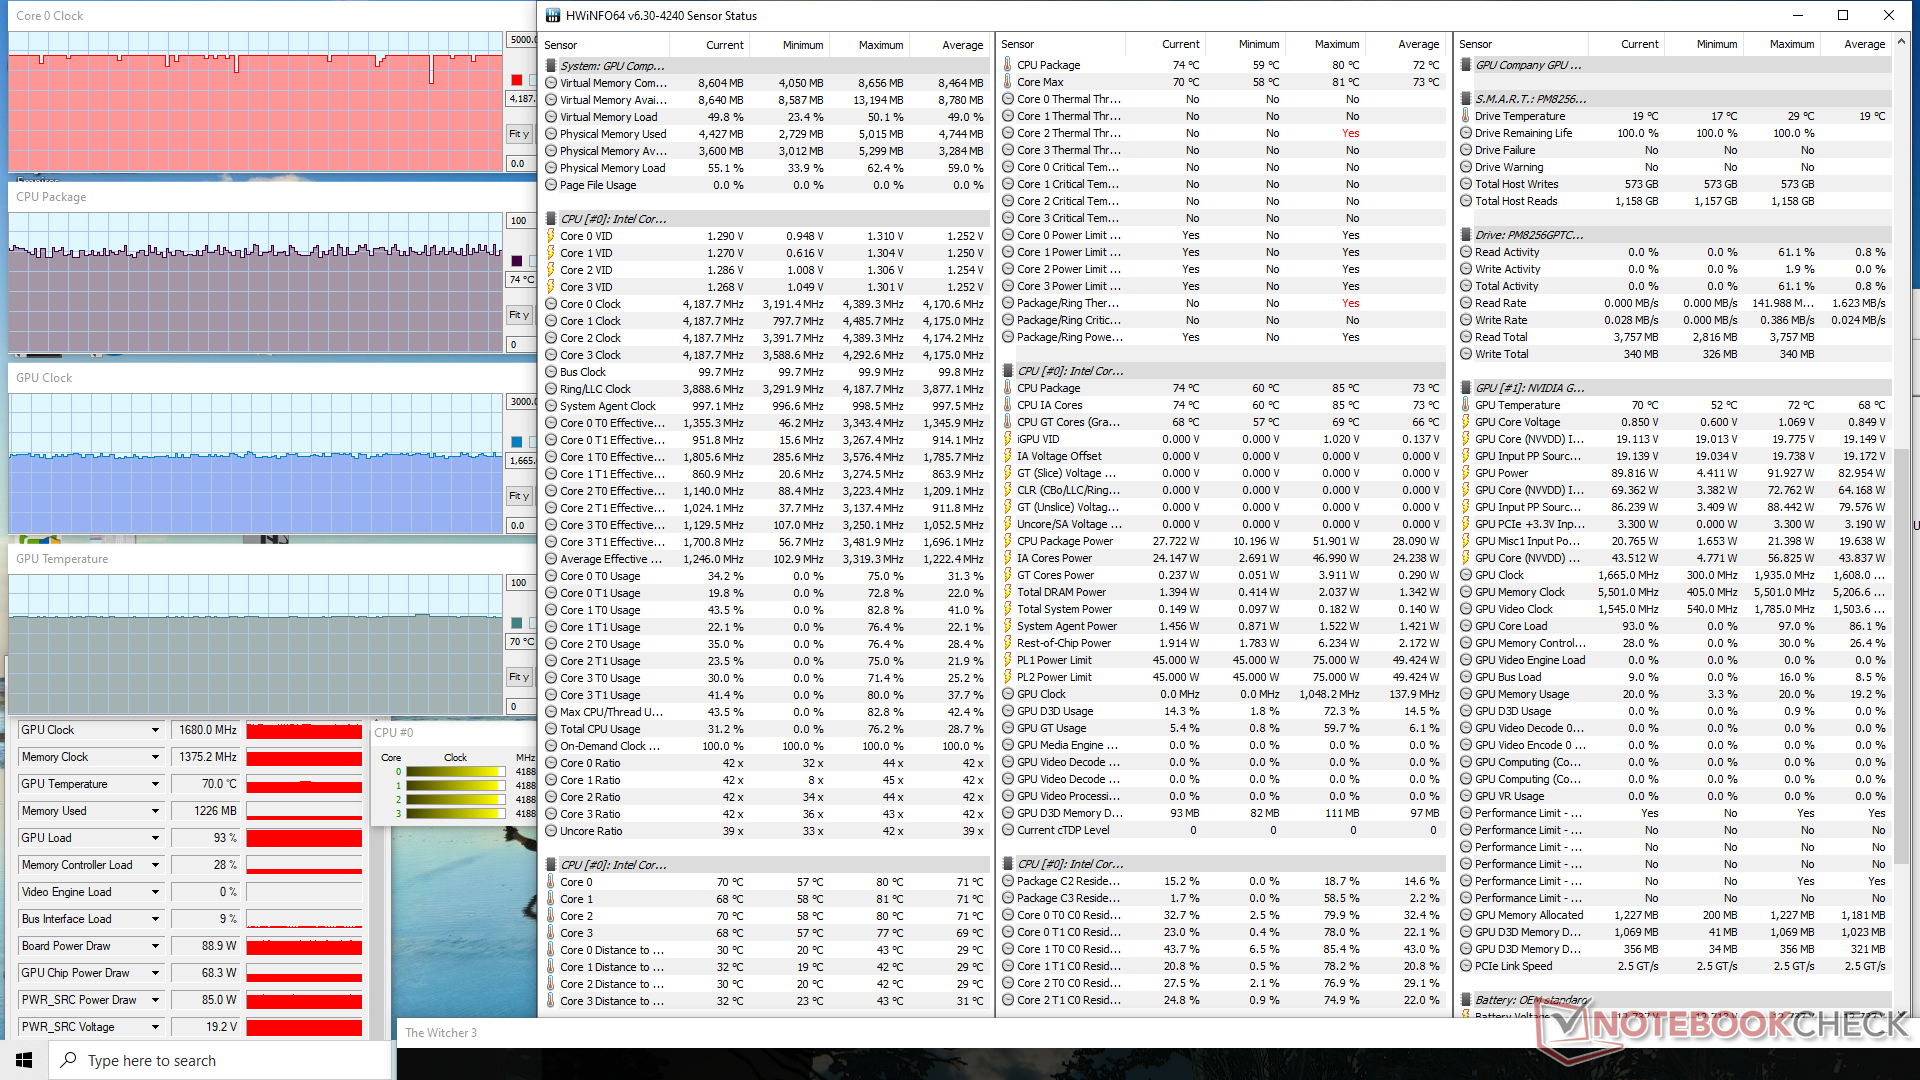
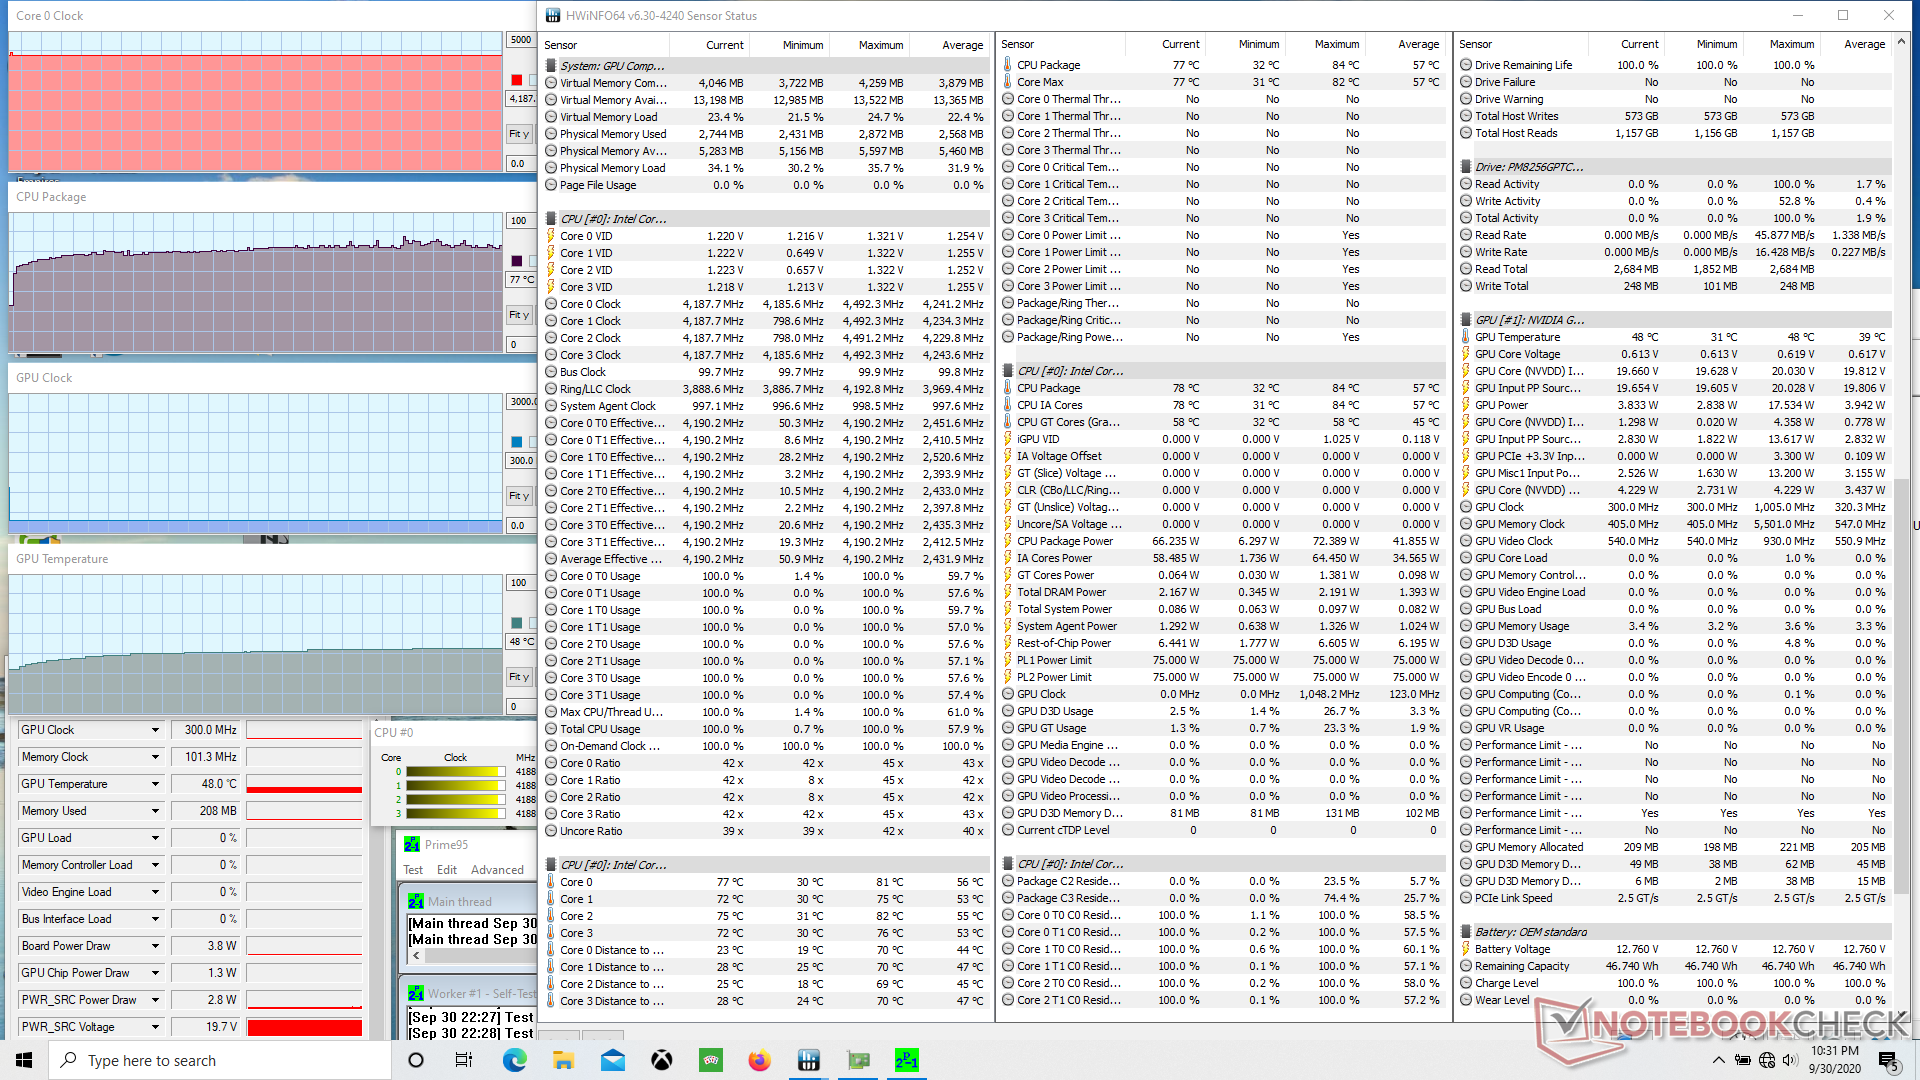
Running Prime95 causes the CPU to stabilize at 4.2 GHz and 77 C with no dips in clock rate over time for excellent Turbo Boost sustainability. When running Witcher 3, CPU and GPU clock rates would stabilize at 74 C and 70 C, respectively, compared to 76 C and 73 C on the AMD-powered Asus Zephyrus G15 GA502IU.
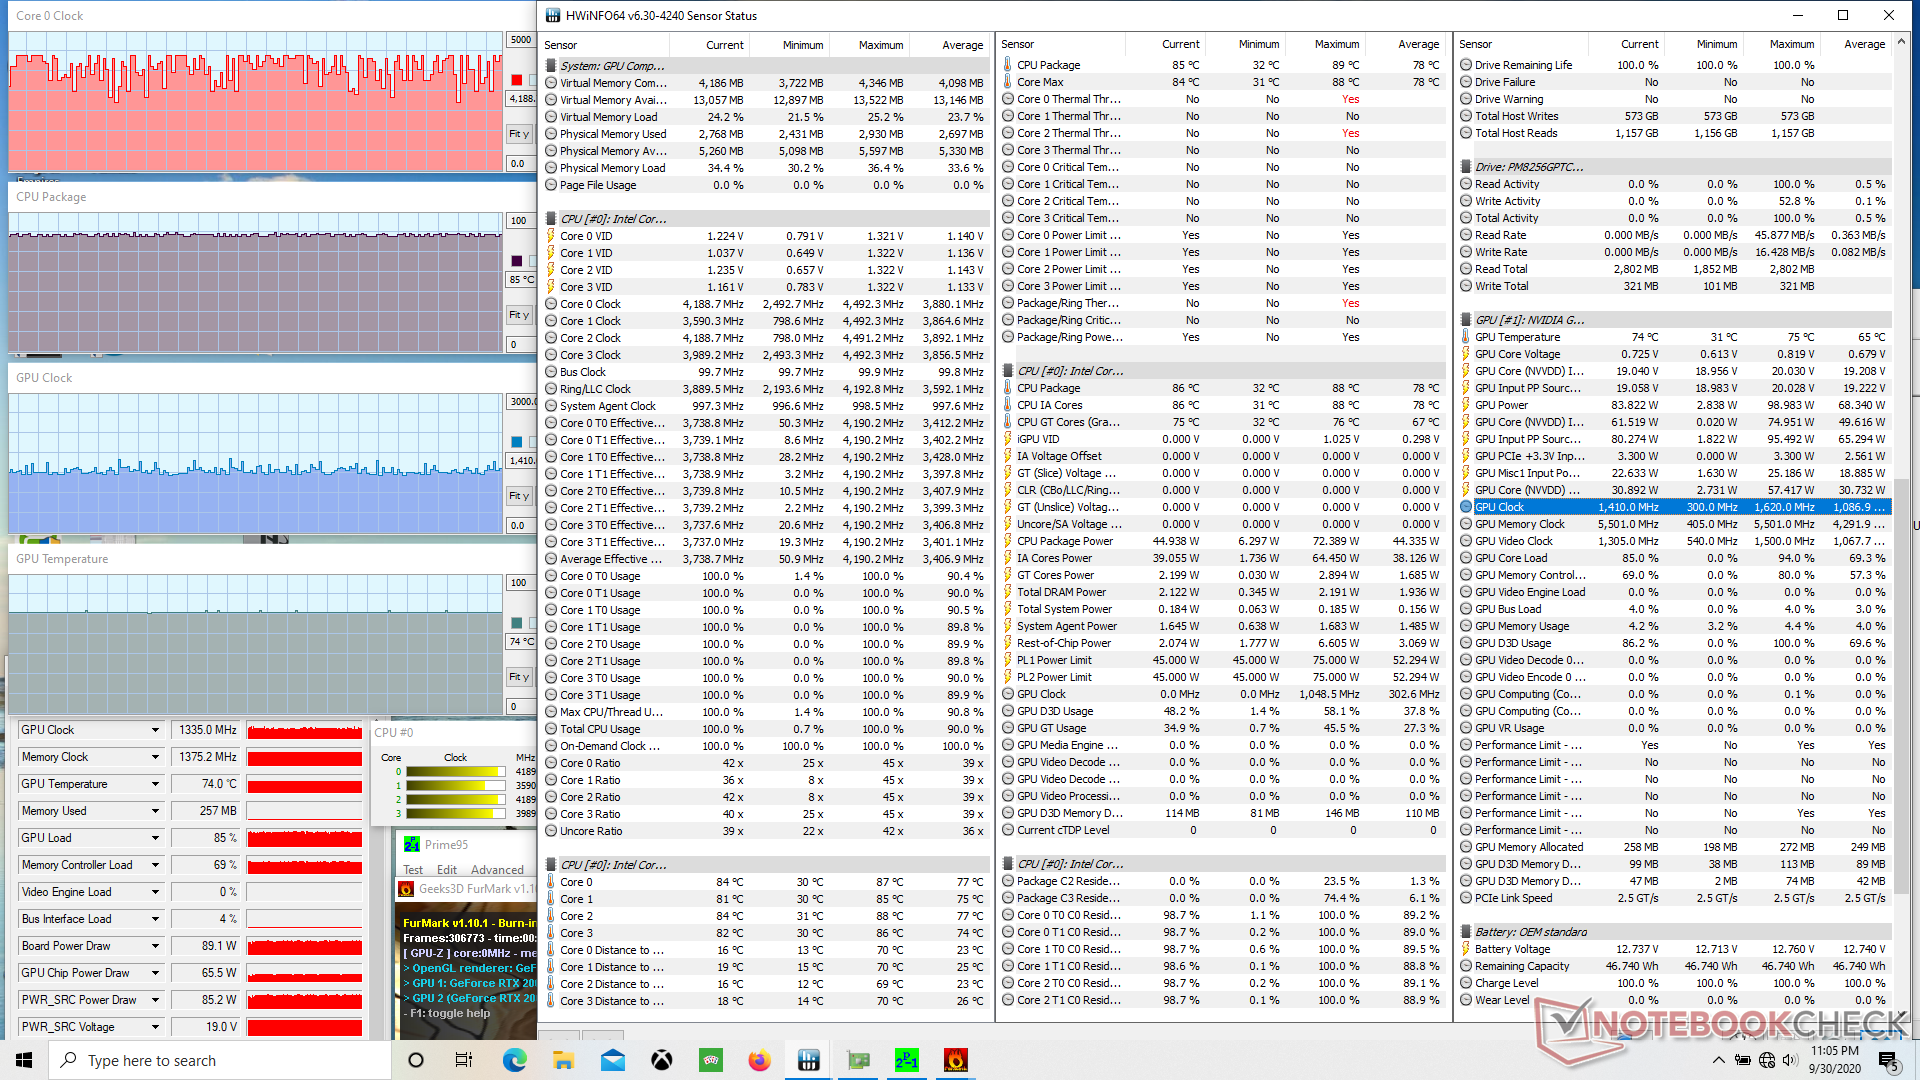
| CPU Clock (GHz) | GPU Clock (MHz) | Average CPU Temperature (°C) | Average GPU Temperature (°C) | |
| System Idle | -- | -- | 32 | 32 |
| Prime95 Stress | 4.2 | -- | 77 | 48 |
| Prime95 + FurMark Stress | 1.6 - 4.2 | 1335 | 85 | 74 |
| Witcher 3 Stress | 4.2 | 1680 | 74 | 70 |
Speakers


Gateway Creator Series 15.6 GWTN156-3BK audio analysis
(+) | speakers can play relatively loud (82.9 dB)
Bass 100 - 315 Hz
(-) | nearly no bass - on average 21.6% lower than median
(±) | linearity of bass is average (14.3% delta to prev. frequency)
Mids 400 - 2000 Hz
(+) | balanced mids - only 2.3% away from median
(+) | mids are linear (4% delta to prev. frequency)
Highs 2 - 16 kHz
(+) | balanced highs - only 3.6% away from median
(+) | highs are linear (6.3% delta to prev. frequency)
Overall 100 - 16.000 Hz
(±) | linearity of overall sound is average (17.2% difference to median)
Compared to same class
» 46% of all tested devices in this class were better, 11% similar, 42% worse
» The best had a delta of 6%, average was 18%, worst was 132%
Compared to all devices tested
» 32% of all tested devices were better, 8% similar, 60% worse
» The best had a delta of 4%, average was 24%, worst was 134%
Apple MacBook 12 (Early 2016) 1.1 GHz audio analysis
(+) | speakers can play relatively loud (83.6 dB)
Bass 100 - 315 Hz
(±) | reduced bass - on average 11.3% lower than median
(±) | linearity of bass is average (14.2% delta to prev. frequency)
Mids 400 - 2000 Hz
(+) | balanced mids - only 2.4% away from median
(+) | mids are linear (5.5% delta to prev. frequency)
Highs 2 - 16 kHz
(+) | balanced highs - only 2% away from median
(+) | highs are linear (4.5% delta to prev. frequency)
Overall 100 - 16.000 Hz
(+) | overall sound is linear (10.2% difference to median)
Compared to same class
» 7% of all tested devices in this class were better, 2% similar, 91% worse
» The best had a delta of 5%, average was 18%, worst was 53%
Compared to all devices tested
» 5% of all tested devices were better, 1% similar, 94% worse
» The best had a delta of 4%, average was 24%, worst was 134%
Energy Management
Power Consumption
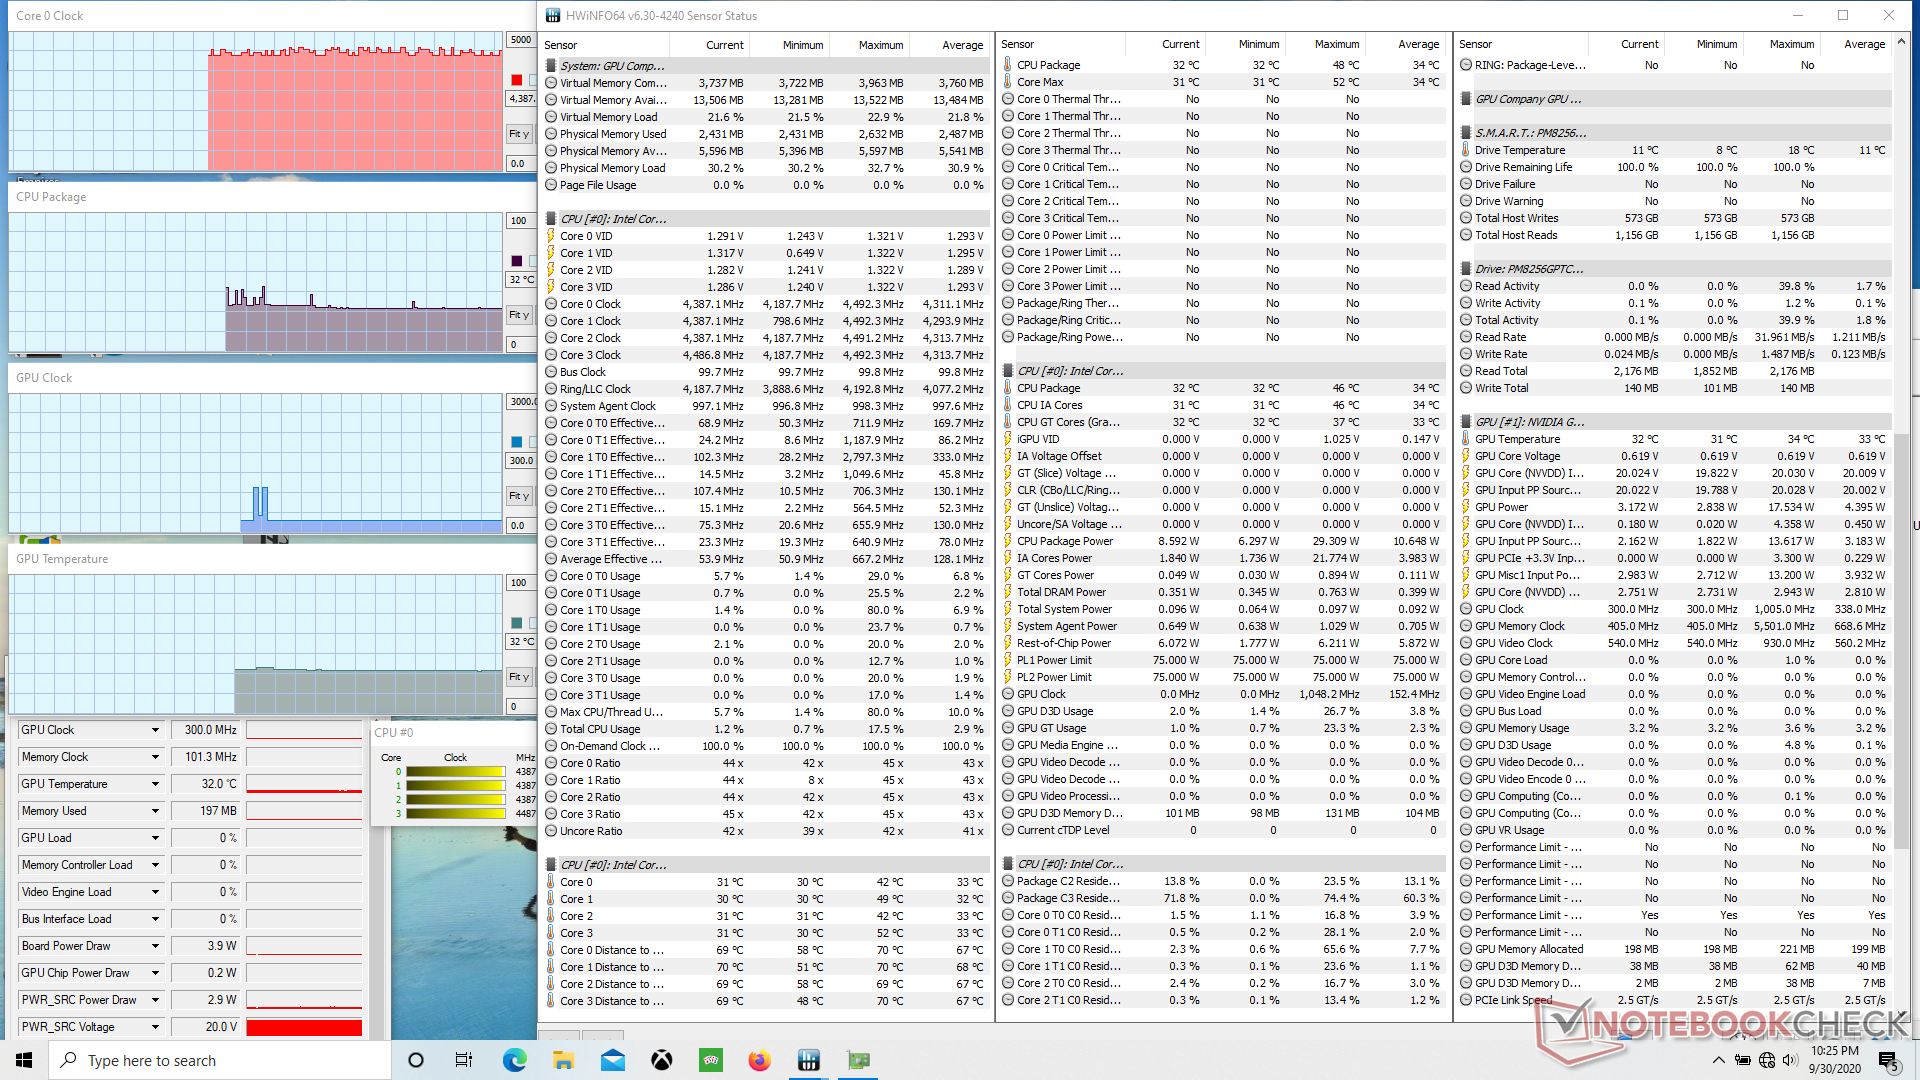
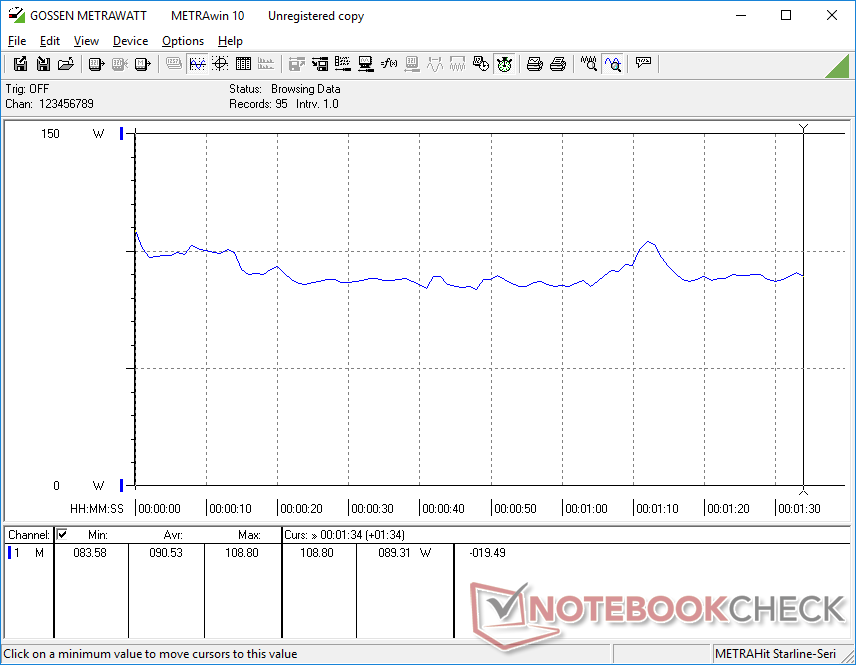
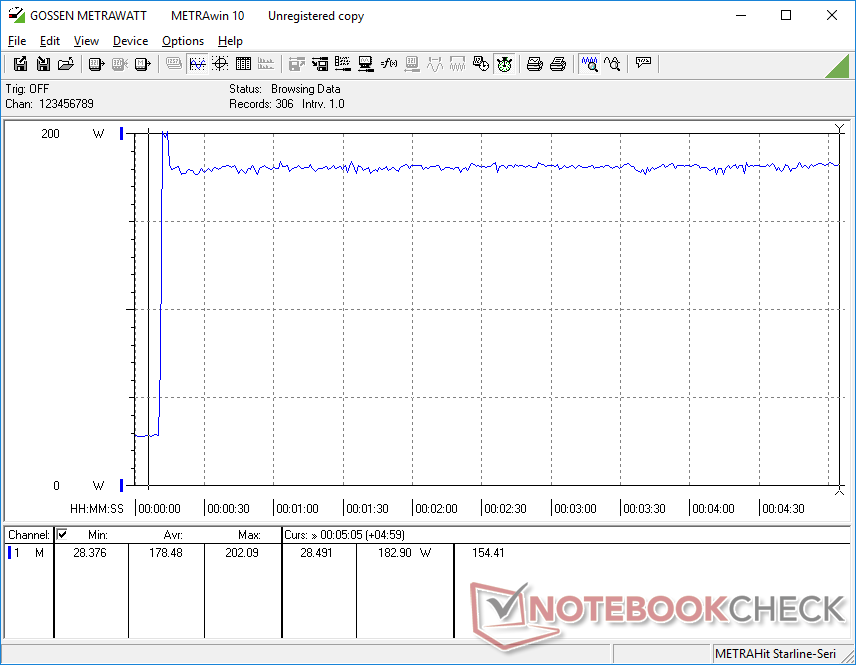
Idling on desktop will demand between 10 W and 17 W depending on the power profile and brightness level. Consumption would jump to 32 W if the Nvidia GPU is initiated and so we recommend exploiting Optimus to optimize battery life.
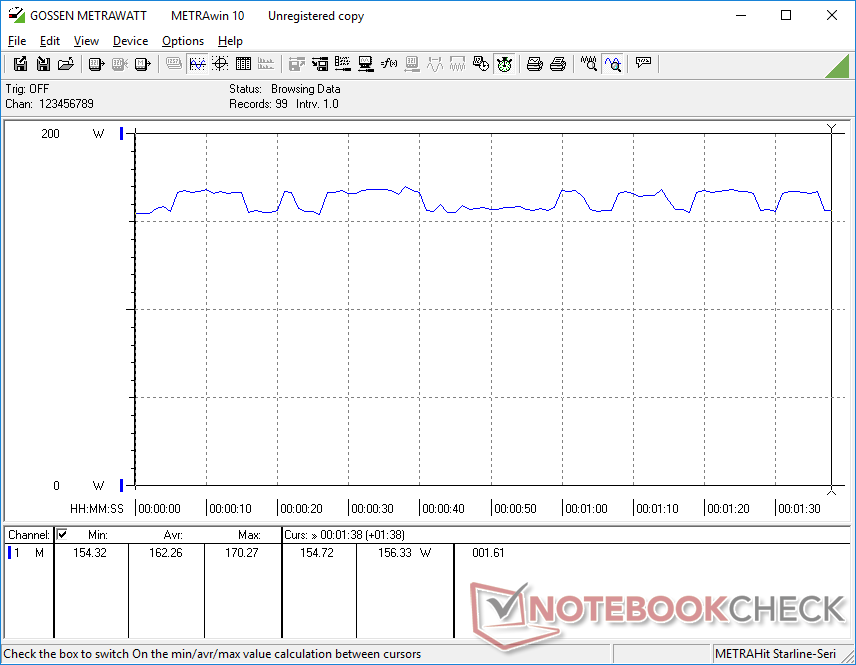
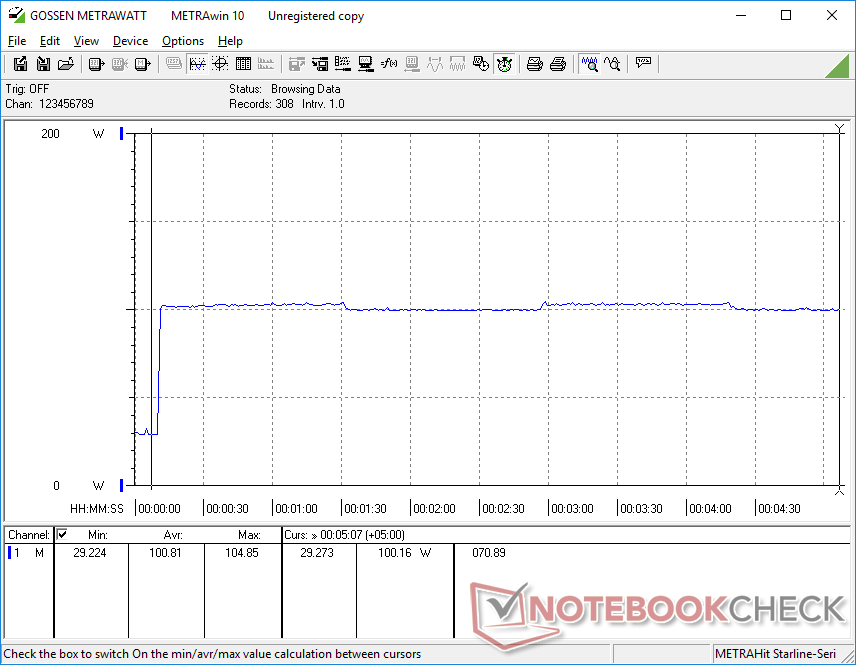
Power consumption is higher than expected at 162 W when running Witcher 3. The Aorus 5 with the same GPU but faster Core i7 CPU, for example, consumes just 138 W when under similar conditions. The Schenker XMG Core 15 with the more power-efficient Ryzen 7 4800H consumes even less when gaming.
| Off / Standby | |
| Idle | |
| Load |
|
Key:
min: | |
| Gateway Creator Series 15.6 GWTN156-3BK i5-10300H, GeForce RTX 2060 Mobile, Phison PS5013 PM8256GPTCB4B8TF, IPS, 1920x1080, 15.6" | Schenker XMG Core 15 GK5NR0O R7 4800H, GeForce RTX 2060 Mobile, Samsung SSD 970 EVO Plus 500GB, IPS, 1920x1080, 15.6" | Aorus 5 KB i7-10750H, GeForce RTX 2060 Mobile, ADATA XPG SX8200 Pro (ASX8200PNP-512GT), IPS, 1920x1080, 15.6" | Asus ROG Zephyrus G15 GA502IU-ES76 R7 4800HS, GeForce GTX 1660 Ti Max-Q, Intel SSD 660p 1TB SSDPEKNW010T8, IPS, 1920x1080, 15.6" | HP Omen 15-ek0456ng i5-10300H, GeForce GTX 1660 Ti Mobile, Toshiba XG6 KXG60ZNV512G, IPS, 1920x1080, 15.6" | Razer Blade 15 GTX 1660 Ti i7-9750H, GeForce GTX 1660 Ti Mobile, Samsung SSD PM981 MZVLB256HAHQ, IPS, 1920x1080, 15.6" | |
|---|---|---|---|---|---|---|
| Power Consumption | 8% | 8% | 47% | 15% | -29% | |
| Idle Minimum * (Watt) | 9.9 | 12 -21% | 8 19% | 5.1 48% | 9.2 7% | 18.7 -89% |
| Idle Average * (Watt) | 17 | 14 18% | 12 29% | 8.4 51% | 14.6 14% | 30.7 -81% |
| Idle Maximum * (Watt) | 31.9 | 20 37% | 21 34% | 9.1 71% | 18.1 43% | 33.9 -6% |
| Load Average * (Watt) | 90.5 | 103 -14% | 128 -41% | 55.1 39% | 84 7% | 93.4 -3% |
| Witcher 3 ultra * (Watt) | 162.3 | 125 23% | 138 15% | 97.5 40% | 142 13% | 158.9 2% |
| Load Maximum * (Watt) | 202.1 | 193 5% | 217 -7% | 140.2 31% | 194 4% | 195.3 3% |
* ... smaller is better
Battery Life
Runtimes are good for a gaming laptop at over 8 hours of real-world WLAN use when on the Balanced power profile with the iGPU active. Recharging from empty to full capacity takes almost two hours.
| Gateway Creator Series 15.6 GWTN156-3BK i5-10300H, GeForce RTX 2060 Mobile, 46.74 Wh | Schenker XMG Core 15 GK5NR0O R7 4800H, GeForce RTX 2060 Mobile, 62 Wh | Aorus 5 KB i7-10750H, GeForce RTX 2060 Mobile, 48.96 Wh | Asus ROG Zephyrus G15 GA502IU-ES76 R7 4800HS, GeForce GTX 1660 Ti Max-Q, 76 Wh | HP Omen 15-ek0456ng i5-10300H, GeForce GTX 1660 Ti Mobile, 70.91 Wh | Razer Blade 15 GTX 1660 Ti i7-9750H, GeForce GTX 1660 Ti Mobile, 65 Wh | |
|---|---|---|---|---|---|---|
| Battery runtime | -27% | -41% | -35% | -20% | -32% | |
| WiFi v1.3 (h) | 8.1 | 5.9 -27% | 4.8 -41% | 5.3 -35% | 6.5 -20% | 5.5 -32% |
| Reader / Idle (h) | 7.8 | 9 | 7.1 | 11.7 | ||
| Load (h) | 1.5 | 1 | 1.9 | 1.7 |
Pros
Cons
Verdict
A thin-and-light laptop with 10th gen Intel and GeForce RTX 2060 graphics for under $1000 USD is understandably tempting. However, there are one too many cut corners that bring down the Gateway system. Color space, for example, is just a fraction of sRGB which most digital artists will balk at. Secondly, ghosting is noticeable due to the average response times which will impact gaming. For a laptop targeting gamers and creators, these drawbacks will be hard to overlook.
Lastly, the paltry 8 GB of system RAM and 256 GB SSD are half the size of what most other gaming laptops offer in this same price range. Adding more RAM and storage yourself is an easy process on this chassis, but this will unfortunately void the warranty.
An even better Gateway Creator SKU would have been to offer the Ryzen 5 4600H CPU, GeForce RTX 2060 GPU, and higher quality 1080p display for the same or similar $1000 price target.
The Gateway Creator 15 is a bargain if your intentions are to maximize performance-per-dollar and performance-per-weight. Just keep in mind that you'll be stuck with a mediocre display and both minimal RAM and storage until the warranty ends.
Gateway Creator Series 15.6 GWTN156-3BK
- 10/02/2020 v7 (old)
Allen Ngo
Price comparison
