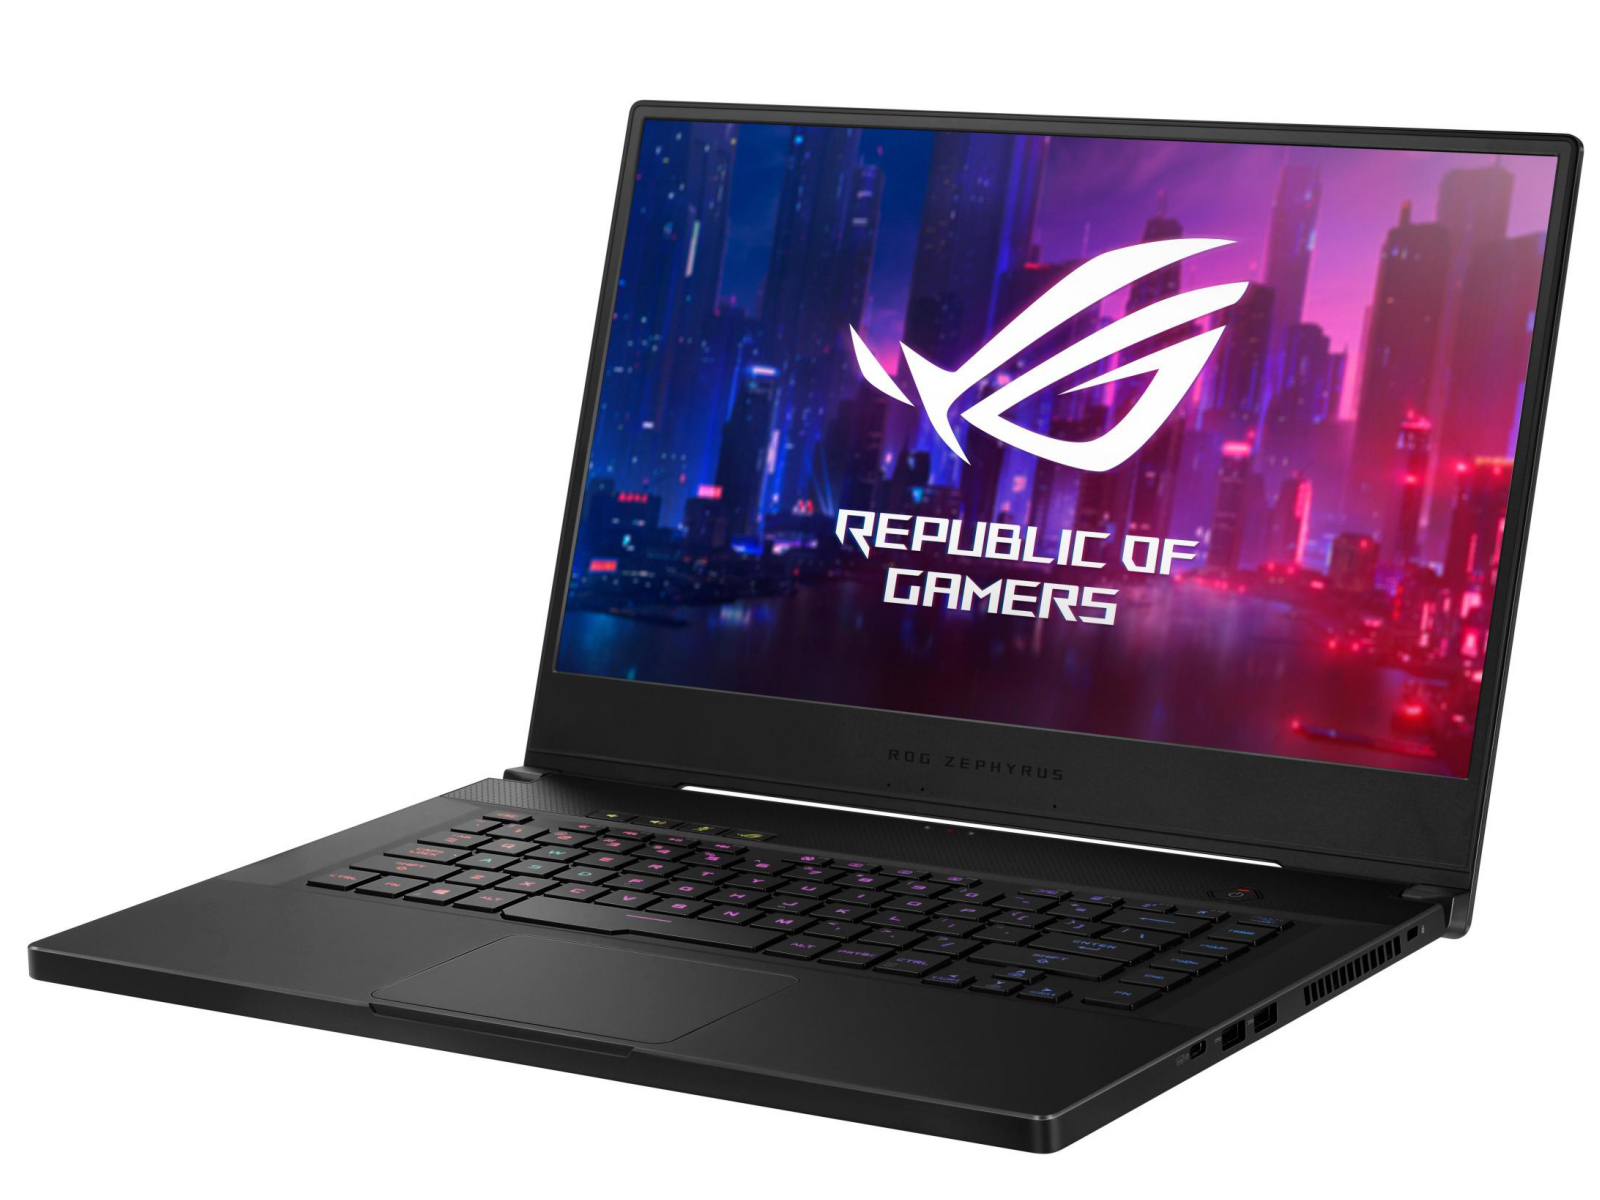
Asus ROG Zephyrus M15 GU502L in review: Compact gaming notebook with Turbo reserves

The Asus Zephyrus M15 GU502L is a slim, compact gaming laptop of the 15.6-inch format. The test device provided to us is powered by a Core i7-10750H processor and a GeForce RTX 2070 Max-Q graphics core. With the Zephyrus M GU502GU, we have already tested an identical sister model. Competitors include devices such as the Schenker Key 15, Razer Blade 15, Gigabyte Aero 15 XB, Acer Predator Triton 500 and the MSI GS66 10SGS.
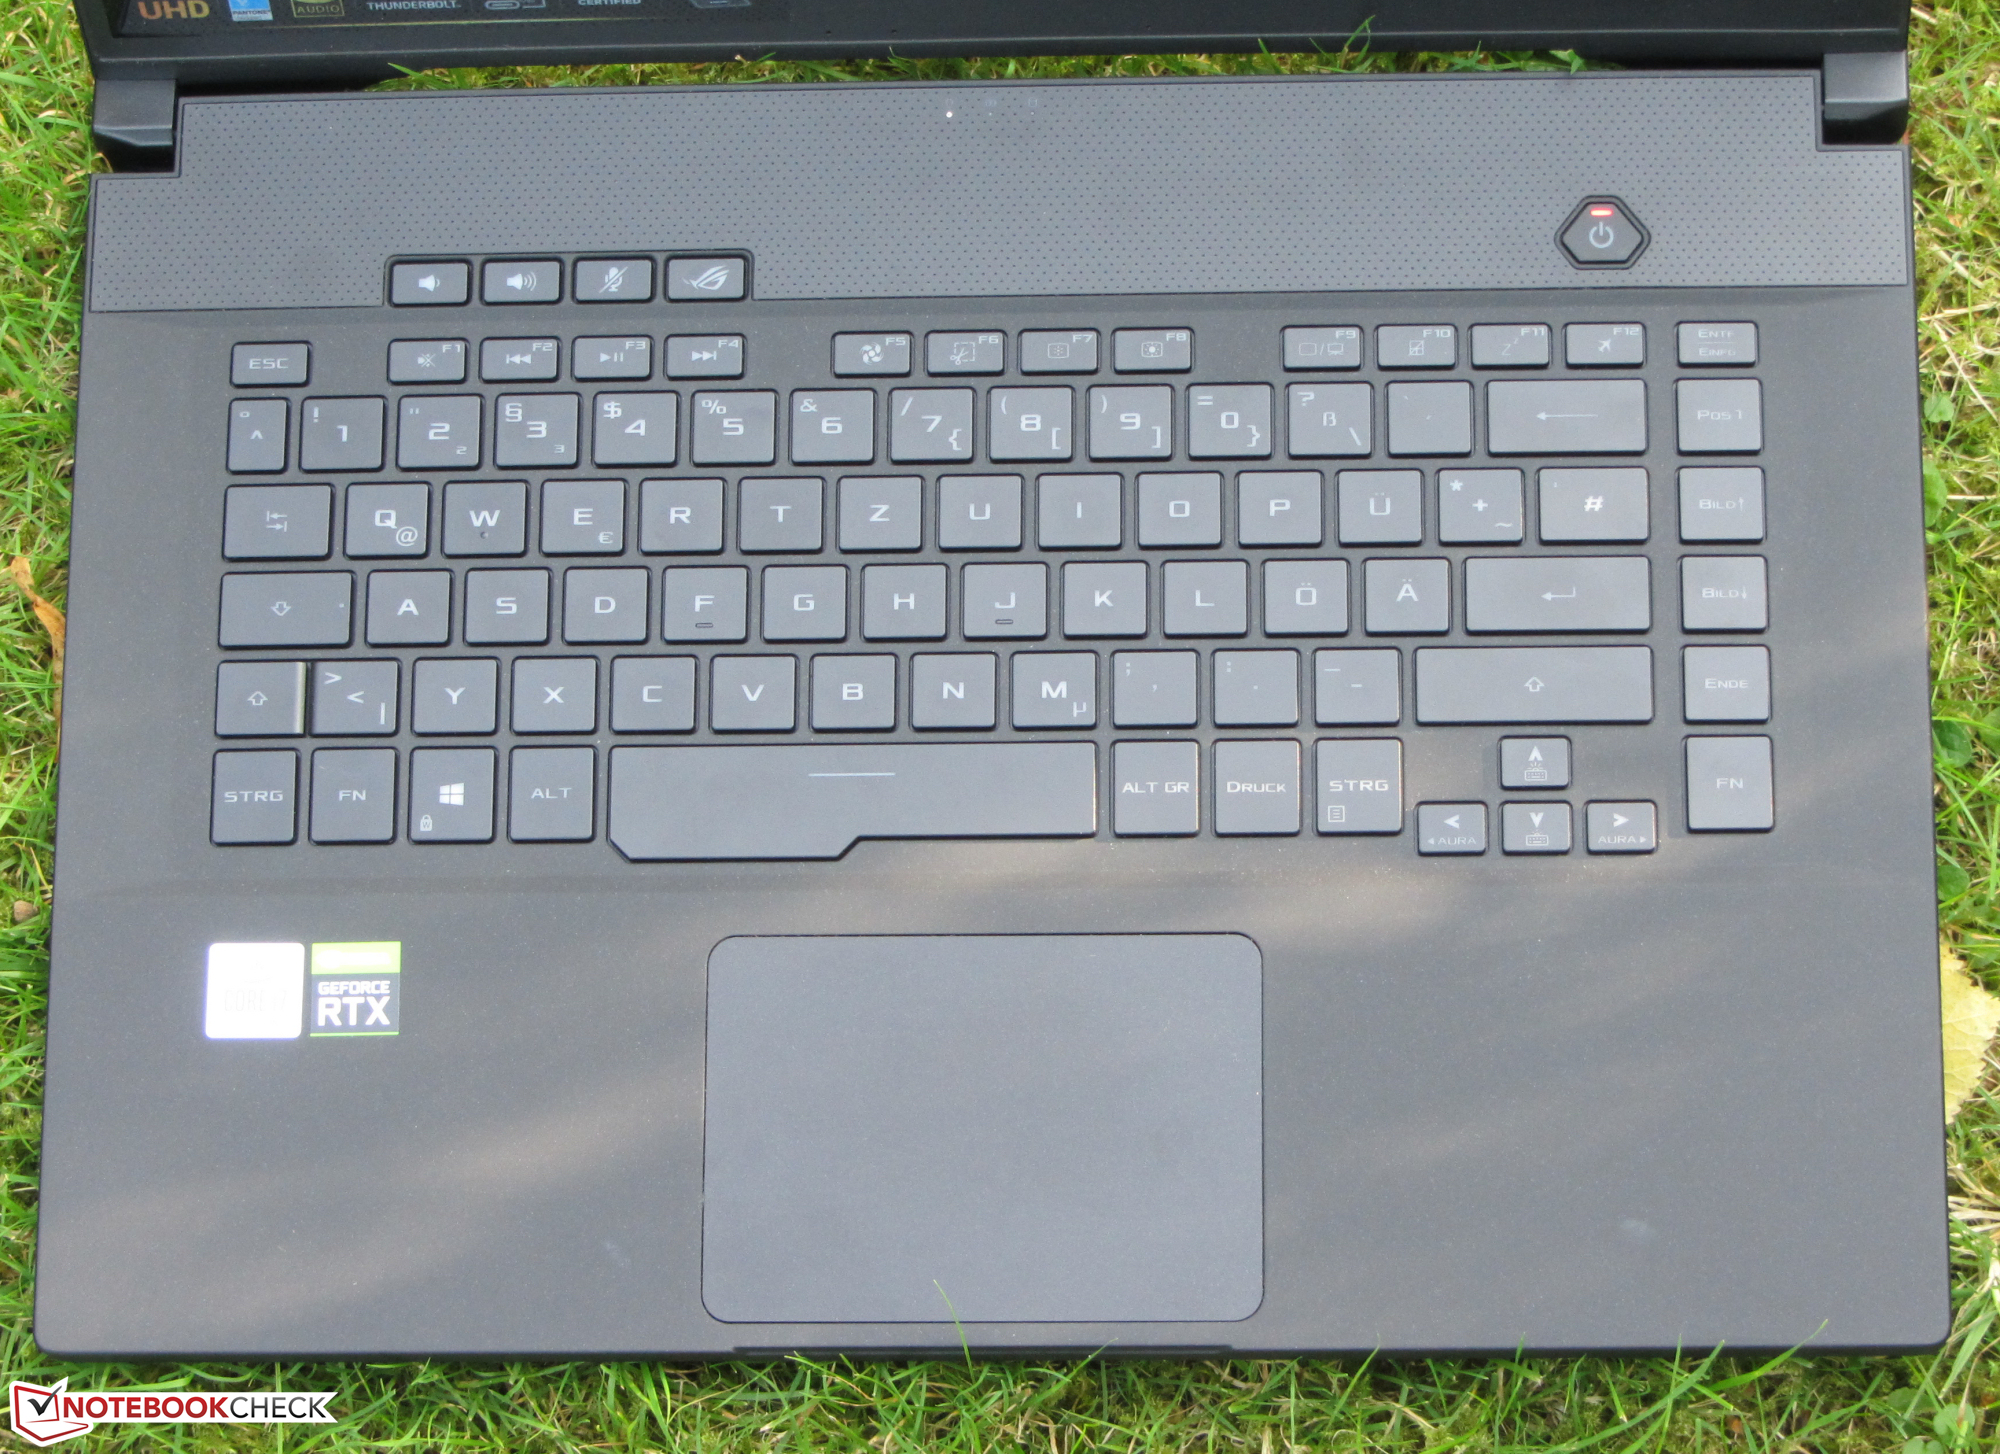
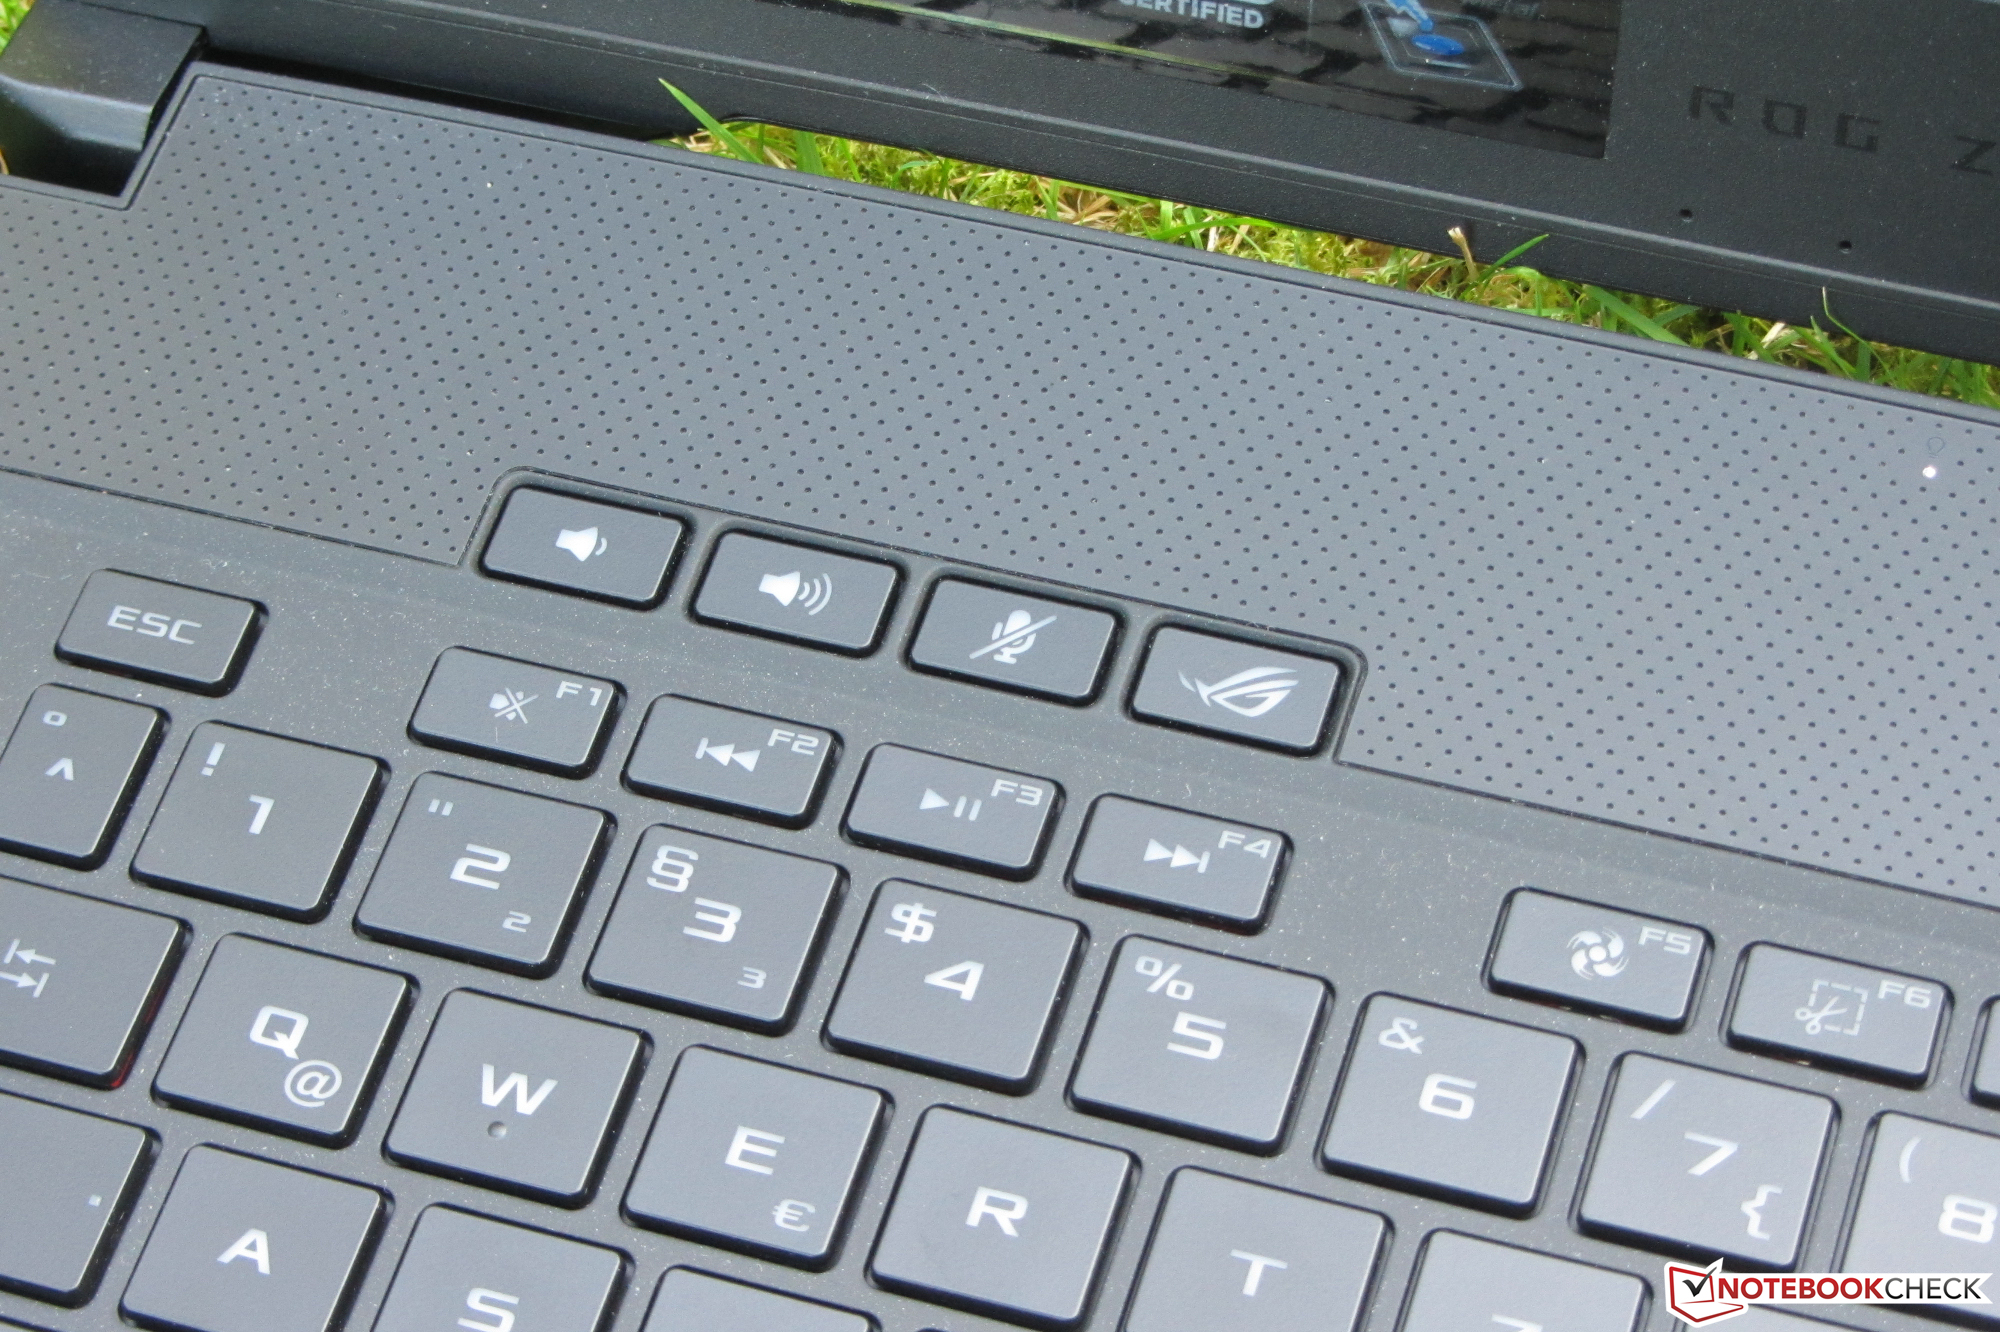
Since the Zephyrus M15 and the Zephyrus M are identical in construction, we will not elaborate much on the case, connectivity, input devices and speakers. You can read about these in our review of the Asus Zephyrus M GU502GU.
Rating | Date | Model | Weight | Height | Size | Resolution | Price |
|---|---|---|---|---|---|---|---|
| 82.5 % v7 (old) | 09 / 2020 | Asus ROG Zephyrus M15 GU502L i7-10750H, GeForce RTX 2070 Max-Q | 2 kg | 18.9 mm | 15.60" | 3840x2160 | |
| 84.5 % v7 (old) | 09 / 2020 | Schenker Key 15 Comet Lake i7-10875H, GeForce RTX 2080 Super Max-Q | 2 kg | 19.8 mm | 15.60" | 1920x1080 | |
| 86.9 % v7 (old) | 08 / 2020 | Razer Blade 15 RTX 2070 Super Max-Q i7-10875H, GeForce RTX 2070 Super Max-Q | 2.1 kg | 17.8 mm | 15.60" | 1920x1080 | |
| 85.8 % v7 (old) | 05 / 2020 | Gigabyte Aero 15 OLED XB-8DE51B0SP i7-10875H, GeForce RTX 2070 Super Max-Q | 2.2 kg | 20 mm | 15.60" | 3840x2160 | |
v (old) | 04 / 2020 | Acer Predator Triton 500 PT515-52-70N3 i7-10750H, GeForce RTX 2080 Super Max-Q | 2.1 kg | 18 mm | 15.60" | 1920x1080 | |
| 84 % v7 (old) | 05 / 2020 | MSI GS66 10SGS i7-10750H, GeForce RTX 2080 Super Max-Q | 2.2 kg | 20 mm | 15.60" | 1920x1080 |
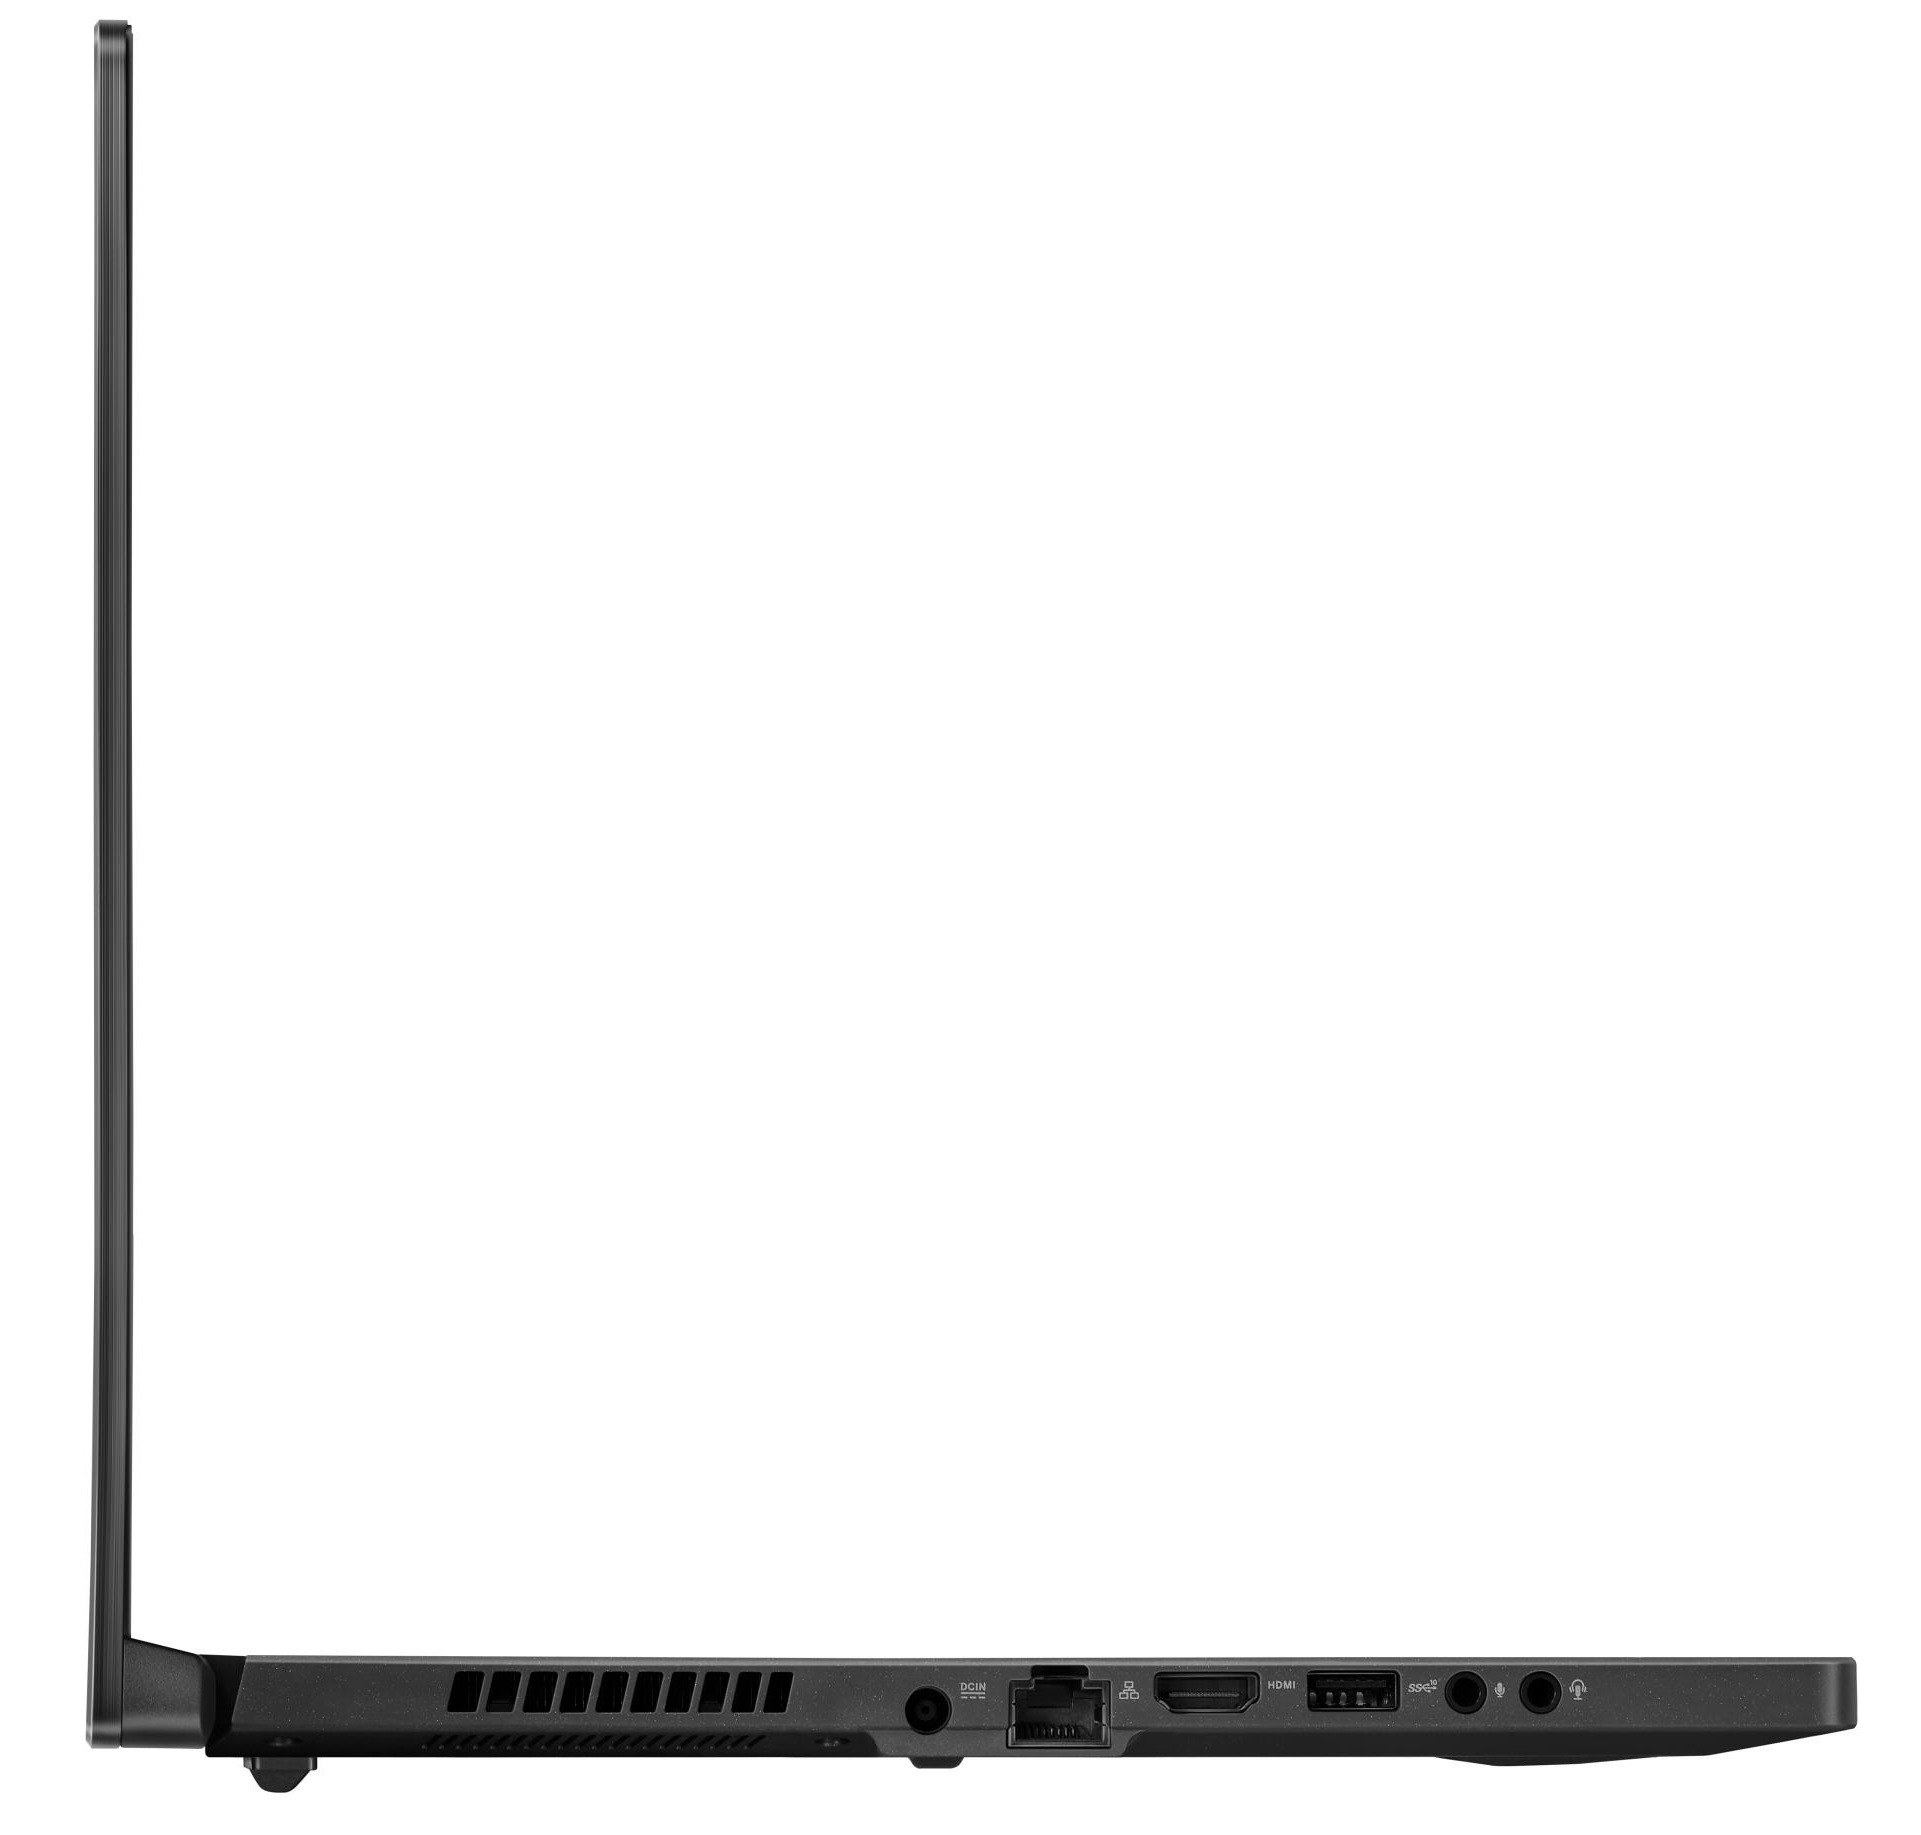
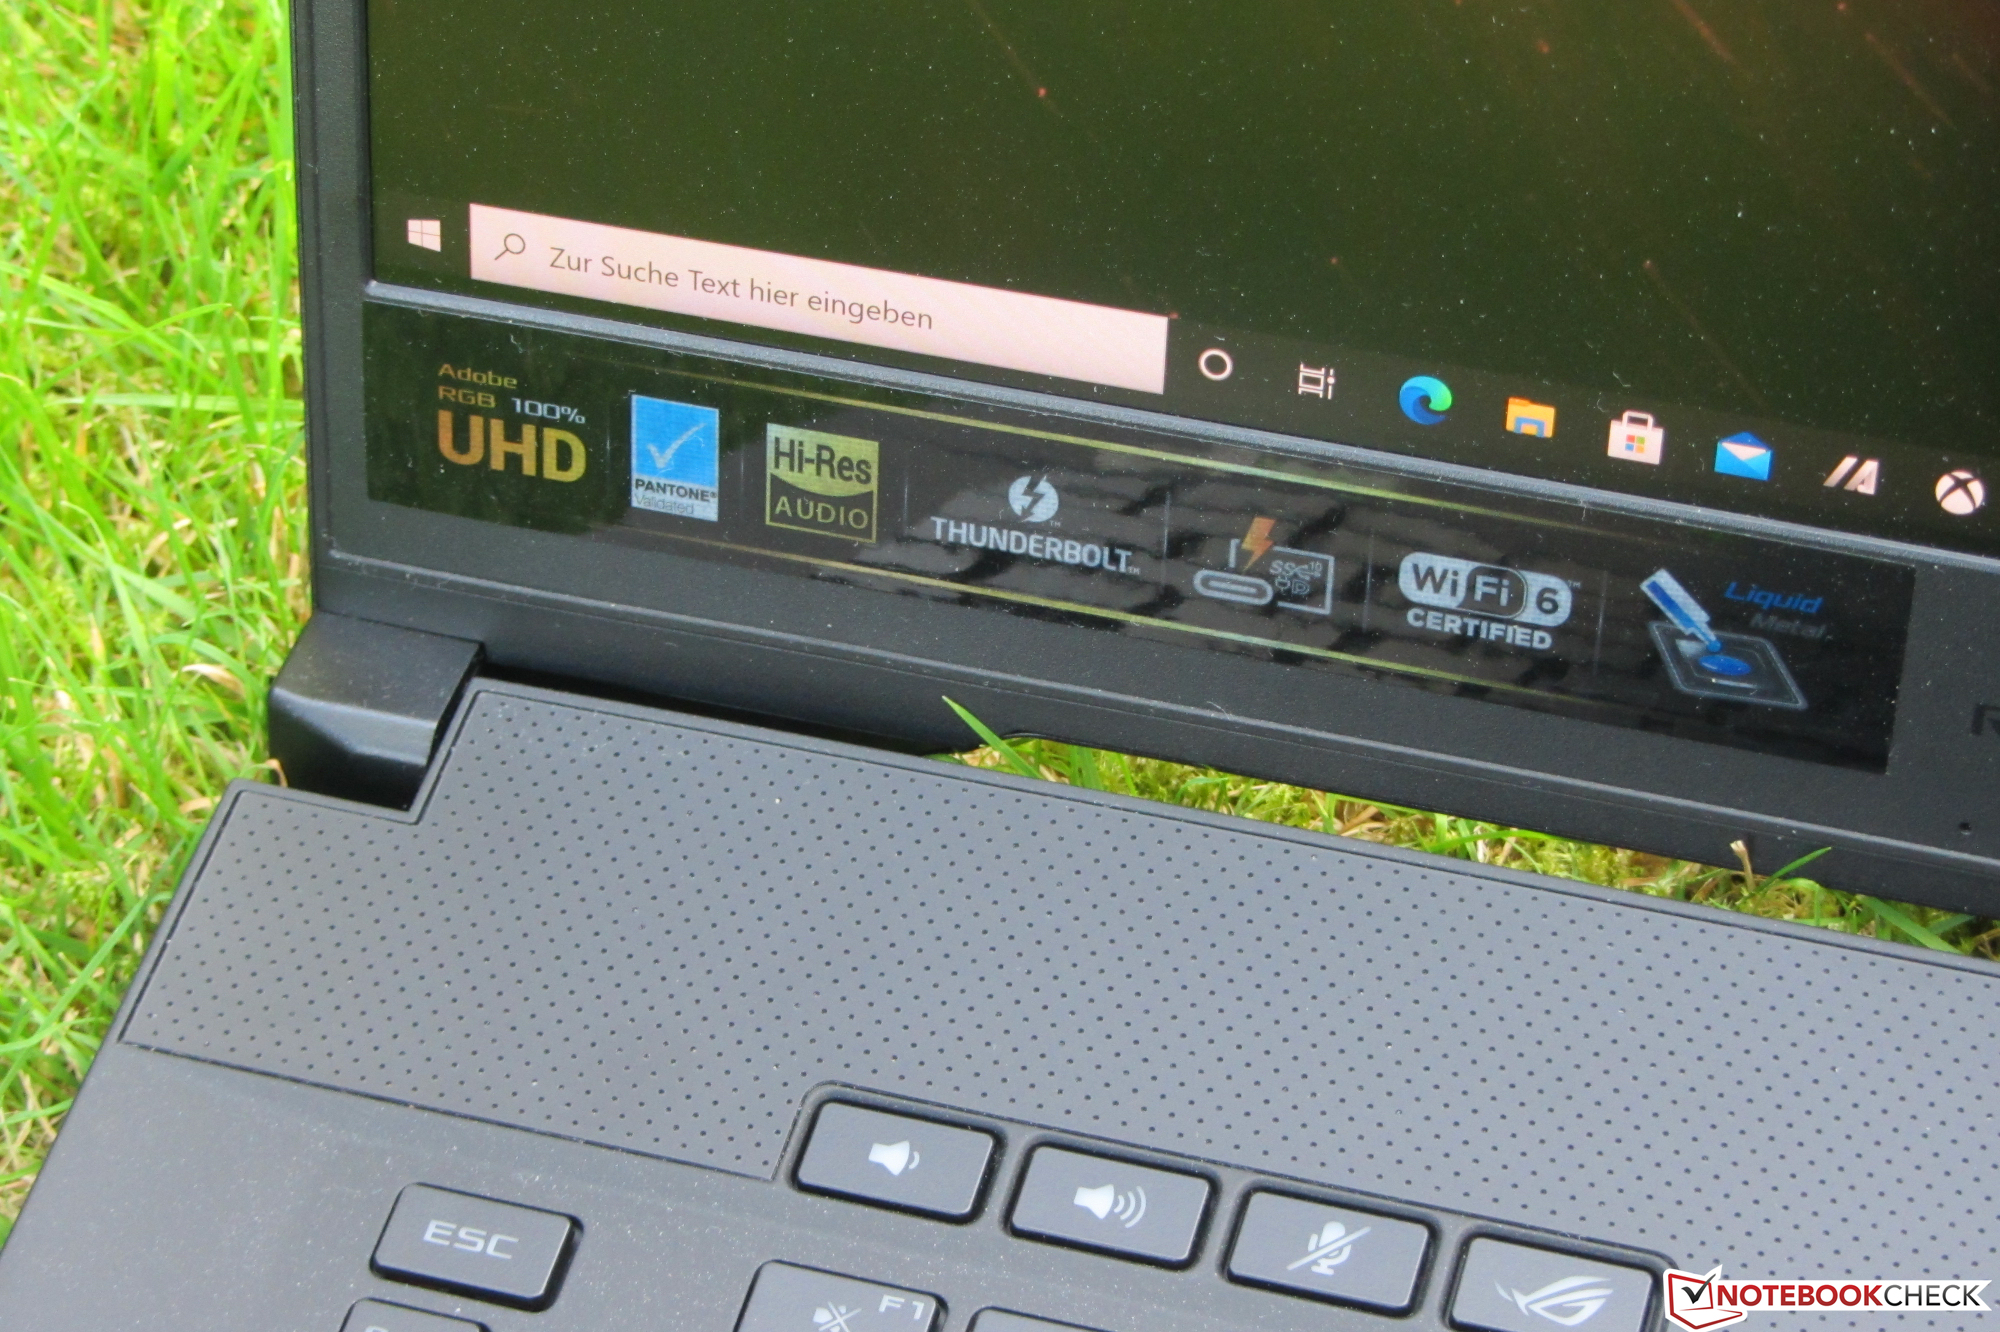
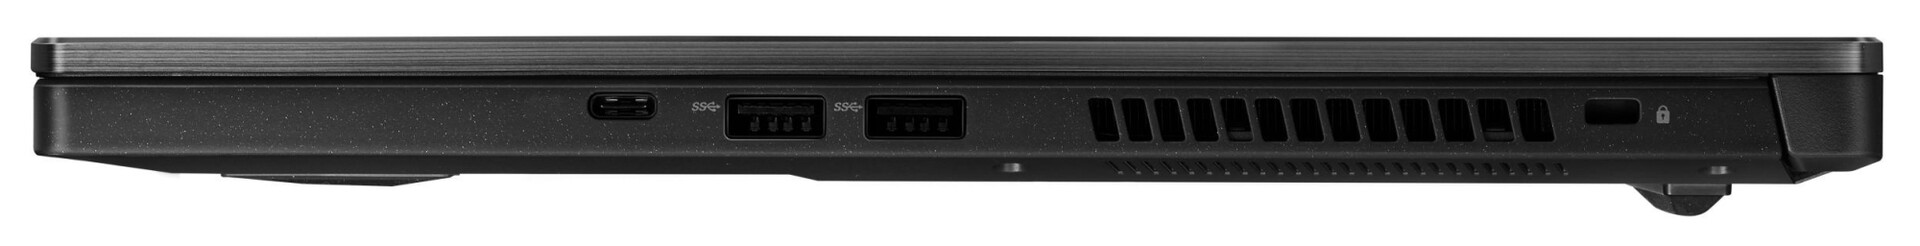
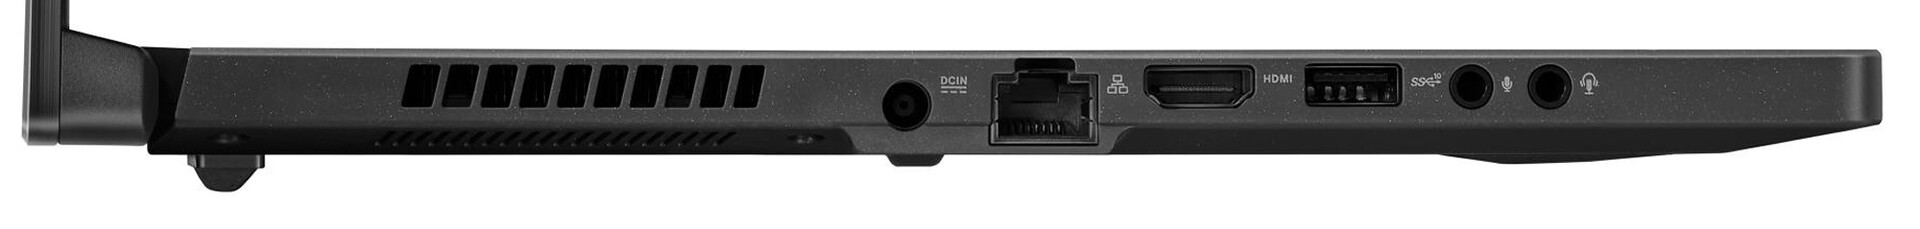
Connectivity - now with Thunderbolt 3
The GU502L and GU502GU do not differ in terms of the type and arrangement of their connections - with one exception. While the latter offers a USB Type C 3.2 Gen 2 slot, the M15 comes with Thunderbolt 3.
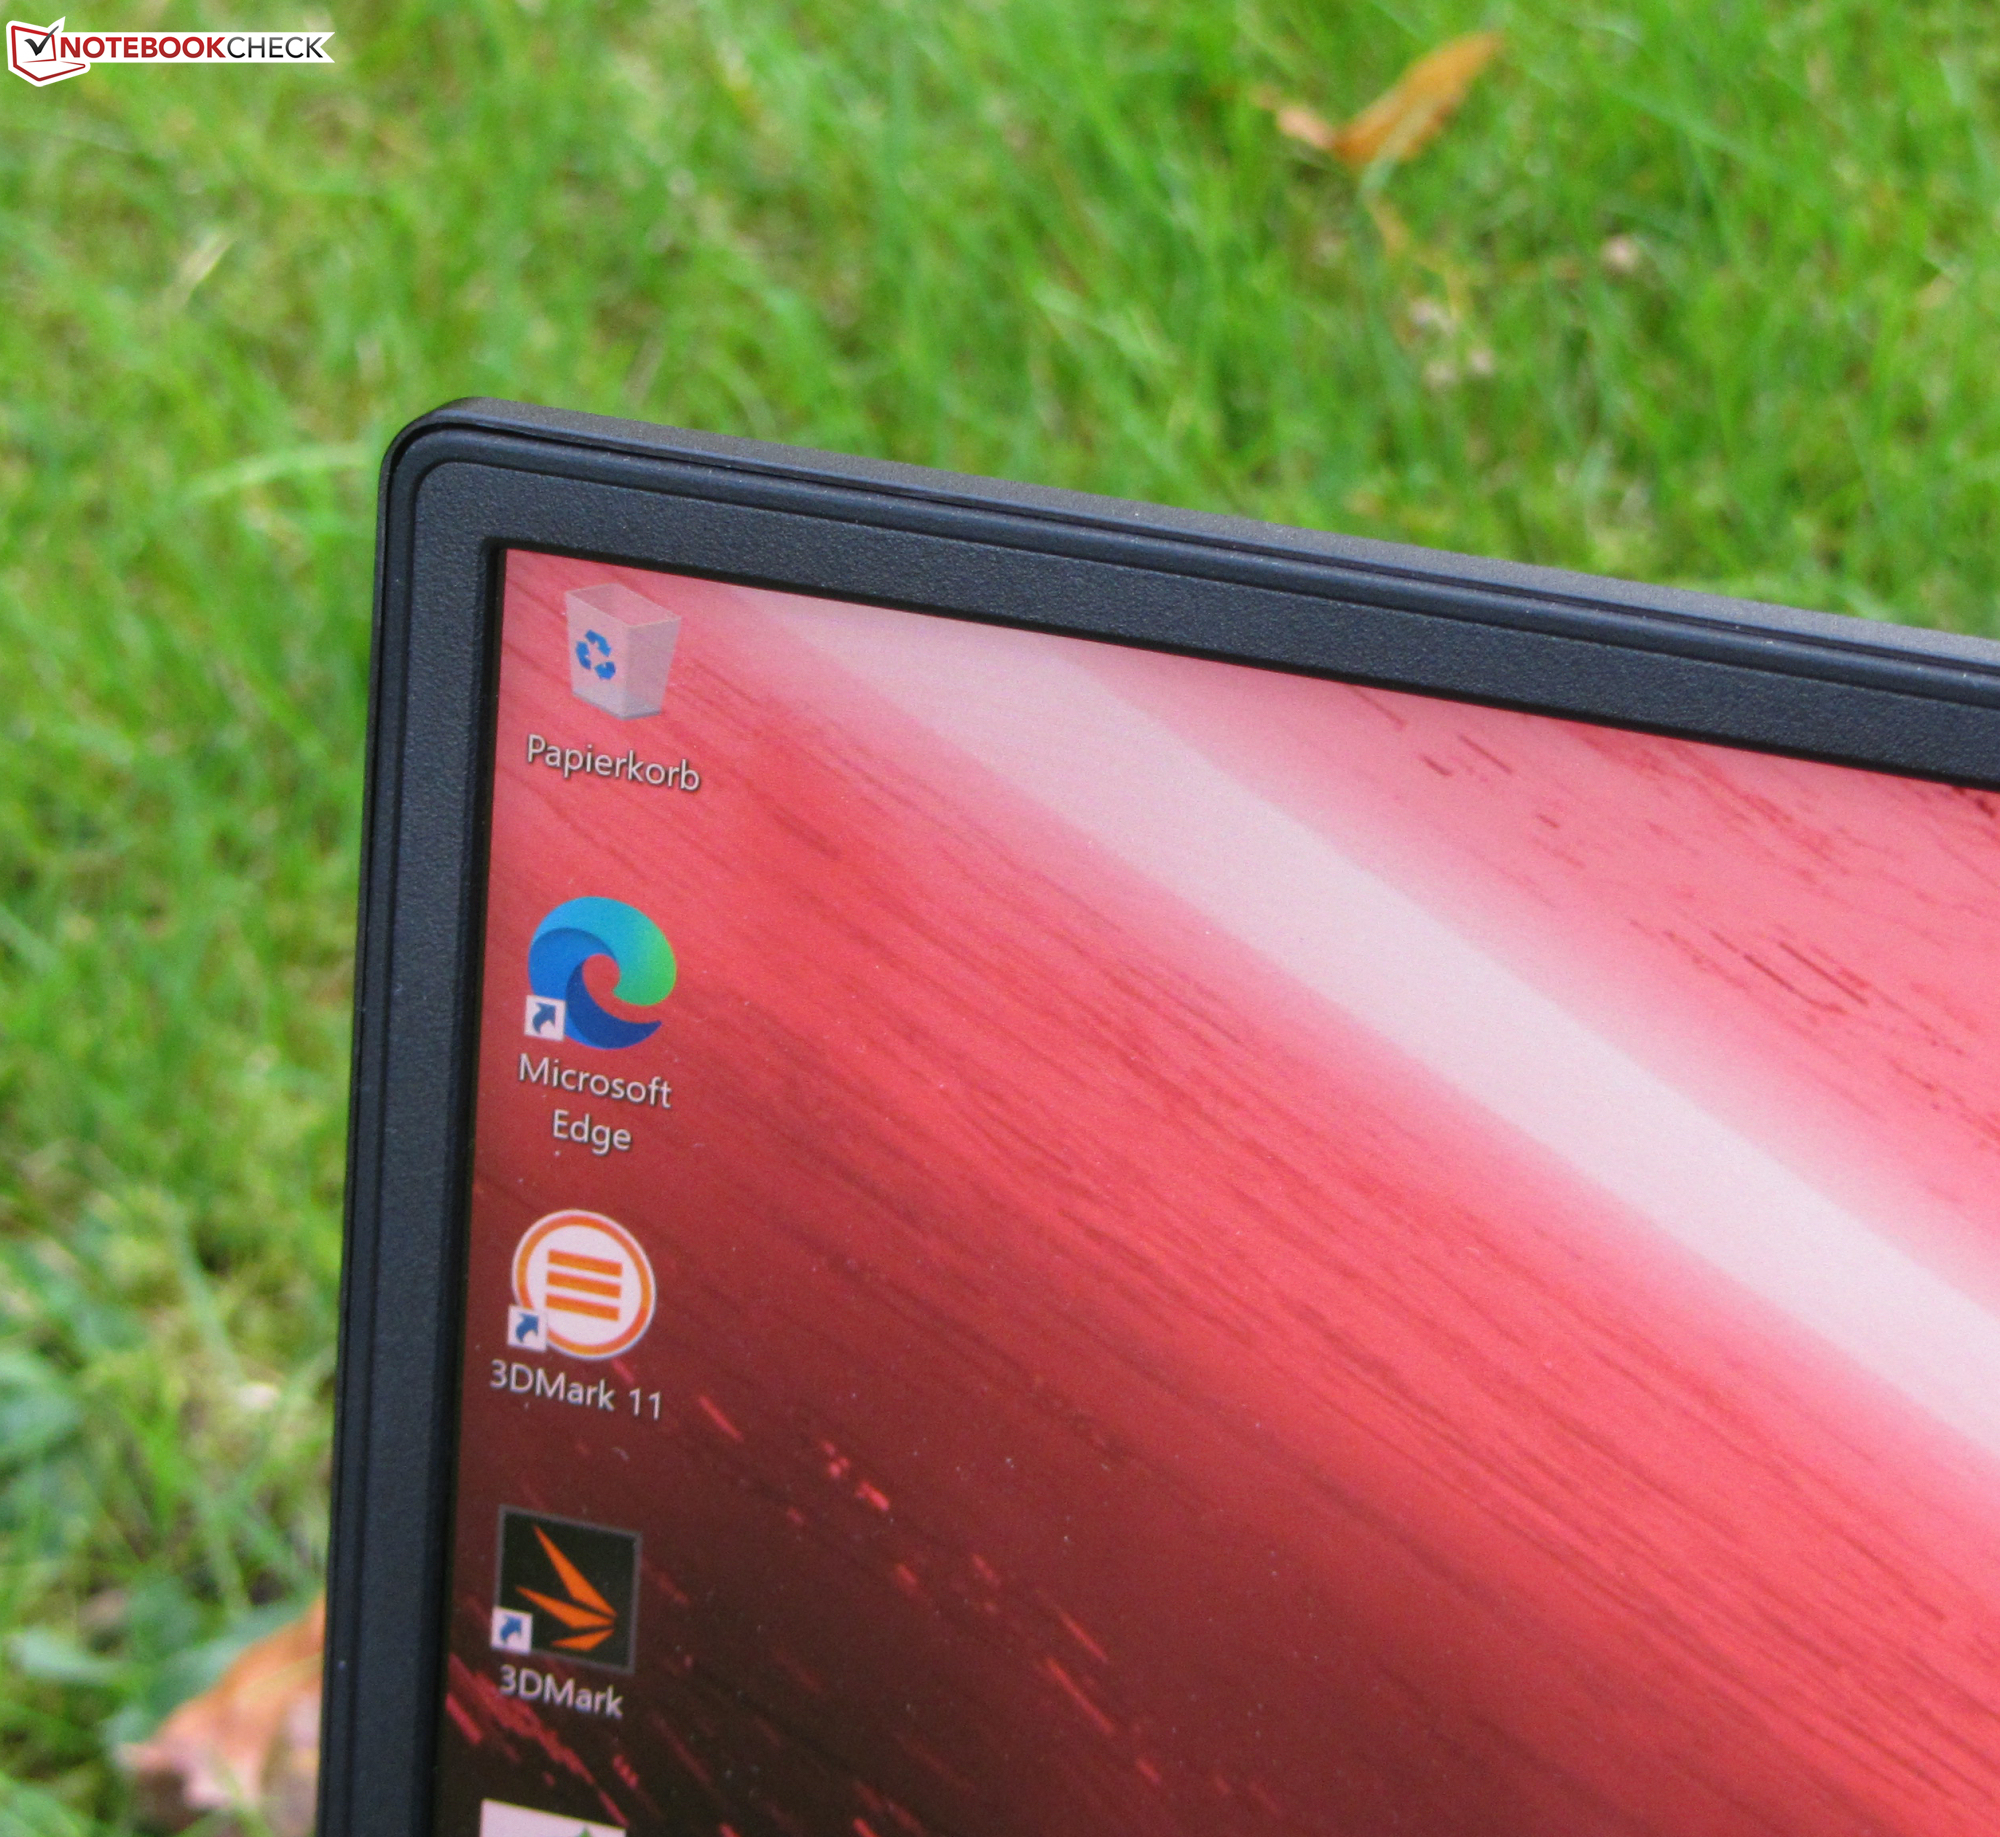
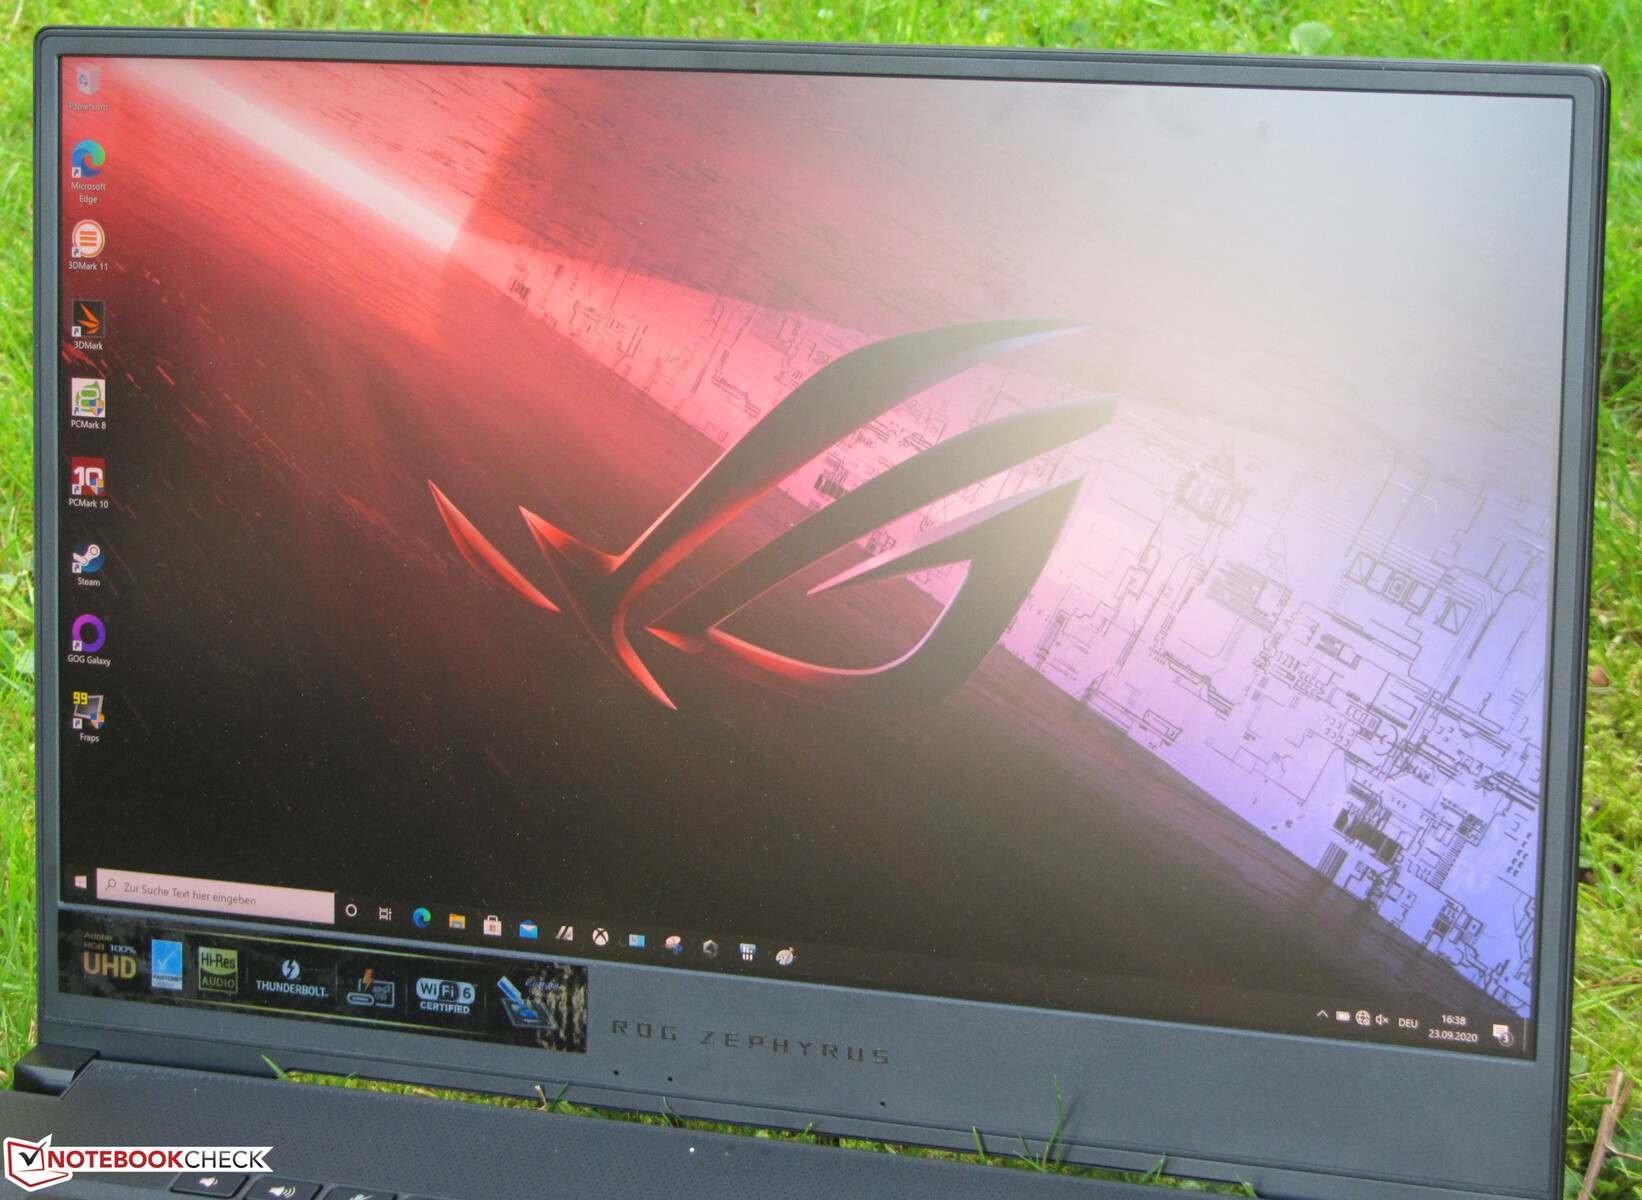
Display - 4k IPS
The 15.6-inch matte screen features a native resolution of 3840x2160 pixels. Contrast (1,683:1) and brightness (376 cd/m²) are excellent. However, the response times of the 60 Hz panel could be better. Two optionally available FHD displays (144 Hz, 240 Hz) offer shorter response times.
| |||||||||||||||||||||||||
Brightness Distribution: 90 %
Center on Battery: 387 cd/m²
Contrast: 1683:1 (Black: 0.23 cd/m²)
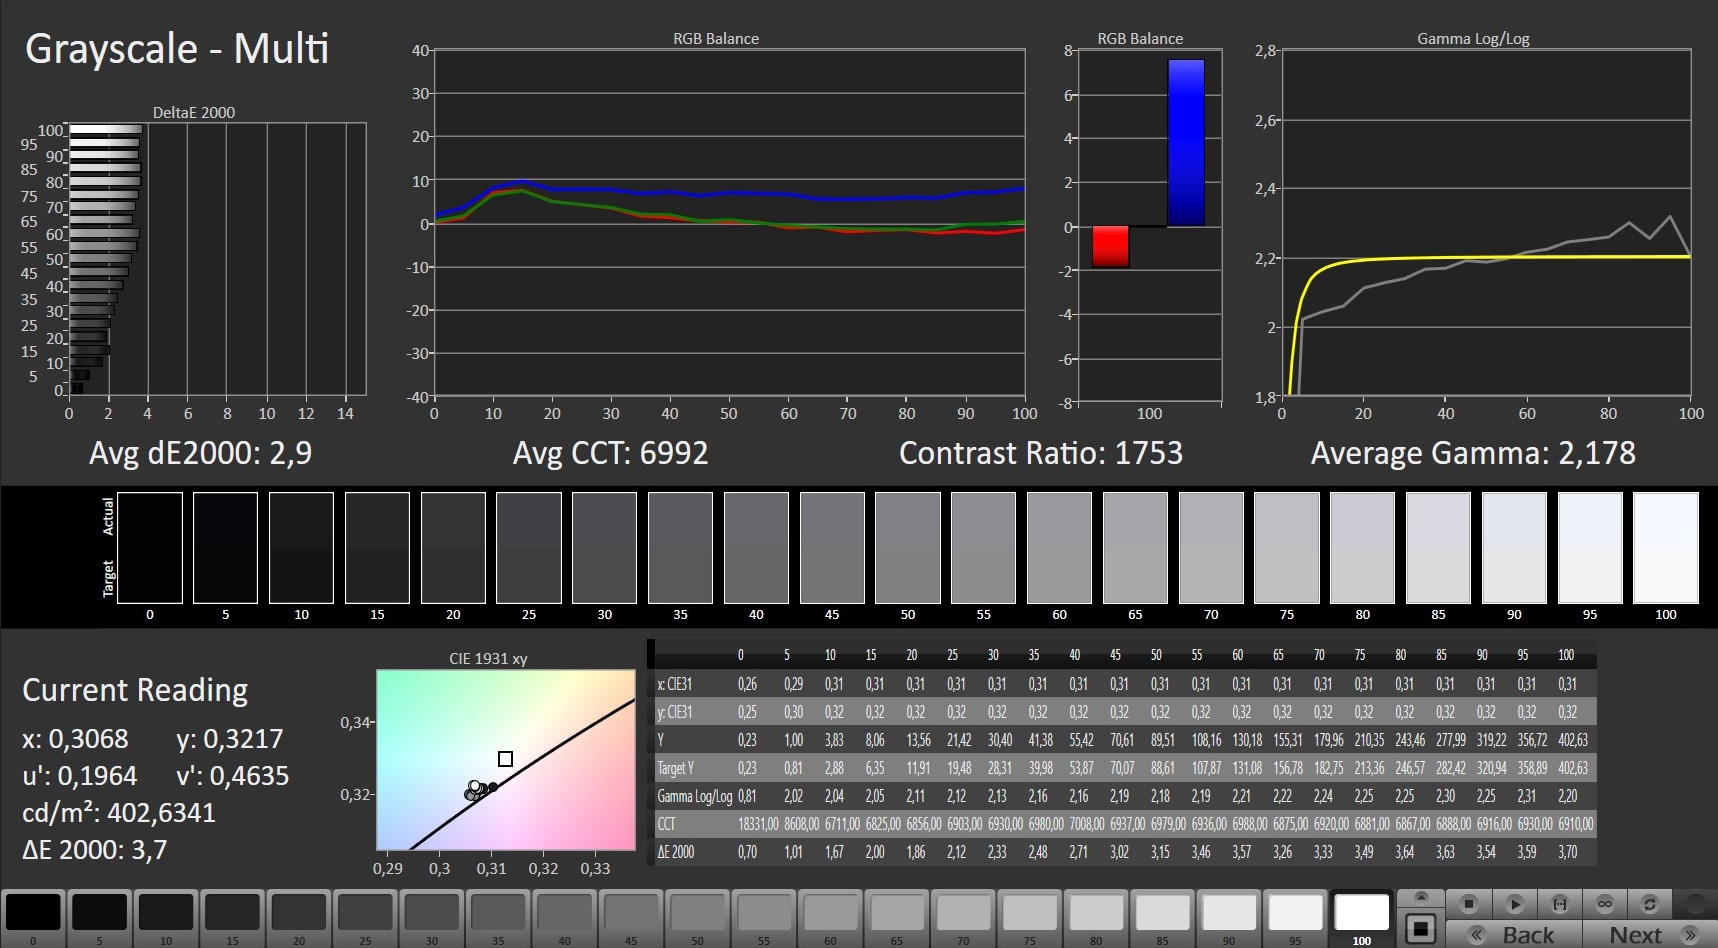
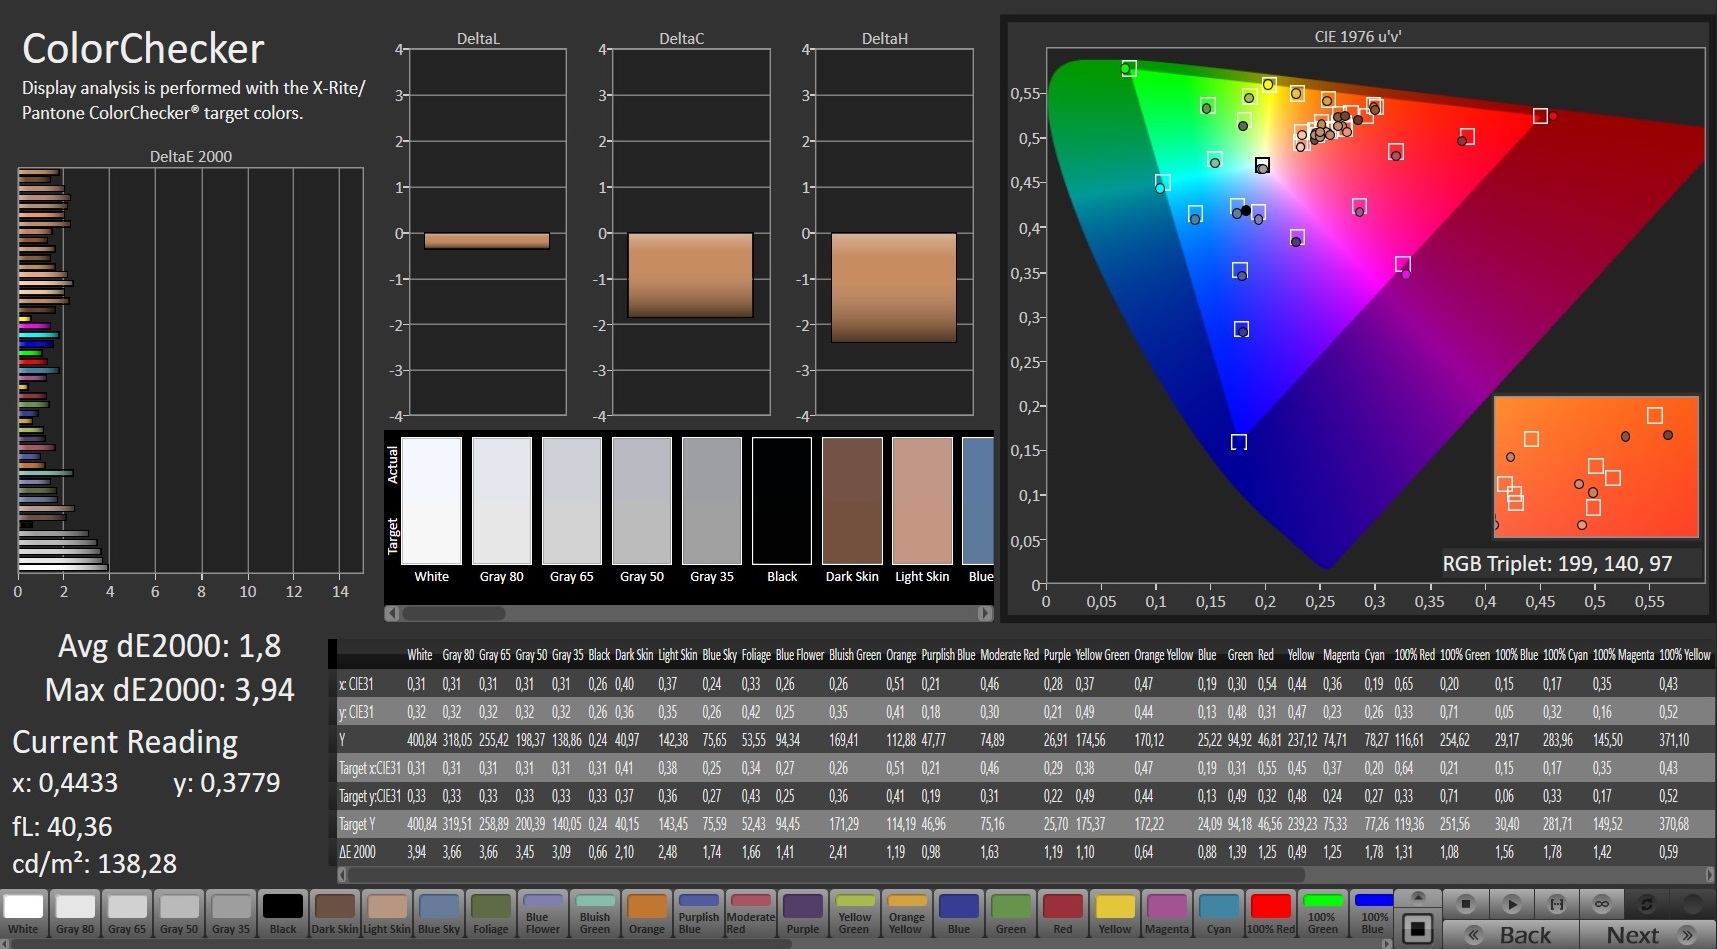
ΔE ColorChecker Calman: 1.8 | ∀{0.5-29.43 Ø4.73}
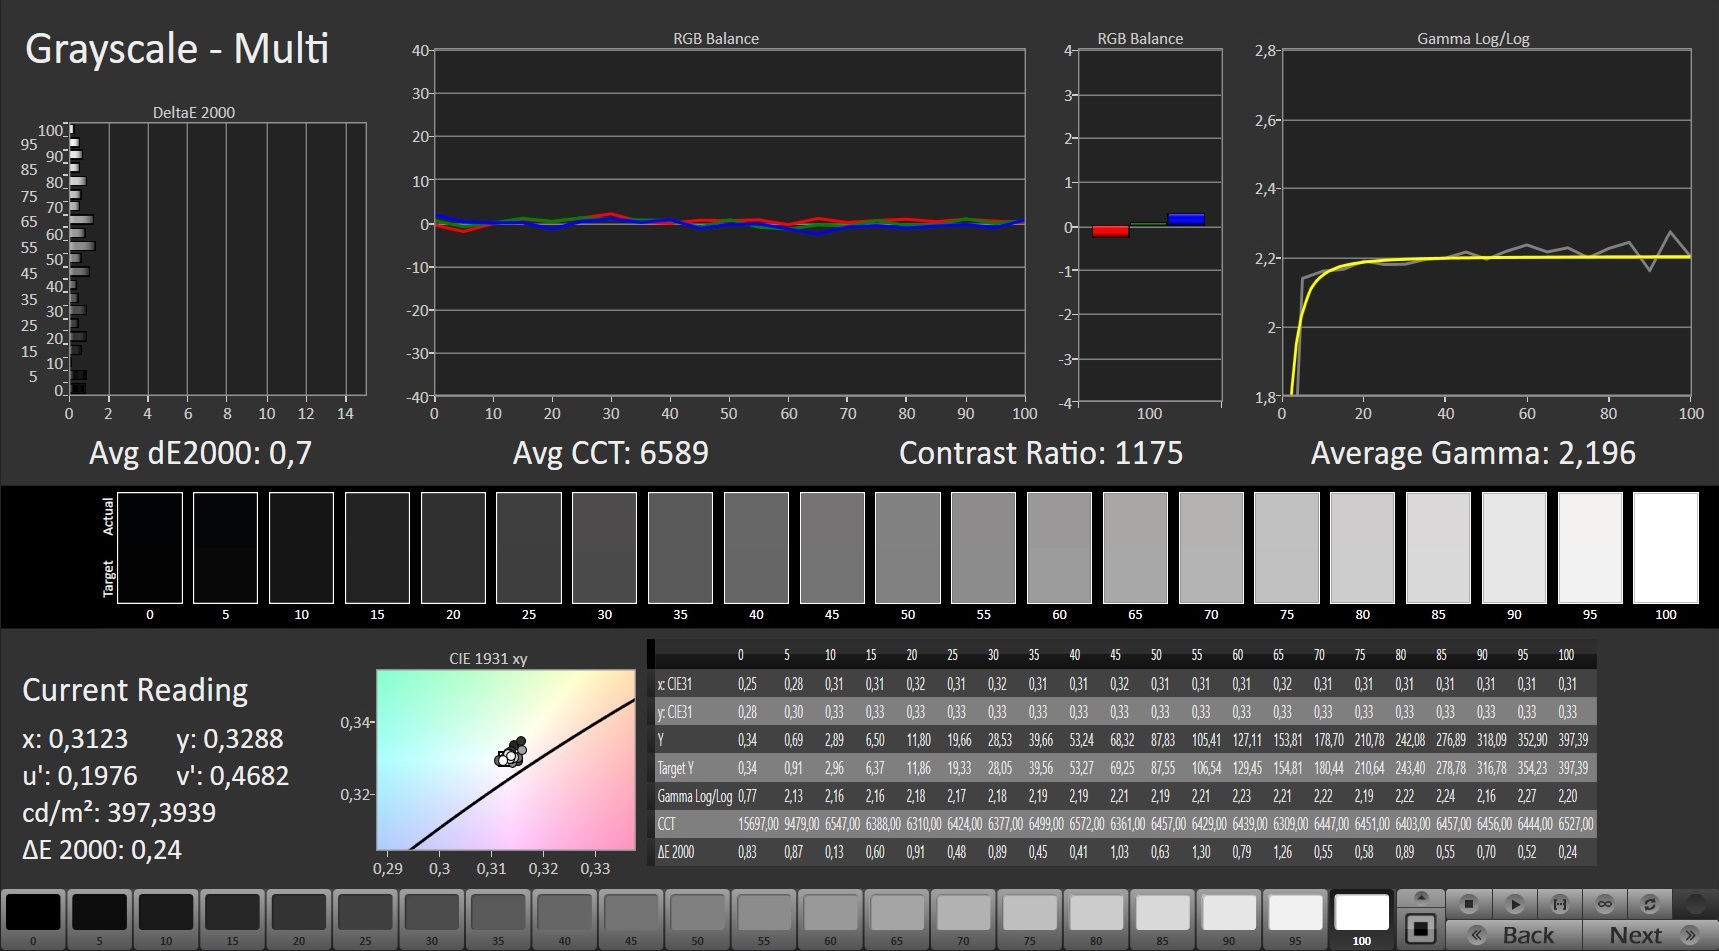
calibrated: 0.7
ΔE Greyscale Calman: 2.9 | ∀{0.09-98 Ø4.97}
99% sRGB (Argyll 1.6.3 3D)
99% AdobeRGB 1998 (Argyll 1.6.3 3D)
70.5% AdobeRGB 1998 (Argyll 3D)
99% sRGB (Argyll 3D)
69.4% Display P3 (Argyll 3D)
Gamma: 2.178
CCT: 6992 K
| Asus ROG Zephyrus M15 GU502L AU Optronics B156ZAN03.1, IPS, 3840x2160, 15.6" | Asus ROG Zephyrus M15 GU502GU-XB74 AU Optronics B156HAN08.2, IPS, 1920x1080, 15.6" | Schenker Key 15 Comet Lake Panda LM156LF-1F02, IPS, 1920x1080, 15.6" | Razer Blade 15 RTX 2070 Super Max-Q AU Optronics B156HAN12.0, IPS, 1920x1080, 15.6" | Gigabyte Aero 15 OLED XB-8DE51B0SP Samsung SDCA029, OLED, 3840x2160, 15.6" | Acer Predator Triton 500 PT515-52-70N3 AUO B156HAN12.0 (AUO7A8C), IPS, 1920x1080, 15.6" | MSI GS66 10SGS AU Optronics B156HAN12.0, IPS, 1920x1080, 15.6" | |
|---|---|---|---|---|---|---|---|
| Display | -6% | -3% | 0% | 28% | 1% | 1% | |
| Display P3 Coverage (%) | 69.4 | 66.5 -4% | 67.2 -3% | 69.4 0% | 99.9 44% | 70.3 1% | 69.9 1% |
| sRGB Coverage (%) | 99 | 90.8 -8% | 96.2 -3% | 98.8 0% | 100 1% | 99.5 1% | 99.1 0% |
| AdobeRGB 1998 Coverage (%) | 70.5 | 66.5 -6% | 68.7 -3% | 70.5 0% | 98.2 39% | 72.2 2% | 71.1 1% |
| Response Times | 78% | 74% | 82% | 95% | 68% | 71% | |
| Response Time Grey 50% / Grey 80% * (ms) | 60 ? | 6.4 ? 89% | 10 ? 83% | 3.2 ? 95% | 2.2 ? 96% | 14.4 ? 76% | 11.2 ? 81% |
| Response Time Black / White * (ms) | 25.6 ? | 8.8 ? 66% | 9.2 ? 64% | 8 ? 69% | 1.8 ? 93% | 10.4 ? 59% | 10 ? 61% |
| PWM Frequency (Hz) | 60 ? | ||||||
| Screen | -64% | -92% | -43% | -28% | -43% | -14% | |
| Brightness middle (cd/m²) | 387 | 297.7 -23% | 300 -22% | 345.4 -11% | 385 -1% | 320 -17% | 339.4 -12% |
| Brightness (cd/m²) | 377 | 280 -26% | 281 -25% | 342 -9% | 390 3% | 318 -16% | 331 -12% |
| Brightness Distribution (%) | 90 | 84 -7% | 80 -11% | 90 0% | 93 3% | 88 -2% | 92 2% |
| Black Level * (cd/m²) | 0.23 | 0.43 -87% | 0.29 -26% | 0.34 -48% | 0.24 -4% | 0.24 -4% | |
| Contrast (:1) | 1683 | 692 -59% | 1034 -39% | 1016 -40% | 1333 -21% | 1414 -16% | |
| Colorchecker dE 2000 * | 1.8 | 3.13 -74% | 5.39 -199% | 3.18 -77% | 2.46 -37% | 4.03 -124% | 1.58 12% |
| Colorchecker dE 2000 max. * | 3.94 | 7.1 -80% | 14.35 -264% | 6.57 -67% | 4.01 -2% | 8.43 -114% | 3.8 4% |
| Colorchecker dE 2000 calibrated * | 0.7 | 3.06 -337% | 1.73 -147% | 1.77 -153% | 2.6 -271% | 0.98 -40% | 1.47 -110% |
| Greyscale dE 2000 * | 2.9 | 1.9 34% | 9.8 -238% | 3.8 -31% | 1.39 52% | 5.94 -105% | 2.3 21% |
| Gamma | 2.178 101% | 2.23 99% | 2.019 109% | 2.15 102% | 2.31 95% | 2.42 91% | 2.24 98% |
| CCT | 6992 93% | 6325 103% | 8174 80% | 7109 91% | 6395 102% | 6751 96% | 6952 93% |
| Color Space (Percent of AdobeRGB 1998) (%) | 99 | 59.2 -40% | 69 -30% | 64.3 -35% | 98 -1% | 66 -33% | 64.8 -35% |
| Color Space (Percent of sRGB) (%) | 99 | 90.5 -9% | 92 -7% | 99 0% | 100 1% | 99 0% | 99.4 0% |
| Total Average (Program / Settings) | 3% /
-36% | -7% /
-54% | 13% /
-19% | 32% /
1% | 9% /
-21% | 19% /
-0% |
* ... smaller is better
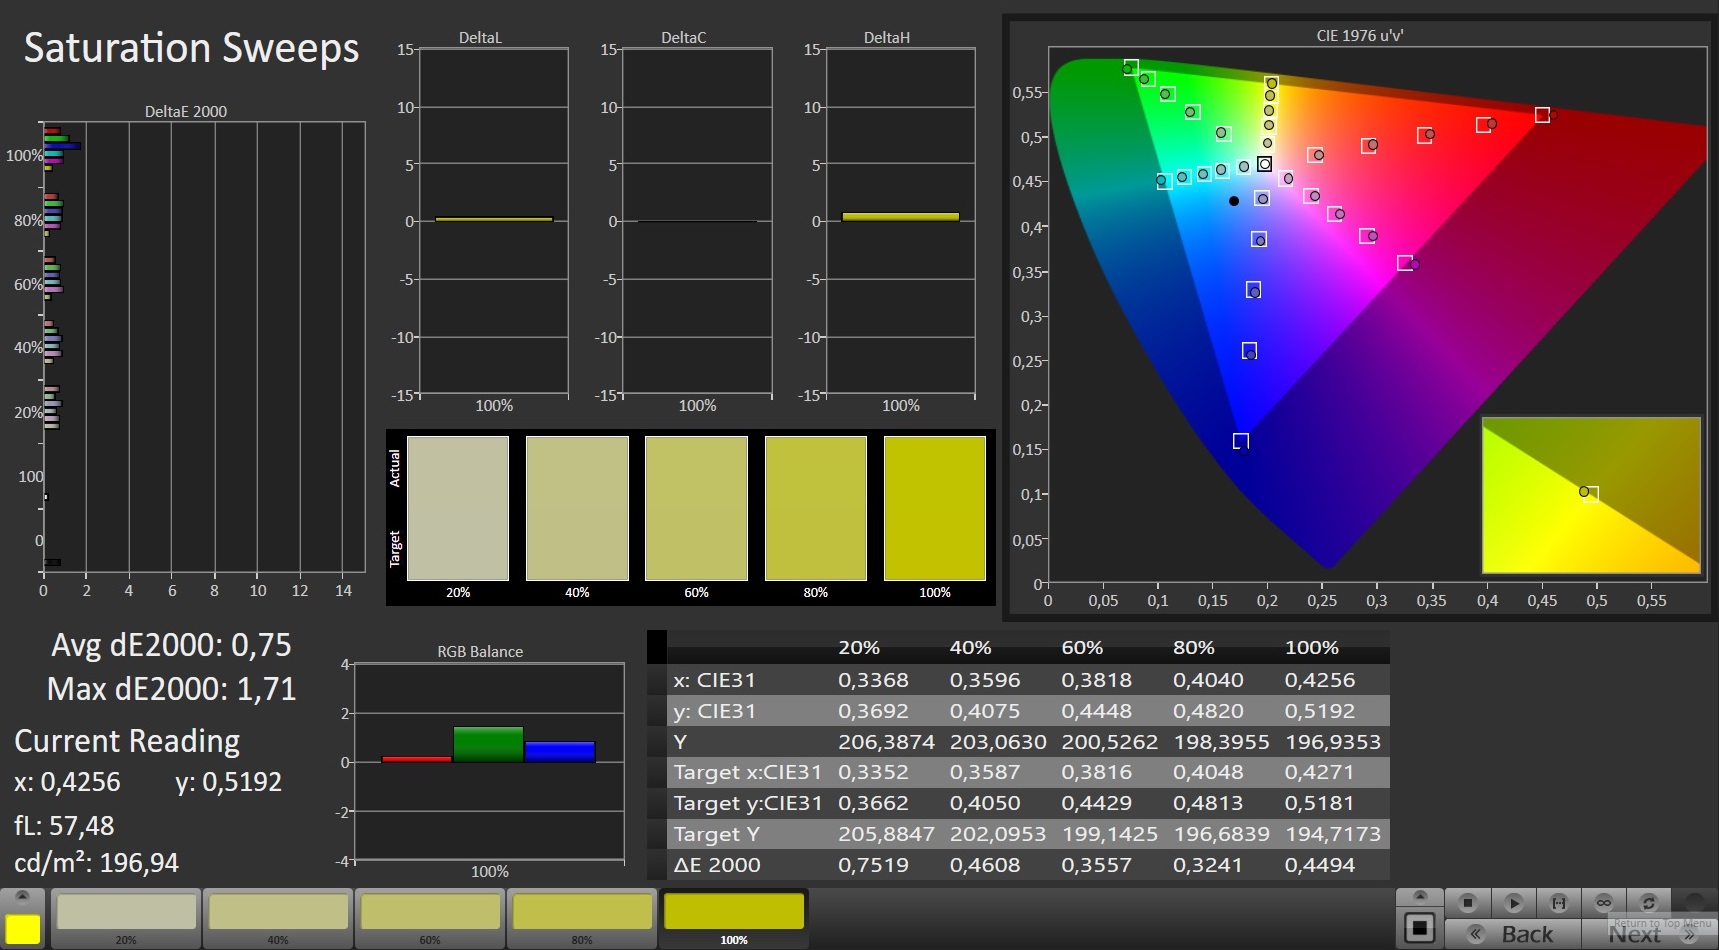
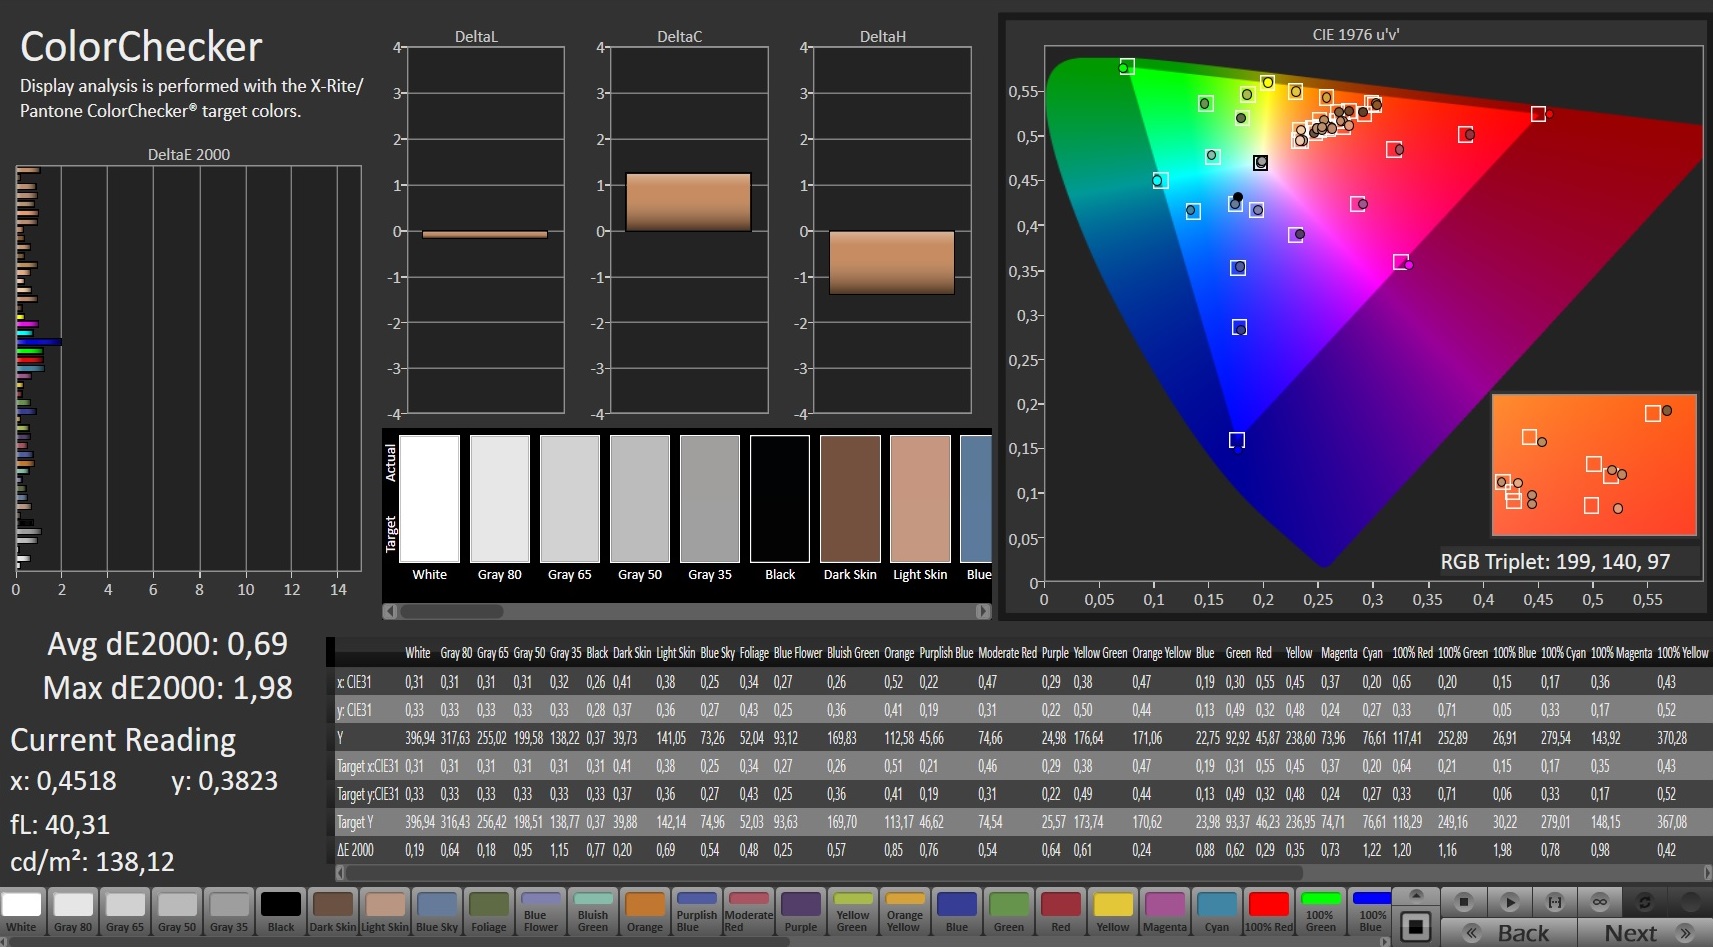
The X-Rite Pantone certification of the screen guarantees a very natural colour display. Even in factory condition, the display meets the target with a Delta E 2000 colour deviation of 1.8 (Delta E less than 3). It does not suffer from a blue cast. Calibrating the display provides further improvements. The colour deviation is reduced to 0.69 and grey scales are more balanced. The colour spaces AdobeRGB (99%) and sRGB (99%) are reproduced almost completely.

Display Response Times
| ↔ Response Time Black to White | ||
|---|---|---|
| 25.6 ms ... rise ↗ and fall ↘ combined | ↗ 11.6 ms rise | 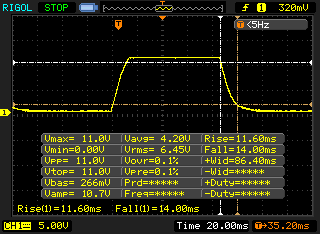 |
| ↘ 14 ms fall | ||
| The screen shows relatively slow response rates in our tests and may be too slow for gamers. In comparison, all tested devices range from 0.1 (minimum) to 240 (maximum) ms. » 61 % of all devices are better. This means that the measured response time is worse than the average of all tested devices (19.9 ms). | ||
| ↔ Response Time 50% Grey to 80% Grey | ||
| 60 ms ... rise ↗ and fall ↘ combined | ↗ 29.2 ms rise | 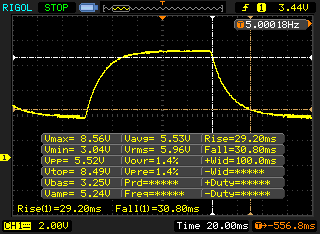 |
| ↘ 30.8 ms fall | ||
| The screen shows slow response rates in our tests and will be unsatisfactory for gamers. In comparison, all tested devices range from 0.165 (minimum) to 636 (maximum) ms. » 96 % of all devices are better. This means that the measured response time is worse than the average of all tested devices (31.1 ms). | ||
Screen Flickering / PWM (Pulse-Width Modulation)
| Screen flickering / PWM not detected | 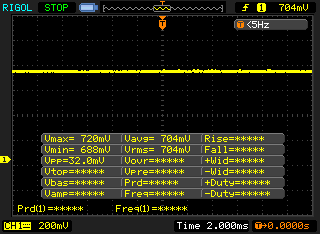 | ||
In comparison: 52 % of all tested devices do not use PWM to dim the display. If PWM was detected, an average of 7798 (minimum: 5 - maximum: 343500) Hz was measured. | |||
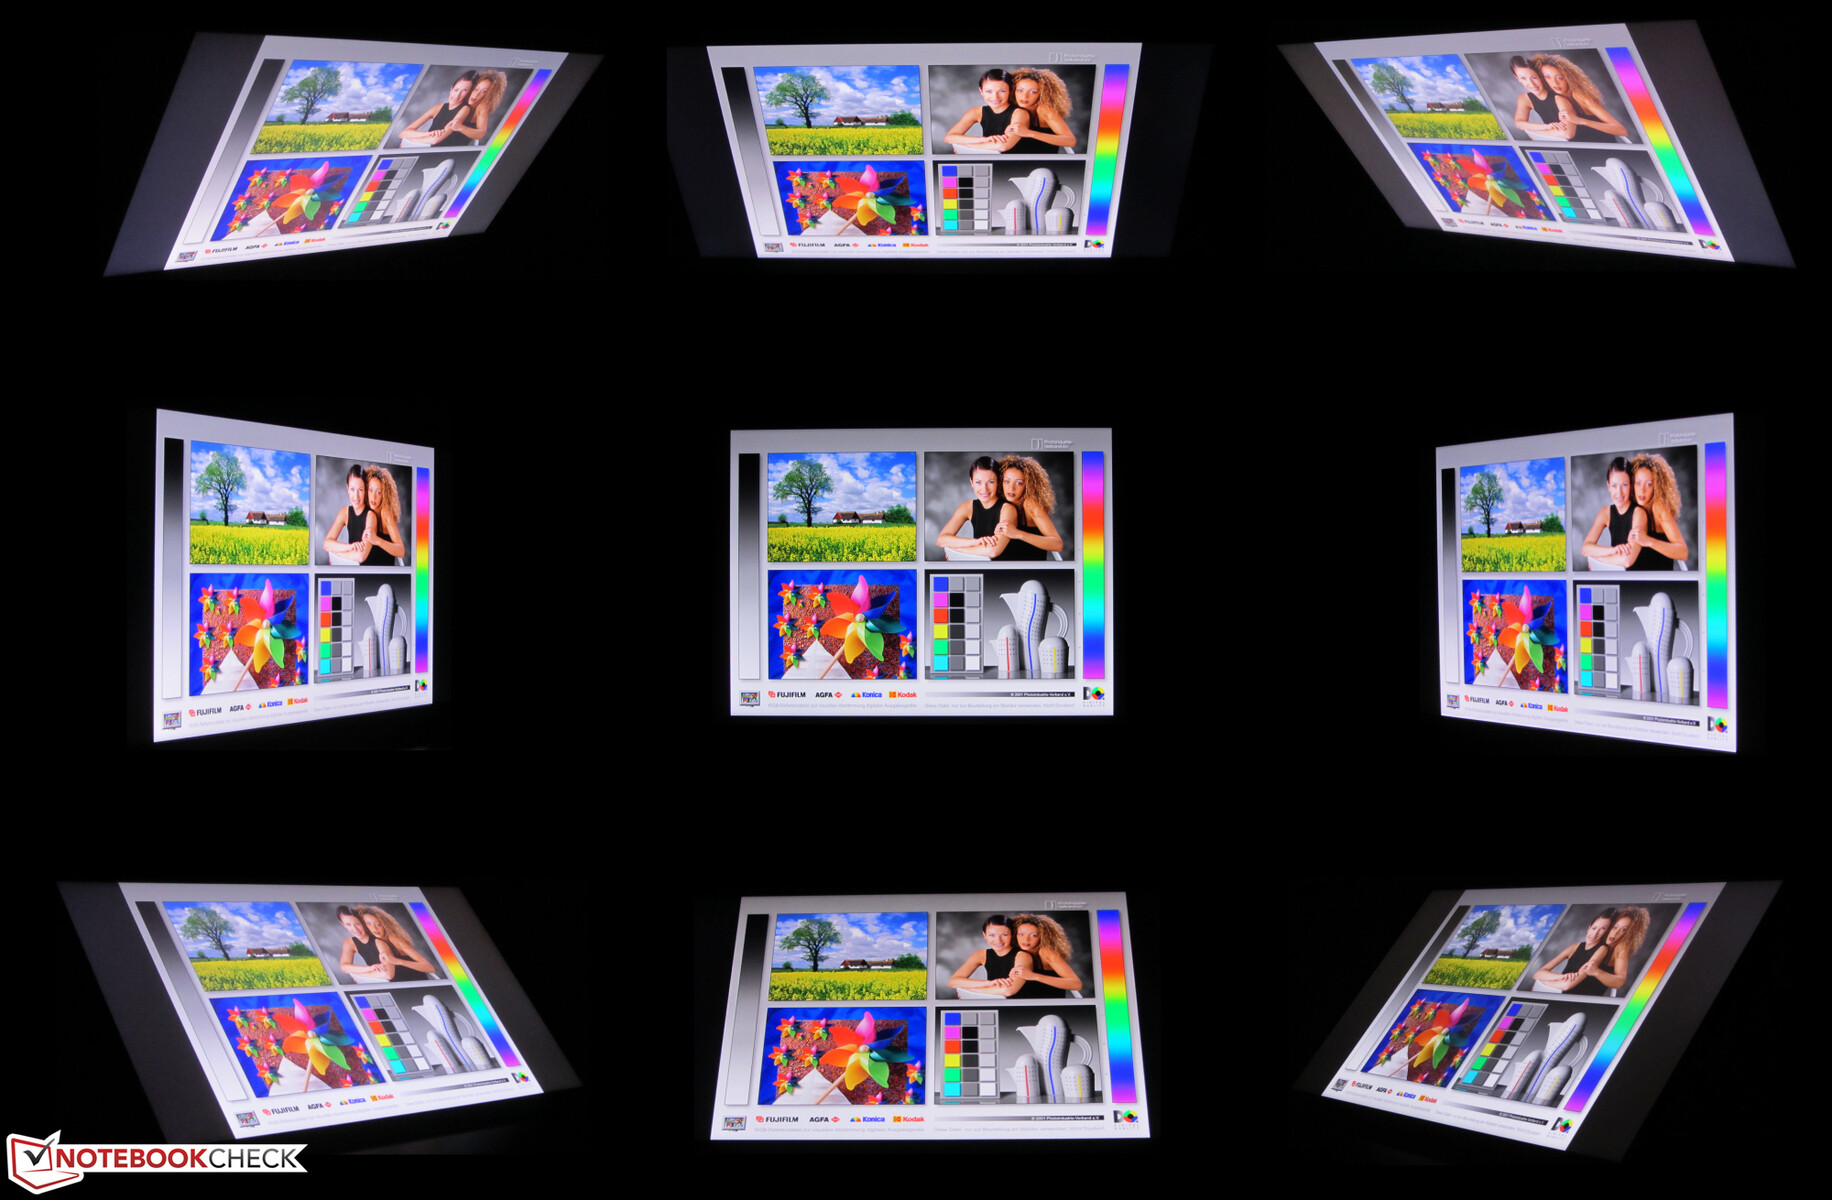
Asus equips the Zephyrus GU502L with a viewing angle stable IPS panel. The display can be read from any position. Outdoor use is certainly possible, given the sun doesn't shine too brightly.
Performance - Even more power thanks to Turbo profile
The Asus Zephyrus M15 GU502L represents a slim, compact 15.6-inch gaming notebook that brings every current game smoothly to the screen and also makes a good impression in all other application areas. Our test device is priced at around $3,000.


Testing conditions
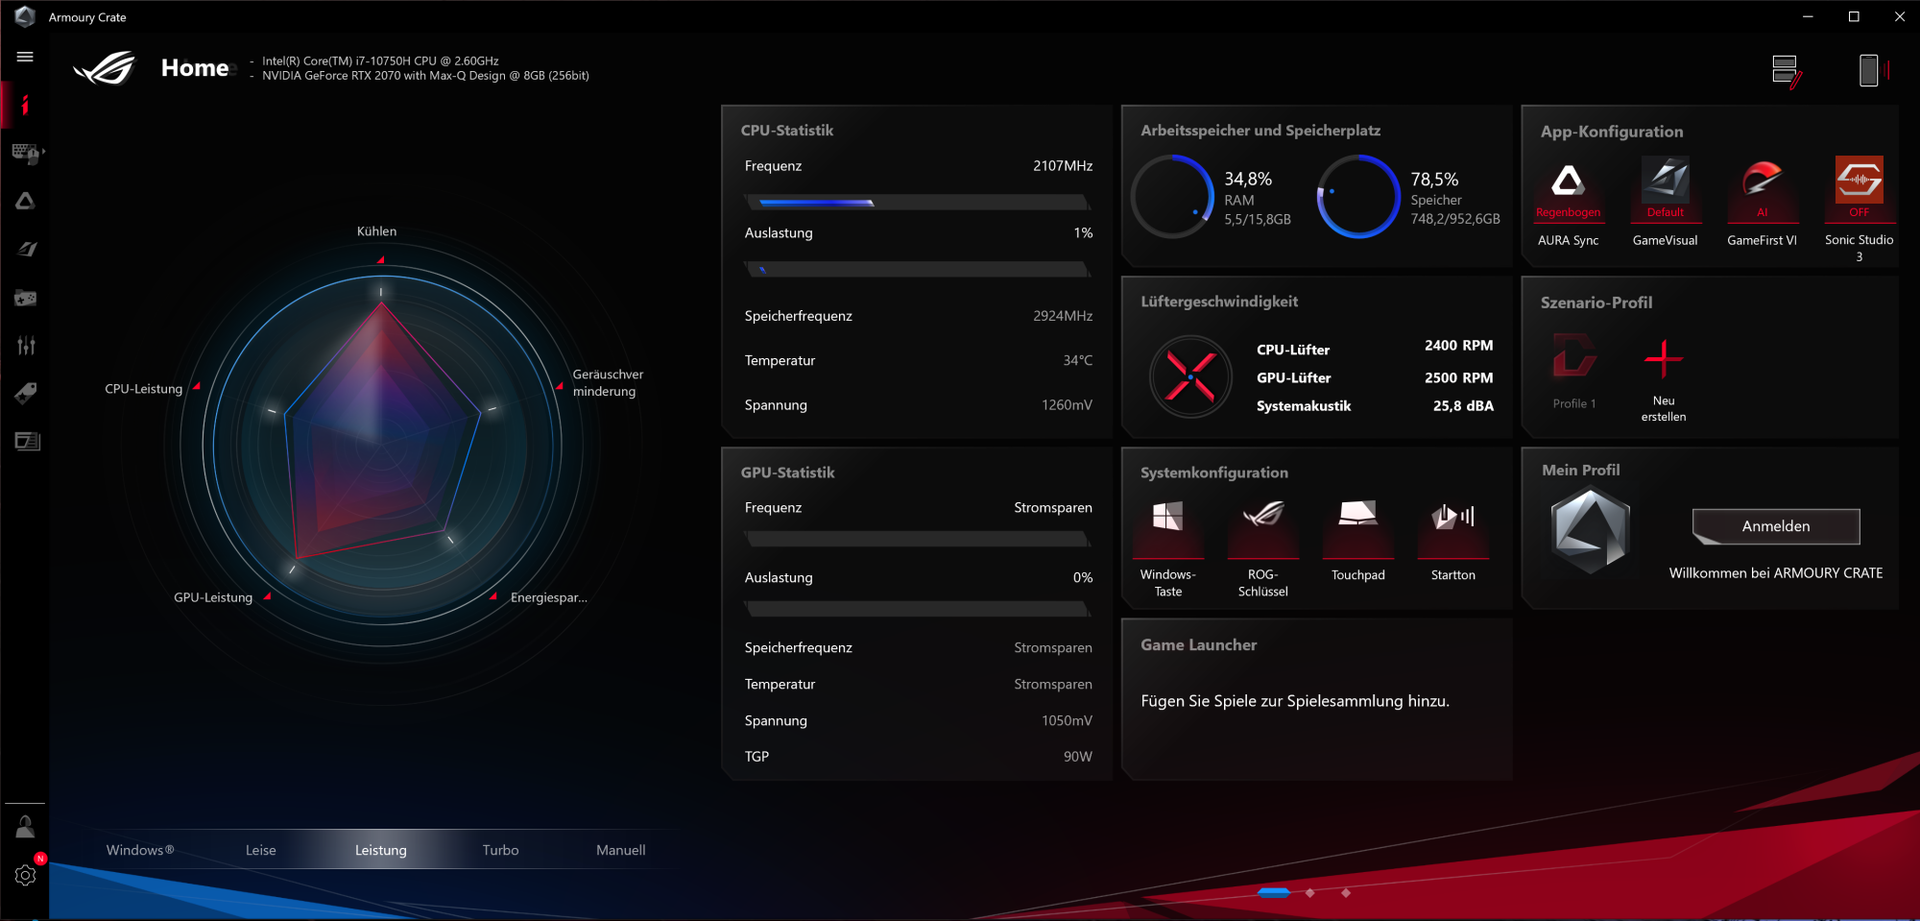
The pre-installed Armoury Crate control center allows the choice of an energy profile. We have conducted our test with the "Performance" profile active. We have also run some benchmarks under the "Turbo" profile. For the battery tests we used the Windows energy schemes.
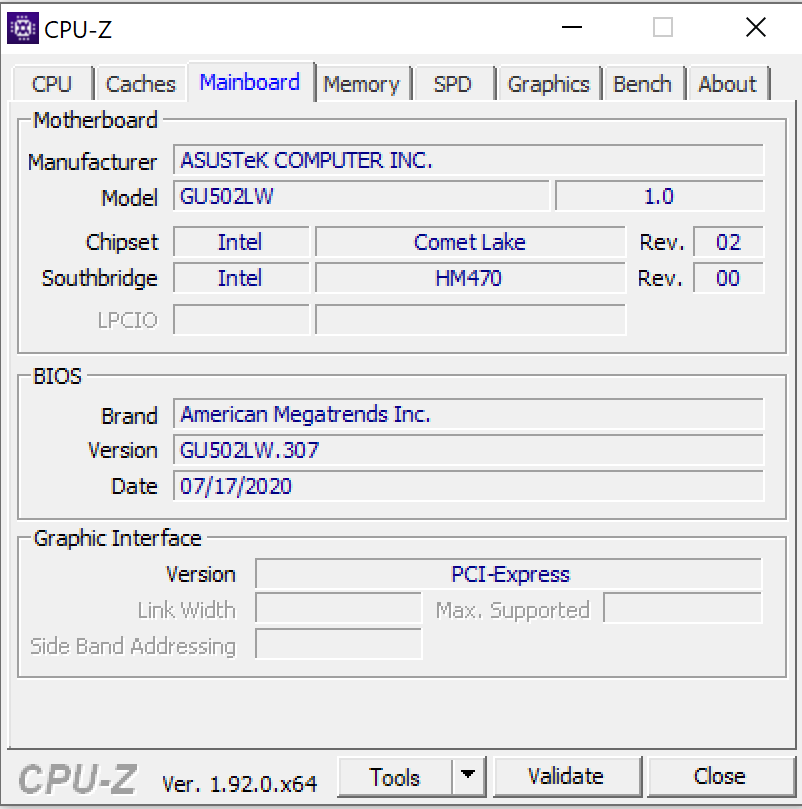
Processor
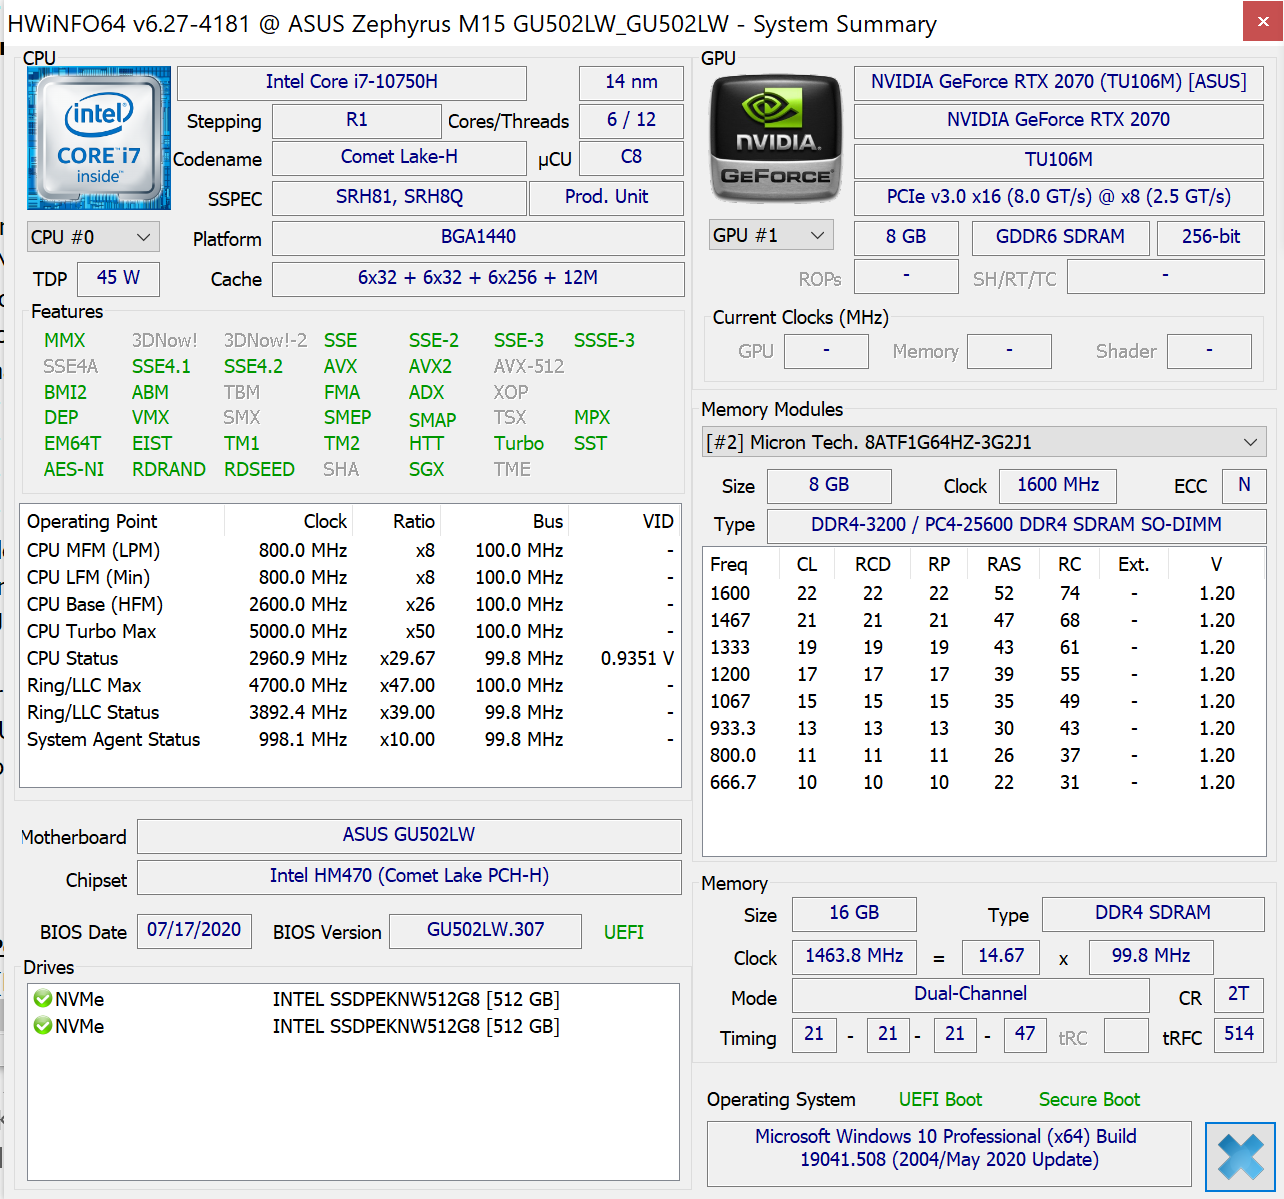
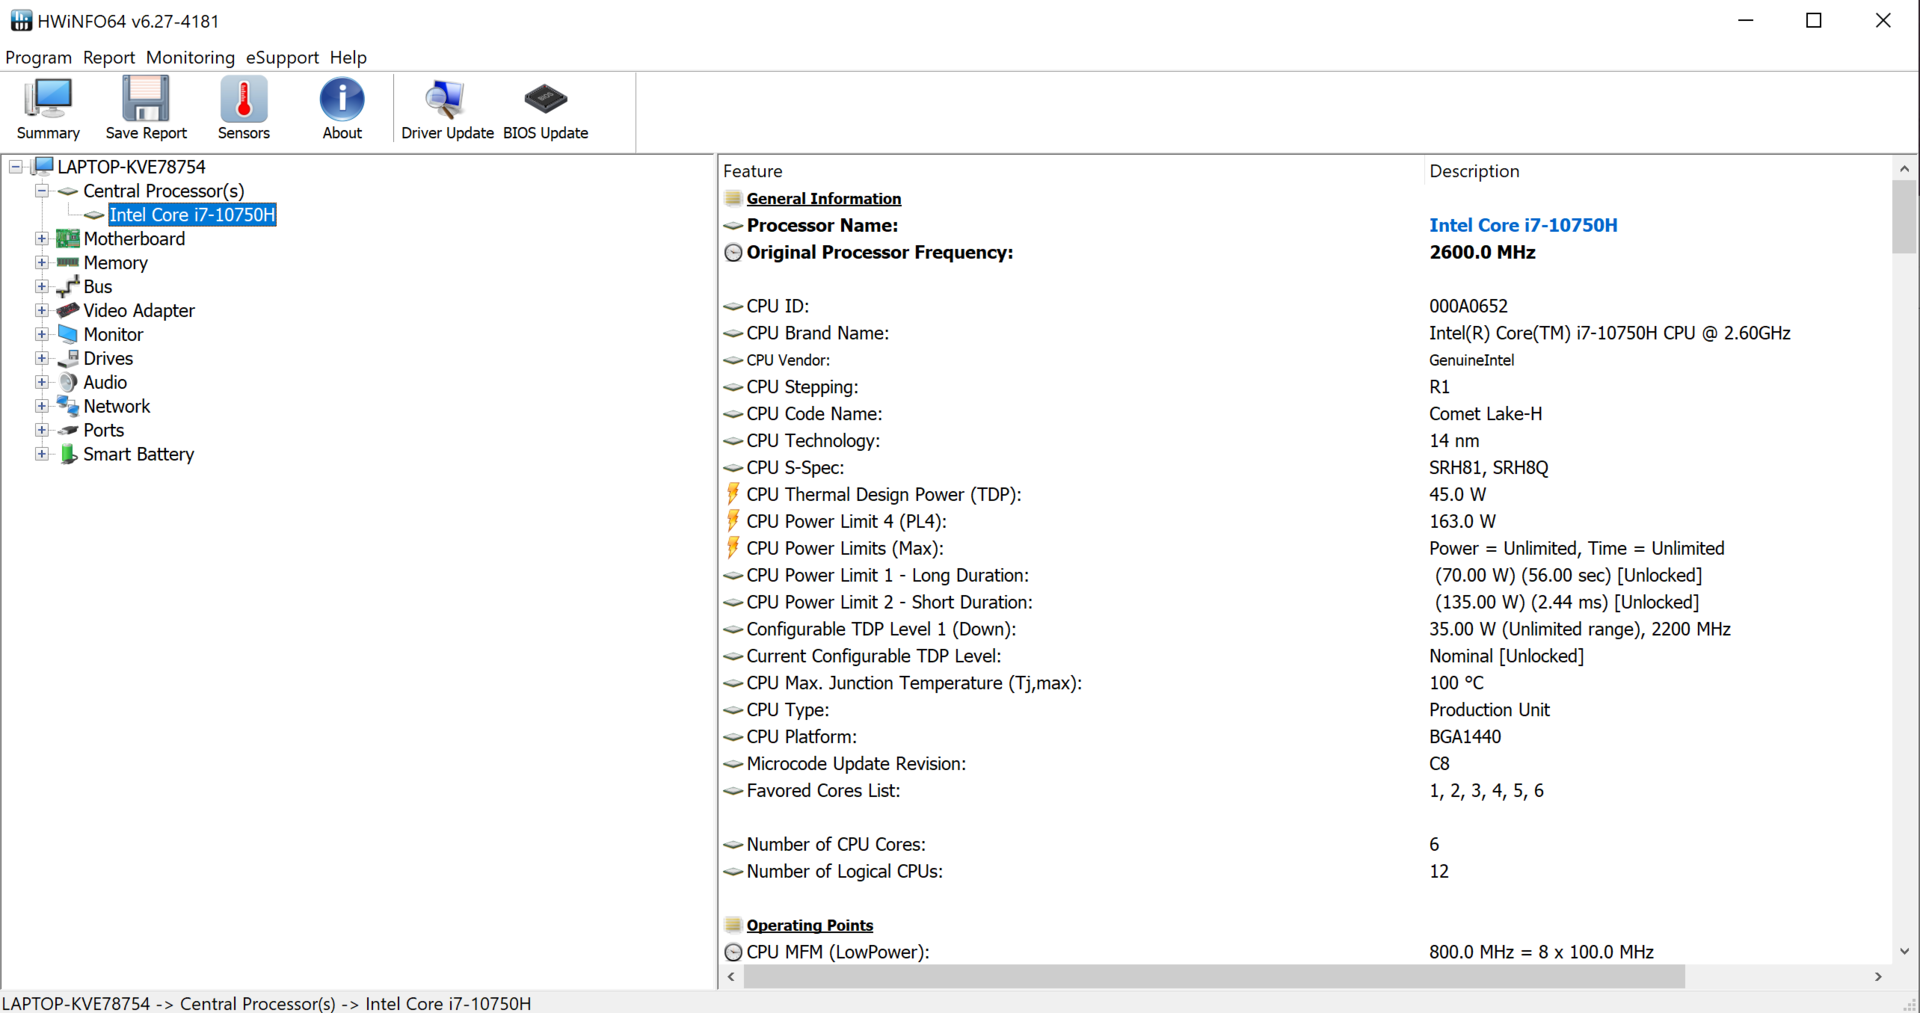
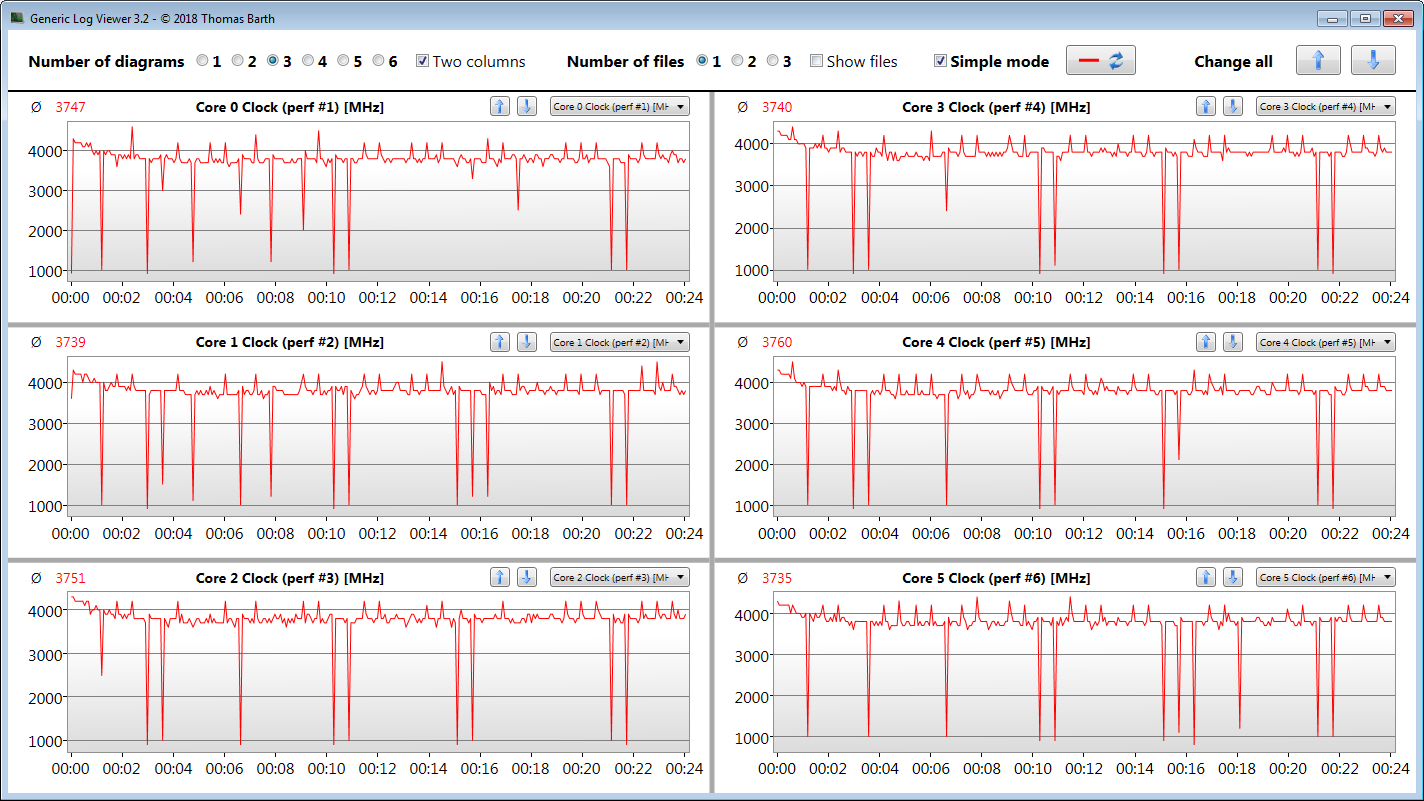
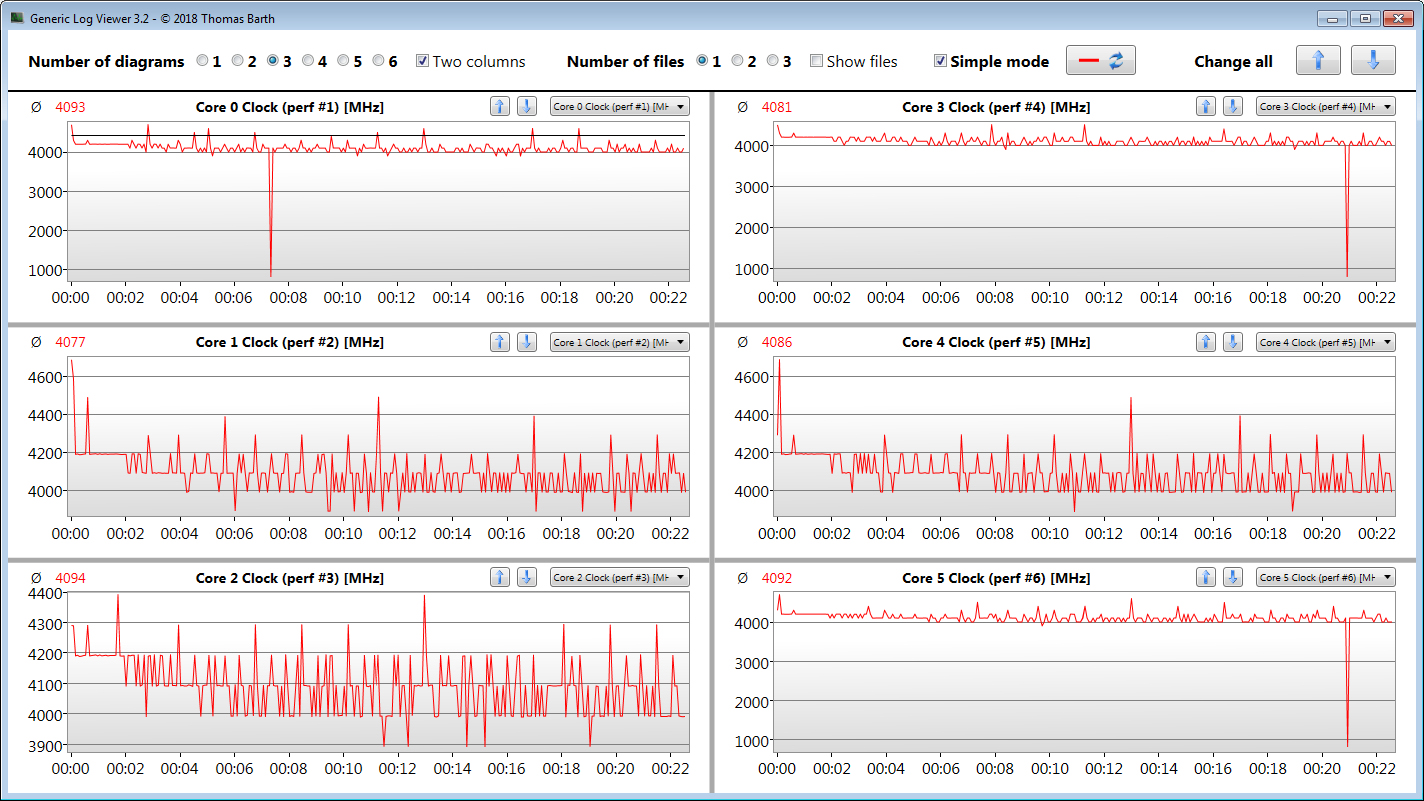
The Core i7-10750H six-core processor (Comet Lake) operates at a basic speed of 2.6 GHz. With Turbo Boost, the clock speed can be increased to 4.3 GHz on six cores and up to 5 GHz on a single core. Hyper-Threading (two threads per core) is supported.
For a short time the CPU processes the multithread test of the Cinebench R15 benchmark at 4.2 GHz. Then the clock rate drops to 3.9 GHz - 4.2 GHz. The single-thread test is run at 4.2 GHz - 4.8 GHz. In battery operation, the speeds are reduced to 3.2 GHz - 3.6 GHz (multithread) and 3.6 GHz (single-thread).
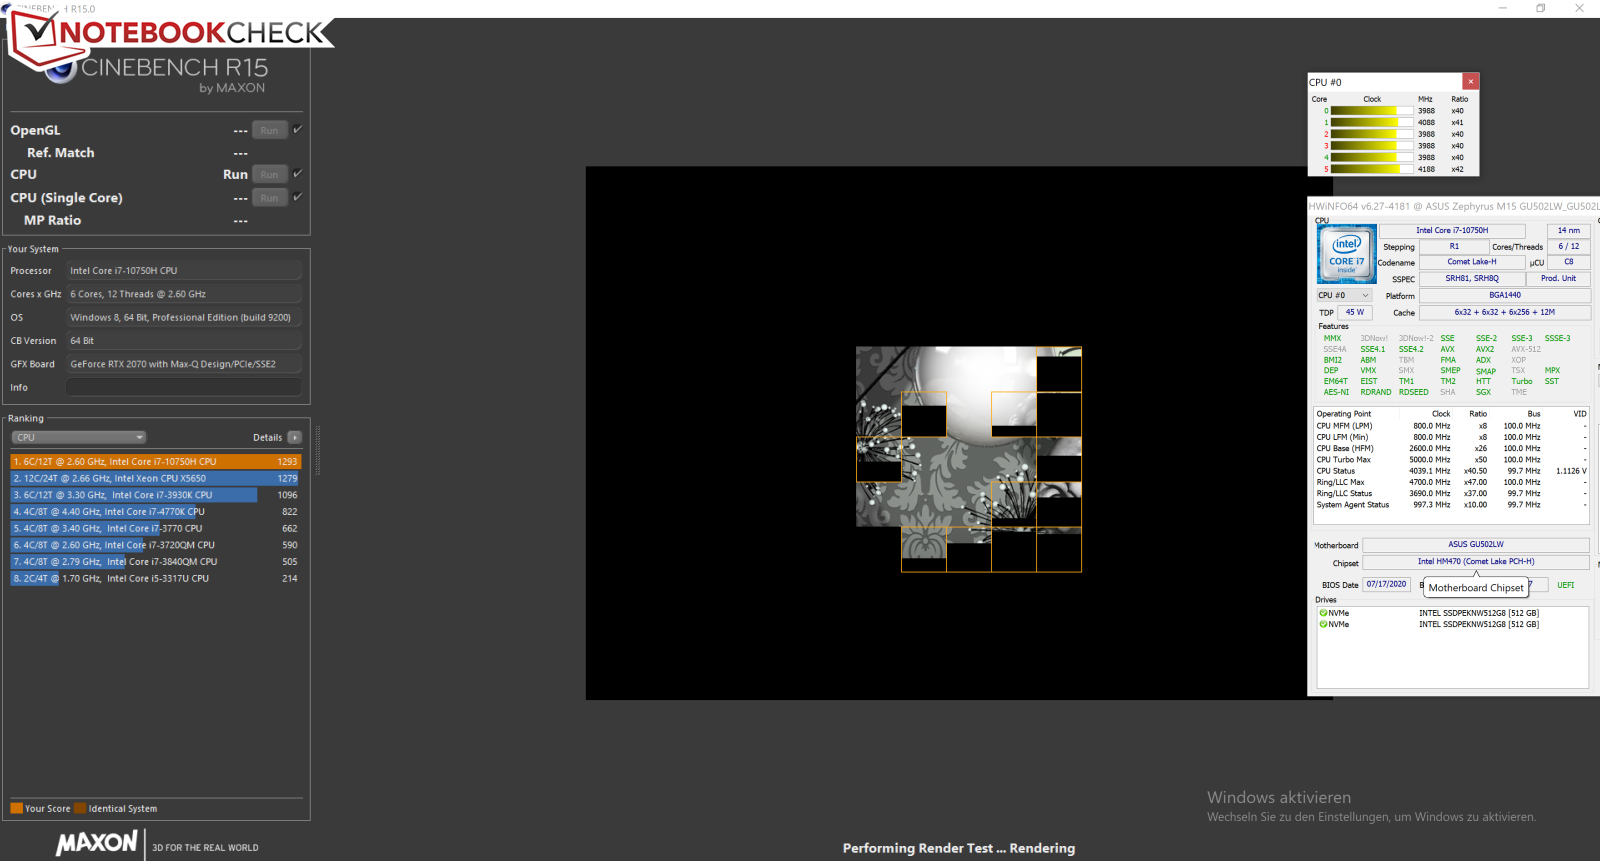
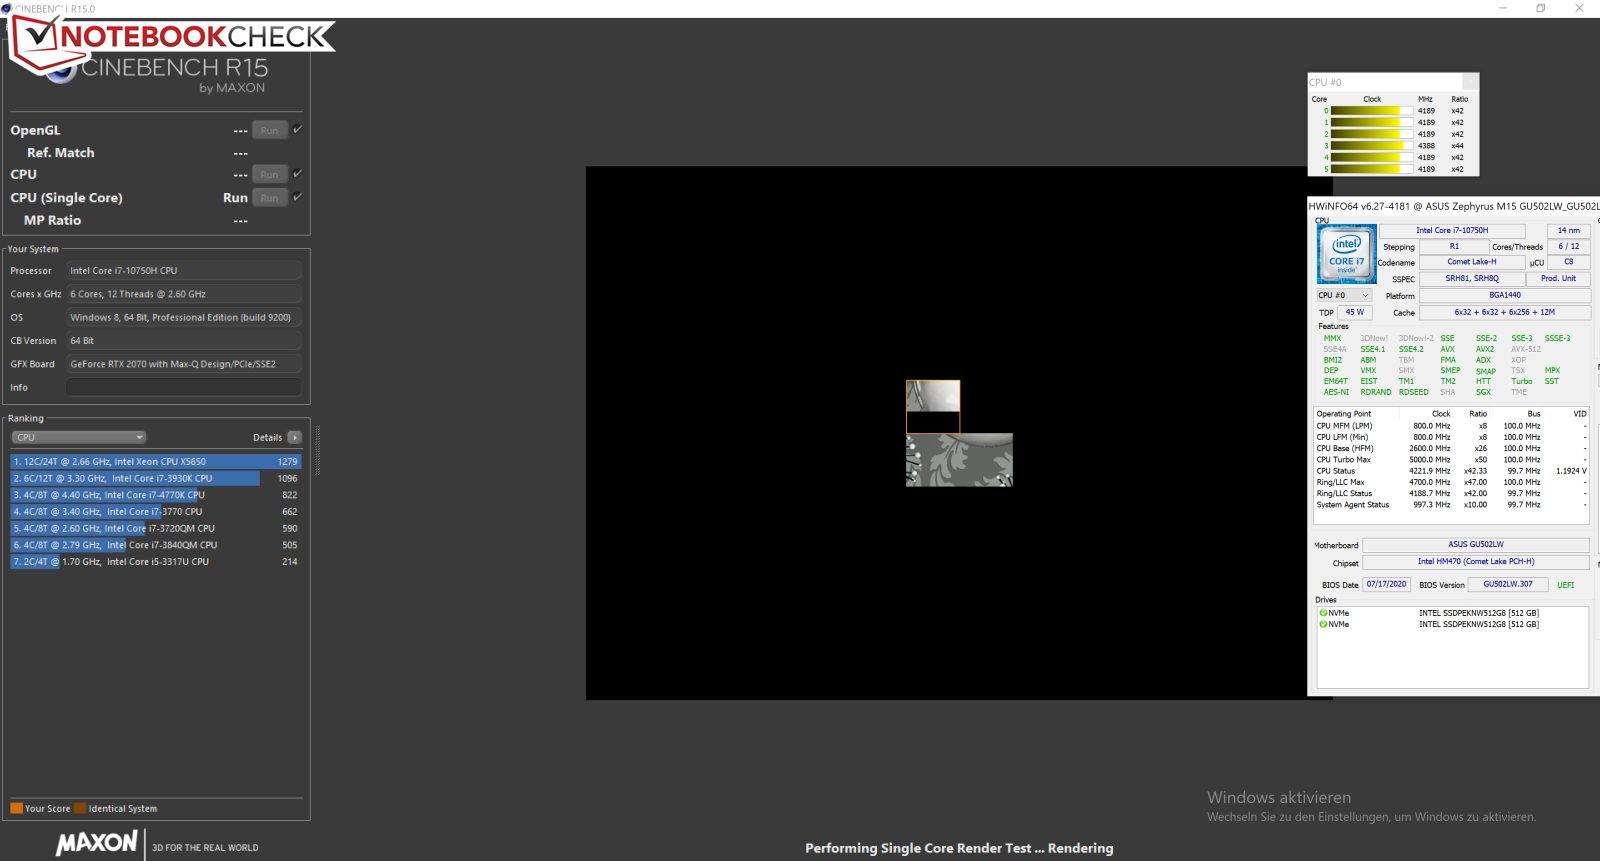
We test whether the CPU Turbo is permanently used in mains operation by running the multithread test of Cinebench R15 in a loop for at least 30 minutes. The results decrease from the first to the fifth run and then remain at a fairly constant level. The CPU Turbo is working. Turbo clock rates increase slightly by choosing the Armoury Crate profile "Turbo".
* ... smaller is better
System Performance
The system works quickly and smoothly. The laptop has enough computing power for all common applications. Gaming, video editing and image processing do not pose any major challenges for the device. The PCMark results are good.
| PCMark 8 Home Score Accelerated v2 | 3409 points | |
| PCMark 8 Creative Score Accelerated v2 | 4848 points | |
| PCMark 8 Work Score Accelerated v2 | 4396 points | |
| PCMark 10 Score | 5208 points | |
Help | ||
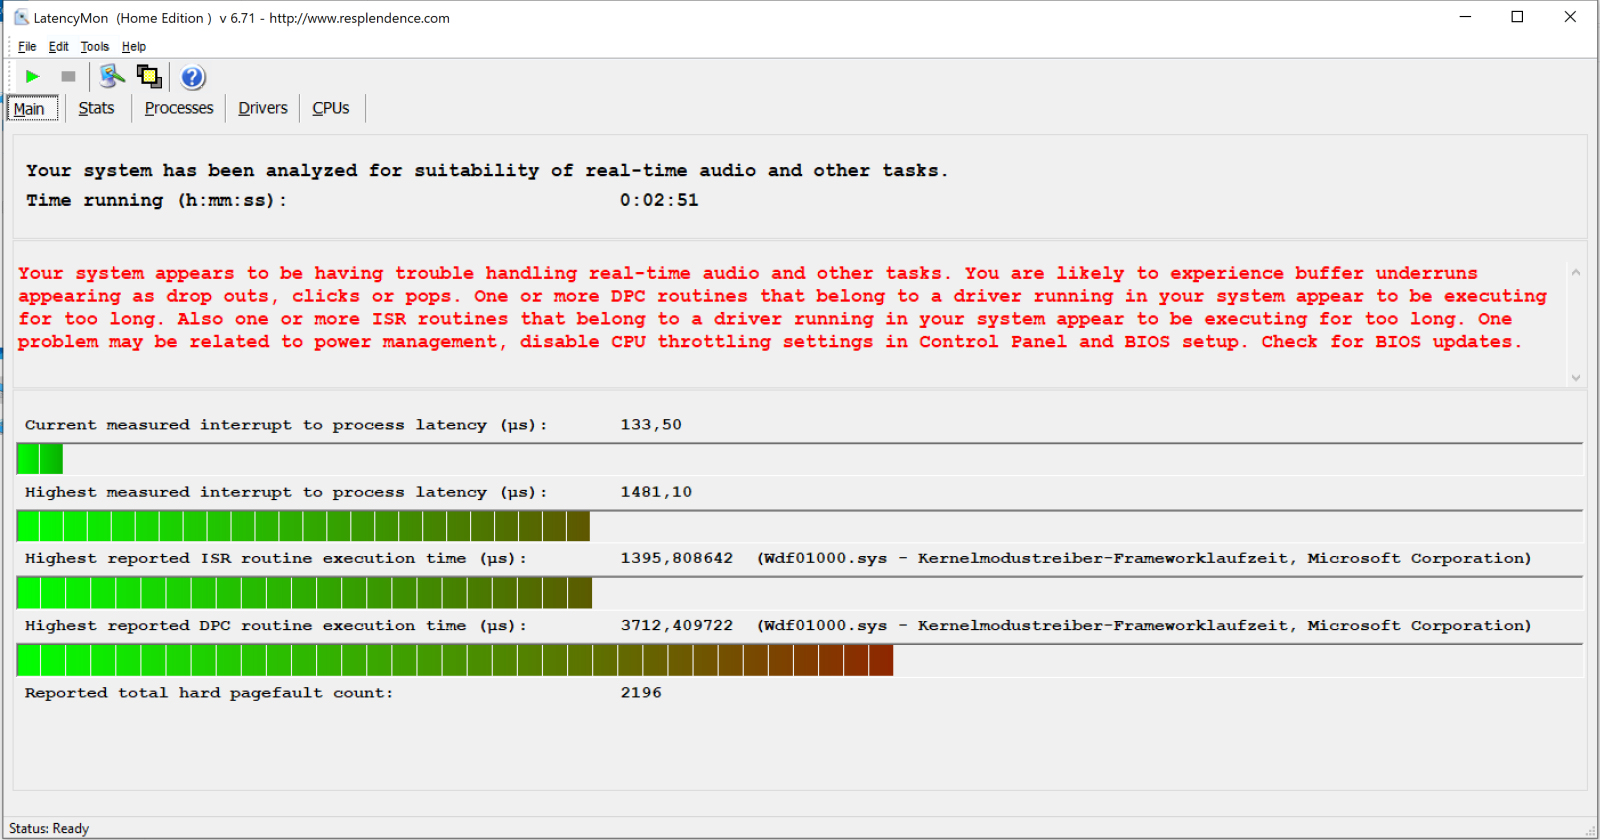
DPC Latencies
In our standardised latency monitor test (web surfing, 4K video playback, Prime95 high load), we observed anomalies in the DPC latencies. The system does not appear to be suitable for real-time video and audio editing.
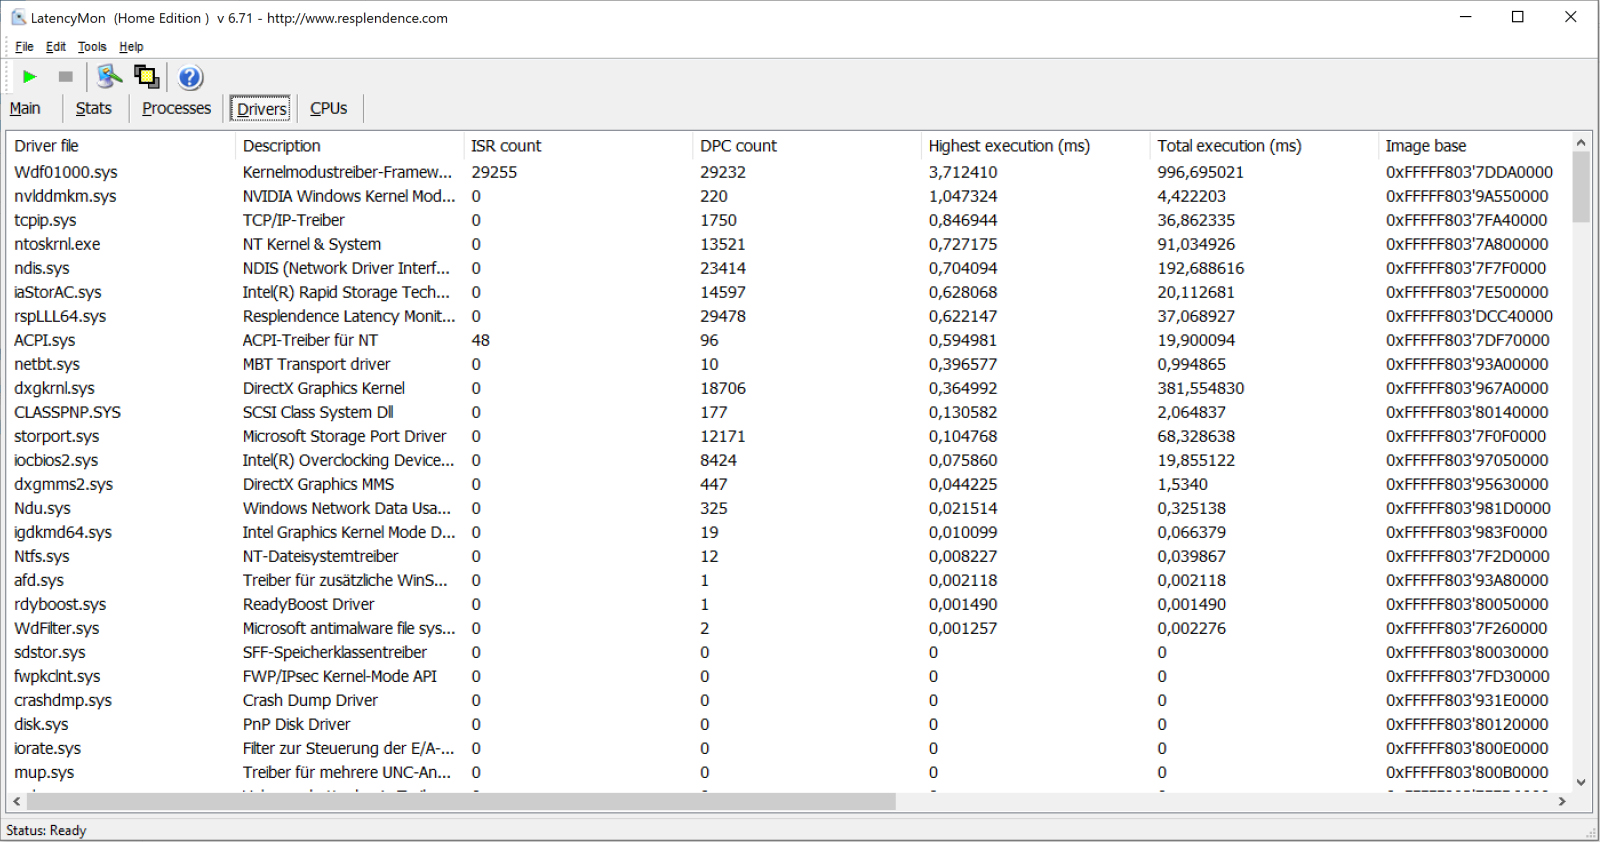
| DPC Latencies / LatencyMon - interrupt to process latency (max), Web, Youtube, Prime95 | |
| Acer Predator Triton 500 PT515-52-70N3 | |
| Gigabyte Aero 15 OLED XB-8DE51B0SP | |
| Razer Blade 15 RTX 2070 Super Max-Q | |
| Asus ROG Zephyrus M15 GU502L | |
| MSI GS66 10SGS | |
| Schenker Key 15 Comet Lake | |
* ... smaller is better
Storage Devices
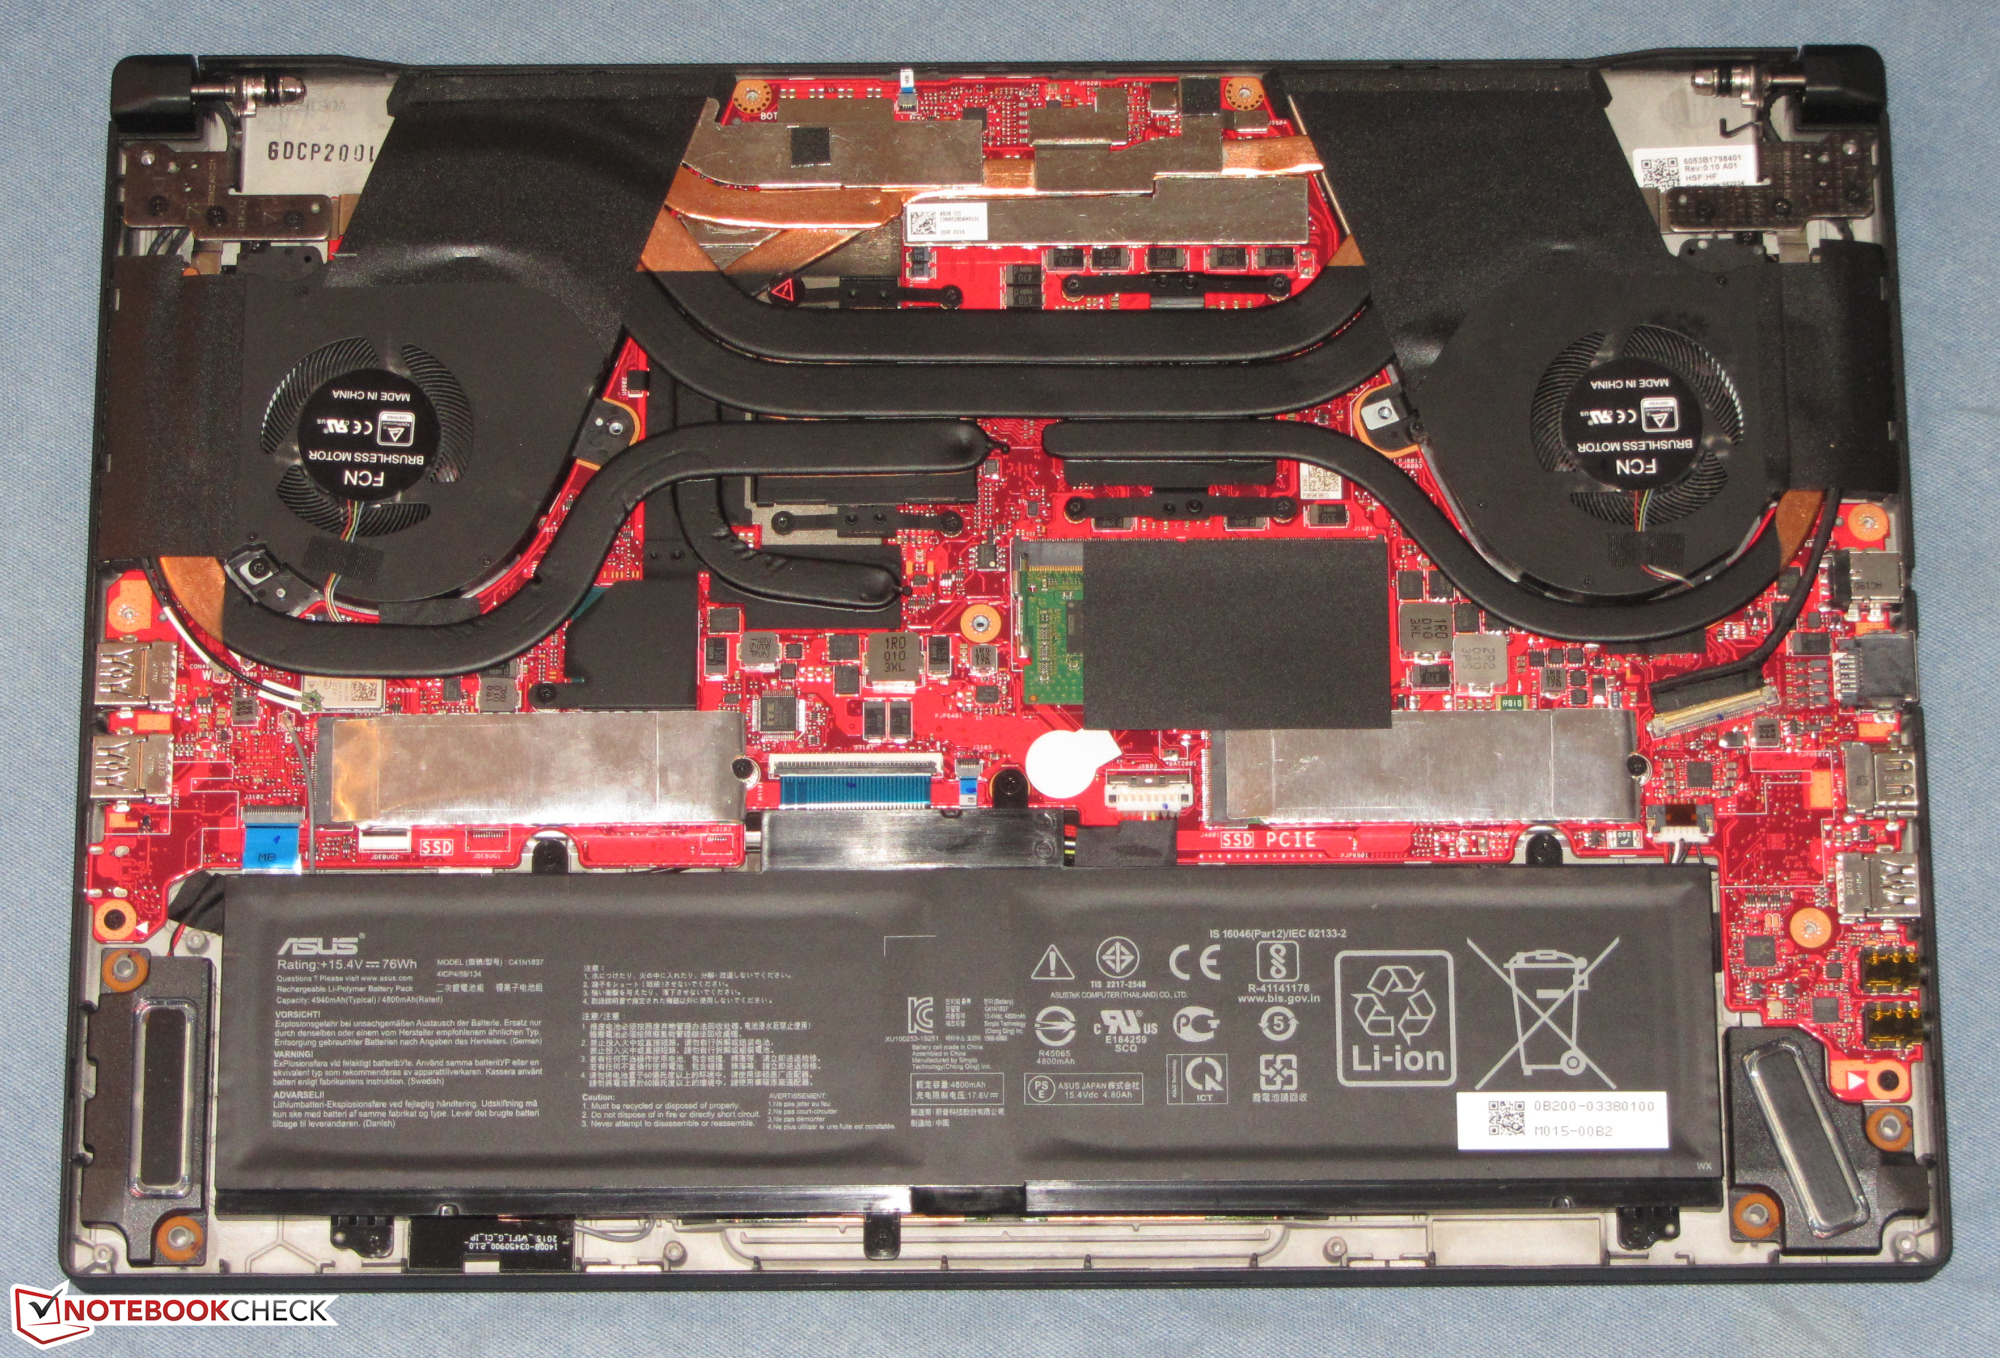
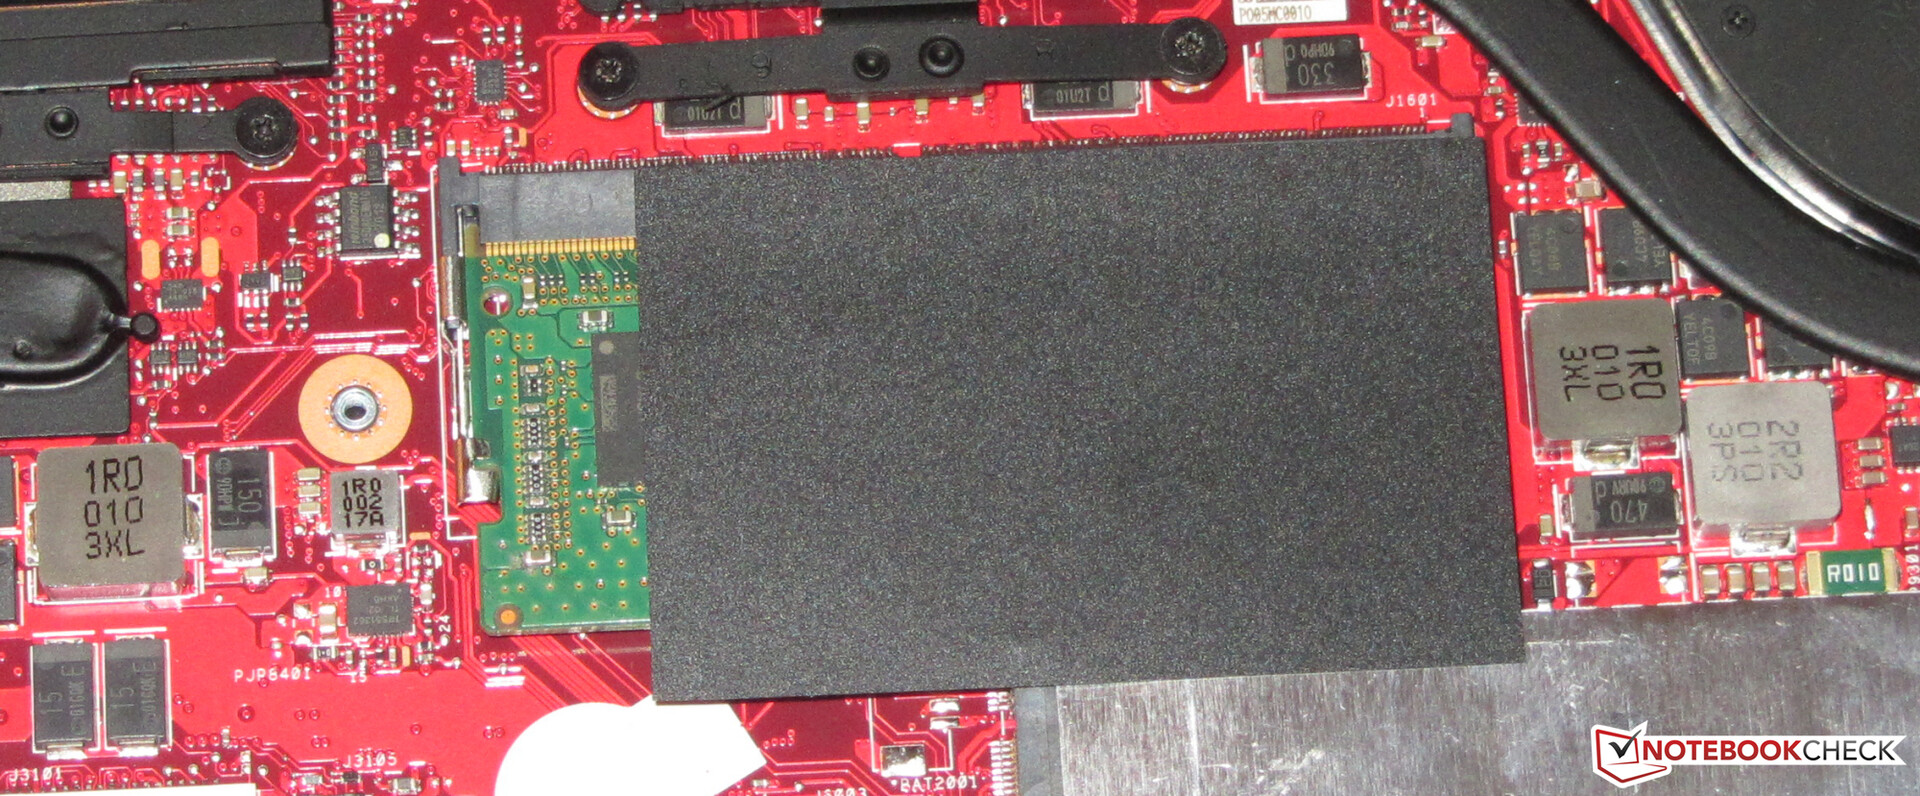
Asus equips the GU502L with two 512 GB NVMe SSDs (M.2-2280) from Intel. These are configured in RAID 0, i.e. for the operating system, the two SSDs appear as one 1 TB SSD. All data stored on this array is distributed to both SSDs. This results in high transfer rates and short loading times. However, the SSDs used are not among the top models. The RAID array delivers lower transfer rates than a single top-of-the-line model from Samsung.
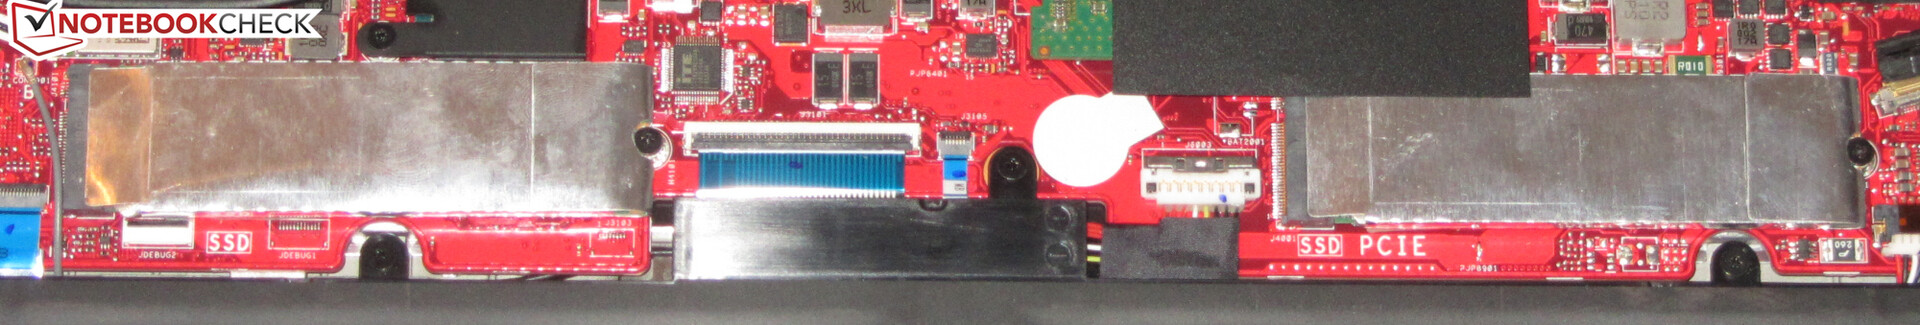

| Asus ROG Zephyrus M15 GU502L 2x Intel SSD 660p SSDPEKNW512G8 (RAID 0) | Asus ROG Zephyrus M15 GU502GU-XB74 Intel SSD 660p SSDPEKNW512G8 | Schenker Key 15 Comet Lake Samsung SSD 970 EVO Plus 1TB | Razer Blade 15 RTX 2070 Super Max-Q Samsung SSD PM981a MZVLB512HBJQ | Gigabyte Aero 15 OLED XB-8DE51B0SP Intel Optane Memory H10 with Solid State Storage 32GB + 512GB HBRPEKNX0202A(L/H) | Acer Predator Triton 500 PT515-52-70N3 Samsung SSD PM981a MZVLB512HBJQ | MSI GS66 10SGS Samsung SSD PM981 MZVLB512HAJQ | |
|---|---|---|---|---|---|---|---|
| CrystalDiskMark 5.2 / 6 | -18% | 36% | 15% | 3% | 16% | 0% | |
| Write 4K (MB/s) | 123 | 156 27% | 193 57% | 139.8 14% | 127.4 4% | 131.7 7% | 132.5 8% |
| Read 4K (MB/s) | 52.5 | 60.7 16% | 54.3 3% | 48.62 -7% | 147.5 181% | 47.34 -10% | 45.03 -14% |
| Write Seq (MB/s) | 1698 | 968 -43% | 2988 76% | 2260 33% | 485.9 -71% | 2884 70% | 1987 17% |
| Read Seq (MB/s) | 2440 | 1619 -34% | 2633 8% | 2135 -12% | 1352 -45% | 2303 -6% | 1434 -41% |
| Write 4K Q32T1 (MB/s) | 450.4 | 485 8% | 540 20% | 499.3 11% | 476.5 6% | 423.9 -6% | 467.5 4% |
| Read 4K Q32T1 (MB/s) | 550 | 337.3 -39% | 620 13% | 552 0% | 531 -3% | 487.7 -11% | 536 -3% |
| Write Seq Q32T1 (MB/s) | 1794 | 969 -46% | 3284 83% | 2960 65% | 1061 -41% | 2822 57% | 2003 12% |
| Read Seq Q32T1 (MB/s) | 2812 | 1825 -35% | 3564 27% | 3269 16% | 2552 -9% | 3478 24% | 3306 18% |
| AS SSD | -44% | 128% | 27% | -11% | 42% | 24% | |
| Seq Read (MB/s) | 2523 | 1221 -52% | 2928 16% | 1957 -22% | 1200 -52% | 2767 10% | 1086 -57% |
| Seq Write (MB/s) | 1578 | 911 -42% | 2733 73% | 2092 33% | 836 -47% | 2613 66% | 1901 20% |
| 4K Read (MB/s) | 50.4 | 48.24 -4% | 51.6 2% | 50.2 0% | 65.8 31% | 47.55 -6% | 51 1% |
| 4K Write (MB/s) | 115.6 | 99.2 -14% | 129.8 12% | 96.5 -17% | 103.8 -10% | 98.9 -14% | 117.3 1% |
| 4K-64 Read (MB/s) | 634 | 321.4 -49% | 1838 190% | 1594 151% | 789 24% | 1205 90% | 1503 137% |
| 4K-64 Write (MB/s) | 1114 | 744 -33% | 2291 106% | 2005 80% | 929 -17% | 2007 80% | 1721 54% |
| Access Time Read * (ms) | 0.095 | 0.071 25% | 0.062 35% | 0.057 40% | 0.103 -8% | 0.065 32% | 0.059 38% |
| Access Time Write * (ms) | 0.038 | 0.139 -266% | 0.029 24% | 0.112 -195% | 0.045 -18% | 0.038 -0% | 0.1 -163% |
| Score Read (Points) | 936 | 492 -47% | 2183 133% | 1840 97% | 975 4% | 1529 63% | 1662 78% |
| Score Write (Points) | 1388 | 934 -33% | 2694 94% | 2310 66% | 1117 -20% | 2367 71% | 2029 46% |
| Score Total (Points) | 2770 | 1681 -39% | 5984 116% | 5103 84% | 2594 -6% | 4677 69% | 4588 66% |
| Copy ISO MB/s (MB/s) | 2106 | 906 -57% | 2183 4% | 1793 -15% | 2155 2% | ||
| Copy Program MB/s (MB/s) | 549 | 486.6 -11% | 2694 391% | 573 4% | 715 30% | ||
| Copy Game MB/s (MB/s) | 854 | 952 11% | 5984 601% | 1418 66% | 1506 76% | ||
| Total Average (Program / Settings) | -31% /
-34% | 82% /
95% | 21% /
22% | -4% /
-5% | 29% /
31% | 12% /
15% |
* ... smaller is better
Disk Throttling: DiskSpd Read Loop, Queue Depth 8
GPU Performance
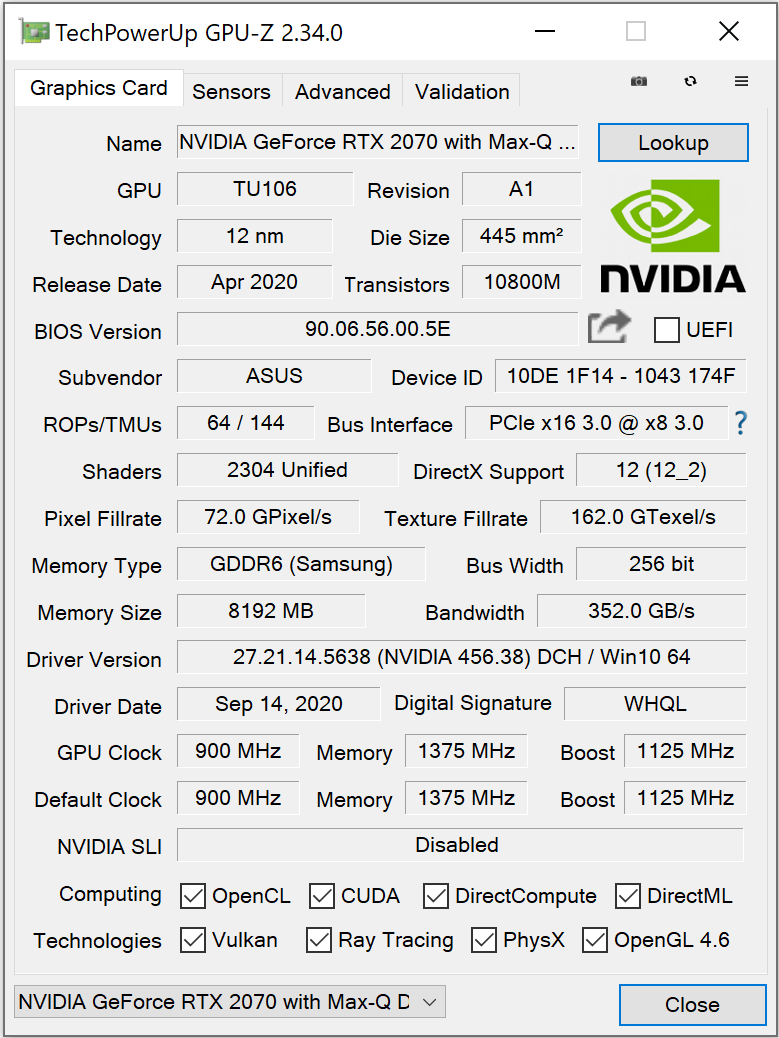
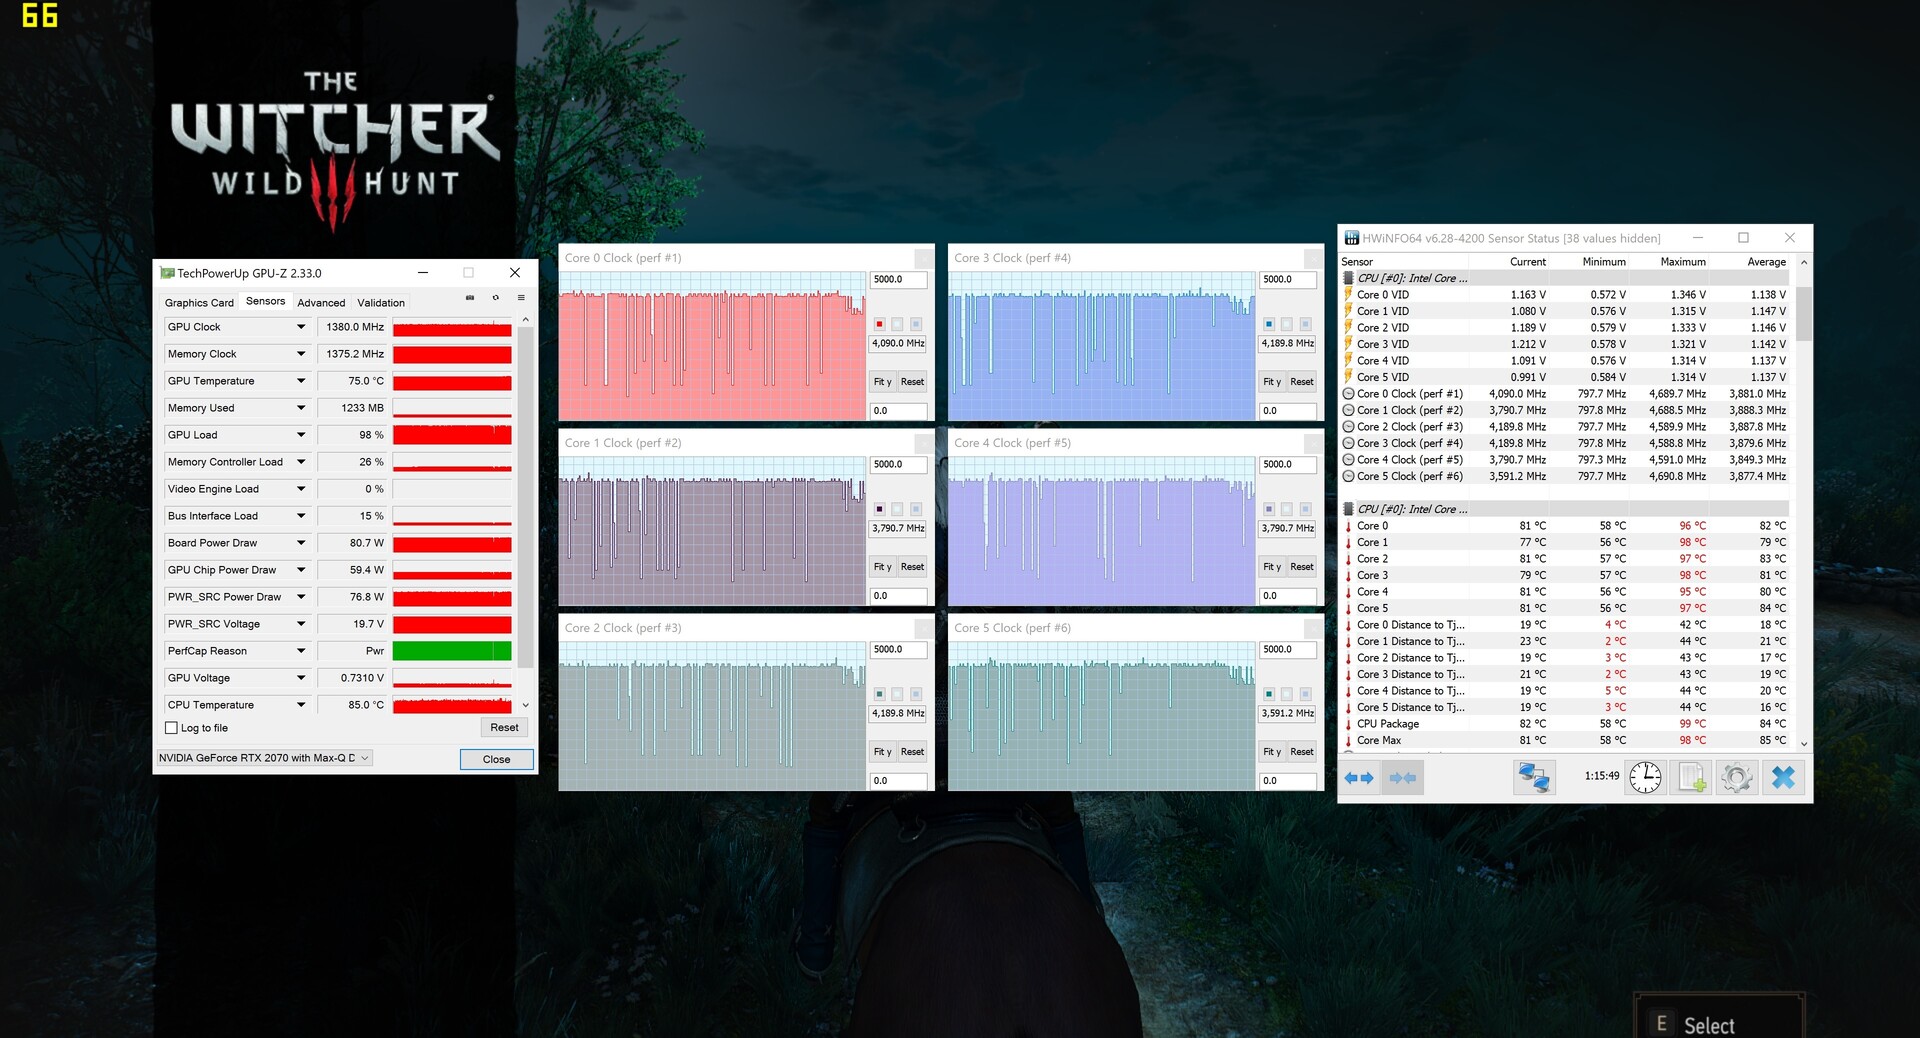
The dedicated GeForce RTX 2070 Max-Q graphics core is an efficiency-trimmed version of the regular RTX 2070 designed for thin and light notebooks. Nvidia plans for this DirectX 12 GPU to have a speed level of 900 MHz (base) to 1,125 MHz (boost).
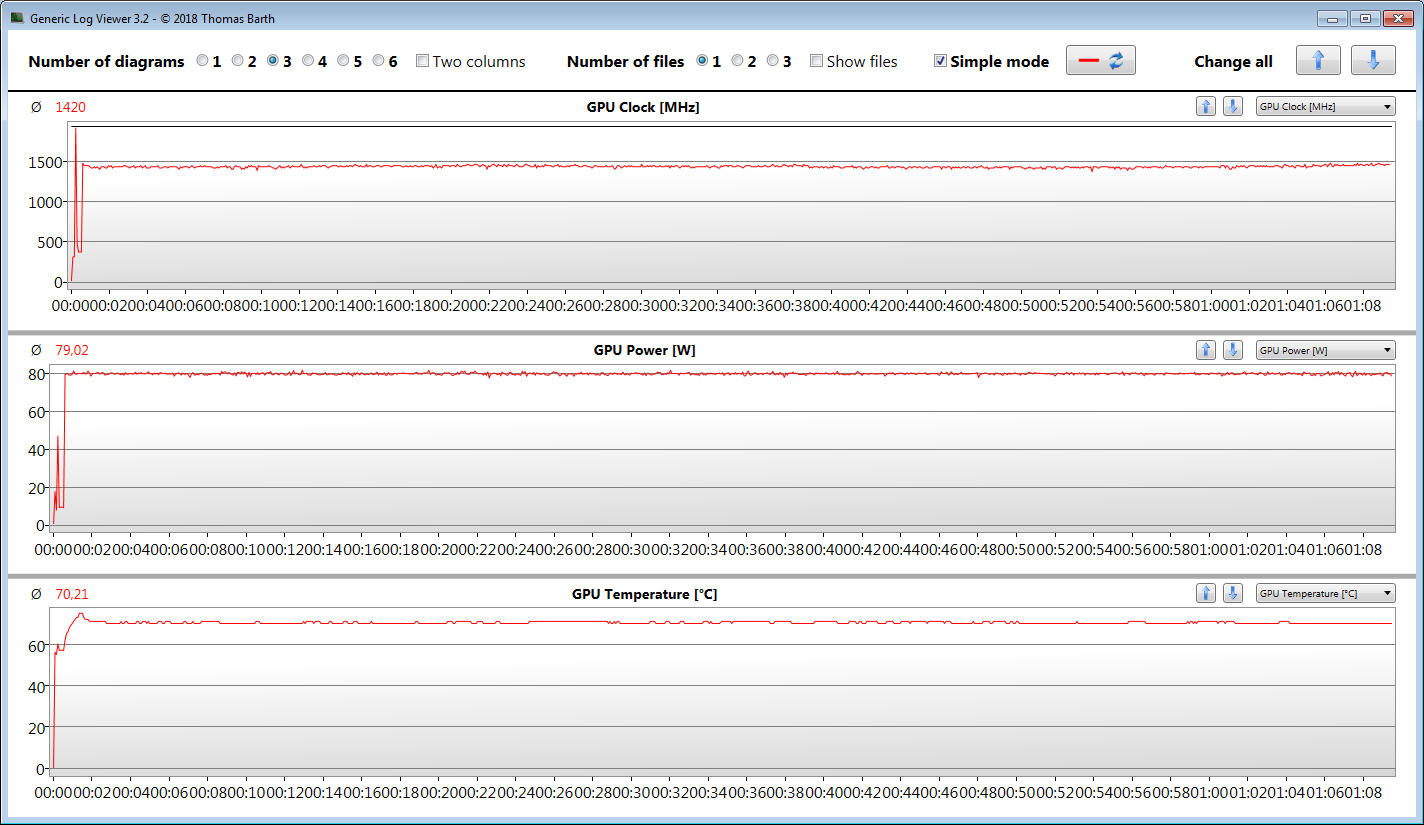
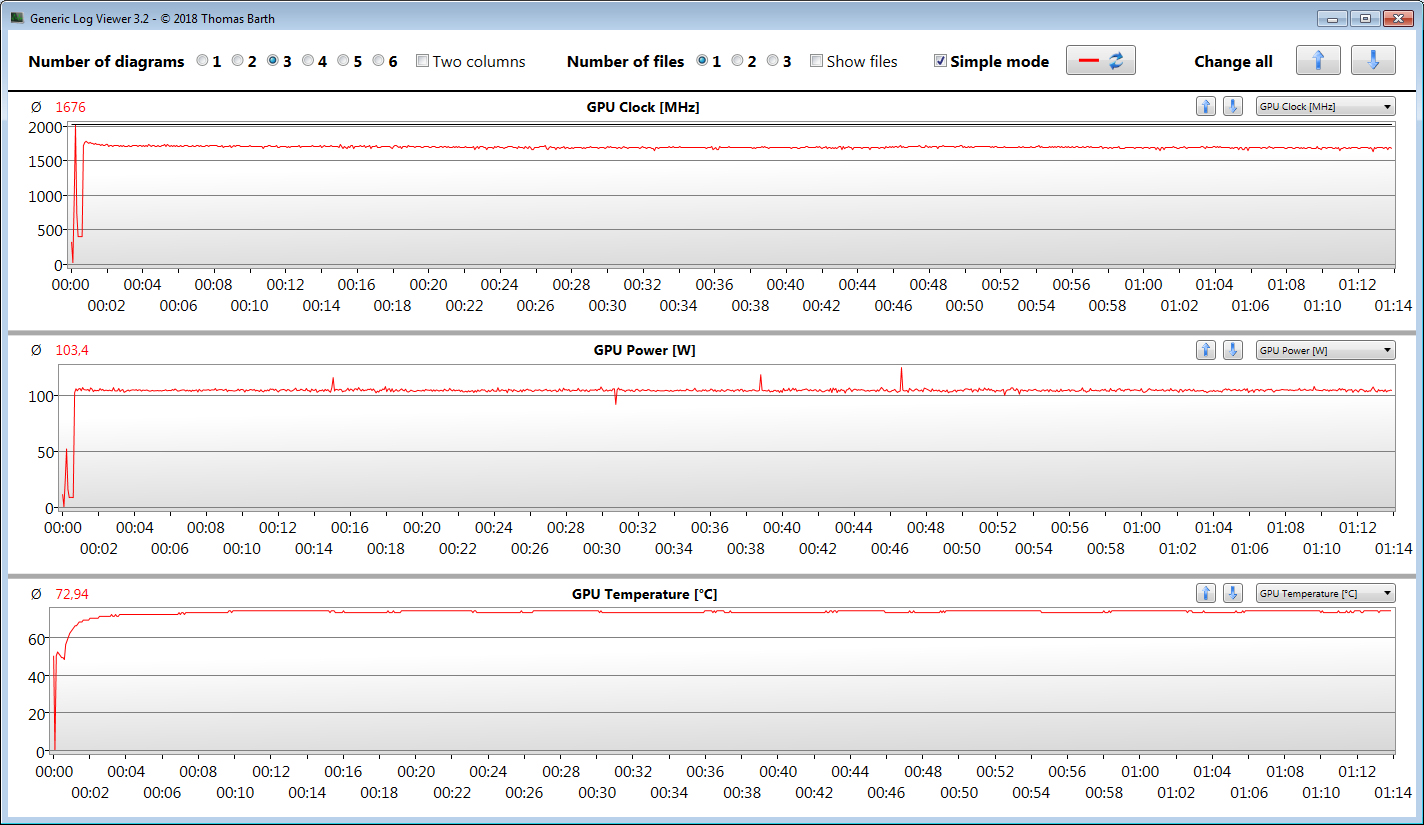
Higher speeds are feasible if the GPU does not reach a specified temperature and/or energy threshold. Thus we register a maximum of 2,009 MHz. The Witcher 3 is run at an average speed of 1,420 MHz or 1,676 MHz (Turbo). The GPU can use fast GDDR6 graphics memory (8,192 MB).
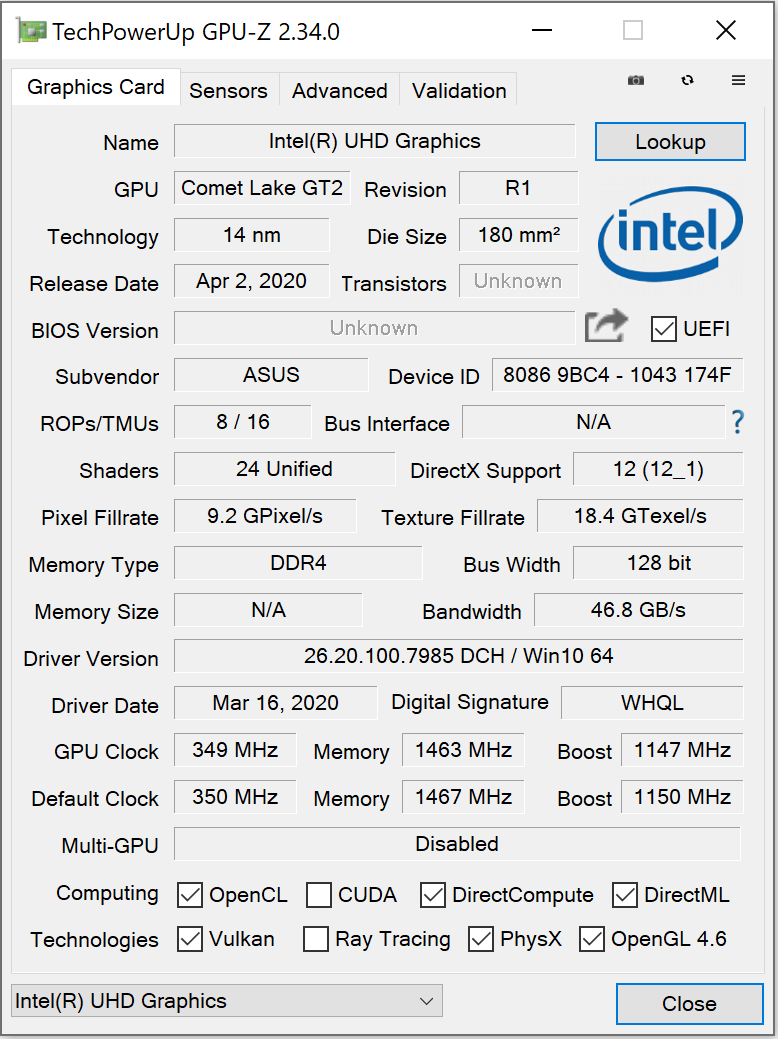
The results in the 3DMark benchmarks are at a normal level for the GPU. The "Turbo" performance scheme allows the graphics performance to increase significantly (see diagram). The UHD Graphics 630 GPU integrated in the processor is active and the laptop works with Nvidia's Optimus GPU switching technology.
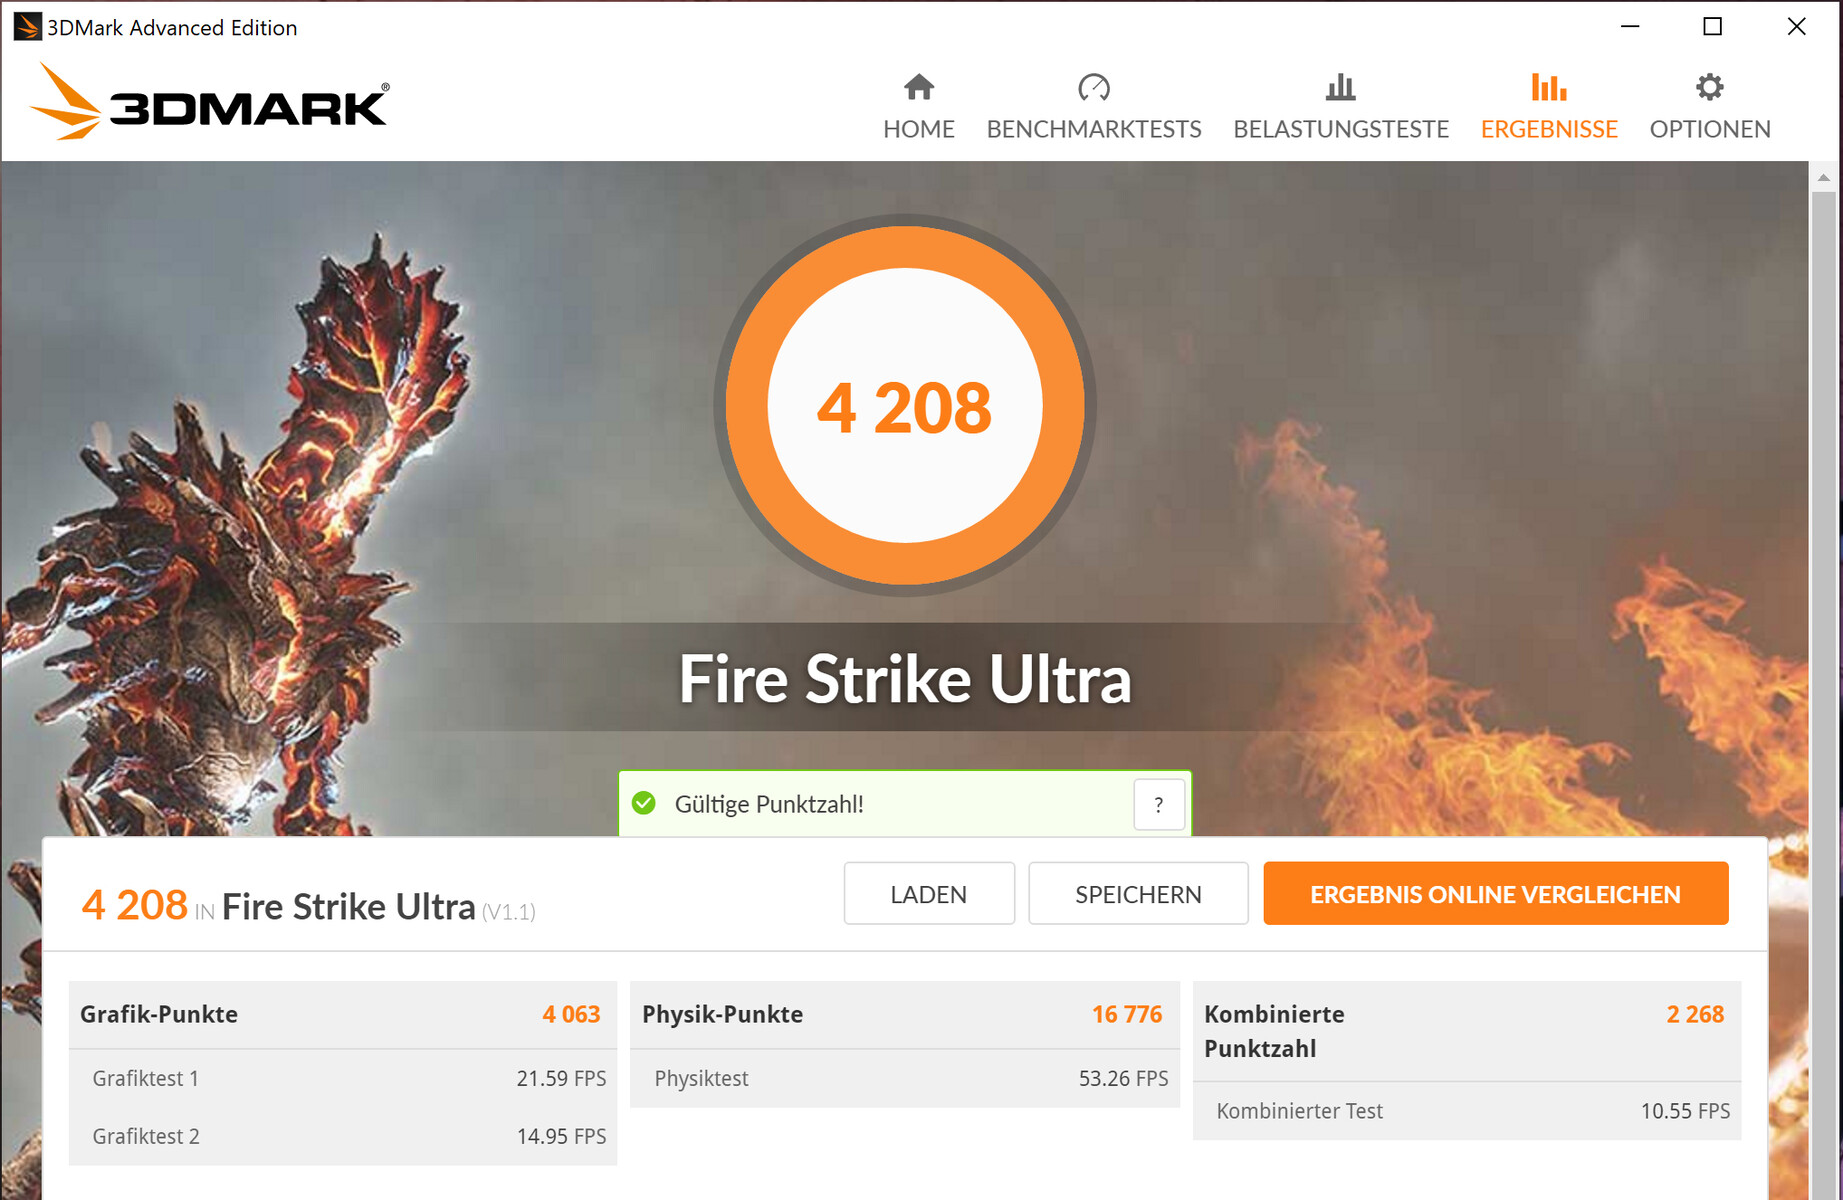
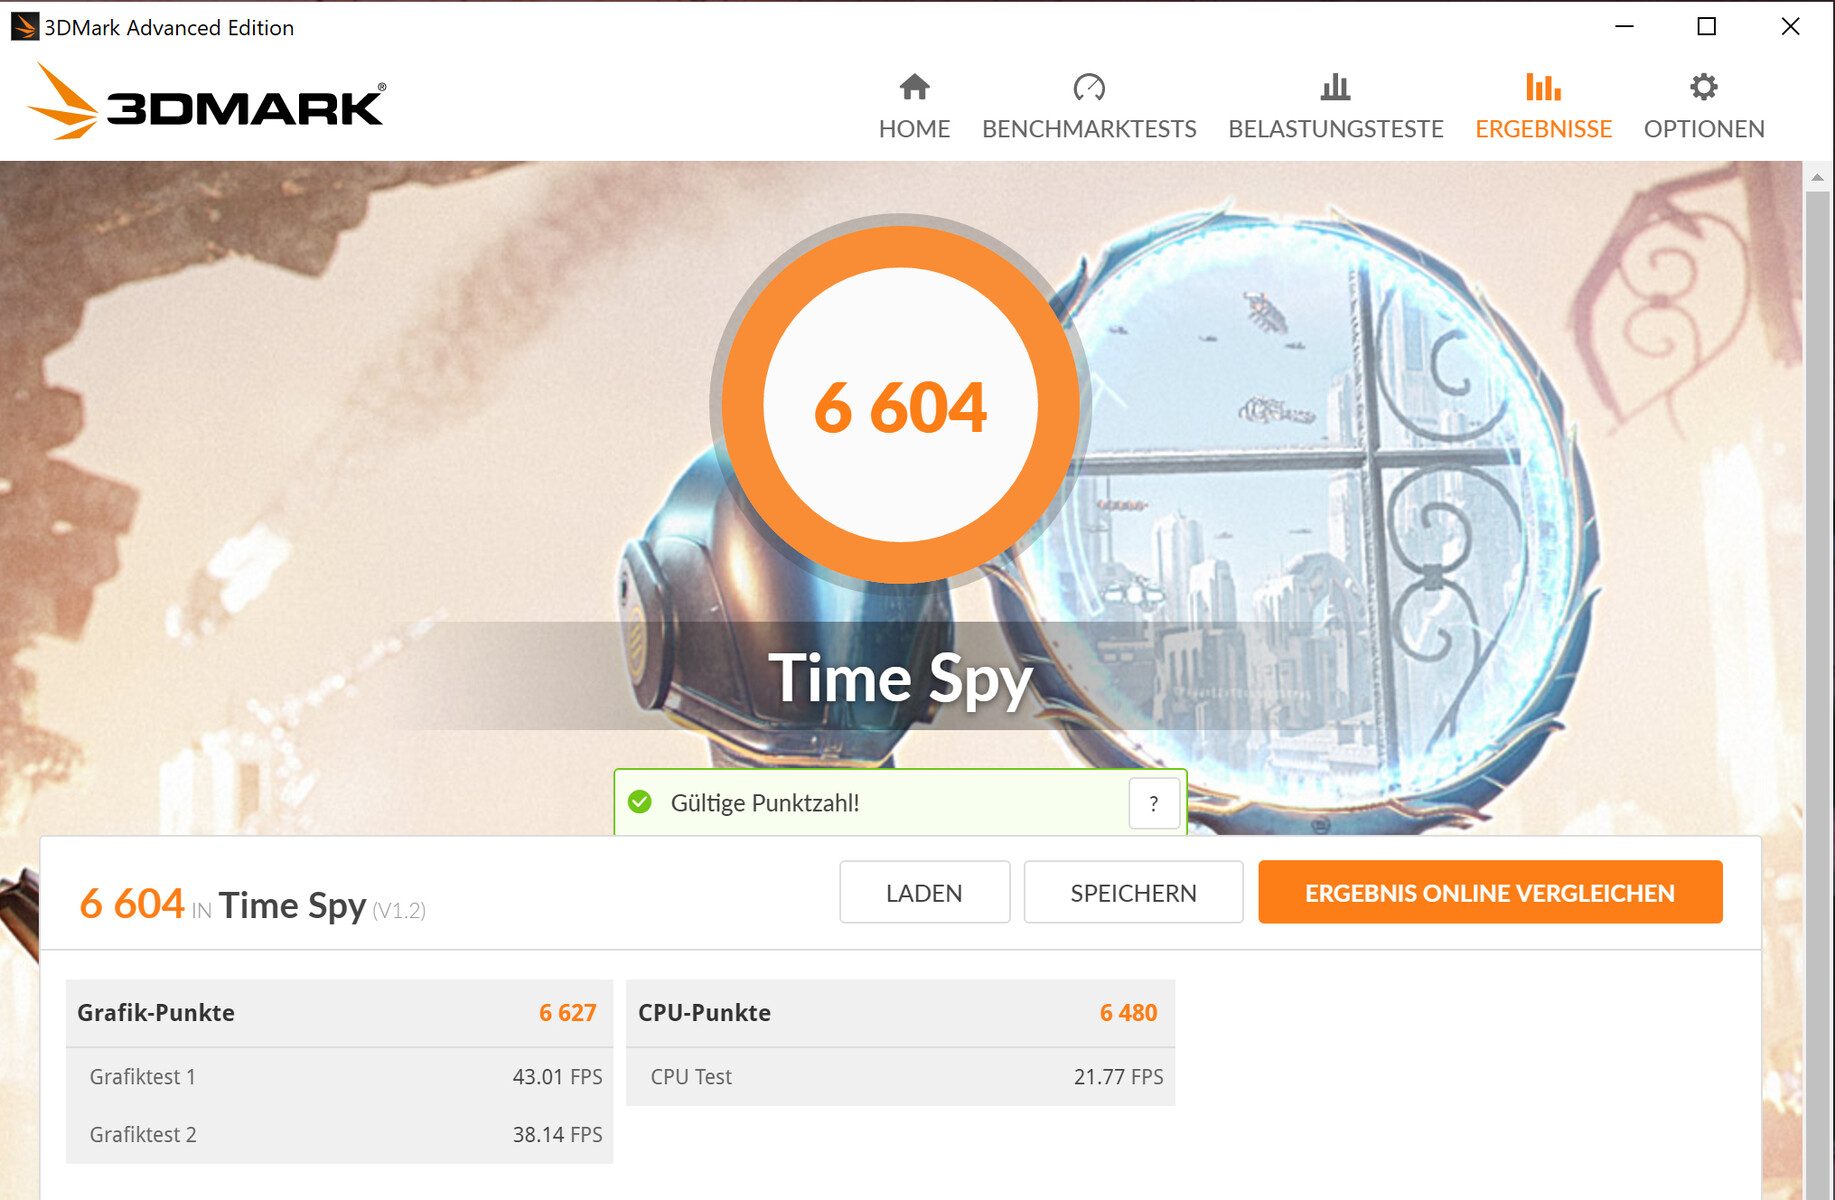
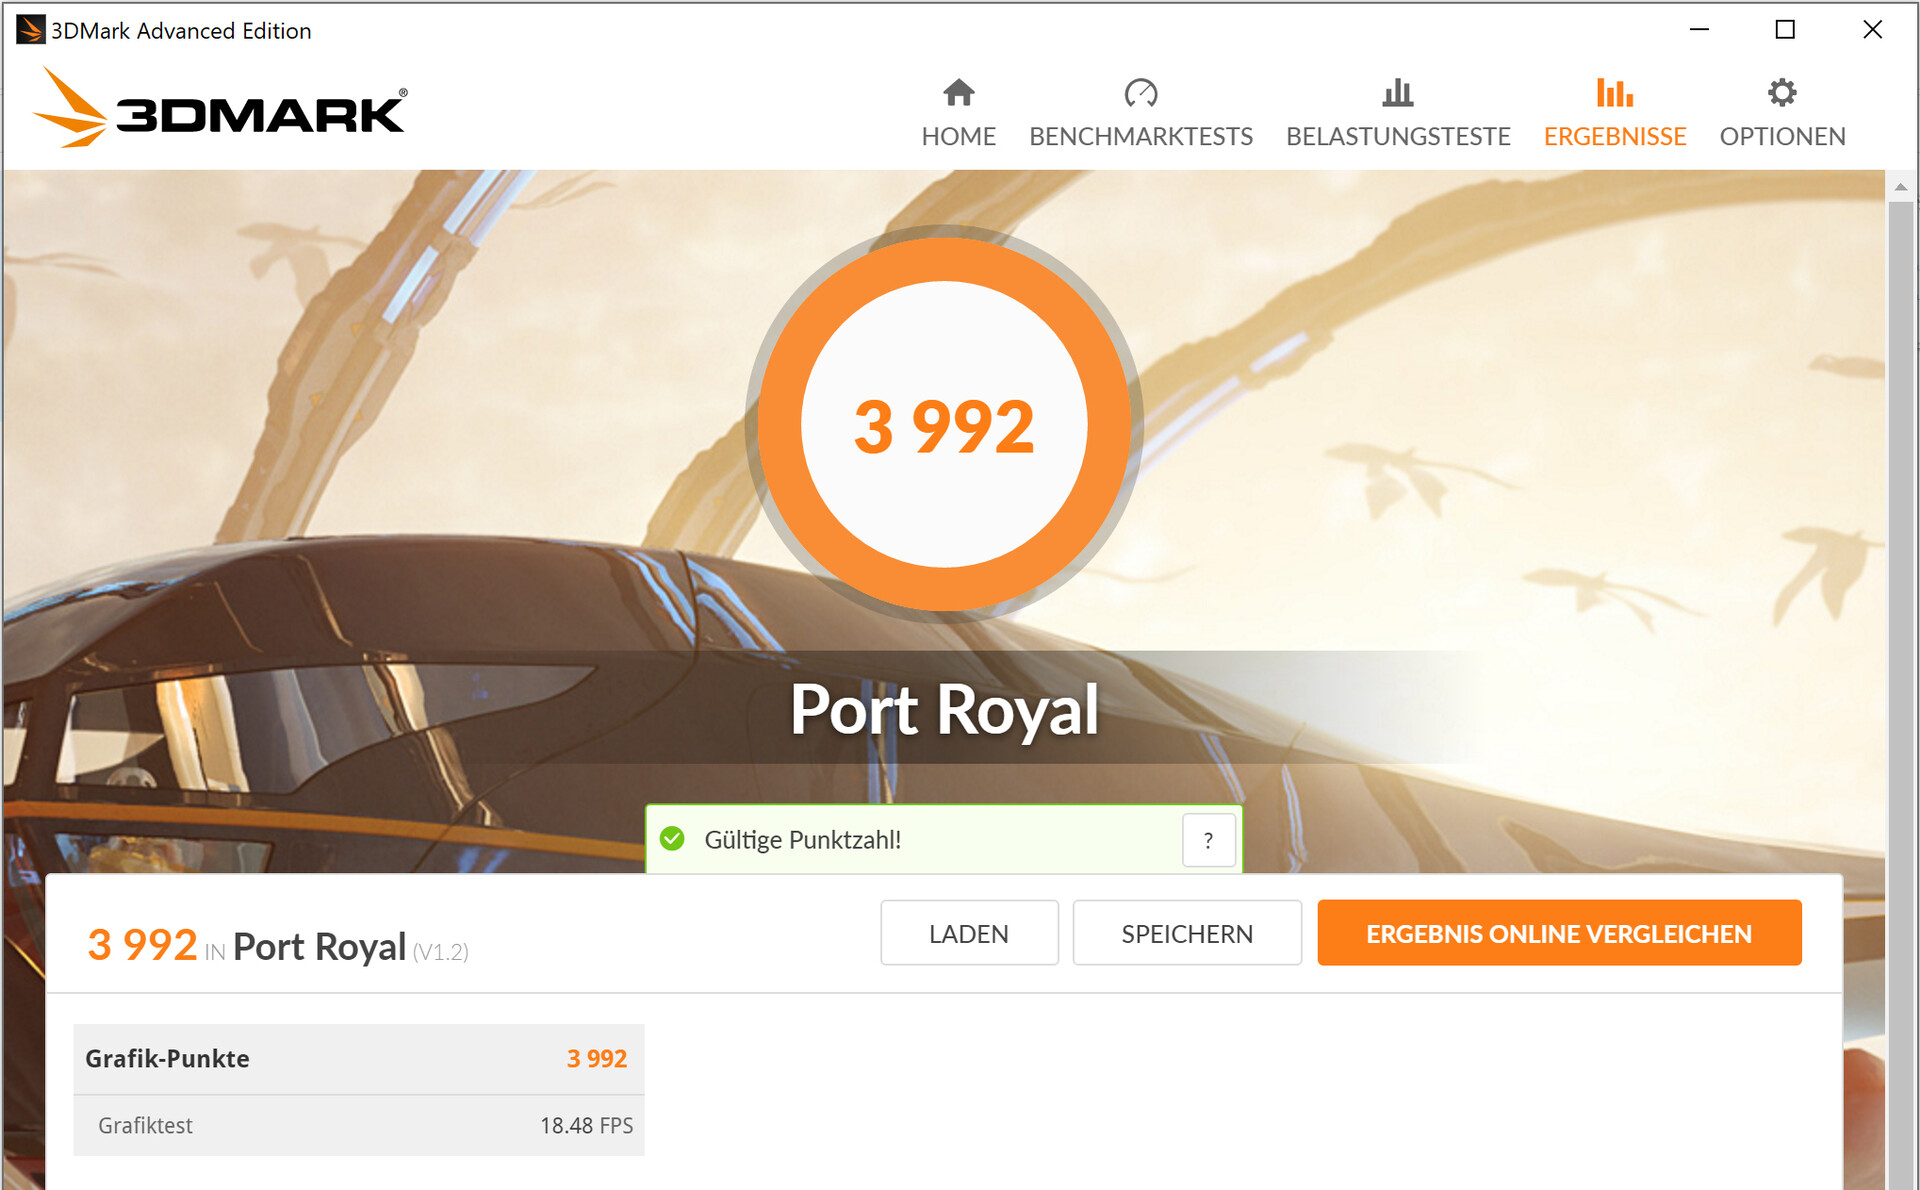
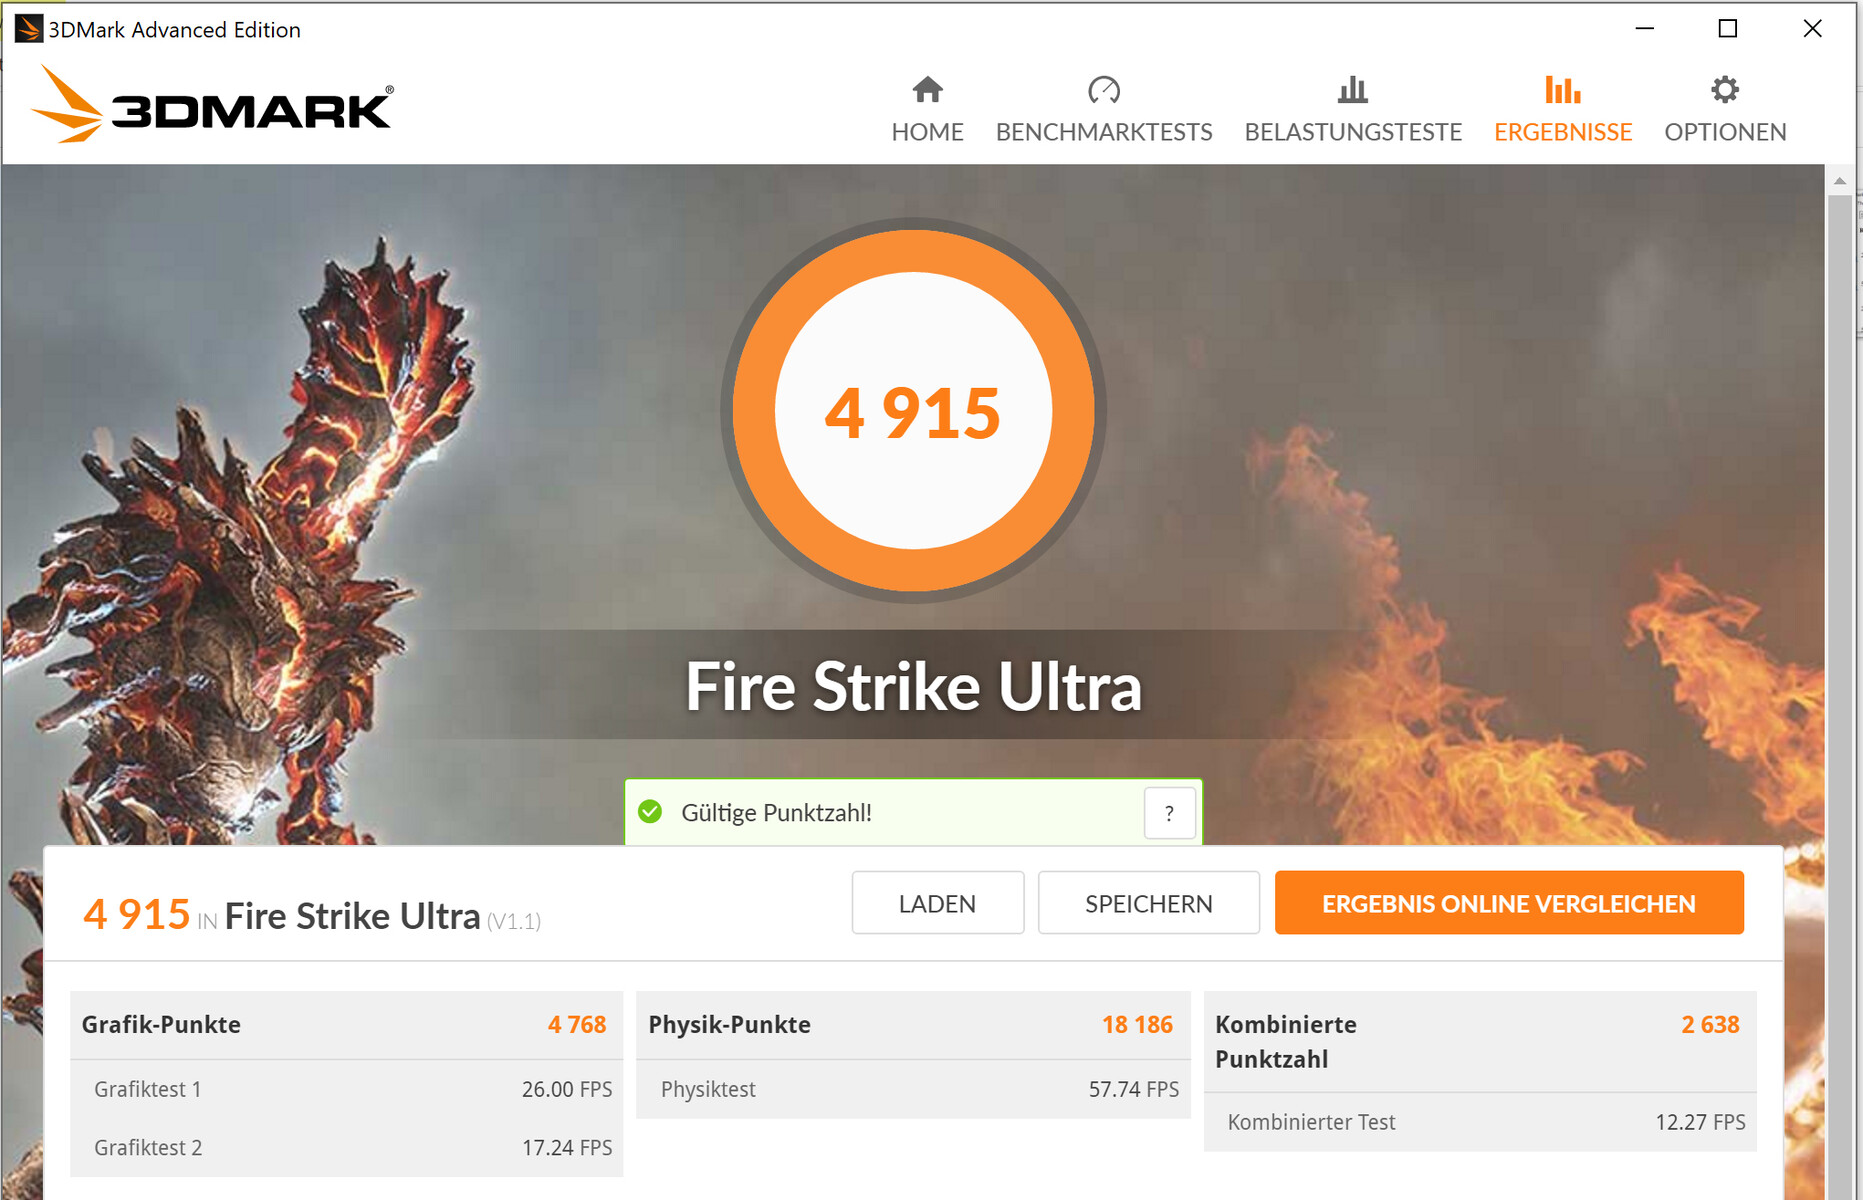
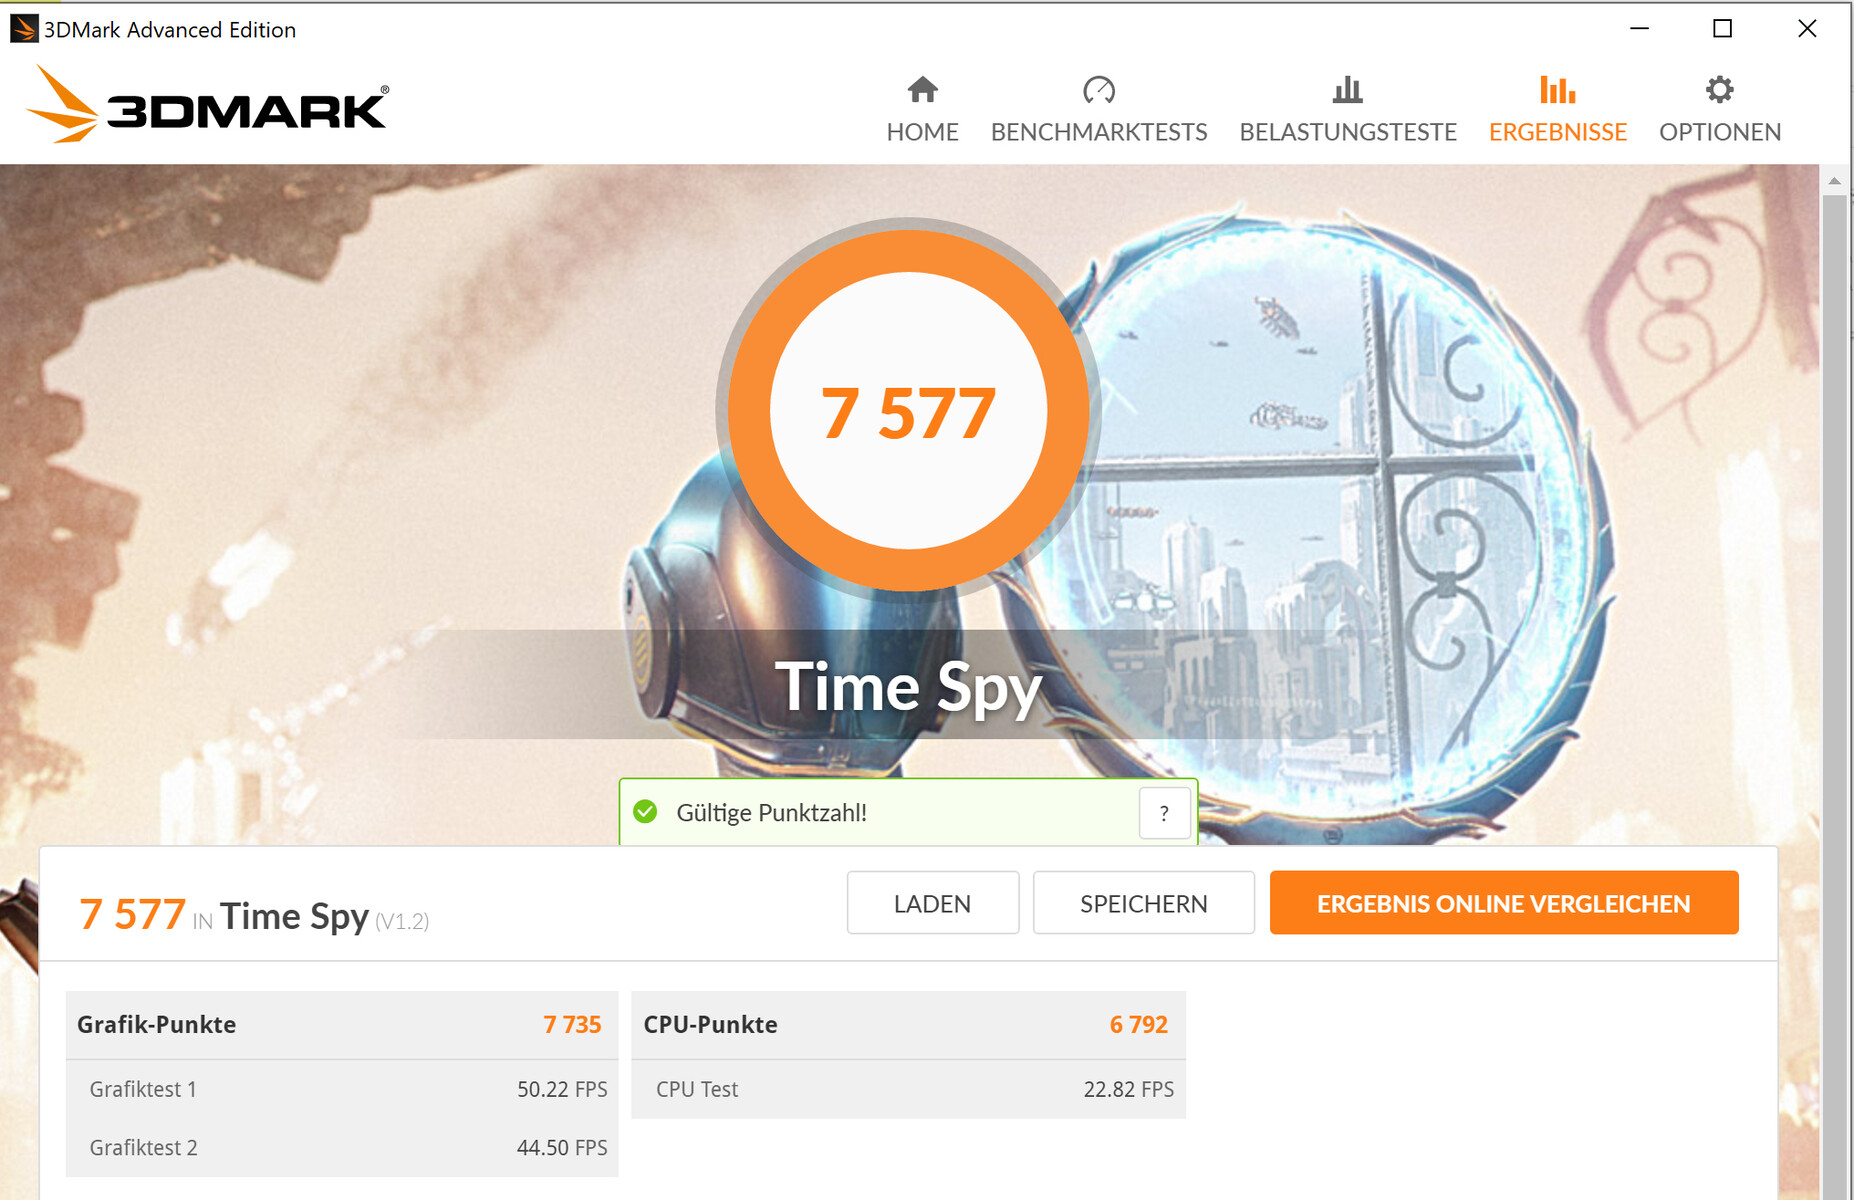

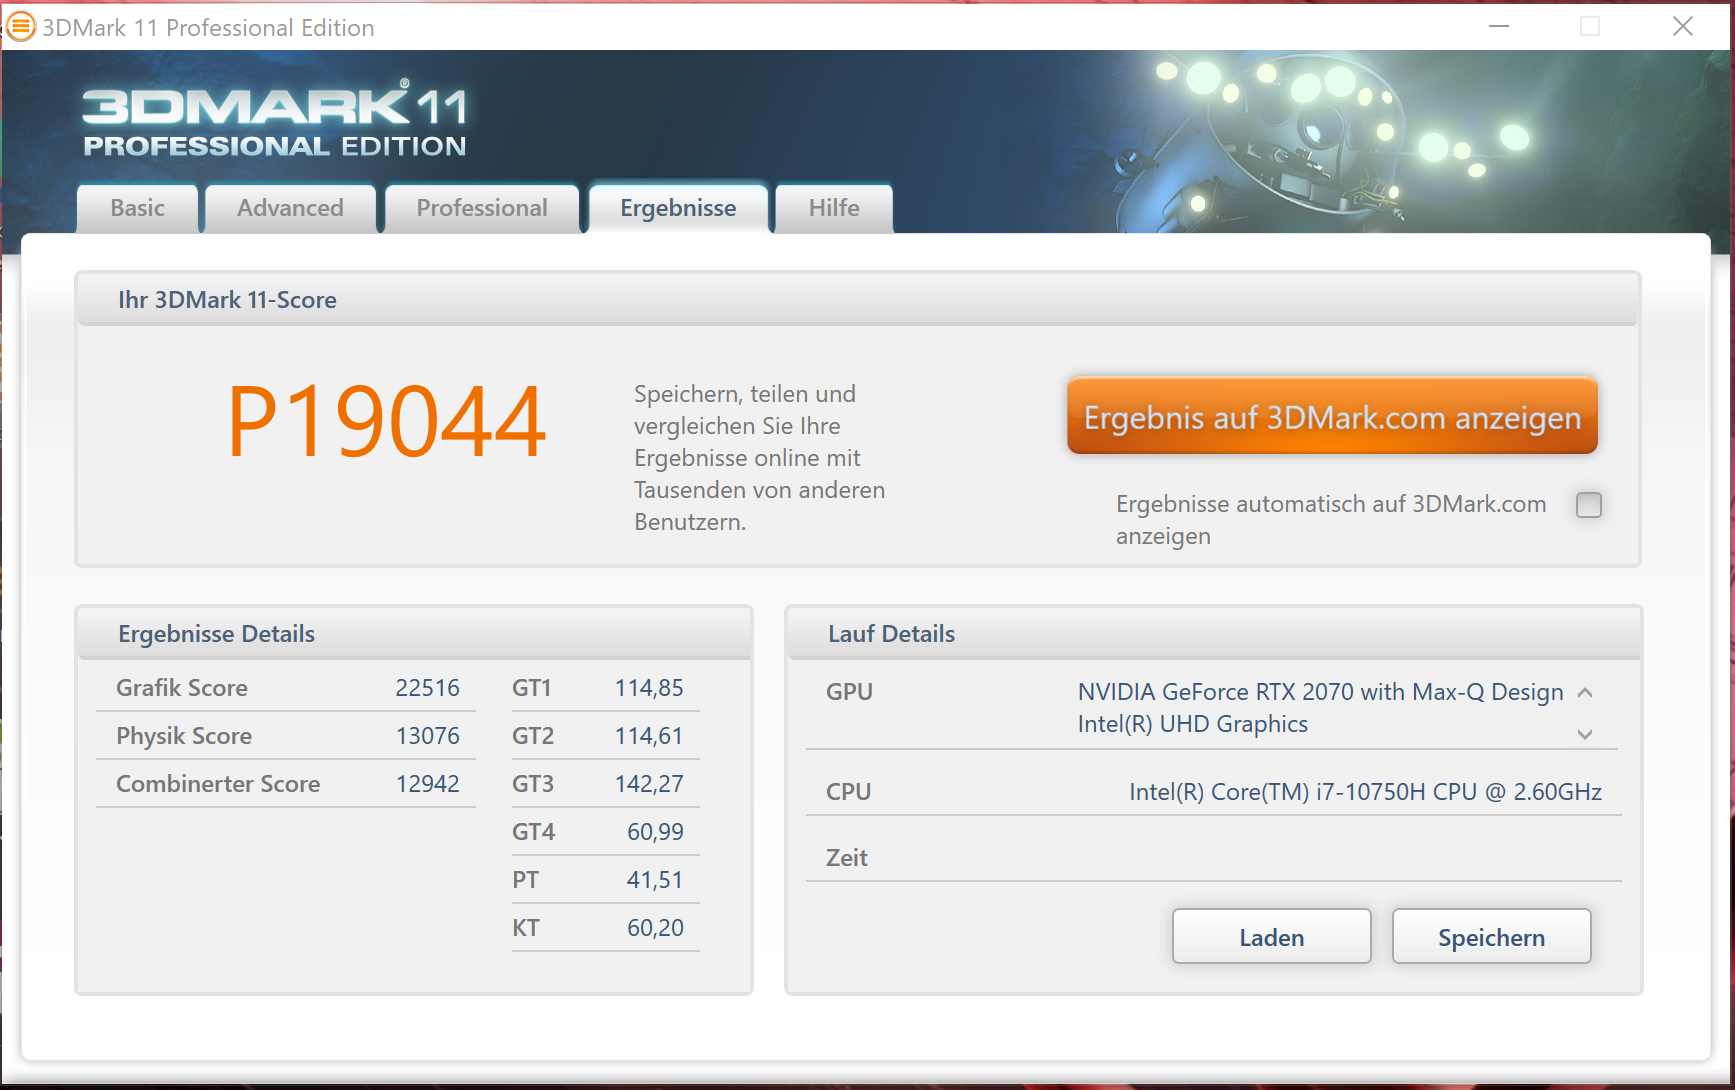
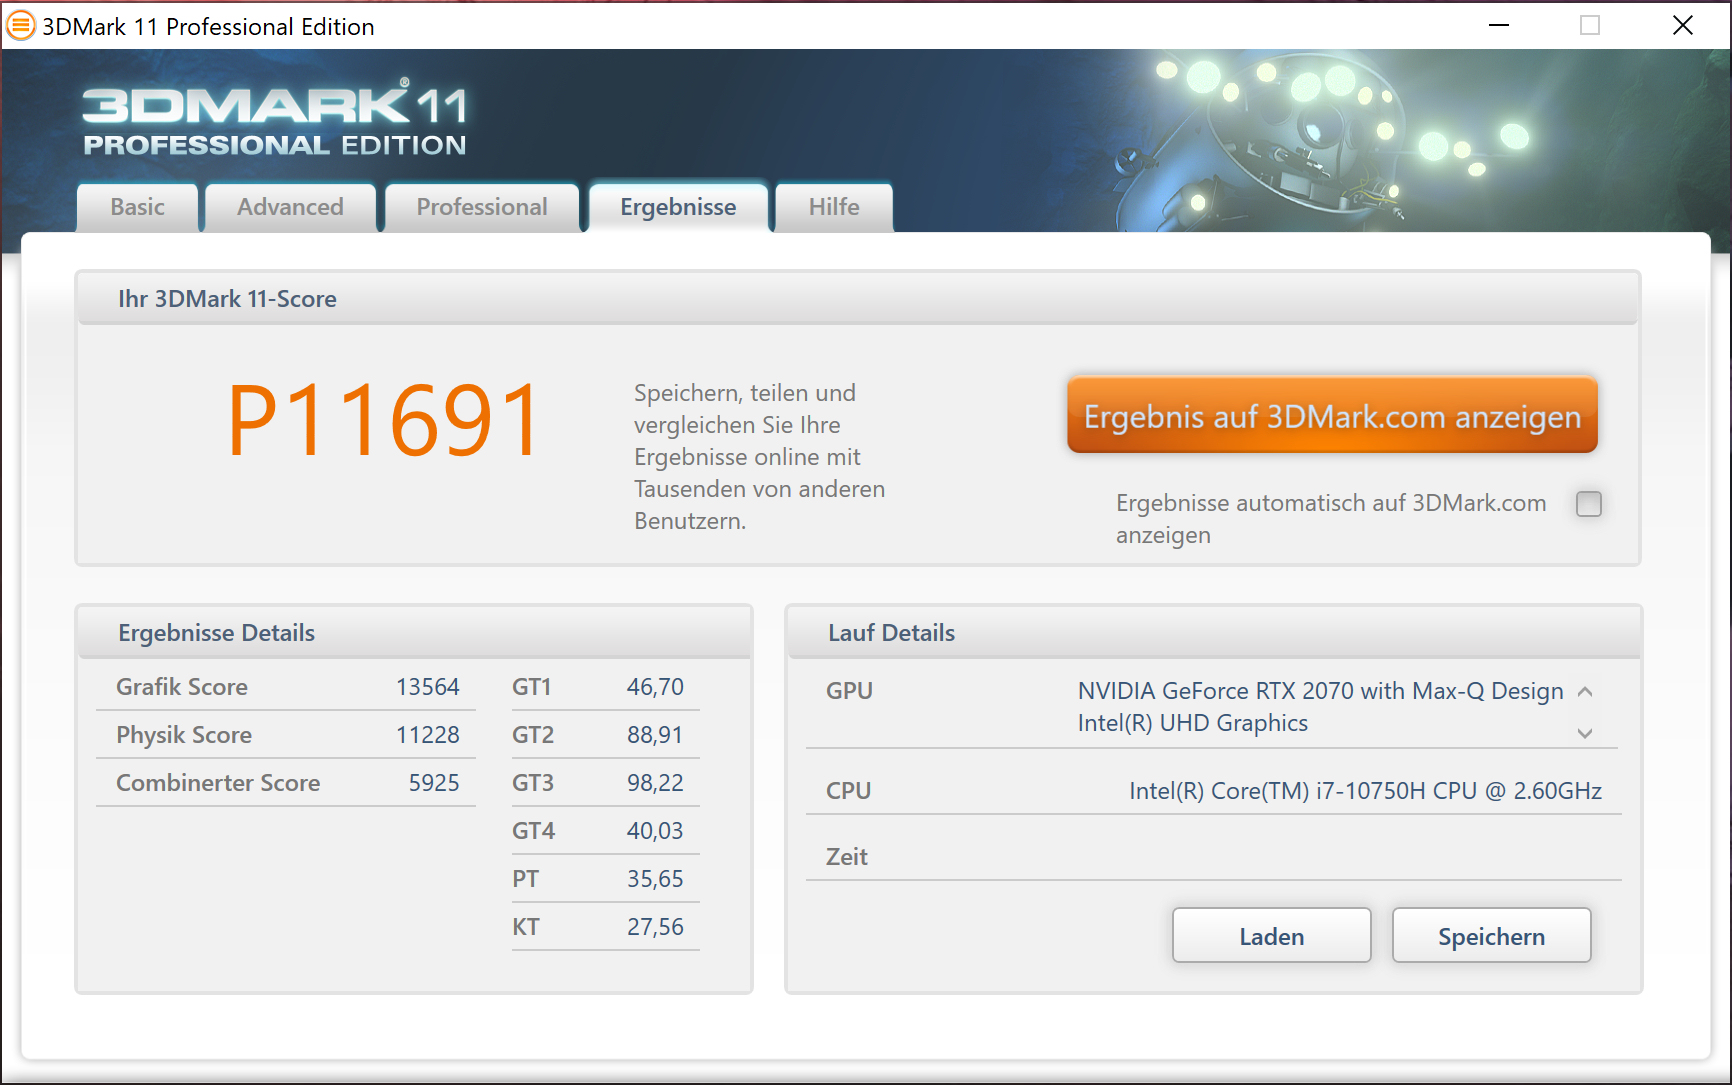
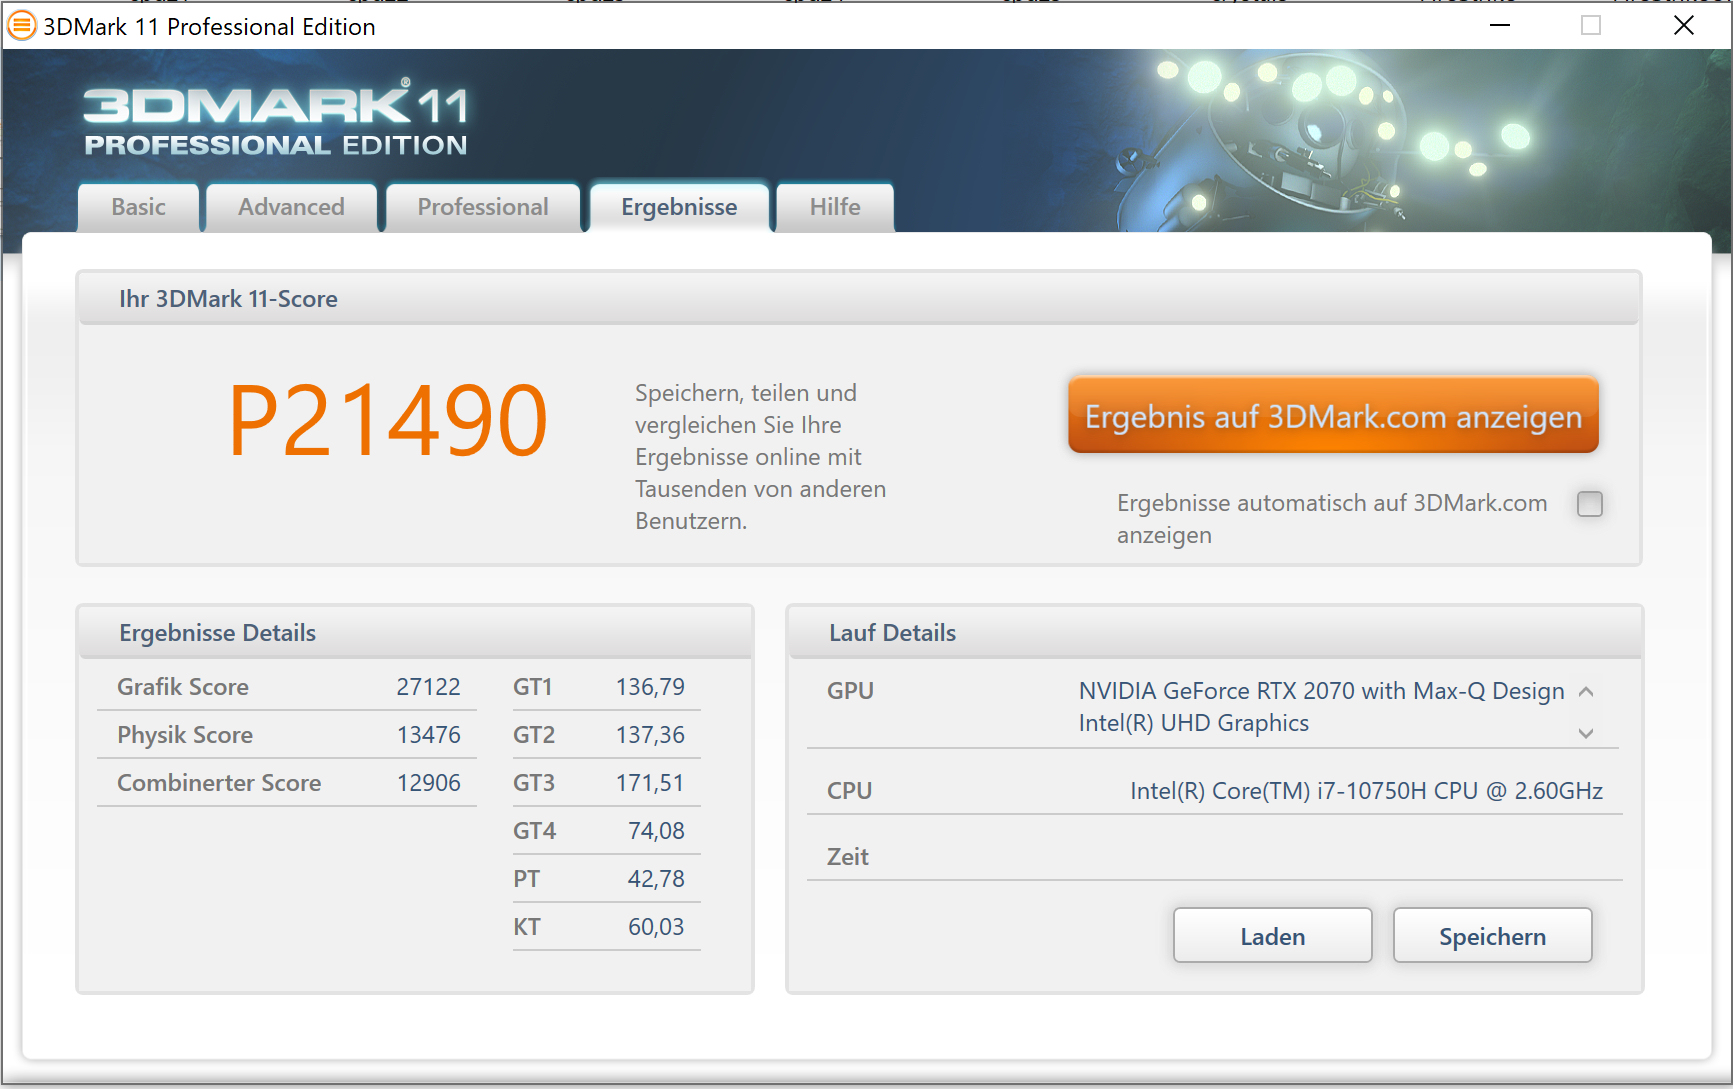
| 3DMark 11 Performance | 19044 points | |
| 3DMark Cloud Gate Standard Score | 39844 points | |
| 3DMark Fire Strike Score | 15573 points | |
| 3DMark Time Spy Score | 6604 points | |
Help | ||
Gaming Performance
The built-in hardware brings all games in our database smoothly to the screen. You can always choose Full HD resolution and high to maximum quality settings. Resolutions beyond Full HD require a reduction of the quality level - especially when using the native screen resolution (3840x2160 pixels). The Armoury Crate profile "Turbo" increases refresh rates (see diagram).
| The Witcher 3 - 1920x1080 Ultra Graphics & Postprocessing (HBAO+) | |
| Average of class Gaming (95 - 240, n=8, last 2 years) | |
| Schenker Key 15 Comet Lake | |
| Asus ROG Zephyrus M15 GU502L (Turbo) | |
| Acer Predator Triton 500 PT515-52-70N3 | |
| Gigabyte Aero 15 OLED XB-8DE51B0SP | |
| MSI GS66 10SGS | |
| Razer Blade 15 RTX 2070 Super Max-Q | |
| Asus ROG Zephyrus M15 GU502L | |
| Average NVIDIA GeForce RTX 2070 Max-Q (56 - 83.8, n=31) | |
| Asus ROG Zephyrus M15 GU502GU-XB74 | |
| F1 2020 - 1920x1080 Ultra High Preset AA:T AF:16x | |
| Asus ROG Zephyrus M15 GU502L (Turbo) | |
| Average NVIDIA GeForce RTX 2070 Max-Q (101 - 109, n=2) | |
| Schenker Key 15 Comet Lake | |
| Asus ROG Zephyrus M15 GU502L | |
| Horizon Zero Dawn - 1920x1080 Ultimate Quality | |
| Schenker Key 15 Comet Lake | |
| Asus ROG Zephyrus M15 GU502L (Turbo) | |
| Average NVIDIA GeForce RTX 2070 Max-Q (60 - 68, n=2) | |
| Asus ROG Zephyrus M15 GU502L | |
| Doom Eternal - 1920x1080 Ultra Preset | |
| Schenker Key 15 Comet Lake | |
| Acer Predator Triton 500 PT515-52-70N3 | |
| MSI GS66 10SGS | |
| Asus ROG Zephyrus M15 GU502L (Turbo) | |
| Average NVIDIA GeForce RTX 2070 Max-Q (125.6 - 137.9, n=4) | |
| Asus ROG Zephyrus M15 GU502L | |
| Death Stranding - 1920x1080 Very High Preset | |
| Schenker Key 15 Comet Lake | |
| Asus ROG Zephyrus M15 GU502L (Turbo) | |
| Average NVIDIA GeForce RTX 2070 Max-Q (81.3 - 97.9, n=2) | |
| Asus ROG Zephyrus M15 GU502L | |
| Flight Simulator 2020 - 1920x1080 Ultra AA:TAA AF:16x | |
| Asus ROG Zephyrus M15 GU502L (Turbo) | |
| Average NVIDIA GeForce RTX 2070 Max-Q (32 - 35.5, n=2) | |
| Asus ROG Zephyrus M15 GU502L | |
To check whether the frame rates remain largely constant over a longer period of time, we run the game The Witcher 3 for about 60 minutes at Full HD resolution and maximum quality settings while not moving the game character. There is no noticeable drop in performance.
| low | med. | high | ultra | QHD | 4K | |
|---|---|---|---|---|---|---|
| BioShock Infinite (2013) | 376.4 | 318.1 | 296.9 | 152.6 | ||
| The Witcher 3 (2015) | 291.2 | 212 | 127.4 | 70.7 | 46.7 | |
| Shadow of the Tomb Raider (2018) | 87 | 82 | 80 | 75 | 55 | 29 |
| Doom Eternal (2020) | 205.6 | 140.4 | 127.8 | 125.6 | 95.2 | 53.2 |
| Gears Tactics (2020) | 210.9 | 157.7 | 100.8 | 100.8 | 72.4 | 38.2 |
| F1 2020 (2020) | 225 | 146 | 129 | 101 | 75 | 43 |
| Death Stranding (2020) | 99.6 | 96.5 | 89 | 81.3 | 61.1 | 36.6 |
| Horizon Zero Dawn (2020) | 125 | 92 | 77 | 60 | 47 | 27 |
| Flight Simulator 2020 (2020) | 54.7 | 45.2 | 38.9 | 32 | 24.6 | 16 |
| Serious Sam 4 (2020) | 127 | 84.3 | 75.3 | 59.9 | 48.2 | 31 |
| Mafia Definitive Edition (2020) | 126.4 | 83.8 | 77.5 | 52.2 | 27.2 |
Emissions - the Zephyrus heats up significantly
System Noise
The two fans work permanently at low speeds in idle mode. The resulting background noise is bearable. Under load though they turn up considerably. We register maximum sound pressure levels of 57 dB(A) (stress test) and 53 dB(A) (The Witcher 3 test). Using headphones is a must. The fans show a very uneven behaviour in the medium load range. Fan speeds and thus the noise development (41 to 57 dB(A)) vary greatly.
Noise level
| Idle |
| 31 / 32 / 36 dB(A) |
| Load |
| 55 / 57 dB(A) |
 | ||
30 dB silent 40 dB(A) audible 50 dB(A) loud |
||
min: | ||
| Asus ROG Zephyrus M15 GU502L i7-10750H, GeForce RTX 2070 Max-Q | Asus ROG Zephyrus M15 GU502GU-XB74 i7-9750H, GeForce GTX 1660 Ti Mobile | Schenker Key 15 Comet Lake i7-10875H, GeForce RTX 2080 Super Max-Q | Razer Blade 15 RTX 2070 Super Max-Q i7-10875H, GeForce RTX 2070 Super Max-Q | Gigabyte Aero 15 OLED XB-8DE51B0SP i7-10875H, GeForce RTX 2070 Super Max-Q | Acer Predator Triton 500 PT515-52-70N3 i7-10750H, GeForce RTX 2080 Super Max-Q | MSI GS66 10SGS i7-10750H, GeForce RTX 2080 Super Max-Q | Average of class Gaming | |
|---|---|---|---|---|---|---|---|---|
| Noise | 5% | 4% | 10% | -4% | 1% | 6% | 13% | |
| off / environment * (dB) | 25 | 28.2 -13% | 25 -0% | 27 -8% | 30 -20% | 30 -20% | 28.5 -14% | 24.1 ? 4% |
| Idle Minimum * (dB) | 31 | 28.7 7% | 26 16% | 27 13% | 34 -10% | 30 3% | 30 3% | 25.8 ? 17% |
| Idle Average * (dB) | 32 | 30.5 5% | 27 16% | 27 16% | 36 -13% | 33 -3% | 30 6% | 27.5 ? 14% |
| Idle Maximum * (dB) | 36 | 31 14% | 44 -22% | 27 25% | 41 -14% | 36 -0% | 30.9 14% | 30 ? 17% |
| Load Average * (dB) | 55 | 39 29% | 53 4% | 44.7 19% | 48 13% | 50 9% | 39.5 28% | 43.1 ? 22% |
| Witcher 3 ultra * (dB) | 53 | 54.2 -2% | 51 4% | 51.2 3% | 48 9% | 48 9% | 48 9% | |
| Load Maximum * (dB) | 57 | 59.6 -5% | 53 7% | 54 5% | 54 5% | 50 12% | 59.4 -4% | 54 ? 5% |
* ... smaller is better
Temperature
Our stress test (Prime95 and FurMark run for at least one hour) is performed at 2.3 GHz. The graphics core operates at around 1,230 MHz. The stress test represents an extreme scenario that does not occur in everyday life. We use this test to check whether the system runs stably even at full capacity.
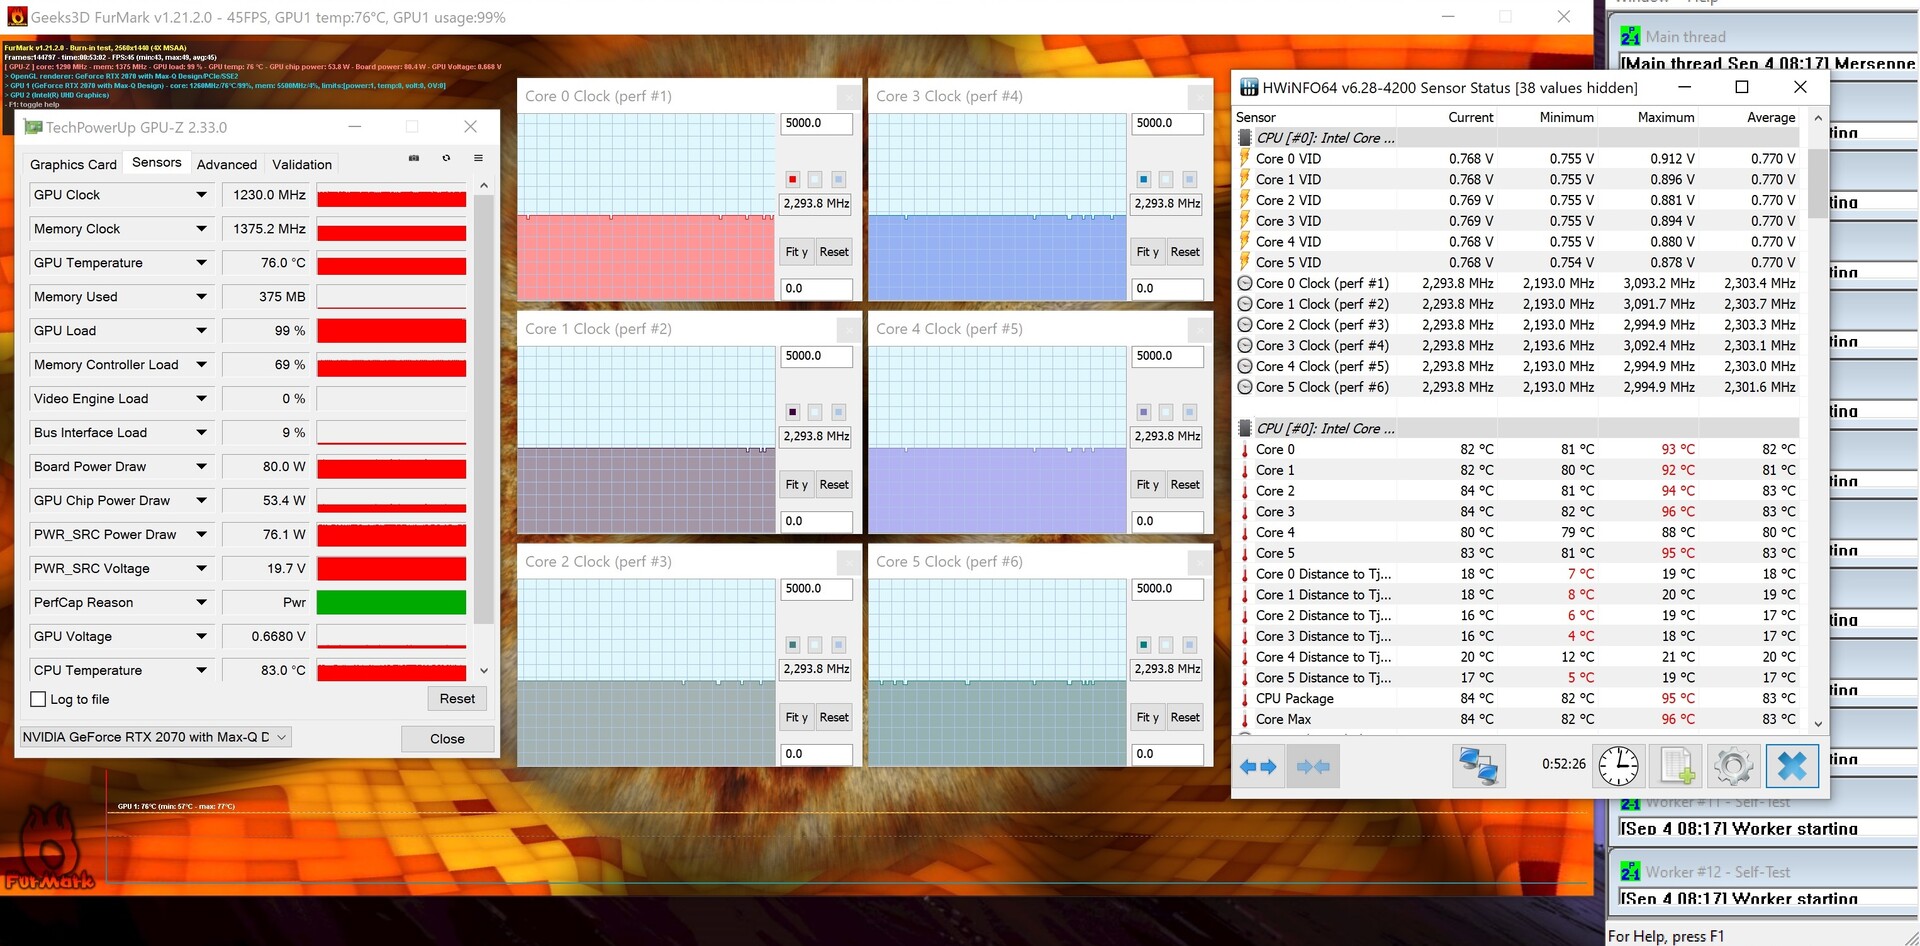
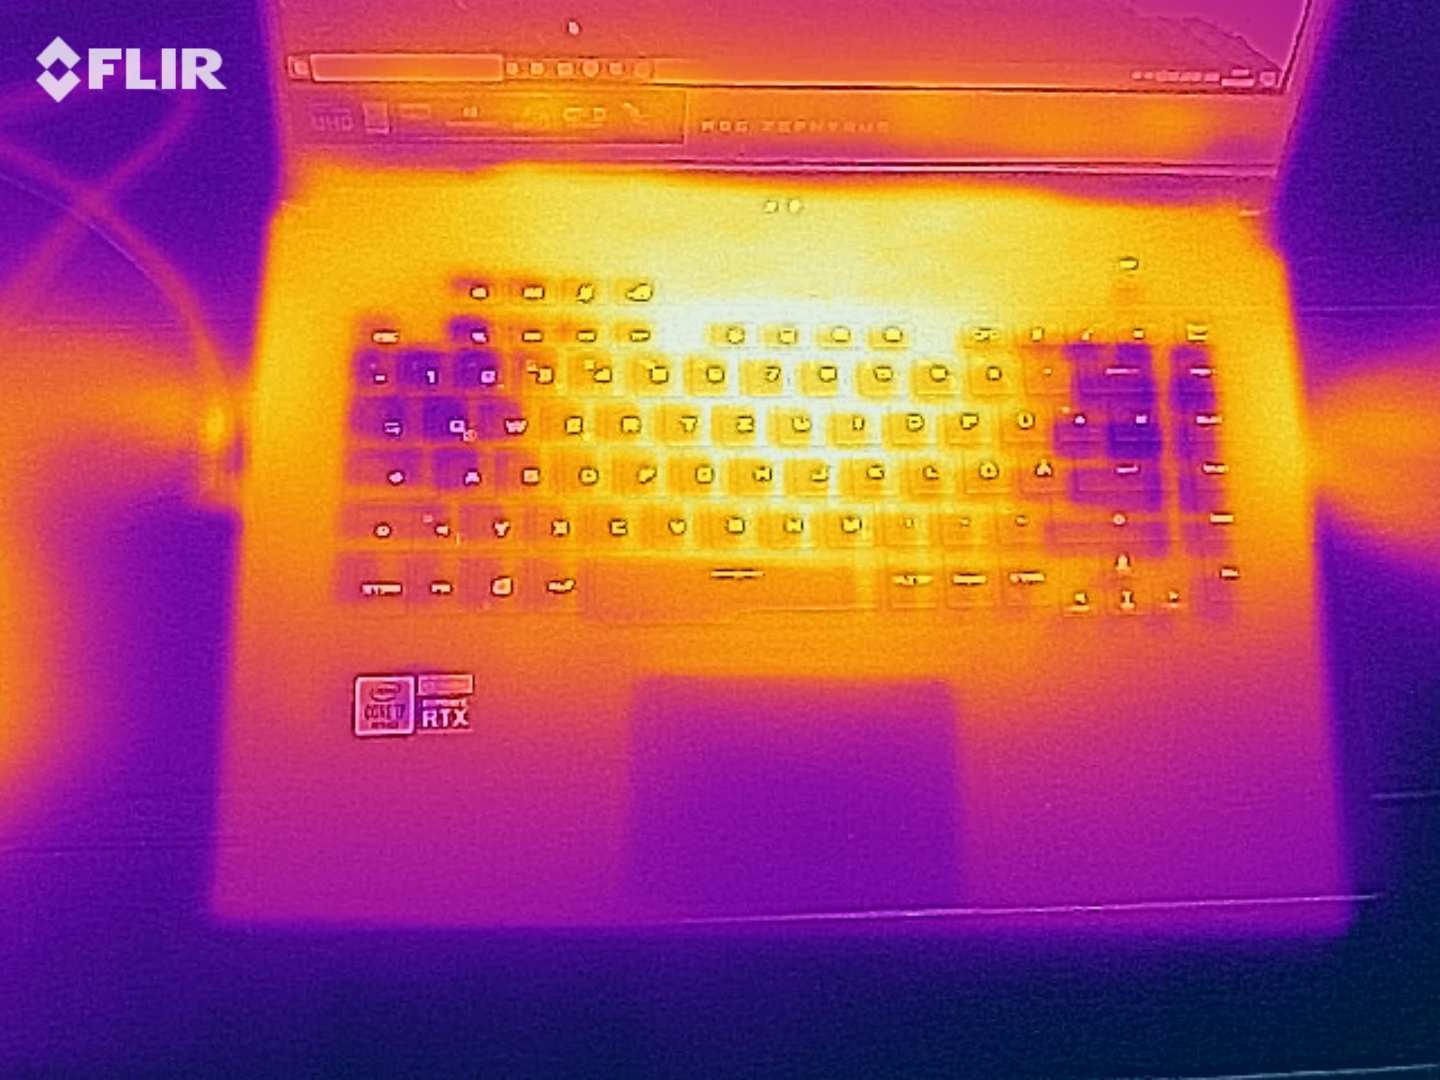
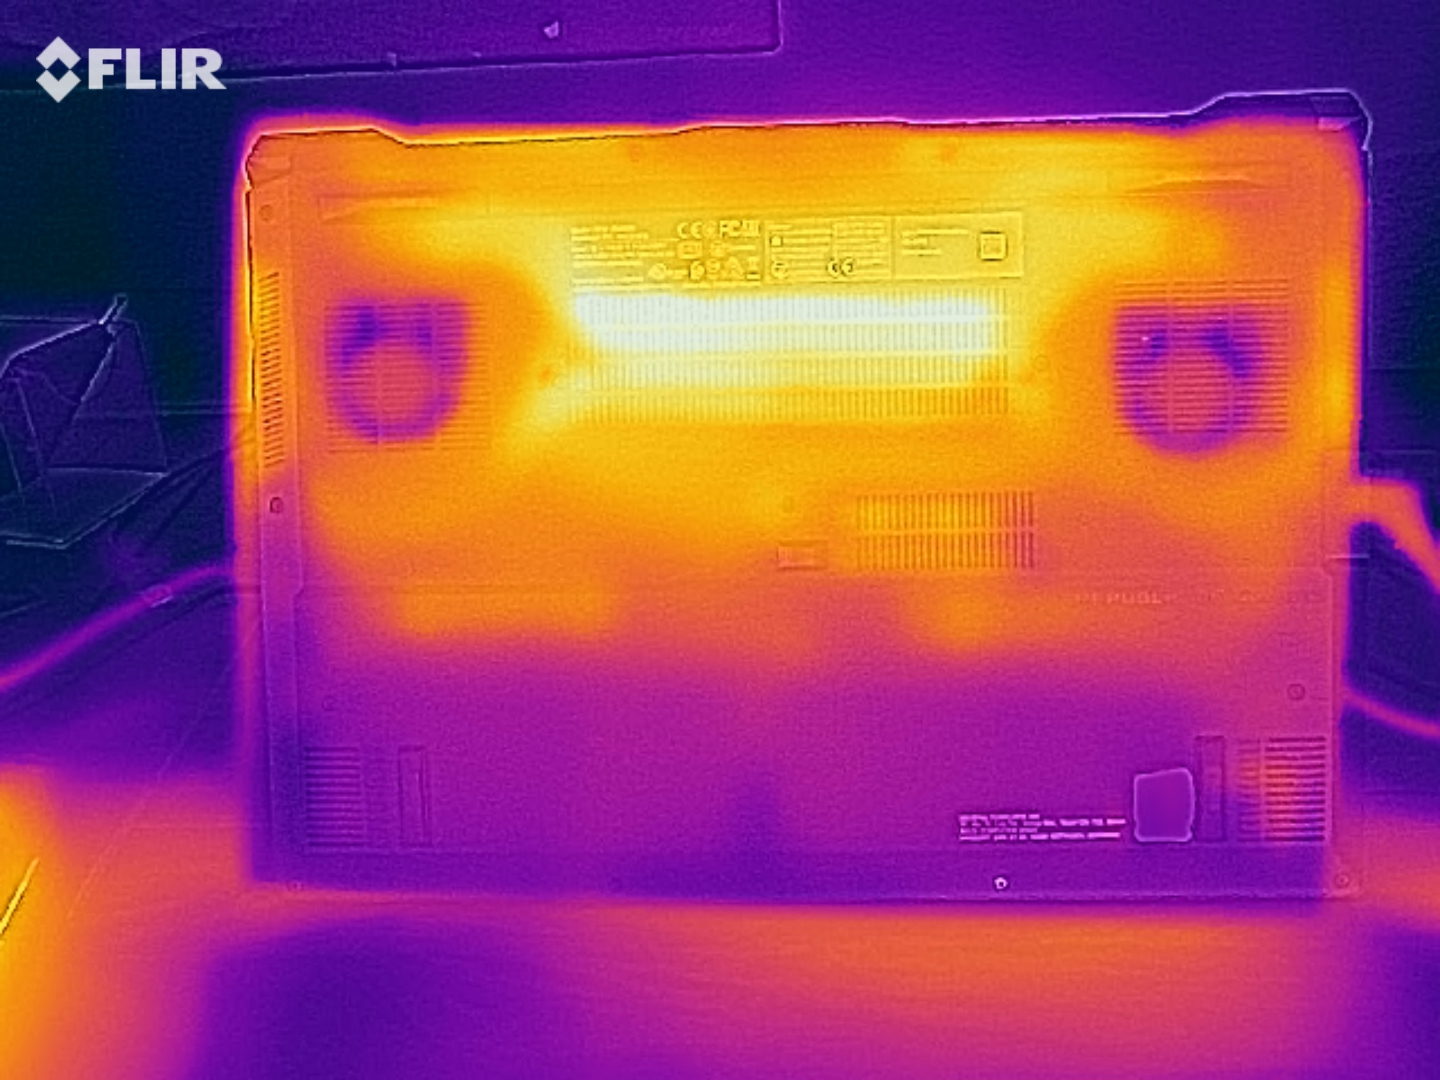
The Zephyrus GU502L heats up significantly under load. During the stress test we register temperatures above 60 °C at two measuring points. The increase in temperature is slightly less when running The Witcher 3. In both cases, we recommend not using the laptop on top of your lap. In everyday use the temperatures are within the safe range.
(-) The maximum temperature on the upper side is 54 °C / 129 F, compared to the average of 40.4 °C / 105 F, ranging from 21.2 to 68.8 °C for the class Gaming.
(-) The bottom heats up to a maximum of 63 °C / 145 F, compared to the average of 43.2 °C / 110 F
(+) In idle usage, the average temperature for the upper side is 26.6 °C / 80 F, compared to the device average of 33.9 °C / 93 F.
(-) Playing The Witcher 3, the average temperature for the upper side is 44.6 °C / 112 F, compared to the device average of 33.9 °C / 93 F.
(±) The palmrests and touchpad can get very hot to the touch with a maximum of 39 °C / 102.2 F.
(-) The average temperature of the palmrest area of similar devices was 28.8 °C / 83.8 F (-10.2 °C / -18.4 F).
| Asus ROG Zephyrus M15 GU502L i7-10750H, GeForce RTX 2070 Max-Q | Asus ROG Zephyrus M15 GU502GU-XB74 i7-9750H, GeForce GTX 1660 Ti Mobile | Schenker Key 15 Comet Lake i7-10875H, GeForce RTX 2080 Super Max-Q | Razer Blade 15 RTX 2070 Super Max-Q i7-10875H, GeForce RTX 2070 Super Max-Q | Gigabyte Aero 15 OLED XB-8DE51B0SP i7-10875H, GeForce RTX 2070 Super Max-Q | Acer Predator Triton 500 PT515-52-70N3 i7-10750H, GeForce RTX 2080 Super Max-Q | MSI GS66 10SGS i7-10750H, GeForce RTX 2080 Super Max-Q | Average of class Gaming | |
|---|---|---|---|---|---|---|---|---|
| Heat | -11% | -8% | -17% | 1% | 5% | 1% | -1% | |
| Maximum Upper Side * (°C) | 54 | 49.8 8% | 52 4% | 50 7% | 49 9% | 44 19% | 47.8 11% | 45.2 ? 16% |
| Maximum Bottom * (°C) | 63 | 63.2 -0% | 62 2% | 52.2 17% | 61 3% | 50 21% | 54.4 14% | 48.2 ? 23% |
| Idle Upper Side * (°C) | 27 | 32 -19% | 31 -15% | 37.2 -38% | 27 -0% | 29 -7% | 27.4 -1% | 31.1 ? -15% |
| Idle Bottom * (°C) | 27 | 36.2 -34% | 33 -22% | 41.4 -53% | 29 -7% | 31 -15% | 32 -19% | 34.3 ? -27% |
* ... smaller is better
Speakers
Asus ROG Zephyrus M15 GU502L audio analysis
(+) | speakers can play relatively loud (85 dB)
Bass 100 - 315 Hz
(±) | reduced bass - on average 10.4% lower than median
(±) | linearity of bass is average (9% delta to prev. frequency)
Mids 400 - 2000 Hz
(+) | balanced mids - only 1.7% away from median
(+) | mids are linear (2.8% delta to prev. frequency)
Highs 2 - 16 kHz
(+) | balanced highs - only 4% away from median
(+) | highs are linear (6.1% delta to prev. frequency)
Overall 100 - 16.000 Hz
(+) | overall sound is linear (8.6% difference to median)
Compared to same class
» 2% of all tested devices in this class were better, 1% similar, 97% worse
» The best had a delta of 6%, average was 18%, worst was 132%
Compared to all devices tested
» 2% of all tested devices were better, 1% similar, 97% worse
» The best had a delta of 4%, average was 24%, worst was 134%
Power management - battery life is average
Power consumption
When idling, we register a maximum power consumption of 23 watts, which makes the Zephyrus more efficient than many competitors. The stress test increases the power consumption up to 222 watts. During the execution of our The Witcher 3 test, we measured an average power consumption of 140 watts. The nominal power of the power supply is 230 watts.
| Off / Standby | |
| Idle | |
| Load |
|
Key:
min: | |
| Asus ROG Zephyrus M15 GU502L i7-10750H, GeForce RTX 2070 Max-Q | Asus ROG Zephyrus M15 GU502GU-XB74 i7-9750H, GeForce GTX 1660 Ti Mobile | Schenker Key 15 Comet Lake i7-10875H, GeForce RTX 2080 Super Max-Q | Razer Blade 15 RTX 2070 Super Max-Q i7-10875H, GeForce RTX 2070 Super Max-Q | Gigabyte Aero 15 OLED XB-8DE51B0SP i7-10875H, GeForce RTX 2070 Super Max-Q | Acer Predator Triton 500 PT515-52-70N3 i7-10750H, GeForce RTX 2080 Super Max-Q | MSI GS66 10SGS i7-10750H, GeForce RTX 2080 Super Max-Q | Average of class Gaming | |
|---|---|---|---|---|---|---|---|---|
| Power Consumption | -46% | 7% | -28% | -35% | 0% | -13% | -16% | |
| Idle Minimum * (Watt) | 10 | 17.6 -76% | 10 -0% | 14.3 -43% | 18 -80% | 11 -10% | 14.9 -49% | 13.3 ? -33% |
| Idle Average * (Watt) | 13 | 24.7 -90% | 14 -8% | 22.3 -72% | 21 -62% | 15 -15% | 17.5 -35% | 19 ? -46% |
| Idle Maximum * (Watt) | 23 | 56.3 -145% | 18 22% | 36.9 -60% | 38 -65% | 25 -9% | 29.5 -28% | 24.5 ? -7% |
| Load Average * (Watt) | 137 | 111.1 19% | 106 23% | 118.4 14% | 113 18% | 95 31% | 94.8 31% | 108.1 ? 21% |
| Witcher 3 ultra * (Watt) | 140 | 149 -6% | 142 -1% | 153.7 -10% | 149 -6% | 140 -0% | 146.1 -4% | |
| Load Maximum * (Watt) | 222 | 170 23% | 210 5% | 220.8 1% | 256 -15% | 211 5% | 210.9 5% | 254 ? -14% |
* ... smaller is better
Battery Life
The battery life is perfectly acceptable for a gaming laptop. Our WLAN test (calling up web pages by means of a script) and our video test (short film Big Buck Bunny (H.264 encoding, FHD) running in a loop) were concluded by the 15.6-incher after 5:31 h and 6:00 h, respectively.
| Asus ROG Zephyrus M15 GU502L i7-10750H, GeForce RTX 2070 Max-Q, 76 Wh | Asus ROG Zephyrus M15 GU502GU-XB74 i7-9750H, GeForce GTX 1660 Ti Mobile, 76 Wh | Schenker Key 15 Comet Lake i7-10875H, GeForce RTX 2080 Super Max-Q, 73 Wh | Razer Blade 15 RTX 2070 Super Max-Q i7-10875H, GeForce RTX 2070 Super Max-Q, 80 Wh | Gigabyte Aero 15 OLED XB-8DE51B0SP i7-10875H, GeForce RTX 2070 Super Max-Q, 94.2 Wh | Acer Predator Triton 500 PT515-52-70N3 i7-10750H, GeForce RTX 2080 Super Max-Q, 84 Wh | MSI GS66 10SGS i7-10750H, GeForce RTX 2080 Super Max-Q, 99.99 Wh | Average of class Gaming | |
|---|---|---|---|---|---|---|---|---|
| Battery runtime | -7% | -13% | 15% | 33% | -0% | 17% | 16% | |
| Reader / Idle (h) | 8.6 | 7.1 -17% | 7 -19% | 8.6 0% | 8.3 -3% | 10.2 19% | 8.71 ? 1% | |
| H.264 (h) | 6 | 5.7 -5% | 8.26 ? 38% | |||||
| WiFi v1.3 (h) | 5.5 | 4.5 -18% | 4.8 -13% | 6.3 15% | 6.1 11% | 6.3 15% | 6.9 25% | 7.01 ? 27% |
| Load (h) | 1.5 | 1.7 13% | 1.3 -13% | 2.8 87% | 1.3 -13% | 1.6 7% | 1.47 ? -2% |
Pros
Cons
Verdict
With the Zephyrus M15, Asus offers a slim, compact 15.6-inch gaming laptop that can smoothly bring all current computer games to the screen. The Core i7-10750H processor and GeForce RTX 2070 Max-Q GPU make this possible.
The Asus ROG Zephyrus M15 GU502L offers plenty of gaming performance despite its compact dimensions.
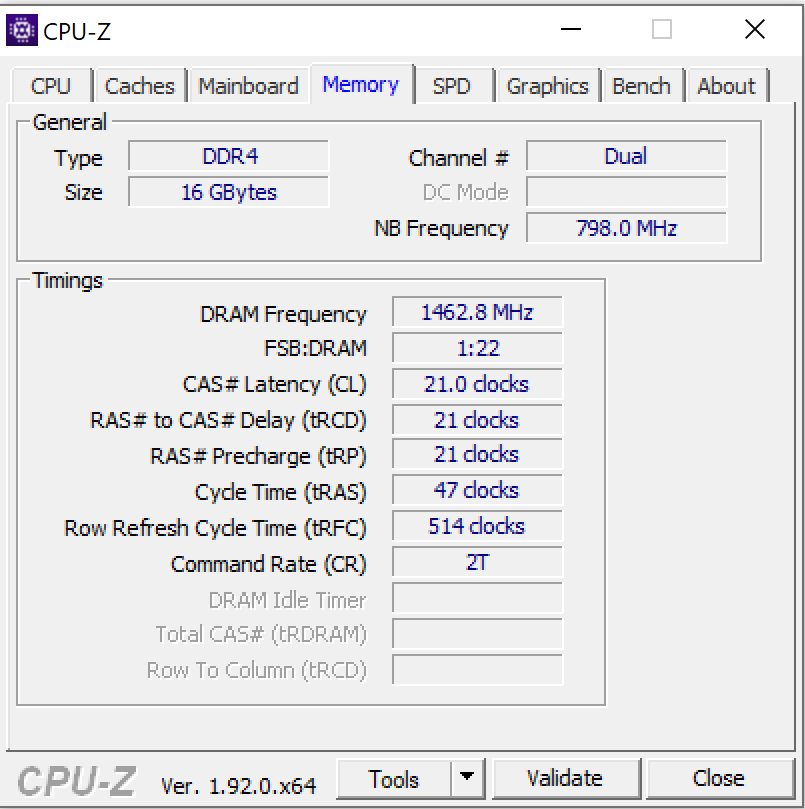
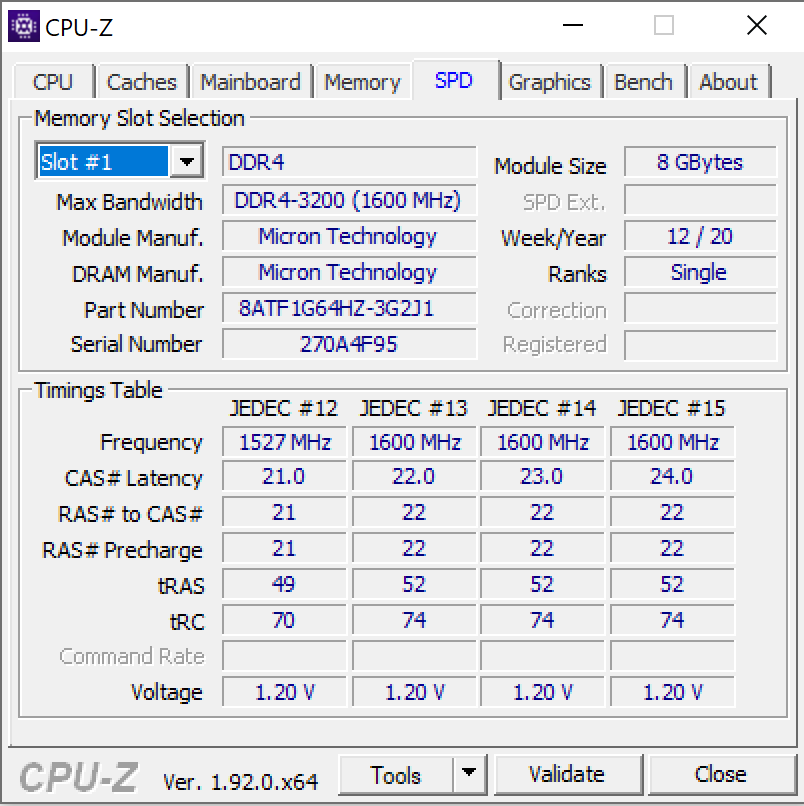
The storage system still offers room for improvement. As part of the RAM (8 GB out of a total of 16 GB; dual-channel mode) is soldered and there is only one memory bank, the maximum capacity can be expanded to 38 GB. Many competitors allow up to 64 GB. The RAID-0 group (1 TB) is very fast but does not reach the transfer rates of the top SSDs of other manufacturers in single operation.
The IPS 4k screen scores with a matt finish, high brightness, good contrast, stable viewing angles and - thanks to Pantone certification - great colour reproduction. The colour-space coverage is also impressive. Battery life is good for a gaming notebook. The keyboard (RGB lighting) has proven its suitability for everyday use.
The GU502L's Thunderbolt 3 slot allows the connection of a docking station or an external GPU. DisplayPort via USB-C and Power Delivery are supported. The latter enables the laptop to be powered via the USB power supply (65 watts) - with reduced computing power. Asus includes a corresponding power adapter.
Asus ROG Zephyrus M15 GU502L
- 09/30/2020 v7 (old)
Sascha Mölck
Price comparison

