Asus Zephyrus M GU502GU Laptop Review: $1800 for Single-Channel RAM
The Zephyrus family is home to Asus' thinnest and most visually appealing gaming laptops. The lineup itself has since expanded into multiple branches: the Zephyrus G series for budget-conscious consumers, the Zephyrus S series for the higher-end enthusiast offerings, and the Zephyrus M series as the in-between middle-ground solution. The model we'll be looking at today is the Zephyrus M GU502GU equipped with the Core i7-9750H CPU, GeForce GTX 1660 Ti GPU, and 1080p 144 Hz IPS display retailing for about $1800 USD on Xotic PC.
A more powerful Zephyrus M GU502GV is also available with the RTX 2060 GPU instead, but everything else remains identical between the two SKUs.
Competitors to the GU502GU include other budget to mid-range 15.6-inch gaming laptops like the MSI GF65, MSI GL65, HP Pavilion 15 Gaming, Lenovo Legion Y740-15, Dell G7 15, and the more recent Razer Blade 15 GTX 1660 Ti.
More Asus reviews:
Rating | Date | Model | Weight | Height | Size | Resolution | Price |
|---|---|---|---|---|---|---|---|
| 82.9 % v7 (old) | 10 / 2019 | Asus ROG Zephyrus M15 GU502GU-XB74 i7-9750H, GeForce GTX 1660 Ti Mobile | 2 kg | 18.9 mm | 15.60" | 1920x1080 |
Case - Minor Differences from the GA502
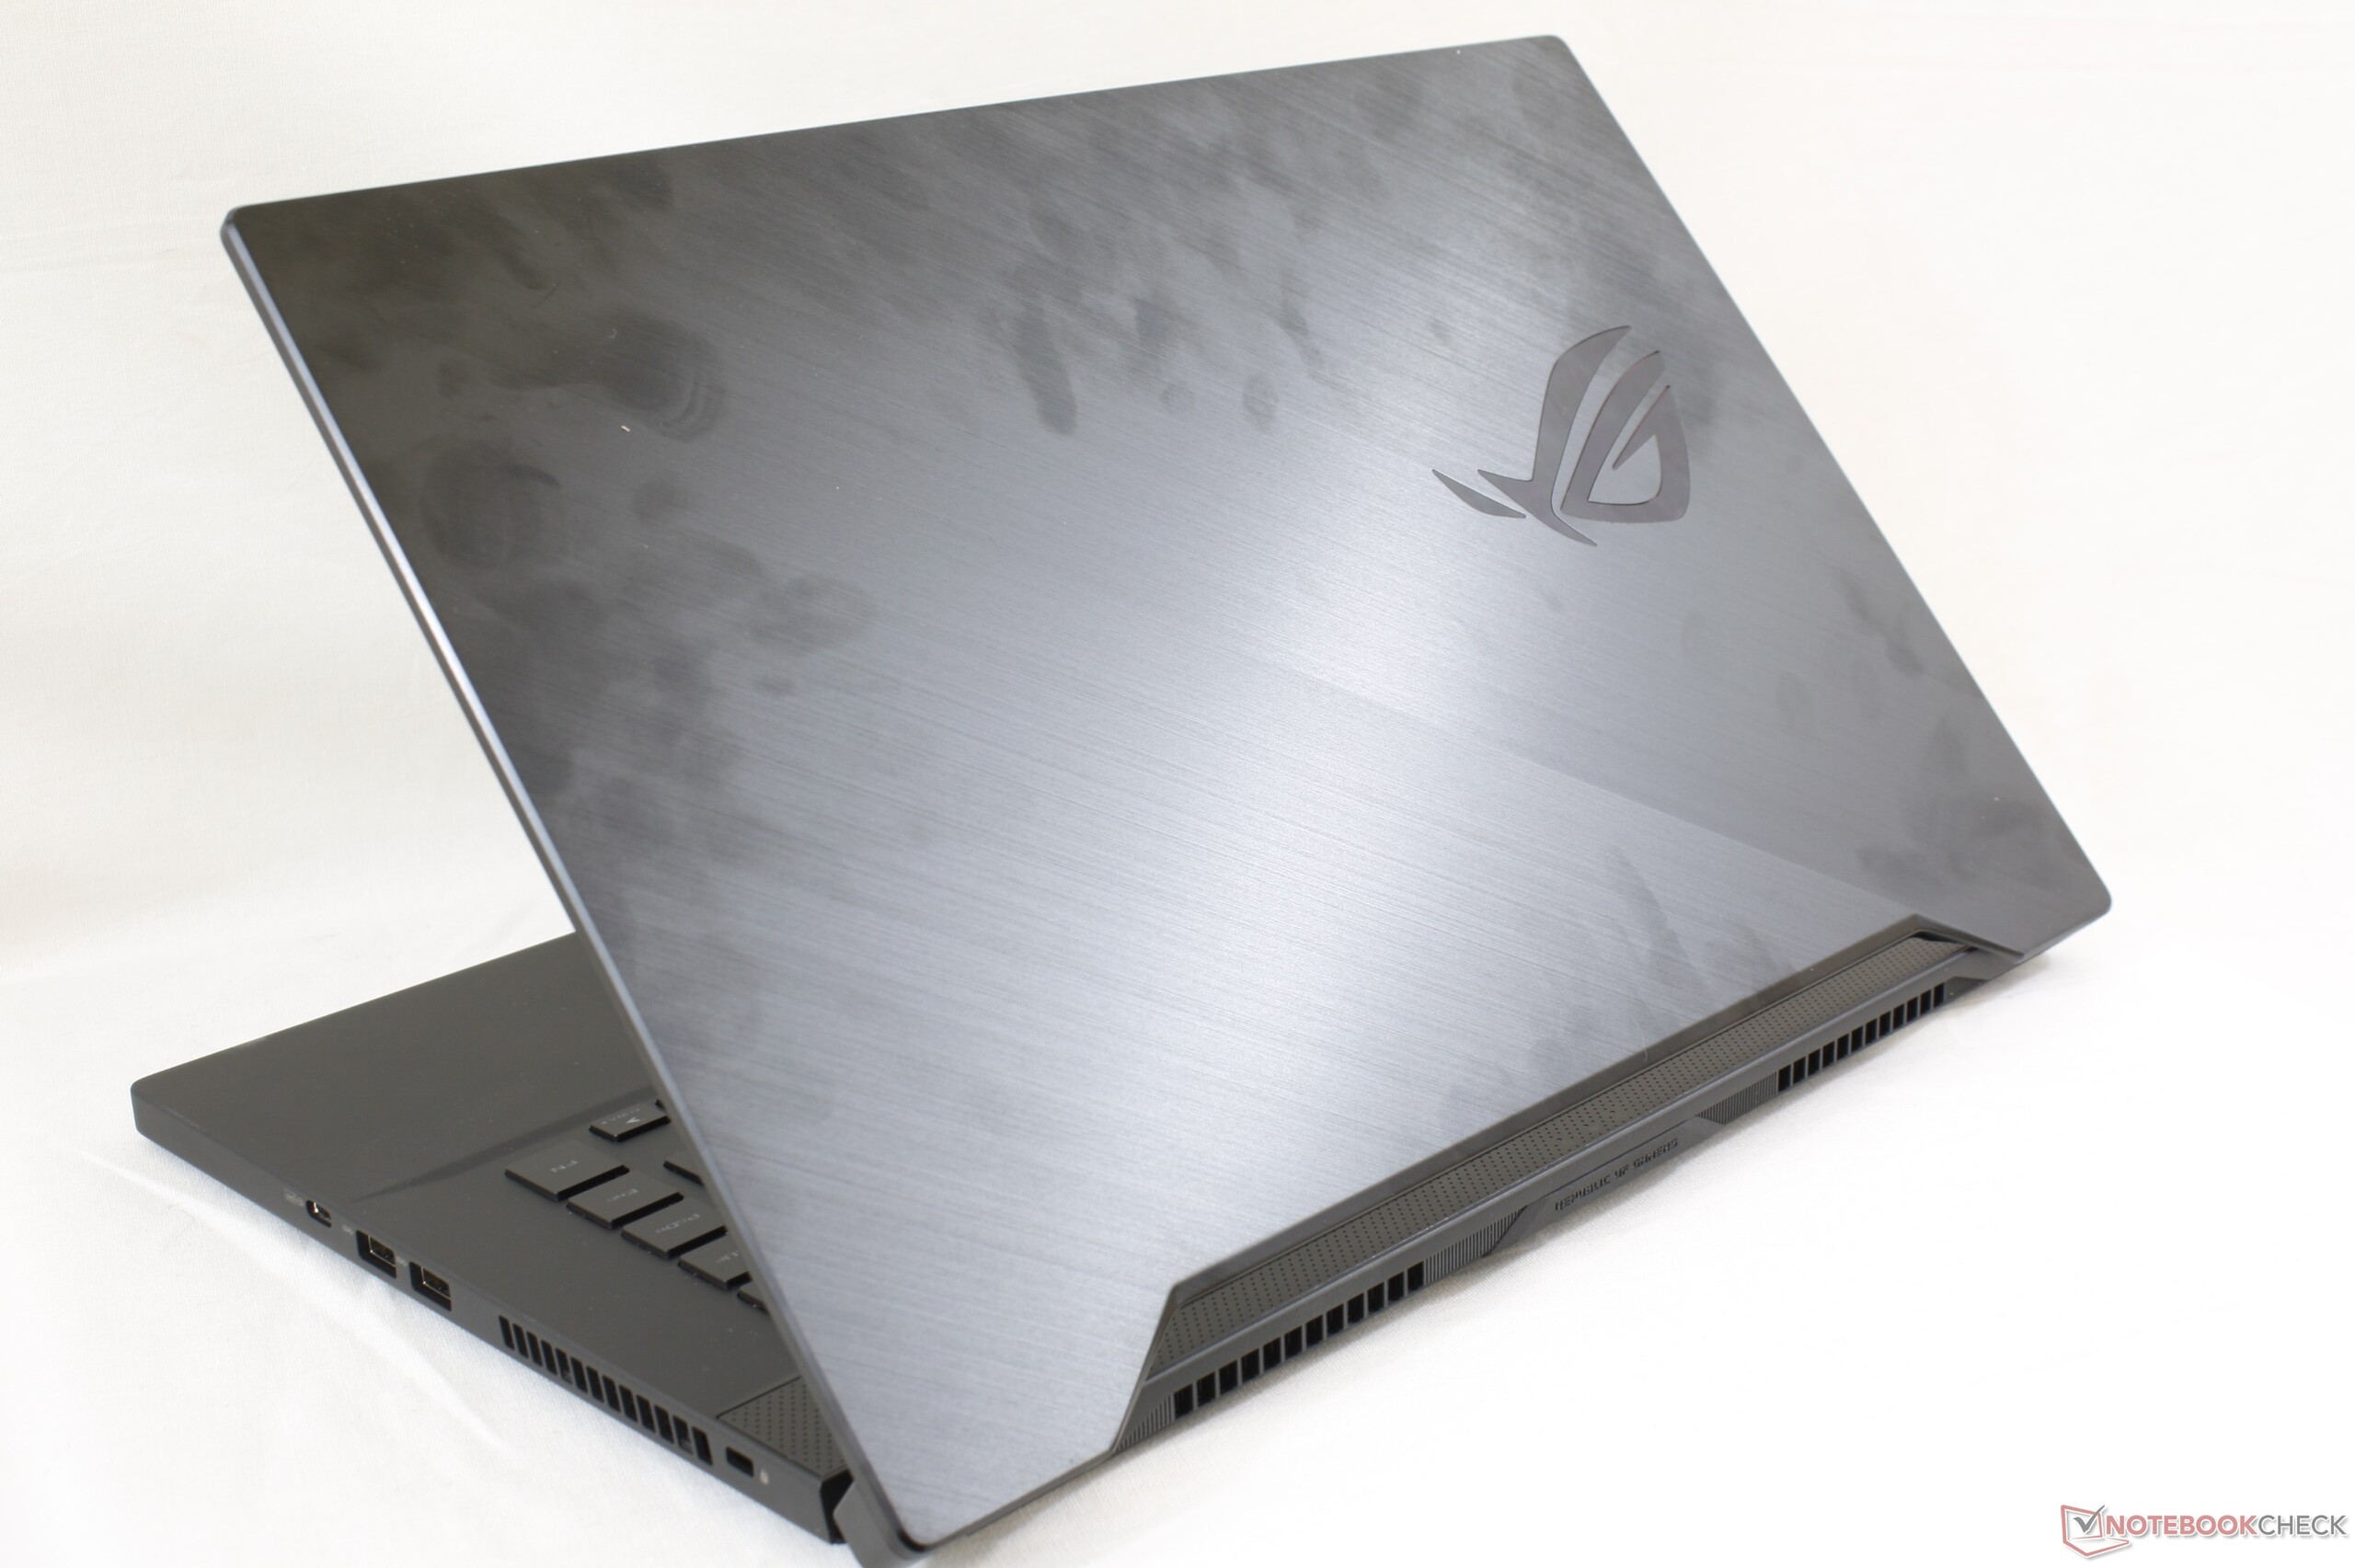
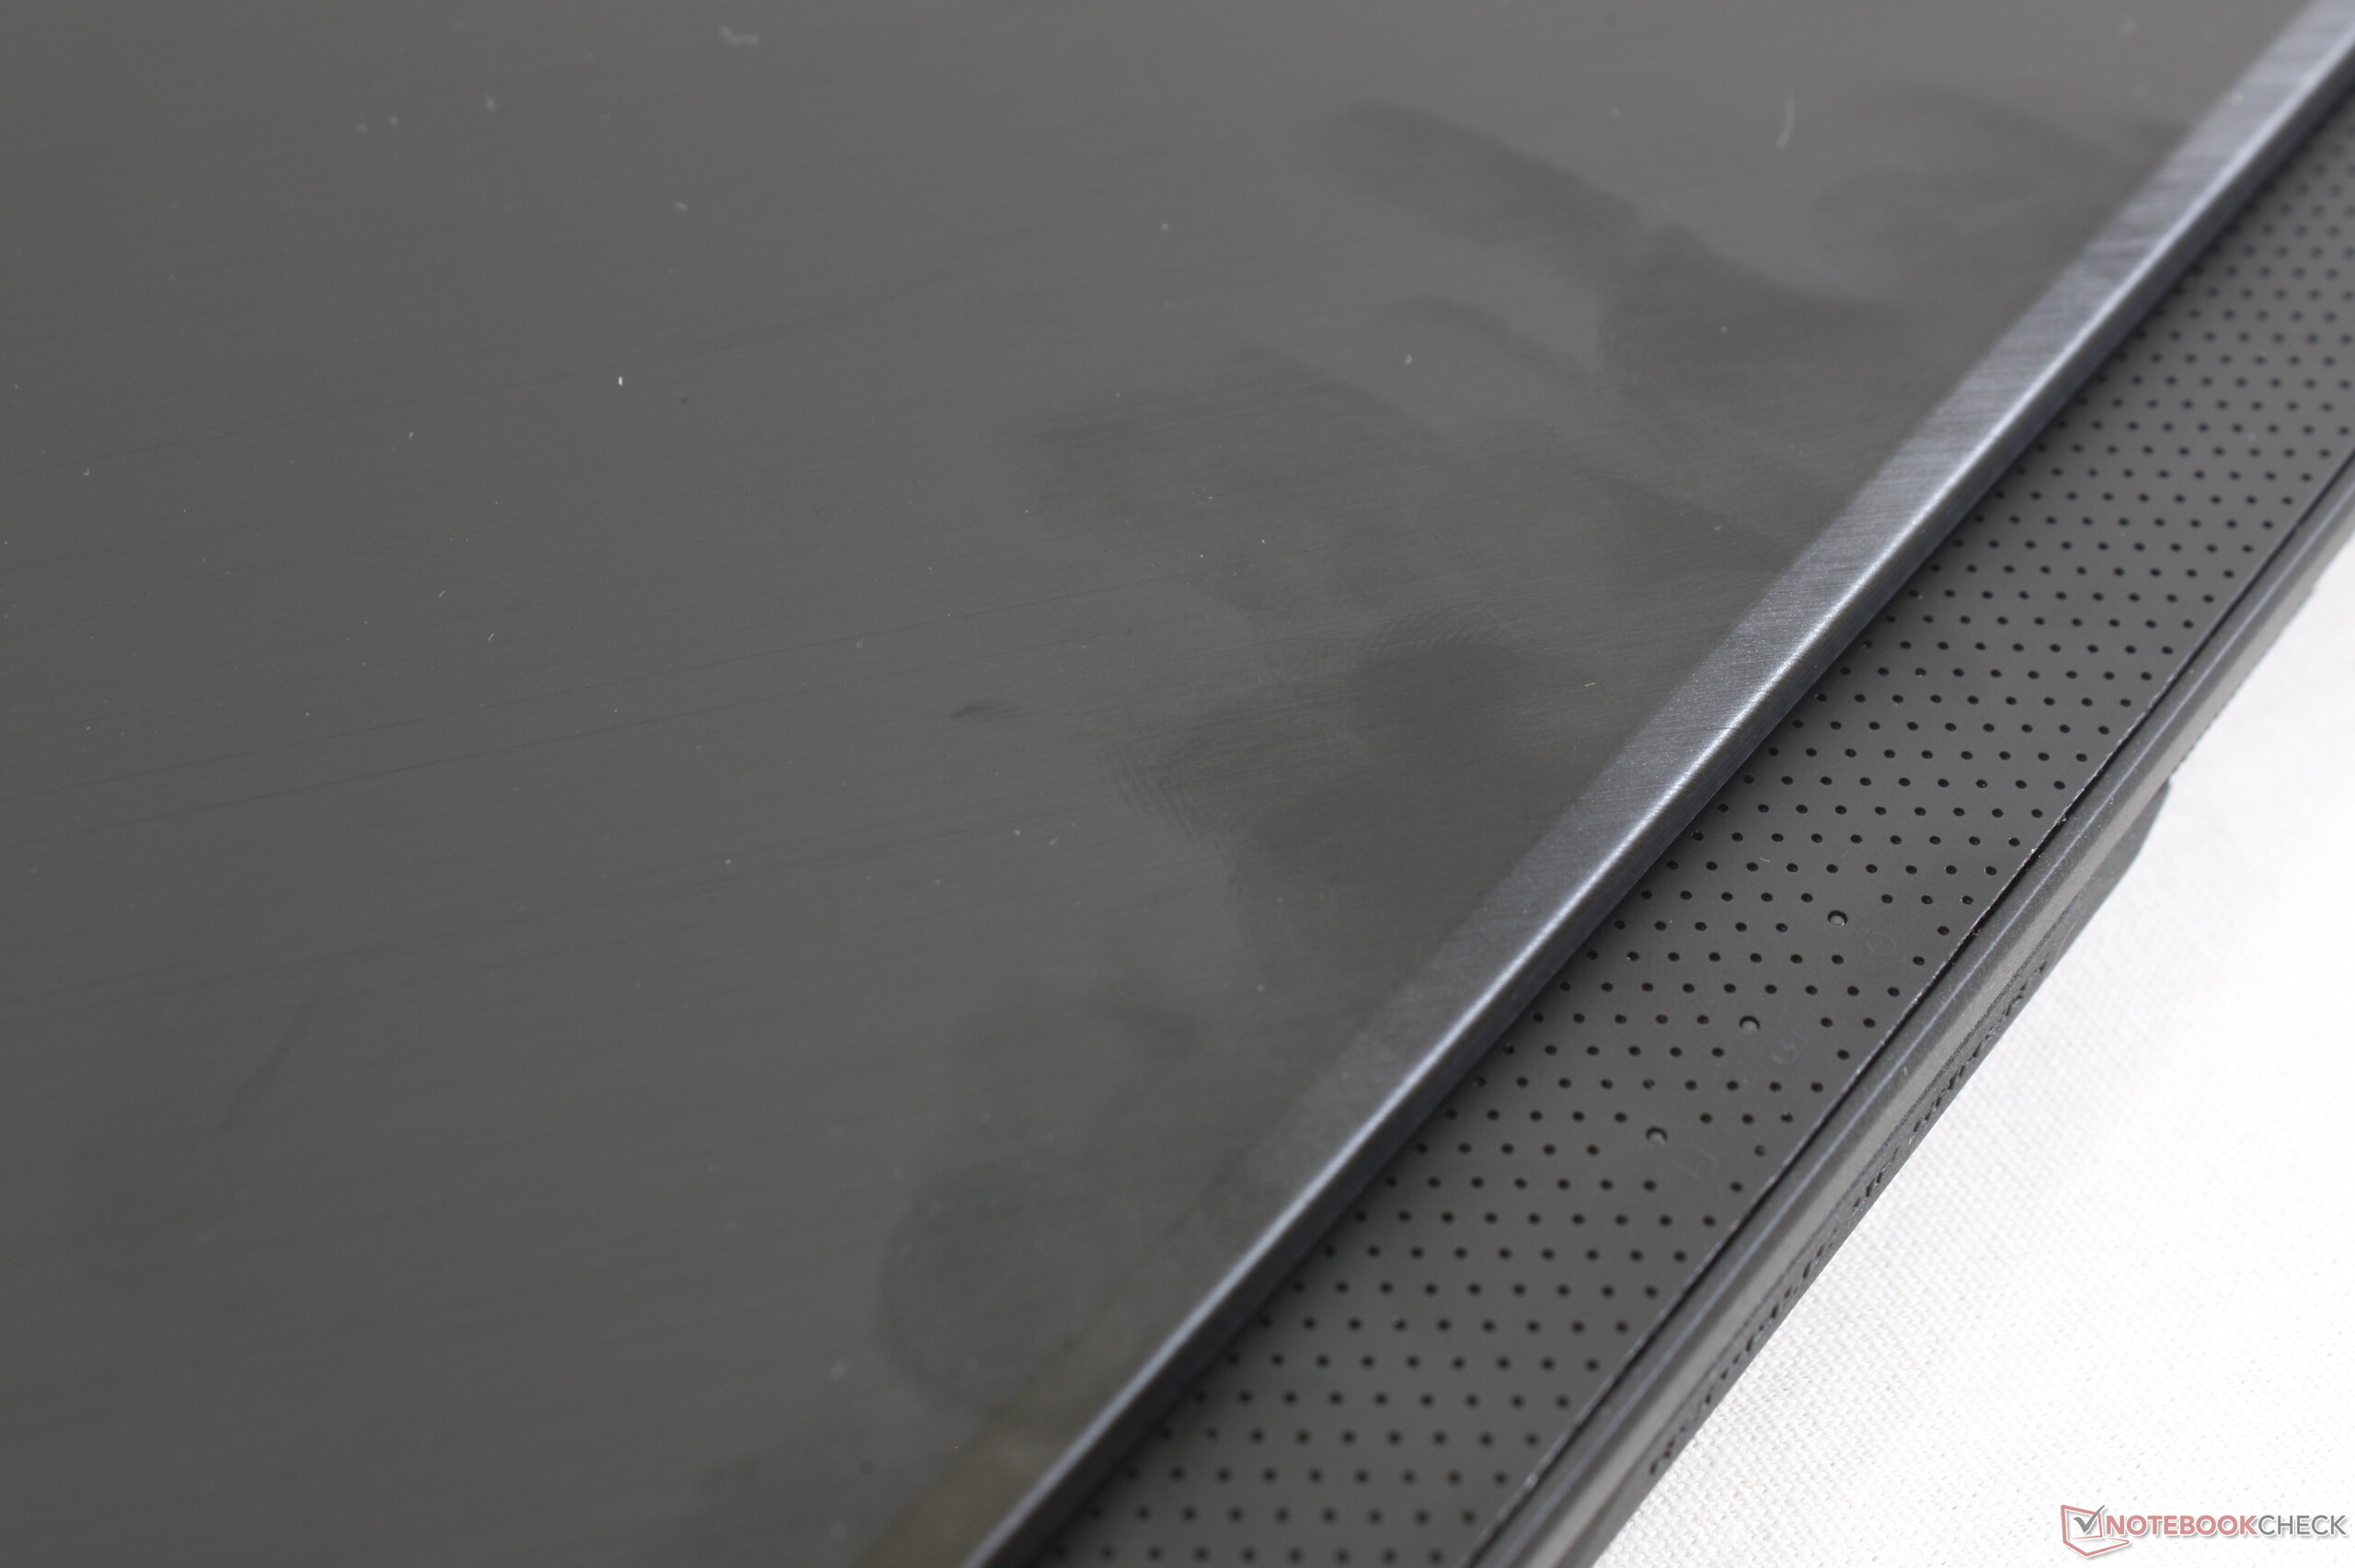
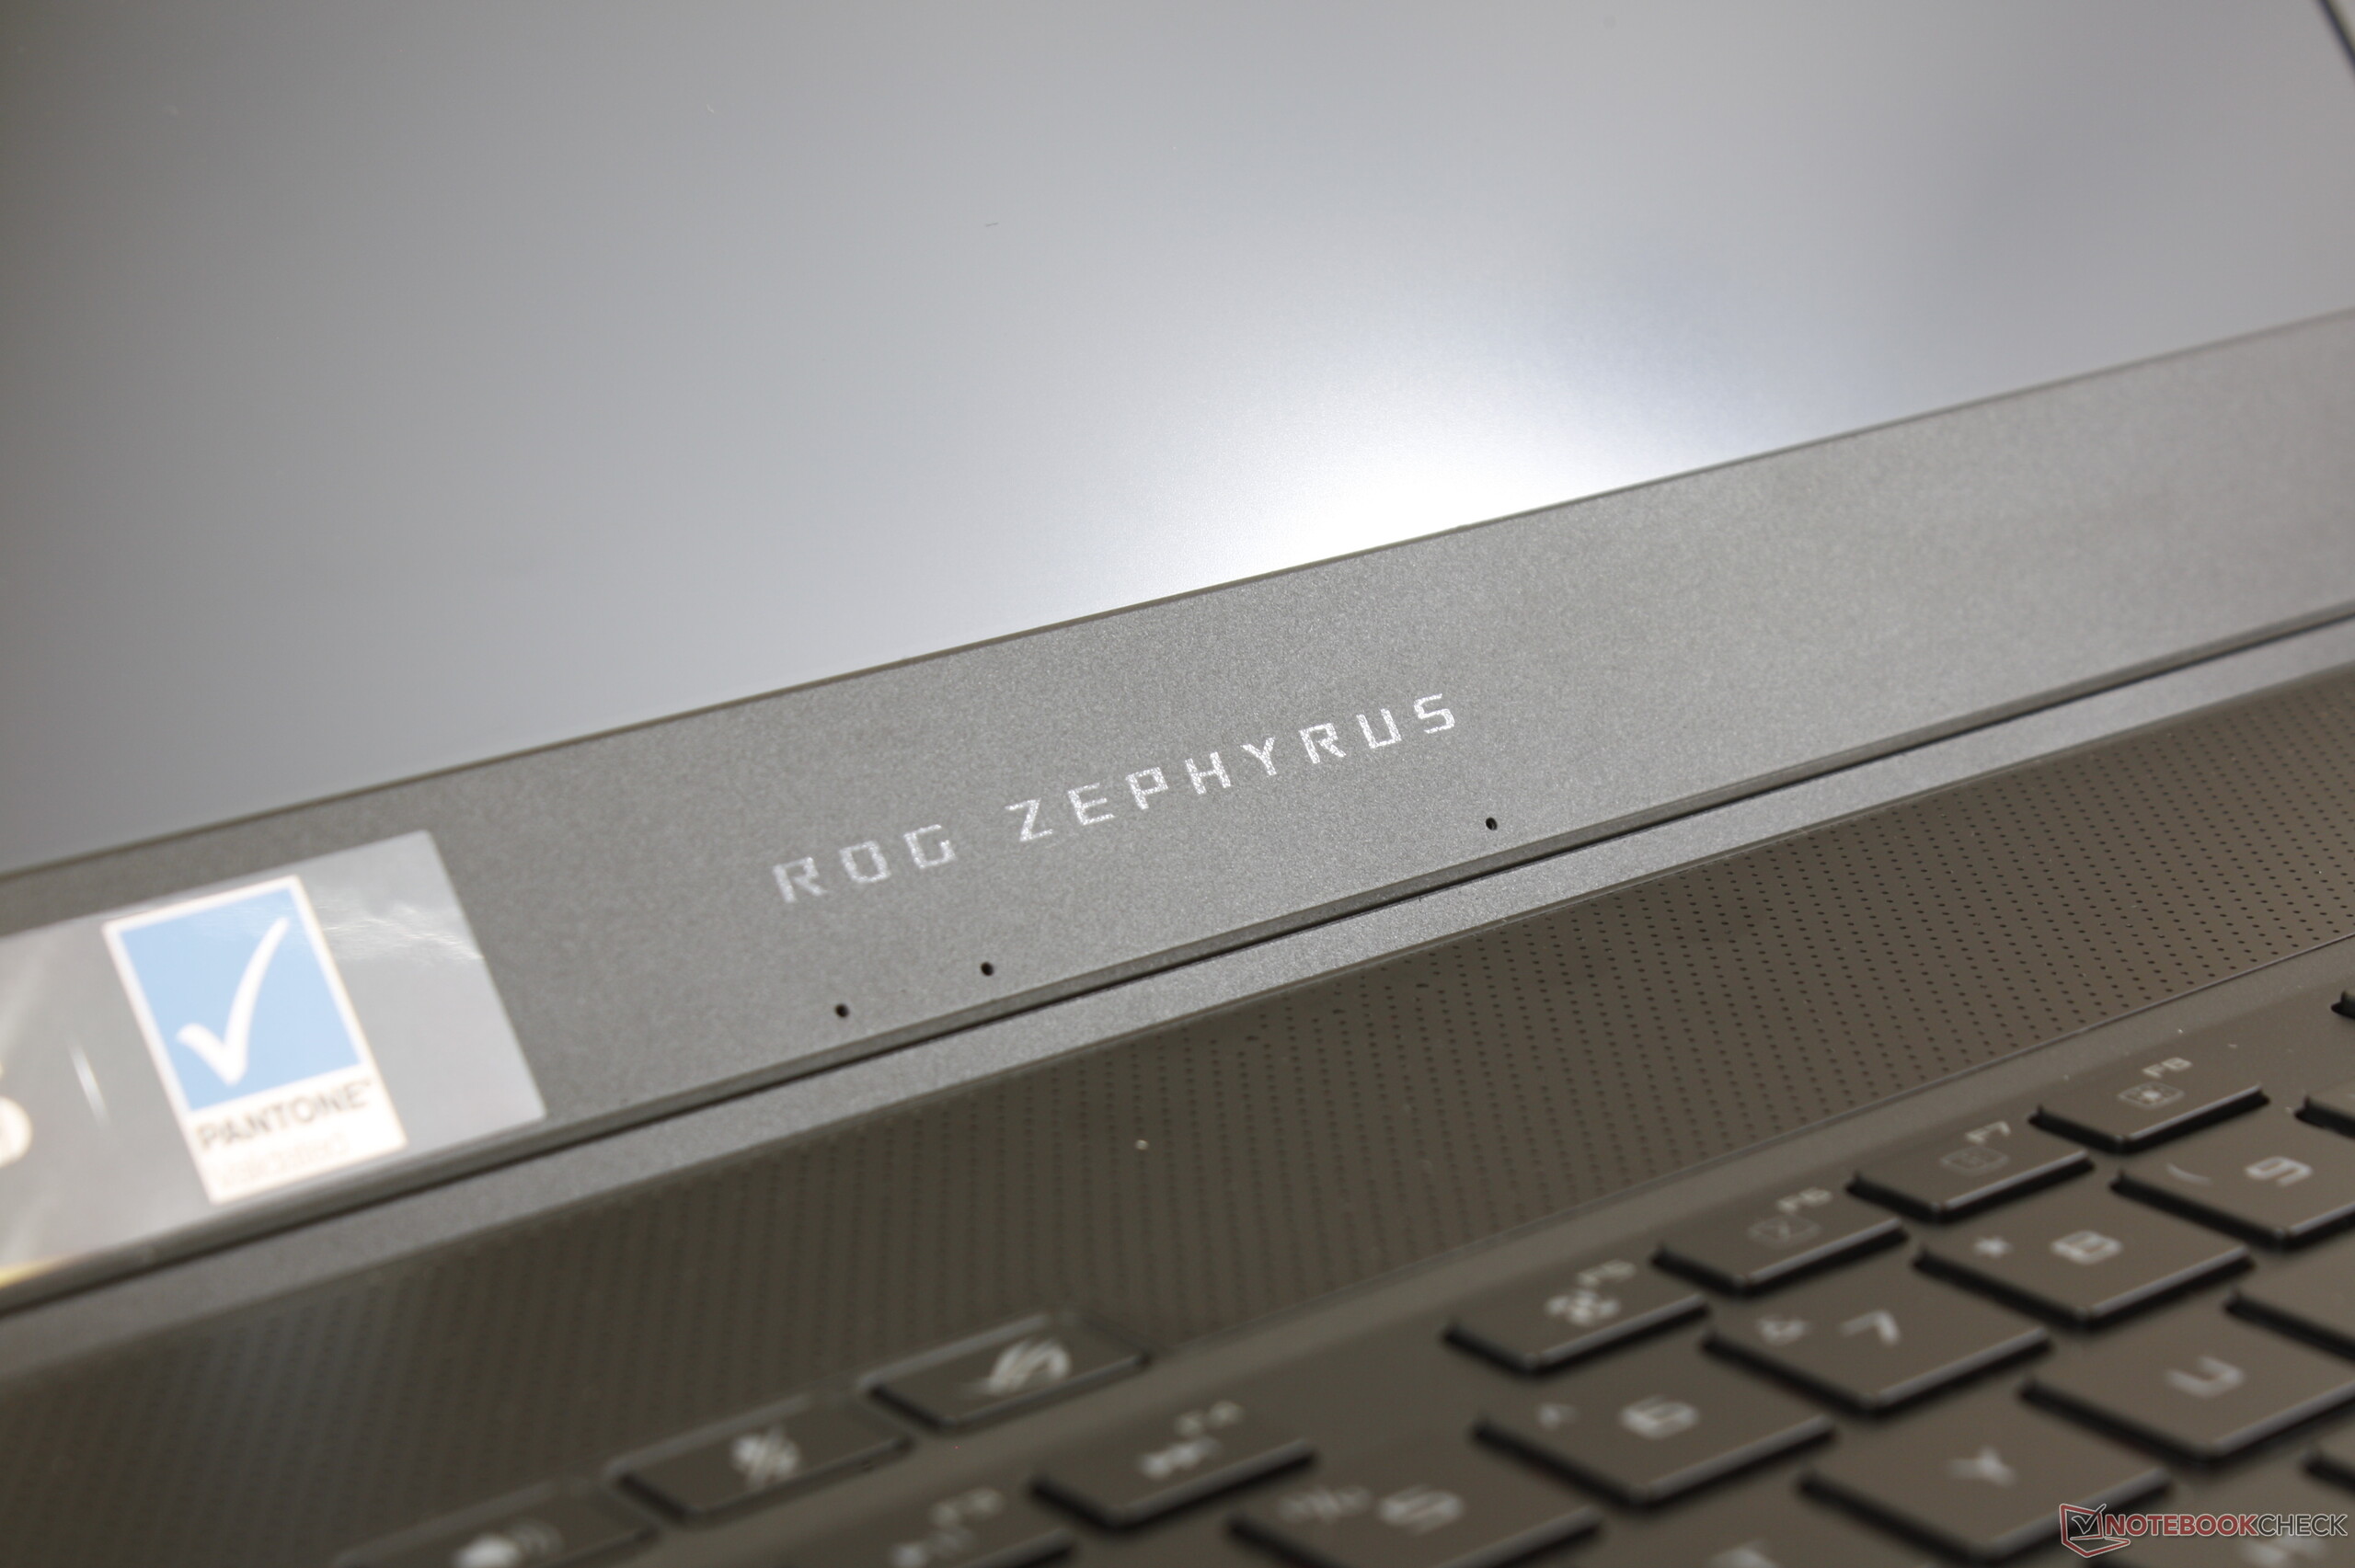
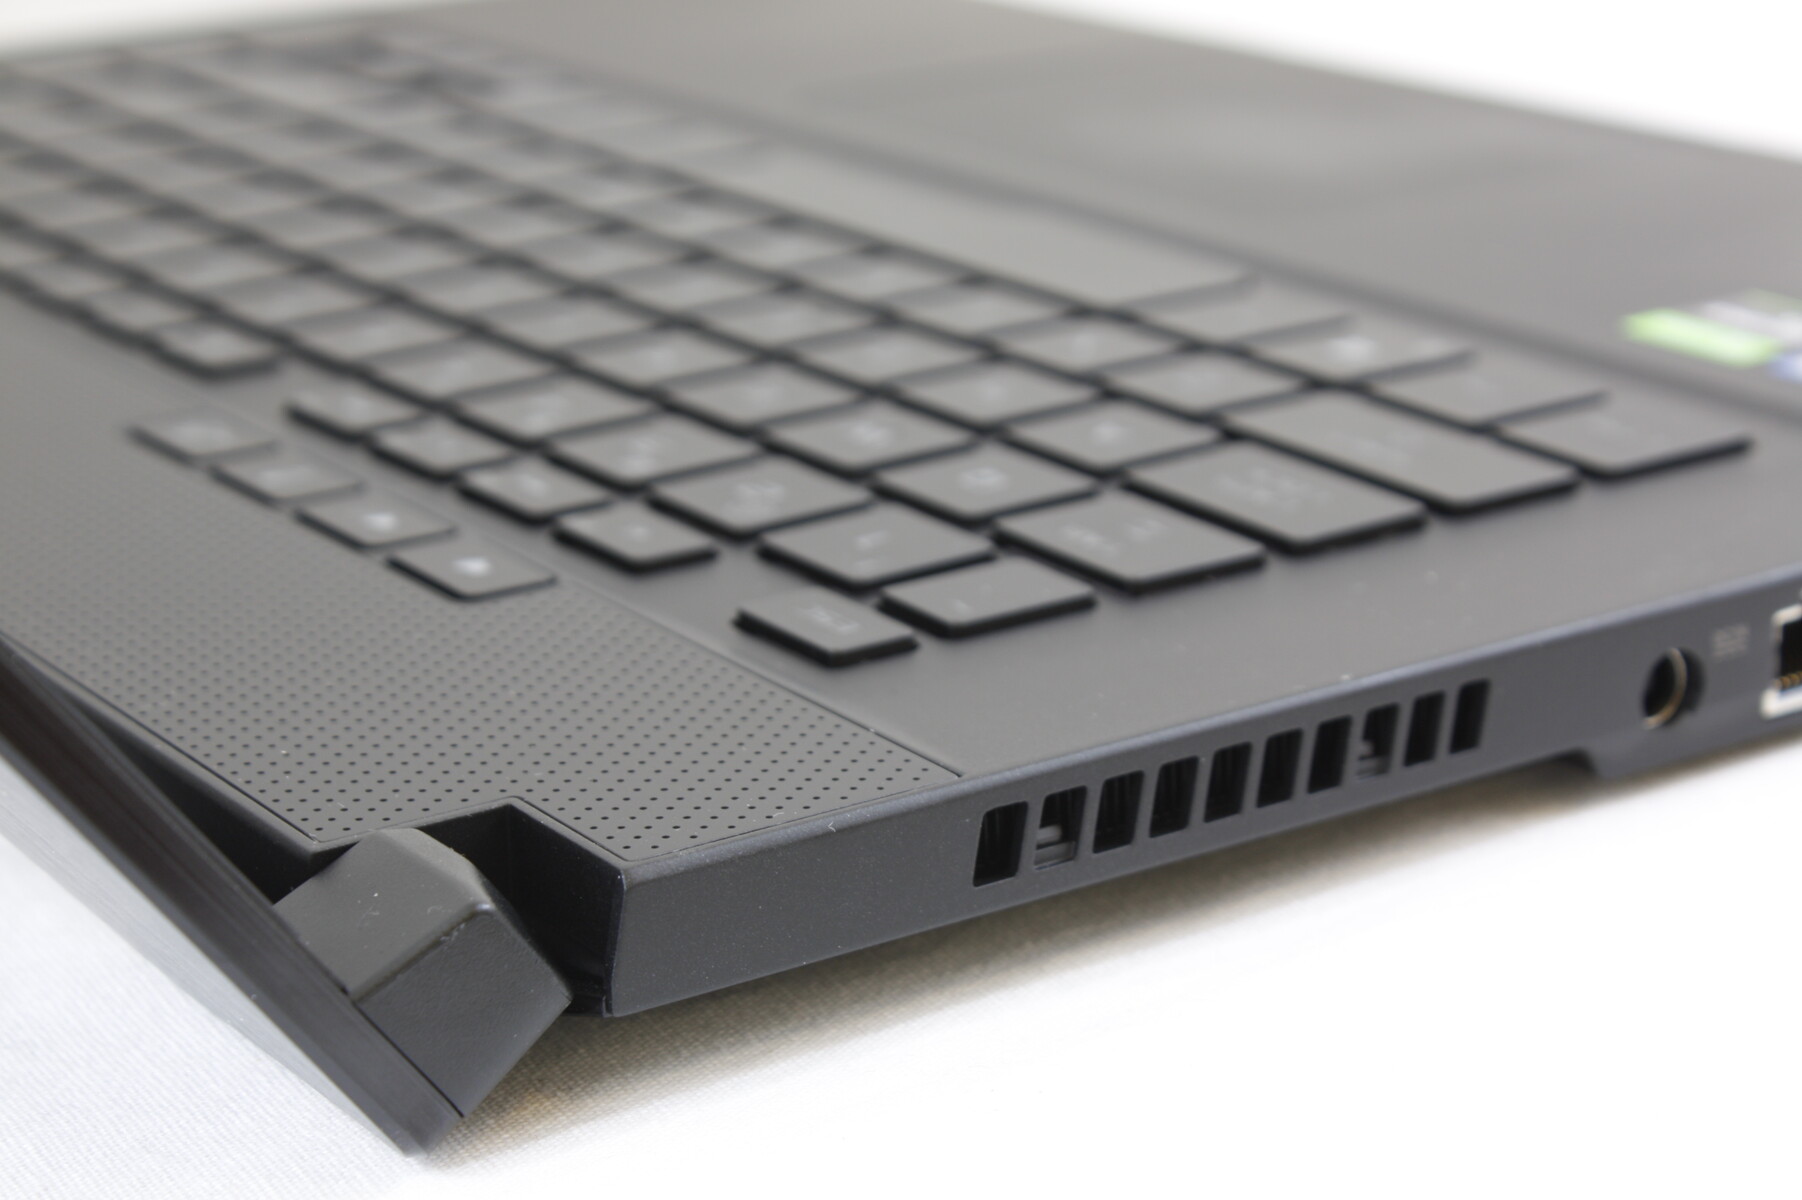
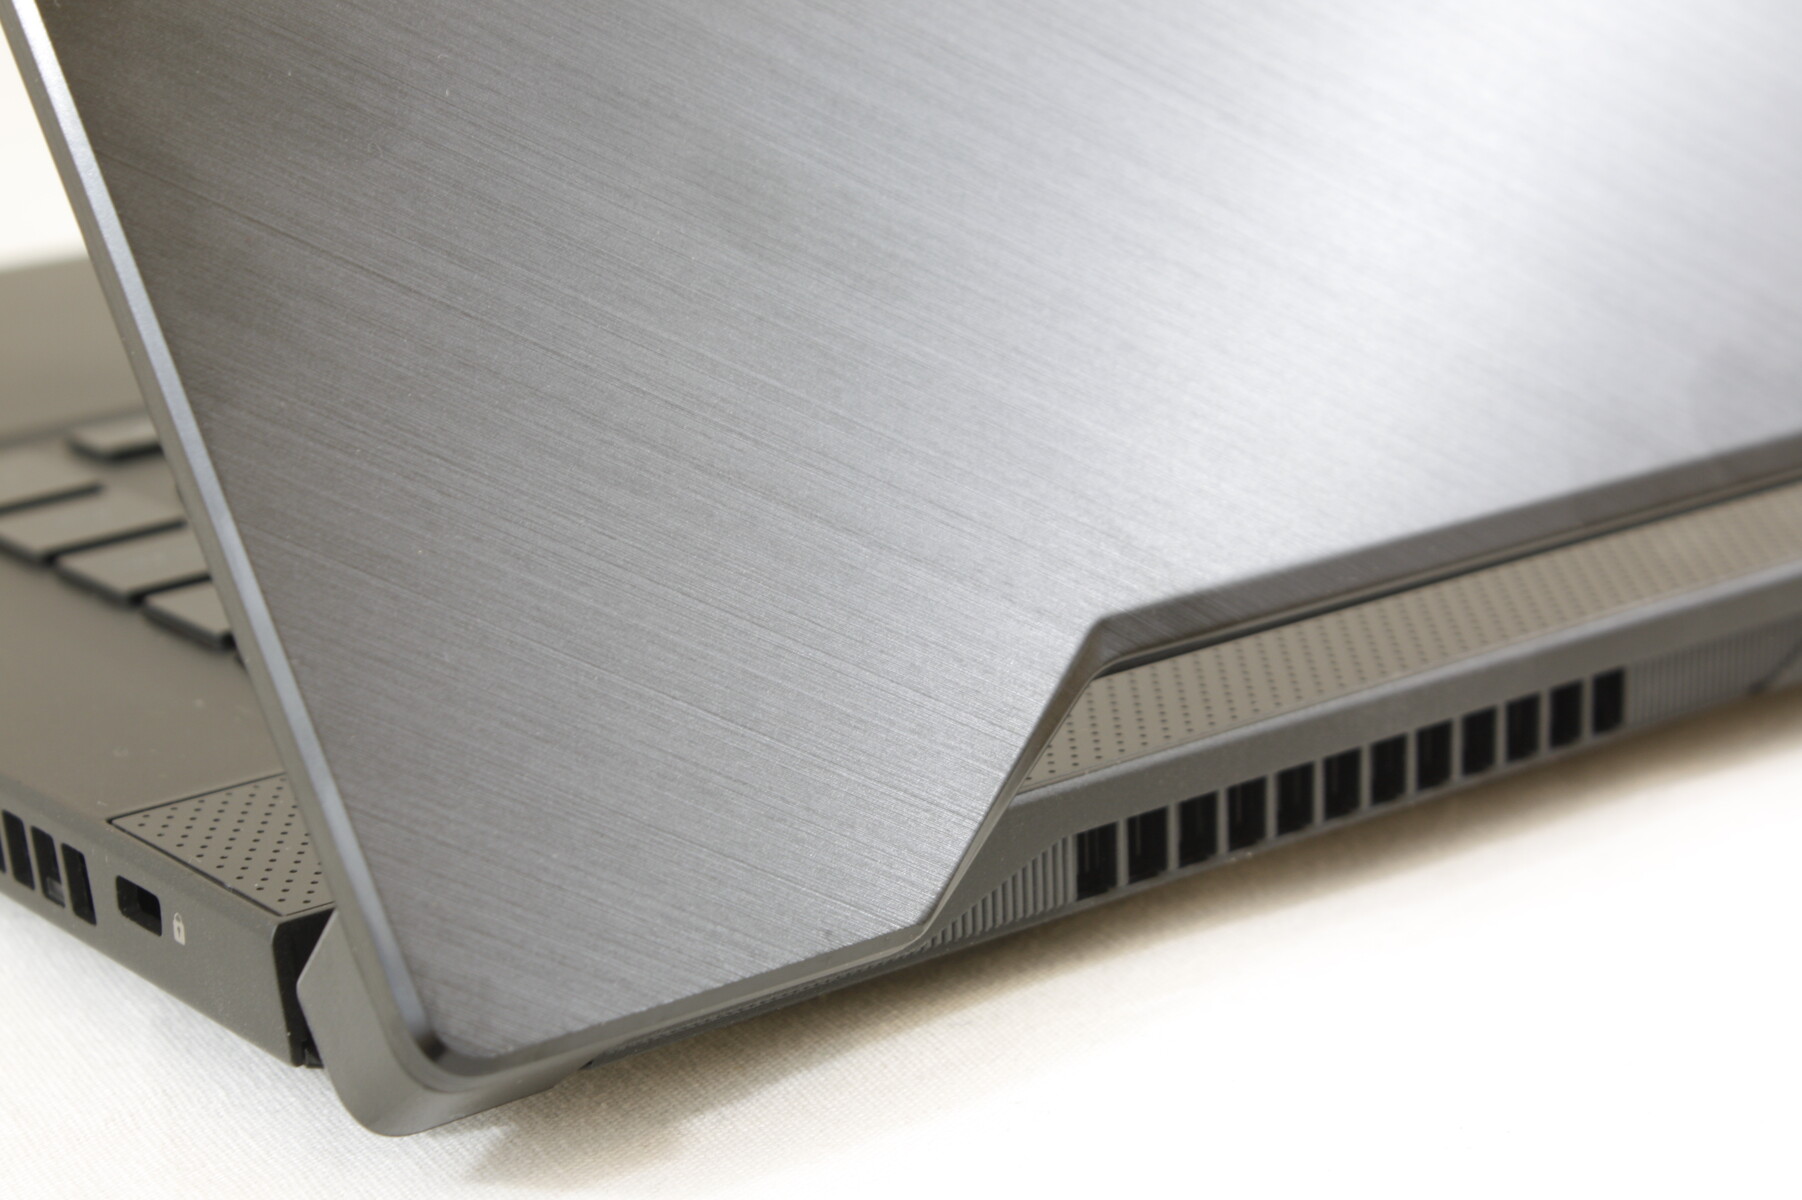
The chassis is nearly identical to the GA502 and GX502 in terms of dimensions, weight, and chassis material. Instead, the main differences between the GU502 and the GA502 or GX502 relate to ports, LED lighting features, small thickness changes, and the omission of Asus' "Active Aerodynamic System". The magnesium alloy chassis and brushed aluminum outer lid remain for stronger first impressions than on the weaker Lenovo Legion Y740 or MSI GF65. When compared to the Razer, however, the Asus chassis is more prone to flexing. Construction quality on our unit is excellent with no unintended gaps or crevices around edges or corners.
Many of our comments on the GA502 chassis apply here for the GU502.

Connectivity - Most of the Basics
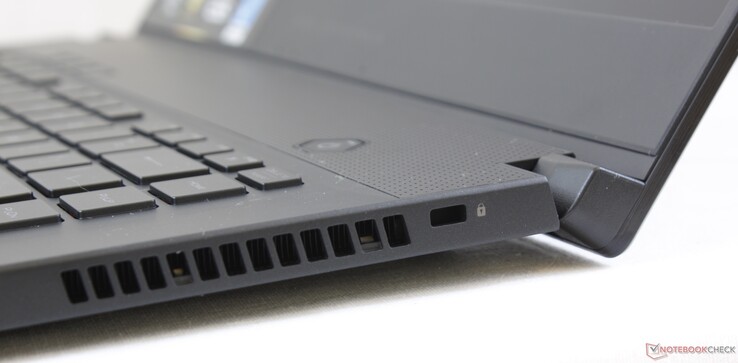
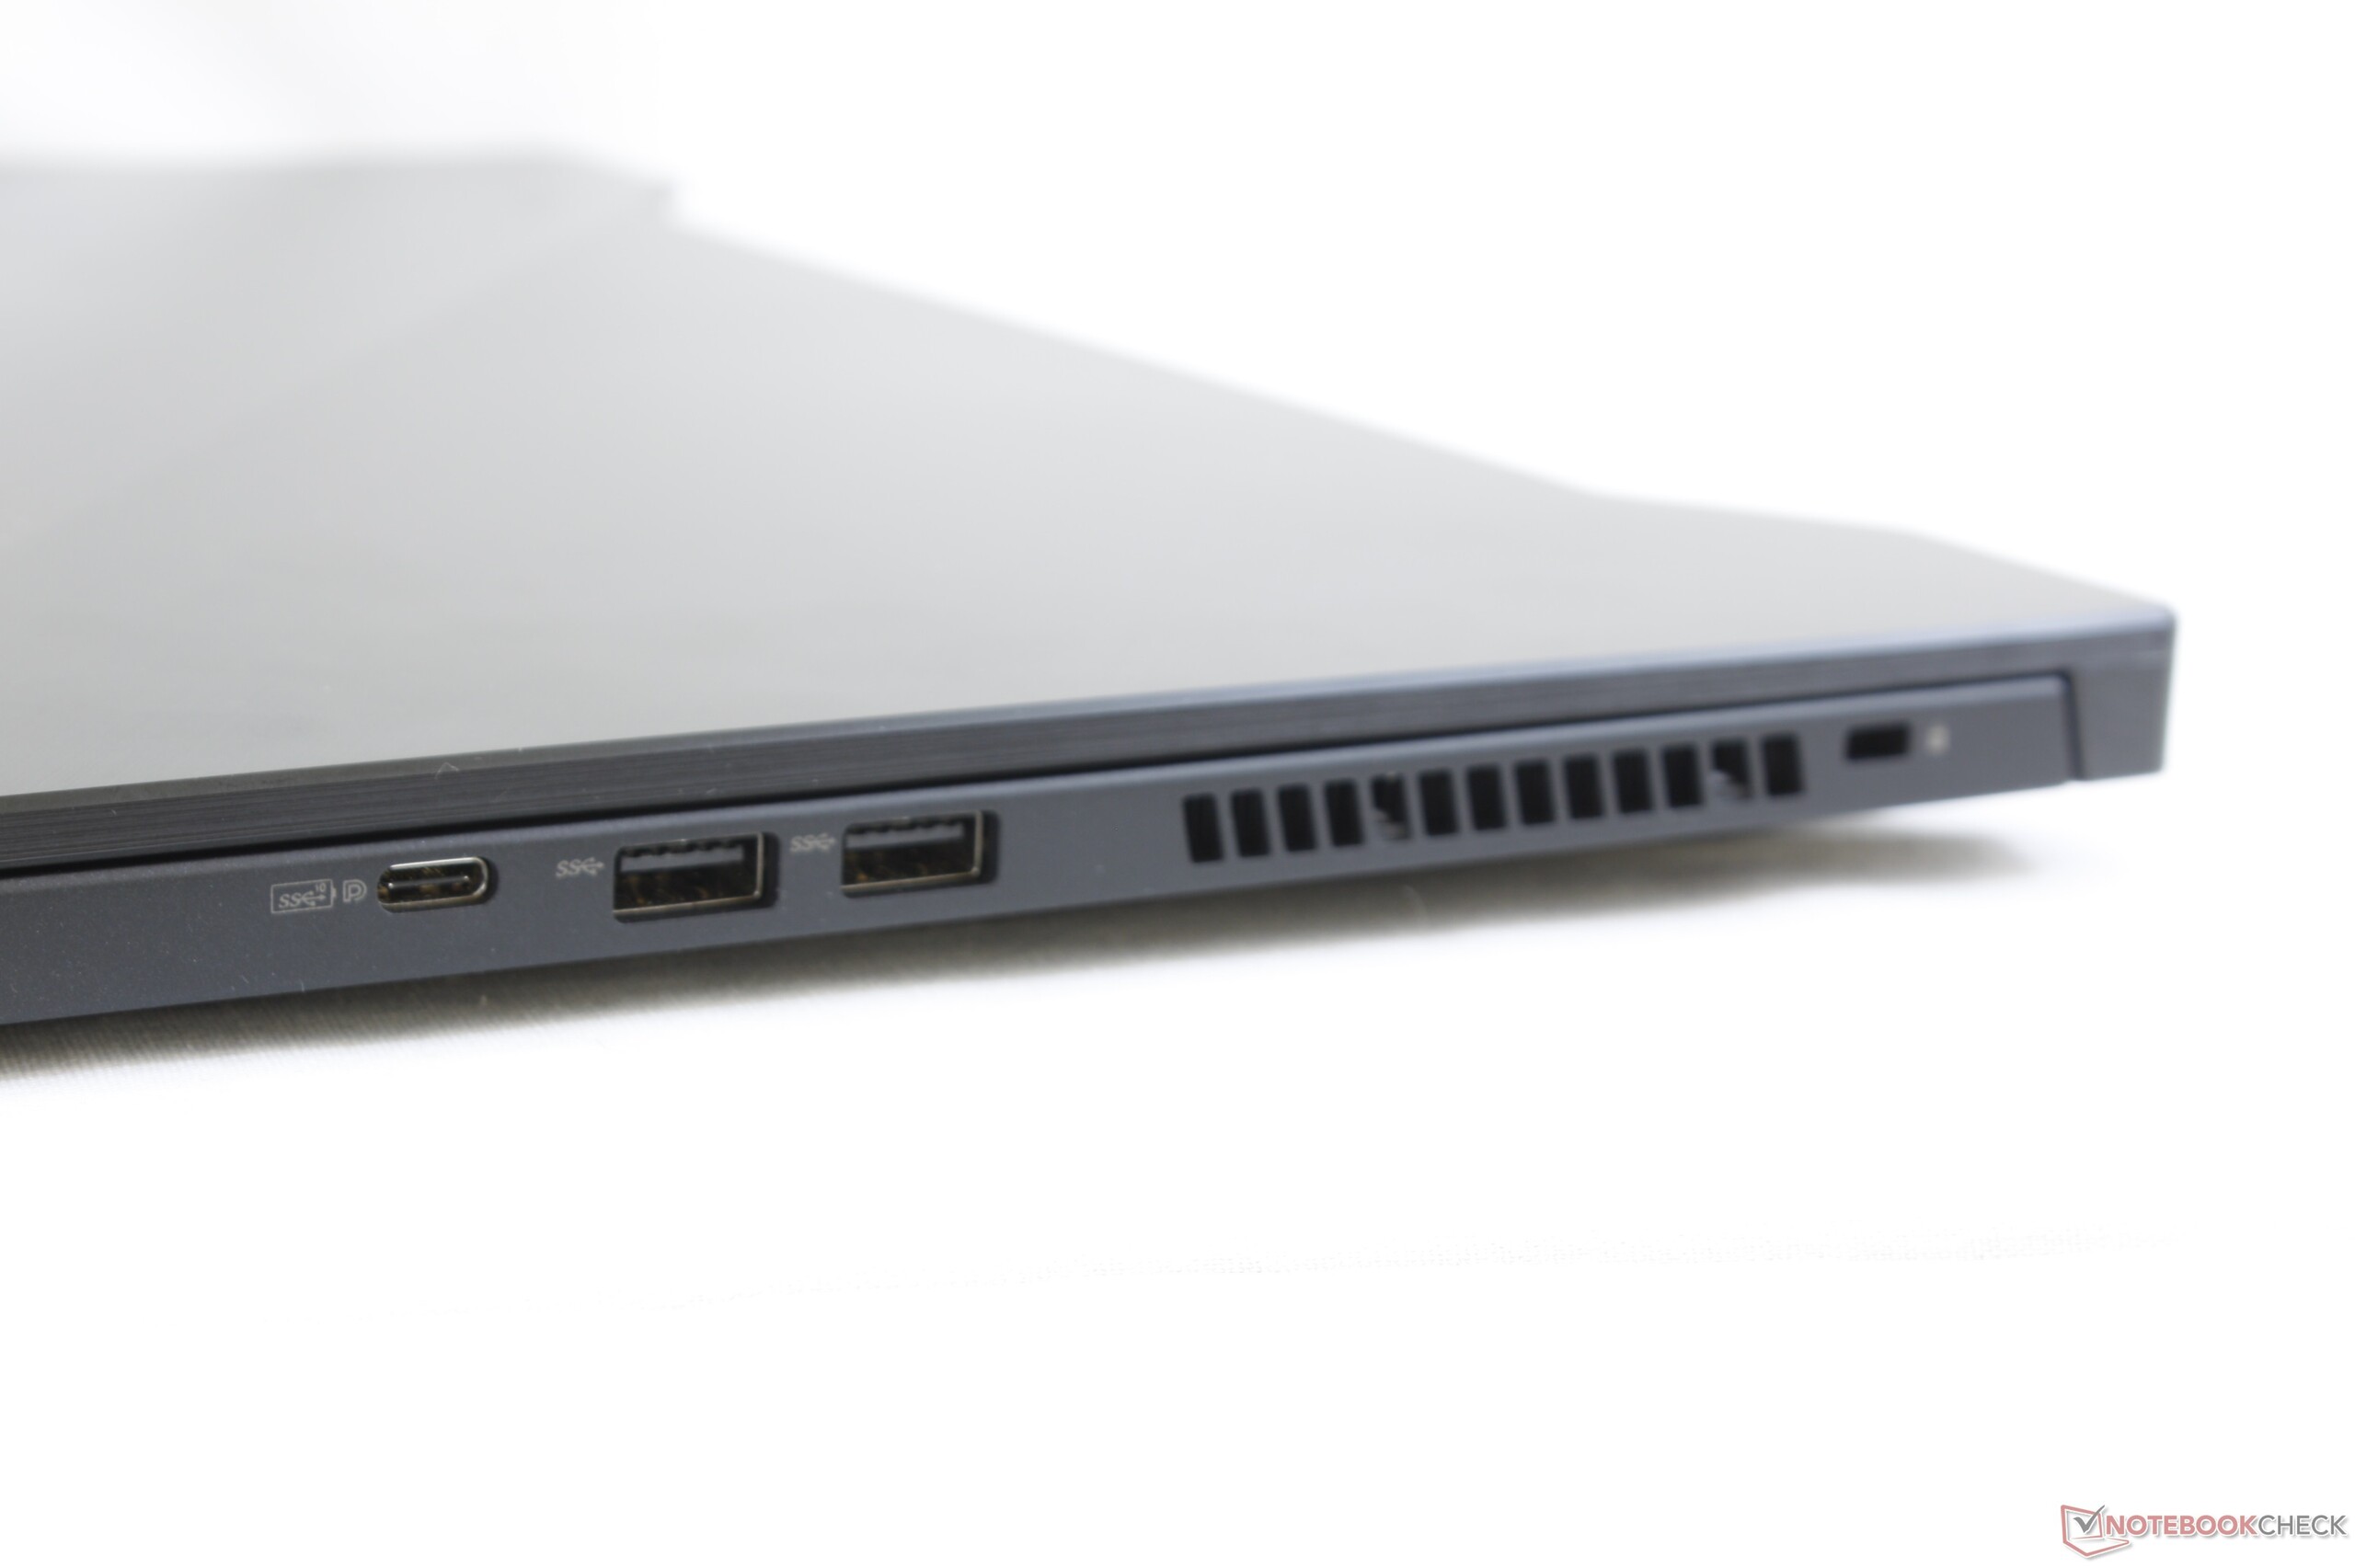
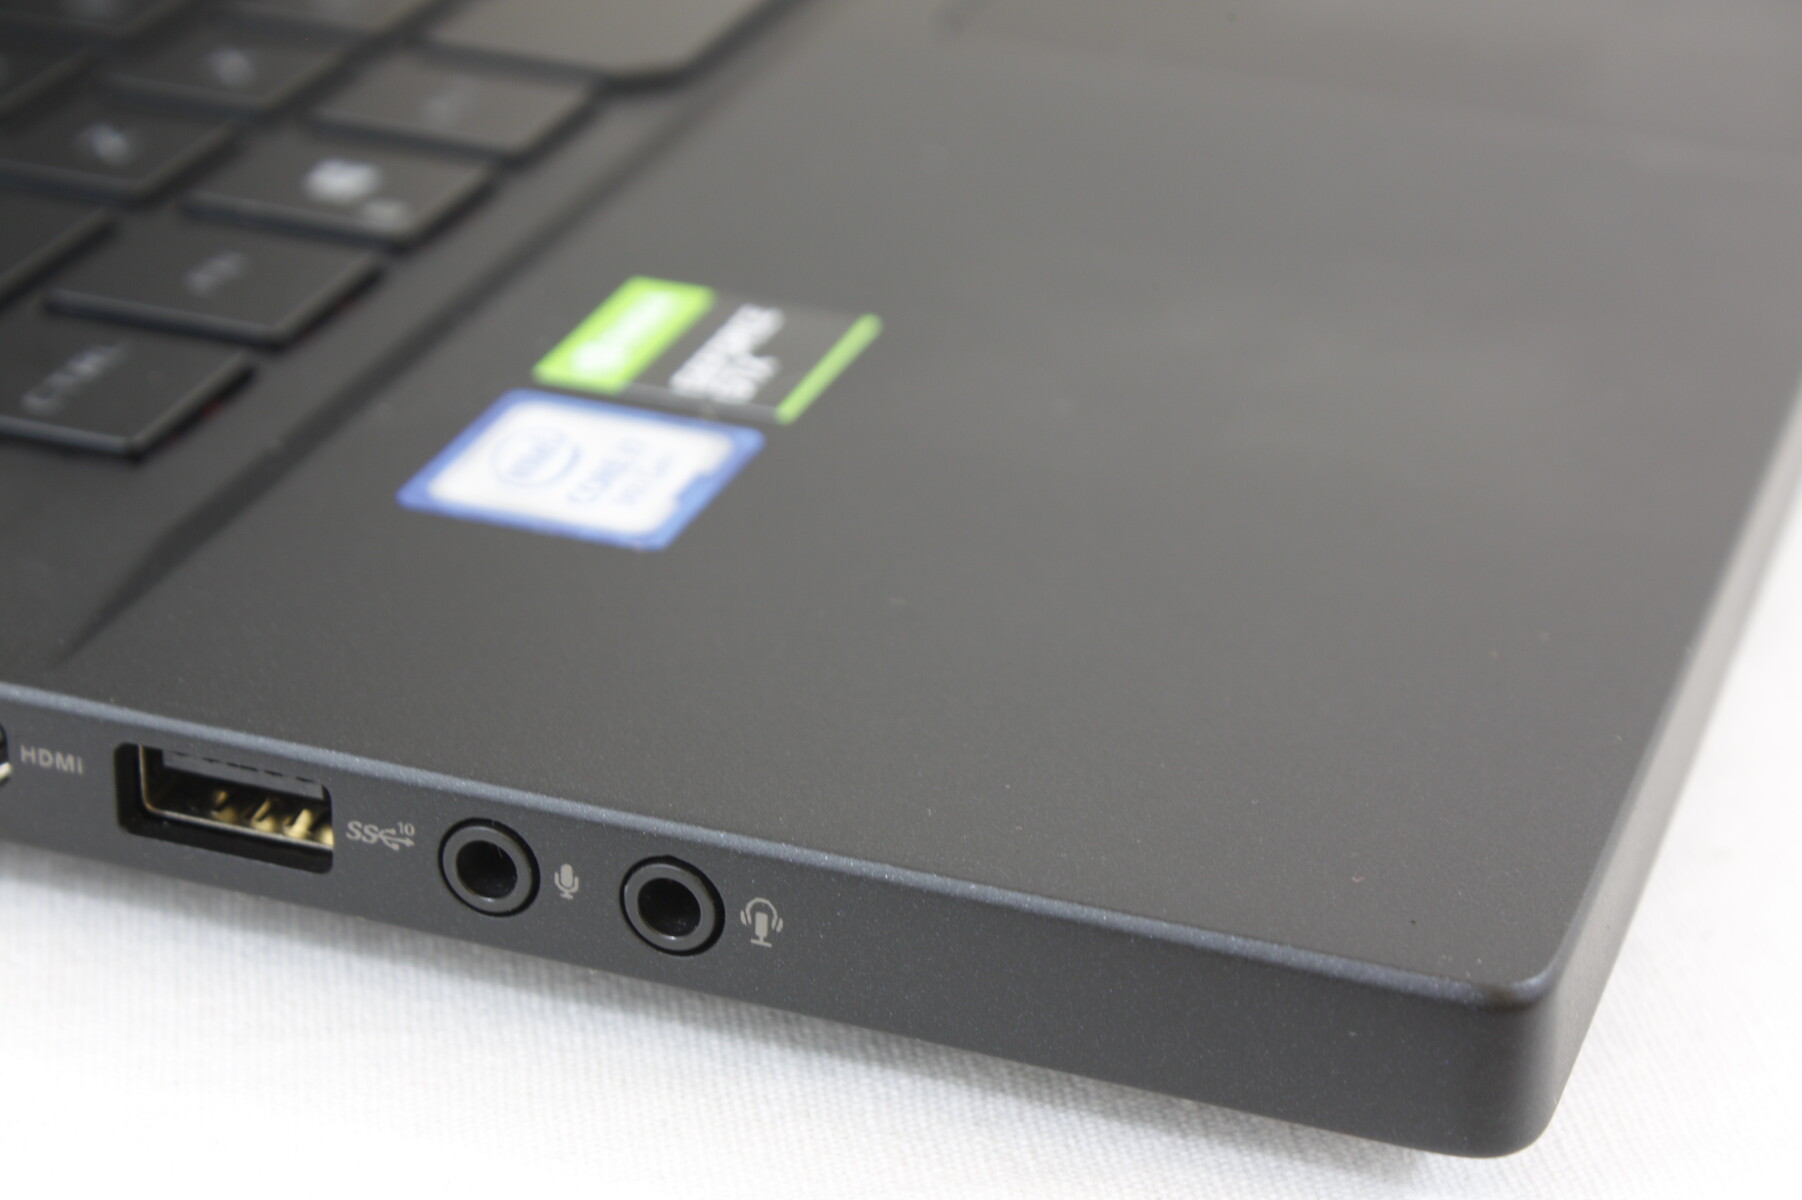
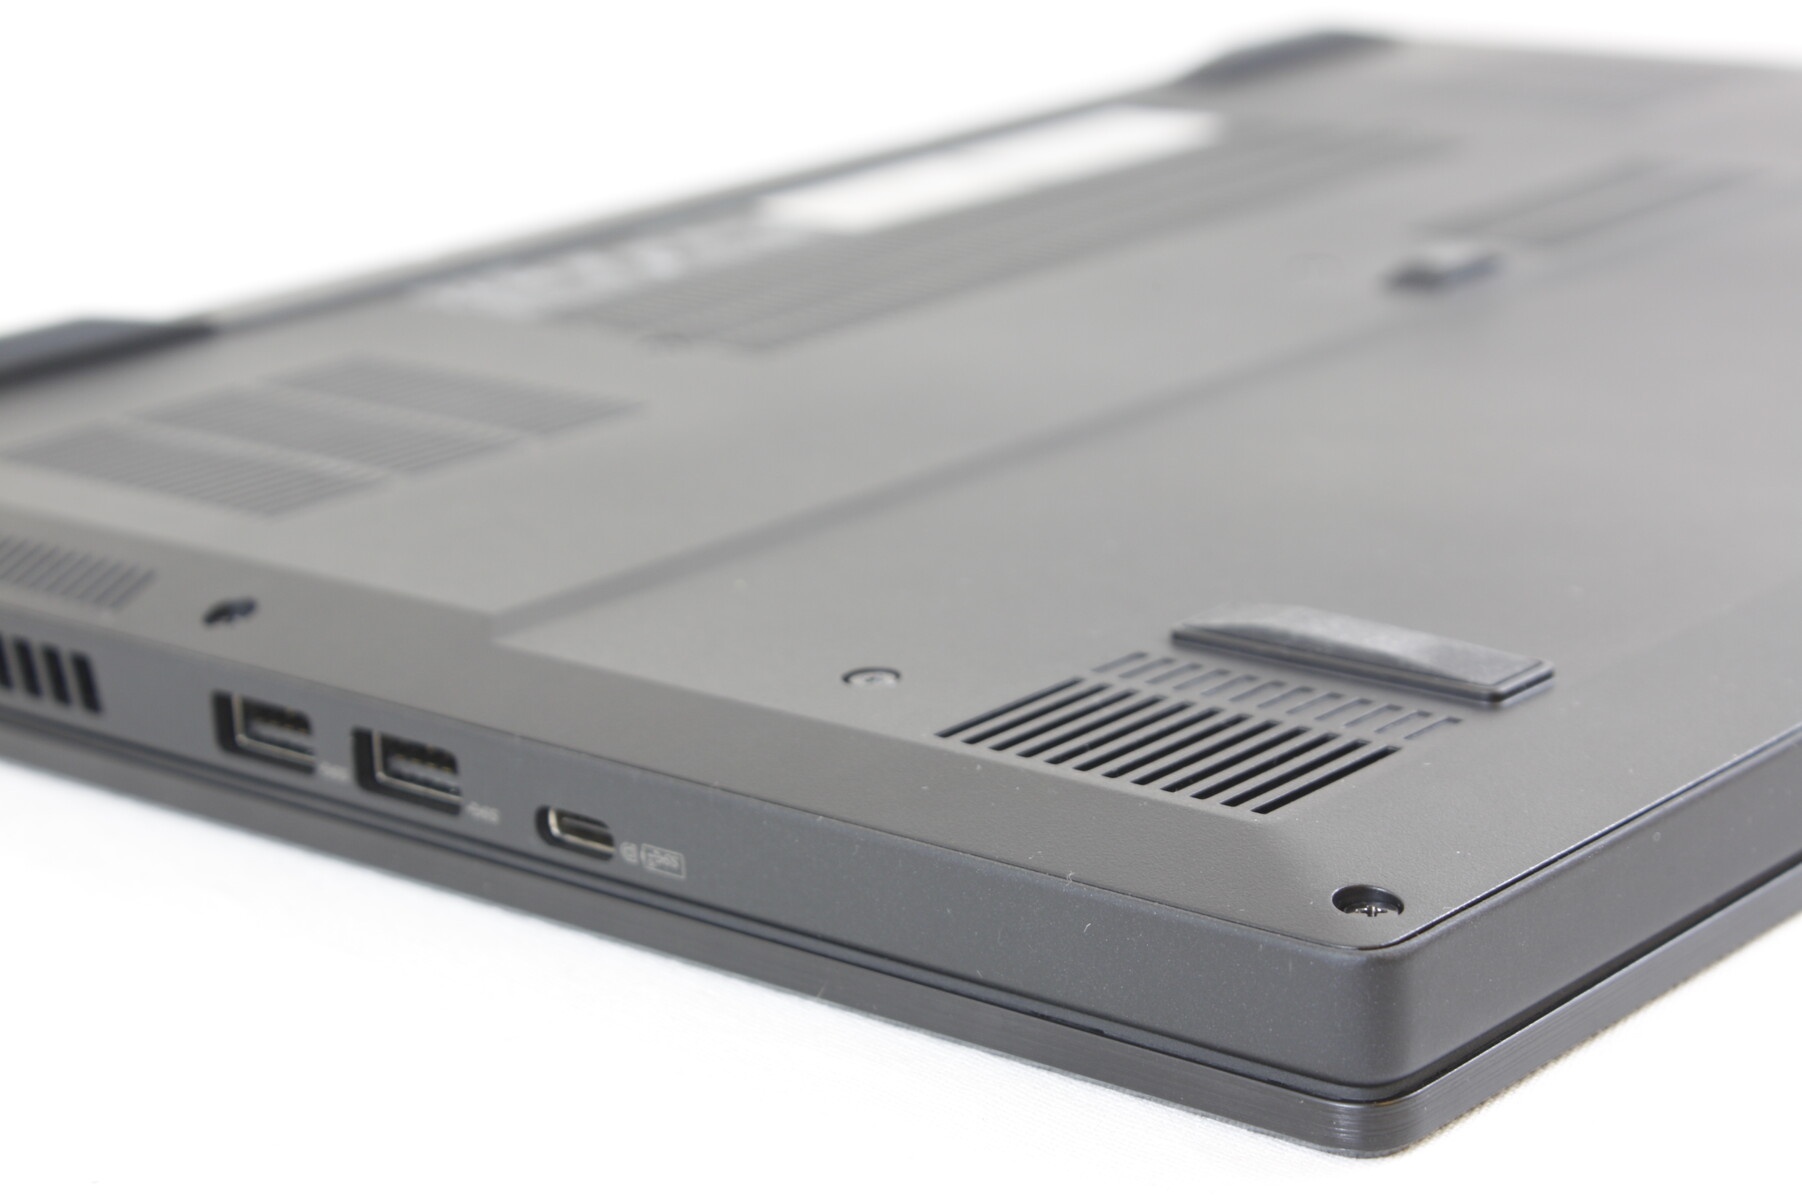
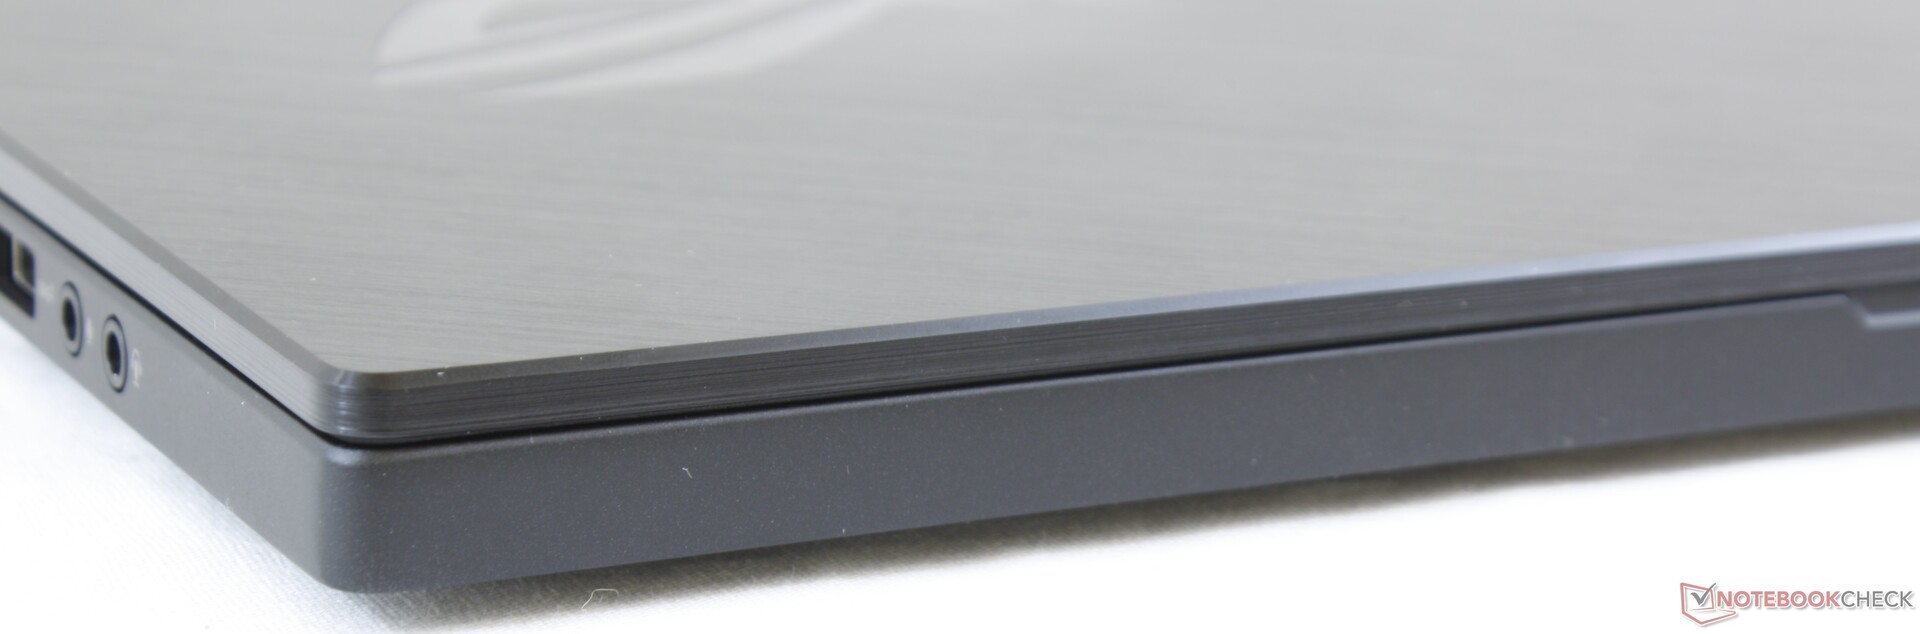
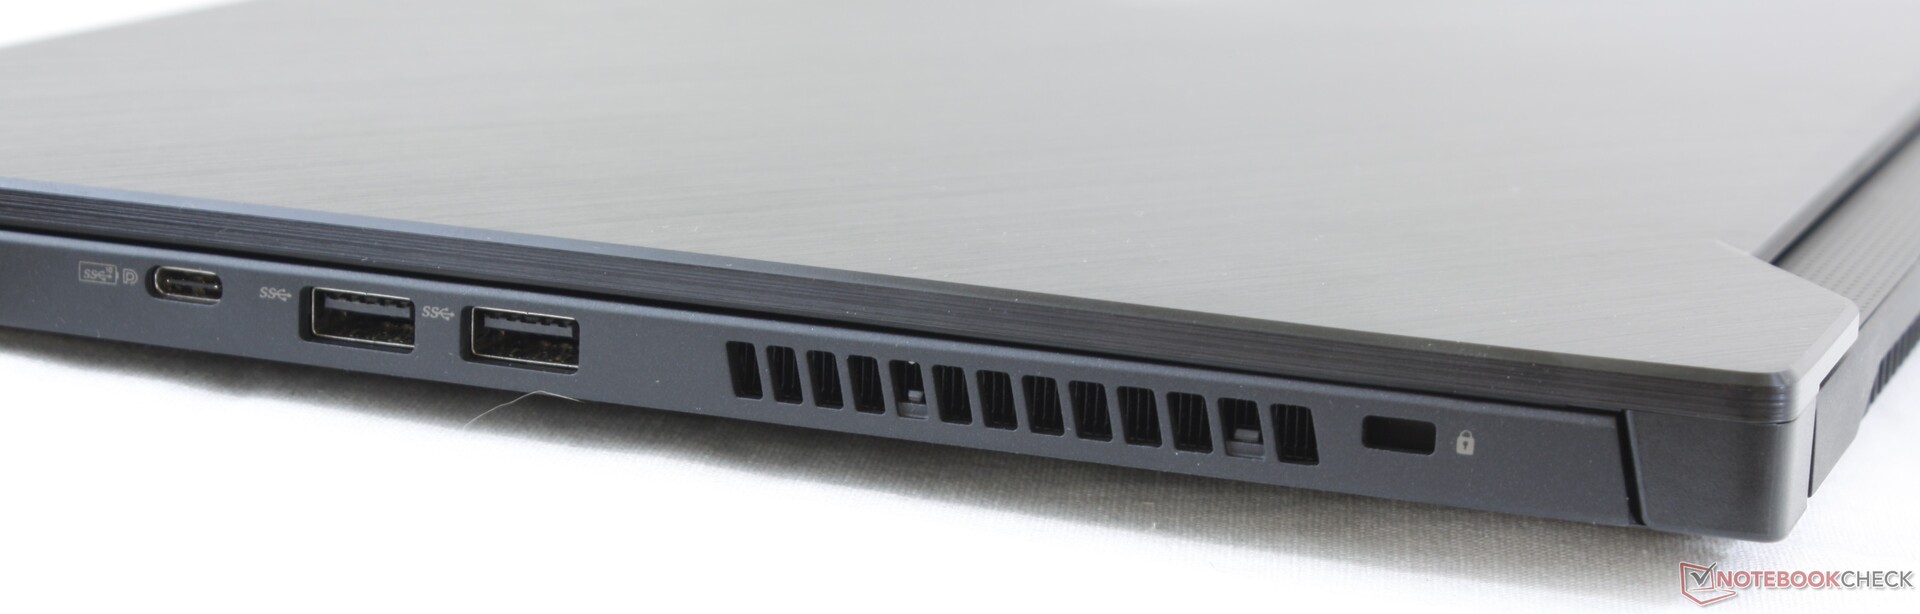
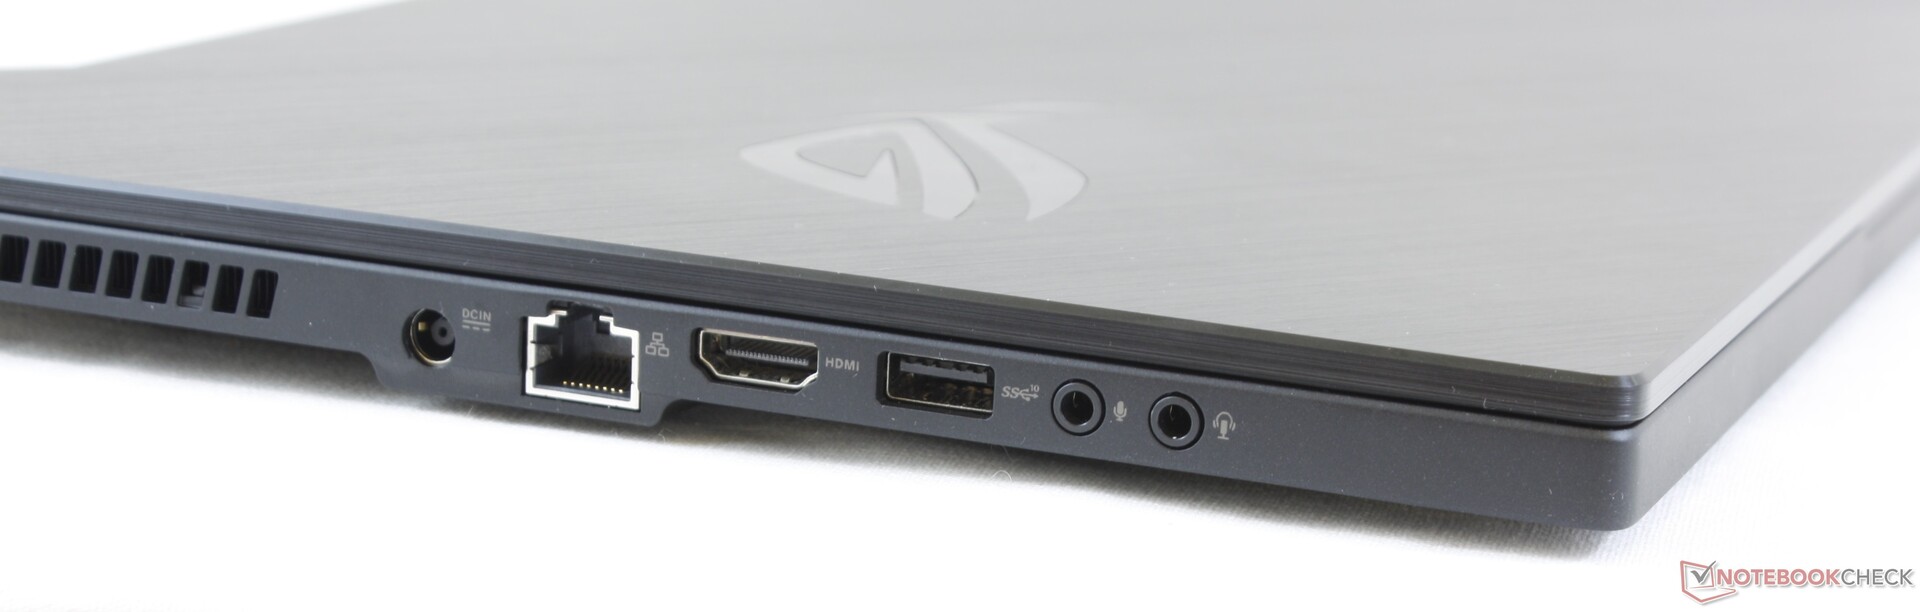
Port options and positioning are nearly identical to the AMD-powered Zephyrus G GA502. The GU502 has moved the USB Type-C port from the left edge to the right edge while integrating a second 3.5 mm microphone jack along the left. Both Thunderbolt 3 and an SD reader are still missing and the left edge can feel quite crowded since the ports are tightly packed.
Communication
Wireless has not changed and so users can expect the same Intel 9560 module as found on the GX502 or GX531. The cheaper GA502 uses a slower 1x1 module.
| Networking | |
| iperf3 transmit AX12 | |
| Asus Zephyrus S GX502GW | |
| Asus Zephyrus S GX531GX | |
| Asus ROG Zephyrus G15 GA502DU | |
| iperf3 receive AX12 | |
| Asus Zephyrus S GX502GW | |
| Asus Zephyrus S GX531GX | |
| Asus ROG Zephyrus G15 GA502DU | |
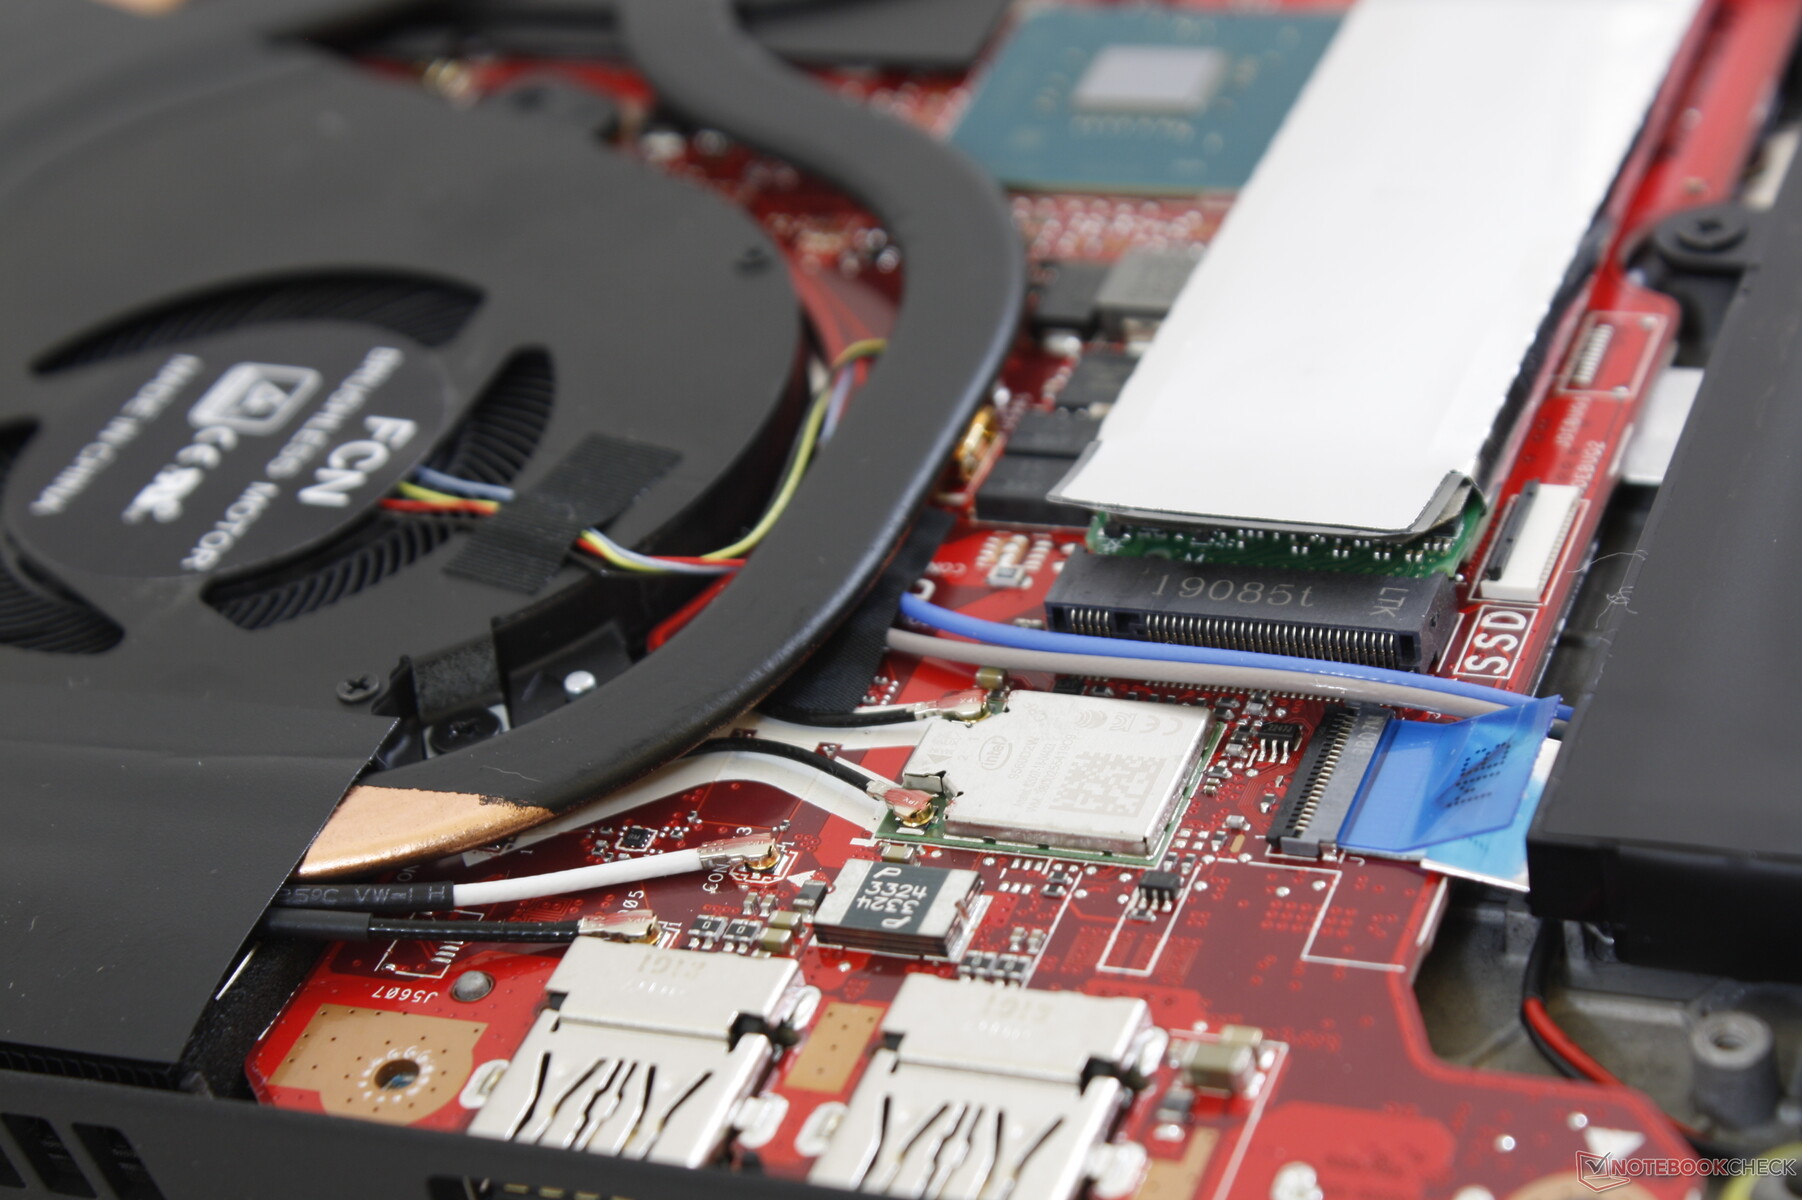
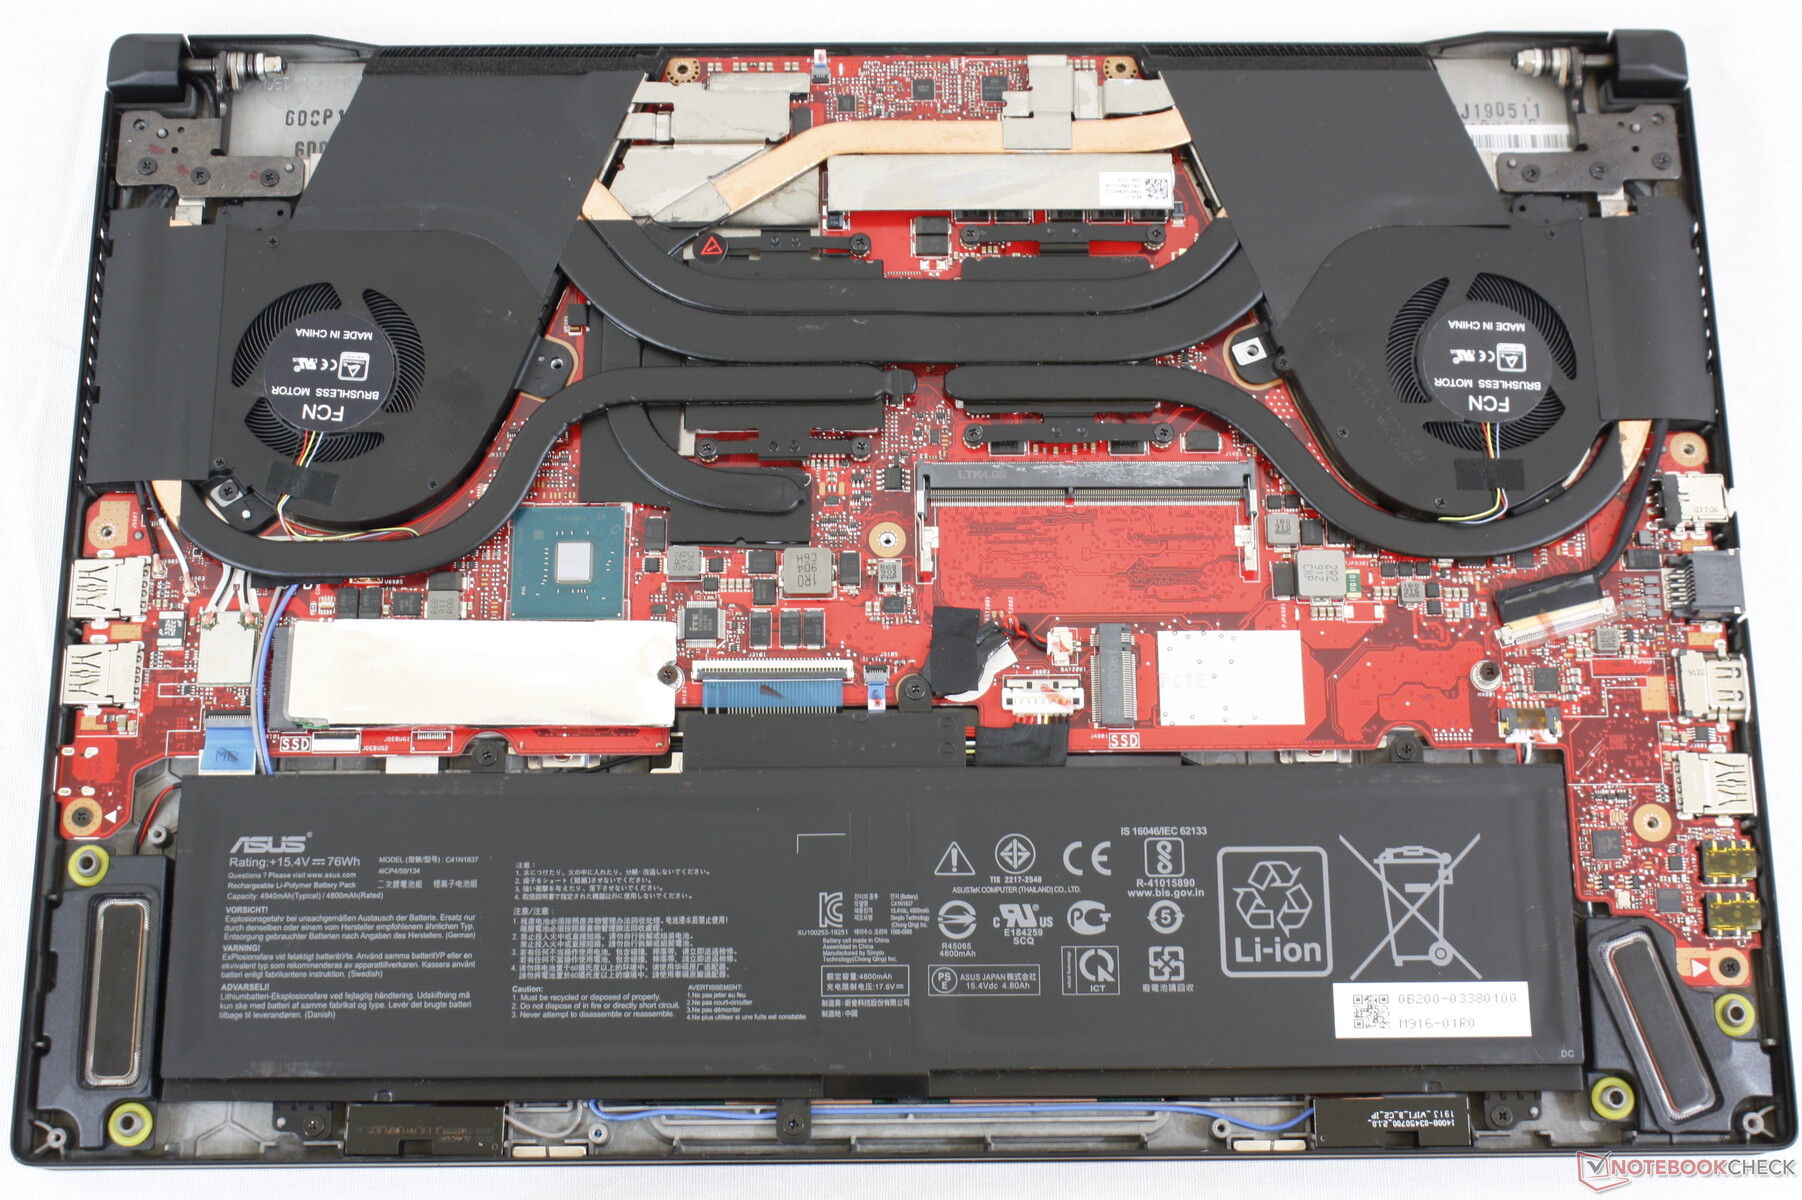
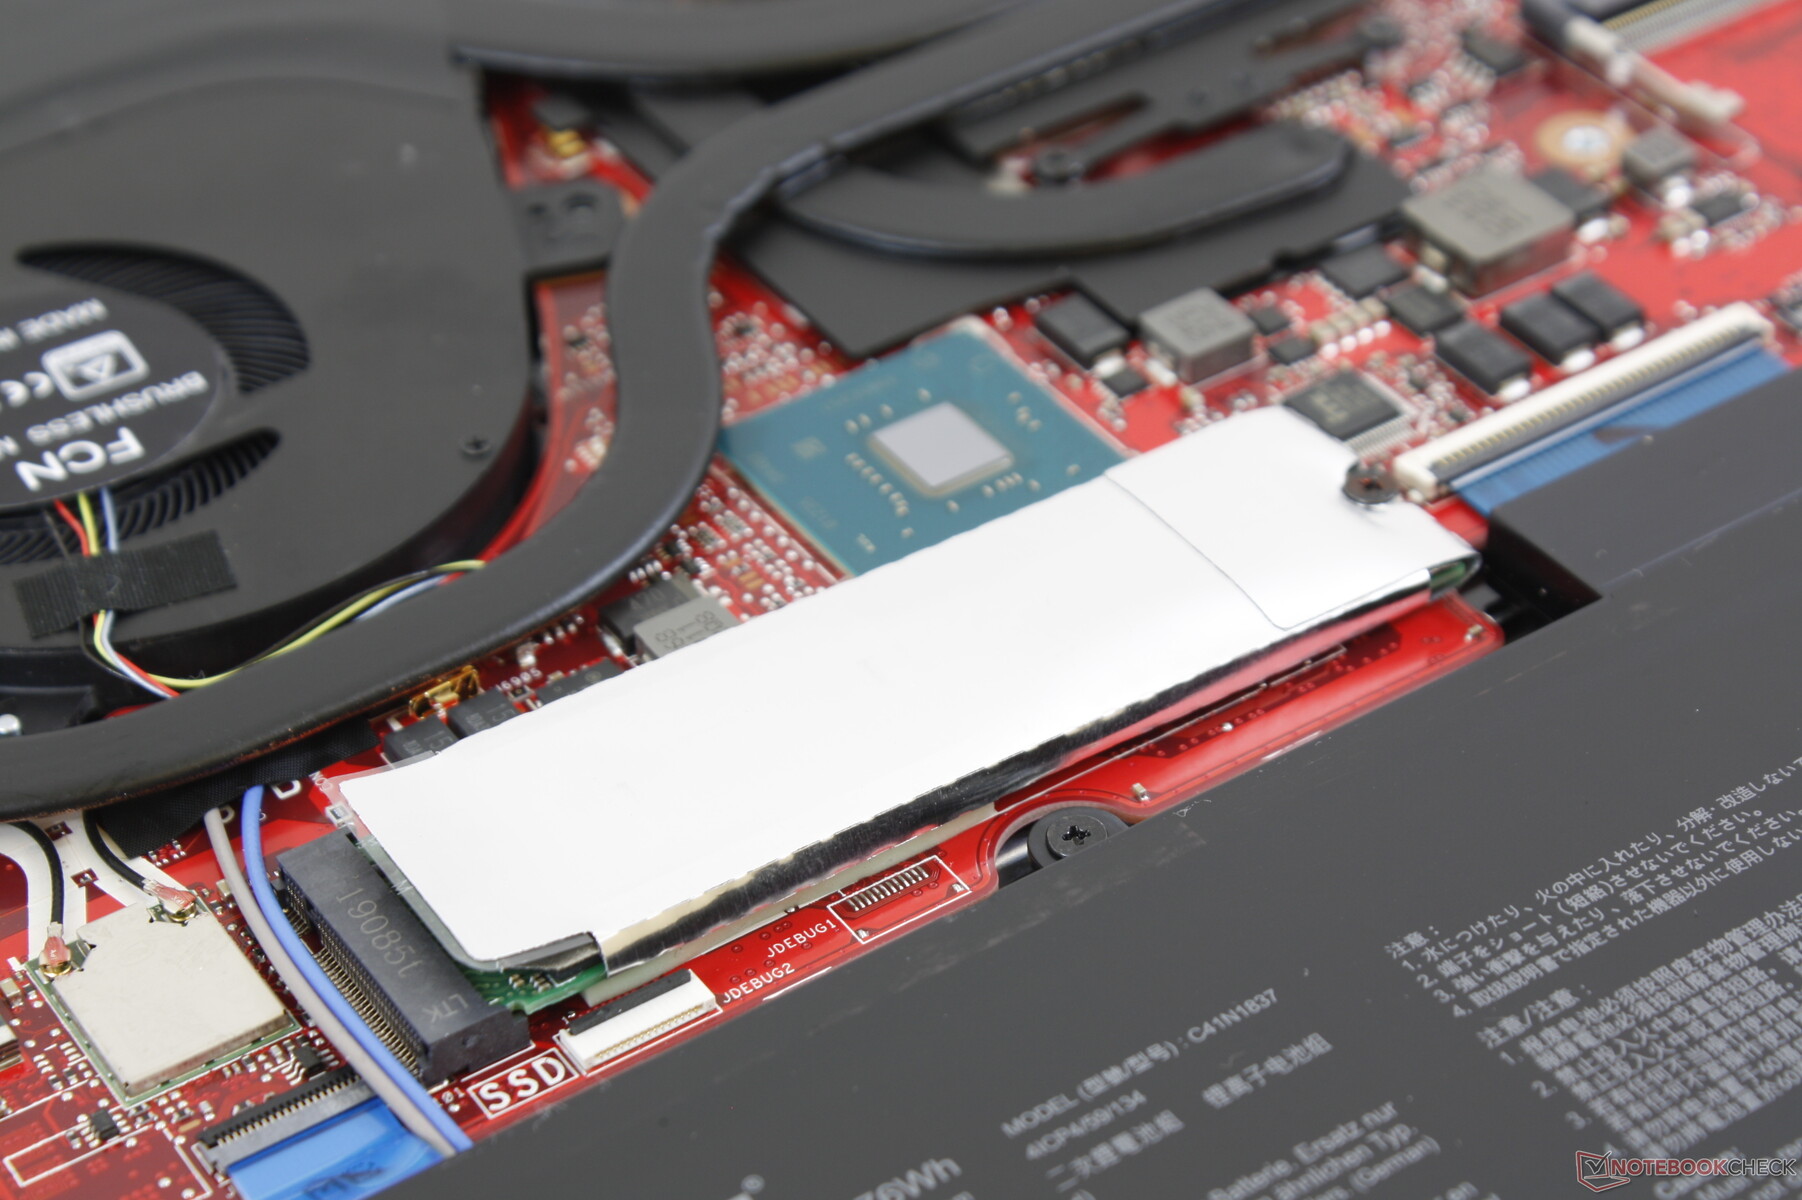
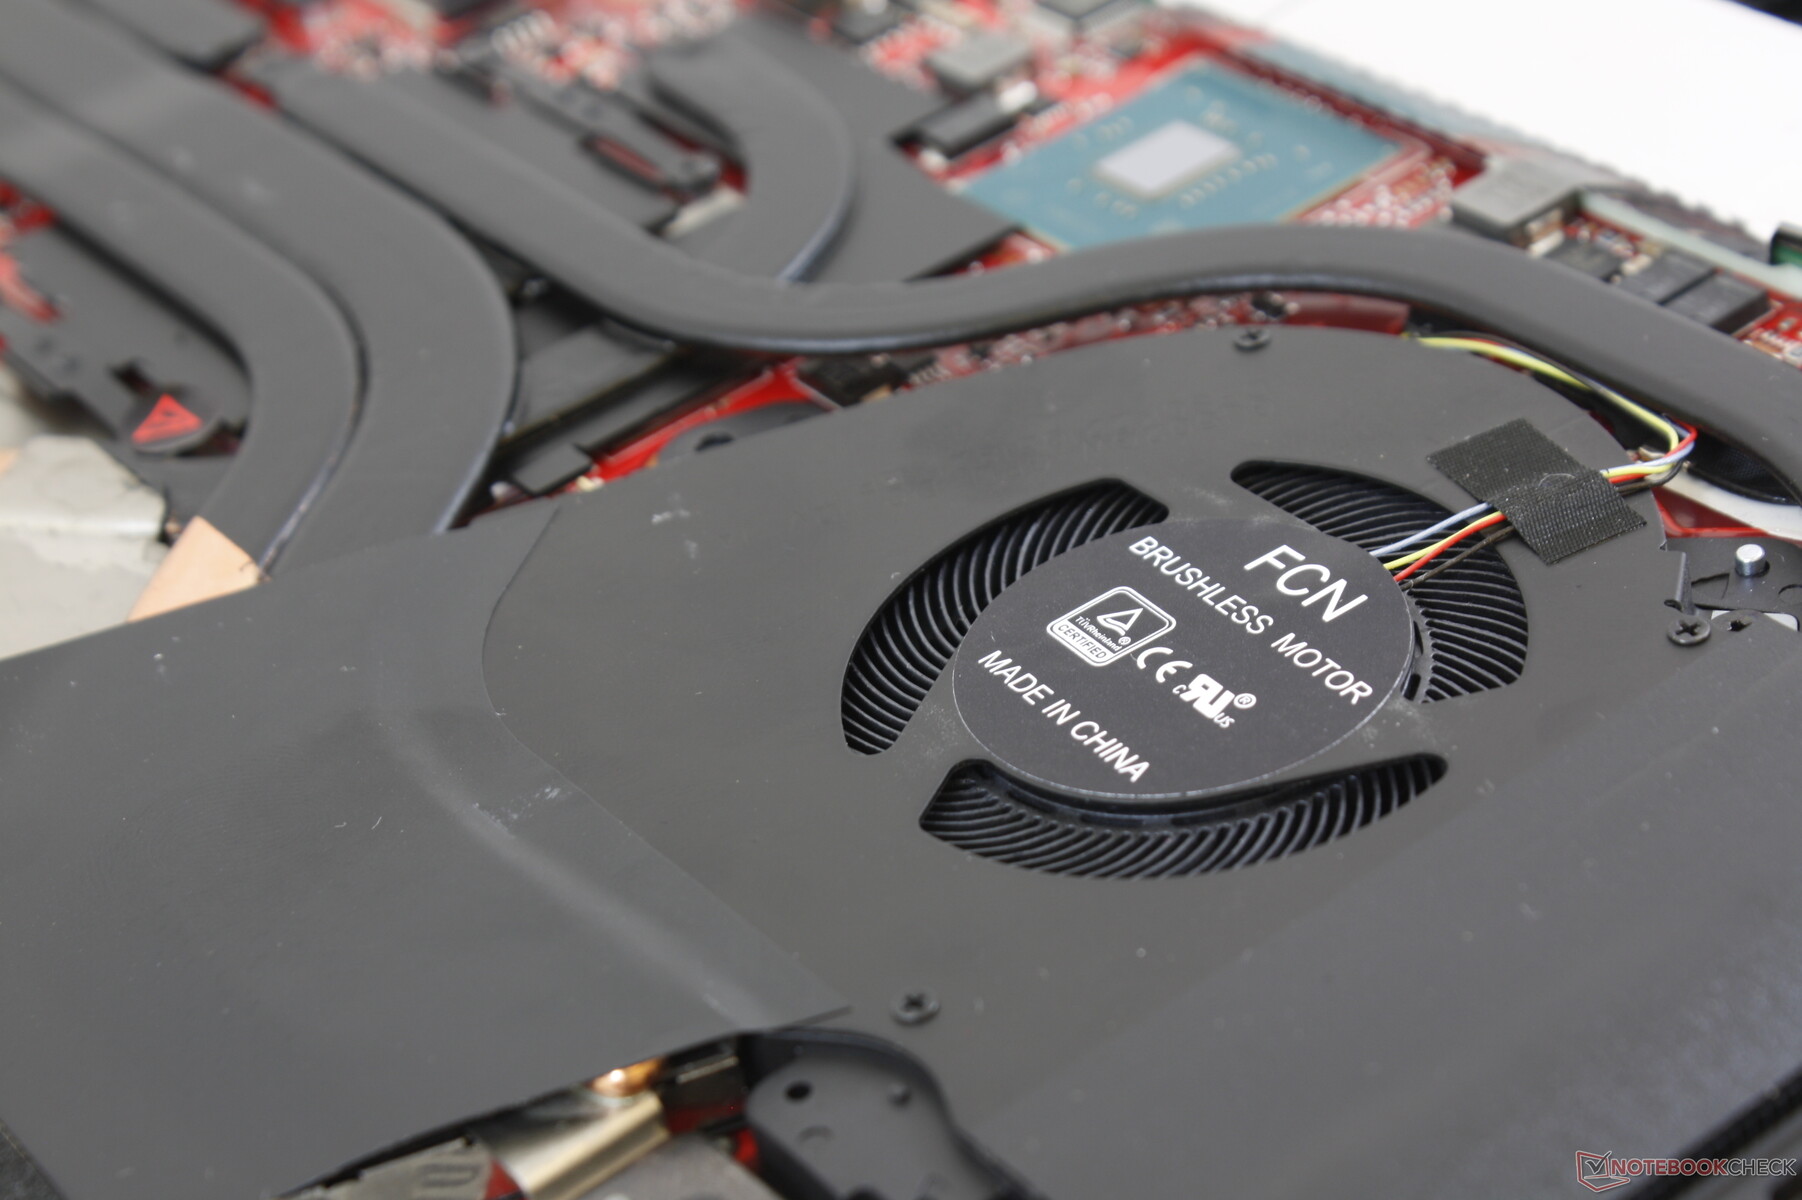
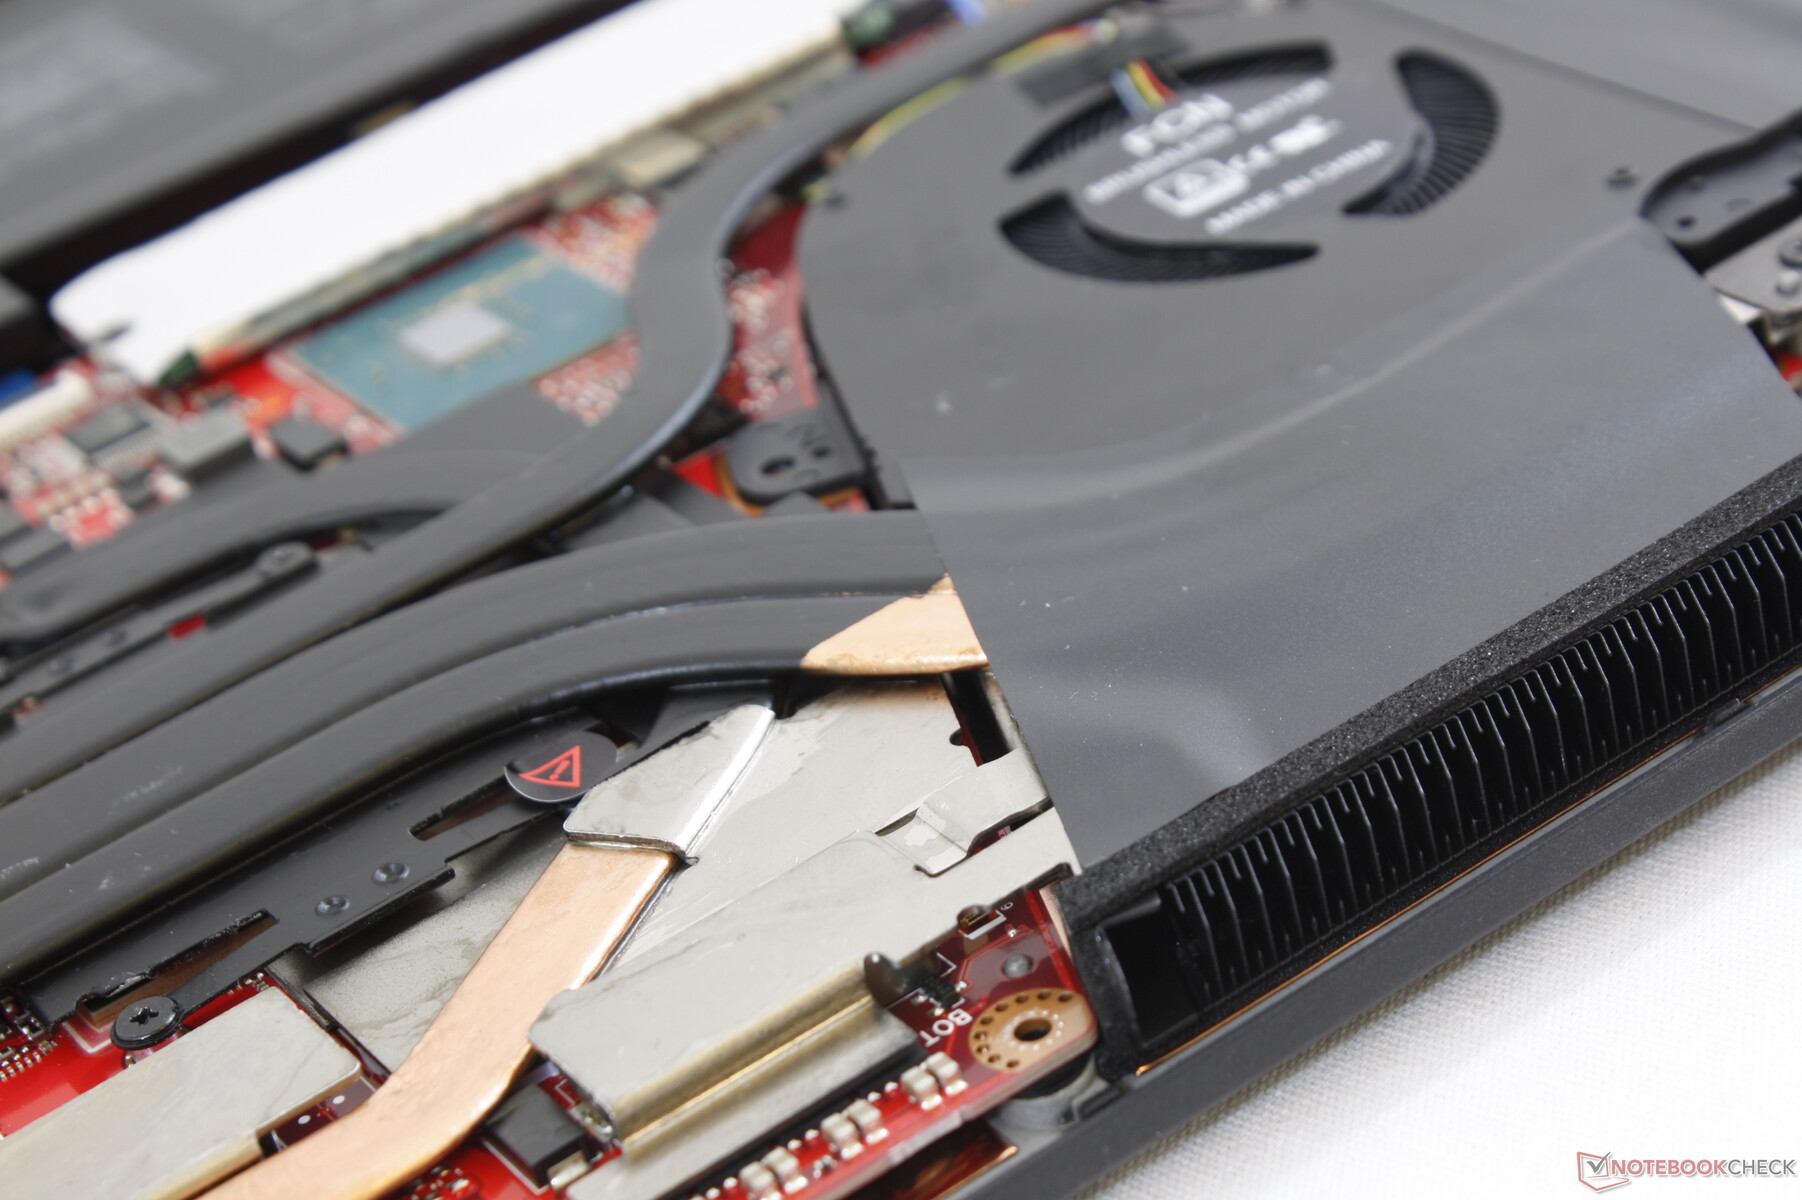
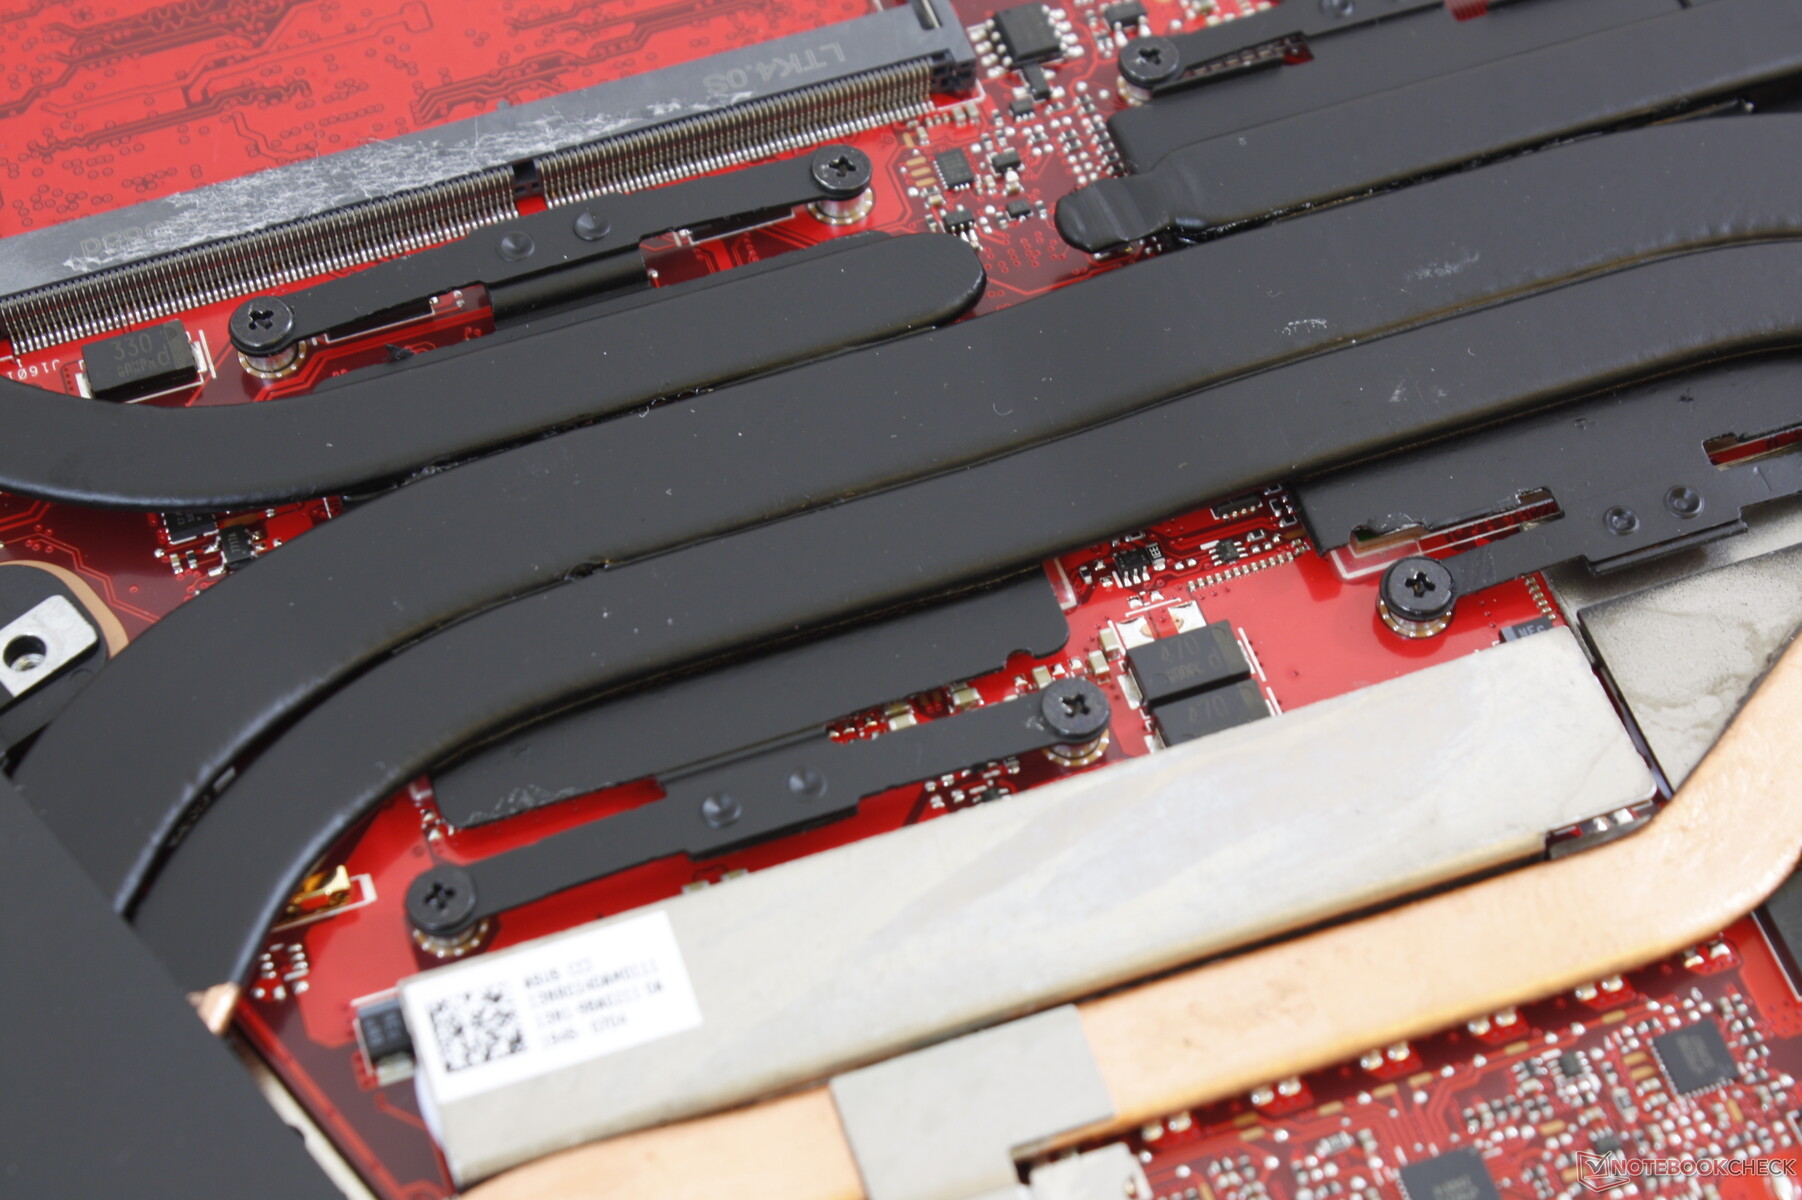
Maintenance
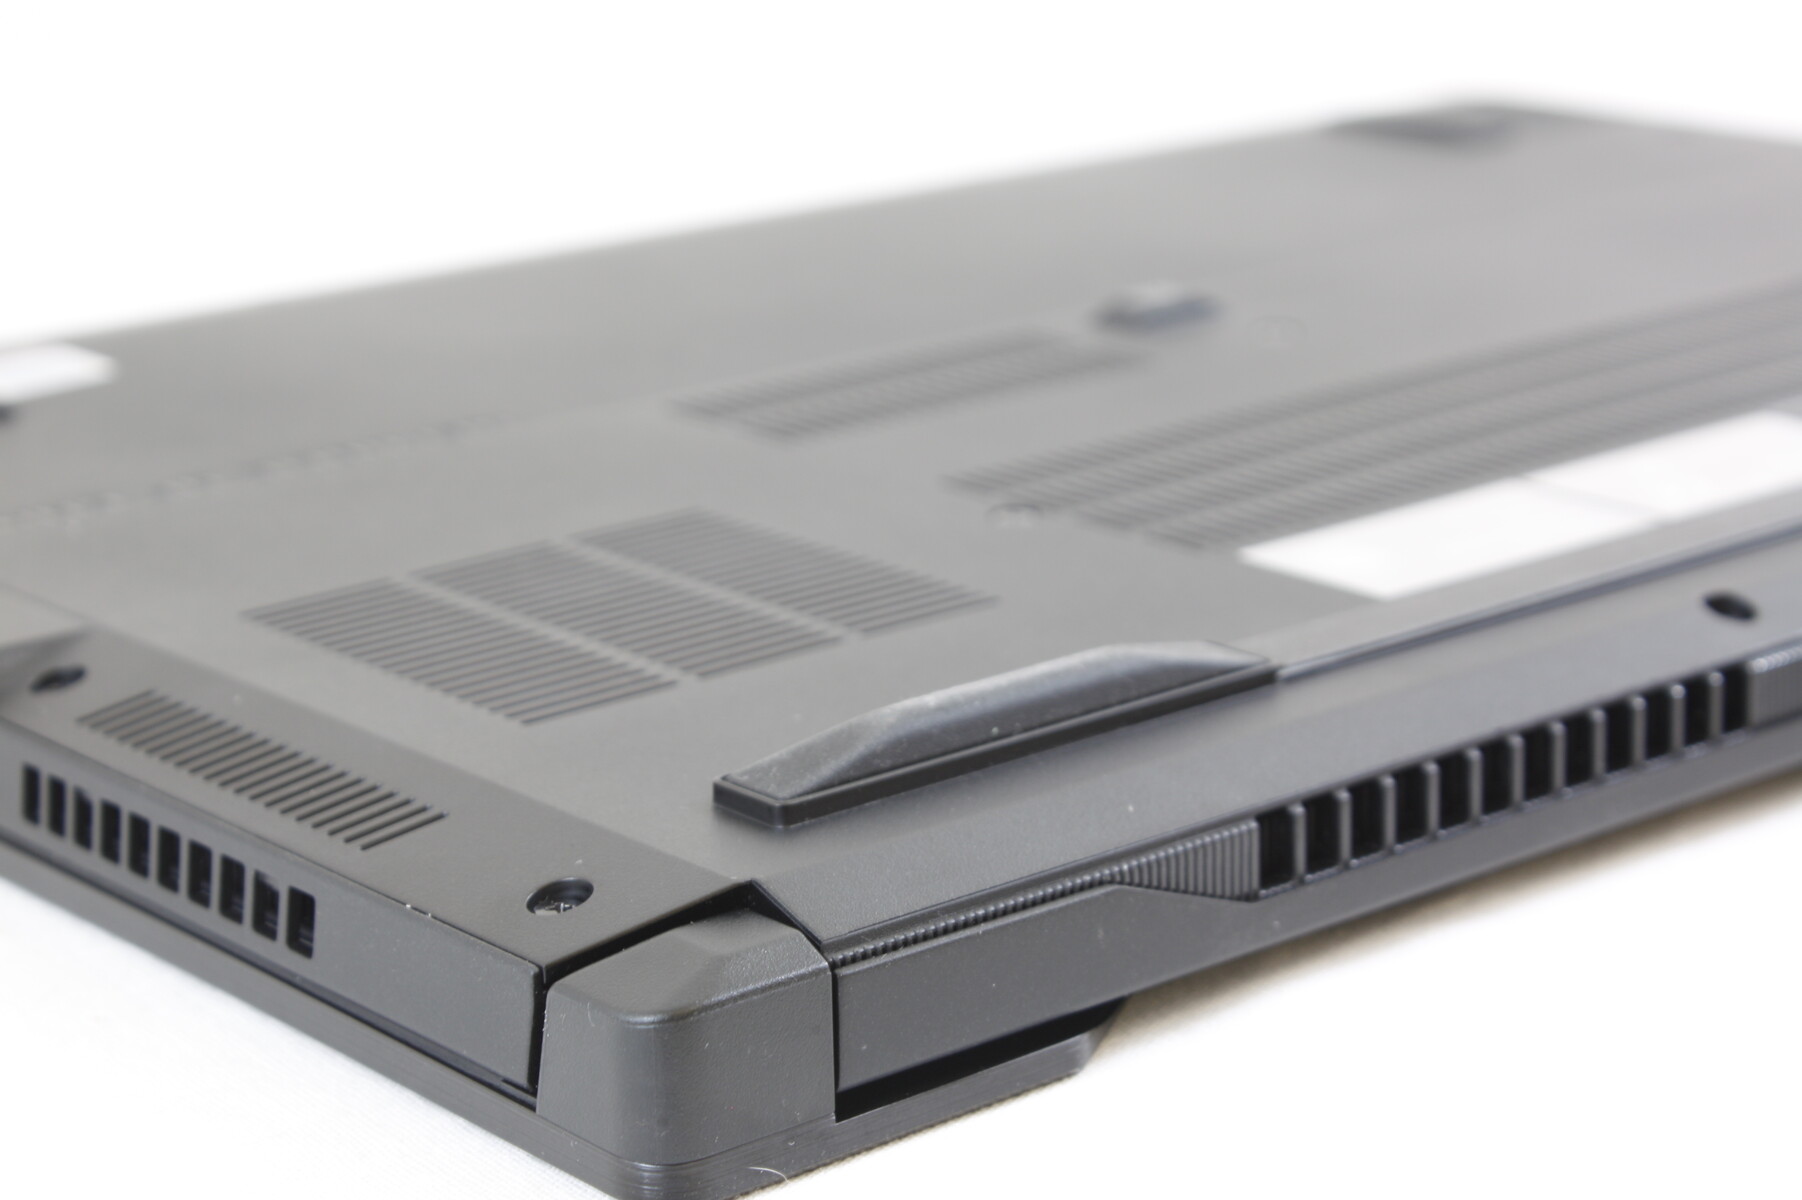
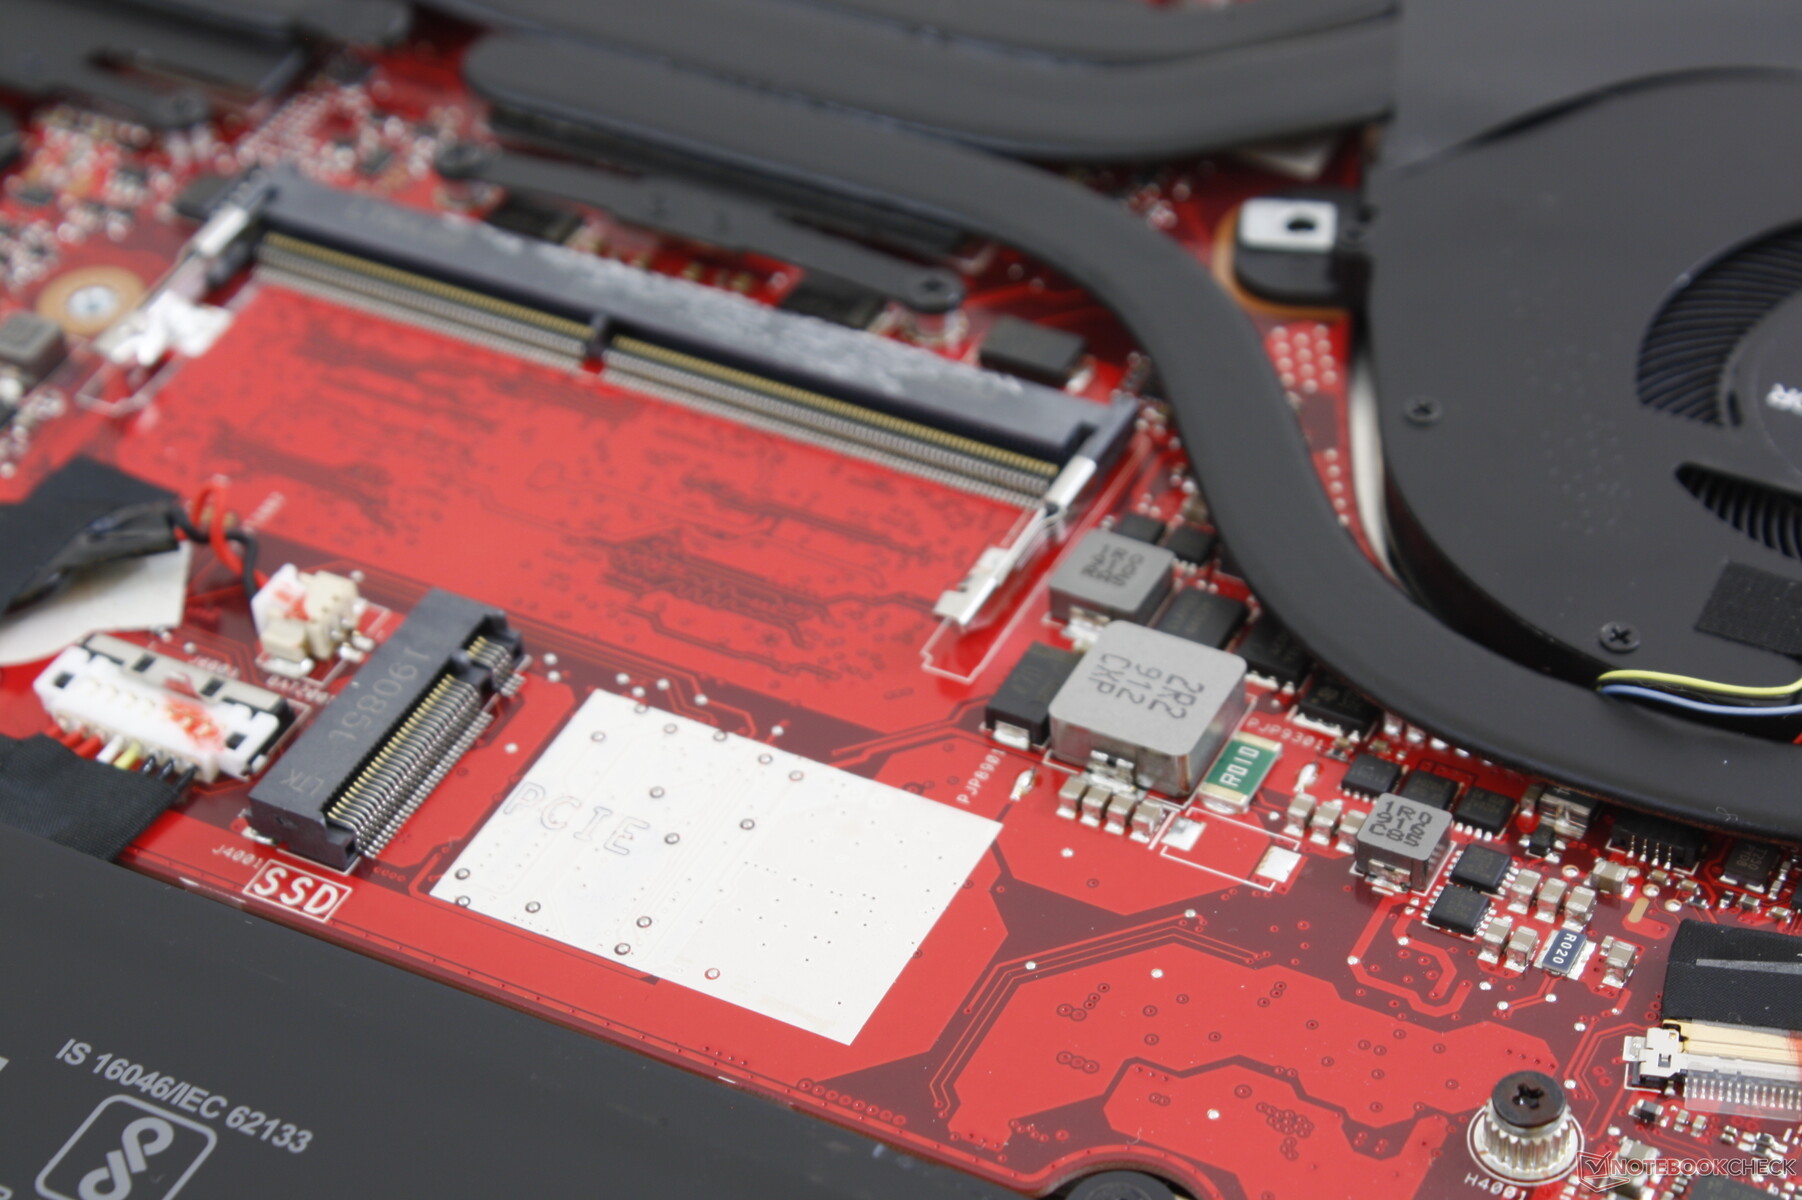
While servicing is relatively easy, it will require a lot of patience because of the sheer number of Philips screws involved (15). Expansions include two M.2 2280 slots and one SODIMM slot.
Accessories and Warranty
There are no accessories outside of the usual AC adapter and small manuals. A one-year limited manufacturer warranty applies with accidental damage protection if owners register their purchases with Asus.
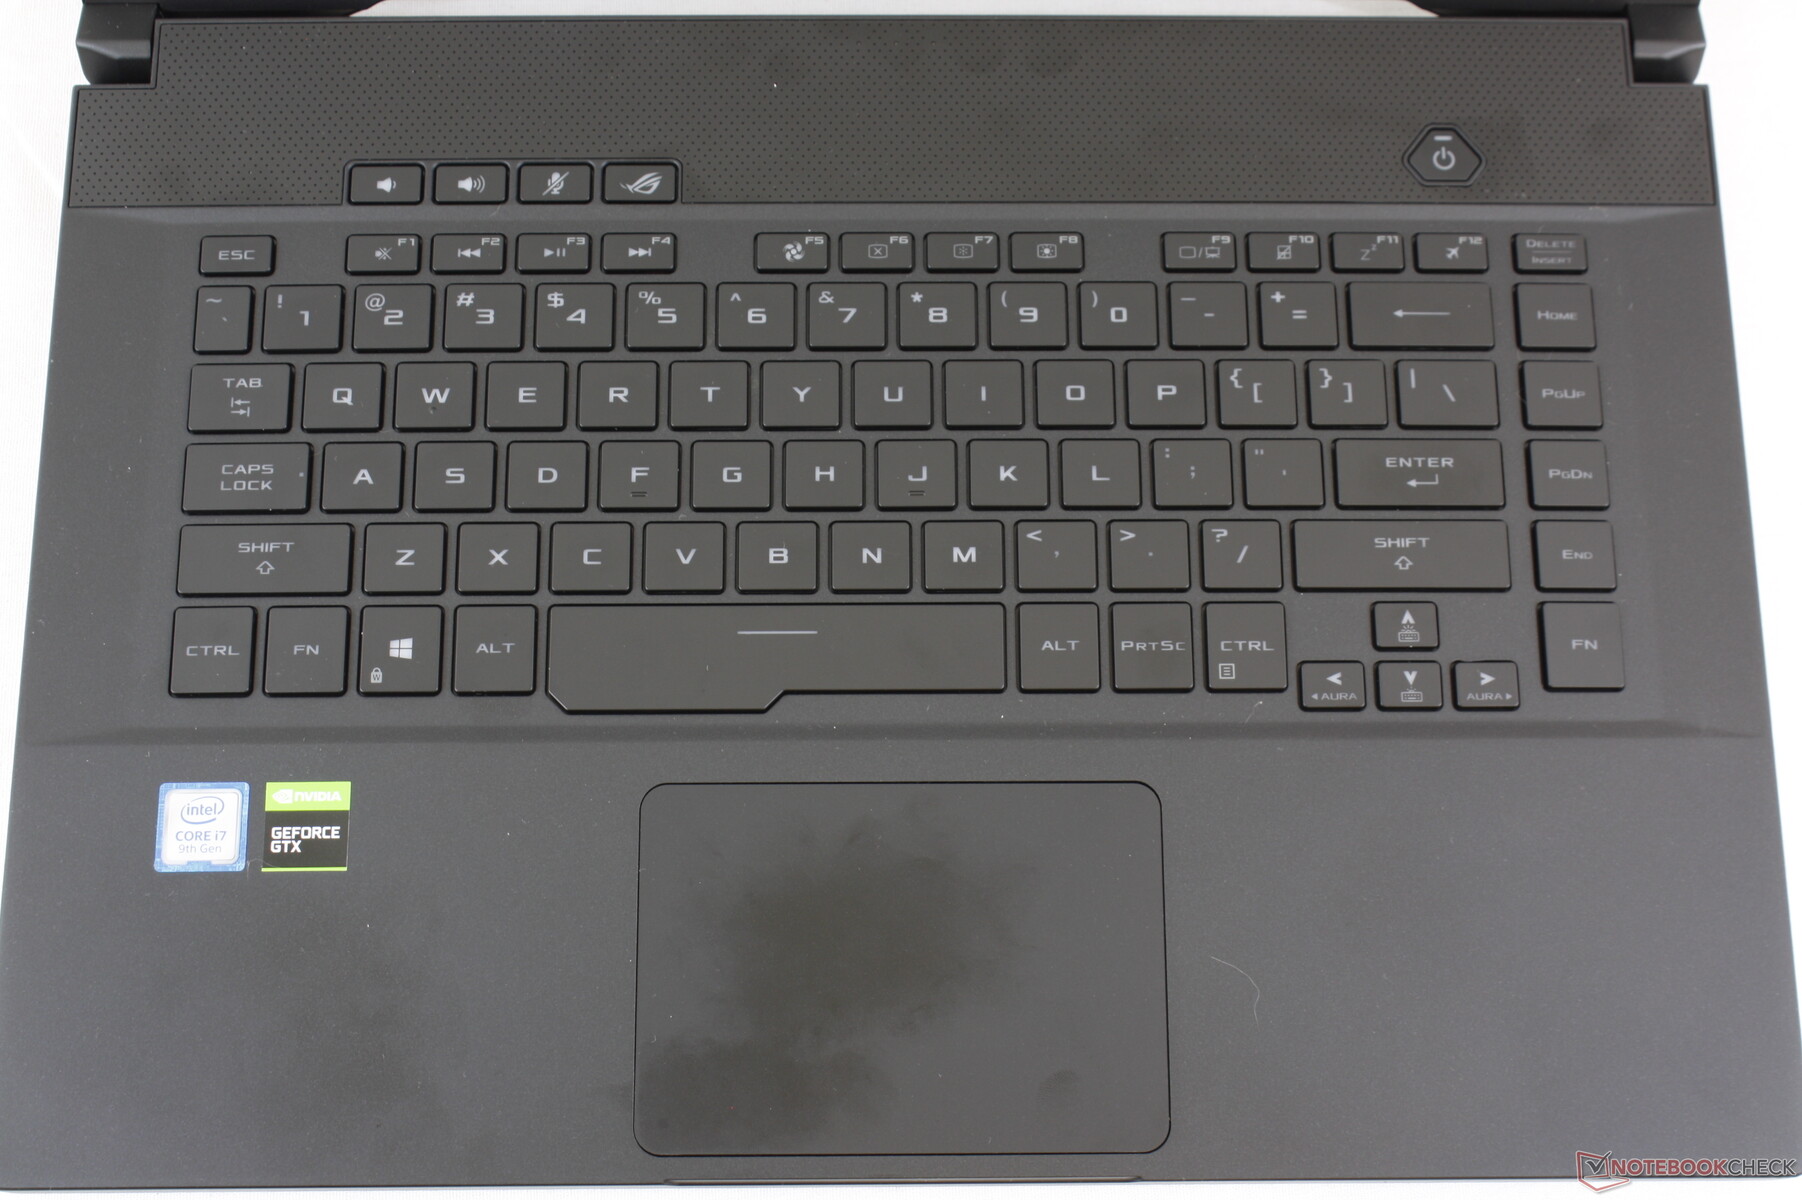
Input Devices - Keys Could be Firmer
Keyboard and Touchpad
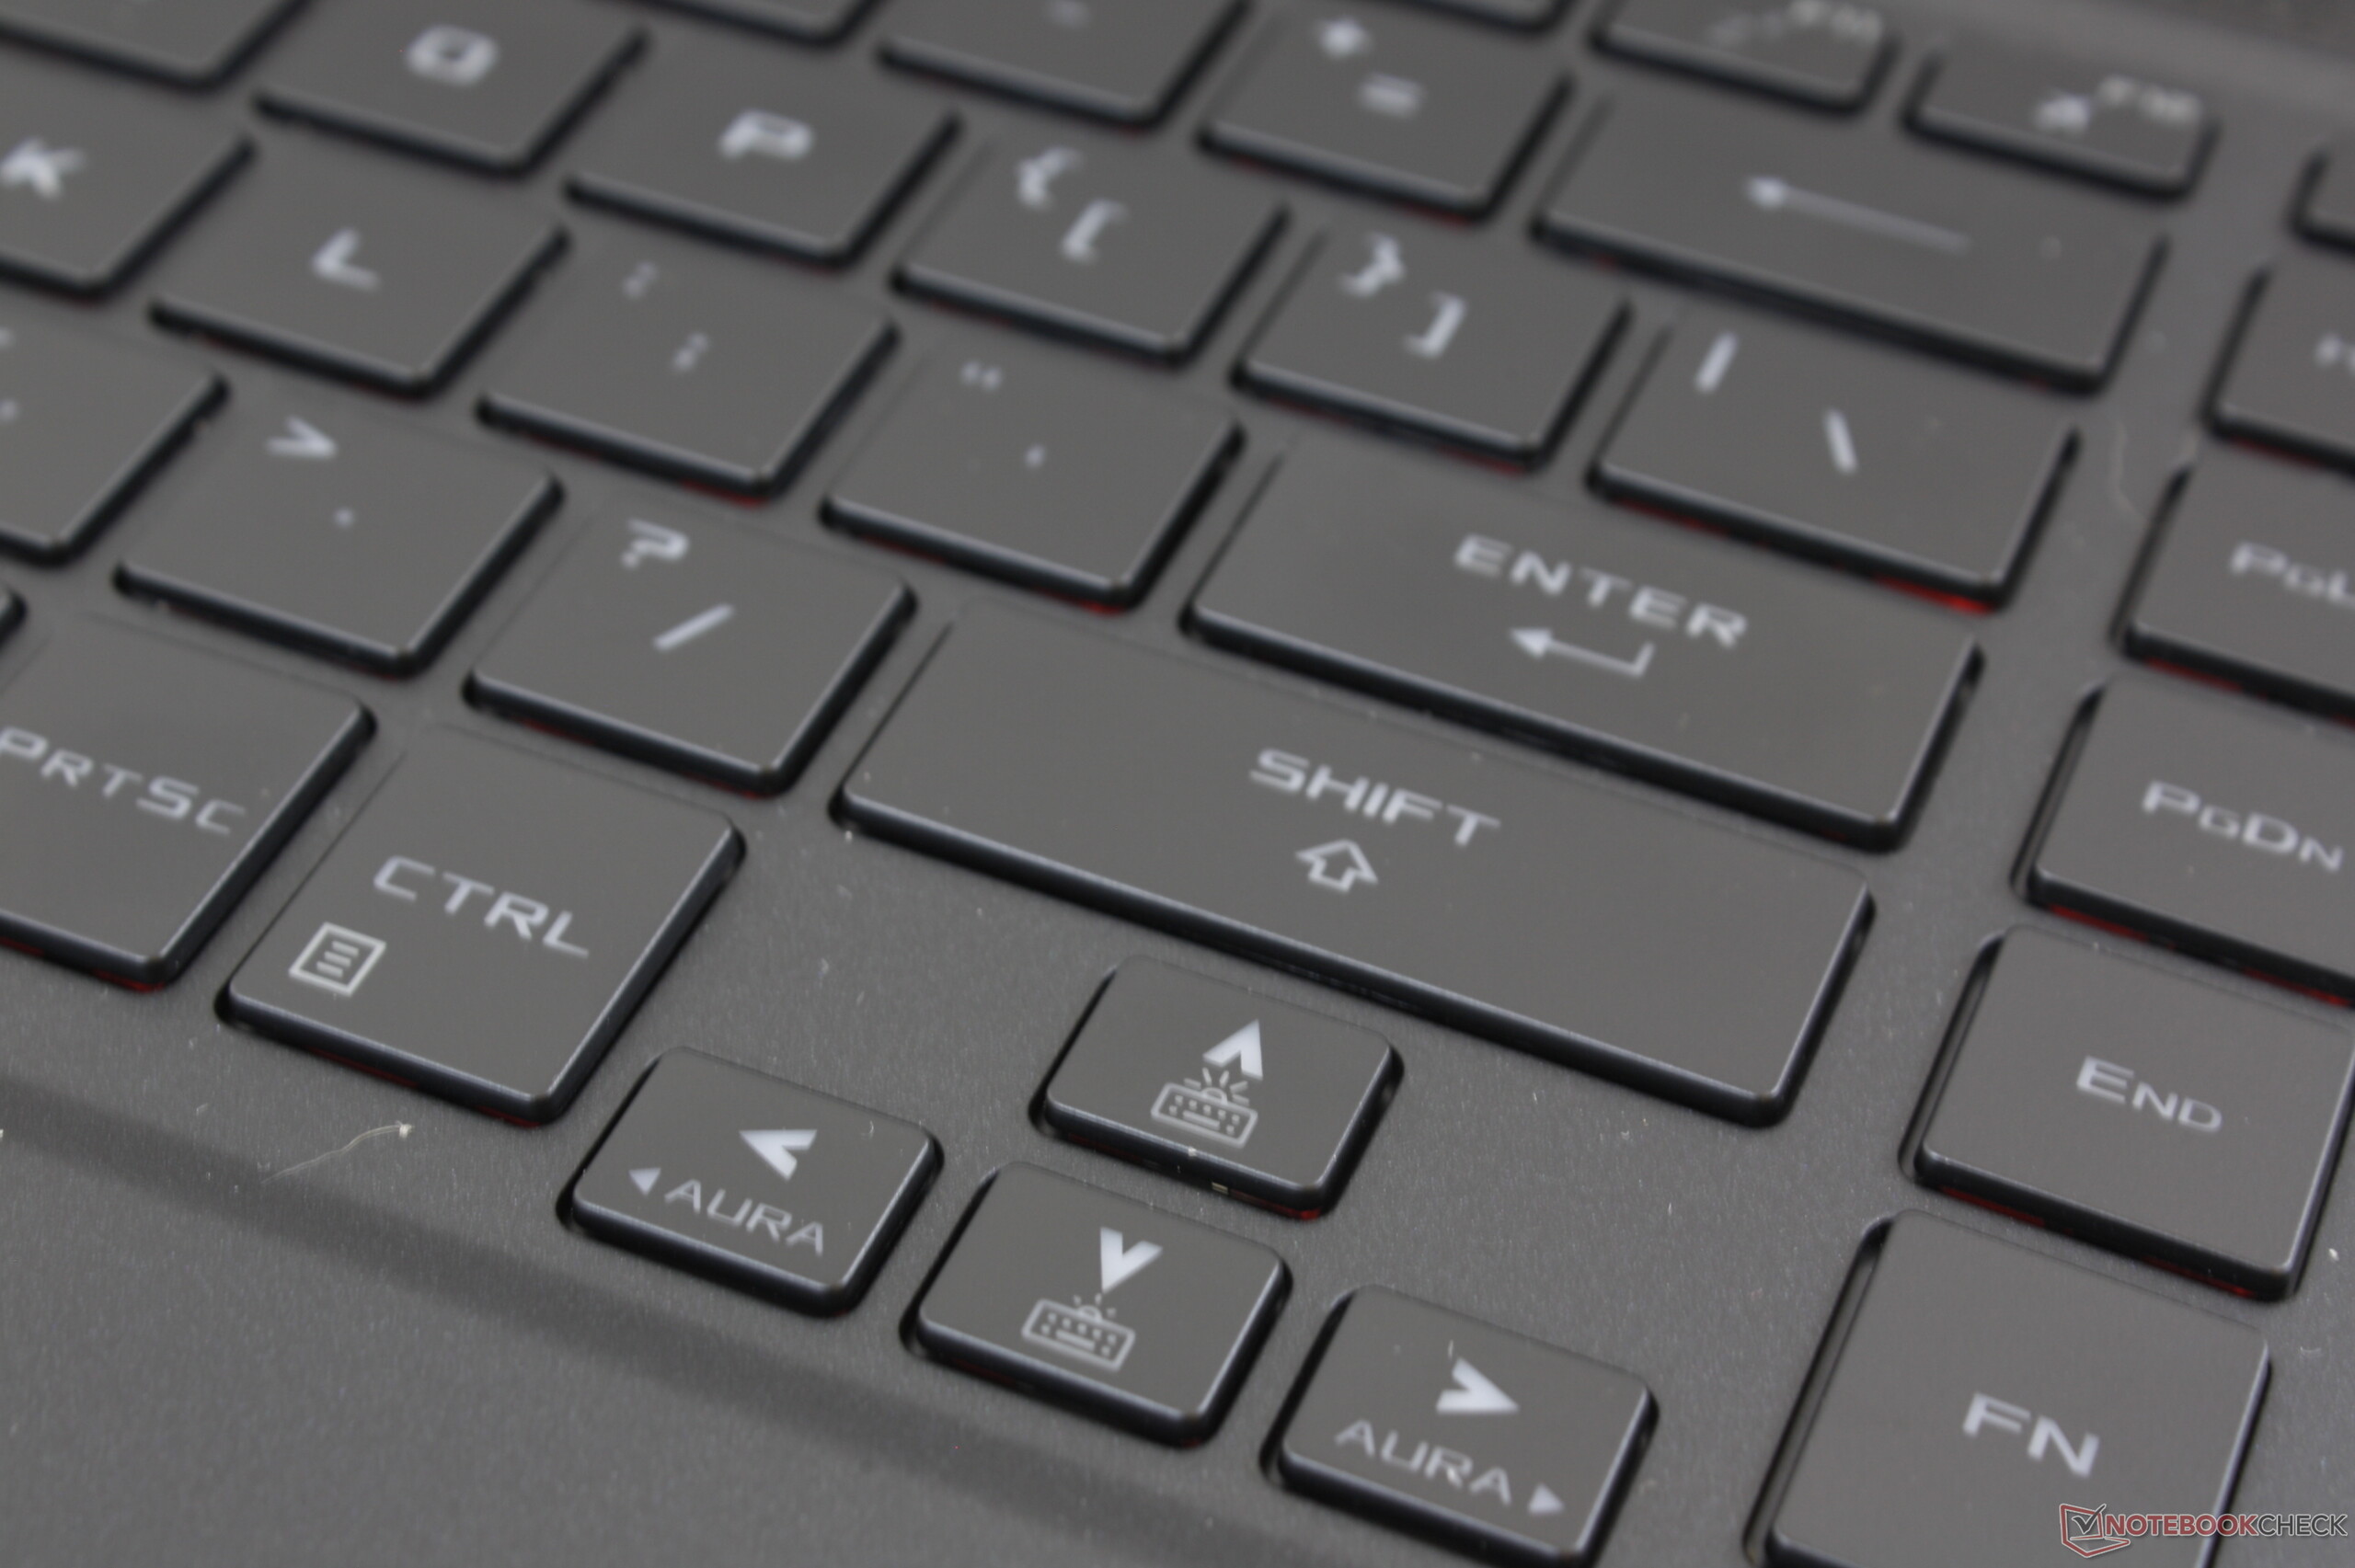
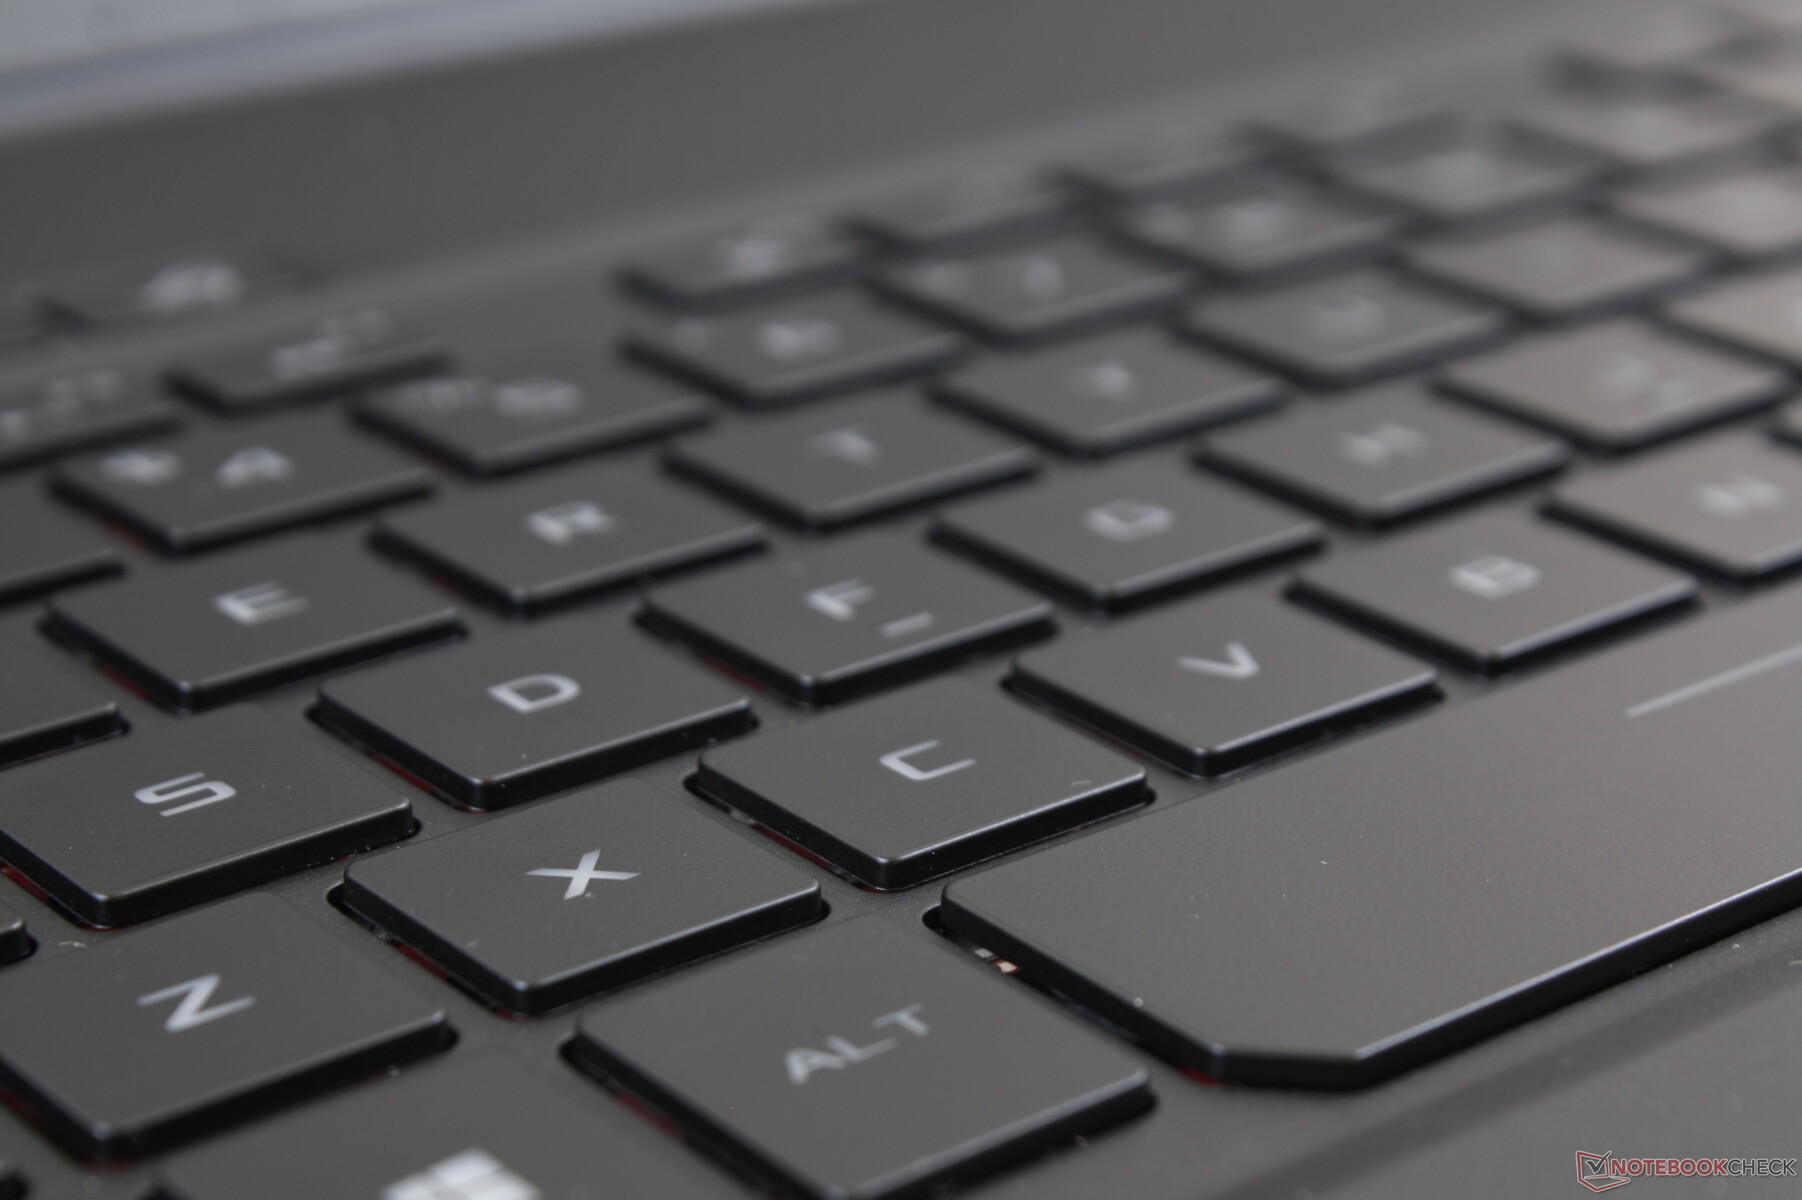
The GU502 shares the same keyboard and clickpad (10.5 x 7.5 cm) as on the GA502 and GX502. Thus, many of our existing comments on those laptops apply here on the GU502. We definitely think the input devices here feel more natural and easy to use than the unorthodox approach on the thinner GX531.
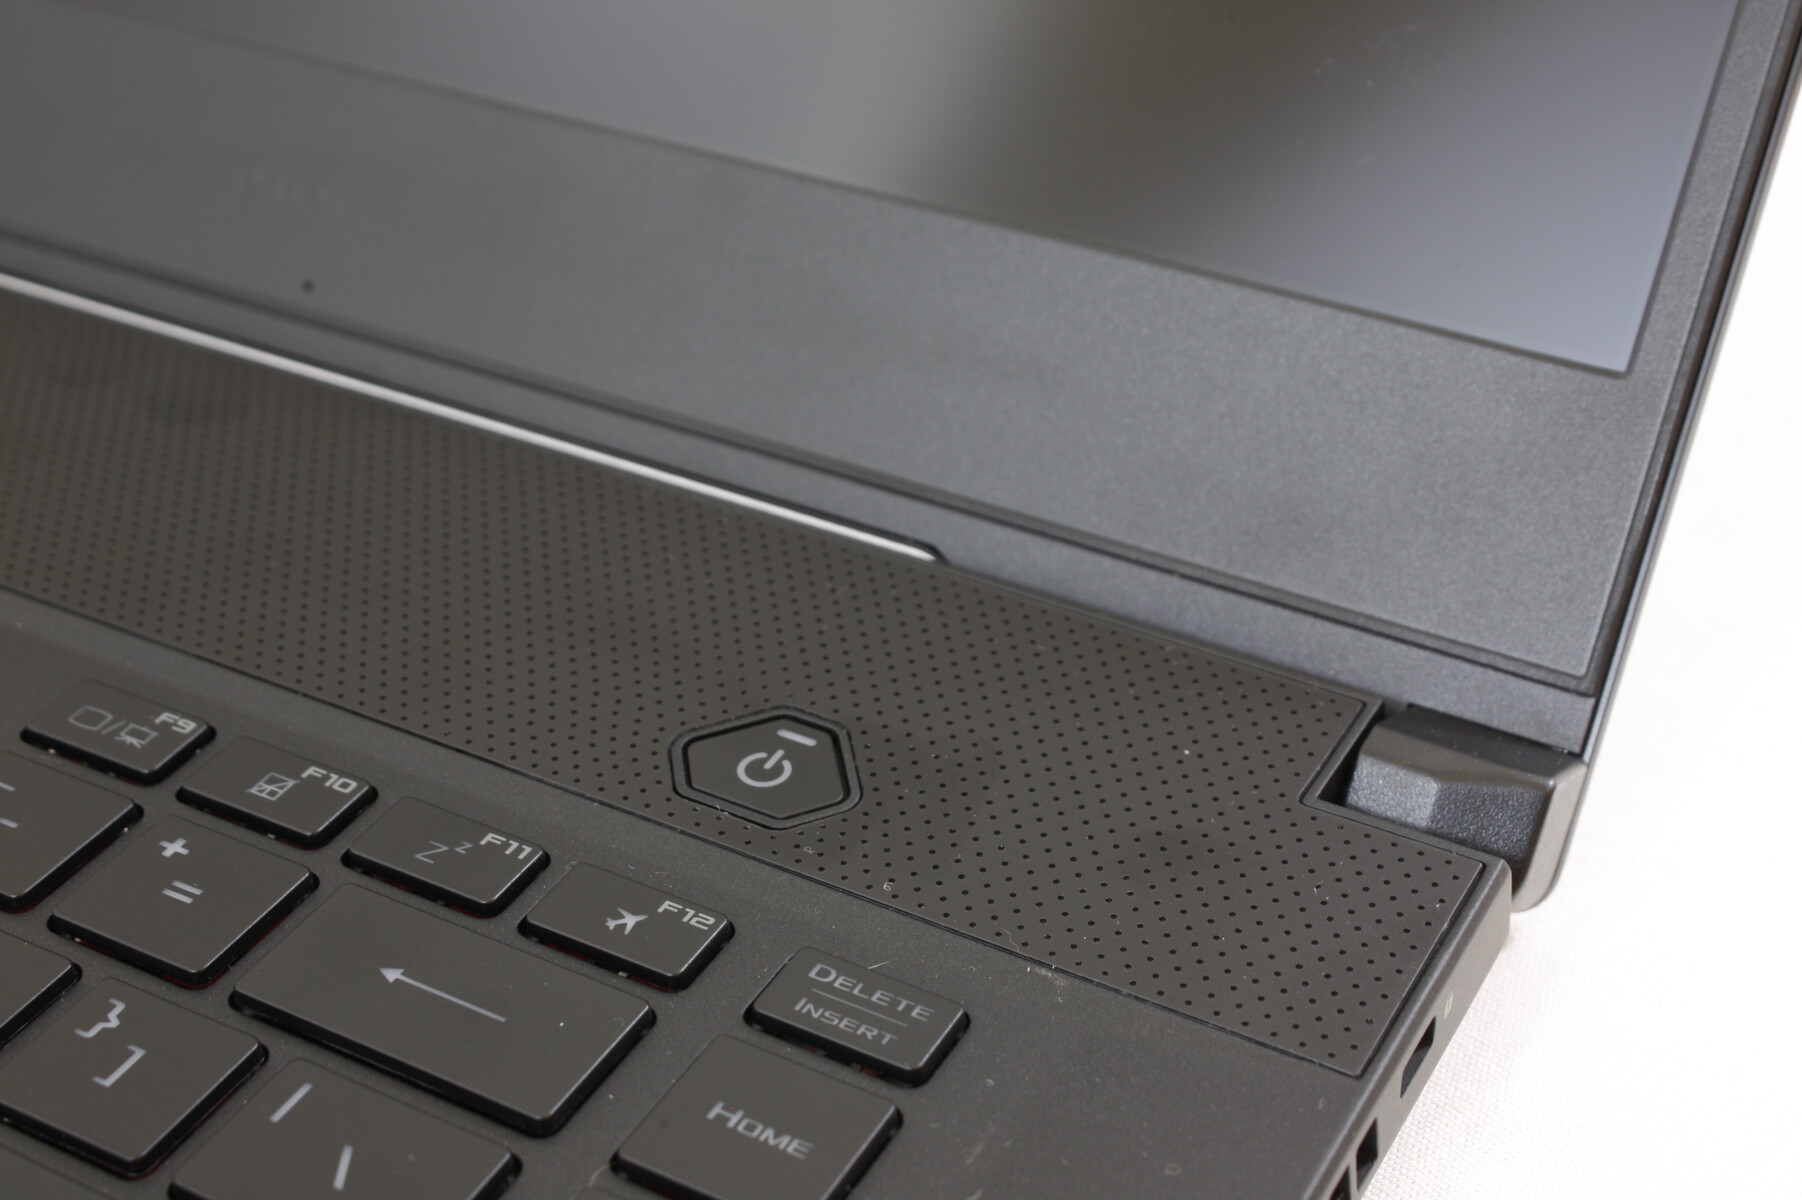
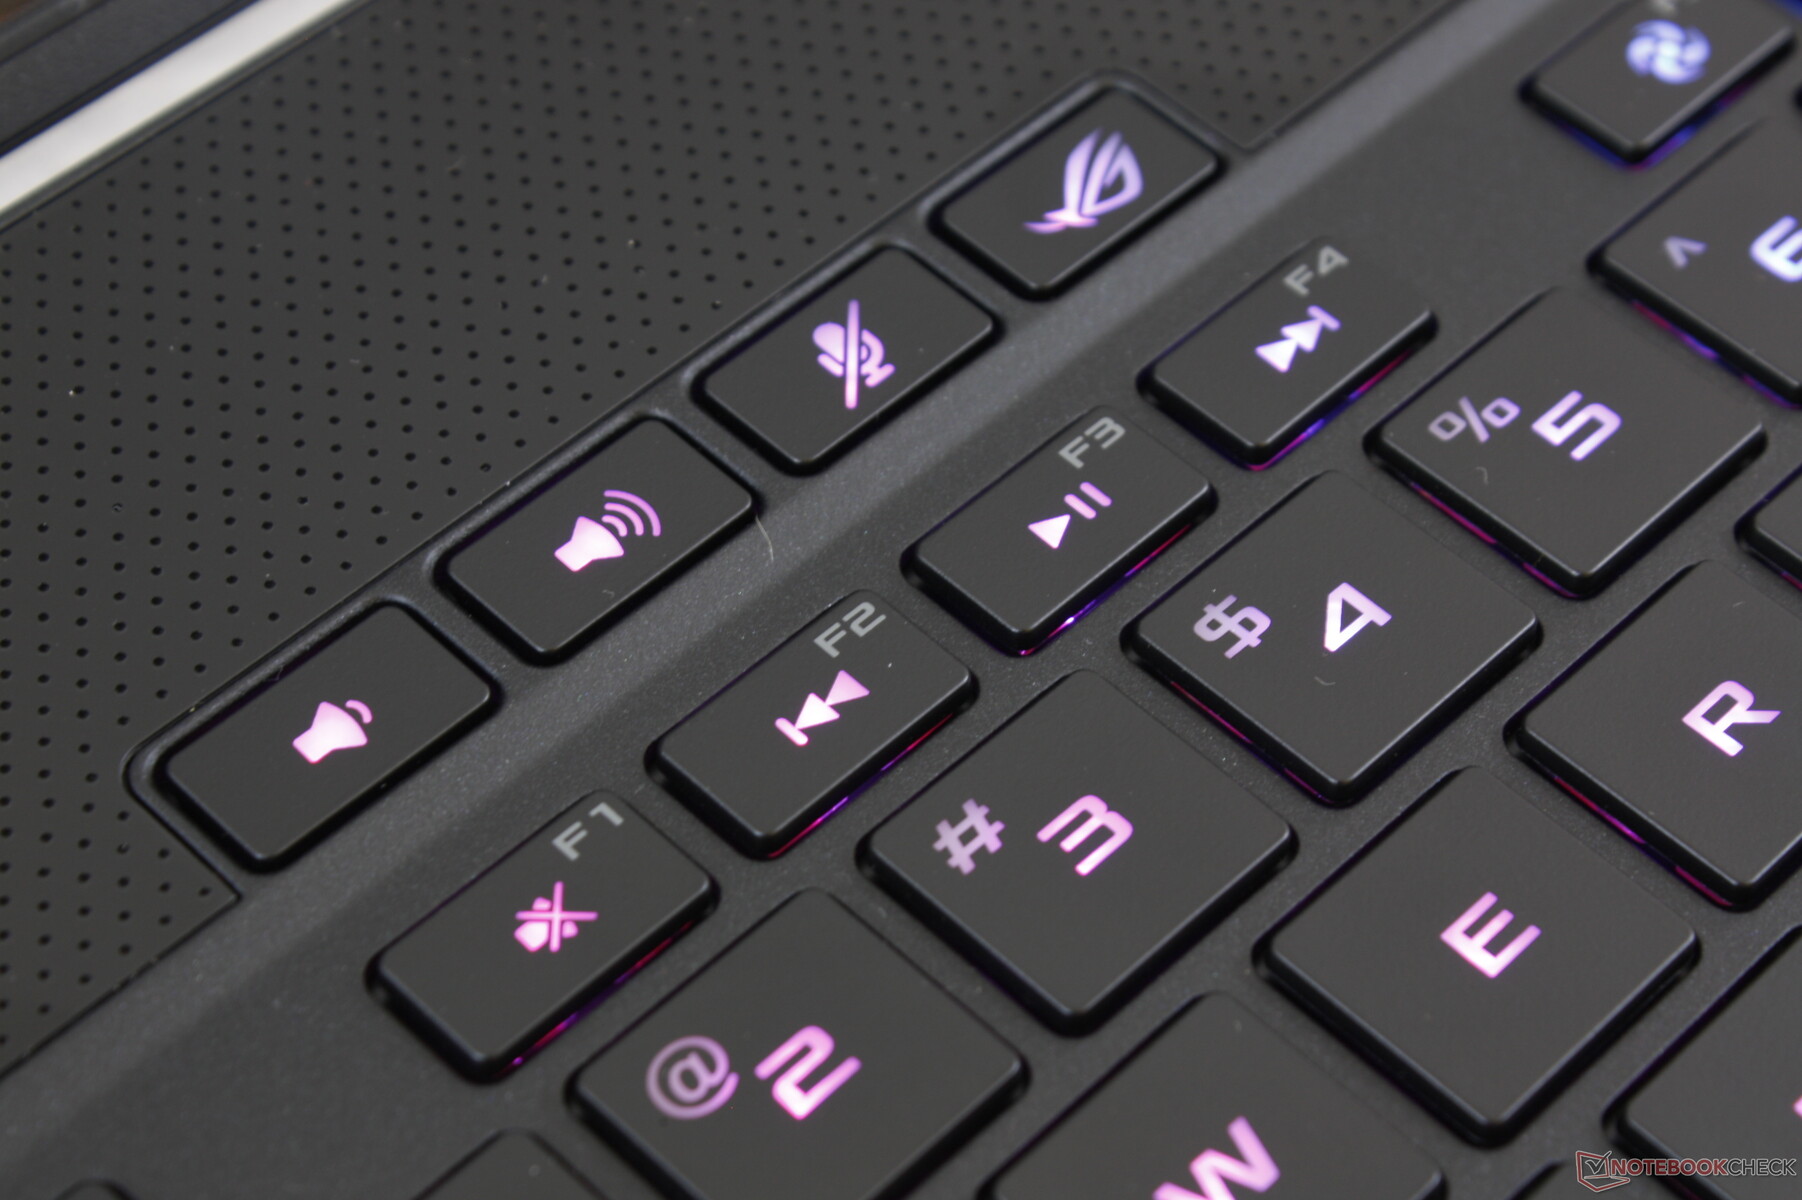
Per-key RGB lighting is available as opposed to the single-zone lighting on the cheaper GA502. Unfortunately, not every key symbol is lit as the small Function symbols (i.e., F1, F2, F3, etc.) are opaque. Additionally, the gray font colors printed on each key do not contrast very well against the black key caps and so it's recommended to have the lighting on for easier typing.
Display - Identical to the GX502
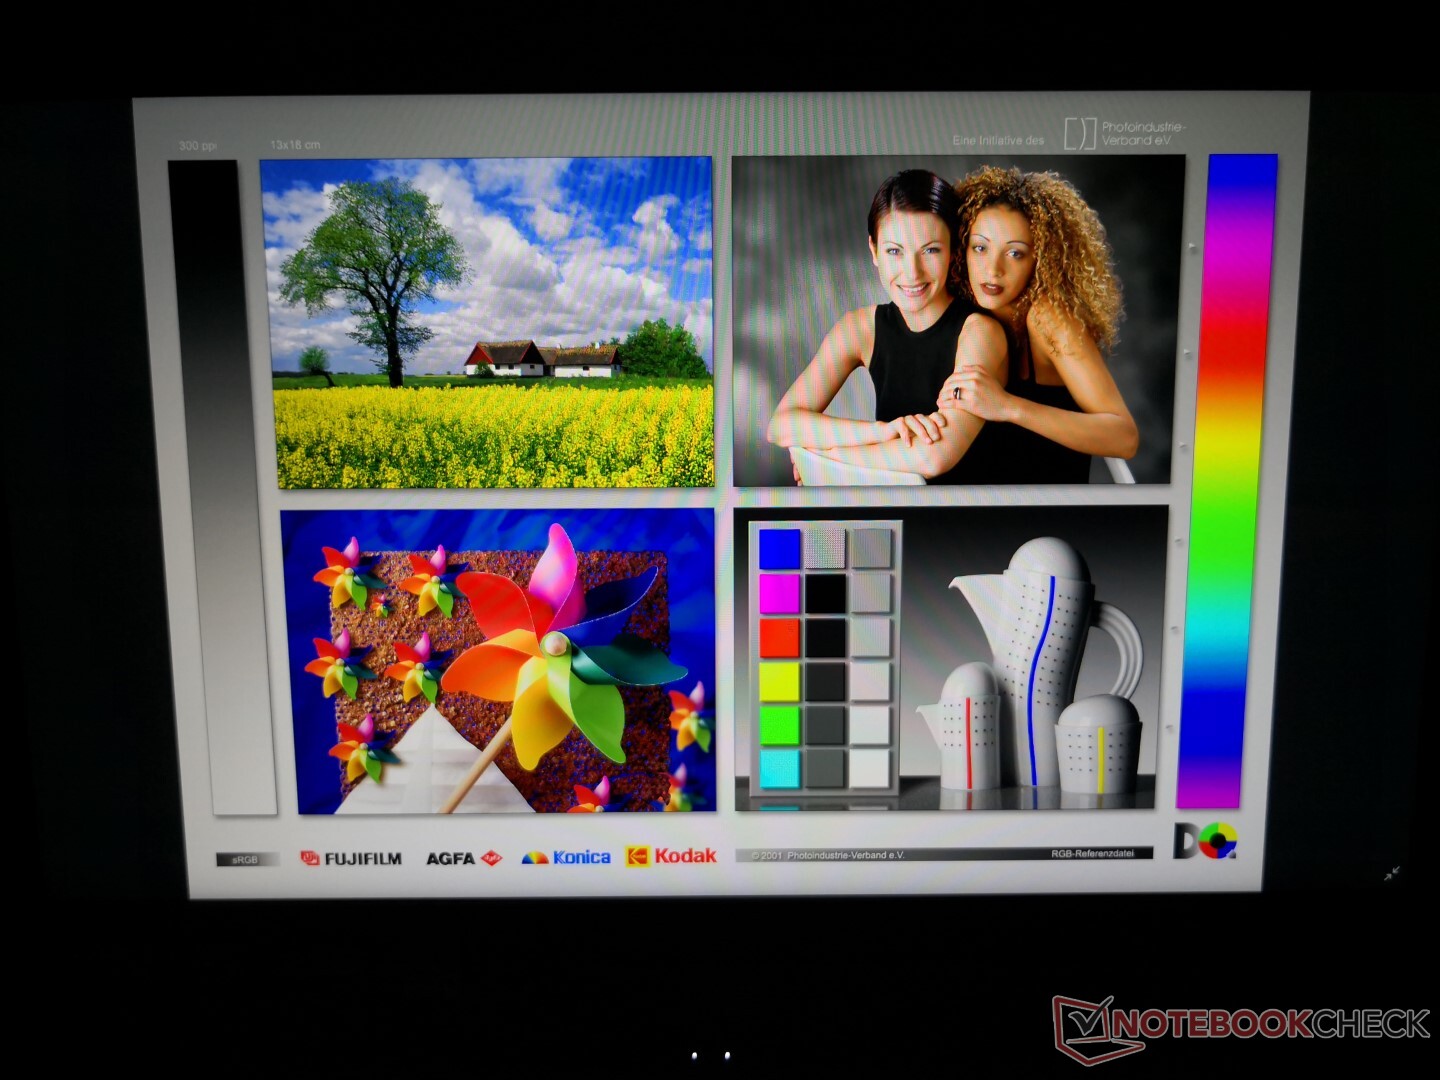
Asus has upped the bar for mid-range gaming laptops by dropping 60 Hz options in favor of 144 Hz and 240 Hz for the GU502 series. We're relieved to see that the GU502 uses the same AU Optronics panel as found on the pricier GX502GW instead of the horrendous 60 Hz panel on the cheaper GA502DU or FX505 series. Thus, our GU502GU test unit shares many of the same display characteristics as the GX502GW including the super-fast response times, relatively wide color space, decent contrast ratio, and average brightness values. We suspect that the 240 Hz display option uses the same or very similar panel as the one on the 240 Hz Razer Blade 15.
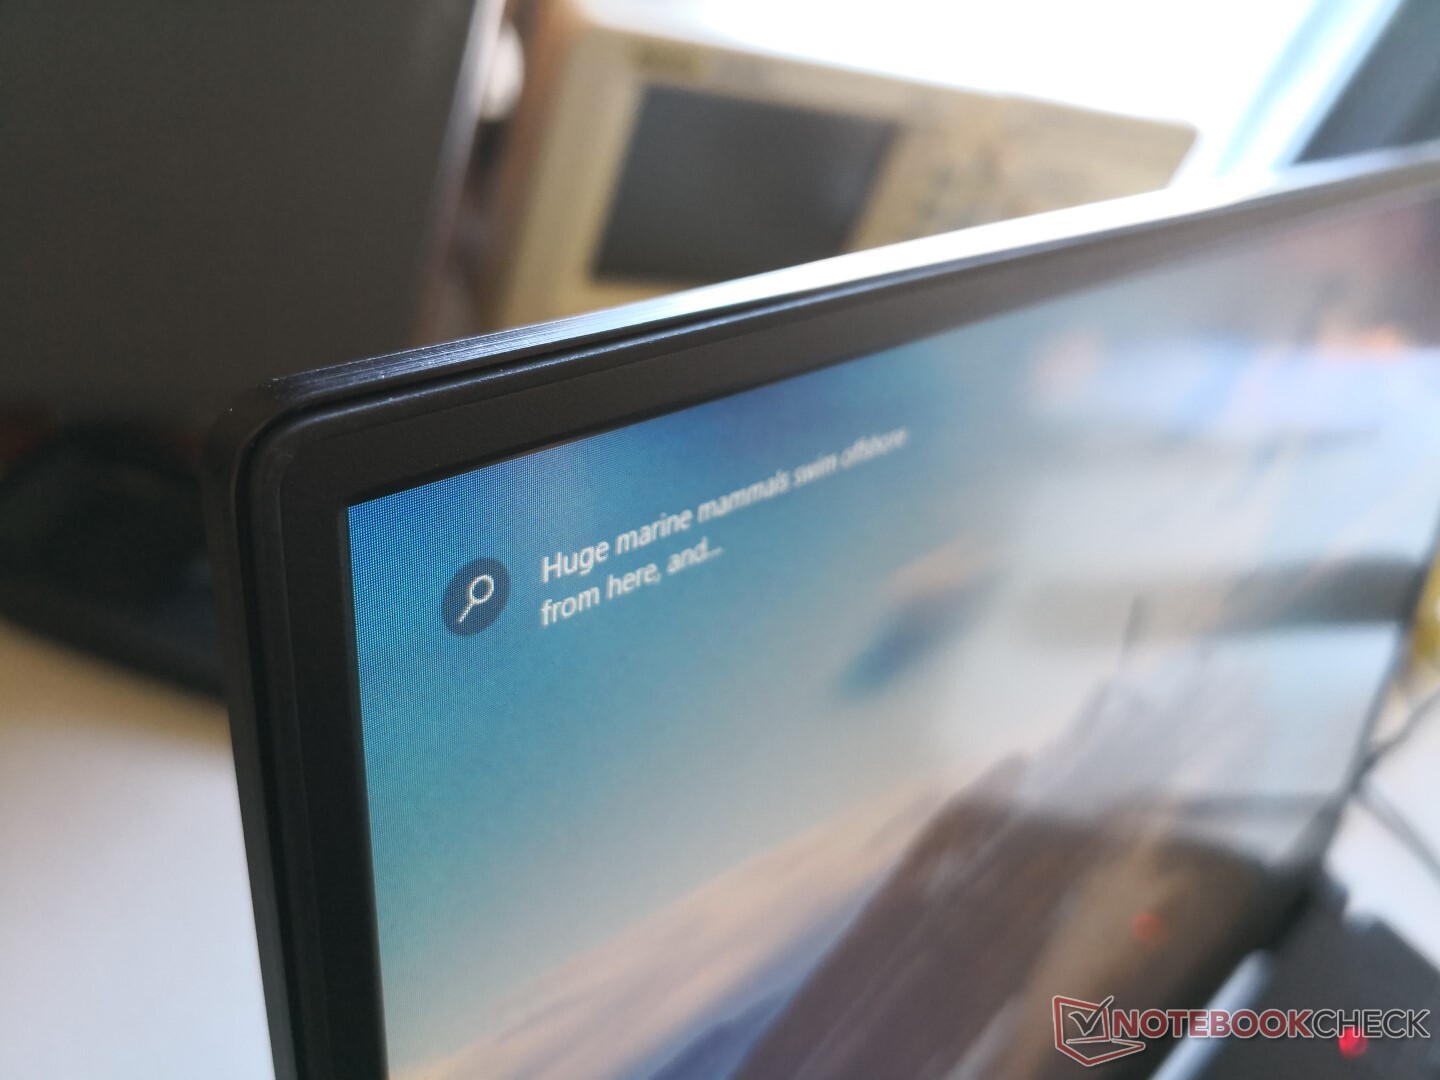
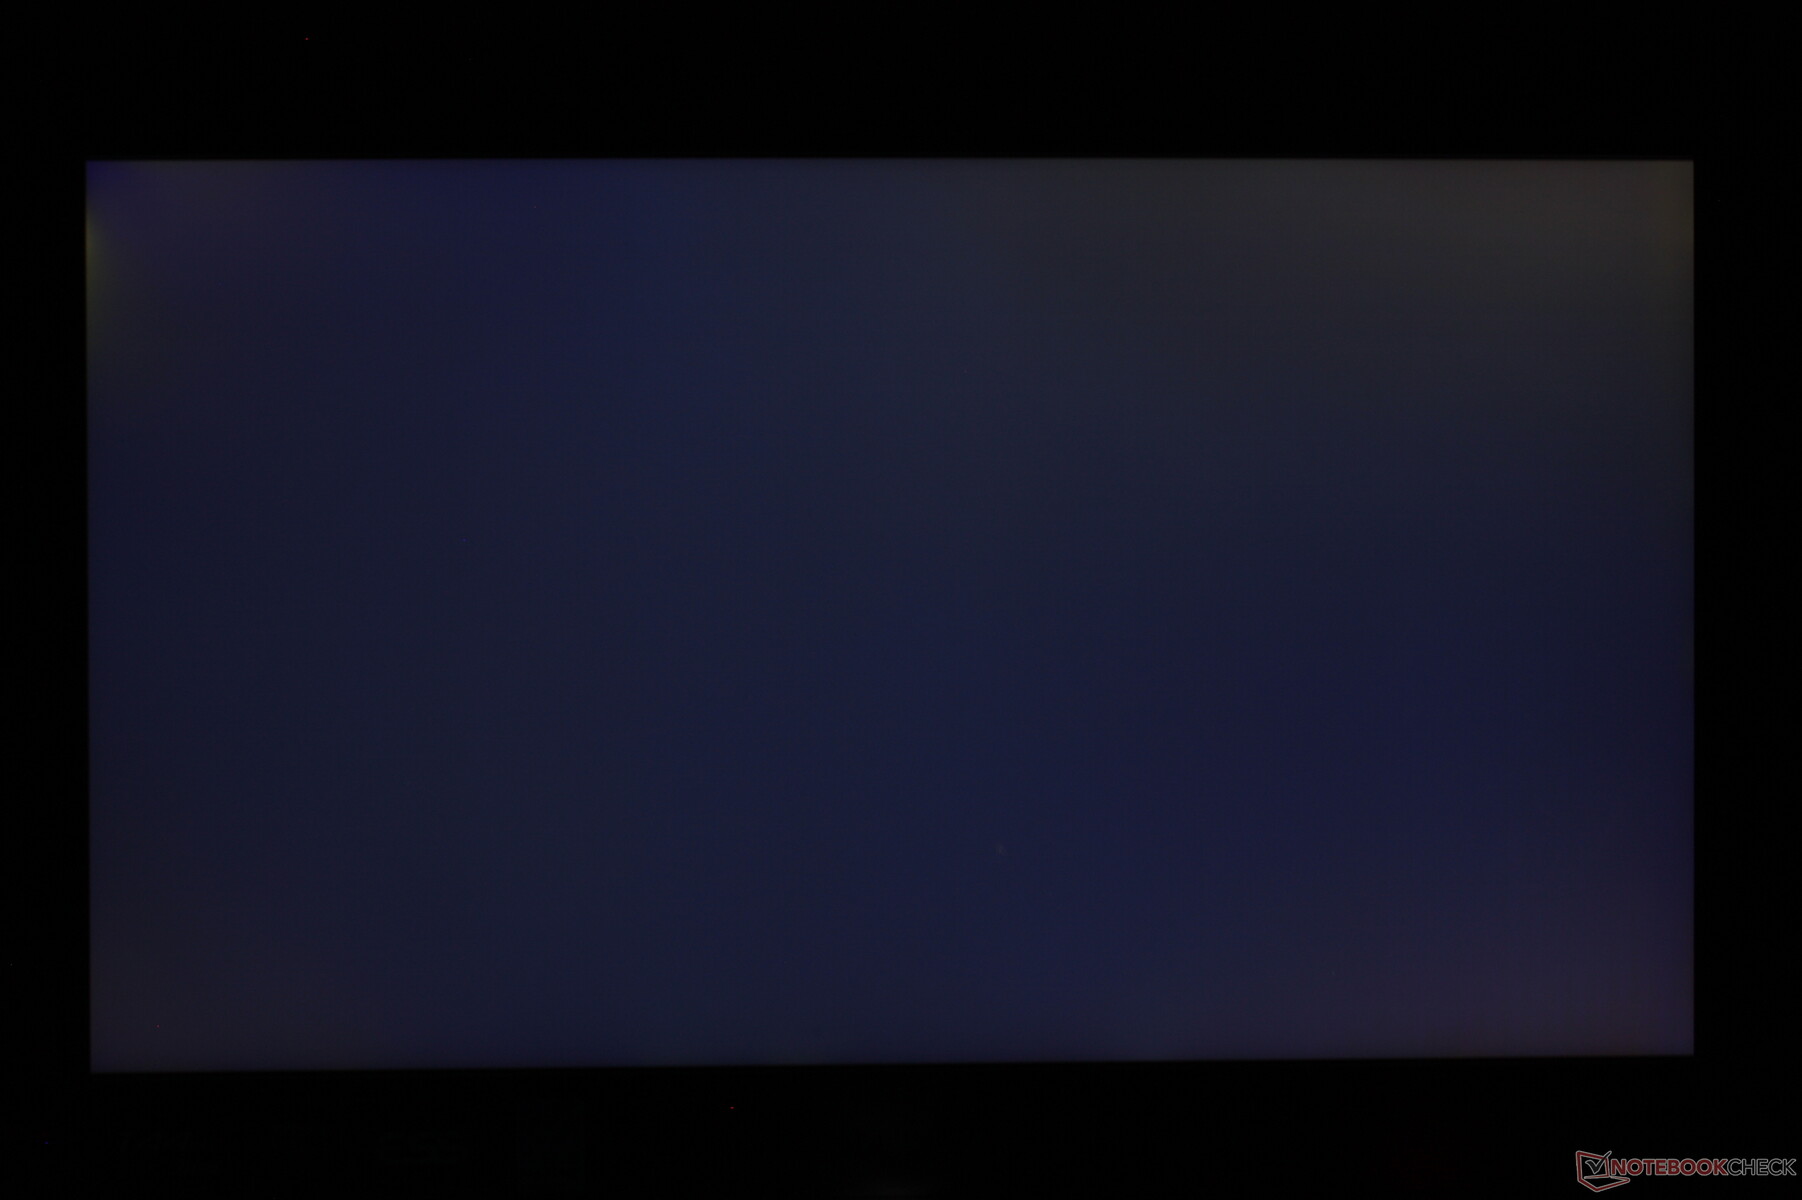
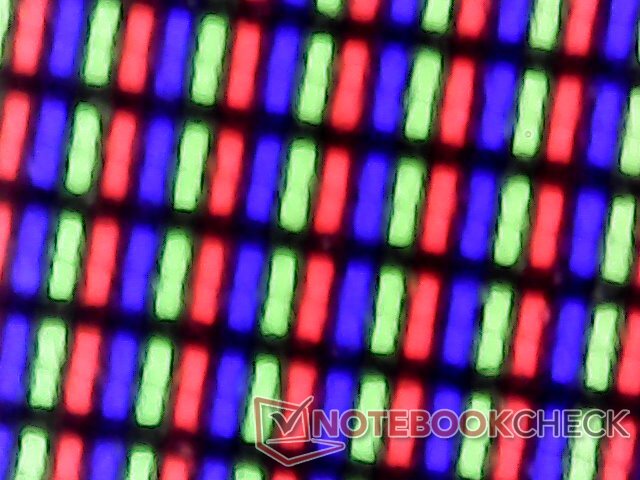
Both graininess and uneven backlight bleeding are minimal for an excellent impression representative of the high asking price.
| |||||||||||||||||||||||||
Brightness Distribution: 84 %
Center on Battery: 297.7 cd/m²
Contrast: 692:1 (Black: 0.43 cd/m²)
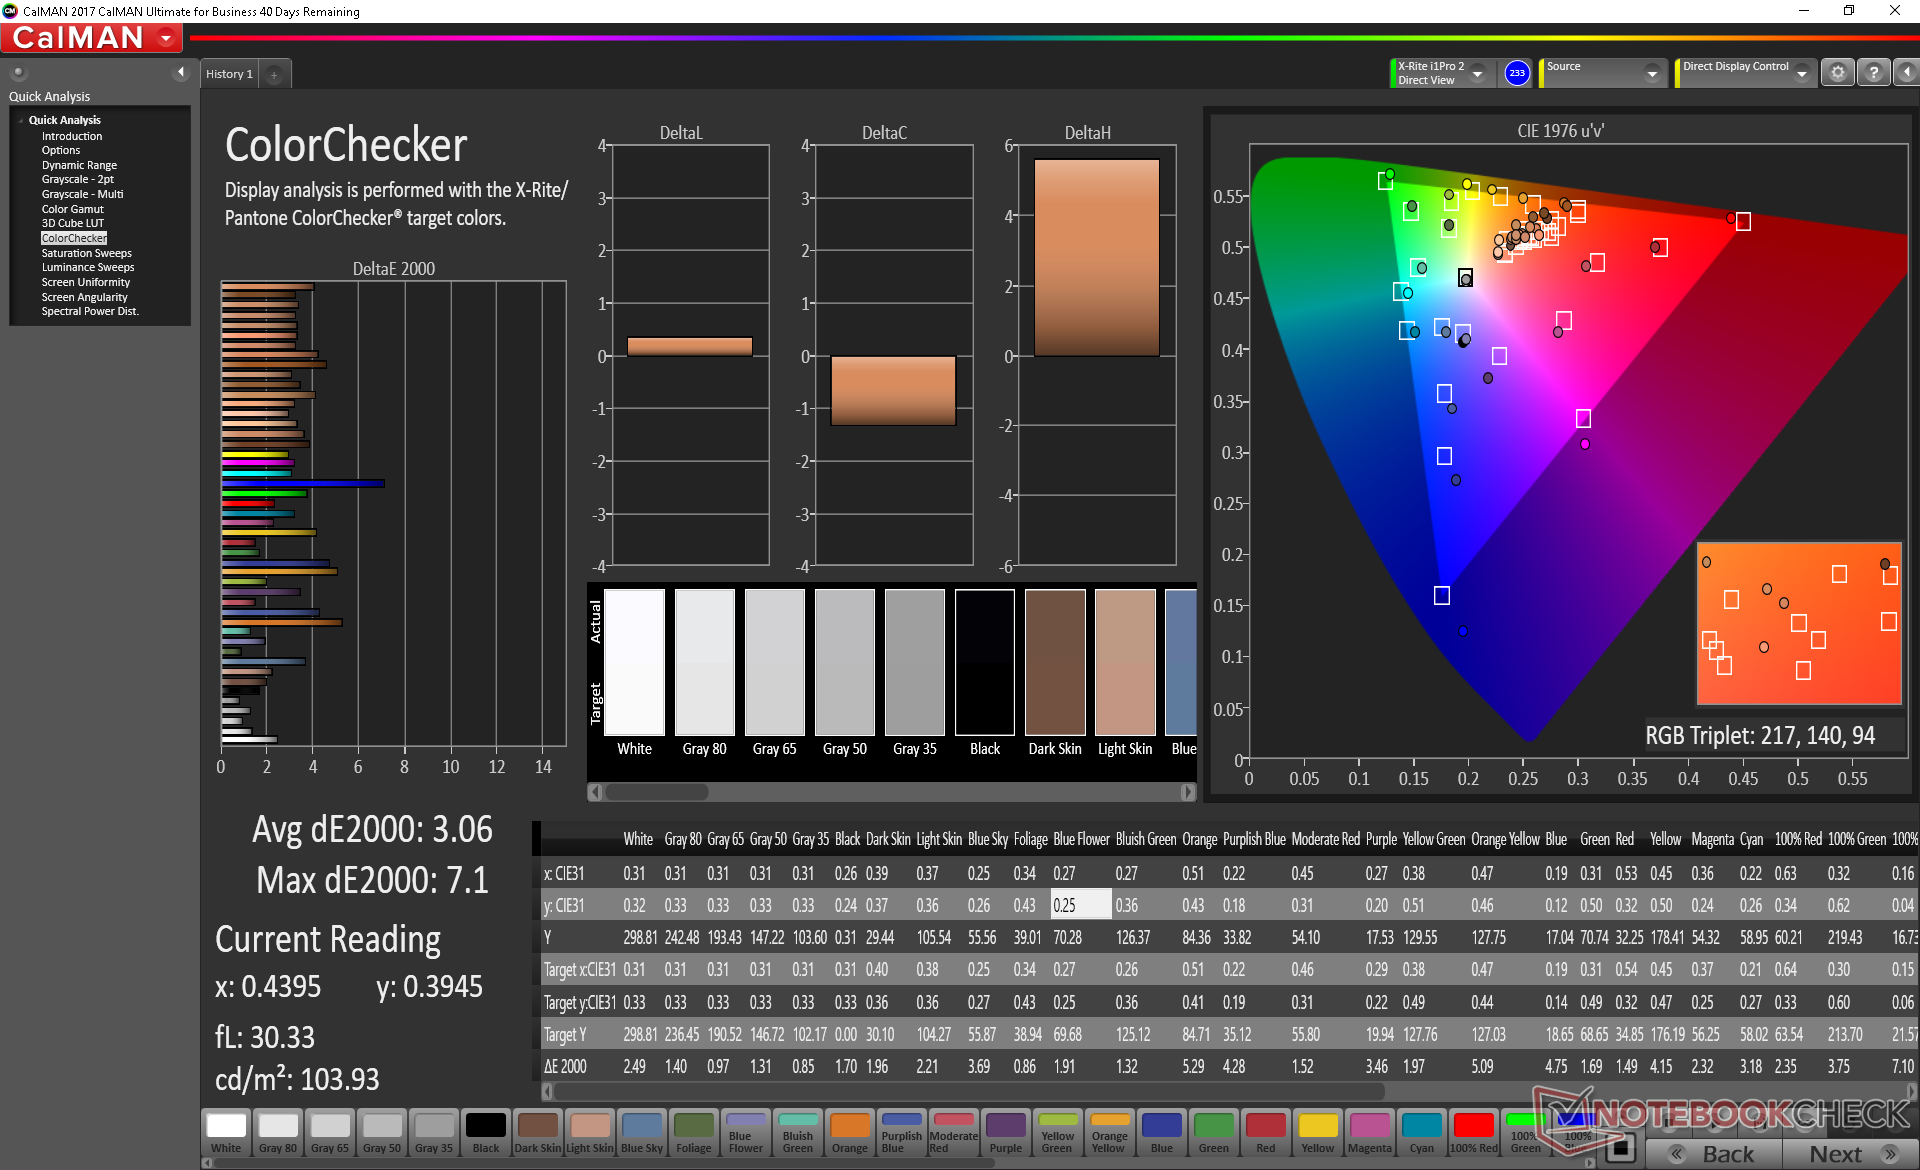
ΔE ColorChecker Calman: 3.13 | ∀{0.5-29.43 Ø4.73}
calibrated: 3.06
ΔE Greyscale Calman: 1.9 | ∀{0.09-98 Ø4.97}
90.5% sRGB (Argyll 1.6.3 3D)
59.2% AdobeRGB 1998 (Argyll 1.6.3 3D)
66.5% AdobeRGB 1998 (Argyll 3D)
90.8% sRGB (Argyll 3D)
66.5% Display P3 (Argyll 3D)
Gamma: 2.23
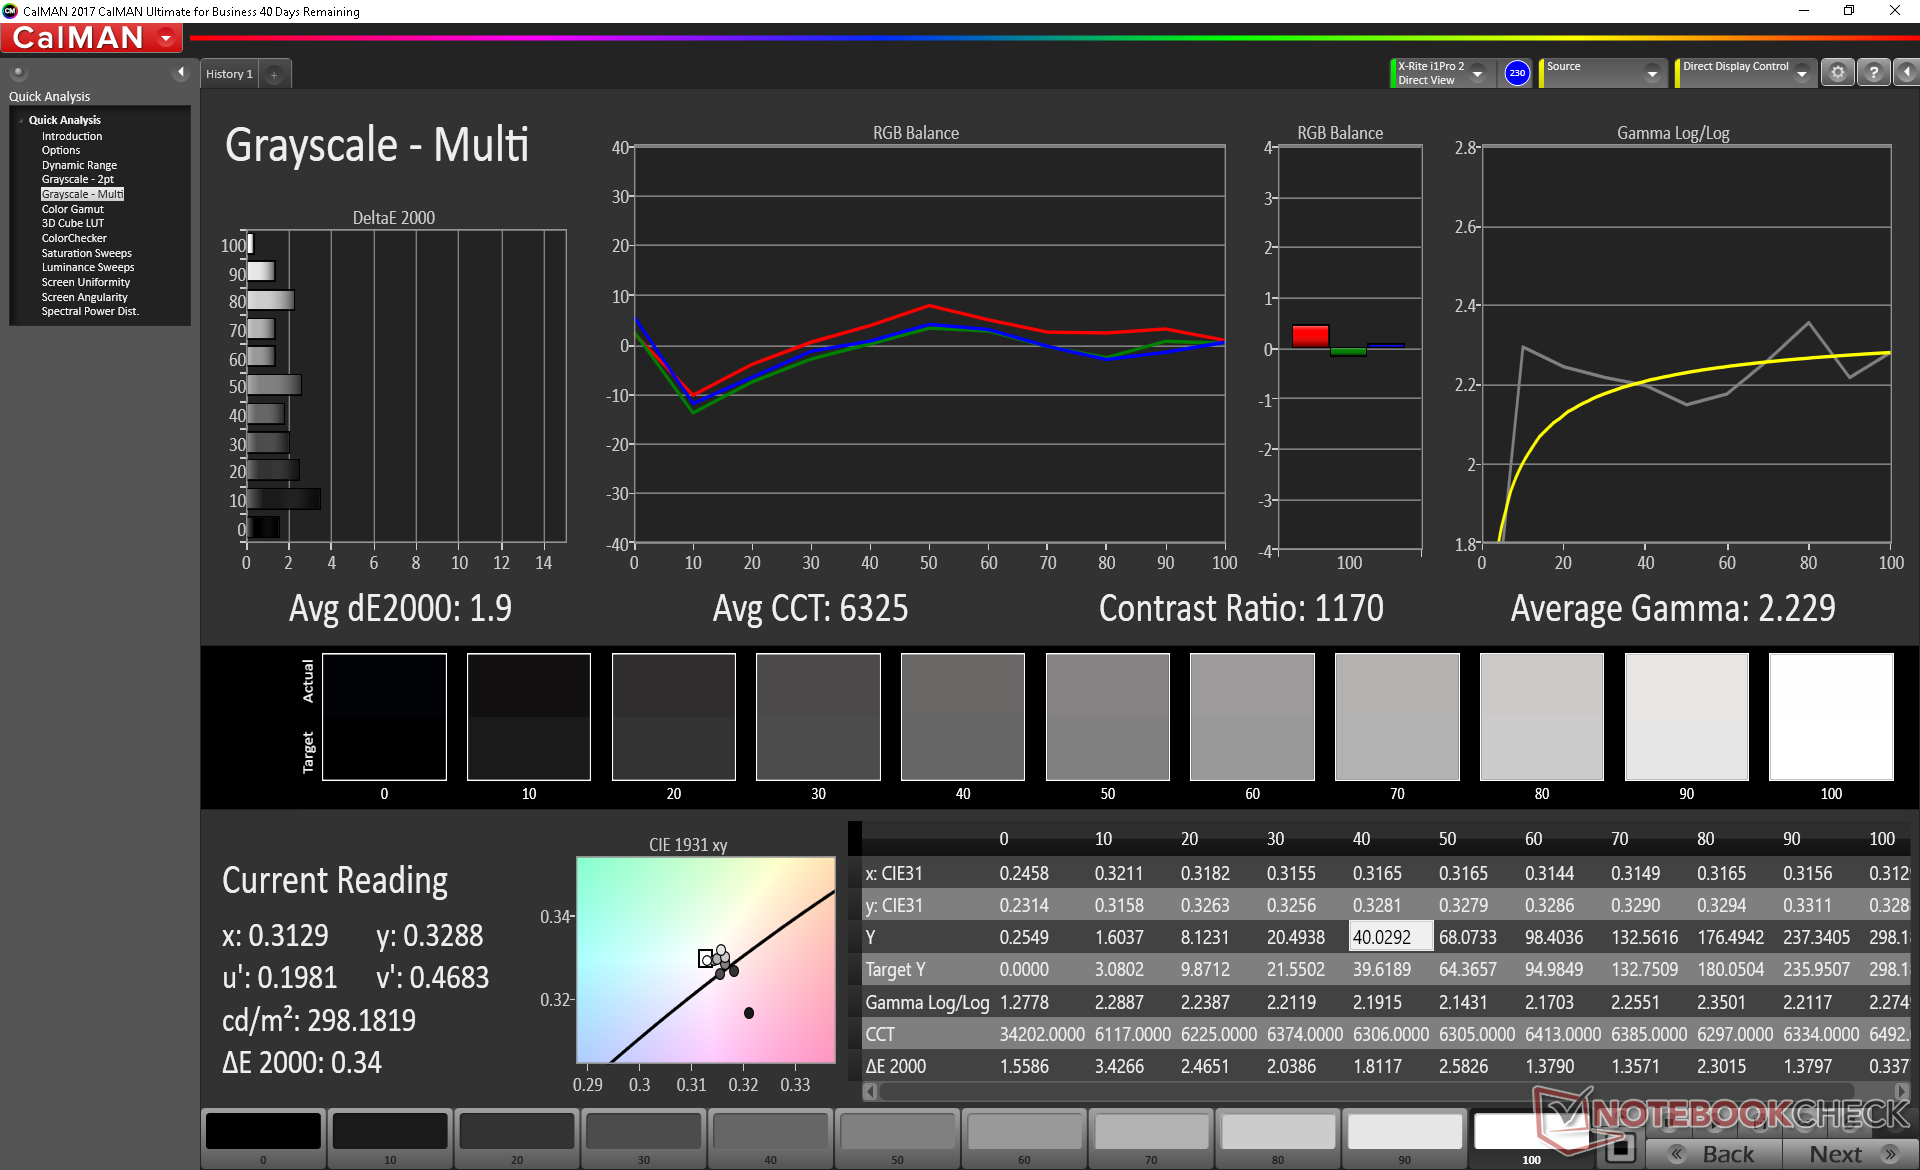
CCT: 6325 K
| Asus ROG Zephyrus M15 GU502GU-XB74 AU Optronics B156HAN08.2, IPS, 15.6", 1920x1080 | Asus Zephyrus S GX502GW AU Optronics B156HAN08.2 (AUO82ED), IPS, 15.6", 1920x1080 | Asus TUF FX505DT-EB73 Panda LM156LF-GL, IPS, 15.6", 1920x1080 | Lenovo Legion Y740-15ICHg BOE NV156FHM-N4J, IPS, 15.6", 1920x1080 | MSI GS65 Stealth 9SG Sharp LQ156M1JW03 (SHP14C5), IPS, 15.6", 1920x1080 | Razer Blade 15 GTX 1660 Ti BOE NV156FHM-N4K, IPS, 15.6", 1920x1080 | |
|---|---|---|---|---|---|---|
| Display | -1% | -38% | 1% | 4% | -0% | |
| Display P3 Coverage (%) | 66.5 | 64.9 -2% | 39.56 -41% | 67.7 2% | 67.6 2% | 65.3 -2% |
| sRGB Coverage (%) | 90.8 | 91 0% | 59.5 -34% | 91.6 1% | 97.5 7% | 91.8 1% |
| AdobeRGB 1998 Coverage (%) | 66.5 | 65.9 -1% | 40.91 -38% | 67.1 1% | 68.9 4% | 66.5 0% |
| Response Times | -7% | -295% | -106% | -75% | -64% | |
| Response Time Grey 50% / Grey 80% * (ms) | 6.4 ? | 7.2 ? -13% | 30.4 ? -375% | 19 ? -197% | 13.6 ? -113% | 13.6 ? -113% |
| Response Time Black / White * (ms) | 8.8 ? | 8.8 ? -0% | 27.6 ? -214% | 10 ? -14% | 12 ? -36% | 10 ? -14% |
| PWM Frequency (Hz) | 23260 ? | 200 ? | ||||
| Screen | 10% | -44% | 34% | 26% | -3% | |
| Brightness middle (cd/m²) | 297.7 | 286 -4% | 286.2 -4% | 477 60% | 282.3 -5% | 312.7 5% |
| Brightness (cd/m²) | 280 | 275 -2% | 267 -5% | 431 54% | 269 -4% | 305 9% |
| Brightness Distribution (%) | 84 | 90 7% | 84 0% | 84 0% | 90 7% | 90 7% |
| Black Level * (cd/m²) | 0.43 | 0.37 14% | 0.33 23% | 0.175 59% | 0.32 26% | 0.27 37% |
| Contrast (:1) | 692 | 773 12% | 867 25% | 2726 294% | 882 27% | 1158 67% |
| Colorchecker dE 2000 * | 3.13 | 2.19 30% | 5.45 -74% | 4.17 -33% | 1.17 63% | 4.57 -46% |
| Colorchecker dE 2000 max. * | 7.1 | 4.4 38% | 18.08 -155% | 6.97 2% | 3.29 54% | 6.81 4% |
| Colorchecker dE 2000 calibrated * | 3.06 | 2.27 26% | 4.47 -46% | 2.51 18% | 1.06 65% | 2.91 5% |
| Greyscale dE 2000 * | 1.9 | 2.2 -16% | 5.3 -179% | 3.49 -84% | 1.3 32% | 4.3 -126% |
| Gamma | 2.23 99% | 2.41 91% | 2.1 105% | 2.5 88% | 2.2 100% | 2.29 96% |
| CCT | 6325 103% | 6405 101% | 7679 85% | 7076 92% | 6643 98% | 7098 92% |
| Color Space (Percent of AdobeRGB 1998) (%) | 59.2 | 59 0% | 37.6 -36% | 60 1% | 63.8 8% | 59.4 0% |
| Color Space (Percent of sRGB) (%) | 90.5 | 91 1% | 59.1 -35% | 91 1% | 97.5 8% | 91.3 1% |
| Total Average (Program / Settings) | 1% /
6% | -126% /
-74% | -24% /
10% | -15% /
9% | -22% /
-10% |
* ... smaller is better
Color space is approximately 59 percent and 91 percent of AdobeRGB and sRGB standards, respectively. High refresh rate panels for laptops have yet to match the same wide color spaces that certain IGZO or 4K UHD panels can provide.
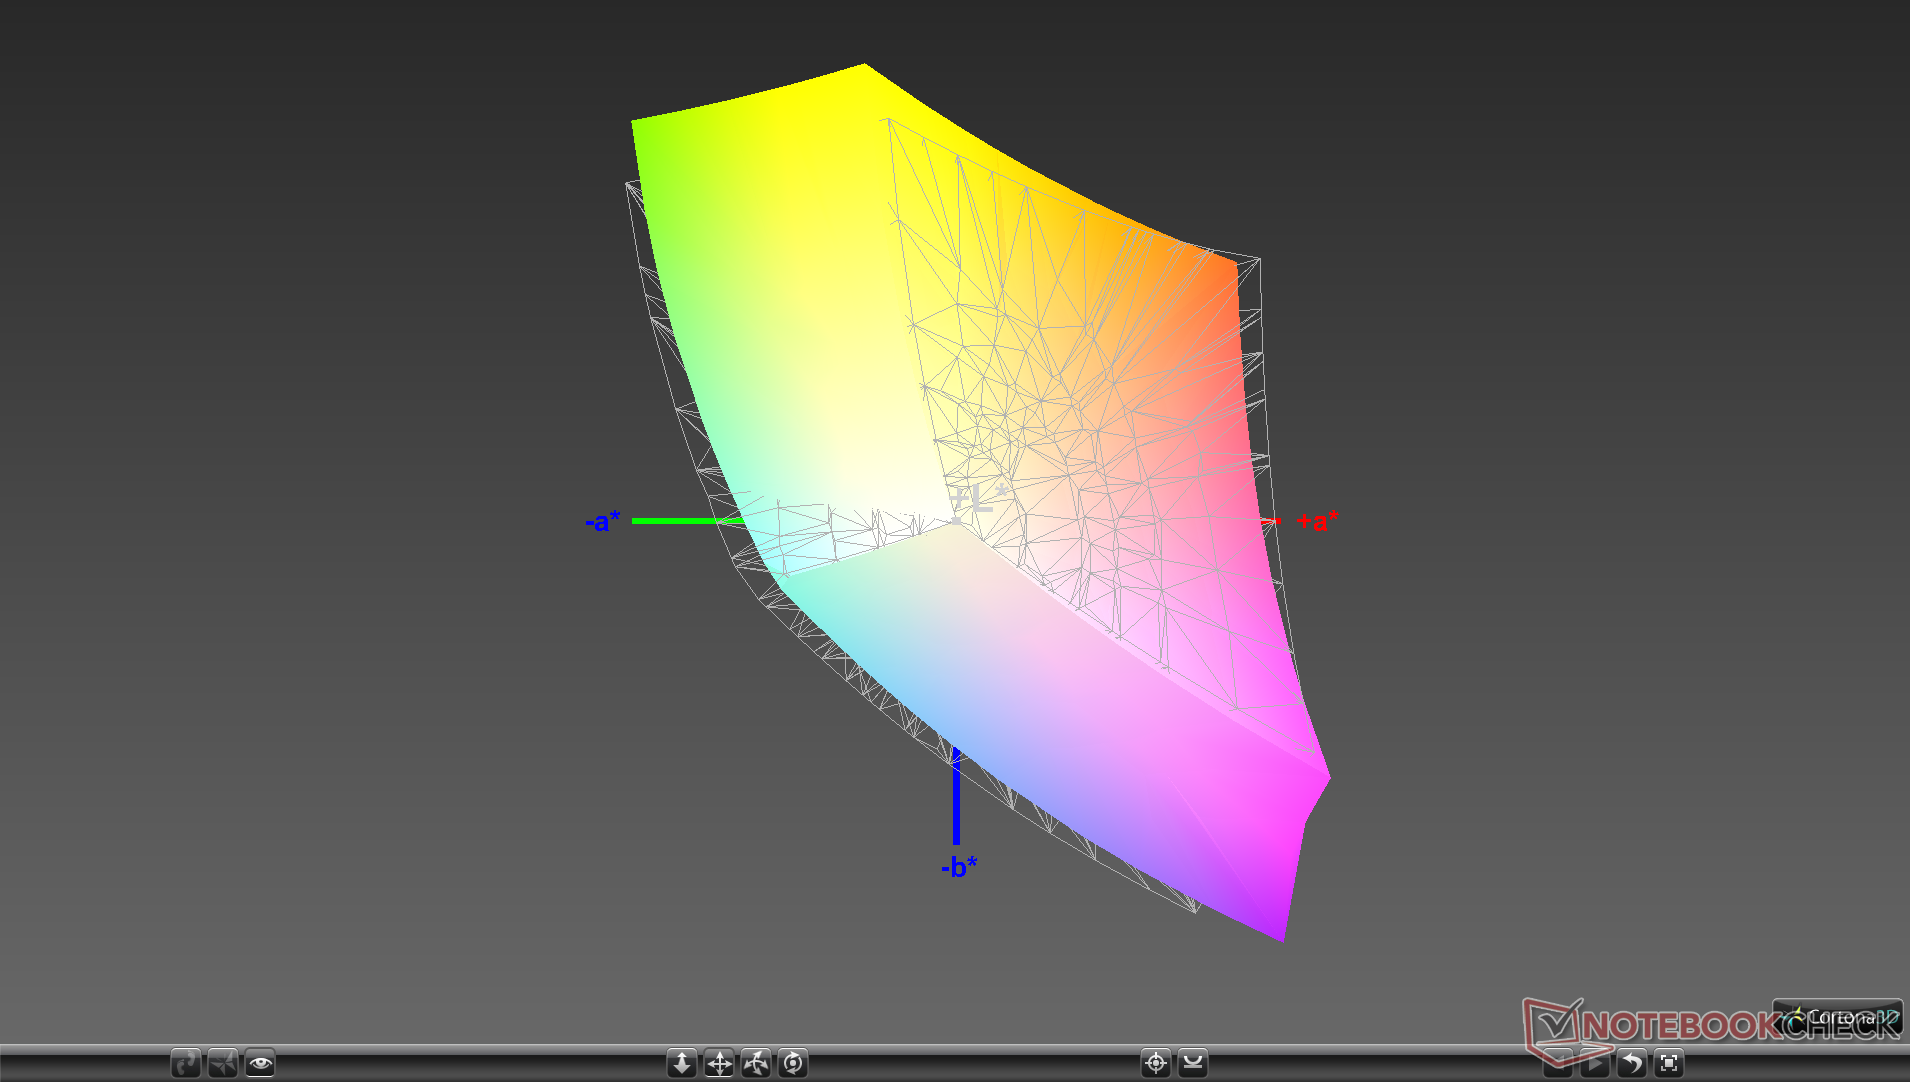
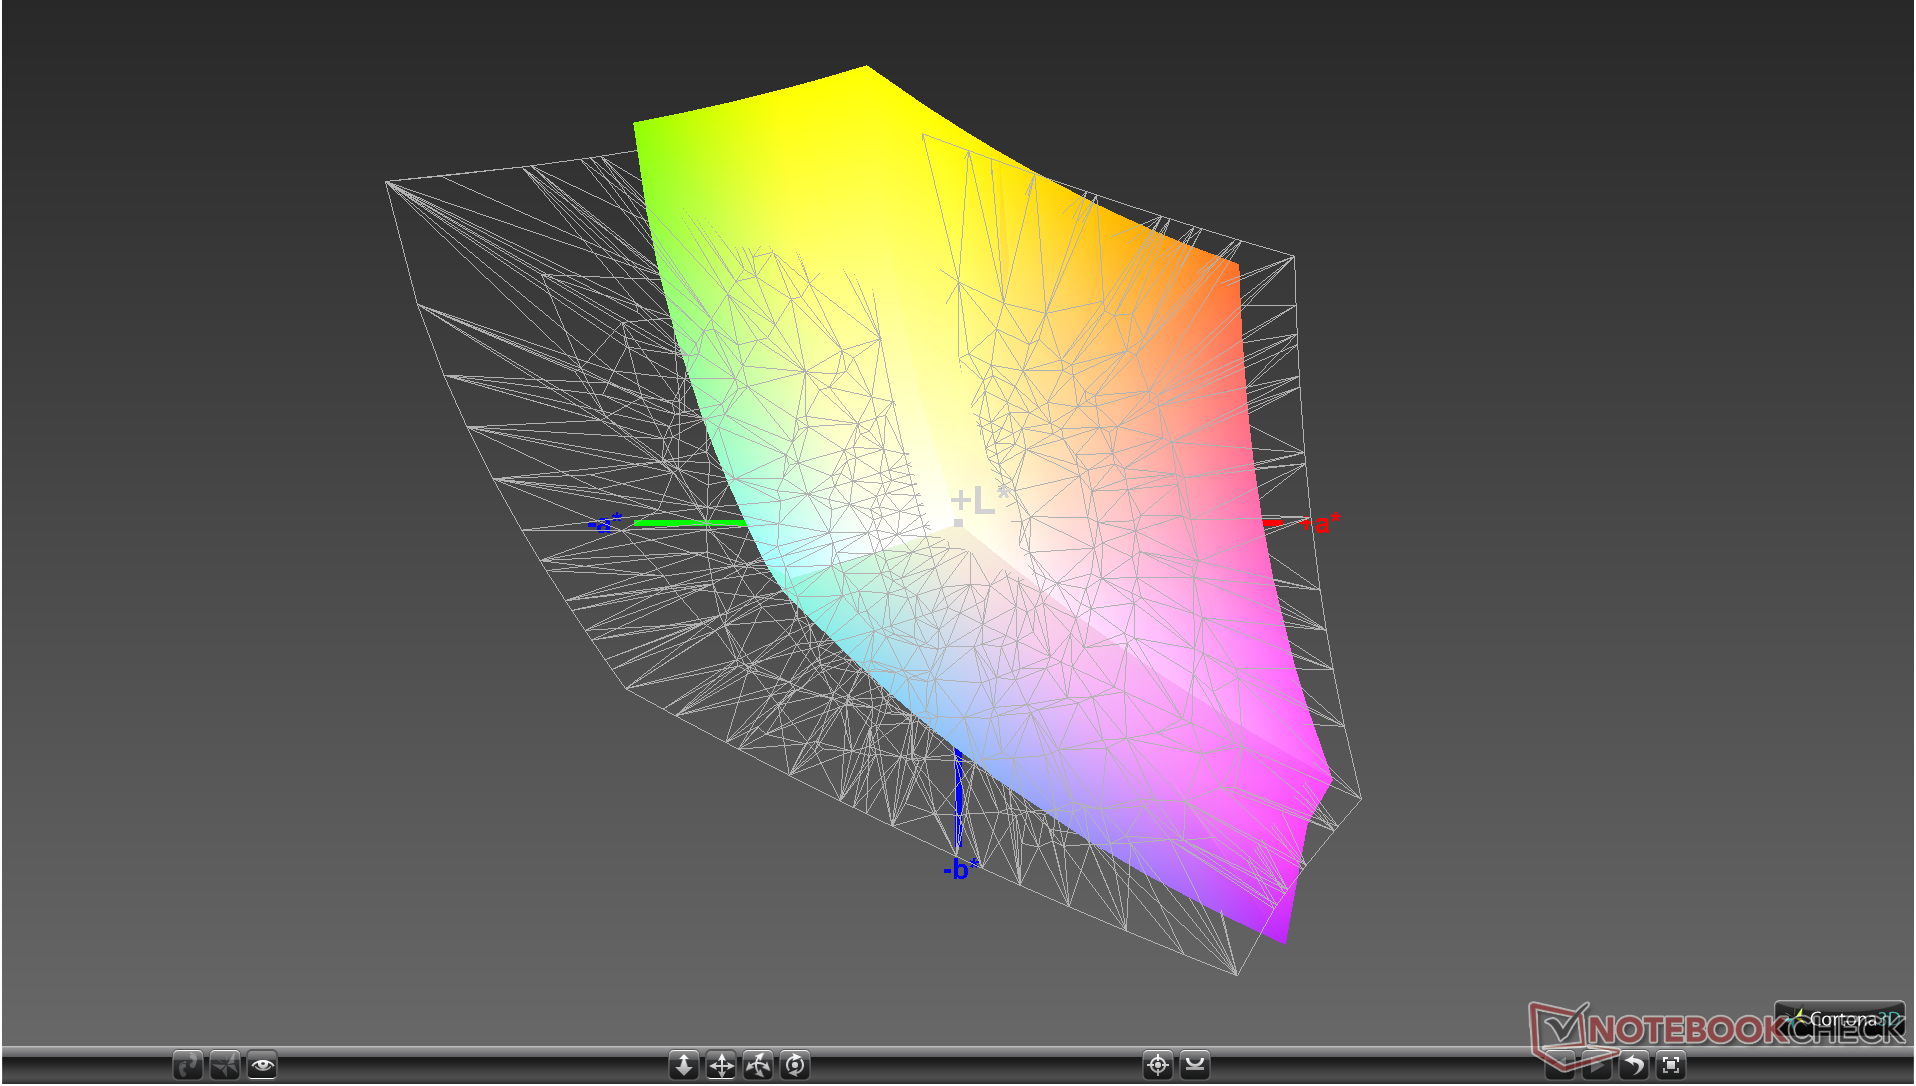
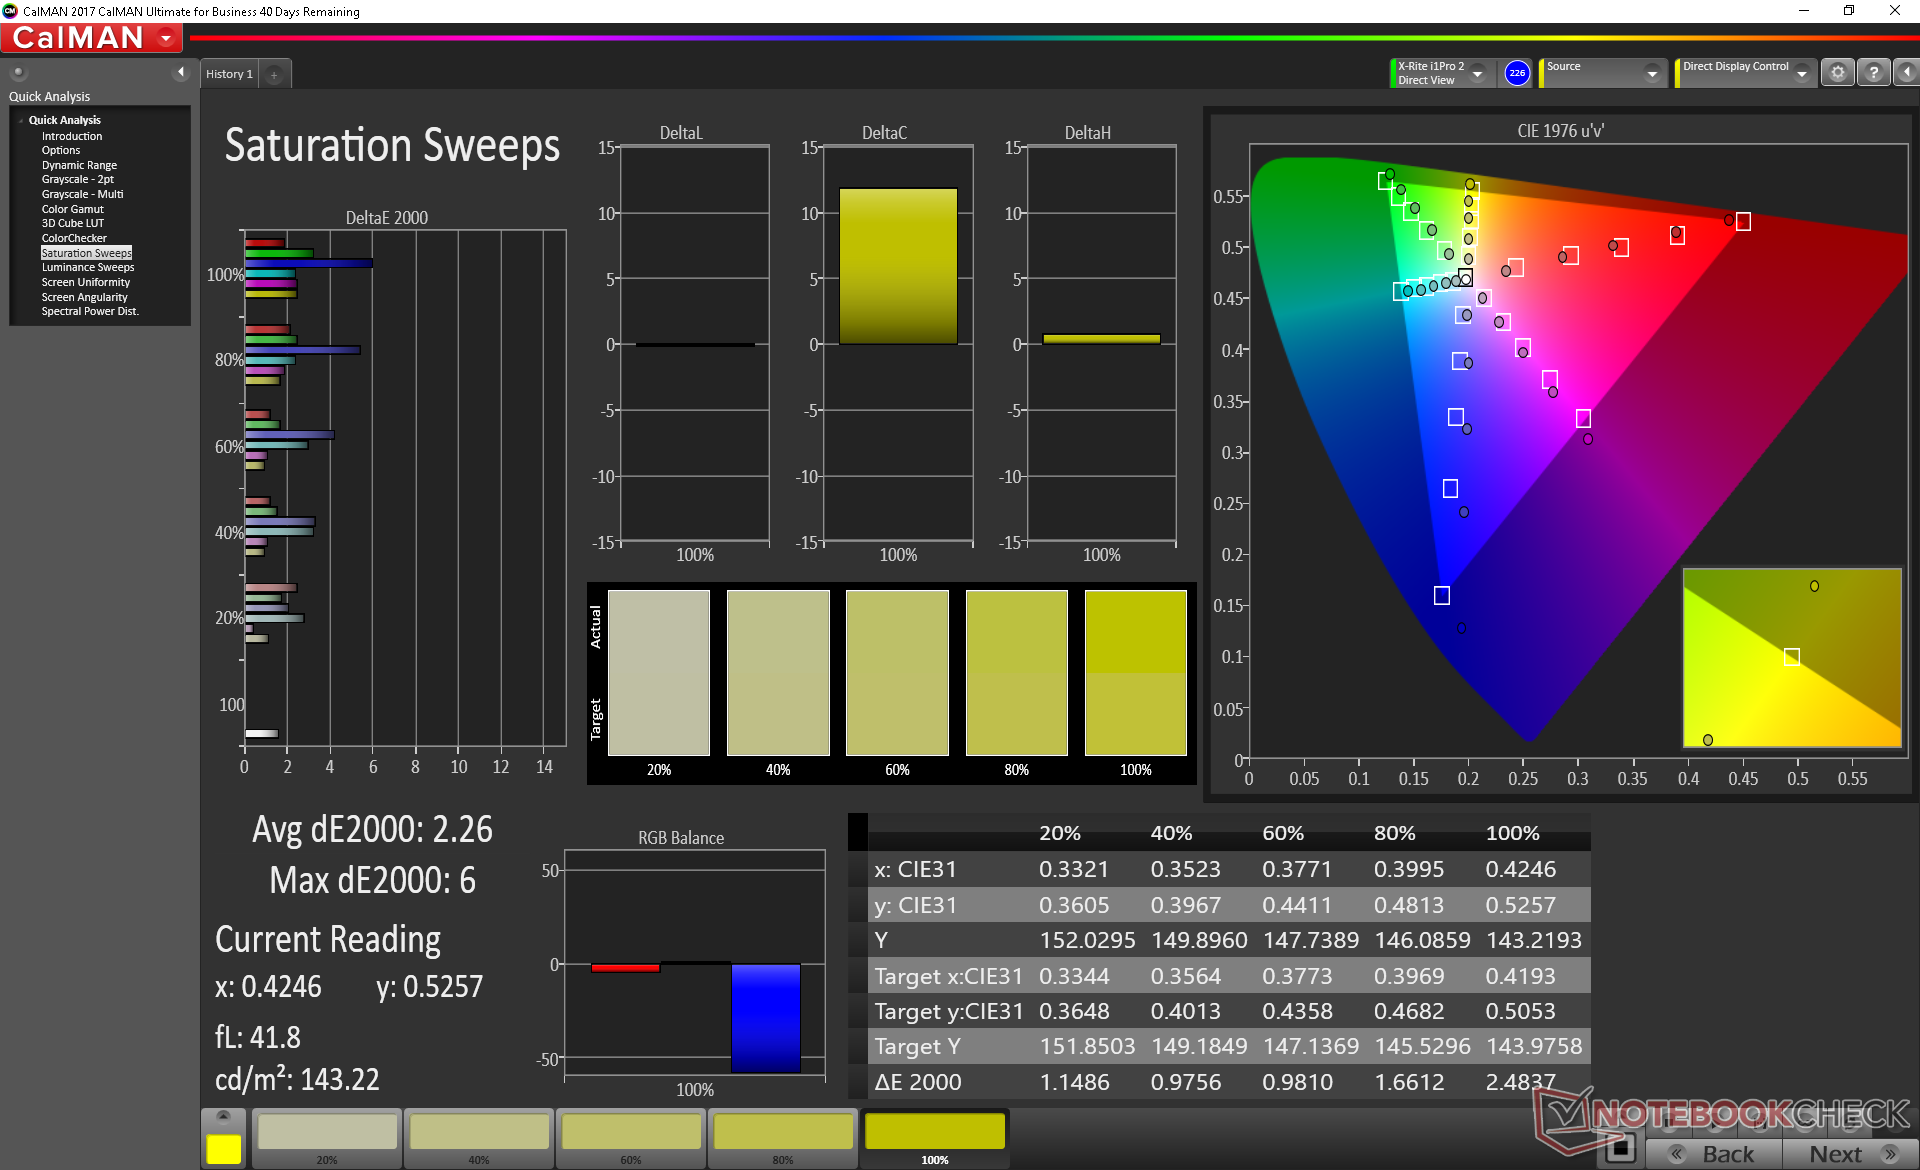
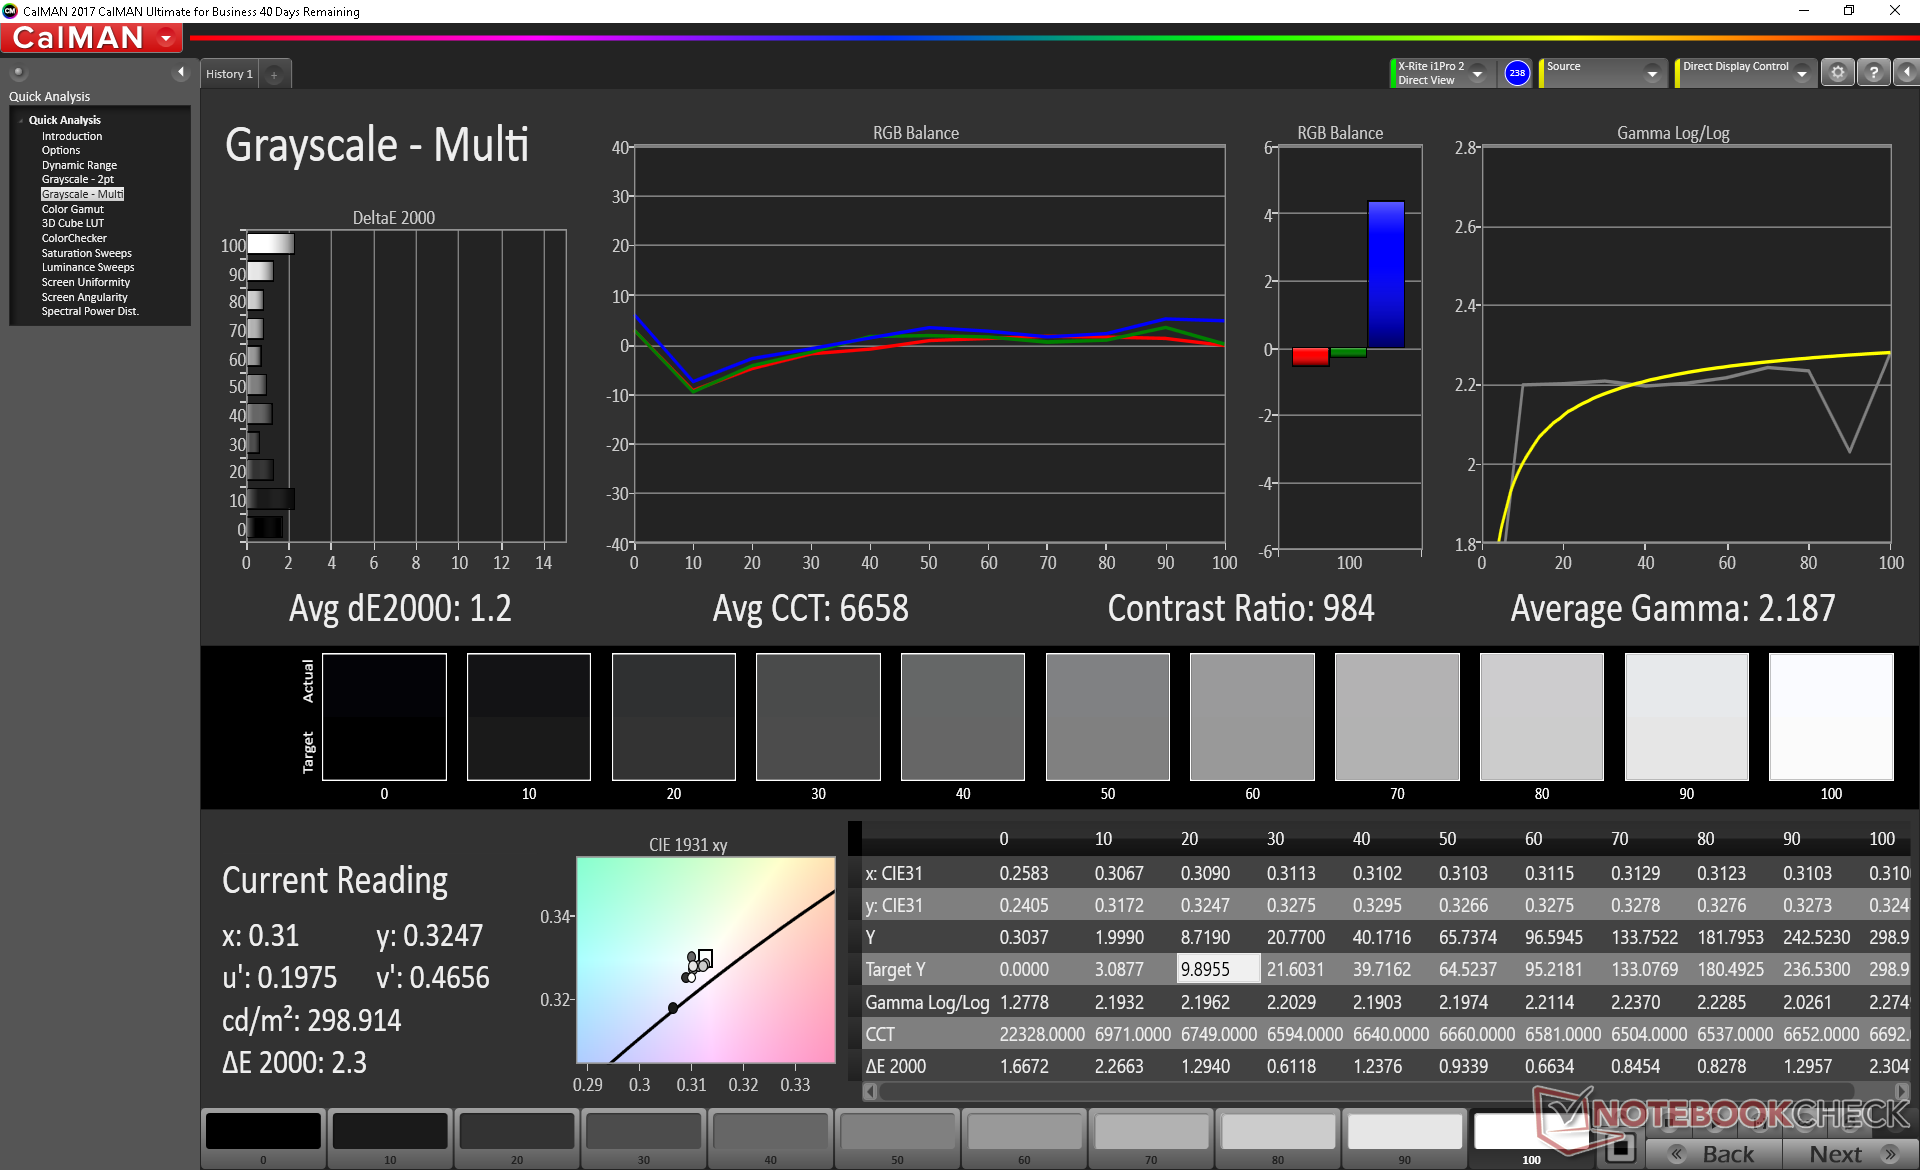
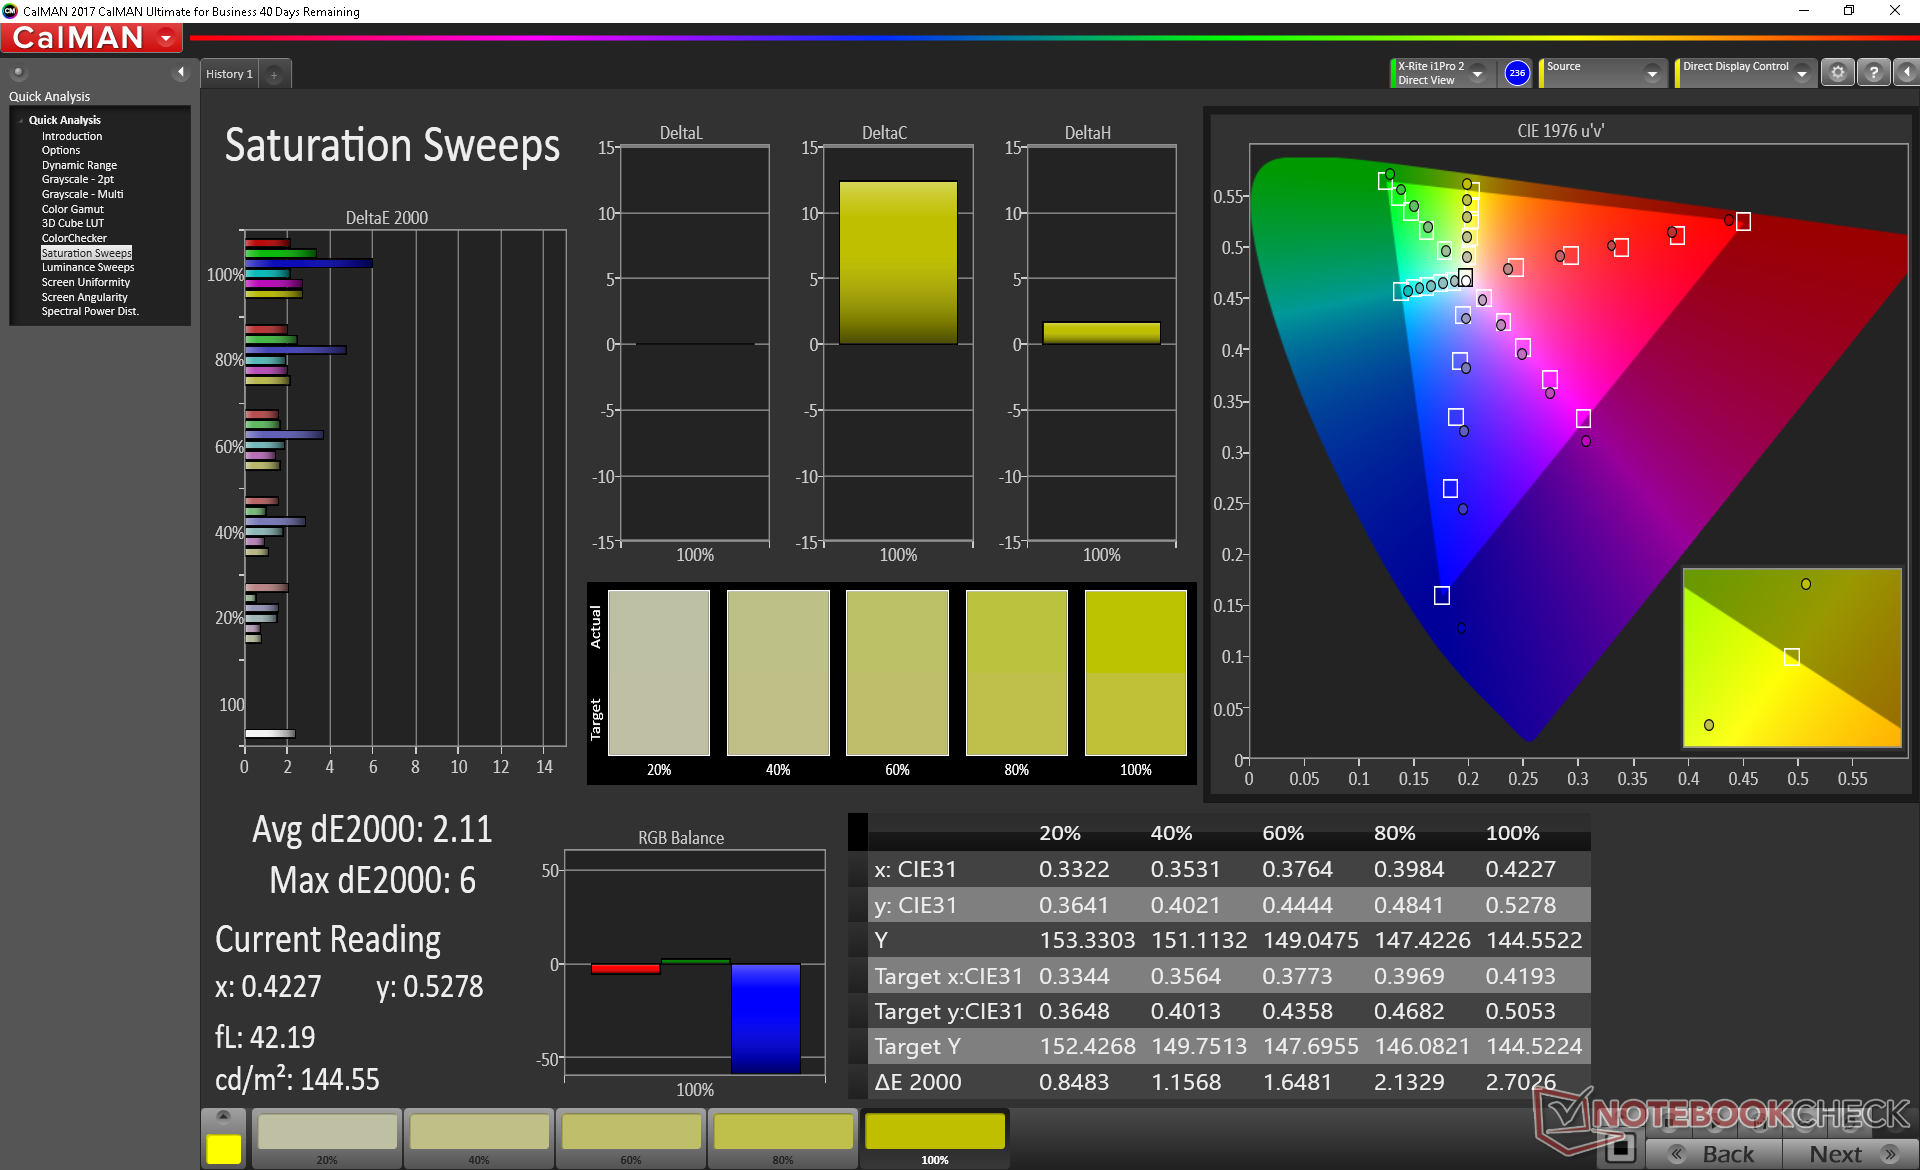
Further measurements with an X-Rite colorimeter show an accurate display out of the box. Color temperature is slightly on the warm side and RGB balance could be better, but our independent calibration addresses both.

Display Response Times
| ↔ Response Time Black to White | ||
|---|---|---|
| 8.8 ms ... rise ↗ and fall ↘ combined | ↗ 4.4 ms rise | 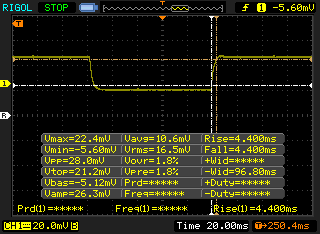 |
| ↘ 4.4 ms fall | ||
| The screen shows fast response rates in our tests and should be suited for gaming. In comparison, all tested devices range from 0.1 (minimum) to 240 (maximum) ms. » 24 % of all devices are better. This means that the measured response time is better than the average of all tested devices (19.9 ms). | ||
| ↔ Response Time 50% Grey to 80% Grey | ||
| 6.4 ms ... rise ↗ and fall ↘ combined | ↗ 3.4 ms rise | 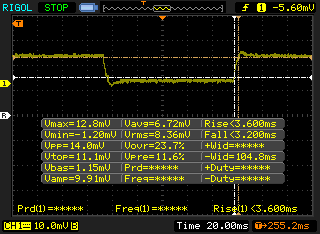 |
| ↘ 3 ms fall | ||
| The screen shows very fast response rates in our tests and should be very well suited for fast-paced gaming. In comparison, all tested devices range from 0.165 (minimum) to 636 (maximum) ms. » 19 % of all devices are better. This means that the measured response time is better than the average of all tested devices (31.1 ms). | ||
Screen Flickering / PWM (Pulse-Width Modulation)
| Screen flickering / PWM not detected | 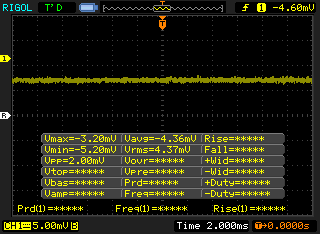 | ||
In comparison: 52 % of all tested devices do not use PWM to dim the display. If PWM was detected, an average of 7794 (minimum: 5 - maximum: 343500) Hz was measured. | |||
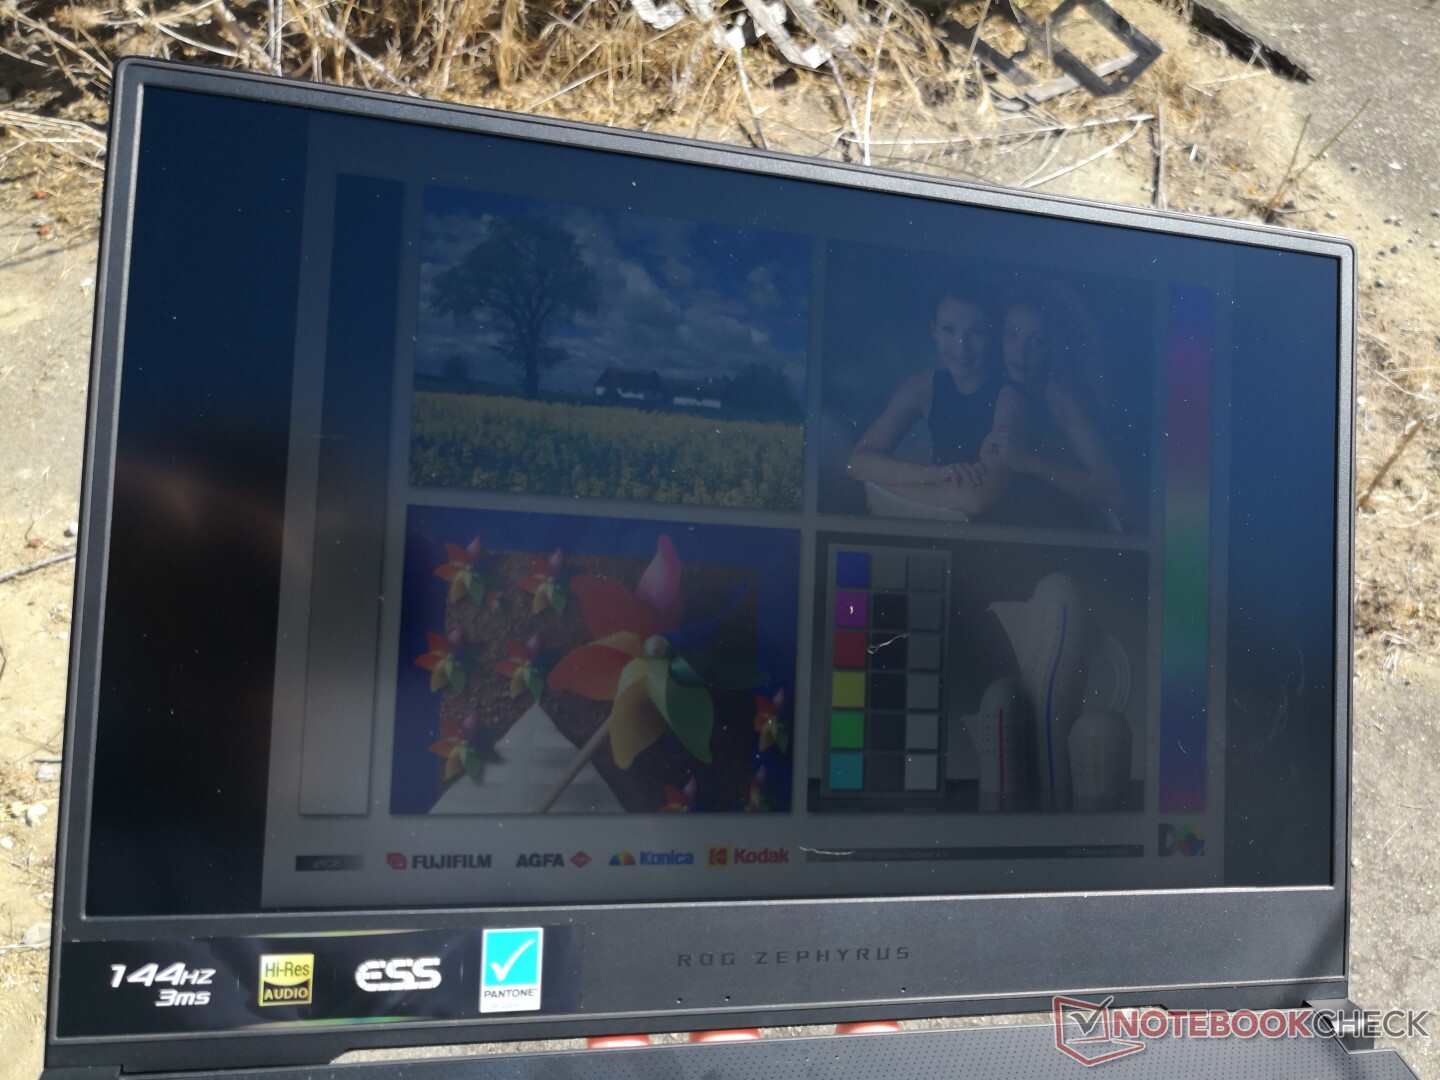
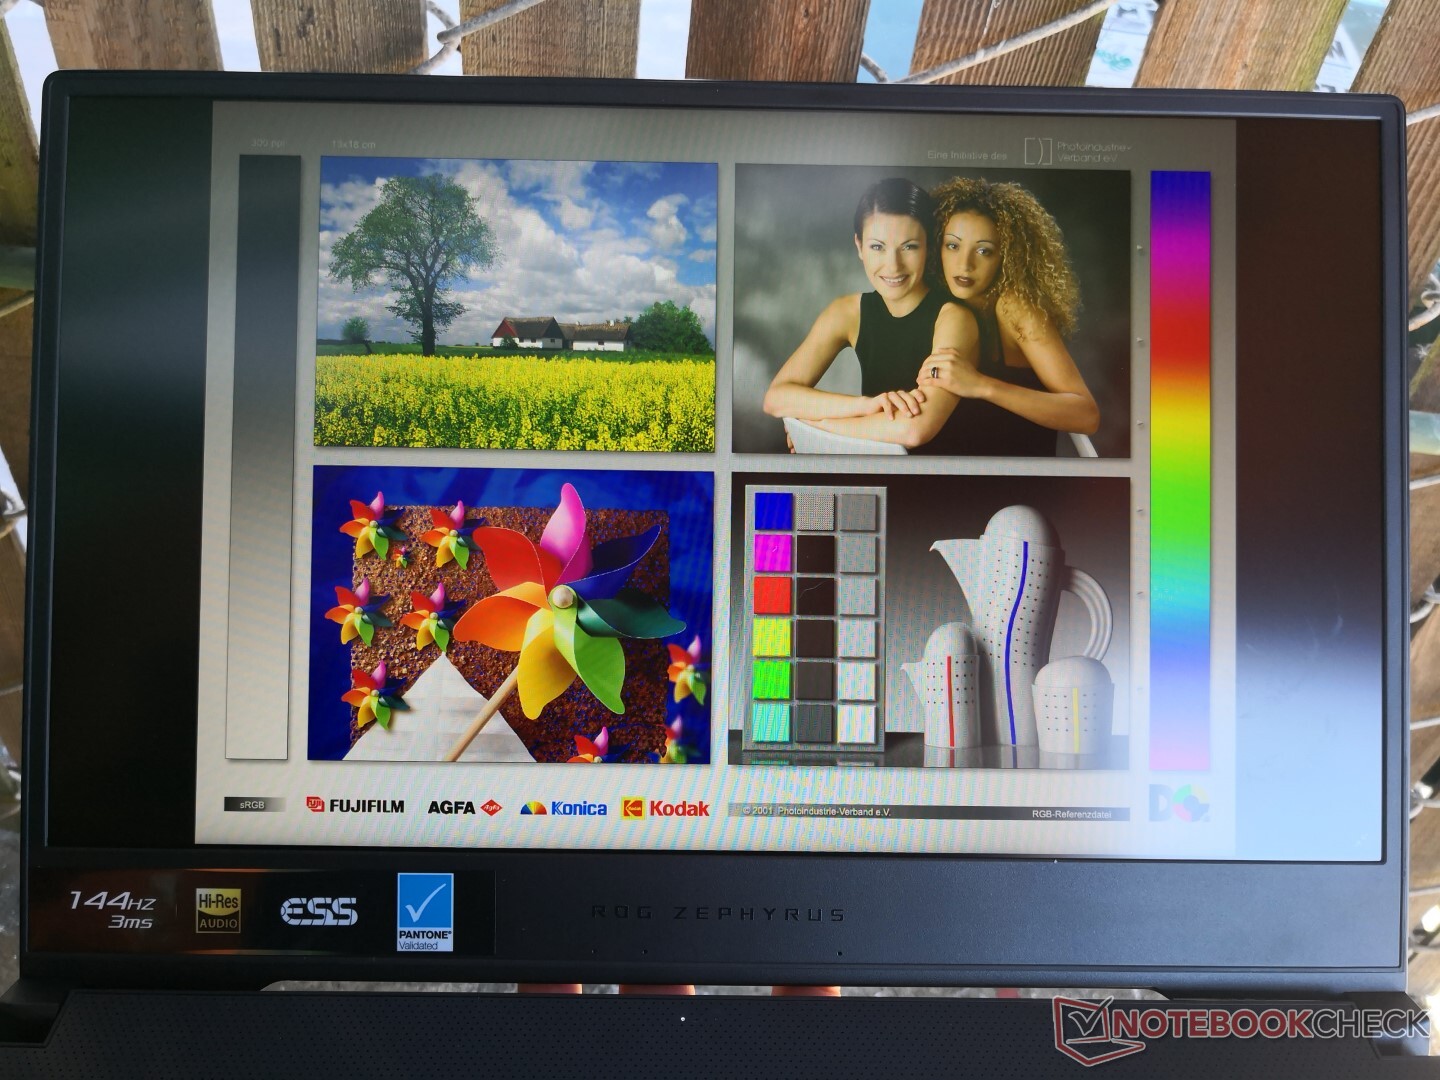
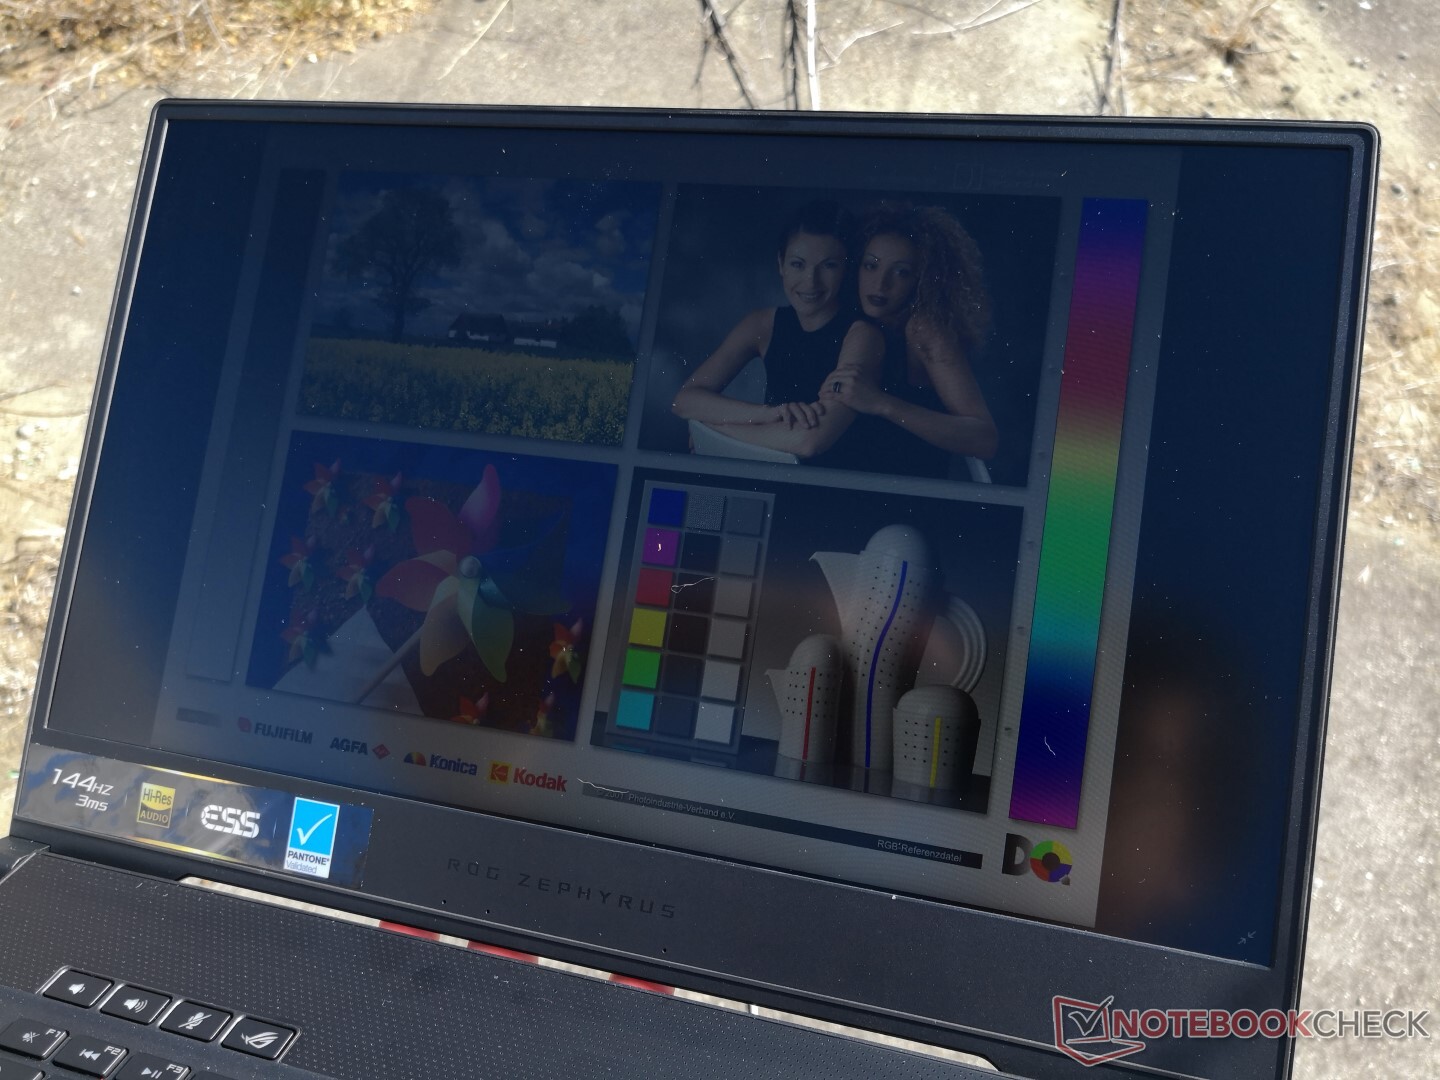
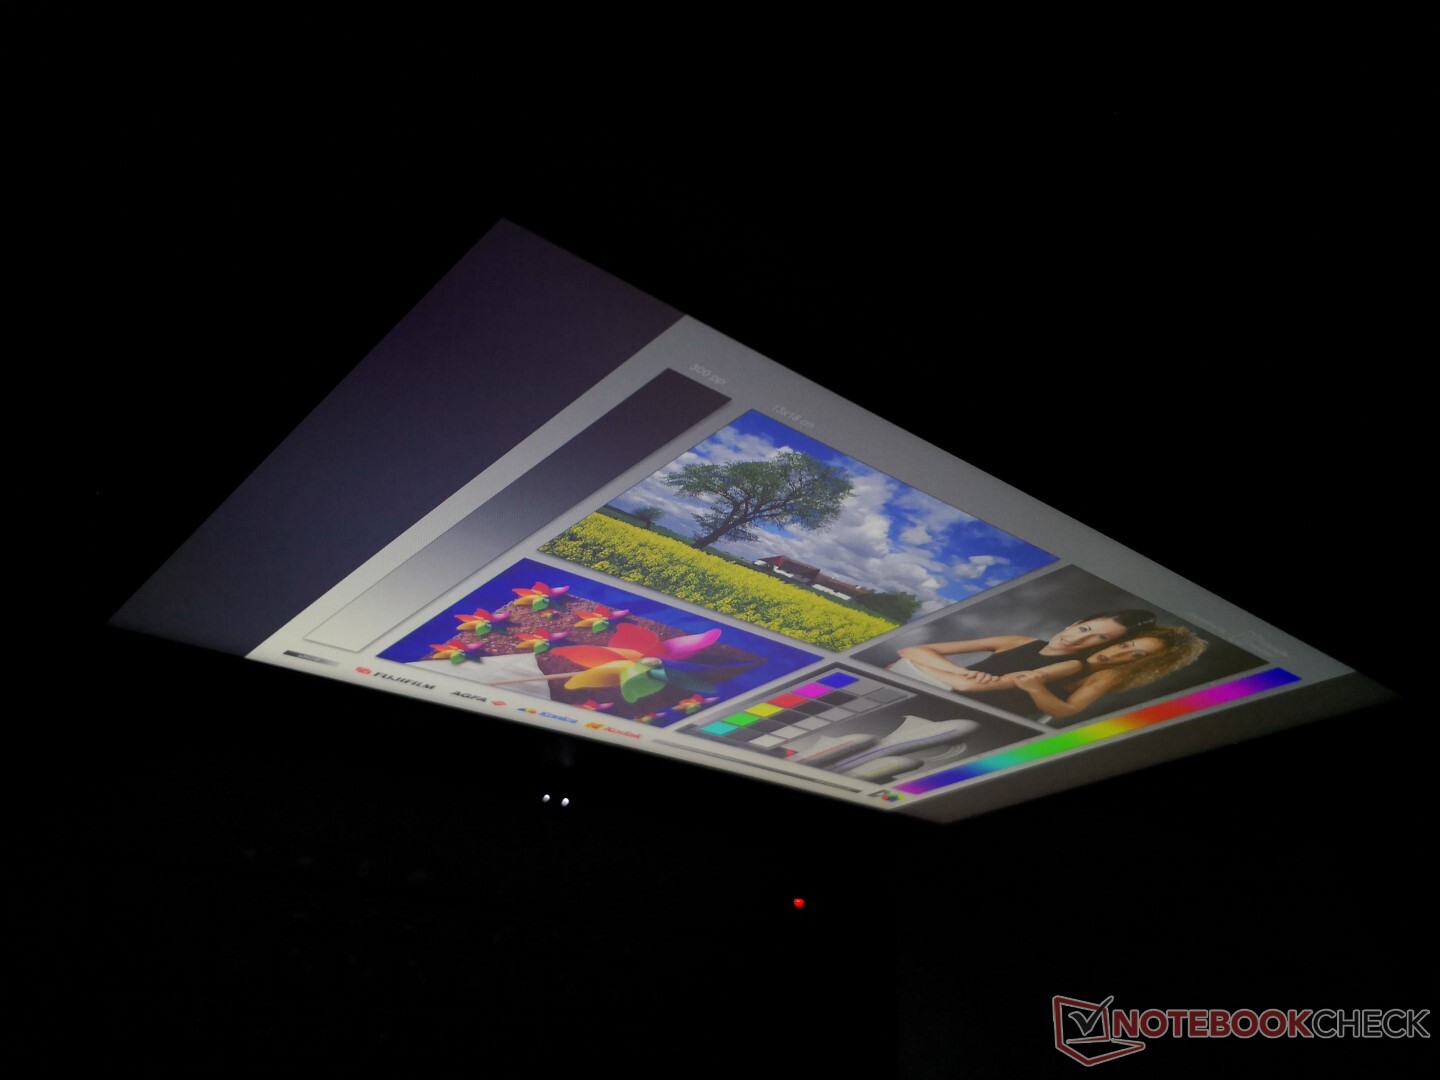
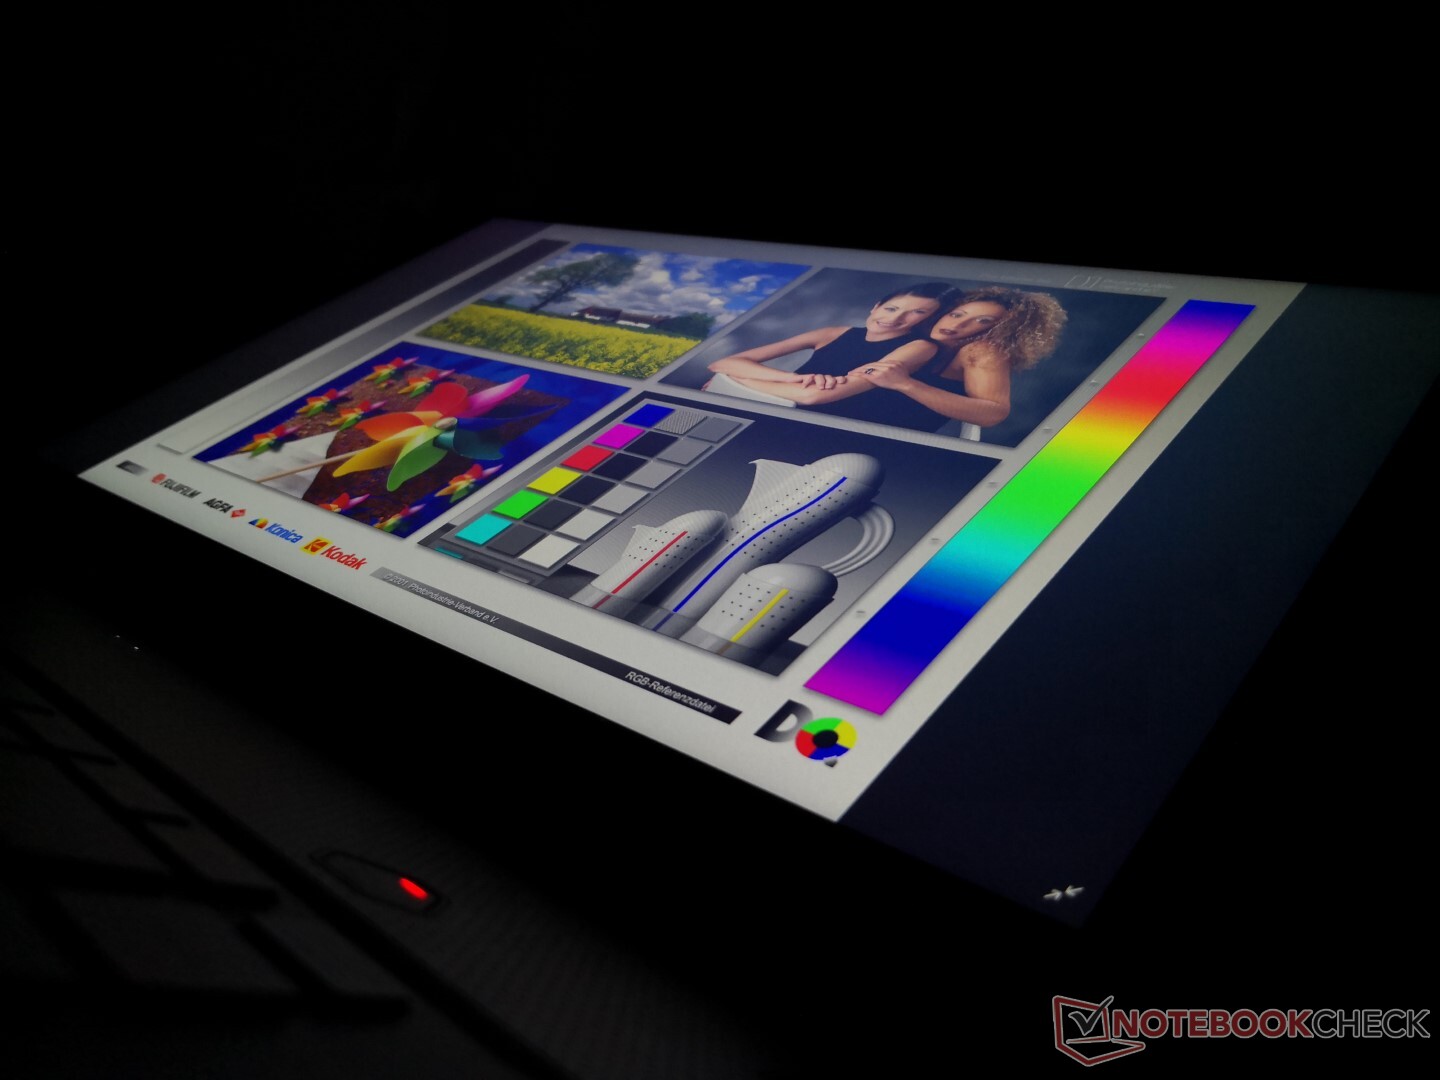
Outdoor visibility and viewing angles are essentially the same as what we observed on the Zephyrus S GX502GW since Asus uses the same panels for both these models. It's recommended to work under shade whenever possible as sunlight will overwhelm the screen and wash out colors.
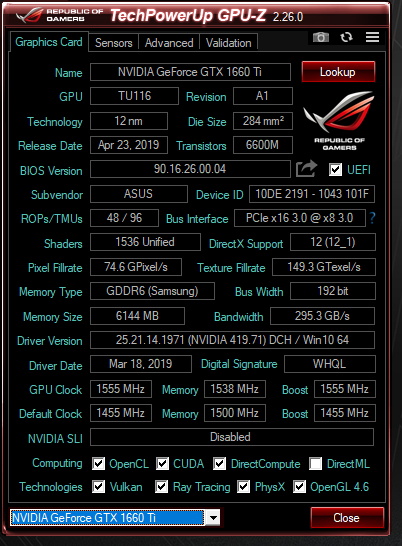
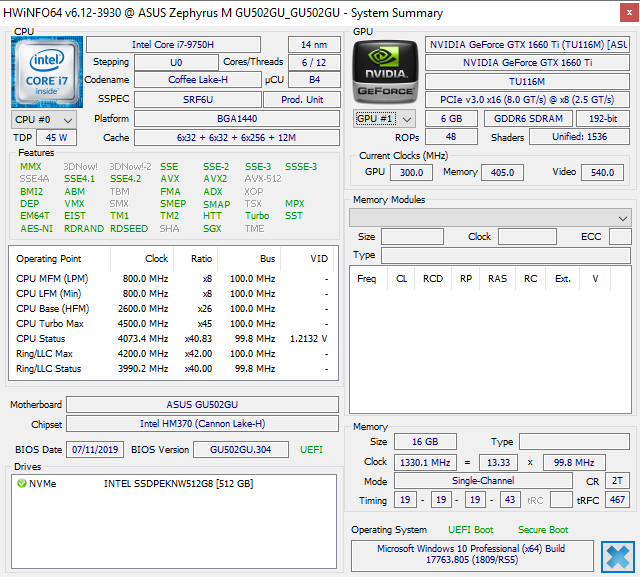
Performance - 9th Gen Coffee Lake-H with Mid-range Turing
The Core i7-9750H CPU and GTX 1660 Ti GPU target upper mainstream gamers in contrast to cheaper laptops with the slower Core i5-9300H, Ryzen 7 3750H, or GTX 1050/1650. You'll be able to play any game at native 1080p with most settings turned to High. For triple-digit frame rates or higher resolutions, however, the Zephyrus S or ROG G series would be better options since they offer graphics options up to the RTX 2080.
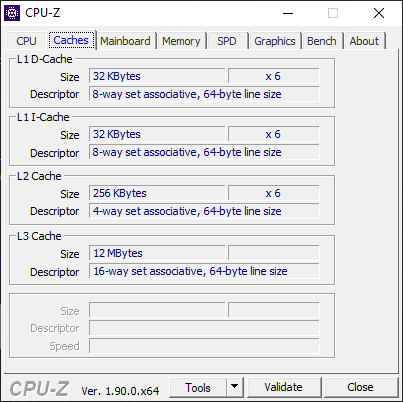
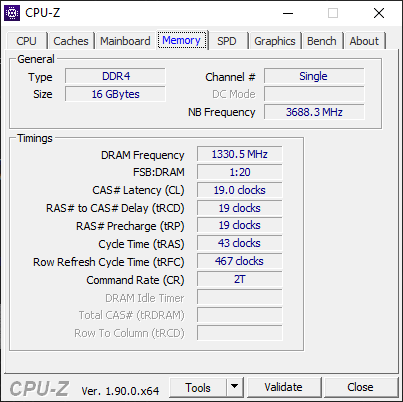
Note that 16 GB of DDR4-2666 RAM is soldered with one SODIMM expansion slot only. Thus, RAM will run in single-channel mode unless if the SODIMM slot is occupied.
Nvidia Optimus comes standard to automatically exclude G-Sync SKUs.
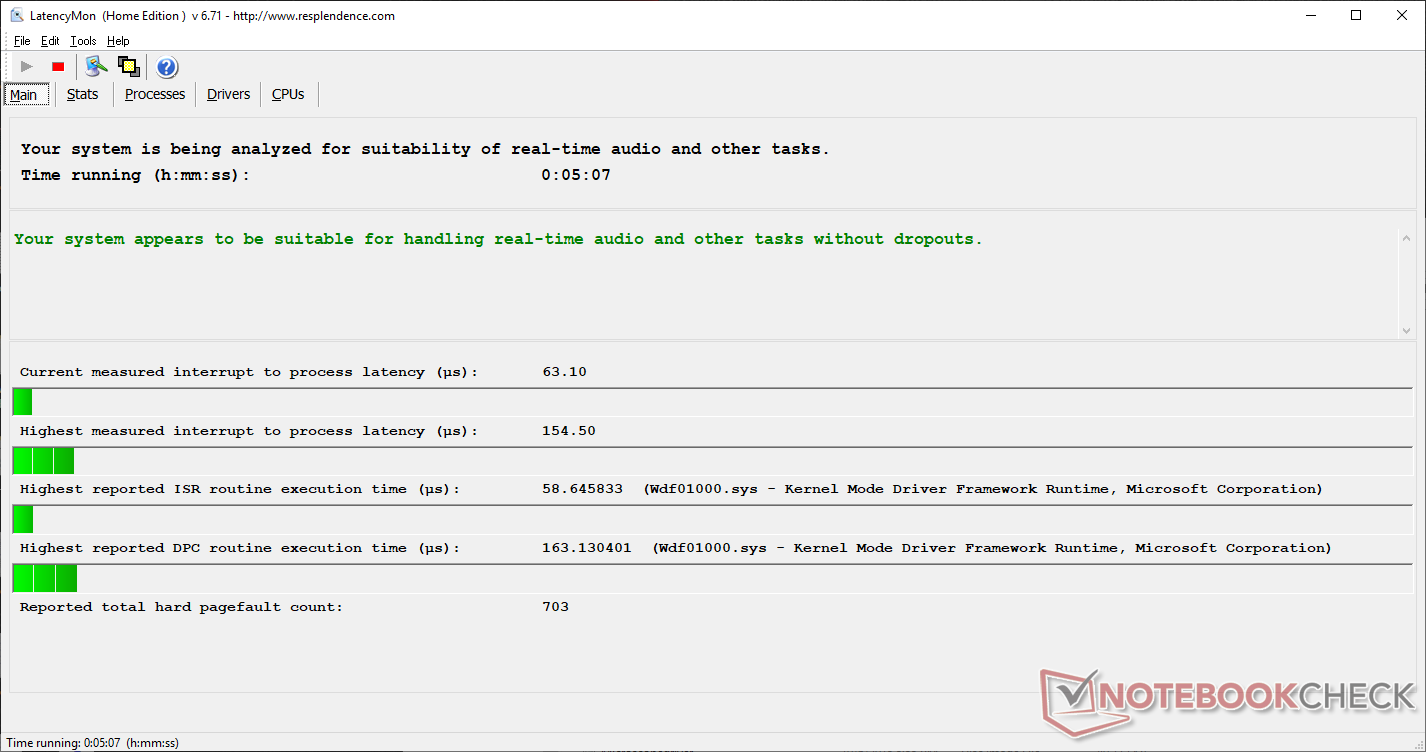
LatencyMon shows no DPC latency issues even when wireless is enabled.
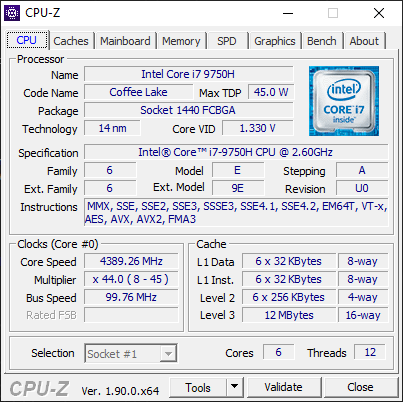
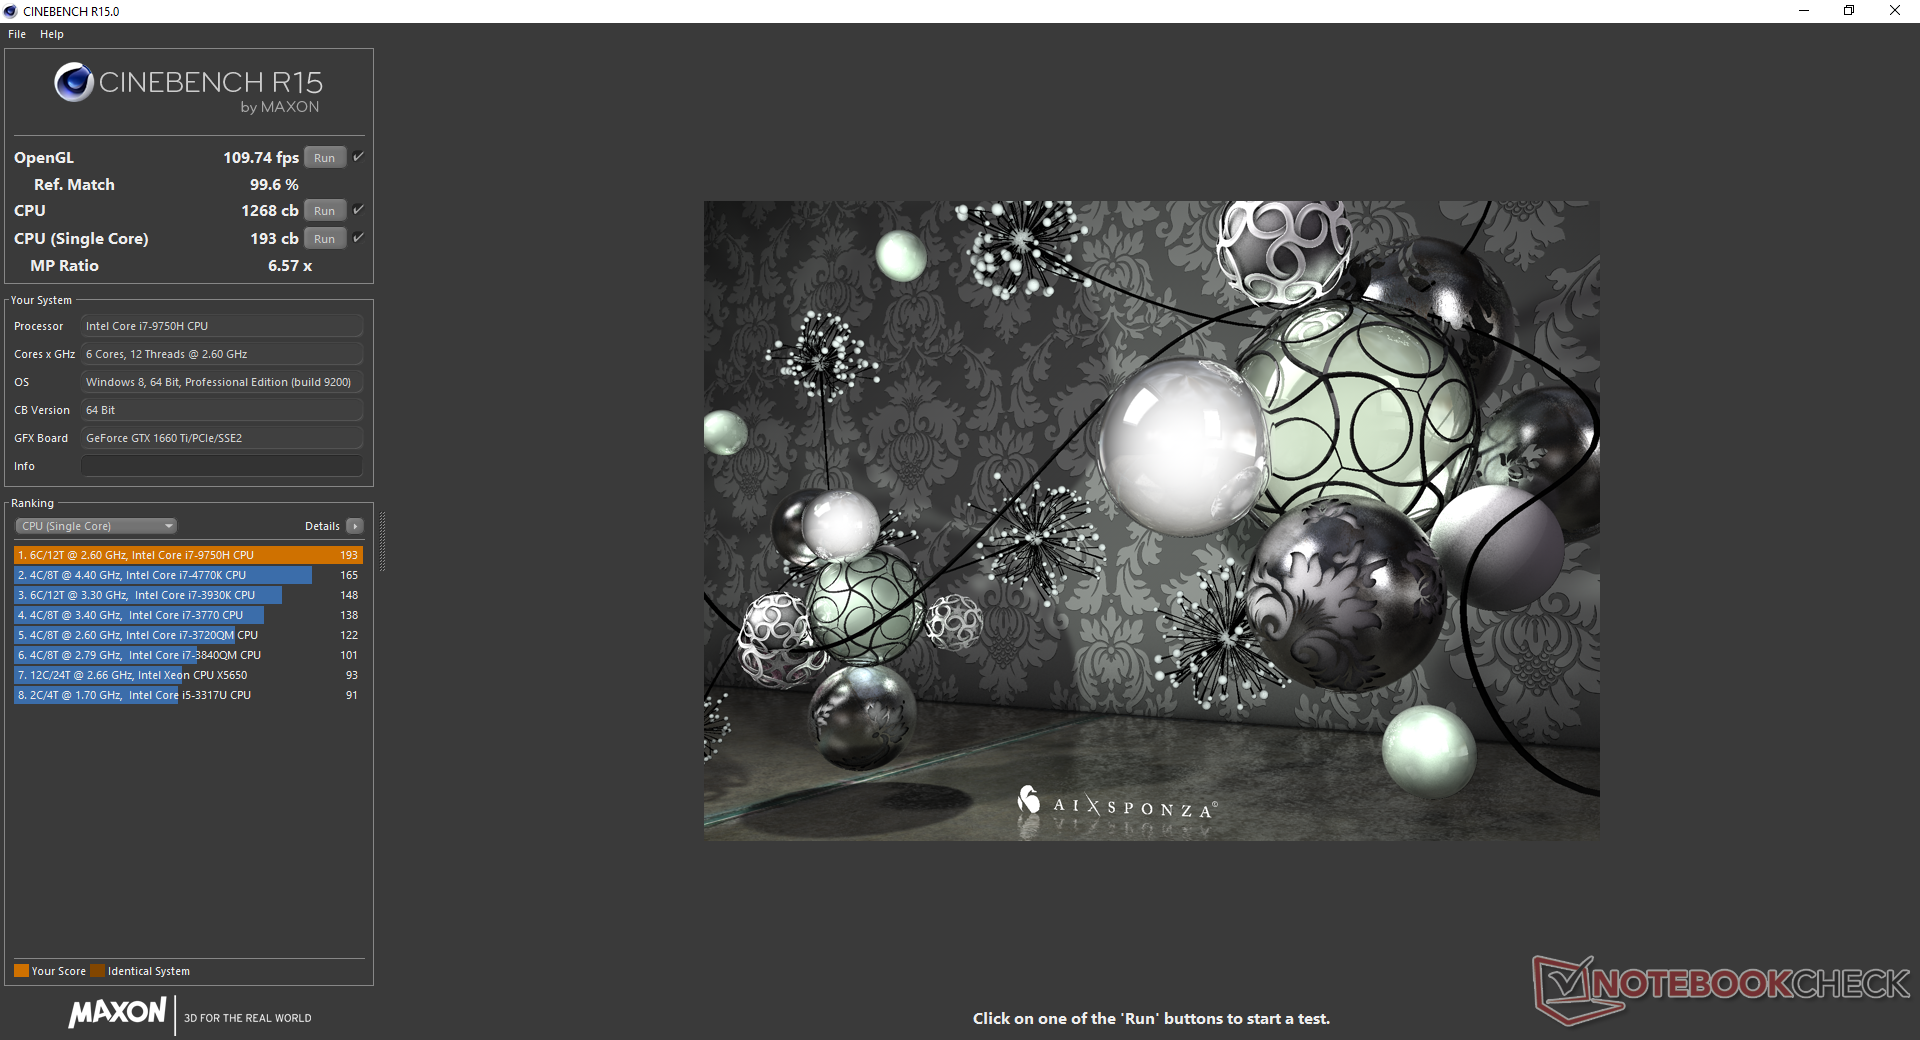
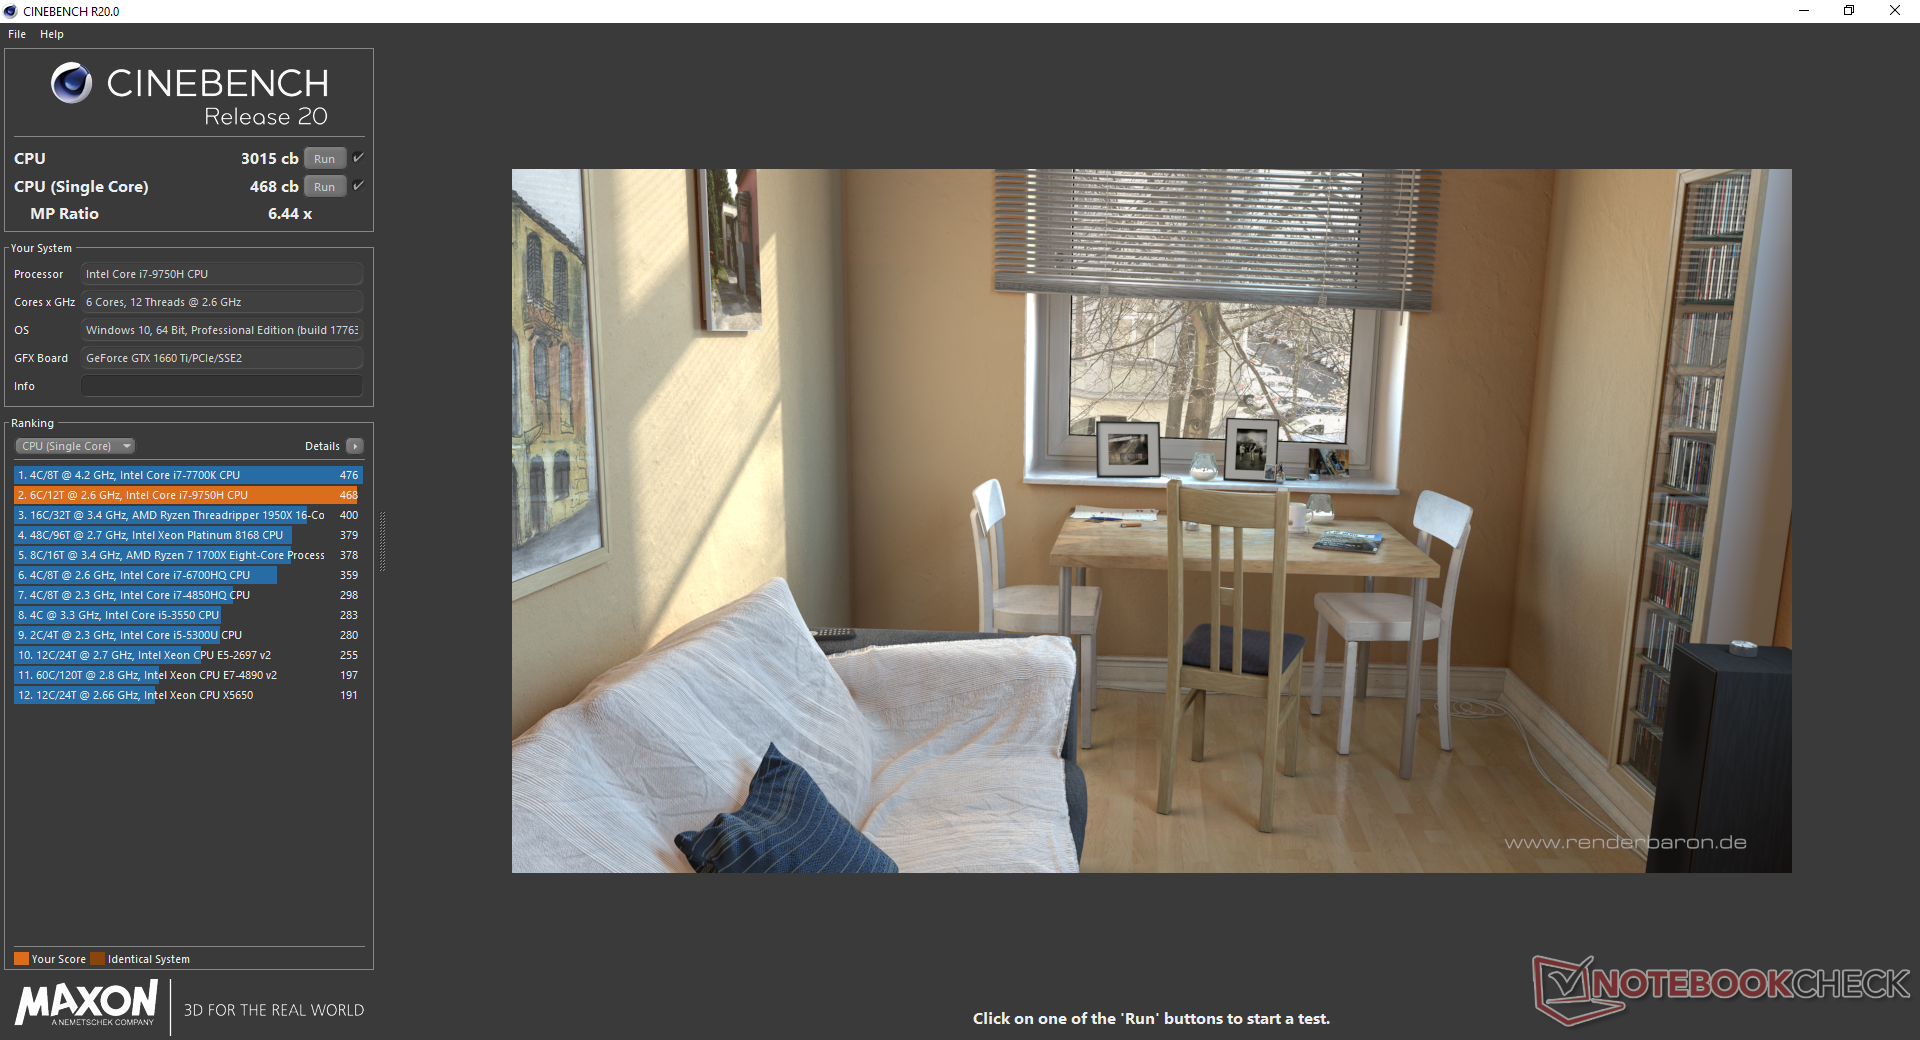
Processor - Maximum Turbo Boost Sustainability
We're already quite familiar with the Core i7-9750H since it's barely any better than the Core i7-8750H. However, we're surprised that the CPU in the GU502GU can sustain a higher level of Turbo Boost than most other laptops with the same or similar CPU. Our CineBench R15 Multi-Thread loop graph below shows stable scores throughout compared to the steeper drops that we observed on the MSI GF65 or Dell G7 17.
See our dedicated page on the Core i7-9750H for more technical information and benchmark comparisons.
System Performance
PCMark results are nearly identical to the Razer Blade 15 equipped with the same CPU and GPU. While we didn't experience any software or hardware glitches during our time with the unit, new owners should be prepared for the deluge of Asus pop-ups upon boot up.
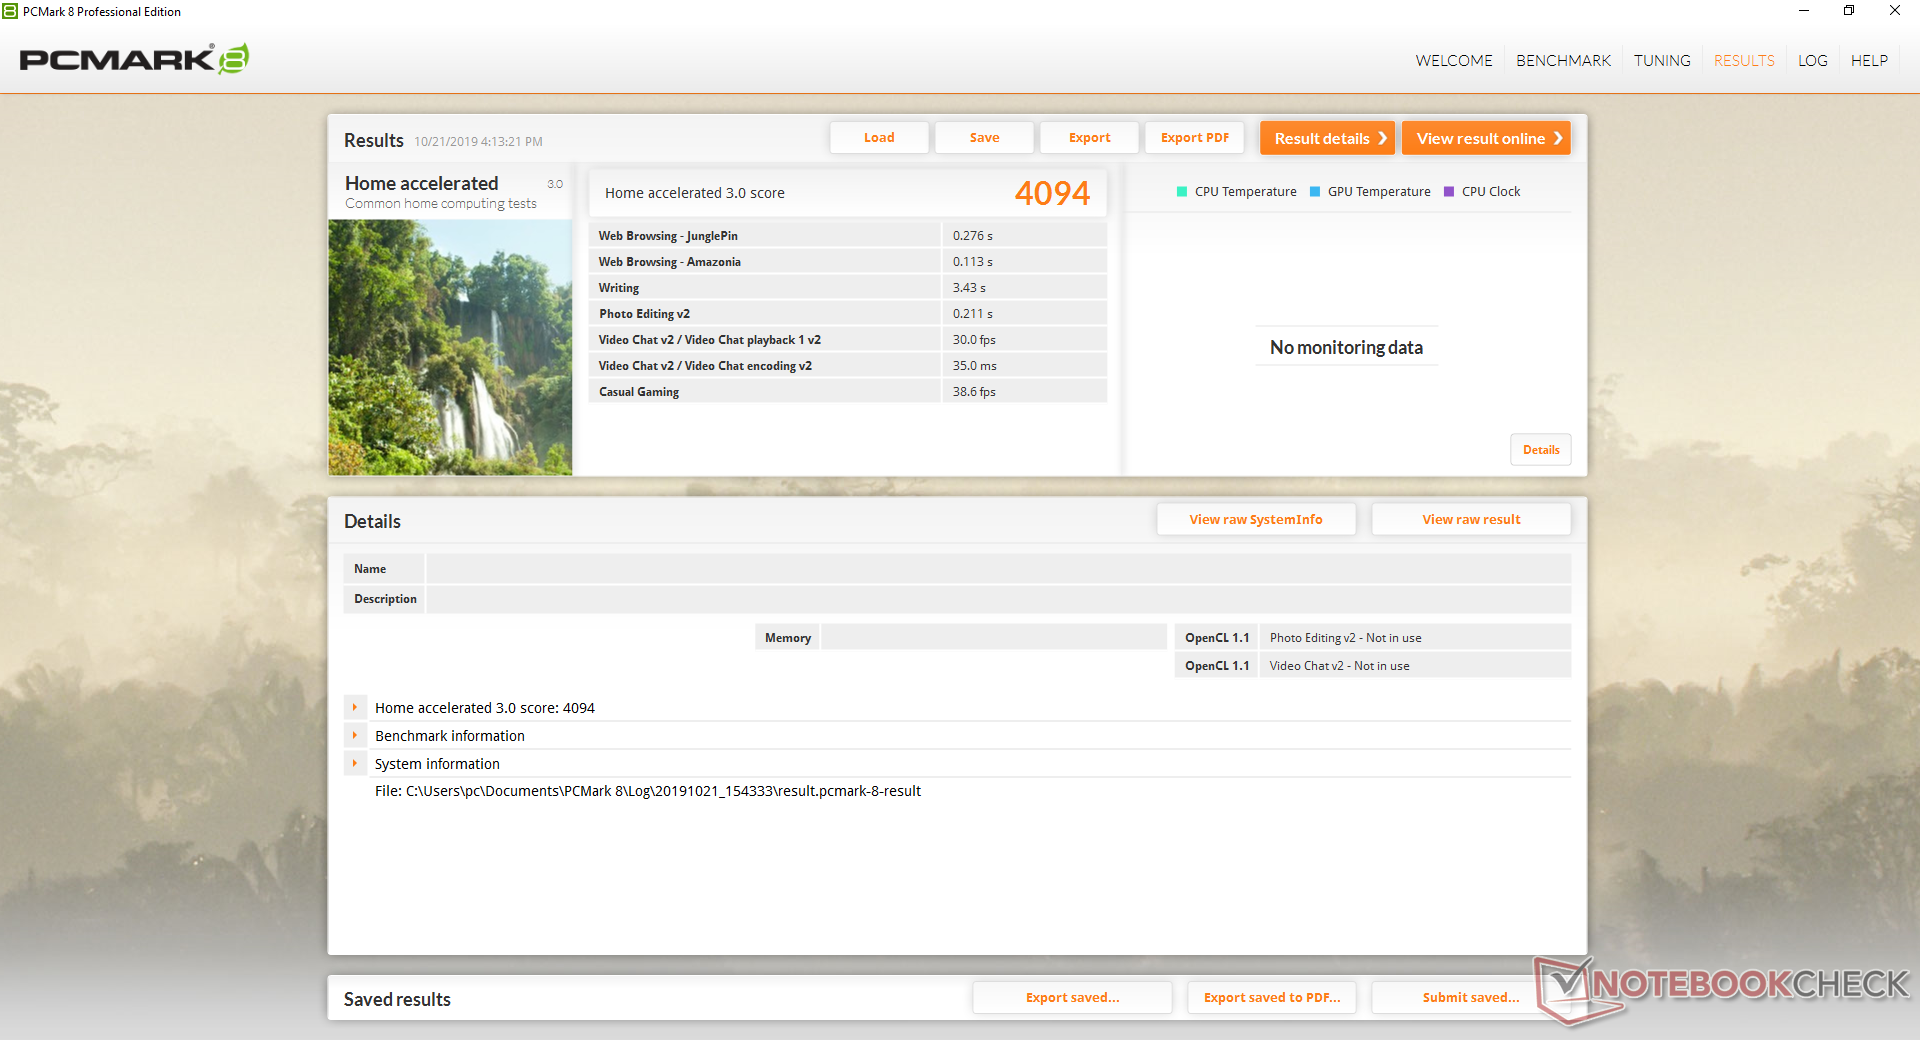
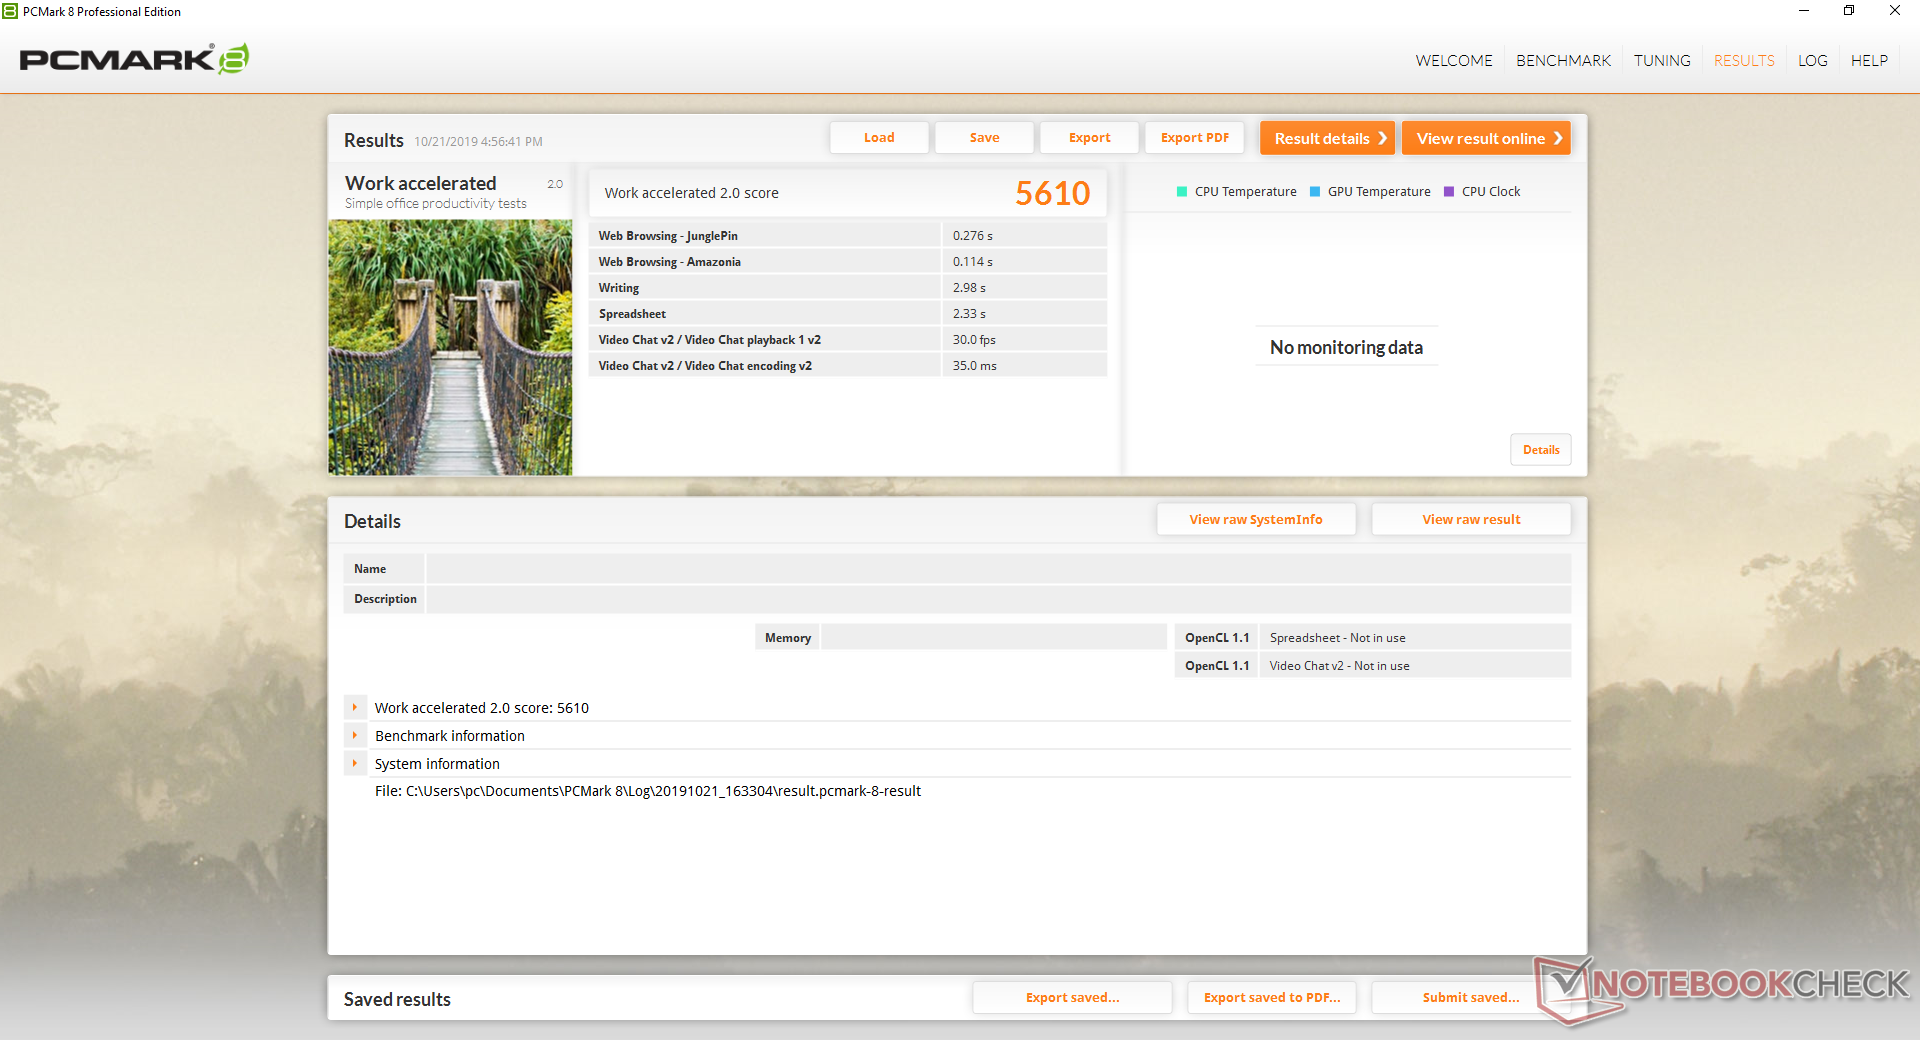
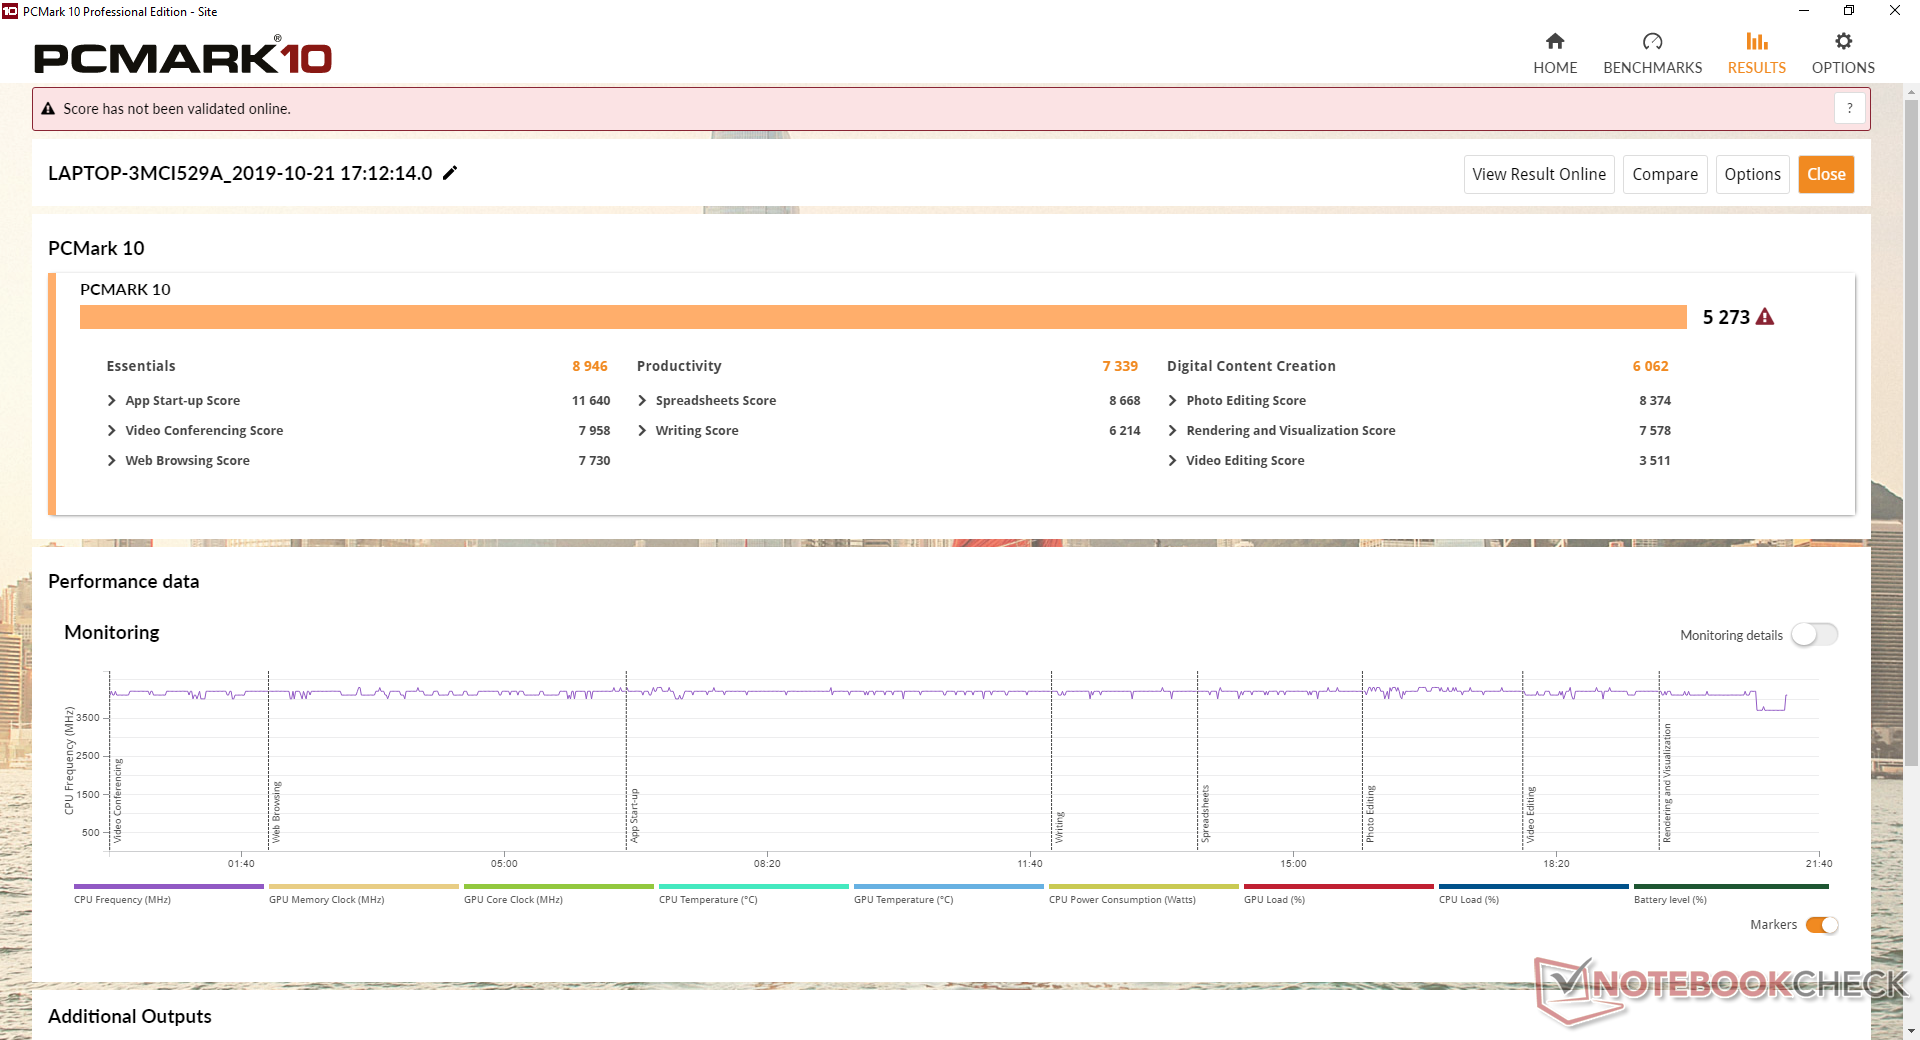
| PCMark 8 Home Score Accelerated v2 | 4094 points | |
| PCMark 8 Work Score Accelerated v2 | 5610 points | |
| PCMark 10 Score | 5273 points | |
Help | ||
Storage Devices - M.2 Only
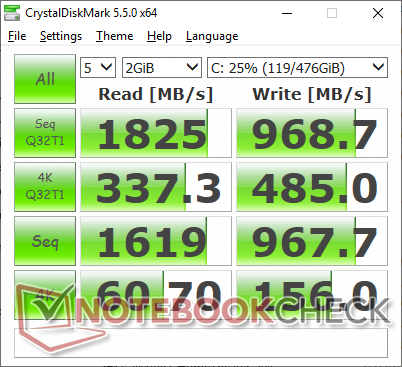
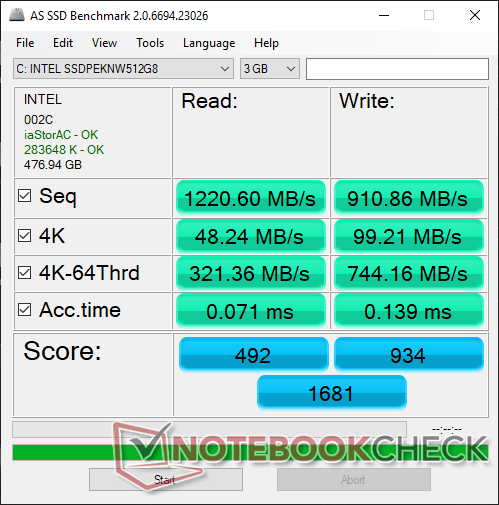
Two M.2 NVMe PCIe x4 slots are available with RAID 0 support. Our specific test unit comes with a 512 GB Intel SSD 660p SSDPEKNW512G8 which is the exact same drive as found on the Zephyrus S GX502GW and GX531GX. Still, different drives are possible depending on the region and reseller. Sequential read and write rates are good for a mid-range NVMe drive at approximately 1220 MB/s and 910 MB/s, respectively. Higher-end alternatives like the Samsung PM981 can offer sequential read rates approaching 2000 MB/s.
See our table of SSDs and HDDs for more benchmark comparisons.
| Asus ROG Zephyrus M15 GU502GU-XB74 Intel SSD 660p SSDPEKNW512G8 | Asus Zephyrus S GX502GW 2x Intel SSD 660p SSDPEKNW512G8 (RAID 0) | Asus Zephyrus S GX531GX Intel SSD 660p SSDPEKNW512G8 | Asus TUF FX505DT-EB73 Intel SSD 660p SSDPEKNW512G8 | Lenovo Legion Y740-15ICHg WDC PC SN520 SDAPMUW-128G | Razer Blade 15 GTX 1660 Ti Samsung SSD PM981 MZVLB256HAHQ | |
|---|---|---|---|---|---|---|
| CrystalDiskMark 5.2 / 6 | 27% | -18% | -9% | -29% | 24% | |
| Write 4K (MB/s) | 156 | 97 -38% | 93.9 -40% | 137.5 -12% | 134.2 -14% | 135 -13% |
| Read 4K (MB/s) | 60.7 | 49.58 -18% | 46.29 -24% | 57 -6% | 37.72 -38% | 41.1 -32% |
| Write Seq (MB/s) | 968 | 1838 90% | 974 1% | 984 2% | 389.2 -60% | 1427 47% |
| Read Seq (MB/s) | 1619 | 2421 50% | 1425 -12% | 1564 -3% | 1030 -36% | 1494 -8% |
| Write 4K Q32T1 (MB/s) | 485 | 326.9 -33% | 259.4 -47% | 237.4 -51% | 238.9 -51% | 494.9 2% |
| Read 4K Q32T1 (MB/s) | 337.3 | 372.9 11% | 296.5 -12% | 340.7 1% | 343.9 2% | 578 71% |
| Write Seq Q32T1 (MB/s) | 969 | 1894 95% | 977 1% | 959 -1% | 789 -19% | 1417 46% |
| Read Seq Q32T1 (MB/s) | 1825 | 2828 55% | 1666 -9% | 1732 -5% | 1502 -18% | 3251 78% |
| Write 4K Q8T8 (MB/s) | 293.4 | |||||
| Read 4K Q8T8 (MB/s) | 405.8 |

GPU Performance - Great for 1080p
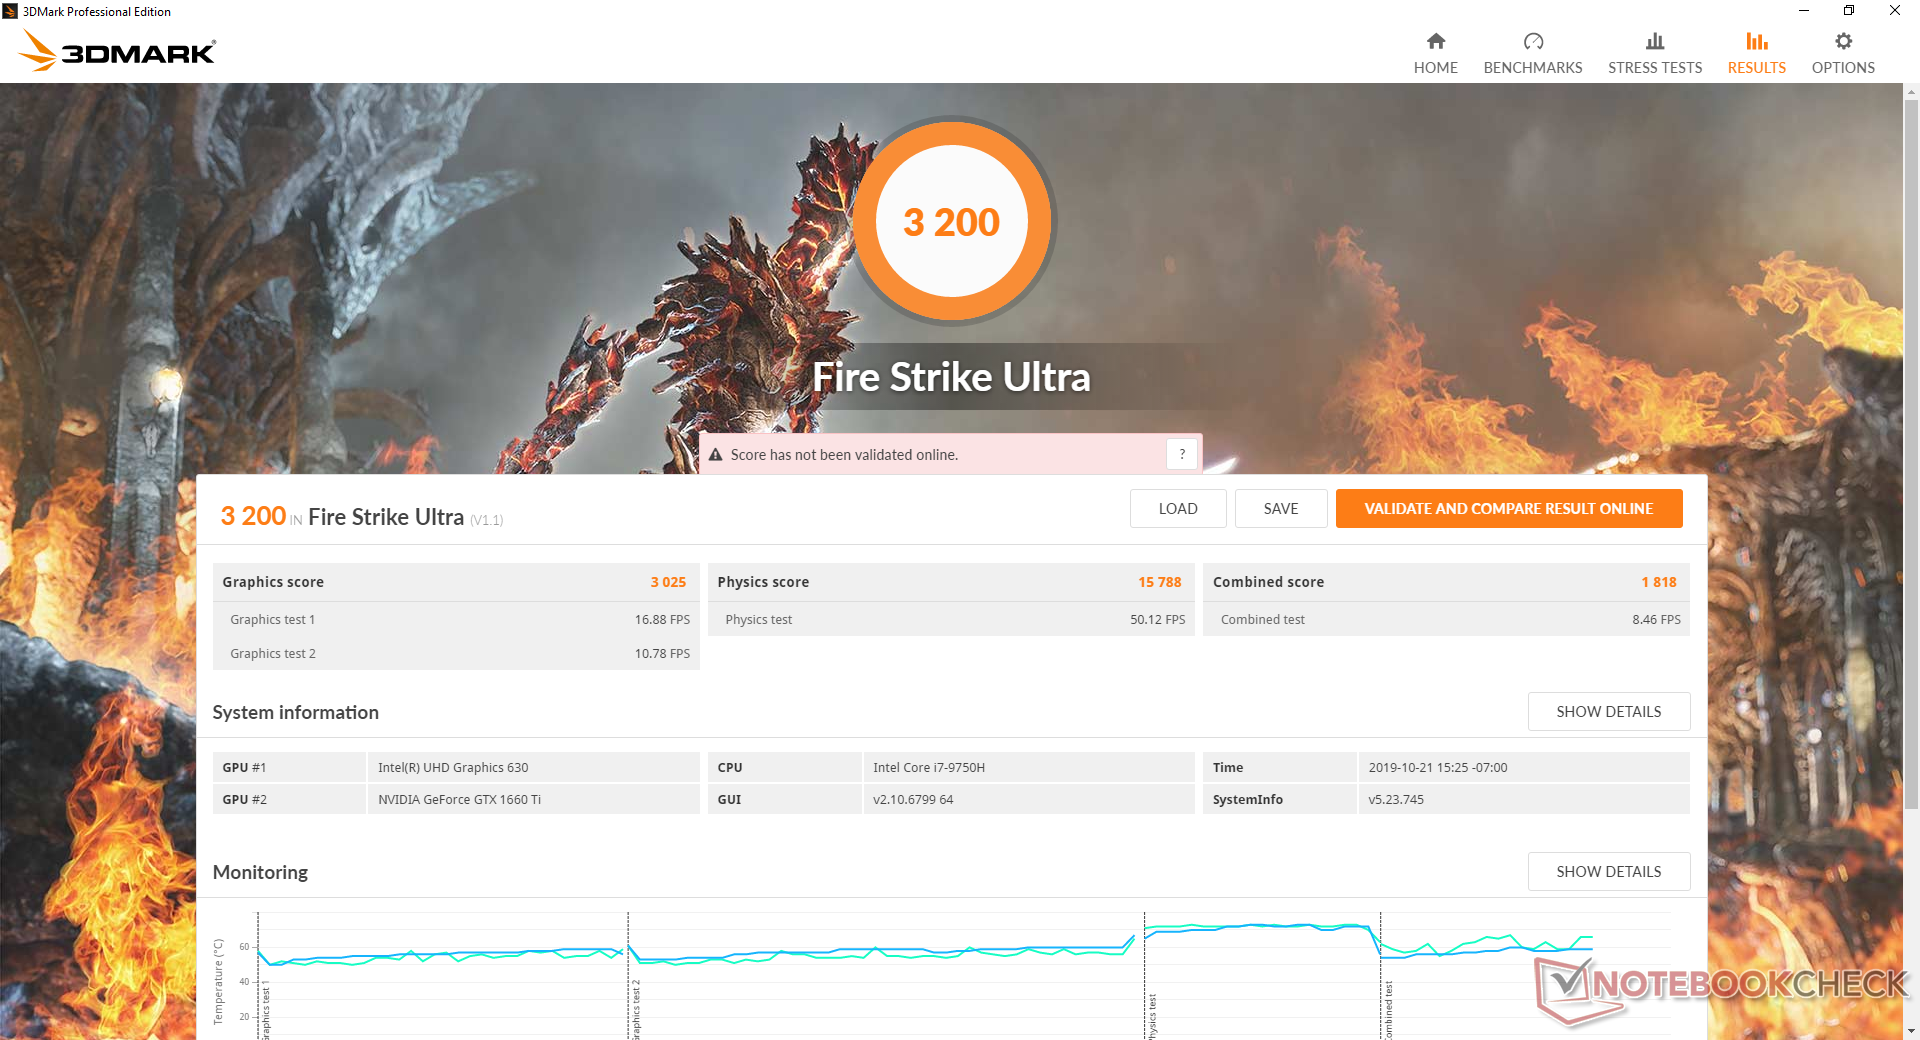
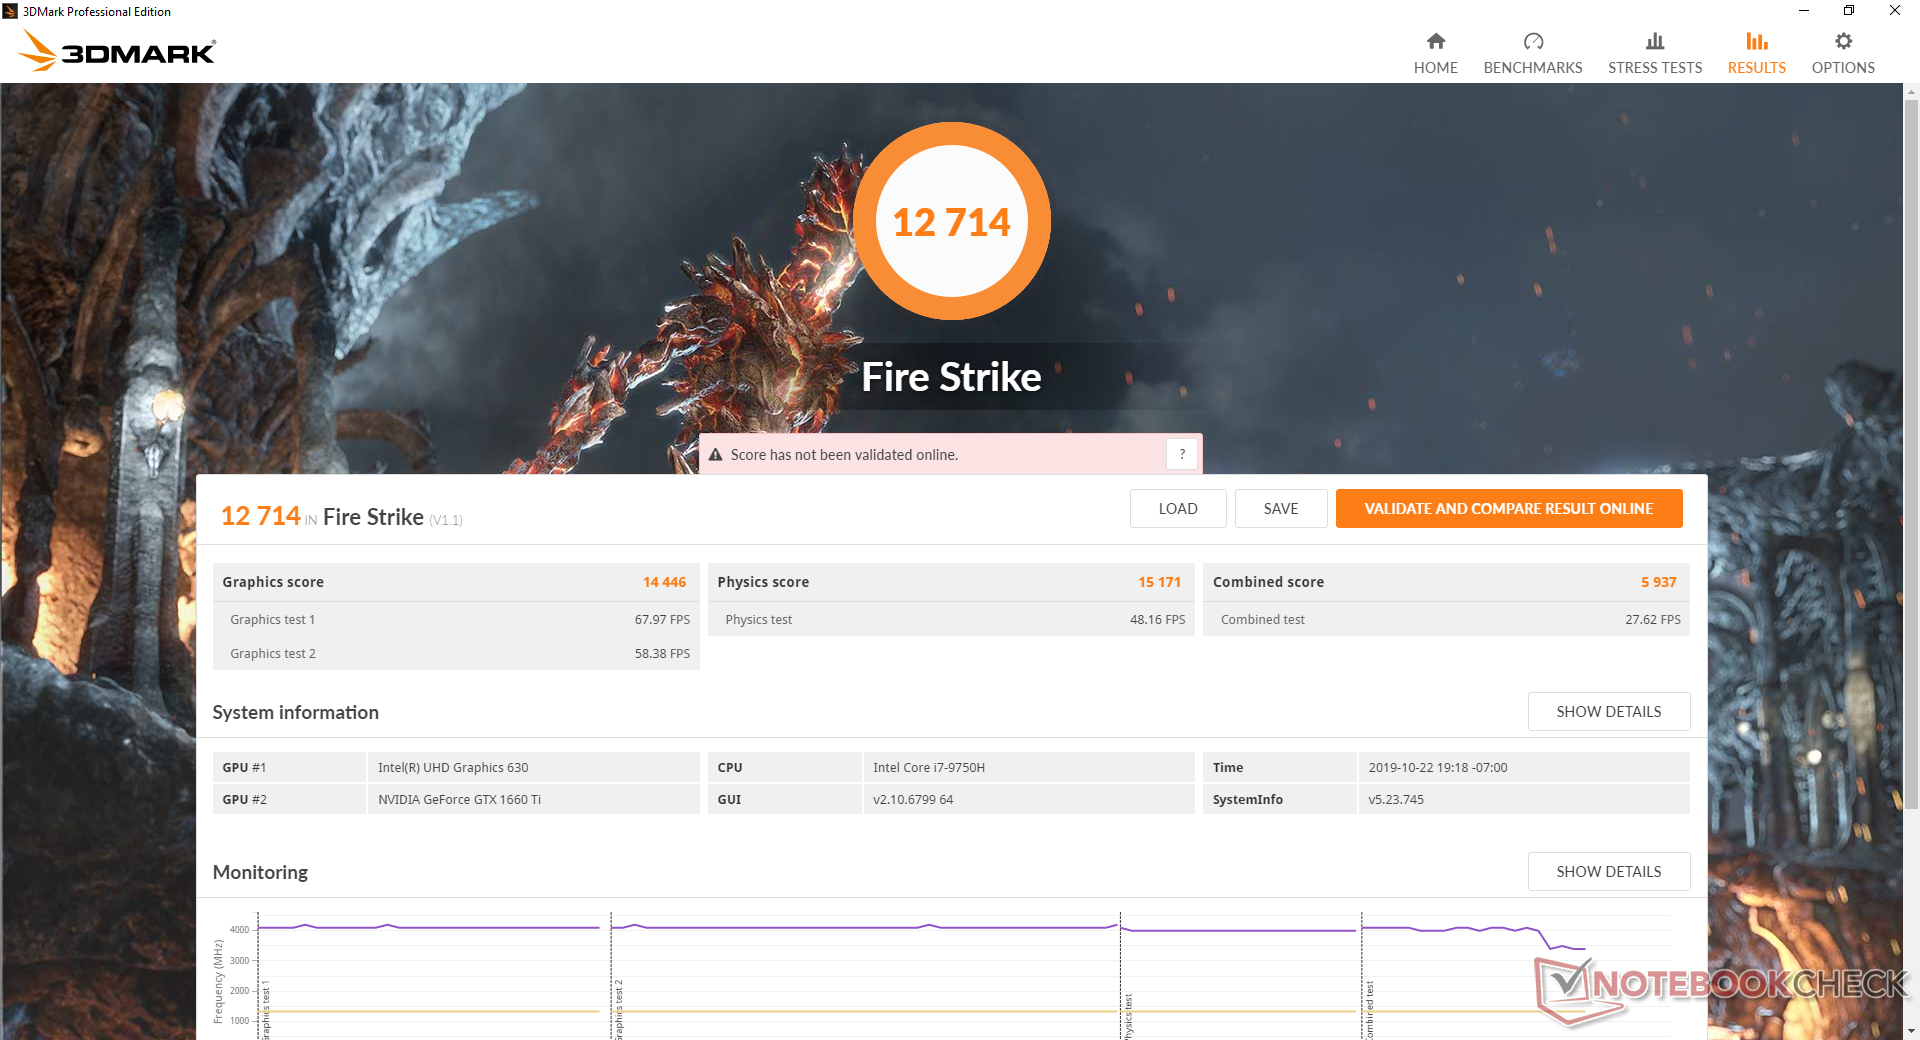
3DMark results are where we expect them to be at just within 5 percent of the costlier RTX 2060 when not taking into account ray-tracing or DLSS features. Keep in mind that scores are slightly higher when running on Turbo mode compared to the regular Performance mode: 13381 points vs. 12714 points on Fire Strike.
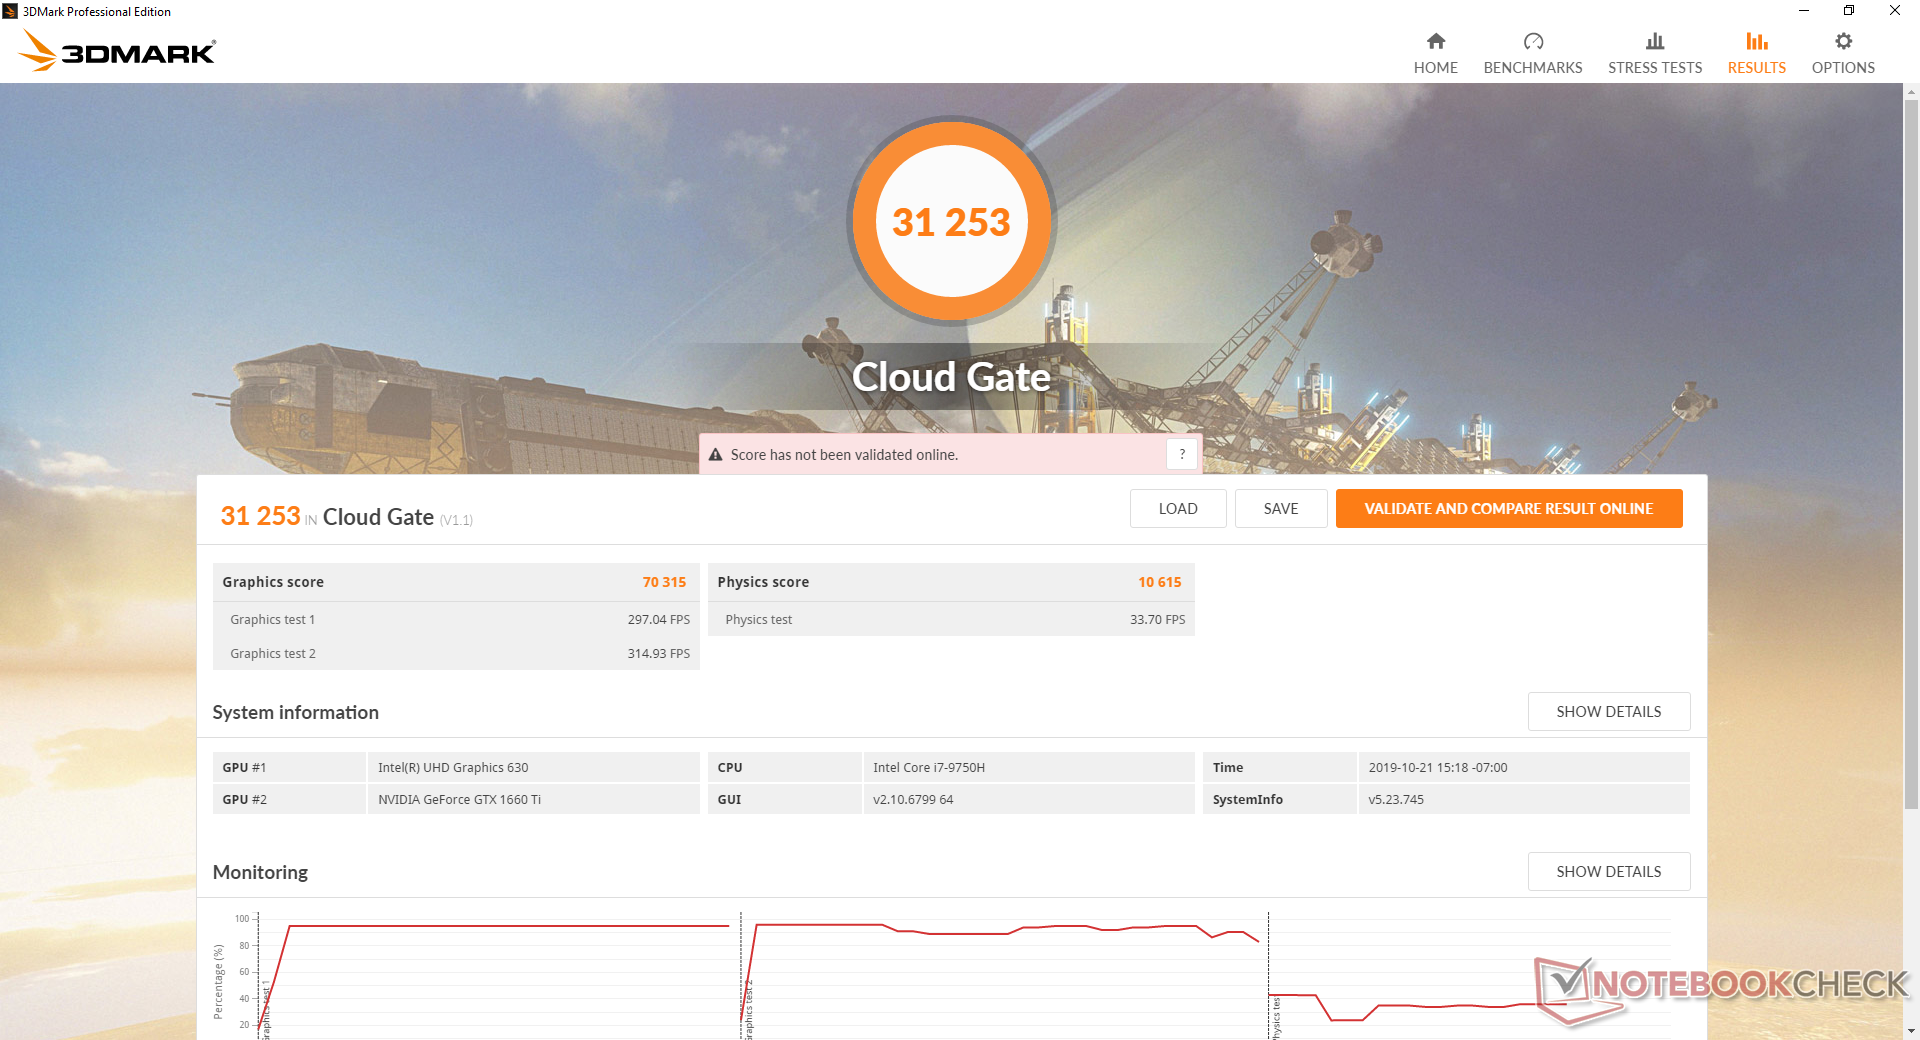
Interestingly, Cloud Gate scores are much lower than expected at 30 percent below the average GTX 1660 Ti in our database. This means that the system may run slower than it's supposed to when aiming for high frame rates which our Gaming Performance section below can confirm.
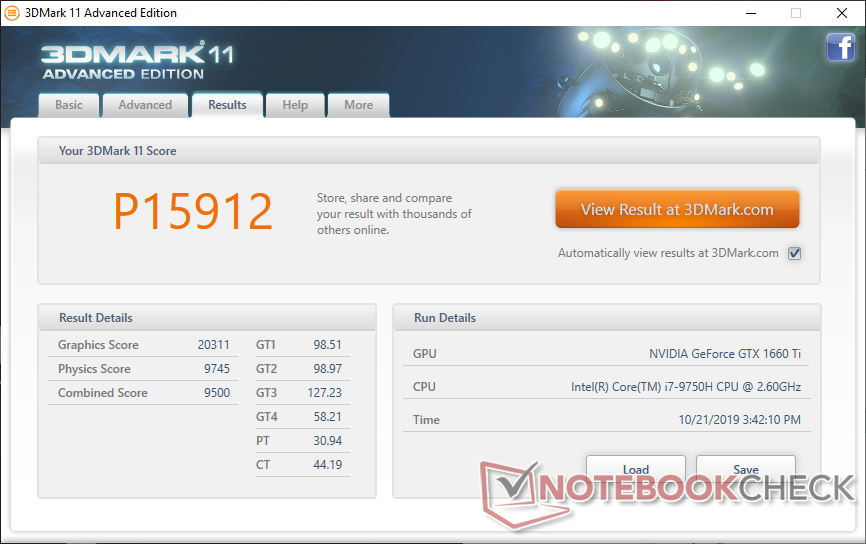

| 3DMark 11 Performance | 15912 points | |
| 3DMark Cloud Gate Standard Score | 31253 points | |
| 3DMark Fire Strike Score | 13381 points | |
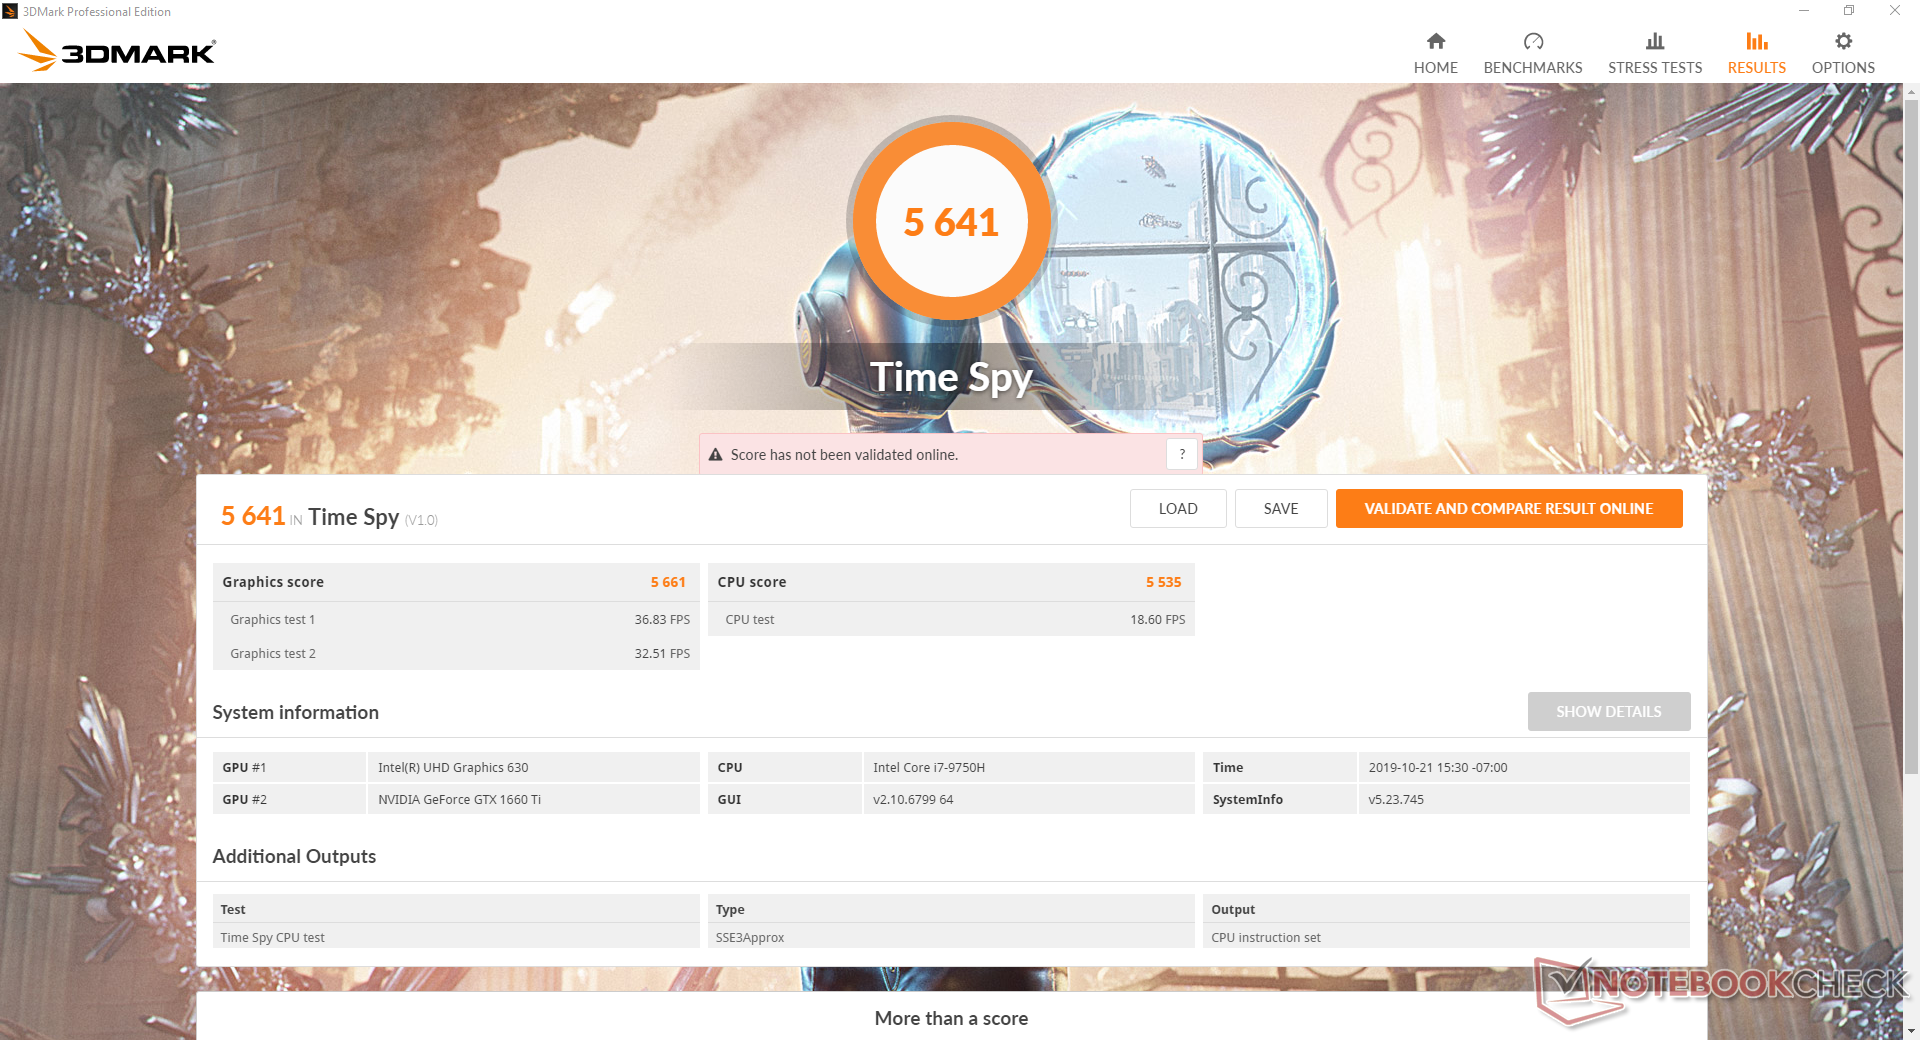
| 3DMark Time Spy Score | 5641 points | |
Help | ||
Gaming Performance
For some strange reason, the GU502GU underperforms when running games at low resolutions as predicted by the low Cloud Gate score above. Shadow of the Tomb Raider on the lowest 720p settings, for example, returns an average frame rate of 88 FPS compared to 115 FPS on the Razer Blade 15 equipped with the exact same CPU and GPU. We suspect that the single-channel RAM of our test unit is at least partly responsible for the performance deficit.
Idling on Witcher 3 shows consistent frame rates throughout to suggest no noticeable throttling when gaming. However, frame rates dipped once to 18 FPS momentarily during the hour-long test possibly due to undesirable background activity.
See our dedicated page on the GeForce GTX 1660 Ti for more technical information and benchmark comparisons.
| low | med. | high | ultra | |
|---|---|---|---|---|
| BioShock Infinite (2013) | 235.5 | 216.4 | 201.6 | 121.6 |
| The Witcher 3 (2015) | 177.3 | 148 | 95.9 | 55.2 |
| Shadow of the Tomb Raider (2018) | 88 | 68 | 67 | 62 |
Emissions
System Noise
The cooling solution consists of twin ~45 mm fans and five copper heat pipes. Fan noise will still be present even when set to Silent mode as low loads like browsing or video streaming will induce a fan noise level of 31 dB(A) against a background of 28.2 dB(A). When gaming on Performance mode, fan noise becomes relatively constant at about 54.2 dB(A) to be noticeably louder than on the MSI GS65 or Razer Blade 15 under similar conditions.
When set to Turbo mode, fan noise will jump to almost 60 dB(A) when gaming. Headphones are recommended at this point because it will be nearly impossible to play games like Fortnite or Overwatch optimally where enemy footsteps and audio cues are of utmost importance.
We can notice no electronic noise or coil whine from our test unit. Even if it were present, the constant fan noise will likely be more overwhelming.

| Asus ROG Zephyrus M15 GU502GU-XB74 GeForce GTX 1660 Ti Mobile, i7-9750H, Intel SSD 660p SSDPEKNW512G8 | Asus Zephyrus S GX502GW GeForce RTX 2070 Mobile, i7-9750H, 2x Intel SSD 660p SSDPEKNW512G8 (RAID 0) | Asus Zephyrus S GX531GX GeForce RTX 2080 Max-Q, i7-8750H, Intel SSD 660p SSDPEKNW512G8 | Asus TUF FX505DT-EB73 GeForce GTX 1650 Mobile, R7 3750H, Intel SSD 660p SSDPEKNW512G8 | MSI GS65 Stealth 9SG GeForce RTX 2080 Max-Q, i7-9750H, Samsung SSD PM981 MZVLB512HAJQ | Razer Blade 15 GTX 1660 Ti GeForce GTX 1660 Ti Mobile, i7-9750H, Samsung SSD PM981 MZVLB256HAHQ | |
|---|---|---|---|---|---|---|
| Noise | -9% | -5% | 5% | 3% | 2% | |
| off / environment * (dB) | 28.2 | 30 -6% | 28.7 -2% | 28.2 -0% | 28.3 -0% | 28.5 -1% |
| Idle Minimum * (dB) | 28.7 | 31 -8% | 29.8 -4% | 28.2 2% | 30.4 -6% | 30.3 -6% |
| Idle Average * (dB) | 30.5 | 33 -8% | 32.4 -6% | 28.2 8% | 30.5 -0% | 30.5 -0% |
| Idle Maximum * (dB) | 31 | 38 -23% | 38 -23% | 31.4 -1% | 30.6 1% | 30.5 2% |
| Load Average * (dB) | 39 | 50 -28% | 38.2 2% | 39.8 -2% | 37.6 4% | 41 -5% |
| Witcher 3 ultra * (dB) | 54.2 | 53 2% | 56.6 -4% | 47 13% | 46 15% | 48 11% |
| Load Maximum * (dB) | 59.6 | 56 6% | 56.6 5% | 50.2 16% | 55.1 8% | 51.9 13% |
* ... smaller is better
Noise level
| Idle |
| 28.7 / 30.5 / 31 dB(A) |
| Load |
| 39 / 59.6 dB(A) |
 | ||
30 dB silent 40 dB(A) audible 50 dB(A) loud |
||
min: | ||
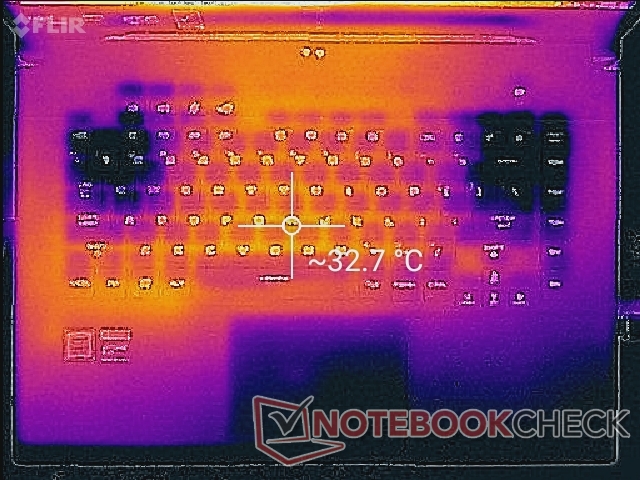
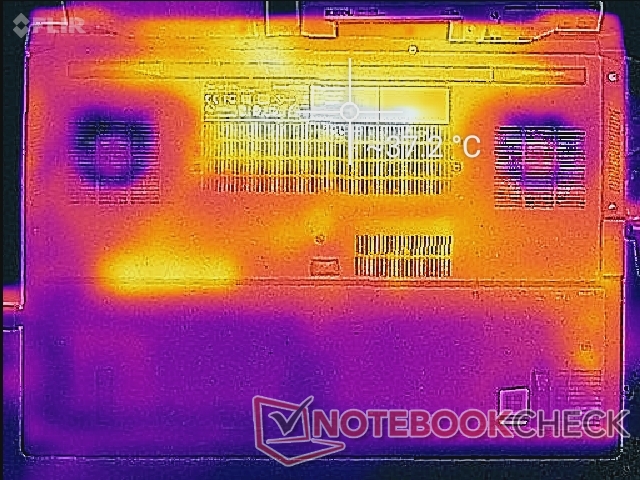
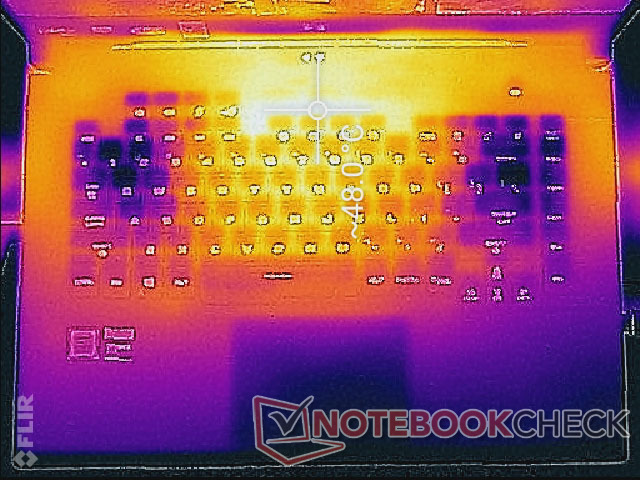
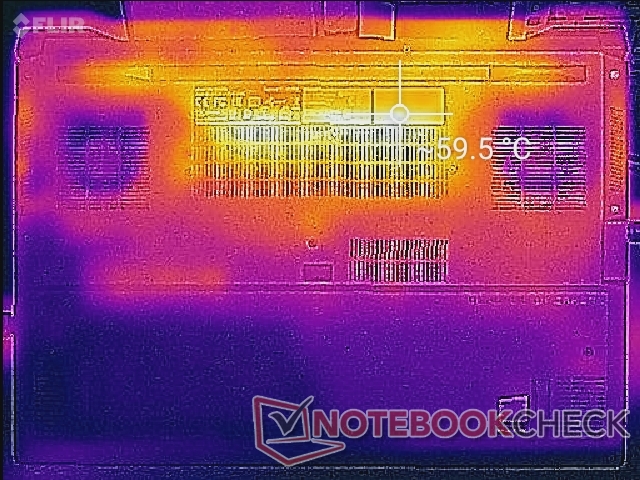
Temperature - Lots of Vents
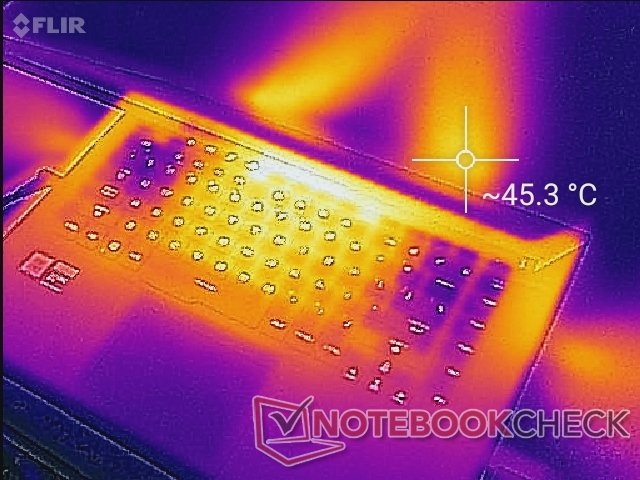
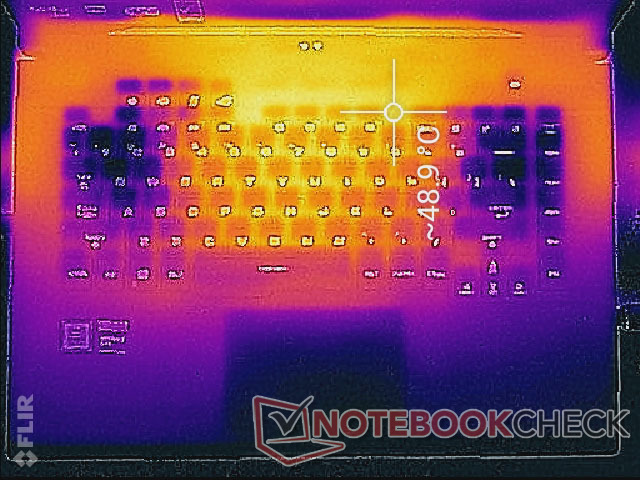
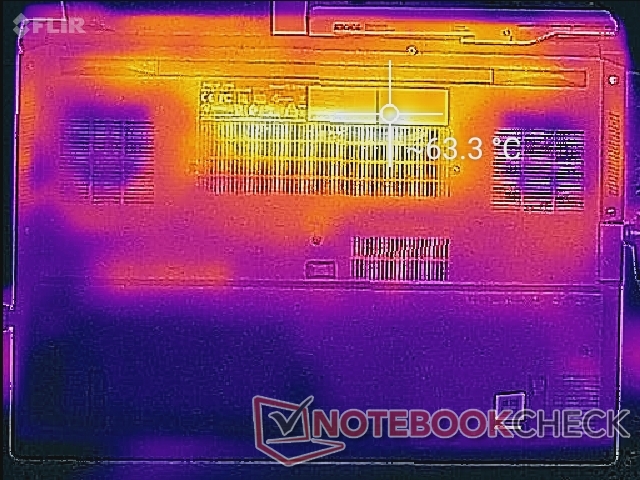
Surface temperatures when idling can be as warm as 32 C and 37 C on the top and bottom surfaces, respectively, as shown by our temperature maps below. When gaming, hot spots can become as warm as 48 C to 63 C near the vents compared to 45 C to 48 C on the competing MSI GF65. Such areas are thankfully toward the back half of the laptop where users are unlikely to touch. The palm rests, WASD keys, and directional keys remain relatively cool for comfortable gaming.
(-) The maximum temperature on the upper side is 49.8 °C / 122 F, compared to the average of 40.4 °C / 105 F, ranging from 21.2 to 68.8 °C for the class Gaming.
(-) The bottom heats up to a maximum of 63.2 °C / 146 F, compared to the average of 43.2 °C / 110 F
(+) In idle usage, the average temperature for the upper side is 29.8 °C / 86 F, compared to the device average of 33.9 °C / 93 F.
(±) Playing The Witcher 3, the average temperature for the upper side is 37.2 °C / 99 F, compared to the device average of 33.9 °C / 93 F.
(+) The palmrests and touchpad are cooler than skin temperature with a maximum of 31.6 °C / 88.9 F and are therefore cool to the touch.
(-) The average temperature of the palmrest area of similar devices was 28.8 °C / 83.8 F (-2.8 °C / -5.1 F).
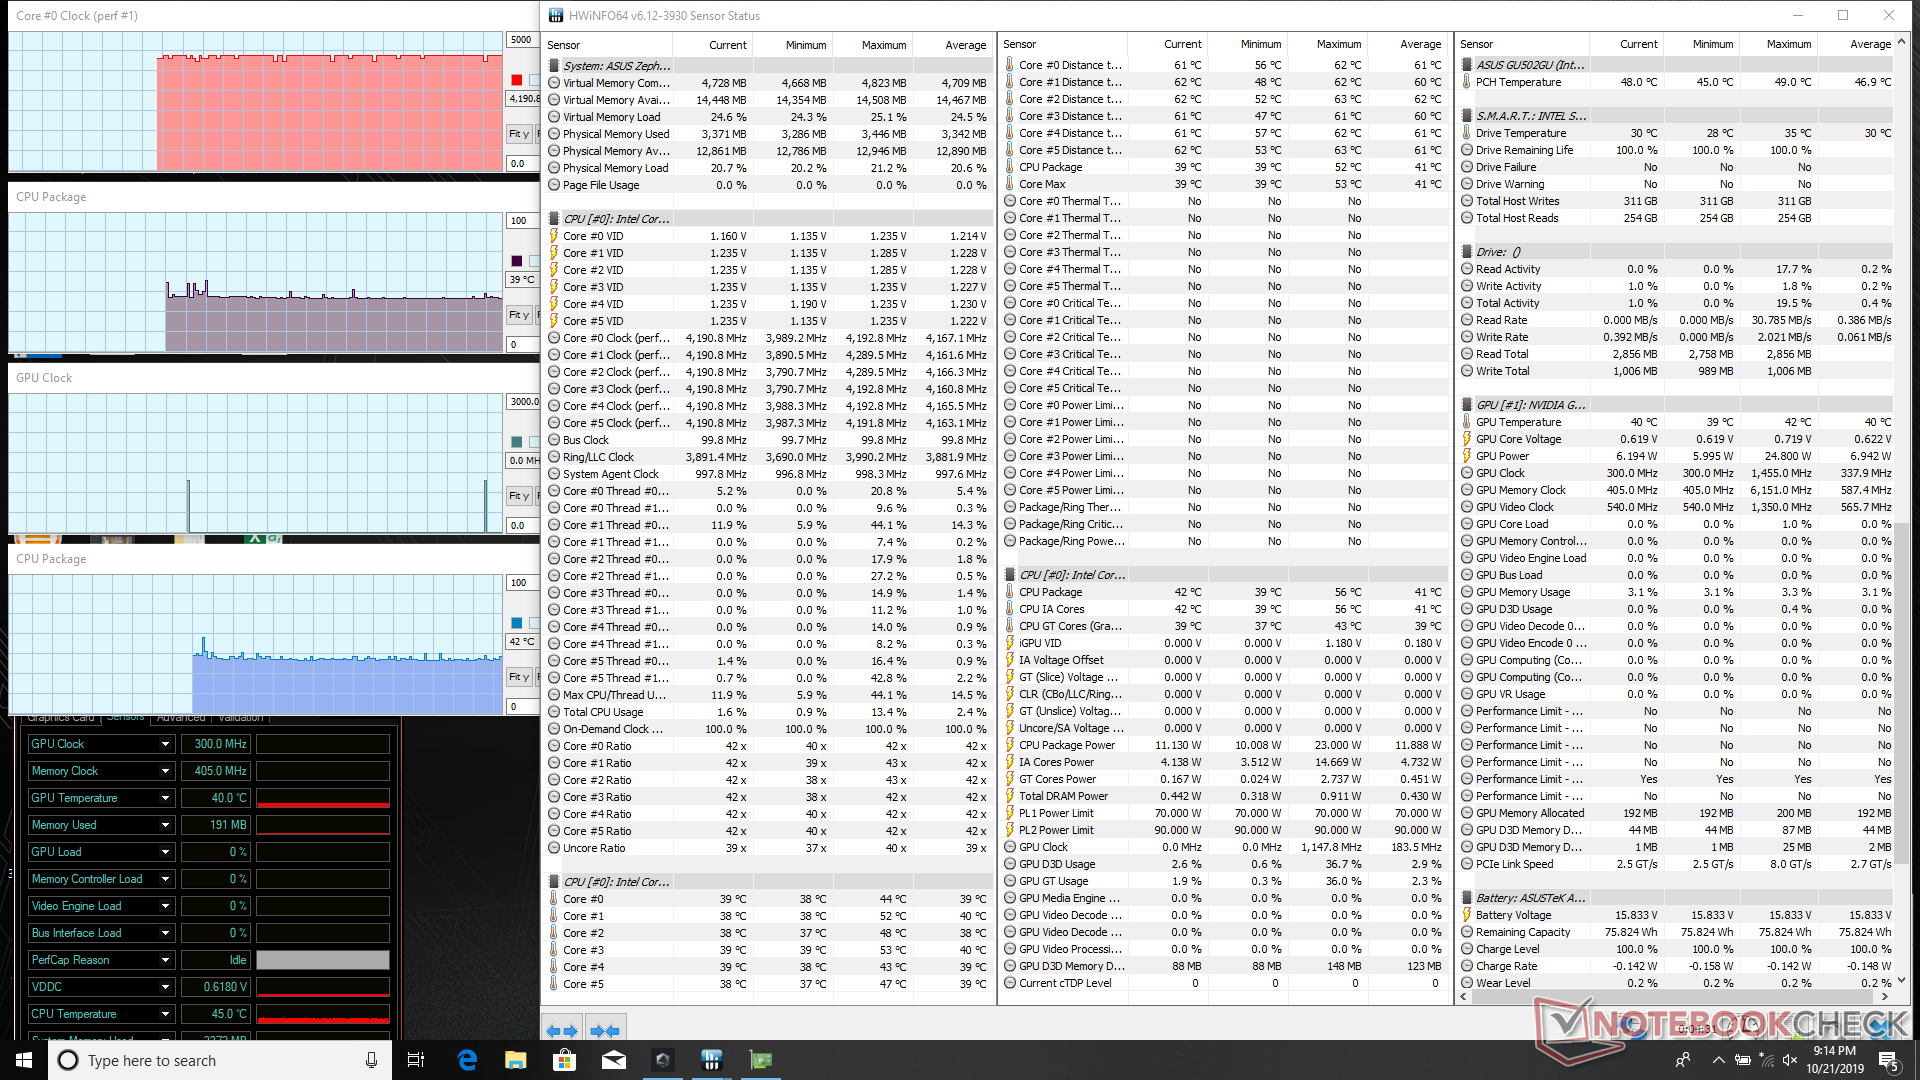
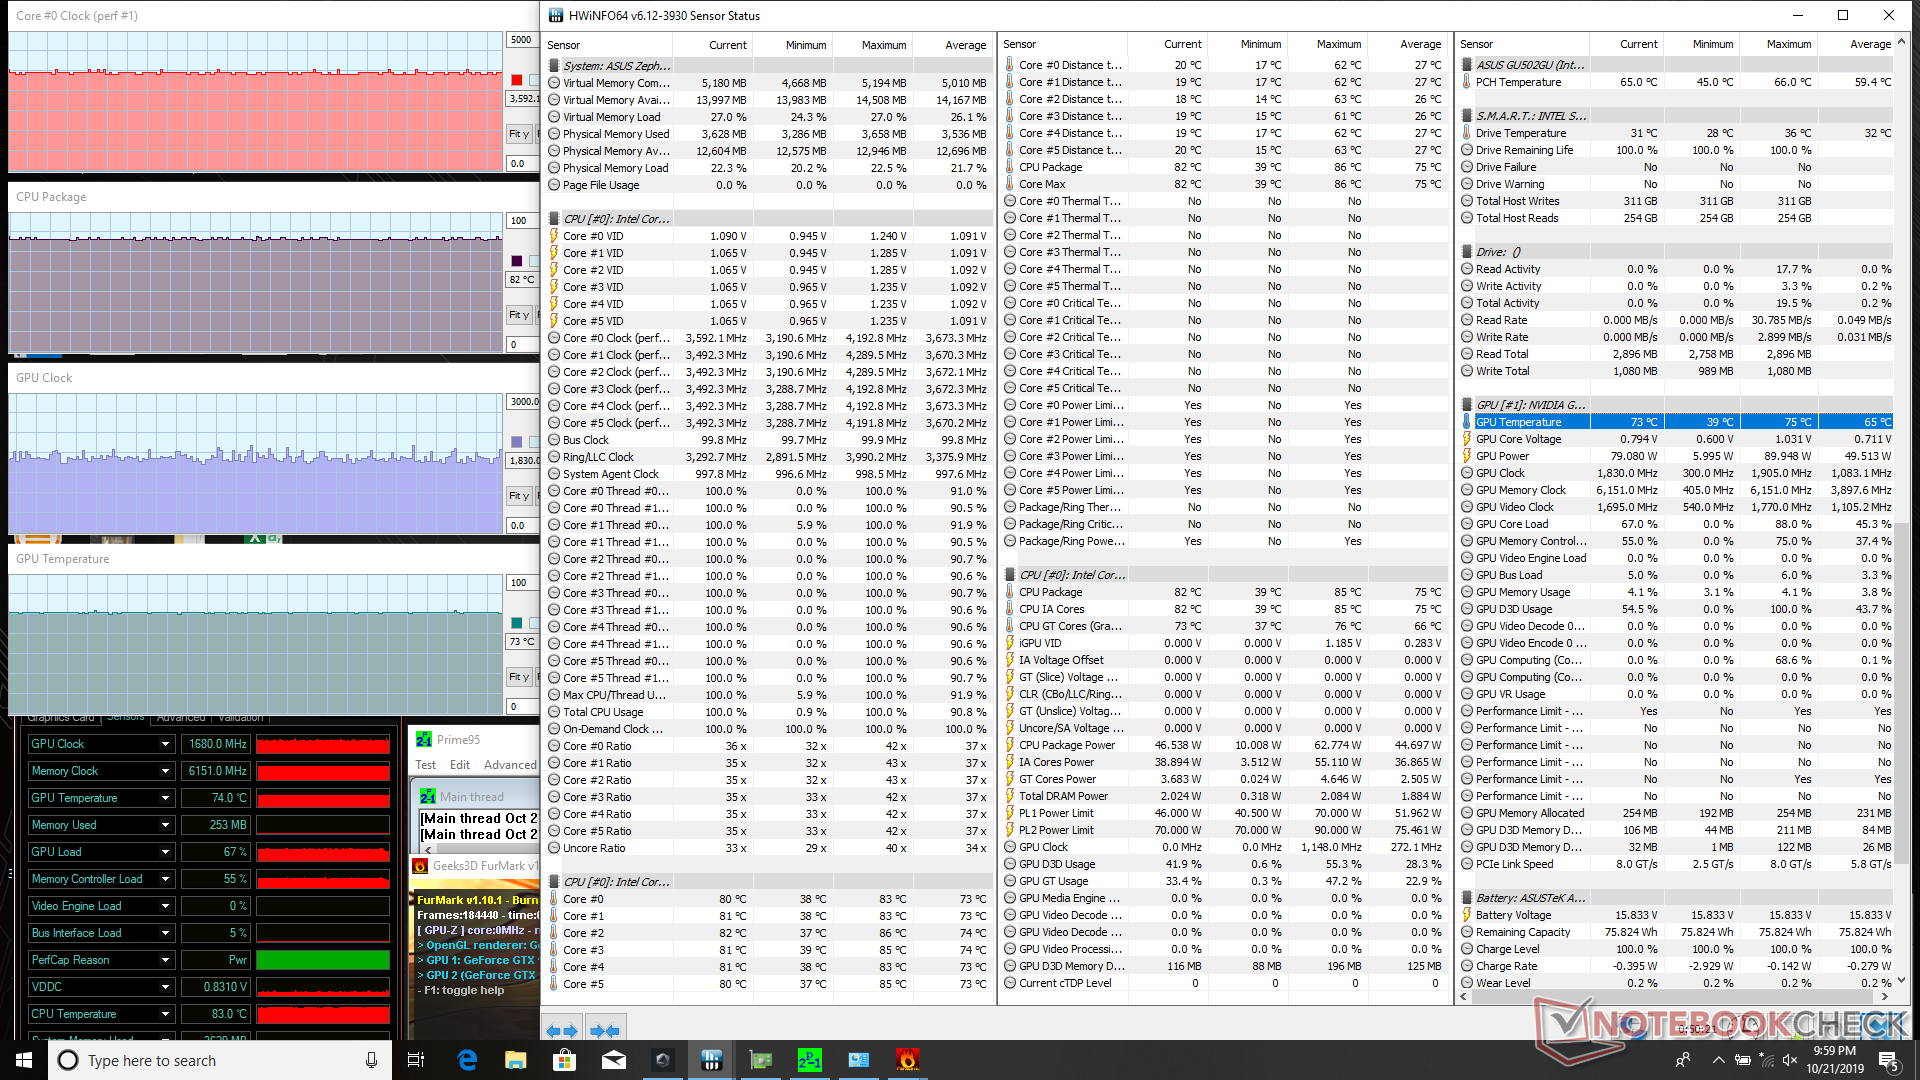
Stress Test - Decent Core Temperatures
When running Prime95 on the regular Performance mode, clock rates top out at only 3.3 to 3.4 GHz and at a core temperature of 73 C. When repeating this same test on Turbo mode, clock rates remain steady at 4 GHz and at a cooler temperature of 69 C. Thus, Turbo mode is recommended if you want every ounce of juice possible from the GU502GU. Running both Prime95 and FurMark simultaneously will cause CPU and GPU temperatures to stabilize at 82 C and 73 C, respectively.
Running Witcher 3 on Turbo mode will result in slightly faster GPU clock rates (~1755 MHz vs. 1665 MHz) and slightly cooler core temperatures by about 5 degrees C. It's a small boost relative to the sharp increase in fan noise between Performance mode and Turbo mode.
Running on battery power will limit performance. A 3DMark Fire Strike run on batteries returns Physics and Graphics scores of 9391 and 3709 points, respectively, compared to 15963 and 15054 when on mains. Turbo mode is disabled when not connected to an outlet.

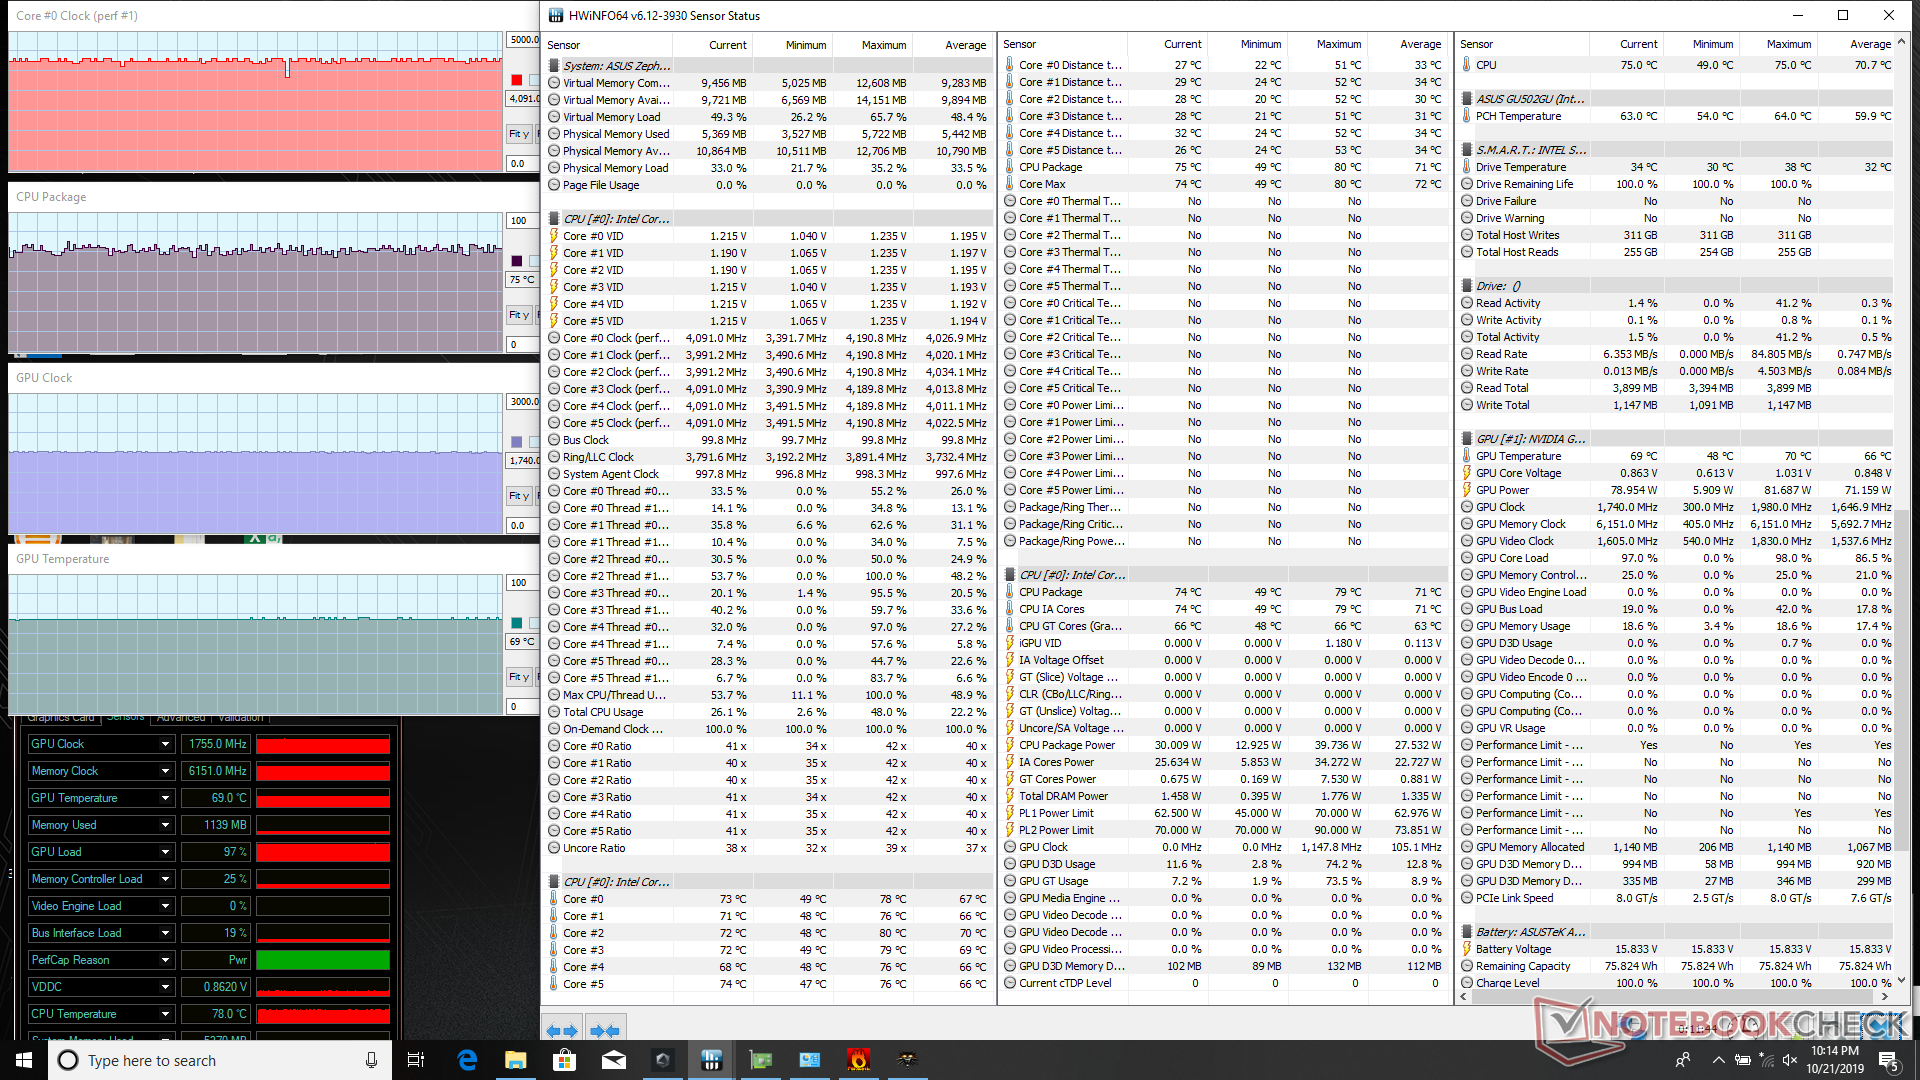
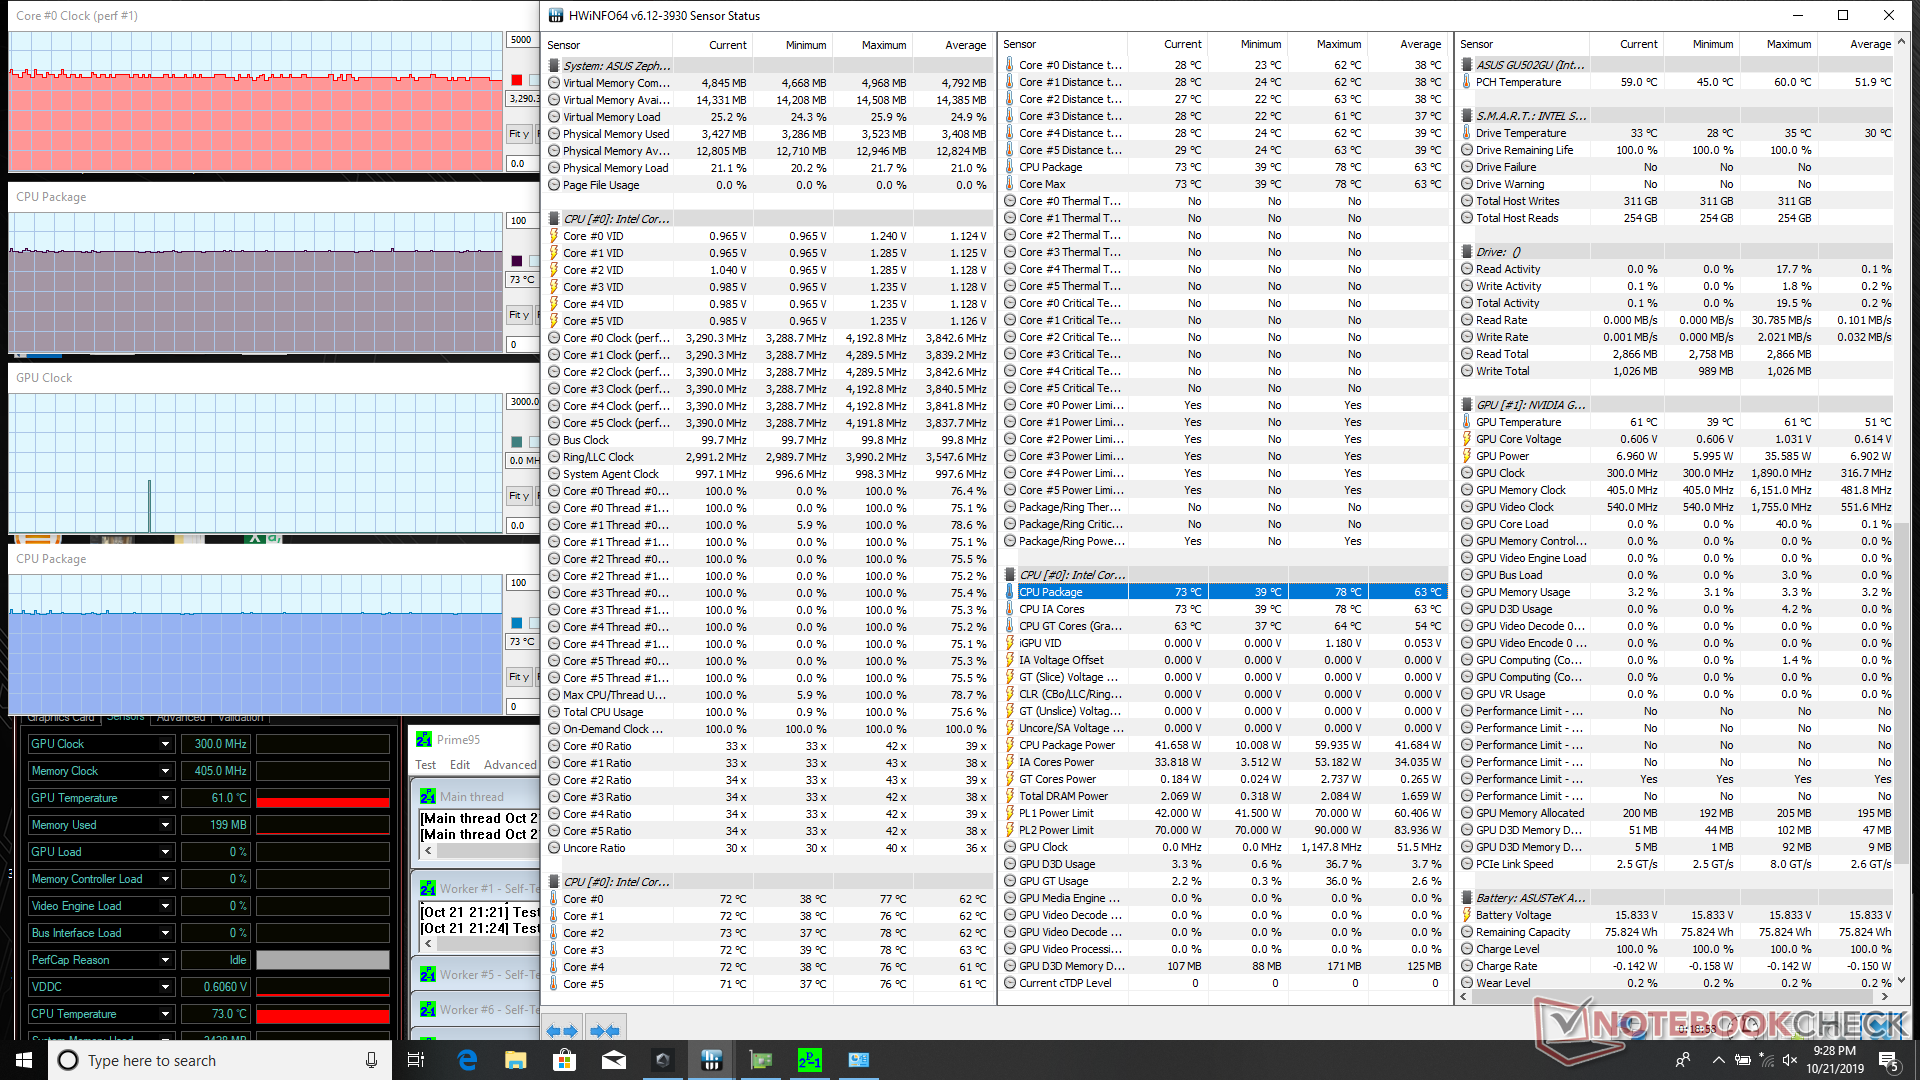

| CPU Clock (GHz) | GPU Clock (MHz) | Average CPU Temperature (°C) | Average GPU Temperature (°C) | |
| System Idle | -- | -- | 39 | 42 |
| Prime95 Stress (Performance fan) | 3.3 - 3.4 | -- | 73 | 73 |
| Prime95 Stress (Turbo fan) | 4.0 | -- | 69 | 68 |
| Prime95 + FurMark Stress (Turbo fan) | 3.5 - 3.6 | ~1680 | 82 | 73 |
| Witcher 3 Stress (Performance fan) | ~4.0 | 1665 | 81 | 74 |
| Witcher 3 Stress (Turbo fan) | ~4.0 | 1755 | 75 | 69 |
Speakers
Audio quality is good considering the size of the chassis. Pink noise measurements show a better balance between treble and bass frequencies when compared to most Ultrabooks. The downside, however, is that the palm rests will vibrate noticeably to the touch when set to higher volume settings.


Asus ROG Zephyrus M15 GU502GU-XB74 audio analysis
(+) | speakers can play relatively loud (85.5 dB)
Bass 100 - 315 Hz
(±) | reduced bass - on average 7.3% lower than median
(-) | bass is not linear (15.2% delta to prev. frequency)
Mids 400 - 2000 Hz
(+) | balanced mids - only 2.8% away from median
(+) | mids are linear (6.3% delta to prev. frequency)
Highs 2 - 16 kHz
(+) | balanced highs - only 2.9% away from median
(+) | highs are linear (6.8% delta to prev. frequency)
Overall 100 - 16.000 Hz
(+) | overall sound is linear (9.9% difference to median)
Compared to same class
» 5% of all tested devices in this class were better, 2% similar, 94% worse
» The best had a delta of 6%, average was 18%, worst was 132%
Compared to all devices tested
» 4% of all tested devices were better, 1% similar, 95% worse
» The best had a delta of 4%, average was 24%, worst was 134%
Apple MacBook 12 (Early 2016) 1.1 GHz audio analysis
(+) | speakers can play relatively loud (83.6 dB)
Bass 100 - 315 Hz
(±) | reduced bass - on average 11.3% lower than median
(±) | linearity of bass is average (14.2% delta to prev. frequency)
Mids 400 - 2000 Hz
(+) | balanced mids - only 2.4% away from median
(+) | mids are linear (5.5% delta to prev. frequency)
Highs 2 - 16 kHz
(+) | balanced highs - only 2% away from median
(+) | highs are linear (4.5% delta to prev. frequency)
Overall 100 - 16.000 Hz
(+) | overall sound is linear (10.2% difference to median)
Compared to same class
» 7% of all tested devices in this class were better, 2% similar, 91% worse
» The best had a delta of 5%, average was 18%, worst was 53%
Compared to all devices tested
» 5% of all tested devices were better, 1% similar, 94% worse
» The best had a delta of 4%, average was 24%, worst was 134%
Energy Management
Power Consumption - Disable Turbo Mode When not Needed
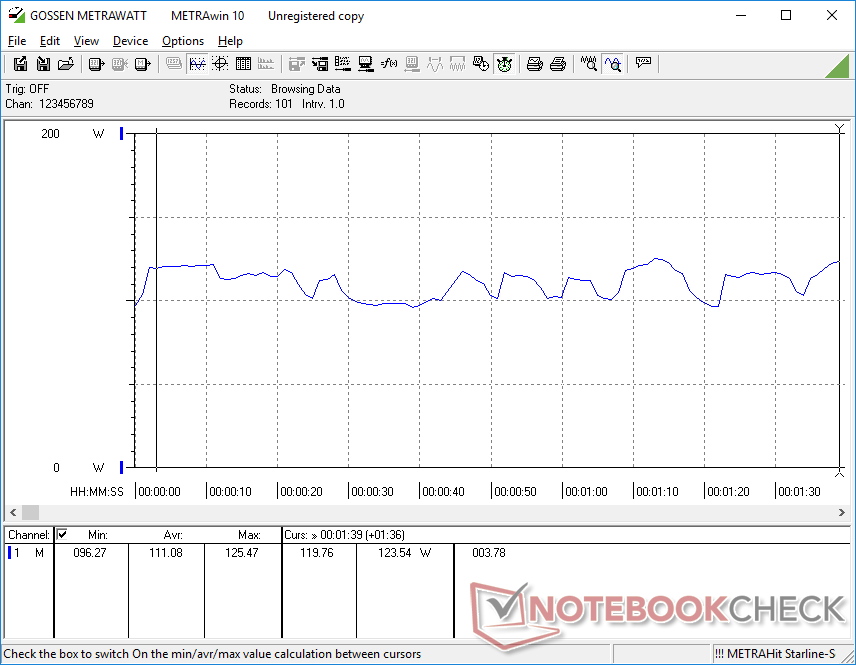
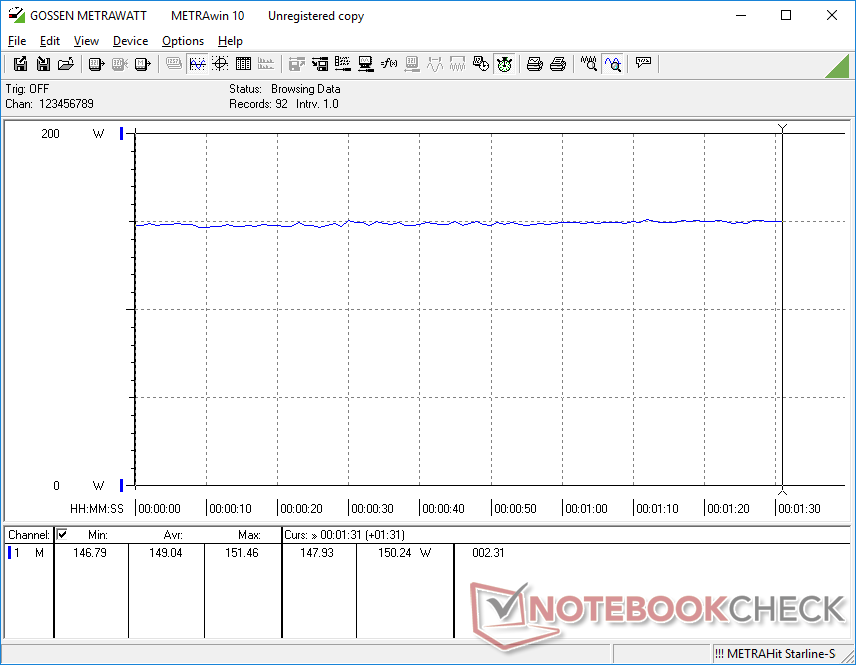
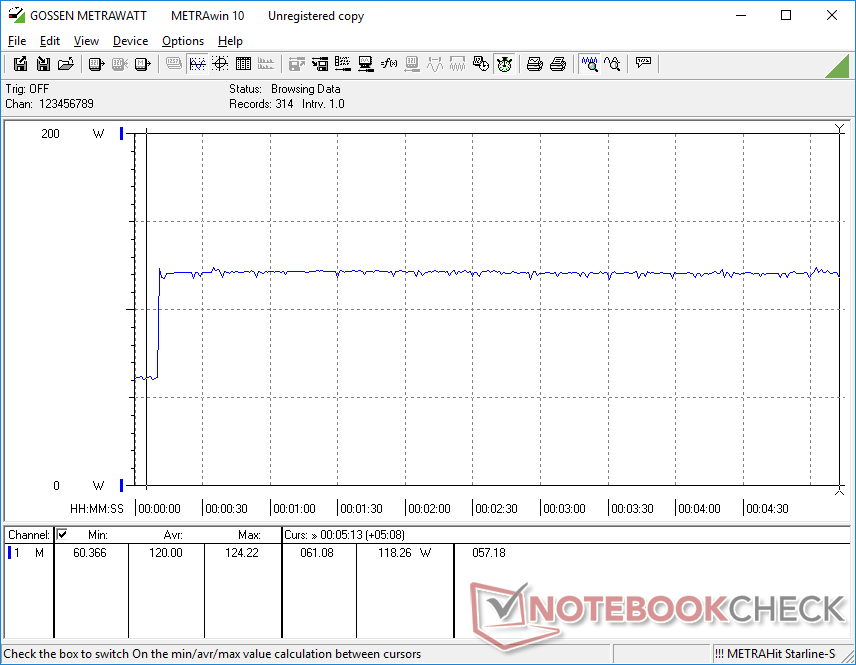
Idling on desktop demands anywhere between 17 W and 57 W depending on the power profile and brightness setting to be less efficient than most other 15.6-inch gaming laptops. Thus, it's even more important to manually set the appropriate performance profile on the GU502GU for better power savings and to keep fan noise in check. Running Witcher 3 draws 149 W compared to 176 W on the GX502GW with RTX 2070 graphics.
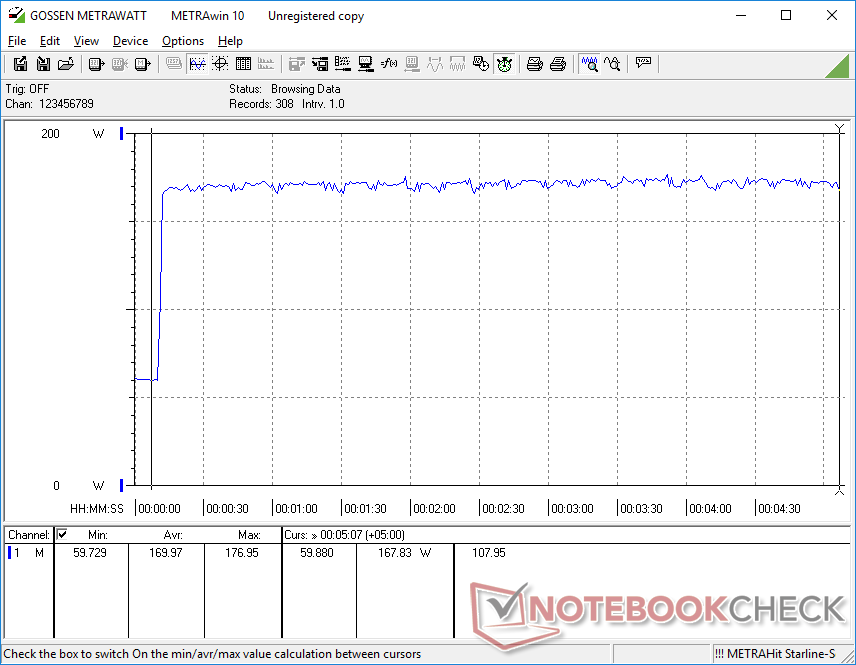
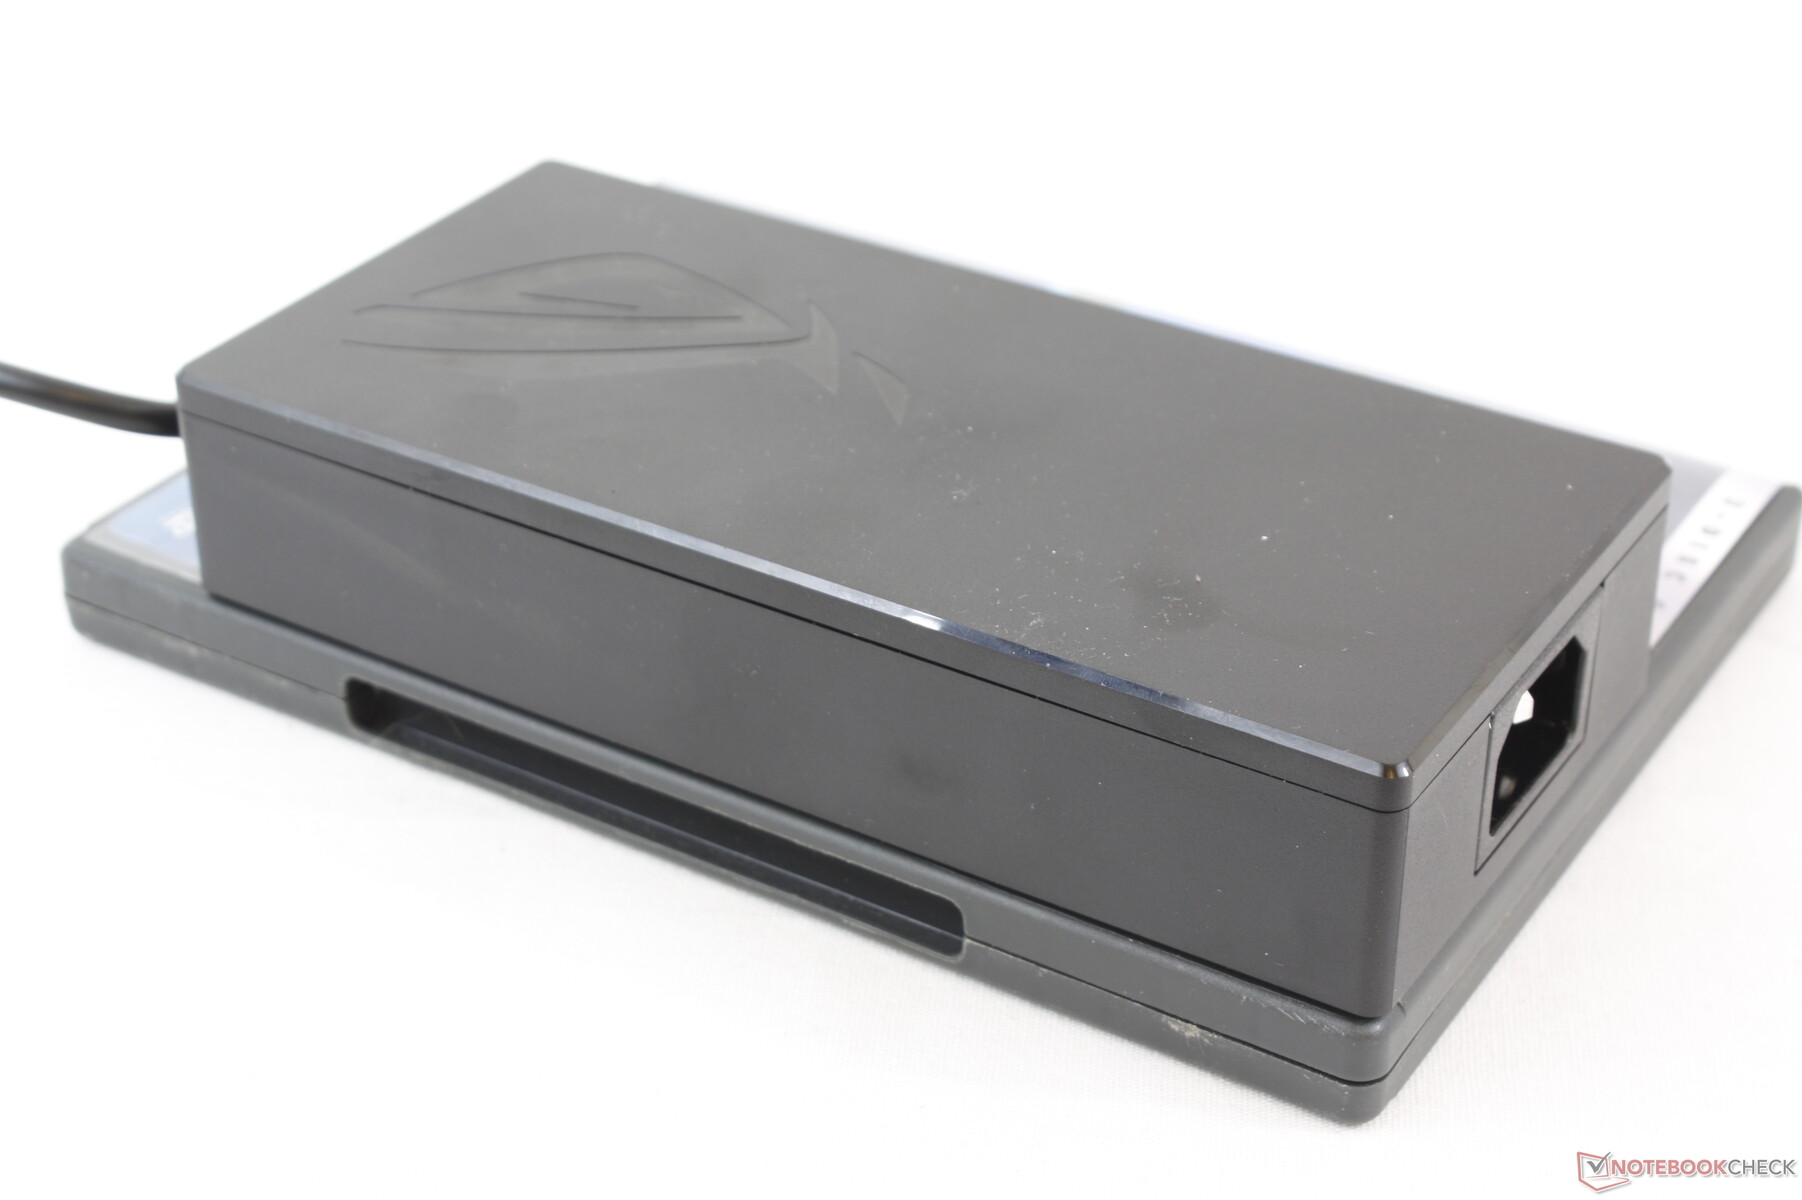
We're able to record a maximum demand of 170 W from the medium-sized (~16.5 x 7.5 x 3.3 cm) 230 W AC adapter. Unlike most other laptops, the GU502GU is able to maintain this power draw indefinitely when on Turbo mode much like what we discovered on our CineBench loop test and Stress Test results above. The system can both recharge and run extremely demanding loads simultaneously.
| Off / Standby | |
| Idle | |
| Load |
|
Key:
min: | |
| Asus ROG Zephyrus M15 GU502GU-XB74 i7-9750H, GeForce GTX 1660 Ti Mobile, Intel SSD 660p SSDPEKNW512G8, IPS, 1920x1080, 15.6" | Asus Zephyrus S GX502GW i7-9750H, GeForce RTX 2070 Mobile, 2x Intel SSD 660p SSDPEKNW512G8 (RAID 0), IPS, 1920x1080, 15.6" | Asus Zephyrus S GX531GX i7-8750H, GeForce RTX 2080 Max-Q, Intel SSD 660p SSDPEKNW512G8, IPS, 1920x1080, 15.6" | Asus TUF FX505DT-EB73 R7 3750H, GeForce GTX 1650 Mobile, Intel SSD 660p SSDPEKNW512G8, IPS, 1920x1080, 15.6" | Lenovo Legion Y740-15ICHg i7-9750H, GeForce RTX 2070 Max-Q, WDC PC SN520 SDAPMUW-128G, IPS, 1920x1080, 15.6" | Razer Blade 15 GTX 1660 Ti i7-9750H, GeForce GTX 1660 Ti Mobile, Samsung SSD PM981 MZVLB256HAHQ, IPS, 1920x1080, 15.6" | |
|---|---|---|---|---|---|---|
| Power Consumption | -11% | 9% | 49% | 4% | 1% | |
| Idle Minimum * (Watt) | 17.6 | 24 -36% | 16.1 9% | 7 60% | 22.2 -26% | 18.7 -6% |
| Idle Average * (Watt) | 24.7 | 27 -9% | 20.9 15% | 9.9 60% | 24.9 -1% | 30.7 -24% |
| Idle Maximum * (Watt) | 56.3 | 33 41% | 27 52% | 12 79% | 30.6 46% | 33.9 40% |
| Load Average * (Watt) | 111.1 | 129 -16% | 93.4 16% | 68.4 38% | 101 9% | 93.4 16% |
| Witcher 3 ultra * (Watt) | 149 | 176 -18% | 168.2 -13% | 94.9 36% | 143 4% | 158.9 -7% |
| Load Maximum * (Watt) | 170 | 216 -27% | 215.3 -27% | 130.9 23% | 186 -9% | 195.3 -15% |
* ... smaller is better
Battery Life - Standard for its Class
Asus doesn't explicitly advertise the capacity of the internal battery, but we've confirmed it to be 76 Wh compared to only 50 Wh on the thinner GX531. Expect only 4.5 hours of real-world WLAN use when on the Balanced power profile which is about average for a gaming laptop. Remember to set the power profile via Armoury Crate to optimize battery life.
Recharging from empty to full capacity with the included AC adapter takes about 1.5 hours. USB PD charging up to 65 W is supported as well to give users a second charging option should they forget to carry the main AC adapter.
| Asus ROG Zephyrus M15 GU502GU-XB74 i7-9750H, GeForce GTX 1660 Ti Mobile, 76 Wh | Asus Zephyrus S GX502GW i7-9750H, GeForce RTX 2070 Mobile, 76 Wh | Asus Zephyrus S GX531GX i7-8750H, GeForce RTX 2080 Max-Q, 50 Wh | Asus TUF FX505DT-EB73 R7 3750H, GeForce GTX 1650 Mobile, 48 Wh | Razer Blade 15 GTX 1660 Ti i7-9750H, GeForce GTX 1660 Ti Mobile, 65 Wh | MSI GS65 Stealth 9SG i7-9750H, GeForce RTX 2080 Max-Q, 82 Wh | |
|---|---|---|---|---|---|---|
| Battery runtime | -25% | -33% | 2% | 22% | 33% | |
| Reader / Idle (h) | 7.1 | 5.9 -17% | 7.8 10% | |||
| WiFi v1.3 (h) | 4.5 | 3.7 -18% | 3 -33% | 4.8 7% | 5.5 22% | 6 33% |
| Load (h) | 1.7 | 1 -41% | 1.5 -12% |
Pros
Cons
Verdict

We recently reviewed the 15.6-inch MSI GF65 which ships with the same CPU and GPU as our Asus Zephyrus M GU502GU for almost half the price. When a competing sub-$1000 laptop can offer the same gaming performance as your ~$2000 laptop, then you better offer enough extra features to warrant the price premium. In Asus' case, the GU502GU is a mixed bag. The system is larger, thicker, noisier, and more flexible with shorter battery life and fewer port options than the Razer Blade 15 which retails for the same price as the GU502GU. Thus, if you're looking for something sturdier and more luxurious than a budget gaming laptop like the GF65, it'd be hard to recommend the Asus since it can't even stand neck-to-neck with the Razer.
There are some minor advantages on the Asus worth mentioning. Firstly, this is one of the few gaming laptops with support for USB PD meaning that you can recharge the system with any third-party USB Type-C 65 W charger. Having a single USB Type-C charger for your smartphone, tablet, Switch, and gaming laptop when traveling will certainly come in handy for some users. Secondly, the higher-than-average CPU Turbo Boost performance can be exploited by power users. Thirdly, it offers per-key RGB lighting which is conspicuously absent on the aforementioned Razer. Nonetheless, this short list of pros pales in comparison to its longer list of missing features, comparatively weaker chassis, and single-channel RAM.
The Asus Zephyrus M GU502GU isn't a bad gaming laptop, but its $1800 USD starting price is about $200 to $300 more expensive than it should be when considering that it feels inferior to the similarly priced Razer Blade 15.
Asus ROG Zephyrus M15 GU502GU-XB74
- 10/25/2019 v7 (old)
Allen Ngo
