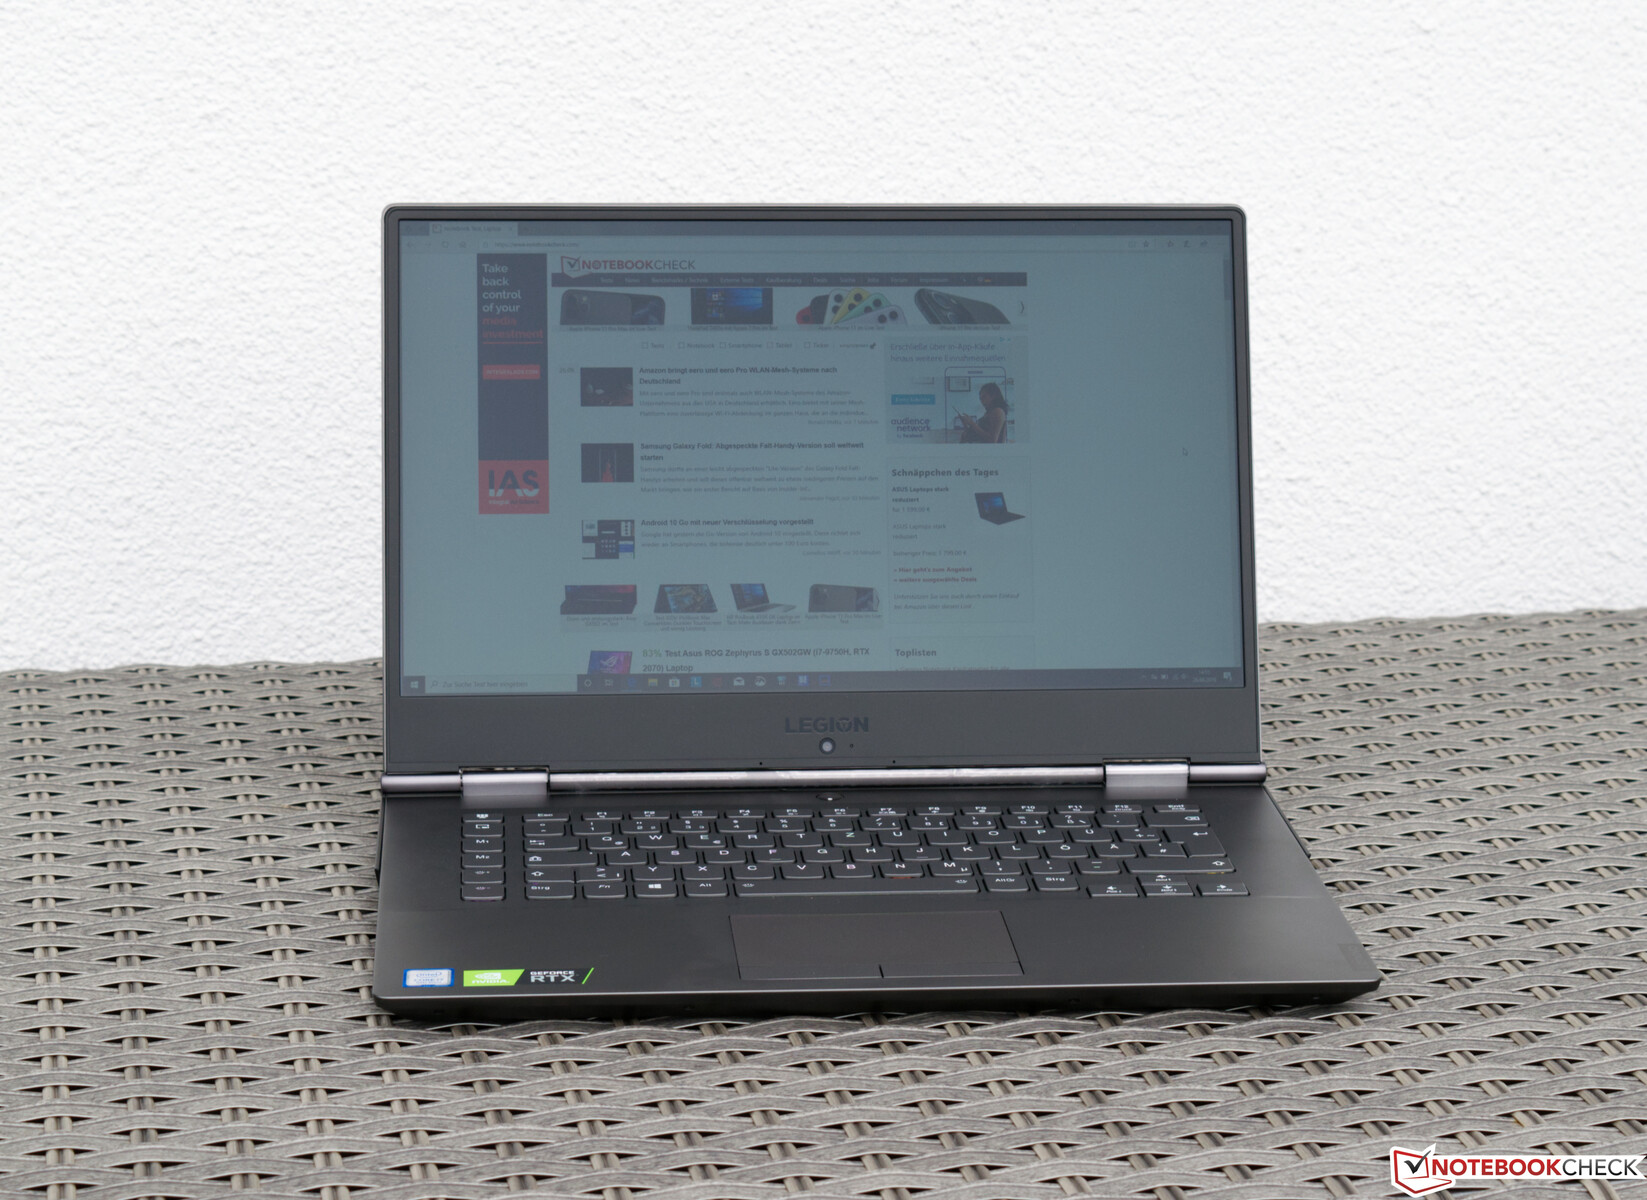
Lenovo Legion Y740 Laptop Review: Only a small CPU upgrade
Lenovo only offered the Legion Y740-15ICHg with 8th generation Intel Core processors, but it has since upgraded the Y740 to the Coffee Lake Refresh (CL-R) generation. CL-R processors offer higher boost clocks than their predecessors, so we thought it would be pertinent to see what benefits the Core i7-9750H powered Y740 had over its Core i7-8750H powered predecessor. Incidentally, our new test device has a much brighter display than the one that Lenovo included in our first review unit.
We shall, of course, compare our new review unit against its predecessor. The Y740 will also go up against the HP Omen X 2S, and Acer Predator Triton 500 as they have comparable hardware.

Display - G-Sync, Dolby Vision and 144 Hz


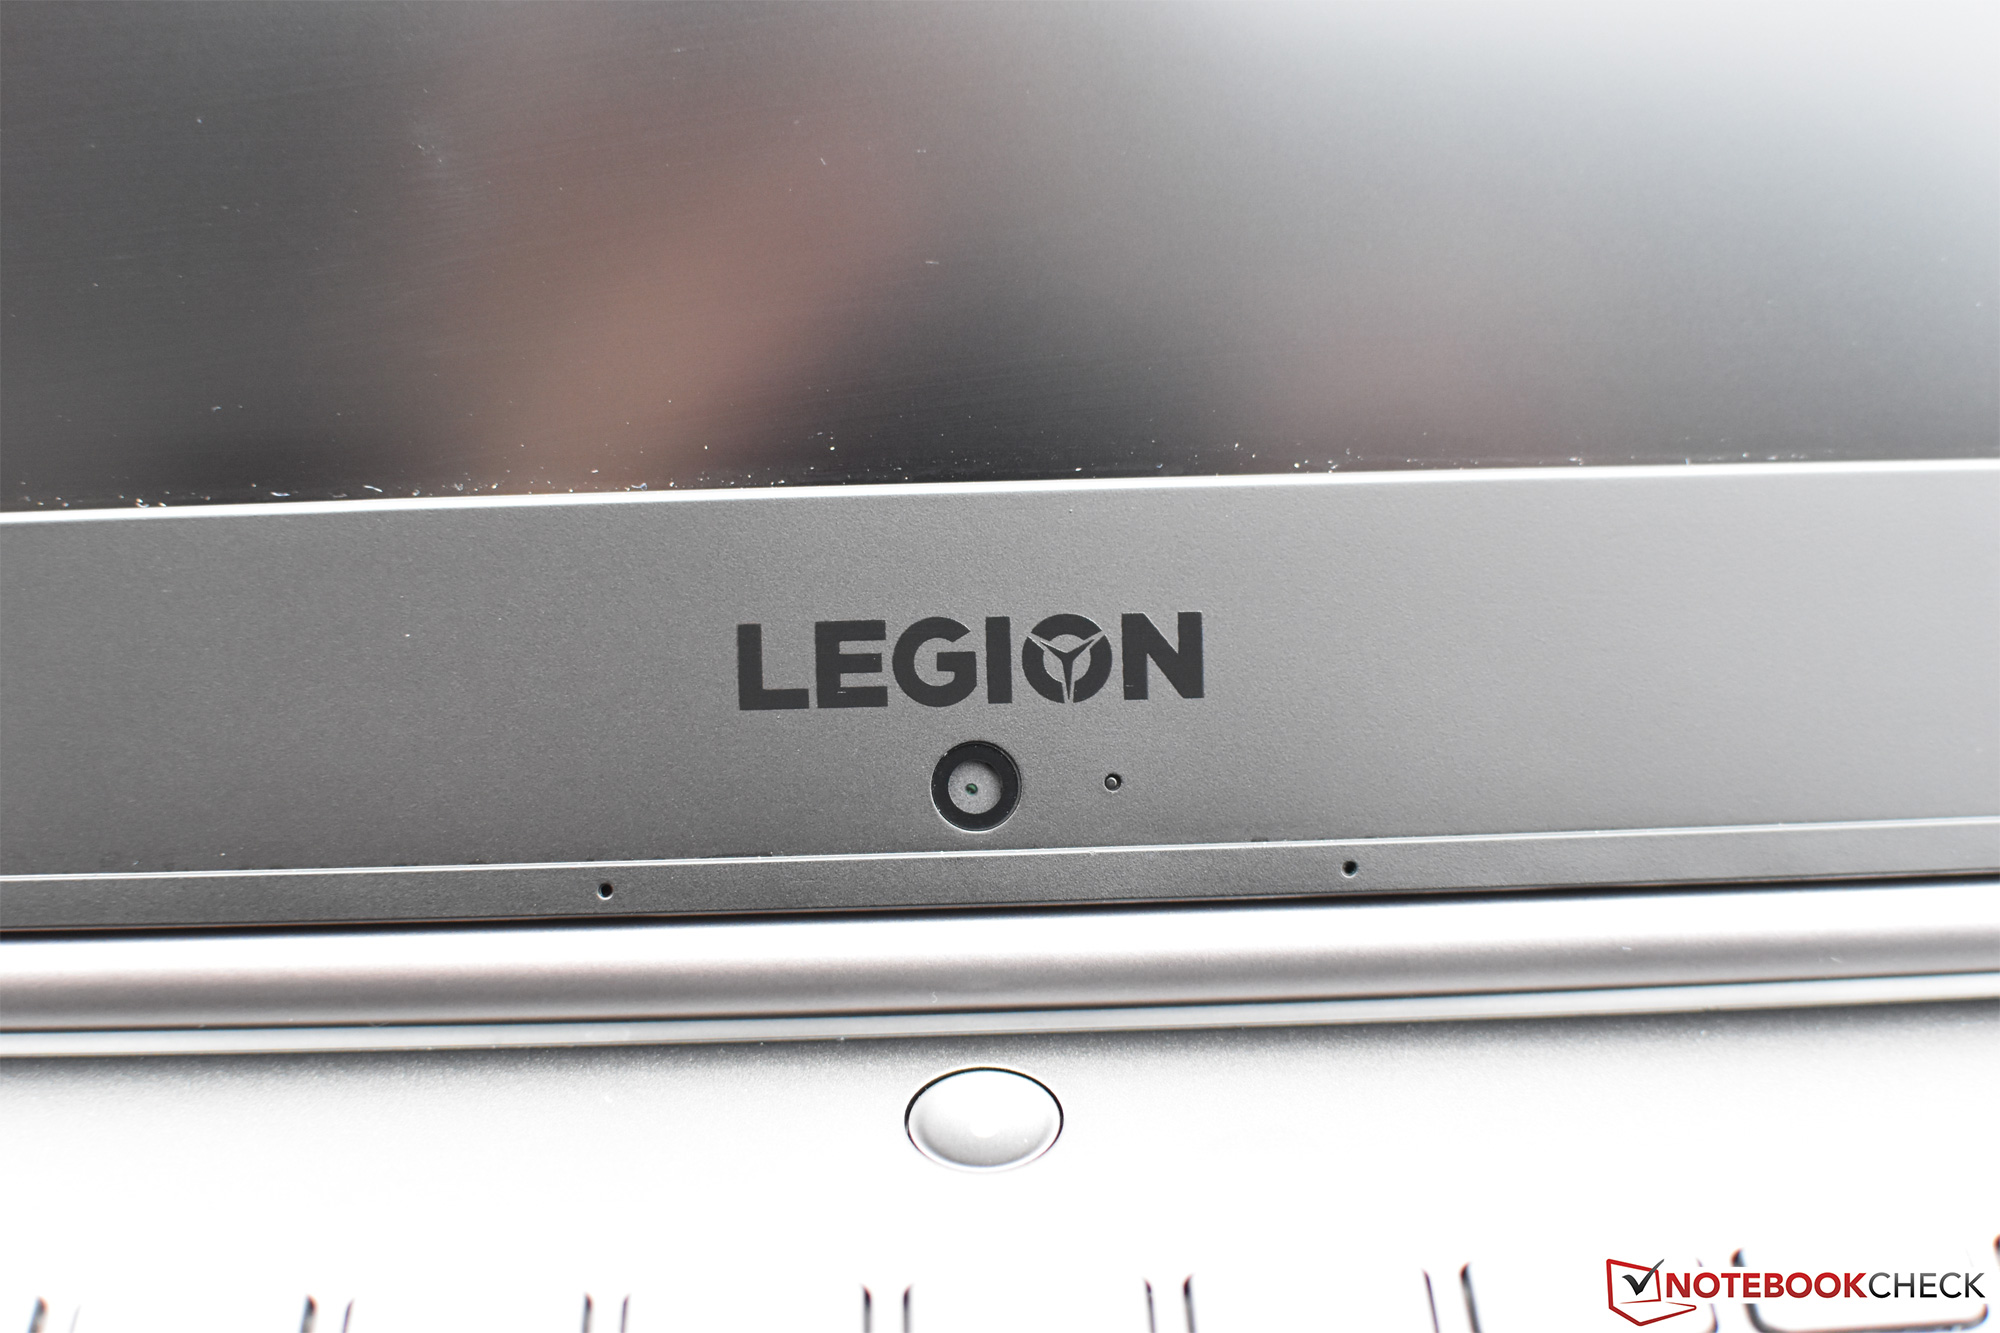
Lenovo equips our review unit with a 15.6-inch IPS panel that it claims can reach up to 500 cd/m². The 144 Hz panel is NVIDIA G-Sync, Dolby Vision and HDR400 certified too. Lenovo only sells 1080p options though, so you will need an external monitor if you want to game in UHD or QHD.
According to our X-Rite i1Pro 2, our review unit manages an average maximum luminosity of 431 cd/m², meaning that it falls short of Lenovo's claims. The brightest point of the display only hits 477 cd/m² too, so it seems no part can reach the advertised threshold of 500 cd/m². However, on closer inspection Lenovo only claims that the display can reach up to 500 cd/m², but does not advertise it is a 500 cd/m² panel. Regardless, the panel exceeds the level to reach HDR400 certification, and it is brighter than all the displays in our comparison devices.
The IPS panel has a comparatively low black level too, which yields an equally impressive contrast ratio. Other conventional IPS panels cannot compete in this regard, but the one in our review unit does have comparatively slow response times. We did not notice any streaking during our gaming tests, though. The display does not rely on the headache and eyestrain inducing pulse-width modulation (PWM) to regulate its brightness either, and it only suffers from minor backlight bleeding.
| |||||||||||||||||||||||||
Brightness Distribution: 84 %
Center on Battery: 477 cd/m²
Contrast: 2726:1 (Black: 0.175 cd/m²)
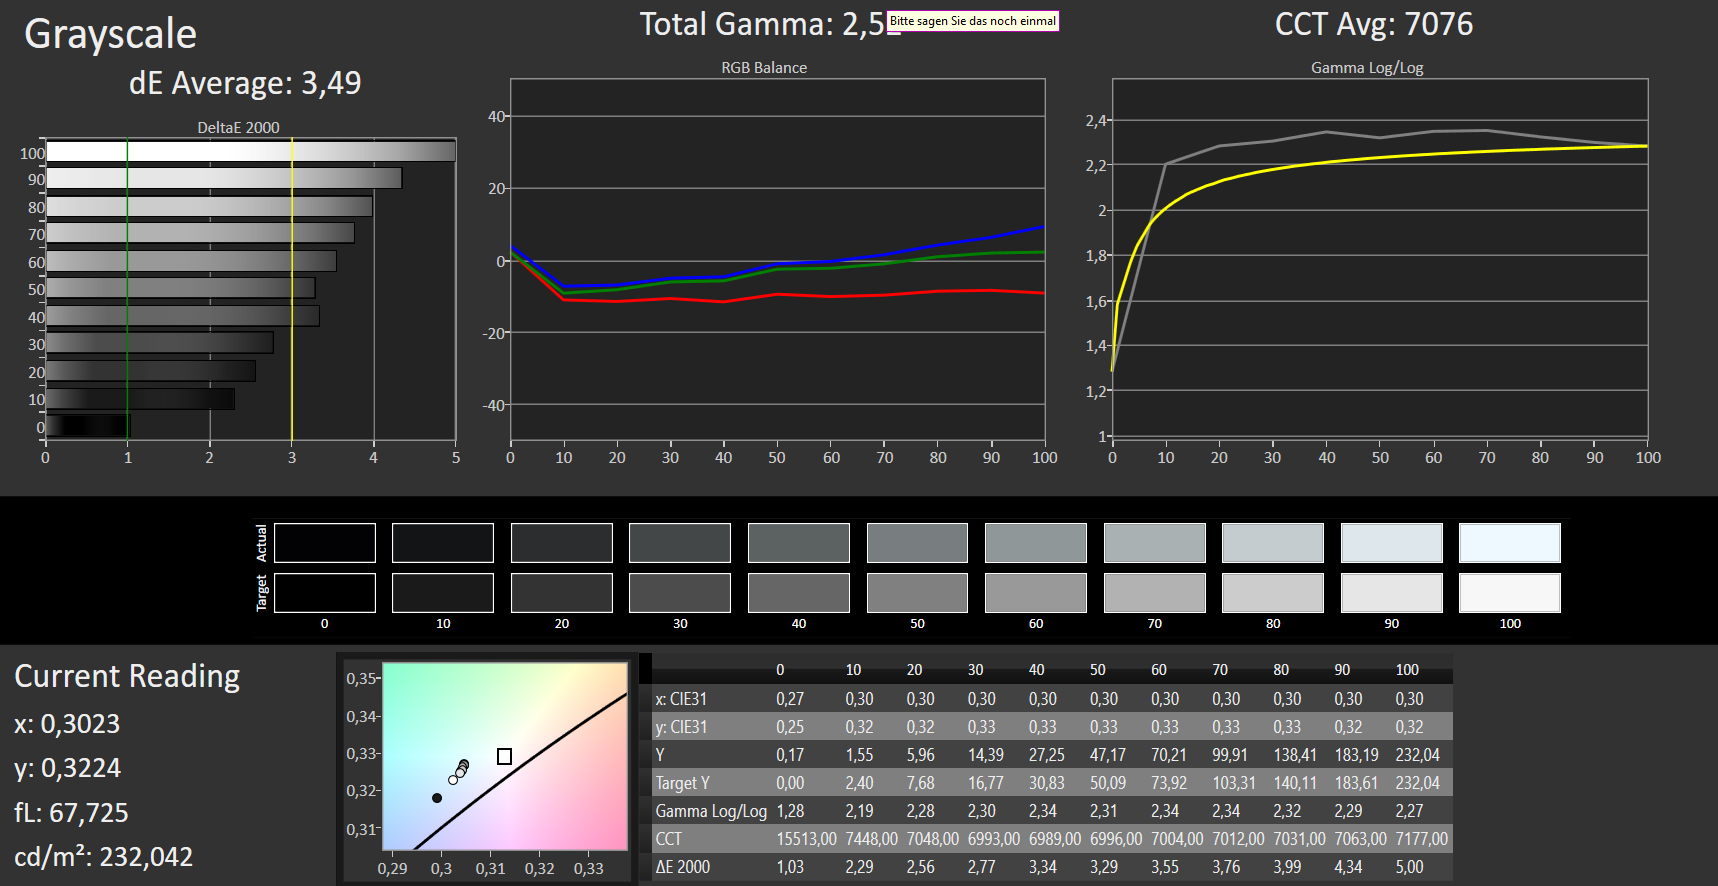
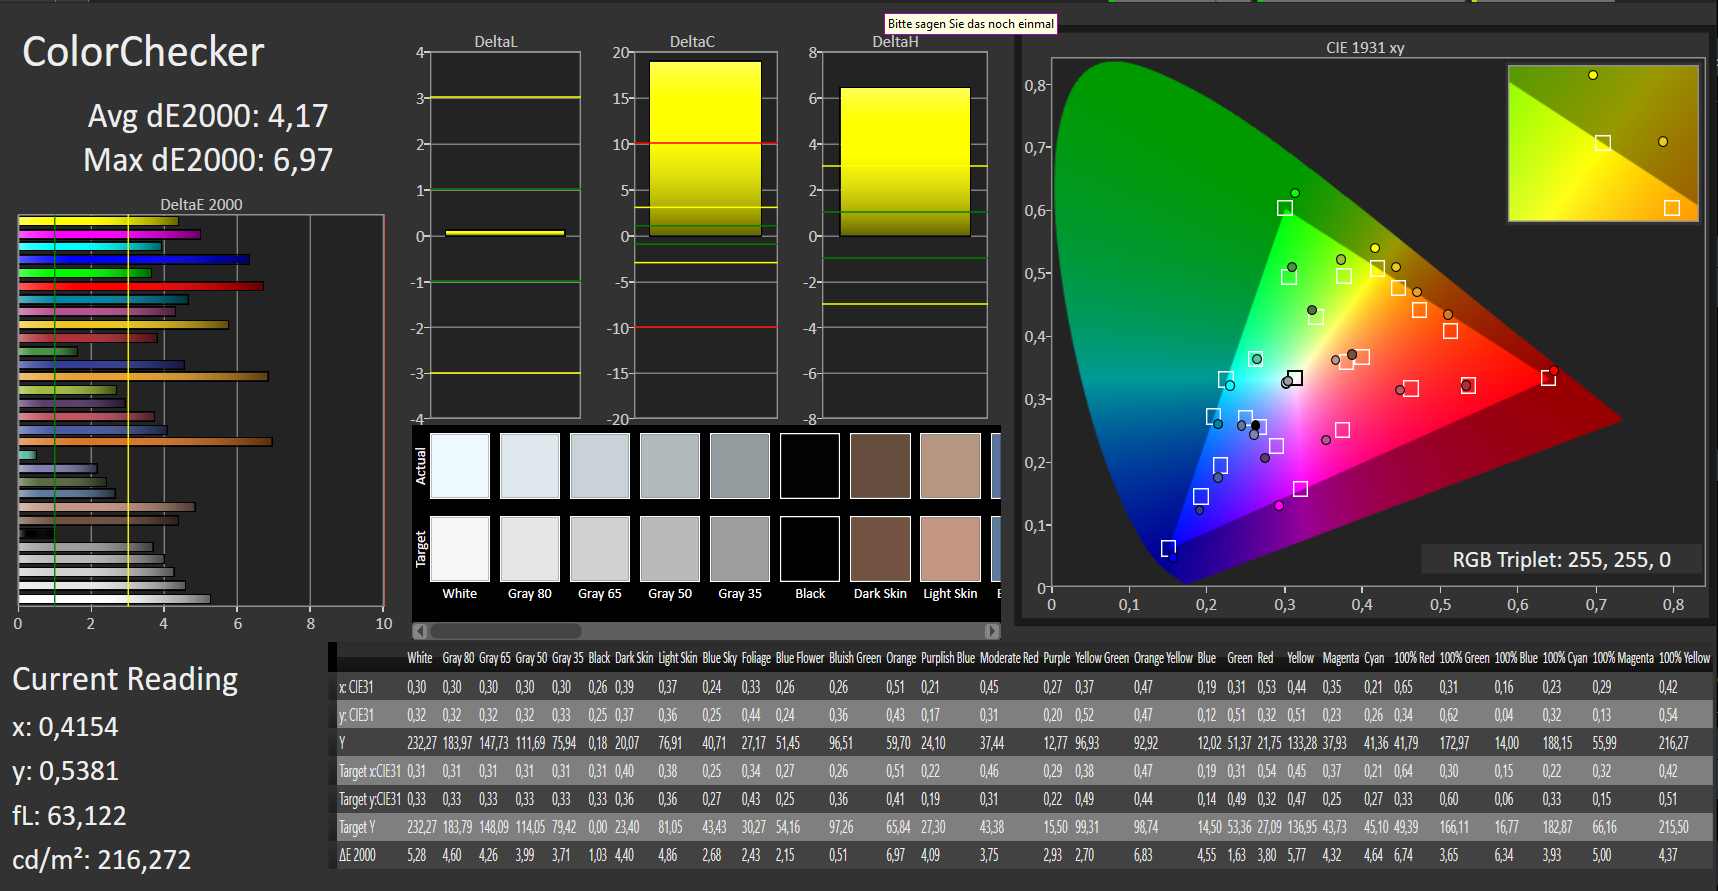
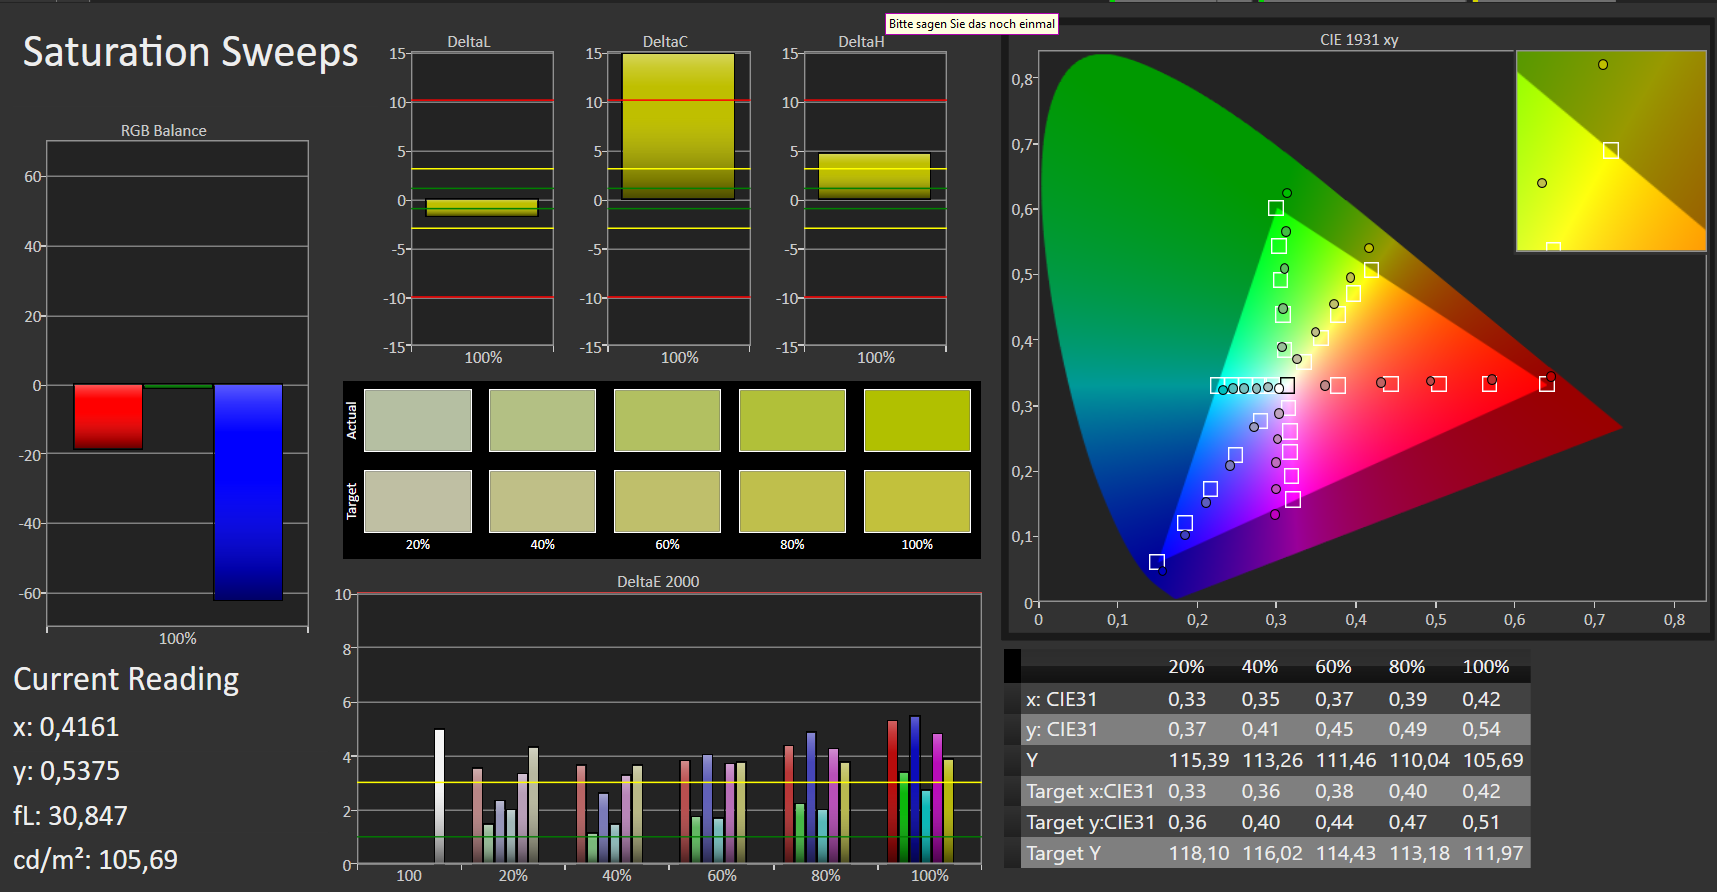
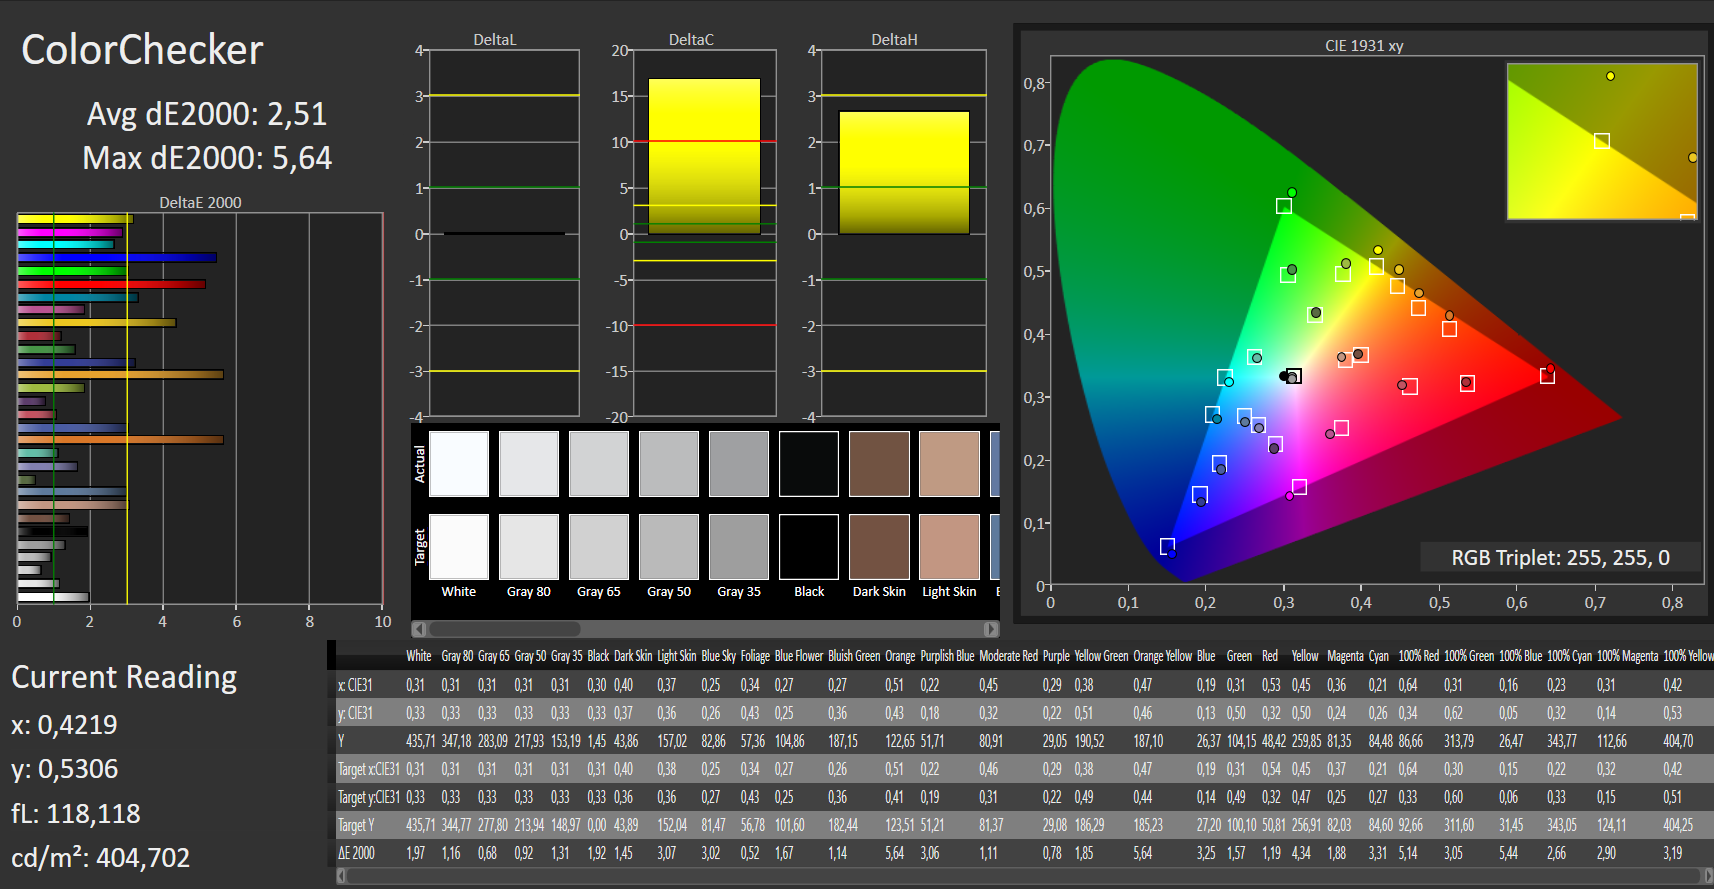
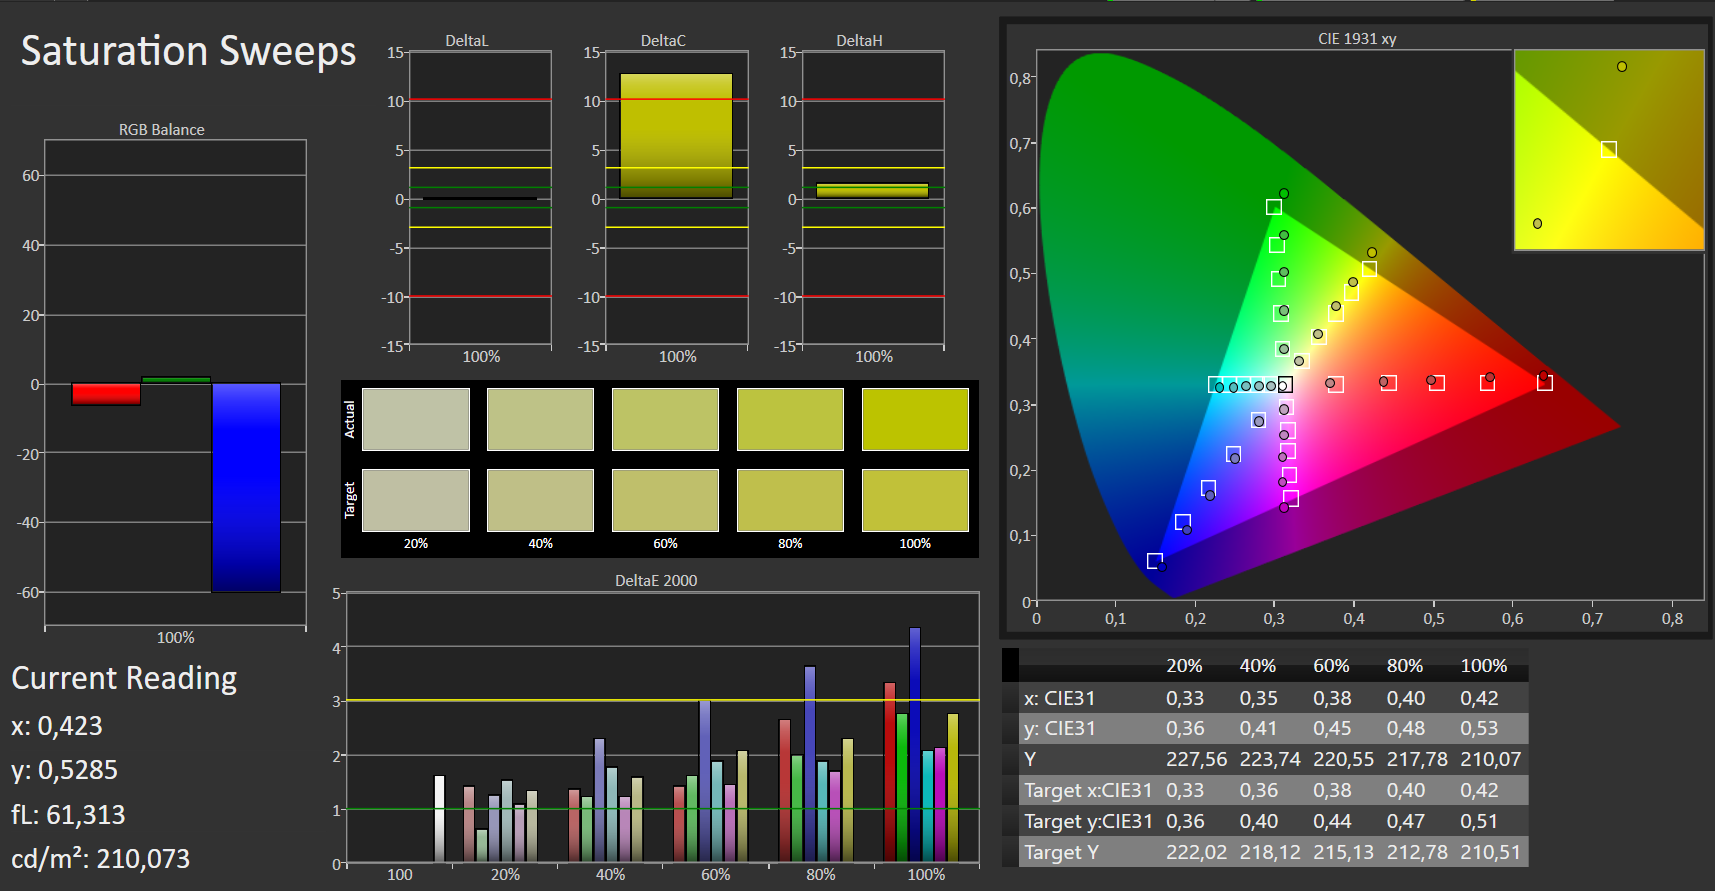
ΔE ColorChecker Calman: 4.17 | ∀{0.5-29.43 Ø4.71}
calibrated: 2.51
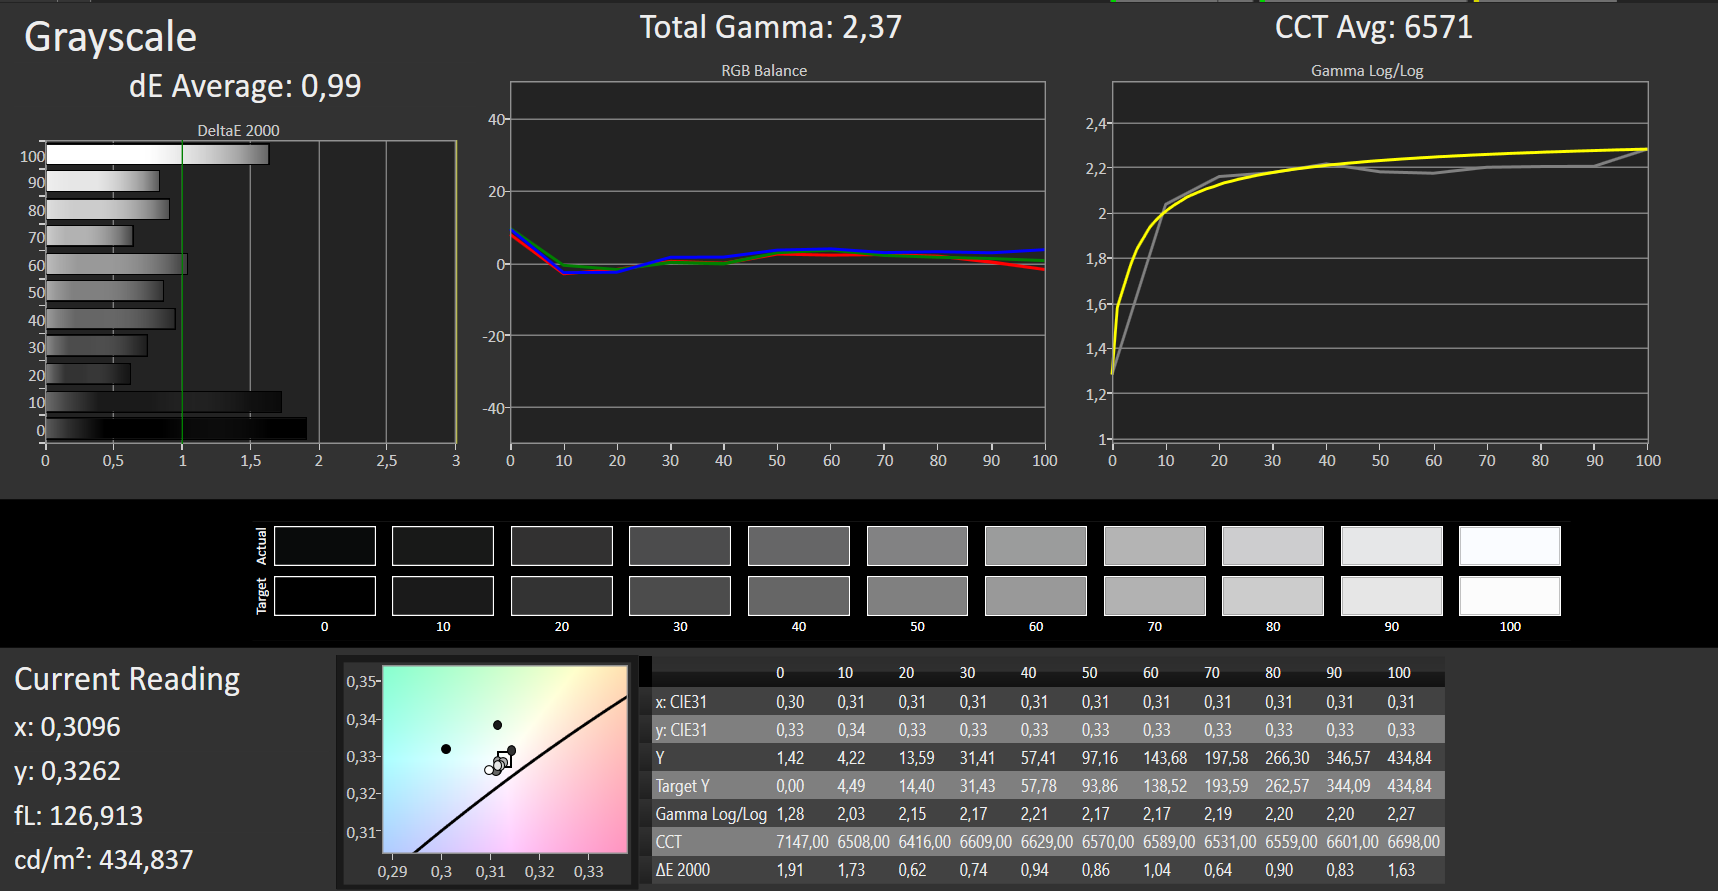
ΔE Greyscale Calman: 3.49 | ∀{0.09-98 Ø4.96}
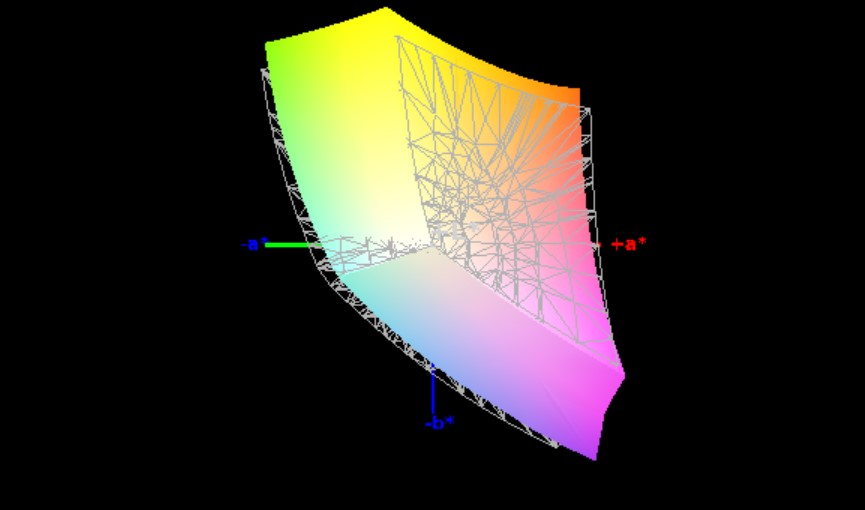
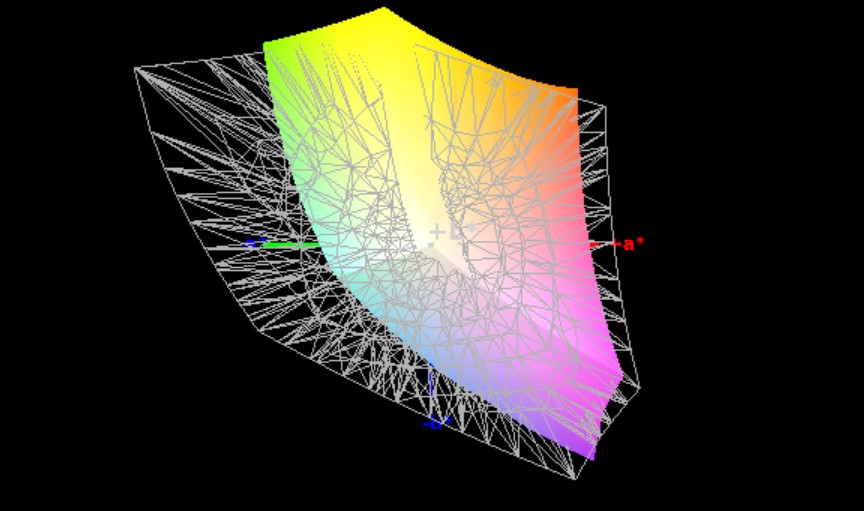
91% sRGB (Argyll 1.6.3 3D)
60% AdobeRGB 1998 (Argyll 1.6.3 3D)
67.1% AdobeRGB 1998 (Argyll 3D)
91.6% sRGB (Argyll 3D)
67.7% Display P3 (Argyll 3D)
Gamma: 2.5
CCT: 7076 K
| Lenovo Legion Y740-15ICHg BOE NV156FHM-N4J, IPS, 1920x1080, 15.6" | Lenovo Legion Y740-15ICHg LP156WFG-SPB2, IPS, 1920x1080, 15.6" | HP Omen X 2S 15-dg0075cl AU Optronics AUO82ED, IPS, 1920x1080, 15.6" | Acer Predator Triton 500 PT515-51-71PZ NV156FHM-N4K (BOE082A), IPS, 1920x1080, 15.6" | |
|---|---|---|---|---|
| Display | -3% | -0% | -2% | |
| Display P3 Coverage (%) | 67.7 | 63.5 -6% | 66.2 -2% | 64.6 -5% |
| sRGB Coverage (%) | 91.6 | 92.4 1% | 92.3 1% | 92.6 1% |
| AdobeRGB 1998 Coverage (%) | 67.1 | 64.7 -4% | 67.2 0% | 66 -2% |
| Response Times | -16% | 6% | 31% | |
| Response Time Grey 50% / Grey 80% * (ms) | 19 ? | 18.8 ? 1% | 15.2 ? 20% | 5.2 ? 73% |
| Response Time Black / White * (ms) | 10 ? | 13.2 ? -32% | 10.8 ? -8% | 11.2 ? -12% |
| PWM Frequency (Hz) | ||||
| Screen | -21% | -25% | -7% | |
| Brightness middle (cd/m²) | 477 | 320.4 -33% | 324.8 -32% | 288 -40% |
| Brightness (cd/m²) | 431 | 298 -31% | 316 -27% | 265 -39% |
| Brightness Distribution (%) | 84 | 85 1% | 84 0% | 84 0% |
| Black Level * (cd/m²) | 0.175 | 0.42 -140% | 0.26 -49% | 0.22 -26% |
| Contrast (:1) | 2726 | 763 -72% | 1249 -54% | 1309 -52% |
| Colorchecker dE 2000 * | 4.17 | 3.21 23% | 4.96 -19% | 3.22 23% |
| Colorchecker dE 2000 max. * | 6.97 | 5.54 21% | 8.95 -28% | 6.26 10% |
| Colorchecker dE 2000 calibrated * | 2.51 | 2.36 6% | 3.23 -29% | 1.5 40% |
| Greyscale dE 2000 * | 3.49 | 3.6 -3% | 5 -43% | 3.43 2% |
| Gamma | 2.5 88% | 2.27 97% | 2.21 100% | 2.41 91% |
| CCT | 7076 92% | 6503 100% | 7742 84% | 7290 89% |
| Color Space (Percent of AdobeRGB 1998) (%) | 60 | 59 -2% | 59.8 0% | 60 0% |
| Color Space (Percent of sRGB) (%) | 91 | 92 1% | 91.8 1% | 93 2% |
| Total Average (Program / Settings) | -13% /
-17% | -6% /
-17% | 7% /
-2% |
* ... smaller is better
Display Response Times
| ↔ Response Time Black to White | ||
|---|---|---|
| 10 ms ... rise ↗ and fall ↘ combined | ↗ 6 ms rise | 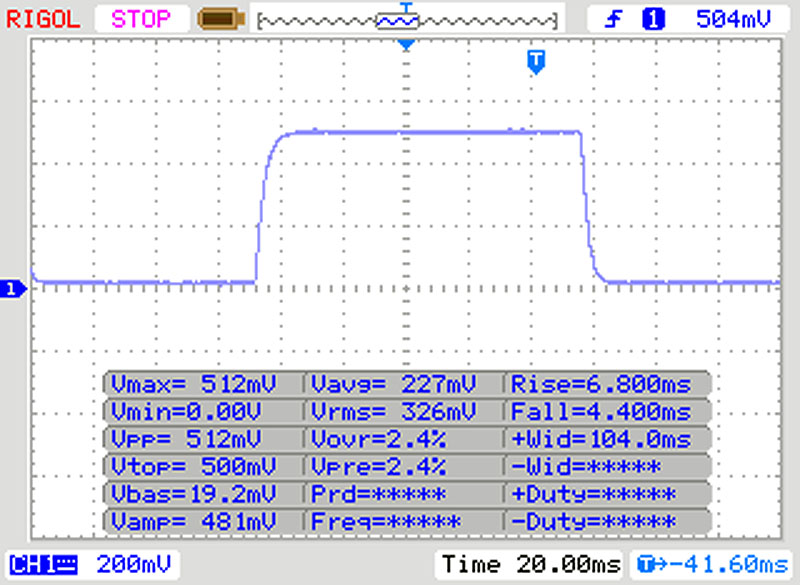 |
| ↘ 4 ms fall | ||
| The screen shows good response rates in our tests, but may be too slow for competitive gamers. In comparison, all tested devices range from 0.1 (minimum) to 240 (maximum) ms. » 27 % of all devices are better. This means that the measured response time is better than the average of all tested devices (19.8 ms). | ||
| ↔ Response Time 50% Grey to 80% Grey | ||
| 19 ms ... rise ↗ and fall ↘ combined | ↗ 9 ms rise | 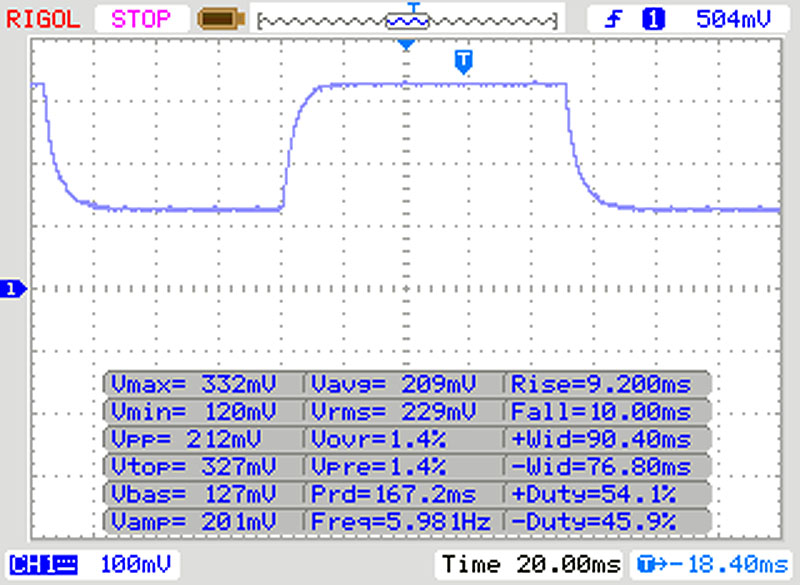 |
| ↘ 10 ms fall | ||
| The screen shows good response rates in our tests, but may be too slow for competitive gamers. In comparison, all tested devices range from 0.165 (minimum) to 636 (maximum) ms. » 33 % of all devices are better. This means that the measured response time is better than the average of all tested devices (30.9 ms). | ||
Screen Flickering / PWM (Pulse-Width Modulation)
| Screen flickering / PWM not detected | 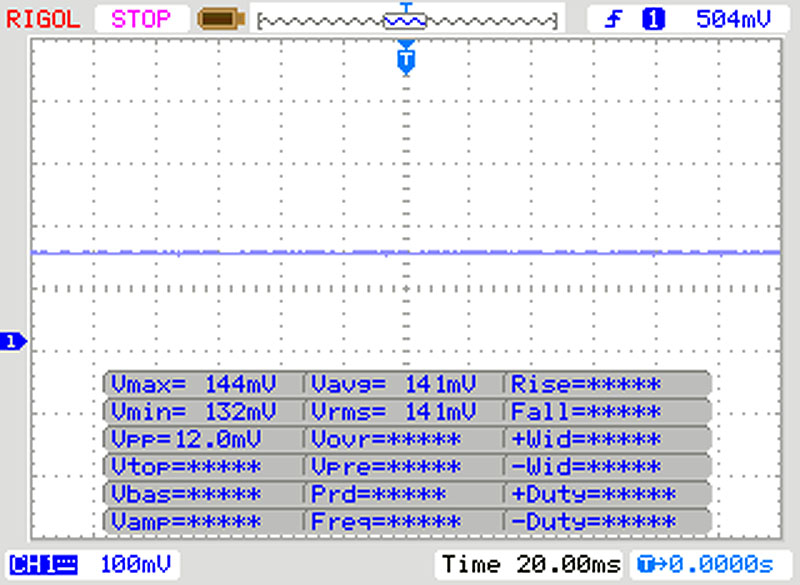 | ||
In comparison: 52 % of all tested devices do not use PWM to dim the display. If PWM was detected, an average of 7741 (minimum: 5 - maximum: 343500) Hz was measured. | |||
The display reproduces colours richly, thanks to its high contrast ratio, while its low black value makes blacks looks intense. Some black areas look more grey in parts of the display that suffer from backlight bleeding, though. However, only OLED panels reproduce colours more vibrantly than the display in our review unit can.
Lenovo also does an excellent job of factory calibrating the display. Our photo spectrometer and CalMAN analysis software determine that the panel only deviates slightly from the sRGB colour space upon delivery, although our previous Legion Y740 test device and the Predator Triton 500 perform slightly better here. Additional calibration reduced these deviations, but we were unable to eradicate the slight blue tint that affects the display. We have linked the calibrated ICC profile in the box above our comparison table should you wish to use it.
Our review unit covers 91% of the sRGB colour space and 60% of AdobeRGB, which is accurate enough for hobbyist level colour work. While these scores put the Y740 on par with its competitors, they are not high enough for colour critical work such as professional photo and video editing.
The Y740 gets bright enough to use outdoors, even on a sunny day, while its matte finish diffuses reflections nicely. The IPS panel has stable viewing angles too, although we noticed some grey hazes in the corners of the display, which spoils things slightly. Nonetheless, this should not affect readability in daily use.

Performance - Fast, but not fast enough
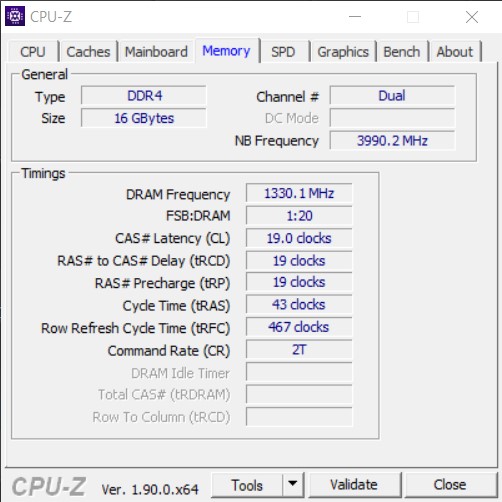
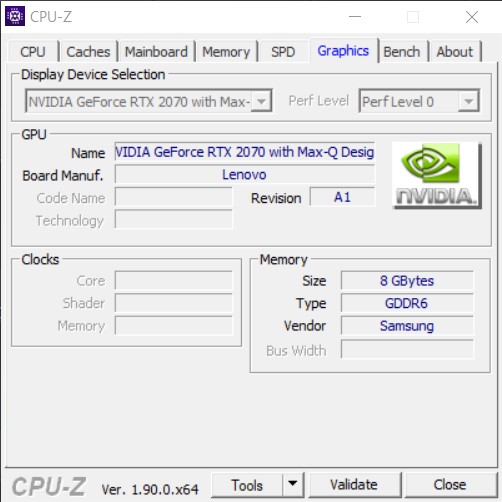
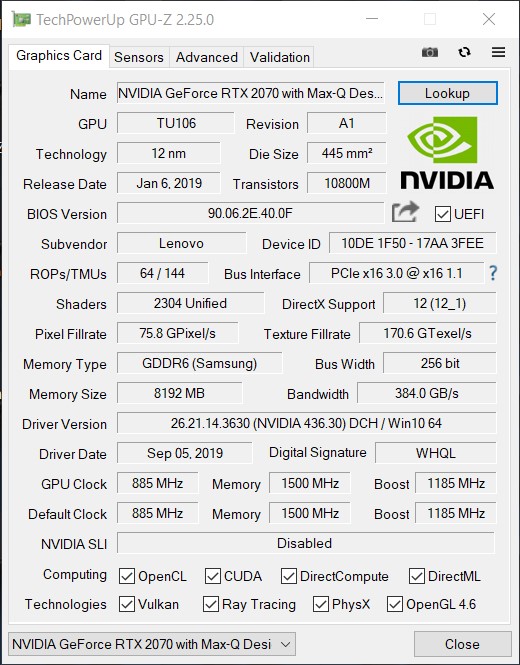
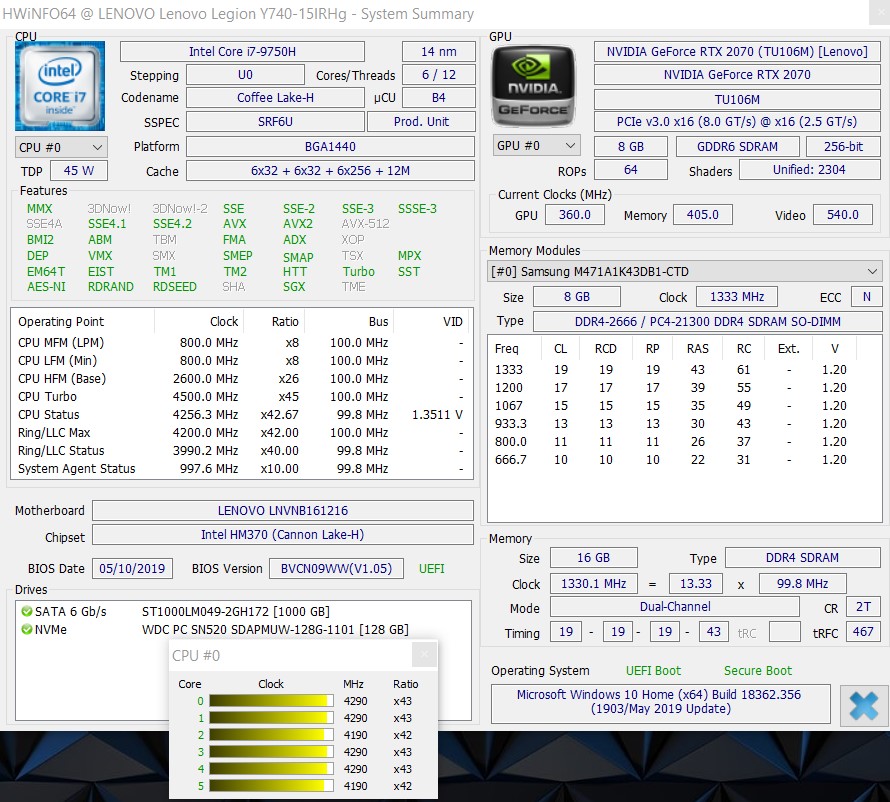
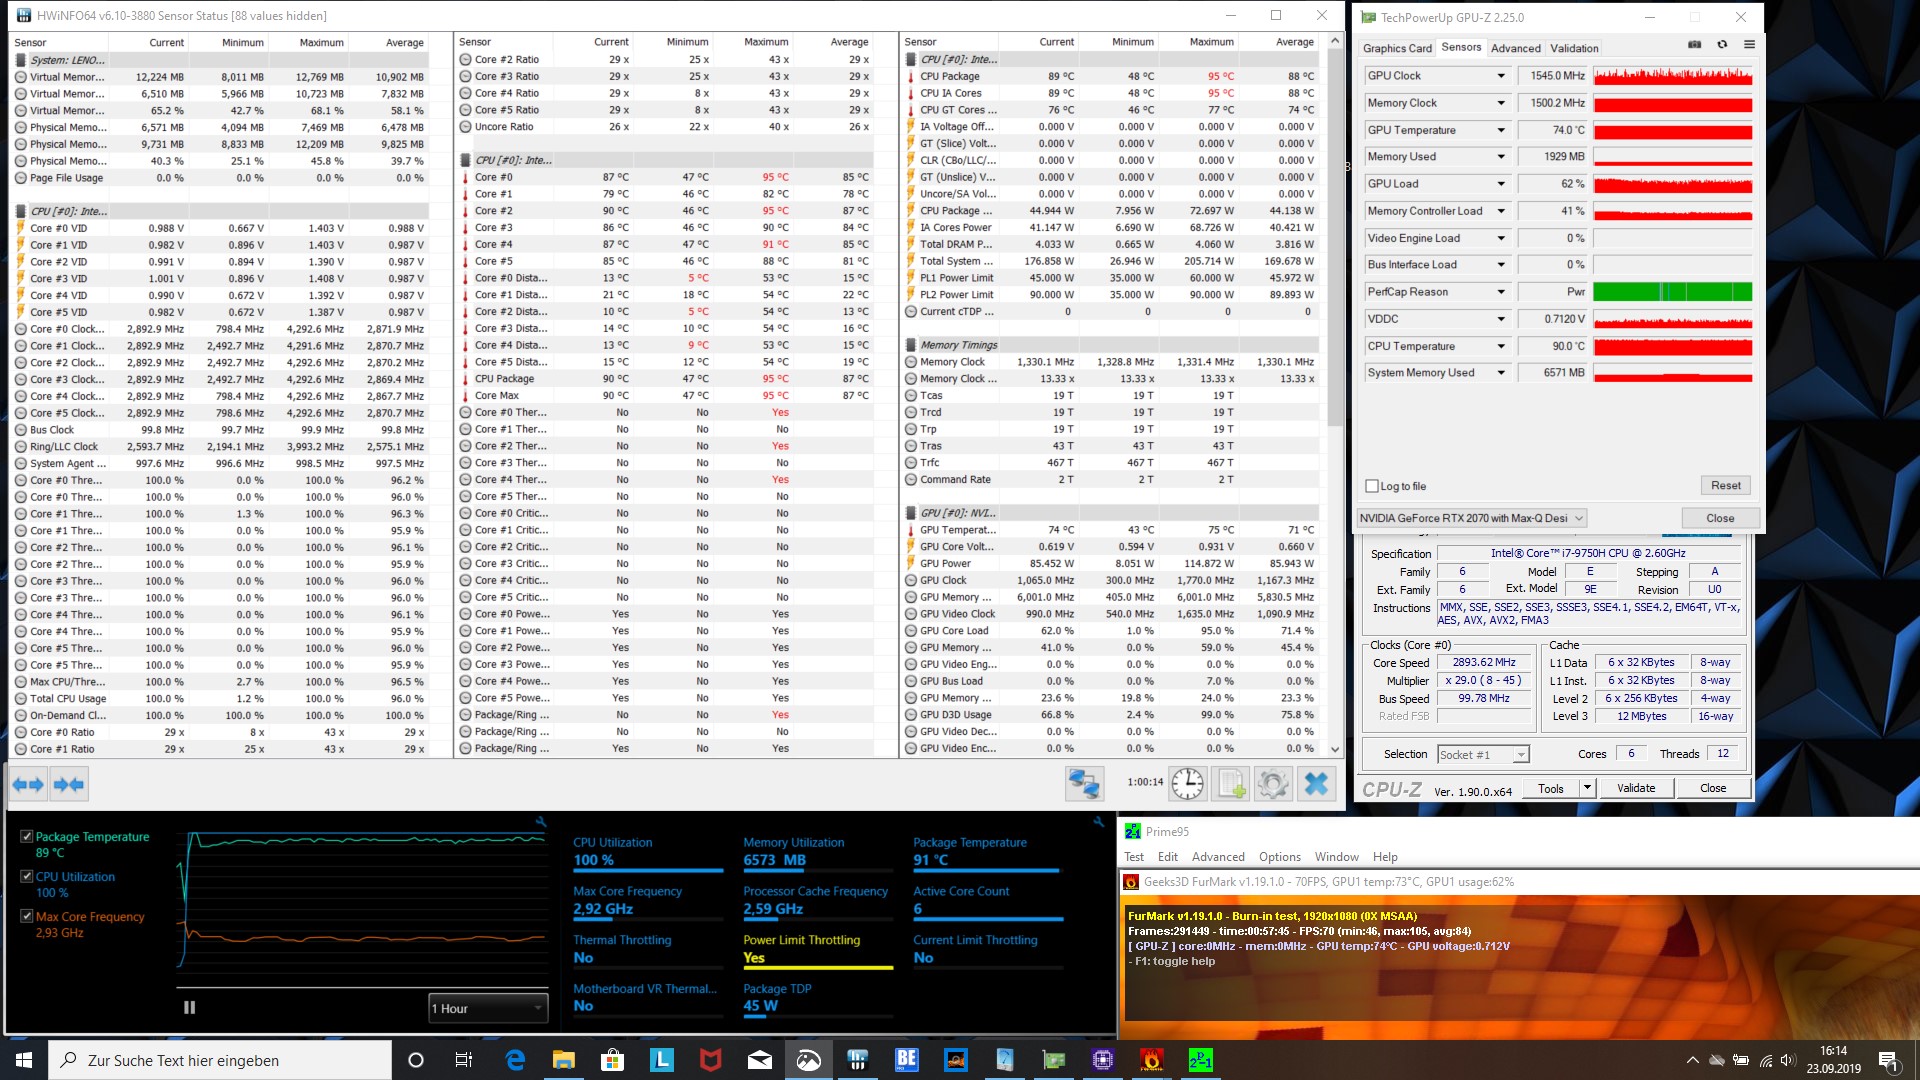
Our review unit may come with a theoretically faster CPU than its predecessor, but this does not necessarily ring true in all scenarios. Lenovo continues to equip the Y740 with a GeForce RTX 2070 Max-Q though, along with identical volumes of RAM and storage. The 16 GB of dual-channel DDR4 RAM should be enough for most memory-intensive applications too.
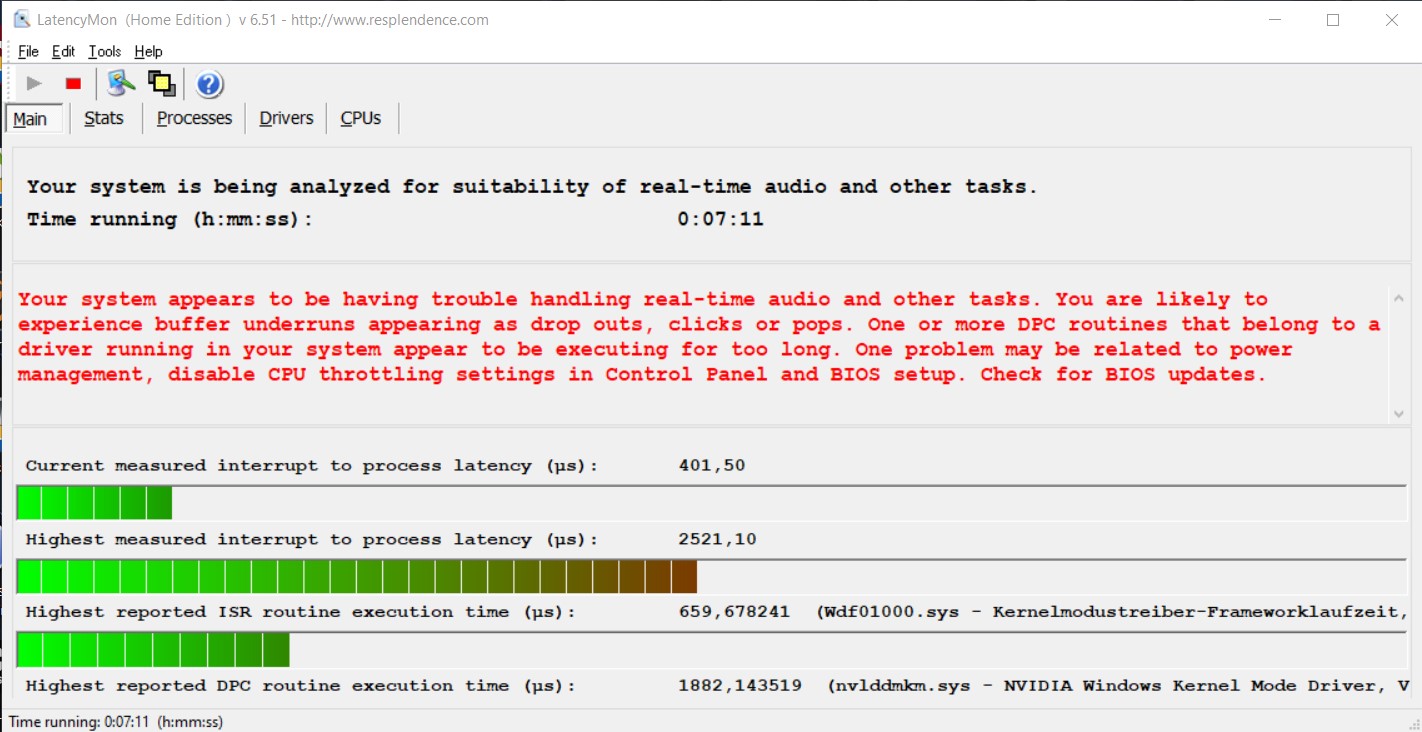
We should also point out that LatencyMon reports much higher DPC latencies with our current review unit than its predecessor. We did not notice any issues during our tests though, and hopefully future driver updates should address this.
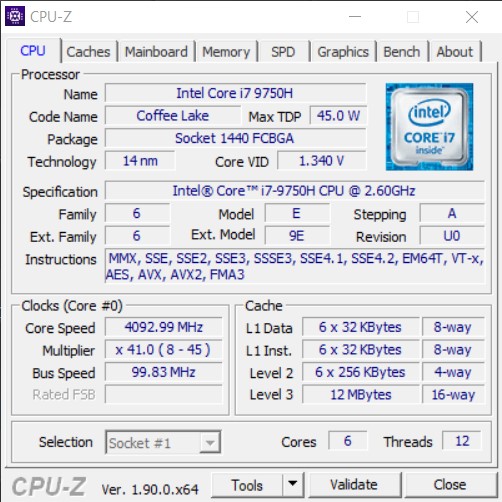
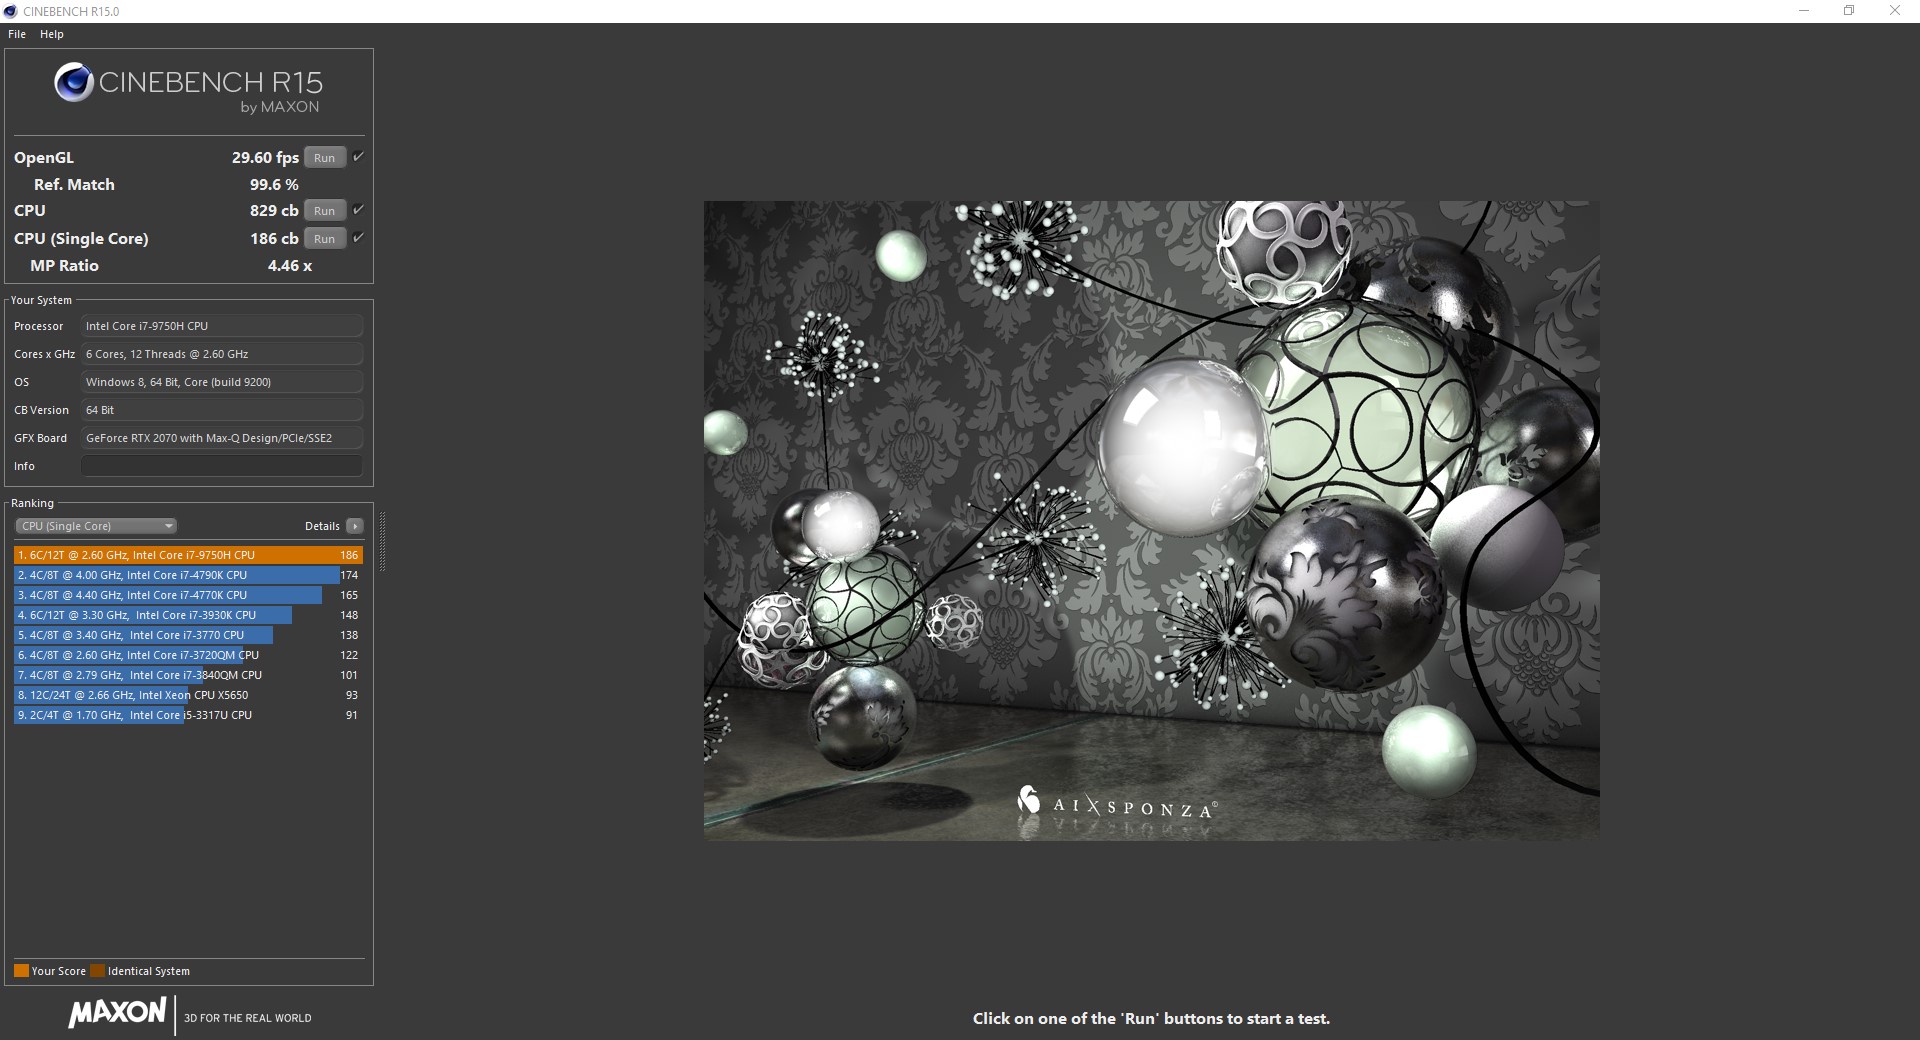
Processor
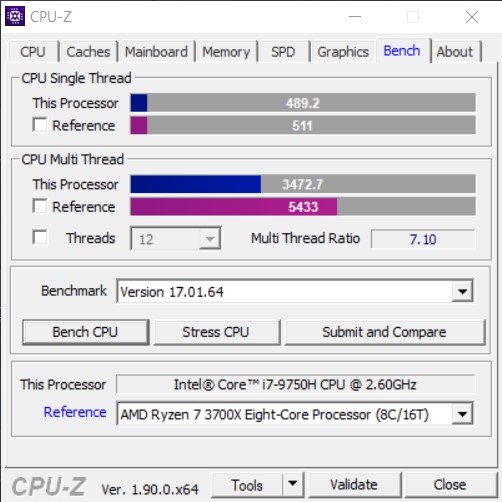
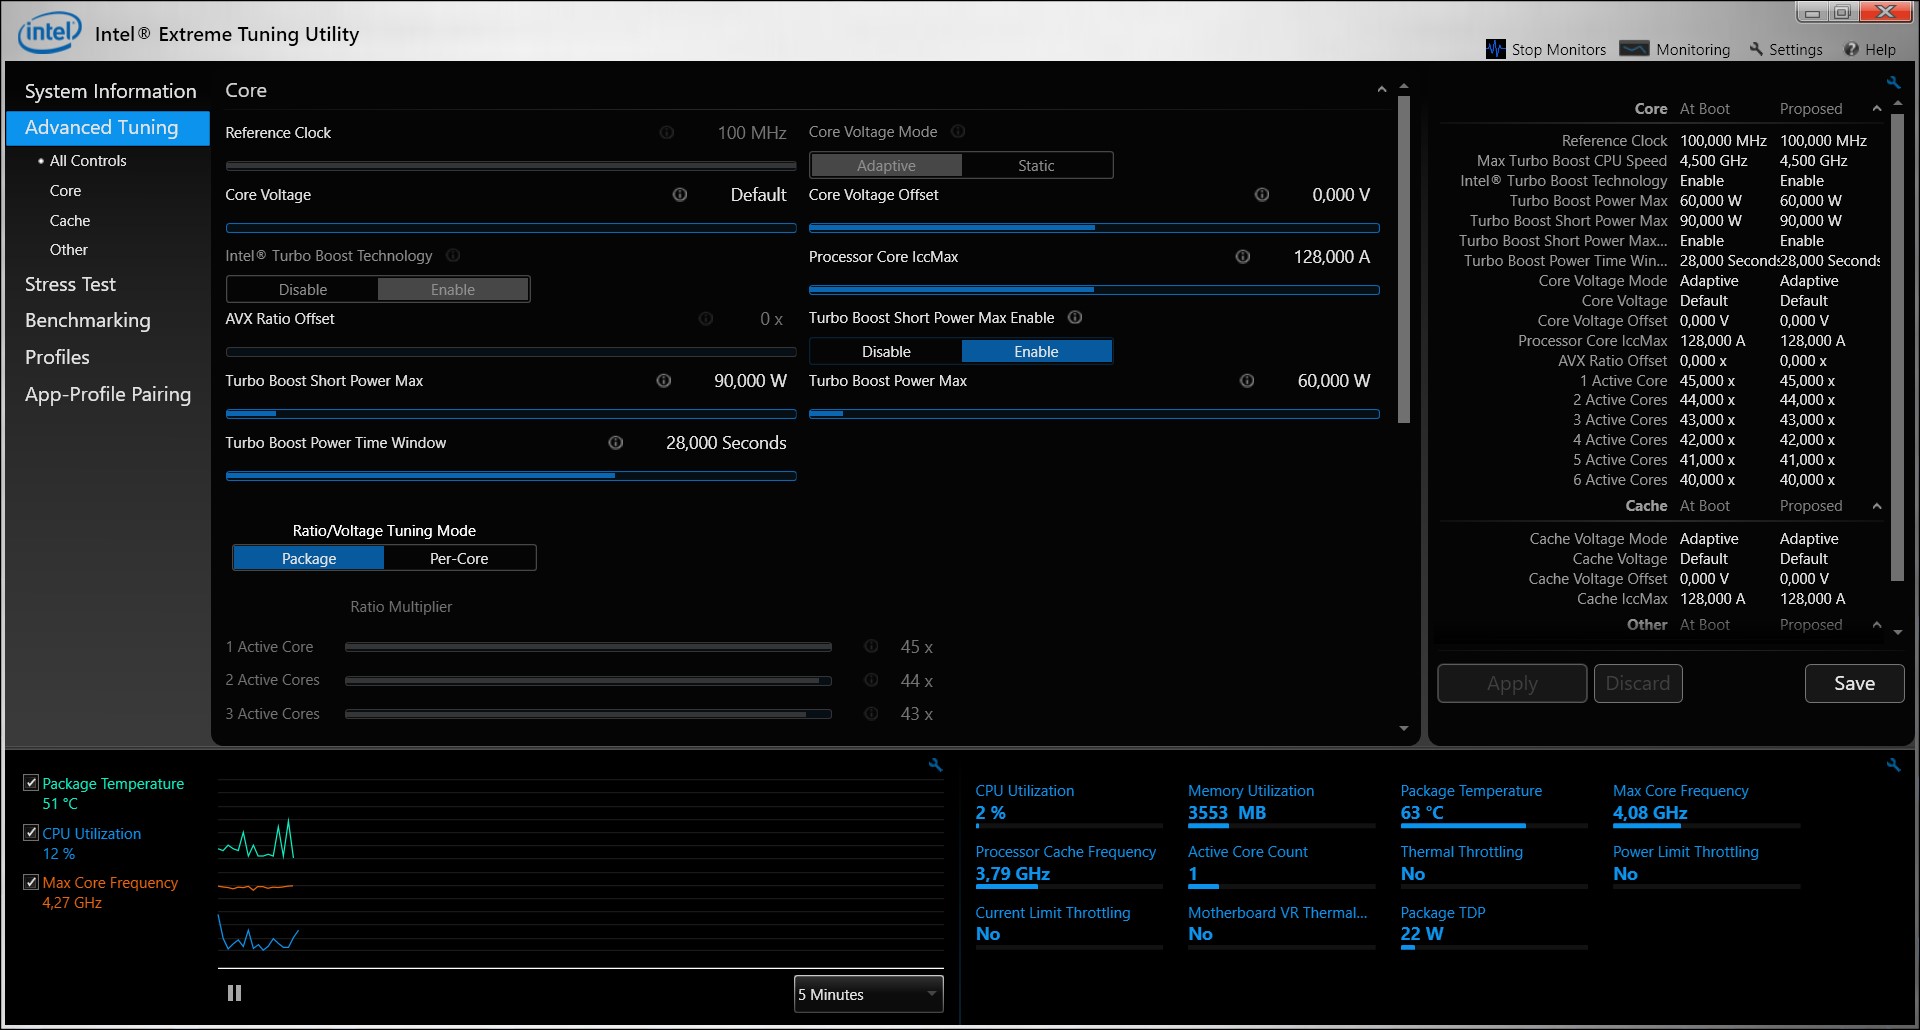
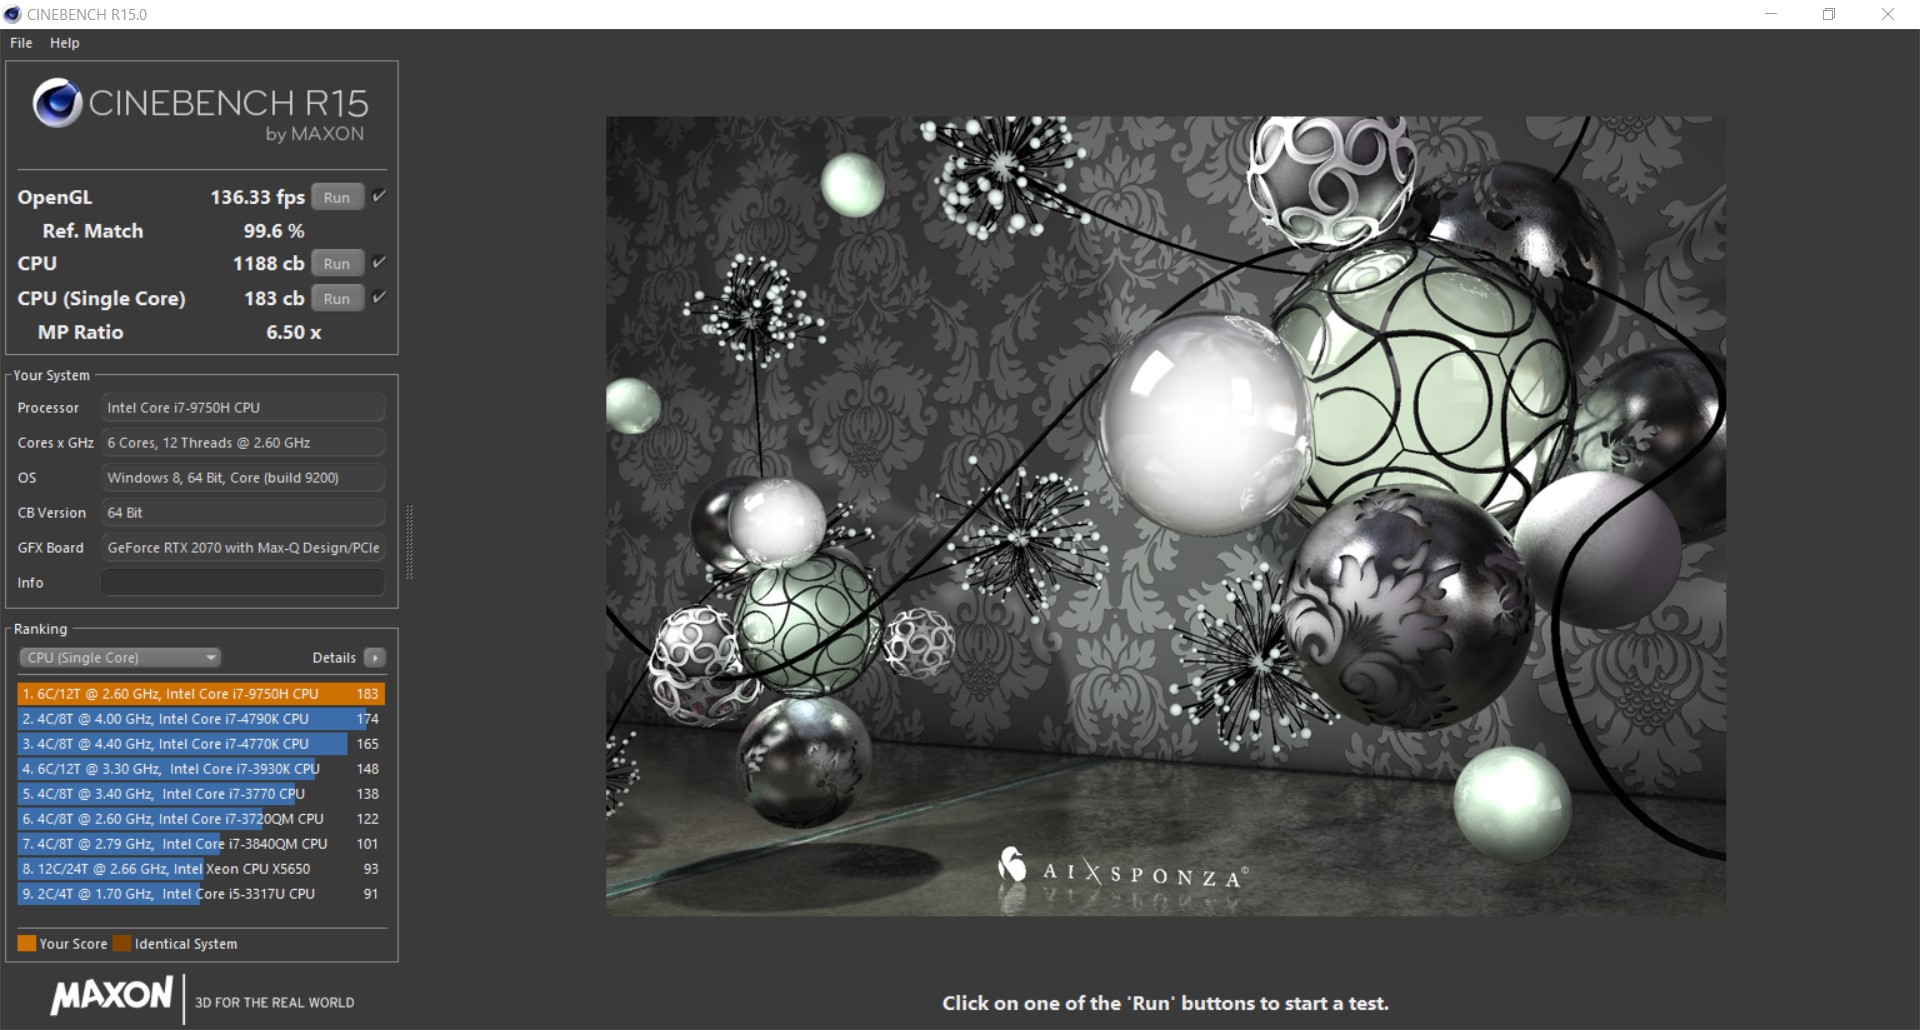
The Core i7-9750H succeeds the Core i7-8750H, with the former offering higher base and boost clock speeds than the latter. The Core i7-9750H clocks between 2.6 GHz and 4.5 GHz, although it can only reach 4.5 GHz on two cores. Its peak boost clock drops to 4.0 GHz on all cores, which is 100 MHz higher than the equivalent of the Core i7-8750H.
Correspondingly, our review unit generally scores around 6% more in single-core synthetic benchmarks than its predecessor. Surprisingly, the opposite is the case in multicore benchmarks, where the Core i7-9750H falls 4% behind the Core i7-9750H. Our review unit performs above the class average, but it hits its thermal limits faster than its Core i7-8750H powered predecessor does.
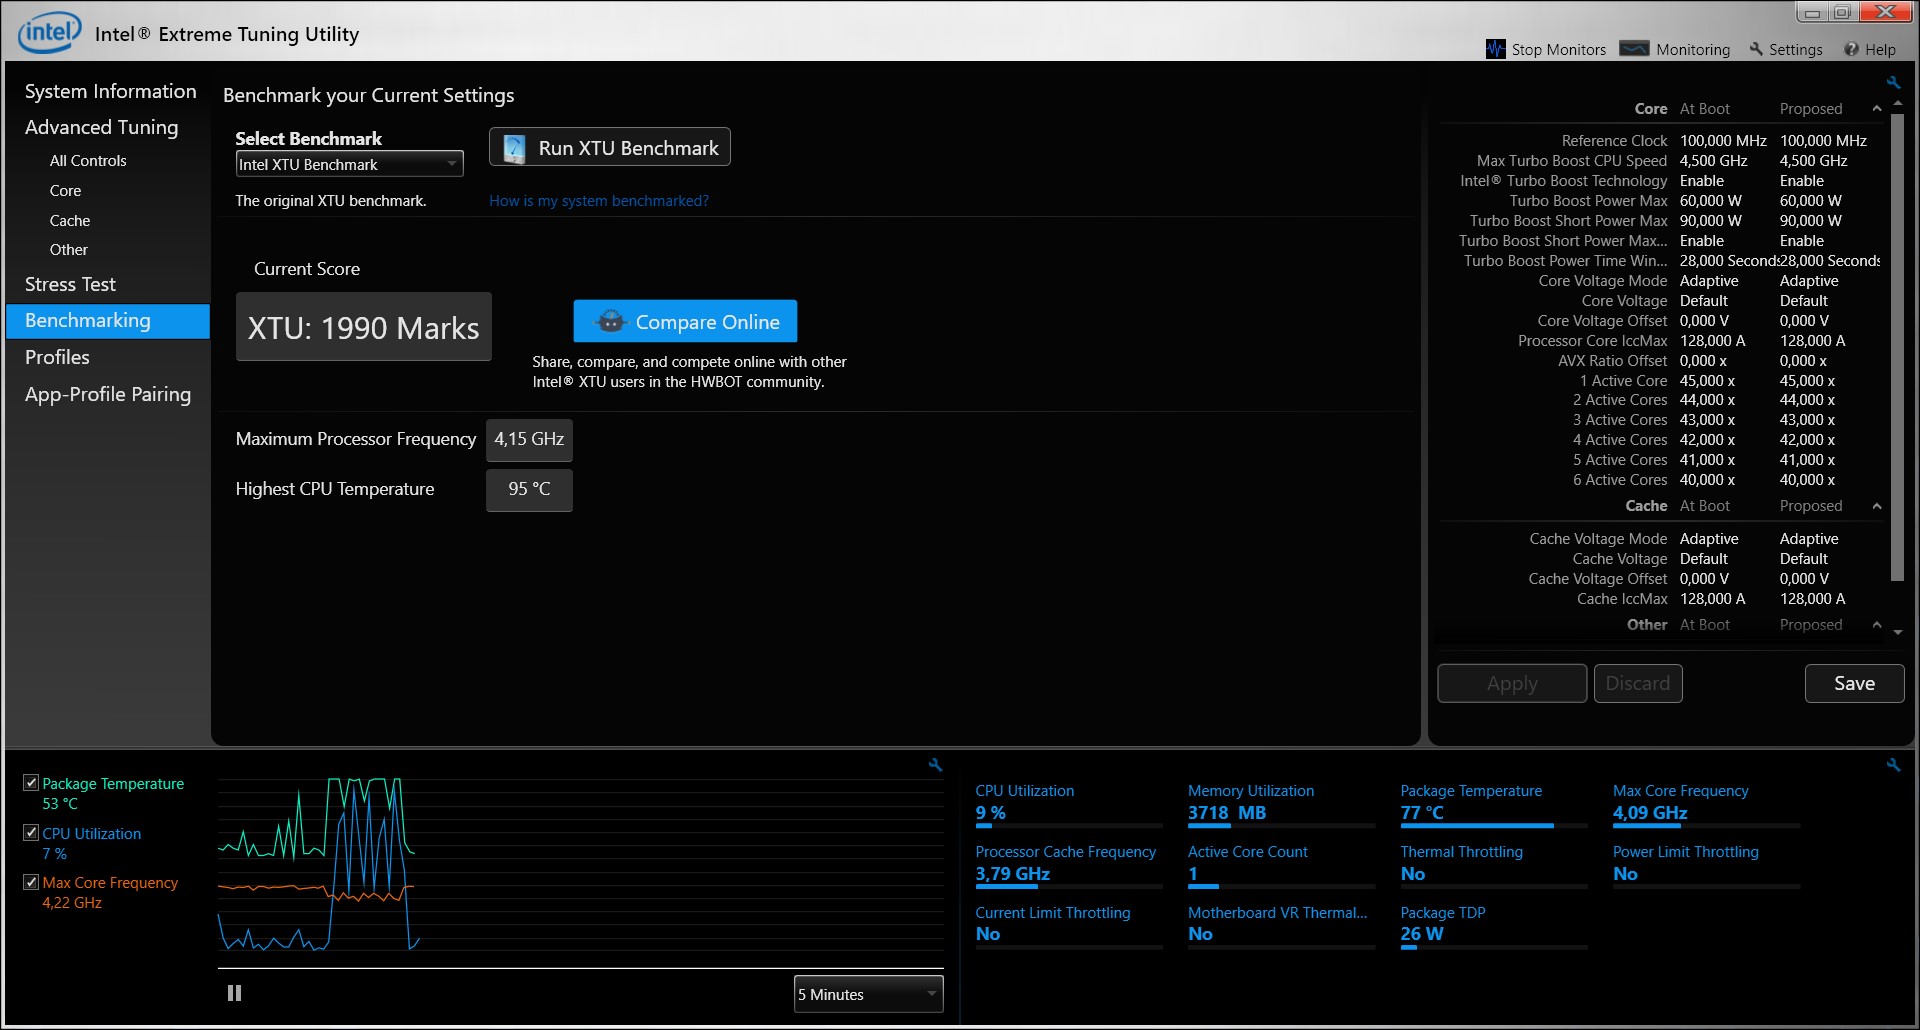
Please see our CPU comparison page for more information on the Core i7-9750H and how it compares against other processors.
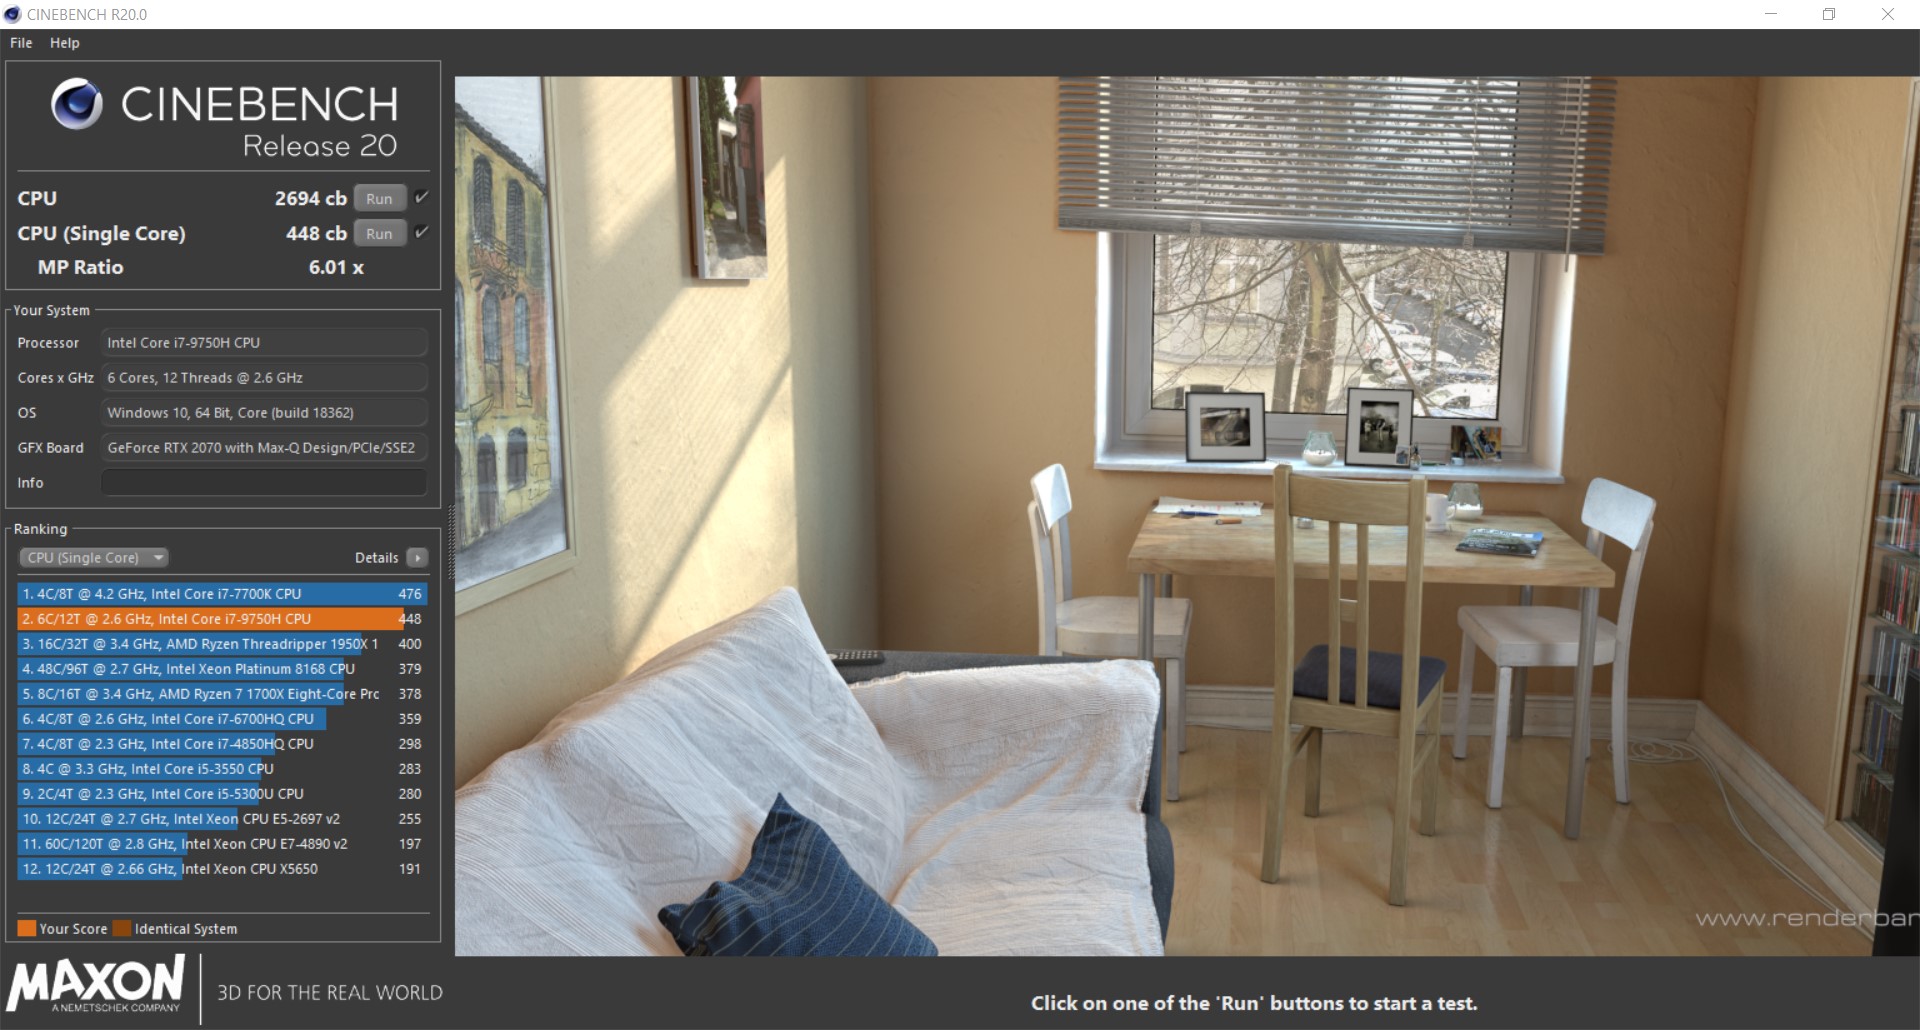
We also ran Cinebench R15 Multi 64Bit benchmark in a loop to determine how well our review unit performed under sustained load. Unsurprisingly, the Y740 throttled below the performance of its predecessor, but it remained well above our Core i7-9750H powered competitors.
| 3DMark 11 - 1280x720 Performance Physics | |
| HP Omen X 2S 15-dg0075cl | |
| Lenovo Legion Y740-15ICHg | |
| Acer Predator Triton 500 PT515-51-71PZ | |
| Average Intel Core i7-9750H (9704 - 14337, n=80) | |
| Lenovo Legion Y740-15ICHg | |
| Blender - v2.79 BMW27 CPU | |
| Average Intel Core i7-9750H (342 - 495, n=21) | |
| Lenovo Legion Y740-15ICHg | |
| Geekbench 4.4 | |
| 64 Bit Single-Core Score | |
| Lenovo Legion Y740-15ICHg | |
| Average Intel Core i7-9750H (4440 - 5511, n=27) | |
| 64 Bit Multi-Core Score | |
| Lenovo Legion Y740-15ICHg | |
| Average Intel Core i7-9750H (17054 - 25043, n=27) | |
| 7-Zip 18.03 | |
| 7z b 4 | |
| Lenovo Legion Y740-15ICHg | |
| Average Intel Core i7-9750H (28512 - 35174, n=21) | |
| 7z b 4 -mmt1 | |
| Lenovo Legion Y740-15ICHg | |
| Average Intel Core i7-9750H (4580 - 5090, n=21) | |
* ... smaller is better
System Performance
While Lenovo has equipped our current review unit with a slower SSD than the one it included in our previous Y740 test device, the two score almost identically in PCMark. Little separates our comparison devices in system performance benchmarks, with all scoring above the class average.
Subjectively, our review unit feels fast. We noticed no system problems or unnecessary waiting times during our tests, with apps and the OS loading quickly.
| PCMark 8 Home Score Accelerated v2 | 5661 points | |
| PCMark 8 Creative Score Accelerated v2 | 8613 points | |
| PCMark 8 Work Score Accelerated v2 | 5870 points | |
| PCMark 10 Score | 5938 points | |
Help | ||
Storage Devices
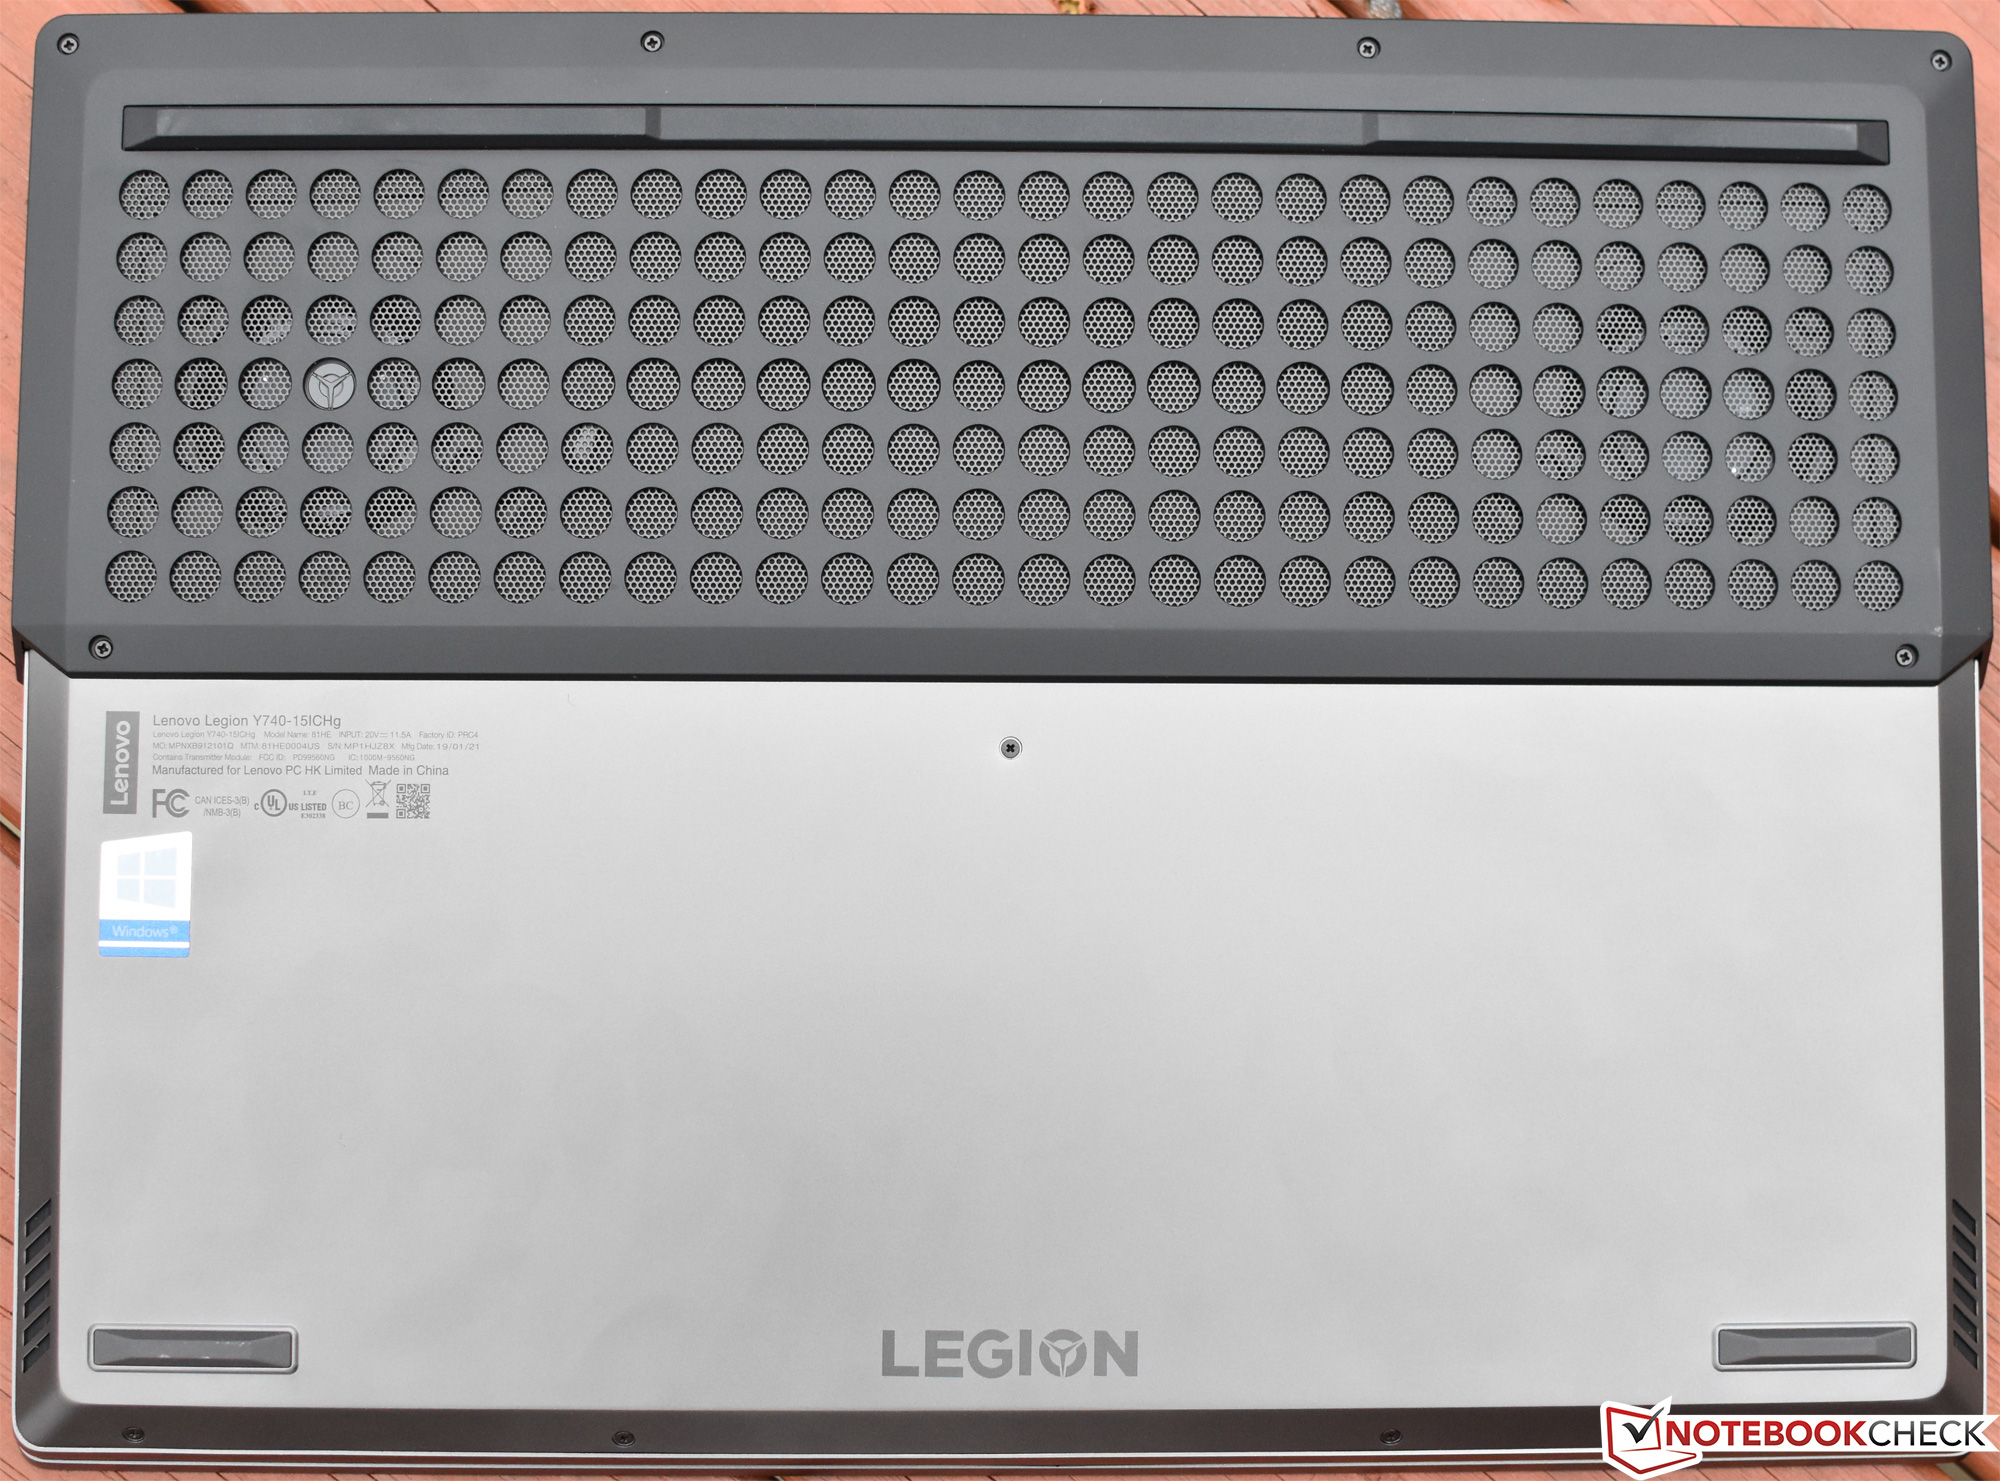
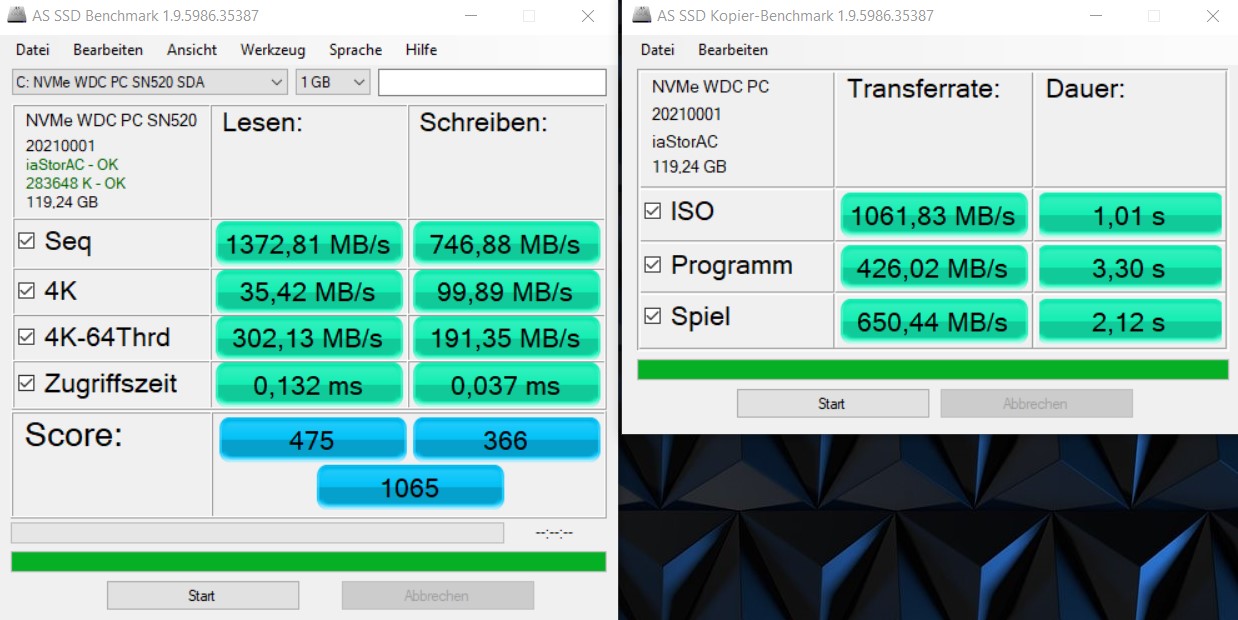
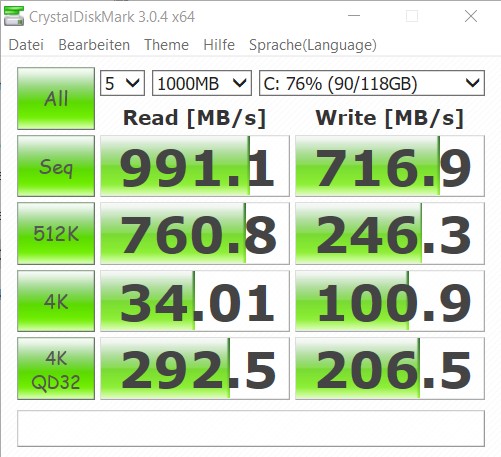
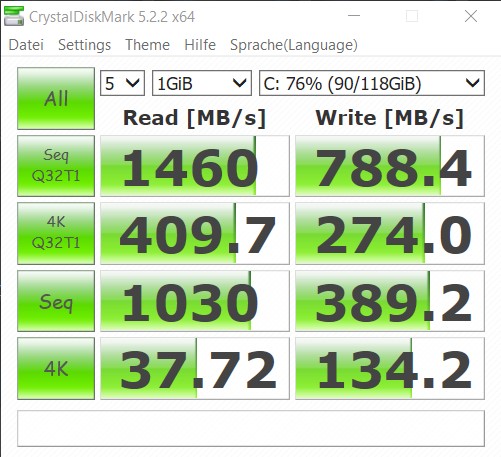
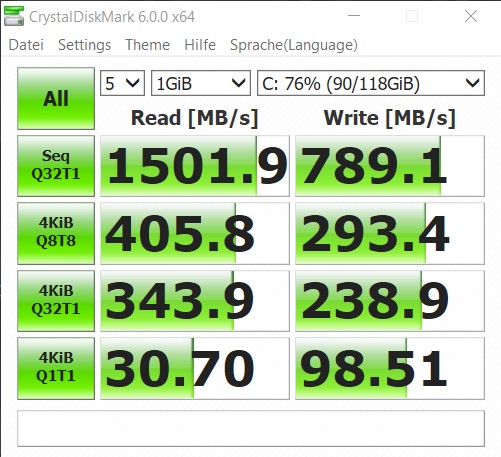
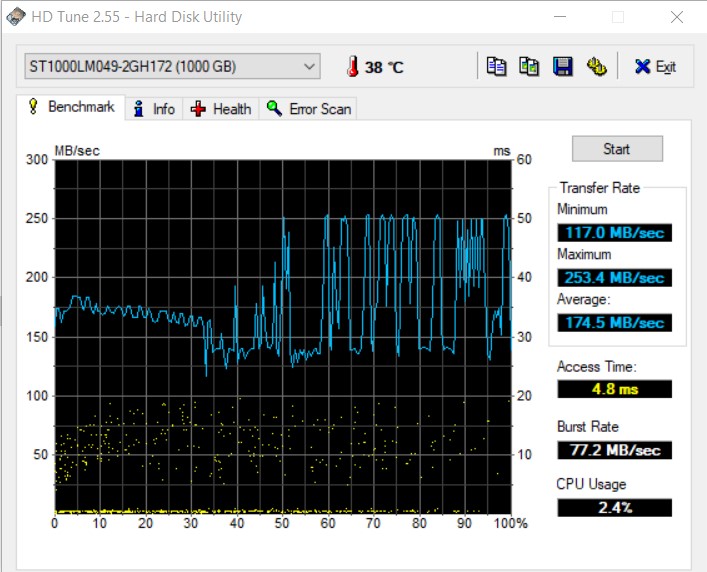
The Y740 has M.2-2280 and 2.5-inch drive bays, which Lenovo has occupied with a 128 GB M.2-2280 SSD and a 1 TB 2.5-inch HDD. The former is a Western Digital drive, on which Lenovo pre-installs Windows 10. While the drive performed well in daily use, it fell well short of the drives in our comparison devices in AS SSD and CrystalDiskMark.
While the 1 TB HDD is well-sized to store a games library on, we would recommend replacing it with an SSD considering how cheap they have now become. Alternatively, you could remove the HDD and swap the 128 GB SSD for a larger capacity and faster drive. Nonetheless, the HDD is fast enough for loading complex modern games.
Please see our HDD/SSD comparison page for more information.
| Lenovo Legion Y740-15ICHg WDC PC SN520 SDAPMUW-128G | Lenovo Legion Y740-15ICHg Samsung SSD PM981 MZVLB256HAHQ | HP Omen X 2S 15-dg0075cl WDC PC SN720 SDAPNTW-1T00 | Acer Predator Triton 500 PT515-51-71PZ WDC PC SN720 SDAPNTW-512G | Average WDC PC SN520 SDAPMUW-128G | Average of class Gaming | |
|---|---|---|---|---|---|---|
| AS SSD | 133% | 199% | 266% | -4% | 373% | |
| Seq Read (MB/s) | 1372 | 1953 42% | 2105 53% | 2888 110% | 1356 ? -1% | 5592 ? 308% |
| Seq Write (MB/s) | 746 | 1629 118% | 2493 234% | 2374 218% | 717 ? -4% | 3960 ? 431% |
| 4K Read (MB/s) | 35.42 | 33.2 -6% | 25.01 -29% | 42.95 21% | 29.3 ? -17% | 71.1 ? 101% |
| 4K Write (MB/s) | 99.9 | 88.1 -12% | 108.7 9% | 143.6 44% | 99.4 ? -1% | 215 ? 115% |
| 4K-64 Read (MB/s) | 302.1 | 757 151% | 1604 431% | 1272 321% | 302 ? 0% | 1623 ? 437% |
| 4K-64 Write (MB/s) | 191.4 | 1501 684% | 1593 732% | 1546 708% | 198 ? 3% | 2938 ? 1435% |
| Access Time Read * (ms) | 0.132 | 0.077 42% | 0.046 65% | 0.158 ? -20% | 0.06395 ? 52% | |
| Access Time Write * (ms) | 0.037 | 0.043 -16% | 0.102 -176% | 0.037 ? -0% | 0.03797 ? -3% | |
| Score Read (Points) | 475 | 985 107% | 1840 287% | 1604 238% | 467 ? -2% | 2253 ? 374% |
| Score Write (Points) | 366 | 1752 379% | 1951 433% | 1927 427% | 369 ? 1% | 3548 ? 869% |
| Score Total (Points) | 1065 | 3230 203% | 4743 345% | 4329 306% | 1052 ? -1% | 6881 ? 546% |
| Copy ISO MB/s (MB/s) | 1062 | 1872 76% | 2250 112% | 1025 ? -3% | 3192 ? 201% | |
| Copy Program MB/s (MB/s) | 426 | 478.2 12% | 896 110% | 377 ? -12% | 989 ? 132% | |
| Copy Game MB/s (MB/s) | 650 | 1165 79% | 1854 185% | 704 ? 8% | 2134 ? 228% |
* ... smaller is better

Graphics Card
The GeForce RTX 2070 Max-Q is a more efficient version of the regular GeForce RTX 2070, which NVIDIA has designed for compact laptops. The GeForce RTX 2070 Max-Q has lower clock speeds and a reduced thermal design power (TDP) compared to the regular GeForce RTX 2070, but they both have 8 GB of GDDR6 VRAM.
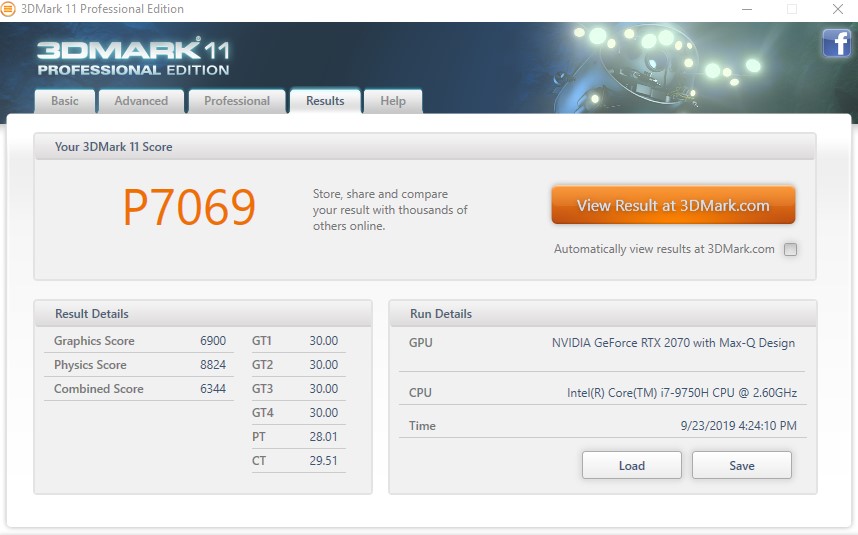
Most synthetic GPU benchmarks put the Core i7-9750H and its predecessor on equal footing, with our current review unit only able to outperform the Core i7-8750H powered Y740 by 6% in 3DMark Time Spy. However, the HP Omen X 2S crushes our test device here, despite them having the same CPU and GPU.
Please see our GPU comparison page for more information on the GeForce RTX 2070 Max-Q and how it compares against other GPUs.
| 3DMark 11 Performance | 18733 points | |
| 3DMark Ice Storm Standard Score | 175118 points | |
| 3DMark Cloud Gate Standard Score | 36994 points | |
| 3DMark Fire Strike Score | 15386 points | |
| 3DMark Fire Strike Extreme Score | 7892 points | |
| 3DMark Time Spy Score | 6777 points | |
Help | ||
Gaming Performance
Our current review unit can achieve slightly better framerates than its predecessor, with the slightly higher clock speed of the Core i7-9750H seemingly having a positive effect. We recorded 5% higher framerates in "The Witcher 3" on the Ultra preset at 1080p, which we suspect few people will notice. The equally well-equipped HP Omen X 2S achieves 15% more FPS than our review unit though, underlining that the Y740 cannot make best use of its CPU and GPU.
Please see our GPU games page for more gaming benchmarks.
We also subjected our review unit to a prolonged "The Witcher 3" test to see how the GPU fared under prolonged load, as we did with the CPU and our CB R15 Multi 64Bit looped benchmark. The Y740 averaged 60 FPS on the Ultra preset at 1080p throughout, so you should not notice any reduction in performance during prolonged gaming sessions.
| The Witcher 3 - 1920x1080 Ultra Graphics & Postprocessing (HBAO+) | |
| Average of class Gaming (104.7 - 240, n=7, last 2 years) | |
| HP Omen X 2S 15-dg0075cl | |
| Average NVIDIA GeForce RTX 2070 Max-Q (56 - 83.8, n=31) | |
| Acer Predator Triton 500 PT515-51-71PZ | |
| Lenovo Legion Y740-15ICHg | |
| Lenovo Legion Y740-15ICHg | |
| low | med. | high | ultra | |
|---|---|---|---|---|
| The Witcher 3 (2015) | 300 | 213 | 123 | 60 |
| Dota 2 Reborn (2015) | 142.4 | 133.7 | 133 | 124.1 |
| X-Plane 11.11 (2018) | 110 | 99 | 83 | |
| Shadow of the Tomb Raider (2018) | 126 | 99 | 92 | 81 |
| Metro Exodus (2019) | 127.2 | 76.8 | 57.3 | 47 |
Emissions - Hotter and noisier than its predecessor, but better than the competition
Fan Noise
Noise level
| Idle |
| 31.3 / 31.3 / 31.3 dB(A) |
| HDD |
| 32 dB(A) |
| Load |
| 42 / 46.5 dB(A) |
 | ||
30 dB silent 40 dB(A) audible 50 dB(A) loud |
||
min: | ||
| Lenovo Legion Y740-15ICHg GeForce RTX 2070 Max-Q, i7-9750H, WDC PC SN520 SDAPMUW-128G | Lenovo Legion Y740-15ICHg GeForce RTX 2070 Max-Q, i7-8750H, Samsung SSD PM981 MZVLB256HAHQ | HP Omen X 2S 15-dg0075cl GeForce RTX 2070 Max-Q, i7-9750H, WDC PC SN720 SDAPNTW-1T00 | Acer Predator Triton 500 PT515-51-71PZ GeForce RTX 2070 Max-Q, i7-9750H, WDC PC SN720 SDAPNTW-512G | |
|---|---|---|---|---|
| Noise | 3% | -4% | -8% | |
| off / environment * (dB) | 30 | 28 7% | 29 3% | 30 -0% |
| Idle Minimum * (dB) | 31.3 | 32.6 -4% | 30.5 3% | 30 4% |
| Idle Average * (dB) | 31.3 | 32.7 -4% | 31.5 -1% | 33 -5% |
| Idle Maximum * (dB) | 31.3 | 32.7 -4% | 31.5 -1% | 39 -25% |
| Load Average * (dB) | 42 | 33.3 21% | 40.6 3% | 45 -7% |
| Witcher 3 ultra * (dB) | 42.1 | 41.6 1% | 49.5 -18% | 49 -16% |
| Load Maximum * (dB) | 46.5 | 45.2 3% | 53.4 -15% | 51 -10% |
* ... smaller is better
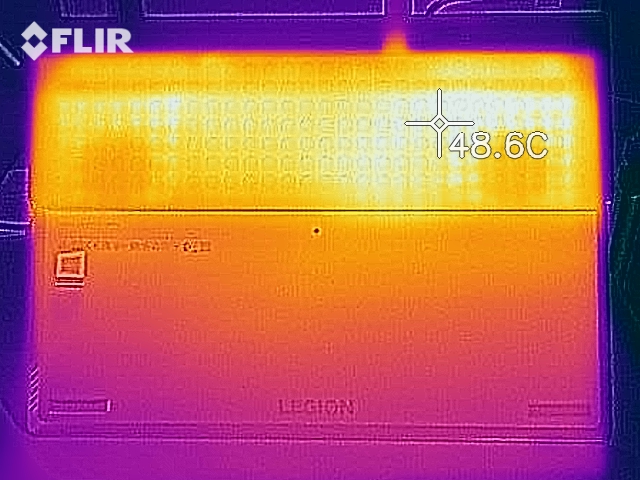
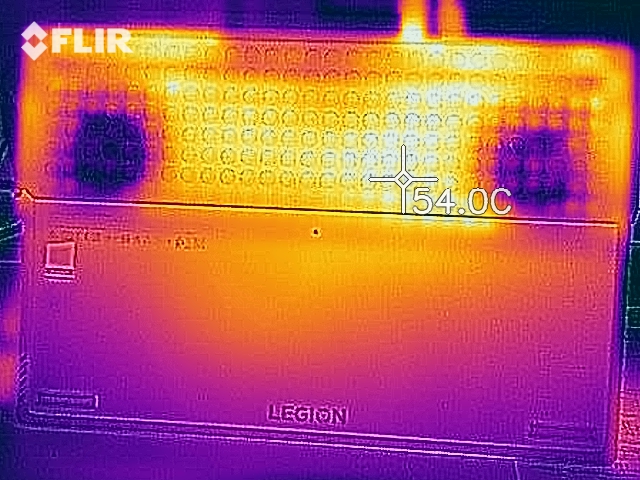
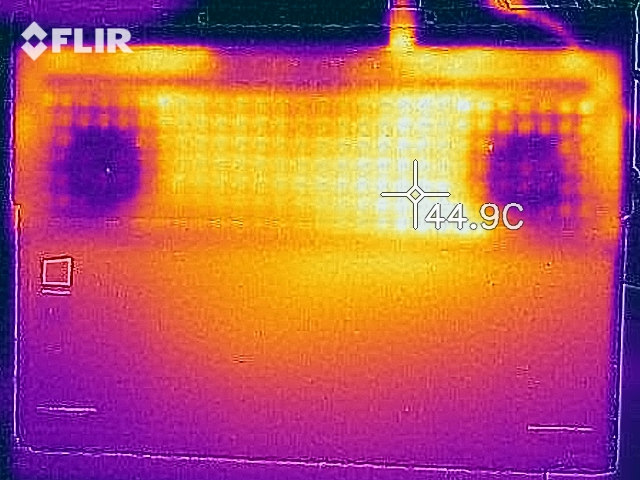
Temperature
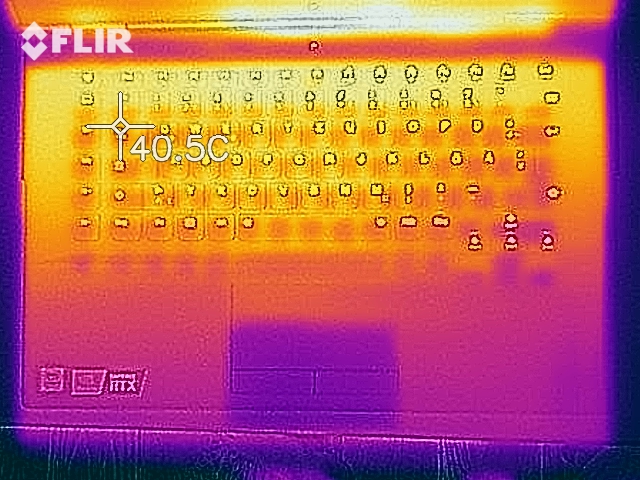
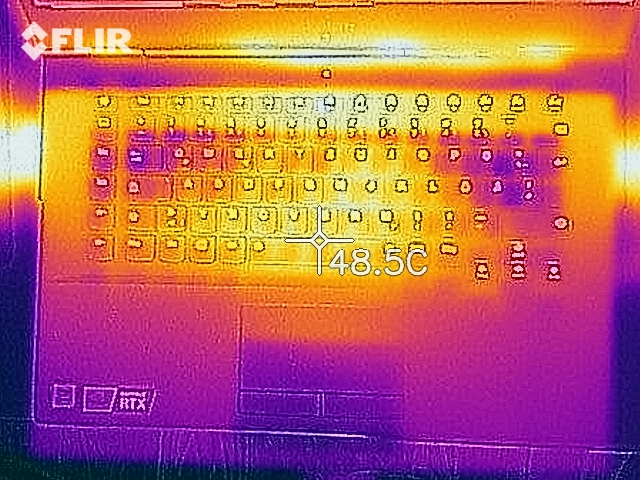
(±) The maximum temperature on the upper side is 43.9 °C / 111 F, compared to the average of 40.4 °C / 105 F, ranging from 21.2 to 68.8 °C for the class Gaming.
(-) The bottom heats up to a maximum of 47.6 °C / 118 F, compared to the average of 43.2 °C / 110 F
(±) In idle usage, the average temperature for the upper side is 34.5 °C / 94 F, compared to the device average of 33.9 °C / 93 F.
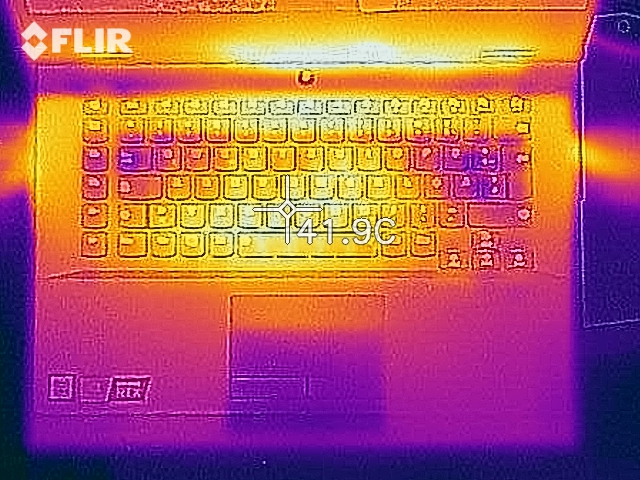
(±) Playing The Witcher 3, the average temperature for the upper side is 33 °C / 91 F, compared to the device average of 33.9 °C / 93 F.
(+) The palmrests and touchpad are reaching skin temperature as a maximum (32.5 °C / 90.5 F) and are therefore not hot.
(-) The average temperature of the palmrest area of similar devices was 28.8 °C / 83.8 F (-3.7 °C / -6.7 F).
| Lenovo Legion Y740-15ICHg GeForce RTX 2070 Max-Q, i7-9750H, WDC PC SN520 SDAPMUW-128G | Lenovo Legion Y740-15ICHg GeForce RTX 2070 Max-Q, i7-8750H, Samsung SSD PM981 MZVLB256HAHQ | HP Omen X 2S 15-dg0075cl GeForce RTX 2070 Max-Q, i7-9750H, WDC PC SN720 SDAPNTW-1T00 | Acer Predator Triton 500 PT515-51-71PZ GeForce RTX 2070 Max-Q, i7-9750H, WDC PC SN720 SDAPNTW-512G | |
|---|---|---|---|---|
| Heat | 11% | -11% | 5% | |
| Maximum Upper Side * (°C) | 43.9 | 37.6 14% | 48.8 -11% | 49 -12% |
| Maximum Bottom * (°C) | 47.6 | 45.2 5% | 55 -16% | 59 -24% |
| Idle Upper Side * (°C) | 38.6 | 32.2 17% | 41 -6% | 28 27% |
| Idle Bottom * (°C) | 40.8 | 37.2 9% | 45.6 -12% | 29 29% |
* ... smaller is better
Speakers
Lenovo Legion Y740-15ICHg audio analysis
(-) | not very loud speakers (68.1 dB)
Bass 100 - 315 Hz
(±) | reduced bass - on average 14.6% lower than median
(±) | linearity of bass is average (12.4% delta to prev. frequency)
Mids 400 - 2000 Hz
(+) | balanced mids - only 4.7% away from median
(+) | mids are linear (5.9% delta to prev. frequency)
Highs 2 - 16 kHz
(+) | balanced highs - only 3.4% away from median
(±) | linearity of highs is average (7.2% delta to prev. frequency)
Overall 100 - 16.000 Hz
(±) | linearity of overall sound is average (18.8% difference to median)
Compared to same class
» 62% of all tested devices in this class were better, 8% similar, 30% worse
» The best had a delta of 6%, average was 18%, worst was 132%
Compared to all devices tested
» 44% of all tested devices were better, 8% similar, 49% worse
» The best had a delta of 4%, average was 23%, worst was 134%
Acer Predator Triton 500 PT515-51-71PZ audio analysis
(±) | speaker loudness is average but good (80 dB)
Bass 100 - 315 Hz
(±) | reduced bass - on average 12.2% lower than median
(±) | linearity of bass is average (12.6% delta to prev. frequency)
Mids 400 - 2000 Hz
(+) | balanced mids - only 4.5% away from median
(+) | mids are linear (4.7% delta to prev. frequency)
Highs 2 - 16 kHz
(+) | balanced highs - only 2.2% away from median
(+) | highs are linear (3.2% delta to prev. frequency)
Overall 100 - 16.000 Hz
(+) | overall sound is linear (14.8% difference to median)
Compared to same class
» 29% of all tested devices in this class were better, 7% similar, 63% worse
» The best had a delta of 6%, average was 18%, worst was 132%
Compared to all devices tested
» 20% of all tested devices were better, 4% similar, 76% worse
» The best had a delta of 4%, average was 23%, worst was 134%
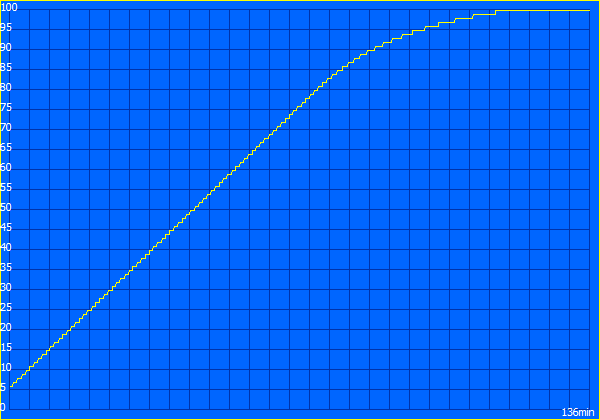
Power Management - Higher power consumption than its predecessor, but better battery life
Power Consumption
| Off / Standby | |
| Idle | |
| Load |
|
Key:
min: | |
| Lenovo Legion Y740-15ICHg i7-9750H, GeForce RTX 2070 Max-Q, WDC PC SN520 SDAPMUW-128G, IPS, 1920x1080, 15.6" | Lenovo Legion Y740-15ICHg i7-8750H, GeForce RTX 2070 Max-Q, Samsung SSD PM981 MZVLB256HAHQ, IPS, 1920x1080, 15.6" | HP Omen X 2S 15-dg0075cl i7-9750H, GeForce RTX 2070 Max-Q, WDC PC SN720 SDAPNTW-1T00, IPS, 1920x1080, 15.6" | Acer Predator Triton 500 PT515-51-71PZ i7-9750H, GeForce RTX 2070 Max-Q, WDC PC SN720 SDAPNTW-512G, IPS, 1920x1080, 15.6" | |
|---|---|---|---|---|
| Power Consumption | 5% | -64% | 28% | |
| Idle Minimum * (Watt) | 22.2 | 22.9 -3% | 46 -107% | 7 68% |
| Idle Average * (Watt) | 24.9 | 27.2 -9% | 59 -137% | 12 52% |
| Idle Maximum * (Watt) | 30.6 | 27.5 10% | 65.5 -114% | 22 28% |
| Load Average * (Watt) | 101 | 83.4 17% | 99.8 1% | 86 15% |
| Witcher 3 ultra * (Watt) | 143 | 143.6 -0% | 154.1 -8% | 144 -1% |
| Load Maximum * (Watt) | 186 | 160.5 14% | 222.7 -20% | 177 5% |
* ... smaller is better
Battery Life
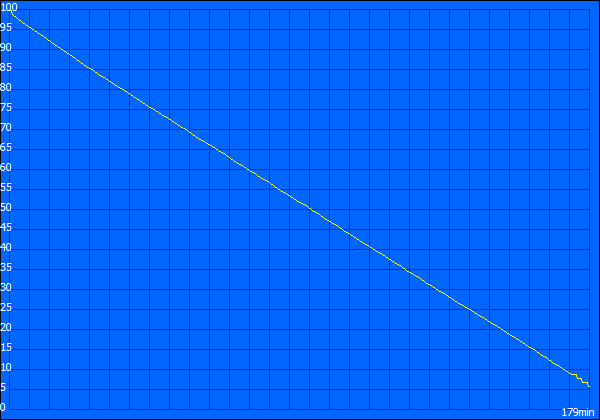
| Battery Runtime - WiFi Websurfing | |
| Acer Predator Triton 500 PT515-51-71PZ | |
| Average of class Gaming (1.967 - 14.6, n=100, last 2 years) | |
| Lenovo Legion Y740-15ICHg | |
| Lenovo Legion Y740-15ICHg (240, switchable graphics enabled) | |
| HP Omen X 2S 15-dg0075cl | |
Pros
Cons
Verdict - Plenty of performance for a lot of money
The Lenovo Legion Y740 is an expensive, yet reasonably priced, 15.6-inch gaming laptop that can handle all modern triple-A games with ease. Its powerful hexa-core processor and GeForce RTX 2070 Max-Q GPU combine to deliver excellent system performance too.
However, the Core i7-9750H in our review unit performed worse than its predecessor, despite Intel advertising it as being capable of reaching higher boost clock speeds. This shortcoming did not affect gaming performance, at least during our tests.
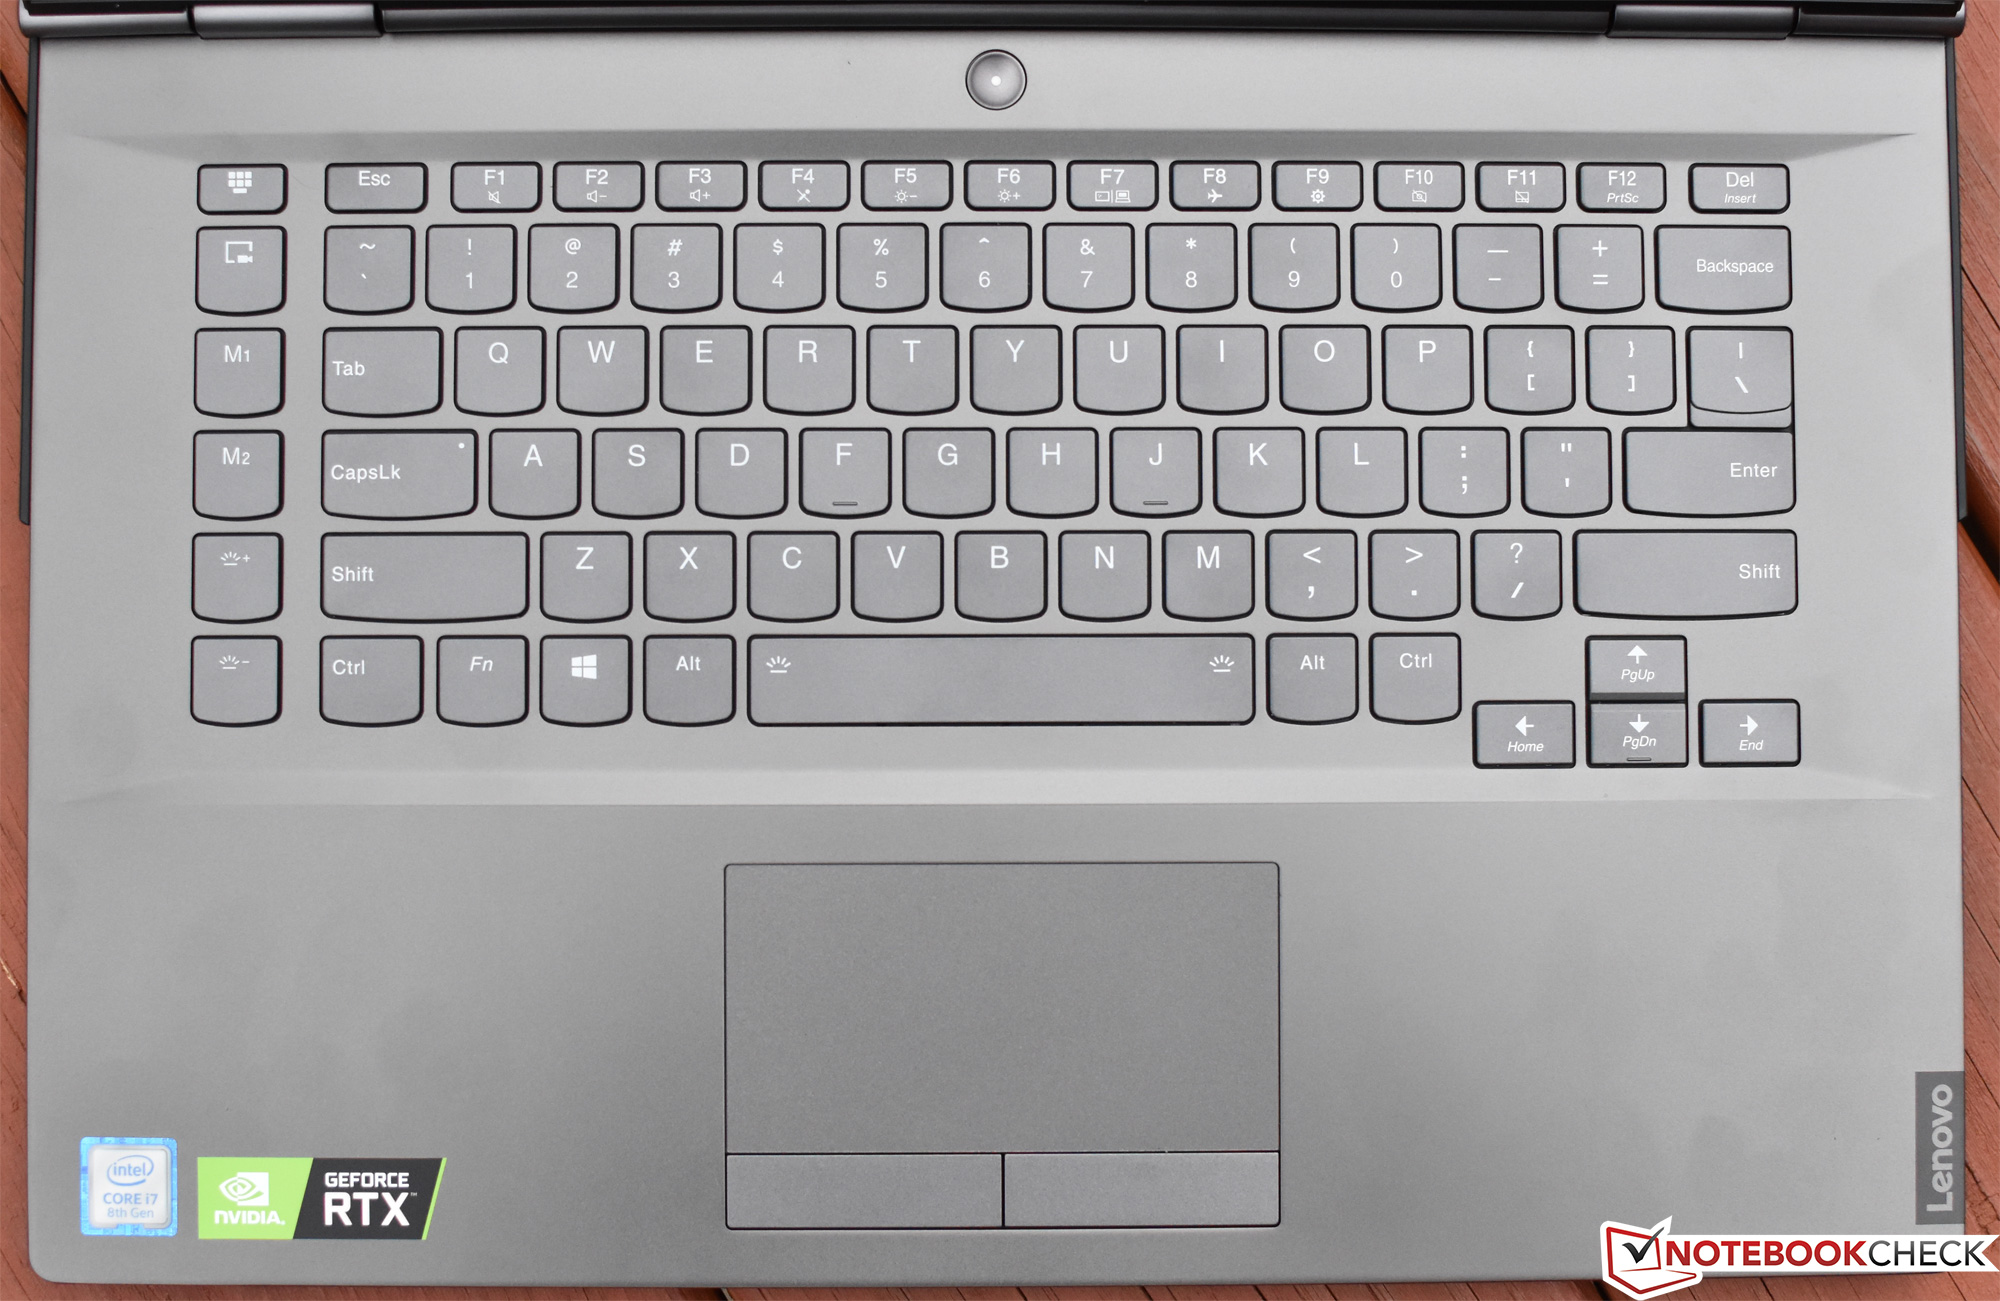
The Lenovo Legion Y740-15ICHg has solid hardware and excels in all modern games. Its input devices sour what is an otherwise viable gaming laptop, though.
Overall, the Legion Y740 is a decent gaming laptop that has a simple design that Lenovo complements with unobtrusive RGB lighting.
The Legion Y740 is a competent upgrade over its predecessor too. The Y740 not only delivers better gaming performance than the Y730, but it also has a brighter display that should please some gamers. The 144 Hz panel is G-Sync and HDR400 certified too, but its comparatively slow response times are wearing keeping in mind if you are thinking about putting down around €2,000 (~$2,179) on a gaming laptop.
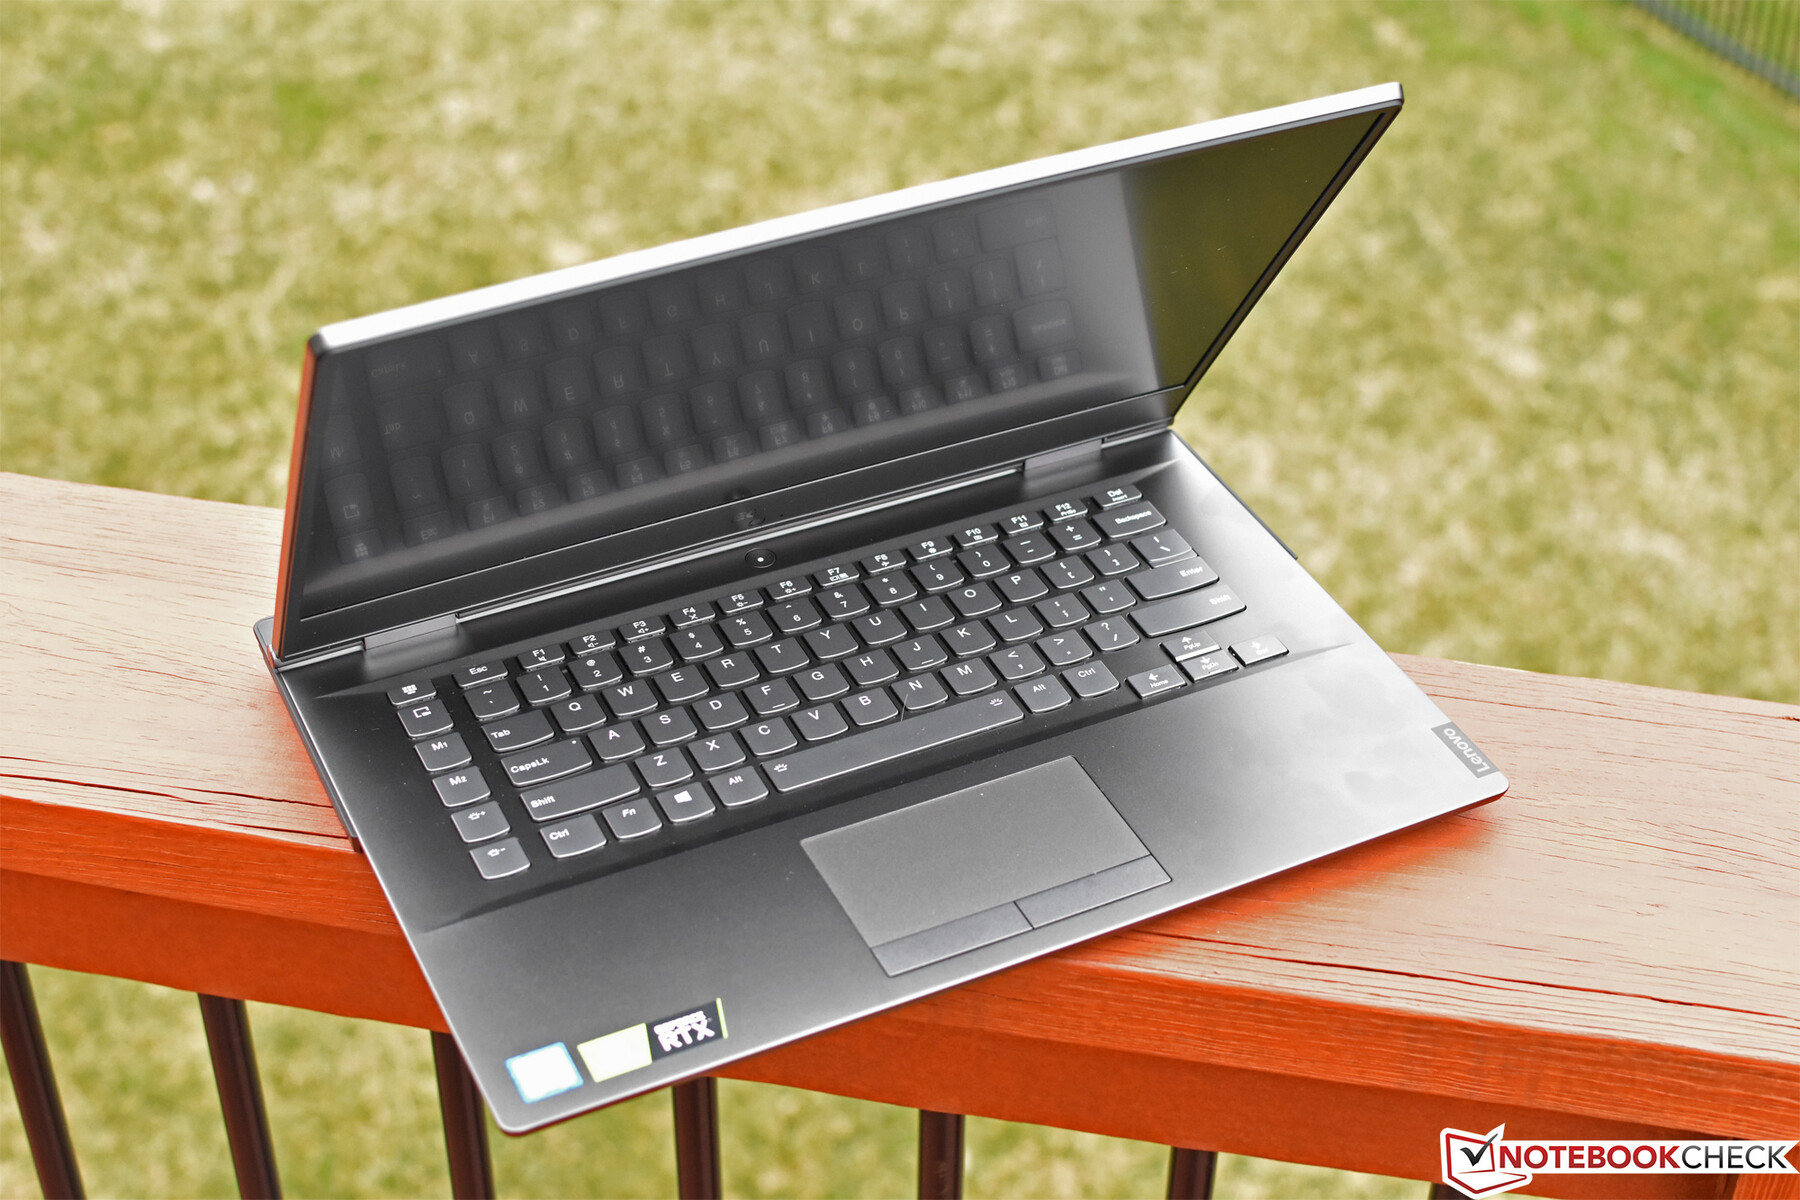
Lenovo Legion Y740-15ICHg
- 06/20/2020 v7 (old)
Sebastian Bade
Price comparison

