Asus ROG Strix G GL531GV Laptop Review: Like a Zephyrus, but Cheaper
Much like how the 17.3-inch Asus ROG Strix G GL731 is the less expensive version of the higher-end 17.3-inch Asus ROG Strix III G731, the 15.6-inch Asus ROG Strix G GL531 is the less expensive version of the higher-end 15.6-inch Asus ROG Strix III G531. The GL531 sits in between the budget TUF FX505 and flagship GX531 or G531 in Asus' expansive lineup of gaming laptops.
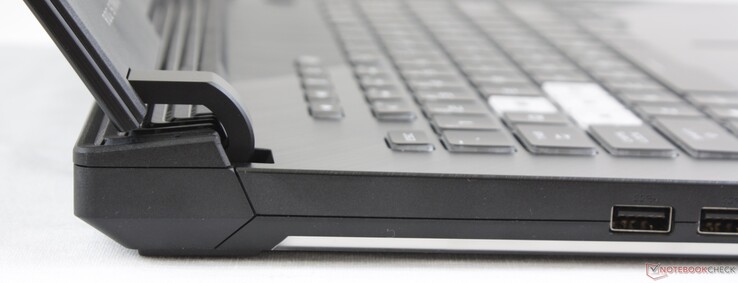
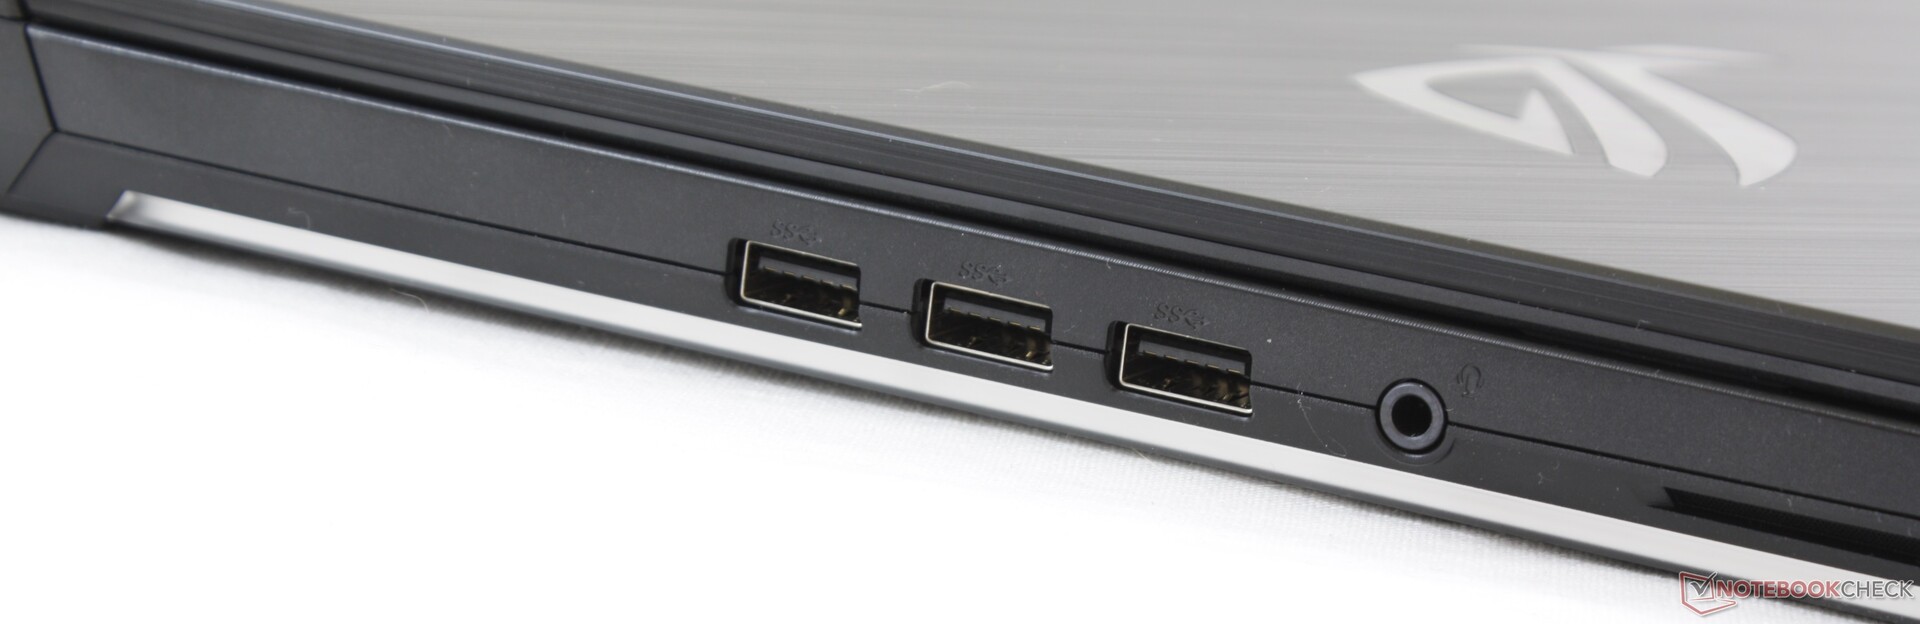
The GL531 is identical to the G531 sans a few minor features that we will go over below. We therefore recommend checking out our existing reviews on the G531 and GL731 for more details on the design, keyboard feedback, port options, speakers, and other physical properties since almost all our comments will apply here on the GL531. For this review, we'll instead be focusing on the performance differences between the GL531, GX531, and G531.
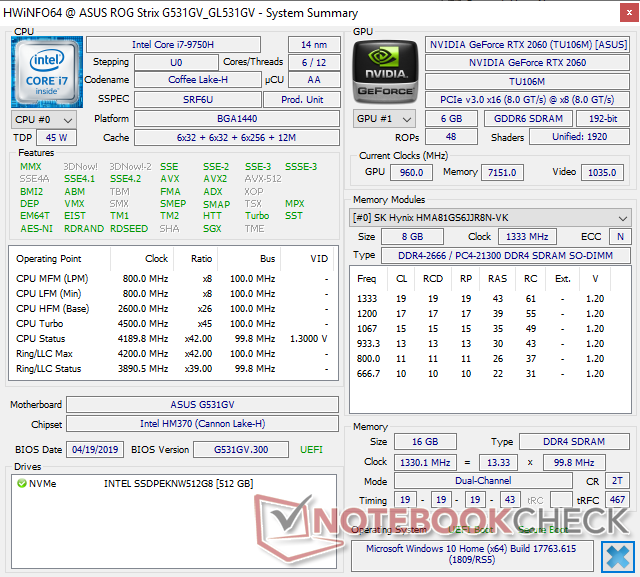
Unveiled at April of this year, the GL531 series is available in at least 5 different SKUs with GTX 1050, GTX 1650, GTX 1660 Ti, RTX 2060, and RTX 2070 graphics. In comparison, the minimum GPU option for the G531 is the GTX 1660 Ti. The complete specifications list for the 15.6-inch GL531 and 17.3-inch GL731 series can be found on the official Asus page here. Our test unit today is the upper mid-range SKU with the Core i7-9750H CPU, RTX 2060 GPU, and 1080p 120 Hz display for $1600 USD on Xotic PC.
Direct competitors include other mid-range to upper mid-range 15.6-inch gaming laptops like the Lenovo Legion Y740, HP Omen 15, Aorus 15, Acer Predator Helios, MSI GP series, or the Dell G7 15.
More Asus reviews:
Case
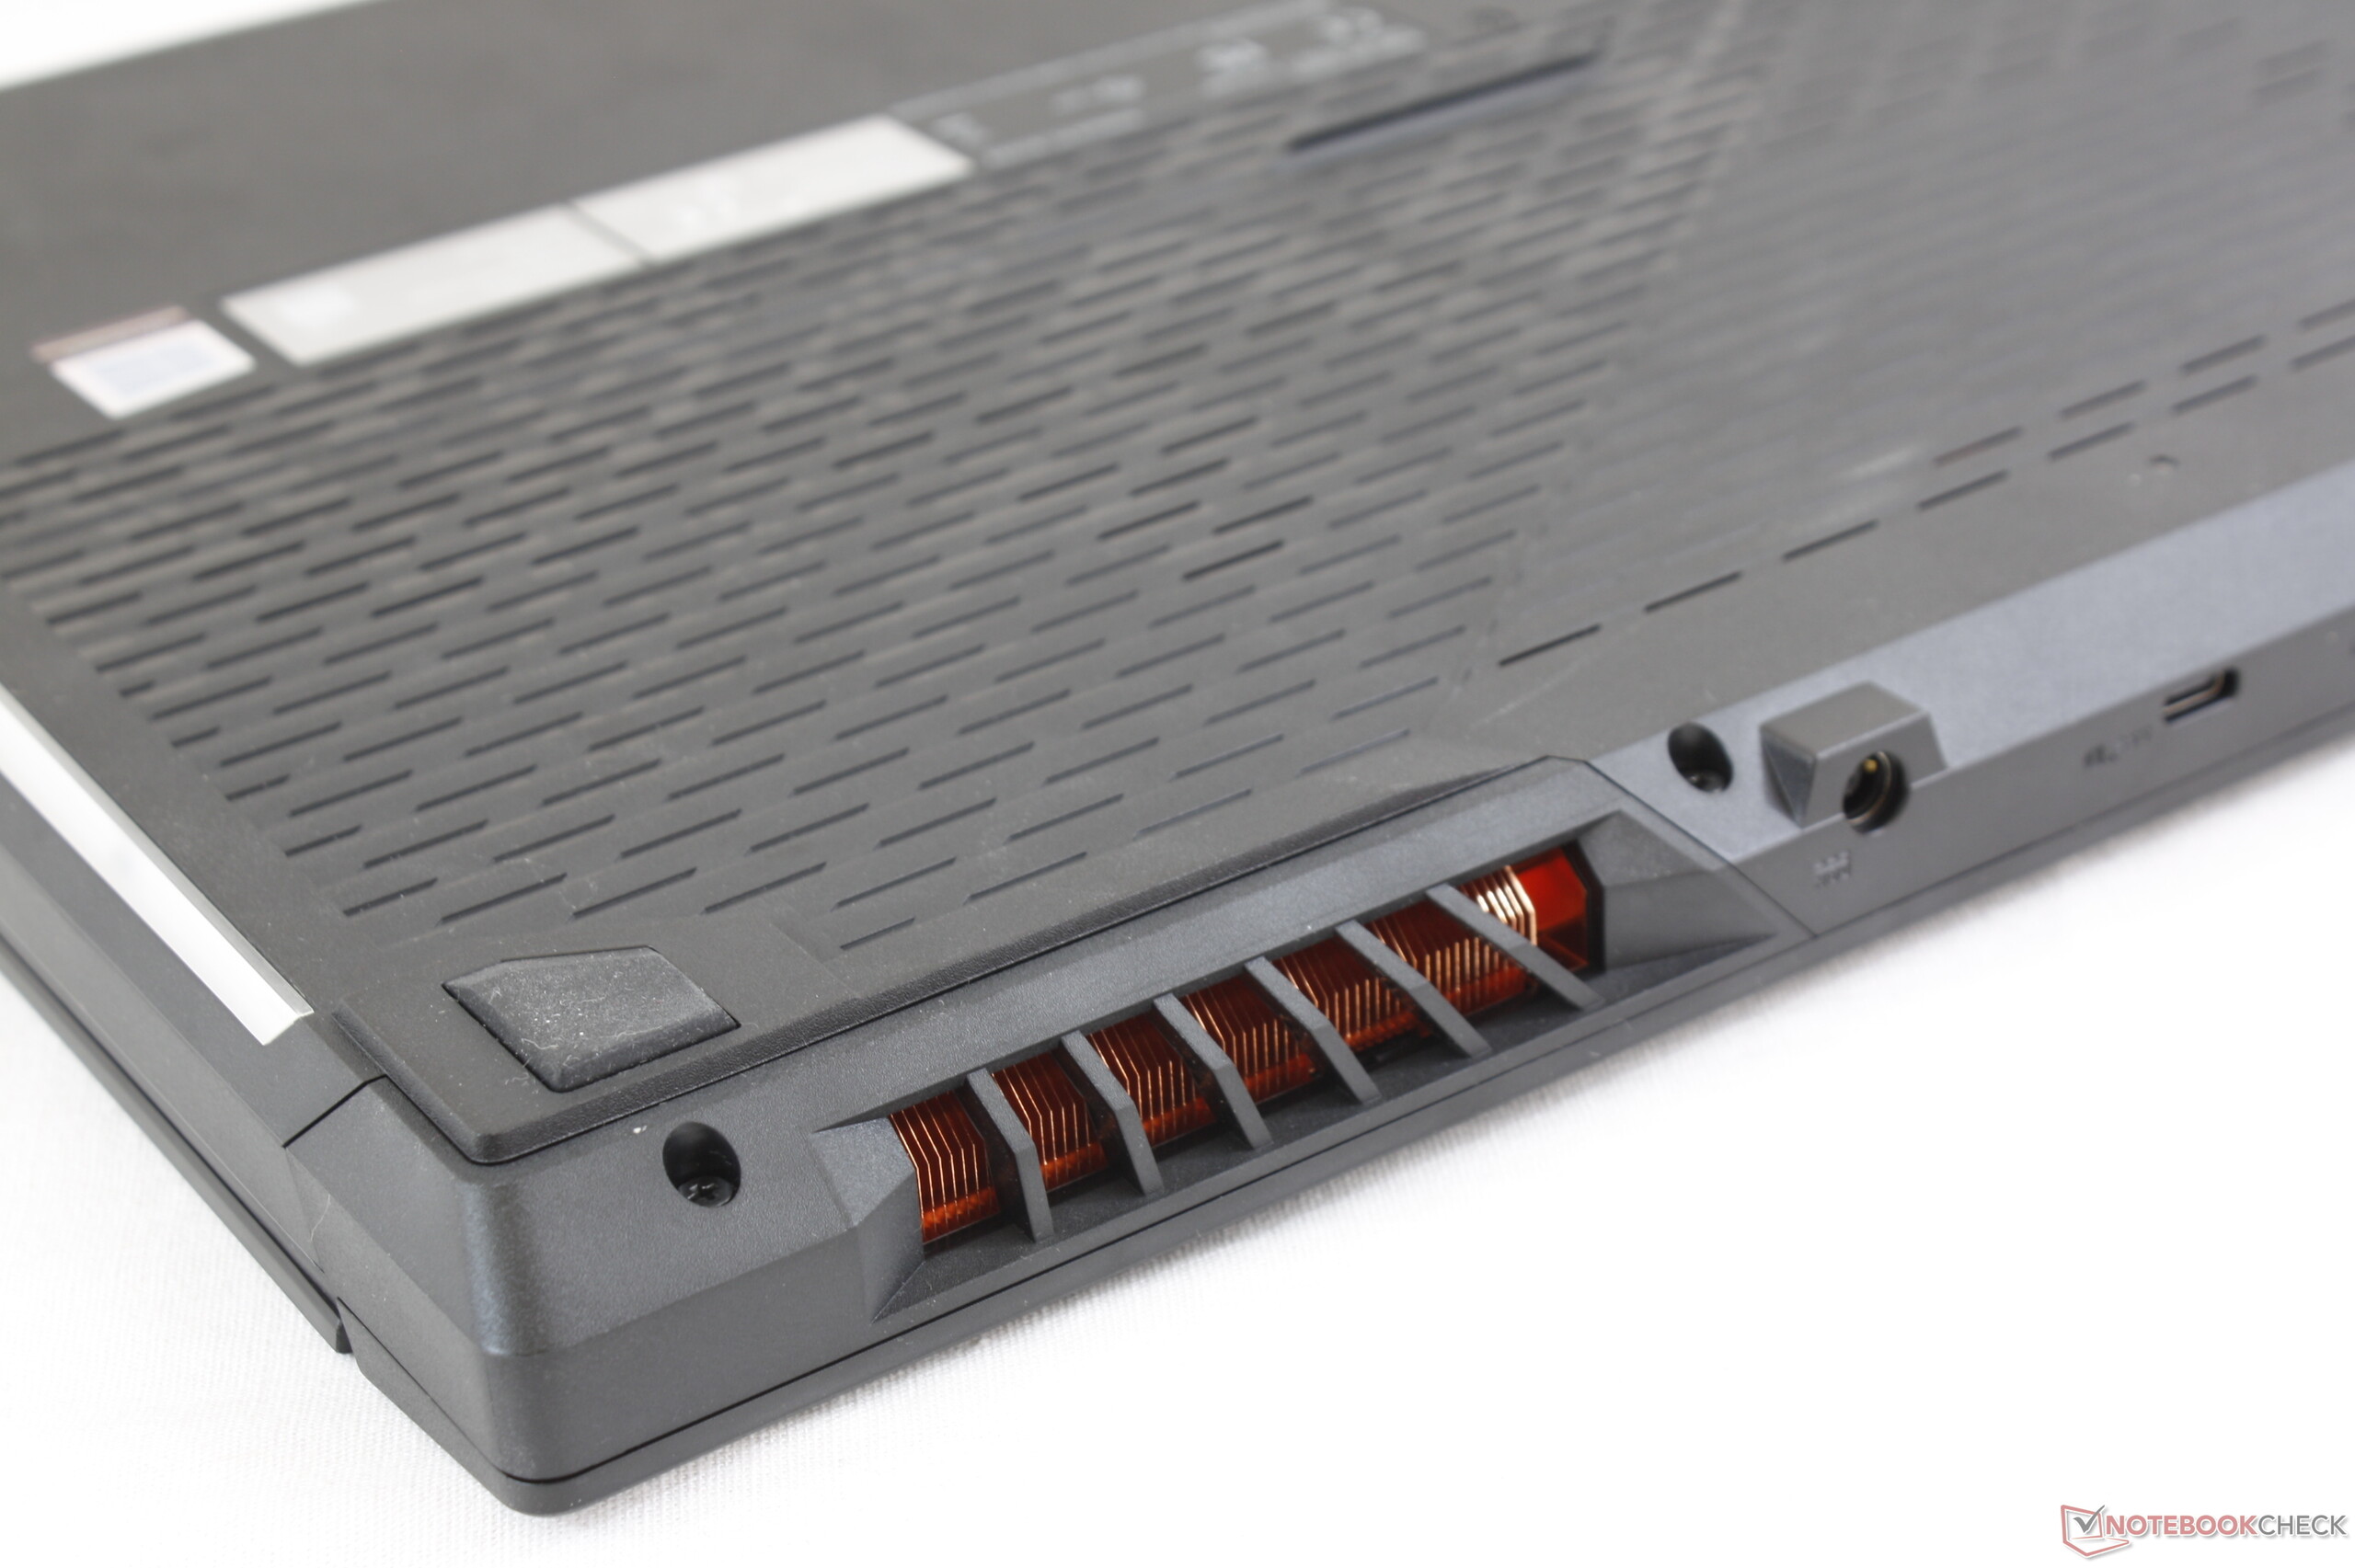
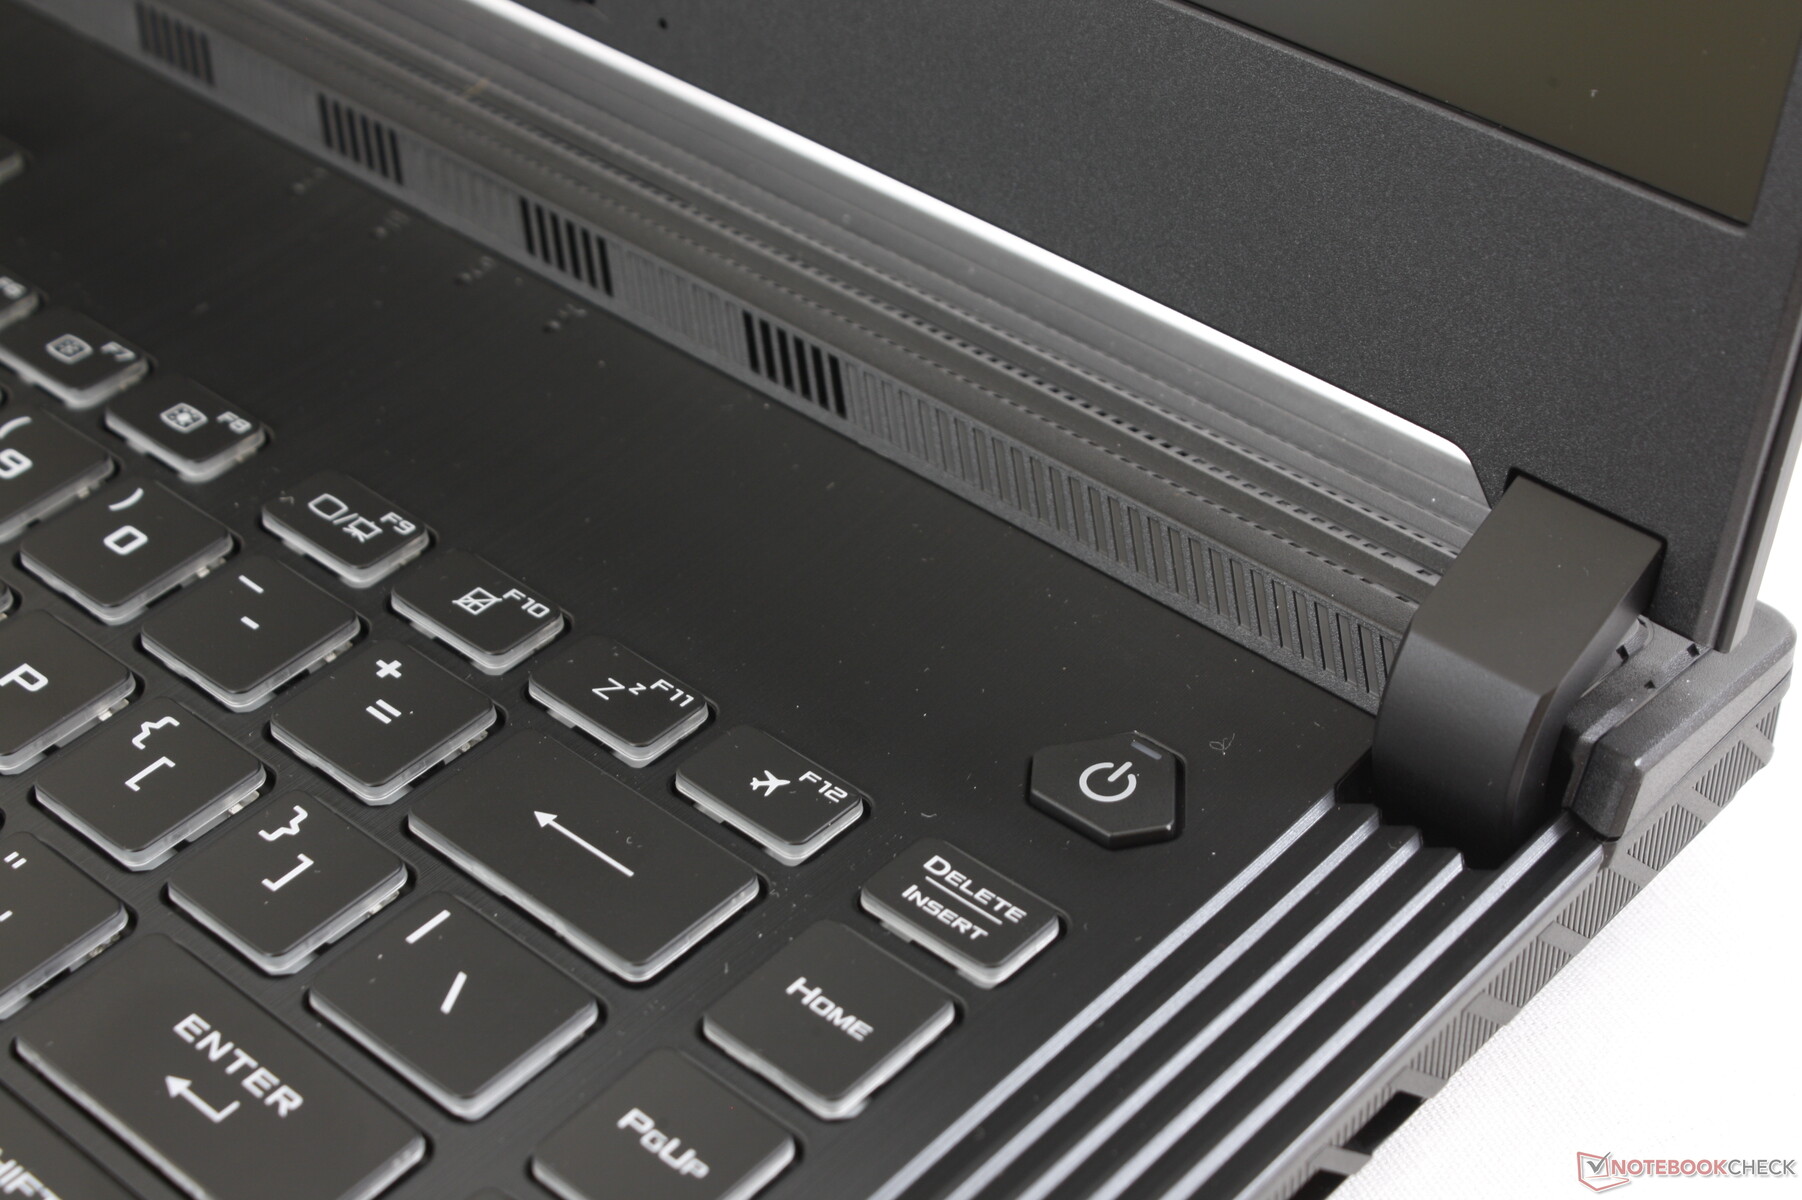
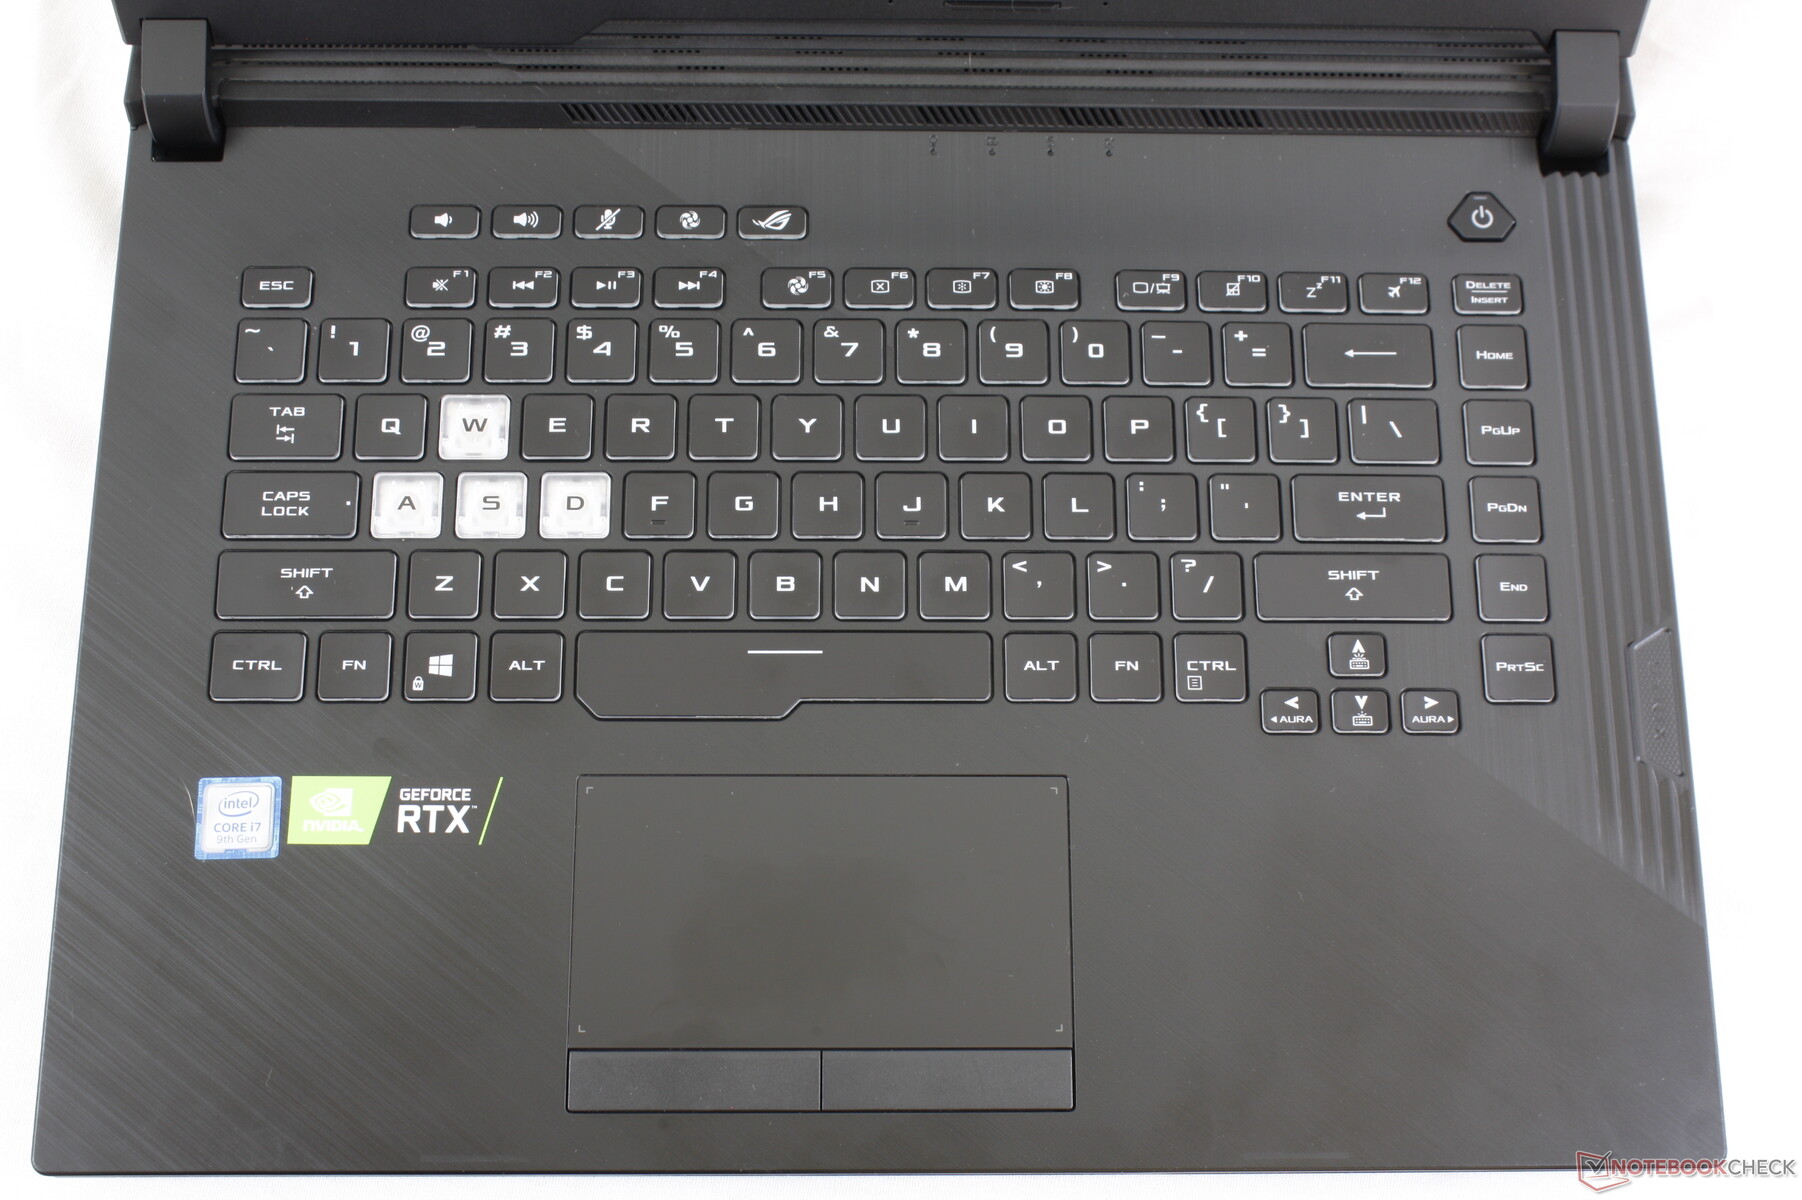
As mentioned above, the chassis of the GL531 is identical to the G531 save for these notable differences:
- The proprietary Asus keystone security feature has been omitted on the GL531
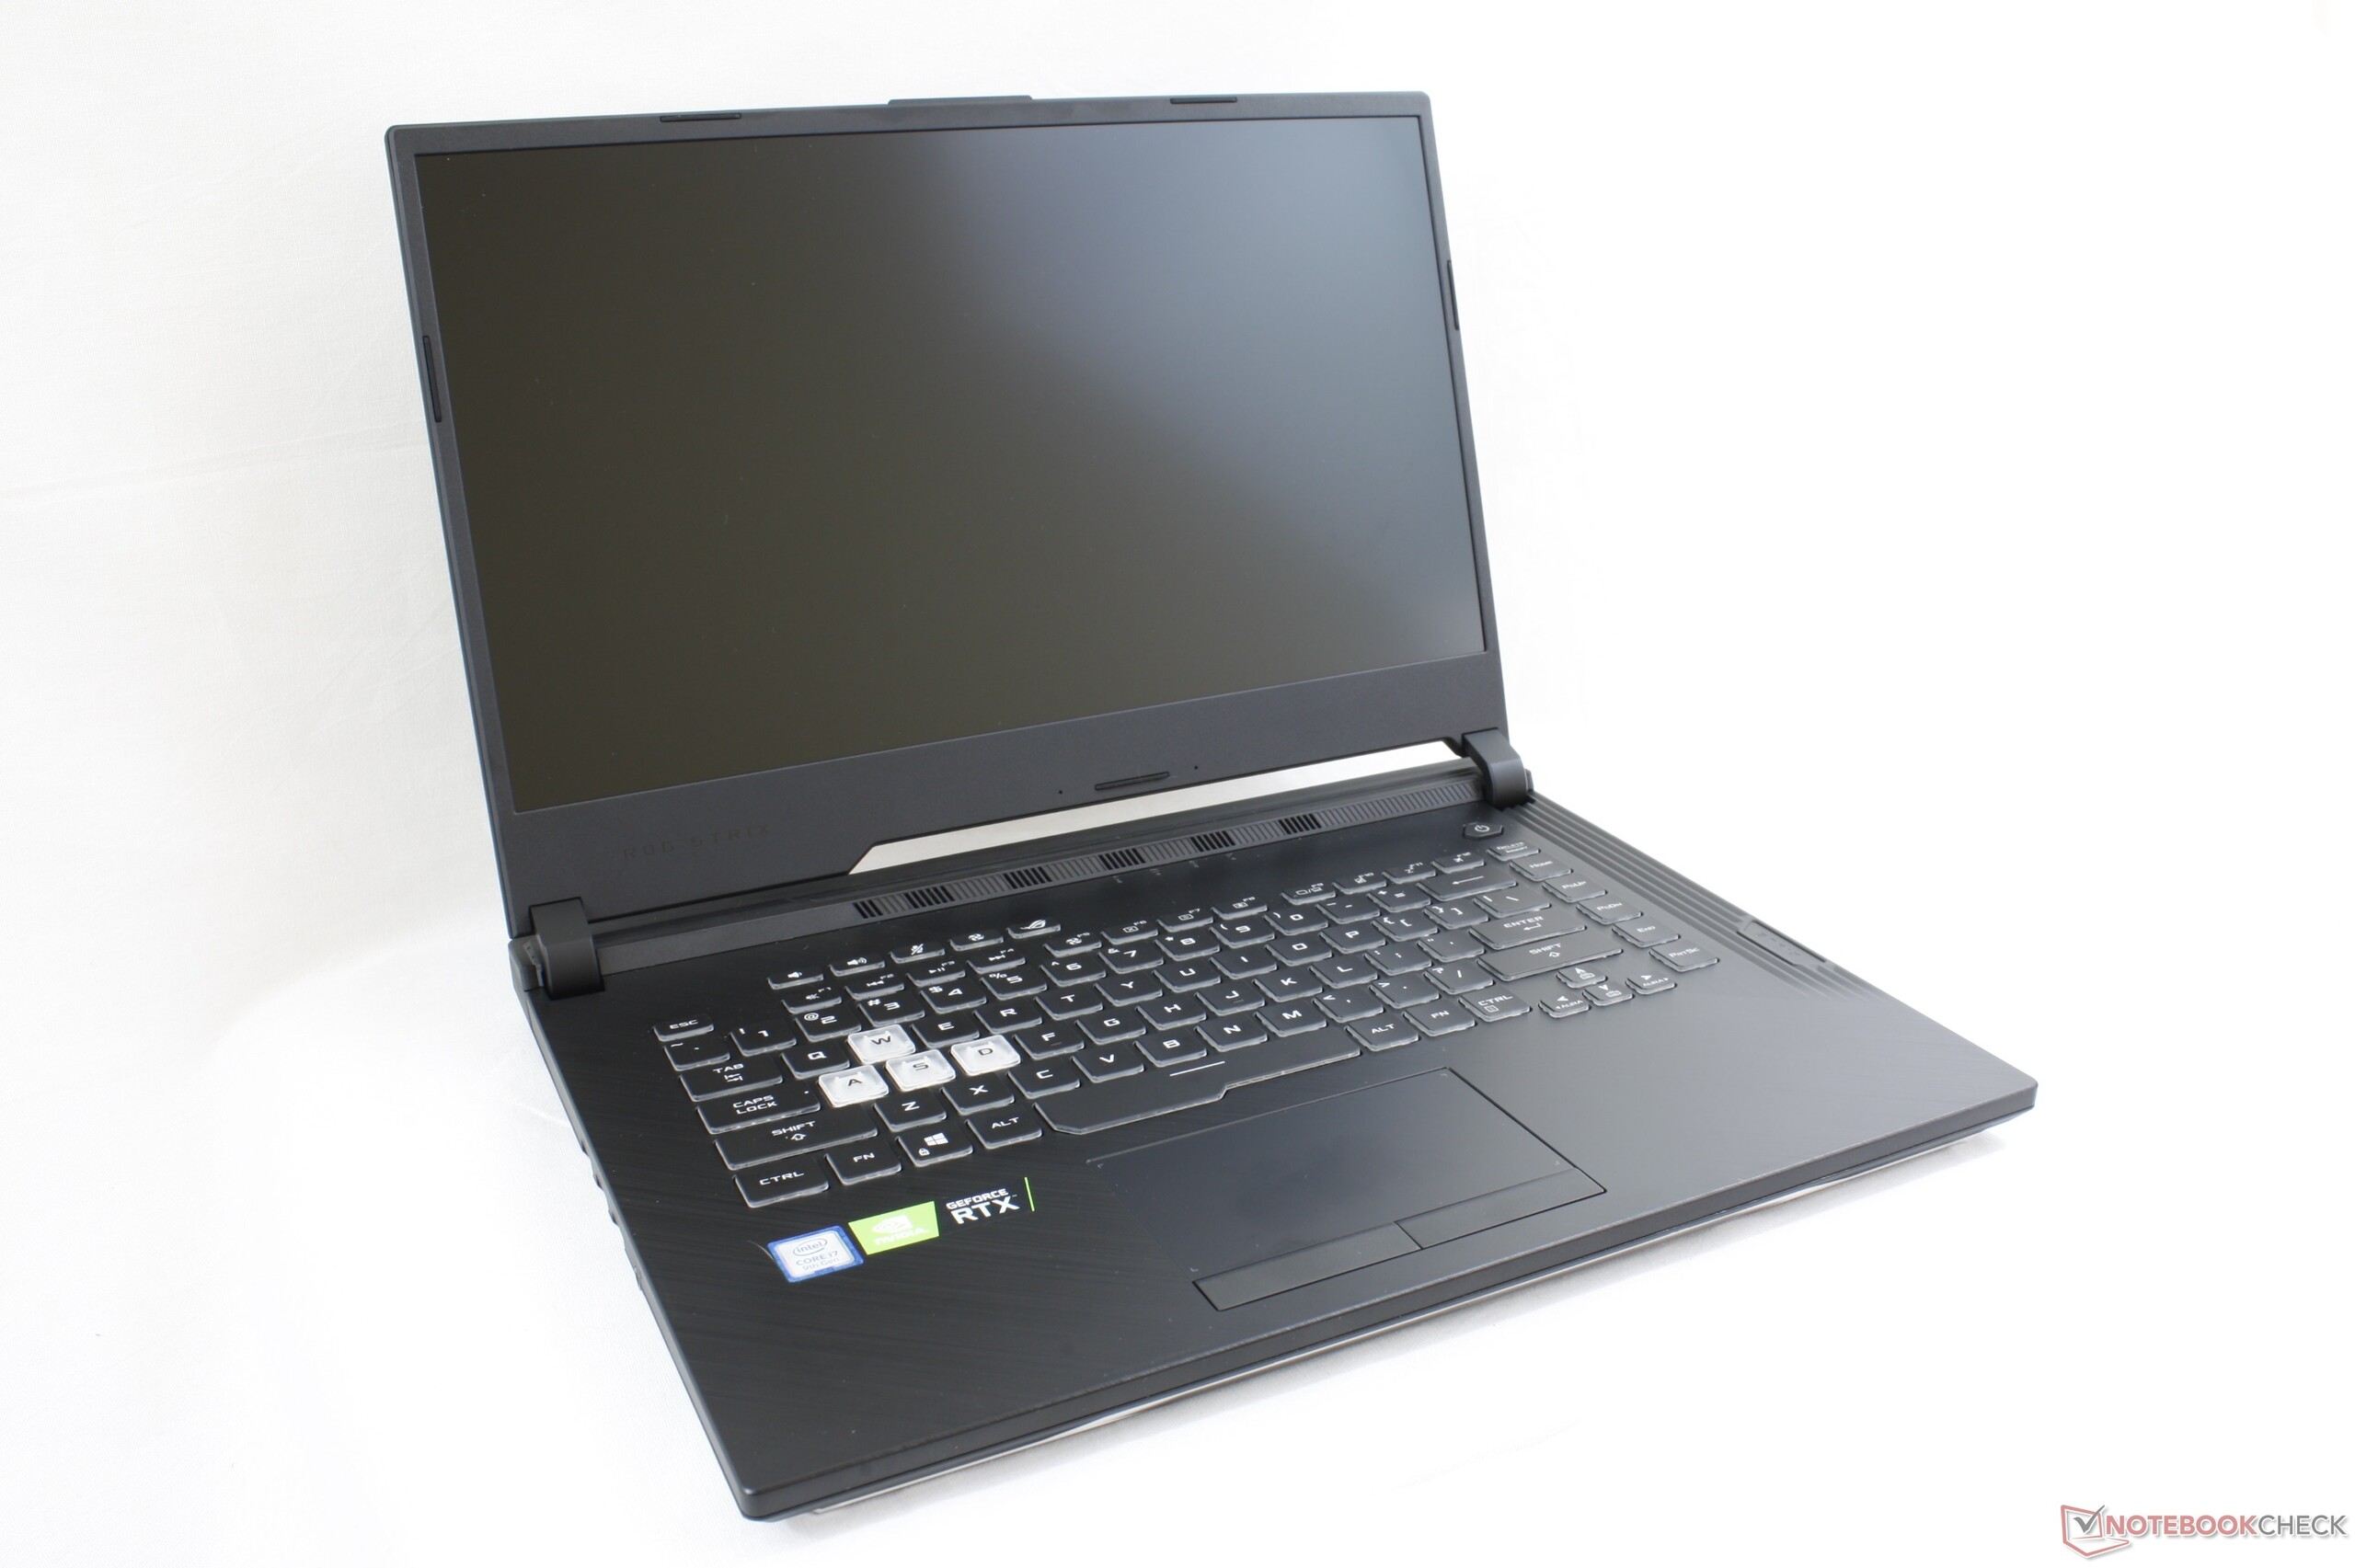
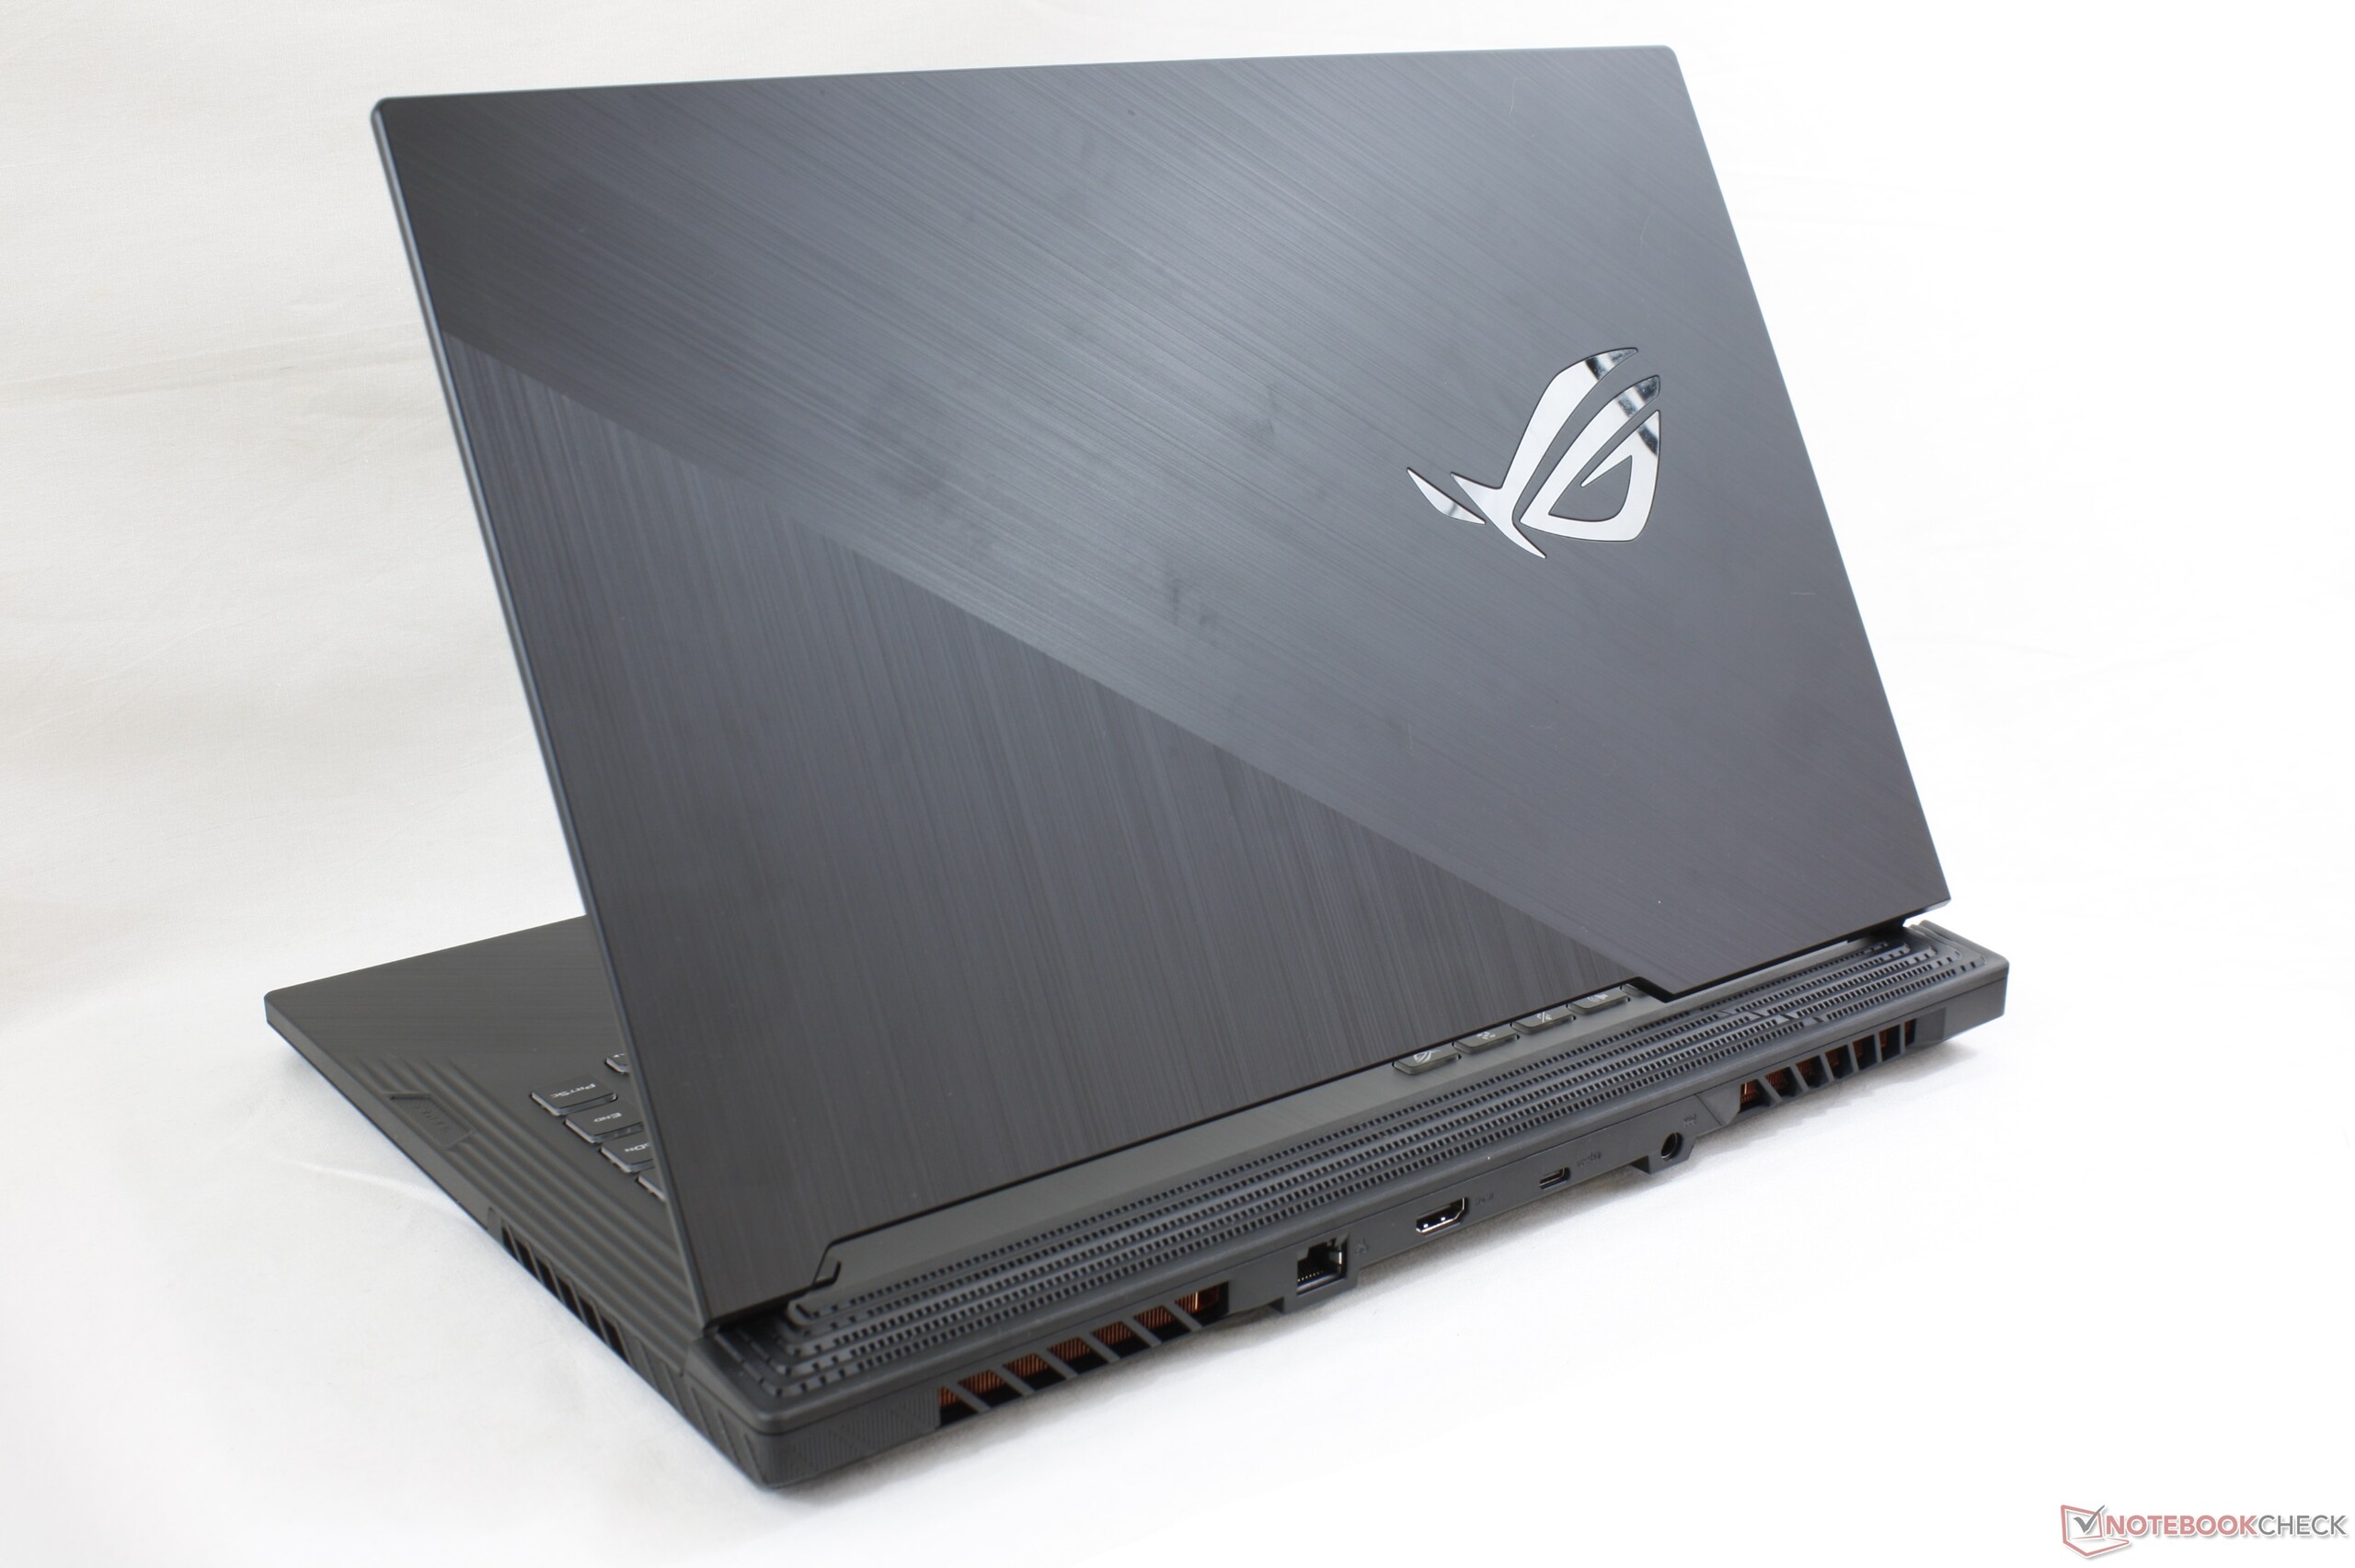
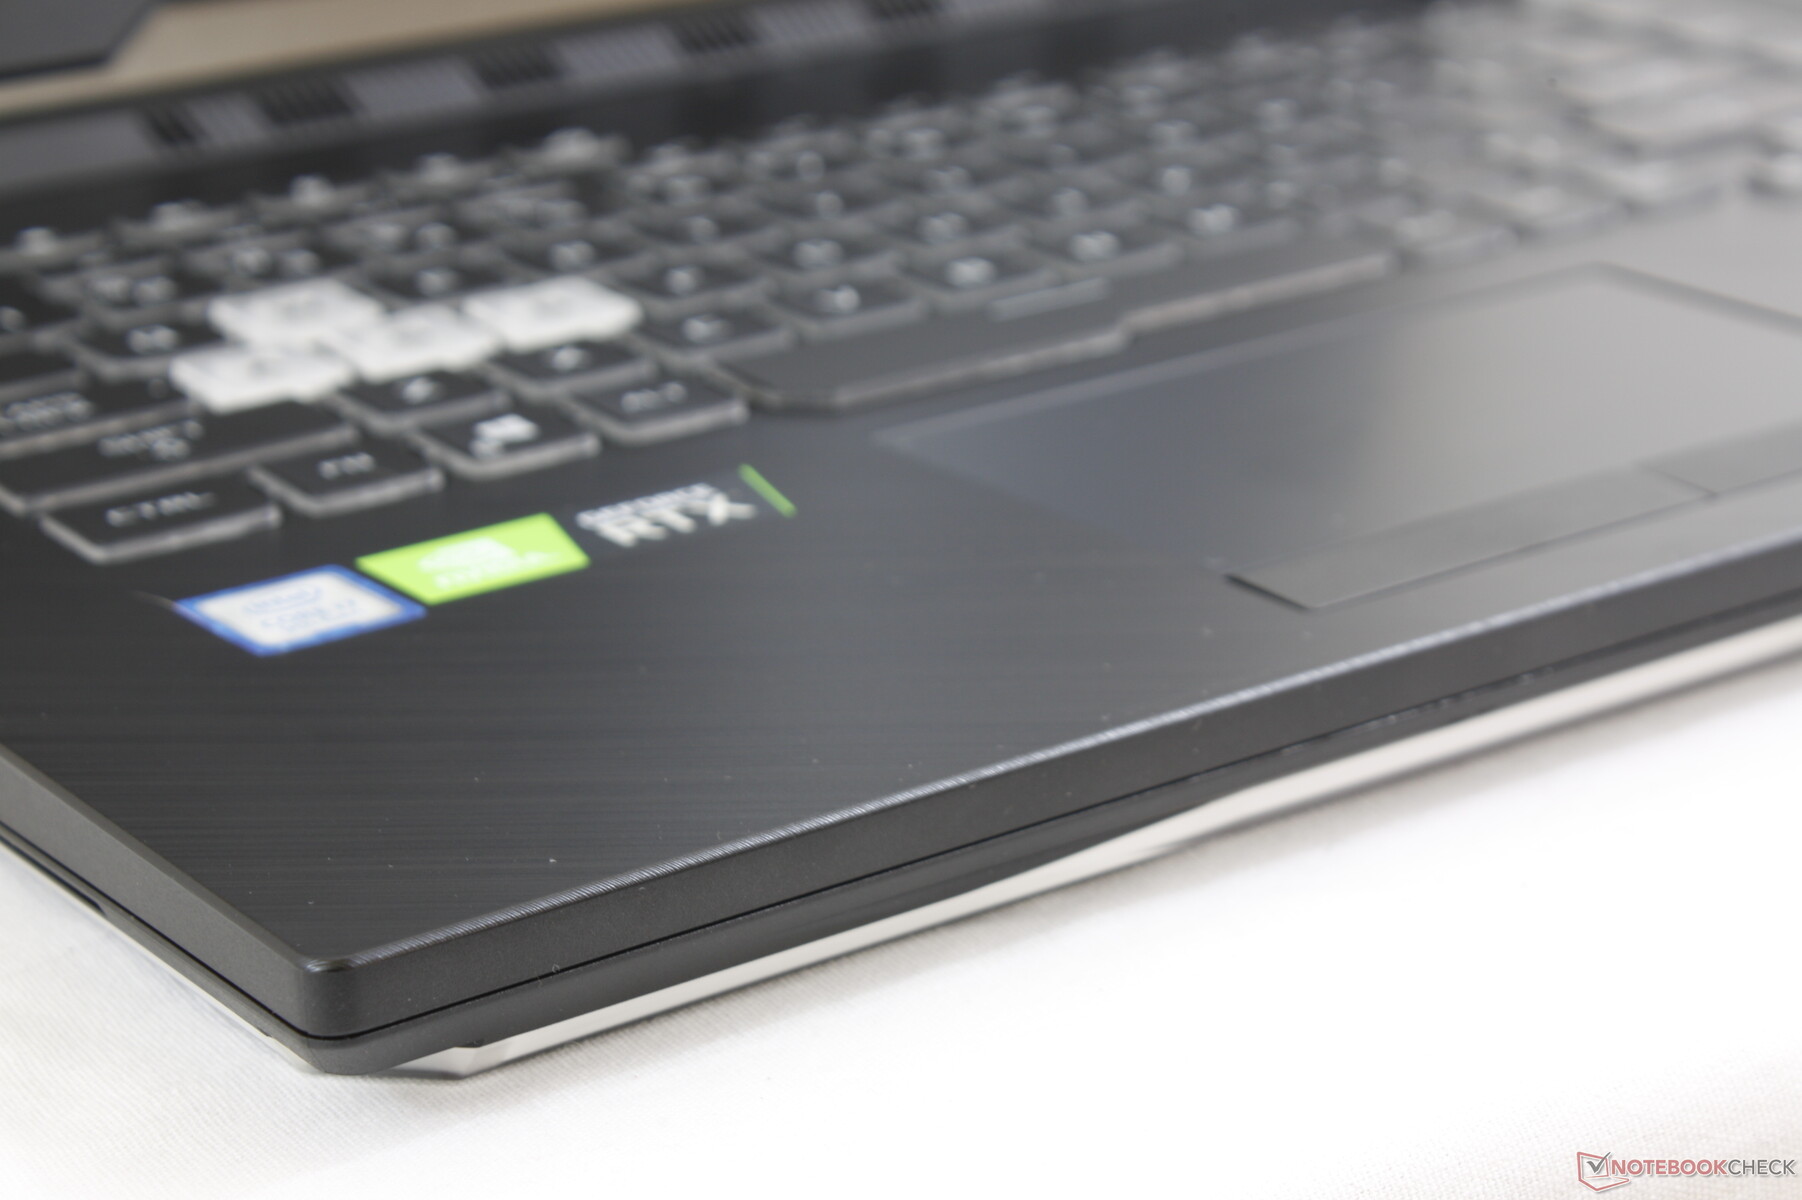
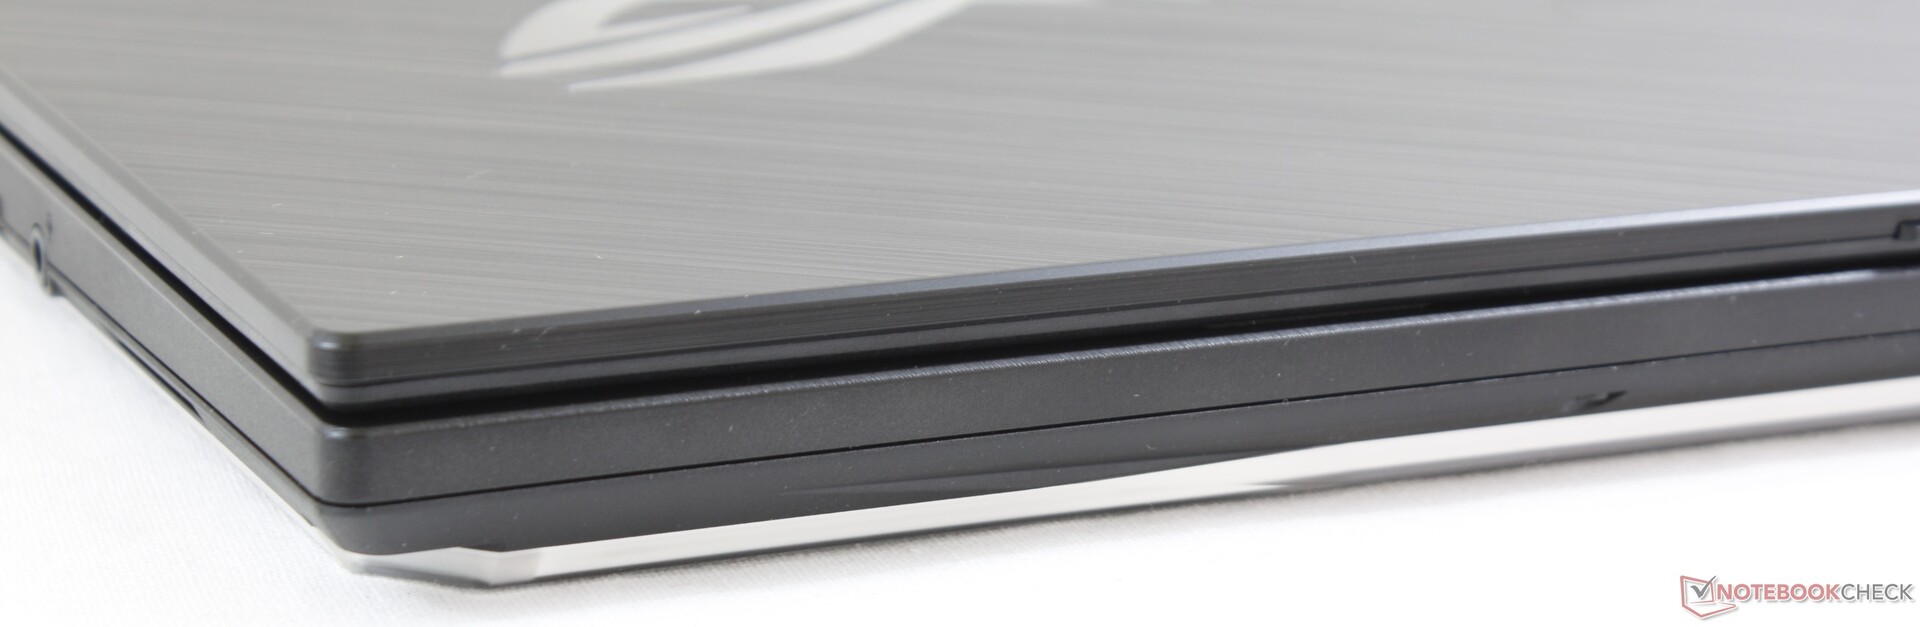
- The brushed aluminum outer lid and palm rests of the G531/G731 are now plastic
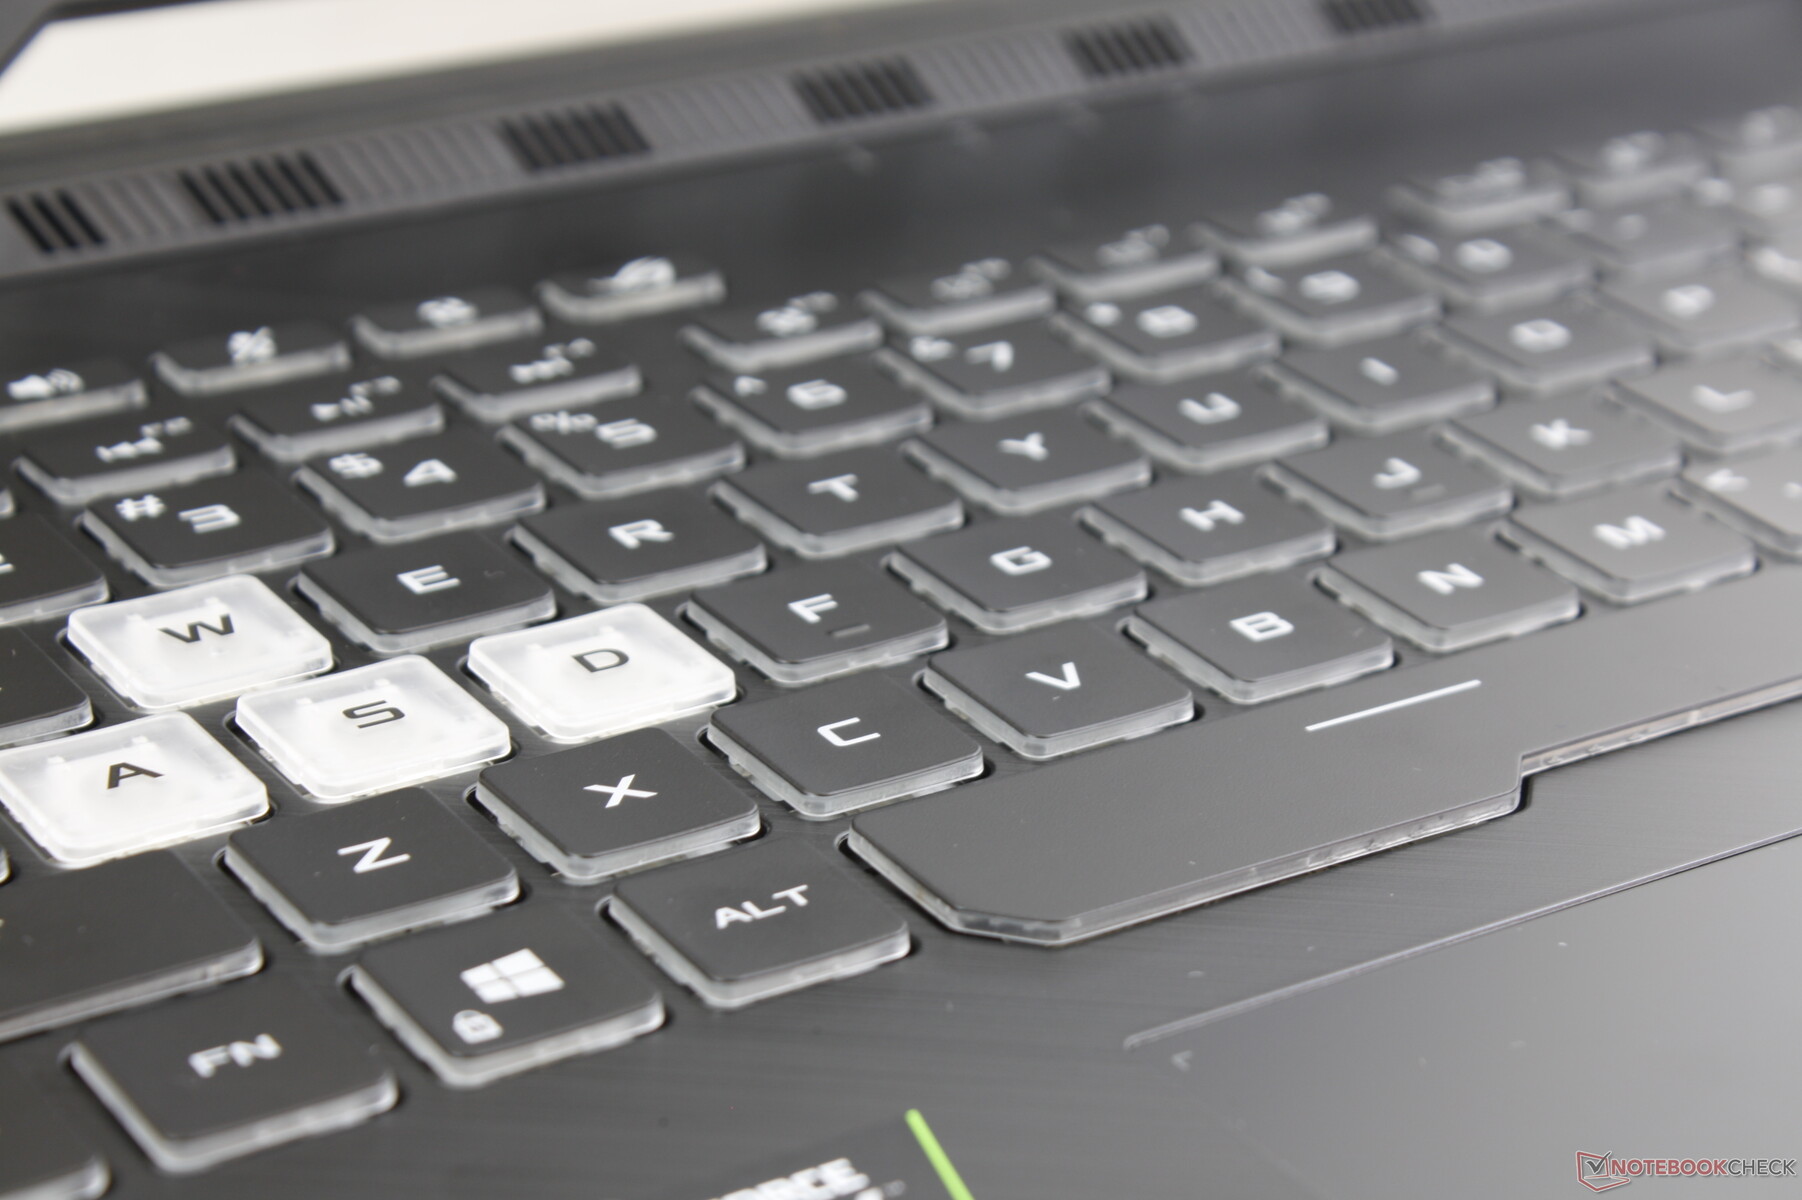
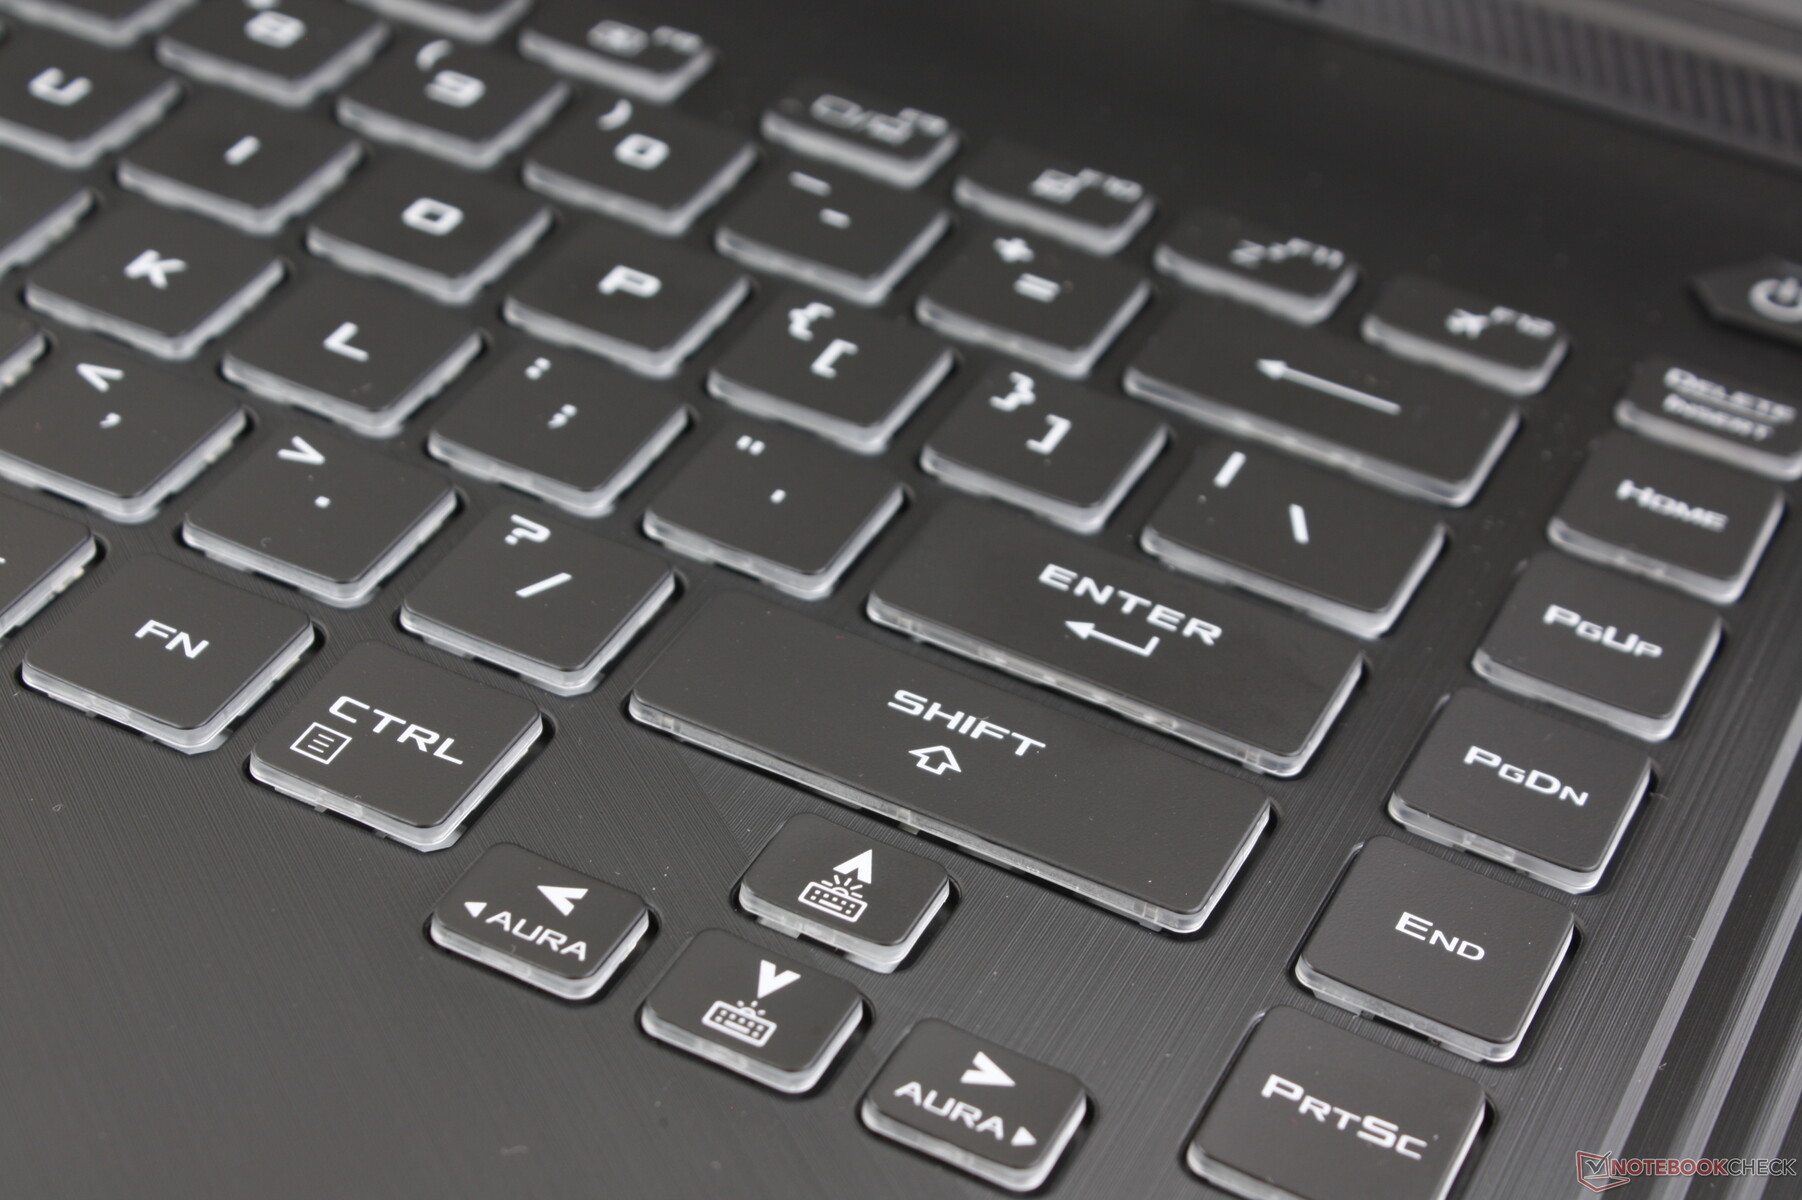
- Some SKUs will have single-zone RGB keyboard lighting only while higher-end SKUs like our GL531GV have quad-zone RGB lighting
- AC adapter sizes and ratings will be different depending on the SKU. Core i5/GTX 1050 SKUs come with a 150 W adapter while Core i9/RTX 2070 SKUs come with a 280 W adapter. Our mid-range Core i7/RTX 2060 SKU comes with a 230 W adapter.
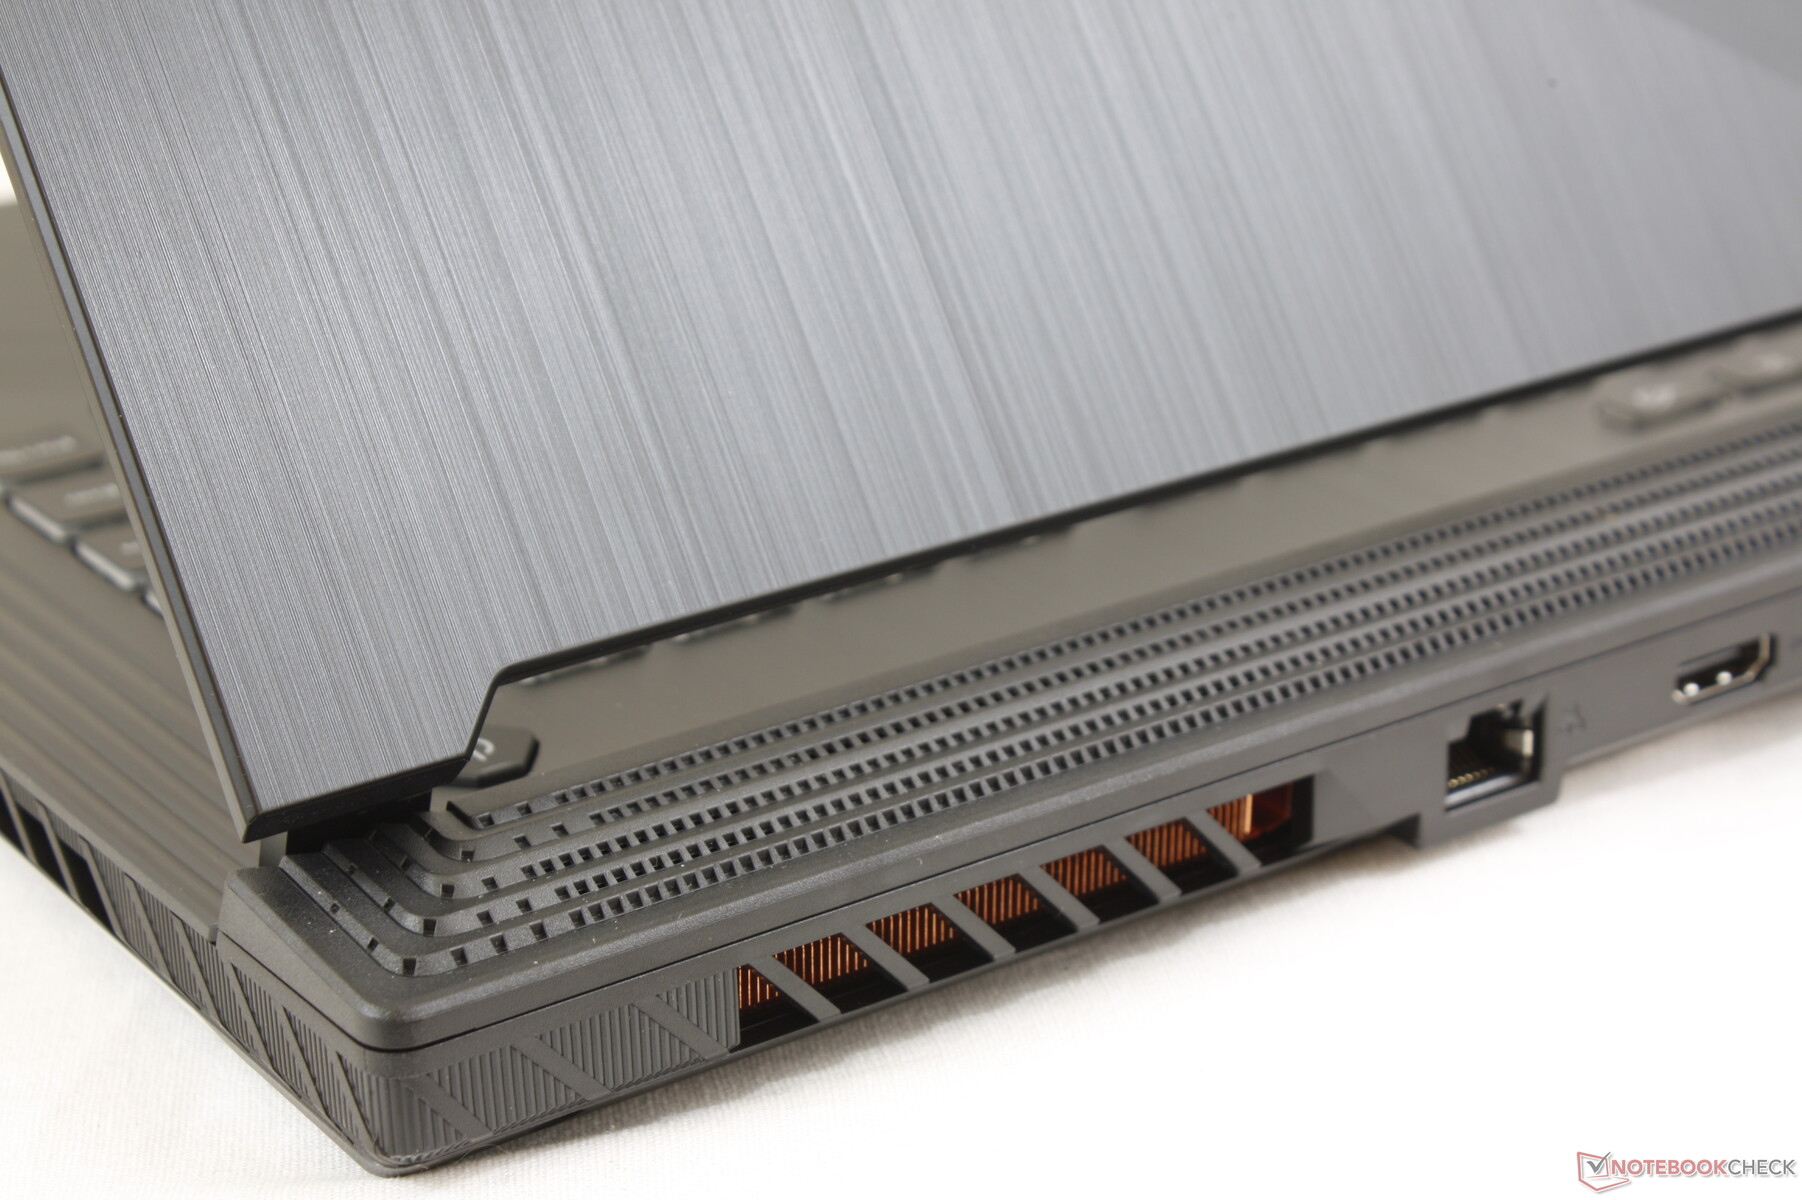
Connectivity
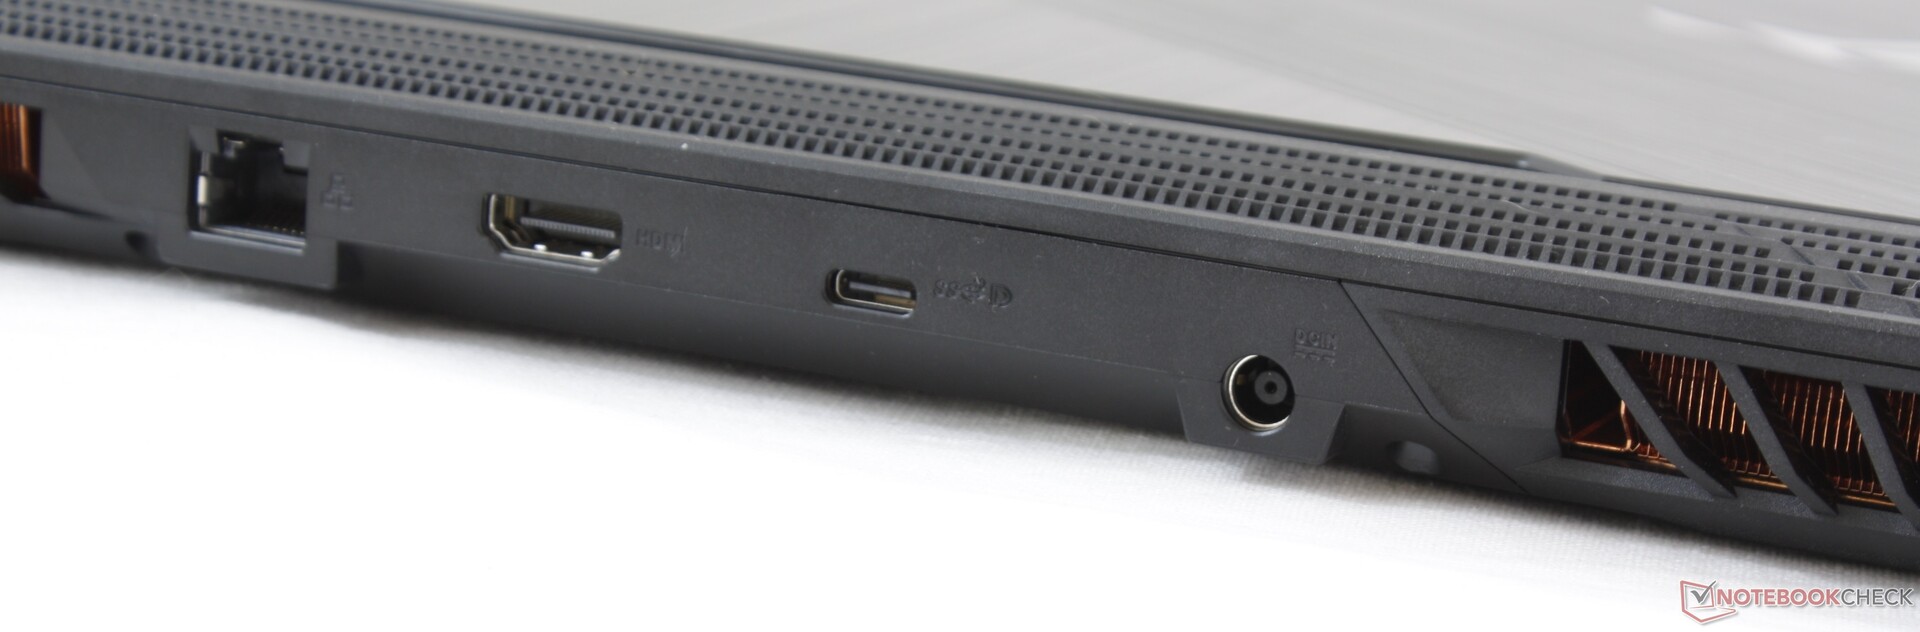
Communication
| Networking | |
| iperf3 transmit AX12 | |
| Asus Zephyrus S GX502GW | |
| Dell G7 15-7588 | |
| Asus TUF FX505DT-EB73 | |
| Asus Strix GL531GV-PB74 | |
| iperf3 receive AX12 | |
| Asus Zephyrus S GX502GW | |
| Dell G7 15-7588 | |
| Asus Strix GL531GV-PB74 | |
| Asus TUF FX505DT-EB73 | |
Maintenance
Accessories and Warranty
There are no extras in the box other than the usual AC adapter and quick start guide. Warranty is the standard one-year limited protection with optional accidental damage protection at no additional charge for owners who register their laptops with Asus within 60 days of purchase.
Input Devices
Display
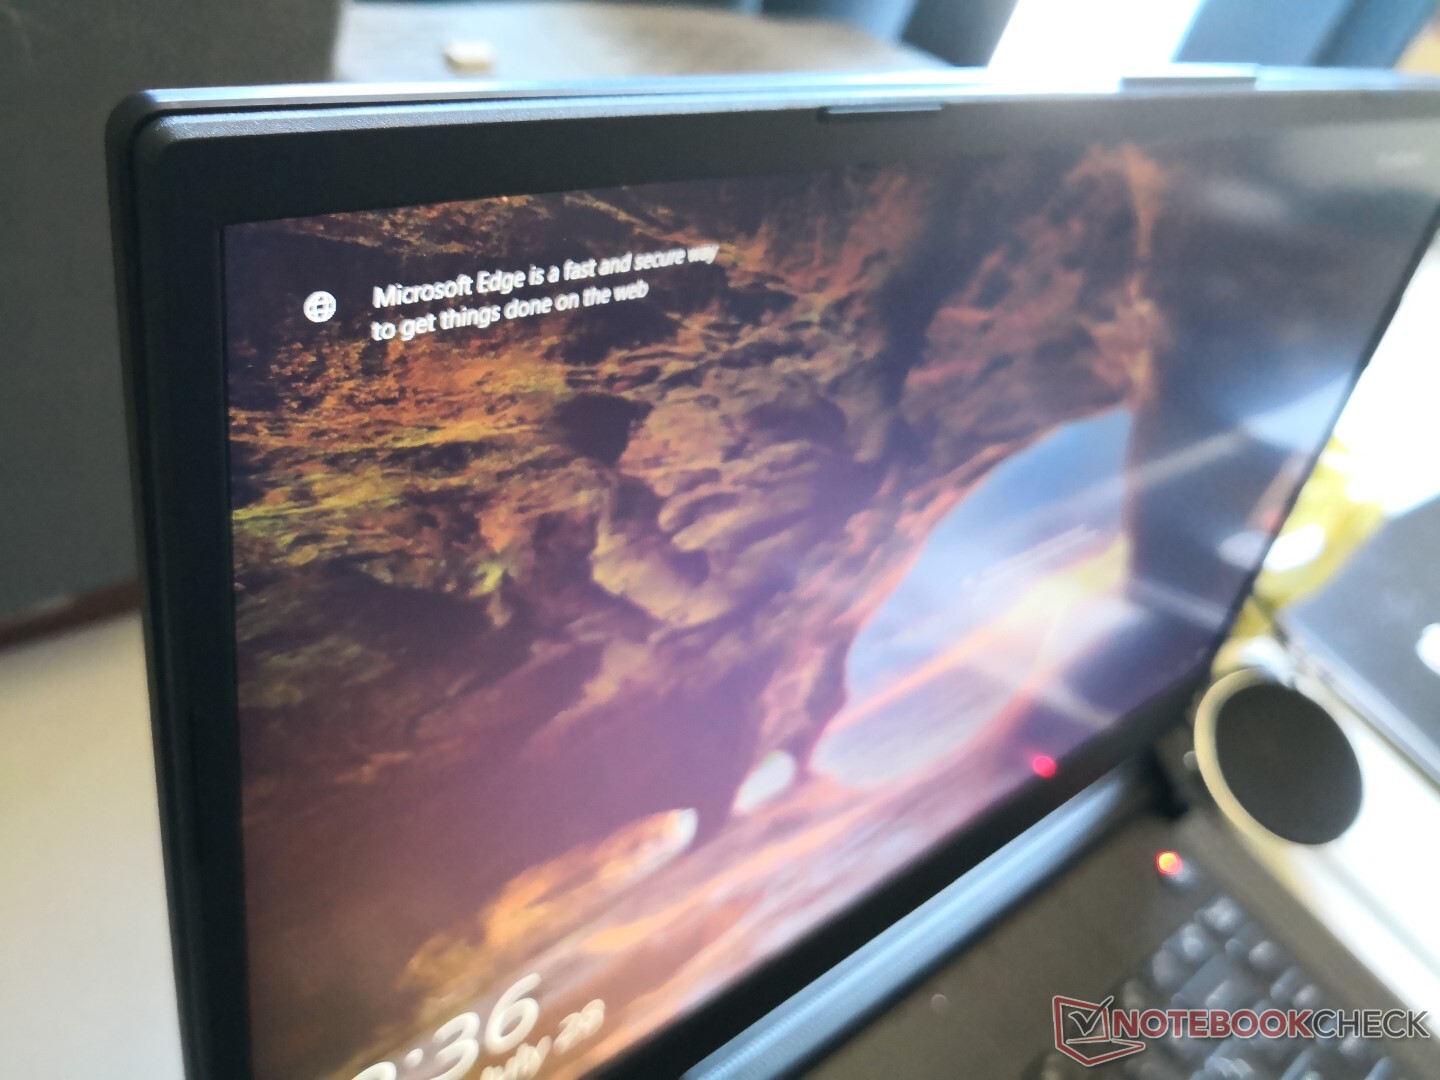
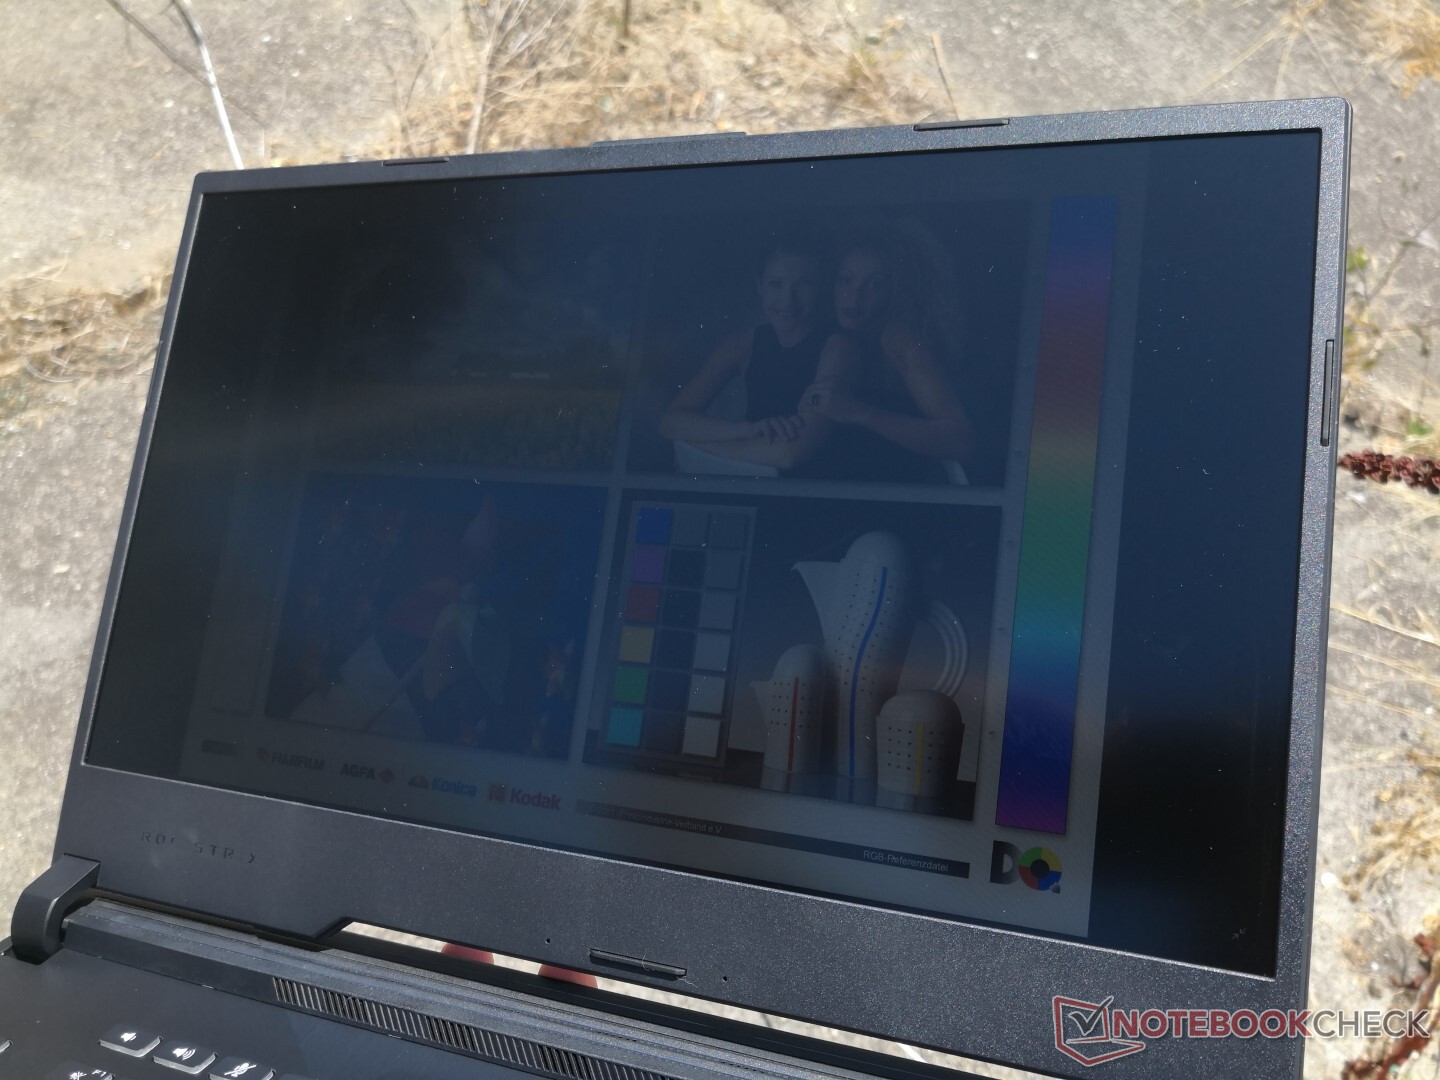
The GL531GV uses the same Panda LM156LF IPS panel as found on Asus' cheaper TUF FX505 series for a very similar visual experience between them. This 120 Hz panel is a budget offering as it doesn't quite match the 144 Hz panel on the pricier GX502GW in terms of response times, color coverage, and contrast ratio. Nonetheless, the silky smooth 120 Hz refresh rate is a tangible improvement over the typical 60 Hz panels on most entry-level gaming laptops like the MSI GF75.
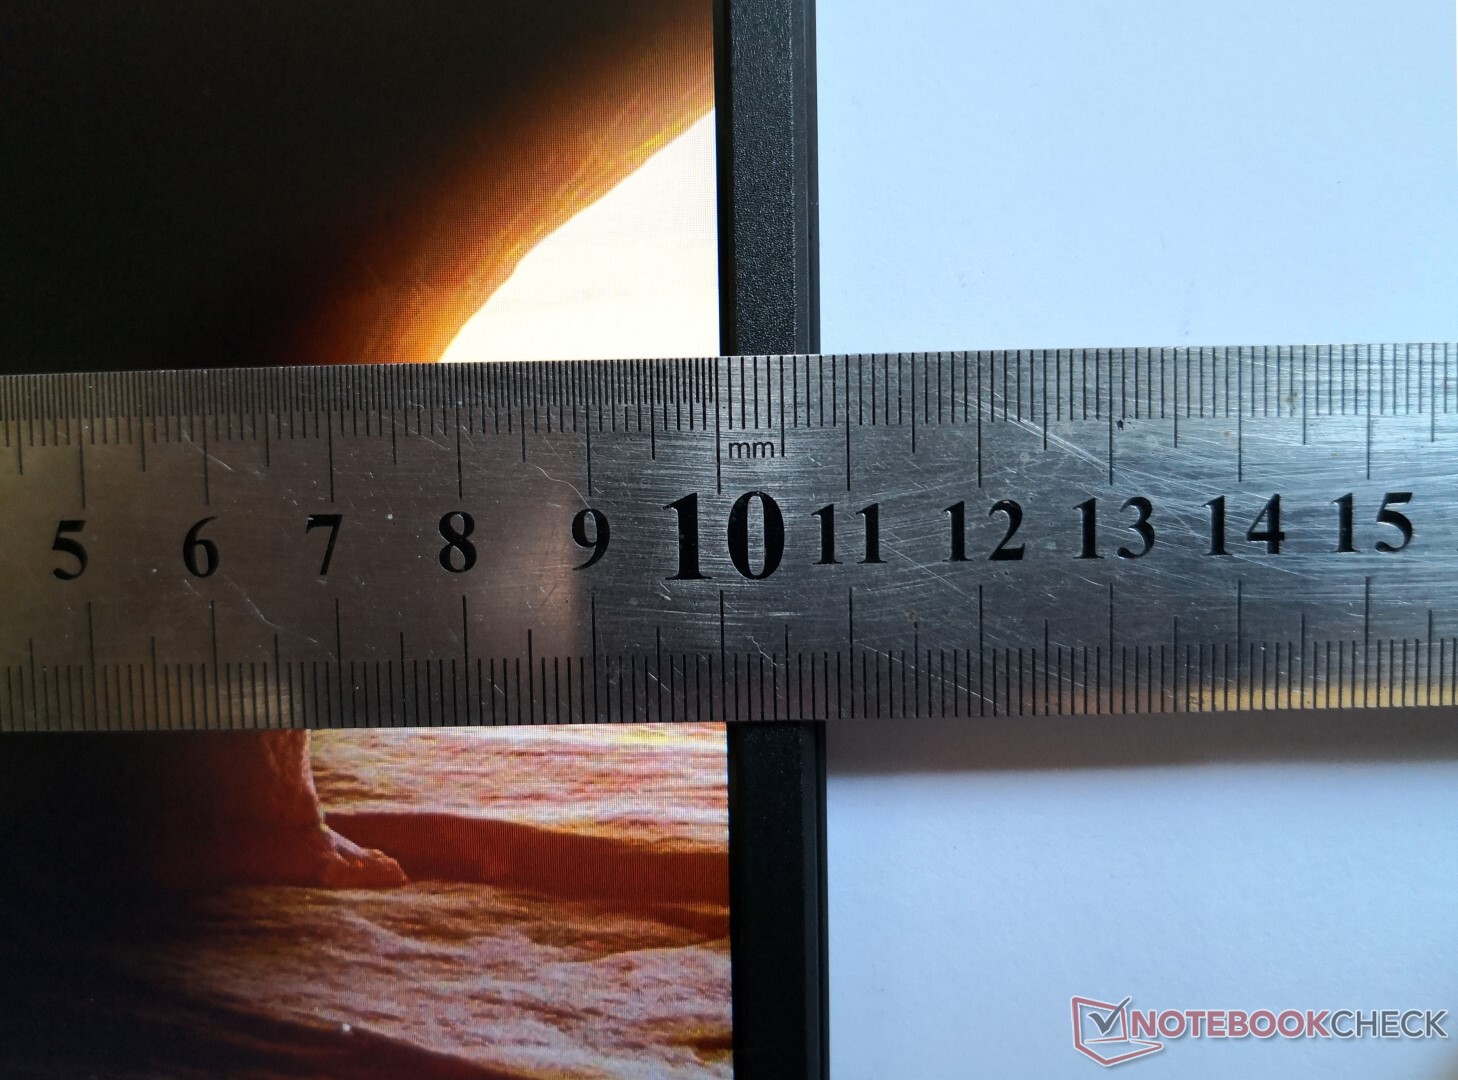
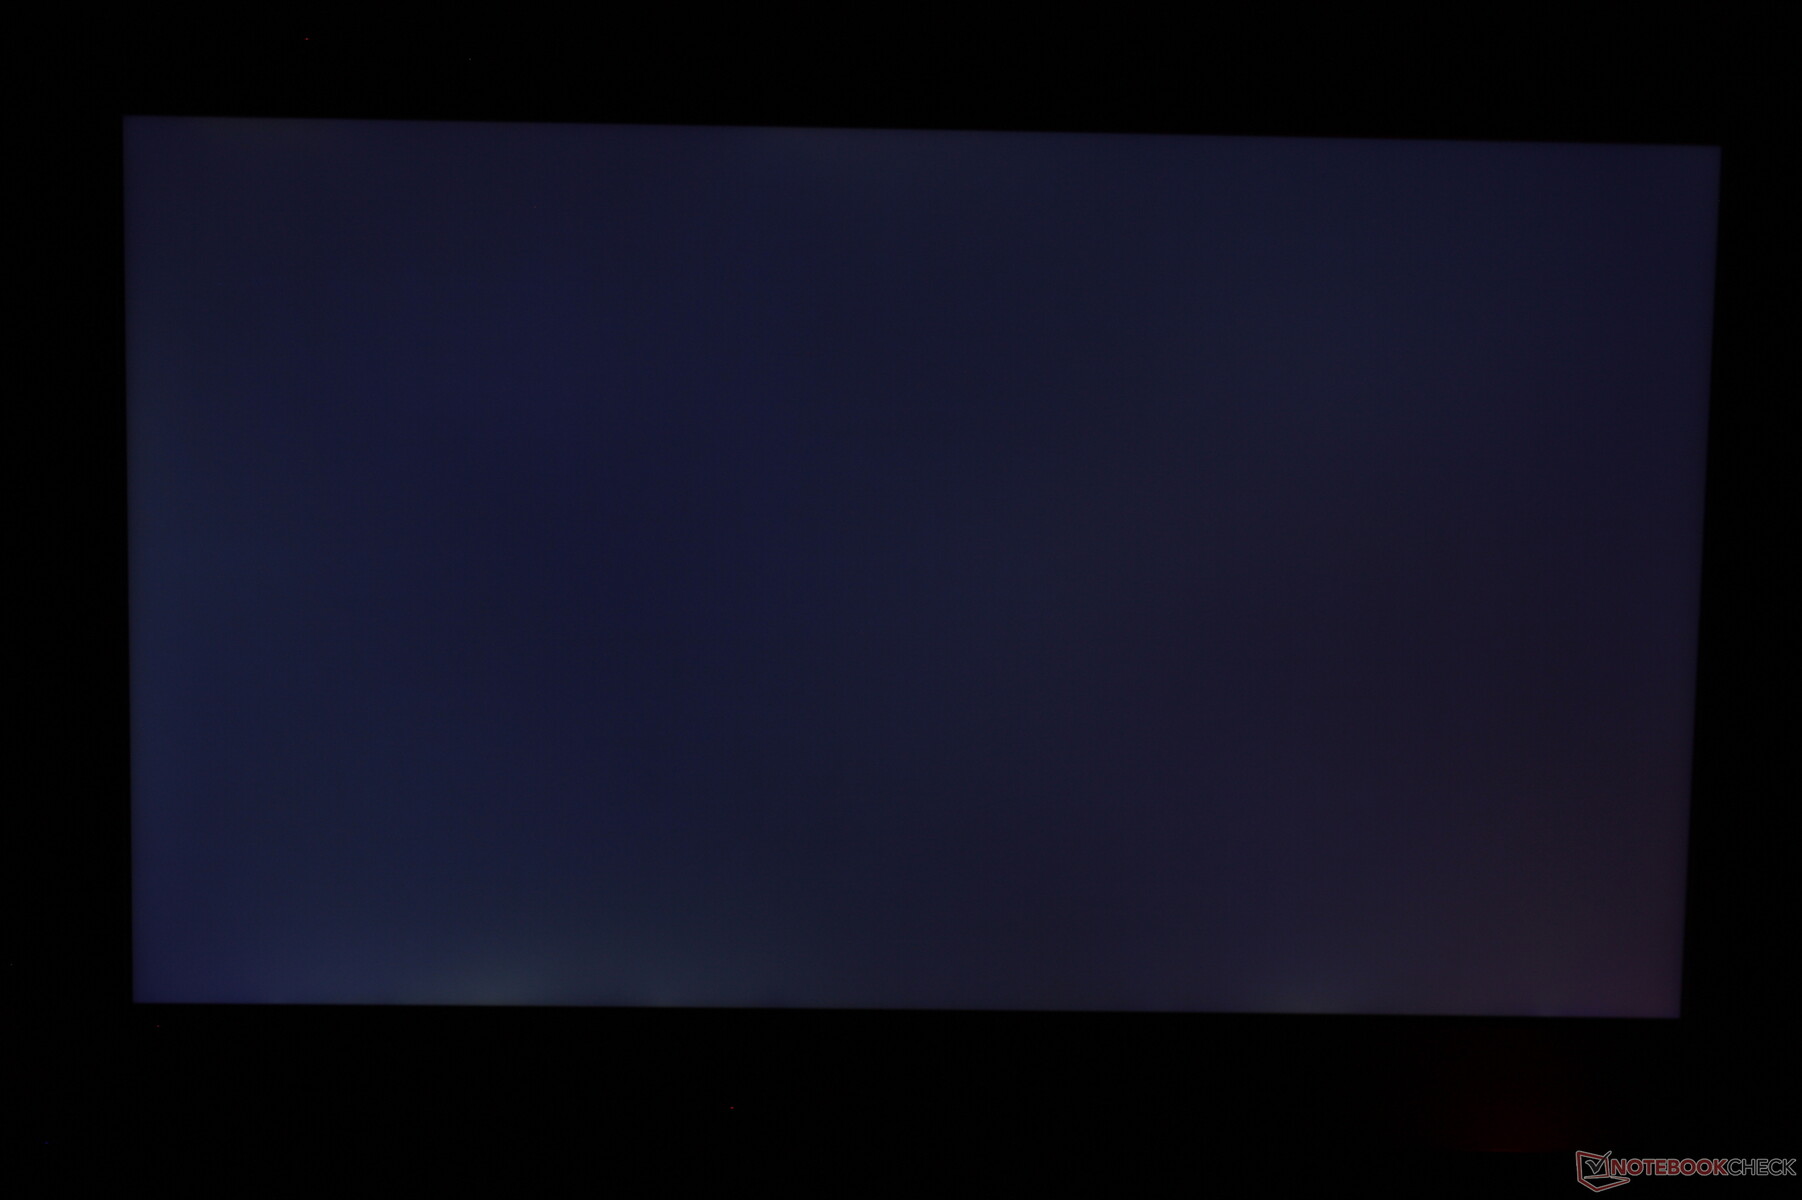
Graininess is noticeable but minimal as is common on matte panels. Similarly, the uneven backlight bleeding along the bottom edge of the display on our test unit is also minor enough to be easy to ignore. Laptops with glossy displays like the Dell XPS 15 offer comparatively sharper texts and images.

| |||||||||||||||||||||||||
Brightness Distribution: 86 %
Center on Battery: 290.1 cd/m²
Contrast: 537:1 (Black: 0.54 cd/m²)
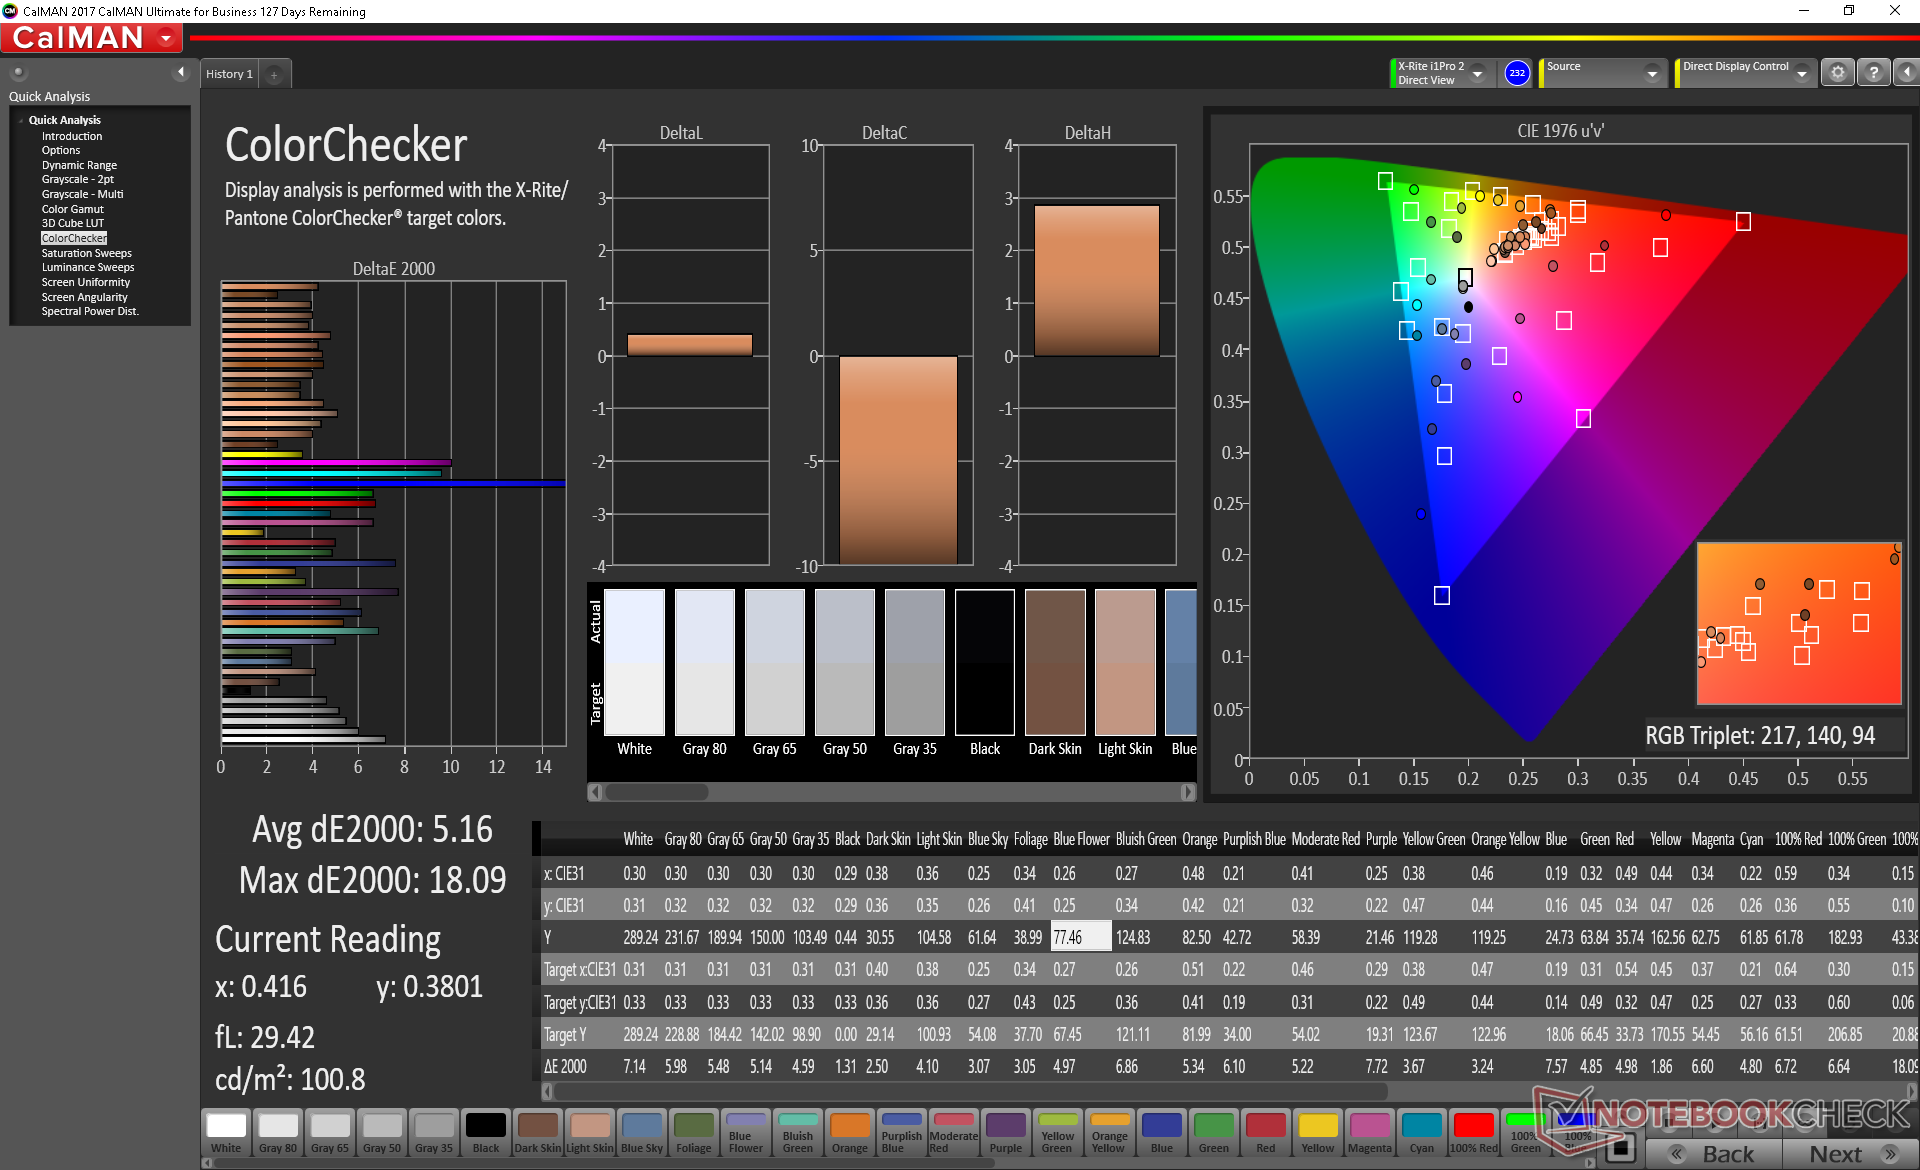
ΔE ColorChecker Calman: 5.16 | ∀{0.5-29.43 Ø4.71}
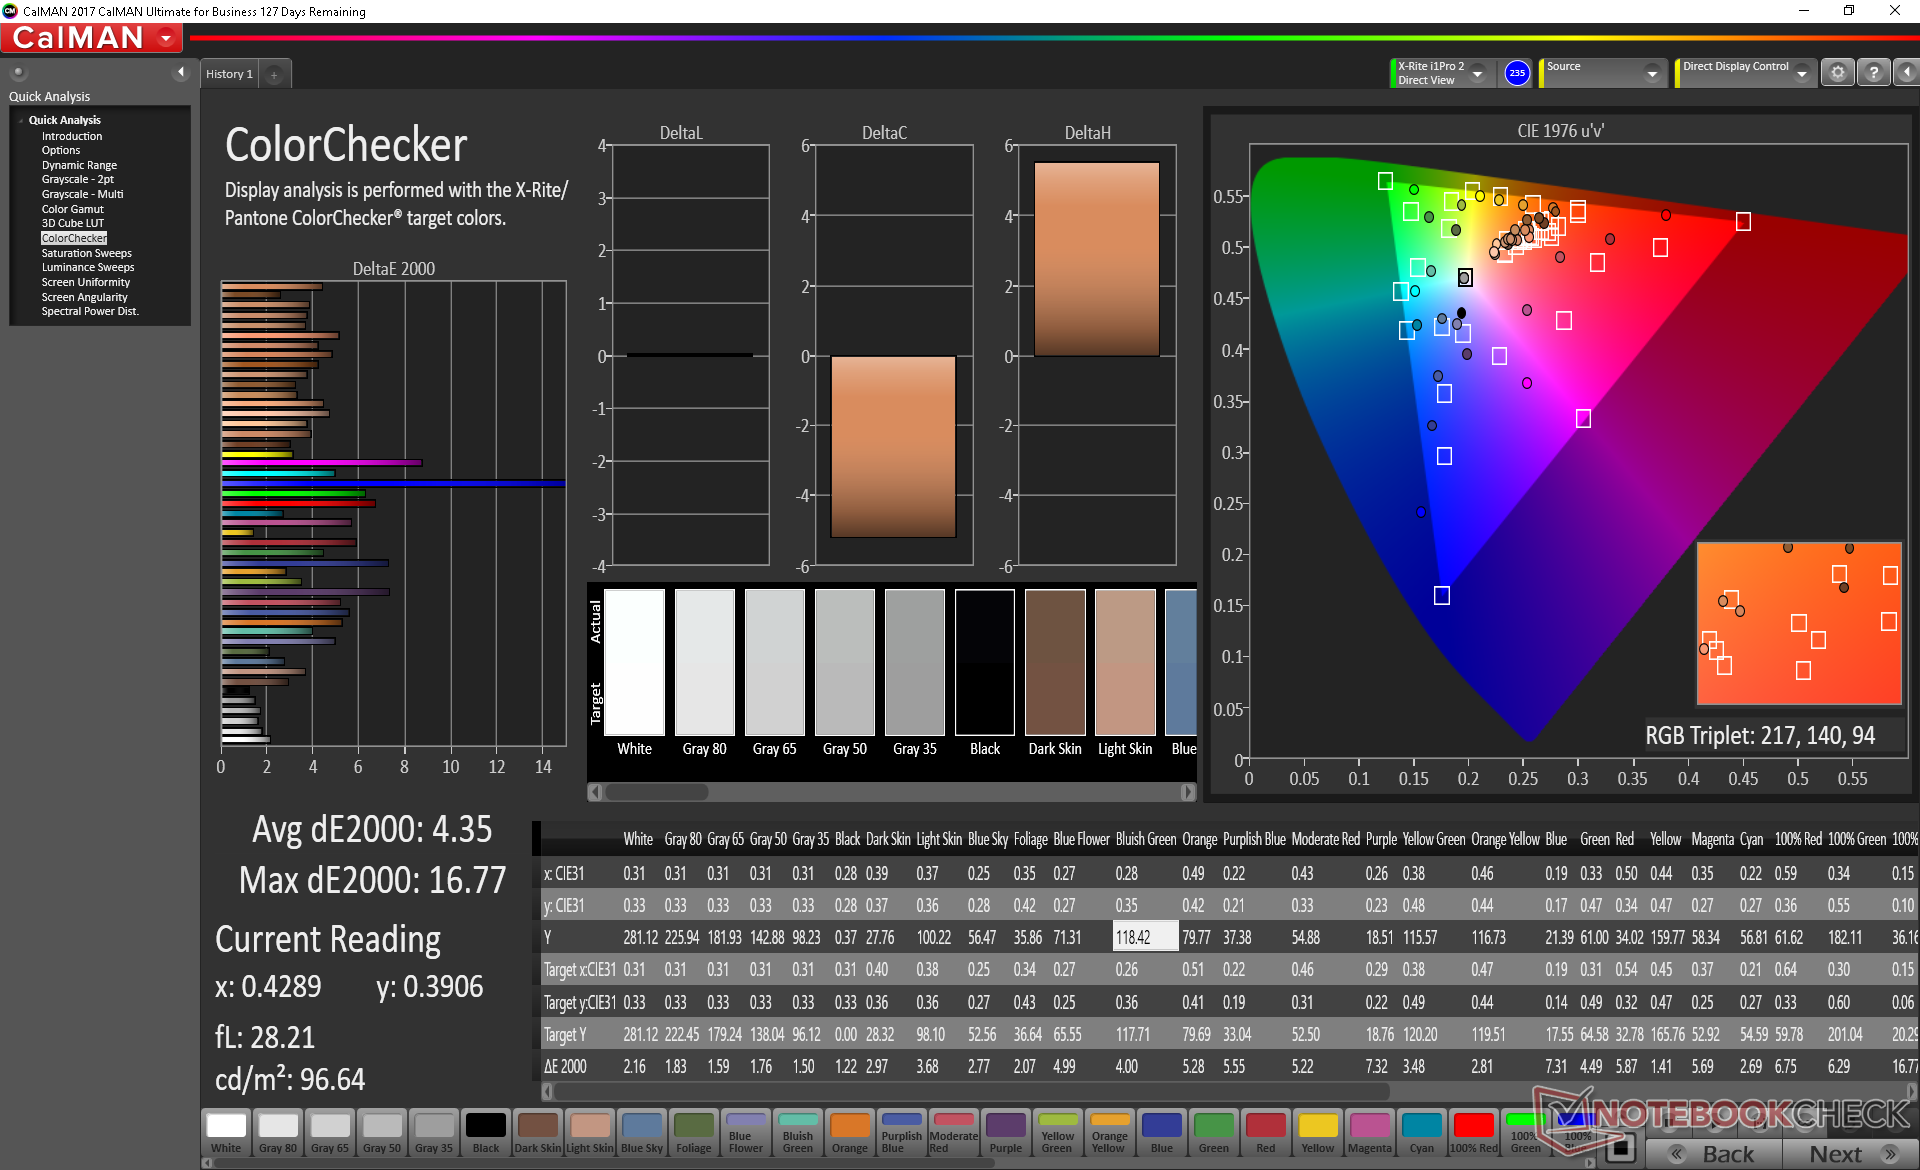
calibrated: 4.35
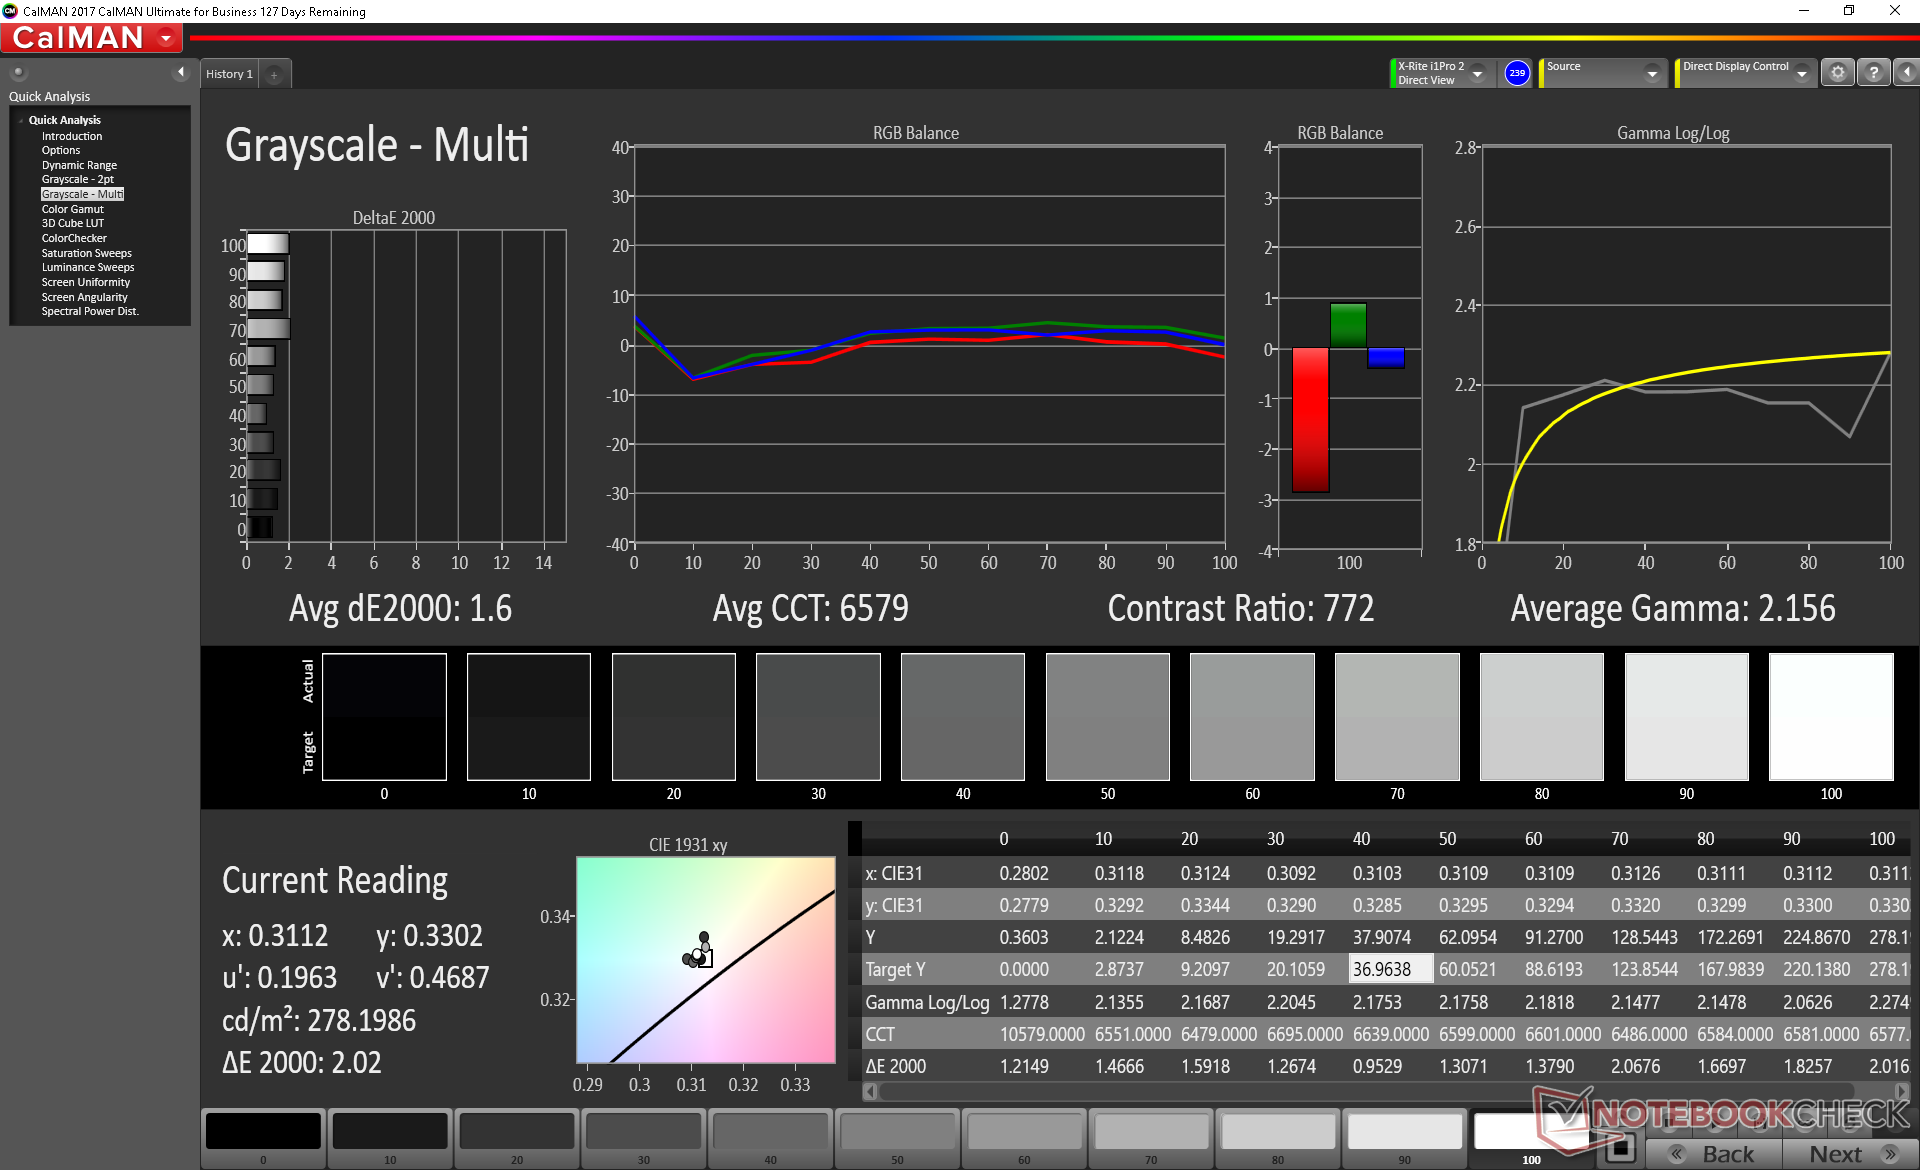
ΔE Greyscale Calman: 4.4 | ∀{0.09-98 Ø4.96}
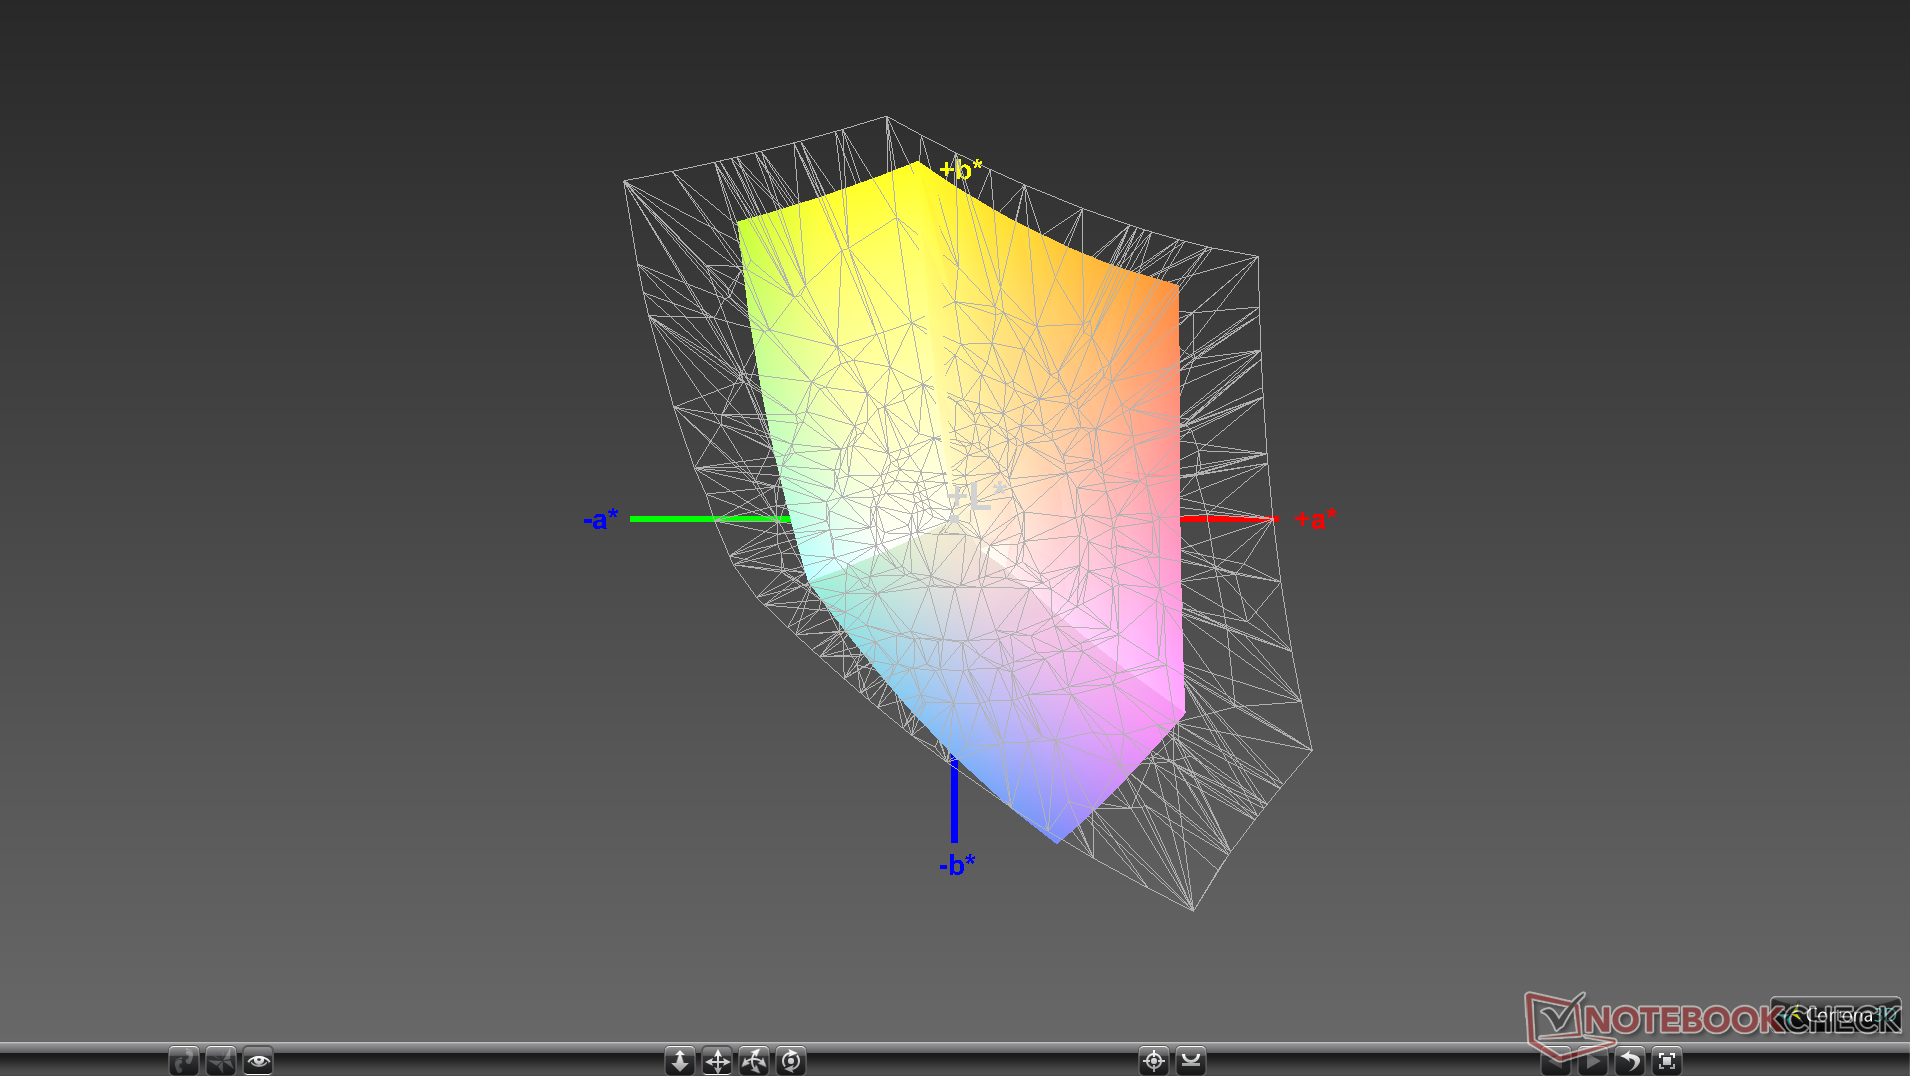
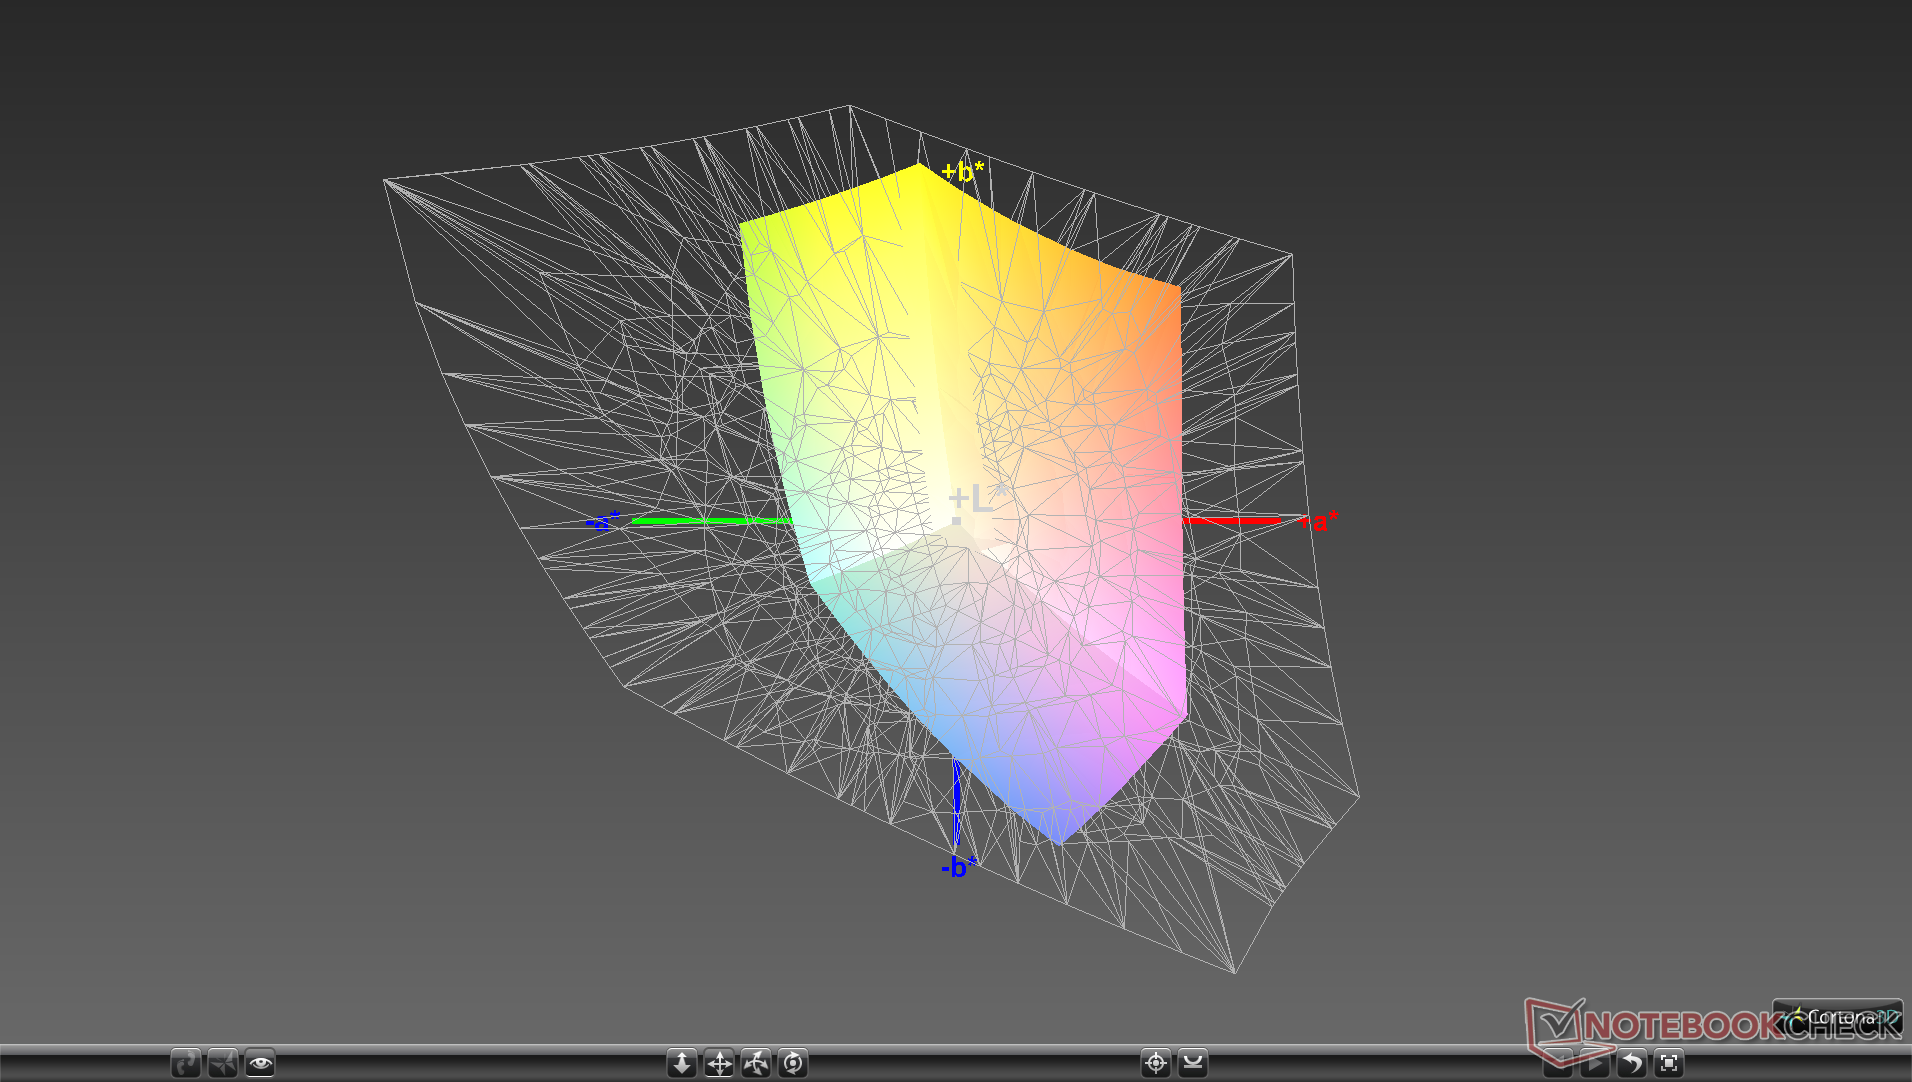
60% sRGB (Argyll 1.6.3 3D)
38.1% AdobeRGB 1998 (Argyll 1.6.3 3D)
41.48% AdobeRGB 1998 (Argyll 3D)
60.3% sRGB (Argyll 3D)
40.13% Display P3 (Argyll 3D)
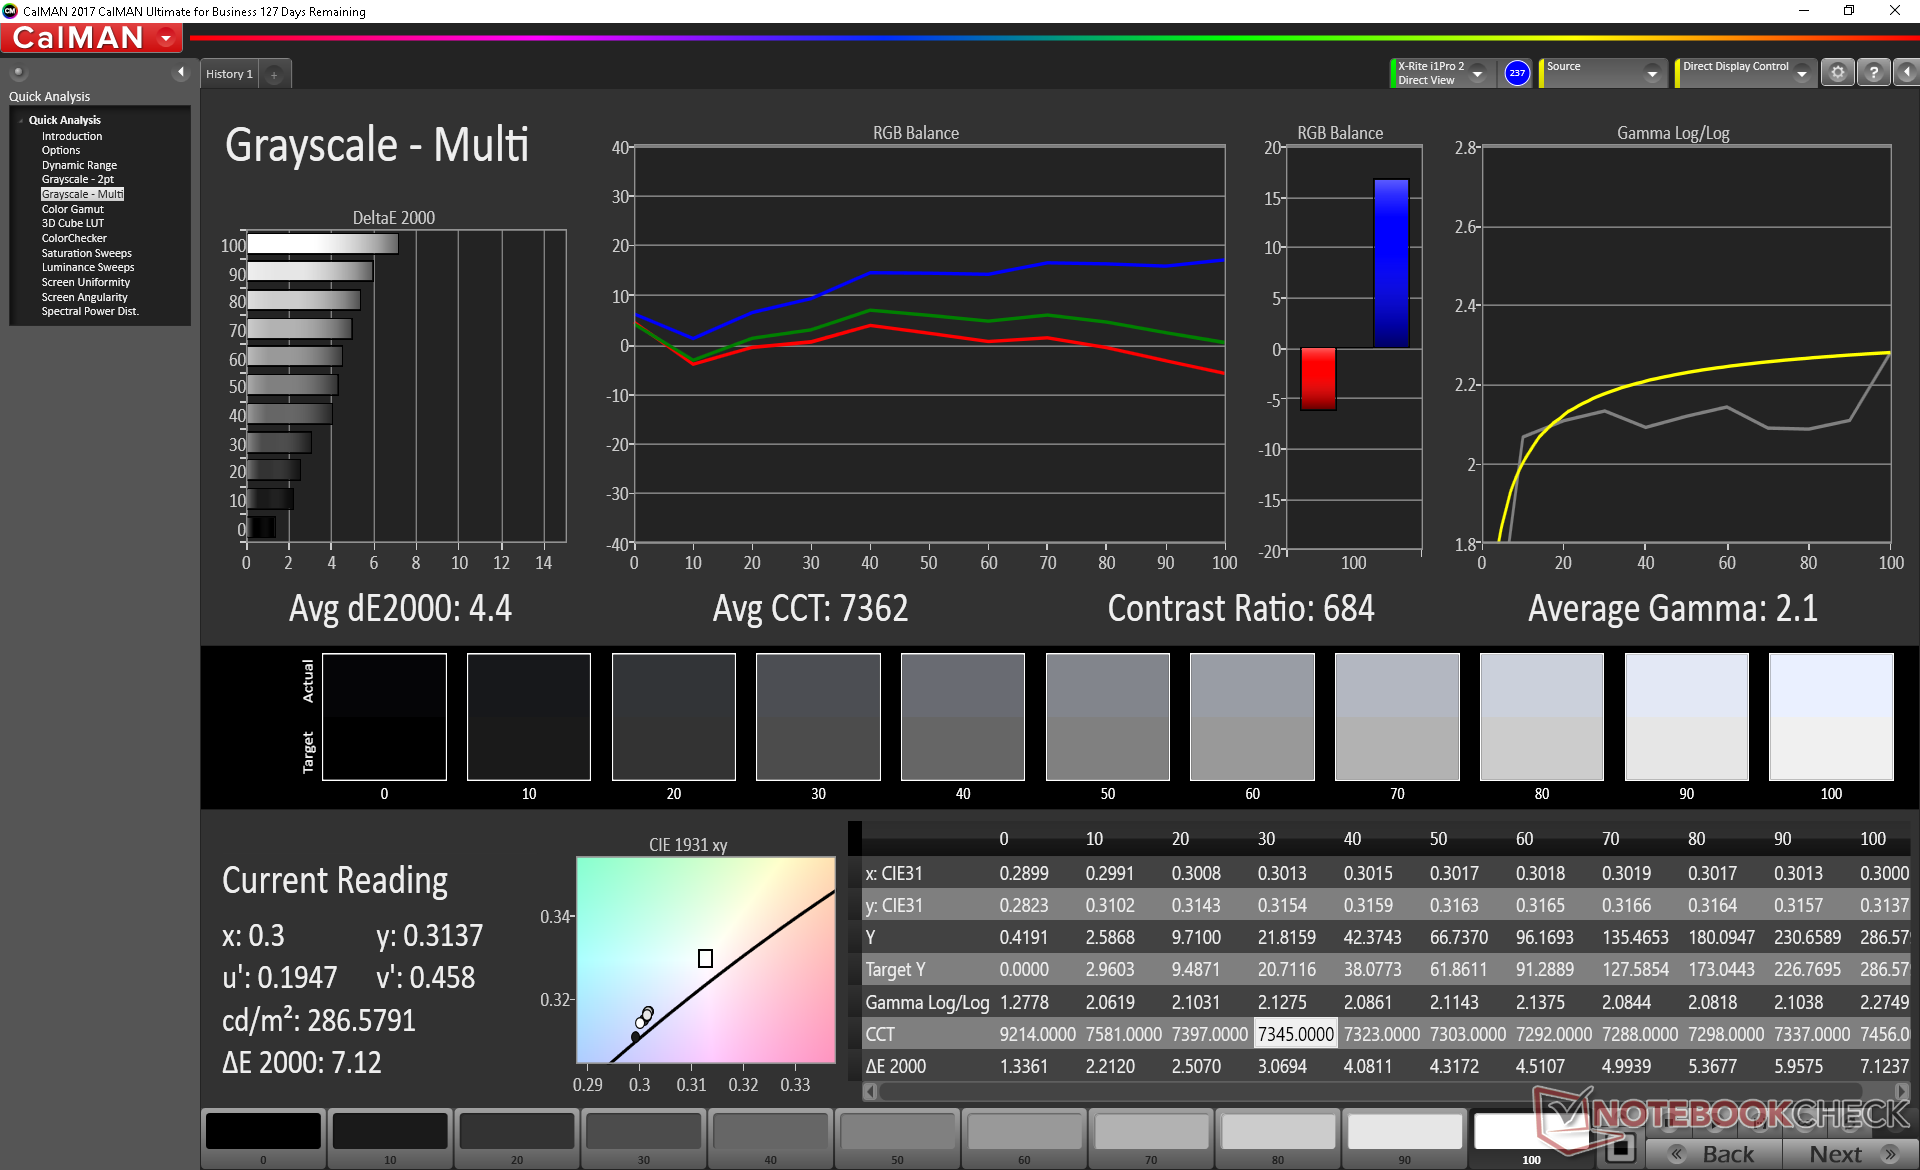
Gamma: 2.1
CCT: 7362 K
| Asus Strix GL531GV-PB74 Panda LM156LF-GL02, IPS, 15.6", 1920x1080 | Asus TUF FX505DT-EB73 Panda LM156LF-GL, IPS, 15.6", 1920x1080 | Asus Zephyrus S GX502GW AU Optronics B156HAN08.2 (AUO82ED), IPS, 15.6", 1920x1080 | Dell G7 15-7588 LG Philips LGD053F, IPS, 15.6", 1920x1080 | Lenovo Legion Y740-15ICHg LP156WFG-SPB2, IPS, 15.6", 1920x1080 | Aorus 15-SA LG Philips LP156WFG-SPB2 (LGD05E8), IPS, 15.6", 1920x1080 | MSI GF63 8RC AU Optronics B156HAN02.1, IPS, 15.6", 1920x1080 | |
|---|---|---|---|---|---|---|---|
| Display | -1% | 57% | -6% | 56% | 58% | -2% | |
| Display P3 Coverage (%) | 40.13 | 39.56 -1% | 64.9 62% | 37.82 -6% | 63.5 58% | 64.3 60% | 39.43 -2% |
| sRGB Coverage (%) | 60.3 | 59.5 -1% | 91 51% | 56.2 -7% | 92.4 53% | 93.6 55% | 59.3 -2% |
| AdobeRGB 1998 Coverage (%) | 41.48 | 40.91 -1% | 65.9 59% | 39.2 -5% | 64.7 56% | 65.6 58% | 40.73 -2% |
| Response Times | -13% | 69% | -27% | 38% | 45% | -17% | |
| Response Time Grey 50% / Grey 80% * (ms) | 26 ? | 30.4 ? -17% | 7.2 ? 72% | 38.8 ? -49% | 18.8 ? 28% | 15.6 ? 40% | 33.2 ? -28% |
| Response Time Black / White * (ms) | 25.6 ? | 27.6 ? -8% | 8.8 ? 66% | 26.8 ? -5% | 13.2 ? 48% | 12.8 ? 50% | 27.2 ? -6% |
| PWM Frequency (Hz) | |||||||
| Screen | 6% | 38% | -11% | 33% | 38% | 6% | |
| Brightness middle (cd/m²) | 290.1 | 286.2 -1% | 286 -1% | 250.9 -14% | 320.4 10% | 266 -8% | 266.6 -8% |
| Brightness (cd/m²) | 274 | 267 -3% | 275 0% | 246 -10% | 298 9% | 254 -7% | 257 -6% |
| Brightness Distribution (%) | 86 | 84 -2% | 90 5% | 89 3% | 85 -1% | 90 5% | 89 3% |
| Black Level * (cd/m²) | 0.54 | 0.33 39% | 0.37 31% | 0.34 37% | 0.42 22% | 0.28 48% | 0.29 46% |
| Contrast (:1) | 537 | 867 61% | 773 44% | 738 37% | 763 42% | 950 77% | 919 71% |
| Colorchecker dE 2000 * | 5.16 | 5.45 -6% | 2.19 58% | 7.34 -42% | 3.21 38% | 3.11 40% | 5.93 -15% |
| Colorchecker dE 2000 max. * | 18.09 | 18.08 -0% | 4.4 76% | 28.66 -58% | 5.54 69% | 5.84 68% | 16.28 10% |
| Colorchecker dE 2000 calibrated * | 4.35 | 4.47 -3% | 2.27 48% | 4.42 -2% | 2.36 46% | 1.37 69% | 3.6 17% |
| Greyscale dE 2000 * | 4.4 | 5.3 -20% | 2.2 50% | 6.8 -55% | 3.6 18% | 3.94 10% | 6.8 -55% |
| Gamma | 2.1 105% | 2.1 105% | 2.41 91% | 2.164 102% | 2.27 97% | 2.53 87% | 2.43 91% |
| CCT | 7362 88% | 7679 85% | 6405 101% | 6780 96% | 6503 100% | 6210 105% | 7192 90% |
| Color Space (Percent of AdobeRGB 1998) (%) | 38.1 | 37.6 -1% | 59 55% | 36 -6% | 59 55% | 60 57% | 37.6 -1% |
| Color Space (Percent of sRGB) (%) | 60 | 59.1 -1% | 91 52% | 56 -7% | 92 53% | 93 55% | 59.3 -1% |
| Total Average (Program / Settings) | -3% /
2% | 55% /
46% | -15% /
-12% | 42% /
38% | 47% /
42% | -4% /
1% |
* ... smaller is better
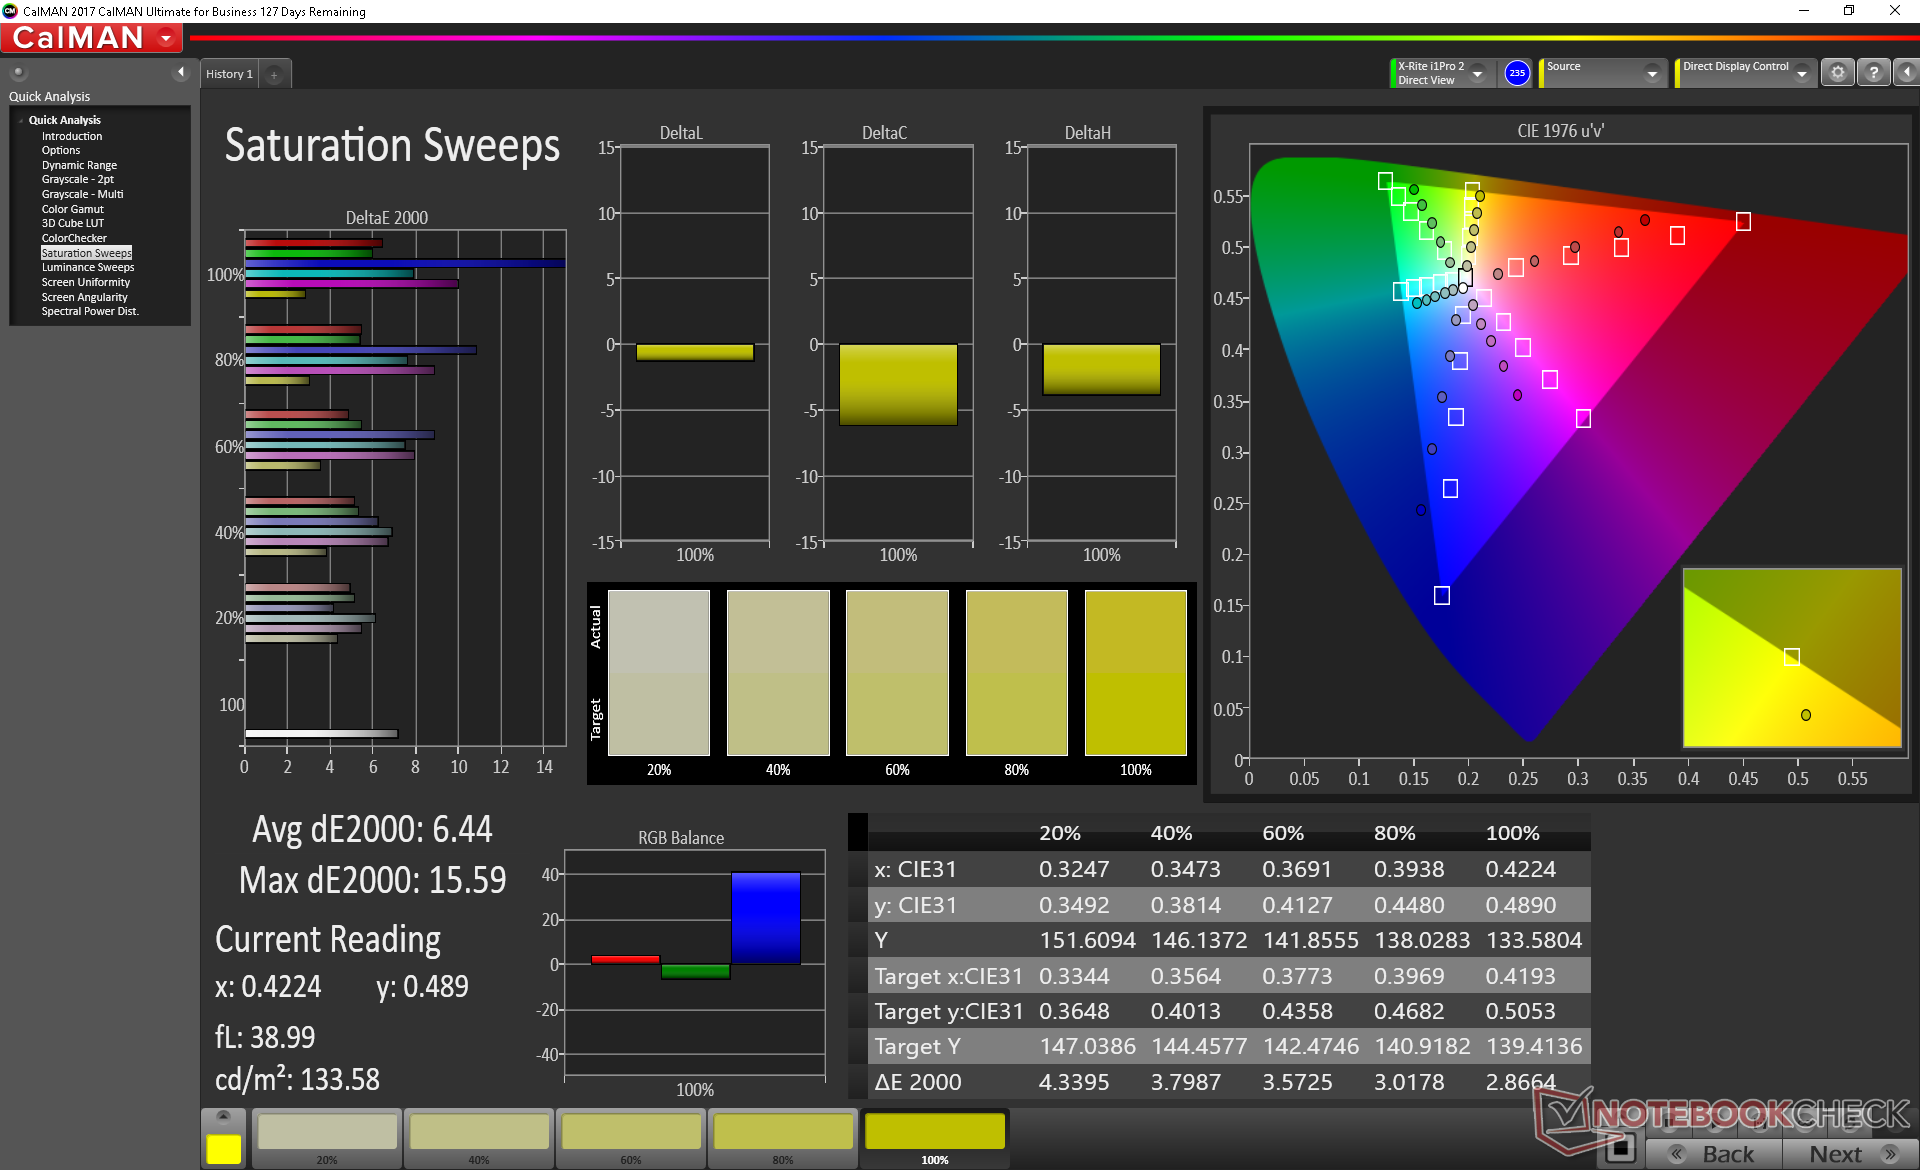
Colors and grayscale are fairly inaccurate out of the box with average DeltaE values of 6.44 and 4.4, respectively. Color temperature is also on the cool side for a bluish hue that is typical of budget panels. While our calibration addresses many of these issues, color accuracy remains relatively poor due to the narrow gamut of the panel. Blue, magenta, and cyan in particular are represented less accurately than other tested colors especially at higher saturation levels.

Display Response Times
| ↔ Response Time Black to White | ||
|---|---|---|
| 25.6 ms ... rise ↗ and fall ↘ combined | ↗ 14.8 ms rise | 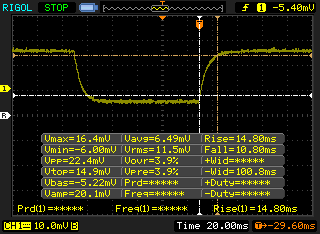 |
| ↘ 10.8 ms fall | ||
| The screen shows relatively slow response rates in our tests and may be too slow for gamers. In comparison, all tested devices range from 0.1 (minimum) to 240 (maximum) ms. » 61 % of all devices are better. This means that the measured response time is worse than the average of all tested devices (19.8 ms). | ||
| ↔ Response Time 50% Grey to 80% Grey | ||
| 26 ms ... rise ↗ and fall ↘ combined | ↗ 13.6 ms rise | 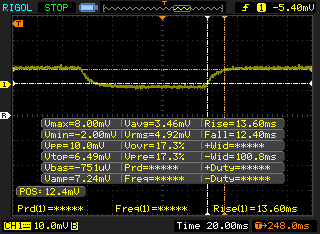 |
| ↘ 12.4 ms fall | ||
| The screen shows relatively slow response rates in our tests and may be too slow for gamers. In comparison, all tested devices range from 0.165 (minimum) to 636 (maximum) ms. » 36 % of all devices are better. This means that the measured response time is better than the average of all tested devices (31 ms). | ||
Screen Flickering / PWM (Pulse-Width Modulation)
| Screen flickering / PWM not detected | 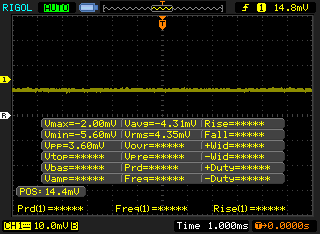 | ||
In comparison: 52 % of all tested devices do not use PWM to dim the display. If PWM was detected, an average of 7757 (minimum: 5 - maximum: 343500) Hz was measured. | |||
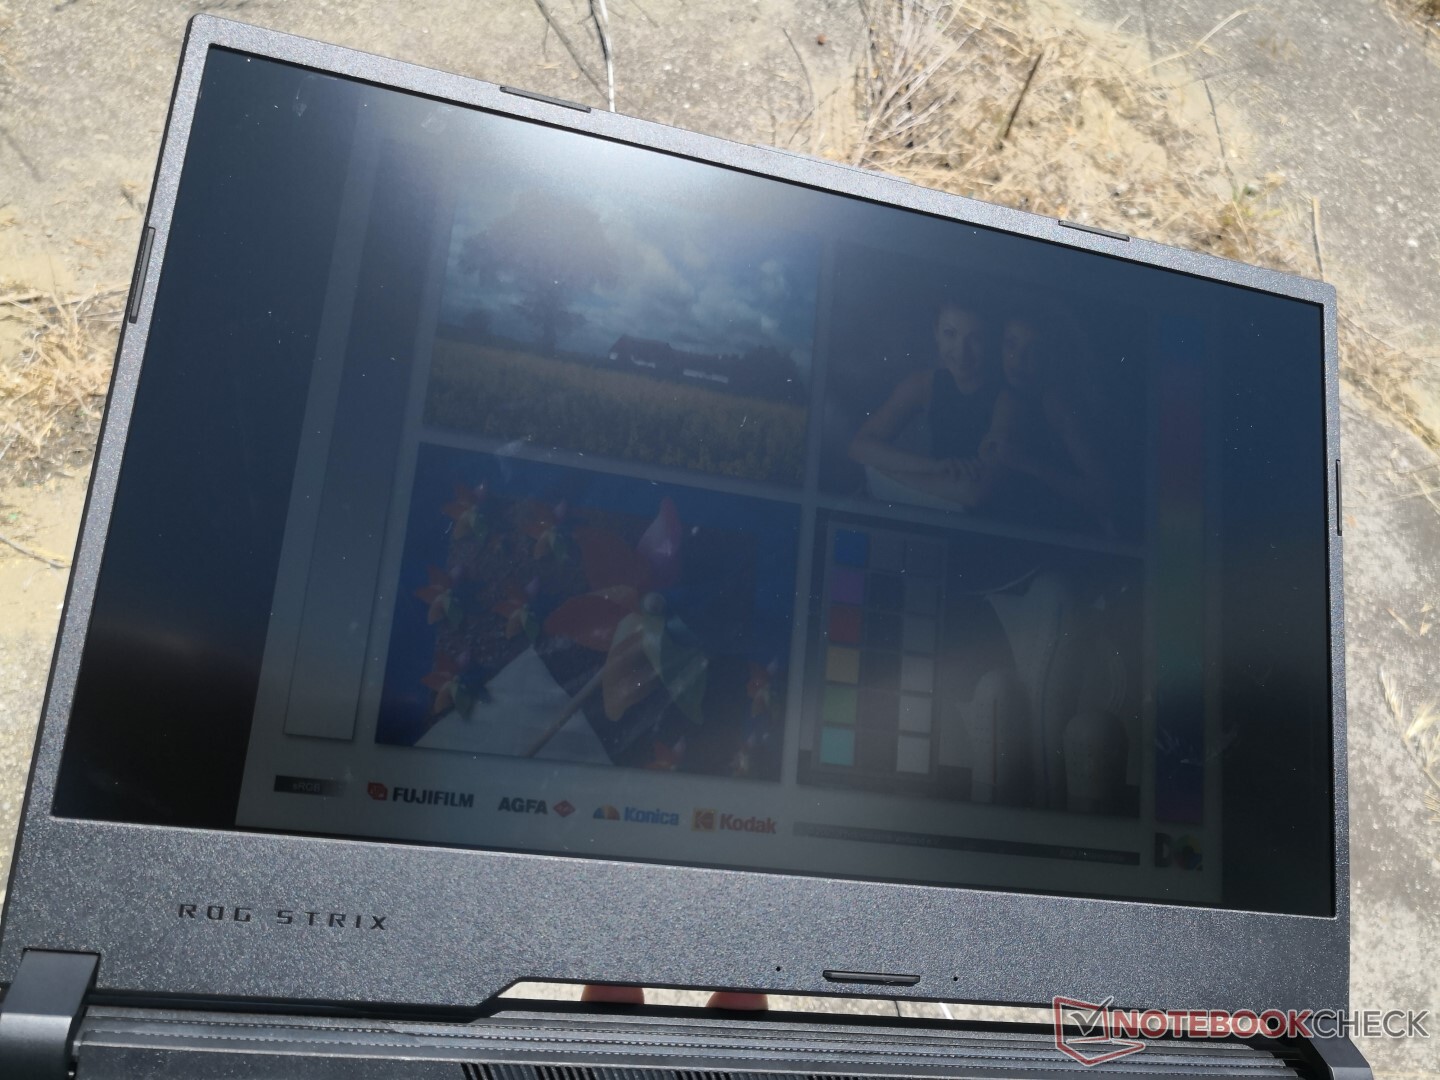
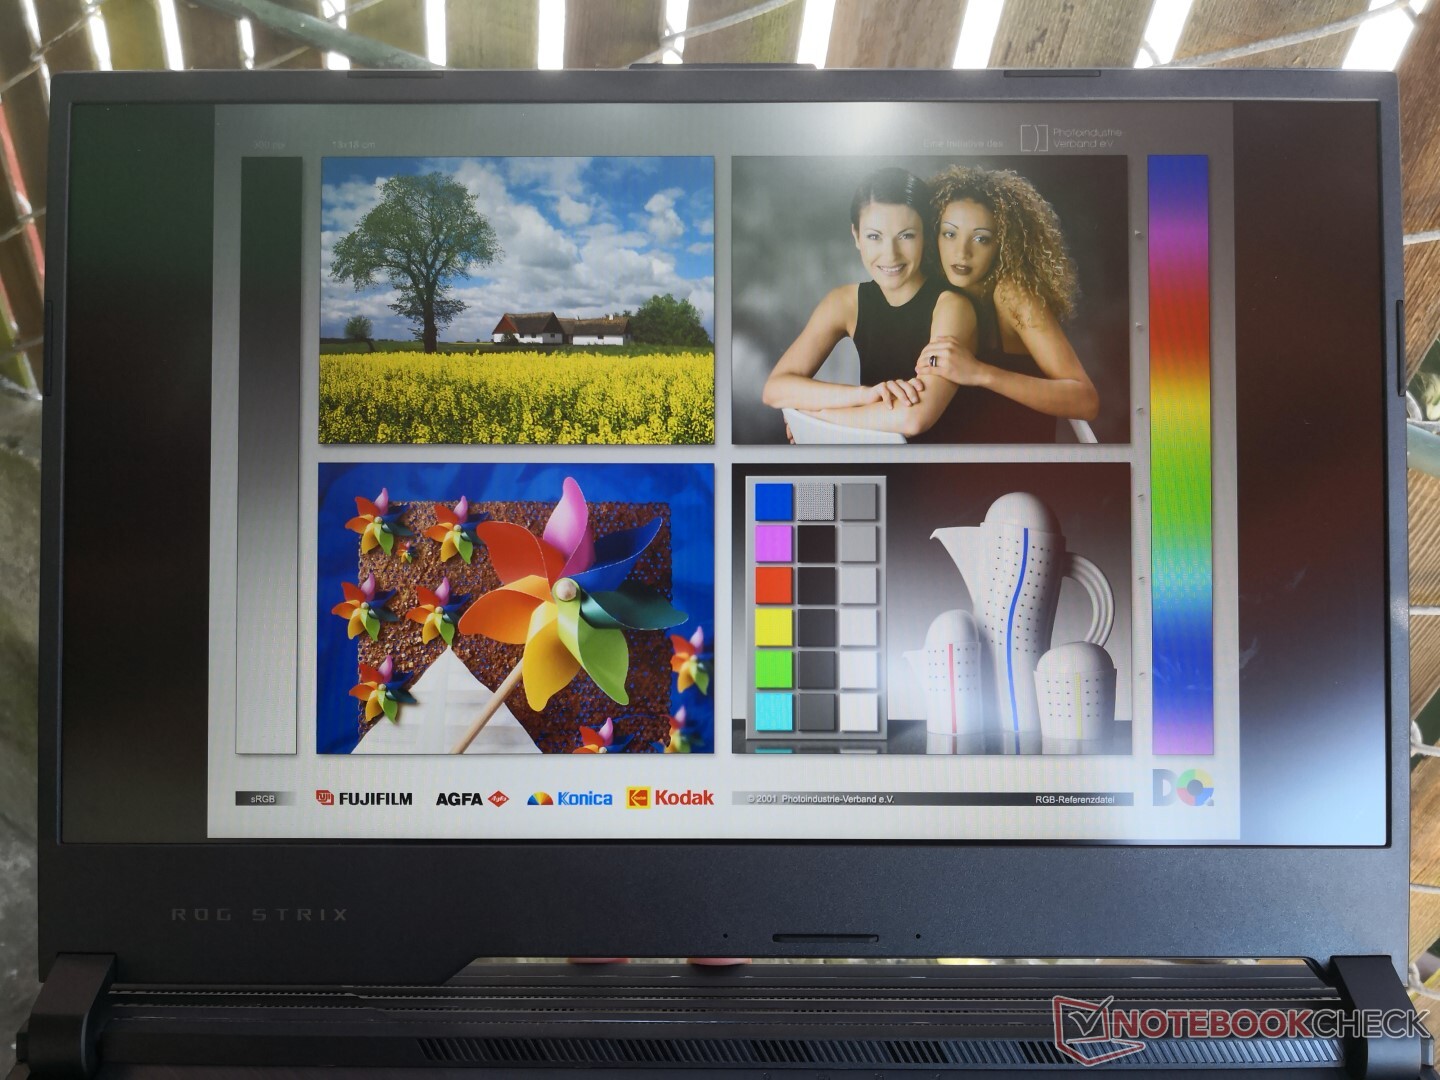
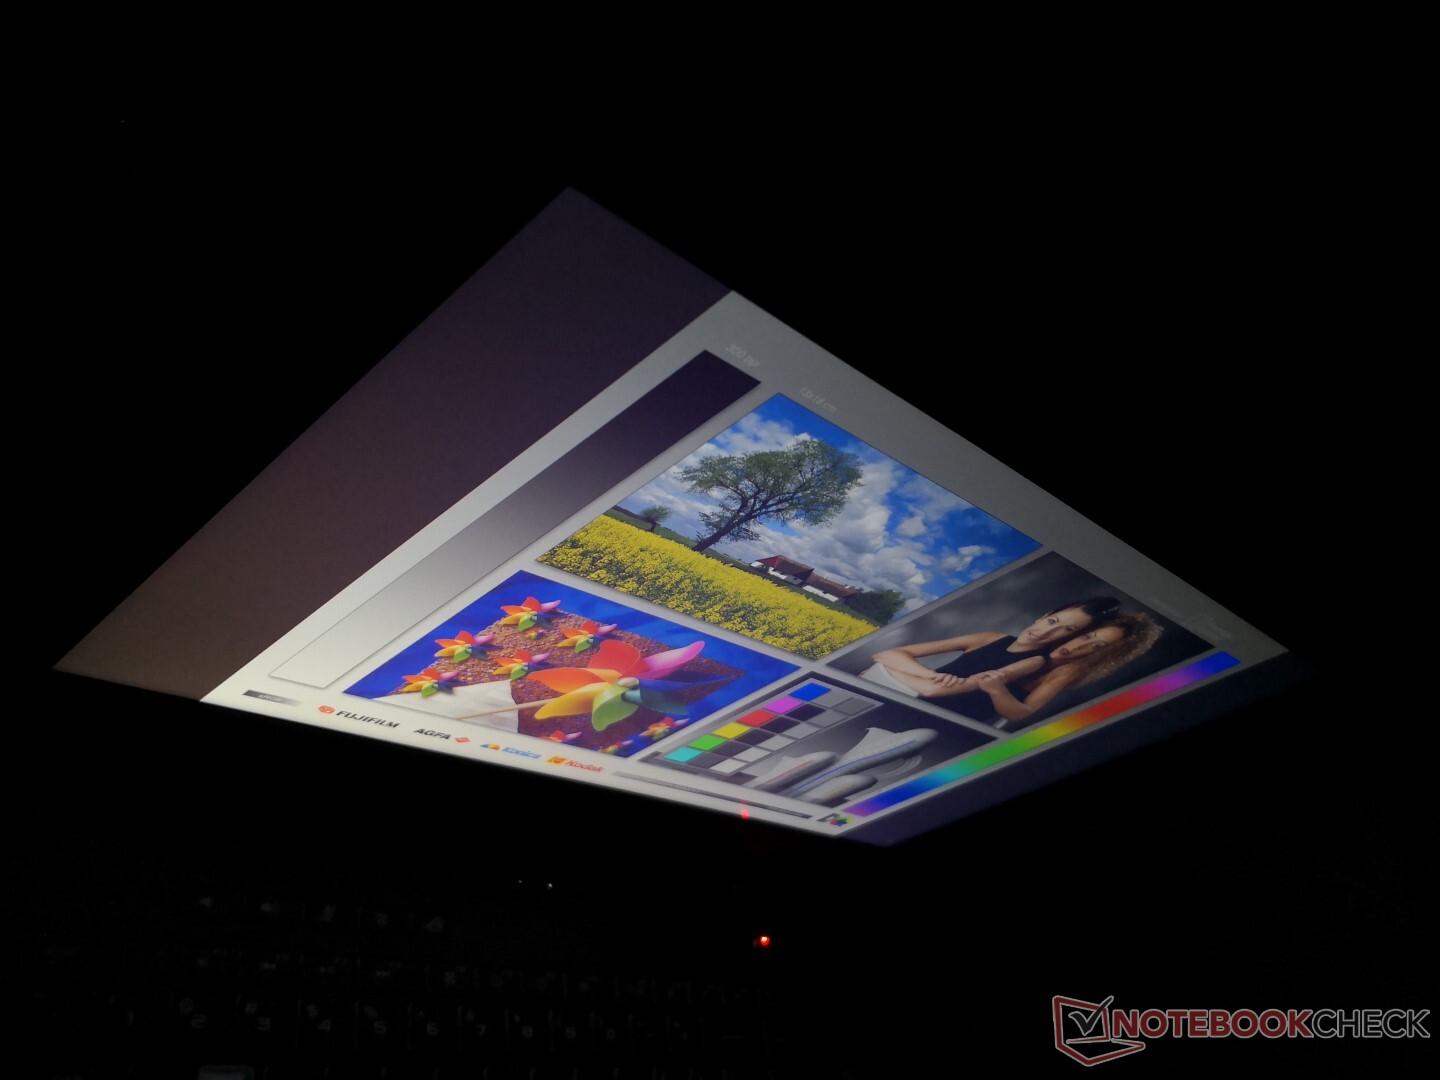
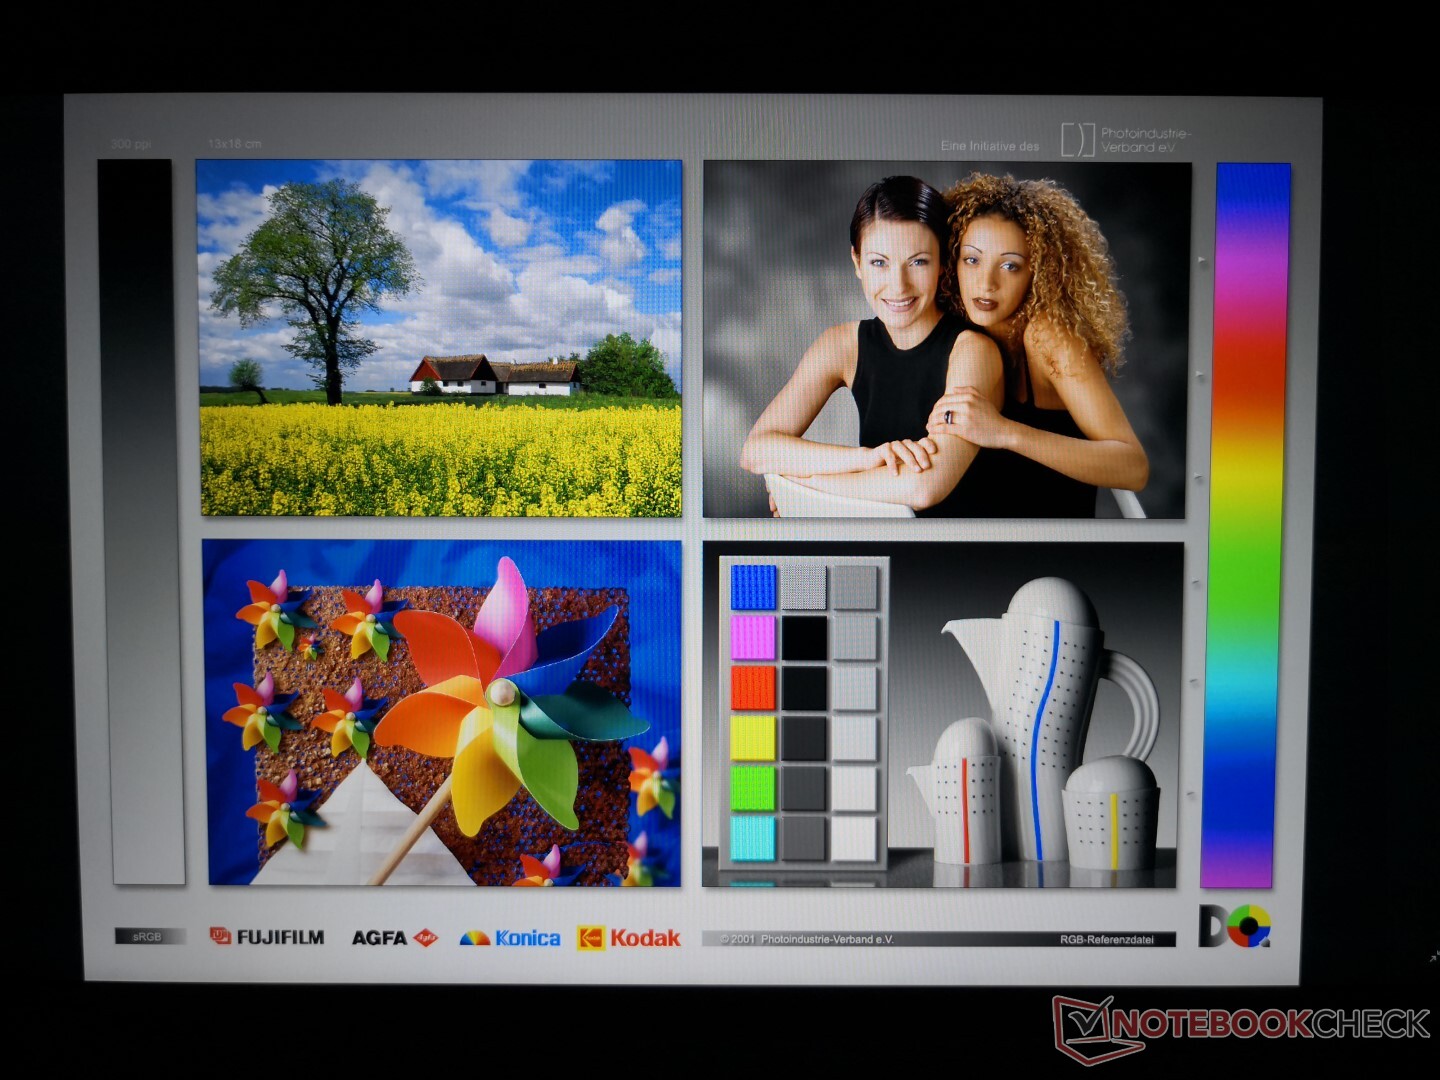
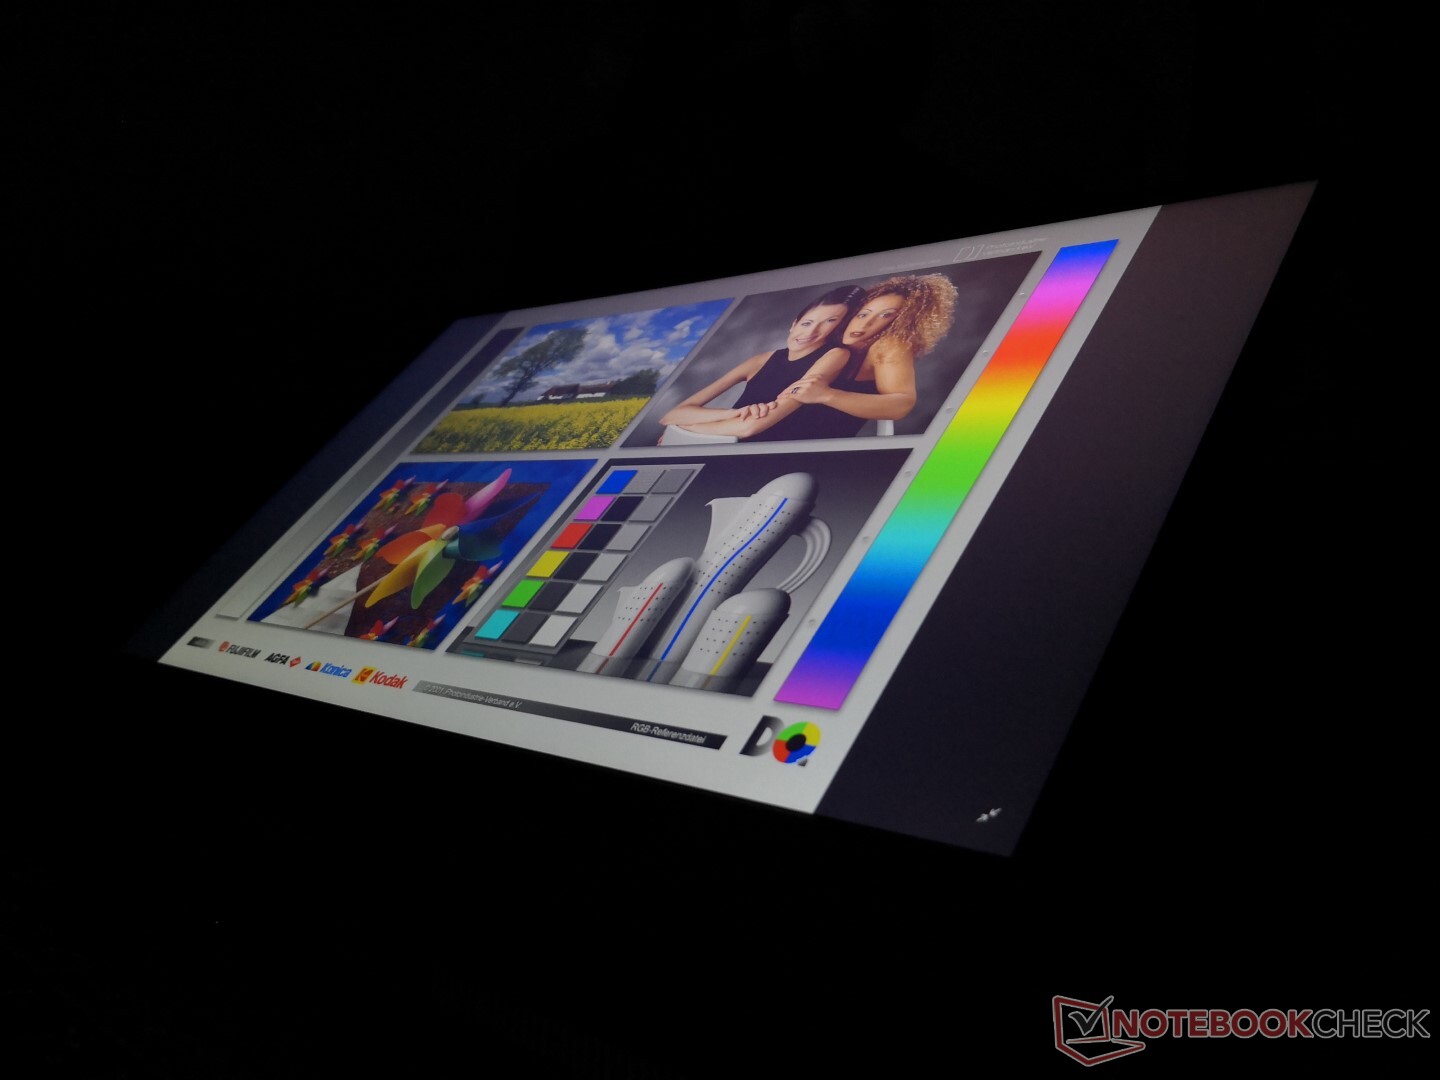
Outdoor visibility is average at best since the backlight is not nearly as bright as what you'd find on a MacBook Pro 15 or Dell XPS 15. We recommend working under shade if possible to avoid squinting and washed out colors. Viewing angles are wide with noticeable color and grayscale shifting only if viewing from extreme and unrealistic angles.
Performance
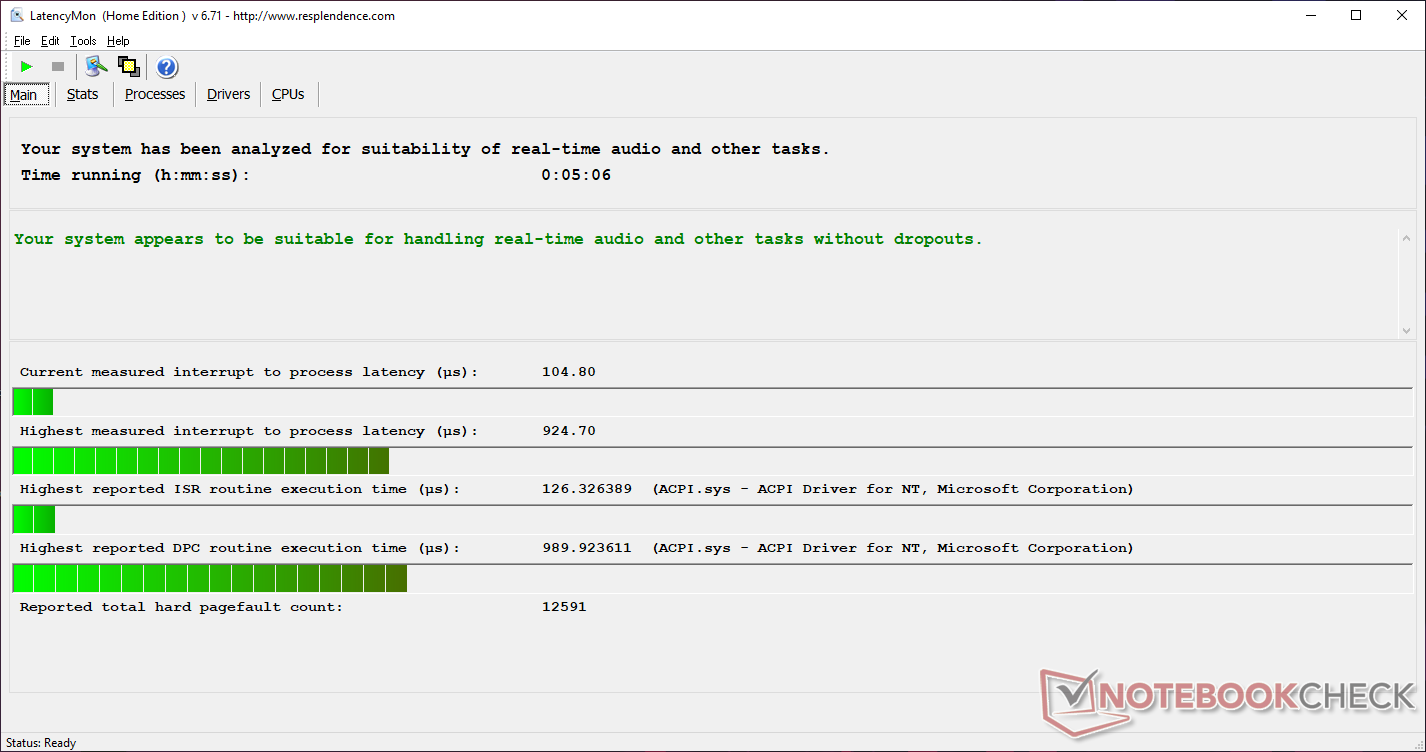
The wide range of CPU and GPU options means the GL531 can perform as slow as a $1000 gaming laptop if configured with the Core i5-9300H and GTX 1050 GPU or as fast as a $2000 gaming laptop if configured with the Core i9-9880H and RTX 2070 GPU. There are no RTX 2080 options as Asus is reserving this for its higher-end Zephyrus or mainline G703 series instead. Latencymon shows no DPC issues even when wireless is enabled.
Nvidia Optimus comes standard meaning that there are no G-Sync options.
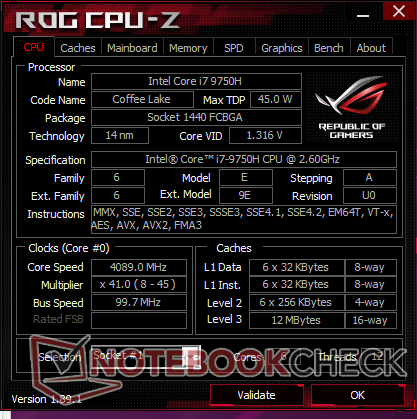
Processor
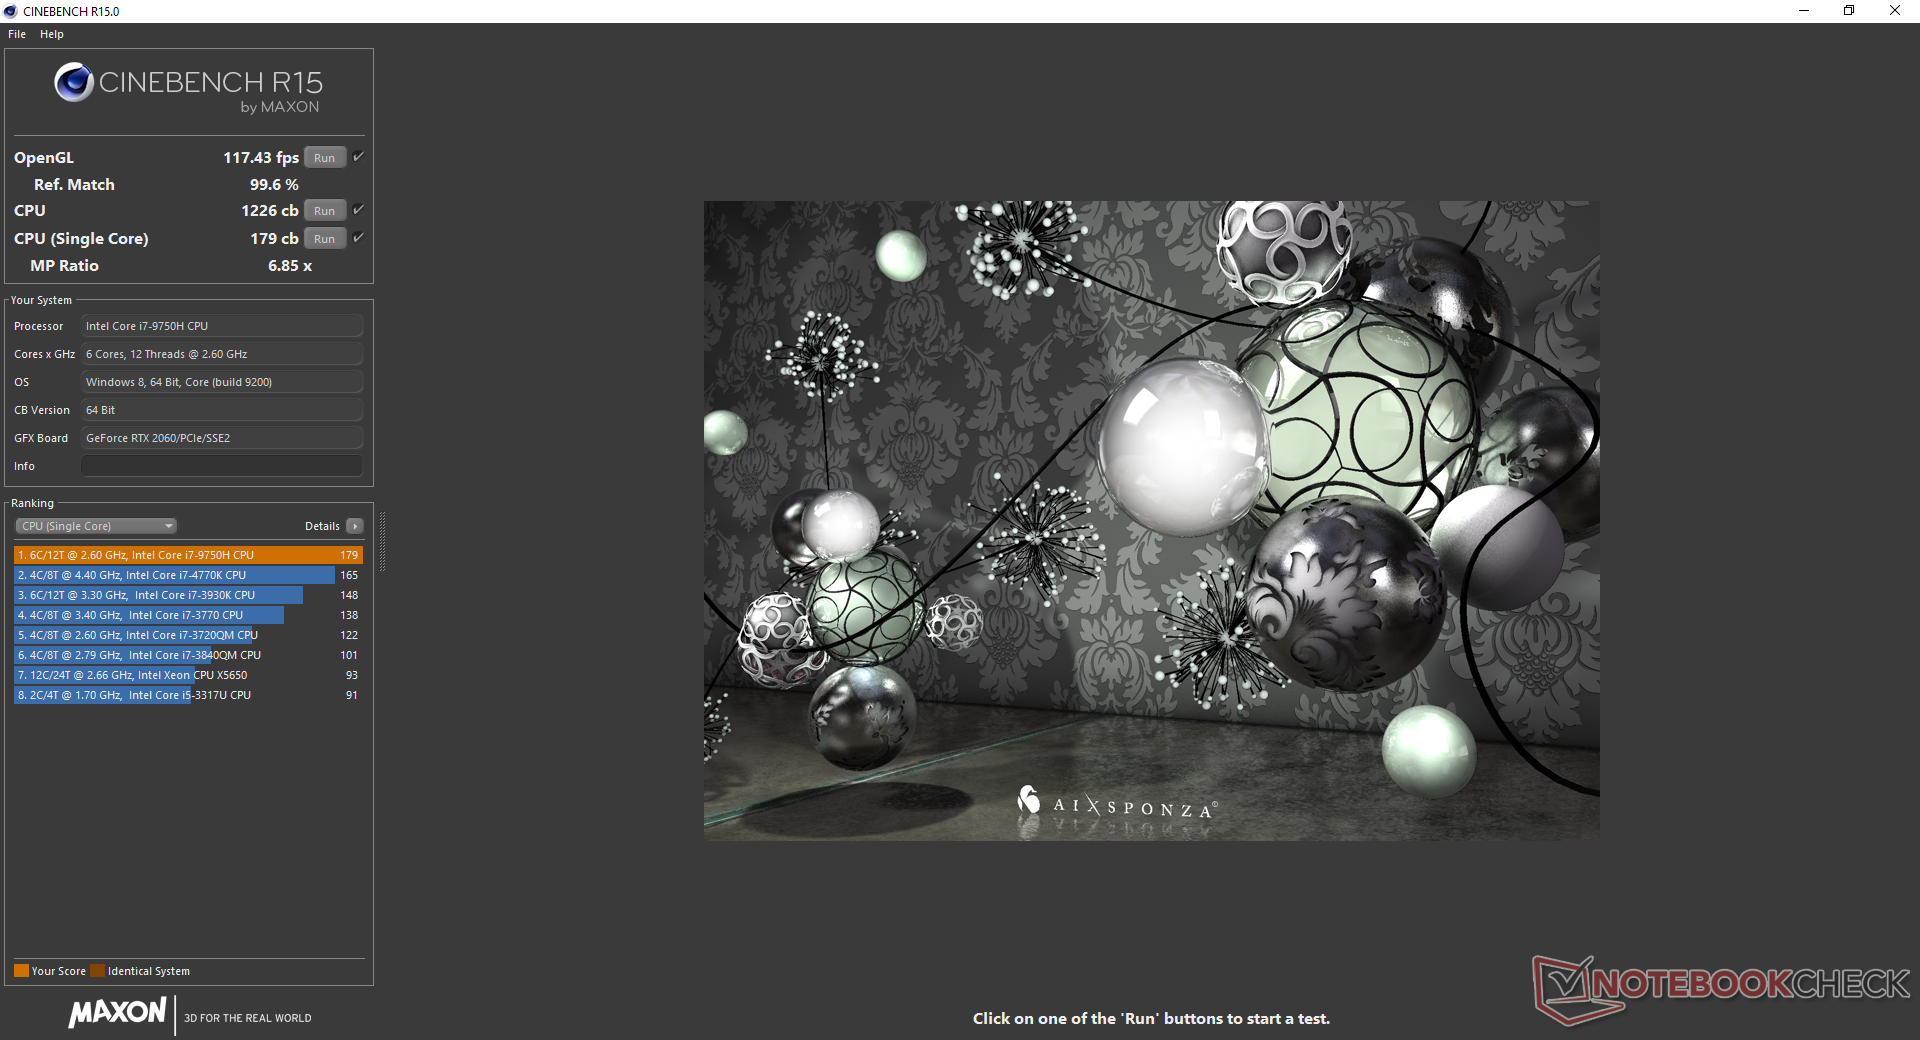
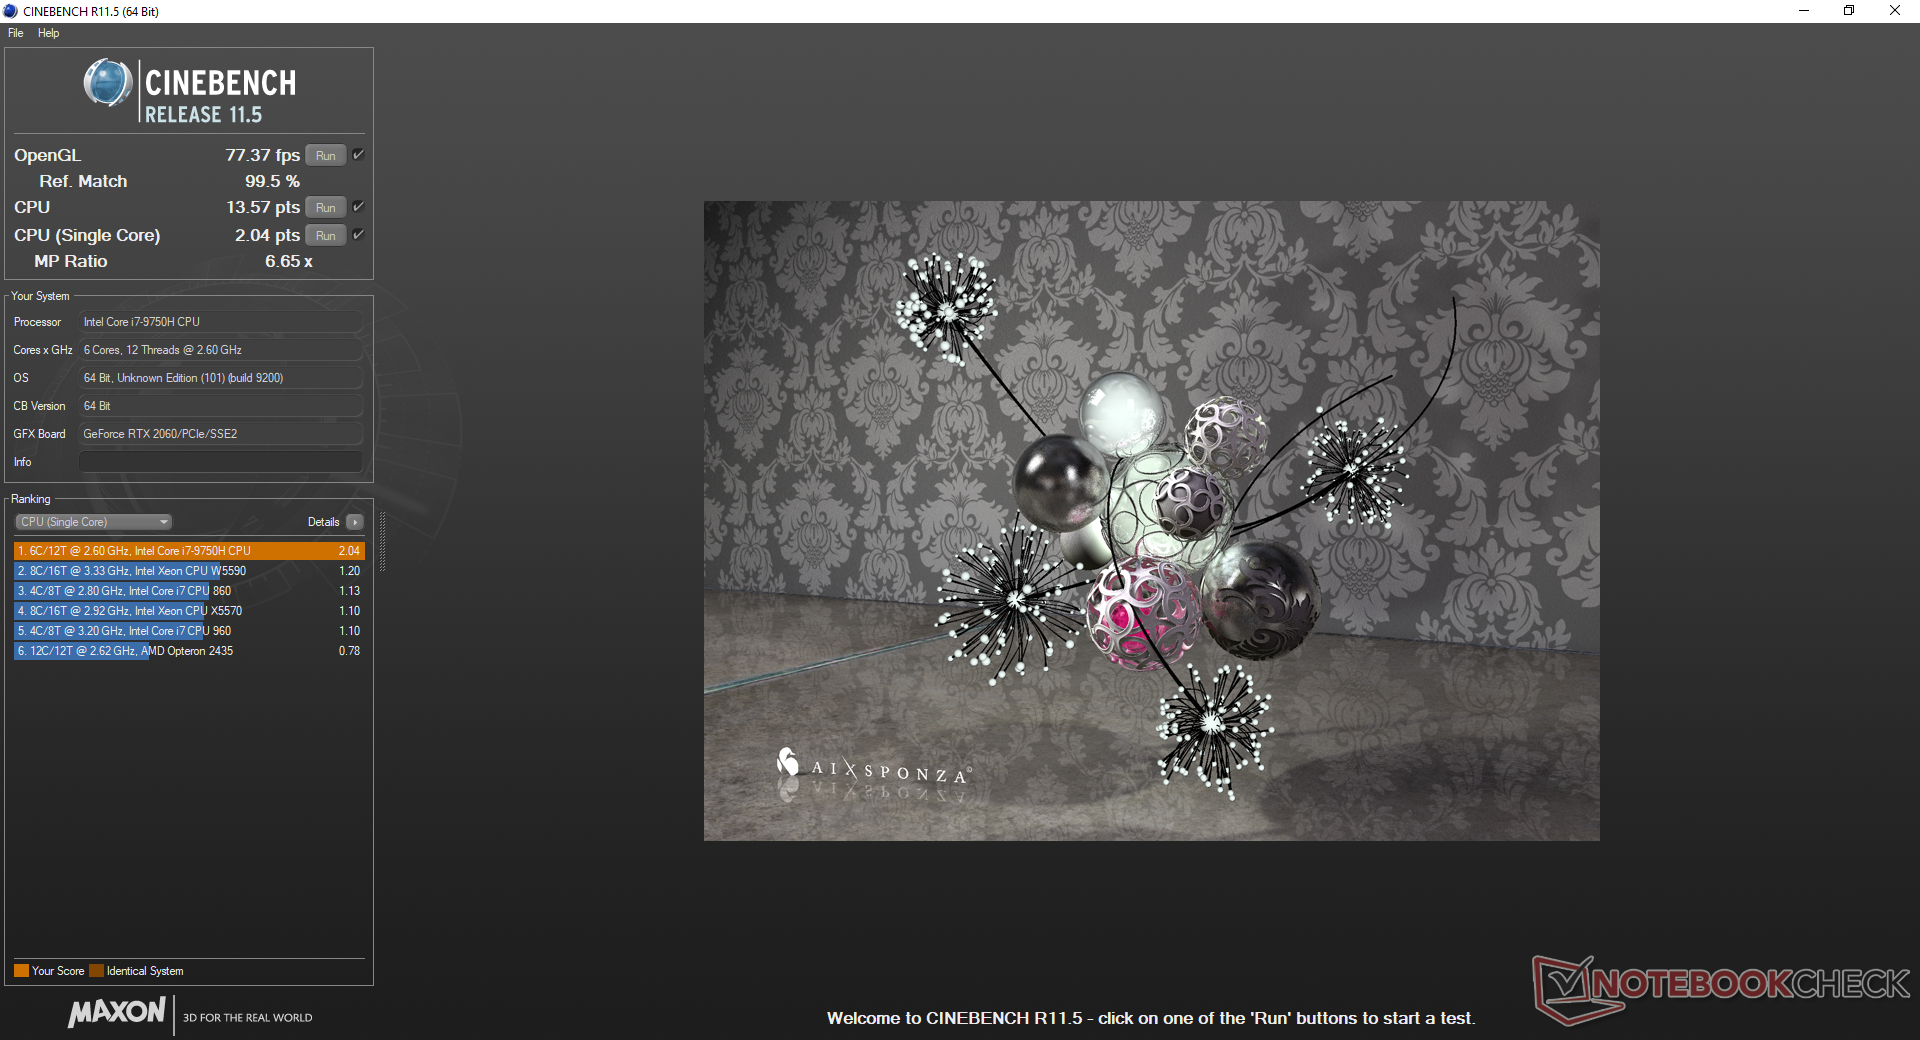
The Core i7-9750H is only a minor leap over the Core i7-8750H in terms of raw performance. Nonetheless, it performs about where we expect it to be on the Asus when compared to other laptops in our database sporting the same processor. Users can expect a 40 to 50 percent boost if jumping from the Core i5-8300H, Core i5-9300H, or Core i7-7700HQ. The Core i9-9880H option will be about 15 to 40 percent faster than the Core i7-9750H.
CPU performance sustainability is decent. When running CineBench R15 Multi-Thread in a loop, the initial score of 1223 points drop to about 1100 points by the third loop to represent a performance dip of about 10 percent. Some competing laptops like the Lenovo Legion Y740-15ICH are able to maintain faster clock rates for longer for slightly faster CPU performance overall.
See our dedicated page on the Core i7-9750H for more technical information and benchmarks.
| Cinebench R10 | |
| Rendering Multiple CPUs 32Bit | |
| MSI GE75 9SG | |
| Medion Erazer X15805 | |
| Dell G7 15-7588 | |
| Average Intel Core i7-9750H (28251 - 36304, n=13) | |
| Eurocom Tornado F5 | |
| Asus FX503VM-EH73 | |
| Rendering Single 32Bit | |
| Medion Erazer X15805 | |
| Eurocom Tornado F5 | |
| MSI GE75 9SG | |
| Average Intel Core i7-9750H (6659 - 7214, n=13) | |
| Dell G7 15-7588 | |
| Asus FX503VM-EH73 | |
| wPrime 2.10 - 1024m | |
| MSI GF63 8RC-040XPL | |
| Asus FX503VM-EH73 | |
| Eurocom Tornado F5 | |
| Average Intel Core i7-9750H (n=1) | |
| Dell G7 15-7588 | |
| MSI GE75 9SG | |
* ... smaller is better
System Performance
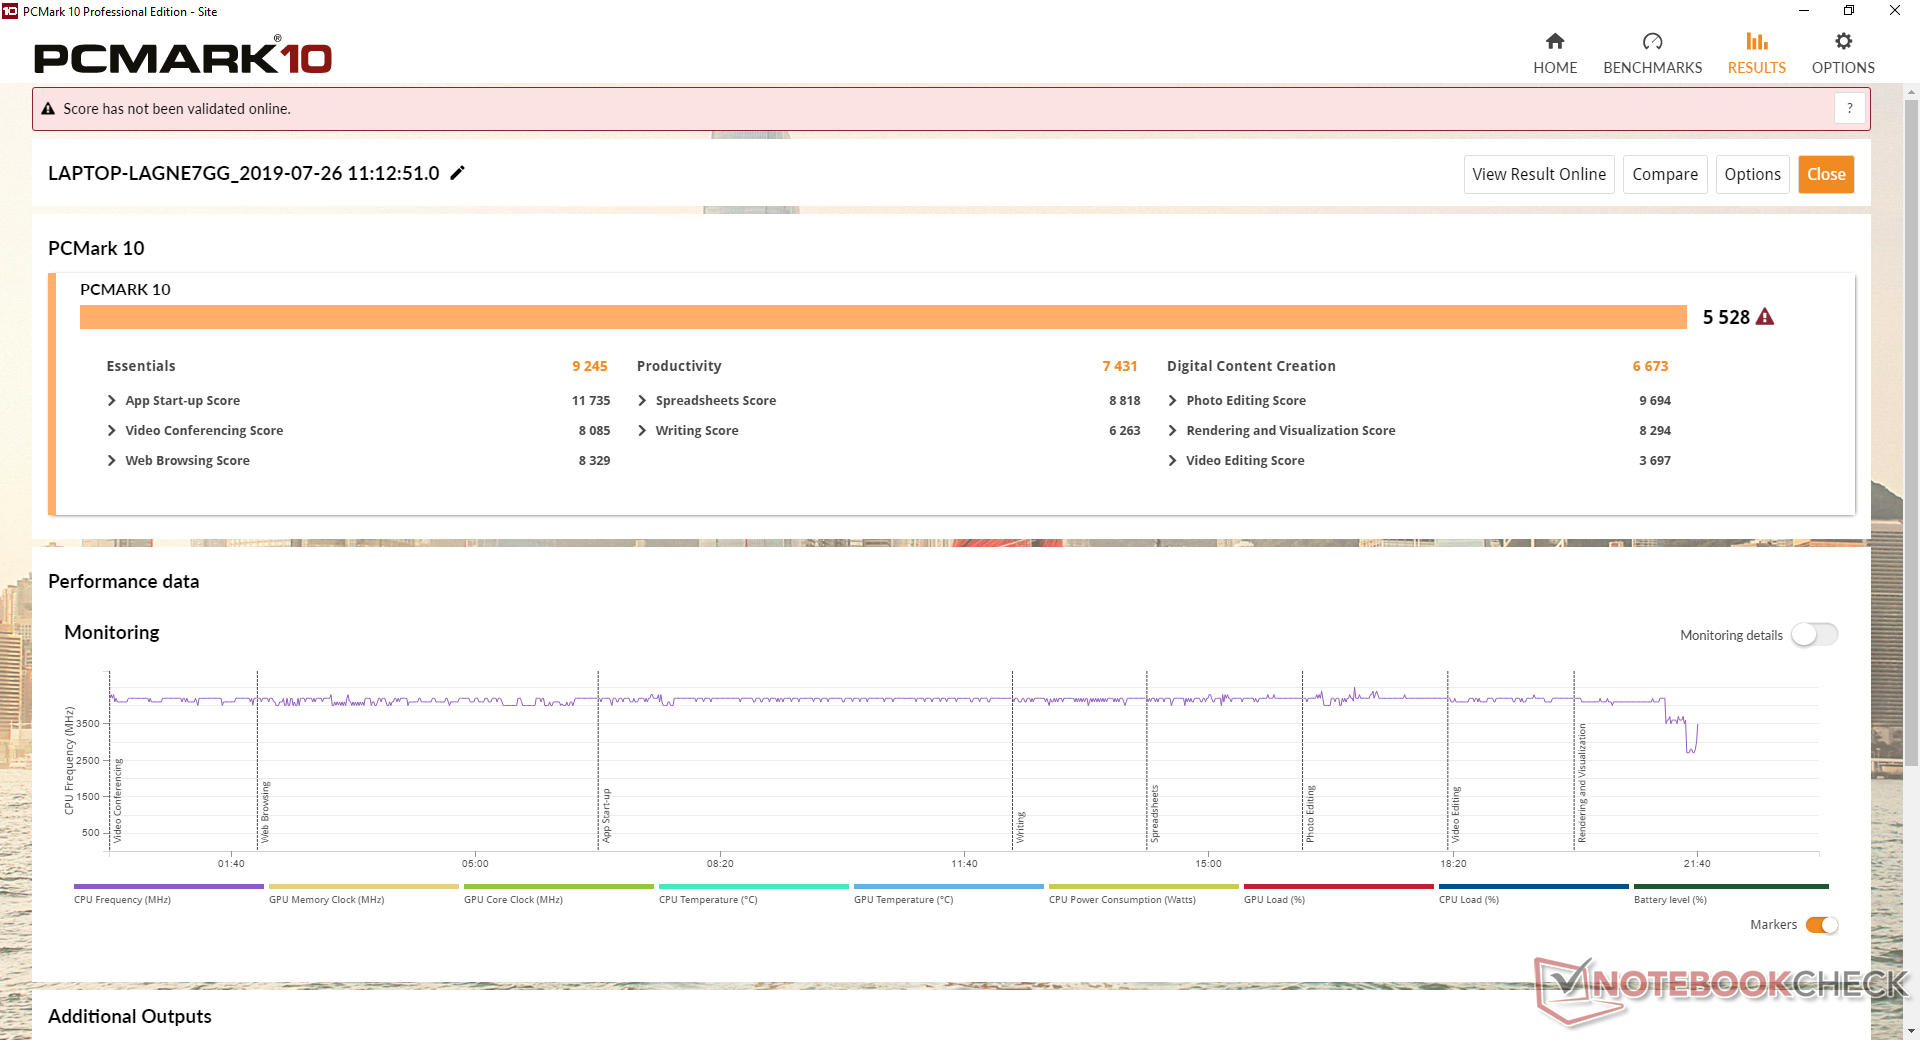
PCMark results are comparable to other mid-range laptops including the Lenovo Legion Y740-15ICH and Asus' own higher-end Zephyrus S GX502GW. We didn't experience any software or hardware issues during our time with the unit save for the annoying Asus pop-ups when first connecting to the Internet. Note that the power profiles on Armoury Crate can be counter intuitive as detailed here.
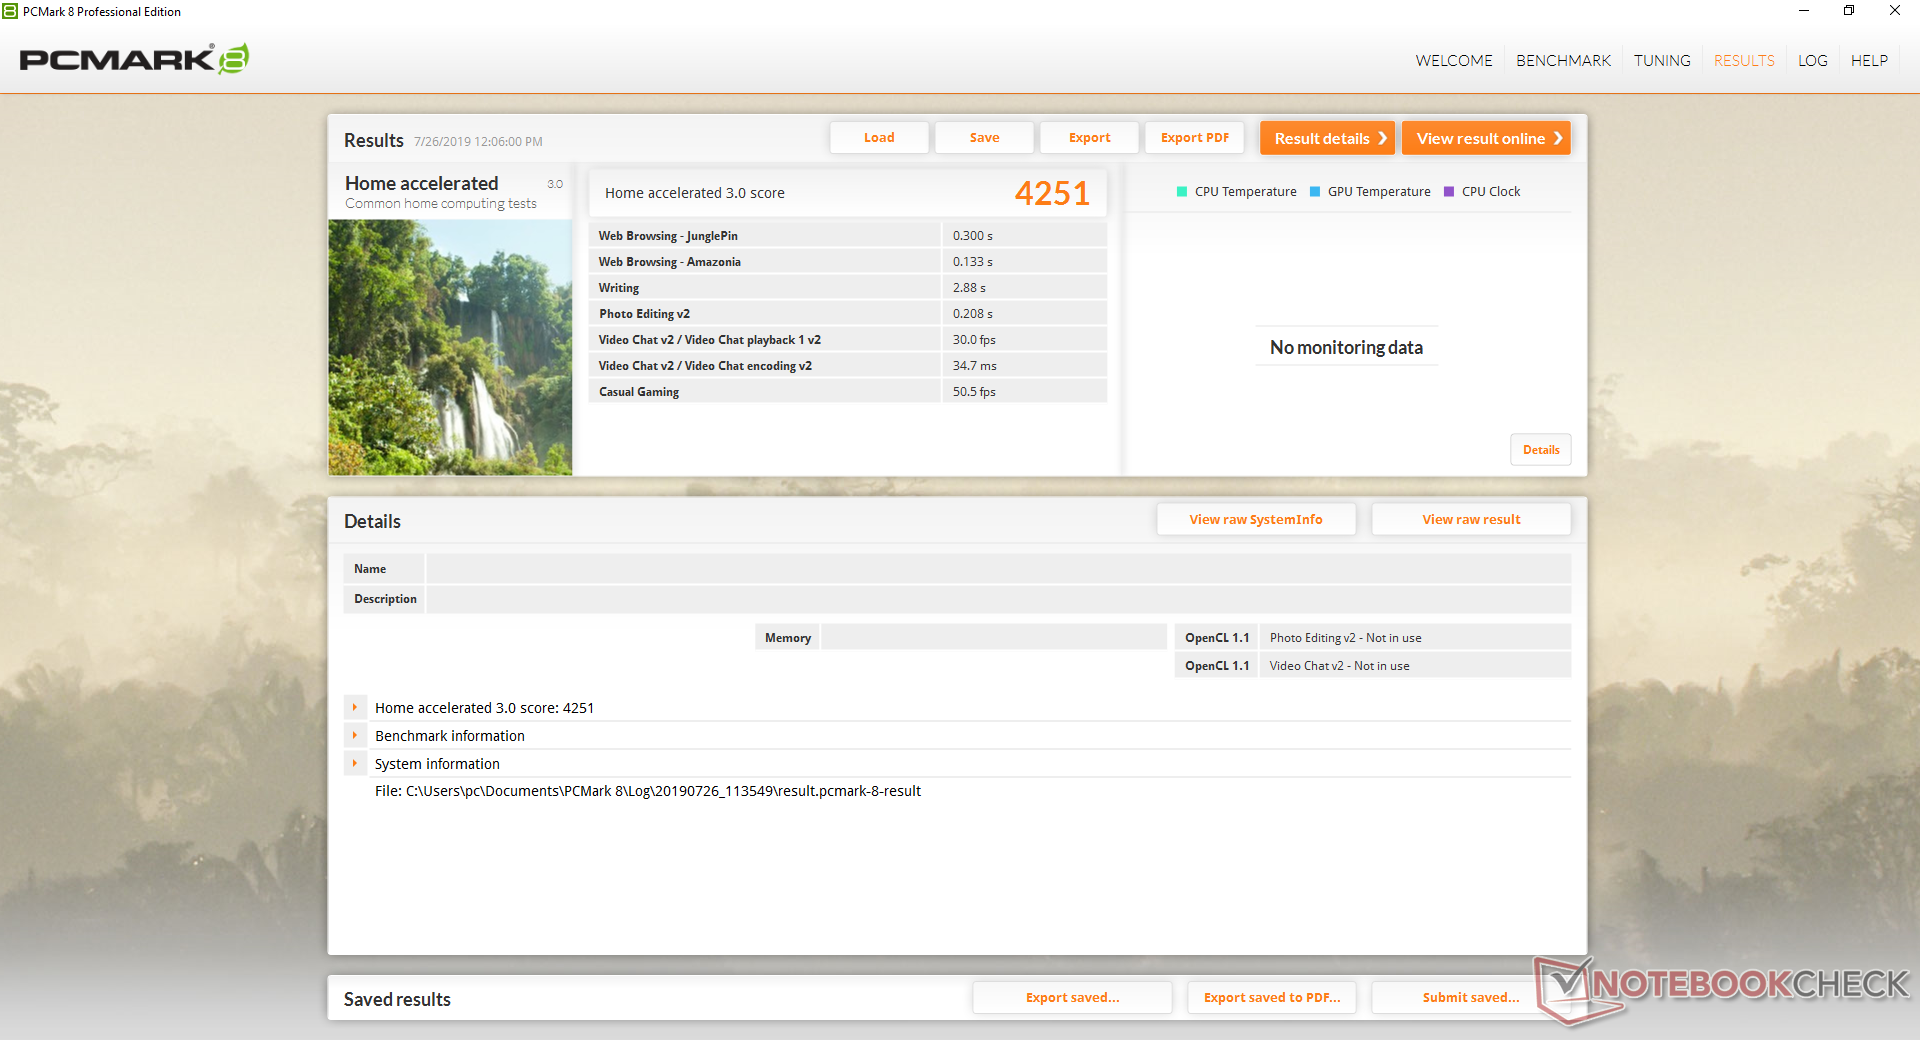
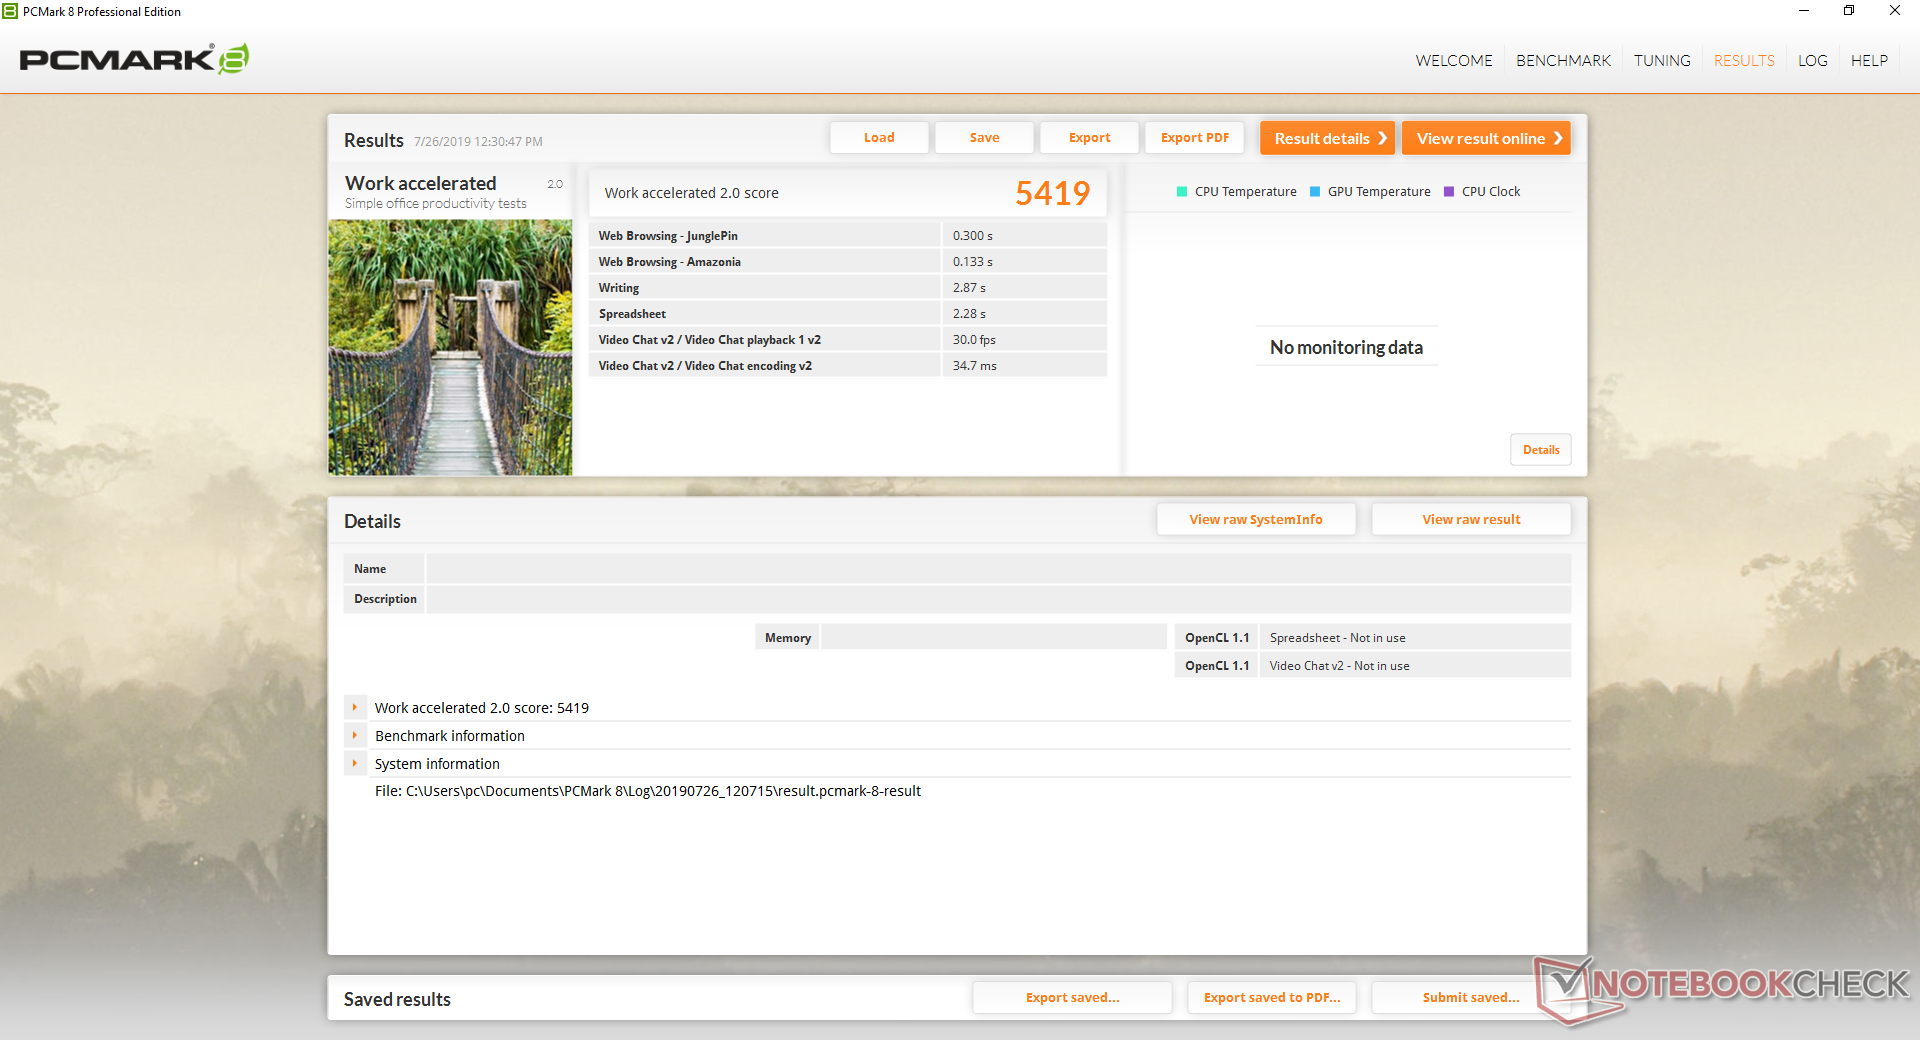
| PCMark 8 Home Score Accelerated v2 | 4251 points | |
| PCMark 8 Work Score Accelerated v2 | 5419 points | |
| PCMark 10 Score | 5528 points | |
Help | ||
Storage Devices
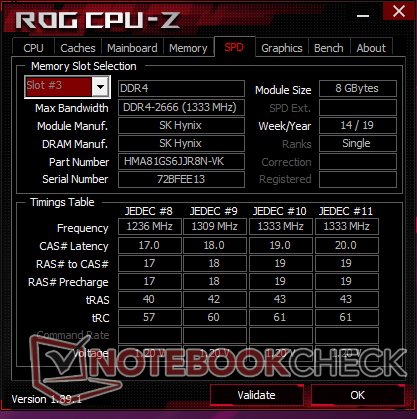
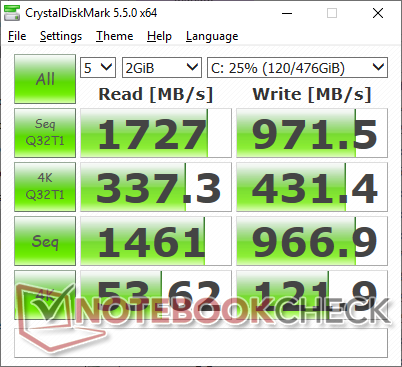
Two internal storage bays are available (1x M.2 2280 PCIe + 1x 2.5-inch SATA III). Our specific test unit comes equipped with the same 512 GB Intel SSD 660p as on the less expensive Asus TUF FX505 and more expenive Zephyrus S GX531. AS SSD results between these systems are unsurprisingly very similar with sequential read and write rates of about 1300 MB/s and 900 MB/s, respectively. It's difficult to know if costlier SKUs come equipped with the faster Samsung PM981 instead as this would depend on the reseller. The Razer Blade 15 and Blade Pro 17 almost always come with Samsung SSDs.
See our table of HDDs and SSDs for more benchmark comparisons.
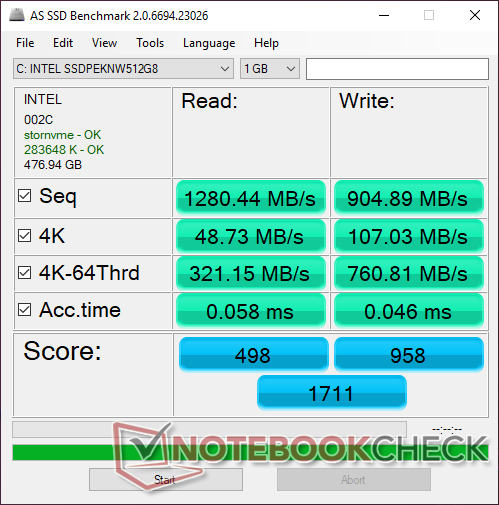
| Asus Strix GL531GV-PB74 Intel SSD 660p SSDPEKNW512G8 | Asus TUF FX505DT-EB73 Intel SSD 660p SSDPEKNW512G8 | Asus Zephyrus S GX502GW 2x Intel SSD 660p SSDPEKNW512G8 (RAID 0) | Lenovo Legion Y740-15ICHg Samsung SSD PM981 MZVLB256HAHQ | Aorus 15-SA Intel SSD 760p SSDPEKKW512G8 | |
|---|---|---|---|---|---|
| AS SSD | -8% | 48% | 41% | 47% | |
| Seq Read (MB/s) | 1280 | 1019 -20% | 2506 96% | 1953 53% | 2601 103% |
| Seq Write (MB/s) | 905 | 889 -2% | 1712 89% | 1629 80% | 1507 67% |
| 4K Read (MB/s) | 48.73 | 48.22 -1% | 48.32 -1% | 33.2 -32% | 56.3 16% |
| 4K Write (MB/s) | 107 | 115.5 8% | 103.6 -3% | 88.1 -18% | 110.3 3% |
| 4K-64 Read (MB/s) | 321.1 | 321.5 0% | 624 94% | 757 136% | 877 173% |
| 4K-64 Write (MB/s) | 761 | 787 3% | 1253 65% | 1501 97% | 914 20% |
| Access Time Read * (ms) | 0.058 | 0.065 -12% | 0.08 -38% | 0.077 -33% | 0.05 14% |
| Access Time Write * (ms) | 0.046 | 0.047 -2% | 0.04 13% | 0.043 7% | 0.034 26% |
| Score Read (Points) | 498 | 472 -5% | 923 85% | 985 98% | 1193 140% |
| Score Write (Points) | 958 | 992 4% | 1528 59% | 1752 83% | 1175 23% |
| Score Total (Points) | 1711 | 1717 0% | 2896 69% | 3230 89% | 2938 72% |
| Copy ISO MB/s (MB/s) | 1519 | 942 -38% | 1872 23% | 2104 39% | |
| Copy Program MB/s (MB/s) | 749 | 444.5 -41% | 478.2 -36% | 387.7 -48% | |
| Copy Game MB/s (MB/s) | 943 | 867 -8% | 1165 24% | 1021 8% |
* ... smaller is better

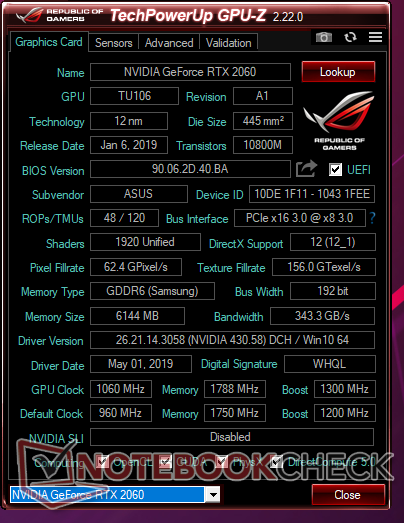
GPU Performance
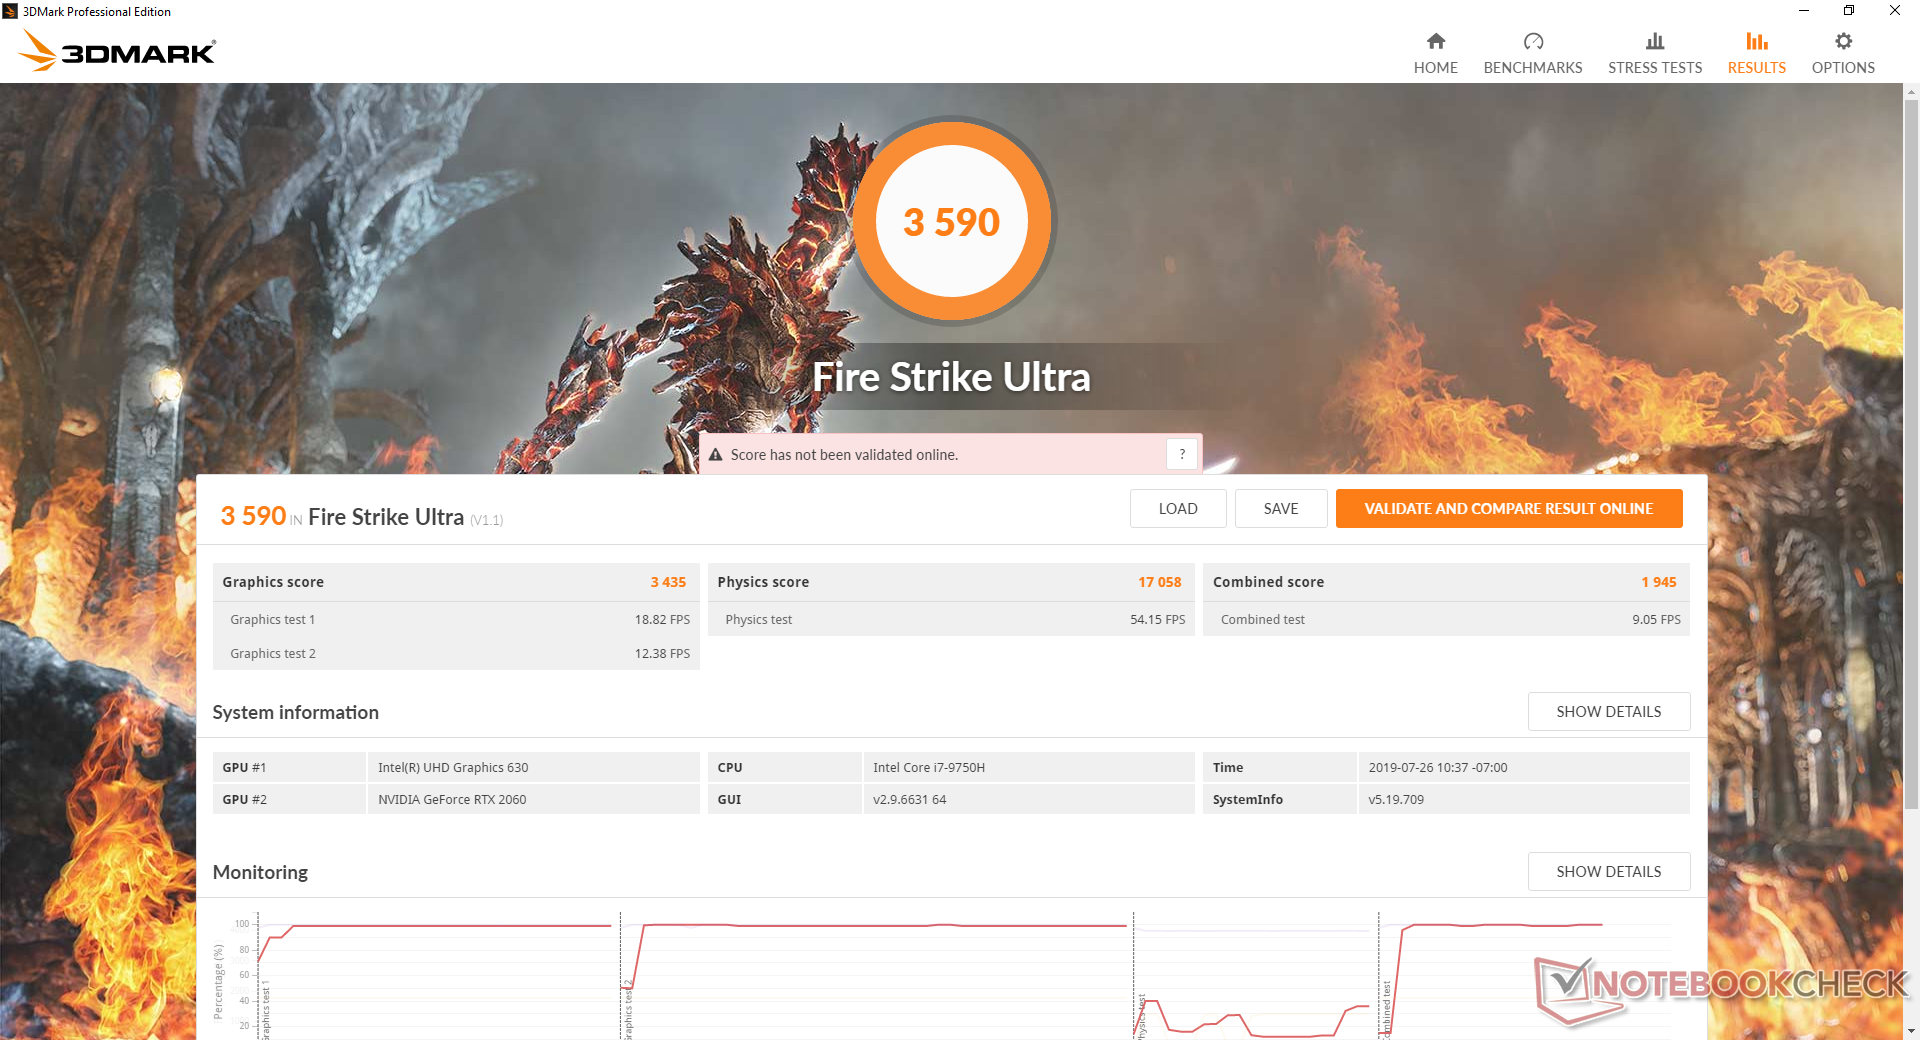
The mobile GeForce RTX 2060 is a mixed bag. While it offers a 40 percent boost and 70 percent boost over the GTX 1060 in DX11 and DX12 titles, respectively, it's still about 20 percent slower than a proper desktop RTX 2060. In contrast, the mobile GTX 1660 Ti performs nearly identically to its desktop GTX 1660 Ti counterpart. It's worth noting that 3DMark benchmark rank the RTX 2060 within just a few percentage points of the often more expensive RTX 2070 Max-Q.
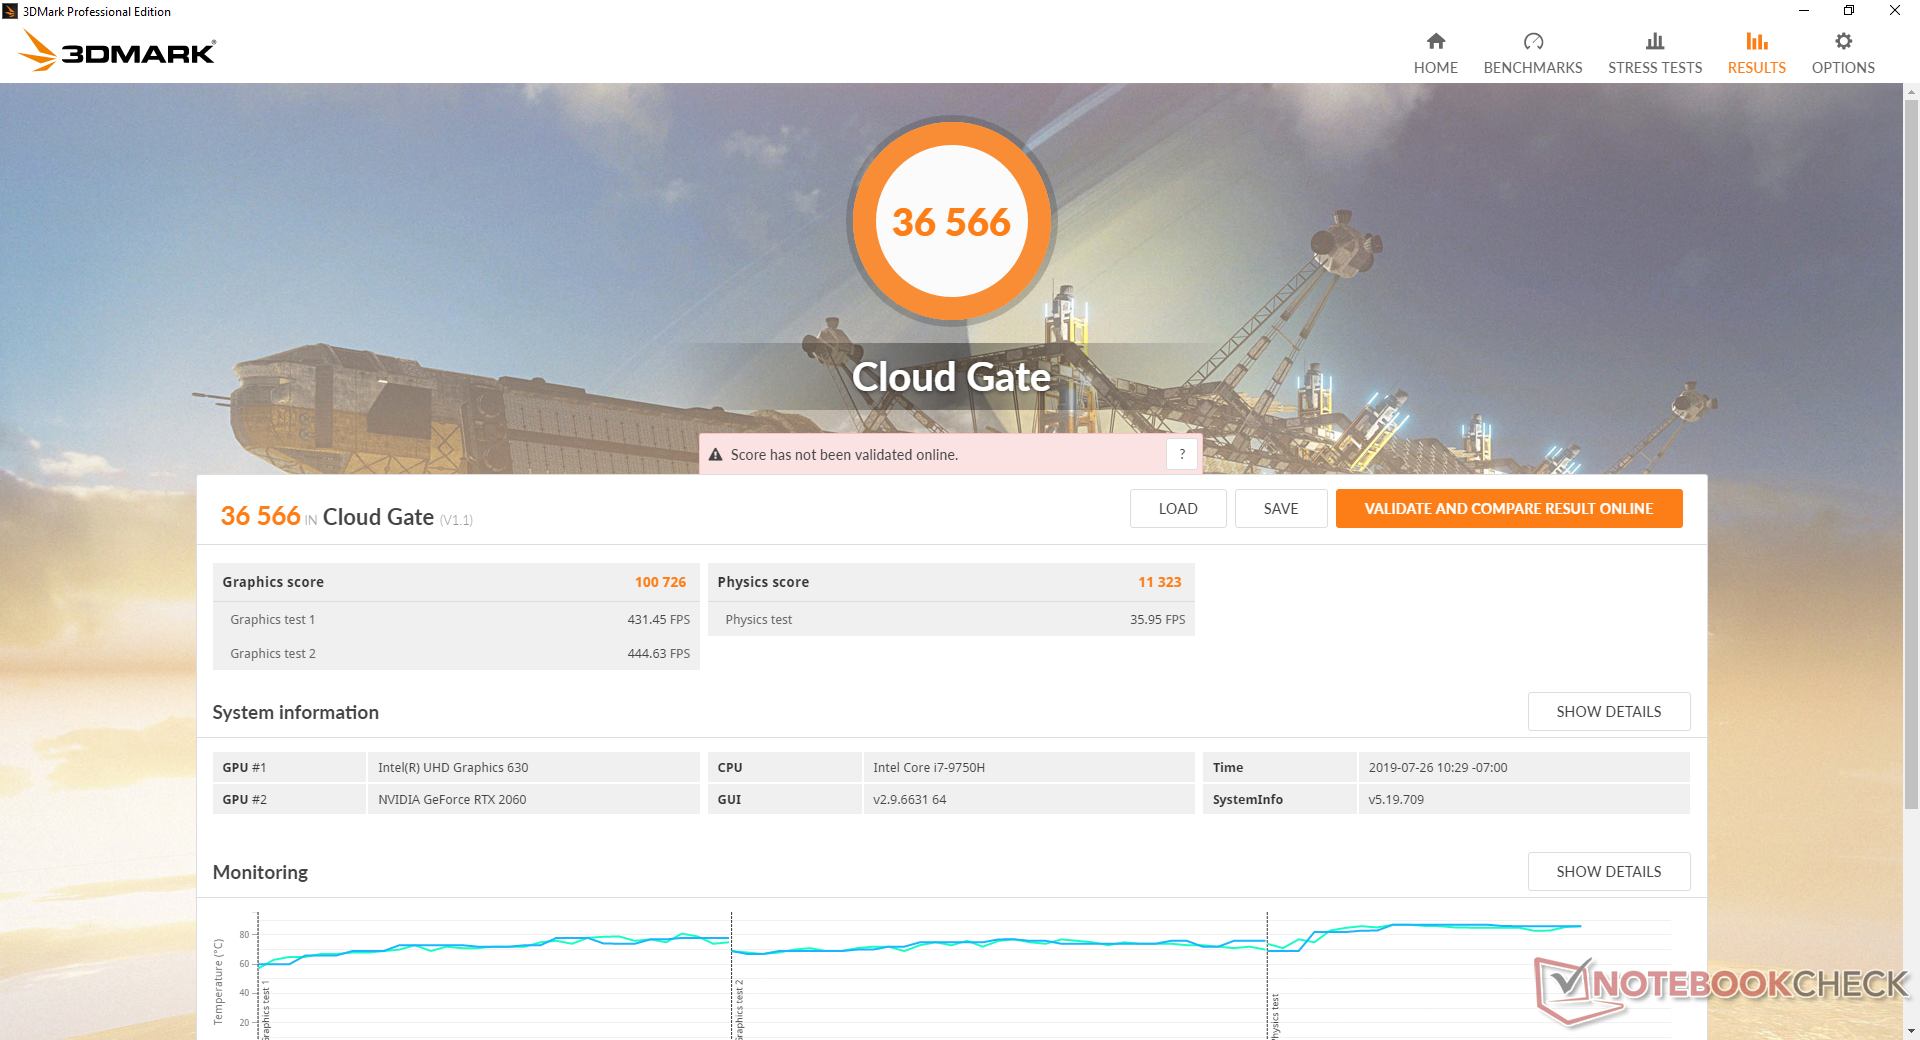
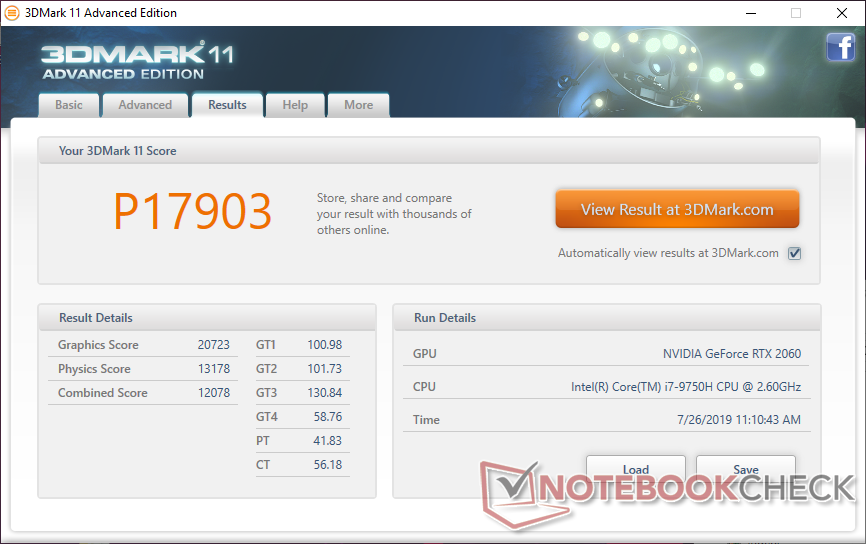
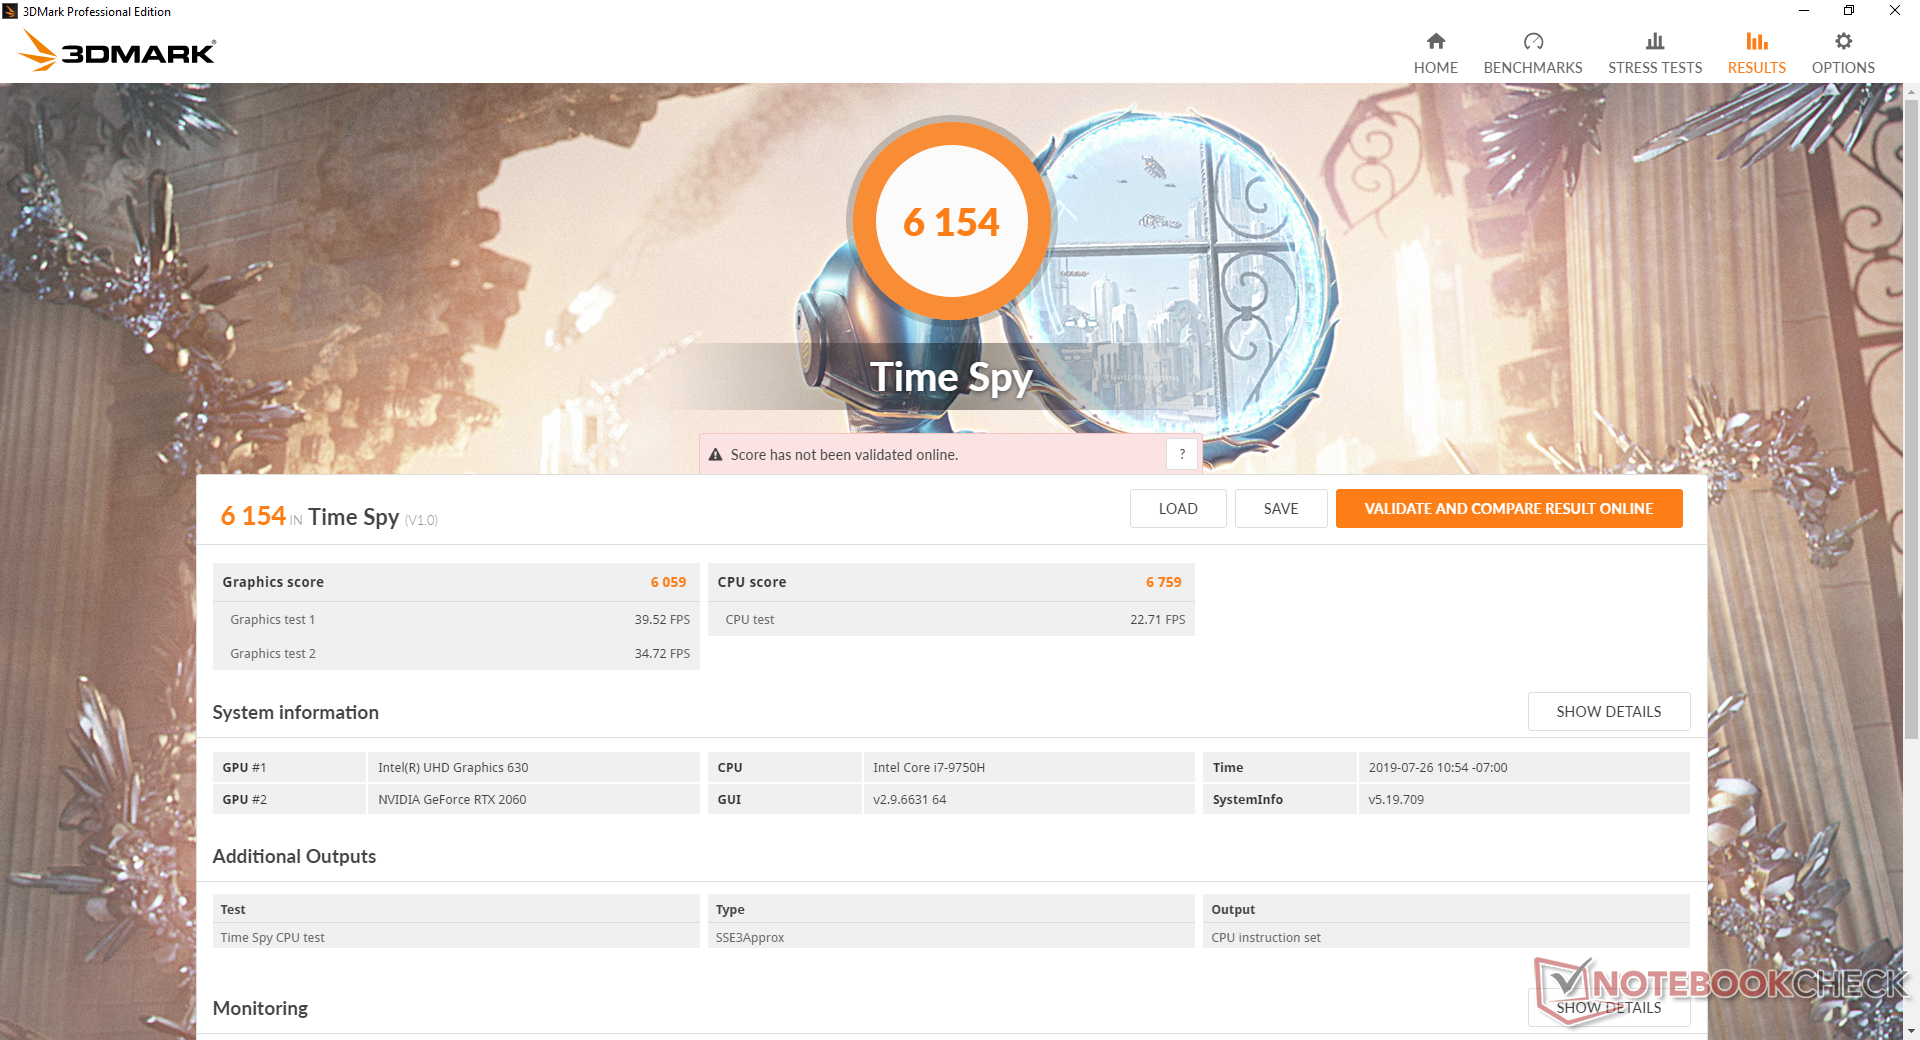
| 3DMark 11 Performance | 17903 points | |
| 3DMark Cloud Gate Standard Score | 36566 points | |
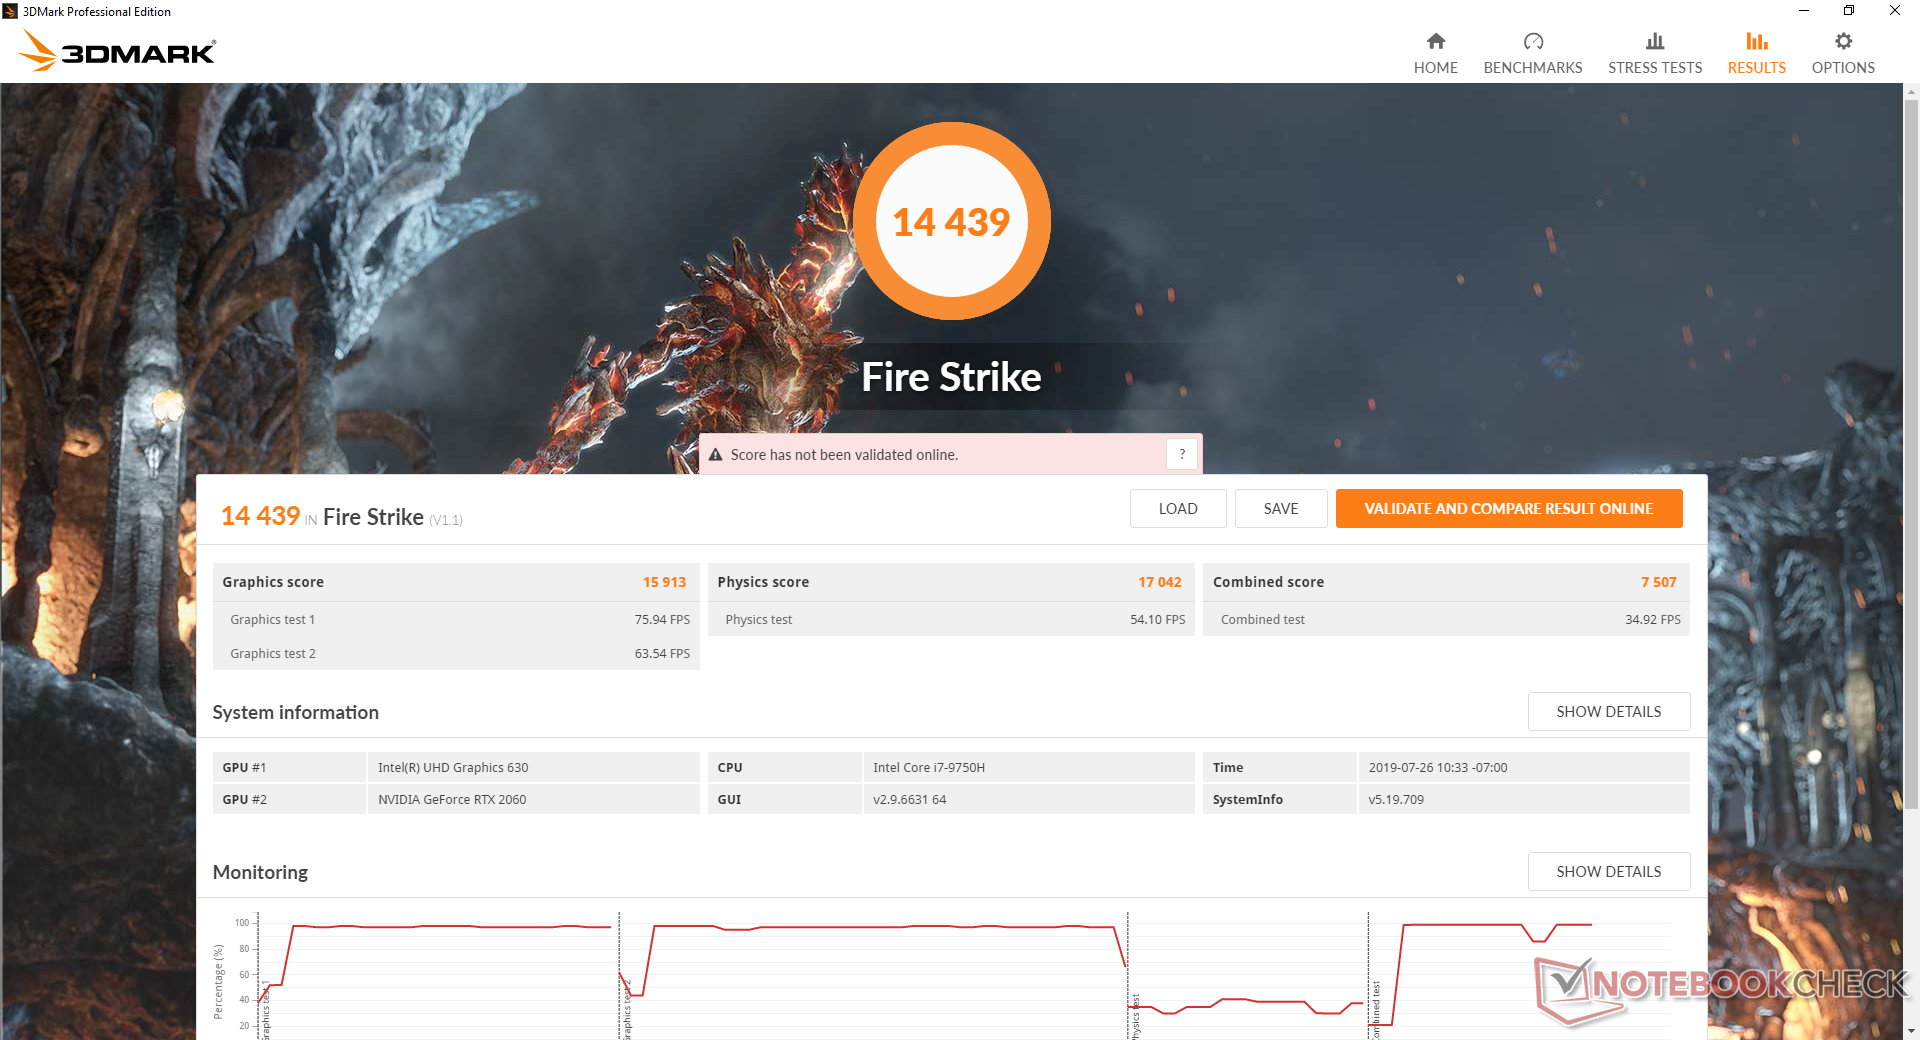
| 3DMark Fire Strike Score | 14439 points | |
| 3DMark Time Spy Score | 6154 points | |
Help | ||
Gaming Performance
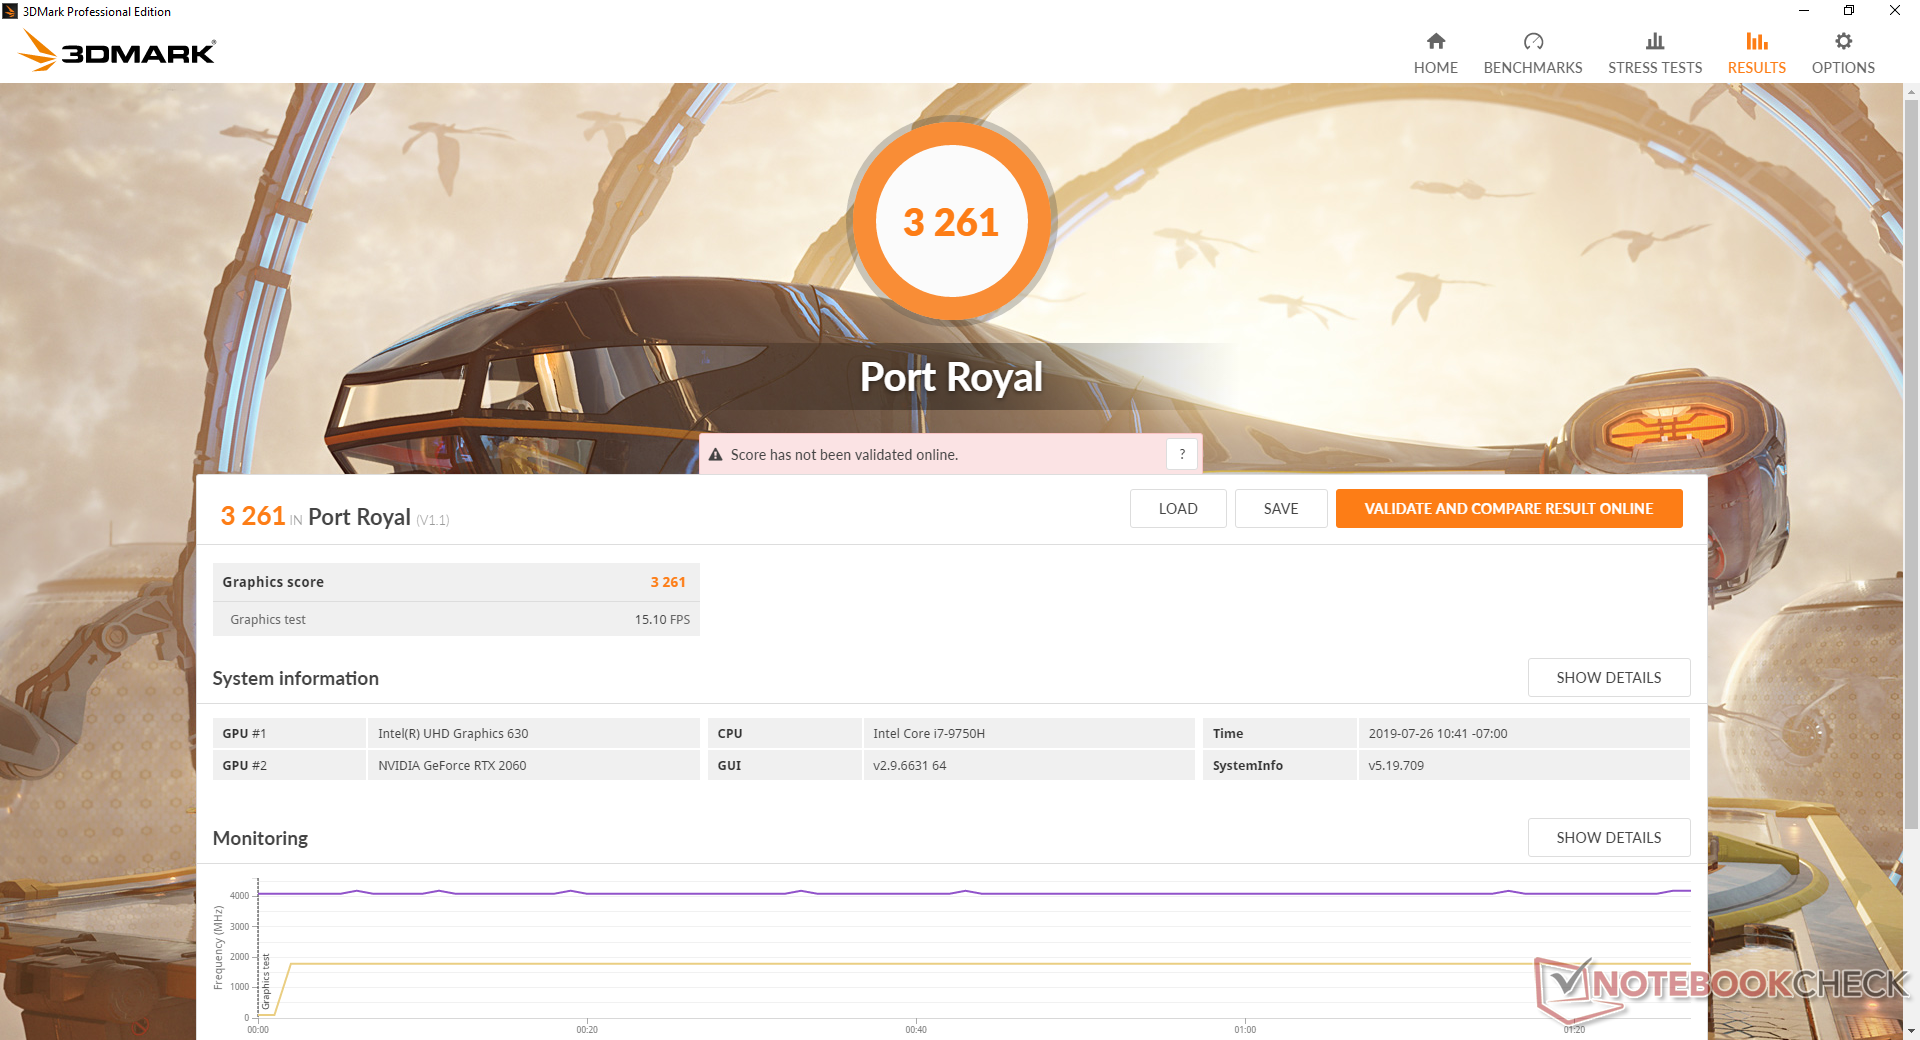
The mobile GeForce RTX 2060 is still powerful enough to play the latest titles at 1080p on maximum settings even if it's not quite as fast as its desktop counterpart. The performance difference between the mobile RTX 2060 and lesser GTX 1660 Ti is surprisingly small unless if you value RTX-exclusive features like DLSS or ray-tracing. If you want to reach a stable 120 FPS to fully exploit the 120 Hz panel, however, be prepared to reduce the graphics settings substantially.
See our dedicated page on the GeForce RTX 2060 for more technical information and benchmarks.
| Shadow of the Tomb Raider - 1920x1080 Highest Preset AA:T | |
| MSI GE75 9SG | |
| MSI RTX 2060 Gaming Z 6G | |
| Alienware m15 P79F | |
| Average NVIDIA GeForce RTX 2060 Mobile (54 - 86, n=22) | |
| Asus Zephyrus S GX502GW | |
| Asus Strix GL531GV-PB74 | |
| Asus ROG Strix G GL731GU-RB74 | |
| HP Pavilion Gaming 17-cd0085cl | |
| Asus TUF FX505DT-EB73 | |
| low | med. | high | ultra | |
|---|---|---|---|---|
| BioShock Infinite (2013) | 297 | 273.2 | 258.5 | 145.3 |
| The Witcher 3 (2015) | 266.7 | 189.9 | 117.4 | 63.3 |
| Shadow of the Tomb Raider (2018) | 122 | 92 | 86 | 74 |
Emissions
System Noise
Much like what we discovered on the G531, the dual fans of the GL531 pulse frequently even during low loads like browsing or video streaming. We recommend setting the system to Silent mode in order to keep fan noise as low as possible during these undemanding sessions.
Although not as loud as the more powerful G531GW with RTX 2070 graphics, expect fan noise to be about 51 dB(A) when gaming which is still on the loud side. Setting the system to Balanced or Turbo mode makes no difference; when on Turbo mode, the fans would simply reach their maximum RPMs at a faster rate. Hearing footsteps or other key in-game audio cues is difficult when the fans are blasting above 50 dB(A).
We can notice no electronic noise or coil whine from our specific test unit.
| Asus Strix GL531GV-PB74 GeForce RTX 2060 Mobile, i7-9750H, Intel SSD 660p SSDPEKNW512G8 | Asus TUF FX505DT-EB73 GeForce GTX 1650 Mobile, R7 3750H, Intel SSD 660p SSDPEKNW512G8 | Asus Strix Scar III G531GW GeForce RTX 2070 Mobile, i9-9880H, Intel SSD 660p 1TB SSDPEKNW010T8 | Asus Zephyrus S GX502GW GeForce RTX 2070 Mobile, i7-9750H, 2x Intel SSD 660p SSDPEKNW512G8 (RAID 0) | Aorus 15-SA GeForce GTX 1660 Ti Mobile, i7-9750H, Intel SSD 760p SSDPEKKW512G8 | MSI GF63 8RC GeForce GTX 1050 Mobile, i5-8300H, Seagate BarraCuda Pro Compute 1TB ST1000LM049 | |
|---|---|---|---|---|---|---|
| Noise | 6% | -10% | -8% | -11% | 2% | |
| off / environment * (dB) | 28.2 | 28.2 -0% | 29 -3% | 30 -6% | 29 -3% | 28 1% |
| Idle Minimum * (dB) | 28.8 | 28.2 2% | 30 -4% | 31 -8% | 32 -11% | 33.8 -17% |
| Idle Average * (dB) | 31.4 | 28.2 10% | 37 -18% | 33 -5% | 35 -11% | 34 -8% |
| Idle Maximum * (dB) | 33.3 | 31.4 6% | 39 -17% | 38 -14% | 41 -23% | 34.2 -3% |
| Load Average * (dB) | 46.2 | 39.8 14% | 54 -17% | 50 -8% | 54 -17% | 37.3 19% |
| Witcher 3 ultra * (dB) | 50.5 | 47 7% | 54 -7% | 53 -5% | 52 -3% | 43.4 14% |
| Load Maximum * (dB) | 51.3 | 50.2 2% | 54 -5% | 56 -9% | 56 -9% | 46 10% |
* ... smaller is better
Noise level
| Idle |
| 28.8 / 31.4 / 33.3 dB(A) |
| Load |
| 46.2 / 51.3 dB(A) |
 | ||
30 dB silent 40 dB(A) audible 50 dB(A) loud |
||
min: | ||
Temperature
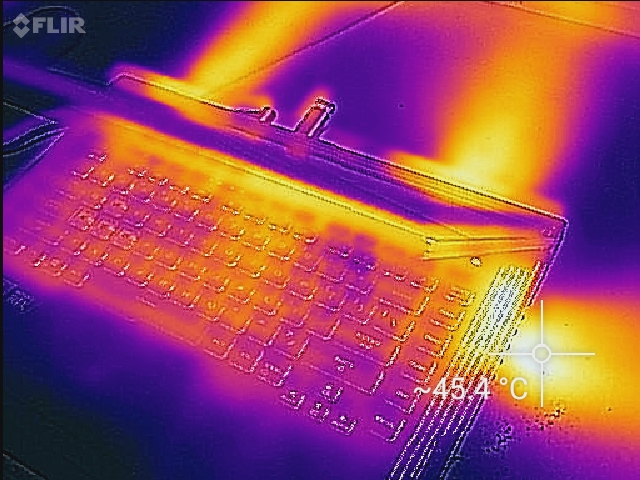
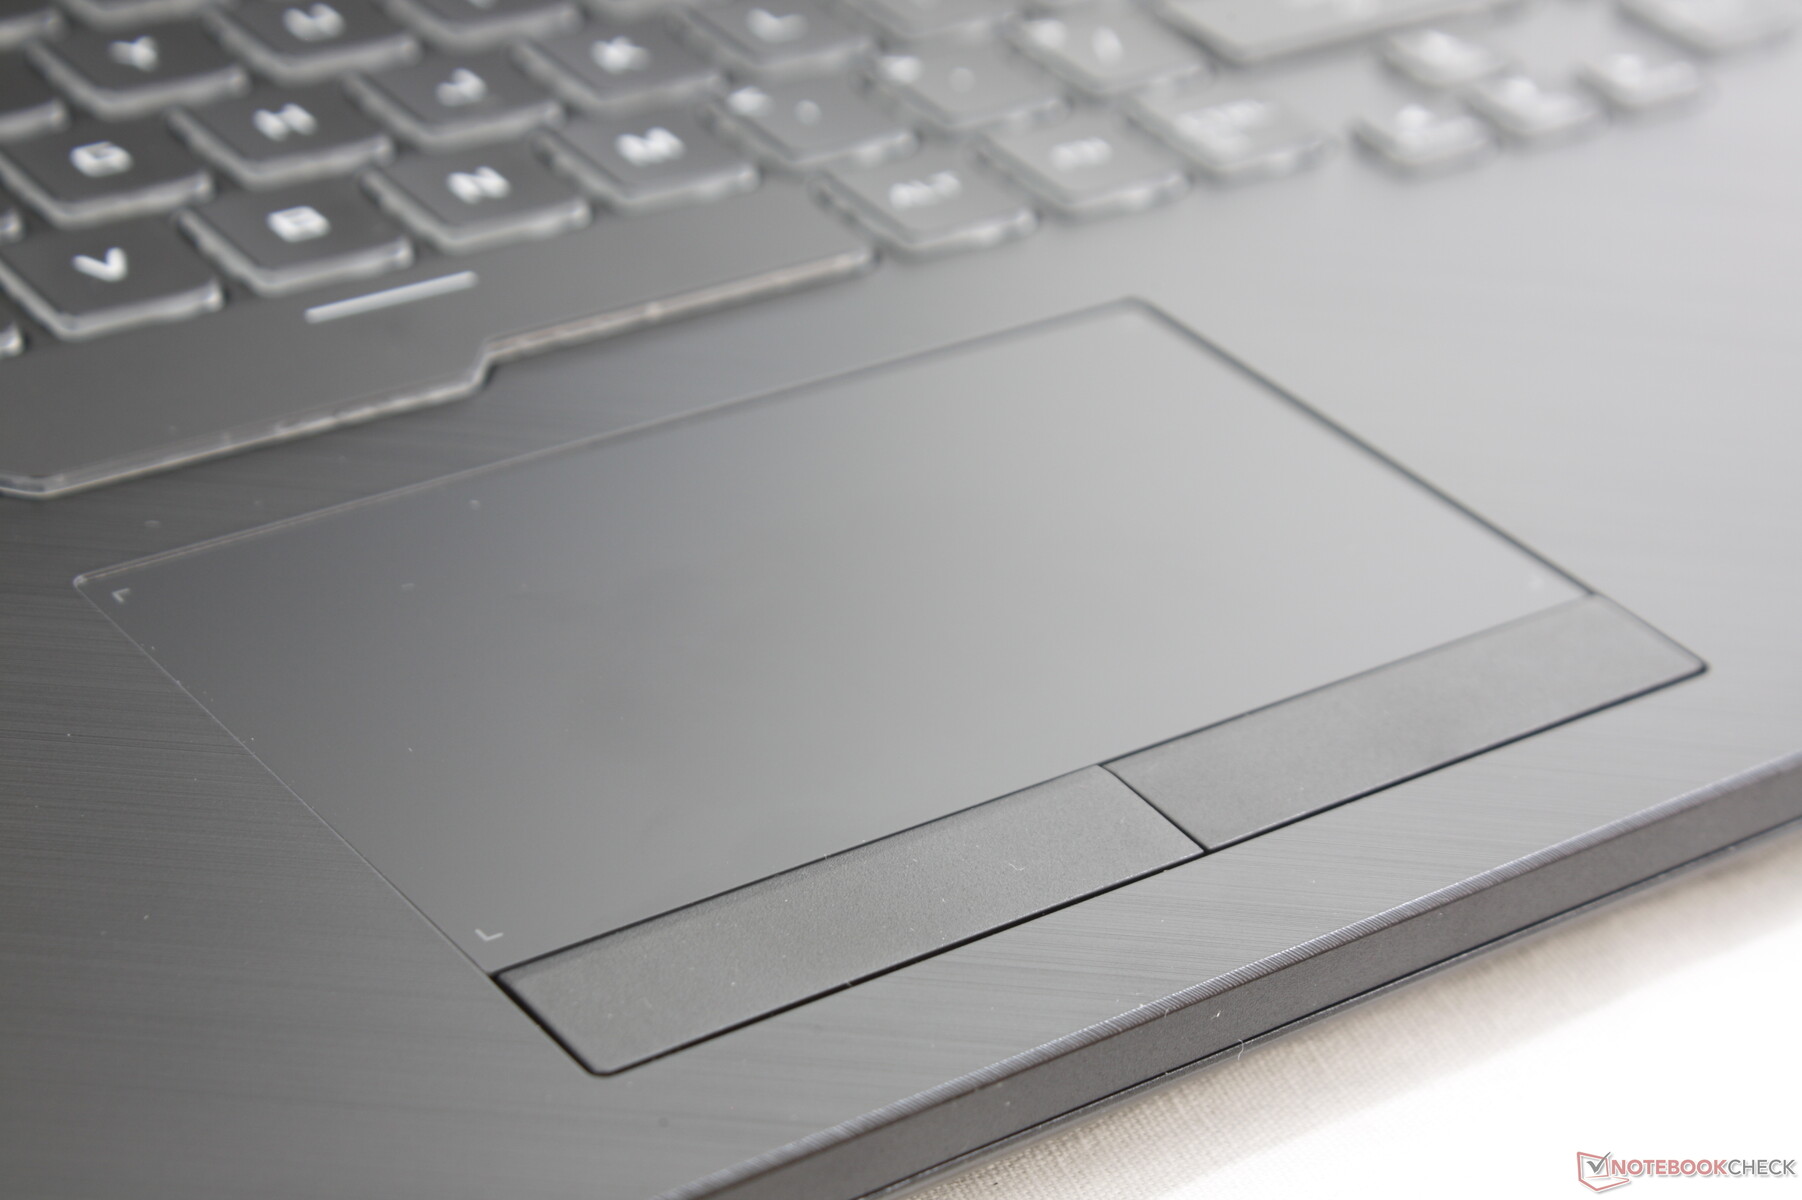
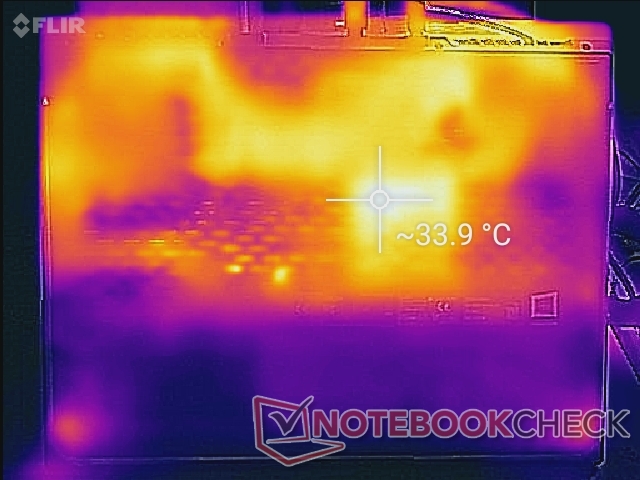
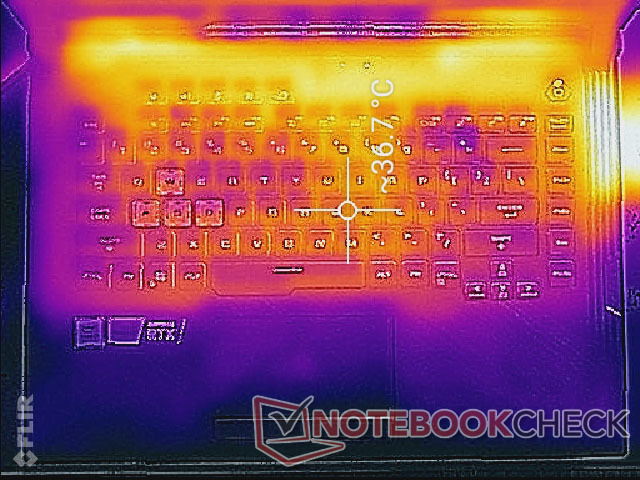
Since the RTX 2060 in our GL531 runs cooler than the RTX 2070 in the G531 as our next section will show, surface temperatures on the GL531 should be cooler as well. This is indeed the case as the center keyboard hot spot on the GL531 stabilizes at about 37 C when running Witcher 3 compared to 41 C on the G531. The WASD keys, palm rests, and clickpad remain cooler at about 27 C to 33 C for comfortable fingers when gaming.
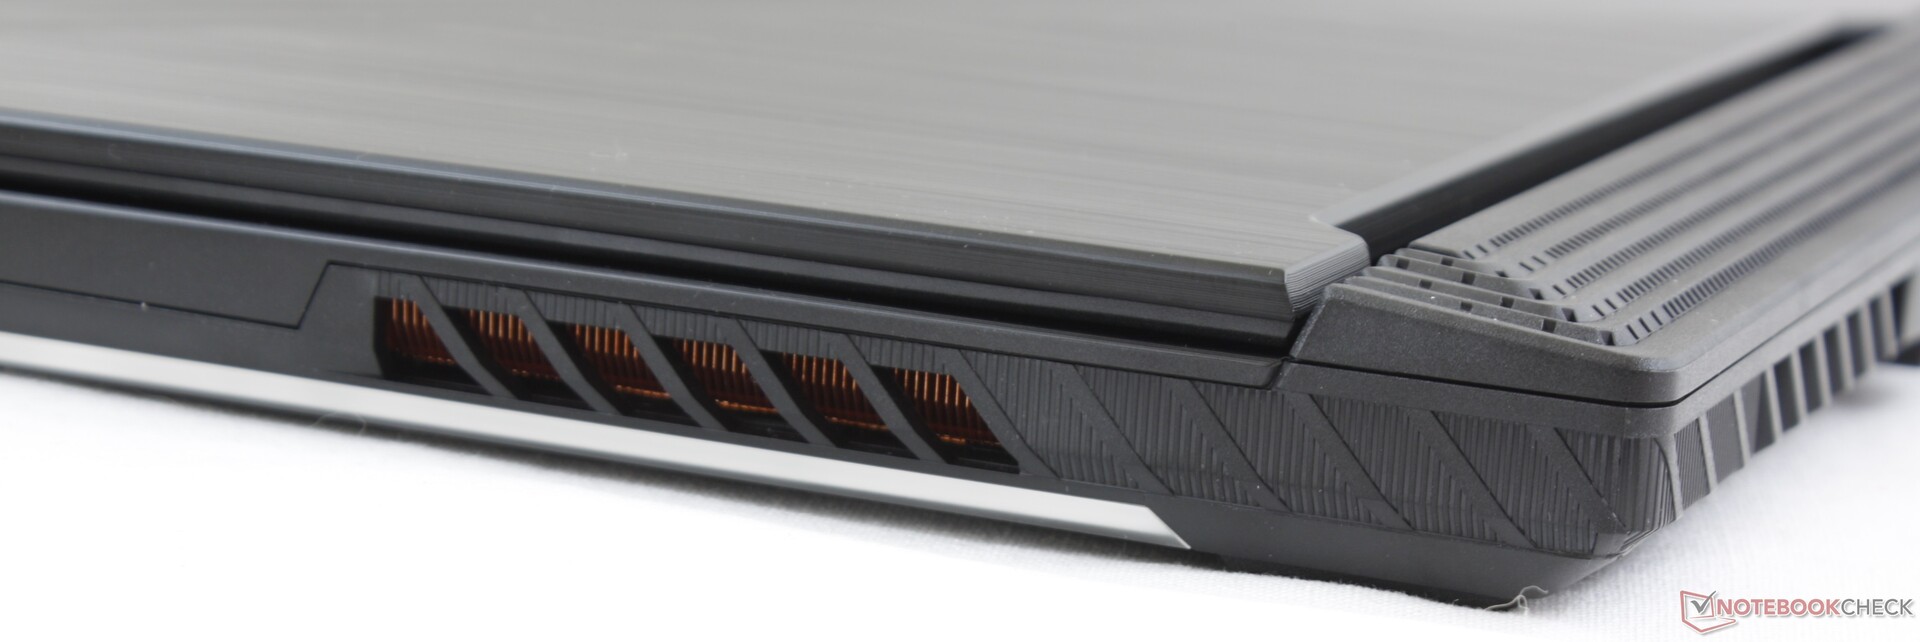
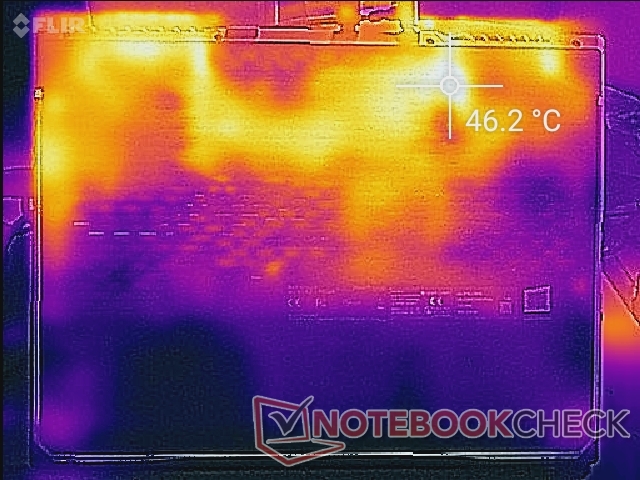
The rear quadrants of the chassis are much warmer than the front since the vents and heat pipes are towards the back of the system.
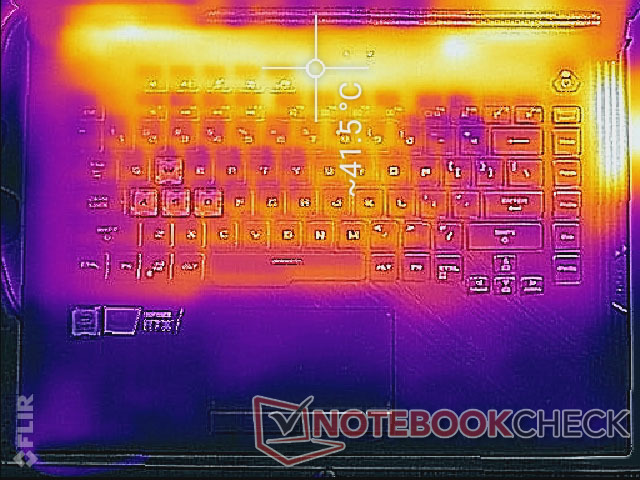
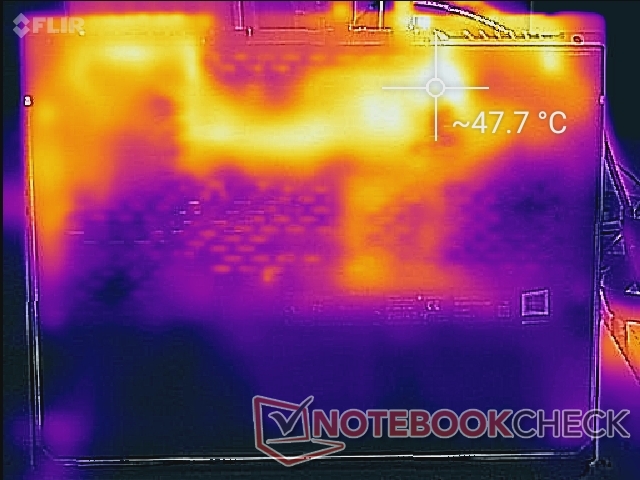
(±) The maximum temperature on the upper side is 43.4 °C / 110 F, compared to the average of 40.4 °C / 105 F, ranging from 21.2 to 68.8 °C for the class Gaming.
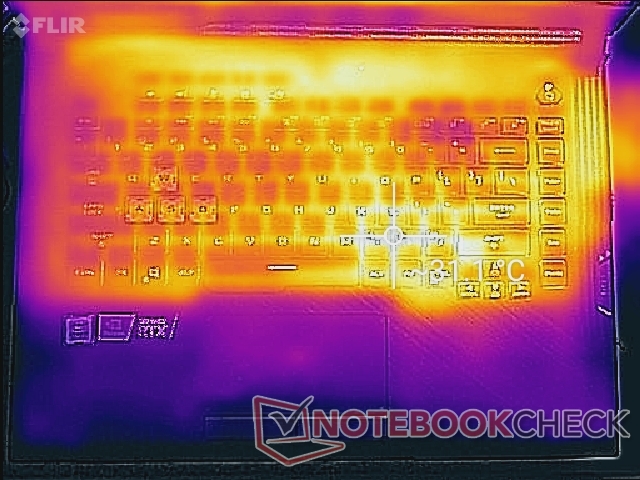
(-) The bottom heats up to a maximum of 49.2 °C / 121 F, compared to the average of 43.2 °C / 110 F
(+) In idle usage, the average temperature for the upper side is 27.6 °C / 82 F, compared to the device average of 33.9 °C / 93 F.
(±) Playing The Witcher 3, the average temperature for the upper side is 34.6 °C / 94 F, compared to the device average of 33.9 °C / 93 F.
(+) The palmrests and touchpad are cooler than skin temperature with a maximum of 27.6 °C / 81.7 F and are therefore cool to the touch.
(±) The average temperature of the palmrest area of similar devices was 28.8 °C / 83.8 F (+1.2 °C / 2.1 F).
Stress Test
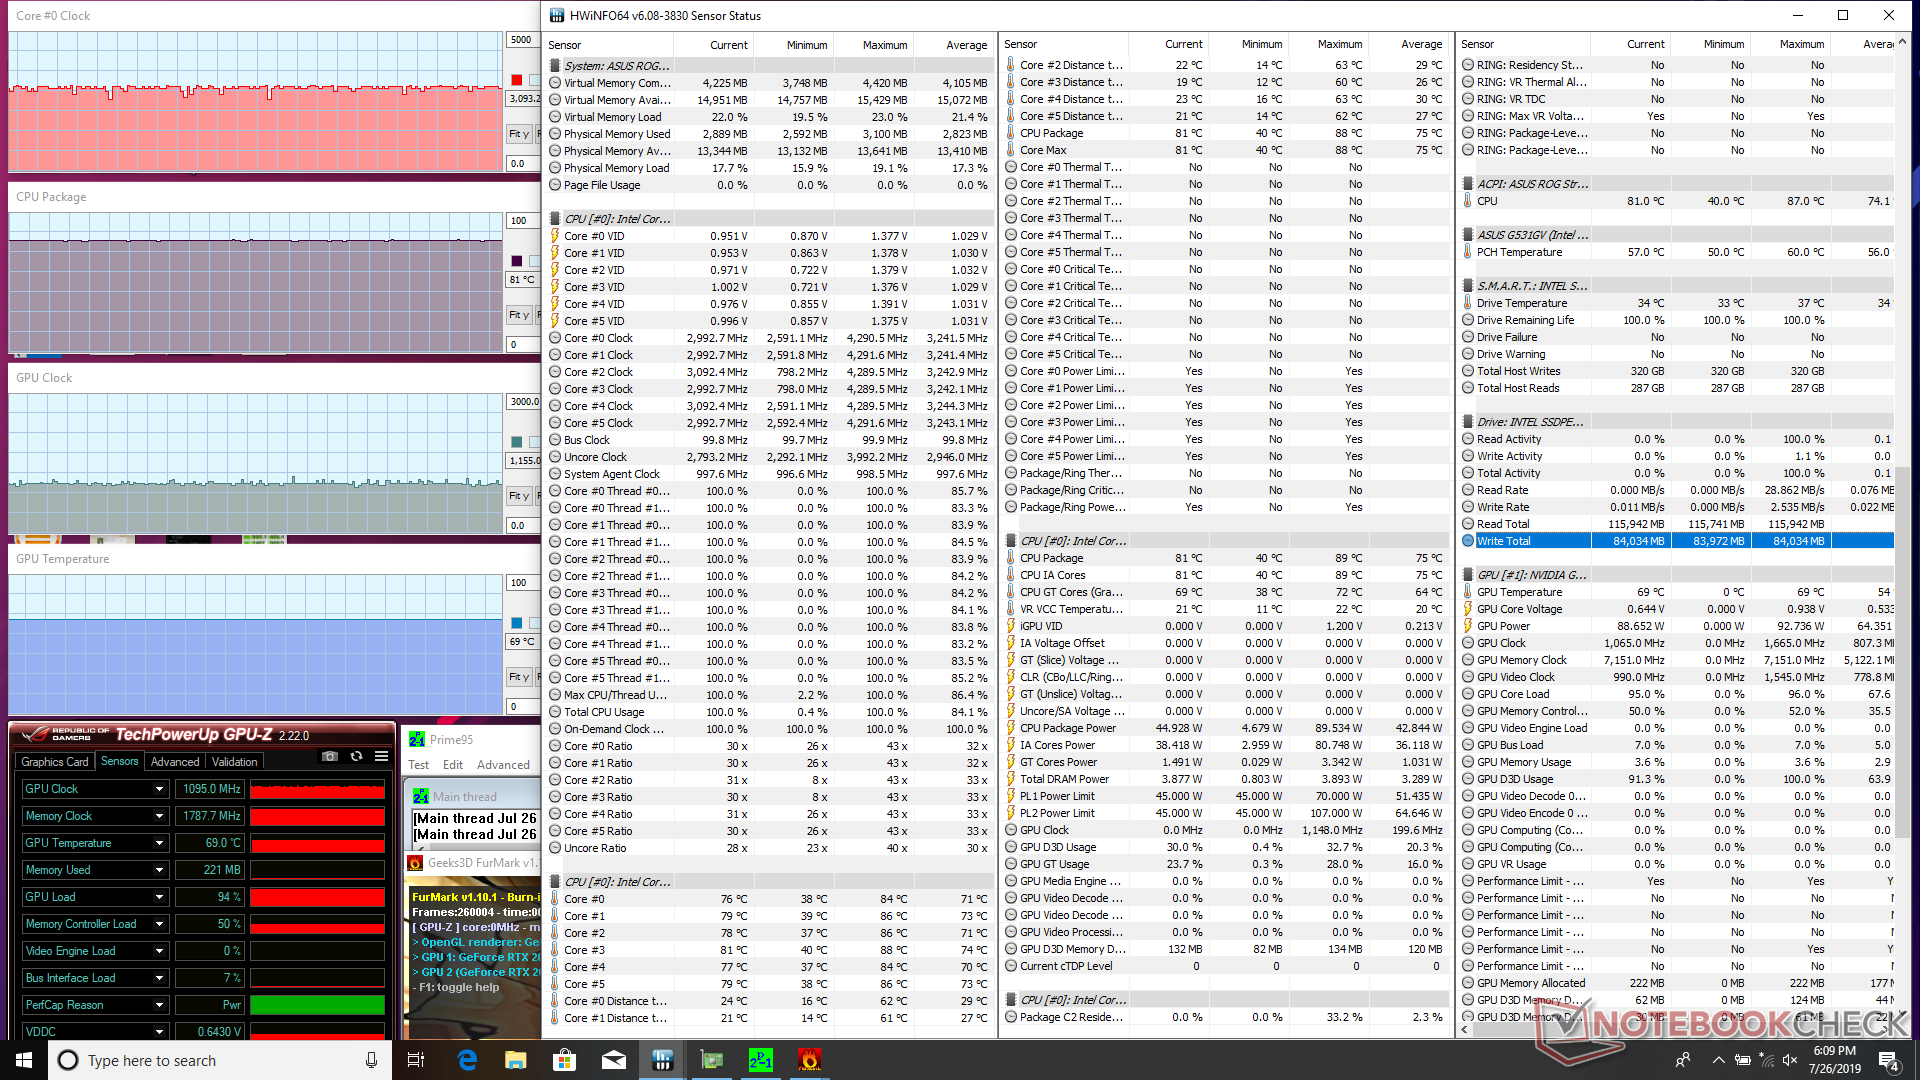
We stress the system to identify for any potential throttling or stability issues. When running Prime95 to stress the CPU, we can observe clock rates as high as 4 GHz for the first few seconds until hitting a core temperature of 88 C. Thereafter, clock rates drop to 3.3 GHz in order to maintain a cooler core temperature of 75 C as shown by our screenshot below. This behavior explains our CineBench R15 loop test results above where performance is fastest only at the start of the test. Clock rates do not throttle below the base clock rate of the i7-9750H even when running both Prime95 and FurMark simultaneously which we expected no less from a gaming laptop.
CPU and GPU temperatures stabilize at 80 C and 67 C, respectively, when running Witcher 3. In contrast, the Core i9 CPU and RTX 2070 GPU on the Asus G531GW stabilize at 81 C and 77 C, respectively, while the older GTX 1060-powered Asus GL504GM stabilizes at about 67 C under similar gaming conditions. The 60 C to 70 C range is relatively cool for a gaming laptop while the very warm 80 C range is quite common on super-thin form factors.
Running on batteries will impact performance. A Fire Strike run on batteries returns Physics and Graphics scores of 9983 and 4423 points, respectively, compared to 17042 and 15913 points when on mains.
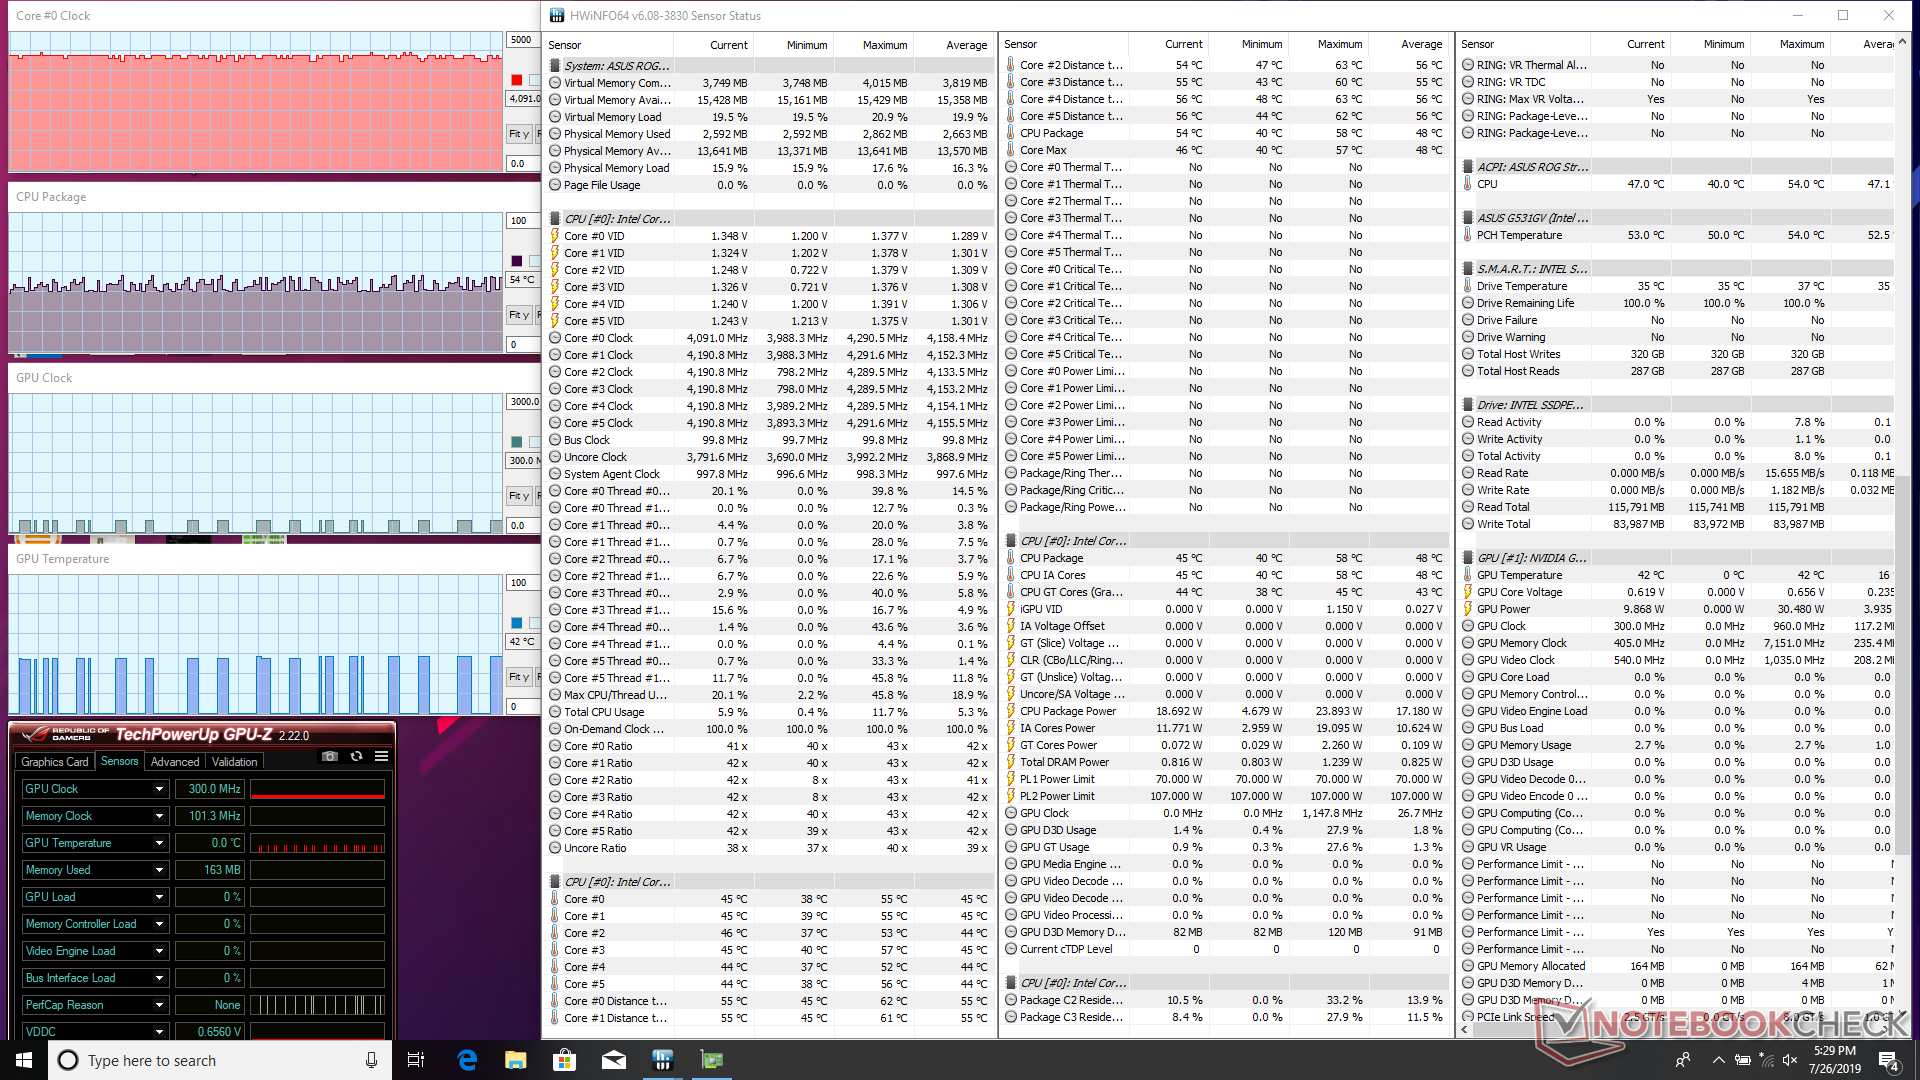
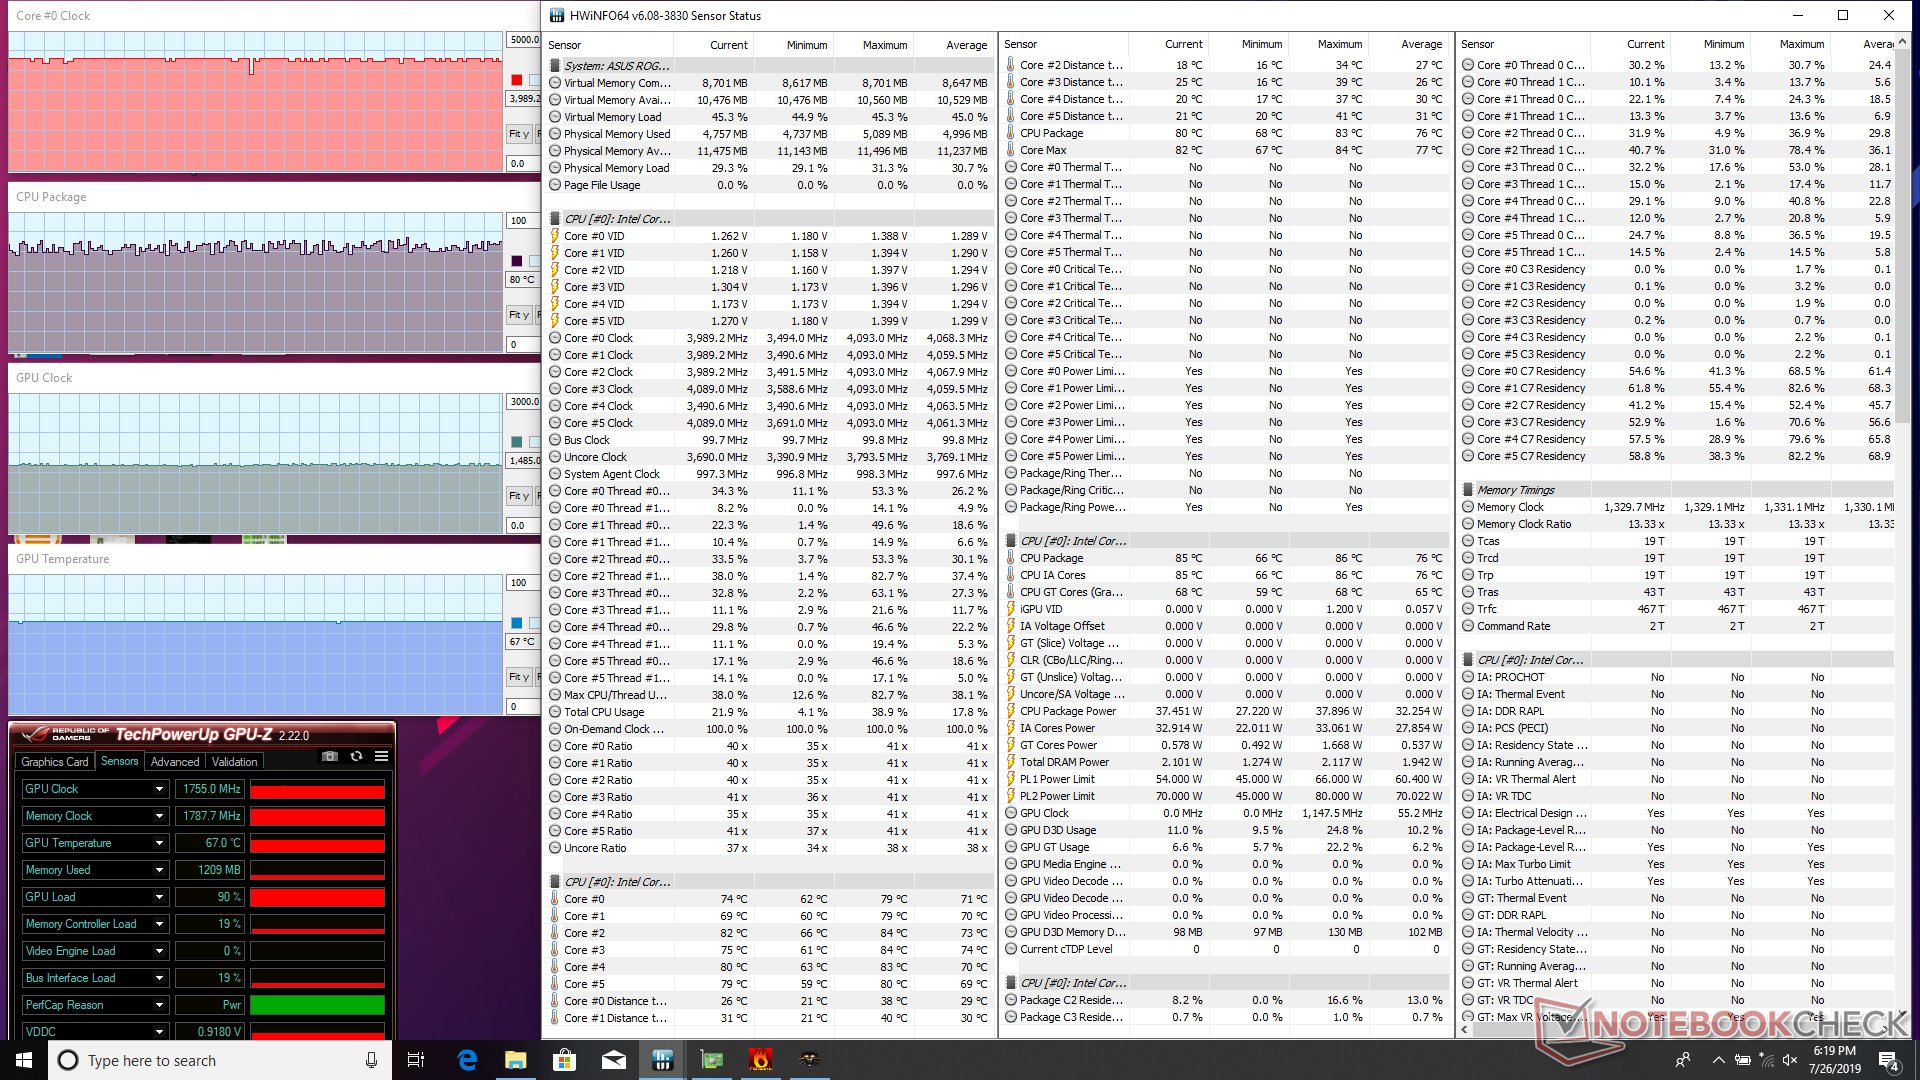
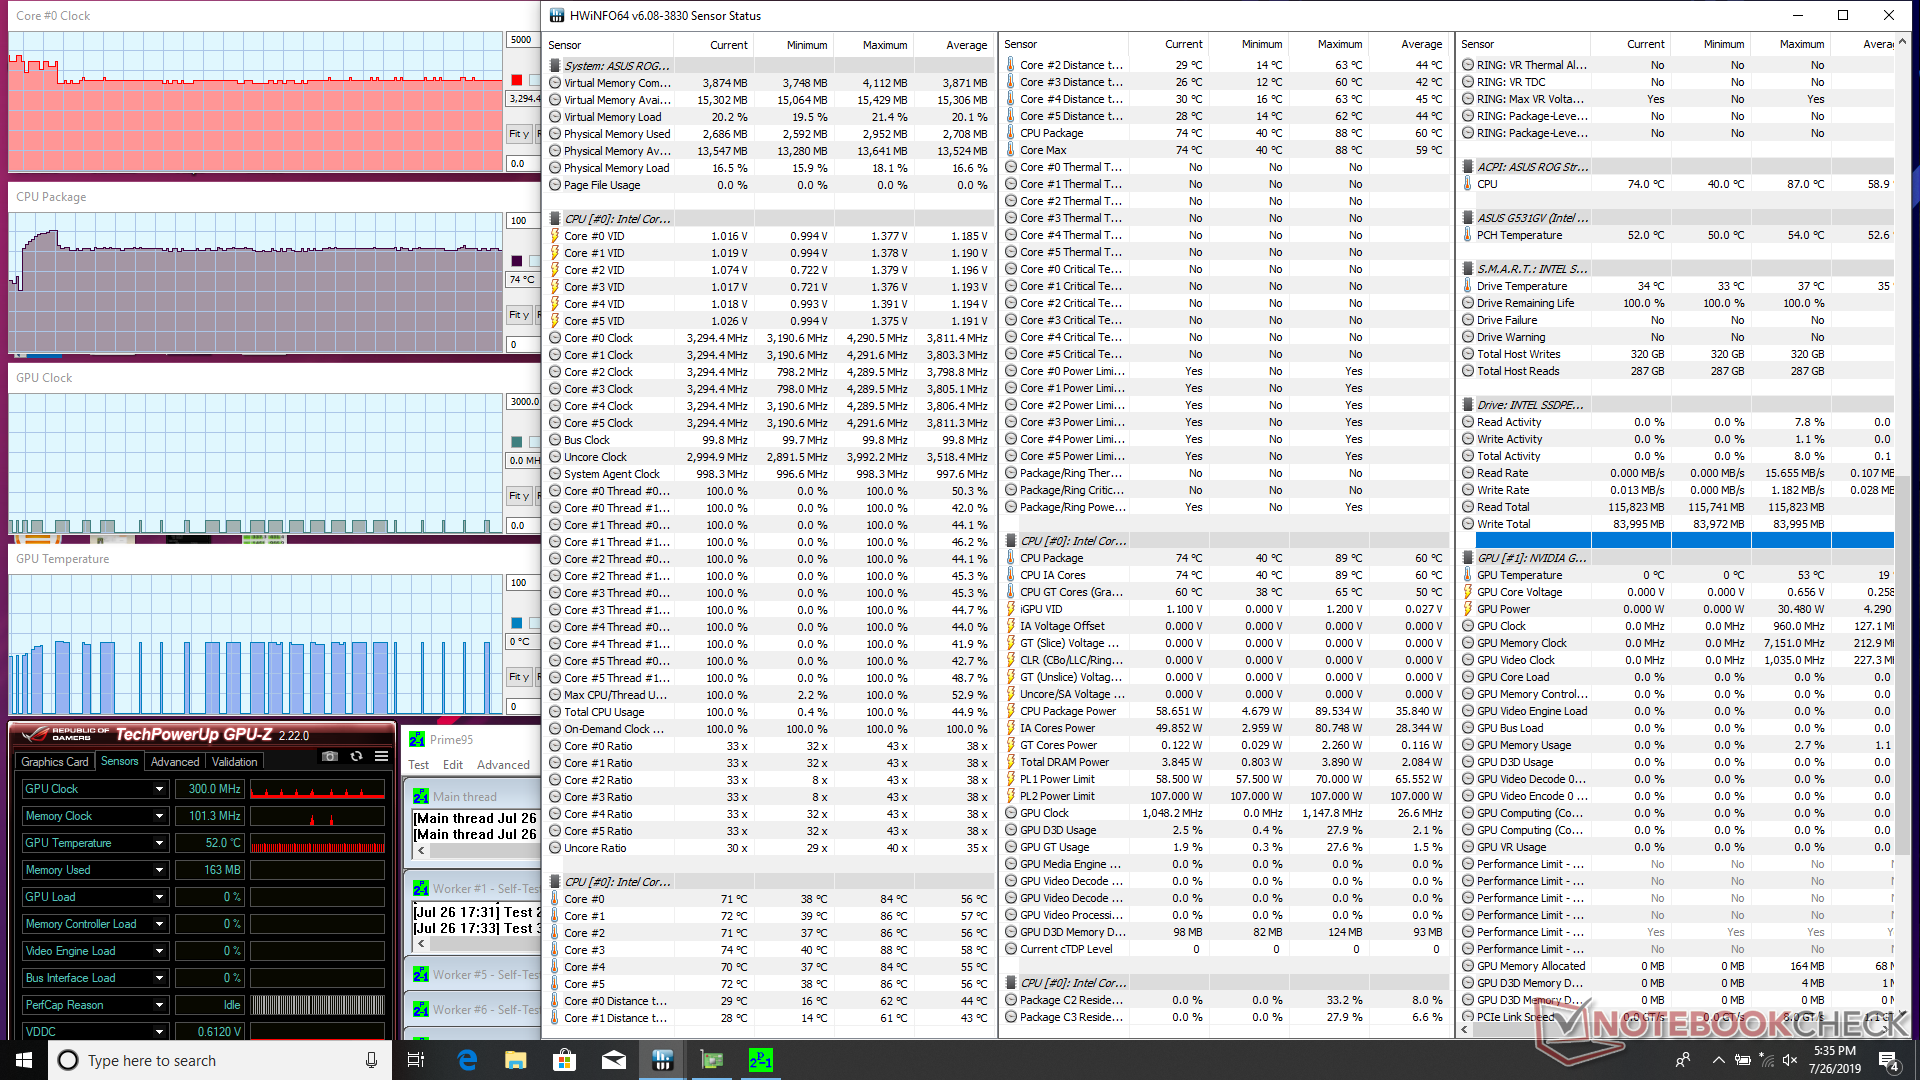
| CPU Clock (GHz) | GPU Clock (MHz) | Average CPU Temperature (°C) | Average GPU Temperature (°C) | |
| System Idle | -- | -- | 54 | 42 |
| Prime95 Stress | 3.3 | -- | 74 | 53 |
| Prime95 + FurMark Stress | 3.1 - 3.2 | 1095 | 81 | 69 |
| Witcher 3 Stress | 4.0 - 4.1 | 1755 | ~80 | 67 |
Speakers

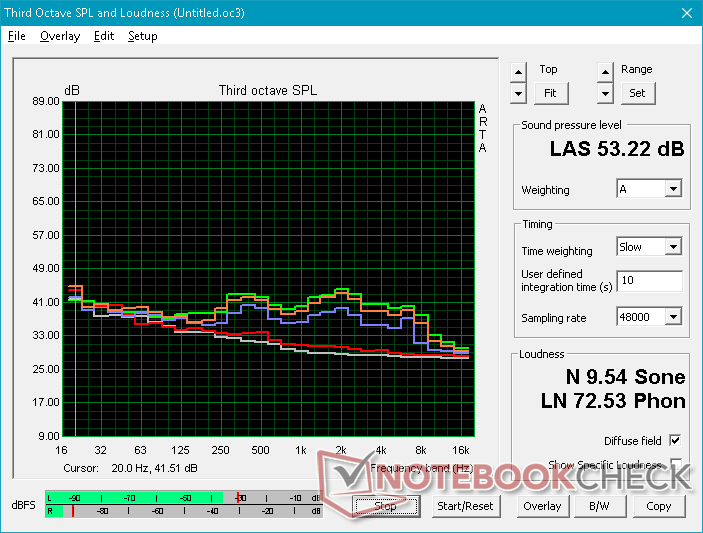
Asus Strix GL531GV-PB74 audio analysis
(+) | speakers can play relatively loud (82.7 dB)
Analysis not possible as minimum curve is missing or too high
Apple MacBook 12 (Early 2016) 1.1 GHz audio analysis
(+) | speakers can play relatively loud (83.6 dB)
Bass 100 - 315 Hz
(±) | reduced bass - on average 11.3% lower than median
(±) | linearity of bass is average (14.2% delta to prev. frequency)
Mids 400 - 2000 Hz
(+) | balanced mids - only 2.4% away from median
(+) | mids are linear (5.5% delta to prev. frequency)
Highs 2 - 16 kHz
(+) | balanced highs - only 2% away from median
(+) | highs are linear (4.5% delta to prev. frequency)
Overall 100 - 16.000 Hz
(+) | overall sound is linear (10.2% difference to median)
Compared to same class
» 7% of all tested devices in this class were better, 2% similar, 90% worse
» The best had a delta of 5%, average was 18%, worst was 53%
Compared to all devices tested
» 5% of all tested devices were better, 1% similar, 94% worse
» The best had a delta of 4%, average was 23%, worst was 134%
Energy Management
Power Consumption
Idling demands between 11 W and 33 W depending on the brightness level and power profile compared to under 12 W and 9 W on the Asus TUF FX505 and Dell G7, respectively. The Asus GX502 and G531 are also unusually demanding at over 30 W each not unlike our GL531 when under similar idling conditions. The poor power efficiencies of the GL531, G531, and GX502 are likely responsible for their relatively short battery lives as shown in our next section.
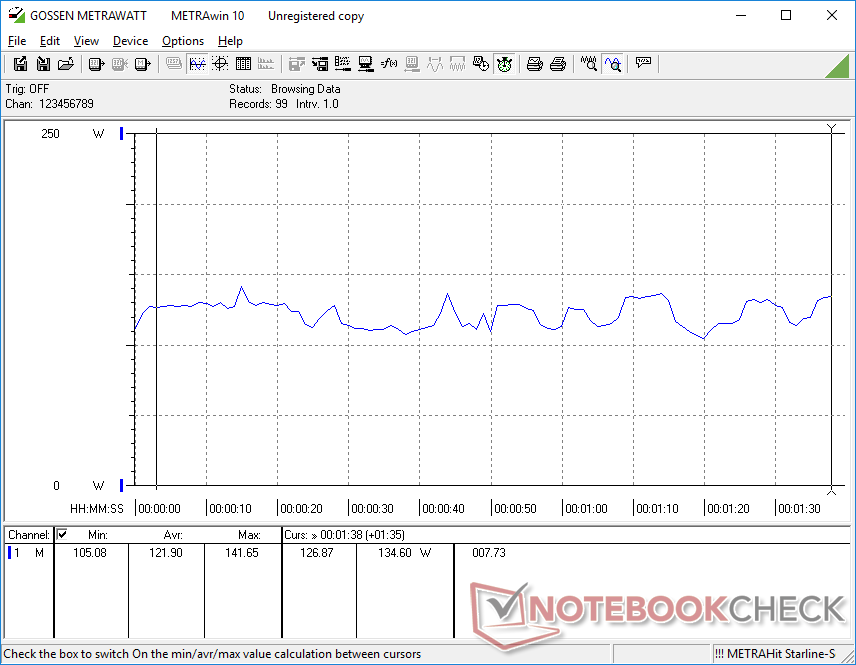
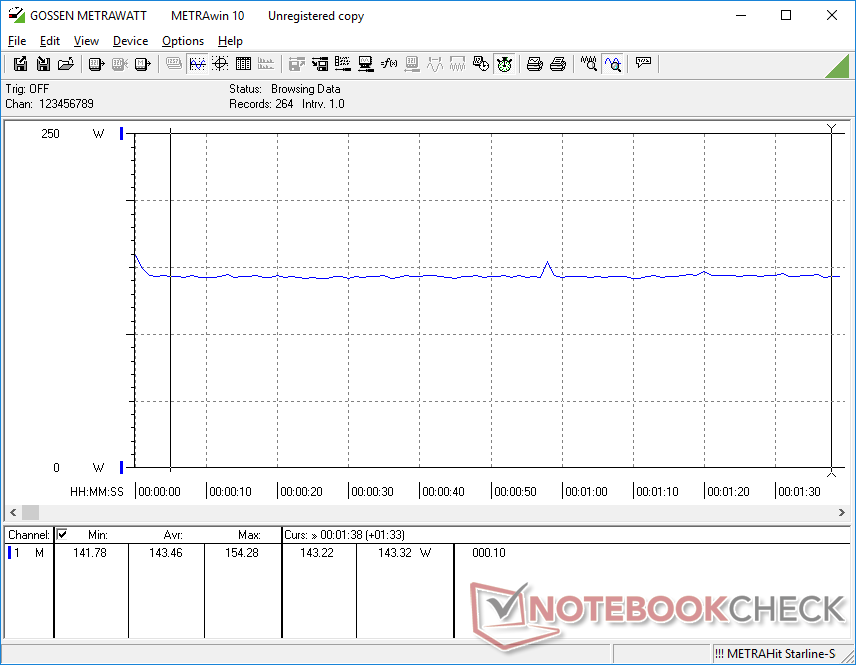
Power consumption values when gaming are more normal and where we expect them to be at about 144 W. The Asus GX502GW with the RTX 2070 GPU consumes about 22 percent more power when under similar gaming conditions for about 20 percent more GPU performance. Perhaps more significantly, our GL531 consumes only about 6 percent more power than the GTX 1060-equipped Asus GL504GM for a comparatively massive 40 to 70 percent increase in GPU performance.
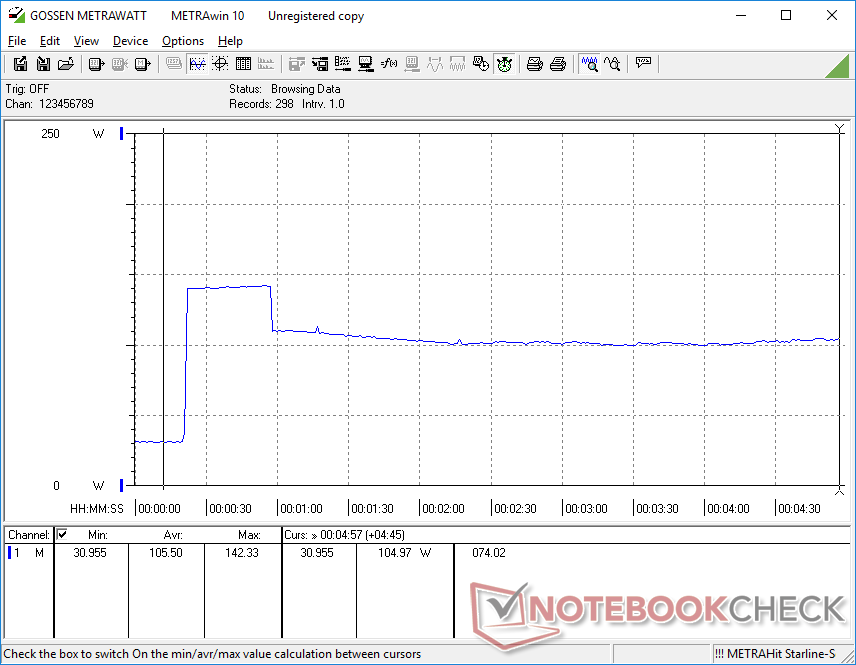
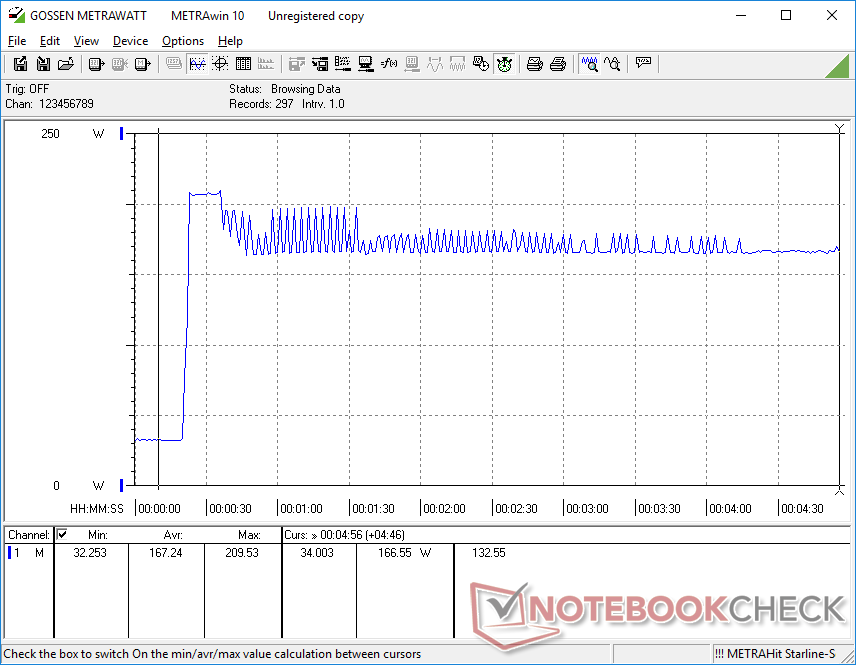
We're able to record a maximum consumption of 210 W from the medium-sized (~16.5 x 7.5 x 3.2 cm) 230 W AC adapter. This eventually falls and stabilizes at 167 W due to performance throttling since maximum Turbo Boost clock rates are unsustainable as demonstrated by the CineBench loop test above.
| Off / Standby | |
| Idle | |
| Load |
|
Key:
min: | |
| Asus Strix GL531GV-PB74 i7-9750H, GeForce RTX 2060 Mobile, Intel SSD 660p SSDPEKNW512G8, IPS, 1920x1080, 15.6" | Asus TUF FX505DT-EB73 R7 3750H, GeForce GTX 1650 Mobile, Intel SSD 660p SSDPEKNW512G8, IPS, 1920x1080, 15.6" | Asus Zephyrus S GX502GW i7-9750H, GeForce RTX 2070 Mobile, 2x Intel SSD 660p SSDPEKNW512G8 (RAID 0), IPS, 1920x1080, 15.6" | Dell G7 15-7588 i7-8750H, GeForce GTX 1060 Max-Q, SK hynix SC311 SATA, IPS, 1920x1080, 15.6" | Lenovo Legion Y740-15ICHg i7-8750H, GeForce RTX 2070 Max-Q, Samsung SSD PM981 MZVLB256HAHQ, IPS, 1920x1080, 15.6" | Aorus 15-SA i7-9750H, GeForce GTX 1660 Ti Mobile, Intel SSD 760p SSDPEKKW512G8, IPS, 1920x1080, 15.6" | Asus Strix GL504GM i7-8750H, GeForce GTX 1060 Mobile, Toshiba NVMe THNSN5256GPU7, IPS, 1920x1080, 15.6" | |
|---|---|---|---|---|---|---|---|
| Power Consumption | 41% | -40% | 40% | -21% | -13% | 11% | |
| Idle Minimum * (Watt) | 10.9 | 7 36% | 24 -120% | 5.5 50% | 22.9 -110% | 20 -83% | 10 8% |
| Idle Average * (Watt) | 14.7 | 9.9 33% | 27 -84% | 7.6 48% | 27.2 -85% | 23 -56% | 16.9 -15% |
| Idle Maximum * (Watt) | 32.4 | 12 63% | 33 -2% | 9 72% | 27.5 15% | 29 10% | 21.1 35% |
| Load Average * (Watt) | 121.9 | 68.4 44% | 129 -6% | 94 23% | 83.4 32% | 87 29% | 112.4 8% |
| Witcher 3 ultra * (Watt) | 143.5 | 94.9 34% | 176 -23% | 116.3 19% | 143.6 -0% | 136 5% | 135.5 6% |
| Load Maximum * (Watt) | 209.6 | 130.9 38% | 216 -3% | 154.4 26% | 160.5 23% | 173 17% | 157.3 25% |
* ... smaller is better
Battery Life
The 66 Wh internal battery is identical in size to the battery of the G531. Some lesser SKUs of the GL531, however, may come equipped with a smaller 48 Wh module instead.
Battery life is poor and even worse than what we recorded on the G531 at just under 2 hours of real-world WLAN load. We set the system to Balanced mode with the integrated GPU active and the display to 150 nits brightness like we do for all our WLAN tests. Asus may want to optimize the power-sipping behavior of the GL531 to boost battery life to more reasonable numbers. Until then, we recommend setting the system to Silent mode to squeeze out as much battery life as possible when not gaming.
Recharging from empty to full capacity takes about 1.5 hours.
| Asus Strix GL531GV-PB74 i7-9750H, GeForce RTX 2060 Mobile, 66 Wh | Asus TUF FX505DT-EB73 R7 3750H, GeForce GTX 1650 Mobile, 48 Wh | Asus Zephyrus S GX502GW i7-9750H, GeForce RTX 2070 Mobile, 76 Wh | Dell G7 15-7588 i7-8750H, GeForce GTX 1060 Max-Q, 56 Wh | Lenovo Legion Y740-15ICHg i7-8750H, GeForce RTX 2070 Max-Q, 57 Wh | Aorus 15-SA i7-9750H, GeForce GTX 1660 Ti Mobile, 62 Wh | Asus Strix Scar III G531GW i9-9880H, GeForce RTX 2070 Mobile, 66 Wh | |
|---|---|---|---|---|---|---|---|
| Battery runtime | 153% | 95% | 295% | 47% | 47% | 58% | |
| WiFi v1.3 (h) | 1.9 | 4.8 153% | 3.7 95% | 7.5 295% | 2.8 47% | 2.8 47% | 3 58% |
| Reader / Idle (h) | 7.8 | 5.9 | 10.9 | 3.9 | 3.5 | 5.5 | |
| Load (h) | 1.5 | 1 | 2.2 | 0.8 | 2 | 1.4 |
Pros
Cons
Verdict

Many of our comments about the 17.3-inch Strix G GL731 apply here for the 15.6-inch Strix G GL531 since they share the same overall design language with similar internal hardware. In particular, drawbacks like the user-unfriendly serviceability, small Arrow keys, short battery life, and loud fans could all use a closer look to create a better next generation model. The ability to customize the keyboard light and LED bar independently would be especially useful to have.
The best qualities of the GL531 are its powerful 3.5 W speakers and chassis design. For a laptop that's mostly plastic, the textured surfaces really elevate it to feel more like a high-end gaming machine when compared to other plastic designs like on the Acer Nitro 5 or the MSI GP and GL series.
Price is the main advantage. At about $1600 USD, the system is several hundred dollars less than the Zephyrus S series while offering many of the same core specifications and performance options. To save even more, we recommend going for the GTX 1660 Ti SKU as it's only about 10 percent slower in games when not accounting for any RTX specific features.
It performs like a Zephyrus without costing as much. You'll have to live with some annoyances like the difficult serviceability, small Arrow keys, loud fans, and lack of a webcam. Core gaming performance is otherwise as fast as most enthusiast gaming laptops.
Asus Strix GL531GV-PB74
- 07/18/2020 v7 (old)
Allen Ngo
Price comparison
