HP Pavilion Gaming 17 vs. MSI GF75: Sacrificing portability for cooler and quieter gaming
Now that laptops with Nvidia Turing have been in market for over six months, we have a better idea of overall performance and a larger sample size to pick and choose from. This face off page will focus on the budget-midrange HP Pavilion Gaming 17 and MSI GF75 9SC each equipped with the same CPU but different GTX Turing GPUs to explore the advantages and disadvantages of each model. As configured, the HP and MSI can be found online for about $1300 and $1200 USD, respectively, depending on RAM and storage choices.
We recommend checking out our full reviews on the HP Pavilion Gaming 17 and MSI GF75 for more detailed information on each.
| HP Pavilion Gaming 17 2019 | MSI GF75 Thin 9SC | |
|---|---|---|
| CPU | Core i7-9750H | Core i7-9750H |
| GPU | GeForce GTX 1660 Ti Max-Q w/ 6 GB GDDR6 VRAM | GeForce GTX 1650 w/ 4 GB GDDR5 VRAM |
| RAM | 2x SODIMM slots (DDR4-2666) | 2x SODIMM slots (DDR4-2666) |
| Ports | 3x USB Type-A, USB Type-C, HDMI, 3.5 mm combo audio, Gigabit Ethernet, SD reader | 3x USB Type-A, USB Type-C, HDMI, 3.5 mm headphones, 3.5 mm mic, Gigabit Ethernet |
| WLAN Battery Life | 5 hr 39 min (52.5 Wh) | 4 hr 44 min (51 Wh) |
| Dimensions | 25 x 405 x 282 mm | 23.1 x 397 x 260 mm |
| Weight | 2.8 kg | 2.3 kg |
| CPU Temperature When Gaming | ~68 C | ~68 C |
| GPU Temperature When Gaming | 64 C | 78 C |
| Fan Noise When Gaming | 34.2 to 36.7 dB(A) | 40.6 dB(A) |
| Price | $1300 USD | $1200 USD |
Case
Despite retailing for about the same price and being nearly the same in thickness, the HP is much denser and heavier than its MSI counterpart by about 500 g. This weight disadvantage comes into play in performance and noise, but users who want a lighter and more travel-friendly solution should consider the MSI over the HP.
Being smaller, lighter, and less expensive has its consequences in terms of chassis rigidity. The HP system is built more strongly and with noticeably less flexing and creaking around its base and lid.
Ports
HP integrates a full-size SD card reader in lieu of a second 3.5 mm audio jack while the opposite is true on the MSI. Otherwise, port selection is identical. One option may be better than the other depending on what you may prefer.
CPU Performance
The Core i7-9750H in the HP outperforms the same Core i7-9750H in the MSI by about 9 percent according to CineBench workloads. Even after accounting for throttling, the HP system is able to maintain higher clock rates for a 10 percent lead.
GPU Performance
The HP system is equipped with the faster GeForce GTX 1660 Ti Max-Q GPU and so it is unsurprisingly faster than the GTX 1650 GPU in the GF75. Users can expect 40 to 50 percent faster graphics performance from the HP.
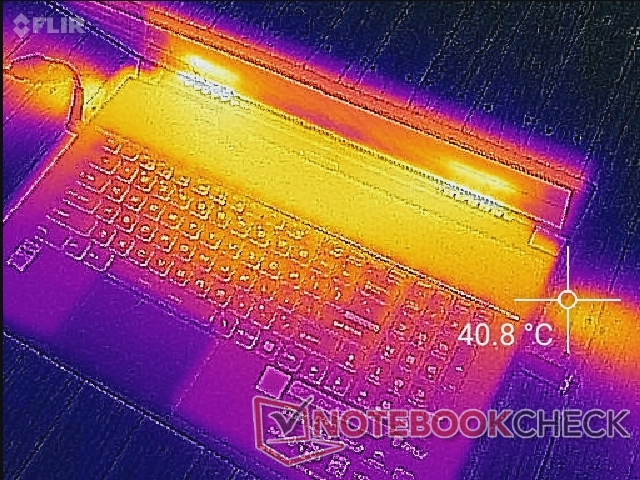
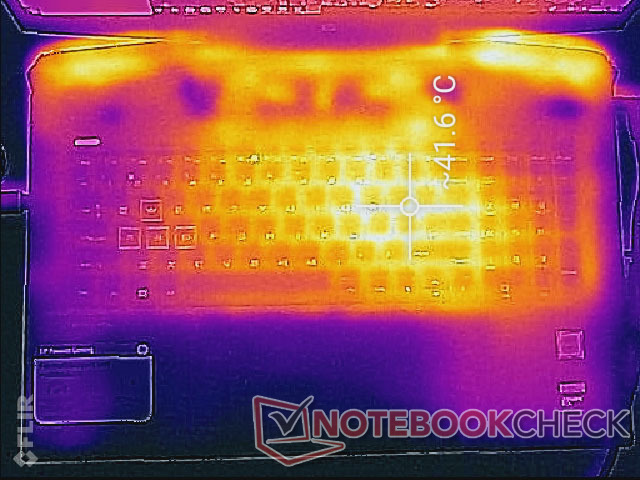
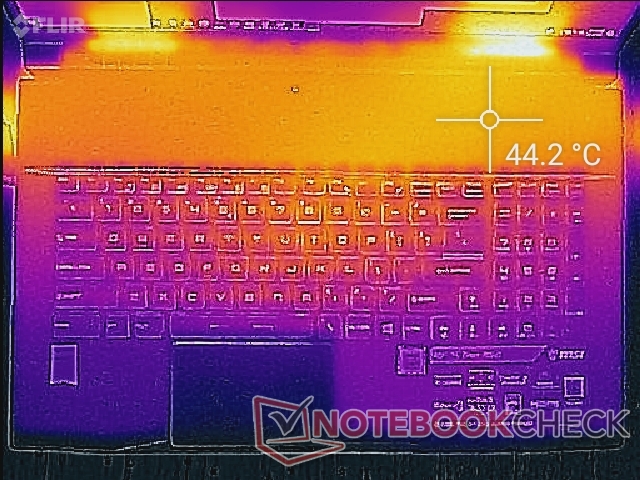
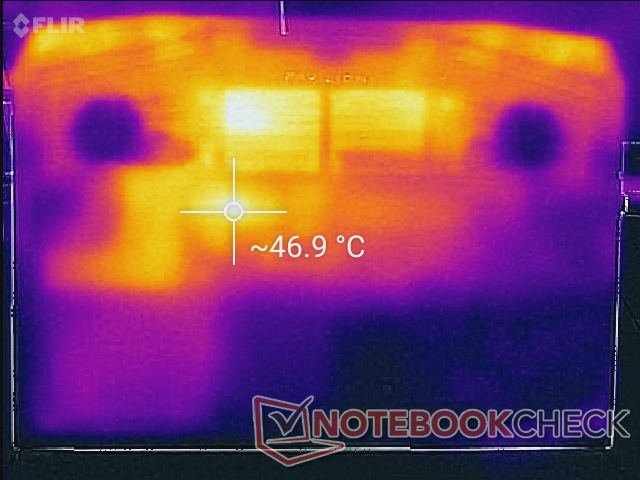
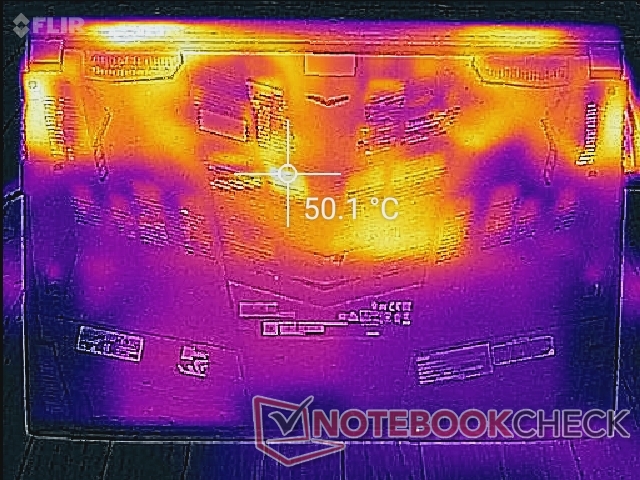
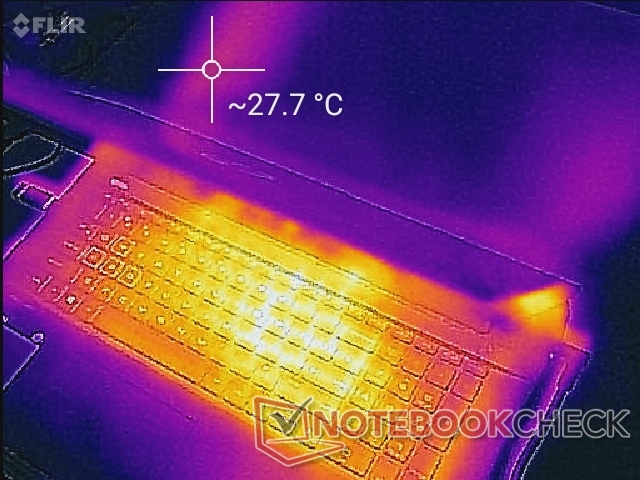
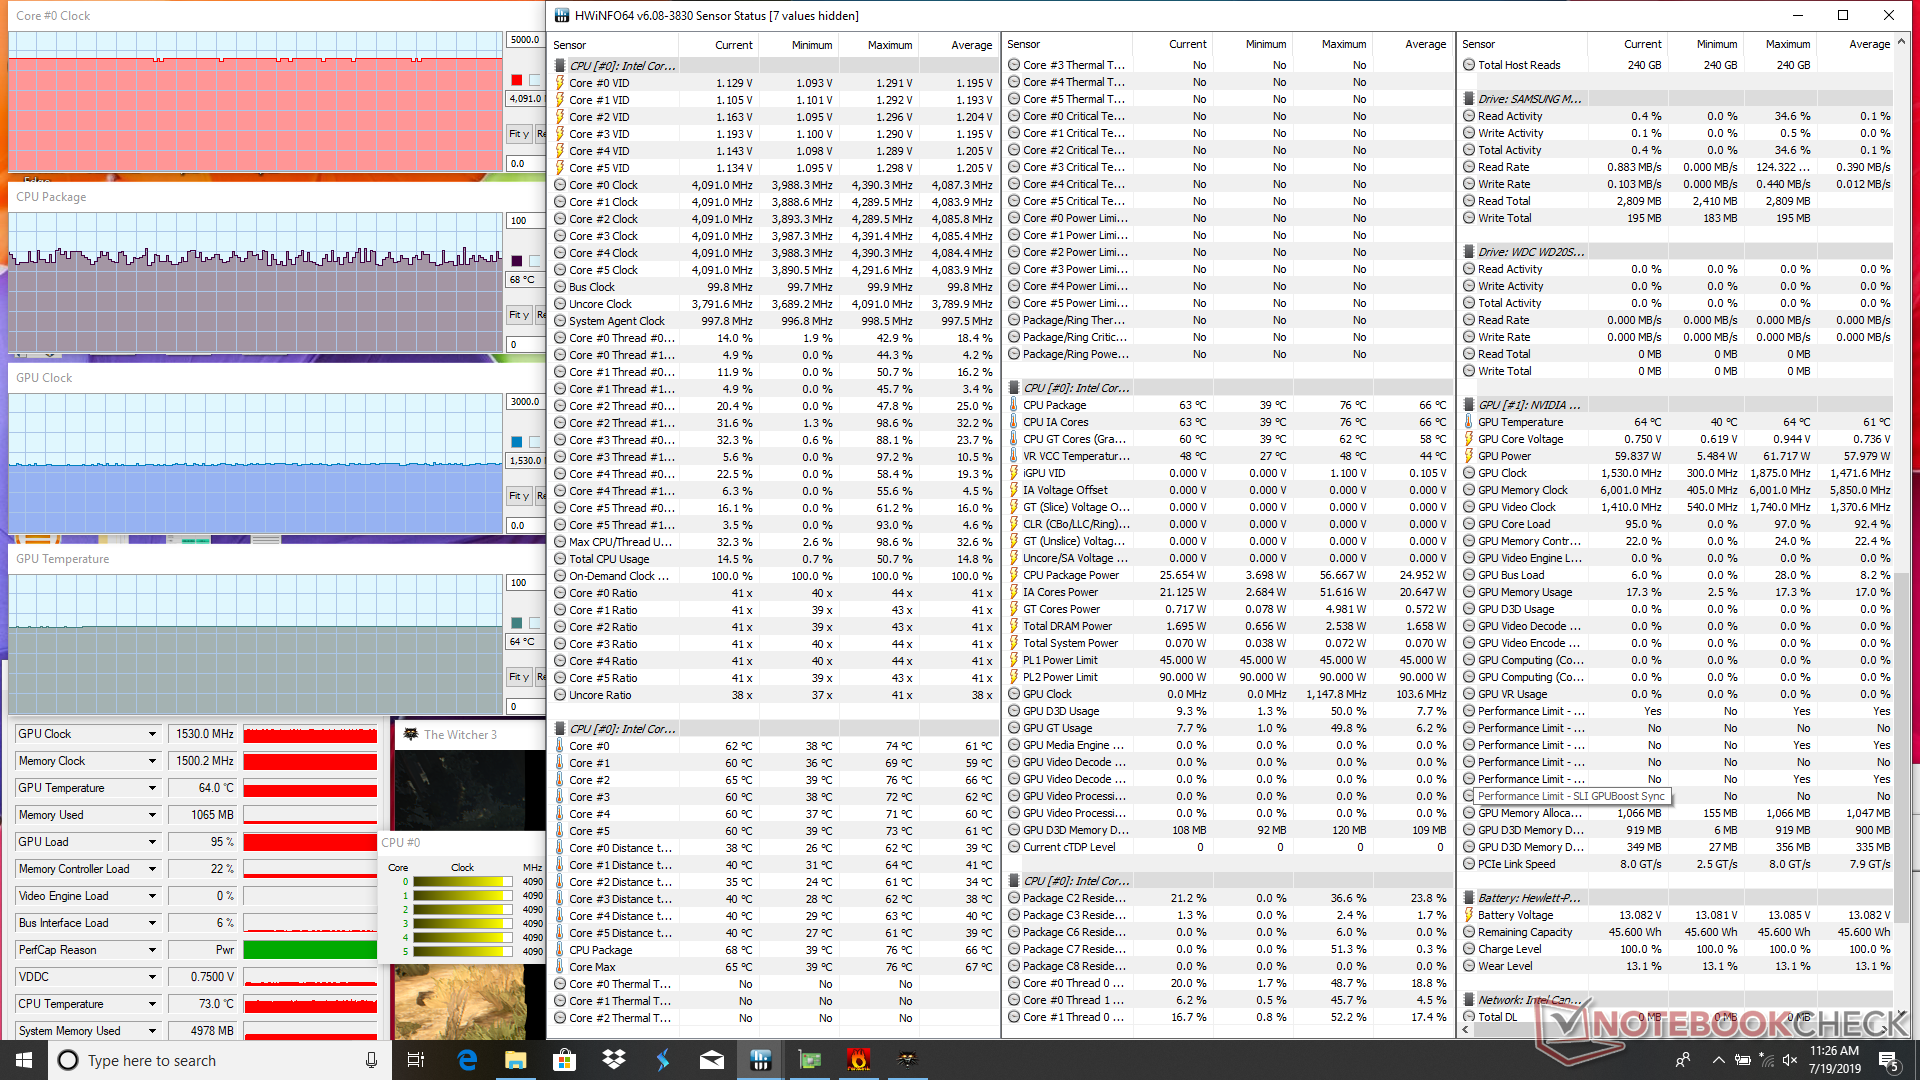
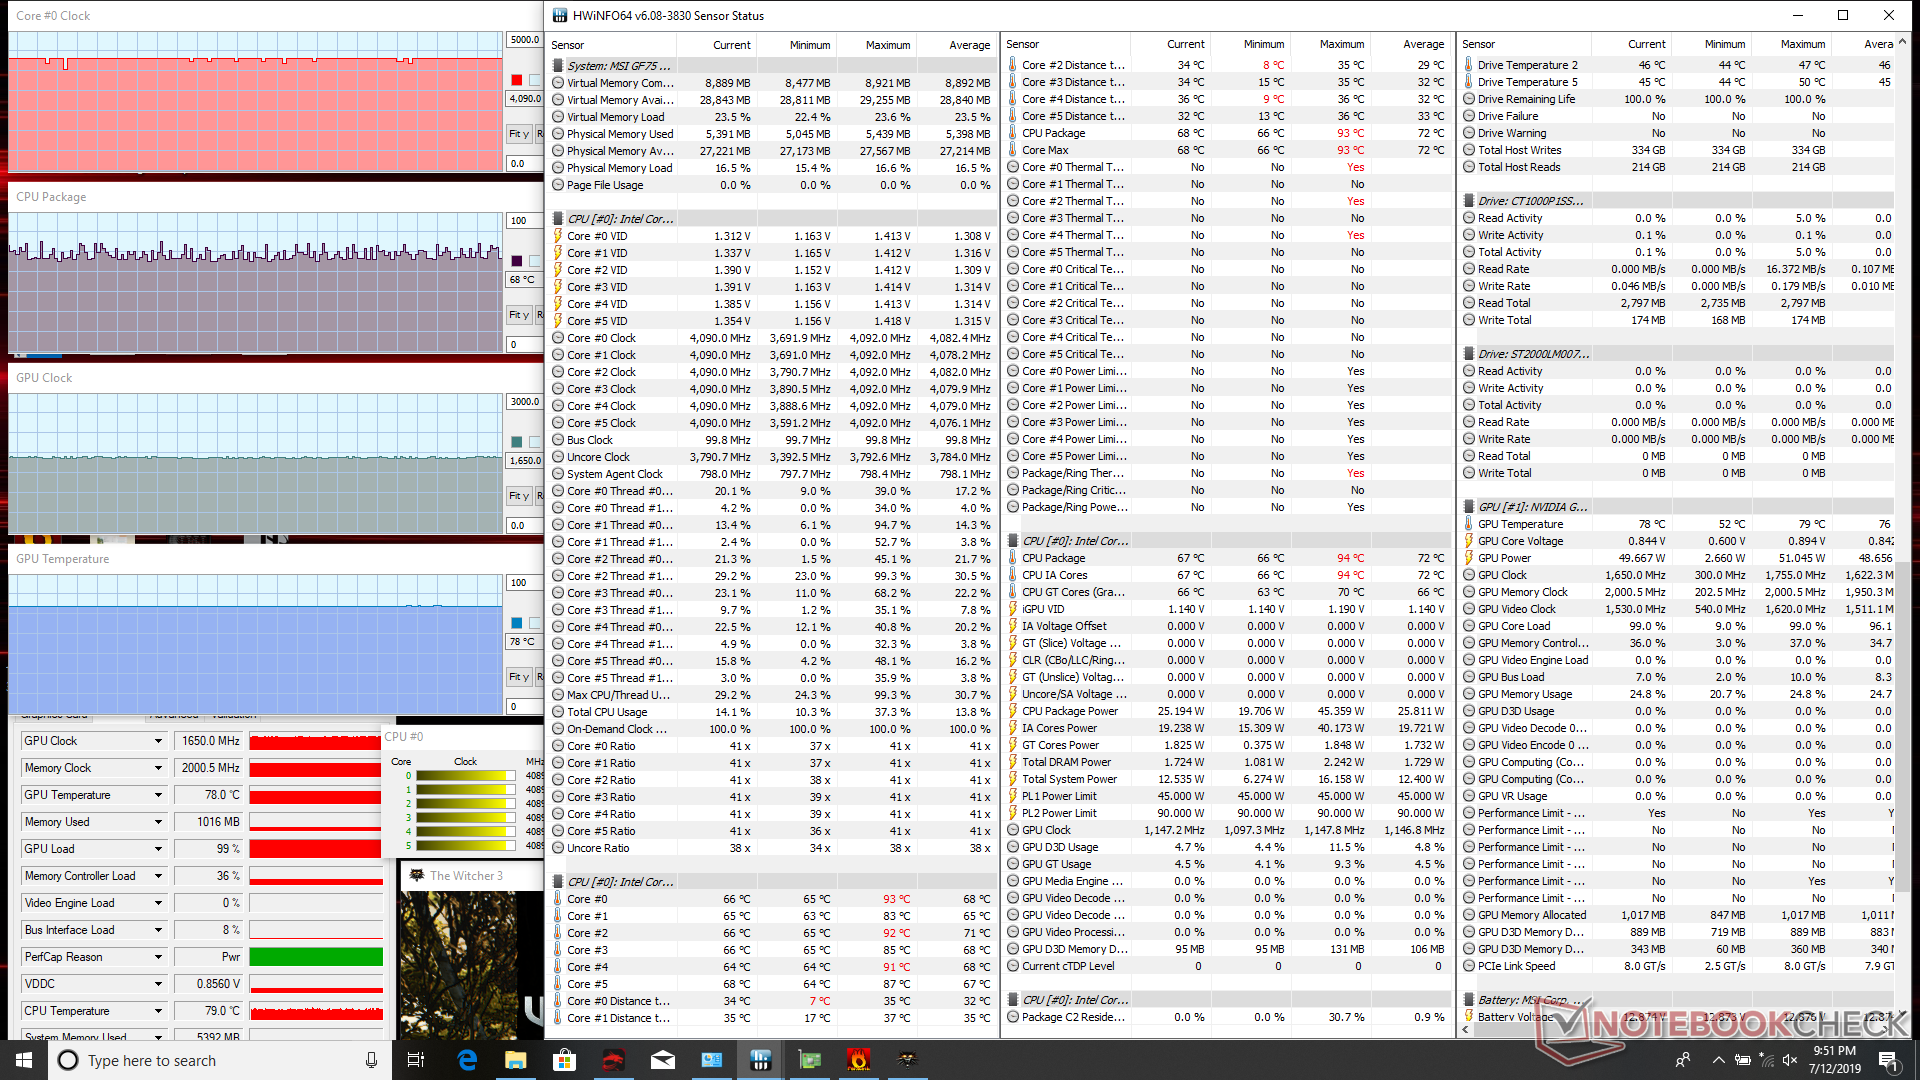
Temperatures
When running Witcher 3, CPU temperatures between the HP and MSI are nearly the same at about 68 C. Meanwhile, the GPU in the HP runs cooler at 64 C vs. 78 C on the MSI. This translates to cooler surface temperatures as well by just a few degrees C.
Display
The BOE panel of the HP has its trade offs when compared to the AUO panel of the MSI. While the former offers faster response times for less ghosting, the latter is brighter and with more accurate colors overall. It's possible to reach the same level of color accuracy on the HP since its reproducible color space is practically the same as the MSI, but this would require an end-user calibration.
Although some gamers will inevitably disagree, we feel that faster response times have priority over color accuracy on gaming laptops especially for faster-paced titles.
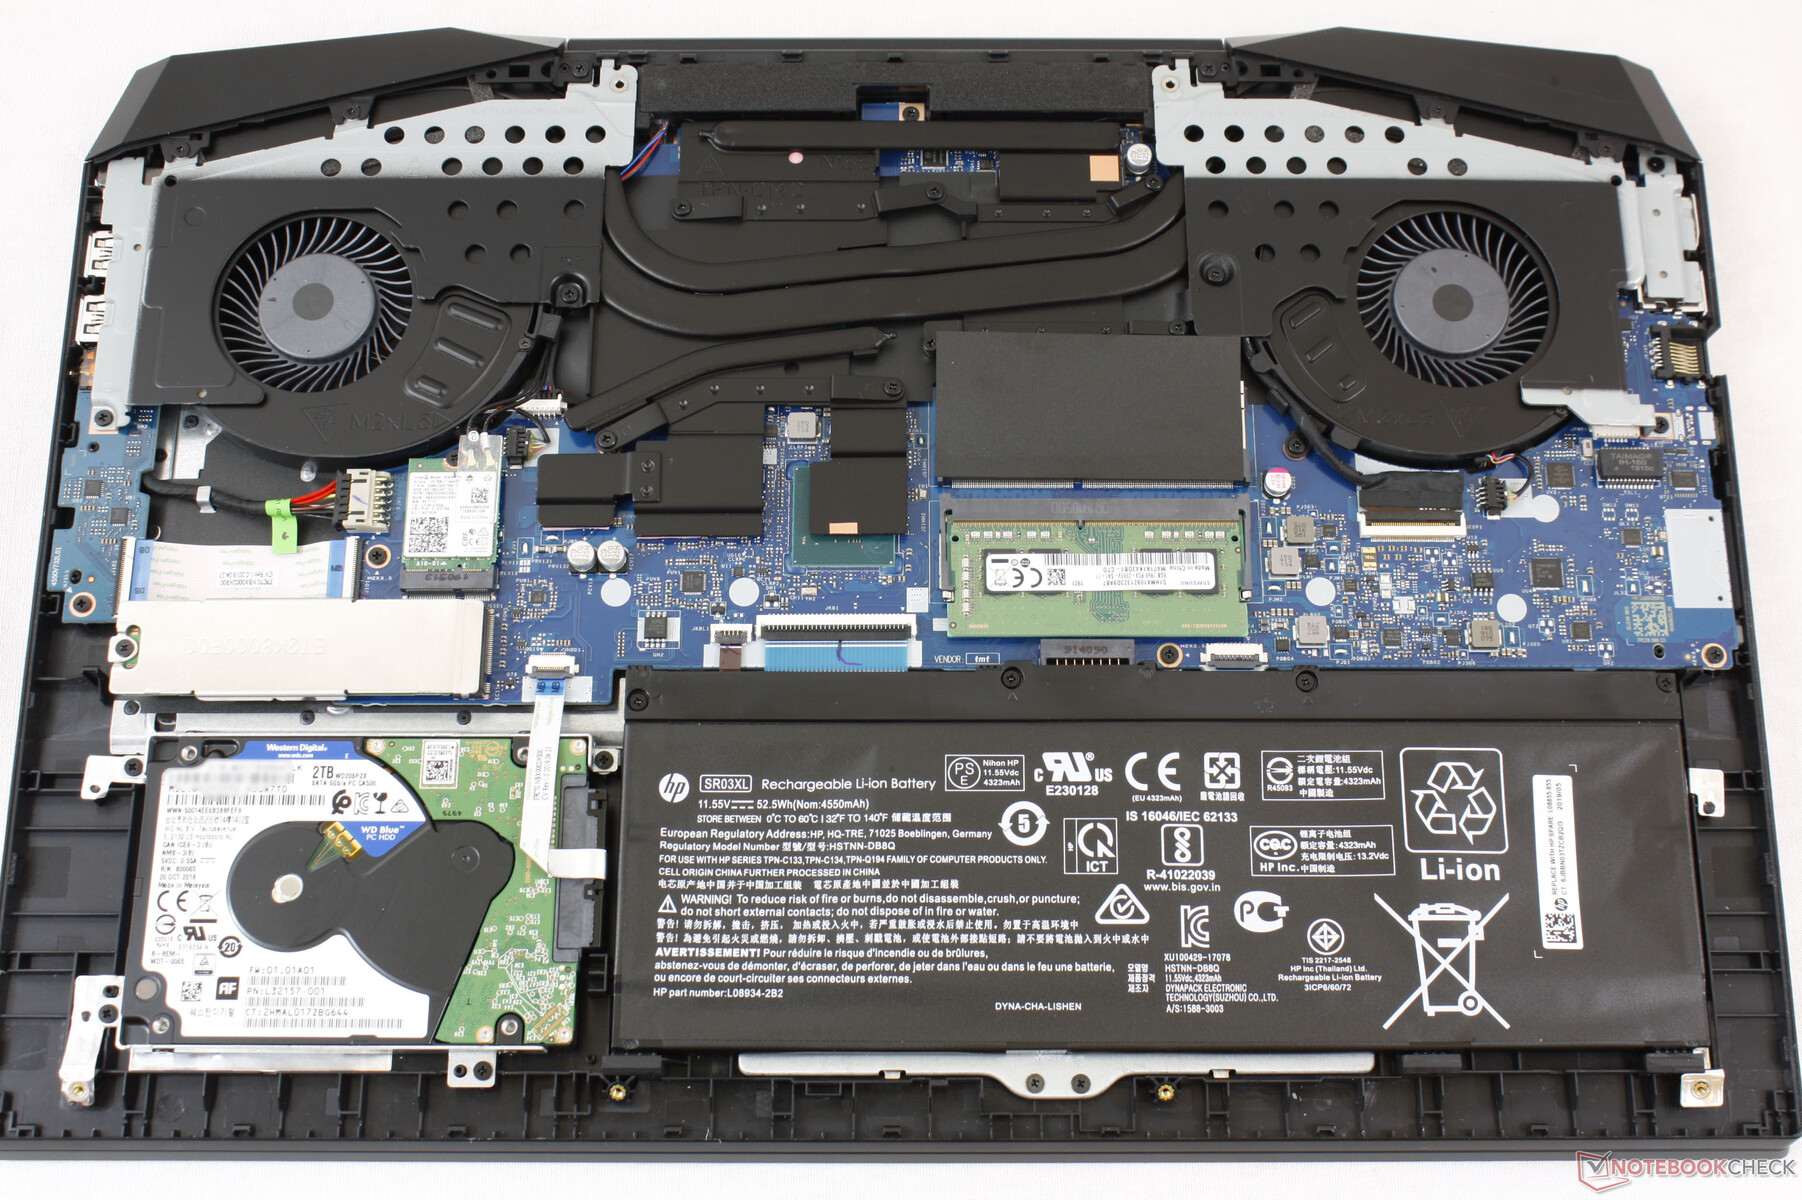
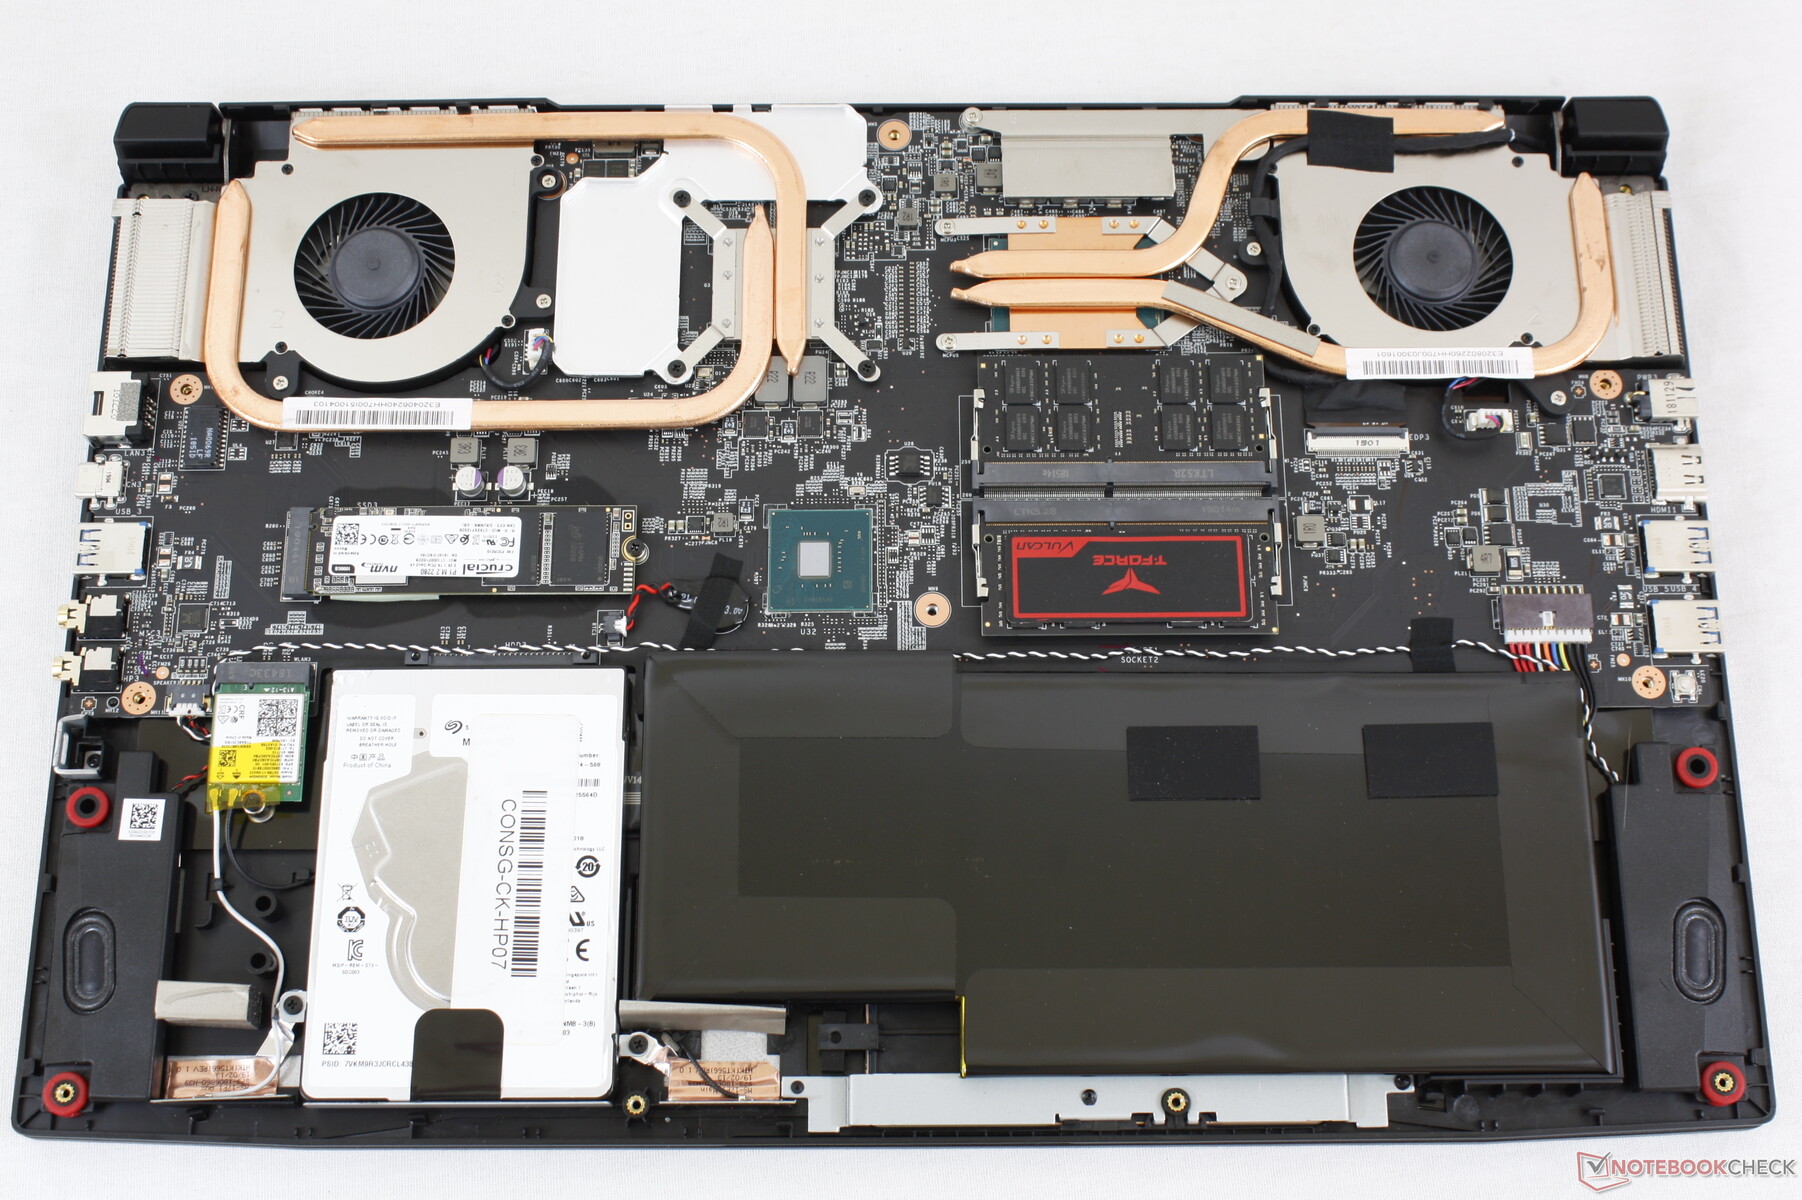
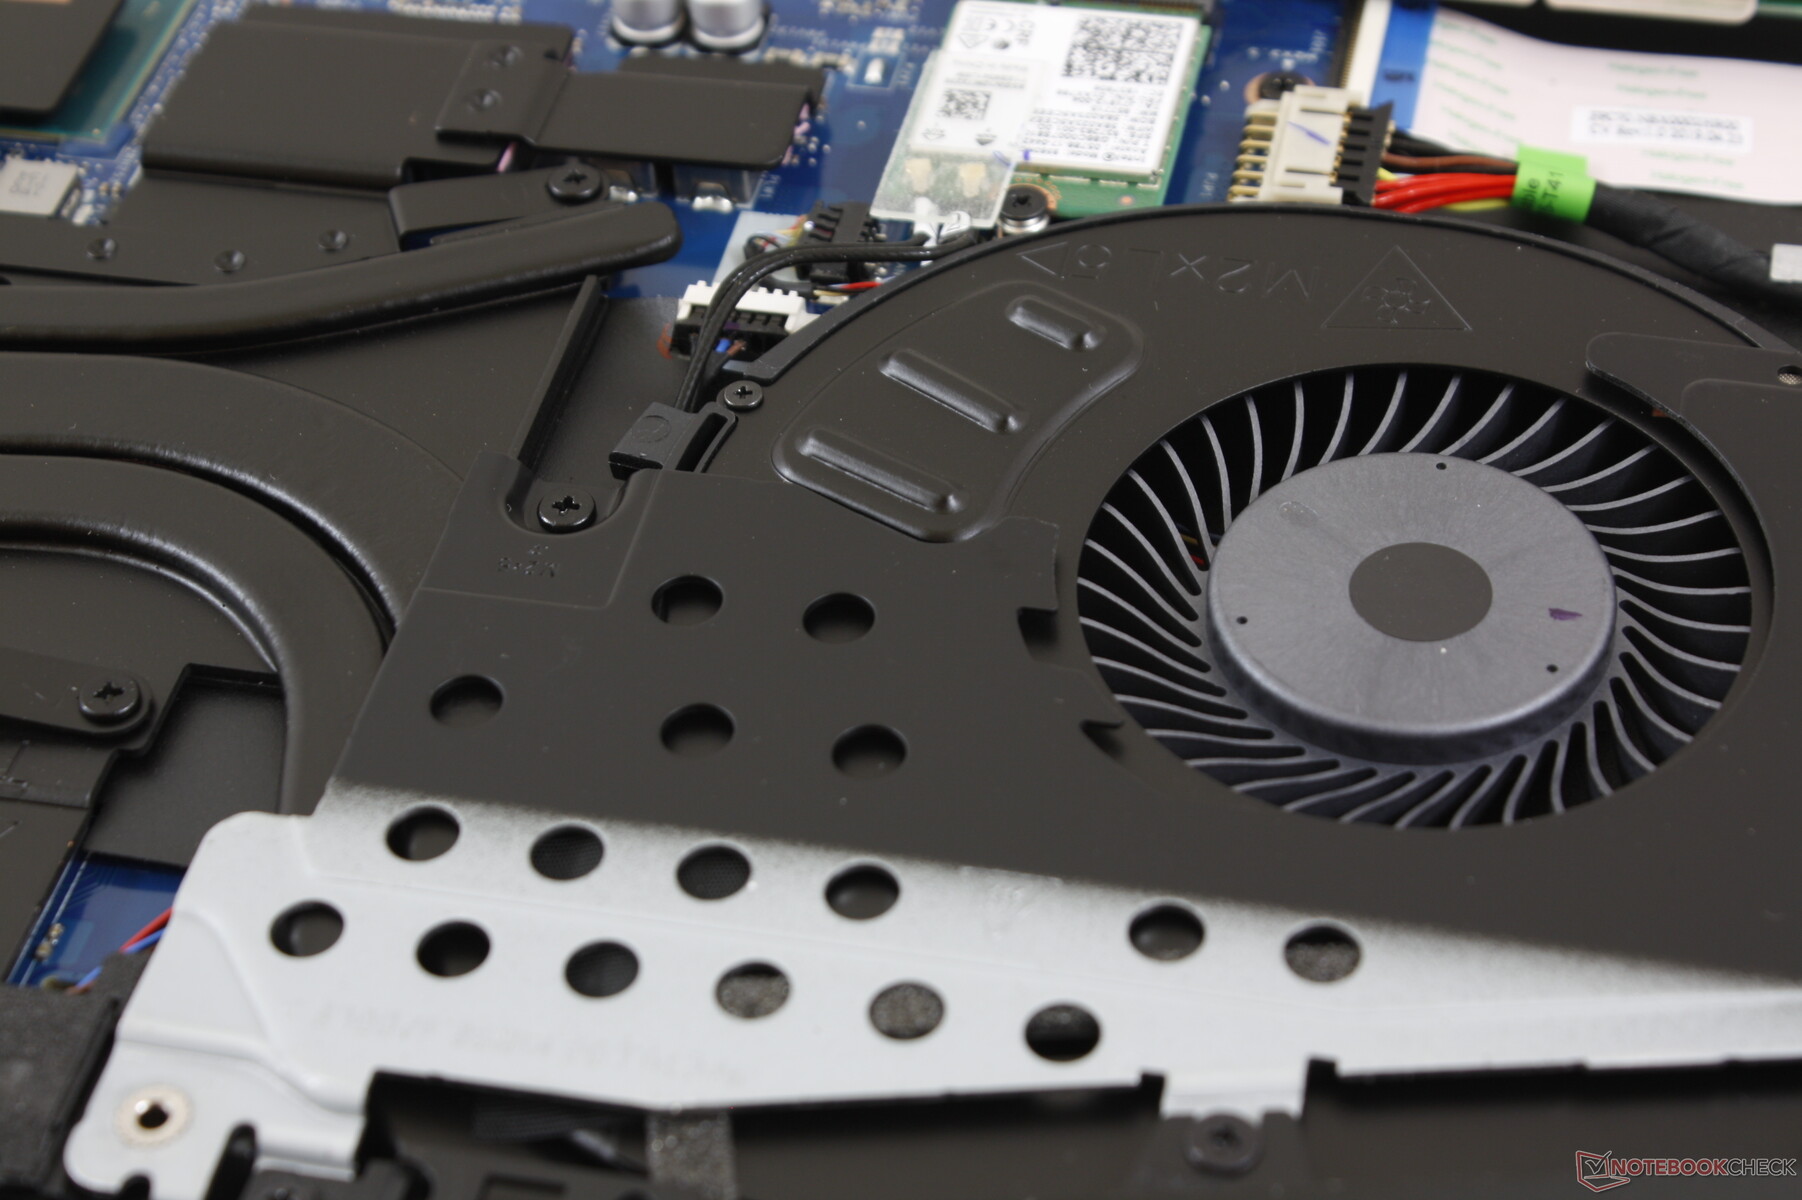
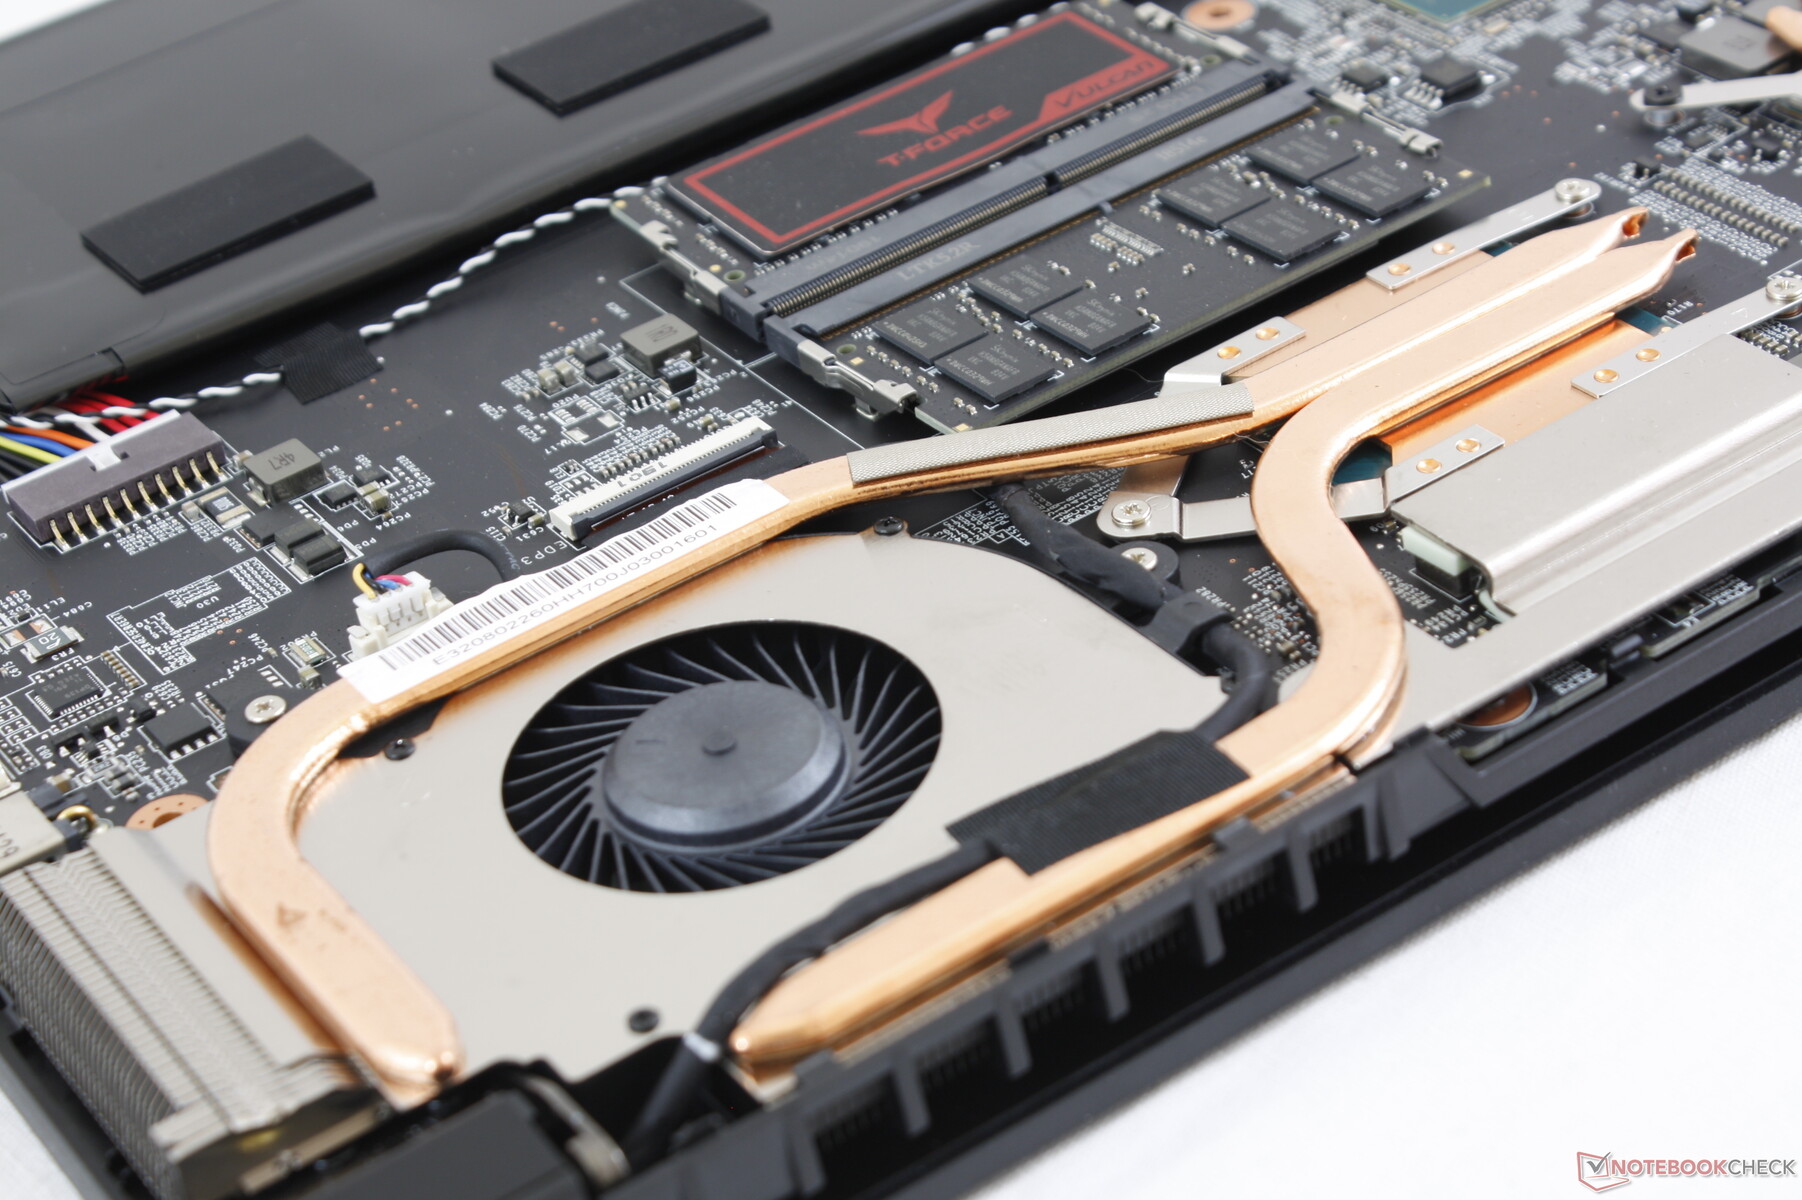
Fan Noise
The Pavilion Gaming 17 is the much quieter system by a wide margin both in and out of gaming. Its fans are more lethargic and less likely to pulse when browsing for a better experience overall. When gaming, fan noise tends to stabilize in the 34.2 to 36.7 dB(A) range compared to almost 41 dB(A) on the MSI. A closer look at their respective cooling solutions reveals that the HP houses larger heat pipes and fans than on the MSI.
Power Consumption
The HP consumes about 2 W more than the MSI when gaming (108 W vs. 106 W) and yet it offers a 40 to 50 percent boost in graphics performance. Needless to say, performance-per-Watt is in HP's favor. Even when not gaming, the HP system manages to be more power efficient overall at <13 W when idling on desktop compared to <25 W on the MSI.
Battery Life
While both laptops have nearly the same same capacities (52.5 Wh vs. 51 Wh), the superior power efficiency of the HP as mentioned above means it can last longer before needing to recharge. We're able to record a WLAN runtime of almost an hour longer on the HP.
Verdict
HP has a long list of advantages over the MSI. Not only does it cost about the same, but it also offers noticeably quieter fans, cooler core temperatures, longer battery life, faster display response times, a stronger chassis design, and a significantly faster GPU. The performance and value winner in this comparison is pretty clear.
The biggest trump card for MSI is its smaller dimensions and much lighter weight. It's half a kilogram lighter, 16 percent brighter, and 16 percent smaller in volume to be easier to carry around and use outdoors. Even so, you'll have to sacrifice a lot along the way for what you gain in portability.
| HP Pavilion Gaming 17 | MSI GF75 9SC | |
|---|---|---|
| Advantages |
|
|
| Cinebench R15 | |
| CPU Single 64Bit | |
| HP Pavilion Gaming 17-cd0085cl | |
| MSI GF75 Thin 9SC | |
| CPU Multi 64Bit | |
| HP Pavilion Gaming 17-cd0085cl | |
| MSI GF75 Thin 9SC | |
| PCMark 10 | |
| Score | |
| HP Pavilion Gaming 17-cd0085cl | |
| MSI GF75 Thin 9SC | |
| Digital Content Creation | |
| HP Pavilion Gaming 17-cd0085cl | |
| MSI GF75 Thin 9SC | |
| Productivity | |
| MSI GF75 Thin 9SC | |
| HP Pavilion Gaming 17-cd0085cl | |
| Essentials | |
| HP Pavilion Gaming 17-cd0085cl | |
| MSI GF75 Thin 9SC | |
| PCMark 8 | |
| Home Score Accelerated v2 | |
| HP Pavilion Gaming 17-cd0085cl | |
| MSI GF75 Thin 9SC | |
| Work Score Accelerated v2 | |
| MSI GF75 Thin 9SC | |
| HP Pavilion Gaming 17-cd0085cl | |
| 3DMark | |
| 1920x1080 Fire Strike Graphics | |
| HP Pavilion Gaming 17-cd0085cl | |
| MSI GF75 Thin 9SC | |
| 2560x1440 Time Spy Graphics | |
| HP Pavilion Gaming 17-cd0085cl | |
| MSI GF75 Thin 9SC | |
| 3840x2160 Fire Strike Ultra Graphics | |
| HP Pavilion Gaming 17-cd0085cl | |
| MSI GF75 Thin 9SC | |
| 3DMark 11 - 1280x720 Performance GPU | |
| HP Pavilion Gaming 17-cd0085cl | |
| MSI GF75 Thin 9SC | |
| HP Pavilion Gaming 17-cd0085cl BOE0825, IPS, 1920x1080 | MSI GF75 Thin 9SC AU Optronics B173HAN04.2, IPS, 1920x1080 | |
|---|---|---|
| Display | ||
| Display P3 Coverage (%) | 63.3 | 62.5 |
| sRGB Coverage (%) | 90.2 | 90 |
| AdobeRGB 1998 Coverage (%) | 64.3 | 64 |
| Response Times | ||
| Response Time Grey 50% / Grey 80% * (ms) | 31.6 ? | 34 ? |
| Response Time Black / White * (ms) | 19.6 ? | 30.4 ? |
| PWM Frequency (Hz) | ||
| Screen | ||
| Brightness middle (cd/m²) | 299.6 | 344.7 |
| Brightness (cd/m²) | 285 | 332 |
| Brightness Distribution (%) | 86 | 91 |
| Black Level * (cd/m²) | 0.33 | 0.3 |
| Contrast (:1) | 908 | 1149 |
| Colorchecker dE 2000 * | 3.68 | 3.08 |
| Colorchecker dE 2000 max. * | 8.05 | 6.32 |
| Colorchecker dE 2000 calibrated * | 3.15 | 2.94 |
| Greyscale dE 2000 * | 3.8 | 3.8 |
| Gamma | 2.12 104% | 2.17 101% |
| CCT | 7240 90% | 7284 89% |
| Color Space (Percent of AdobeRGB 1998) (%) | 58.1 | 58 |
| Color Space (Percent of sRGB) (%) | 89.8 | 89.6 |
| Total Average (Program / Settings) |
* ... smaller is better
| HP Pavilion Gaming 17-cd0085cl i7-9750H, GeForce GTX 1660 Ti Max-Q | MSI GF75 Thin 9SC i7-9750H, GeForce GTX 1650 Mobile | |
|---|---|---|
| Noise | ||
| off / environment * (dB) | 28.2 | 28.2 |
| Idle Minimum * (dB) | 30.1 | 33.6 |
| Idle Average * (dB) | 30.1 | 33.6 |
| Idle Maximum * (dB) | 30.1 | 33.8 |
| Load Average * (dB) | 34.2 | 37.2 |
| Witcher 3 ultra * (dB) | 34.2 | 40.6 |
| Load Maximum * (dB) | 43.8 | 44.4 |
* ... smaller is better
| HP Pavilion Gaming 17-cd0085cl i7-9750H, GeForce GTX 1660 Ti Max-Q, 52.5 Wh | MSI GF75 Thin 9SC i7-9750H, GeForce GTX 1650 Mobile, 51 Wh | |
|---|---|---|
| Battery runtime | ||
| Reader / Idle (h) | 11.6 | |
| WiFi v1.3 (h) | 5.7 | 4.7 |
| Load (h) | 1 |
| HP Pavilion Gaming 17-cd0085cl i7-9750H, GeForce GTX 1660 Ti Max-Q | MSI GF75 Thin 9SC i7-9750H, GeForce GTX 1650 Mobile | |
|---|---|---|
| Power Consumption | ||
| Idle Minimum * (Watt) | 5.4 | 6.1 |
| Idle Average * (Watt) | 9.2 | 11.2 |
| Idle Maximum * (Watt) | 13 | 24.5 |
| Load Average * (Watt) | 85.9 | 94.7 |
| Witcher 3 ultra * (Watt) | 107.9 | 105.8 |
| Load Maximum * (Watt) | 182.2 | 192.2 |
* ... smaller is better
Update by Klaus Hinum: Clarified the weight and size differences, made updates to the wording
Source(s)
