ASUS ROG Strix SCAR III G531GW (Core i9-9880H, RTX 2070) Laptop Review

ASUS sells countless gaming laptops under its Republic of Gamers (ROG) brand, which should suit just about any budget. The company caters for the premium market with the likes of the ROG G703GX right down to the sub-$1,000 ROG Zephyrus G GA502DU. All models share a striking design language, and they should handle most triple-A titles comfortably in at least 1080p. Somewhere in between is the ROG Strix SCAR III, a 15.6-inch gaming laptop that comes with up to an Intel Core i9-9880H processor, an NVIDIA GeForce RTX 2070 GPU and 32 GB of RAM. Our review unit is the G531GW, which comes with all those components along with a 1 TB Intel 660p SSD.
We have chosen to compare the G531GW against other comparably priced and equipped gaming laptops. Our comparison devices will include the Aorus 15 X9, Gigabyte Aero 15-X9, MSI GE75 Raider 8SF and Schenker XMG Neo 17. You can also add additional laptops into each of our comparison tables below, for reference.
Case
ASUS has built the ROG Strix SCAR III with a mostly plastic design, to which it incorporates several textures and finishes. The plastic is surprisingly sturdy, which gives our review unit a premium feel to it. The base unit is impressively robust too, with only the lid giving way slightly when we open or close it with one hand.
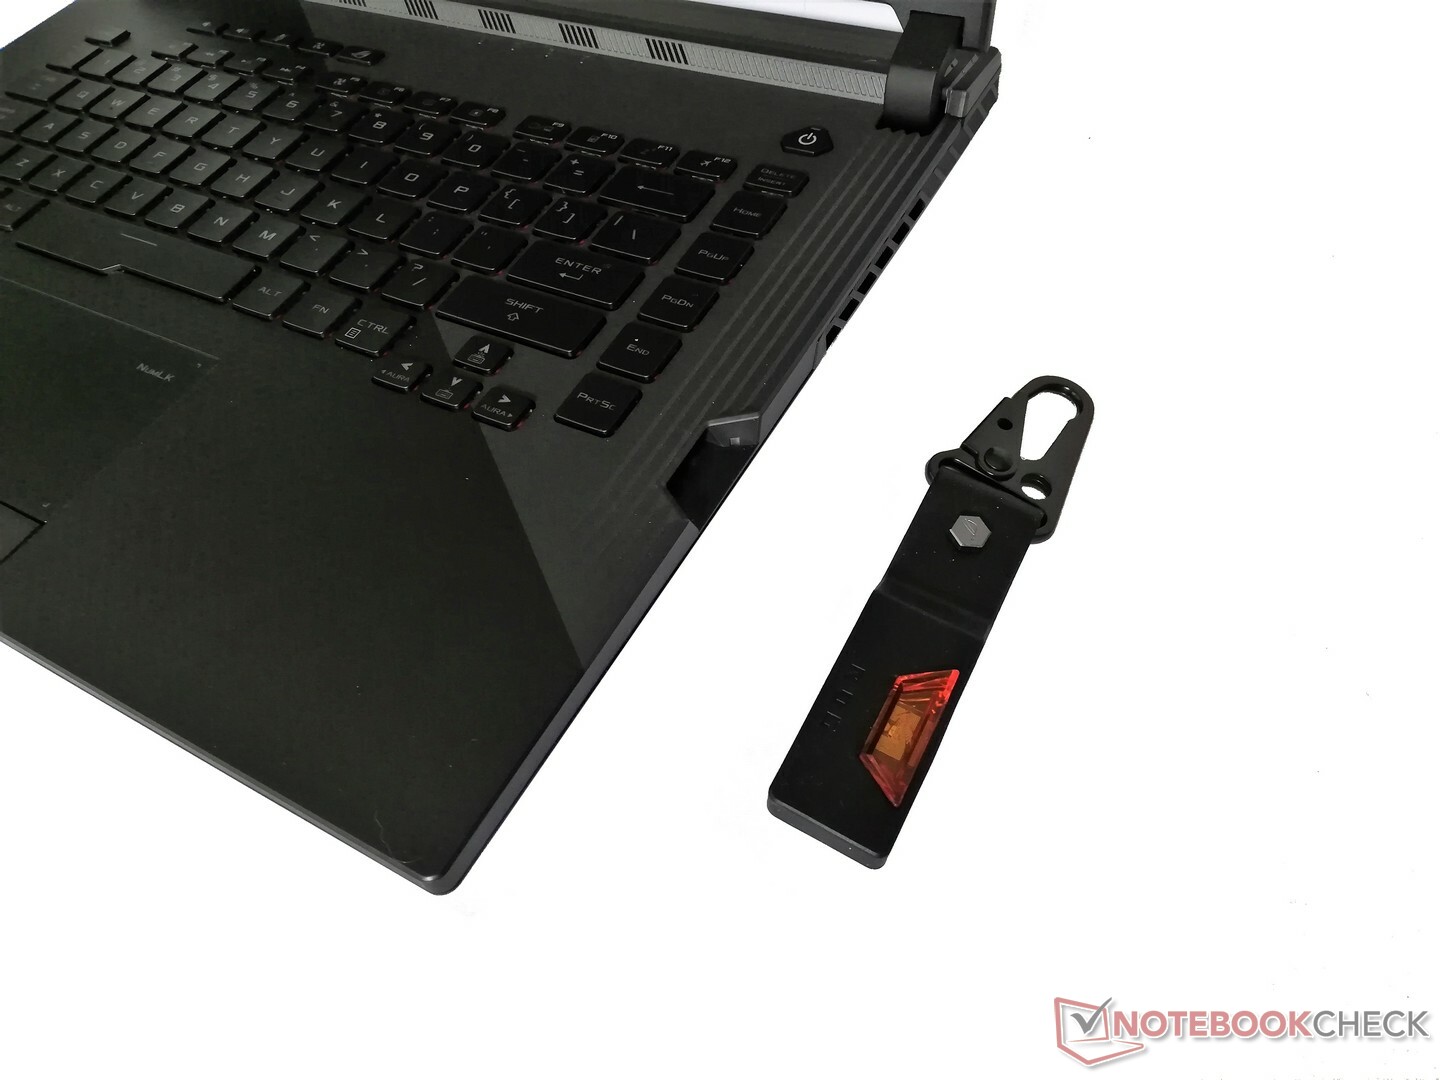
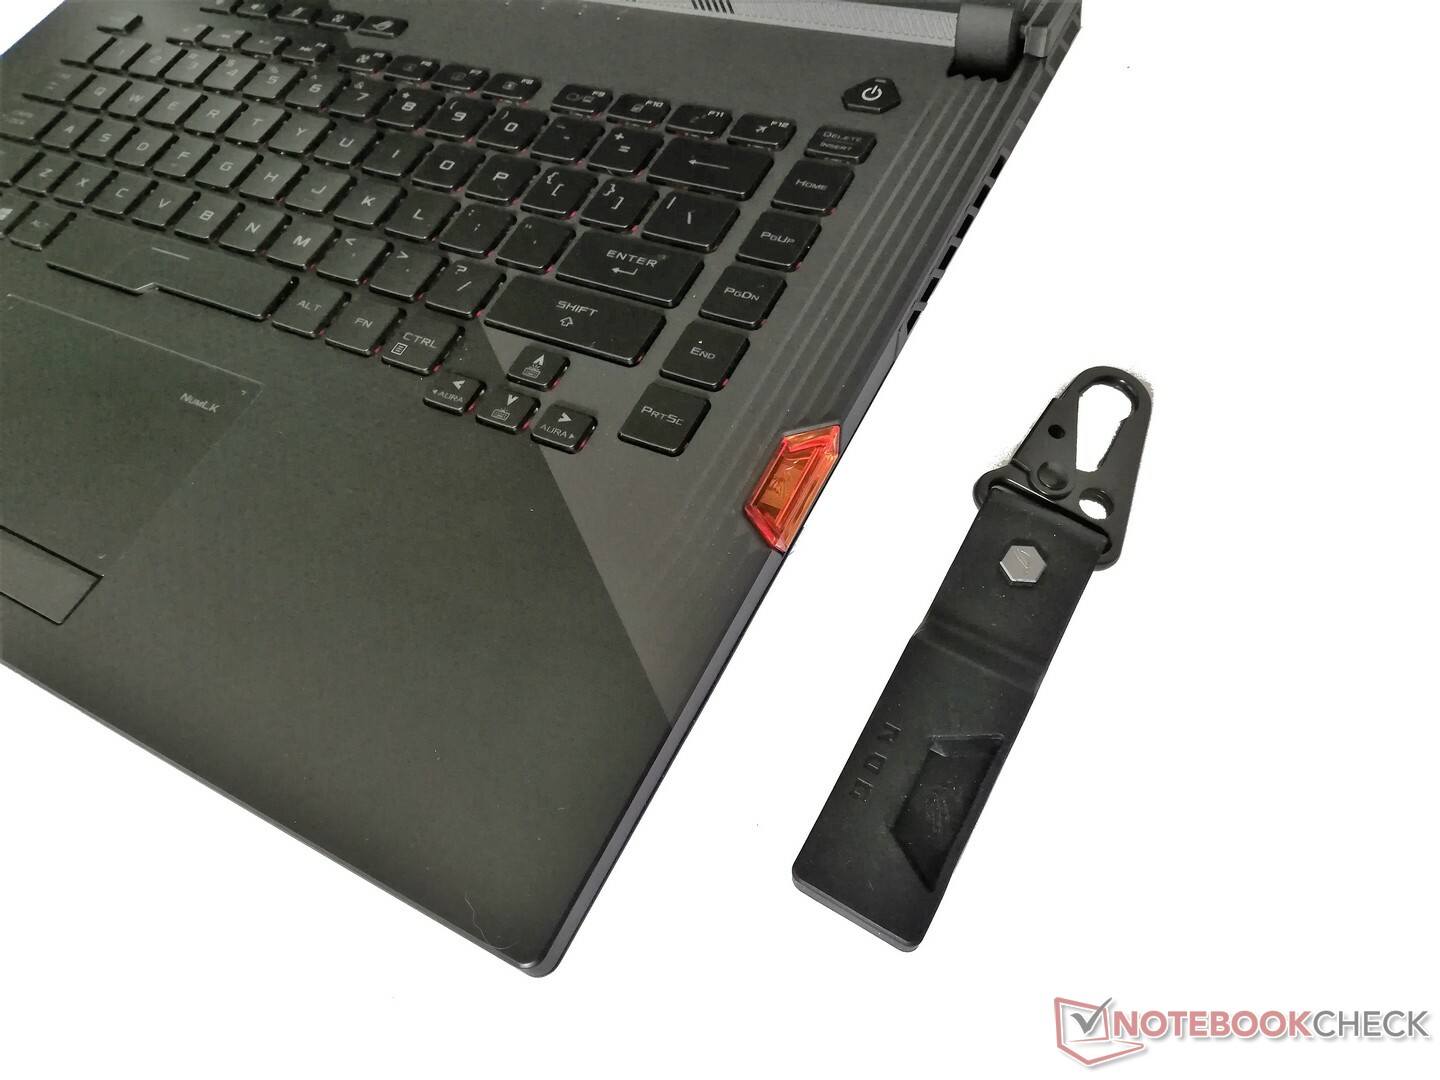
The G531GW not only has an RGB backlit keyboard, but also an RGB LED strip around the edge of its bottom case. There is an indent for the removable Keystone security chip, which also lights up when inserted.
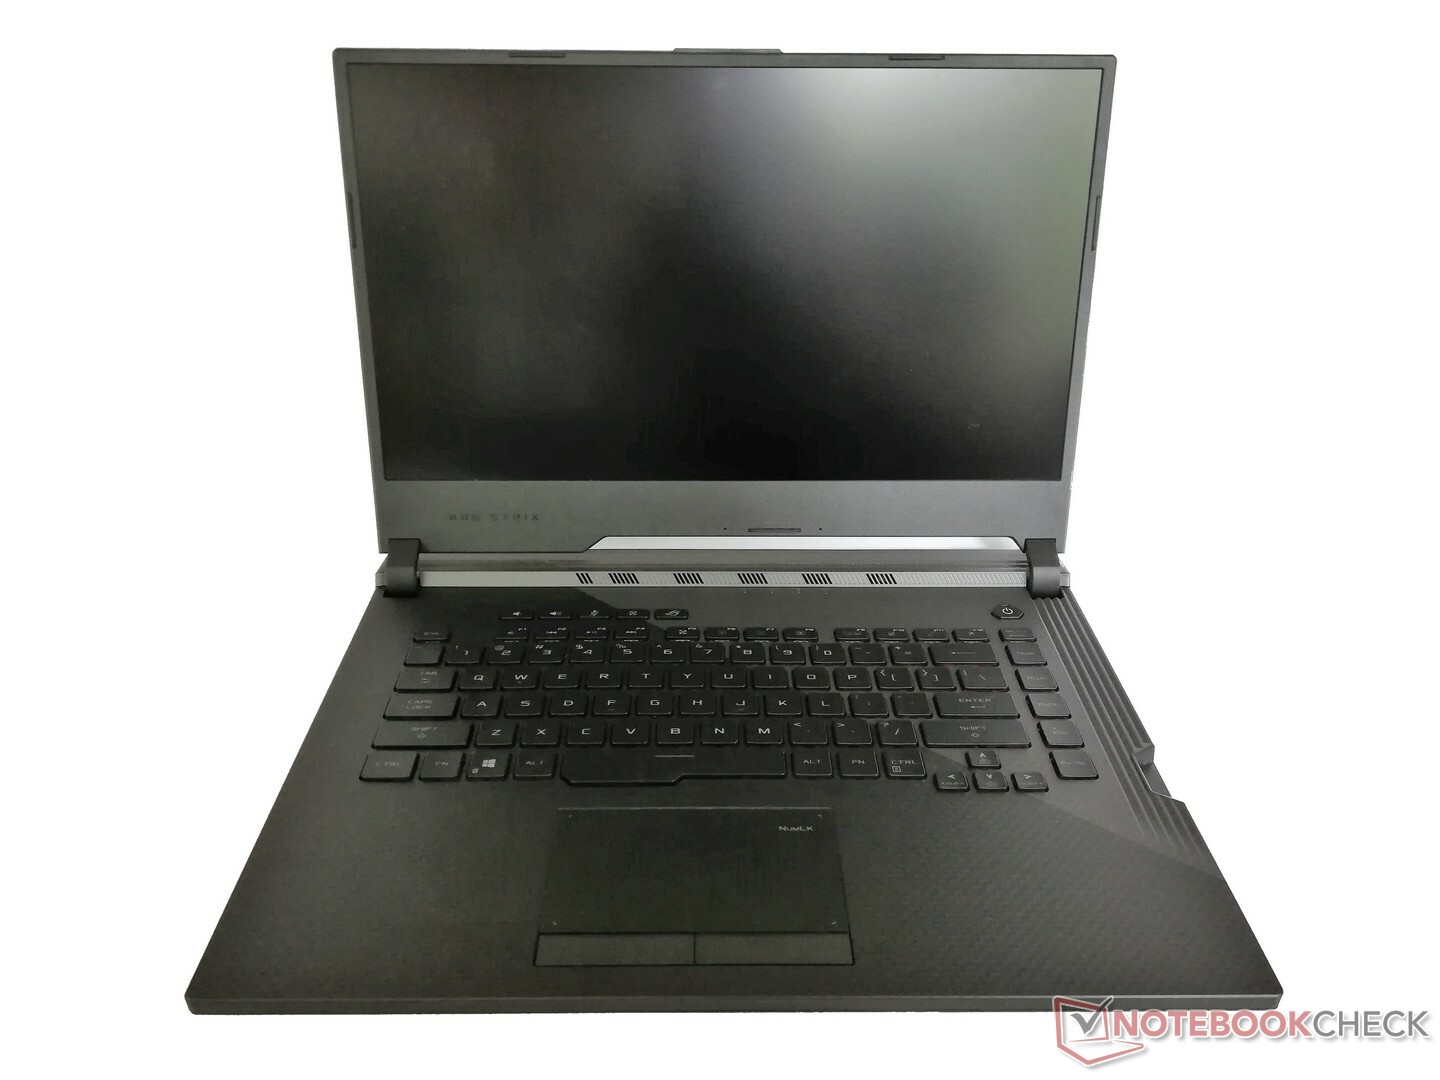
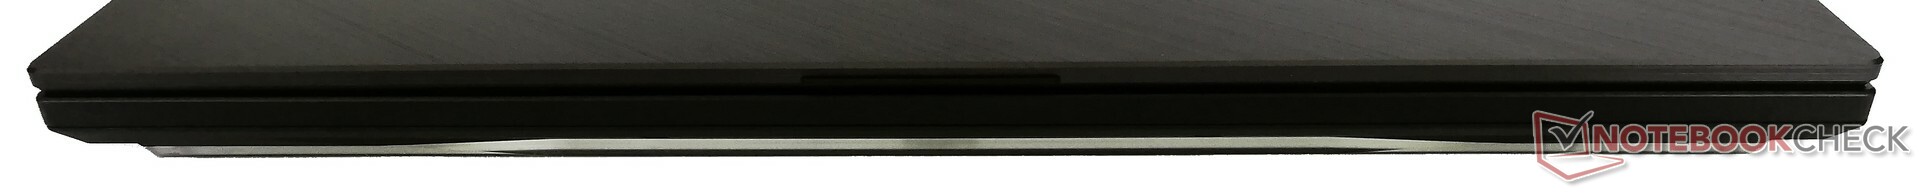
The G531GW is comparably compact for a 15.6-inch gaming laptop thanks to its narrow display bezels. It is deeper than our comparison devices though at 275 mm (~10.8 in). However, only the Aero 15-X9 is lighter than our review unit.
Connectivity
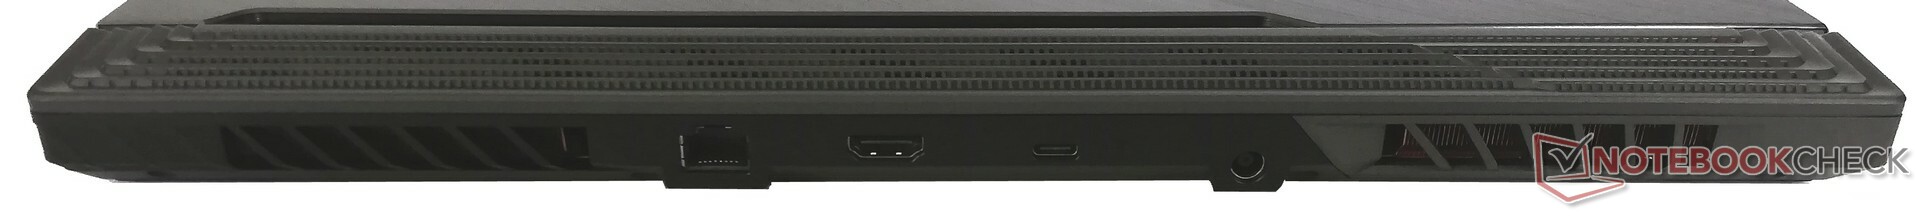
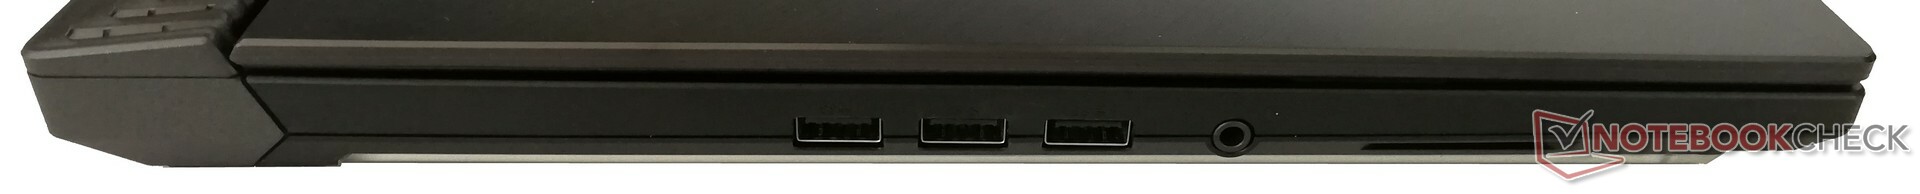
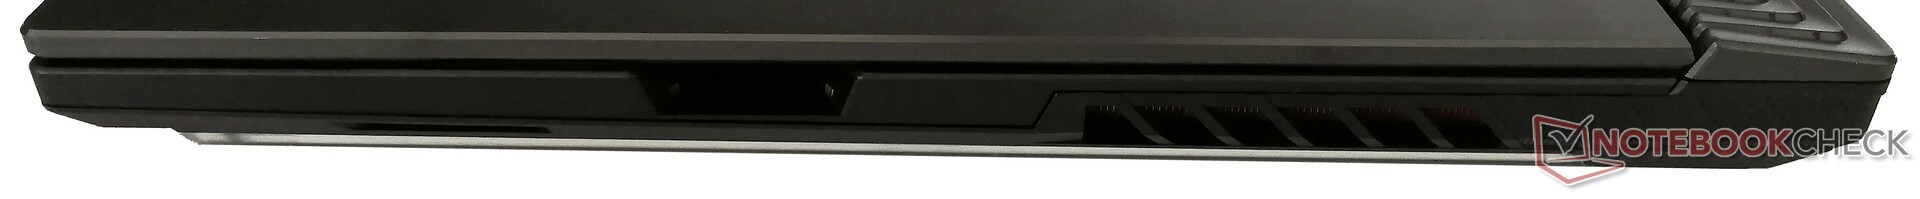
The G531GW has a rock solid selection of ports that should prevent most people from resorting to using dongles or docks. You can connect the latter by USB Type-C should you need to though. The Type-C port also supports DisplayPort if you have the appropriate adapter. The G531GW has an HDMI 2.0b port too, which can output in 4K at 60 Hz. Sadly, ASUS has not included a card reader, which would have been useful.
Communication
ASUS has equipped our review unit with an Intel Wireless-AC 9560 module, which supports Bluetooth 5.0 and up to IEEE 802.11 ac Wi-Fi. Our review unit achieved excellent transfer speeds in our iperf3 Client Wi-Fi tests with our Linksys EA8500 reference router thanks to its 2x2 MIMO antenna. The G531GW finished top of our download test and third in our upload test, but our comparison tables are tightly packed with only a maximum spread of only 10% between devices.
| Networking | |
| iperf3 transmit AX12 | |
| MSI GE75 8SF | |
| Gigabyte Aero 15-X9 | |
| Asus Strix Scar III G531GW | |
| Schenker XMG Neo 17 | |
| Aorus 15 X9 | |
| iperf3 receive AX12 | |
| Asus Strix Scar III G531GW | |
| Gigabyte Aero 15-X9 | |
| Schenker XMG Neo 17 | |
| MSI GE75 8SF | |
| Aorus 15 X9 | |
Security
ASUS has incorporated several security features within the G531GW. The company has included password protection at boot within the BIOS along with a removable Keystone chip. The latter not only stores your user profile with corresponding RGB settings, but it also decrypts an existing Shadow Drive when it is plugged into your machine. Keystone re-encrypts the data when removed to protect against unauthorised access.
Accessories
ASUS does not currently offer any ROG Strix SCAR III specific accessories other than those included with the device. The company does sell generic gaming and travel accessories such as keyboards, mice and bags though.
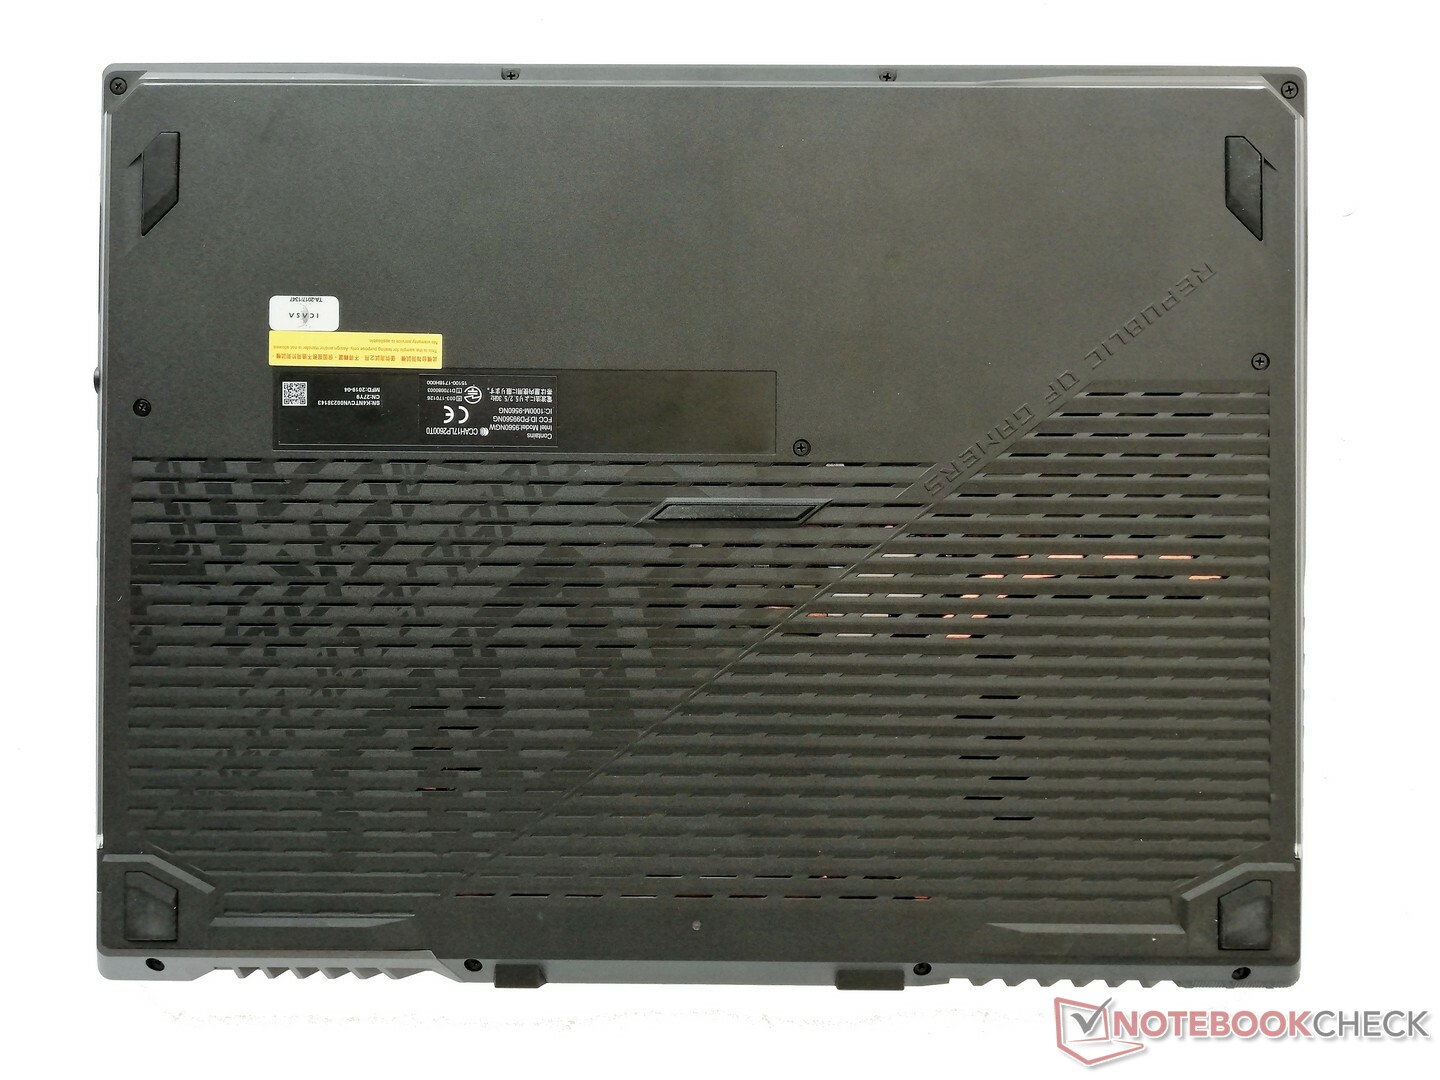
Maintenance
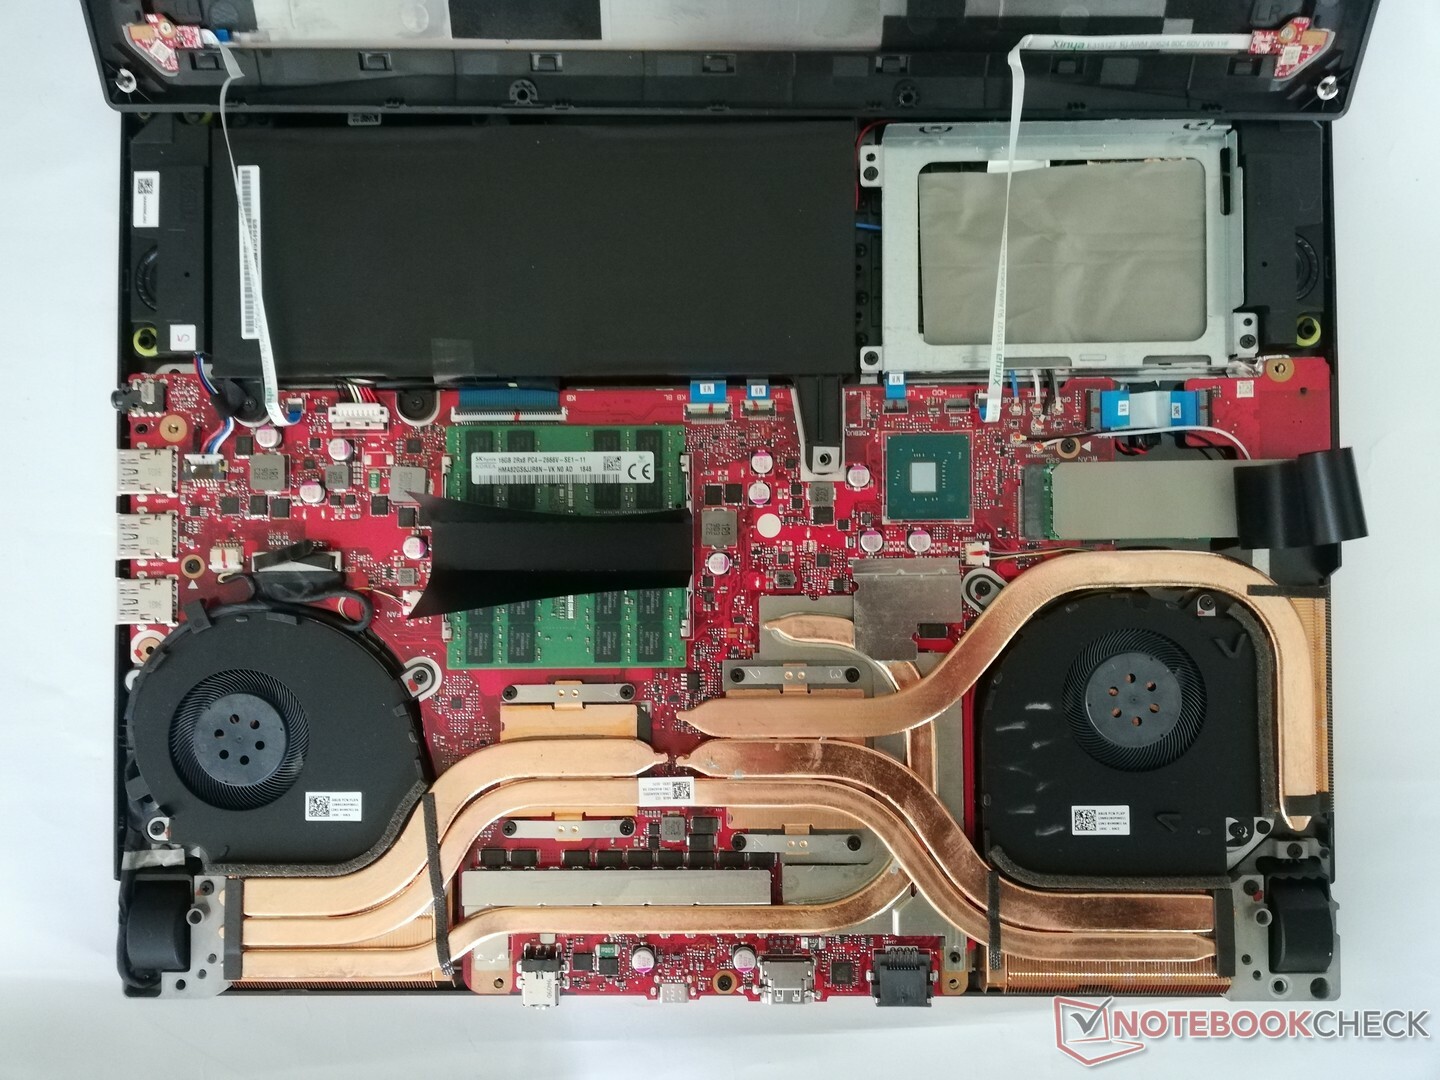
The G531GW is easy to maintain and repair. Only a few screws hold the bottom plate in place, the removal of which gives access to all internal components. The battery, RAM, SSD and Wi-Fi module are all easy to swap out, while you can maintain the cooling system too. Additionally, ASUS has included a spare 2.5-inch drive bay, to which you can connect a SATA drive should you need more storage. The company pre-installs the mounting cage and drive cable too.
Warranty
The G531GW comes with 24 months manufacturer’s warranty. Please see our Guarantees, Return Policies & Warranties FAQ for country-specific information.
Input Devices
Keyboard
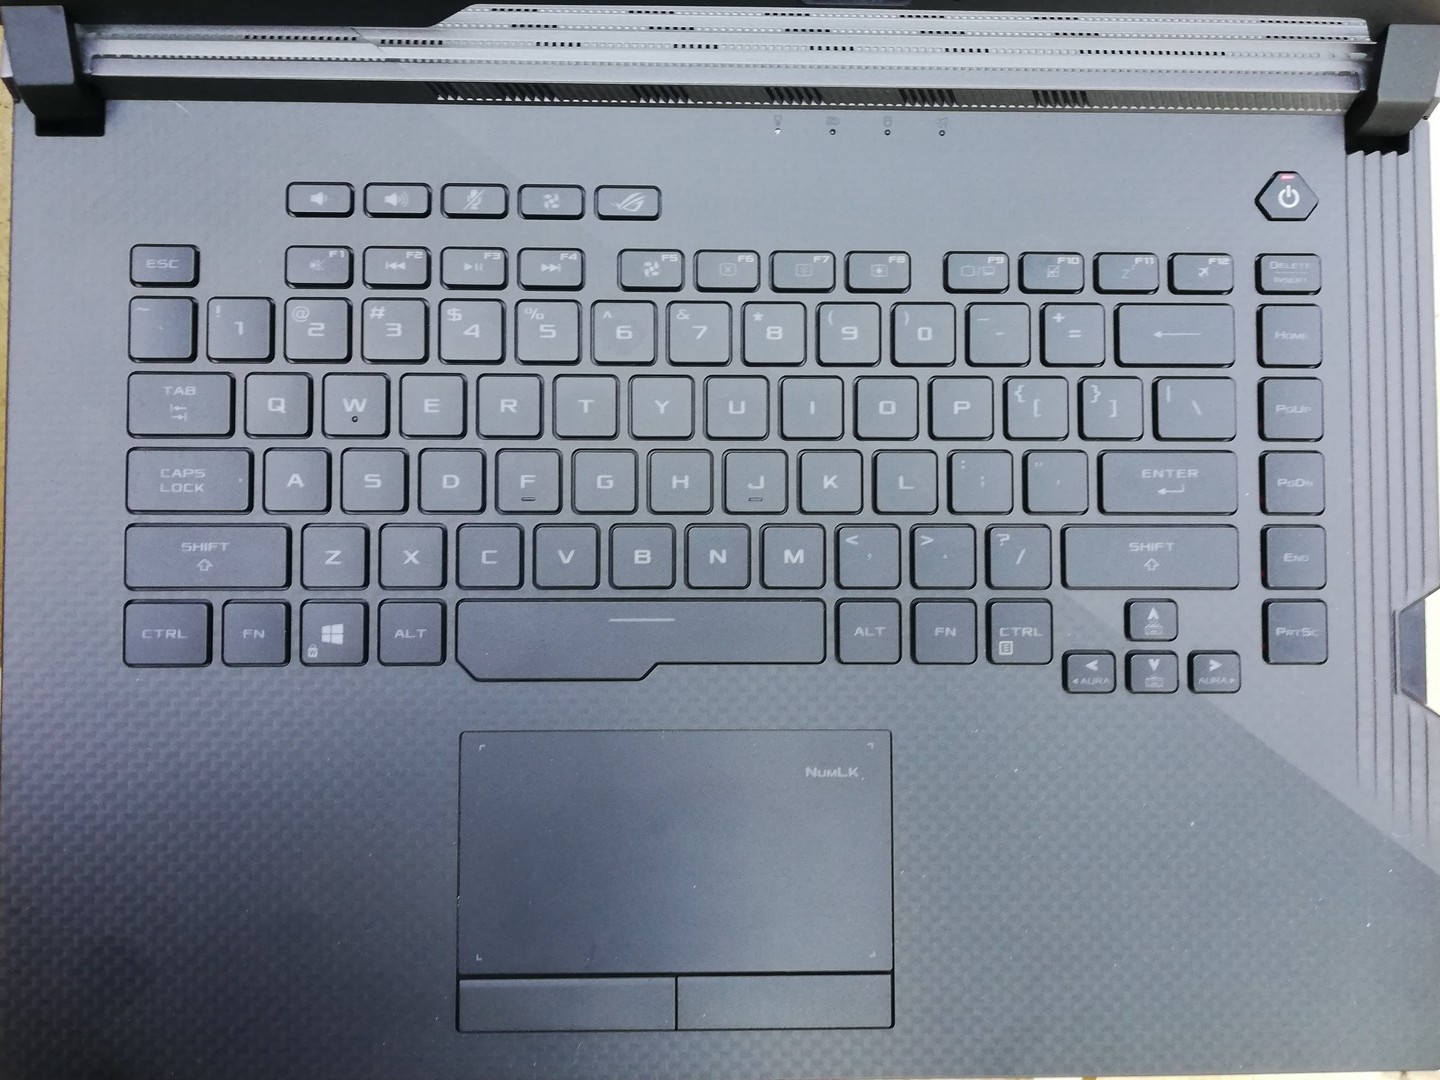
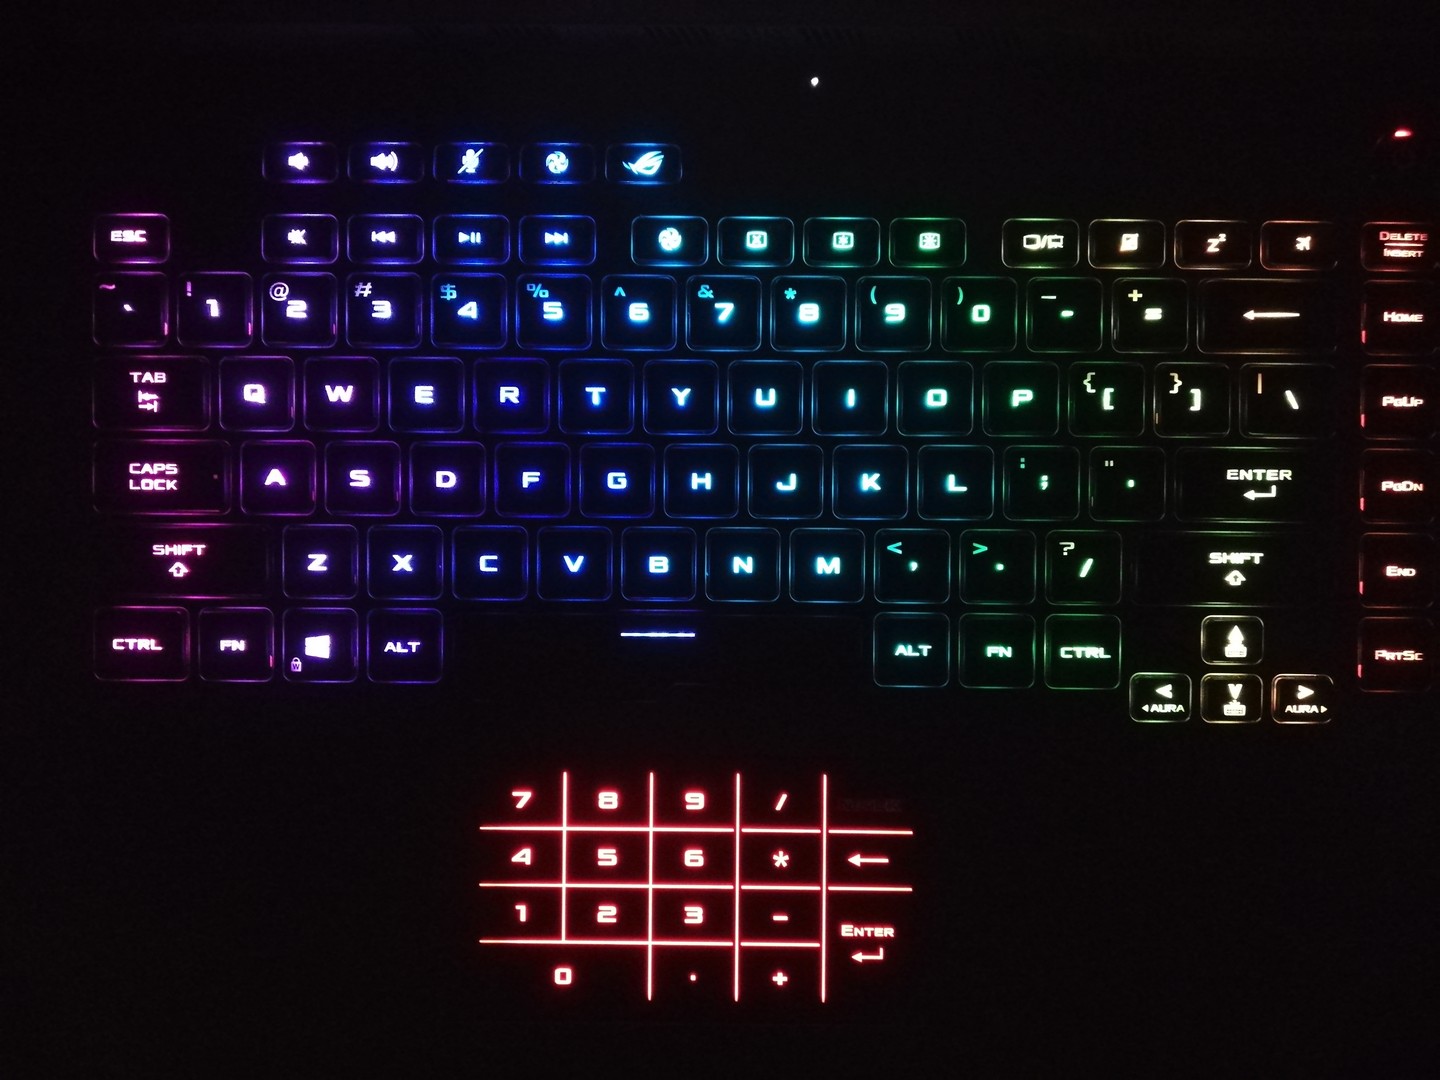
The keyboard on the G531GW is likely to divide opinion. ASUS has included half-sized arrow keys, while the omission of a physical number pad will probably annoy some people. The company has printed the keys with pale lettering too that can be difficult to read in bright environments. The Function key numbers are also not backlit, which is an odd decision.
The keys have a soft touch finish and noticeable pressure points, which makes the G531GW suitable for prolonged typing sessions and for working in noise-sensitive environments. The surface of the keys is grippy too, so you should not find your fingers slipping from key to key when typing. The RGB keyboard backlighting is ubiquitous for gaming laptops, but it is a shame to see ASUS include zonal lighting rather than the individually backlit keys that other OEMs include on their gaming laptops.
Trackpad
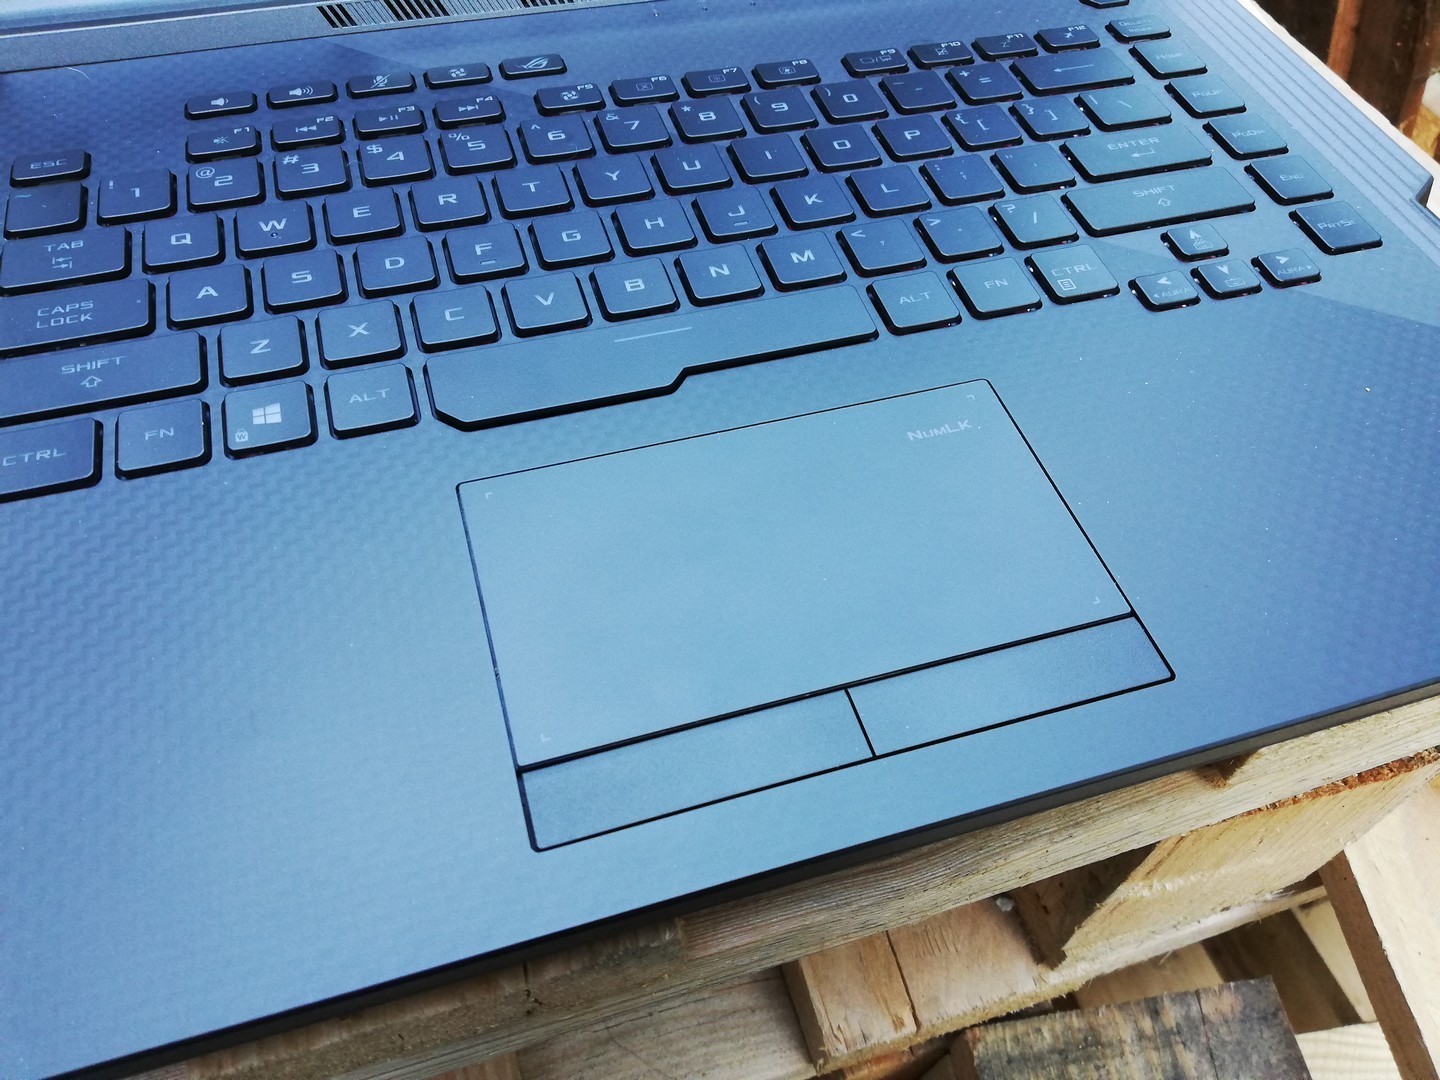
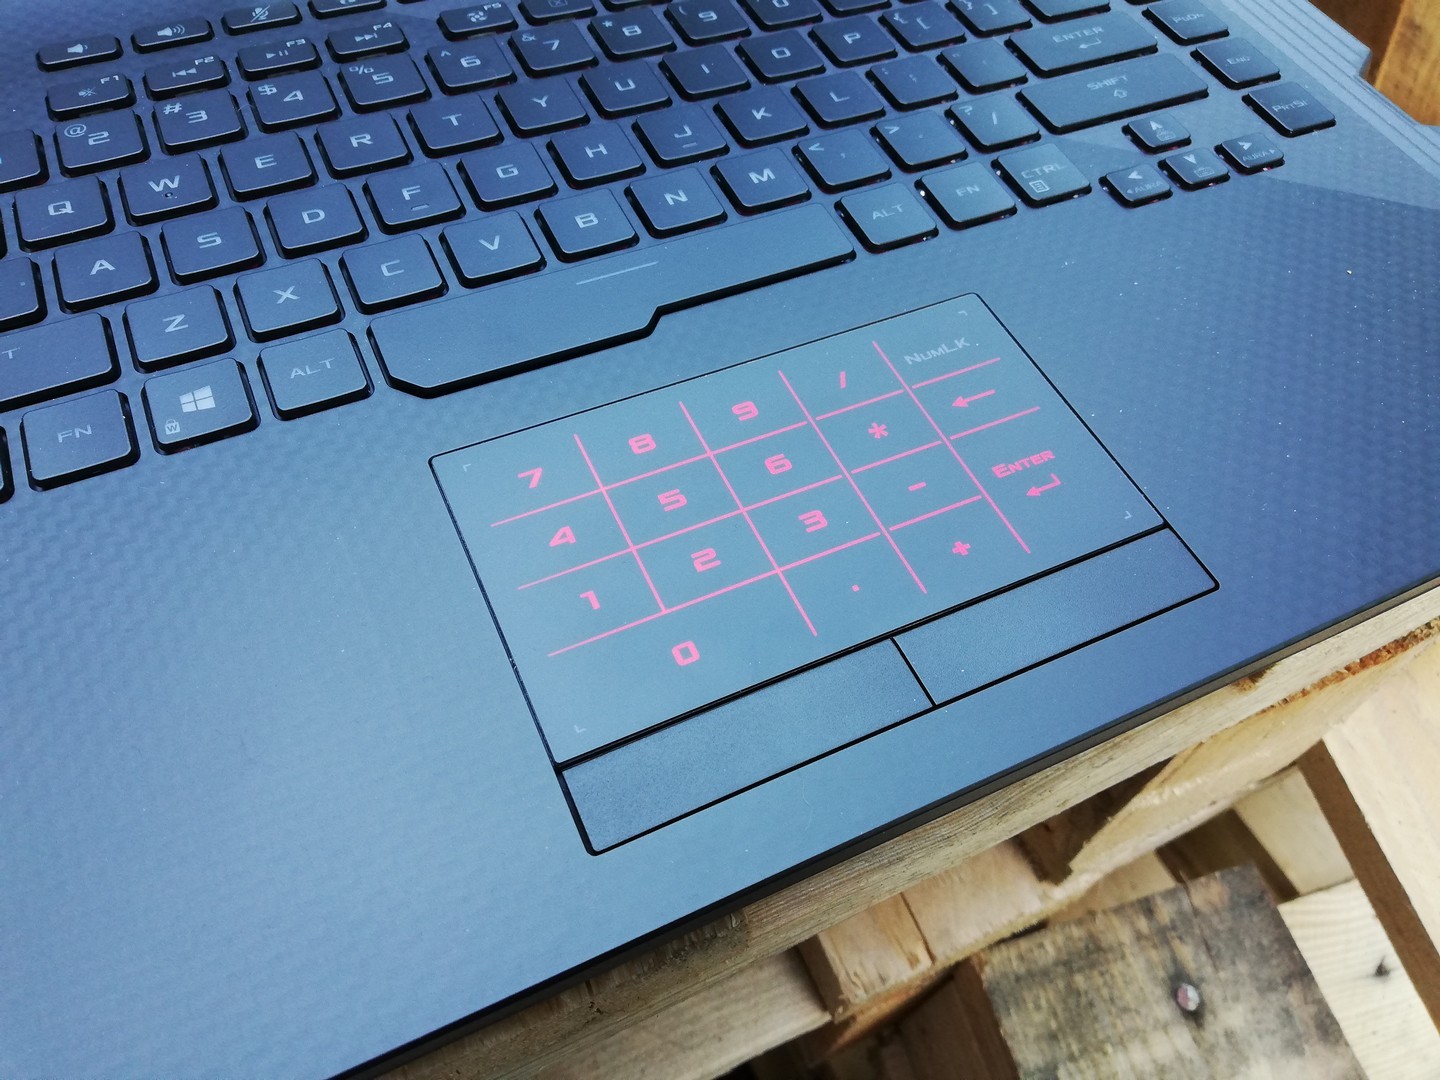
The trackpad in our review unit has a smooth finish that works reliably and accurately even with wet fingers. ASUS has integrated a number pad too, which you can access by long pressing on the upper right-hand corner of the trackpad. You can only use the trackpad as a number pad with this mode enabled, but it works well enough.
ASUS has integrated two dedicated mouse buttons too, which emit a soft clicking sound when pressed. The buttons have pronounced pressure points and worked reliably during our tests.
Display
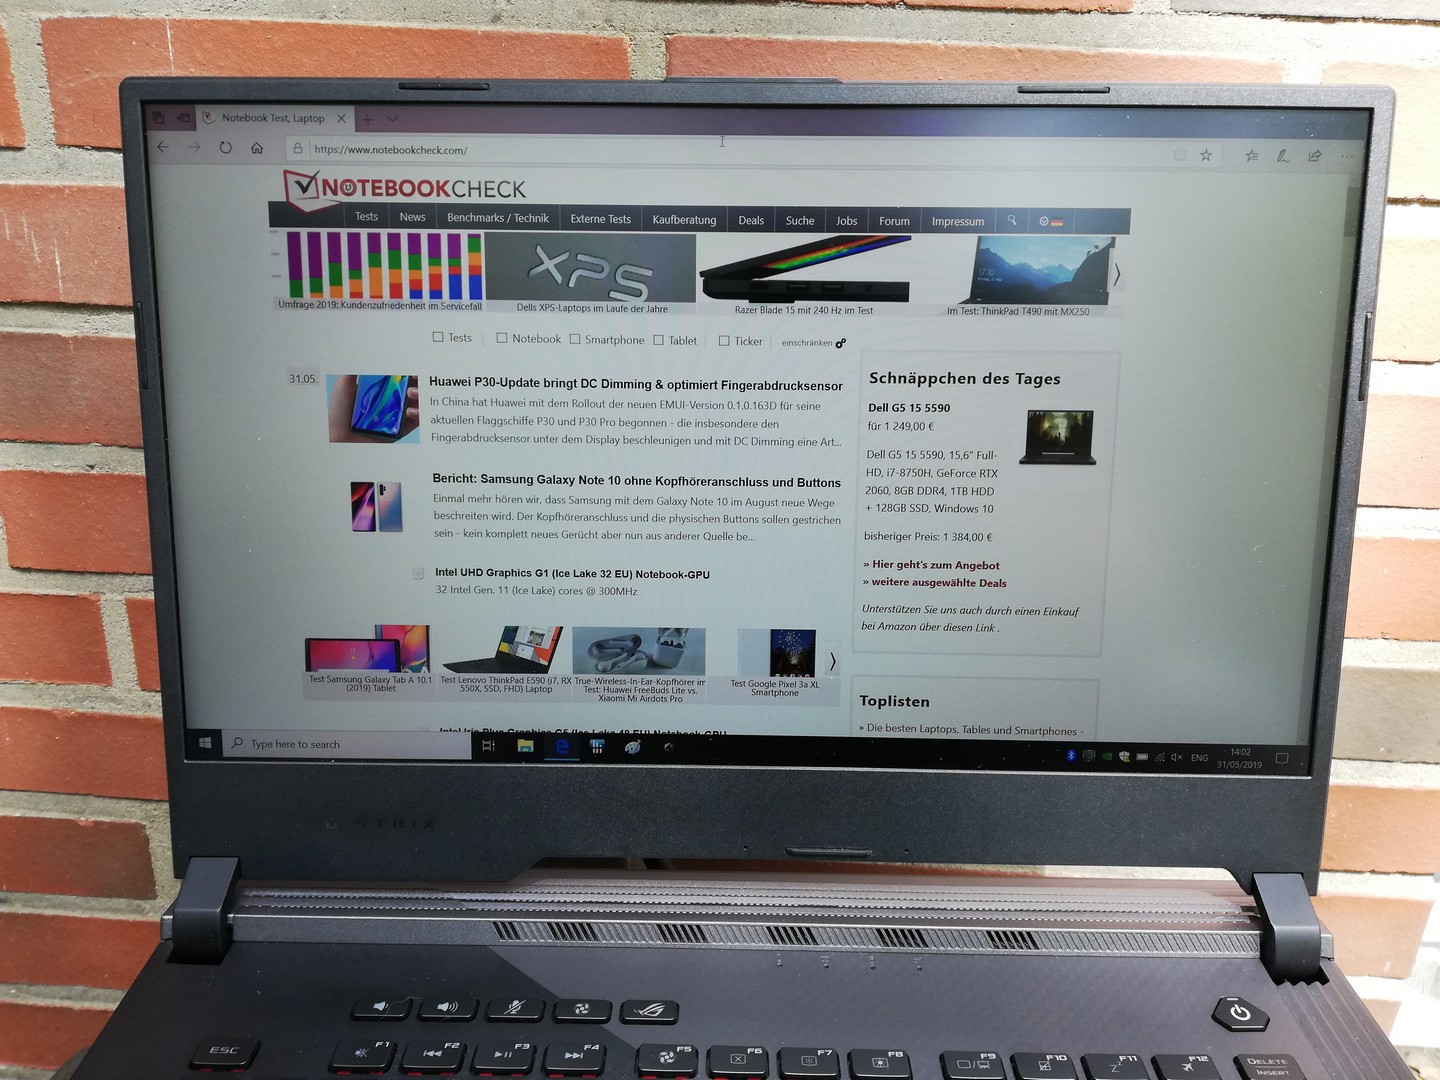
The G531GW has a 15.6-inch IPS panel that operates natively at 1,920x1,080. The panel has a 240 Hz refresh rate and achieved an average maximum brightness of 252 cd/m² in X-Rite i1Pro 2 tests. This makes the G531GW, which also has an 88% evenly lit panel, the second dimmest device in our comparison table ahead of the Aero 15-X9.
Disappointingly, the display uses pulse-width modulation (PWM) to regulate its luminosity, which can cause eye strain and headaches for some people. The panel in our review unit flickers at 24,040 Hz when set to 29% brightness, which should be a high enough resolution not to cause too many people any health issues. We would still recommend testing the G531GW first before you buy it if you are PWM sensitive though.
ASUS currently offers four displays with the ROG Strix SCAR III including the 240 Hz panel in our review unit. The company gives you a choice between a 90 Hz, 120 Hz or a 144 Hz panel, although they are all 1080p panels.
| |||||||||||||||||||||||||
Brightness Distribution: 88 %
Contrast: 985:1 (Black: 0.27 cd/m²)
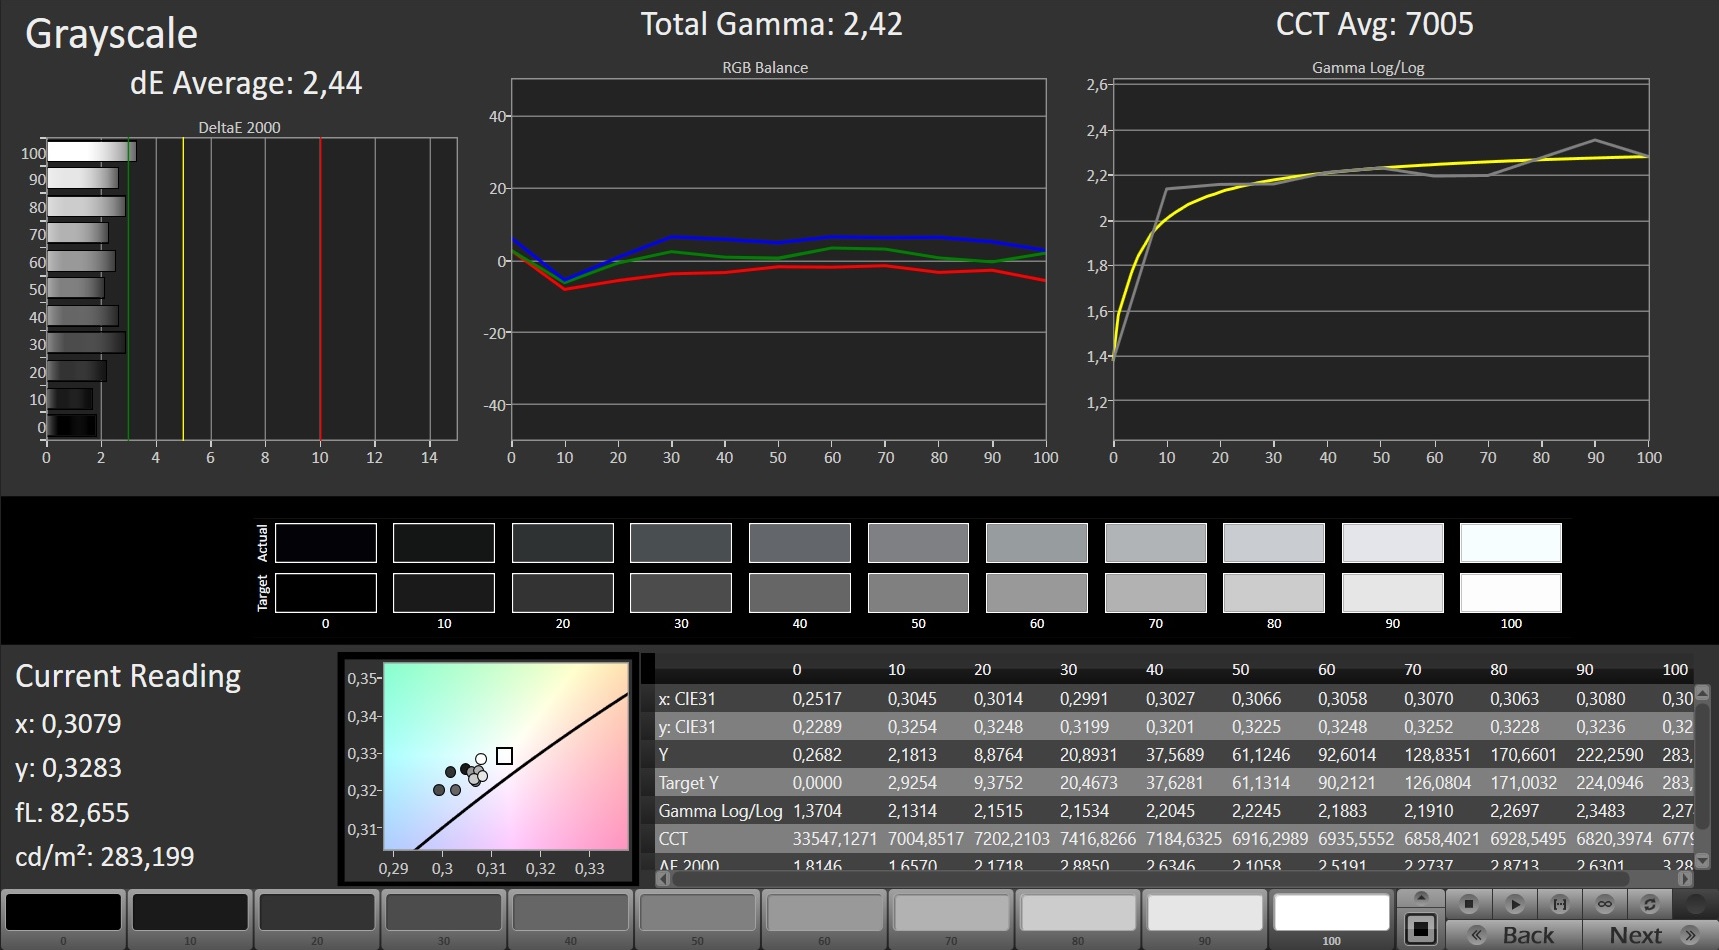
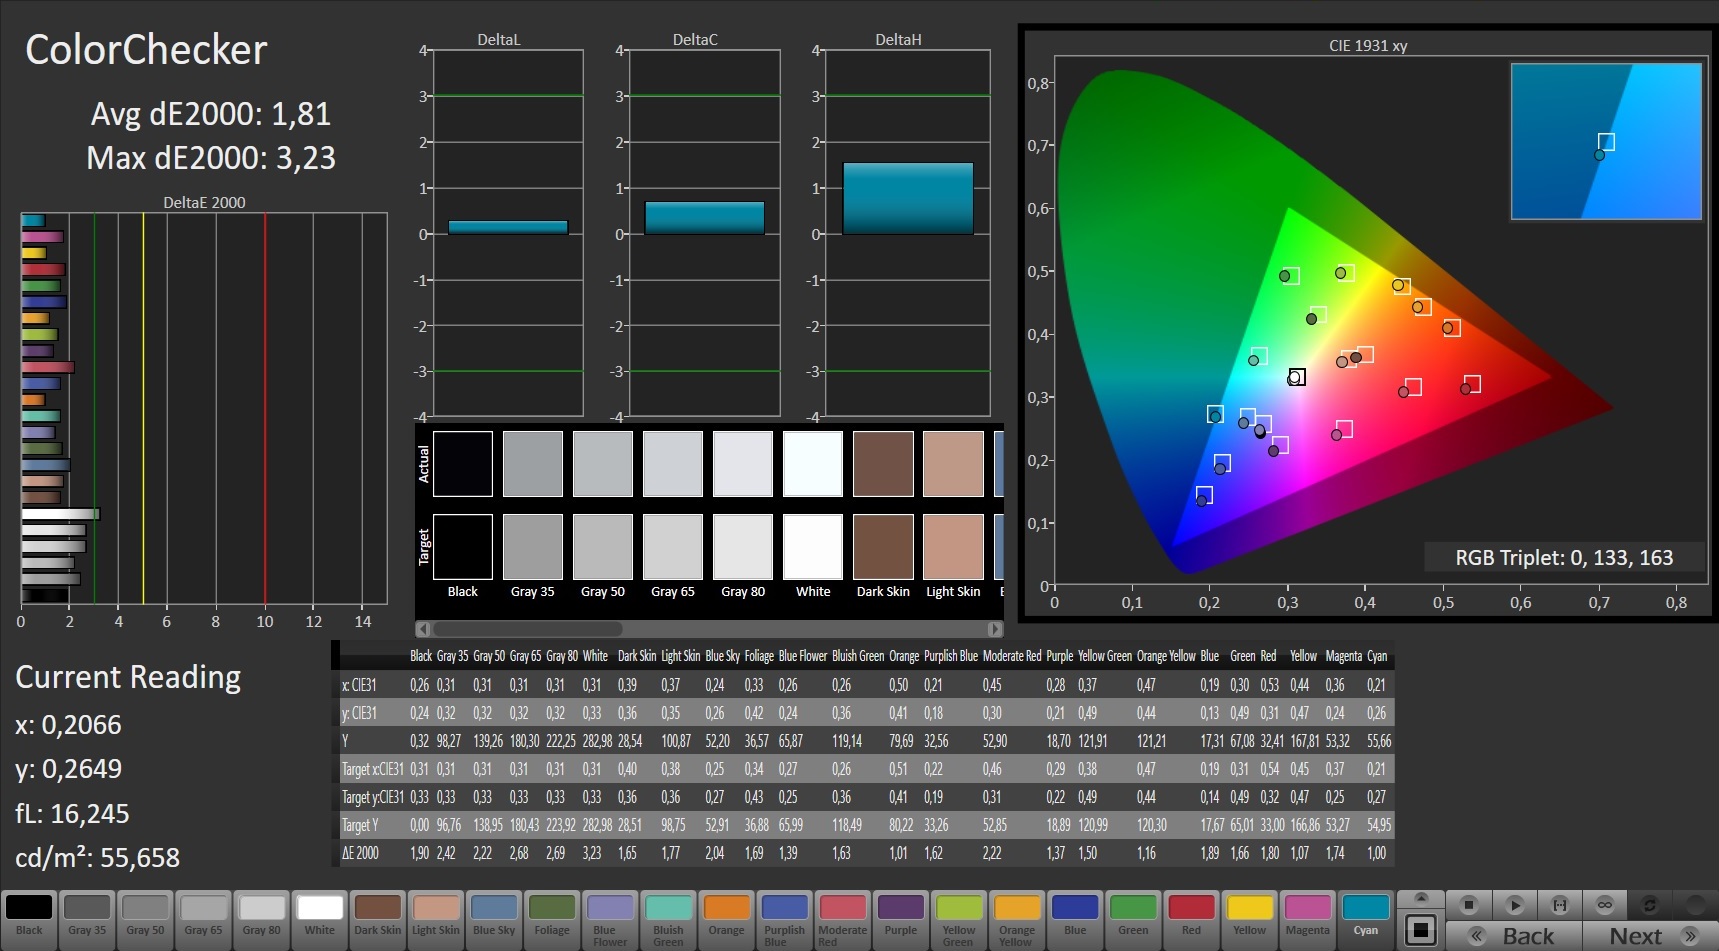
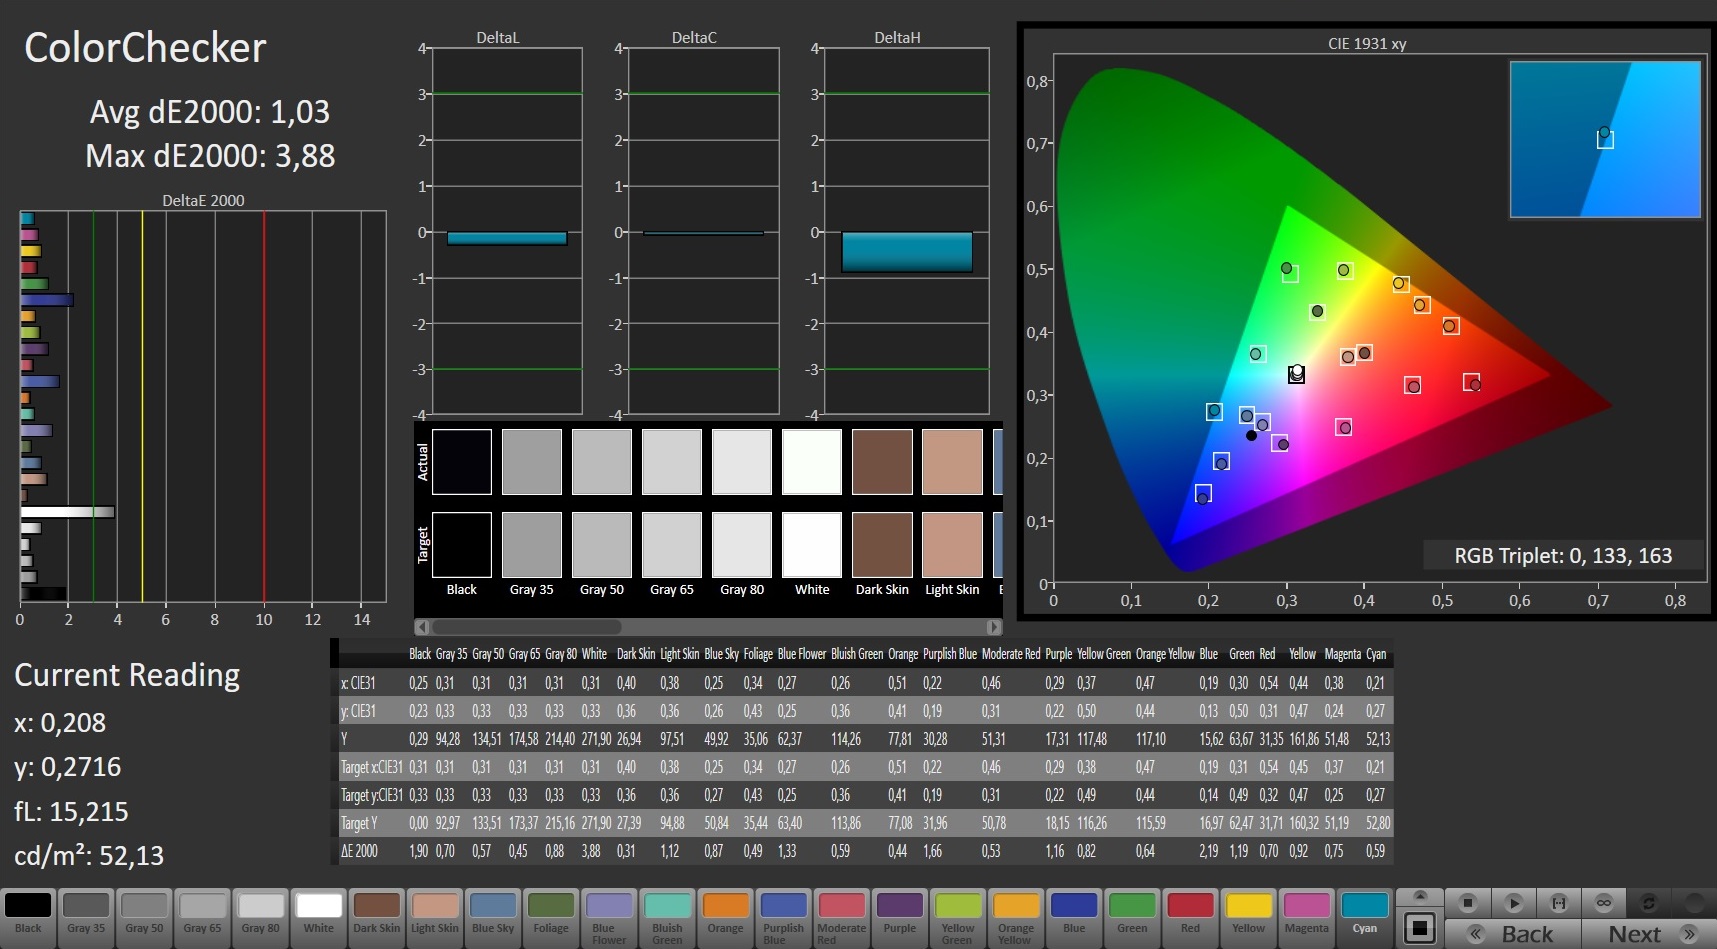
ΔE ColorChecker Calman: 1.81 | ∀{0.5-29.43 Ø4.72}
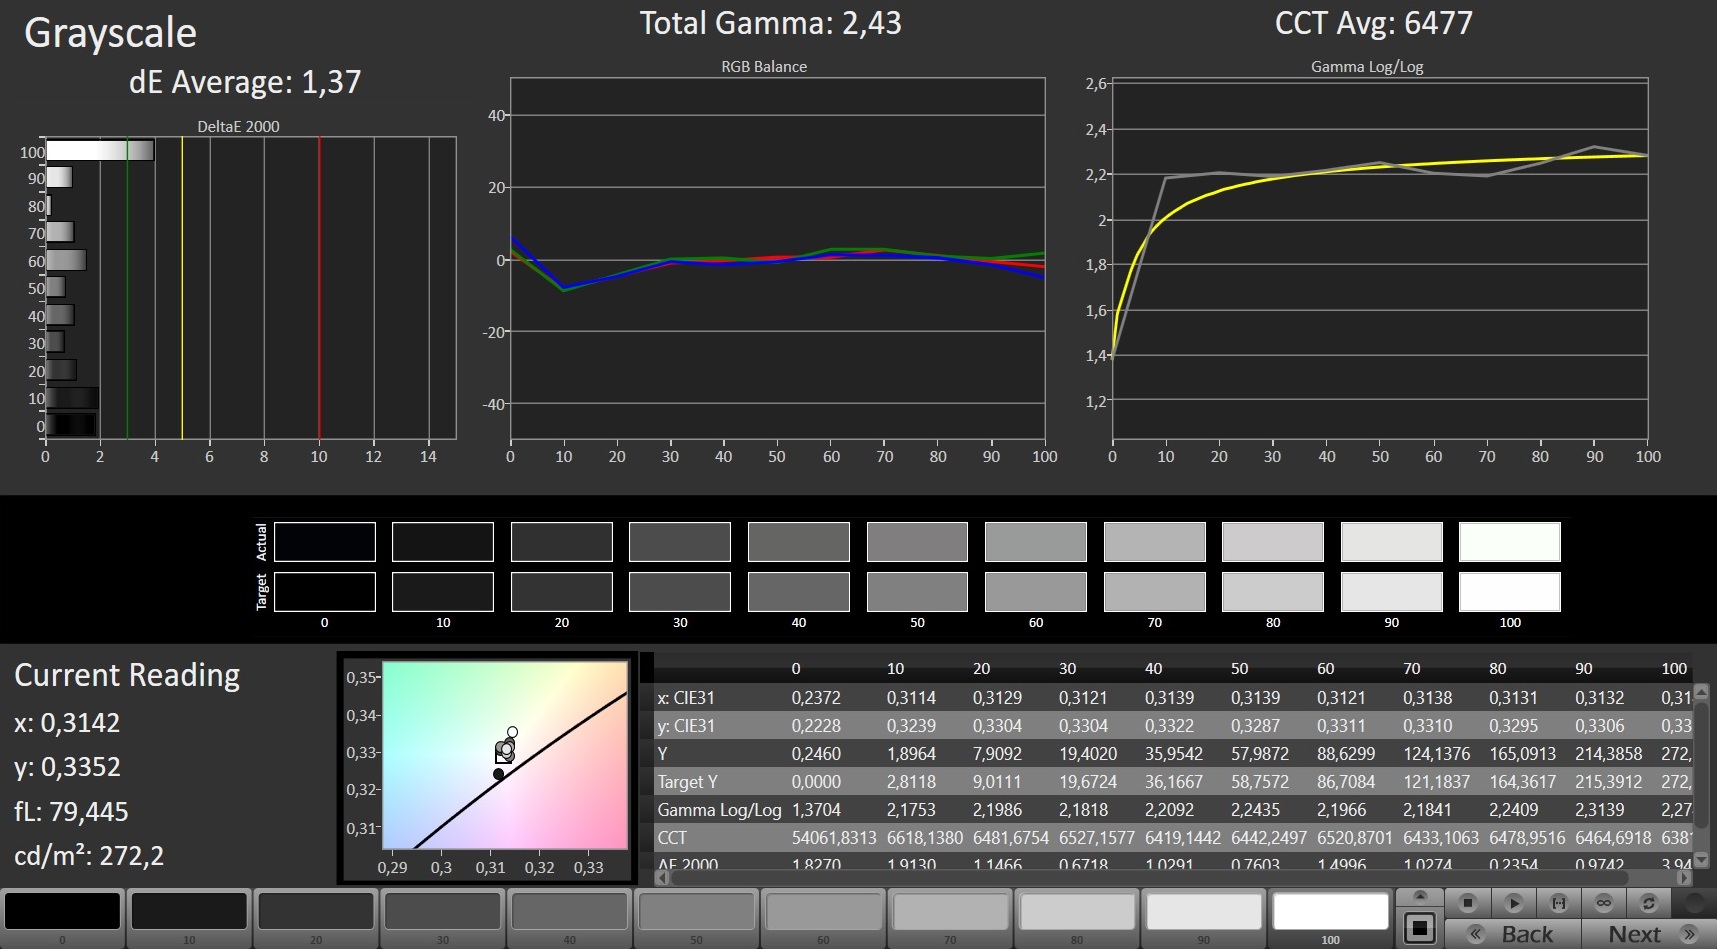
calibrated: 1.03
ΔE Greyscale Calman: 2.44 | ∀{0.09-98 Ø4.97}
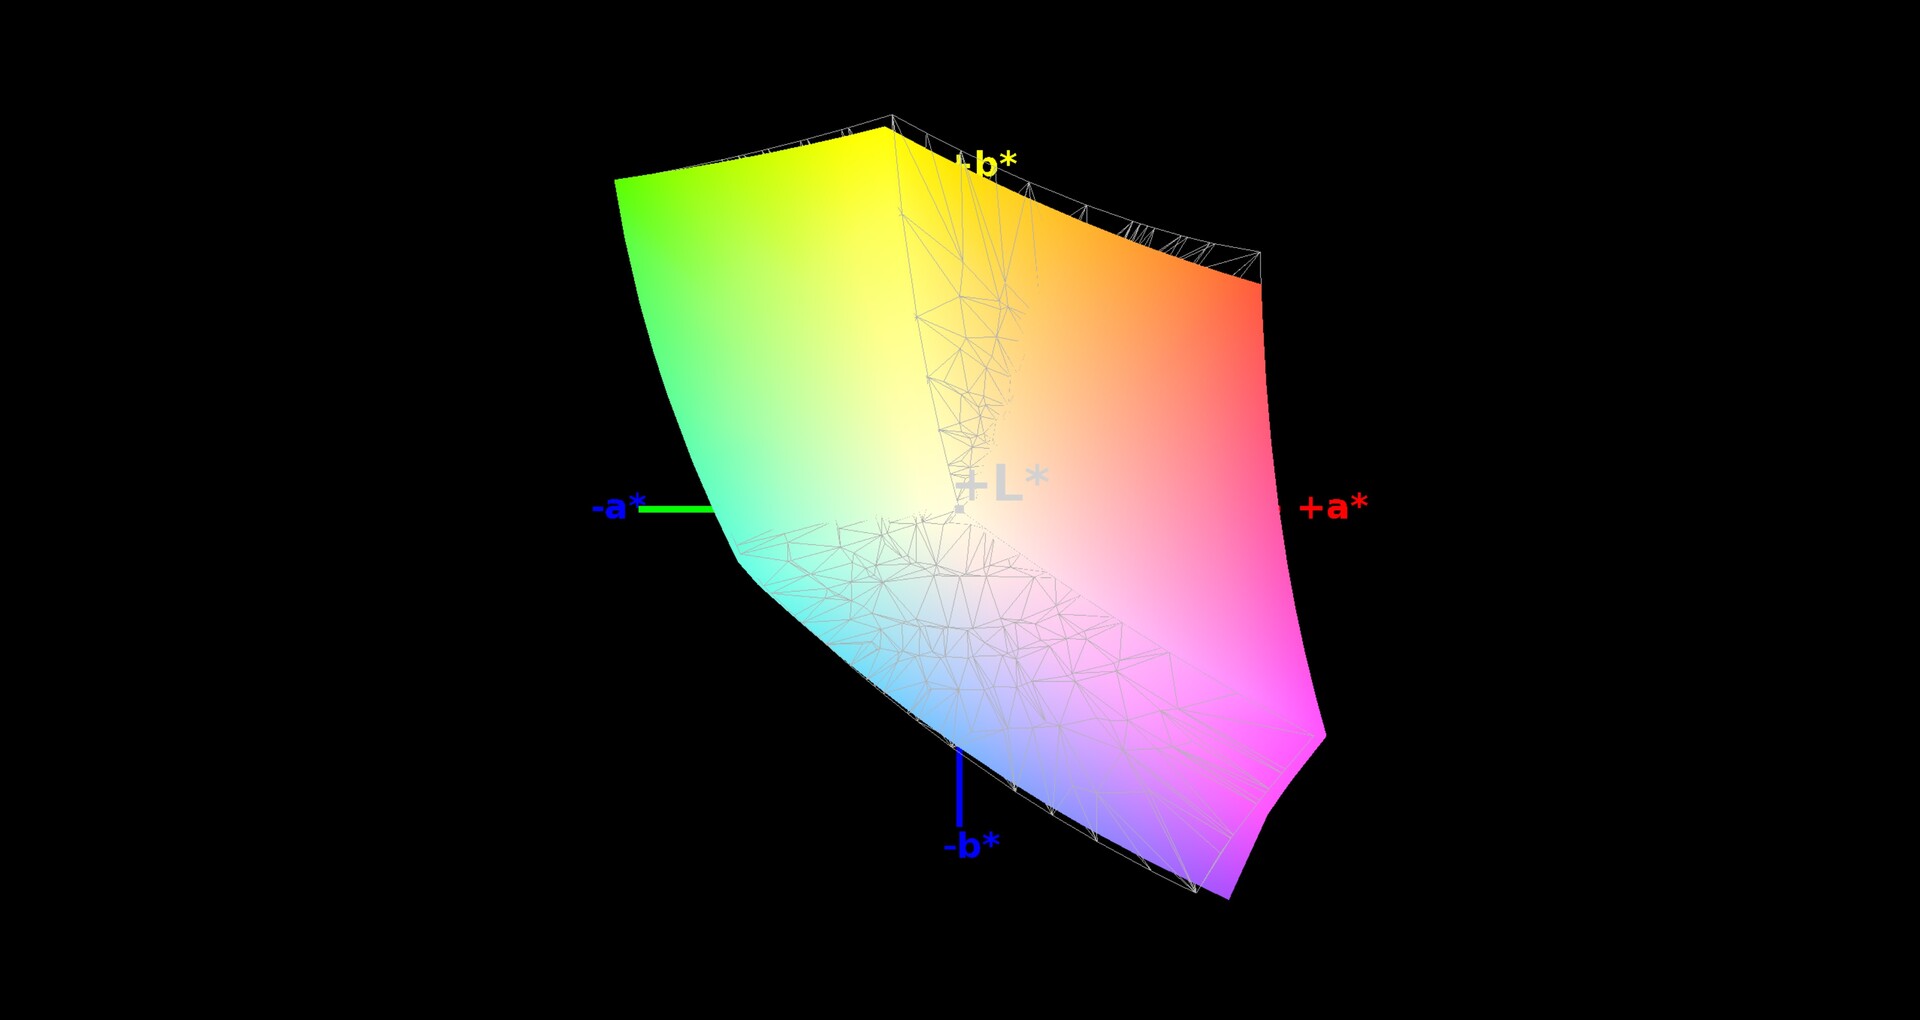
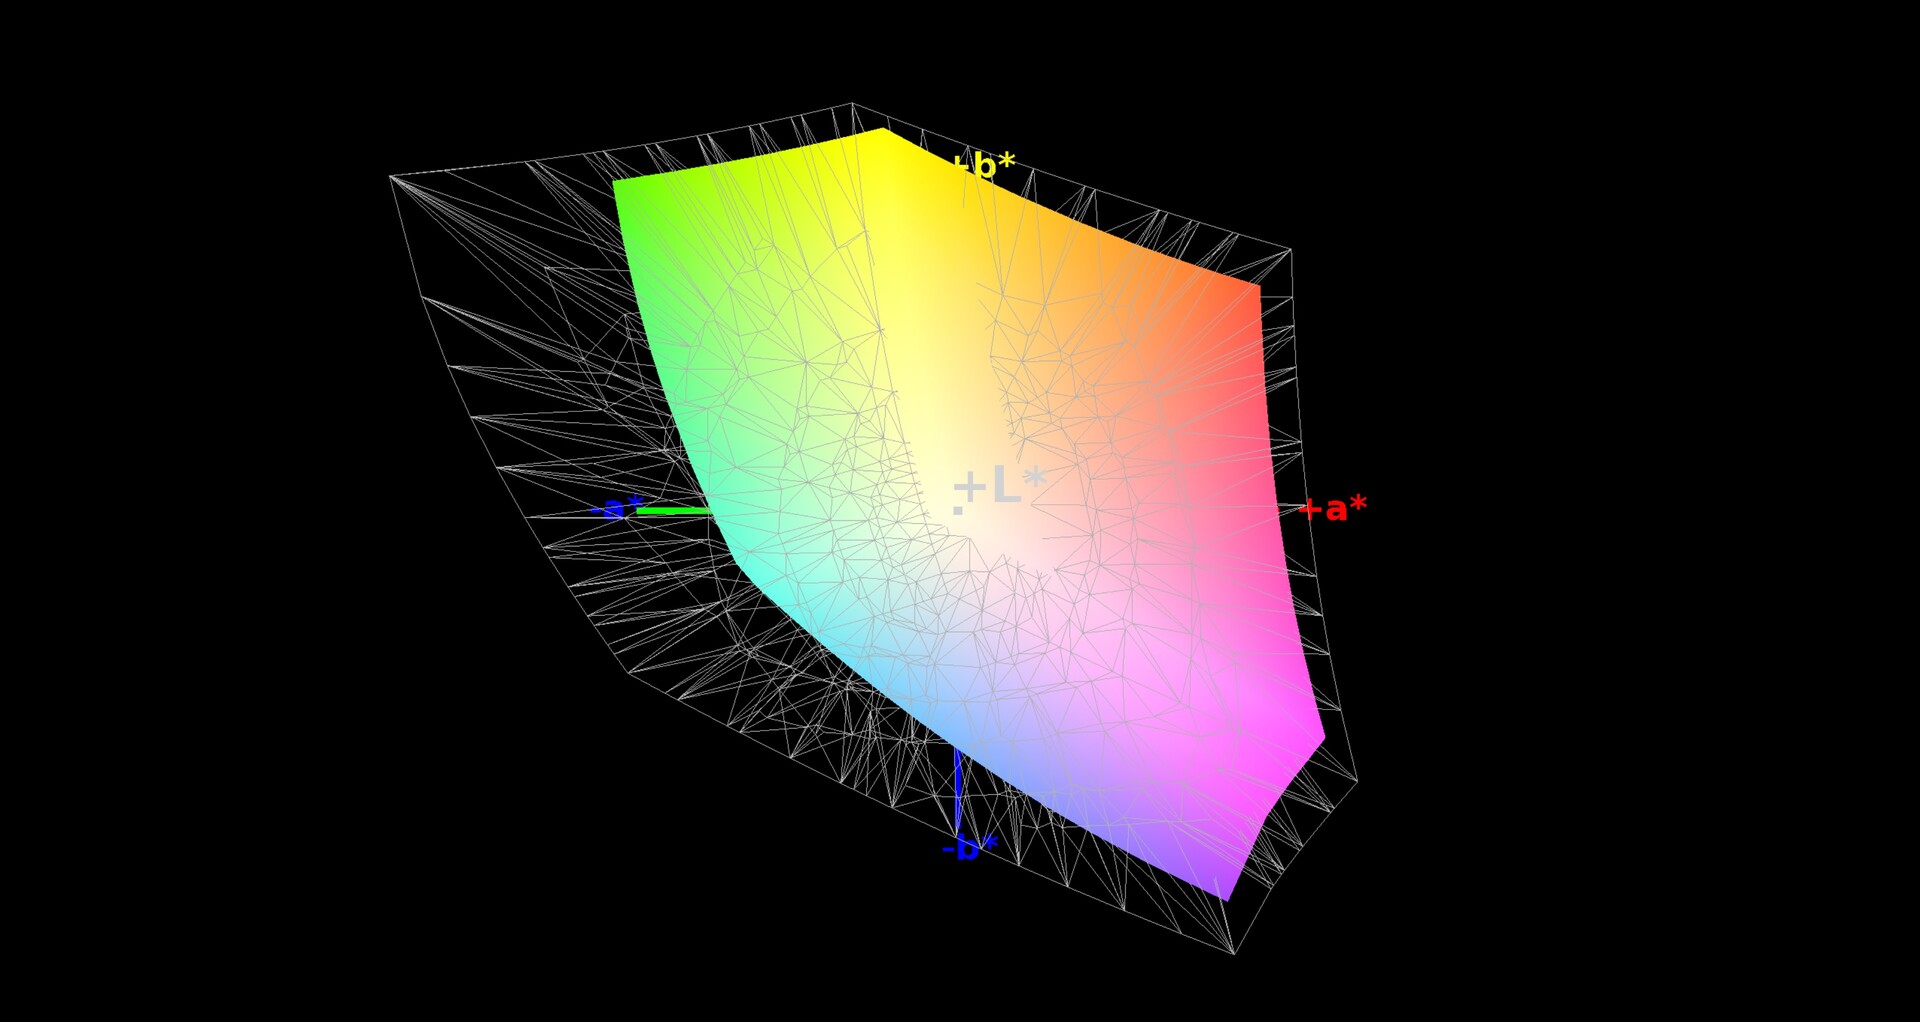
97% sRGB (Argyll 1.6.3 3D)
62% AdobeRGB 1998 (Argyll 1.6.3 3D)
67.5% AdobeRGB 1998 (Argyll 3D)
96.5% sRGB (Argyll 3D)
66.2% Display P3 (Argyll 3D)
Gamma: 2.42
CCT: 7005 K
| Asus Strix Scar III G531GW Sharp LQ156M1JW09 (SHP14D3), IPS, 1920x1080, 15.6" | Aorus 15 X9 LG Philips LP156WFG-SPB2, IPS, 1920x1080, 15.6" | Gigabyte Aero 15-X9 LGD05C0, IPS, 1920x1080, 15.6" | Schenker XMG Neo 17 BOEhydis NV173FHM-N44 (BOE07B6), IPS, 1920x1080, 17.3" | MSI GE75 8SF Chi Mei N173HCE-G33, IPS, 1920x1080, 17.3" | |
|---|---|---|---|---|---|
| Display | -2% | -4% | -2% | -3% | |
| Display P3 Coverage (%) | 66.2 | 64.9 -2% | 63.5 -4% | 65.2 -2% | 63.1 -5% |
| sRGB Coverage (%) | 96.5 | 95.6 -1% | 93.1 -4% | 92.2 -4% | 94.4 -2% |
| AdobeRGB 1998 Coverage (%) | 67.5 | 66.3 -2% | 64.5 -4% | 66.5 -1% | 65.2 -3% |
| Response Times | 1% | -8% | -8% | 26% | |
| Response Time Grey 50% / Grey 80% * (ms) | 17.2 ? | 15.2 ? 12% | 16.4 ? 5% | 18.8 ? -9% | 9.6 ? 44% |
| Response Time Black / White * (ms) | 11.2 ? | 12.4 ? -11% | 13.6 ? -21% | 12 ? -7% | 10.4 ? 7% |
| PWM Frequency (Hz) | 24040 ? | 971 ? | 25770 ? | ||
| Screen | -14% | 5% | -13% | 14% | |
| Brightness middle (cd/m²) | 266 | 305.1 15% | 250 -6% | 304 14% | 370.4 39% |
| Brightness (cd/m²) | 252 | 295 17% | 235 -7% | 289 15% | 348 38% |
| Brightness Distribution (%) | 88 | 78 -11% | 85 -3% | 90 2% | 89 1% |
| Black Level * (cd/m²) | 0.27 | 0.33 -22% | 0.29 -7% | 0.26 4% | 0.29 -7% |
| Contrast (:1) | 985 | 925 -6% | 862 -12% | 1169 19% | 1277 30% |
| Colorchecker dE 2000 * | 1.81 | 2.58 -43% | 1.46 19% | 2.65 -46% | 1.26 30% |
| Colorchecker dE 2000 max. * | 3.23 | 4.32 -34% | 2.47 24% | 6.11 -89% | 3.02 7% |
| Colorchecker dE 2000 calibrated * | 1.03 | 1.33 -29% | 1.5 -46% | 1.21 -17% | |
| Greyscale dE 2000 * | 2.44 | 3.4 -39% | 1.27 48% | 2.75 -13% | 1.4 43% |
| Gamma | 2.42 91% | 2.28 96% | 2.4 92% | 2.46 89% | 2.2 100% |
| CCT | 7005 93% | 6374 102% | 6749 96% | 6763 96% | 6747 96% |
| Color Space (Percent of AdobeRGB 1998) (%) | 62 | 60.7 -2% | 60 -3% | 60 -3% | 59.7 -4% |
| Color Space (Percent of sRGB) (%) | 97 | 95.2 -2% | 93 -4% | 92 -5% | 94.4 -3% |
| Total Average (Program / Settings) | -5% /
-10% | -2% /
1% | -8% /
-11% | 12% /
12% |
* ... smaller is better
Our tests also certify that the display in our review unit has a 0.27 cd/m² black value, which is lower than all but the XMG Neo 17 of our comparison devices. However, its meagre maximum brightness results in a disappointing 985:1 contrast ratio. Correspondingly, colours look rather washed out, while a slight grey tint covers blacks.
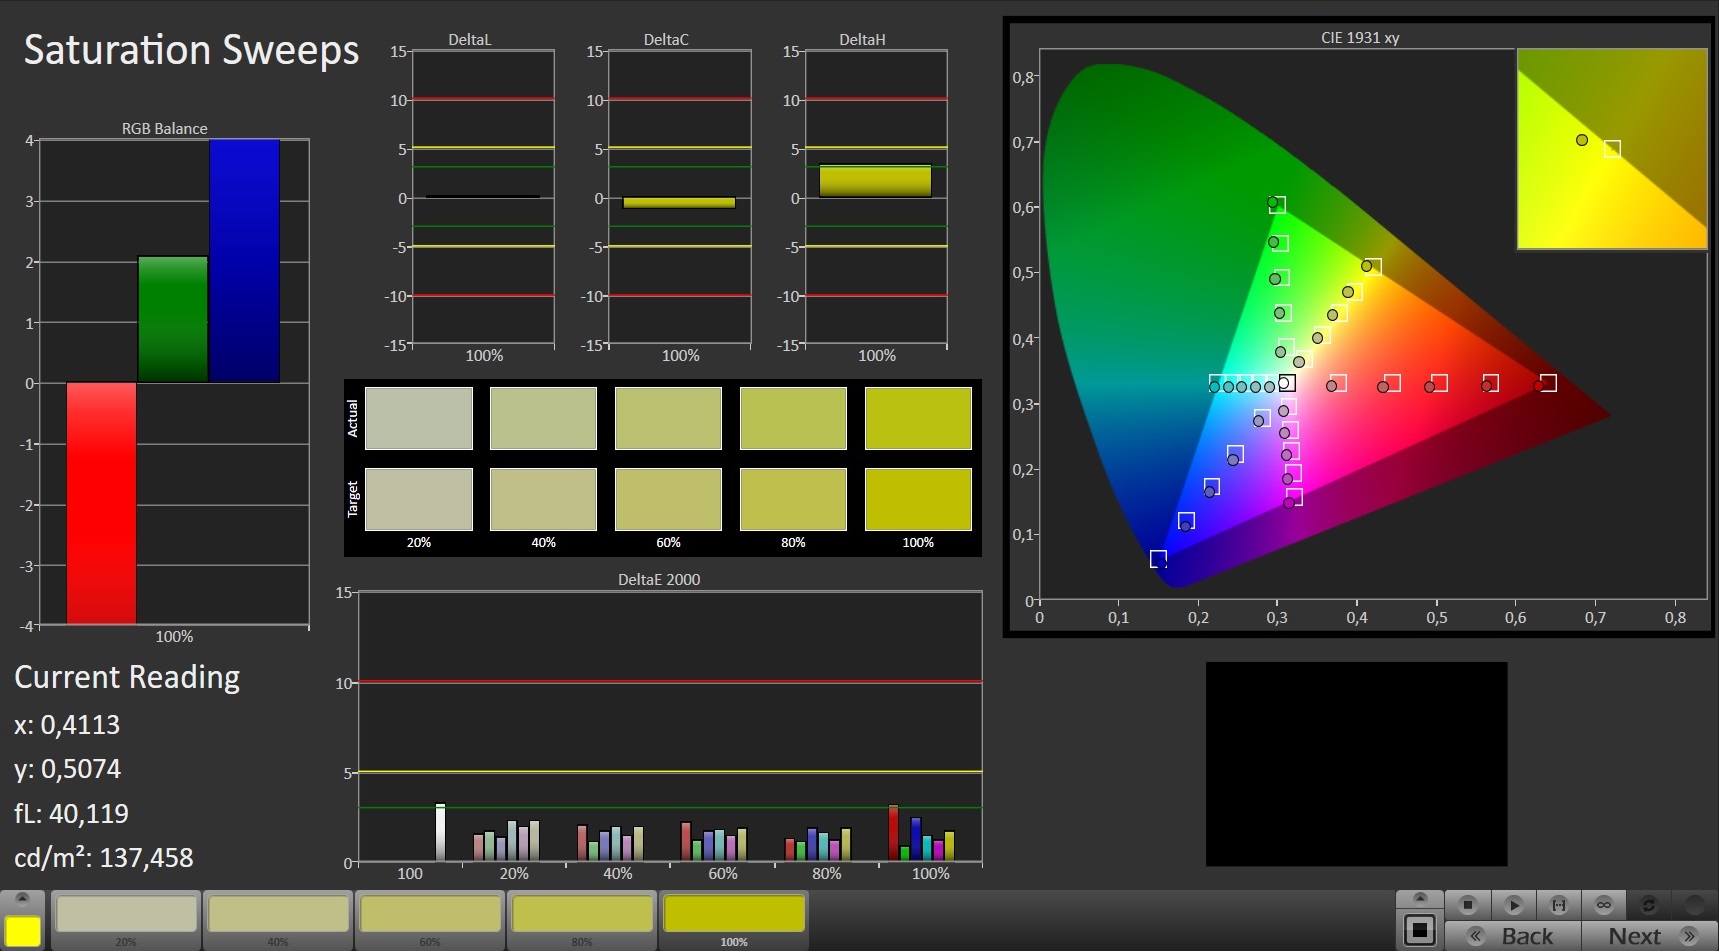
The G531GW still manages respectable 97% sRGB and 62% AdobeRGB colour space coverages. ASUS promises that the display will also cover 72% of NTSC, but we were unable to test this at the time of writing. Its AdobeRGB and sRGB coverages are better than all our comparison devices though.
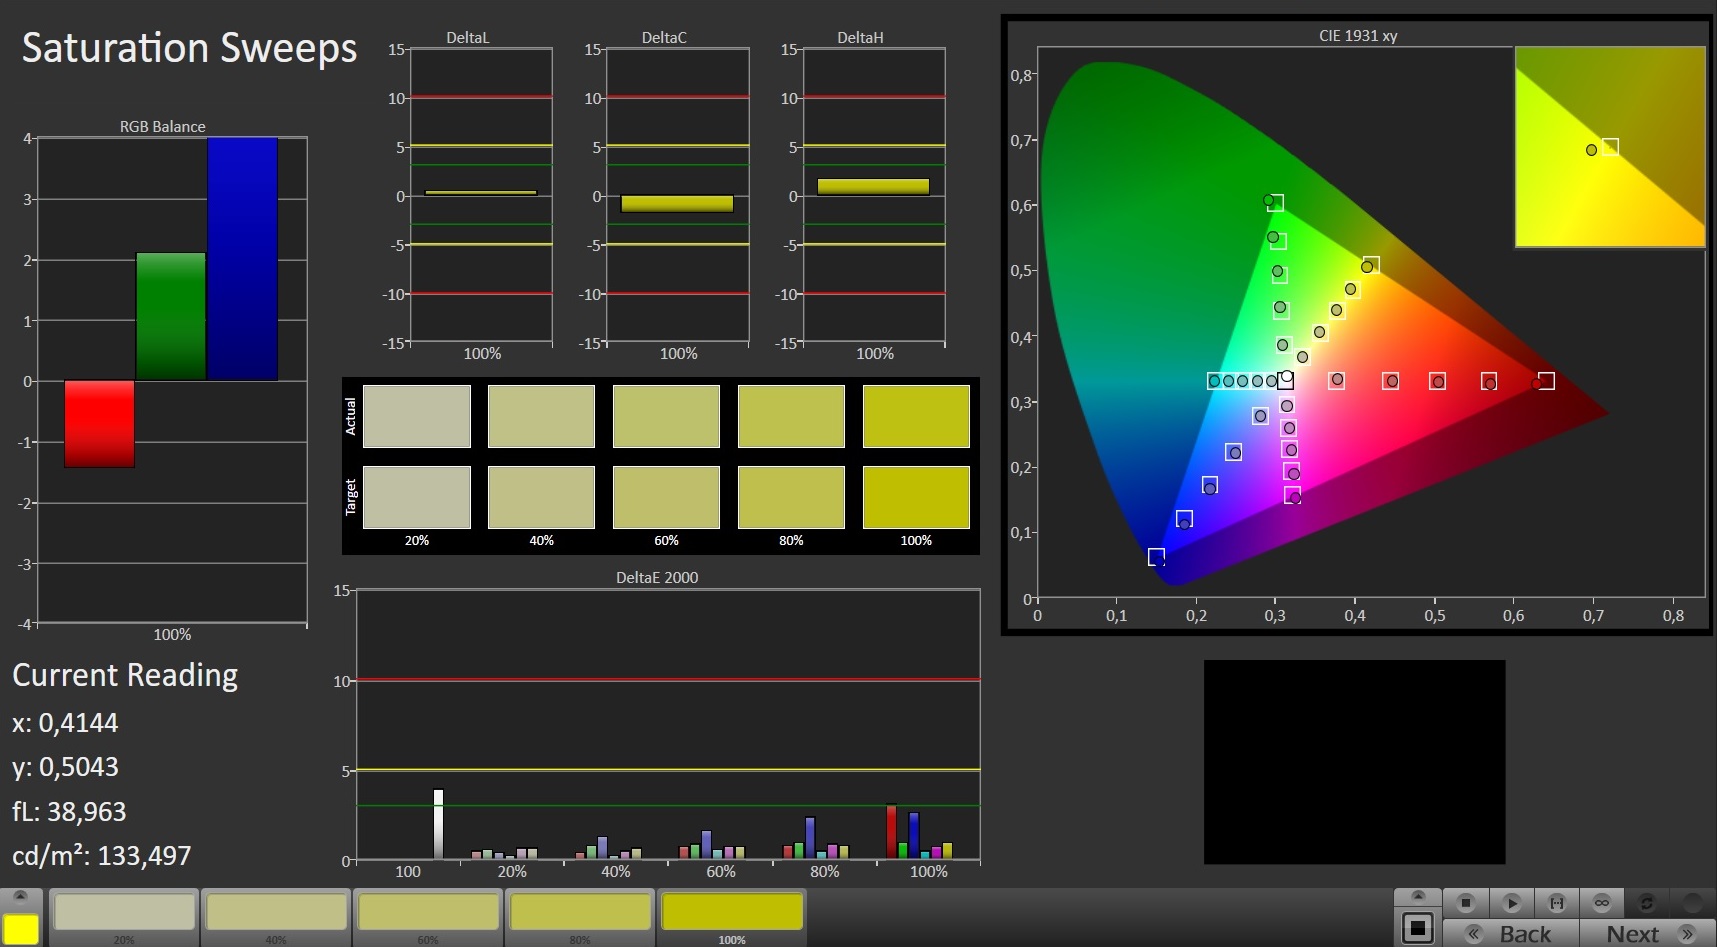
Additionally, CalMAN analysis software and our photo spectrometer demonstrate that ASUS has done a decent job at calibrating the display in our review unit out of the box. The panel has comparably low DeltaE deviations upon delivery, but we managed to reduce these further with additional calibration. We have included the corresponding ICC file in the box above our comparison table should you wish to. It will only improve the colour reproduction of devices with a Sharp LQ156M1JW09 (SHP14D3) panel though and will probably reduce colour accuracy on other displays.
The G531GW is difficult to use outdoors because of its dim and contrast-weak display. Bright sunlight will overpower the panel, but its matte finish does a good job at diffusing reflections, so you should have no issues with using the G531GW outdoors in the shade.

Display Response Times
| ↔ Response Time Black to White | ||
|---|---|---|
| 11.2 ms ... rise ↗ and fall ↘ combined | ↗ 6.8 ms rise | 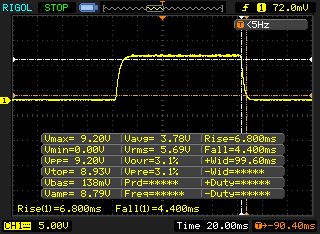 |
| ↘ 4.4 ms fall | ||
| The screen shows good response rates in our tests, but may be too slow for competitive gamers. In comparison, all tested devices range from 0.1 (minimum) to 240 (maximum) ms. » 30 % of all devices are better. This means that the measured response time is better than the average of all tested devices (19.8 ms). | ||
| ↔ Response Time 50% Grey to 80% Grey | ||
| 17.2 ms ... rise ↗ and fall ↘ combined | ↗ 9.2 ms rise | 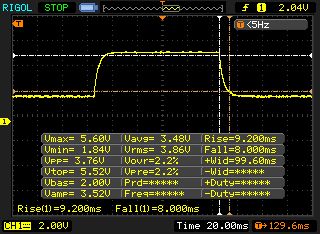 |
| ↘ 8 ms fall | ||
| The screen shows good response rates in our tests, but may be too slow for competitive gamers. In comparison, all tested devices range from 0.165 (minimum) to 636 (maximum) ms. » 31 % of all devices are better. This means that the measured response time is better than the average of all tested devices (31 ms). | ||
Screen Flickering / PWM (Pulse-Width Modulation)
| Screen flickering / PWM detected | 24040 Hz | ≤ 29 % brightness setting | 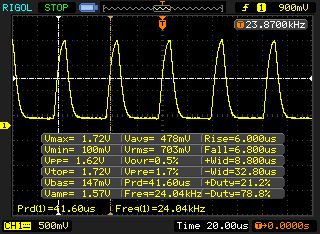 |
The display backlight flickers at 24040 Hz (worst case, e.g., utilizing PWM) Flickering detected at a brightness setting of 29 % and below. There should be no flickering or PWM above this brightness setting. The frequency of 24040 Hz is quite high, so most users sensitive to PWM should not notice any flickering. In comparison: 52 % of all tested devices do not use PWM to dim the display. If PWM was detected, an average of 7747 (minimum: 5 - maximum: 343500) Hz was measured. | |||
The G531GW has stable viewing angles too, thanks to its IPS panel. Contrast levels drop off at acute viewing angles, but there are no brightness or image distortions. Hence, you should have no issues with reading the G531GW from practically any angle.

Performance
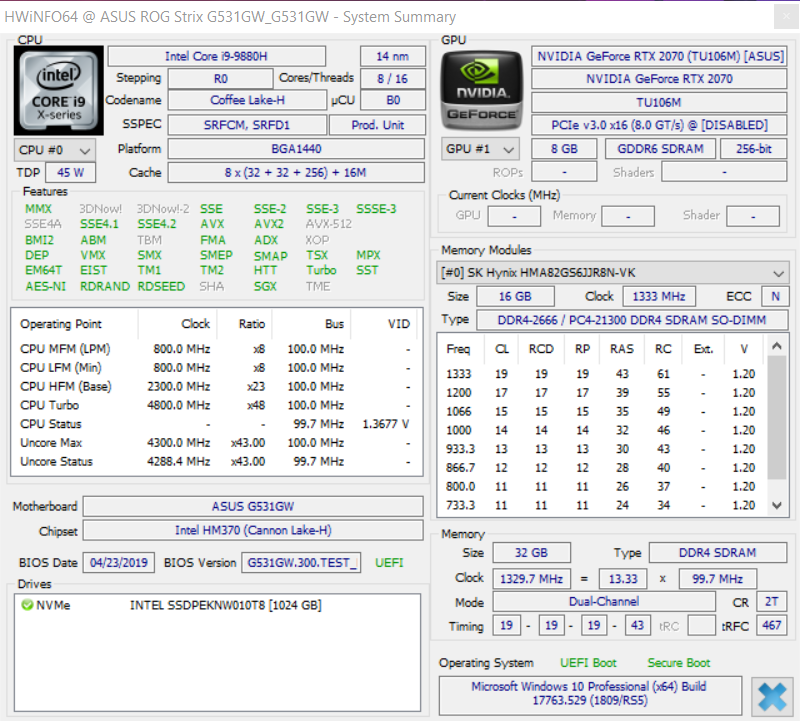
ASUS has equipped the G531GW with an Intel Core i9-9880H processor, an NVIDIA GeForce RTX 2070 GPU and 32 GB of RAM. The company also sells GeForce RTX 2060, GeForce GTX 1650 and GeForce GTX 1660 Ti variants along with Core i5-9300H and Core i7-9750H SKUs.
All variants are powerful to play modern triple-A games smoothly at 1080p. However, we would recommend the RTX 2070 model if you want to game in 4K on an external monitor or play in 1080p with DLSS and raytracing enabled.

Processor
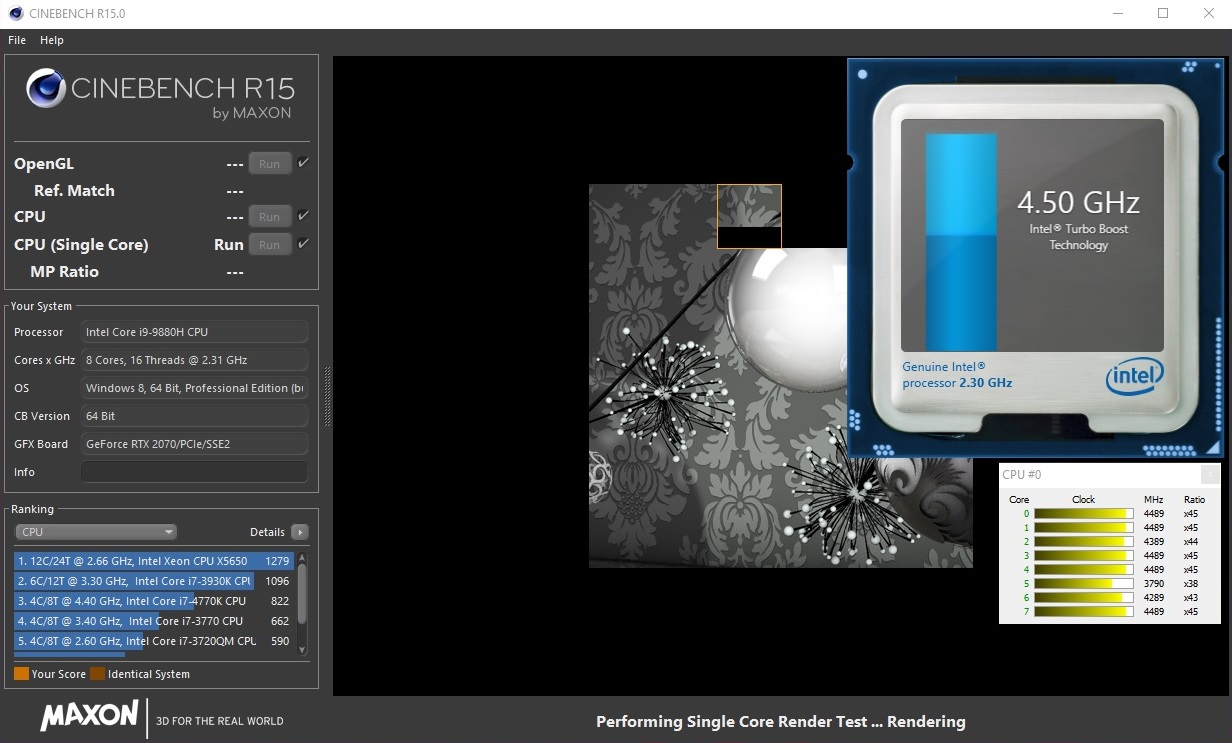
The Core i9-9880H is an octa-core CPU based on Intel’s Coffee Lake architecture. The processor supports Intel Hyper-Threading, which means that it can execute up to 16 threads simultaneously. The Core i9-9880H also has a 2.3 GHz base clock speed that it can temporarily boost to 4.8 GHz using Intel Turbo Boost. The CPU can also use Thermal Velocity Boost to increase its clock speeds beyond what Turbo Boost would, but only when its core temperatures are 50 °C (~122 °F) or cooler. Hence, the use of Velocity Boost depends largely on the capabilities of a machine’s cooling system. One that kicks in early and keeps a CPU below the 50 °C (~122 °F) threshold should allow it to utilise Velocity Boost effectively.
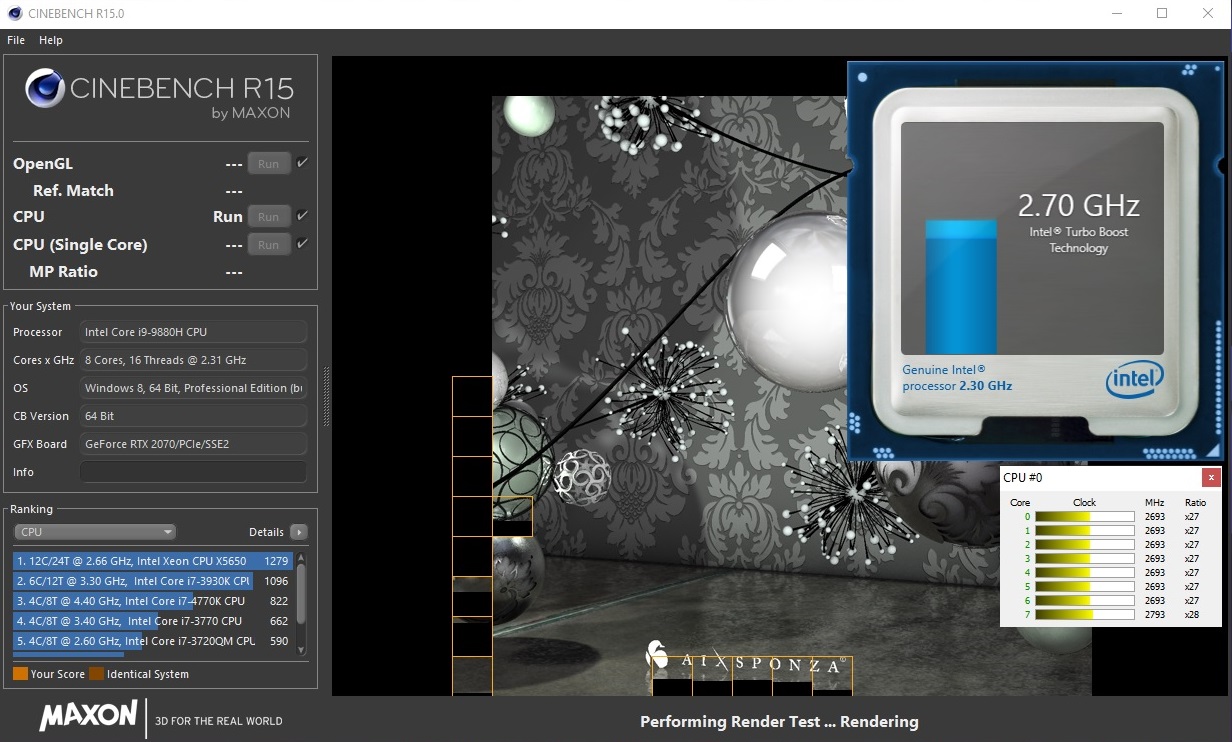
We subjected our review unit to a looped Cinebench R15 Multi 64Bit benchmark to see how it performed under sustained load. Initially, the G531GW scored 1,310 points, which is well ahead of our Core i7-8750H powered comparison devices. Expectedly, the score for the second run through drops with the CPU having exhausted its turbo clock speeds. Surprisingly, the system peaked at 1,278 points by the fifth benchmark, before settling at between 1,260 and 1,270 points for the remainder of the loop, save for one instance where it dropped to 1,239 points.
Overall, these are impressively stable scores, which demonstrate that the G531GW should not throttle under sustained load, apart from early on when it exhausts its turbo. However, our review unit consistently scores around 10% worse than the P65 Creator 9SF, so the G531GW could be getting more from its CPU.
We should also point out that the system automatically switches to the Balanced power mode when we disconnect the power supply. This causes CB R15 Multi 64Bit scores to plummet to 363. Frustratingly, we were only able to select the more powerful Turbo power mode with our review unit connected to the mains.
Please see our CPU benchmarks page for more information about the Core i9-9880H and how it fares against other CPUs.
System Performance
The G531GW also performs well in system performance benchmarks such as PCMark. Our review unit generally trades blows with the Aorus 15 X9 for first place in our comparison tables. These decent benchmark results reflect our experiences in daily use too. Our review unit always runs smoothly and loads programs quickly. Likewise, the OS boots promptly, and we noticed no micro-stutters or lags even during heavy multitasking.
| PCMark 8 | |
| Home Score Accelerated v2 | |
| Average of class Gaming (n=1last 2 years) | |
| Aorus 15 X9 | |
| Asus Strix Scar III G531GW | |
| Gigabyte Aero 15-X9 | |
| MSI GE75 8SF | |
| MSI P65 Creator 9SF-657 | |
| Work Score Accelerated v2 | |
| Asus Strix Scar III G531GW | |
| Aorus 15 X9 | |
| Gigabyte Aero 15-X9 | |
| MSI GE75 8SF | |
| MSI P65 Creator 9SF-657 | |
| Average of class Gaming (n=1last 2 years) | |
| PCMark 8 Home Score Accelerated v2 | 4578 points | |
| PCMark 8 Work Score Accelerated v2 | 5919 points | |
| PCMark 10 Score | 5826 points | |
Help | ||
Storage Devices
ASUS has equipped our review unit with a 1 TB Intel 660p SSD, which puts the G531GW in the midfield of our comparison devices. The 660p has decent transfer speeds, but it falls just short of the Samsung 970 EVO Plus and around 21% behind its sibling, the Intel 760p.
Please see our HDD/SSD benchmarks page for more information on the Intel 660p and how it compares against other drives.
| Asus Strix Scar III G531GW Intel SSD 660p 1TB SSDPEKNW010T8 | Schenker XMG Neo 17 Samsung SSD 970 EVO Plus 1TB | MSI GE75 8SF Kingston RBUSNS8154P3256GJ1 | Aorus 15 X9 Intel SSD 760p SSDPEKKW512G8 | Gigabyte Aero 15-X9 Intel SSD 760p SSDPEKKW010T8 | |
|---|---|---|---|---|---|
| CrystalDiskMark 5.2 / 6 | 1% | -40% | 21% | -9% | |
| Write 4K (MB/s) | 135 | 92.7 -31% | 73.3 -46% | 147.2 9% | 97.1 -28% |
| Read 4K (MB/s) | 54.9 | 41.4 -25% | 33.35 -39% | 63.7 16% | 53.7 -2% |
| Write Seq (MB/s) | 1649 | 1363 -17% | 849 -49% | 1573 -5% | 1526 -7% |
| Read Seq (MB/s) | 1449 | 1259 -13% | 964 -33% | 2602 80% | 2020 39% |
| Write 4K Q32T1 (MB/s) | 508 | 289.7 -43% | 236.2 -54% | 531 5% | 285.6 -44% |
| Read 4K Q32T1 (MB/s) | 559 | 337.5 -40% | 384.7 -31% | 598 7% | 321.8 -42% |
| Write Seq Q32T1 (MB/s) | 1759 | 3332 89% | 867 -51% | 1592 -9% | 1533 -13% |
| Read Seq Q32T1 (MB/s) | 1826 | 3477 90% | 1586 -13% | 2981 63% | 2351 29% |
| AS SSD | 109% | -14% | 32% | 31% | |
| Seq Read (MB/s) | 1574 | 2359 50% | 949 -40% | 1912 21% | 2113 34% |
| Seq Write (MB/s) | 1591 | 2469 55% | 823 -48% | 1553 -2% | 1471 -8% |
| 4K Read (MB/s) | 26.79 | 53.5 100% | 25.36 -5% | 56.5 111% | 55 105% |
| 4K Write (MB/s) | 105.1 | 117.6 12% | 67.1 -36% | 119.6 14% | 107.1 2% |
| 4K-64 Read (MB/s) | 583 | 1579 171% | 748 28% | 869 49% | 914 57% |
| 4K-64 Write (MB/s) | 603 | 2048 240% | 650 8% | 584 -3% | 703 17% |
| Access Time Read * (ms) | 0.128 | 0.048 62% | 0.173 -35% | 0.049 62% | 0.114 11% |
| Access Time Write * (ms) | 0.043 | 0.03 30% | 0.059 -37% | 0.031 28% | 0.034 21% |
| Score Read (Points) | 768 | 1869 143% | 869 13% | 1116 45% | 1180 54% |
| Score Write (Points) | 867 | 2413 178% | 799 -8% | 859 -1% | 957 10% |
| Score Total (Points) | 2033 | 5248 158% | 2109 4% | 2544 25% | 2722 34% |
| Copy ISO MB/s (MB/s) | 1121 | 1329 | 1864 | ||
| Copy Program MB/s (MB/s) | 532 | 404.3 | 362.6 | ||
| Copy Game MB/s (MB/s) | 380.5 | 1071 | 936 | ||
| Total Average (Program / Settings) | 55% /
64% | -27% /
-25% | 27% /
27% | 11% /
14% |
* ... smaller is better

Graphics Card
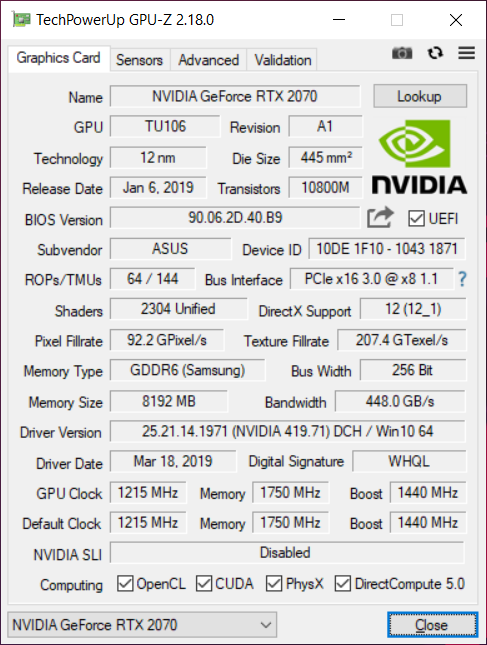
ASUS has equipped our review unit with a GeForce RTX 2070 GPU, a 12 nm chip based on NVIDIA’s Turing architecture. The GPU supports DLSS and raytracing, which can theoretically create more sophisticated lighting effects than GeForce GTX 10 series GPUs could achieve. The GeForce RTX 2070 is powerful enough to play modern triple-A games in 4K too.
The G531GW achieves decent 3DMark benchmark results in isolation, it is well beaten by many of our RTX 2070 powered comparison devices. Strikingly, our review unit only just edges out our RTX 2070 Max-Q powered comparison devices in 3DMark 11 and Fire Strike, despite theoretically having a 15% more powerful GPU.
Please see our GPU benchmarks page for more information about the GeForce RTX 2070 and how it compares with other GPUs.
| 3DMark 11 Performance | 19674 points | |
| 3DMark Cloud Gate Standard Score | 37721 points | |
| 3DMark Fire Strike Score | 16068 points | |
| 3DMark Time Spy Score | 6909 points | |
Help | ||
Gaming Performance
The G531GW performed well in all our gaming tests too. Our review unit breezes through older titles such as "BioShock Infinite" and "Dota 2 Reborn" at maximum details in 1080p, while it averages an acceptable 67 FPS in more complex games such as "The Witcher 3". However, the G531GW achieves approximately 6% lower framerates than what we would have expected from an RTX 2070 powered laptop. Likewise, the Aorus 15 X9, GE75 Raider 8SF and XMG Neo 17 all averaged at least 70 FPS during the same test, underlining that the G531GW cannot get the best out of its GPU, for some reason.
Please see our games comparison page to see how the RTX 2070 performs in our games and in other machines. You can compare the GPU with other cards too.
| The Witcher 3 - 1920x1080 Ultra Graphics & Postprocessing (HBAO+) | |
| Average of class Gaming (104.7 - 240, n=6, last 2 years) | |
| Average NVIDIA GeForce RTX 2070 Mobile (64 - 82.1, n=21) | |
| Schenker XMG Neo 17 | |
| Aorus 15 X9 | |
| MSI GE75 8SF | |
| Asus Strix Scar III G531GW | |
| Gigabyte Aero 15-X9 | |
| BioShock Infinite - 1920x1080 Ultra Preset, DX11 (DDOF) | |
| Asus Strix Scar III G531GW | |
| Average NVIDIA GeForce RTX 2070 Mobile (136.9 - 187.8, n=9) | |
| Aorus 15 X9 | |
| MSI GE75 8SF | |
| Gigabyte Aero 15-X9 | |
| Dota 2 Reborn - 1920x1080 ultra (3/3) best looking | |
| Average of class Gaming (84.8 - 248, n=106, last 2 years) | |
| Asus Strix Scar III G531GW | |
| Average NVIDIA GeForce RTX 2070 Mobile (98.4 - 124, n=9) | |
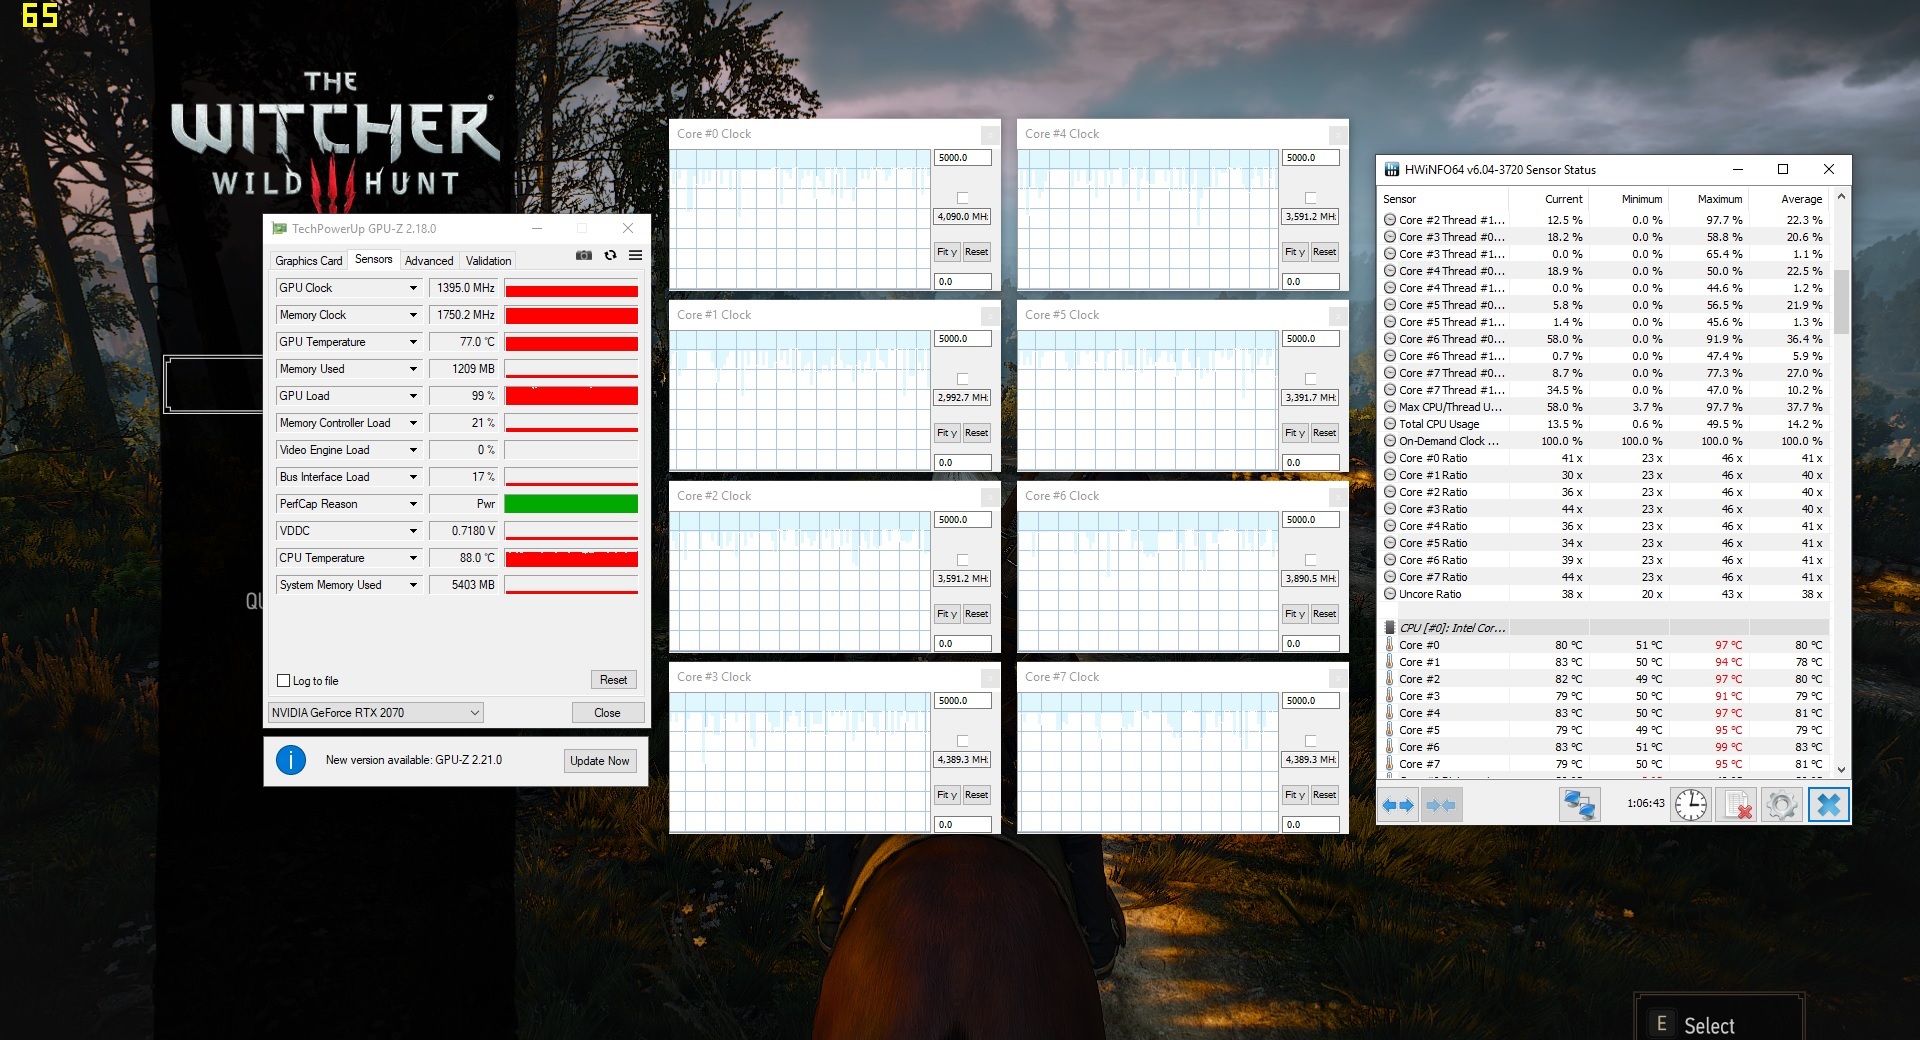
We also subjected the G531GW to an hour-long "The Witcher 3" run-through to determine how the machine manages its performance under prolonged load. Our review unit averaged 66.4 FPS during this test, with it occasionally dipping to a minimum of 62 FPS. Overall, you should experience only a negligible loss in framerates during a prolonged gaming session.
| low | med. | high | ultra | |
|---|---|---|---|---|
| BioShock Infinite (2013) | 362.2 | 305.4 | 291.9 | 167.4 |
| The Witcher 3 (2015) | 67 | |||
| Dota 2 Reborn (2015) | 137.4 | 126.5 | 122.1 | 117.1 |
Emissions
Fan Noise
The G531GW has two fans that work with several heatpipes to dissipate heat generated by the CPU and GPU. Our review unit runs silently during light tasks when set to the Balanced fan profile, but we measured the fan noise peaking at 39 dB(A) at idle.
The fans also reached a maximum of 54 dB(A) during our stress tests, which is loud enough to drown out the speakers even if they are playing at maximum volume. Worse still, they take a while to spin down after prolonged gaming, so you could be browsing the web or replying to emails with the fans running at full tilt.
Noise level
| Idle |
| 30 / 37 / 39 dB(A) |
| Load |
| 54 / 54 dB(A) |
 | ||
30 dB silent 40 dB(A) audible 50 dB(A) loud |
||
min: | ||
Temperature
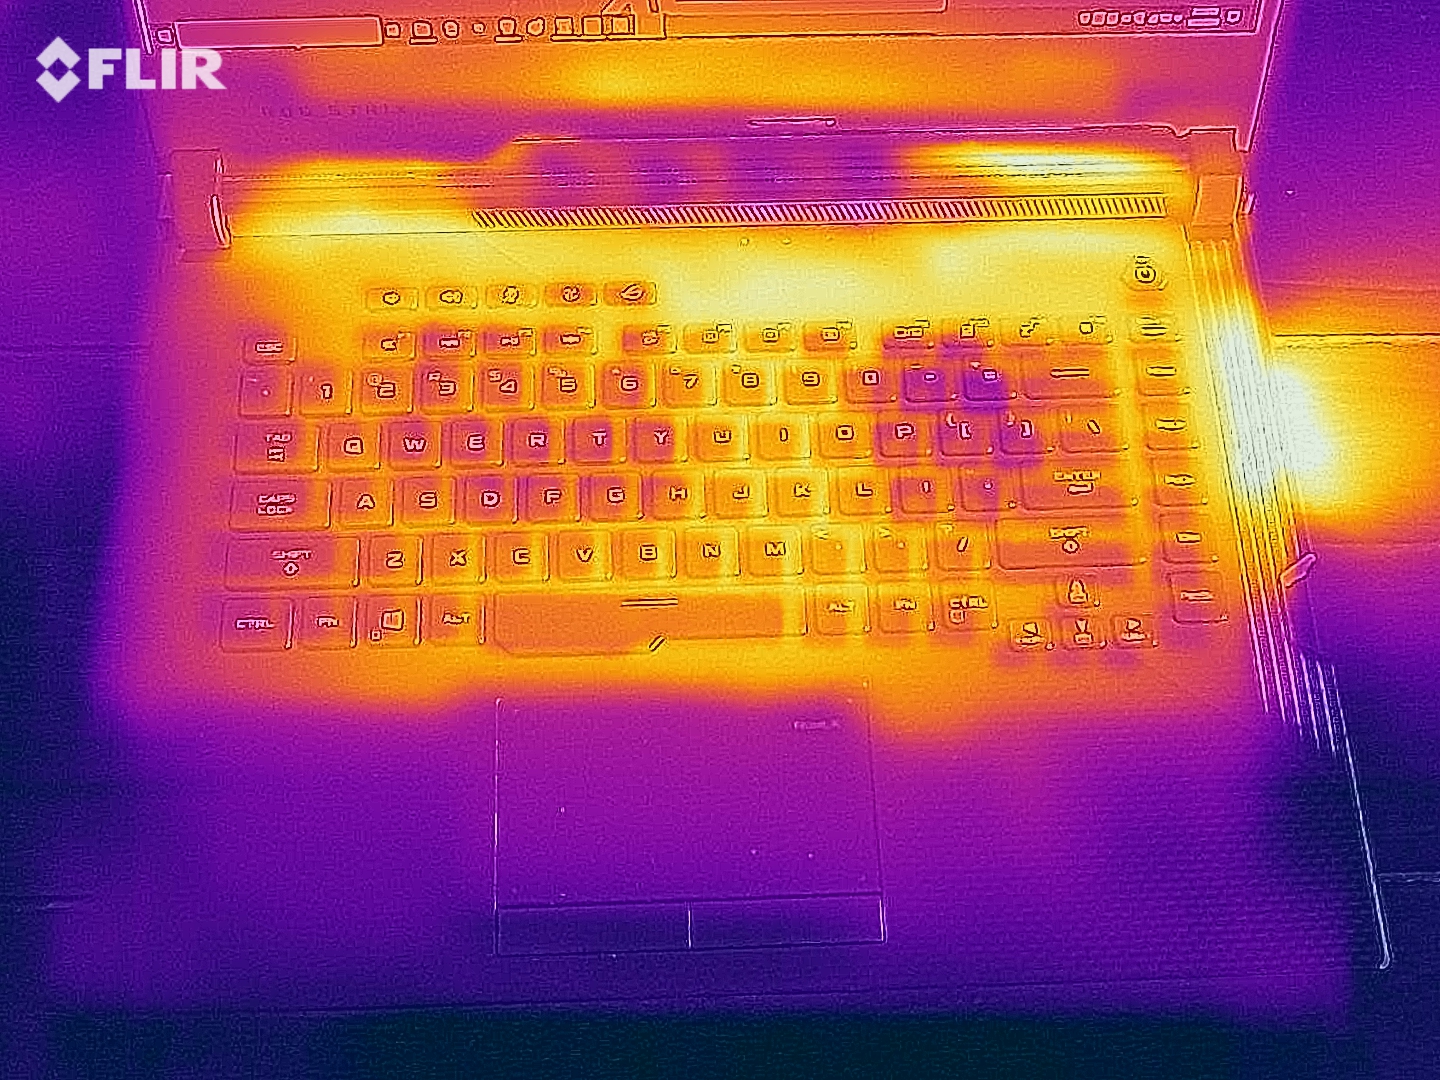
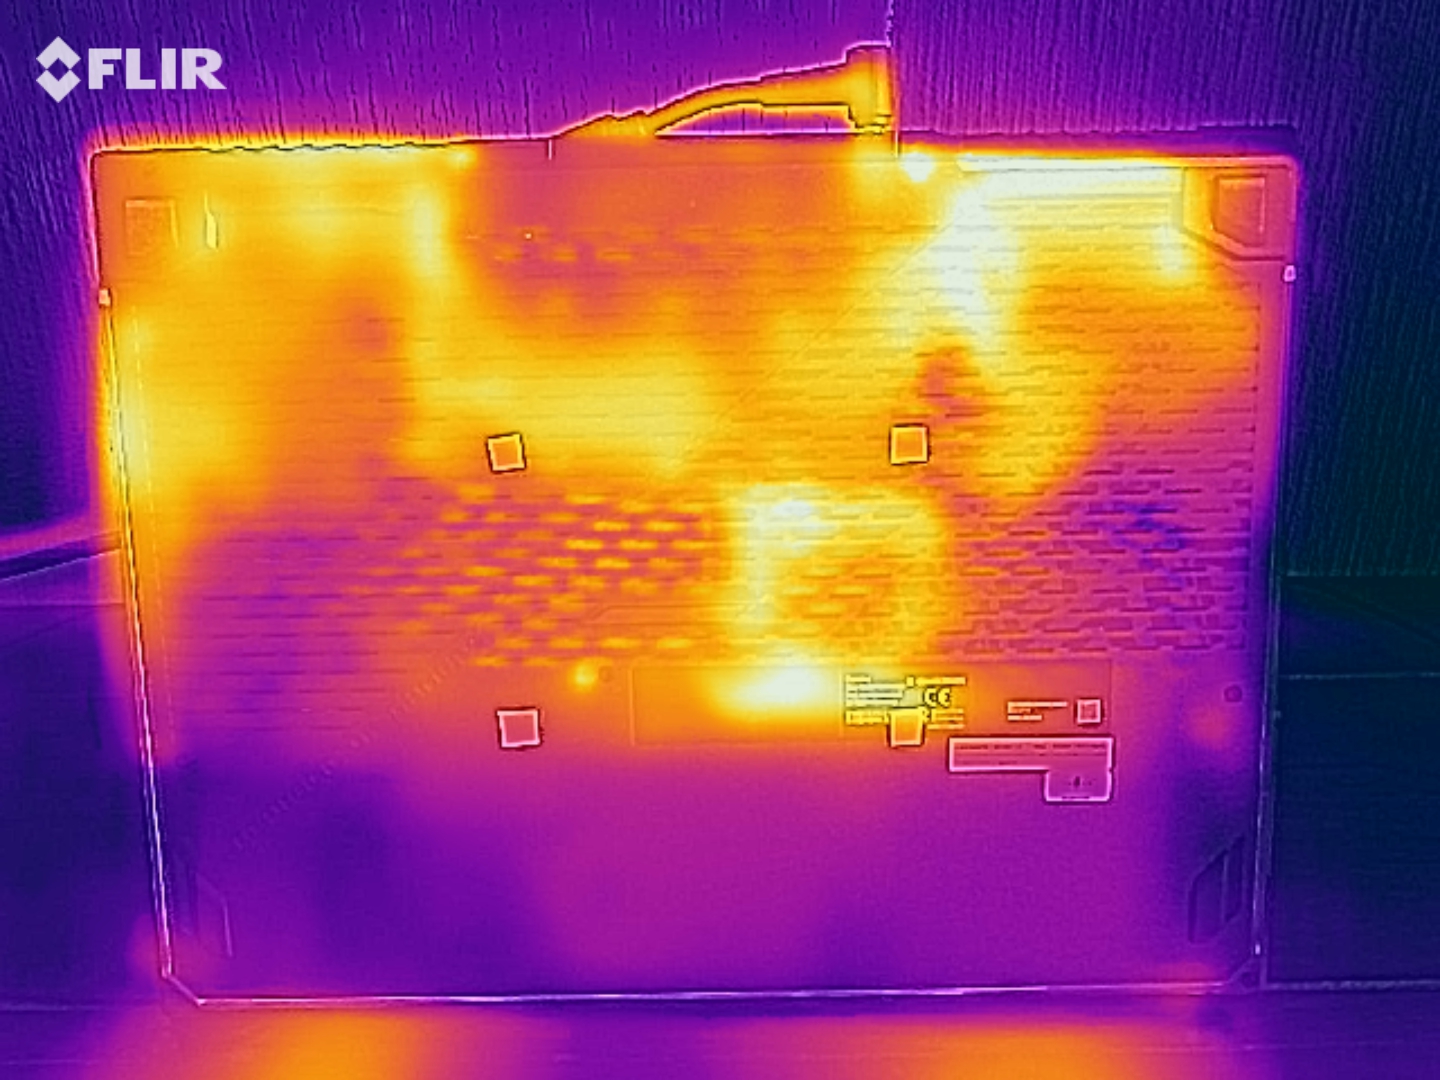
The G531GW runs hot too. Surface temperatures peaked at 52 °C (~126 °F) while playing "The Witcher 3", although most of the device remained at between 41 °C (~106 °F) and 50 °C (~122 °F). The palm rest area remained below 35 °C (~95 °F) though, so you could game on the G531GW with it resting on your lap. We would not recommend it though as most of the chassis will feel hot to the touch.
You should have no problems when the system is idling though. Most of our review unit remained at around 30 °C (~86 °F), although the centre of the bottom case peaked at 35 °C (~95 °F). This should not feel uncomfortable against your lap in daily use, in our opinion.
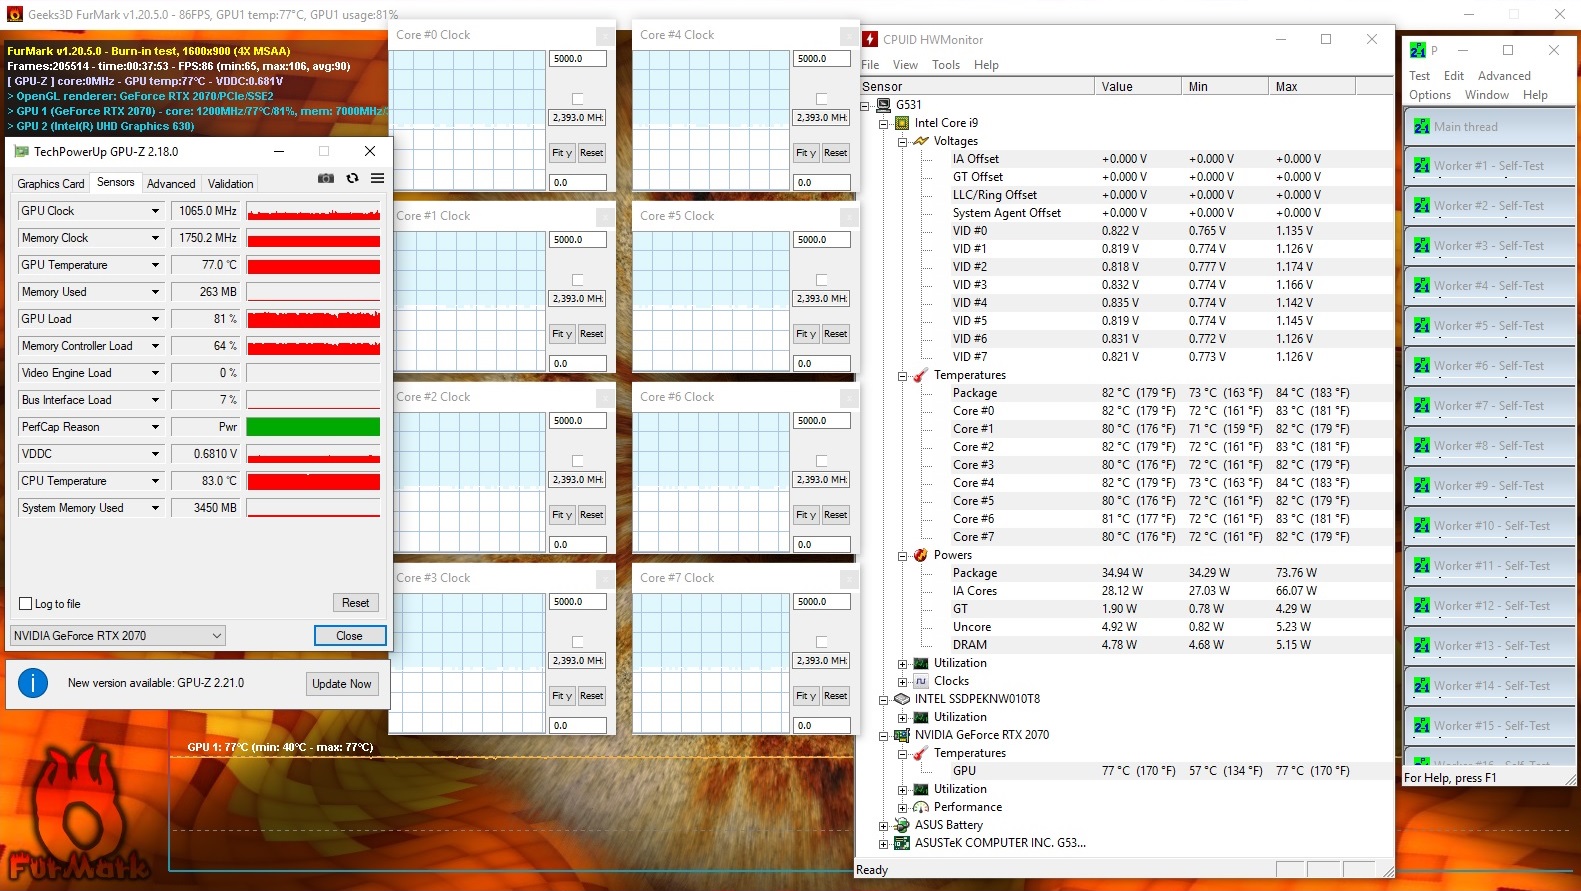
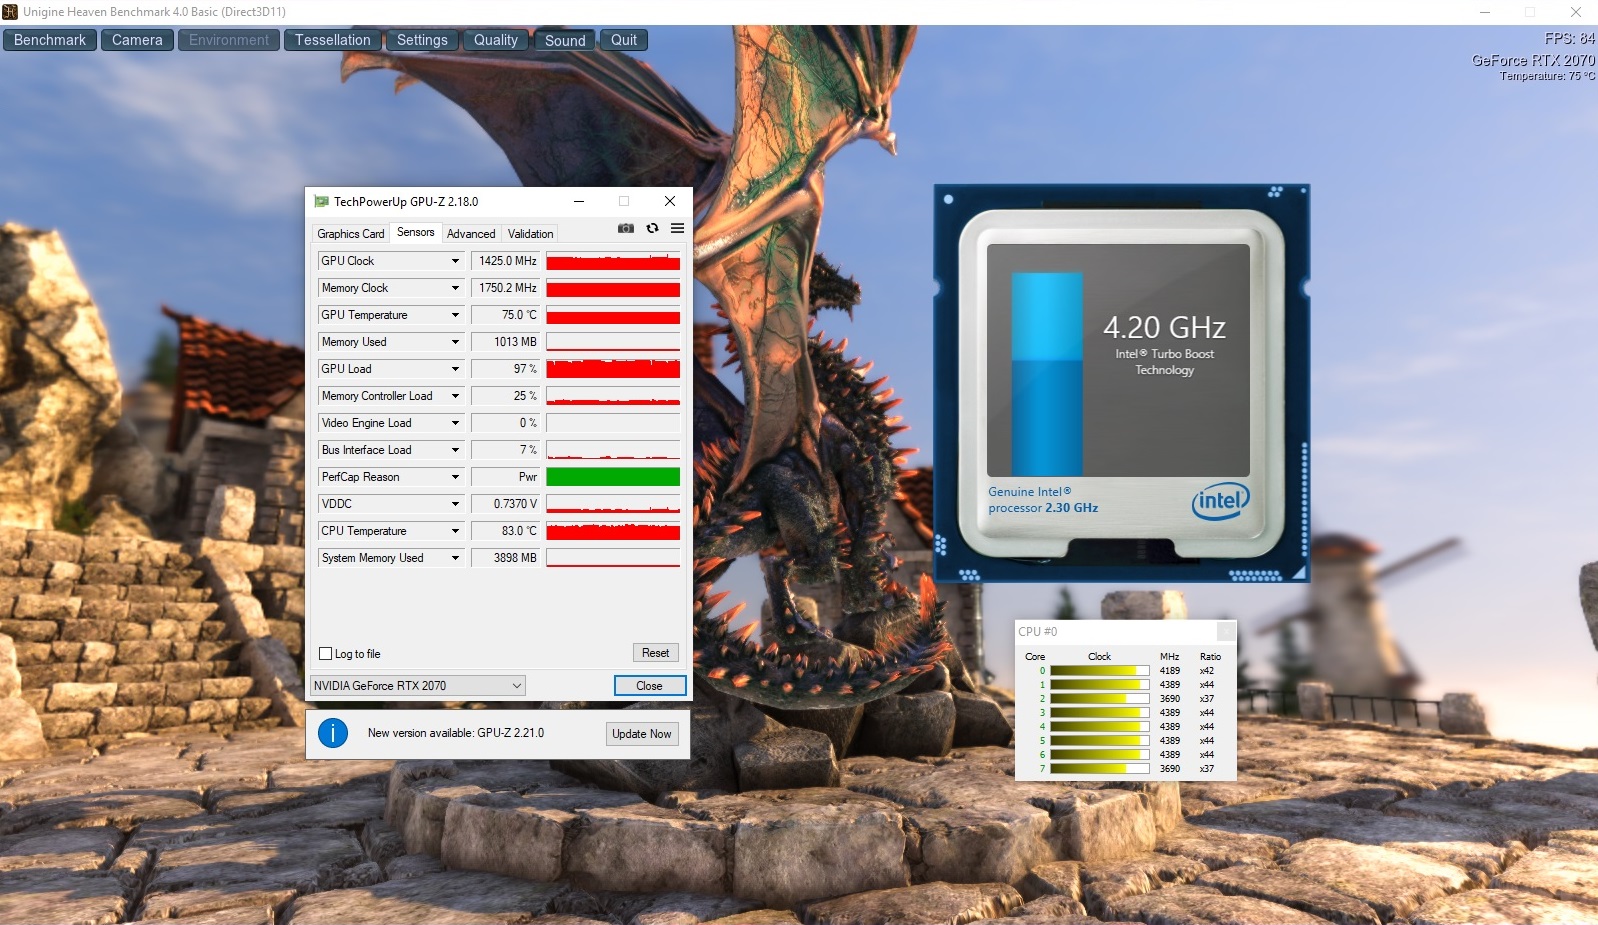
We also subjected our review unit to a one-hour stress test, during which we ran FurMark and Prime95 to push both the CPU and GPU to their limits. Internal temperatures did not reach critical levels, but both components thermal throttled, nonetheless. CPU core temperatures peaked at 84 °C (~183 °F), which caused the clock speed to drop to around 2.3 GHz. GPU core temperatures reached 77 °C (~171 °F), which should not necessarily cause it to limit its performance to prevent it from overheating. However, the GPU downclocks to 1,065 MHz, which is 150 MHz below its base clock speed.
(-) The maximum temperature on the upper side is 51 °C / 124 F, compared to the average of 40.4 °C / 105 F, ranging from 21.2 to 68.8 °C for the class Gaming.
(-) The bottom heats up to a maximum of 49 °C / 120 F, compared to the average of 43.2 °C / 110 F
(+) In idle usage, the average temperature for the upper side is 28.9 °C / 84 F, compared to the device average of 33.9 °C / 93 F.
(-) Playing The Witcher 3, the average temperature for the upper side is 40.4 °C / 105 F, compared to the device average of 33.9 °C / 93 F.
(+) The palmrests and touchpad are reaching skin temperature as a maximum (33 °C / 91.4 F) and are therefore not hot.
(-) The average temperature of the palmrest area of similar devices was 28.8 °C / 83.8 F (-4.2 °C / -7.6 F).
Speakers
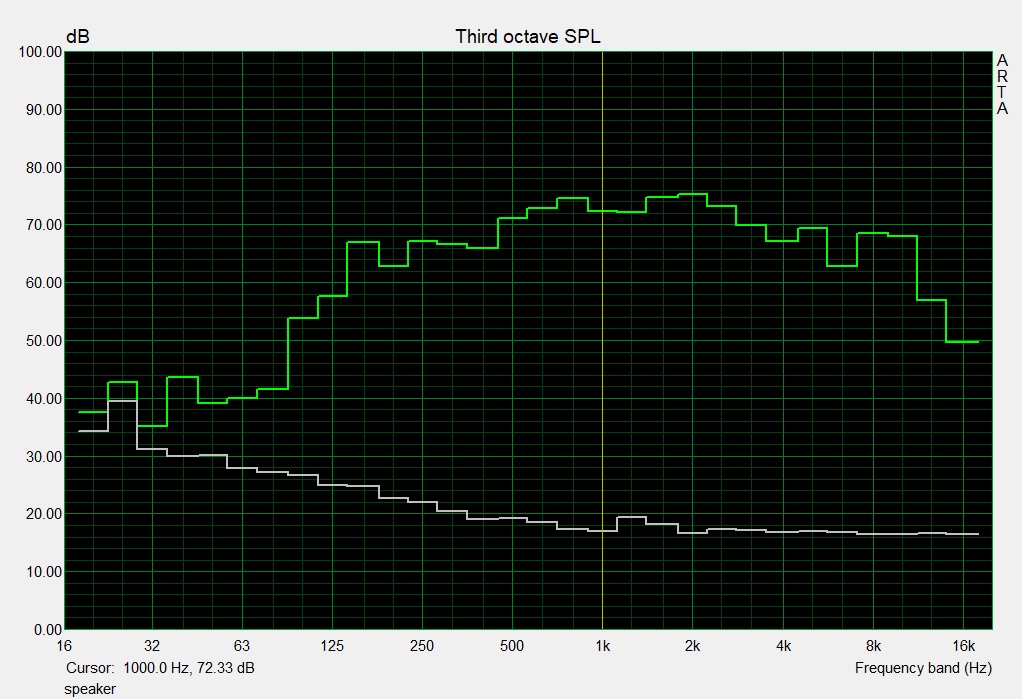
The G531GW has surprisingly good stereo speakers. They reached a maximum of 83.8 dB(A) during our tests and delivered a broad sound spectrum. Audio sounds detailed, and the speakers are a worthy replacement for external speakers.
You could still connect external audio equipment using Bluetooth or the 3.5 mm jack though. The latter is a combined headphone and microphone jack that gripped jack plugs tightly during our tests.
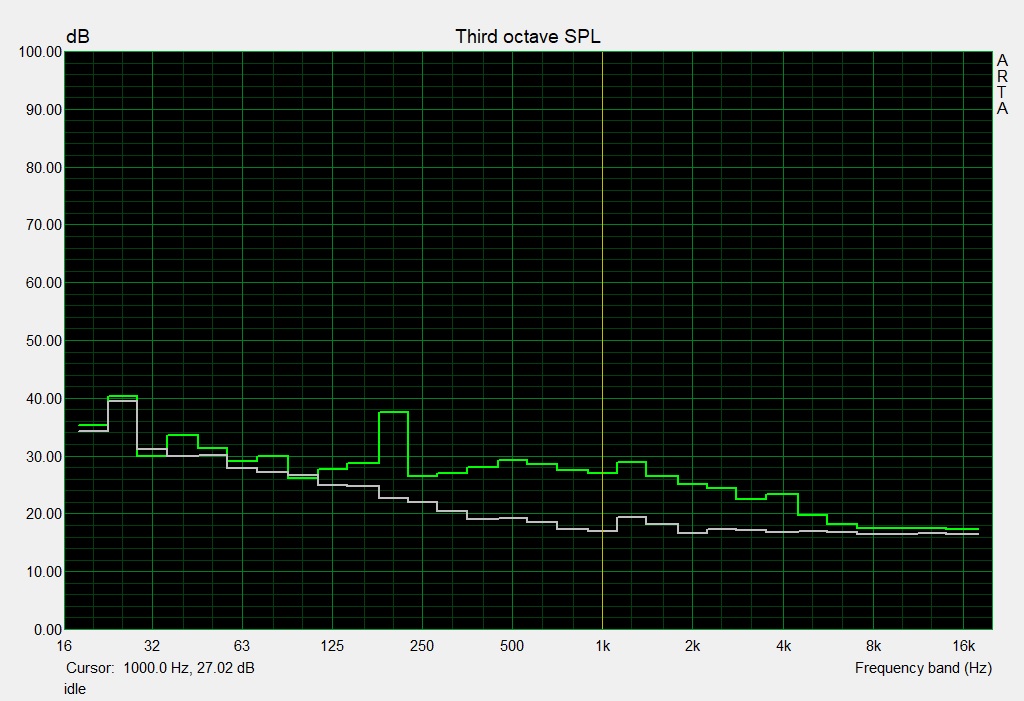
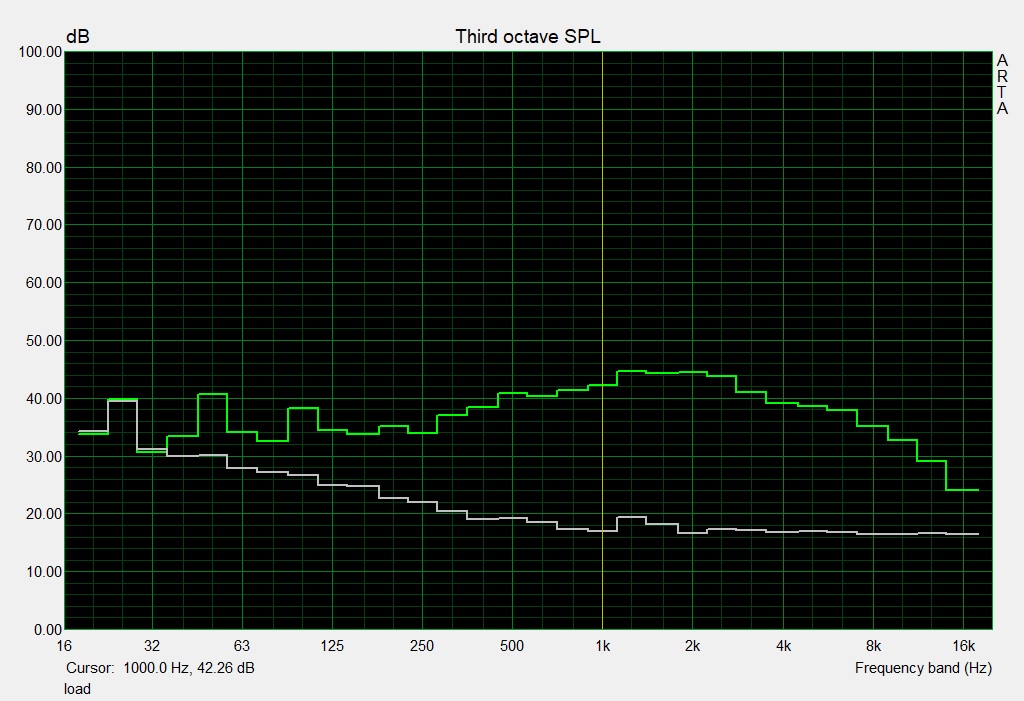
Asus Strix Scar III G531GW audio analysis
(+) | speakers can play relatively loud (84 dB)
Bass 100 - 315 Hz
(±) | reduced bass - on average 5.5% lower than median
(±) | linearity of bass is average (11.3% delta to prev. frequency)
Mids 400 - 2000 Hz
(+) | balanced mids - only 4.9% away from median
(+) | mids are linear (3.7% delta to prev. frequency)
Highs 2 - 16 kHz
(+) | balanced highs - only 2.1% away from median
(+) | highs are linear (6.5% delta to prev. frequency)
Overall 100 - 16.000 Hz
(+) | overall sound is linear (11% difference to median)
Compared to same class
» 7% of all tested devices in this class were better, 3% similar, 89% worse
» The best had a delta of 6%, average was 18%, worst was 132%
Compared to all devices tested
» 6% of all tested devices were better, 2% similar, 92% worse
» The best had a delta of 4%, average was 23%, worst was 134%
Asus GL504GS audio analysis
(±) | speaker loudness is average but good (79 dB)
Bass 100 - 315 Hz
(+) | good bass - only 2.9% away from median
(±) | linearity of bass is average (7.8% delta to prev. frequency)
Mids 400 - 2000 Hz
(+) | balanced mids - only 3.3% away from median
(+) | mids are linear (4.5% delta to prev. frequency)
Highs 2 - 16 kHz
(+) | balanced highs - only 4.6% away from median
(+) | highs are linear (4.2% delta to prev. frequency)
Overall 100 - 16.000 Hz
(+) | overall sound is linear (11.6% difference to median)
Compared to same class
» 10% of all tested devices in this class were better, 3% similar, 87% worse
» The best had a delta of 6%, average was 18%, worst was 132%
Compared to all devices tested
» 8% of all tested devices were better, 2% similar, 90% worse
» The best had a delta of 4%, average was 23%, worst was 134%
Power Management
Power Consumption
We expected our review unit to have higher power consumption than our comparison devices because of its more powerful CPU, but the results are startling. The G531GW consumes a minimum of 29 W at idle, which is higher than the maximum idle consumption of all but the Aorus 15 X9 of our comparison devices. Our review unit averages 157 W under load, which is around 40% higher than what our comparison devices averaged under the same conditions. Power consumption peaked at 217 W during our stress test, which is 12% higher than the XMG Neo 17 and 23% higher than the Aero 15-X9 respectively. Surprisingly, the G531GW is slightly more efficient than the GE75 Raider 8SF and the Aero 15-X9 under load.
ASUS includes a 280-W charger in the box. The charger is powerful enough to keep the G531GW charging even under sustained load.
| Off / Standby | |
| Idle | |
| Load |
|
Key:
min: | |
| Asus Strix Scar III G531GW i9-9880H, GeForce RTX 2070 Mobile | Schenker XMG Neo 17 i7-8750H, GeForce RTX 2070 Mobile | MSI GE75 8SF i7-8750H, GeForce RTX 2070 Mobile | Aorus 15 X9 i7-8750H, GeForce RTX 2070 Mobile | Gigabyte Aero 15-X9 i7-8750H, GeForce RTX 2070 Max-Q | Average of class Gaming | |
|---|---|---|---|---|---|---|
| Power Consumption | 33% | 21% | 8% | 38% | 28% | |
| Idle Minimum * (Watt) | 29 | 13 55% | 16.4 43% | 26 10% | 16 45% | 13 ? 55% |
| Idle Average * (Watt) | 32 | 16 50% | 21.9 32% | 30.8 4% | 18 44% | 18.7 ? 42% |
| Idle Maximum * (Watt) | 37 | 21 43% | 25.4 31% | 34.9 6% | 23 38% | 24.3 ? 34% |
| Load Average * (Watt) | 157 | 96 39% | 90.7 42% | 90.7 42% | 88 44% | 110.2 ? 30% |
| Witcher 3 ultra * (Watt) | 173 | 172 1% | 203.3 -18% | 175 -1% | 120 31% | |
| Load Maximum * (Watt) | 217 | 191 12% | 222.9 -3% | 241.2 -11% | 167 23% | 258 ? -19% |
* ... smaller is better
Battery Life
The G531GW has a 66 Wh battery, which is a larger capacity than all but the Aero 15-X9 of our comparison devices. Despite this, our review unit finished second bottom in our practical Wi-Fi battery life comparison table with a runtime of just under three hours. Likewise, the G531GW needs recharging over an hour sooner than the average of gaming laptops that we have already tested. Our review unit performs comparatively better in our sustained load battery life test, but it still runs out of battery after just 1:21 hours.
| Asus Strix Scar III G531GW i9-9880H, GeForce RTX 2070 Mobile, 66 Wh | Schenker XMG Neo 17 i7-8750H, GeForce RTX 2070 Mobile, 46.74 Wh | MSI GE75 8SF i7-8750H, GeForce RTX 2070 Mobile, 65 Wh | Aorus 15 X9 i7-8750H, GeForce RTX 2070 Mobile, 62 Wh | Gigabyte Aero 15-X9 i7-8750H, GeForce RTX 2070 Max-Q, 94.24 Wh | Average of class Gaming | |
|---|---|---|---|---|---|---|
| Battery runtime | -6% | 17% | -48% | 96% | 68% | |
| Reader / Idle (h) | 5.5 | 5.3 -4% | 1.8 -67% | 9.2 67% | 8.71 ? 58% | |
| WiFi v1.3 (h) | 3 | 3.7 23% | 3.5 17% | 1.6 -47% | 6.4 113% | 7.15 ? 138% |
| Load (h) | 1.4 | 0.9 -36% | 1 -29% | 2.9 107% | 1.502 ? 7% |
Pros
Cons
Verdict
The ASUS ROG Strix SCAR III G531WG is a solid gaming laptop. Unsurprisingly, modern triple-A games run smoothly on its 240 Hz Full HD display, while its RTX 2070 GPU is powerful to handle games at 4K on external monitors too. The laptop is easy to repair and maintain too, and we are fans of the inclusion of Keystone security. The number pad integrated within the trackpad is also a nice touch and distinguishes the ROG Strix from its competitors.
The ASUS ROG Strix SCAR III G531GW is a solid 15.6-inch gaming laptop. However, its loud fans and underwhelming RTX 2070 performance prevent it from attaining top marks.
Disappointingly, the ROG Strix did not perform as well as we would have expected in benchmarks and in our gaming tests. Other laptops simply get more performance out of similar hardware than our review unit can. Additionally, ASUS has equipped the device with punishingly loud fans, which drown its impressive speakers. Unfortunately, you will only be able to appreciate the speakers when you are not gaming. It is a shame that ASUS does not offer a 4K display option too, as the ROG Strix is powerful enough to play modern triple-A titles at that resolution. Overall, the ROG Strix SCAR III G531GW has a lot going for it, but it is let down by some significant deficiencies.
Asus Strix Scar III G531GW
- 06/03/2019 v6 (old)
Mike Wobker
Price comparison

