An LED Light Show: Asus ROG Strix G GL731GU Laptop Review
The Asus ROG Strix G series is the budget version of the "proper" ROG Strix III series similar to how the Zephyrus G series is the budget version of the Zephyrus S series. Unveiled in April of this year, the Taiwanese OEM has been slowly expanding its ROG family with more affordable models to attract a wider range of gamers. Prior to the Strix G series or Zephyrus G series, the ROG laptop family was made up almost entirely of high-end to enthusiast gaming laptops.
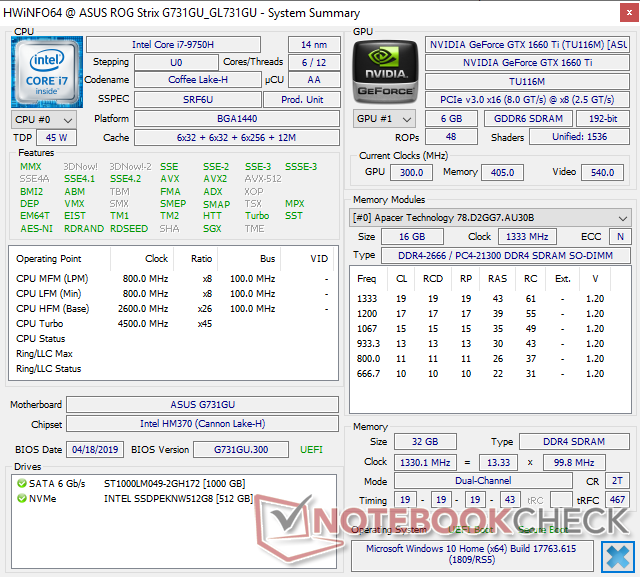
The ROG Strix G consists of 15.6-inch (GL531) and 17.3-inch (GL731) offerings. The latter is divided even further into the GL731GT with GeForce GTX 1650, GL731GU with the GTX 1660 Ti, GL731GV with the RTX 2060, and GL731GW with the RTX 2070 graphics. CPU options include the Core i5-9300H or i7-9750H with either a 60 Hz or 144 Hz 1080p display. There are no RTX 2080 or 4K UHD options as of this writing.
For this review, we'll be checking out the Strix G GL731GU with GeForce GTX 1660 Ti graphics, Core i7-9750H CPU, and a 144 Hz display for a retail price of about $1500 USD on CUKUSA.com. Direct competitors in this space include other mid-range to upper mid-range 17.3-inch gaming laptops such as the Dell Alienware m17, MSI GE75, Acer Predator Helios, Lenovo Legion Y740, or Gigabyte Aorus 7.
The detailed specifications list for the Strix G GL531 and GL731 series can be found on the official Asus product page here.
More Asus reviews:
Case
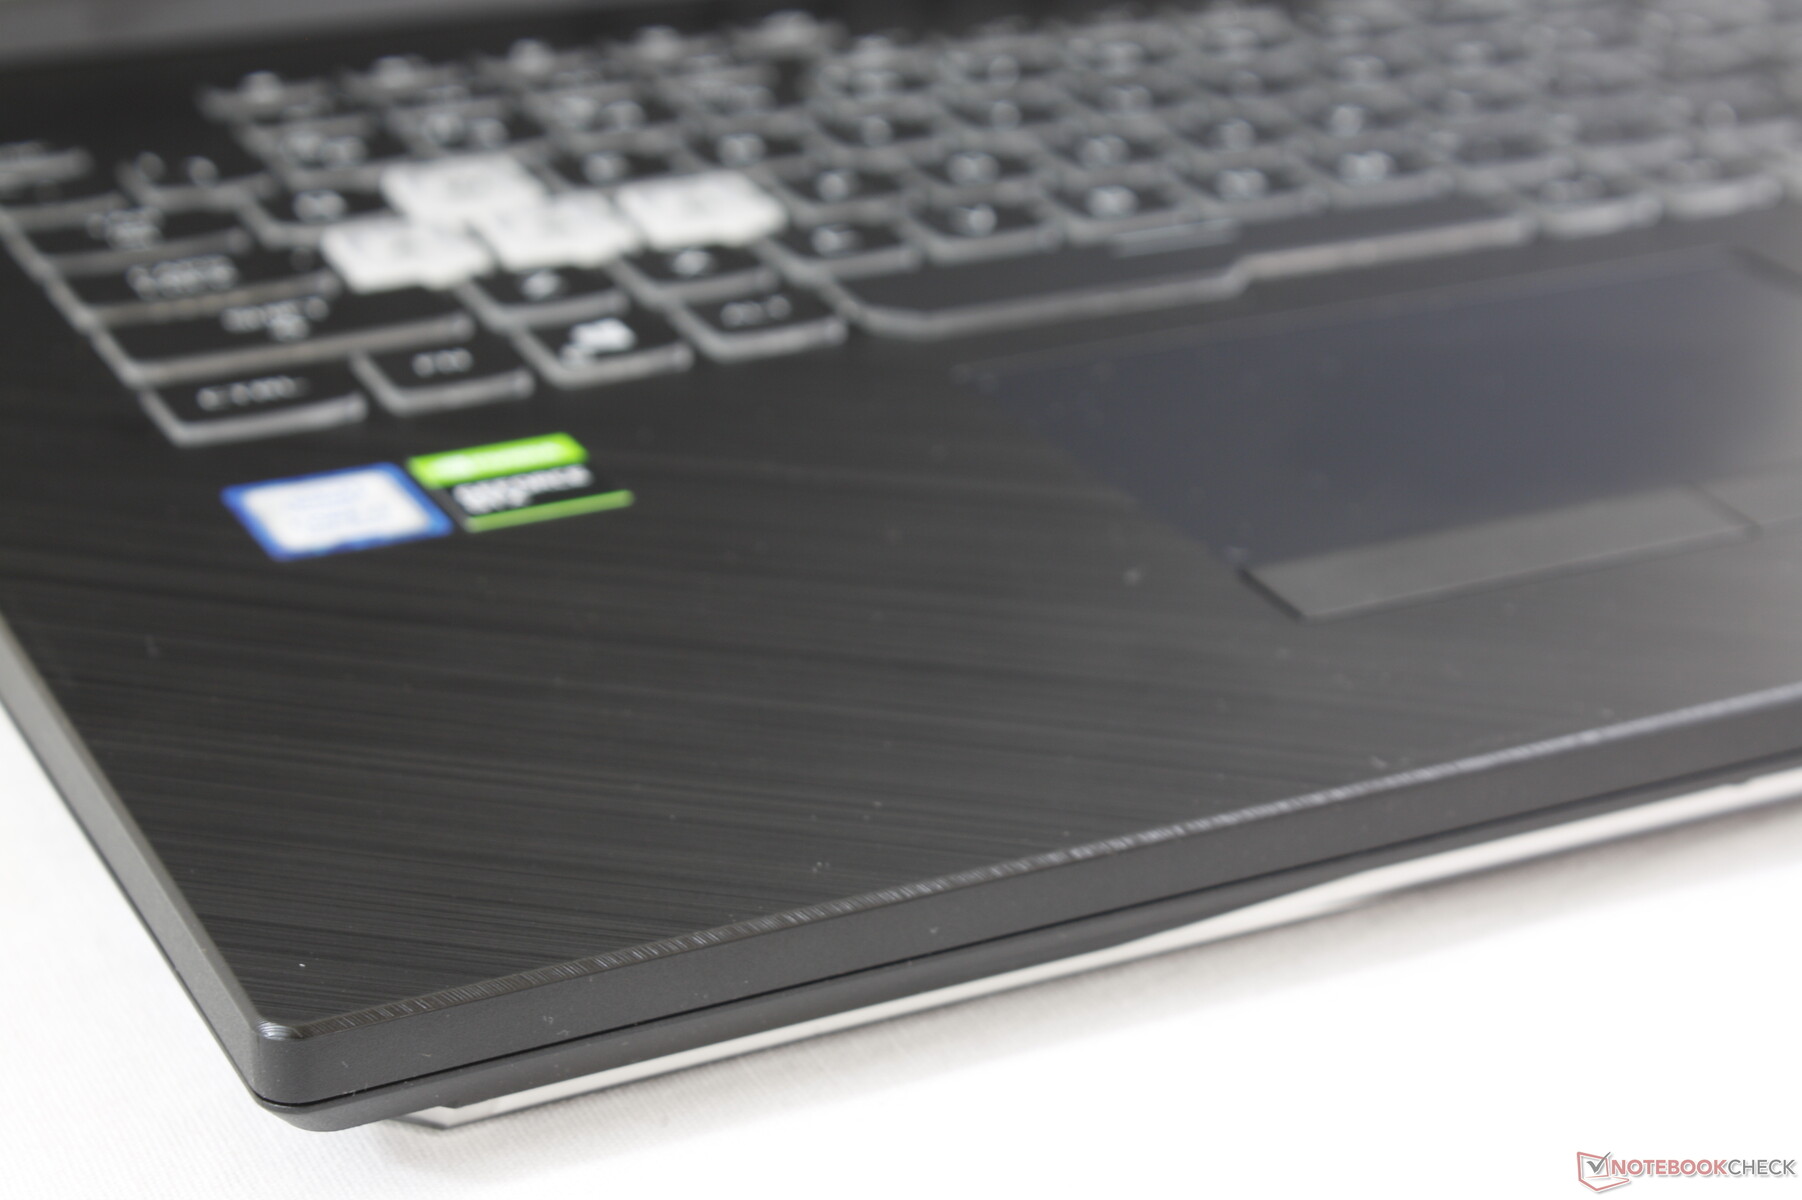
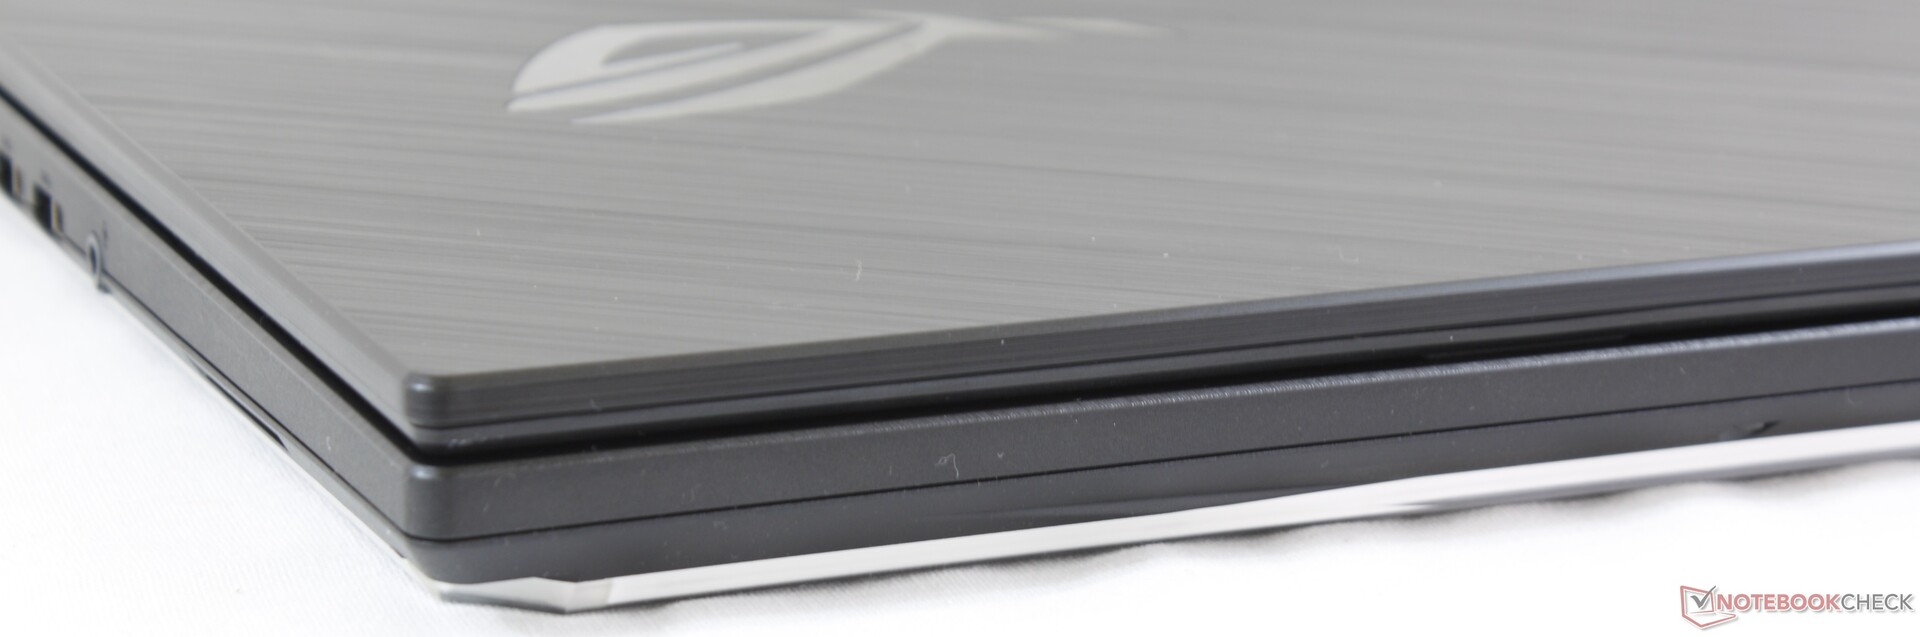
The chassis is a nearly 1:1 cheaper plastic version of the ROG Strix Scar III G731 series. The gunmetal gray aesthetic and smooth brushed aluminum surfaces have been replaced for a less luxurious feel. The LED lights have fewer options while the Asus Keystone security feature has been removed to save on costs. It's almost as if Asus made a cheaper knockoff of its own flagship series.
Despite the above, the system still feels strong in the hand. The base is more rigid than on both the competing Lenovo Legion Y740 and MSI GF75 and its brushed plastic texture is better at staving off fingerprints than the real brushed aluminum texture it's emulating. Attempting to twist the base or depress the keyboard center results in minor warping and creaking as to be expected from plastic skeletons. All-aluminum alternatives like the Razer Blade Pro 17 have the advantage in this regard.
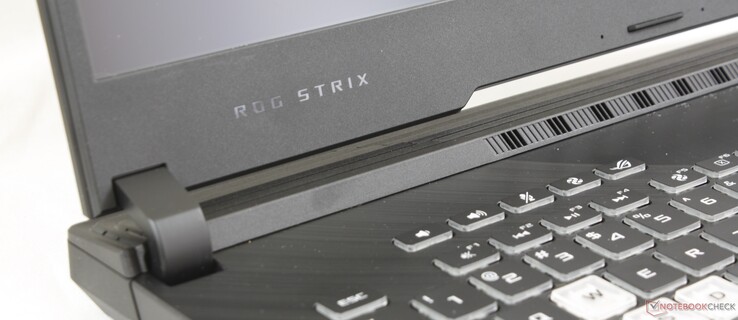
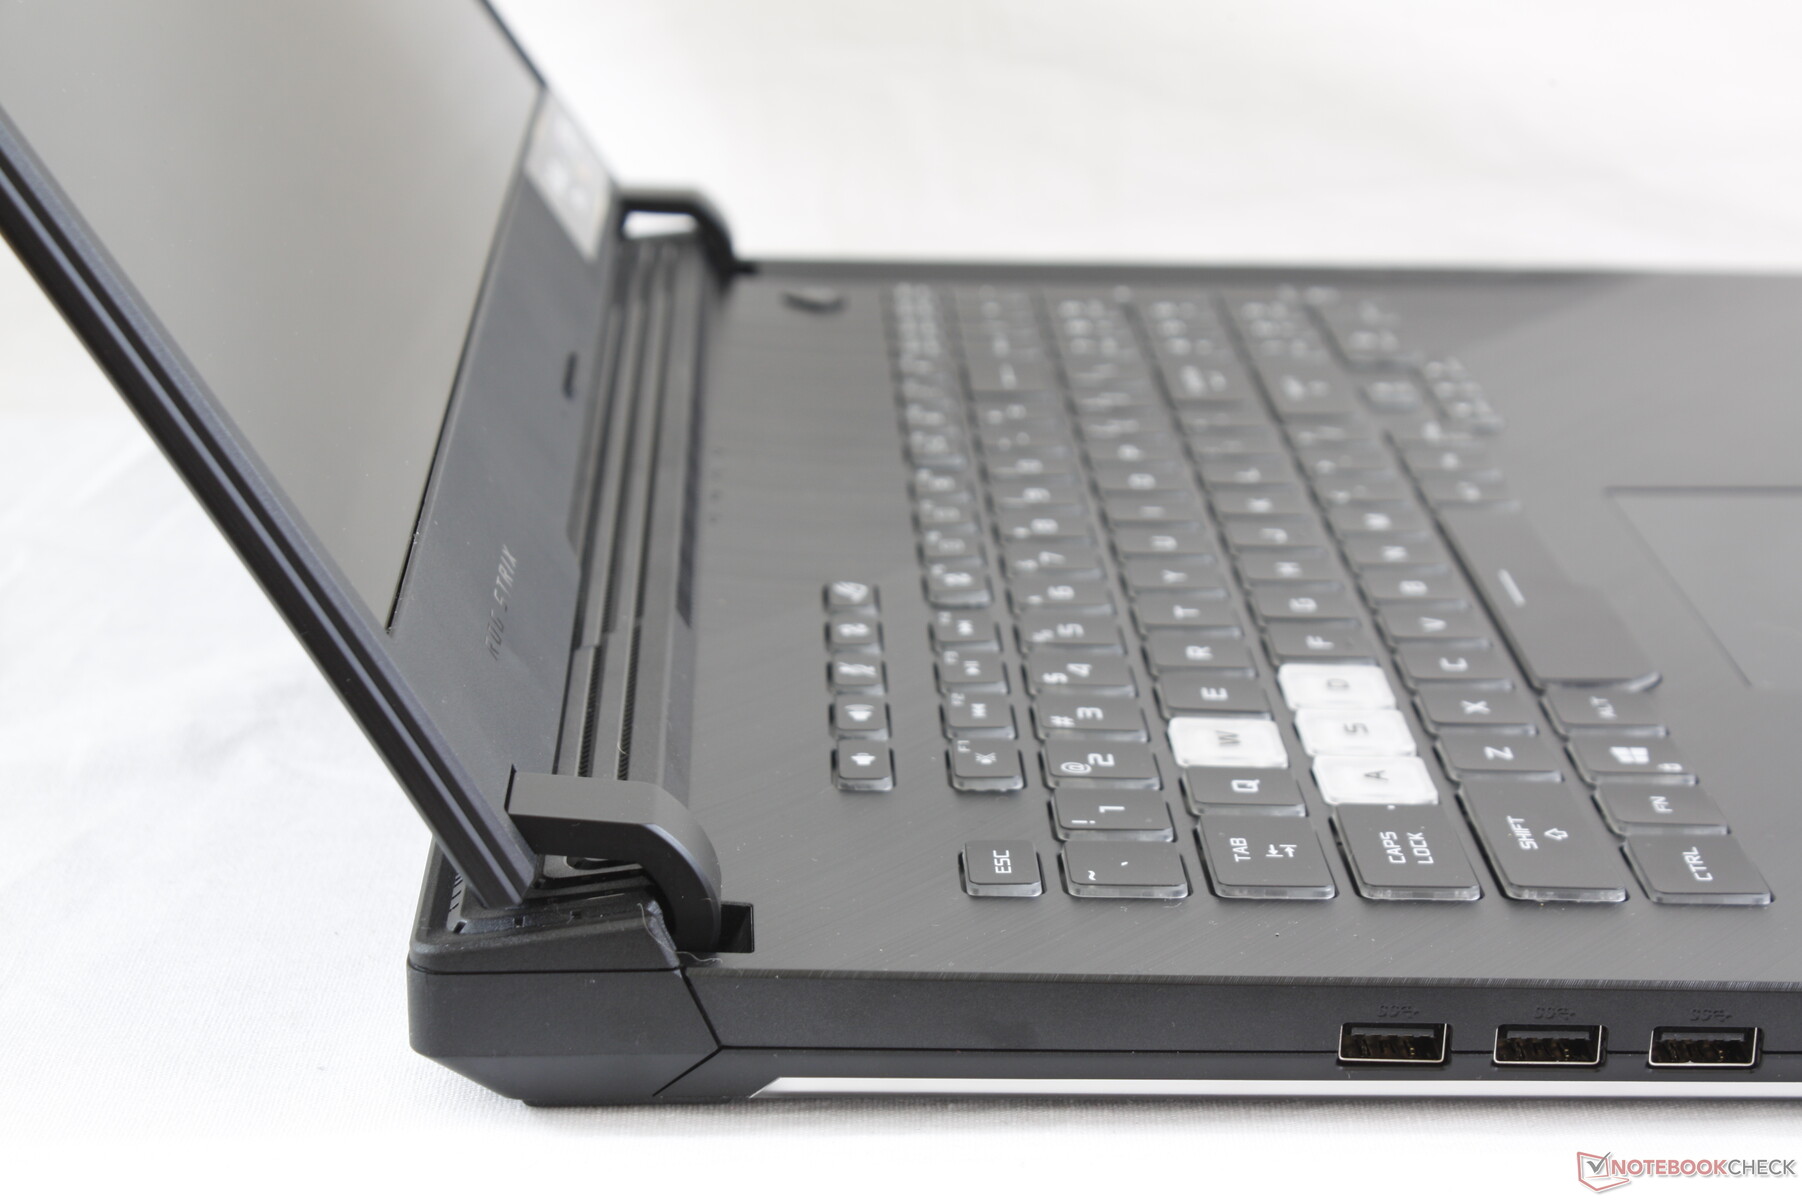
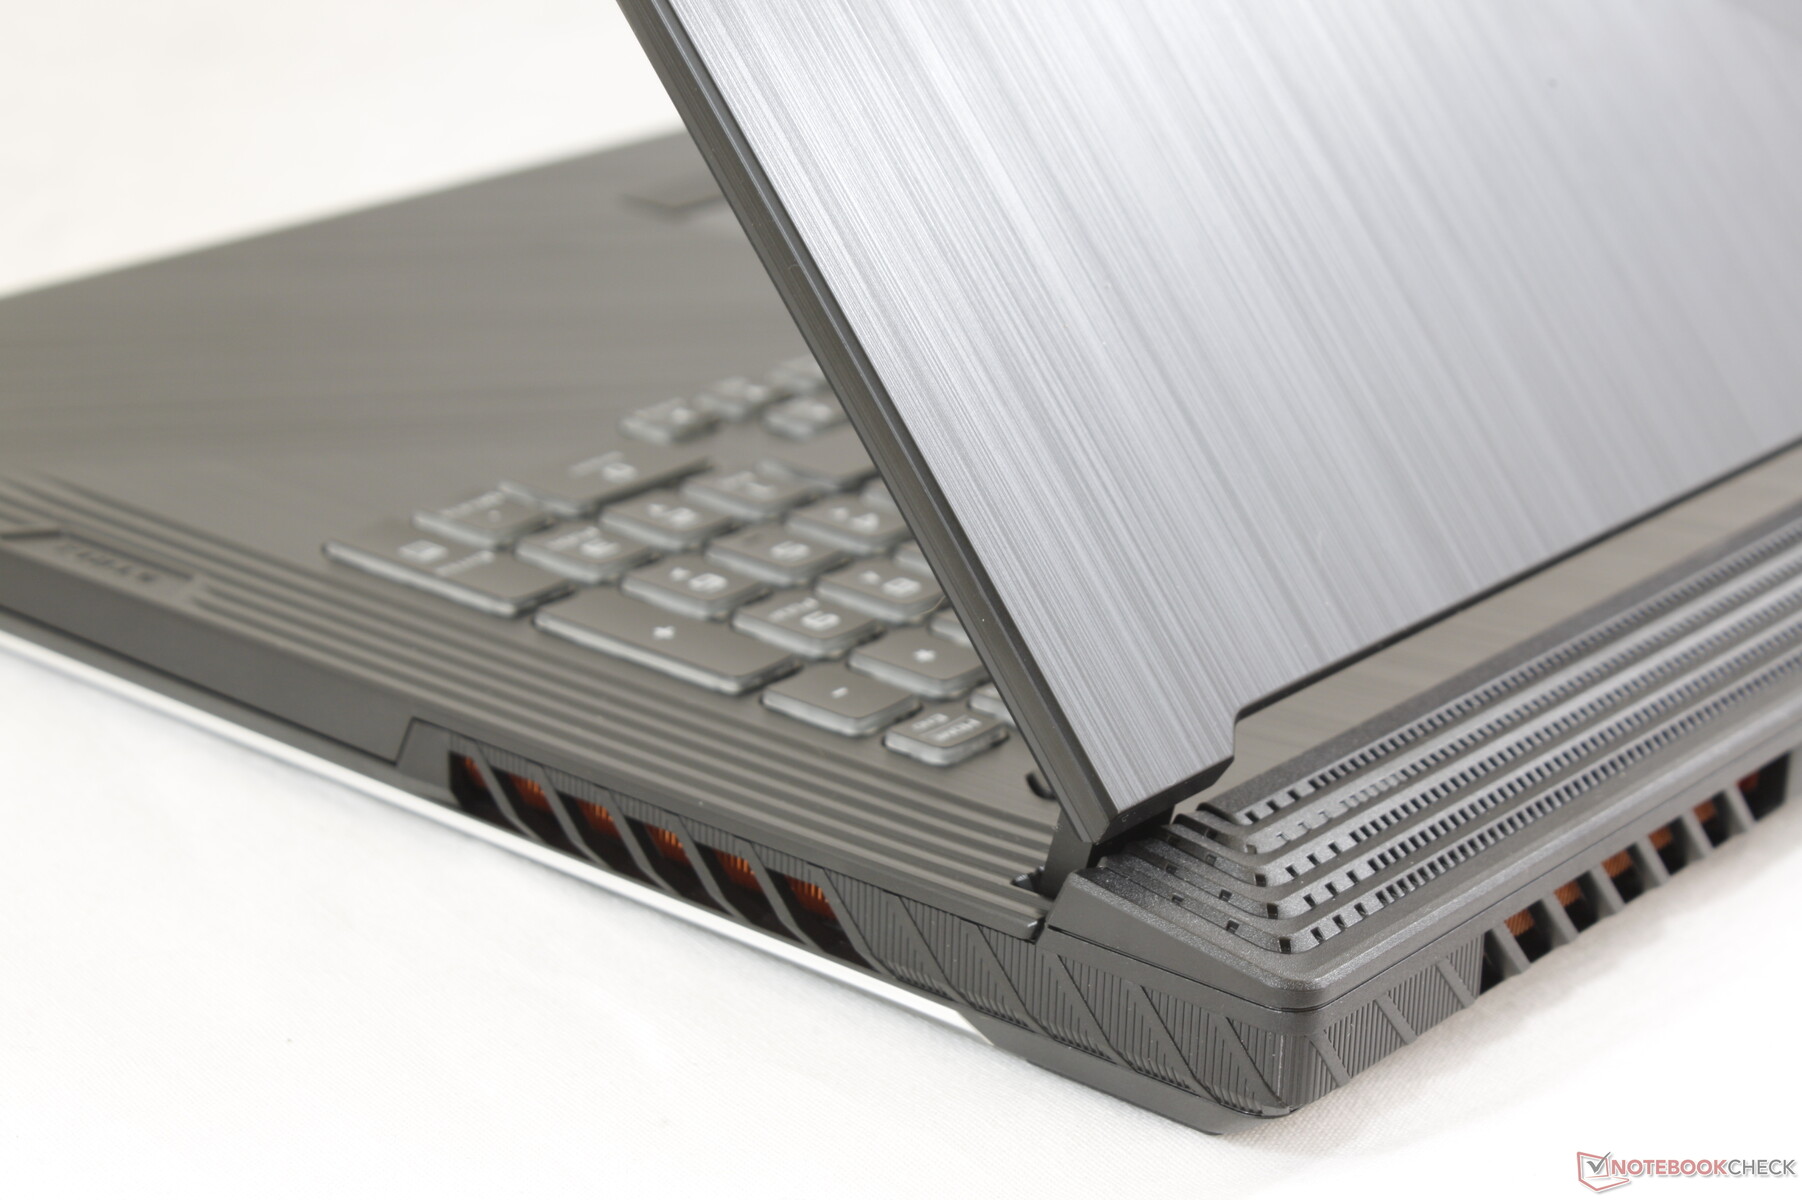
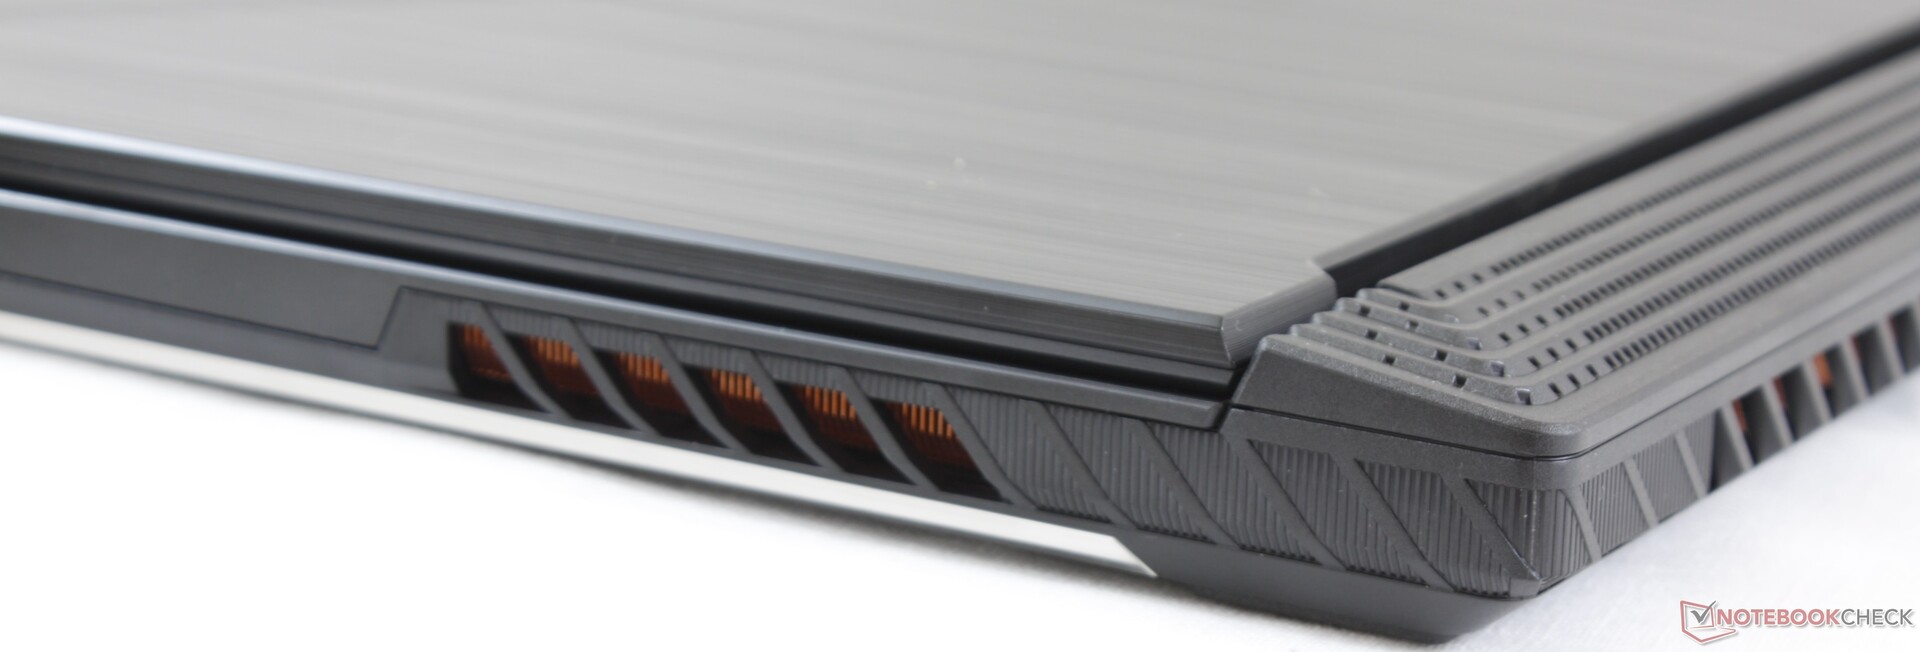
Less impressive are the hinges and lid. Unlike the Zephyrus GX701 or last generation Strix Scar II, the Strix Scar G incorporates large "jet engine" grilles along the rear that limits the maximum hinge angle to only about 120 degrees. Strangely, the hinges creak when opening and closing even though they feel taut and teeter only minimally when typing. The lid could have been more rigid as well as it falls somewhere in the middle between the lids of the more flexible Legion Y740 and the firmer Blade Pro 17.
While future iterations could improve upon the minor-but-noticeable creaking and flexing, this is still one of the better plastic chassis designs in the market. Clevo and MSI GT laptops tend to feel firmer albeit they are also much heavier and thicker than our Asus.
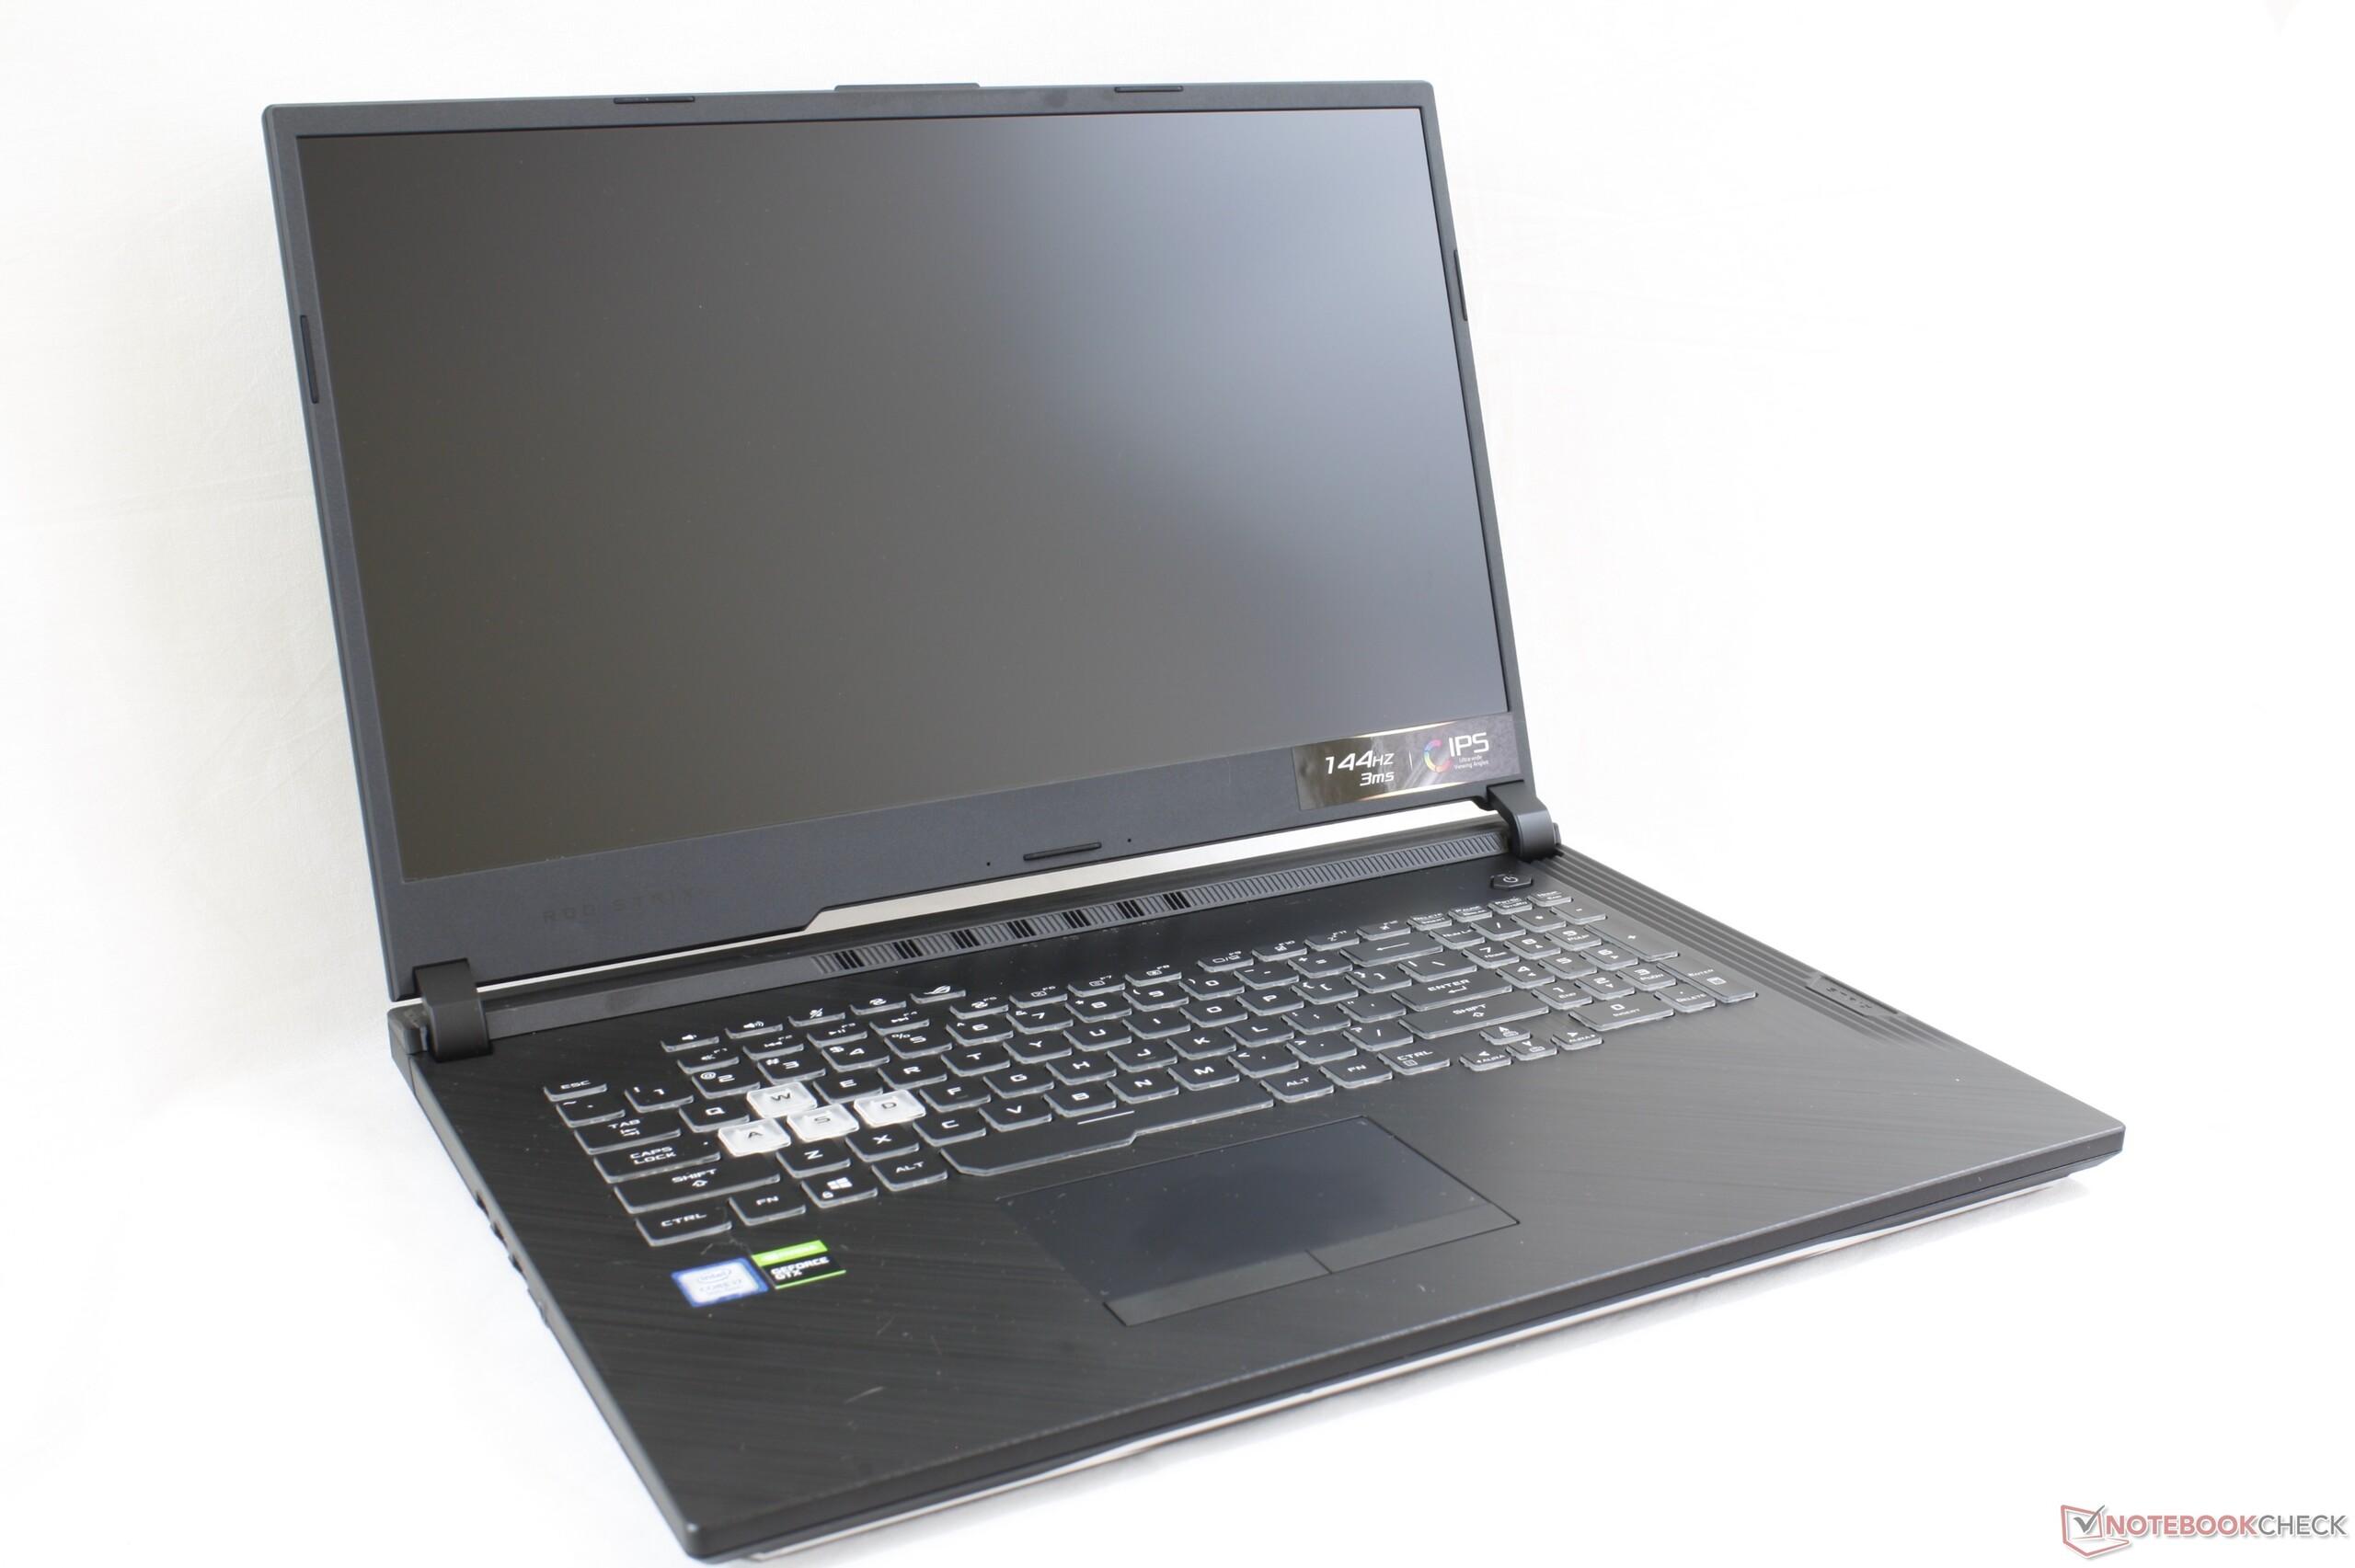
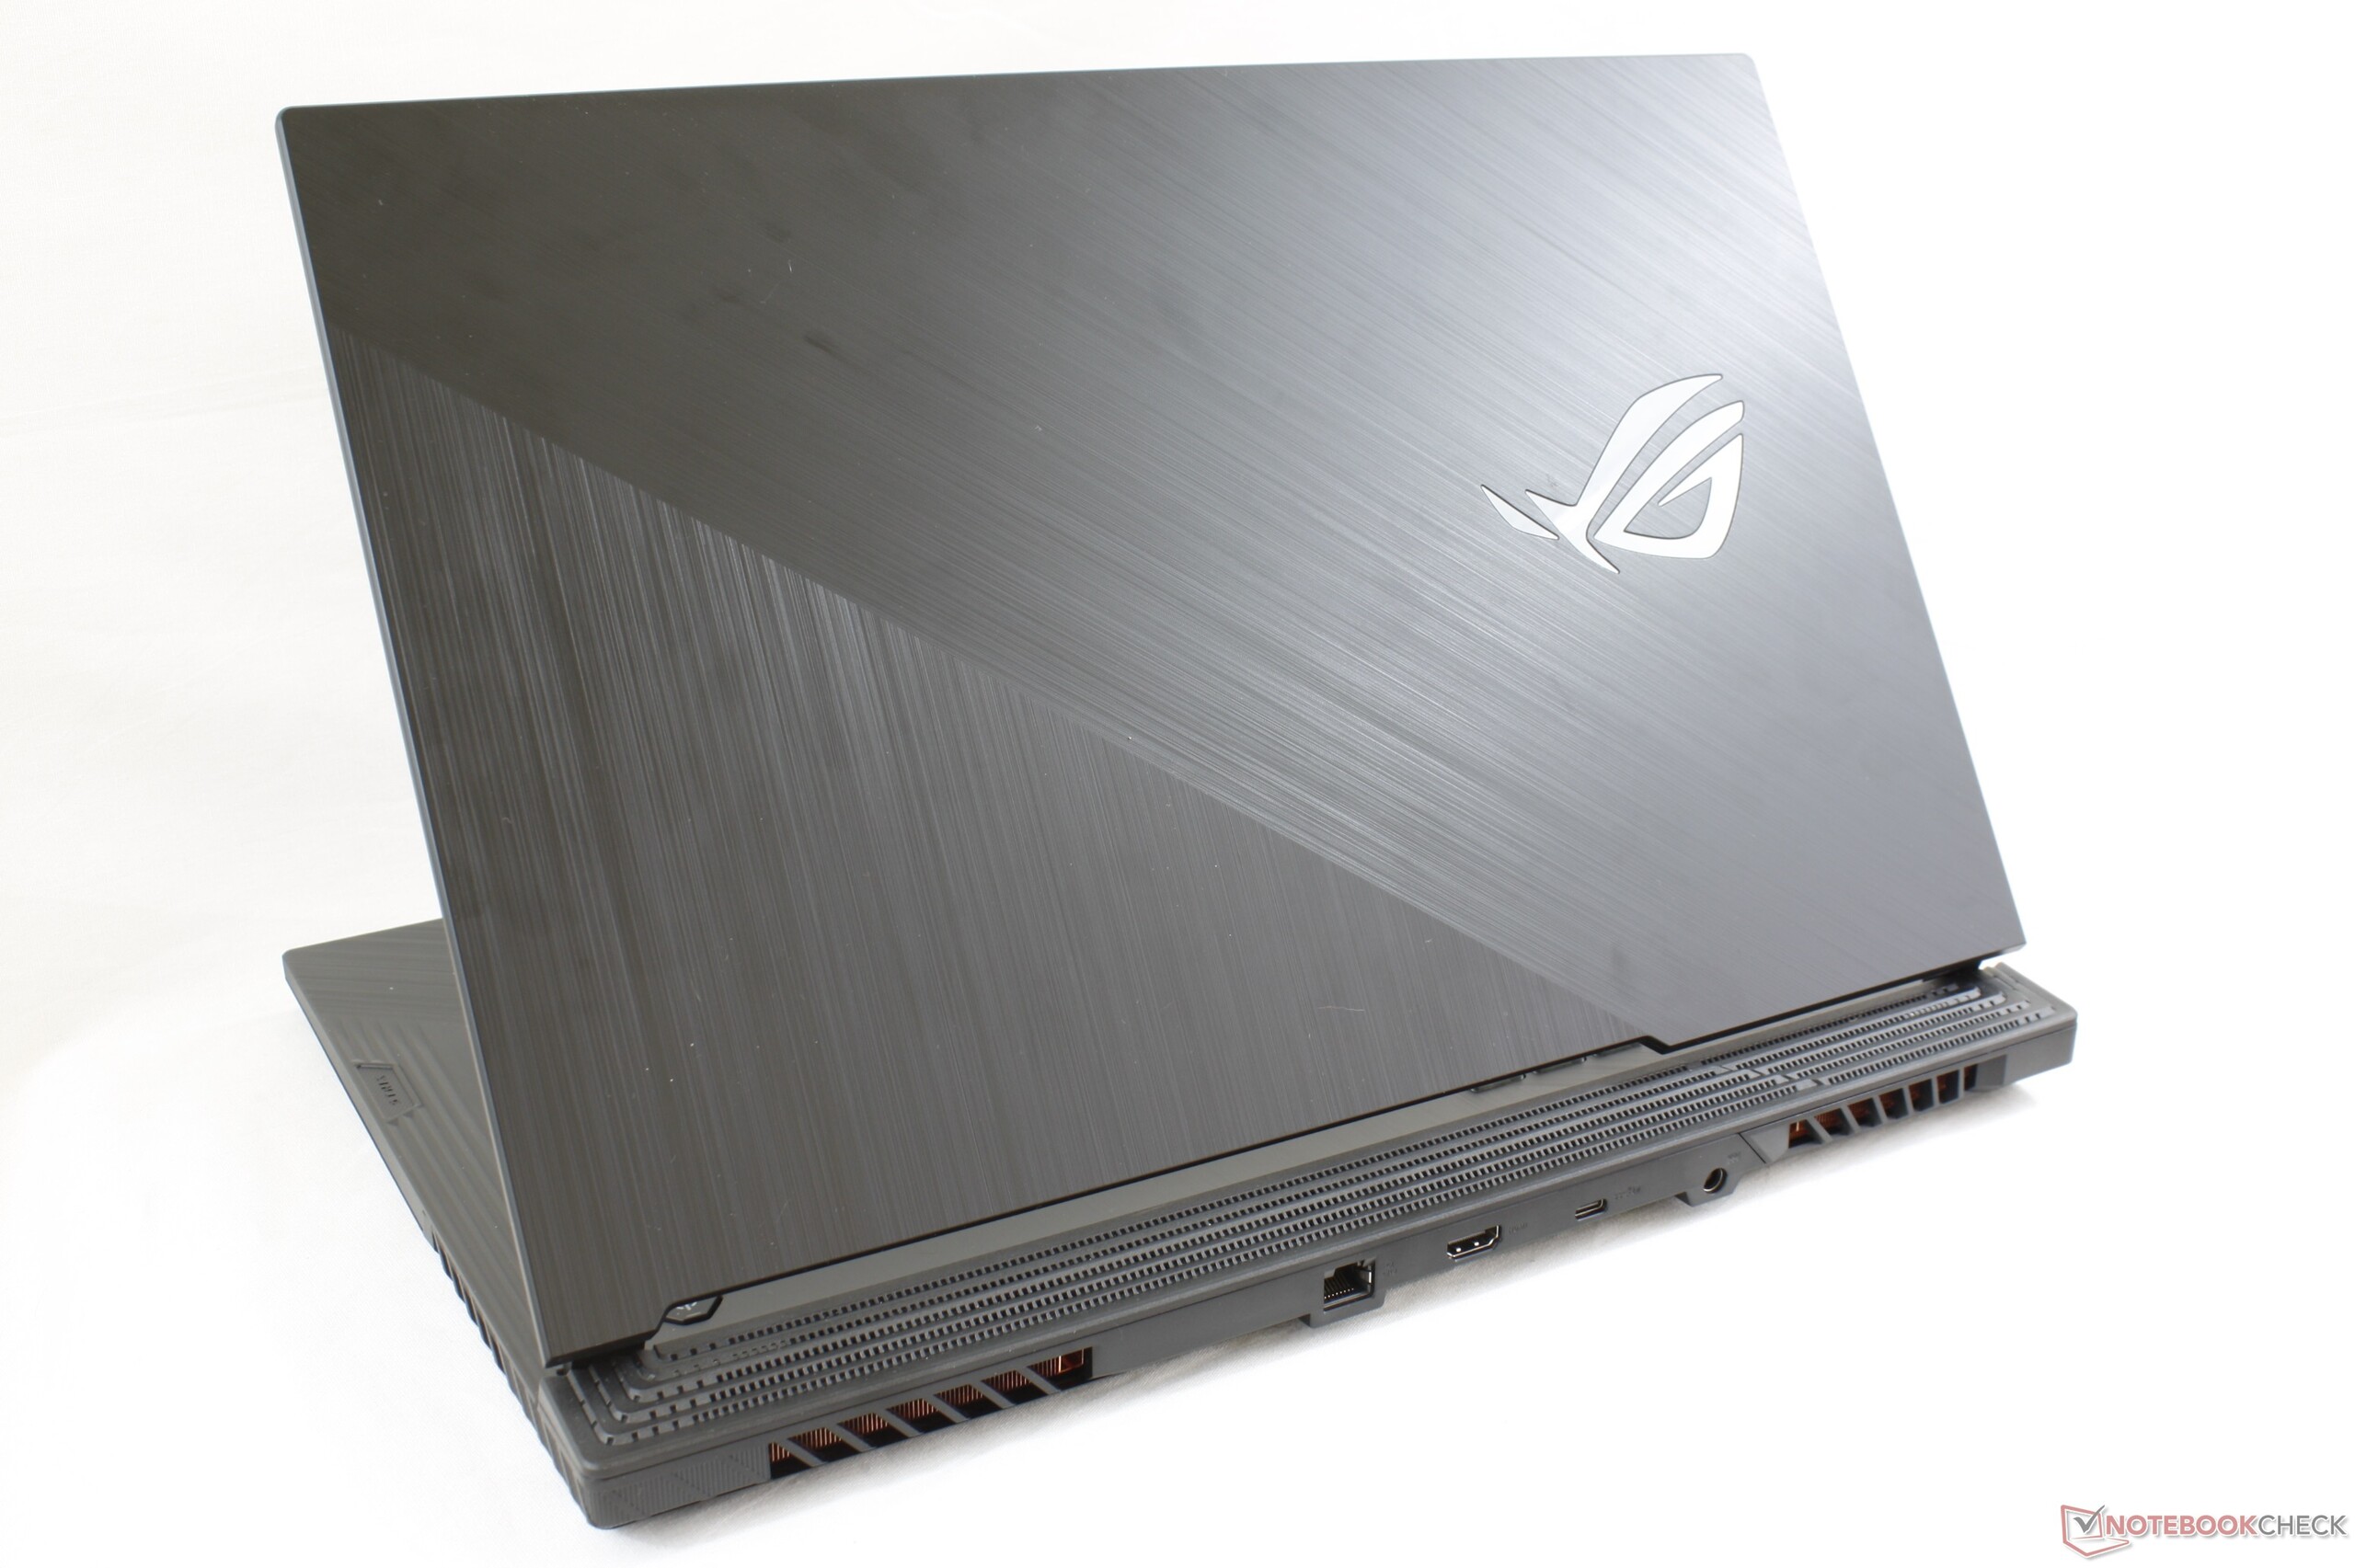
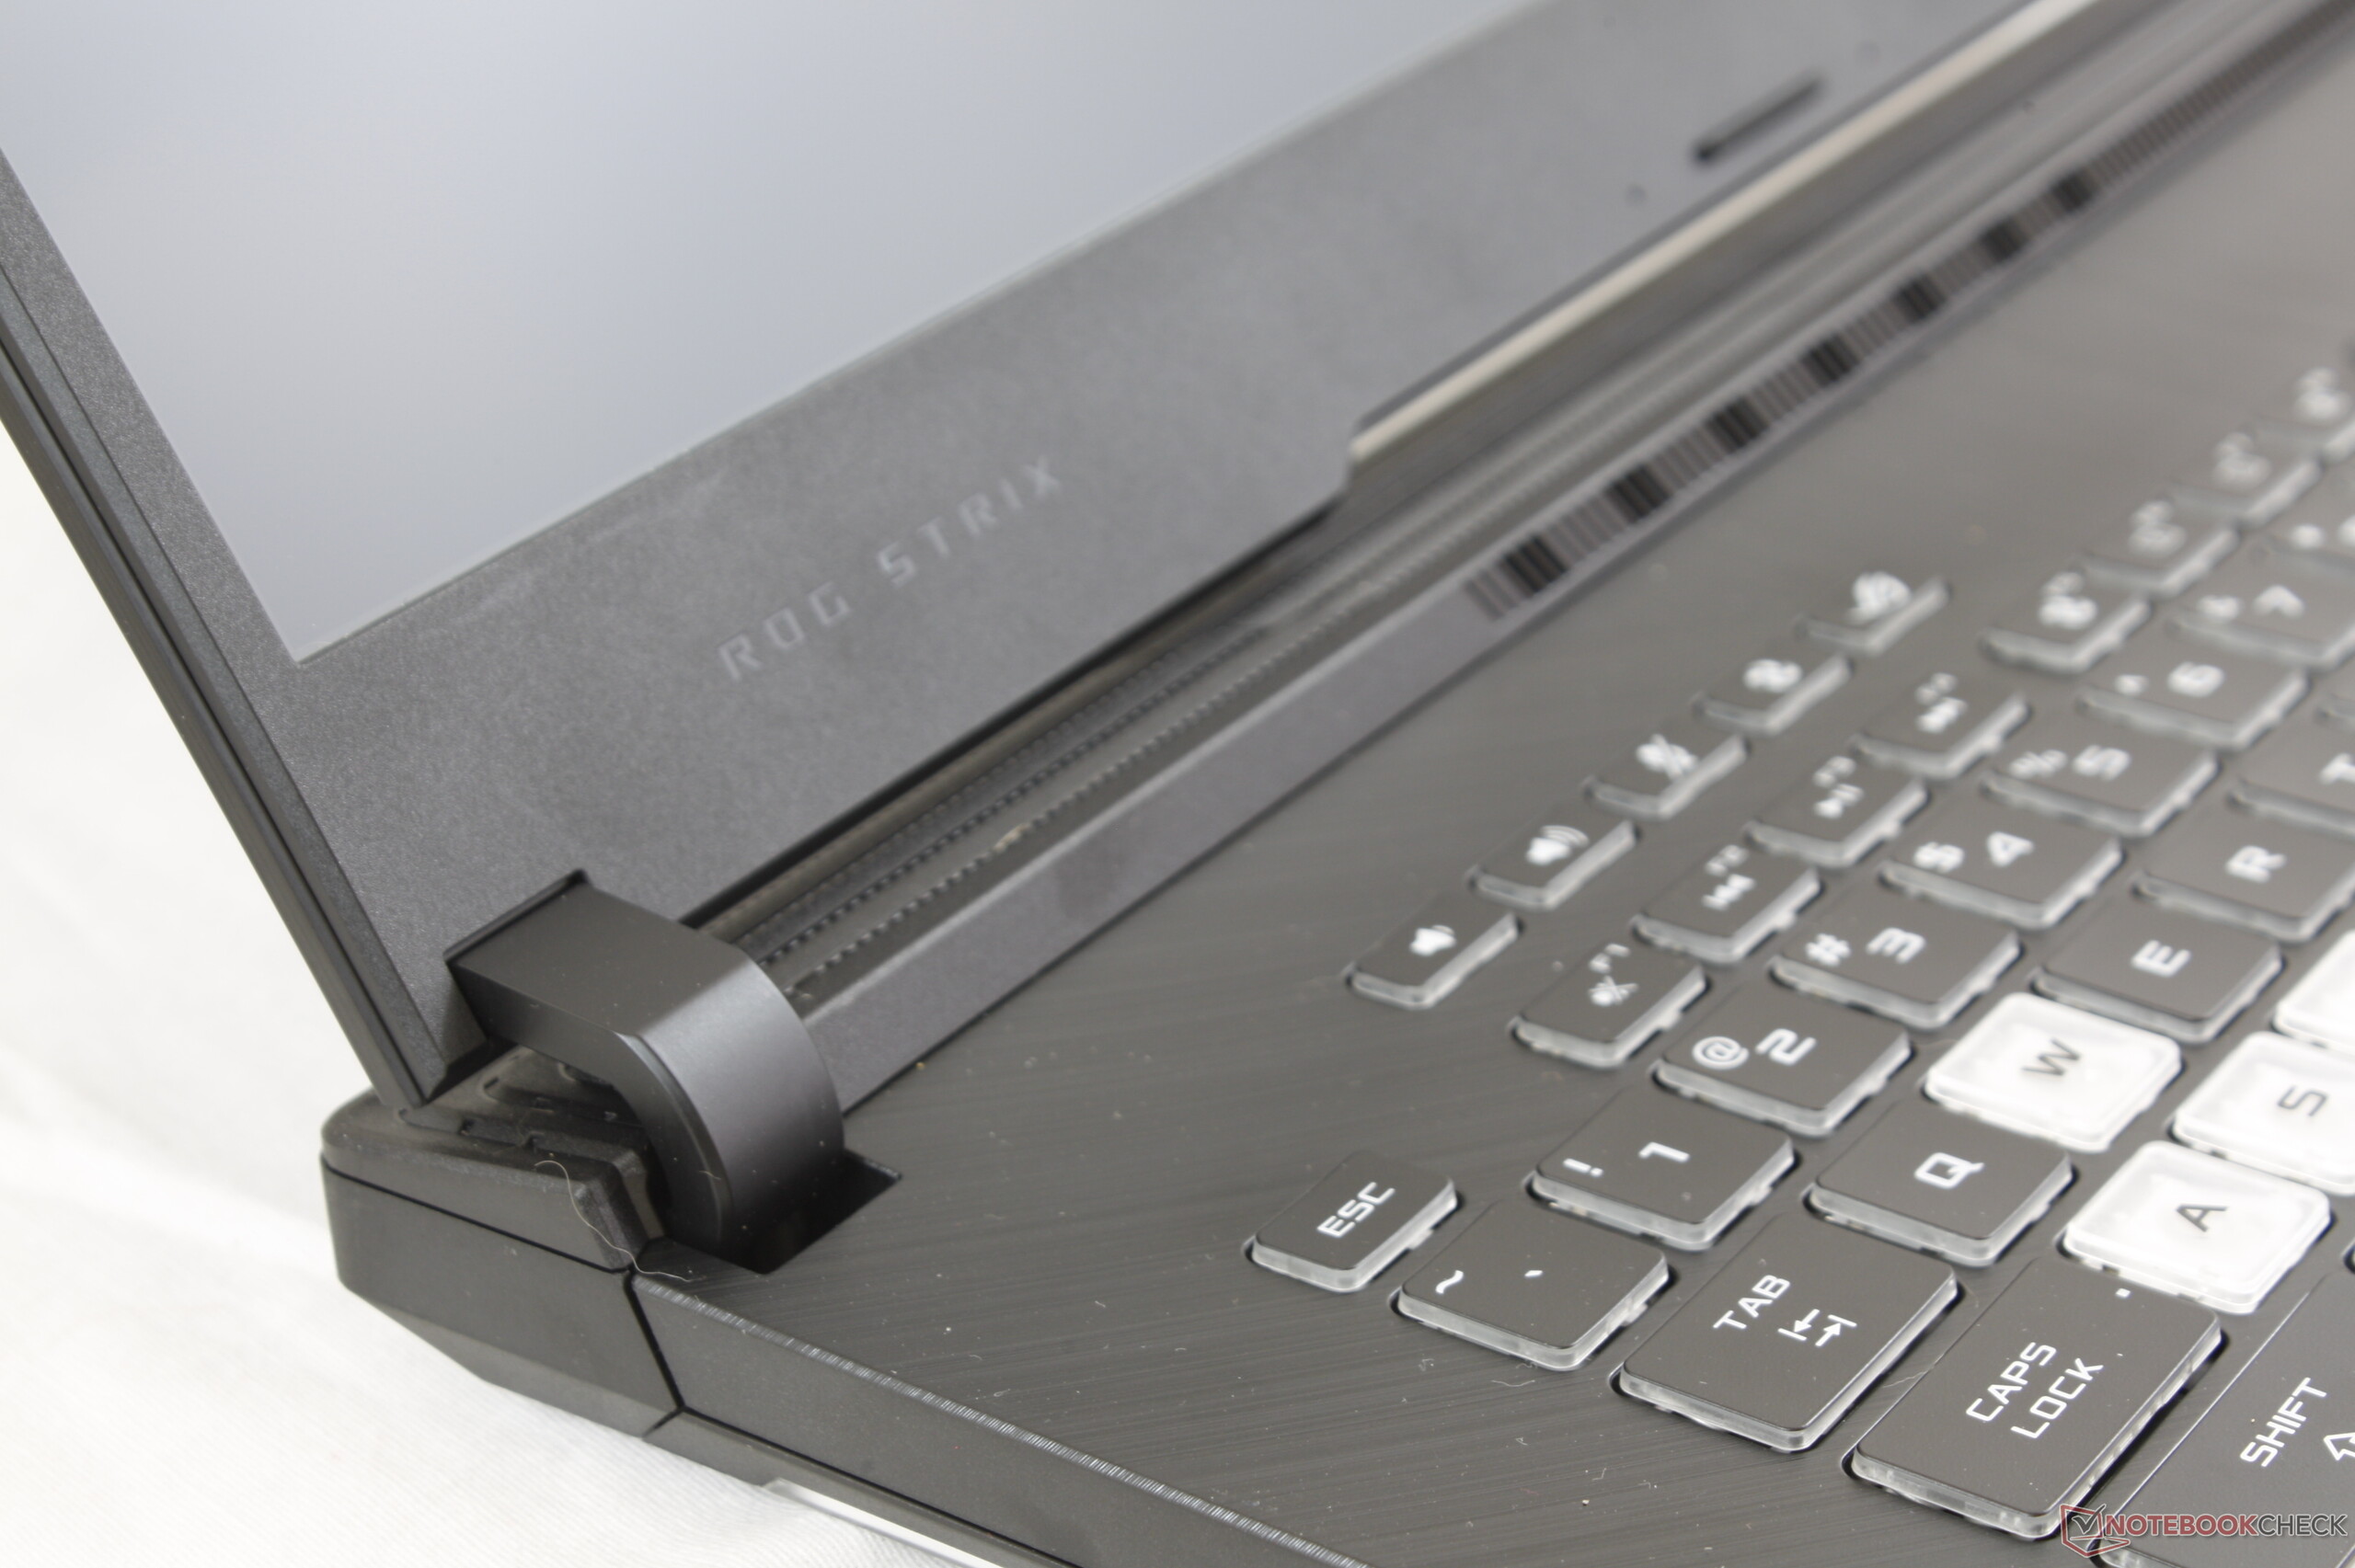
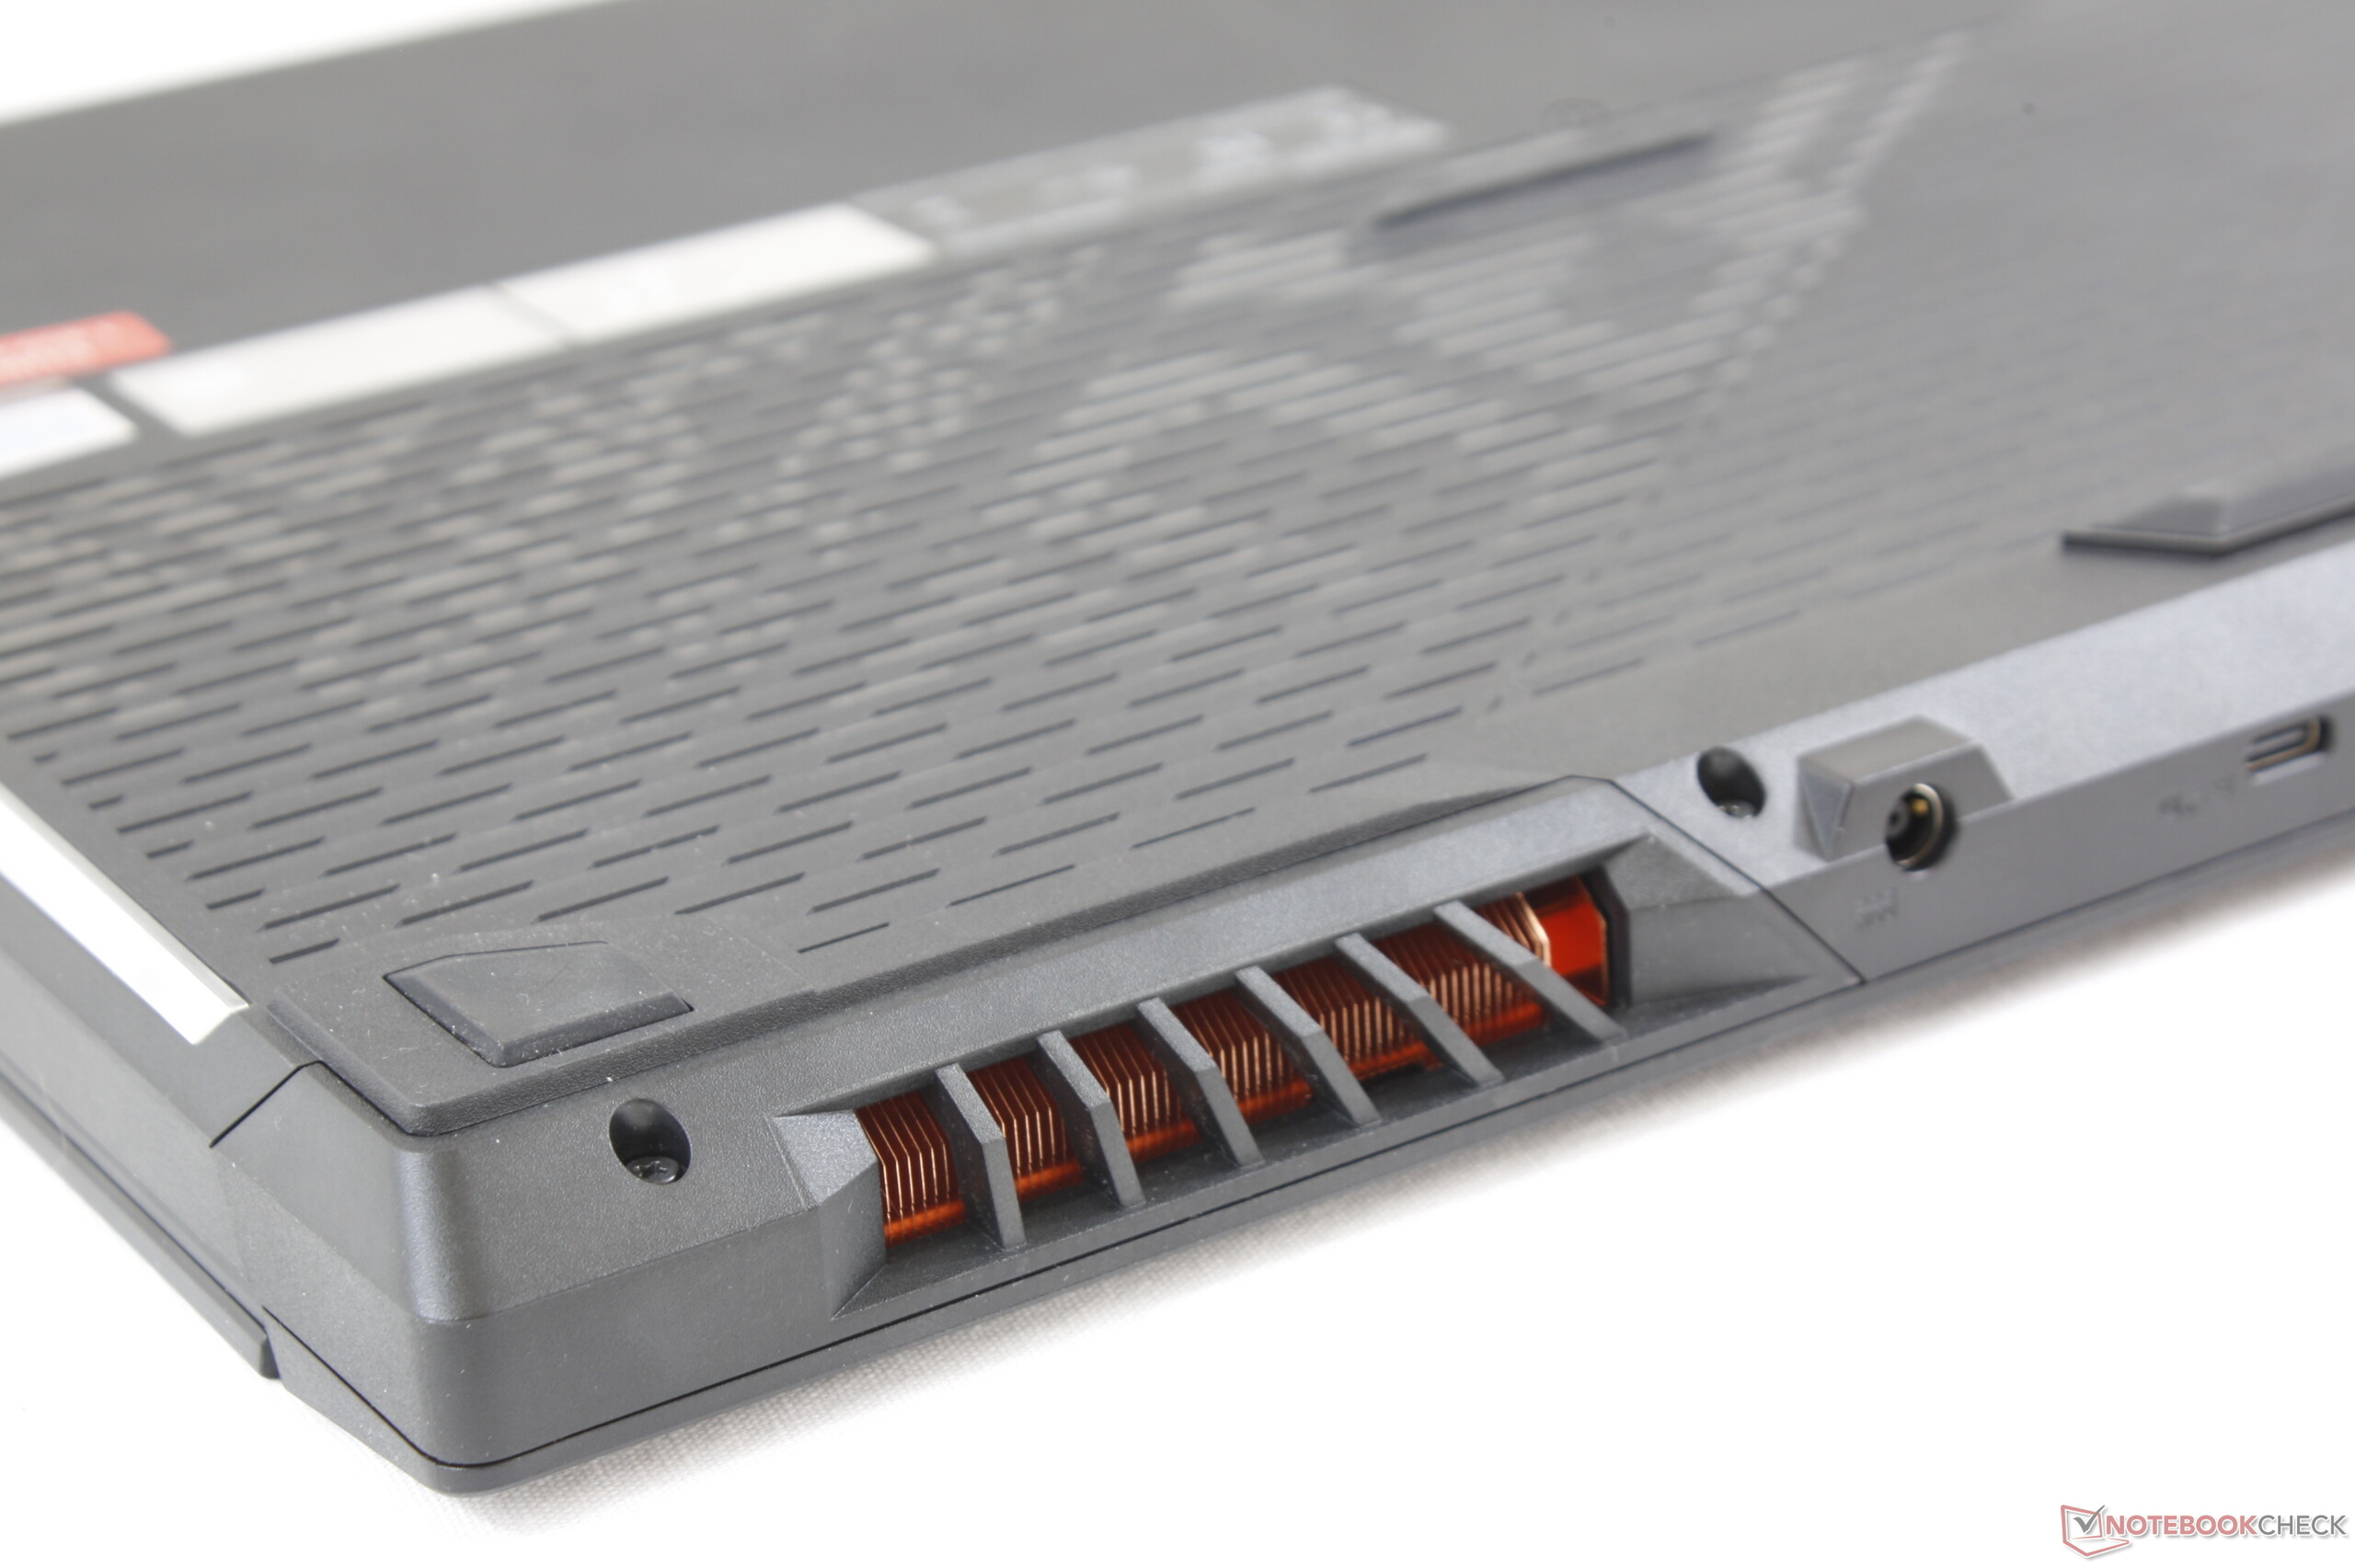

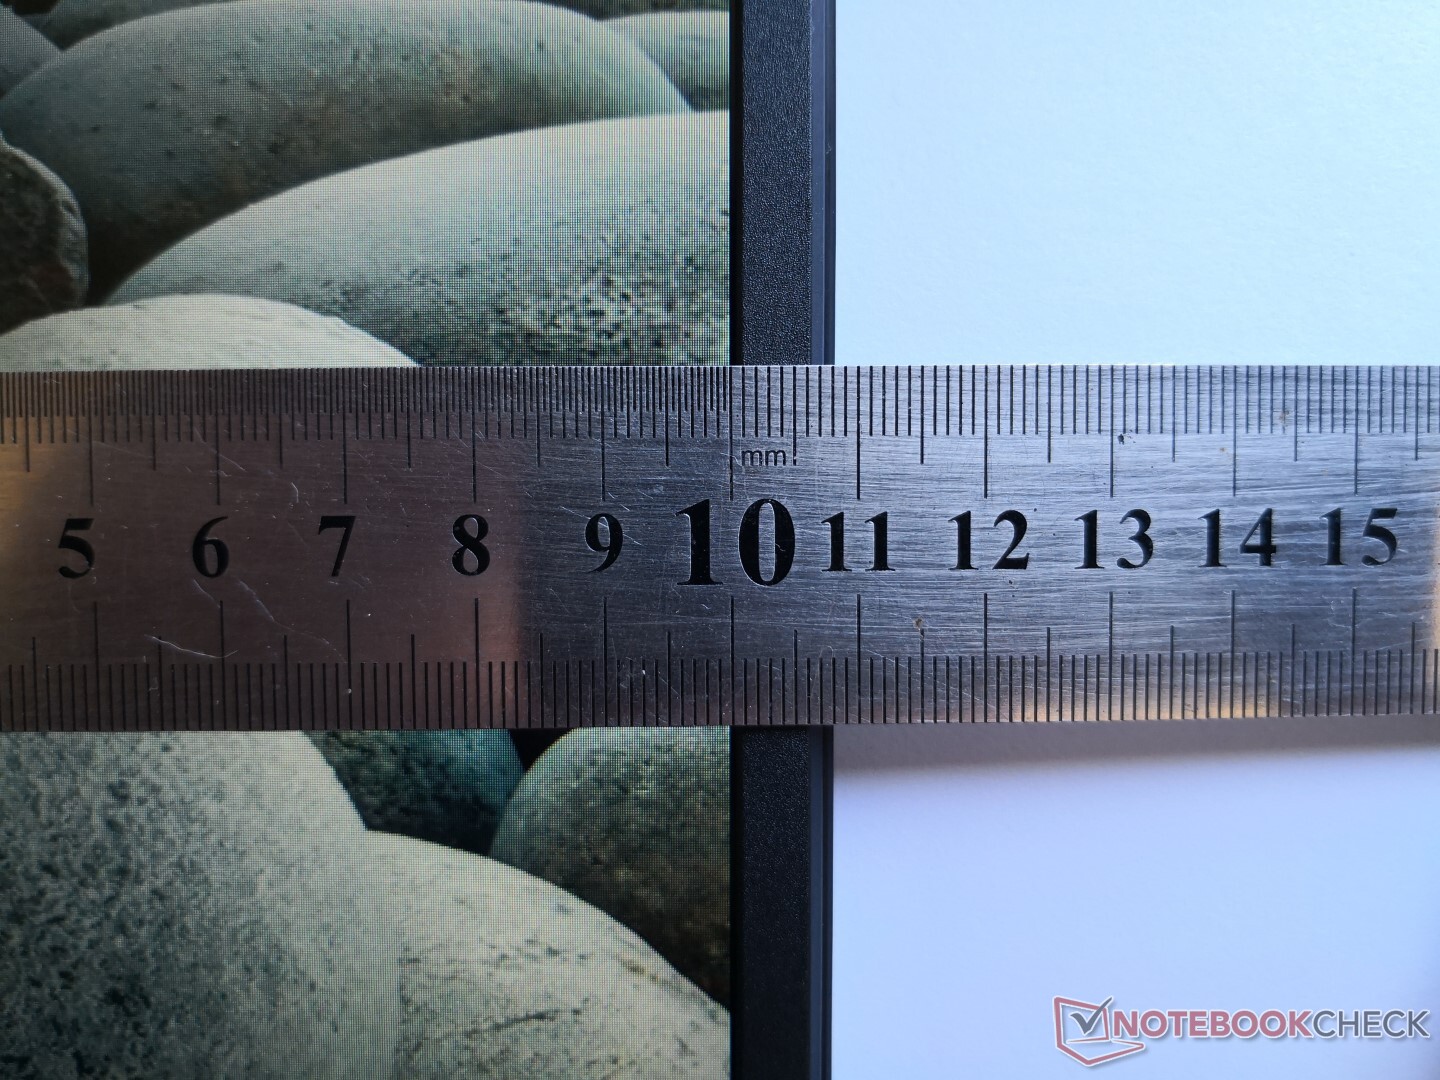
The system sports narrow bezels on three sides of the display to minimize footprint and weight. However, this is counteracted by the "jet engine" grilles that protrude from the rear of the system similar to Asus' own G703 series. This approach improves cooling at the cost of increased size and weight. Alternative 17.3-inch systems like the Razer Blade Pro 17, MSI GF75, or Asus' own Zephyrus S GX701 are much smaller in length since they don't use this same approach to cooling.
Speaking of weight, the GL731 is one of the heavier mid-range 17.3-inch gaming laptops out there at 2.9 kg. It's not nearly as heavy as the Asus ROG G703 flagship (4.7 kg), but it's still a bit heavier than the MSI GF75, Legion Y740, Blade Pro 17, and the TUF FX705.
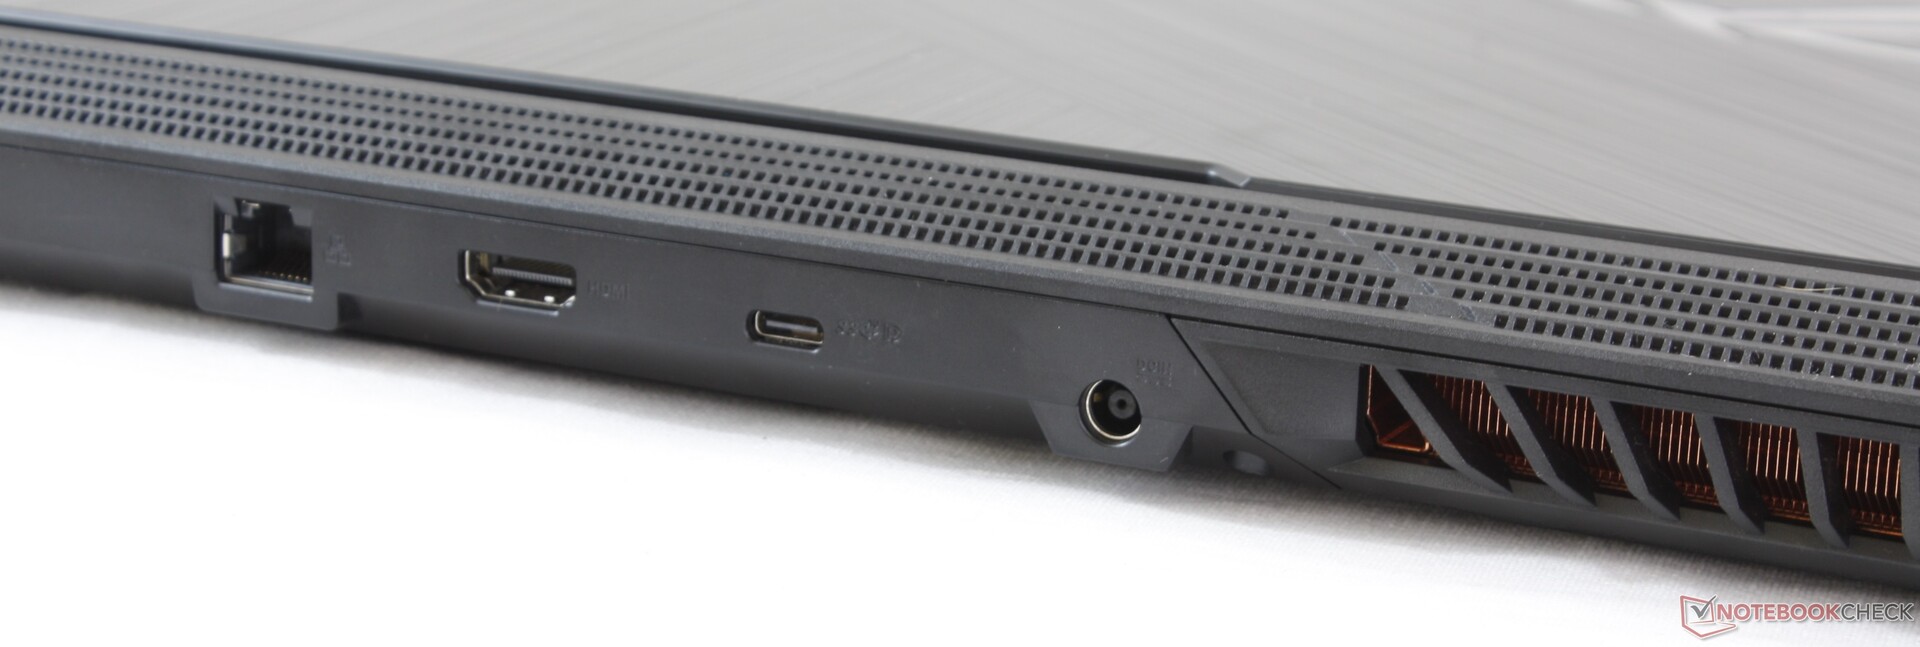
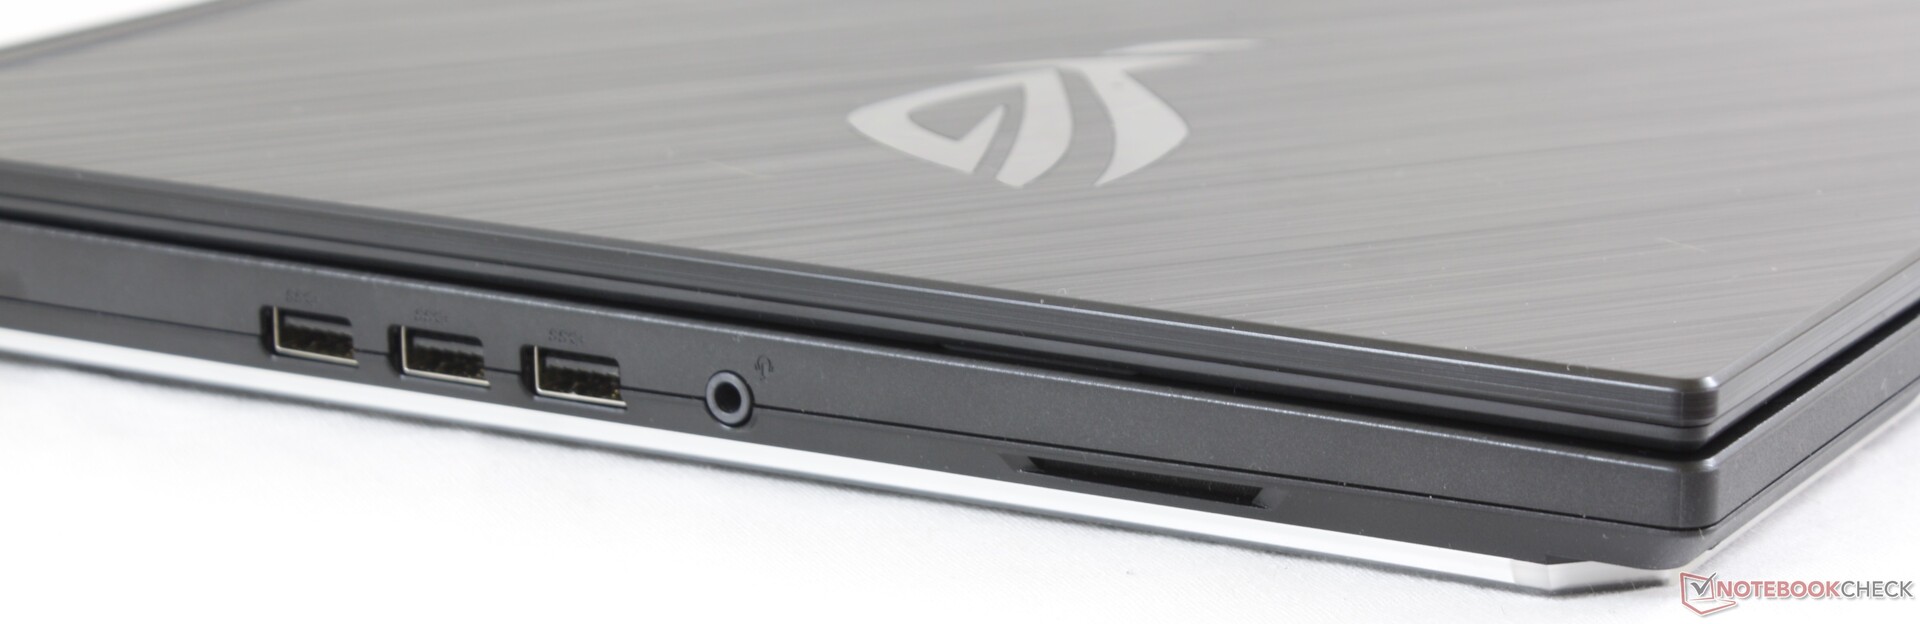
Connectivity
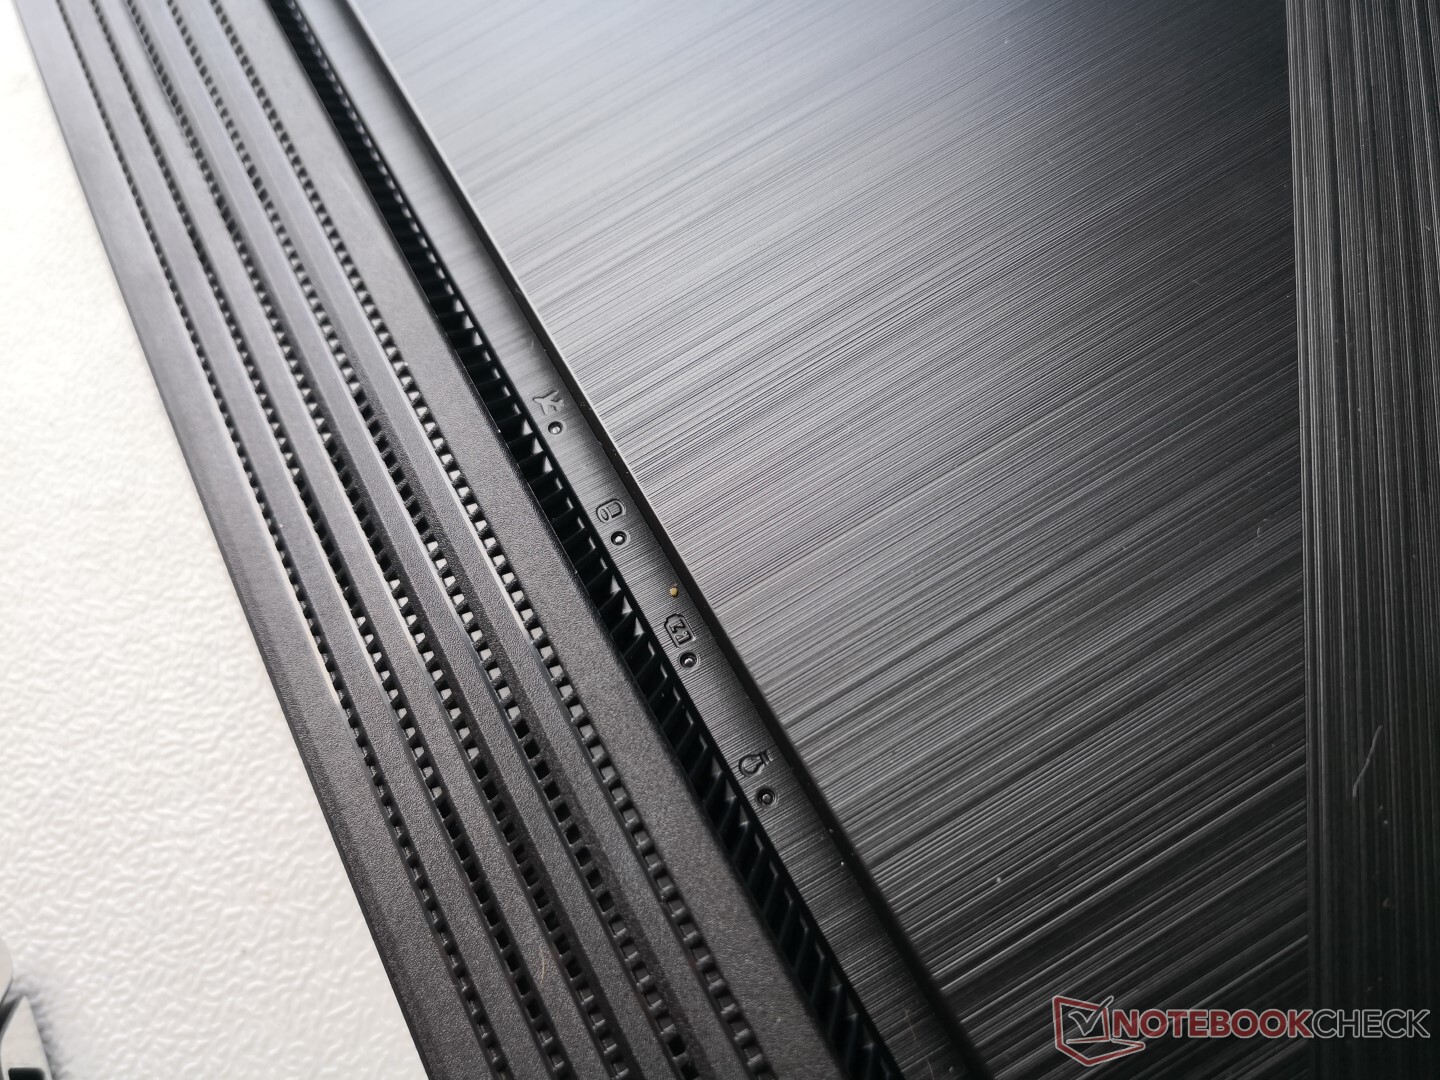
Port options are decent for a 17.3-inch gaming laptop. The system omits both Thunderbolt 3 and an SD card reader which is understandable for a budget-mainstream offering. What irks us the most, however, is port positioning. There are no ports along the right edge while the rear ports are difficult to access without first bending over to take a peek. Lenovo has seemingly solved this latter issue on its Legion Y740 series by including LED port indicators along the top edge of the laptop so you'll always know where the rear ports are. Asus could definitely learn a thing or two in this regard.
Communication
The Intel 9560 comes standard with integrated Bluetooth 5.0 and theoretical transfer rates of up to 1.73 Gbps. Performance is essentially identical to the Killer 1550 but without the software features of the latter. We did not experience any wireless connectivity issues during our time with the unit.
| Networking | |
| iperf3 transmit AX12 | |
| MSI GF75 Thin 9SC | |
| Asus ROG Strix G GL731GU-RB74 | |
| Lenovo Legion Y740-17ICH | |
| Asus TUF FX705DT-AU068T | |
| iperf3 receive AX12 | |
| MSI GF75 Thin 9SC | |
| Lenovo Legion Y740-17ICH | |
| Asus ROG Strix G GL731GU-RB74 | |
| Asus TUF FX705DT-AU068T | |
Maintenance
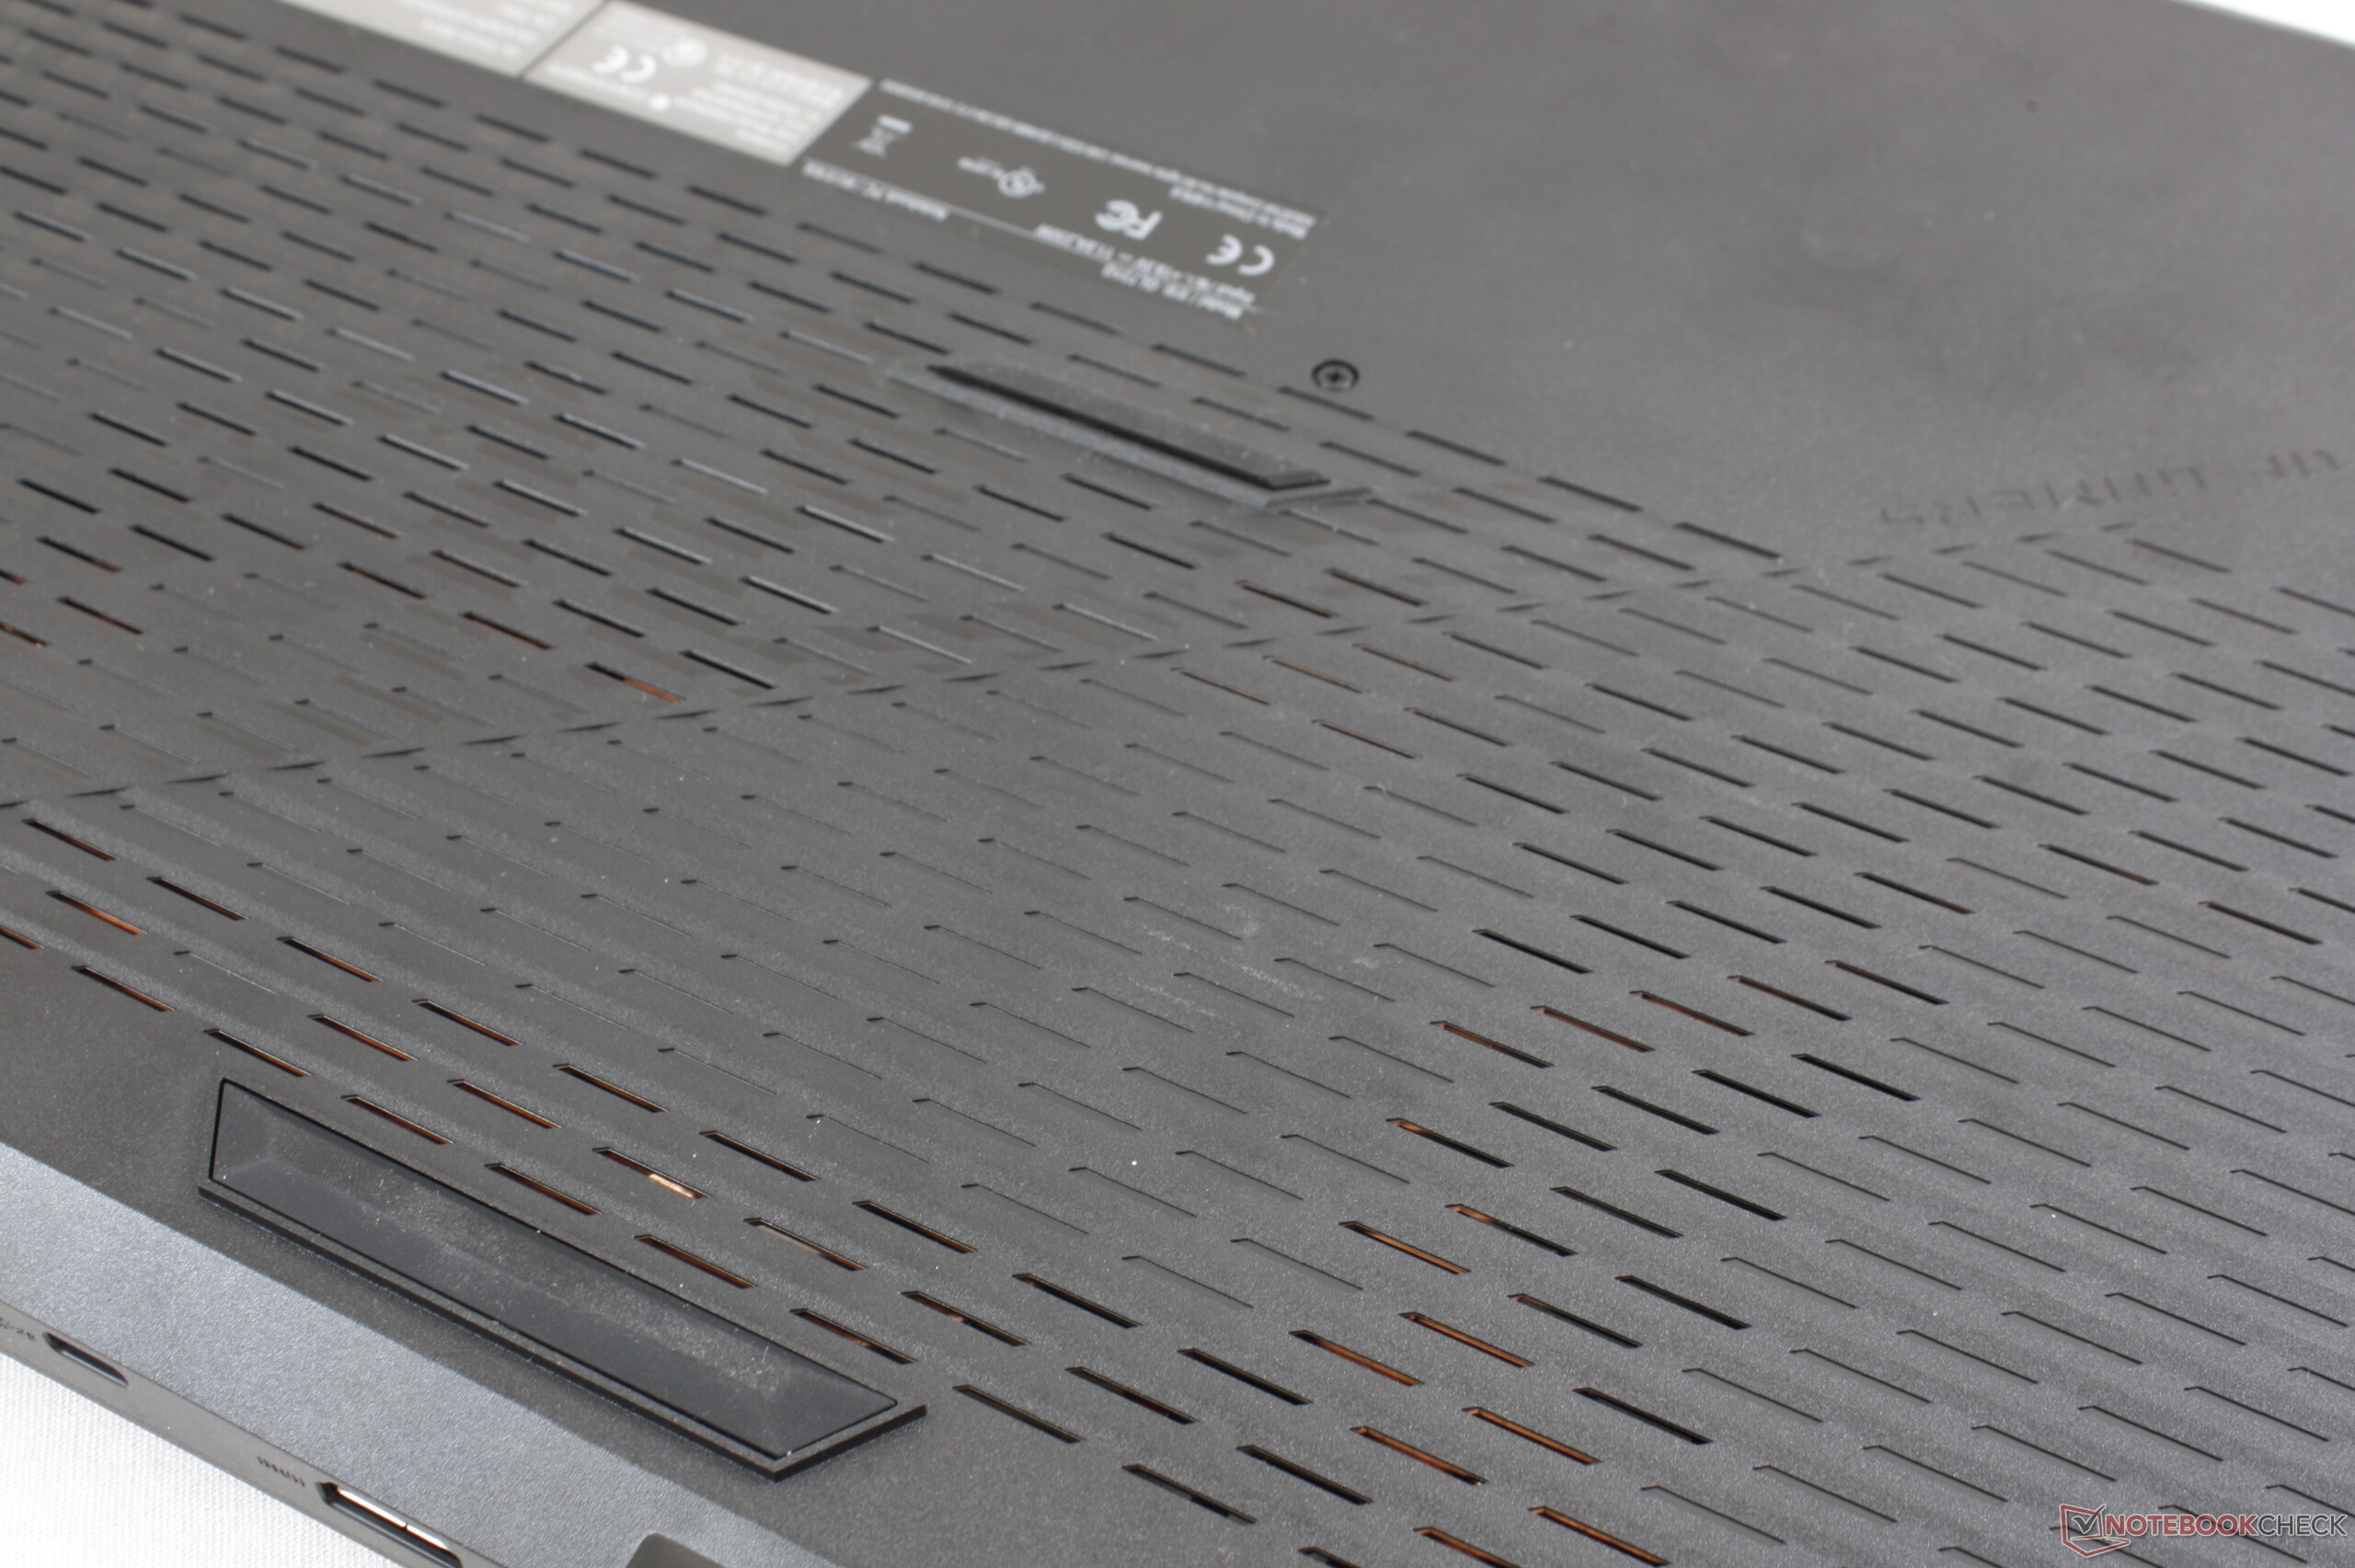
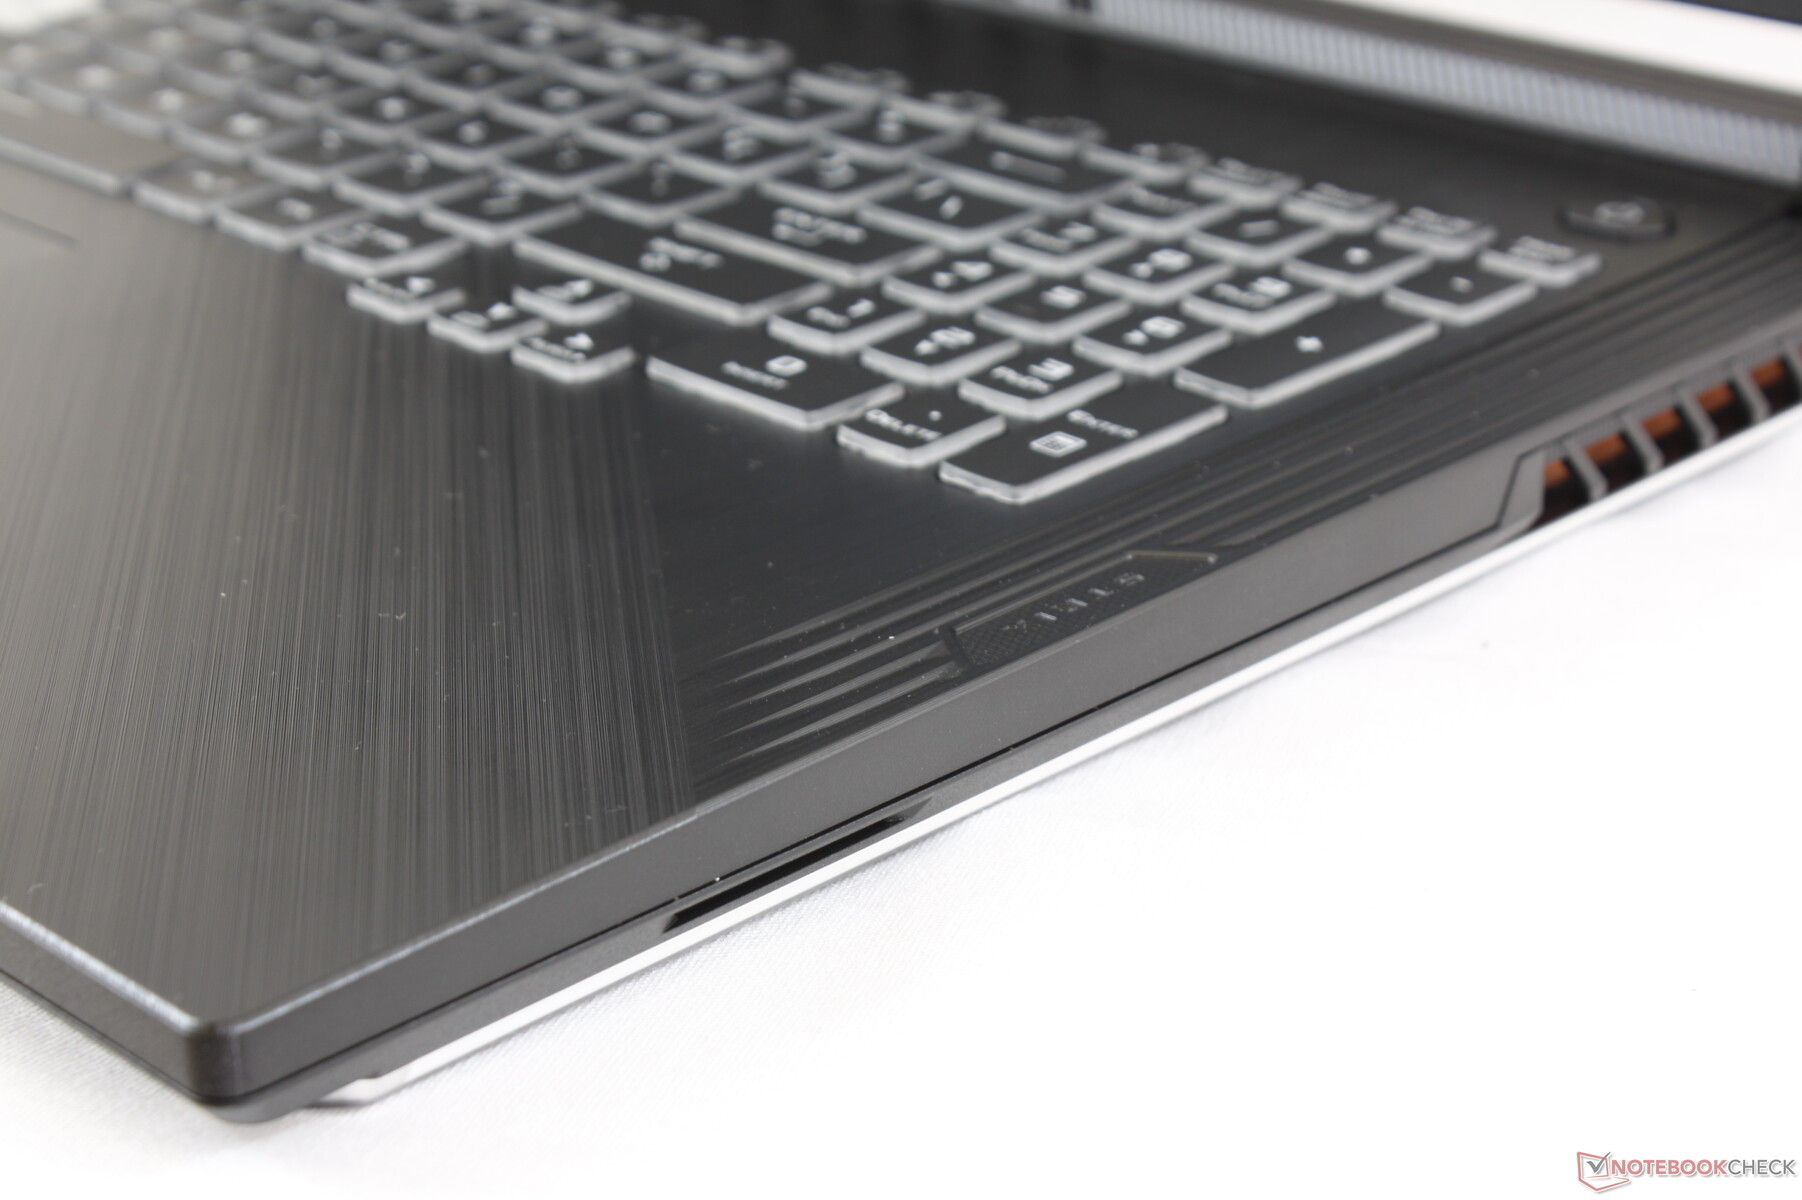
Adding the unique LED light bar along the bottom edges of the laptop has impacted the serviceability of the system. In addition to the usual Philips screws holding down the bottom panel, there are now also multiple ribbon cables connecting the bottom panel to the motherboard. These ribbons are difficult to connect and disconnect making any upgrades very user-unfriendly. Even the less expensive Asus TUF series is easier to service and upgrade. This is a shame because the GL731 offers 2x SODIMM slots and 2x storage bays for end-user upgrades.
Since the chassis is essentially the same as the Strix III G731, both of these systems share the same annoying ribbon issue.
Accessories and Warranty
There are no included accessories outside of the warranty card and short quick start guide. The usual one-year limited warranty applies and users who register their laptops with Asus online may receive additional benefits like free cloud storage.
Input Devices
Keyboard
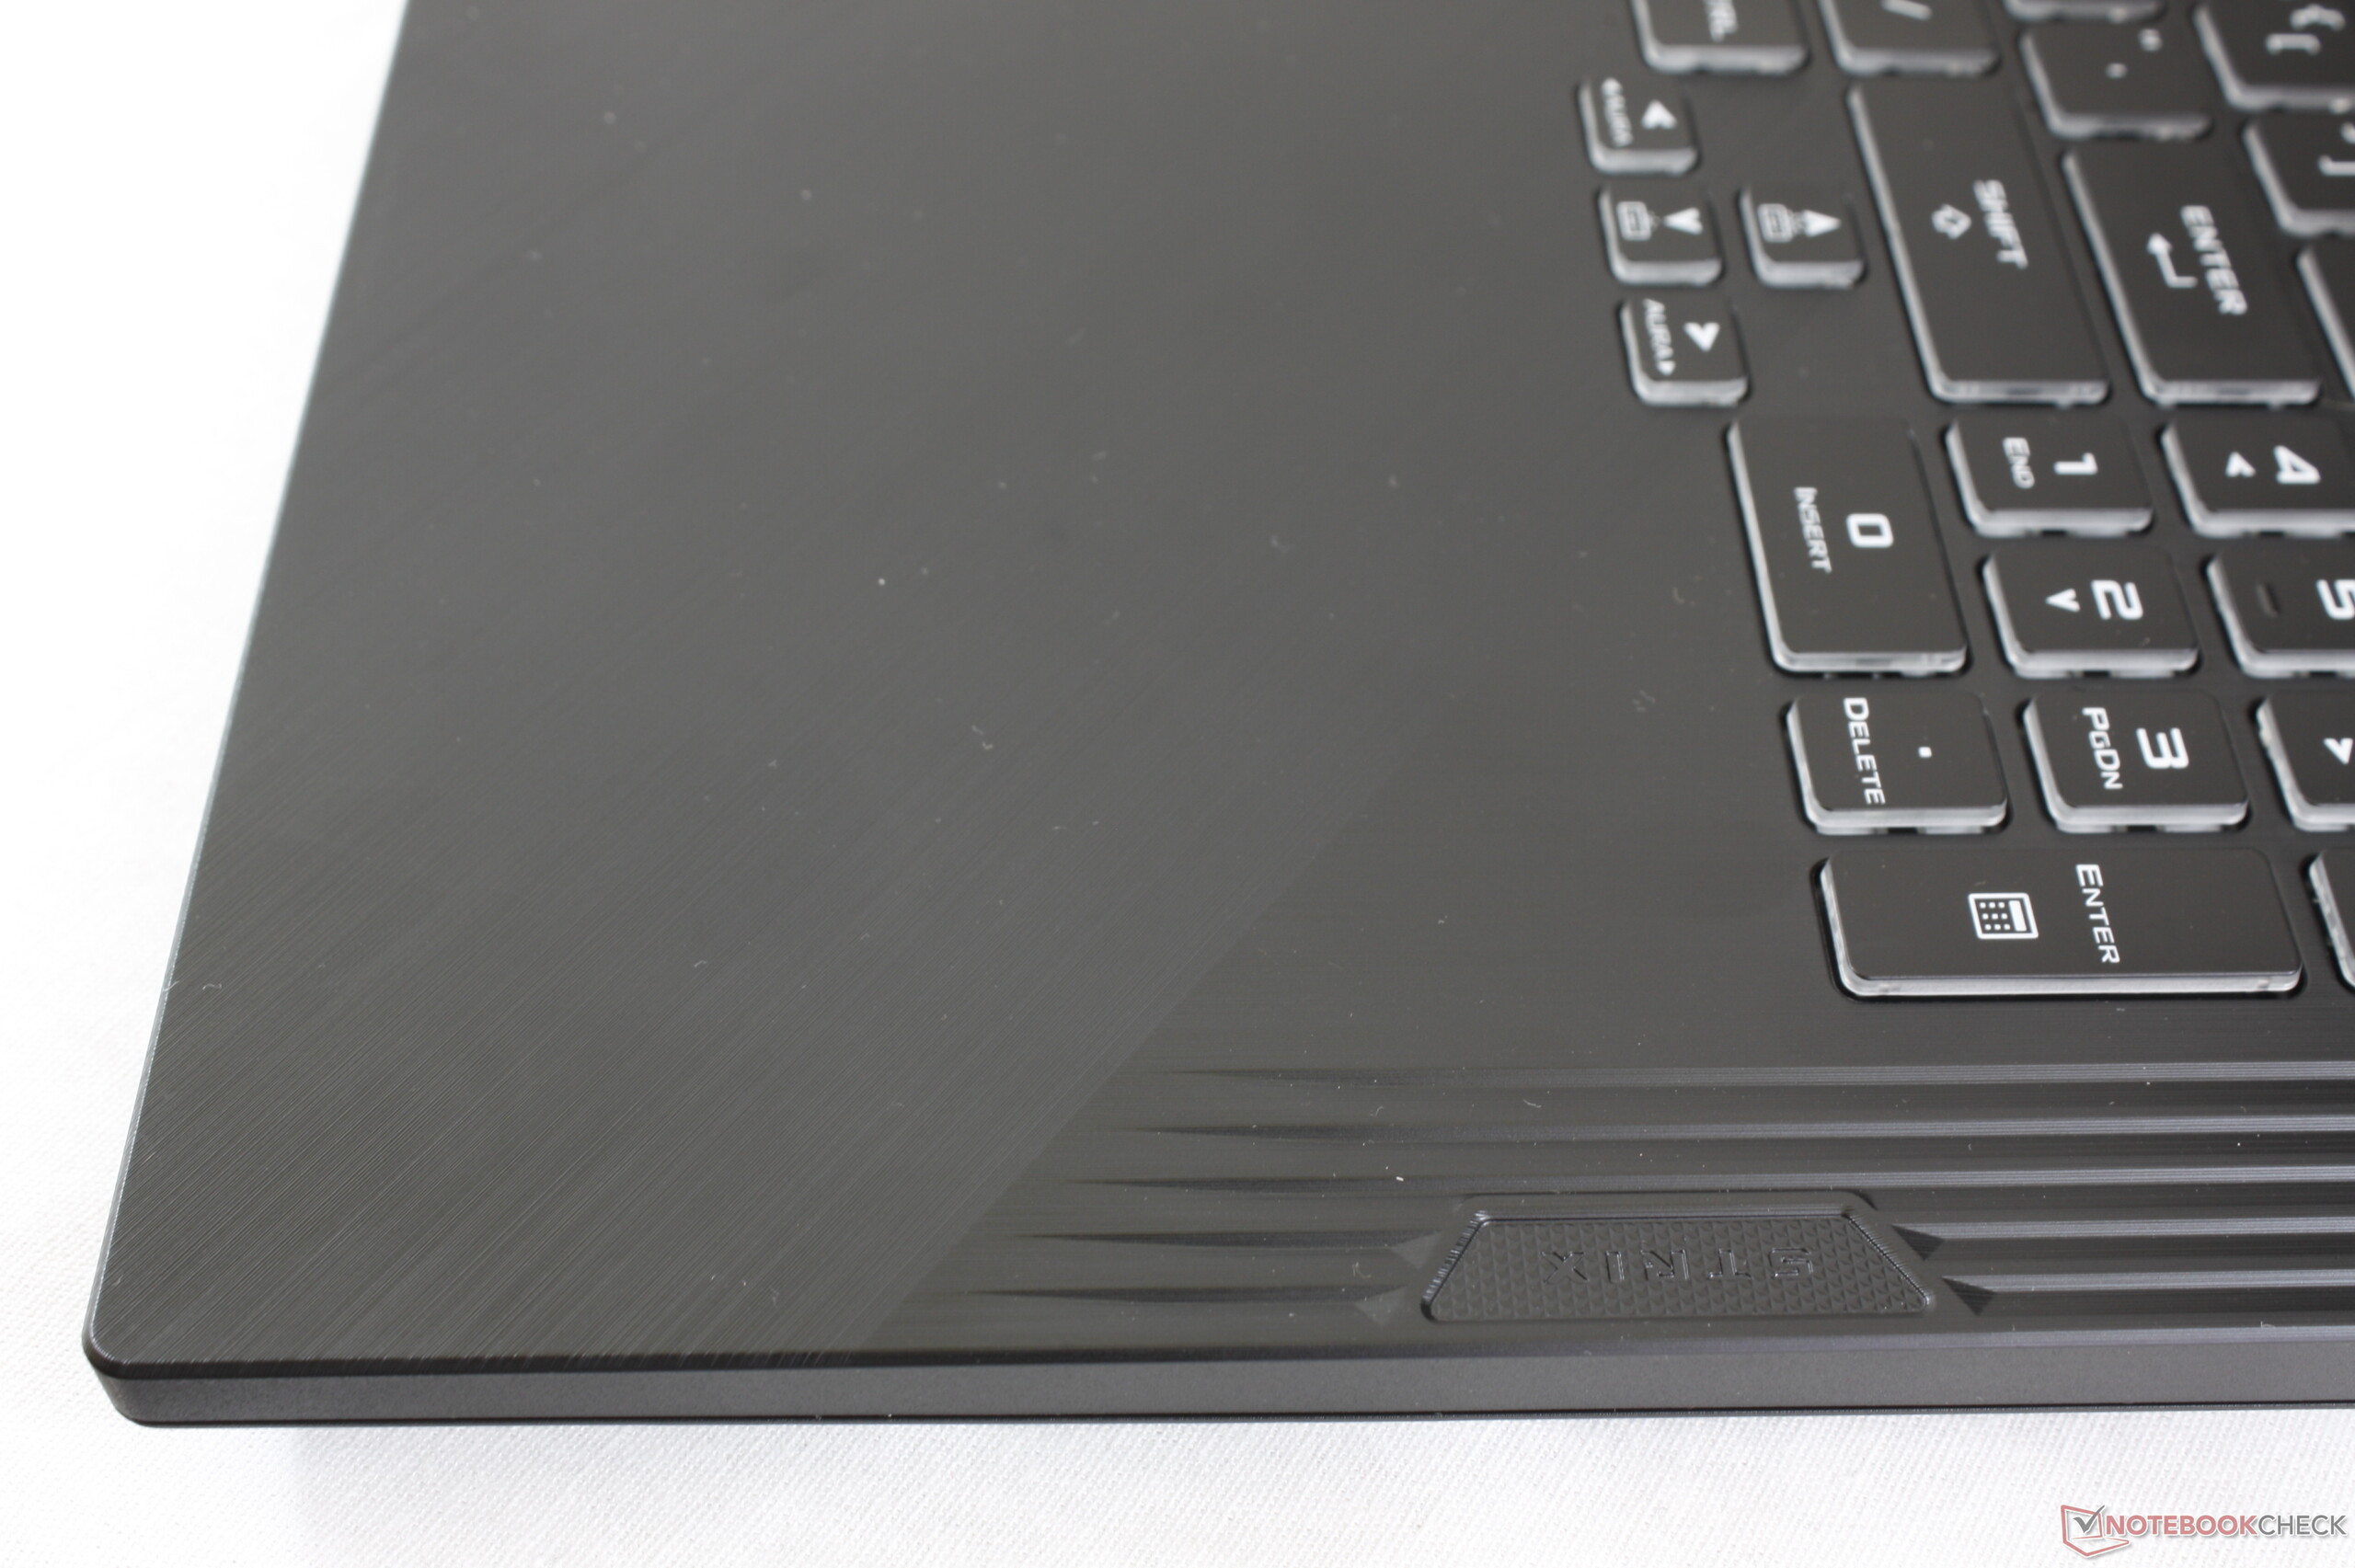
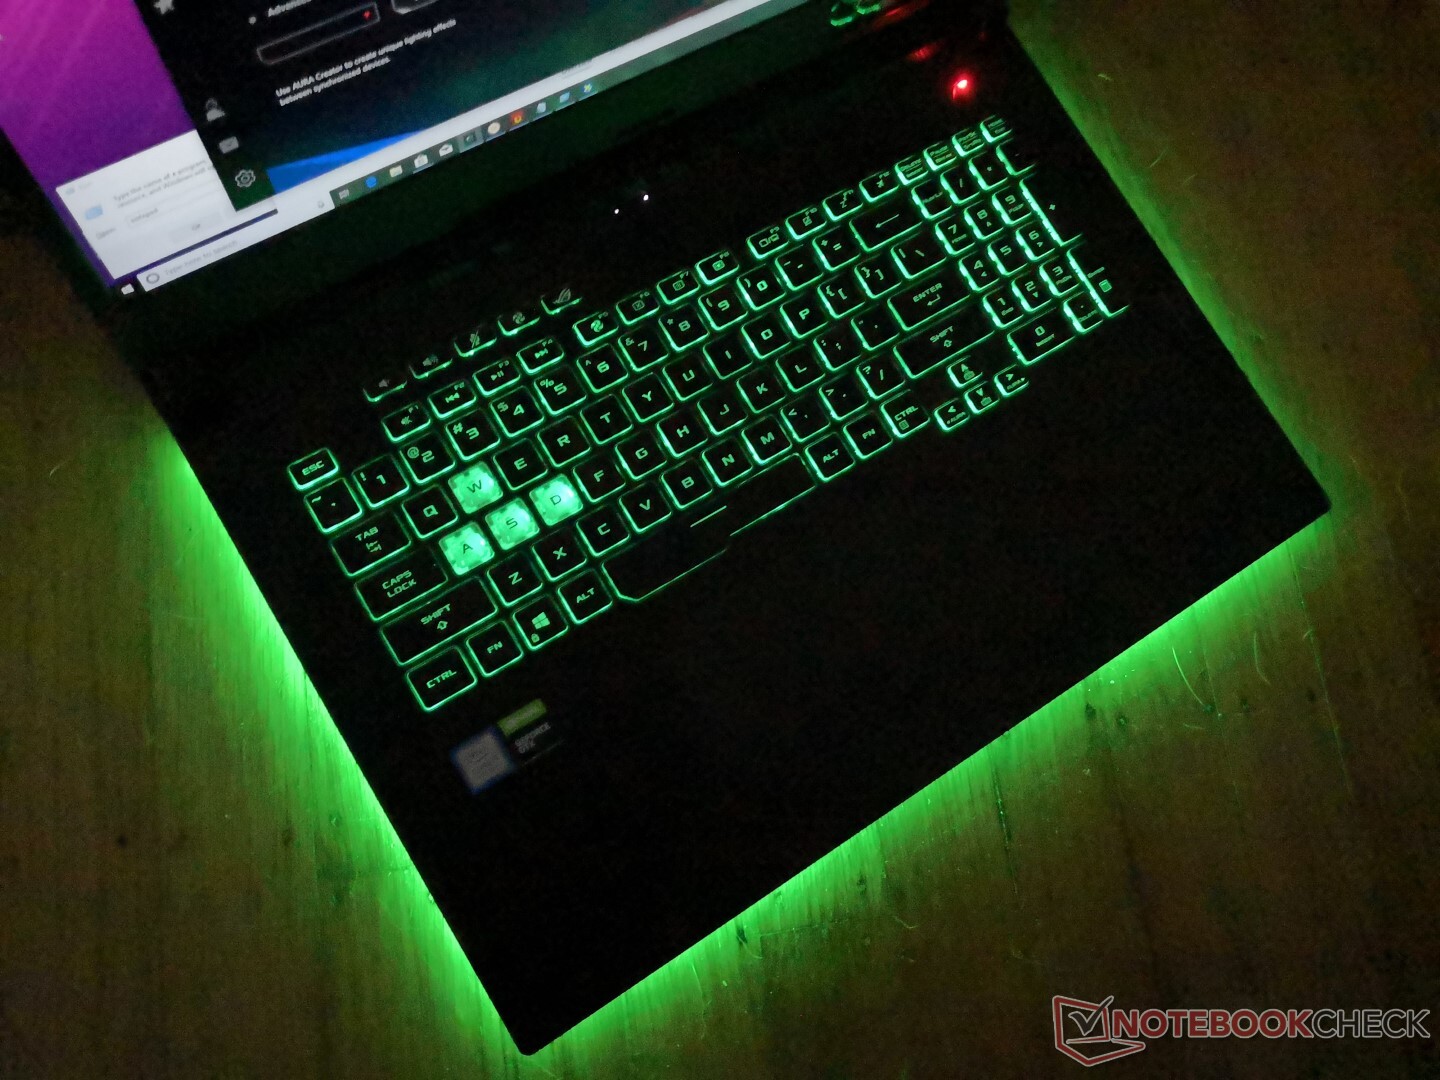
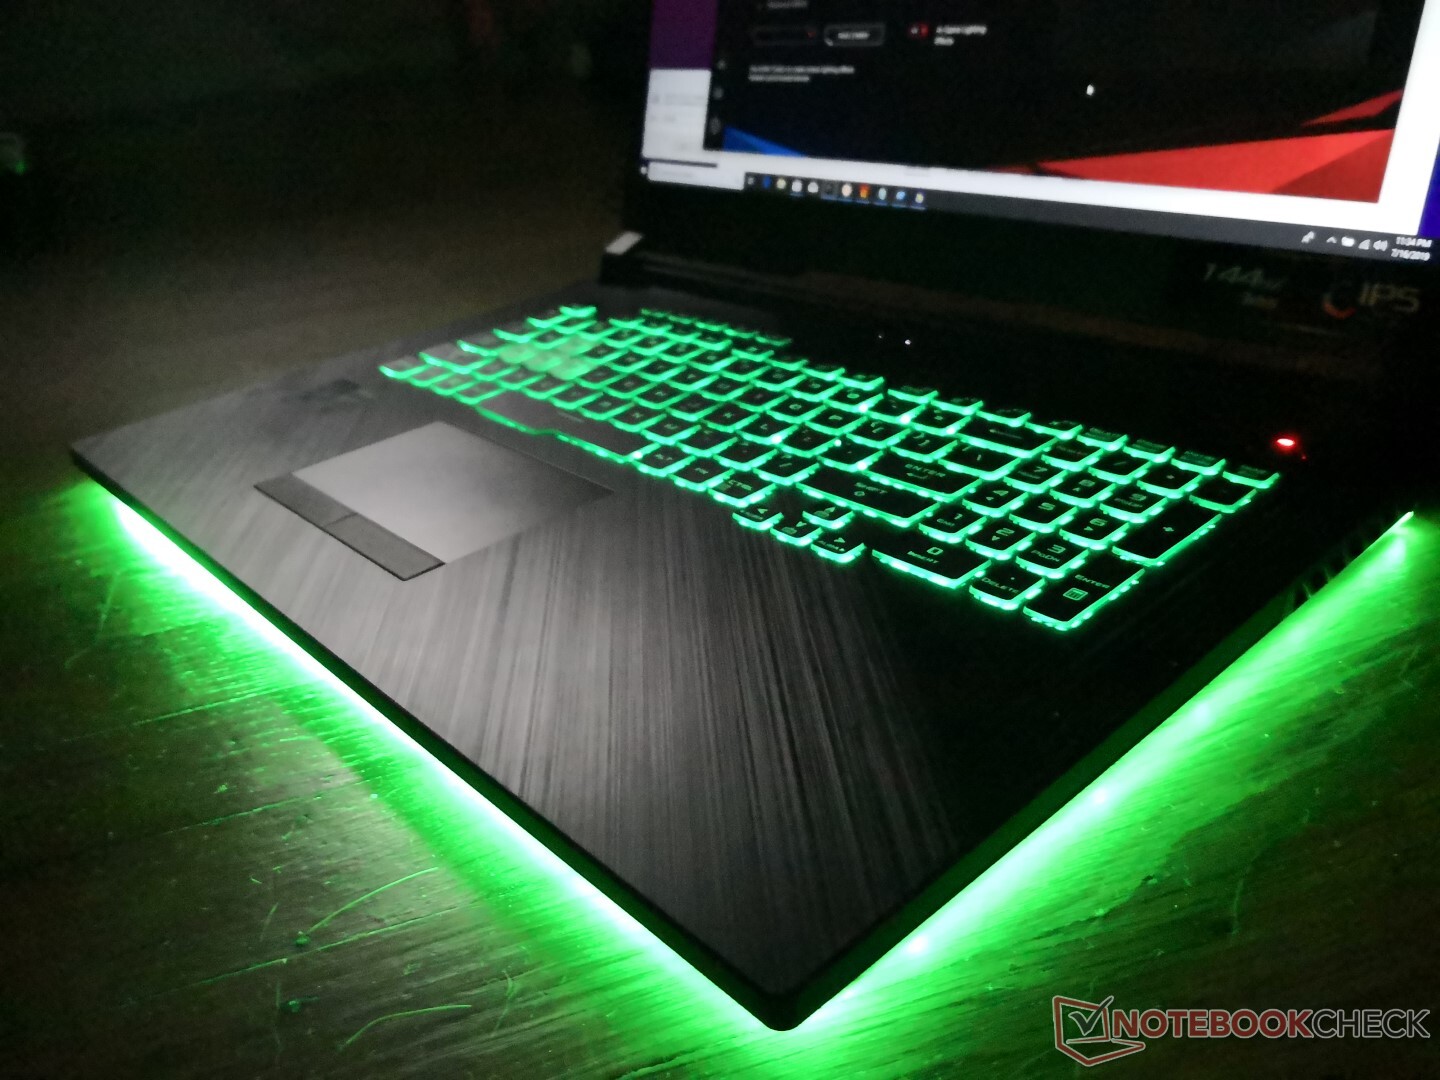
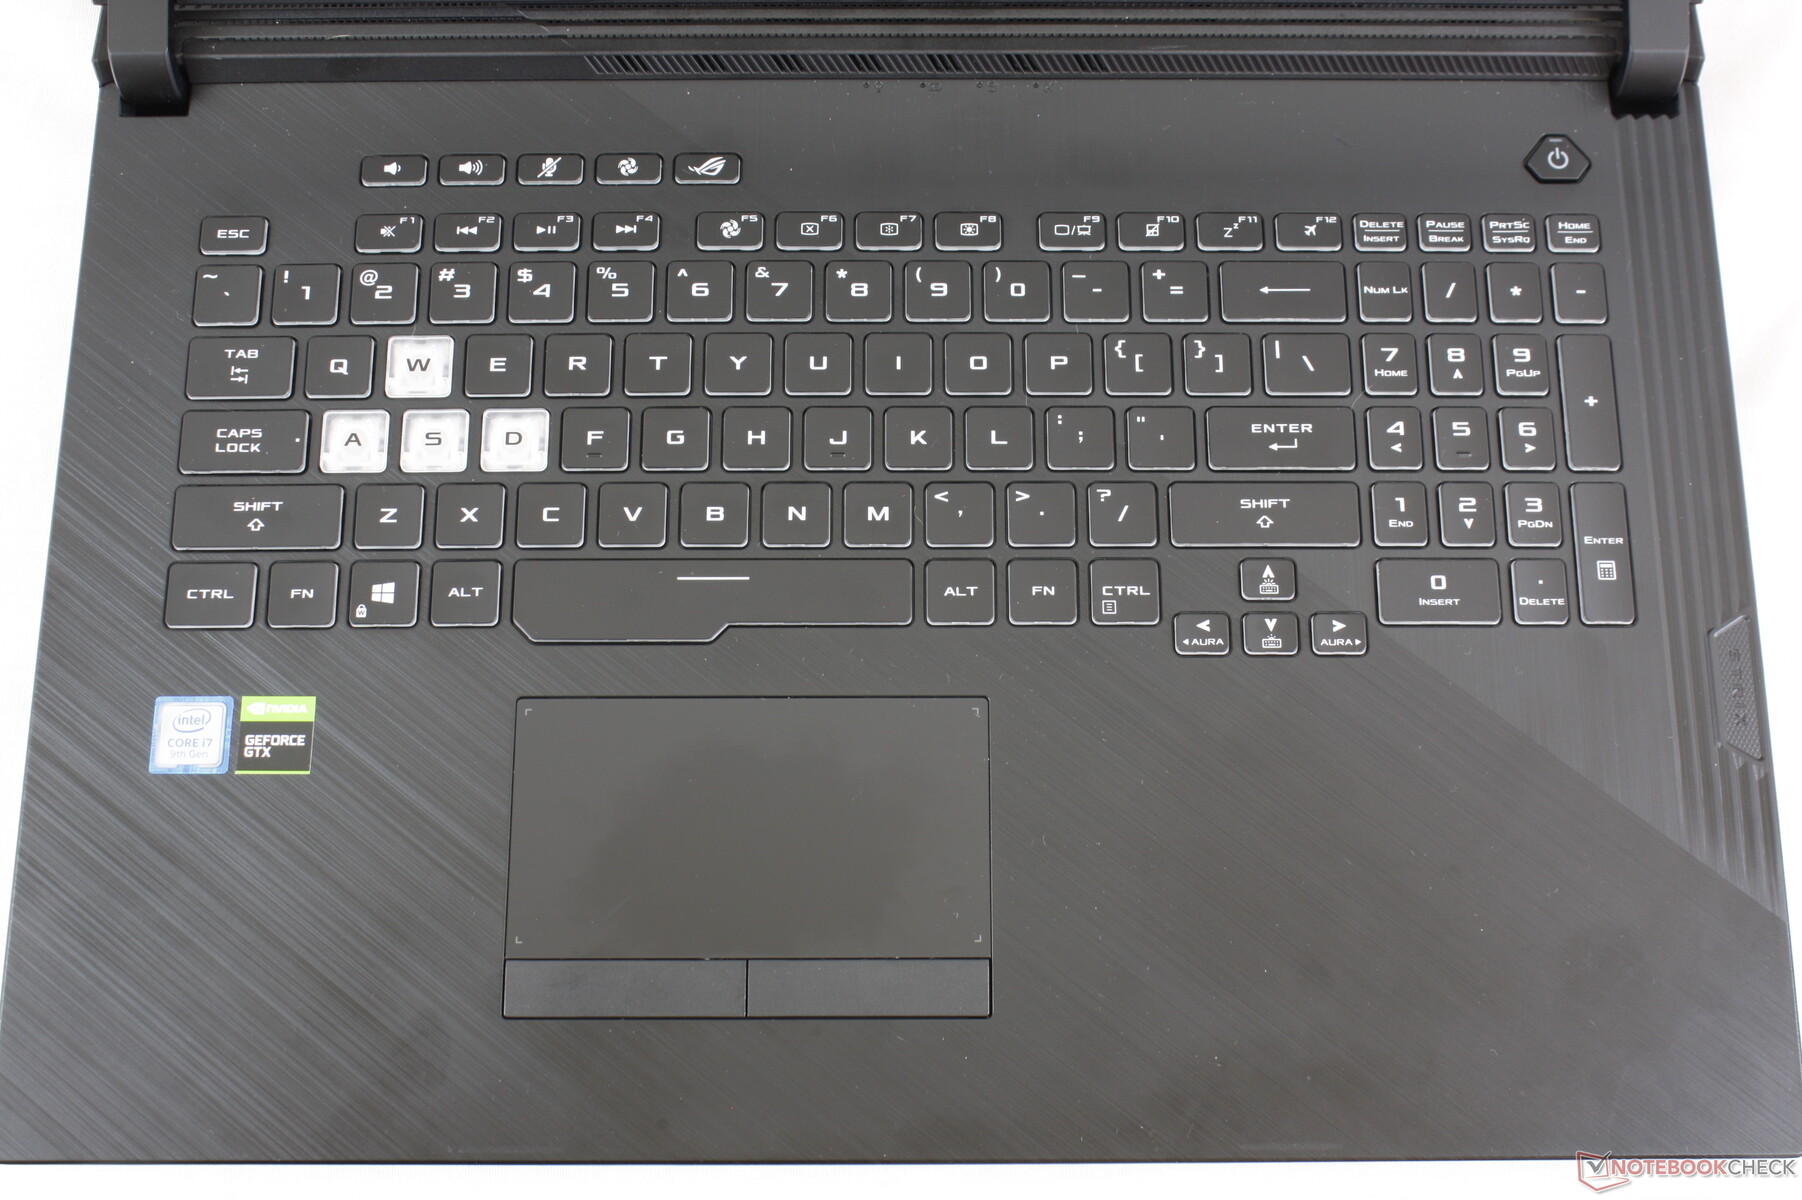
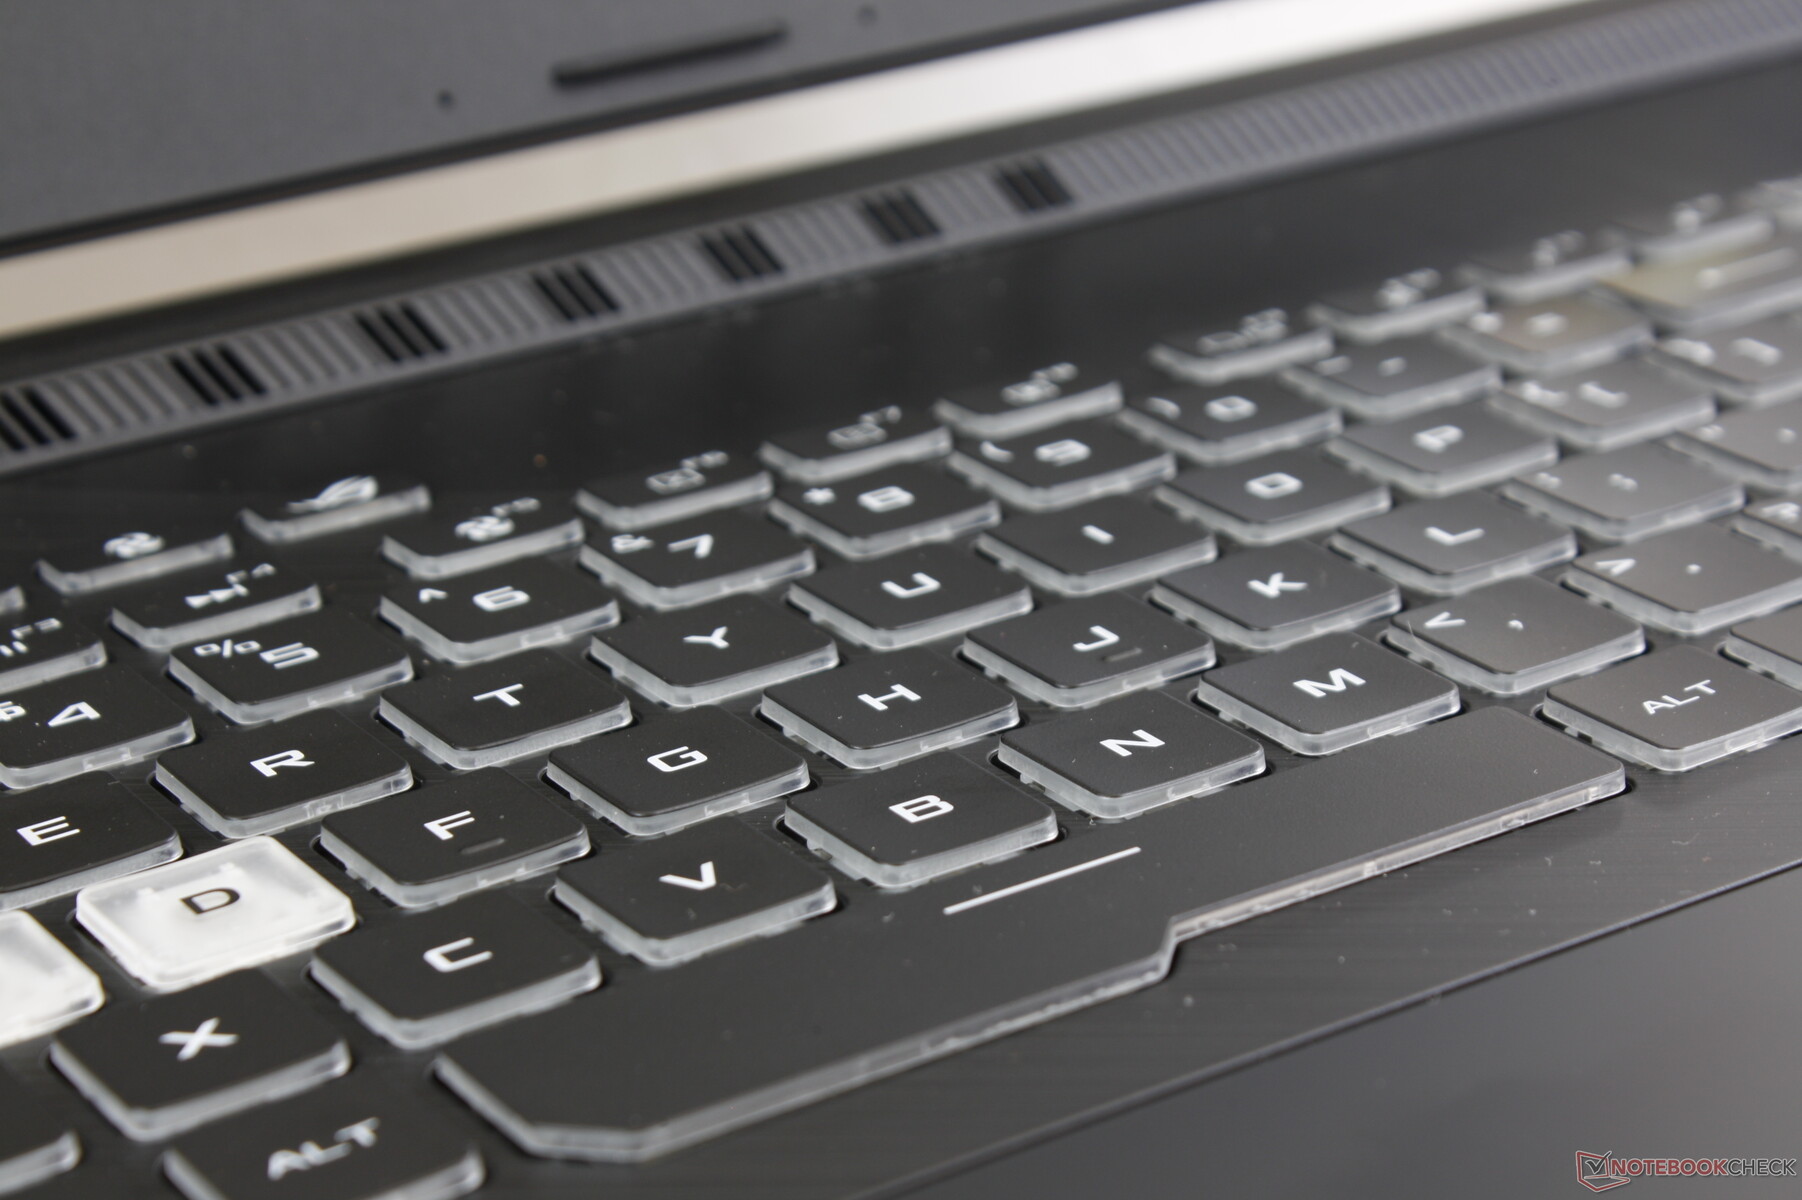
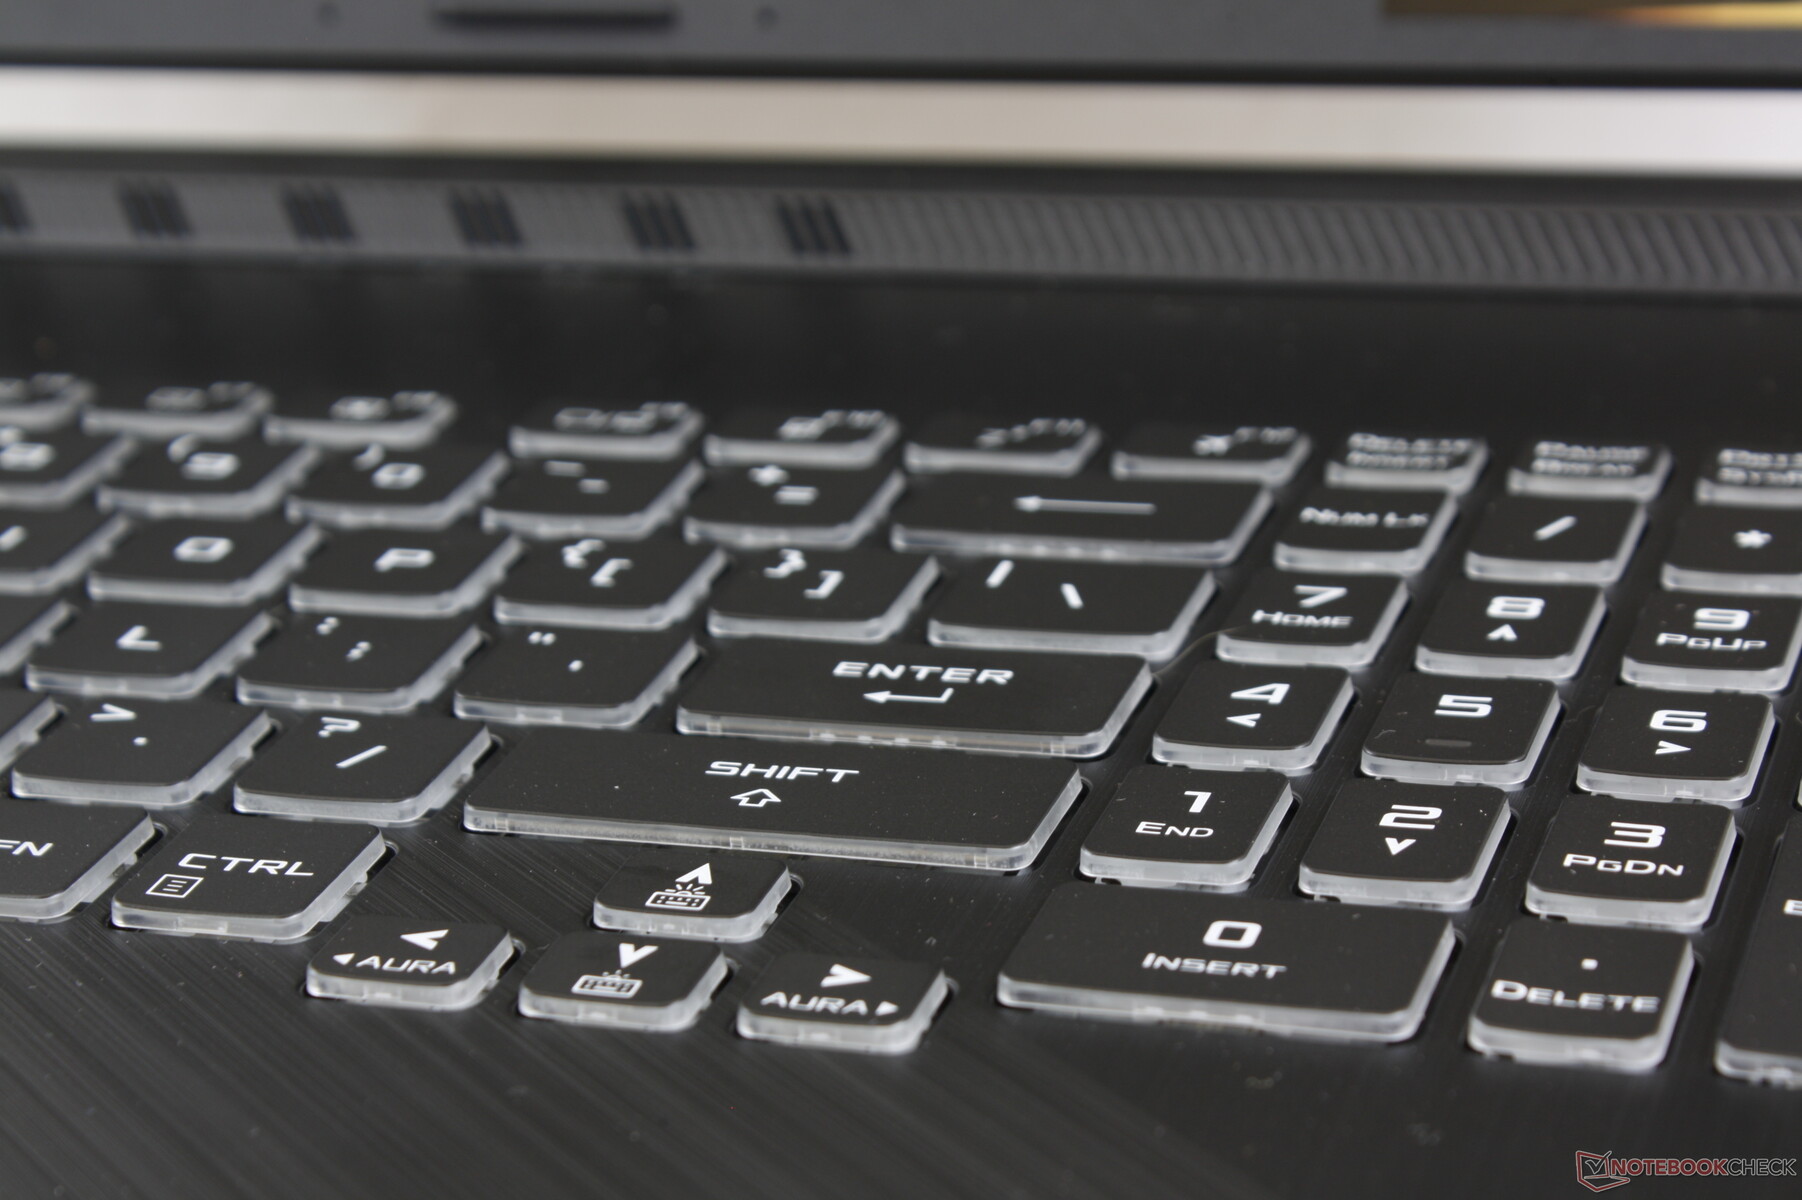
When compared to the usual SteelSeries keyboards commonly found on MSI laptops, the Asus keys have an audibly sharper clatter with slightly firmer feedback when pressed. We find the keys to be deeper and more comfortable to type on than the shallower and lighter keys of the Blade Pro 17, Zephyrus GX501, or the cheaper Asus VivoBook series. A single-zone RGB backlight comes standard as Asus wants to reserve the per-key RGB feature for its more luxurious Strix III and Zephyrus families. Higher-end SKUs of this model have quad-zone RGB lighting.
Our grievance with the keyboard is on the reduced sizes of the NumPad and Arrow keys. While these keys are usually smaller than the main QWERTY keys on most 15.6-inch laptops, there is less of an excuse for a larger 17.3-inch form factor. There is no reason why the Arrow keys are especially small on the GL731. As a result, these keys are spongier and more cramped to use than the main QWERTY keys which could impact data entry or games that rely on these inputs.
Another annoyance from a customization standpoint is that the U-shaped LED bar is tied to the keyboard in terms of light control. Want a green light bar with a blue keyboard backlight? Too bad, because it's either one color or the other. Asus Aura Creator for fine-tuning the LED lights is not compatible with this particular SKU.
Touchpad
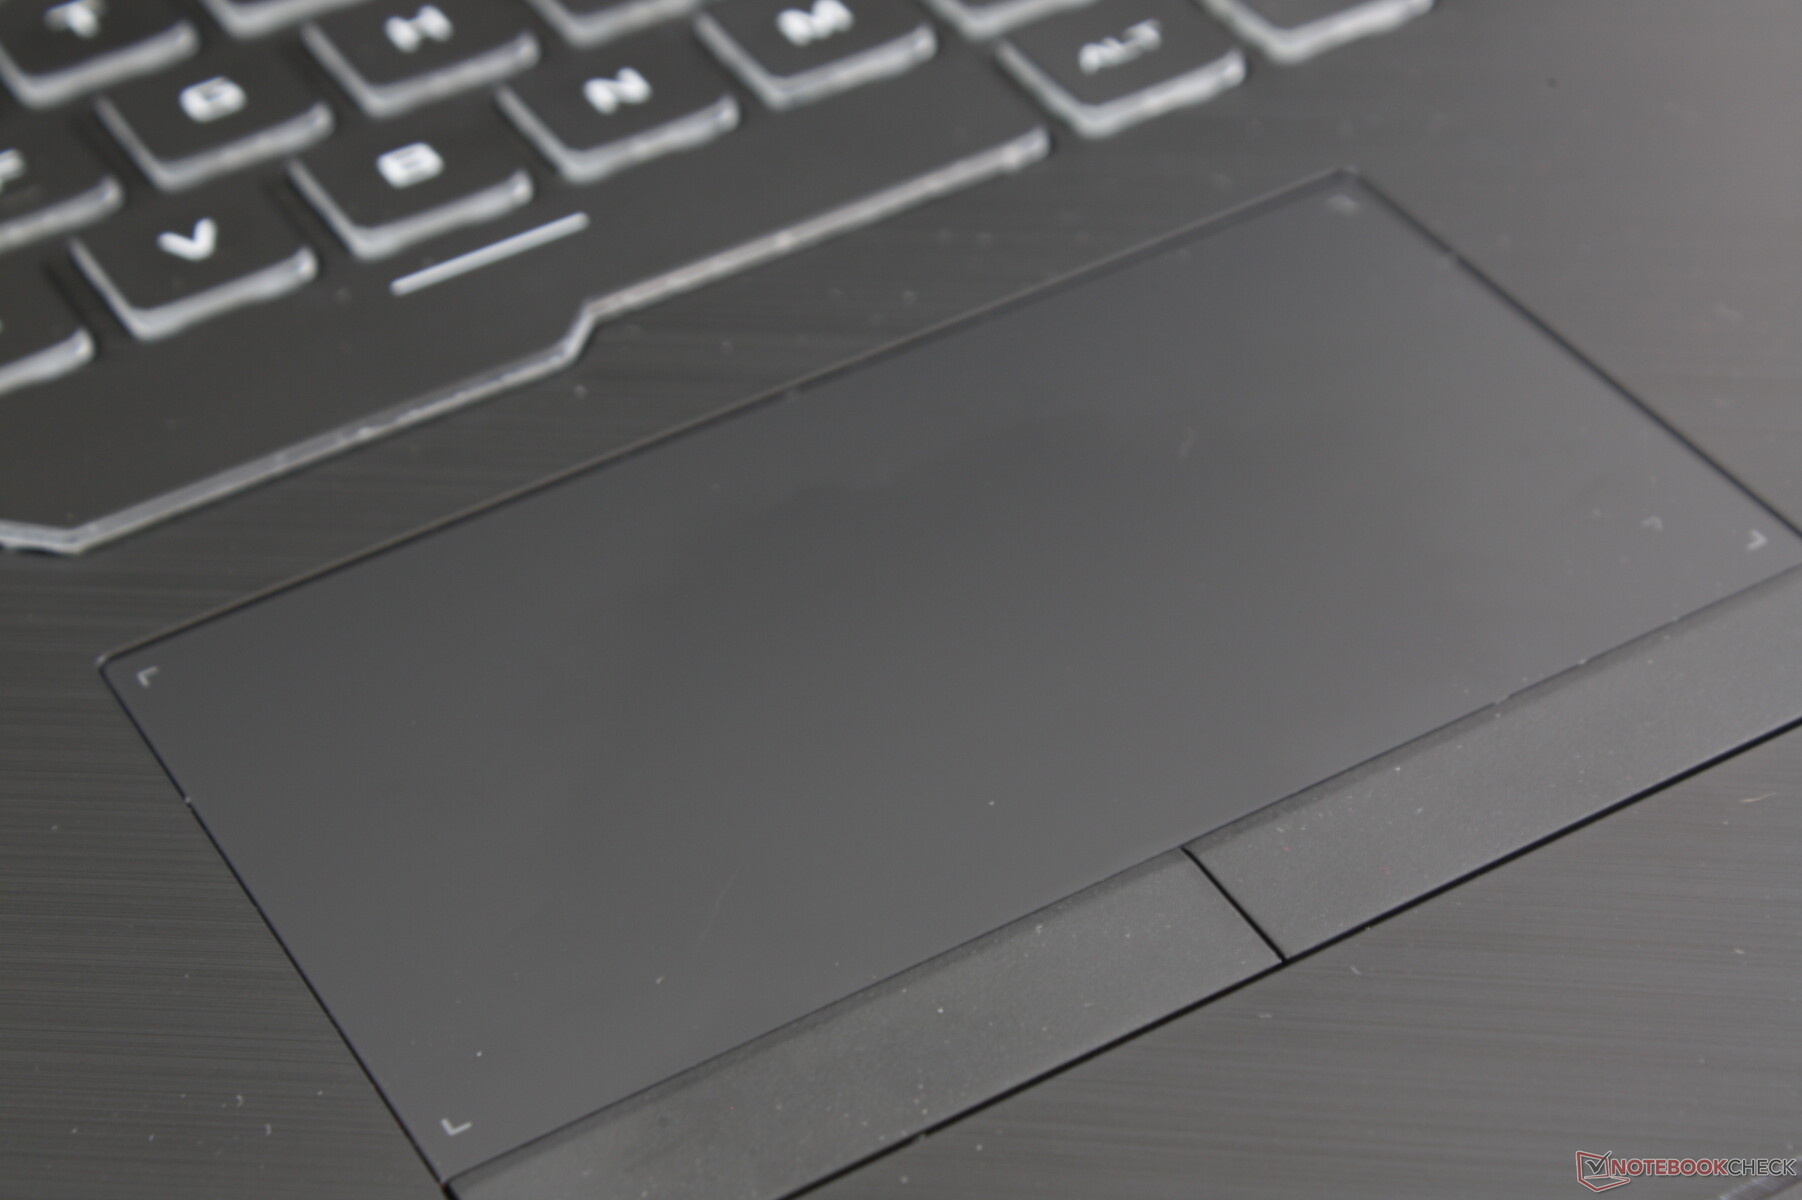
The touchpad is slightly smaller (10.8 x 6 cm) than the clickpads of the Blade Pro 17 (13 x 8 cm) or Alienware m17 (10.5 x 6.5 cm). Asus makes up for this by including dedicated mouse keys for better accuracy and usability than the integrated clickpad keys on the aforementioned alternatives. Feedback from the mouse keys are surprisingly quiet with both average feedback and decent travel. We find the experience to be very well balanced especially for users who may not like how loud some other clickpads can be.
As for the firm touchpad surface, glide is smooth and uniform when moving slowly or quickly for trouble-free cursor control. There is just slight sticking when moving very slowly, but this aids in accuracy when dragging and dropping. Our main complaint is that the touchpad collects unsightly grease almost immediately in comparison to the rest of the laptop.
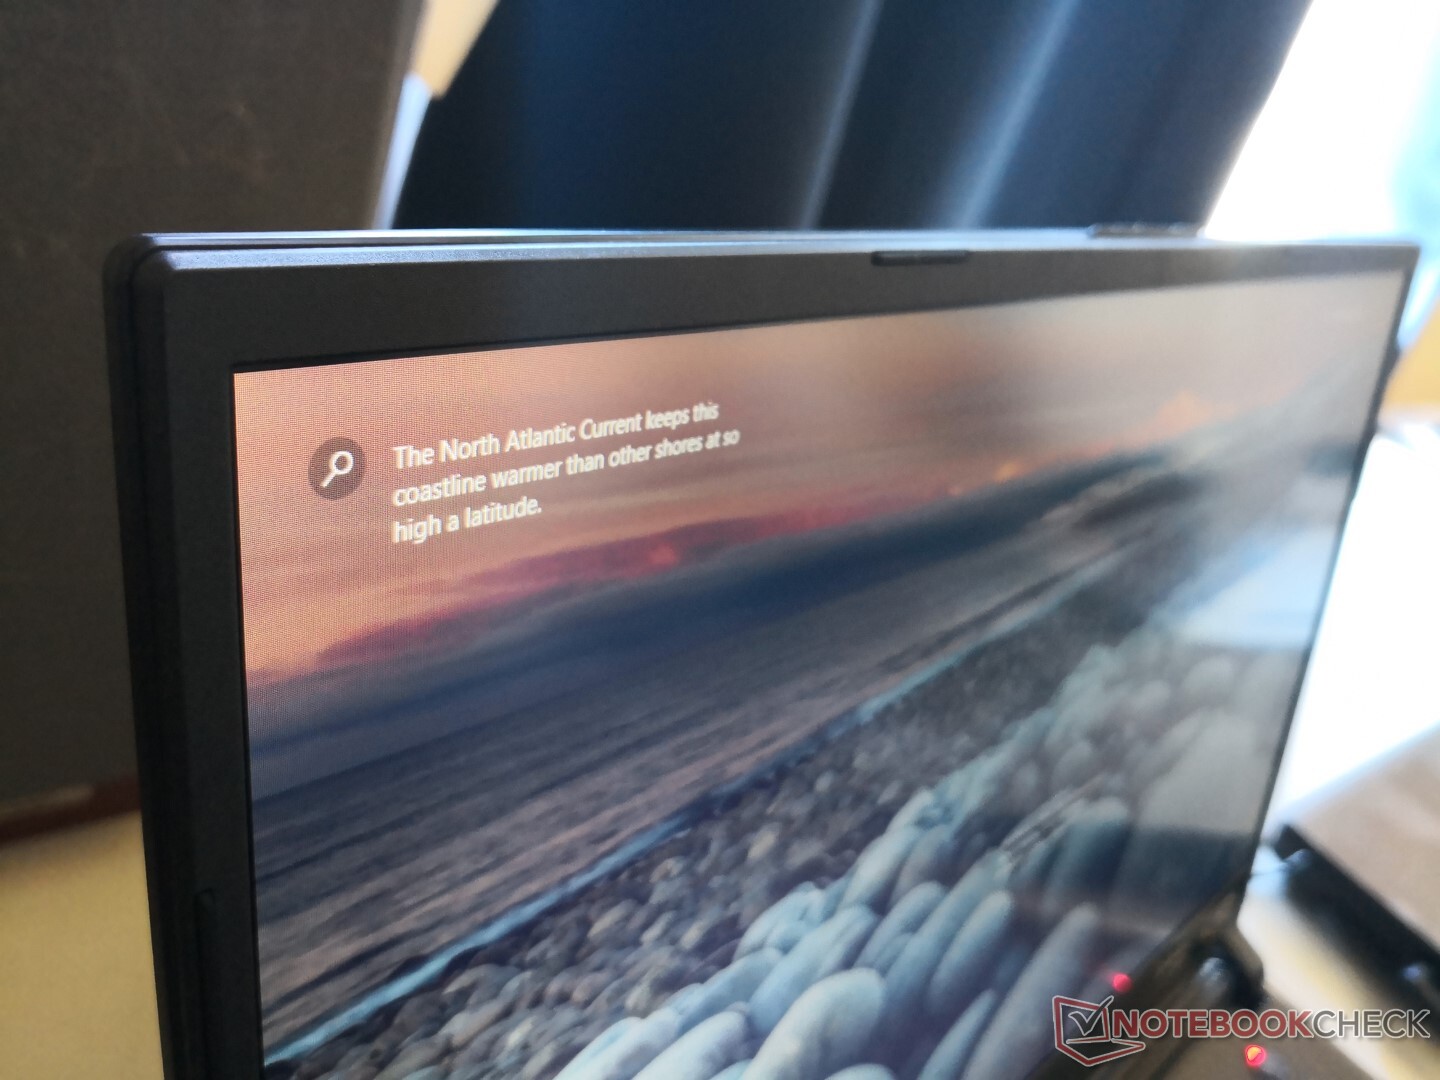
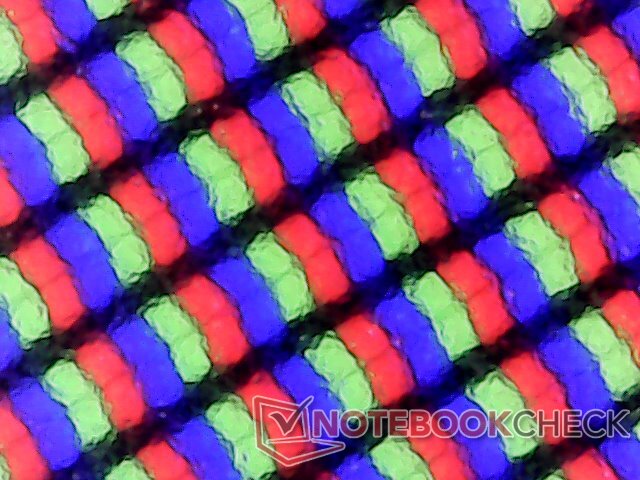
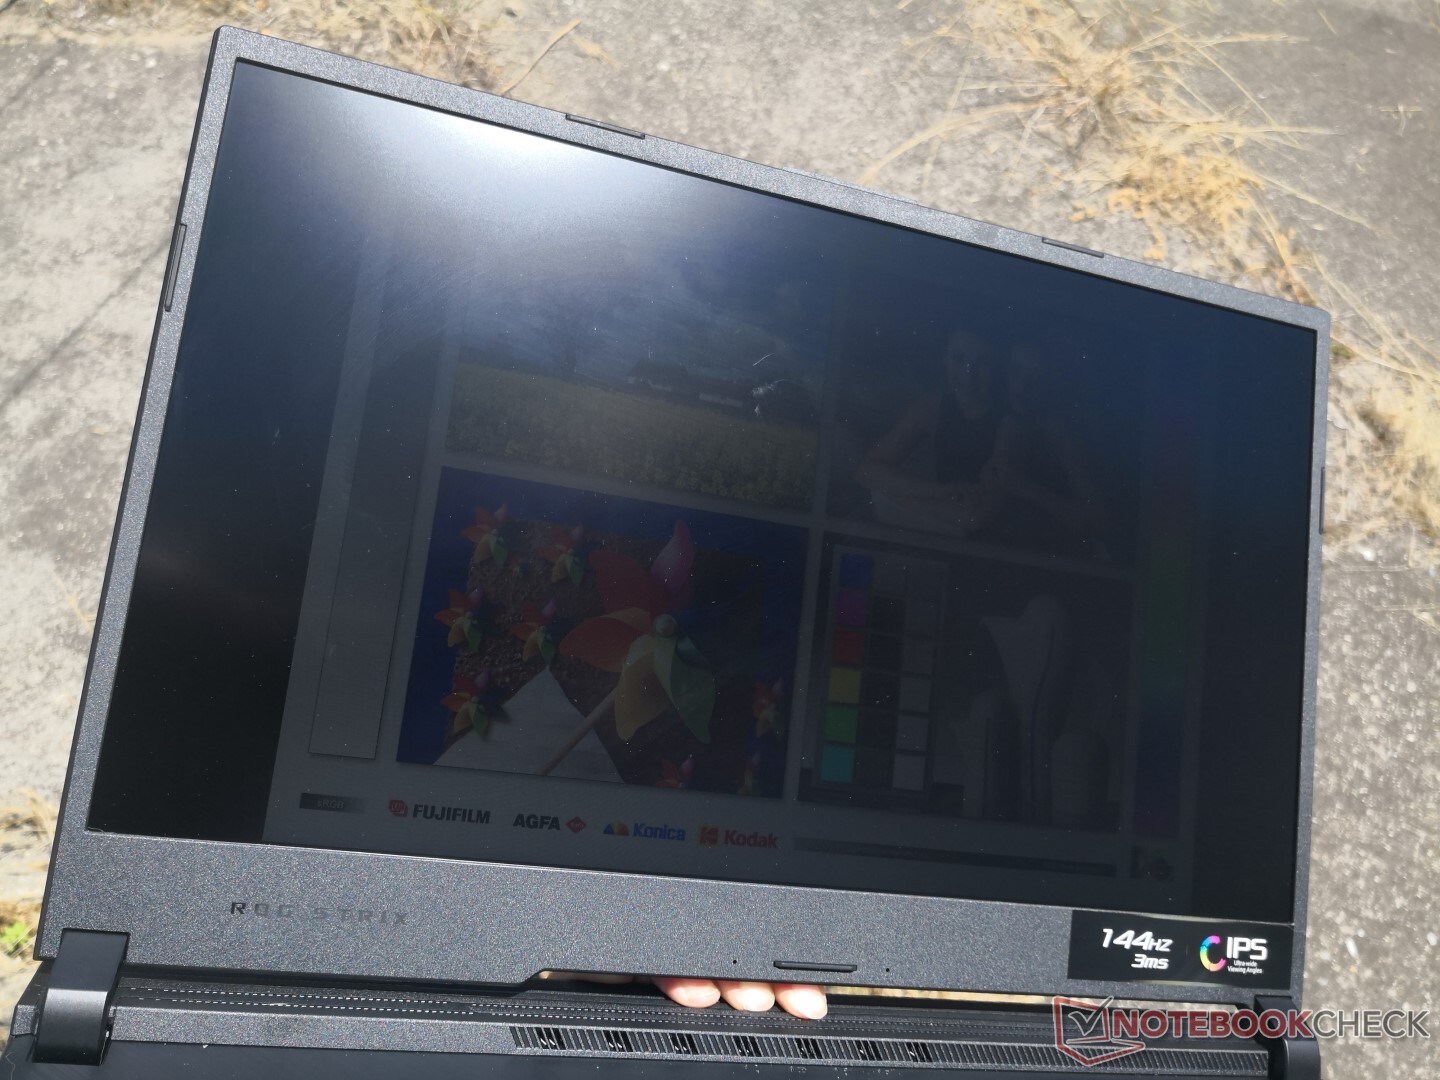
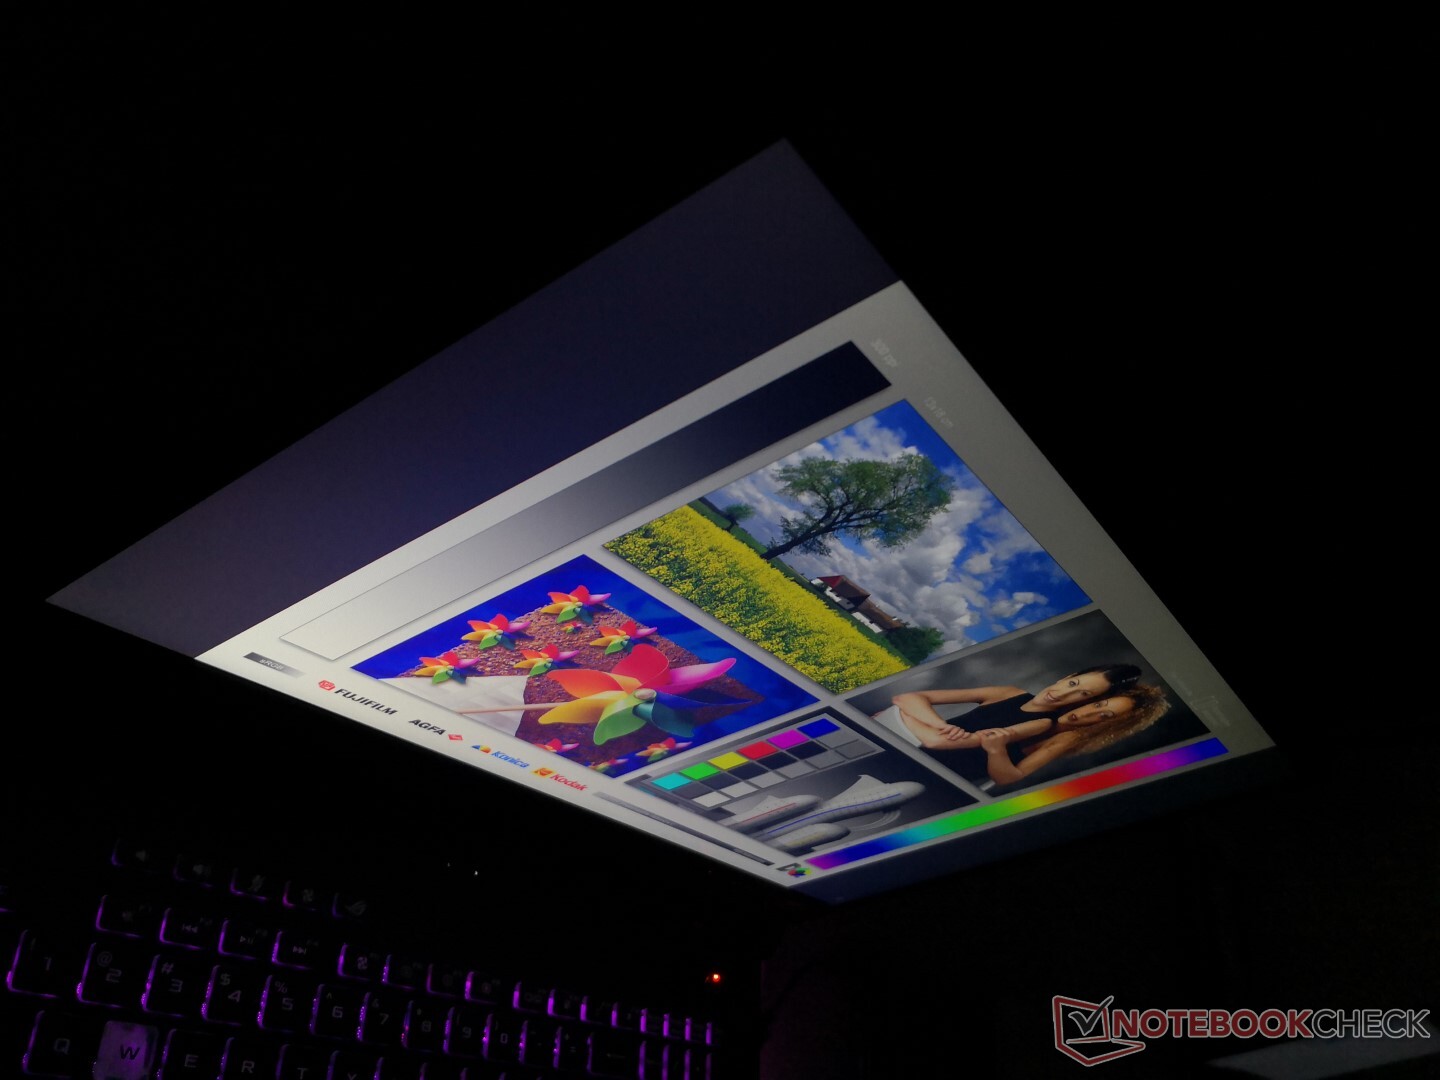
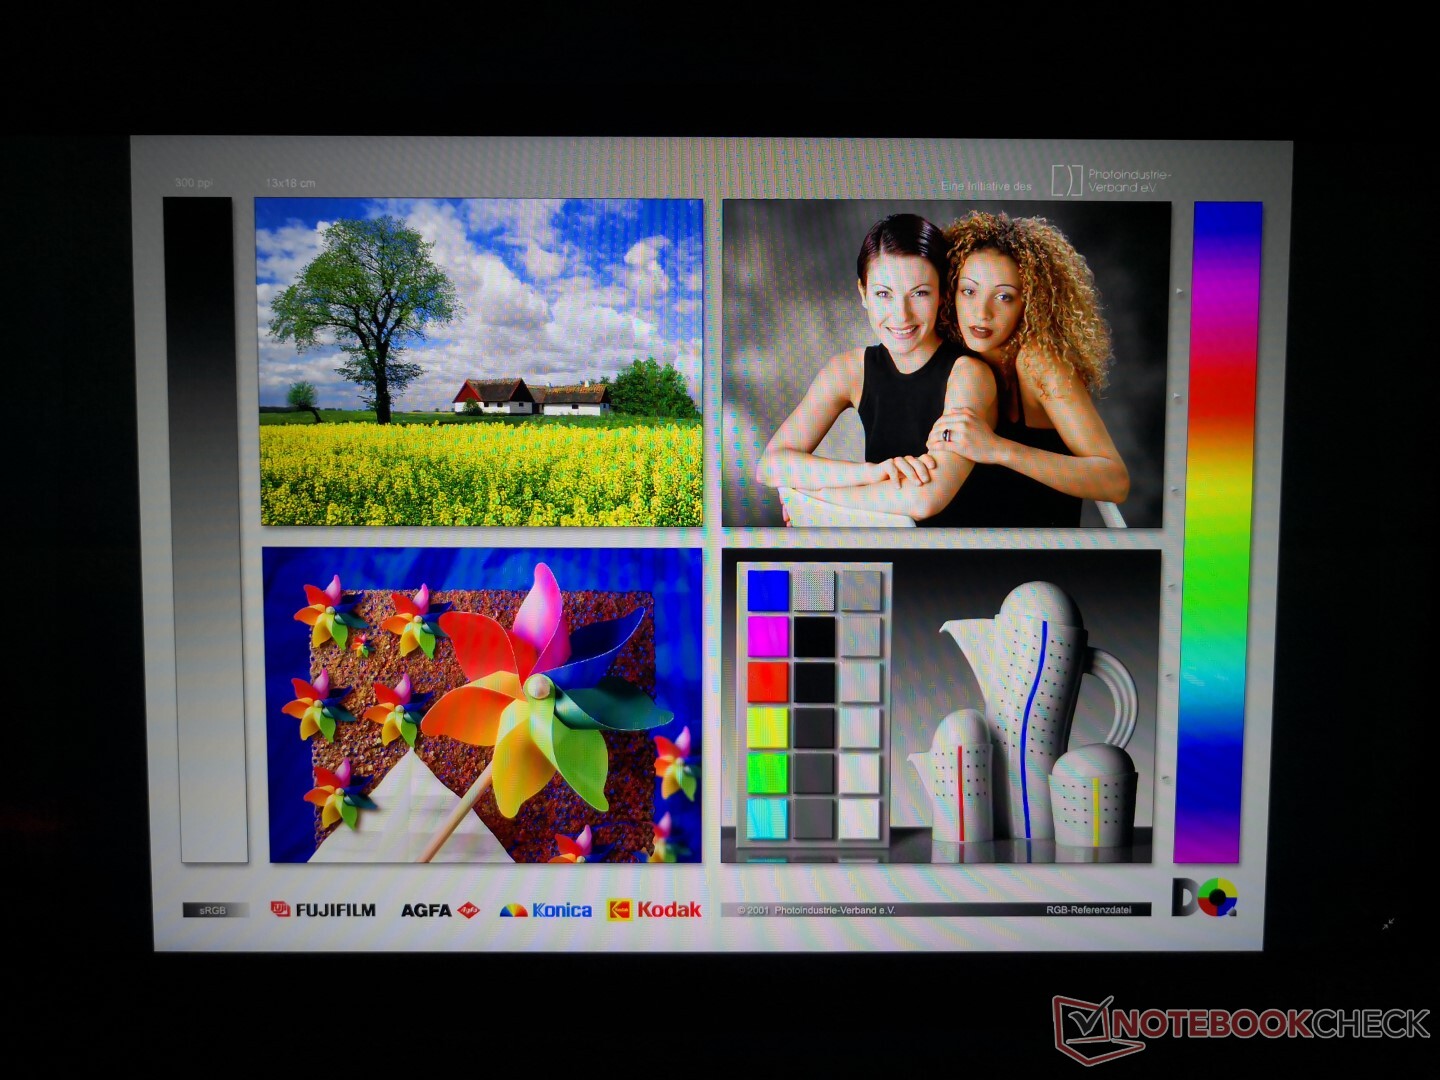
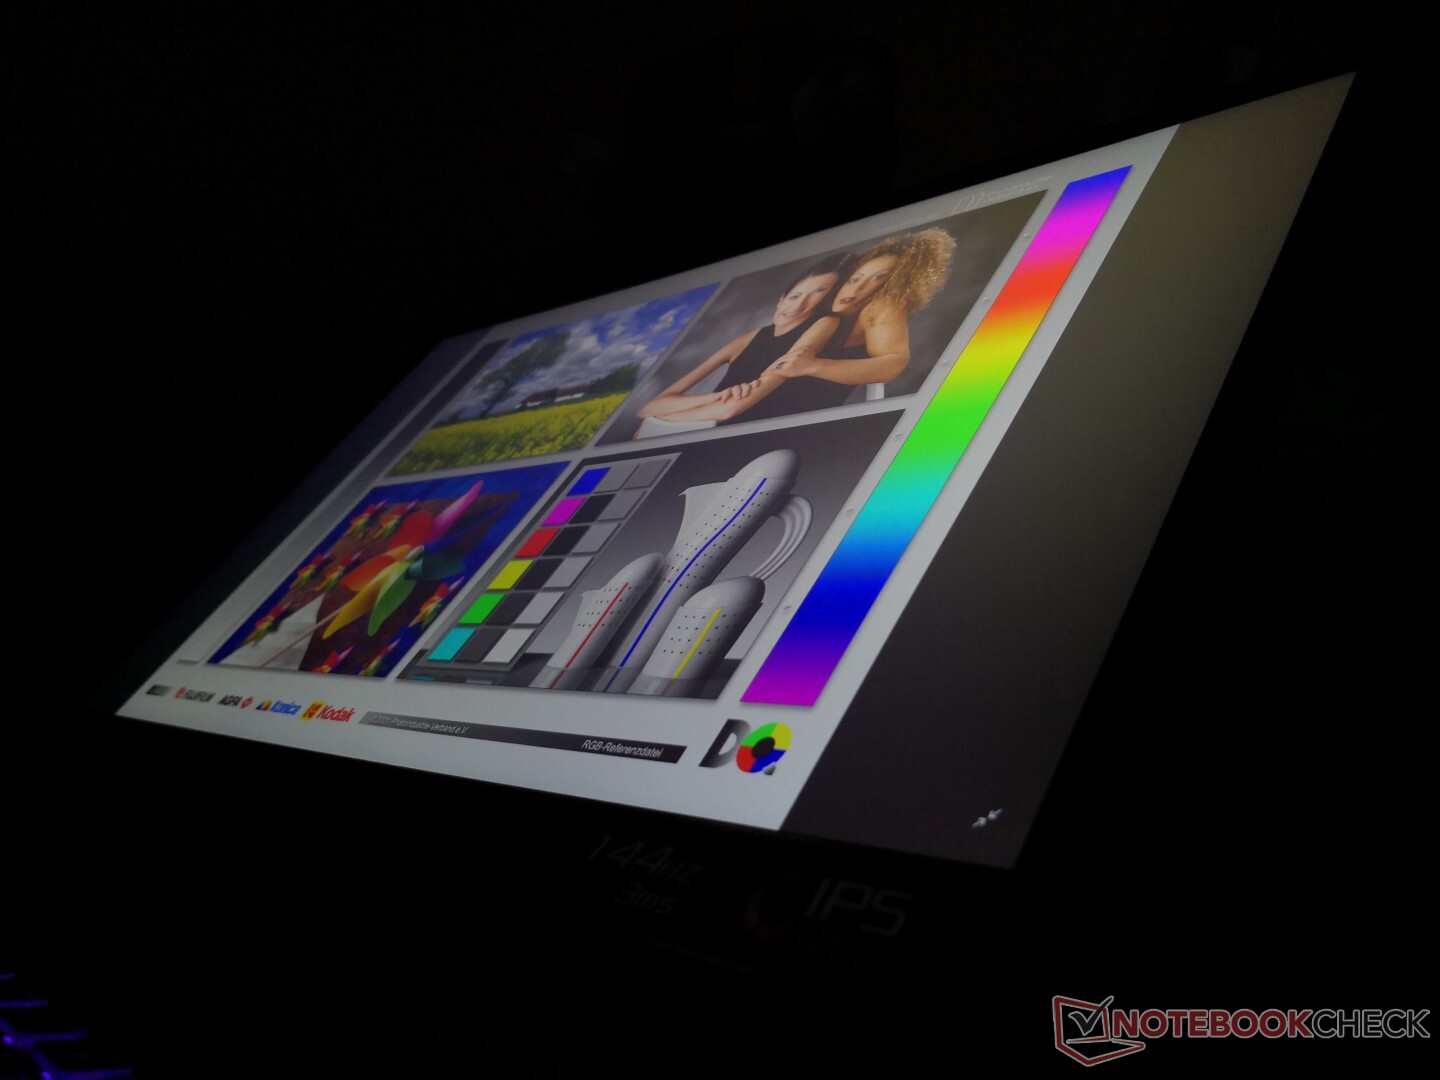
Display
Our configuration comes equipped with the same high quality AU Optronics B173HAN04.0 144 Hz/3 ms 1080p IPS panel as found on the Razer Blade Pro 17. Thus, innate characteristics like the respectable ~1000:1 contrast ratio, color reproduction, and fast response times are similar between these two laptops despite their price discrepancies. Asus' Strix II GL704 series utilizes this same panel as well.
The difference between 144 Hz and the 60 Hz panel as found on the Asus TUF FX705DT is night and day. Movement is noticeably smoother and with less ghosting when in and out of gaming.
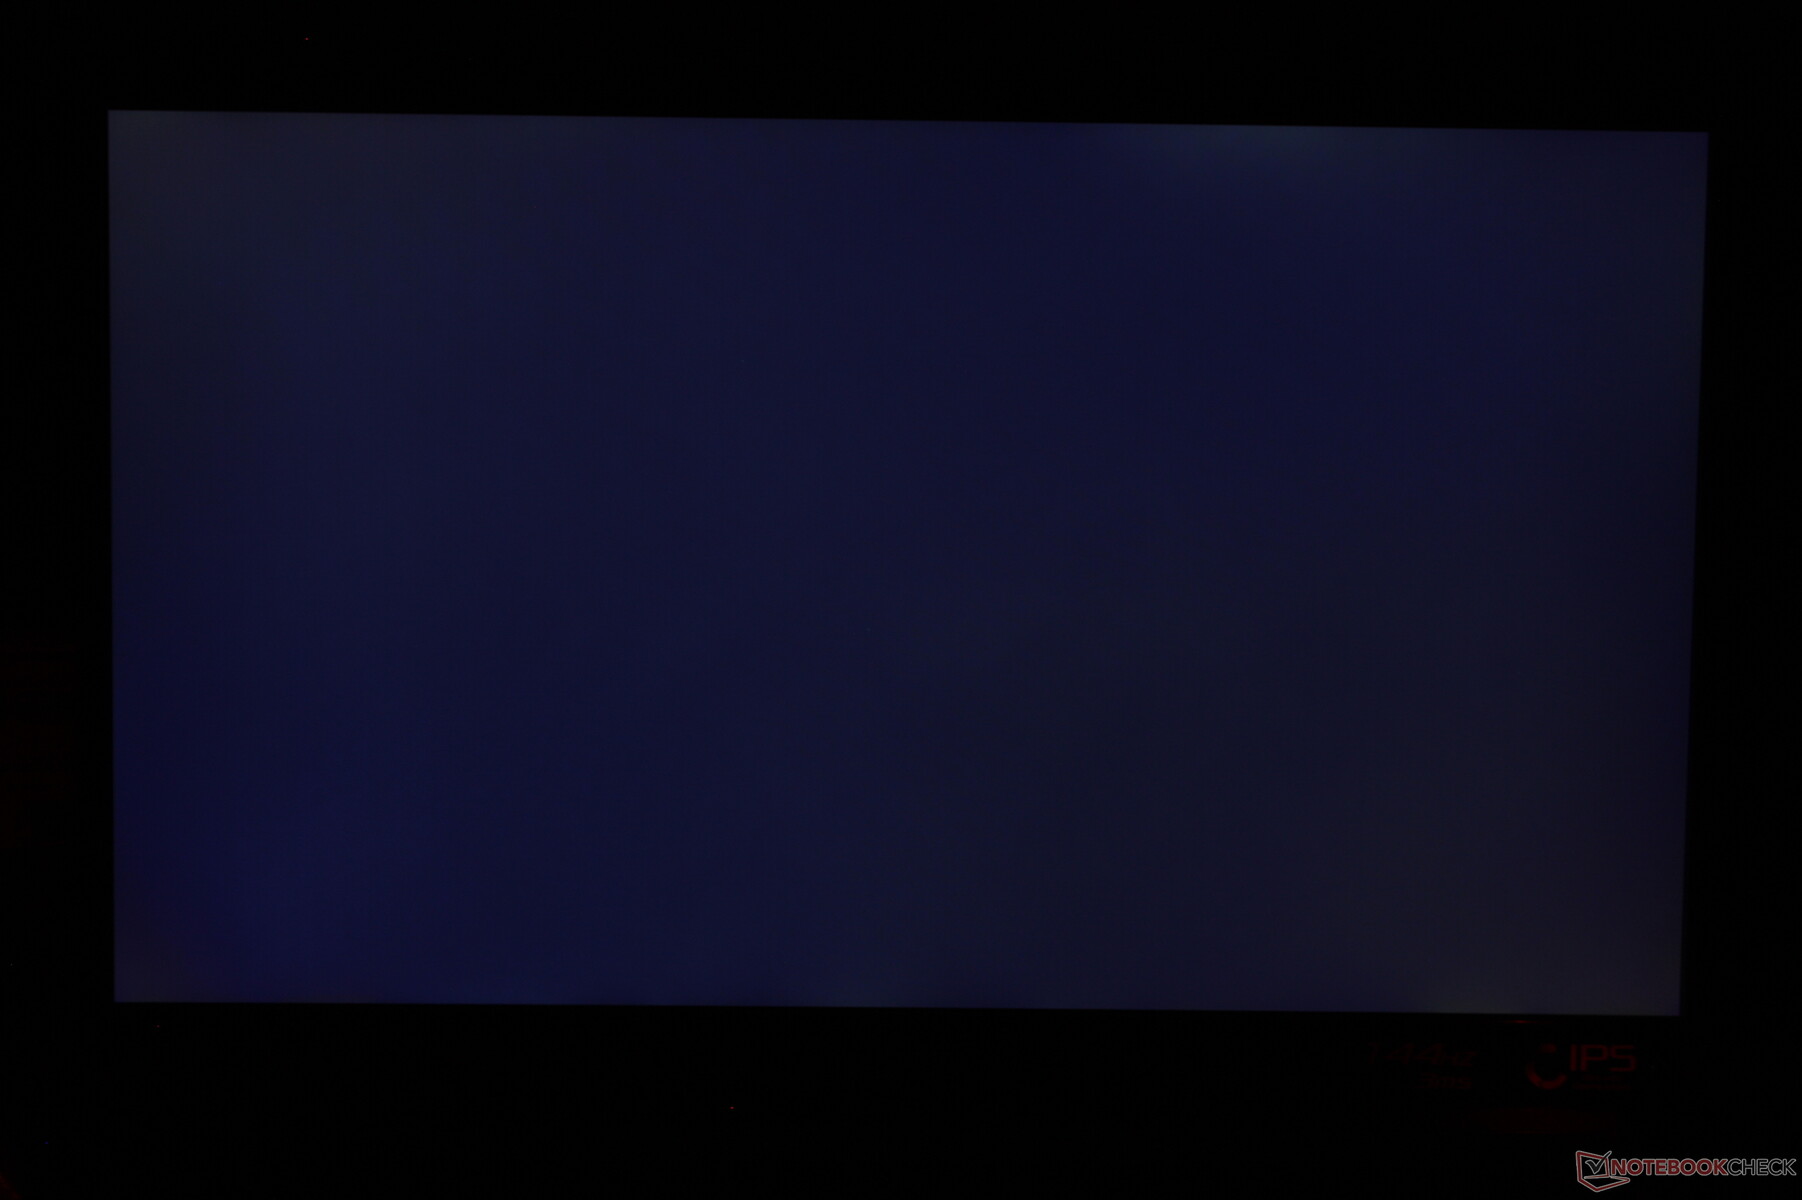
The display is slightly grainier than a glossy panel as is common on matte panels.
| |||||||||||||||||||||||||
Brightness Distribution: 89 %
Center on Battery: 294.3 cd/m²
Contrast: 981:1 (Black: 0.3 cd/m²)
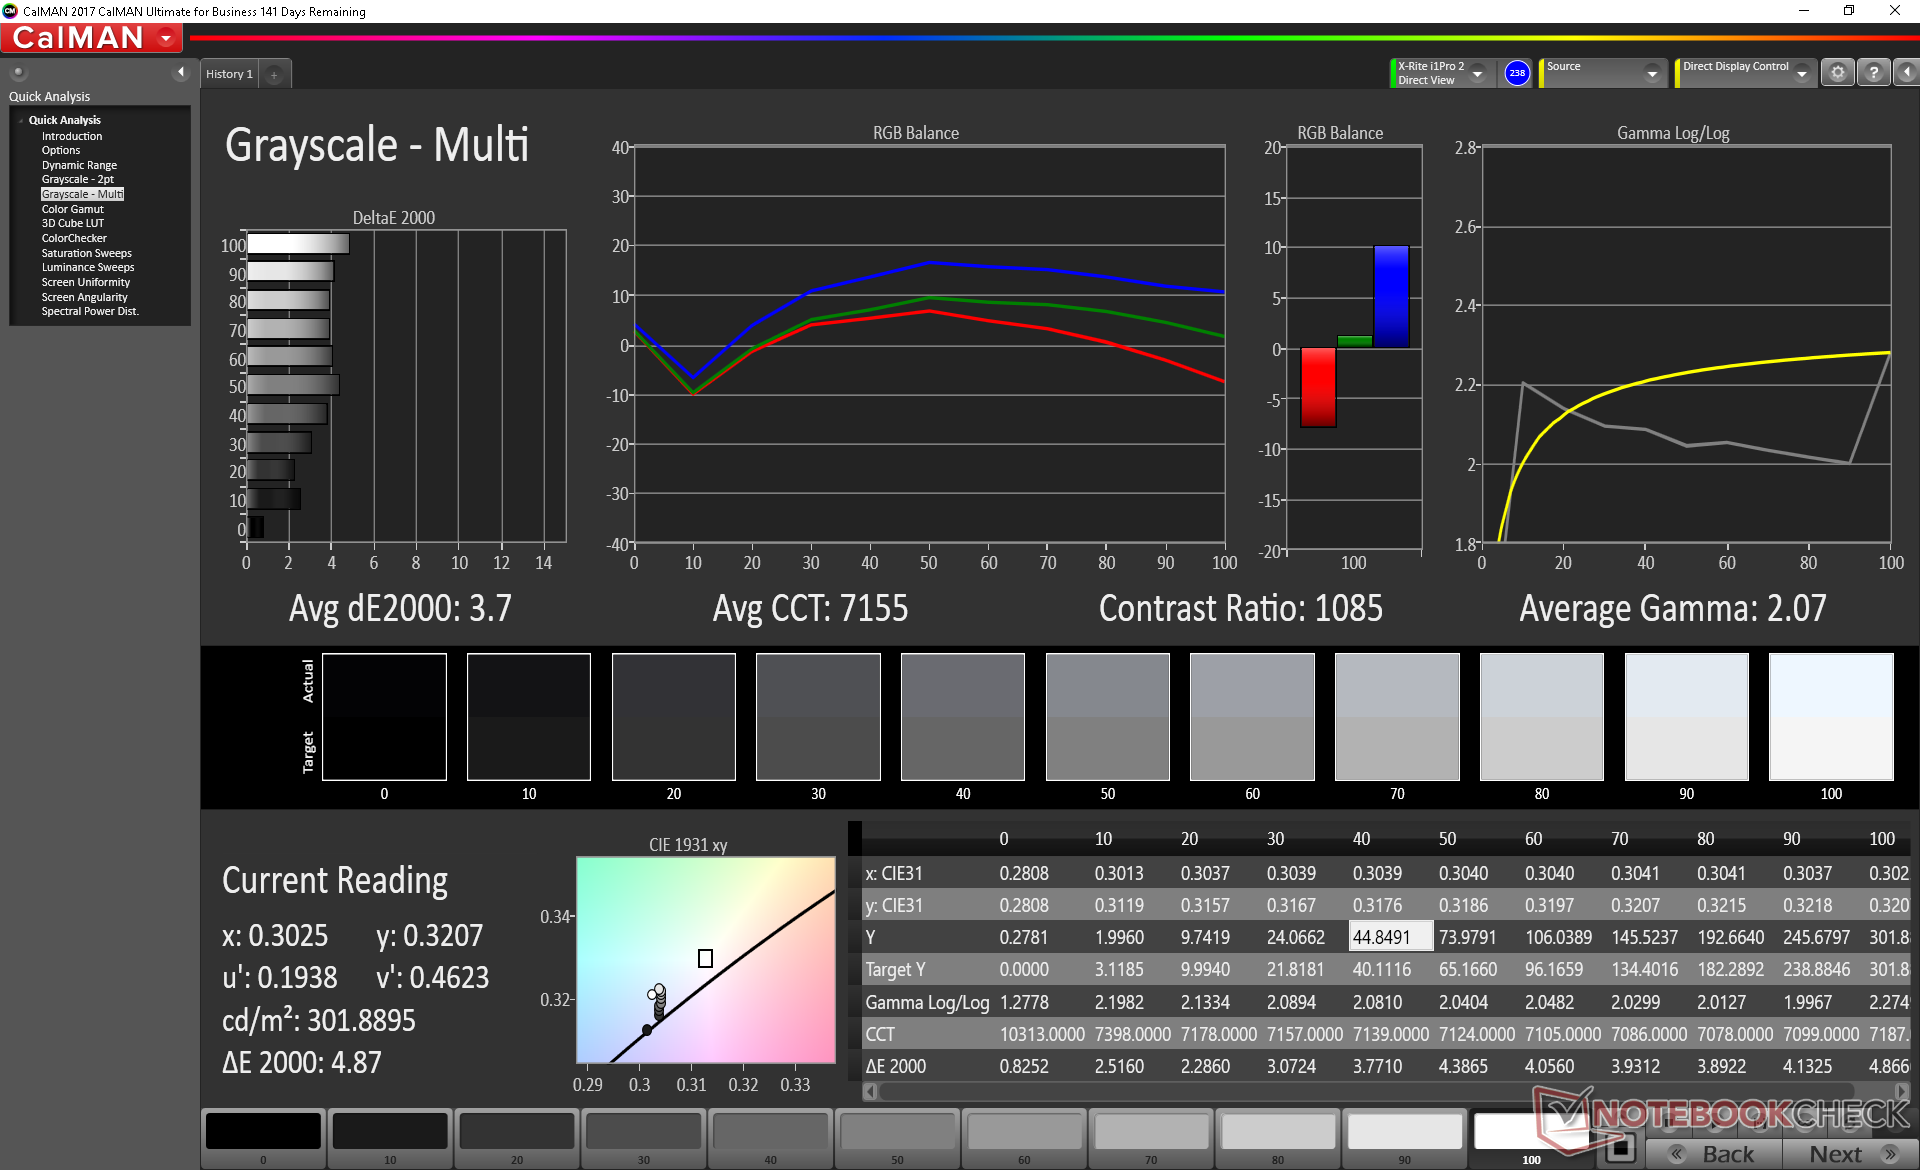
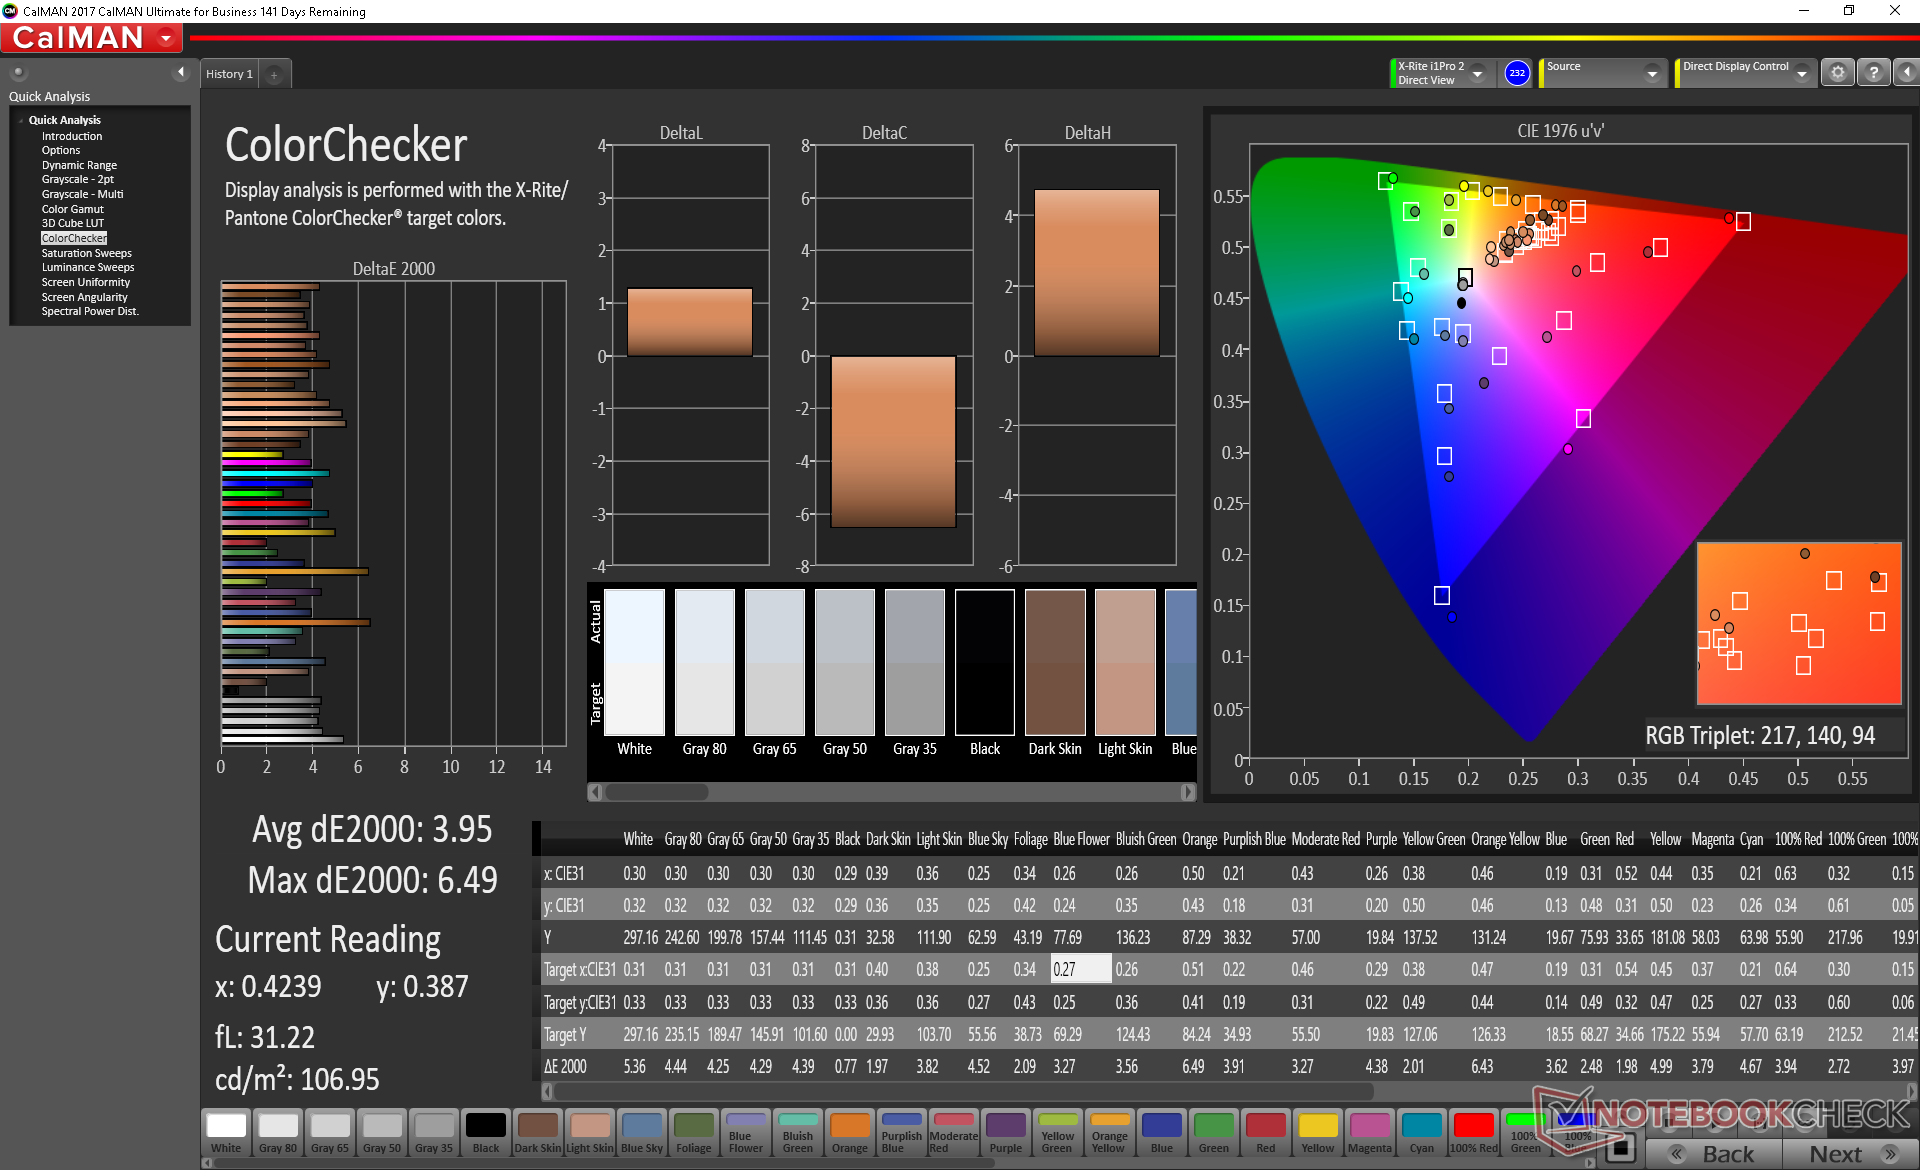
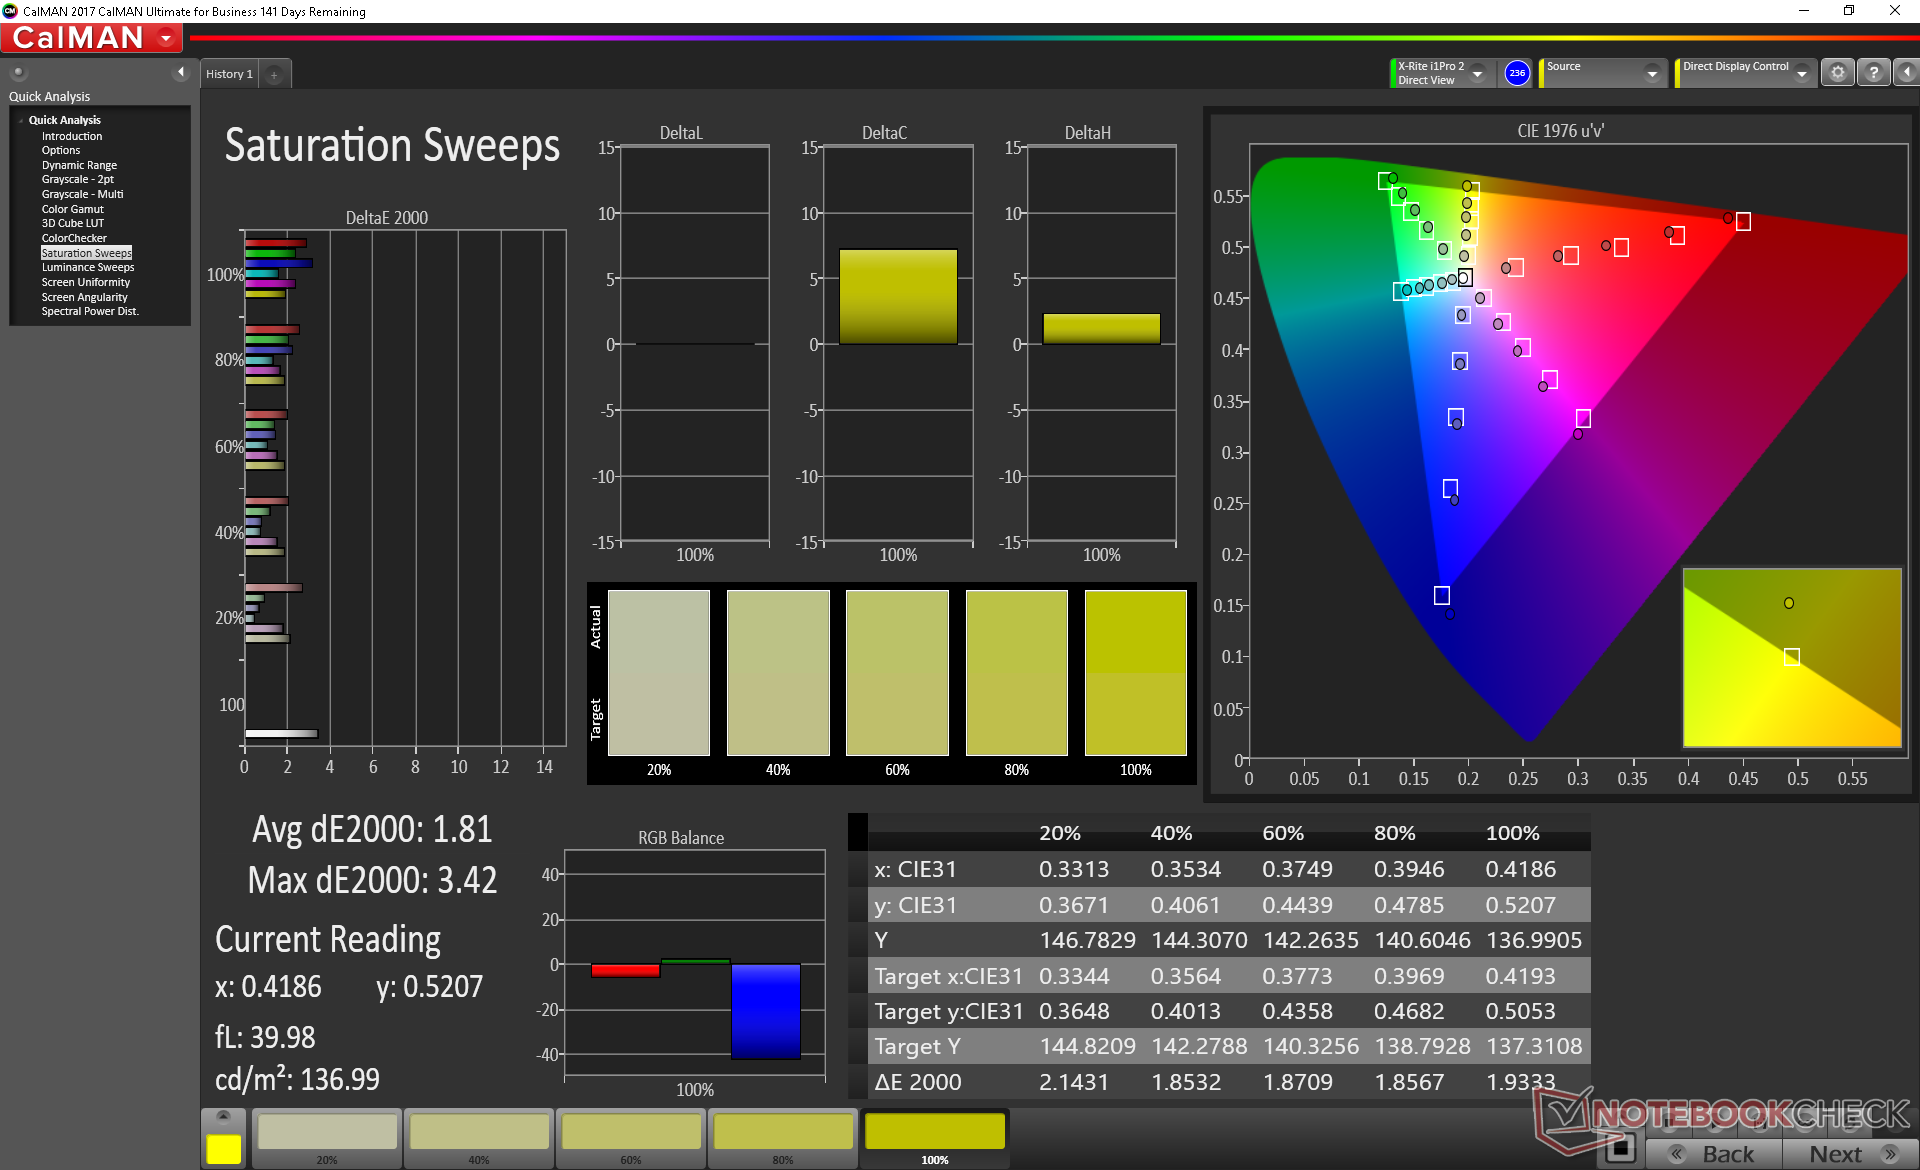
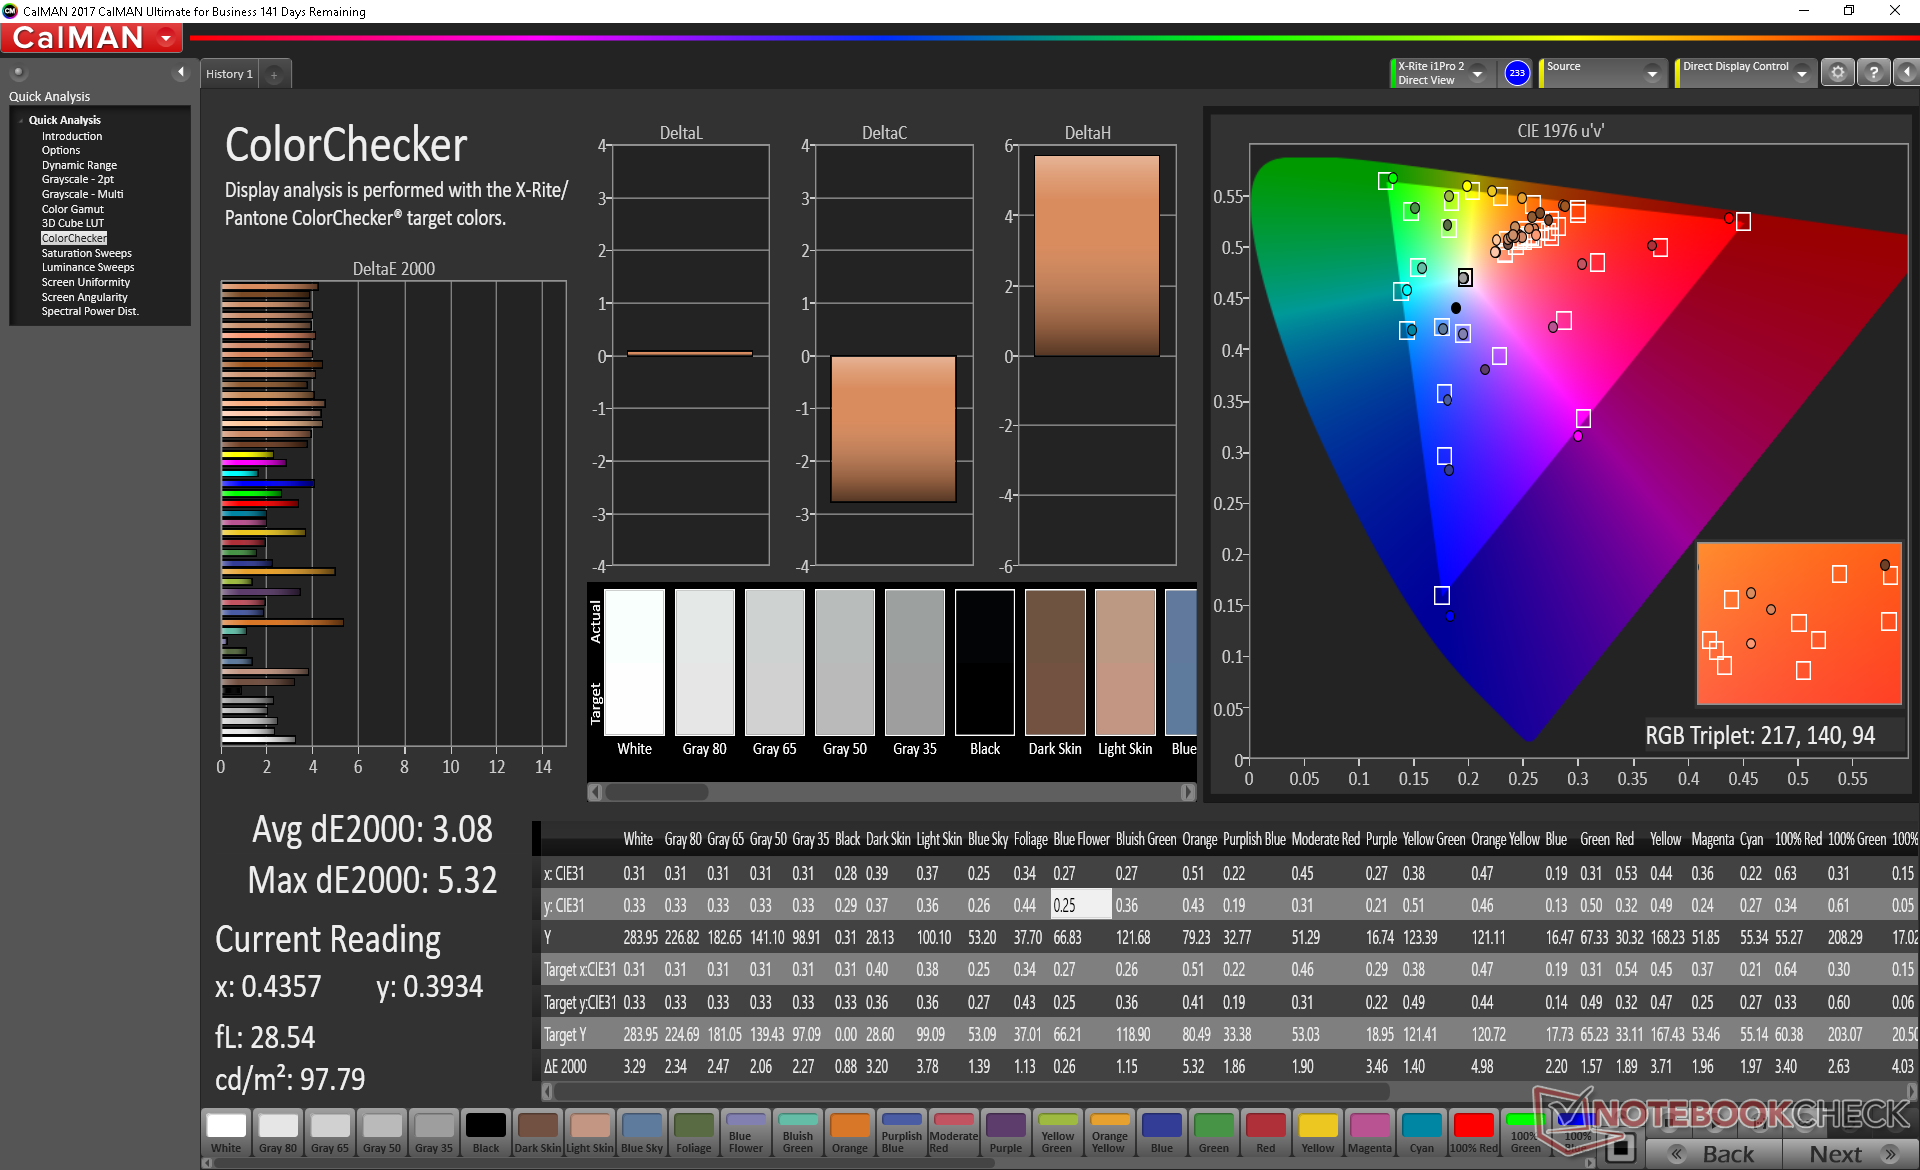
ΔE ColorChecker Calman: 3.95 | ∀{0.5-29.43 Ø4.72}
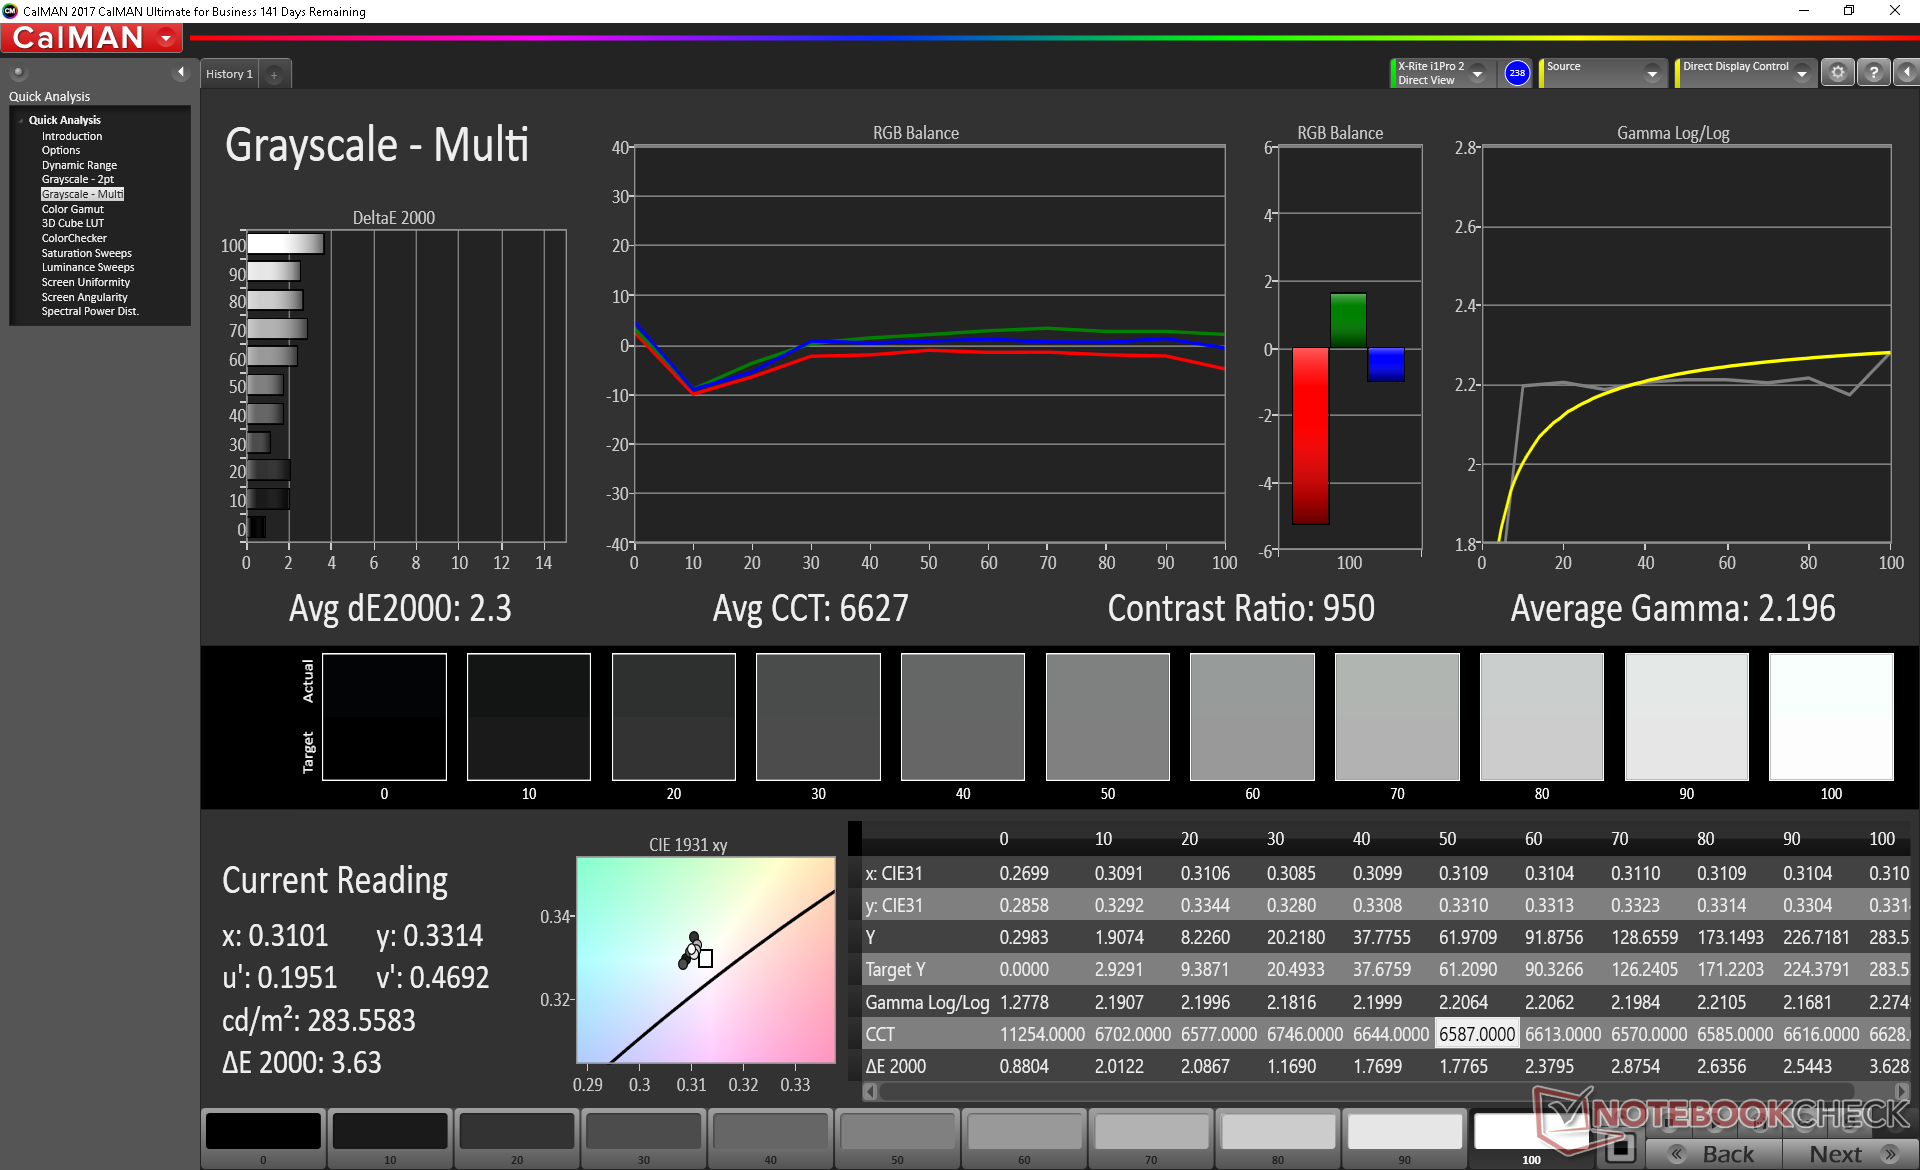
calibrated: 3.08
ΔE Greyscale Calman: 3.7 | ∀{0.09-98 Ø4.97}
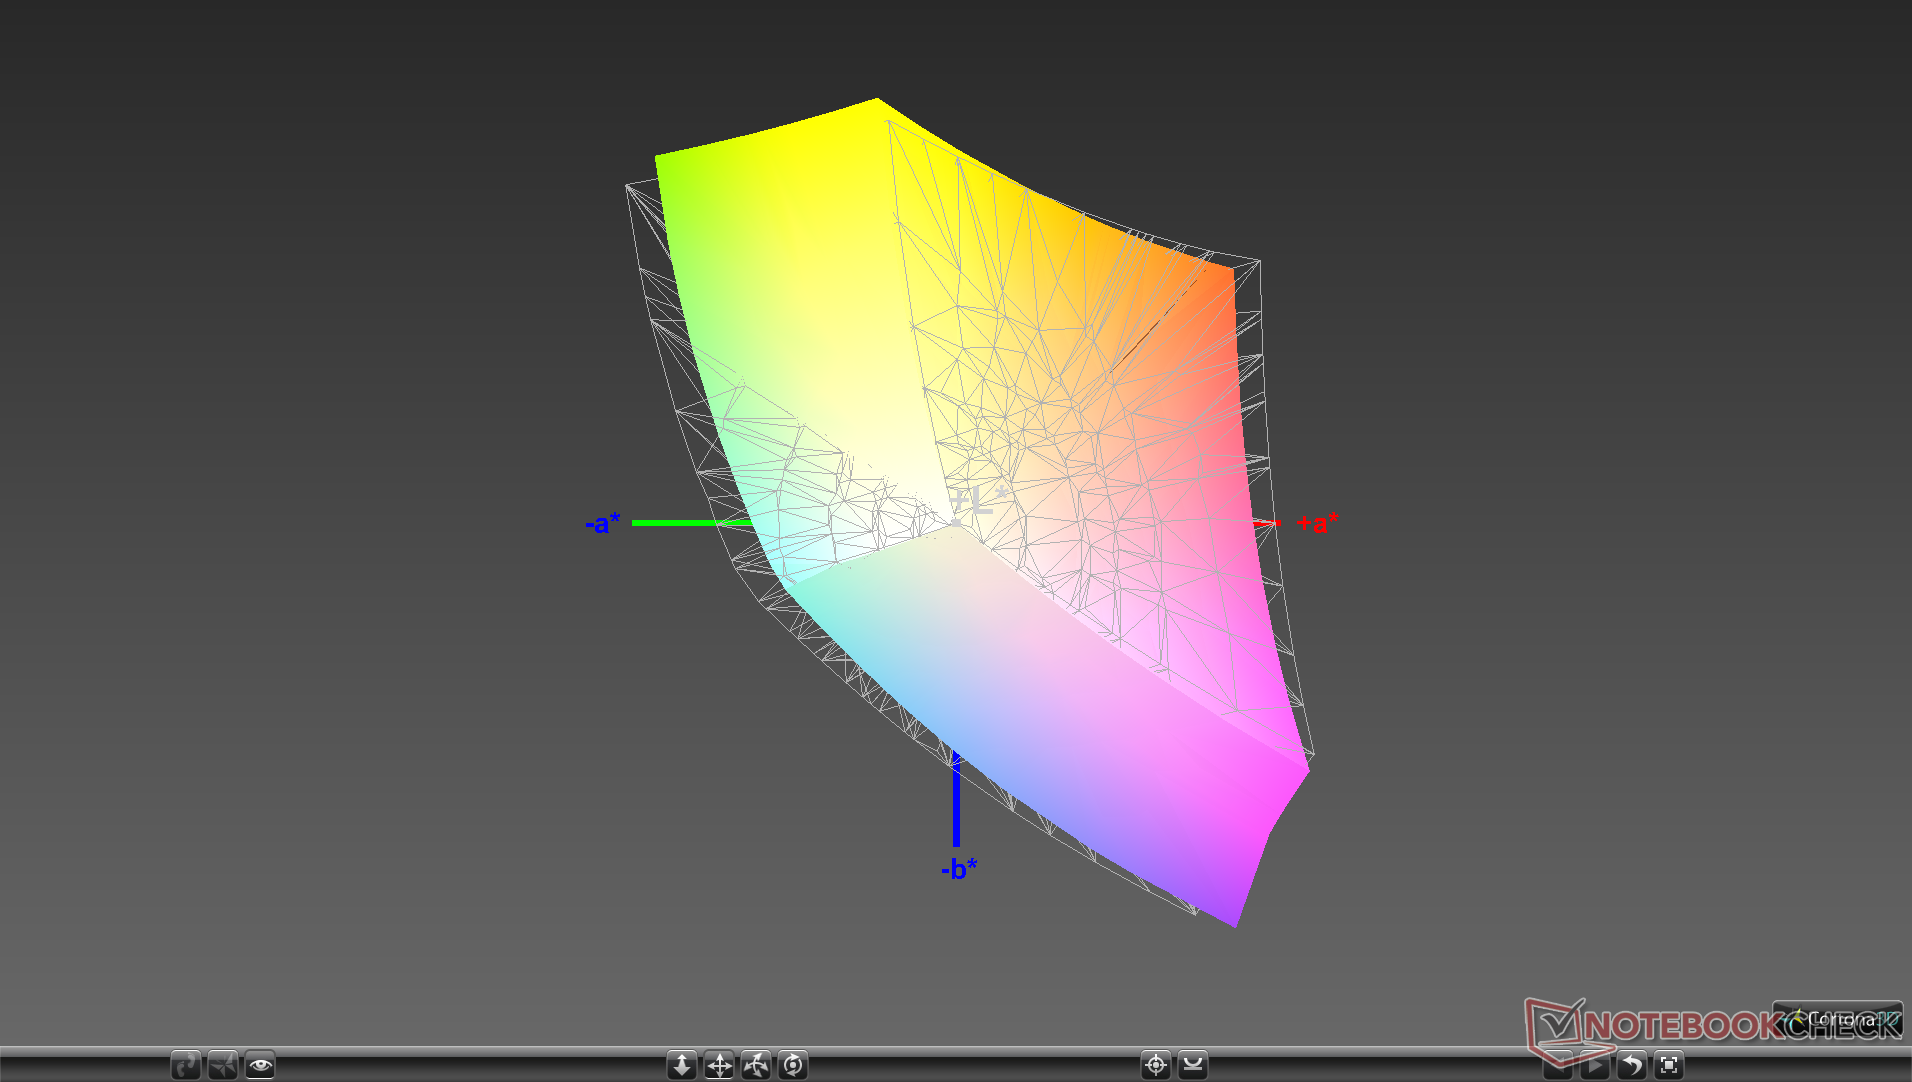
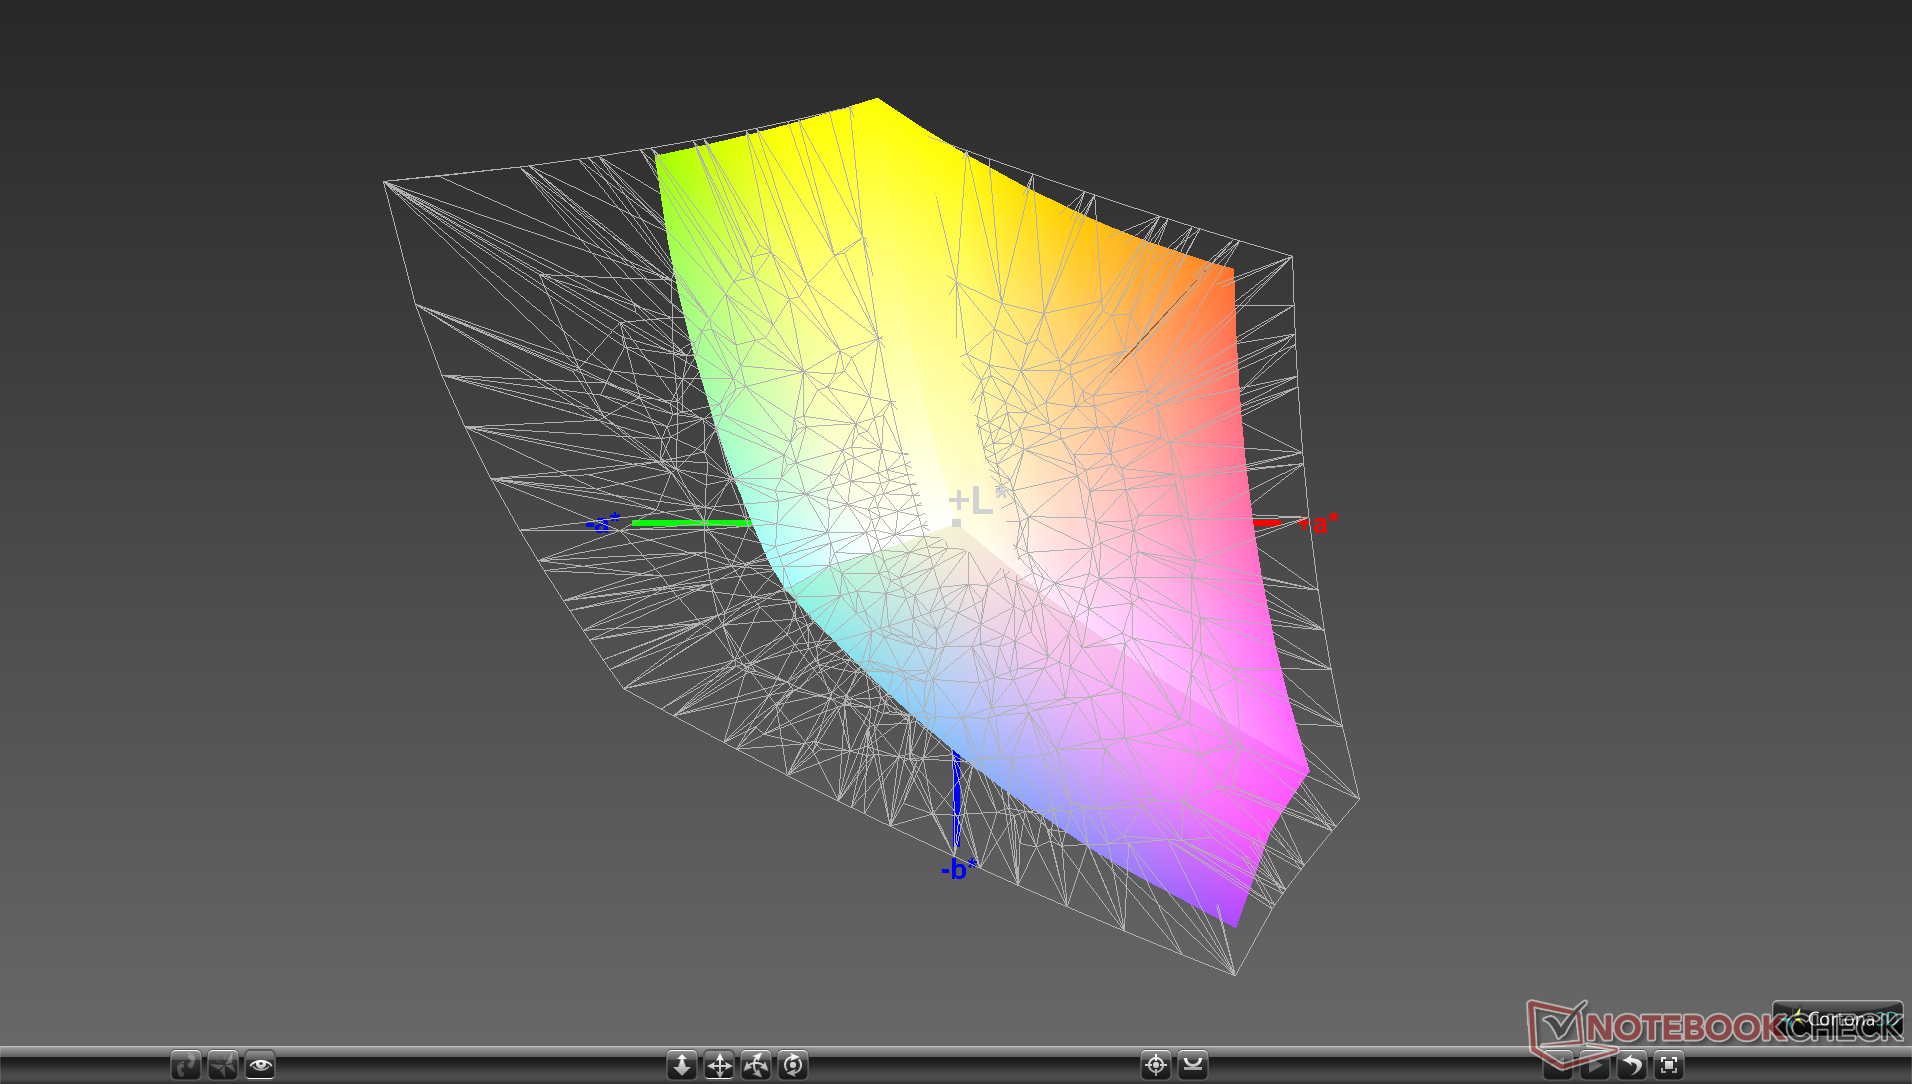
89% sRGB (Argyll 1.6.3 3D)
57.7% AdobeRGB 1998 (Argyll 1.6.3 3D)
63.3% AdobeRGB 1998 (Argyll 3D)
89.4% sRGB (Argyll 3D)
61.9% Display P3 (Argyll 3D)
Gamma: 2.07
CCT: 7155 K
| Asus ROG Strix G GL731GU-RB74 AU Optronics B173HAN04.0, IPS, 17.3", 1920x1080 | Asus TUF FX705DT-AU068T AU Optronics B173HAN04.2, IPS, 17.3", 1920x1080 | MSI GF75 Thin 9SC AU Optronics B173HAN04.2, IPS, 17.3", 1920x1080 | Lenovo Legion Y740-17ICH AU Optronics B173HAN03.2, IPS, 17.3", 1920x1080 | Asus ROG Strix Scar II GL704GW B173HAN04.0 (AUO409D), AHVA, 17.3", 1920x1080 | Razer Blade Pro 17 RTX 2080 Max-Q AU Optronics B173HAN04.0, IPS, 17.3", 1920x1080 | |
|---|---|---|---|---|---|---|
| Display | 1% | 1% | 2% | 0% | -1% | |
| Display P3 Coverage (%) | 61.9 | 62.3 1% | 62.5 1% | 64 3% | 62.9 2% | 60.6 -2% |
| sRGB Coverage (%) | 89.4 | 89.1 0% | 90 1% | 90.4 1% | 87.1 -3% | 89 0% |
| AdobeRGB 1998 Coverage (%) | 63.3 | 63.7 1% | 64 1% | 64.8 2% | 63.7 1% | 62.1 -2% |
| Response Times | -355% | -301% | -79% | -88% | 4% | |
| Response Time Grey 50% / Grey 80% * (ms) | 6.4 ? | 41 ? -541% | 34 ? -431% | 15.6 ? -144% | 17.6 ? -175% | 6.8 ? -6% |
| Response Time Black / White * (ms) | 11.2 ? | 30 ? -168% | 30.4 ? -171% | 12.8 ? -14% | 11.2 ? -0% | 9.6 ? 14% |
| PWM Frequency (Hz) | ||||||
| Screen | 5% | 7% | -15% | 12% | 8% | |
| Brightness middle (cd/m²) | 294.3 | 316 7% | 344.7 17% | 299.1 2% | 295 0% | 299.3 2% |
| Brightness (cd/m²) | 289 | 294 2% | 332 15% | 273 -6% | 291 1% | 294 2% |
| Brightness Distribution (%) | 89 | 84 -6% | 91 2% | 81 -9% | 96 8% | 94 6% |
| Black Level * (cd/m²) | 0.3 | 0.32 -7% | 0.3 -0% | 0.27 10% | 0.24 20% | 0.29 3% |
| Contrast (:1) | 981 | 988 1% | 1149 17% | 1108 13% | 1229 25% | 1032 5% |
| Colorchecker dE 2000 * | 3.95 | 3.39 14% | 3.08 22% | 5.07 -28% | 3.2 19% | 2.55 35% |
| Colorchecker dE 2000 max. * | 6.49 | 5.56 14% | 6.32 3% | 10.55 -63% | 6.64 -2% | 4.73 27% |
| Colorchecker dE 2000 calibrated * | 3.08 | 2.14 31% | 2.94 5% | 3.31 -7% | 2.52 18% | 2.9 6% |
| Greyscale dE 2000 * | 3.7 | 3.17 14% | 3.8 -3% | 6.8 -84% | 2.16 42% | 3.5 5% |
| Gamma | 2.07 106% | 2.39 92% | 2.17 101% | 2.46 89% | 2.46 89% | 2.28 96% |
| CCT | 7155 91% | 7098 92% | 7284 89% | 7805 83% | 6872 95% | 7101 92% |
| Color Space (Percent of AdobeRGB 1998) (%) | 57.7 | 51 -12% | 58 1% | 58.5 1% | 57 -1% | 57 -1% |
| Color Space (Percent of sRGB) (%) | 89 | 89 0% | 89.6 1% | 89.9 1% | 87 -2% | 88.7 0% |
| Total Average (Program / Settings) | -116% /
-41% | -98% /
-32% | -31% /
-20% | -25% /
-3% | 4% /
6% |
* ... smaller is better
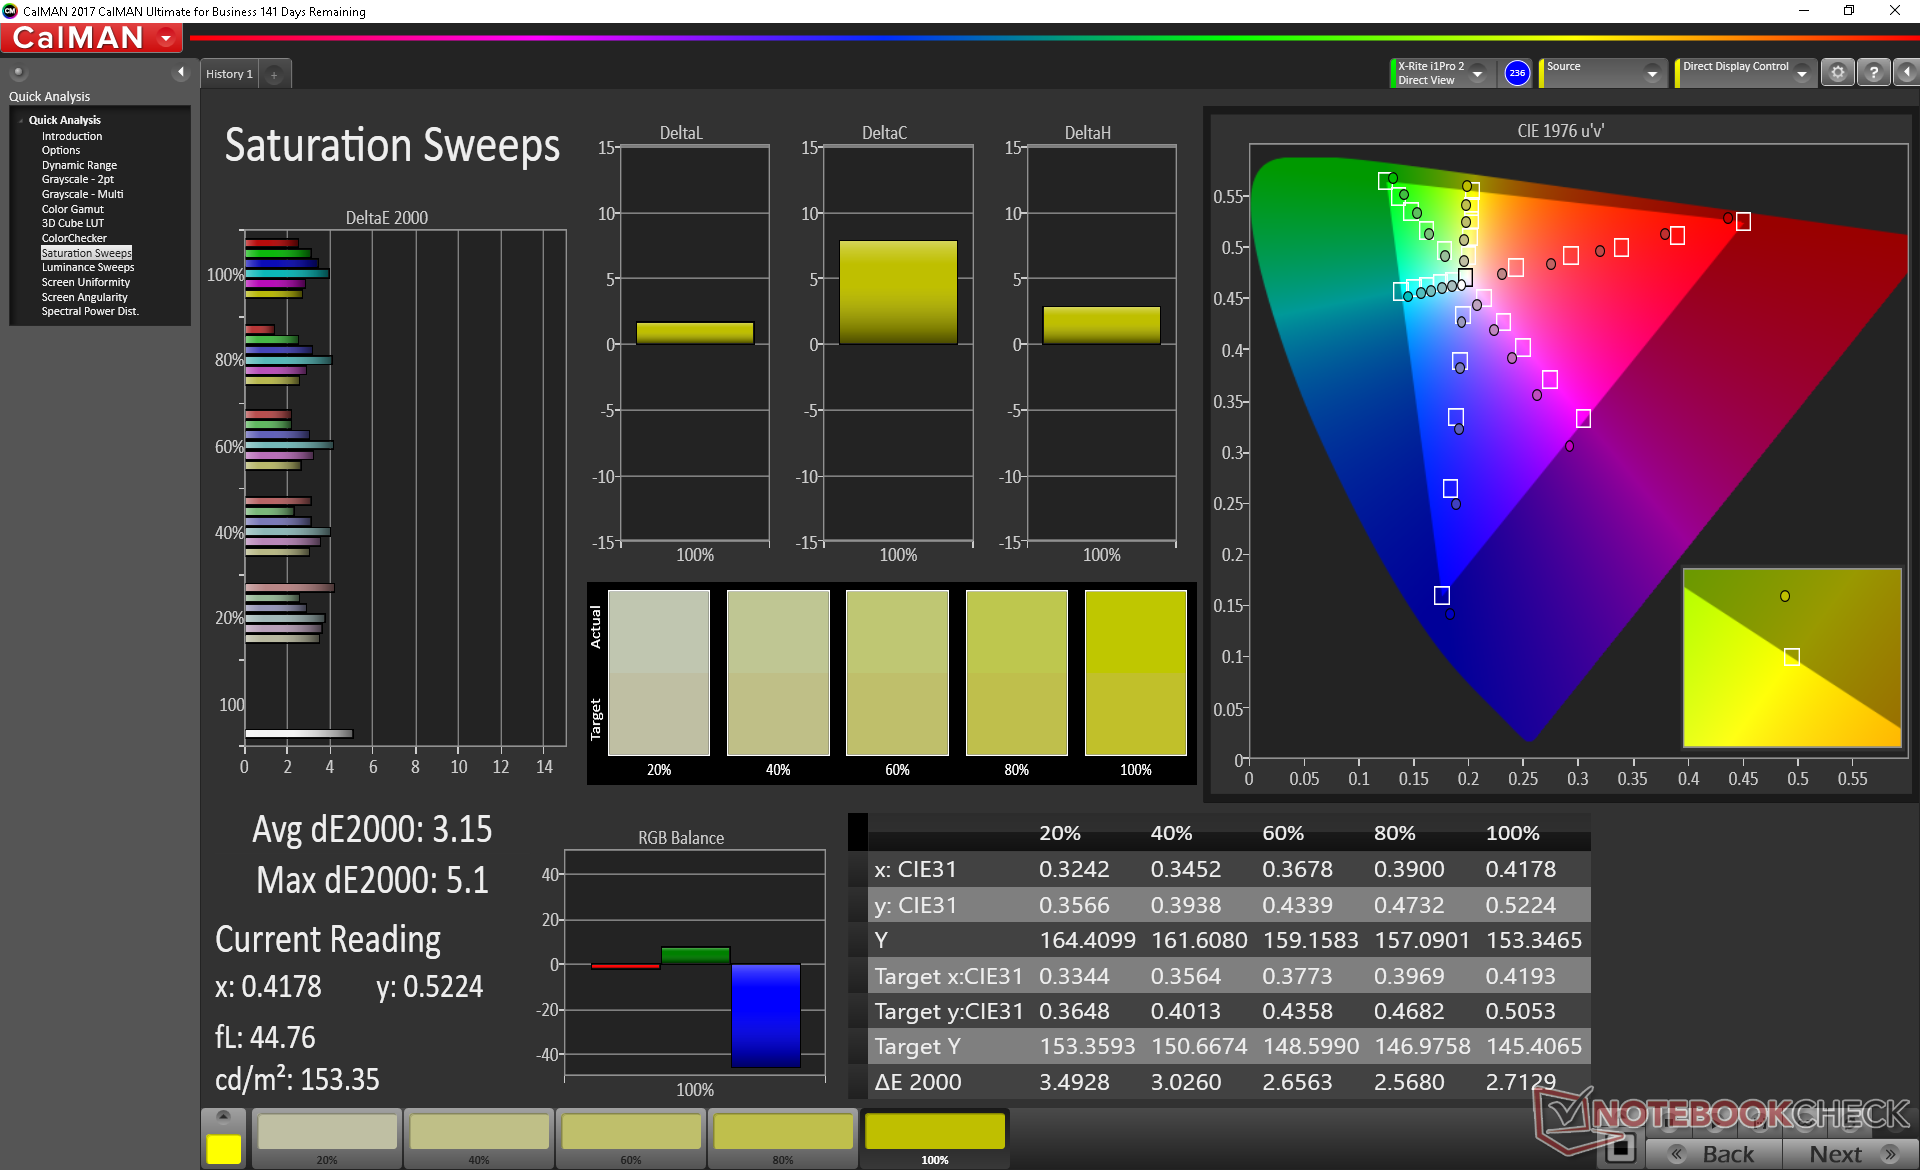
Color space covers approximately 89 percent of sRGB and 58 percent of AdobeRGB not unlike essentially all 120/144/240 Hz panels in the market today. Panel manufacturers have yet to develop laptop displays with both fast refresh rates and full AdobeRGB coverage meaning that these panels are unfit for most types of professional digital work. For gaming purposes, however, the gamut is more than sufficient.
Grayscale and colors are reasonably accurate with deltaE values of 3.7 and 3.15, respectively, before any calibration. Color temperature, however, is slightly on the cooler side. A calibration attempt improves grayscale, colors, and color temperature for more a more accurate display. The changes are relatively minor and so an end-user calibration isn't necessary if not available.
Display Response Times
| ↔ Response Time Black to White | ||
|---|---|---|
| 11.2 ms ... rise ↗ and fall ↘ combined | ↗ 6 ms rise | 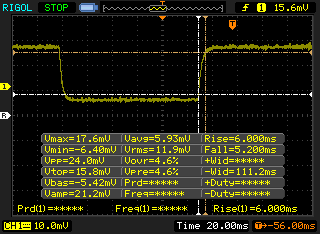 |
| ↘ 5.2 ms fall | ||
| The screen shows good response rates in our tests, but may be too slow for competitive gamers. In comparison, all tested devices range from 0.1 (minimum) to 240 (maximum) ms. » 30 % of all devices are better. This means that the measured response time is better than the average of all tested devices (19.8 ms). | ||
| ↔ Response Time 50% Grey to 80% Grey | ||
| 6.4 ms ... rise ↗ and fall ↘ combined | ↗ 3.4 ms rise | 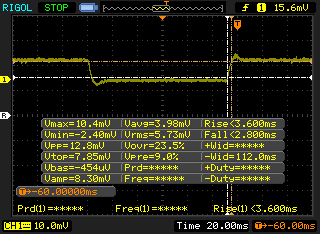 |
| ↘ 3 ms fall | ||
| The screen shows very fast response rates in our tests and should be very well suited for fast-paced gaming. In comparison, all tested devices range from 0.165 (minimum) to 636 (maximum) ms. » 19 % of all devices are better. This means that the measured response time is better than the average of all tested devices (31 ms). | ||
Screen Flickering / PWM (Pulse-Width Modulation)
| Screen flickering / PWM not detected | 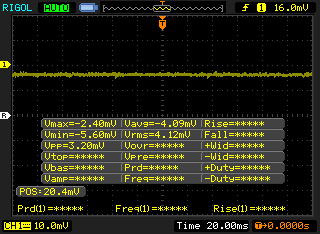 | ||
In comparison: 52 % of all tested devices do not use PWM to dim the display. If PWM was detected, an average of 7750 (minimum: 5 - maximum: 343500) Hz was measured. | |||
Outdoor visibility is similar to the Lenovo Legion Y740, Asus ROG GL704, or Razer Blade Pro 17 since all these laptops have matte 1080p IPS panels of similar brightness and contrast ratios. Direct sunlight will immediately wash out onscreen content and so we recommend working under shade whenever possible. Viewing angles are wide with minor shifting in colors and contrast if viewing from extreme angles.
Performance
As a mid-range to upper mid-range product, the Strix G GL731 can perform as slow as a $1000 gaming laptop with GTX 1650 graphics or as fast as a $2000 one with RTX 2070 graphics depending on the configuration. It's therefore quite likely that temperature and/or fan noise would be even higher for the pricier SKUs than what we've recorded for this particular review unit.
Nvidia Optimus comes standard across all SKUs which automatically disqualifies G-Sync for the time being. There are no Max-Q options for this particular series.
Processor
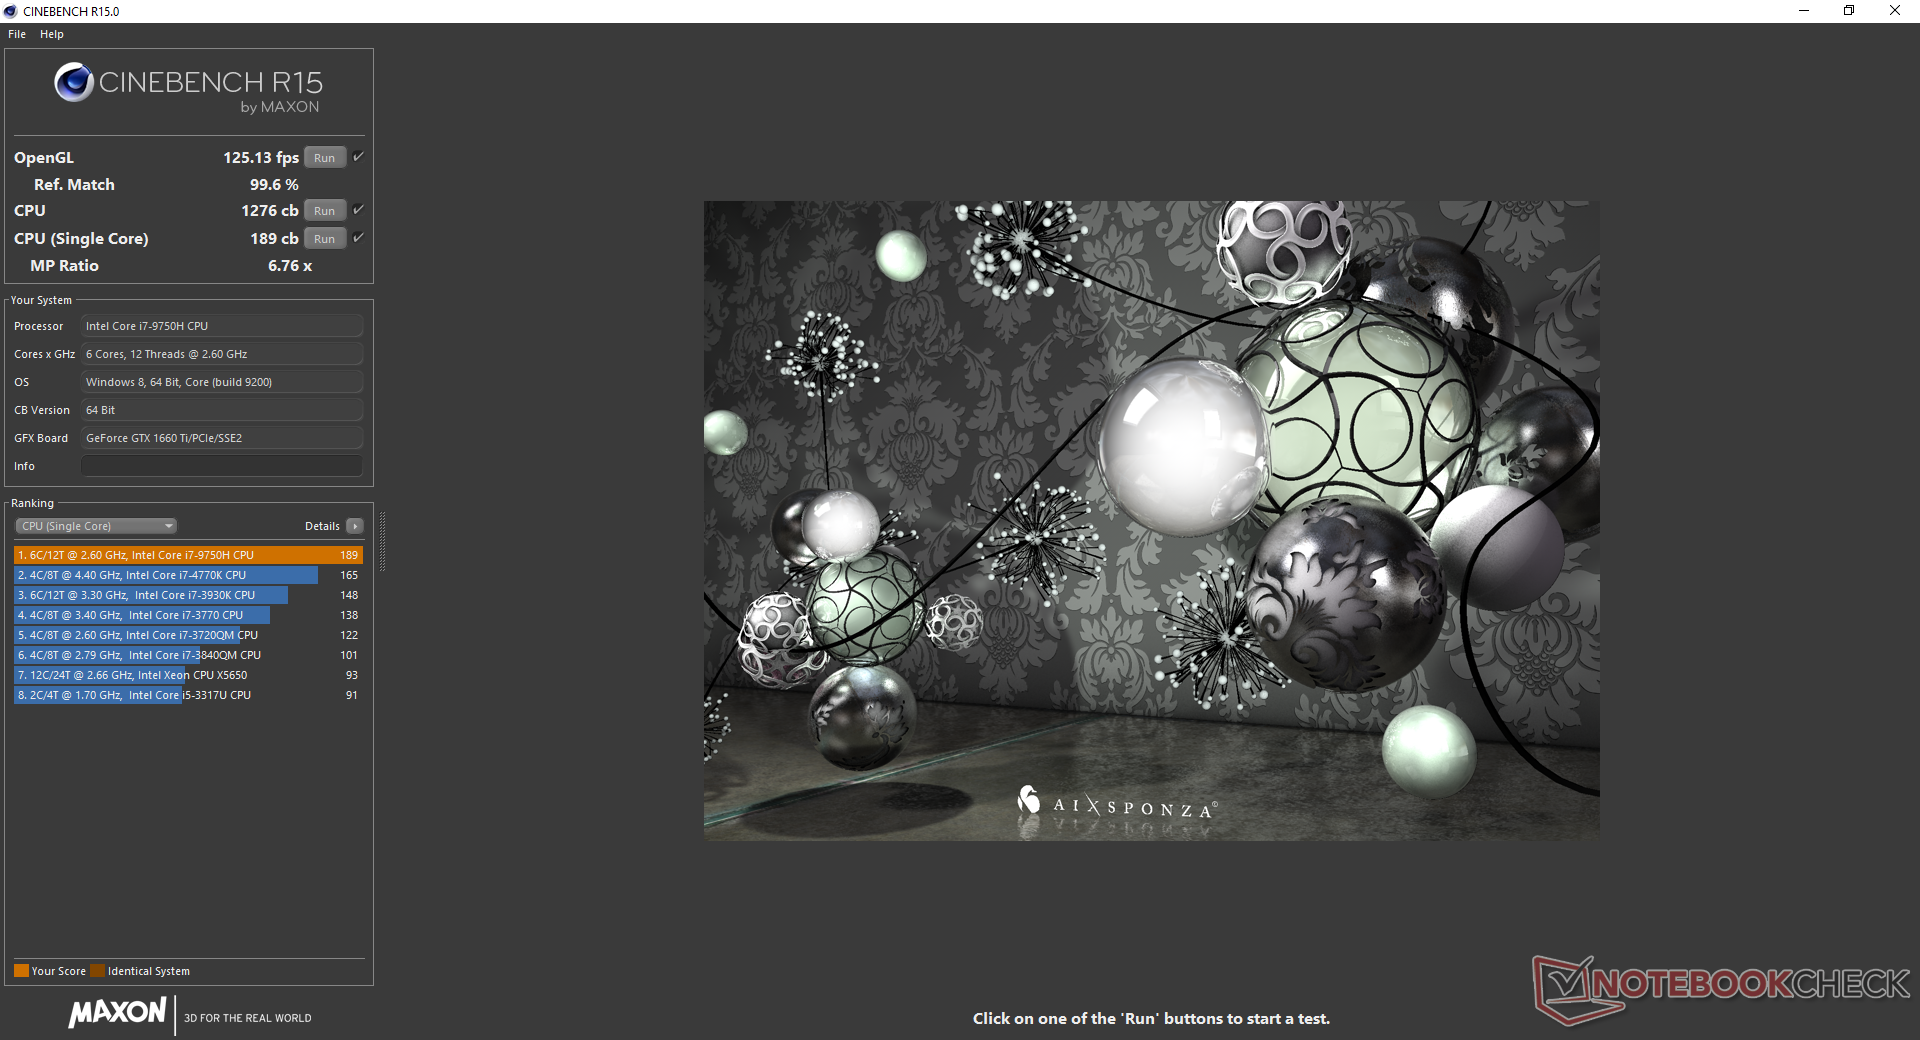
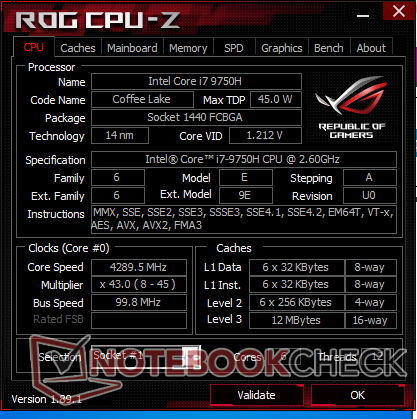
As stated many times before, the Core i7-9750H offers only marginally better performance than the Core i7-8750H at best. CineBench R15 shows a performance advantage of just 6 to 9 percent over the Asus GL704GW with the i7-8750H. Users upgrading from a Core i5-8300H or 9300H will see a boost of about 60 to 70 percent, but there is absolutely no reason to upgrade if you already own a Core i7-8750H laptop.
Running CineBench R15 Multi-Thread in a loop shows a performance dip of about 10 percent over time since maximum Turbo Boost clock rates are not sustainable. A drop of 5 to 10 percent is not uncommon on gaming laptops as illustrated by the comparison graph below.
See our dedicated page on the Core i7-9750H for more technical information and benchmark comparisons.
System Performance
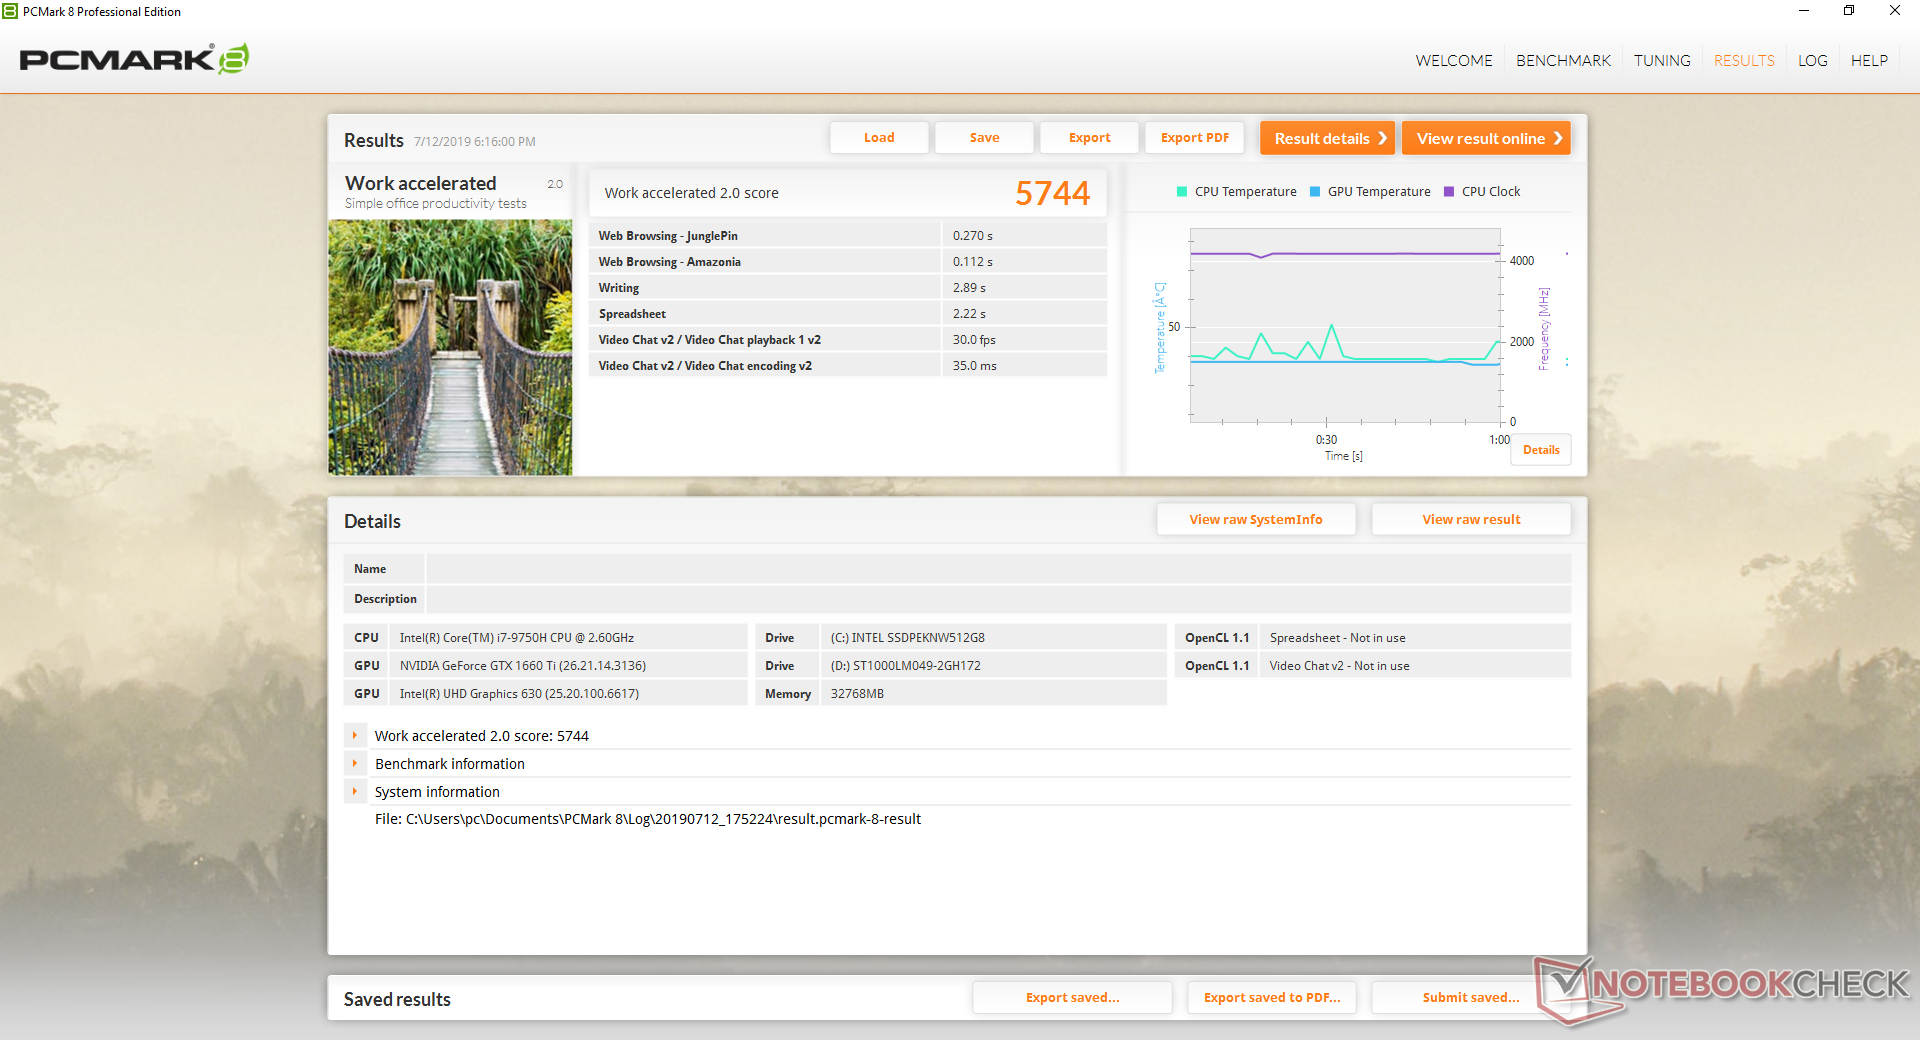
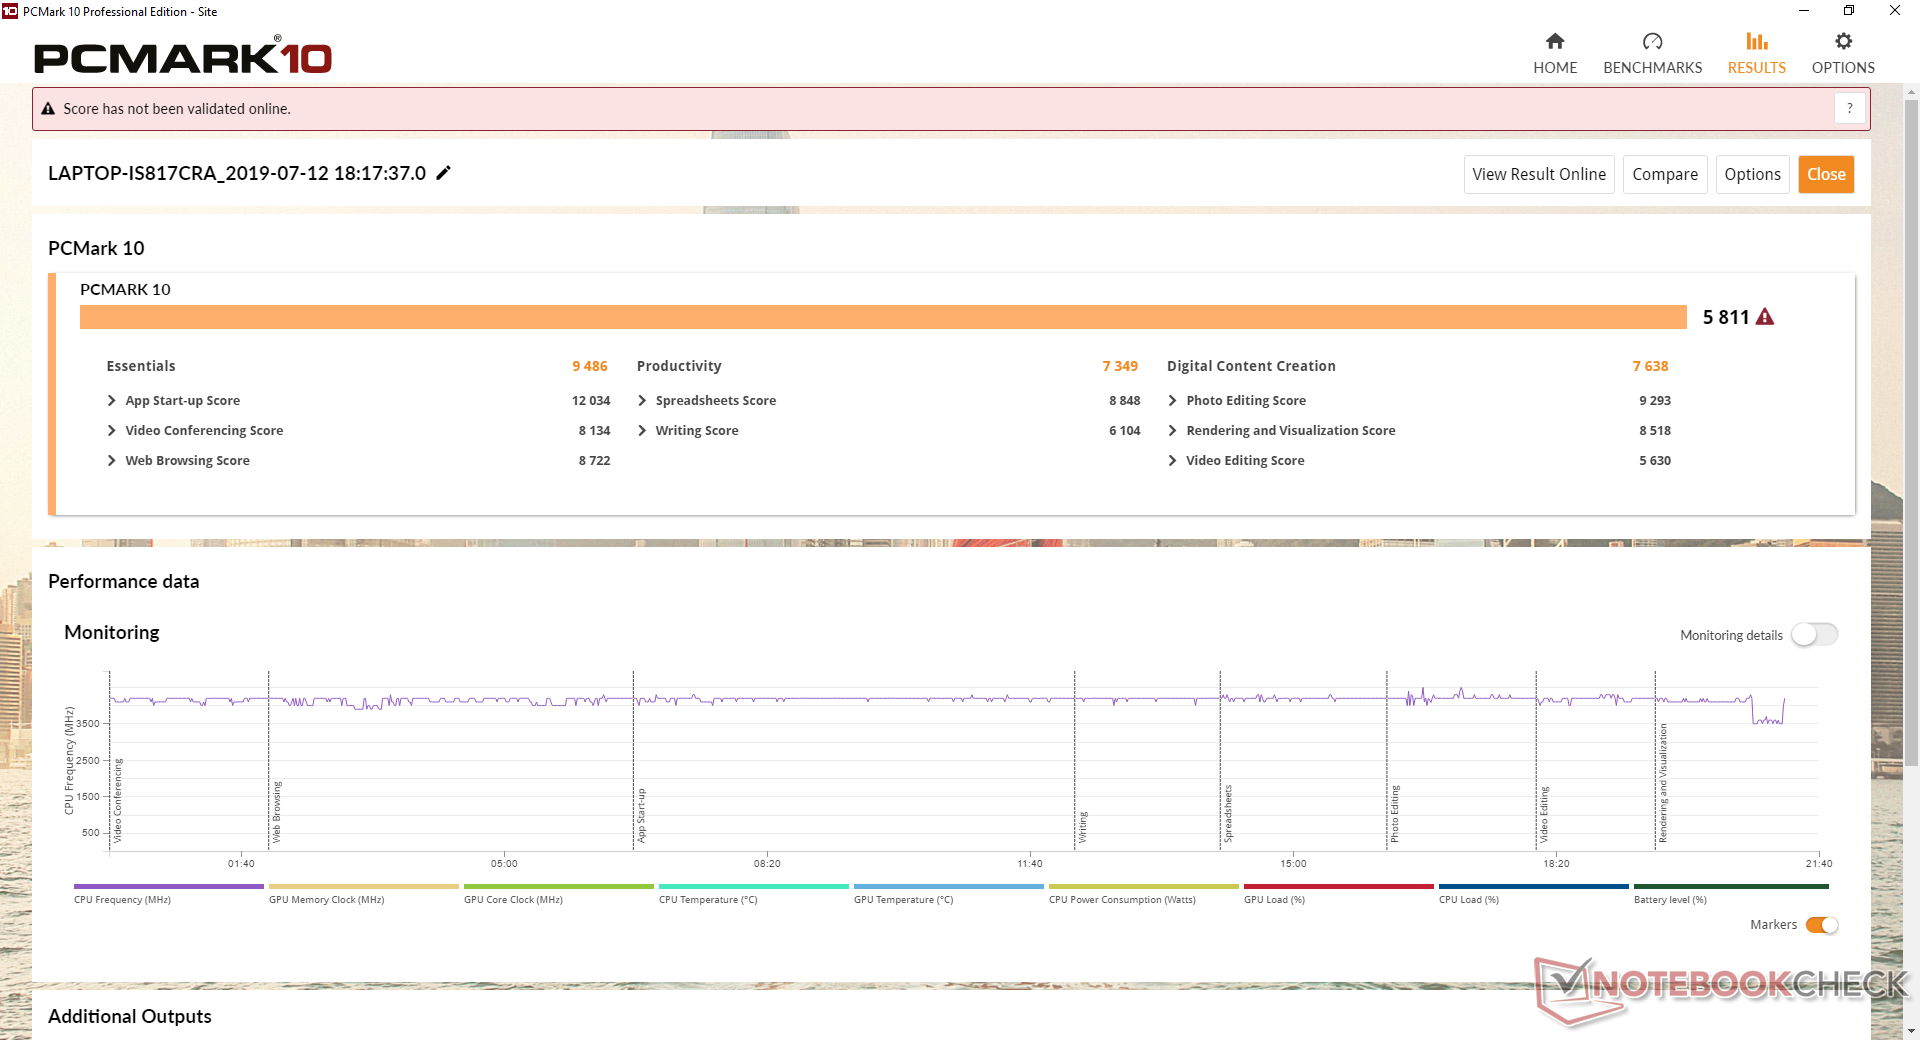
PCMark benchmarks rank our GL731 more similarly to systems like the pricier Razer Blade Pro 17 or Asus ROG GL704GW rather than the cheaper MSI GF75 or Asus TUF FX705DT. Subjectively, Windows operations run smoothly without a hitch as one would expect from an SSD-based gaming laptop. Be prepared for the usual barrage of registration pop-ups and Asus account creation screens during the initial boot up.
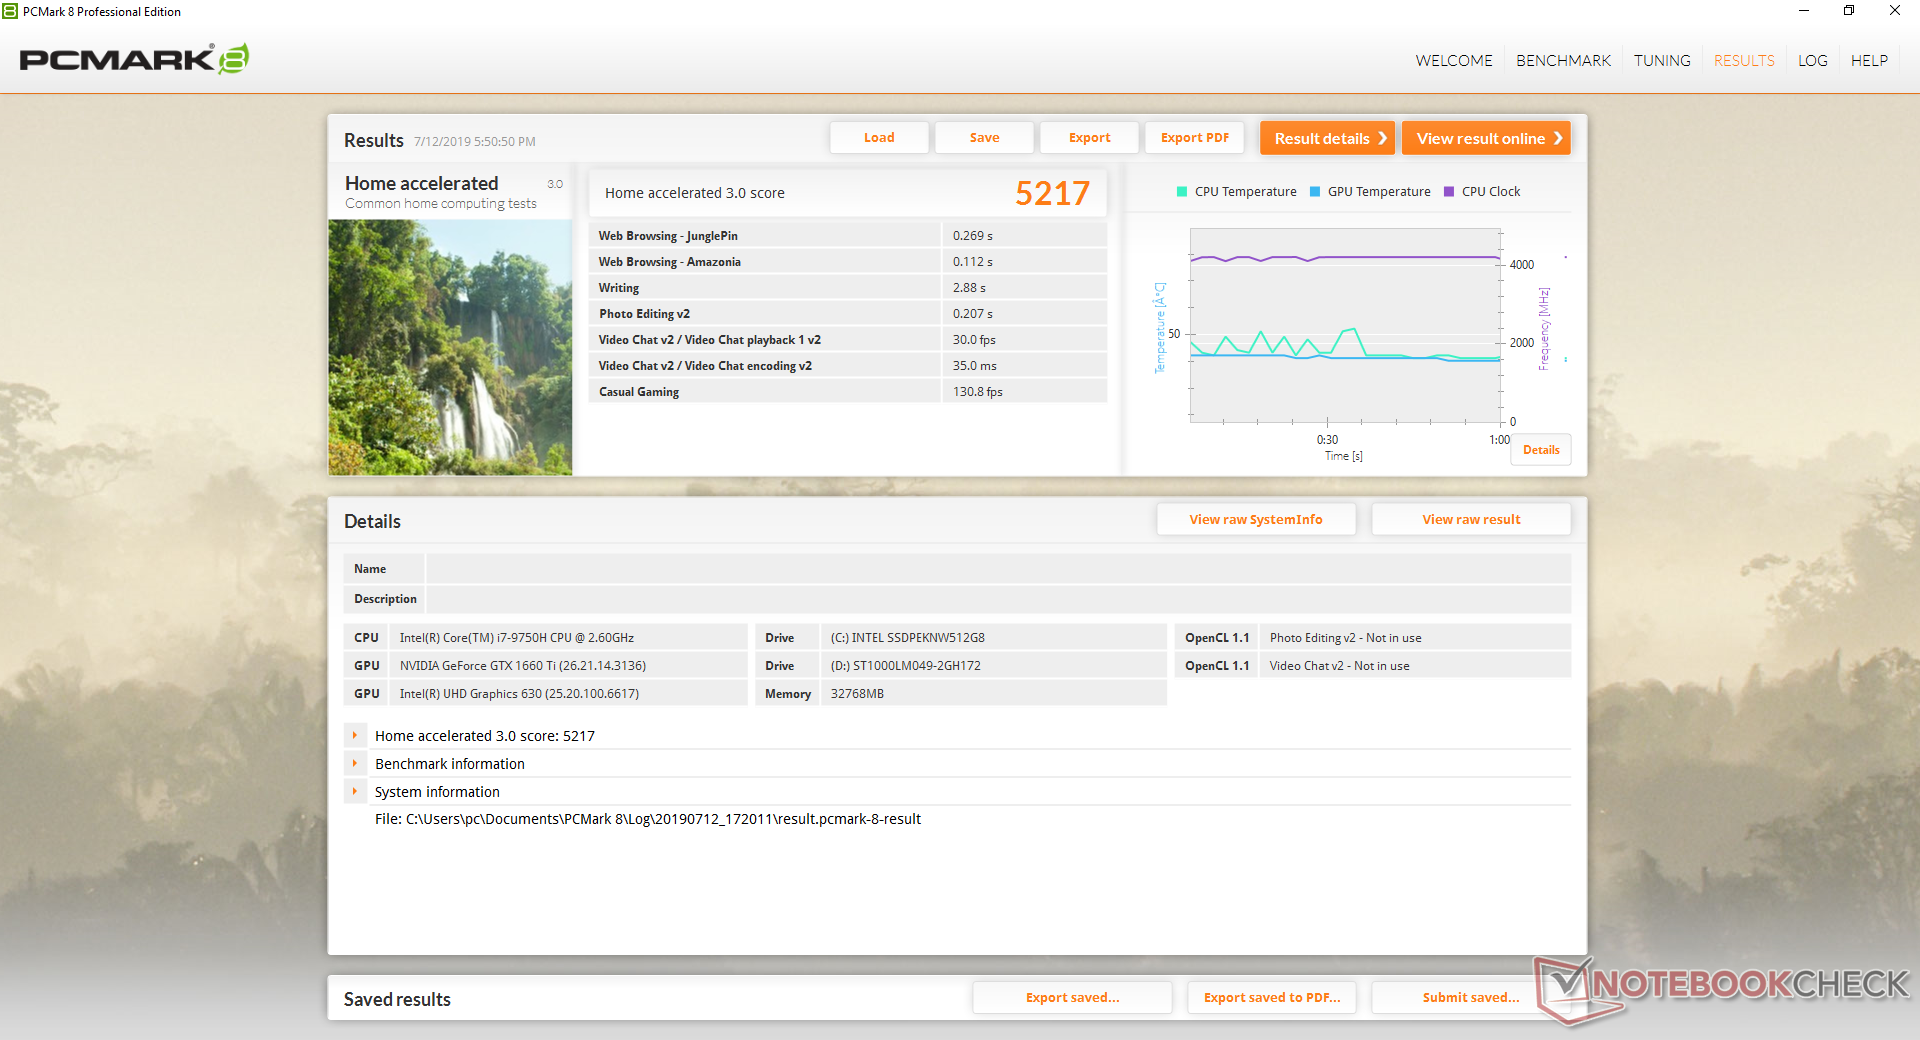
| PCMark 8 Home Score Accelerated v2 | 5217 points | |
| PCMark 8 Work Score Accelerated v2 | 5744 points | |
| PCMark 10 Score | 5811 points | |
Help | ||
Storage Devices
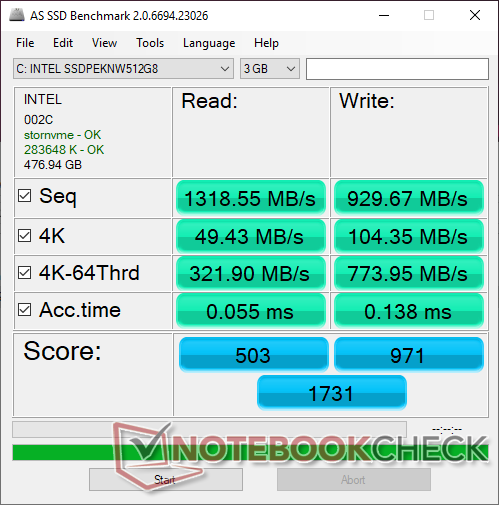
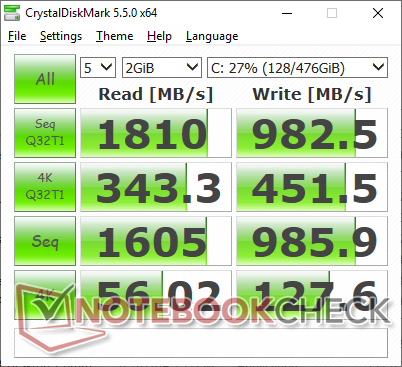
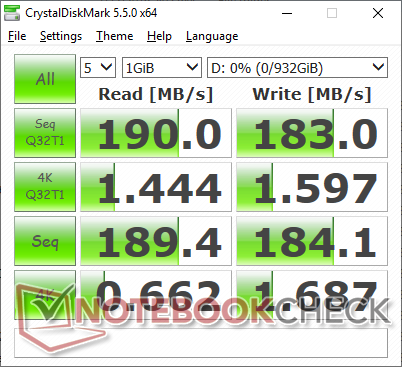
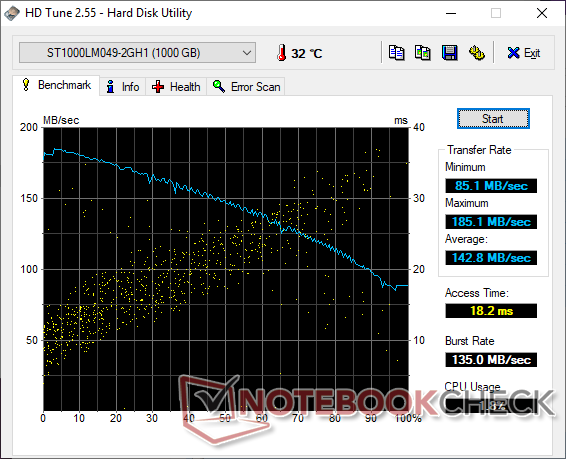
Users can configure with a lone M.2 2280 NVMe PCIe SSD or pair it with a secondary 2.5-inch SATA HDD for additional storage capacity. Our specific test unit comes configured with a 512 GB Intel 660p SSD and a 1 TB Seagate ST1000LM049 HDD, but other resellers are likely to offer different drives than what we have here.
Perhaps not by coincidence, our pricier Asus ROG Strix Scar II GL704GW also sports the exact same 512 GB Intel 660p SSD as our GL731. Sequential read and write rates are thus similar between them at about 1300 MB/s and 900 MB/s, respectively, which are common results for an entry-level NVMe SSD. Costlier NVMe drives like the Samsung PM981 can run at about 1800 MB/s in the same benchmark.
See our table of HDDs and SSDs for more benchmark comparisons.
| Asus ROG Strix G GL731GU-RB74 Intel SSD 660p SSDPEKNW512G8 | Asus TUF FX705DT-AU068T WDC PC SN520 SDAPNUW-256G | Lenovo Legion Y740-17ICH Samsung SSD PM981 MZVLB256HAHQ | Asus ROG Strix Scar II GL704GW Intel SSD 660p SSDPEKNW512G8 | Razer Blade Pro 17 RTX 2080 Max-Q Samsung SSD PM981 MZVLB512HAJQ | |
|---|---|---|---|---|---|
| AS SSD | -9% | 29% | -2% | 68% | |
| Seq Read (MB/s) | 1319 | 1546 17% | 1153 -13% | 1315 0% | 1831 39% |
| Seq Write (MB/s) | 930 | 1182 27% | 1328 43% | 927 0% | 1744 88% |
| 4K Read (MB/s) | 49.43 | 36.54 -26% | 35.05 -29% | 52.4 6% | 45.16 -9% |
| 4K Write (MB/s) | 104.3 | 109.2 5% | 96 -8% | 122.8 18% | 107.1 3% |
| 4K-64 Read (MB/s) | 321.9 | 612 90% | 727 126% | 326.5 1% | 1240 285% |
| 4K-64 Write (MB/s) | 774 | 436.6 -44% | 1212 57% | 727 -6% | 1695 119% |
| Access Time Read * (ms) | 0.055 | 0.113 -105% | 0.063 -15% | 0.11 -100% | 0.064 -16% |
| Access Time Write * (ms) | 0.138 | 0.034 75% | 0.04 71% | 0.045 67% | 0.037 73% |
| Score Read (Points) | 503 | 803 60% | 878 75% | 510 1% | 1468 192% |
| Score Write (Points) | 971 | 664 -32% | 1441 48% | 942 -3% | 1977 104% |
| Score Total (Points) | 1731 | 1869 8% | 2784 61% | 1715 -1% | 4197 142% |
| Copy ISO MB/s (MB/s) | 1707 | 698 -59% | 1487 -13% | 2086 22% | |
| Copy Program MB/s (MB/s) | 852 | 114.1 -87% | 608 -29% | 425.5 -50% | |
| Copy Game MB/s (MB/s) | 930 | 379.6 -59% | 1162 25% | 555 -40% |
* ... smaller is better

GPU Performance
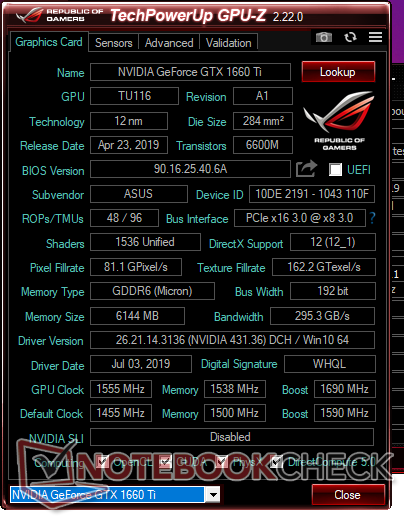
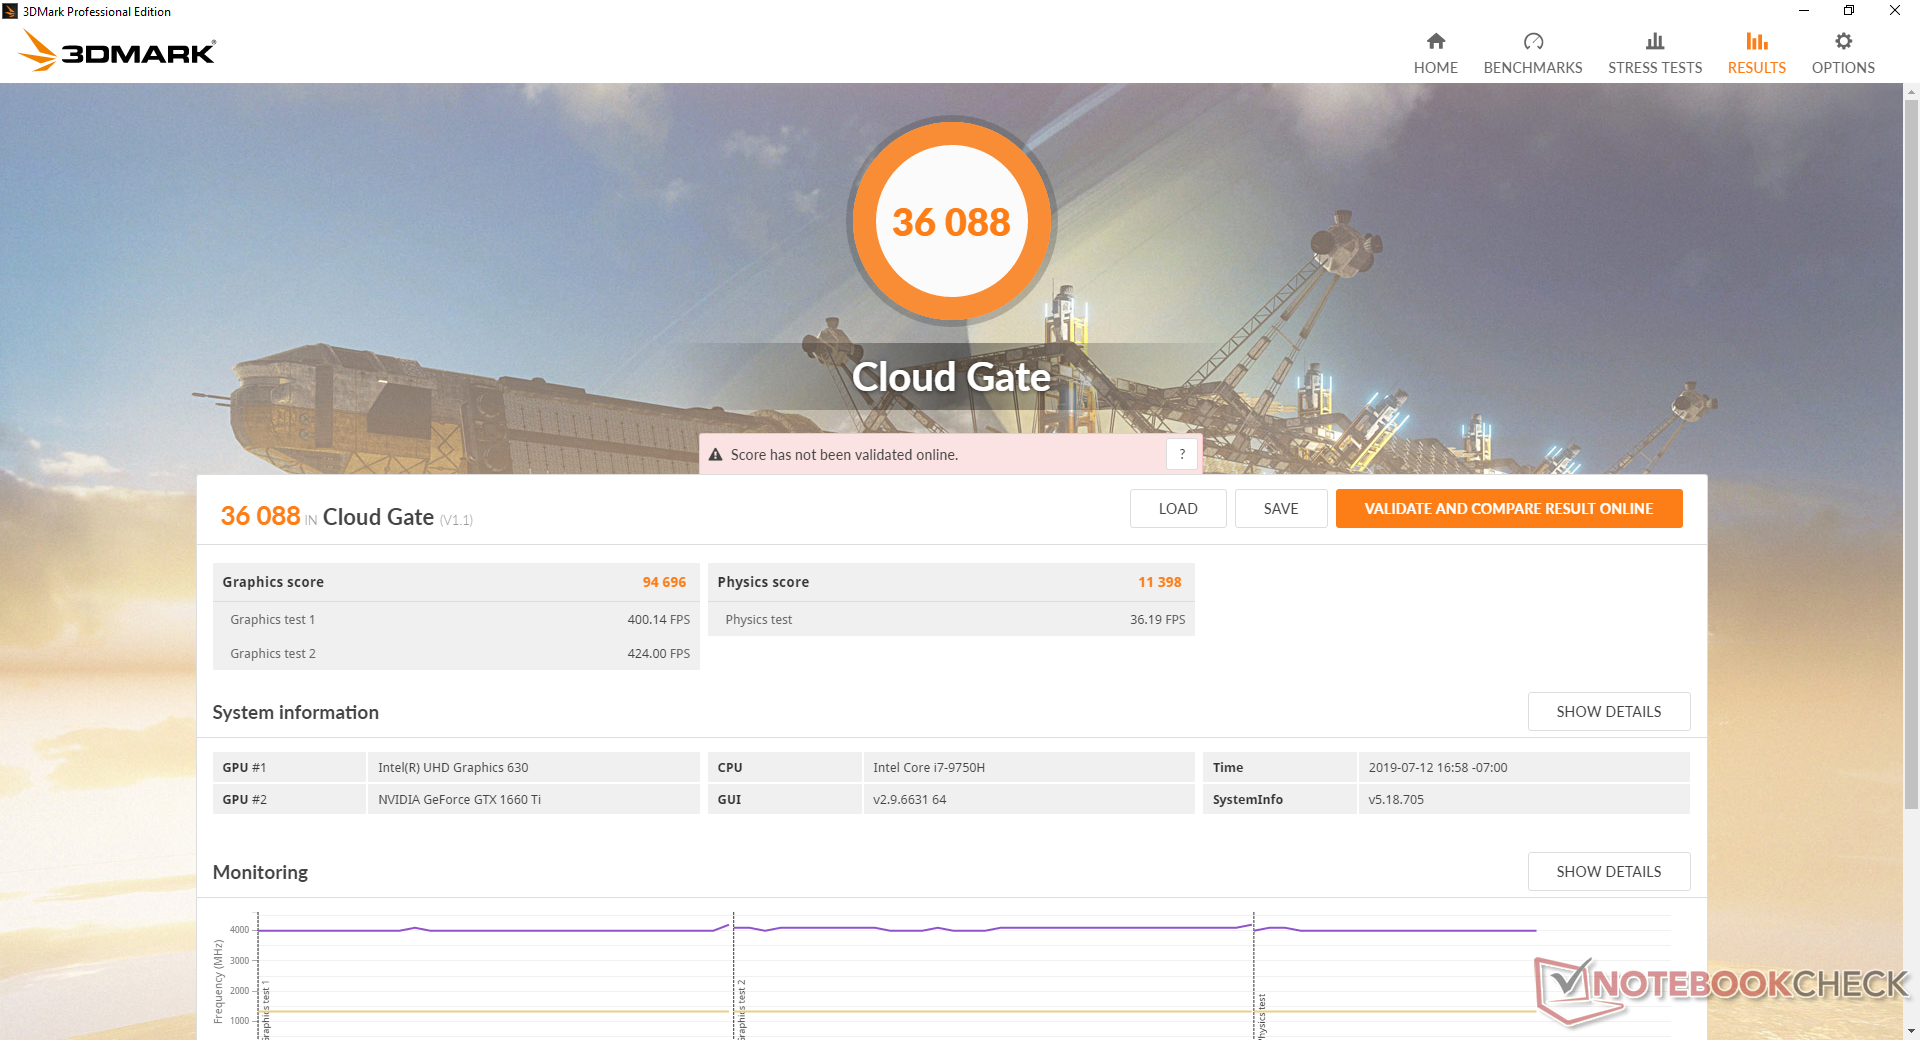
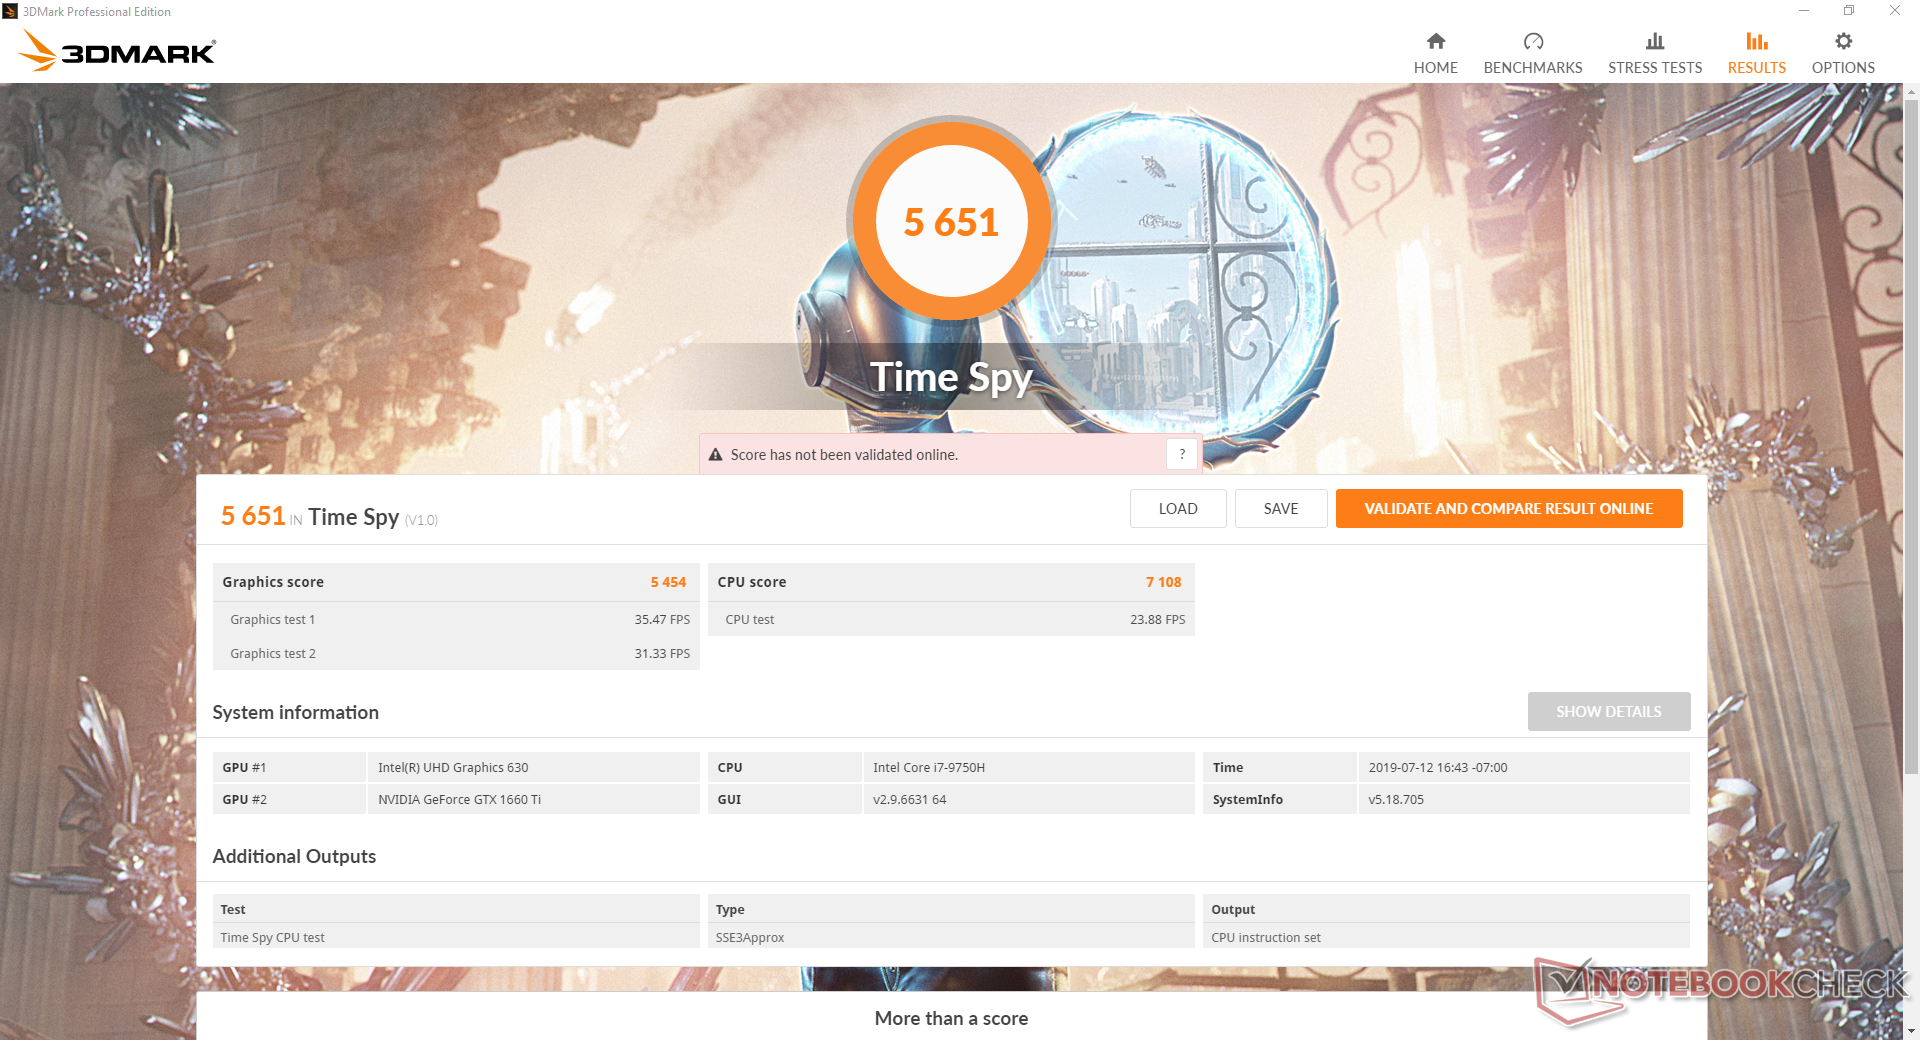
The GTX 1660 Ti is performing where we expect it to be when compared to other laptops sporting the same GPU in our database. Raw performance is about 27 to 50 percent faster than the popular GTX 1060 or about two times faster than the GTX 1050 Ti. Users should enable DX12 to better exploit the performance advantages of Nvidia Turing over Pascal as exemplified by the Time Spy results below. Jumping to the RTX 2060 or RTX 2070 SKU will bring a performance boost of about 6 percent and 36 percent, respectively.
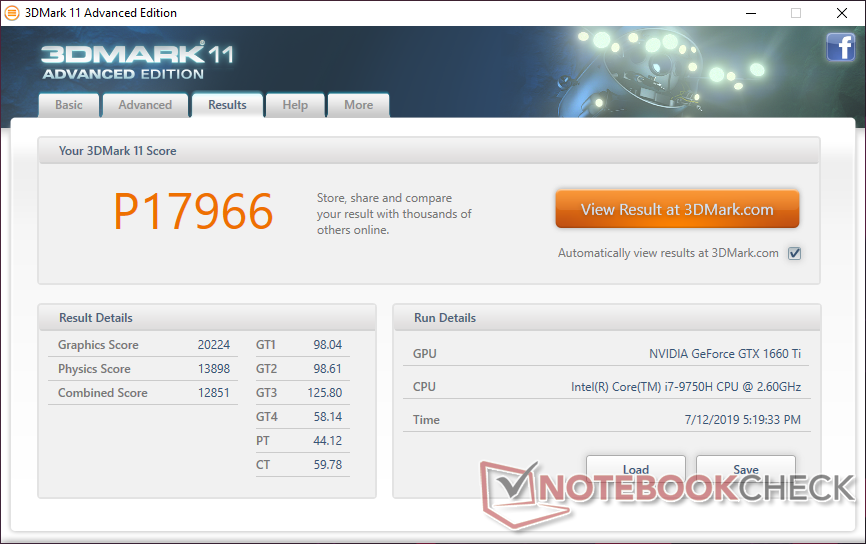
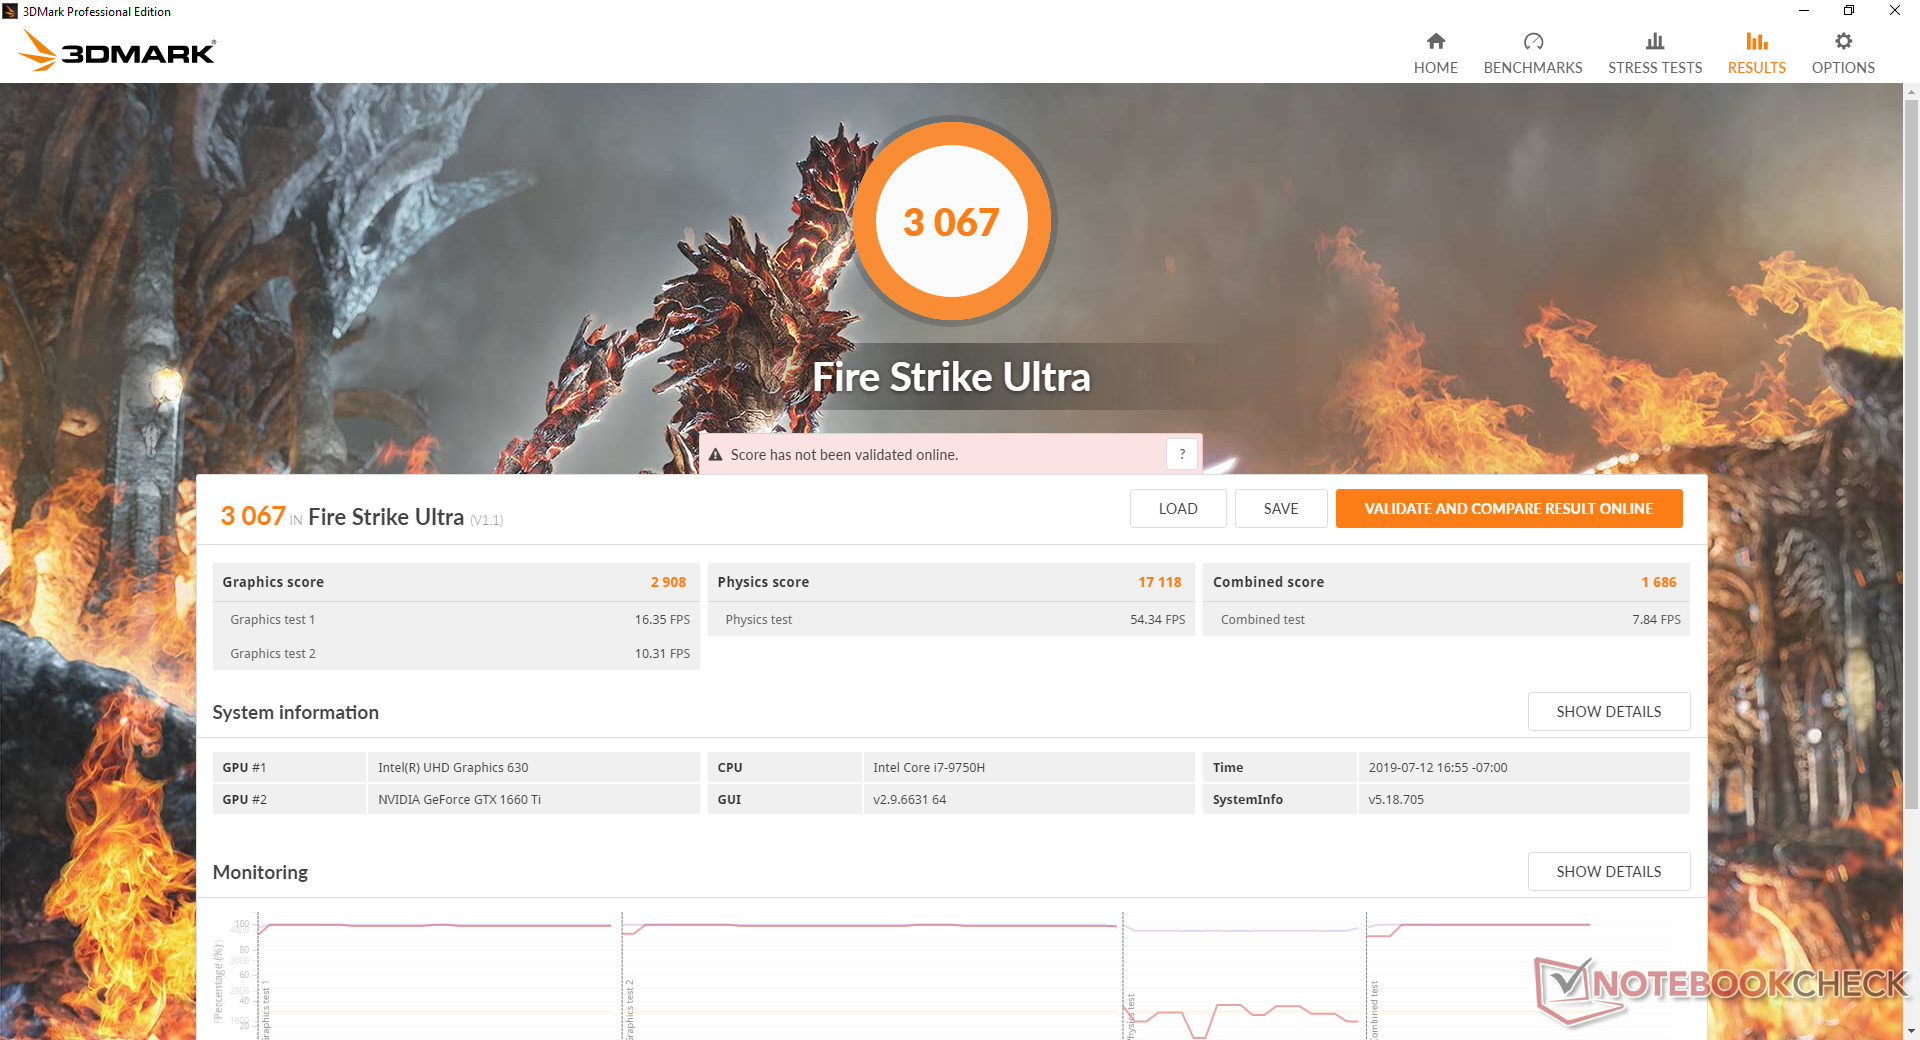
| 3DMark 11 Performance | 17966 points | |
| 3DMark Cloud Gate Standard Score | 36088 points | |
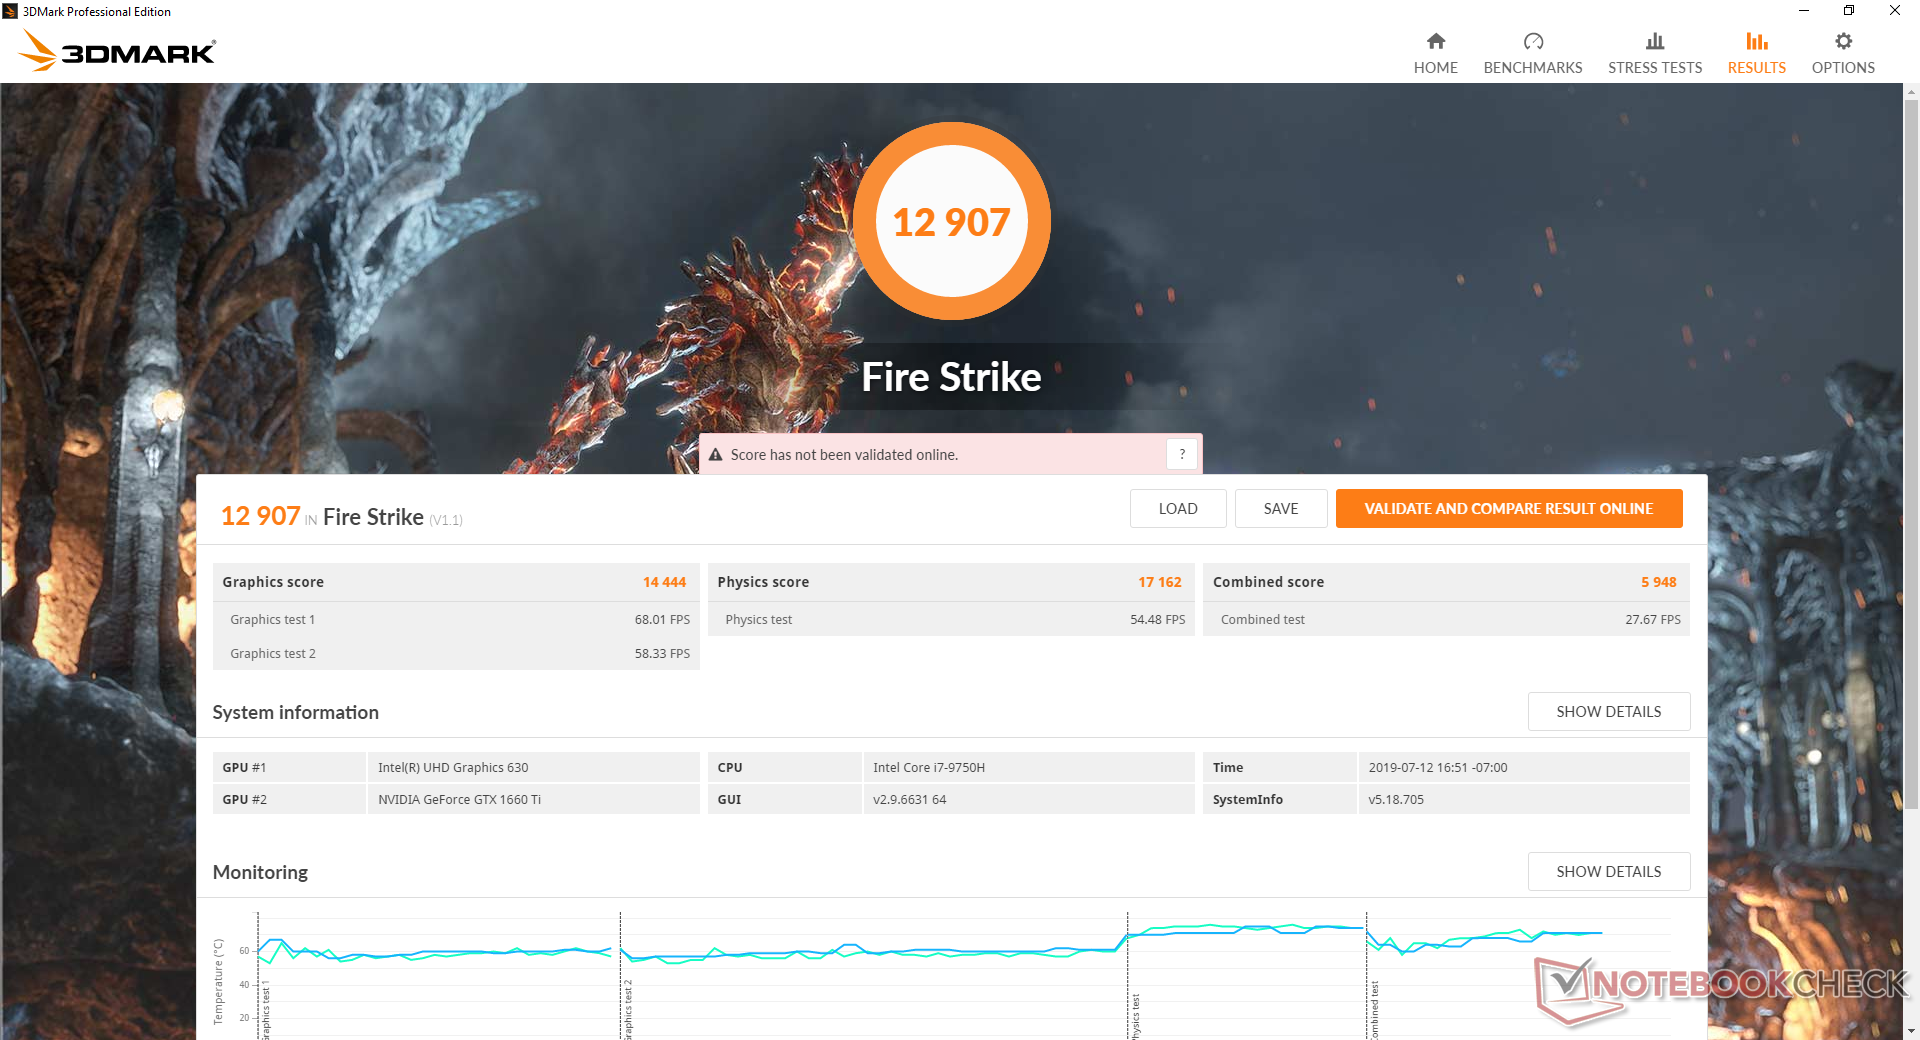
| 3DMark Fire Strike Score | 12907 points | |
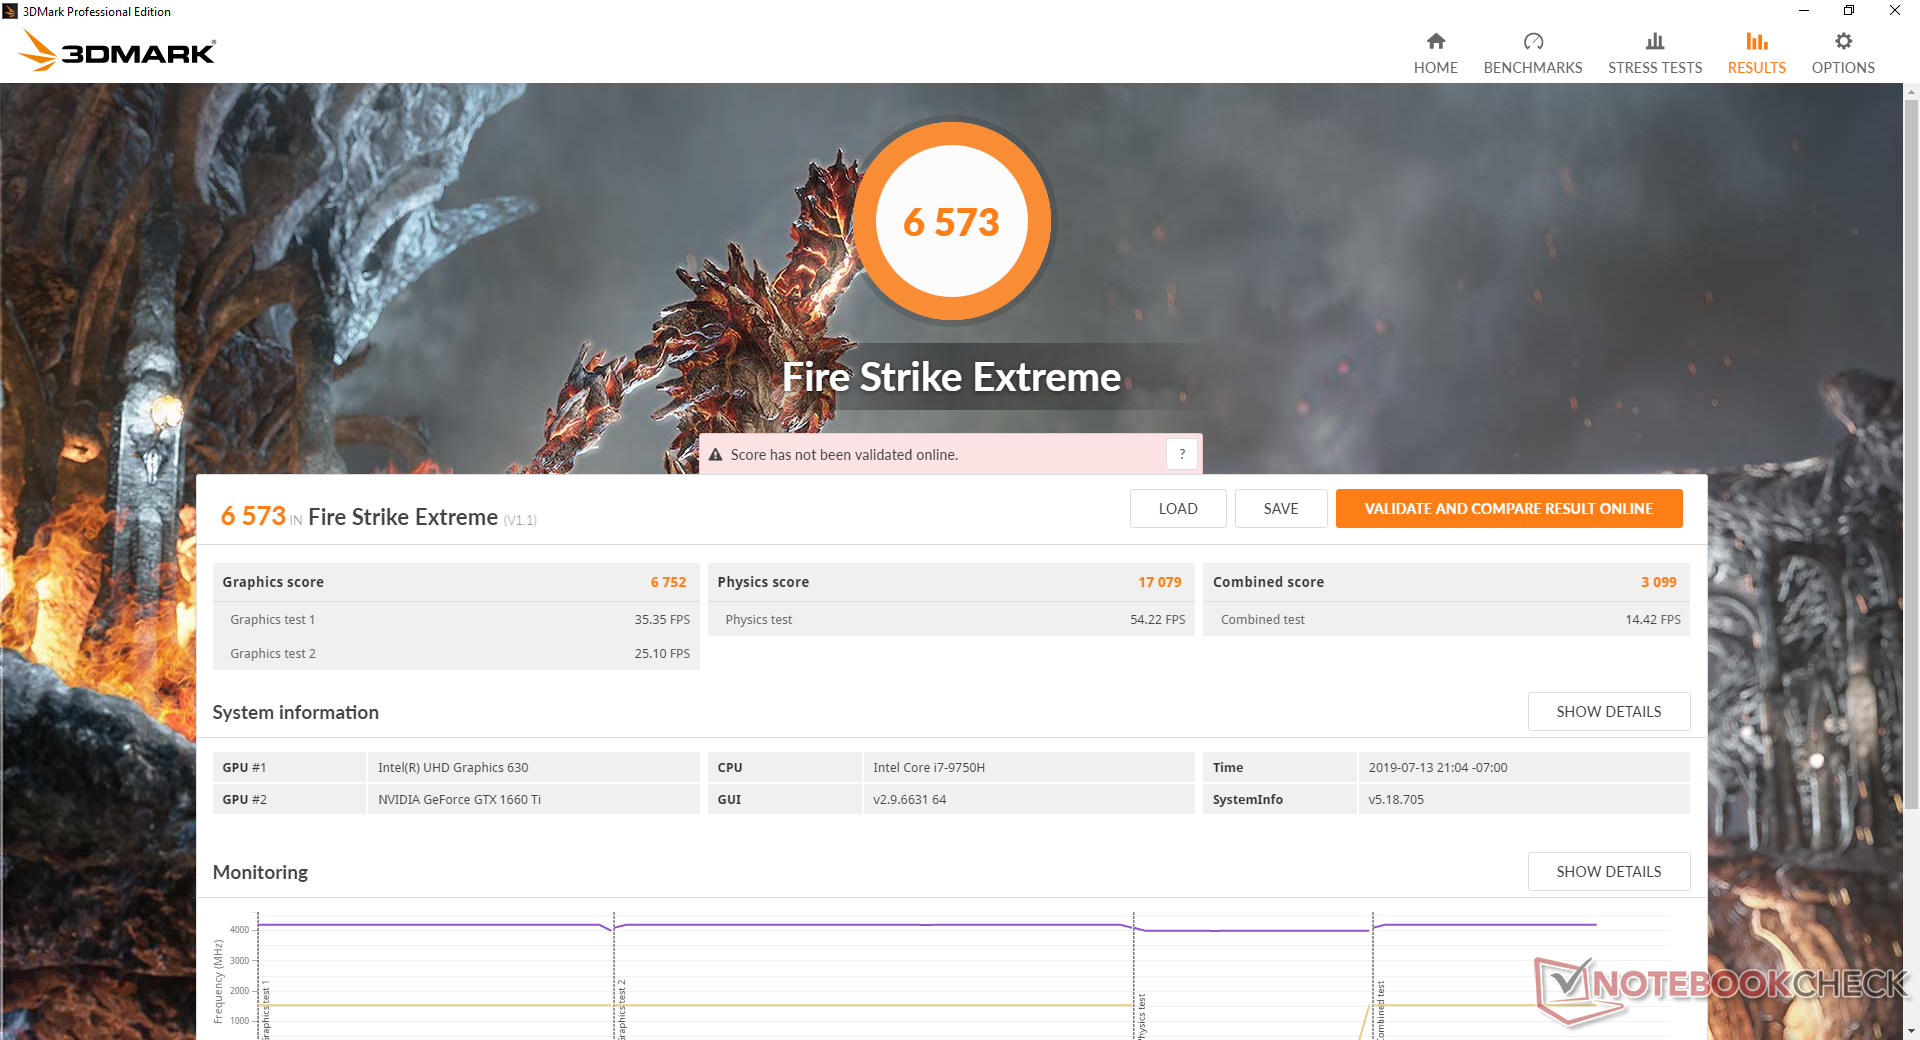
| 3DMark Fire Strike Extreme Score | 6573 points | |
| 3DMark Time Spy Score | 5651 points | |
Help | ||
Gaming Performance
For a mid-range graphics card, the GTX 1660 Ti performs closer to the high-end RTX series than it does to the lower-end GTX 1650. In fact, Shadow of the Tomb Raider results are 50 percent better than the Asus TUF FX705GM with GTX 1060 graphics and even slightly better than the MSI GL73 equipped with RTX 2060 graphics and single-channel RAM. The latest titles will be playable at maximum settings while less demanding ones like Overwatch can reach a stable 144 FPS on lower settings to take full advantage of the 144 Hz panel.
See our dedicated page on the GeForce GTX 1660 Ti for more technical information and gaming benchmark comparisons. The mobile GTX 1660 Ti is roughly 10 percent slower than our reference desktop GTX 1660 Ti.
| Shadow of the Tomb Raider - 1920x1080 Highest Preset AA:T | |
| MSI GE75 9SG | |
| Asus ROG Strix Scar II GL704GW | |
| Alienware m15 P79F | |
| Asus G752VS | |
| Asus ROG Strix G GL731GU-RB74 | |
| Average NVIDIA GeForce GTX 1660 Ti Mobile (62 - 73, n=8) | |
| MSI GL73 8SE-010US | |
| Asus ROG Zephyrus G15 GA502DU | |
| Asus TUF FX705GM | |
| MSI GF75 Thin 9SC | |
| Asus TUF FX705GE-EW096T | |
| Asus GL753VD | |
| low | med. | high | ultra | |
|---|---|---|---|---|
| BioShock Infinite (2013) | 320.1 | 256.8 | 263.3 | 140.8 |
| The Witcher 3 (2015) | 261.5 | 180.7 | 99.5 | 53.7 |
| Shadow of the Tomb Raider (2018) | 135 | 90 | 79 | 70 |
Emissions
System Noise
The cooling solution consists of twin fans with 83 blades each and five heat pipes shared between the CPU and GPU. The fans almost never idle when on AC power and so the system is never truly silent even when set to "Silent" mode. Fan noise remains relatively constant at about 31.8 dB(A) when browsing or streaming in Silent mode. This is quiet enough to be easy to ignore in most home or office scenarios.
Fan noise picks up considerably when set to Balanced or Turbo modes. We're able to record a fan noise of 40.6 dB(A) just by idling on Turbo mode while fan pulsing becomes more frequent in Balanced mode. Thus, we recommend Silent mode when the extra horsepower is not needed.
When gaming in either Balanced or Turbo mode, fan noise jumps and stabilizes at 48 dB(A) to be quieter than the more powerful Asus ROG Strix Scar II GL704GW or Razer Blade Pro 17. As mentioned earlier, however, we wouldn't be surprised if the faster RTX GL731 SKUs run more loudly than our GTX SKU. We still recommend a pair of headphones whenever possible for a better gaming experience.
We're unable to notice any electronic noise or coil whine from our particular test unit.
| Asus ROG Strix G GL731GU-RB74 GeForce GTX 1660 Ti Mobile, i7-9750H, Intel SSD 660p SSDPEKNW512G8 | Asus TUF FX705DT-AU068T GeForce GTX 1650 Mobile, R5 3550H, WDC PC SN520 SDAPNUW-256G | Asus ROG Strix Scar II GL704GW GeForce RTX 2070 Mobile, i7-8750H, Intel SSD 660p SSDPEKNW512G8 | Razer Blade Pro 17 RTX 2080 Max-Q GeForce RTX 2080 Max-Q, i7-9750H, Samsung SSD PM981 MZVLB512HAJQ | MSI GF75 Thin 9SC GeForce GTX 1650 Mobile, i7-9750H, Crucial P1 SSD CT1000P1SSD8 | Asus GL704GM-DH74 GeForce GTX 1060 Mobile, i7-8750H, WDC PC SN520 SDAPNUW-256G | |
|---|---|---|---|---|---|---|
| Noise | 9% | 1% | 7% | 8% | -3% | |
| off / environment * (dB) | 28.2 | 30.8 -9% | 29 -3% | 28.2 -0% | 28.2 -0% | 28.2 -0% |
| Idle Minimum * (dB) | 31.8 | 30.8 3% | 29 9% | 28.2 11% | 33.6 -6% | 30 6% |
| Idle Average * (dB) | 32 | 30.8 4% | 32 -0% | 28.2 12% | 33.6 -5% | 31.8 1% |
| Idle Maximum * (dB) | 40.6 | 32.2 21% | 40 1% | 30.8 24% | 33.8 17% | 34.6 15% |
| Load Average * (dB) | 48 | 38.6 20% | 46 4% | 42 12% | 37.2 22% | 56 -17% |
| Witcher 3 ultra * (dB) | 48 | 51 -6% | 51 -6% | 40.6 15% | 54.2 -13% | |
| Load Maximum * (dB) | 51.5 | 44.8 13% | 52 -1% | 53 -3% | 44.4 14% | 56.7 -10% |
* ... smaller is better
Noise level
| Idle |
| 31.8 / 32 / 40.6 dB(A) |
| Load |
| 48 / 51.5 dB(A) |
 | ||
30 dB silent 40 dB(A) audible 50 dB(A) loud |
||
min: | ||
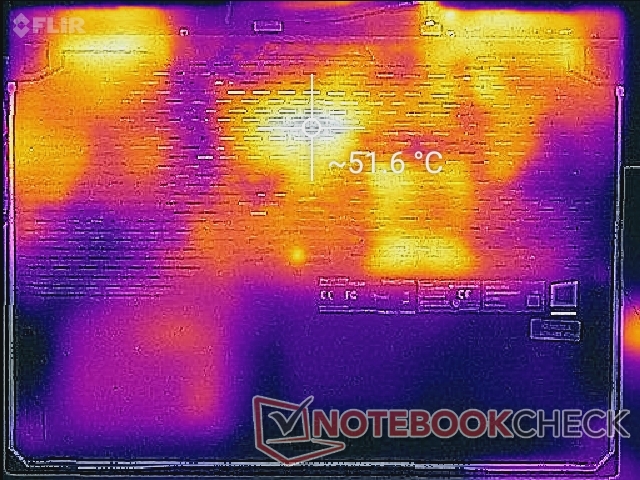
Temperature
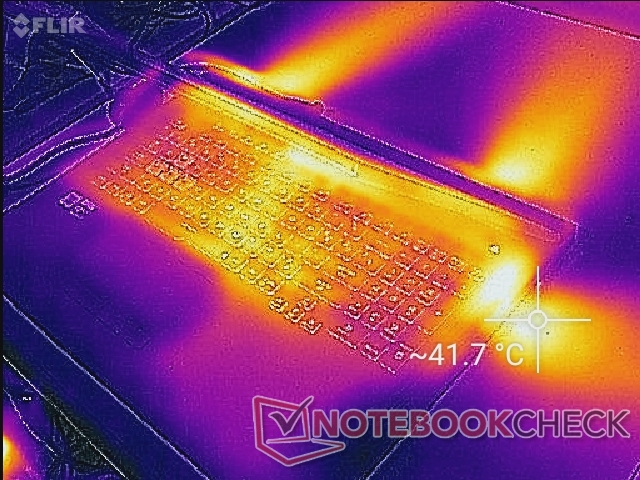
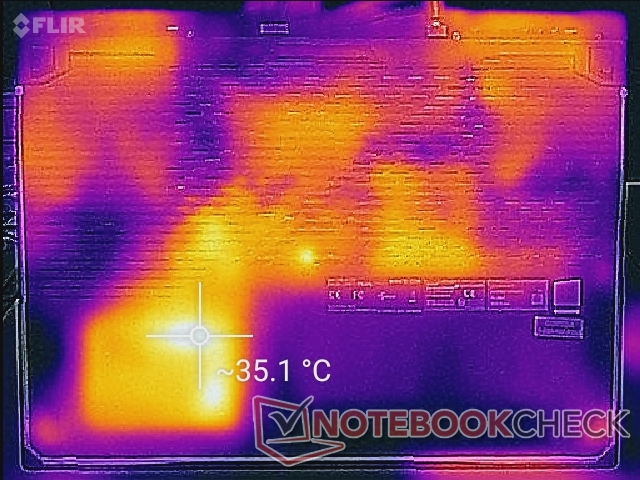
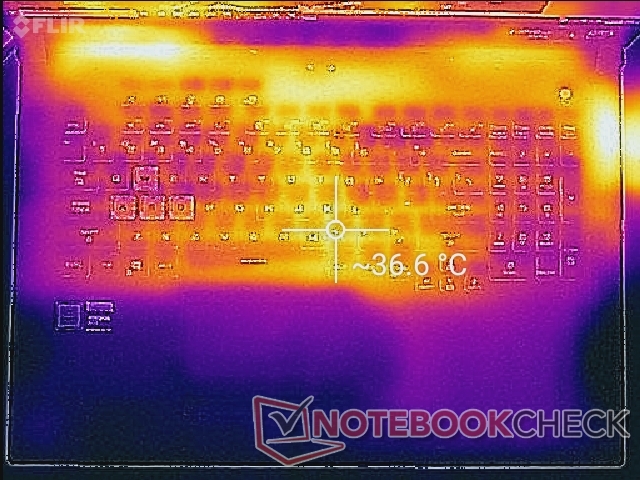
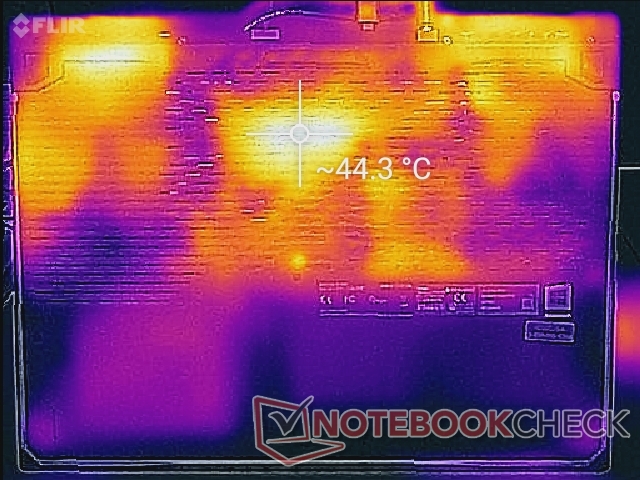
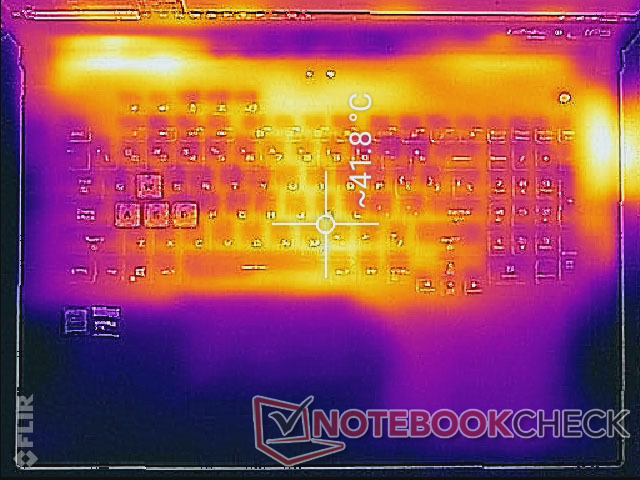
The hot spot on the GL731 is nearest the center of the keyboard as shown by our temperature maps below. This particular spot can become as warm as 36 C to 42 C when gaming or running very high loads which is actually not bad for a gaming laptop. In comparison, the faster Asus ROG GL704GW can become as warm as 60 C towards the rear quadrants of the system. The more commonly used areas for gaming like the WASD keys, NumPad, and palm rests remain much cooler for more comfortable gaming. It's very likely that the higher-end GL731 SKUs with RTX graphics will be measurably warmer than what we've recorded here.
Note that the right palm rest will always be a few degrees warmer than the left palm rest if the system is configured with a 2.5-inch storage drive.
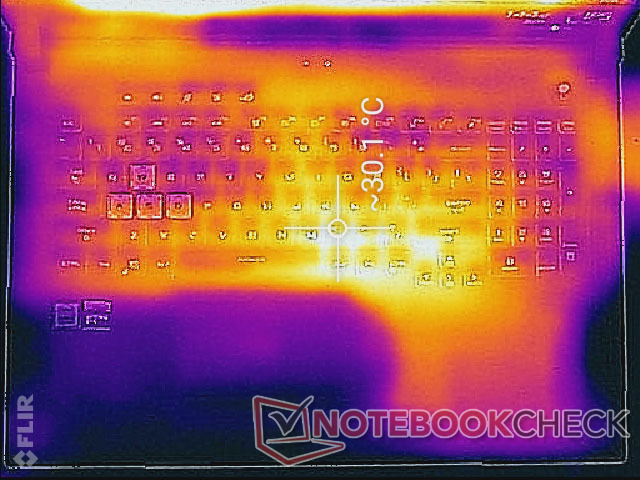
(±) The maximum temperature on the upper side is 44.6 °C / 112 F, compared to the average of 40.4 °C / 105 F, ranging from 21.2 to 68.8 °C for the class Gaming.
(-) The bottom heats up to a maximum of 51.6 °C / 125 F, compared to the average of 43.2 °C / 110 F
(+) In idle usage, the average temperature for the upper side is 27 °C / 81 F, compared to the device average of 33.9 °C / 93 F.
(+) Playing The Witcher 3, the average temperature for the upper side is 30.2 °C / 86 F, compared to the device average of 33.9 °C / 93 F.
(+) The palmrests and touchpad are cooler than skin temperature with a maximum of 27 °C / 80.6 F and are therefore cool to the touch.
(±) The average temperature of the palmrest area of similar devices was 28.8 °C / 83.8 F (+1.8 °C / 3.2 F).
Stress Test
We stress the system with synthetic loads in order to identify for any potential throttling or stability issues. When running Prime95, we can observe the CPU running at 4 GHz for the first few seconds before hitting a core temperature of 76 C. Thereafter, clock rates drop to the 3.1 - 3.2 GHz range in order to maintain a cooler core temperature of 66 C. Since the base clock rate of the Core i7-9750H is 2.6 GHz, the Asus is able to sustain a Turbo Boost of +400 to +500 MHz. Running both Prime95 and FurMark simultaneously will cause CPU and GPU temperatures to plateau at 83 C and 71 C, respectively, compared to 92 C and 78 C on the less powerful MSI GF75 9SC.
When running Witcher 3, the CPU and GPU stabilize at 68 C and 65 C, respectively, which is relatively cool for a gaming laptop. The smaller 15.6-inch Asus ROG GA502DU, for example, stabilizes in the low 70 C range when running the same game.
Running on batteries will reduce performance. A 3DMark Fire Strike run on batteries returns Physics and Graphics scores of only 9451 and 4000 points, respectively, compared to 17162 and 14444 points when on mains. The Asus Turbo Mode is automatically disabled when on battery power. The included Armoury Crate software for controlling system performance can be a bit confusing to use as detailed here.
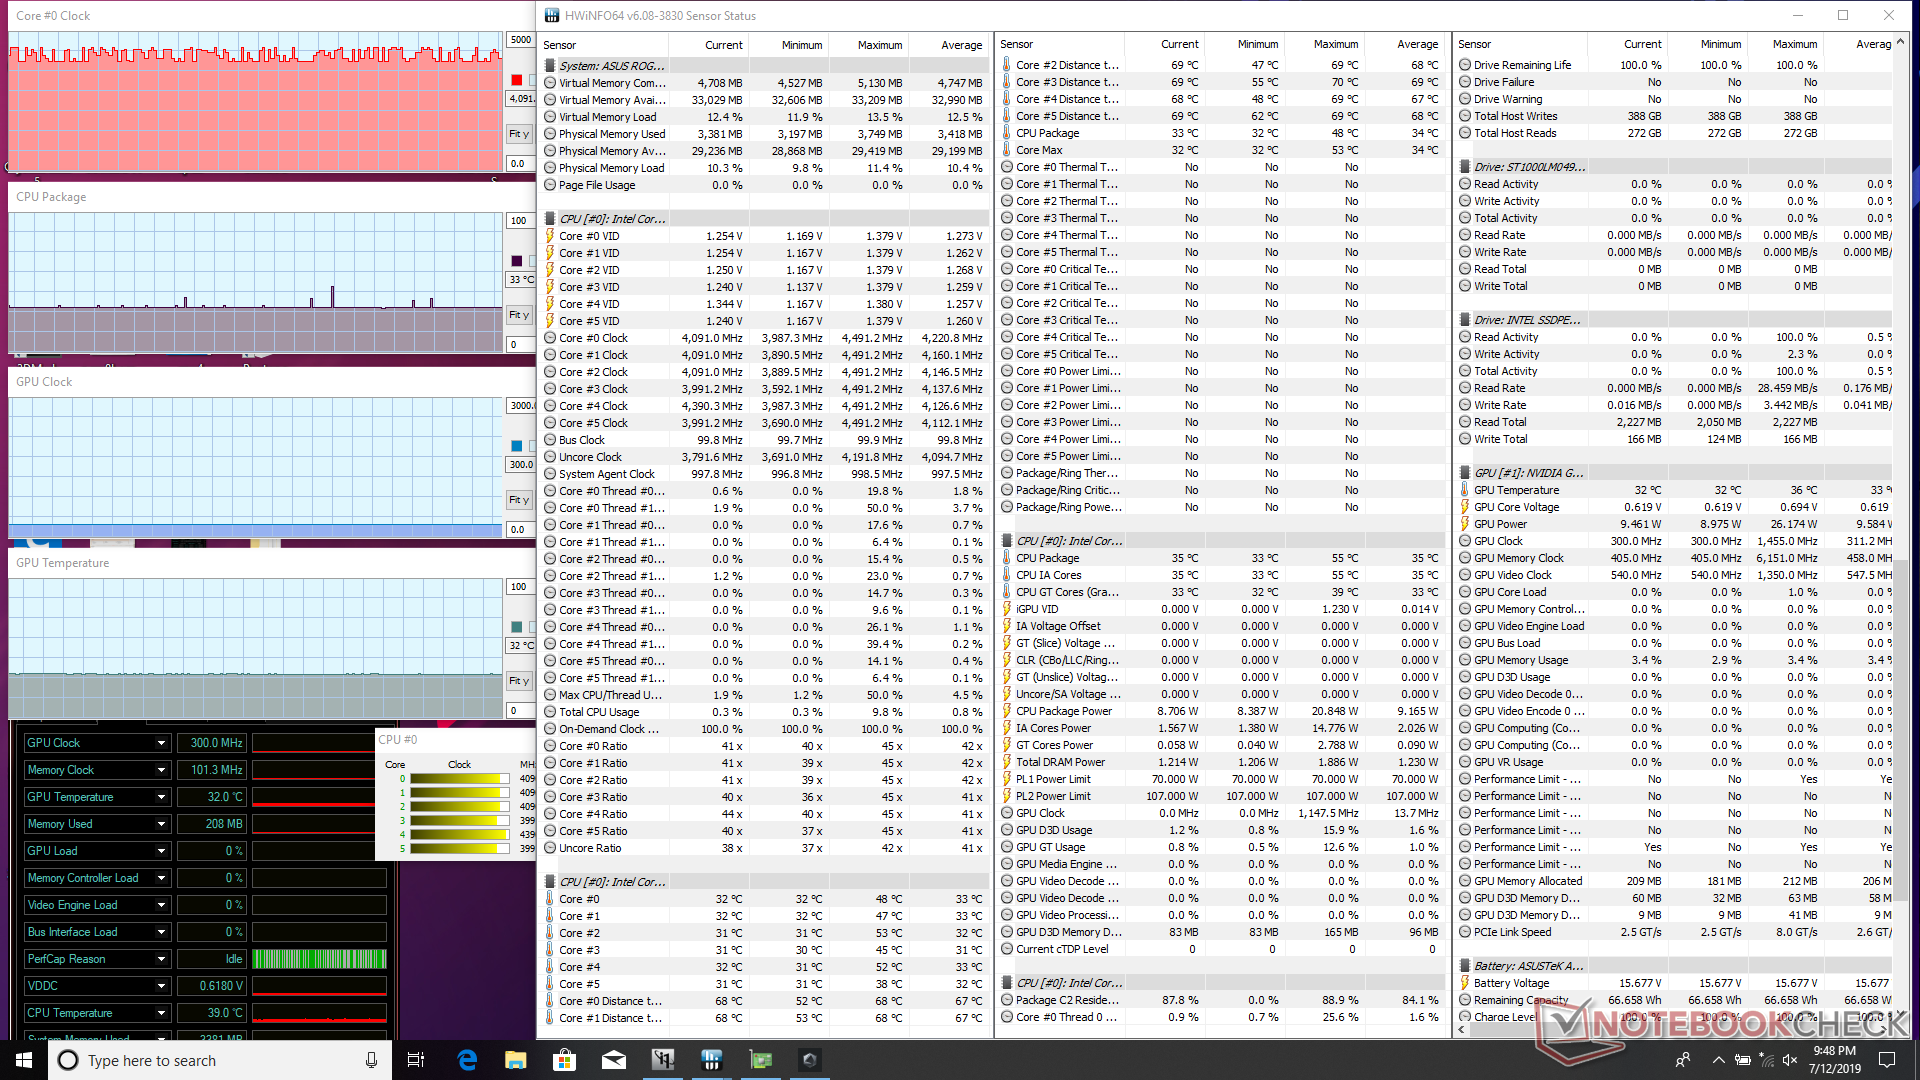
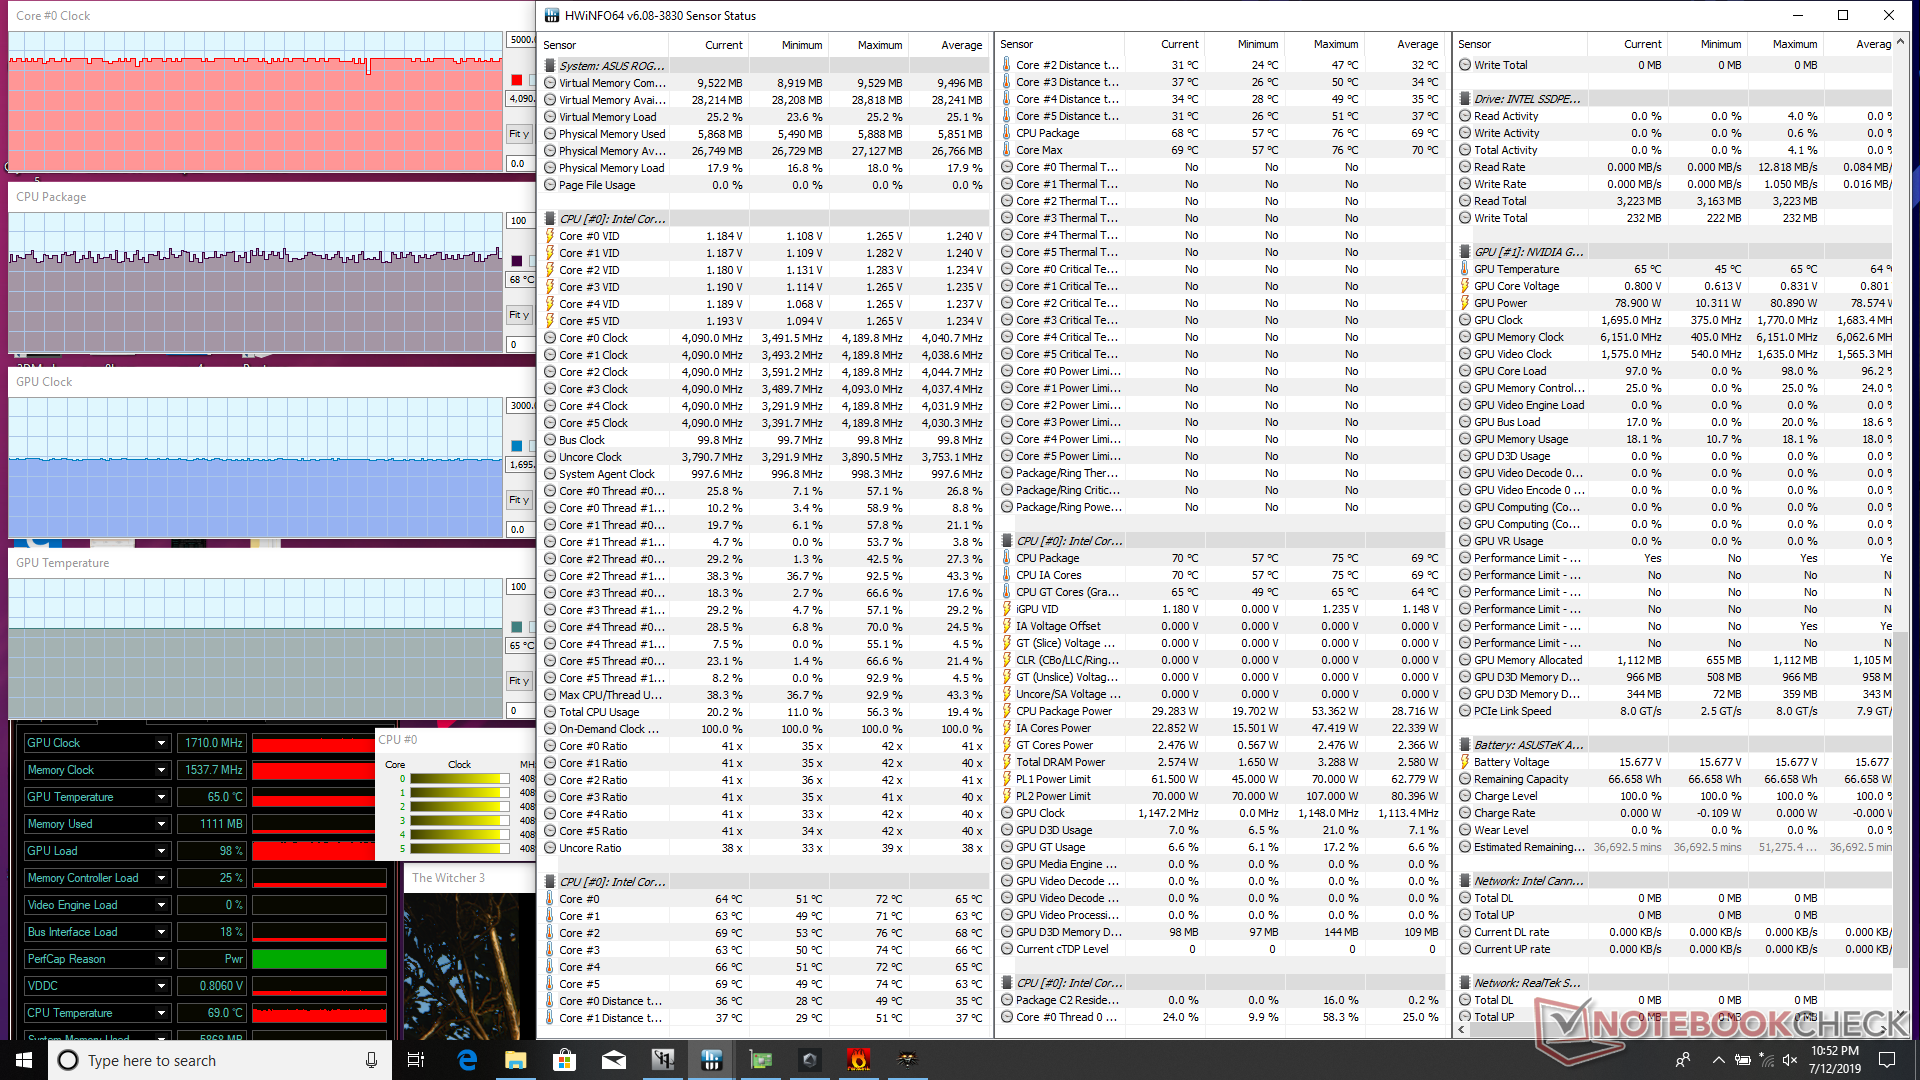
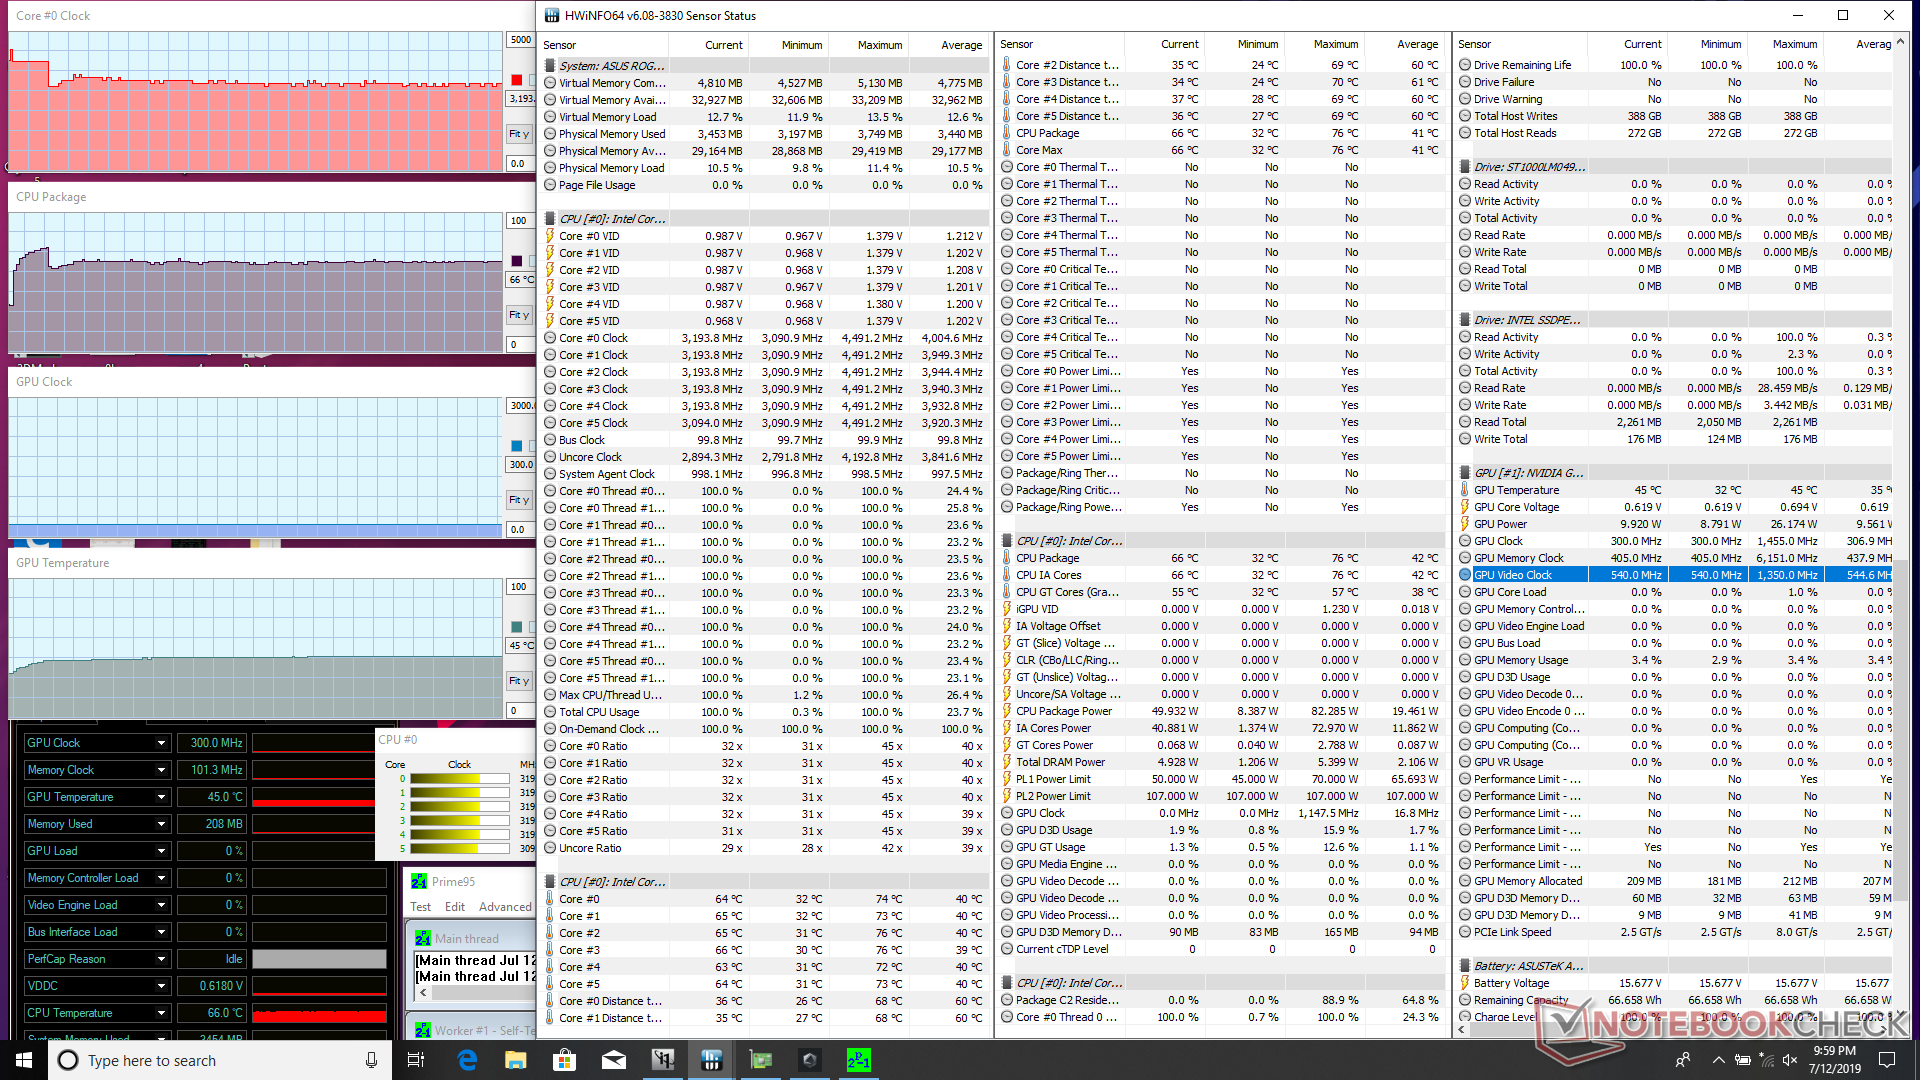
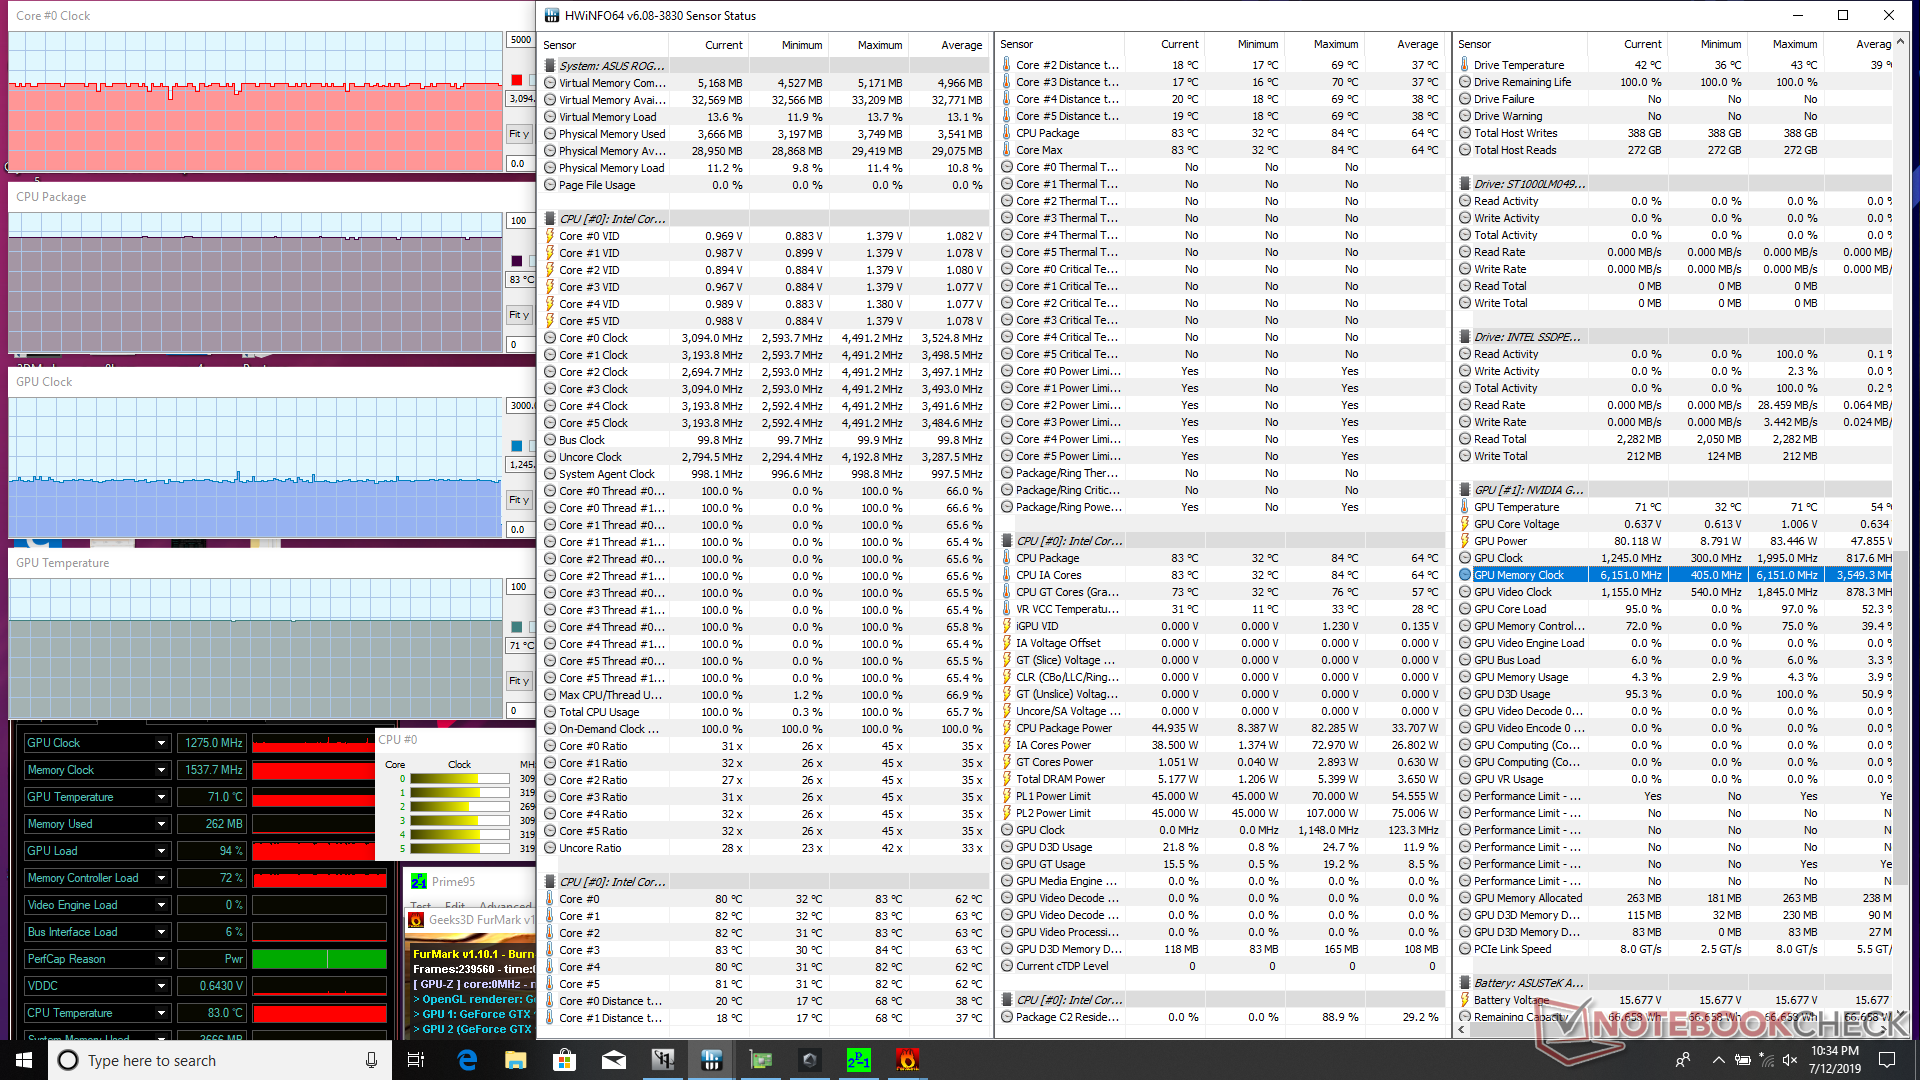
| CPU Clock (GHz) | GPU Clock (MHz) | Average CPU Temperature (°C) | Average GPU Temperature (°C) | |
| System Idle | -- | -- | 33 | 32 |
| Prime95 Stress | 3.1 - 3.2 | -- | 66 | 45 |
| Prime95 + FurMark Stress | 3.1 - 3.2 | 1275 | 83 | 71 |
| Witcher 3 Stress | 4.0 - 4.1 | 1710 | ~68 | 65 |
Speakers
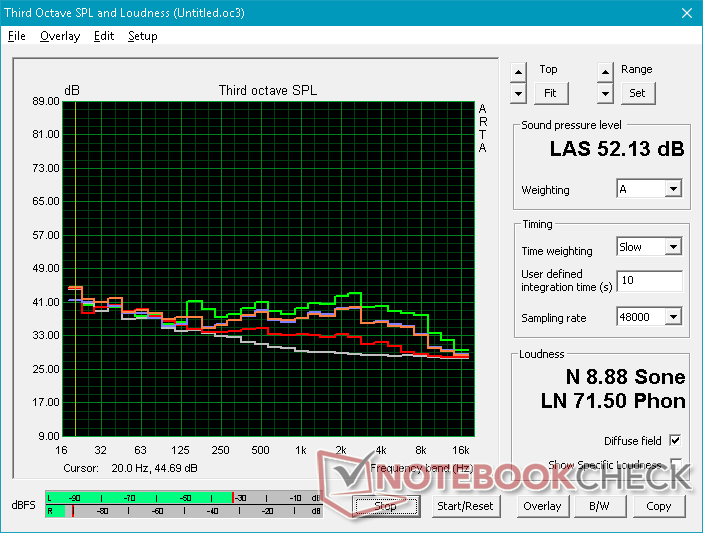
The 2x 4 W stereo speakers are more powerful than on most other laptops where 1.5 W or 2 W speakers are common. This becomes evident when placing a hand on the palm rest because you can feel the vibrations more strongly. These vibrations can potentially be distracting when gaming or typing especially if on higher volume settings.
Audio quality is excellent with a relatively balanced pink noise graph as shown below. Bass roll off doesn't occur until about 125 Hz compared to 250 Hz or higher on most Ultrabooks. The bass difference is noticeable even from a subjective standpoint.


Asus ROG Strix G GL731GU-RB74 audio analysis
(±) | speaker loudness is average but good (81.9 dB)
Analysis not possible as minimum curve is missing or too high
Apple MacBook 12 (Early 2016) 1.1 GHz audio analysis
(+) | speakers can play relatively loud (83.6 dB)
Bass 100 - 315 Hz
(±) | reduced bass - on average 11.3% lower than median
(±) | linearity of bass is average (14.2% delta to prev. frequency)
Mids 400 - 2000 Hz
(+) | balanced mids - only 2.4% away from median
(+) | mids are linear (5.5% delta to prev. frequency)
Highs 2 - 16 kHz
(+) | balanced highs - only 2% away from median
(+) | highs are linear (4.5% delta to prev. frequency)
Overall 100 - 16.000 Hz
(+) | overall sound is linear (10.2% difference to median)
Compared to same class
» 7% of all tested devices in this class were better, 2% similar, 91% worse
» The best had a delta of 5%, average was 18%, worst was 53%
Compared to all devices tested
» 5% of all tested devices were better, 1% similar, 94% worse
» The best had a delta of 4%, average was 23%, worst was 134%
Energy Management
Power Consumption
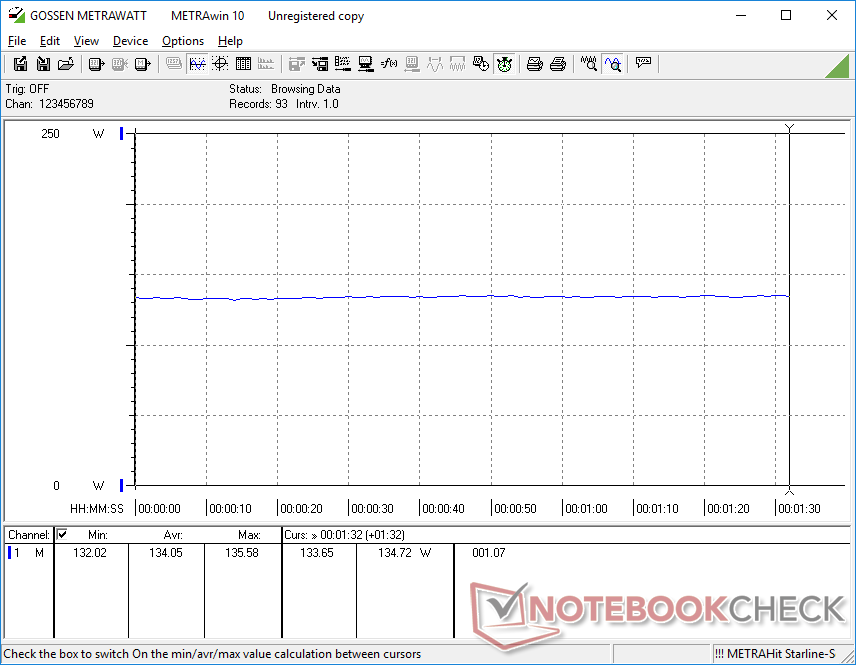
Idling on desktop demands anywhere between 13 W and 35 W depending on the brightness level and power profile. In comparison, the Asus TUF FX705DT or Strix II GL704GW top out at just 12 W and 29 W, respectively, when under similar idling conditions. We attribute the higher power consumption of the GL731 to the secondary HDD, 144 Hz display, and LED lights around the edges of the system.
When gaming, consumption jumps to about 134 W to be very similar to the last generation MSI GF72VR with GTX 1060 graphics. Users get up to 50 percent more graphics performance out of the GTX 1660 Ti over the GTX 1060 even though power consumption between them are very close. The MSI GF75 with slower GTX 1650 graphics consumes 21 percent less power for a greater 36 percent loss in GPU performance.
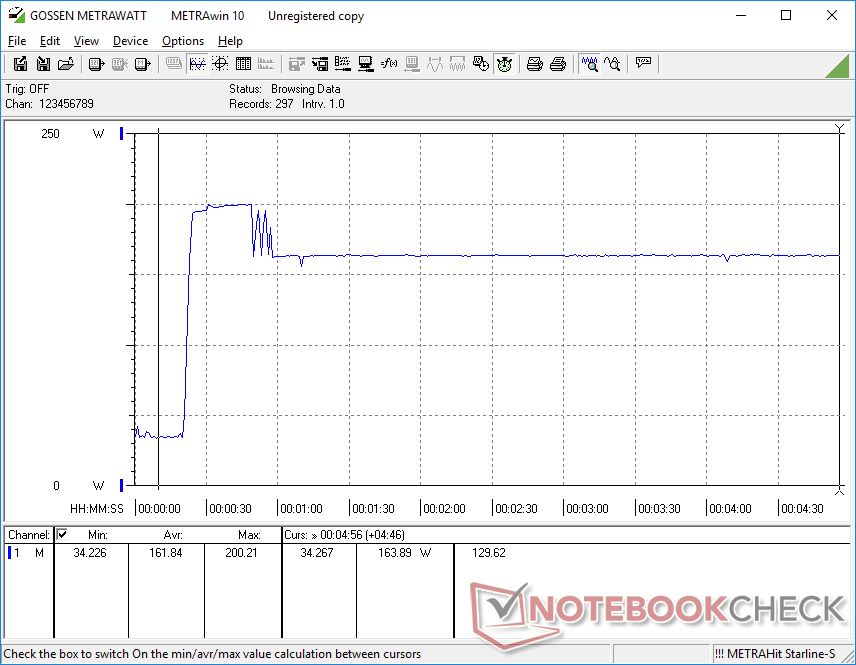
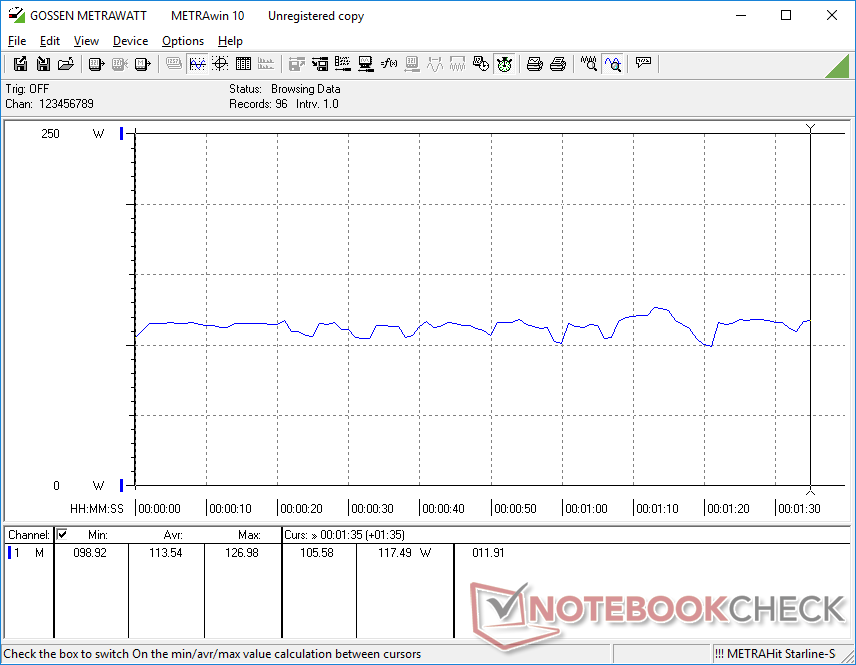
When running Prime95, we're able to record a power spike of up to 137 W for the first few seconds before dropping and stabilizing at about 109 W. This behavior mirrors our stress test observations above where Turbo Boost clock rates would be fastest only during the first few seconds.
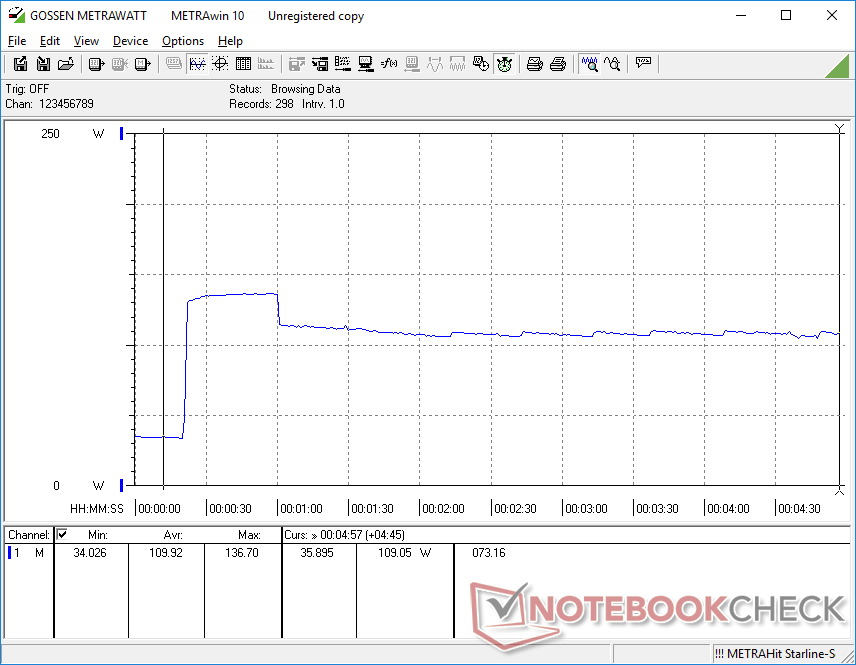
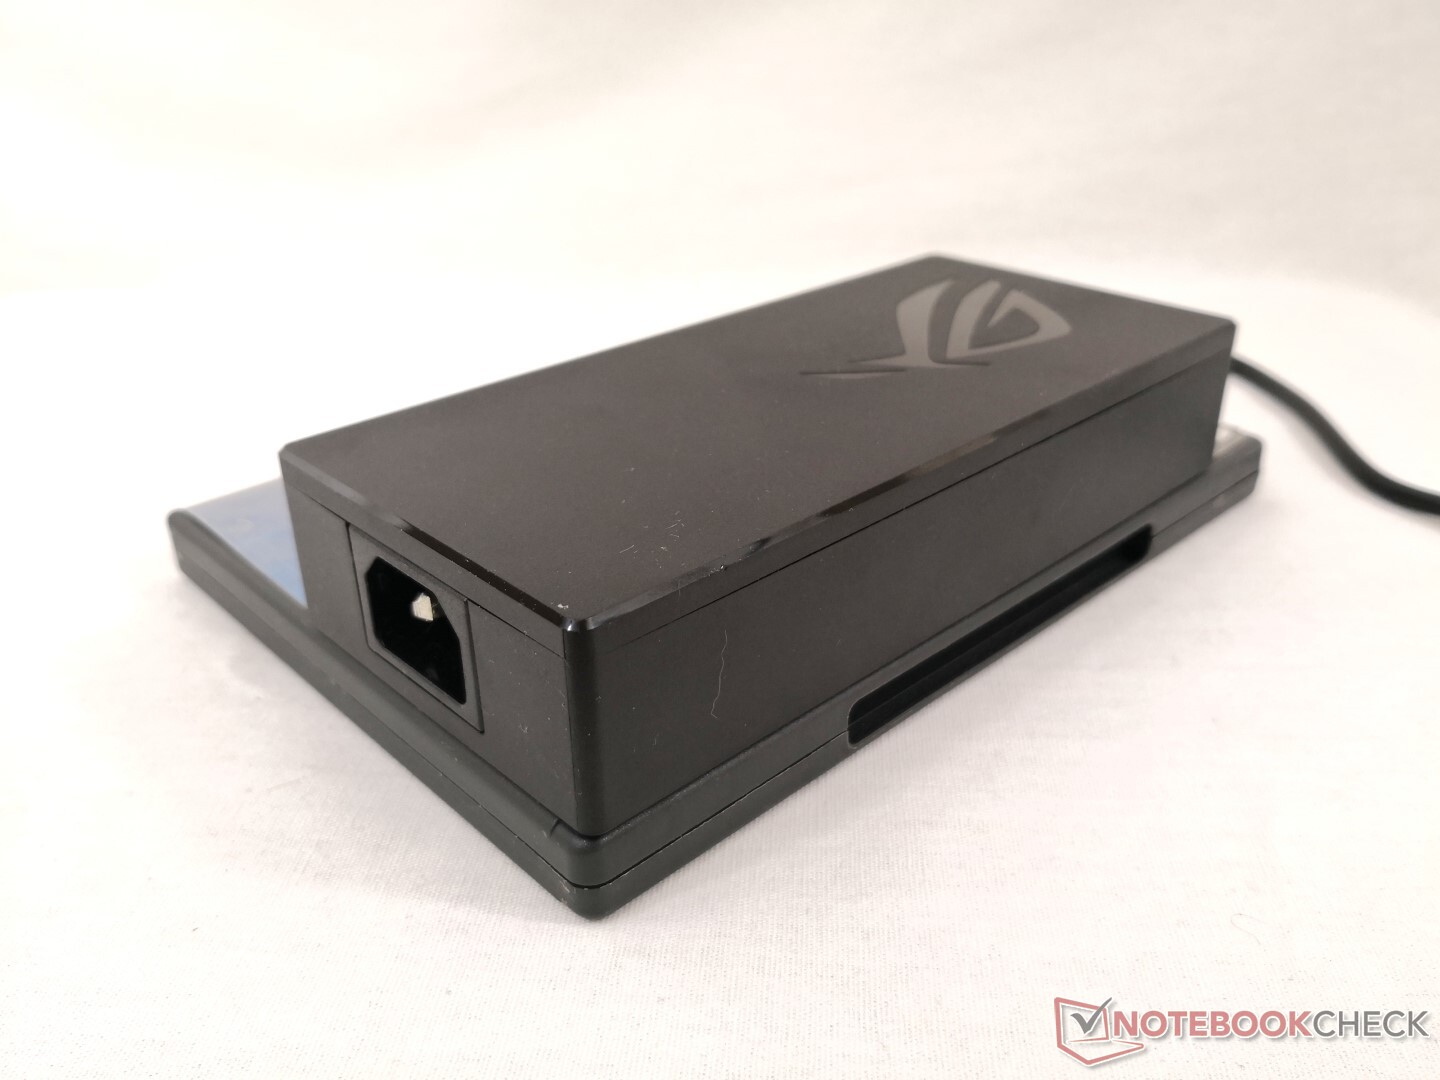
We're able to record a maximum draw of 200 W from the small-medium (~16.5 x 7.5 x 3.3 cm) 230 W AC adapter when running both Prime95 and FurMark simultaneously. This high of a consumption is thermally unsustainable for the laptop and so consumption quickly falls to 164 W in order to maintain more reasonable temperatures.
| Off / Standby | |
| Idle | |
| Load |
|
Key:
min: | |
| Asus ROG Strix G GL731GU-RB74 i7-9750H, GeForce GTX 1660 Ti Mobile, Intel SSD 660p SSDPEKNW512G8, IPS, 1920x1080, 17.3" | Asus TUF FX705DT-AU068T R5 3550H, GeForce GTX 1650 Mobile, WDC PC SN520 SDAPNUW-256G, IPS, 1920x1080, 17.3" | Asus ROG Strix Scar II GL704GW i7-8750H, GeForce RTX 2070 Mobile, Intel SSD 660p SSDPEKNW512G8, AHVA, 1920x1080, 17.3" | Razer Blade Pro 17 RTX 2080 Max-Q i7-9750H, GeForce RTX 2080 Max-Q, Samsung SSD PM981 MZVLB512HAJQ, IPS, 1920x1080, 17.3" | MSI GF75 Thin 9SC i7-9750H, GeForce GTX 1650 Mobile, Crucial P1 SSD CT1000P1SSD8, IPS, 1920x1080, 17.3" | MSI GF72VR 7RF i7-7700HQ, GeForce GTX 1060 Mobile, Samsung PM961 MZVLW256HEHP, TN LED, 1920x1080, 17.3" | |
|---|---|---|---|---|---|---|
| Power Consumption | 61% | -9% | 0% | 31% | 15% | |
| Idle Minimum * (Watt) | 13.6 | 3.9 71% | 19 -40% | 16.2 -19% | 6.1 55% | 15.7 -15% |
| Idle Average * (Watt) | 26.2 | 9.6 63% | 22 16% | 20.4 22% | 11.2 57% | 21.4 18% |
| Idle Maximum * (Watt) | 35 | 12.2 65% | 29 17% | 26.1 25% | 24.5 30% | 21.9 37% |
| Load Average * (Watt) | 113.6 | 59 48% | 102 10% | 96.5 15% | 94.7 17% | 83.9 26% |
| Witcher 3 ultra * (Watt) | 134.1 | 190 -42% | 182.9 -36% | 105.8 21% | 130.2 3% | |
| Load Maximum * (Watt) | 200.2 | 80 60% | 231 -15% | 214.3 -7% | 192.2 4% | 159.6 20% |
* ... smaller is better
Battery Life
Expect just under five hours of real-world WLAN use when set to the Balanced profile with the integrated GPU active. The AMD-powered Asus TUF FX705DT with the slower GTX 1650 GPU is able to last for a few hours longer when subjected to the same WLAN conditions. The 66 Wh battery is about average for a 17.3-inch gaming laptop as it is larger than the 51 Wh battery of the MSI GF75 and smaller than the 90 W battery of the Alienware m17.
Charging from empty to full capacity takes about 1.5 hours.
| Asus ROG Strix G GL731GU-RB74 i7-9750H, GeForce GTX 1660 Ti Mobile, 66 Wh | Asus TUF FX705DT-AU068T R5 3550H, GeForce GTX 1650 Mobile, 64 Wh | Lenovo Legion Y740-17ICH i7-8750H, GeForce RTX 2080 Max-Q, 76 Wh | Asus ROG Strix Scar II GL704GW i7-8750H, GeForce RTX 2070 Mobile, 66 Wh | Razer Blade Pro 17 RTX 2080 Max-Q i7-9750H, GeForce RTX 2080 Max-Q, 70 Wh | MSI GF75 Thin 9SC i7-9750H, GeForce GTX 1650 Mobile, 51 Wh | |
|---|---|---|---|---|---|---|
| Battery runtime | 49% | -35% | -26% | -20% | -4% | |
| Reader / Idle (h) | 8.6 | 13.6 58% | 6.2 -28% | 4.9 -43% | ||
| WiFi v1.3 (h) | 4.9 | 7.8 59% | 3.2 -35% | 3.9 -20% | 4.7 -4% | 4.7 -4% |
| Load (h) | 1.6 | 2.1 31% | 1.1 -31% | 1.4 -13% | ||
| Witcher 3 ultra (h) | 0.9 |
Pros
Cons
Verdict

Even though there is a lot to like about the Asus GL731GU, we can't help but to facepalm on a few design decisions. Firstly, the LED light bar comes at the unexpected cost of serviceability because the bottom panel is now much more user-unfriendly to remove. If all you want to do is expand storage or RAM, then be prepared to gingerly disconnect and reconnect a few very fragile ribbon cables along the way. Secondly, there is no reason why the Arrow keys have to be so small and cramped for such a large form factor chassis especially when the last generation Strix II had larger Arrow keys. Thirdly, the lack of separate color options for the LED bar and keyboard backlight is a huge blow to the customization of the system. We understand the reasoning for locking per-key RGB lighting options to higher-end models only, but this is particularly egregious for a $1500 laptop. And lastly, the unusual positioning of the ports may not be to everyone's fancy as there are none along the right edge — a rarity for a 17.3-inch gaming laptop.
Aside from the perplexing drawbacks above, the Strix G GL731 successfully captures the core performance, display, and design of its pricier Strix III G731 series very well. Users who want the looks and gaming capabilities of a high-end G731 but aren't willing to pay for the fancy per-key RGB lights or aluminum chassis will find the GL731 to be an attractive prospect. The $1500 USD price range for our configuration is about standard for a 17.3-inch laptop with GTX 1660 Ti graphics.
A few annoyances hold back the great performer. If you can get past the relatively large footprint, heavier weight, small Arrow keys, and user-unfriendly serviceability, then you'll find the GL731GU to be one of the better-looking mid-range gaming laptops for its size category. Core temperatures and audio quality in particular are better than expected.
Asus ROG Strix G GL731GU-RB74
- 07/19/2019 v6 (old)
Allen Ngo
