Eurocom Nightsky RX17 (Clevo PB71RF) Laptop Review
The Eurocom Nightsky RX17 is a high-end 17.3-inch gaming laptop based on the Clevo PB71RF chassis design. When compared to the thinner Eurocom Q8 and thicker Eurocom Sky X7C, the Nightsky RX17 sits comfortably in between in terms of size and weight while still offering the kind of gaming experience enthusiasts would expect.
Configurations are surprisingly minimal when compared to most other Eurocom systems. As of this writing, users can choose between just two 9th gen Intel CPUs (i7-9750H or i9-9980HK) and two GPUs (GTX 1660 Ti or RTX 2070) while the 144 Hz FHD display remains fixed across all SKUs. Our test unit today is equipped with the Core i7 CPU, RTX 2070 GPU, 32 GB RAM, and two 512 GB Samsung SSD 970 Pro drives for a retail price of about $2900. The system competes directly with other enthusiast ultra-thin or mid-sized 17.3-inch gaming laptops like the Asus ROG GL704, Lenovo Legion Y740, MSI GS75, MSI GE75, Razer Blade Pro 17, Alienware m17, and Acer Predator Helios 500.
More Eurocom reviews:
Case
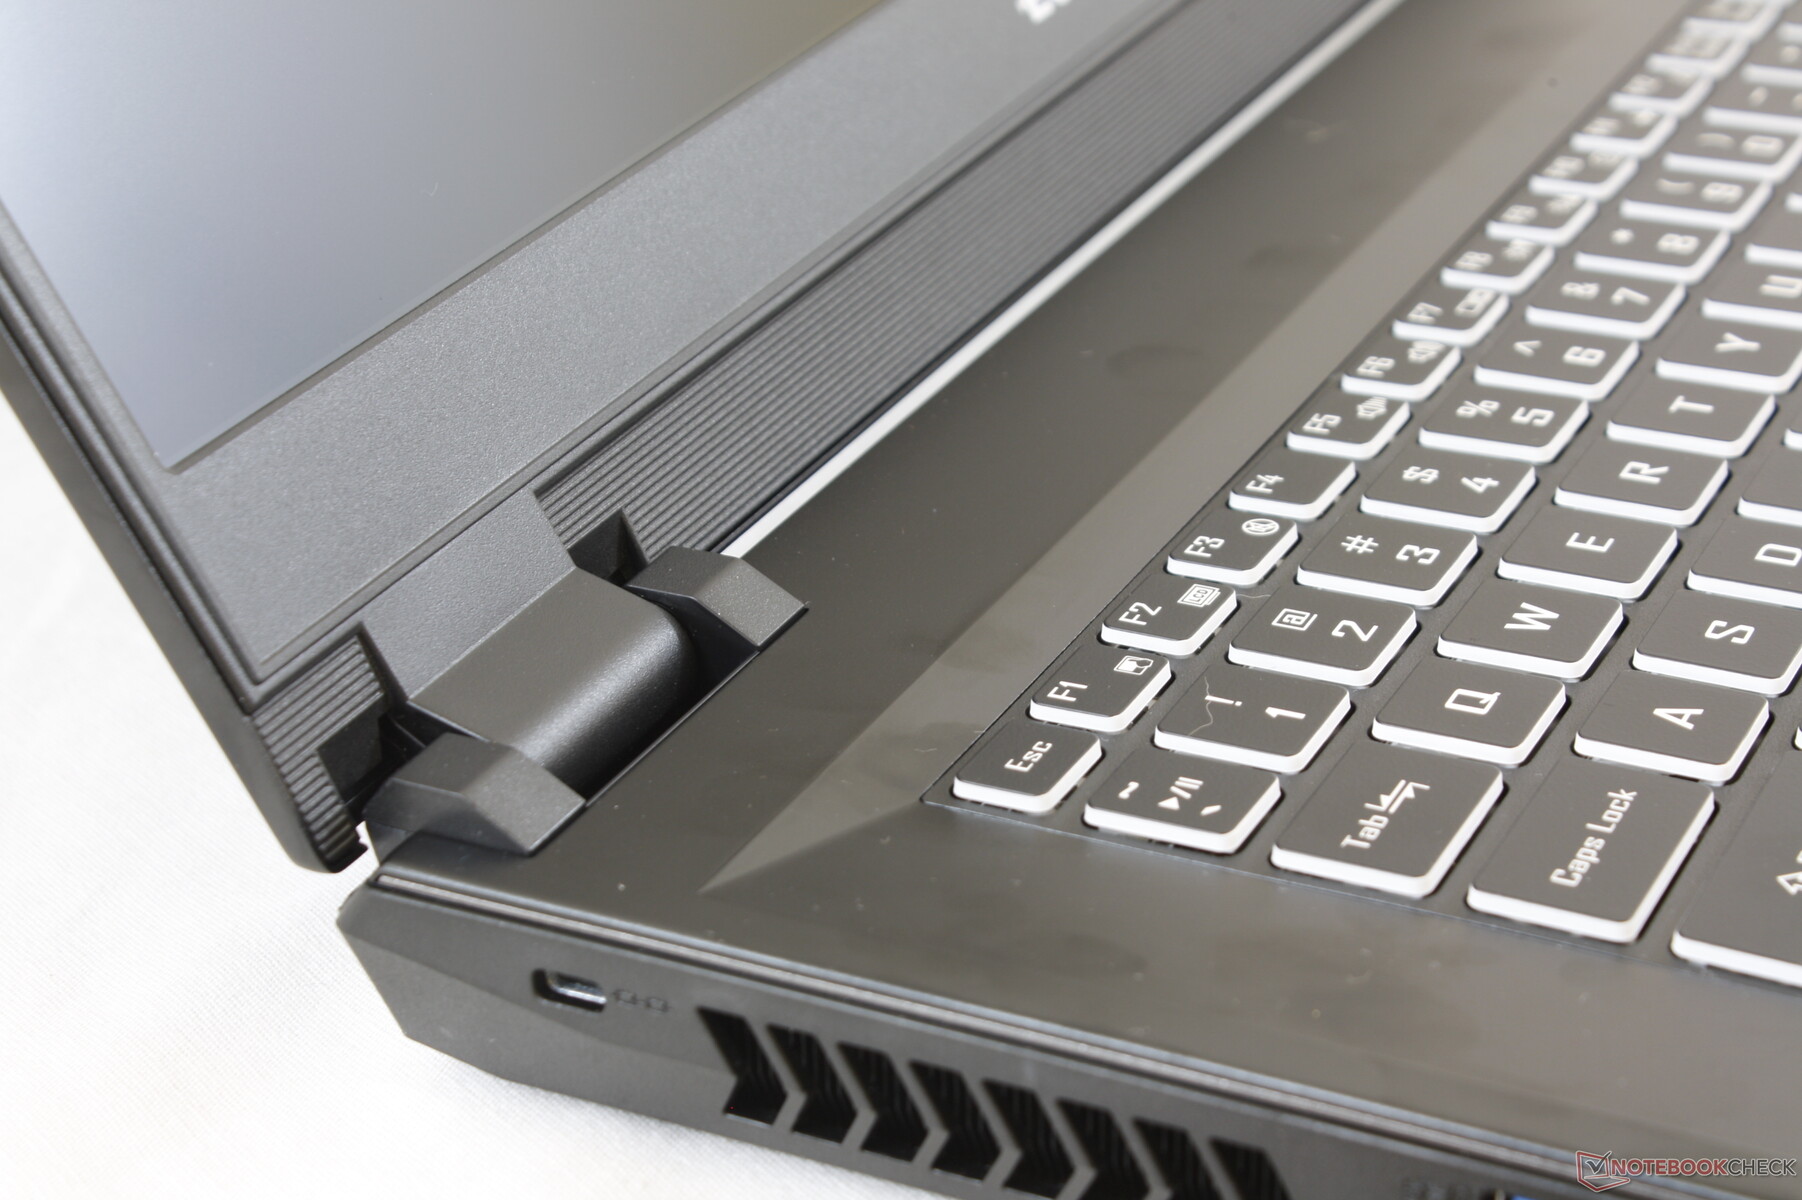
Clevo laptop designs are the antithesis to unibody designs. In contrast to the leaner look of an Apple MacBook or Razer Blade, a Clevo chassis will have more texture differences and more individual pieces. This isn't necessarily an inferior approach because it allows for a wider variety of styles and potentially easier serviceability. The Nightsky RX17 has plenty of screws and sharp design elements that make it standout visually from the usual crowd of MSI, Asus, Alienware, or Acer gaming laptops.
Chassis rigidity is excellent around the base while the lid is more flexible as one would expect from most 17-inch laptops. Applying moderate pressure on the keyboard center or outer lid will depress their surfaces just slightly. The main drawback isn't the minimal flexing, but the minor creaking when attempting to twist the base or lid. Even opening up the display will cause some slight-but-audible creaking. This gives a poorer first impression than the more unibody varieties which tend to creak less or almost none at all.
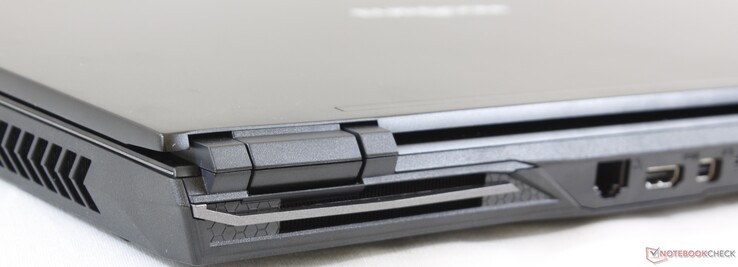
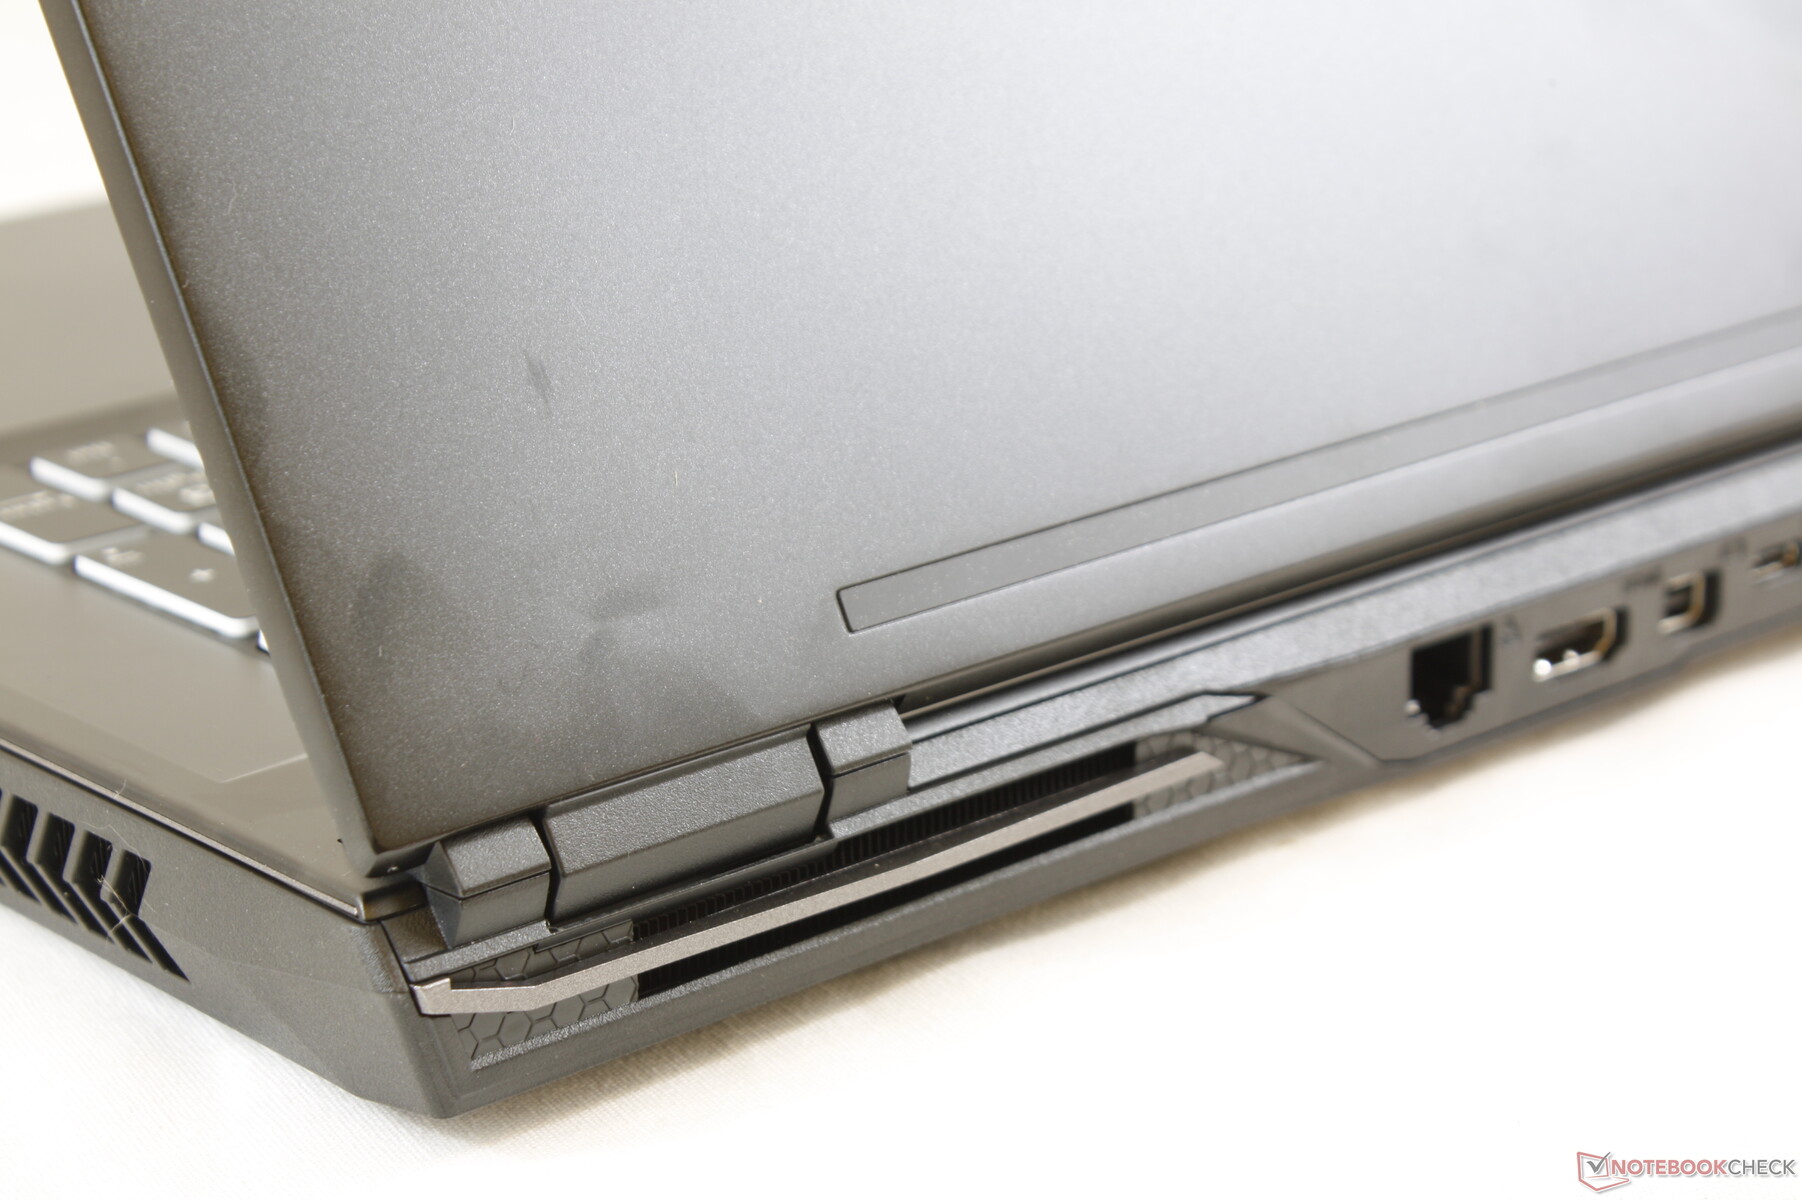
The most fragile parts of the chassis continues to be the grilles along the rear corners of the machine as shown by our picture below. Applying just light pressure to the thin grilles will flex them noticeably. We pointed out this same issue on the Clevo P775TM1 as well and the Nightsky RX17 is no different in this regard.
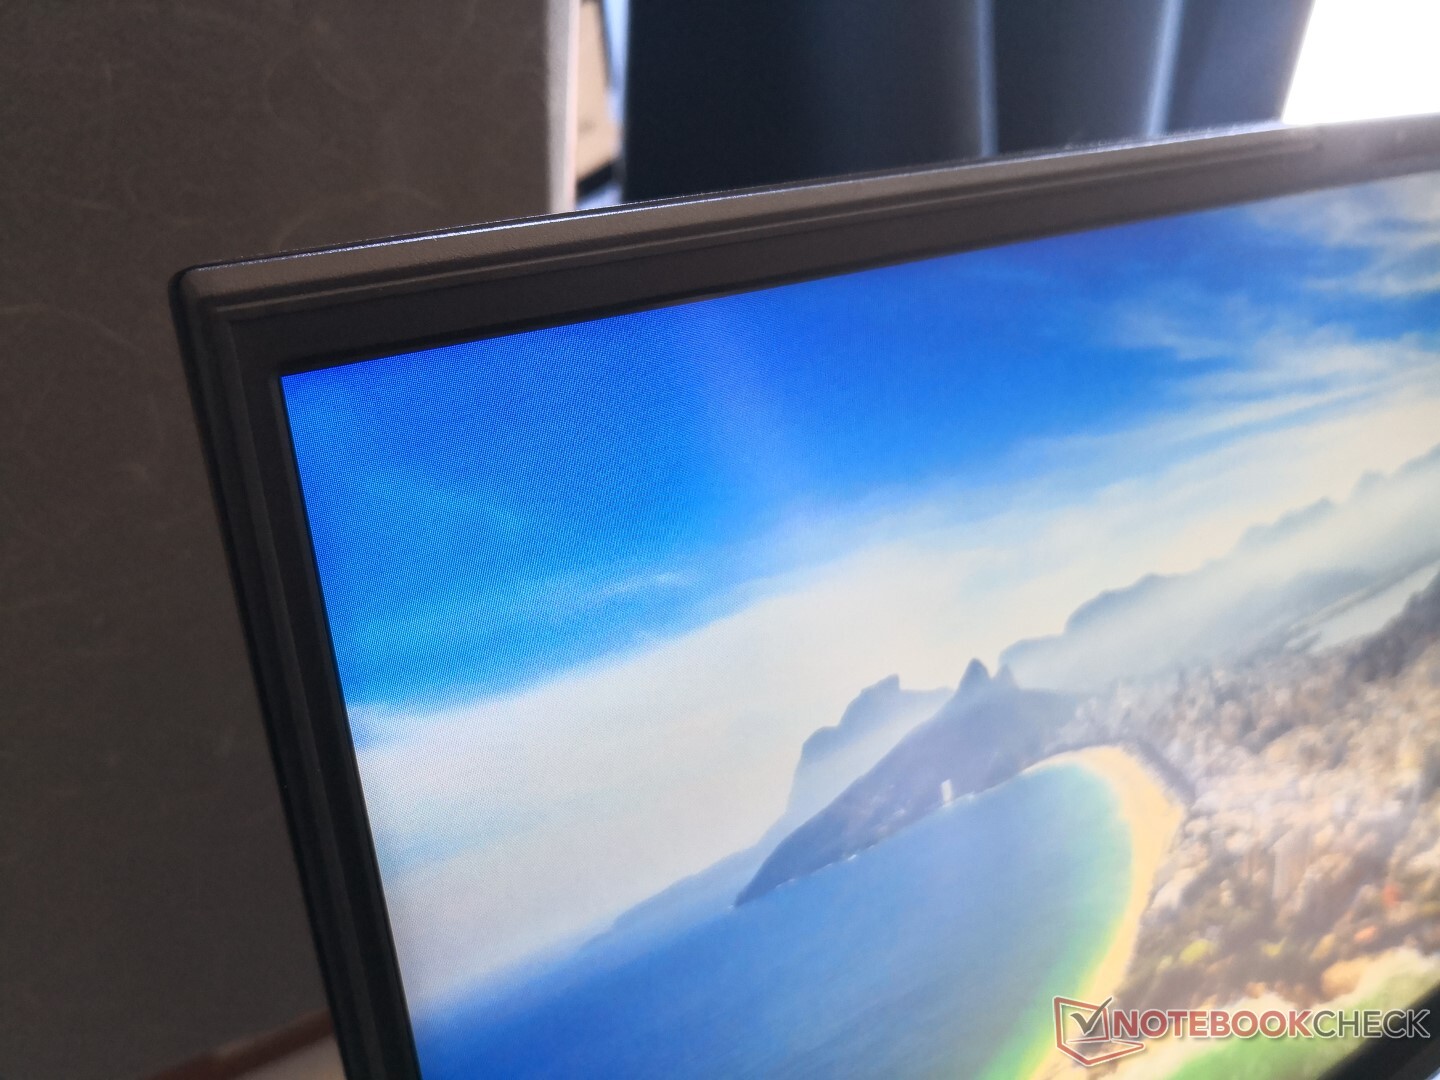
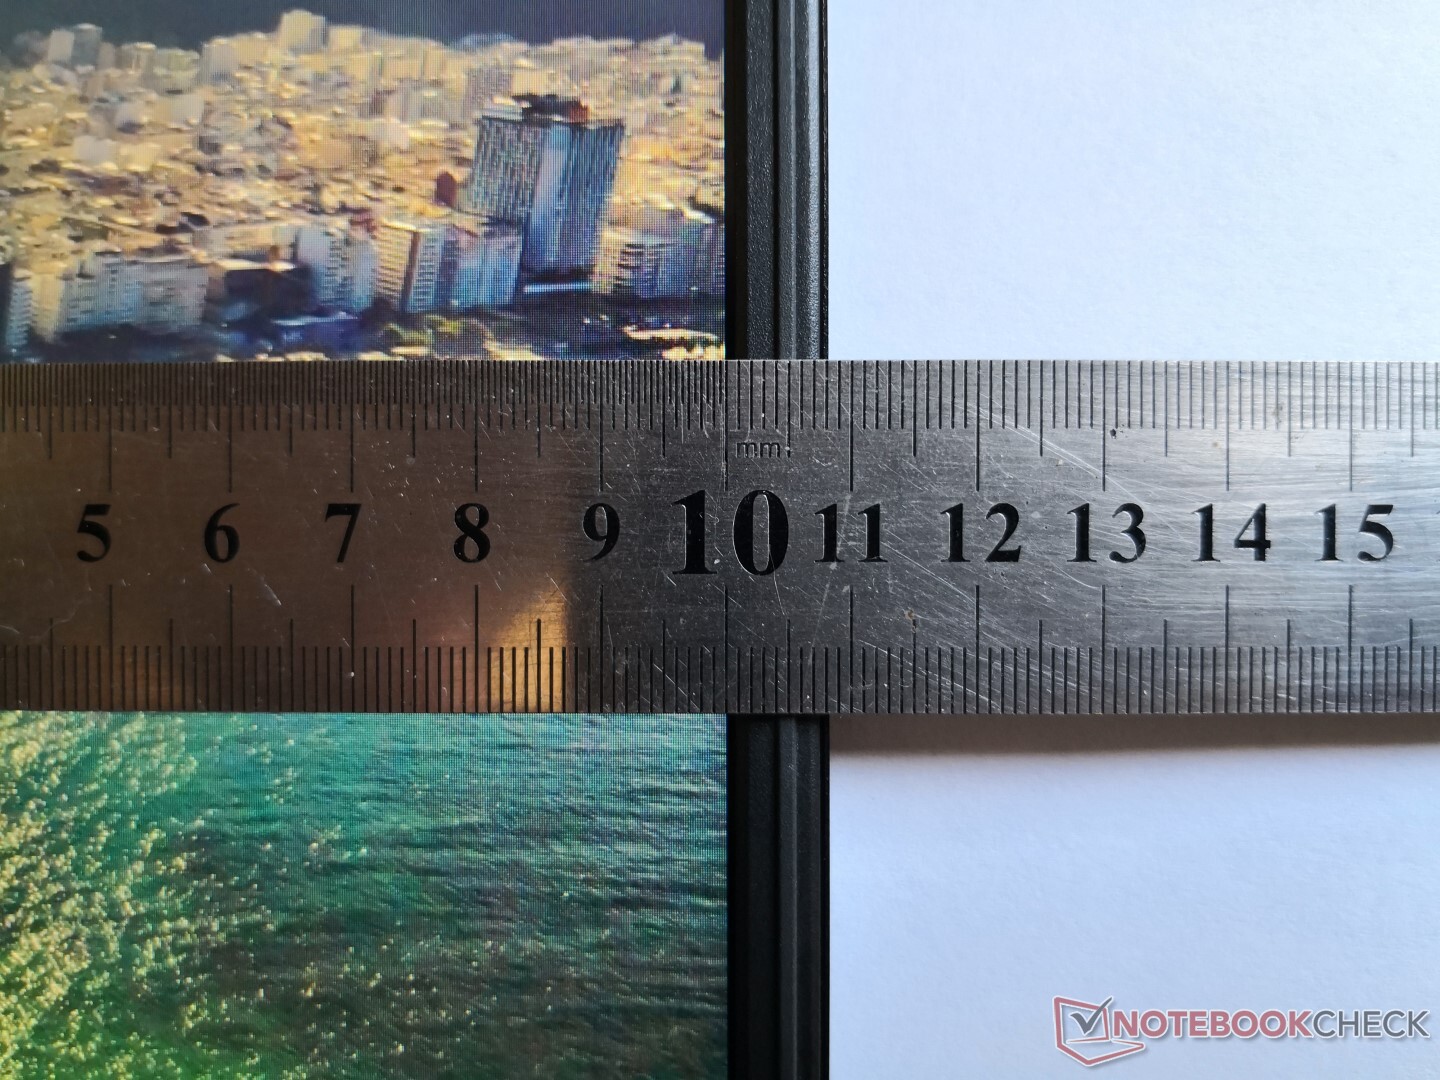
The narrow bezels make the system both noticeably smaller in footprint and slightly thinner when compared to the older Eurocom Q8. In fact, dimensions are quite close to the high-end MSI GE75. Users who may be turned off by the bulkier MSI GT series or Eurocom Sky X7C will find the Nightsky RX17 to be an acceptable compromise in terms of size.
Connectivity
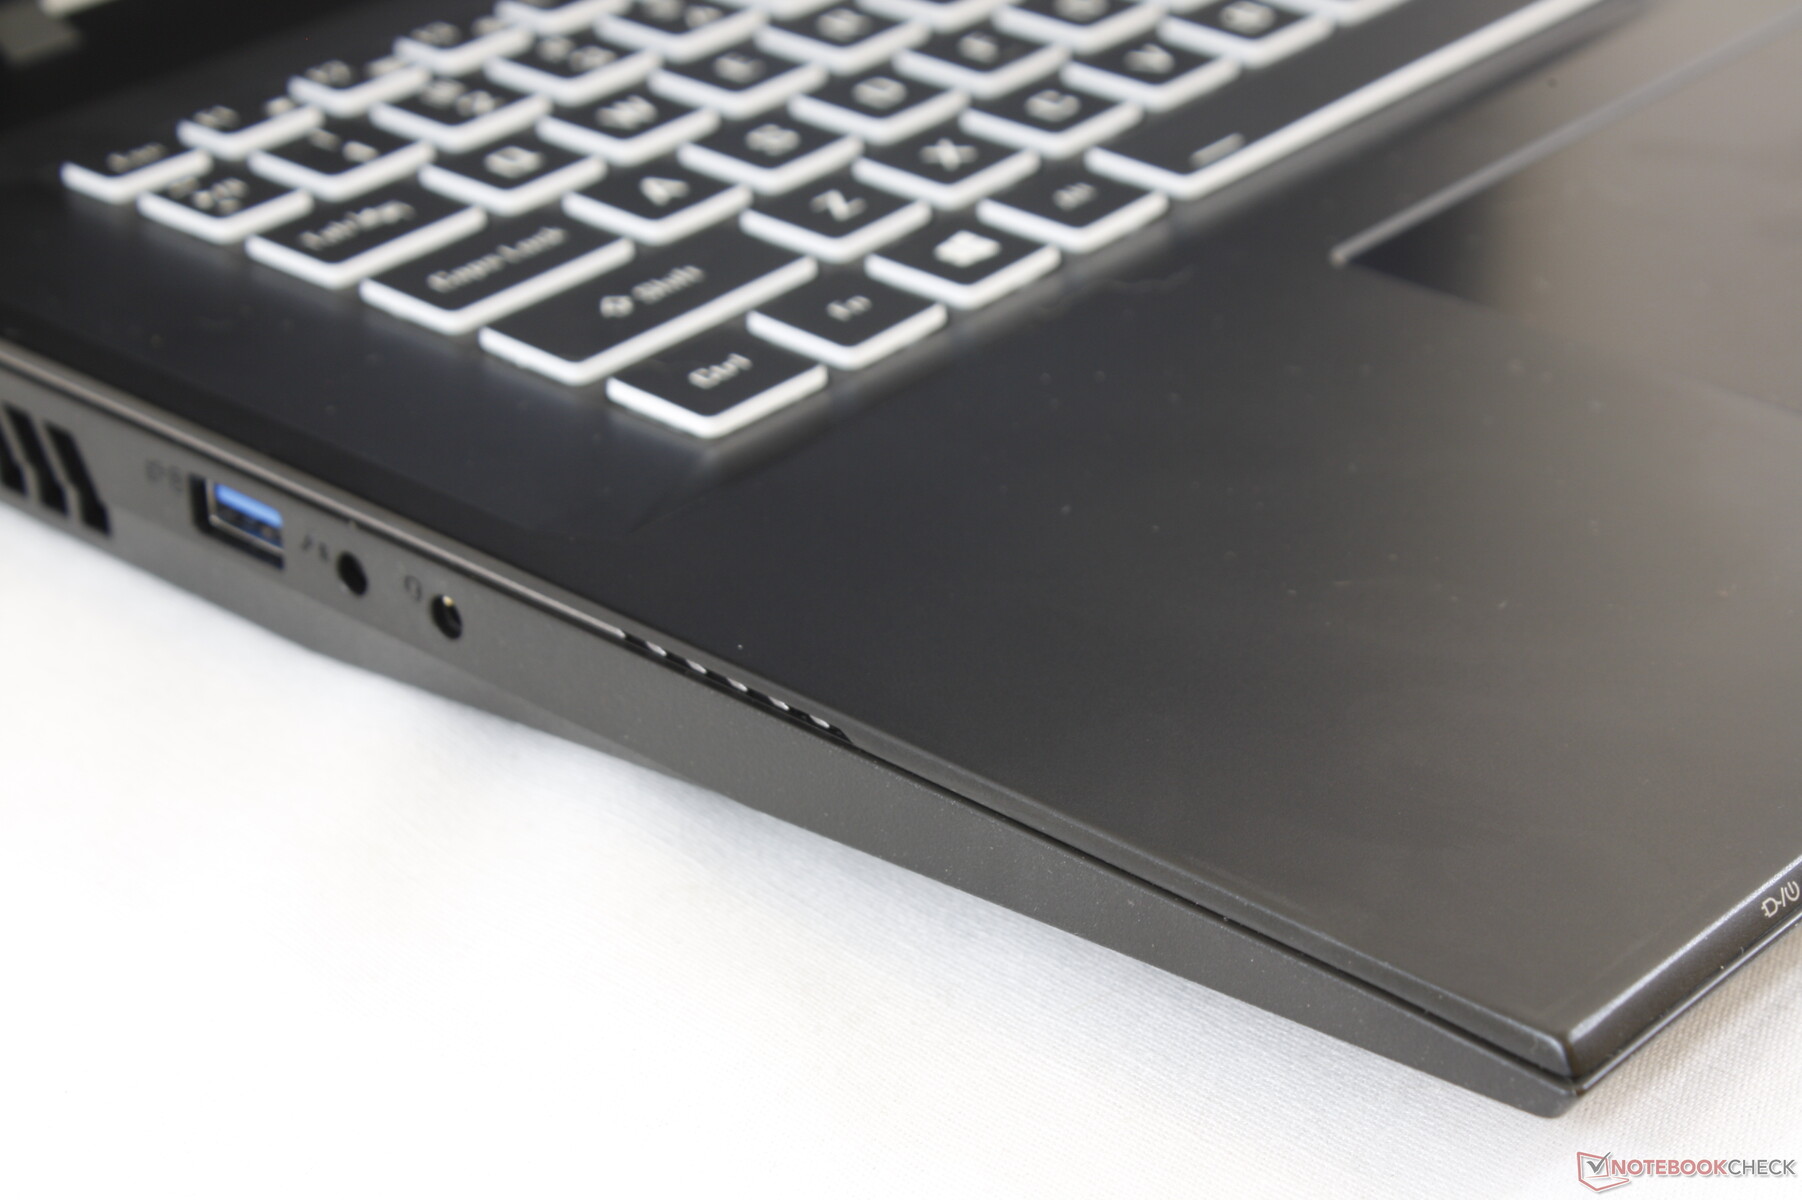
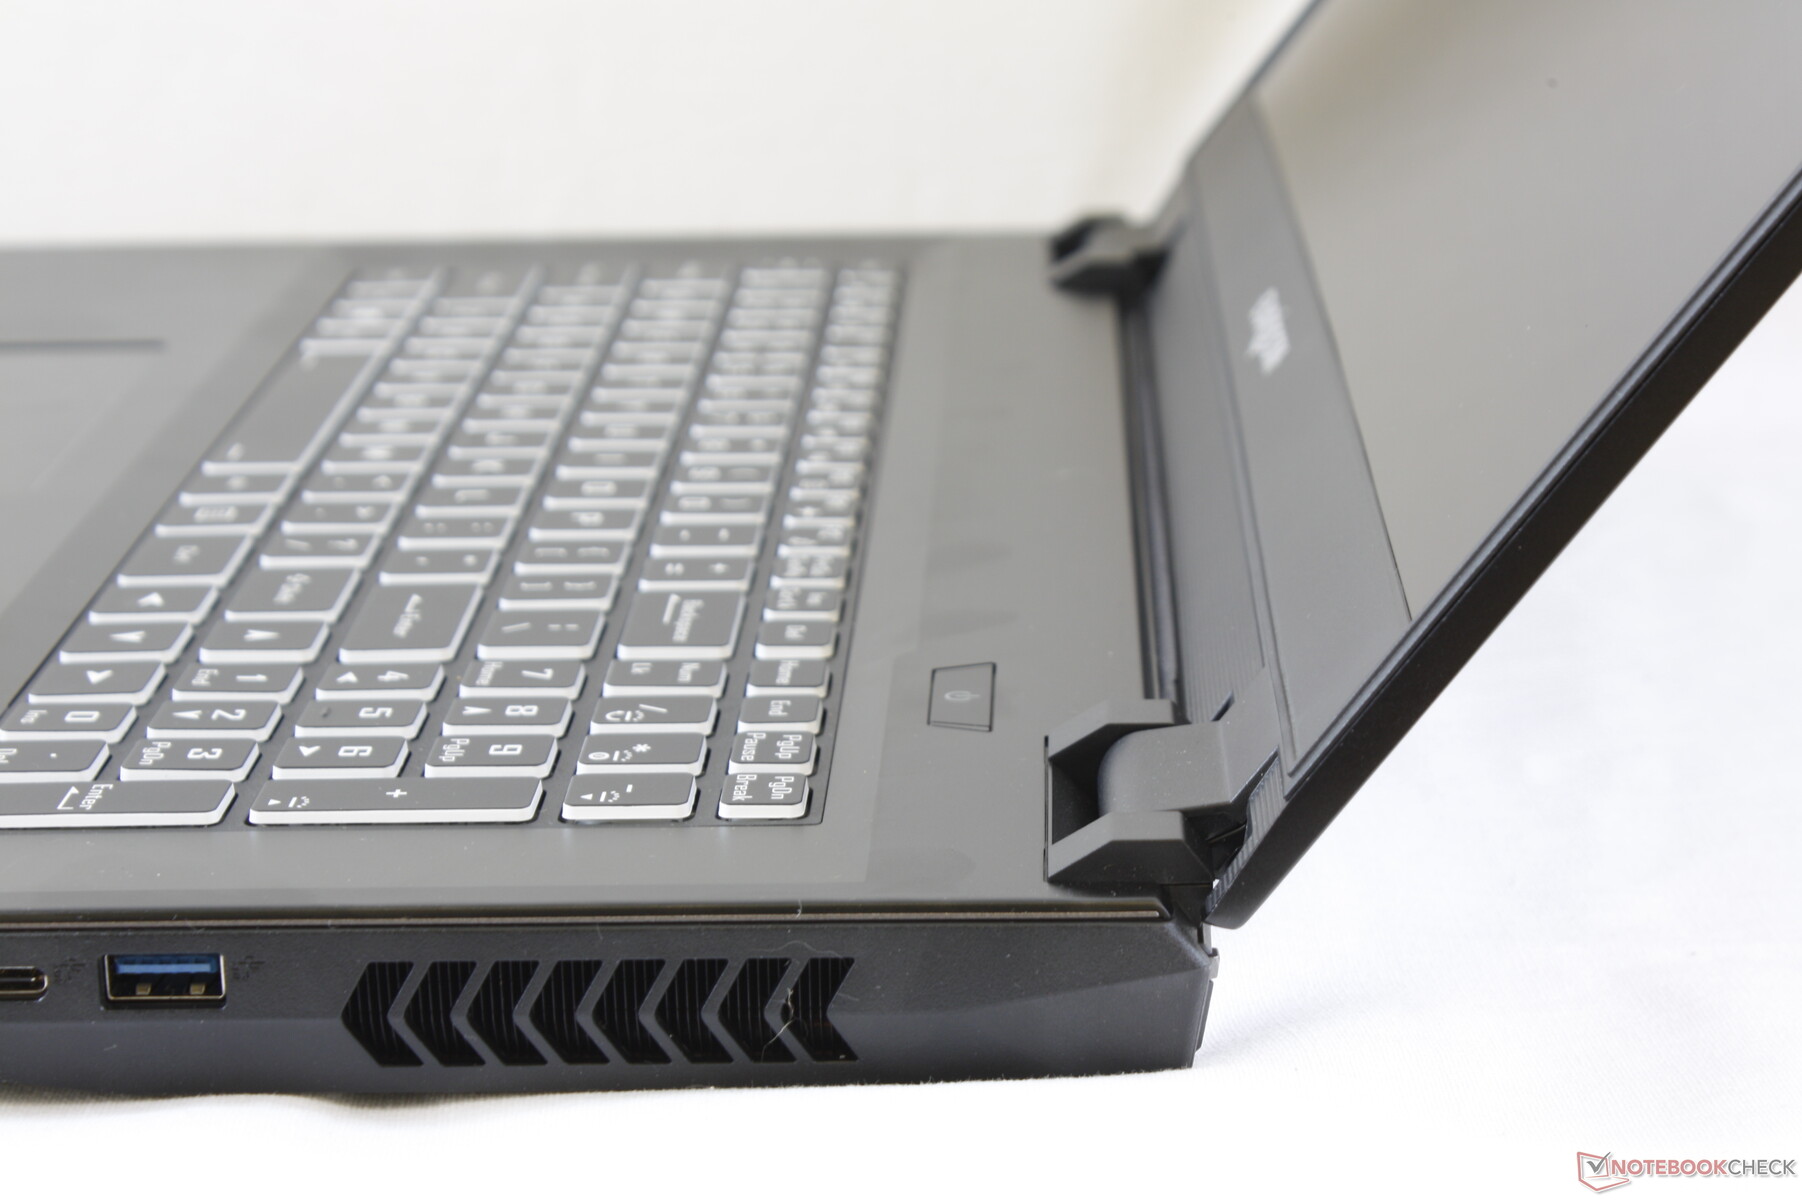
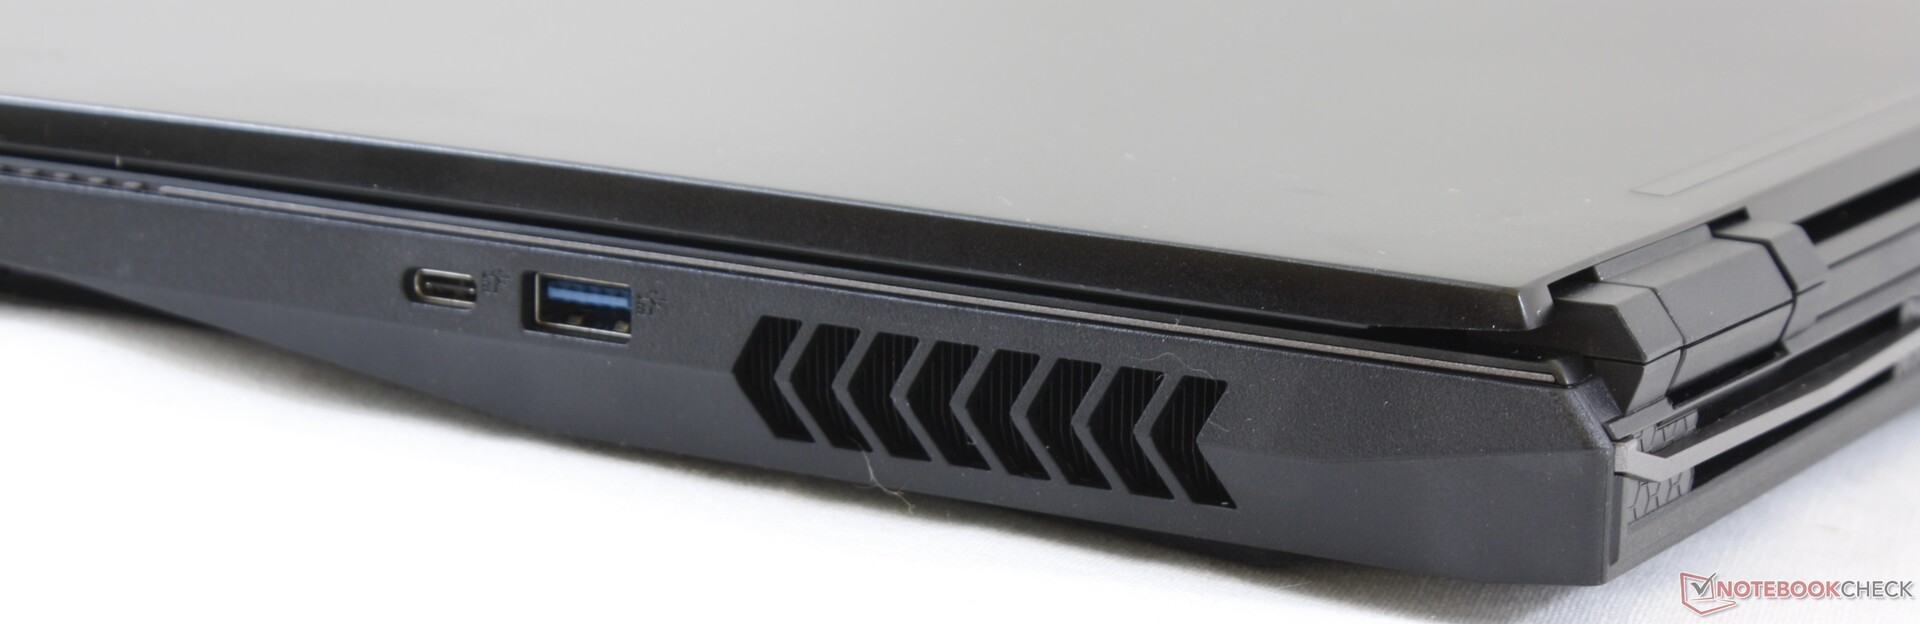
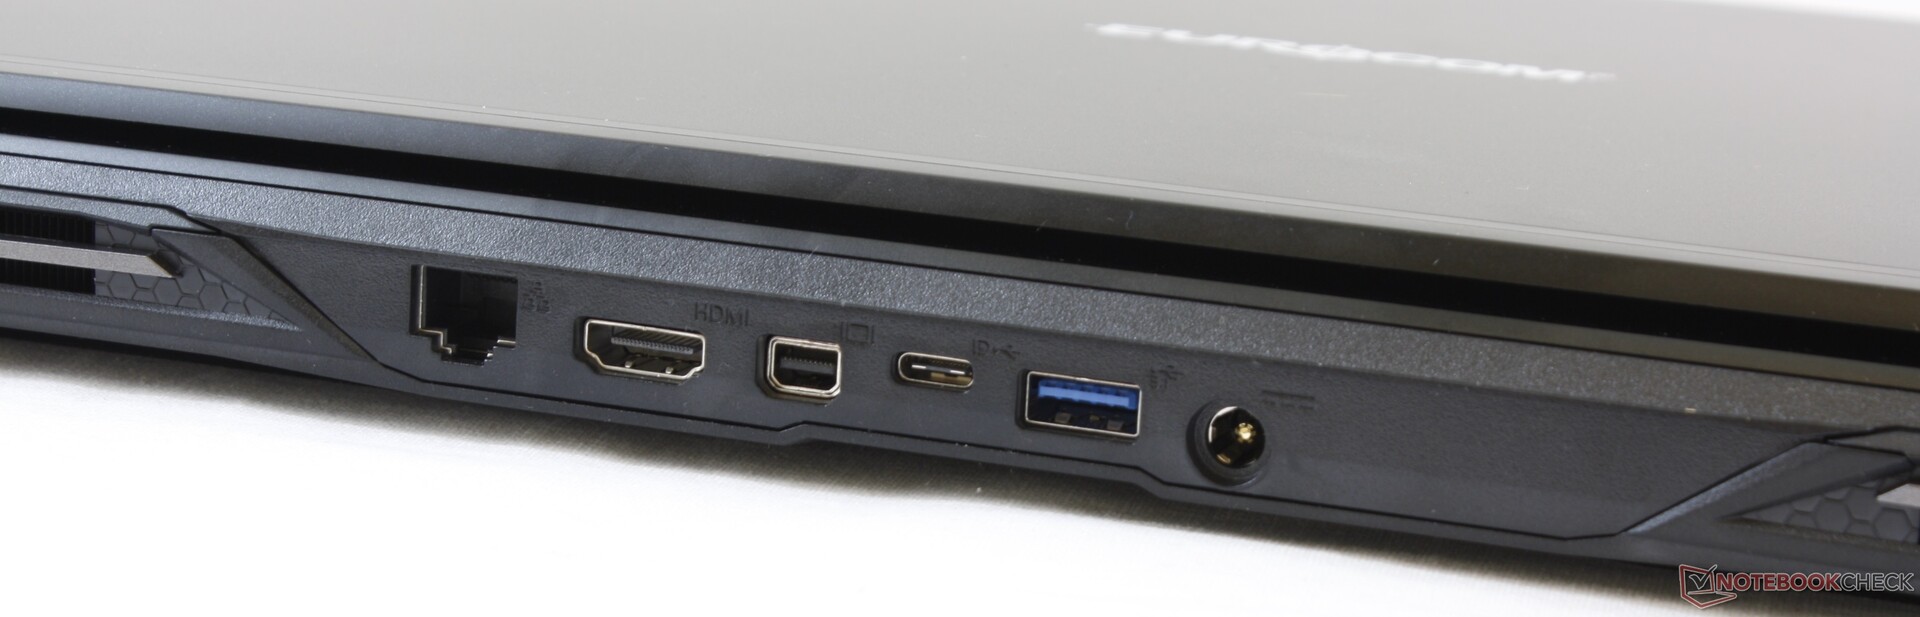
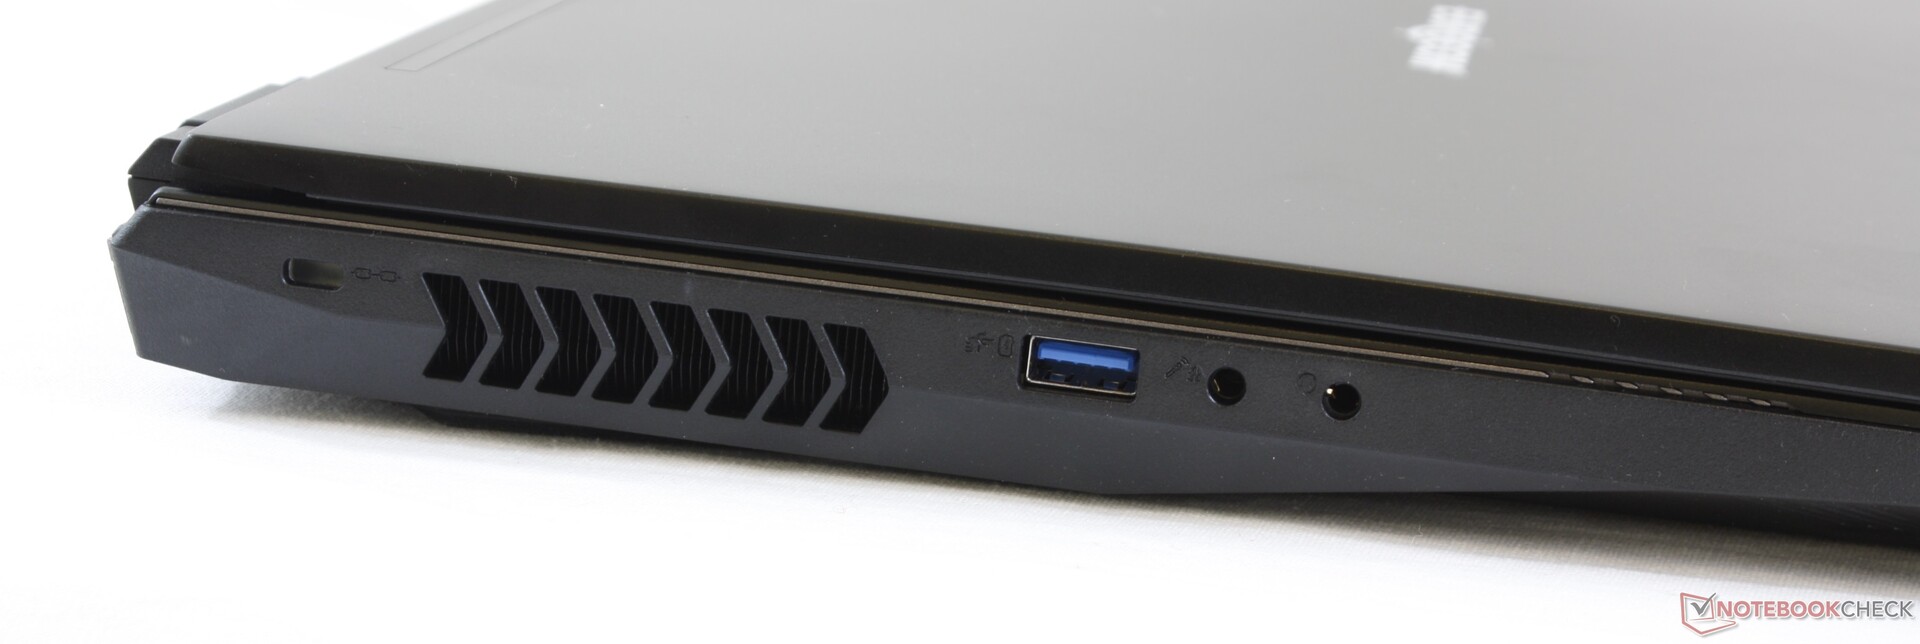
Most ports are located along the rear of the unit which can save on desk space at the cost of accessibility. We appreciate the smaller and less cumbersome AC adapter port as opposed to the thicker AC adapter cable for the Sky X7C. Competing systems like the Alienware m17 or MSI GE75 offer fewer ports than the Nightsky RX17.
SD Card Reader
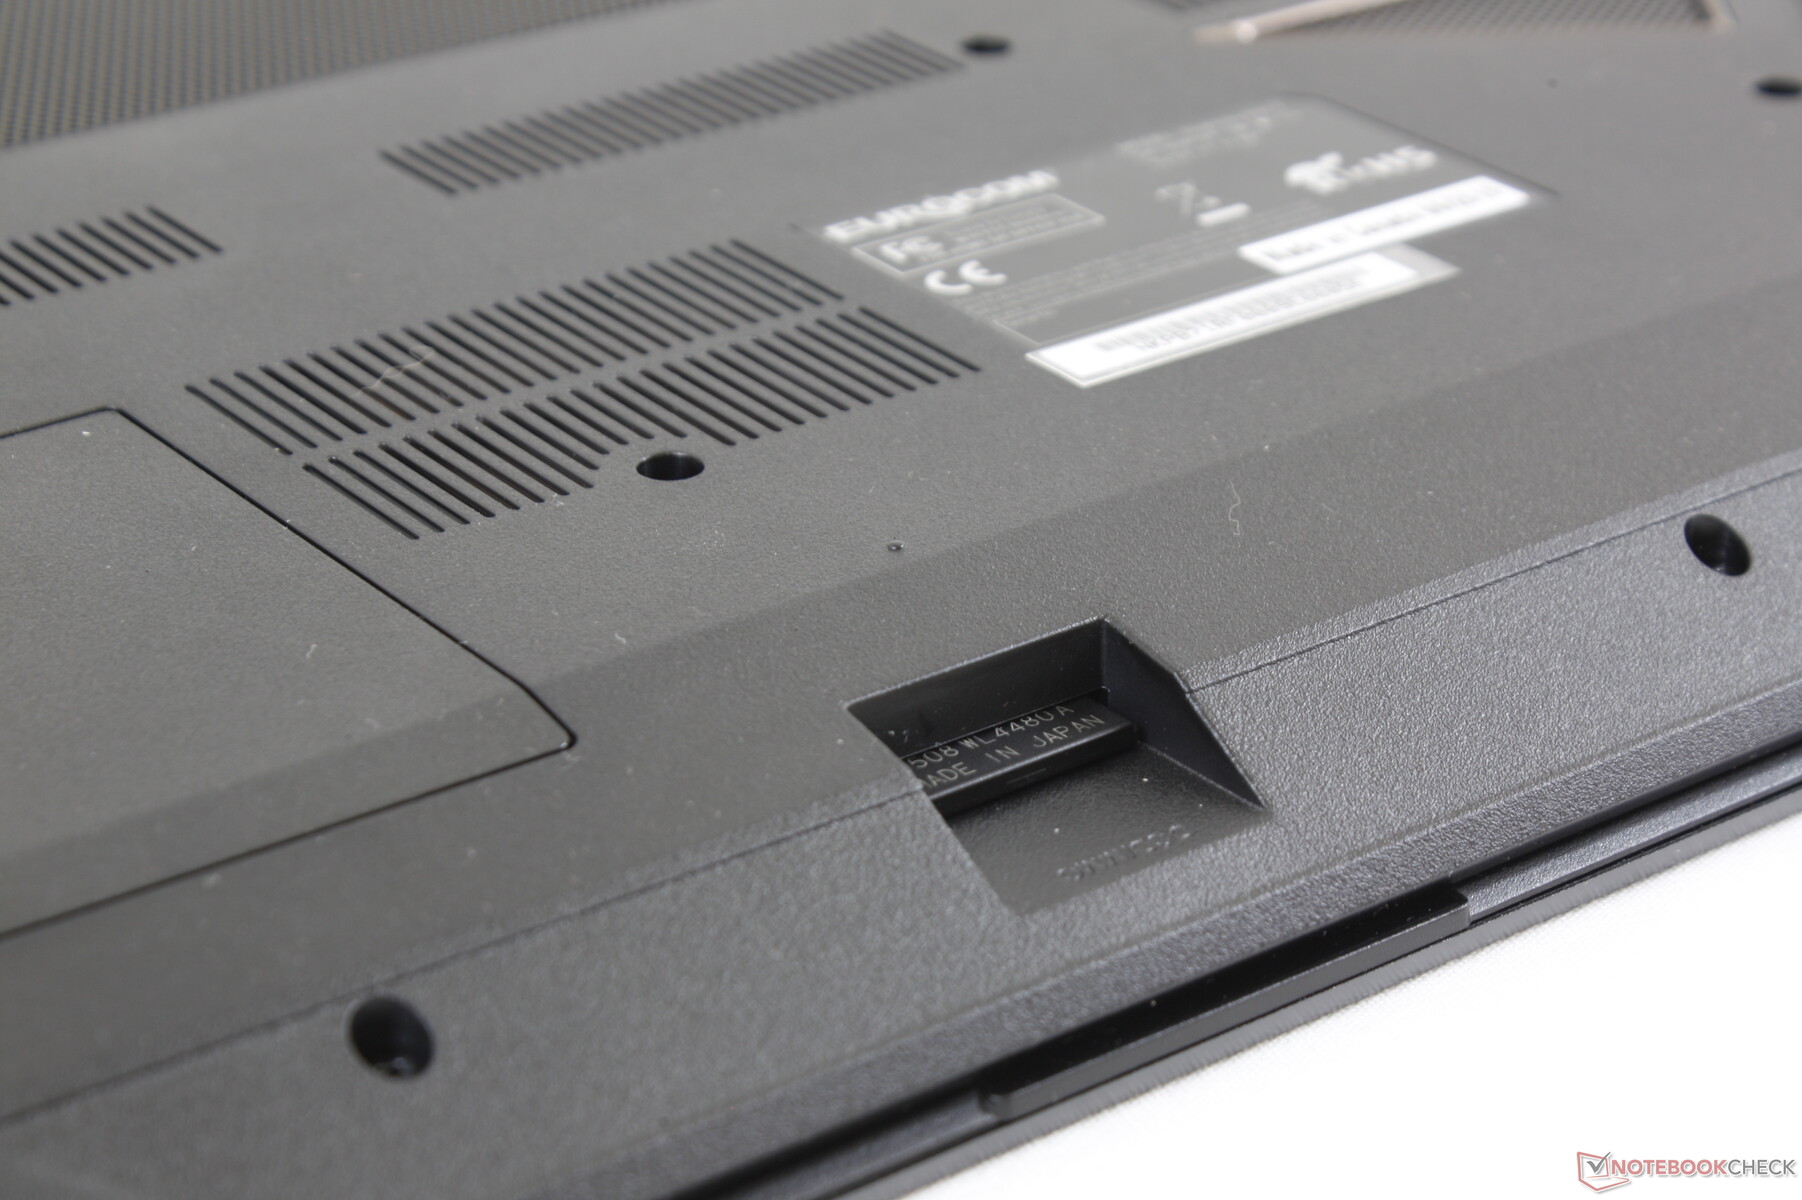
Users must flip the laptop upside-down in order to access the SD reader along the front edge. It's somewhat of an inconvenience especially for a gaming laptop of this screen size, but it's definitely better than having no card reader at all. Transfer rates are very fast from our UHS-II test card; moving 1 GB worth of pictures from card to desktop takes just under 6 seconds compared to 15 seconds on the Asus ZenBook 15 card reader.
| SD Card Reader | |
| average JPG Copy Test (av. of 3 runs) | |
| Eurocom Nightsky RX17 (Toshiba Exceria Pro SDXC 64 GB UHS-II) | |
| Eurocom Q8 (Toshiba Exceria Pro SDXC 64 GB UHS-II) | |
| Razer Blade Pro 17 RTX 2080 Max-Q (Toshiba Exceria Pro SDXC 64 GB UHS-II) | |
| Asus ZenBook 15 UX533FD (Toshiba Exceria Pro SDXC 64 GB UHS-II) | |
| maximum AS SSD Seq Read Test (1GB) | |
| Eurocom Nightsky RX17 (Toshiba Exceria Pro SDXC 64 GB UHS-II) | |
| Eurocom Q8 (Toshiba Exceria Pro SDXC 64 GB UHS-II) | |
| Razer Blade Pro 17 RTX 2080 Max-Q (Toshiba Exceria Pro SDXC 64 GB UHS-II) | |
| Asus ZenBook 15 UX533FD (Toshiba Exceria Pro SDXC 64 GB UHS-II) | |
Communication
WLAN and Bluetooth are provided by the Intel 9260, 9560, or Killer 1550 depending on the configuration. Our test unit comes equipped with the latter to be compatible with Killer-specific features as detailed here. Note that performance can be faster than what we've recorded below since our server setup is limited by a 1 Gbps line. Theoretical transfer rates can go up to 1.73 Gbps for the Intel 9560 or Killer 1550.
| Networking | |
| iperf3 transmit AX12 | |
| Razer Blade Pro 17 RTX 2080 Max-Q | |
| Eurocom Q8 | |
| Asus Zephyrus S GX701GX | |
| Eurocom Nightsky RX17 | |
| iperf3 receive AX12 | |
| Razer Blade Pro 17 RTX 2080 Max-Q | |
| Asus Zephyrus S GX701GX | |
| Eurocom Q8 | |
| Eurocom Nightsky RX17 | |
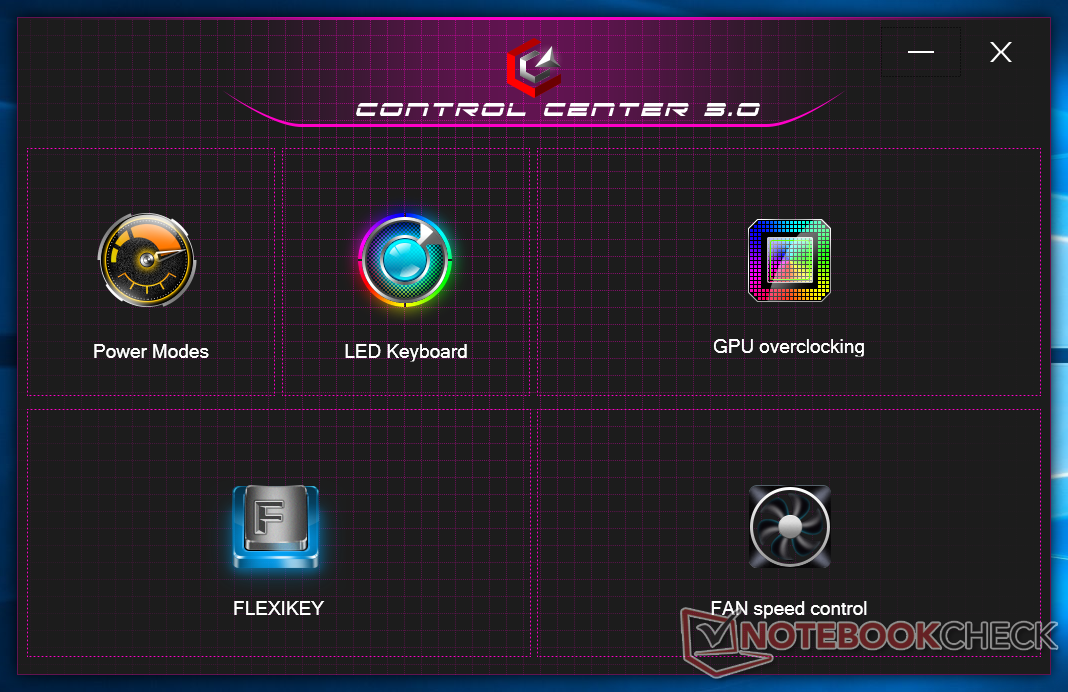
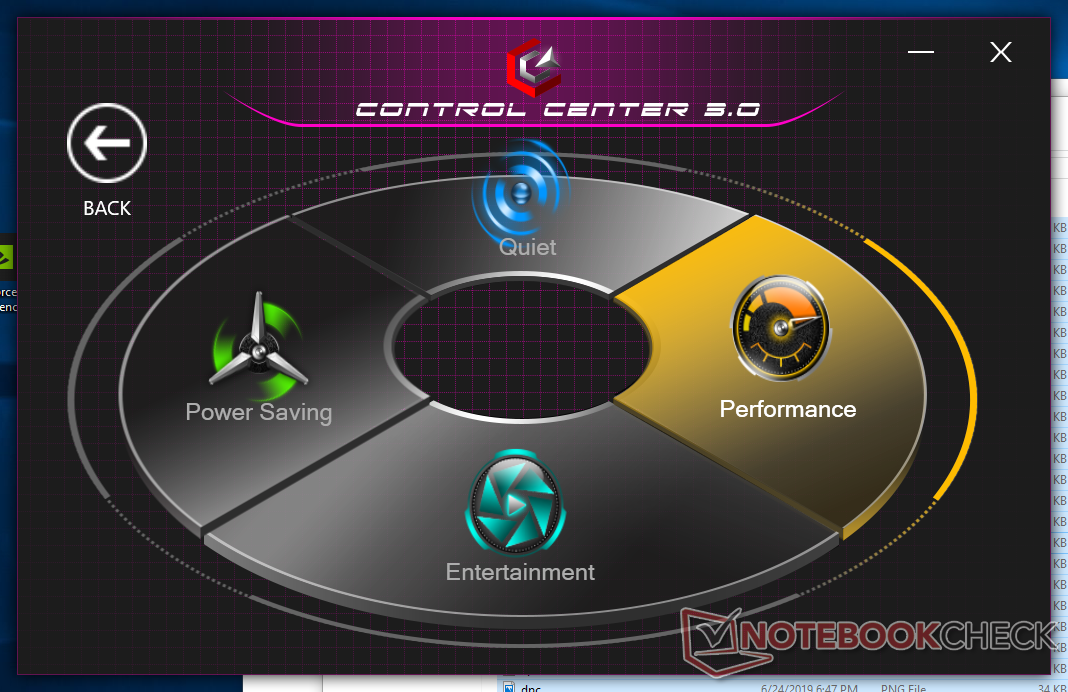
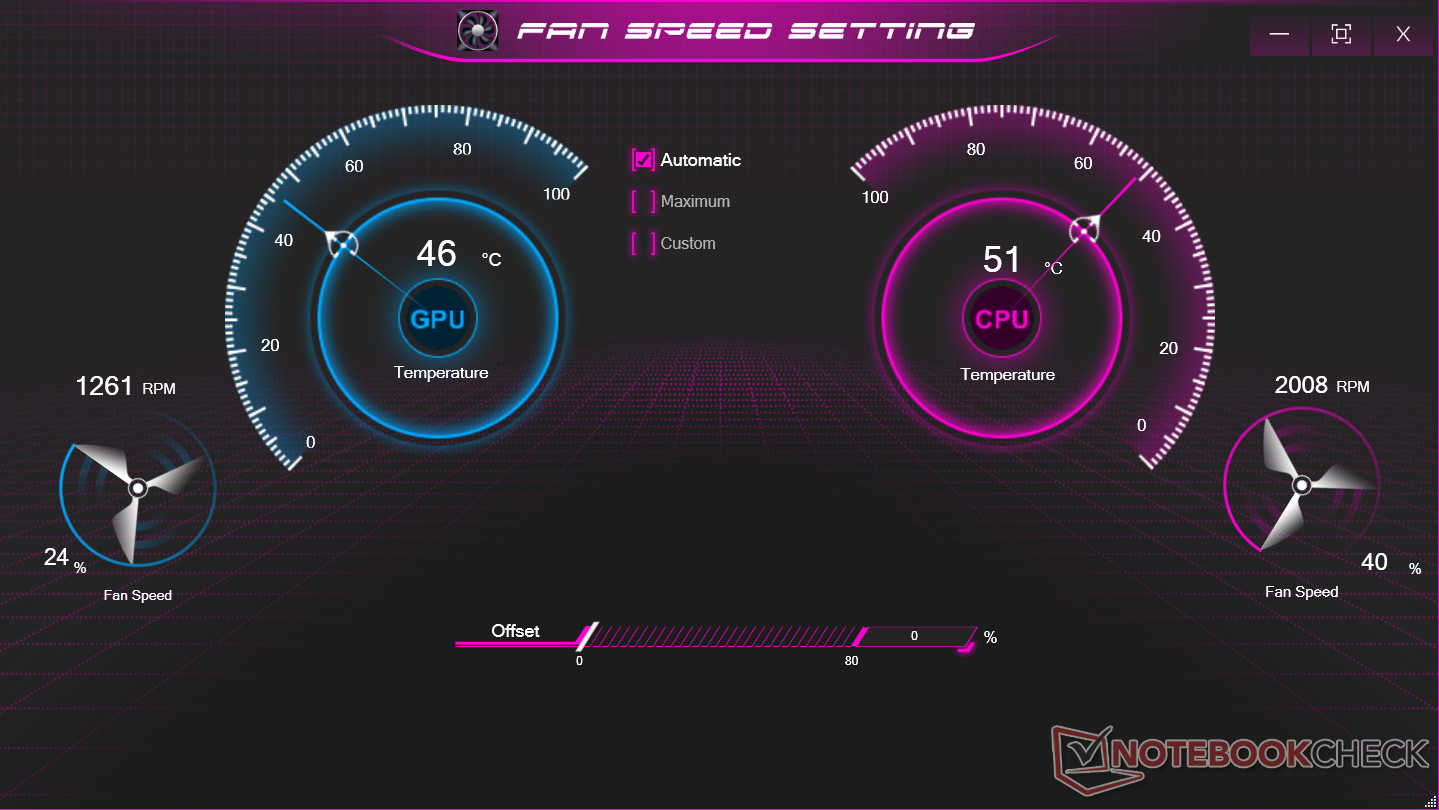
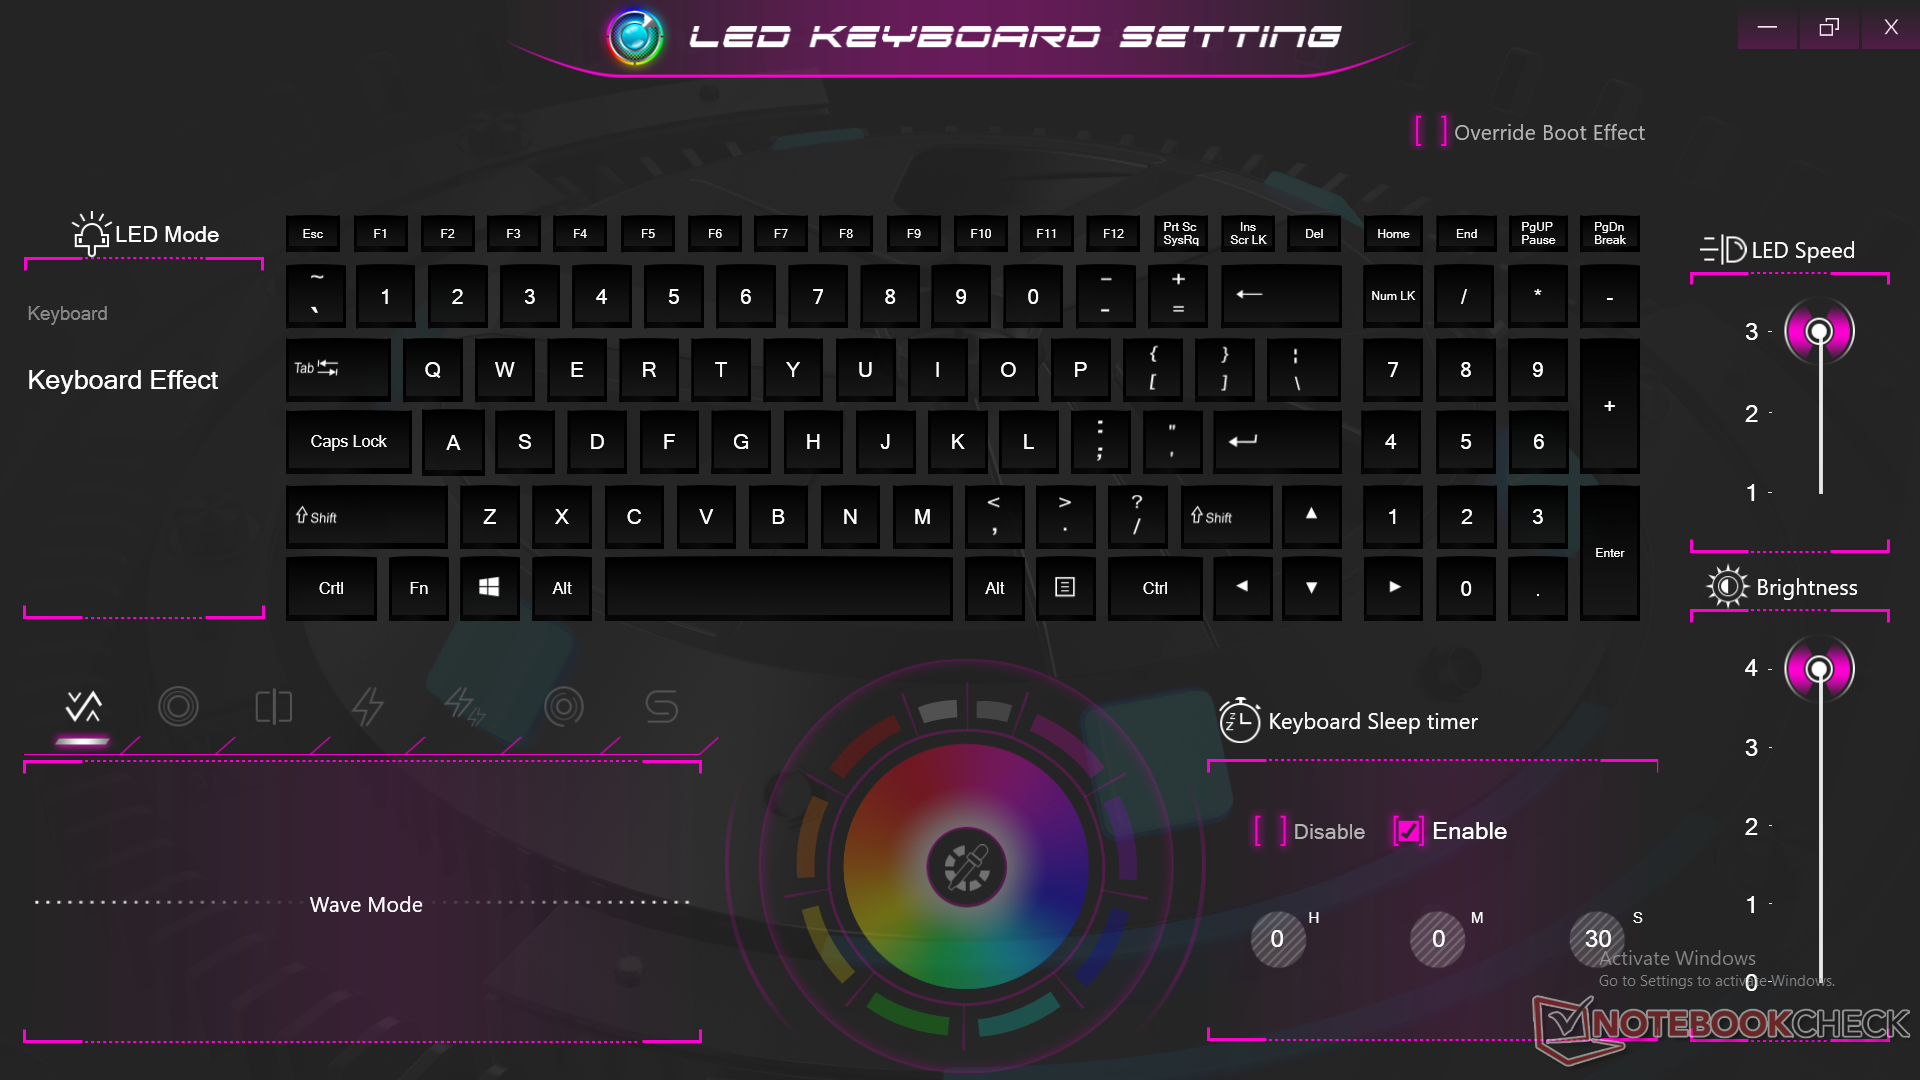
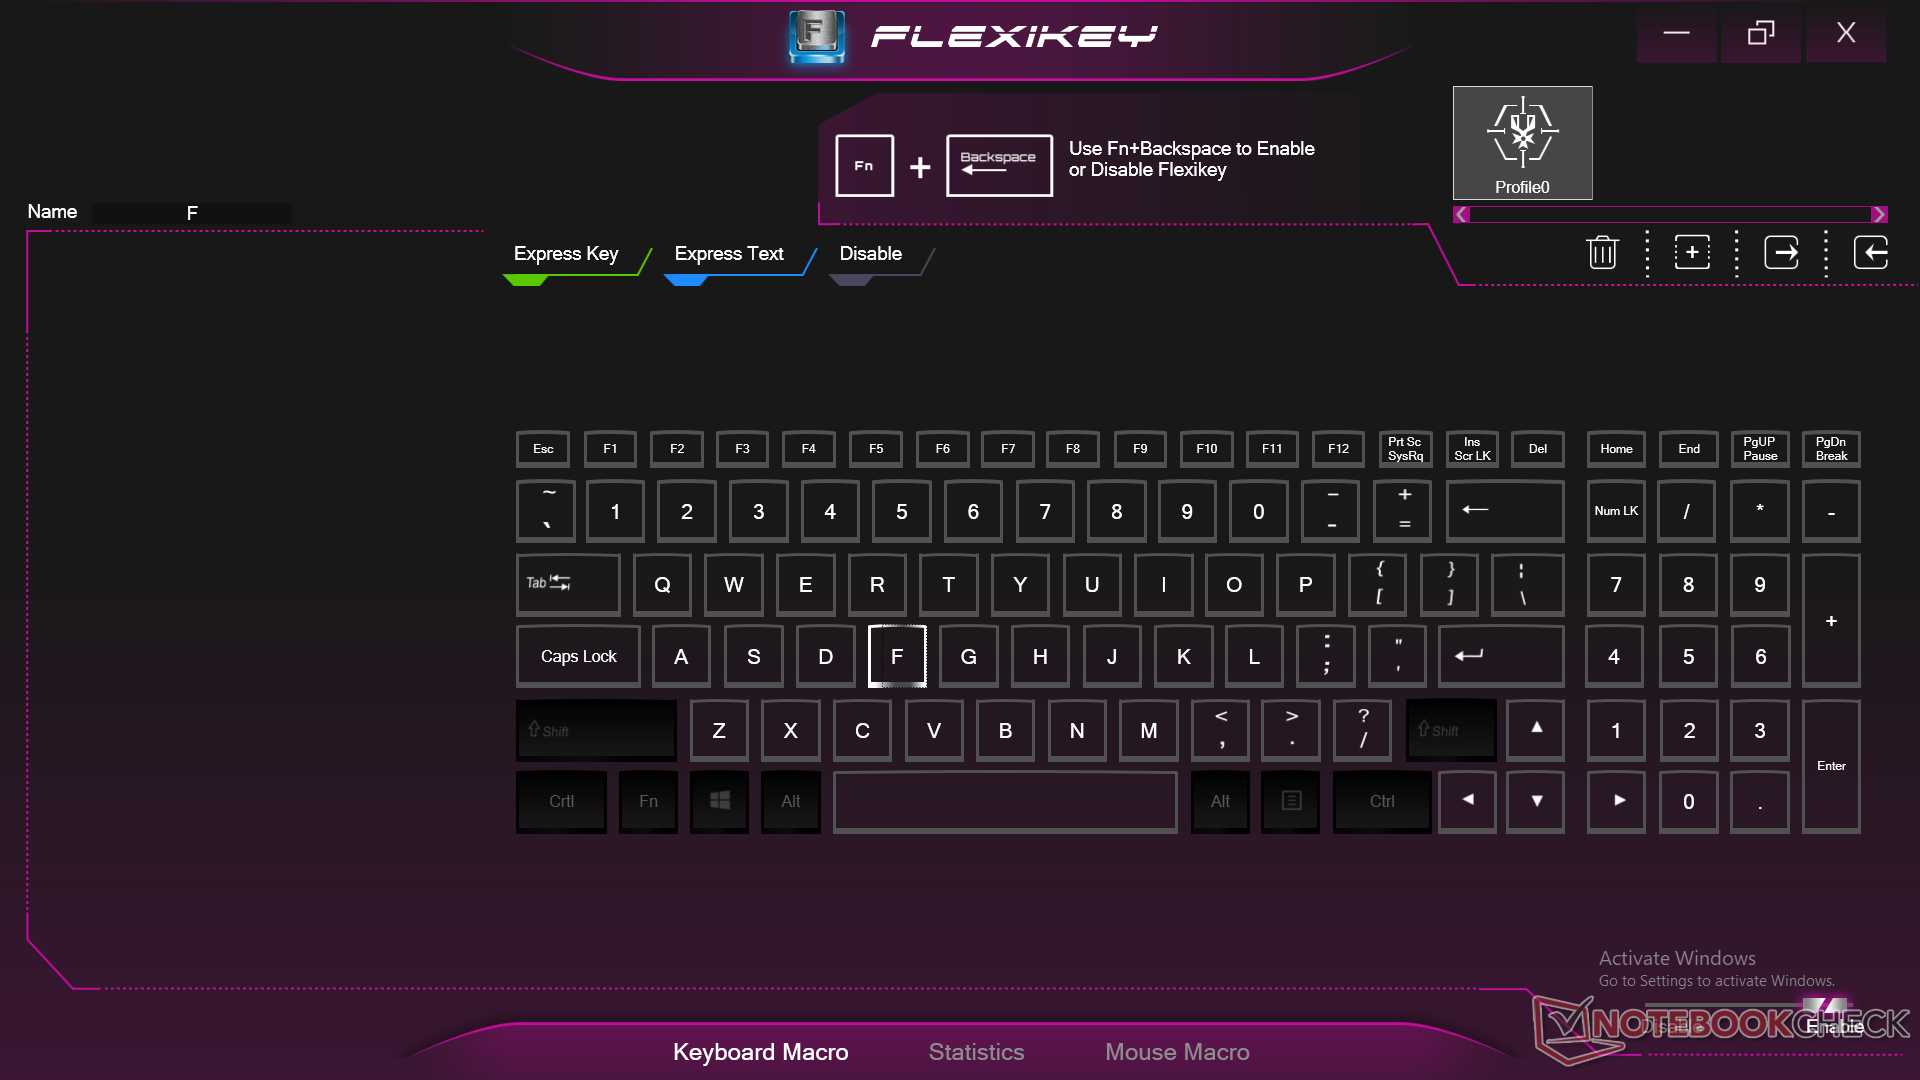
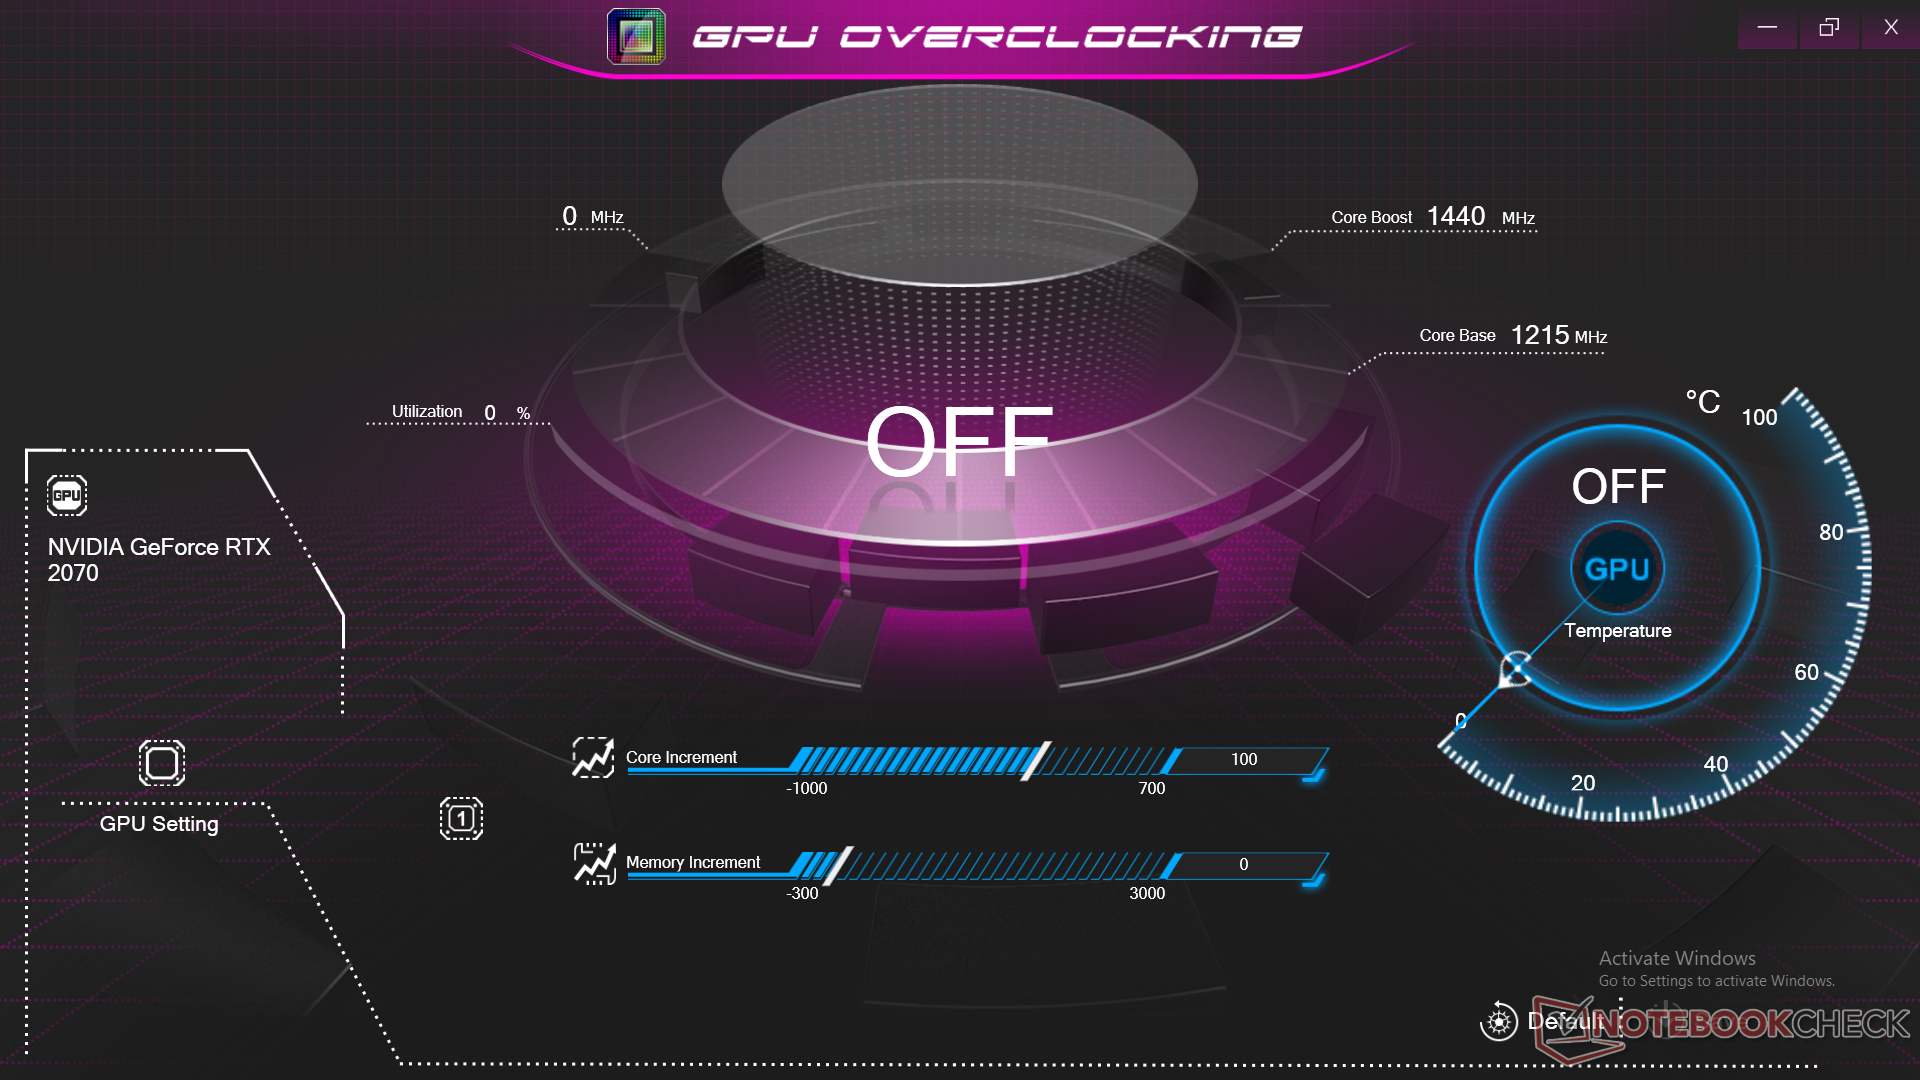
Control Center 3.0
Maintenance
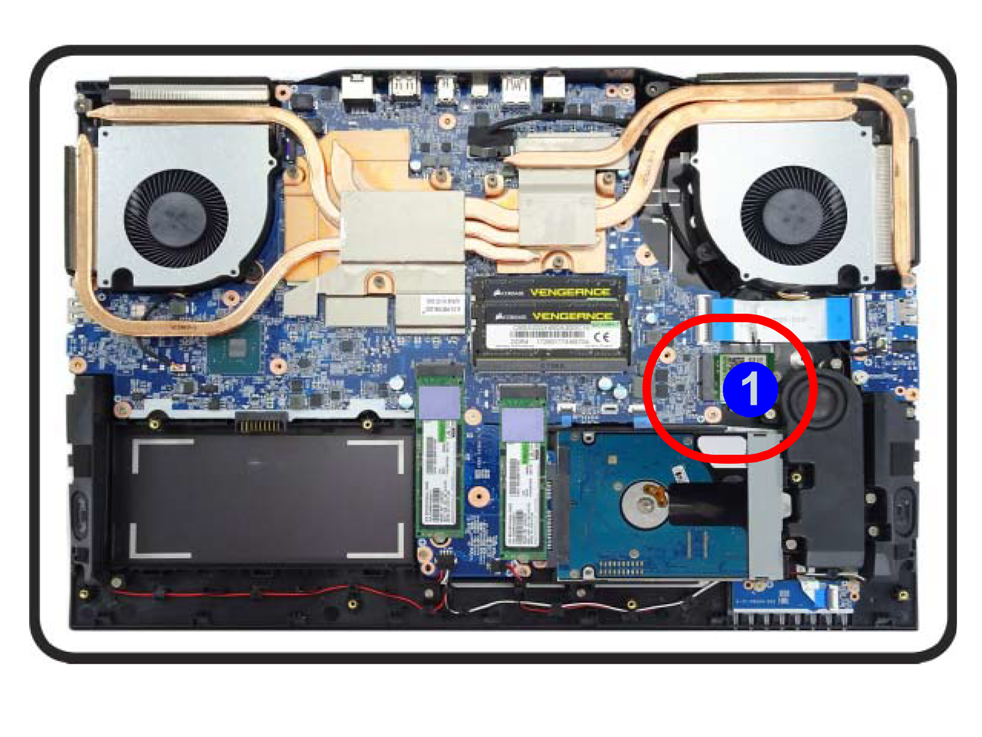
For a Clevo chassis, this is one of the harder models to service. Not only are there far too many screws (20!) securing the bottom panel, but users must also remove the keyboard and disconnect its ribbons before they can even pop off the bottom panel. This is a far cry from all other Clevo models we've tested thus far where 30 seconds with a basic Philips screwdriver would be all the time and effort you needed to begin servicing.
The included user's manual does not detail how to properly disassemble or upgrade the system. Nonetheless, users will have two M.2 2280 storage slots, two SODIMM slots, a 2.5-inch SATA III bay, and an M.2 WLAN slot.
Accessories and Warranty
Included extras are a user's guide and a drivers and utilities DVD. We find the latter to be pointless since the Nightsky RX17 does not integrate an optical drive and all drivers can be easily found on the official Eurocom website anyway.
The standard one-year limited warranty applies with options to extend up to three years for an additional $300.
Input Devices
Keyboard
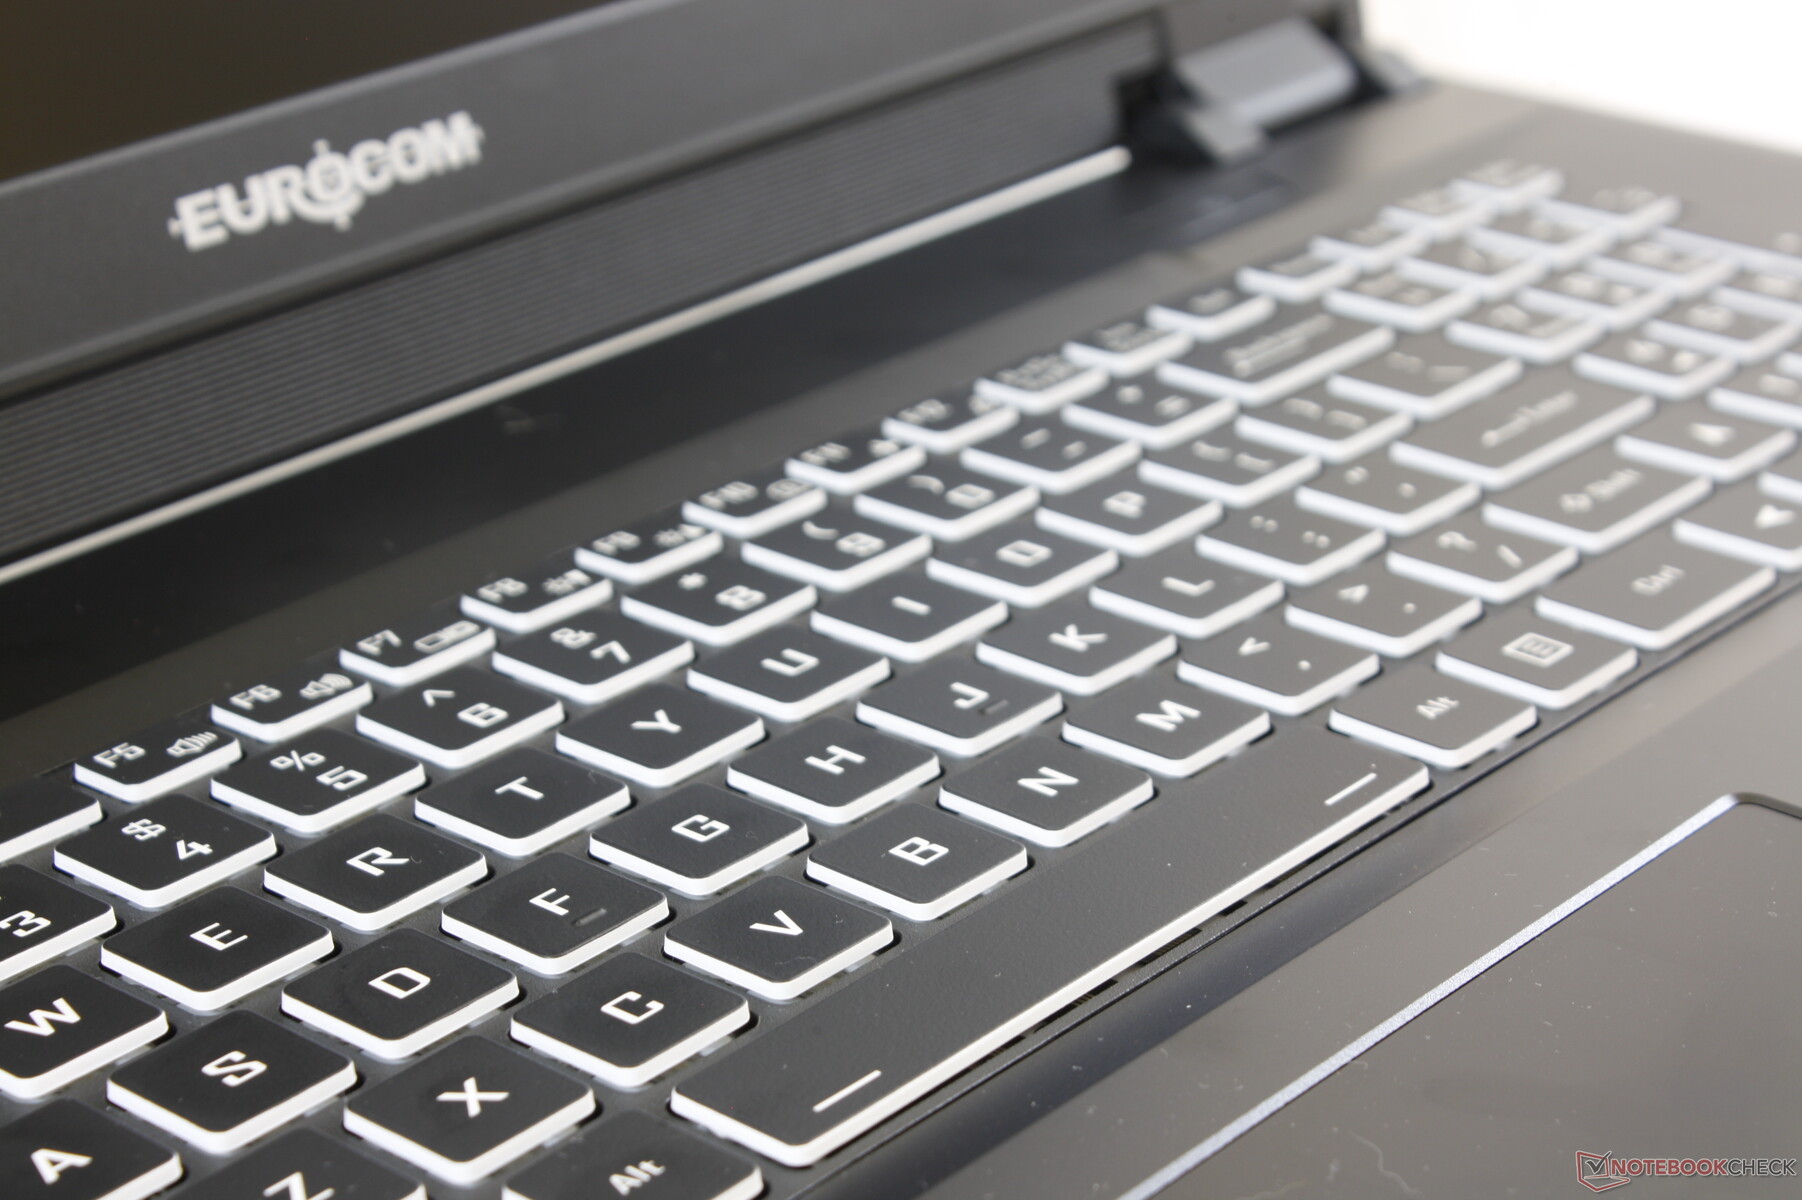
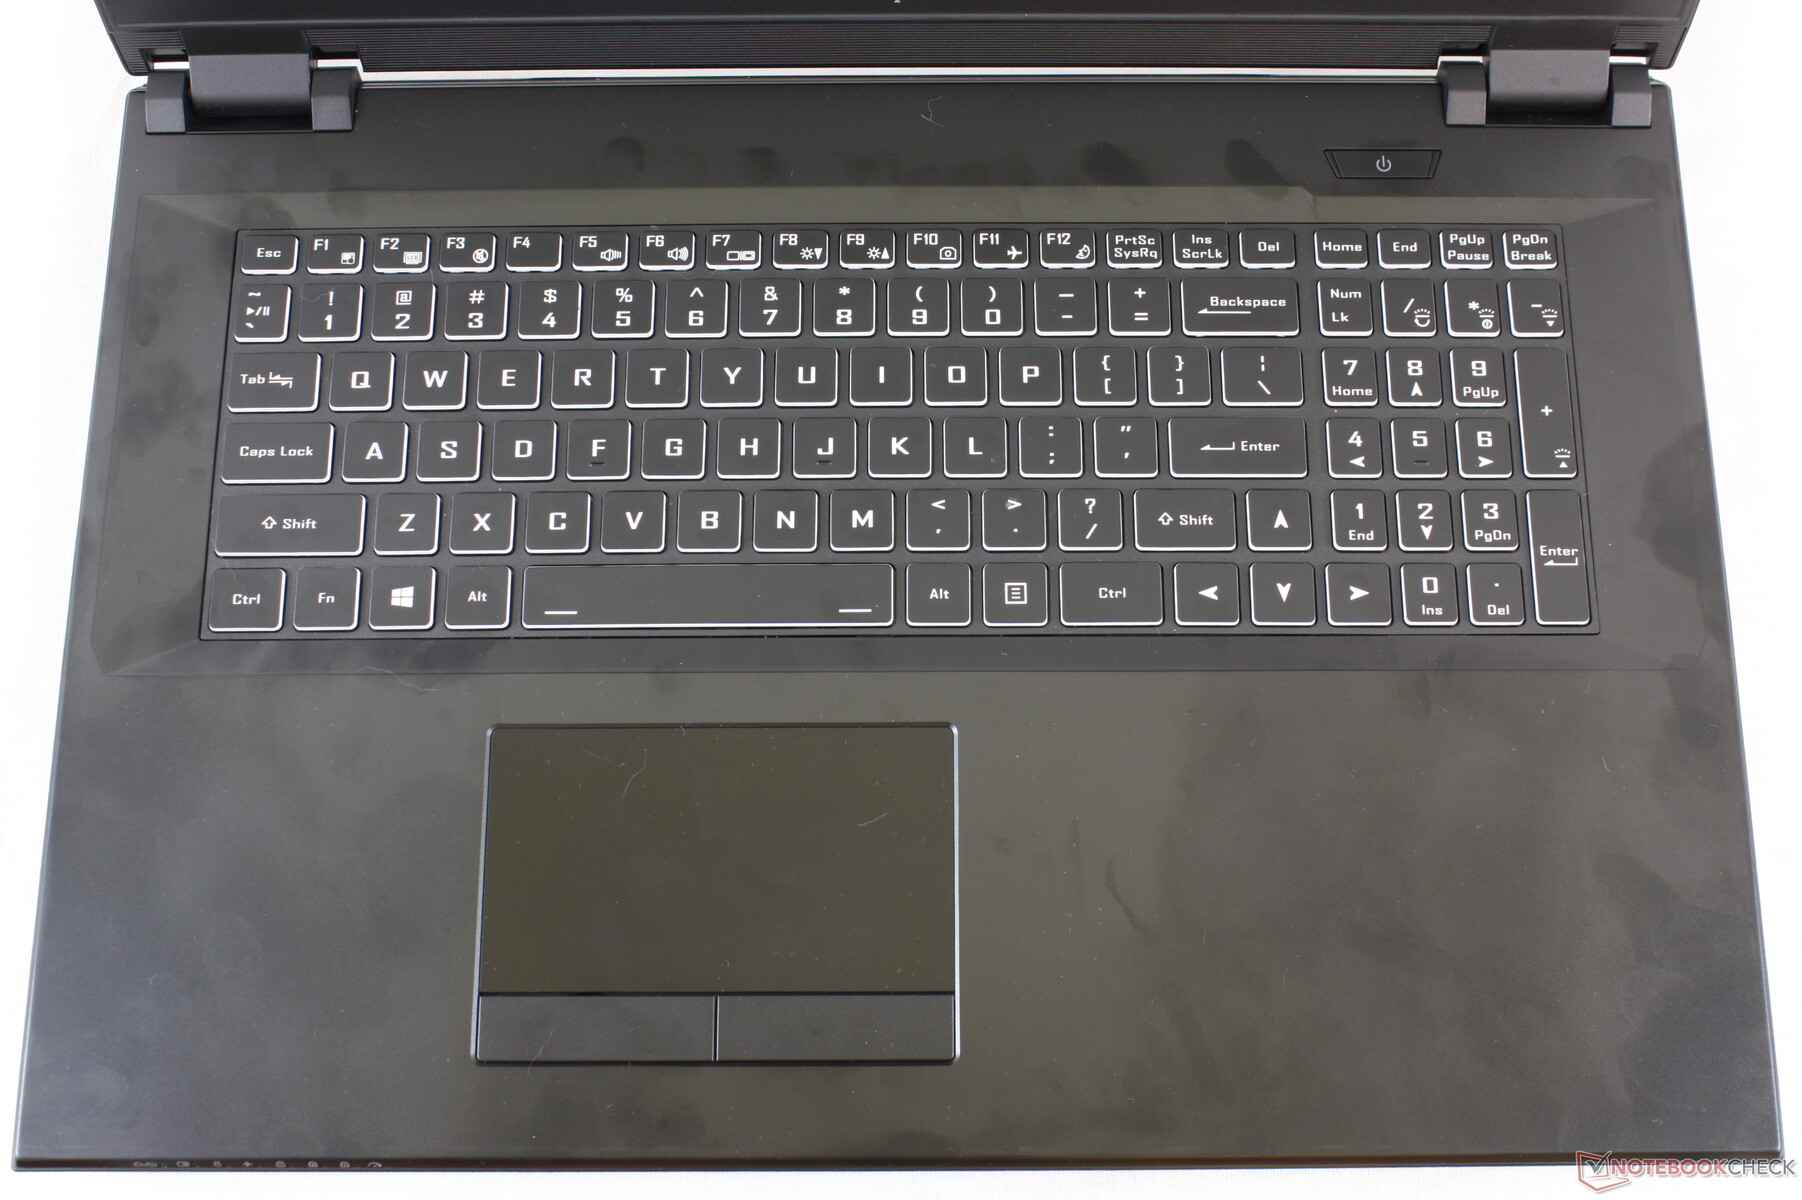
The per-key RGB keyboard feels a lot like the SteelSeries keyboards on most MSI laptops like the GE75 or GS75. Aspects like the moderate key clatter and satisfying click are very similar between them. We find the beveled keyboard on the larger Sky X7C to be firmer and quieter but not by enough to make the typing experience feel better or worse on the chiclet Nightsky RX17 keyboard.
Our main complaint stems from the cramped NumPad keys as they are narrower than the main QWERTY keys. While the size reduction would be understandable for a 15-inch laptop, 17-inch laptops like our Nightsky RX17 have the space for a full-size NumPad. The NumPad keys on the Sky X7C, for example, are the same size as the main QWERTY keys.
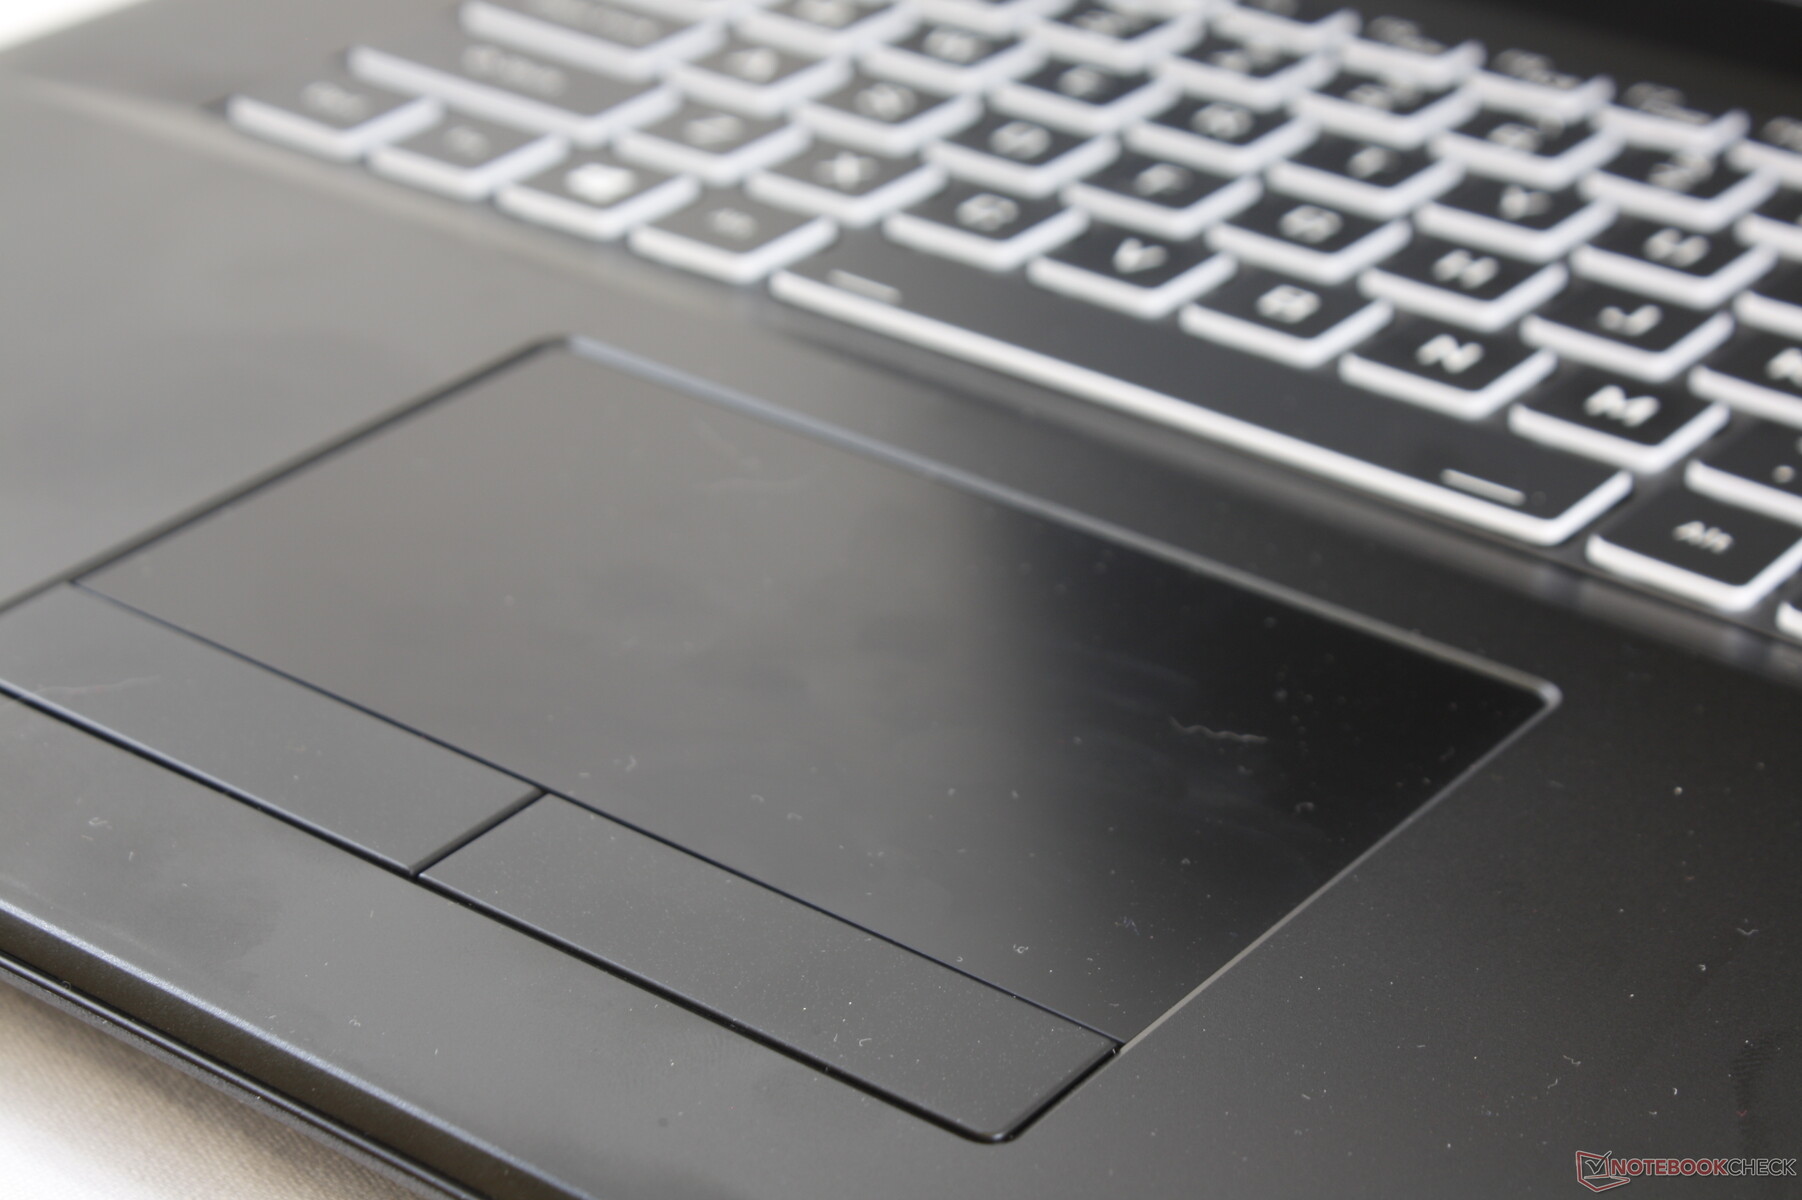
Touchpad
The trackpad surface (~10.8 x 6.2 cm) is unlike most trackpads we've seen because it's completely smooth with no bumps or roughness to it at all. The tactile experience can be reproduced by putting your smartphone on a flat surface and gliding your finger back and forth across the glass screen; you will notice that resistance is not consistent which makes for a poorer experience when translated onto a laptop clickpad. It's especially difficult to hold the cursor completely still since there is little traction when gliding very slowly. Early Gigabyte Aorus laptops took a similar approach to its trackpad before eventually moving on to a textured surface for later redesigns.
The dedicated mouse keys are very quiet with soft feedback and moderate travel when pressed in contrast to the shallower and louder keys of the MSI GT73. Dedicated mouse keys allow for more accurate clicking and dragging and dropping when compared to clickpads.
Display
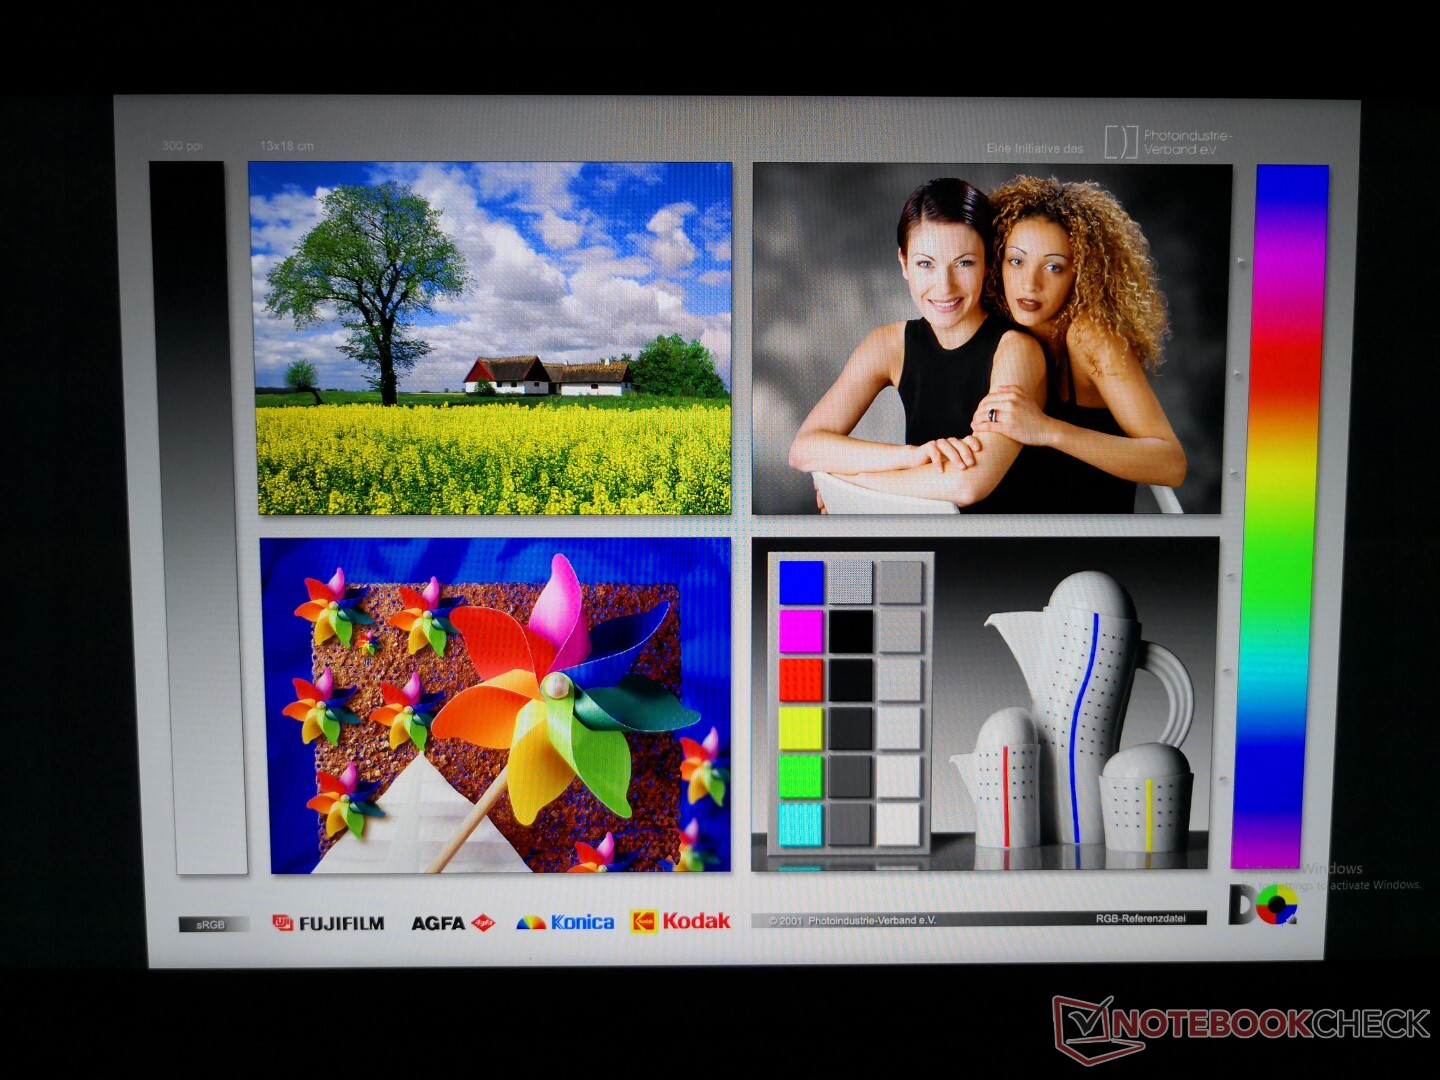
The BOE NV173FHM-N44 IPS panel on our unit can also be found on the Schenker XMG Neo 17 and so both of these systems share nearly the same response times, contrast levels, and color coverage. This particular panel is notable for its fast 144 Hz refresh rate for smoother movements both in and out of gaming. It's difficult to revert back to 60 Hz displays once you become accustomed to high refresh rate panels.
Display quality is significantly better than the AU Optronics TN panel on last year's Eurocom Q8. Contrast is higher, gamut is wider, and colors are both deeper and more accurate. The display is slightly dimmer this time around to be on equal footing with most other 17-inch gaming laptops like the Zephyrus S GX701 and Legion Y740-17ICH. While response times are still fast to minimize ghosting, they aren't nearly as fast as the latest 3 ms panels on some 15.6-inch laptops like the MSI GS65.
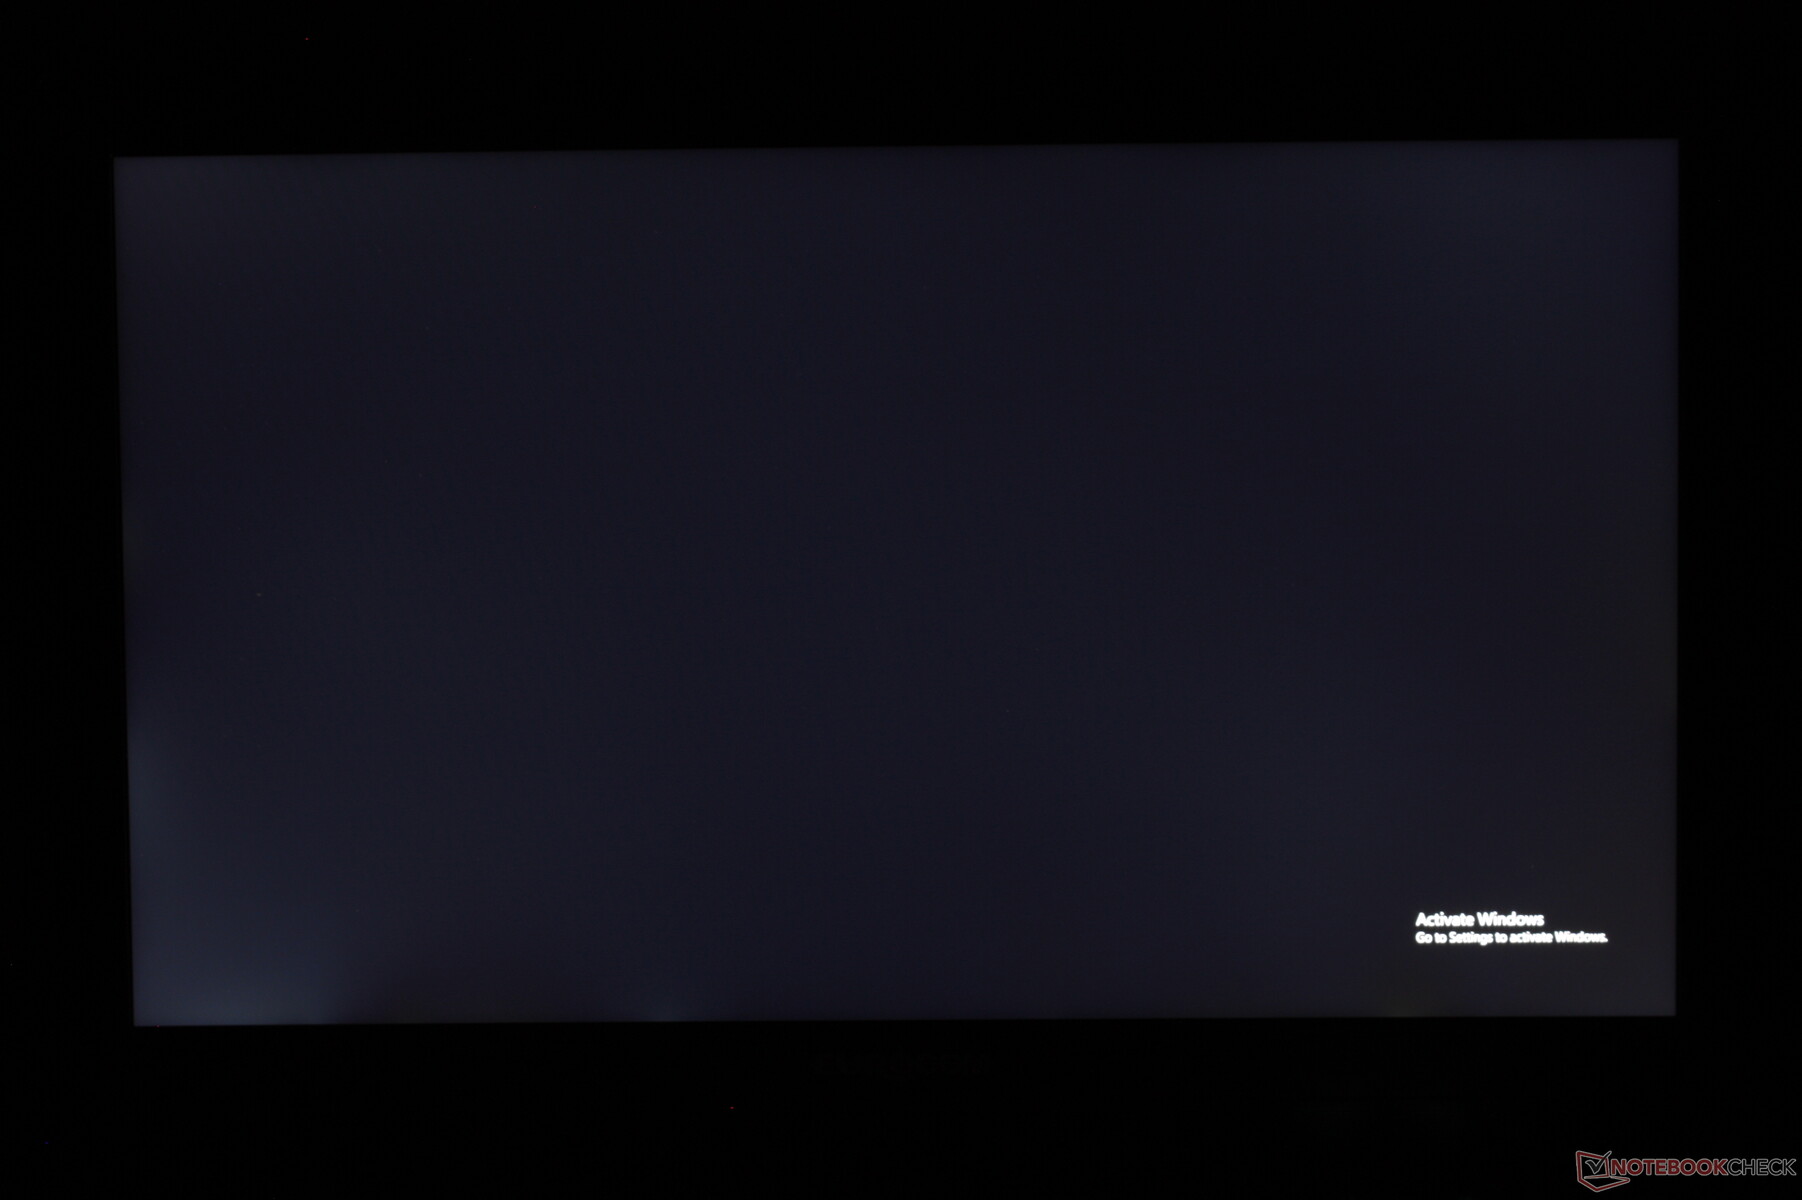
The screen is every-so-slightly grainy as to be expected from a matte panel when compared to glossy alternatives. There is light-moderate uneven backlight bleeding along the bottom left corner of our unit that only becomes noticeable during the initial dark bootup screen or when viewing videos with black borders.

| |||||||||||||||||||||||||
Brightness Distribution: 90 %
Center on Battery: 298.4 cd/m²
Contrast: 995:1 (Black: 0.3 cd/m²)
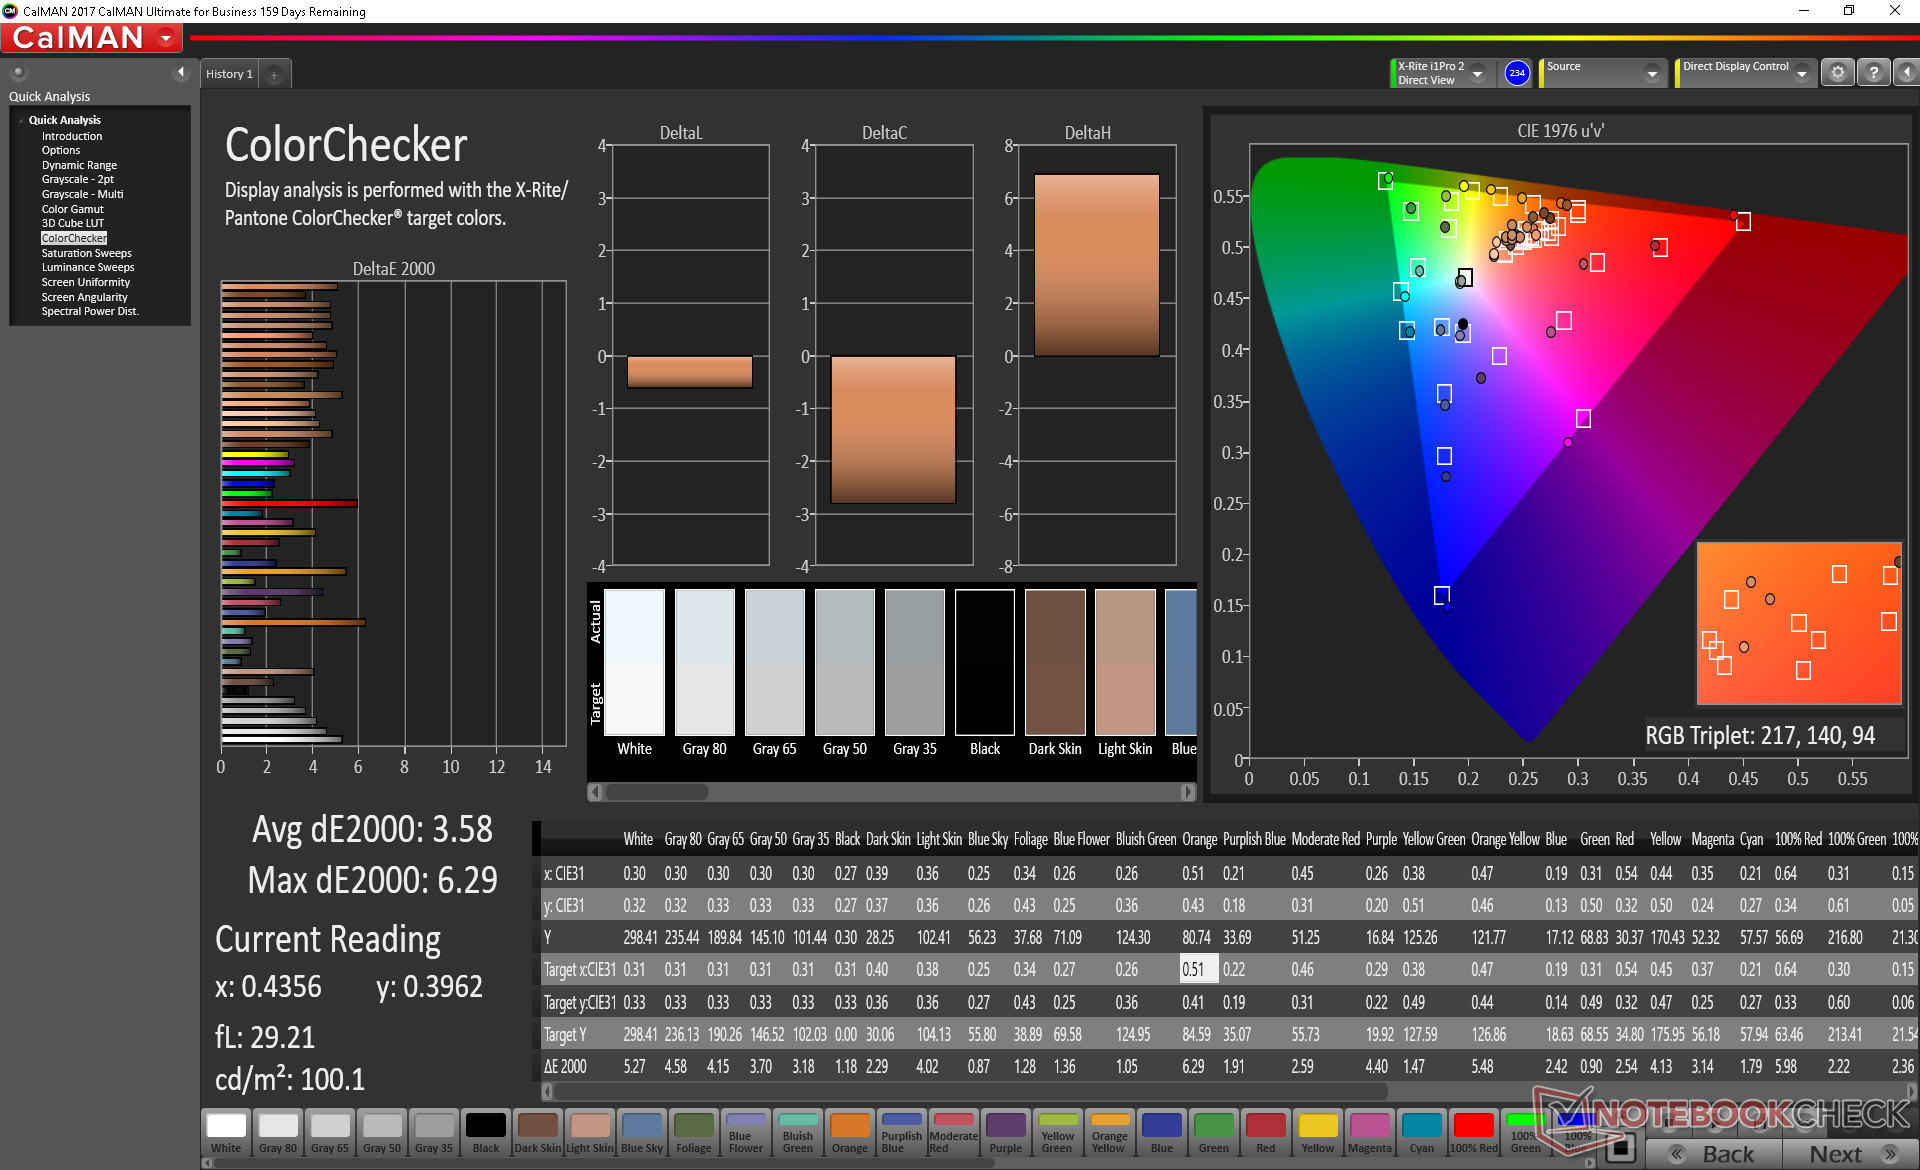
ΔE ColorChecker Calman: 3.58 | ∀{0.5-29.43 Ø4.71}
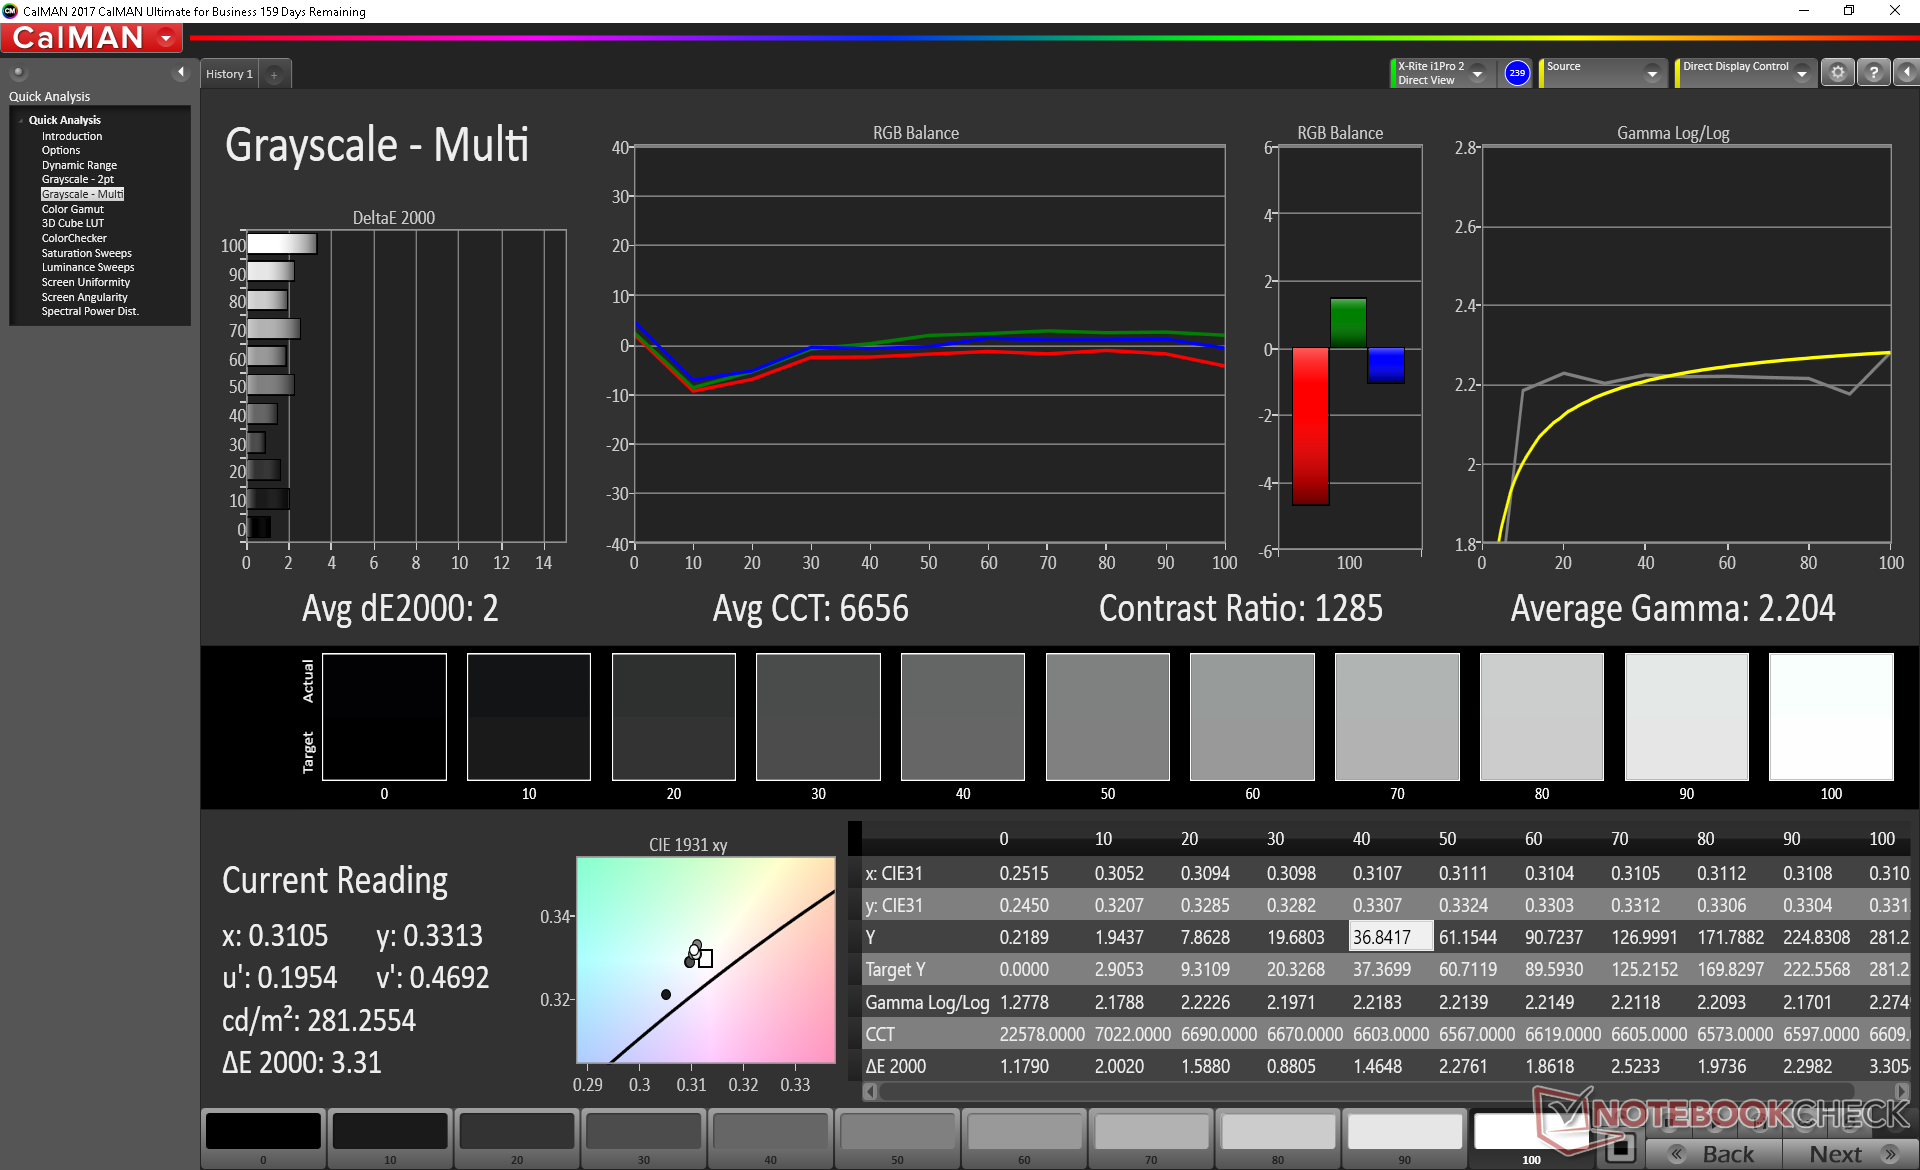
calibrated: 2.82
ΔE Greyscale Calman: 3.1 | ∀{0.09-98 Ø4.96}
92.7% sRGB (Argyll 1.6.3 3D)
60.2% AdobeRGB 1998 (Argyll 1.6.3 3D)
67.2% AdobeRGB 1998 (Argyll 3D)
93.1% sRGB (Argyll 3D)
66.1% Display P3 (Argyll 3D)
Gamma: 2.24
CCT: 7064 K
| Eurocom Nightsky RX17 BOE NV173FHM-N44, IPS, 17.3", 1920x1080 | Razer Blade Pro 17 RTX 2080 Max-Q AU Optronics B173HAN04.0, IPS, 17.3", 1920x1080 | Asus Zephyrus S GX701GX B173HAN04.0 (AUO409D), IPS, 17.3", 1920x1080 | MSI GS75 8SG Stealth N173HCE-G33 (CMN175C), IPS, 17.3", 1920x1080 | Eurocom Q8 AU Optronics B173QTN01.0, Dell P/N WJGD4, TN LED, 17.3", 2560x1440 | Lenovo Legion Y740-17ICH AU Optronics B173HAN03.2, IPS, 17.3", 1920x1080 | |
|---|---|---|---|---|---|---|
| Display | -7% | -5% | -2% | -12% | -3% | |
| Display P3 Coverage (%) | 66.1 | 60.6 -8% | 62.9 -5% | 63.6 -4% | 58.7 -11% | 64 -3% |
| sRGB Coverage (%) | 93.1 | 89 -4% | 87.8 -6% | 95.4 2% | 81 -13% | 90.4 -3% |
| AdobeRGB 1998 Coverage (%) | 67.2 | 62.1 -8% | 63.9 -5% | 65.5 -3% | 58.9 -12% | 64.8 -4% |
| Response Times | 34% | 32% | 31% | -10% | -9% | |
| Response Time Grey 50% / Grey 80% * (ms) | 16.4 ? | 6.8 ? 59% | 7.2 ? 56% | 7.6 ? 54% | 21.6 ? -32% | 15.6 ? 5% |
| Response Time Black / White * (ms) | 10.4 ? | 9.6 ? 8% | 9.6 ? 8% | 9.6 ? 8% | 9 ? 13% | 12.8 ? -23% |
| PWM Frequency (Hz) | 990 ? | 25510 ? | ||||
| Screen | 4% | 17% | 26% | -74% | -22% | |
| Brightness middle (cd/m²) | 298.4 | 299.3 0% | 288 -3% | 355 19% | 367.9 23% | 299.1 0% |
| Brightness (cd/m²) | 287 | 294 2% | 287 0% | 327 14% | 346 21% | 273 -5% |
| Brightness Distribution (%) | 90 | 94 4% | 91 1% | 85 -6% | 84 -7% | 81 -10% |
| Black Level * (cd/m²) | 0.3 | 0.29 3% | 0.2 33% | 0.26 13% | 0.55 -83% | 0.27 10% |
| Contrast (:1) | 995 | 1032 4% | 1440 45% | 1365 37% | 669 -33% | 1108 11% |
| Colorchecker dE 2000 * | 3.58 | 2.55 29% | 2.33 35% | 1.54 57% | 9.86 -175% | 5.07 -42% |
| Colorchecker dE 2000 max. * | 6.29 | 4.73 25% | 5.34 15% | 3 52% | 17.56 -179% | 10.55 -68% |
| Colorchecker dE 2000 calibrated * | 2.82 | 2.9 -3% | 2.47 12% | 0.77 73% | 4.43 -57% | 3.31 -17% |
| Greyscale dE 2000 * | 3.1 | 3.5 -13% | 1.19 62% | 2.19 29% | 12.4 -300% | 6.8 -119% |
| Gamma | 2.24 98% | 2.28 96% | 2.41 91% | 2.42 91% | 2.09 105% | 2.46 89% |
| CCT | 7064 92% | 7101 92% | 6710 97% | 6893 94% | 11064 59% | 7805 83% |
| Color Space (Percent of AdobeRGB 1998) (%) | 60.2 | 57 -5% | 57 -5% | 61 1% | 52.5 -13% | 58.5 -3% |
| Color Space (Percent of sRGB) (%) | 92.7 | 88.7 -4% | 88 -5% | 95 2% | 80.5 -13% | 89.9 -3% |
| Total Average (Program / Settings) | 10% /
6% | 15% /
15% | 18% /
22% | -32% /
-54% | -11% /
-17% |
* ... smaller is better
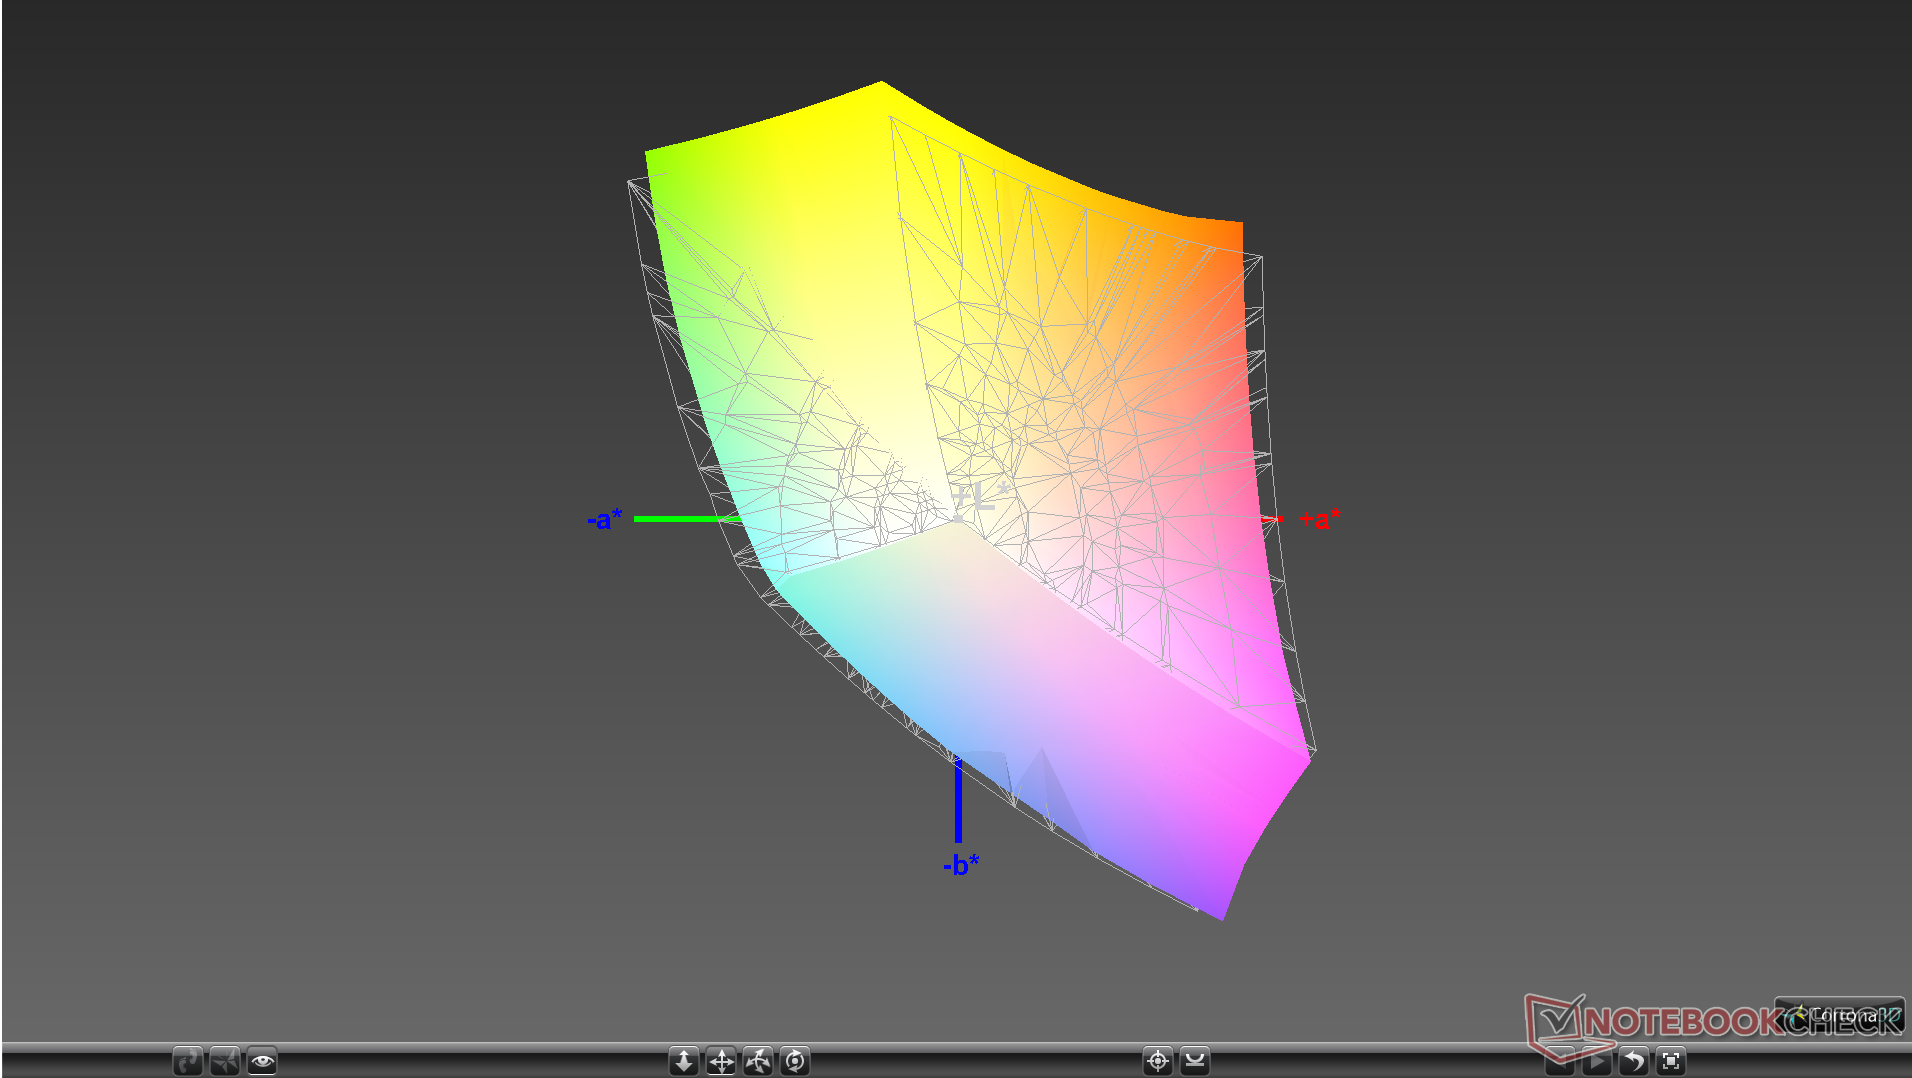
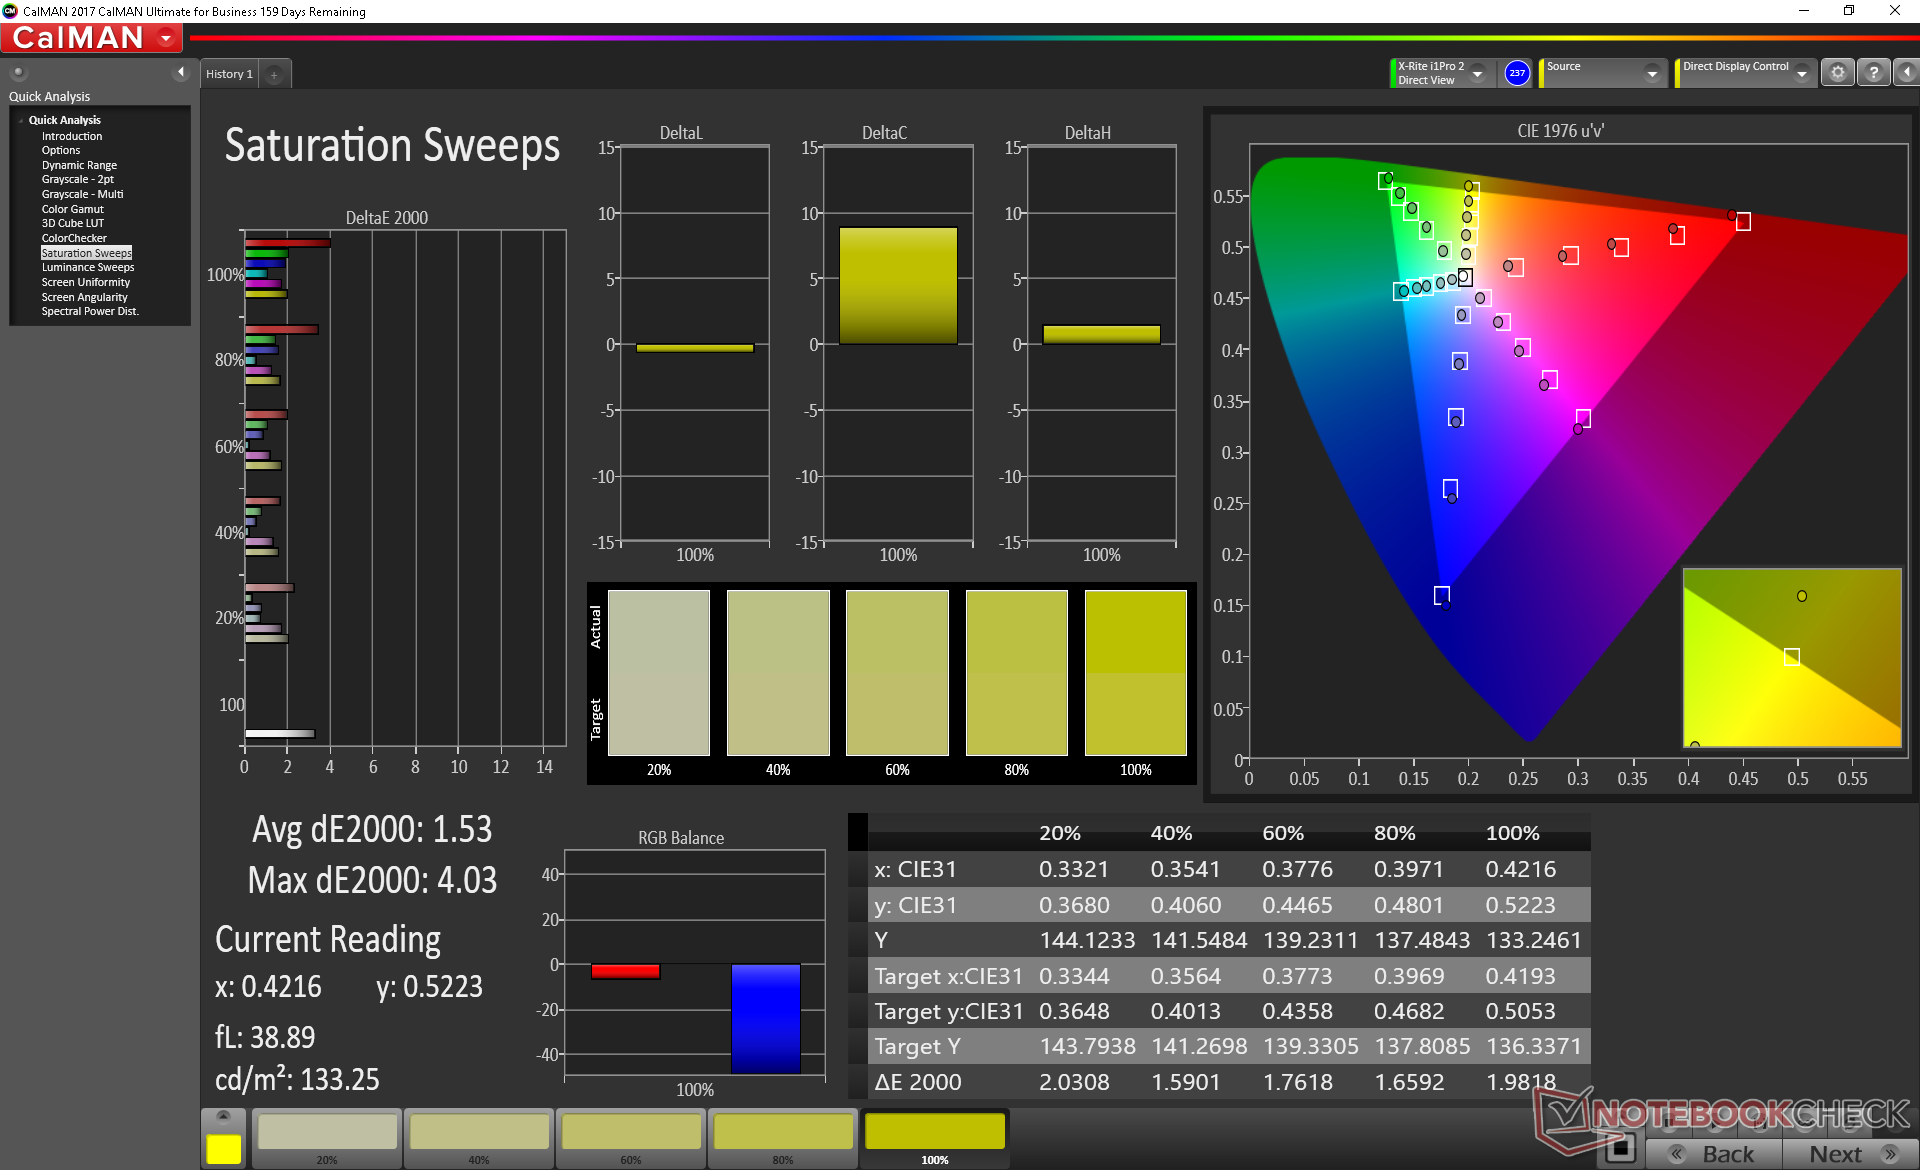
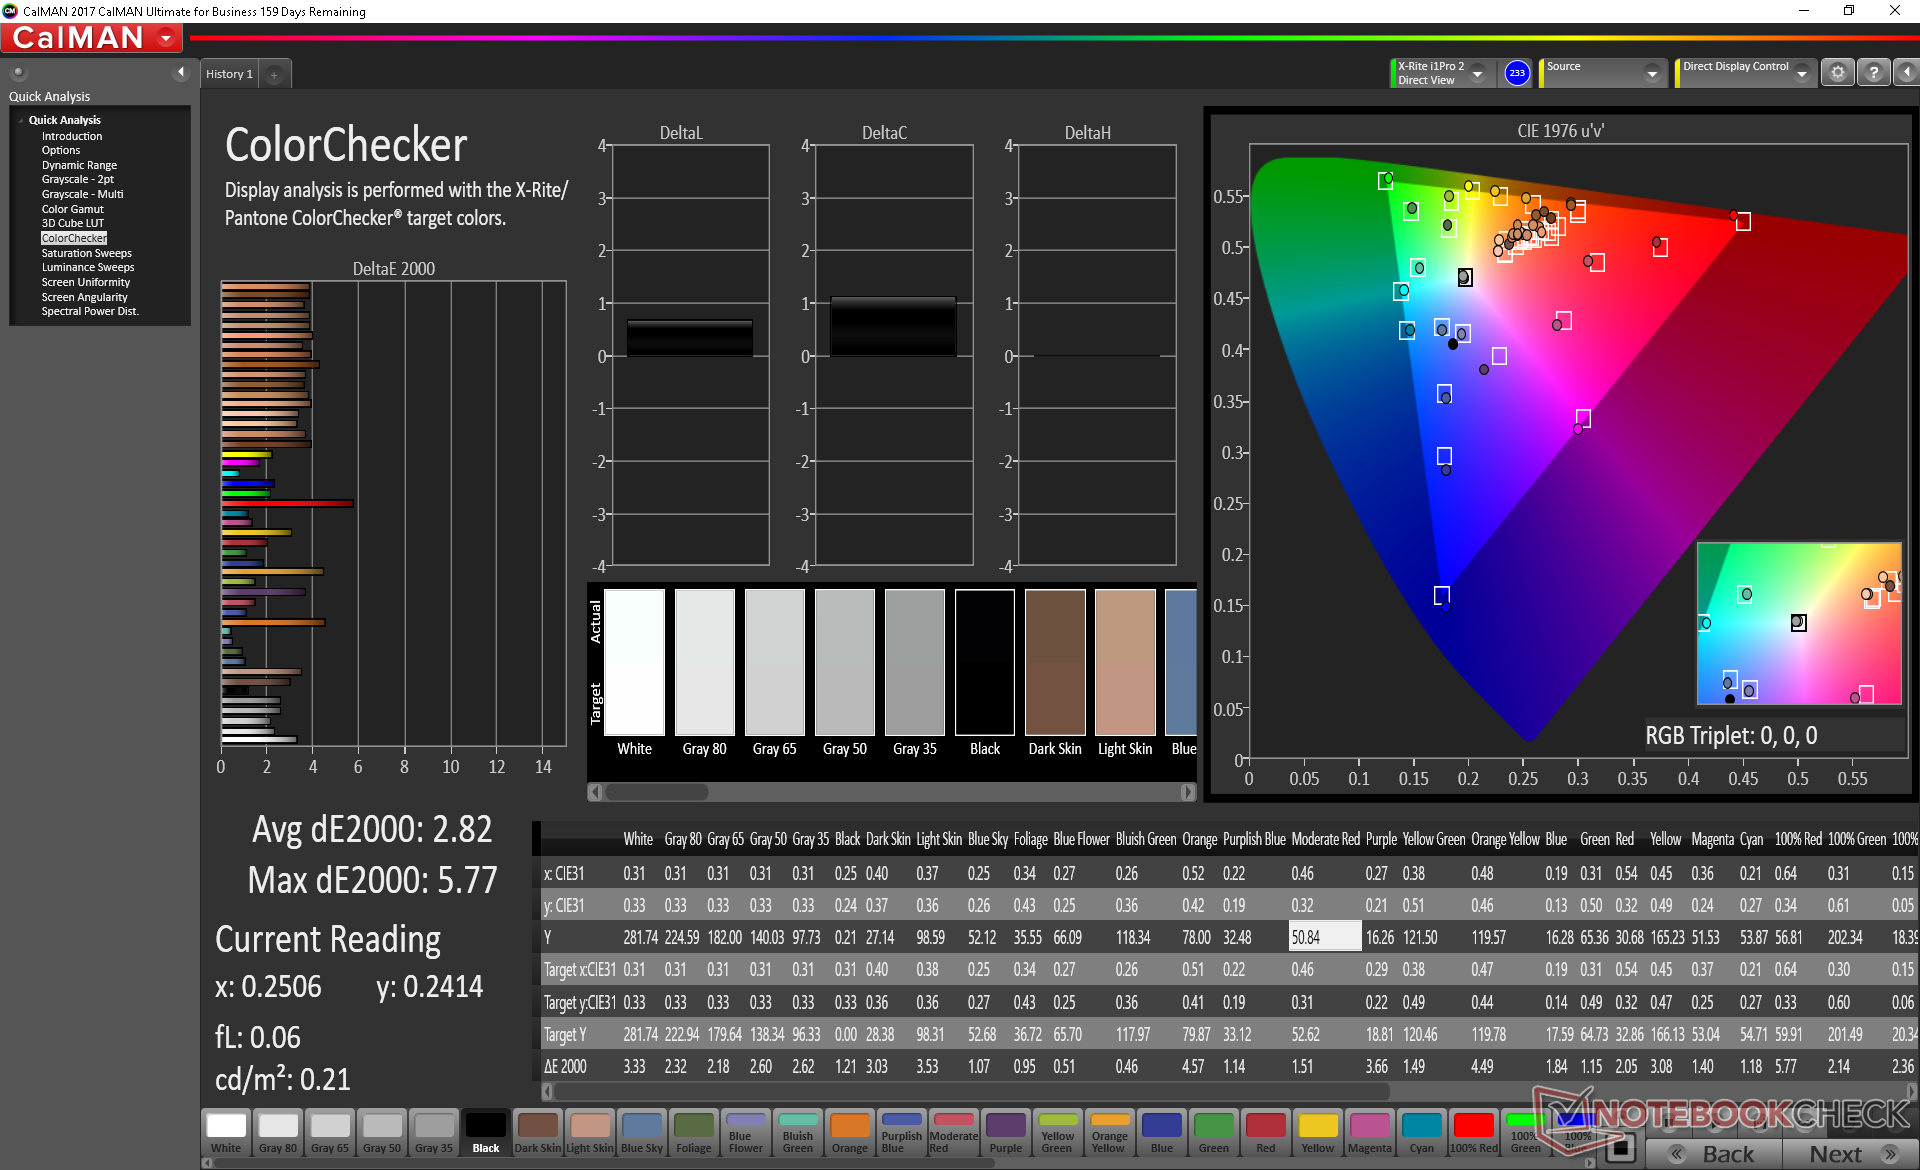
Color space covers approximately 95 percent of sRGB and 60 percent of AdobeRGB to be comparable to most Ultrabooks and other 144 Hz panels in the market including the competing AU Optronics B173HAN04.0. Users or artists who demand even deeper colors will have to go elsewhere where 4K UHD and full AdobeRGB options are available like on the Sky X7C.
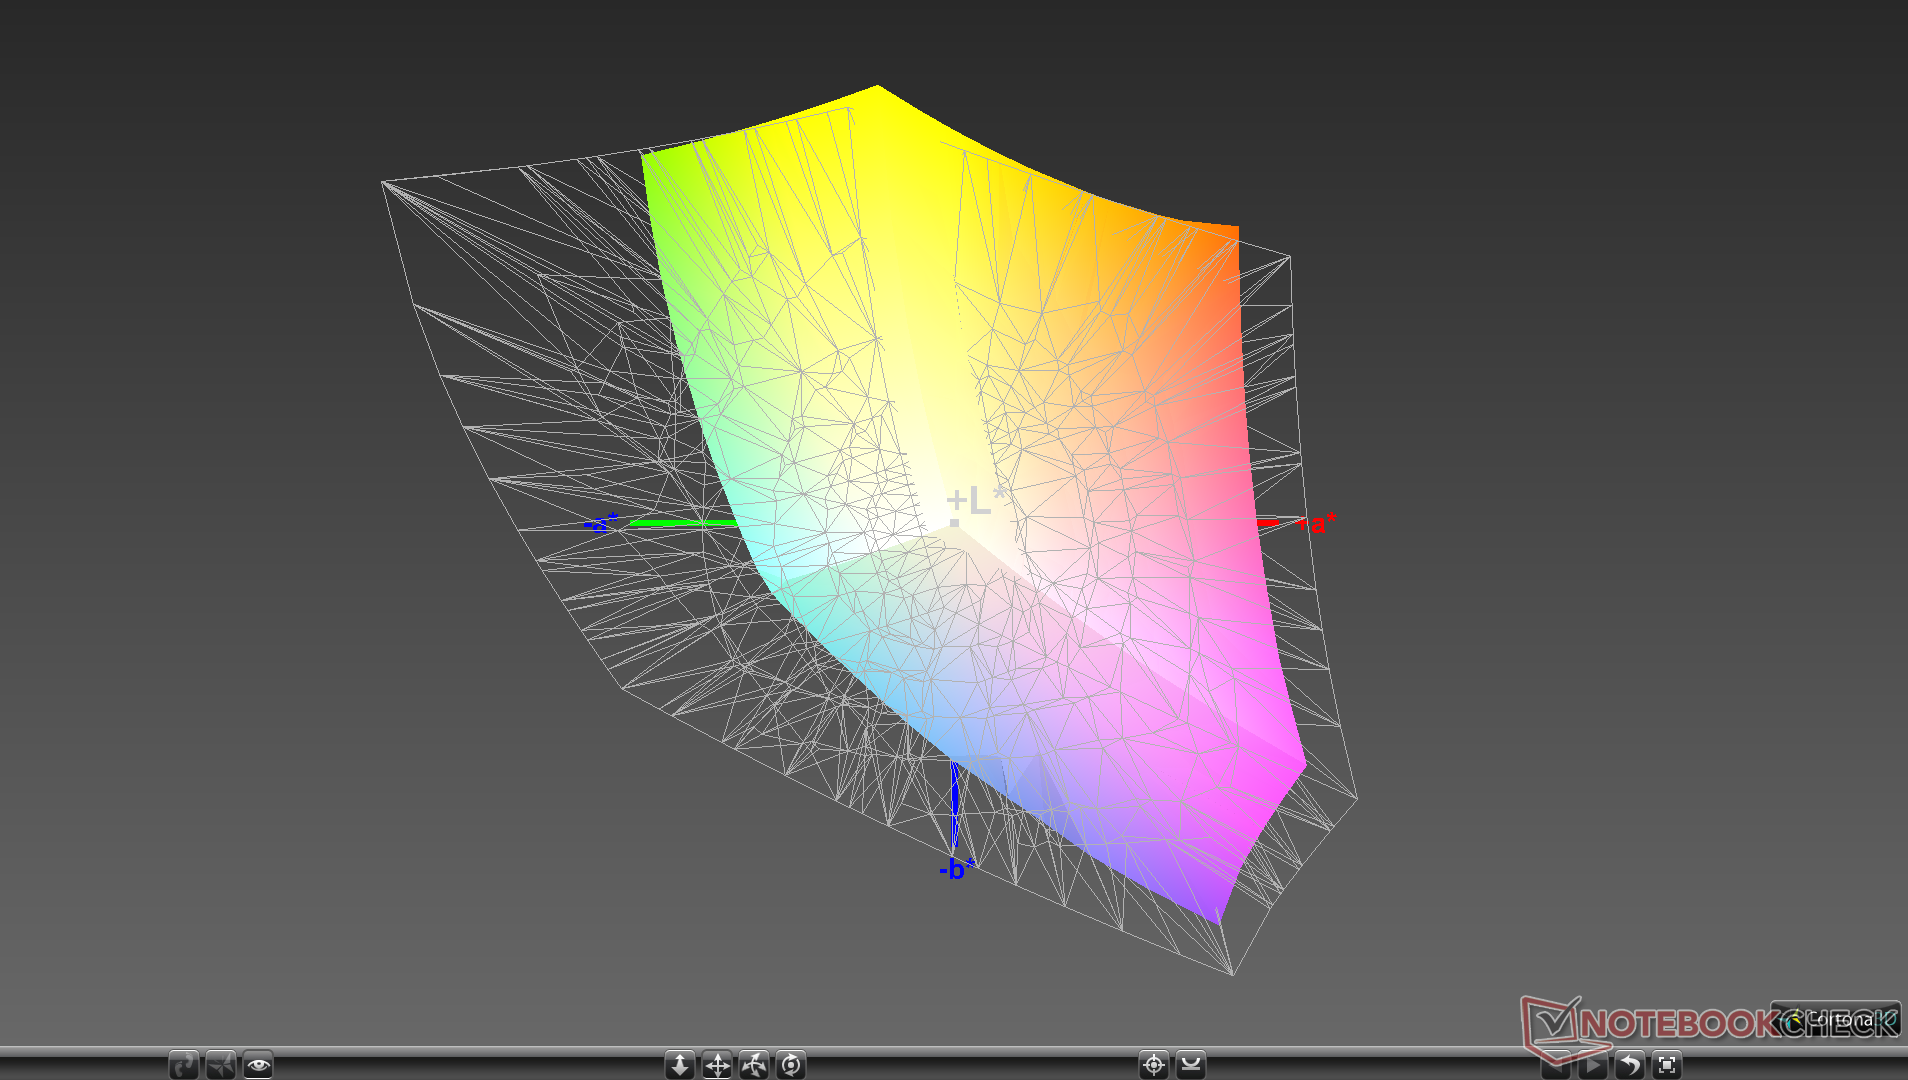
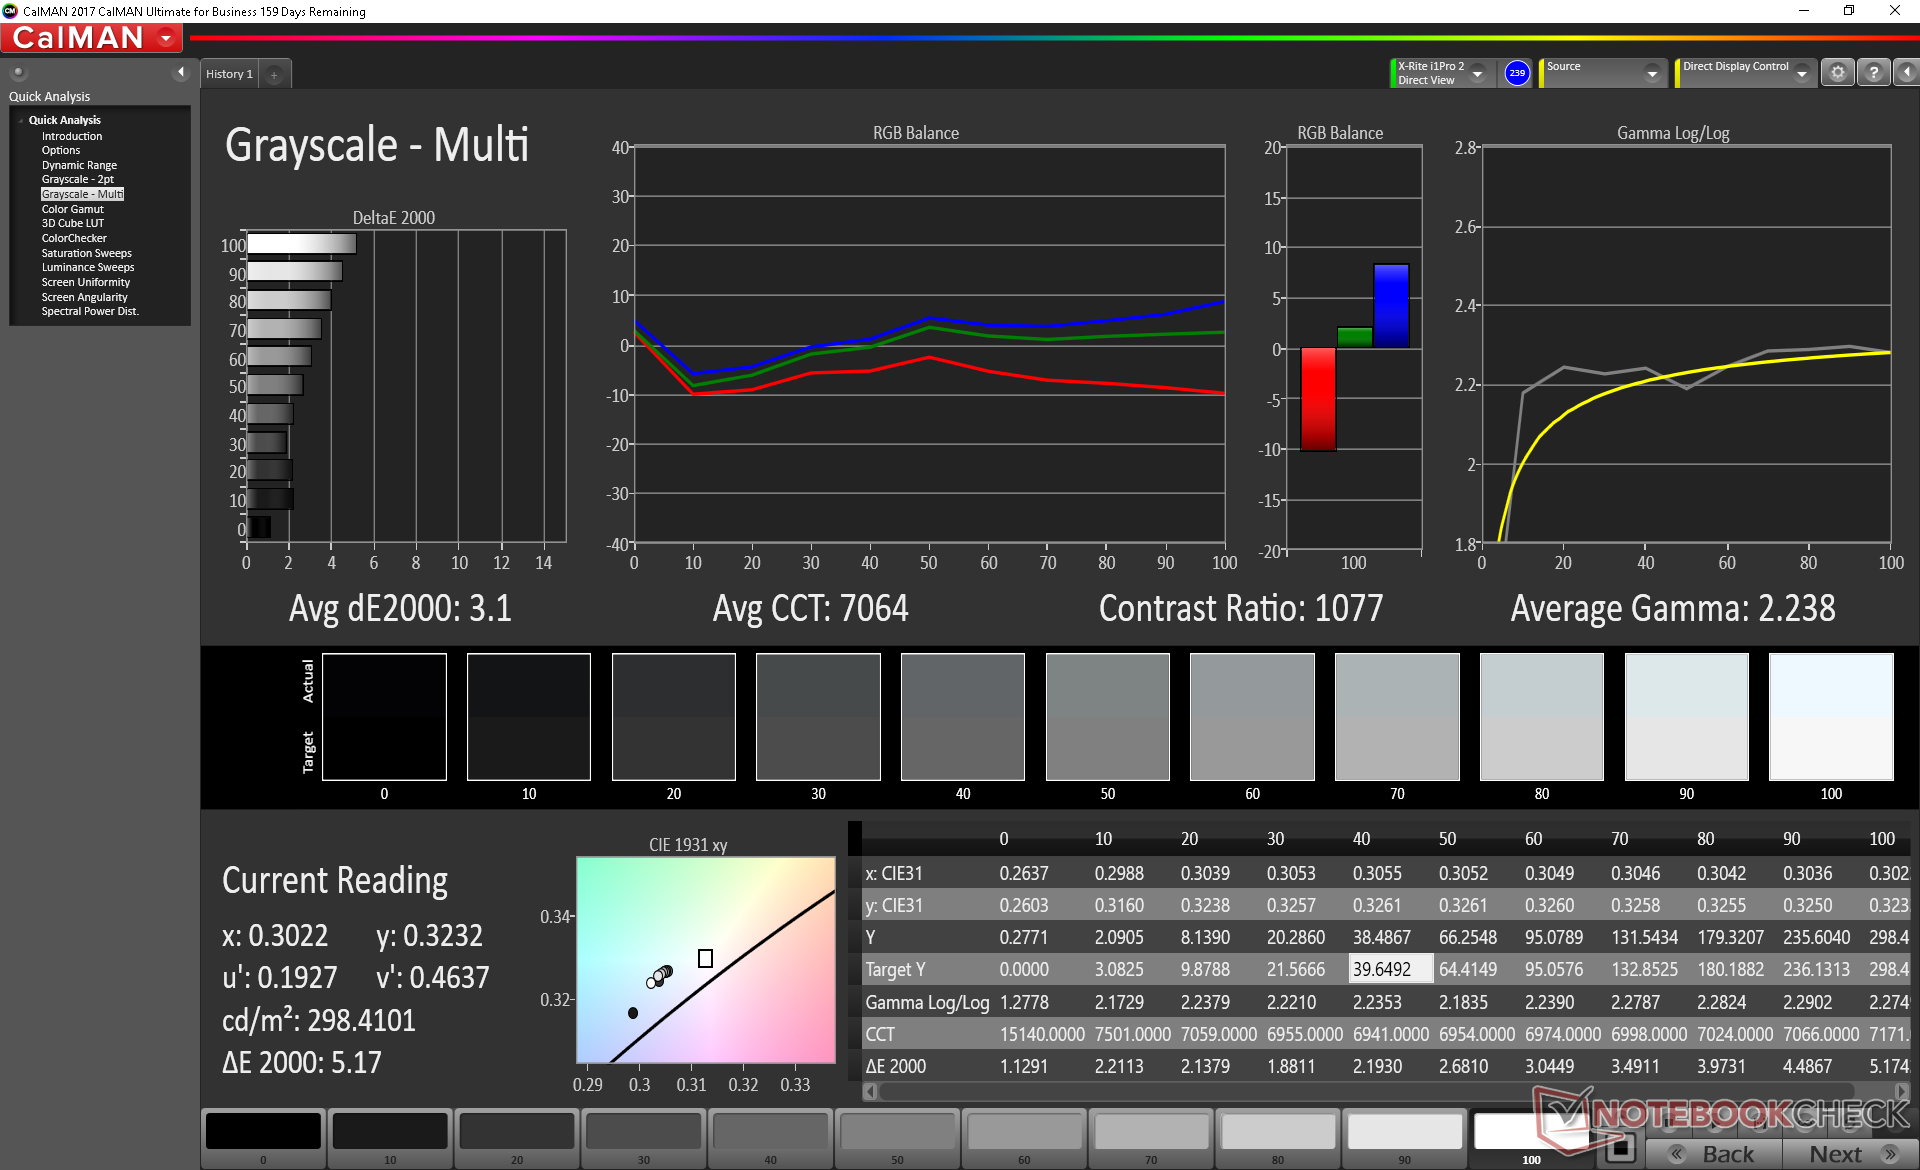
Further measurements with an X-Rite colorimeter reveal generally accurate grayscale and colors out of the box with a color temperature that's slightly on the cool side. Our calibration attempt addresses these minor shortcomings for a slightly more accurate display. Eurocom will calibrate the display at factory for an additional cost whereas some OEMs like Gigabyte and MSI will calibrate free of charge on certain models.

Display Response Times
| ↔ Response Time Black to White | ||
|---|---|---|
| 10.4 ms ... rise ↗ and fall ↘ combined | ↗ 6 ms rise | 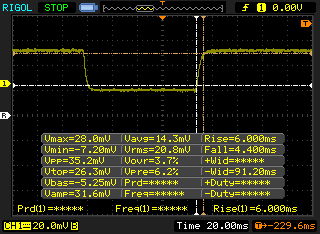 |
| ↘ 4.4 ms fall | ||
| The screen shows good response rates in our tests, but may be too slow for competitive gamers. In comparison, all tested devices range from 0.1 (minimum) to 240 (maximum) ms. » 28 % of all devices are better. This means that the measured response time is better than the average of all tested devices (19.8 ms). | ||
| ↔ Response Time 50% Grey to 80% Grey | ||
| 16.4 ms ... rise ↗ and fall ↘ combined | ↗ 8.4 ms rise | 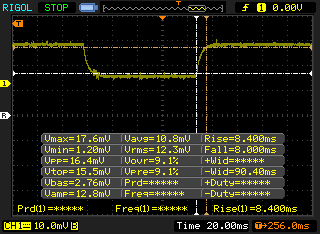 |
| ↘ 8 ms fall | ||
| The screen shows good response rates in our tests, but may be too slow for competitive gamers. In comparison, all tested devices range from 0.165 (minimum) to 636 (maximum) ms. » 31 % of all devices are better. This means that the measured response time is better than the average of all tested devices (30.9 ms). | ||
Screen Flickering / PWM (Pulse-Width Modulation)
| Screen flickering / PWM detected | 990 Hz | ≤ 99 % brightness setting | 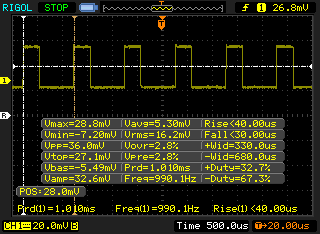 |
The display backlight flickers at 990 Hz (worst case, e.g., utilizing PWM) Flickering detected at a brightness setting of 99 % and below. There should be no flickering or PWM above this brightness setting. The frequency of 990 Hz is quite high, so most users sensitive to PWM should not notice any flickering. In comparison: 52 % of all tested devices do not use PWM to dim the display. If PWM was detected, an average of 7741 (minimum: 5 - maximum: 343500) Hz was measured. | |||
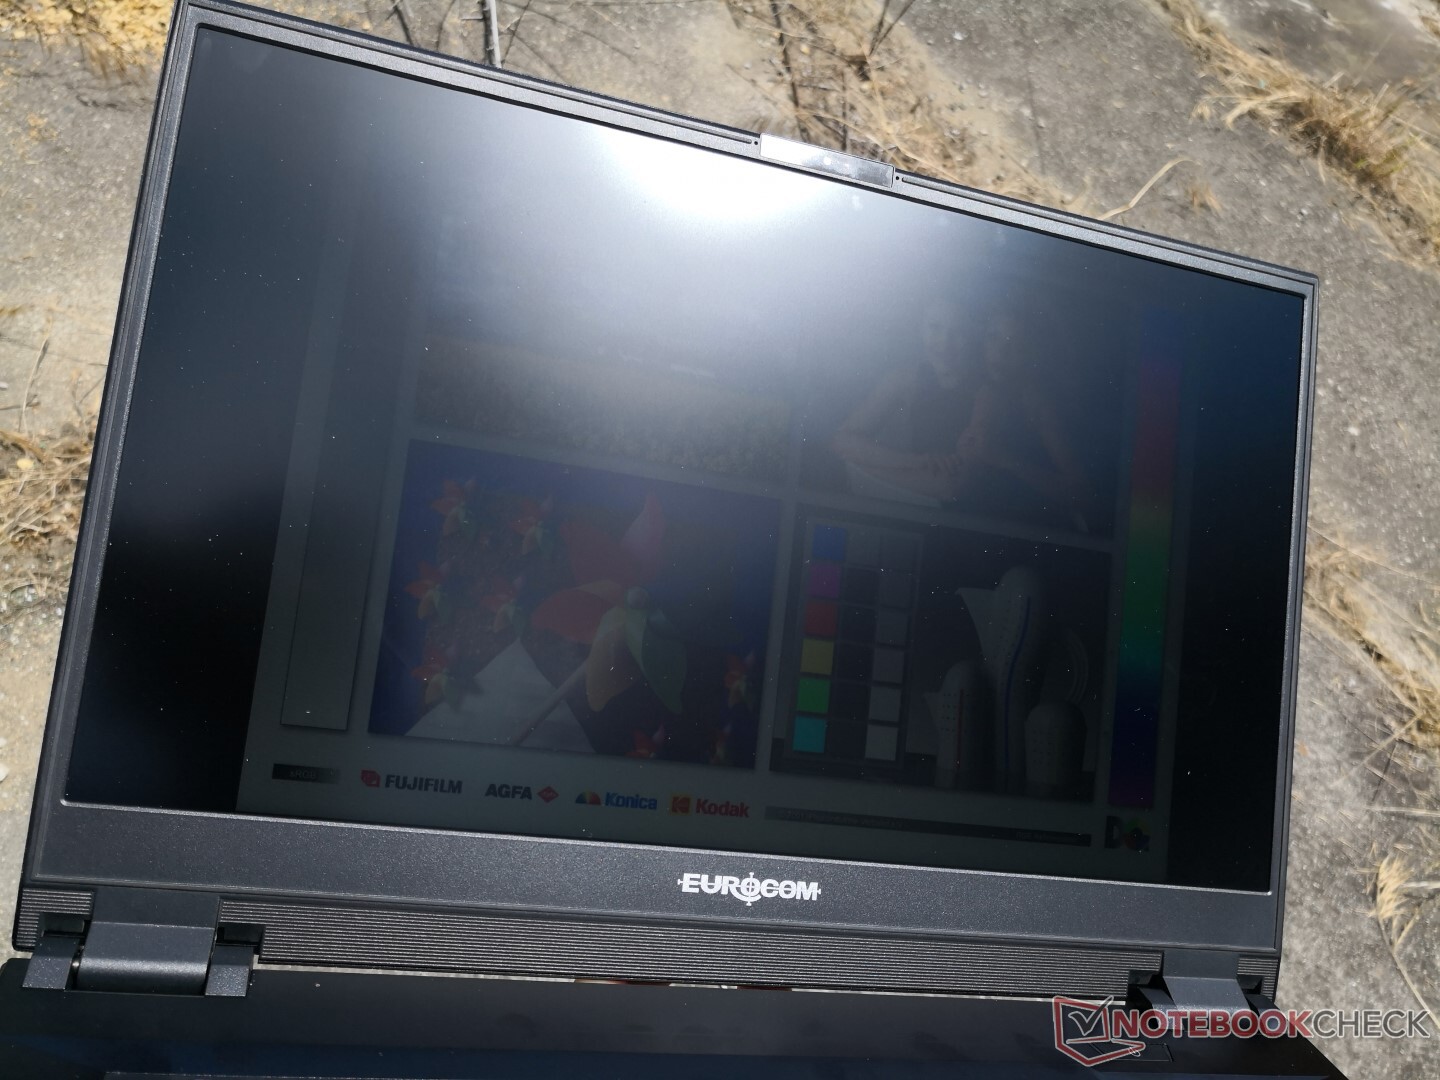
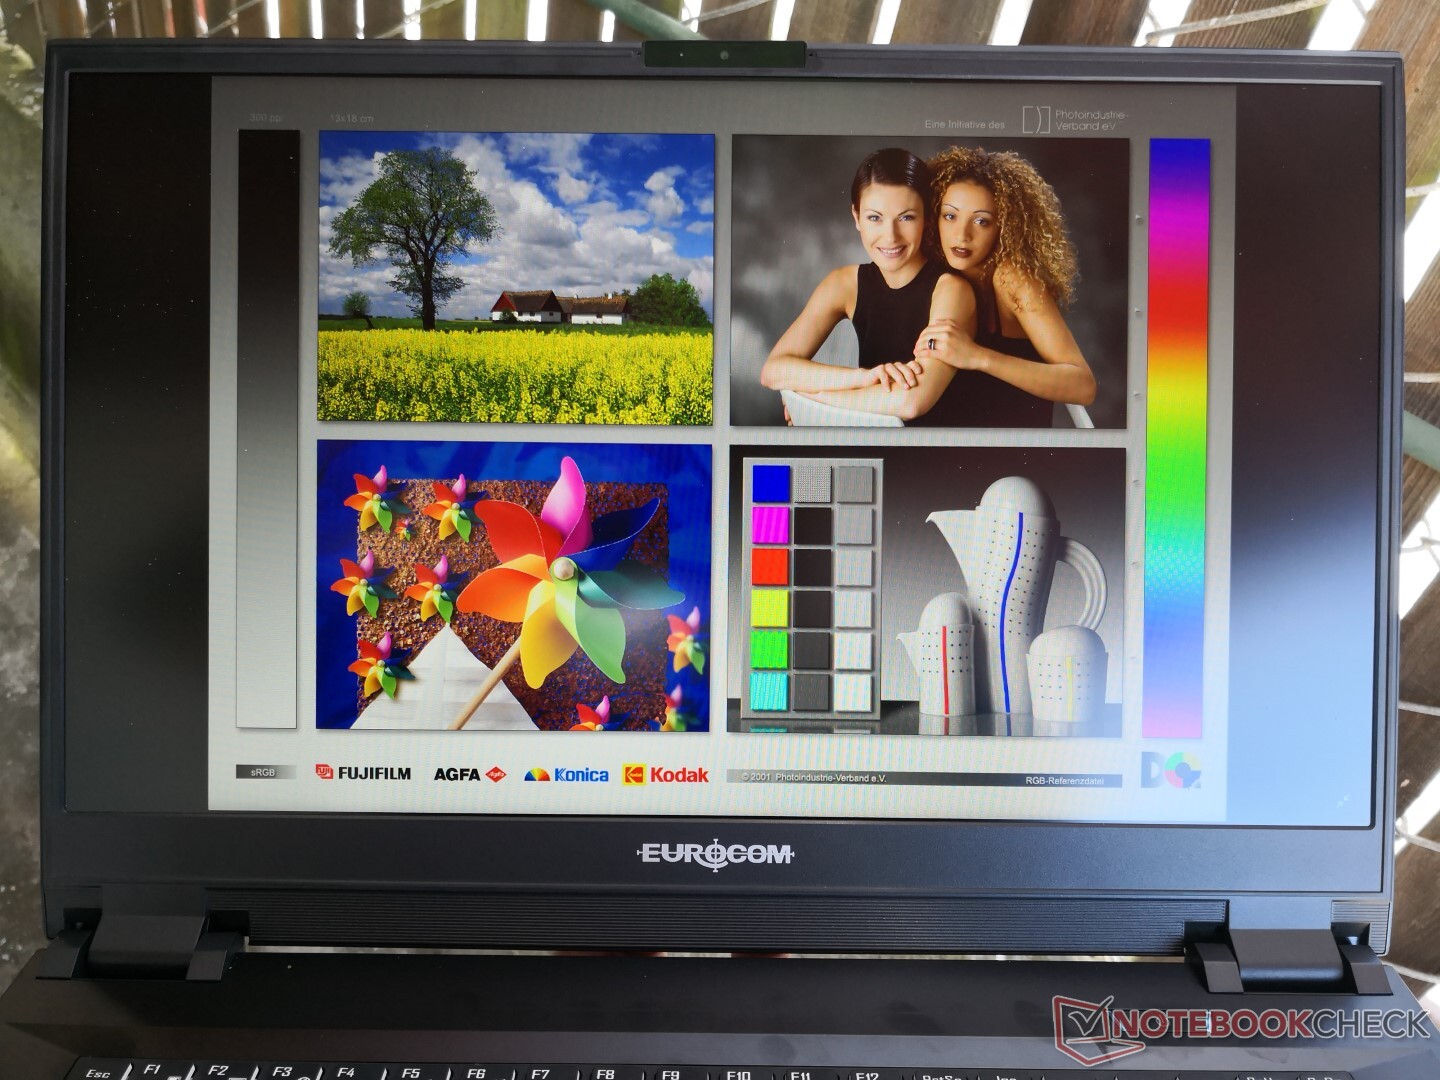
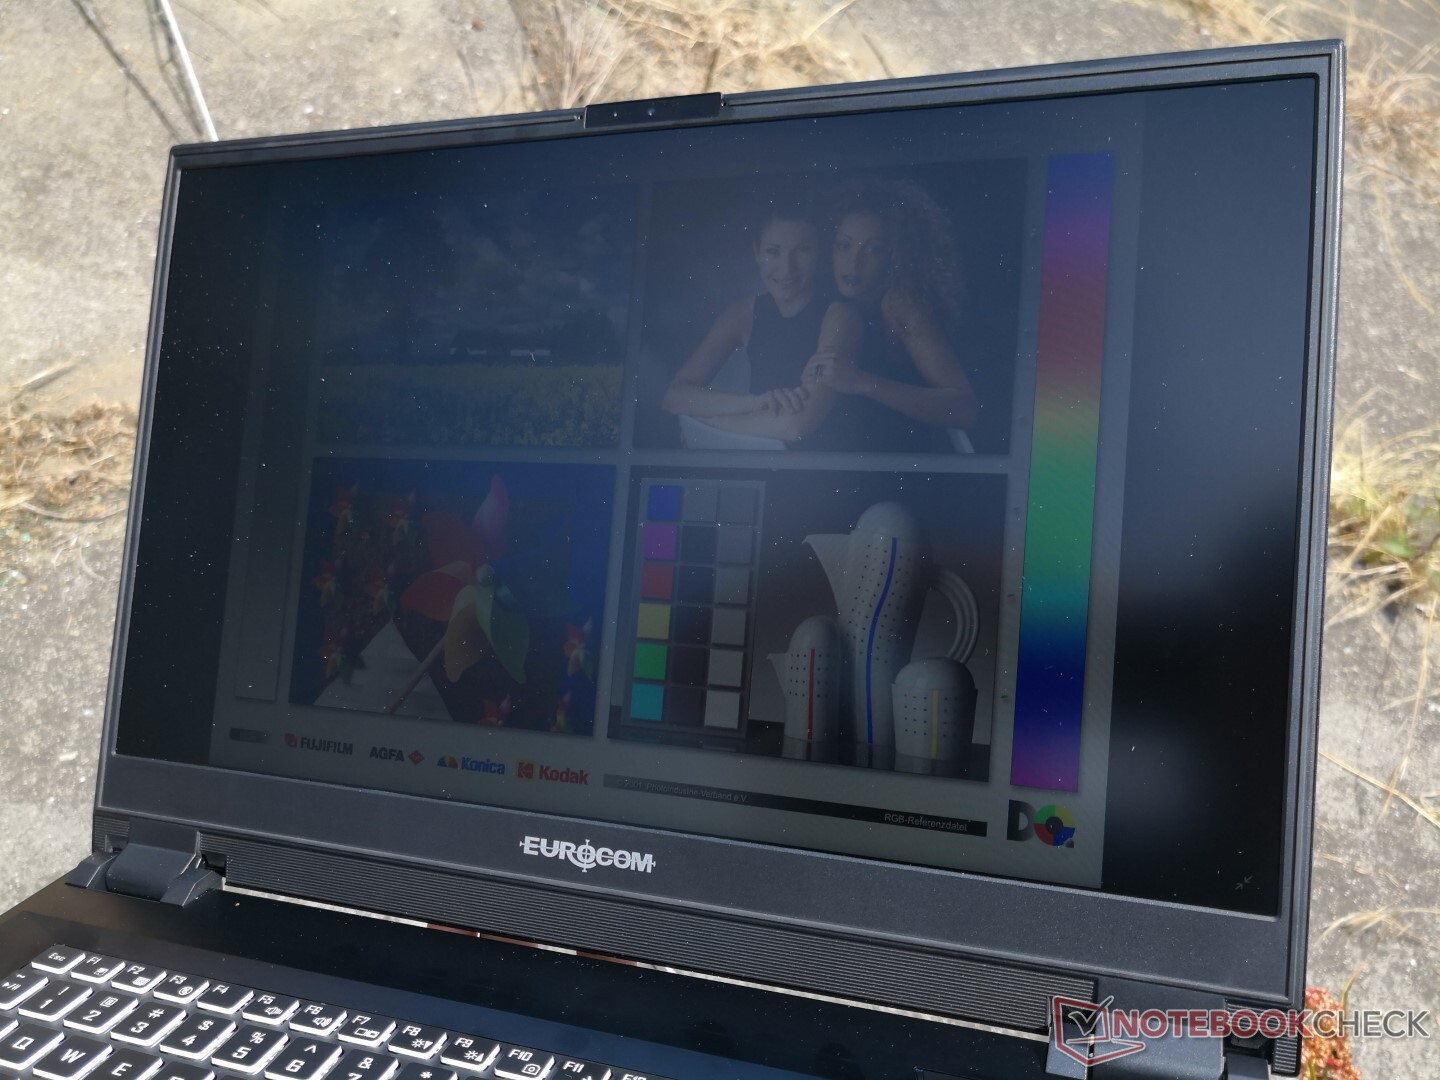
Outdoor visibility is average at best when standing under shade. This system was not designed to be used outdoors frequently and so direct sunlight or overcast will overwhelm onscreen colors and text. Both the lighter Eurocom Q8 and MSI GS75 have brighter displays for a slightly better outdoor experience.
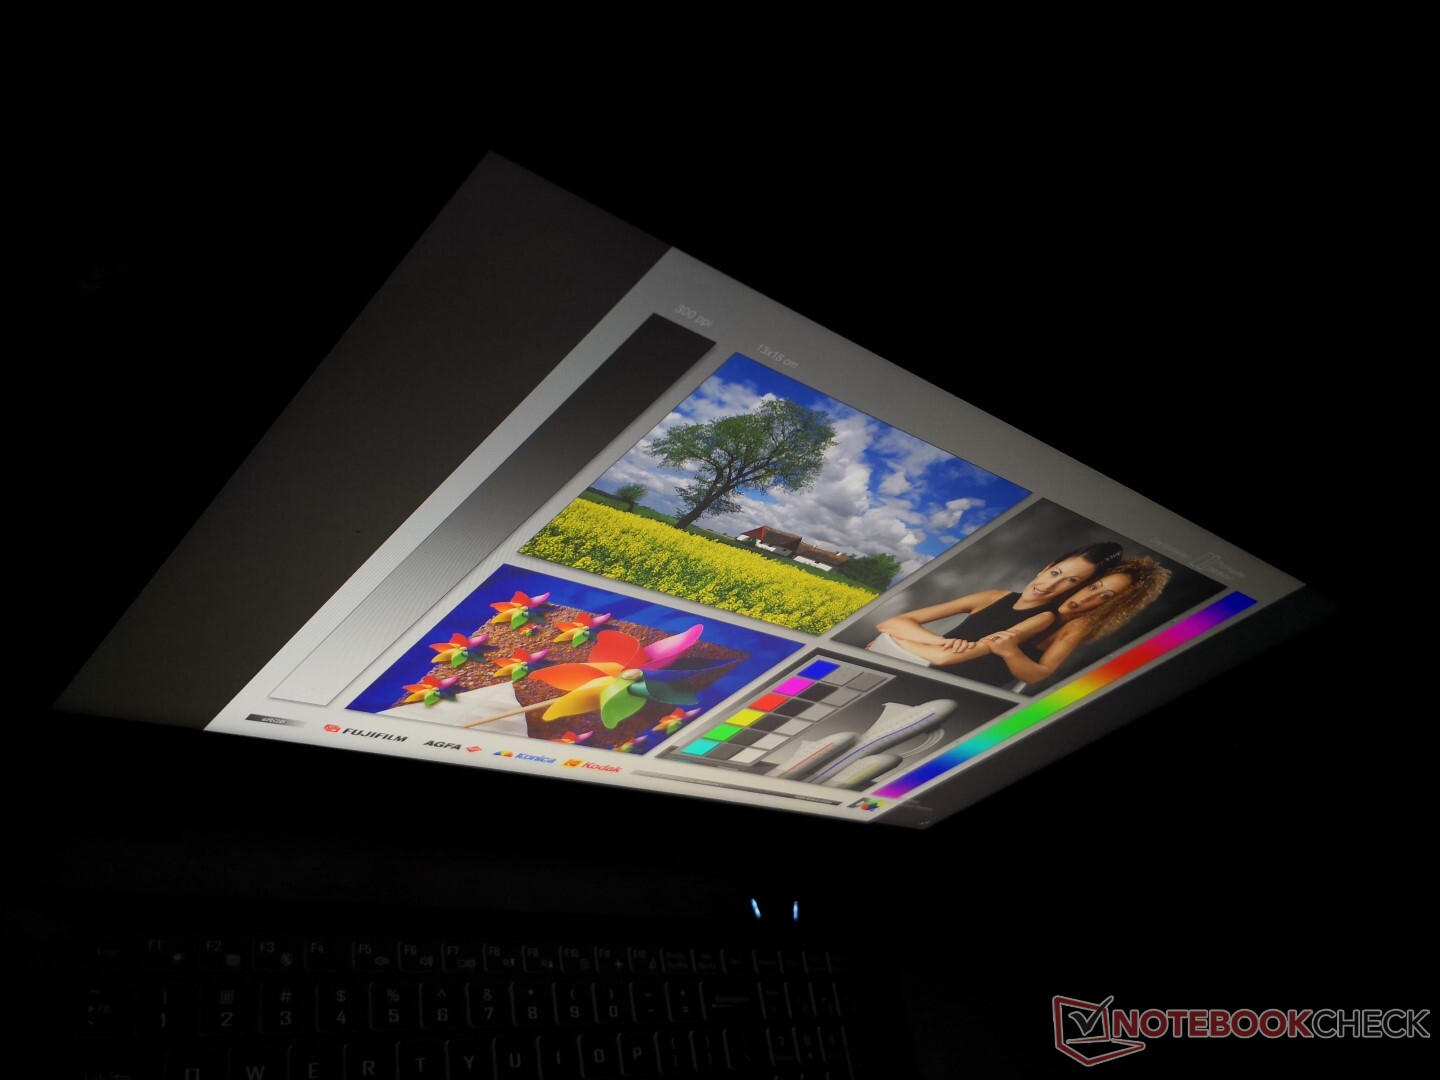
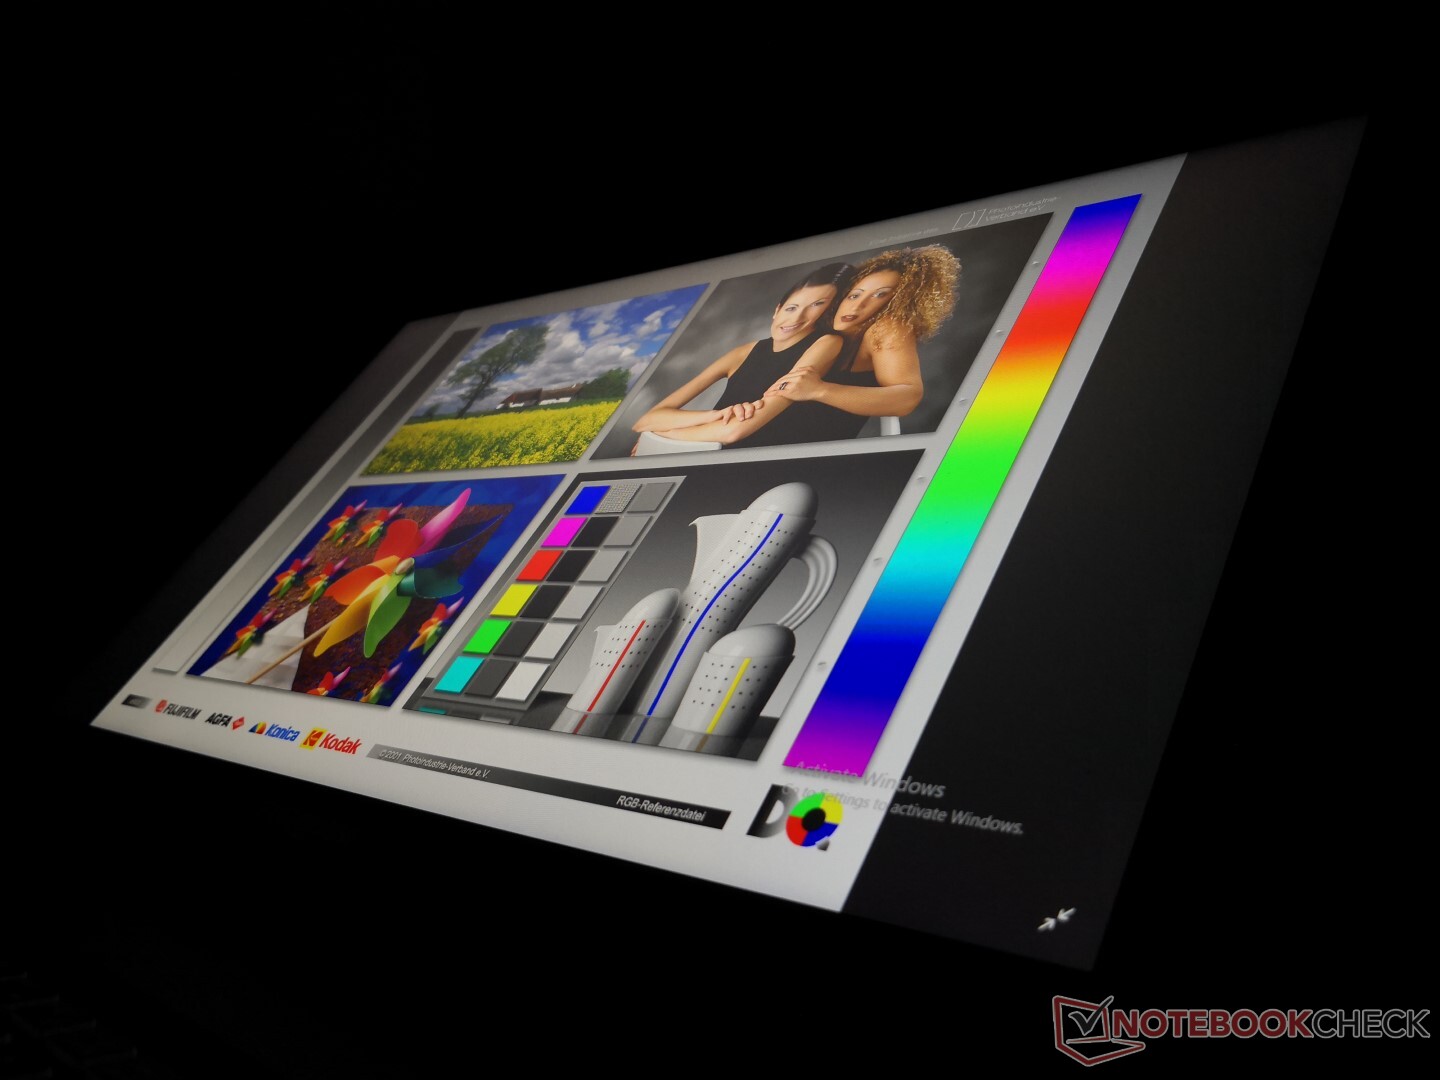
Colors and contrast do not change dramatically if viewing from extreme angles
Performance
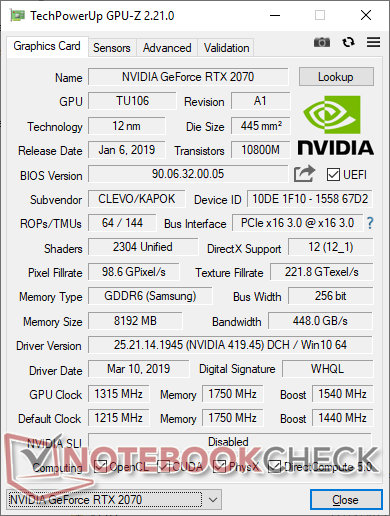
The Nightsky RX17 is one of the few laptops with both Core i7-9750H and unlocked Core i9-9980HK options and GTX 1660 Ti or RTX 2070 graphics. Depending on the configuration, the system can perform similarly to a $1000 gaming laptop or a $2000 gaming laptop. Optimus is included by default which automatically omits any G-Sync options.
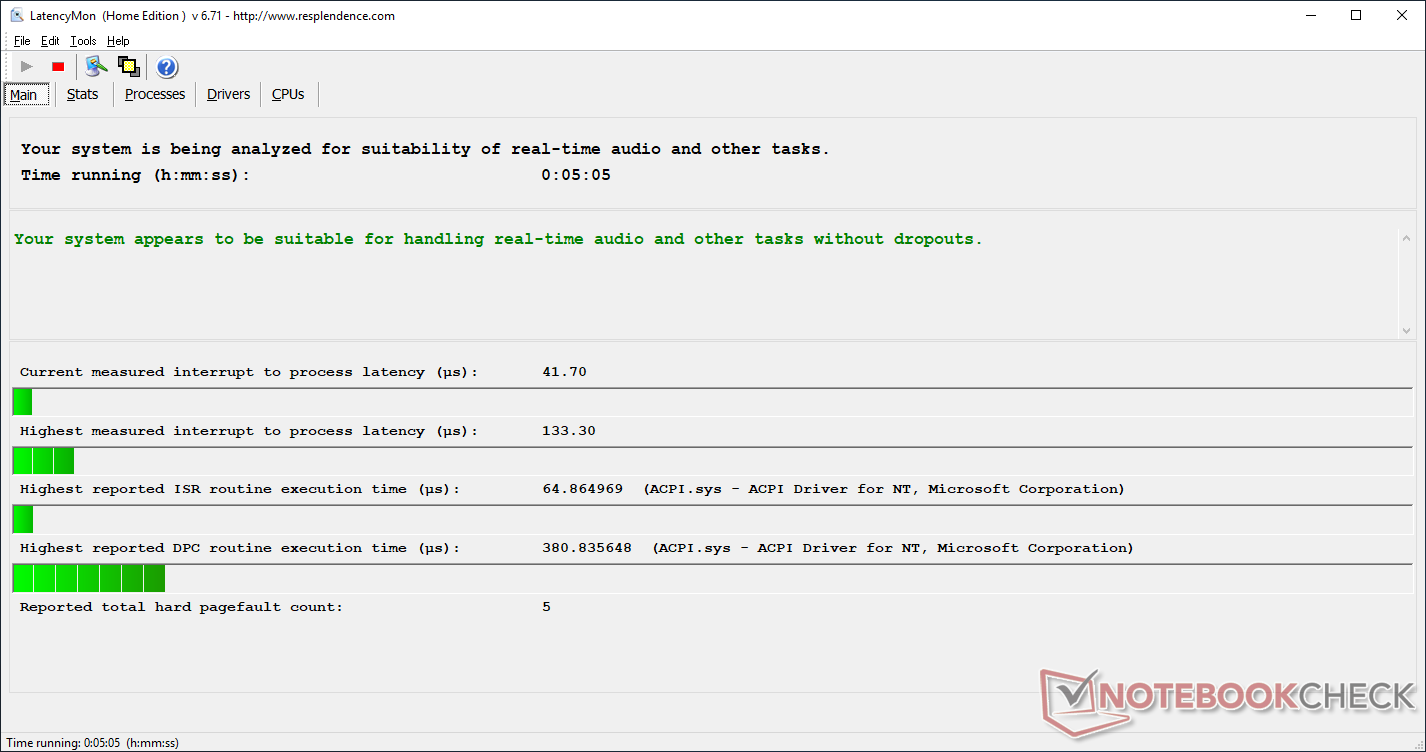
Latencymon shows no issues with real-time audio processes.
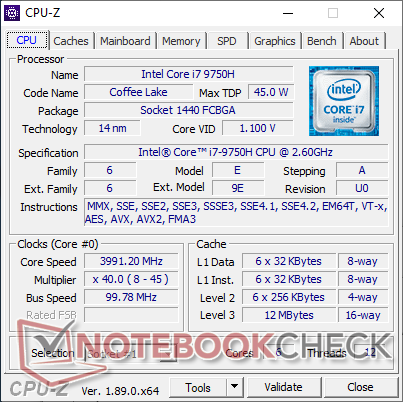

Processor
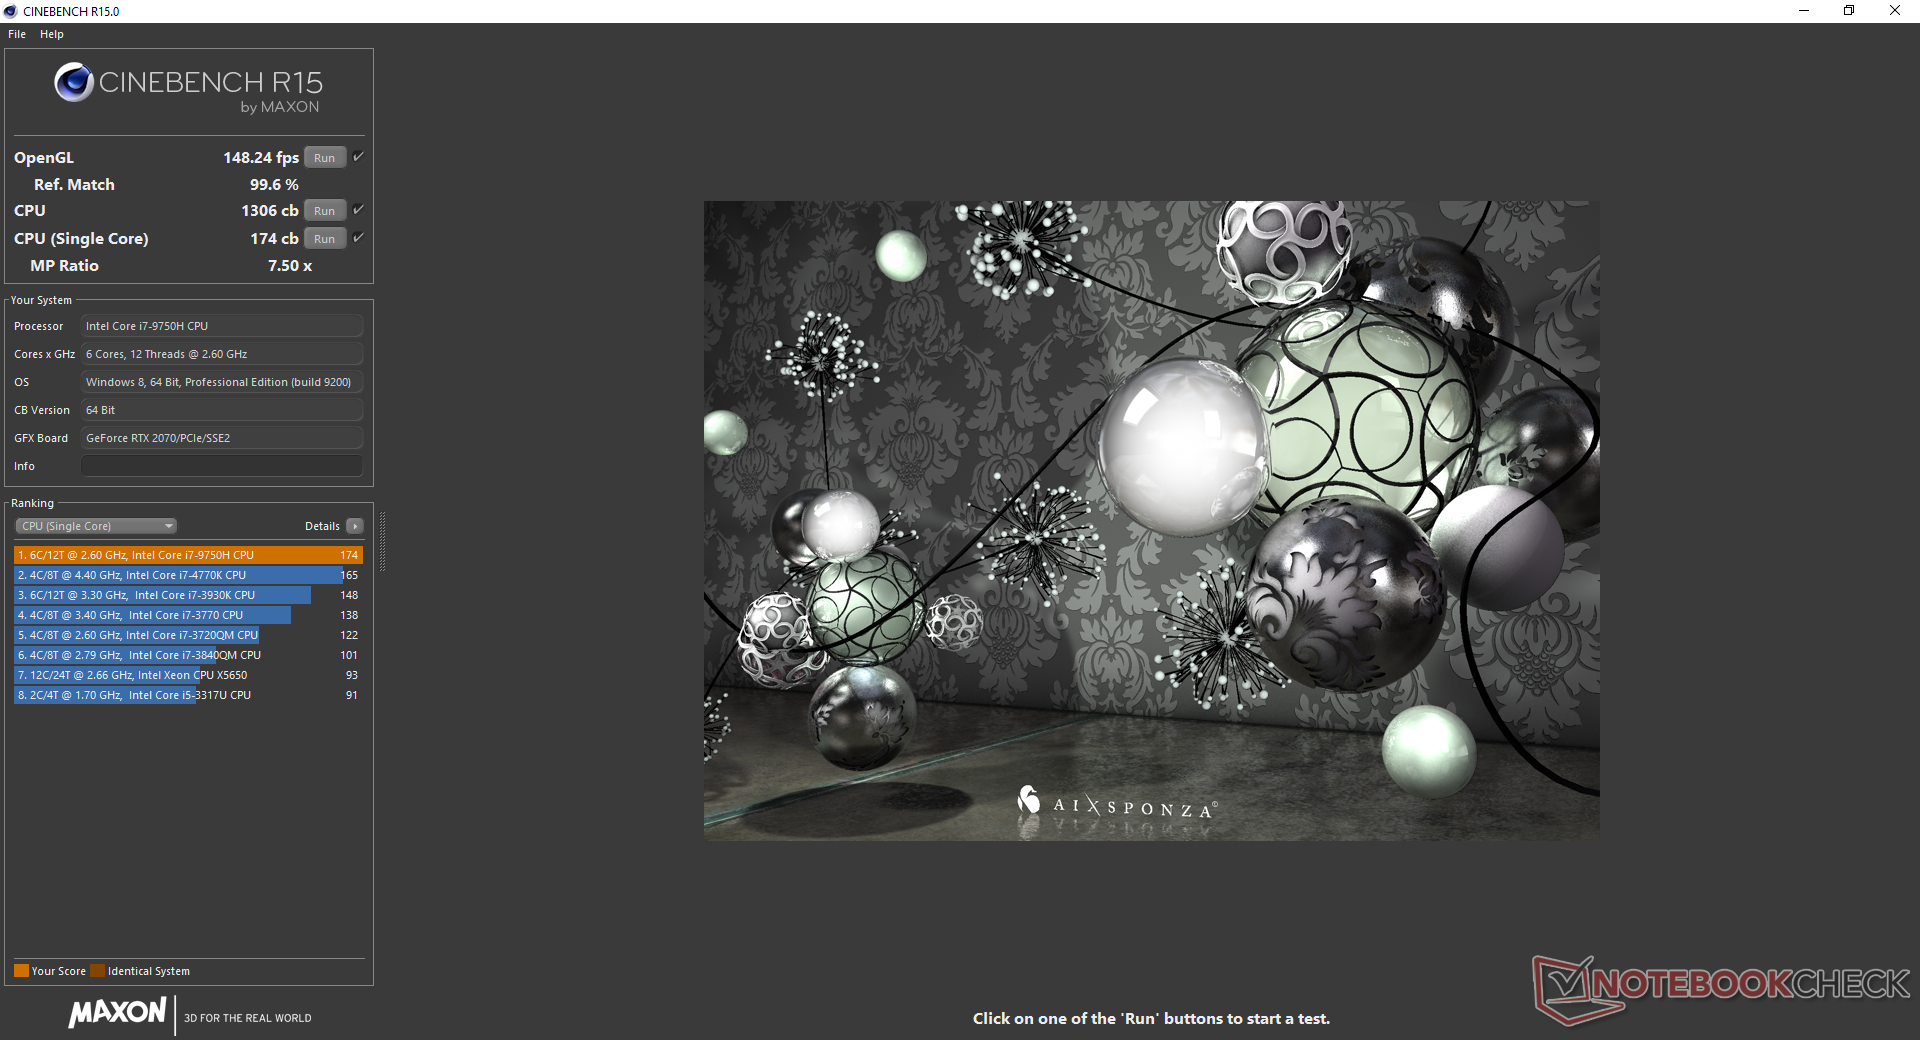
CineBench R15 ranks our unit as one of the fastest laptops with the Core i7-9750H as its Multi-Thread score is 10 percent higher than the average i7-9750H in our database. The catch, however, is that the Nightsky RX17 is unable to maintain this lead after extended periods of stress. When running CineBench R15 Multi-Thread in a loop, its score drops from 1306 points to 1133 points (-13 percent) by the third loop and never recovers. Performance sustainability is still better than the Razer Blade Pro 17 equipped with the same CPU.
Raw processor performance is still impressive even though the performance delta between it and the last generation Core i7-8750H can be very narrow. Users would have to upgrade to the Core i9-9980HK SKU for a more tangible 30 percent performance increase.
See our dedicated page on the Core i7-9750H for more technical information and benchmark comparisons.
| wPrime 2.10 - 1024m | |
| Asus ROG Zephyrus G15 GA502DU | |
| Alienware 17 R4 | |
| Average Intel Core i7-9750H (n=1) | |
| Eurocom Sky X7C | |
| MSI GE75 9SG | |
* ... smaller is better
System Performance
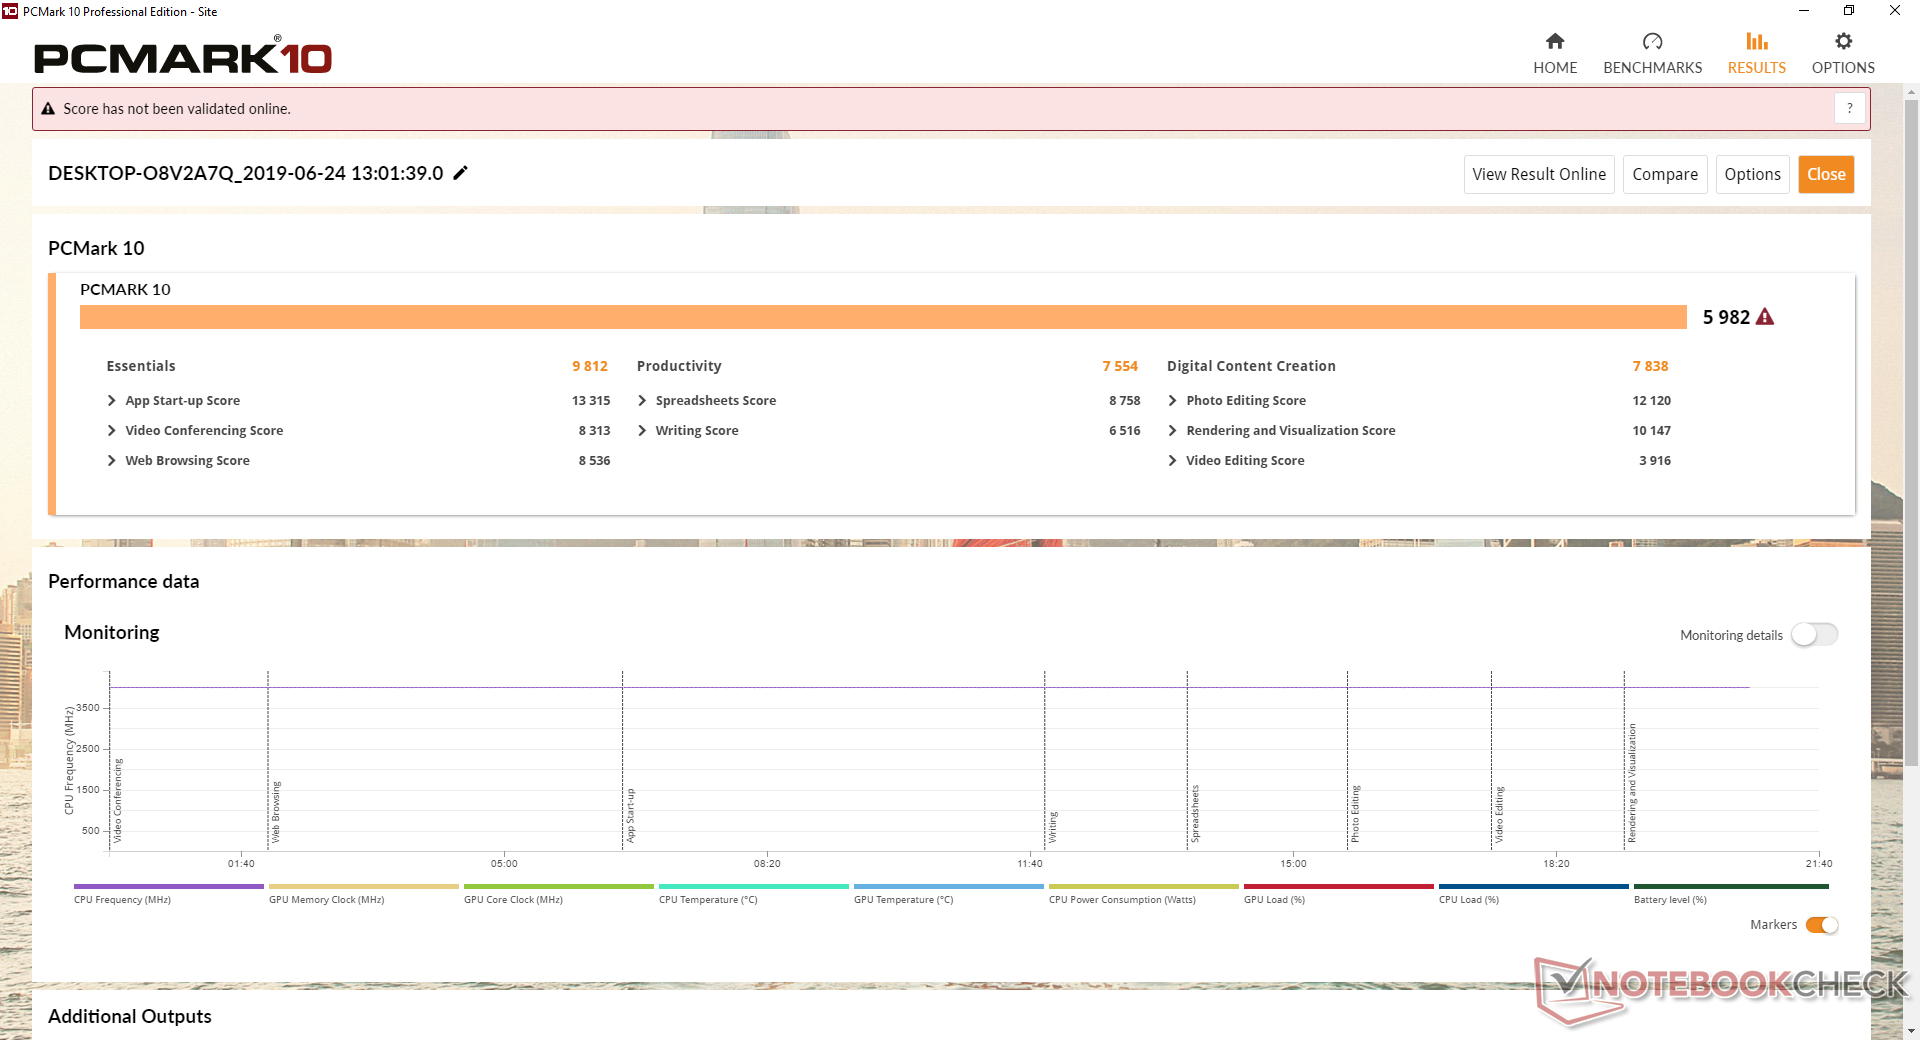
PCMark results are nearly identical to other enthusiast gaming systems like the MSI GS75. Even the older Eurocom Q8 is able to match or outscore our Nightsky RX17. While this doesn't suggest that the Q8 is the faster machine, it does imply that both machines are nearly identical when it comes to day-to-day office-type workloads where the GPU or CPU are not as stressed.
We experienced no software or hardware issues during our time with the unit. We appreciate the fact that there is no pre-installed bloatware and that all applications run in Administrator Mode by default.
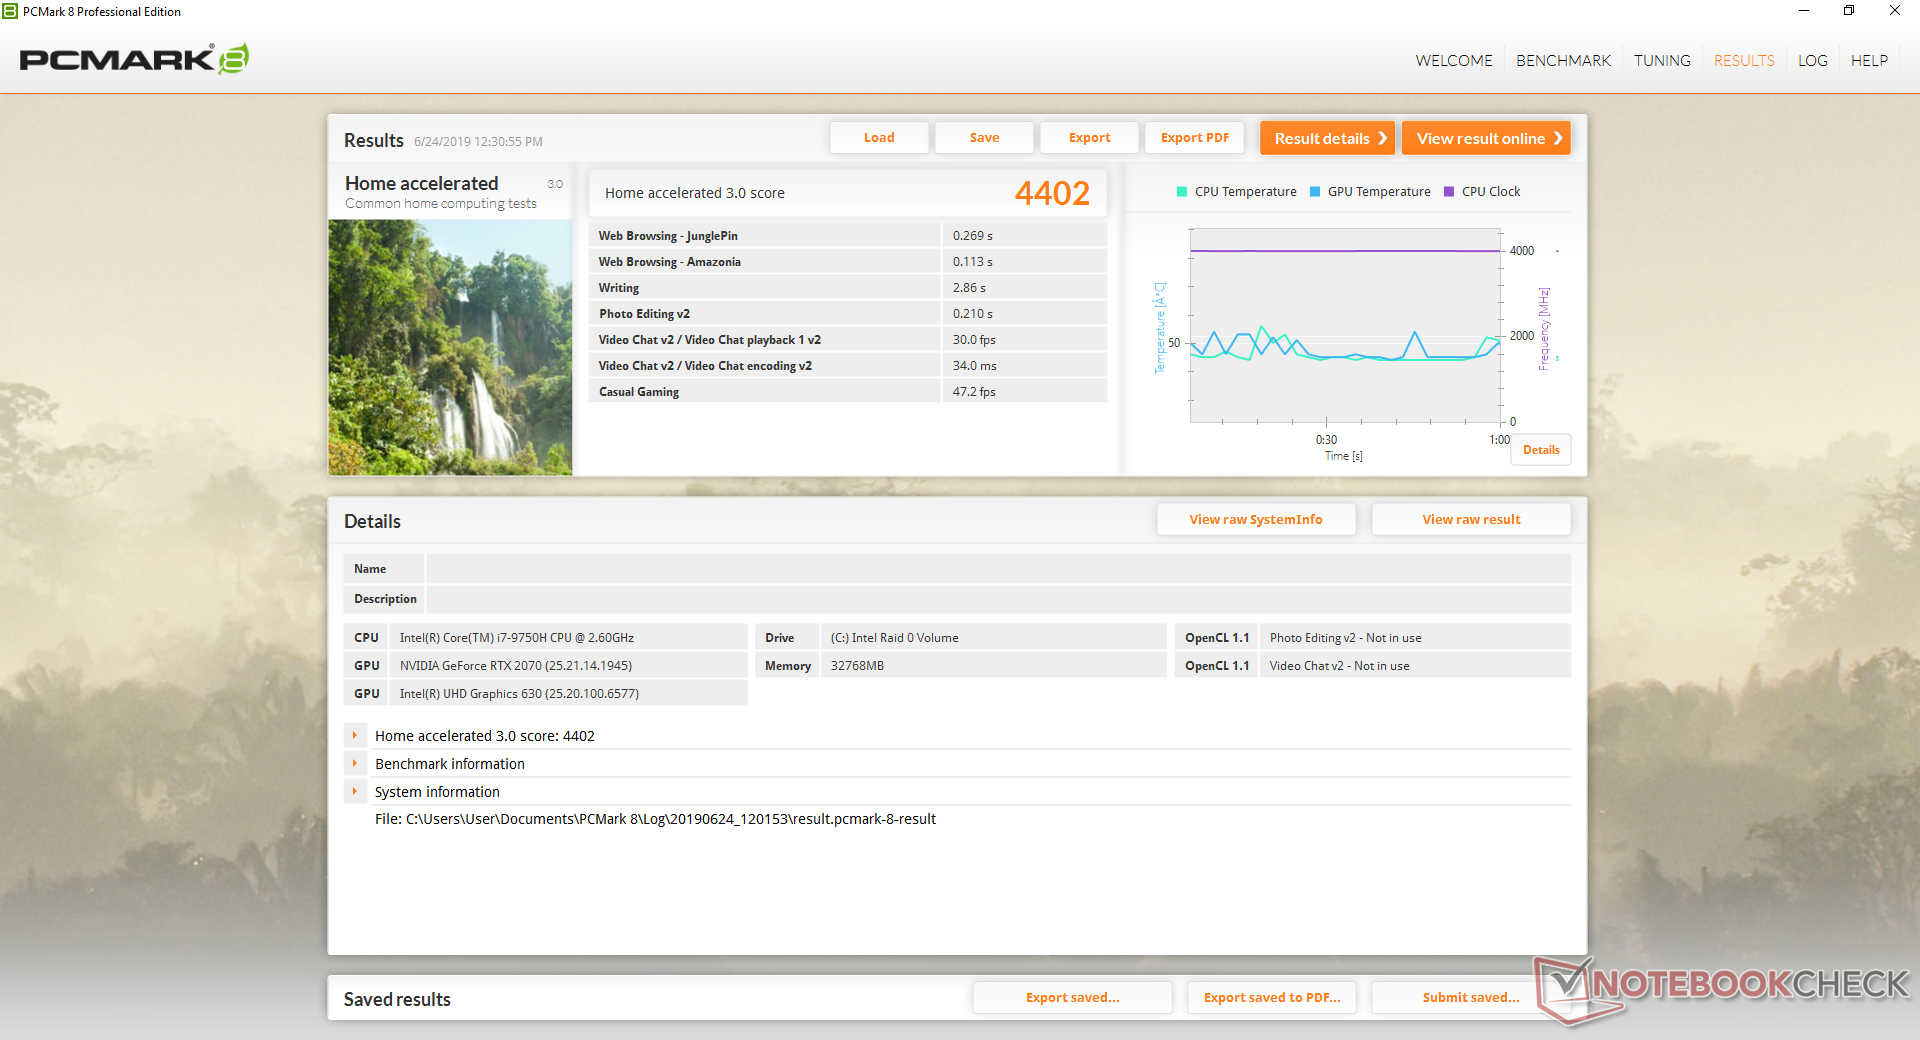
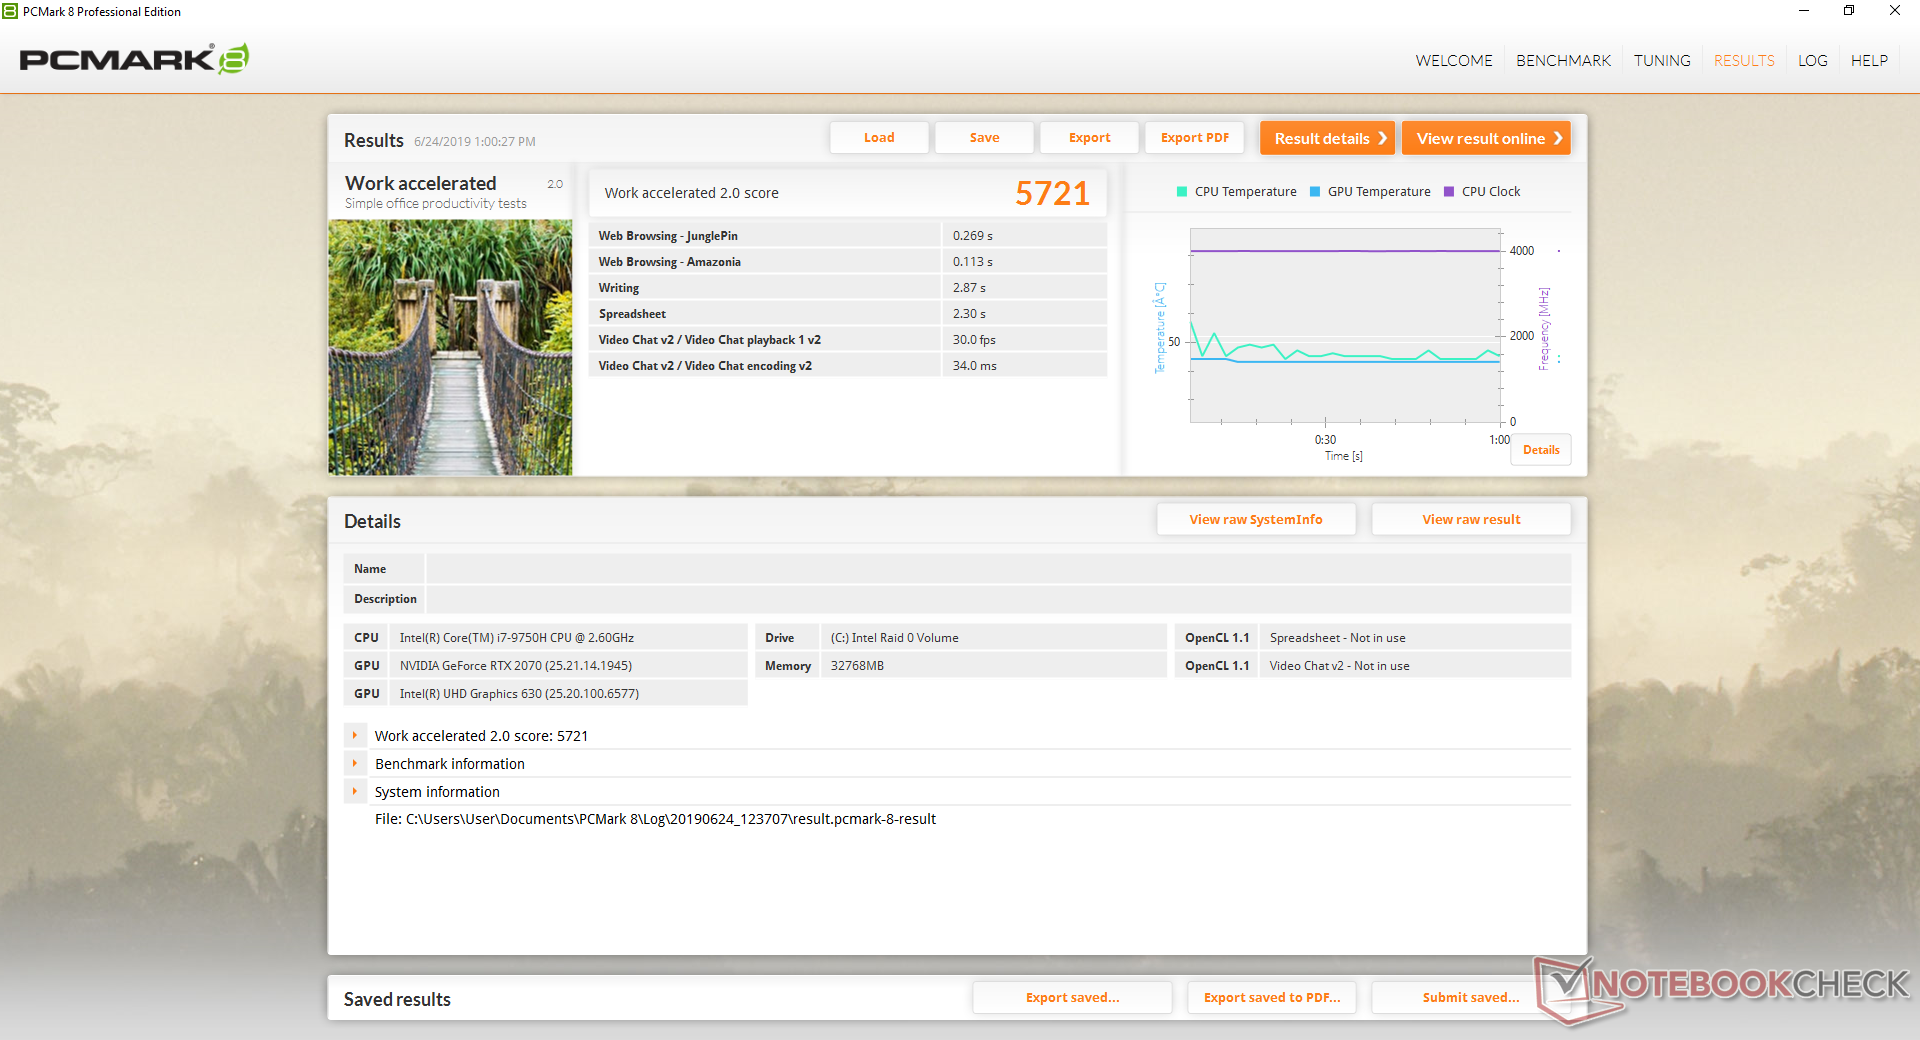
| PCMark 8 Home Score Accelerated v2 | 4402 points | |
| PCMark 8 Work Score Accelerated v2 | 5721 points | |
| PCMark 10 Score | 5982 points | |
Help | ||
Storage Devices
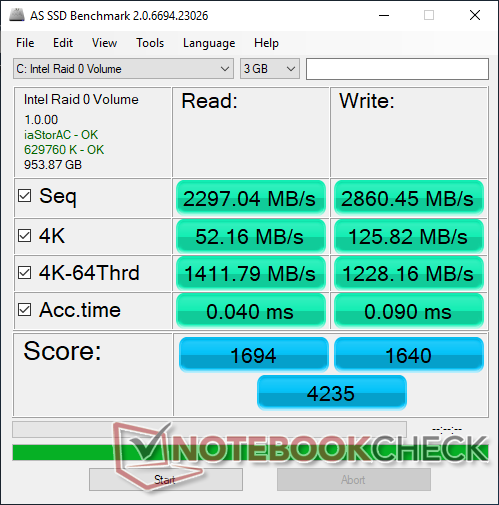
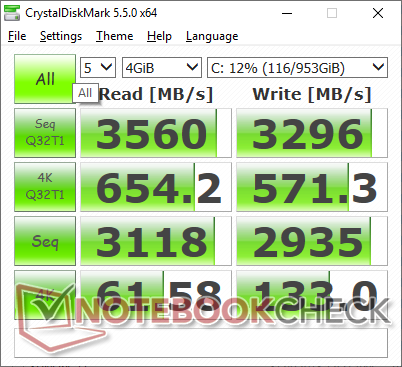
Users can configure up to two M.2 SSDs and a 2.5-inch SATA III drive for a total of three drives. Our test unit comes equipped with two 512 GB Samsung SSD 970 Pro drives in RAID 0 for sequential read and write rates approaching 3000 MB/s according to CrystalDiskMark. In comparison, a single Samsung SSD PM981 tops out at about 1800 MB/s in the same benchmark test. Eurocom offers mostly Samsung M.2 SSDs for its Nightsky RX17 since they tend to perform faster than alternatives from Lite-On, Micron, ADATA, or Toshiba.
See our table of HDDs and SSDs for more technical information and benchmark comparisons.
| Eurocom Nightsky RX17 2x Samsung SSD 970 Pro 512GB (RAID 0) | Razer Blade Pro 17 RTX 2080 Max-Q Samsung SSD PM981 MZVLB512HAJQ | MSI GS75 8SG Stealth 2x Samsung SSD PM981 MZVLB512HAJQ (RAID 0) | Eurocom Q8 Samsung SSD 960 Pro 512 GB m.2 | Lenovo Legion Y740-17ICH Samsung SSD PM981 MZVLB256HAHQ | |
|---|---|---|---|---|---|
| AS SSD | -12% | -2% | -11% | -26% | |
| Seq Read (MB/s) | 2297 | 1831 -20% | 3005 31% | 2481 8% | 1153 -50% |
| Seq Write (MB/s) | 2860 | 1744 -39% | 2668 -7% | 1869 -35% | 1328 -54% |
| 4K Read (MB/s) | 52.2 | 45.16 -13% | 40.89 -22% | 35.57 -32% | 35.05 -33% |
| 4K Write (MB/s) | 125.8 | 107.1 -15% | 94.4 -25% | 107.9 -14% | 96 -24% |
| 4K-64 Read (MB/s) | 1412 | 1240 -12% | 1366 -3% | 1232 -13% | 727 -49% |
| 4K-64 Write (MB/s) | 1228 | 1695 38% | 1197 -3% | 1285 5% | 1212 -1% |
| Access Time Read * (ms) | 0.04 | 0.064 -60% | 0.055 -38% | 0.043 -8% | 0.063 -58% |
| Access Time Write * (ms) | 0.09 | 0.037 59% | 0.039 57% | 0.035 61% | 0.04 56% |
| Score Read (Points) | 1694 | 1468 -13% | 1708 1% | 1515 -11% | 878 -48% |
| Score Write (Points) | 1640 | 1977 21% | 1558 -5% | 1579 -4% | 1441 -12% |
| Score Total (Points) | 4235 | 4197 -1% | 4123 -3% | 3840 -9% | 2784 -34% |
| Copy ISO MB/s (MB/s) | 2514 | 2086 -17% | 1596 -37% | 1487 -41% | |
| Copy Program MB/s (MB/s) | 592 | 425.5 -28% | 406.7 -31% | 608 3% | |
| Copy Game MB/s (MB/s) | 1494 | 555 -63% | 958 -36% | 1162 -22% |
* ... smaller is better

GPU Performance
The mobile RTX 2070 is performing where we expect it to be if not slightly faster when compared to other laptops with the same GPU. 3DMark results are about 6 to 7 percent higher than the average RTX 2070 laptop in our database or about 15 percent faster than the RTX 2070 Max-Q. When compared to the last generation mobile Eurocom Q8 with GTX 1070 graphics, users can expect 19 to 41 percent faster performance. Games that run on DX12 tend to benefit more from the Nvidia Turing series as exemplified by the wider gap in 3DMark Time Spy scores.
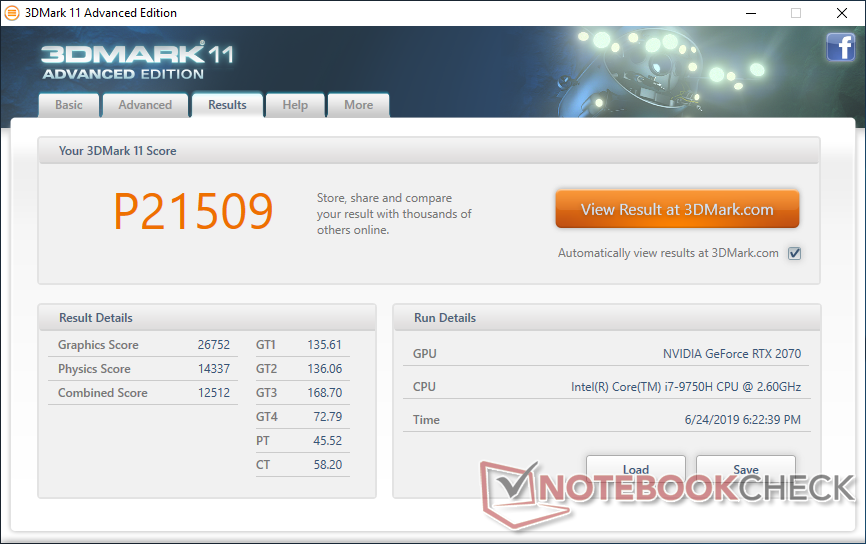

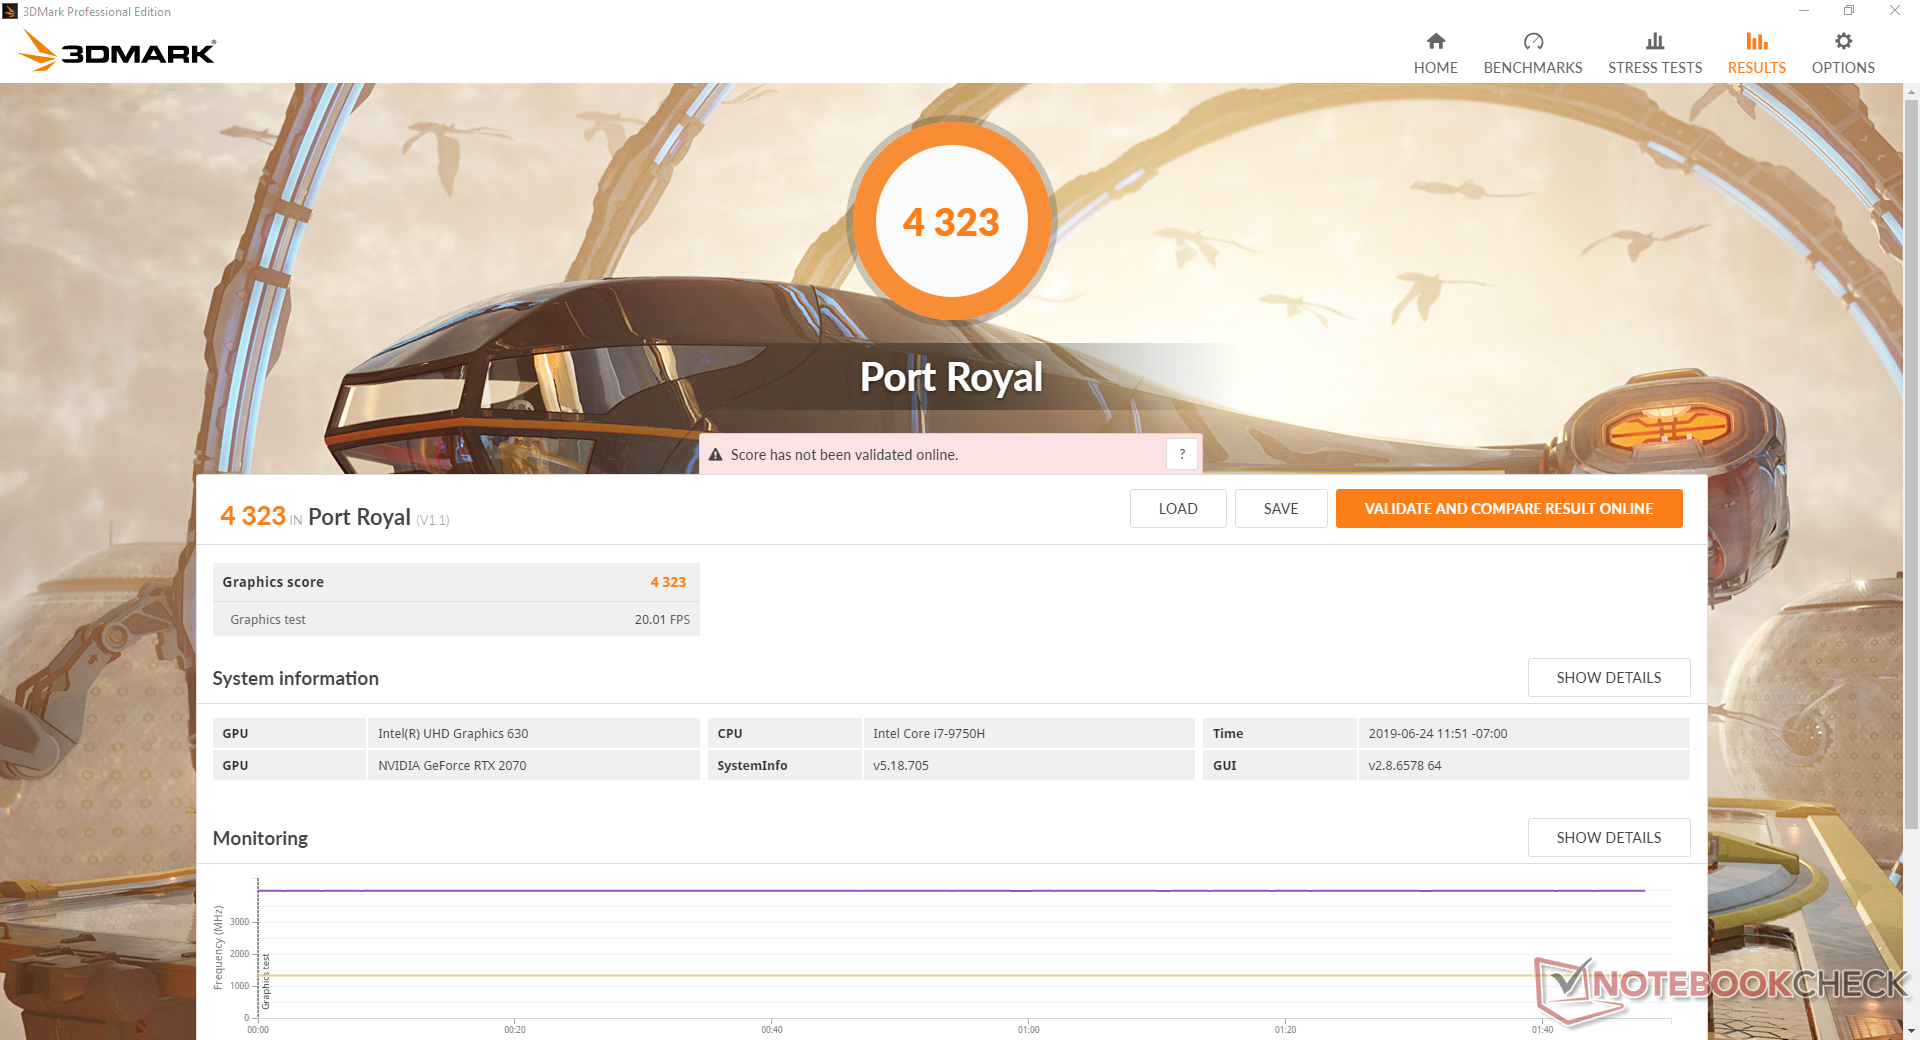
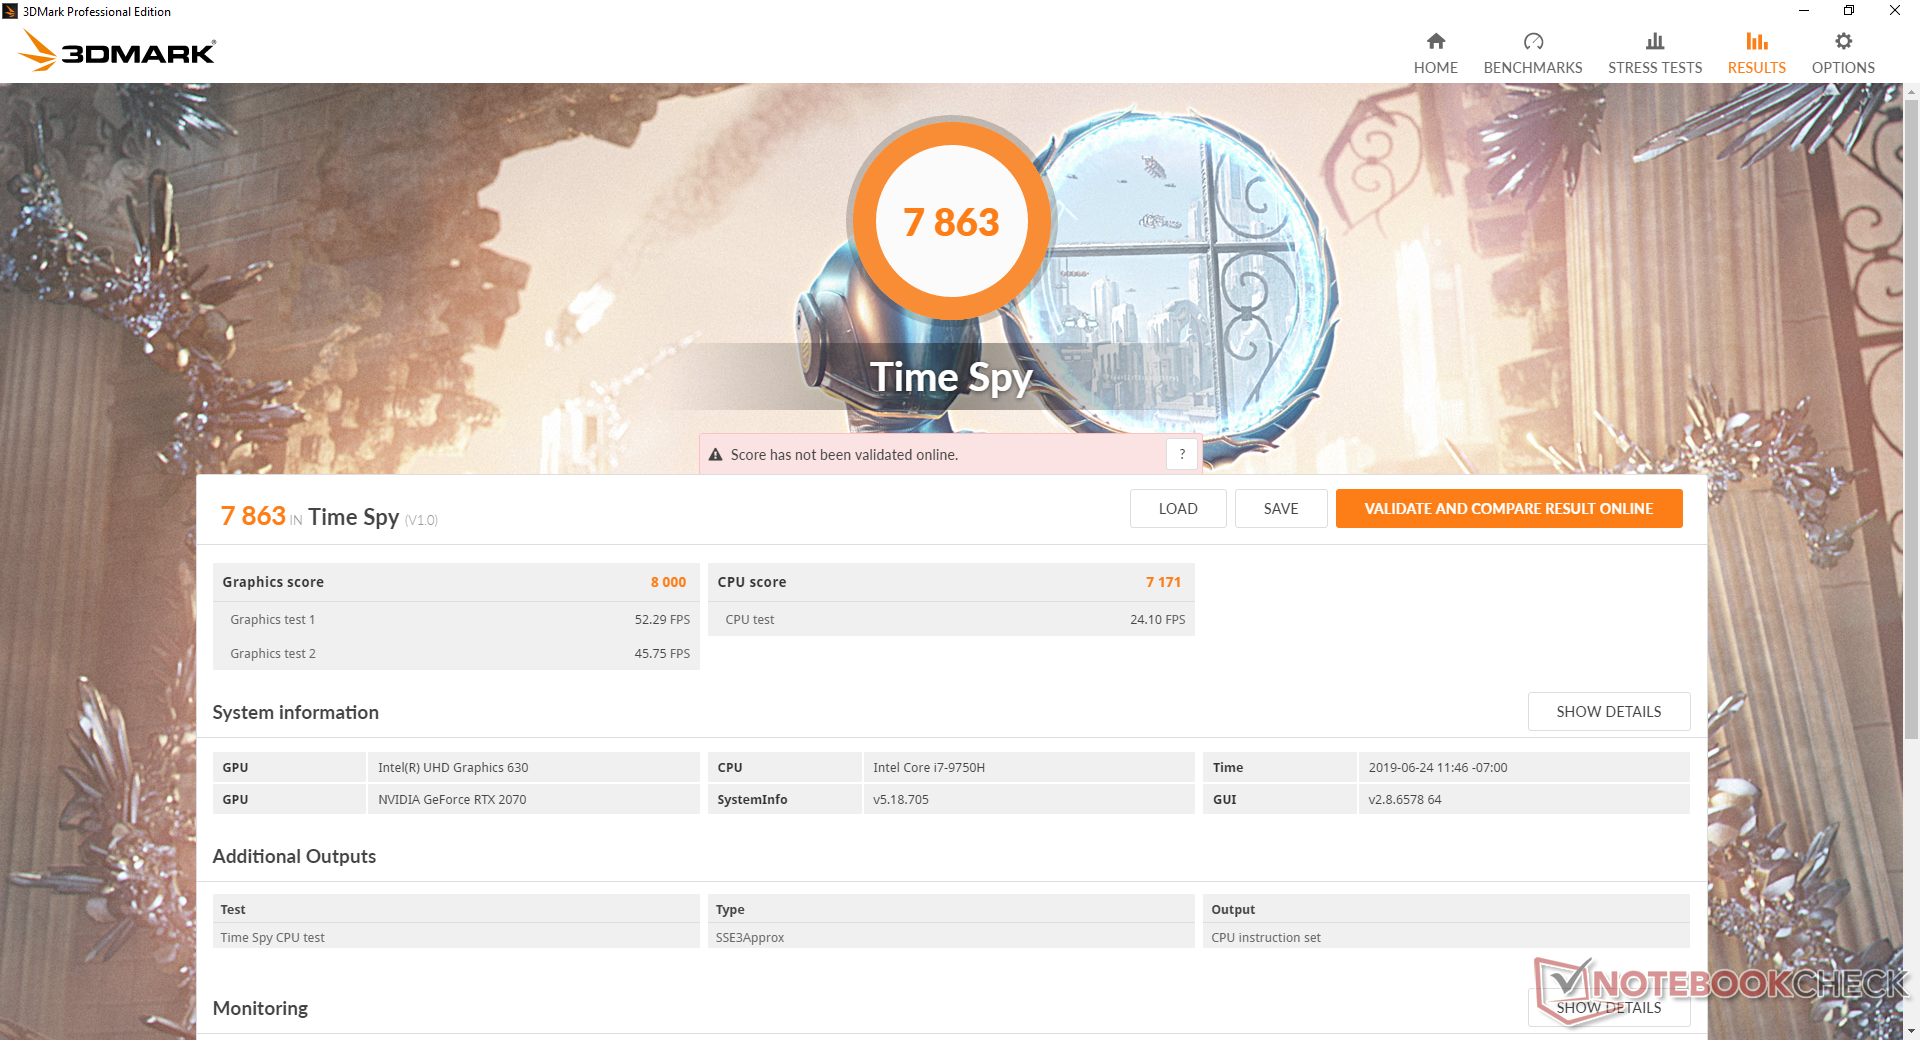
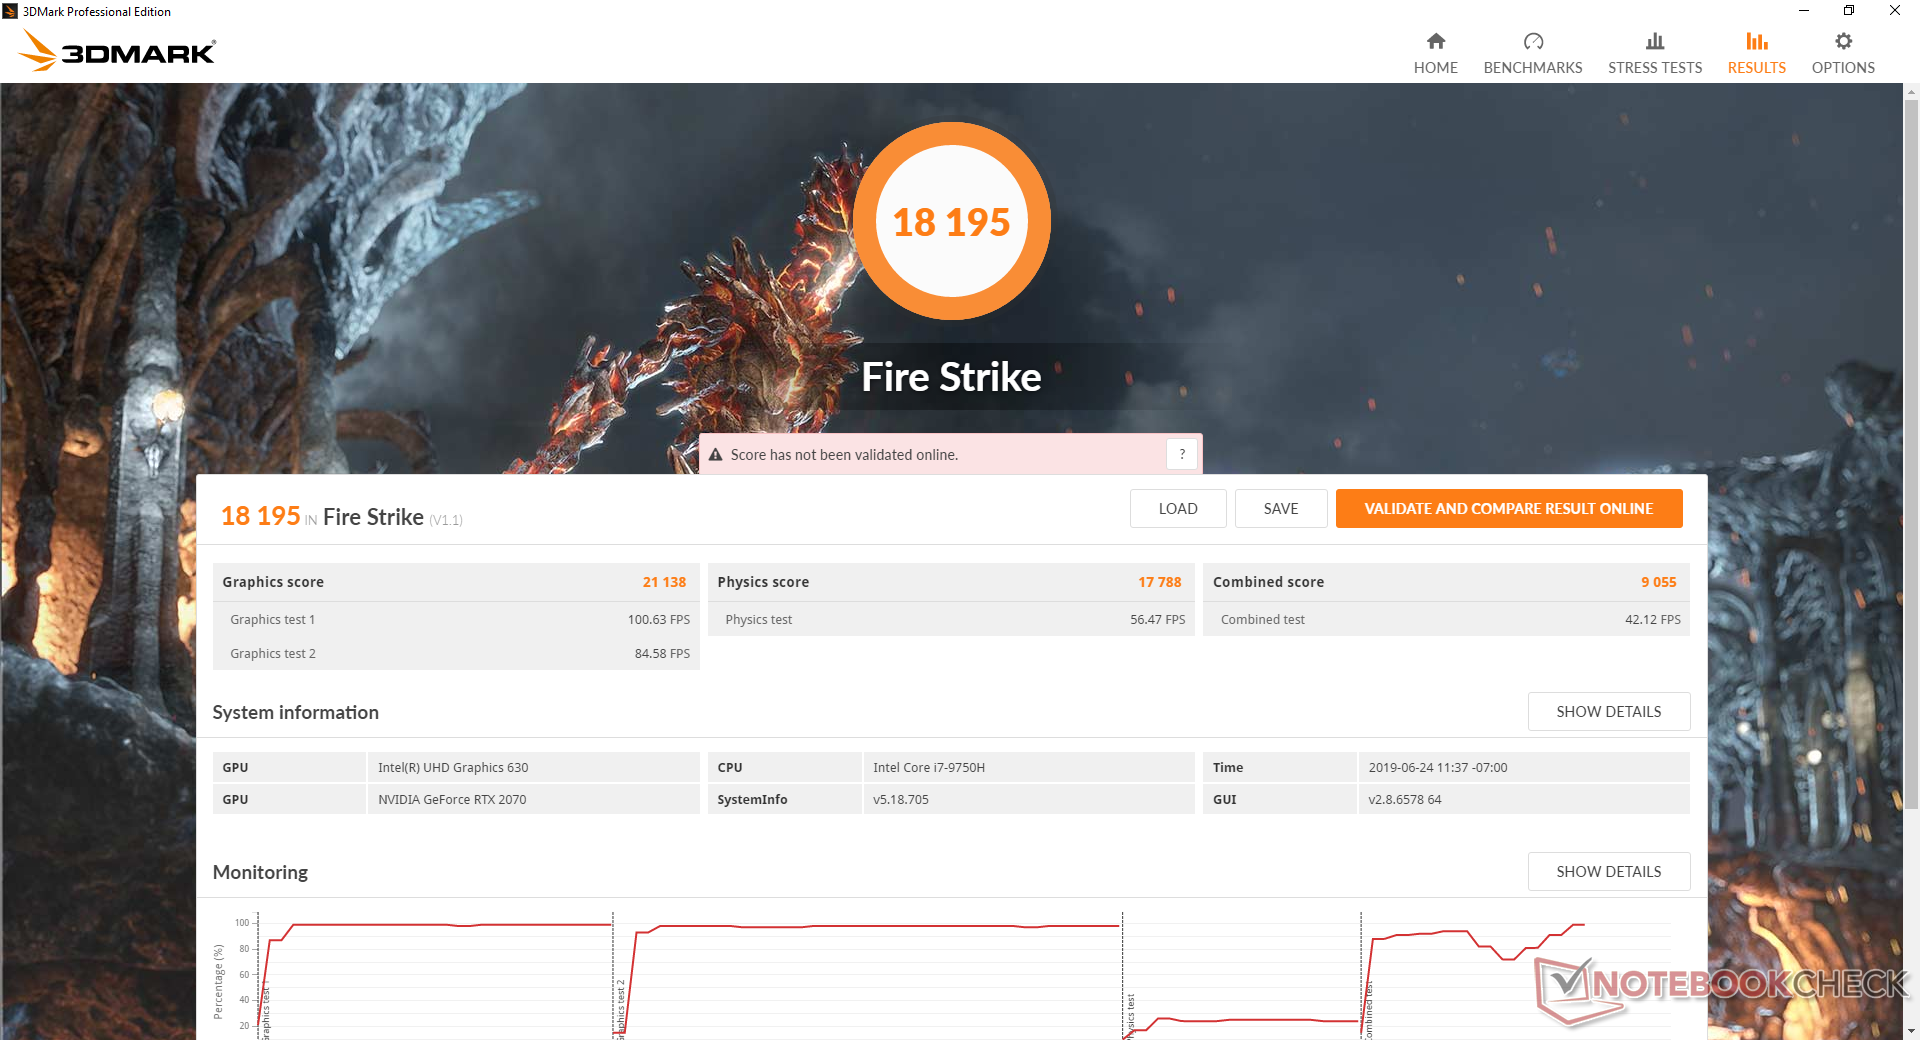
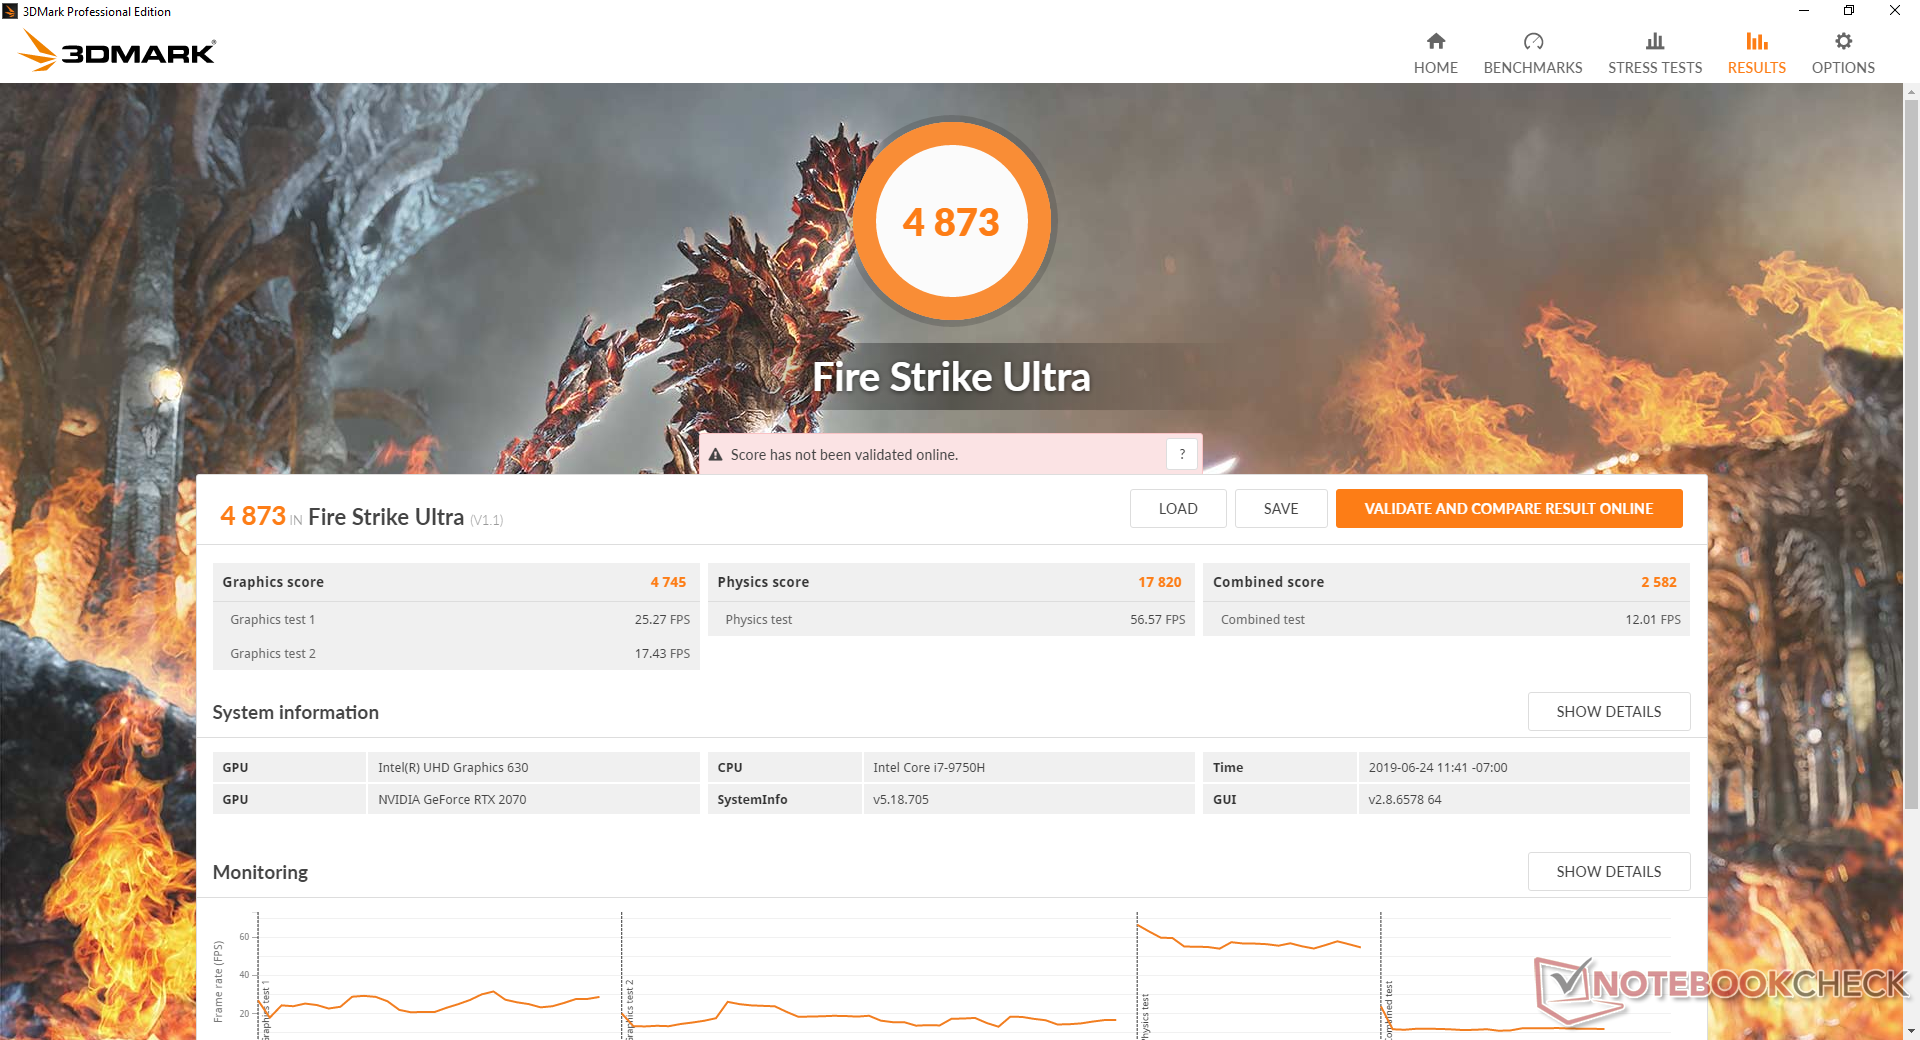
| 3DMark 11 Performance | 21509 points | |
| 3DMark Cloud Gate Standard Score | 40478 points | |
| 3DMark Fire Strike Score | 18195 points | |
| 3DMark Time Spy Score | 7863 points | |
Help | ||
Gaming Performance
All titles will be playable at the "low" native resolution of 1080p. Instead, the challenge lies in reaching a stable 144 FPS to make the most of the 144 Hz display. The RTX 2070 is up to the task and sufficient for undemanding titles like Fortnite or Overwatch, but more demanding titles like Witcher 3 will require a host of graphical adjustments. Keep in mind that you can still exploit the advantages of a 144 Hz display when running at lower frame rates since the refresh rate is much faster than a 60 Hz panel to reduce screen tearing.
Running Witcher 3 shows no recurring frame dips to suggest no interrupting background activity when gaming.
See our dedicated page on the mobile GeForce RTX 2070 for more technical information and benchmarks.
| The Witcher 3 - 1920x1080 Ultra Graphics & Postprocessing (HBAO+) | |
| Asus ROG Strix RTX 2080 OC | |
| MSI GT76 Titan DT 9SG | |
| Razer Blade Pro 17 RTX 2080 Max-Q | |
| Average NVIDIA GeForce RTX 2070 Mobile (64 - 82.1, n=21) | |
| Eurocom Nightsky RX17 | |
| MSI GT63 Titan 8RG-046 | |
| Dell G7 17 7790 | |
| MSI GL73 8SE-010US | |
| Asus ROG Zephyrus G15 GA502DU | |
| Eurocom Q8 | |
| Asus TUF FX705DT-AU068T | |
| Asus G752VY-GC110T | |
| Asus ZenBook 15 UX533FD | |
| low | med. | high | ultra | |
|---|---|---|---|---|
| BioShock Infinite (2013) | 355 | 305.3 | 272.2 | 172.9 |
| The Witcher 3 (2015) | 317.7 | 245.5 | 145.1 | 73.8 |
| Rise of the Tomb Raider (2016) | 218.2 | 201.7 | 148.5 | 122 |
Emissions
System Noise
Fan noise is quiet and essentially inaudible during low loads like browsing or video streaming. The fans are never truly idle, but it's still difficult to notice them over ambient office noise. At worst, the fans can bump up to 33 dB(A) for very short periods before they power back down again. Be sure to set the system to Power Saving or Quiet mode via the Control Center software to avoid pulsing fan behavior.
When gaming, the Eurocom becomes just as loud as most other gaming laptops if not louder. Thinner alternatives like the Razer Blade Pro 17 and Asus Zephyrus S GX701GX are slightly quieter while fan noise is about the same as the Asus G531GW. According to the Control Center app, both fans will automatically operate at their maximum RPMs when gaming on High Performance mode.
We're unable to notice any coil whine or electronic noise from our test unit.
| Eurocom Nightsky RX17 GeForce RTX 2070 Mobile, i7-9750H, 2x Samsung SSD 970 Pro 512GB (RAID 0) | Razer Blade Pro 17 RTX 2080 Max-Q GeForce RTX 2080 Max-Q, i7-9750H, Samsung SSD PM981 MZVLB512HAJQ | Asus Zephyrus S GX701GX GeForce RTX 2080 Max-Q, i7-8750H, Samsung SSD PM981 MZVLB1T0HALR | MSI GS75 8SG Stealth GeForce RTX 2080 Max-Q, i7-8750H, 2x Samsung SSD PM981 MZVLB512HAJQ (RAID 0) | Eurocom Q8 GeForce GTX 1070 Mobile, i9-8950HK, Samsung SSD 960 Pro 512 GB m.2 | Asus Strix Scar III G531GW GeForce RTX 2070 Mobile, i9-9880H, Intel SSD 660p 1TB SSDPEKNW010T8 | |
|---|---|---|---|---|---|---|
| Noise | 2% | -2% | -5% | -1% | -12% | |
| off / environment * (dB) | 28 | 28.2 -1% | 29 -4% | 30 -7% | 28 -0% | 29 -4% |
| Idle Minimum * (dB) | 28 | 28.2 -1% | 29 -4% | 31 -11% | 28.2 -1% | 30 -7% |
| Idle Average * (dB) | 28.4 | 28.2 1% | 32 -13% | 32 -13% | 31.8 -12% | 37 -30% |
| Idle Maximum * (dB) | 32.9 | 30.8 6% | 33 -0% | 41 -25% | 36.3 -10% | 39 -19% |
| Load Average * (dB) | 45 | 42 7% | 47 -4% | 47 -4% | 46.7 -4% | 54 -20% |
| Witcher 3 ultra * (dB) | 53.2 | 51 4% | 49 8% | 47 12% | 46.9 12% | 54 -2% |
| Load Maximum * (dB) | 53.2 | 53 -0% | 51 4% | 48 10% | 49.7 7% | 54 -2% |
* ... smaller is better
Noise level
| Idle |
| 28 / 28.4 / 32.9 dB(A) |
| Load |
| 45 / 53.2 dB(A) |
 | ||
30 dB silent 40 dB(A) audible 50 dB(A) loud |
||
min: | ||
Temperature
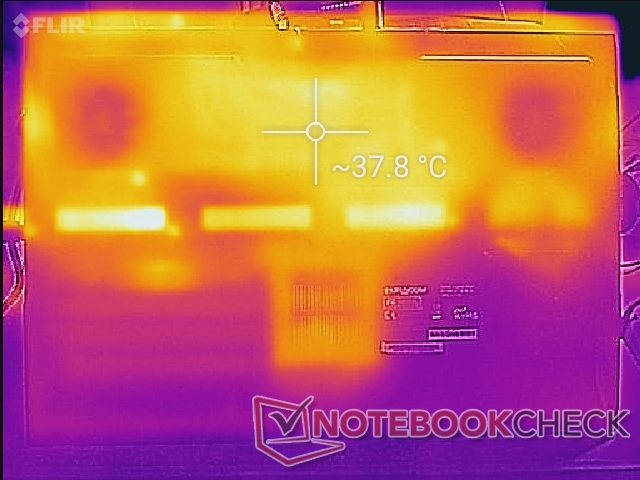
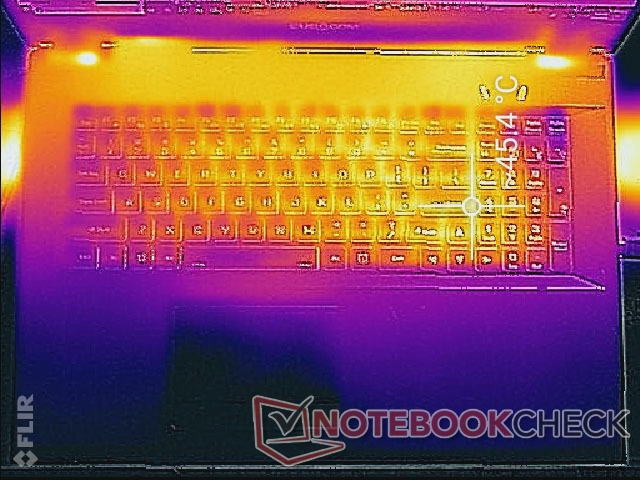
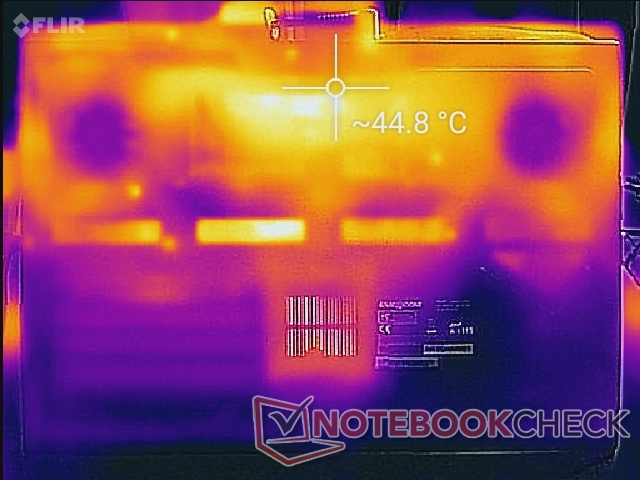
Surface temperatures when idling are generally cool with the hot spots concentrated toward the rear of the system as one would expect. The thermal images below give a pretty accurate outline of the motherboard from the bottom of the chassis. We're able to record a surface temperature of almost 38 C nearest the processors.
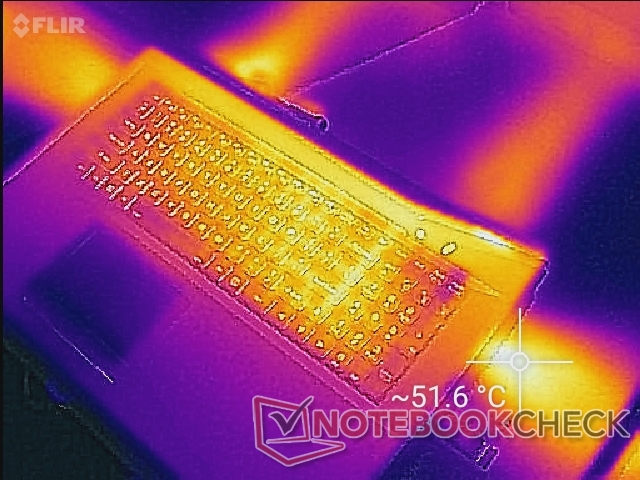
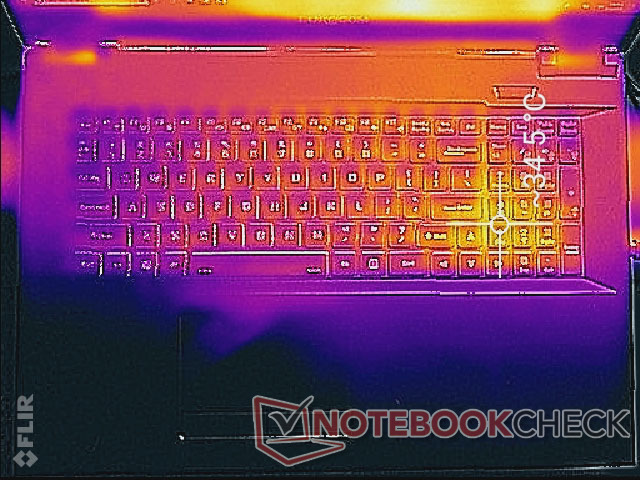
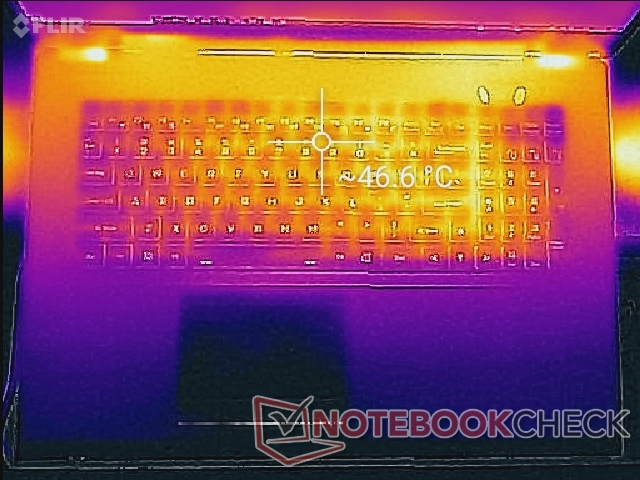
When gaming, much of the keyboard can reach 45 C while the palm rests and trackpad barely change. The WASD keys will become warmer but not enough to be distracting when gaming. The rest of the keyboard is not so lucky; you probably don't want to be typing up long essays or spreadsheets when the system is under high processing loads as the NumPad and Enter keys can be as warm as 40 to 45 C. In comparison, the keyboard keys of the Lenovo Legion Y740 or Razer Blade Pro 17 reach only about 36 C to 38 C each when under the same gaming loads.
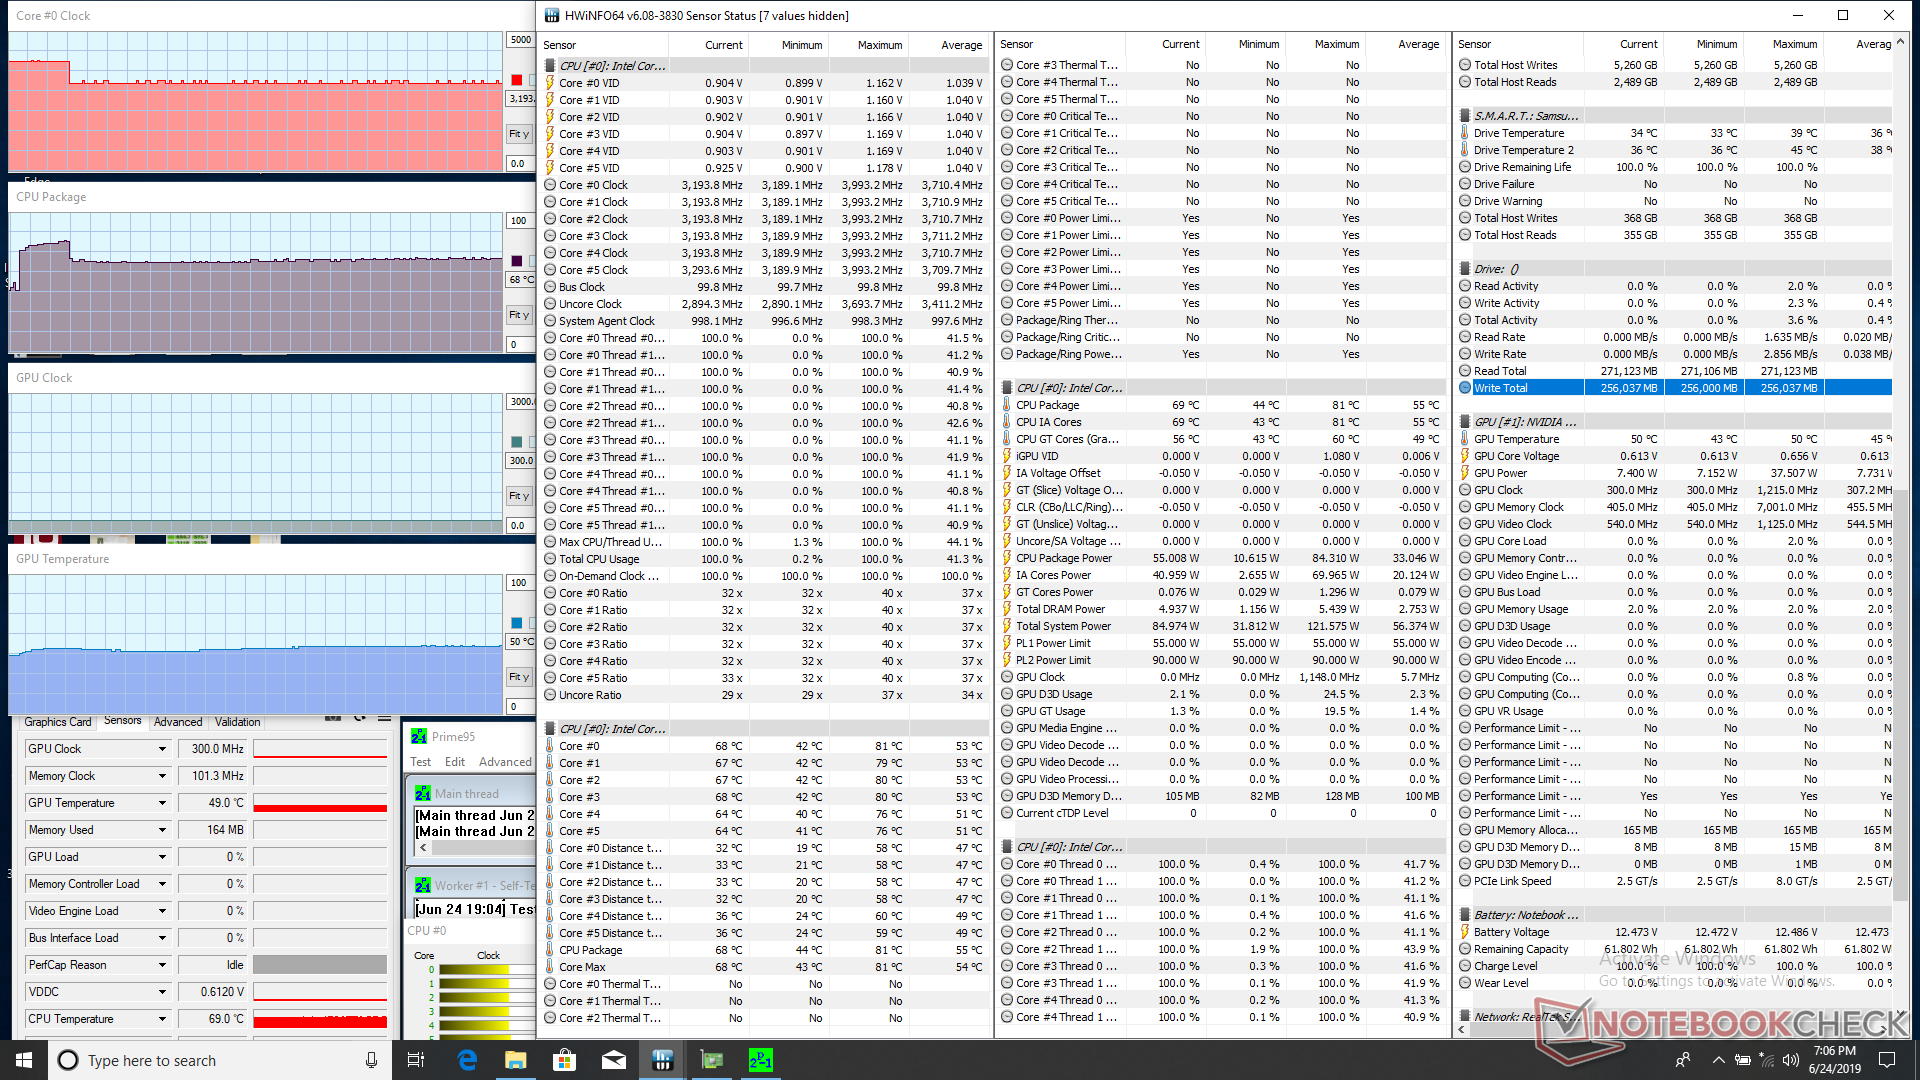
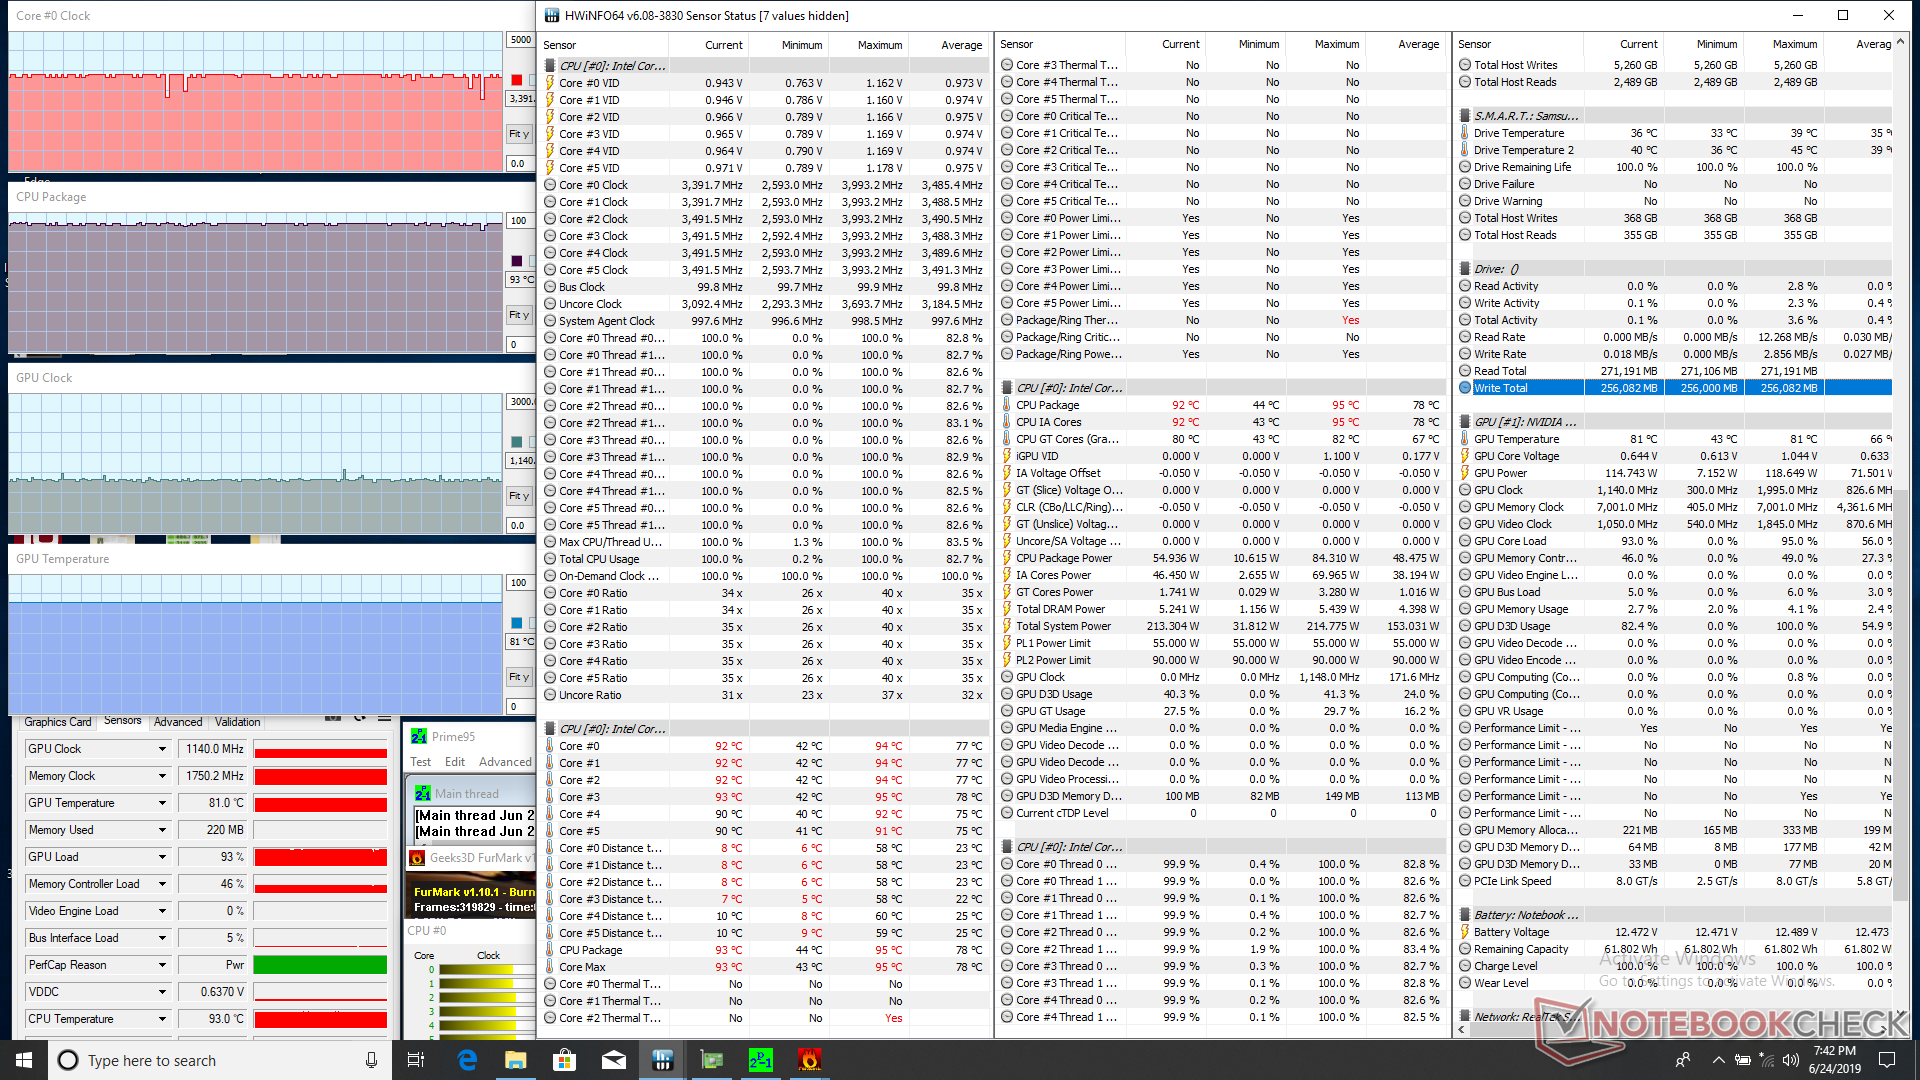
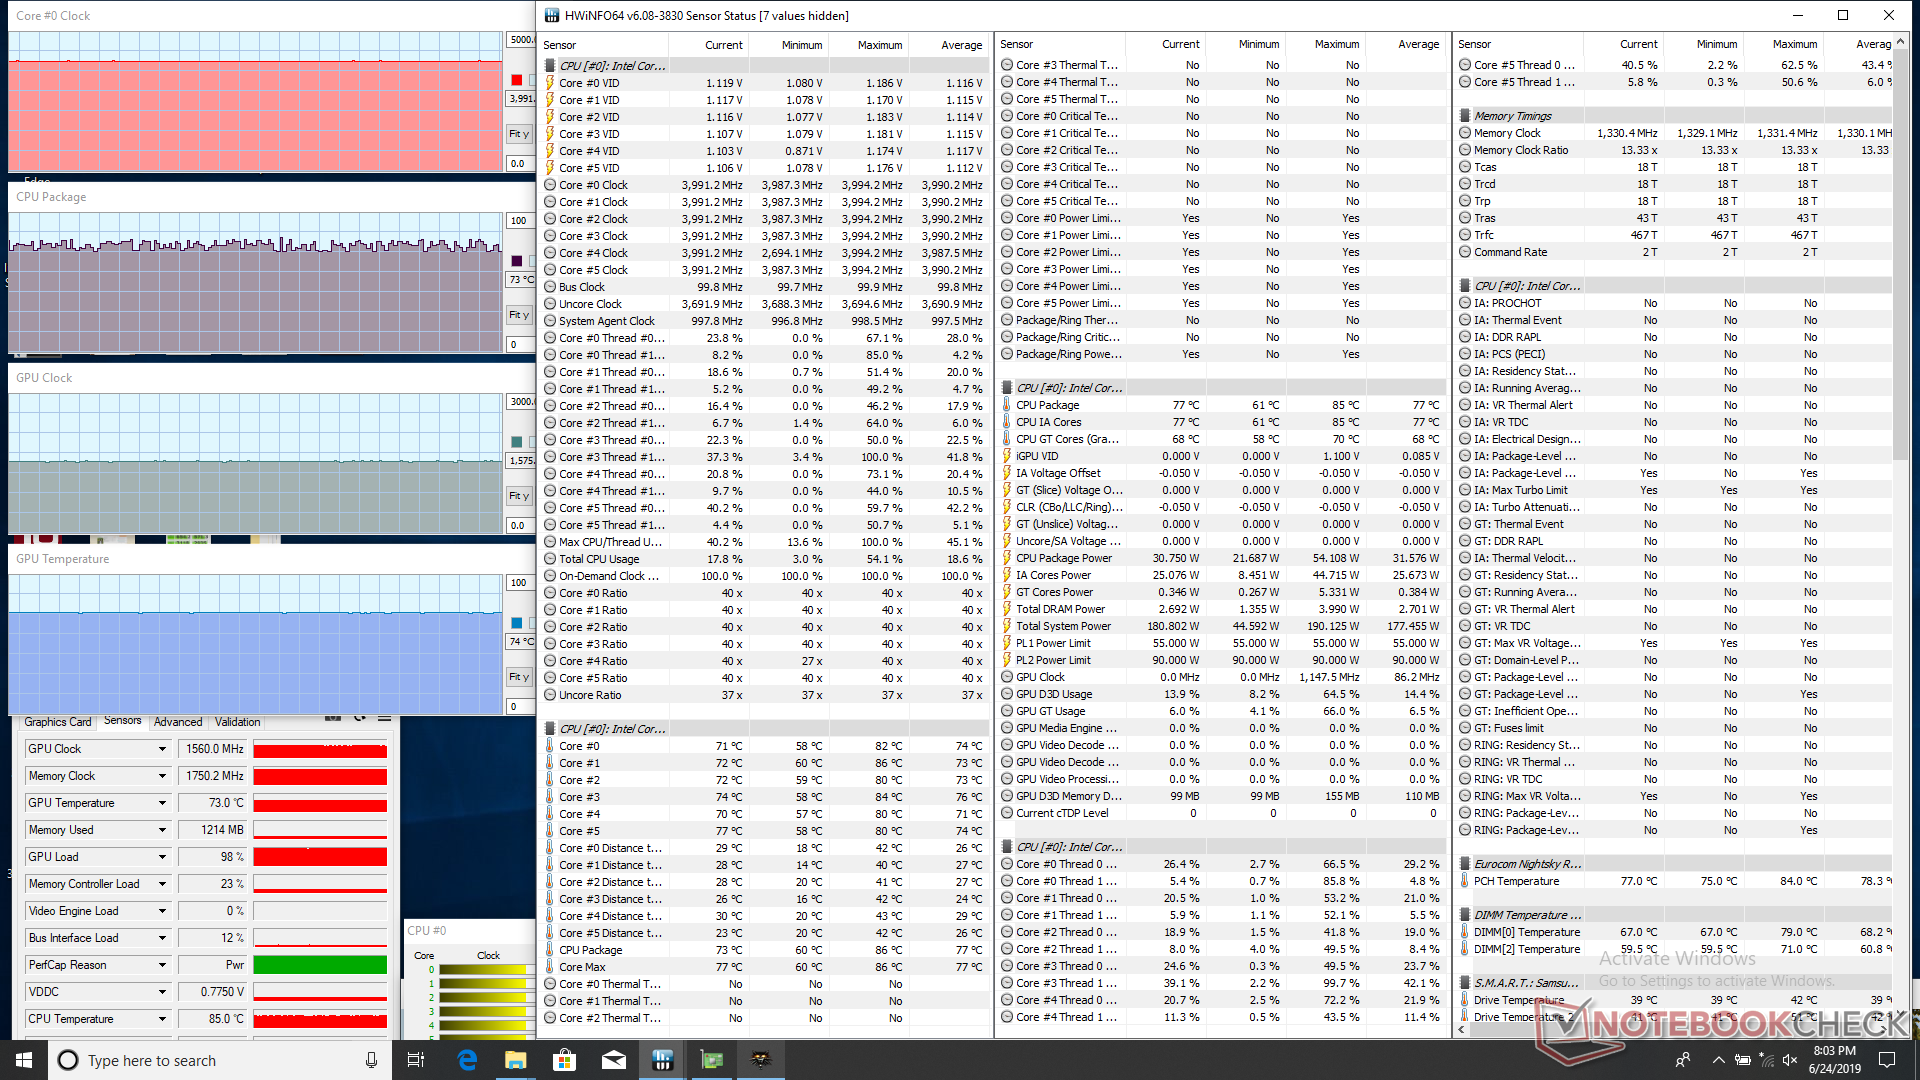
Stress Test
We stress the system with synthetic loads to identify for any potential throttling or stability issues. When running Prime95, the CPU can be observed operating as high as 4 GHz until reaching a core temperature of 81 C after just a few seconds. Thereafter, clock rates drop to the 2.2 to 2.3 GHz range in order to maintain a cooler core temperature of 68 C. It's very likely that the unlocked Core i9-9980HK SKU will run at warmer core temperatures once overclocked since the 60 C range is relatively reserved for a gaming laptop. Stressing both the CPU and GPU simultaneously will cause core temperatures to stabilize at 93 C and 81 C, respectively. The CPU never falls to its base clock rate even when subjected to such extreme loads albeit at the cost of a very warm core temperature.
Running Witcher 3 is more representative of real-world gaming conditions. CPU and GPU temperatures each stabilize at 73 C to be somewhat comparable to the Razer Blade Pro 17 and slightly cooler than the MSI GS75.
Running on batteries will limit performance. A 3DMark Time Spy run on battery power returns Physics and Graphics scores of just 4132 and 1872 points, respectively, compared to 7171 and 8000 points when on mains.
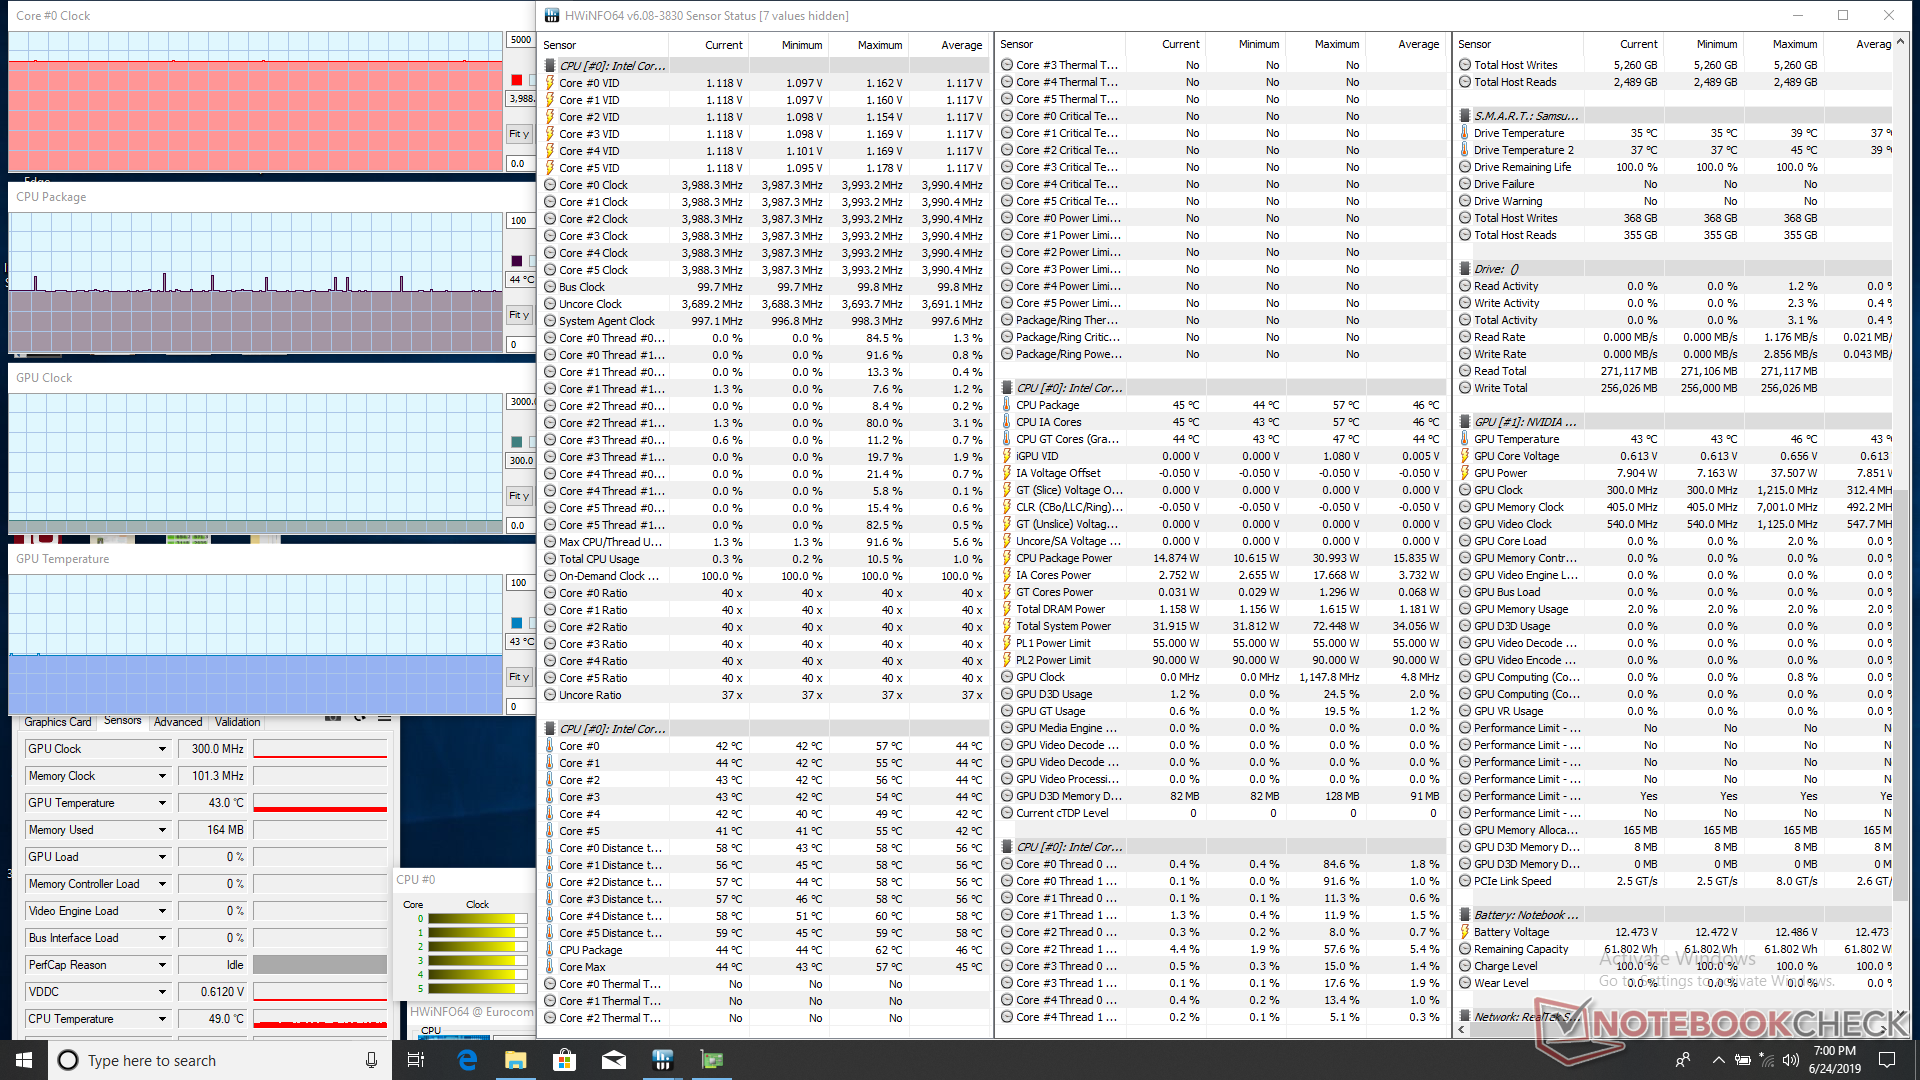
| CPU Clock (GHz) | GPU Clock (MHz) | Average CPU Temperature (°C) | Average GPU Temperature (°C) | |
| System Idle | -- | -- | 44 | 43 |
| Prime95 Stress | 3.2 - 3.3 | -- | 68 | -- |
| Prime95 + FurMark Stress | 3.2 - 3.3 | 1140 | 93 | 81 |
| Witcher 3 Stress | 4.0 | 1560 | ~73 | 74 |
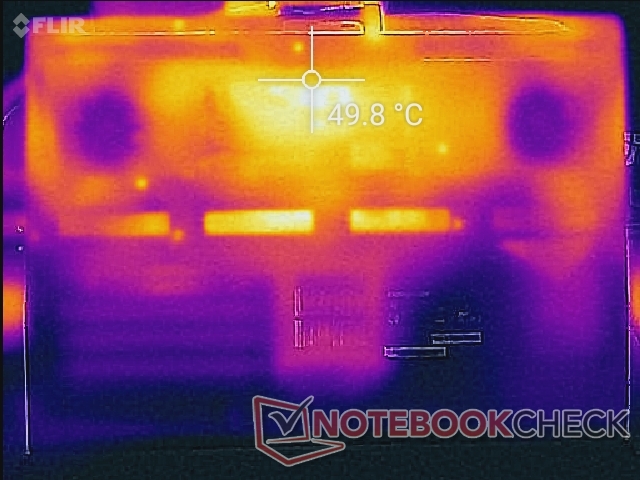
(-) The maximum temperature on the upper side is 48.6 °C / 119 F, compared to the average of 40.4 °C / 105 F, ranging from 21.2 to 68.8 °C for the class Gaming.
(-) The bottom heats up to a maximum of 46.8 °C / 116 F, compared to the average of 43.2 °C / 110 F
(+) In idle usage, the average temperature for the upper side is 31.4 °C / 89 F, compared to the device average of 33.9 °C / 93 F.
(±) Playing The Witcher 3, the average temperature for the upper side is 37.1 °C / 99 F, compared to the device average of 33.9 °C / 93 F.
(+) The palmrests and touchpad are cooler than skin temperature with a maximum of 31.2 °C / 88.2 F and are therefore cool to the touch.
(-) The average temperature of the palmrest area of similar devices was 28.8 °C / 83.8 F (-2.4 °C / -4.4 F).
Speakers
The stereo 2 W speakers are loud at almost 89 dB(A) with decent bass reproduction (additional 4 W subwoofer). Higher volume settings will not introduce any static, but the palm rests will vibrate which can be slightly annoying on the hand when gaming or typing while listening to music.

Eurocom Nightsky RX17 audio analysis
(+) | speakers can play relatively loud (88.6 dB)
Bass 100 - 315 Hz
(±) | reduced bass - on average 8.5% lower than median
(+) | bass is linear (5.3% delta to prev. frequency)
Mids 400 - 2000 Hz
(±) | higher mids - on average 5.4% higher than median
(+) | mids are linear (4.8% delta to prev. frequency)
Highs 2 - 16 kHz
(+) | balanced highs - only 1.1% away from median
(+) | highs are linear (4.1% delta to prev. frequency)
Overall 100 - 16.000 Hz
(+) | overall sound is linear (12% difference to median)
Compared to same class
» 12% of all tested devices in this class were better, 4% similar, 84% worse
» The best had a delta of 6%, average was 18%, worst was 132%
Compared to all devices tested
» 9% of all tested devices were better, 2% similar, 88% worse
» The best had a delta of 4%, average was 23%, worst was 134%
Apple MacBook 12 (Early 2016) 1.1 GHz audio analysis
(+) | speakers can play relatively loud (83.6 dB)
Bass 100 - 315 Hz
(±) | reduced bass - on average 11.3% lower than median
(±) | linearity of bass is average (14.2% delta to prev. frequency)
Mids 400 - 2000 Hz
(+) | balanced mids - only 2.4% away from median
(+) | mids are linear (5.5% delta to prev. frequency)
Highs 2 - 16 kHz
(+) | balanced highs - only 2% away from median
(+) | highs are linear (4.5% delta to prev. frequency)
Overall 100 - 16.000 Hz
(+) | overall sound is linear (10.2% difference to median)
Compared to same class
» 7% of all tested devices in this class were better, 2% similar, 90% worse
» The best had a delta of 5%, average was 18%, worst was 53%
Compared to all devices tested
» 5% of all tested devices were better, 1% similar, 94% worse
» The best had a delta of 4%, average was 23%, worst was 134%
Energy Management
Power Consumption
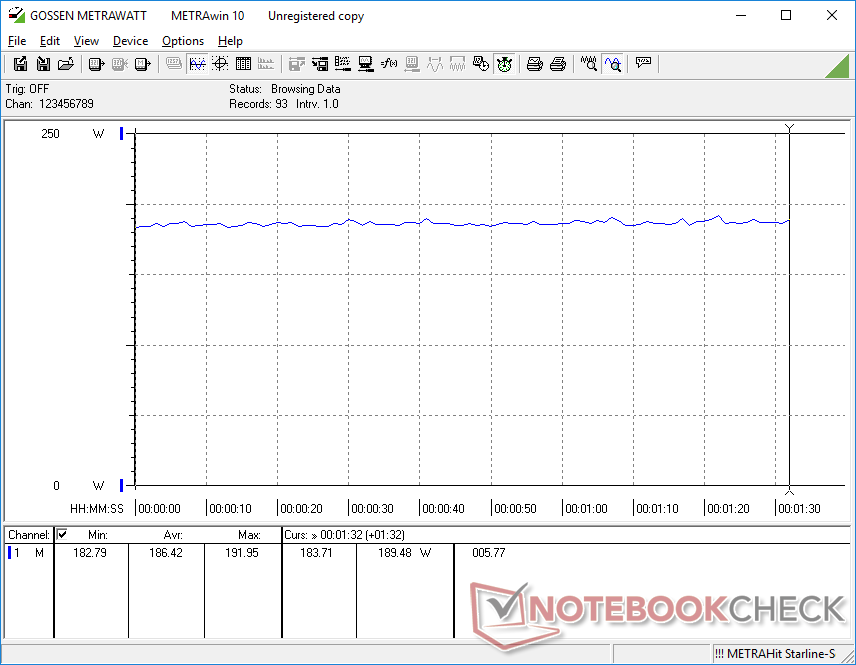
Idling on desktop averages somewhere between 18 W and 23 W depending on the brightness setting and power profile. When gaming, consumption jumps to 186 W to be nearly identical to the Blade Pro 17 with RTX 2080 Max-Q graphics and Eurocom Q8 with the last generation GTX 1070. When considering that the RTX 2070 offers 19 to 41 percent more performance than the GTX 1070, the gen-to-gen improvements in performance-per-Watt should definitely be noted.
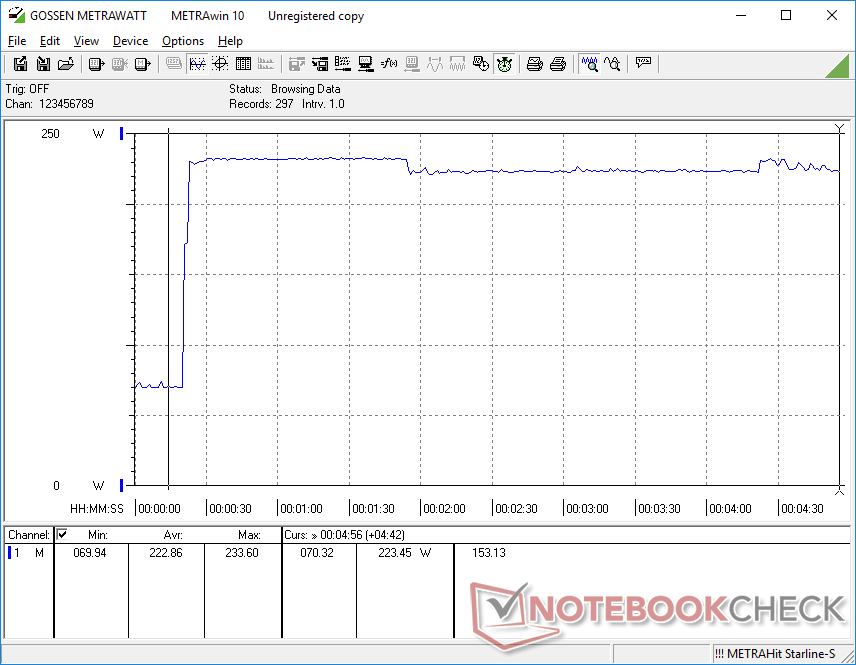
At most, we're able to record a maximum consumption of 234 W from the medium-sized (~15.3 x 7.3 x 3 cm) 230 W AC adapter. This high of a consumption remains relatively steady when running both Prime95 and FurMark and so the recharge rate will slow to a crawl if both the CPU and GPU are each at 100 percent utilization.
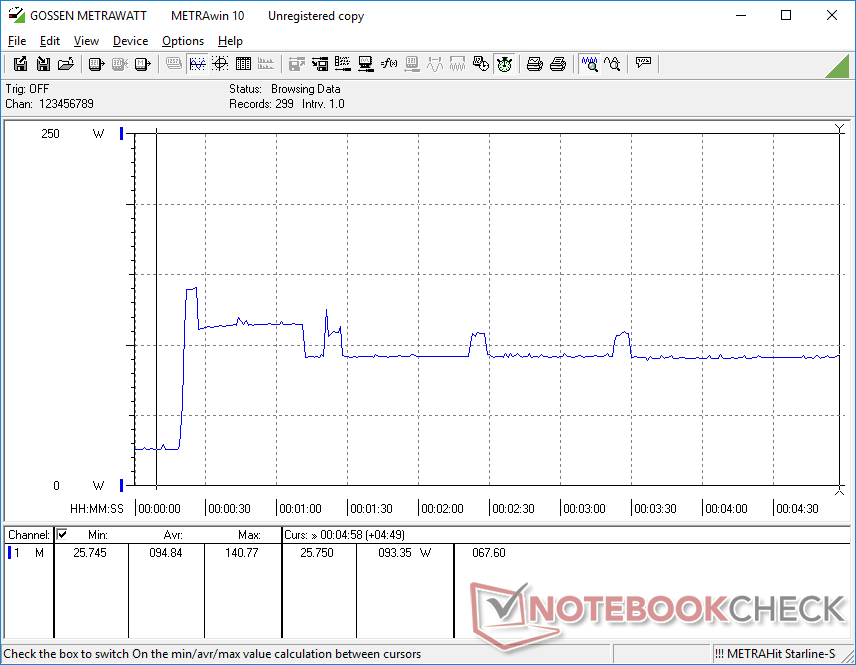
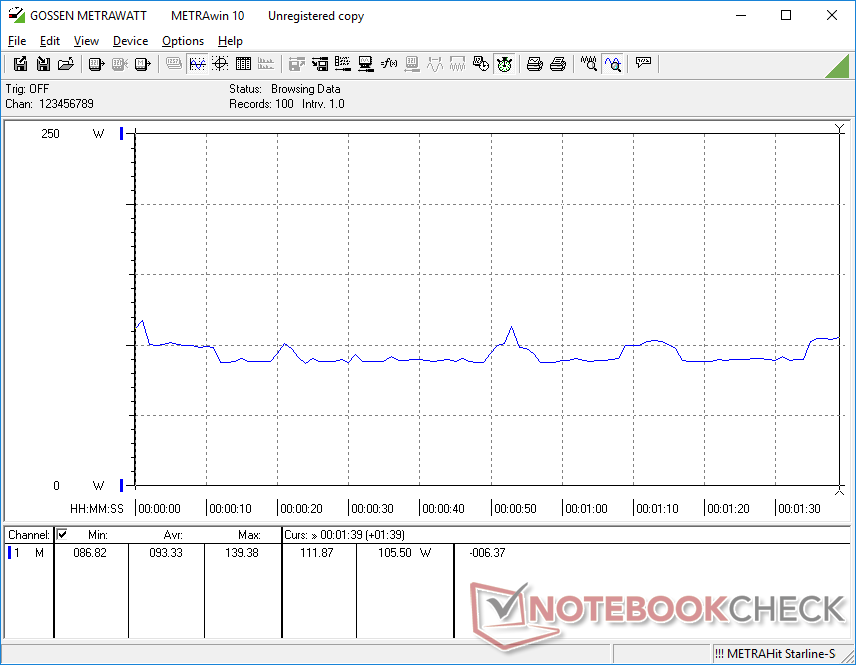
Running Prime95 will spike consumption up to 141 W for a few short seconds before falling and stabilizing at about 93 W as shown by our graph below. This behavior mirrors our stress test and CineBench R15 loop test observations above where clock rates would be fastest only during the beginning of each test.
| Off / Standby | |
| Idle | |
| Load |
|
Key:
min: | |
| Eurocom Nightsky RX17 i7-9750H, GeForce RTX 2070 Mobile, 2x Samsung SSD 970 Pro 512GB (RAID 0), IPS, 1920x1080, 17.3" | Razer Blade Pro 17 RTX 2080 Max-Q i7-9750H, GeForce RTX 2080 Max-Q, Samsung SSD PM981 MZVLB512HAJQ, IPS, 1920x1080, 17.3" | Eurocom Q8 i9-8950HK, GeForce GTX 1070 Mobile, Samsung SSD 960 Pro 512 GB m.2, TN LED, 2560x1440, 17.3" | Dell G7 17 7790 i7-8750H, GeForce RTX 2070 Max-Q, Toshiba BG3 KBG30ZMS256G, IPS, 1920x1080, 17.3" | MSI GL73 8SE-010US i7-8750H, GeForce RTX 2060 Mobile, Kingston RBUSNS8154P3128GJ, TN LED, 1920x1080, 17.3" | Alienware 17 R4 i7-7820HK, GeForce GTX 1080 Mobile, SK Hynix PC300 NVMe 512 GB, TN LED, 2560x1440, 17.3" | |
|---|---|---|---|---|---|---|
| Power Consumption | 3% | -12% | 18% | 25% | -46% | |
| Idle Minimum * (Watt) | 18.6 | 16.2 13% | 26.3 -41% | 9.5 49% | 8.8 53% | 37.5 -102% |
| Idle Average * (Watt) | 22.6 | 20.4 10% | 29 -28% | 16.2 28% | 16.2 28% | 37.6 -66% |
| Idle Maximum * (Watt) | 23 | 26.1 -13% | 32.3 -40% | 23.8 -3% | 18.3 20% | 37.6 -63% |
| Load Average * (Watt) | 93.4 | 96.5 -3% | 82.4 12% | 101.7 -9% | 86.1 8% | 122.4 -31% |
| Witcher 3 ultra * (Watt) | 186.4 | 182.9 2% | 192 -3% | 155 17% | 146.7 21% | 180.3 3% |
| Load Maximum * (Watt) | 233.6 | 214.3 8% | 170.2 27% | 172.2 26% | 186.4 20% | 277.4 -19% |
* ... smaller is better
Battery Life
Runtimes are poor even after taking into account the small 62 Wh battery. When looping a web page every 40 seconds on Windows Balanced mode, we were only able to record a total runtime of only two hours compared to twice that on the Razer Blade Pro 17 or Zephyrus S GX701. We definitely expected longer not only because the system comes equipped with Optimus, but also because other 17-inch gaming laptops have proven that it's possible to have both decent battery life and a high-end GPU. At most, we're able to record just over 4 hours of runtime when idling on desktop at the lowest brightness setting with everything set to Power Saver.
To the system's credit, its battery is easy to replace. You'll still need a screwdriver, however, which is a step back from the more user-friendly switch and latch mechanism of other Eurocom laptops like the Sky X7C. Recharging from empty to full capacity takes about 2 hours.
| Eurocom Nightsky RX17 i7-9750H, GeForce RTX 2070 Mobile, 62 Wh | Razer Blade Pro 17 RTX 2080 Max-Q i7-9750H, GeForce RTX 2080 Max-Q, 70 Wh | Asus Zephyrus S GX701GX i7-8750H, GeForce RTX 2080 Max-Q, 76 Wh | MSI GS75 8SG Stealth i7-8750H, GeForce RTX 2080 Max-Q, 80.25 Wh | Eurocom Q8 i9-8950HK, GeForce GTX 1070 Mobile, 66 Wh | Lenovo Legion Y740-17ICH i7-8750H, GeForce RTX 2080 Max-Q, 76 Wh | |
|---|---|---|---|---|---|---|
| Battery runtime | 56% | 28% | 74% | 30% | 60% | |
| Reader / Idle (h) | 4.2 | 4.9 17% | 5 19% | 7.7 83% | ||
| WiFi v1.3 (h) | 2 | 4.7 135% | 3.8 90% | 5.3 165% | 2.6 30% | 3.2 60% |
| Load (h) | 1.2 | 1.4 17% | 0.9 -25% | 0.9 -25% |
Pros
Cons
Verdict
We always cite easy serviceability as the top reason for owning a Clevo-based laptop over more popular options from Asus, Alienware, Acer, or MSI. This is unfortunately not the case for the Eurocom Nightsky RX17. The fact that there are two to three times more screws to remove and that the keyboard must first be disconnected just to upgrade something as simple as RAM or storage is a step in the opposite direction. Clevo designs have always been successful at connecting the user to the core components of a laptop more so than on competitors, but we just don't feel that same bond with the closed nature of the Nightsky RX17. When it becomes faster and easier to add a stick of RAM to a Razer Blade Pro 17 than a larger Clevo barebones, then you know you've done something wrong somewhere along the line.
Aside from the disappointing serviceability, the Nightsky RX17 doesn't do enough to set itself apart from the sea of 17-inch gaming alternatives. Yes, performance is outstanding, but fan noise, battery life, clickpad surface, and chassis rigidity can all be improved. The Asus ROG Strix Hero III G731GW can be found online with the same Core i7-9750H CPU, RTX 2070 GPU, and 144 Hz display as our Eurocom configuration for about $200 to $300 less. If you're insistent on having the best that Clevo has to offer, however, then the Eurocom Sky X4C or X7C will be the better buy than the Nightsky RX17.
The Nightsky RX17 performs slightly faster than a competing laptop with the same Core i7-9750H and GeForce RTX 2070 GPU. Unfortunately, it is likely to be significantly more difficult to service or upgrade as well.
Eurocom Nightsky RX17
- 07/01/2019 v6 (old)
Allen Ngo
Price comparison
