MSI GT63 Titan 8RG-046 (i7-8750H, GTX 1080, FHD) Laptop Review
It’s been nearly two years since we evaluated the MSI GT62VR, a large “desktop replacement” 15.6-inch machine which was among the first notebooks to implement NVIDIA Pascal architecture GPUs. We were impressed by its strong performance, great RGB-LED illuminated keyboard, and good display. However, the device also suffered GPU throttling under heavy loads and exhibited suboptimal heat distribution across the top cover/palm rests.
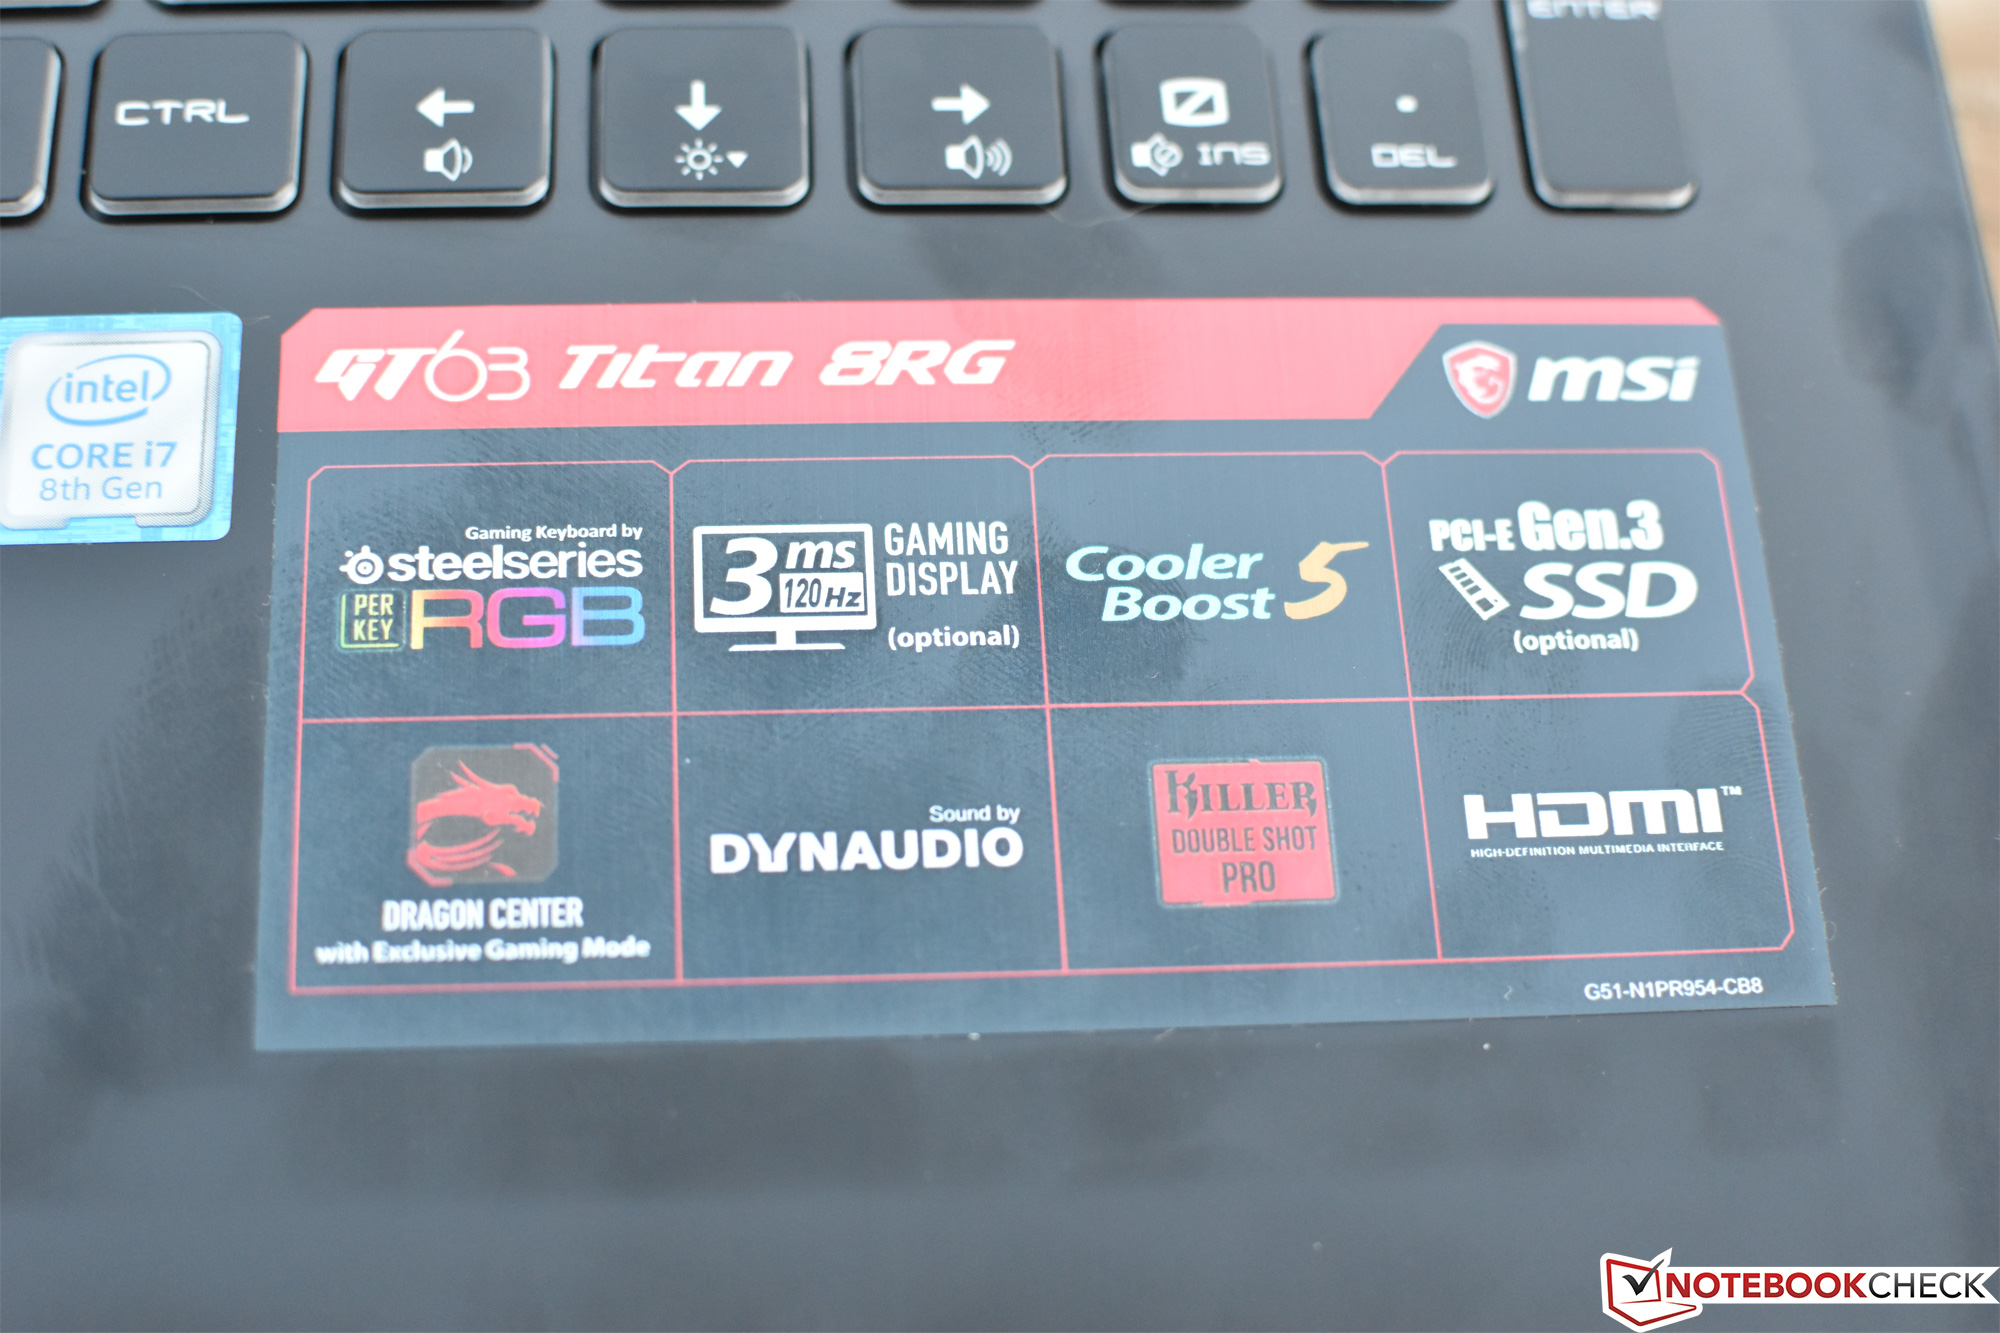
Today, we’re taking a look at the GT63 Titan, which adopts the same case design and board layout, but leverages a respected NVIDIA GeForce GTX 1080 GPU alongside a CPU—an Intel Core i7-8750H—that’s two generations newer. Joining these formidable chips are 16 GB of DDR4 memory and an NVMe SSD. At a current retail asking price (available from Computer Upgrade King) of $2,639, can the GT63 Titan preserve its status among the top 15.6-inch gaming notebooks currently available?
Case
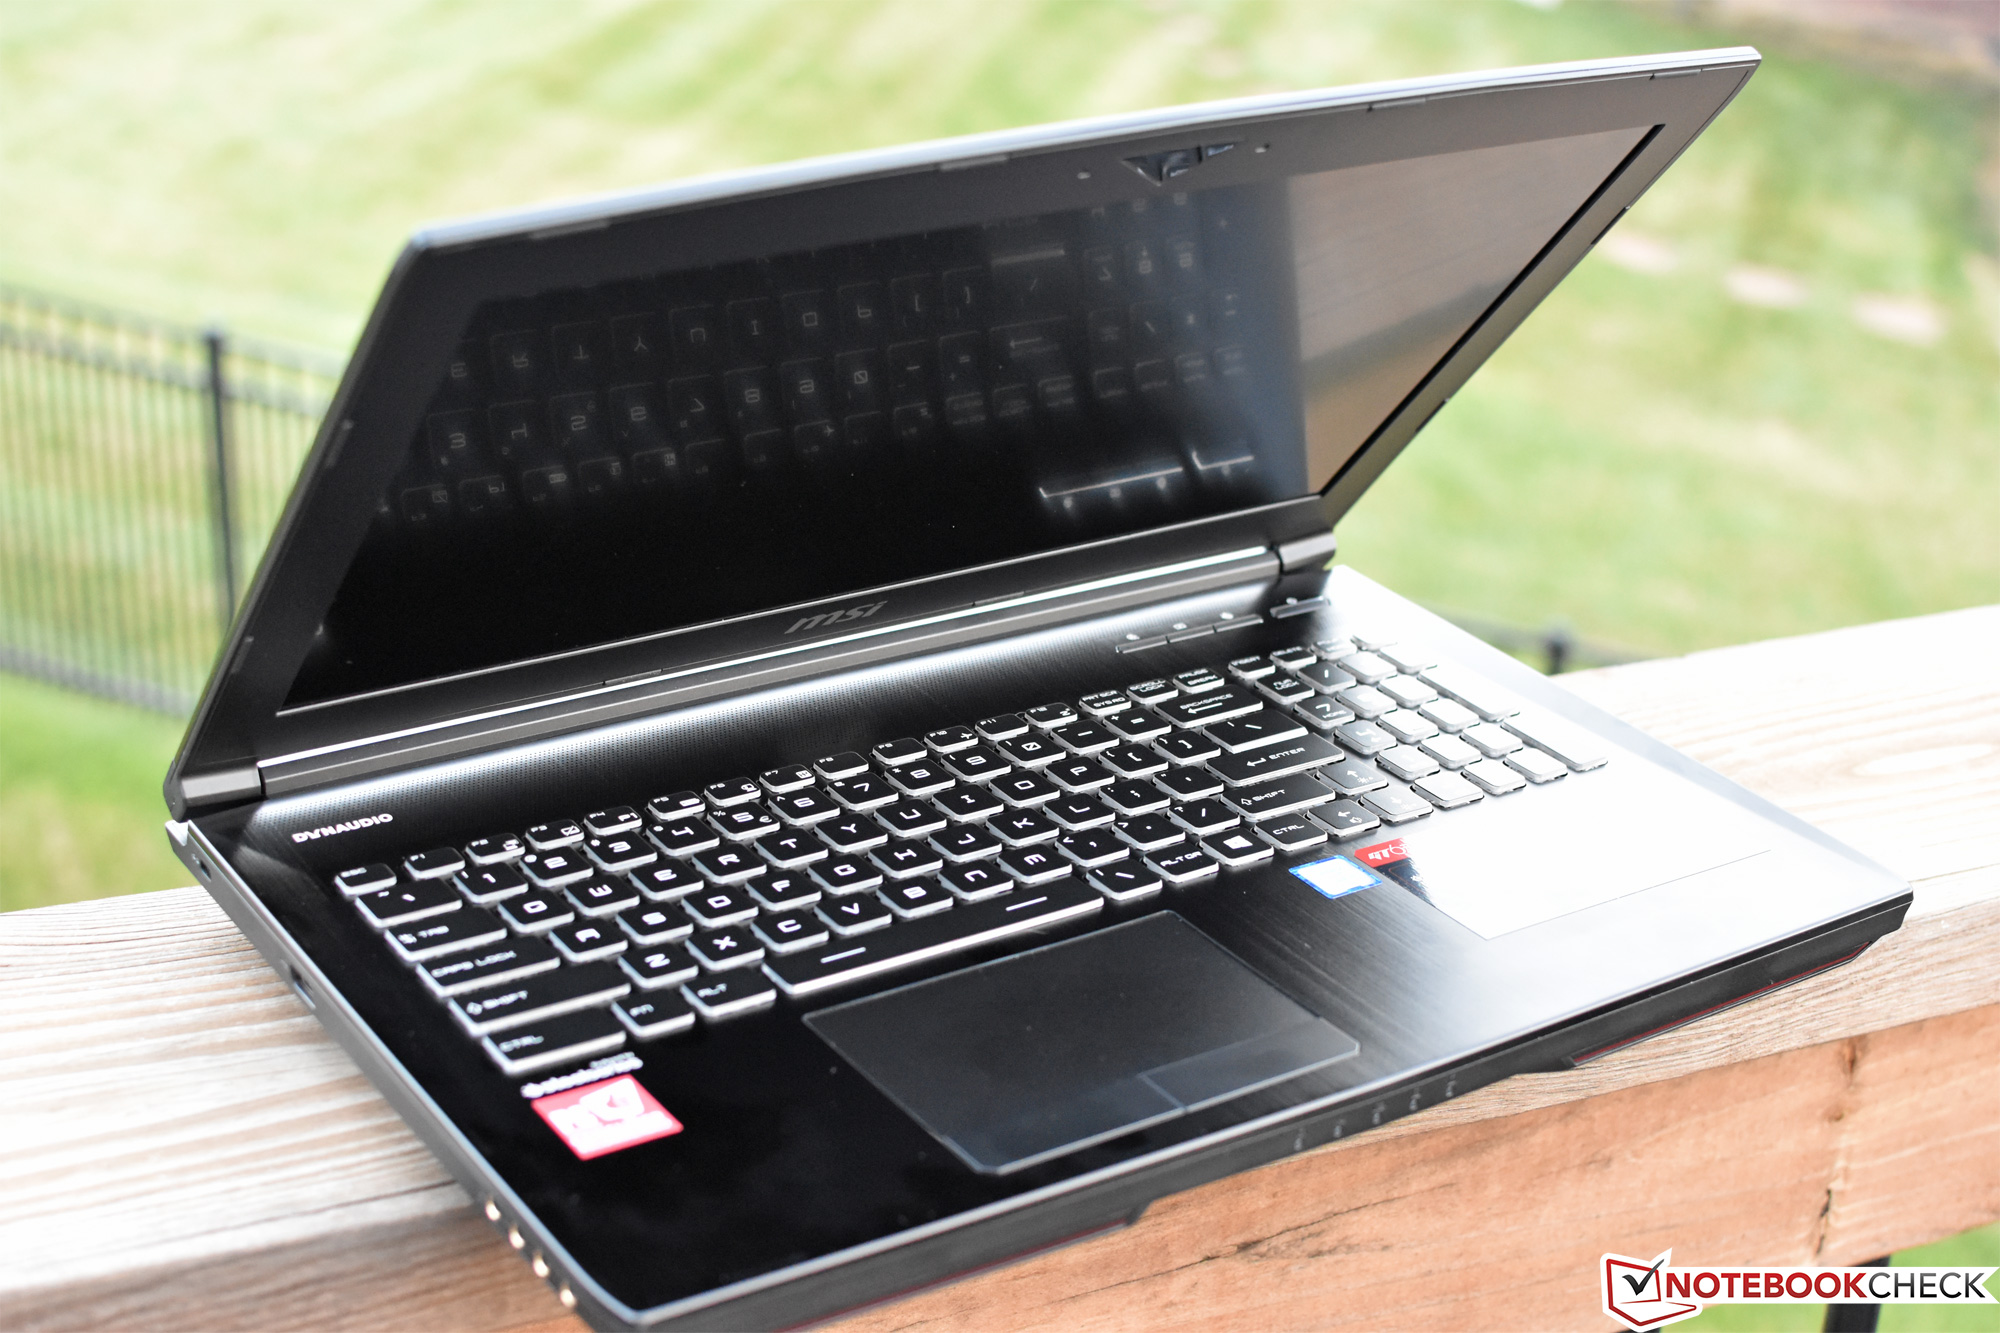
The case hasn’t changed since our original review of the GT62VR nearly two years ago. Having said that, considering its classification as a desktop replacement, there isn’t a whole lot of need for improvement. While the primary construction (including the internal frame and the bottom) is plastic, the display lid and top cover/palm rest are made from aluminum. Stability is quite good on the base unit, with only minor flex detectable in the middle of the machine (above the touchpad) under moderate pressure. The display lid, meanwhile, is quite a bit more flexible and can be twisted with hardly any effort. It also succumbs to pressure from the back and curves inward with little provocation, which concerns us somewhat about its resilience in transit.
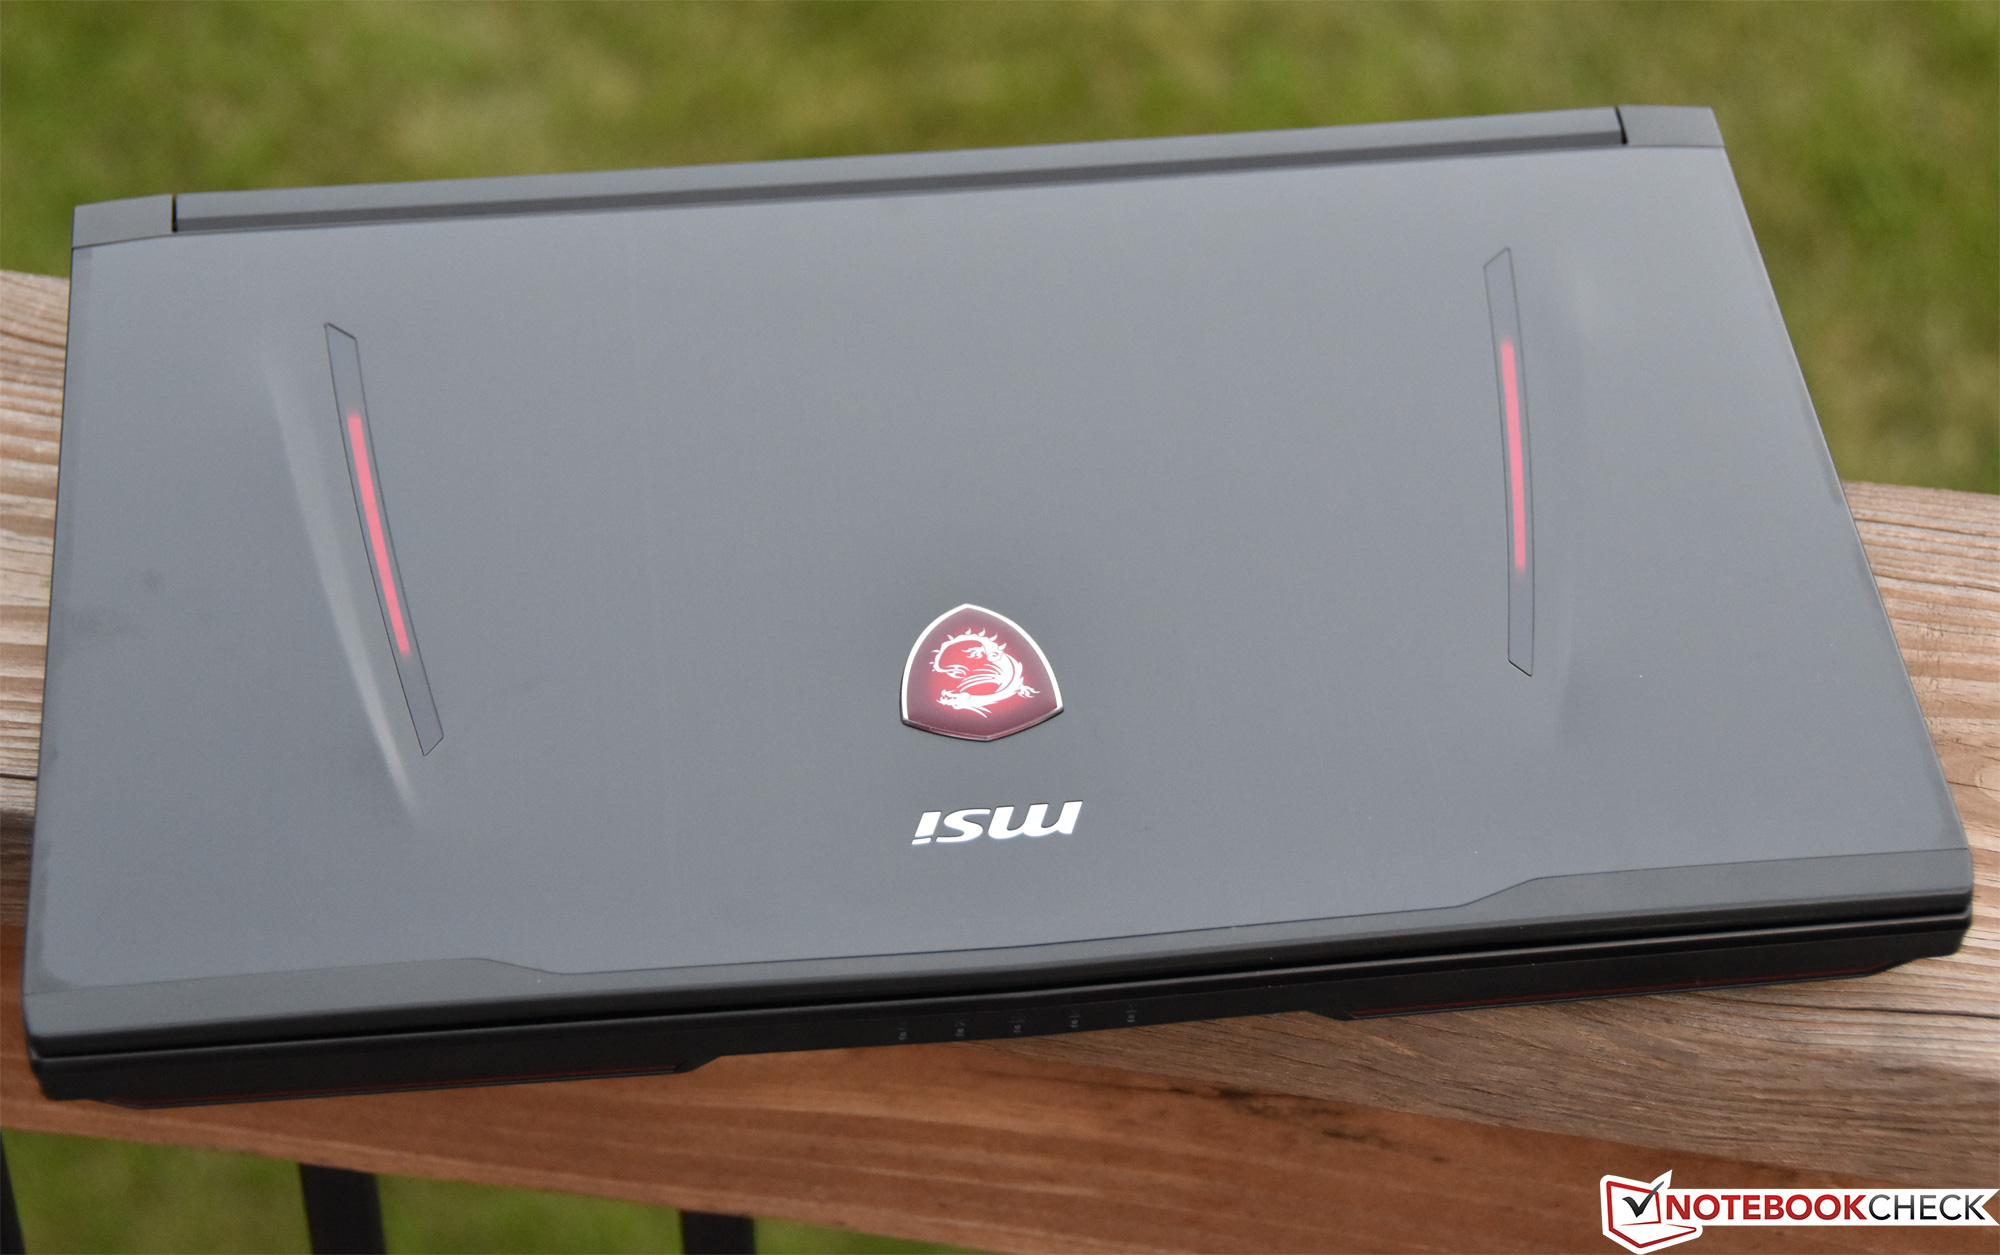

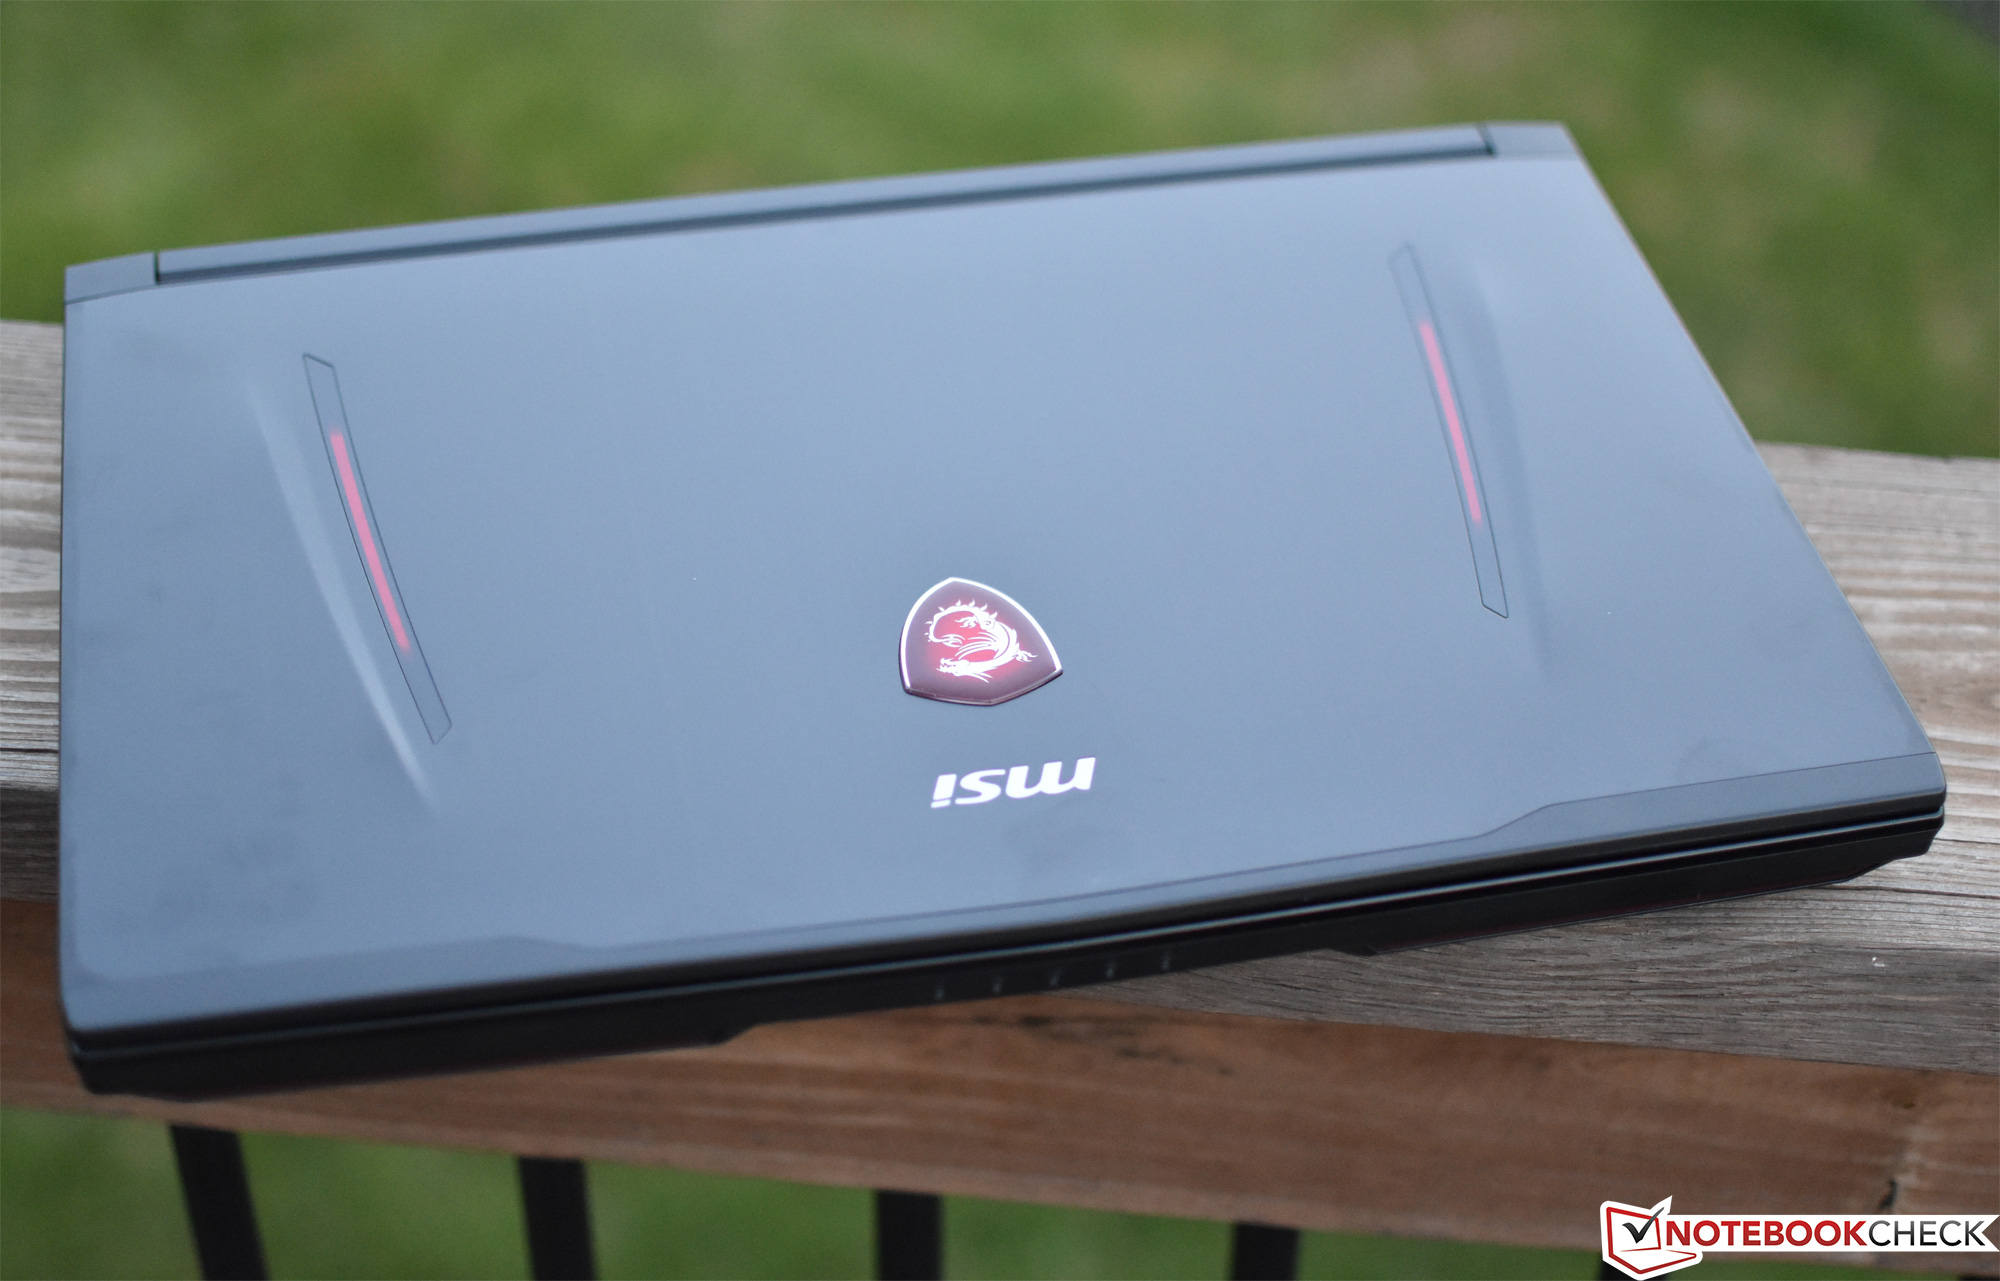
Size and weight are also basically unchanged. While the GT63 is fairly large (especially in comparison to thinner, less powerful alternatives such as the MSI GS65 8RF Stealth Thin or Razer Blade 15), once again, it isn’t intended to be constantly on the move. To that end, the hinges are also fairly loose, which would be a problem if the machine was in motion, but instead simply means that the lid is easy to open single-handedly. The lid can open to approximately a 165 degree angle and is quiet during movement.
Connectivity
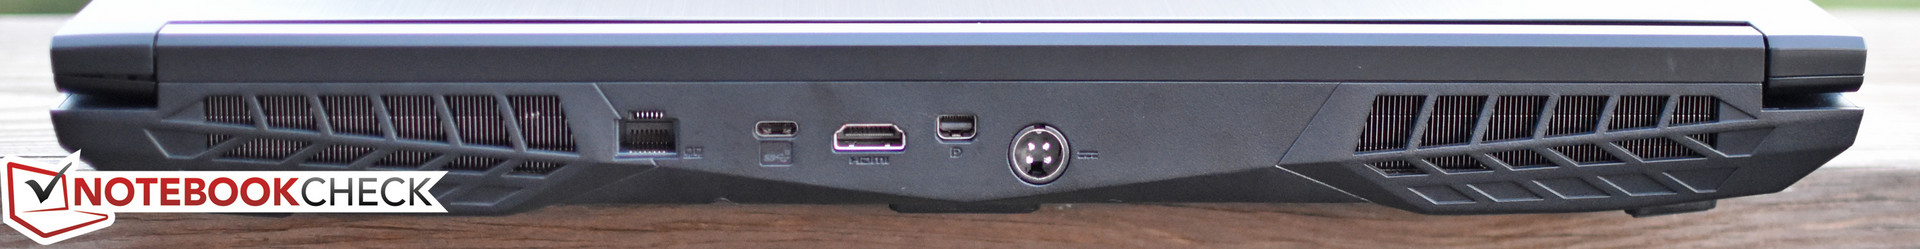
Once again, port selection and placement remains identical to that of the MSI GT62VR 7RE Dominator Pro Notebook ReviewGT62VR. We’re treated to some five total USB ports (3x USB 3.1 Gen 1, 1x USB 2.0, and 1x USB 3.1 Gen 2 Type-C) as well as multiple options for video output (HDMI, mini-DisplayPort) and a full gamut of audio connections. The USB and audio ports are located on the left and right sides of the machines, but most of the rest of the connections (power, video, Ethernet, and one of the USB ports) are on the rear—a decision which some users may find inconvenient. It would also be nice to see Thunderbolt in a laptop of this class.


SD Card Reader
Oddly enough, the SD card reader in today’s unit is considerably slower than that of the GT62VR. We measured just 13.44 MB/s during our AS SSD benchmark of the card reader, which is less than one-tenth the speed of its predecessor.
| SD Card Reader | |
| average JPG Copy Test (av. of 3 runs) | |
| Asus Chimera G703GI (Toshiba Exceria Pro SDXC 64 GB UHS-II) | |
| Average of class Gaming (20.9 - 210, n=54, last 2 years) | |
| Lenovo Legion Y520-15IKBA-80WY001VGE (Toshiba Exceria Pro SDXC 64 GB UHS-II) | |
| Dell G5 15 5587 (Toshiba Exceria Pro SDXC 64 GB UHS-II) | |
| MSI GT63 Titan 8RG-046 (Toshiba Exceria Pro SDXC 64 GB UHS-II) | |
| maximum AS SSD Seq Read Test (1GB) | |
| Asus Chimera G703GI (Toshiba Exceria Pro SDXC 64 GB UHS-II) | |
| Average of class Gaming (25.5 - 261, n=51, last 2 years) | |
| Lenovo Legion Y520-15IKBA-80WY001VGE (Toshiba Exceria Pro SDXC 64 GB UHS-II) | |
| Dell G5 15 5587 (Toshiba Exceria Pro SDXC 64 GB UHS-II) | |
| MSI GT63 Titan 8RG-046 (Toshiba Exceria Pro SDXC 64 GB UHS-II) | |
Communication
The GT63 leverages a Killer e2400 Gigabit Ethernet Controller for physical network connectivity and a Killer Wireless-AC 1550 WLAN adapter for wireless connections (the latter also includes Bluetooth 4.2 functionality). In our tests, network connection speeds were decent—neither topping the charts nor below expectations.
Software
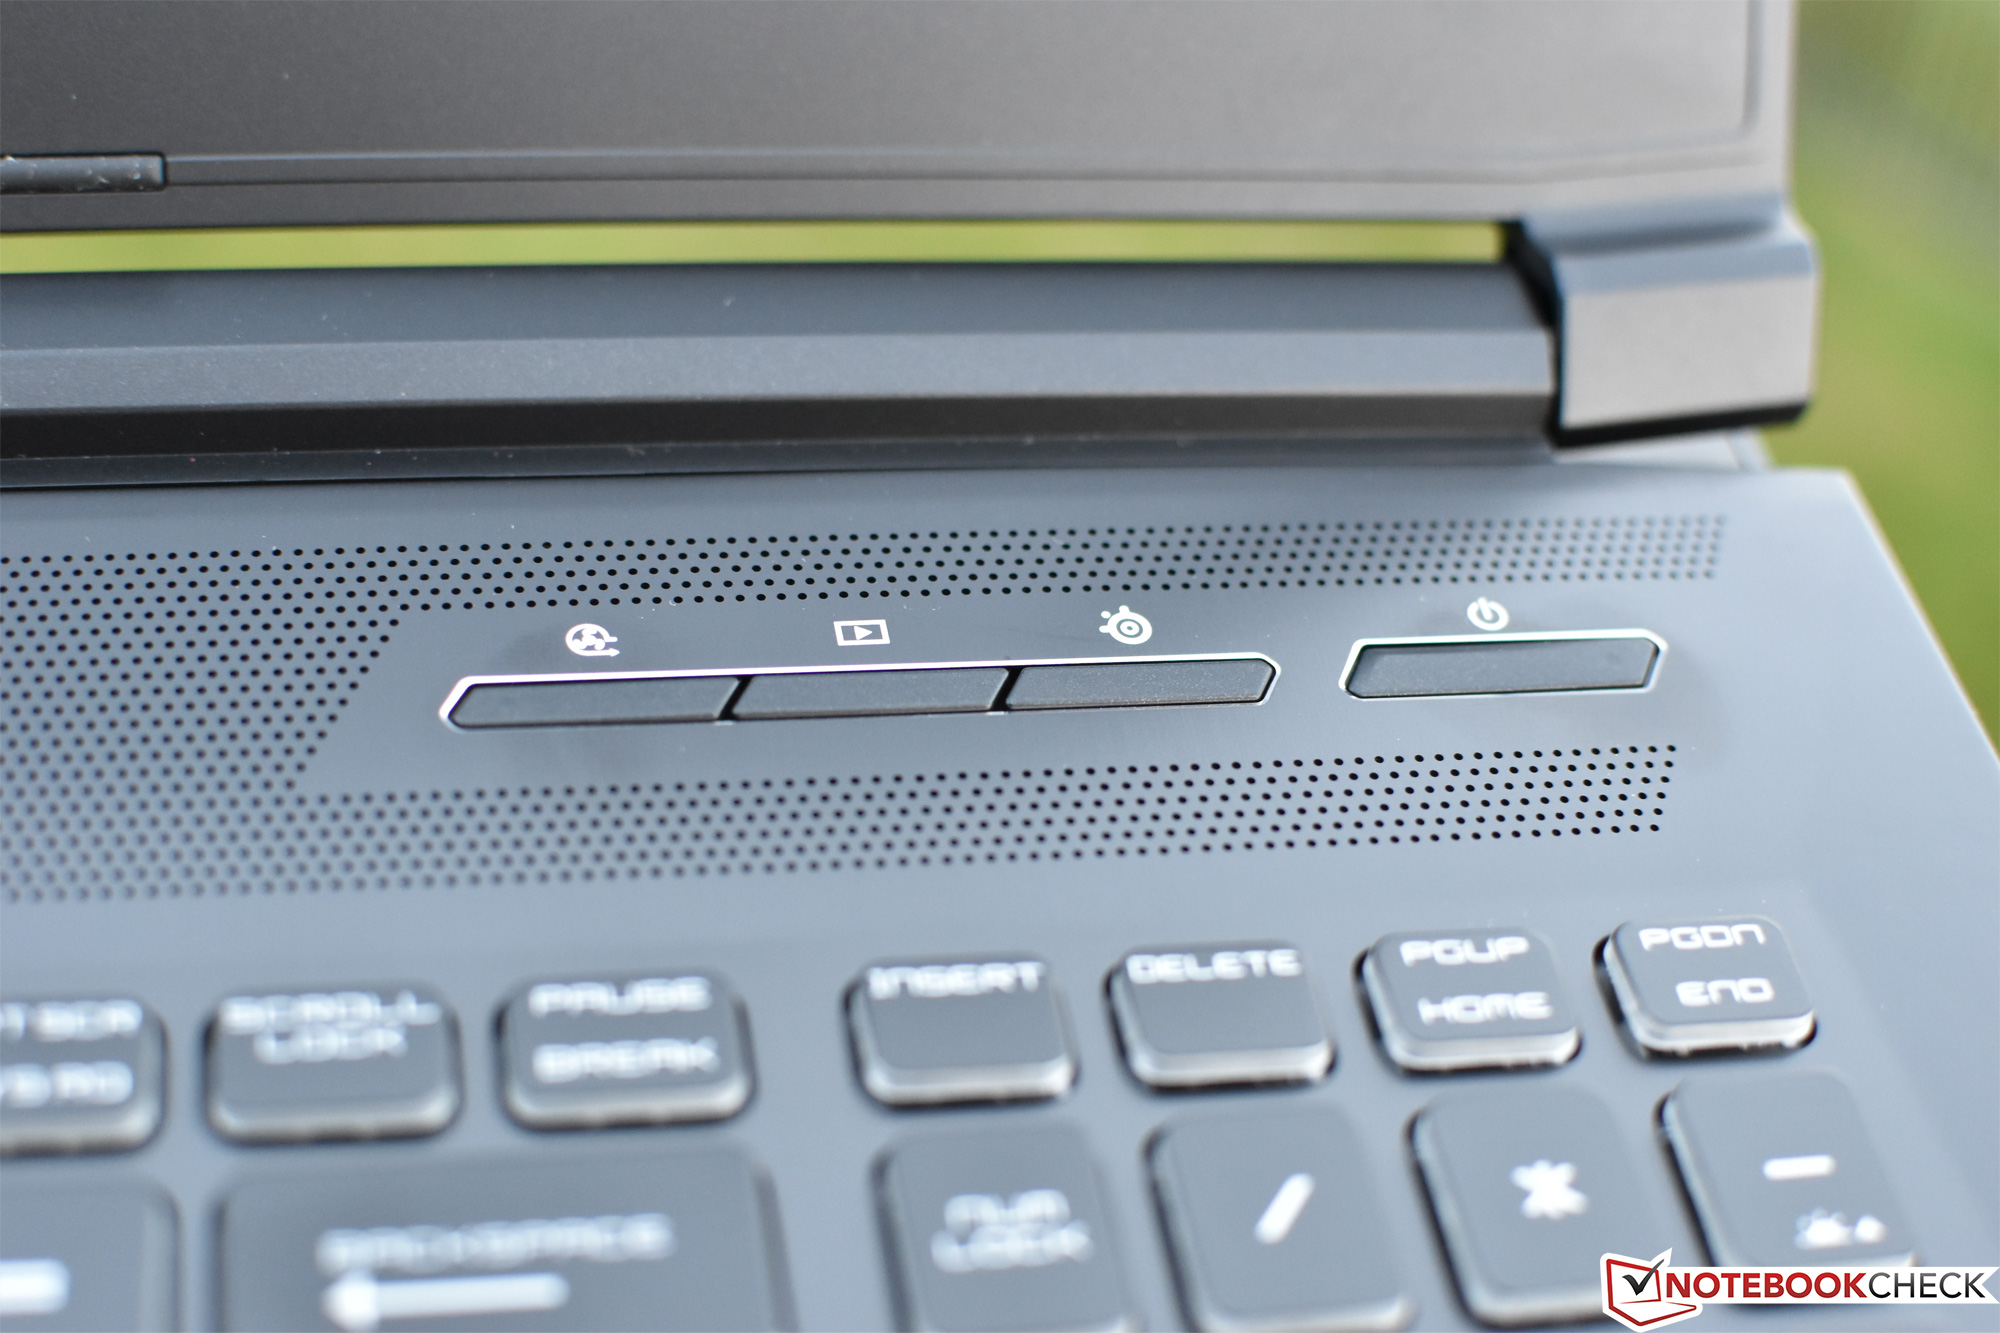
The Dragon Center software remains central to the MSI gaming laptop experience, providing resource monitoring, power management, audio/network tuning, and a few other useful features. Cooler Boost 5 is also supported, with a dedicated hardware key (as usual) located above the keyboard near the power button.
Accessories
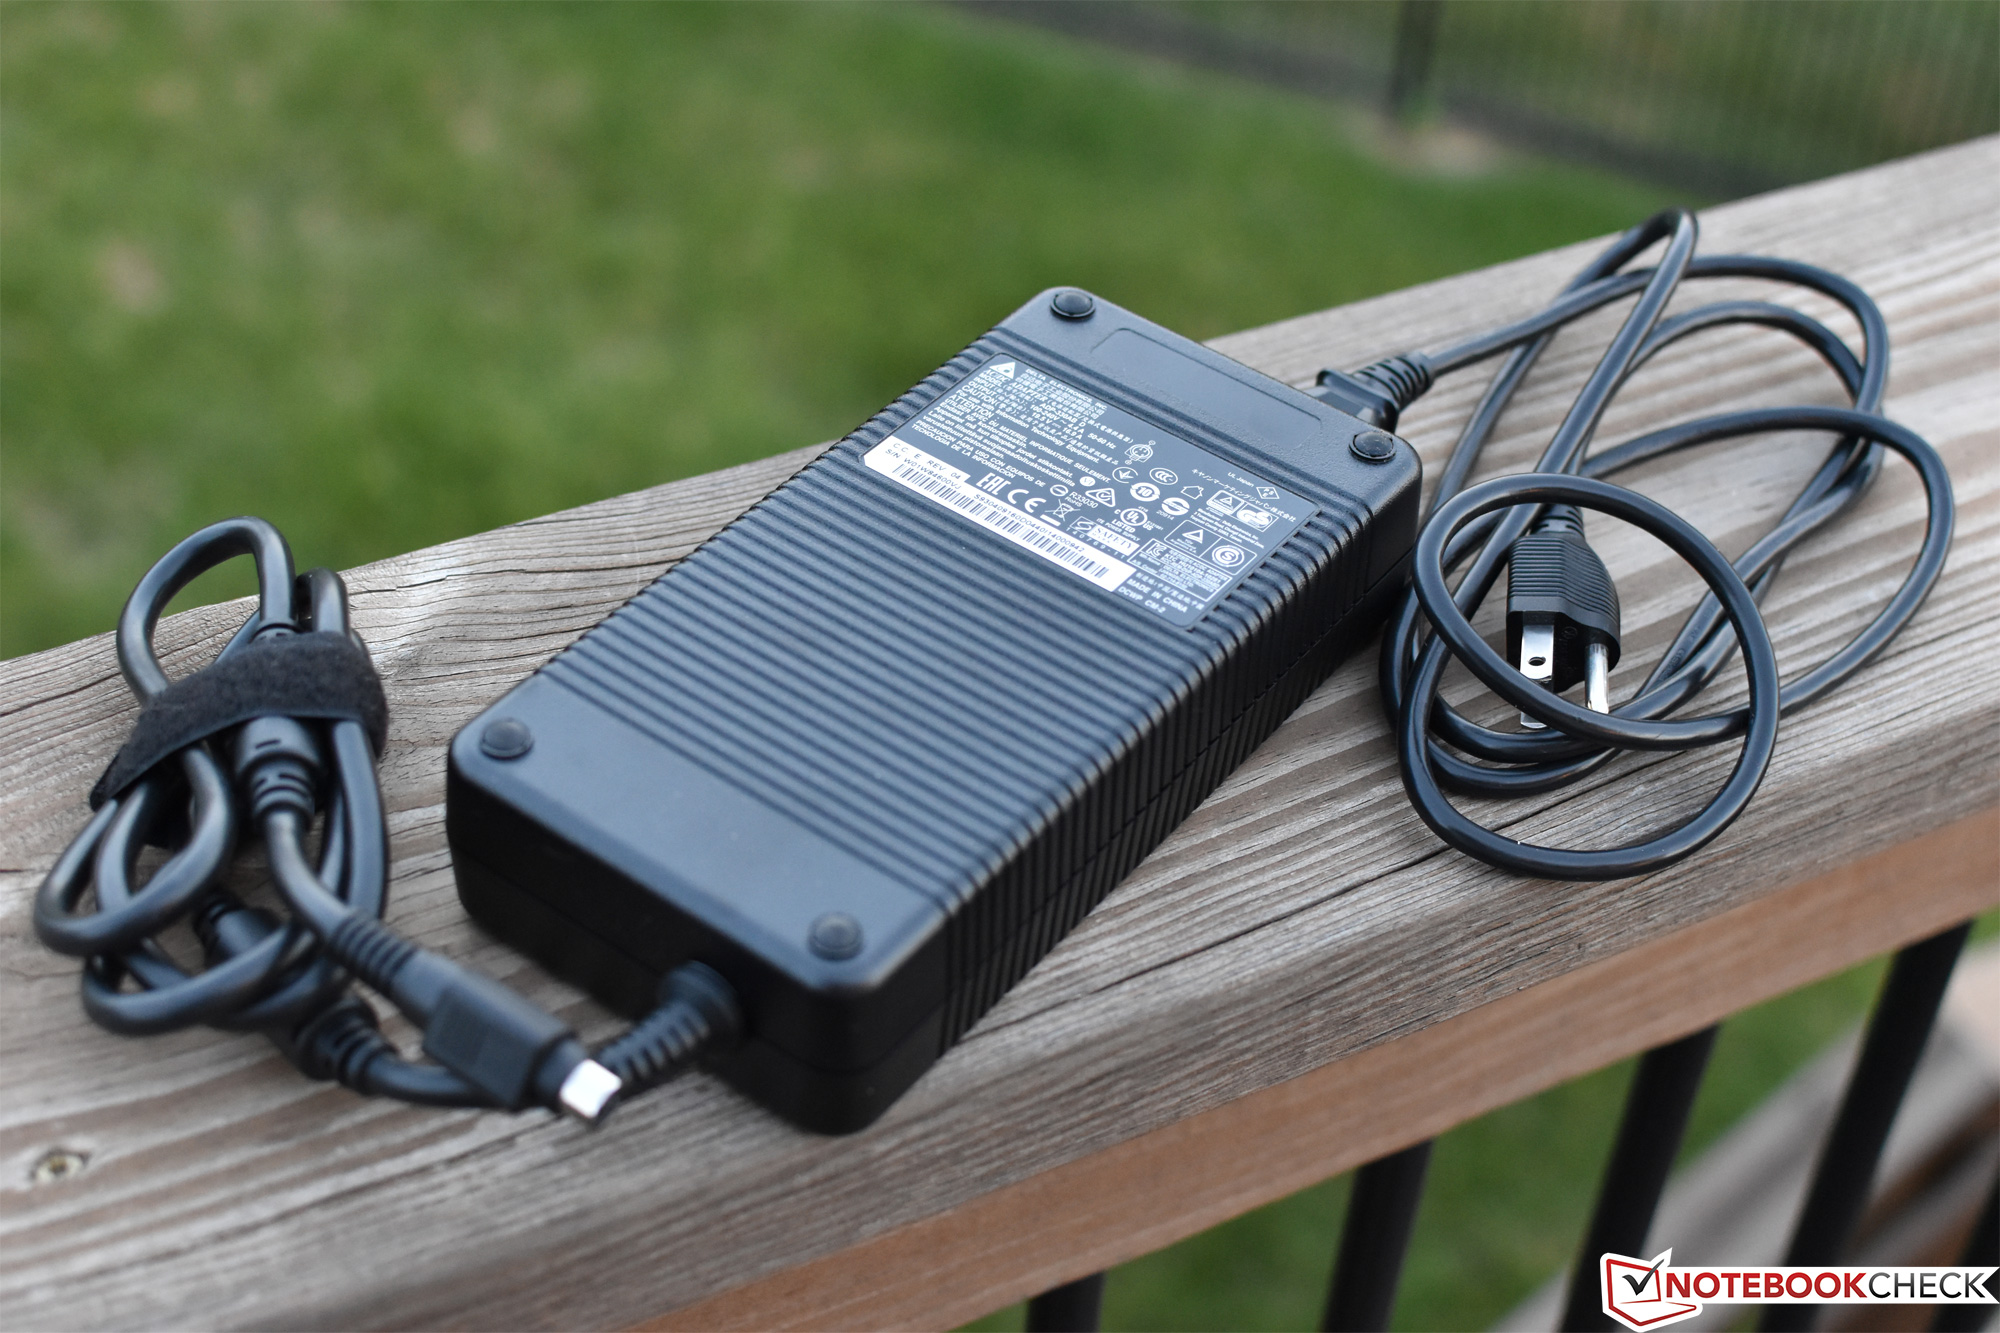
The GT63 comes with a large AC Adapter (Delta Electronics 330W) and a microfiber cleaning cloth. No other accessories are included.
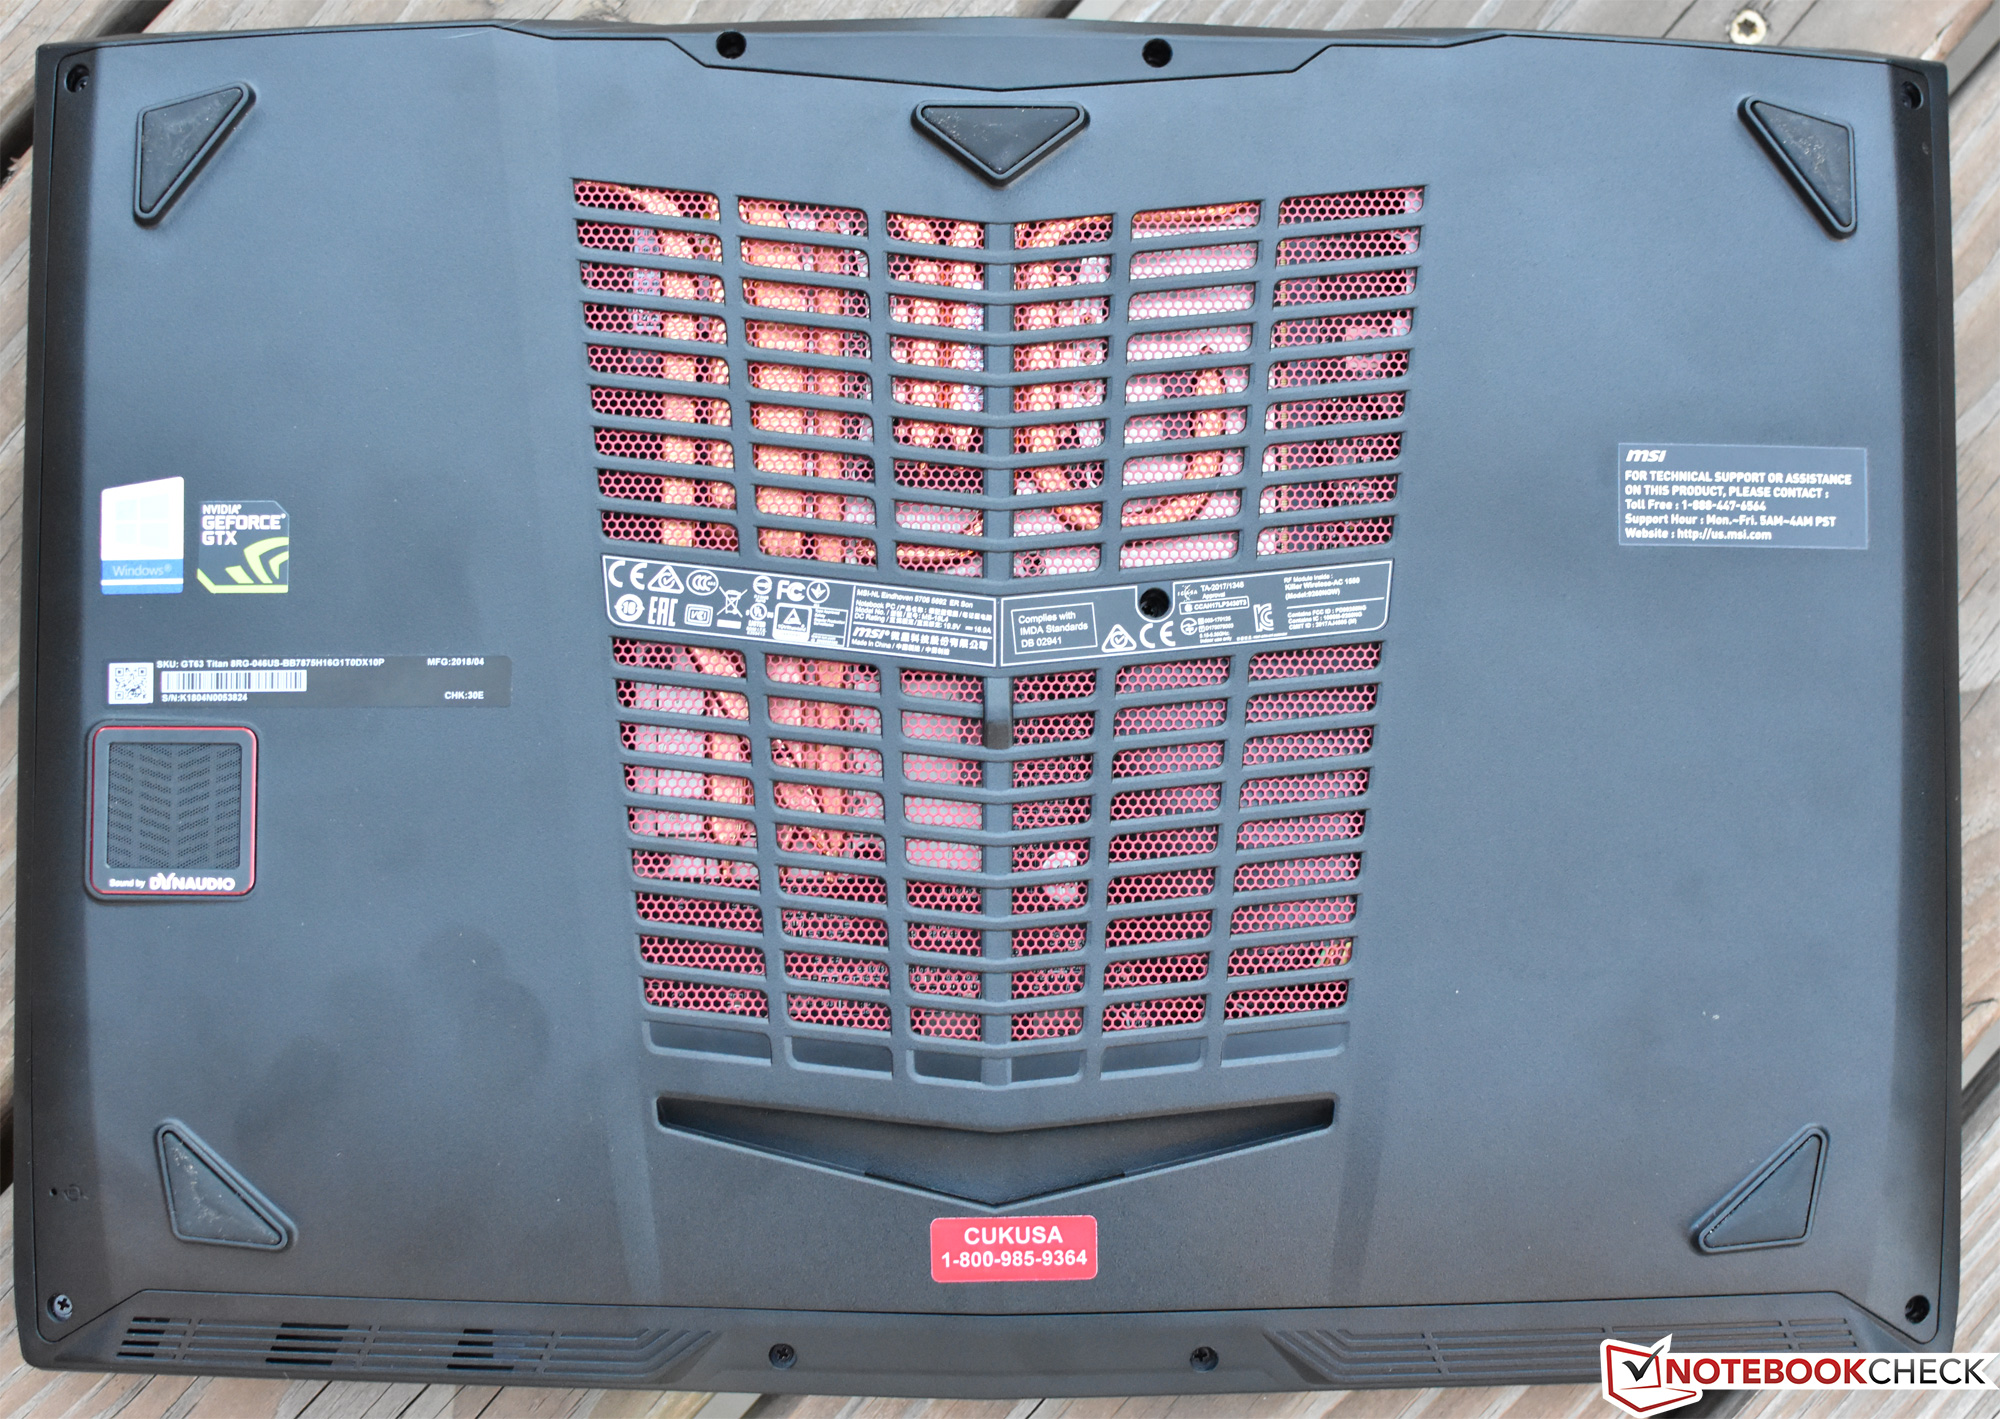
Maintenance
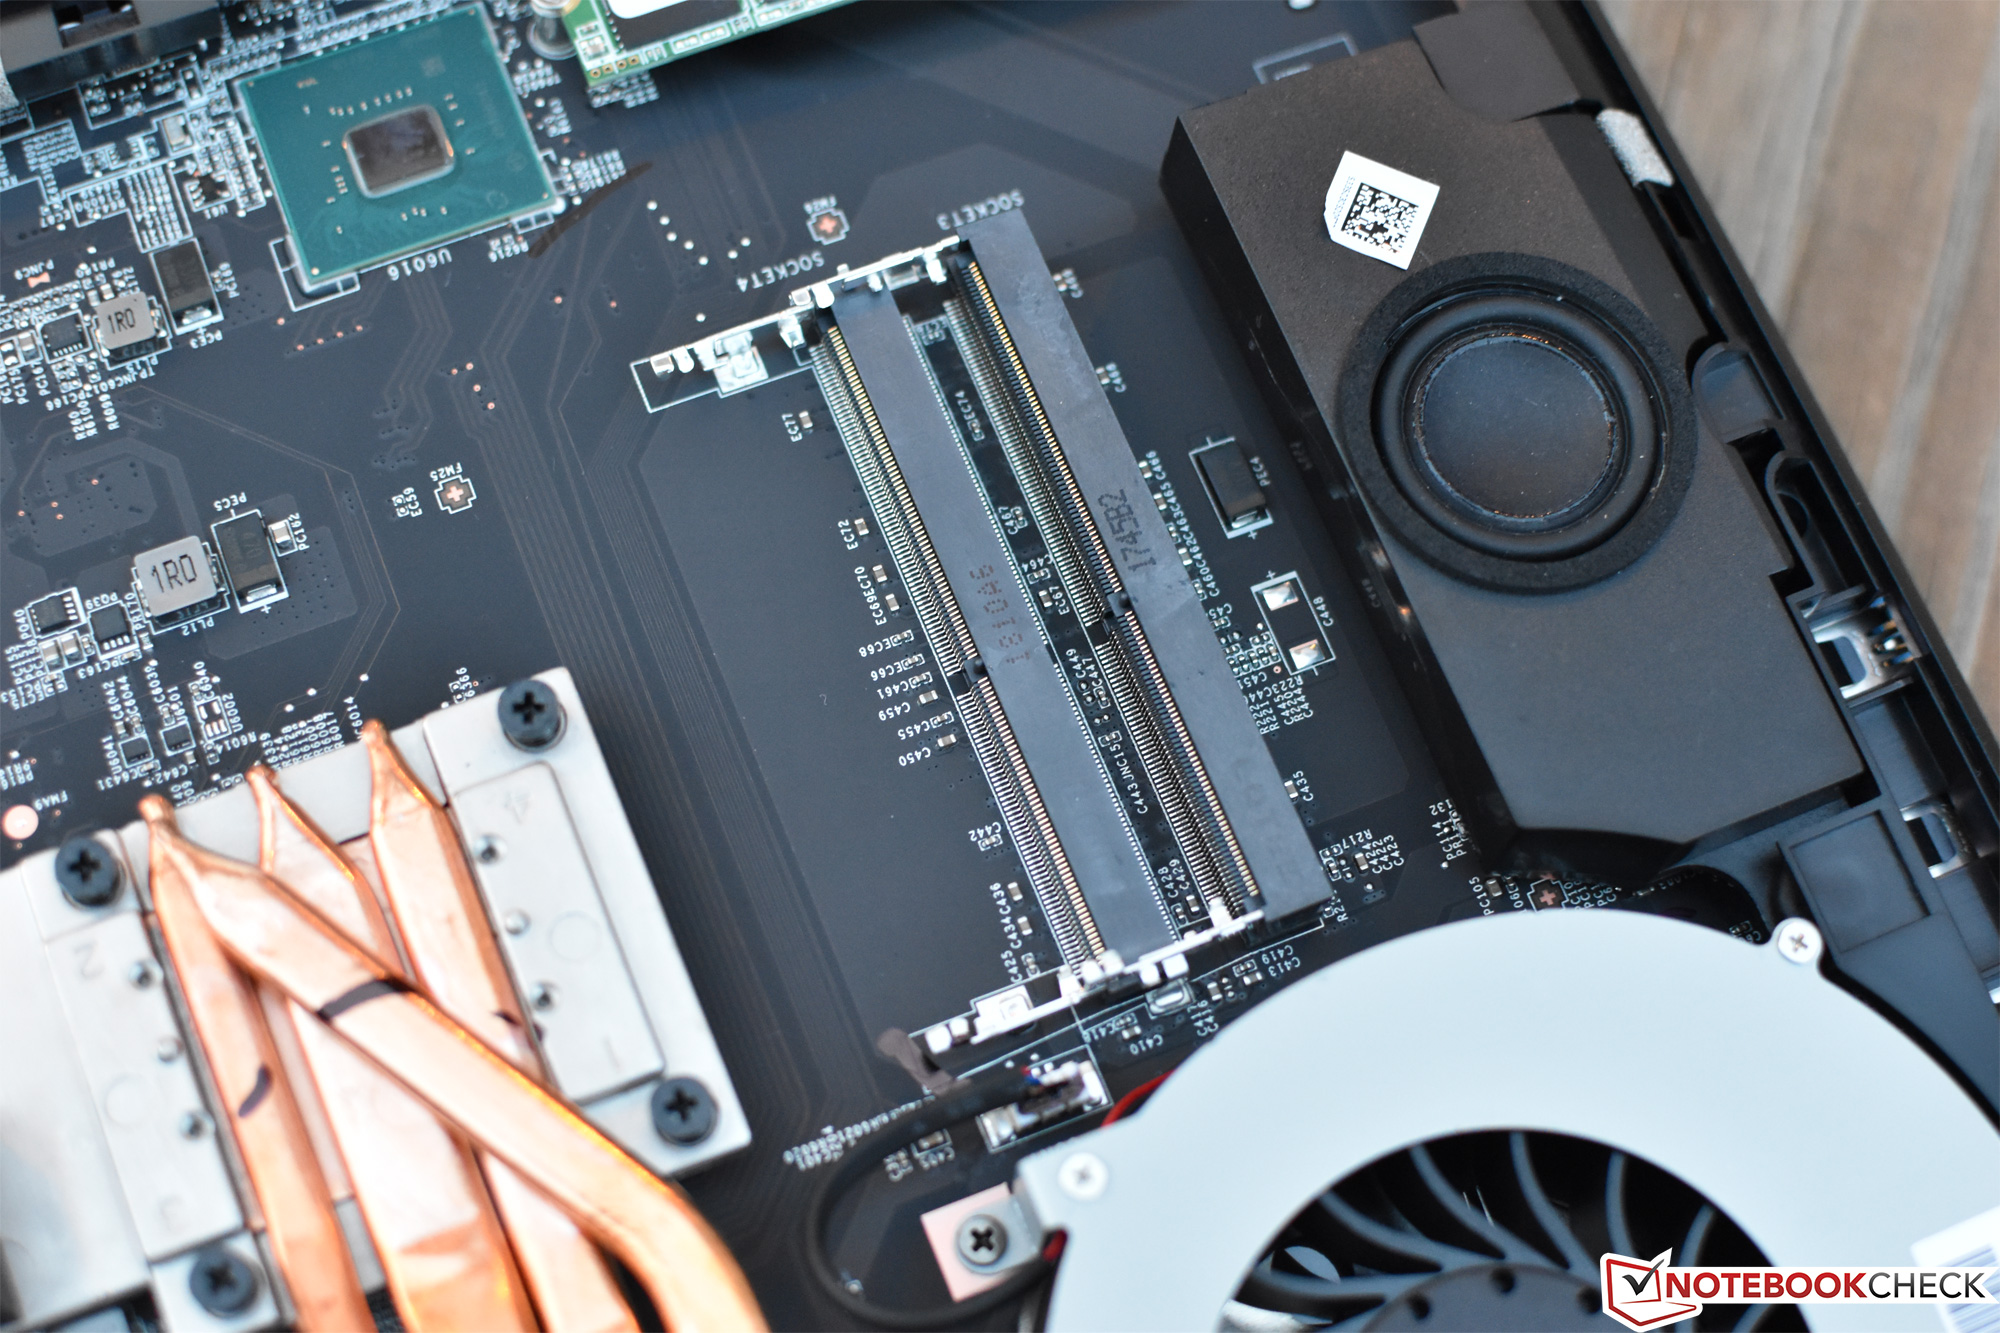
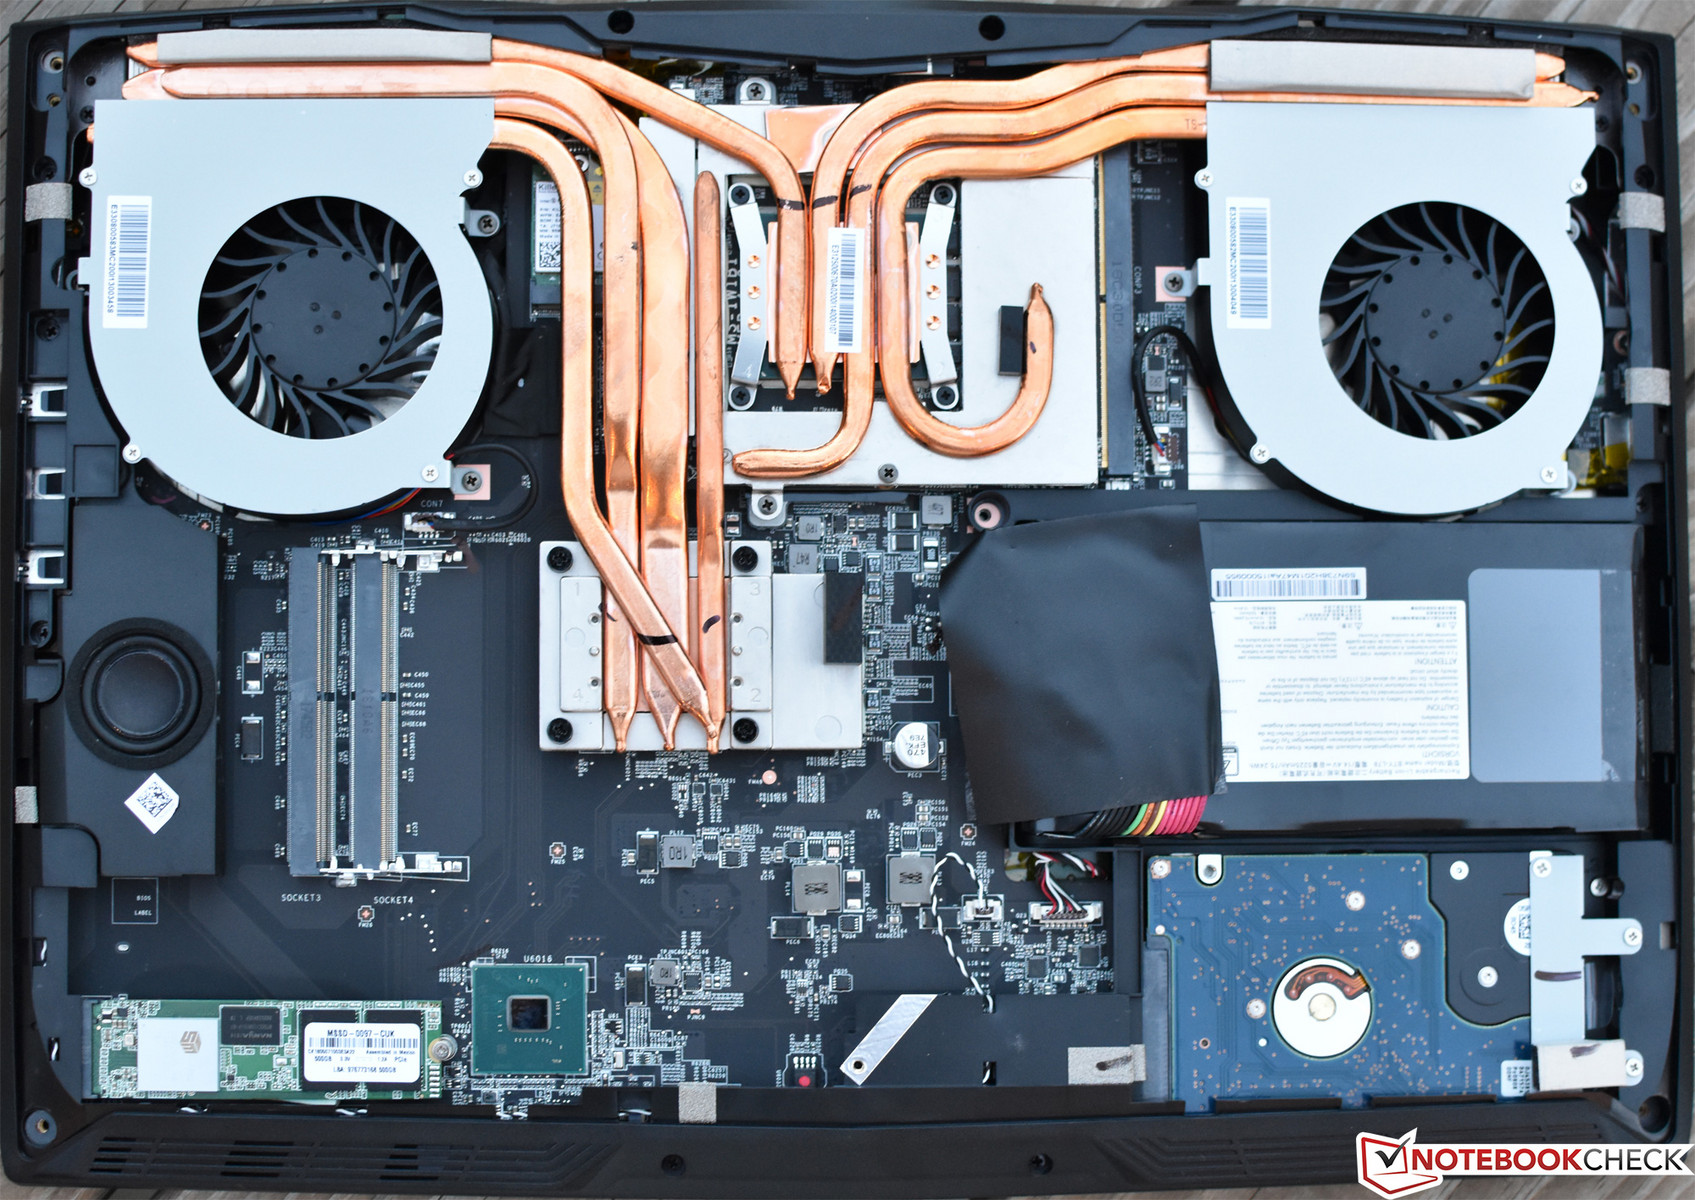
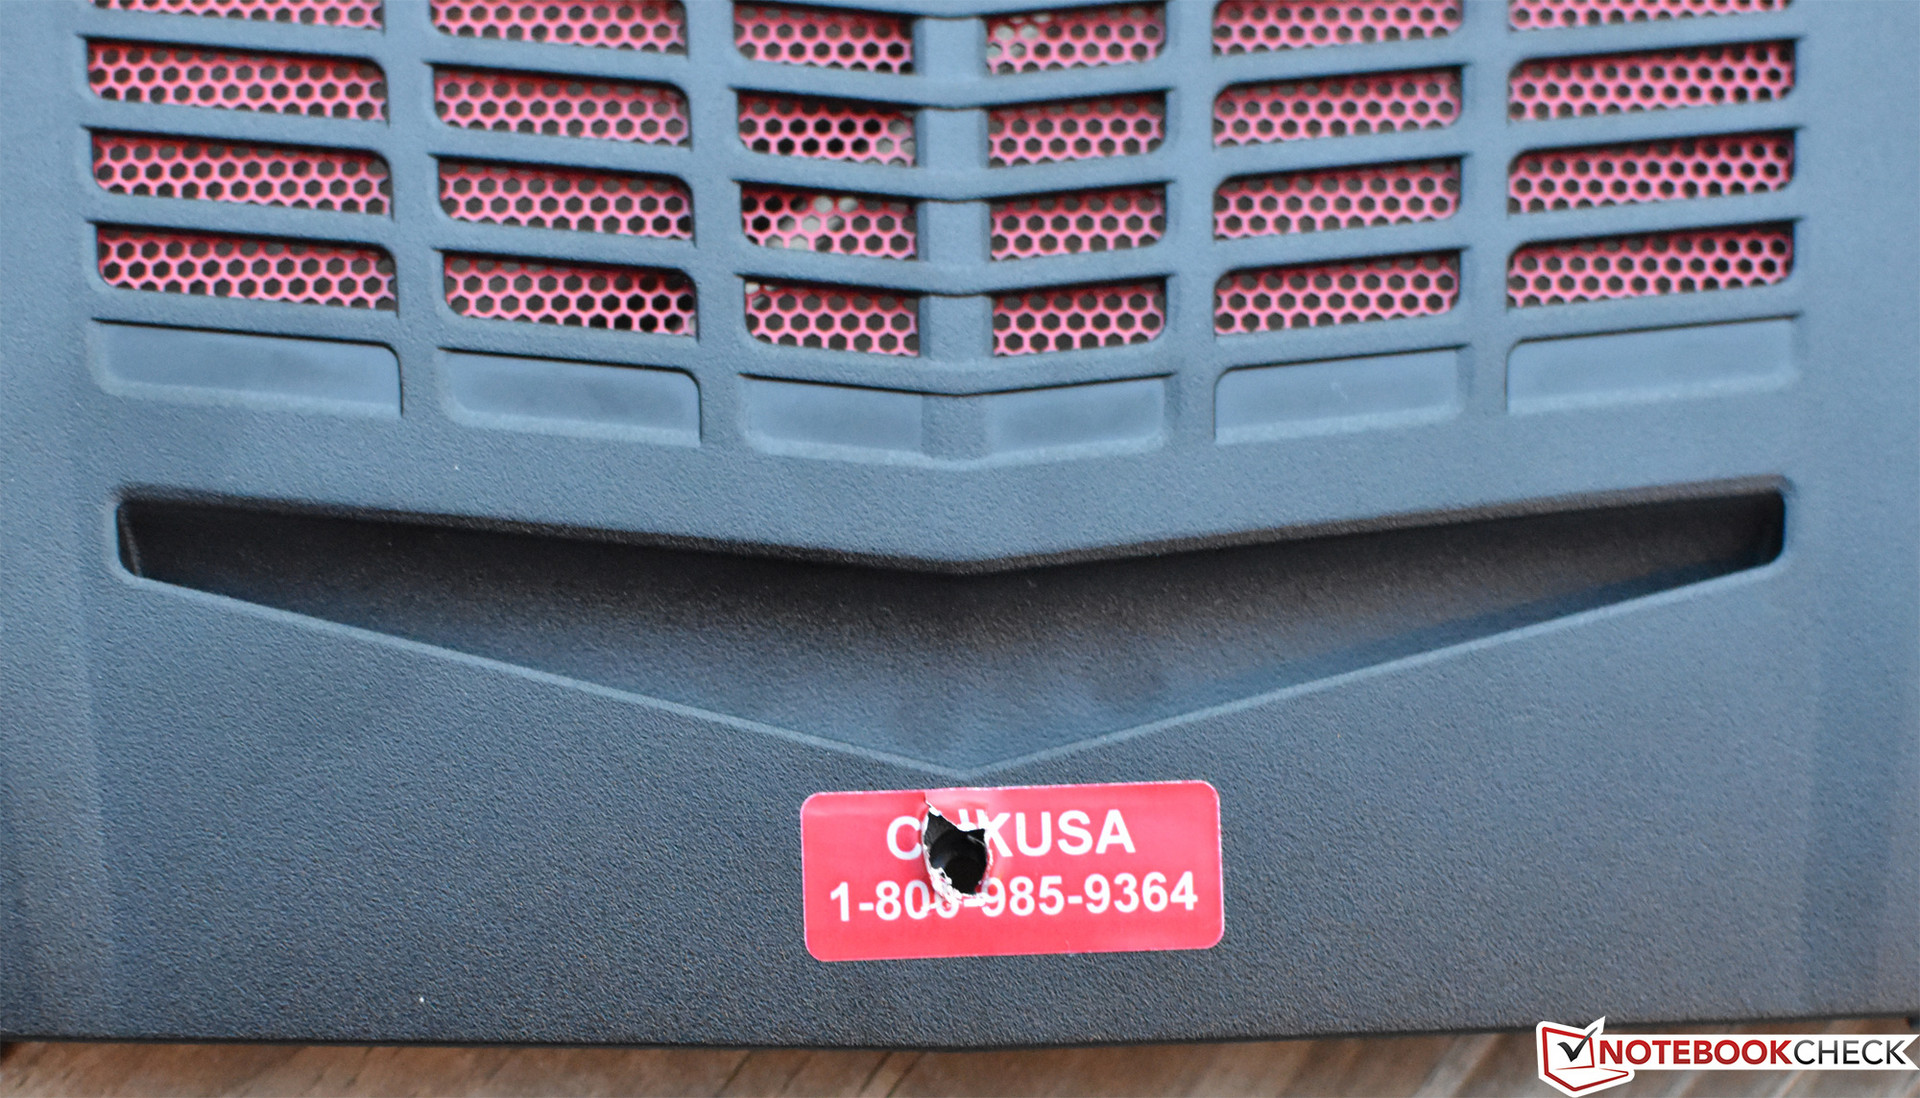
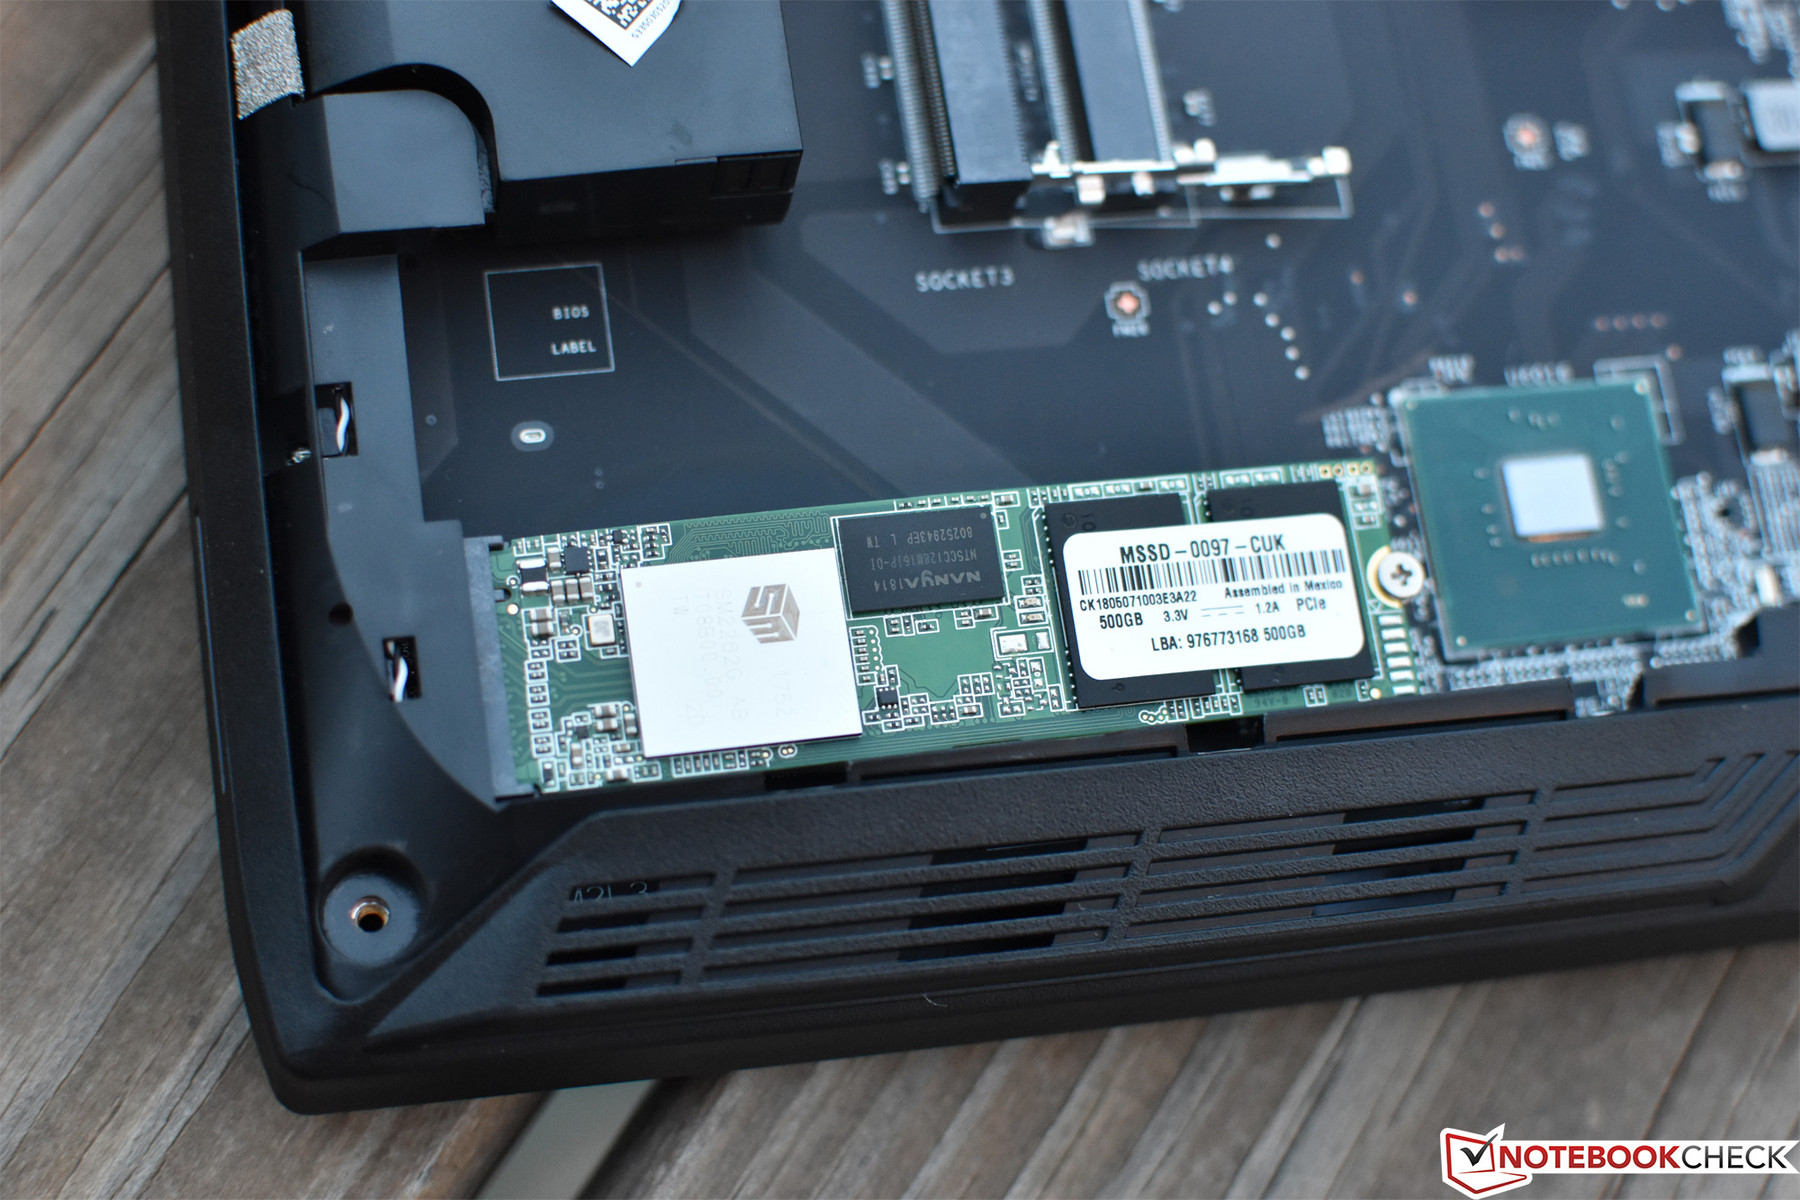
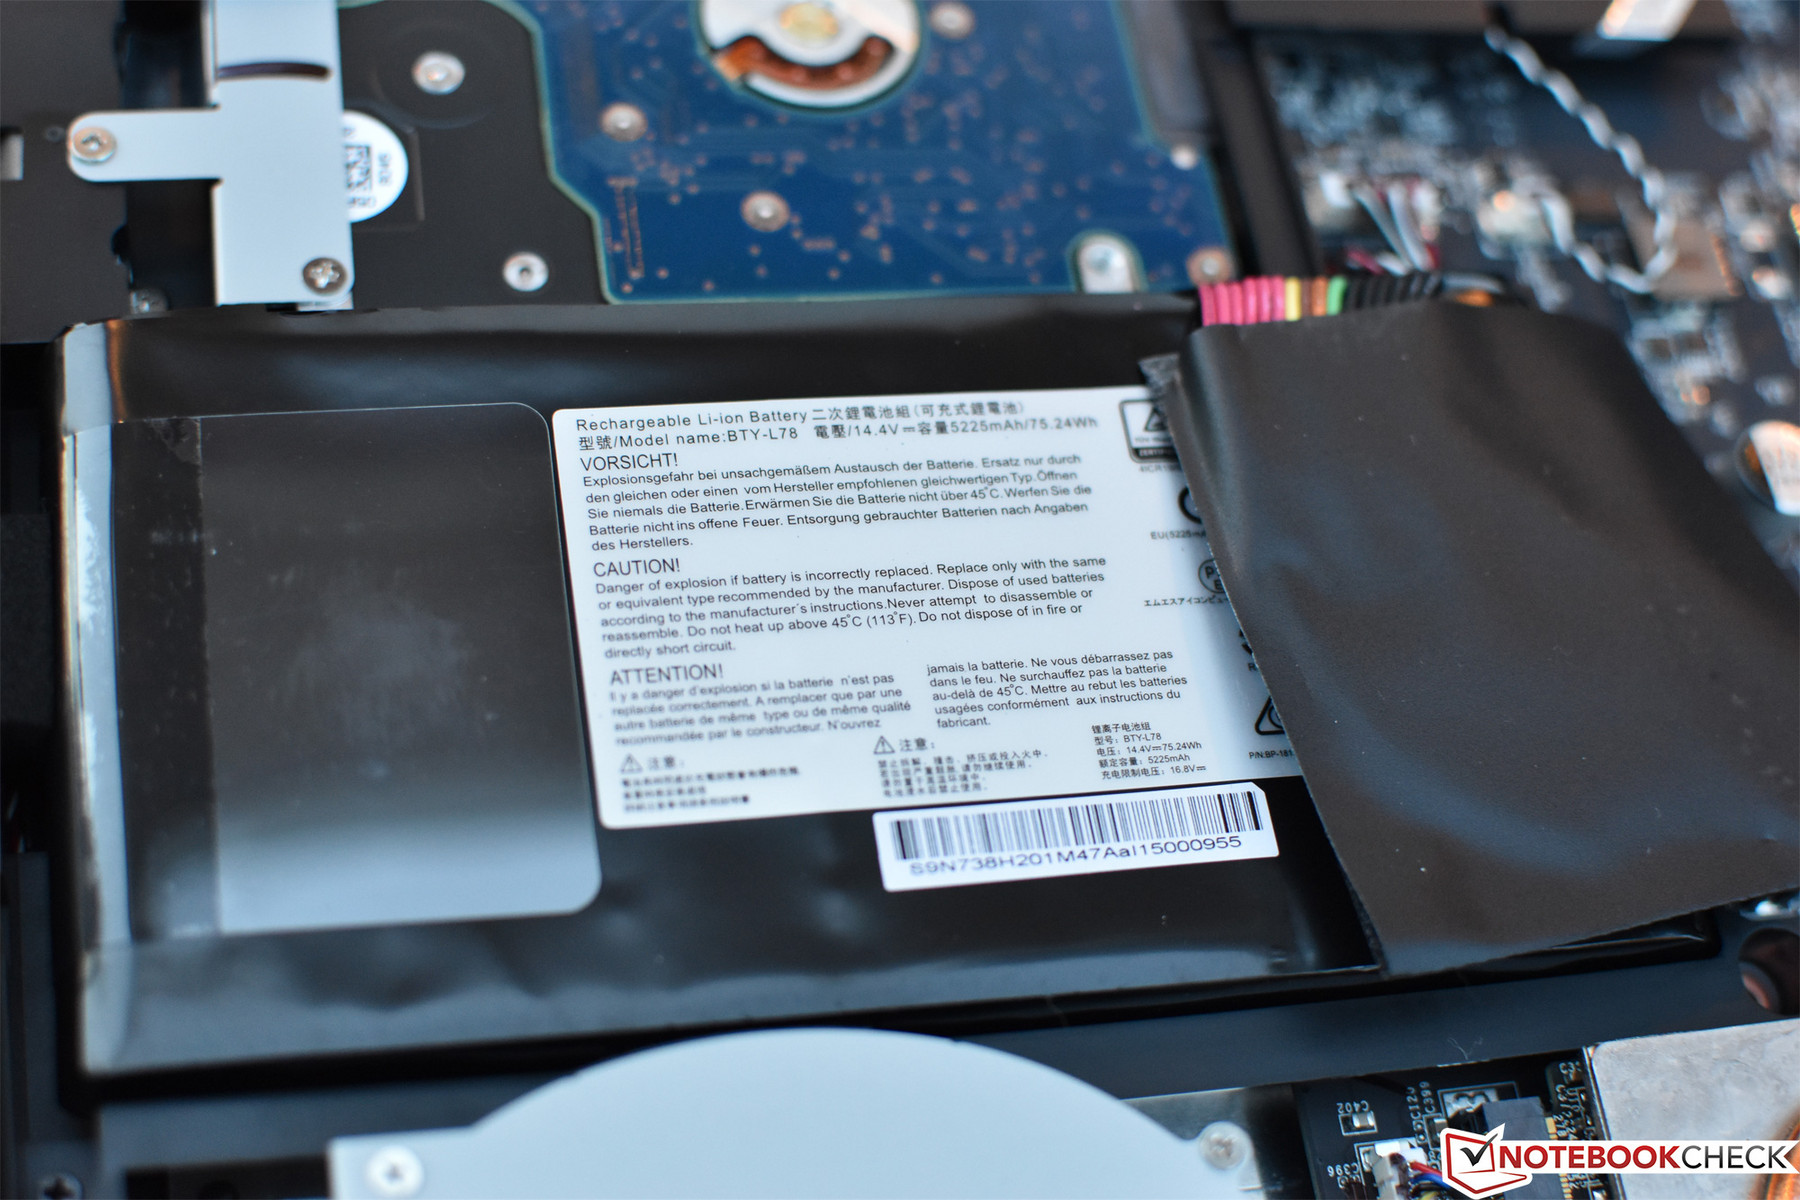
Six Phillips-head screws secure the bottom cover to the device, and once removed, nearly every major replaceable component is accessible. That’s hardly inconvenient, but CUKUSA’s sticker obscures the sixth and final screw at the bottom. Whether or not warranty terms are voided if this sticker is broken is a topic we’d recommend addressing with the retailer before opening it up.
It’s unfortunate that only a single M.2 slot exists within the GT63 given the board real estate available within. We fielded this complaint back in 2016 with regard to the GT62VR, and it unfortunately still applies today.
Warranty
Our MSI GT63 review unit includes a 1-year warranty on the machine and 3 years warranty on all upgraded parts. More details can be found at Computer Upgrade King's website here.
Input Devices
Keyboard
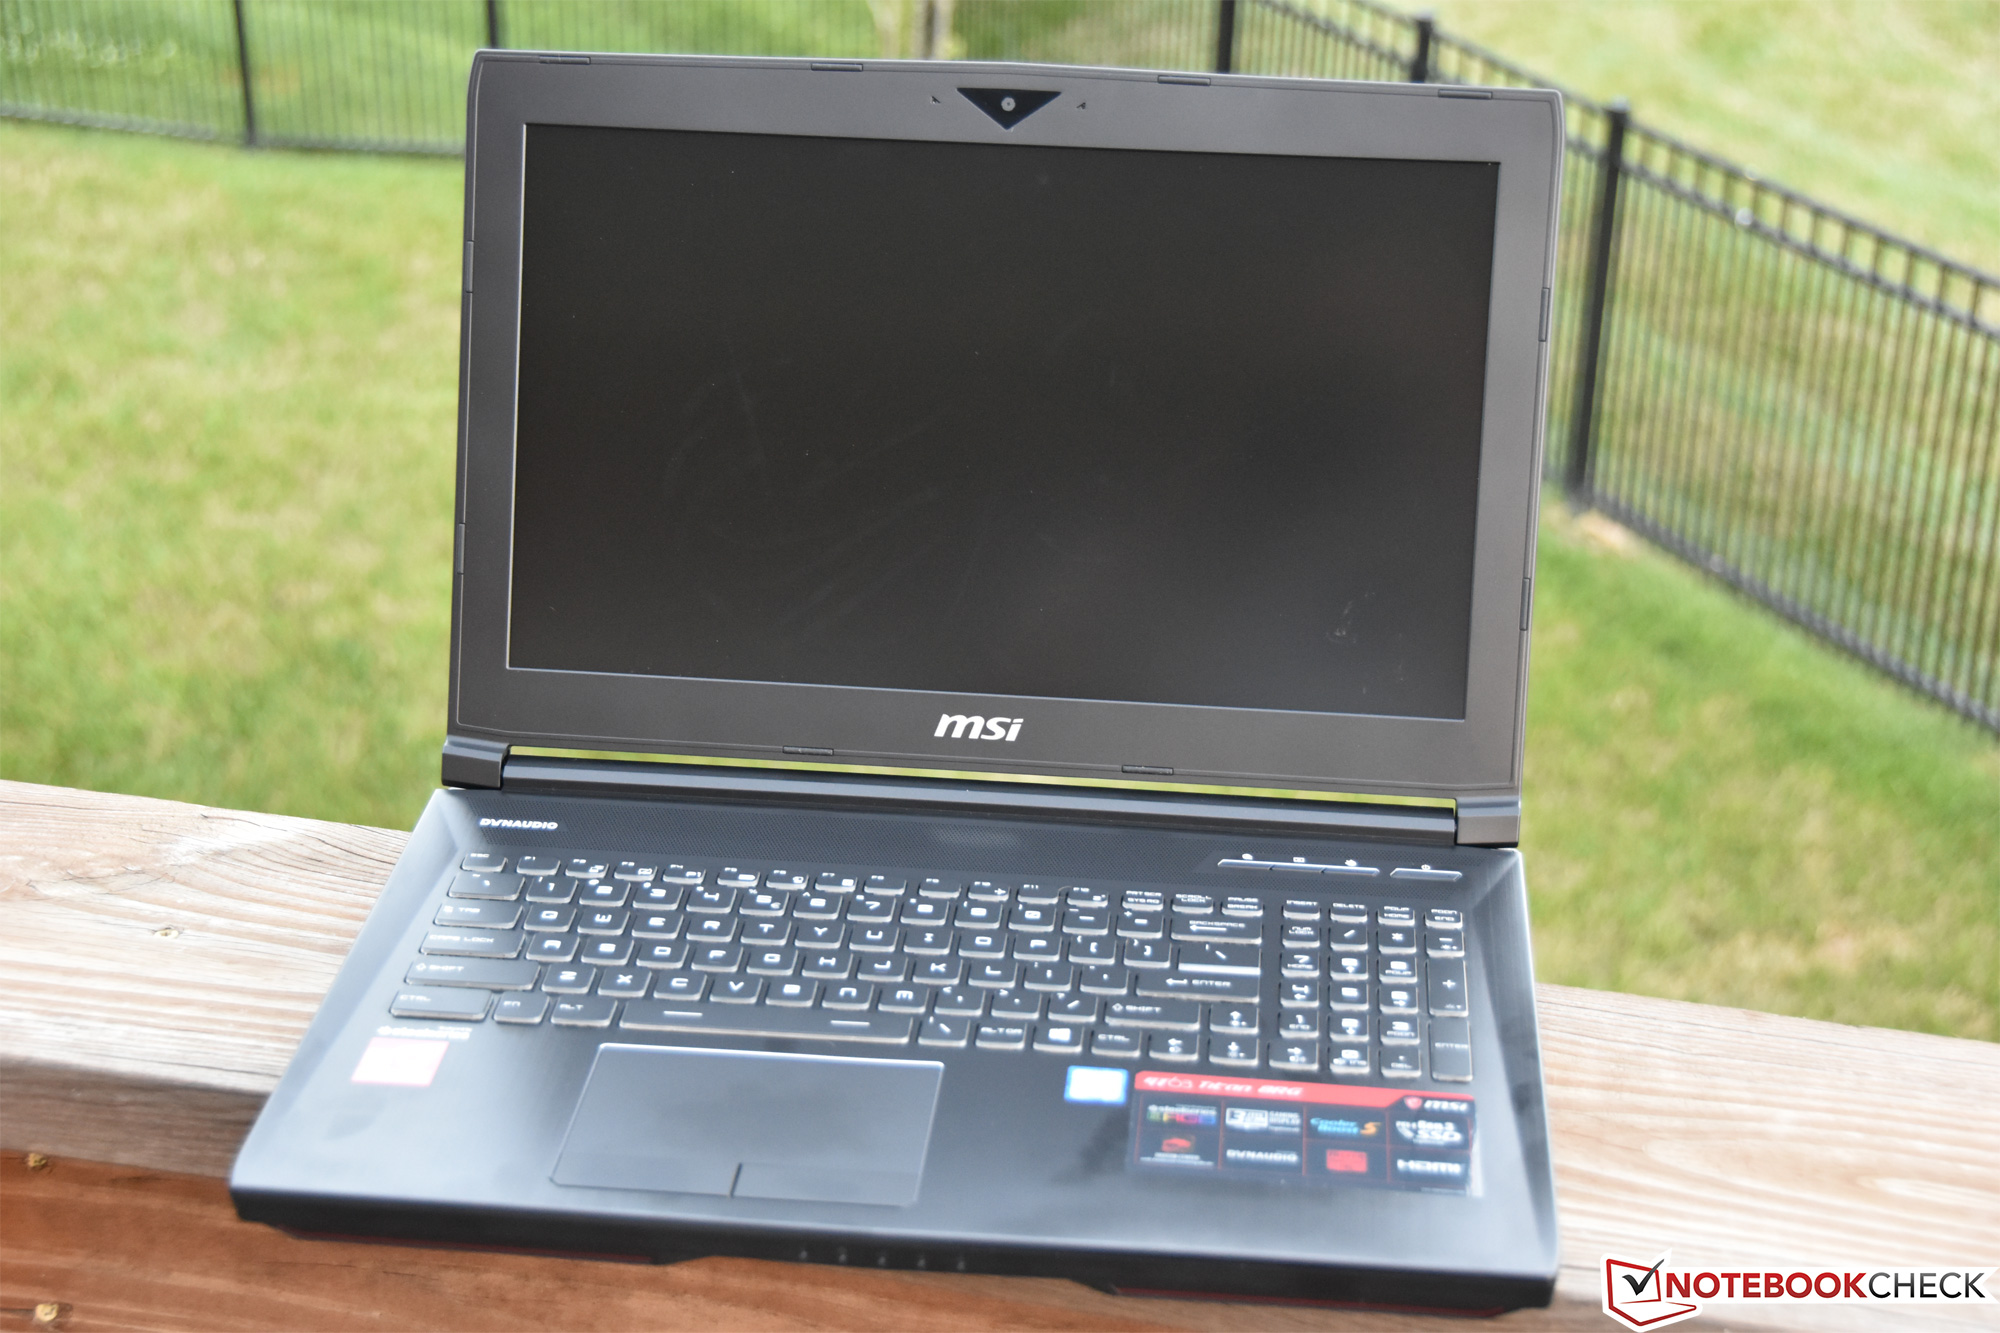
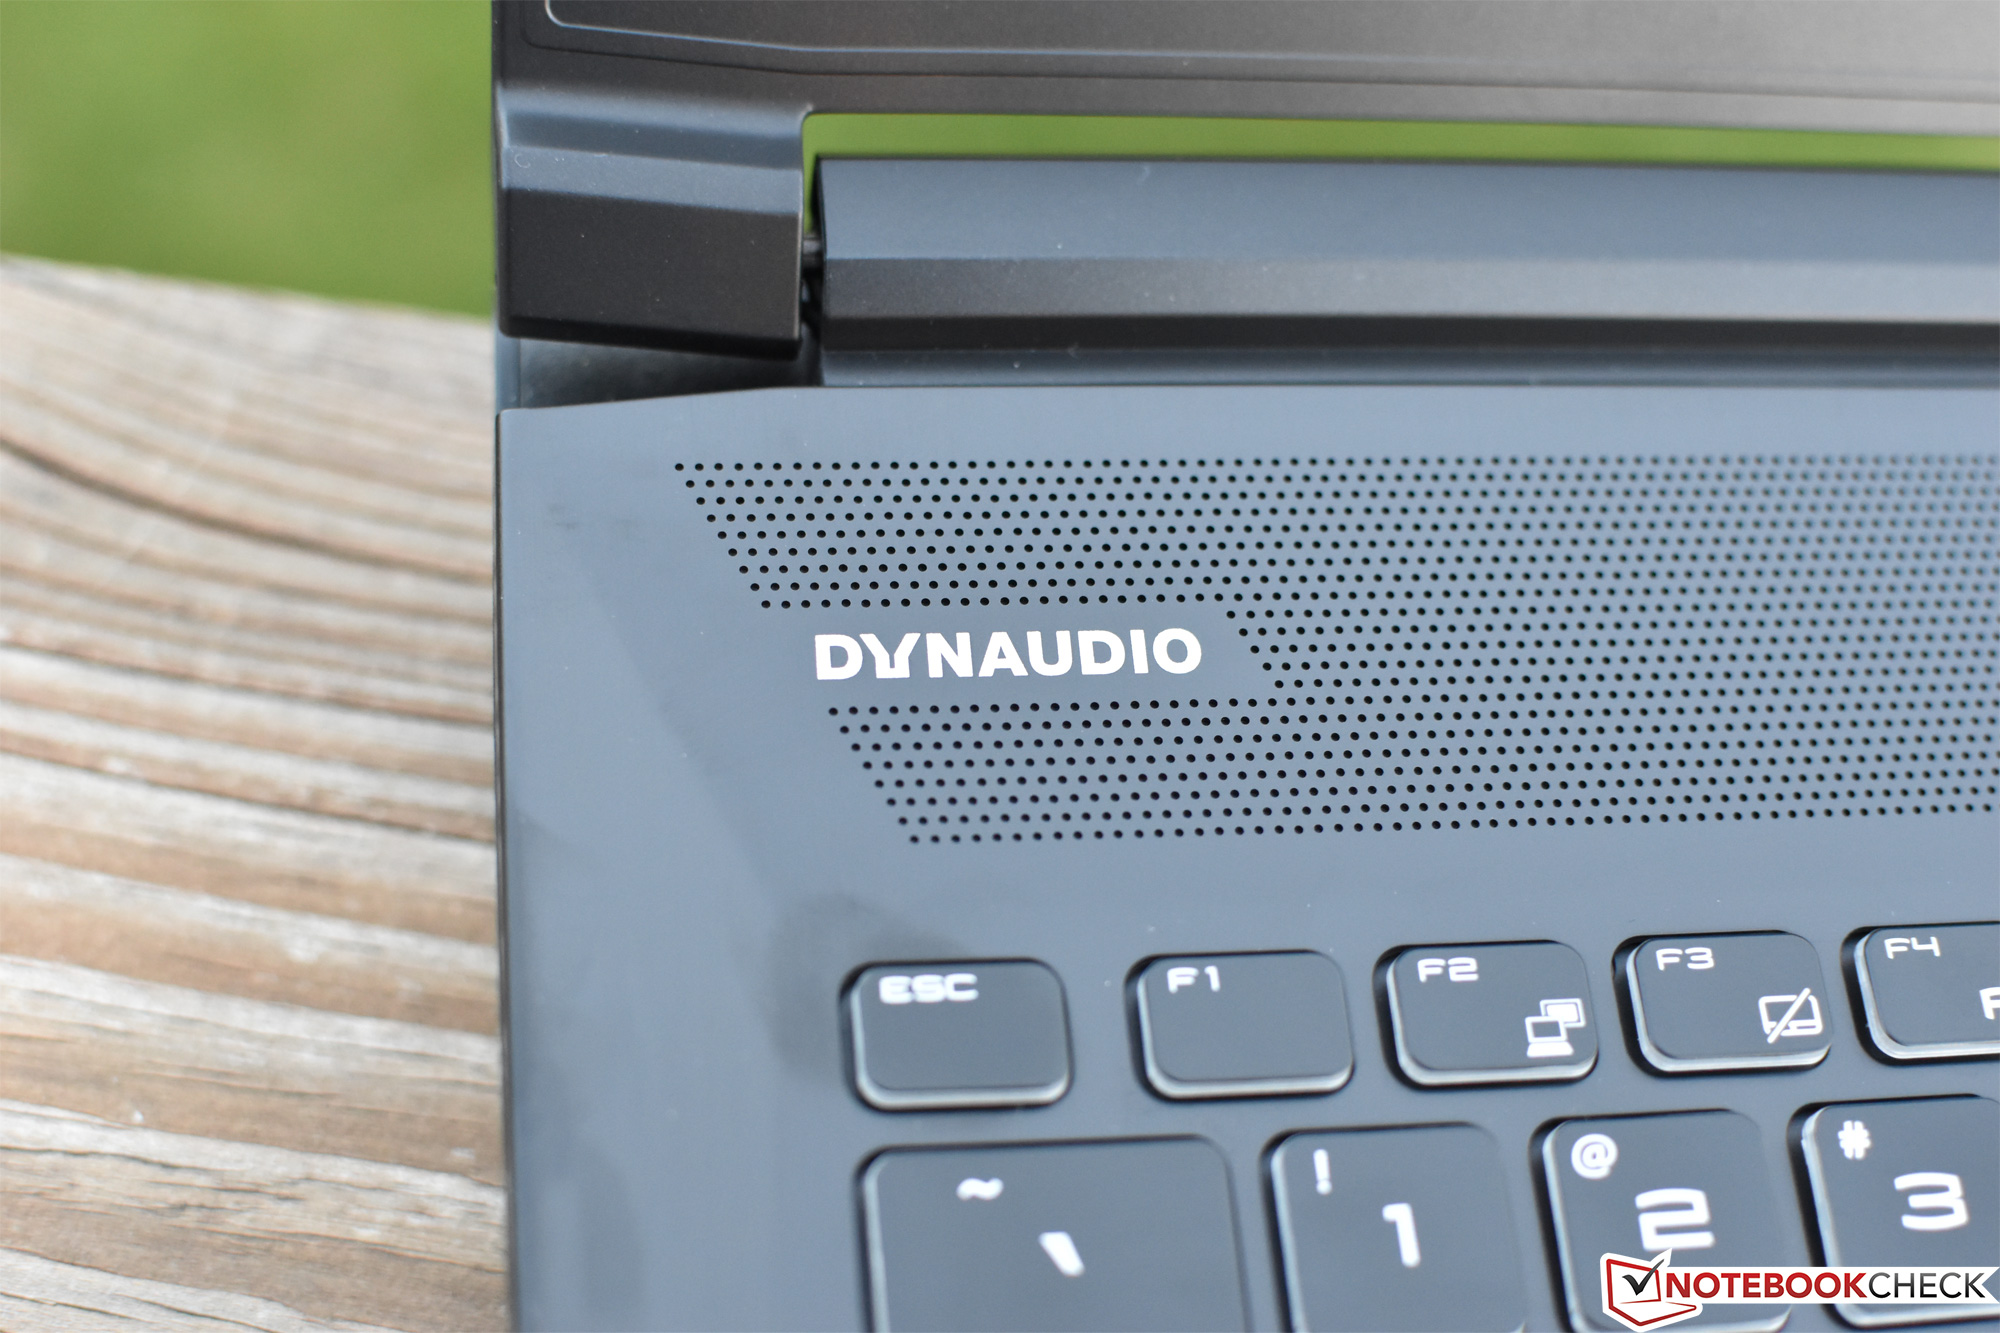
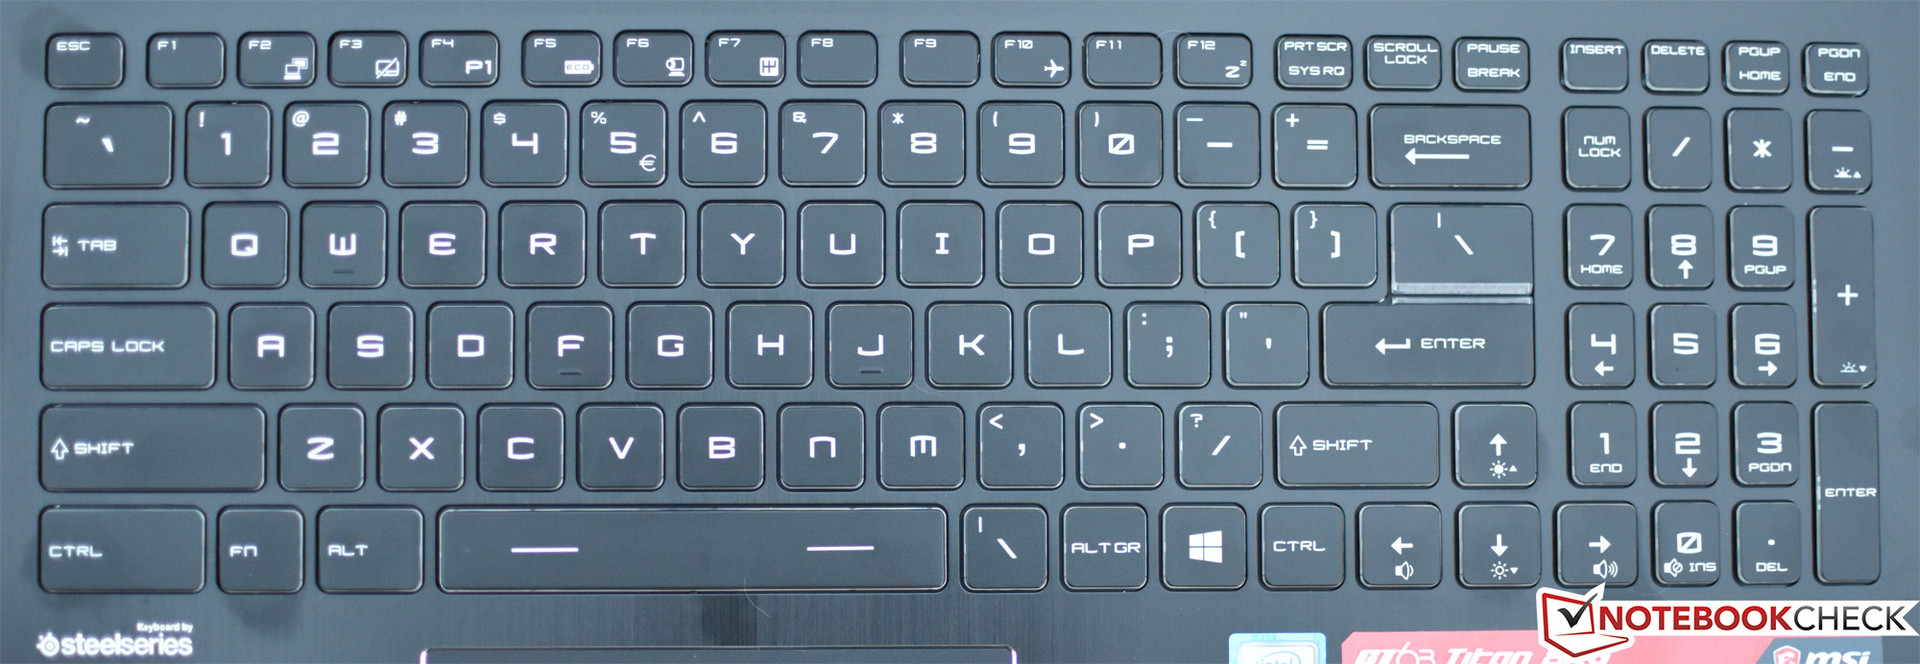
The SteelSeries keyboard is as good as ever, and yet again, it appears mostly identical to its predecessor. The chiclet-style keys are highly visible thanks to the contrast between their black backgrounds and white labels, and in the dark, they now sport per-key RGB-LED backlighting (as opposed to the previous three-zone backlighting approach of the GT62VR). Key travel is medium with reasonable, consistent feedback and quiet operation; it seems good for fast typing. The keys are tightly affixed with no clatter.
The layout hasn’t changed, and it’s immediately familiar. Only the number pad off to the right is horizontally compressed slightly (and with it, the Insert/Delete/PgUp/PgDown/Home/End keys). The arrow keys, by contrast, are fully-sized.
Touchpad
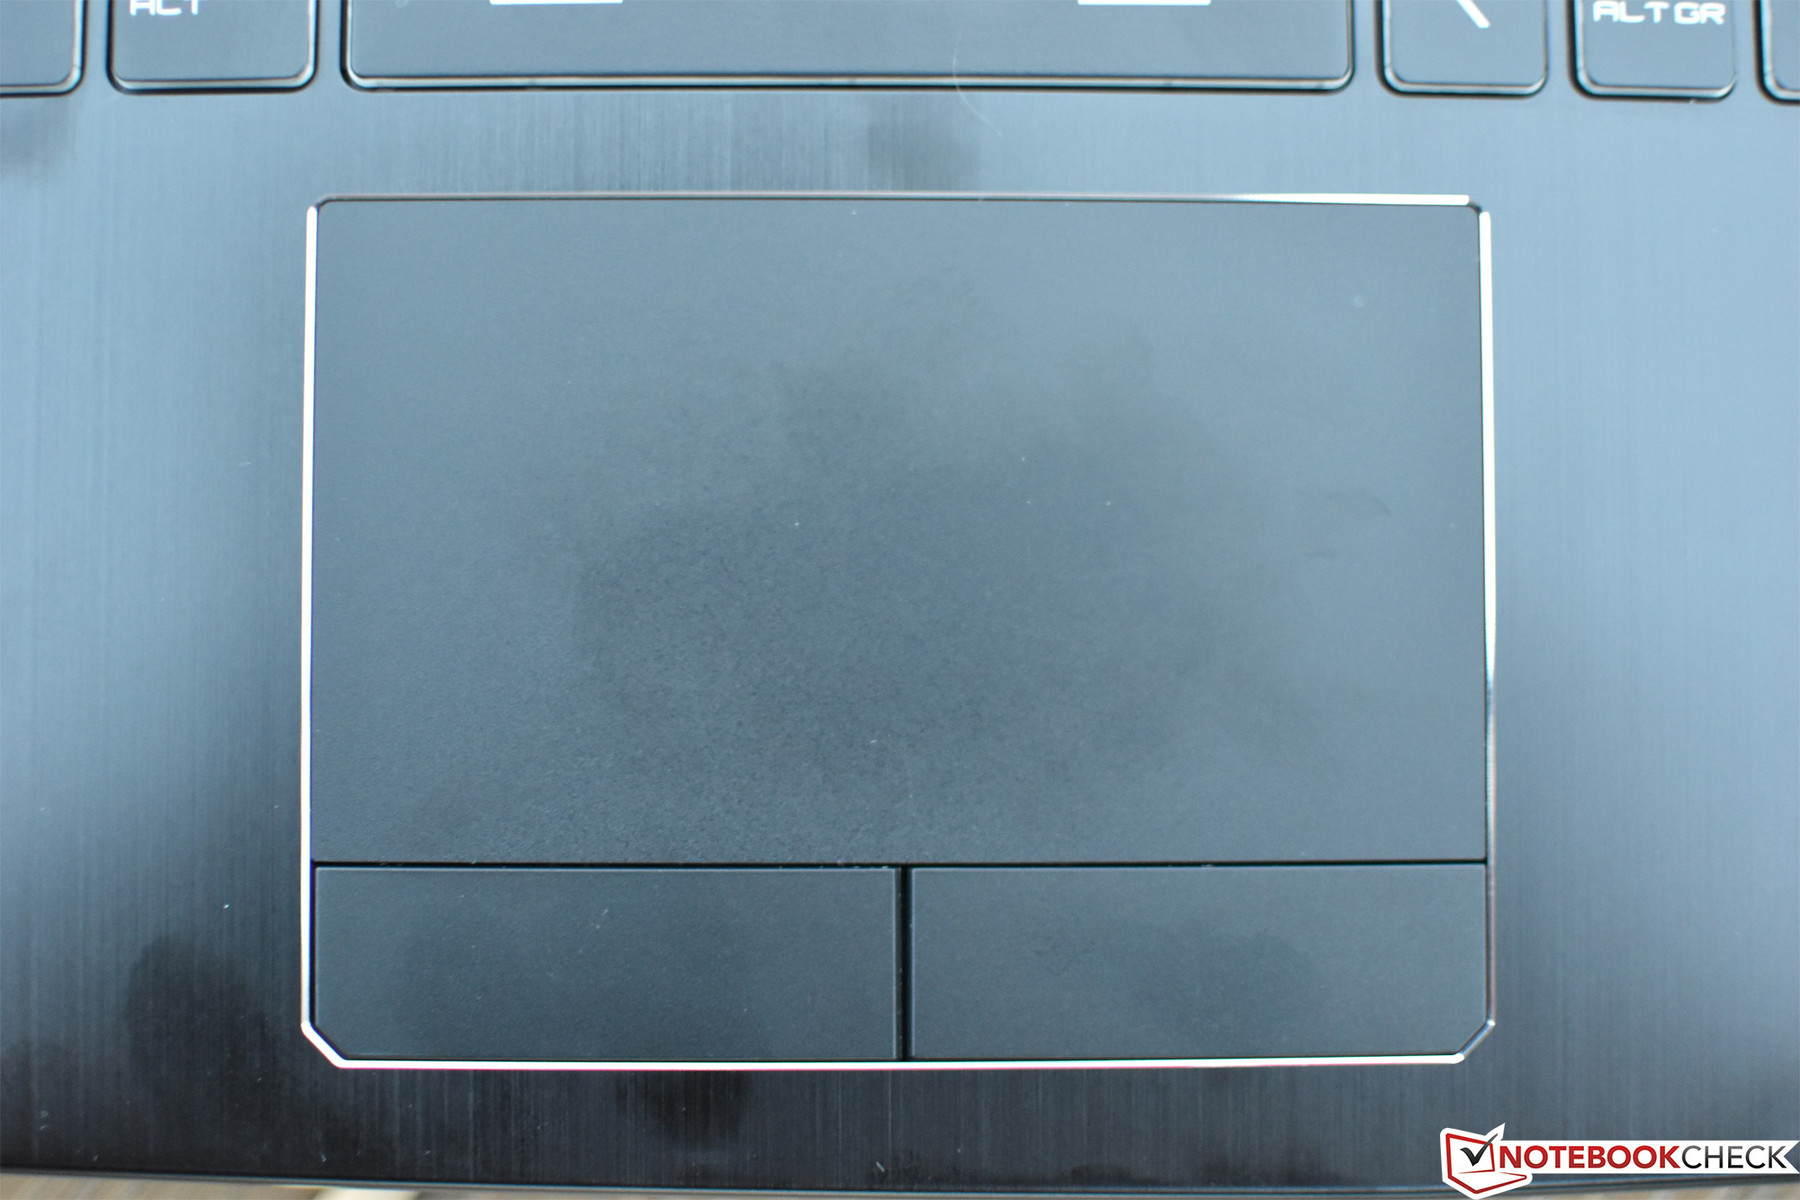
The 107x60 mm Synaptics touchpad is reasonably large, and pointer movement is subject to very little lag. It isn’t a Precision Touchpad out of the box, though it can likely be transformed into one using some fancy driver-oriented tricks. The basic gestures still worked without any technical sorcery, so perhaps most users won’t mind regardless. The biggest complaint we have with the touchpad is actually the two physical buttons below it: they’re incredibly loud, especially the left button, which also sounds rather hollow. The pitch of the noise and the feel of the click also change depending on where the button is pressed.
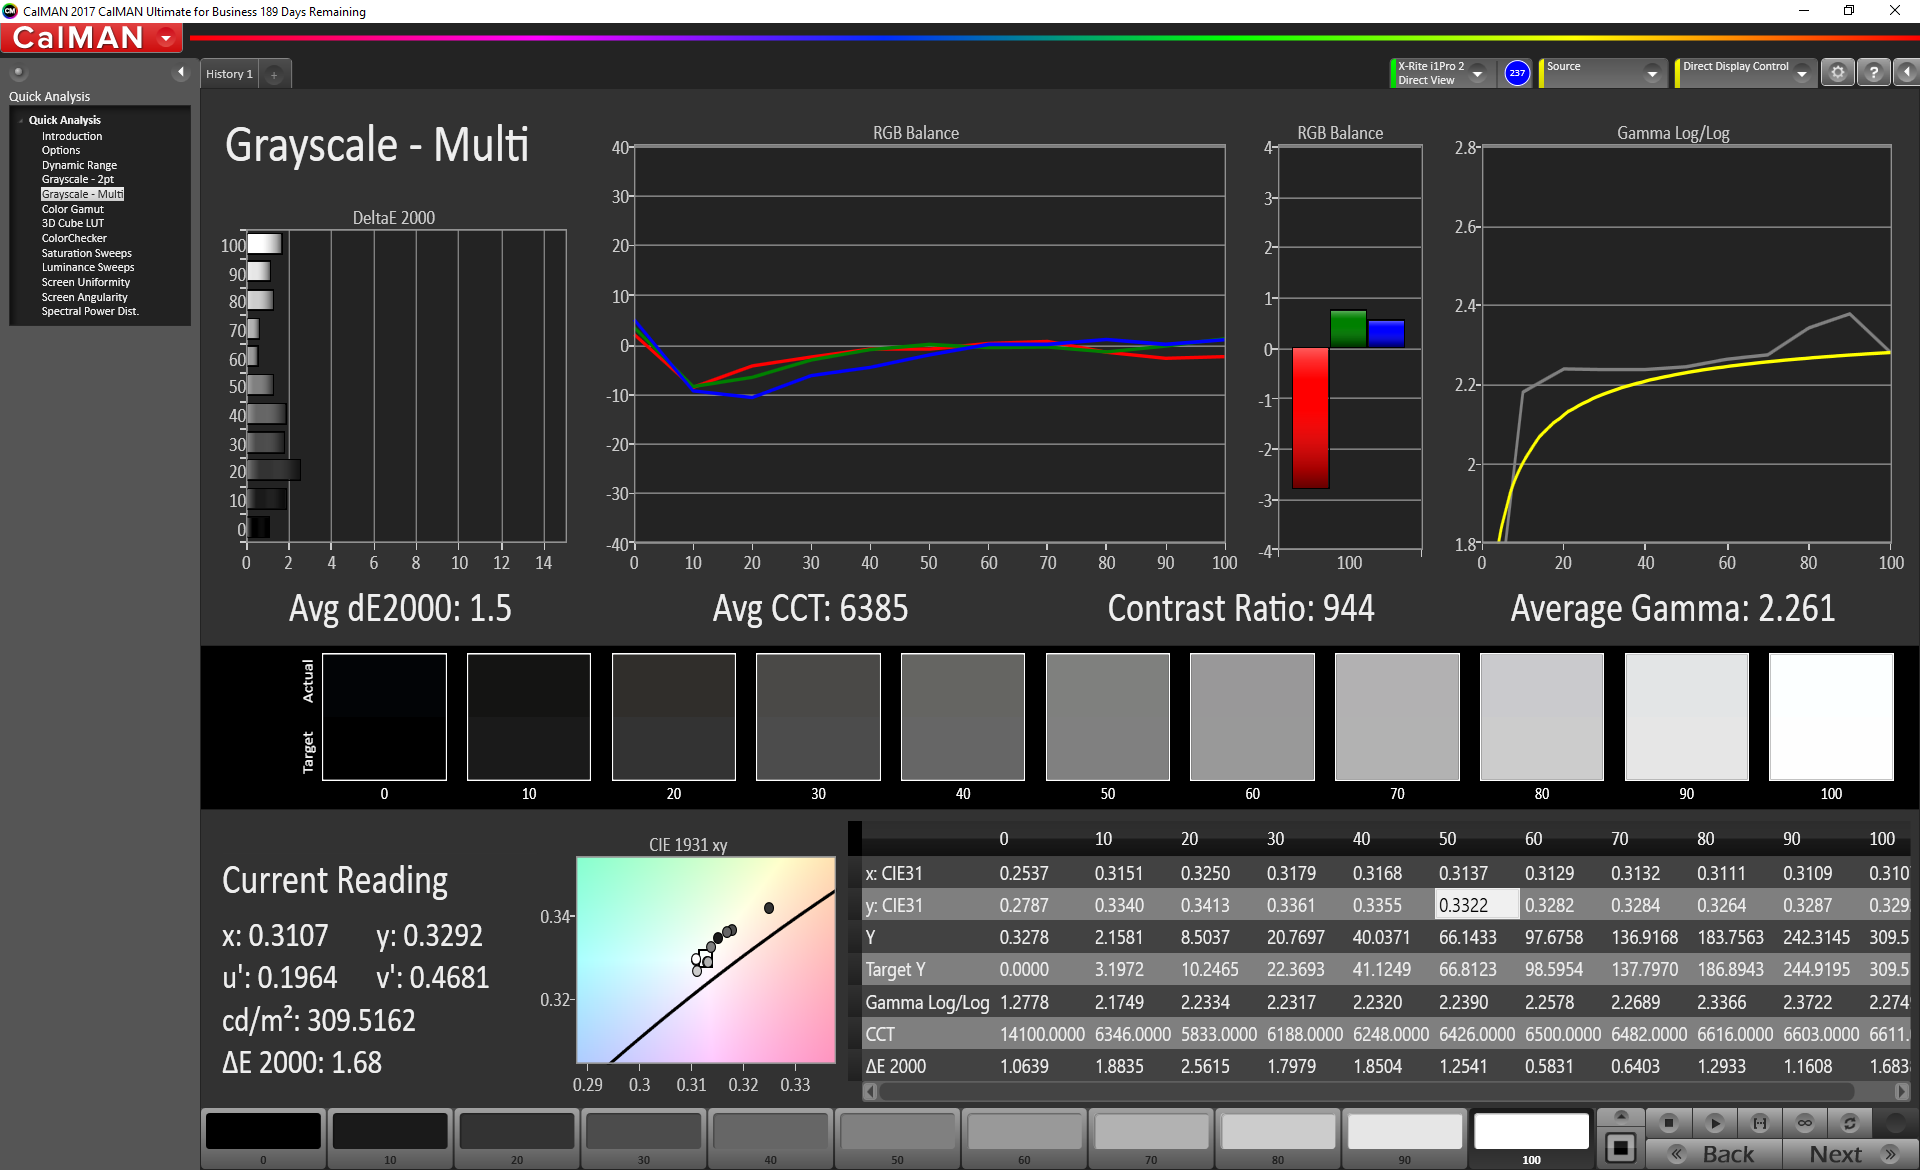
Display
The GT63 offers a couple of different 15.6-inch panel options: a 4K IPS display, and an FHD (1920x1080) 120 Hz 3 ms response time TN LED screen. Our review unit came configured with the latter, which subjectively appears only moderately bright, but which also possesses immediately obvious color rendering proficiency.
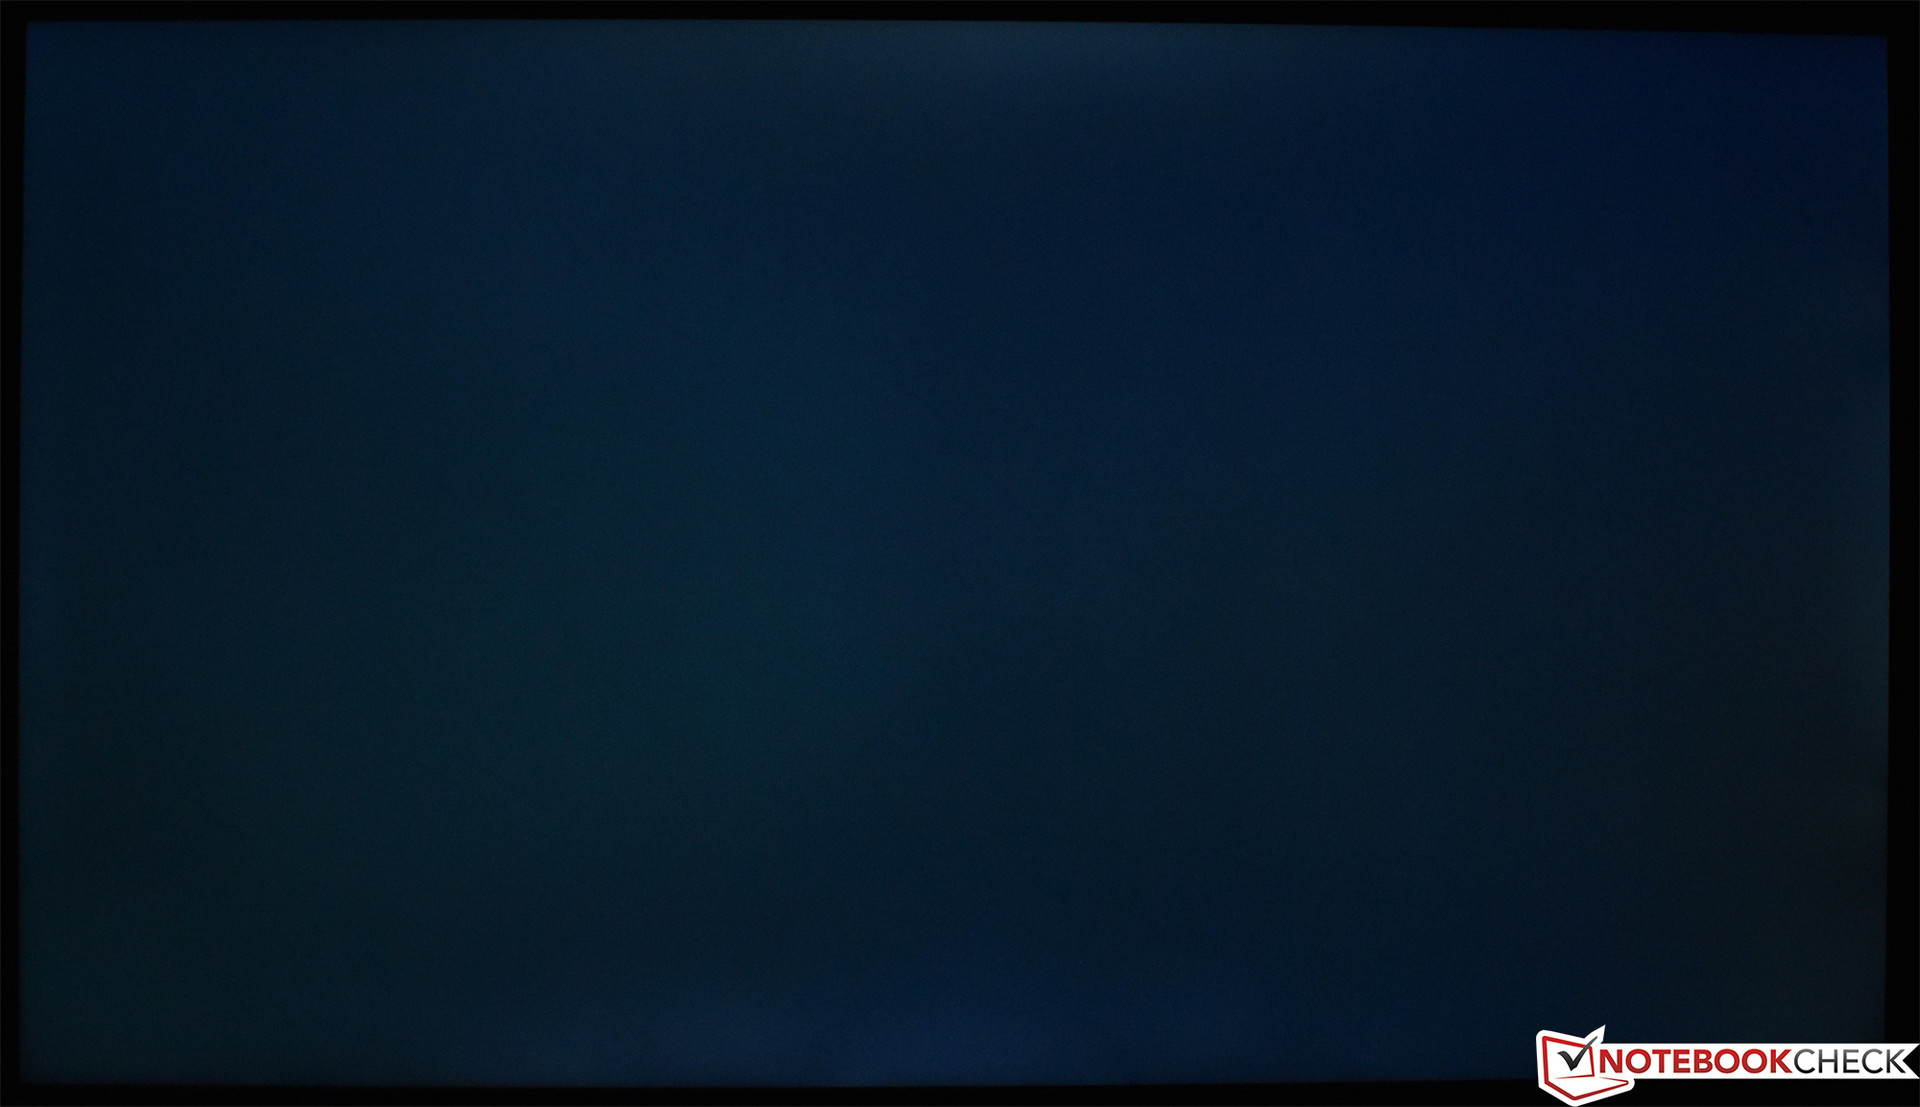
We measured 275.8 cd/m² brightness with a distribution of 80%, both of which are merely average numbers. Contrast came in at 830:1 (on the heels of a 0.37 cd/m² black level), which is decent. Some minor clouding on black screens is visible.
| |||||||||||||||||||||||||
Brightness Distribution: 80 %
Center on Battery: 307.1 cd/m²
Contrast: 830:1 (Black: 0.37 cd/m²)
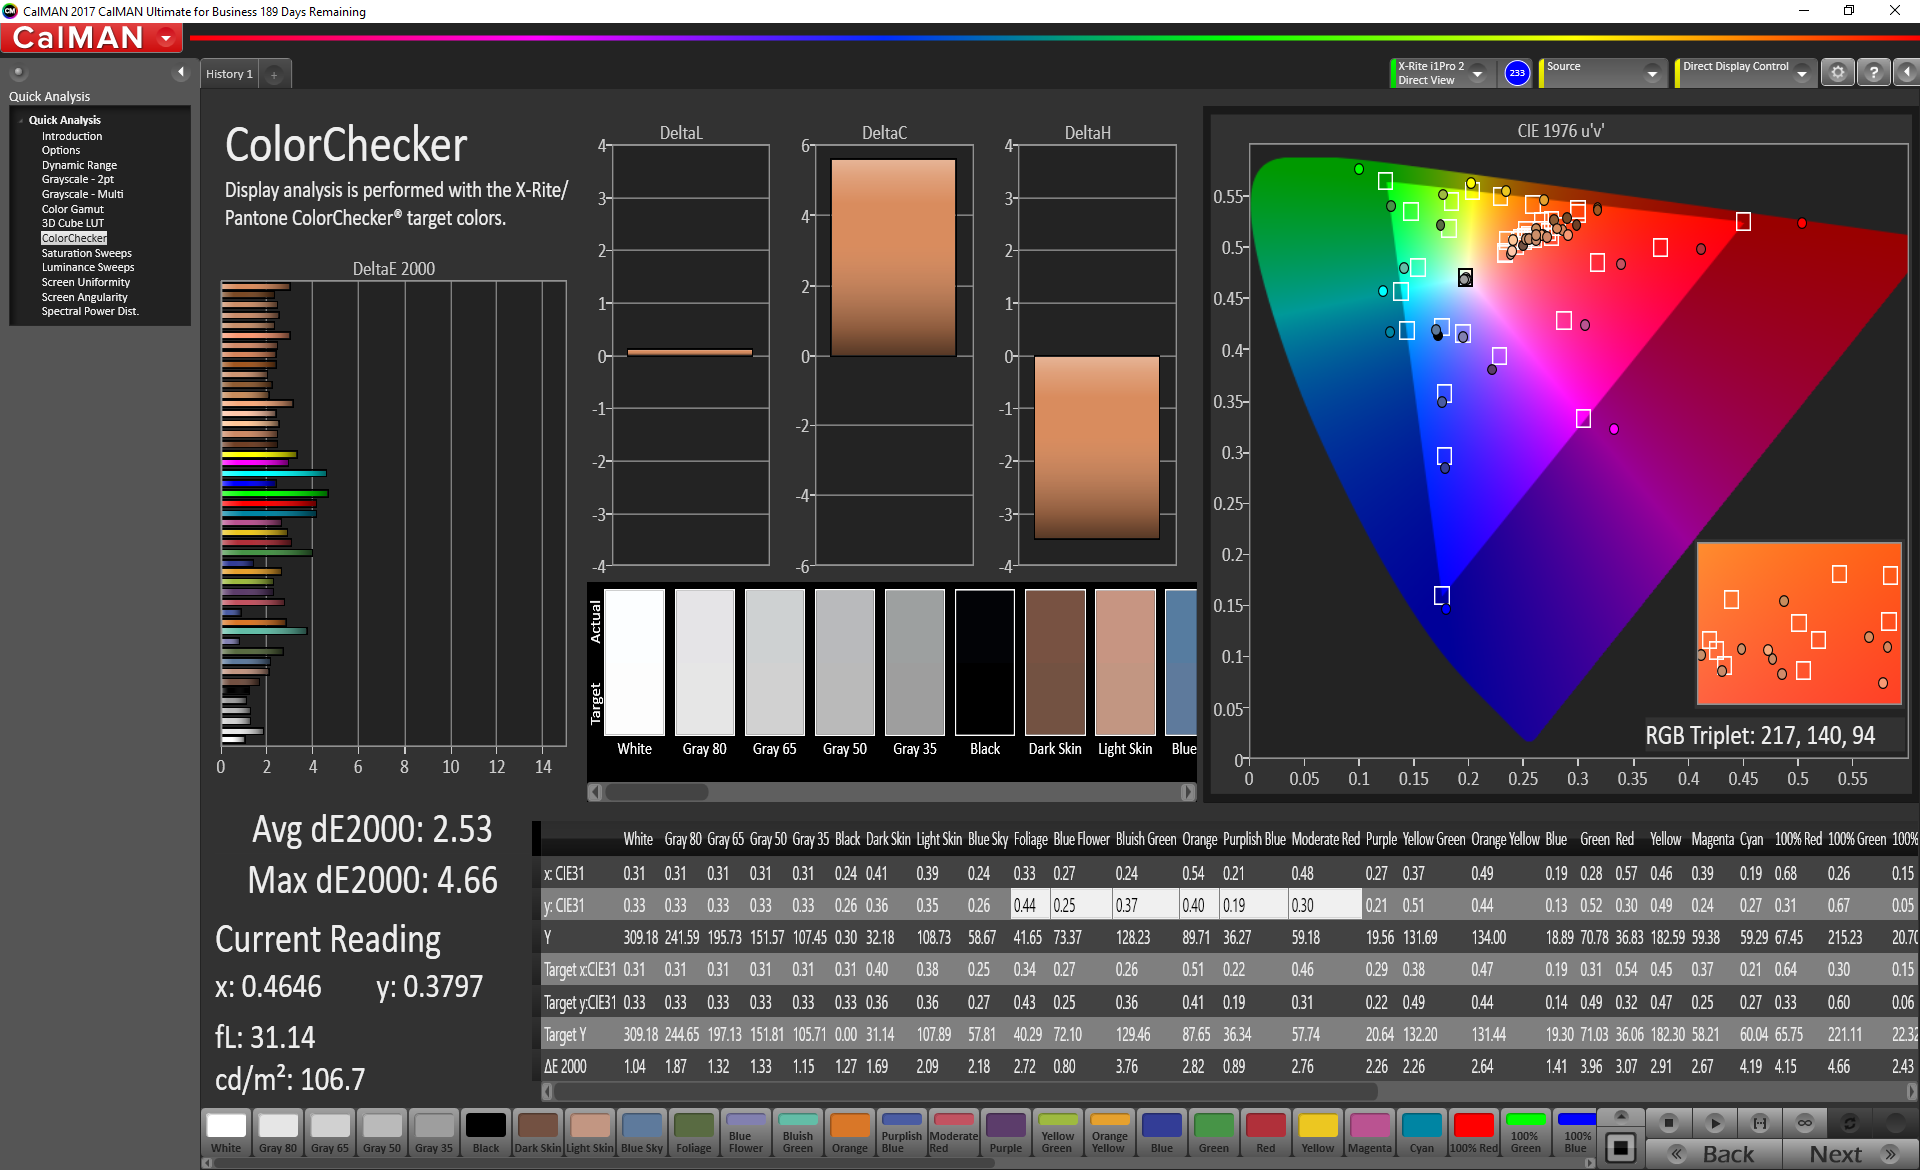
ΔE ColorChecker Calman: 2.53 | ∀{0.5-29.43 Ø4.73}
calibrated: 2.82
ΔE Greyscale Calman: 1.7 | ∀{0.09-98 Ø4.97}
100% sRGB (Argyll 1.6.3 3D)
76% AdobeRGB 1998 (Argyll 1.6.3 3D)
85.7% AdobeRGB 1998 (Argyll 3D)
99.9% sRGB (Argyll 3D)
91.3% Display P3 (Argyll 3D)
Gamma: 2.194
CCT: 6893 K
| MSI GT63 Titan 8RG-046 N156HHE-GA1, TN, 15.6", 1920x1080 | Asus ROG GU501GM-BI7N8 AU Optronics AUO45ED, IPS, 15.6", 1920x1080 | Razer Blade 15 2018 LGD05C0, IPS, 15.6", 1920x1080 | Lenovo Legion Y520-15IKBA-80WY001VGE LG Philips LGD0533, IPS, 15.6", 1920x1080 | Alienware 15 R3 Max-Q LG Philips LP156WF6 (LGD049B), IPS, 15.6", 1920x1080 | Dell G5 15 5587 LGD053F, 156WF6, IPS, 15.6", 1920x1080 | Asus Chimera G703GI B173HAN03.2 (AUO329D), IPS, 17.3", 1920x1080 | Acer Predator Helios 500 PH517-51-79BY AUO_B173HAN03, IPS, 17.3", 1920x1080 | |
|---|---|---|---|---|---|---|---|---|
| Display | -22% | -20% | -50% | -25% | -52% | -19% | -20% | |
| Display P3 Coverage (%) | 91.3 | 63.4 -31% | 64.3 -30% | 39.53 -57% | 64.3 -30% | 38.13 -58% | 65.8 -28% | 64.4 -29% |
| sRGB Coverage (%) | 99.9 | 87.7 -12% | 93.7 -6% | 59.2 -41% | 82.9 -17% | 56.8 -43% | 92.6 -7% | 91.3 -9% |
| AdobeRGB 1998 Coverage (%) | 85.7 | 65.5 -24% | 40.86 -52% | 60.6 -29% | 39.47 -54% | 67 -22% | 65.6 -23% | |
| Response Times | -322% | -106% | -383% | -380% | -304% | -31% | -61% | |
| Response Time Grey 50% / Grey 80% * (ms) | 8.4 ? | 30.8 ? -267% | 17.2 ? -105% | 42 ? -400% | 40 ? -376% | 33 ? -293% | 6.4 ? 24% | 14 ? -67% |
| Response Time Black / White * (ms) | 5.8 ? | 27.6 ? -376% | 12 ? -107% | 27 ? -366% | 28 ? -383% | 24 ? -314% | 10.8 ? -86% | 9 ? -55% |
| PWM Frequency (Hz) | 25510 ? | 24900 ? | 21100 ? | |||||
| Screen | -21% | -3% | -68% | -38% | -69% | -2% | -47% | |
| Brightness middle (cd/m²) | 307.1 | 286.7 -7% | 290 -6% | 243 -21% | 306 0% | 229 -25% | 285 -7% | 335 9% |
| Brightness (cd/m²) | 276 | 281 2% | 281 2% | 231 -16% | 297 8% | 224 -19% | 275 0% | 300 9% |
| Brightness Distribution (%) | 80 | 92 15% | 82 2% | 87 9% | 89 11% | 87 9% | 82 2% | 82 2% |
| Black Level * (cd/m²) | 0.37 | 0.39 -5% | 0.3 19% | 0.24 35% | 0.28 24% | 0.28 24% | 0.22 41% | 0.7 -89% |
| Contrast (:1) | 830 | 735 -11% | 967 17% | 1013 22% | 1093 32% | 818 -1% | 1295 56% | 479 -42% |
| Colorchecker dE 2000 * | 2.53 | 4.17 -65% | 2.85 -13% | 6.36 -151% | 5.45 -115% | 6.1 -141% | 3.18 -26% | 4.99 -97% |
| Colorchecker dE 2000 max. * | 4.66 | 7.22 -55% | 6.27 -35% | 12.76 -174% | 9.45 -103% | 12.2 -162% | 5.99 -29% | 9.32 -100% |
| Colorchecker dE 2000 calibrated * | 2.82 | 1.39 51% | 6.51 -131% | 6.12 -117% | 1.73 39% | 1.93 32% | ||
| Greyscale dE 2000 * | 1.7 | 2.5 -47% | 2.4 -41% | 5.63 -231% | 4.9 -188% | 5.68 -234% | 2.93 -72% | 5.2 -206% |
| Gamma | 2.194 100% | 2.274 97% | 2.34 94% | 2.47 89% | 2.49 88% | 2.4 92% | 2.45 90% | 2.49 88% |
| CCT | 6893 94% | 6885 94% | 6718 97% | 7411 88% | 7062 92% | 6989 93% | 7165 91% | 7719 84% |
| Color Space (Percent of AdobeRGB 1998) (%) | 76 | 57 -25% | 60 -21% | 38 -50% | 54 -29% | 36 -53% | 60 -21% | 59 -22% |
| Color Space (Percent of sRGB) (%) | 100 | 87 -13% | 94 -6% | 59 -41% | 83 -17% | 57 -43% | 93 -7% | 91 -9% |
| Total Average (Program / Settings) | -122% /
-64% | -43% /
-19% | -167% /
-104% | -148% /
-81% | -142% /
-95% | -17% /
-9% | -43% /
-44% |
* ... smaller is better
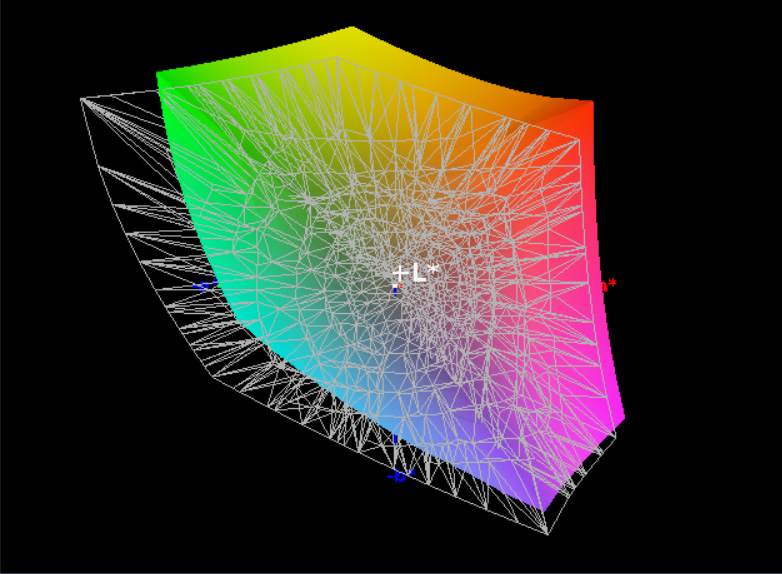
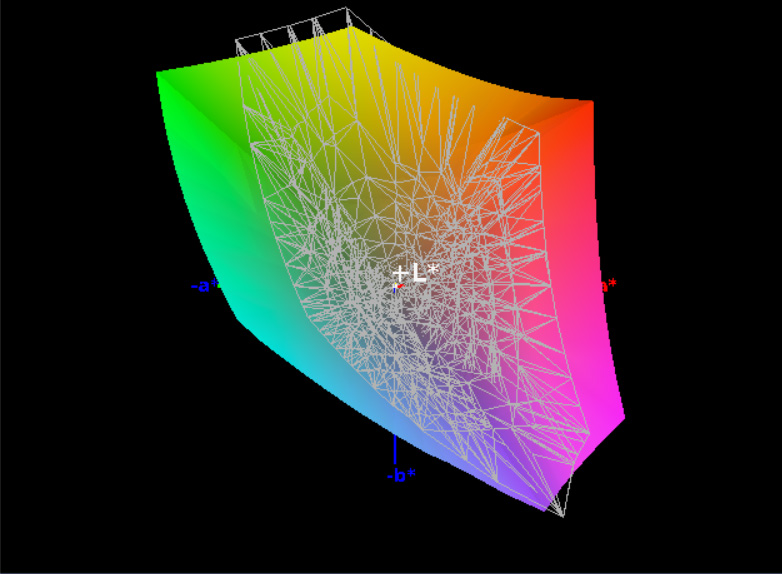
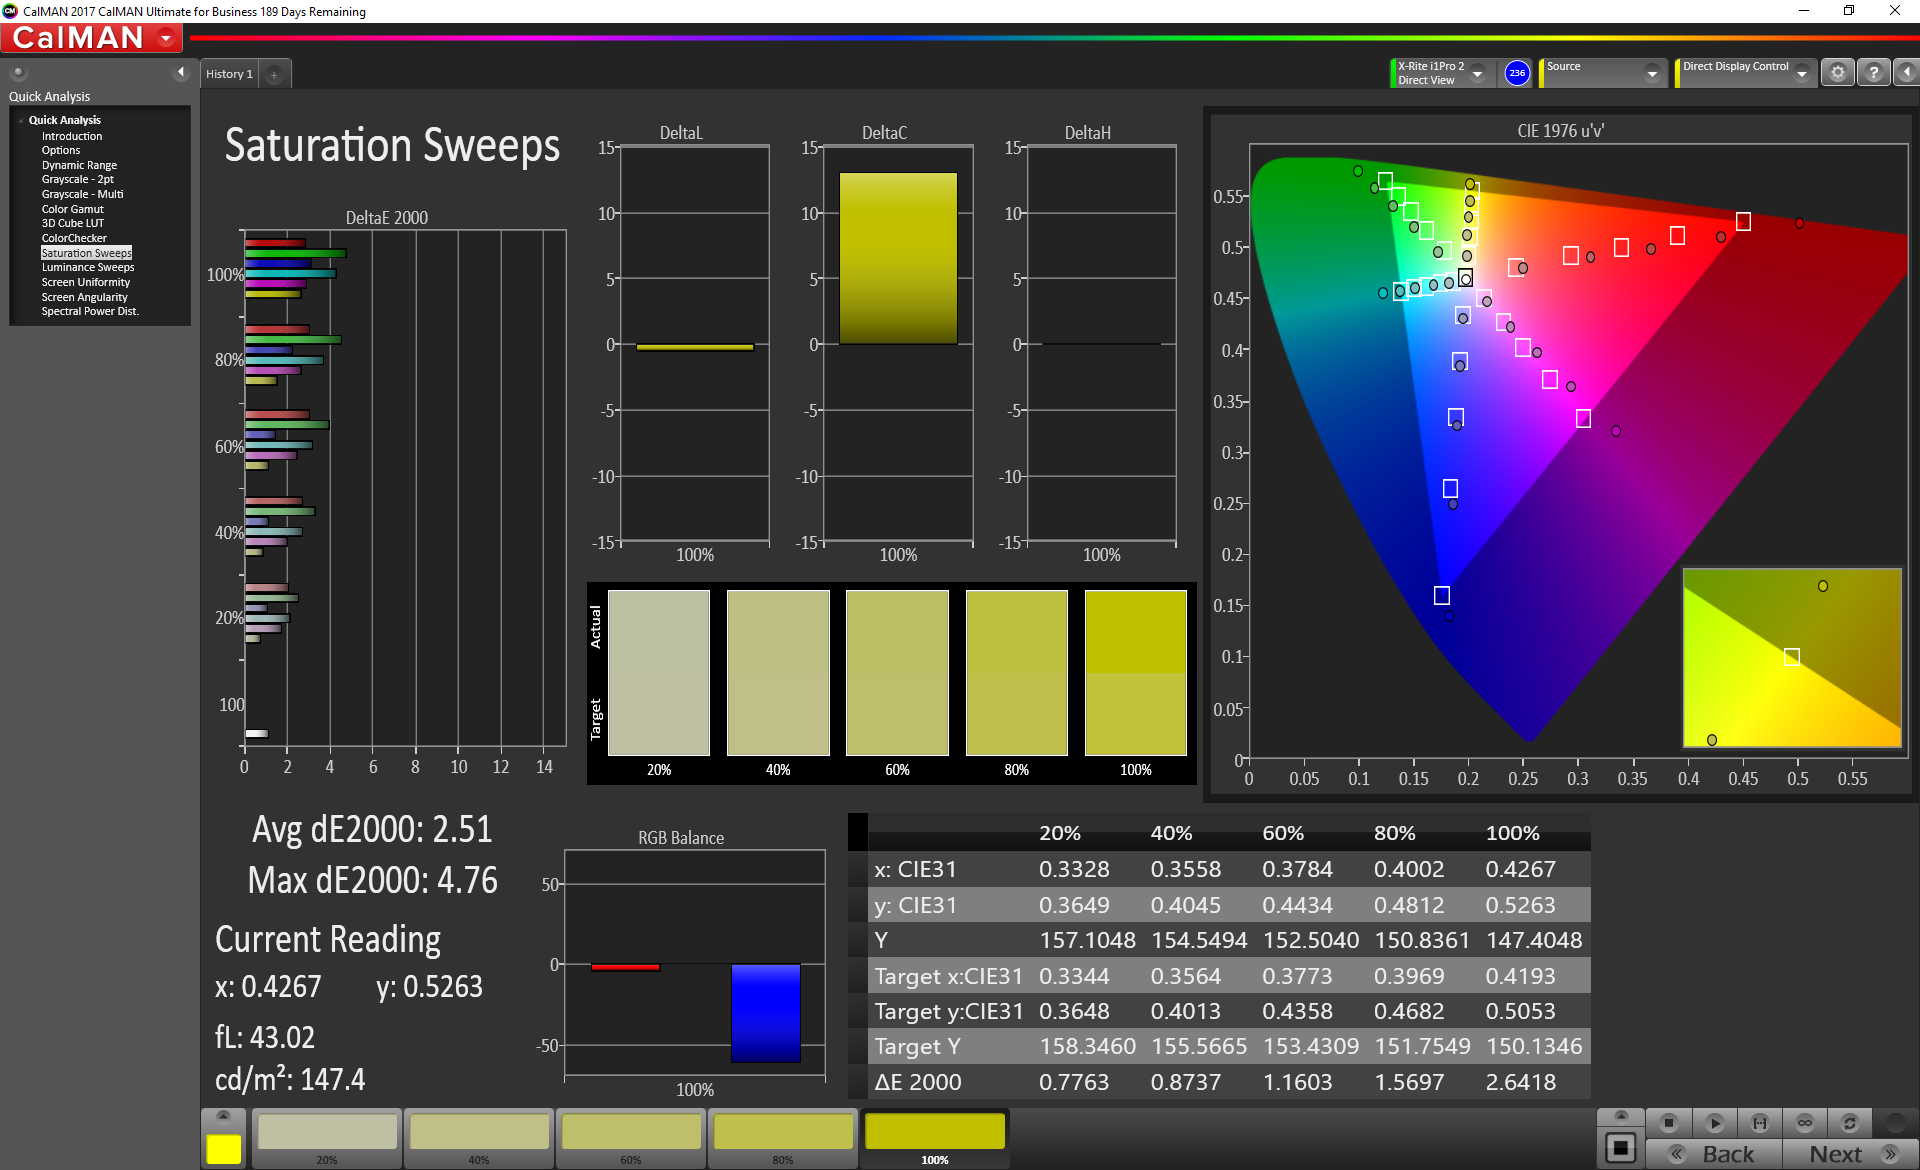
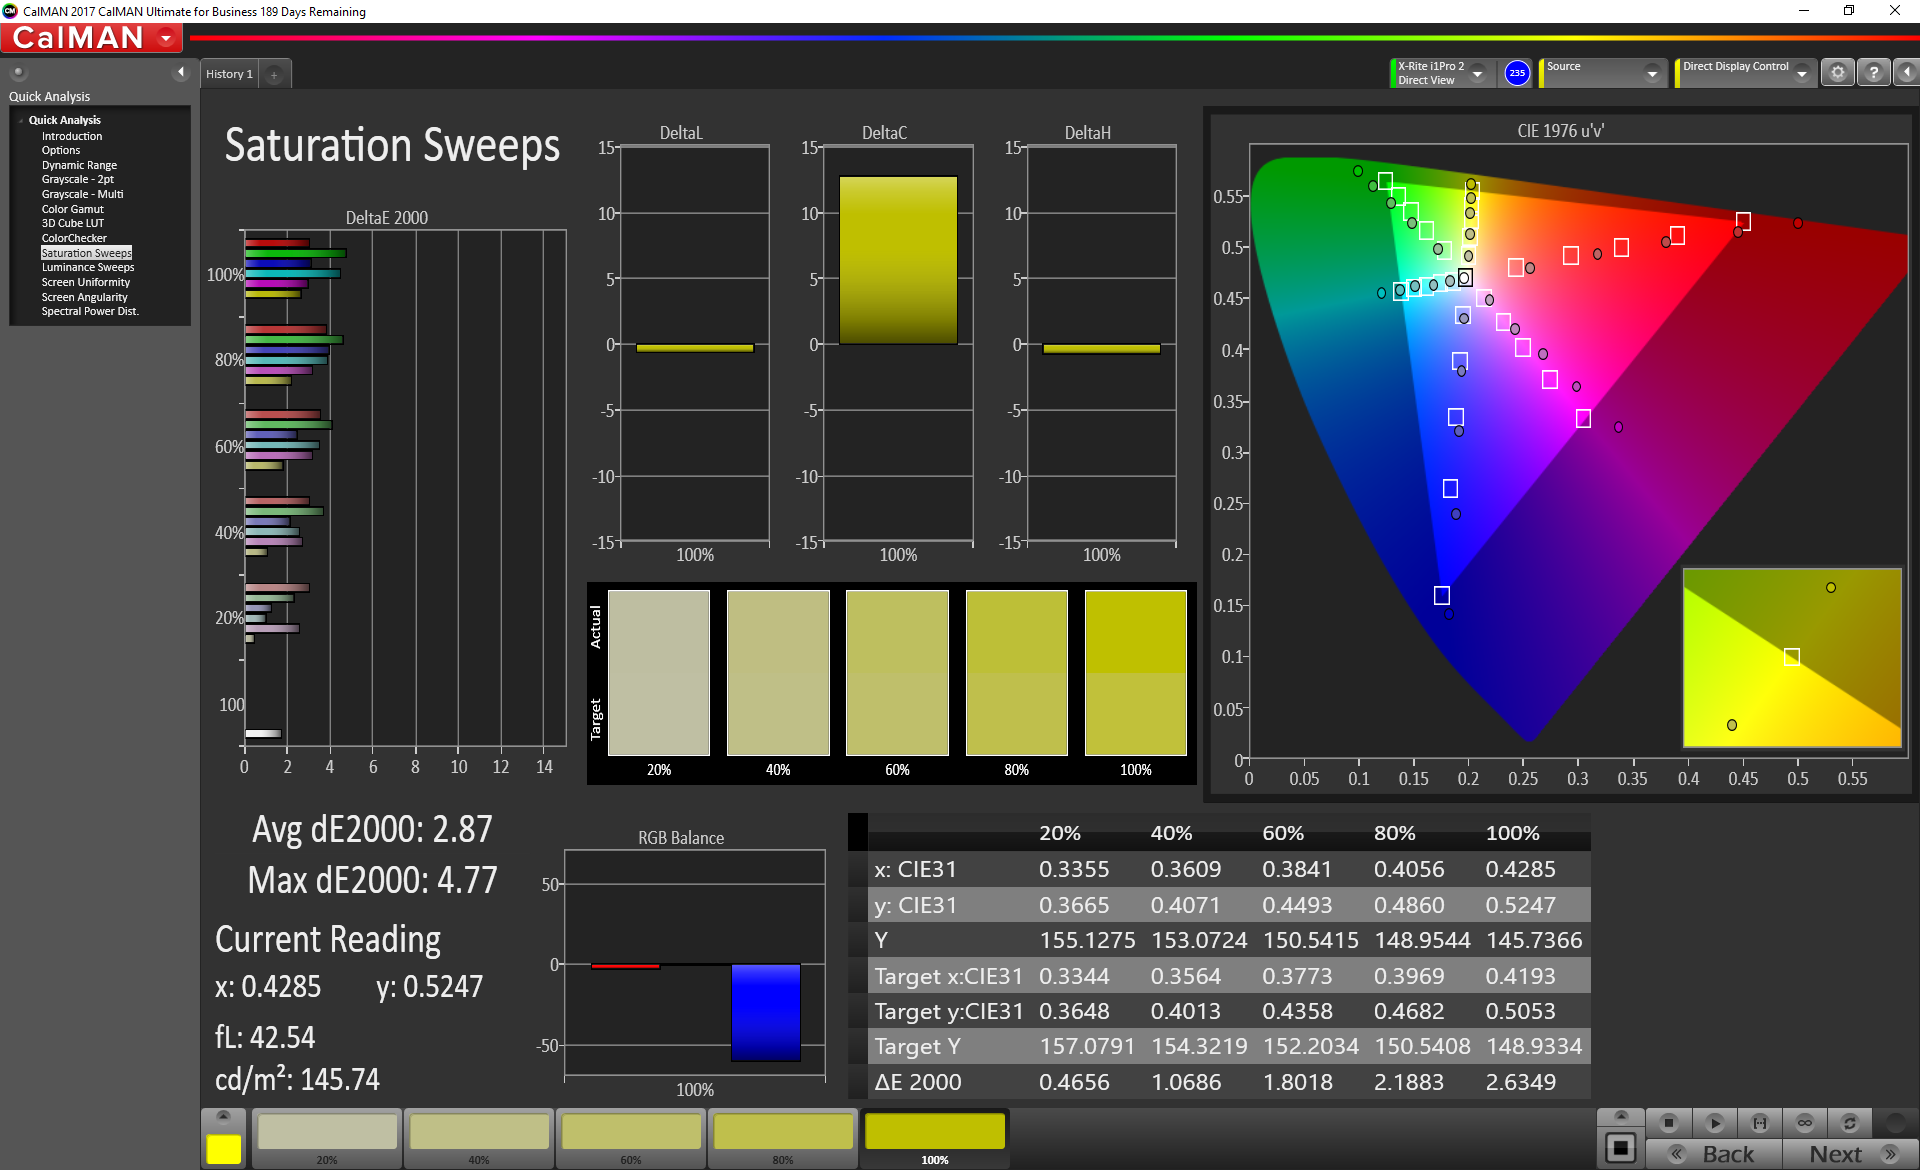
Color reproduction, on the other hand, is leagues ahead of most of the competition. Our analysis shows that the panel covers 100% of the sRGB spectrum and 76% of AdobeRGB, which is a good result in context with its peers (most of which hover within the 54 – 63% AdobeRGB range).


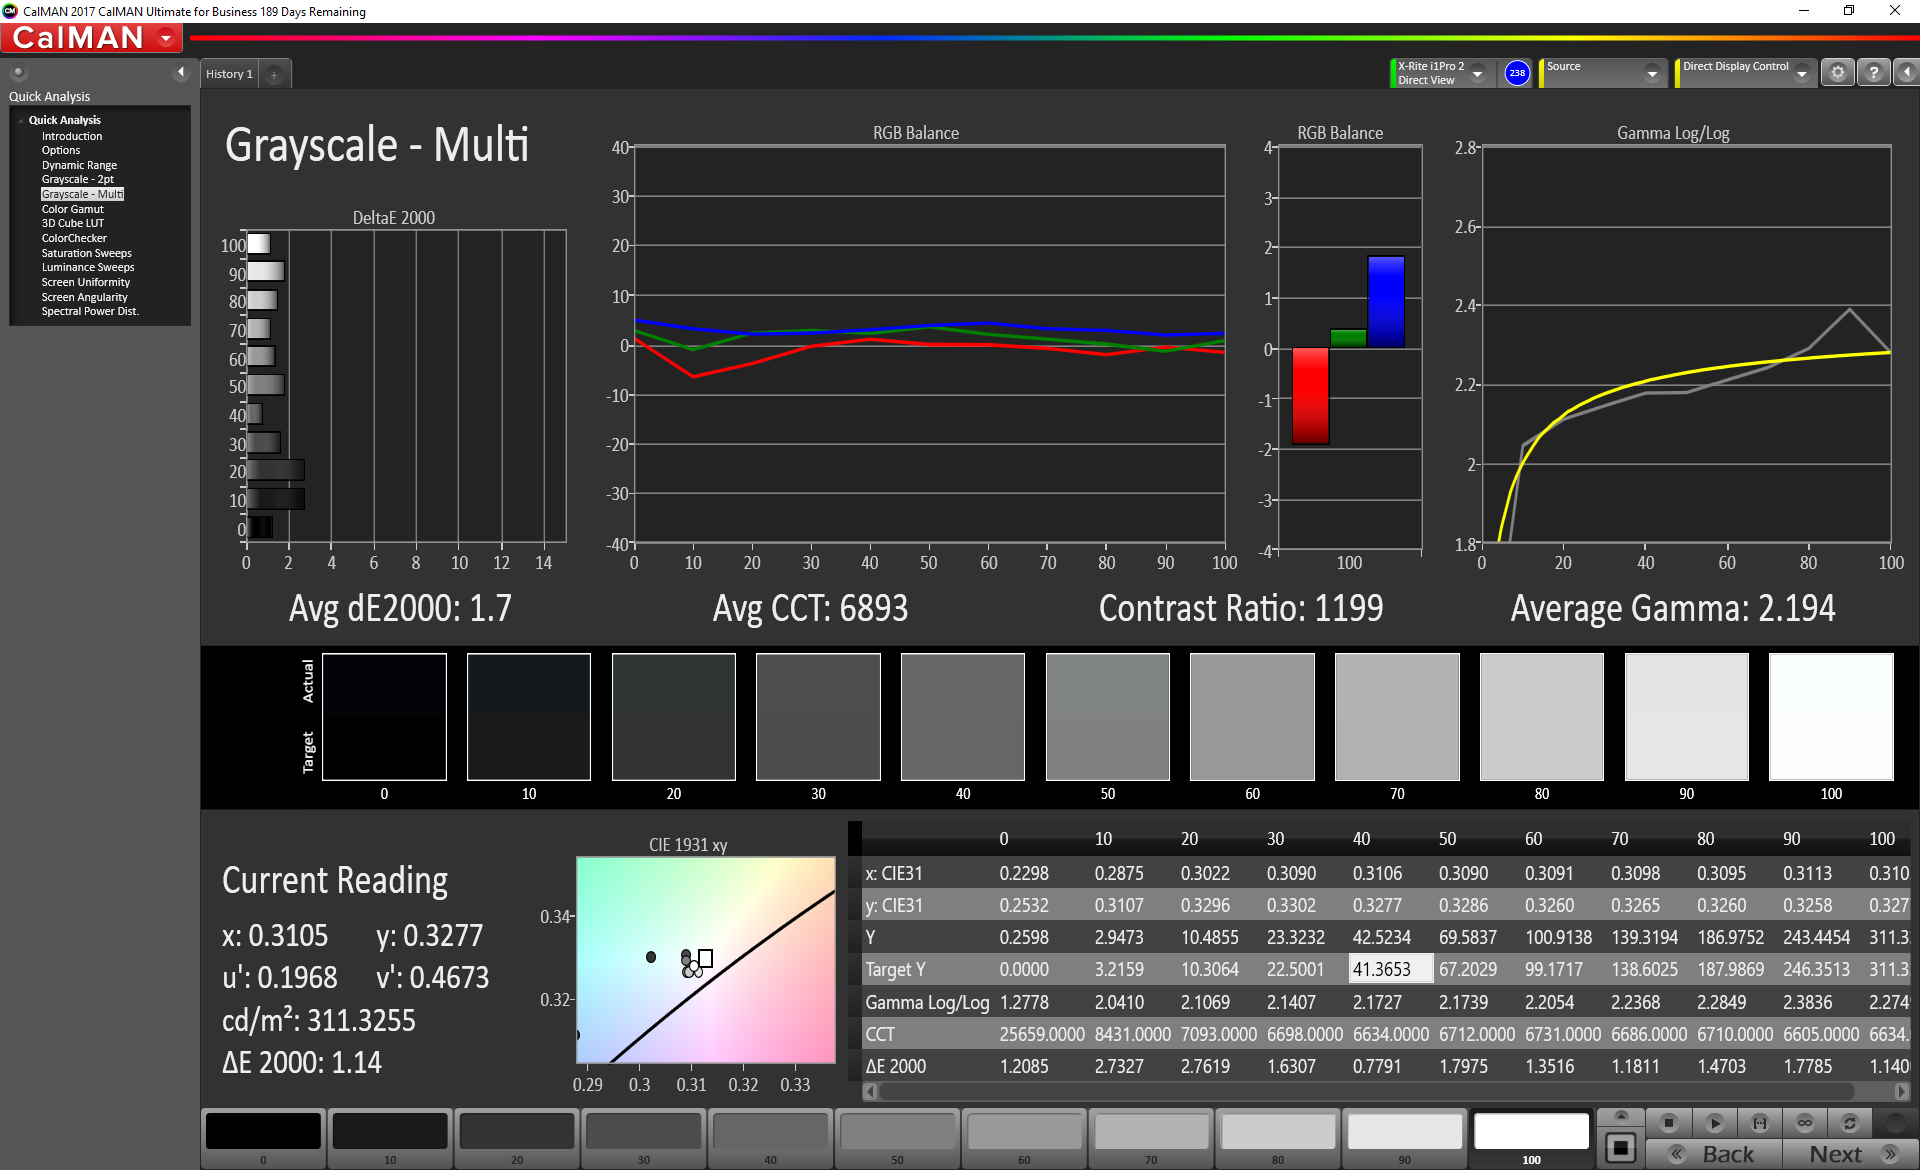
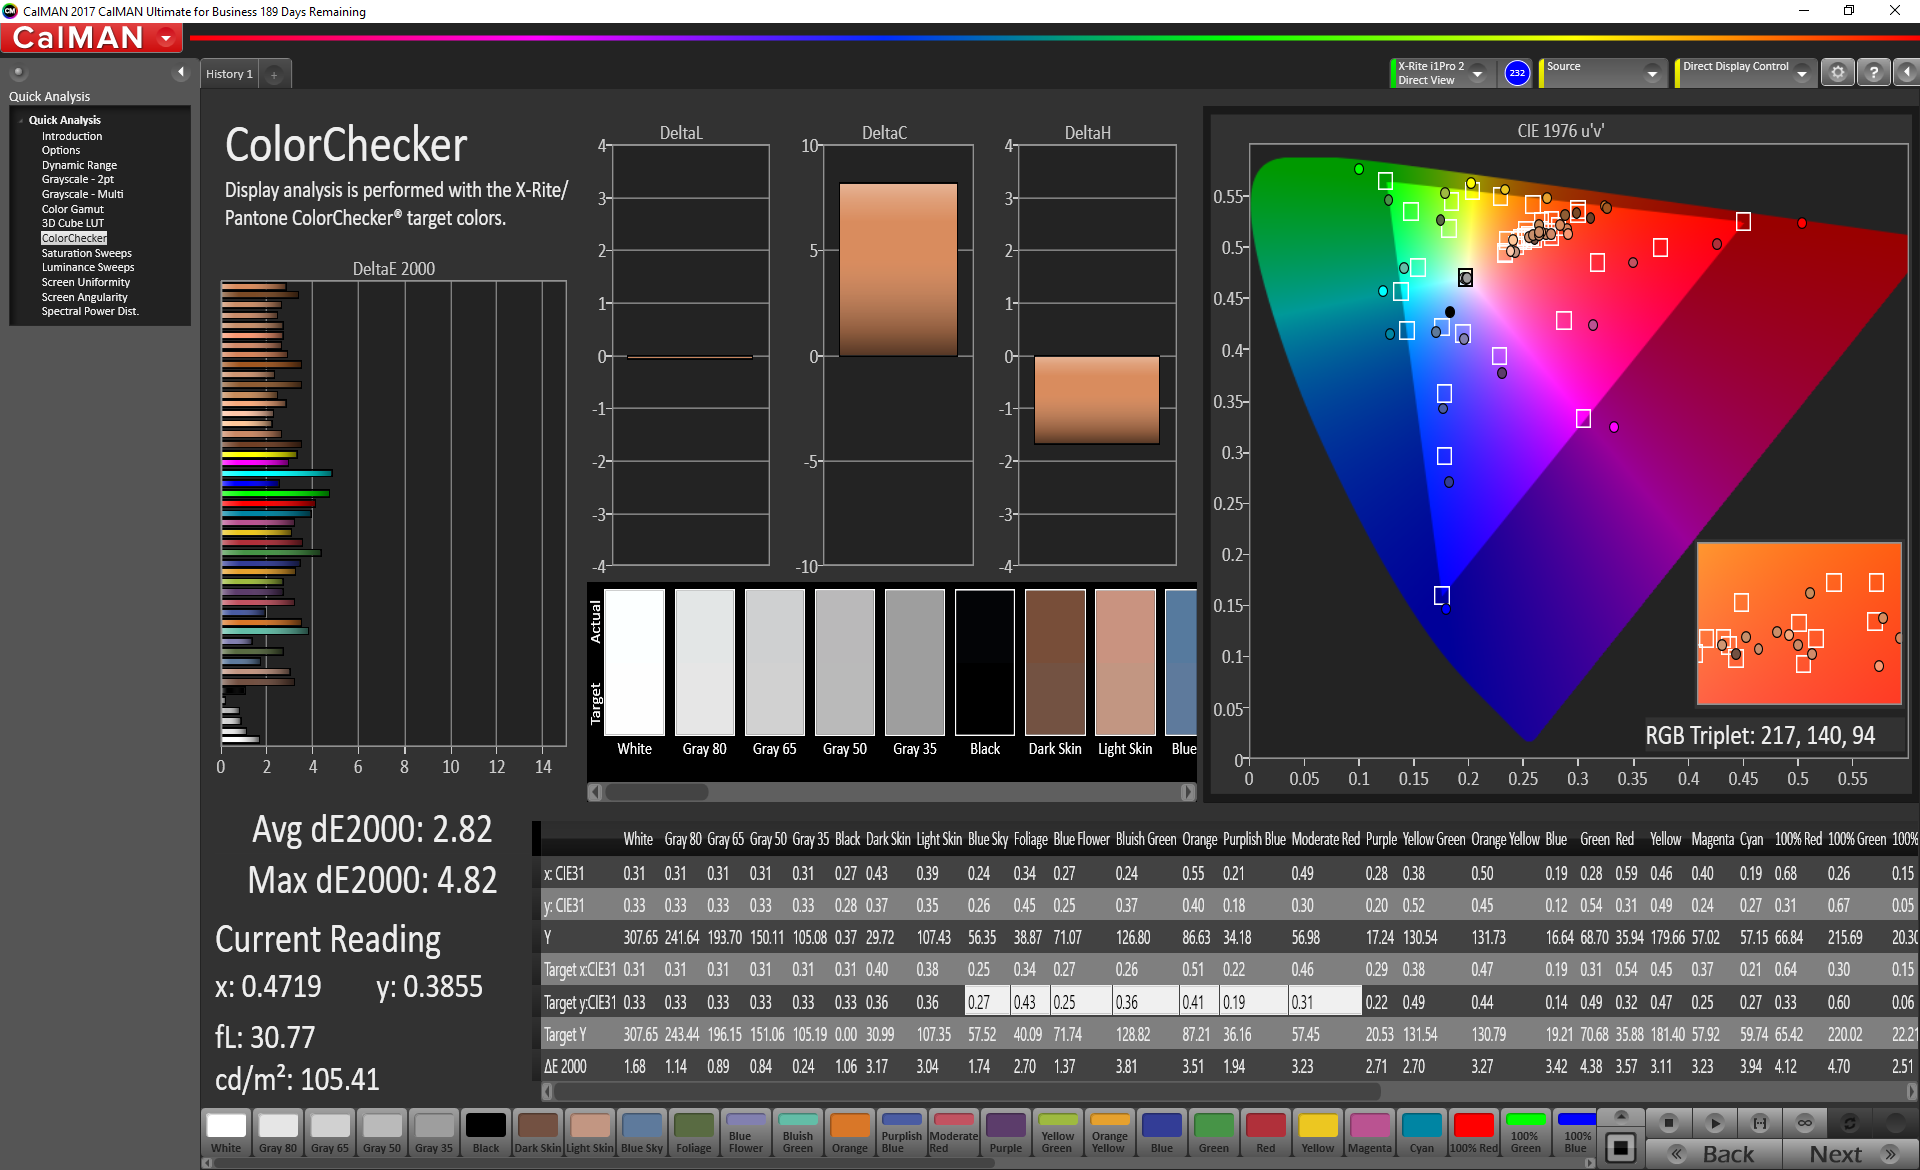
Accuracy is similarly good, with average pre-calibration DeltaE2000 results of just 2.82 for ColorChecker and 1.7 for Greyscale. Total gamma of 2.194 and the CCT Average of 6893 are also impressive results. MSI’s helpful True Color app provides full control over the tone and gamma of the panel, and provides handy preset profiles to match common settings (sRGB, Development, Gaming, Blue Light Filter, etc.).
Display Response Times
| ↔ Response Time Black to White | ||
|---|---|---|
| 5.8 ms ... rise ↗ and fall ↘ combined | ↗ 4.4 ms rise | 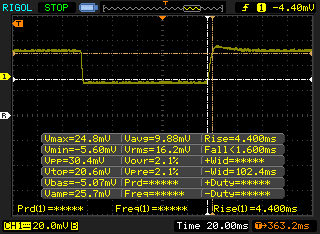 |
| ↘ 1.4 ms fall | ||
| The screen shows very fast response rates in our tests and should be very well suited for fast-paced gaming. In comparison, all tested devices range from 0.1 (minimum) to 240 (maximum) ms. » 18 % of all devices are better. This means that the measured response time is better than the average of all tested devices (19.9 ms). | ||
| ↔ Response Time 50% Grey to 80% Grey | ||
| 8.4 ms ... rise ↗ and fall ↘ combined | ↗ 4.4 ms rise | 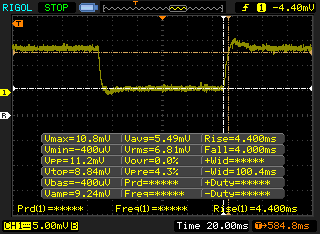 |
| ↘ 4 ms fall | ||
| The screen shows fast response rates in our tests and should be suited for gaming. In comparison, all tested devices range from 0.165 (minimum) to 636 (maximum) ms. » 22 % of all devices are better. This means that the measured response time is better than the average of all tested devices (31.1 ms). | ||
Screen Flickering / PWM (Pulse-Width Modulation)
| Screen flickering / PWM detected | 25510 Hz | ≤ 34 % brightness setting | 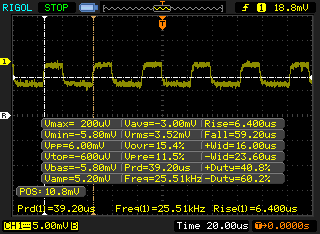 |
The display backlight flickers at 25510 Hz (worst case, e.g., utilizing PWM) Flickering detected at a brightness setting of 34 % and below. There should be no flickering or PWM above this brightness setting. The frequency of 25510 Hz is quite high, so most users sensitive to PWM should not notice any flickering. In comparison: 52 % of all tested devices do not use PWM to dim the display. If PWM was detected, an average of 7794 (minimum: 5 - maximum: 343500) Hz was measured. | |||
Panel response times are terrific; we measured just 6 ms / 8.4 ms in Black to White / 50% Grey to 80% Grey respectively. Very few devices achieve such stellar results. While PWM is implemented at brightness values below 34%, the frequency is sufficiently high (at 25510 Hz) that it isn’t likely to bother most users.
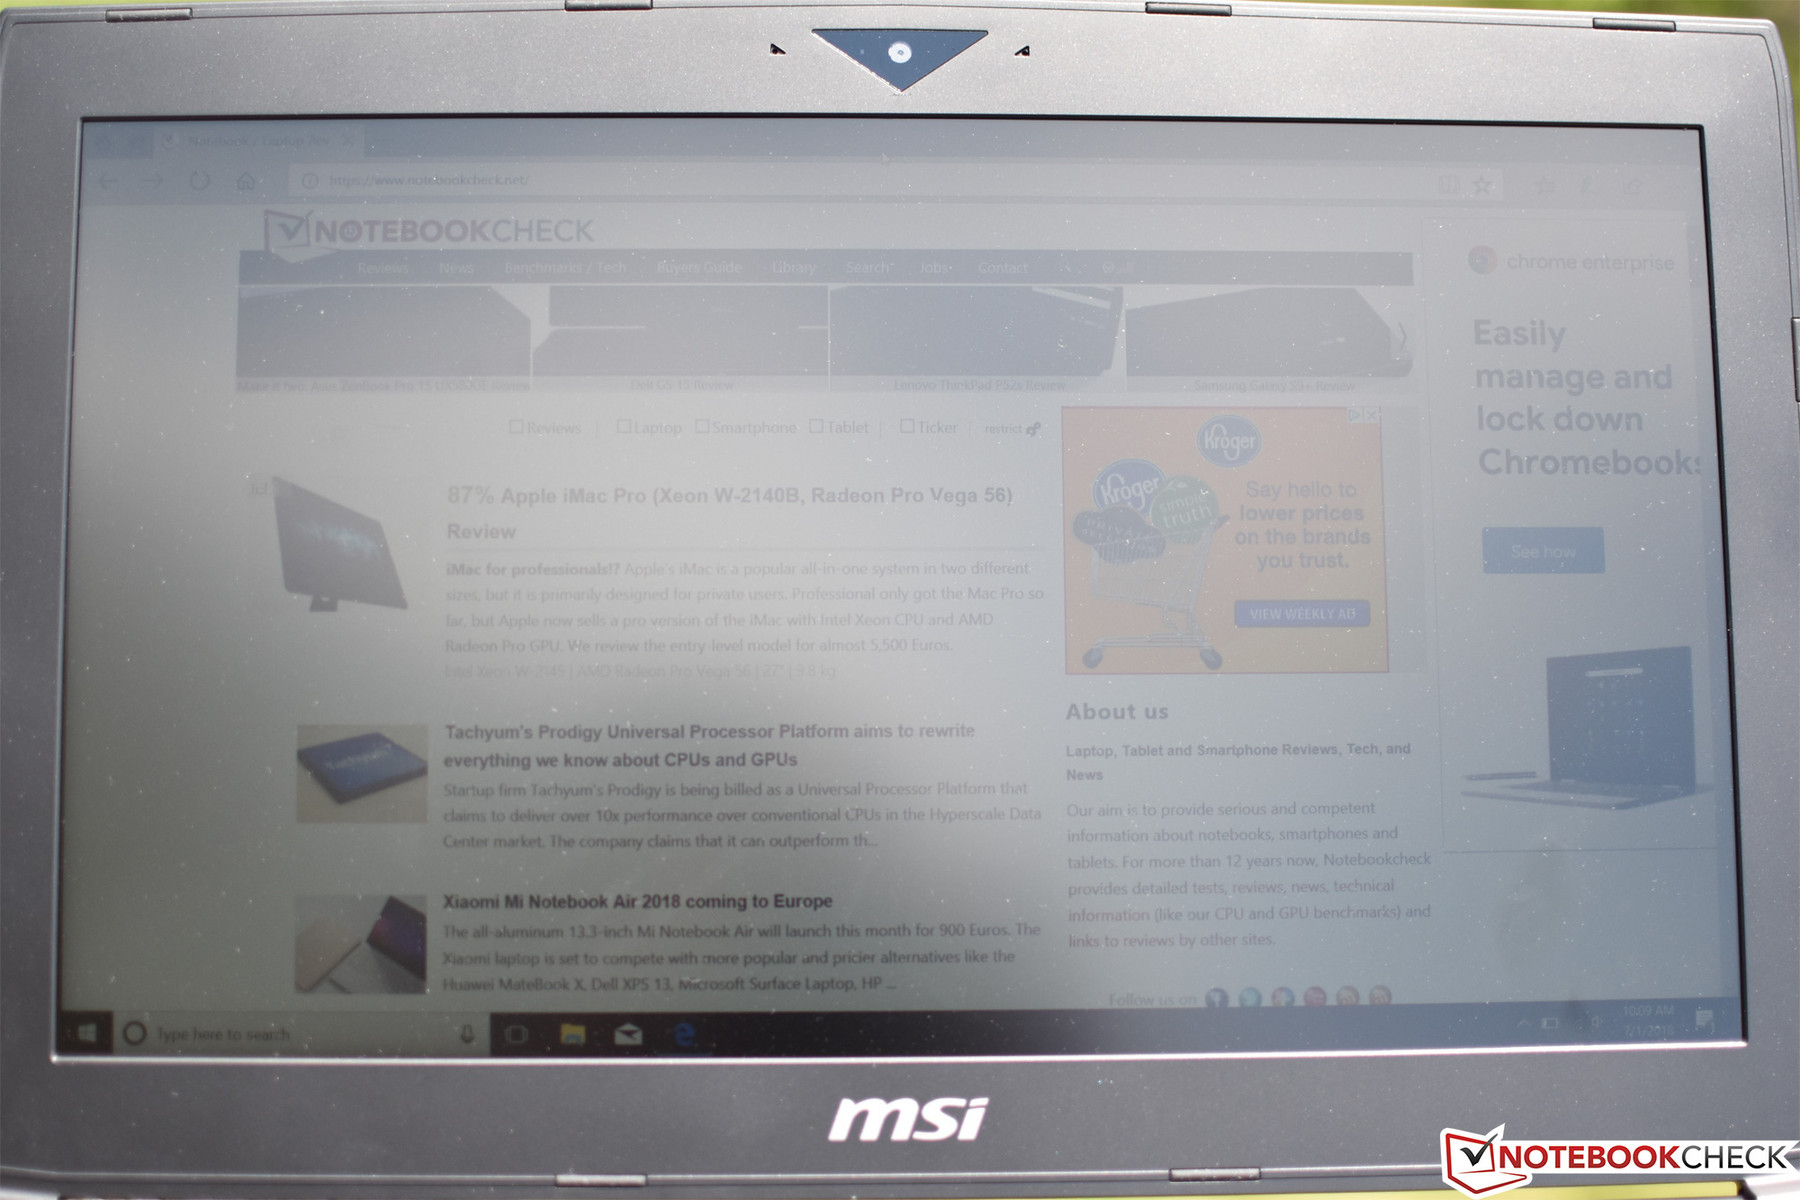
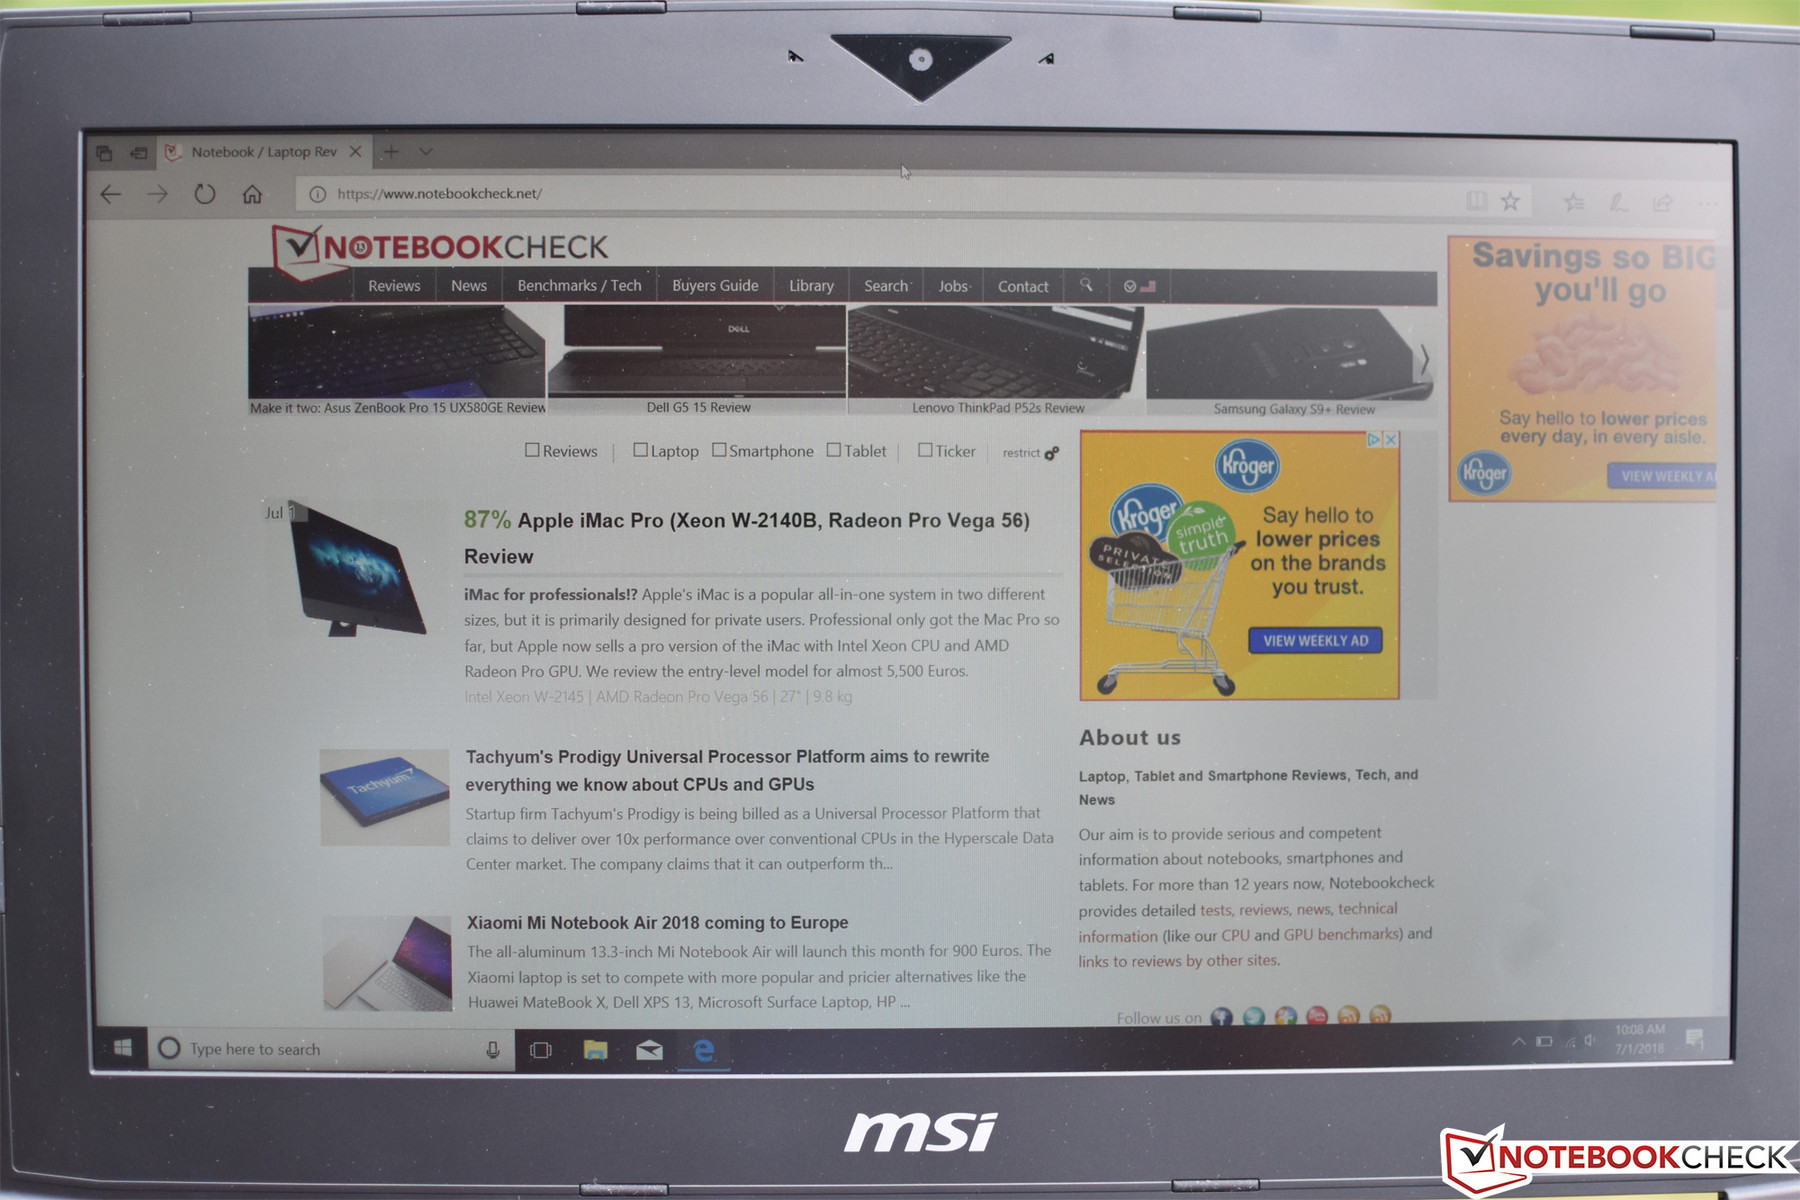
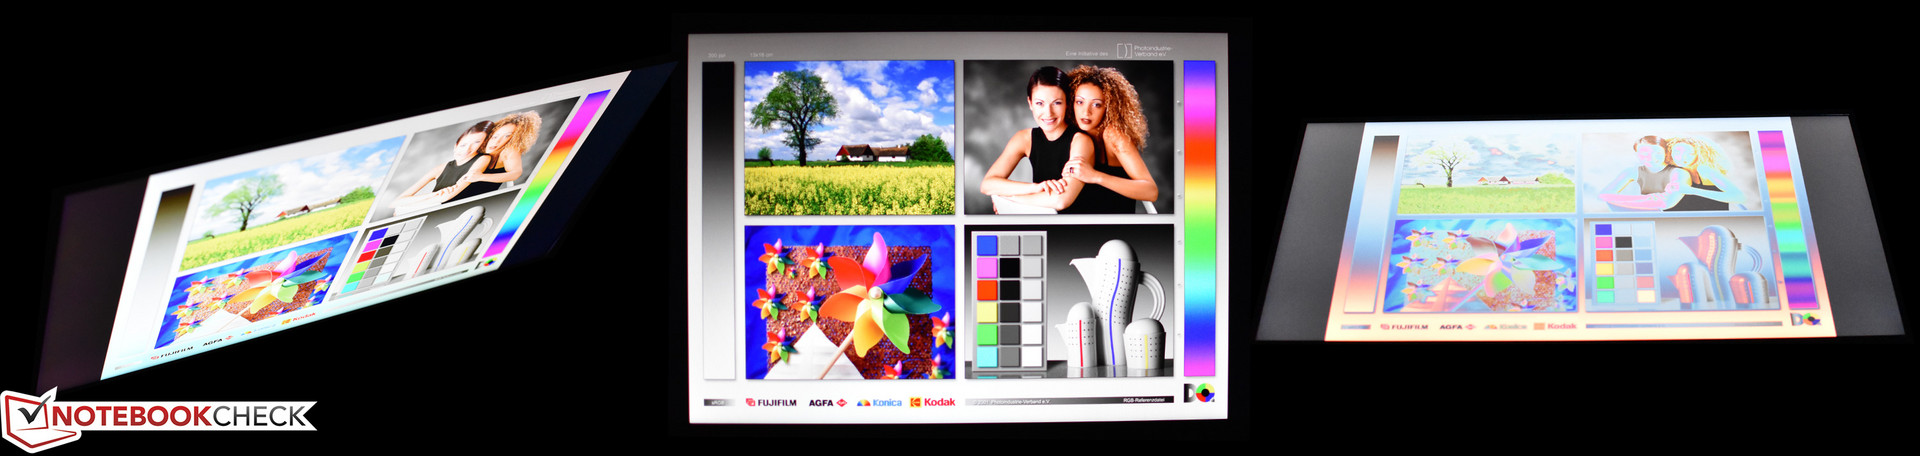
The middling brightness does thwart the GT63’s outdoor utility somewhat, but given its intended use that’s probably not so debilitating. Although the display in today’s review unit is not an IPS panel, viewing angles are still very good both horizontally and vertically, with the exception of extreme angles from the bottom, which do result in brightness inversions.
Performance
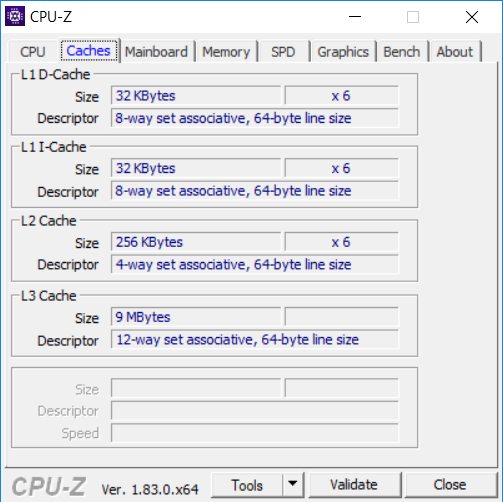
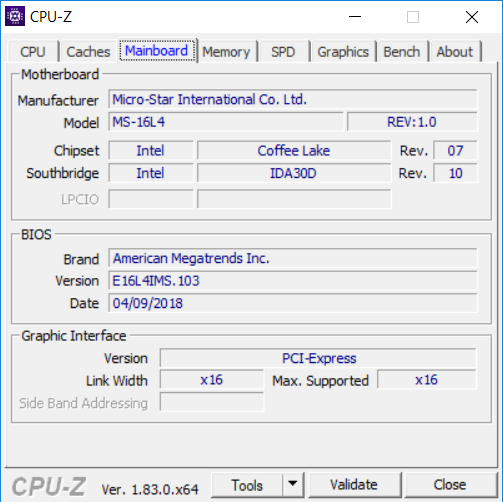
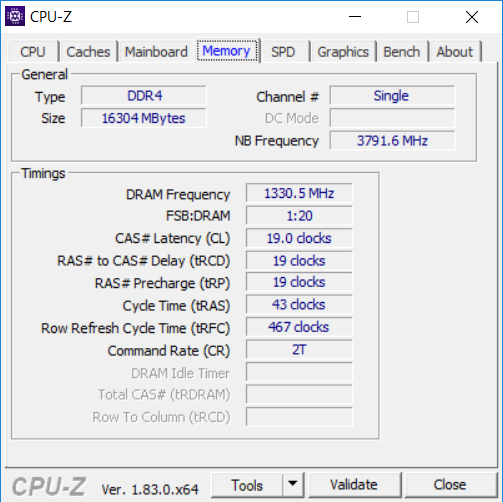
The MSI GT63 is configurable with Intel H-series 8th-generation CPUs ranging from Core i5 up to Core i7 six-core chips. It supports up to 2 SODIMMs of DDR4-2666 RAM, or up to 4 DDR4-2400 sticks. Dual storage is also possible, with both a 2.5-inch HDD bay and a single M.2/NVMe slot available.
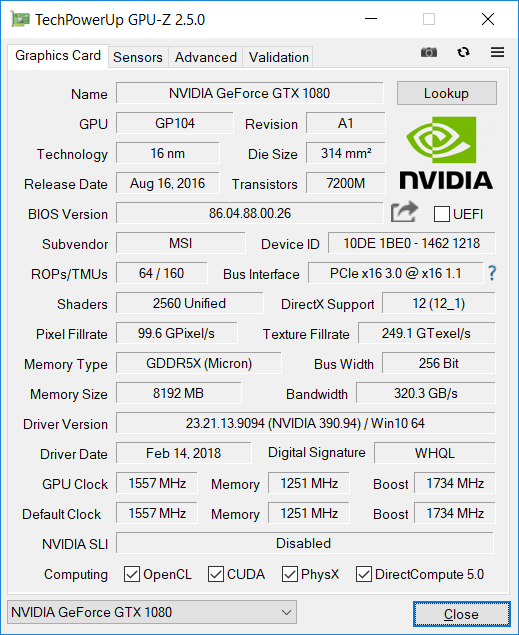
Our particular unit features 16 GB of DDR4-2666 RAM. Although both RAM slots beneath the bottom panel are unoccupied, as mentioned above, we’d need to operate at 2400 MHz to support all four slots—but at least upgrades are relatively simple should users find themselves motivated. Our CPU is the venerable Core i7-8750H, and the GPU is an equally impressive NVIDIA GeForce GTX 1080 (8 GB GDDR5).
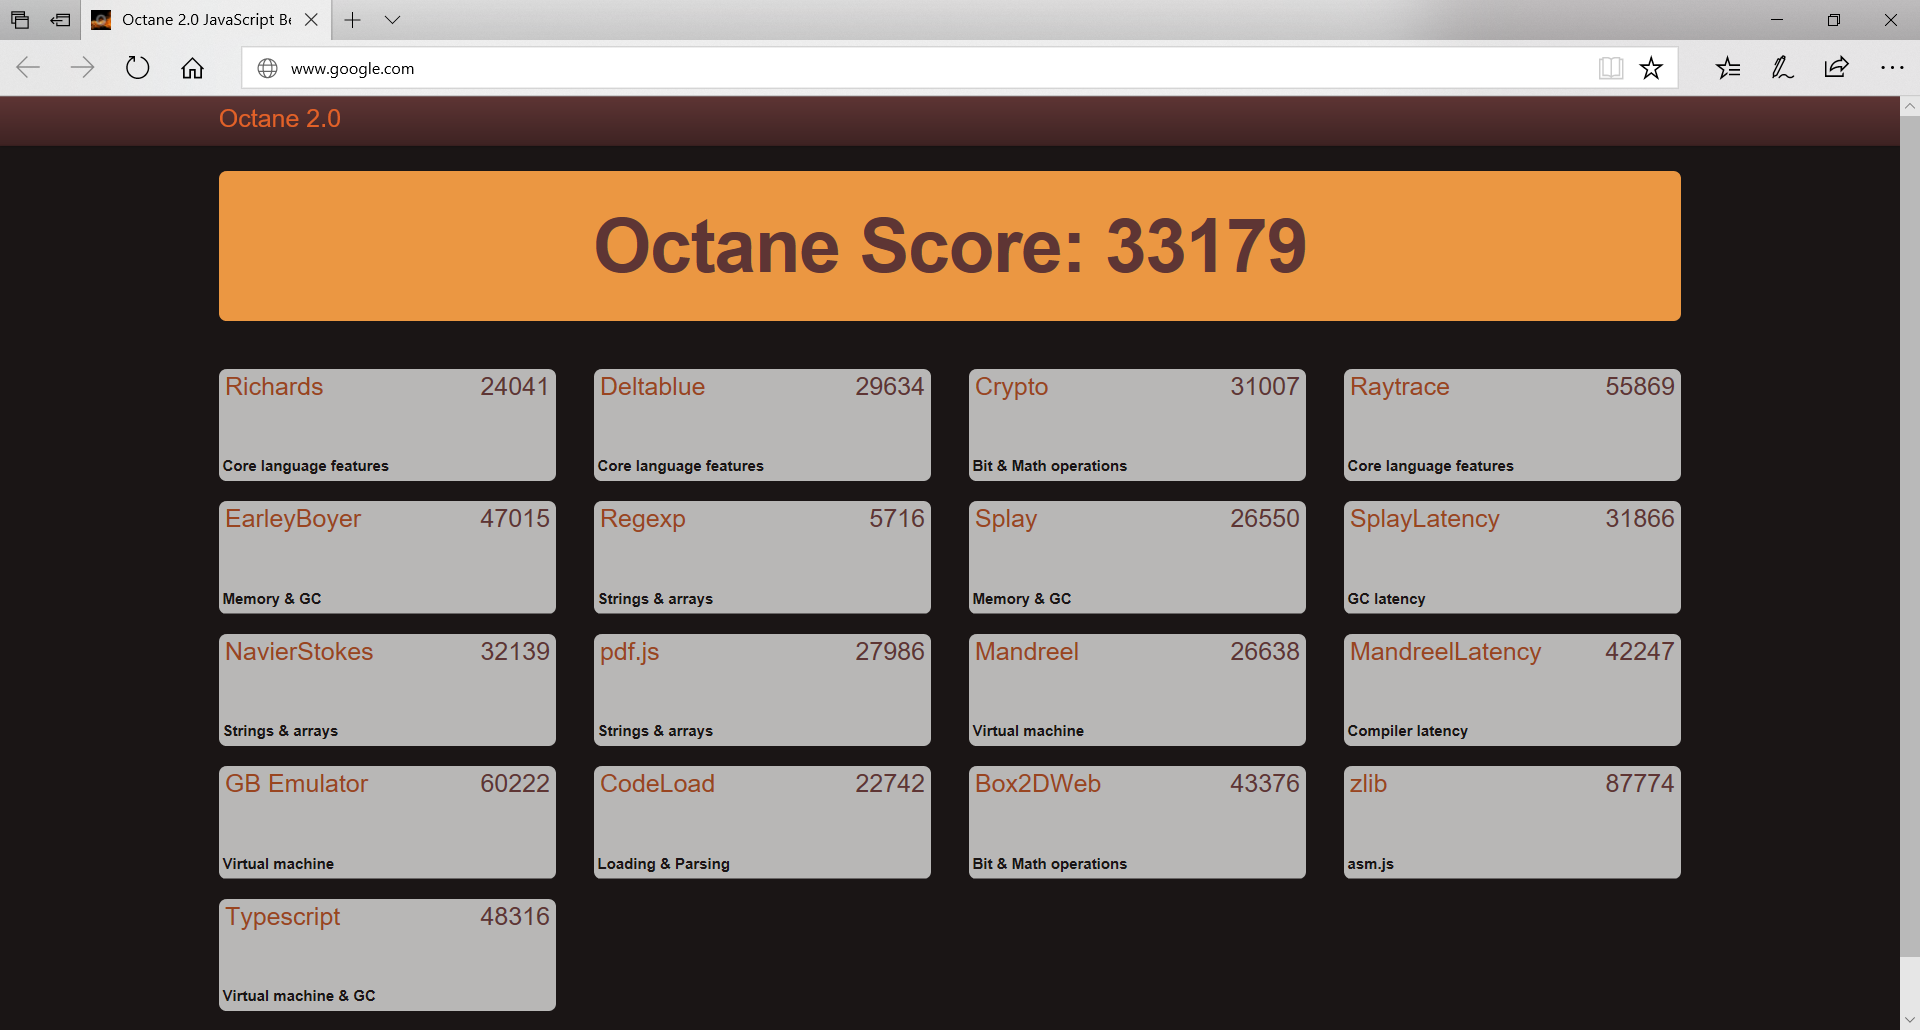
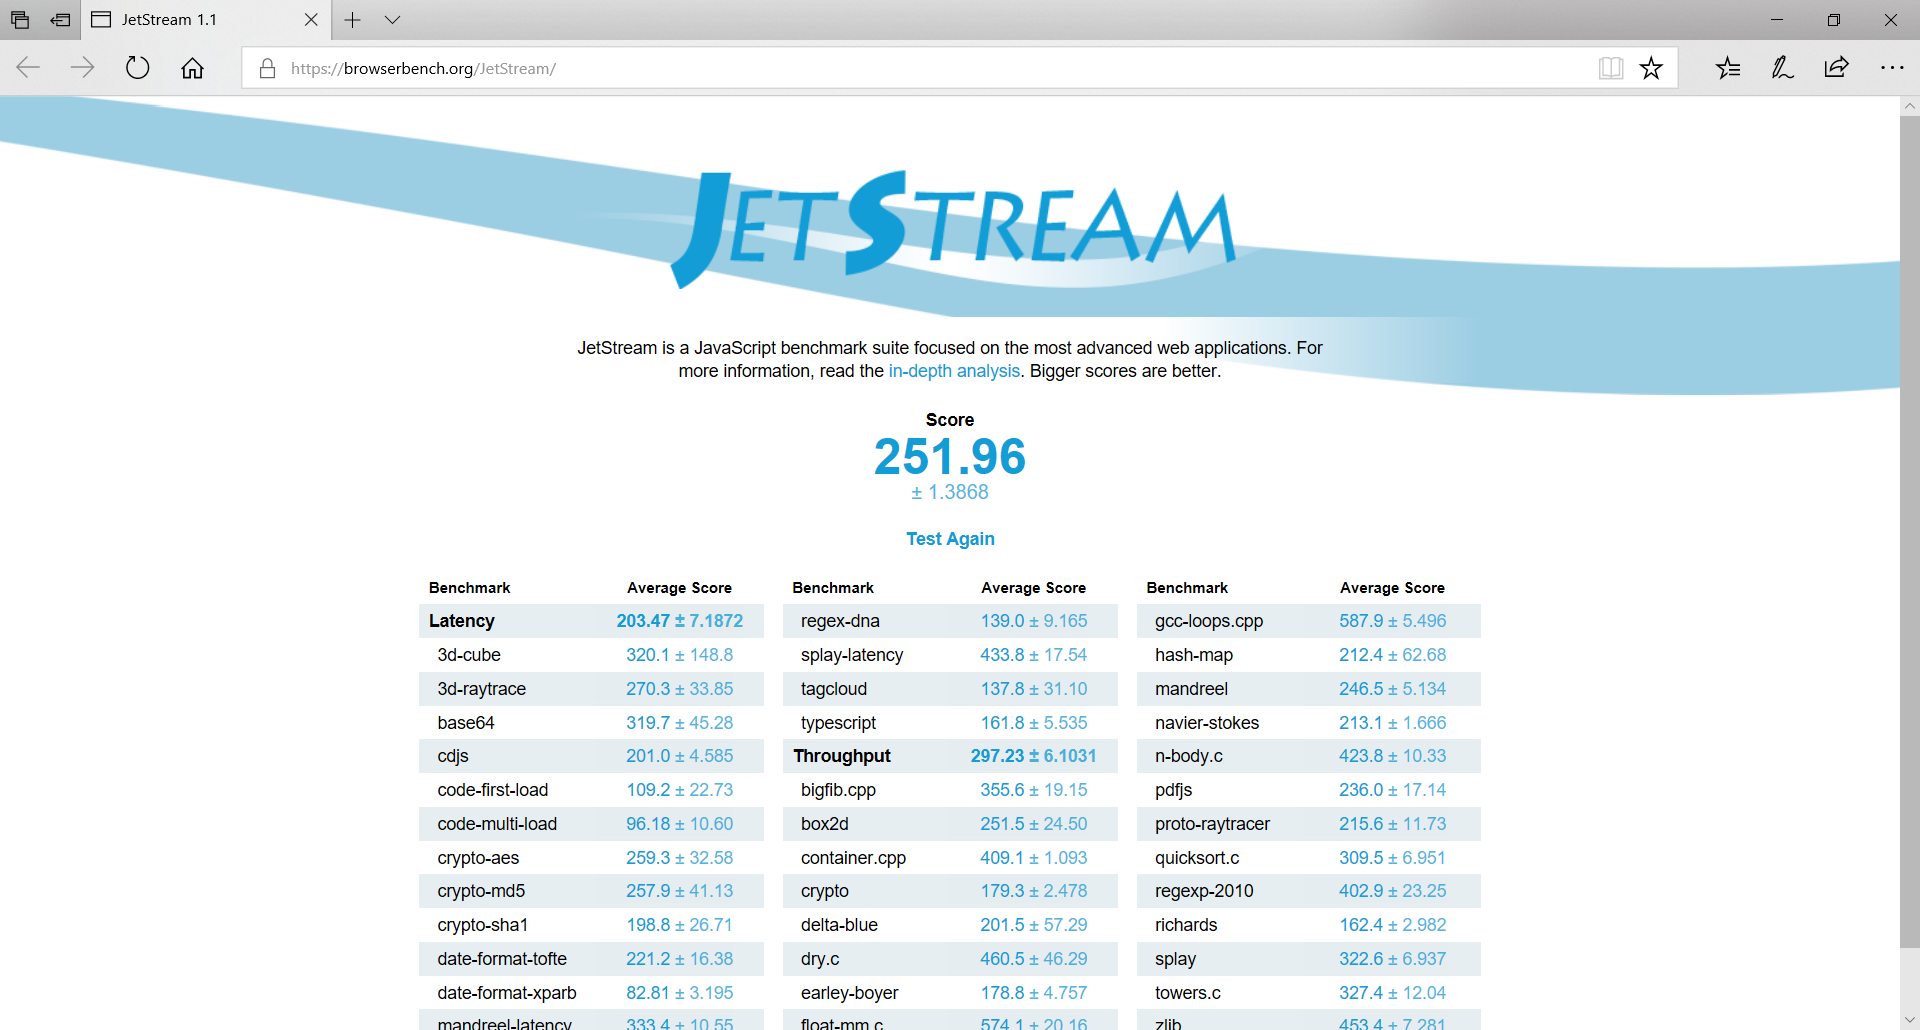
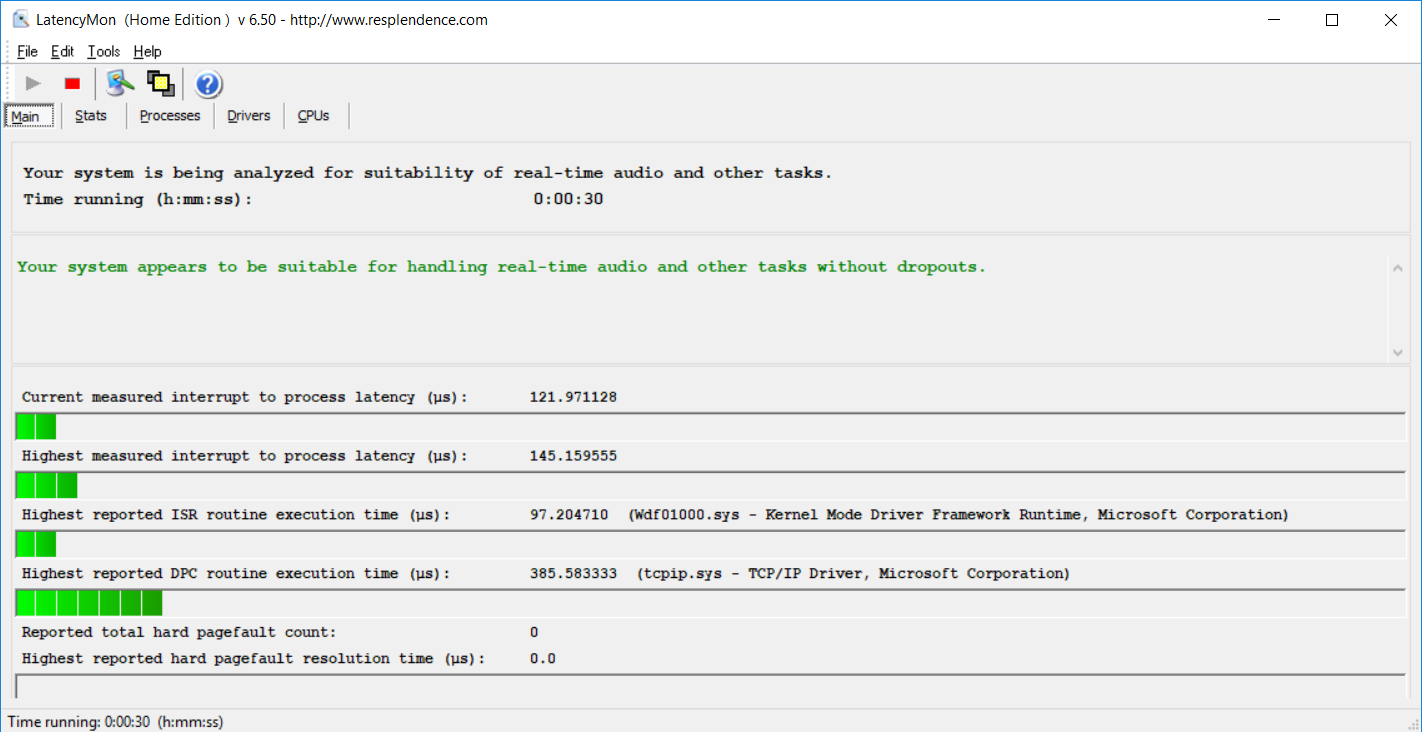
As always, the system needs to be plugged in to achieve anything close to full performance (we received a 3DMark 11 score of just 7065 while unplugged). LatencyMon, meanwhile, didn’t detect any issues with DPC latencies that might prevent the smooth operation of real-time audio or video streaming.
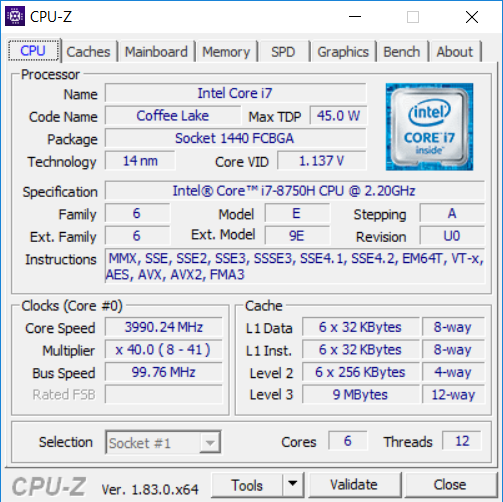
Processor
The Intel Core i7-8750H is a formidable six-core high-end CPU based on the 14 nm Coffee Lake architecture. It clocks between 2.2 and 4.1 GHz (3.9 GHz with 6 cores, 4.0 GHz with 4 cores), and it also supports Hyper-Threading. It carries a staggering performance premium of nearly 50% versus its predecessor (the Core i7-7820HQ) thanks to the addition of 2 cores. The TDP of 45 W is significant, but no problem for a laptop as large as the GT63.
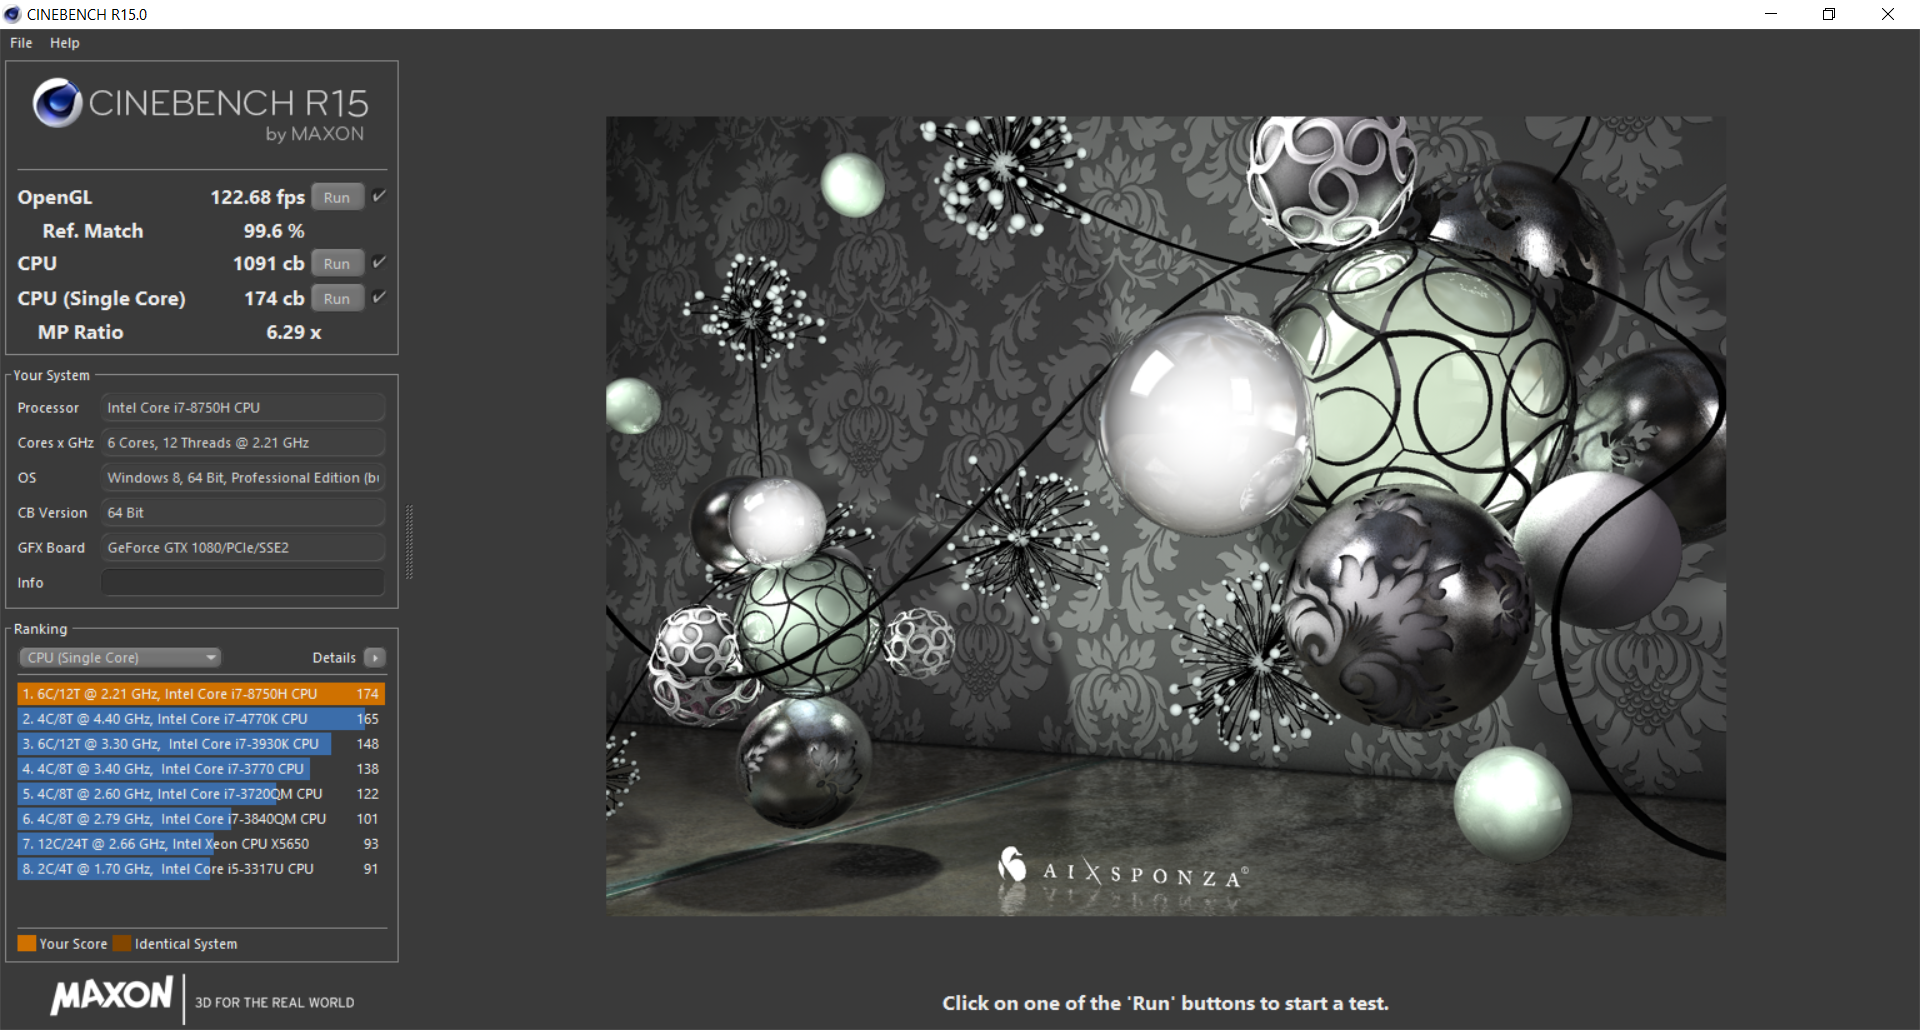
The performance gains are illustrated by our comparisons to the previous-gen Alienware 15 R3, which is powered by an Intel Core i7-7820HK. While single-core speed has only jumped around 5% in our benchmarks, multi-core performance is up by an astounding 42%—a terrific 1091 points in Cinebench R15 multi-CPU (versus the Alienware’s 767 points). This is also slightly above the average for the i7-8750H, but ever-so-slightly below the ASUS ROG GU501GM’s score of 1113. The Asus ROG Chimera, equipped with its Core i9-8950HK, meanwhile, naturally posts even higher scores: some 18% and 20% higher in single- and multi-core respectively. It’s worth mentioning that subsequent runs of Cinebench R15 multi-CPU did produce higher scores (around 1130), but this is likely because those runs were divorced from the preliminary single-core benchmark, which heats up the CPU beforehand. We record the original scores from the combined benchmark when we run our Cinebench tests, so 1091 is the score that remains on record in spite of the difference. This is absolutely hair-splitting, however; both of these scores are excellent overall.
As for sustained performance, in our Cinebench multi-CPU loop test, the MSI GT63 first starts out at 1130 before dropping significantly (and permanently) into the 910 – 925 range by the second run. A notable drop in performance following a short initial burst is typical of 8th-generation Intel CPUs, but the GT63’s drop is steeper than most at nearly 19%. By contrast, the ASUS ROG starts at a higher initial value of 1174 before wavering around the 1000 mark (and a bit below) thereafter, with an average drop of closer to 15/16% over a long period. Even the MSI GS65 Stealth manages better sustained performance with a mostly stable long-term average of around 980 (down from a comparably lower initial score of 1023). We’d like to see better results here; perhaps a firmware update could improve these down the road.
For what it’s worth, invoking Cooler Boost doesn’t materially affect these scores; although the first few runs are marginally higher (by perhaps fewer than 10 points), over the long haul, scores still hover in the same range.
System Performance
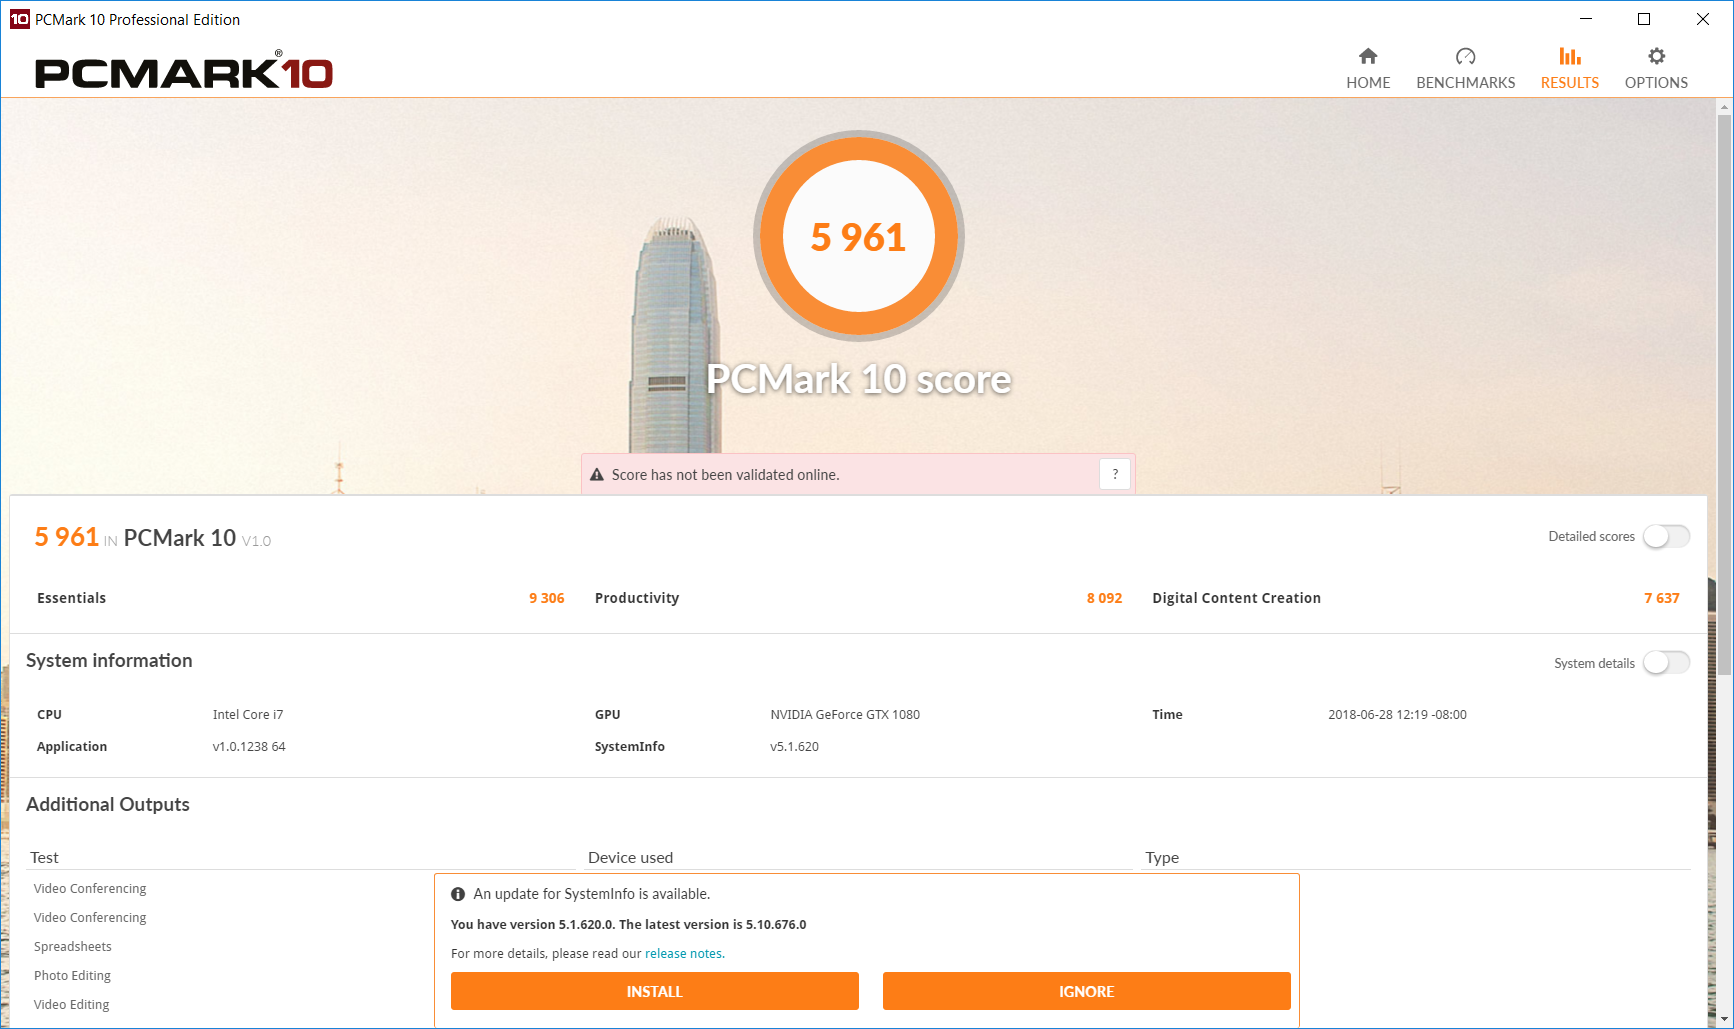
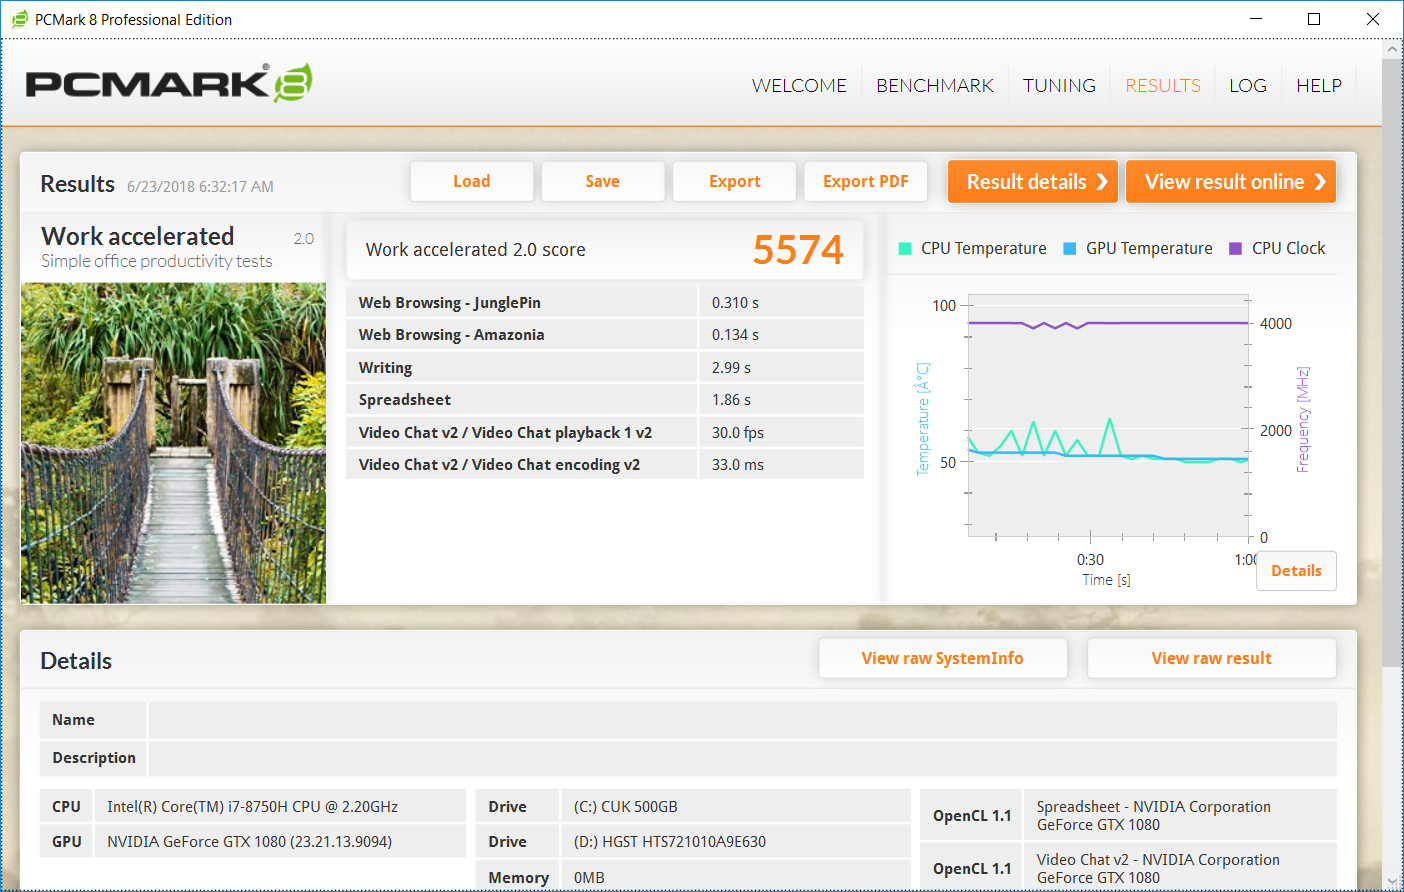
The MSI GT63 fares well in our general system performance tests with a very good score of 5961 in PCMark 10—some 7% above the third place finisher, the Acer Predator Helios 500, but around 11% below the 6607 posted by the Asus ROG Chimera. Results are similar in PCMark 8 Home Score Accelerated (5445), though it loses out slightly to the Razer Blade 15 and Acer Predator Helios as well in Work Score Accelerated, a test which is far more dependent on storage speeds than the other tests (and the PM961 bests the CUK 500 GB SSD, as we’ll see in the next section).
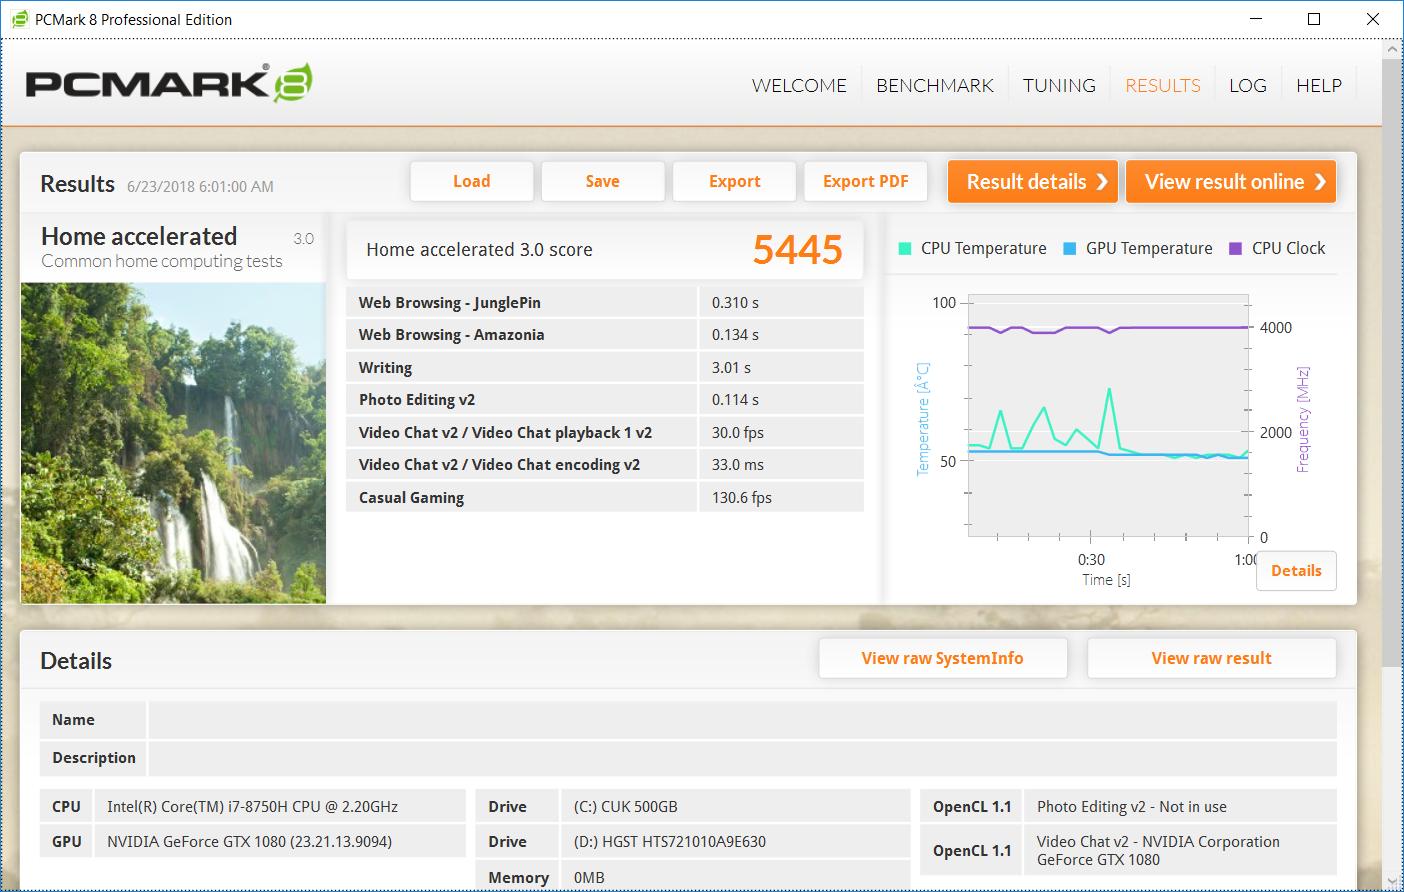
| PCMark 8 Home Score Accelerated v2 | 5445 points | |
| PCMark 8 Work Score Accelerated v2 | 5574 points | |
| PCMark 10 Score | 5961 points | |
Help | ||
Storage Devices
The GT63 offers two internal drive connections, an M.2/NVMe slot and a conventional 2.5-inch SATA drive bay. It’s disappointing that by now MSI hasn’t added a second M.2 slot (for RAID or otherwise), as a laptop of this size can absolutely support it.
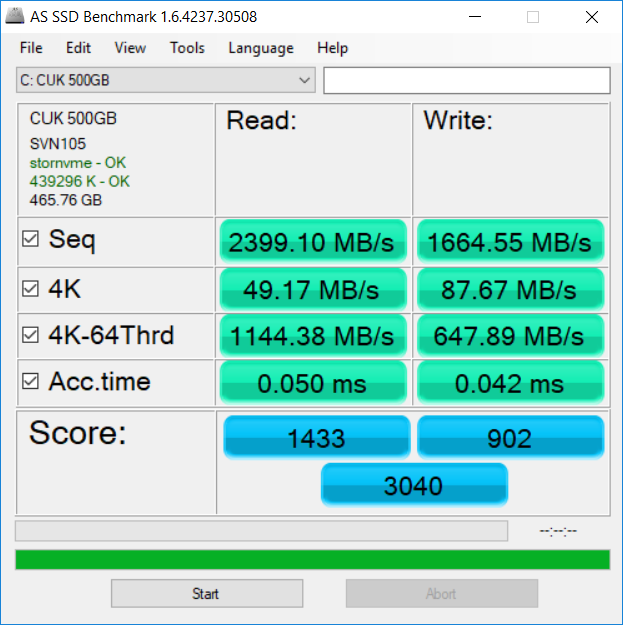
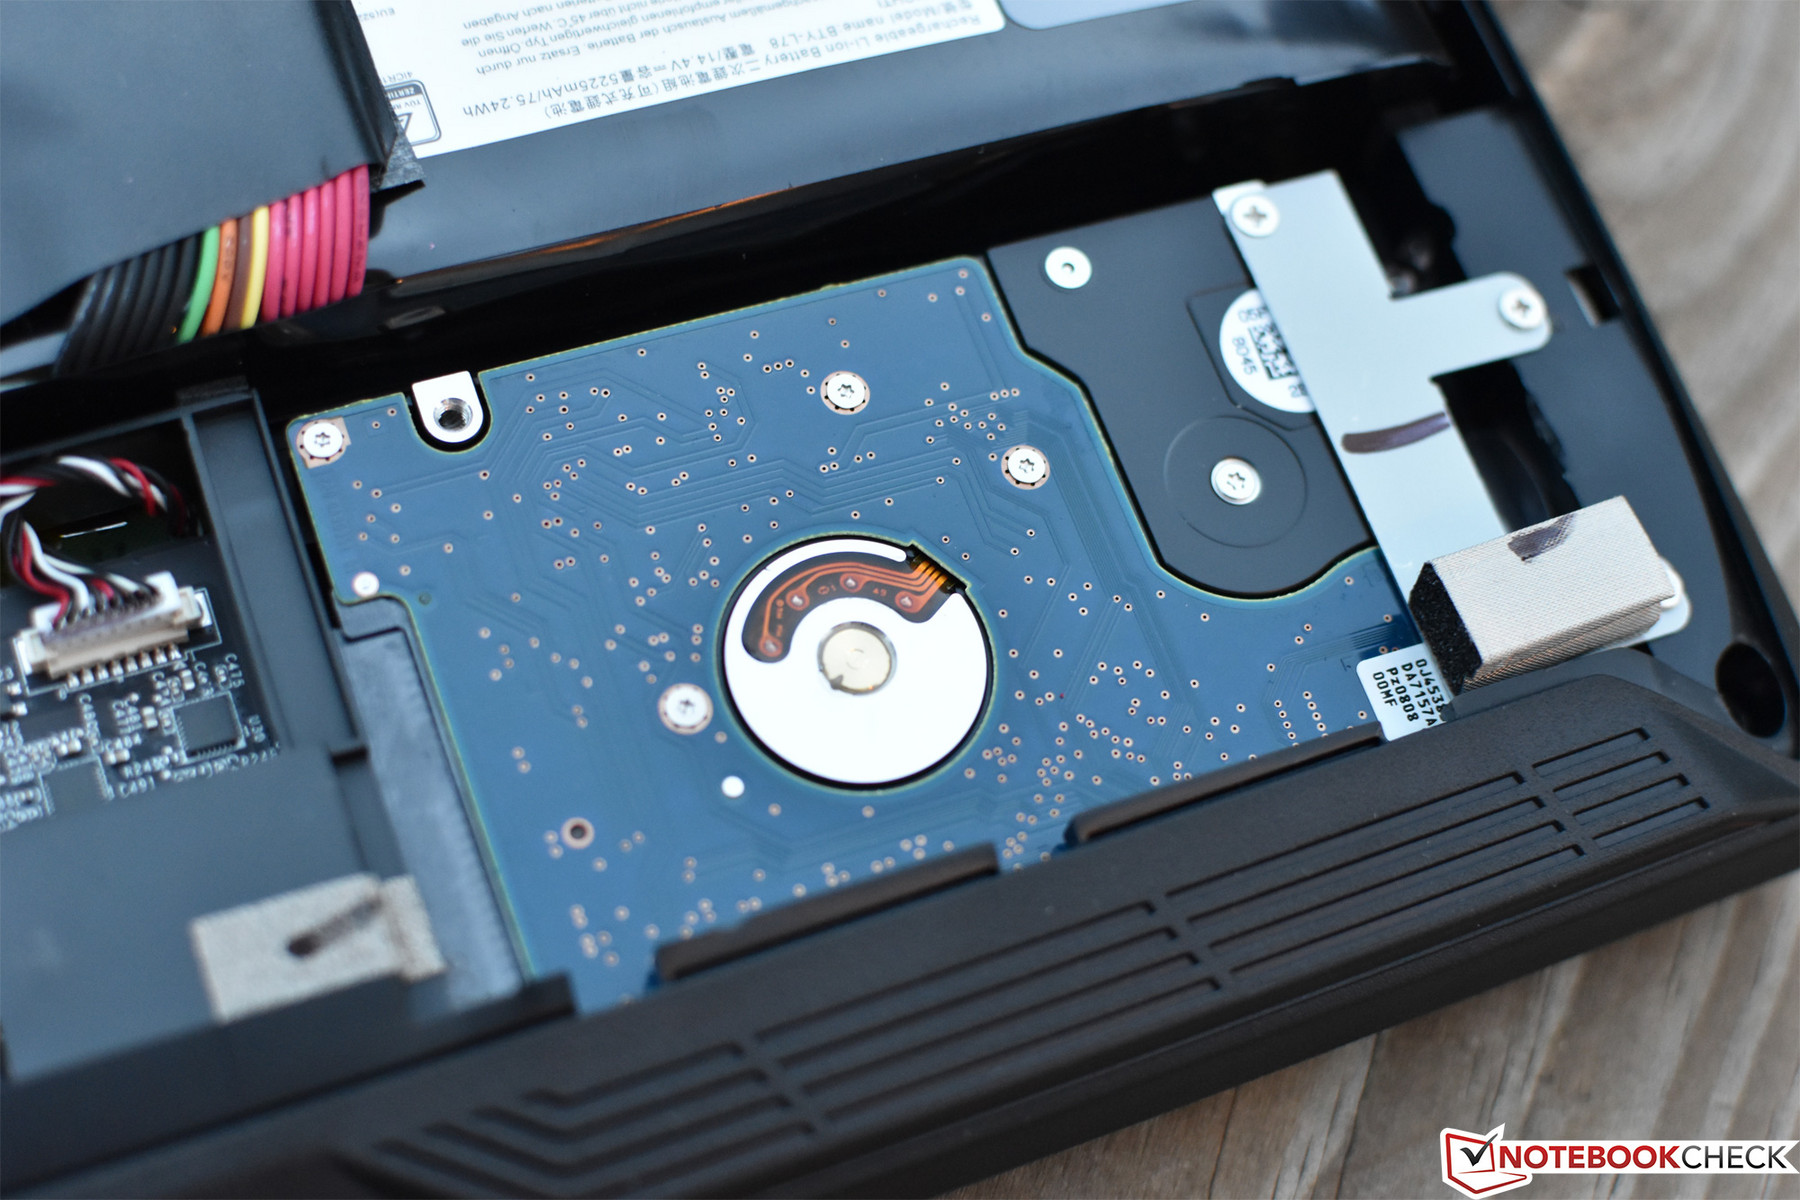
Nevertheless, our review unit shipped with both ports populated—a 1 TB 7200 RPM storage drive in the SATA bay and a 500 GB “CUK Cyclone” NVMe SSD in the M.2 slot. The SSD turns in a good performance overall, with an AS SSD overall score of 3040 and Read/Write scores of 1433/902. In our comparison field, only the two Samsung SSDs beat this result (the PM961 thanks to a superior 4K-64 Write speed of 1203.91 MB/s—versus the CUK 500 GB’s result of 647.89 MB/s; the SM961 across the board). As mentioned previously, replacements and upgrades of either of the two storage drives are easy thanks to their accessibility directly beneath the bottom cover.
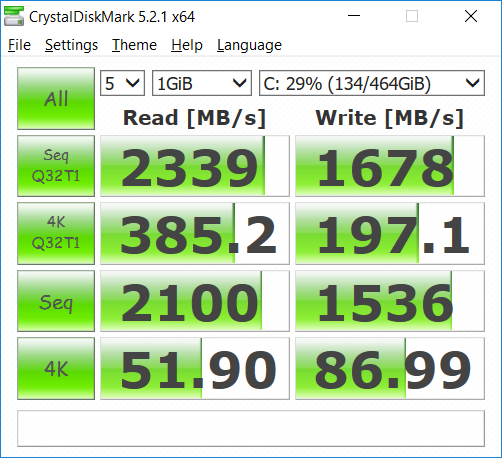
| MSI GT63 Titan 8RG-046 CUK Cyclone 500GB M.2 NVMe | Asus ROG GU501GM-BI7N8 Kingston RBUSNS8154P3128GJ | Razer Blade 15 2018 Samsung PM961 NVMe MZVLW512HMJP | Alienware 15 R3 Max-Q LiteOn CX2-8B256 | Asus Chimera G703GI 2x Intel 760p 512 GB + 1x Samsung SM961 512 GB (RAID) | Acer Predator Helios 500 PH517-51-79BY SK hynix SSD Canvas SC300 HFS256GD9MNE-6200A | |
|---|---|---|---|---|---|---|
| AS SSD | -96% | 18% | -12% | 67% | -28% | |
| Copy Game MB/s (MB/s) | 419.3 | 572 | 590 | |||
| Copy Program MB/s (MB/s) | 269.2 | 332 | 337 | |||
| Copy ISO MB/s (MB/s) | 773 | 1266 | 868 | |||
| Score Total (Points) | 3040 | 900 -70% | 3806 25% | 2328 -23% | 4843 59% | |
| Score Write (Points) | 902 | 345 -62% | 1450 61% | 894 -1% | 1855 106% | 812 -10% |
| Score Read (Points) | 1433 | 377 -74% | 1584 11% | 989 -31% | 1999 39% | 859 -40% |
| Access Time Write * (ms) | 0.042 | 0.058 -38% | 0.038 10% | 0.032 24% | 0.026 38% | 0.054 -29% |
| Access Time Read * (ms) | 0.05 | 0.278 -456% | 0.051 -2% | 0.063 -26% | 0.03 40% | |
| 4K-64 Write (MB/s) | 648 | 237 -63% | 1204 86% | 710 10% | 1303 101% | 647 0% |
| 4K-64 Read (MB/s) | 1144 | 270.3 -76% | 1300 14% | 741 -35% | 1453 27% | 723 -37% |
| 4K Write (MB/s) | 87.7 | 67.1 -23% | 93.6 7% | 119.3 36% | 141.3 61% | 80.7 -8% |
| 4K Read (MB/s) | 49.17 | 22.62 -54% | 46.45 -6% | 42.73 -13% | 57.4 17% | 38.57 -22% |
| Seq Write (MB/s) | 1665 | 404.7 -76% | 1521 -9% | 645 -61% | 4110 147% | 838 -50% |
| Seq Read (MB/s) | 2399 | 841 -65% | 2376 -1% | 2058 -14% | 4886 104% | 972 -59% |
* ... smaller is better

GPU Performance
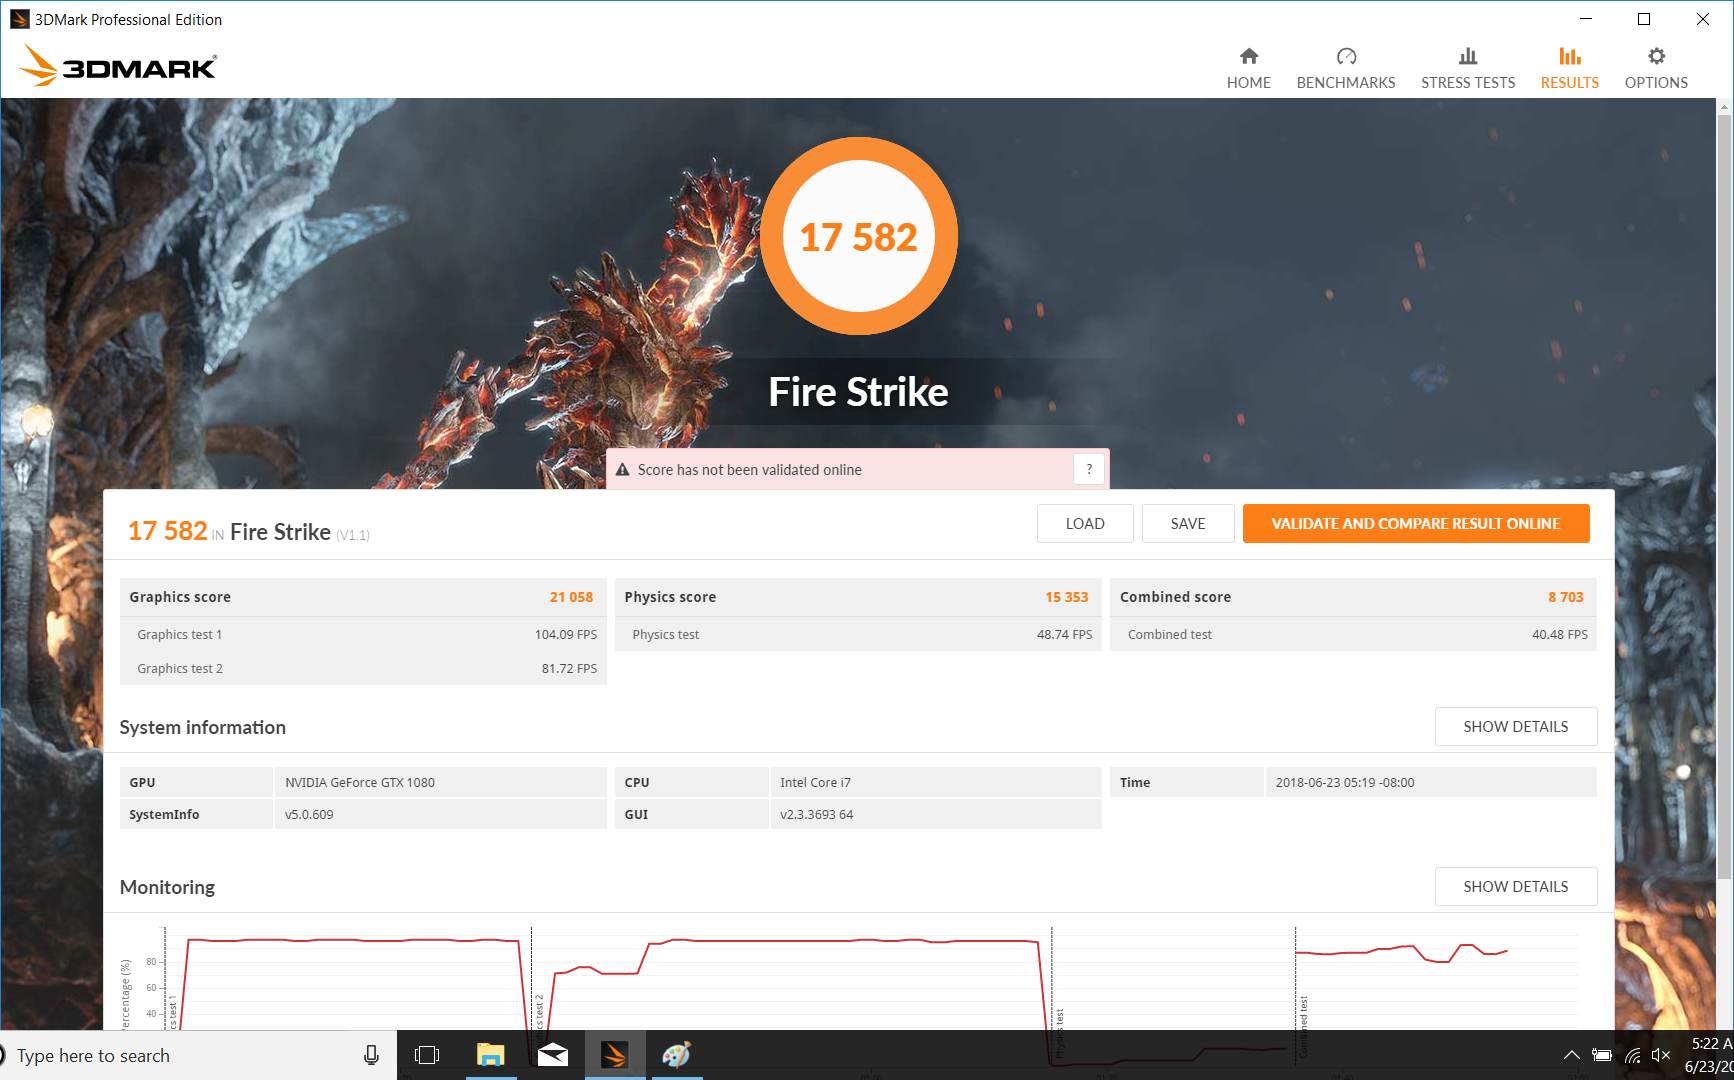
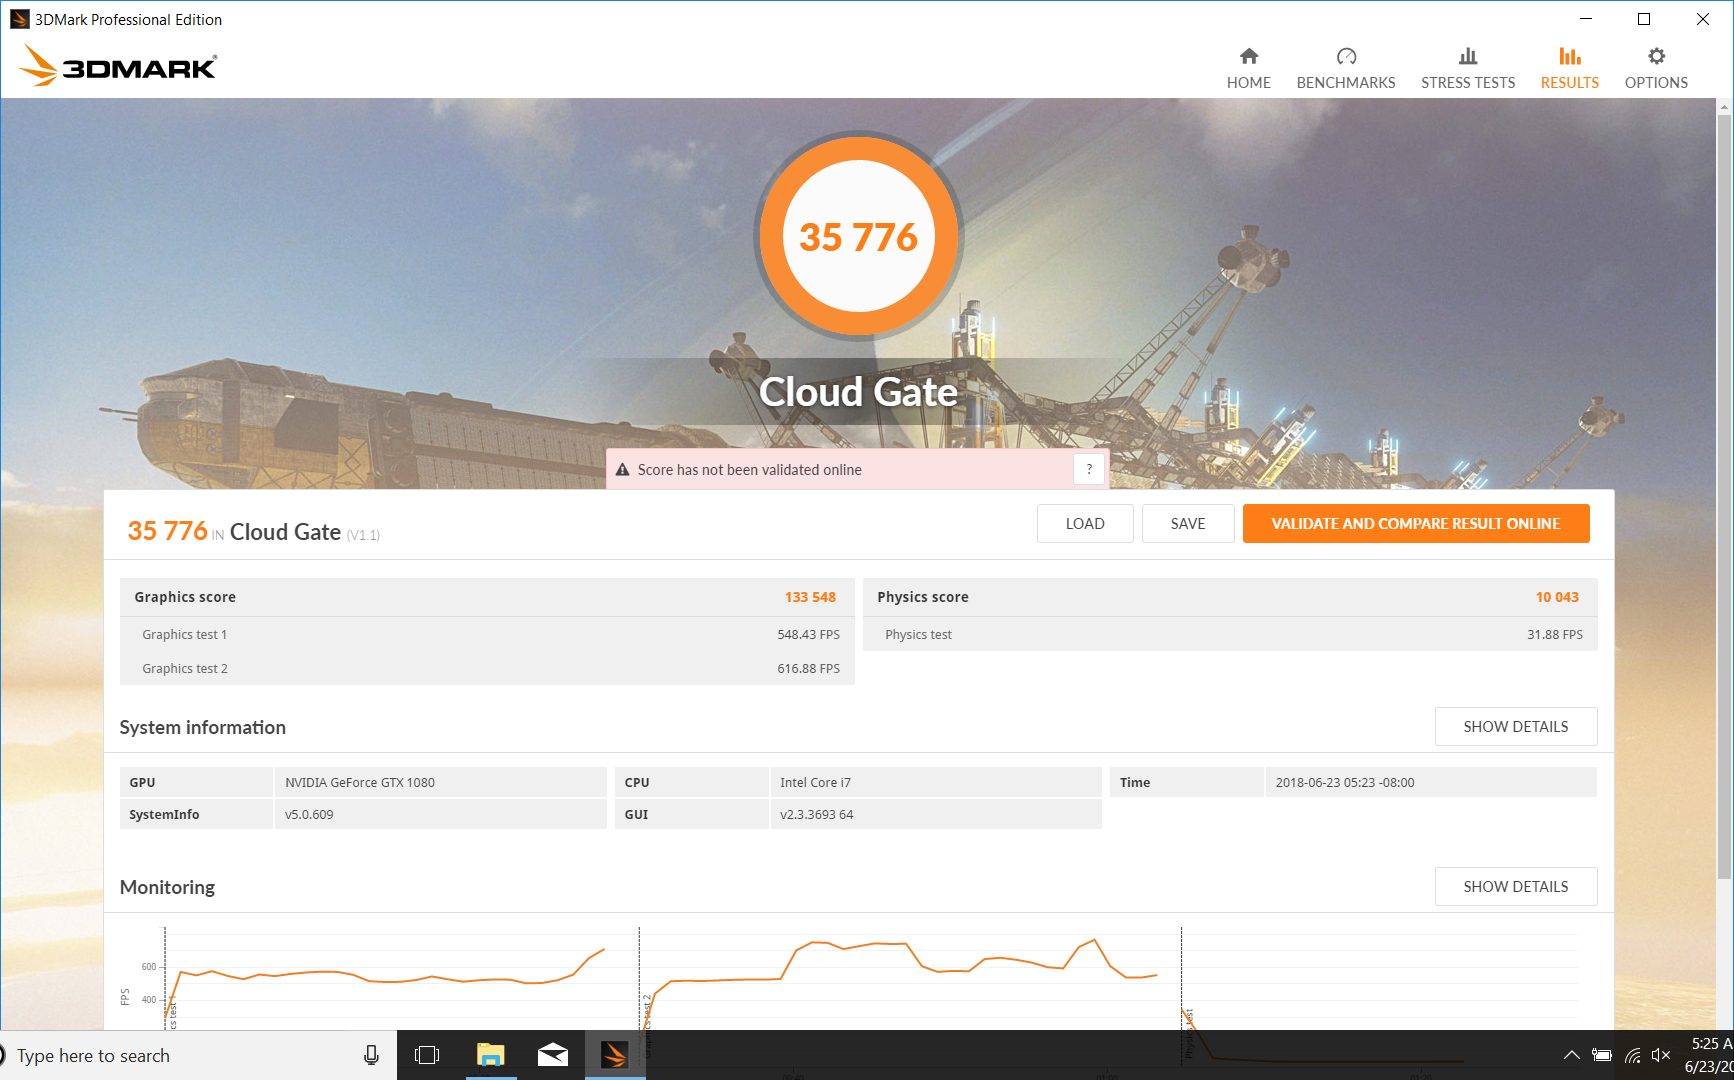
The MSI GT63 easily ranks near the top (just below the Asus ROG Chimera) in most of our GPU benchmarks thanks to its combination of the GTX 1080 GPU and very fast six-core CPU. Our 3DMark Fire Strike Graphics test awarded the machine a 21058—a very respectable score—and Cloud Gate Graphics, 133548. Both of these are the highest in today’s field. 3DMark 11 shows the GT63 below the average for GTX 1080-equipped machines in Performance Combined, but in Performance GPU, it’s slightly above average (and 18% above the Max-Q variant in the Alienware 15 R3).
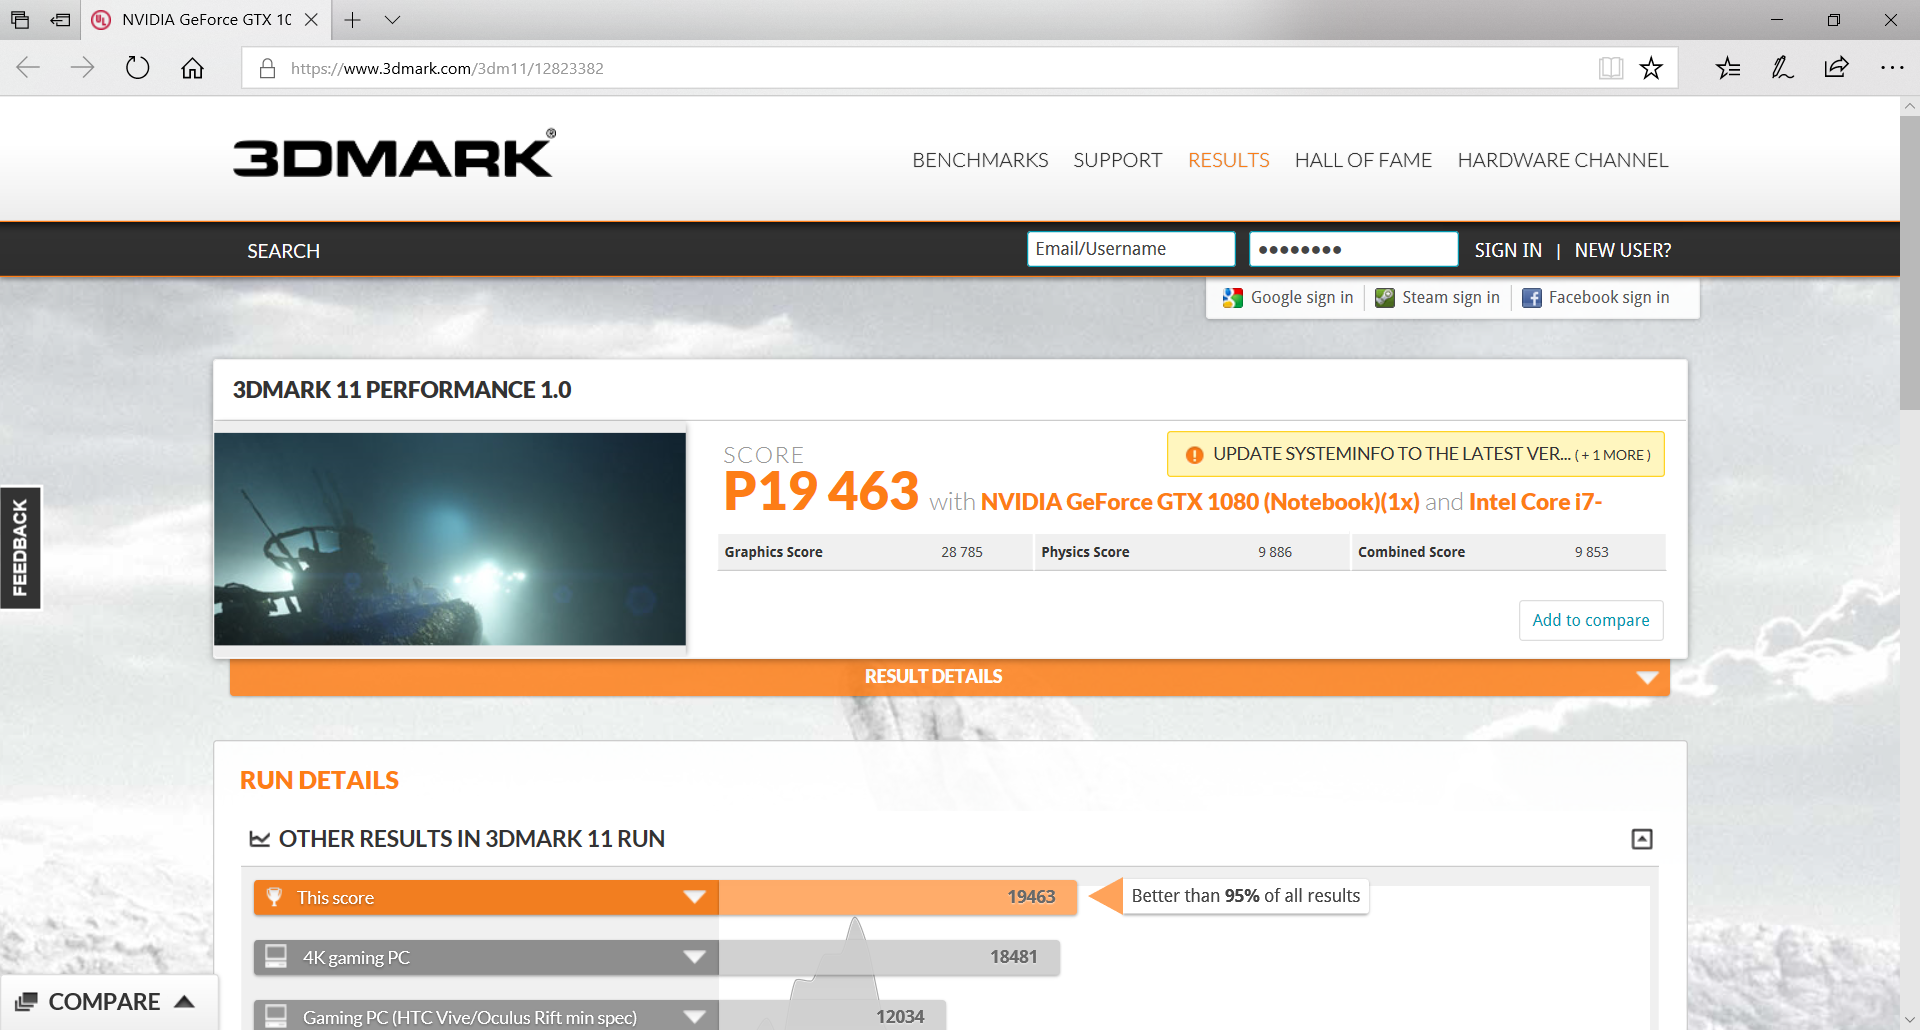
| 3DMark 11 Performance | 19463 points | |
| 3DMark Cloud Gate Standard Score | 35776 points | |
| 3DMark Fire Strike Score | 17582 points | |
Help | ||
Gaming Performance
As expected, the GT63 absolutely obliterated all of the game benchmarks we threw at it, with smooth performance at even the highest settings. This is one reason to opt for the 1080p 120 Hz panel over the 4K panel: the added smoothness and terrific response times arguably will be more beneficial than the additional resolution (which might not even be usable in many cases).
In comparison with other machines packing the same GPU, performance is actually slightly lower—some 2 to 10% to be precise. As we’ll see in the next section, thermal limitations under combined stress likely play some part in this discrepancy.
| Metro: Last Light | |
| 1024x768 Low (DX10) AF:4x (sort by value) | |
| MSI GT63 Titan 8RG-046 | |
| Average NVIDIA GeForce GTX 1080 Mobile (n=1) | |
| 1366x768 Medium (DX10) AF:4x (sort by value) | |
| MSI GT63 Titan 8RG-046 | |
| Average NVIDIA GeForce GTX 1080 Mobile (n=1) | |
| 1366x768 High (DX11) AF:16x (sort by value) | |
| MSI GT63 Titan 8RG-046 | |
| Average NVIDIA GeForce GTX 1080 Mobile (n=1) | |
| 1920x1080 Very High (DX11) AF:16x (sort by value) | |
| MSI GT63 Titan 8RG-046 | |
| Dell Inspiron 15 7000 7577 4K | |
| Average NVIDIA GeForce GTX 1080 Mobile (110.2 - 141.1, n=7) | |
| low | med. | high | ultra | |
|---|---|---|---|---|
| BioShock Infinite (2013) | 309 | 270 | 259 | 169 |
| Metro: Last Light (2013) | 128 | 131 | 129 | 117 |
| The Witcher 3 (2015) | 72 | |||
| Rise of the Tomb Raider (2016) | 210 | 166 | 131 | 120 |
Stress Test
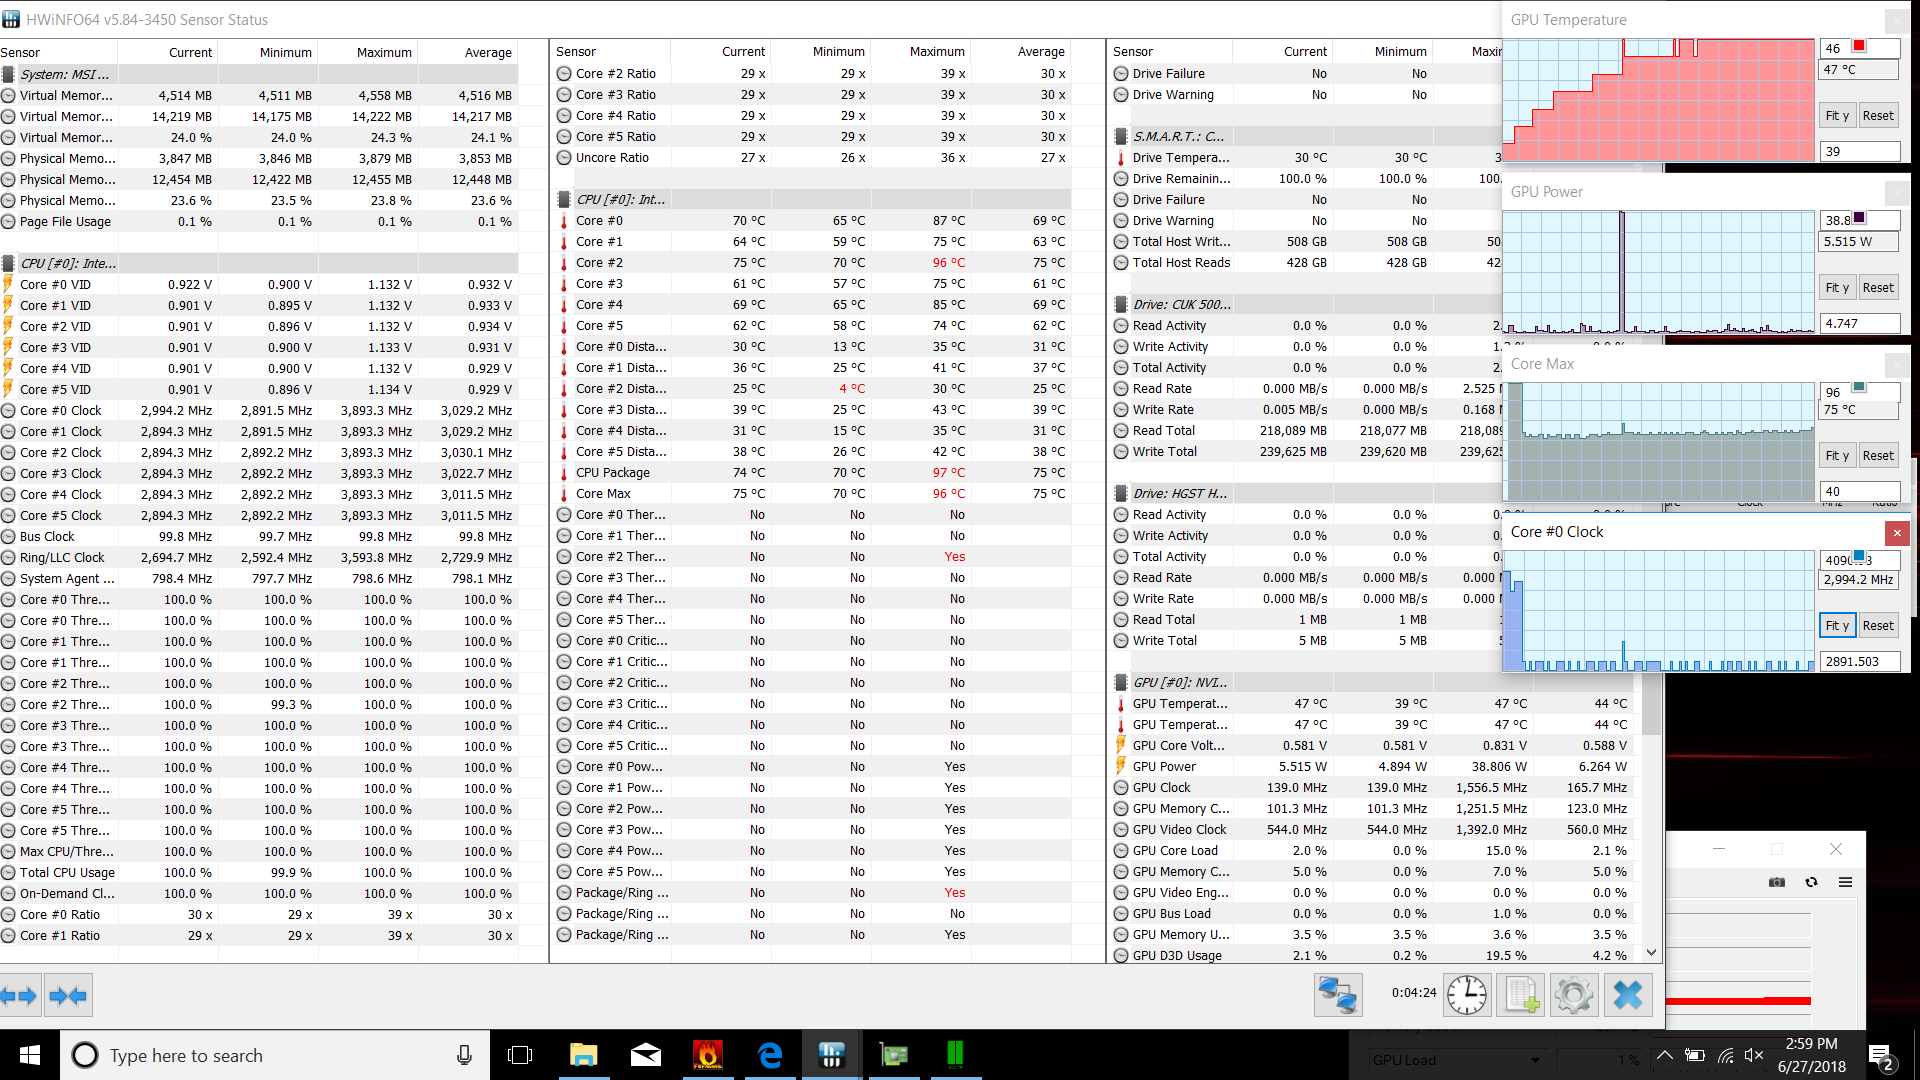
As we noted earlier, in spite of its strong overall performance scores, the GT63 struggles a bit with heavy CPU loads. Under full synthetic CPU stress, we witness the details of that struggle, which involve the expected initial jump up to full clock rates for a few precious seconds before core temperatures plummet from the 90s down to roughly 75 °C average. Correspondingly, clock rates remain stable at just 3.0 GHz across all six cores—some 0.9 GHz below the max turbo target, though still well above the base clock frequency of 2.2 GHz. On the other hand, full GPU stress provides no such challenge, with GPU clock rates stable at 1772 (near max turbo) and temperatures hovering around the 90 °C mark.
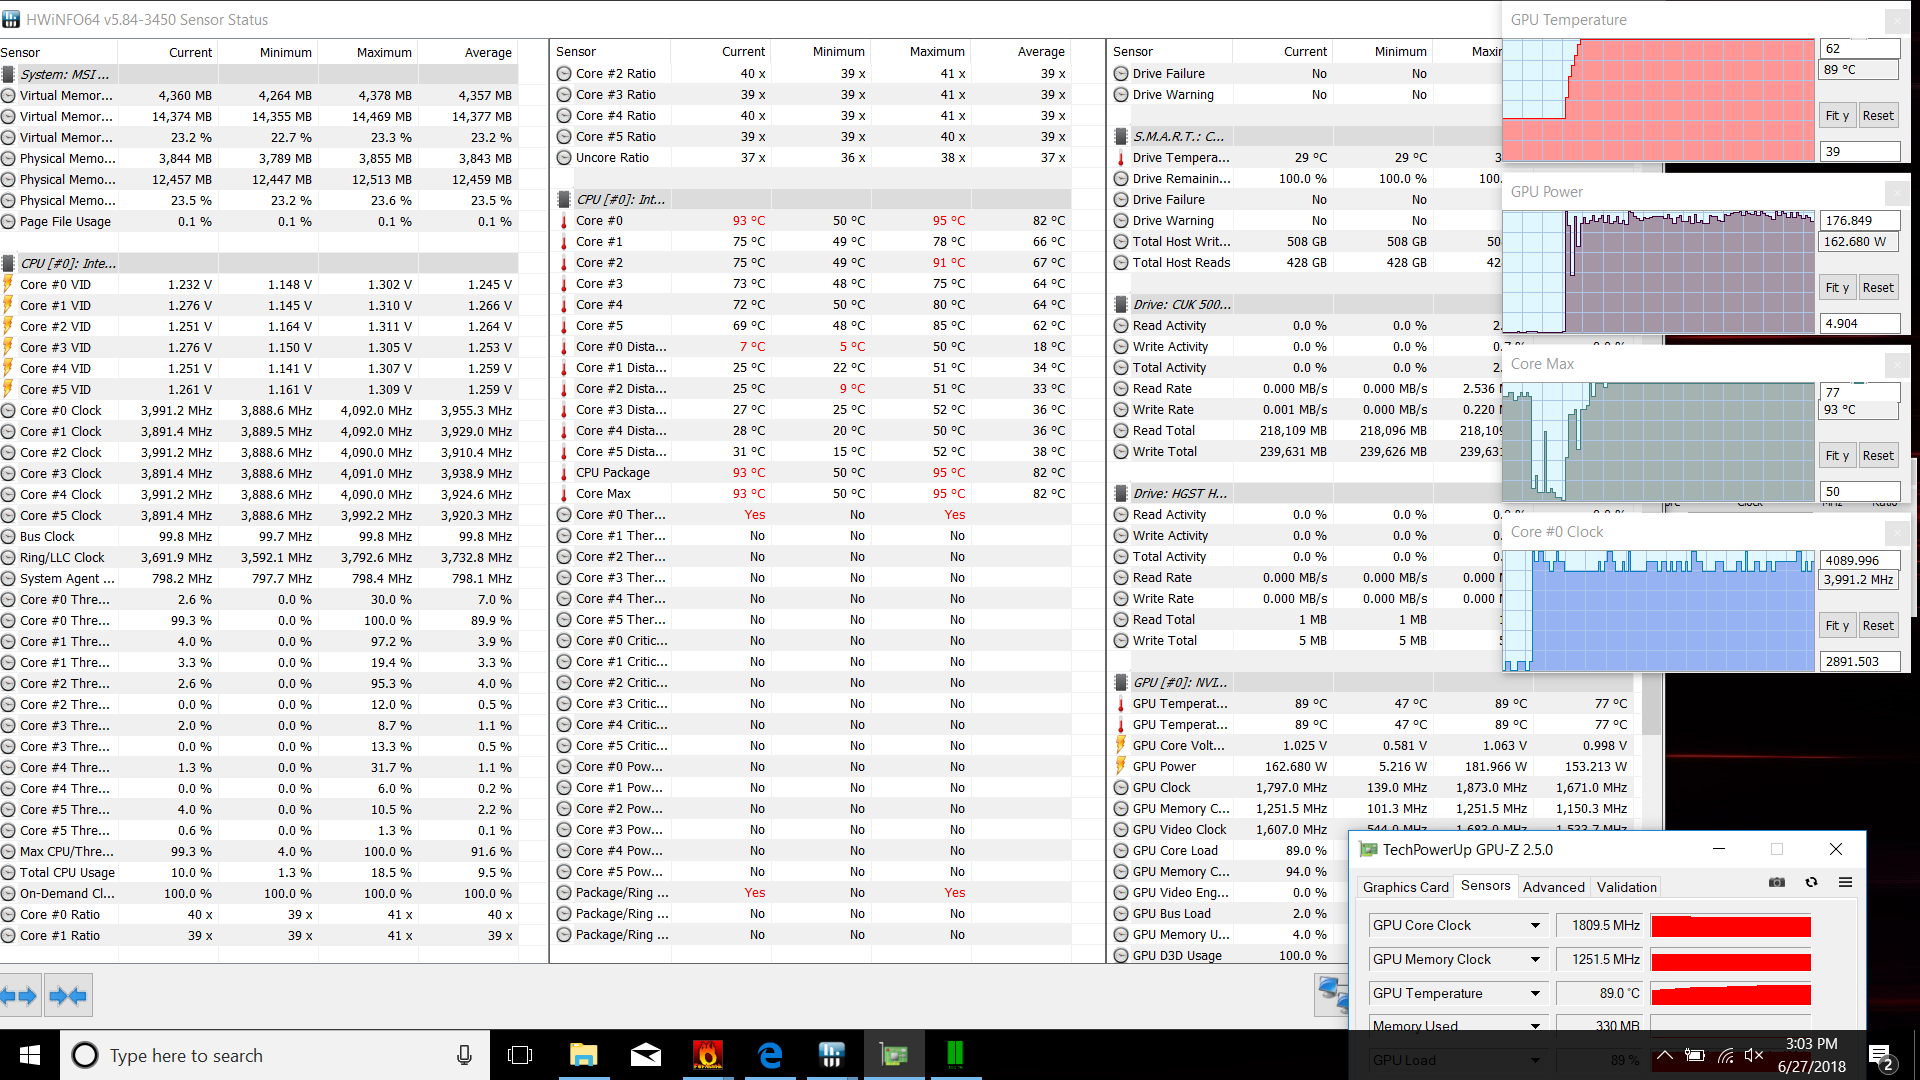
Combined system stress seems to favor CPU, with GPU clock rates at around 1 GHz on average and CPU reaching 3.1 GHz. GPU core temperatures we measured at 66 °C while the CPU reached a blistering 96 °C. The more realistic Witcher 3 stress test resulted in CPU/GPU temperatures of 87 °C / 90 °C respectively, which are more in line with what can be realistically expected during typical gaming sessions.
As mentioned earlier, Cooler Boost only marginally improves the thermals and corresponding clock rates. It staves off the frequency drops for a very short period, but ultimately sustained performance is more or less the same.

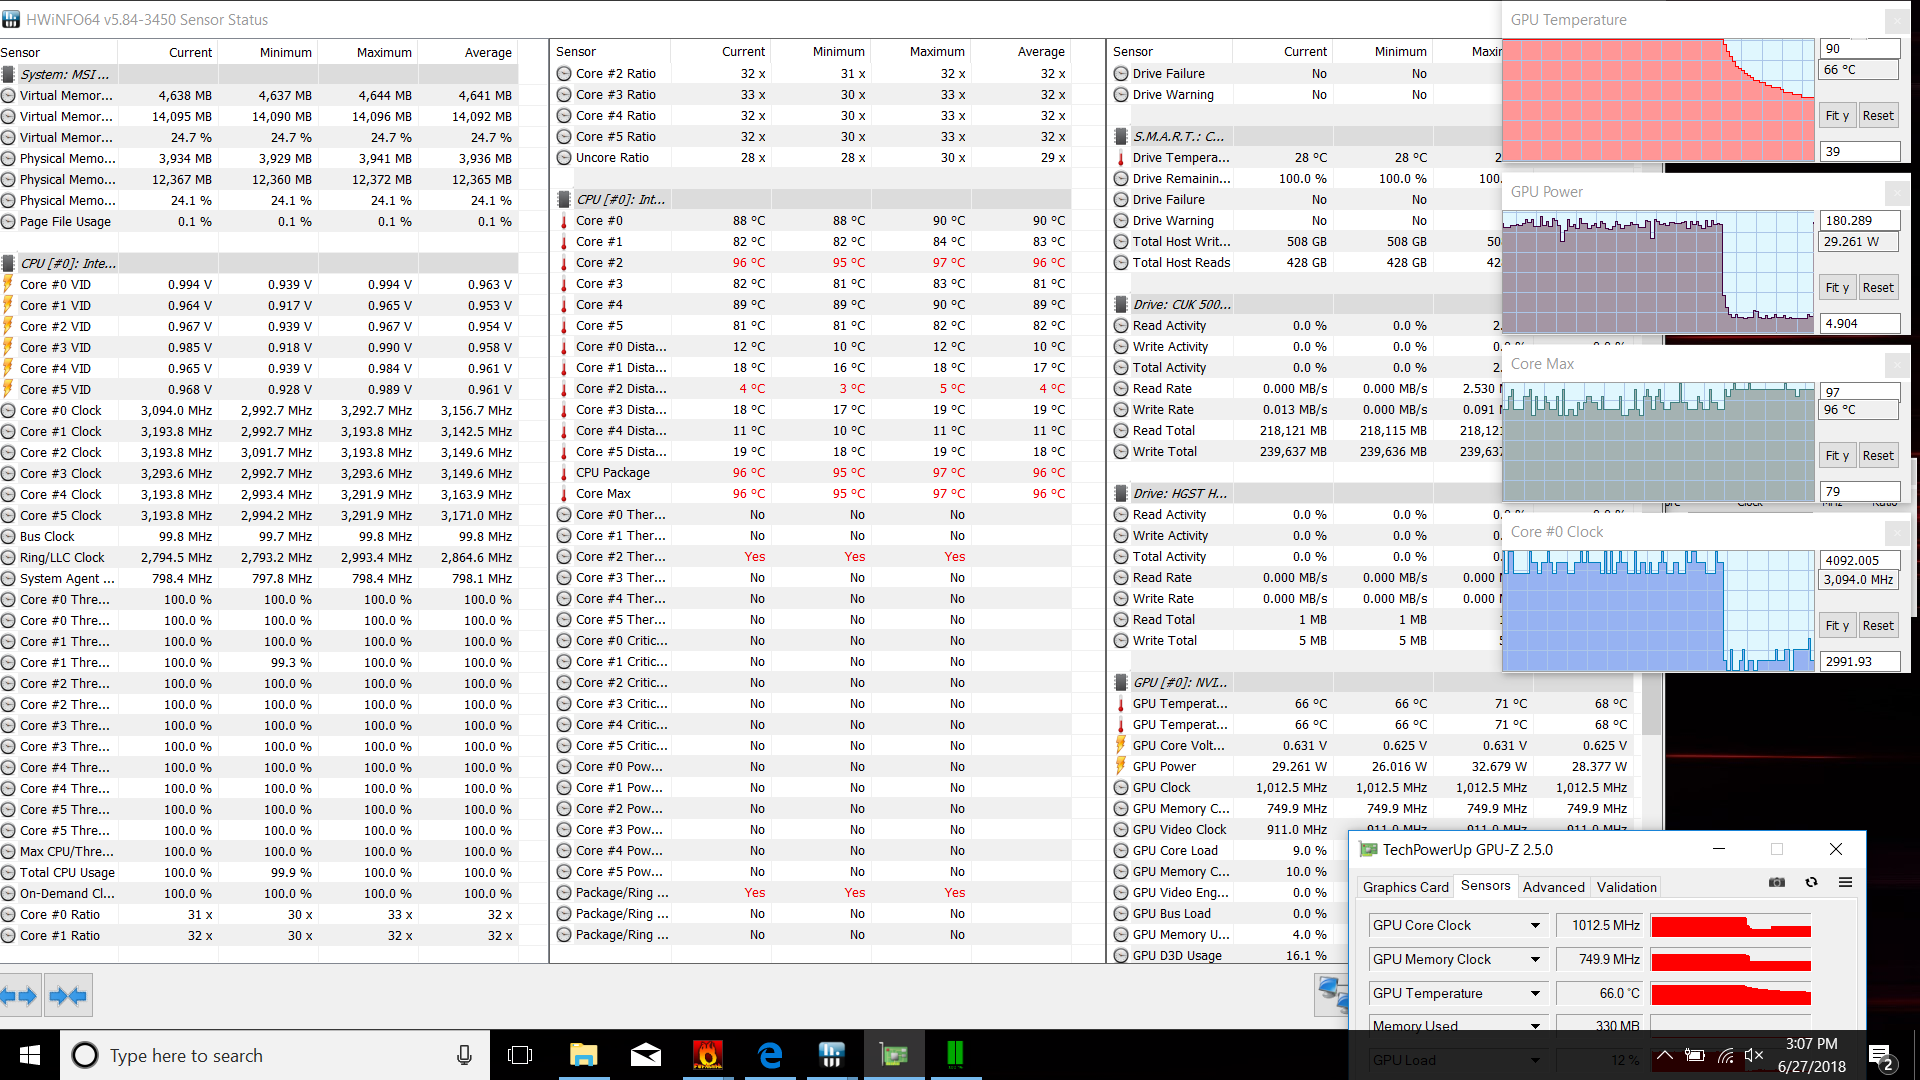
| CPU Clock (GHz) | GPU Clock (MHz) | Average CPU Temperature (°C) | Average GPU Temperature (°C) | |
| Prime95 Stress | 3.0 | - | 75 | - |
| FurMark Stress | - | 1772 | - | 90 |
| Prime95 + FurMark Stress | 3.1 | 1013 | 96 | 66 |
Emissions
System Noise
After taking into account ambient noise levels of 28 dB(A), the GT63 is technically among the loudest of all of the tested machines at max stress levels—50.8 dB(A). However, average load values are considerably lower at just 35.5 dB(A), which isn’t really all that bad. Idle values, meanwhile, are higher than most of the rest of the laptops we’re comparing, with an average of 31.4 dB(A).
Noise level
| Idle |
| 31.4 / 31.4 / 32.2 dB(A) |
| Load |
| 35.5 / 50.8 dB(A) |
 | ||
30 dB silent 40 dB(A) audible 50 dB(A) loud |
||
min: | ||
| MSI GT63 Titan 8RG-046 GeForce GTX 1080 Mobile, i7-8750H, CUK Cyclone 500GB M.2 NVMe | Asus ROG GU501GM-BI7N8 GeForce GTX 1060 Mobile, i7-8750H, Kingston RBUSNS8154P3128GJ | Razer Blade 15 2018 GeForce GTX 1070 Max-Q, i7-8750H, Samsung PM961 NVMe MZVLW512HMJP | Alienware 15 R3 Max-Q GeForce GTX 1080 Max-Q, i7-7820HK, LiteOn CX2-8B256 | Dell G5 15 5587 GeForce GTX 1060 Max-Q, i5-8300H, SK hynix SC311 M.2 | Asus Chimera G703GI GeForce GTX 1080 Mobile, i9-8950HK, 2x Intel 760p 512 GB + 1x Samsung SM961 512 GB (RAID) | Acer Predator Helios 500 PH517-51-79BY GeForce GTX 1070 Mobile, i7-8750H, SK hynix SSD Canvas SC300 HFS256GD9MNE-6200A | |
|---|---|---|---|---|---|---|---|
| Noise | -5% | -5% | -7% | 2% | -14% | -4% | |
| off / environment * (dB) | 28 | 28.6 -2% | 29 -4% | 29 -4% | 30.3 -8% | 29 -4% | 30.4 -9% |
| Idle Minimum * (dB) | 31.4 | 31.4 -0% | 29 8% | 32 -2% | 31.1 1% | 30 4% | 31.2 1% |
| Idle Average * (dB) | 31.4 | 31.4 -0% | 30 4% | 33 -5% | 31.1 1% | 34 -8% | 35.3 -12% |
| Idle Maximum * (dB) | 32.2 | 34.2 -6% | 38 -18% | 35 -9% | 34.2 -6% | 42 -30% | 35.3 -10% |
| Load Average * (dB) | 35.5 | 42.8 -21% | 46 -30% | 46 -30% | 34.9 2% | 53 -49% | 44.4 -25% |
| Witcher 3 ultra * (dB) | 47.6 | 50.9 -7% | 49 -3% | 48 -1% | 42.7 10% | 51 -7% | 41 14% |
| Load Maximum * (dB) | 50.8 | 50.9 -0% | 46 9% | 50 2% | 44 13% | 53 -4% | 45.2 11% |
* ... smaller is better
Temperature
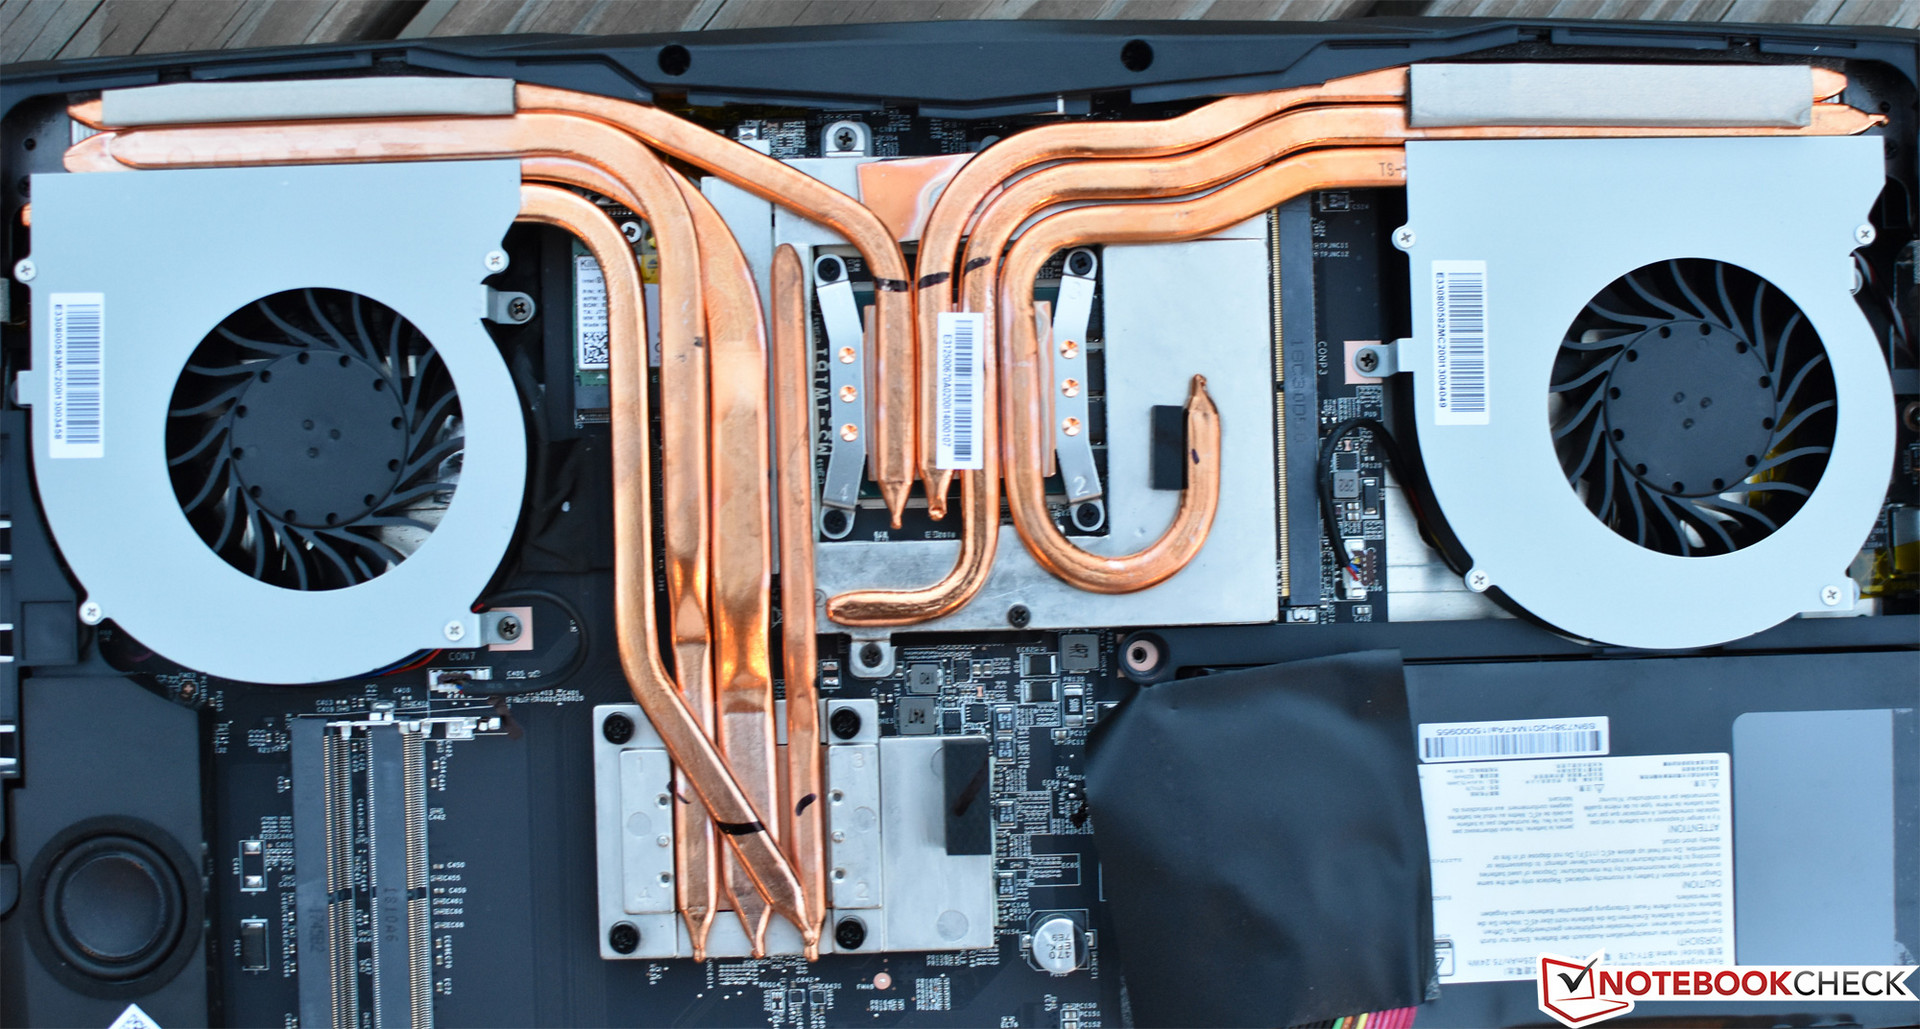
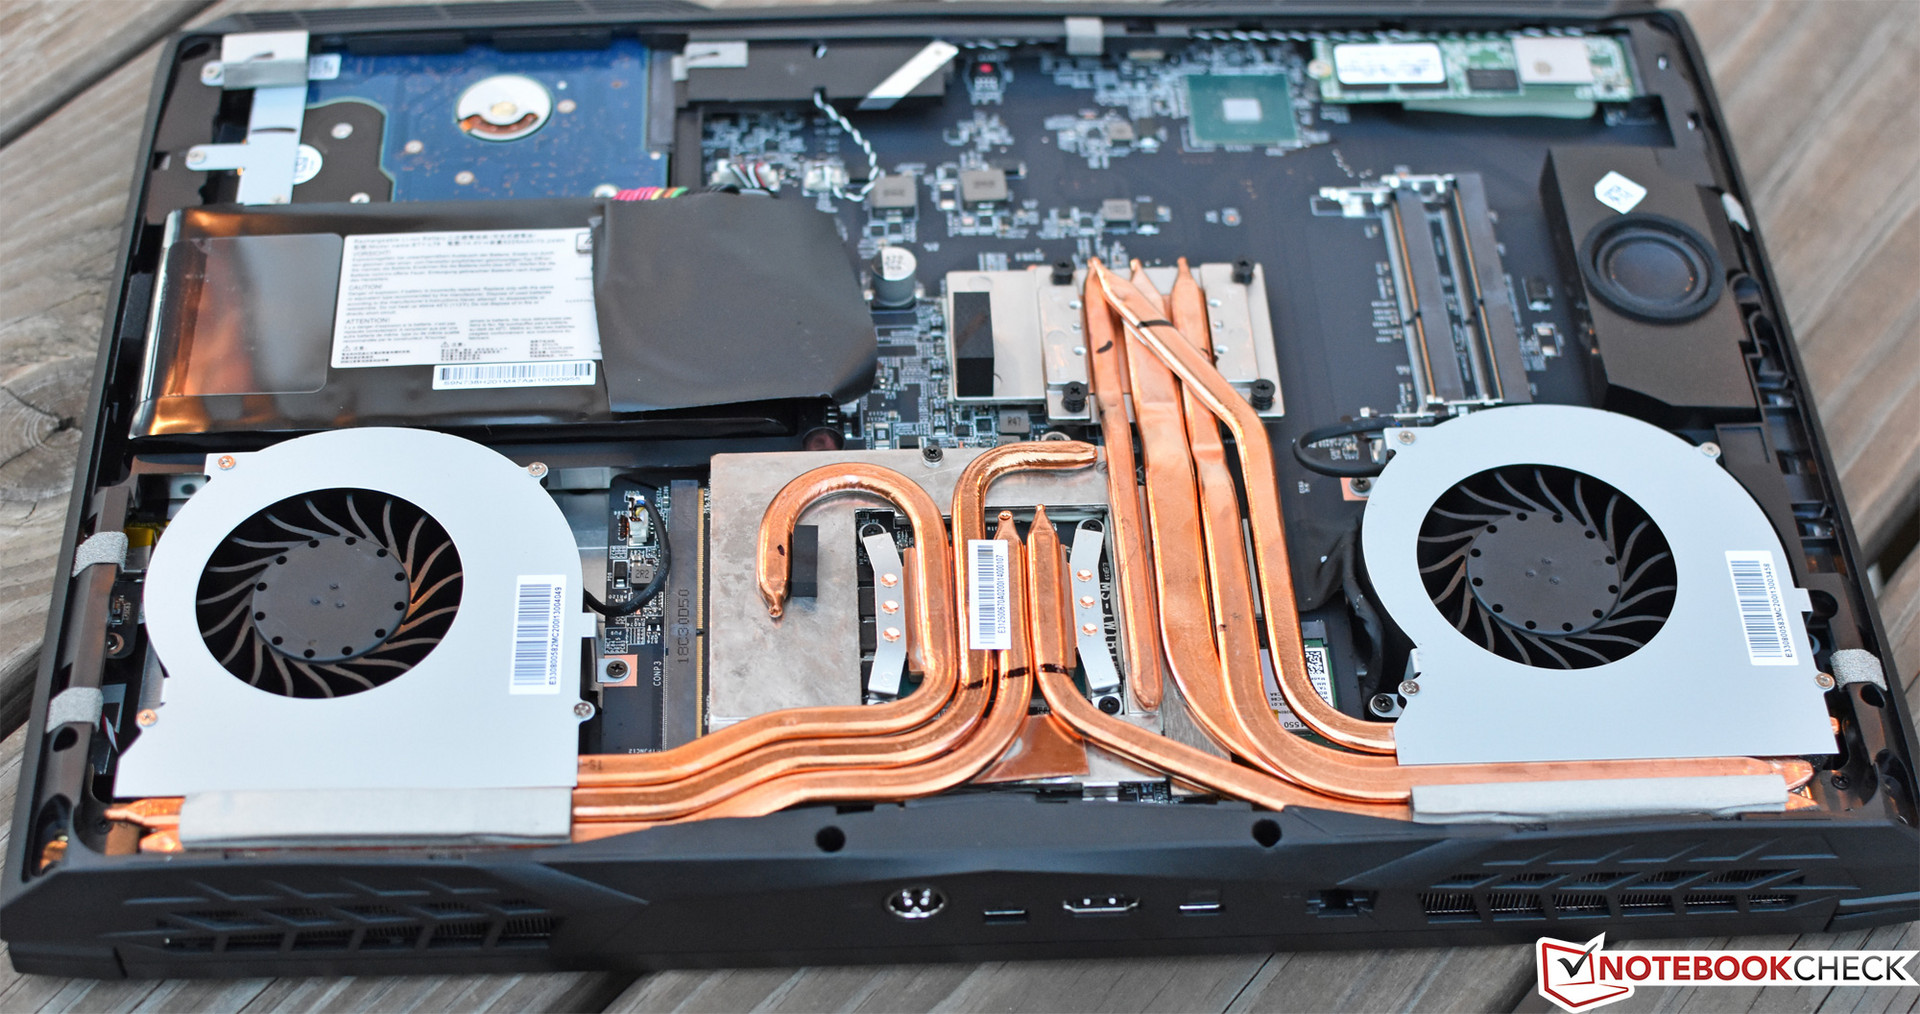
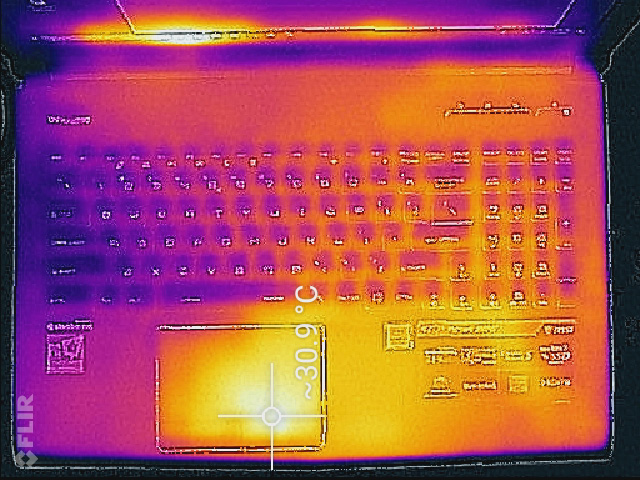
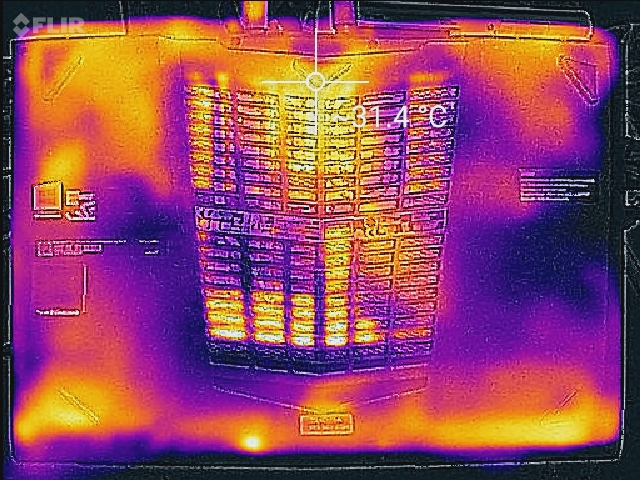
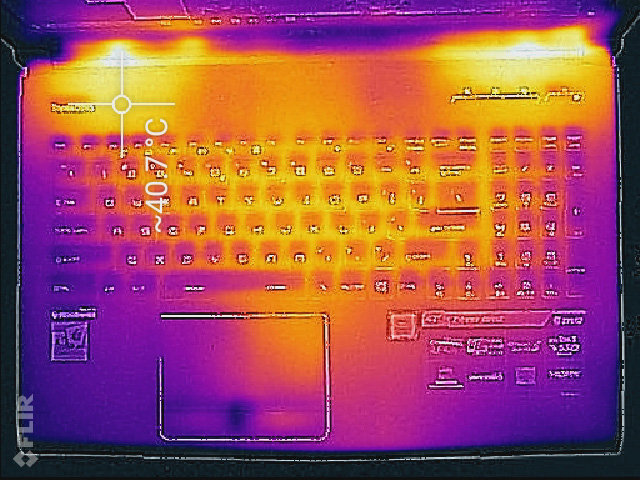
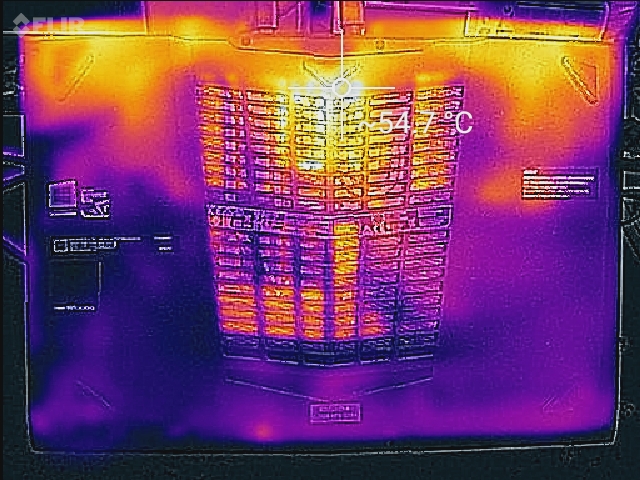
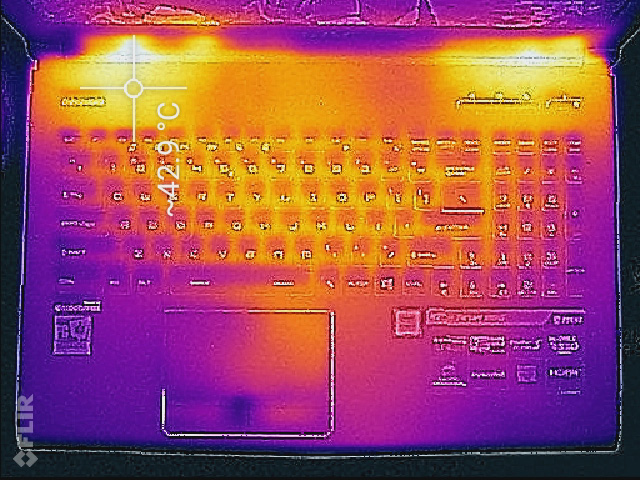
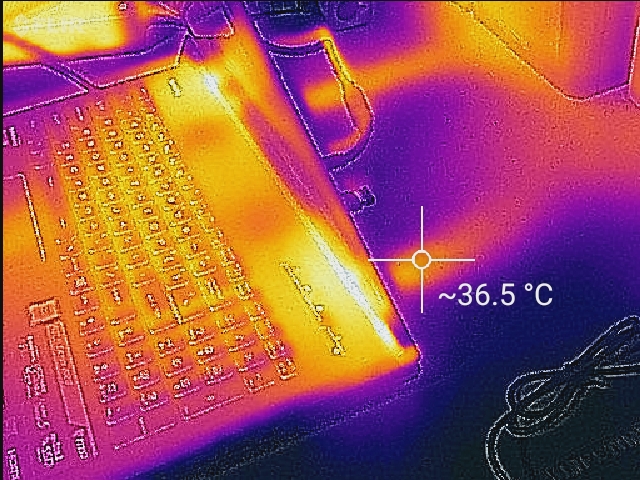
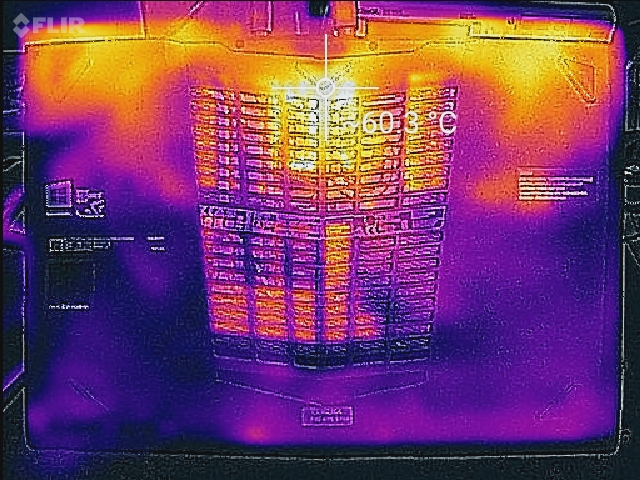
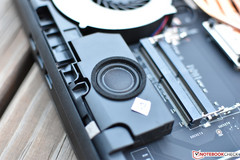
Average temperatures of 36.9 °C / 37.1 °C on top/bottom (room temperature: 23 °C) indicate good thermal management. For a notebook with a GTX 1080 inside, these are great values; they’re a product of the GT63 employing more (and longer) heat pipes than its predecessor. However, it is worth noting that the WASD buttons do become appreciably warmer under load, reaching a temperature of 35.4 °C. Hot spots on the top of the base unit reach just 41.6 °C, which is perfectly reasonable. Underneath, the heat is concentrated in the rear three quadrants, with the center warming to 54.8 °C—again, a good design. By contrast, the Alienware 15 R3 reaches much higher temperatures on the top of the base unit and sees thermals in the mid-40s and 50s across the breadth of the bottom (and that’s with a significantly lower room temperature of just 20 °C).
(±) The maximum temperature on the upper side is 41.6 °C / 107 F, compared to the average of 40.4 °C / 105 F, ranging from 21.2 to 68.8 °C for the class Gaming.
(-) The bottom heats up to a maximum of 54.8 °C / 131 F, compared to the average of 43.2 °C / 110 F
(±) The palmrests and touchpad can get very hot to the touch with a maximum of 37 °C / 98.6 F.
(-) The average temperature of the palmrest area of similar devices was 28.8 °C / 83.8 F (-8.2 °C / -14.8 F).
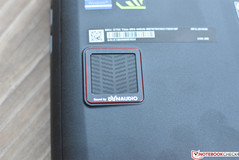
Speakers
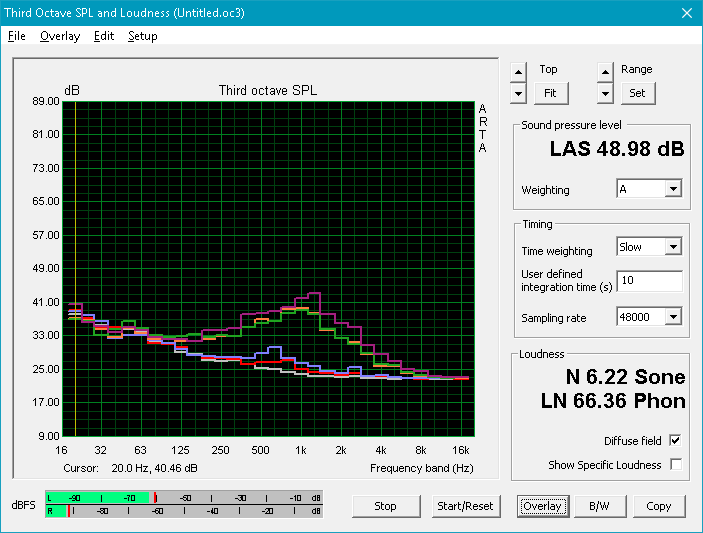
The MSI GT63 features a 4.1 (4 speakers, 1 subwoofer) sound system that’s relatively loud, reaching 87 dB in our measurements. In spite of the woofer, there’s still hardly any bass, but frequencies across the board are fairly linear (including low frequencies). Mids are a bit higher than ideal, but for the most part, the results aren’t bad. As of this writing, some 38% of gaming notebooks achieve better numbers.

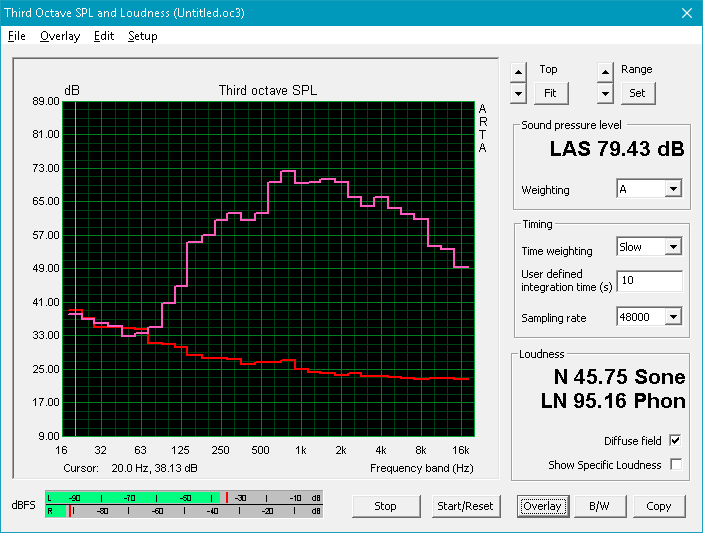
MSI GT63 Titan 8RG-046 audio analysis
(±) | speaker loudness is average but good (79.4 dB)
Bass 100 - 315 Hz
(±) | reduced bass - on average 8.7% lower than median
(±) | linearity of bass is average (12.1% delta to prev. frequency)
Mids 400 - 2000 Hz
(±) | higher mids - on average 6.2% higher than median
(+) | mids are linear (6% delta to prev. frequency)
Highs 2 - 16 kHz
(+) | balanced highs - only 2.9% away from median
(±) | linearity of highs is average (7.3% delta to prev. frequency)
Overall 100 - 16.000 Hz
(±) | linearity of overall sound is average (18.7% difference to median)
Compared to same class
» 61% of all tested devices in this class were better, 8% similar, 31% worse
» The best had a delta of 6%, average was 18%, worst was 132%
Compared to all devices tested
» 43% of all tested devices were better, 8% similar, 50% worse
» The best had a delta of 4%, average was 24%, worst was 134%
Asus Chimera G703GI audio analysis
(+) | speakers can play relatively loud (89 dB)
Bass 100 - 315 Hz
(±) | reduced bass - on average 8.9% lower than median
(+) | bass is linear (6.4% delta to prev. frequency)
Mids 400 - 2000 Hz
(+) | balanced mids - only 3.1% away from median
(+) | mids are linear (2.4% delta to prev. frequency)
Highs 2 - 16 kHz
(+) | balanced highs - only 4.4% away from median
(+) | highs are linear (3.2% delta to prev. frequency)
Overall 100 - 16.000 Hz
(+) | overall sound is linear (11.8% difference to median)
Compared to same class
» 11% of all tested devices in this class were better, 4% similar, 85% worse
» The best had a delta of 6%, average was 18%, worst was 132%
Compared to all devices tested
» 8% of all tested devices were better, 3% similar, 89% worse
» The best had a delta of 4%, average was 24%, worst was 134%
Energy Management
Power Consumption
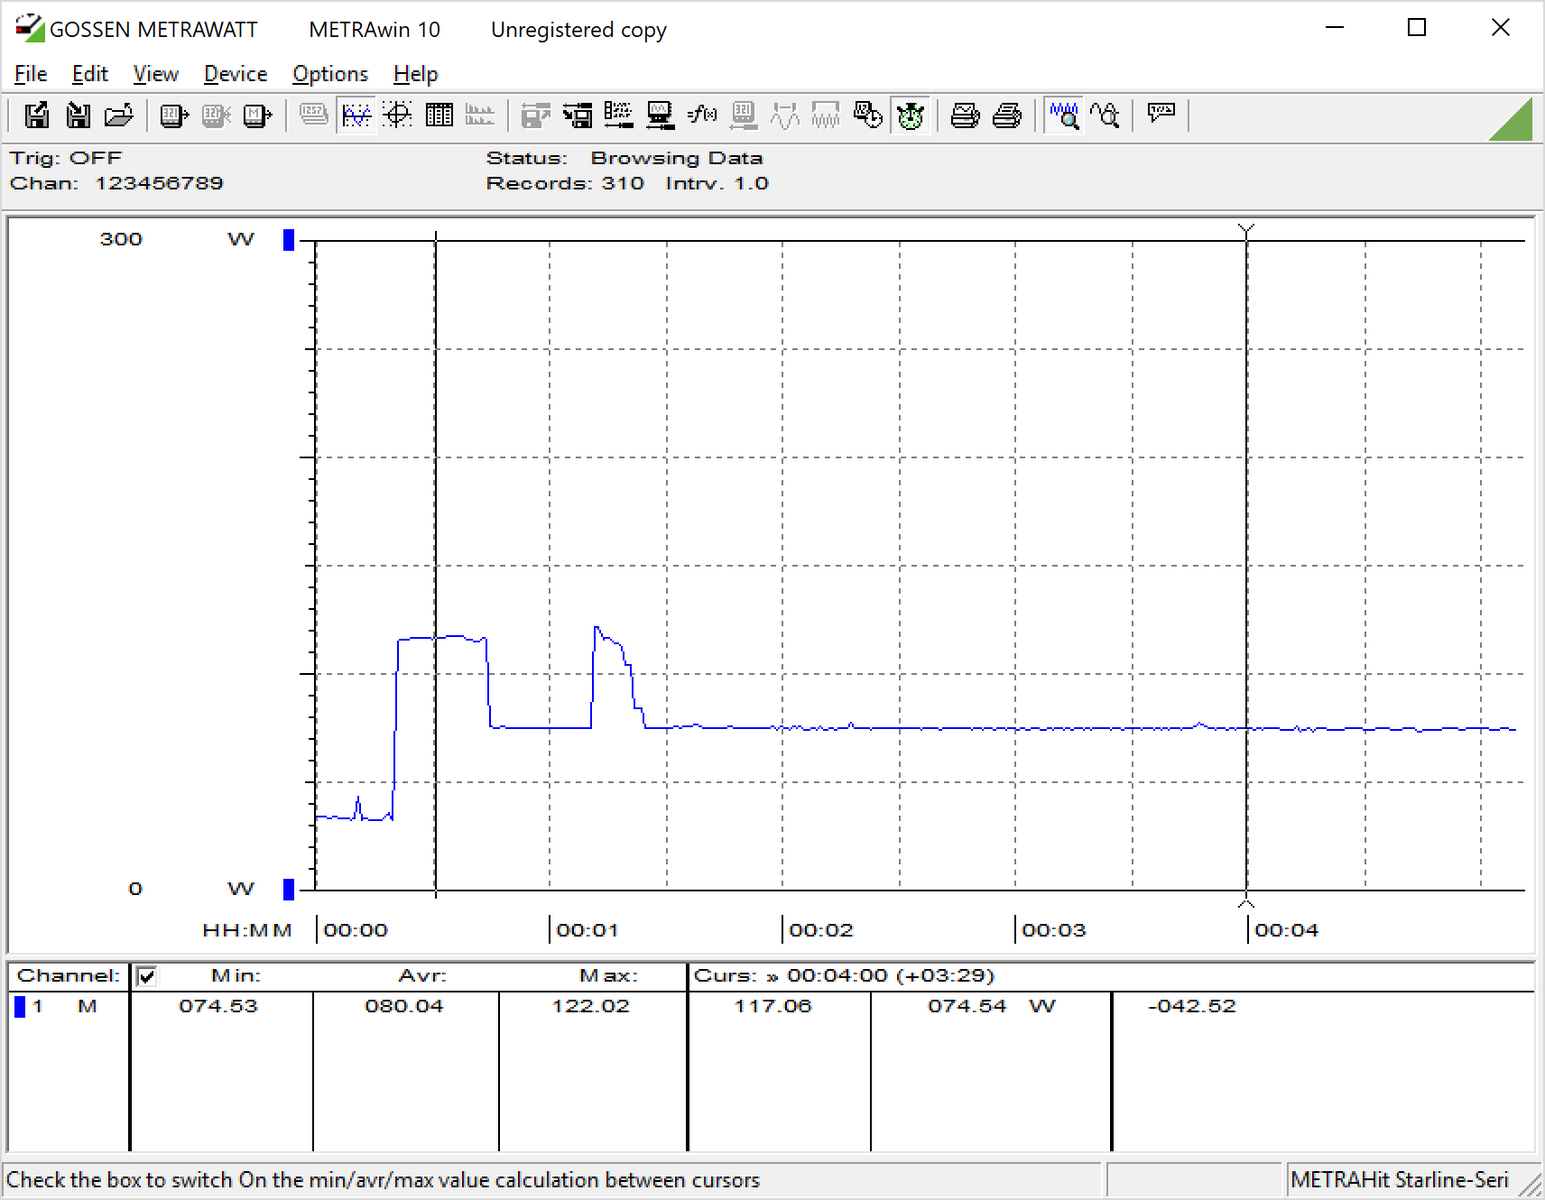
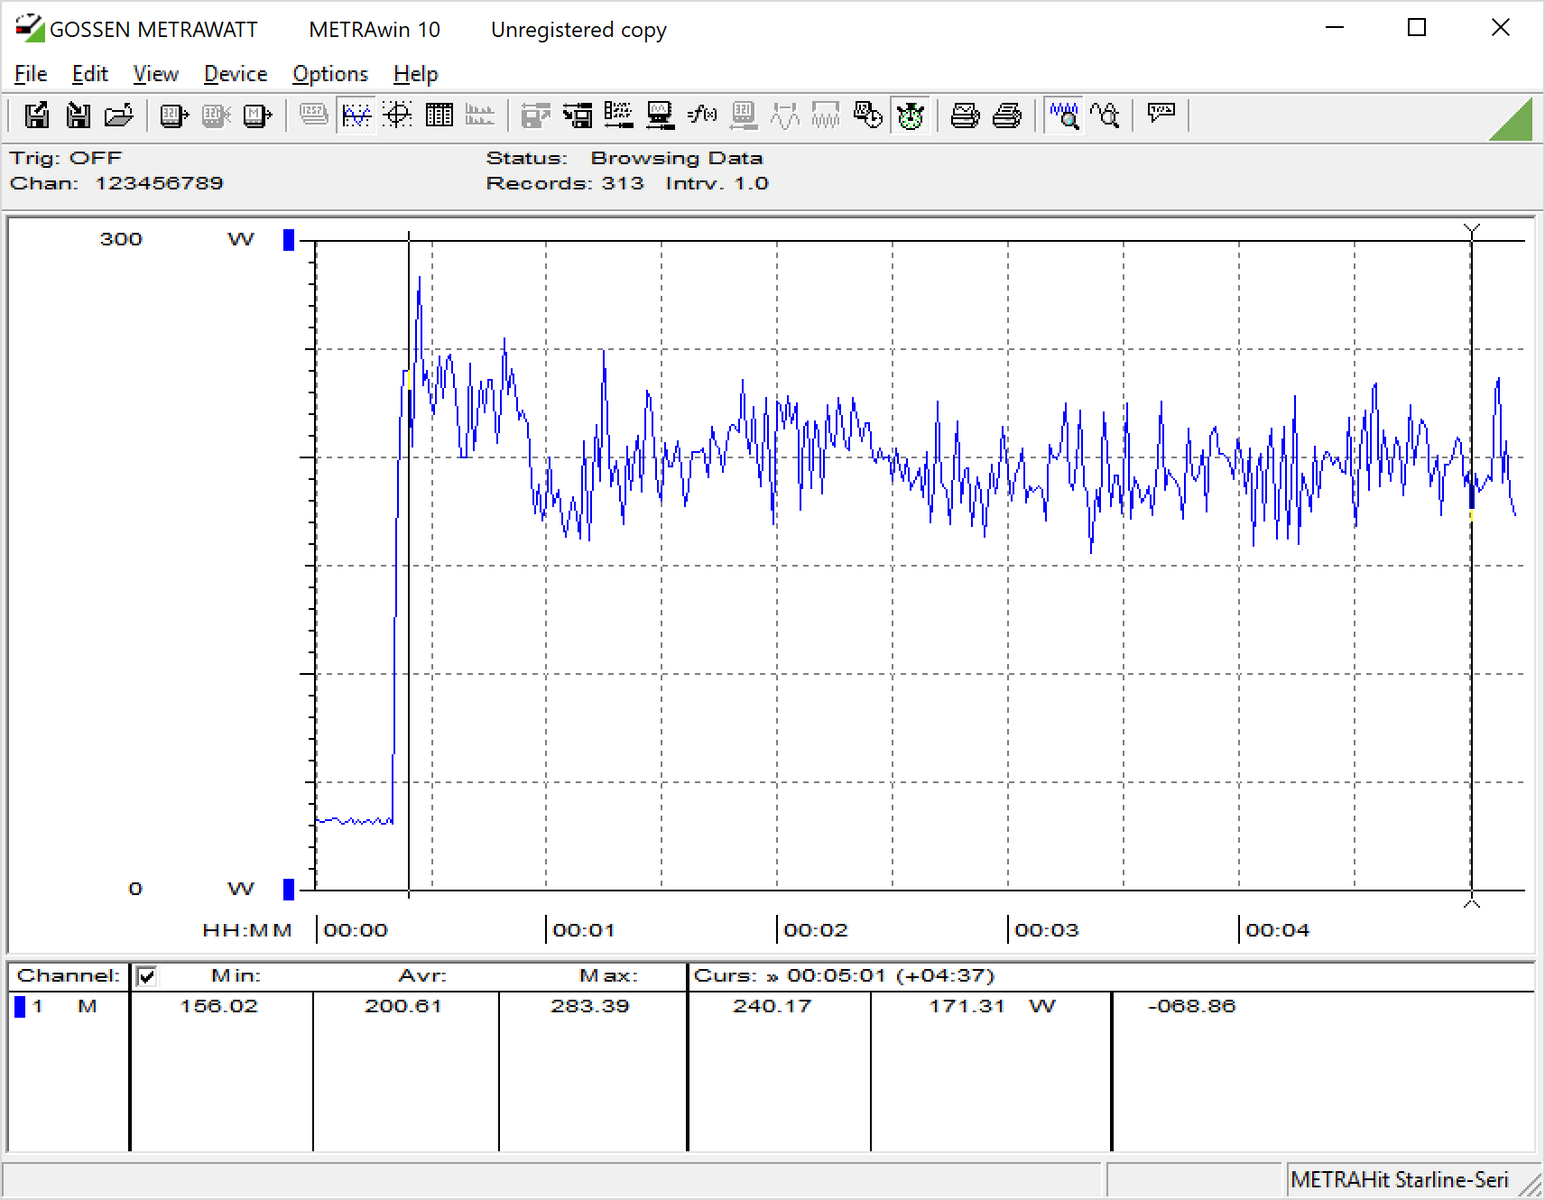
Unsurprisingly, apart from the absolutely decked-out Asus ROG Chimera, the MSI GT63 is the most power-hungry of all the machines in our comparison field. We measured some 225 W max under load (compared with 215 W for the Alienware 15 R3), with an average of 90.4 W. Witcher 3 provoked an even higher reading of 255.6 W—again, quite a bit higher than anything else against which we’re comparing today.
| Off / Standby | |
| Idle | |
| Load |
|
Key:
min: | |
| MSI GT63 Titan 8RG-046 i7-8750H, GeForce GTX 1080 Mobile, CUK Cyclone 500GB M.2 NVMe, TN, 1920x1080, 15.6" | Asus ROG GU501GM-BI7N8 i7-8750H, GeForce GTX 1060 Mobile, Kingston RBUSNS8154P3128GJ, IPS, 1920x1080, 15.6" | Razer Blade 15 2018 i7-8750H, GeForce GTX 1070 Max-Q, Samsung PM961 NVMe MZVLW512HMJP, IPS, 1920x1080, 15.6" | Alienware 15 R3 Max-Q i7-7820HK, GeForce GTX 1080 Max-Q, LiteOn CX2-8B256, IPS, 1920x1080, 15.6" | Dell G5 15 5587 i5-8300H, GeForce GTX 1060 Max-Q, SK hynix SC311 M.2, IPS, 1920x1080, 15.6" | Asus Chimera G703GI i9-8950HK, GeForce GTX 1080 Mobile, 2x Intel 760p 512 GB + 1x Samsung SM961 512 GB (RAID), IPS, 1920x1080, 17.3" | Acer Predator Helios 500 PH517-51-79BY i7-8750H, GeForce GTX 1070 Mobile, SK hynix SSD Canvas SC300 HFS256GD9MNE-6200A, IPS, 1920x1080, 17.3" | |
|---|---|---|---|---|---|---|---|
| Power Consumption | 31% | 30% | 12% | 53% | -33% | 0% | |
| Idle Minimum * (Watt) | 26.4 | 12.35 53% | 14 47% | 22 17% | 4.9 81% | 29 -10% | 20.4 23% |
| Idle Average * (Watt) | 30 | 19.98 33% | 17 43% | 26 13% | 8.5 72% | 37 -23% | 26.5 12% |
| Idle Maximum * (Watt) | 30.6 | 25.44 17% | 21 31% | 33 -8% | 9.1 70% | 46 -50% | 37 -21% |
| Load Average * (Watt) | 90.4 | 94.28 -4% | 95 -5% | 86 5% | 90.7 -0% | 156 -73% | 129 -43% |
| Witcher 3 ultra * (Watt) | 255.6 | 132.9 48% | 141 45% | 159 38% | 110 57% | 252 1% | 186 27% |
| Load Maximum * (Watt) | 224.4 | 140.63 37% | 179 20% | 215 4% | 144 36% | 314 -40% | 216 4% |
* ... smaller is better
Battery Life
Correspondingly, battery life is expectedly poor. Lacking switchable graphics as a crutch, our machine lasted just 194 minutes during our Wi-Fi web surfing test, well below any of the less powerful machines in today’s field. Again, though, desktop replacements are just that—and they aren’t really expected to offer abundance in the category of battery runtimes. It’s long enough to survive a trip from the bedroom to the basement, or perhaps to remain asleep in a bag while in transit.
| MSI GT63 Titan 8RG-046 i7-8750H, GeForce GTX 1080 Mobile, 75.24 Wh | Asus ROG GU501GM-BI7N8 i7-8750H, GeForce GTX 1060 Mobile, 55 Wh | Razer Blade 15 2018 i7-8750H, GeForce GTX 1070 Max-Q, 80 Wh | Alienware 15 R3 Max-Q i7-7820HK, GeForce GTX 1080 Max-Q, 99 Wh | Dell G5 15 5587 i5-8300H, GeForce GTX 1060 Max-Q, 56 Wh | Asus Chimera G703GI i9-8950HK, GeForce GTX 1080 Mobile, 71 Wh | Acer Predator Helios 500 PH517-51-79BY i7-8750H, GeForce GTX 1070 Mobile, 72 Wh | |
|---|---|---|---|---|---|---|---|
| Battery runtime | 25% | 69% | 69% | 103% | -31% | -9% | |
| WiFi v1.3 (h) | 3.2 | 4 25% | 5.4 69% | 5.4 69% | 6.5 103% | 2.2 -31% | 2.9 -9% |
| Reader / Idle (h) | 4.5 | 6.4 | 7.1 | 11.8 | 2.8 | 4.2 | |
| Load (h) | 0.8 | 1.2 | 1.9 | 2.2 | 0.9 | 1.5 | |
| Witcher 3 ultra (h) | 1.1 |
Pros
Cons
Verdict


For raw gaming performance, the MSI GT63 Titan 8RG does the trick. The design may not have changed, but the overall speed has only improved since we last evaluated the GT62VR a couple of years back. Its thermal management is noticeably better than that of its predecessor, and the graphical performance absolutely delivers. Yes, it’s big, it’s heavy, and it’s somewhat noisy—but it’s a classic desktop replacement through and through.
Apart from that, we only have a few other significant complaints. Ideally we’d hope to see more than one M.2 slot in a machine of this size and class to pave the way for RAID options or even simply three separate storage volumes. The touchpad buttons are loud and irritating (especially the left button on our review unit). And, while it’s a minor complaint, positioning some of the major ports on the rear of the unit does make for an inconvenient acrobatic exercise in some instances.
Yes, it’s big, it’s heavy, and it’s somewhat noisy—but the MSI GT63 Titan 8RG is a classic desktop replacement through and through.
But is it worth springing for this $2,639 device over its numerous competitors? By comparison—while we haven’t had the chance to evaluate the Alienware 15 R4 yet—the R3 offers not one but three M.2 SSD slots (two of which are fully-sized 2280 slots), and though its surface temperatures across the keyboard are higher, it’s overall a very well-balanced machine. The Asus ROG Chimera and Acer Predator Helios 500 also offer a second M.2 slot and great performance, but struggle to match the GT63’s value. For those willing to trade some power for portability, the trendy thin-and-light gaming category offers the MSI GS65, ASUS ROG GU501GM, and Razer Blade 15, all of which feature their own unique sets of pros and cons. And finally, for those on a budget, the Dell Inspiron 15 7000 (and the newer Dell G5 15) and Lenovo Y500 series machines can be a great place to start.
MSI GT63 Titan 8RG-046
- 07/02/2018 v6 (old)
Steve Schardein
Price comparison
