Eurocom Sky X7C (i7-8086K, GTX 1080, Clevo P775TM1-G) Laptop Review
The Sky series is Eurocom's family of high-end gaming laptops designed to compete against popular flagship alternatives like those from the MSI G series, Dell Alienware series, Asus ROG G series, Aorus series, Acer Predator Triton, Lenovo Legion Y920, and the HP Omen X 17 just to name a few. In the sea of gaming laptops, Eurocom's solution has been to offer superior serviceability and CPU options in an attempt to one-up and potentially outperform competitors.
The Sky X7C is notable because its chassis is able to house a full-fledged Core i7-8086K CPU whereas notebooks like the Asus G703GI, Alienware 15 R4, or Aorus X9 turn to the Core i9-8950HK instead. Does Eurocom's unique approach really benefit gamers when compared to the numerous mobile i7 and i9 alternatives?
Our unit today is similar in design to the Sky X7E2 and three-year old Sky DLX7 and so we recommend checking out these existing reviews for more information on chassis quality and its features. We will instead focus on the performance of the Sky X7C and what the Core i7-8086K can bring to the table.
Full configuration options for the Sky X7C can be found on its official product page here.
More Eurocom Reviews:
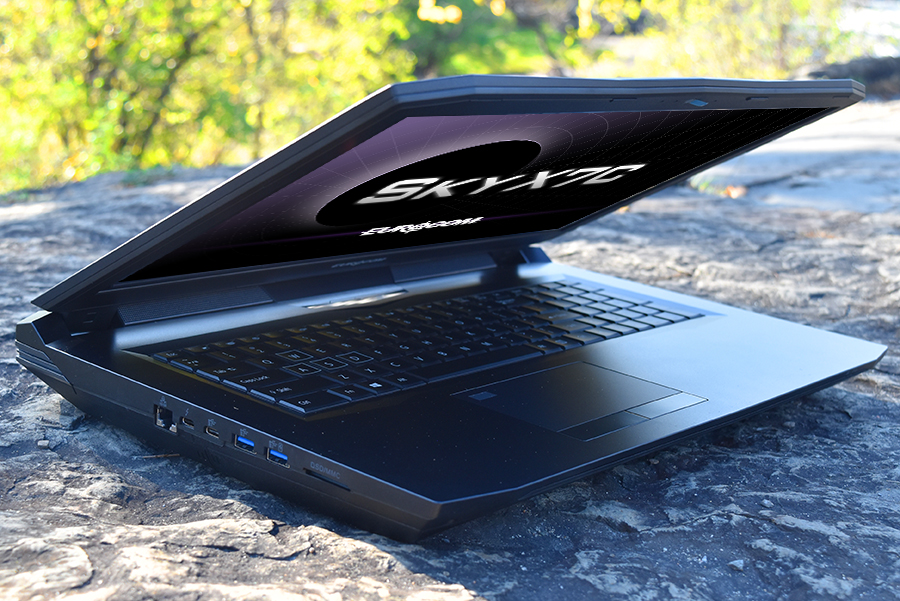
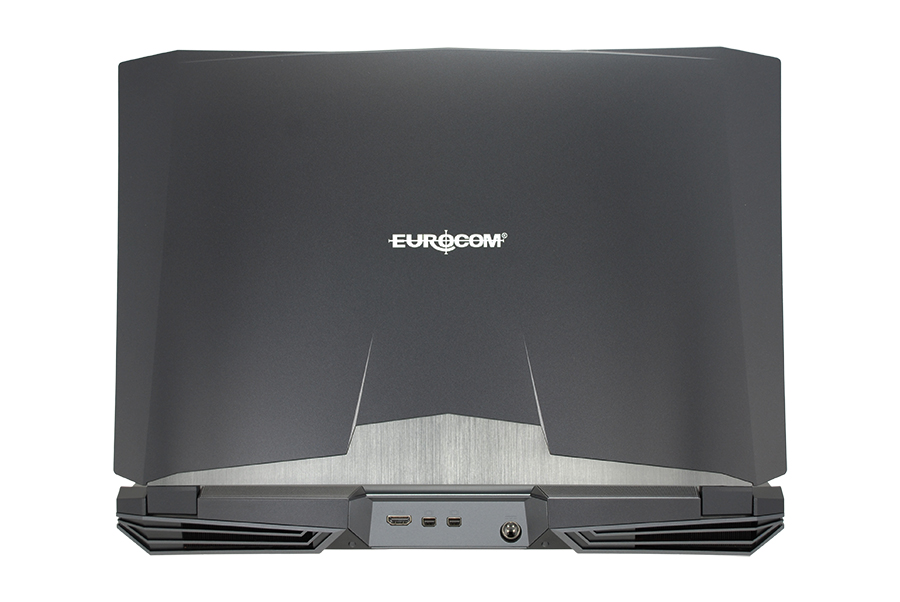

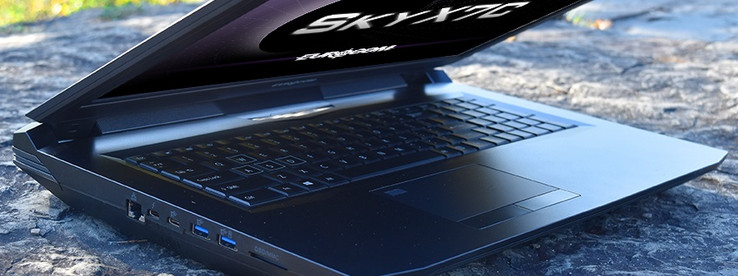
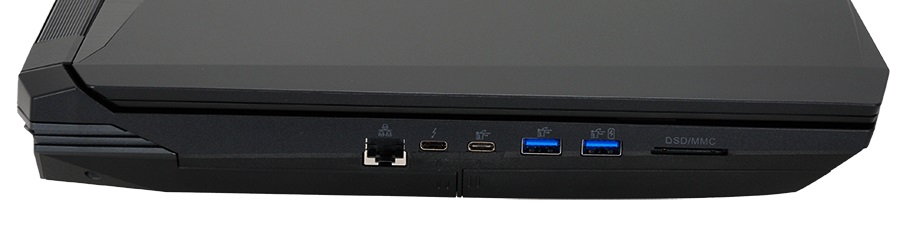
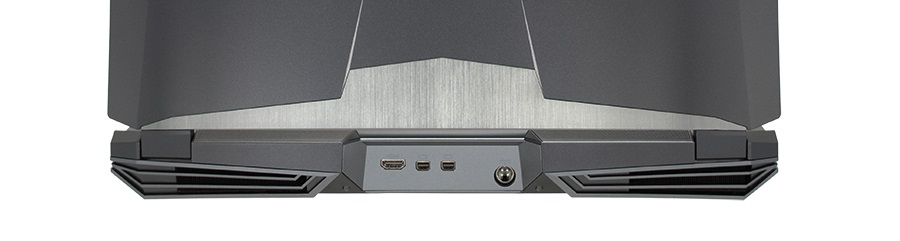
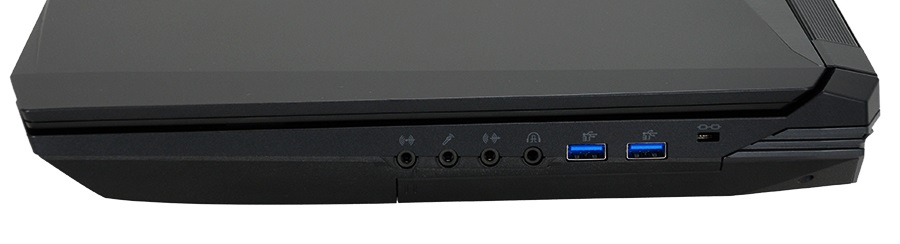
Connectivity
Ports are distributed evenly between the three edges of the system. Our one major complaint lies in the power cord as the rigid cable is thick and it must be plugged in a certain orientation. It's an annoyance similar to plugging in USB Type-A devices.
Another small nitpick is the 1 Gbit RJ-45 port as competing MSI laptops have been shipping with 10 Gbit RJ-45 ports since last year.
SD Card Reader
The spring-loaded SD card reader supports UHS-II transfer rates. Moving 1 GB worth of photos from our test card to desktop takes only 5 seconds compared to 13 seconds on the MSI GT75.
| SD Card Reader | |
| average JPG Copy Test (av. of 3 runs) | |
| Asus Chimera G703GI (Toshiba Exceria Pro SDXC 64 GB UHS-II) | |
| Eurocom Sky X7C (Toshiba Exceria Pro SDXC 64 GB UHS-II) | |
| MSI GT75 8RG-090 Titan (Toshiba Exceria Pro SDXC 64 GB UHS-II) | |
| Alienware 17 R3 (A17-9935) (Toshiba Exceria Pro SDXC 64 GB UHS-II) | |
| maximum AS SSD Seq Read Test (1GB) | |
| Asus Chimera G703GI (Toshiba Exceria Pro SDXC 64 GB UHS-II) | |
| Eurocom Sky X7C (Toshiba Exceria Pro SDXC 64 GB UHS-II) | |
| Alienware 17 R3 (A17-9935) (Toshiba Exceria Pro SDXC 64 GB UHS-II) | |
| MSI GT75 8RG-090 Titan (Toshiba Exceria Pro SDXC 64 GB UHS-II) | |
Communication
Like the Intel 9560, the Killer 1550 promises speeds of up to 1.73 Gbps. Our setup is limited to 1 Gbps and so our test results are much lower. We didn't experience any connectivity issues during our time with the review unit.
| Networking | |
| iperf3 transmit AX12 | |
| Asus Chimera G703GI | |
| MSI GT75 8RG-090 Titan | |
| Eurocom Sky X7C | |
| Aorus X7 DT v8 | |
| iperf3 receive AX12 | |
| MSI GT75 8RG-090 Titan | |
| Asus Chimera G703GI | |
| Eurocom Sky X7C | |
| Aorus X7 DT v8 | |
Accessories
Eurocom offers more extras in the box than competitors since the reseller encourages end-user tinkering. Additional screws, service manual, drivers disc, 2.5-inch SATA III brackets, pads, and 0.6 g of thermal paste are all included. A velvet cleaning cloth is conspicuously absent and we're hoping to see a USB stick instead of a disc in the future.
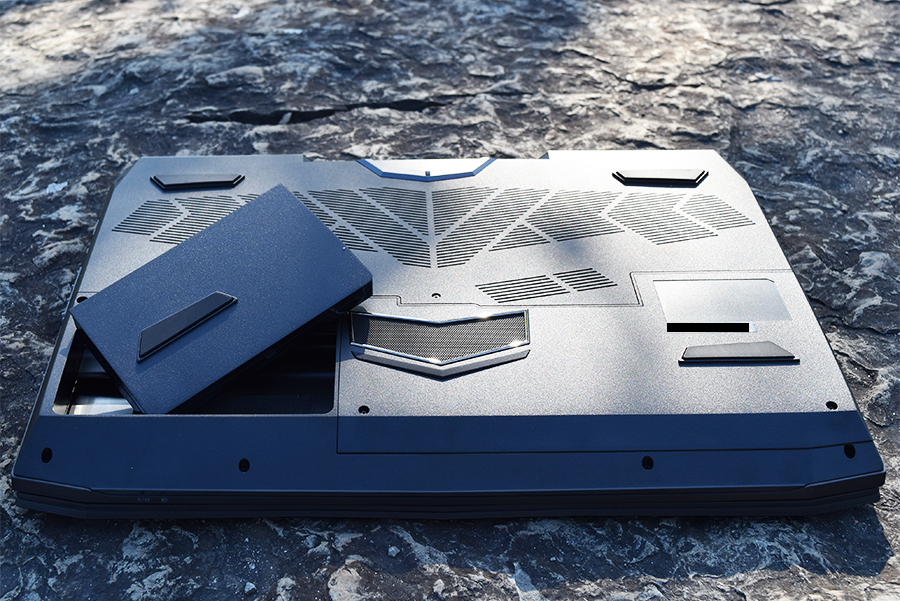
Maintenance
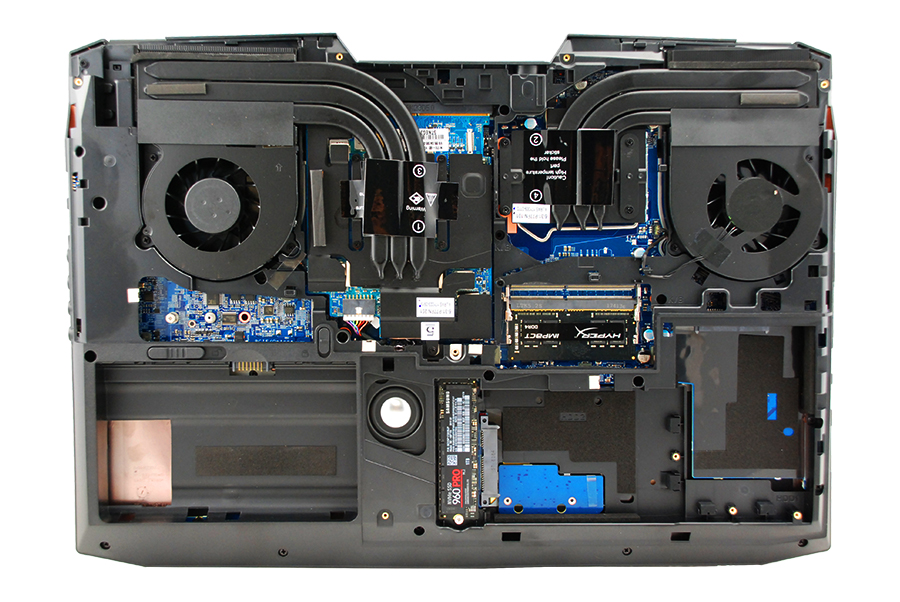
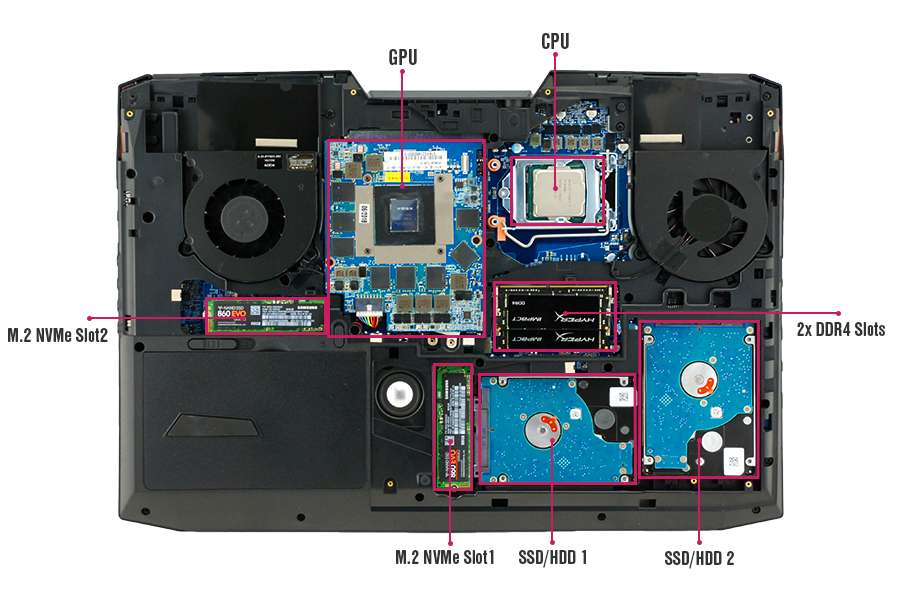
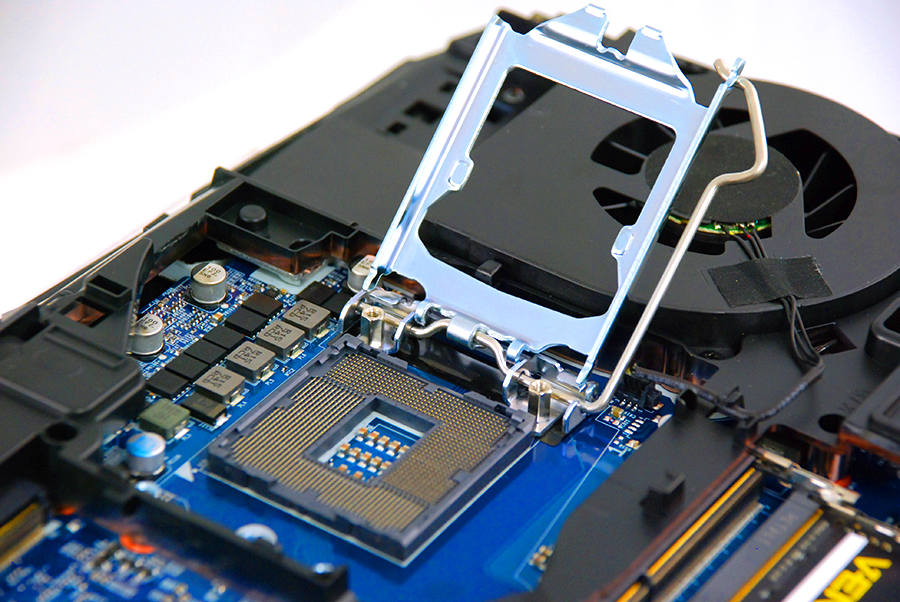
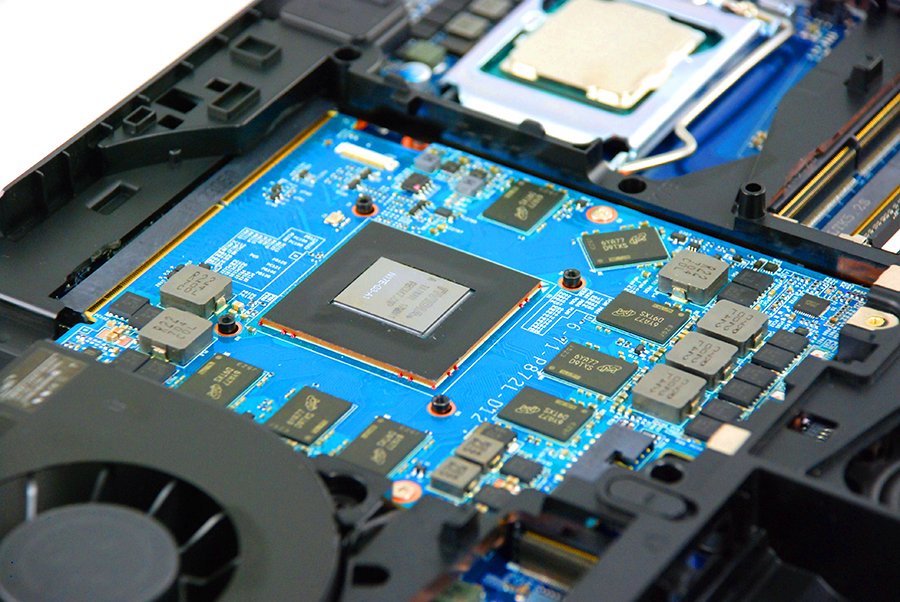
Unsurprisingly, serviceability is very easy and requires only a Philips screwdriver. Both the CPU and GPU are upgradeable unlike on most other gaming laptops in the market. Note that the processors do not share heat pipes for even easier upgrading unlike on the older Sky X7E2 or DLX7. Eurocom offers hard-to-find MXM GPUs for sale should owners want to swap out the GTX 1080.
Warranty
A one-year limited warranty applies with optional extensions of up to three years. We're hoping that future Eurocom laptops will have two-year warranties as standard since competitors like Aorus and EVGA offer two-year warranties by default.
Input Devices
Keyboard and Touchpad
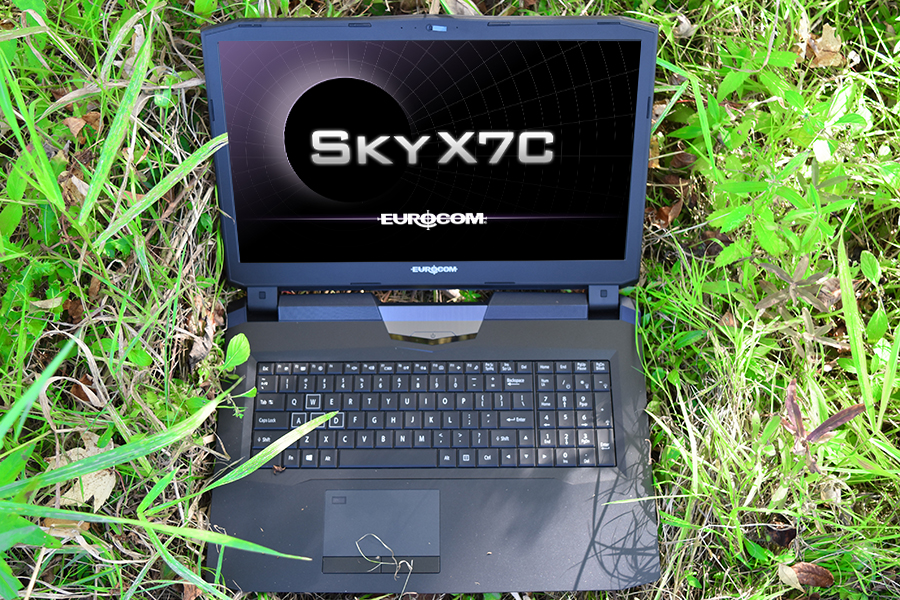
The keyboards and trackpads of Clevo systems have always been very consistent between models and the Sky X7C is no different. Users will find key feedback to be very similar to the Sky X4C, X9C, and Schenker XMG Ultra 15 with firm pressure points and moderate clatter. The trackpad (10.8 x 6.2 cm) is about as large as the one of the XPS 15 (10.5 x 8.5 cm) but with dedicated mouse keys for increased precision and easier dragging and dropping.
Display
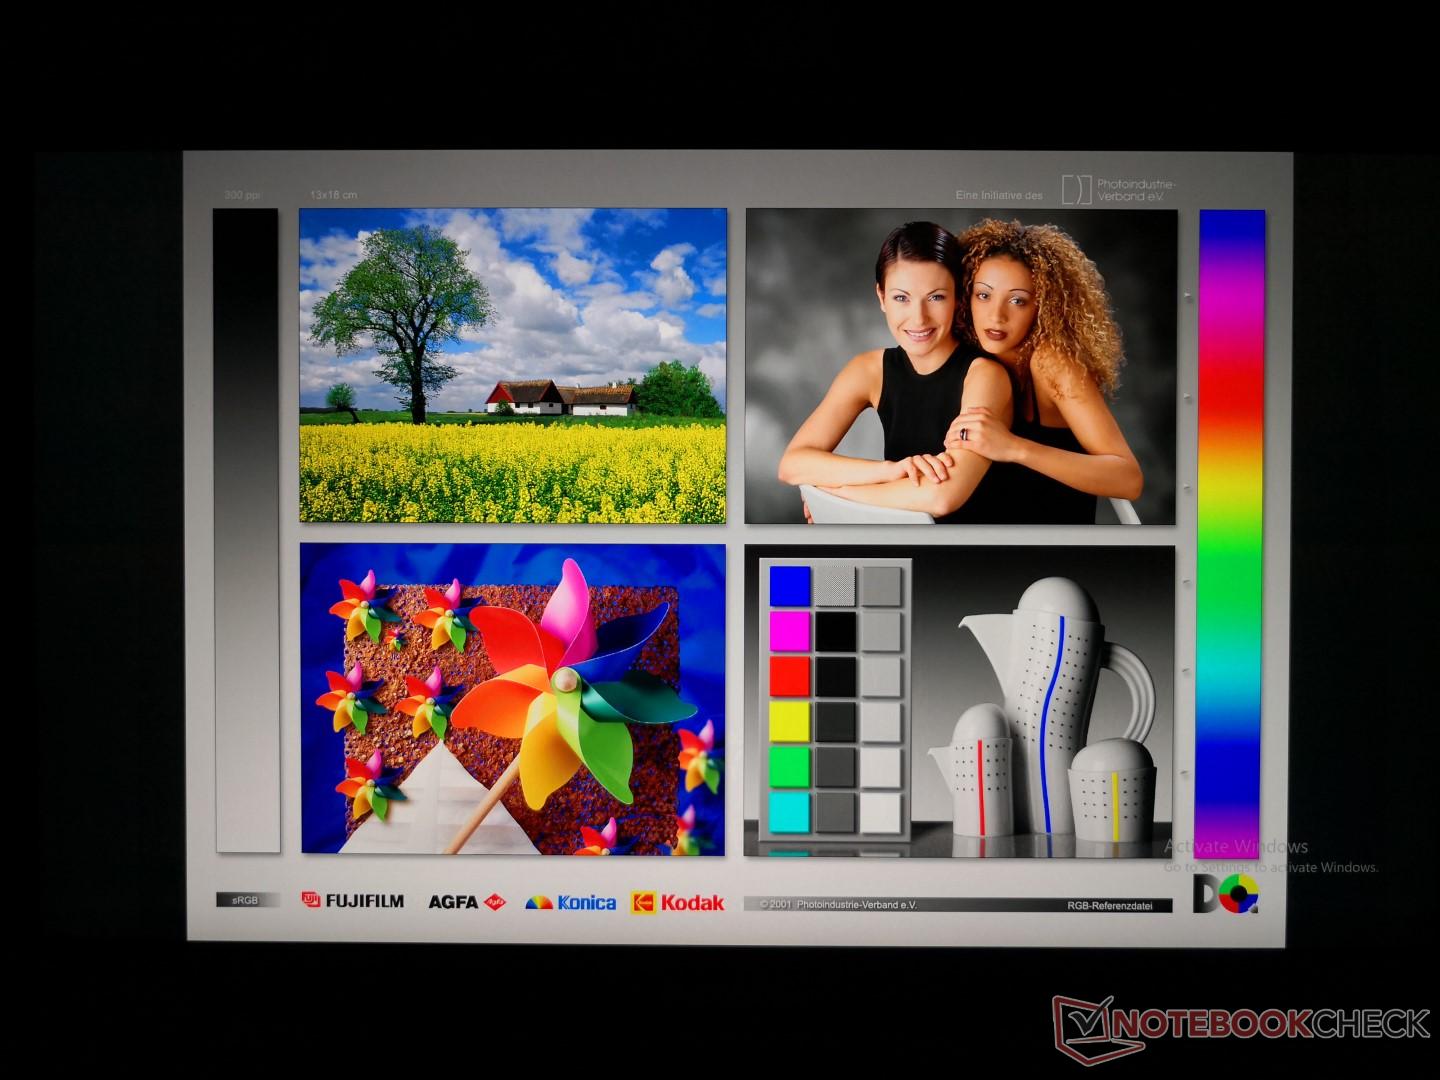
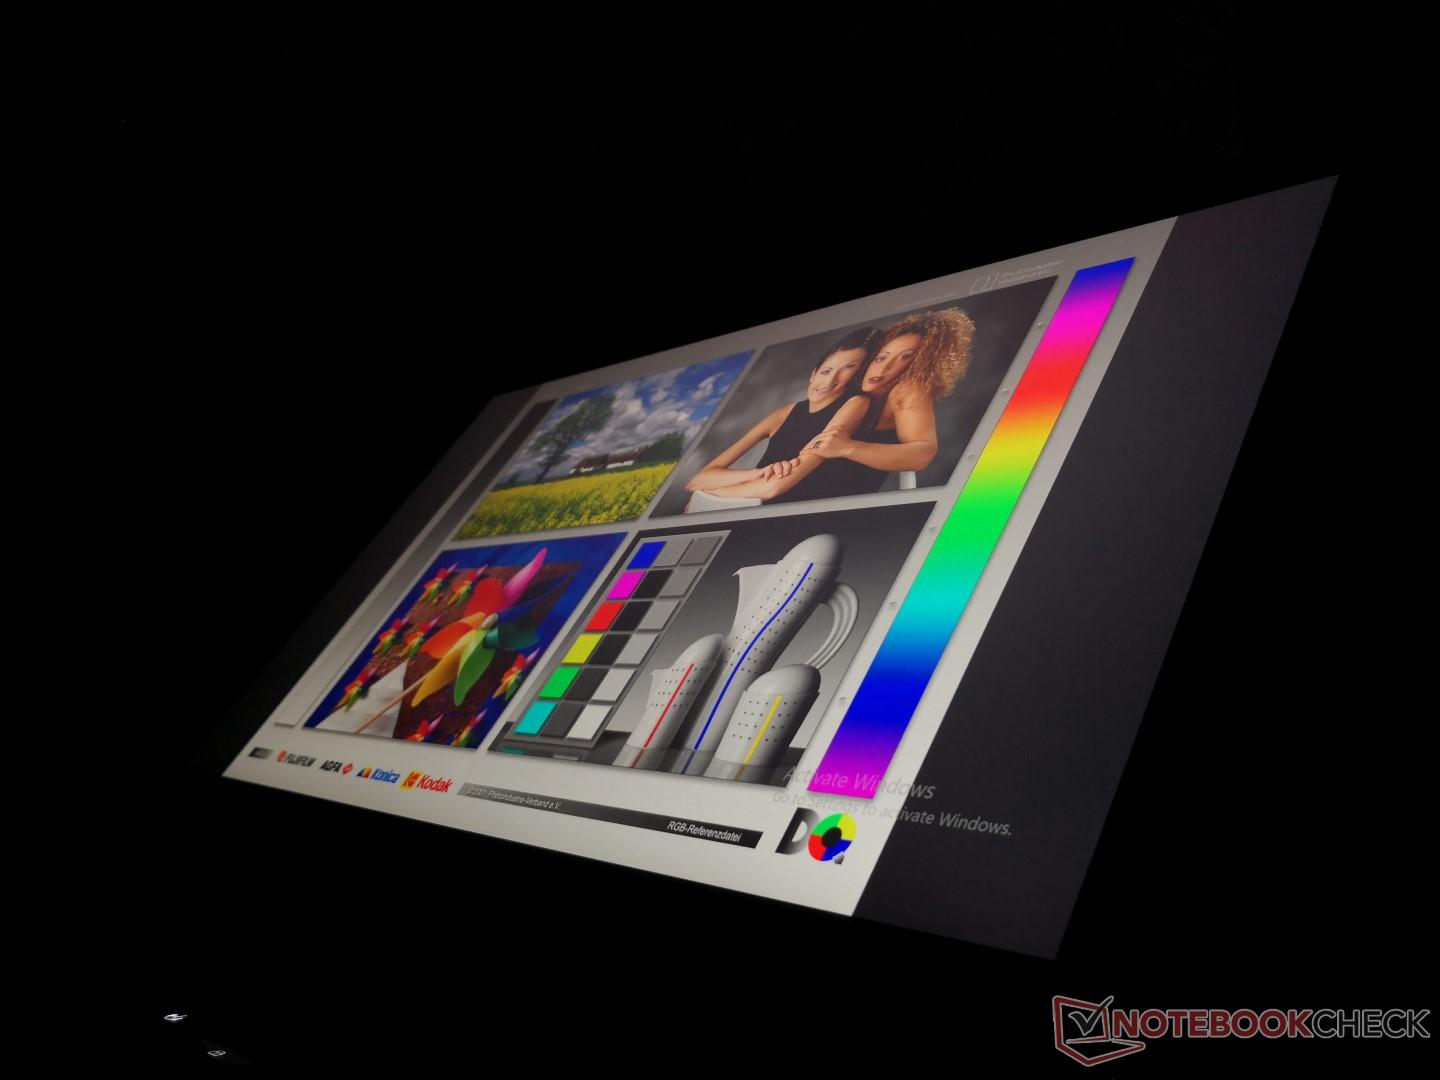
The Sky X7C has one of the widest range of display options available for a 17.3-inch notebook with a total of 6 different panels to choose from. Our particular test unit is equipped with a 4K UHD AU Optronics B173ZAN01.0 IPS panel that promises full AdobeRGB coverage. This exact same panel can also be found on the Sky DLX7, MSI GT73, Schenker XMG U726, and the Acer Predator 17. As a result, our Sky X7C shares very similar display properties as the aforementioned alternatives. Sharp IGZO panels as found on the XPS 15 or Razer Blade 15 (i7-8750H, GTX 1060 Max-Q, FHD) Laptop ReviewRazer Blade series are not available on the Eurocom nor are any touchscreen features.
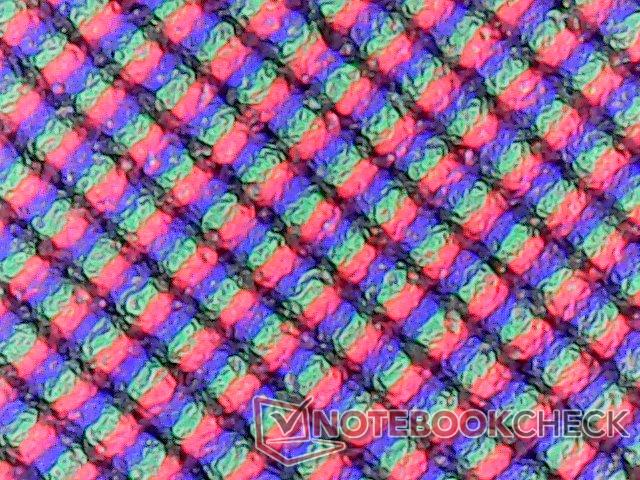
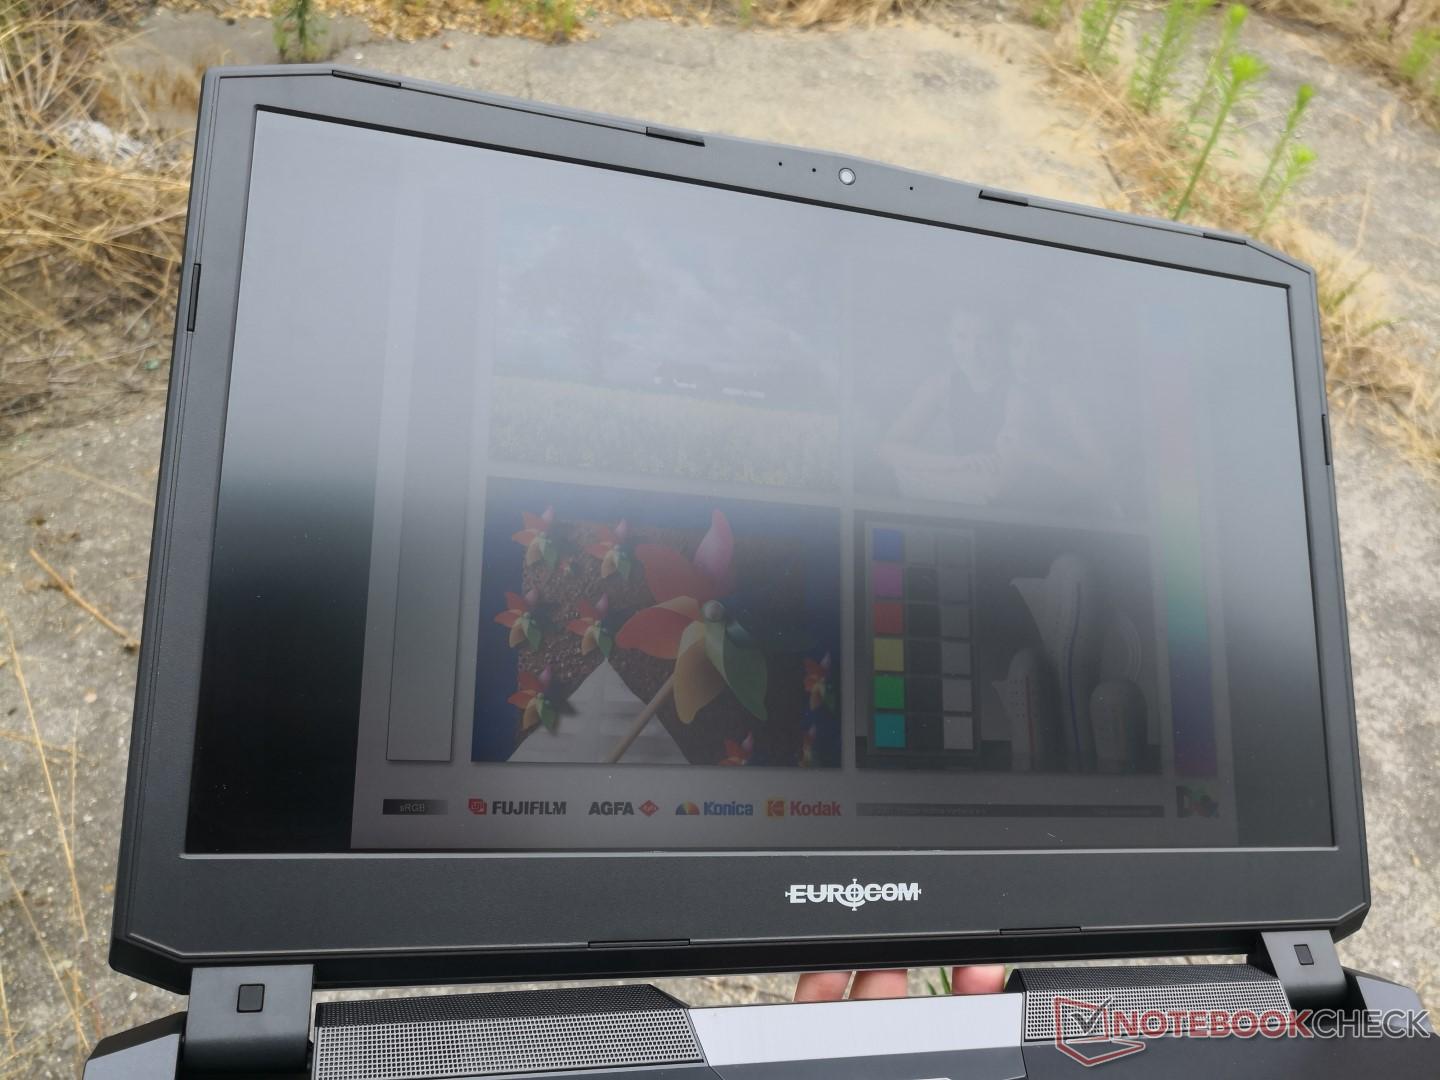
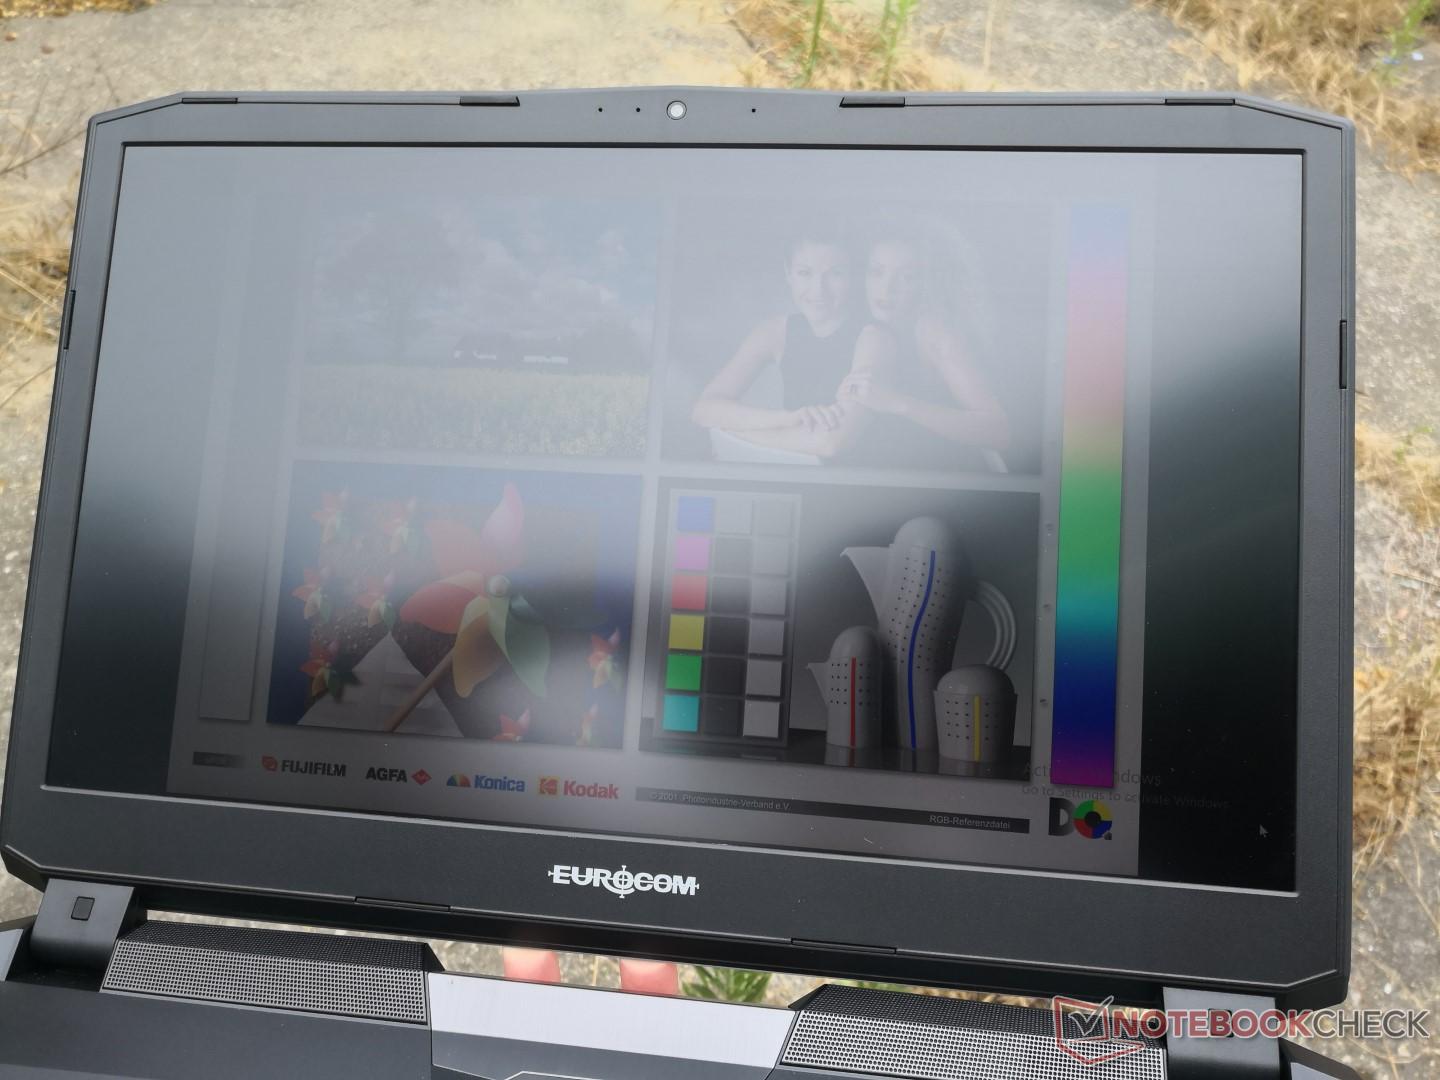
Backlight bleeding is moderate around the top edge of the screen as shown by our picture below. Onscreen content is sharp without any graininess issues despite the matte panel.
| |||||||||||||||||||||||||
Brightness Distribution: 88 %
Center on Battery: 333 cd/m²
Contrast: 833:1 (Black: 0.4 cd/m²)
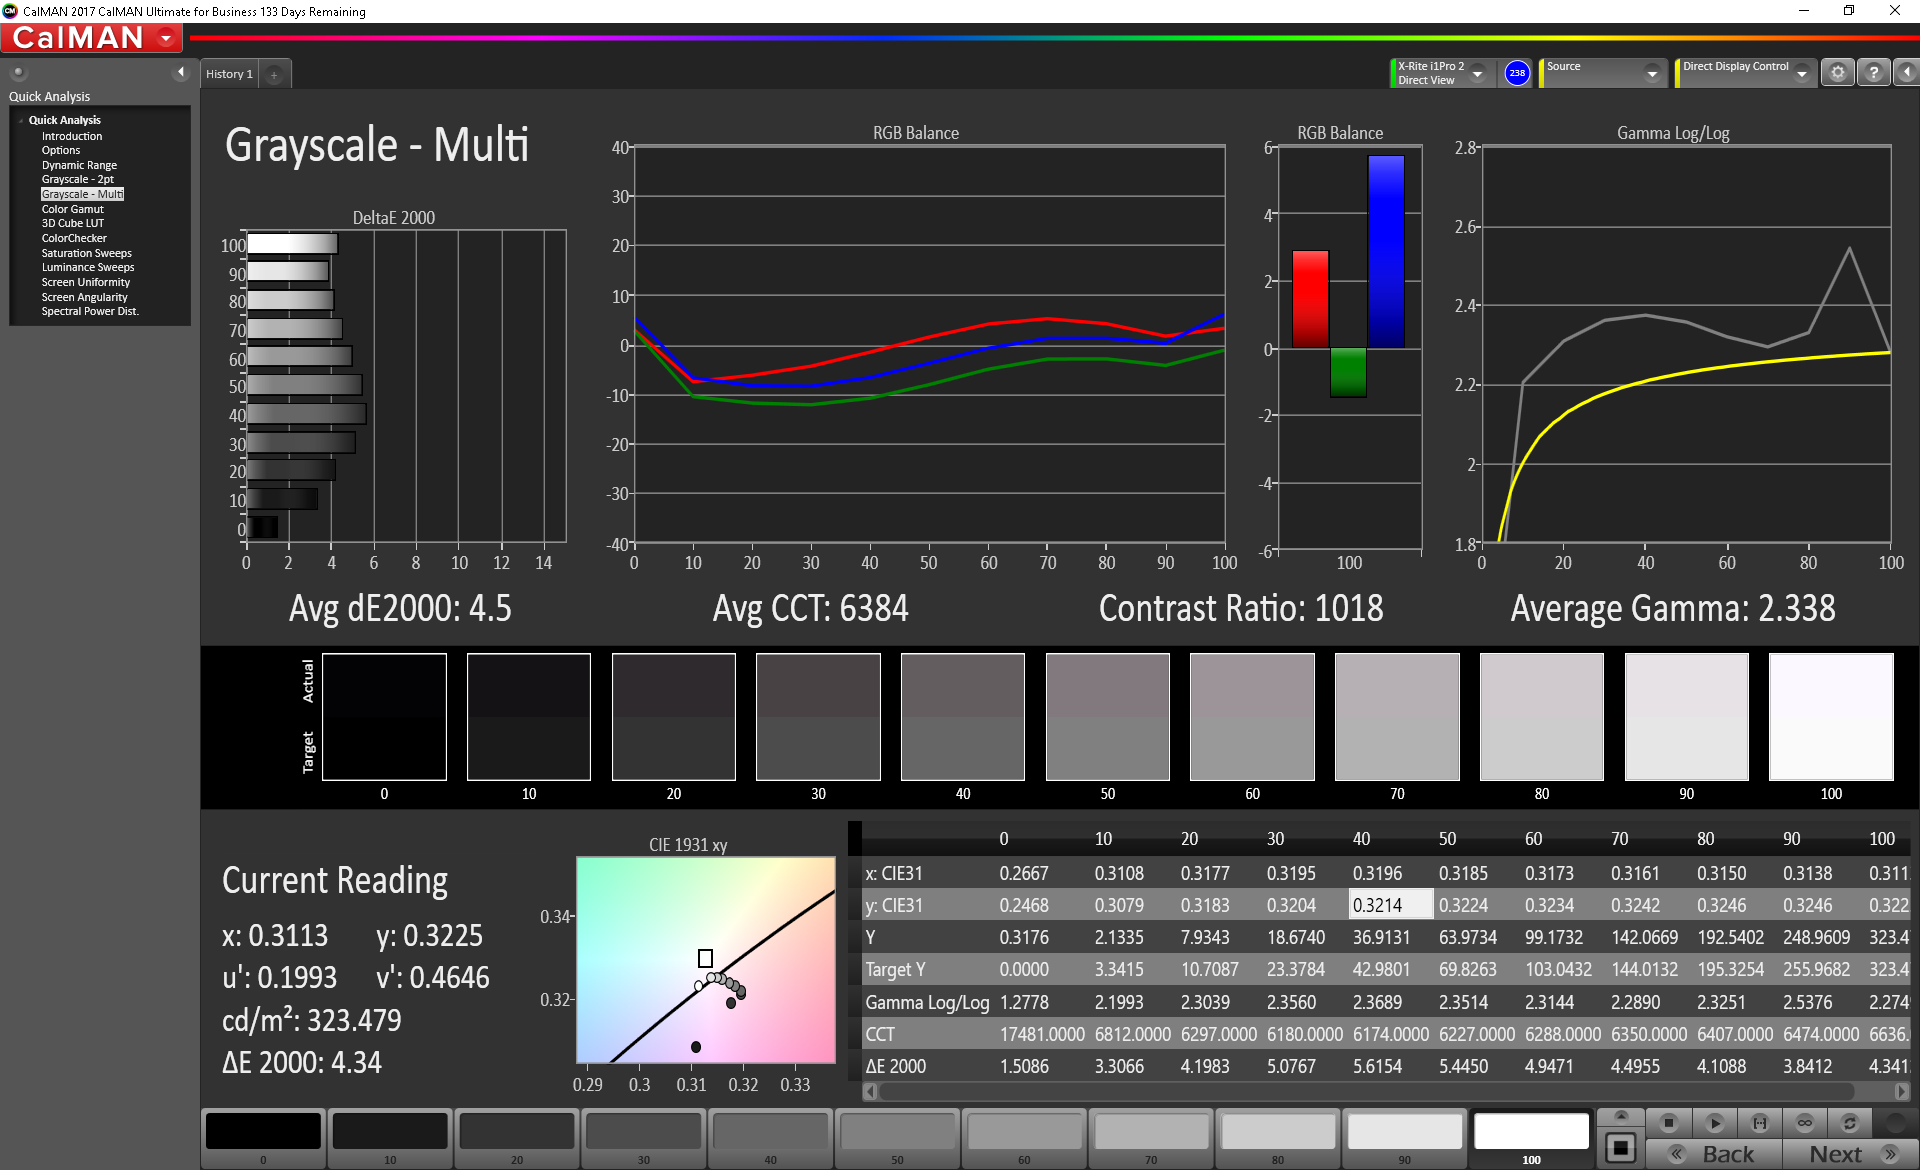
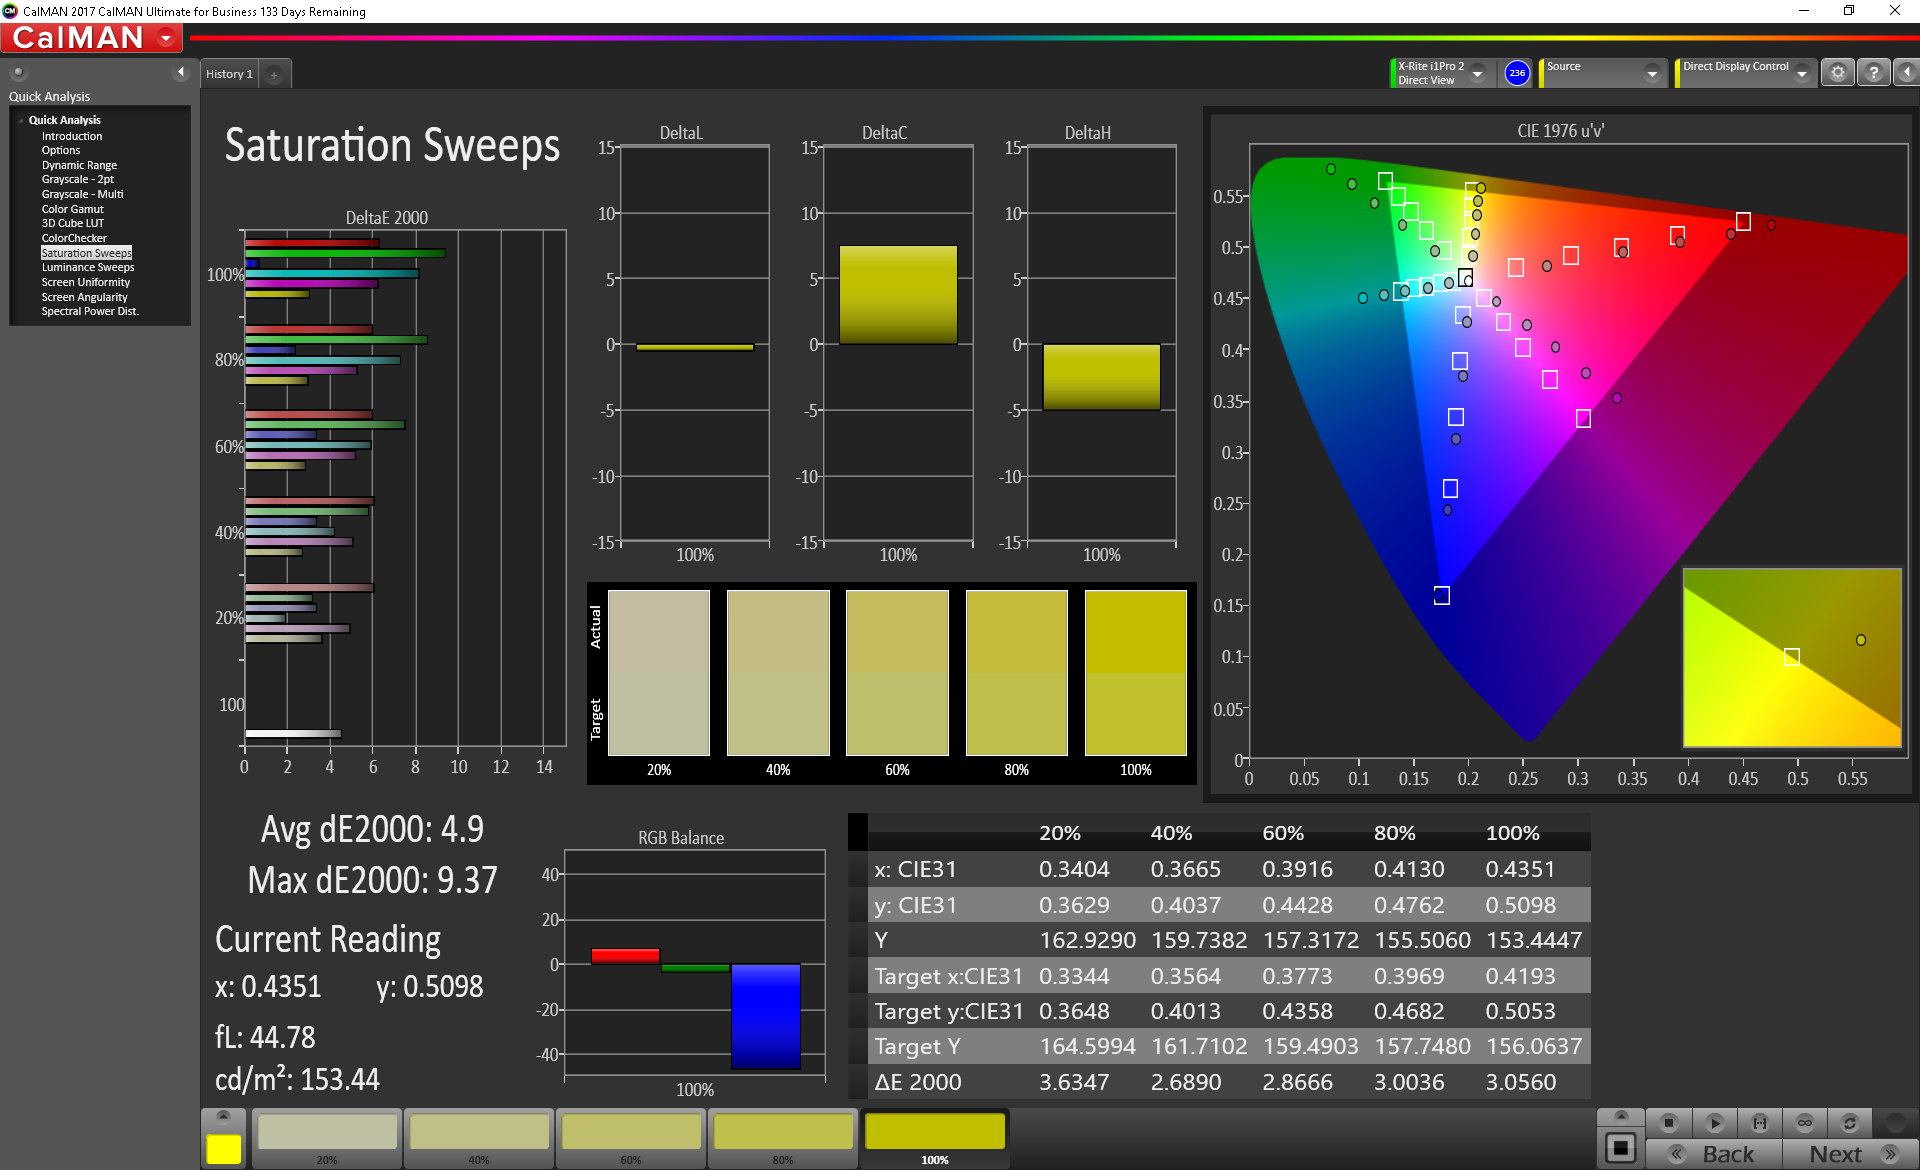
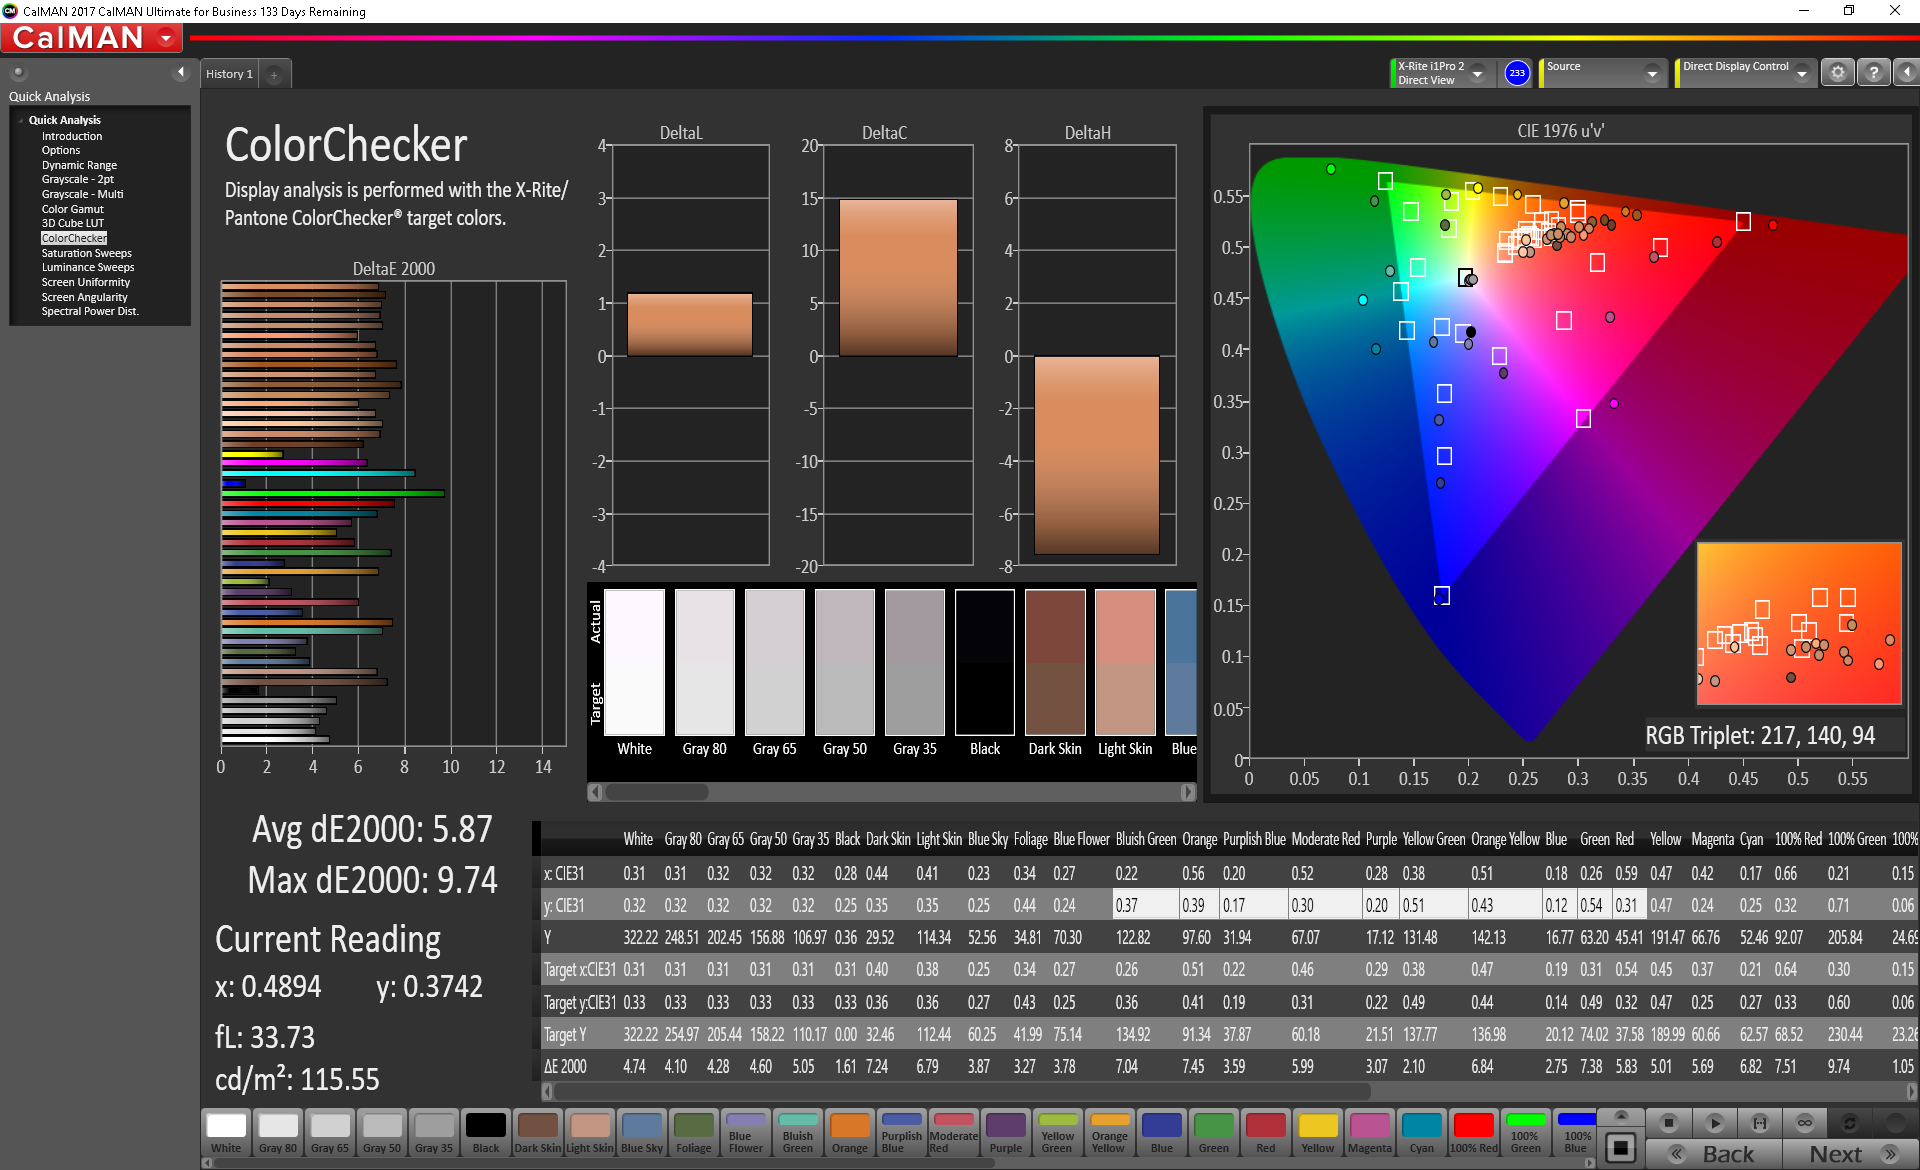
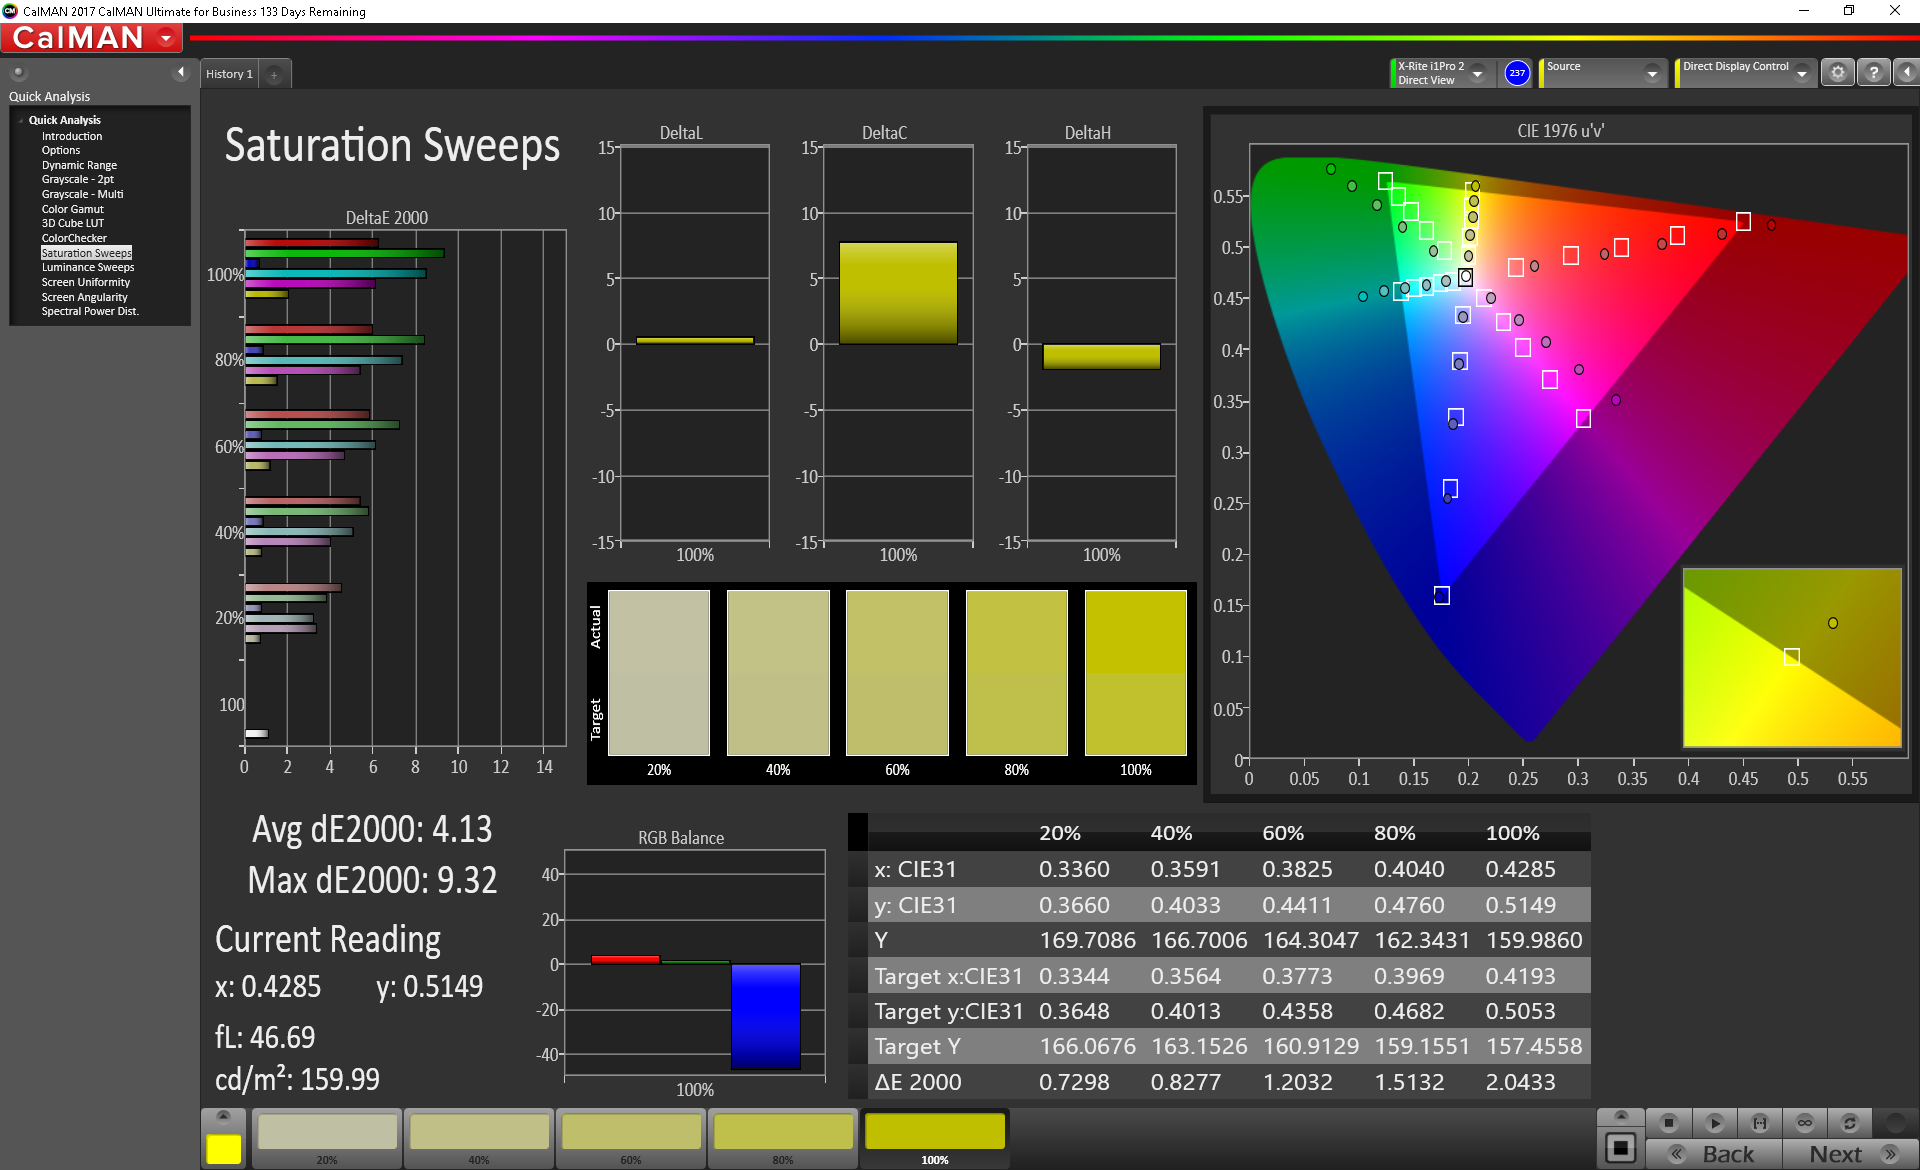
ΔE ColorChecker Calman: 5.87 | ∀{0.5-29.43 Ø4.76}
calibrated: 4.59
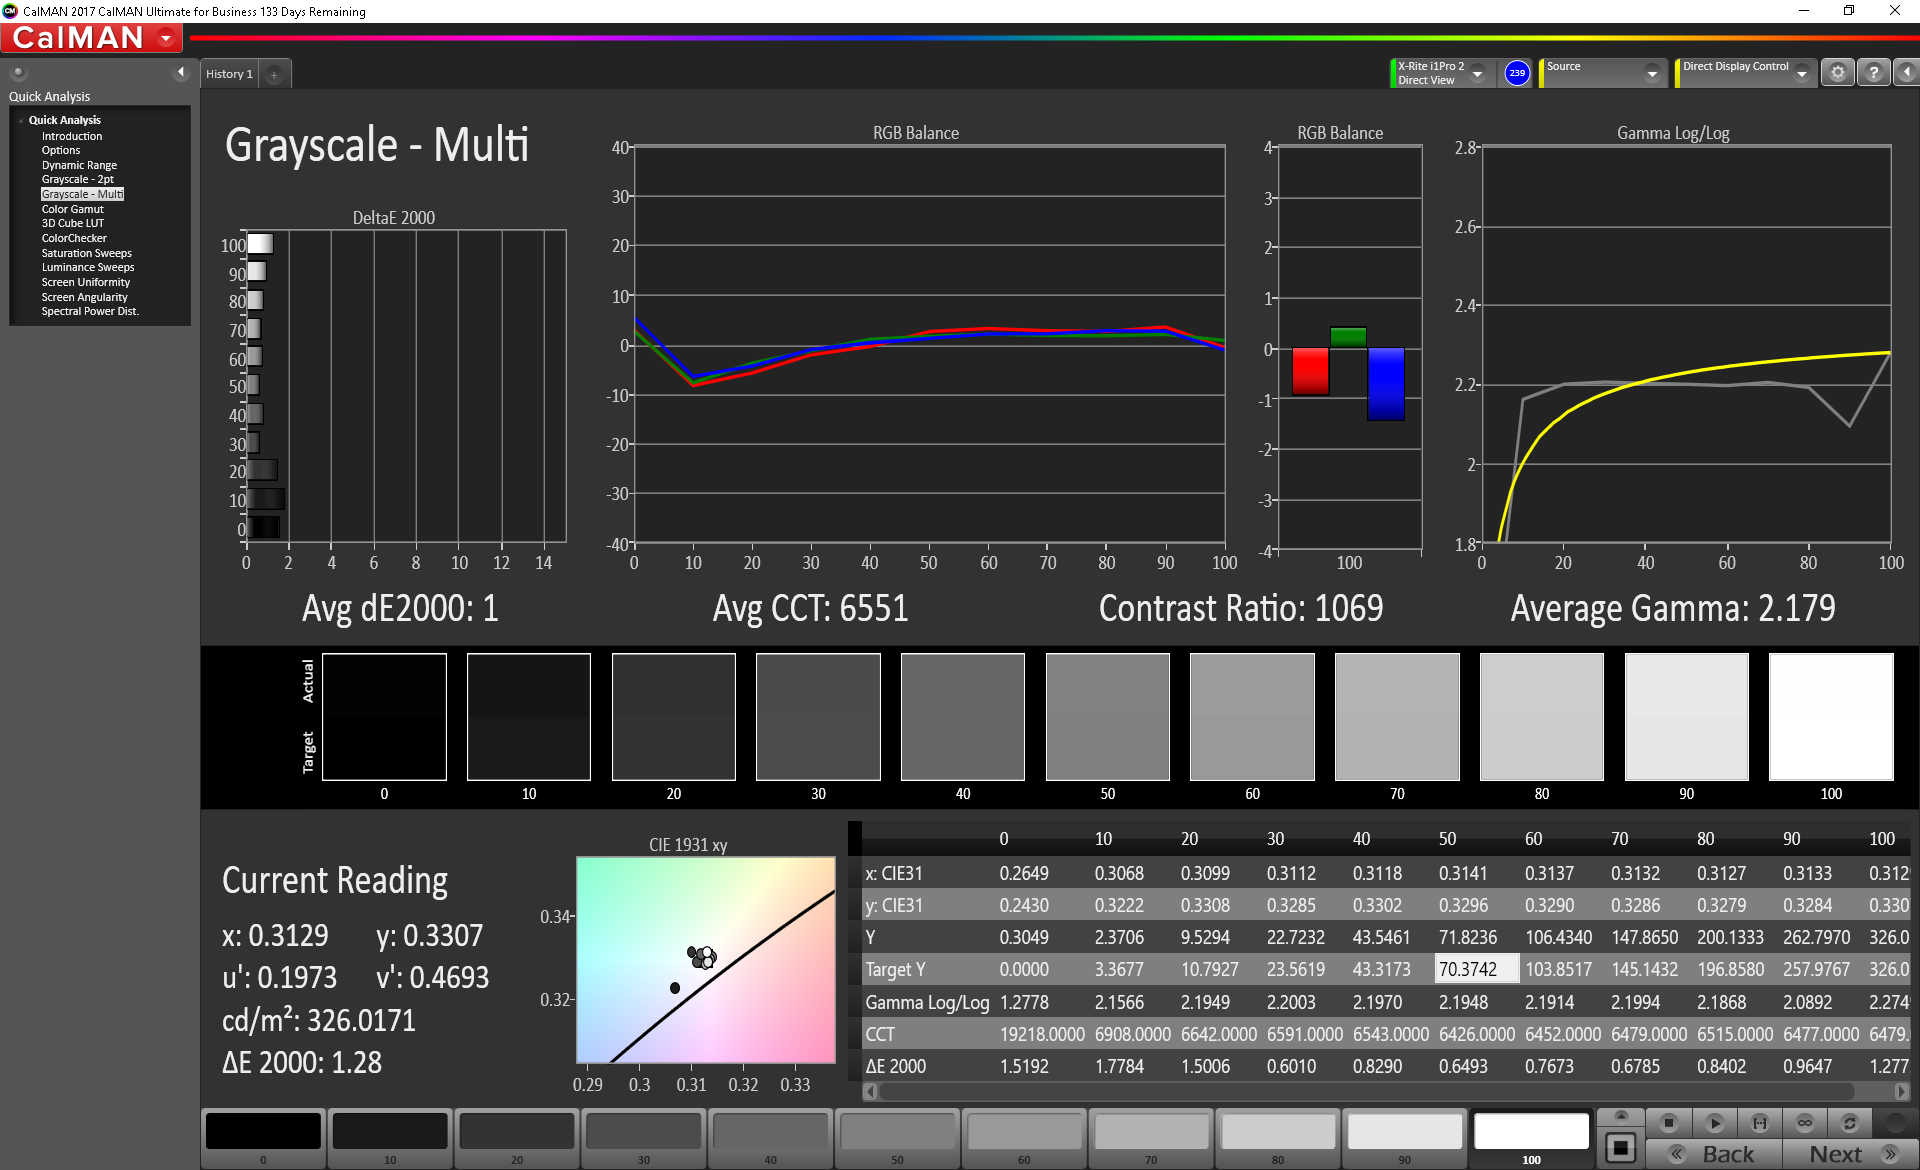
ΔE Greyscale Calman: 4.5 | ∀{0.09-98 Ø5}
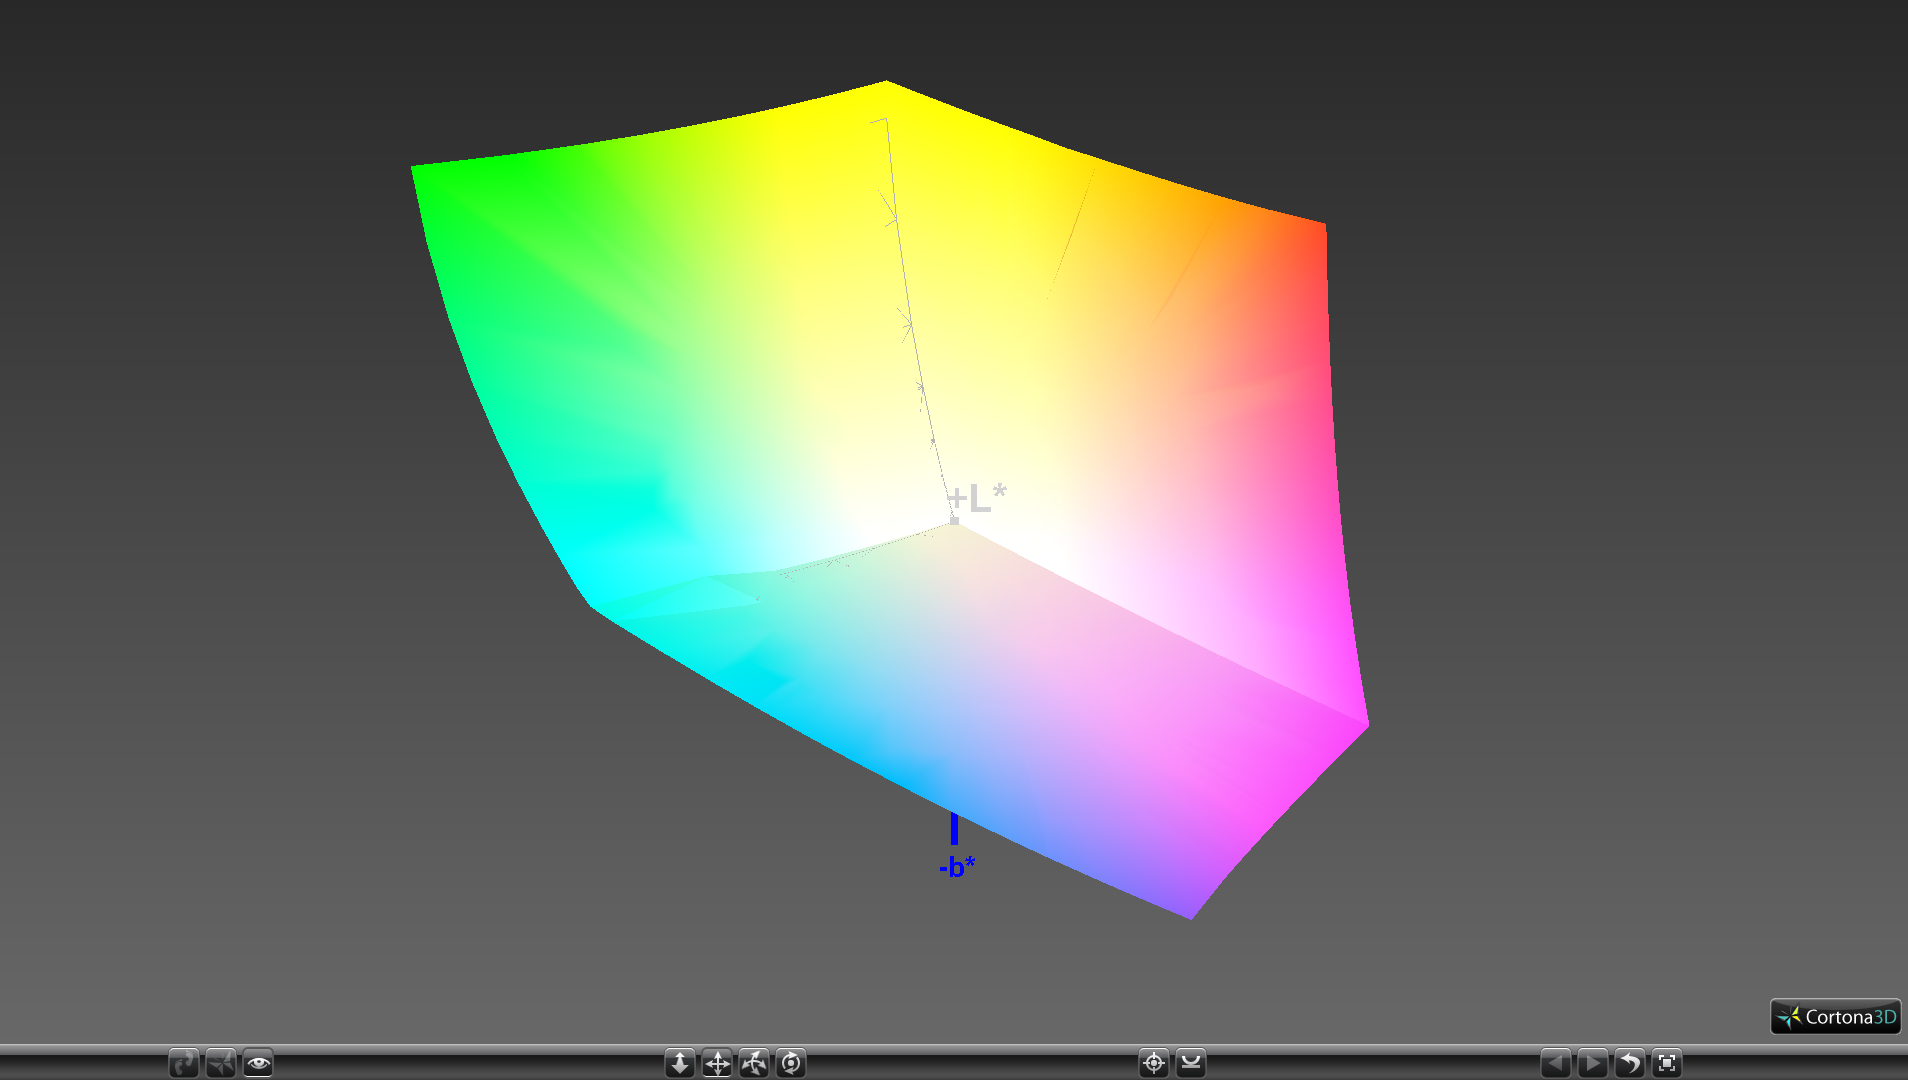
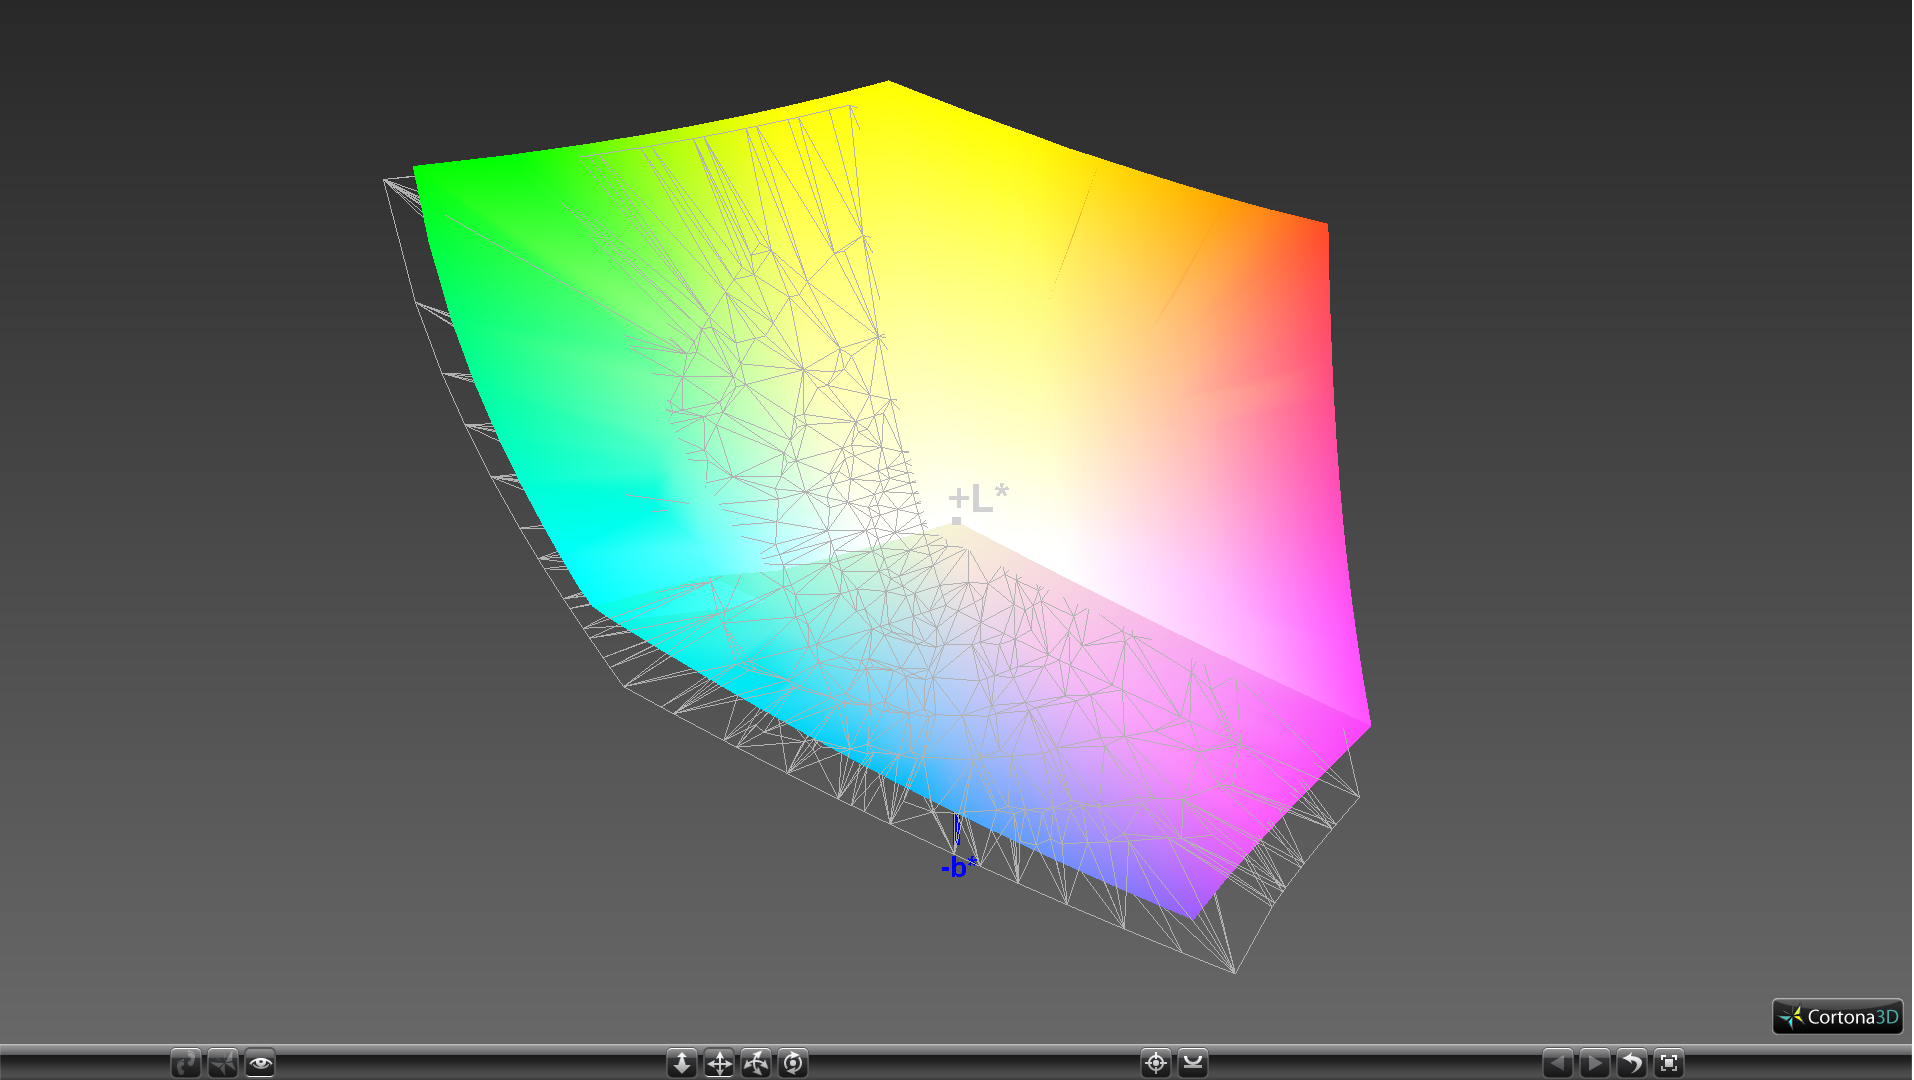
100% sRGB (Argyll 1.6.3 3D)
88% AdobeRGB 1998 (Argyll 1.6.3 3D)
98.9% AdobeRGB 1998 (Argyll 3D)
99.9% sRGB (Argyll 3D)
86% Display P3 (Argyll 3D)
Gamma: 2.34
CCT: 6384 K
| Eurocom Sky X7C AU Optronics B173ZAN01.0, IPS, 17.3", 3840x2160 | MSI GT75 8RG-090 Titan CMN N173HHE-G32 (CMN1747), TN, 17.3", 1920x1080 | Alienware 17 R3 (A17-9935) CV69H_173WF4 (LGD0459), IPS, 17.3", 1920x1080 | Asus Chimera G703GI B173HAN03.2 (AUO329D), IPS, 17.3", 1920x1080 | Aorus X7 DT v8 AU Optronics B173HAN03.0 (AUO309D), IPS, 17.3", 1920x1080 | Razer Blade Pro 2017 Sharp LQ173D1JW33 (SHP145A), IGZO, 17.3", 3840x2160 | |
|---|---|---|---|---|---|---|
| Display | -2% | -25% | -21% | -22% | 1% | |
| Display P3 Coverage (%) | 86 | 90.9 6% | 66.9 -22% | 65.8 -23% | 65.3 -24% | 88.9 3% |
| sRGB Coverage (%) | 99.9 | 100 0% | 83.9 -16% | 92.6 -7% | 91.2 -9% | 100 0% |
| AdobeRGB 1998 Coverage (%) | 98.9 | 86.2 -13% | 61.4 -38% | 67 -32% | 66.3 -33% | 99.7 1% |
| Response Times | 79% | 14% | 72% | 54% | -51% | |
| Response Time Grey 50% / Grey 80% * (ms) | 38.4 ? | 8 ? 79% | 33 ? 14% | 6.4 ? 83% | 18 ? 53% | 60.8 ? -58% |
| Response Time Black / White * (ms) | 26.8 ? | 5.6 ? 79% | 23 ? 14% | 10.8 ? 60% | 12 ? 55% | 38.4 ? -43% |
| PWM Frequency (Hz) | 26000 ? | 204.9 ? | ||||
| Screen | 22% | -3% | 19% | 21% | 1% | |
| Brightness middle (cd/m²) | 333 | 240 -28% | 360 8% | 285 -14% | 297 -11% | 230 -31% |
| Brightness (cd/m²) | 330 | 248 -25% | 336 2% | 275 -17% | 281 -15% | 207 -37% |
| Brightness Distribution (%) | 88 | 83 -6% | 90 2% | 82 -7% | 84 -5% | 83 -6% |
| Black Level * (cd/m²) | 0.4 | 0.22 45% | 0.44 -10% | 0.22 45% | 0.23 43% | 0.2 50% |
| Contrast (:1) | 833 | 1091 31% | 818 -2% | 1295 55% | 1291 55% | 1150 38% |
| Colorchecker dE 2000 * | 5.87 | 2.14 64% | 4.76 19% | 3.18 46% | 2.19 63% | 5.62 4% |
| Colorchecker dE 2000 max. * | 9.74 | 5.04 48% | 10.8 -11% | 5.99 39% | 4.81 51% | 10.24 -5% |
| Colorchecker dE 2000 calibrated * | 4.59 | 1.54 66% | 1.73 62% | |||
| Greyscale dE 2000 * | 4.5 | 1.62 64% | 3.69 18% | 2.93 35% | 1.31 71% | 4.54 -1% |
| Gamma | 2.34 94% | 2.28 96% | 2.24 98% | 2.45 90% | 2.42 91% | 2.36 93% |
| CCT | 6384 102% | 6846 95% | 6091 107% | 7165 91% | 6464 101% | 6625 98% |
| Color Space (Percent of AdobeRGB 1998) (%) | 88 | 77 -12% | 55 -37% | 60 -32% | 59 -33% | 88 0% |
| Color Space (Percent of sRGB) (%) | 100 | 100 0% | 84 -16% | 93 -7% | 91 -9% | 100 0% |
| Total Average (Program / Settings) | 33% /
25% | -5% /
-5% | 23% /
18% | 18% /
17% | -16% /
-6% |
* ... smaller is better
Color space covers the entirety of sRGB and approximately 88 percent of AdobeRGB to appeal to professional graphic artists. Even subjectively, colors appear much deeper and clearer than on budget or mainstream Ultrabooks.
Further measurements with a X-Rite spectrophotometer reveal average grayscale and colors. Our attempts to calibrate the display result in improved grayscale levels, but colors are still inaccurate against the sRGB standard. The panel is clearly able to reproduce the entire sRGB spectrum and so additional calibration may be required to get the most out of the display. Eurocom offers individually calibrated ICC profiles against the AdobeRGB standard for an additional charge.
Display Response Times
| ↔ Response Time Black to White | ||
|---|---|---|
| 26.8 ms ... rise ↗ and fall ↘ combined | ↗ 15.6 ms rise | 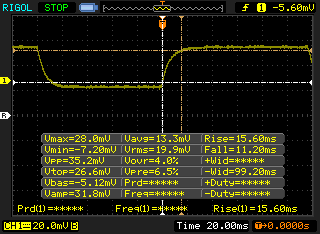 |
| ↘ 11.2 ms fall | ||
| The screen shows relatively slow response rates in our tests and may be too slow for gamers. In comparison, all tested devices range from 0.1 (minimum) to 240 (maximum) ms. » 66 % of all devices are better. This means that the measured response time is worse than the average of all tested devices (20.1 ms). | ||
| ↔ Response Time 50% Grey to 80% Grey | ||
| 38.4 ms ... rise ↗ and fall ↘ combined | ↗ 18 ms rise | 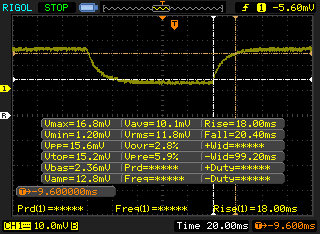 |
| ↘ 20.4 ms fall | ||
| The screen shows slow response rates in our tests and will be unsatisfactory for gamers. In comparison, all tested devices range from 0.165 (minimum) to 636 (maximum) ms. » 57 % of all devices are better. This means that the measured response time is worse than the average of all tested devices (31.5 ms). | ||
Screen Flickering / PWM (Pulse-Width Modulation)
| Screen flickering / PWM not detected | 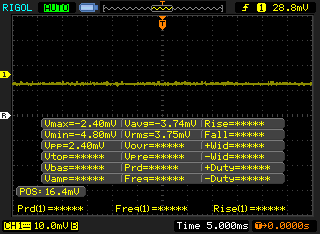 | ||
In comparison: 53 % of all tested devices do not use PWM to dim the display. If PWM was detected, an average of 8082 (minimum: 5 - maximum: 343500) Hz was measured. | |||
Outdoor visibility is average under shade but otherwise poor on a bright day due to unavoidable glare. Gaming laptops of this caliber are not designed to be used outdoors for extended periods. Viewing angles are very wide with no major shifts in color or contrast.
Performance
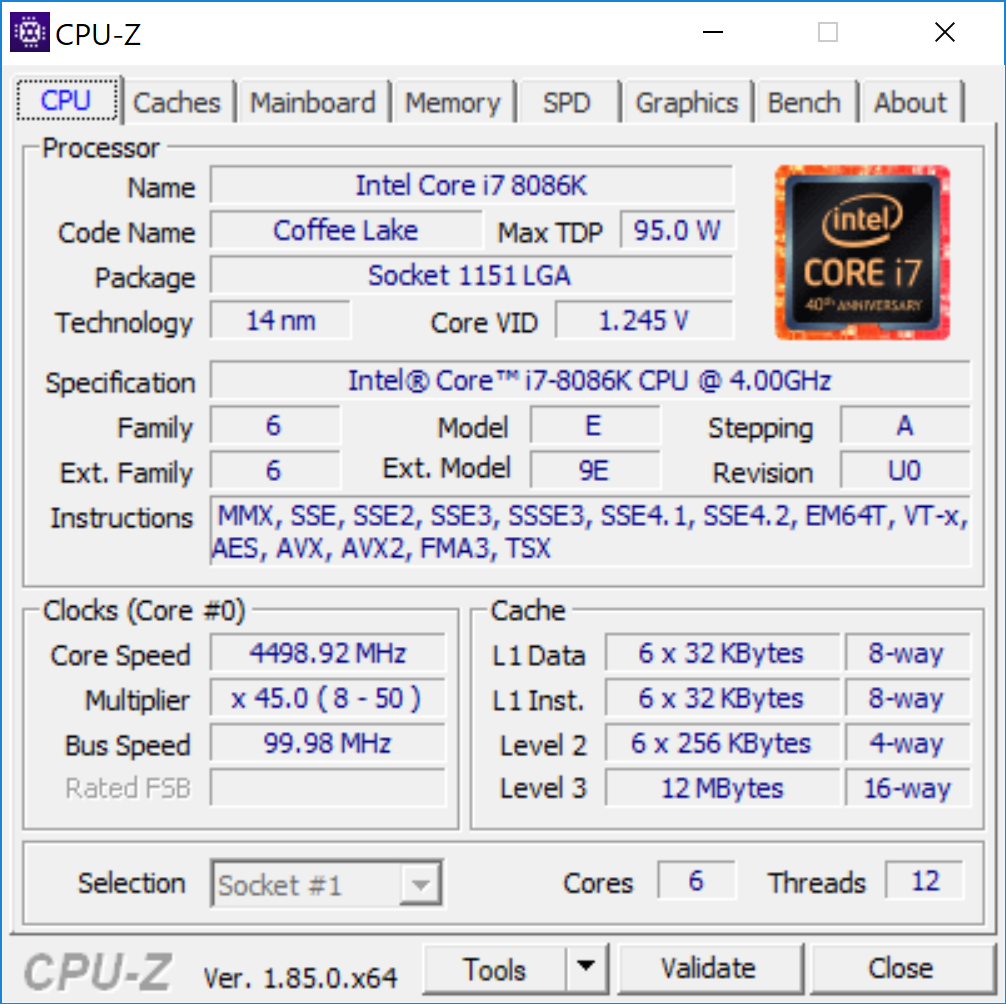
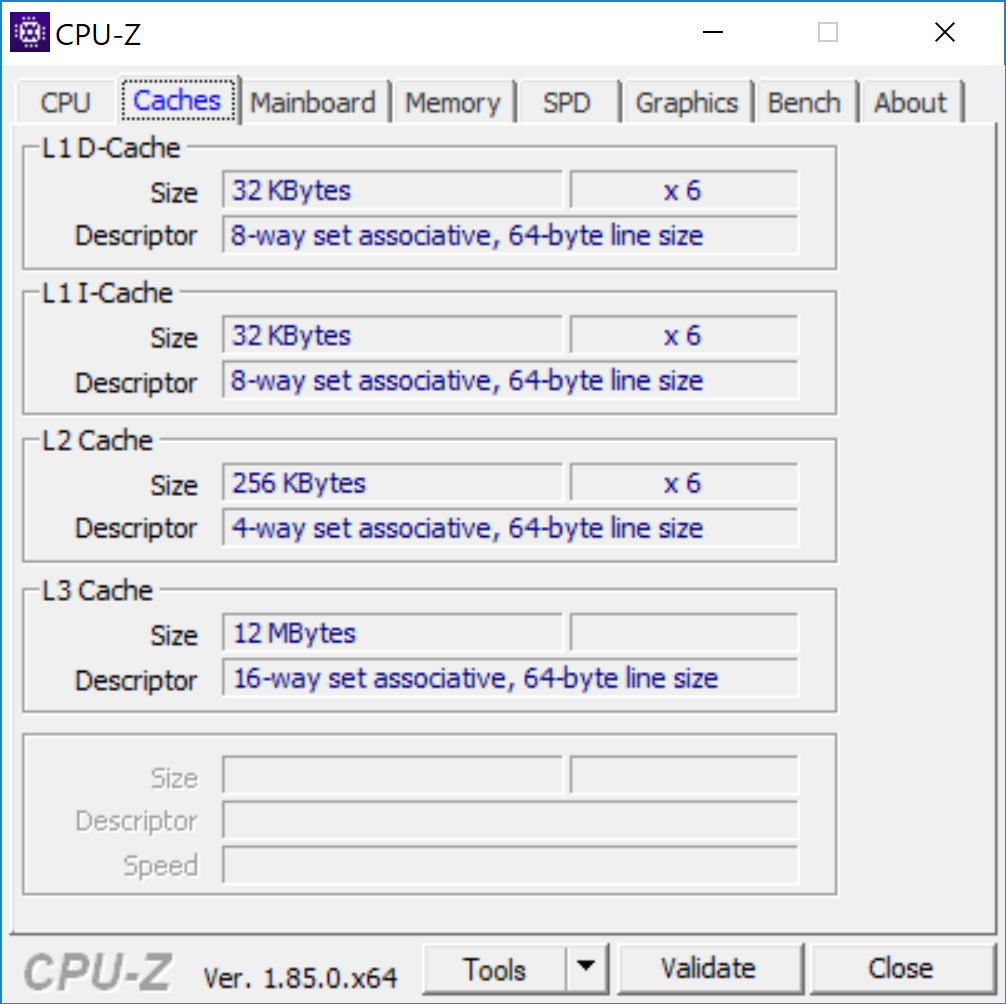
The defining feature of the Sky X7C is its hexa-core Core i7-8086K desktop CPU. This processor promises to be 300 MHz faster than the Core i7-8700K in both base clock rate (4.0 GHz vs. 3.7 GHz) and Turbo Boost clock rate (5.0 GHz vs. 4.7 GHz) with integrated vPro features. Both CPUs are otherwise identical in cache (12 MB), TDP (95 W), and socket type (FCLGA 1151). The integrated UHD Graphics 630 GPU is disabled in order to offer G-Sync.
It's important to note that the performance tests below were performed on the stock version of Clevo Control Center and Nvidia driver version 398.11 unless otherwise stated.
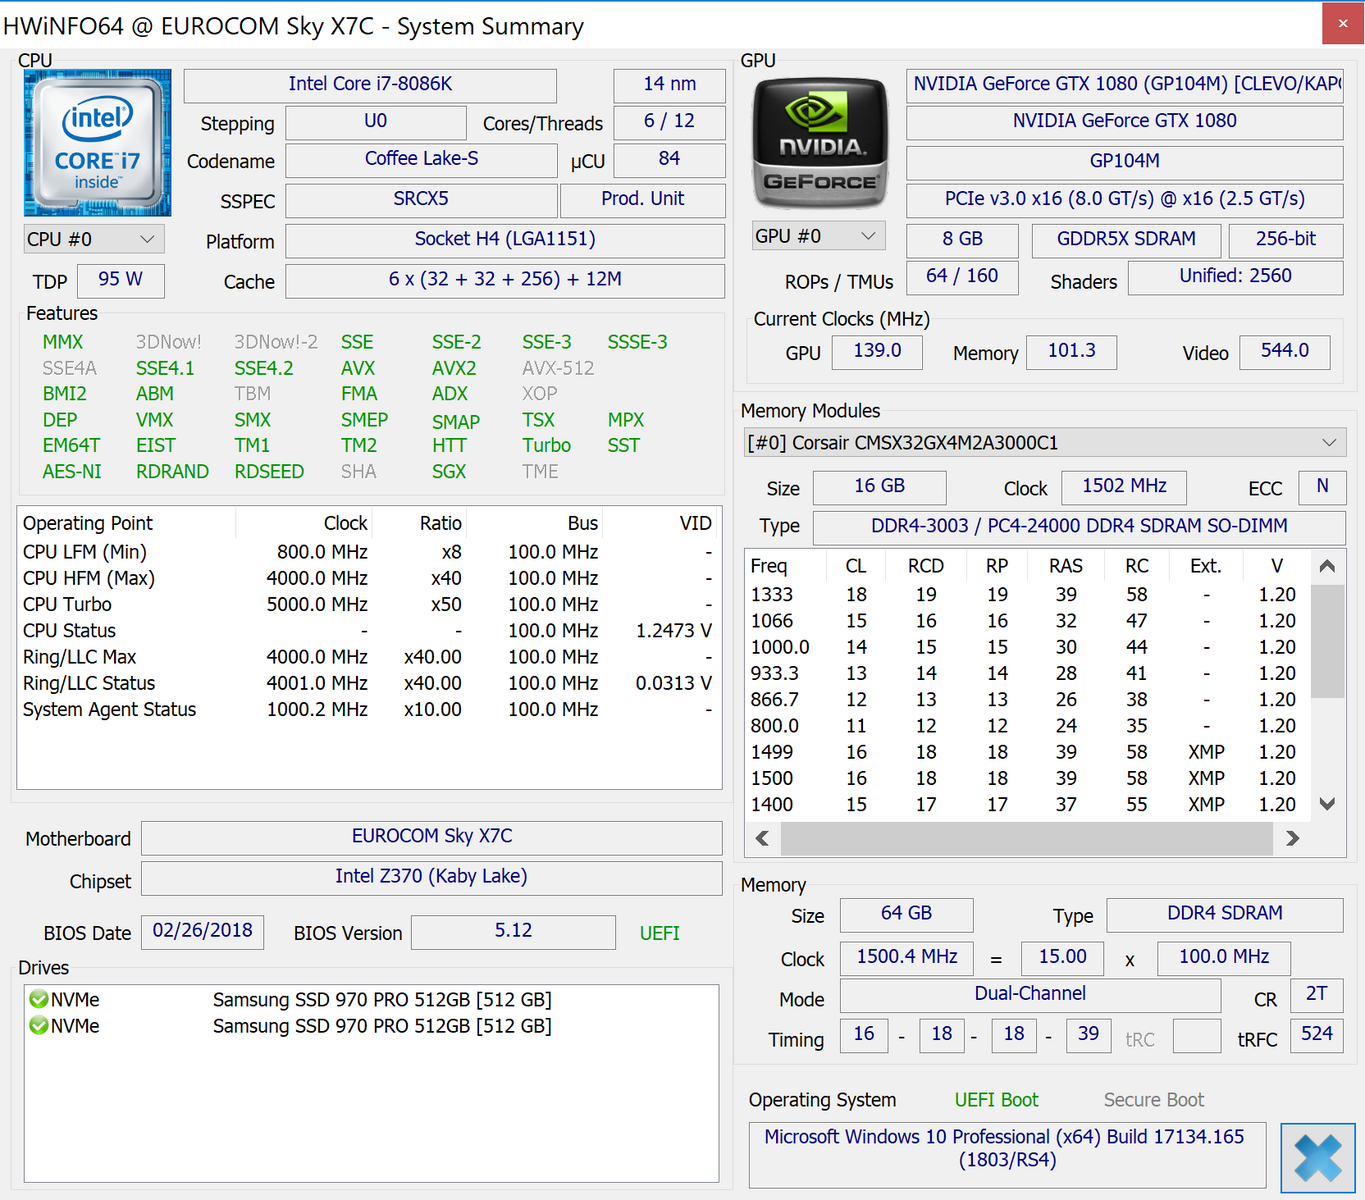
Processor
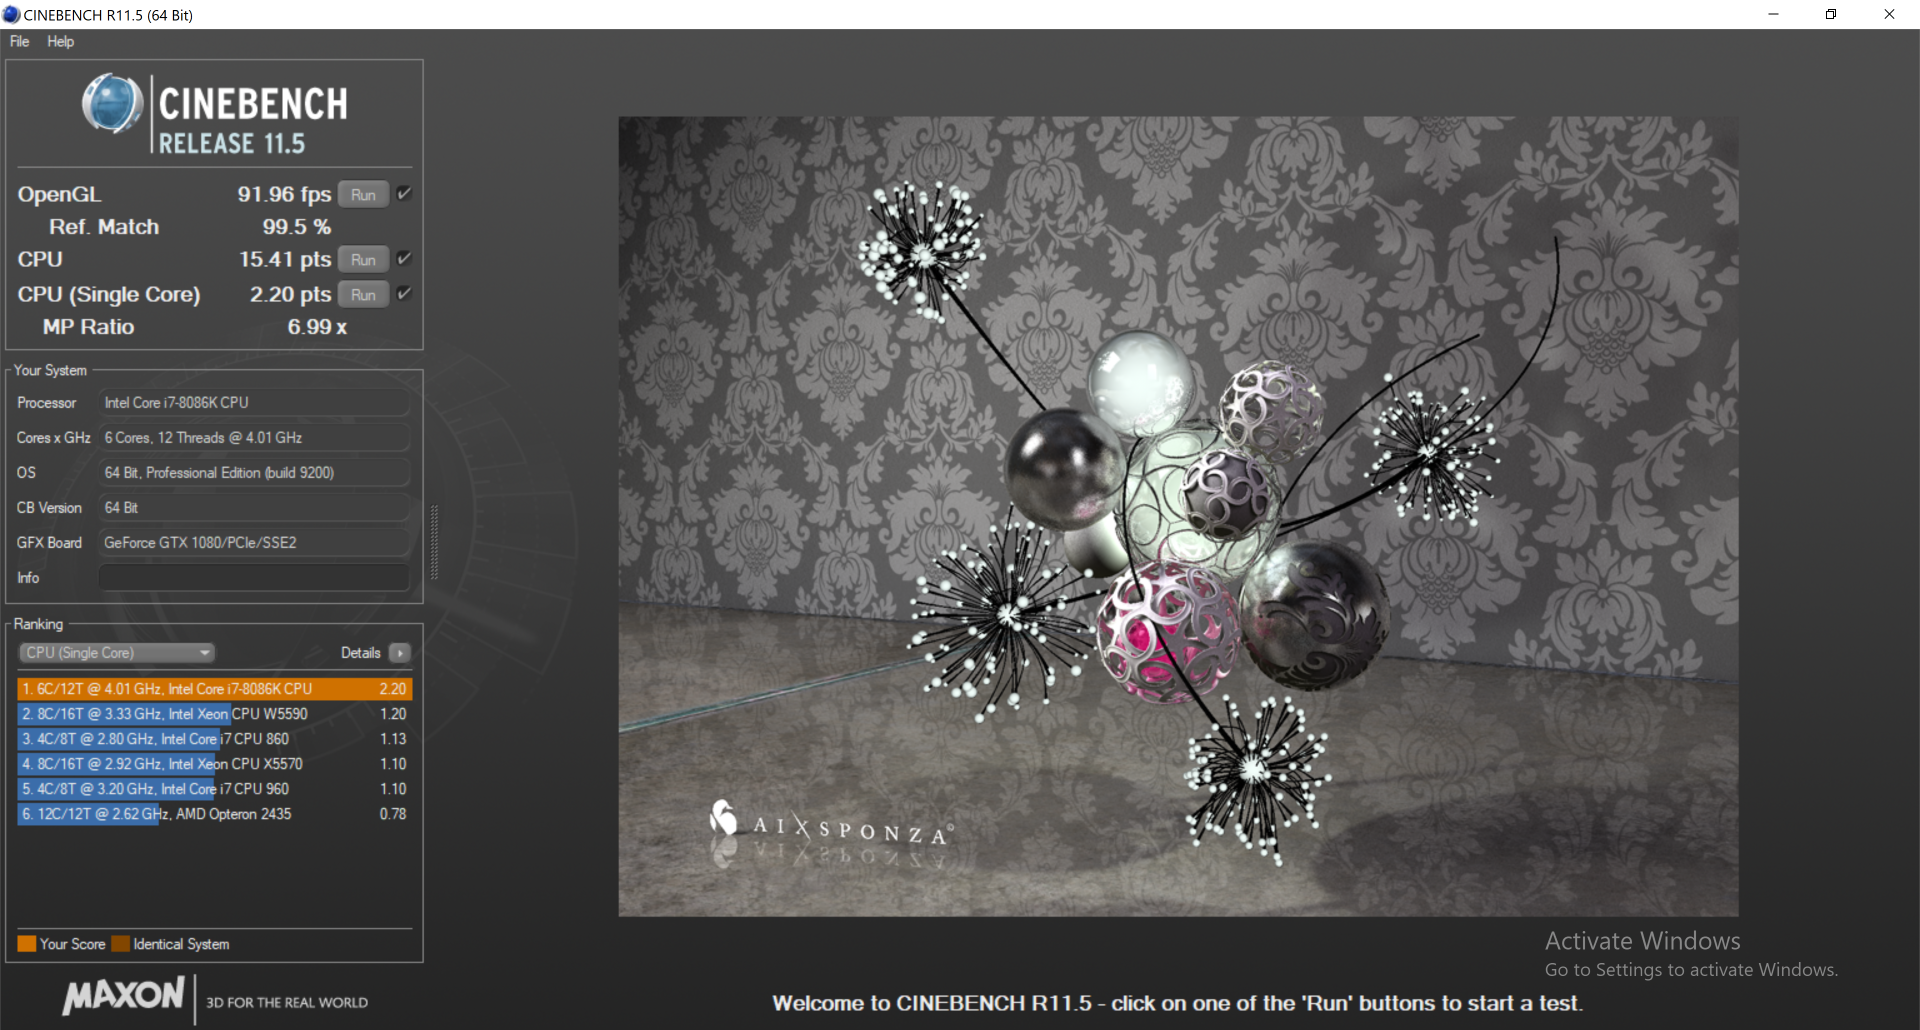
CPU performance is one of the highest in our database. The Core i7-8750H as found on most newer high-end gaming laptops is about 15 to 25 percent slower than our i7-8086K according to CineBench benchmarks. When compared to the i7-8700K, however, expect only a 5 to 10 percent performance boost. The vaunted Core i9-8950HK is also merely just a few percentage points behind.
Turbo Boost potential is poor. Running CineBench R15 Multi-Thread in a loop results in an initial high score of 1407 points before falling to around 1350 points. The small 4 percent drop is very minor especially for gaming purposes.
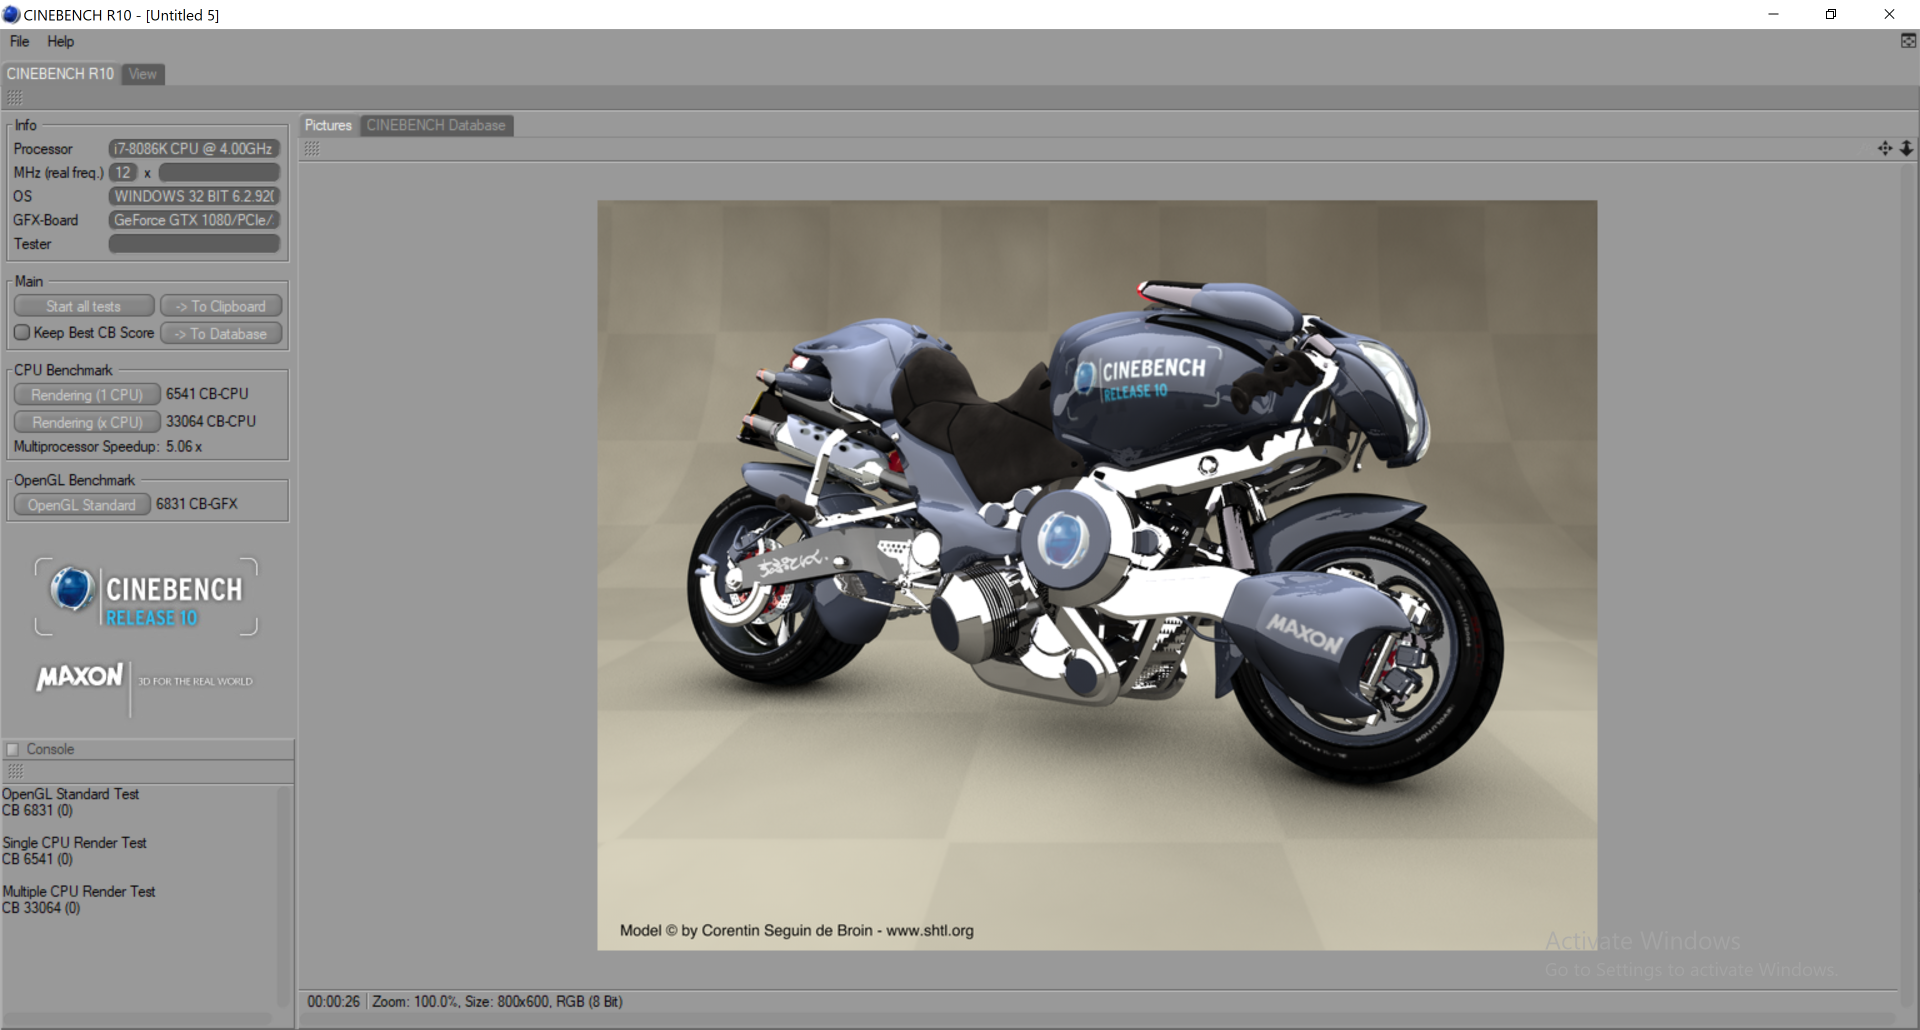
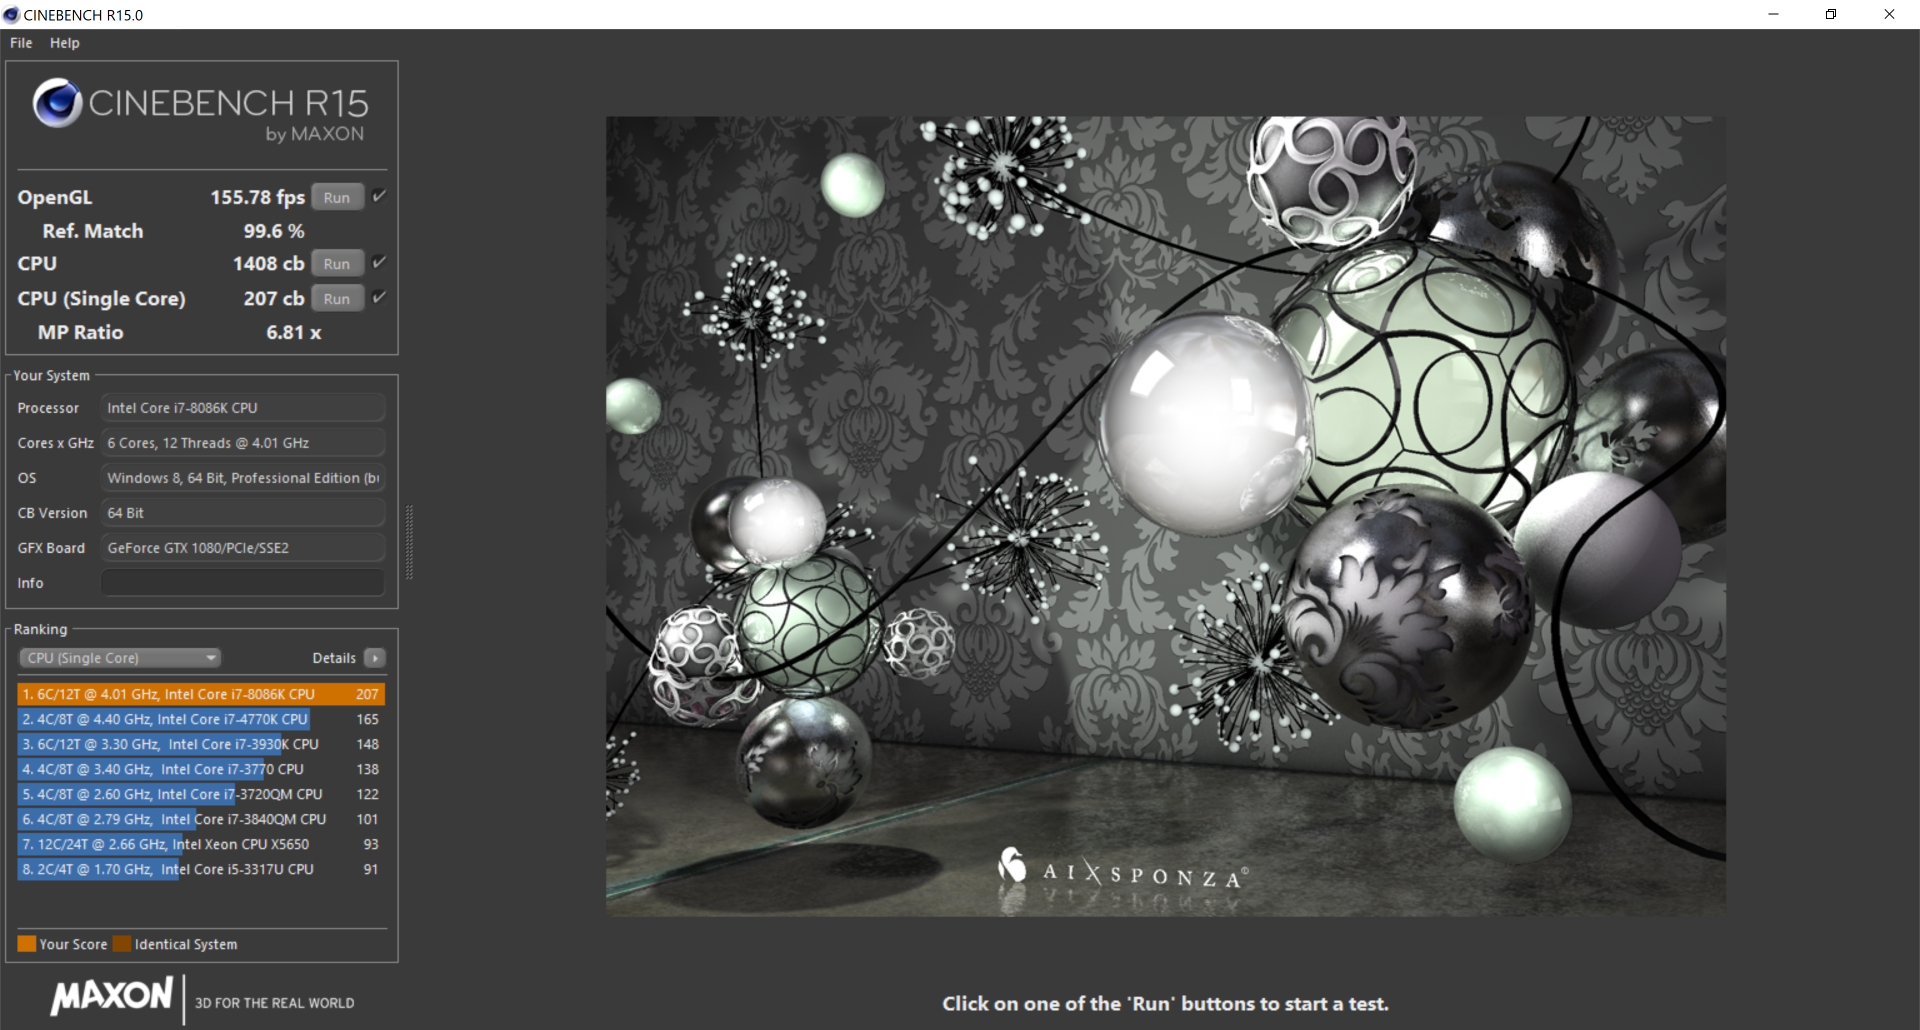
| Cinebench R10 | |
| Rendering Multiple CPUs 32Bit | |
| no name | |
| Eurocom Sky X9C | |
| Aorus X9 DT | |
| Eurocom Sky X7C | |
| Asus GL702ZC-GC104T | |
| Eurocom Tornado F5 | |
| Asus ROG Strix GL702VI-WB74 | |
| MSI GV62 8RE-016US | |
| Aorus X5S v5 | |
| Rendering Single 32Bit | |
| Eurocom Sky X9C | |
| no name | |
| Eurocom Tornado F5 | |
| Aorus X9 DT | |
| Eurocom Sky X7C | |
| MSI GV62 8RE-016US | |
| Asus ROG Strix GL702VI-WB74 | |
| Aorus X5S v5 | |
| Asus GL702ZC-GC104T | |
| wPrime 2.10 - 1024m | |
| Asus ROG Strix GL702VI-WB74 | |
| Aorus X5S v5 | |
| MSI GV62 8RE-016US | |
| Eurocom Tornado F5 | |
| Eurocom Sky X7C | |
| no name | |
| Eurocom Sky X9C | |
* ... smaller is better
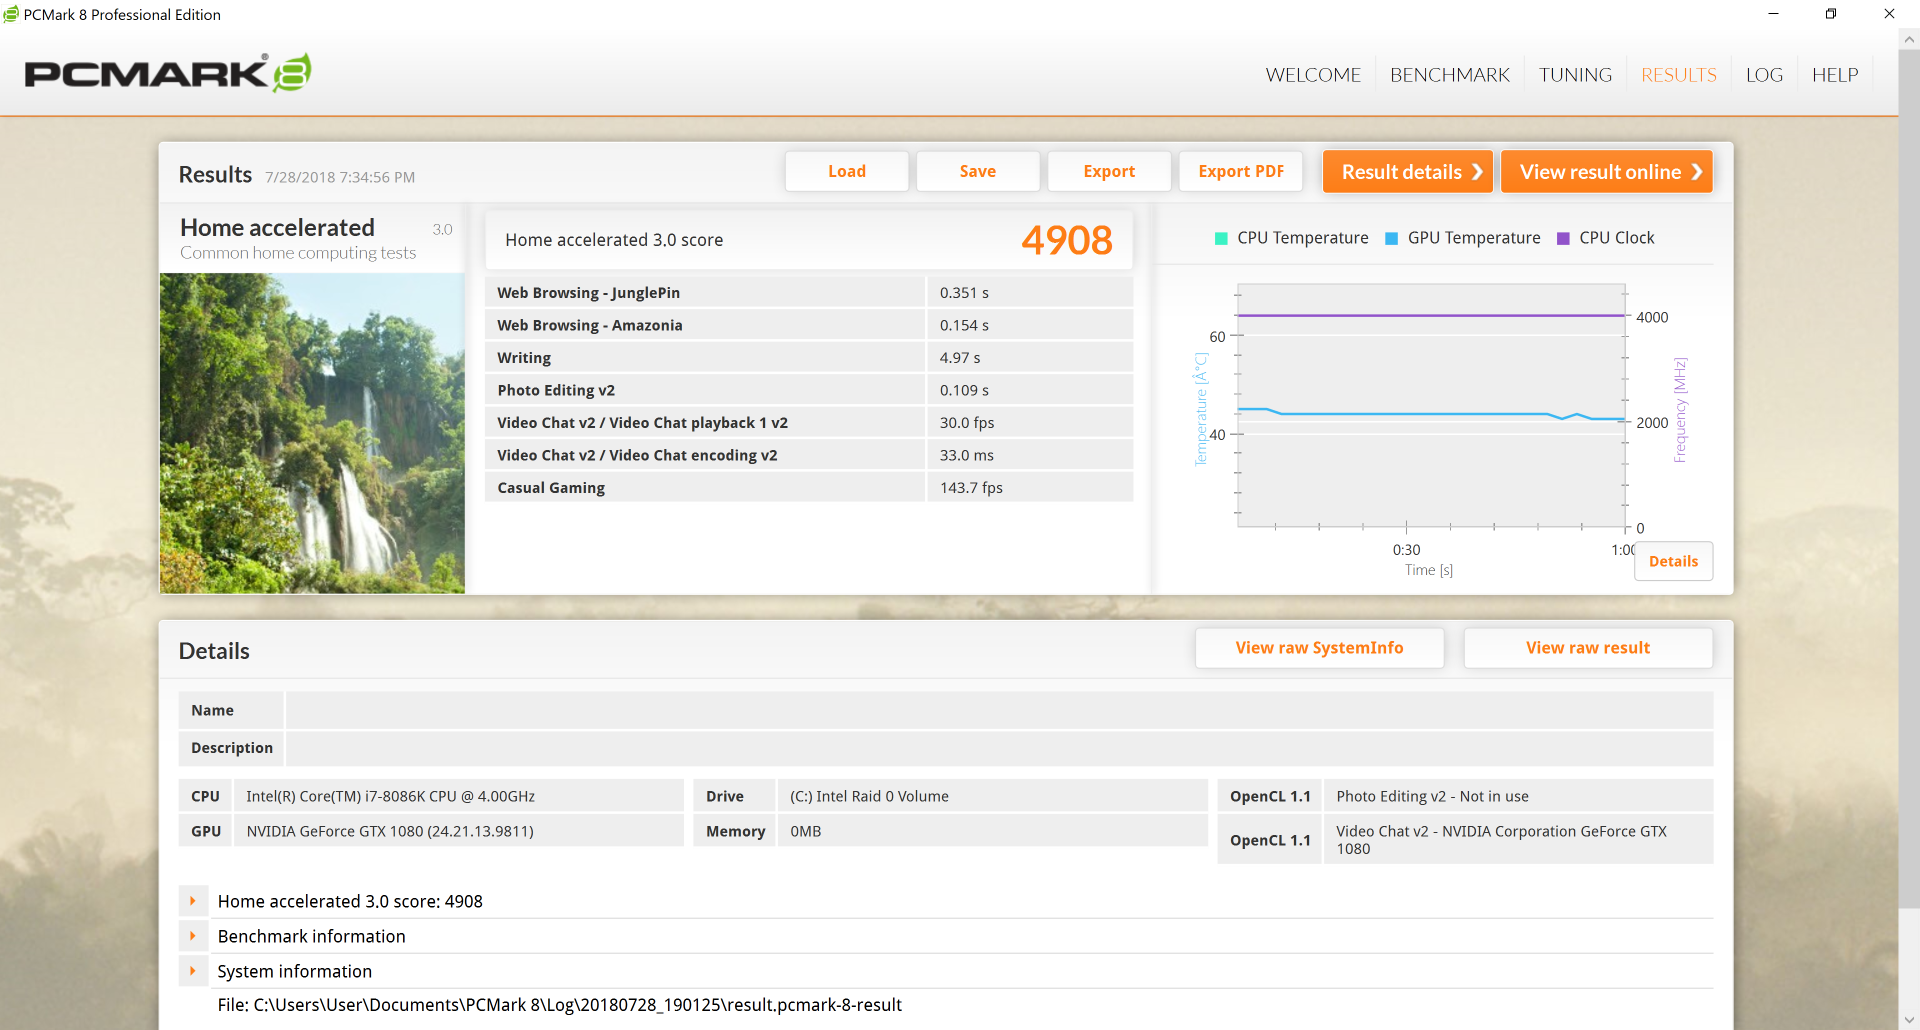
System Performance
PCMark benchmarks are within single-digit percentage points from competitors despite having the Core i7-8086K.
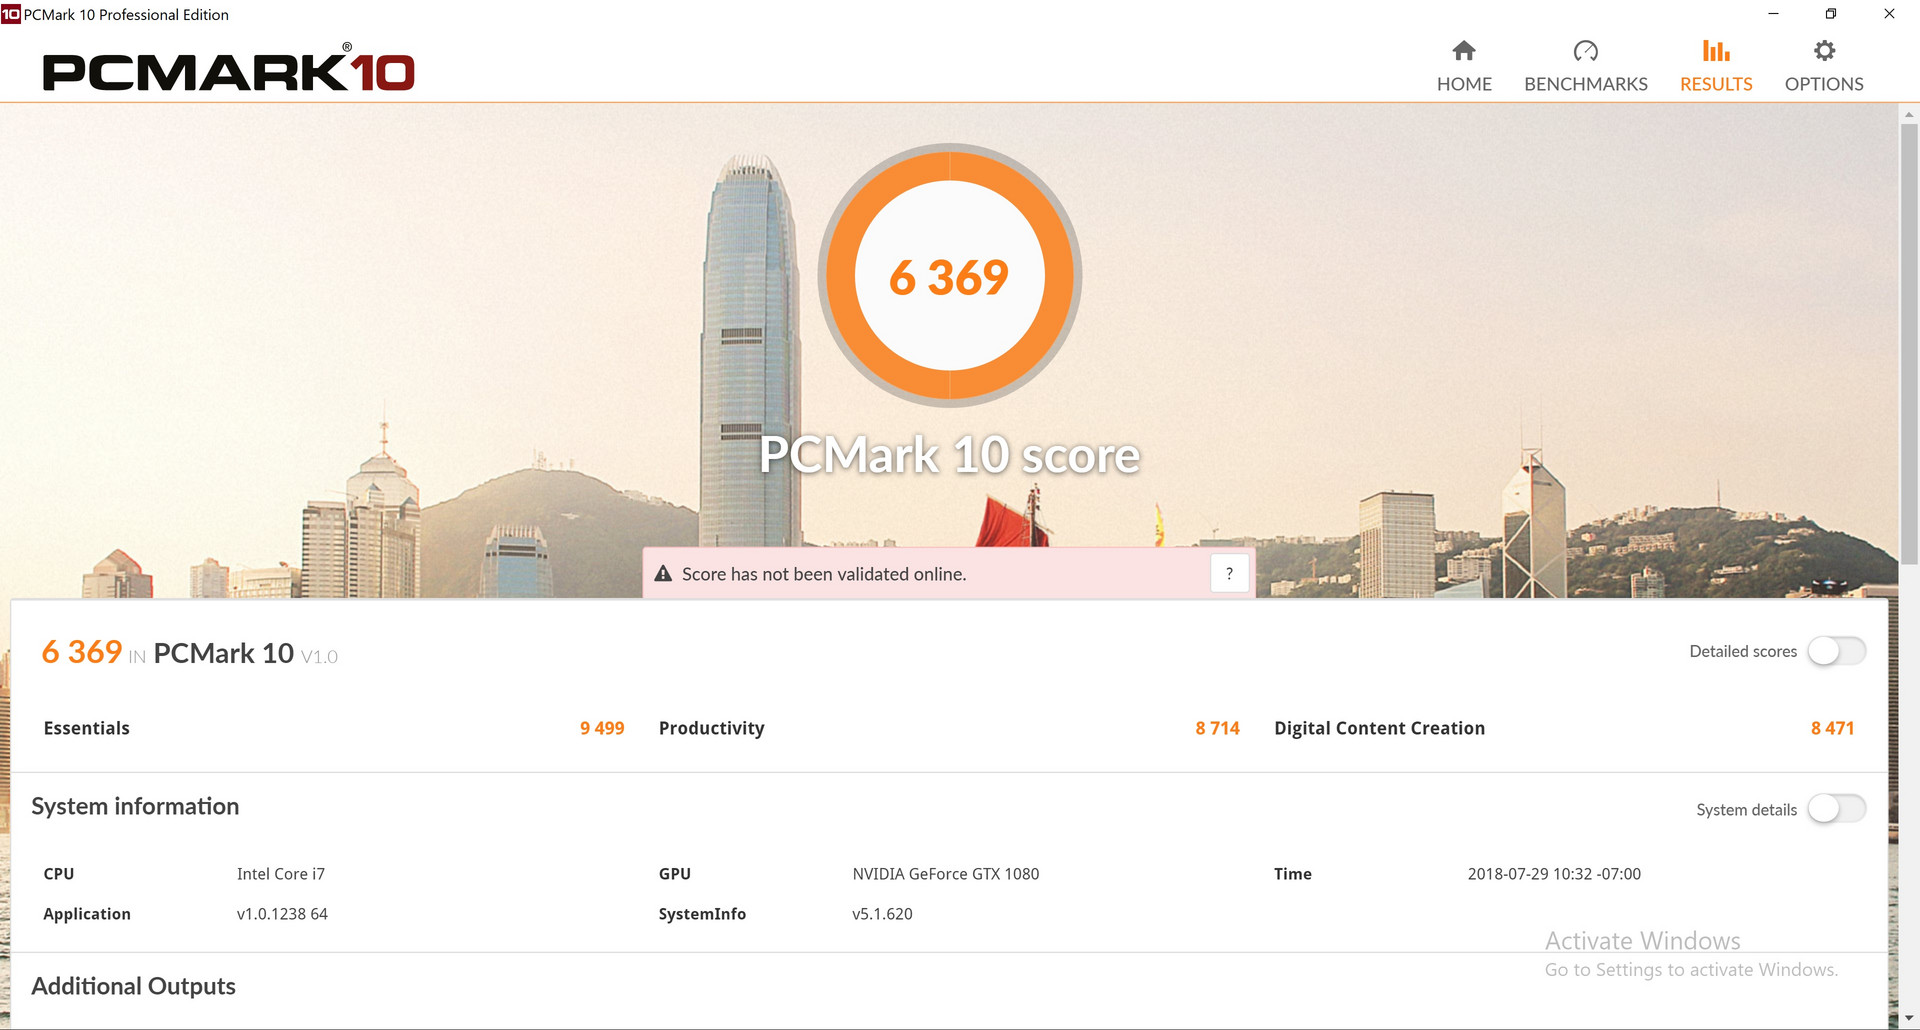
| PCMark 10 - Score | |
| Asus Chimera G703GI | |
| MSI GT75 8RG-090 Titan | |
| Eurocom Sky X9C | |
| Aorus X9 DT | |
| Eurocom Sky X7C | |
| Razer Blade Pro 2017 | |
| PCMark 8 - Home Score Accelerated v2 | |
| Asus Chimera G703GI | |
| Aorus X9 DT | |
| MSI GT75 8RG-090 Titan | |
| Eurocom Sky X9C | |
| Eurocom Sky X7C | |
| Razer Blade Pro 2017 | |
| PCMark 8 Home Score Accelerated v2 | 4908 points | |
| PCMark 10 Score | 6369 points | |
Help | ||
Storage Devices
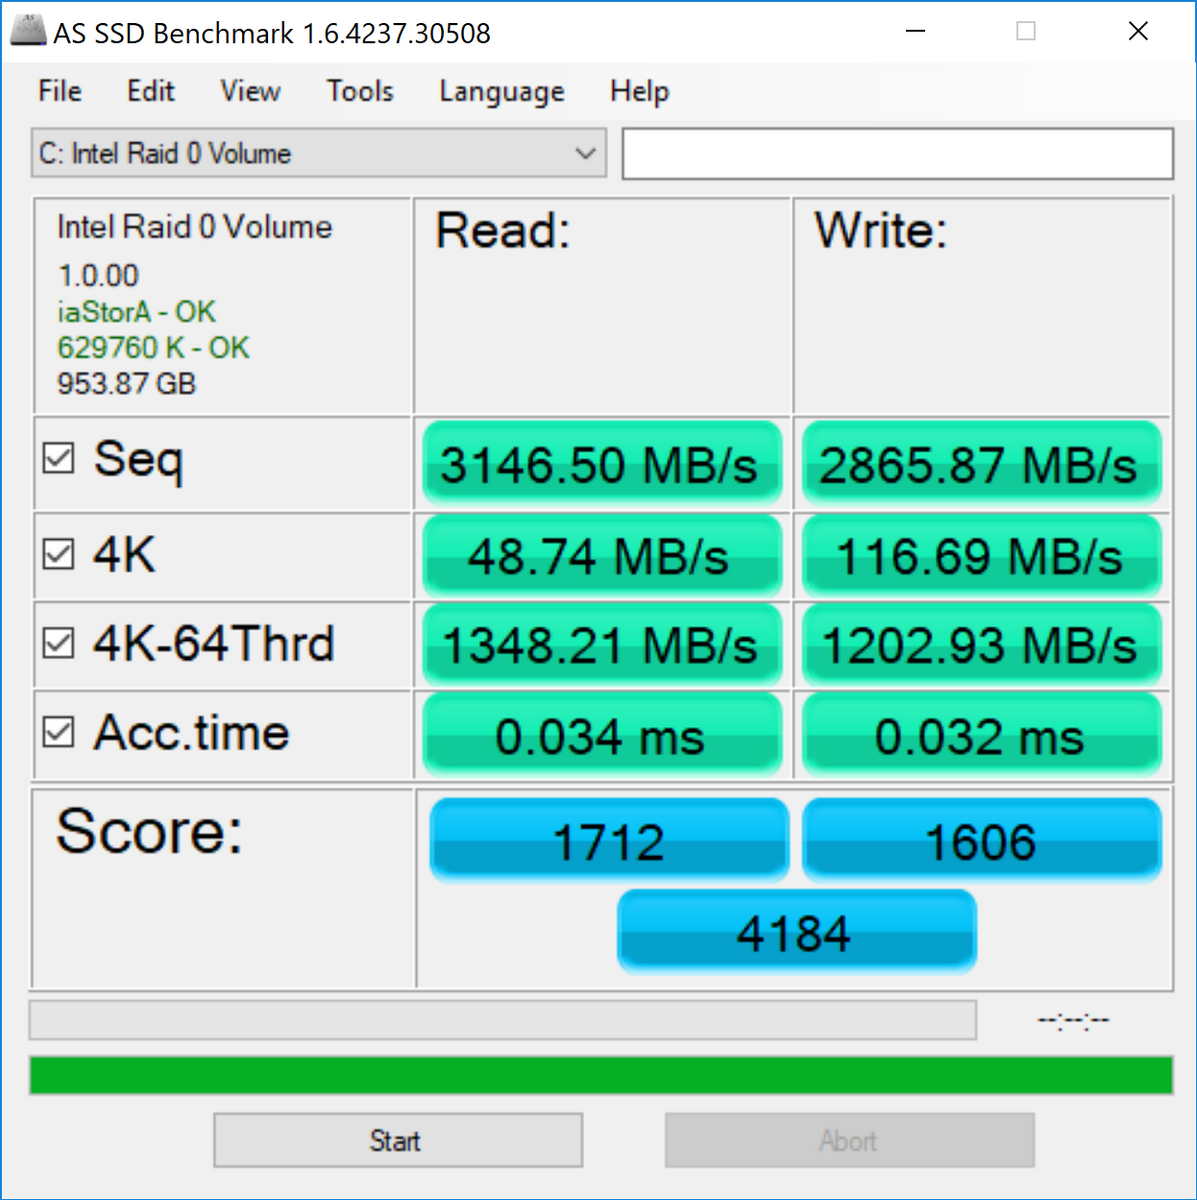
Up to four internal drives can be installed (2x M.2 2280 PCIe x4 + 2x 2.5-inch SATA III) with support for NVMe, RAID 0/1, and Intel Optane technology. Our specific review unit is equipped with two 1 TB Samsung SSD 970 Pro M.2 SSDs in RAID 0 configuration.
Sequential read and write rates are some of the fastest in our database with each topping out at 3000 to 3300 MB/s according to CrystalDiskMark. The write rate in particular is extremely fast as we rarely see it pass 3000 MB/s even when the SSDs are in RAID configuration. Performance is still slower than our Asus G703GI which utilizes 3 M.2 SSDs in RAID 0 for even faster sequential read and write rates.
See our table of HDDs and SSDs for more benchmark comparisons.
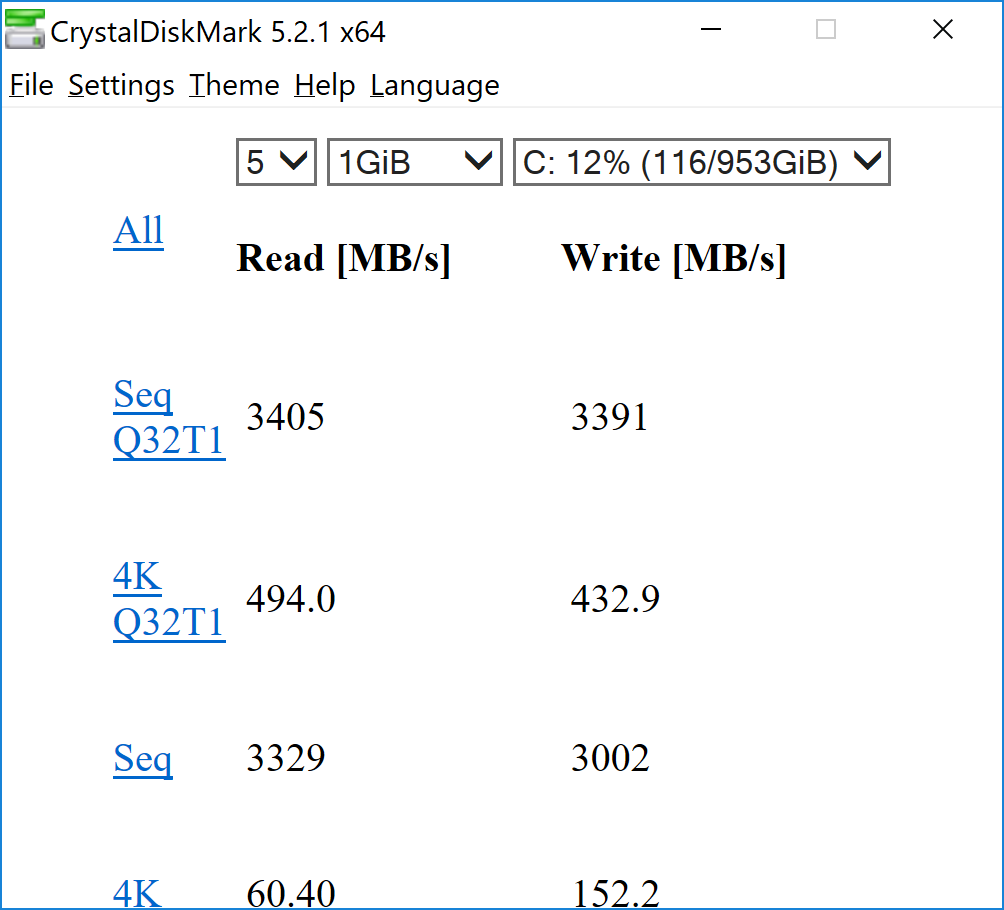
| Eurocom Sky X7C 2x Samsung SSD 970 Pro 512GB (RAID 0) | MSI GT75 8RG-090 Titan 2x Samsung PM961 MZVLW256HEHP (RAID 0) | Asus Chimera G703GI 2x Intel 760p 512 GB + 1x Samsung SM961 512 GB (RAID) | Aorus X7 DT v8 Toshiba NVMe THNSN5512GPU7 | Razer Blade Pro 2017 2x Samsung SSD PM951 MZVLV256HCHP (RAID 0) | Aorus X9 DT Transcend TS1TMTE850 | |
|---|---|---|---|---|---|---|
| CrystalDiskMark 5.2 / 6 | -20% | 30% | -43% | -28% | -45% | |
| Write 4K (MB/s) | 152.2 | 111.8 -27% | 130.2 -14% | 88.6 -42% | 124 -19% | 104.4 -31% |
| Read 4K (MB/s) | 60.4 | 42.09 -30% | 57.3 -5% | 30.76 -49% | 40.68 -33% | 35.69 -41% |
| Write Seq (MB/s) | 3002 | 2288 -24% | 4049 35% | 1340 -55% | 618 -79% | 1015 -66% |
| Read Seq (MB/s) | 3329 | 3321 0% | 5325 60% | 1362 -59% | 2446 -27% | 1283 -61% |
| Write 4K Q32T1 (MB/s) | 432.9 | 308.3 -29% | 383.2 -11% | 305.7 -29% | 554 28% | 308.9 -29% |
| Read 4K Q32T1 (MB/s) | 494 | 364.9 -26% | 424.9 -14% | 366.8 -26% | 627 27% | 371.9 -25% |
| Write Seq Q32T1 (MB/s) | 3391 | 2440 -28% | 4316 27% | 1562 -54% | 620 -82% | 1056 -69% |
| Read Seq Q32T1 (MB/s) | 3405 | 3485 2% | 8905 162% | 2414 -29% | 2228 -35% | 2204 -35% |

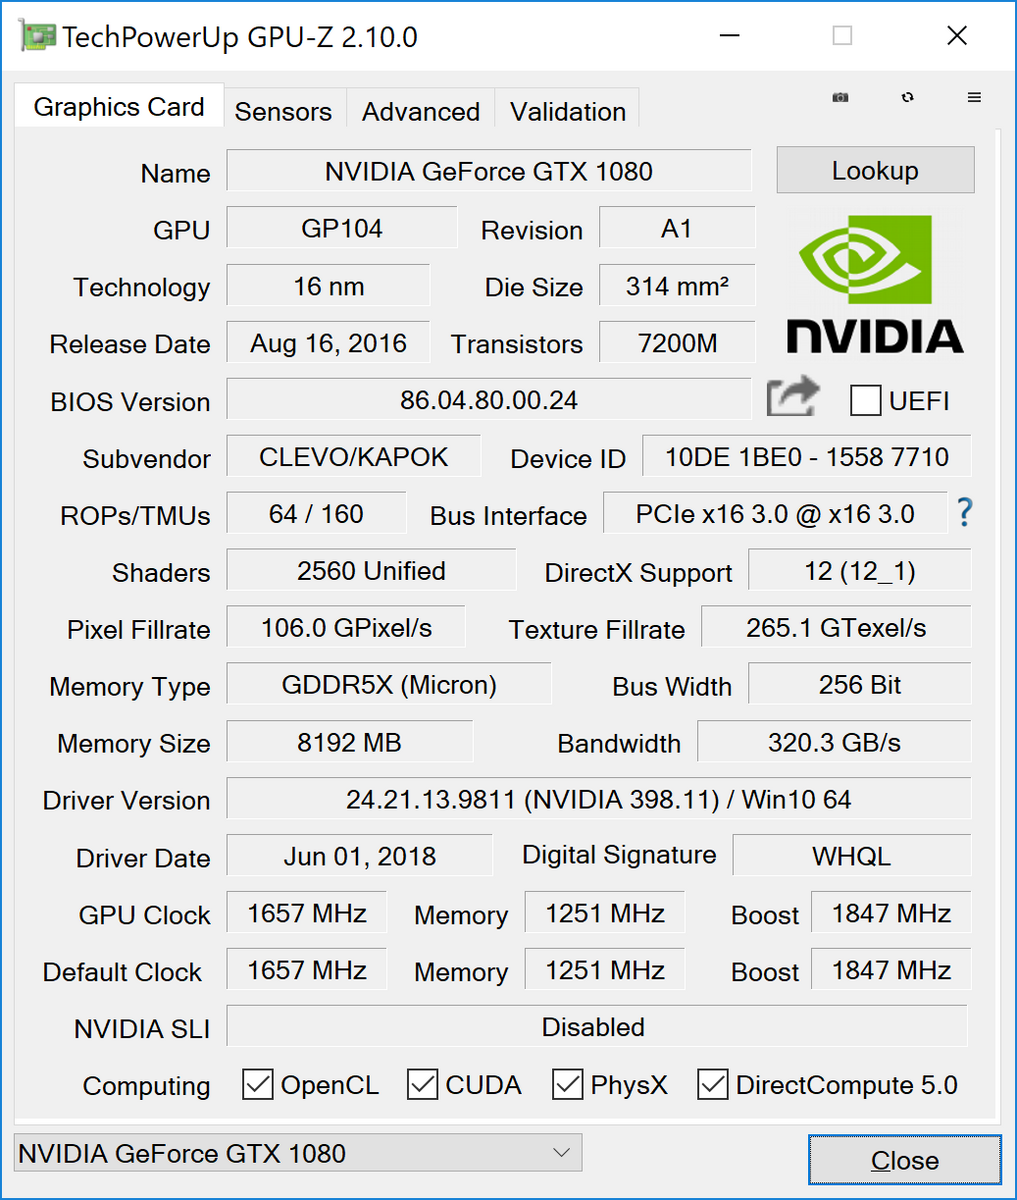
GPU Performance
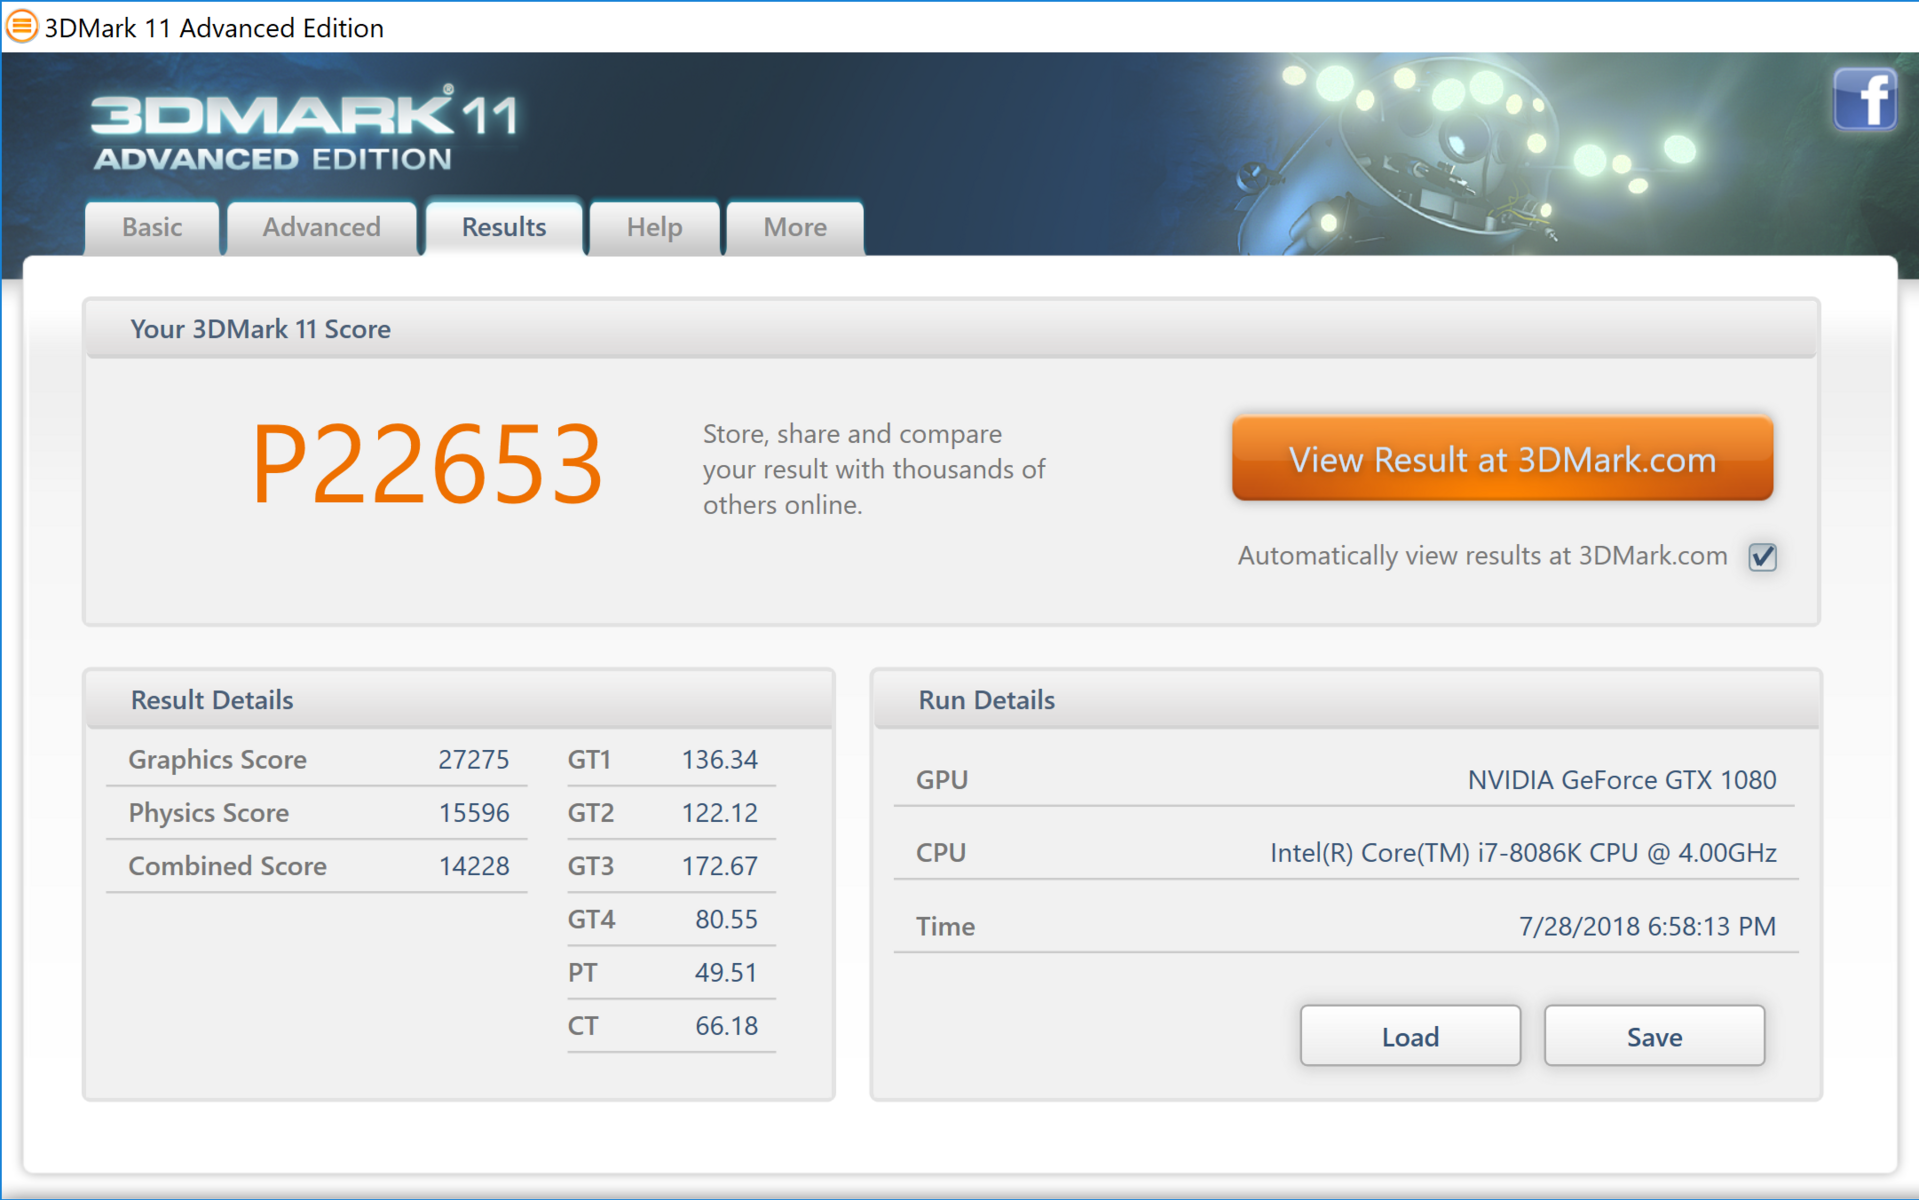
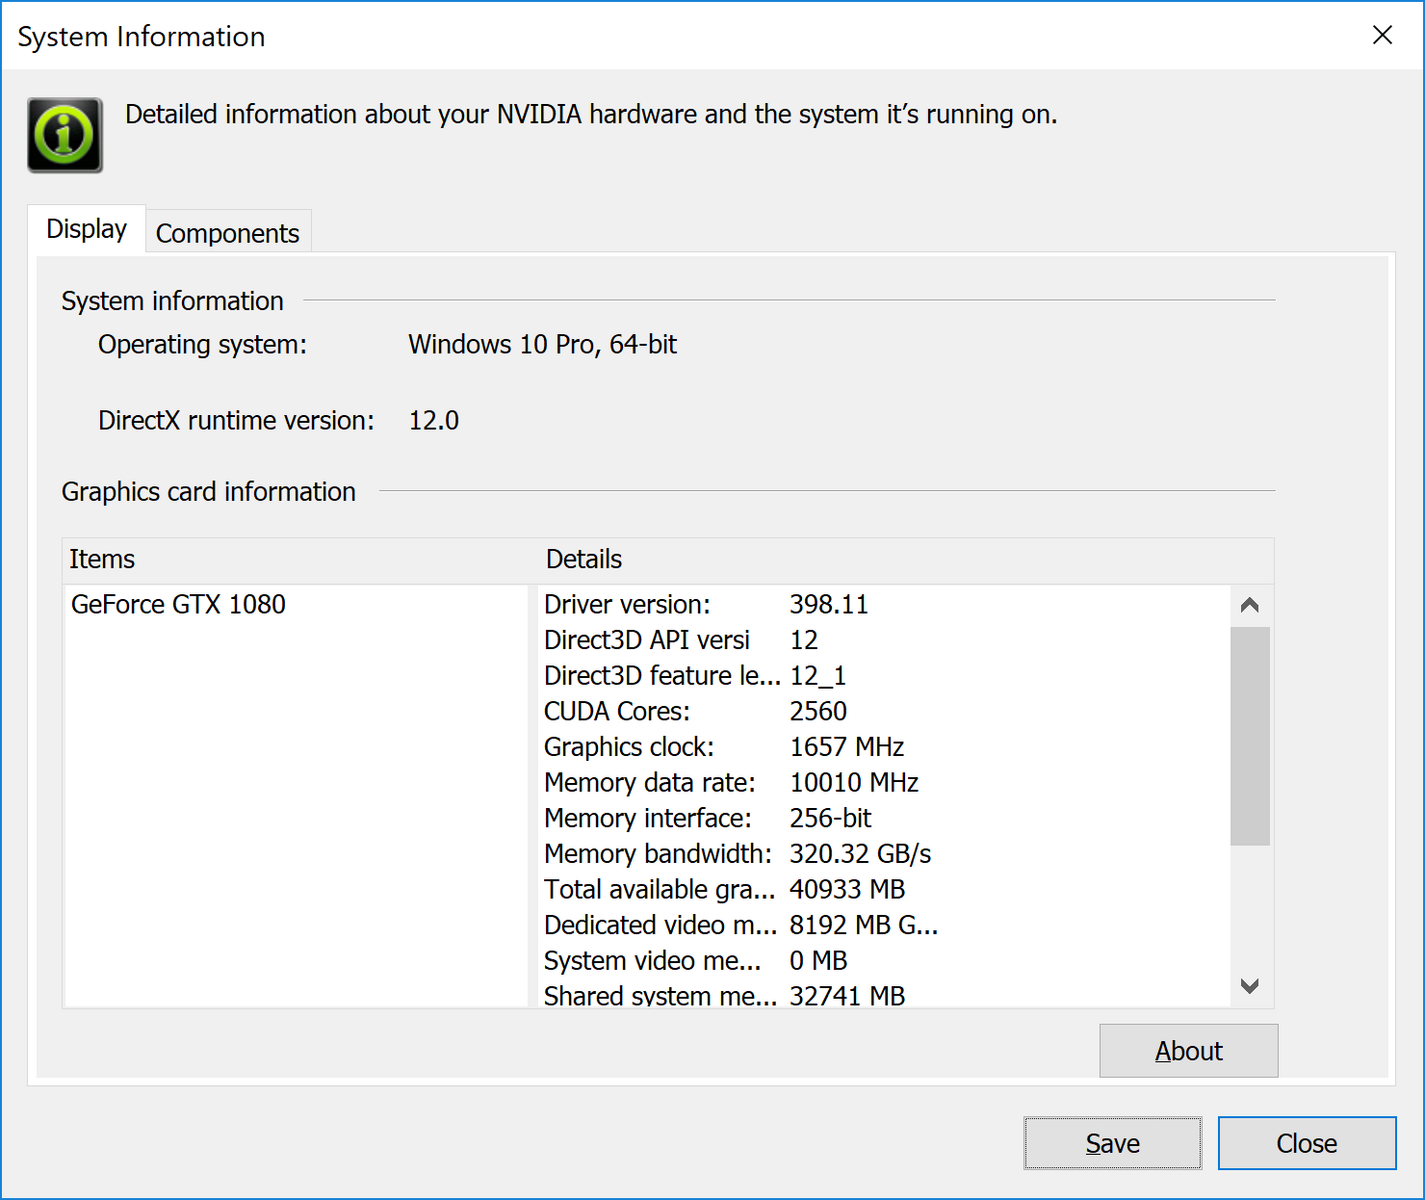
The GeForce GTX 1080 is performing where we expect it to be when compared to other GPUs in our database. The desktop GTX 1080 still provides about 15 to 20 percent more raw graphics power than the laptop variant.
Performance when gaming is below average for the GTX 1080 not unlike on the Eurocom Q8. Running Witcher 3 at 1080p and Ultra settings returns an average frame rate of 62 FPS compared to almost 80 FPS on the Alienware 17 R4, Asus G703, or Aorus X9 DT. The buggy Control Center is to blame as frame rates return to normal after disabling the Clevo software.
See our page on the GTX 1080 GPU for more technical information and gaming benchmark comparisons.
| 3DMark 11 Performance | 22653 points | |
Help | ||
| low | med. | high | ultra | |
|---|---|---|---|---|
| BioShock Infinite (2013) | 379.5 | 320.7 | 303.4 | 178.5 |
| The Witcher 3 (2015) | 72 |
Stress Test
We stress the system with synthetic loads to identify for any potential throttling or stability issues. When running Prime95, the CPU can be observed operating at 4.3 GHz for the first few seconds until core temperature reaches 87 C. Once this threshold is reached, the clock rate will drop and stabilize at 4.0 GHz or the base clock rate of the i7-8086K in order to maintain a cooler temperature of 83 C. The results mirror our CineBench loop test from above and confirms that the CPU is unable to benefit from Turbo Boost for extended periods. Core temperatures and clock rates will throttle even further if subjected to maximum CPU and GPU stress.
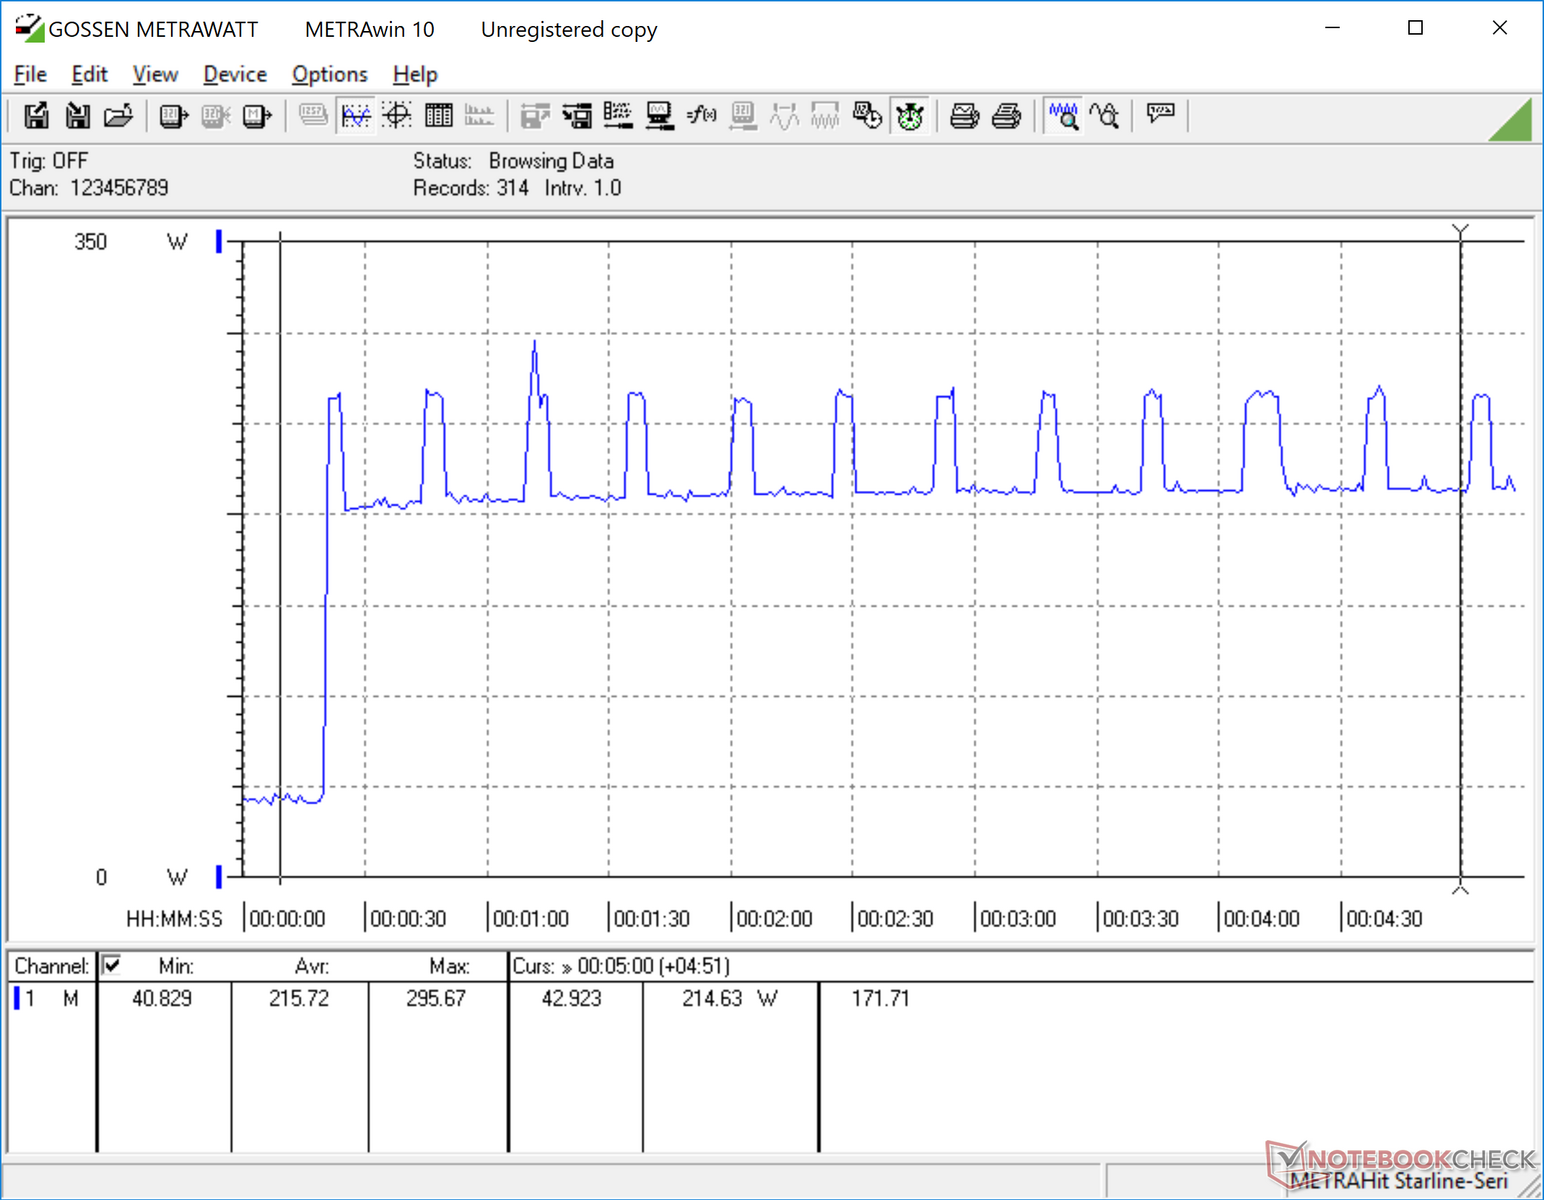
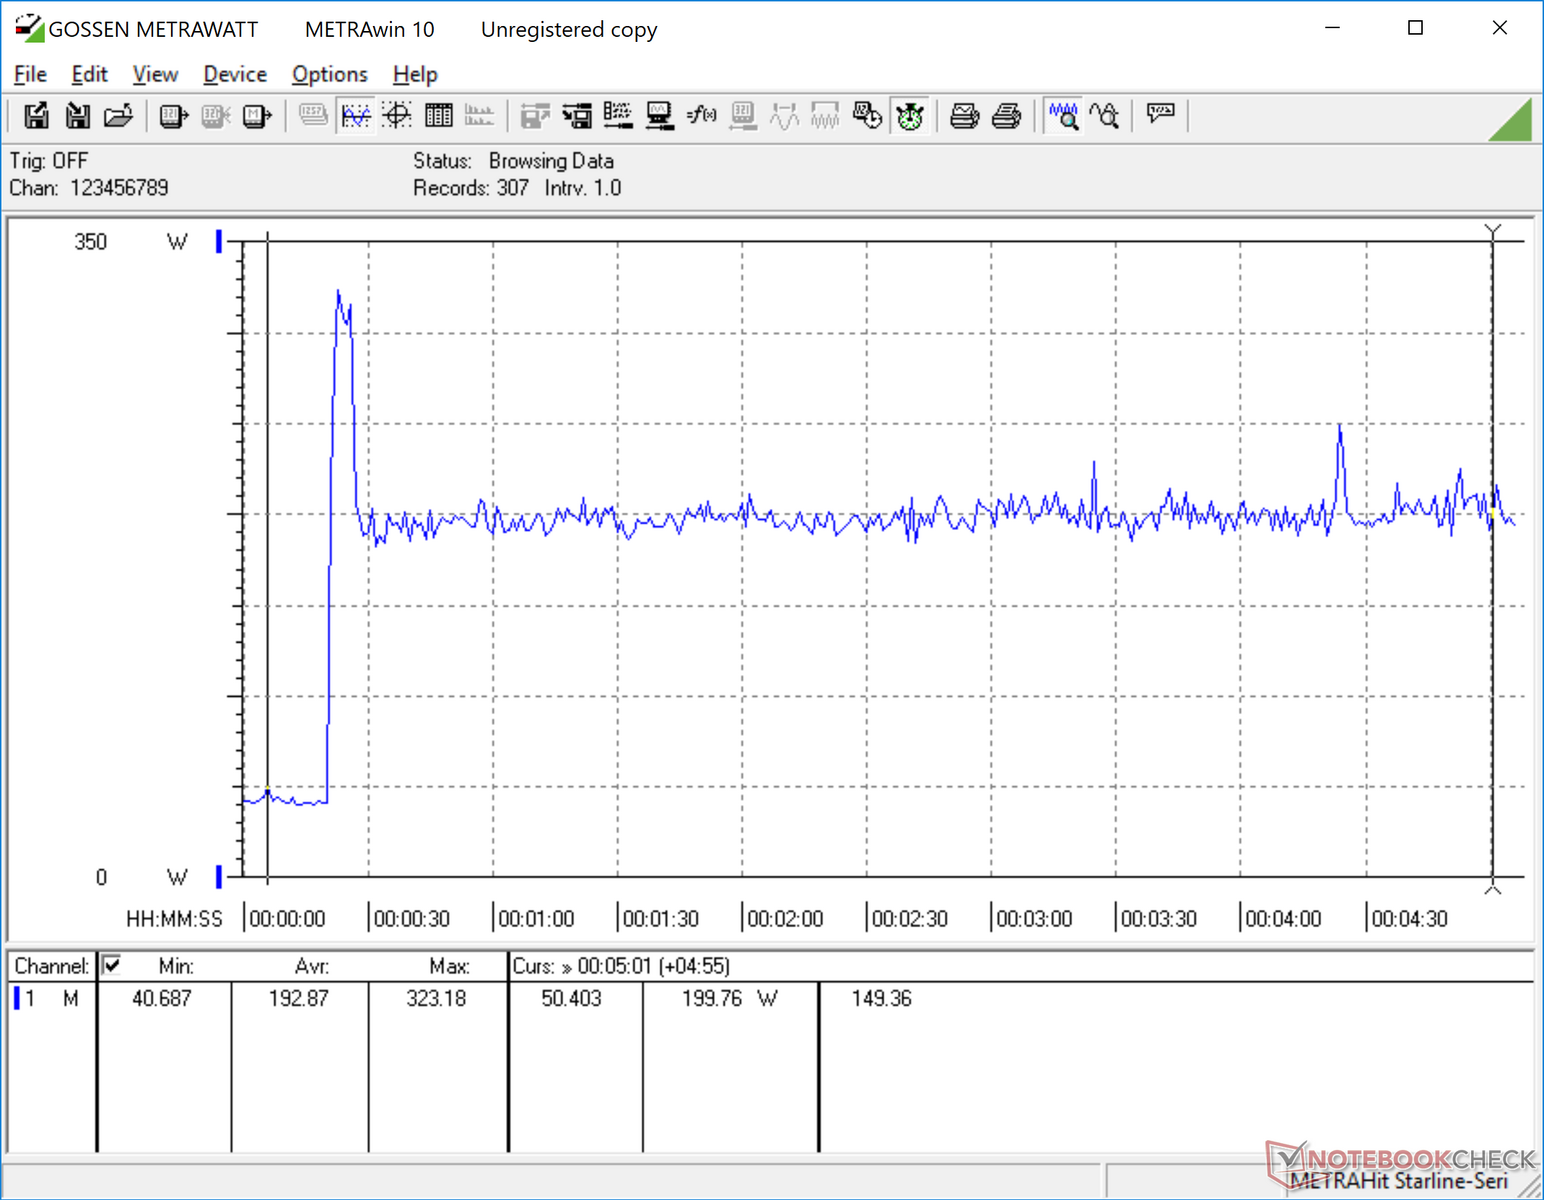
Strangely, running only FurMark to stress the GPU will cause the GPU clock to fluctuate between 1405 and 1582 MHz. Running Witcher 3 shows wildly fluctuating frame rates as illustrated by our graph below due to a bug in the current version of Control Center. Killing the program via the task manager alleviates the issue.
Running on batteries will limit CPU and GPU performance. A 3DMark 11 run on battery power returns Physics and Graphics scores of 10142 and 17354 points, respectively, compared to 15596 and 27275 points when on mains.
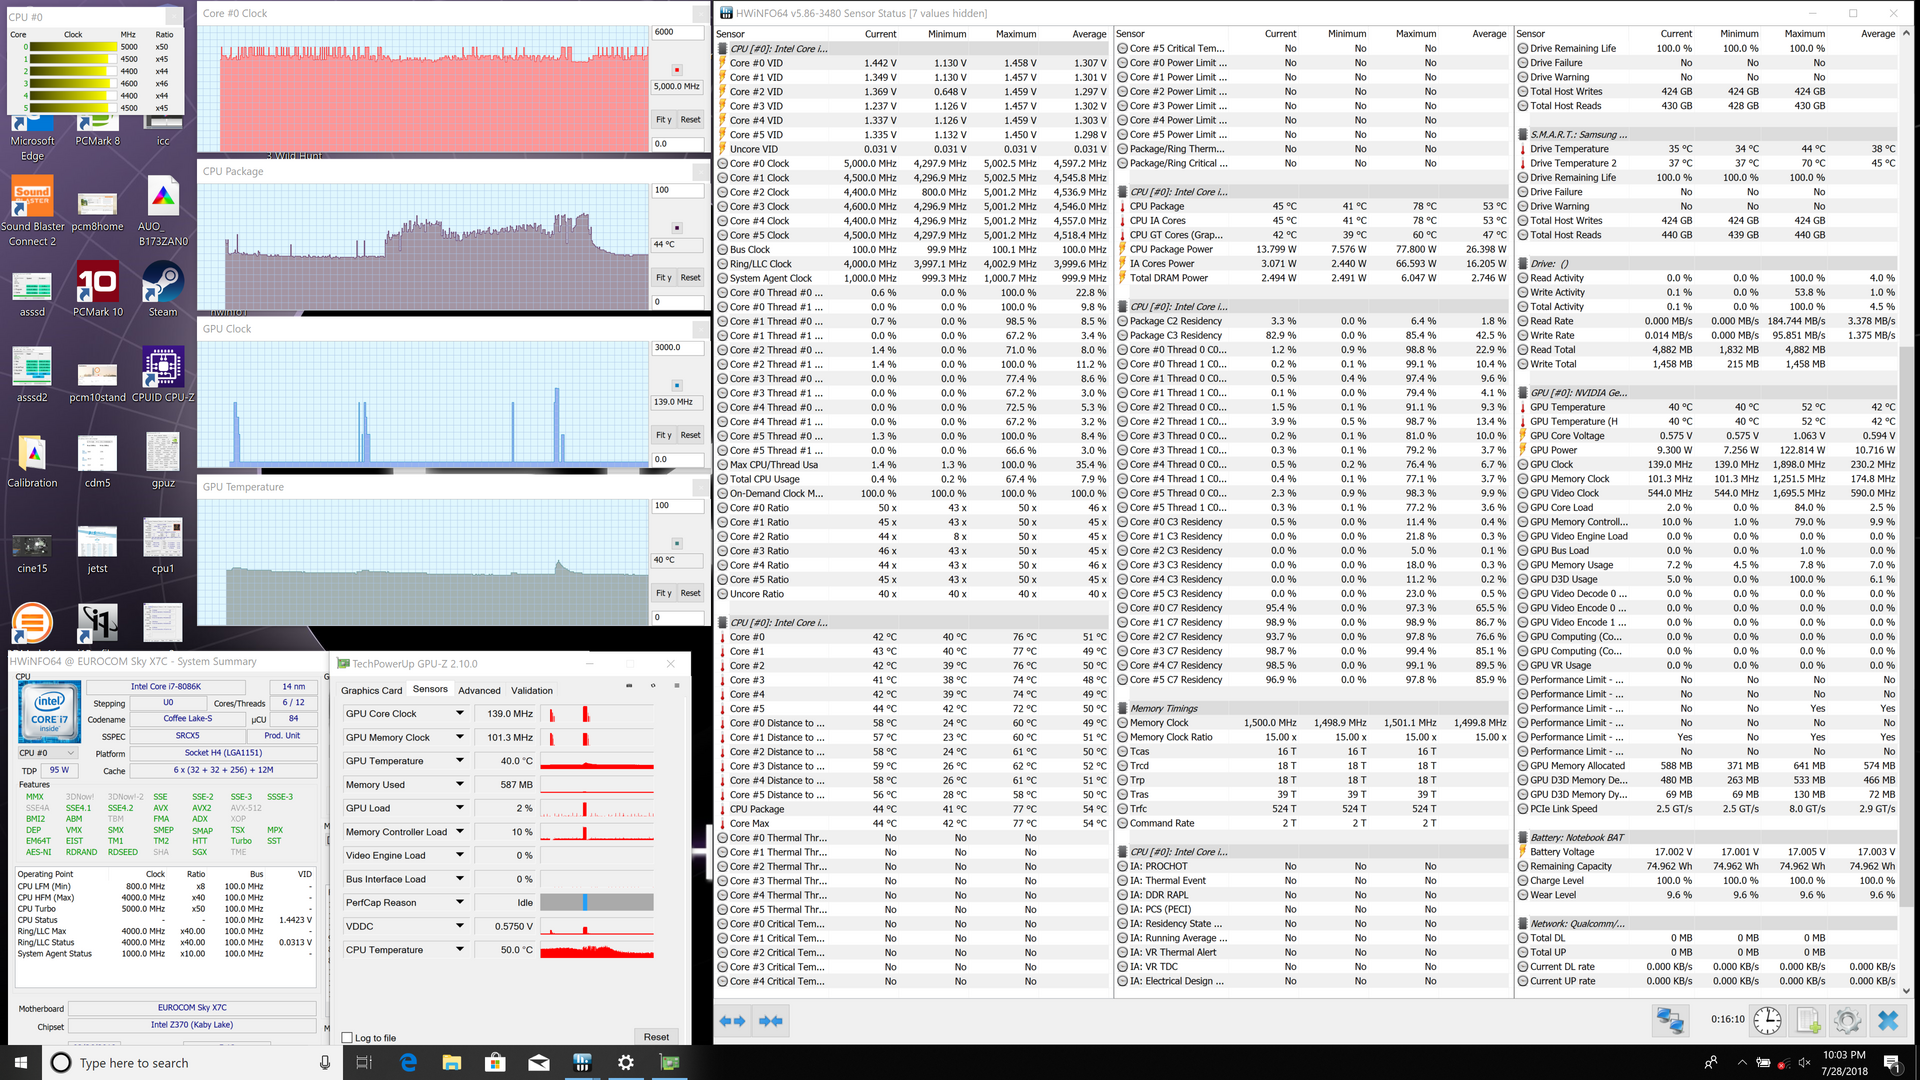
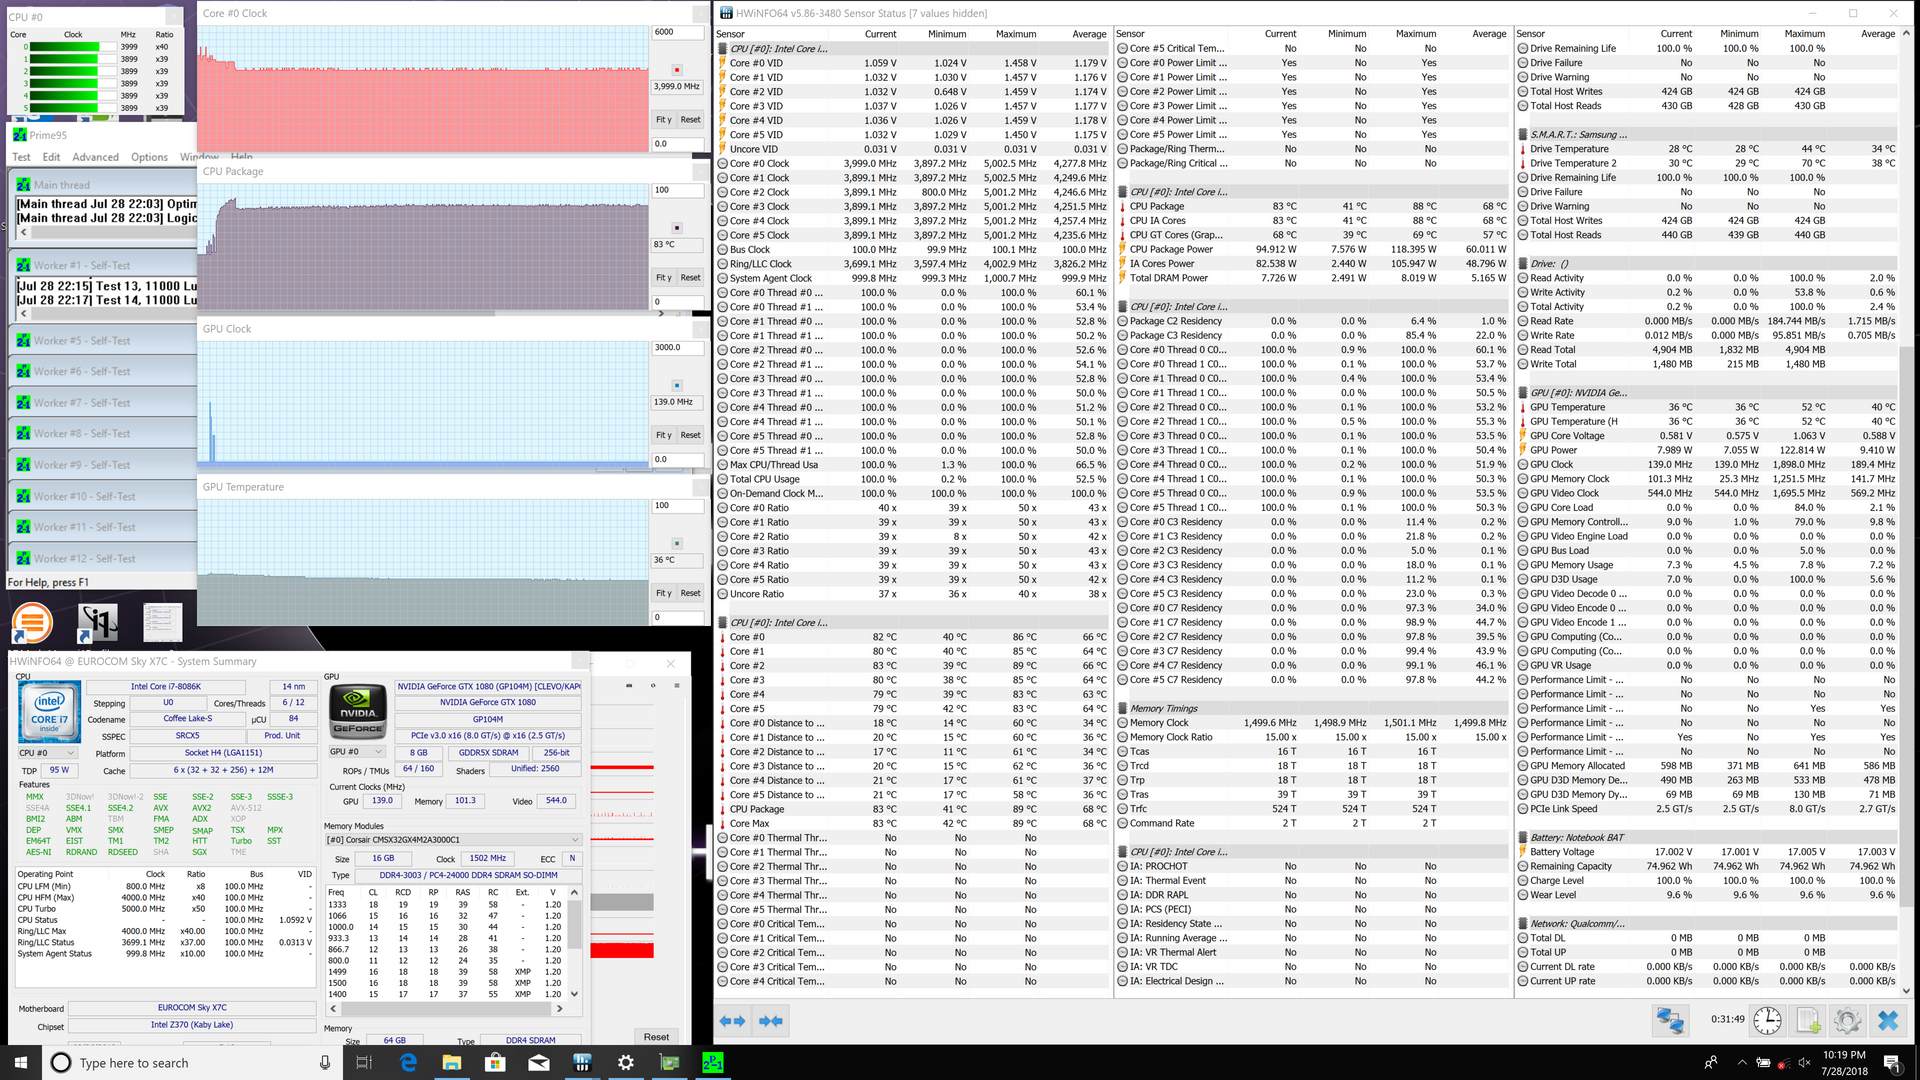
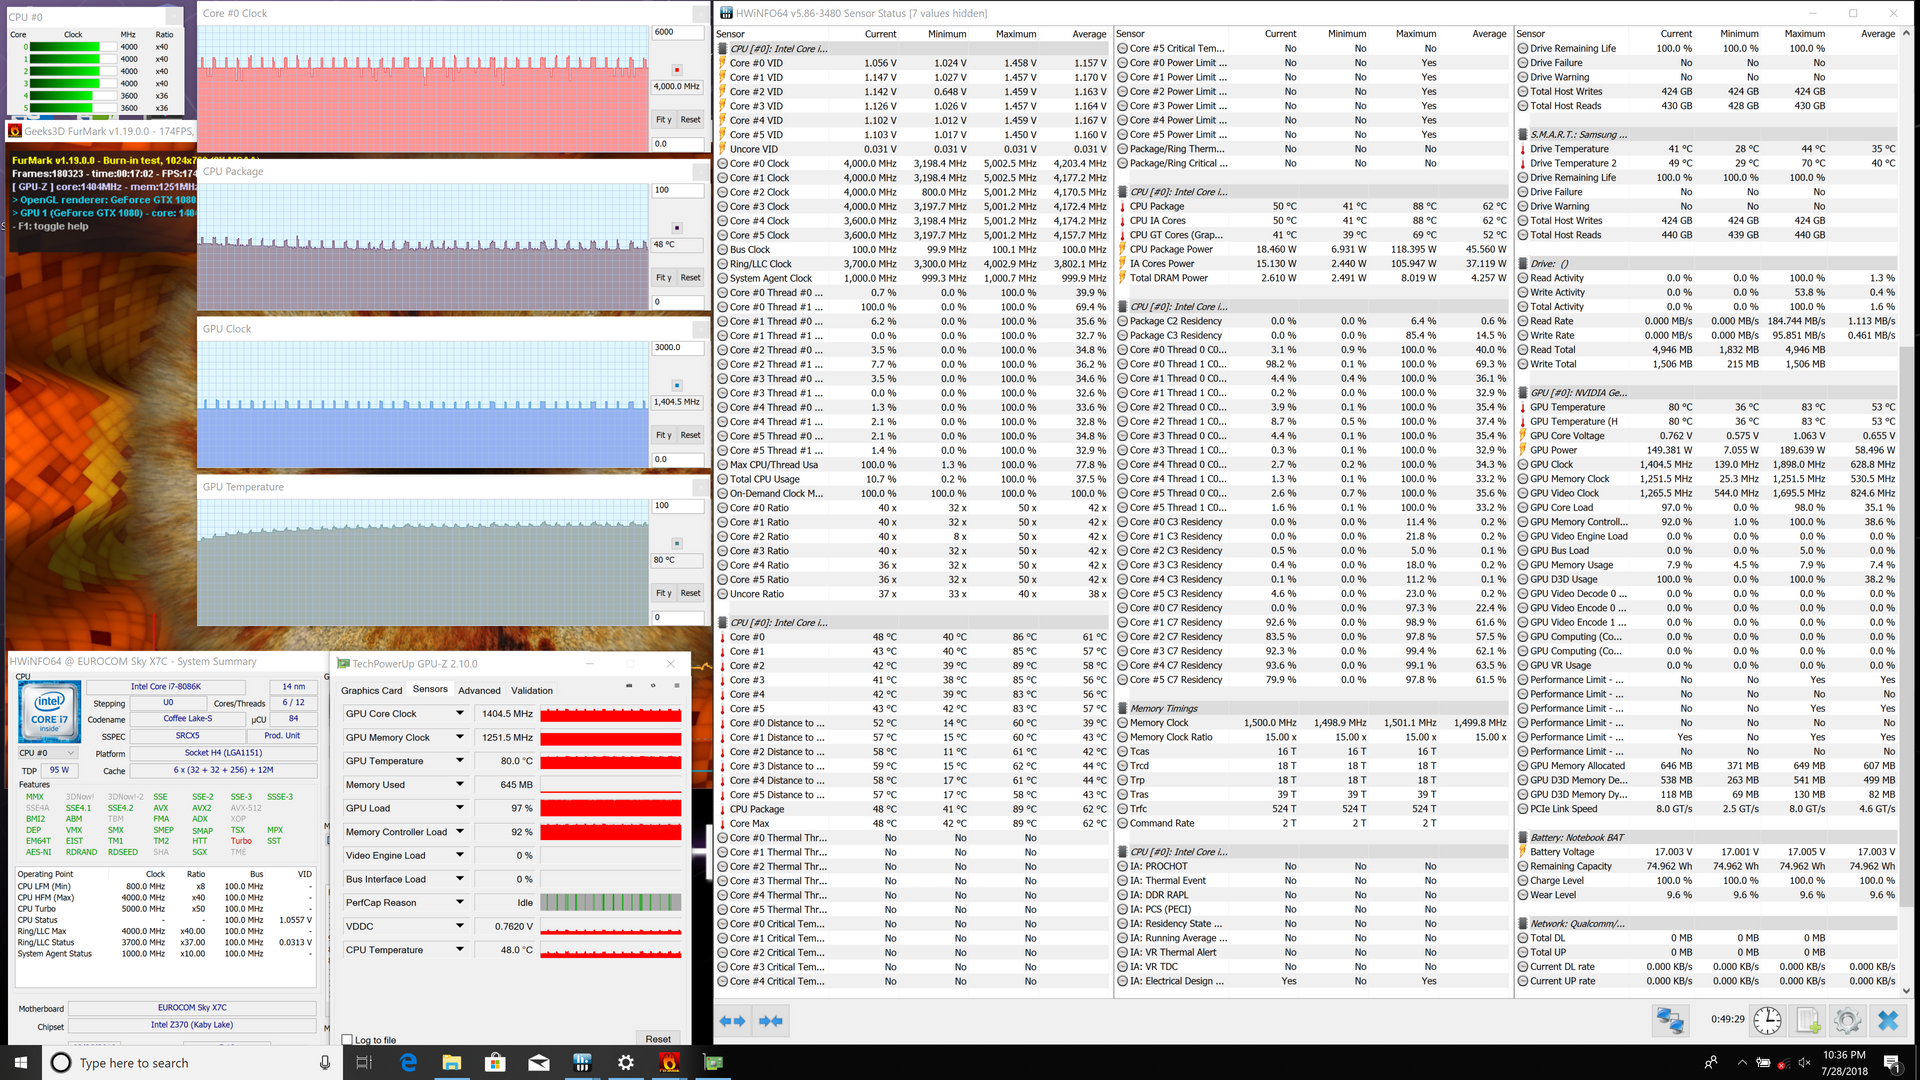
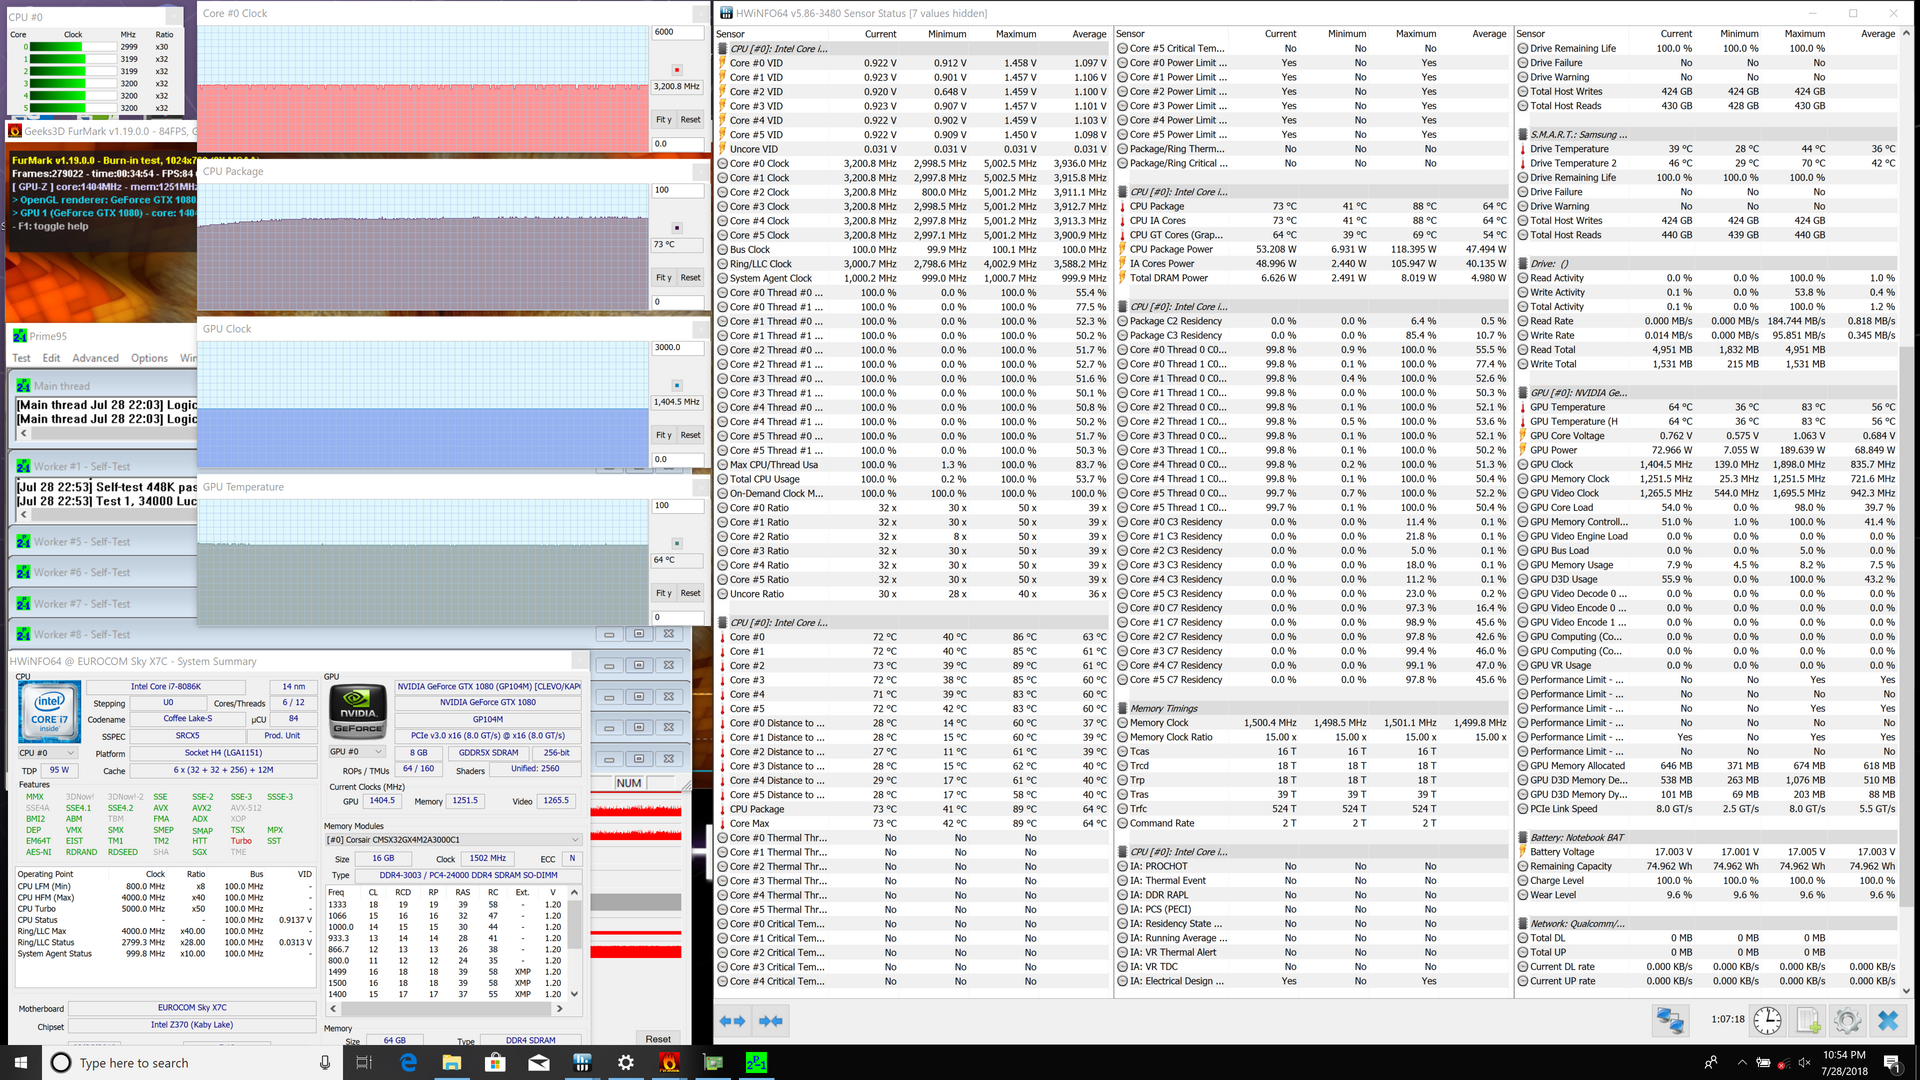
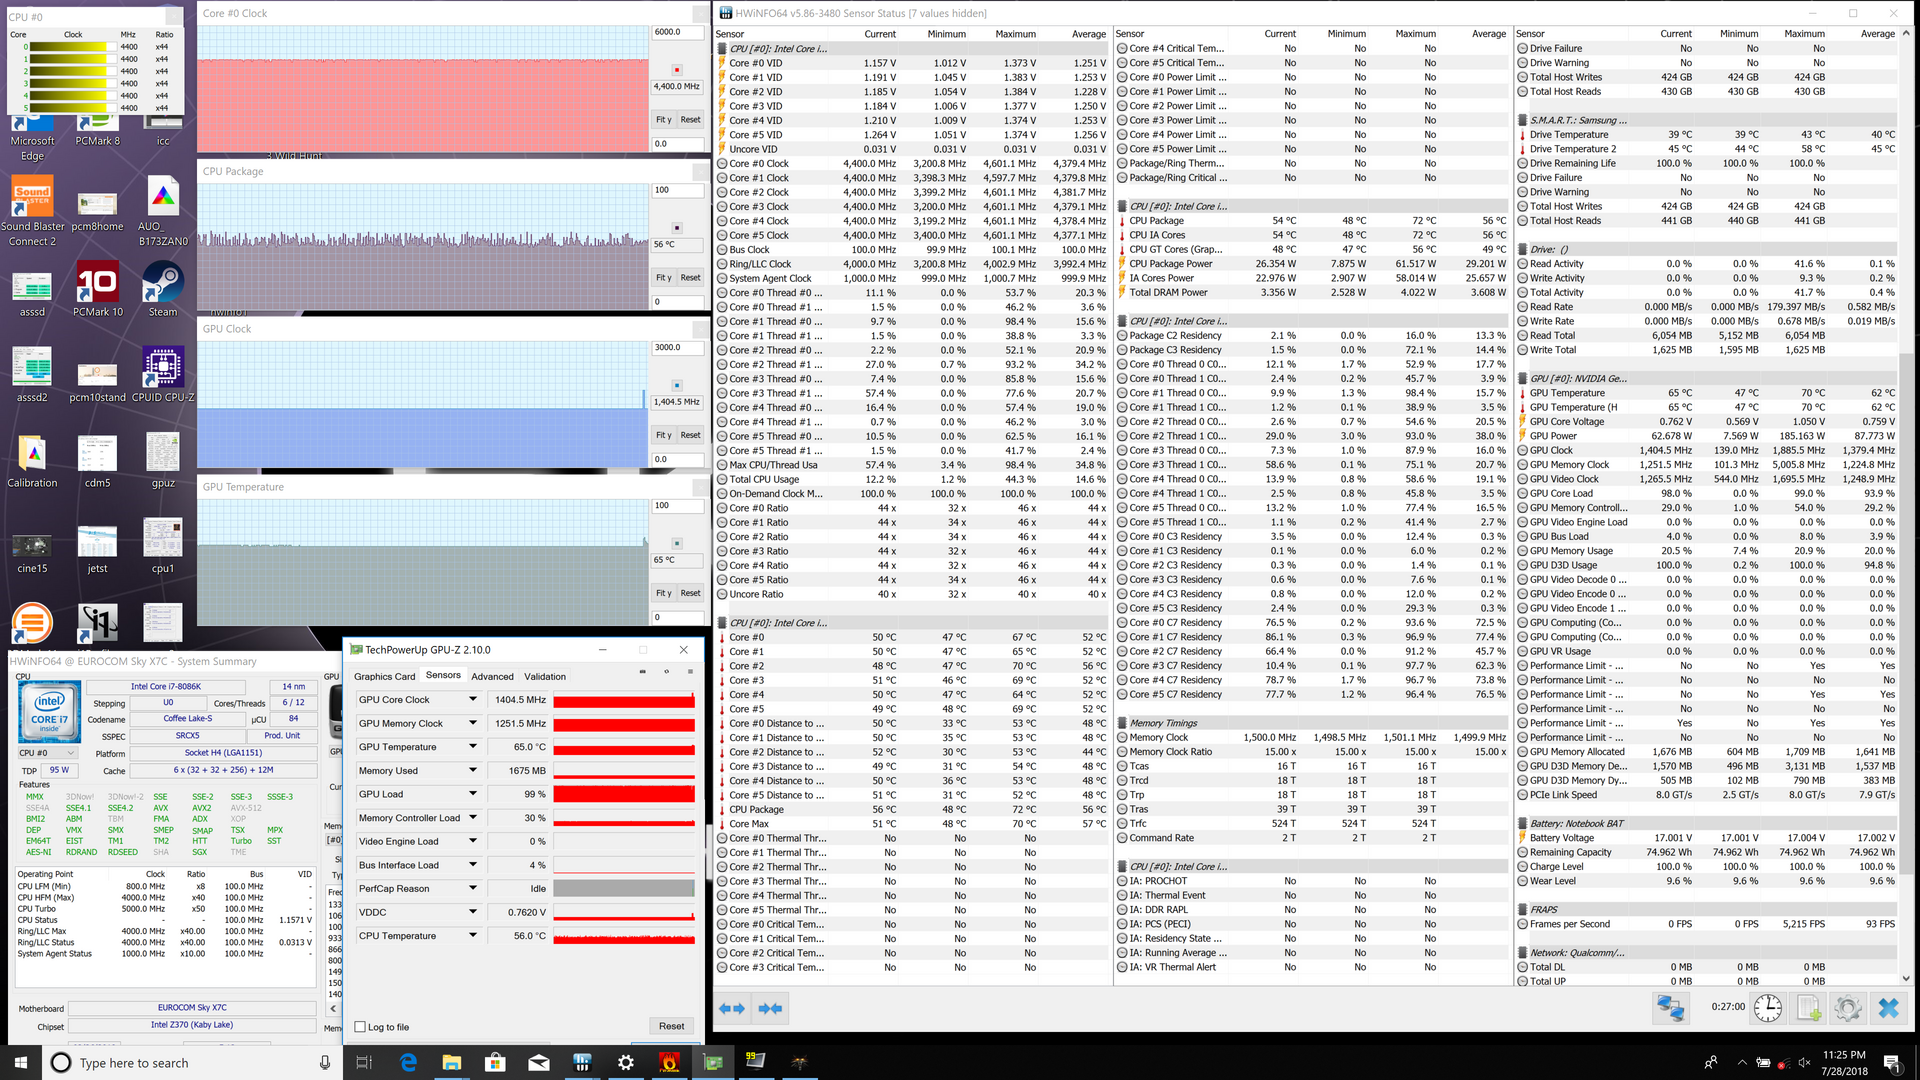
| CPU Clock (GHz) | GPU Clock (MHz) | Average CPU Temperature (°C) | Average GPU Temperature (°C) | |
| Prime95 Stress | 4.0 | -- | 83 | -- |
| FurMark Stress | -- | 1405 - 1582 | -- | 80 - 82 |
| Prime95 + FurMark Stress | 3.2 | 1405 | 73 | 64 |
| Witcher 3 Stress | 4.4 | 1405 | 56 | 65 |
Emissions
System Noise
The cooling solution consists of twin fans and six heat pipes. The Eurocom is quiet but audible in the 29 to 34 dB(A) range during low loads like word processing, browsing, or streaming. When gaming, the system runs significantly quieter than the competition at just 42 dB(A). This is again likely due to the Control Center software throttling frame rates when gaming.
We can notice no electronic noise or coil whine from our test unit.
Noise level
| Idle |
| 28.2 / 28.2 / 29 dB(A) |
| Load |
| 41.8 / 42.2 dB(A) |
 | ||
30 dB silent 40 dB(A) audible 50 dB(A) loud |
||
min: | ||
| Eurocom Sky X7C GeForce GTX 1080 Mobile, i7-8086K, 2x Samsung SSD 970 Pro 512GB (RAID 0) | MSI GT75 8RG-090 Titan GeForce GTX 1080 Mobile, i9-8950HK, 2x Samsung PM961 MZVLW256HEHP (RAID 0) | Alienware 17 R3 (A17-9935) GeForce GTX 980M, 6700HQ, Samsung PM951 NVMe 512 GB | Asus Chimera G703GI GeForce GTX 1080 Mobile, i9-8950HK, 2x Intel 760p 512 GB + 1x Samsung SM961 512 GB (RAID) | Aorus X7 DT v8 GeForce GTX 1080 Mobile, i7-8850H, Toshiba NVMe THNSN5512GPU7 | Razer Blade Pro 2017 GeForce GTX 1080 Mobile, i7-7820HK, 2x Samsung SSD PM951 MZVLV256HCHP (RAID 0) | |
|---|---|---|---|---|---|---|
| Noise | -22% | -9% | -21% | -22% | -15% | |
| off / environment * (dB) | 28.2 | 30 -6% | 30 -6% | 29 -3% | 29 -3% | 30 -6% |
| Idle Minimum * (dB) | 28.2 | 32 -13% | 31 -10% | 30 -6% | 35 -24% | 30 -6% |
| Idle Average * (dB) | 28.2 | 34 -21% | 32 -13% | 34 -21% | 36 -28% | 31 -10% |
| Idle Maximum * (dB) | 29 | 37 -28% | 33 -14% | 42 -45% | 41 -41% | 33 -14% |
| Load Average * (dB) | 41.8 | 43 -3% | 38 9% | 53 -27% | 43 -3% | 43 -3% |
| Witcher 3 ultra * (dB) | 42.2 | 57 -35% | 51 -21% | 53 -26% | 55 -30% | |
| Load Maximum * (dB) | 42.2 | 62 -47% | 50 -18% | 53 -26% | 54 -28% | 58 -37% |
* ... smaller is better
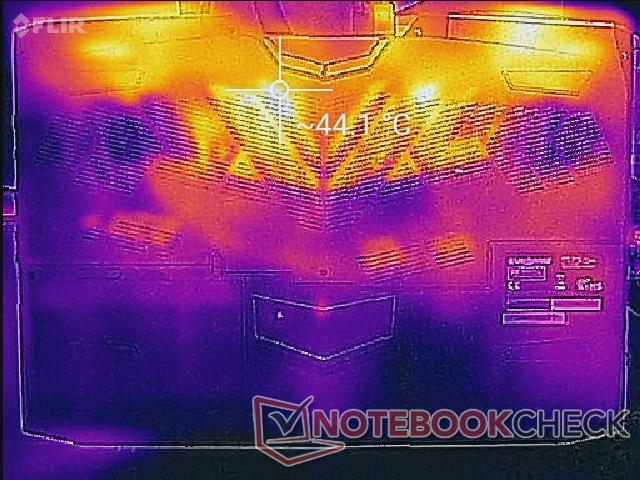
Temperature
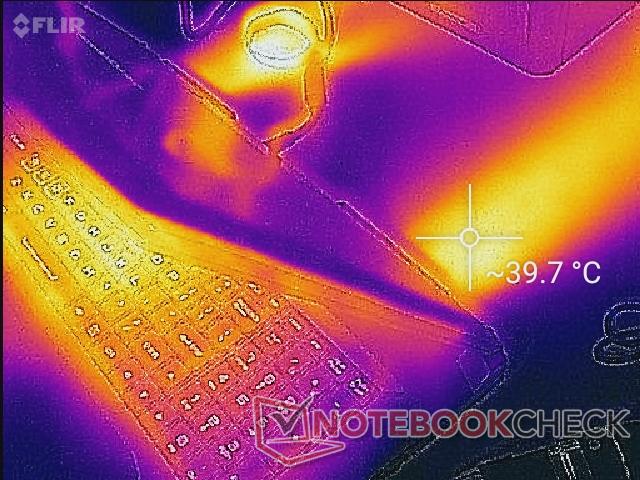
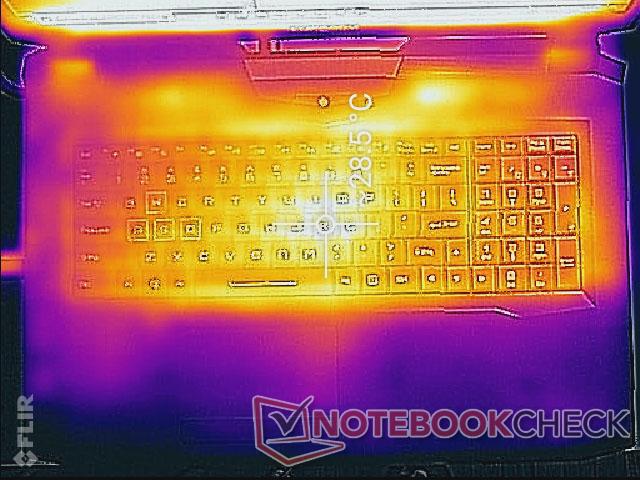
The relatively thick design means the system can remain cooler than many of its competitors despite having two very demanding processors inside. Nonetheless, hot spots can be easily identified. The center of the keyboard can be as warm as 28 C compared to 21 C on the palm rests when the system is idling.
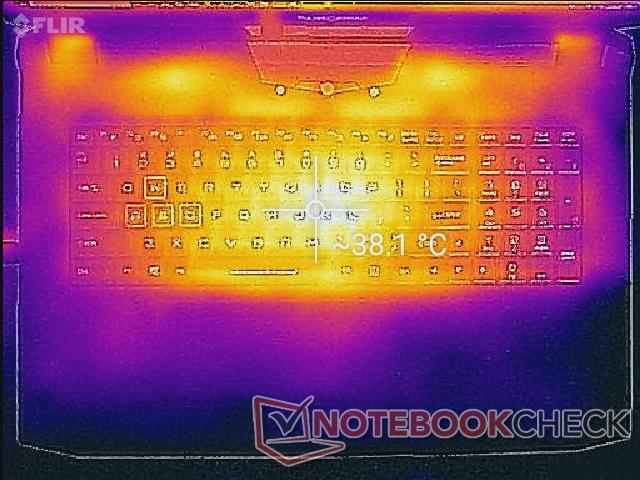
Gaming loads will cause the keyboard center to be as warm as 38 C. Fortunately, the palm rests, WASD keys, and NumPad all remain relatively cool for comfortable gaming.
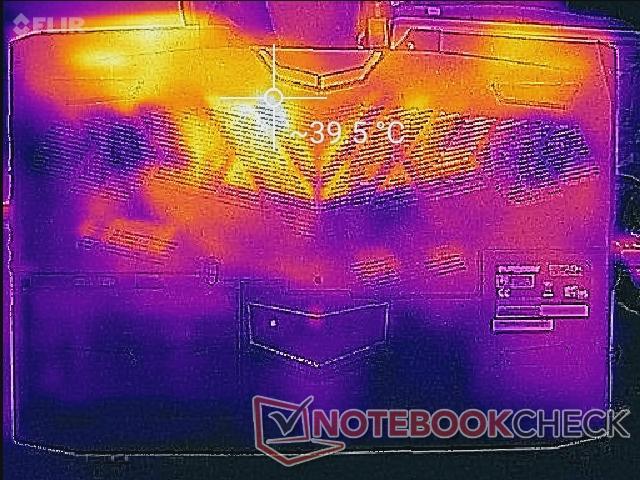
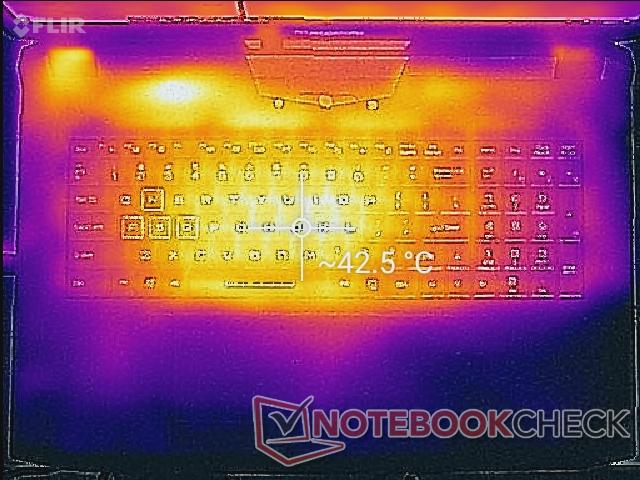
(±) The maximum temperature on the upper side is 42 °C / 108 F, compared to the average of 40.4 °C / 105 F, ranging from 21.2 to 68.8 °C for the class Gaming.
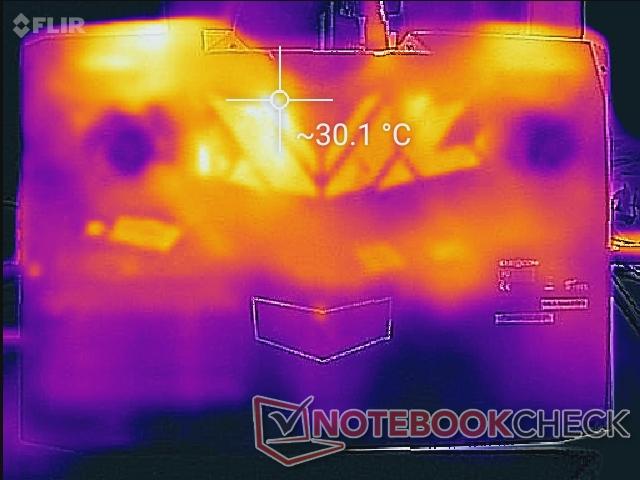
(±) The bottom heats up to a maximum of 40.2 °C / 104 F, compared to the average of 43.3 °C / 110 F
(+) In idle usage, the average temperature for the upper side is 24.4 °C / 76 F, compared to the device average of 33.9 °C / 93 F.
(+) Playing The Witcher 3, the average temperature for the upper side is 29.6 °C / 85 F, compared to the device average of 33.9 °C / 93 F.
(+) The palmrests and touchpad are cooler than skin temperature with a maximum of 25 °C / 77 F and are therefore cool to the touch.
(+) The average temperature of the palmrest area of similar devices was 28.8 °C / 83.8 F (+3.8 °C / 6.8 F).
Speakers

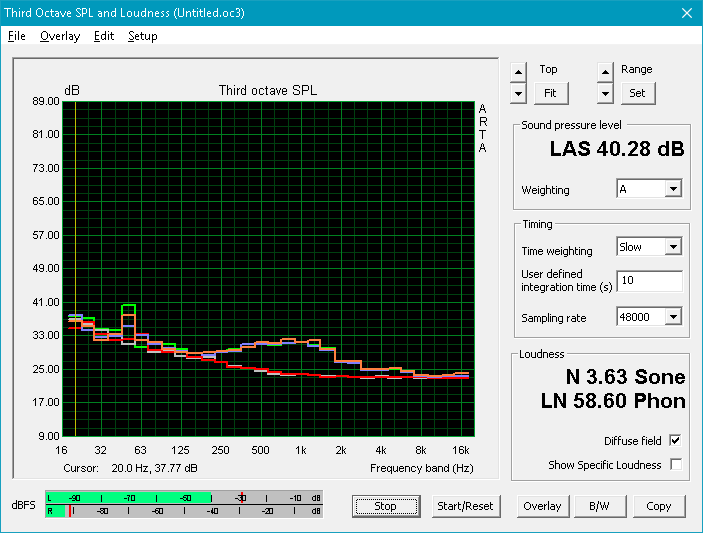
Sound quality from the stereo 2.2 W speakers and 2.5 W subwoofer is excellent. As our pink noise graph below shows, frequencies are reproduced more evenly across a wider range when compared to other laptops for a balanced audio experience. The palm rest will reverberate moderately due to the bass, but there is thankfully no static or clicking.
Eurocom Sky X7C audio analysis
(-) | not very loud speakers (63.2 dB)
Bass 100 - 315 Hz
(±) | reduced bass - on average 5.3% lower than median
(±) | linearity of bass is average (14.8% delta to prev. frequency)
Mids 400 - 2000 Hz
(+) | balanced mids - only 2.3% away from median
(±) | linearity of mids is average (7% delta to prev. frequency)
Highs 2 - 16 kHz
(+) | balanced highs - only 1% away from median
(+) | highs are linear (4.6% delta to prev. frequency)
Overall 100 - 16.000 Hz
(+) | overall sound is linear (12% difference to median)
Compared to same class
» 12% of all tested devices in this class were better, 4% similar, 84% worse
» The best had a delta of 6%, average was 18%, worst was 132%
Compared to all devices tested
» 9% of all tested devices were better, 2% similar, 89% worse
» The best had a delta of 4%, average was 24%, worst was 134%
Apple MacBook 12 (Early 2016) 1.1 GHz audio analysis
(+) | speakers can play relatively loud (83.6 dB)
Bass 100 - 315 Hz
(±) | reduced bass - on average 11.3% lower than median
(±) | linearity of bass is average (14.2% delta to prev. frequency)
Mids 400 - 2000 Hz
(+) | balanced mids - only 2.4% away from median
(+) | mids are linear (5.5% delta to prev. frequency)
Highs 2 - 16 kHz
(+) | balanced highs - only 2% away from median
(+) | highs are linear (4.5% delta to prev. frequency)
Overall 100 - 16.000 Hz
(+) | overall sound is linear (10.2% difference to median)
Compared to same class
» 7% of all tested devices in this class were better, 2% similar, 91% worse
» The best had a delta of 5%, average was 18%, worst was 53%
Compared to all devices tested
» 4% of all tested devices were better, 1% similar, 94% worse
» The best had a delta of 4%, average was 24%, worst was 134%
Energy Management
Power Consumption
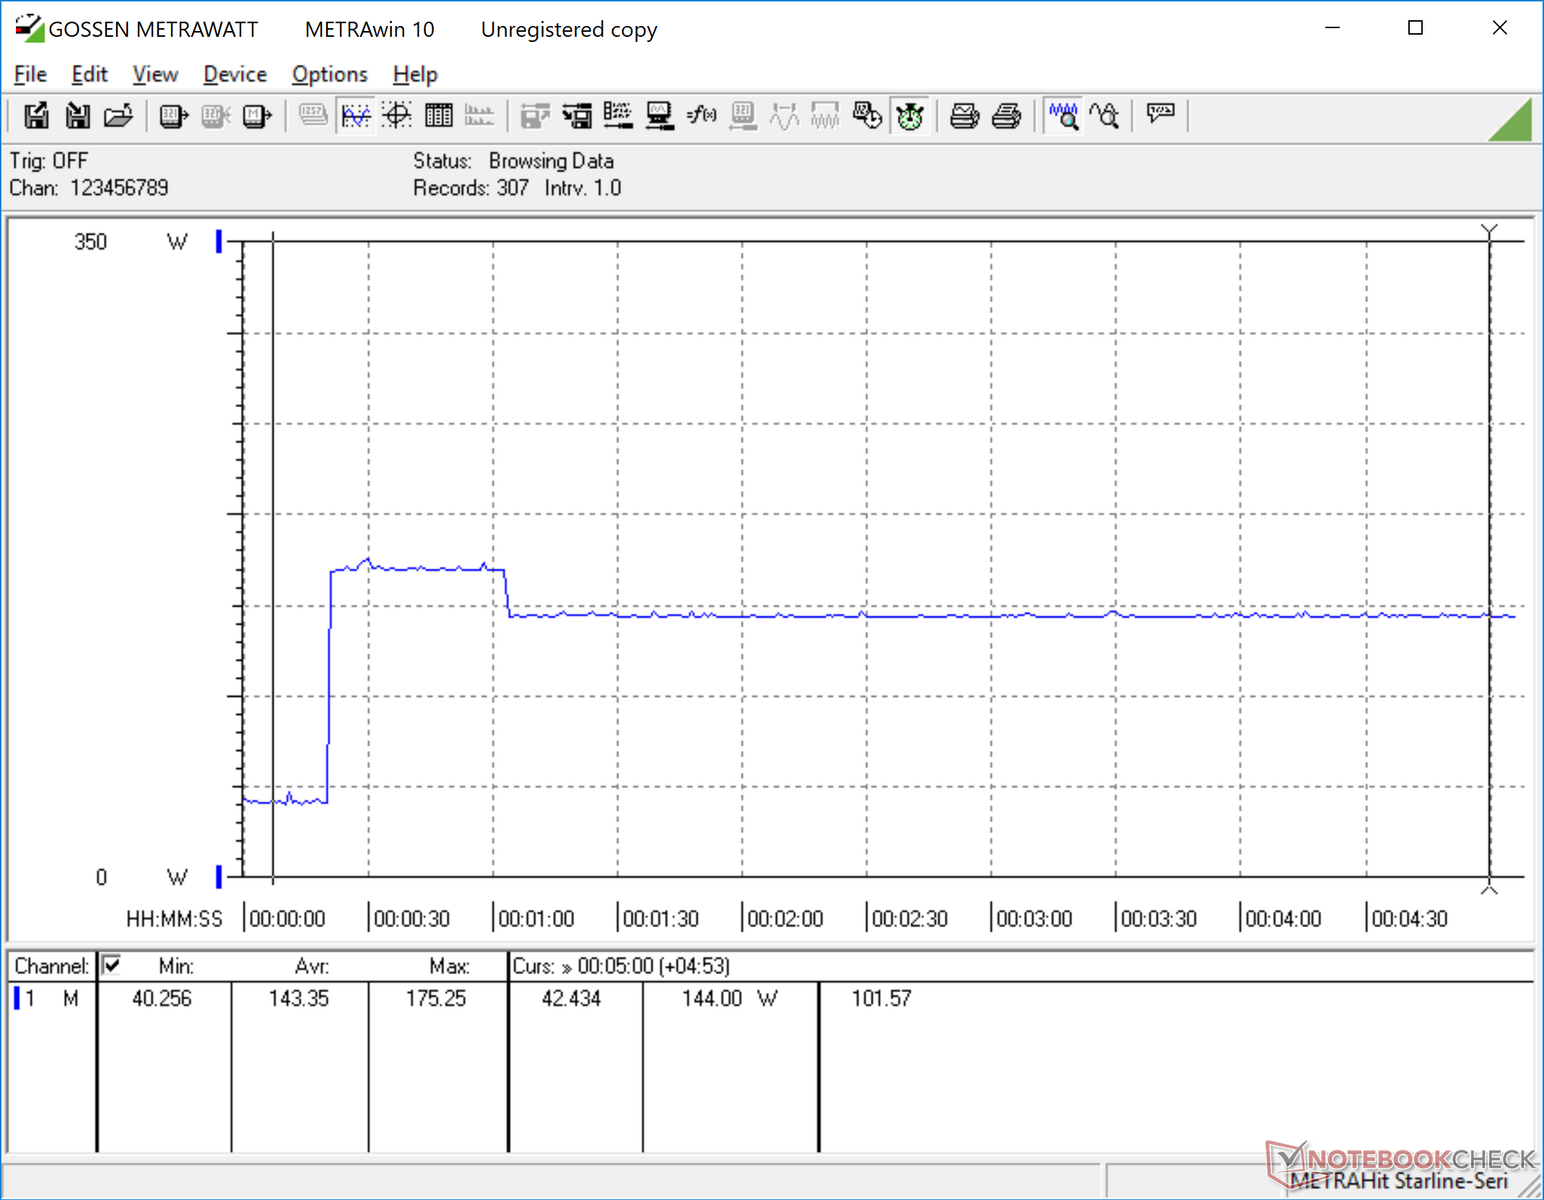
Consumption when idling ranges from 33 W to 42 W depending on the brightness level and power profile. Results are very similar to Coffee Lake-H Core i7 and i9 laptops despite carrying a full-fledged desktop CPU.
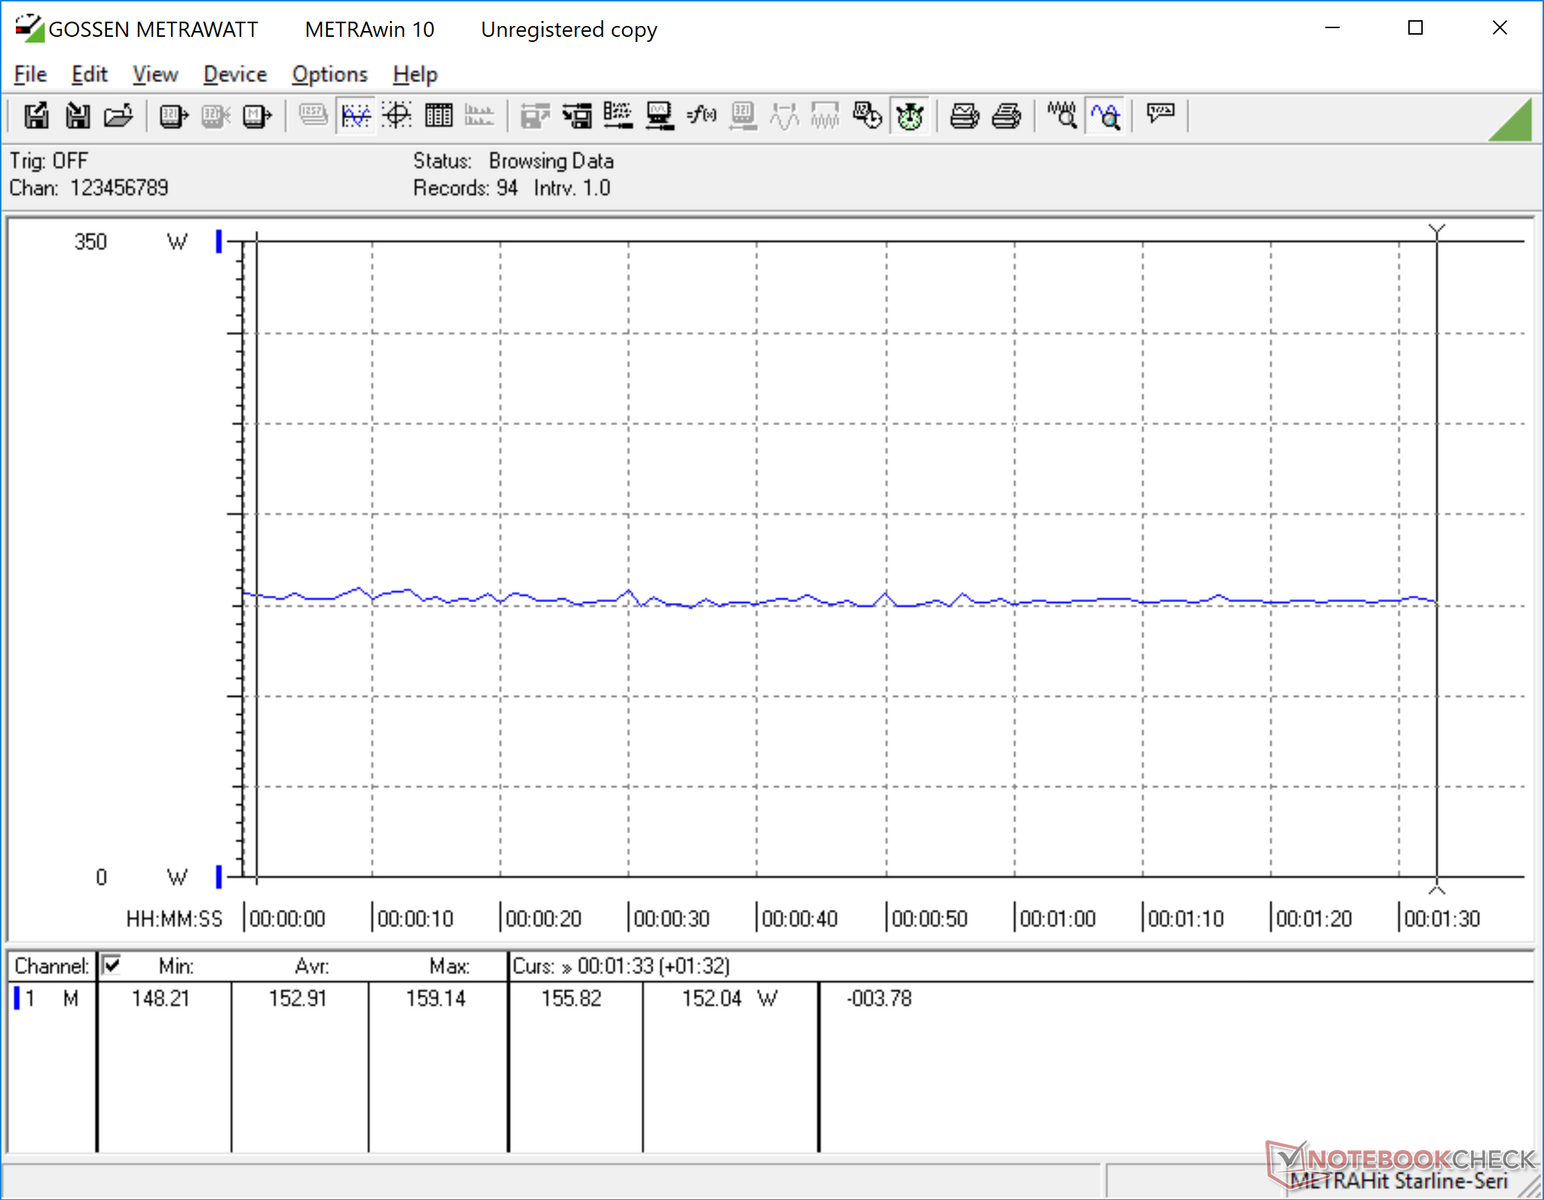
Running Witcher 3 consumes only 153 W compared to over 200 W on competing models as shown by our table below. The wide delta could be explained by the throttling behavior of the GPU and the buggy Control Center affecting performance. Maximum load draws an average of 220 W over a 90-second period from a large (~20 x 10 x 4.5 cm) 330 W AC adapter. This exact same Lite-On AC adapter is also used on some other gaming PCs such as the MSI Trident 3 or Zotac ZBox.
| Off / Standby | |
| Idle | |
| Load |
|
Key:
min: | |
| Eurocom Sky X7C i7-8086K, GeForce GTX 1080 Mobile, 2x Samsung SSD 970 Pro 512GB (RAID 0), IPS, 3840x2160, 17.3" | MSI GT75 8RG-090 Titan i9-8950HK, GeForce GTX 1080 Mobile, 2x Samsung PM961 MZVLW256HEHP (RAID 0), TN, 1920x1080, 17.3" | Alienware 17 R3 (A17-9935) 6700HQ, GeForce GTX 980M, Samsung PM951 NVMe 512 GB, IPS, 1920x1080, 17.3" | Asus Chimera G703GI i9-8950HK, GeForce GTX 1080 Mobile, 2x Intel 760p 512 GB + 1x Samsung SM961 512 GB (RAID), IPS, 1920x1080, 17.3" | Aorus X7 DT v8 i7-8850H, GeForce GTX 1080 Mobile, Toshiba NVMe THNSN5512GPU7, IPS, 1920x1080, 17.3" | Razer Blade Pro 2017 i7-7820HK, GeForce GTX 1080 Mobile, 2x Samsung SSD PM951 MZVLV256HCHP (RAID 0), IGZO, 3840x2160, 17.3" | Aorus X9 DT i9-8950HK, GeForce GTX 1080 Mobile, Transcend TS1TMTE850, IPS, 1920x1080, 17.3" | |
|---|---|---|---|---|---|---|---|
| Power Consumption | -28% | 35% | -27% | -6% | -9% | -19% | |
| Idle Minimum * (Watt) | 33.3 | 31 7% | 12 64% | 29 13% | 23 31% | 31 7% | 28 16% |
| Idle Average * (Watt) | 40.1 | 35 13% | 18 55% | 37 8% | 33 18% | 36 10% | 37 8% |
| Idle Maximum * (Watt) | 42.1 | 45 -7% | 26 38% | 46 -9% | 37 12% | 44 -5% | 40 5% |
| Load Average * (Watt) | 95.6 | 130 -36% | 95 1% | 156 -63% | 115 -20% | 107 -12% | 109 -14% |
| Witcher 3 ultra * (Watt) | 152.9 | 268 -75% | 252 -65% | 225 -47% | 212 -39% | 256 -67% | |
| Load Maximum * (Watt) | 220 | 374 -70% | 188 15% | 314 -43% | 281 -28% | 258 -17% | 353 -60% |
* ... smaller is better
Battery Life
The 82 Wh battery is slightly smaller in capacity than on the Aorus X7, Razer Blade Pro, or Alienware 17 R4. In return, the battery pack is easily removable on the Eurocom. Expect about two hours of real-world WLAN use on a full charge.
Charging from empty to full capacity takes just over two hours.
| Eurocom Sky X7C i7-8086K, GeForce GTX 1080 Mobile, 82 Wh | MSI GT75 8RG-090 Titan i9-8950HK, GeForce GTX 1080 Mobile, 75 Wh | Asus Chimera G703GI i9-8950HK, GeForce GTX 1080 Mobile, 71 Wh | Aorus X7 DT v8 i7-8850H, GeForce GTX 1080 Mobile, 94.24 Wh | Razer Blade Pro 2017 i7-7820HK, GeForce GTX 1080 Mobile, 99 Wh | Eurocom Sky X9C i7-8700K, GeForce GTX 1080 SLI (Laptop), 89 Wh | Aorus X9 DT i9-8950HK, GeForce GTX 1080 Mobile, 94.24 Wh | |
|---|---|---|---|---|---|---|---|
| Battery runtime | -8% | 58% | 38% | -46% | 33% | ||
| WiFi v1.3 (h) | 2.4 | 2.2 -8% | 3.8 58% | 3.3 38% | 1.3 -46% | 3.2 33% | |
| Reader / Idle (h) | 3.8 | 2.8 | 4.9 | 4.2 | 1.4 | 4.2 | |
| Load (h) | 1.1 | 0.9 | 1.3 | 1.4 | 0.8 | 1.3 |
Pros
Cons
Verdict
Before giving our thoughts on the Sky X7C, it's imperative that owners of the system update their software to the latest version here. Older versions of Control Center are confirmed to have a bug where the GPU will throttle under certain gaming applications like Witcher 3. Unfortunately for us, our test unit shipped with the bugged version of the software and so our test results reflect this stock configuration. We observed the exact same results on our recent Eurocom Q8 review as well.
With our forewarning out of the way, the stock Core i7-8086K in the Eurocom is at best 5 to 10 percent faster in raw performance than both the i7-8700K in the Sky X9C and i9-8950HK in the Aorus X9 DT. Full load at the base clock rate of 4.0 GHz will already induce a steady core temperature of 83 C. The performance benefits when gaming are marginal to say the least.
The best aspect of the Sky X7C continues to be its modularity. Enthusiasts who crave every ounce of multi-core performance may want to consider the less expensive Ryzen 1800X over the i7-8086K. Until such AMD options become available, however, the Sky X7C is still the ultimate DTR in the 17-inch space.
The Sky X7C houses the fastest Intel CPU currently available for a mobile form factor. Nonetheless. we're hopeful that Threadripper options will become available in the future simply because AMD has been extremely competitive in the desktop space as of late.
Price comparison
