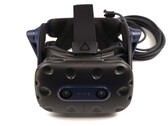
Intel Core i7-8086K
The Intel Core i7-8086K is a high-end desktop processor with six cores based on the Coffee Lake architecture and was announced in mid 2018. It is a limited edition for the 40 year X86 anniversary and at the time of announcement the fastest Coffee-Lake CPU. The processor clocks at between 3.7 and 5 GHz and can execute up to twelve threads simultaneously thanks to Hyper-Threading. According to Intel, the CPU is manufactured in an improved 14nm (14nm++) process. The i7-8086K is comparatively easy to overclock thanks to the unlocked multiplier. Compared to the cheaper i7-8700K (-66 Dollars) only the single core Turbo clock speed is faster (5 GHz versus 4.7 GHz).
Performance
Due to the two additional cores, performance has increased by almost 50% compared to the Core i7-7700K when all cores are in use. Compared to the cheaper Core i7-8700K, the 8086K offers only a higher single core Turbo Boost and therefore in daily usage and gaming not faster. As a high-end model, the i7-8086K is suitable for the most demanding applications and games.
Graphics
The integrated Intel UHD Graphics 630 iGPU is supposed to offer higher performance as its clock rate has been increased by 50 MHz. The build is identical to that of the Intel HD Graphics 630 . We do expect a performance improvement, but as a low-end solution it will probably only display current games smoothly at reduced details - if at all.
Power Consumption
Intel specifies the TDP with 95 watts. Therefore, well-dimensioned cooling systems should easily manage to deal with the created heat. We expect increased efficiency due to the higher performance.
Series Intel Coffee Lake Codename Coffee Lake-S Series: Coffee Lake Coffee Lake-S Clock Rate 3700 - 5000 MHz Level 1 Cache 384 KB Level 2 Cache 1.5 MB Level 3 Cache 12 MB Number of Cores / Threads 6 / 12 Power Consumption (TDP = Thermal Design Power) 95 Watt Manufacturing Technology 14 nm Max. Temperature 100 °C Socket FCLGA1151 Features Dual-Channel DDR3(L)-1600/DDR4-2666 Memory Controller, HyperThreading, AVX, AVX2, AES-NI, TSX-NI, Quick Sync, Virtualization, vPro GPU Intel UHD Graphics 630 (350 - 1200 MHz)64 Bit 64 Bit support Architecture x86 Starting Price $425 U.S. Announcement Date 06/01/2018 Product Link (external) Intel Coffee Lake i7-8086K
Benchmarks Performance Rating - CB R15 + R20 + 7-Zip + X265 + Blender + 3DM11 CPU
43.4 pt (49%)
...
...
Cinebench R23 - Cinebench R23 Multi Core
8686 Points (14%)
...
...
Cinebench R23 - Cinebench R23 Single Core
1260 Points (55%)
...
...
Cinebench R20 - Cinebench R20 CPU (Single Core)
min: 488 avg: 495 median: 495 (57%) max: 502 Points
...
...
Cinebench R20 - Cinebench R20 CPU (Multi Core)
min: 2998 avg: 3111 median: 3111 (13%) max: 3224 Points
...
...
Cinebench R15 - Cinebench R15 CPU Multi 64 Bit
min: 1340 avg: 1366 median: 1349 (14%) max: 1408 Points
...
...
0 75 150 225 300 375 450 525 600 675 750 825 900 975 1050 1125 1200 1275 1350 Tooltip Aorus Z370 Ultra Gaming Desktop DDR4-2666: Ø1327 (1309.76-1339.9)
Aorus Z370 Ultra Gaming Desktop DDR4-2666: Ø1334 (1200.44-1349.12)
Eurocom Sky X7C: Ø1353 (1329.48-1407.71)
Cinebench R15 - Cinebench R15 CPU Single 64 Bit
min: 202 avg: 205 median: 206 (63%) max: 207 Points
...
...
Cinebench R11.5 - Cinebench R11.5 CPU Multi 64 Bit
min: 14.67 avg: 15 median: 15 (21%) max: 15.41 Points
...
...
Cinebench R11.5 - Cinebench R11.5 CPU Single 64 Bit
min: 2.2 avg: 2.3 median: 2.3 (7%) max: 2.35 Points
...
...
Cinebench R10 - Cinebench R10 Rend. Single (32bit)
min: 6541 avg: 7216 median: 7216 (59%) max: 7891 points
...
...
Cinebench R10 - Cinebench R10 Rend. Multi (32bit)
min: 33064 avg: 35896 median: 35896 (41%) max: 38728 points
...
...
wPrime 2.10 - wPrime 2.0 1024m *
min: 119.7 avg: 119.8 median: 119.8 (1%) max: 119.9 s
...
...
VIA C3-M C3-M-1200 6962%
wPrime 2.10 - wPrime 2.0 32m *
min: 4.041 avg: 4.1 median: 4.1 (1%) max: 4.21 s
...
...
min: 6637 avg: 6752 median: 6751.5 (39%) max: 6866 points
...
...
7-Zip 18.03 - 7-Zip 18.03 Multli Thread 4 runs
min: 35473 avg: 36060 median: 36059.5 (22%) max: 36646 MIPS
...
...
7-Zip 18.03 - 7-Zip 18.03 Single Thread 4 runs
min: 5325 avg: 5417 median: 5416.5 (65%) max: 5508 MIPS
...
...
X264 HD Benchmark 4.0 - x264 Pass 2
min: 85.1 avg: 85.5 median: 85.5 (31%) max: 85.8 fps
Intel Pentium 4 2.4 GHz -98%
...
...
X264 HD Benchmark 4.0 - x264 Pass 1
min: 227.5 avg: 230.6 median: 230.6 (54%) max: 233.6 fps
...
...
HWBOT x265 Benchmark v2.2 - HWBOT x265 4k Preset
min: 11.2 avg: 11.3 median: 11.3 (24%) max: 11.4 fps
...
...
0 1 2 3 4 5 6 7 8 9 10 11 12 13 14 15 16 17 18 Tooltip Aorus Z370 Ultra Gaming Desktop DDR4-2666: Ø11.5 (1-16.8)
Aorus Z370 Ultra Gaming Desktop DDR4-2666: Ø11.8 (1.03-18.4)
TrueCrypt - TrueCrypt Serpent
min: 0.792 avg: 0.8 median: 0.8 (0%) max: 0.795 GB/s
...
...
TrueCrypt - TrueCrypt Twofish
1.4 GB/s (0%)
...
...
TrueCrypt - TrueCrypt AES
min: 7.8 avg: 7.9 median: 7.9 (0%) max: 7.9 GB/s
...
...
Blender - Blender 2.79 BMW27 CPU *
min: 315 avg: 383.7 median: 316 (2%) max: 520 Seconds
...
...
R Benchmark 2.5 - R Benchmark 2.5 *
min: 0.567 avg: 0.6 median: 0.6 (13%) max: 0.5974 sec
...
...
3DMark 06 - CPU - 3DMark 06 - CPU
min: 10397 avg: 11218 median: 11218 (24%) max: 12039 Points
...
...
Super Pi mod 1.5 XS 1M - Super Pi mod 1.5 XS 1M *
min: 7.74 avg: 8.5 median: 8.5 (2%) max: 9.261 s
...
...
VIA C3-M C3-M-1200 5346%
Super Pi mod 1.5 XS 2M - Super Pi mod 1.5 XS 2M *
min: 17.06 avg: 18.8 median: 18.8 (1%) max: 20.59 s
...
...
Super Pi Mod 1.5 XS 32M - Super Pi mod 1.5 XS 32M *
min: 429.9 avg: 467 median: 467 (2%) max: 504 s
...
...
VIA C3-M C3-M-1200 4721%
3DMark 11 - 3DM11 Performance Physics
min: 11434 avg: 12861 median: 11554 (32%) max: 15596 Points
...
...
3DMark - 3DMark Time Spy CPU
6745 Points (33%)
...
...
Geekbench 5.4 - Geekbench 5.1 - 5.4 64 Bit Single-Core
1240 points (54%)
...
...
Geekbench 5.4 - Geekbench 5.1 - 5.4 64 Bit Multi-Core
5485 points (19%)
...
...
Geekbench 5.0 - Geekbench 5.0 64 Bit Single-Core
min: 1234 avg: 1276 median: 1276 (6%) max: 1318 points
...
...
Geekbench 5.0 - Geekbench 5.0 64 Bit Multi-Core
min: 5618 avg: 5644 median: 5644 (18%) max: 5670 points
...
...
Geekbench 4.1 - 4.4 - Geekbench 4.1 - 4.4 64 Bit Single-Core
min: 5768 avg: 5821 median: 5792 (60%) max: 5904 points
...
...
Geekbench 4.1 - 4.4 - Geekbench 4.1 - 4.4 64 Bit Multi-Core
min: 22817 avg: 24618 median: 24527 (27%) max: 26509 points
...
...
Mozilla Kraken 1.1 - Kraken 1.1 Total Score *
min: 861 avg: 862 median: 862 (1%) max: 863 ms
...
...
WebXPRT 3 - WebXPRT 3 Score
min: 216 avg: 217 median: 217 (55%) max: 218 Points
...
...
- Range of benchmark values for this graphics card
- Average benchmark values for this graphics card
* Smaller numbers mean a higher performance