Skylake-X Top Model: Intel Core i9-7900X Review
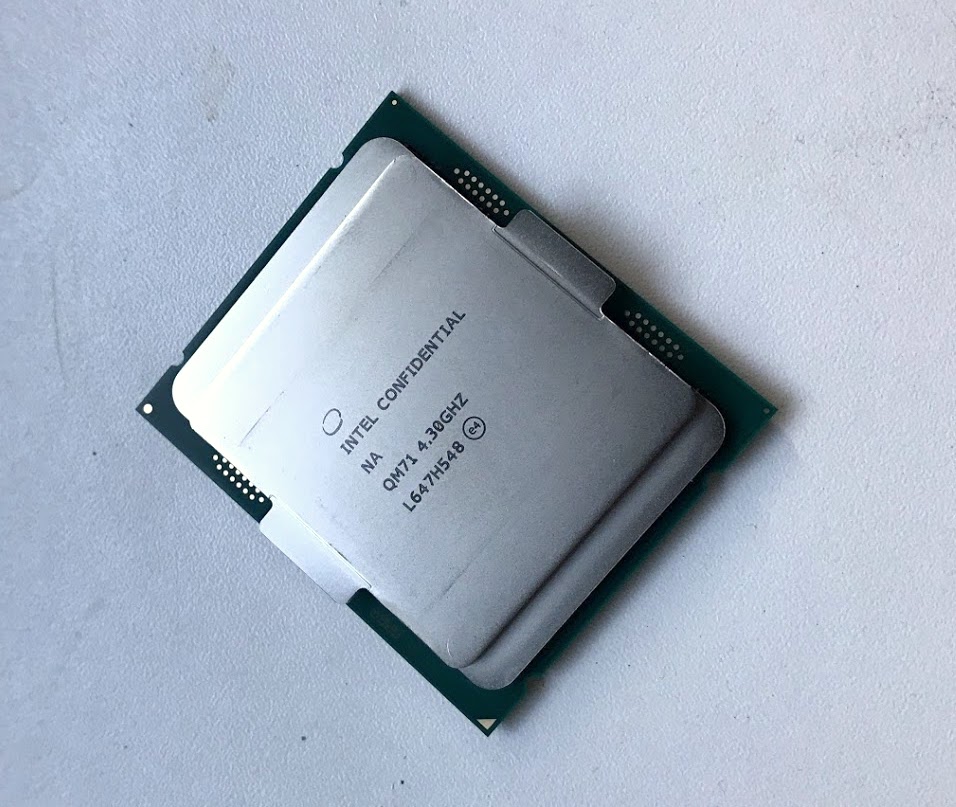
The Core i7-7900X
As of the end of July, the Core i7-7900X was still the fastest available Skylake-X processor. It features ten cores, Hyperthreading, and a cache capacity of 13.75 MB. The larger Core i9-7920X with twelve cores, yet reduced base clock rate is supposed to be launched in early August. In October, Skylake-X models with up to 18 cores are expected to be rolled out. The specification of the larger models are only official in part. Unofficially, they are already entirely leaked.
Skylake-X is - also because of its high price - markedly a HEDT platform. Hence, it does not target the normal users, but professional customers who require very high CPU performance. Currently, AMD does still not have a competitor in this market segment. First Threadripper is supposed to cater to this segment. For example, the 1950X with 16 cores, 32 threads, and a clock rate of up to 4 GHz is supposed to cost 1000 US dollars.
We have already discussed the innovations of the Skylake architecture, i.e. the replacement of the classic Ring Bus with a network, in an analysis of the first Core i9-7900X reviews. Analysis of the latencies within the processor has shown that the new Mesh structure ensures more consistent latencies. For the first few cores, they are significantly higher than AMD and Intel competitors'. However, this changes from the eight core; at least when compared to Ryzen CPUs.
| Model | Cores - Threads | Base clock | Turbo clock | L3 cache | TDP | Straßenpreis, ca. |
| Core i7-7920X | 12-24 | 2.9 GHz | unknown | 16 MB | 160 Watt | (1200 Euros) |
| Core i7-7900X | 10-20 | 3.3 GHz | 4.3/4.5 GHz | 13,75 MB | 160 Watt | 1000 Euros |
| Core i7-7740X | 4-8 | 4.3 GHz | 4.5 GHz | 8 MB | 112 Watt | 350 Euros |
| Core i7-7700K | 4-8 | 4.2 GHz | 4.5 GHz | 8 MB | 95 Watt | 330 Euros |
| Ryzen R7 1800X | 8-16 | 3.6 GHz | 4/3.7 GHz | 16 MB | 95 Watt | 450 Euros |
| Ryzen R7 1700X | 8-16 | 3.4 GHz | 3.8/3.5 GHz | 16 MB | 95 Watt | 360 Euros |
Synthetic Benchmarks
Cinebench R15
Cinebench R15 uses rendering of a photo realistic scene made of over 300000 polygons for quantifying the CPU performance. It can either use a single core (thread, respectively) or all threads. While the first test benefits from a high clock rate, the Multithreading test benefits from multiple cores, Hyperthreading support, and SMT. As usual for synthetic tests, the results need not automatically apply to specific applications. Nevertheless, they are quite meaningful since each program has a different level of usage and optimization for high core count.
In extreme scenarios, a significantly cheaper processor with two cores and high clock rate can be significantly faster than a 16 core CPU which only uses a low clock rate in order to, for example, prevent exceeding specified power consumption. Turbo Boost 3.0, which can overclock two cores heavily, is supposed to prevent bottlenecks. Professional, modern software which is used on HEDT platforms should usually be optimized for parallel computing.
As expected, the Core i9-7900X remains behind the Core i7-7740X and the i7-7700K in single-core tests, but it outclasses all AMD competitors by far with plus 20%. The Ryzen 7 1800X is only half as expensive and basically belongs to a different market segment however.
As expected, the Core i7-7900X's performance is beyond any doubt when using all its cores. No other desktop processor can reach 2148 points. The Ryzen 7 1800X is about 23% slower. This proves that the Core i9-7900X is disproportionately expensive and is an indication for the market situation after the Threadripper launch - we will discuss this a little later.
| Cinebench R15 | |
| CPU Single 64Bit | |
| Intel Core i7-7740X | |
| Intel Core i7-7700K | |
| Intel Core i9-7900X | |
| Intel Core i5-7600K | |
| Intel Core i7-6950X | |
| Intel Core i7-6950X | |
| AMD Ryzen 7 1800X | |
| AMD Ryzen 7 1700X | |
| AMD Ryzen 5 1500X | |
| Intel Core i7-7700HQ | |
| AMD Ryzen 5 1600 | |
| AMD Ryzen 7 1700 | |
| AMD Ryzen 5 1600 | |
| Intel Core i7-5960X | |
| AMD Ryzen 5 1400 | |
| Intel Xeon E5-2697 v2 | |
| Intel Xeon E5-2680 v4 | |
| AMD FX-8350 | |
| CPU Multi 64Bit | |
| Intel Core i9-7900X | |
| Intel Core i7-6950X | |
| Intel Xeon E5-2680 v4 | |
| AMD Ryzen 7 1800X | |
| AMD Ryzen 7 1700X | |
| Intel Xeon E5-2697 v2 | |
| AMD Ryzen 7 1700 | |
| Intel Core i7-5960X | |
| AMD Ryzen 5 1600 | |
| AMD Ryzen 5 1600 | |
| Intel Core i7-7740X | |
| Intel Core i7-7700K | |
| AMD Ryzen 5 1500X | |
| Intel Core i7-7700HQ | |
| AMD Ryzen 5 1400 | |
| Intel Core i5-7600K | |
| AMD FX-8350 | |
Truecrypt
Truecrypt quantifies CPU performance with the help of different encryption algorithms, i.e., Serpent, Twofisch, and Rijndael. The latter won out over its two competitors and as AES (Advanced Encryption Standard) it is publicly quite well-known. Apart from very specific application scenarios, the real-world relevance of the Truecrypt benchmarks might be relatively low. It is not an entirely synthetic benchmark however.
Since encryption algorithms benefit to a high extent from parallelization, the Core i9-7900X is taking the lead again and performs 31% faster than the Ryzen 7 1800X. The Core i9-7900X is more than twice as fast as the Kaby-Lake-X Core i7-7740X processor.
| Performance rating - Percent | |
| Intel Core i9-7900X | |
| Intel Core i7-6950X | |
| AMD Ryzen 7 1800X | |
| Intel Xeon E5-2697 v2 | |
| AMD Ryzen 7 1700X | |
| Intel Xeon E5-2680 v4 | |
| Intel Core i7-5960X | |
| AMD Ryzen 5 1600 | |
| AMD Ryzen 5 1600 | |
| Intel Core i7-7740X | |
| Intel Core i7-7700K | |
| AMD Ryzen 5 1500X | |
| AMD Ryzen 5 1400 | |
| Intel Core i5-7600K | |
| TrueCrypt | |
| Serpent Mean 100MB | |
| Intel Core i7-6950X | |
| Intel Core i9-7900X | |
| AMD Ryzen 7 1800X | |
| Intel Xeon E5-2697 v2 | |
| AMD Ryzen 7 1700X | |
| Intel Xeon E5-2680 v4 | |
| Intel Core i7-5960X | |
| AMD Ryzen 5 1600 | |
| AMD Ryzen 5 1600 | |
| Intel Core i7-7700K | |
| Intel Core i7-7740X | |
| AMD Ryzen 5 1500X | |
| AMD Ryzen 5 1400 | |
| Intel Core i5-7600K | |
| Twofish Mean 100MB | |
| Intel Core i9-7900X | |
| Intel Core i7-6950X | |
| Intel Xeon E5-2697 v2 | |
| AMD Ryzen 7 1800X | |
| Intel Xeon E5-2680 v4 | |
| AMD Ryzen 7 1700X | |
| Intel Core i7-5960X | |
| AMD Ryzen 5 1600 | |
| AMD Ryzen 5 1600 | |
| Intel Core i7-7740X | |
| Intel Core i7-7700K | |
| AMD Ryzen 5 1500X | |
| AMD Ryzen 5 1400 | |
| Intel Core i5-7600K | |
| AES Mean 100MB | |
| Intel Core i9-7900X | |
| Intel Core i7-6950X | |
| AMD Ryzen 7 1800X | |
| Intel Xeon E5-2680 v4 | |
| AMD Ryzen 7 1700X | |
| Intel Xeon E5-2697 v2 | |
| Intel Core i7-5960X | |
| AMD Ryzen 5 1600 | |
| Intel Core i7-7740X | |
| Intel Core i7-7700K | |
| AMD Ryzen 5 1600 | |
| AMD Ryzen 5 1500X | |
| AMD Ryzen 5 1400 | |
| Intel Core i5-7600K | |
wPrime
wPrime calculates square roots with the Newton algorithm for quantifying CPU performance and particularly benefits from a high core count and Hyperthreading. In view of the multi-core performance of the Core i9-7900X, it is absolutely not surprising that the Skylake-X model achieves a top place. The differences are approximately the same as in the previous benchmarks.
| wPrime 2.10 | |
| 1024m | |
| Intel Xeon E5-2697 v2 | |
| Intel Core i5-7600K | |
| AMD Ryzen 5 1400 | |
| AMD Ryzen 5 1500X | |
| Intel Core i7-7700K | |
| Intel Core i7-7740X | |
| AMD Ryzen 5 1600 | |
| Intel Core i7-5960X | |
| AMD Ryzen 7 1700X | |
| AMD Ryzen 7 1800X | |
| Intel Core i7-6950X | |
| Intel Core i9-7900X | |
| 32m | |
| Intel Xeon E5-2697 v2 | |
| Intel Core i5-7600K | |
| AMD Ryzen 5 1400 | |
| AMD Ryzen 5 1500X | |
| Intel Core i7-7700K | |
| Intel Core i7-7740X | |
| AMD Ryzen 5 1600 | |
| Intel Core i7-5960X | |
| AMD Ryzen 7 1700X | |
| AMD Ryzen 7 1800X | |
| Intel Core i7-6950X | |
| Intel Core i9-7900X | |
* ... smaller is better
Other synthetic benchmarks
The results of other benchmarks primarily confirm the results of the previous benchmarks. WinRAR in particular provided reproducible, yet faintly meaningful values.
| Geekbench 4.0 | |
| 64 Bit Single-Core Score | |
| Intel Core i7-7740X | |
| Intel Core i7-7700K | |
| Intel Core i5-7600K | |
| Intel Core i9-7900X | |
| AMD Ryzen 7 1800X | |
| AMD Ryzen 7 1700X | |
| Intel Core i7-7700HQ | |
| AMD Ryzen 7 1700 | |
| AMD Ryzen 5 1500X | |
| AMD Ryzen 5 1600 | |
| Intel Core i7-6950X | |
| Intel Core i7-5960X | |
| AMD Ryzen 5 1400 | |
| Intel Xeon E5-2680 v4 | |
| 64 Bit Multi-Core Score | |
| Intel Core i9-7900X | |
| Intel Core i7-6950X | |
| Intel Core i7-5960X | |
| AMD Ryzen 7 1800X | |
| Intel Xeon E5-2680 v4 | |
| AMD Ryzen 7 1700X | |
| AMD Ryzen 7 1700 | |
| Intel Core i7-7740X | |
| AMD Ryzen 5 1600 | |
| Intel Core i7-7700K | |
| Intel Core i5-7600K | |
| AMD Ryzen 5 1500X | |
| Intel Core i7-7700HQ | |
| AMD Ryzen 5 1400 | |
| WinRAR - Result | |
| Intel Core i7-6950X | |
| Intel Xeon E5-2697 v2 | |
| Intel Core i7-5960X | |
| Intel Core i7-7740X | |
| Intel Xeon E5-2680 v4 | |
| Intel Core i9-7900X | |
| Intel Core i7-7700K | |
| AMD Ryzen 7 1800X | |
| AMD Ryzen 7 1700X | |
| AMD Ryzen 5 1500X | |
| AMD Ryzen 5 1600 | |
| Intel Core i5-7600K | |
| AMD Ryzen 5 1400 | |
| X264 HD Benchmark 4.0 | |
| Pass 1 | |
| Intel Core i7-7740X | |
| Intel Core i7-7700K | |
| Intel Core i5-7600K | |
| Intel Core i9-7900X | |
| Intel Core i7-6950X | |
| AMD Ryzen 7 1800X | |
| Intel Core i7-5960X | |
| AMD Ryzen 7 1700X | |
| AMD Ryzen 5 1600 | |
| AMD Ryzen 5 1500X | |
| Intel Xeon E5-2697 v2 | |
| AMD Ryzen 5 1400 | |
| Intel Xeon E5-2680 v4 | |
| Pass 2 | |
| Intel Core i9-7900X | |
| Intel Core i7-6950X | |
| AMD Ryzen 7 1800X | |
| AMD Ryzen 7 1700X | |
| Intel Xeon E5-2697 v2 | |
| Intel Core i7-5960X | |
| Intel Xeon E5-2680 v4 | |
| AMD Ryzen 5 1600 | |
| Intel Core i7-7740X | |
| Intel Core i7-7700K | |
| AMD Ryzen 5 1500X | |
| Intel Core i5-7600K | |
| AMD Ryzen 5 1400 | |
| PCMark 8 | |
| Home Score Accelerated v2 | |
| Intel Core i7-7740X | |
| Intel Core i9-7900X | |
| Intel Core i7-7700K | |
| Intel Core i5-7600K | |
| AMD Ryzen 7 1800X | |
| AMD Ryzen 5 1500X | |
| Intel Core i7-4790K | |
| AMD Ryzen 7 1700X | |
| AMD Ryzen 7 1700 | |
| AMD Ryzen 5 1600 | |
| AMD Ryzen 5 1400 | |
| Intel Core i7-6950X | |
| Intel Core i7-5960X | |
| Intel Core i7-7700HQ | |
| Intel Xeon E5-2697 v2 | |
| Work Score Accelerated v2 | |
| Intel Core i9-7900X | |
| Intel Core i7-7700HQ | |
| Intel Core i7-7700K | |
| Intel Core i7-7740X | |
| AMD Ryzen 5 1500X | |
| Intel Xeon E5-2697 v2 | |
| AMD Ryzen 7 1800X | |
| AMD Ryzen 7 1700X | |
| Intel Core i7-6950X | |
| AMD Ryzen 5 1600 | |
| Intel Core i7-5960X | |
| AMD Ryzen 7 1700 | |
| AMD Ryzen 5 1400 | |
| 3DMark | |
| 1920x1080 Fire Strike Physics | |
| Intel Core i9-7900X | |
| Intel Core i7-6950X | |
| AMD Ryzen 7 1800X | |
| AMD Ryzen 7 1700X | |
| Intel Core i7-5960X | |
| AMD Ryzen 7 1700 | |
| Intel Xeon E5-2697 v2 | |
| Intel Xeon E5-2680 v4 | |
| AMD Ryzen 5 1600 | |
| Intel Core i7-7740X | |
| Intel Core i7-7700K | |
| Intel Core i7-4790K | |
| AMD Ryzen 5 1400 | |
| Intel Core i7-7700HQ | |
| Intel Core i5-7600K | |
| 2560x1440 Time Spy CPU | |
| Intel Core i9-7900X | |
| Intel Core i7-6950X | |
| Intel Xeon E5-2680 v4 | |
| AMD Ryzen 7 1800X | |
| Intel Core i7-5960X | |
| AMD Ryzen 7 1700X | |
| AMD Ryzen 7 1700X | |
| AMD Ryzen 7 1700 | |
| Intel Core i7-7740X | |
| AMD Ryzen 5 1600 | |
| Intel Core i7-7700K | |
| Intel Core i7-4790K | |
| Intel Core i7-7700HQ | |
| Intel Core i5-7600K | |
| AMD Ryzen 5 1500X | |
| AMD Ryzen 5 1400 | |
| 3DMark 11 - 1280x720 Performance Physics | |
| Intel Core i7-6950X | |
| Intel Core i9-7900X | |
| Intel Core i7-5960X | |
| AMD Ryzen 7 1800X | |
| Intel Xeon E5-2697 v2 | |
| AMD Ryzen 7 1700 | |
| Intel Xeon E5-2680 v4 | |
| Intel Core i7-7740X | |
| Intel Core i7-7700K | |
| AMD Ryzen 5 1600 | |
| Intel Core i7-4790K | |
| AMD Ryzen 5 1500X | |
| Intel Core i7-7700HQ | |
| AMD Ryzen 5 1400 | |
| 3DMark 06 - CPU - CPU Score | |
| Intel Core i9-7900X | |
| Intel Core i7-6950X | |
| Intel Core i7-7740X | |
| Intel Core i7-7700K | |
| Intel Core i7-5960X | |
| AMD Ryzen 7 1700 | |
| Intel Xeon E5-2697 v2 | |
| Intel Core i5-7600K | |
| AMD Ryzen 5 1600 | |
| Intel Xeon E5-2680 v4 | |
| Intel Core i7-7700HQ | |
| AMD Ryzen 5 1500X | |
| AMD Ryzen 5 1400 | |
Preliminary Verdict
In the synthetic benchmarks, the 10 cores of the Skylake i9-7900X deliver a performance so far unmatched by desktop processors and significantly outperform the (significantly cheaper) Ryzen processors.
Gaming Benchmarks
Test System
We use a GeForce GTX 1080 Ti Founder's edition, which is currently one of the fastest GPUs, in order to eliminate that the GPU is a limiting factor and create acceptable conditions for the comparison. The Skylake-X model was already tested in an Asus Prime X299-A with 16 GB of DDR4-2.666 RAM in dual channel mode. The test system for the Ryzen and other Intel models is described in detail in our Ryzen 7 1700, 1700X and 1800X review. It also features a GTX 1080 Ti.
Frame rates
With the exception of the CPU-intensive “Farming Simulator 17” - the results in low detail level are relevant in the gaming benchmarks. In combination with a powerful graphic card such as the used GeForce GTX 1080 Ti, the frames rates are only limited by the used CPU. This test method is anything but realistic. However, it is the only way to quantify the real-world performance of the CPU in very complex, real-world applications such as video games.
In “For Honor”, which apparently scales very poorly with high core count, the Core i7-7900X got last place by far. Above all, we want to mention that the frame rate is twice as high in the CPU limit as with realistic 4K-resolution and high detail level. Hence, the CPU should not even be a limiting factor with two 1080 Ti models in SLI. In contrast, the test system achieves the highest average frame rate so far in “Farming Simulator” and performs a significant 12% better than the Ryzen 7 1800X.
The Core i7-7900X also took the lead in our main benchmark, “The Witcher 3”. With plus 18%, it performs significantly better than Ryzen CPUs. The performance gain falls to only 7% in comparison with the quad-core i7-7740X.
| Farming Simulator 17 - 3840x2160 High Preset AA:2xMS AF:2x | |
| Intel Core i7-7740X | |
| Intel Core i7-6950X | |
| Intel Core i5-7600K | |
| Intel Core i7-4790K | |
| Intel Core i7-7700K | |
| Intel Core i9-7900X | |
| AMD Ryzen 5 1500X | |
| Intel Core i7-5960X | |
| AMD Ryzen 7 1800X | |
| AMD Ryzen 5 1600 | |
| AMD Ryzen 7 1700 | |
| Intel Xeon E5-2680 v4 | |
| AMD Ryzen 5 1400 | |
| The Witcher 3 | |
| 1920x1080 Ultra Graphics & Postprocessing (HBAO+) | |
| Intel Core i7-7740X | |
| Intel Core i7-7700K | |
| Intel Core i7-6950X | |
| Intel Core i7-4790K | |
| AMD Ryzen 7 1700 | |
| AMD Ryzen 7 1800X | |
| Intel Core i9-7900X | |
| AMD Ryzen 5 1500X | |
| AMD Ryzen 5 1400 | |
| AMD Ryzen 5 1600 | |
| Intel Xeon E5-2680 v4 | |
| 1024x768 Low Graphics & Postprocessing | |
| Intel Core i9-7900X | |
| Intel Core i7-7740X | |
| Intel Core i7-4790K | |
| Intel Core i7-6950X | |
| Intel Core i7-7700K | |
| AMD Ryzen 7 1800X | |
| AMD Ryzen 7 1700 | |
| Intel Xeon E5-2680 v4 | |
| AMD Ryzen 5 1600 | |
| AMD Ryzen 5 1500X | |
| AMD Ryzen 5 1400 | |
| For Honor | |
| 3840x2160 High Preset AA:T AF:8x | |
| Intel Xeon E5-2680 v4 | |
| Intel Core i7-7700K | |
| Intel Core i7-7740X | |
| Intel Core i7-6950X | |
| AMD Ryzen 7 1700 | |
| Intel Core i9-7900X | |
| Intel Core i5-7600K | |
| AMD Ryzen 5 1500X | |
| AMD Ryzen 5 1400 | |
| AMD Ryzen 5 1600 | |
| Intel Core i7-4790K | |
| AMD Ryzen 7 1800X | |
| Intel Core i7-5960X | |
| 1280x720 Low Preset | |
| Intel Core i7-7740X | |
| Intel Core i7-7700K | |
| Intel Core i7-4790K | |
| AMD Ryzen 5 1500X | |
| Intel Core i5-7600K | |
| AMD Ryzen 5 1600 | |
| Intel Xeon E5-2680 v4 | |
| AMD Ryzen 5 1400 | |
| AMD Ryzen 7 1800X | |
| Intel Core i7-5960X | |
| AMD Ryzen 7 1700 | |
| Intel Core i7-6950X | |
| Intel Core i9-7900X | |
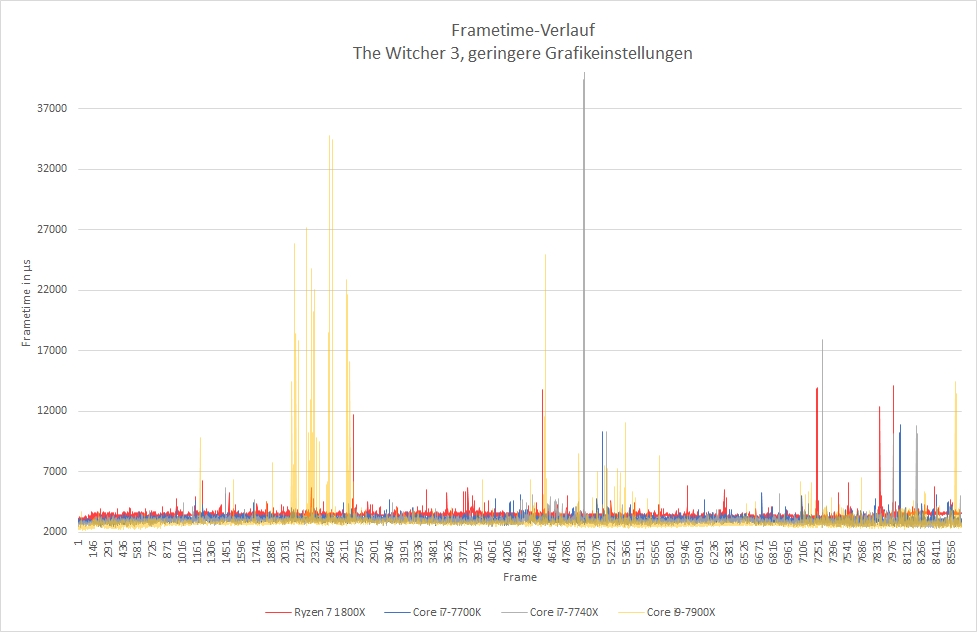
Frame time analysis
In the frame time analysis, the Core i9-7900X performs significantly poorer than to be expected from FPS alone; at least in “The Witcher 3”. The diagram clearly shows many unusual and large anomalies. Overall, it reaches entirely new - negative - dimensions. In order to put this into perspective: Even a frame time of 32.000 µS corresponds to a frame rate of just above 31 frames per second and is still far from real stuttering. Nevertheless, the performance appears significantly less smooth due to the erratic frame times. By the way, the higher average frame rate directly shows in the diagram - the baseline is slightly lower than all other processors'.
The statistical analysis confirms the visual impression: The Core i9-7900X shows a relatively high frame rate variability for an Intel CPU, especially in view of higher deviations. Hence, the Skylake-X CPU often has problems maintaining its basically very high frame rate; at least in “The Witcher 3”.
| Model | Core i9-7900X | Core i7-7740X | Core i7-7700K | Core i7-4790K | Ryzen 7 1800X |
| Frame time (Median, in µs) | 2815 | 3032 | 3169 | 3084 | 3525 |
| deviations ≥ 20% | 2.572% | 1.891% | 1.555% | 2.711% | 0.473% |
| deviations ≥ 50% | 0.616% | 0.266% | 0.187% | 0.276% | 0.141% |
| deviations ≥ 100% | 0.382% | 0.091% | 0.049% | 0.049% | 0.068% |
| deviations ≥ 300% | 0.134% | 0.032% | 0.000% | 0.005% | 0.018% |
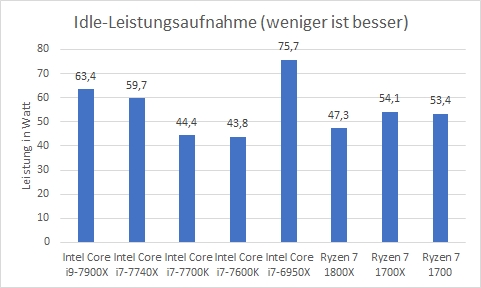
Energy efficiency
We have to mention again that we only measure the total power consumption. Hence, the motherboard causes a relative error which should not be underestimated. This is particularly true of the idle results.
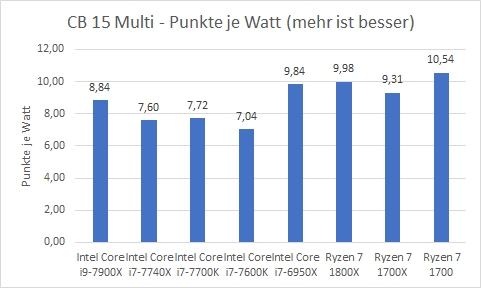
The used X299 motherboard already requires about 4 watts more with i9-7900X than with i7-7740X. Without exception, all Ryzen models require less energy in this scenario. On the other hand, the Skylake-X processor shows to be quite energy efficient in Cinebench 15 in our comparison. Nevertheless, it cannot catch up with the Ryzen CPUs. Anyhow, it should be noted that the power consumption of the entire system increases to 243 watts in Cinebench - which causes a waste heat not to be underestimated.
Verdict
It is not surprising, that the Core i9-7900X is the fastest desktop processor we have tested so far. It delivers so far unmatched performance in synthetic benchmarks and games. The frame rate variability is remarkably high however. The high performance is at the expense of thermal problems and high power consumption. The efficiency is acceptable at least. It would be presumptuous to call it the "top end of the flagpole". However, the Core i9-7900X appears a bit like a counterattack born out of distress and huge effort.
The consumer should not have a real reason to actually buy the 1000 Euro Skylake-X processor however, since the Ryzen 7 1800X and for those on a tighter budget who prefer Intel to some extent the Core i7-7740X are products which more than adequately speed up all current programs and video games. The Ryzen 7 1800X in particular also performs well in complex application scenarios thanks to its 16 threads. Hence, it is our current recommendation for consumers who require the highest possible performance, but want to stay within a reasonable level.
Finally, Intel has not targeted consumers (or even gamers), but professional users with the HEDT processor. Hence, the Ryzen 7 1800X actually belongs to a different category. Nevertheless, it can keep up excellently in terms of price performance ratio. For example, the Core i9-7900X performs 30% better than the Ryzen for twice the price.
Hence, a comparison of Skylake-X and AMD's Threadripper might be exciting. Citing AMD's public video, which compares the Cinebench performance of Threadripper 1920X and 1950X to the Core i9-7900, we attest Threadripper a relatively high performance advance. Moreover, the CPUs should suffer less from thermal problems due to soldering and larger size.
Test Samples
Most of the test samples for this review have been provided by Intel (CPU), AMD (Ryzen CPUs, Asus Board, memory kit, Noctua cooler). Intel lent us the Core i7-6950X and i7-5960X. The X99-E motherboard and X299 motherboard were provided by Asus. Noctua provided us with a NH-U12S cooler for the AMD AM4, and the X99/X299 board.
Addendum
Intel Core i9-7900X
| Codename | Skylake-X |
| Series | Intel Core i9 |
| Clock Rate | 3300 - 4500 MHz |
| Level 1 Cache | 640 KB |
| Level 2 Cache | 10 MB |
| Level 3 Cache | 13.8 MB |
| Number of Cores / Threads | 10 / 20 |
| Power Consumption (TDP = Thermal Design Power) | 140 Watt |
| Manufacturing Technology | 14 nm |
| Max. Temperature | 95 °C |
| Socket | FCLGA-2066 |
| Features | DDR4-2666 Memory Controller Quad-Channel, HyperThreading, AVX, AVX2, AES-NI, TSX-NI, Quick Sync, Virtualization, vPro |
| 64 Bit | 64 Bit support |
| Architecture | x86 |
| Starting Price | $999 U.S. |
| Announcement Date | 05/30/2017 |
| Product Link (external) | www.intel.com |
Benchmarks
* Smaller numbers mean a higher performance
- $136.49Intel BX80673I97900X Core i9-7900X X-Series Processor 10 Cores up to 4.3 GHz Turbo Unlocked LGA2066 X299 Series 140W
- $179.97Intel Core i9-7960X X-Series Processor 16 Cores up to 4.2 GHz Turbo Unlocked LGA2066 X299 Series 165W (Renewed)
- $129.97Intel Core i9-7920X X-Series Processor 12 Cores up to 4.3 GHz Turbo Unlocked LGA2066 X299 Series 140W (Renewed)
- $194.97Intel Core i9-7980XE Processors BX80673I97980X (Renewed)
- $289.99Intel Core i9-9900K Desktop Processor 8 Cores up to 5.0 GHz Turbo unlocked LGA1151 300 Series 95W (Renewed)