Notebookcheck Logo

Intel Core i5-11400F desktop processor

Intel's Core i5-11400F is a fast 6-core processor with Hyperthreading based on the new Rocket Lake S architecture. Thus, this CPU is ideally suited for gaming. You can find out what else can be expected in this short review.

Intel Core i5-11400F

Intel i5-11400F

The Intel Core i5-11400F is a fast six-core desktop processor based on the new Rocket Lake architecture, which was introduced in March 2021. The processor clocks with a base clock of 2.6 GHz and reaches an all-core boost of 4.2 GHz under load. In single-thread applications, the Intel Core i5-11400F even reaches up to 4.4 GHz. Intel also gives the Rocket Lake processors the Hyperthreading feature, which allows the i5-11400F to process up to 12 threads simultaneously. As known, the Intel Core i5-11400F is manufactured in the 14 nm process. Nevertheless, many changes have been made with the Rocket Lake architecture, which is also reflected in the performance compared to the Comet Lake. The Intel Core i5-11400F is a non-K CPU, which means that there is no freely selectable multiplier. Thus, the scope for overclocking is relatively small.

Performance

Compared to the Intel Core i5-10400F, the Core i5-11400F offers a significantly better IPC. This can be seen clearly in the single-core benchmarks. But the multi-core performance also benefits from the better IPC compared to Comet-Lake. A performance increase of up to 20 percent can be expected. The Core i5 has to do without the TVB (Thermal Velocity Boost). However, 4.2 GHz is still possible when all cores are loaded. Due to the very high single-thread performance, the Intel Core i5-11400F is best suited for video games.

Graphics

The processors marked with "F" in the nomenclature don't offer an integrated graphics unit. All other non-F processors can fall back on the Intel UHD Graphics 750 and also allow operation without a dedicated graphics card.

Power consumption

The TDP turns out relatively low with 65 watts. This is the PL1 value. For Turbo, the Intel Core i5-11400F offers a higher TDP of up to 154 watts with PL2. However, this may only be applied for a maximum of 28 seconds (dew). A good air cooler should be able to handle the resulting waste heat, so no AiO is necessary for this processor.

SeriesIntel Rocket Lake
CodenameRocket Lake

Series: Rocket Lake Rocket Lake

Intel Core i9-11900K compare3.5 - 5.3 GHz8 / 16 cores16 MB L3
Intel Core i7-11700K compare3.6 - 5 GHz8 / 16 cores16 MB L3
Intel Core i7-11700 compare2.5 - 4.9 GHz8 / 16 cores16 MB L3
Intel Core i5-11600K compare3.9 - 4.9 GHz6 / 12 cores12 MB L3
Intel Core i5-11400F « 2.6 - 4.4 GHz6 / 12 cores12 MB L3
Intel Core i5-11400T compare1.3 - 3.7 GHz6 / 12 cores12 MB L3
Clock Rate2600 - 4400 MHz
Level 1 Cache480 KB
Level 2 Cache3 MB
Level 3 Cache12 MB
Number of Cores / Threads6 / 12
Power Consumption (TDP = Thermal Design Power)65 Watt
Manufacturing Technology14 nm
Die Size276 mm2
Max. Temperature100 °C
SocketLGA1200
FeaturesDDR4-3200 RAM, PCIe 4, 8 GT/s bus, DL Boost, GNA, MMX, SSE, SSE2, SSE3, SSSE3, SSE4.1, SSE4.2, AVX, AVX2, AVX-512, BMI2, ABM, FMA, ADX, VMX, SMEP, SMAP, MPX, EIST, TM1, TM2, HT, Turbo, SST, AES-NI, RDRAND, RDSEED, SHA
64 Bit64 Bit support
Architecturex86
Starting Price$157 U.S.
Announcement Date05/19/2021
Product Link (external)ark.intel.com
v1.26
log 25. 07:41:05

#0 no ids found in url (should be separated by "_") +0s ... 0s

#1 not redirecting to Ajax server +0s ... 0s

#2 did not recreate cache, as it is less than 5 days old! Created at Thu, 25 Apr 2024 05:38:32 +0200 +0.001s ... 0.001s

#3 return log +0.007s ... 0.008s

Details about our test system

We use the following system for the following benchmarks and tests:

  • Raijintek Pean Benchtable
  • Intel Core i5-11400F
  • MSI B560 MAG Tomahawk WiFi
  • Alphacool Eisbaer 280 AiO
  • Nvidia Titan RTX (Nvidia 456.71)
  • Corsair HX 1200i power supply
  • G.Skill Trident Z Neo RGB DDR4-4000 memory kit 2 x 16 GB, set to DDR4-4000 CL16-19-39
  • Intel Optane 905P 480GB PCIe SSD
  • Microsoft Windows 10 Professional 64-bit (version 20H2)

From Intel comes the Core i5-11400F, as well as the used MSI B560 motherboard and Caseking provided us with the Raijintek Pean Showcase for the tests. We used the Alphacool Eisbaer 280 AiO for cooling and G.Skill provided us with the DDR4-4000 memory kit.

Processor benchmarks

In a direct comparison with the predecessor (Intel Core i5-10400F), the newer Rocket Lake S model can place itself in front, as expected. The Intel Core i5-11400F now has a lead of almost 20 percent. The even older Intel Core i5-9400F can even be surpassed by up to 66 percent in the multi-thread benchmarks. However, the comparison to the AMD Ryzen 5 5600X, which also comes with 6 cores and 12 threads, is much more interesting. This shows that Intel still has a lot of homework to do, because the gap to the rival from the red camp is clear and cannot be denied. Moreover, AMD can accommodate up to 16 cores on the AM4 socket with its chiplet design.  Due to the larger cache (compared to Comet-Lake-S) Intel now only allows a maximum of 8 cores in the top model (Intel Core i9-11900K).

CPU-Z
CPU-Z
CPU-Z
CPU-Z
CPU-Z
CPU-Z
CPU-Z
HWiNFO
XTU
XTU (Benchmark)
Cinebench R15
CPU Single 64Bit
AMD Ryzen 5 5600X
R5 5600X, 3700 MHz
254 Points +21%
Intel Core i5-11600K
i5-11600K, 3900 MHz
242 Points +15%
Intel Core i5-11400F
i5-11400F, 2600 MHz
210 Points
Intel Core i5-10400F
i5-10400F, 2900 MHz
180 Points -14%
Intel Core i5-9400F
i5-9400F, 2900 MHz
173 Points -18%
CPU Multi 64Bit
AMD Ryzen 5 5600X
R5 5600X, 3700 MHz
1968 Points +25%
Intel Core i5-11600K
i5-11600K, 3900 MHz
1738 Points +10%
Intel Core i5-11400F
i5-11400F, 2600 MHz
1574 Points
Intel Core i5-10400F
i5-10400F, 2900 MHz
1332 Points -15%
Intel Core i5-9400F
i5-9400F, 2900 MHz
984 Points -37%
Cinebench R20
CPU (Single Core)
AMD Ryzen 5 5600X
R5 5600X, 3700 MHz
601 Points +20%
Intel Core i5-11600K
i5-11600K, 3900 MHz
595 Points +19%
Intel Core i5-11400F
i5-11400F, 2600 MHz
502 Points
Intel Core i5-10400F
i5-10400F, 2900 MHz
438 Points -13%
Intel Core i5-9400F
i5-9400F, 2900 MHz
416 Points -17%
CPU (Multi Core)
AMD Ryzen 5 5600X
R5 5600X, 3700 MHz
4567 Points +16%
Intel Core i5-11600K
i5-11600K, 3900 MHz
4349 Points +10%
Intel Core i5-11400F
i5-11400F, 2600 MHz
3945 Points
Intel Core i5-10400F
i5-10400F, 2900 MHz
3201 Points -19%
Intel Core i5-9400F
i5-9400F, 2900 MHz
2378 Points -40%
Cinebench R11.5
CPU Single 64Bit
AMD Ryzen 5 5600X
R5 5600X, 3700 MHz
2.95 Points +32%
Intel Core i5-11600K
i5-11600K, 3900 MHz
2.87 Points +29%
Intel Core i5-11400F
i5-11400F, 2600 MHz
2.23 Points
Intel Core i5-10400F
i5-10400F, 2900 MHz
2.03 Points -9%
Intel Core i5-9400F
i5-9400F, 2900 MHz
1.95 Points -13%
CPU Multi 64Bit
AMD Ryzen 5 5600X
R5 5600X, 3700 MHz
21.75 Points +23%
Intel Core i5-11600K
i5-11600K, 3900 MHz
19.32 Points +9%
Intel Core i5-11400F
i5-11400F, 2600 MHz
17.65 Points
Intel Core i5-10400F
i5-10400F, 2900 MHz
14.39 Points -18%
Intel Core i5-9400F
i5-9400F, 2900 MHz
11.27 Points -36%
Cinebench R10
Rendering Single CPUs 64Bit
Intel Core i5-11600K
i5-11600K, 3900 MHz
12957 Points +46%
AMD Ryzen 5 5600X
R5 5600X, 3700 MHz
12563 Points +42%
Intel Core i5-11400F
i5-11400F, 2600 MHz
8876 Points
Intel Core i5-10400F
i5-10400F, 2900 MHz
8849 Points 0%
Intel Core i5-9400F
i5-9400F, 2900 MHz
8182 Points -8%
Rendering Multiple CPUs 64Bit
AMD Ryzen 5 5600X
R5 5600X, 3700 MHz
69545 Points +21%
Intel Core i5-11600K
i5-11600K, 3900 MHz
64663 Points +13%
Intel Core i5-11400F
i5-11400F, 2600 MHz
57417 Points
Intel Core i5-10400F
i5-10400F, 2900 MHz
47901 Points -17%
Intel Core i5-9400F
i5-9400F, 2900 MHz
40065 Points -30%
Blender - v2.79 BMW27 CPU
Intel Core i5-9400F
i5-9400F, 2900 MHz
468.5 Seconds * -61%
Intel Core i5-10400F
i5-10400F, 2900 MHz
332.4 Seconds * -15%
Intel Core i5-11400F
i5-11400F, 2600 MHz
290.2 Seconds *
Intel Core i5-11600K
i5-11600K, 3900 MHz
264.5 Seconds * +9%
AMD Ryzen 5 5600X
R5 5600X, 3700 MHz
260.2 Seconds * +10%
wPrime 2.10
32m
Intel Core i5-9400F
i5-9400F, 2900 MHz
6.757 s * -65%
Intel Core i5-10400F
i5-10400F, 2900 MHz
6.25 s * -53%
Intel Core i5-11600K
i5-11600K, 3900 MHz
4.919 s * -20%
Intel Core i5-11400F
i5-11400F, 2600 MHz
4.085 s *
AMD Ryzen 5 5600X
R5 5600X, 3700 MHz
3.891 s * +5%
1024m
Intel Core i5-9400F
i5-9400F, 2900 MHz
198.7 s * -70%
Intel Core i5-10400F
i5-10400F, 2900 MHz
134.7 s * -15%
Intel Core i5-11400F
i5-11400F, 2600 MHz
117.2 s *
AMD Ryzen 5 5600X
R5 5600X, 3700 MHz
113.9 s * +3%
Intel Core i5-11600K
i5-11600K, 3900 MHz
107.6 s * +8%
X264 HD Benchmark 4.0
Pass 1
AMD Ryzen 5 5600X
R5 5600X, 3700 MHz
320 (319min - 321max) fps +24%
Intel Core i5-11600K
i5-11600K, 3900 MHz
299 (294min - 299max) fps +16%
Intel Core i5-11400F
i5-11400F, 2600 MHz
258 (253min - 261max) fps
Intel Core i5-9400F
i5-9400F, 2900 MHz
234 (233min - 234max) fps -9%
Intel Core i5-10400F
i5-10400F, 2900 MHz
228.5 (228min - 231max) fps -11%
Pass 2
AMD Ryzen 5 5600X
R5 5600X, 3700 MHz
117 (117min - 117max) fps +28%
Intel Core i5-11600K
i5-11600K, 3900 MHz
101 (101min - 101max) fps +10%
Intel Core i5-11400F
i5-11400F, 2600 MHz
91.5 (88.4min - 92max) fps
Intel Core i5-10400F
i5-10400F, 2900 MHz
81.2 (81min - 81.3max) fps -11%
Intel Core i5-9400F
i5-9400F, 2900 MHz
64 (63.9min - 64.1max) fps -30%
WinRAR - Result
AMD Ryzen 5 5600X
R5 5600X, 3700 MHz
13282 KB/s +86%
Intel Core i5-11600K
i5-11600K, 3900 MHz
7850 KB/s +10%
Intel Core i5-11400F
i5-11400F, 2600 MHz
7147 KB/s
Intel Core i5-9400F
i5-9400F, 2900 MHz
5794 KB/s -19%
TrueCrypt
AES Mean 100MB
AMD Ryzen 5 5600X
R5 5600X, 3700 MHz
10.7 GB/s +23%
Intel Core i5-11600K
i5-11600K, 3900 MHz
9.7 GB/s +11%
Intel Core i5-11400F
i5-11400F, 2600 MHz
8.7 GB/s
Intel Core i5-9400F
i5-9400F, 2900 MHz
5.2 GB/s -40%
Twofish Mean 100MB
AMD Ryzen 5 5600X
R5 5600X, 3700 MHz
1.5 GB/s +7%
Intel Core i5-11600K
i5-11600K, 3900 MHz
1.5 GB/s +7%
Intel Core i5-11400F
i5-11400F, 2600 MHz
1.4 GB/s
Intel Core i5-9400F
i5-9400F, 2900 MHz
0.86 GB/s -39%
Serpent Mean 100MB
AMD Ryzen 5 5600X
R5 5600X, 3700 MHz
0.938 GB/s +12%
Intel Core i5-11600K
i5-11600K, 3900 MHz
0.9 GB/s +8%
Intel Core i5-11400F
i5-11400F, 2600 MHz
0.836 GB/s
Intel Core i5-9400F
i5-9400F, 2900 MHz
0.51 GB/s -39%
Geekbench 5.5
Multi-Core
AMD Ryzen 5 5600X
R5 5600X, 3700 MHz
8980 Points +17%
Intel Core i5-11600K
i5-11600K, 3900 MHz
8523 Points +11%
Intel Core i5-11400F
i5-11400F, 2600 MHz
7681 Points
Intel Core i5-10400F
i5-10400F, 2900 MHz
6372 Points -17%
Intel Core i5-10400F
i5-10400F, 2900 MHz
6358 Points -17%
Intel Core i5-9400F
i5-9400F, 2900 MHz
5715 Points -26%
Single-Core
Intel Core i5-11600K
i5-11600K, 3900 MHz
1752 Points +11%
AMD Ryzen 5 5600X
R5 5600X, 3700 MHz
1657 Points +5%
Intel Core i5-11400F
i5-11400F, 2600 MHz
1575 Points
Intel Core i5-10400F
i5-10400F, 2900 MHz
1223 Points -22%
Intel Core i5-10400F
i5-10400F, 2900 MHz
1217 Points -23%
Intel Core i5-9400F
i5-9400F, 2900 MHz
1139 Points -28%
Geekbench 5.0
5.0 Multi-Core
AMD Ryzen 5 5600X
R5 5600X, 3700 MHz
8926 Points +16%
Intel Core i5-11600K
i5-11600K, 3900 MHz
8542 Points +11%
Intel Core i5-11400F
i5-11400F, 2600 MHz
7679 Points
Intel Core i5-10400F
i5-10400F, 2900 MHz
6349 Points -17%
Intel Core i5-9400F
i5-9400F, 2900 MHz
5698 Points -26%
5.0 Single-Core
Intel Core i5-11600K
i5-11600K, 3900 MHz
1731 Points +12%
AMD Ryzen 5 5600X
R5 5600X, 3700 MHz
1587 Points +3%
Intel Core i5-11400F
i5-11400F, 2600 MHz
1543 Points
Intel Core i5-10400F
i5-10400F, 2900 MHz
1217 Points -21%
Intel Core i5-9400F
i5-9400F, 2900 MHz
1132 Points -27%
Geekbench 4.4
64 Bit Single-Core Score
Intel Core i5-11600K
i5-11600K, 3900 MHz
7438 Points +9%
AMD Ryzen 5 5600X
R5 5600X, 3700 MHz
6953 Points +2%
Intel Core i5-11400F
i5-11400F, 2600 MHz
6836 Points
Intel Core i5-10400F
i5-10400F, 2900 MHz
5587 Points -18%
Intel Core i5-9400F
i5-9400F, 2900 MHz
5347 Points -22%
64 Bit Multi-Core Score
AMD Ryzen 5 5600X
R5 5600X, 3700 MHz
35617 Points +18%
Intel Core i5-11600K
i5-11600K, 3900 MHz
33266 Points +10%
Intel Core i5-11400F
i5-11400F, 2600 MHz
30191 Points
Intel Core i5-10400F
i5-10400F, 2900 MHz
25403 Points -16%
Intel Core i5-9400F
i5-9400F, 2900 MHz
21830 Points -28%
3DMark 11 - 1280x720 Performance Physics
AMD Ryzen 5 5600X
R5 5600X, 3700 MHz
19649 Points +28%
Intel Core i5-11600K
i5-11600K, 3900 MHz
17381 Points +13%
Intel Core i5-11400F
i5-11400F, 2600 MHz
15367 Points
Intel Core i5-10400F
i5-10400F, 2900 MHz
14539 Points -5%
Intel Core i5-9400F
i5-9400F, 2900 MHz
11185 Points -27%
7-Zip 18.03
7z b 4
AMD Ryzen 5 5600X
R5 5600X, 3700 MHz
56607 MIPS +36%
Intel Core i5-11600K
i5-11600K, 3900 MHz
45322 MIPS +9%
Intel Core i5-11400F
i5-11400F, 2600 MHz
41522 MIPS
Intel Core i5-10400F
i5-10400F, 2900 MHz
36731 MIPS -12%
Intel Core i5-9400F
i5-9400F, 2900 MHz
25639 MIPS -38%
7z b 4 -mmt1
AMD Ryzen 5 5600X
R5 5600X, 3700 MHz
6594 MIPS +21%
Intel Core i5-11600K
i5-11600K, 3900 MHz
6136 MIPS +12%
Intel Core i5-11400F
i5-11400F, 2600 MHz
5466 MIPS
Intel Core i5-10400F
i5-10400F, 2900 MHz
5064 MIPS -7%
Intel Core i5-9400F
i5-9400F, 2900 MHz
4678 MIPS -14%
HWBOT x265 Benchmark v2.2 - 4k Preset
AMD Ryzen 5 5600X
R5 5600X, 3700 MHz
15.7 fps +16%
Intel Core i5-11600K
i5-11600K, 3900 MHz
14.7 fps +9%
Intel Core i5-11400F
i5-11400F, 2600 MHz
13.5 fps
Intel Core i5-10400F
i5-10400F, 2900 MHz
11.2 fps -17%
Intel Core i5-9400F
i5-9400F, 2900 MHz
9.07 fps -33%
R Benchmark 2.5 - Overall mean
Intel Core i5-9400F
i5-9400F, 2900 MHz
0.667 sec * -16%
Intel Core i5-10400F
i5-10400F, 2900 MHz
0.618 sec * -7%
Intel Core i5-11400F
i5-11400F, 2600 MHz
0.576 sec *
Intel Core i5-11600K
i5-11600K, 3900 MHz
0.506 sec * +12%
AMD Ryzen 5 5600X
R5 5600X, 3700 MHz
0.4778 sec * +17%
LibreOffice - 20 Documents To PDF
Intel Core i5-9400F
i5-9400F, 2900 MHz
58.9 s * -28%
Intel Core i5-10400F
i5-10400F, 2900 MHz
57.1 s * -24%
Intel Core i5-11400F
i5-11400F, 2600 MHz
46 s *
AMD Ryzen 5 5600X
R5 5600X, 3700 MHz
45.14 s * +2%
Intel Core i5-11600K
i5-11600K, 3900 MHz
39.7 s * +14%
WebXPRT 3 - Overall
AMD Ryzen 5 5600X
R5 5600X, 3700 MHz
286 Points +12%
Intel Core i5-11600K
i5-11600K, 3900 MHz
280 Points +10%
Intel Core i5-11400F
i5-11400F, 2600 MHz
255 Points
Intel Core i5-10400F
i5-10400F, 2900 MHz
215 Points -16%
Intel Core i5-9400F
i5-9400F, 2900 MHz
211 Points -17%
Mozilla Kraken 1.1 - Total
Intel Core i5-9400F
i5-9400F, 2900 MHz
867 ms * -33%
Intel Core i5-10400F
i5-10400F, 2900 MHz
849 ms * -30%
Intel Core i5-11400F
i5-11400F, 2600 MHz
654 ms *
Intel Core i5-11600K
i5-11600K, 3900 MHz
587 ms * +10%
AMD Ryzen 5 5600X
R5 5600X, 3700 MHz
578 ms * +12%
3DMark
3840x2160 Fire Strike Ultra Physics
AMD Ryzen 5 5600X
R5 5600X, 3700 MHz
26038 Points +23%
Intel Core i5-11600K
i5-11600K, 3900 MHz
23190 Points +9%
Intel Core i5-11400F
i5-11400F, 2600 MHz
21181 Points
Intel Core i5-10400F
i5-10400F, 2900 MHz
18082 Points -15%
Intel Core i5-9400F
i5-9400F, 2900 MHz
12651 Points -40%
1920x1080 Fire Strike Physics
AMD Ryzen 5 5600X
R5 5600X, 3700 MHz
25990 Points +23%
Intel Core i5-11600K
i5-11600K, 3900 MHz
22631 Points +7%
Intel Core i5-11400F
i5-11400F, 2600 MHz
21144 Points
Intel Core i5-9400F
i5-9400F, 2900 MHz
12616 Points -40%
2560x1440 Time Spy CPU
Intel Core i5-11600K
i5-11600K, 3900 MHz
9482 Points +12%
AMD Ryzen 5 5600X
R5 5600X, 3700 MHz
8911 Points +5%
Intel Core i5-11400F
i5-11400F, 2600 MHz
8468 Points
Intel Core i5-10400F
i5-10400F, 2900 MHz
7548 Points -11%
Intel Core i5-9400F
i5-9400F, 2900 MHz
5777 Points -32%

* ... smaller is better

0801602403204004805606407208008809601040112012001280136014401520Tooltip
Intel Core i5-11400F: Ø1585 (1554.18-1597.95)

Application performance

The application benchmarks show an identical picture as the pure CPU benchmarks before. The bottom line is that all applications benefit from the higher IPC, which can also be implemented. However, Intel cannot currently compete with AMD's 6-core ala Ryzen 5 5600X.

PCMark 10 - Score
AMD Ryzen 5 5600X
NVIDIA Titan RTX
8270 Points +14%
Intel Core i5-11600K
NVIDIA Titan RTX
7740 Points +7%
Intel Core i5-11400F
NVIDIA Titan RTX
7238 Points
Intel Core i5-9400F
NVIDIA Titan RTX
6671 Points -8%
Intel Core i5-10400F
NVIDIA Titan RTX
6551 Points -9%
3DMark 11
1280x720 Performance
AMD Ryzen 5 5600X
NVIDIA Titan RTX
35426 Points +14%
Intel Core i5-11600K
NVIDIA Titan RTX
33664 Points +8%
Intel Core i5-11400F
NVIDIA Titan RTX
31157 Points
Intel Core i5-10400F
NVIDIA Titan RTX
30904 Points -1%
Intel Core i5-9400F
NVIDIA Titan RTX
27081 Points -13%
1280x720 Performance GPU
Intel Core i5-10400F
NVIDIA Titan RTX
50564 Points +6%
AMD Ryzen 5 5600X
NVIDIA Titan RTX
49946 Points +5%
Intel Core i5-11600K
NVIDIA Titan RTX
49388 Points +4%
Intel Core i5-9400F
NVIDIA Titan RTX
49072 Points +3%
Intel Core i5-11400F
NVIDIA Titan RTX
47656 Points
3DMark
1920x1080 Fire Strike Score
AMD Ryzen 5 5600X
NVIDIA Titan RTX
29473 Points +15%
Intel Core i5-11600K
NVIDIA Titan RTX
27563 Points +8%
Intel Core i5-11400F
NVIDIA Titan RTX
25593 Points
Intel Core i5-9400F
NVIDIA Titan RTX
23324 Points -9%
1920x1080 Fire Strike Graphics
Intel Core i5-9400F
NVIDIA Titan RTX
36421 Points +6%
Intel Core i5-11600K
NVIDIA Titan RTX
36352 Points +6%
AMD Ryzen 5 5600X
NVIDIA Titan RTX
35684 Points +4%
Intel Core i5-11400F
NVIDIA Titan RTX
34390 Points
3840x2160 Fire Strike Ultra Score
Intel Core i5-11600K
NVIDIA Titan RTX
9080 Points +5%
AMD Ryzen 5 5600X
NVIDIA Titan RTX
9015 Points +4%
Intel Core i5-10400F
NVIDIA Titan RTX
8734 Points +1%
Intel Core i5-11400F
NVIDIA Titan RTX
8634 Points
Intel Core i5-9400F
NVIDIA Titan RTX
8625 Points 0%
3840x2160 Fire Strike Ultra Graphics
Intel Core i5-11600K
NVIDIA Titan RTX
8995 Points +5%
Intel Core i5-9400F
NVIDIA Titan RTX
8958 Points +5%
AMD Ryzen 5 5600X
NVIDIA Titan RTX
8870 Points +4%
Intel Core i5-10400F
NVIDIA Titan RTX
8769 Points +3%
Intel Core i5-11400F
NVIDIA Titan RTX
8534 Points
2560x1440 Time Spy Score
Intel Core i5-11600K
NVIDIA Titan RTX
13690 Points +2%
AMD Ryzen 5 5600X
NVIDIA Titan RTX
13656 Points +2%
Intel Core i5-11400F
NVIDIA Titan RTX
13357 Points
Intel Core i5-10400F
NVIDIA Titan RTX
12841 Points -4%
Intel Core i5-9400F
NVIDIA Titan RTX
12066 Points -10%
2560x1440 Time Spy Graphics
AMD Ryzen 5 5600X
NVIDIA Titan RTX
15073 Points +1%
Intel Core i5-9400F
NVIDIA Titan RTX
14936 Points 0%
Intel Core i5-11400F
NVIDIA Titan RTX
14873 Points
Intel Core i5-11600K
NVIDIA Titan RTX
14854 Points 0%
Intel Core i5-10400F
NVIDIA Titan RTX
14655 Points -1%
SPECviewperf 12
1900x1060 Solidworks (sw-03)
AMD Ryzen 5 5600X
NVIDIA Titan RTX
194 fps +18%
Intel Core i5-11600K
NVIDIA Titan RTX
171 fps +4%
Intel Core i5-11400F
NVIDIA Titan RTX
165 fps
Intel Core i5-10400F
NVIDIA Titan RTX
146.7 fps -11%
Intel Core i5-9400F
NVIDIA Titan RTX
146.5 fps -11%
1900x1060 Siemens NX (snx-02)
AMD Ryzen 5 5600X
NVIDIA Titan RTX
266 fps +3%
Intel Core i5-10400F
NVIDIA Titan RTX
260.2 fps +1%
Intel Core i5-11400F
NVIDIA Titan RTX
258 fps
Intel Core i5-11600K
NVIDIA Titan RTX
251 fps -3%
Intel Core i5-9400F
NVIDIA Titan RTX
241.6 fps -6%
1900x1060 Showcase (showcase-01)
Intel Core i5-11600K
NVIDIA Titan RTX
202 fps +4%
Intel Core i5-11400F
NVIDIA Titan RTX
195 fps
Intel Core i5-10400F
NVIDIA Titan RTX
194.2 fps 0%
AMD Ryzen 5 5600X
NVIDIA Titan RTX
191.9 fps -2%
Intel Core i5-9400F
NVIDIA Titan RTX
189.8 fps -3%
1900x1060 Medical (medical-01)
Intel Core i5-10400F
NVIDIA Titan RTX
94.3 fps +6%
Intel Core i5-11400F
NVIDIA Titan RTX
88.8 fps
Intel Core i5-11600K
NVIDIA Titan RTX
88.7 fps 0%
AMD Ryzen 5 5600X
NVIDIA Titan RTX
88.3 fps -1%
Intel Core i5-9400F
NVIDIA Titan RTX
87.6 fps -1%
1900x1060 Maya (maya-04)
AMD Ryzen 5 5600X
NVIDIA Titan RTX
226 fps +19%
Intel Core i5-11400F
NVIDIA Titan RTX
190 fps
Intel Core i5-11600K
NVIDIA Titan RTX
186 fps -2%
Intel Core i5-9400F
NVIDIA Titan RTX
158.5 fps -17%
Intel Core i5-10400F
NVIDIA Titan RTX
155.1 fps -18%
1900x1060 Energy (energy-01)
Intel Core i5-10400F
NVIDIA Titan RTX
28.62 fps 0%
Intel Core i5-11400F
NVIDIA Titan RTX
28.5 fps
Intel Core i5-11600K
NVIDIA Titan RTX
28.3 fps -1%
Intel Core i5-9400F
NVIDIA Titan RTX
28.17 fps -1%
AMD Ryzen 5 5600X
NVIDIA Titan RTX
27.75 fps -3%
1900x1060 Creo (creo-01)
AMD Ryzen 5 5600X
NVIDIA Titan RTX
169.7 fps +9%
Intel Core i5-11600K
NVIDIA Titan RTX
164 fps +5%
Intel Core i5-11400F
NVIDIA Titan RTX
156 fps
Intel Core i5-10400F
NVIDIA Titan RTX
133.6 fps -14%
Intel Core i5-9400F
NVIDIA Titan RTX
132.8 fps -15%
1900x1060 Catia (catia-04)
AMD Ryzen 5 5600X
NVIDIA Titan RTX
263.4 fps +8%
Intel Core i5-11600K
NVIDIA Titan RTX
251 fps +3%
Intel Core i5-11400F
NVIDIA Titan RTX
243 fps
Intel Core i5-9400F
NVIDIA Titan RTX
205.1 fps -16%
Intel Core i5-10400F
NVIDIA Titan RTX
197.8 fps -19%
1900x1060 3ds Max (3dsmax-05)
AMD Ryzen 5 5600X
NVIDIA Titan RTX
299.9 fps +5%
Intel Core i5-10400F
NVIDIA Titan RTX
291.3 fps +2%
Intel Core i5-11600K
NVIDIA Titan RTX
288 fps +1%
Intel Core i5-11400F
NVIDIA Titan RTX
285 fps
Intel Core i5-9400F
NVIDIA Titan RTX
257.7 fps -10%
SPECviewperf 13
Solidworks (sw-04)
AMD Ryzen 5 5600X
NVIDIA Titan RTX
195.1 fps +10%
Intel Core i5-11600K
NVIDIA Titan RTX
185 fps +4%
Intel Core i5-11400F
NVIDIA Titan RTX
178 fps
Intel Core i5-9400F
NVIDIA Titan RTX
144.8 fps -19%
Intel Core i5-10400F
NVIDIA Titan RTX
141.6 fps -20%
Siemens NX (snx-03)
AMD Ryzen 5 5600X
NVIDIA Titan RTX
480.1 fps +3%
Intel Core i5-10400F
NVIDIA Titan RTX
467.8 fps 0%
Intel Core i5-11400F
NVIDIA Titan RTX
466 fps
Intel Core i5-11600K
NVIDIA Titan RTX
453 fps -3%
Intel Core i5-9400F
NVIDIA Titan RTX
436.5 fps -6%
Showcase (showcase-02)
Intel Core i5-11400F
NVIDIA Titan RTX
194 fps
Intel Core i5-10400F
NVIDIA Titan RTX
193.9 fps 0%
Intel Core i5-11600K
NVIDIA Titan RTX
193 fps -1%
AMD Ryzen 5 5600X
NVIDIA Titan RTX
190.8 fps -2%
Intel Core i5-9400F
NVIDIA Titan RTX
188.5 fps -3%
Medical (medical-02)
Intel Core i5-11400F
NVIDIA Titan RTX
92.2 fps
AMD Ryzen 5 5600X
NVIDIA Titan RTX
90.6 fps -2%
Intel Core i5-11600K
NVIDIA Titan RTX
90 fps -2%
Intel Core i5-9400F
NVIDIA Titan RTX
88.9 fps -4%
Intel Core i5-10400F
NVIDIA Titan RTX
87.3 fps -5%
Maya (maya-05)
Intel Core i5-11400F
NVIDIA Titan RTX
460 fps
AMD Ryzen 5 5600X
NVIDIA Titan RTX
453.6 fps -1%
Intel Core i5-11600K
NVIDIA Titan RTX
449 fps -2%
Intel Core i5-9400F
NVIDIA Titan RTX
365.8 fps -20%
Intel Core i5-10400F
NVIDIA Titan RTX
364.3 fps -21%
Energy (energy-02)
Intel Core i5-11600K
NVIDIA Titan RTX
53.9 fps +2%
Intel Core i5-9400F
NVIDIA Titan RTX
53.5 fps +1%
Intel Core i5-11400F
NVIDIA Titan RTX
53.1 fps
Intel Core i5-10400F
NVIDIA Titan RTX
53 fps 0%
AMD Ryzen 5 5600X
NVIDIA Titan RTX
52.2 fps -2%
Creo (creo-02)
Intel Core i5-11600K
NVIDIA Titan RTX
354 fps 0%
Intel Core i5-11400F
NVIDIA Titan RTX
354 fps
AMD Ryzen 5 5600X
NVIDIA Titan RTX
350 fps -1%
Intel Core i5-10400F
NVIDIA Titan RTX
328.5 fps -7%
Intel Core i5-9400F
NVIDIA Titan RTX
311.4 fps -12%
Catia (catia-05)
AMD Ryzen 5 5600X
NVIDIA Titan RTX
427.8 fps +13%
Intel Core i5-11600K
NVIDIA Titan RTX
397 fps +4%
Intel Core i5-11400F
NVIDIA Titan RTX
380 fps
Intel Core i5-9400F
NVIDIA Titan RTX
333.5 fps -12%
Intel Core i5-10400F
NVIDIA Titan RTX
314.8 fps -17%
3ds Max (3dsmax-06)
AMD Ryzen 5 5600X
NVIDIA Titan RTX
298.8 fps +5%
Intel Core i5-10400F
NVIDIA Titan RTX
288.3 fps +1%
Intel Core i5-11600K
NVIDIA Titan RTX
288 fps +1%
Intel Core i5-11400F
NVIDIA Titan RTX
285 fps
Intel Core i5-9400F
NVIDIA Titan RTX
258.9 fps -9%

Intel Core i5-11400F + Nvidia Titan RTX

low med. high ultraQHD4K
GTA V (2015) 184 180 172 105 99.5 127
The Witcher 3 (2015) 412 362 270 147 104
Dota 2 Reborn (2015) 168.8 156.4 151 146.8 143.7
Final Fantasy XV Benchmark (2018) 196 176 136 107 65.5
X-Plane 11.11 (2018) 141 127 105 90.9
Far Cry 5 (2018) 183 160 152 143 130 78
Strange Brigade (2018) 435 338 287 244 184 108
Shadow of the Tomb Raider (2018) 172 160 156 150 124 68.5
Far Cry New Dawn (2019) 152 134 129 117 117 80
Metro Exodus (2019) 192 158 129 104 84.1 54.7
Borderlands 3 (2019) 168 149 129 111 83.2 46.4

Energy consumption

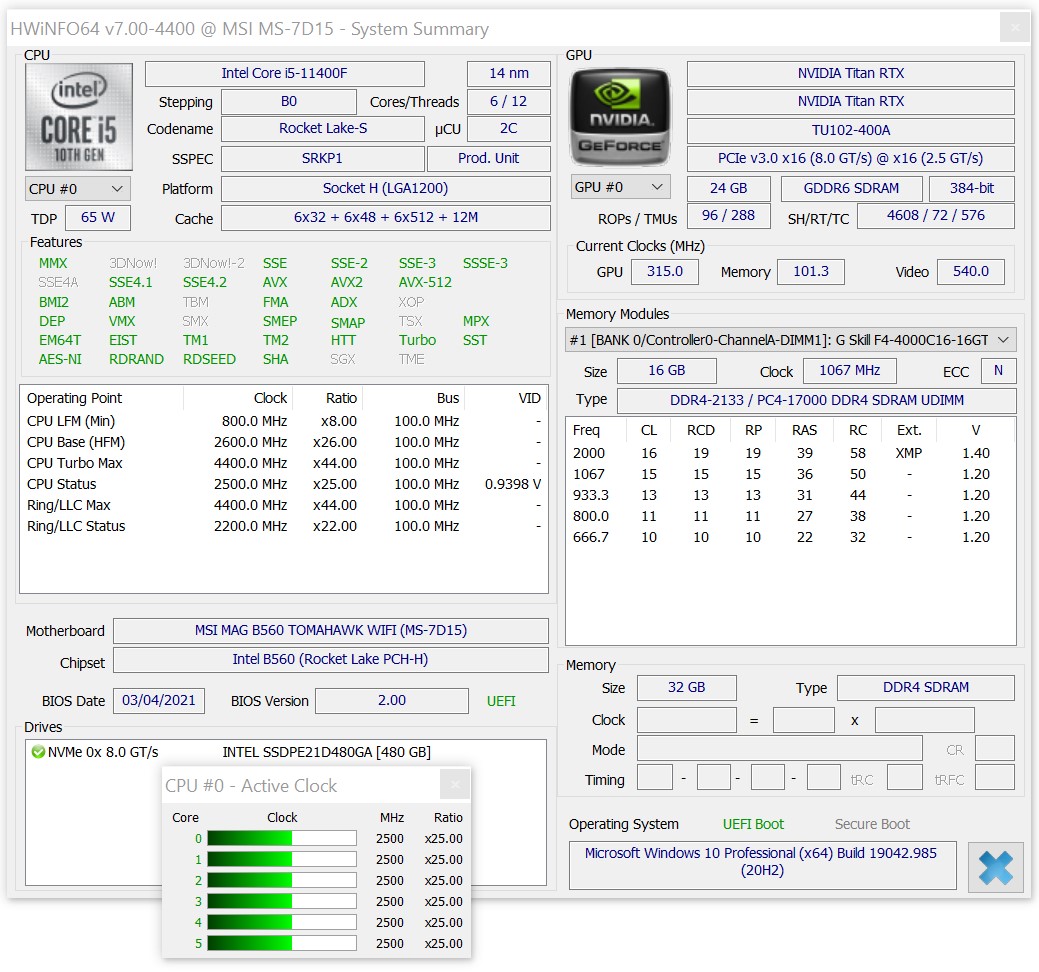
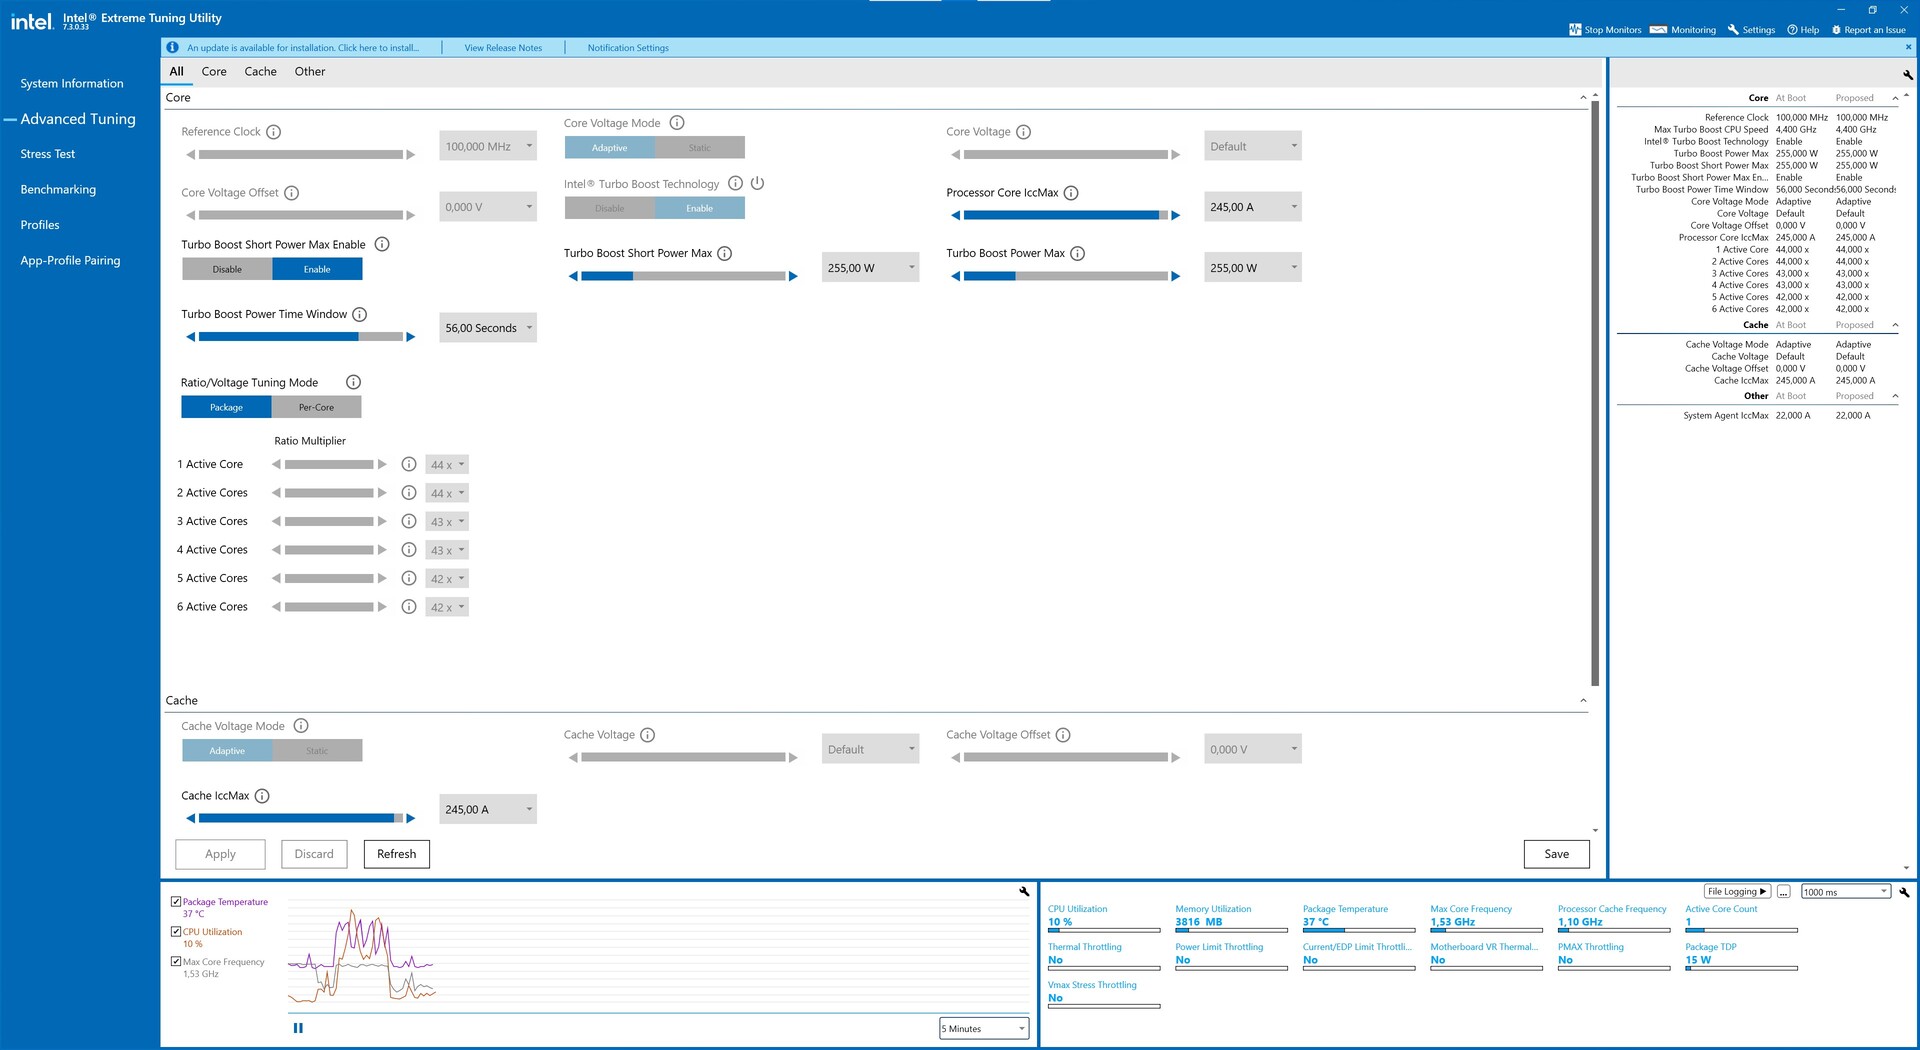
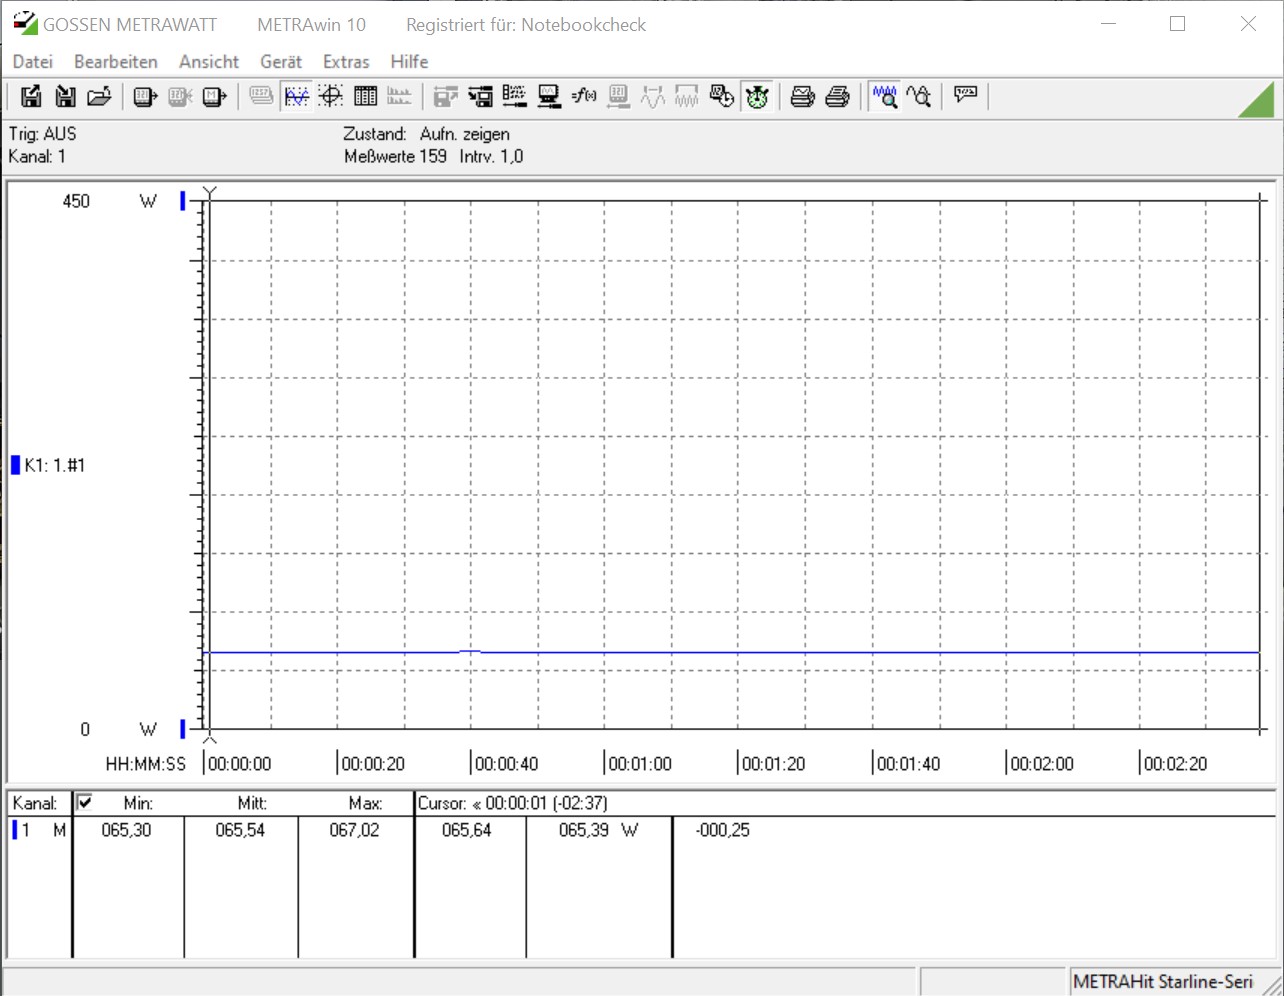
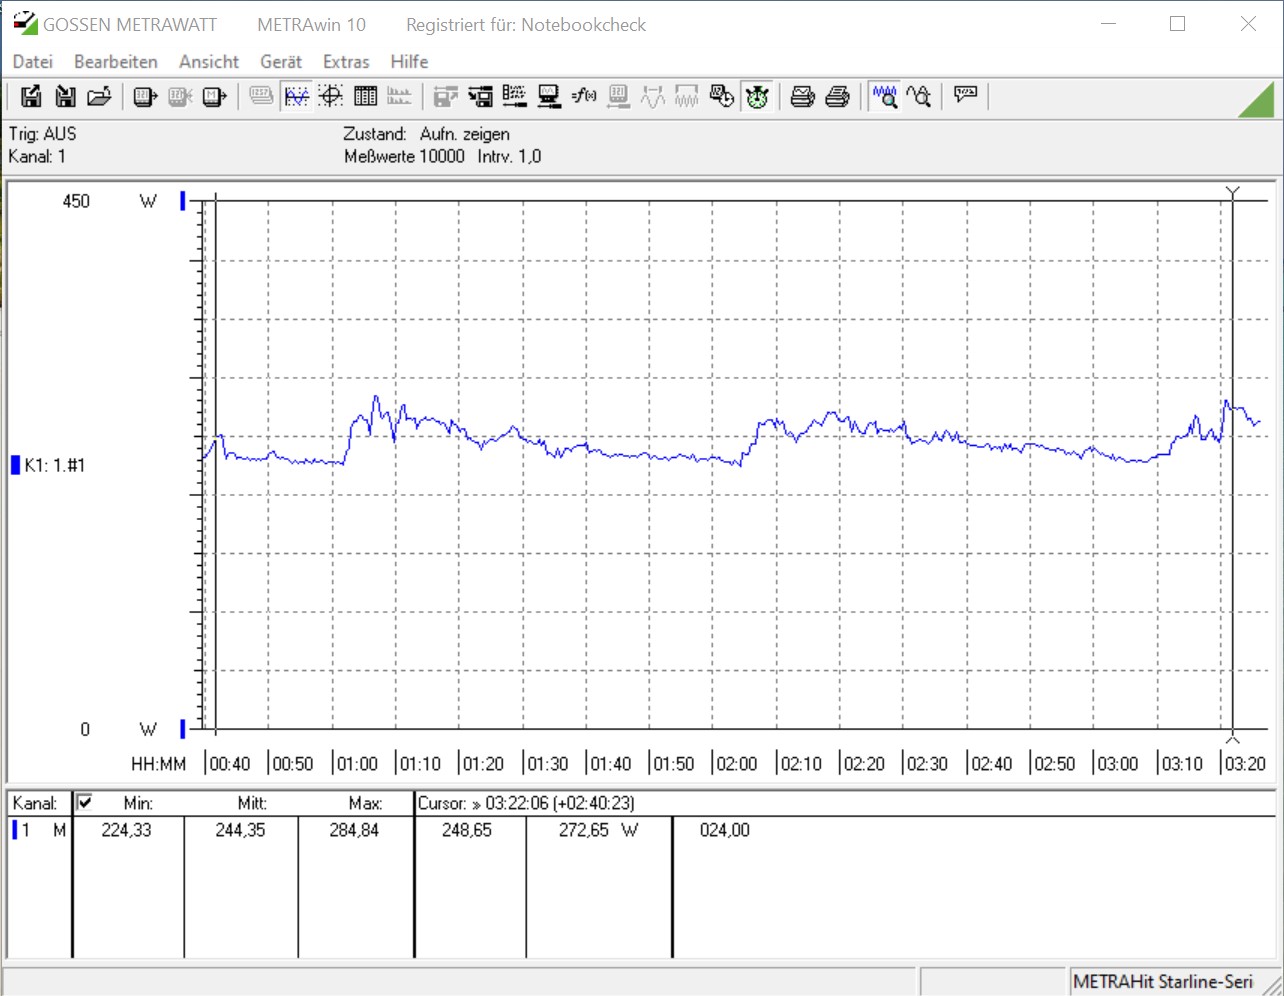
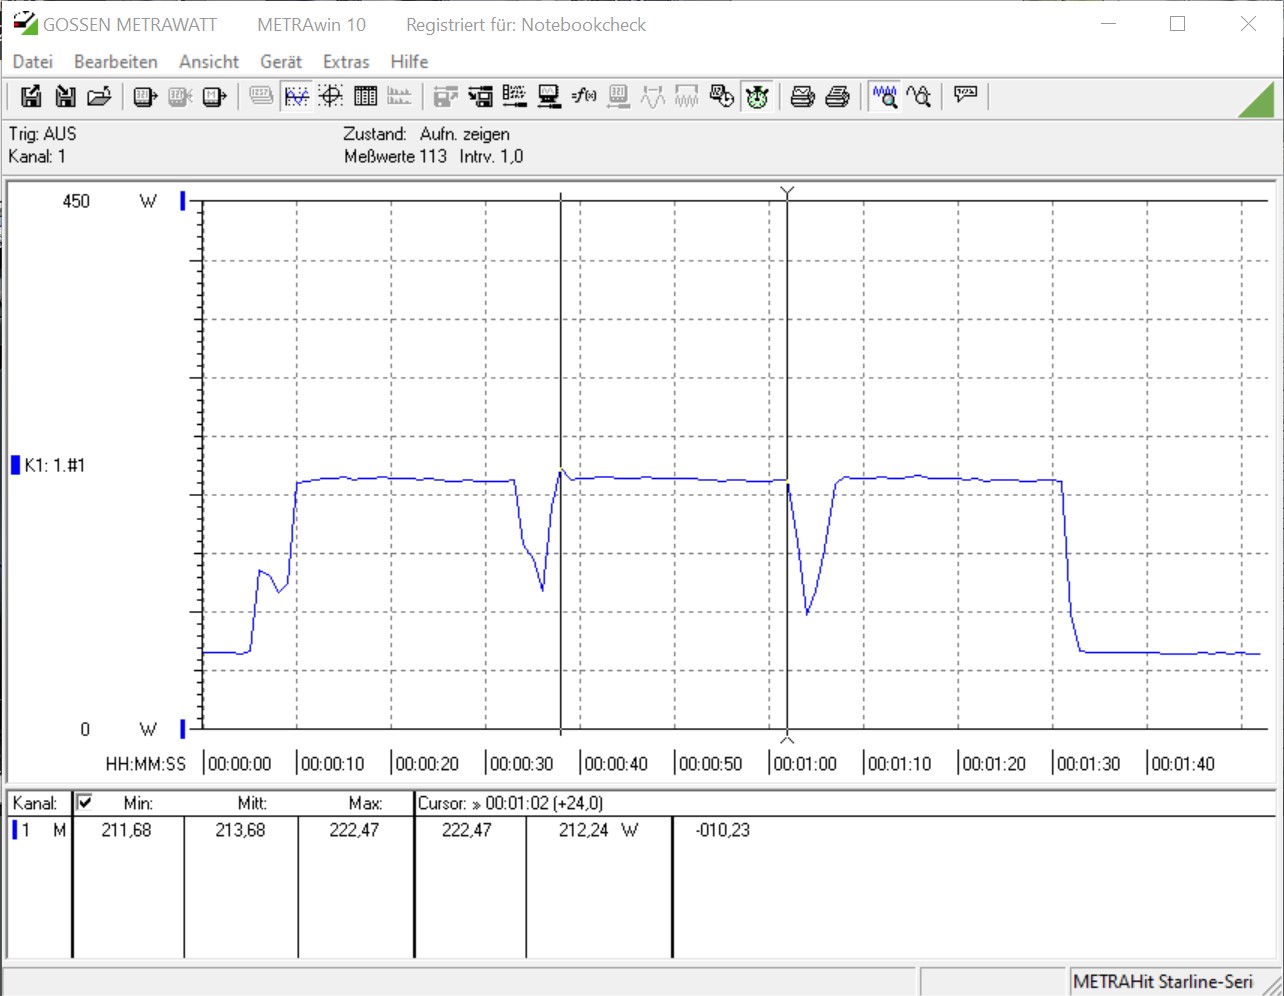
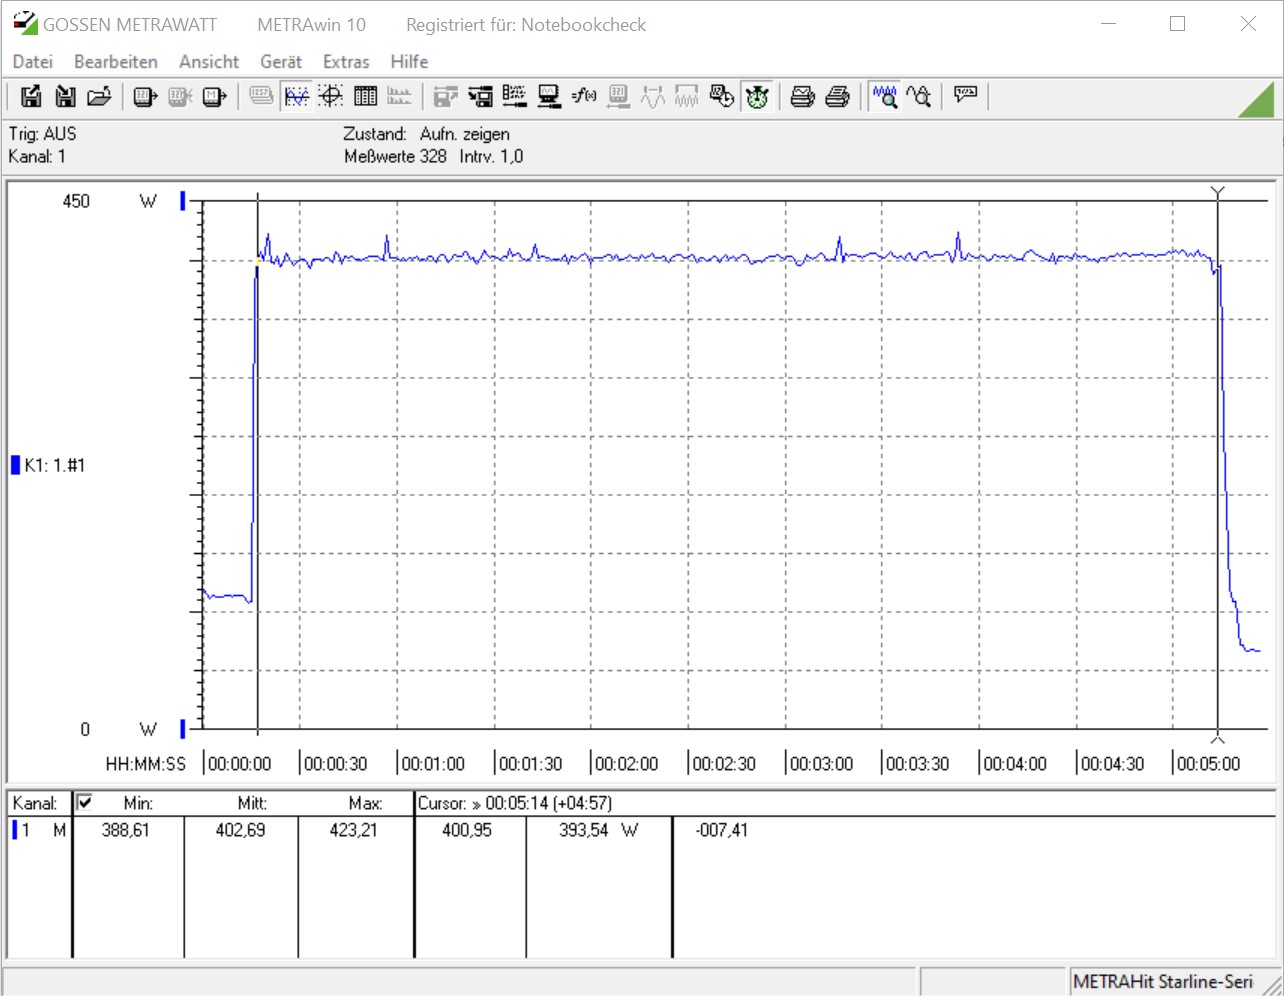
We already noticed that the new Rocket Lake S processors are not exactly frugal in our review of the two faster models. However, the Intel Core i5-11400F also needs a lot of energy if you leave it alone and deactivate all BIOS restrictions. By default, the PL1 value is 65 watts and the PL2 value is 154 watts. The latter can demand the processor's full performance for a maximum of 56 seconds, if the conditions allow it. In a direct comparison, the Intel Core i5-11400F is rather on par with the Intel Core i5-11600K. AMD's Ryzen 5 5600X is partly a bit more frugal, even though it draws more power from the socket than our test sample from Intel during gaming. However, these two are only separated by 6 watts, which is negligible.

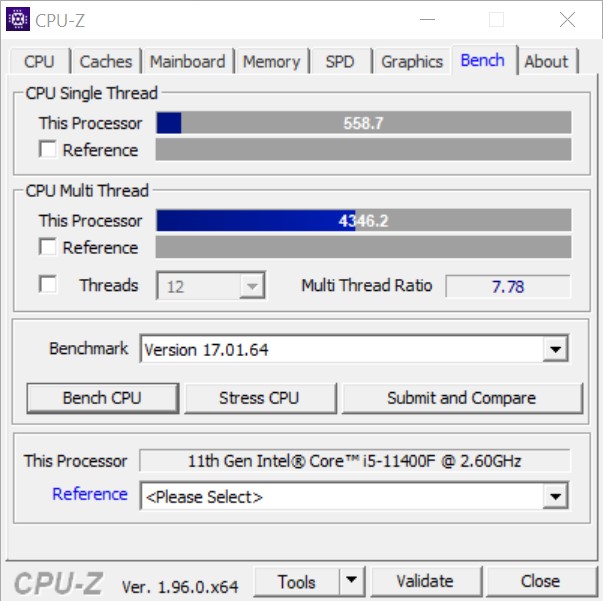
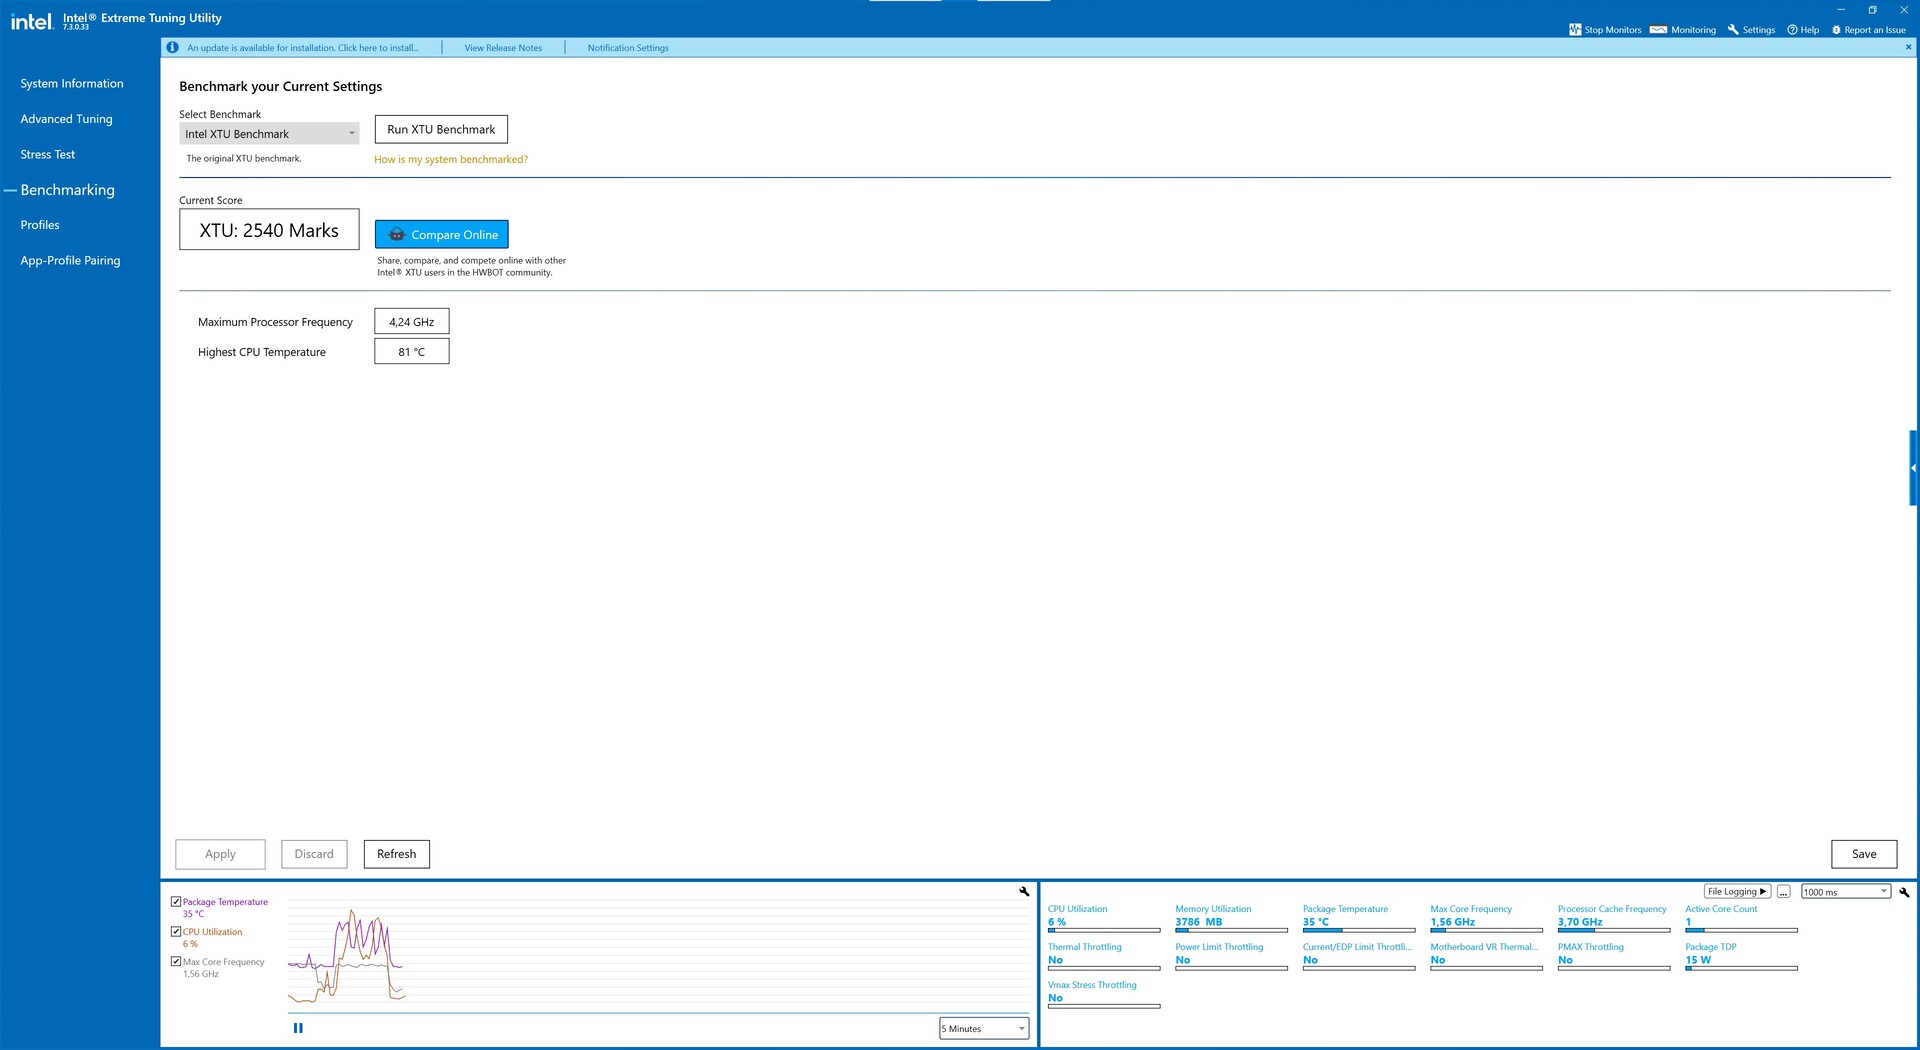
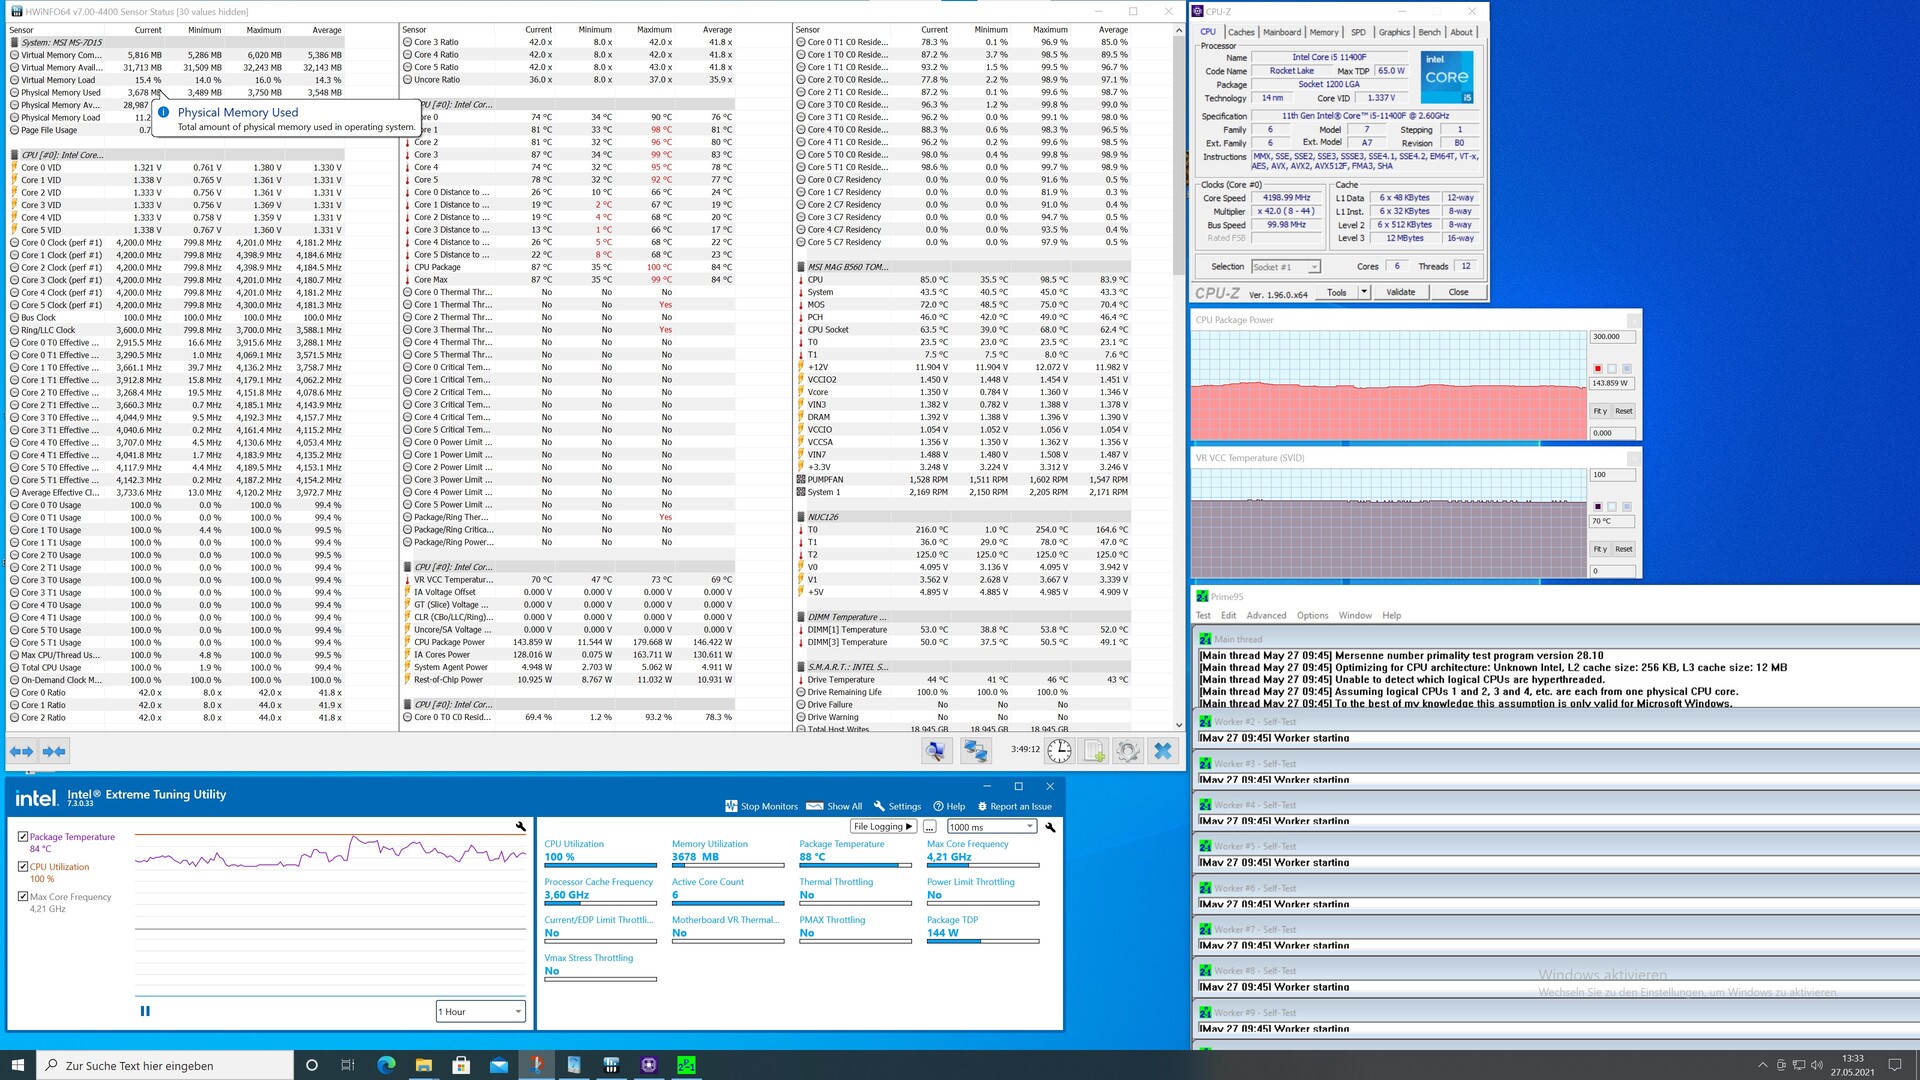
The temperatures under load are high, but not dramatic. Nevertheless, the Intel Core i5-11400F reaches 99 °C (210.2 °F) for a short time in the stress test. Nevertheless, it can keep the specified 4.2 GHz all-core boost stable in the test. The Intel Core i5-11400F also manages 4.4 GHz on one core.

Power consumption test system (idle)
Power consumption test system (Prime95)
Power consumption test system (Cinebench R15 Multi)
Power consumption test system (while gaming - The Witcher 3 Ultra-Preset)
Stress test Prime95
Stress test Prime95
 
Power Consumption
1920x1080 The Witcher 3 ultra (external Monitor)
Intel Core i5-11600K
NVIDIA Titan RTX, i5-11600K, Intel Optane 905P 480GB 2.5 (Idle: 69.49 W)
435 (427min - 463max) Watt * -8%
AMD Ryzen 5 5600X
NVIDIA Titan RTX, R5 5600X, Intel Optane 905P 480GB 2.5 (Idle: 79.23 W)
409.2 (381min - 434max) Watt * -2%
Intel Core i5-11400F
NVIDIA Titan RTX, i5-11400F, Intel Optane 905P 480GB 2.5
403 (379min, 394P1 - 423max) Watt *
Intel Core i5-10400F
NVIDIA Titan RTX, i5-10400F, Intel Optane 905P 480GB 2.5 (Idle: 58.8 W)
386.7 (383min - 391max) Watt * +4%
Intel Core i5 9400F
NVIDIA Titan RTX, i5-9400F (Idle: 57 W)
379.5 (292min - 402max) Watt * +6%
Prime95 V2810 Stress (external Monitor)
Intel Core i5-11400F
NVIDIA Titan RTX, i5-11400F, Intel Optane 905P 480GB 2.5
236 (232min, 232P1 - 240max) Watt *
Intel Core i5-11600K
NVIDIA Titan RTX, i5-11600K, Intel Optane 905P 480GB 2.5 (Idle: 69.49 W)
228 (212min - 295max) Watt * +3%
AMD Ryzen 5 5600X
NVIDIA Titan RTX, R5 5600X, Intel Optane 905P 480GB 2.5 (Idle: 79.23 W)
175.8 (170min - 179max) Watt * +26%
Intel Core i5-10400F
NVIDIA Titan RTX, i5-10400F, Intel Optane 905P 480GB 2.5 (Idle: 58.8 W)
135.8 (134min - 146max) Watt * +42%
Intel Core i5 9400F
NVIDIA Titan RTX, i5-9400F (Idle: 57 W)
131.6 (122min - 187max) Watt * +44%
Cinebench R15 Multi (external Monitor)
Intel Core i5-11600K
NVIDIA Titan RTX, i5-11600K, Intel Optane 905P 480GB 2.5 (Idle: 69.49 W)
219.9 (206min - 236max) Watt * -8%
Intel Core i5-11400F
NVIDIA Titan RTX, i5-11400F, Intel Optane 905P 480GB 2.5 (Idle: 65.5 W)
204 (98.2min, 104P1 - 222max) Watt *
AMD Ryzen 5 5600X
NVIDIA Titan RTX, R5 5600X, Intel Optane 905P 480GB 2.5 (Idle: 79.23 W)
170.1 (165min - 210max) Watt * +17%
Intel Core i5-10400F
NVIDIA Titan RTX, i5-10400F, Intel Optane 905P 480GB 2.5 (Idle: 58.8 W)
125.5 (125min - 126max) Watt * +38%
Intel Core i5 9400F
NVIDIA Titan RTX, i5-9400F (Idle: 57 W)
122.5 (121min - 125max) Watt * +40%
Temperatures - CPU Temperature Prime95
Intel Core i5-11600K
NVIDIA Titan RTX, i5-11600K, Intel Optane 905P 480GB 2.5
88 °C
Intel Core i5 9400F
NVIDIA Titan RTX, i5-9400F
61 °C
Intel Core i5-10400F
NVIDIA Titan RTX, i5-10400F, Intel Optane 905P 480GB 2.5
50 °C

* ... smaller is better

Benchmarks

Performance Rating - CB R15 + R20 + 7-Zip + X265 + Blender + 3DM11 CPU
36.2 pt (50%)
Cinebench R15 - Cinebench R15 CPU Multi 64 Bit
1574 Points (10%)
0801602403204004805606407208008809601040112012001280136014401520Tooltip
Cinebench R10 - Cinebench R10 Rend. Multi (32bit)
44220 points (32%)
Cinebench R10 - Cinebench R10 Rend. Multi (64bit)
57417 Points (40%)
7-Zip 18.03 - 7-Zip 18.03 Single Thread 4 runs
5466 MIPS (65%)
HWBOT x265 Benchmark v2.2 - HWBOT x265 4k Preset
13.5 fps (24%)
05101520Tooltip
3DMark - 3DMark Ice Storm Extreme Physics
71496 Points (58%)
3DMark - 3DMark Ice Storm Unlimited Physics
74053 Points (62%)
Geekbench 5.0 - Geekbench 5.0 64 Bit Single-Core
1543 points (7%)
Geekbench 4.4 - Geekbench 4.1 - 4.4 64 Bit Multi-Core
30191 points (34%)
Power Consumption - Prime95 Power Consumption - external Monitor *
236 Watt (41%)
0153045607590105120135150165180195210225Tooltip
Power Consumption - Cinebench R15 Multi Power Consumption - external Monitor *
204 Watt (37%)
0153045607590105120135150165180195210Tooltip
Power Consumption - Cinebench R15 Multi Power Efficiency - external Monitor
7.7 Points per Watt (6%)
- Range of benchmark values for this graphics card
- Average benchmark values for this graphics card
* Smaller numbers mean a higher performance

v1.26
log 25. 07:41:06

#0 no ids found in url (should be separated by "_") +0s ... 0s

#1 not redirecting to Ajax server +0s ... 0s

#2 did not recreate cache, as it is less than 5 days old! Created at Thu, 25 Apr 2024 05:38:32 +0200 +0.001s ... 0.001s

#3 getting avg benchmarks for device 13219 +0.02s ... 0.021s

#4 got single benchmarks 13219 +0.012s ... 0.033s

#5 got avg benchmarks for devices +0s ... 0.033s

#6 min, max, avg, median took s +1.252s ... 1.286s

#7 return log +0s ... 1.286s

Please share our article, every link counts!

"Comparison of mobile processors
All CPU series for notebooks with short description

"Mobile processors benchmark list
Sortable and filterable benchmark list

Other CPUs of the series Rocket Lake

» Intel Core i9-11900K
   8x 3.5 GHz - 5.3 GHz
» Intel Core i7-11700K
   8x 3.6 GHz - 5 GHz
» Intel Core i7-11700
   8x 2.5 GHz - 4.9 GHz
» Intel Core i5-11600K
   6x 3.9 GHz - 4.9 GHz
» Intel Core i5-11400F
   6x 2.6 GHz - 4.4 GHz
» Intel Core i5-11400T
   6x 1.3 GHz - 3.7 GHz

Surrounding CPUs

+ Intel Core i9-7900X
   10x 3.3 GHz - 4.5 GHz
+ Intel Core i7-10700
   8x 2.9 GHz - 4.8 GHz
+ AMD Ryzen 5 5600G
   6x 3.9 GHz - 4.4 GHz
+ Intel Core i7-9700K
   8x 3.6 GHz - 4.9 GHz
+ Intel Core i5-12400F
   6x 2.5 GHz - 4.4 GHz
» Intel Core i5-11400F
   6x 2.6 GHz - 4.4 GHz
- Intel Core i5-10600K
   6x 4.1 GHz - 4.8 GHz
- Intel Core i7-8086K
   6x 3.7 GHz - 5 GHz
- Intel Core i7-8700K
   6x 3.7 GHz - 4.7 GHz
- AMD Ryzen 7 2700X
   8x 3.7 GHz - 4.3 GHz
- Intel Core i5-10400F
   6x 2.9 GHz - 4.3 GHz
> Expert Reviews and News on Laptops, Smartphones and Tech Innovations > Reviews > Intel Core i5-11400F desktop processor
Sebastian Bade, 2021-06-10 (Update: 2021-06-12)