Intel Rocket Lake-S Review: Only 8 cores for the Core i9-11900K
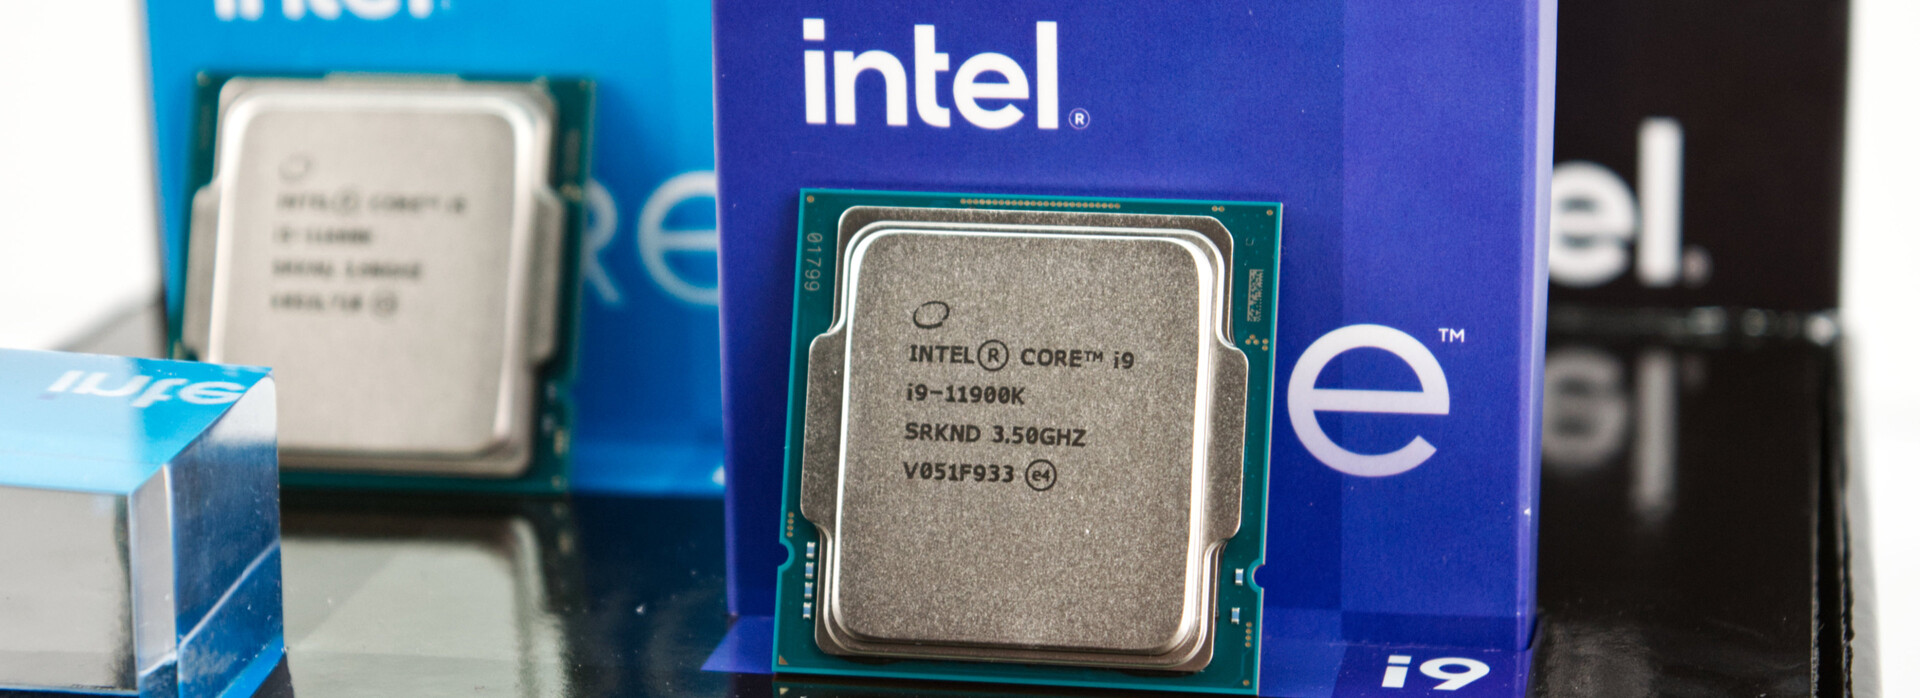
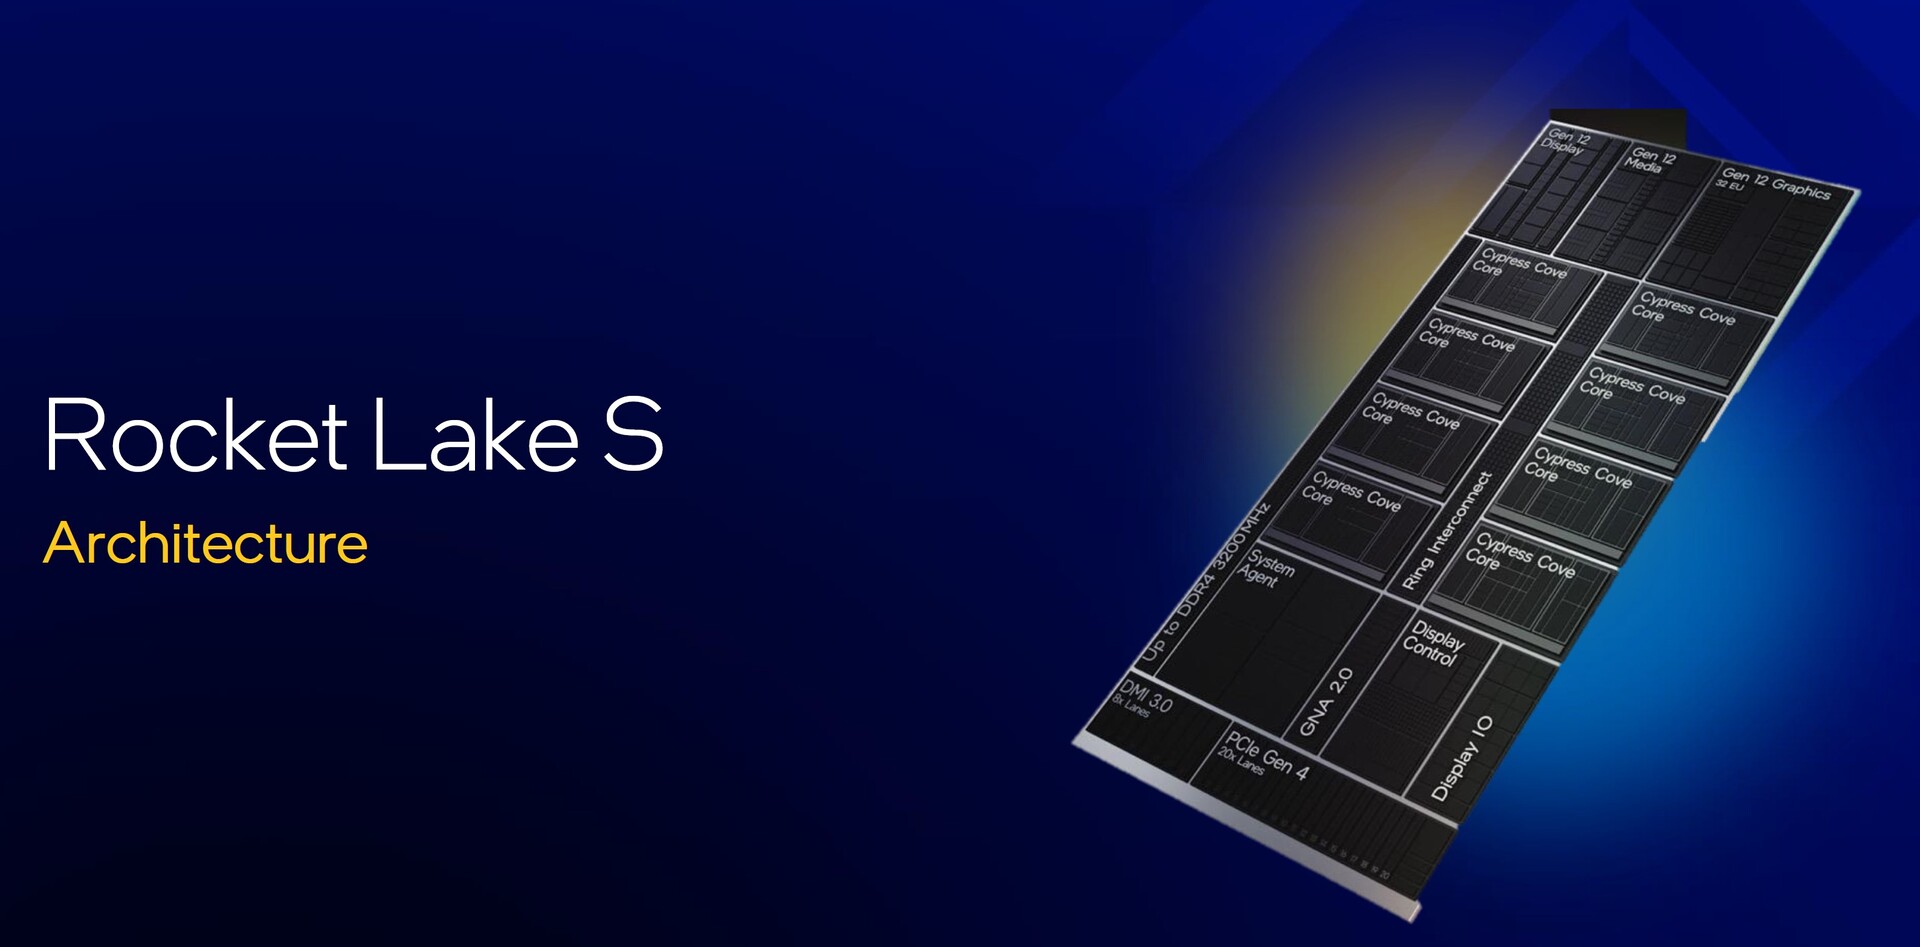
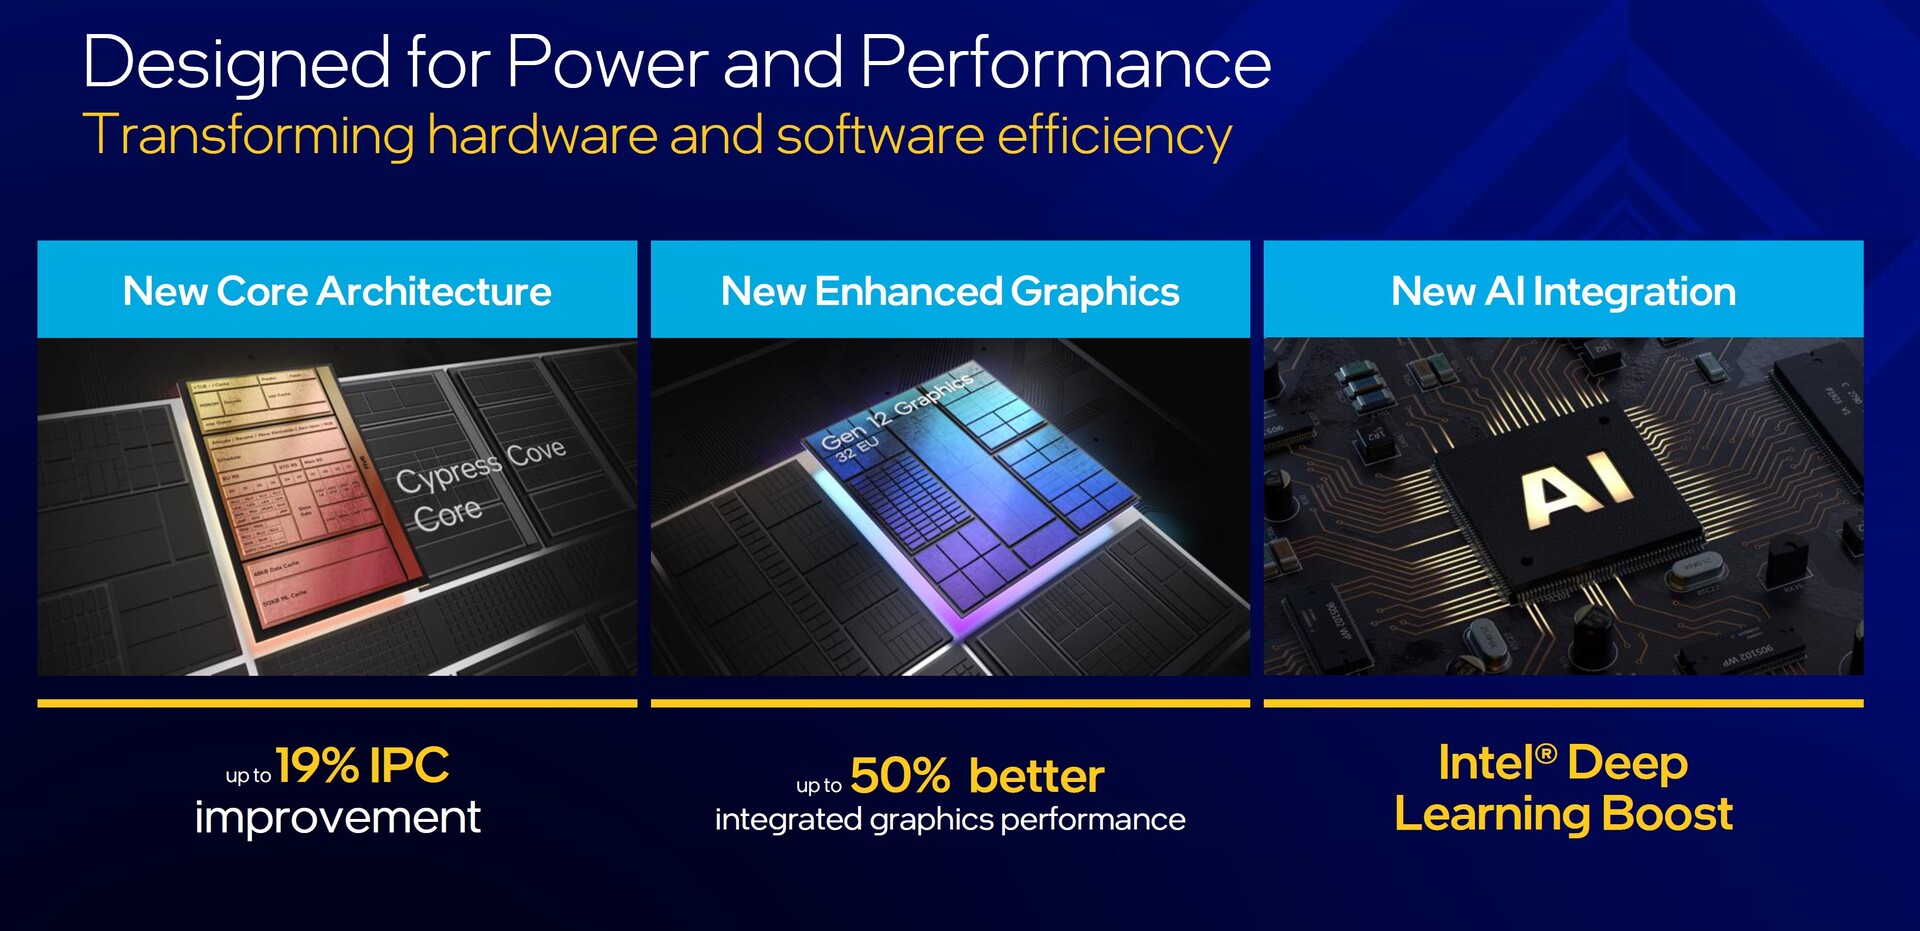
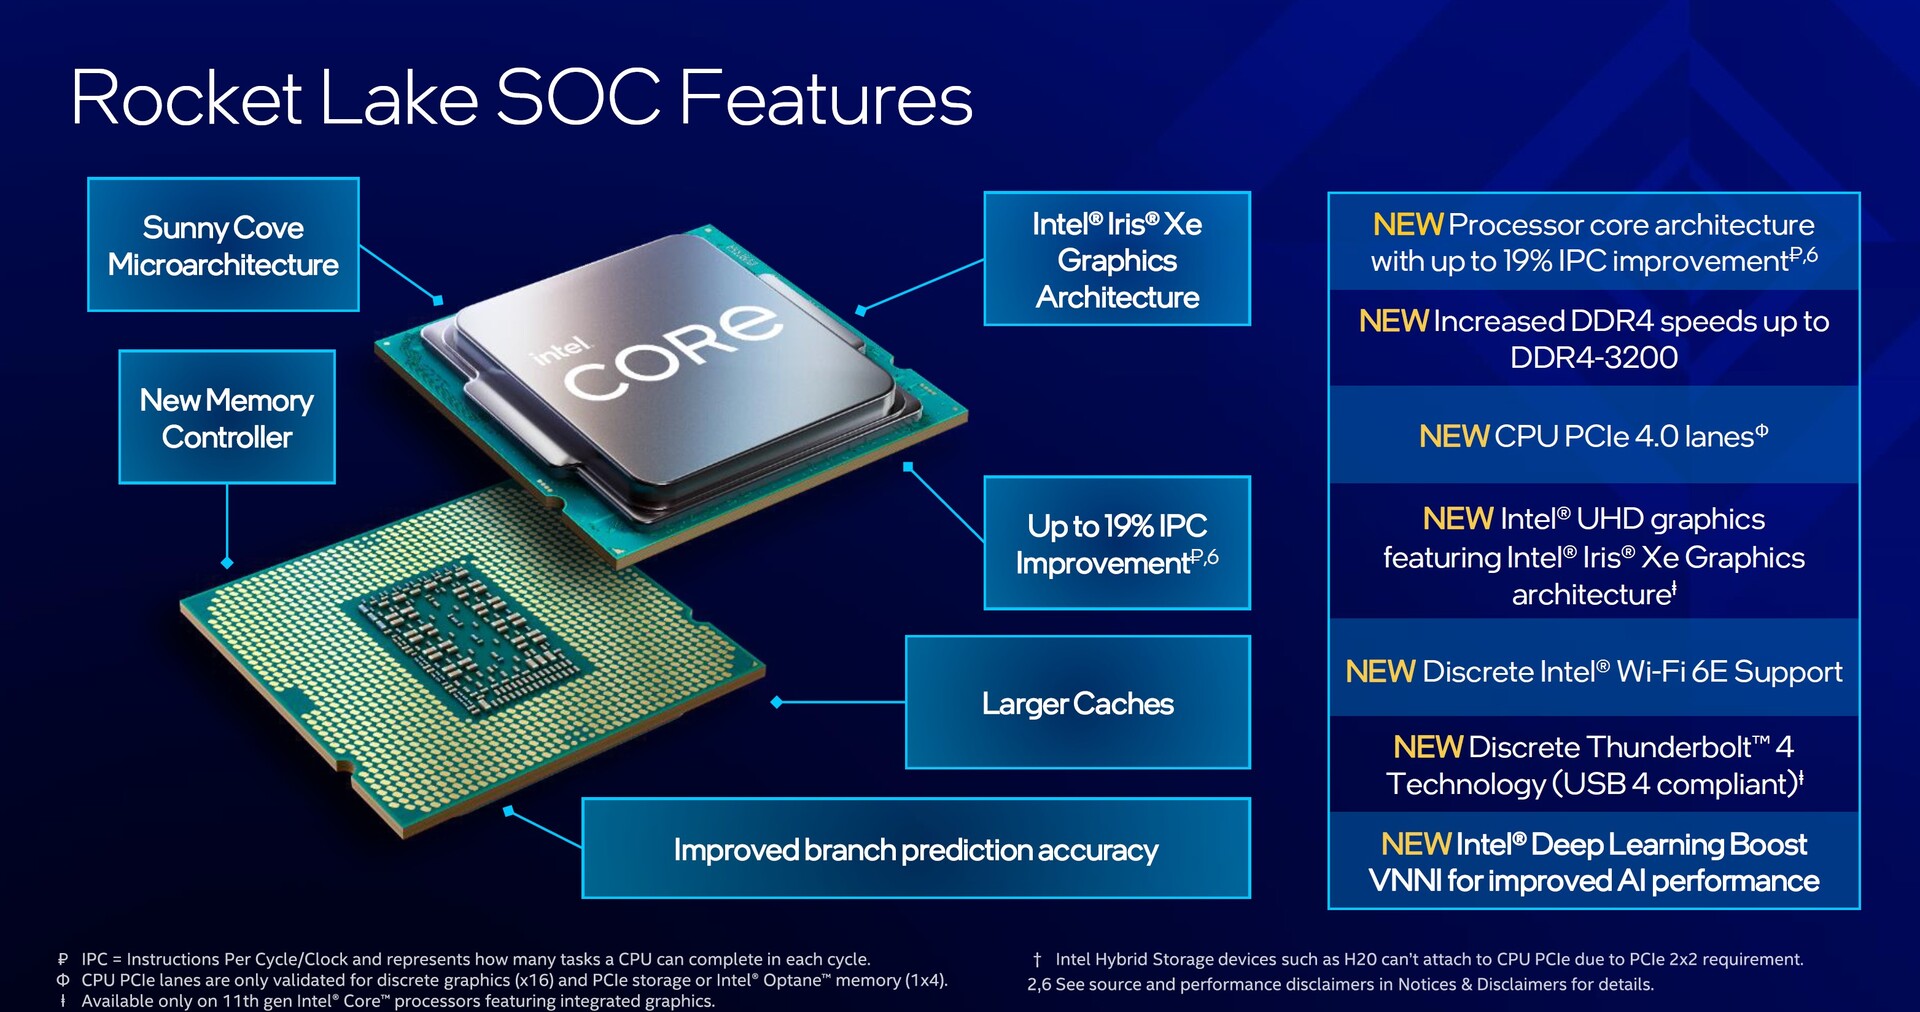
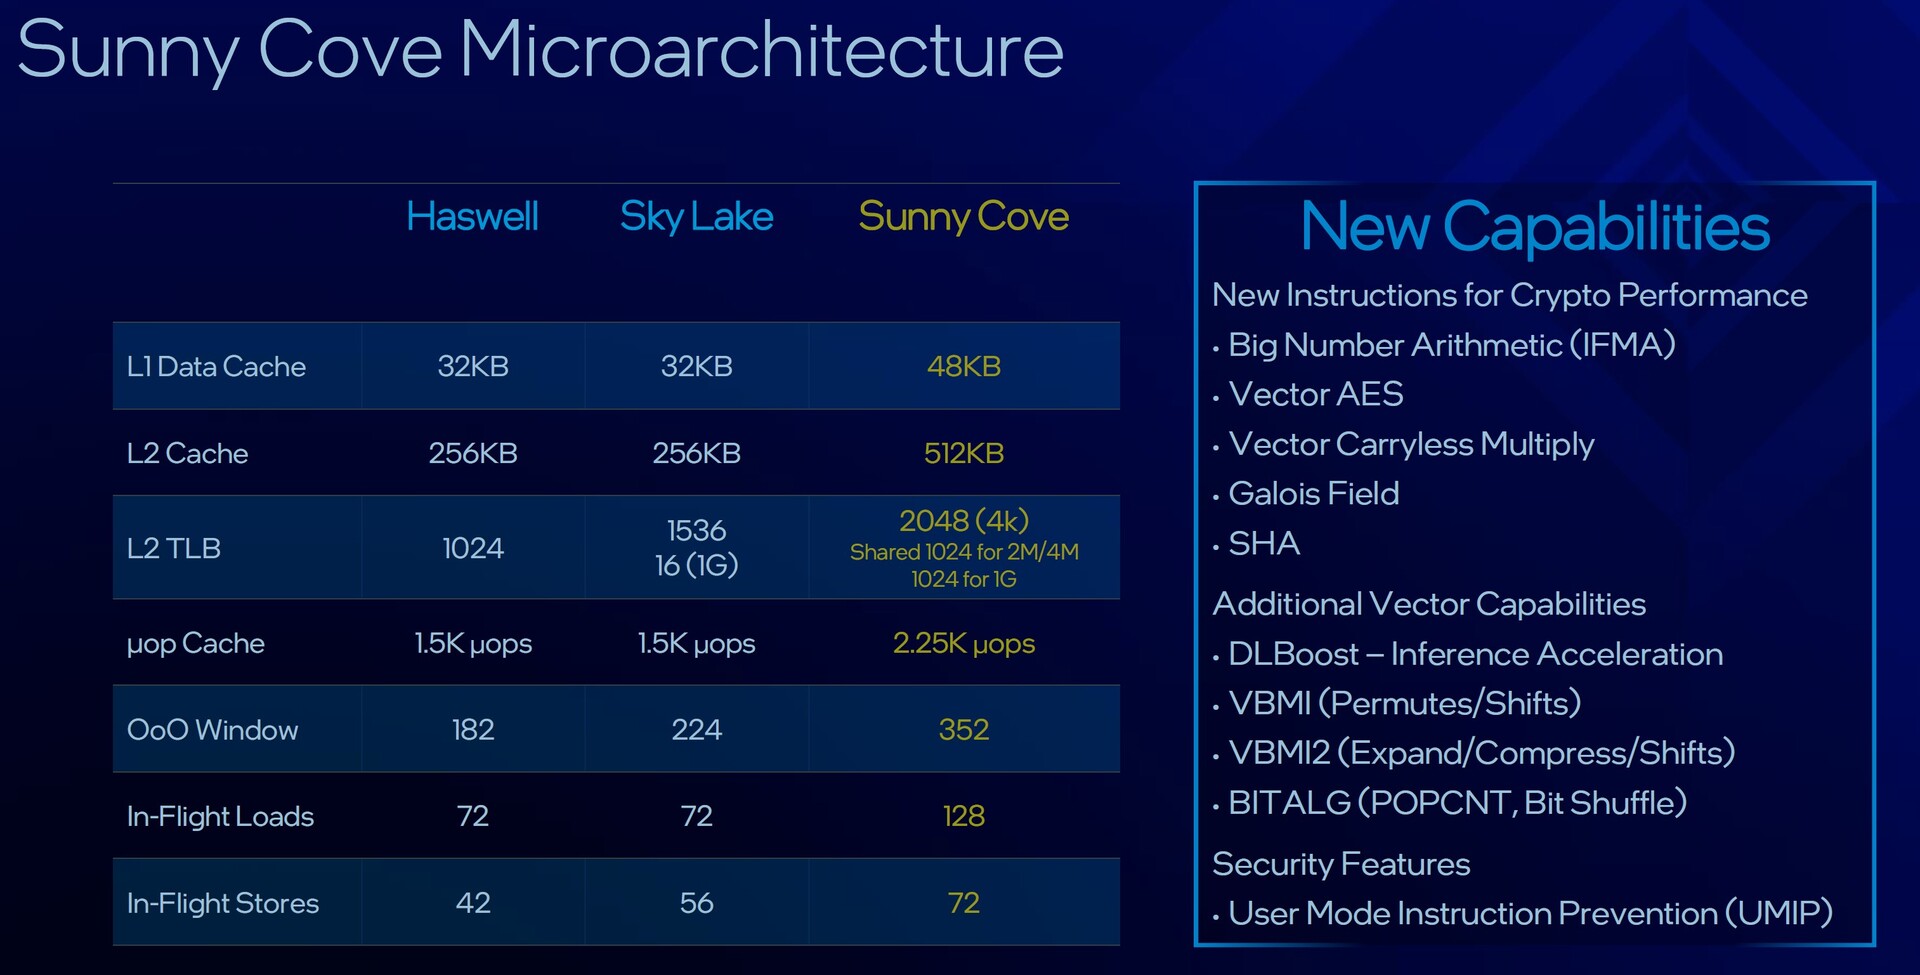
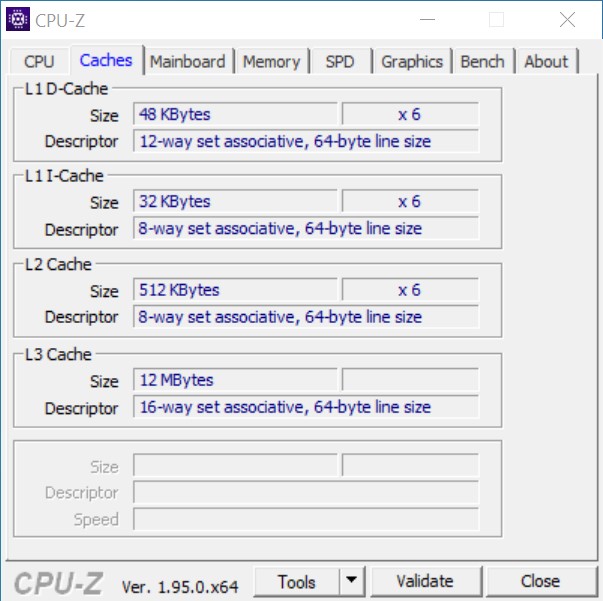
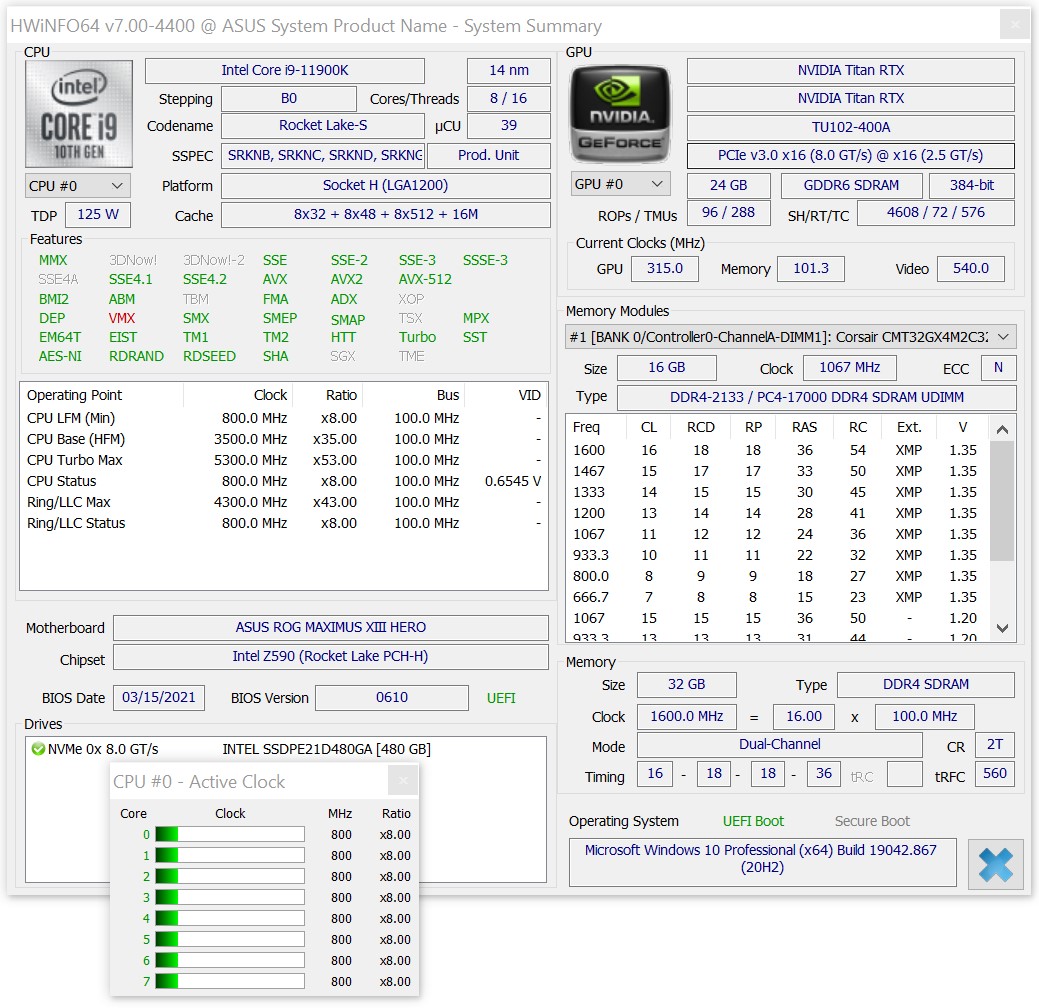
The specifications sheets of the new Rocket Lake-S CPUs deserve more than a cursory look. Despite the fact that Rocket Lake-S processors are still manufactured on the 14-nm node, a lot has changed under the heat spreader. The old Skylake architecture has been supplanted by the new Sunny Cove architecture. We have already seen Sunny Cove cores in Intel’s Ice Lake-based mobile chips. One of the features of the new architecture is a larger L2 cache. Each core has gotten a bit larger, which is why the die size has increased. What is more, Intel has reworked the integrated graphics chip. It is now based on the Intel Iris Xe architecture and takes up a little more space. This is why this generation’s top-end model features only 8 cores. For comparison, the Intel Core i9-10900K offered 10 cores.
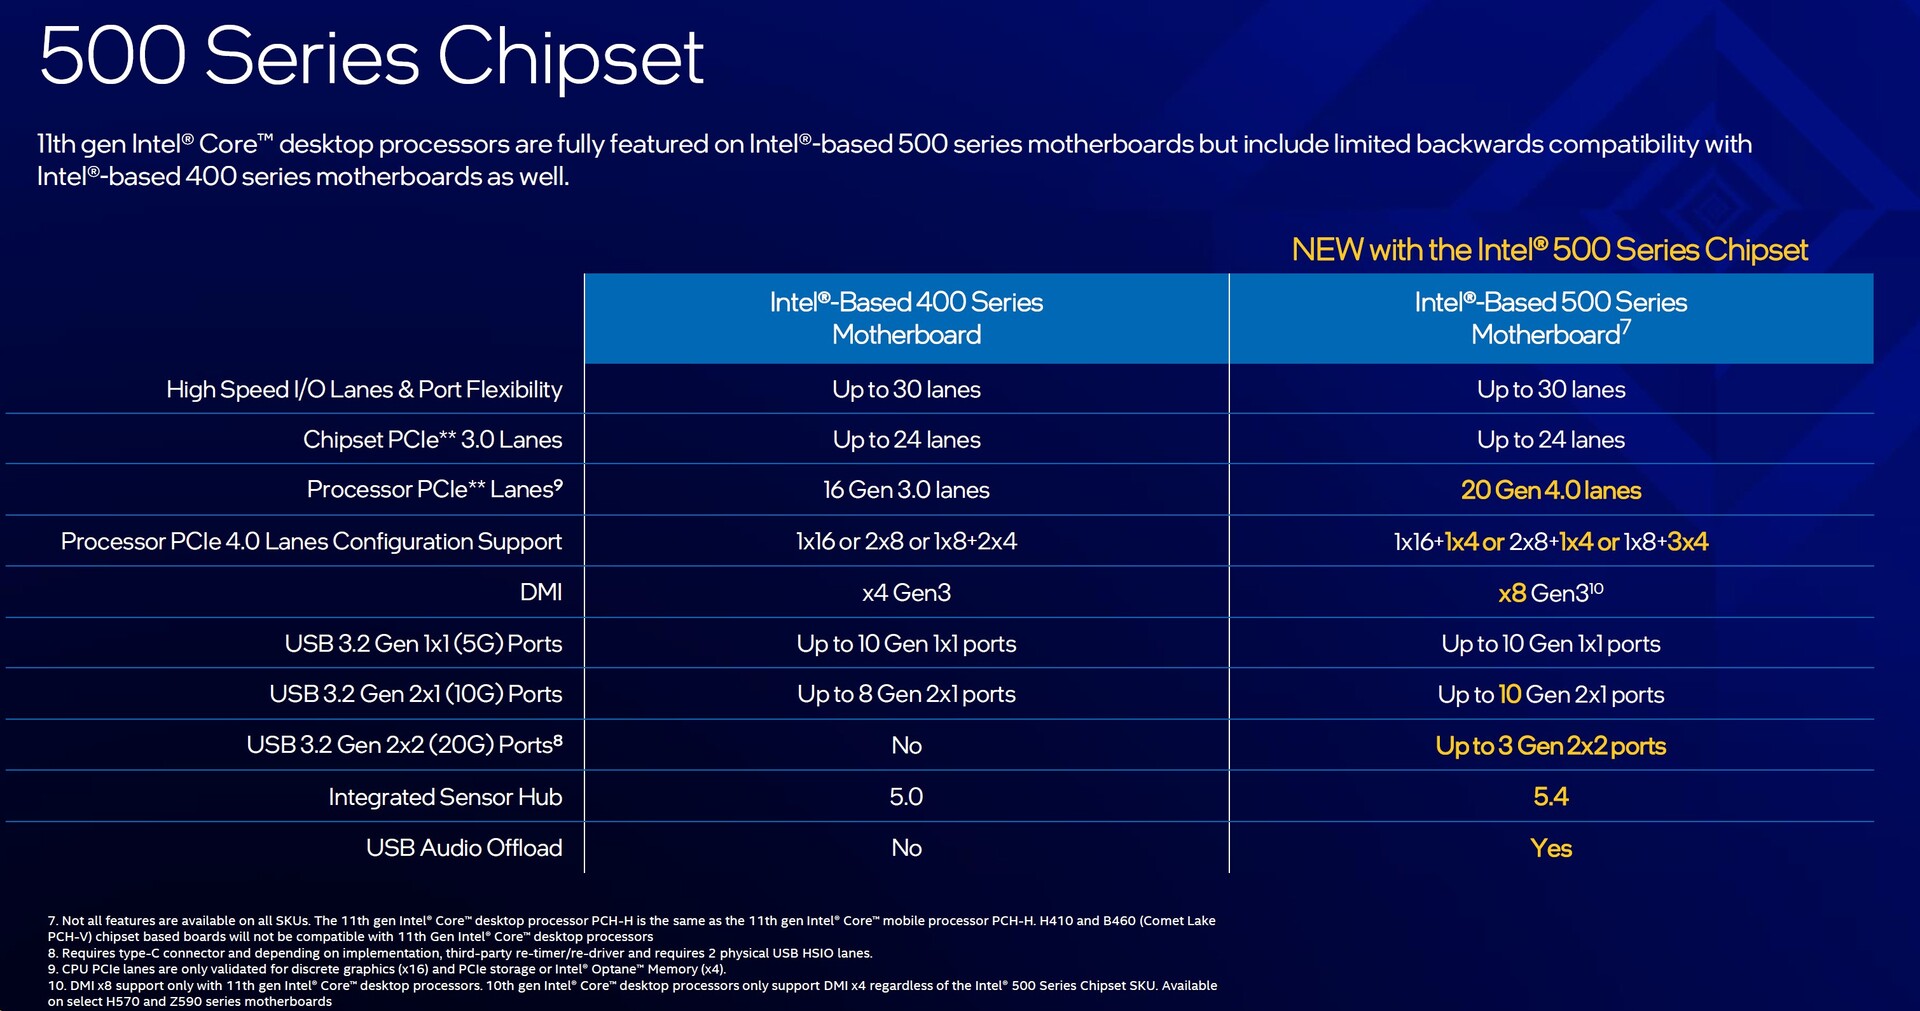
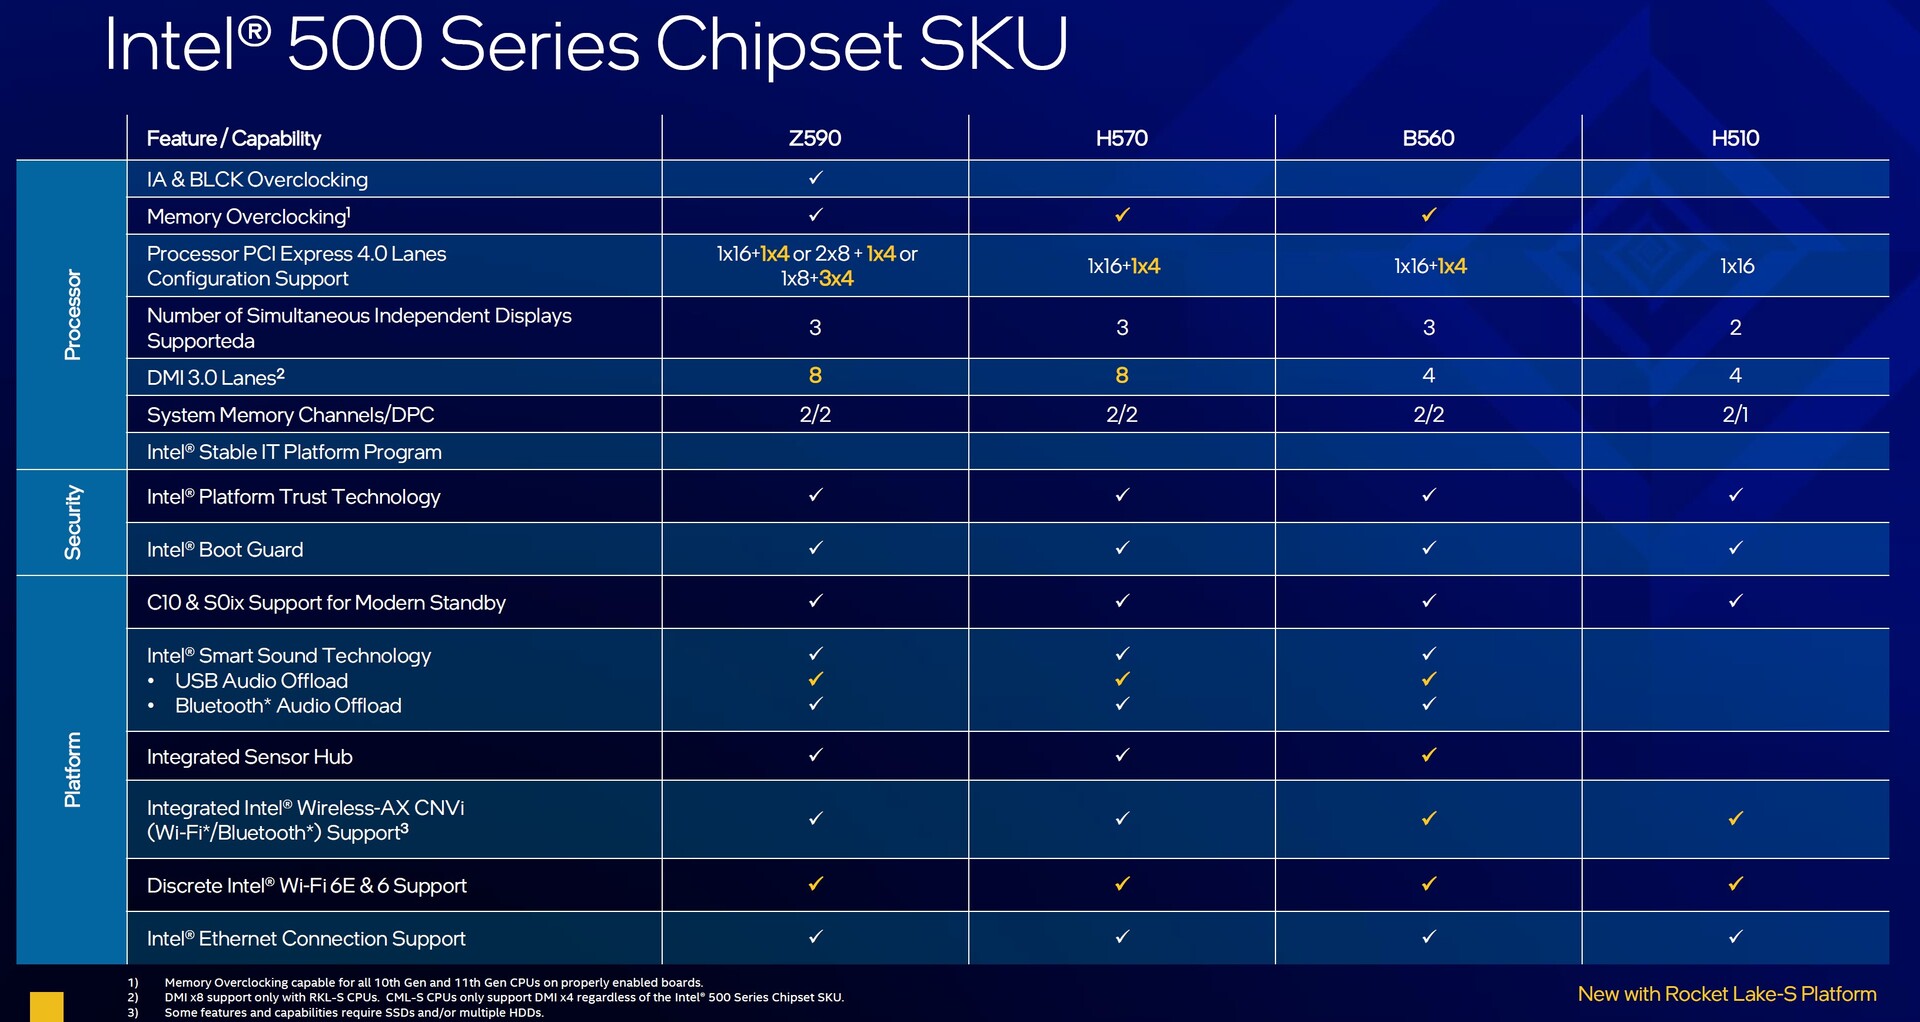
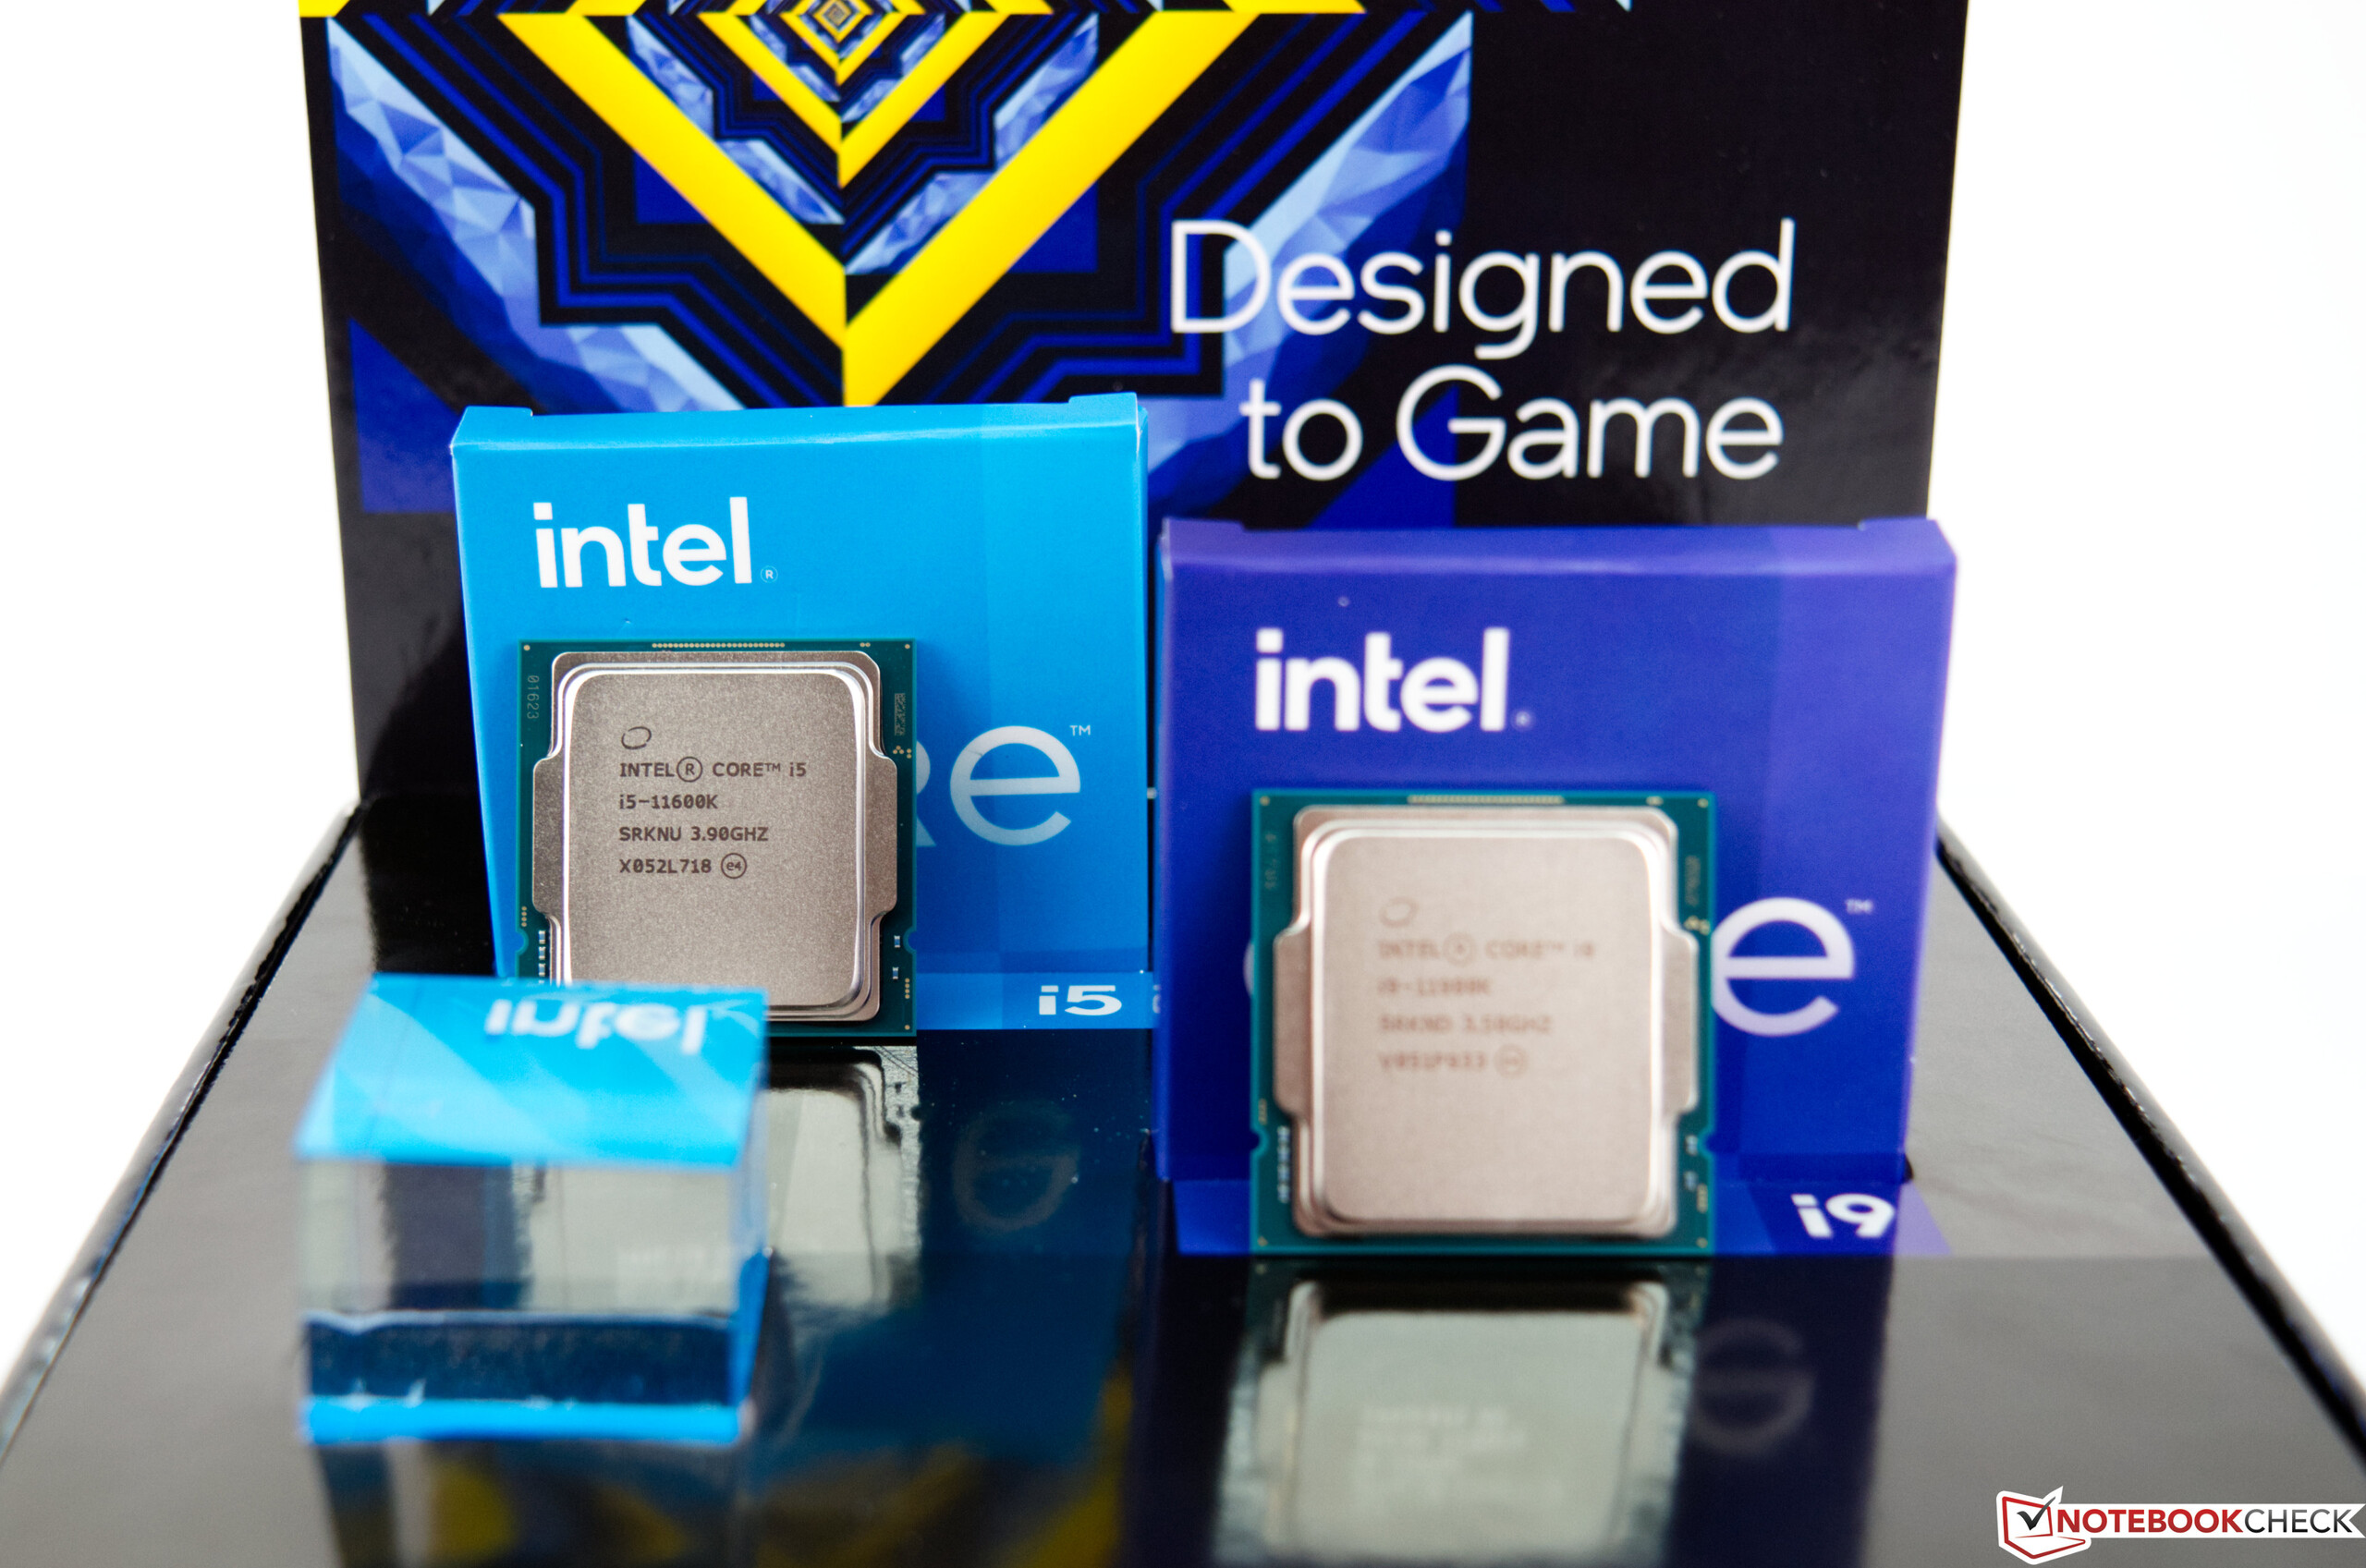
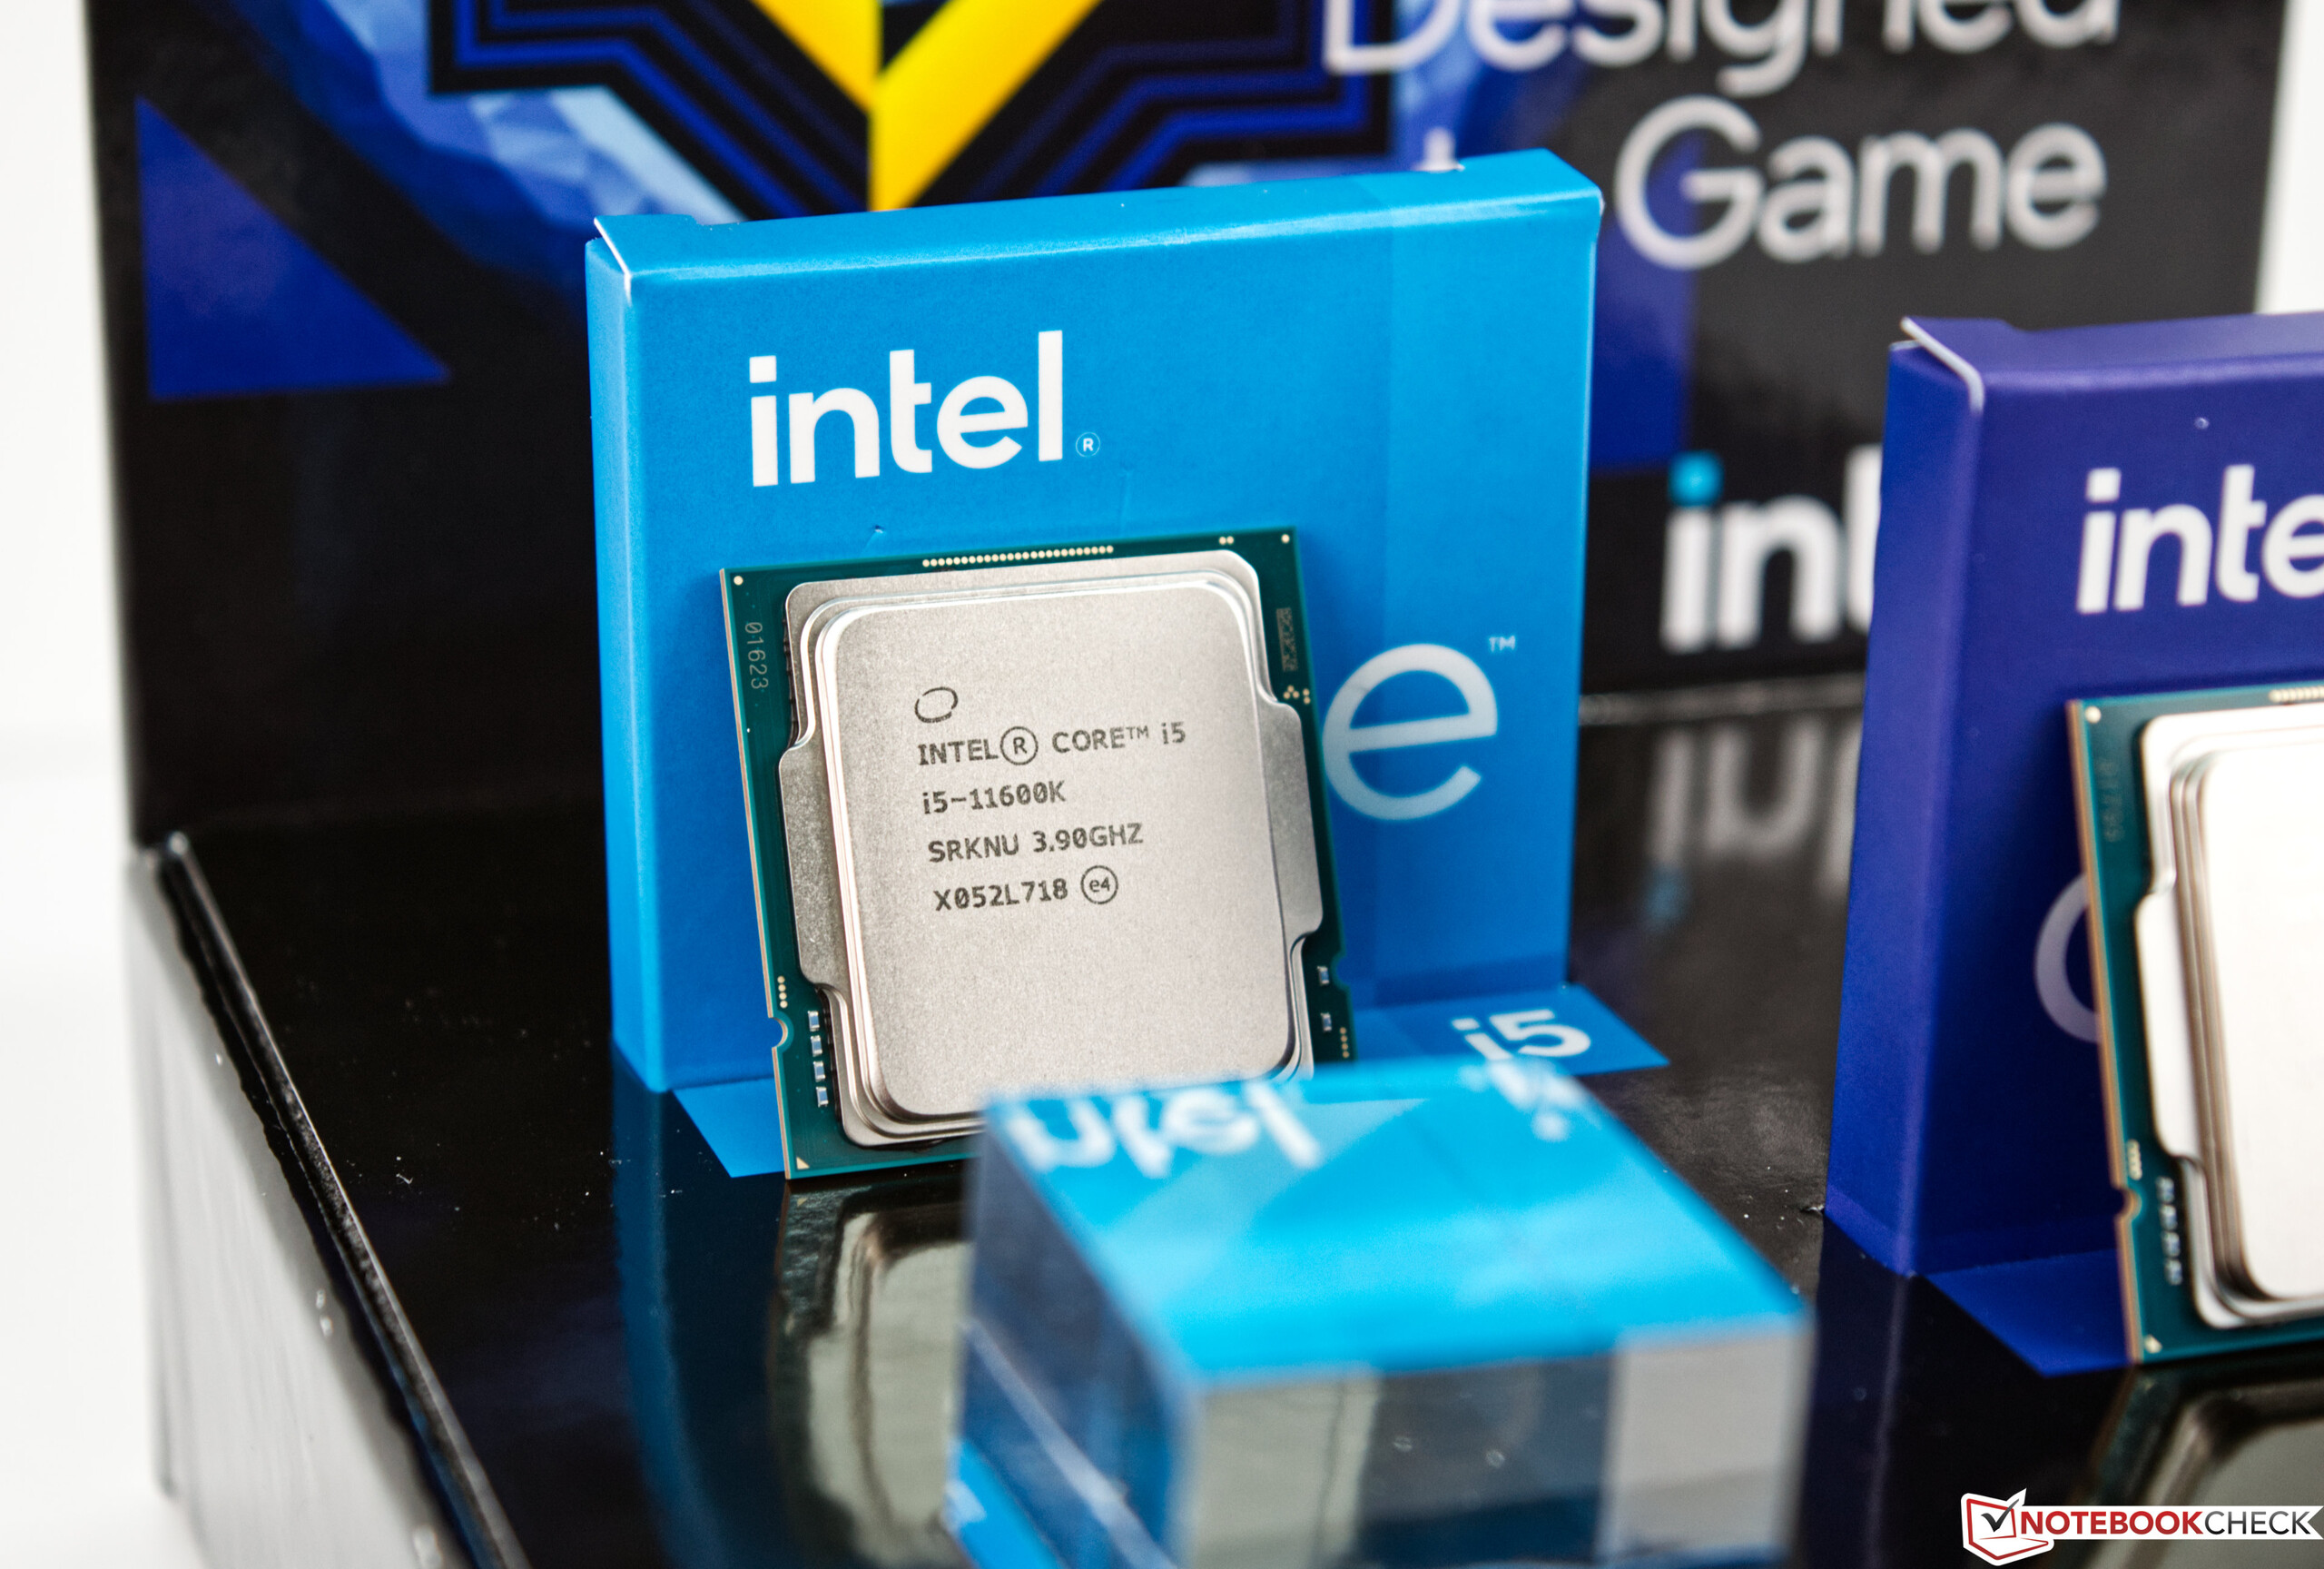
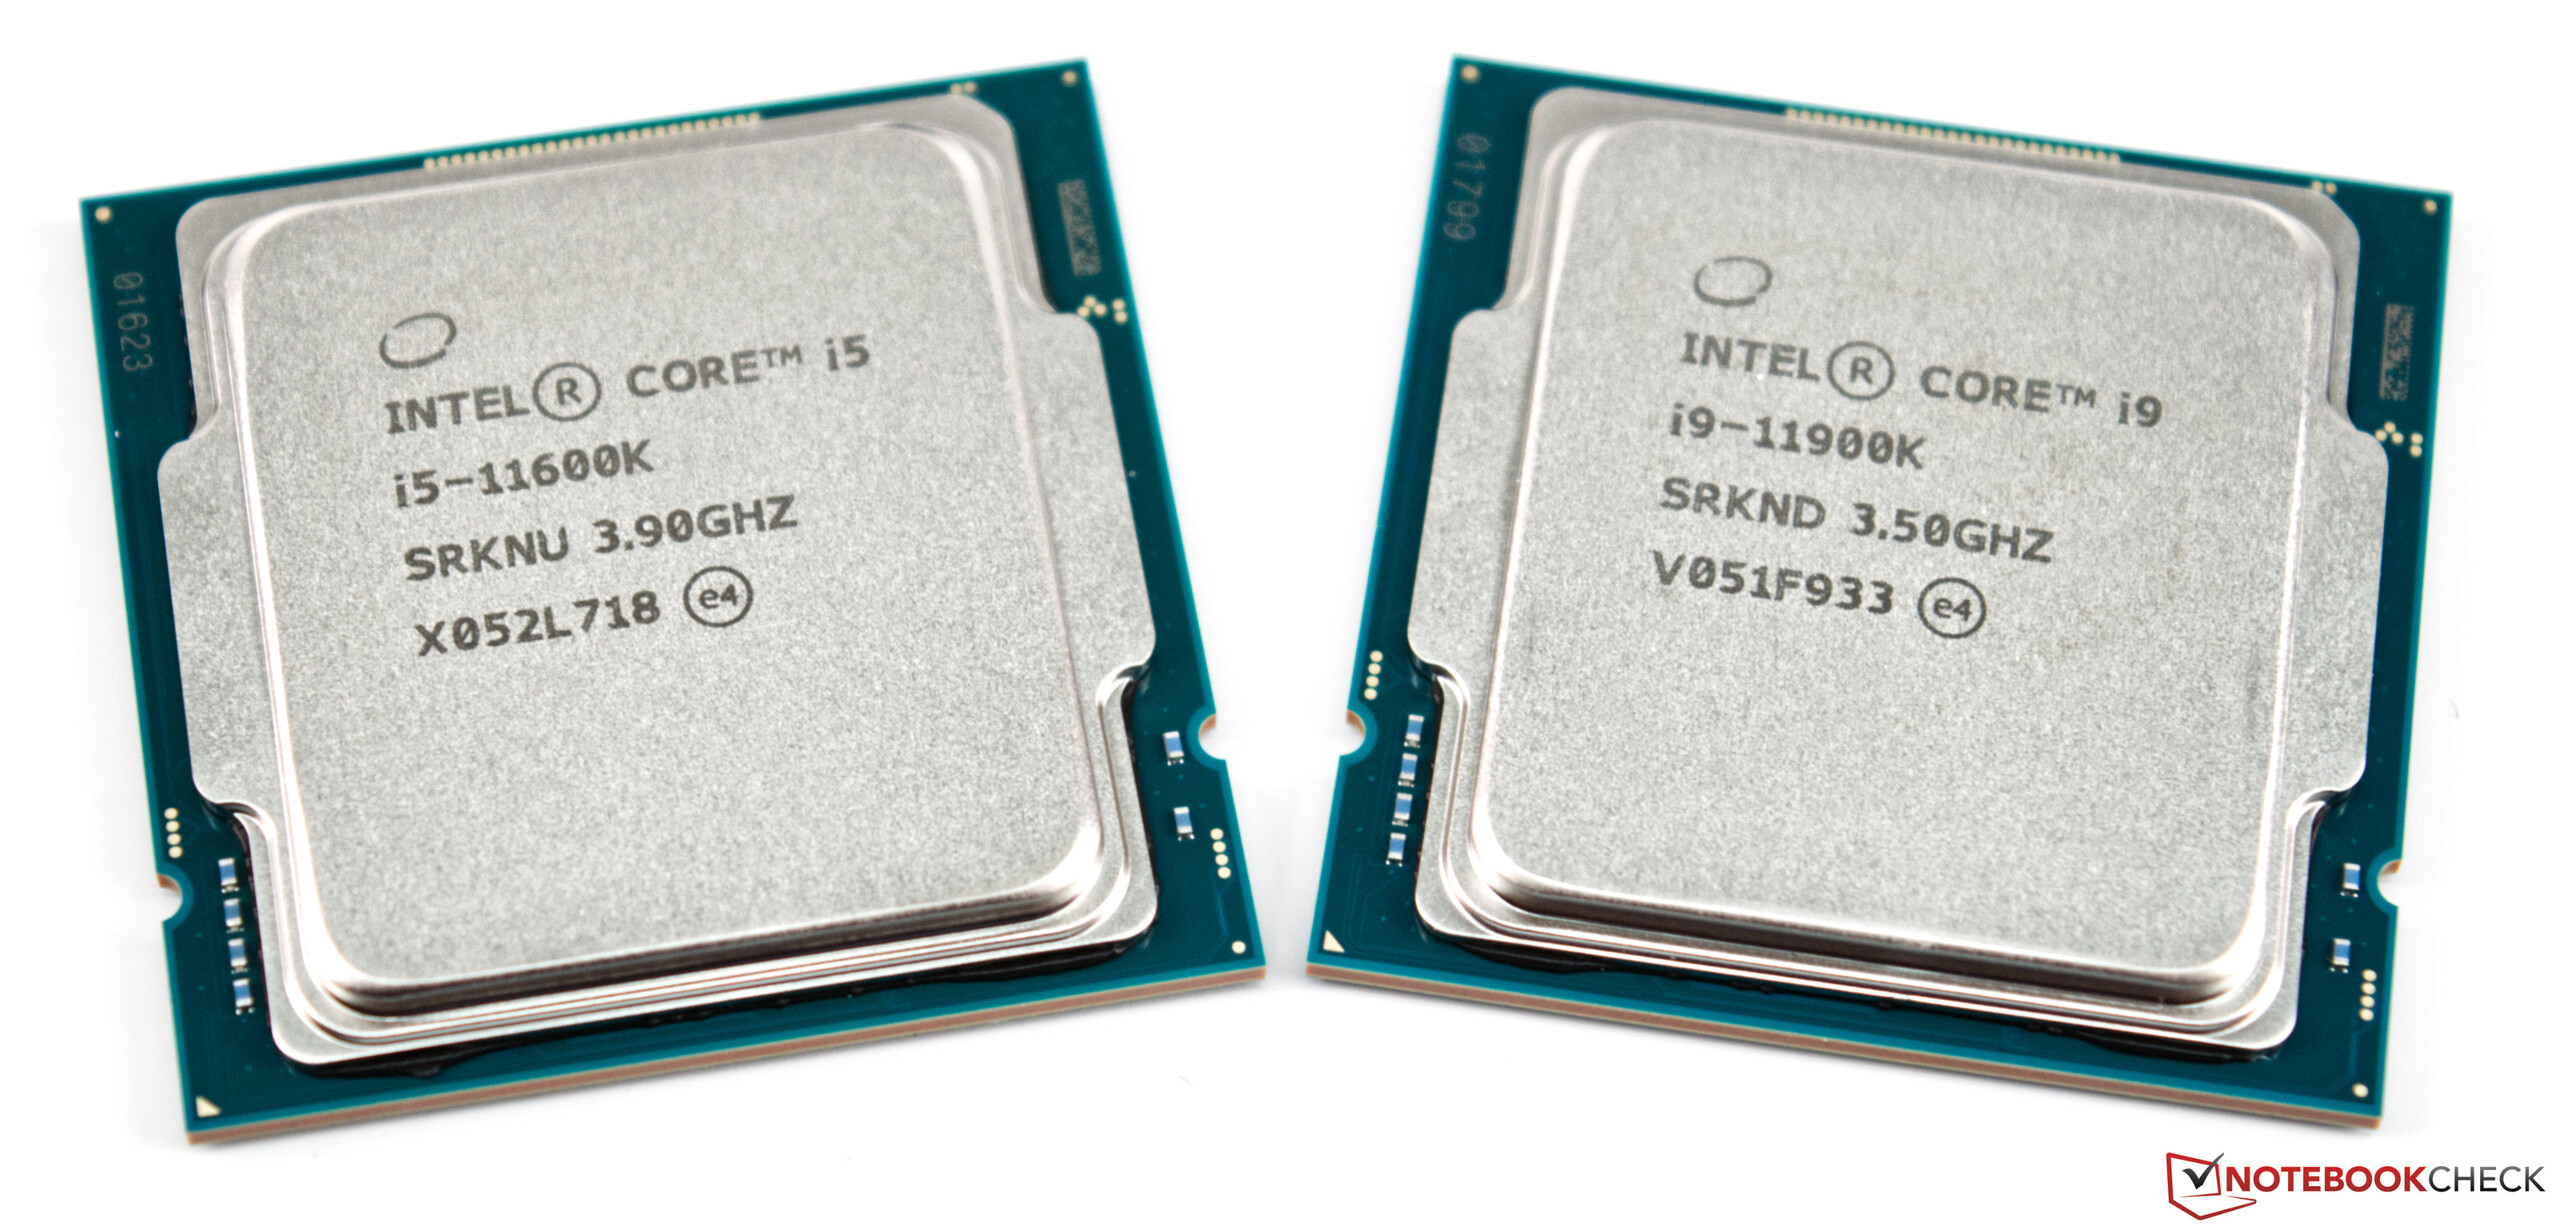
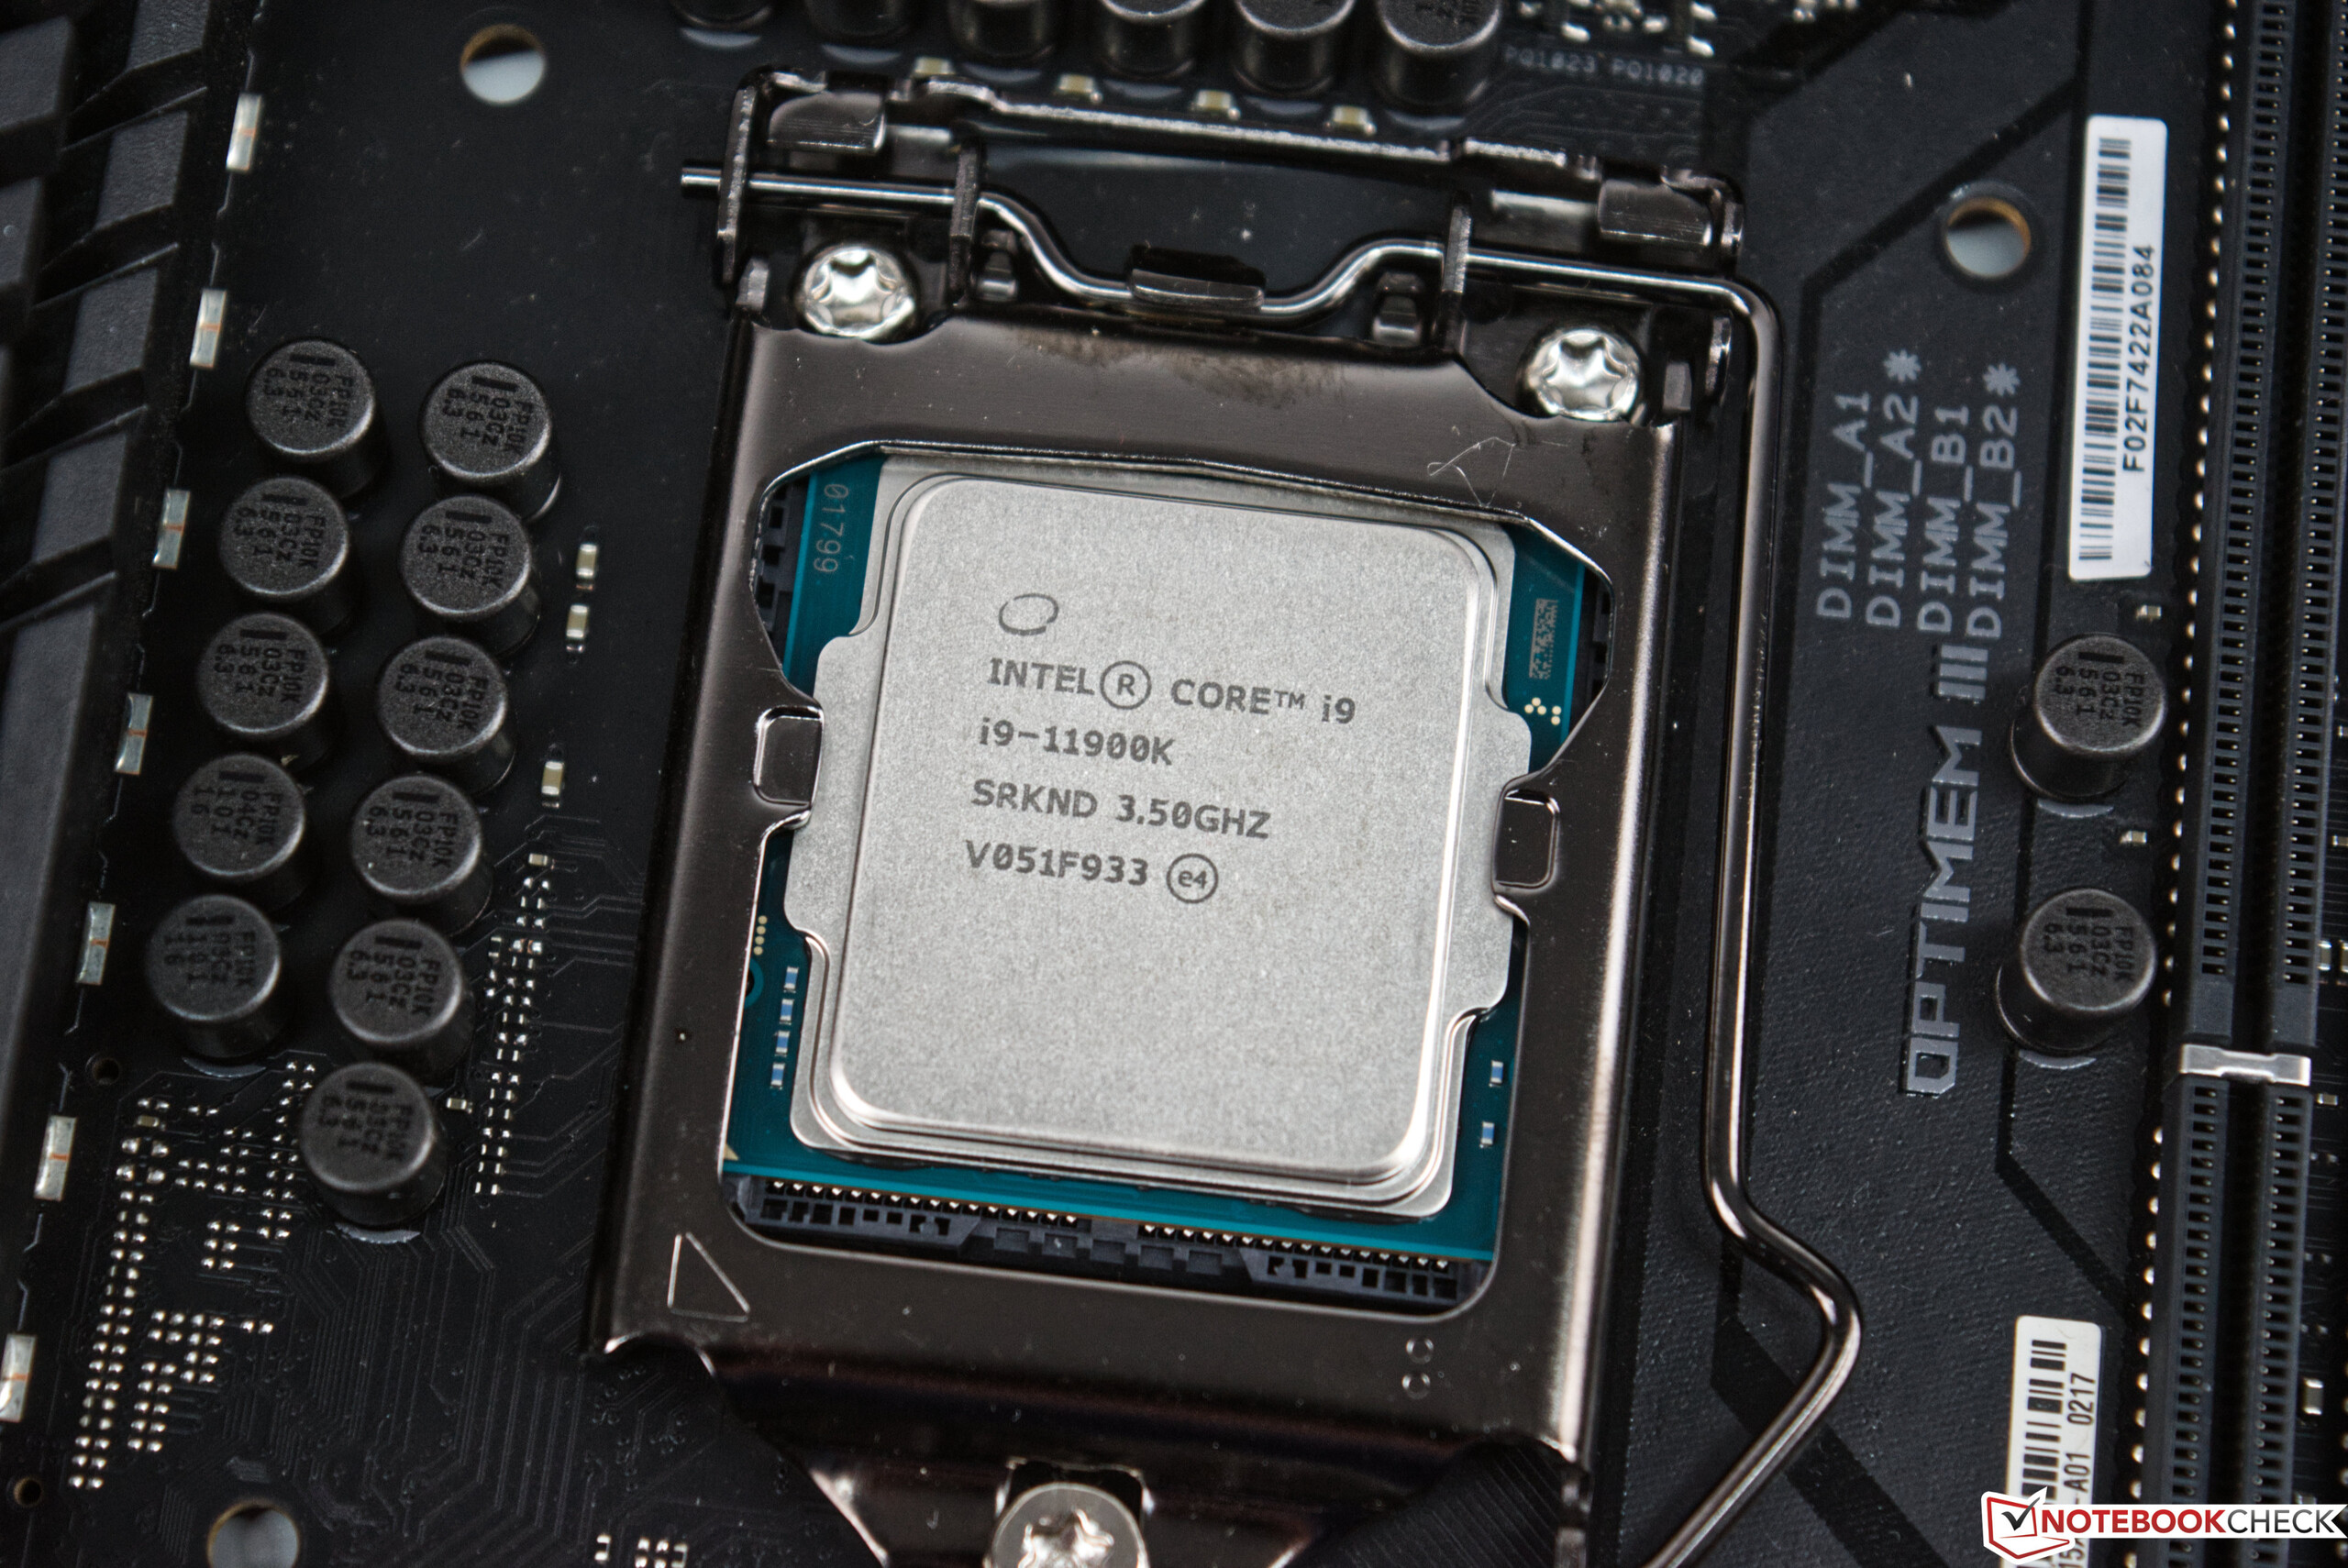
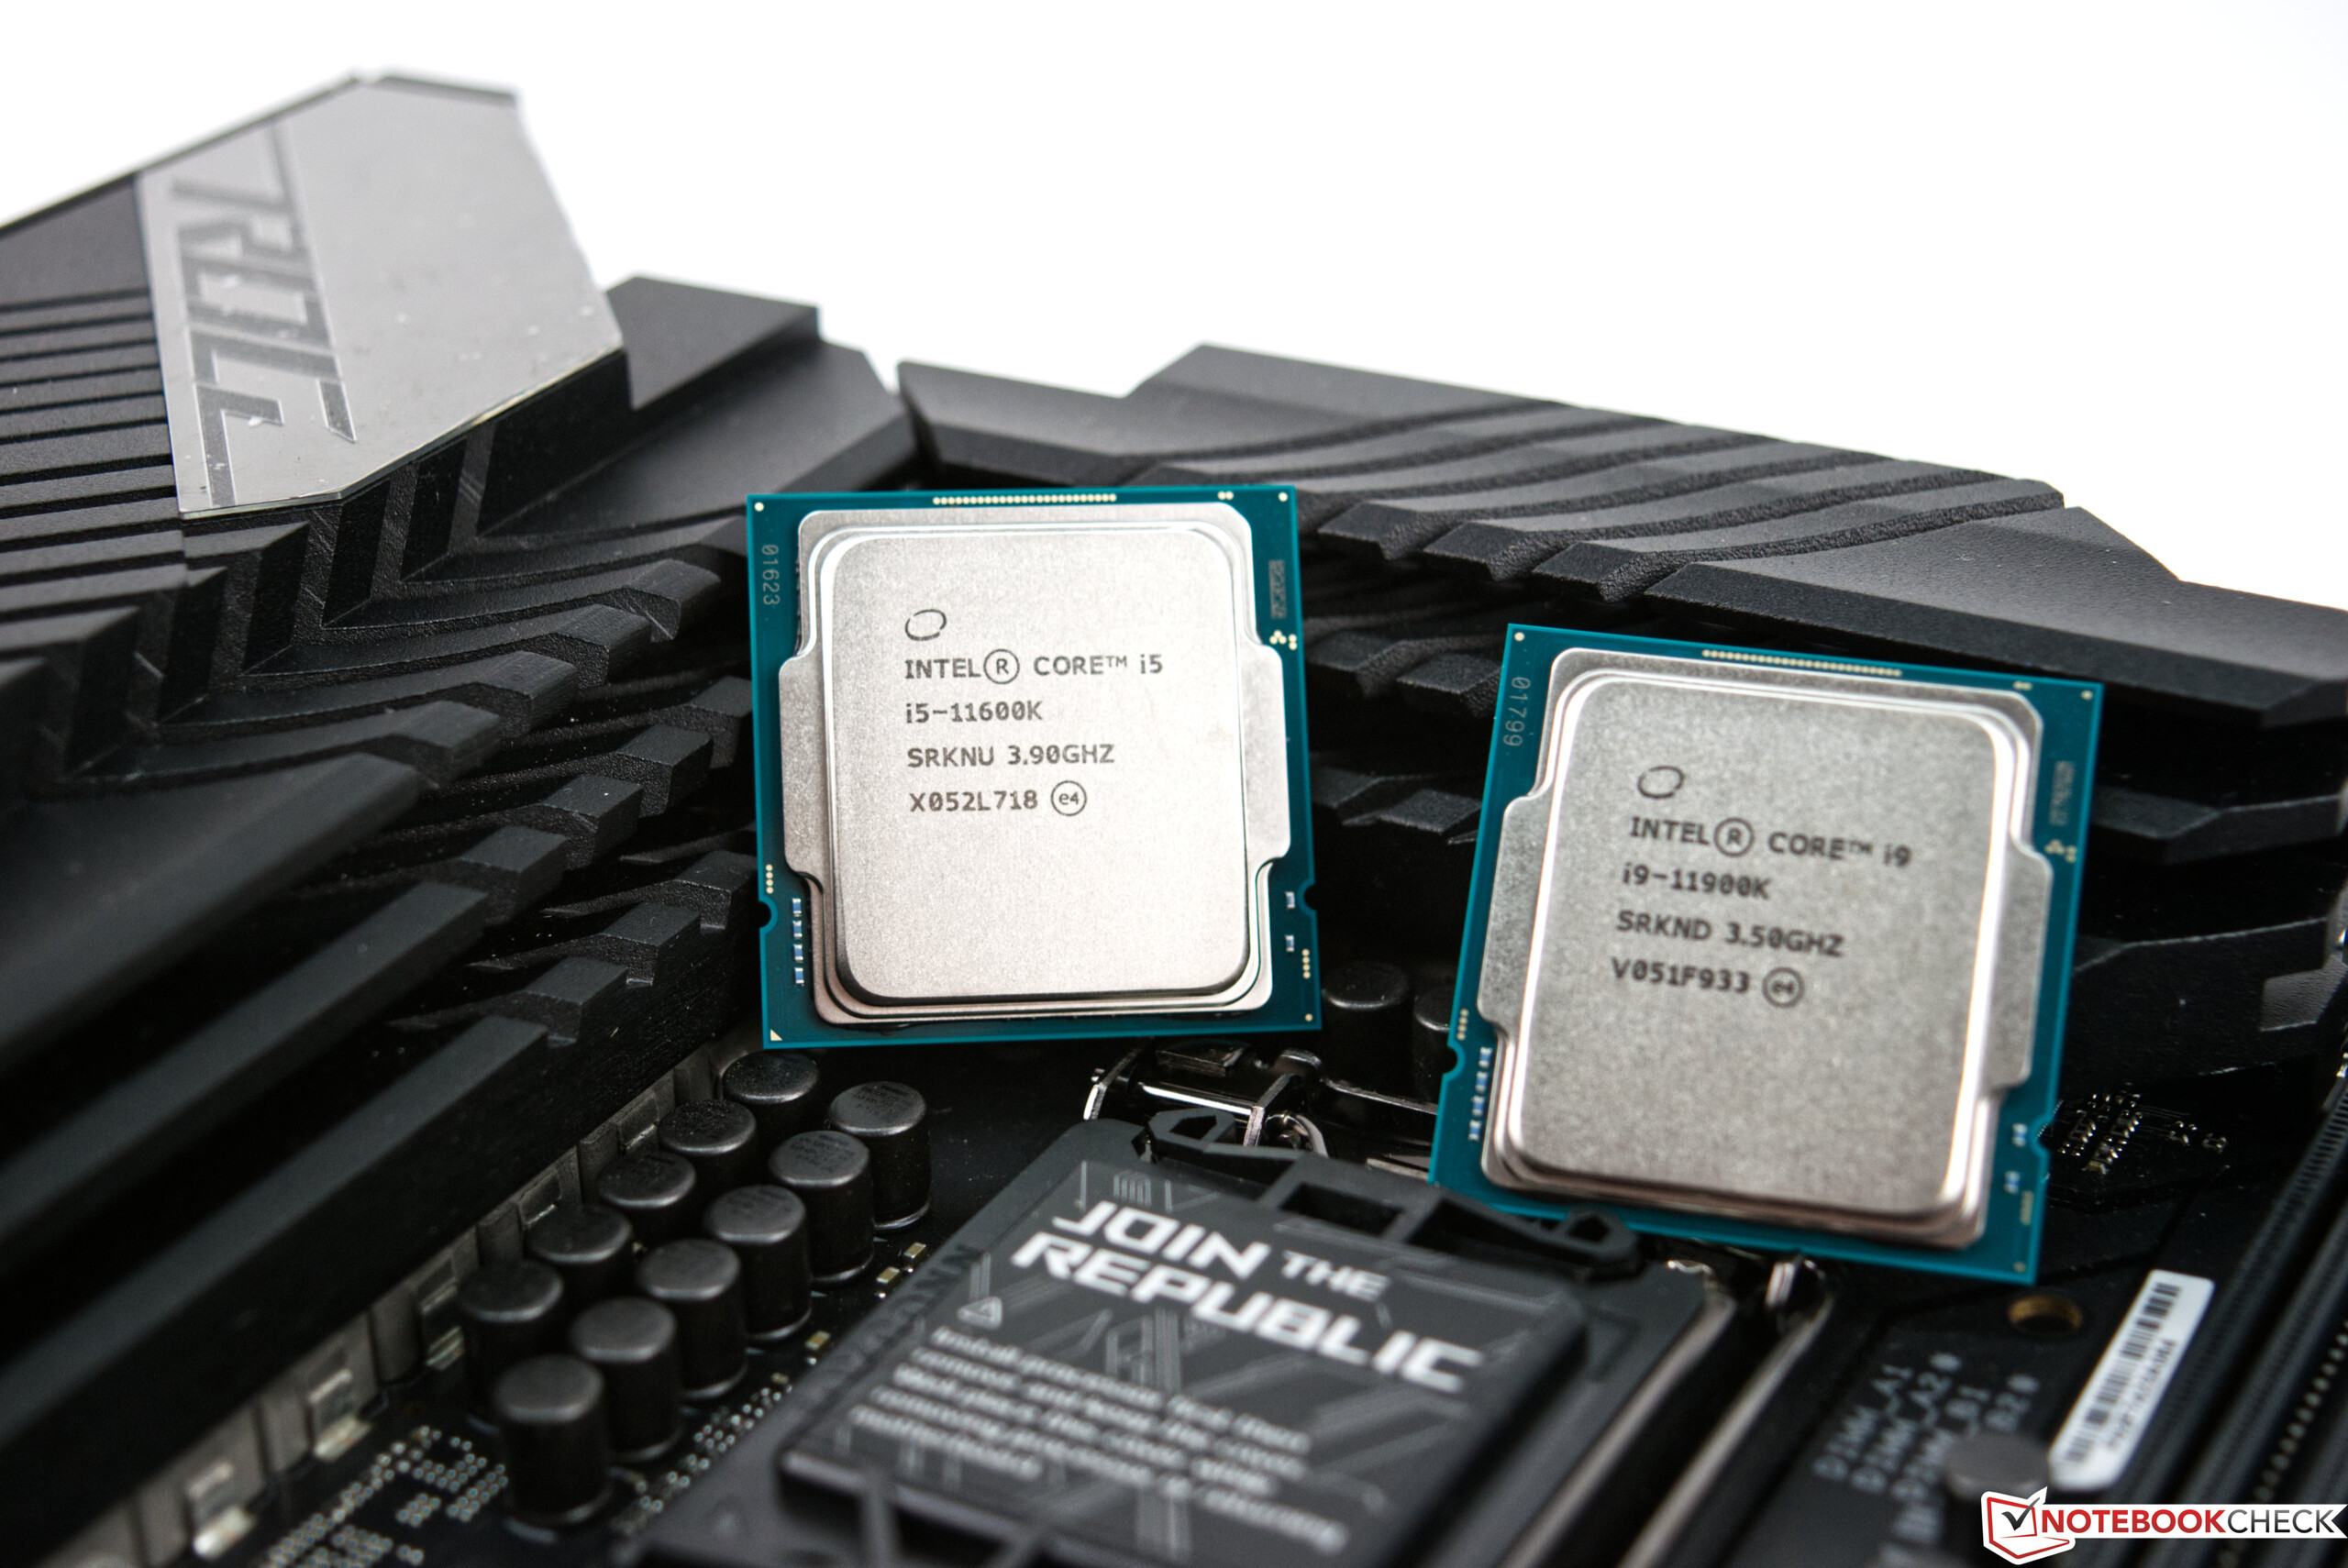
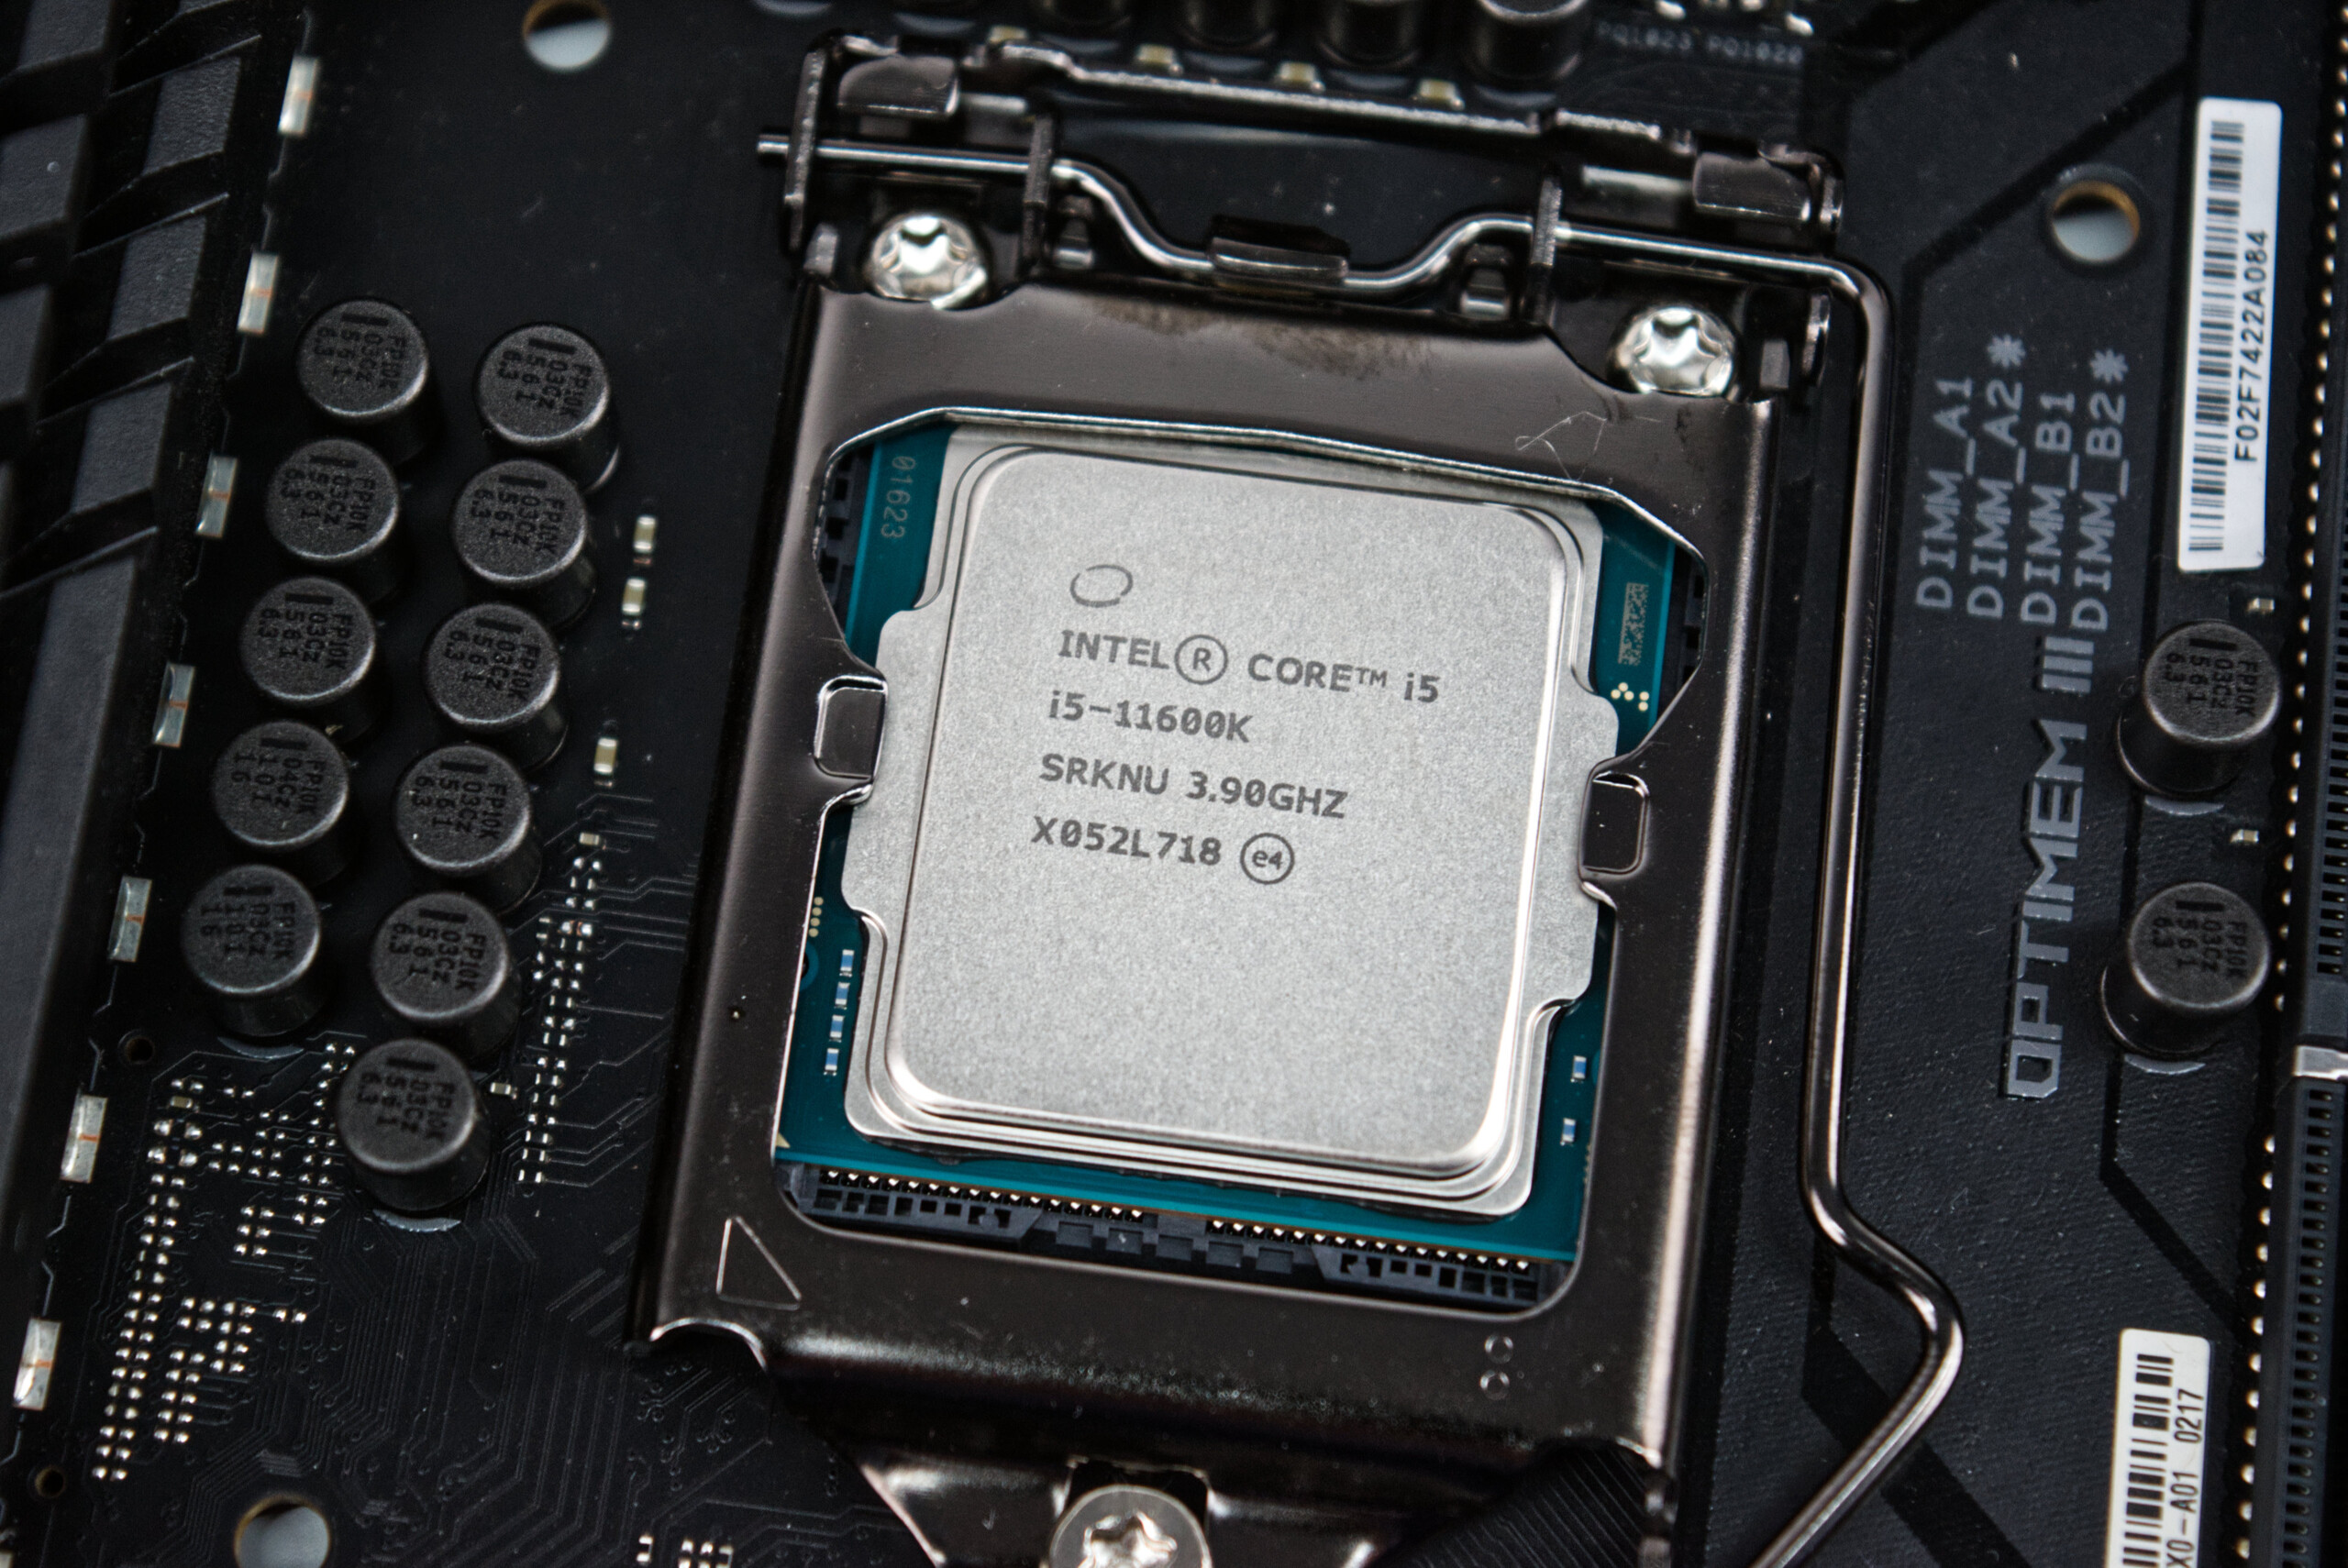
In this review, we are going to examine the Intel Core i9-11900K and the Intel Core i5-11600K. Both are K SKUs, which means that they come with an unlocked multiplier. Moreover, both chips come with integrated GPUs. The well-known naming scheme is preserved with this generation. There are also models without an iGPU and with a locked multiplier, which makes overclocking basically impossible. The current Rocket Lake generation still uses the LGA 1200 socket. Intel has also released a new high-end chipset (Z590) for its new CPUs. However, the new processors can be used with older 400-series motherboards as well, provided you get a BIOS update. Whether or not older boards will support new features will depend on the board maker. The only sure-fire way to get all the new features is to get the latest motherboard. This way, you will definitely be able to take advantage of the 20 PCIe 4.0 lanes that the CPUs offer. The lower-end chipsets have the following names: H570, B560 and H510. The main difference between the chipsets is memory overclocking, which is supported by all chipsets, except the H510.
In the table below, you can see the most important Rocket Lake-S chips that Intel has released.
Overview of the Rocket Lake-S Core CPUs
| Model | Core/thread count | Base clock | Turbo boost 2.0 | Turbo boost 3.0 | TVB 1C/xC | All core boost | Memory | Graphics | TDP | Price (MSRP) |
|---|---|---|---|---|---|---|---|---|---|---|
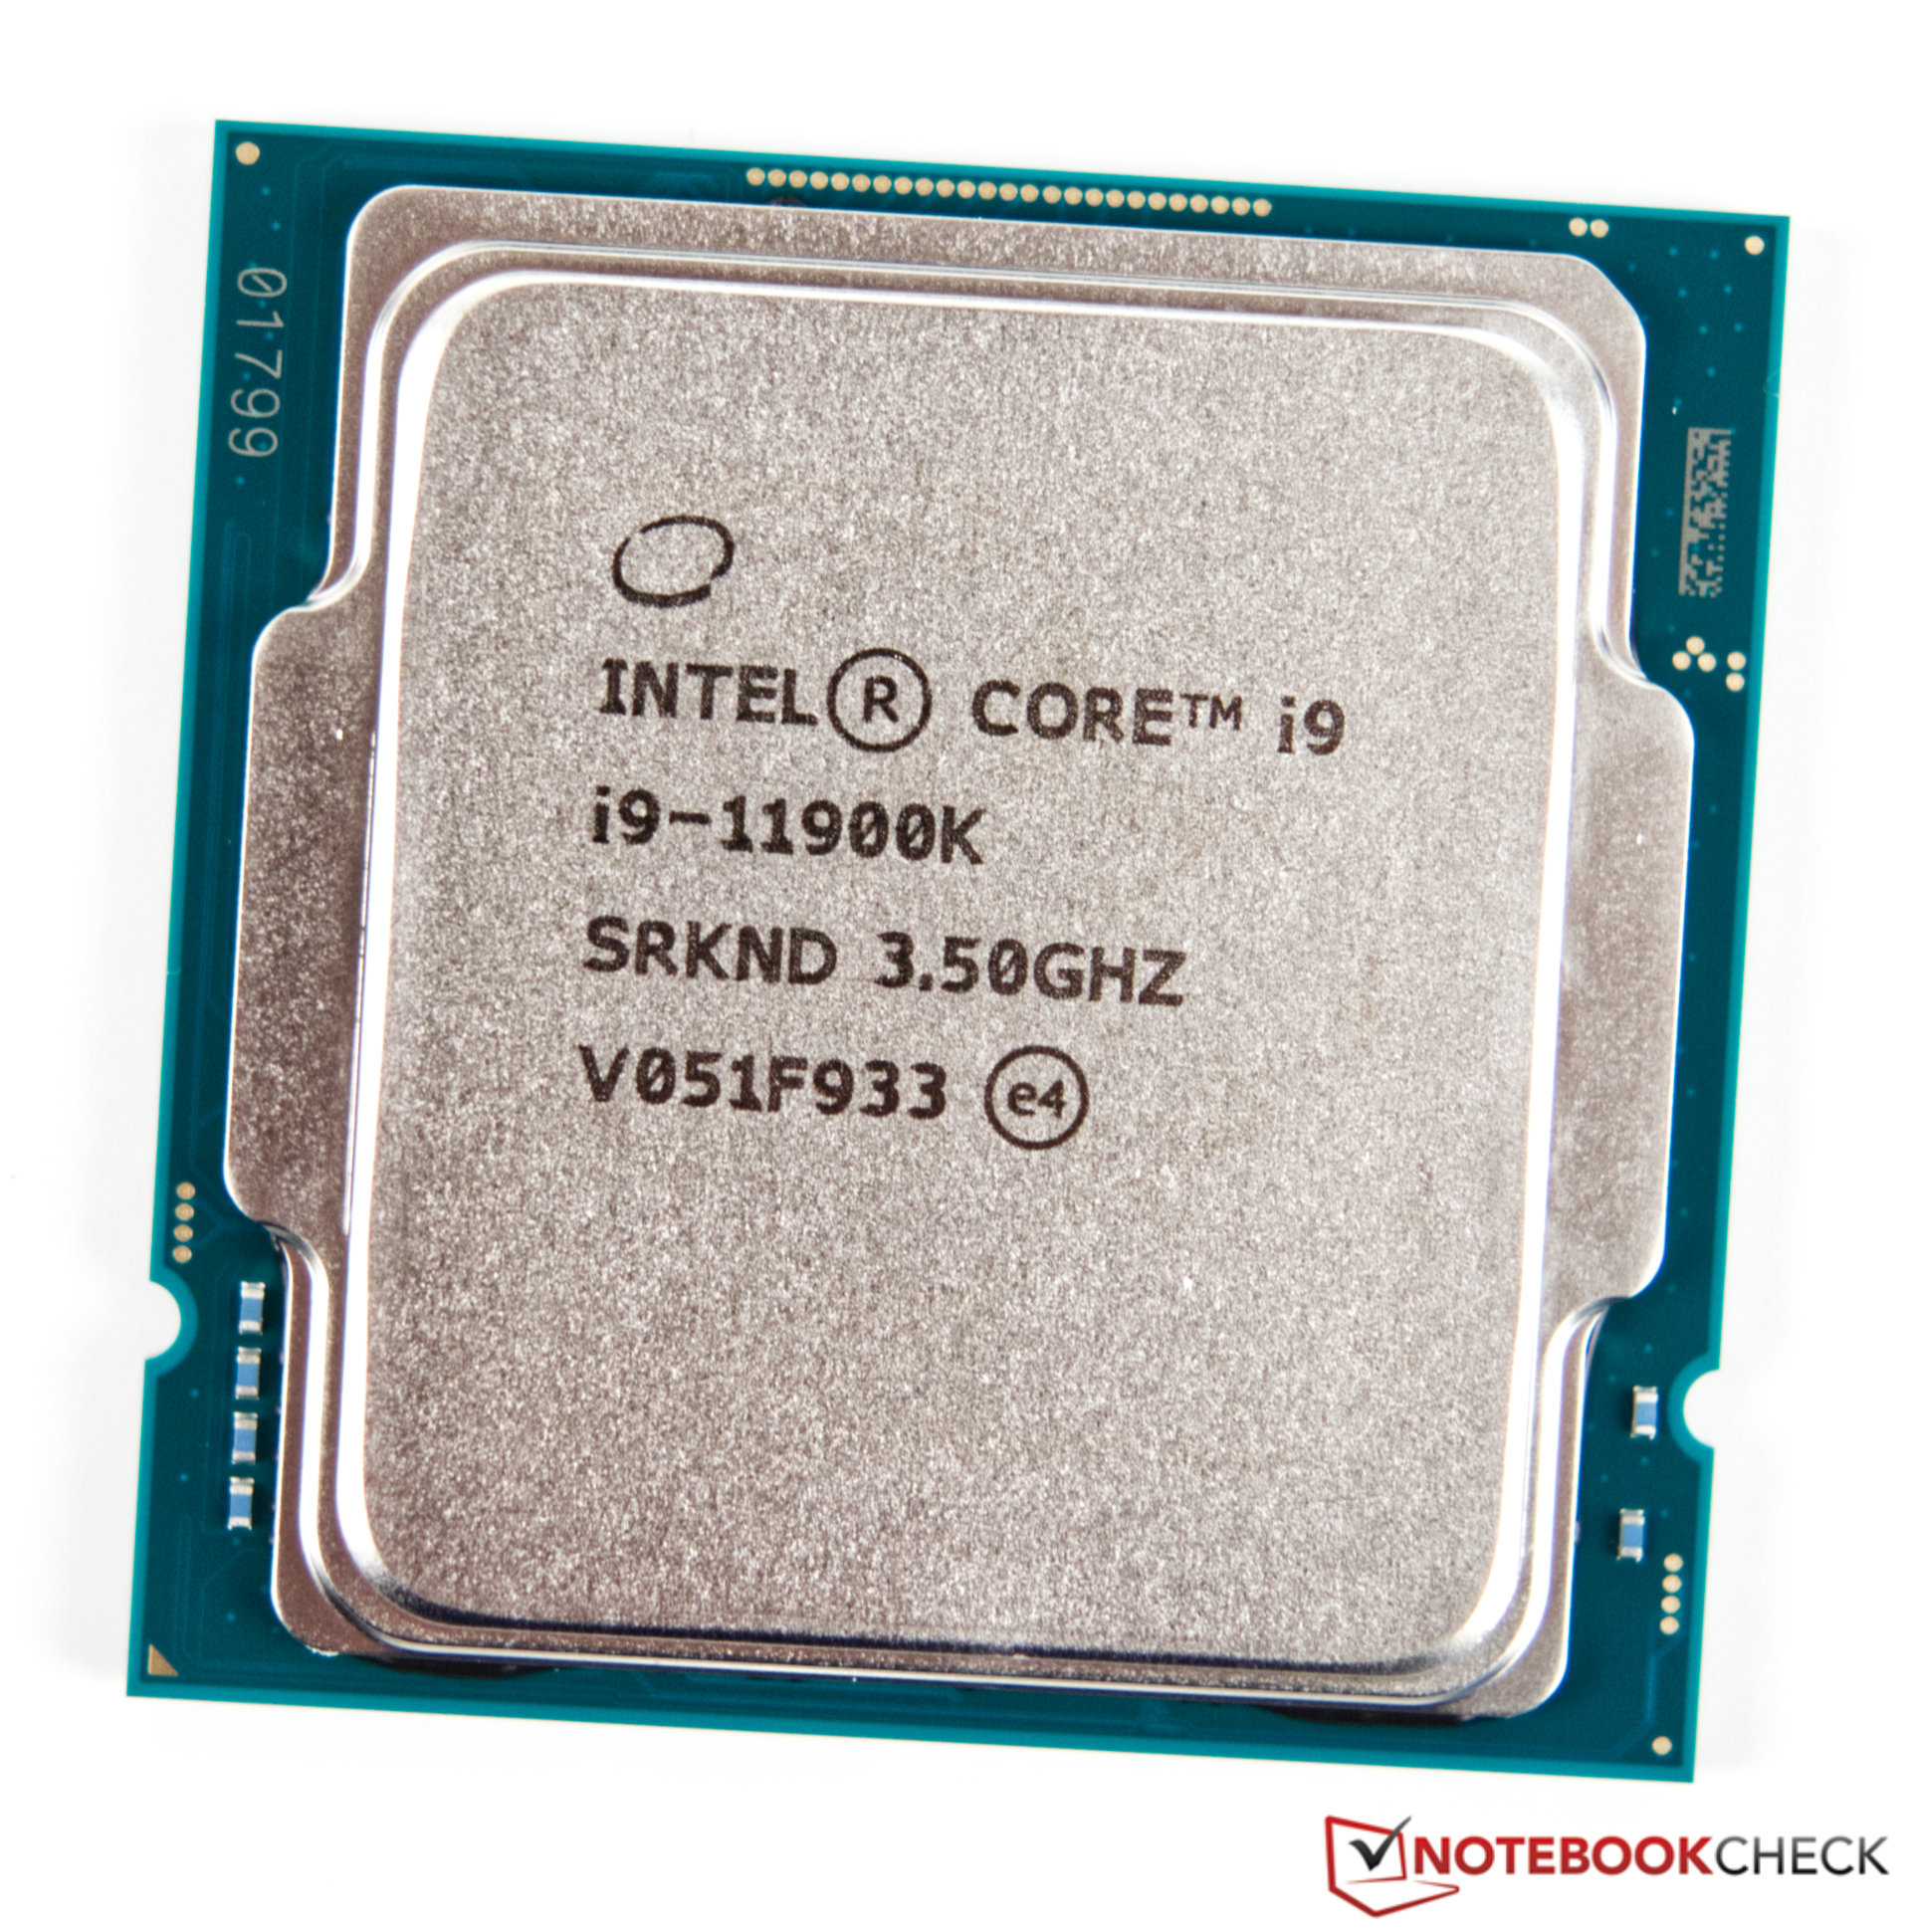
| Core i9-11900K | 8/16 | 3.5 GHz | 5.1 GHz | 5.3 GHz | 5.3 / 4.8 GHz | 4.7 GHz | DDR4-3200 | UHD 750 | 125 watts | €629 |
| Core i9-11900KF | 8/16 | 3.5 GHz | 5.1 GHz | 5.2 GHz | 5.3 / 4.8 GHz | 4.7 GHz | DDR4-3200 | - | 125 watts | €599 |
| Core i9-11900 | 8/16 | 2.5 GHz | 5.0 GHz | 5.1 GHz | 5.2 / 4.7 GHz | 4.6 GHz | DDR4-3200 | UHD 750 | 65 watts | €509 |
| Core i9-11900F | 8/16 | 2.5 GHz | 5.0 GHz | 5.1 GHz | 5.2 / 4.7 GHz | 4.6 GHz | DDR4-3200 | - | 65 watts | €479 |
| Core i9-11900T | 8/16 | 1.5 GHz | 4.8 GHz | 4.9 GHz | - | 3.7 GHz | DDR4-3200 | UHD 750 | 35 watts | TBD |
| Core i7-11700K | 8/16 | 3.6 GHz | 4.9 GHz | 5.0 GHz | - | 4.6 GHz | DDR4-3200 | UHD 750 | 125 watts | €469 |
| Core i7-11700KF | 8/16 | 3.6 GHz | 4.9 GHz | 5.0 GHz | - | 4.6 GHz | DDR4-3200 | - | 125 watts | €439 |
| Core i7-11700 | 8/16 | 2.5 GHz | 4.8 GHz | 4.9 GHz | - | 4.4 GHz | DDR4-3200 | UHD 750 | 65 watts | €379 |
| Core i7-11700F | 8/16 | 2.5 GHz | 4.8 GHz | 4.9 GHz | - | 4.4 GHz | DDR4-3200 | - | 65 watts | TBD |
| Core i7-11700T | 8/16 | 1.4 GHz | 4.5 GHz | 4.6 GHz | - | 3.6 GHz | DDR4-3200 | UHD 750 | 35 watts | TBD |
| Core i5-11600K | 6/12 | 3.9 GHz | 4.9 GHz | - | - | 4.6 GHz | DDR4-3200 | UHD 750 | 125 watts | €299 |
| Core i5-11600KF | 6/12 | 3.9 GHz | 4.9 GHz | - | - | 4.6 GHz | DDR4-3200 | - | 125 Watt | watts |
| Core i5-11600 | 6/12 | 2.8 GHz | 4.8 GHz | - | - | 4.3 GHz | DDR4-3200 | UHD 750 | 65 watts | €259 |
| Core i5-11600T | 6/12 | 1.7 GHz | 4.1 GHz | - | - | 3.5 GHz | DDR4-3200 | UHD 750 | 35 watts | TBD |
| Core i5-11500 | 6/12 | 2.7 GHz | 4.6 GHz | - | - | 4.2 GHz | DDR4-3200 | UHD 750 | 65 watts | €229 |
| Core i5-11500T | 6/12 | 1.5 GHz | 3.9 GHz | - | - | 3.4 GHz | DDR4-3200 | UHD 750 | 35 watts | TBD |
| Core i5-11400 | 6/12 | 2.6 GHz | 4.4 GHz | - | - | 4.2 GHz | DDR4-3200 | UHD 730 | 65 watts | €209 |
| Core i5-11400F | 6/12 | 2.6 GHz | 4.4 GHz | - | - | 4.2 GHz | DDR4-3200 | - | 65 watts | €179 |
| Core i5-11400T | 6/12 | 1.3 GHz | 3.7 GHz | - | - | 3.3 GHz | DDR4-3200 | UHD 730 | 35 watts | TBD |
Our Test System
We used the following hardware to perform our benchmarks and tests:
- Raijintek Paean Benchtable
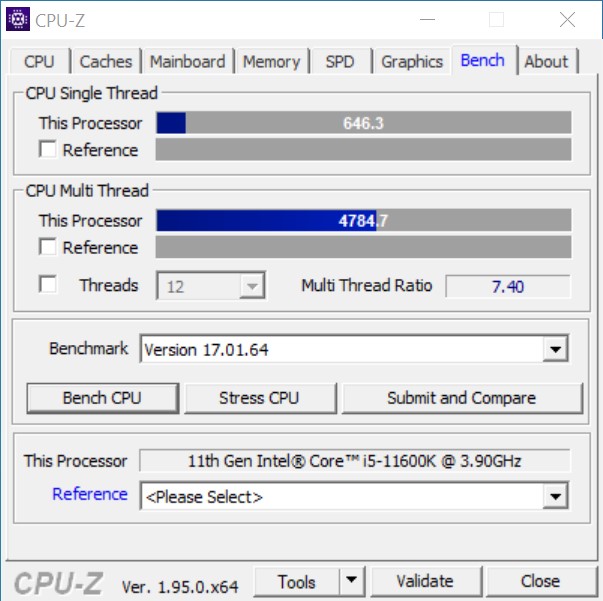
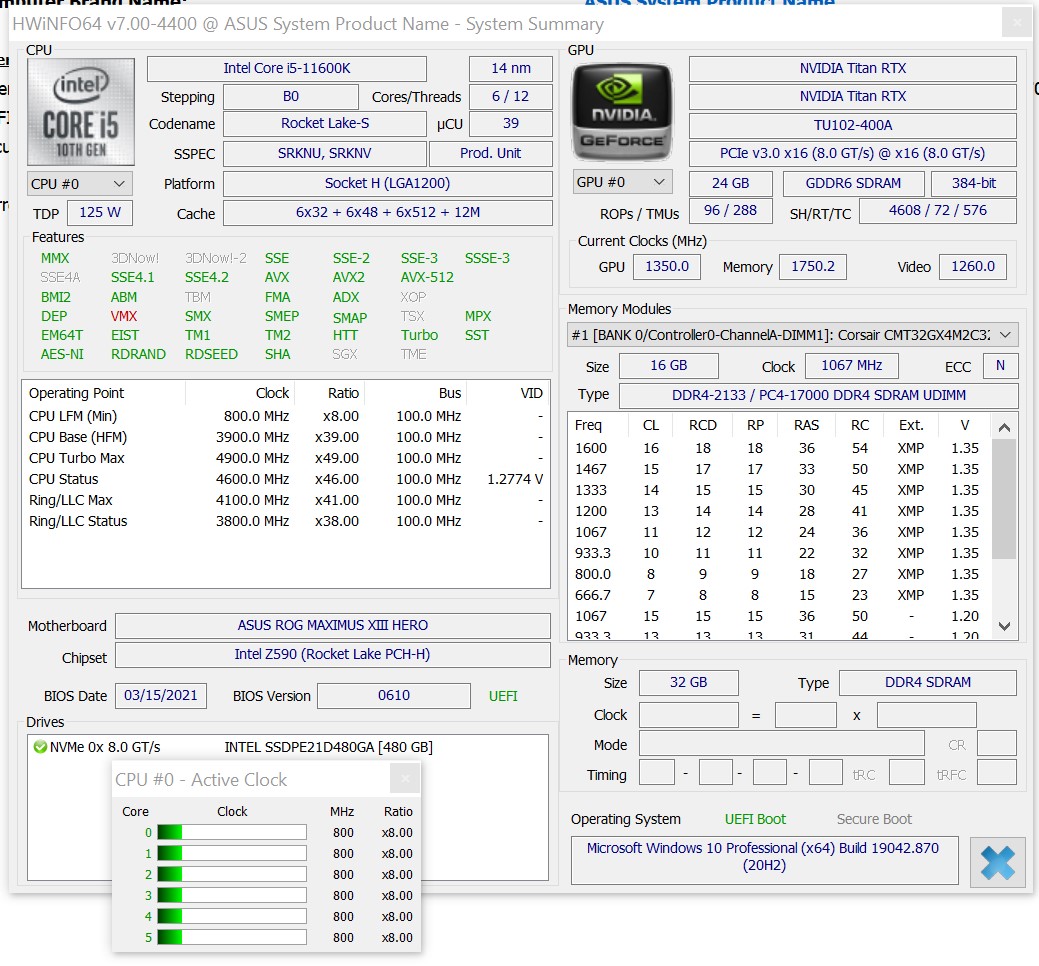
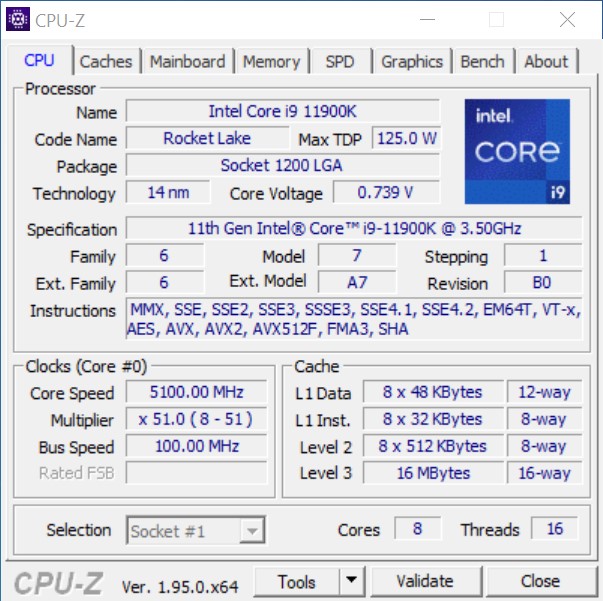
- Intel Core i9-11900K, Intel Core i5-11600K
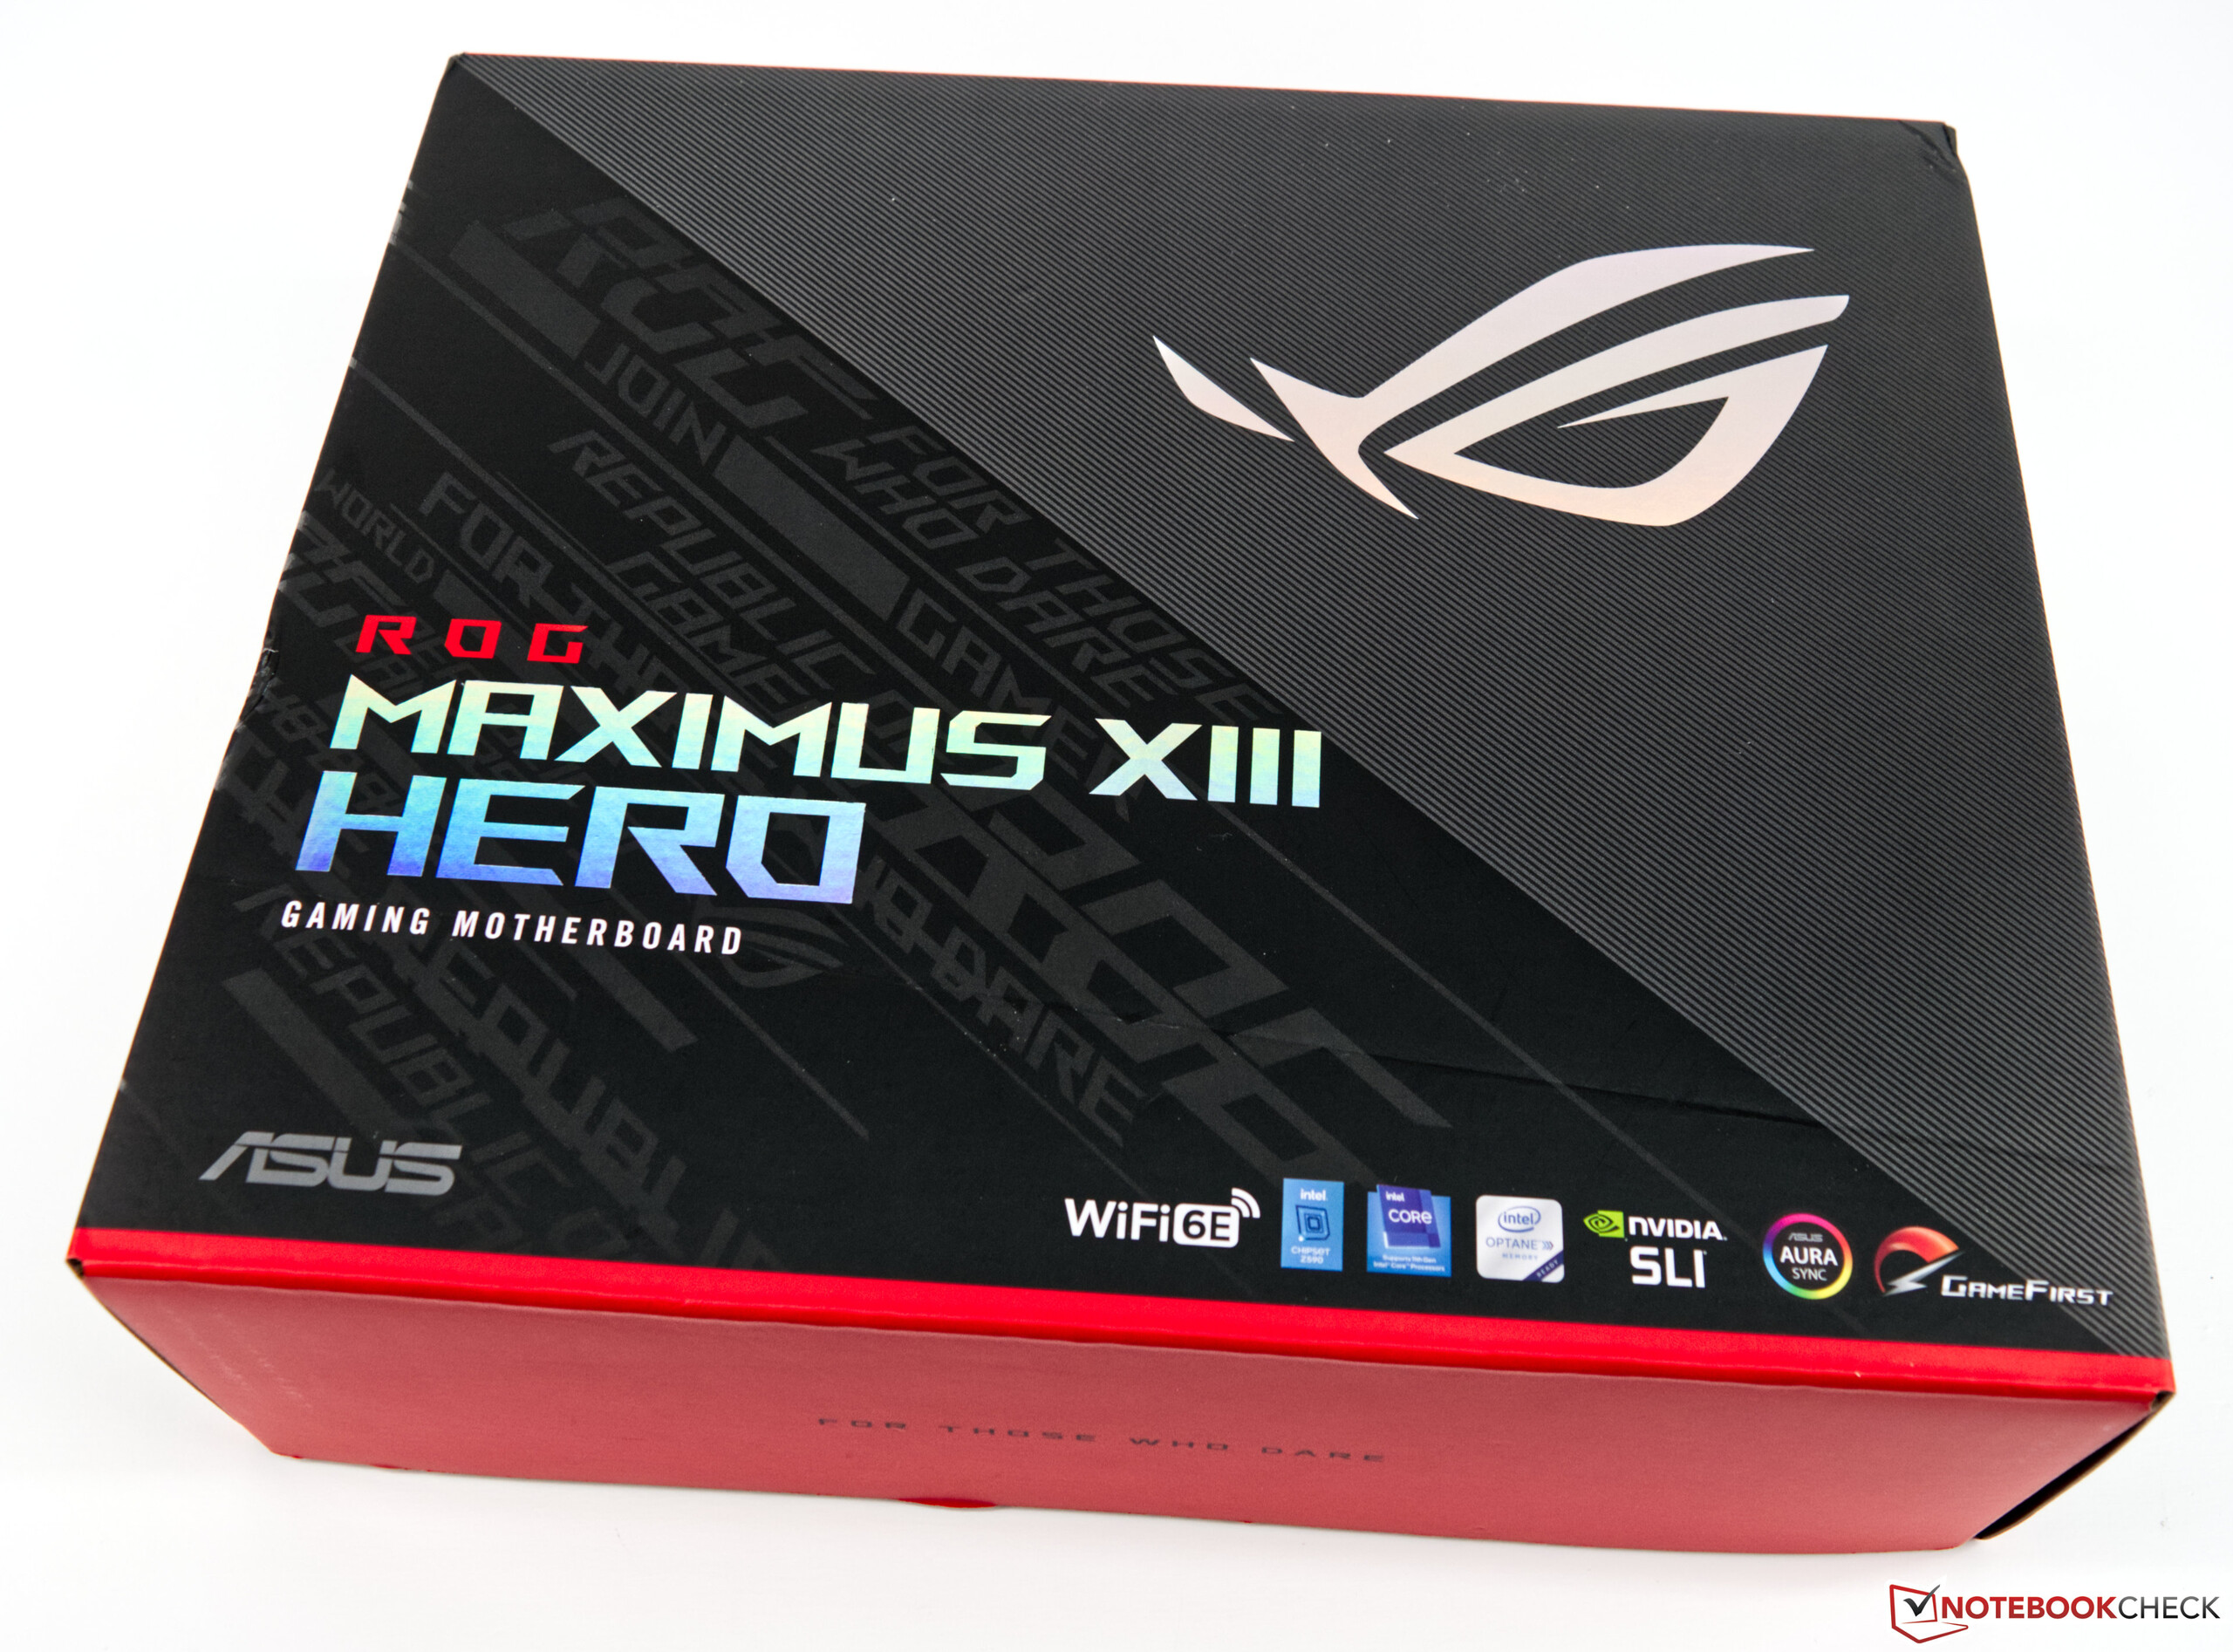
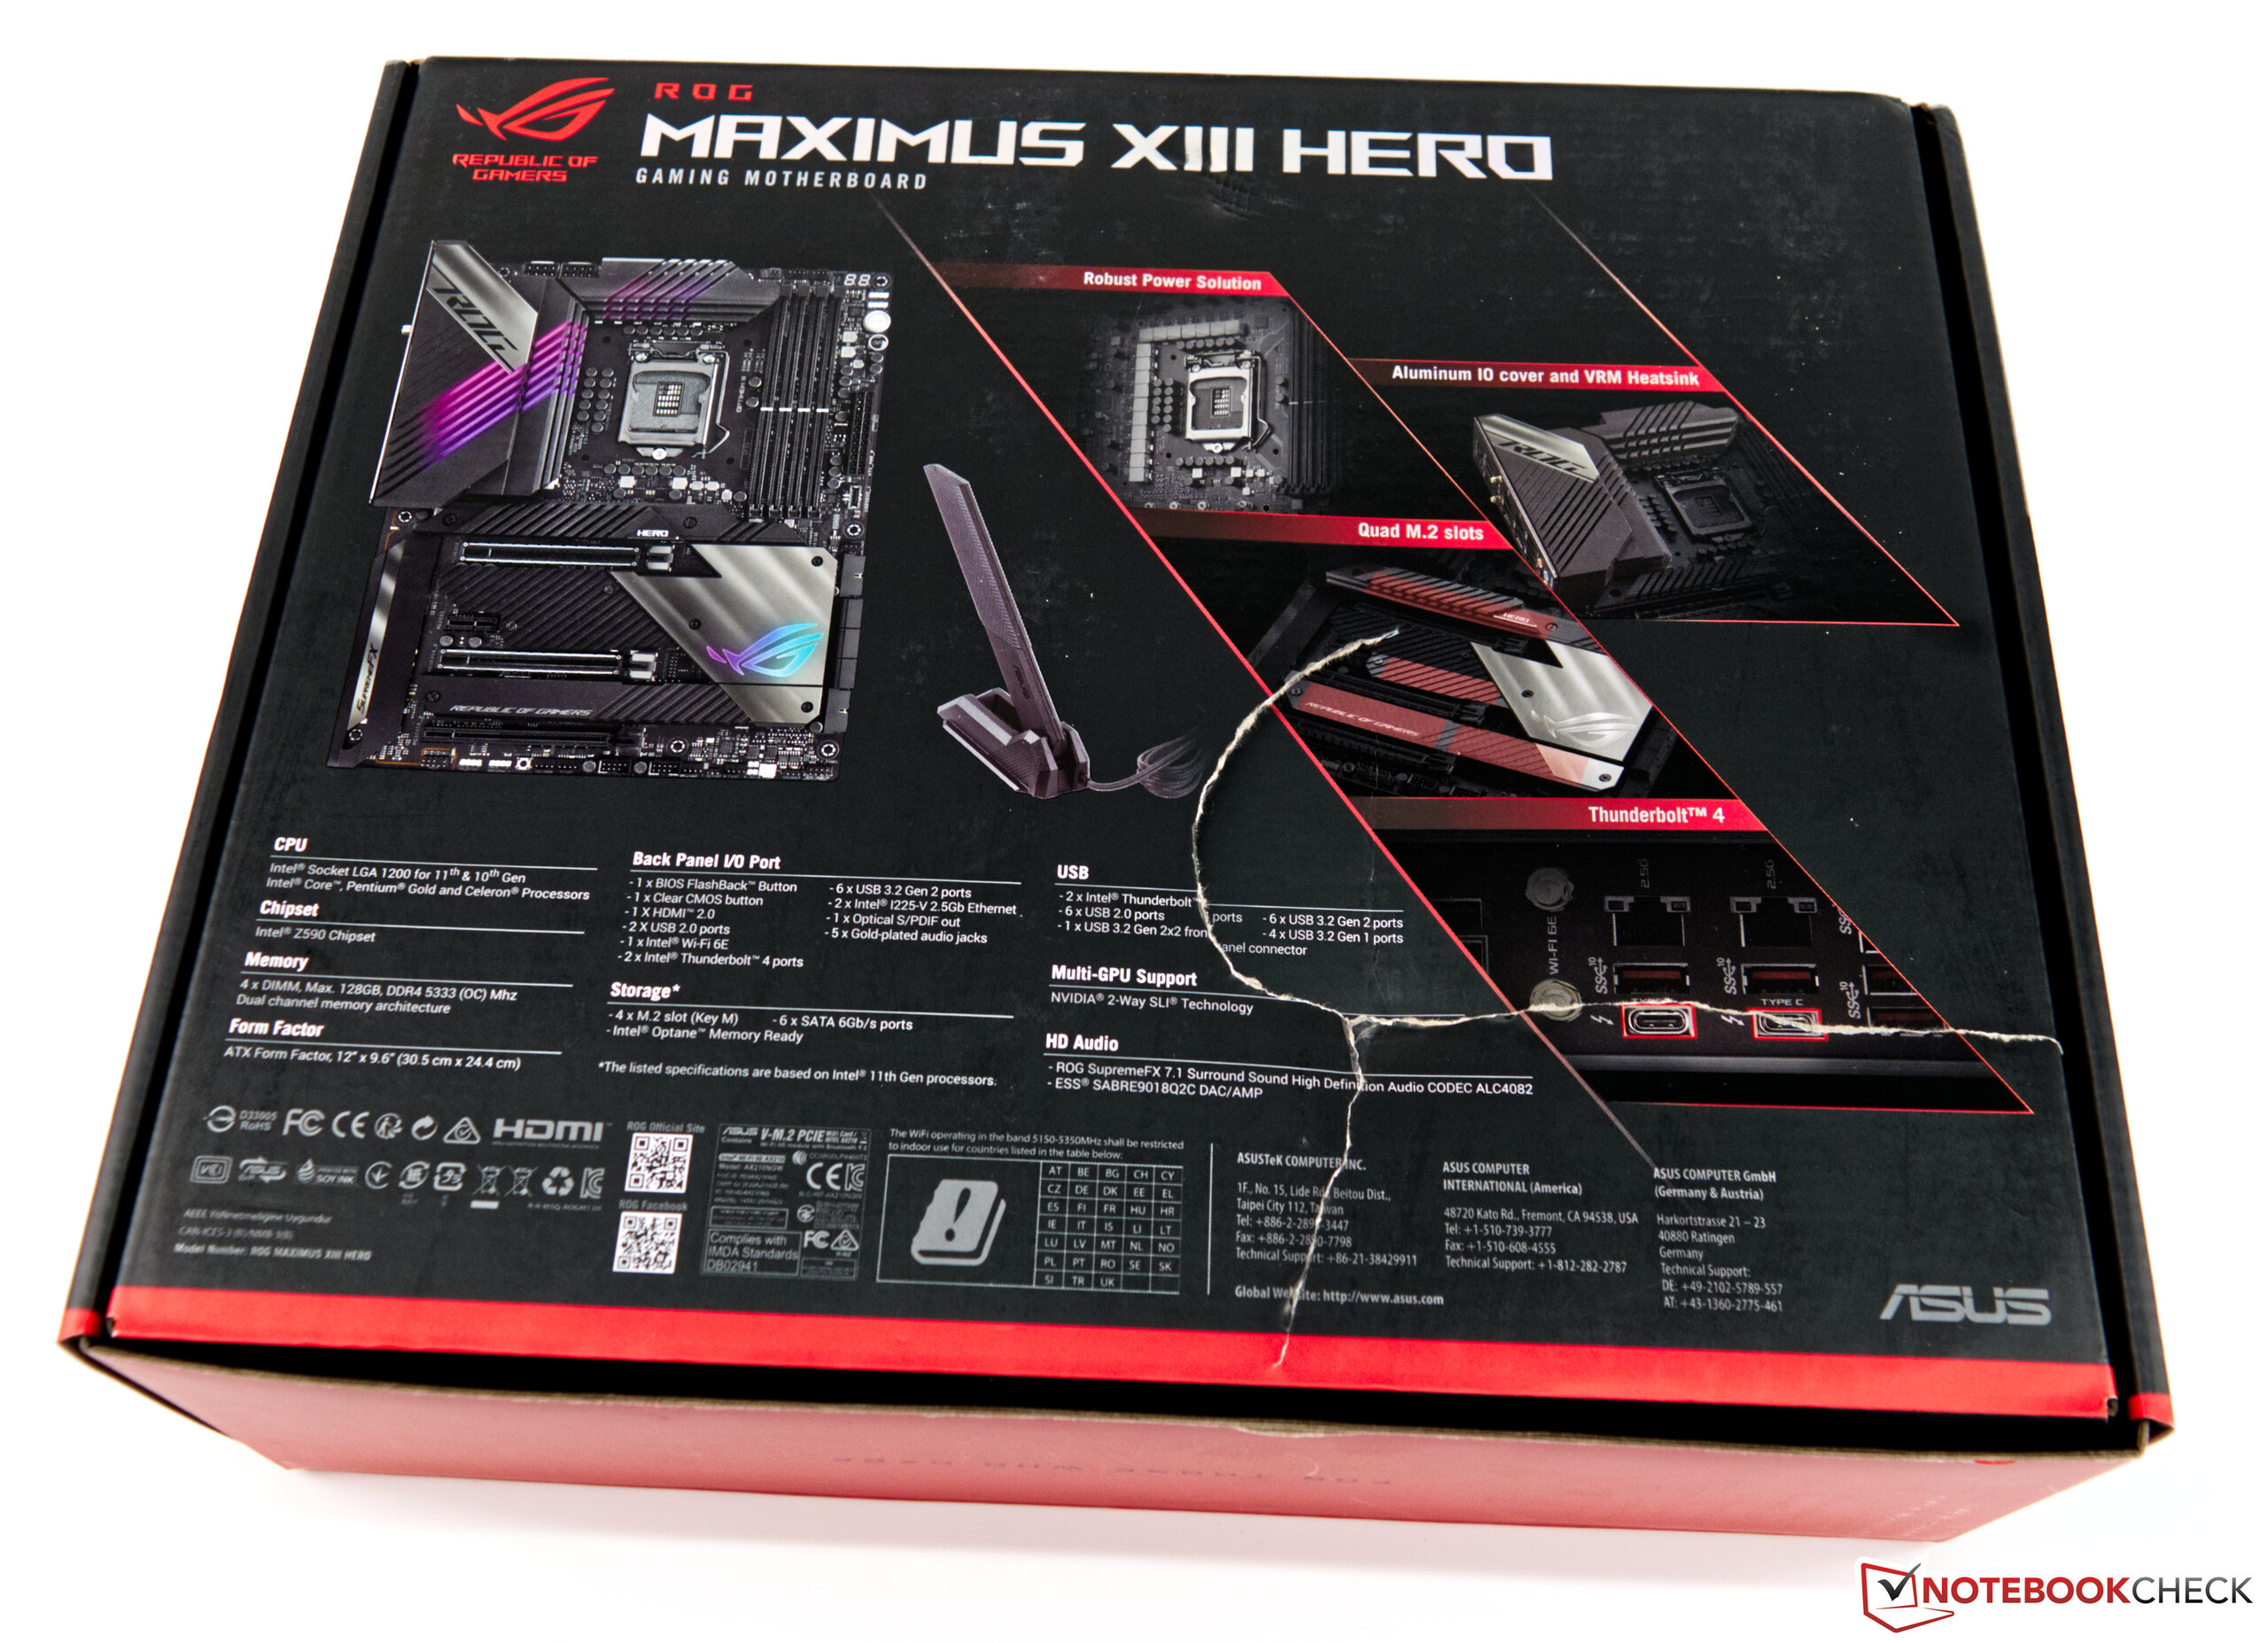
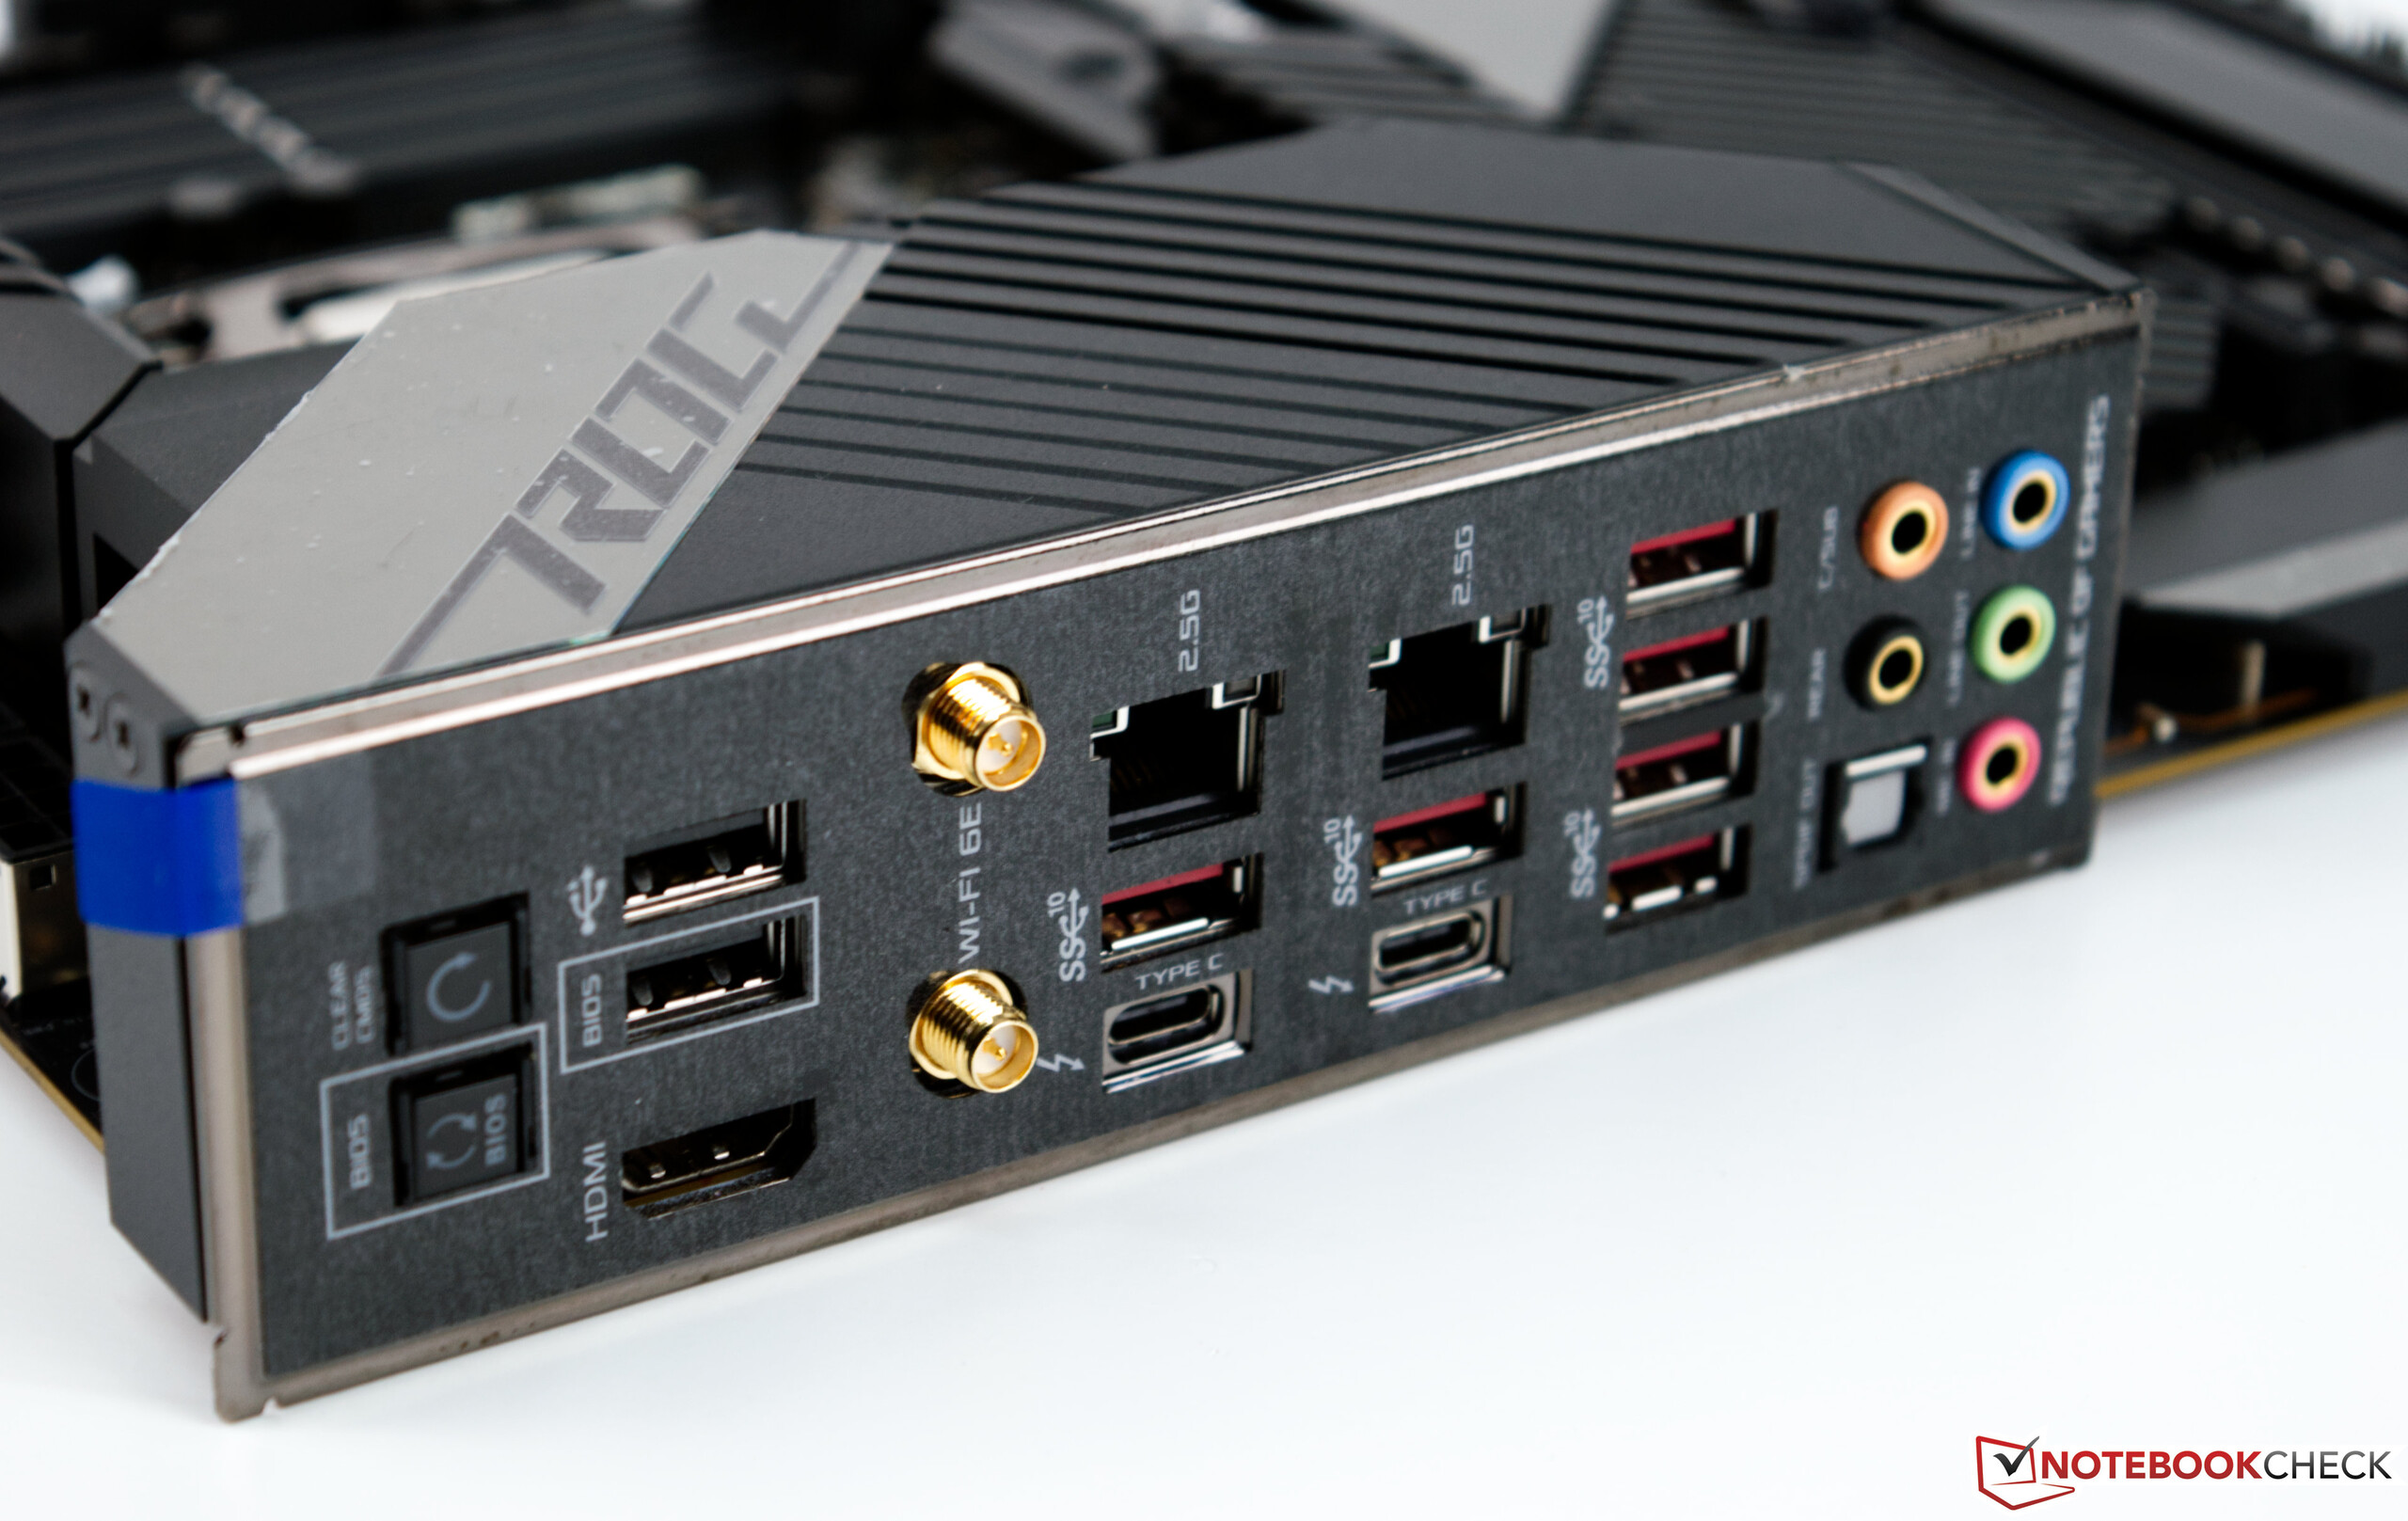
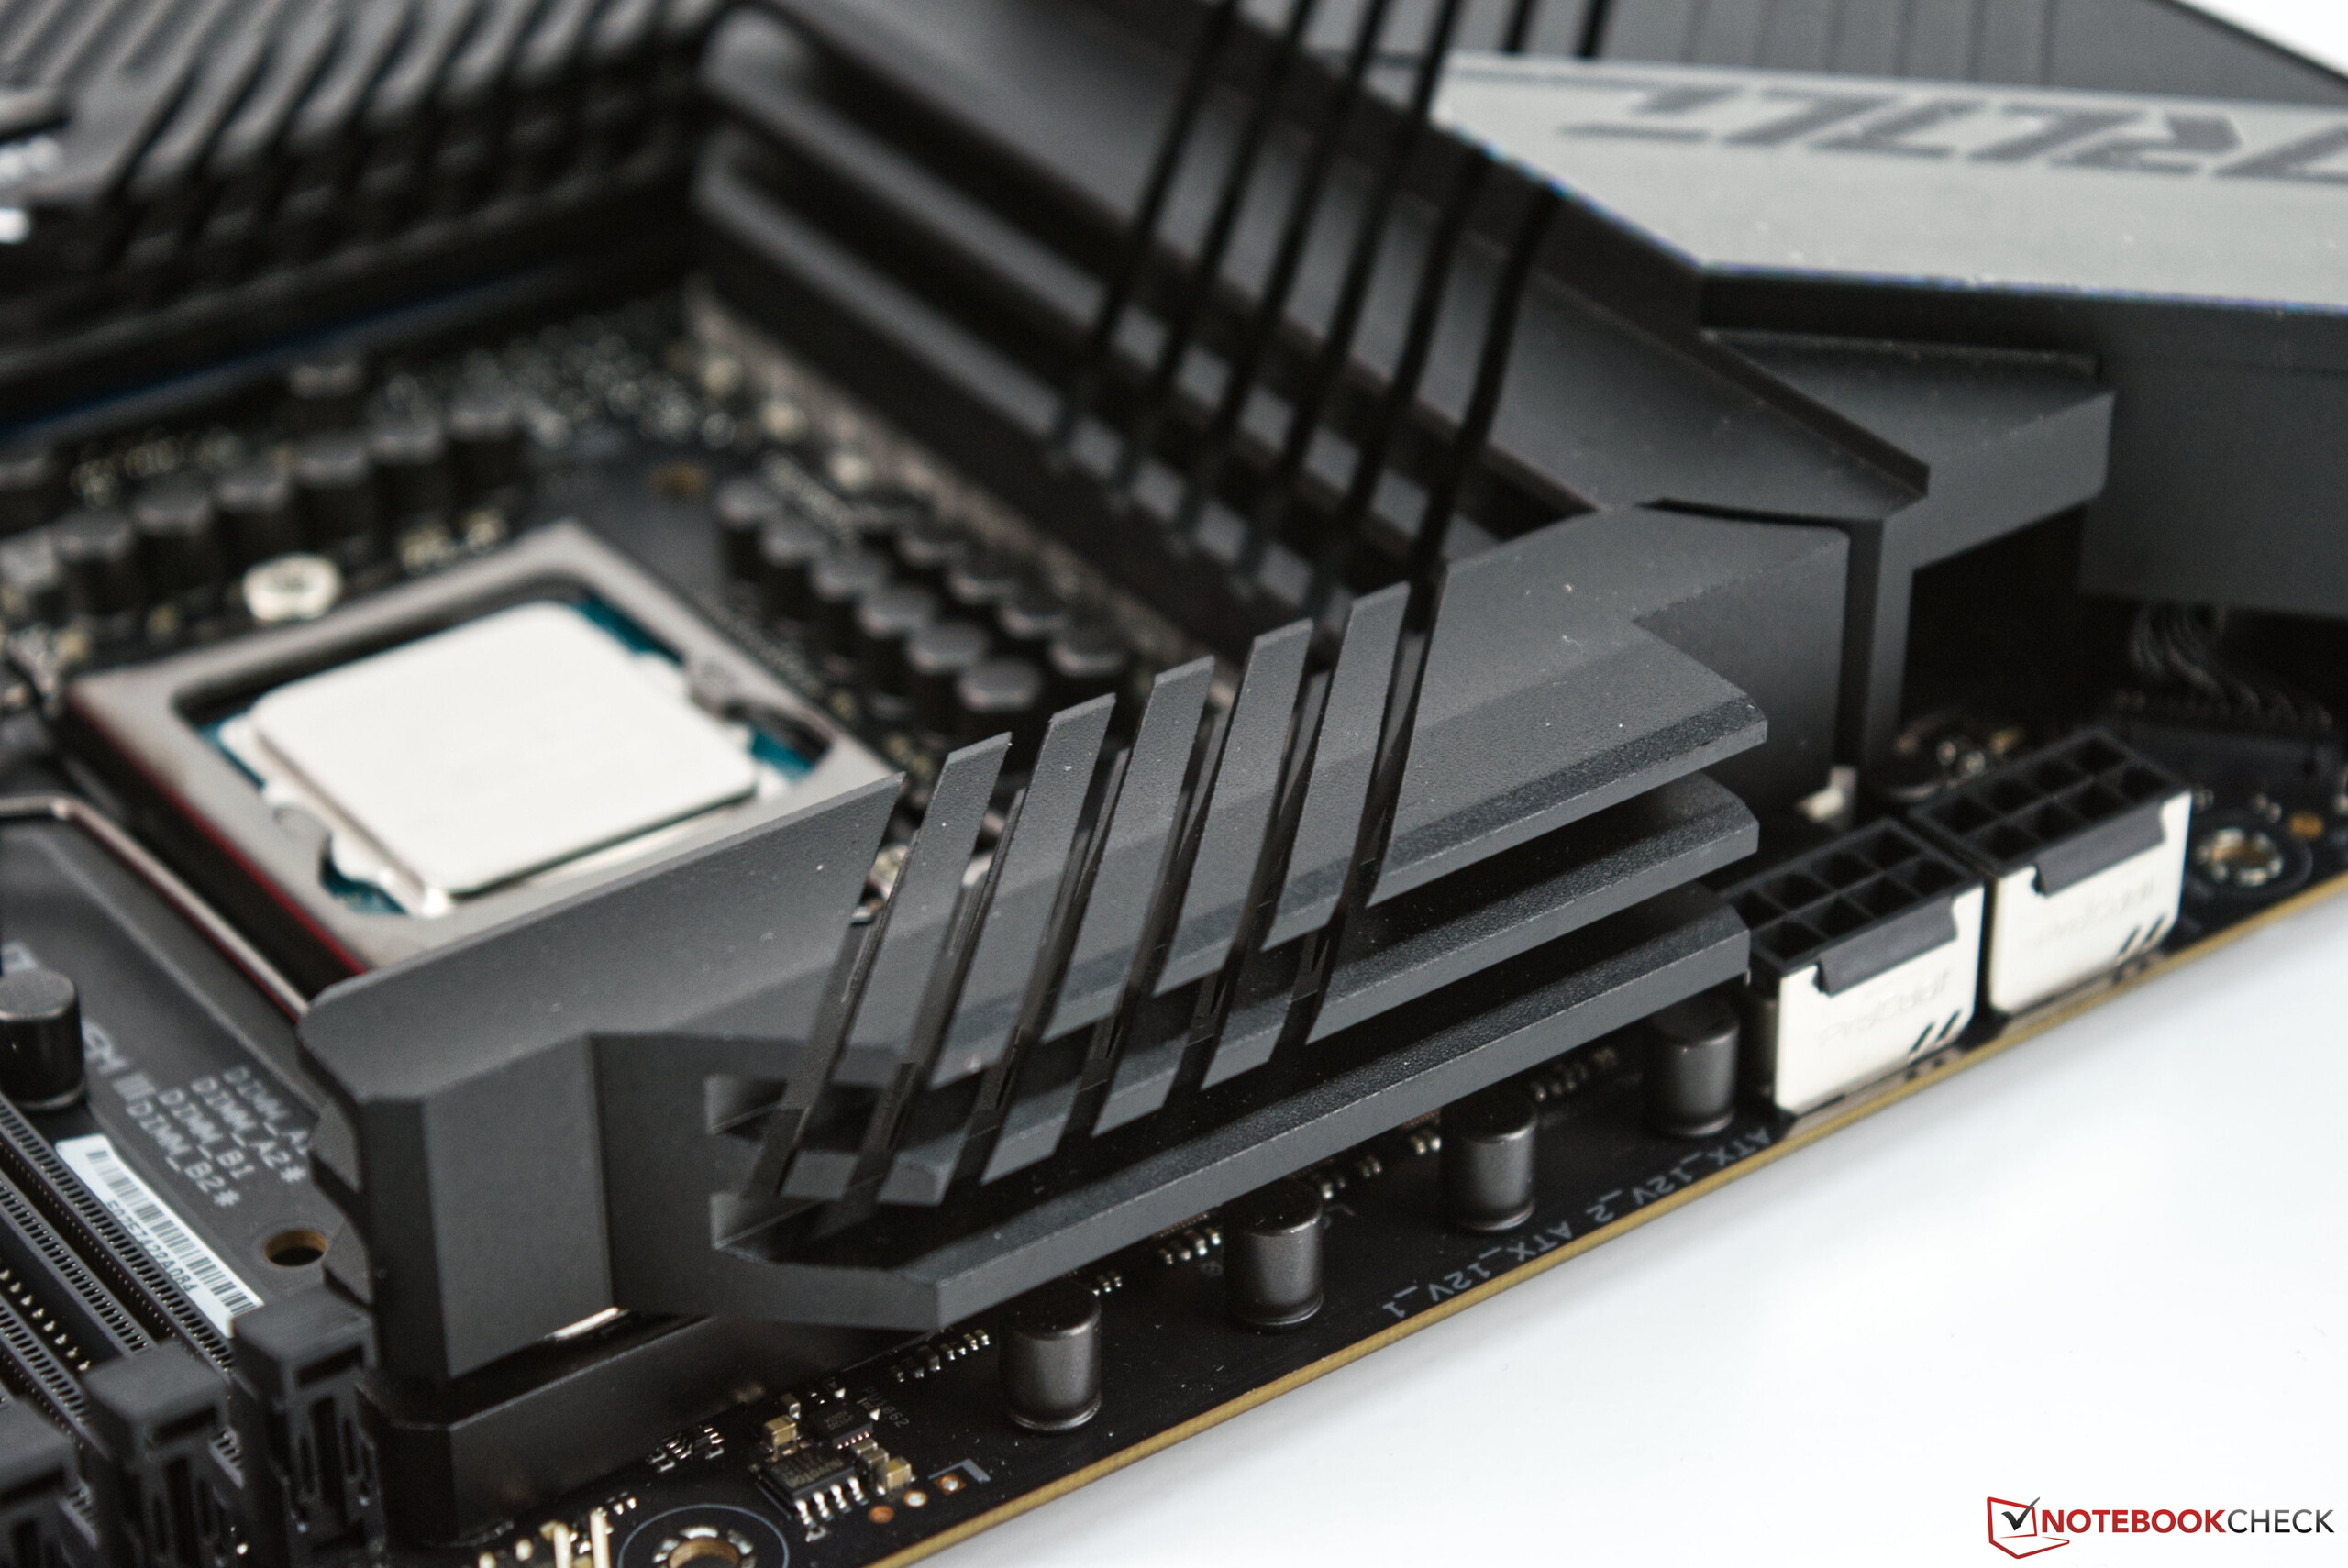
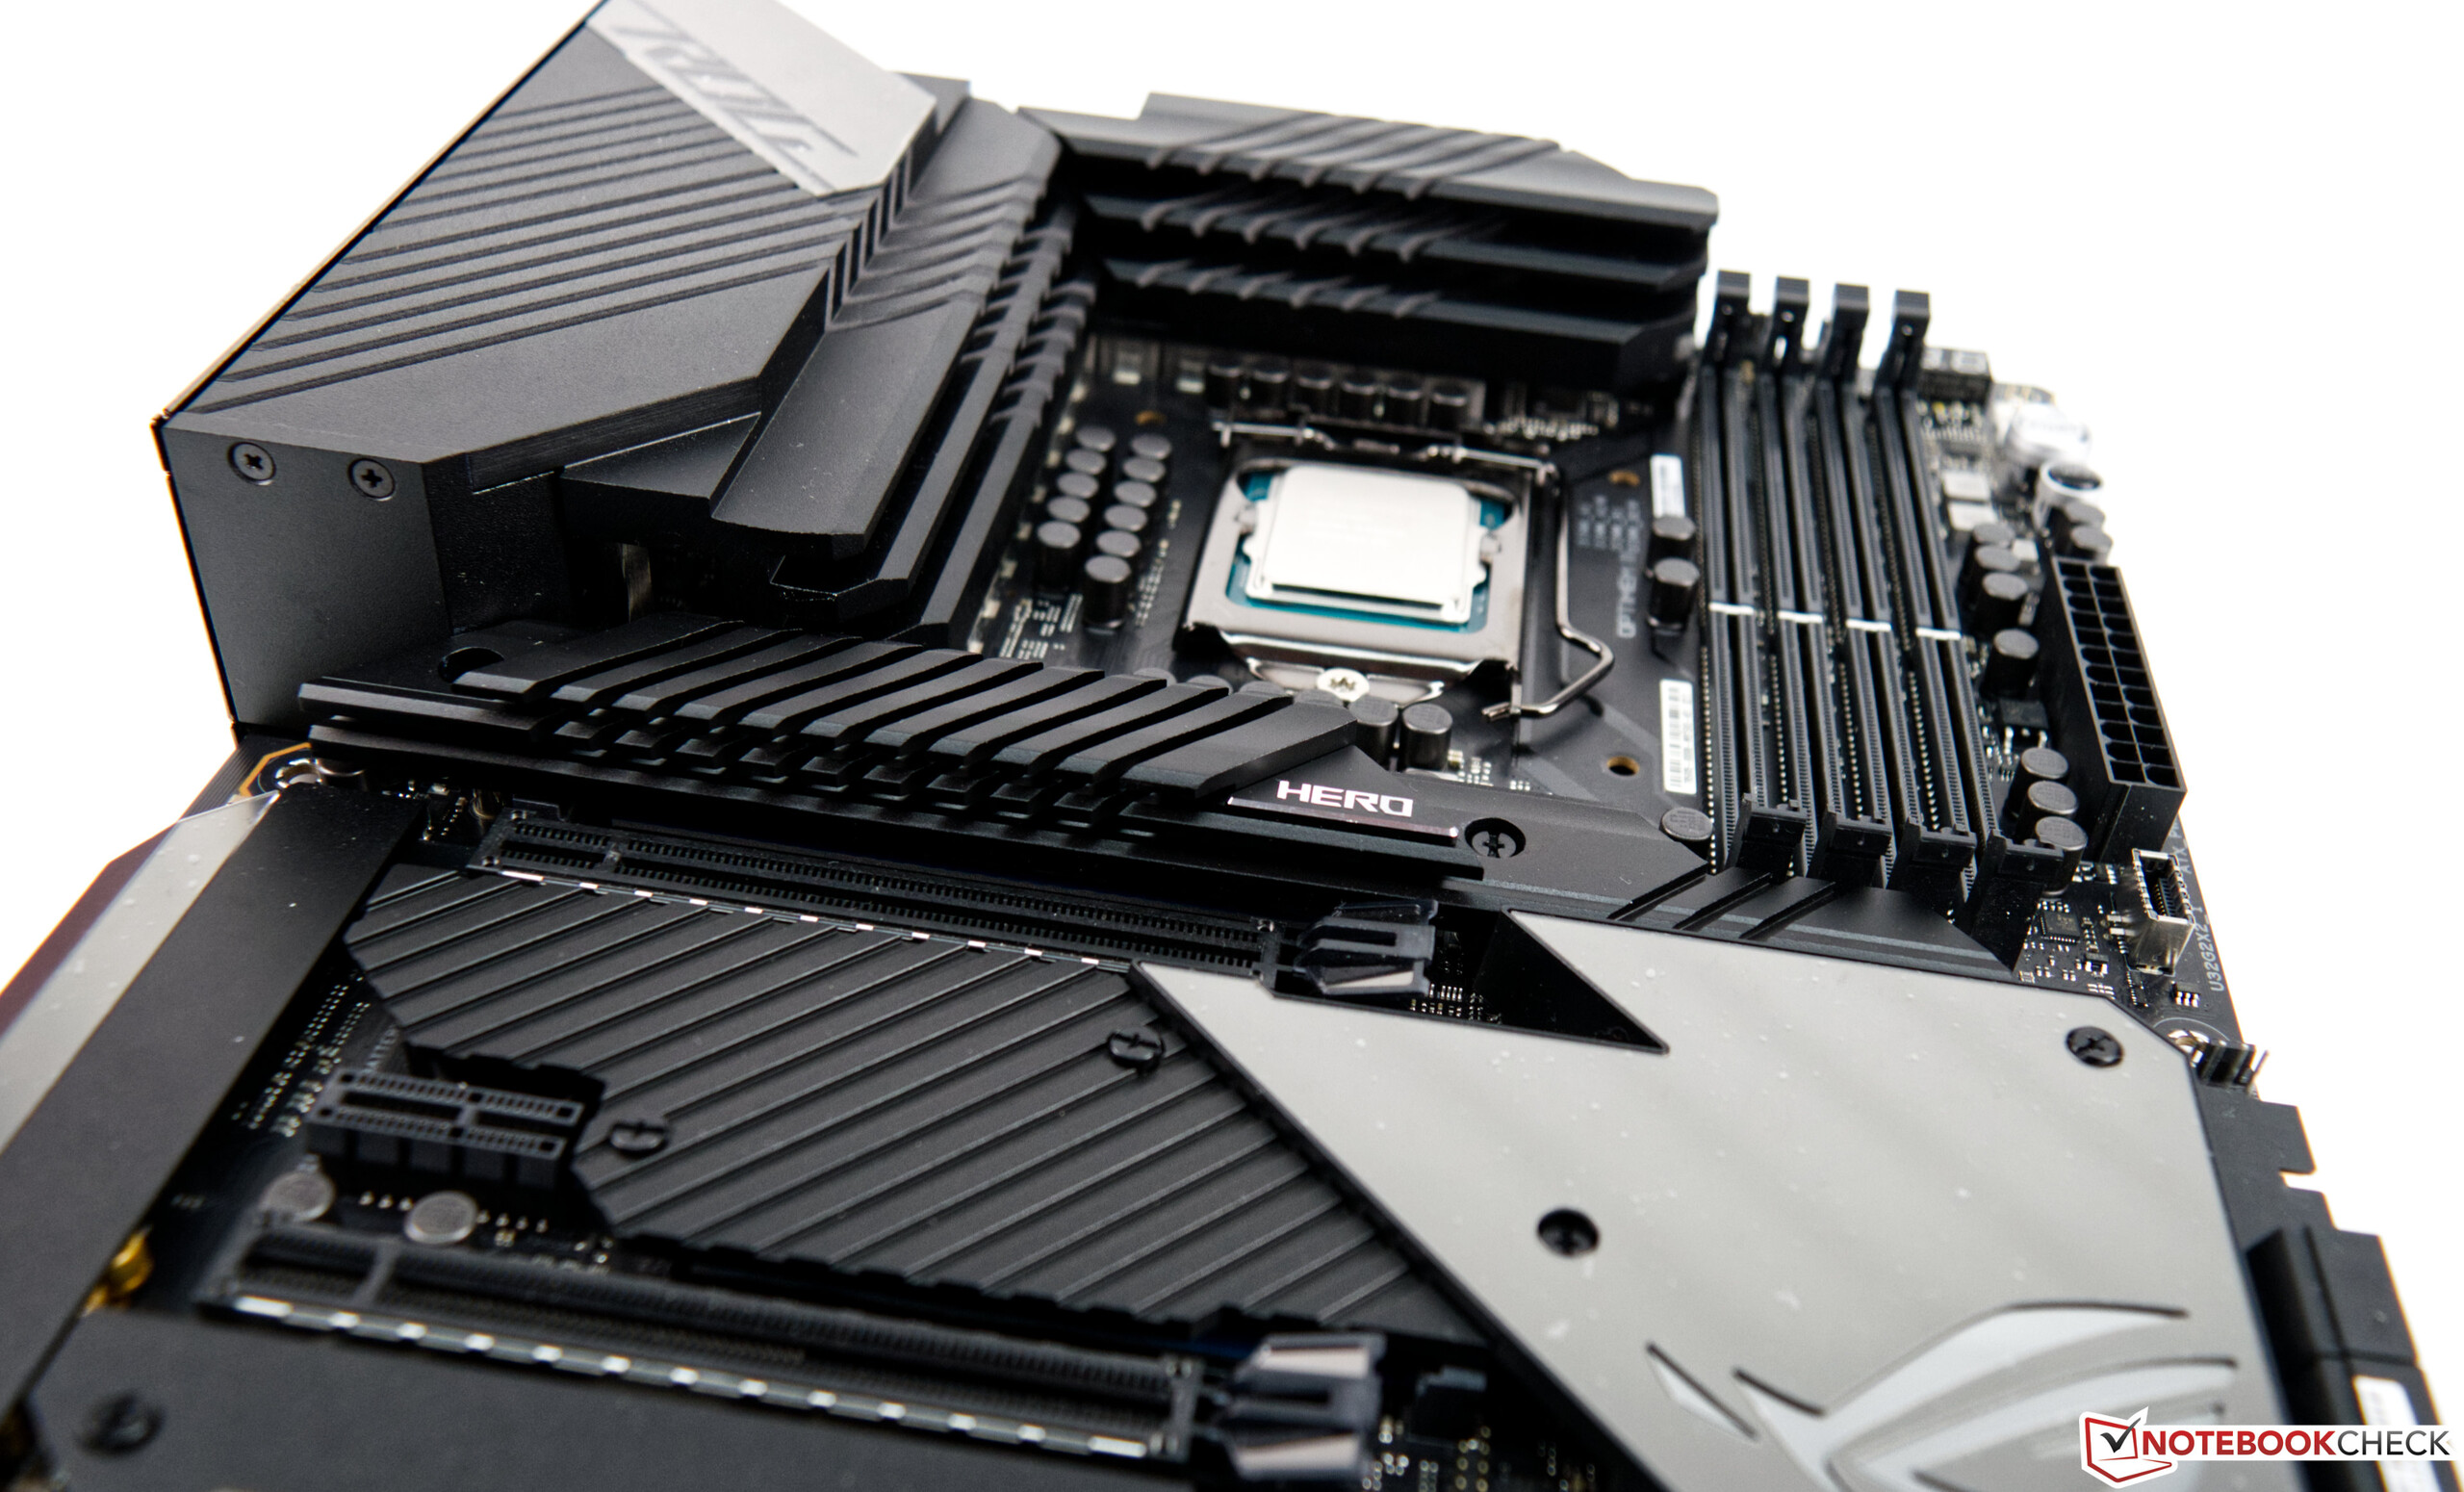
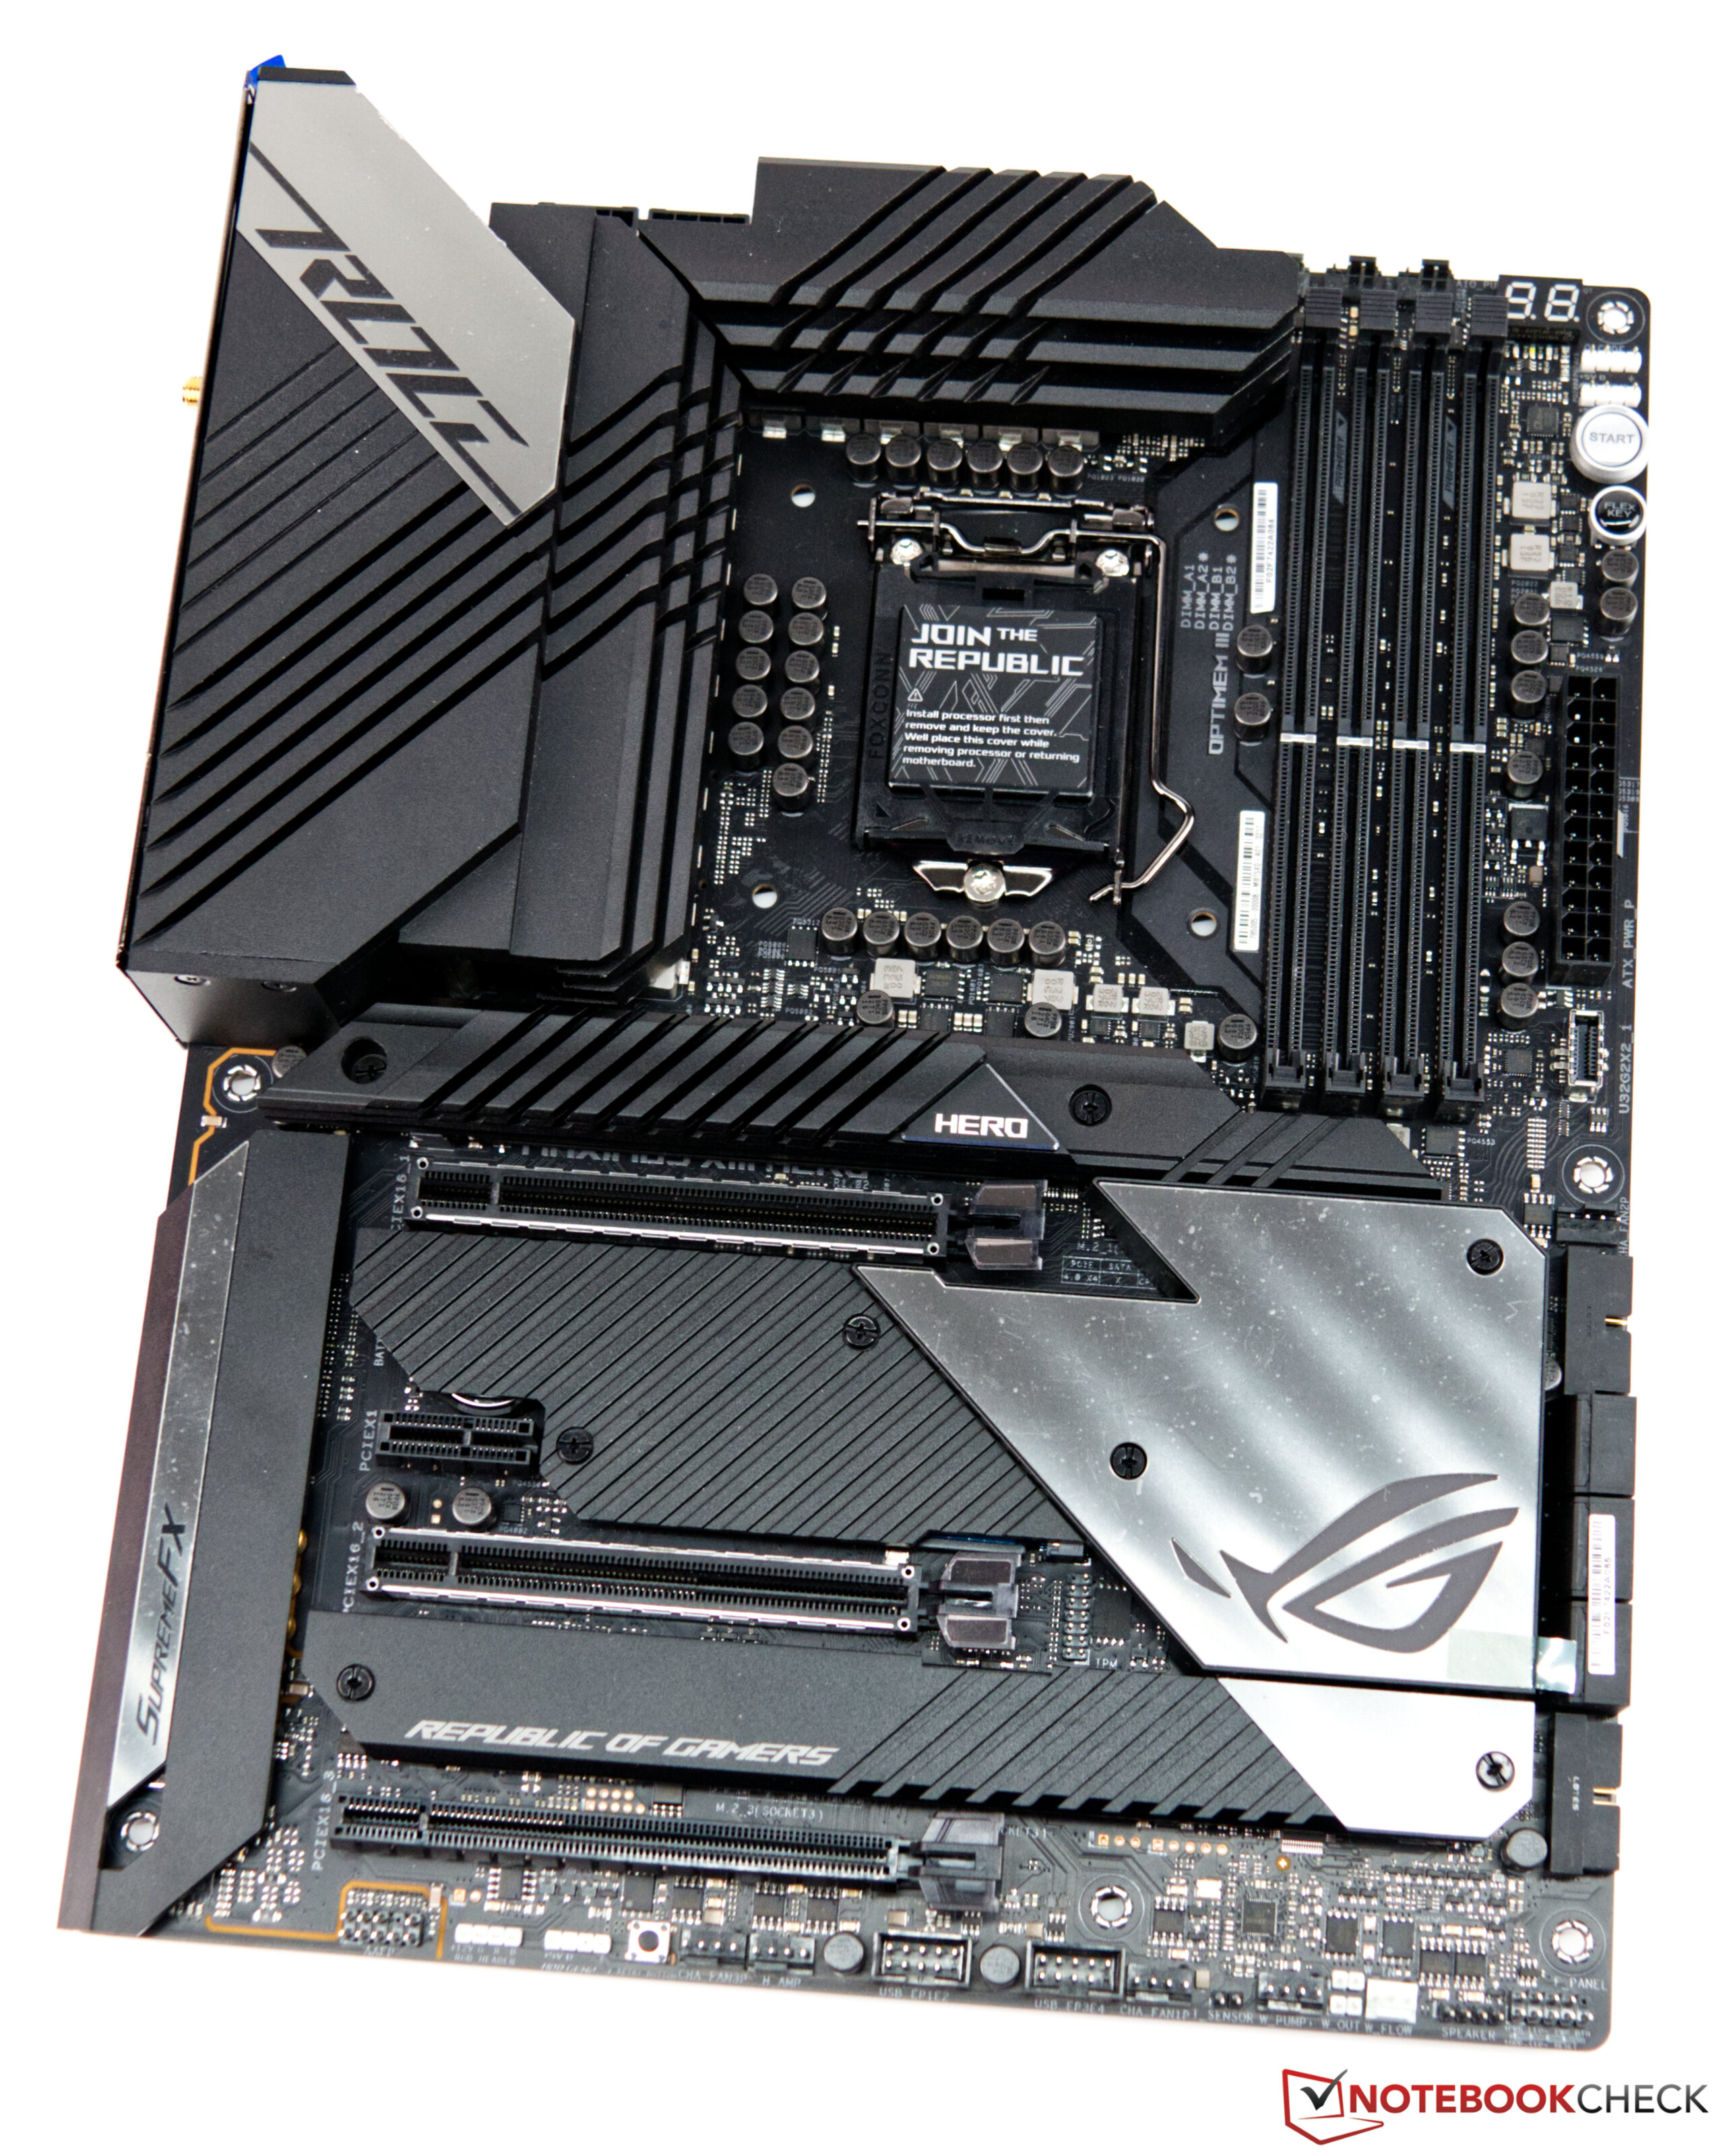
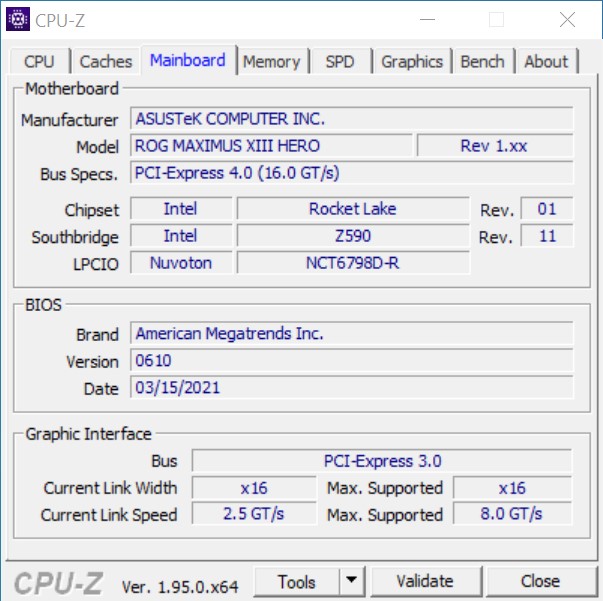
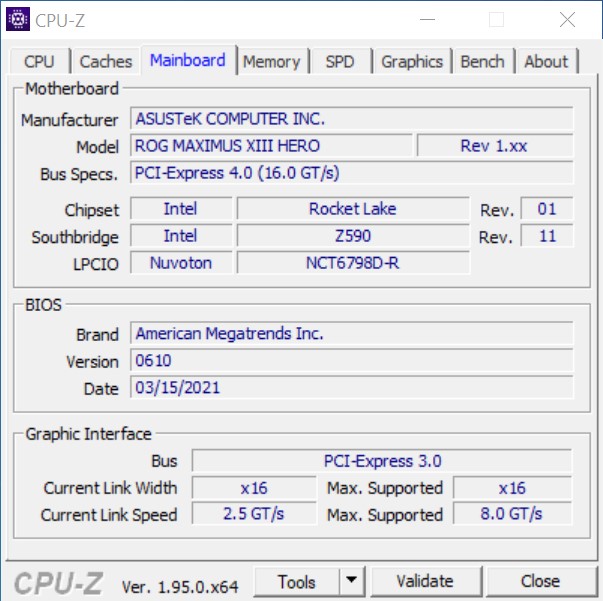
- Asus Z590 ROG Maximus XIII Hero
- Alphacool Eisbear 280 AiO
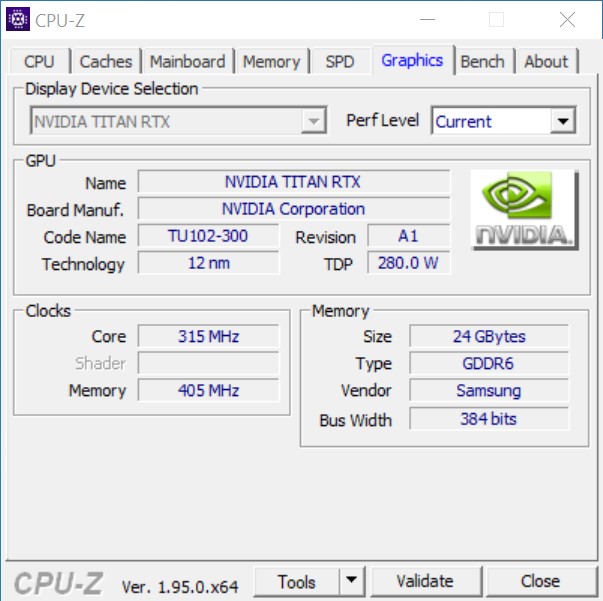
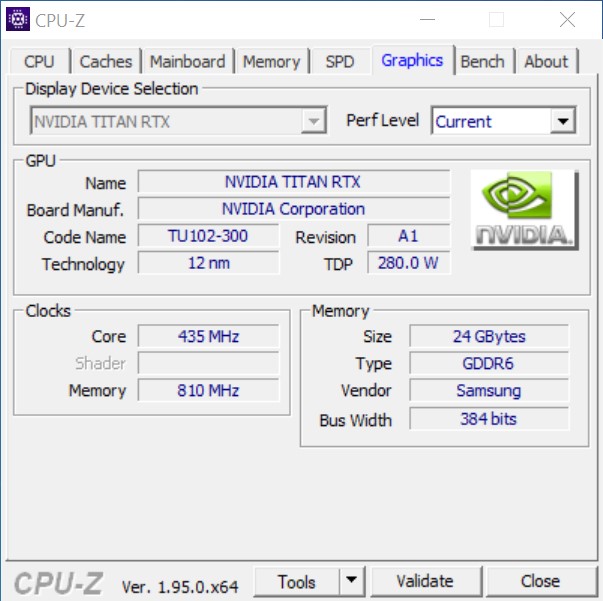
- Nvidia Titan RTX
- Corsair HX 1200X (power supply)
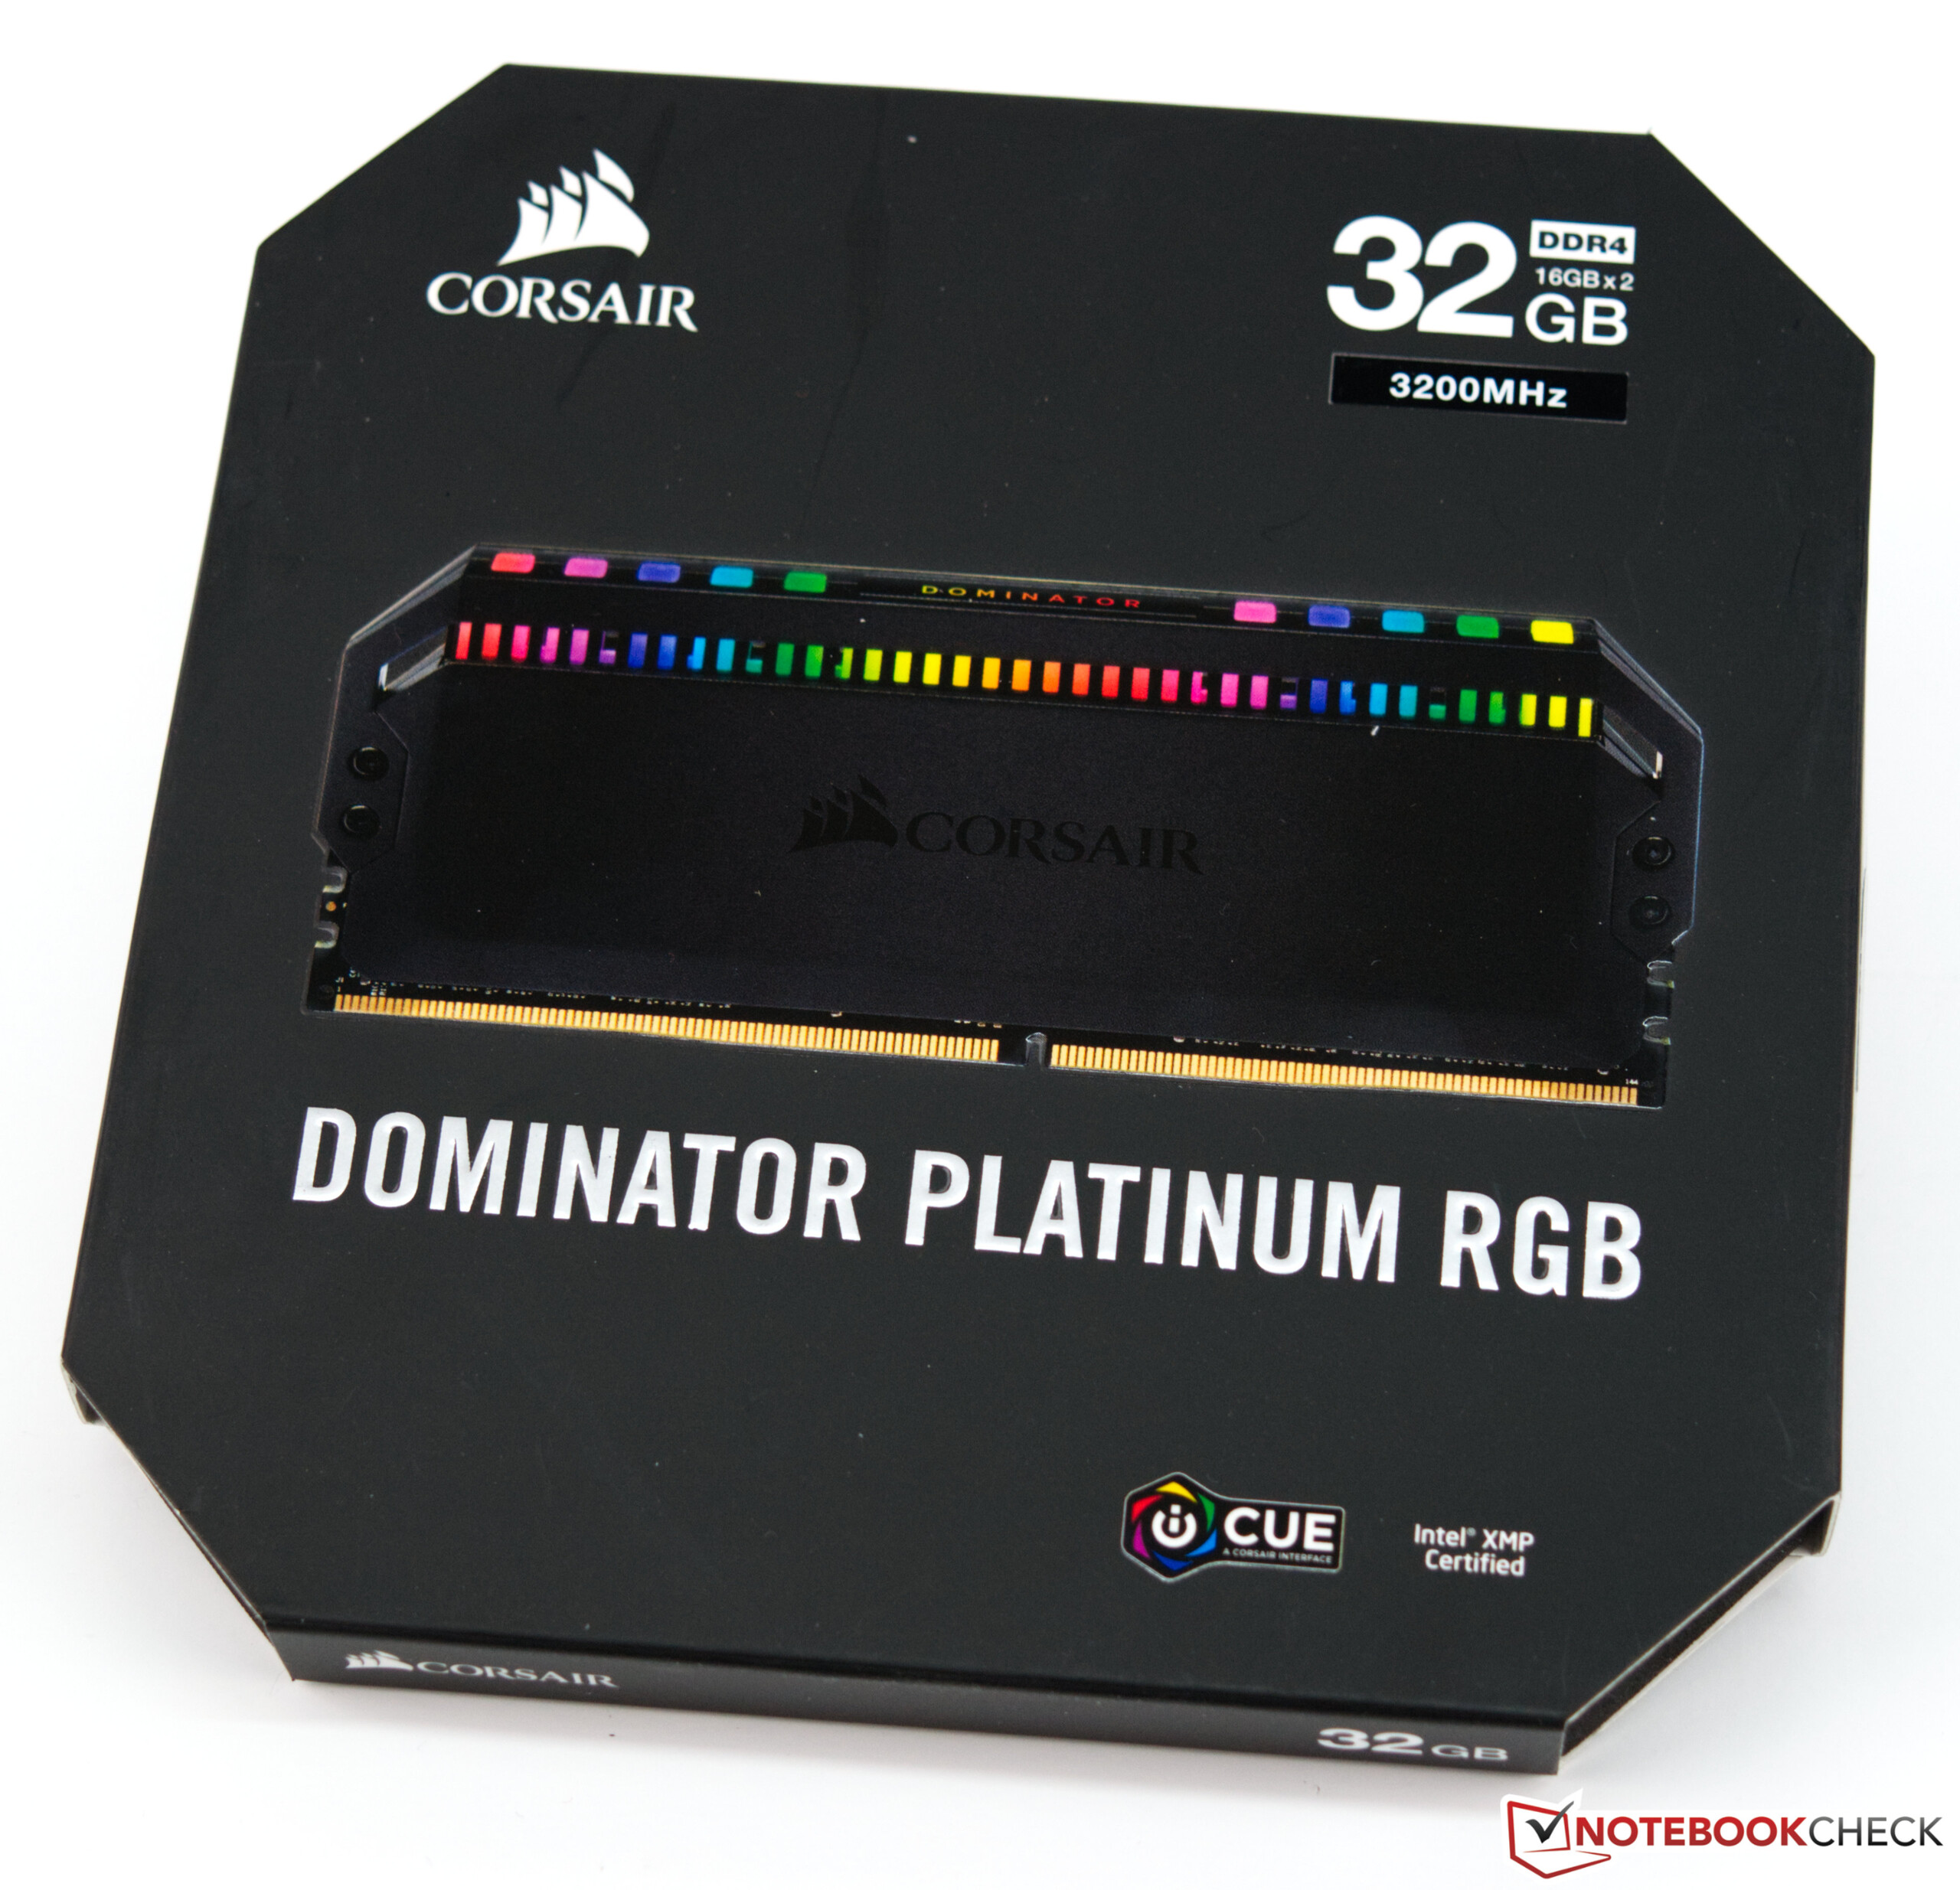
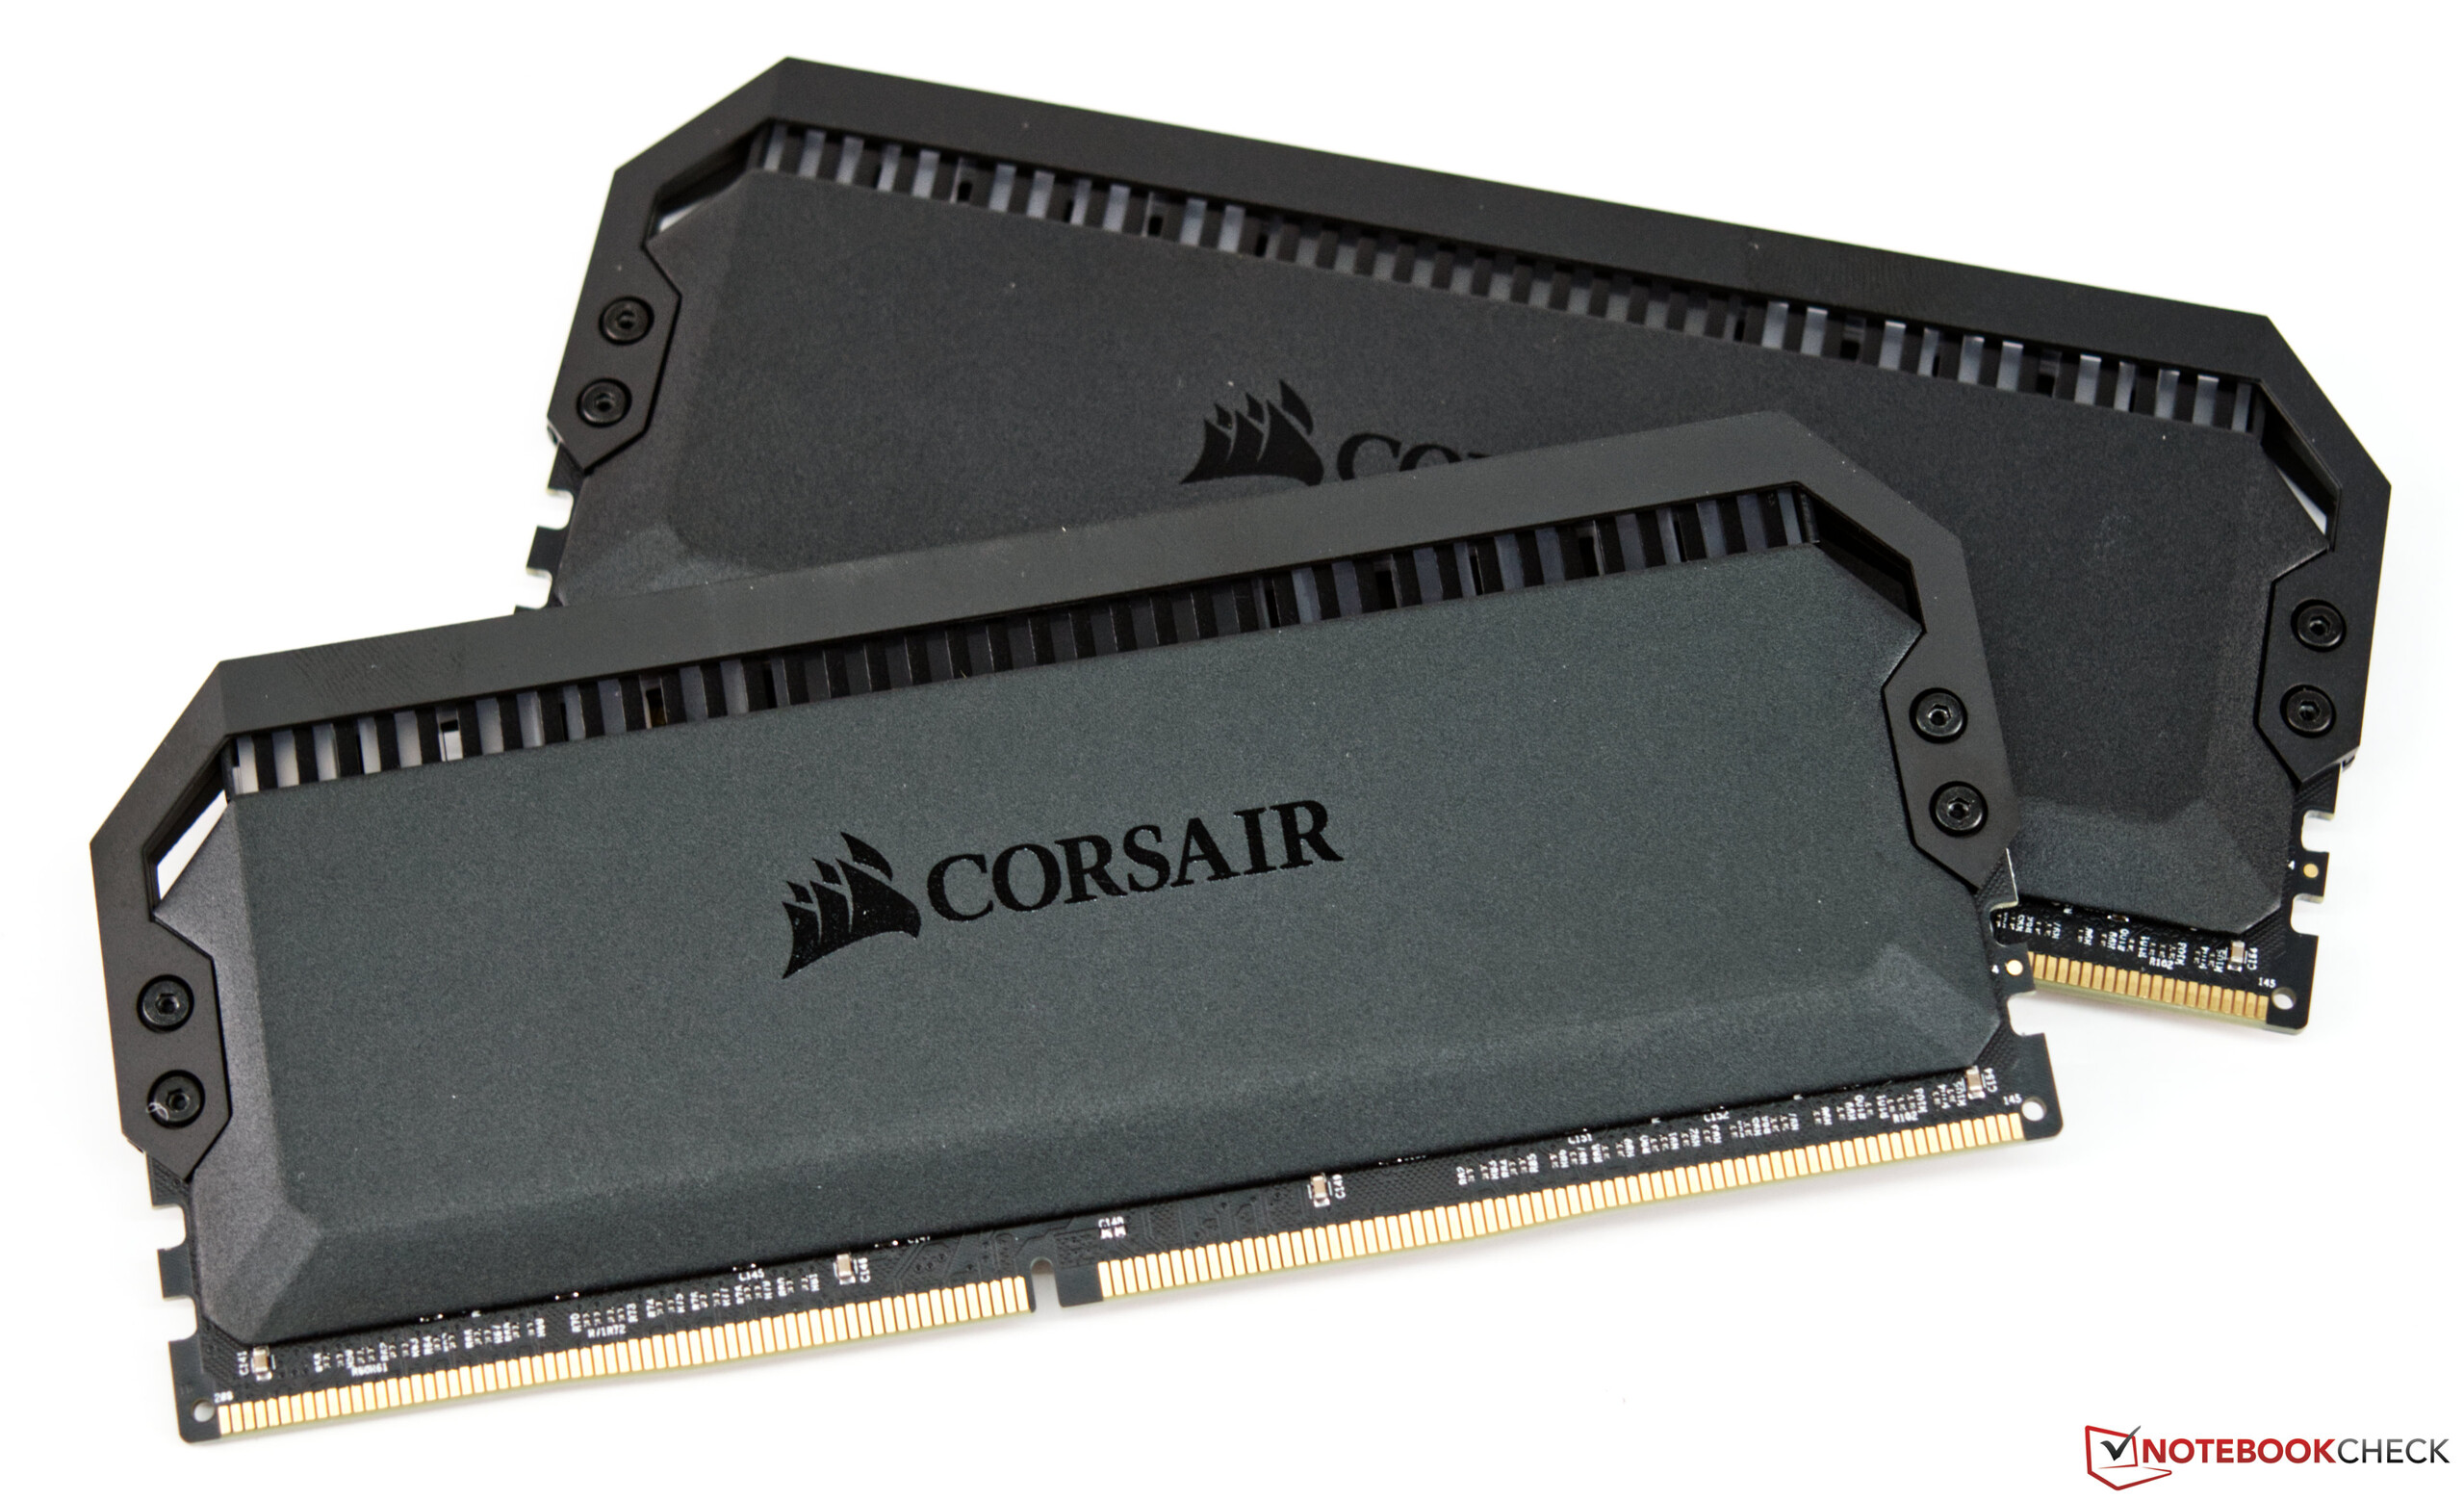
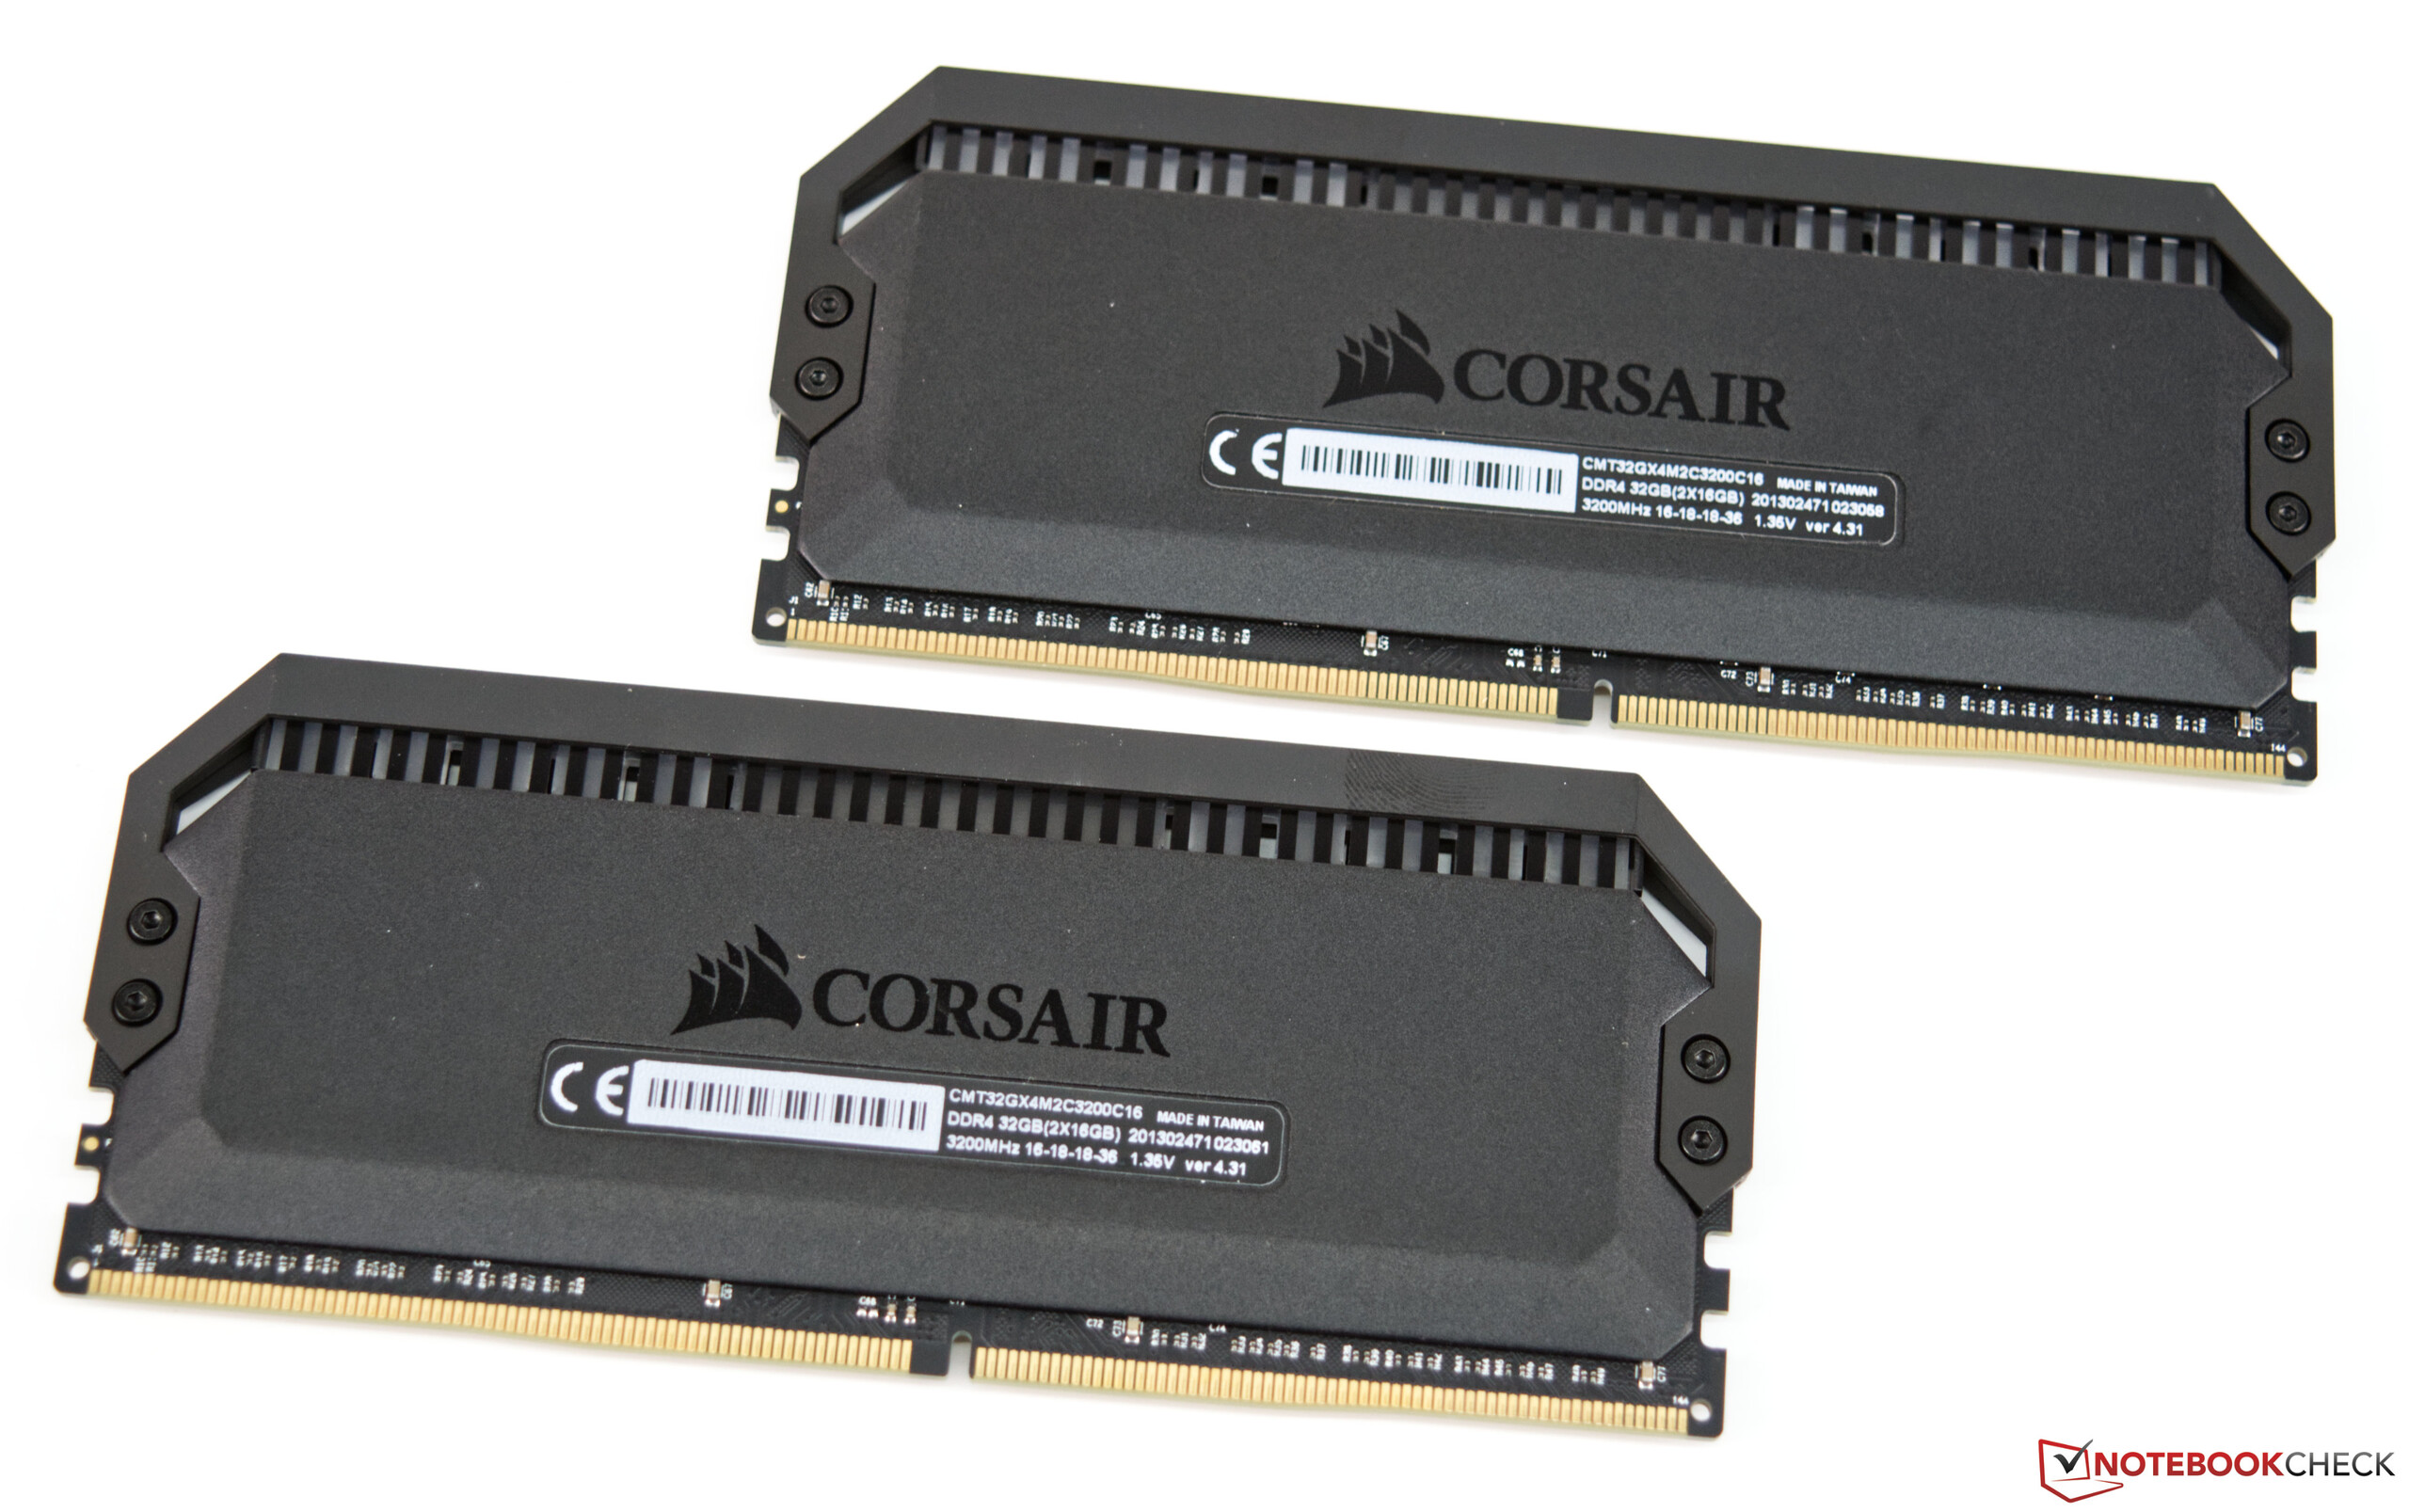
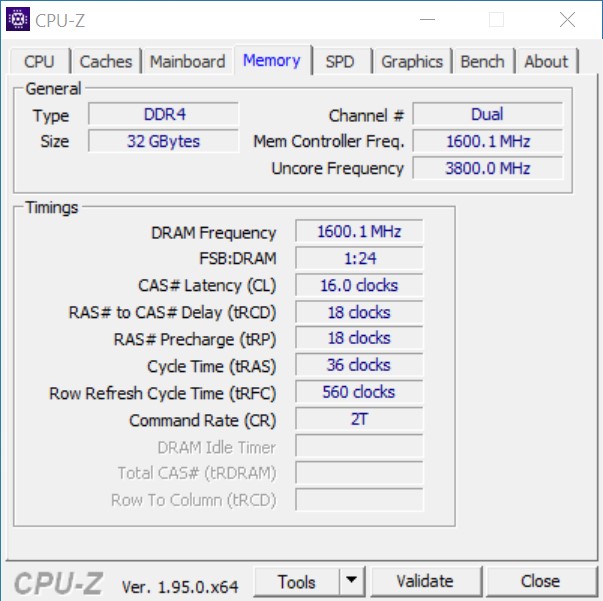
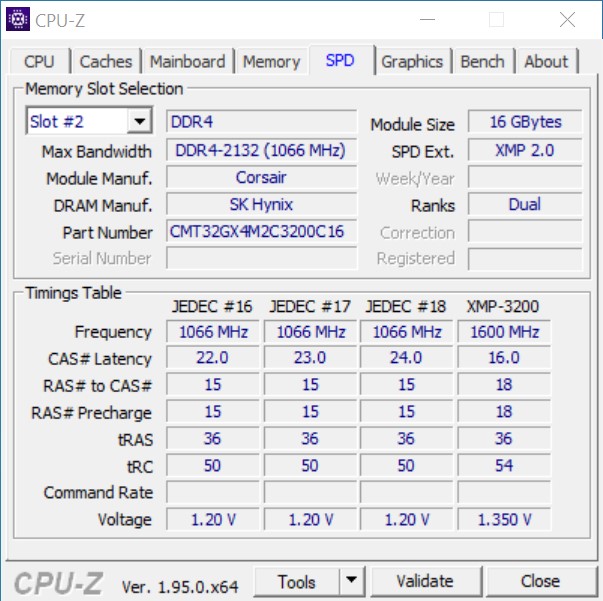
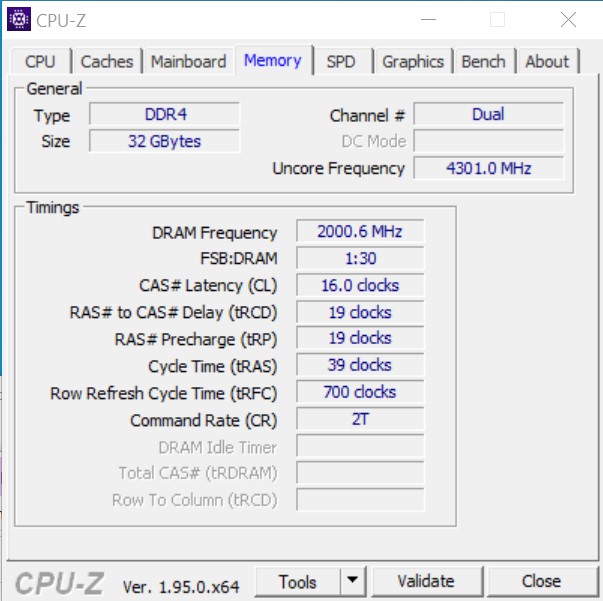
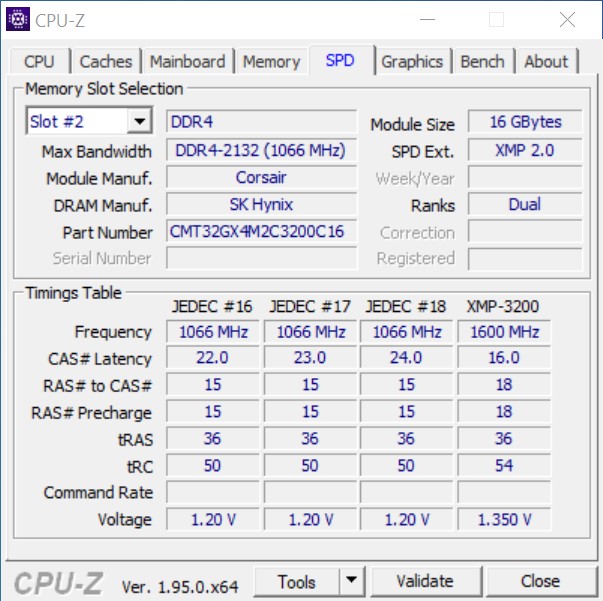
- Corsair Dominator Platinum RGB (2x 16GB - DDR4-3200)
- Intel Optane 905p
- Microsoft Windows 10 Professional 64-Bit (Version 20H2)
Intel provided us with both CPUs, the RAM and the new Z590 motherboard. The Raijintek Paean bench comes from Caseking. For cooling we used the Alphacool Eisbear 280 AiO, which we received from Alphacool.

CPU Benchmarks
When compared to Comet Lake-S chips, Rocket Lake-S CPUs are considerably more capable, which is quite surprising, given the fact that the Rocket Lake-S processors are manufactured using the same 14-nm node. AMD is much farther ahead with the 7-nm node. To make things fairer for Intel, we only included 6- and 8-core AMD processors in this review. However, in this direct comparison, AMD comes out ahead. AMD’s 6- and 8-core processors outperform their Intel counterparts. Nevertheless, it was still important for Intel to make these chips in order to narrow the considerable performance gap that existed between Comet Lake-S parts and Zen 3 processors. Now the Intel chips are only 5% behind their AMD counterparts, according to our cumulative synthetic benchmark results.
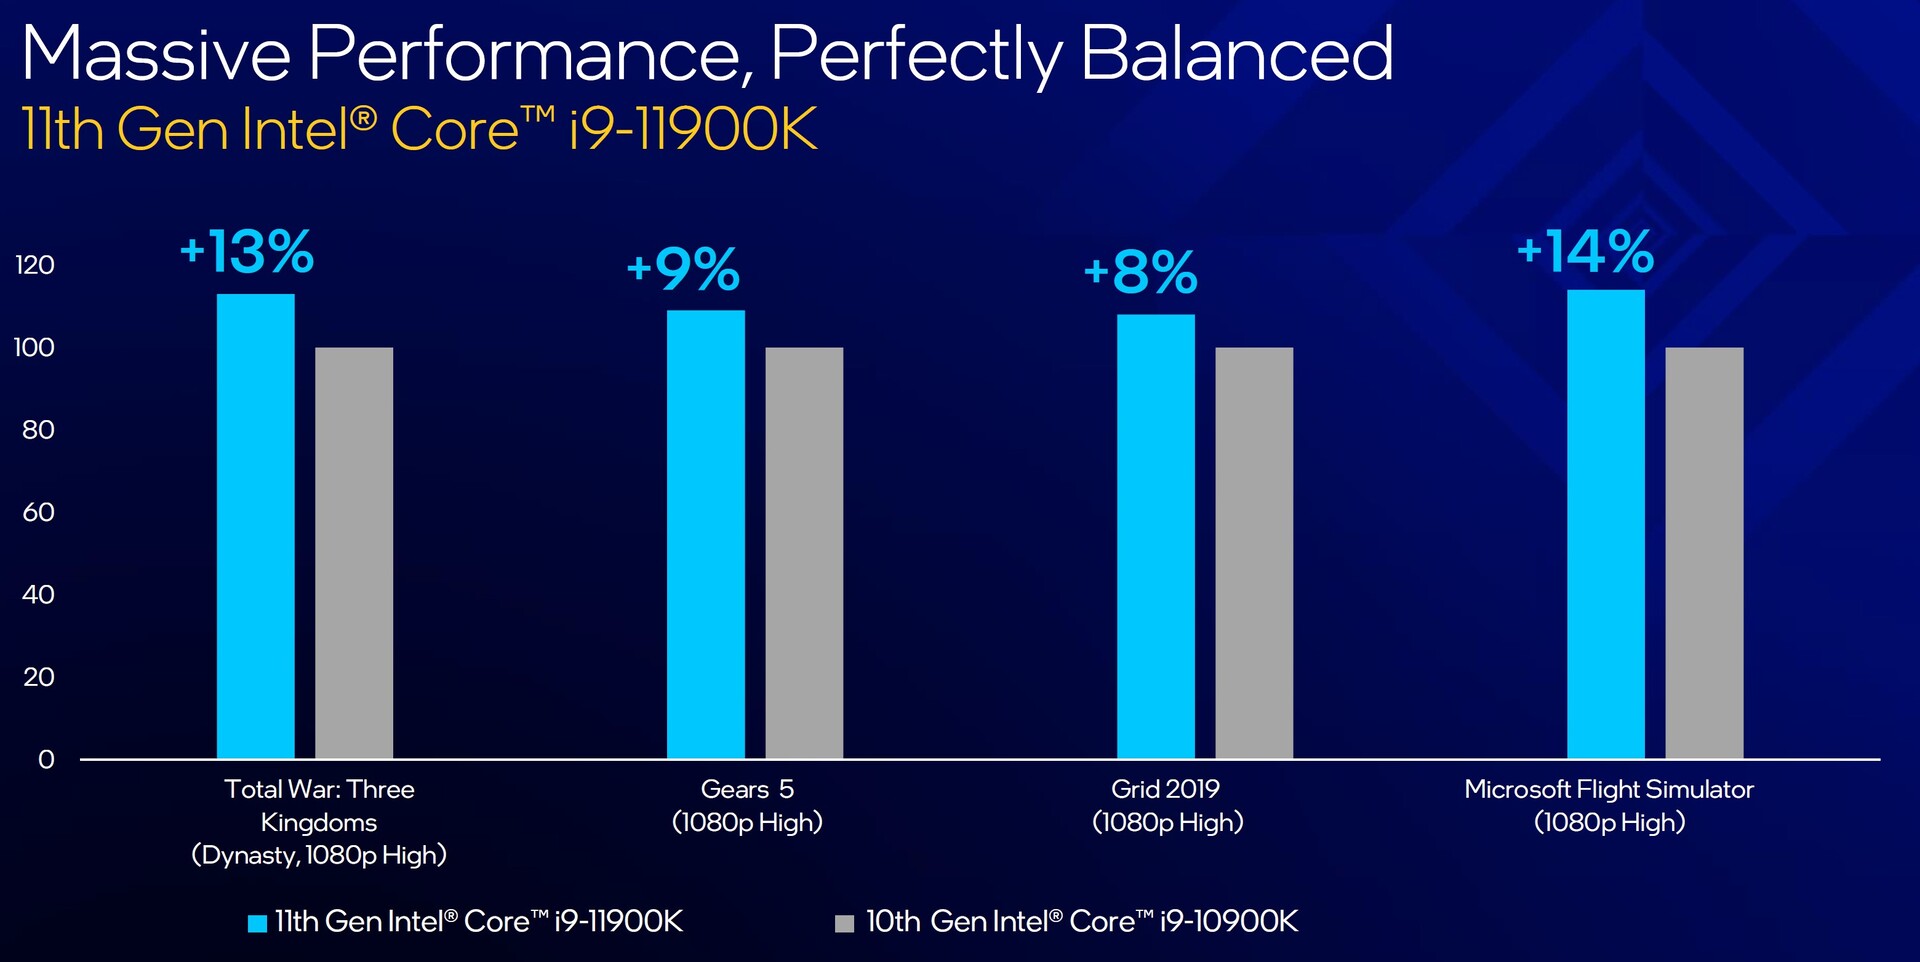
Now, we have to mention that the generational jump in performance is quite considerable. The Intel Core i9-10900K is able to beat the Core i9-11900K only in a few multi-core benchmarks. However, the gap in multi-core performance is very small, which is why the Core i9-11900K is an overall more capable chip. In our view, Intel has managed to overcome the 2-core deficit quite gracefully, especially given the fact that the Core i9-11900K provides up to 20% more performance in single-core workloads. It is worth mentioning that AMD offers 12- and 16-core CPUs in the consumer space. This is why it has a considerable performance lead here. To keep up with AMD in this area, Intel will have to switch to a smaller node so that it could produce processors with more cores on the die of the same size.
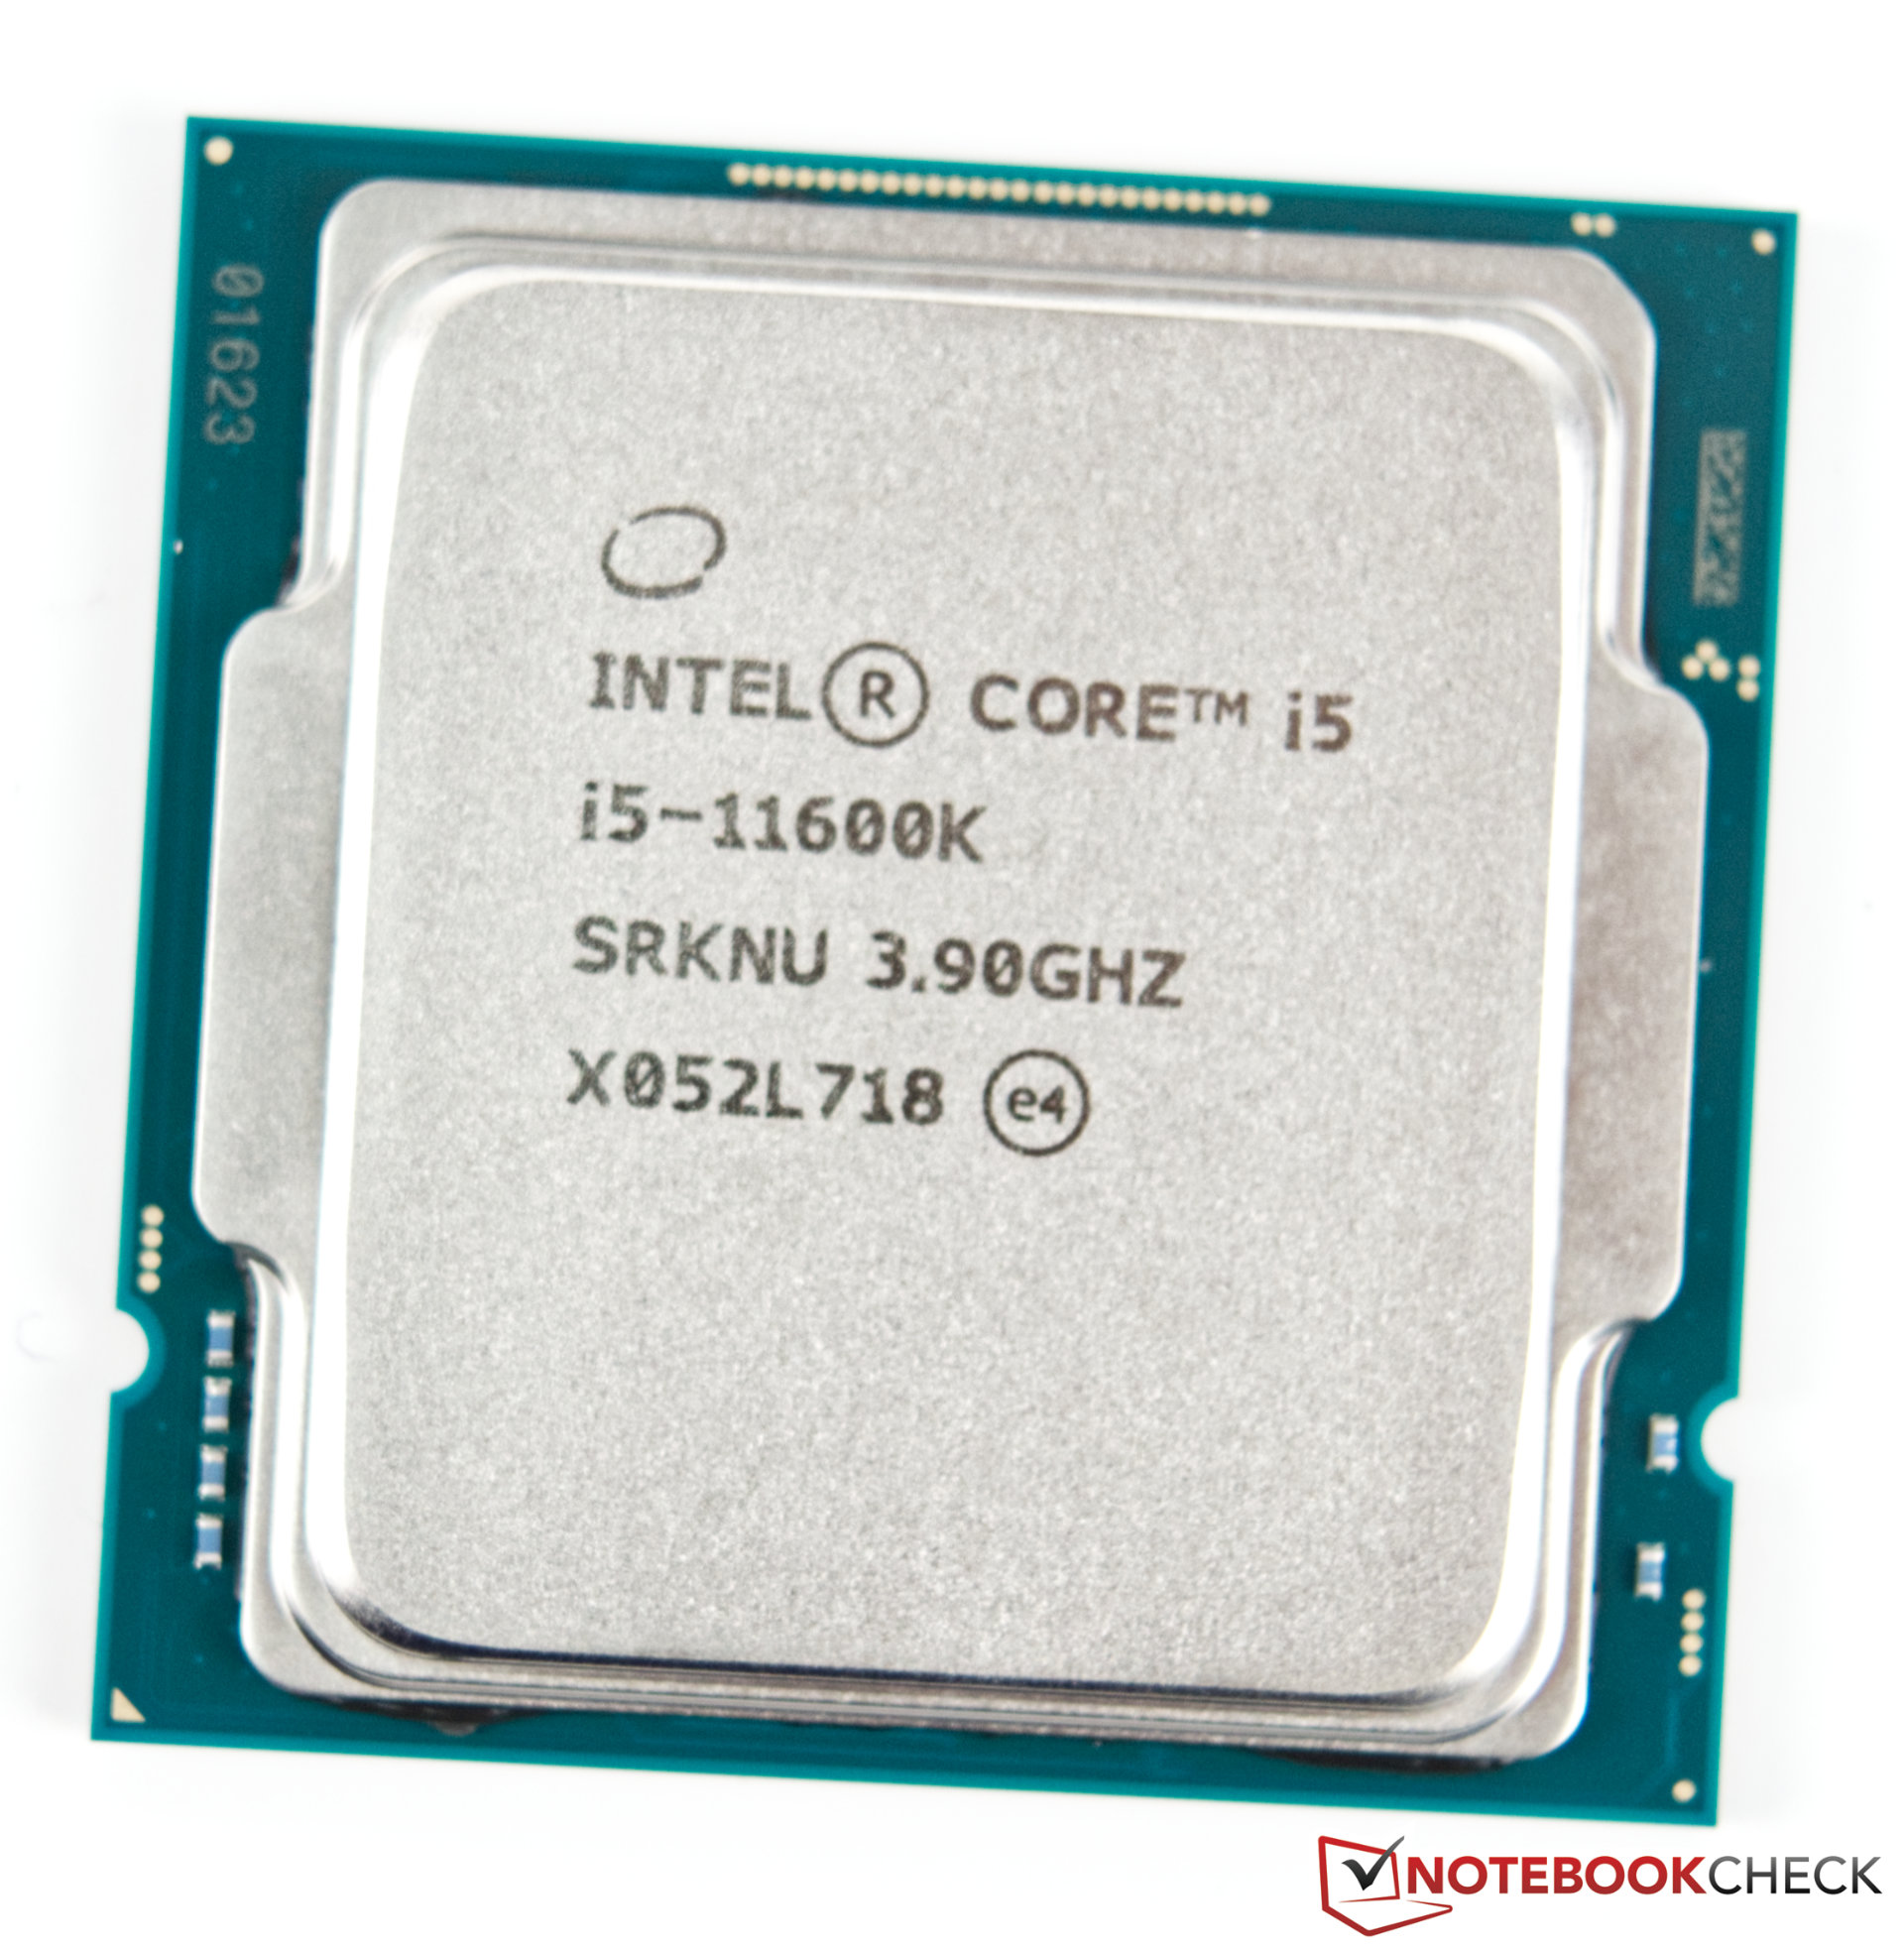
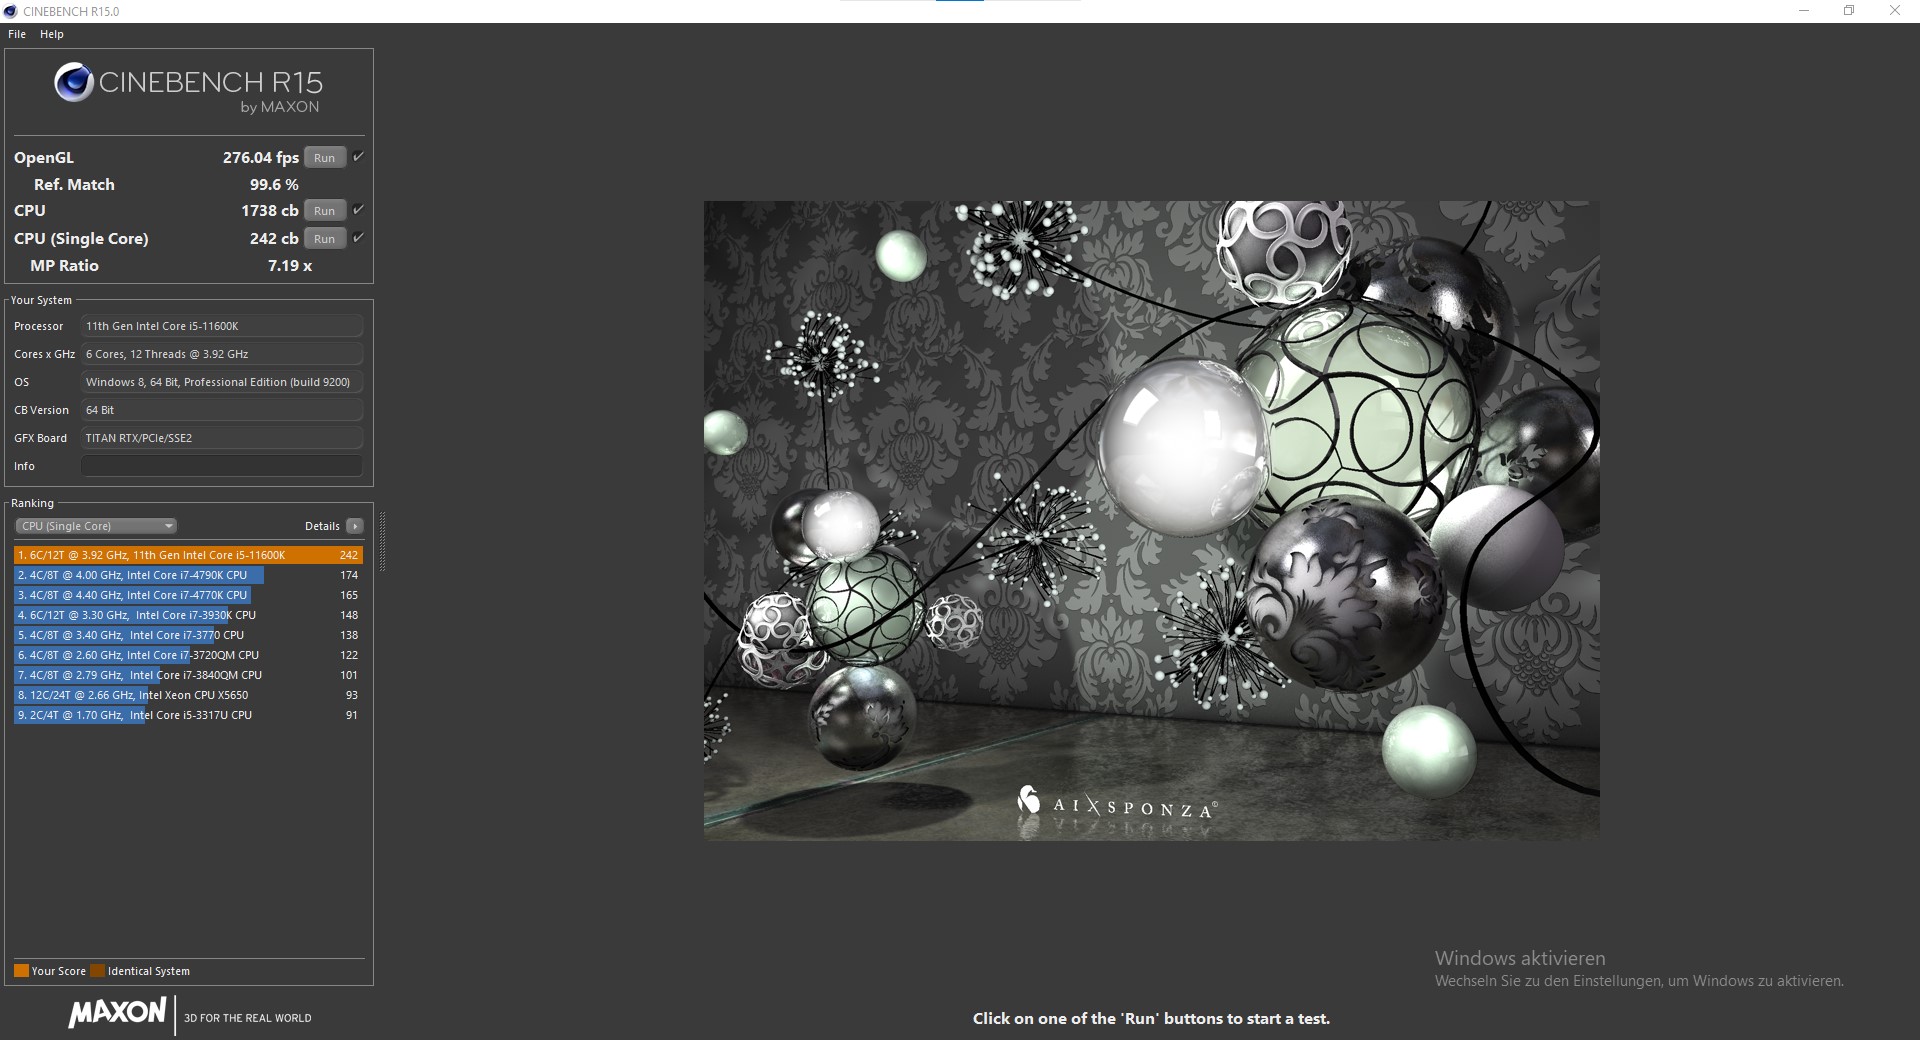
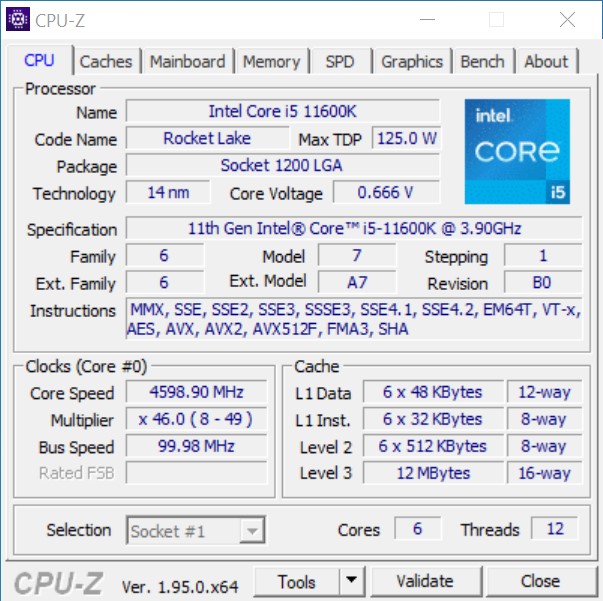
Intel Core i5-11600K
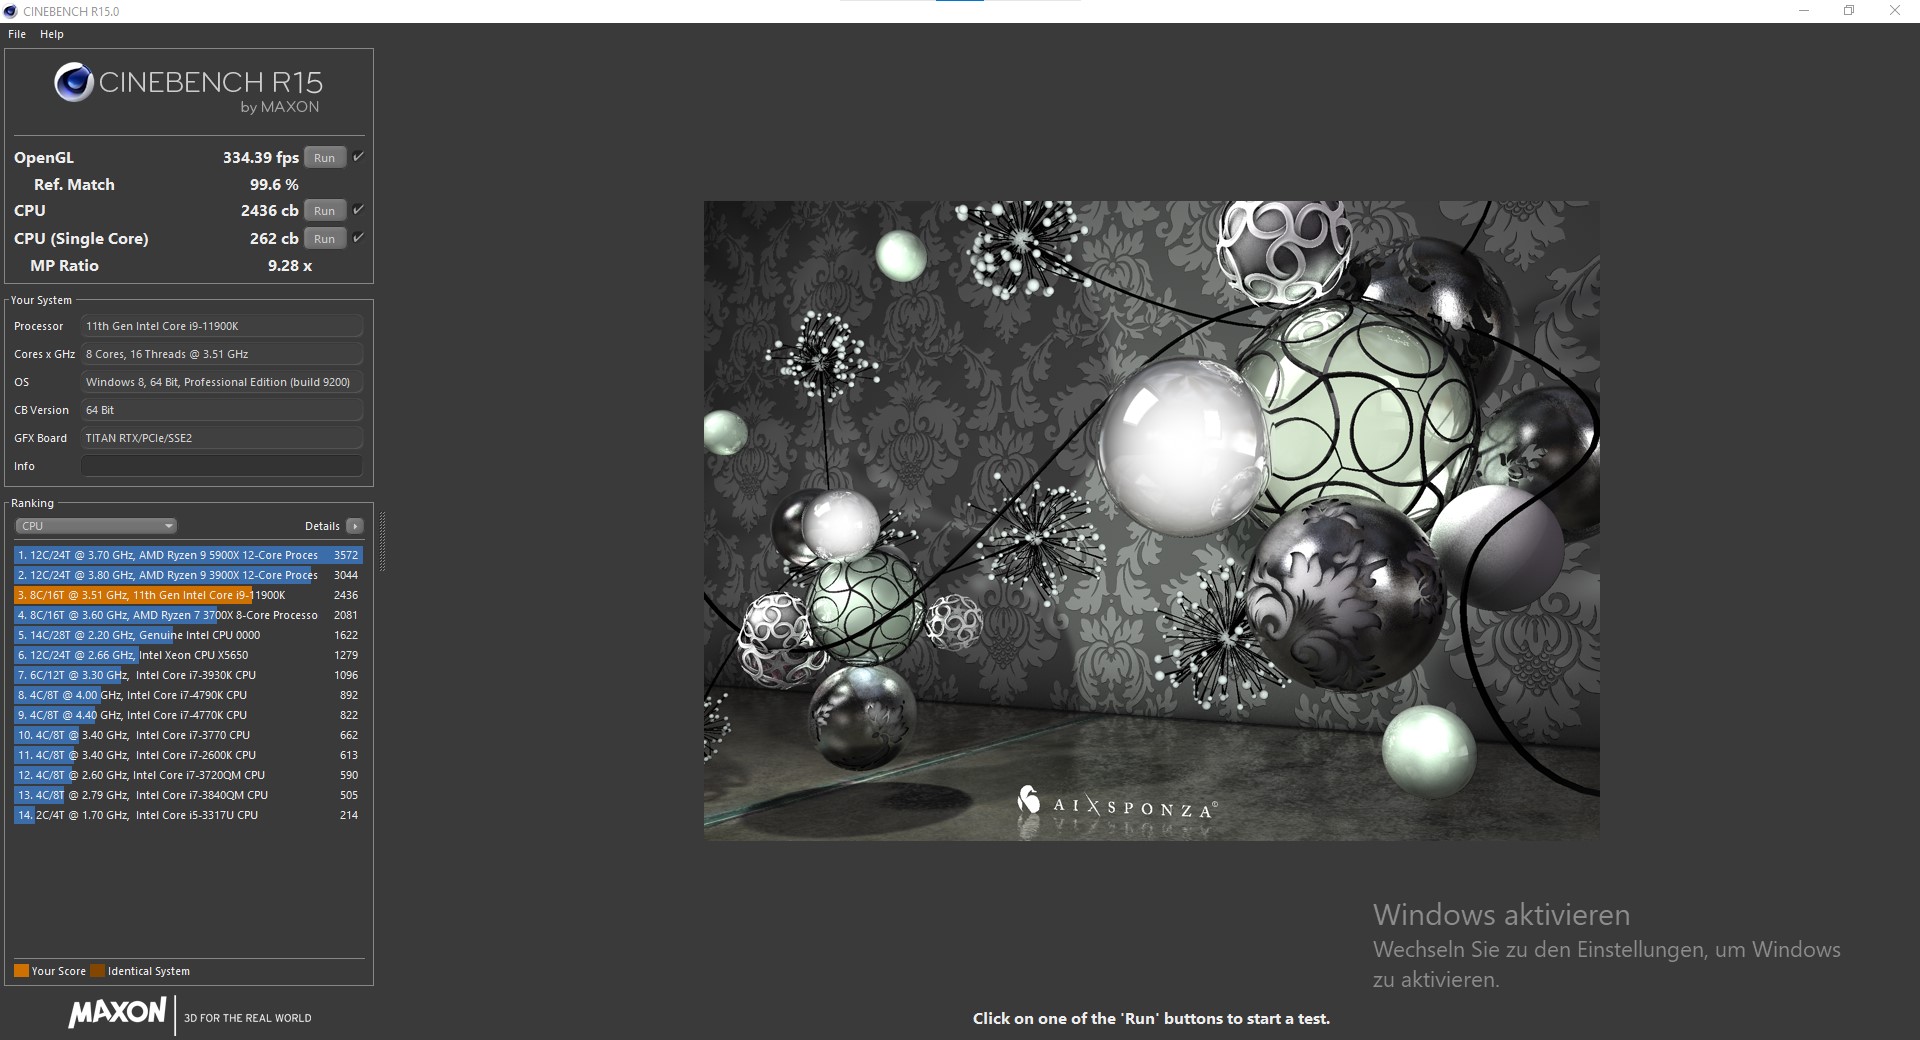
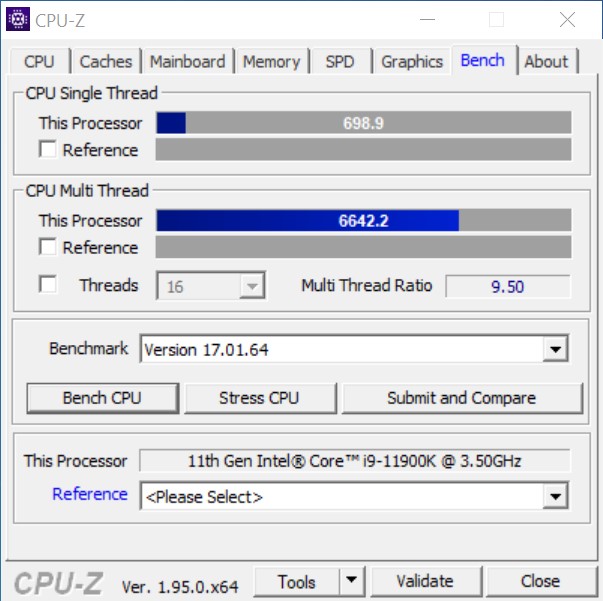
Intel Core i9-11900K

| Performance rating - Percent | |
| AMD Ryzen 7 5800X | |
| Intel Core i9-11900K | |
| Intel Core i9-10900K | |
| AMD Ryzen 5 5600X | |
| Intel Core i5-11600K | |
| Intel Core i5-10600K | |
| Cinebench R10 | |
| Rendering Single CPUs 64Bit | |
| Intel Core i9-11900K | |
| AMD Ryzen 7 5800X | |
| Intel Core i5-11600K | |
| AMD Ryzen 5 5600X | |
| Intel Core i9-10900K | |
| Intel Core i5-10600K | |
| Rendering Multiple CPUs 64Bit | |
| AMD Ryzen 7 5800X | |
| Intel Core i9-11900K | |
| Intel Core i9-10900K | |
| AMD Ryzen 5 5600X | |
| Intel Core i5-11600K | |
| Intel Core i5-10600K | |
| Blender - v2.79 BMW27 CPU | |
| Intel Core i5-10600K | |
| Intel Core i5-11600K | |
| AMD Ryzen 5 5600X | |
| AMD Ryzen 7 5800X | |
| Intel Core i9-11900K | |
| Intel Core i9-10900K | |
| WinRAR - Result | |
| AMD Ryzen 7 5800X | |
| AMD Ryzen 5 5600X | |
| Intel Core i9-10900K | |
| Intel Core i9-11900K | |
| Intel Core i5-11600K | |
| Intel Core i5-10600K | |
| Geekbench 4.4 | |
| 64 Bit Single-Core Score | |
| Intel Core i9-11900K | |
| Intel Core i5-11600K | |
| AMD Ryzen 7 5800X | |
| AMD Ryzen 5 5600X | |
| Intel Core i9-10900K | |
| Intel Core i5-10600K | |
| 64 Bit Multi-Core Score | |
| AMD Ryzen 7 5800X | |
| Intel Core i9-10900K | |
| Intel Core i9-11900K | |
| AMD Ryzen 5 5600X | |
| Intel Core i5-11600K | |
| Intel Core i5-10600K | |
| 3DMark 11 - 1280x720 Performance Physics | |
| AMD Ryzen 7 5800X | |
| Intel Core i9-10900K | |
| Intel Core i9-11900K | |
| AMD Ryzen 5 5600X | |
| Intel Core i5-11600K | |
| Intel Core i5-10600K | |
| HWBOT x265 Benchmark v2.2 - 4k Preset | |
| Intel Core i9-10900K | |
| AMD Ryzen 7 5800X | |
| Intel Core i9-11900K | |
| AMD Ryzen 5 5600X | |
| Intel Core i5-11600K | |
| Intel Core i5-10600K | |
| R Benchmark 2.5 - Overall mean | |
| Intel Core i5-10600K | |
| Intel Core i9-10900K | |
| Intel Core i5-11600K | |
| AMD Ryzen 5 5600X | |
| Intel Core i9-11900K | |
| AMD Ryzen 7 5800X | |
| LibreOffice - 20 Documents To PDF | |
| Intel Core i9-10900K | |
| Intel Core i9-11900K | |
| Intel Core i5-10600K | |
| AMD Ryzen 5 5600X | |
| AMD Ryzen 7 5800X | |
| Intel Core i5-11600K | |
| WebXPRT 3 - Overall | |
| AMD Ryzen 7 5800X | |
| AMD Ryzen 5 5600X | |
| Intel Core i5-11600K | |
| Intel Core i9-10900K | |
| Intel Core i5-10600K | |
| Intel Core i9-11900K | |
| Mozilla Kraken 1.1 - Total | |
| Intel Core i5-10600K | |
| Intel Core i9-10900K | |
| Intel Core i5-11600K | |
| AMD Ryzen 5 5600X | |
| AMD Ryzen 7 5800X | |
| Intel Core i9-11900K | |
| 3DMark | |
| 3840x2160 Fire Strike Ultra Physics | |
| AMD Ryzen 7 5800X | |
| Intel Core i9-10900K | |
| Intel Core i9-11900K | |
| AMD Ryzen 5 5600X | |
| Intel Core i5-11600K | |
| Intel Core i5-10600K | |
| 1920x1080 Fire Strike Physics | |
| AMD Ryzen 7 5800X | |
| Intel Core i9-10900K | |
| Intel Core i9-11900K | |
| AMD Ryzen 5 5600X | |
| Intel Core i5-11600K | |
| Intel Core i5-10600K | |
| 2560x1440 Time Spy CPU | |
| Intel Core i9-10900K | |
| Intel Core i9-11900K | |
| AMD Ryzen 7 5800X | |
| Intel Core i5-11600K | |
| AMD Ryzen 5 5600X | |
| Intel Core i5-10600K | |
* ... smaller is better
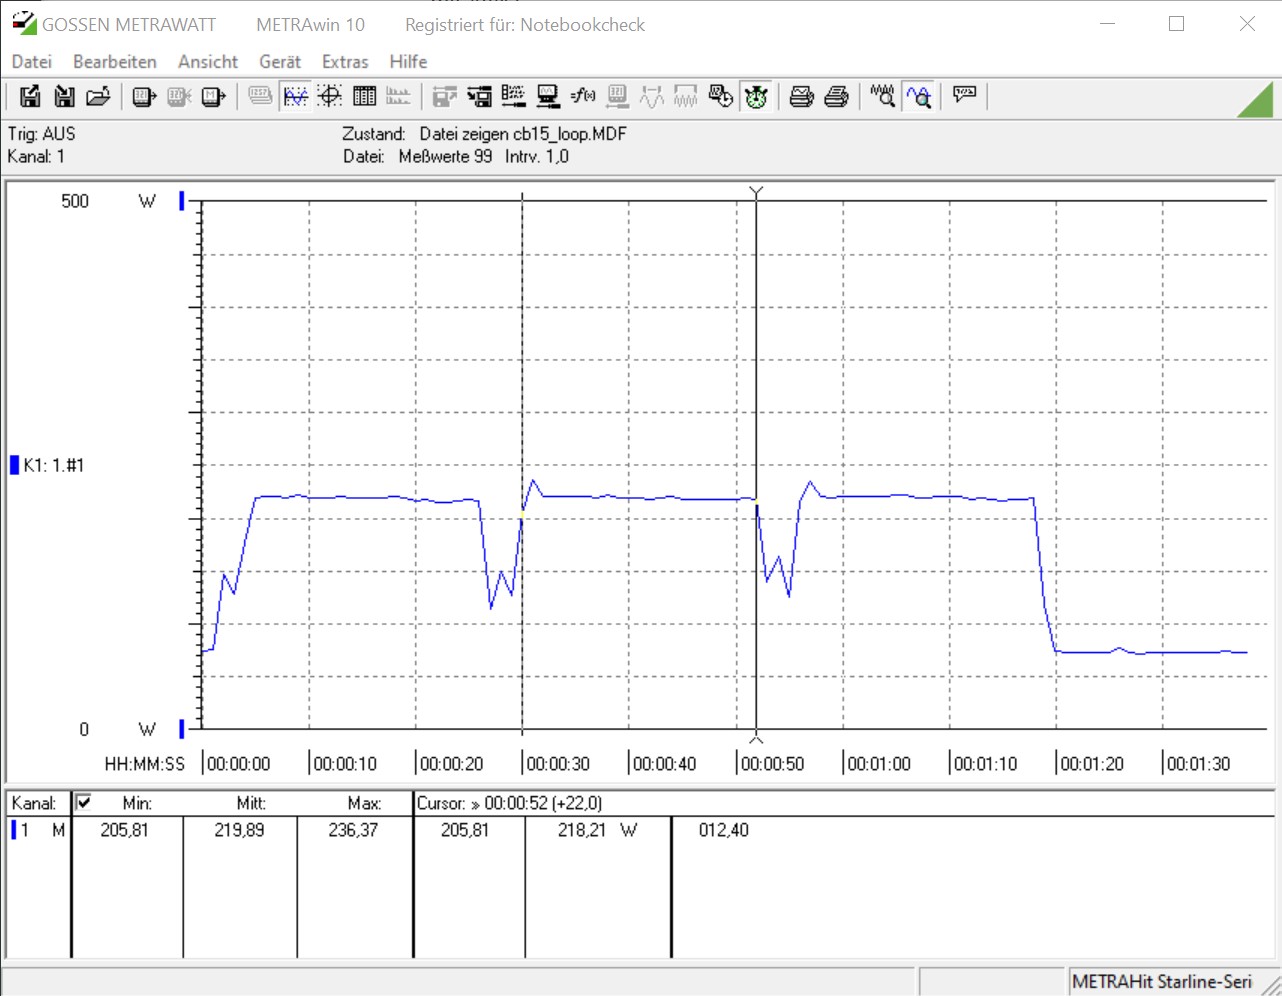
Rocket Lake-S vs. Cinebench R15 Multi-Core Loop
In the first stress test, both chips hold up very well. The octa-core i9-11900K is beaten by the deca-core i9-10900K, but only by a small margin. The battle between the Core i5 models is fairer. This is why the Core i5-11600K is able to significantly outperform the Core i5-10600K.
Productivity Benchmarks
| PCMark 10 - Score | |
| AMD Ryzen 5 5600X | |
| AMD Ryzen 7 5800X | |
| Intel Core i9-11900K | |
| Intel Core i5-11600K | |
| Intel Core i9-10900K | |
| Intel Core i7-10700K | |
| Intel Core i5-10600K | |
Gaming Benchmarks
Now we turn to gaming performance, Intel’s strong suit. Not that long ago, before the arrival of Zen 3 parts, Intel was king when it came to gaming performance. Unfortunately, Rocket Lake-S chips fail to reclaim the gaming crown. The Intel Core i9-11900K takes third place in our suite of gaming benchmarks. However, the difference in performance between the Intel Core i9-11900K and the Ryzen 7 5800X is so small that virtually no one ever is going to be able to notice any difference between them in actual gameplay. Both chips here go toe-to-toe with each other, which is a good thing for consumers.
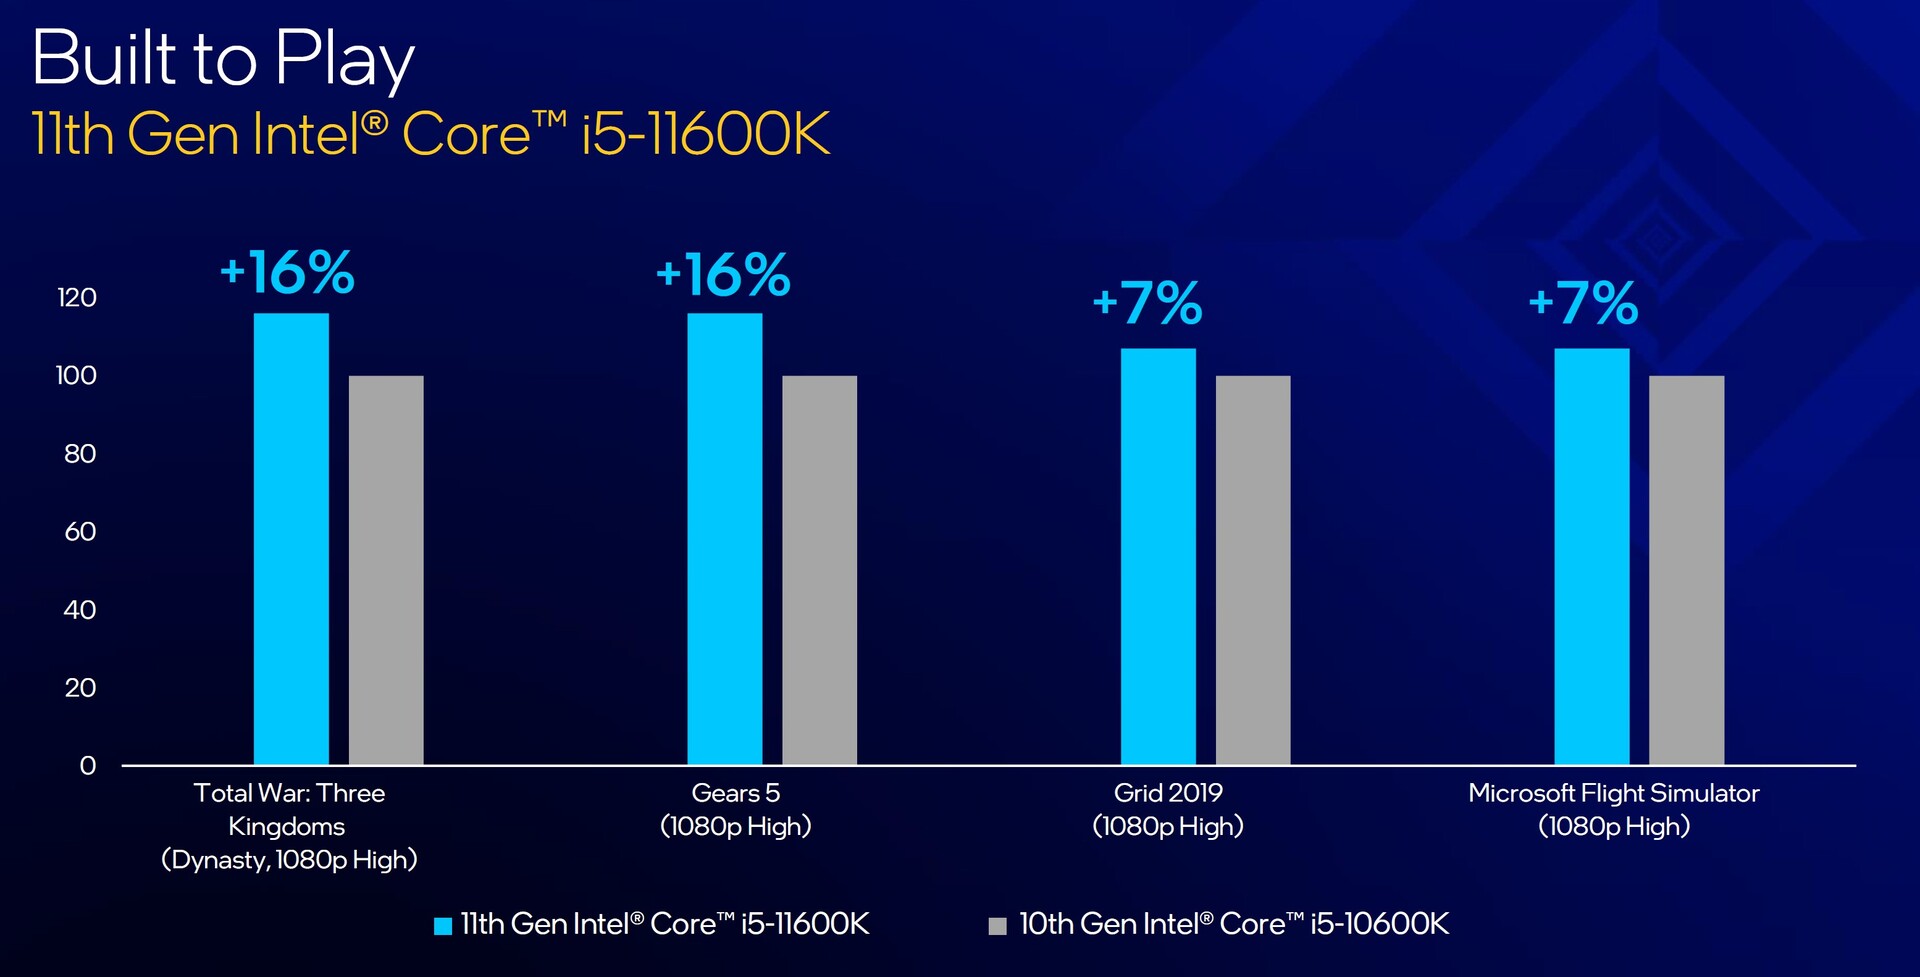
The lower-end Intel Core i5-11600K has made some serious progress. Nevertheless, it only manages to take fourth place in our suite of gaming benchmarks. However, the performance gap between the Core i5-11600K and the Ryzen 5 5600X is so vanishingly small that we cannot declare a clear winner here.
Both Rocket Lake-S chips are superb gaming CPUs. The Intel Core i9-11900K is able to achieve high frame rates in CPU-bound titles, because it offers a high level of IPC performance. In GPU-limited titles, the graphics card represents the main bottleneck, which is why CPU performance in such games is not as important. Only a very small number of video games can fully leverage CPUs with a huge core count. Here, consumers have to decide for themselves what is important to them. Nevertheless, the price and the availability also have to be taken into account.
| Performance rating - Percent | |
| AMD Ryzen 7 5800X -2! | |
| AMD Ryzen 5 5600X -2! | |
| Intel Core i9-11900K | |
| Intel Core i5-11600K | |
| Intel Core i9-10900K | |
| Intel Core i7-10700K -4! | |
| Intel Core i5-10600K | |
| Borderlands 3 | |
| 1280x720 Very Low Overall Quality (DX11) | |
| AMD Ryzen 7 5800X | |
| AMD Ryzen 5 5600X | |
| Intel Core i9-11900K | |
| Intel Core i9-10900K | |
| Intel Core i5-11600K | |
| Intel Core i7-10700K | |
| Intel Core i5-10600K | |
| 1920x1080 Badass Overall Quality (DX11) | |
| Intel Core i9-11900K | |
| Intel Core i9-10900K | |
| Intel Core i7-10700K | |
| Intel Core i5-11600K | |
| AMD Ryzen 7 5800X | |
| AMD Ryzen 5 5600X | |
| Intel Core i5-10600K | |
| Metro Exodus | |
| 1280x720 Low Quality AF:4x | |
| AMD Ryzen 7 5800X | |
| AMD Ryzen 5 5600X | |
| Intel Core i9-11900K | |
| Intel Core i9-10900K | |
| Intel Core i7-10700K | |
| Intel Core i5-10600K | |
| Intel Core i5-11600K | |
| 1920x1080 Ultra Quality AF:16x | |
| Intel Core i7-10700K | |
| Intel Core i9-10900K | |
| Intel Core i5-10600K | |
| AMD Ryzen 5 5600X | |
| AMD Ryzen 7 5800X | |
| Intel Core i9-11900K | |
| Intel Core i5-11600K | |
| Forza Horizon 4 | |
| 1280x720 Very Low Preset | |
| Intel Core i9-11900K | |
| Intel Core i9-10900K | |
| Intel Core i5-11600K | |
| Intel Core i5-10600K | |
| 1920x1080 Ultra Preset AA:2xMS | |
| Intel Core i9-10900K | |
| Intel Core i9-11900K | |
| Intel Core i5-11600K | |
| Intel Core i5-10600K | |
| Final Fantasy XV Benchmark | |
| 1280x720 Lite Quality | |
| AMD Ryzen 7 5800X | |
| AMD Ryzen 5 5600X | |
| Intel Core i9-10900K | |
| Intel Core i9-11900K | |
| Intel Core i5-11600K | |
| Intel Core i5-10600K | |
| Intel Core i7-10700K | |
| 1920x1080 High Quality | |
| Intel Core i9-11900K | |
| Intel Core i9-10900K | |
| Intel Core i5-11600K | |
| Intel Core i5-10600K | |
| AMD Ryzen 7 5800X | |
| AMD Ryzen 5 5600X | |
| Intel Core i7-10700K | |
| Dota 2 Reborn | |
| 1280x720 min (0/3) fastest | |
| AMD Ryzen 7 5800X | |
| AMD Ryzen 5 5600X | |
| Intel Core i9-10900K | |
| Intel Core i9-11900K | |
| Intel Core i7-10700K | |
| Intel Core i5-11600K | |
| Intel Core i5-10600K | |
| 1920x1080 ultra (3/3) best looking | |
| AMD Ryzen 7 5800X | |
| AMD Ryzen 5 5600X | |
| Intel Core i9-10900K | |
| Intel Core i9-11900K | |
| Intel Core i5-11600K | |
| Intel Core i7-10700K | |
| Intel Core i5-10600K | |
| The Witcher 3 | |
| 1024x768 Low Graphics & Postprocessing | |
| AMD Ryzen 7 5800X | |
| AMD Ryzen 5 5600X | |
| Intel Core i9-10900K | |
| Intel Core i9-11900K | |
| Intel Core i7-10700K | |
| Intel Core i5-11600K | |
| Intel Core i5-10600K | |
| 1920x1080 Ultra Graphics & Postprocessing (HBAO+) | |
| Intel Core i5-11600K | |
| Intel Core i7-10700K | |
| Intel Core i5-10600K | |
| Intel Core i9-11900K | |
| Intel Core i9-10900K | |
| AMD Ryzen 7 5800X | |
| AMD Ryzen 5 5600X | |
| Shadow of the Tomb Raider | |
| 1280x720 Lowest Preset | |
| AMD Ryzen 7 5800X | |
| AMD Ryzen 5 5600X | |
| Intel Core i9-10900K | |
| Intel Core i9-11900K | |
| Intel Core i5-11600K | |
| Intel Core i5-10600K | |
| 1920x1080 Highest Preset AA:T | |
| AMD Ryzen 7 5800X | |
| Intel Core i9-11900K | |
| Intel Core i9-10900K | |
| AMD Ryzen 5 5600X | |
| Intel Core i5-11600K | |
| Intel Core i5-10600K | |
Intel Core i9-11900K + Nvidia Titan RTX
| low | med. | high | ultra | QHD | 4K | |
|---|---|---|---|---|---|---|
| The Witcher 3 (2015) | 514 | 447 | 190 | 140 | 105 | |
| Dota 2 Reborn (2015) | 195.1 | 180.2 | 173.2 | 165.3 | 161.8 | |
| Final Fantasy XV Benchmark (2018) | 219 | 186 | 143 | 108 | 64.9 | |
| X-Plane 11.11 (2018) | 170 | 153 | 125 | 109 | ||
| Far Cry 5 (2018) | 212 | 183 | 175 | 164 | 141 | 80 |
| Shadow of the Tomb Raider (2018) | 203 | 186 | 178 | 168 | 127 | 70.4 |
| Forza Horizon 4 (2018) | 251 | 221 | 218 | 192 | 162 | 115 |
| Far Cry New Dawn (2019) | 178 | 155 | 149 | 135 | 126 | 82 |
| Metro Exodus (2019) | 228 | 173 | 133 | 106 | 84.6 | 54.7 |
| Borderlands 3 (2019) | 200 | 175 | 141 | 118 | 84.8 | 47.2 |
Intel Core i5-11600K + Nvidia Titan RTX
| low | med. | high | ultra | QHD | 4K | |
|---|---|---|---|---|---|---|
| The Witcher 3 (2015) | 466 | 396 | 275 | 144 | 106 | |
| Dota 2 Reborn (2015) | 184.8 | 170.7 | 164.8 | 162.9 | 159.1 | |
| Final Fantasy XV Benchmark (2018) | 216 | 182 | 141 | 107 | 65.5 | |
| X-Plane 11.11 (2018) | 157 | 138 | 112 | 99.3 | ||
| Far Cry 5 (2018) | 199 | 177 | 167 | 157 | 140 | 83 |
| Shadow of the Tomb Raider (2018) | 188 | 171 | 168 | 158 | 127 | 70.2 |
| Forza Horizon 4 (2018) | 236 | 209 | 207 | 189 | 165 | 117 |
| Far Cry New Dawn (2019) | 168 | 148 | 143 | 129 | 122 | 83 |
| Metro Exodus (2019) | 210 | 167 | 132 | 105 | 85.4 | 55.2 |
| Borderlands 3 (2019) | 188 | 165 | 138 | 117 | 85 | 47.2 |
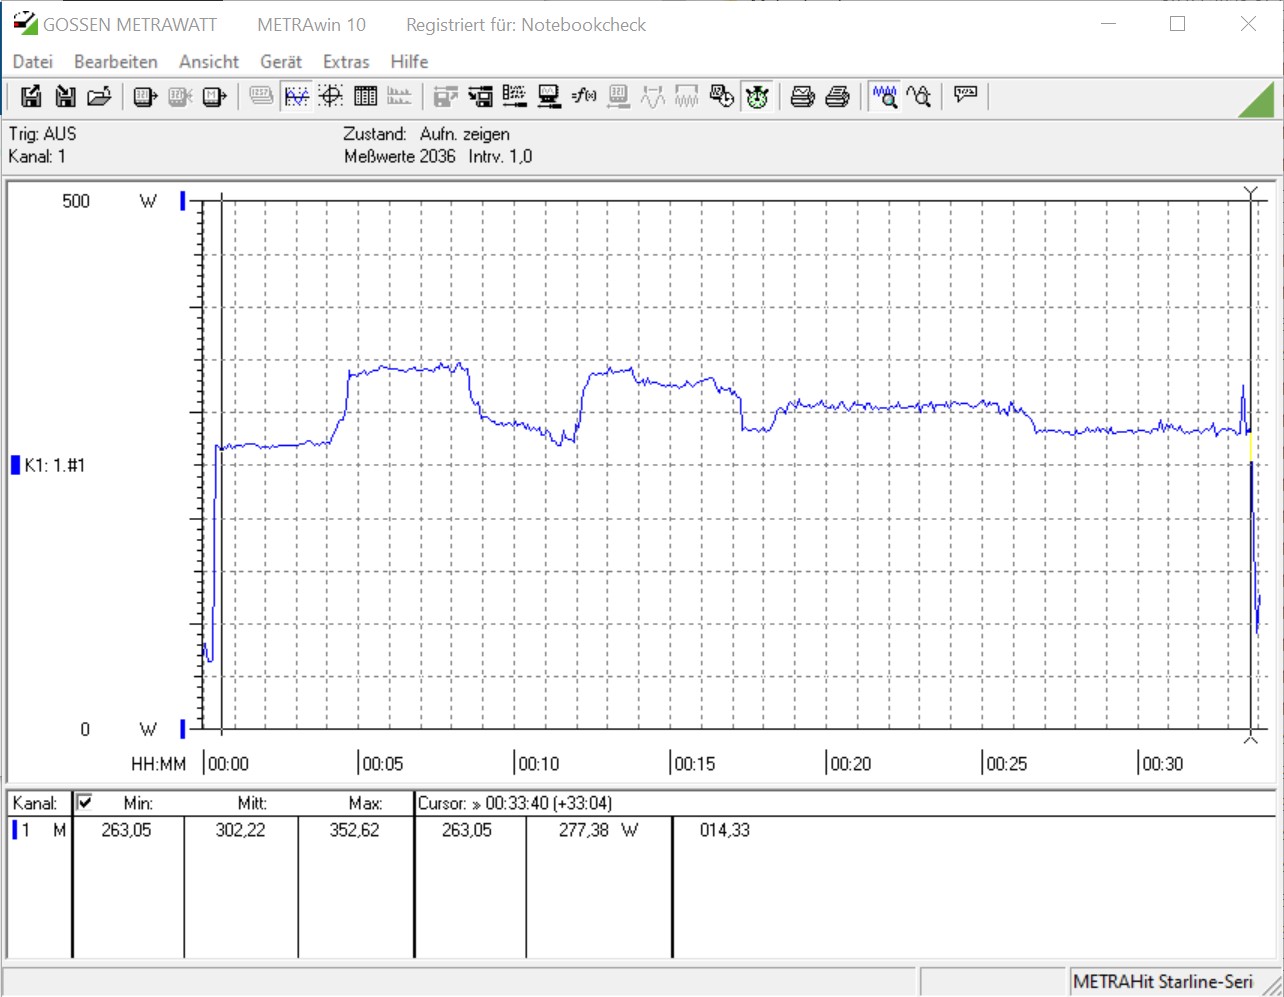
Energy Consumption
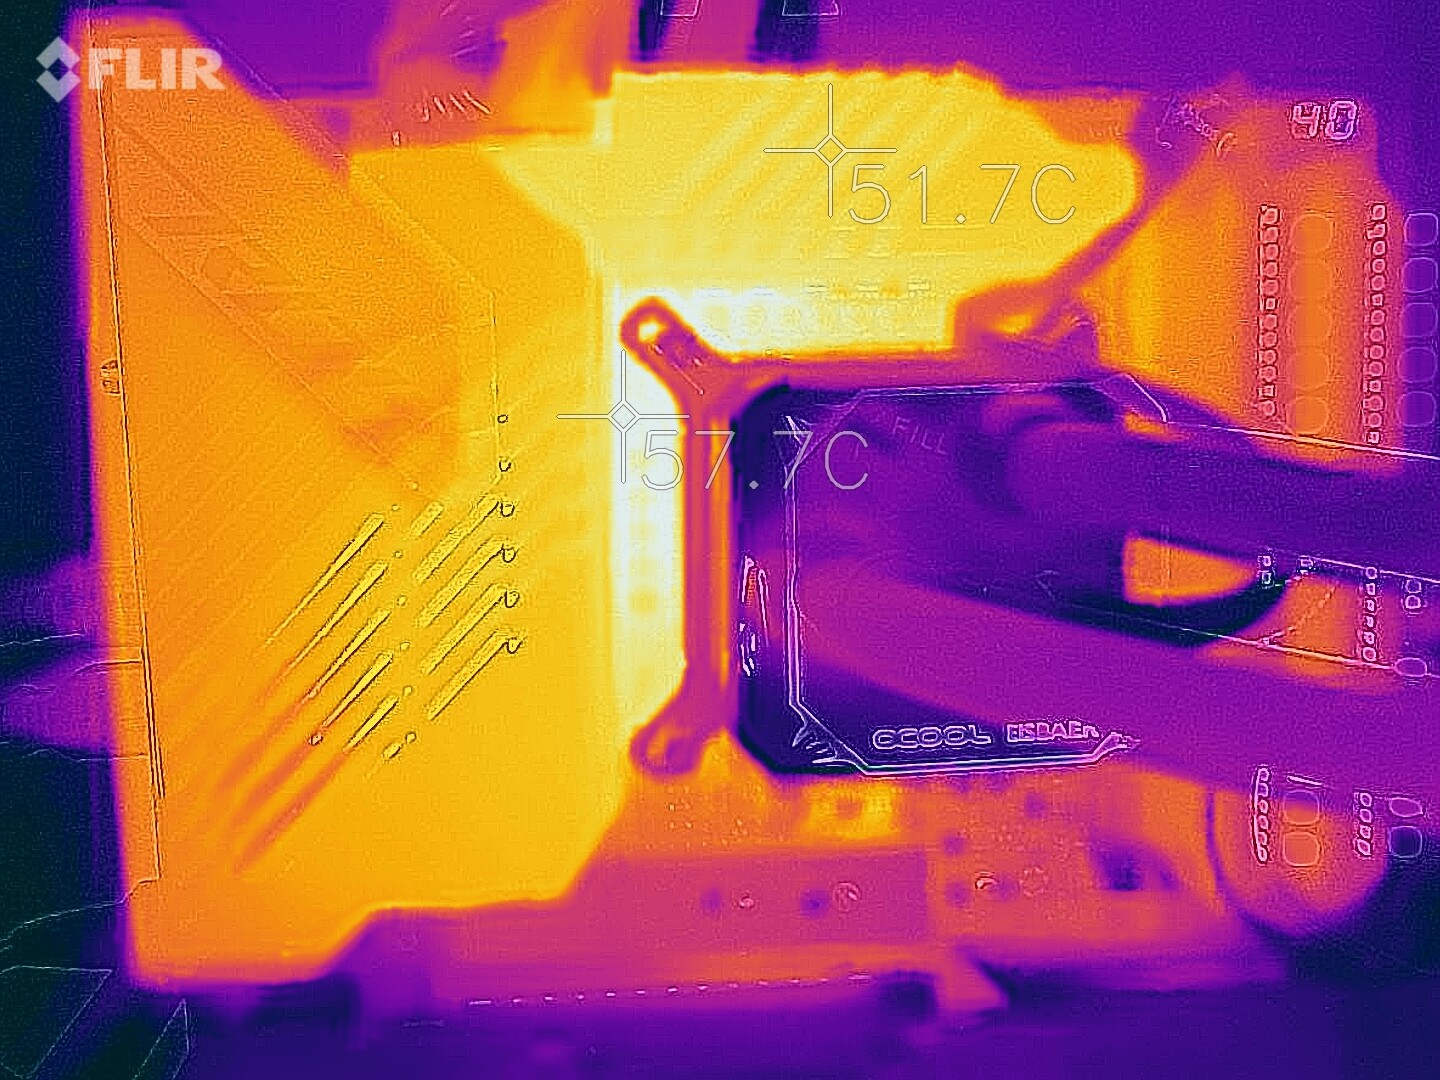
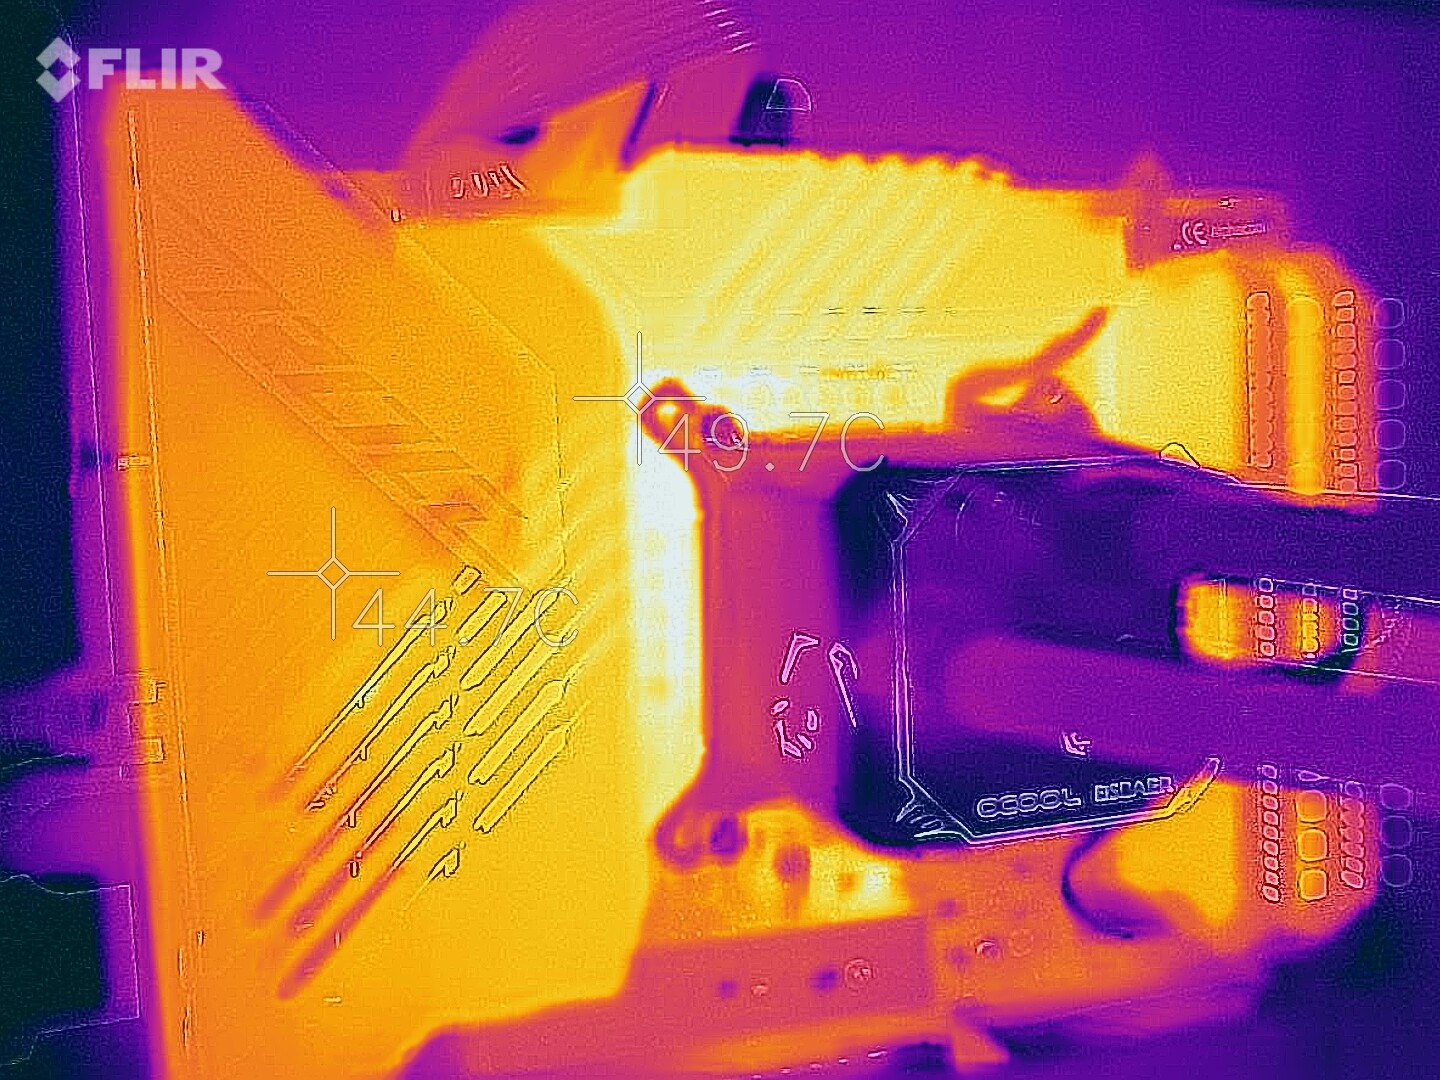
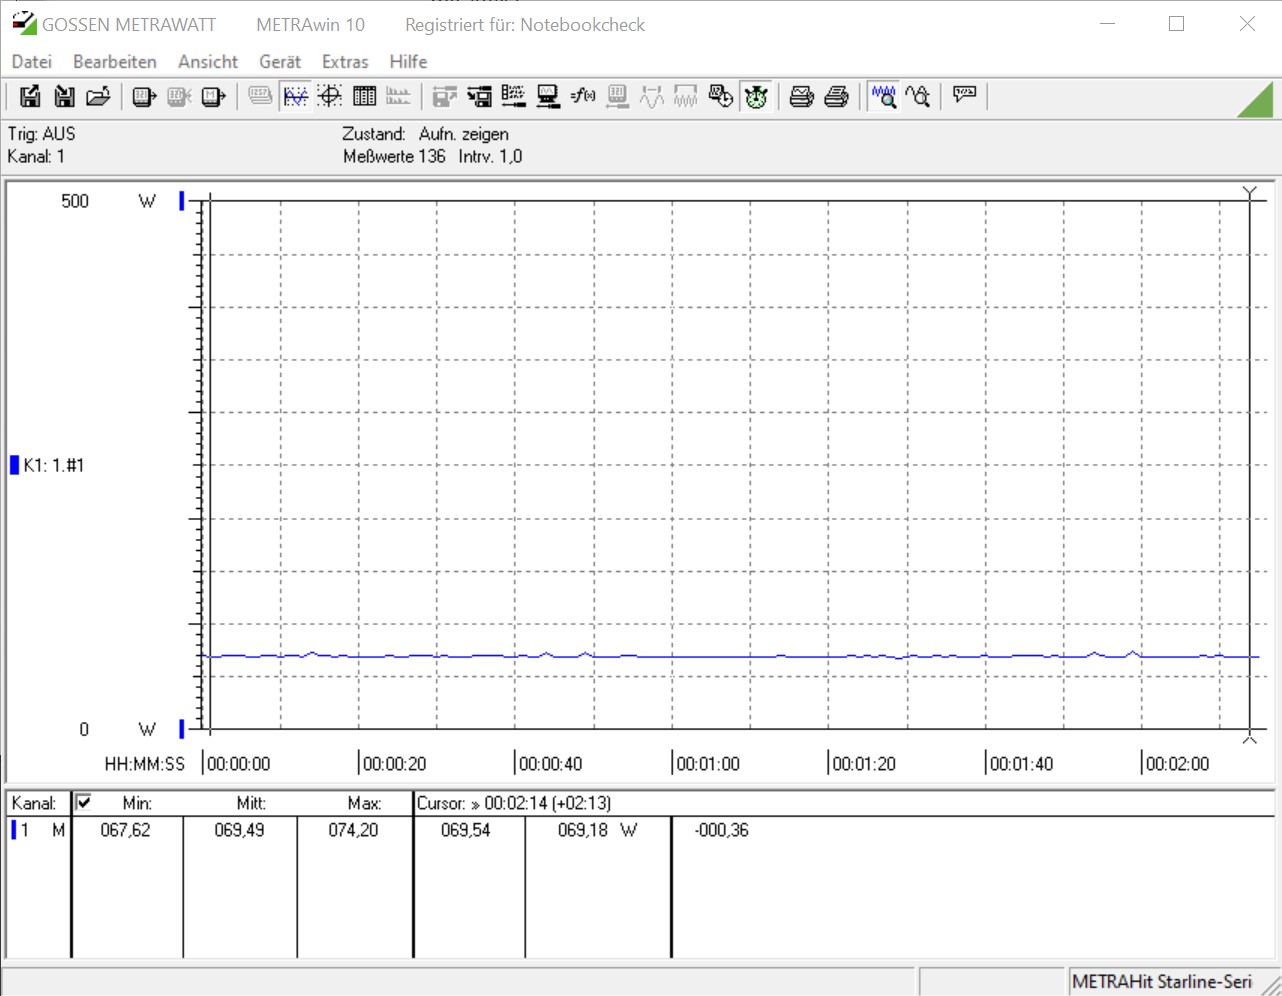
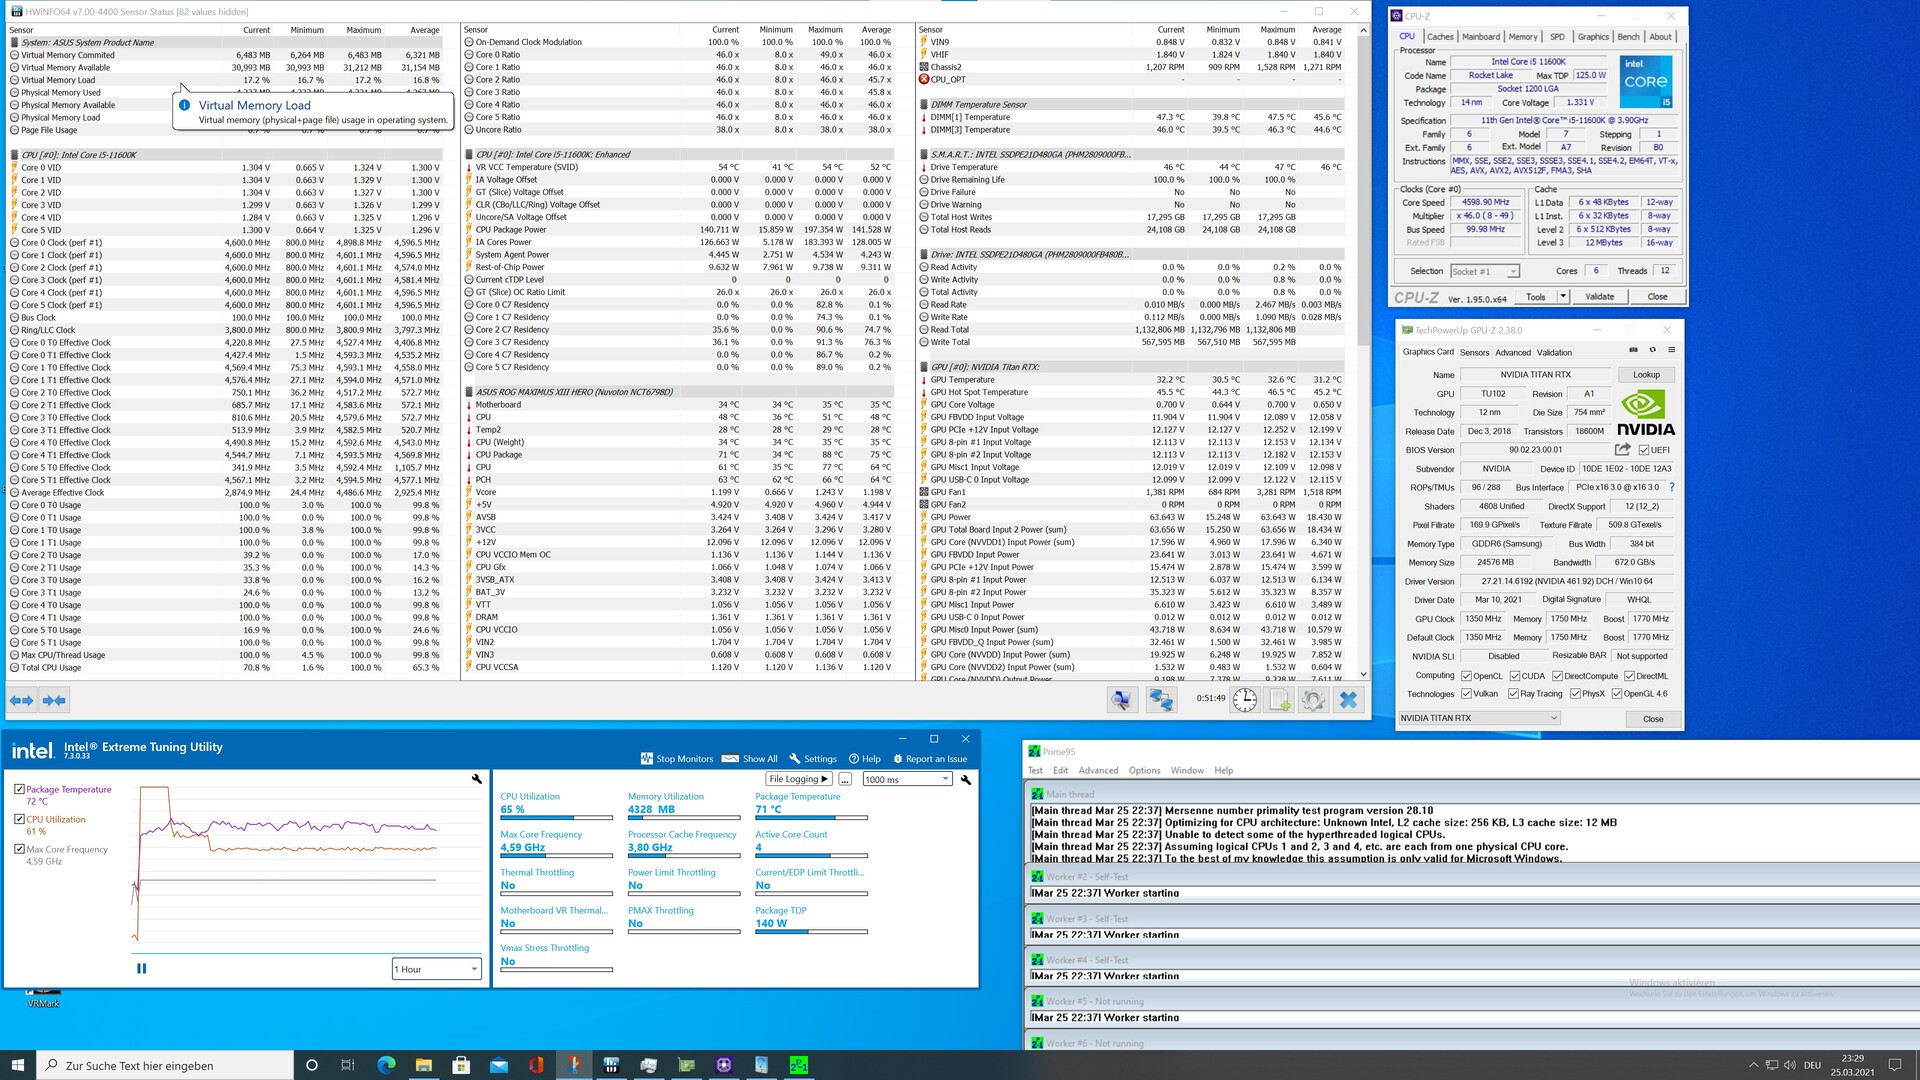
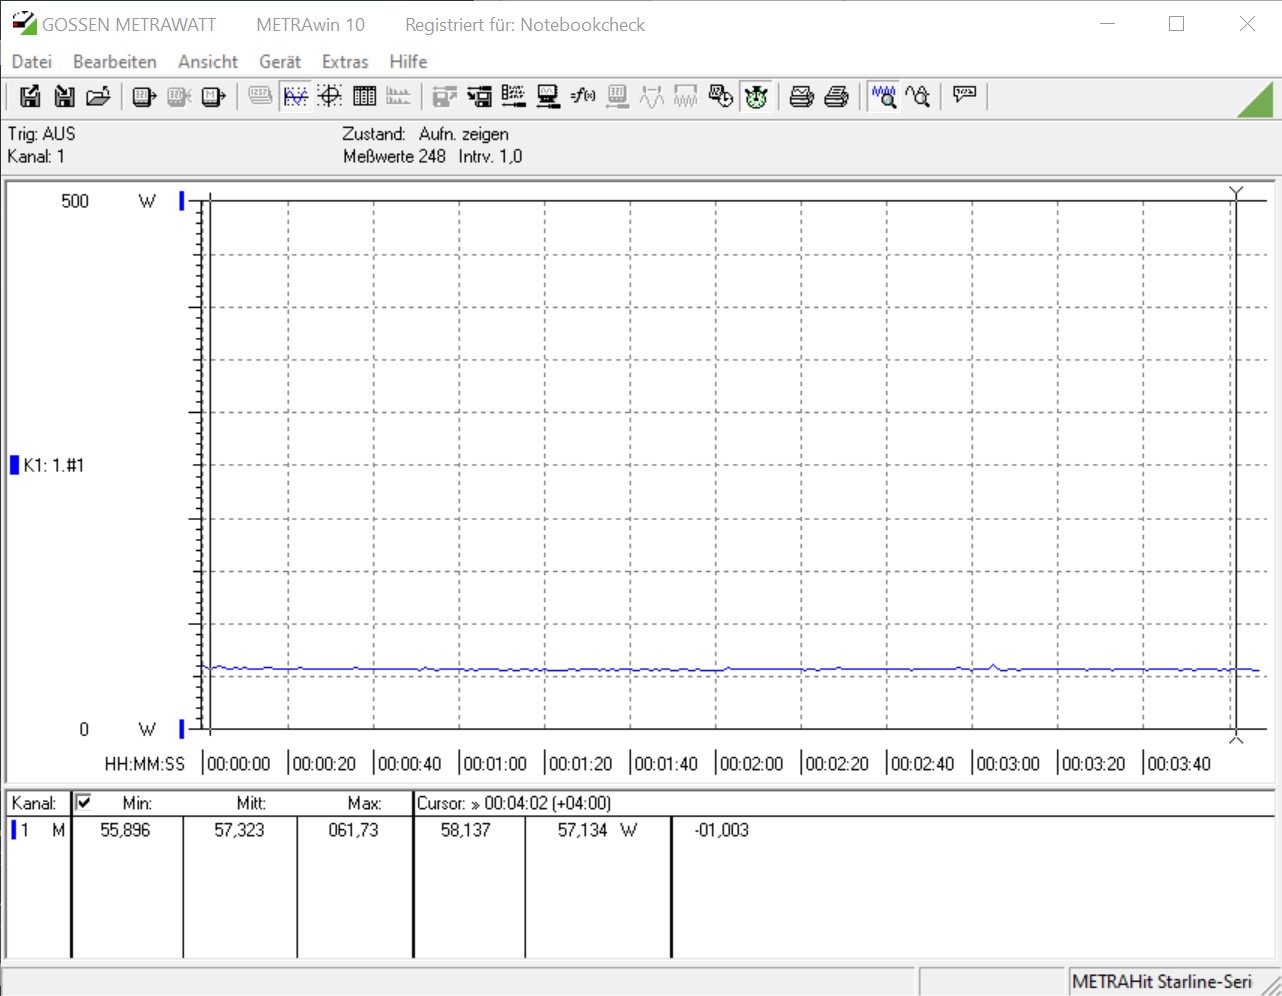
When compared to Comet Lake-S chips, the power draw is on the same level. Intel still specifies a PL1 TDP of 125 watts and a PL2 TDP of 250 watts. The TAU values, which determine the Turbo Boost duration, are also unchanged. When idle, the entire system draws only 57 watts with the Core i9-11900K and 67 watts with the Core i5-11600K. These are very good results. Here, AMD offers worse results. Howbeit, it is worthing bearing in mind that the system power draw can fluctuate depending on the motherboard and other components.
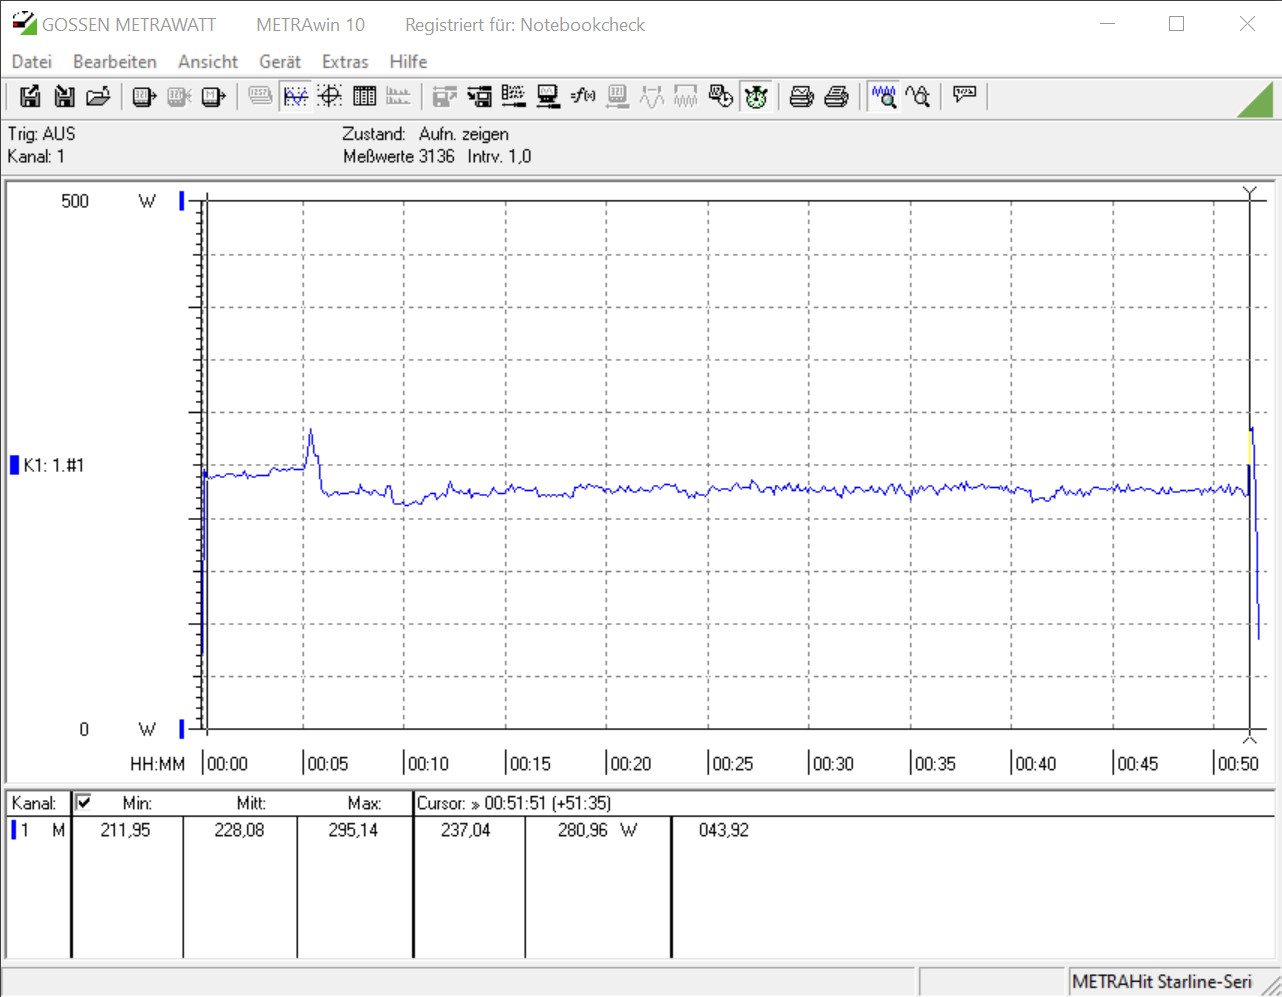
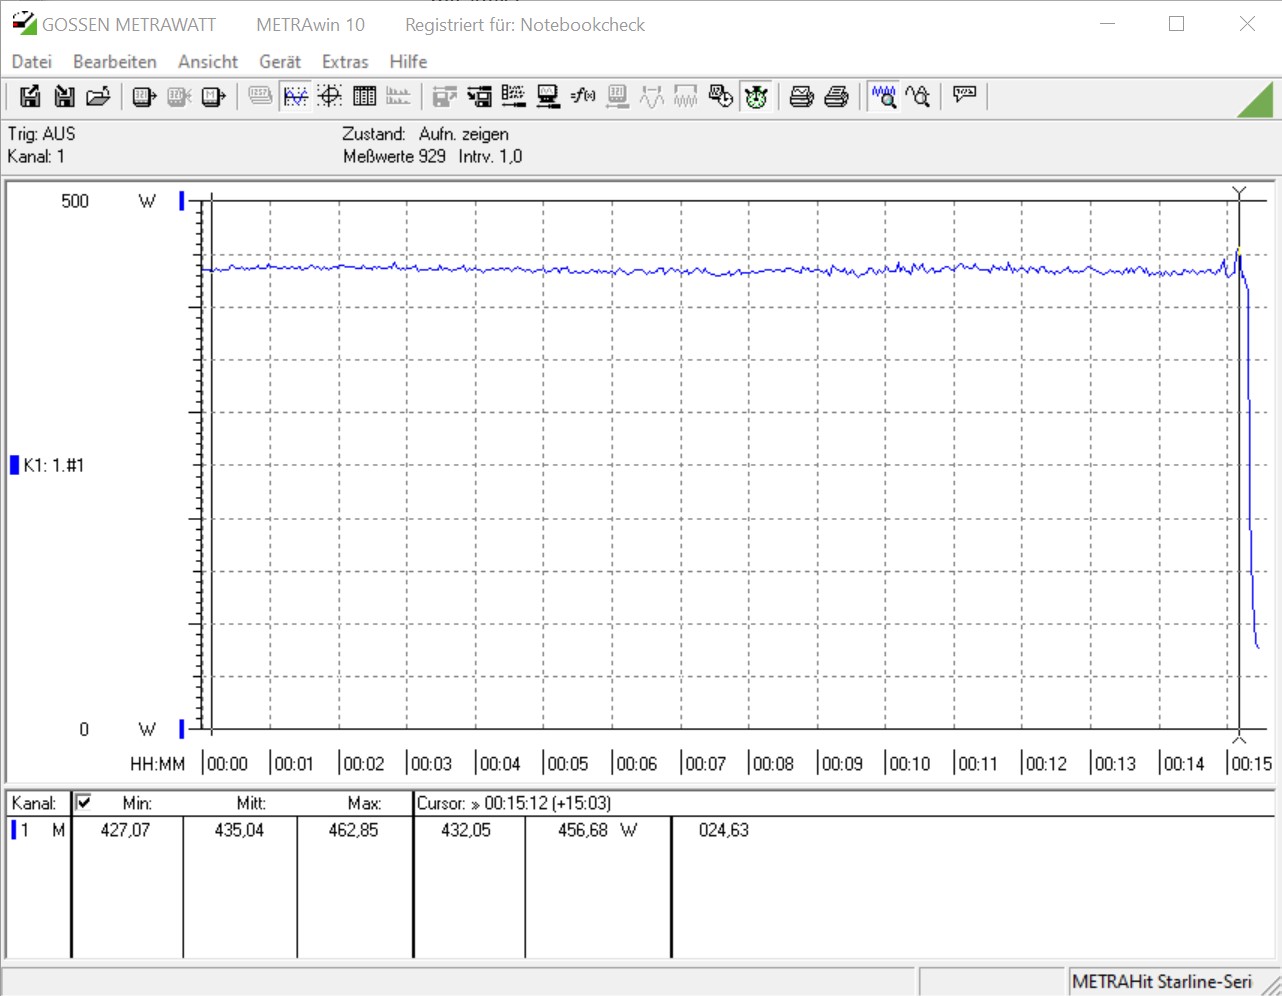
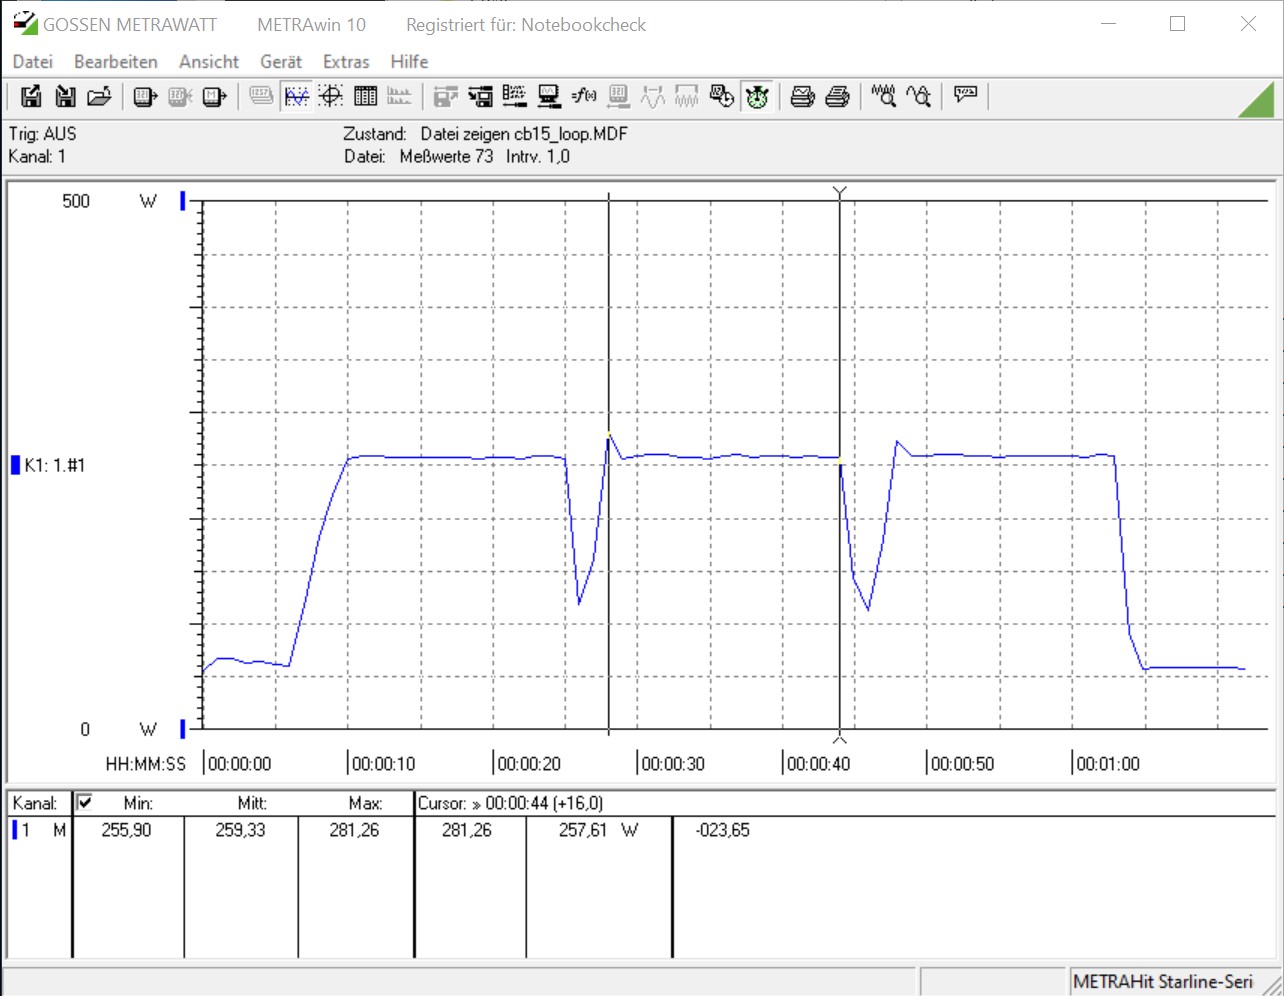
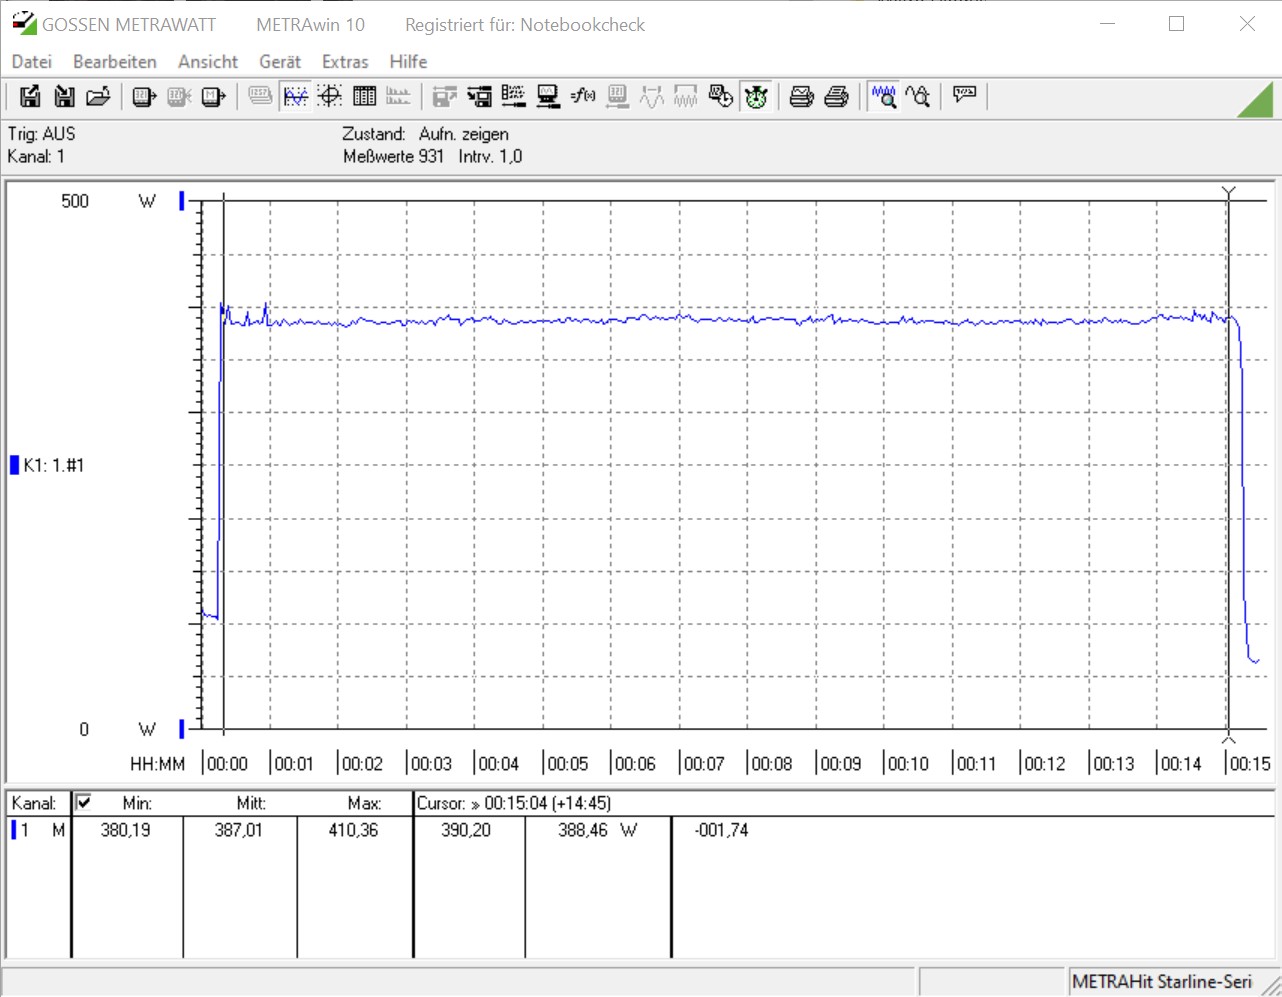
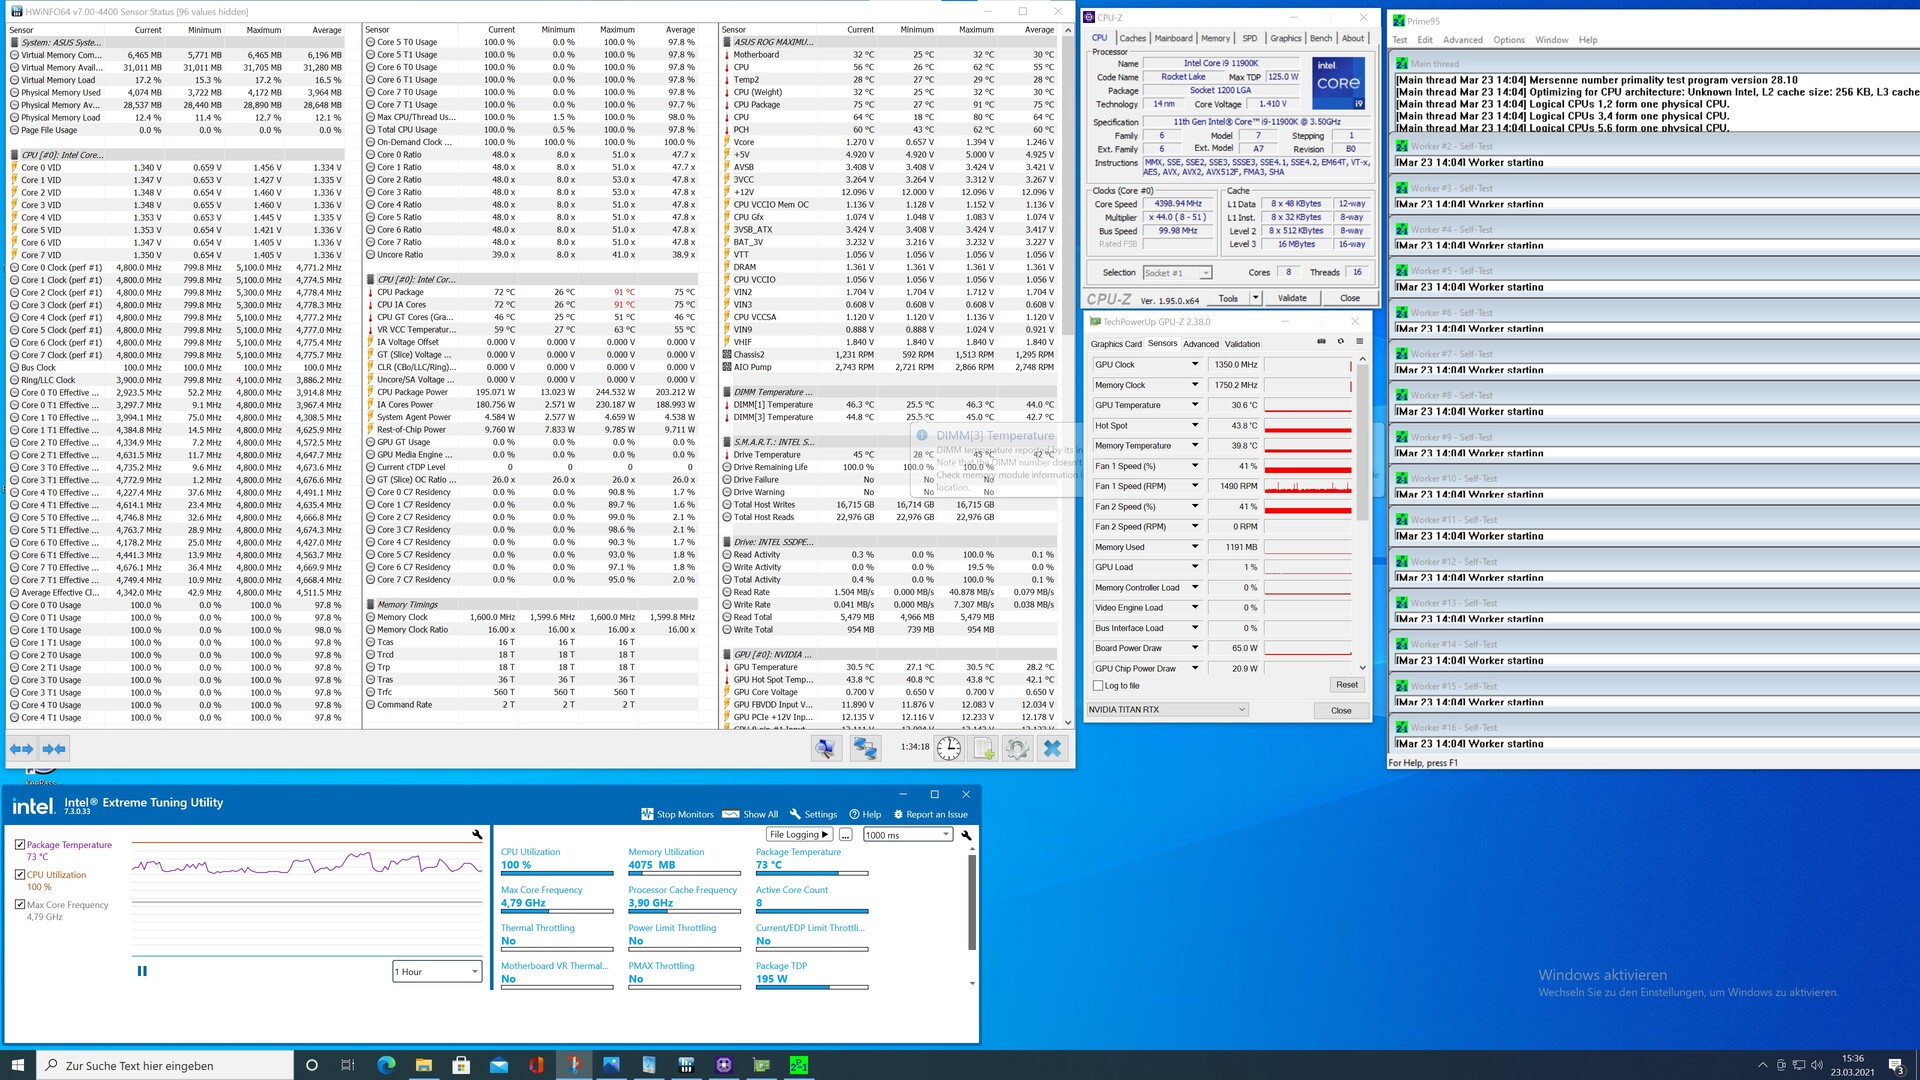
During our stress test, the system power draw hovered around 300 watts. When gaming, the Core i9 system actually drew up to 387 watts. Surprisingly enough, the Intel Core i5-11600K drew more power than the Core i9-11900K when gaming. This indicates that the hexa-core CPU is more heavily utilised when gaming. In any case, the octa-core i9-11900K appears to be a more energy-efficient gaming CPU. In terms of energy consumption, the Core i9-11900K compares well against the AMD Ryzen 7 5800X, even though it has a higher TDP, at least on paper. Under load, the temperatures are high, but not critical. For our review, we used an All-in-One cooler with a 280-mm radiator. Users will also need good fans to keep the octa-core CPU from hitting high temperatures.
| Power Consumption | |
| 1920x1080 The Witcher 3 ultra (external Monitor) | |
| Intel Core i5-11600K (Idle: 69.49 W) | |
| AMD Ryzen 7 5800X (Idle: 77.5 W) | |
| AMD Ryzen 5 5600X (Idle: 79.23 W) | |
| Intel Core i7-10700K (Idle: 67.7 W) | |
| Intel Core i9-10900K (Idle: 52.3 W) | |
| Intel Core i9-11900K (Idle: 57.3 W) | |
| Intel Core i5-10600K (Idle: 52.2 W) | |
| Prime95 V2810 Stress (external Monitor) | |
| Intel Core i9-11900K (Idle: 57.3 W) | |
| Intel Core i9-10900K (Idle: 52.3 W) | |
| AMD Ryzen 7 5800X (Idle: 77.5 W) | |
| Intel Core i5-11600K (Idle: 69.49 W) | |
| Intel Core i7-10700K (Idle: 67.7 W) | |
| Intel Core i5-10600K (Idle: 52.2 W) | |
| AMD Ryzen 5 5600X (Idle: 79.23 W) | |
| Cinebench R15 Multi (external Monitor) | |
| Intel Core i9-10900K (Idle: 52.3 W) | |
| Intel Core i9-11900K (Idle: 57.3 W) | |
| AMD Ryzen 7 5800X (Idle: 77.5 W) | |
| Intel Core i5-11600K (Idle: 69.49 W) | |
| Intel Core i7-10700K (Idle: 67.7 W) | |
| Intel Core i5-10600K (Idle: 52.2 W) | |
| AMD Ryzen 5 5600X (Idle: 79.23 W) | |
| Temperatures - CPU Temperature Prime95 | |
| Intel Core i9-11900K | |
| AMD Ryzen 7 5800X | |
| Intel Core i9-10900K | |
| Intel Core i5-11600K | |
| Intel Core i5-10600K | |
* ... smaller is better
Pros
Cons
Verdict - Only 8 cores, but still pretty fast!
With Rocket Lake-S, Intel has tried to close the performance gap with AMD. Intel has succeeded in some areas, while in other areas it is basically on the same level as AMD. However, prospective buyers should not forget that Intel’s consumer chips currently top out at 8 cores and 16 threads, whereas AMD’s chips reach up to 16 cores and 32 threads. However, high core-count AMD processors are a lot more expensive, which is why they are not a good option for most consumers. Speaking of expensive processors, the Intel Core i9-11900K with an MSRP of 629 Euros (~$740) is no bargain either, because the similarly capable AMD Ryzen 7 5800X costs about 200 Euros (~$240) less. The Intel Core i5-11600K is much more interesting, especially since it offers very similar gaming performance. The 299-Euro (~$350) AMD Ryzen 5 5600X has a very similar price tag to the Core i5-11600K.
The Intel Core i9-11900K is a very good gaming CPU. However, it fails to reclaim the gaming crown for Intel.
Only time will tell whether AMD or Intel CPUs will end up ruling this cycle. A lot will depend on availability, of course. If Intel manages to avoid supply shortages, then its Rocket Lake-S chips will probably do reasonably well. However, the price of the Core i9-11900K needs to fall considerably for it to become competitive. Intel’s octa-core i9-11900K simply cannot be positioned to compete against AMD’s dodeca-core Ryzen 9 5900X.
In summary, we would like to state that we are quite impressed by the amount of performance that Intel has been able to squeeze out of its ageing 14-nm node. Here, Intel has basically delivered a completely new chip on the LGA 1200 socket. Howbeit, potential buyers should keep in mind the fact that the Rocket Lake-S chips are the last CPUs, which are going to use the LGA 1200 socket. The next generation of Intel’s desktop CPUs is rumoured to use the LGA 1700 socket, support DDR5 RAM and be manufactured on the 10-nm node.

