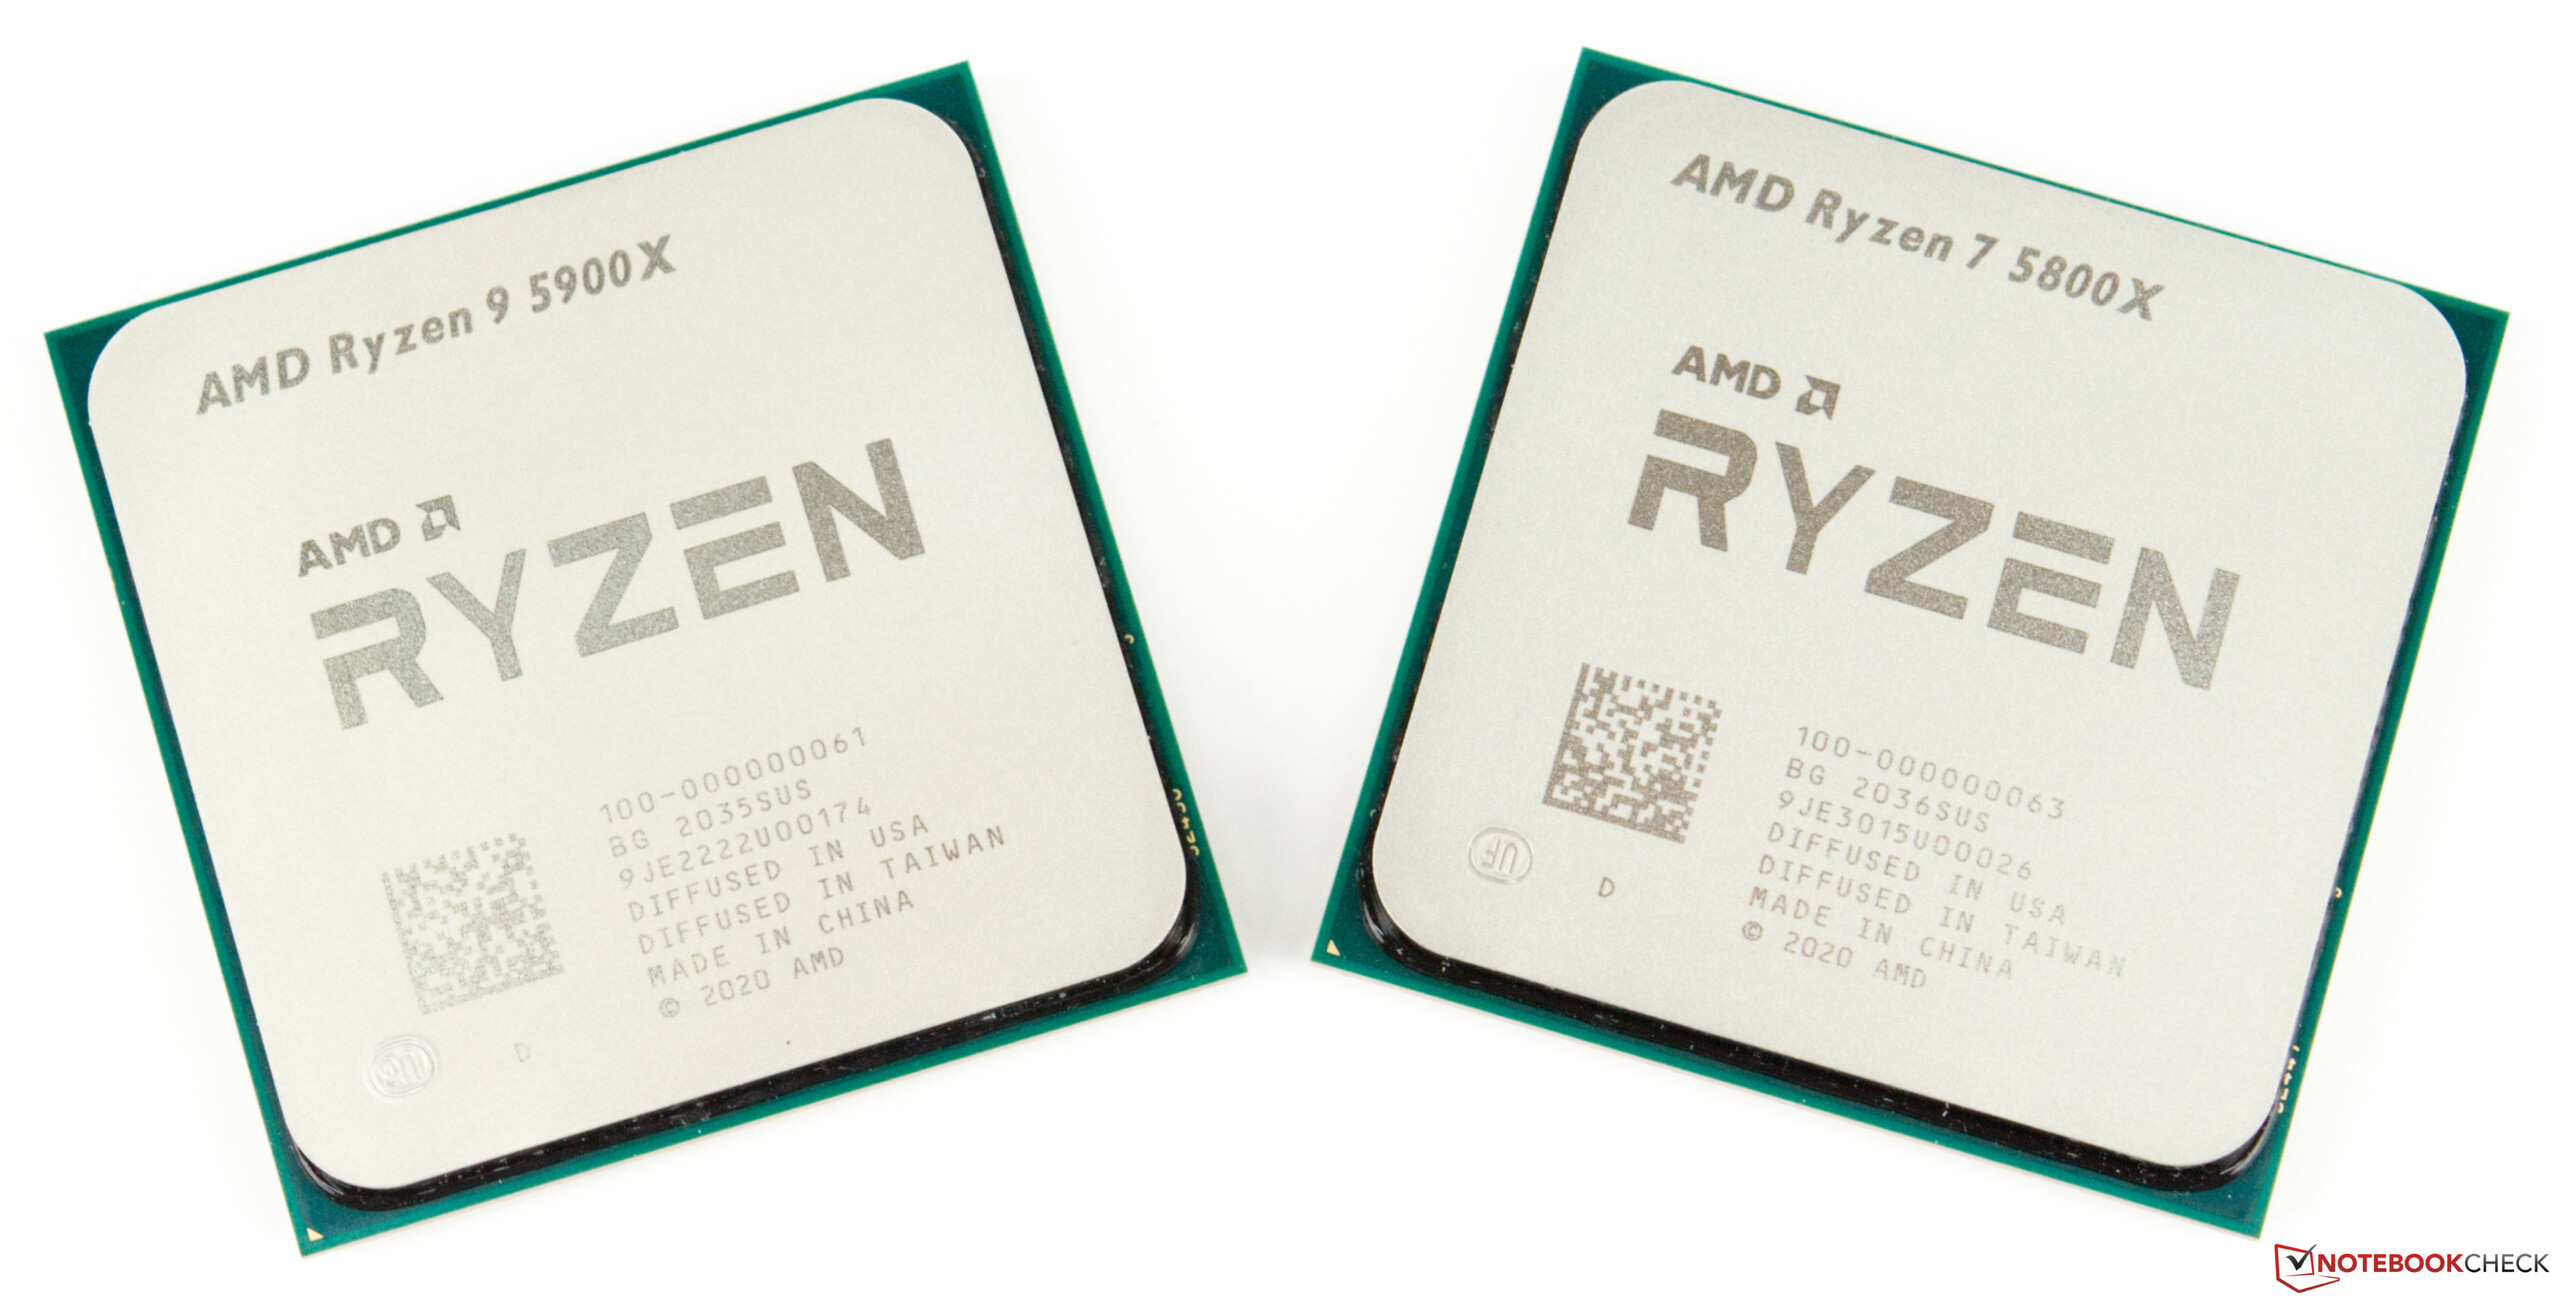
AMD Ryzen 9 5900X and AMD Ryzen 7 5800X in Review: AMD dethrones Intel as Fastest Gaming CPU
AMD’s inception of their Ryzen 3000-series brought new life to the CPU market. For the first time you could get a 16-core CPU that fit into an AM4 socket. In regard of performance these new CPUs were mostly running laps around Intel’s processors in multi-core scenarios where they miles ahead their competition. However, single-core performance remained a sore point, and Intel continued to sell the fastest gaming CPU available and managed to raise that bar even further with the Intel Core i9-10900K by sacrificing energy efficiency for extra single-core performance. AMD, in return, continued to optimize its Zen 3 architecture, which brings updated load and store units that, combined with the cache, are much more powerful than before. On paper, Zen 3 is supposed to offer a 19 % higher IPC than Zen 2. At least in part responsible for this performance increase are the noticeably improved bandwidth and lower latencies. The Infinity Fabric, the connector between the CPU dies and the I/O die, runs at up to 2,000 MHz now resulting in an optimal RAM speed of 4,000 MHz.
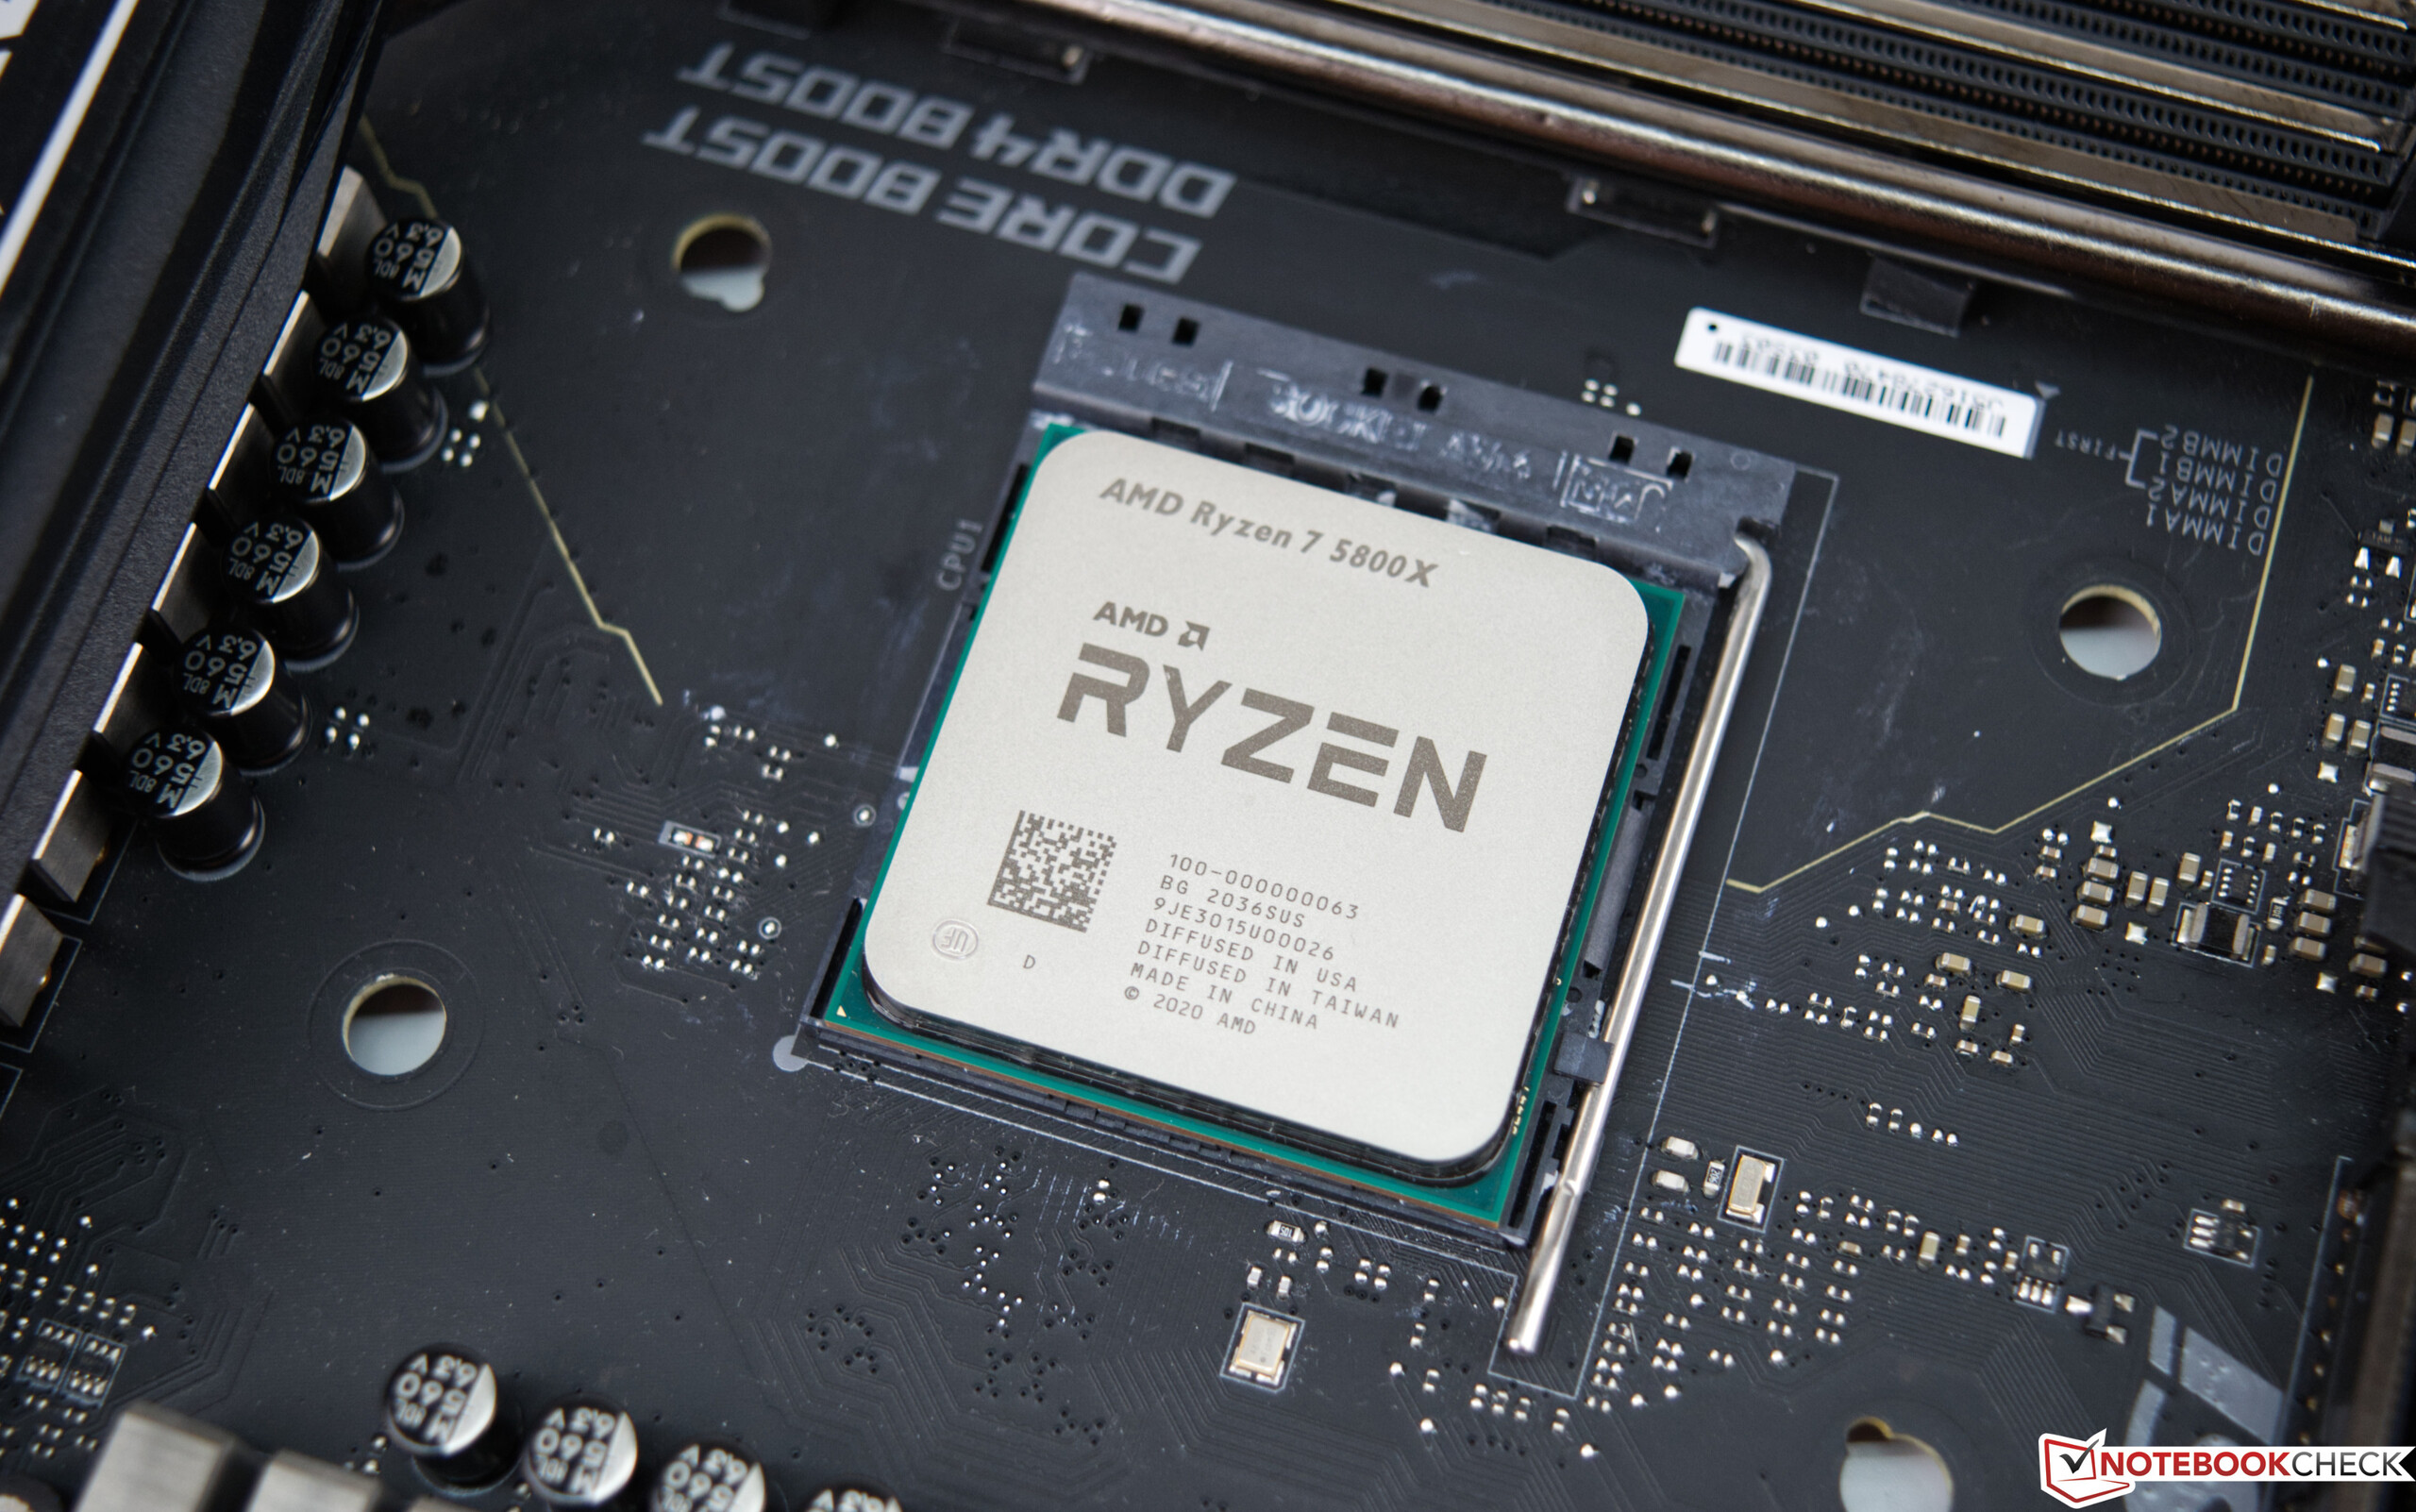
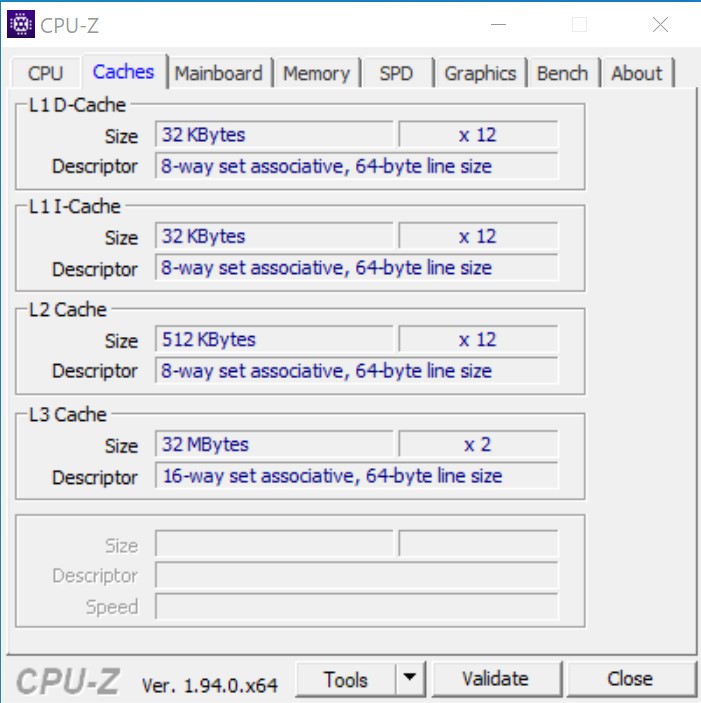
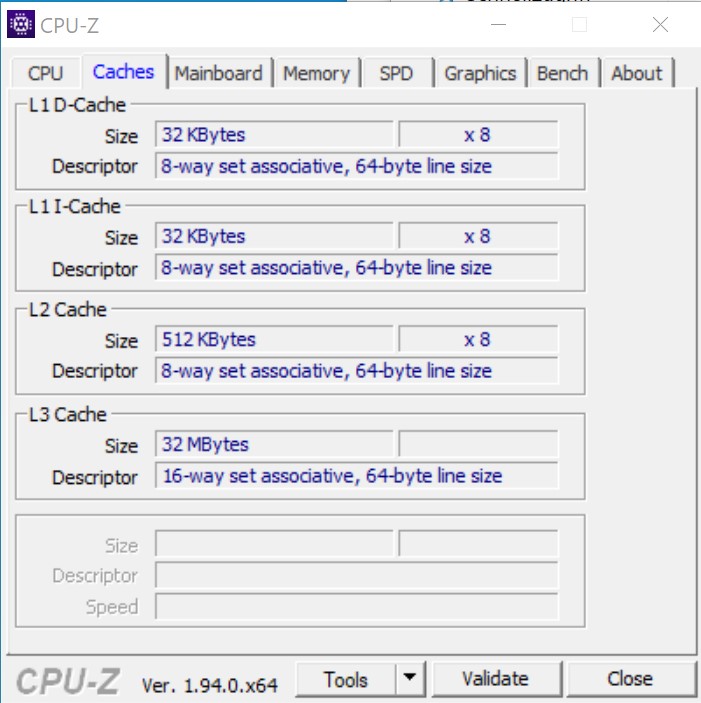
Visually, not much changed on the CPU dies. A Zen 3 CCX now contains eight cores where before there were only four. Each core has access to 32 MB of L3 cache. The I/O die remained unchanged and, unlike the 7 nm CPU dies, continues to be manufactured in a 12 nm process. The next step in lithography evolution, the 5 nm manufacturing process, is expected to arrive with Zen 4.
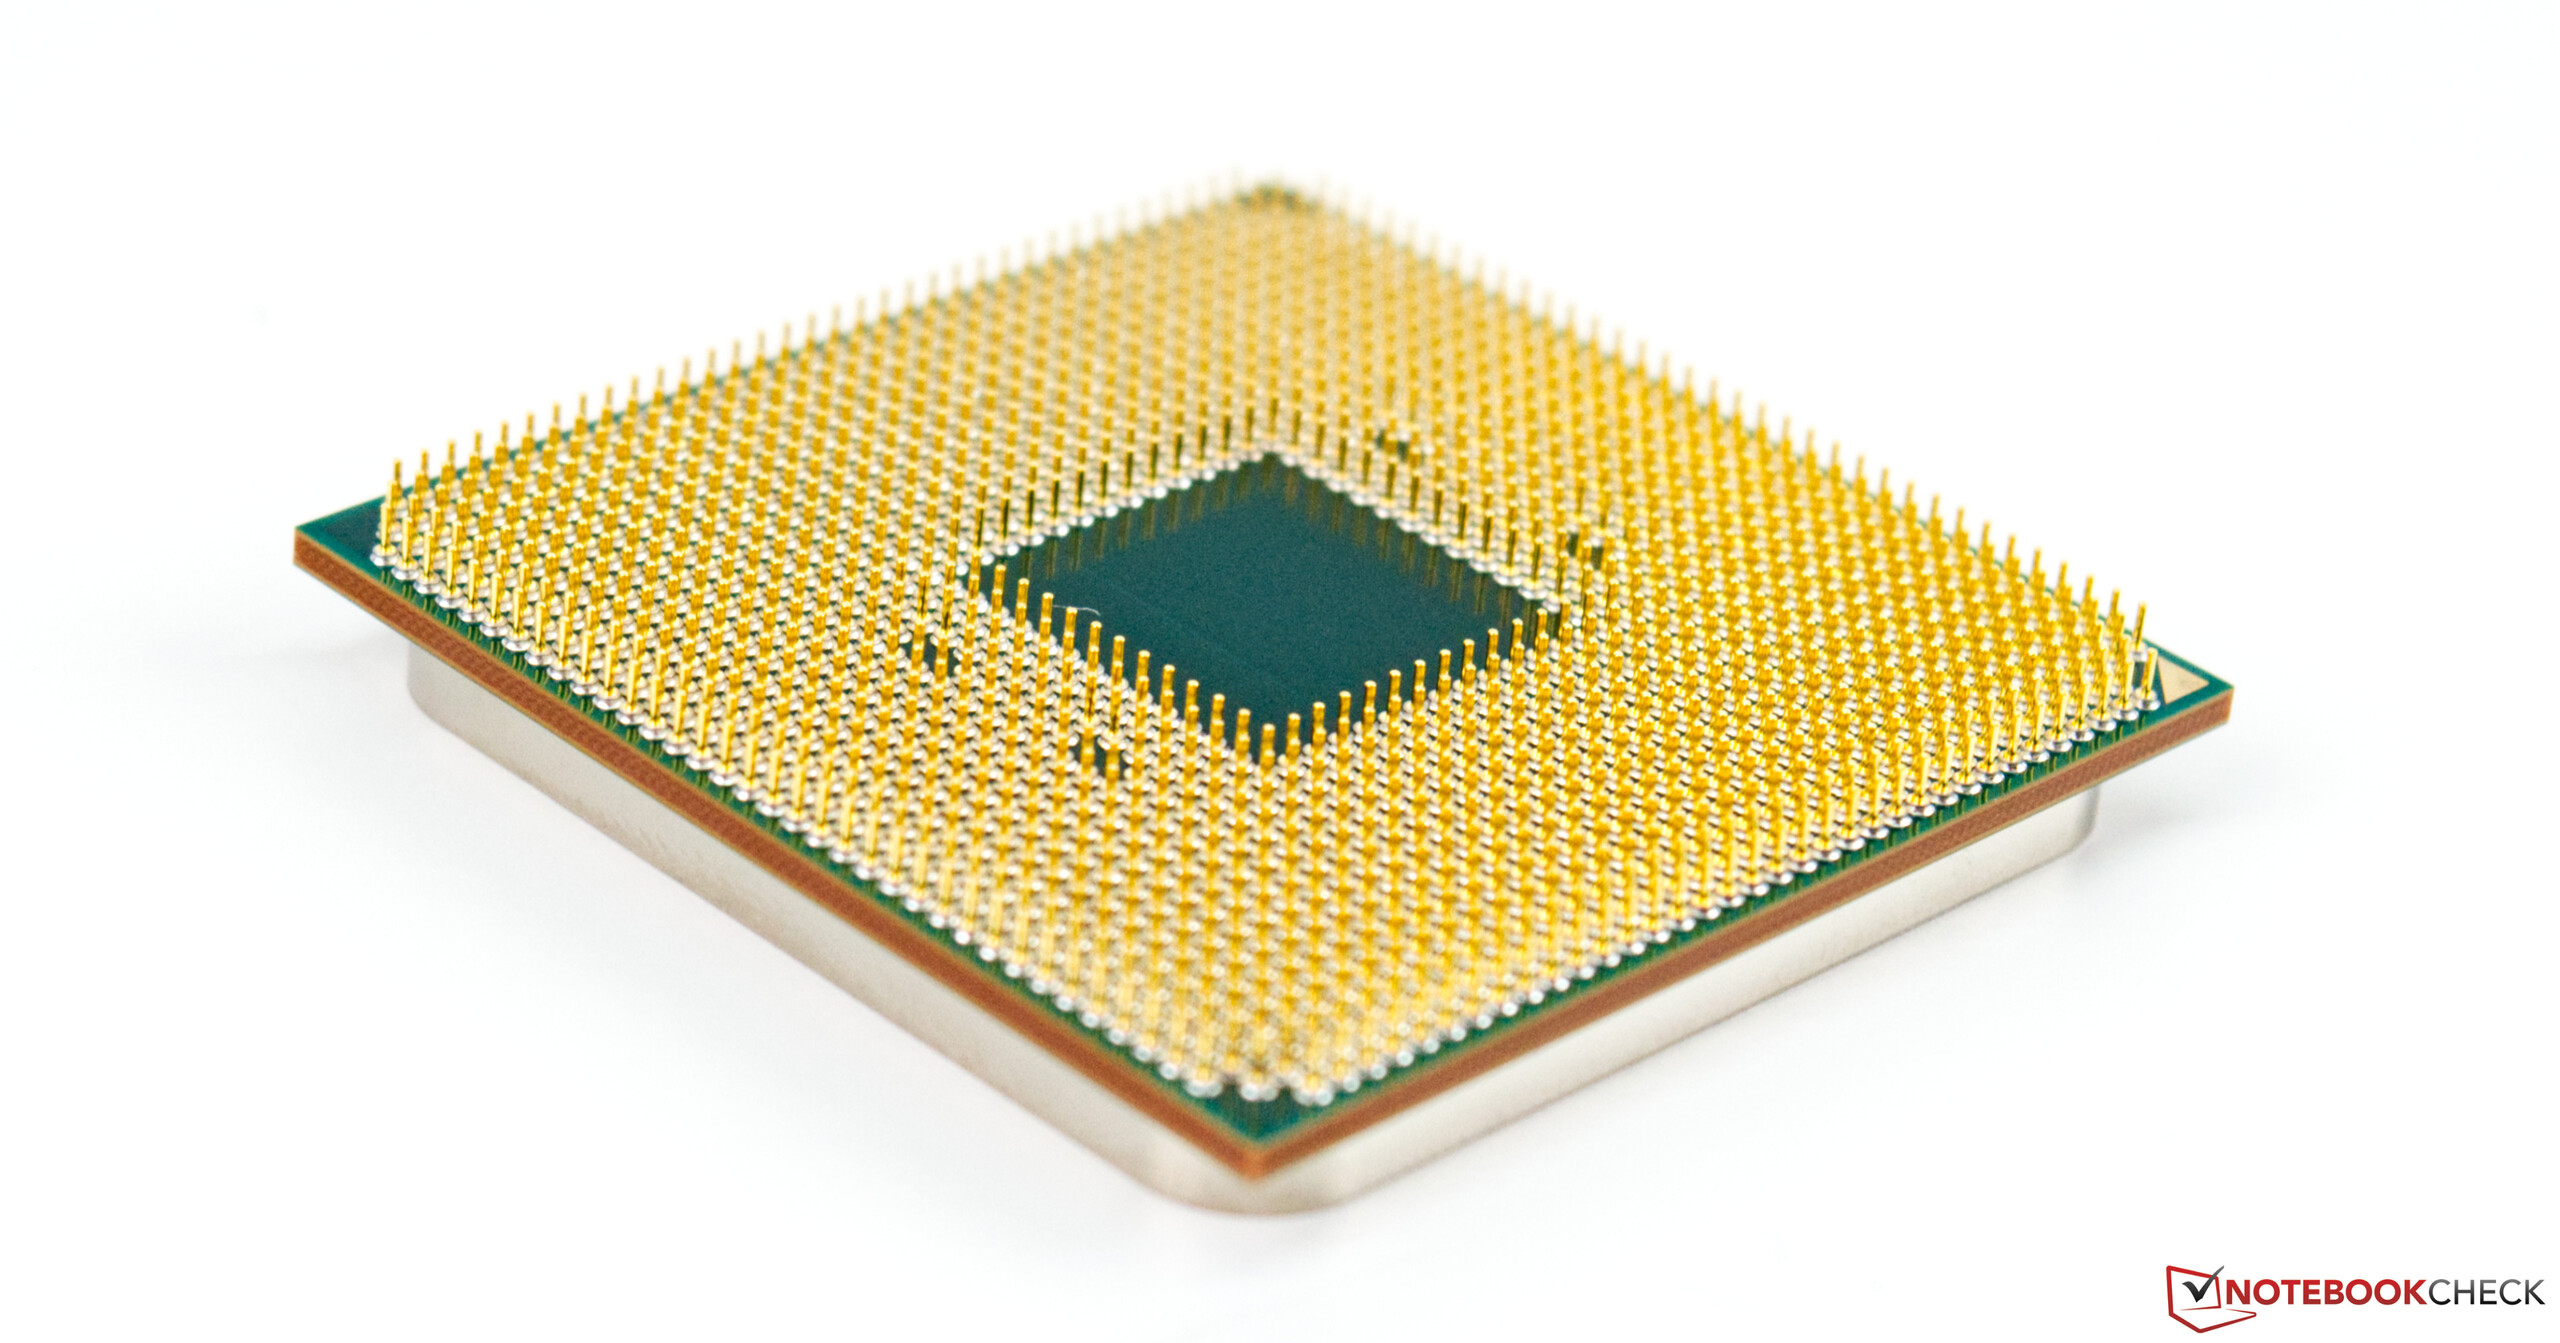
Unlike Intel AMD did not have to increase TDP ratings by any significant amount, and the new Vermeer CPUs are therefore compatible with existing 500-series chipsets. Compared to Intel’s Core i9-10900K’s power consumption of up to 250 W AMD’s new CPU are significantly more energy efficient.
The Ryzen Desktop CPUs
| Model | Cores/Threads | Base Clock | Turbo Clock | L3-Cache | TDP | MSRP at Launch |
|---|---|---|---|---|---|---|
| Ryzen 9 5950X | 16/32 | 3.4 GHz | 4.9 GHz | 64 MB | 105 Watts | $799 |
| Ryzen 9 3950X | 16/32 | 3.5 GHz | 4.7 GHz | 64 MB | 105 Watts | $749 |
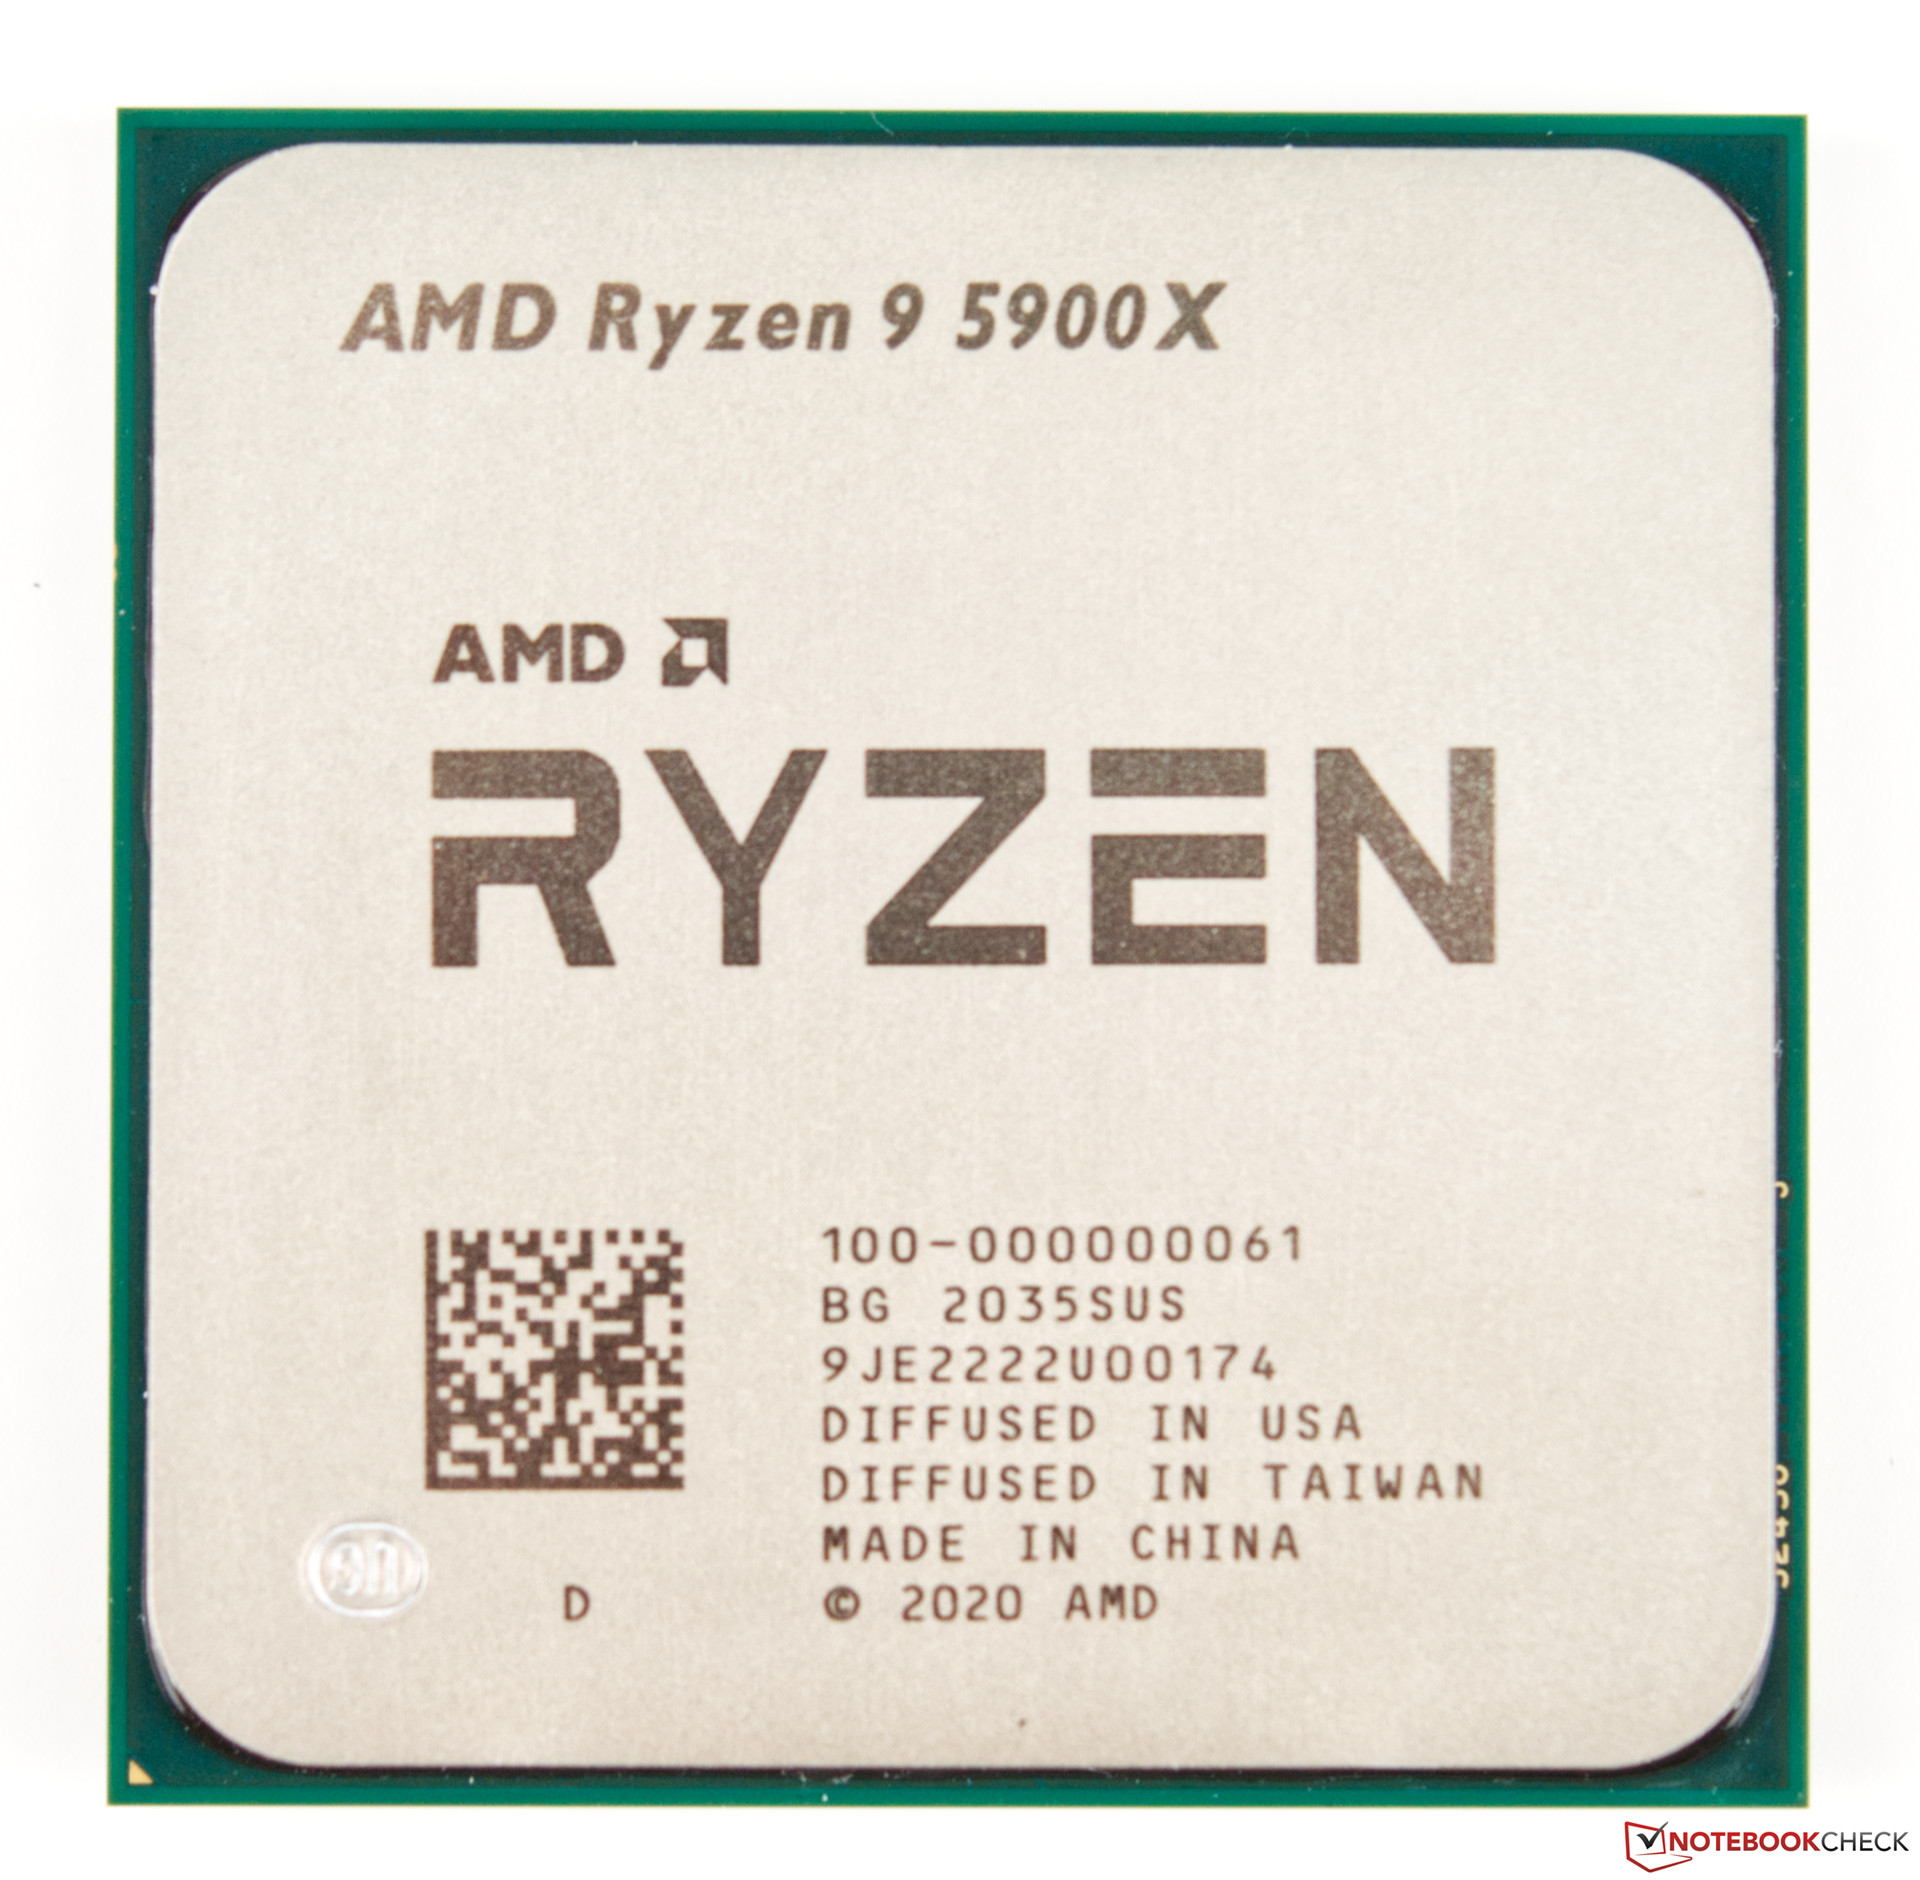
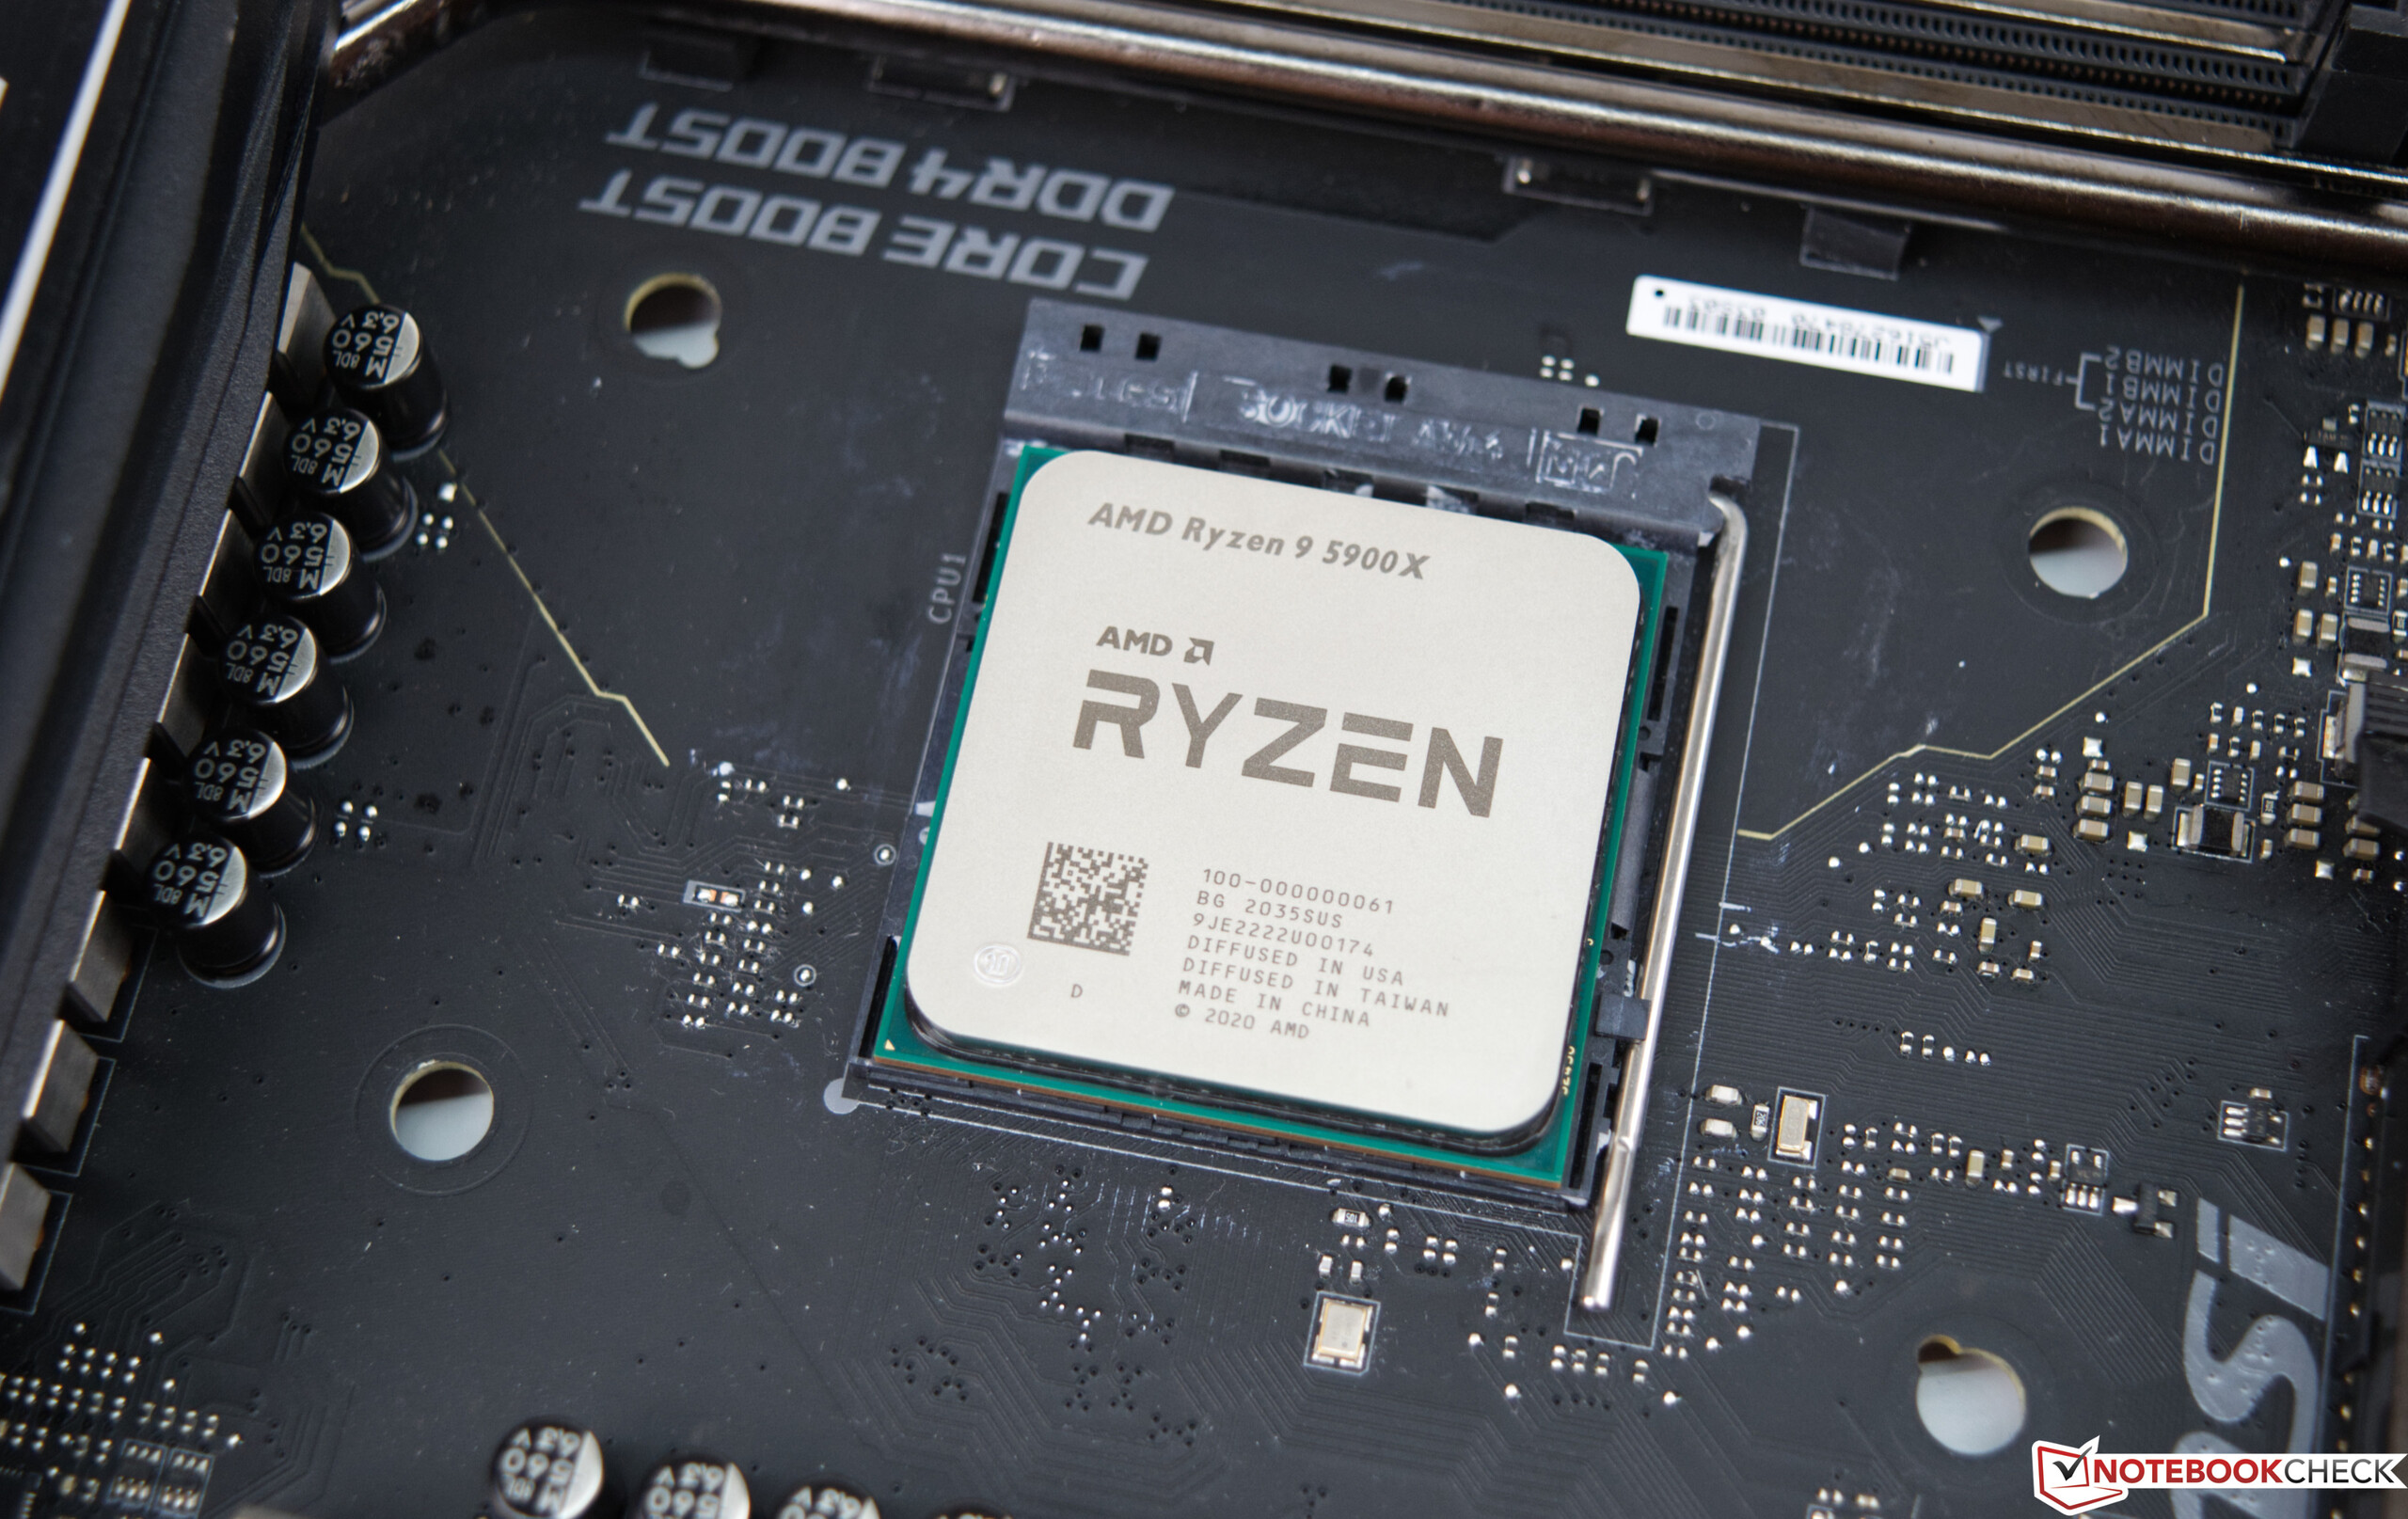
| Ryzen 9 5900X | 12/24 | 3.7 GHz | 4.8 GHz | 64 MB | 105 Watts | $549 |
| Ryzen 9 3900XT | 12/24 | 3.8 GHz | 4.7 GHz | 64 MB | 105 Watts | $499 |
| Ryzen 9 3900X | 12/24 | 3.8 GHz | 4.6 GHz | 64 MB | 105 Watts | $499 |
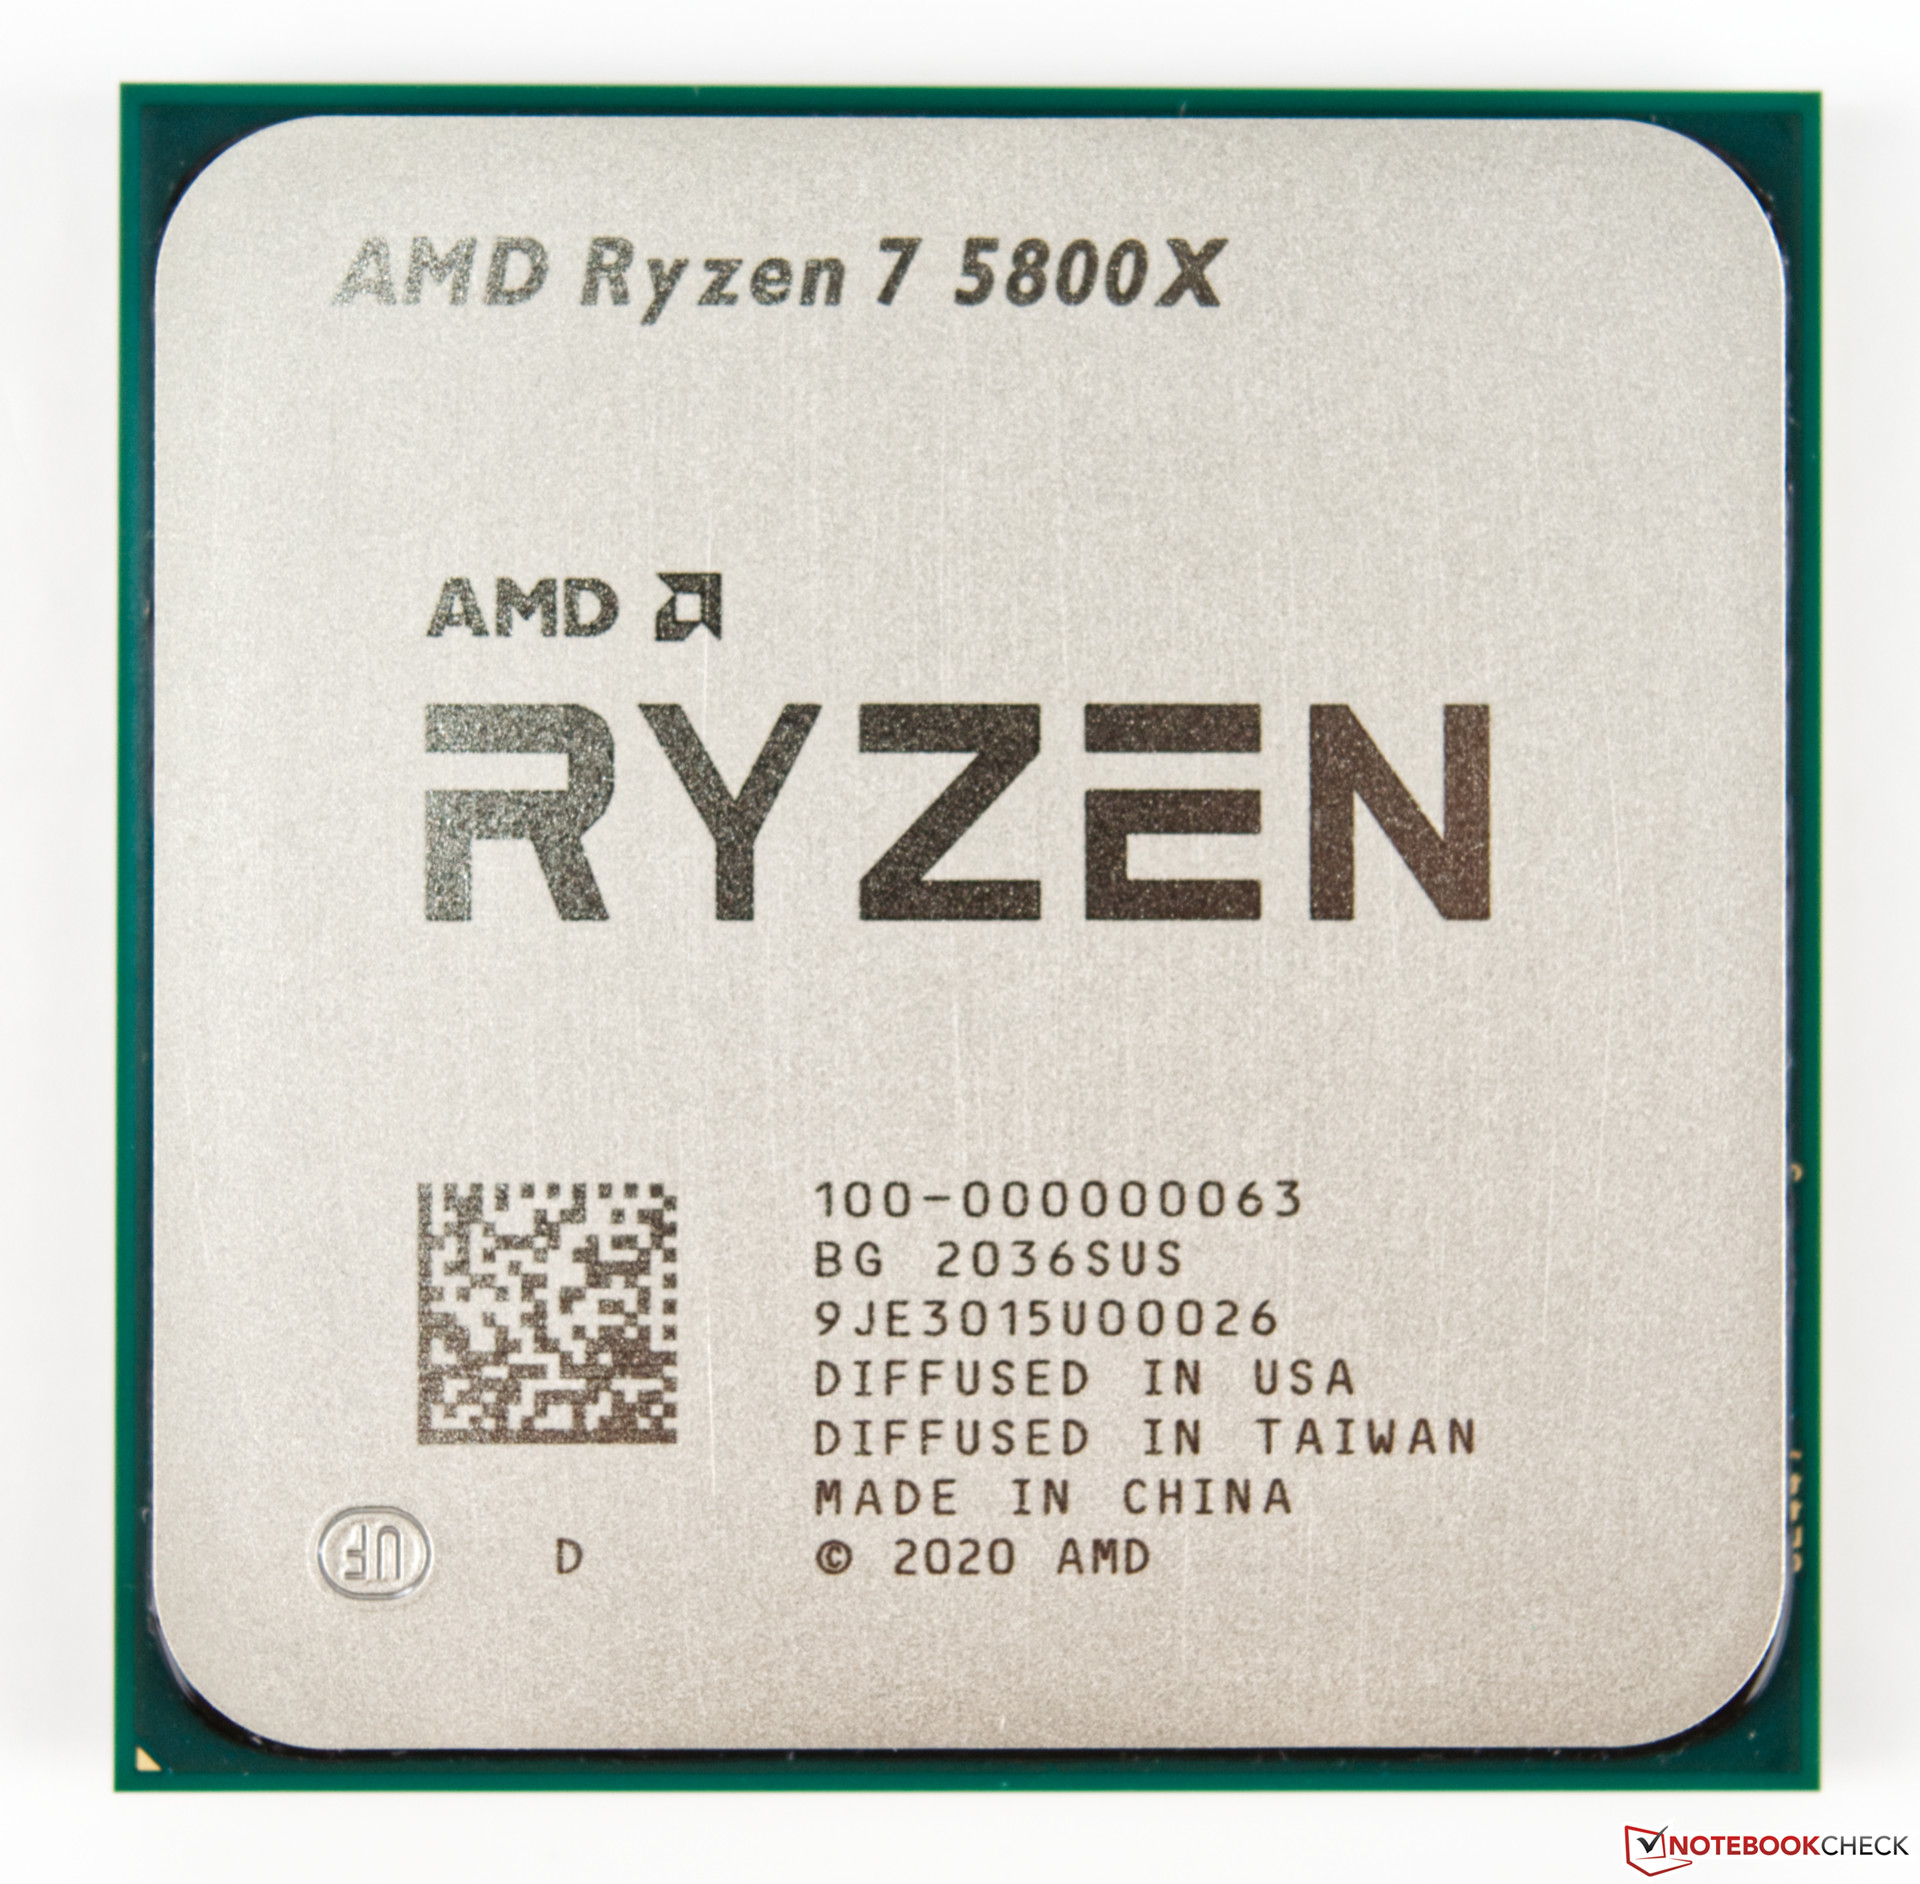
| Ryzen 7 5800X | 8/16 | 3.8 GHz | 4.7 GHz | 32 MB | 105 Watts | $449 |
| Ryzen 7 3800XT | 8/16 | 3.9 GHz | 4.7 GHz | 32 MB | 105 Watts | $399 |
| Ryzen 7 3800X | 8/16 | 3.9 GHz | 4.5 GHz | 32 MB | 105 Watts | $399 |
| Ryzen 7 3700X | 8/16 | 3.6 GHz | 4.4 GHz | 32 MB | 65 Watts | $329 |
| Ryzen 5 5600X | 6/12 | 3.7 GHz | 4.6 GHz | 32 MB | 65 Watt | $299 |
| Ryzen 5 3600XT | 6/12 | 3.8 GHz | 4.5 GHz | 32 MB | 95 Watts | $249 |
| Ryzen 5 3600X | 6/12 | 3.8 GHz | 4.4 GHz | 32 MB | 95 Watts | $229 |
| Ryzen 5 3600 | 6/12 | 3.6 GHz | 4.2 GHz | 32 MB | 65 Watts | $199 |
Test System Details
We used the following system to run all benchmarks and tests in this review:
- Raijintek Pean Benchtable
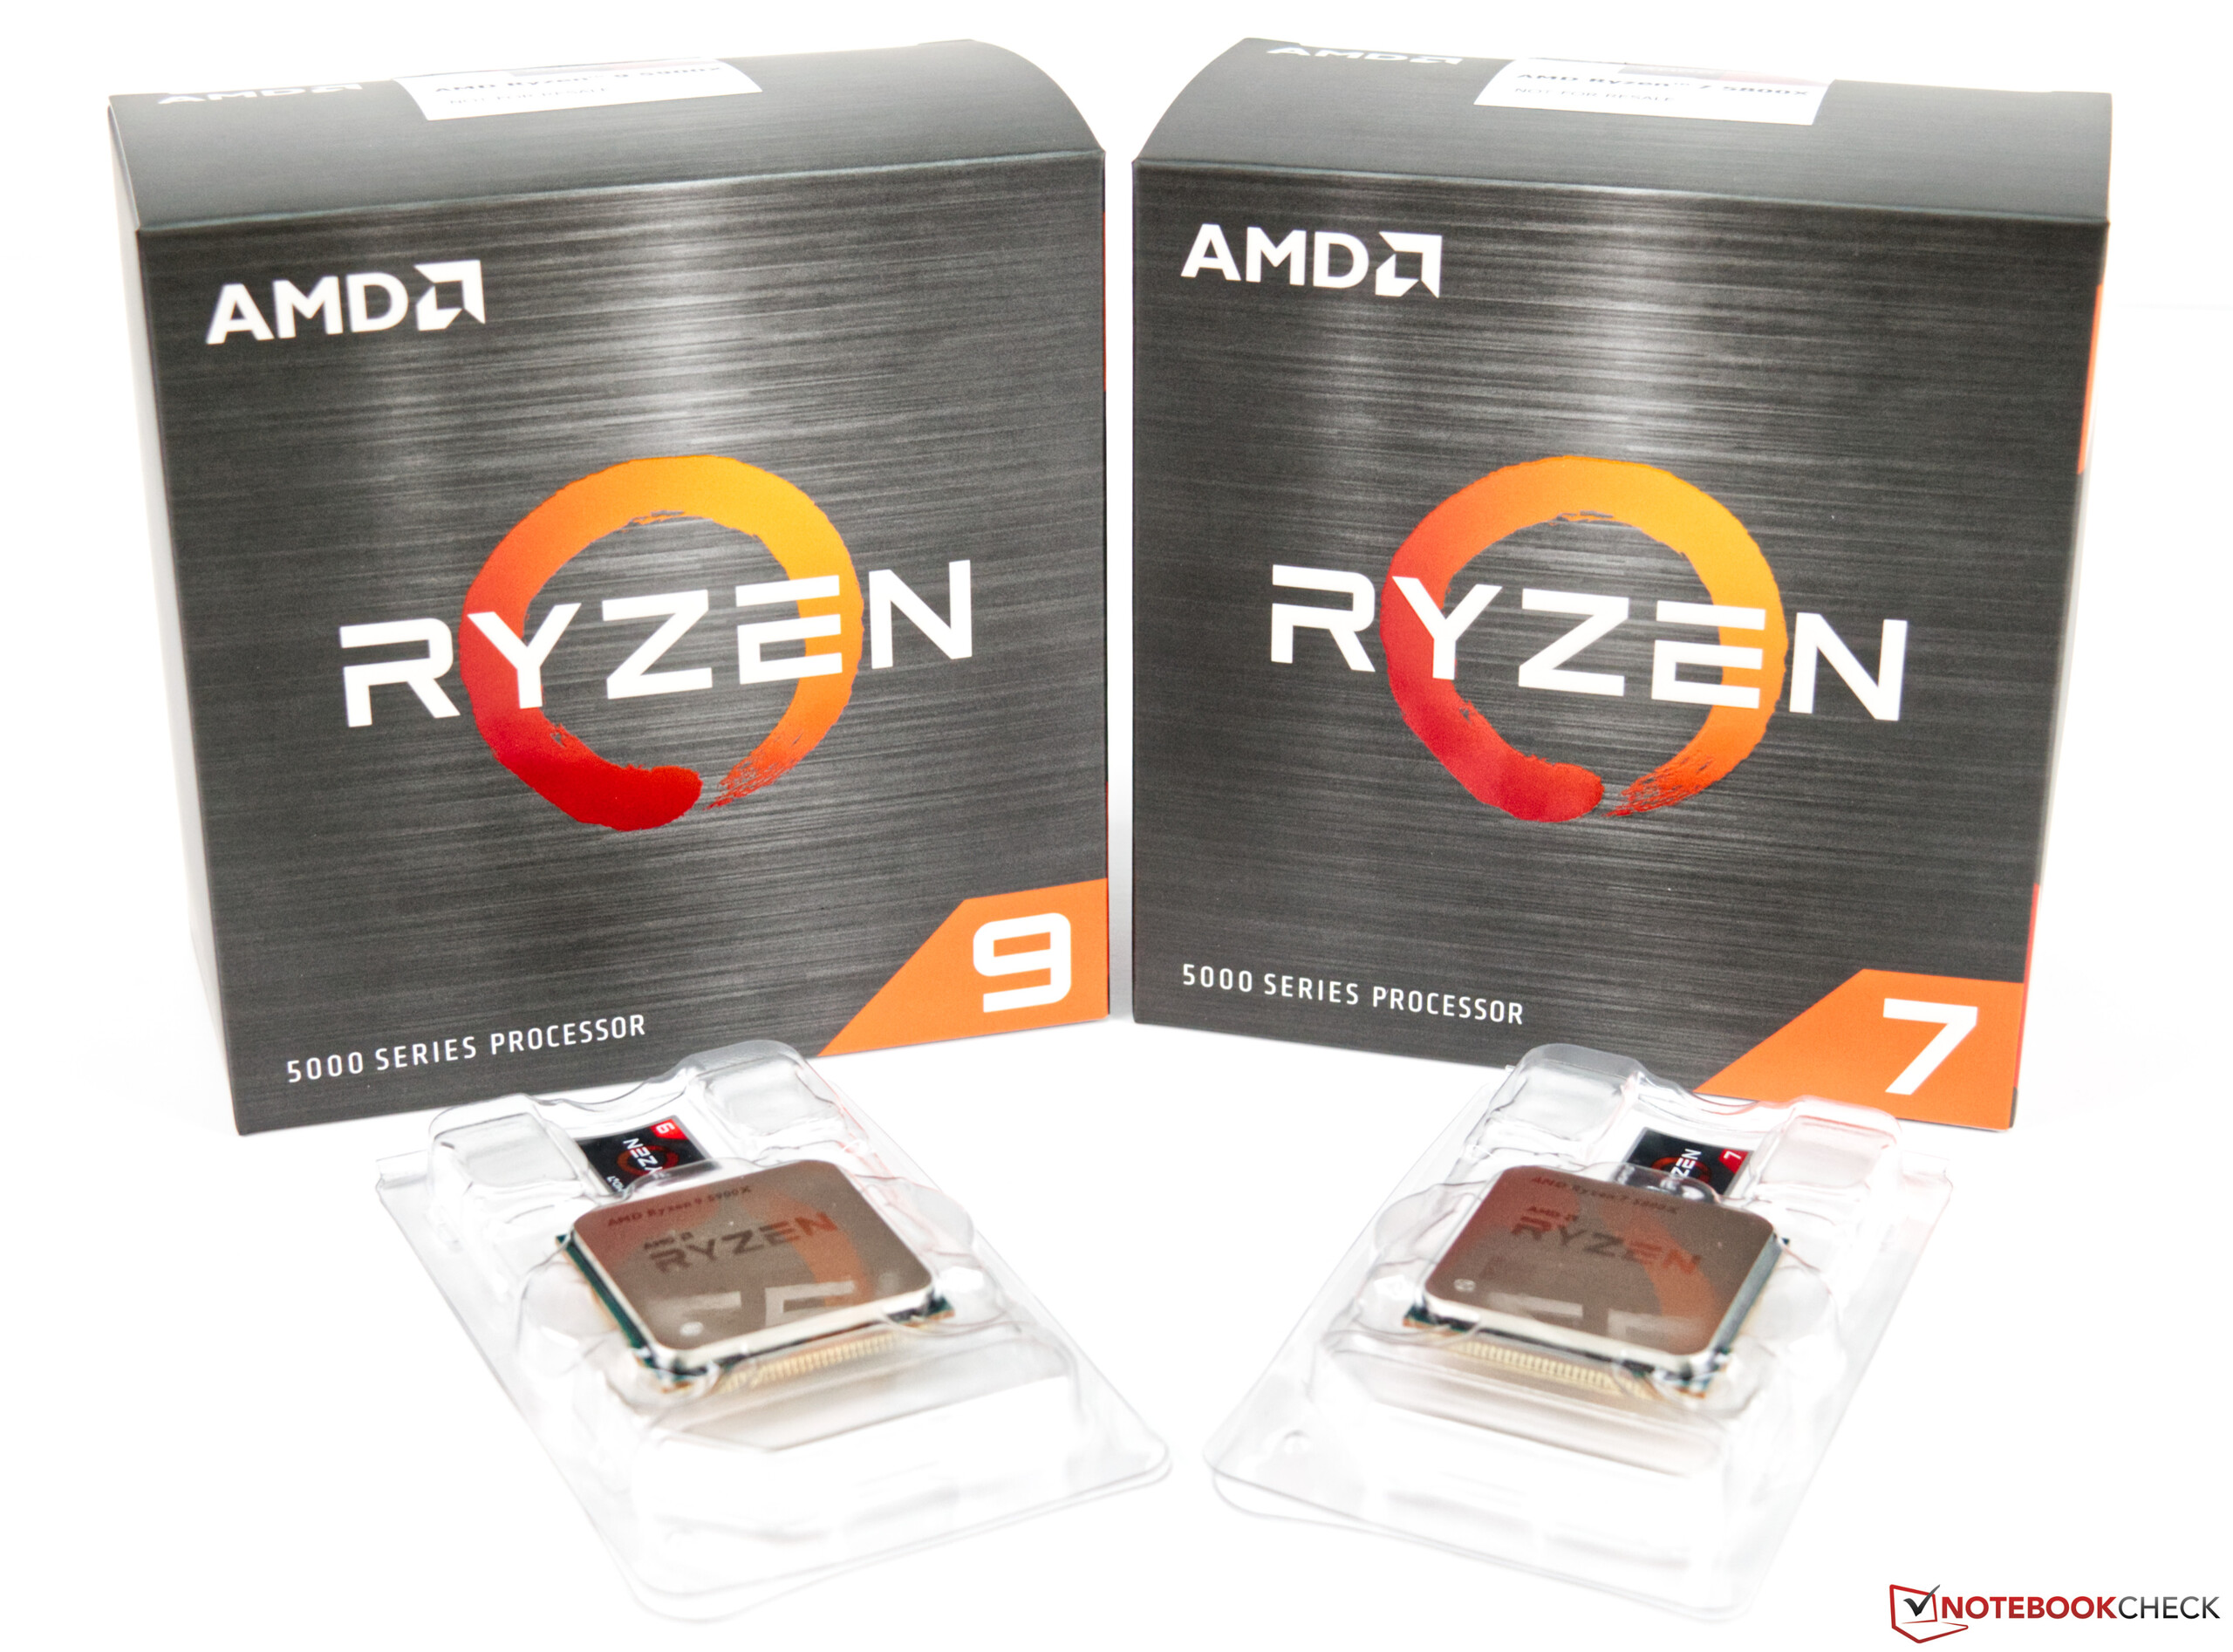
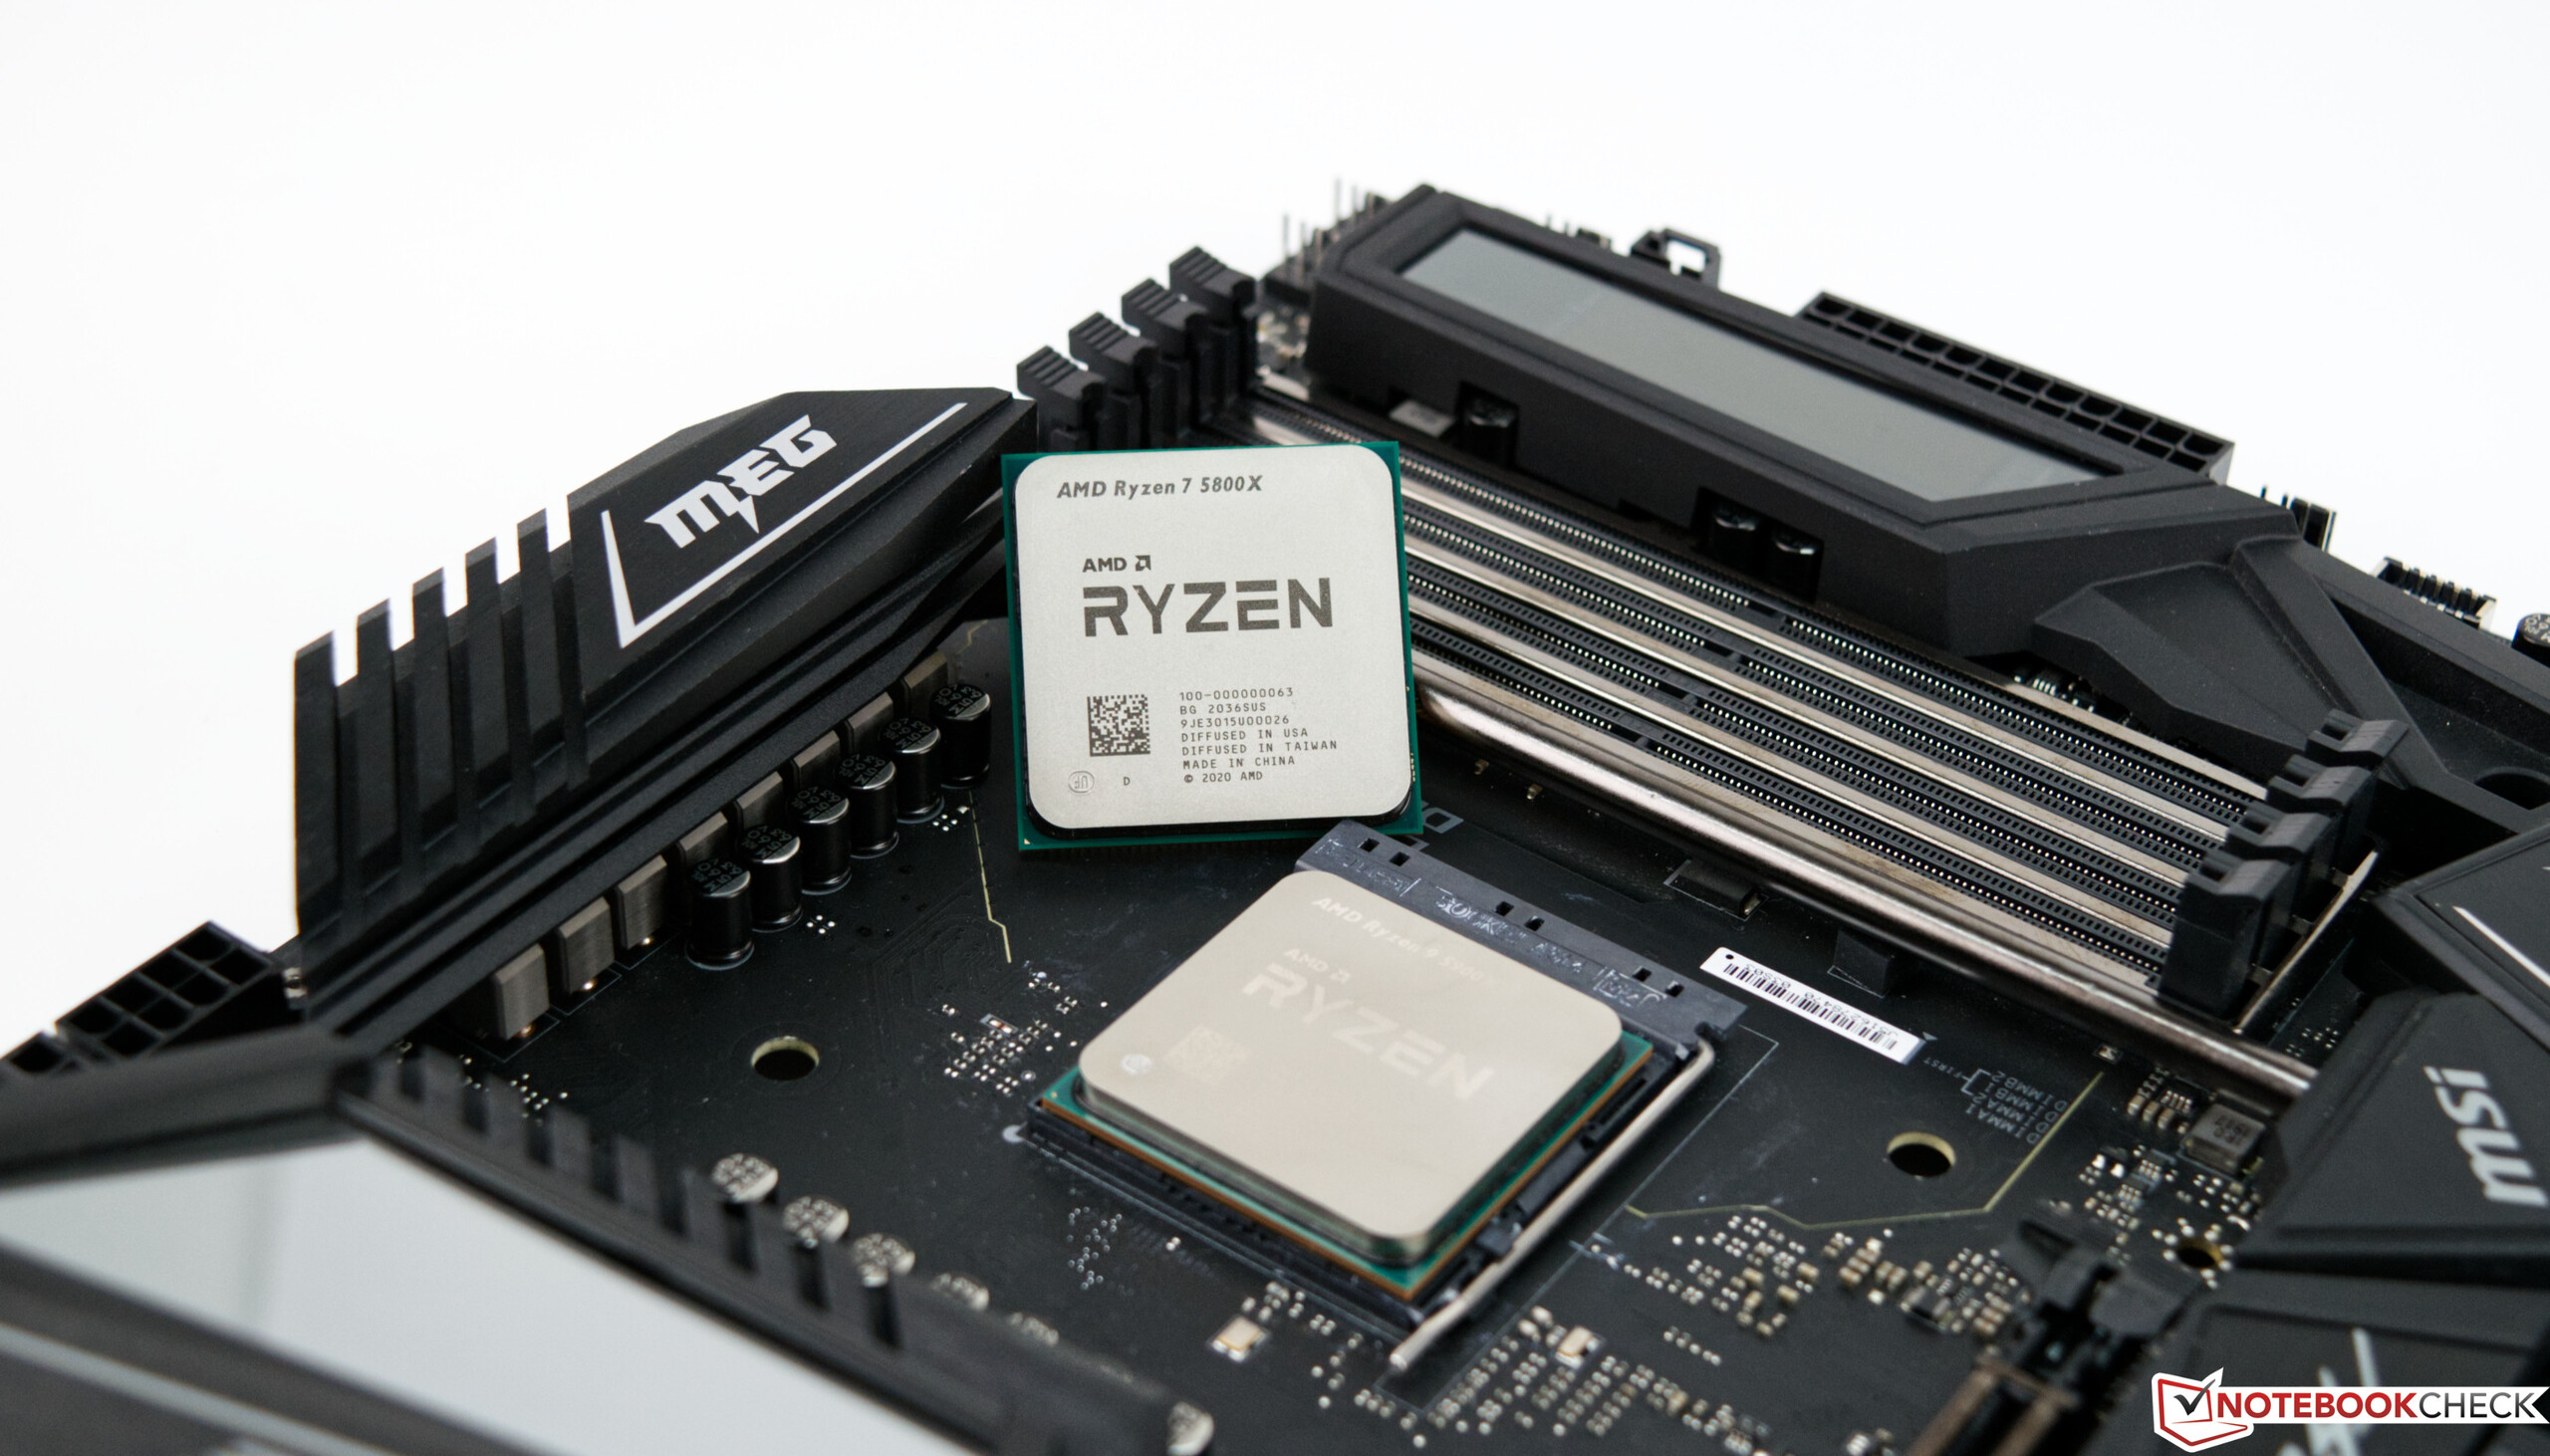
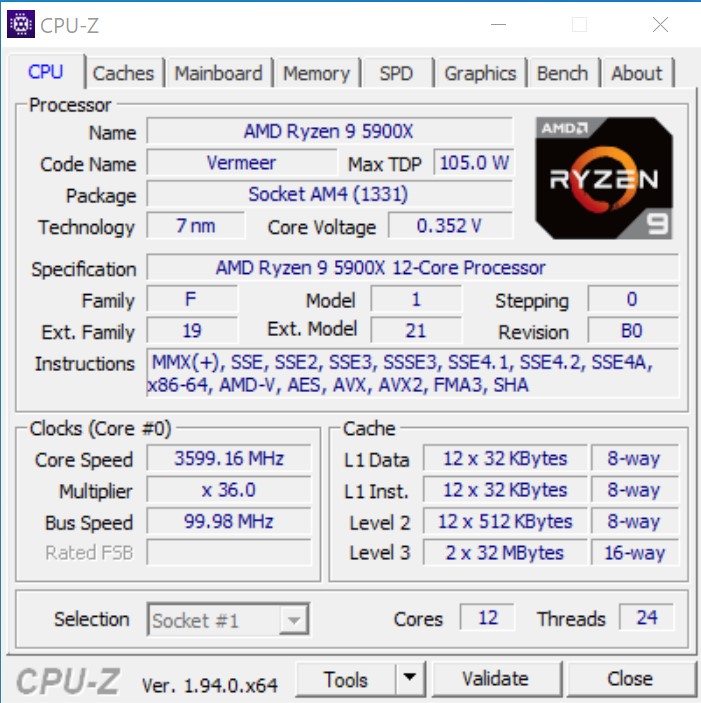
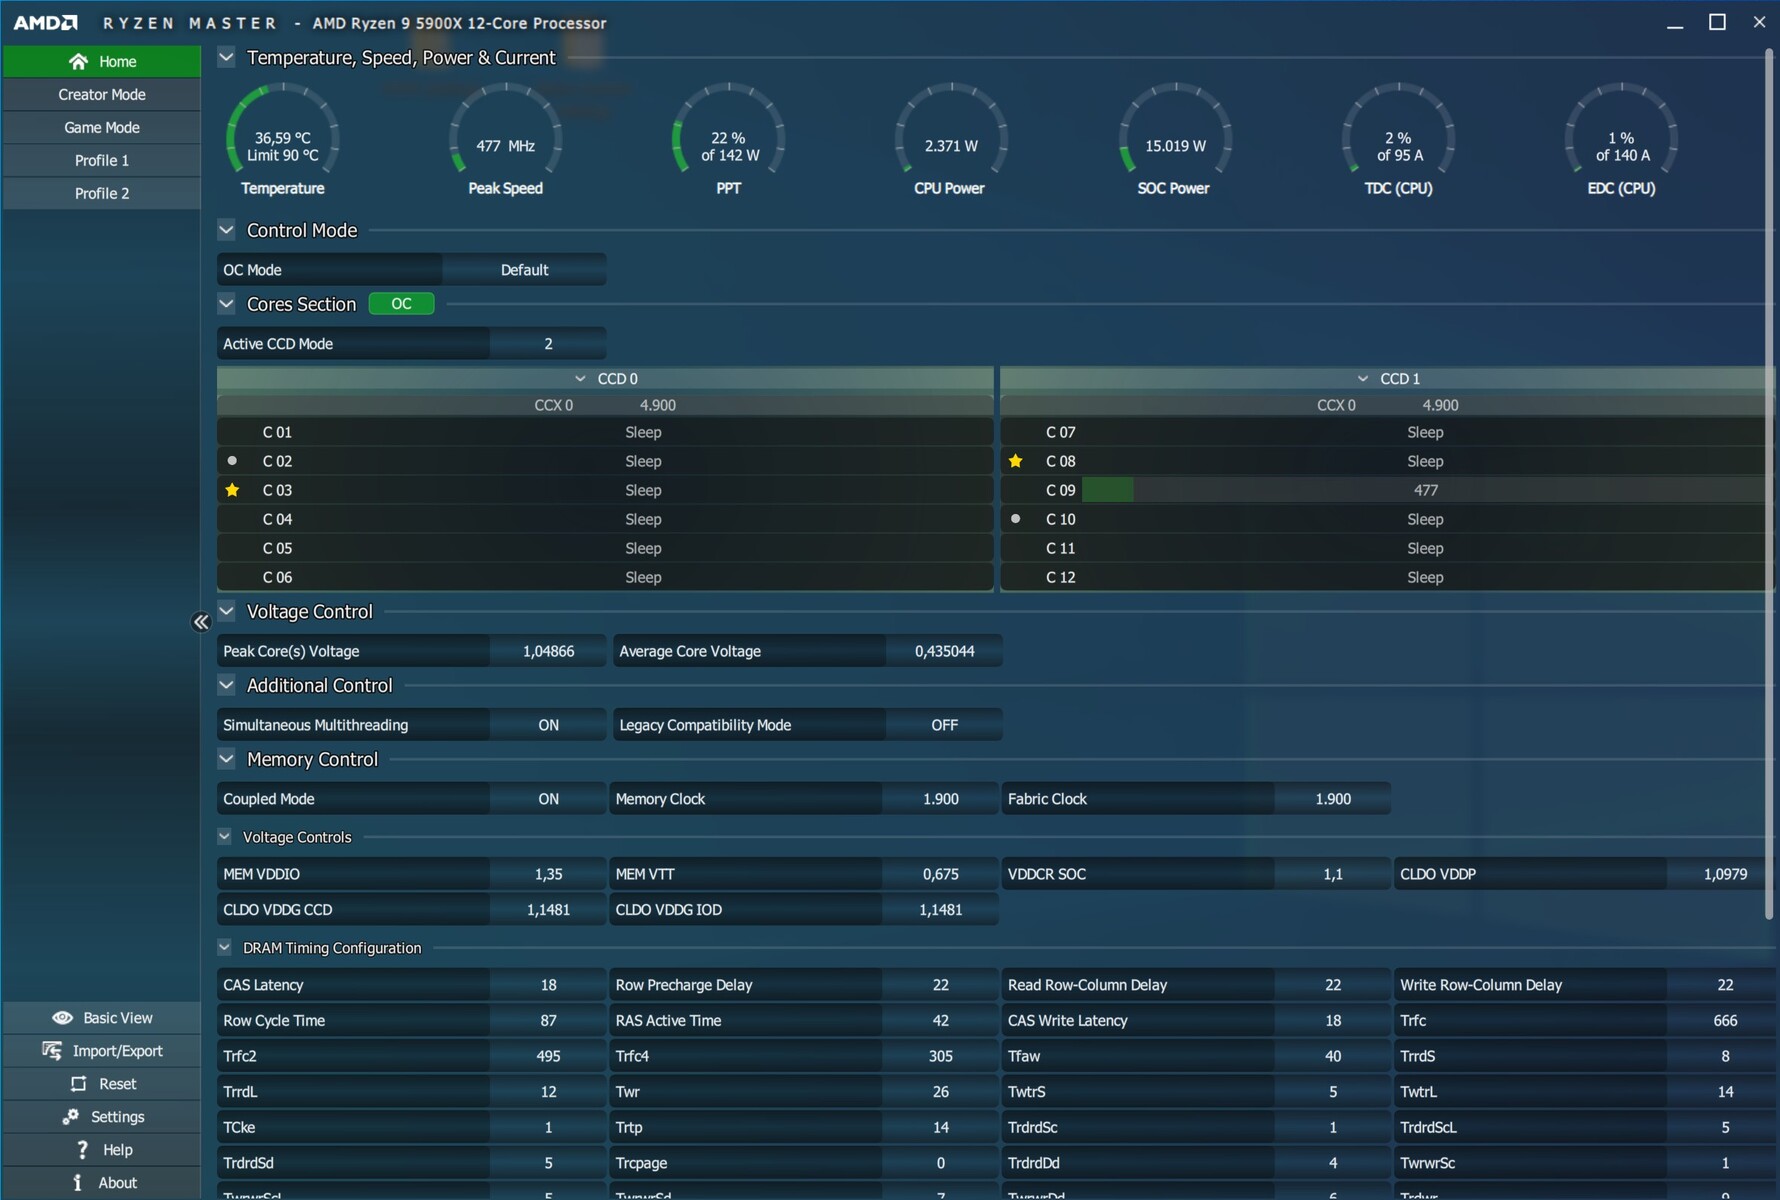
- AMD Ryzen 9 5900X, AMD Ryzen 7 5800X
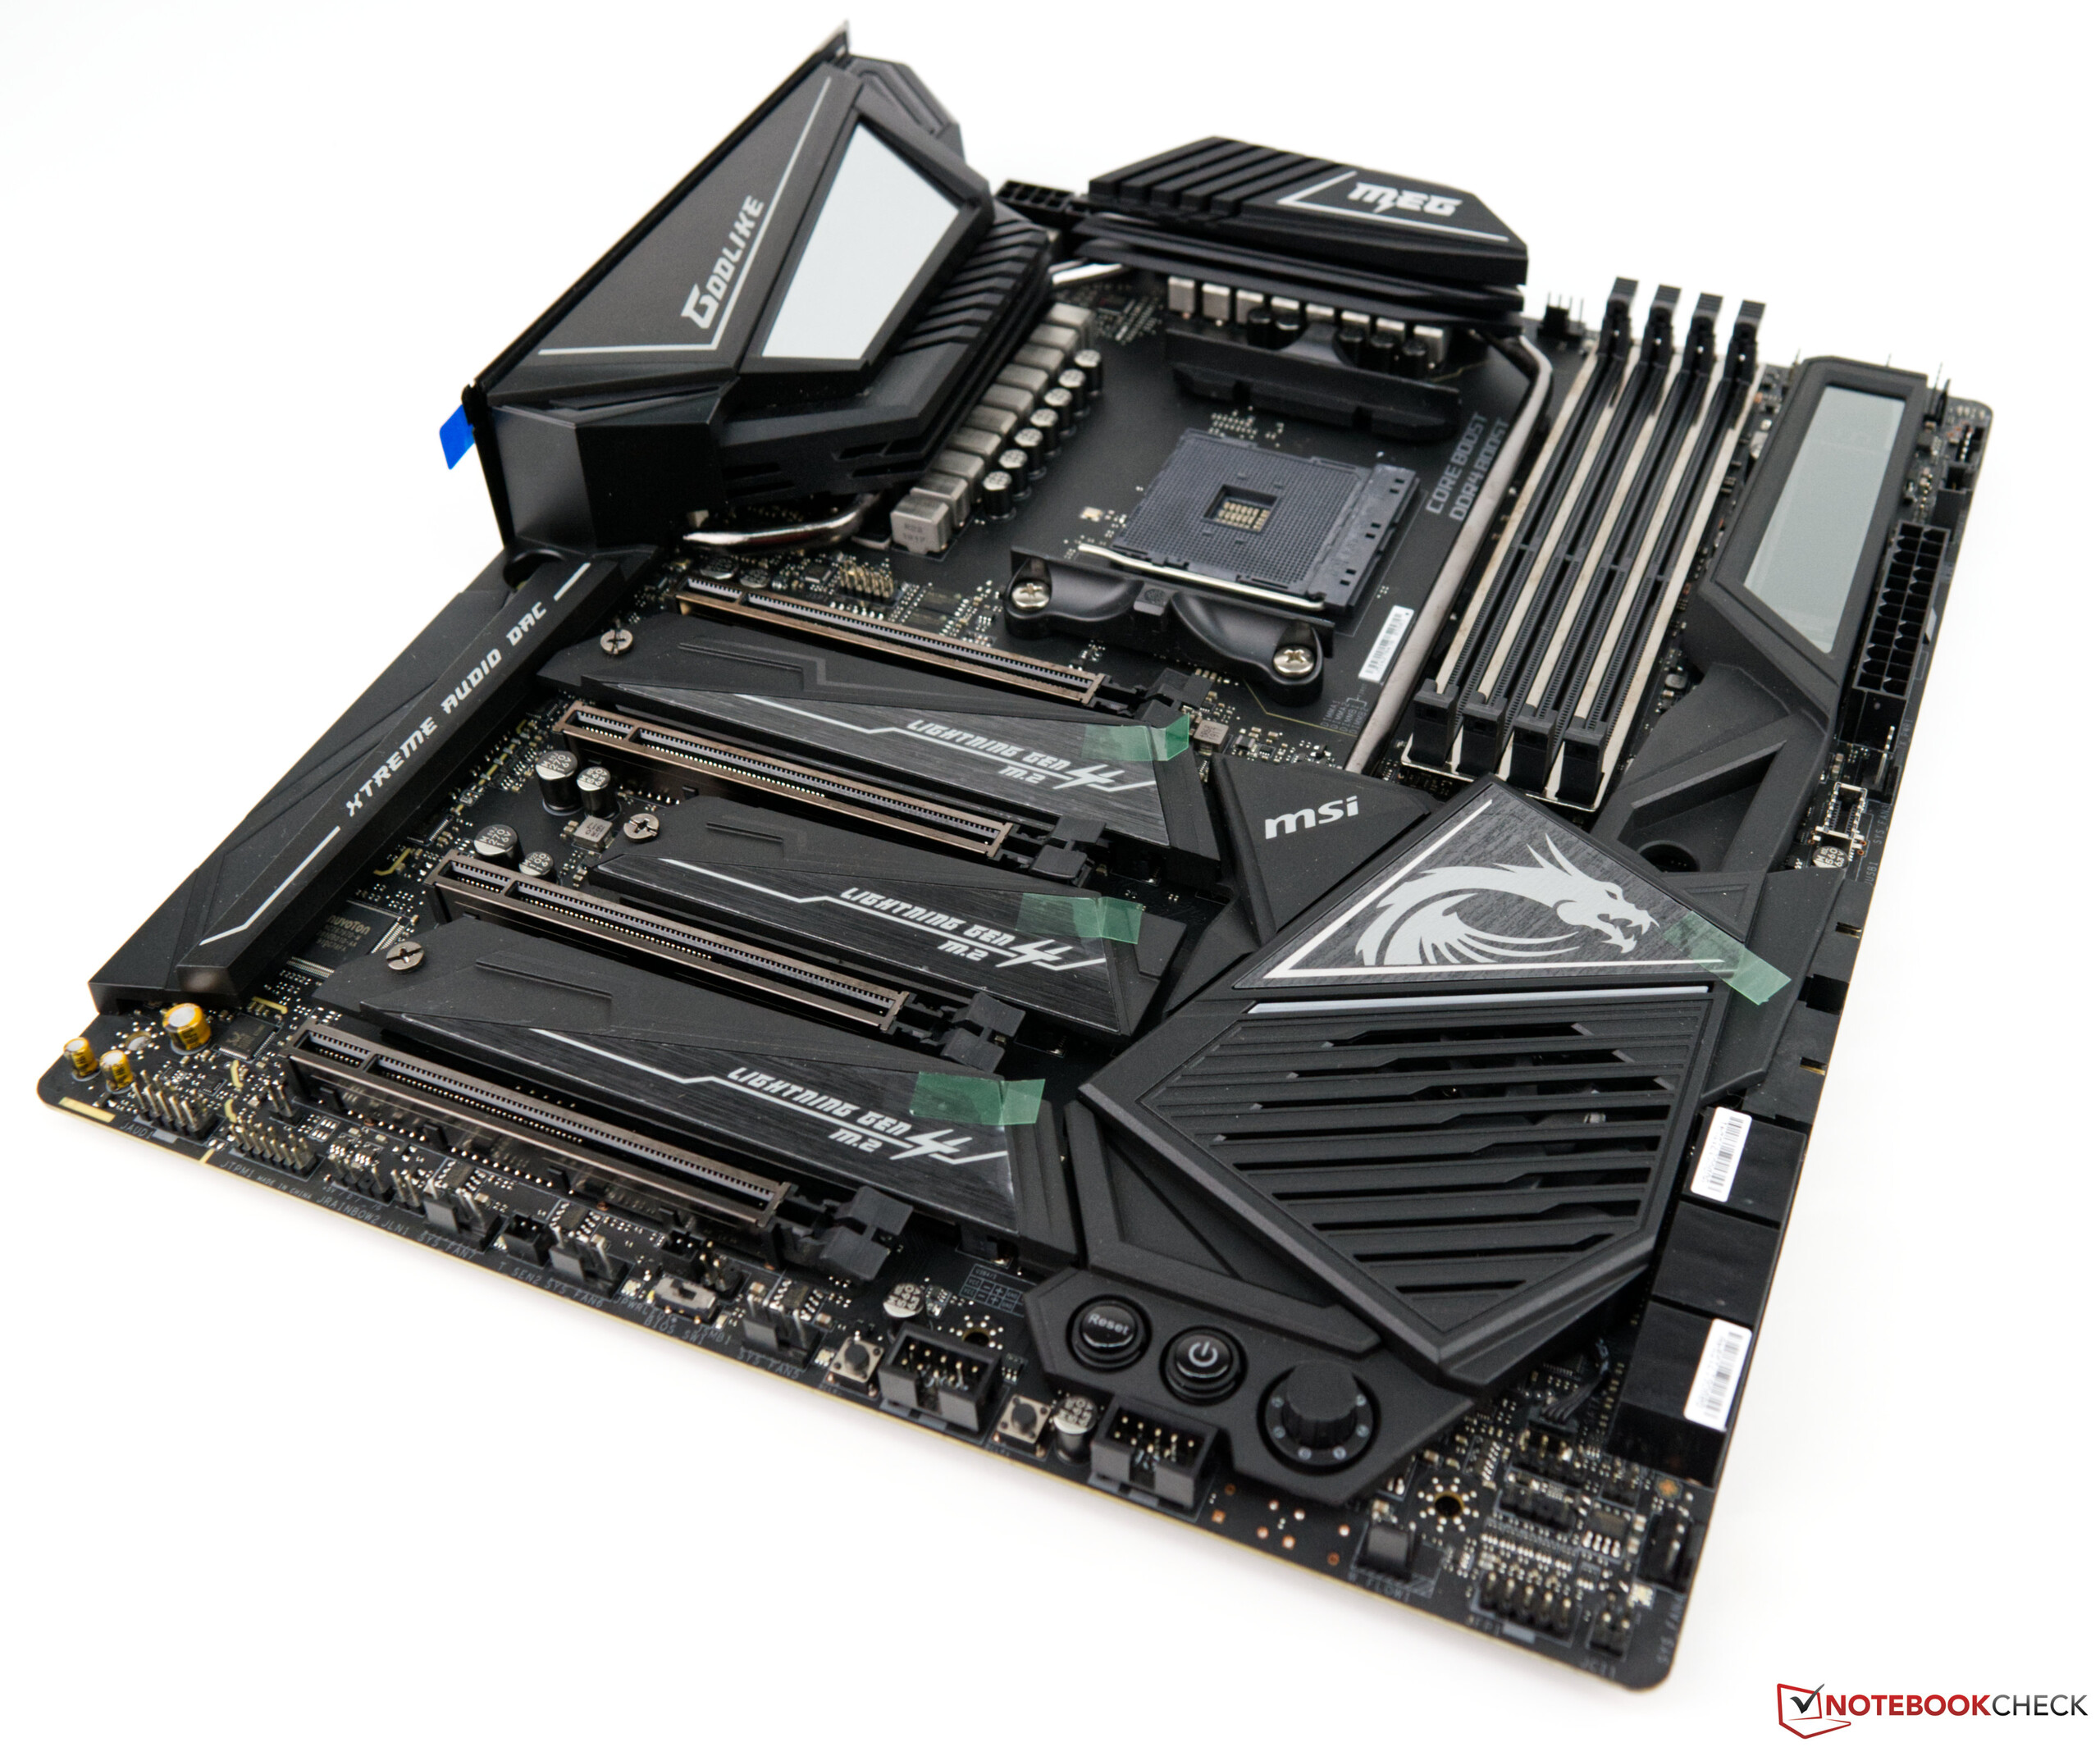
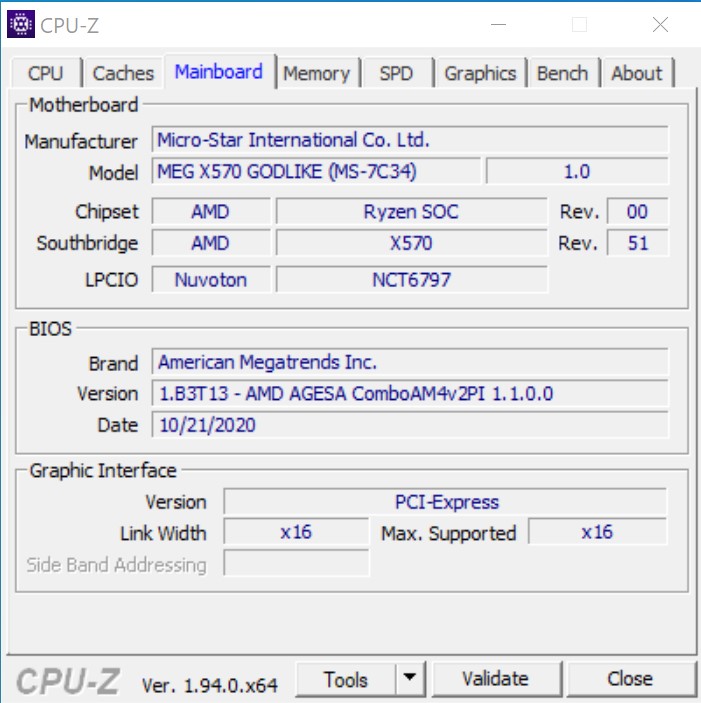
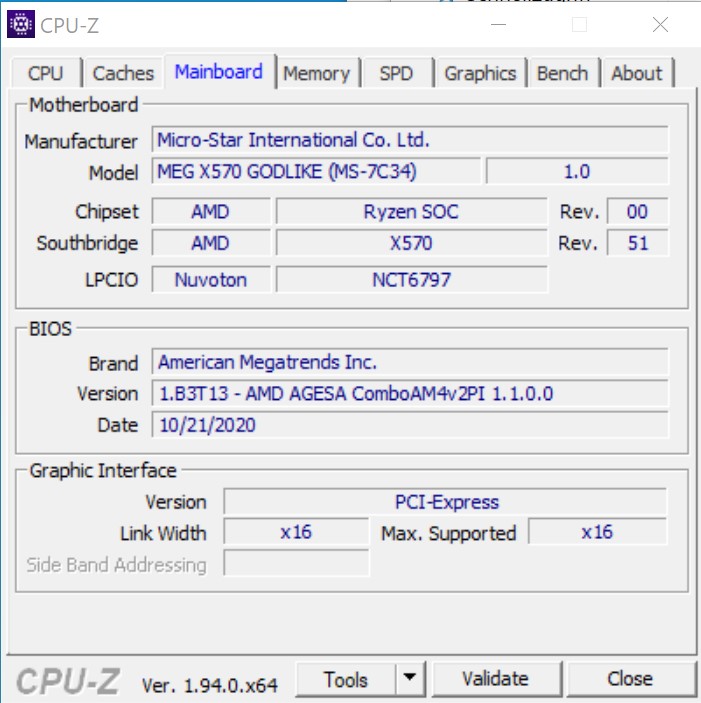
- MSI MEG X570 Godlike
- Alphacool Eisbear 280 AiO
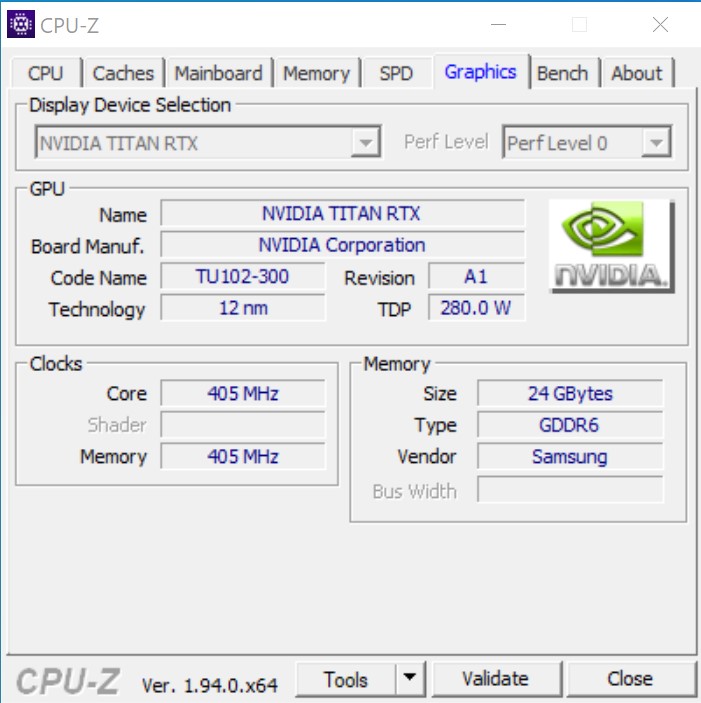
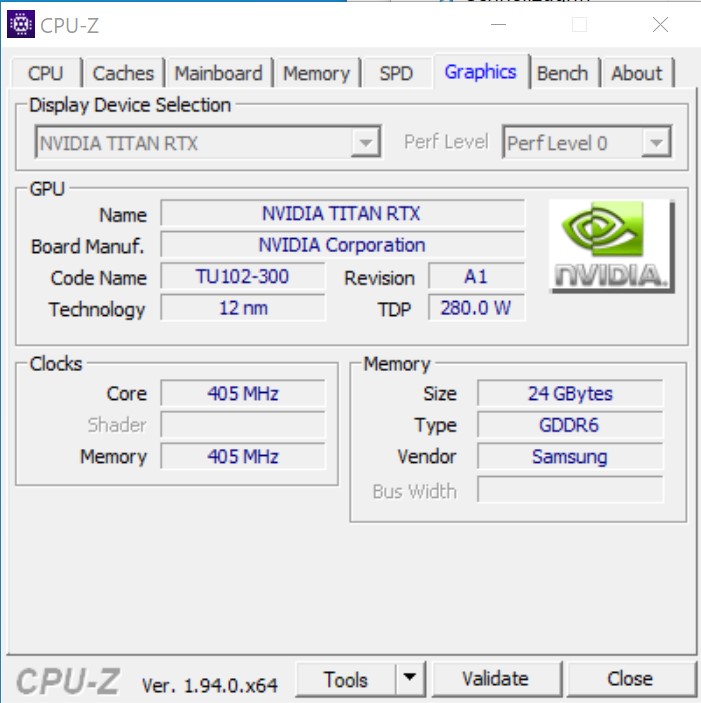
- Nvidia Titan RTX
- Corsair HX 1200i power supply
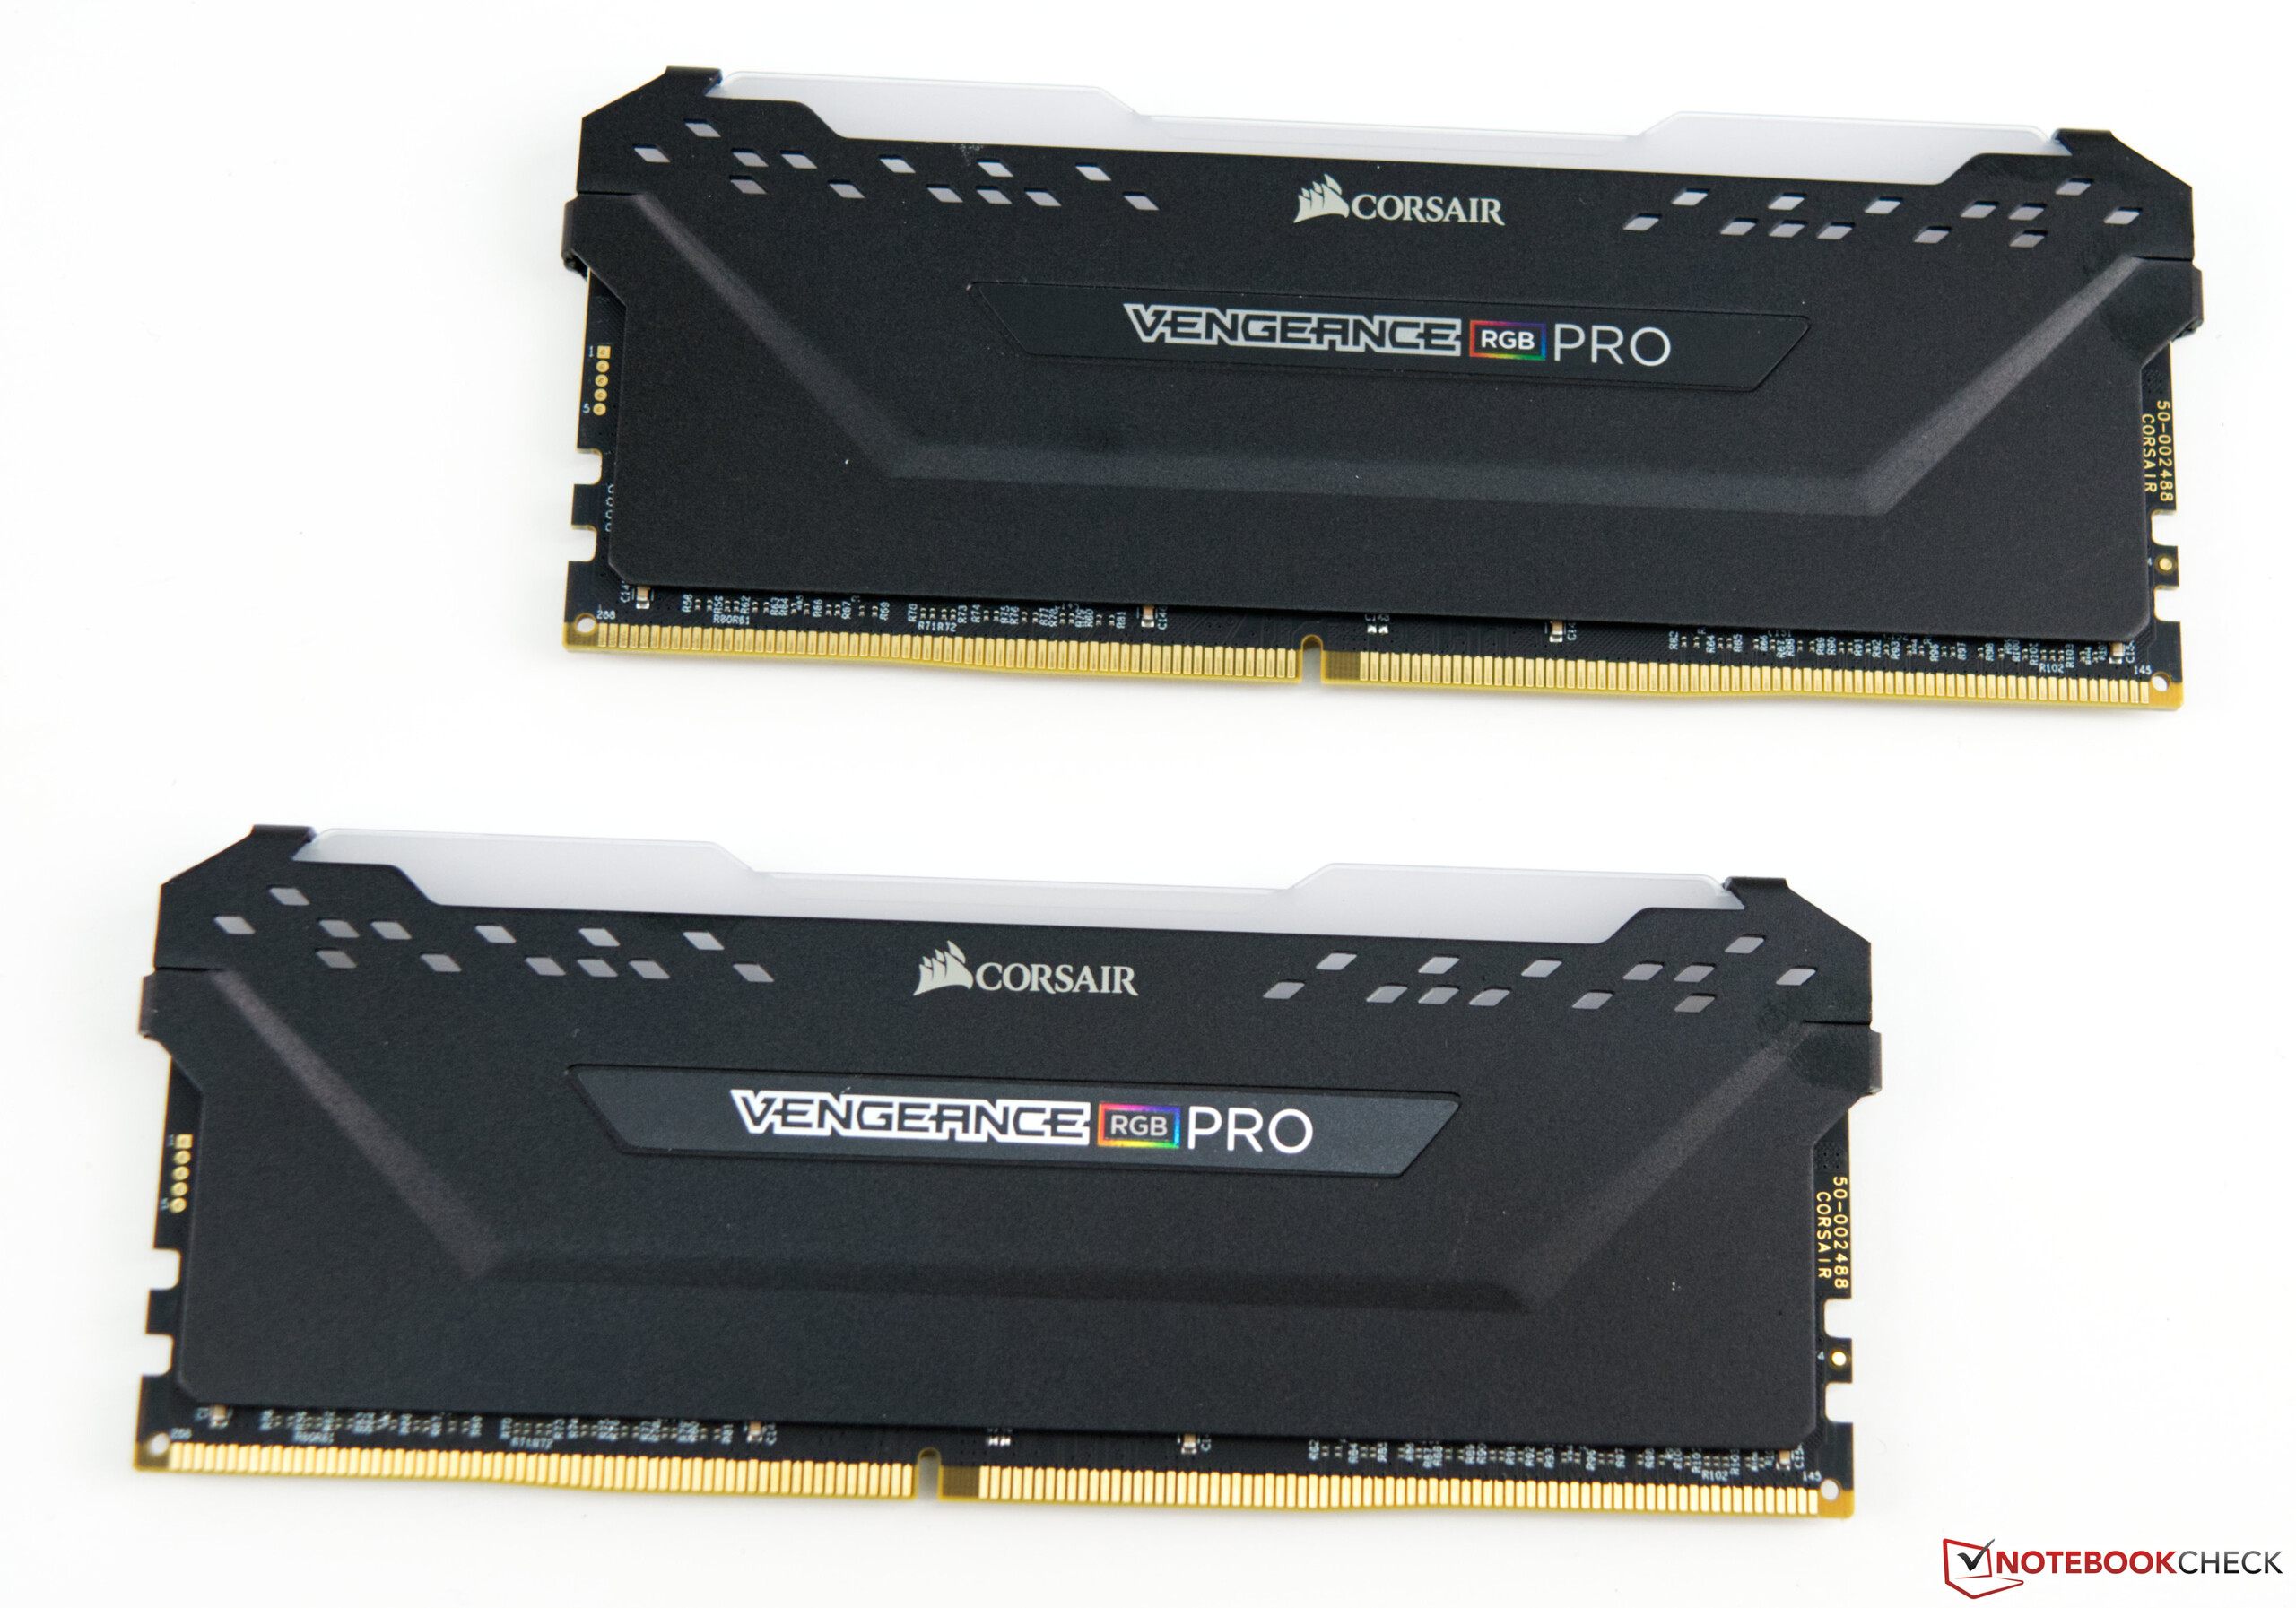
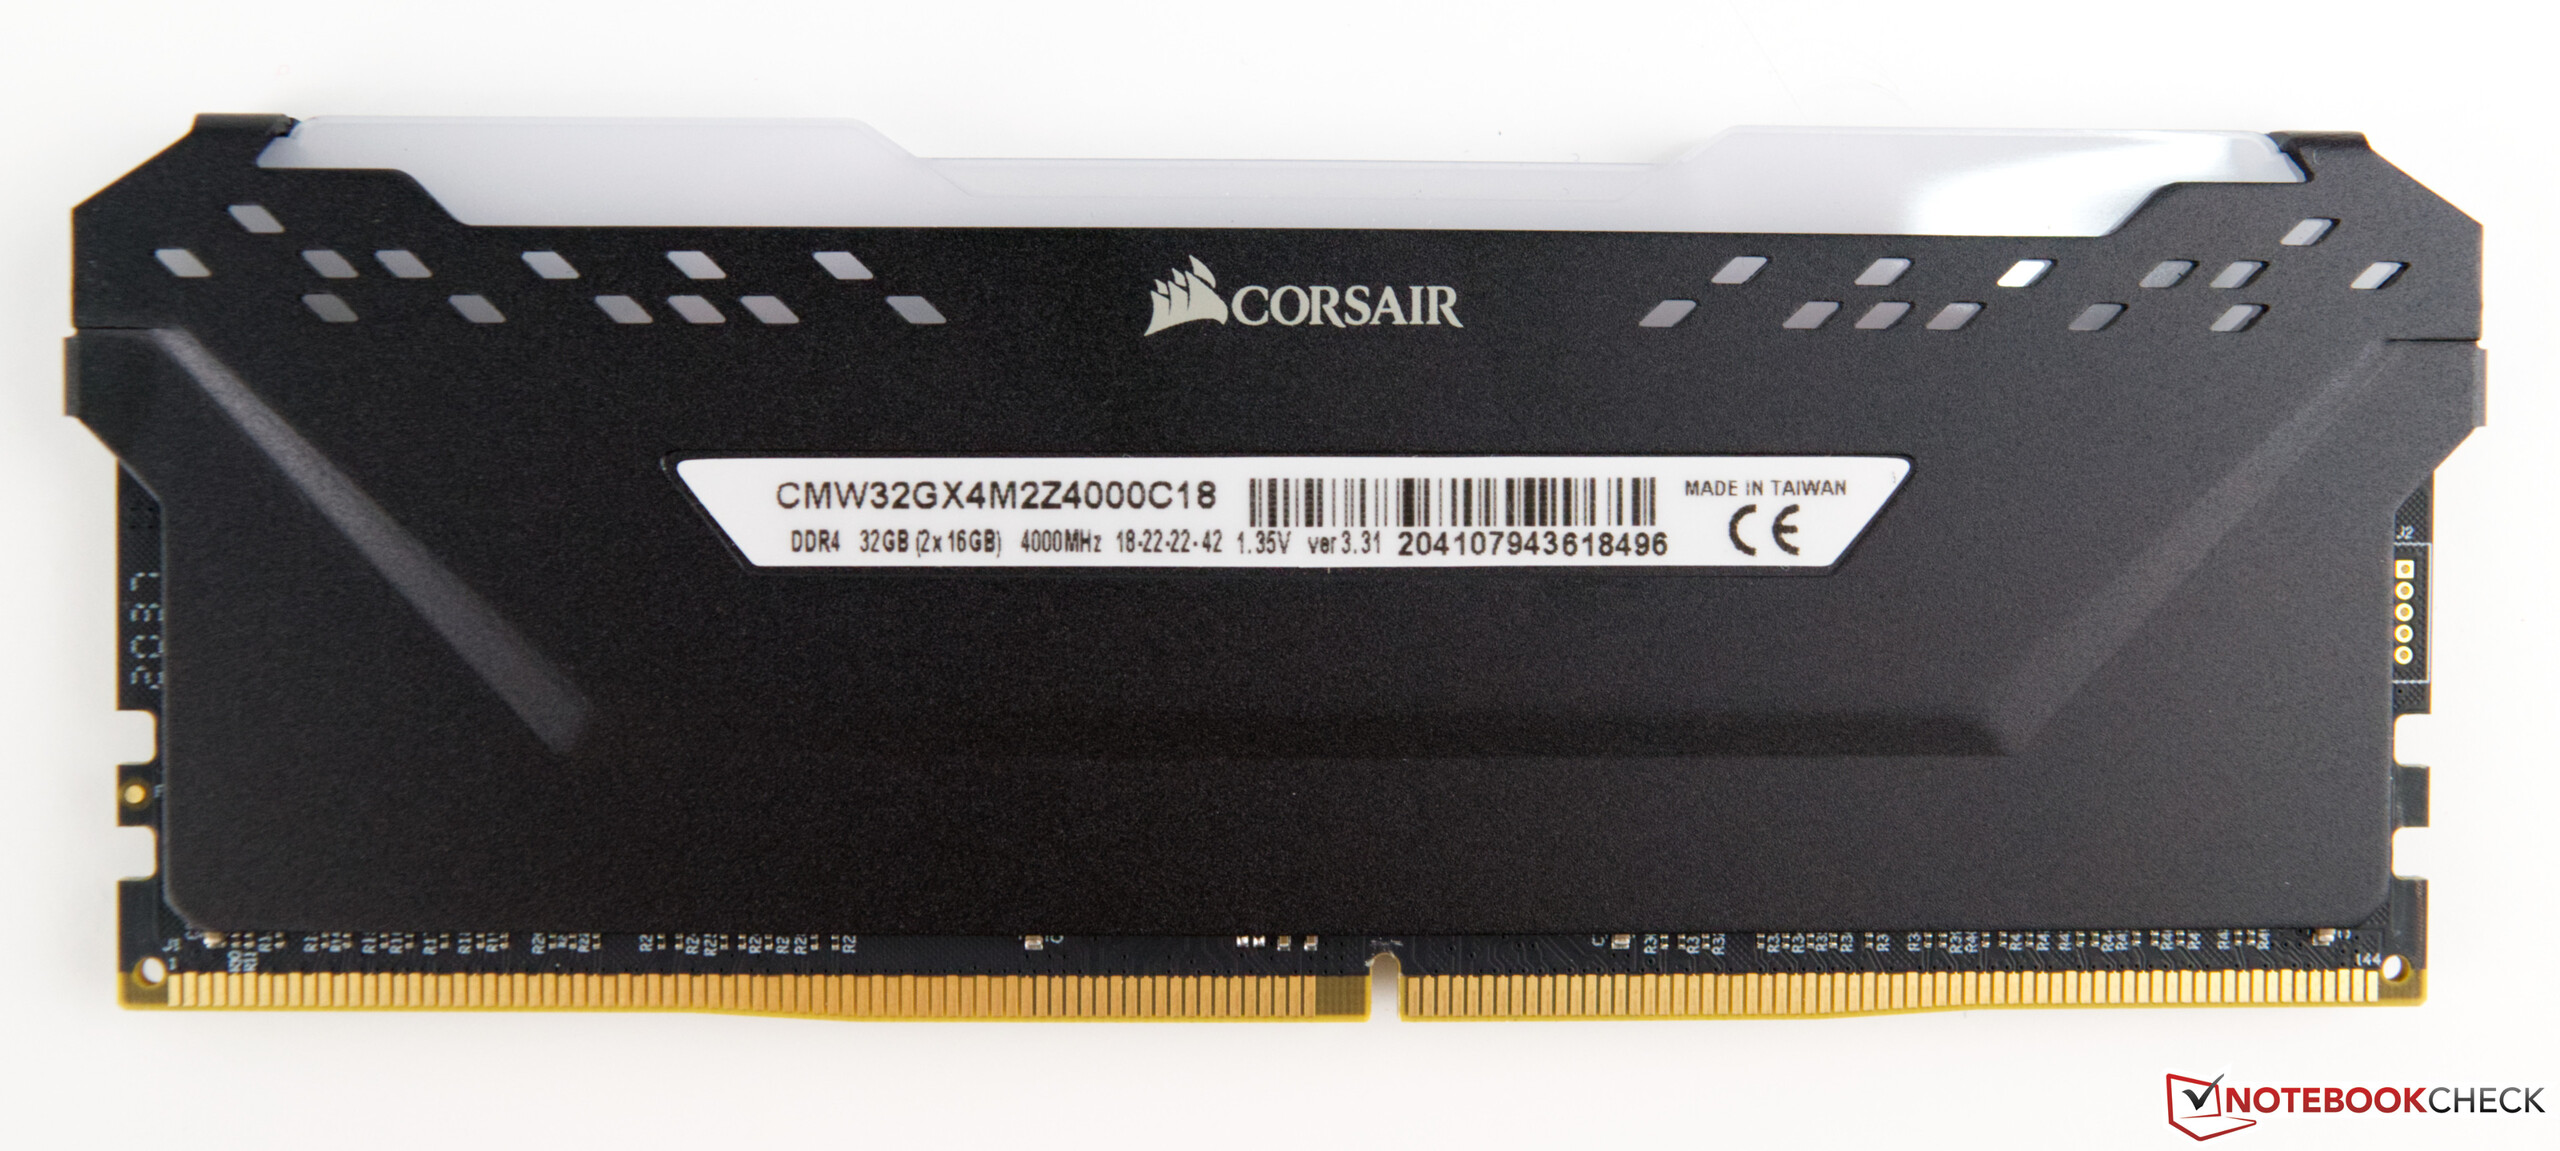
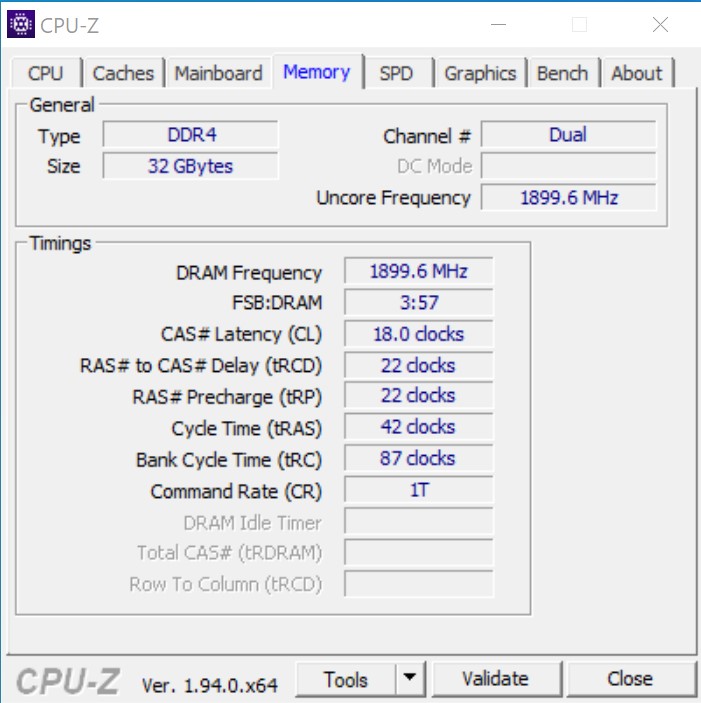
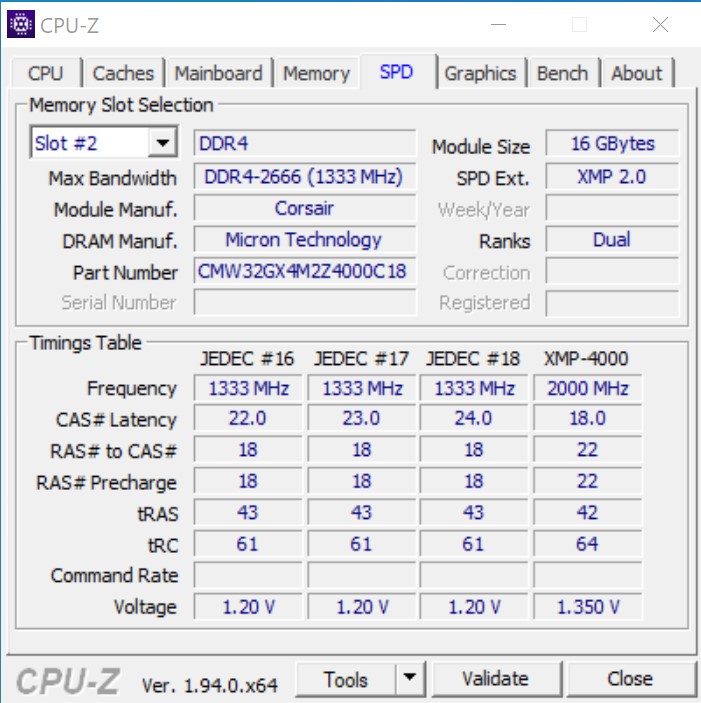
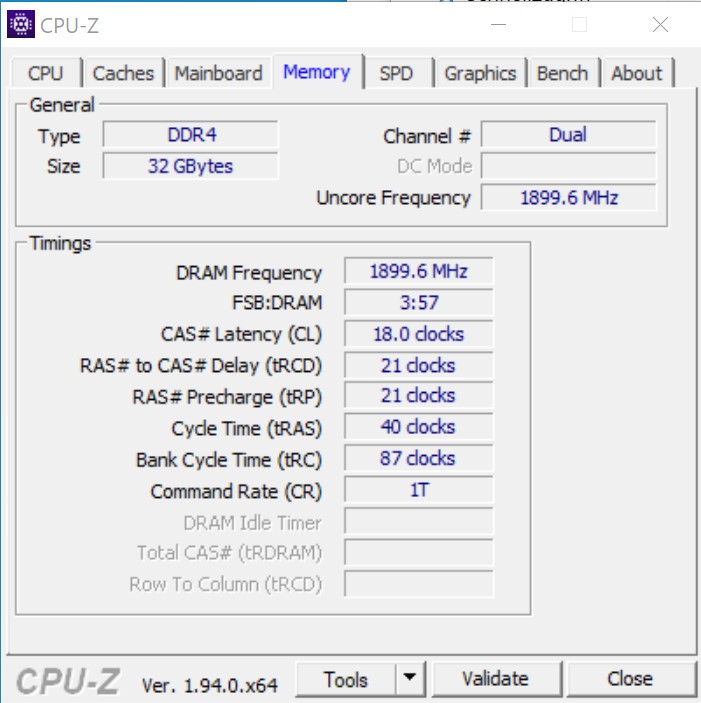
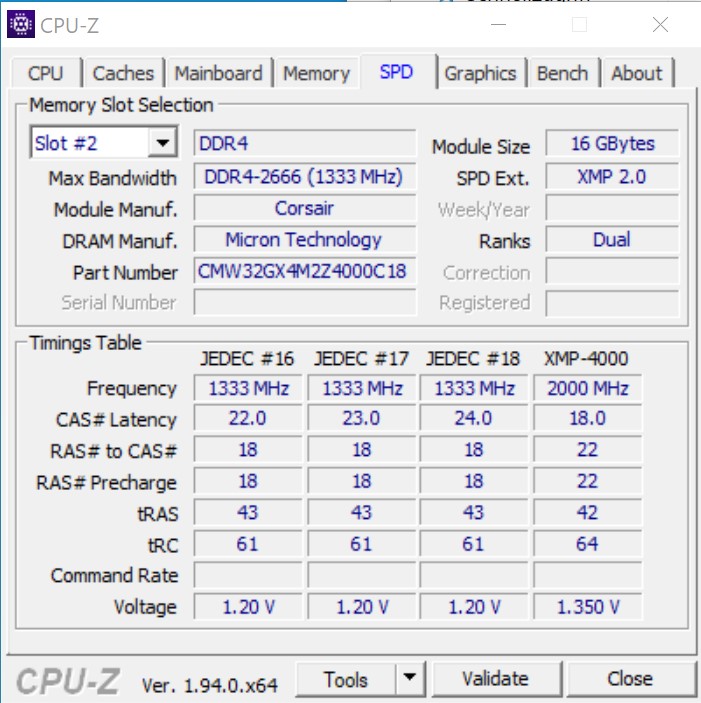
- Corsair Vengeance RGB Pro DDR4-4000 memory kit 2 x 16 GB
- Intel Optane 905P 480GB PCIe SSD
- Microsoft Windows 10 Professional 64-Bit (Version 2004)
We would like to thank Caseking for providing us with the Raijintek Pean, which even contained an individual laser engraving, as well as AMD for the mainboard, which was part of the Zen 2 press kit that AMD sent out with its previous Ryzen 9 3900X and Ryzen 7 3700X processors. Our cooler of choice was an Alphacool Eisbear 280, which was provided by Alphacool. We would furthermore like to thank Corsair for supporting us and providing us with RAM.
Processor Benchmarks
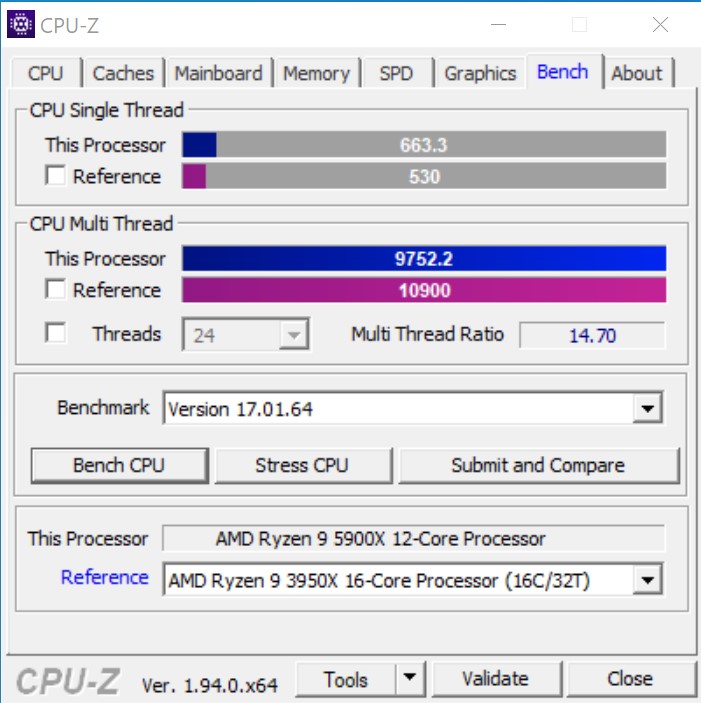
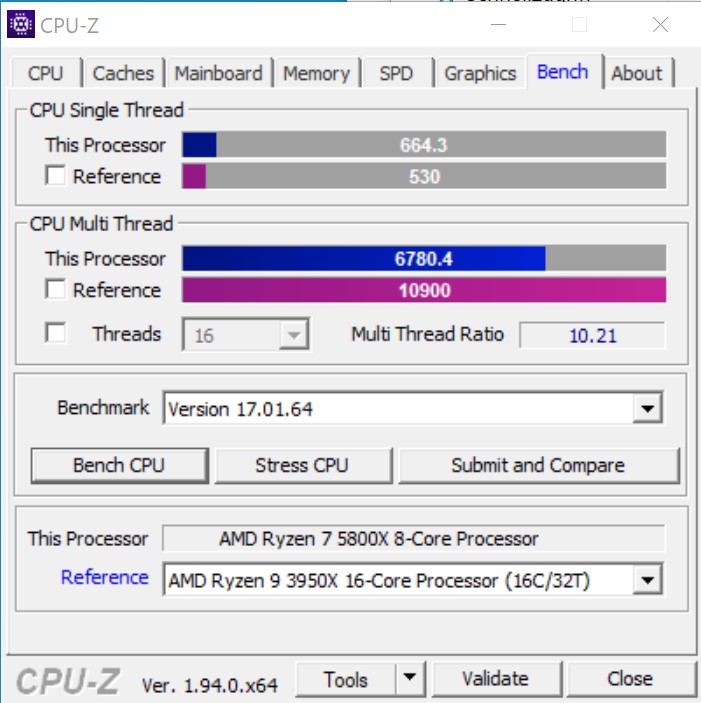
The benefits of AMD’s updated Zen 3 architecture were immediately noticeable in our CPU benchmarks. AMD’s comparatively poor single-thread performance is no more thanks to significant improvements in single-core performance. The result: Intel’s Core i9-10900K trailed around 20 % behind AMD’s Ryzen 9 5900X. Even the slower 8-core Ryzen 7 5800X had no trouble keeping up with Intel’s 10-core processor, and its multi-core performance was often higher as well. Compared to its own in-house predecessors and competitors the Ryzen 9 5800X easily managed to keep up with the Ryzen 9 3950X. The new flagship CPU, the AMD Ryzen 9 5950X, will be reviewed separately together with AMD’s new entry-level offering, the Ryzen 5 5600X.
Additional benchmarks can be found here.
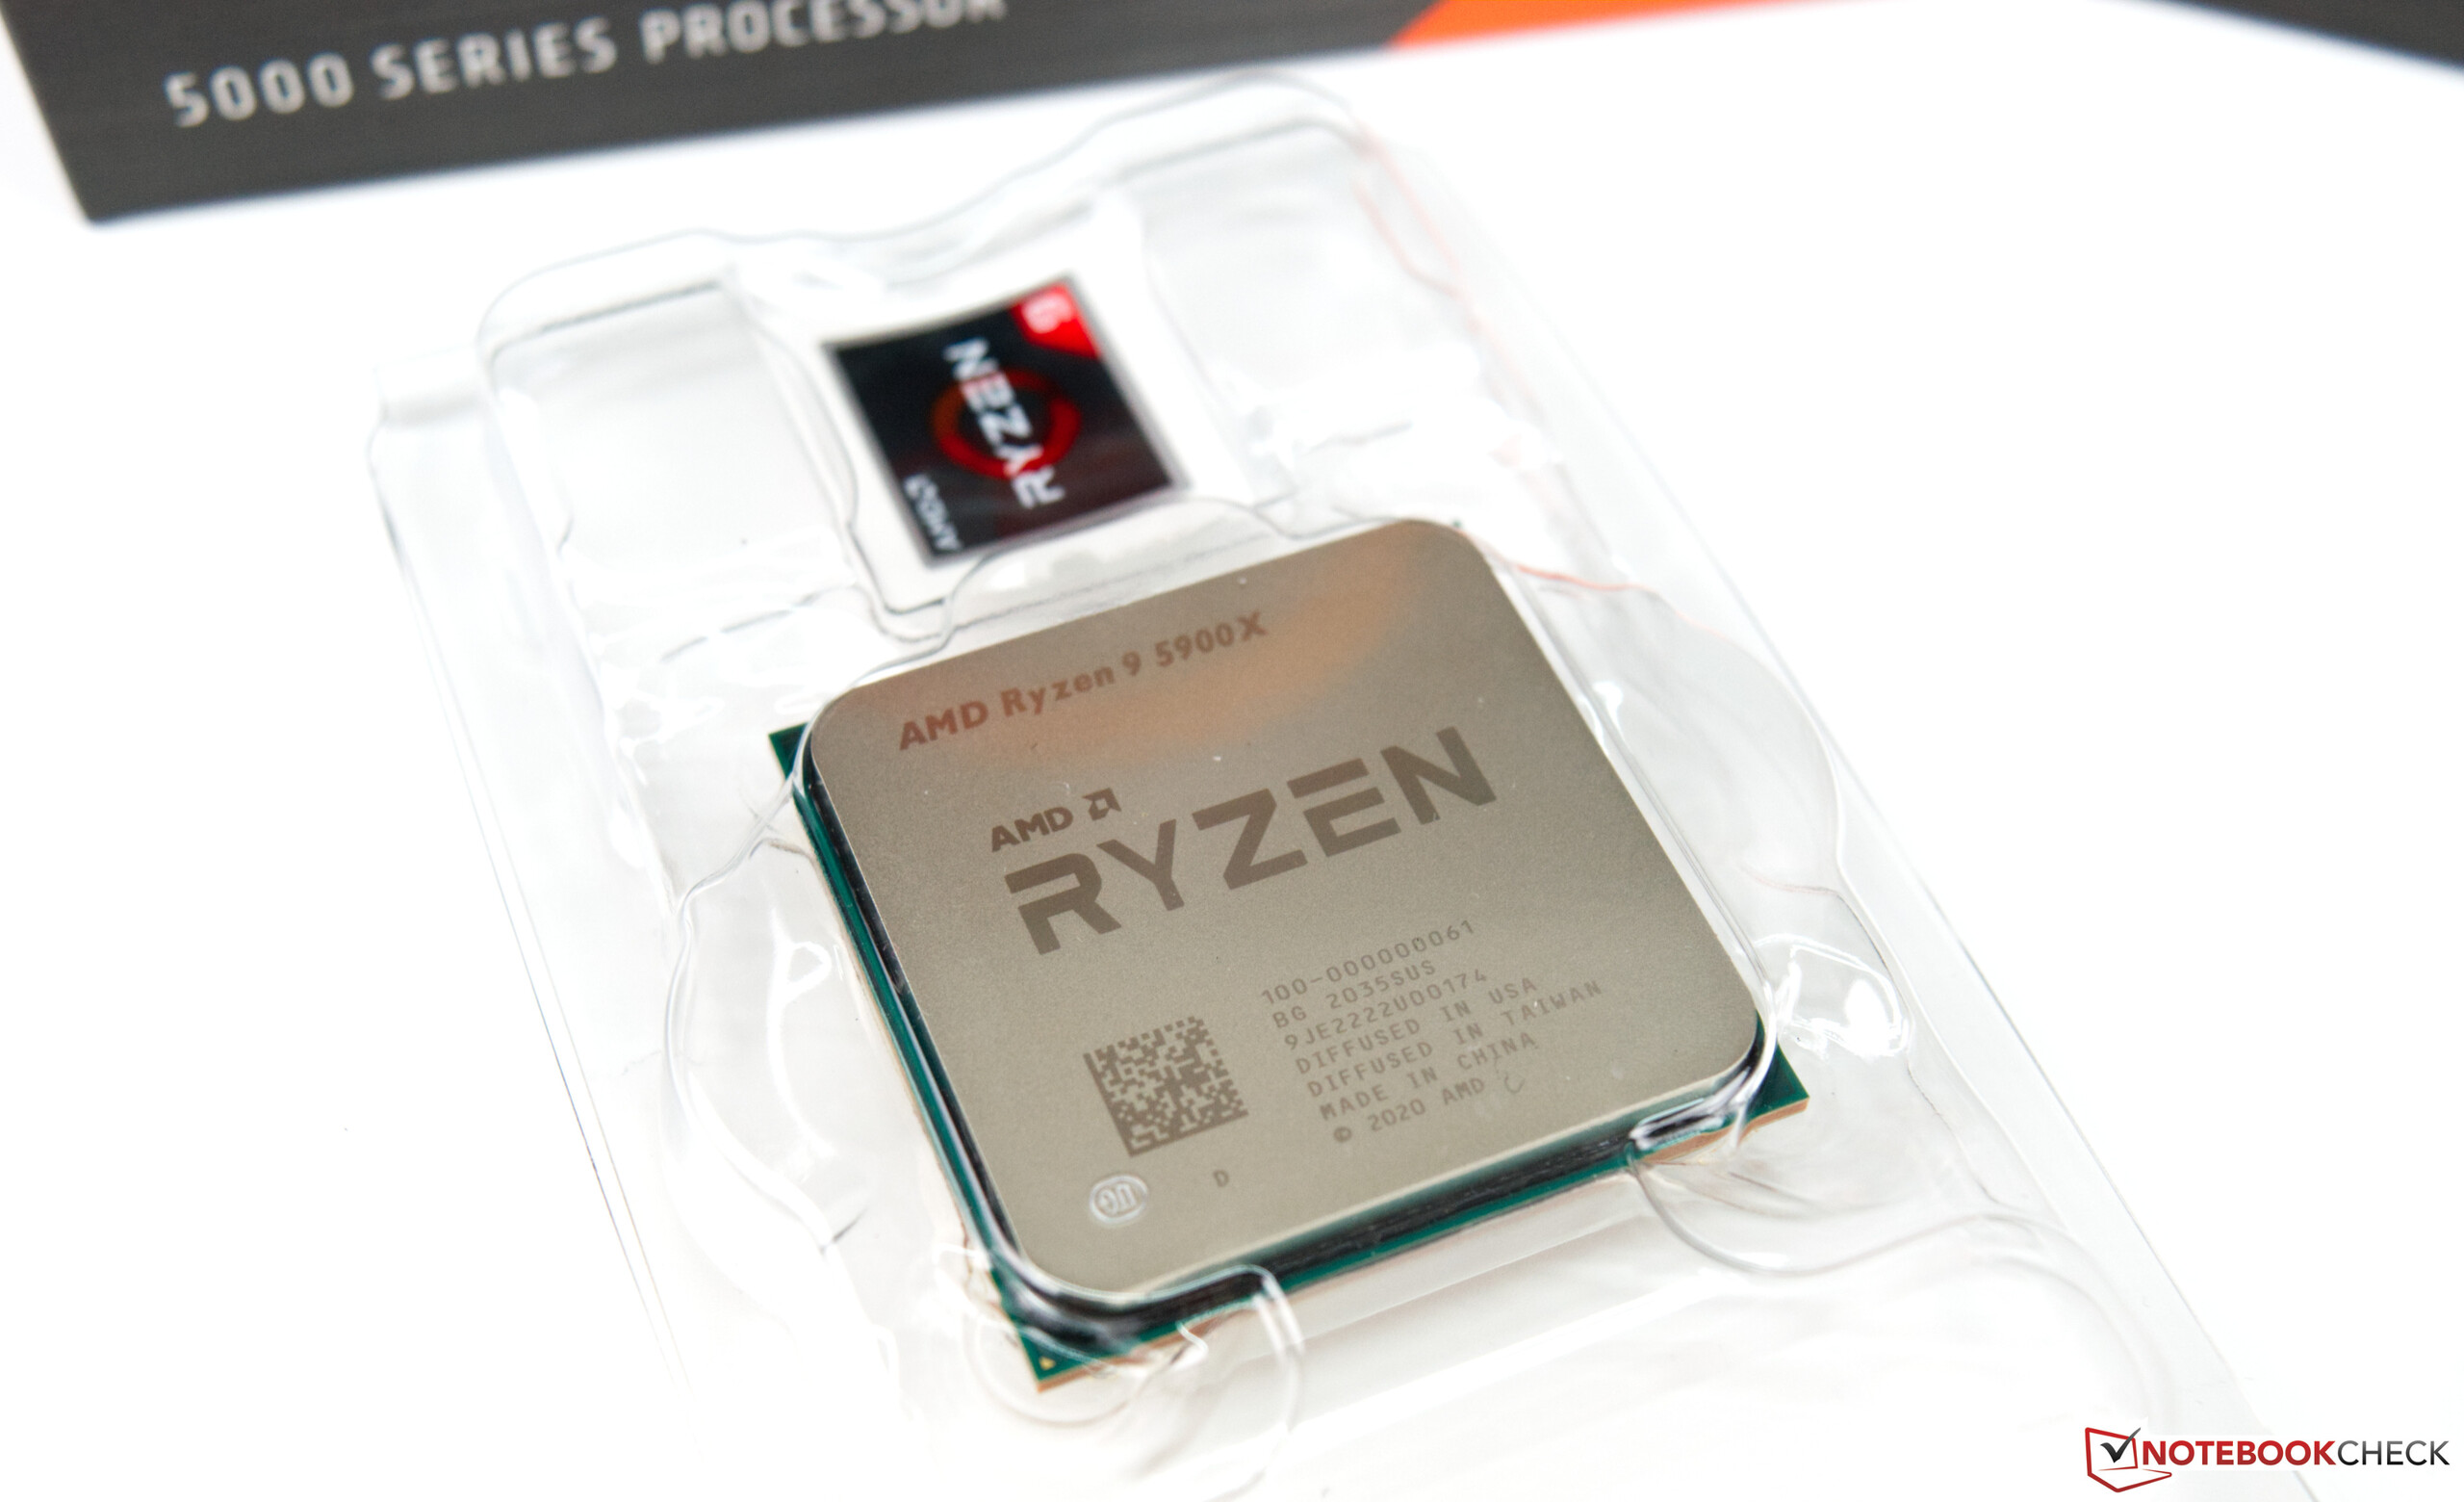
AMD Ryzen 9 5900X
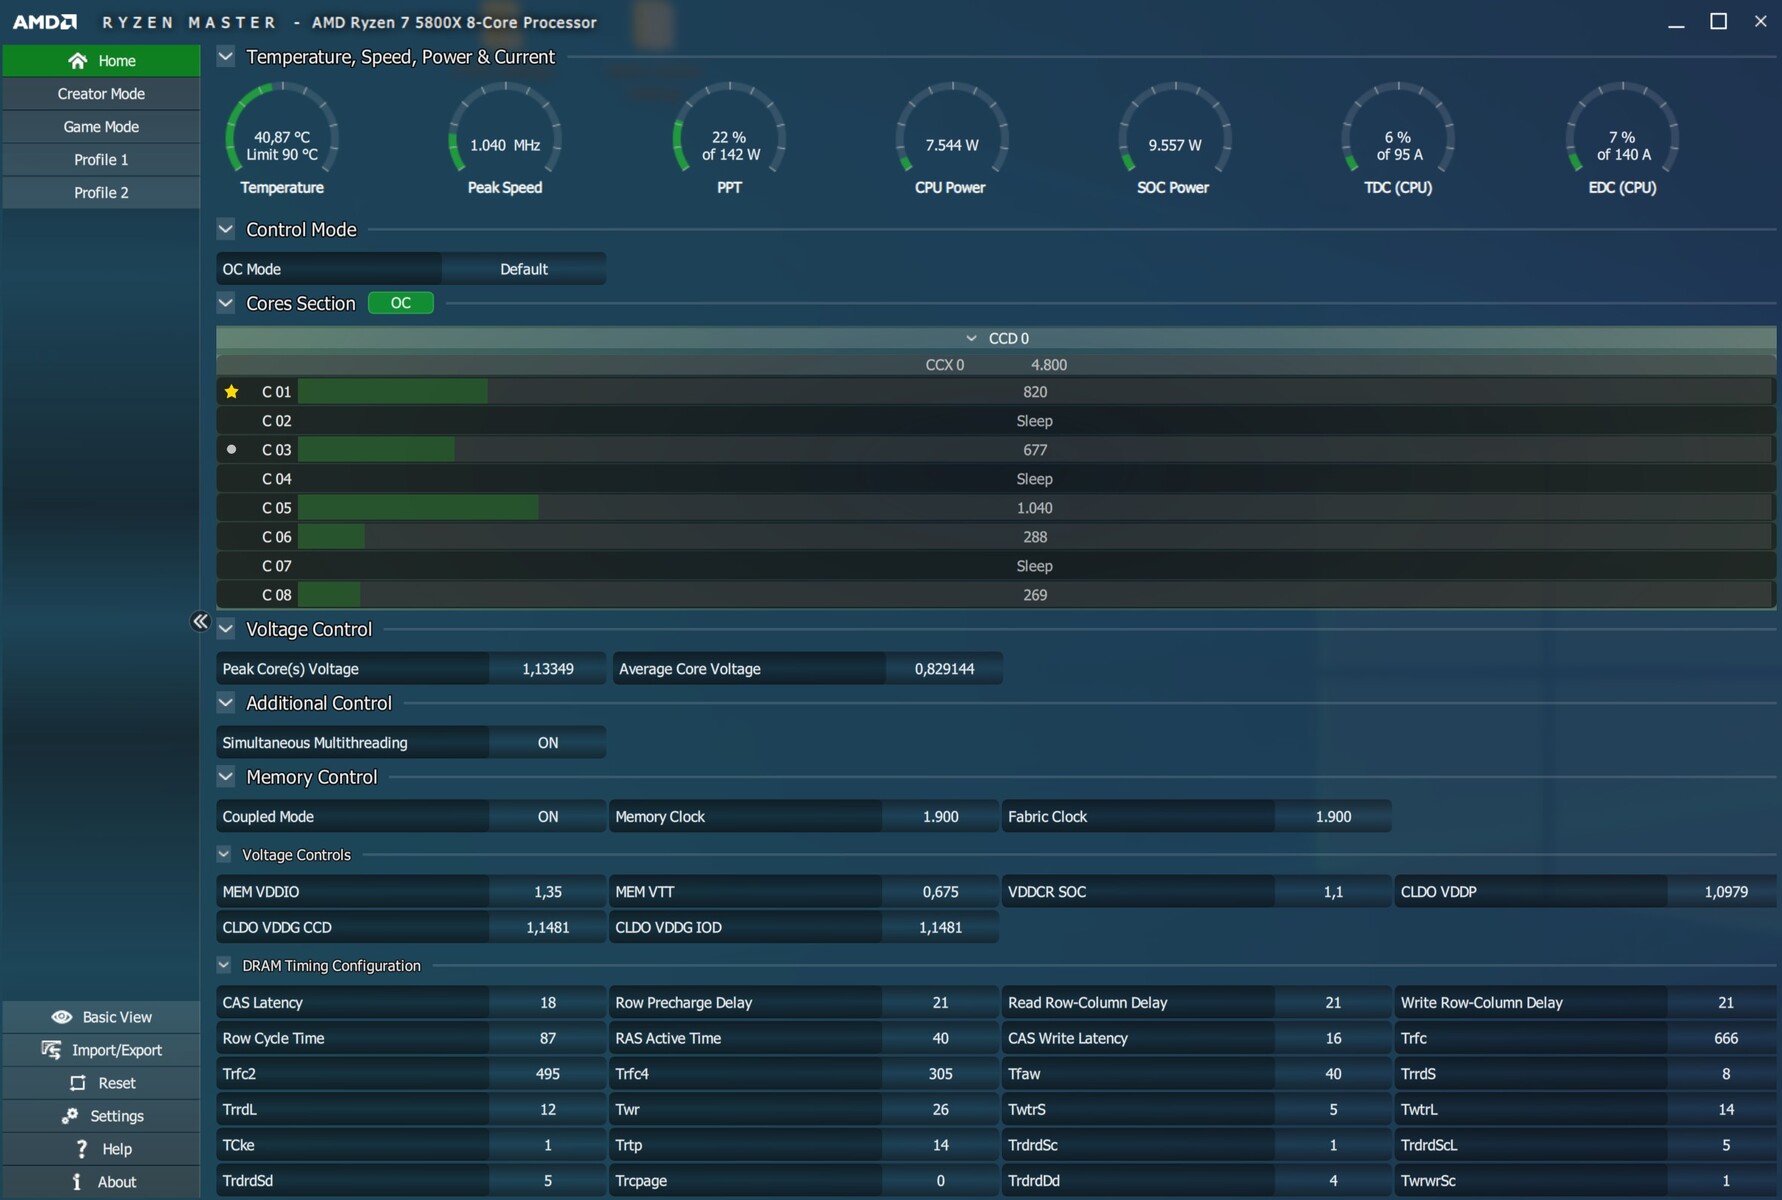
AMD Ryzen 7 5800X

| Cinebench R10 | |
| Rendering Single CPUs 64Bit | |
| AMD Ryzen 7 5800X | |
| AMD Ryzen 9 5900X | |
| Intel Core i9-10900K | |
| AMD Ryzen 9 3950X | |
| AMD Ryzen 9 3900X | |
| AMD Ryzen 3 3300X | |
| AMD Ryzen 7 3700X | |
| Rendering Multiple CPUs 64Bit | |
| AMD Ryzen 9 5900X | |
| AMD Ryzen 9 3950X | |
| AMD Ryzen 7 5800X | |
| Intel Core i9-10900K | |
| AMD Ryzen 9 3900X | |
| AMD Ryzen 7 3700X | |
| AMD Ryzen 3 3300X | |
| Blender - v2.79 BMW27 CPU | |
| AMD Ryzen 3 3300X | |
| AMD Ryzen 7 5800X | |
| AMD Ryzen 7 3700X | |
| Intel Core i9-10900K | |
| AMD Ryzen 9 3900X | |
| AMD Ryzen 9 5900X | |
| AMD Ryzen 9 3950X | |
| WinRAR - Result | |
| AMD Ryzen 7 5800X | |
| AMD Ryzen 9 5900X | |
| Intel Core i9-10900K | |
| AMD Ryzen 9 3900X | |
| AMD Ryzen 7 3700X | |
| AMD Ryzen 9 3950X | |
| AMD Ryzen 3 3300X | |
| Geekbench 4.4 | |
| 64 Bit Single-Core Score | |
| AMD Ryzen 7 5800X | |
| AMD Ryzen 9 5900X | |
| Intel Core i9-10900K | |
| AMD Ryzen 9 3900X | |
| AMD Ryzen 7 3700X | |
| AMD Ryzen 3 3300X | |
| AMD Ryzen 9 3950X | |
| 64 Bit Multi-Core Score | |
| AMD Ryzen 9 5900X | |
| AMD Ryzen 9 3950X | |
| AMD Ryzen 7 5800X | |
| AMD Ryzen 9 3900X | |
| Intel Core i9-10900K | |
| AMD Ryzen 7 3700X | |
| AMD Ryzen 3 3300X | |
| 3DMark 11 - 1280x720 Performance Physics | |
| AMD Ryzen 9 5900X | |
| AMD Ryzen 7 5800X | |
| Intel Core i9-10900K | |
| AMD Ryzen 9 3950X | |
| AMD Ryzen 9 3900X | |
| AMD Ryzen 7 3700X | |
| AMD Ryzen 3 3300X | |
| HWBOT x265 Benchmark v2.2 - 4k Preset | |
| AMD Ryzen 9 5900X | |
| Intel Core i9-10900K | |
| AMD Ryzen 9 3900X | |
| AMD Ryzen 7 5800X | |
| AMD Ryzen 9 3950X | |
| AMD Ryzen 7 3700X | |
| AMD Ryzen 3 3300X | |
| R Benchmark 2.5 - Overall mean | |
| AMD Ryzen 9 3900X | |
| AMD Ryzen 3 3300X | |
| Intel Core i9-10900K | |
| AMD Ryzen 9 3950X | |
| AMD Ryzen 9 5900X | |
| AMD Ryzen 7 5800X | |
| LibreOffice - 20 Documents To PDF | |
| Intel Core i9-10900K | |
| AMD Ryzen 9 3900X | |
| AMD Ryzen 9 3950X | |
| AMD Ryzen 3 3300X | |
| AMD Ryzen 9 5900X | |
| AMD Ryzen 7 5800X | |
| WebXPRT 3 - Overall | |
| AMD Ryzen 7 5800X | |
| AMD Ryzen 9 5900X | |
| Intel Core i9-10900K | |
| AMD Ryzen 9 3950X | |
| AMD Ryzen 3 3300X | |
| Mozilla Kraken 1.1 - Total | |
| AMD Ryzen 3 3300X | |
| Intel Core i9-10900K | |
| AMD Ryzen 9 3950X | |
| AMD Ryzen 9 5900X | |
| AMD Ryzen 7 5800X | |
| 3DMark | |
| 3840x2160 Fire Strike Ultra Physics | |
| AMD Ryzen 9 5900X | |
| AMD Ryzen 9 3950X | |
| AMD Ryzen 7 5800X | |
| Intel Core i9-10900K | |
| AMD Ryzen 9 3900X | |
| AMD Ryzen 7 3700X | |
| AMD Ryzen 3 3300X | |
| 1920x1080 Fire Strike Physics | |
| AMD Ryzen 9 5900X | |
| AMD Ryzen 9 3950X | |
| AMD Ryzen 7 5800X | |
| Intel Core i9-10900K | |
| AMD Ryzen 9 3900X | |
| AMD Ryzen 7 3700X | |
| AMD Ryzen 3 3300X | |
| 2560x1440 Time Spy CPU | |
| Intel Core i9-10900K | |
| AMD Ryzen 9 5900X | |
| AMD Ryzen 9 3950X | |
| AMD Ryzen 9 3900X | |
| AMD Ryzen 7 5800X | |
| AMD Ryzen 7 3700X | |
| AMD Ryzen 3 3300X | |
* ... smaller is better
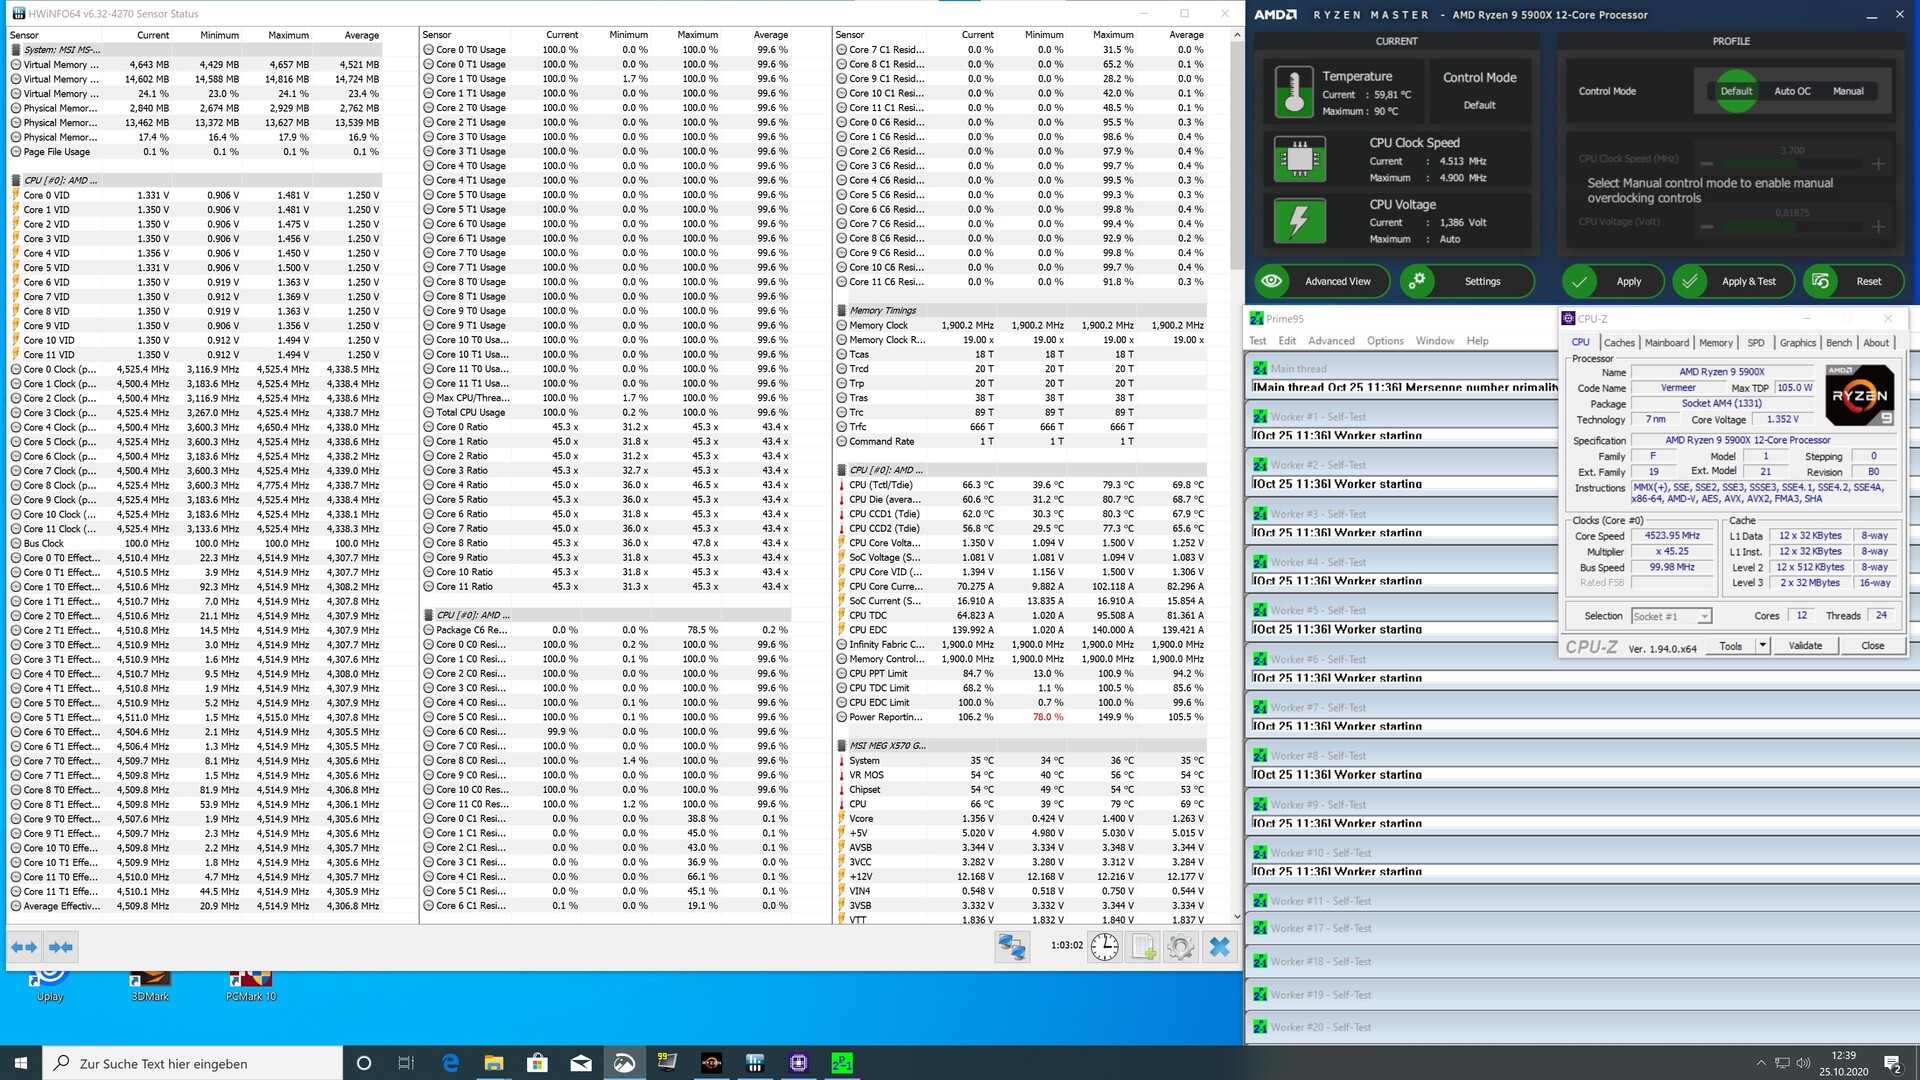
Sustained Load Test Running Our CineBench R15 Loop
Neither the Ryzen 9 5900X nor the Ryzen 7 5800X had any issues running our CineBench R15 multi-thread loop. The AiO combined with the 280 mm radiator managed to keep the CPUs cool at all times.
Vermeer Gaming Performance
So far, Intel made the fastest gaming CPU available. Thanks to the new Ryzen 5000-series, this honor now goes to AMD instead. Let’s start with the synthetic benchmarks: both, the Ryzen 9 5900X and the Ryzen 7 5800X managed to beat their respective predecessors. However, Intel’s Comet Lake S processor continues to outperform AMD’s CPUs by single digit margins.
This changes completely when we take a look at our game benchmarks. Zen 3 manages to outperform Intel’s Intel Core i9-10900K by up to 20 %. The higher resolution and details the lower the difference between the two competitors. Nevertheless, both our review samples performed exceptionally well when paired with the Nvidia Titan RTX. The difference compared to previous Ryzen 3000-series processors is immense, and somewhere between 10 and 40 % depending on game.
| 3DMark 11 - 1280x720 Performance GPU | |
| Intel Core i7-10700K | |
| Intel Core i9-10900K | |
| AMD Ryzen 7 5800X | |
| AMD Ryzen 7 3800XT | |
| AMD Ryzen 3 3300X | |
| AMD Ryzen 9 5900X | |
| AMD Ryzen 3 3100 | |
| AMD Ryzen 9 3950X | |
| AMD Ryzen 5 1600 | |
| AMD Ryzen 3 3100 | |
| AMD Ryzen 9 3900X | |
| AMD Ryzen 7 2700X | |
| 3DMark | |
| 2560x1440 Time Spy Graphics | |
| AMD Ryzen 9 5900X | |
| AMD Ryzen 7 3800XT | |
| AMD Ryzen 7 5800X | |
| AMD Ryzen 3 3300X | |
| Intel Core i9-10900K | |
| AMD Ryzen 9 3900X | |
| AMD Ryzen 5 1600 | |
| AMD Ryzen 3 3100 | |
| Intel Core i7-10700K | |
| AMD Ryzen 9 3950X | |
| AMD Ryzen 7 2700X | |
| 1280x720 Sky Diver Graphics | |
| Intel Core i7-10700K | |
| Intel Core i9-10900K | |
| AMD Ryzen 9 5900X | |
| AMD Ryzen 7 5800X | |
| AMD Ryzen 9 3900X | |
| AMD Ryzen 9 3950X | |
| AMD Ryzen 7 3800XT | |
| AMD Ryzen 3 3300X | |
| AMD Ryzen 7 2700X | |
| AMD Ryzen 5 1600 | |
| AMD Ryzen 3 3100 | |
| 1280x720 Cloud Gate Standard Graphics | |
| Intel Core i7-10700K | |
| Intel Core i9-10900K | |
| AMD Ryzen 7 5800X | |
| AMD Ryzen 9 5900X | |
| AMD Ryzen 9 3900X | |
| AMD Ryzen 9 3950X | |
| AMD Ryzen 7 3800XT | |
| AMD Ryzen 3 3300X | |
| AMD Ryzen 3 3100 | |
| AMD Ryzen 5 1600 | |
| AMD Ryzen 7 2700X | |
| 1920x1080 Fire Strike Graphics | |
| Intel Core i7-10700K | |
| AMD Ryzen 7 5800X | |
| Intel Core i9-10900K | |
| AMD Ryzen 3 3100 | |
| AMD Ryzen 3 3100 | |
| AMD Ryzen 3 3300X | |
| AMD Ryzen 7 3800XT | |
| AMD Ryzen 7 2700X | |
| AMD Ryzen 9 3900X | |
| AMD Ryzen 9 5900X | |
| AMD Ryzen 5 1600 | |
| AMD Ryzen 9 3950X | |
| Unigine Heaven 4.0 | |
| Extreme Preset DX11 | |
| AMD Ryzen 9 5900X | |
| AMD Ryzen 7 5800X | |
| AMD Ryzen 9 3900X | |
| AMD Ryzen 7 2700X | |
| Extreme Preset OpenGL | |
| AMD Ryzen 7 5800X | |
| AMD Ryzen 9 5900X | |
| AMD Ryzen 9 3900X | |
| AMD Ryzen 7 2700X | |
| Unigine Valley 1.0 | |
| 1920x1080 Extreme HD Preset OpenGL AA:x8 | |
| AMD Ryzen 9 5900X | |
| AMD Ryzen 7 5800X | |
| AMD Ryzen 9 3900X | |
| AMD Ryzen 7 2700X | |
| 1920x1080 Extreme HD DirectX AA:x8 | |
| AMD Ryzen 9 5900X | |
| AMD Ryzen 7 5800X | |
| AMD Ryzen 9 3900X | |
| AMD Ryzen 7 2700X | |
| Unigine Superposition | |
| 1280x720 720p Low | |
| AMD Ryzen 7 5800X | |
| AMD Ryzen 9 5900X | |
| AMD Ryzen 9 3900X | |
| 1920x1080 1080p Extreme | |
| AMD Ryzen 9 5900X | |
| AMD Ryzen 7 5800X | |
| AMD Ryzen 9 3900X | |
| 7680x4320 8k Optimized | |
| AMD Ryzen 9 5900X | |
| AMD Ryzen 7 5800X | |
| AMD Ryzen 9 3900X | |
| Borderlands 3 | |
| 1280x720 Very Low Overall Quality (DX11) | |
| AMD Ryzen 9 5900X, NVIDIA Titan RTX | |
| AMD Ryzen 7 5800X, NVIDIA Titan RTX | |
| Intel Core i9-10900K, NVIDIA Titan RTX | |
| Intel Core i7-10700K, NVIDIA Titan RTX | |
| AMD Ryzen 9 3900X, NVIDIA Titan RTX | |
| AMD Ryzen 9 3950X, NVIDIA Titan RTX | |
| AMD Ryzen 7 3800XT, NVIDIA Titan RTX | |
| AMD Ryzen 3 3300X, NVIDIA Titan RTX | |
| AMD Ryzen 3 3100, NVIDIA Titan RTX | |
| AMD Ryzen 5 1600, NVIDIA Titan RTX | |
| 1920x1080 Badass Overall Quality (DX11) | |
| AMD Ryzen 9 5900X, NVIDIA Titan RTX | |
| Intel Core i9-10900K, NVIDIA Titan RTX | |
| Intel Core i7-10700K, NVIDIA Titan RTX | |
| AMD Ryzen 7 3800XT, NVIDIA Titan RTX | |
| AMD Ryzen 7 5800X, NVIDIA Titan RTX | |
| AMD Ryzen 9 3900X, NVIDIA Titan RTX | |
| AMD Ryzen 9 3950X, NVIDIA Titan RTX | |
| AMD Ryzen 3 3300X, NVIDIA Titan RTX | |
| AMD Ryzen 3 3100, NVIDIA Titan RTX | |
| AMD Ryzen 5 1600, NVIDIA Titan RTX | |
| The Witcher 3 | |
| 1024x768 Low Graphics & Postprocessing | |
| AMD Ryzen 9 5900X, NVIDIA Titan RTX | |
| AMD Ryzen 7 5800X, NVIDIA Titan RTX | |
| Intel Core i9-10900K, NVIDIA Titan RTX | |
| Intel Core i7-10700K, NVIDIA Titan RTX | |
| AMD Ryzen 9 3900X, NVIDIA Titan RTX | |
| AMD Ryzen 7 3800XT, NVIDIA Titan RTX | |
| AMD Ryzen 9 3950X, NVIDIA Titan RTX | |
| AMD Ryzen 3 3300X, NVIDIA Titan RTX | |
| AMD Ryzen 5 1600, NVIDIA Titan RTX | |
| AMD Ryzen 3 3100, NVIDIA Titan RTX | |
| 1920x1080 Ultra Graphics & Postprocessing (HBAO+) | |
| Intel Core i7-10700K, NVIDIA Titan RTX | |
| AMD Ryzen 9 5900X, NVIDIA Titan RTX | |
| Intel Core i9-10900K, NVIDIA Titan RTX | |
| AMD Ryzen 7 3800XT, NVIDIA Titan RTX | |
| AMD Ryzen 7 5800X, NVIDIA Titan RTX | |
| AMD Ryzen 9 3900X, NVIDIA Titan RTX | |
| AMD Ryzen 5 1600, NVIDIA Titan RTX | |
| AMD Ryzen 9 3950X, NVIDIA Titan RTX | |
| AMD Ryzen 3 3300X, NVIDIA Titan RTX | |
| AMD Ryzen 3 3100, NVIDIA Titan RTX | |
| Shadow of the Tomb Raider | |
| 1280x720 Lowest Preset | |
| AMD Ryzen 7 5800X, NVIDIA Titan RTX | |
| AMD Ryzen 9 5900X, NVIDIA Titan RTX | |
| Intel Core i9-10900K, NVIDIA Titan RTX | |
| AMD Ryzen 9 3950X, NVIDIA Titan RTX | |
| AMD Ryzen 7 3800XT, NVIDIA Titan RTX | |
| AMD Ryzen 9 3900X, NVIDIA Titan RTX | |
| AMD Ryzen 3 3300X, NVIDIA Titan RTX | |
| AMD Ryzen 3 3100, NVIDIA Titan RTX | |
| AMD Ryzen 5 1600, NVIDIA Titan RTX | |
| 1920x1080 Highest Preset AA:T | |
| AMD Ryzen 7 5800X, NVIDIA Titan RTX | |
| AMD Ryzen 9 5900X, NVIDIA Titan RTX | |
| Intel Core i9-10900K, NVIDIA Titan RTX | |
| AMD Ryzen 7 3800XT, NVIDIA Titan RTX | |
| AMD Ryzen 9 3950X, NVIDIA Titan RTX | |
| AMD Ryzen 3 3300X, NVIDIA Titan RTX | |
| AMD Ryzen 9 3900X, NVIDIA Titan RTX | |
| AMD Ryzen 3 3100, NVIDIA Titan RTX | |
| AMD Ryzen 5 1600, NVIDIA Titan RTX | |
| Strange Brigade | |
| 1280x720 lowest AF:1 | |
| AMD Ryzen 7 5800X, NVIDIA Titan RTX | |
| AMD Ryzen 9 5900X, NVIDIA Titan RTX | |
| Intel Core i7-10700K, NVIDIA Titan RTX | |
| AMD Ryzen 9 3900X, NVIDIA Titan RTX | |
| 1920x1080 ultra AA:ultra AF:16 | |
| AMD Ryzen 9 5900X, NVIDIA Titan RTX | |
| AMD Ryzen 7 5800X, NVIDIA Titan RTX | |
| Intel Core i7-10700K, NVIDIA Titan RTX | |
| AMD Ryzen 9 3900X, NVIDIA Titan RTX | |
| GTA V | |
| 1024x768 Lowest Settings possible | |
| Intel Core i7-10700K, NVIDIA Titan RTX | |
| AMD Ryzen 9 5900X, NVIDIA Titan RTX | |
| AMD Ryzen 7 5800X, NVIDIA Titan RTX | |
| 1920x1080 Highest AA:4xMSAA + FX AF:16x | |
| AMD Ryzen 9 5900X, NVIDIA Titan RTX | |
| AMD Ryzen 7 5800X, NVIDIA Titan RTX | |
| Intel Core i7-10700K, NVIDIA Titan RTX | |
Ryzen 9 5900X mit Nvidia Titan RTX
| low | med. | high | ultra | QHD | 4K | |
|---|---|---|---|---|---|---|
| GTA V (2015) | 187 | 186 | 184 | 128 | 115 | 134 |
| The Witcher 3 (2015) | 617 | 437 | 276 | 141 | 104 | |
| Dota 2 Reborn (2015) | 232.6 | 208.7 | 199.4 | 180.3 | 172.1 | |
| Final Fantasy XV Benchmark (2018) | 225 | 182 | 139 | 105 | 63.6 | |
| X-Plane 11.11 (2018) | 177 | 158 | 130 | 111 | ||
| Far Cry 5 (2018) | 212 | 184 | 173 | 161 | 136 | 81 |
| Strange Brigade (2018) | 607 | 352 | 287 | 243 | 183 | 110 |
| Shadow of the Tomb Raider (2018) | 225 | 183 | 177 | 166 | 120 | 66.3 |
| Far Cry New Dawn (2019) | 176 | 152 | 147 | 131 | 121 | 84 |
| Metro Exodus (2019) | 241 | 173 | 133 | 106 | 84.9 | 54.9 |
| Borderlands 3 (2019) | 229 | 187 | 144 | 118 | 84.7 | 46.7 |
| Crysis Remastered (2020) | 273 | 74.5 | 212 | 115 | 90.9 | 48.9 |
| Dirt 5 (2020) | 187 | 128 | 106 | 95.9 | 79.5 | 57 |
| Assassin´s Creed Valhalla (2020) | 137 | 104 | 88 | 80 | 66 | 43 |
| Call of Duty Black Ops Cold War (2020) | 254 | 238 | 162 | 144 | 87.6 | 52.9 |
| Yakuza Like a Dragon (2020) | 119 | 117 | 116 | 111 | 100 | 55.2 |
| Immortals Fenyx Rising (2020) | 136 | 106 | 93 | 71 | 64 | 48 |
| Cyberpunk 2077 1.0 (2020) | 109 | 103 | 93.2 | 82.3 | 58.4 | 30.9 |
| Hitman 3 (2021) | 271 | 222 | 210 | 202 | 145 | 82 |
| Outriders (2021) | 136 | 162 | 158 | 156 | 119 | 64 |
| Resident Evil Village (2021) | 304 | 264 | 241 | 212 | 142 | 74.2 |
| Mass Effect Legendary Edition (2021) | 106 | 113 | 107 | 106 | ||
| Days Gone (2021) | 190 | 181 | 174 | 141 | 108 | 64.9 |
| Monster Hunter Stories 2 (2021) | 144 | 144 | 144 | 144 | 144 | |
| F1 2021 (2021) | 451 | 388 | 331 | 165 | 126 | 74.3 |
| Deathloop (2021) | 128 | 125 | 124 | 119 | 91.6 | 51.8 |
| New World (2021) | 180 | 139 | 131 | 123 | 101 | 54.5 |
| Alan Wake Remastered (2021) | 93.1 | 88.3 | 88.4 | 88.5 | ||
| Far Cry 6 (2021) | 143 | 106 | 95.8 | 94.7 | 80.9 | 52.8 |
| Back 4 Blood (2021) | 294 | 270 | 255 | 182 | 101 | |
| Guardians of the Galaxy (2021) | 135 | 134 | 134 | 133 | 131 | 82 |
| Riders Republic (2021) | 221 | 179 | 152 | 143 | 109 | 65 |
| Call of Duty Vanguard (2021) | 113 | 153 | 144 | 133 | 100 | 59.6 |
| Forza Horizon 5 (2021) | 237 | 161 | 148 | 96 | 84 | 62 |
| Battlefield 2042 (2021) | 99.3 | 139 | 129 | 117 | 93.6 | 60.2 |
| Farming Simulator 22 (2021) | 279 | 221 | 186 | 164 | 163 | 122 |
| Halo Infinite (2021) | 144 | 125 | 119 | 95.5 | 68.8 | |
| God of War (2022) | 174 | 149 | 124 | 89 | 72.8 | 48.9 |
| Rainbow Six Extraction (2022) | 264 | 225 | 223 | 179 | 130 | 70 |
| Dying Light 2 (2022) | 169 | 110 | 93.6 | 66.5 | 37.1 | |
| GRID Legends (2022) | 215.9 | 195.2 | 172.8 | 132.5 | 112.2 | 78.6 |
| Elden Ring (2022) | 59.9 | 59.9 | 59.7 | 59.9 | 59.9 | 59.6 |
| Cyberpunk 2077 1.6 (2022) | 78.9 | 78.7 | 78.6 | 78.3 | 66.2 | 32.8 |
| Elex 2 (2022) | 111 | 105 | 98 | 95.4 | 81.2 | 47.7 |
| Ghostwire Tokyo (2022) | 205 | 196.8 | 203 | 202 | 141 | 73.3 |
| Tiny Tina's Wonderlands (2022) | 245 | 201 | 151.3 | 124.3 | 92.4 | 50.4 |
| Vampire Bloodhunt (2022) | 391 | 267 | 252 | 244 | 173.2 | 93.6 |
Ryzen 7 5800X mit Nvidia Titan RTX
| low | med. | high | ultra | QHD | 4K | |
|---|---|---|---|---|---|---|
| GTA V (2015) | 187 | 187 | 184 | 123 | 112 | 125 |
| The Witcher 3 (2015) | 602 | 431 | 274 | 139 | 102 | |
| Dota 2 Reborn (2015) | 242.5 | 213.8 | 204 | 186.8 | 175.6 | |
| Final Fantasy XV Benchmark (2018) | 225 | 184 | 140 | 106 | 63.1 | |
| X-Plane 11.11 (2018) | 178 | 158 | 128 | 109 | ||
| Far Cry 5 (2018) | 207 | 177 | 168 | 158 | 134 | 79 |
| Strange Brigade (2018) | 662 | 352 | 288 | 242 | 183 | 110 |
| Shadow of the Tomb Raider (2018) | 230 | 193 | 183 | 170 | 121 | 66.3 |
| Far Cry New Dawn (2019) | 166 | 145 | 140 | 124 | 115 | 82 |
| Metro Exodus (2019) | 251 | 172 | 133 | 106 | 84.7 | 54.9 |
| Borderlands 3 (2019) | 221 | 183 | 141 | 116 | 83.8 | 46.3 |
Application Performance
Considering that the new Vermeer processors are the fastest currently available CPUs it should not come as a surprise that everyday application performance was impeccable. We used an Intel Optane 905p SSD for our tests, which contained the operating system as well as some synthetic benchmarks.
Just like with the CPU tests both our test samples managed to secure the first two spots in almost every single application benchmark. They even managed to find some extra performance in the render test. Performance improvements of up to 20 % were no exception.
The pervious king of the hill in PCMark 10, AMD's Ryzen 9 3950X, was outperformed by significant margins. Intel's Core i9-10900K had no chance of keeping up and performed 11 % slower than AMD’s Ryzen 9 5900X and a slightly better yet still noteworthy 8 % slower than AMD’s Ryzen 7 5800X.
* ... smaller is better
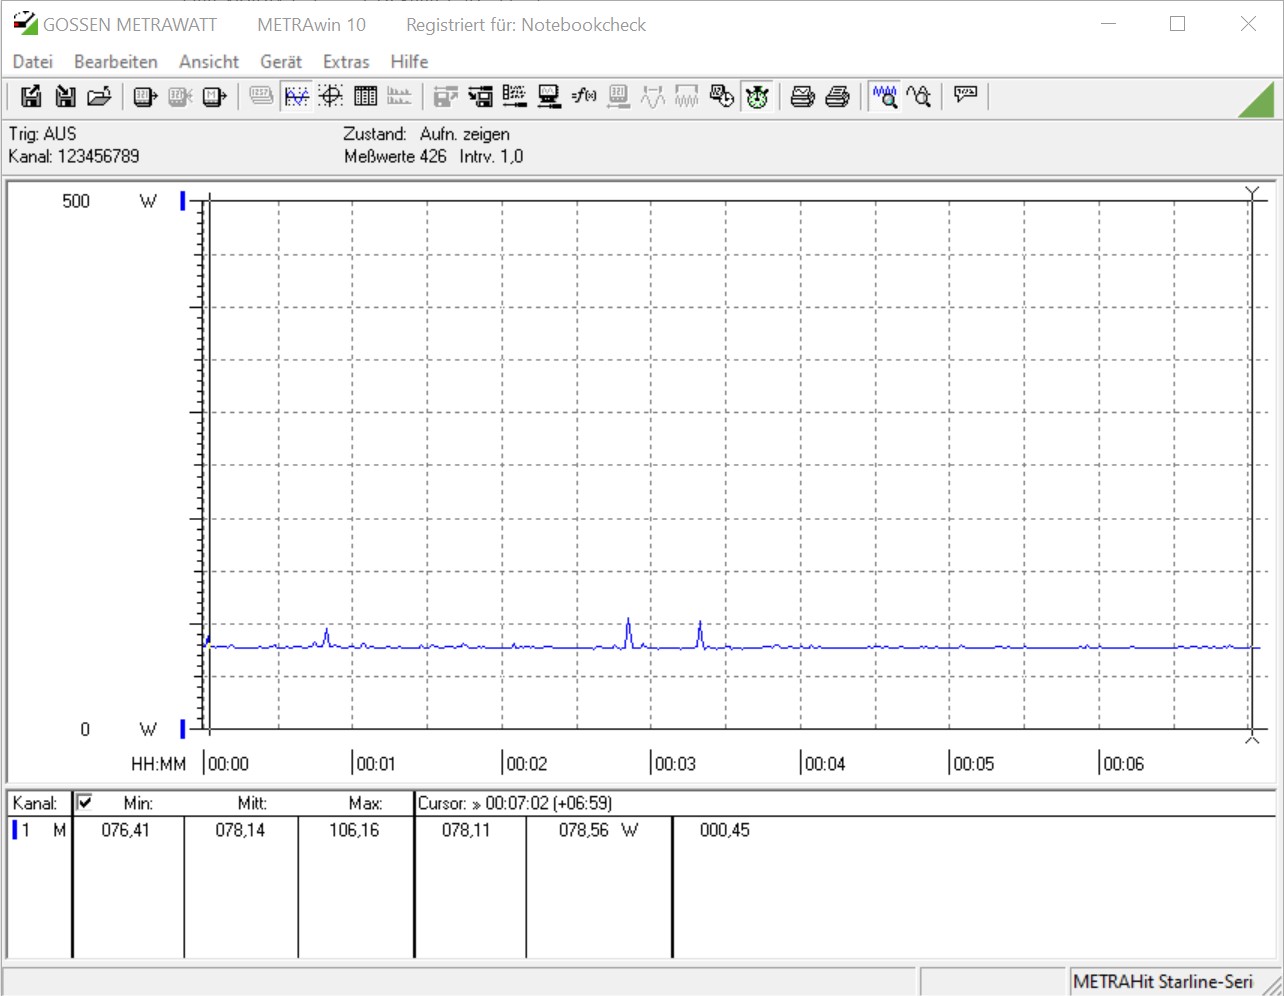
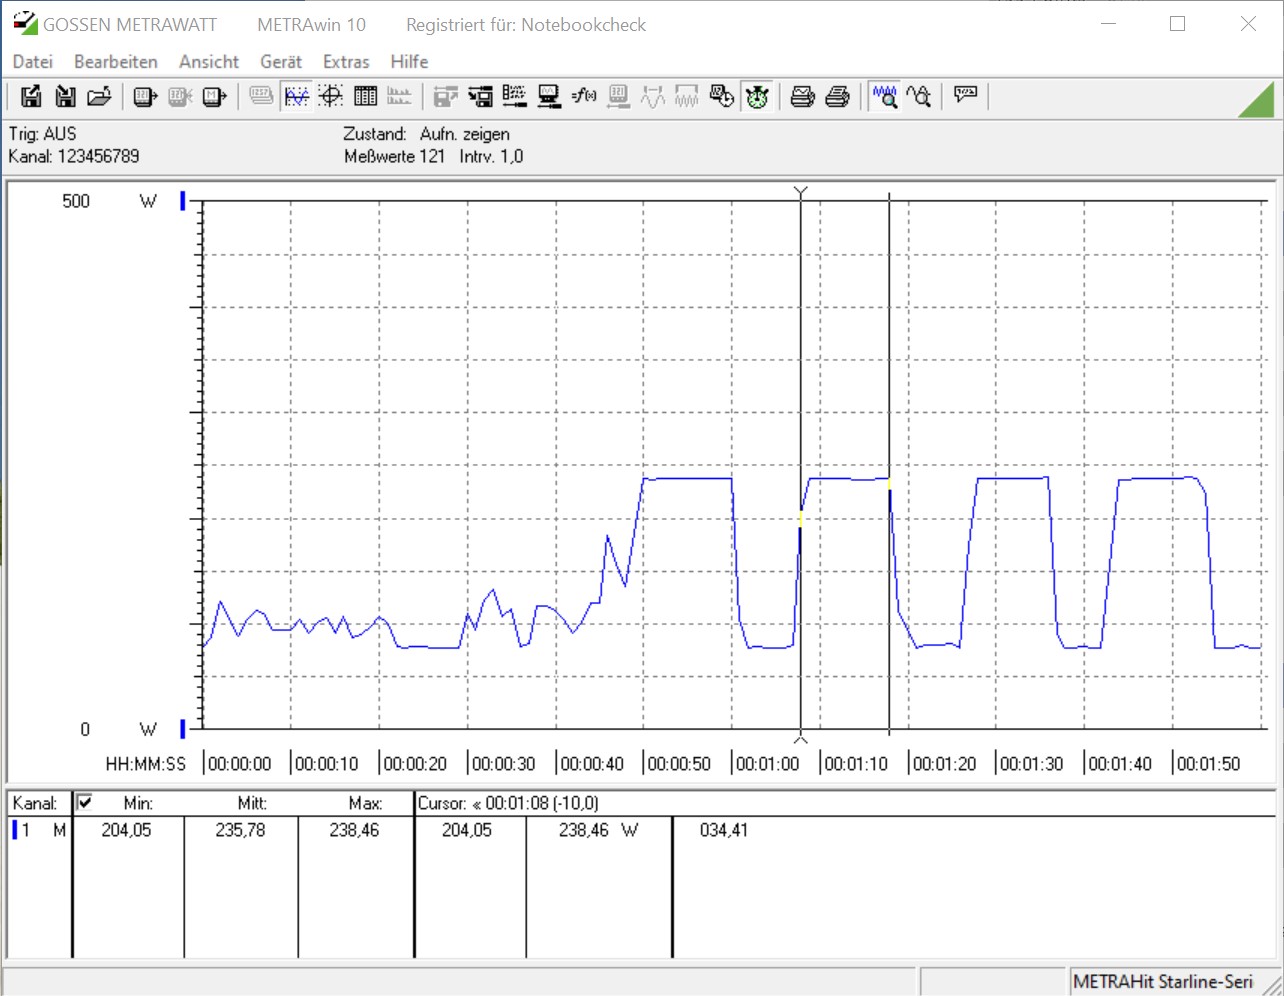
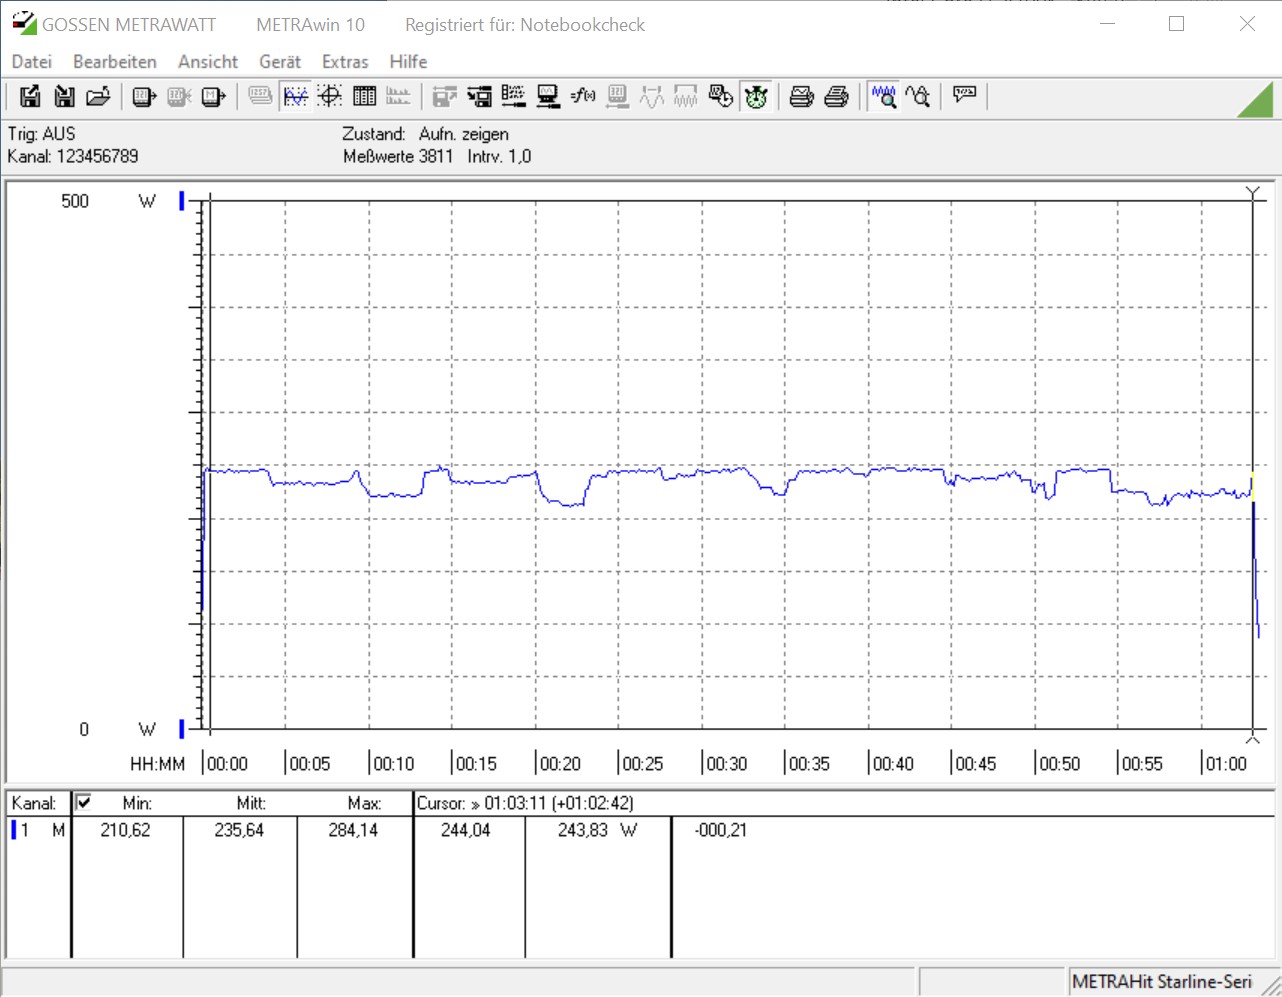
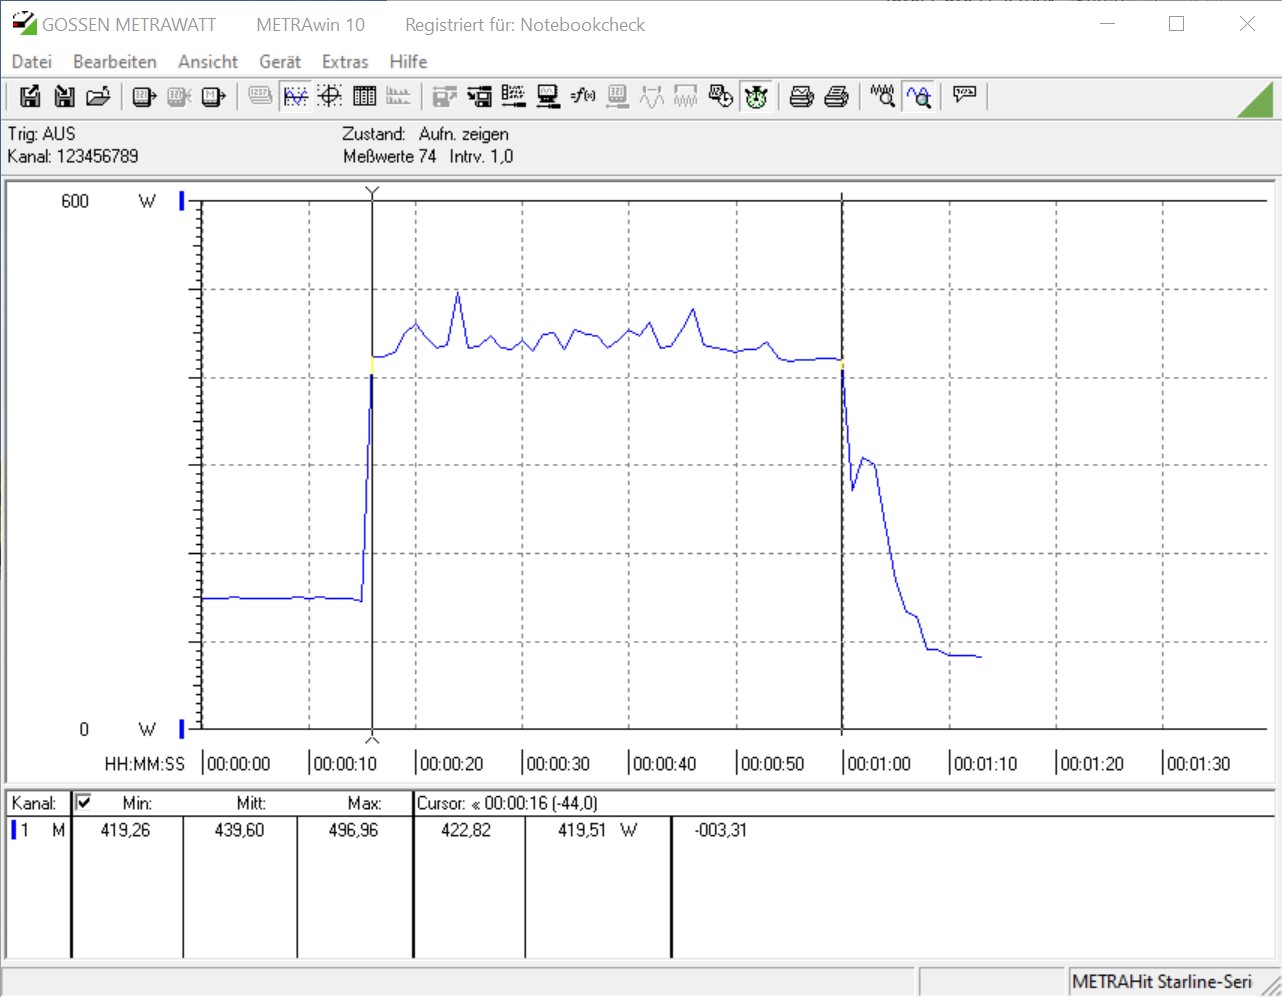
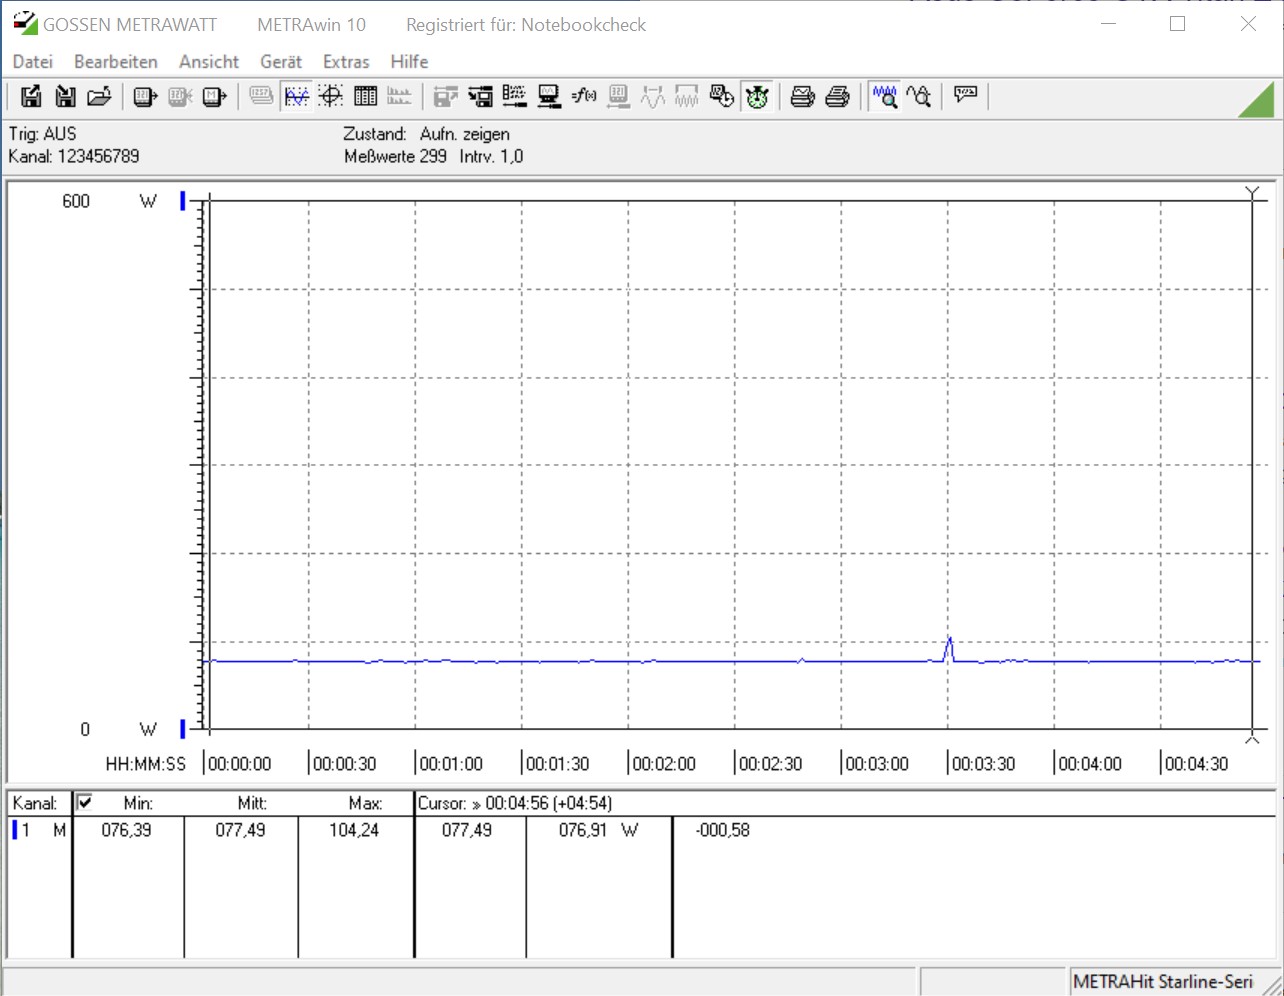
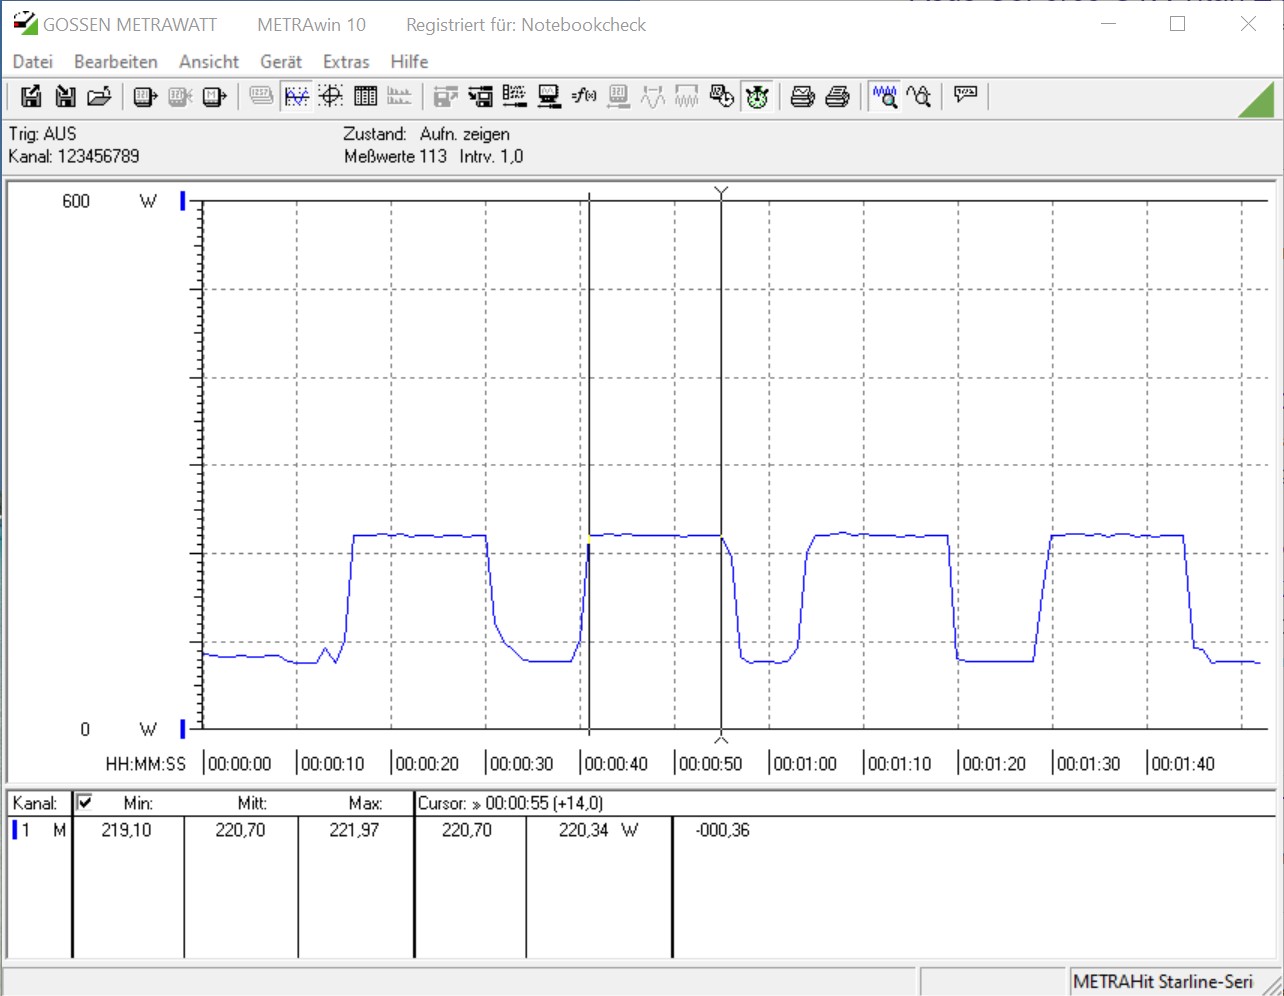
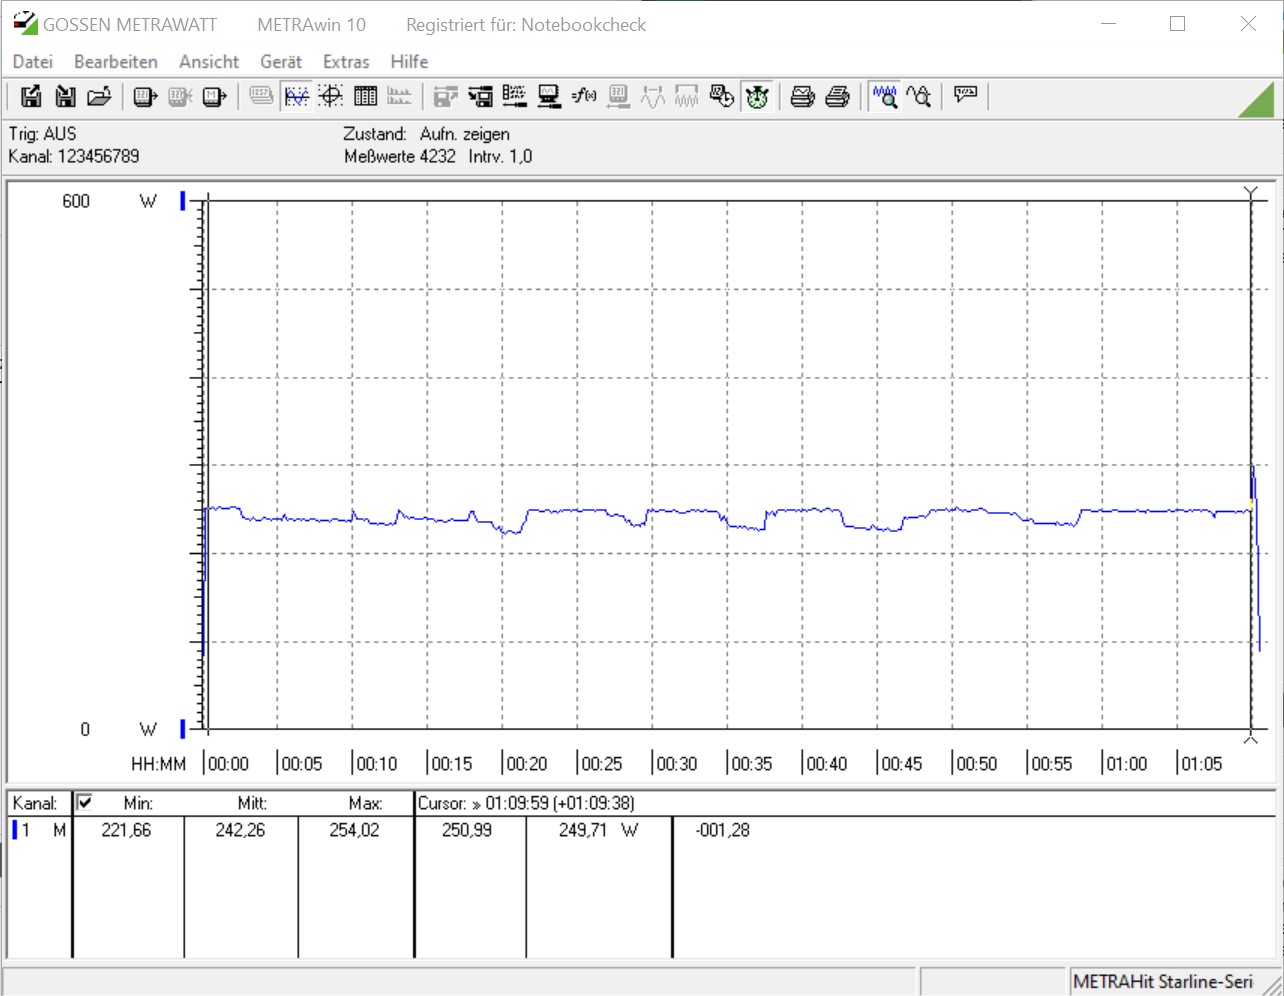
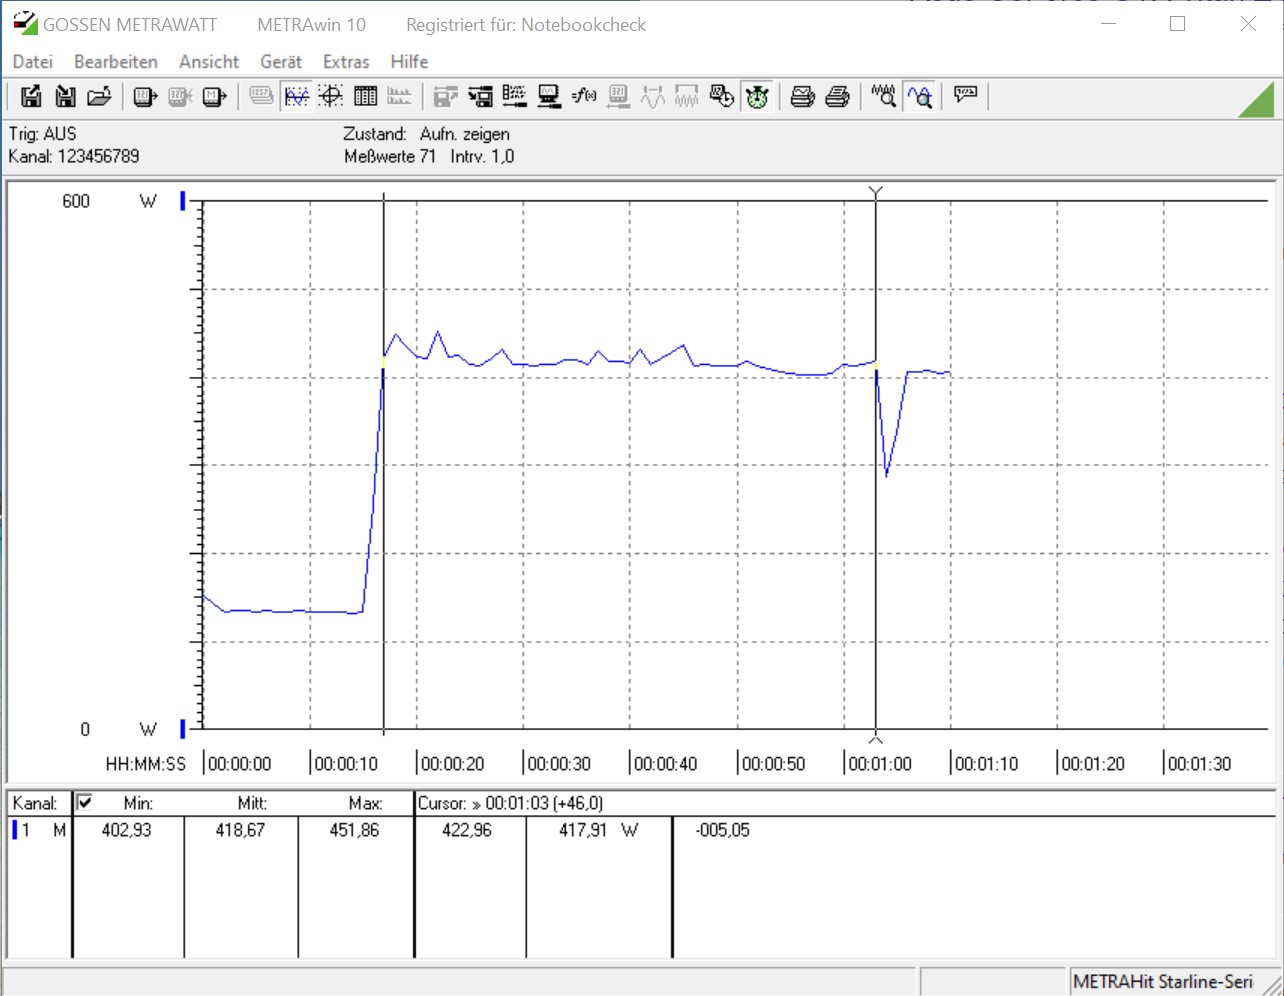
Power Consumption
Officially, AMD specifies both the Ryzen 9 5900X as well as the Ryzen 7 5800X with a TDP of 105 W. However, we already know from its predecessor that this official specification is no more than a rough ballpark, and in the past, we saw spikes of up to 142 W. The same is basically true for the new Ryzen CPUs as well as they are allowed to consume up to 142 W thanks to PBO2 (Precision Boost 2) with a tCase temperature of no more than 61.8 °C. The Core i9-10900K is specified with up to 250 W. Given that AMD did not create a new platform specification to accompany the Vermeer CPUs we can expect all other specs regarding power consumption to remain unchanged. Zen 3 should thus consume about as much power as Zen 2. However, our own tests revealed that both the Ryzen 9 5900X and the Ryzen 7 5800X require slightly more energy than the Ryzen 9 3950X but less than the Core i9-10900K. The latter required around 14 % more energy during our stress test and the CineBench R15 multi-thread test. The tide turned in favor of Intel’s Core i9-10900K in our game benchmarks where it was around 11 % more energy efficient than the Ryzen 9 5900X when equipped with the identical GPU.
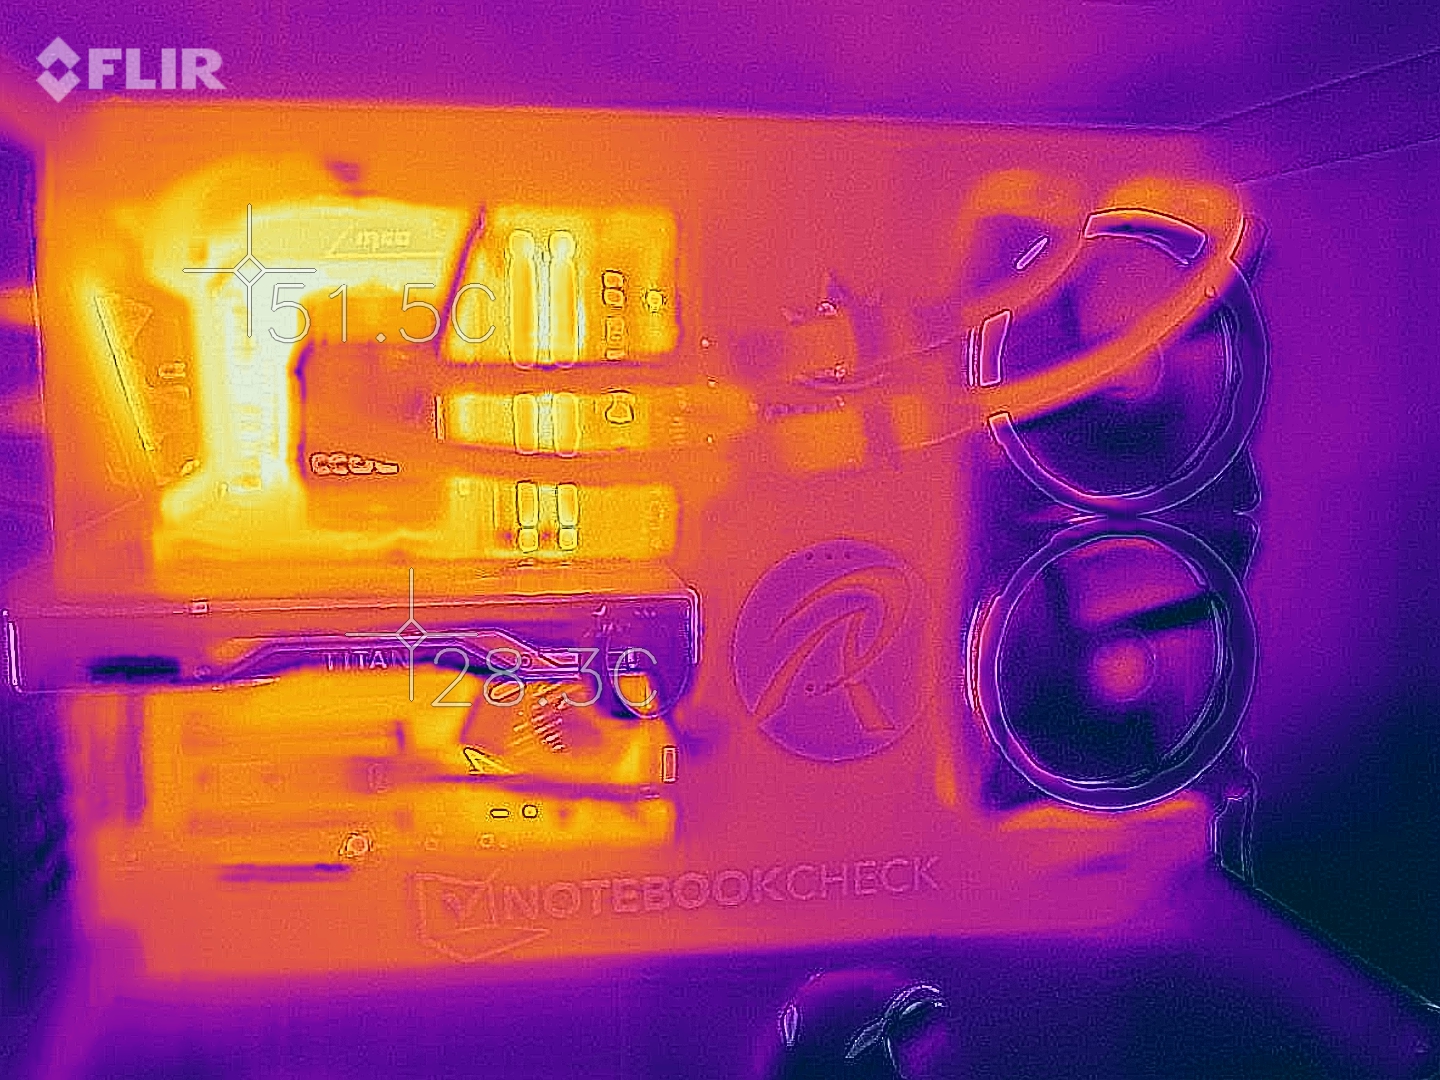
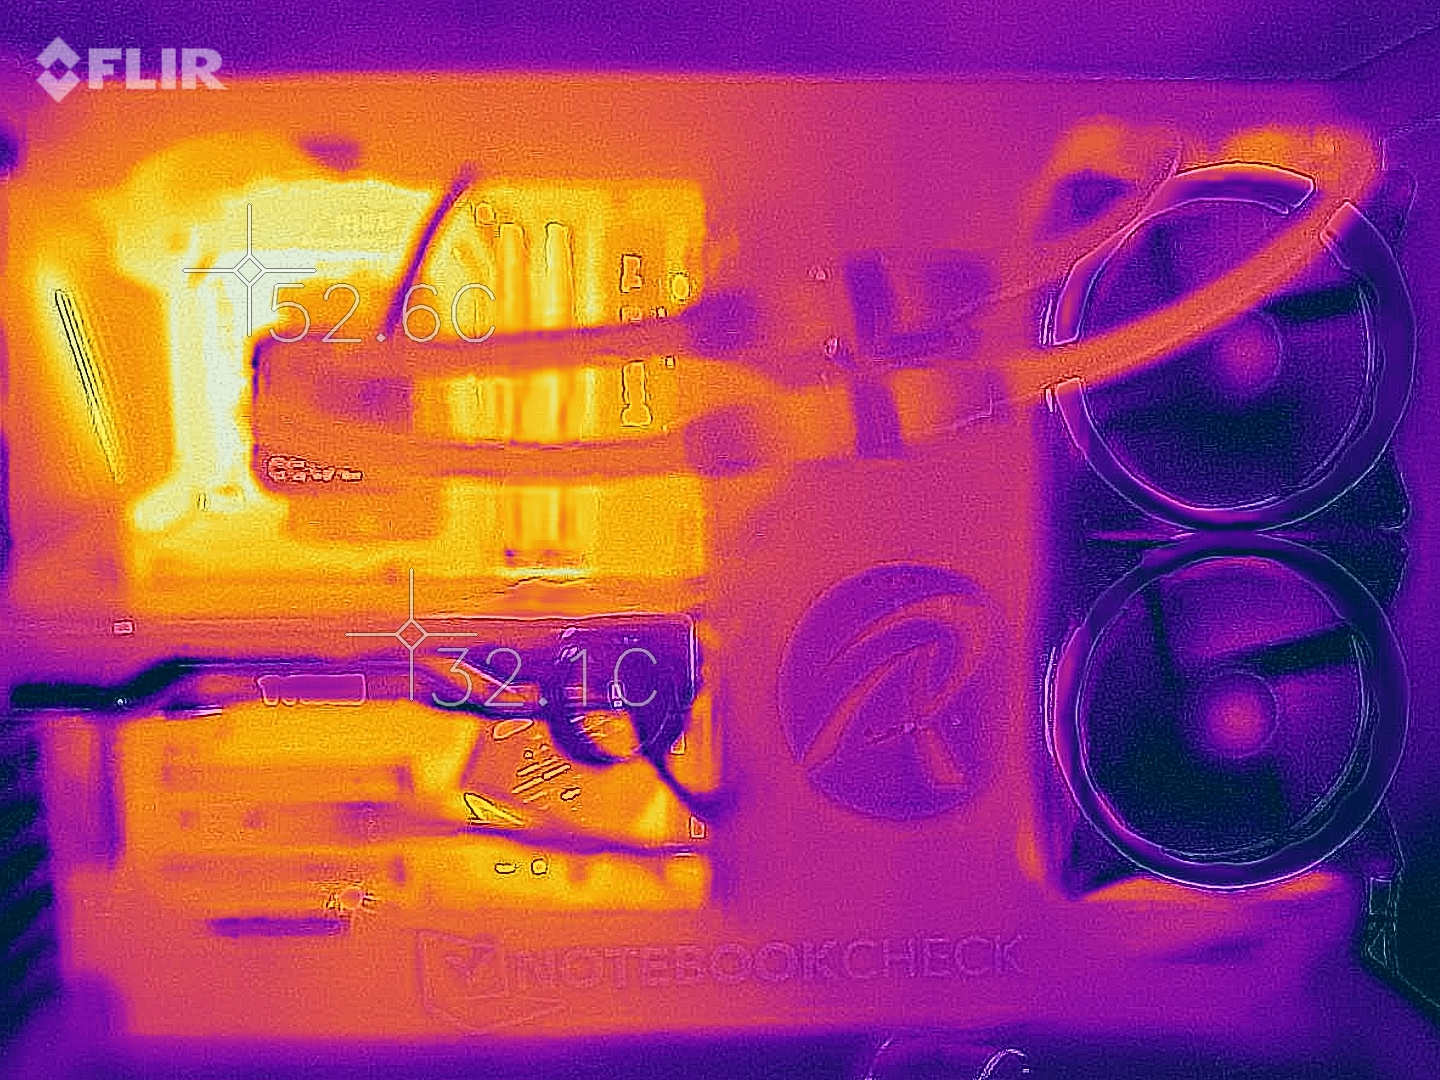
Neither of our two test samples exhibited any thermal issues during our stress test. The Alphacool Eisbear 280 had no problems keeping temperatures in check on both samples on our open bench table, albeit we should note that the Ryzen 7 5800X got quite a bit warmer than the Ryzen 9 5900X during our tests.
Unlike the AMD Ryzen 9 3900X these CPUs do not come with a boxed cooler. If you opt for a Ryzen 5000-series processor you will need to provide a powerful CPU cooler yourself.
Please note that the power consumption as noted in this test is for the entire system without monitor.
AMD Ryzen 9 5900X
AMD Ryzen 7 5800X

* ... smaller is better
Overclocking – Would Not Recommend
Overclocking is one way to squeeze that extra little bit of performance out of one’s components. However, it requires a very powerful CPU cooler, and you won’t gain any ground otherwise.
As we have already established in the past Ryzen processors are not particularly well suited for overclocking, and this holds true for the latest Zen 3 generation as well. Considering the increased CPU voltage and resulting higher temperatures we would not consider a 5 % performance increase a worthwhile trade-off. Especially considering that you actually lose single-core performance due to the fact that PBO is disabled when overclocking manually.
Pros
Cons
Verdict – AMD has the Fastest Gaming CPU

AMD’s Ryzen 5000 family is a seamless continuation of AMD’s Ryzen success story, and for the first time a Ryzen processor is the better gaming CPU and beats the previous kingpin, the Core i9-10900K. And we have not even taken the new high-end flagship model, the Ryzen 9 5950X, into consideration yet and based our opinions on the AMD Ryzen 9 5900X and the AMD Ryzen 7 5800X. We expect the 5950X to raise the bar for the fastest gaming CPU even further, hopefully in no more than a few days’ time.
Until then we can conclude that AMD’s Zen 3 improvements worked brilliantly well. Not only did AMD manage to pack even more cores onto a single die, they also redesigned the CCX completely in order to improve IPC. And unsurprisingly, this is exactly where the new Ryzen 5000 series processors shine and manage to outclass Intel’s current flagship CPU in many single-core CPU benchmarks. Furthermore, this improved single-core performance also directly correlates with increased multi-core performance as well, which improved significantly over the 3000-series Zen 2 generation.
AMD’s MSRP of $549 is slightly higher than Intel’s asking price for the Core i9-10900K. The less powerful Ryzen 7 5800X costs $100 less, and at $449 it is at a similar price level as Intel’s competitor while offering a higher performance at the same time. Another benefit is the lower TDP, which can make do with a smaller cooling system than would work on the Core i9-10900K. Also, PCI Express 4.0 is currently only available on AMDs platform. Intel platforms are expected to get PCIe 4.0 support with Rocket Lake in the near future.
AMD beat Intel and has the fastest gaming CPU currently available. Intel’s forte, single-core performance, has been smashed to pieces.
Customers now have a choice and can decide between a fast 8-core and an even faster 12-core CPU. Both samples performed exceptionally well in our tests. However, if your main interest is gaming then you should keep in mind that the Ryzen 7 5800X offered a practically identical performance to the Ryzen 9 5900X. Content creators and streamers who don’t want to run a dedicated streaming PC will most likely benefit from the Ryzen 9 5900X or possibly even Ryzen 9 5950X.

