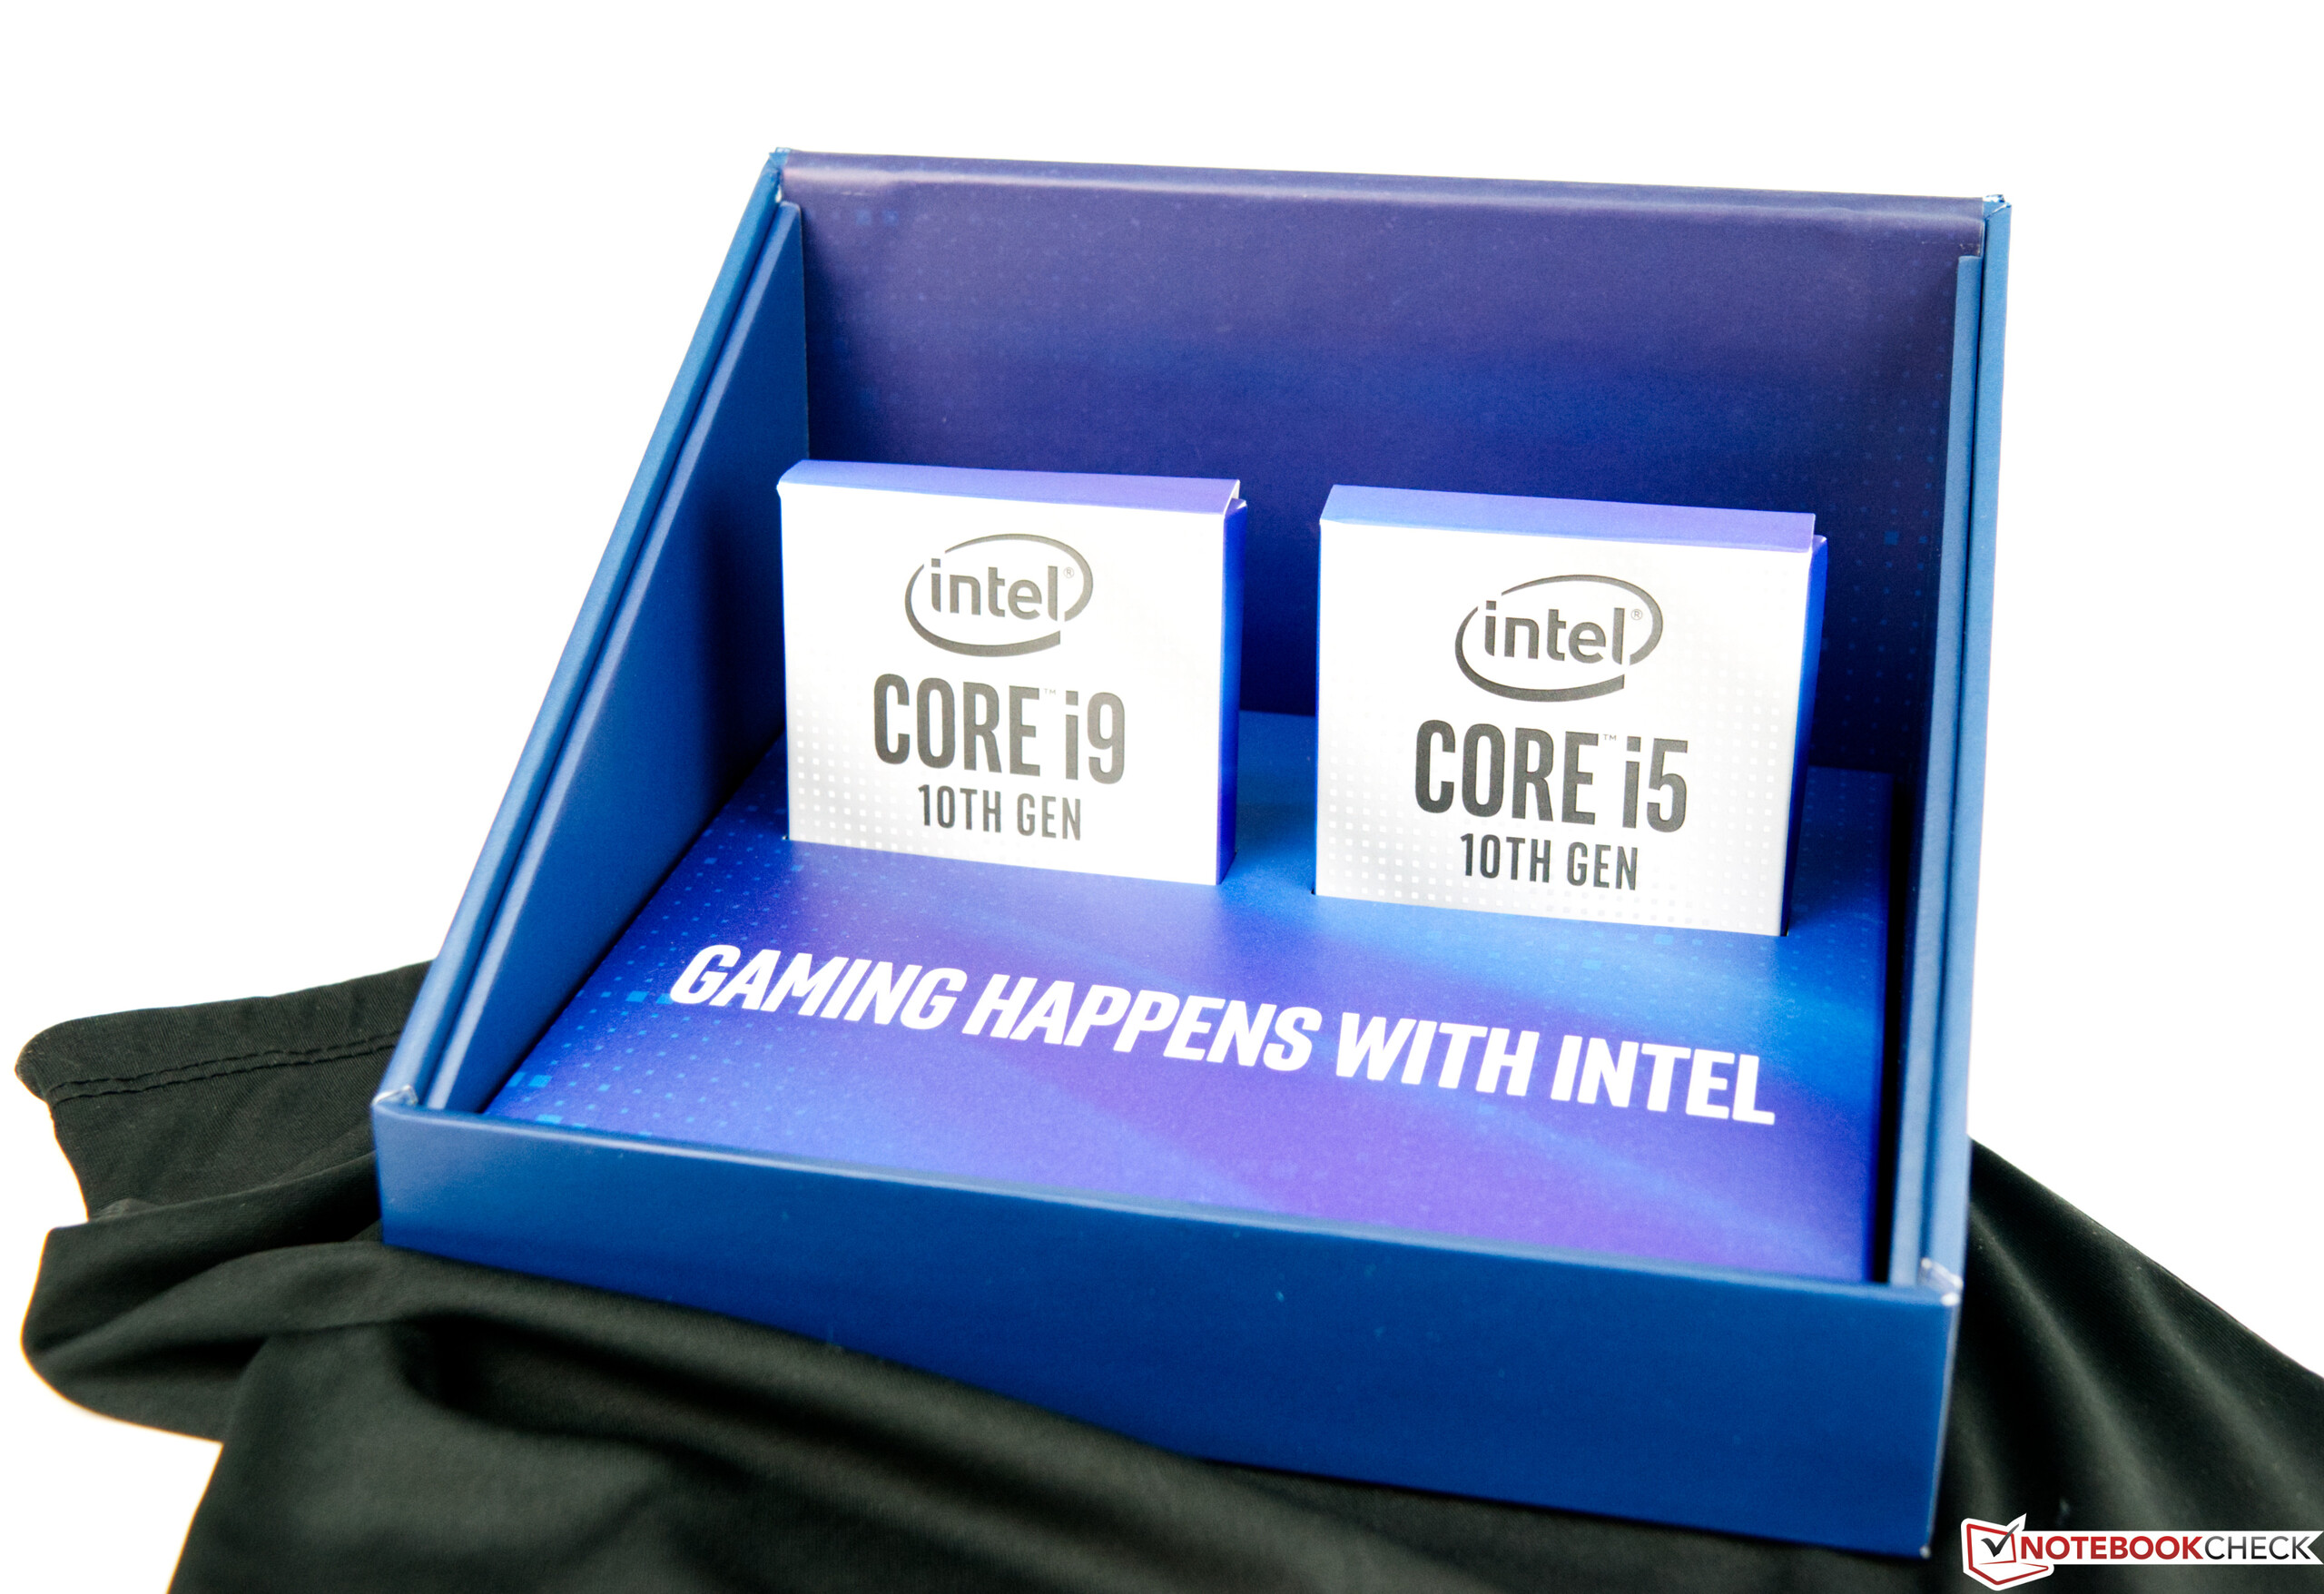
Benchmarking Intel Comet Lake-S CPUs with up to 10 cores
Comet Lake-S is the name of Intel’s latest generation of processors, which was first revealed on the 30th of April, 2020. It is based on the 14-nm manufacturing process, which has been around for years now. Here, AMD is far ahead. It produces Ryzen 3000 chips using the 7-nm node.
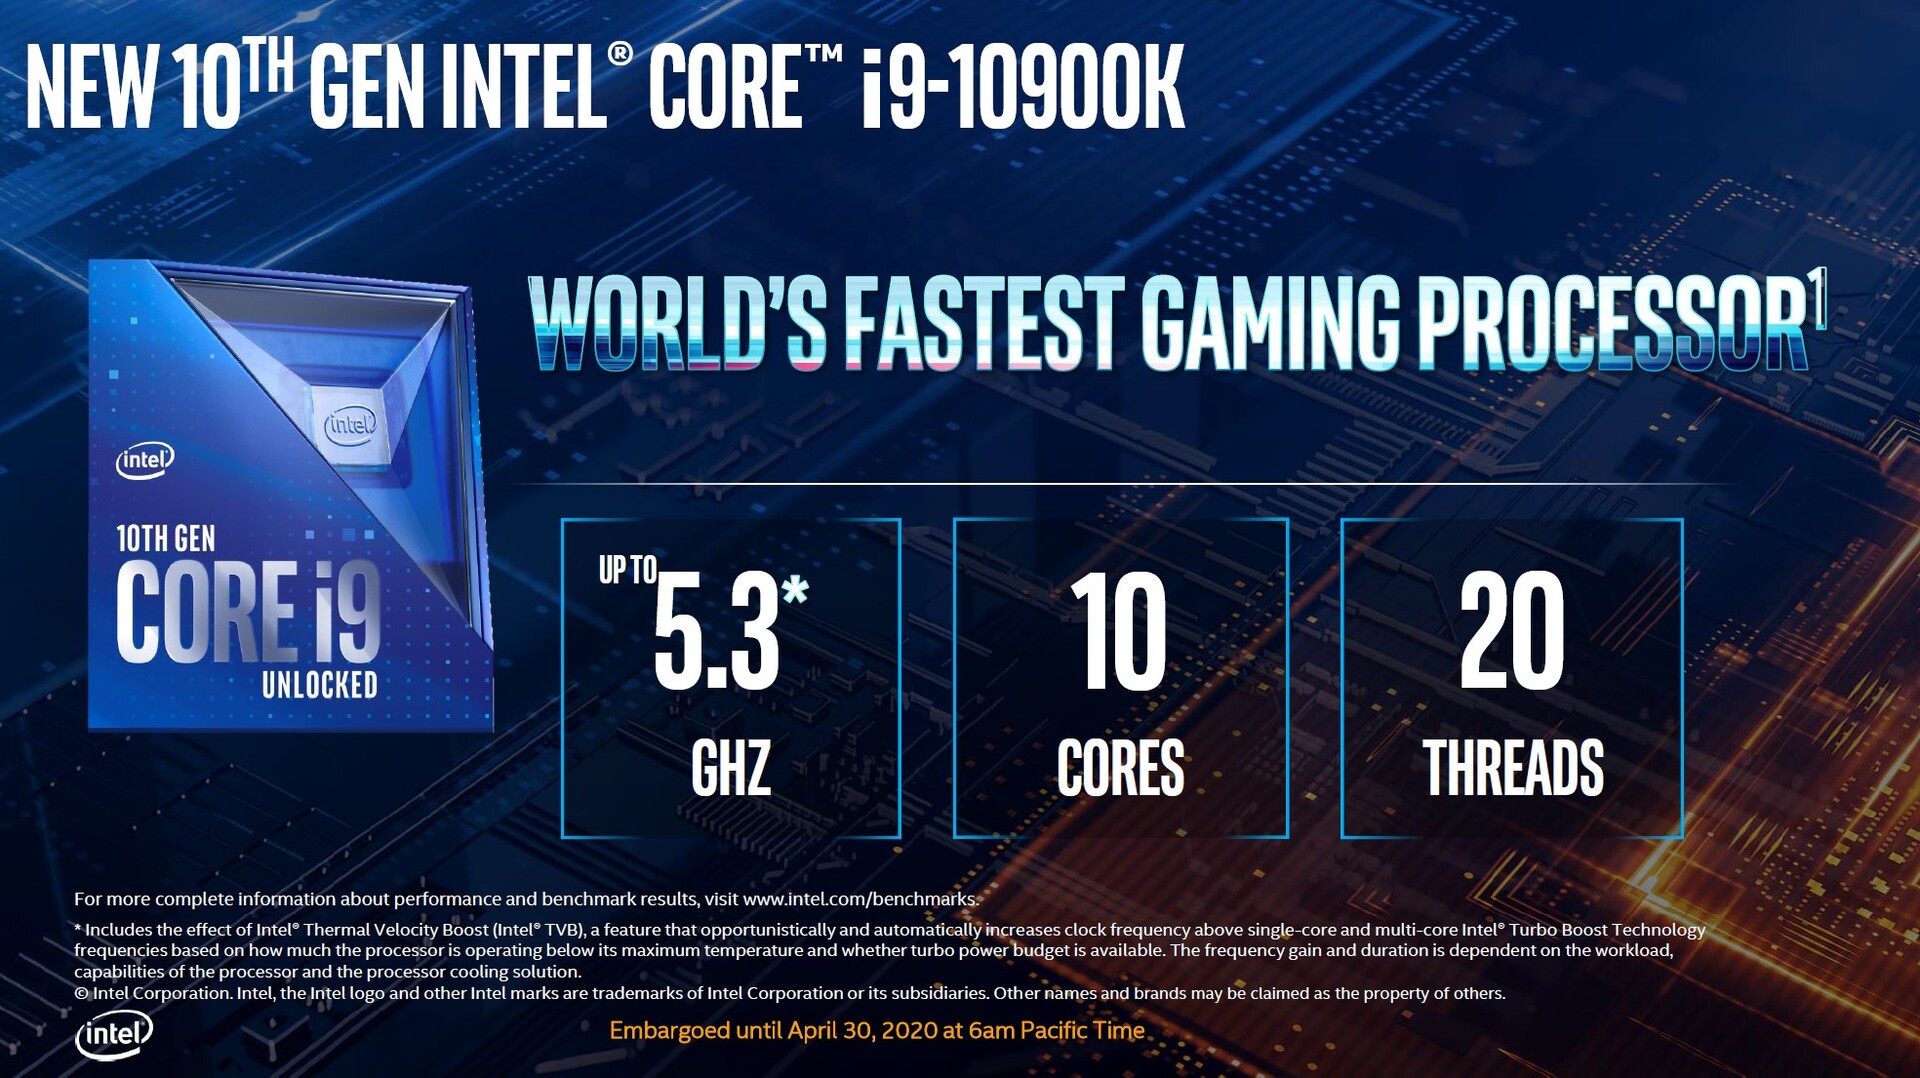
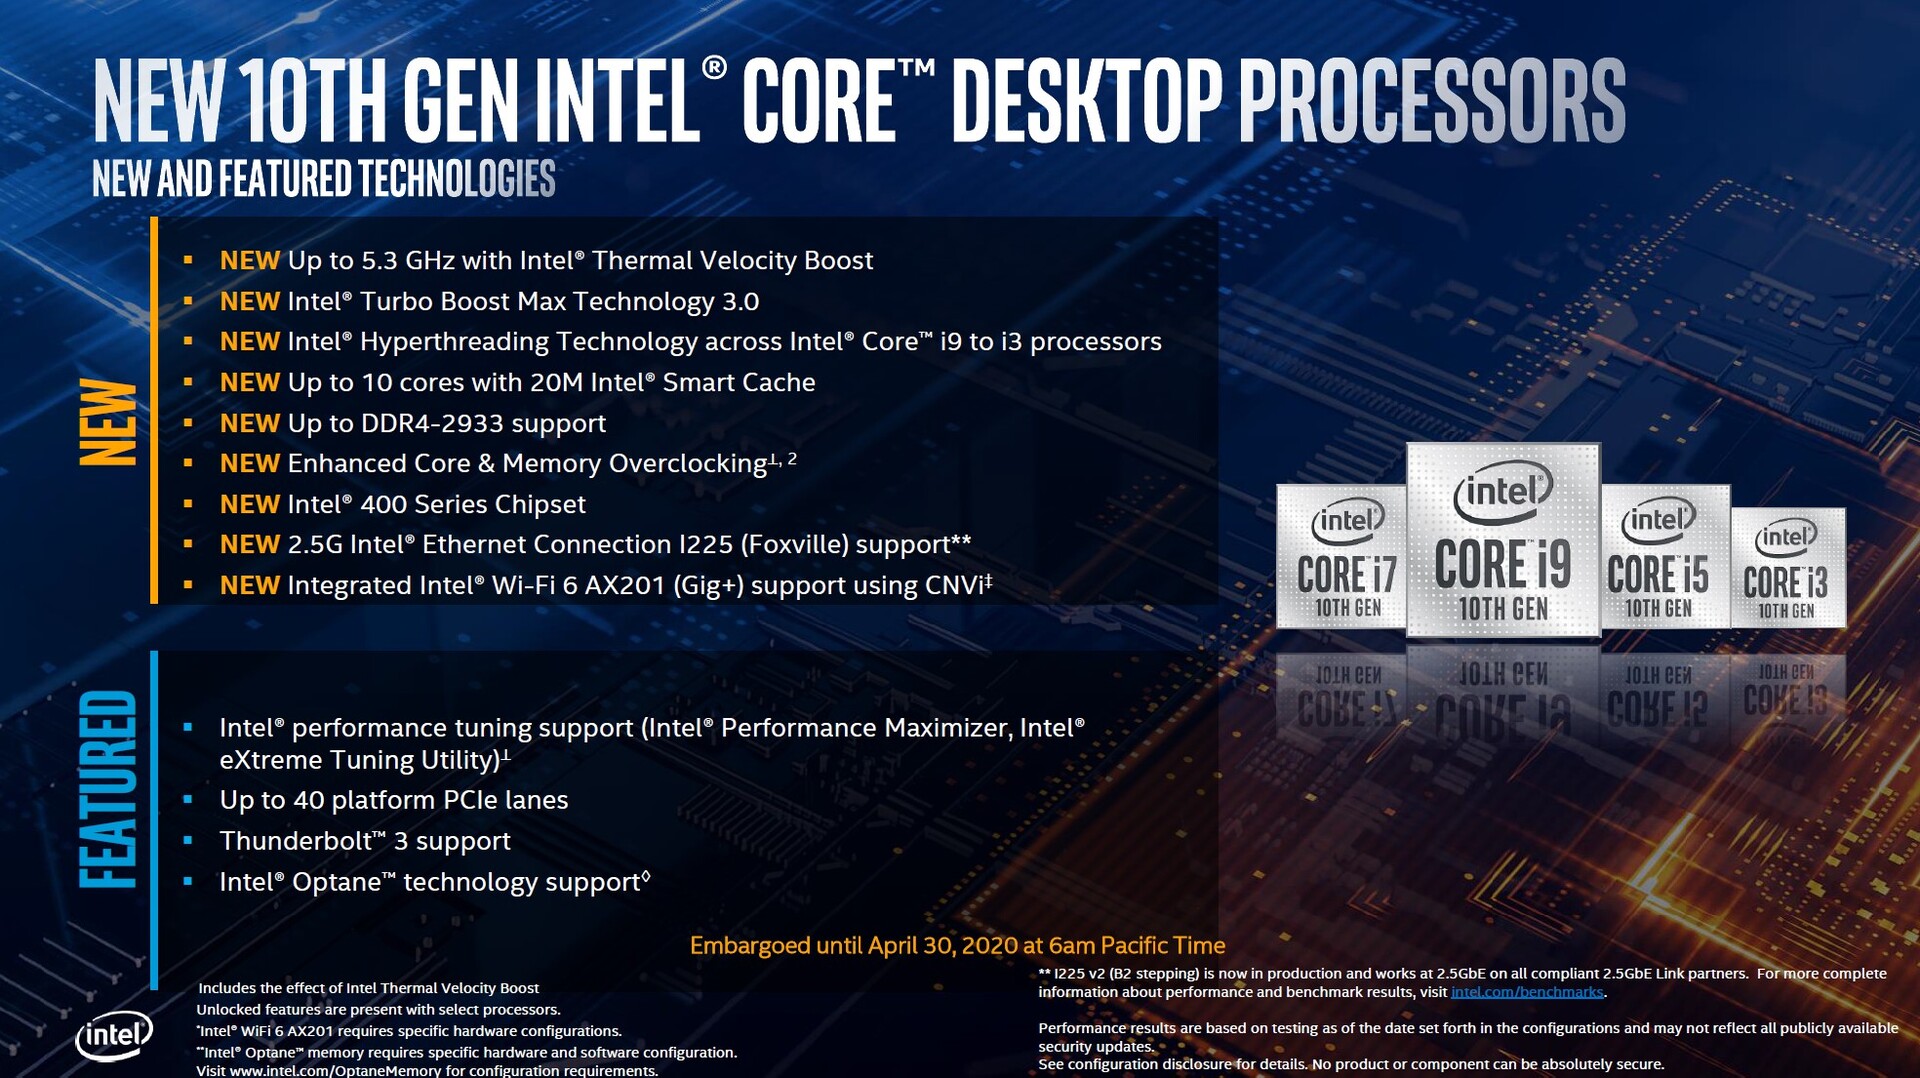
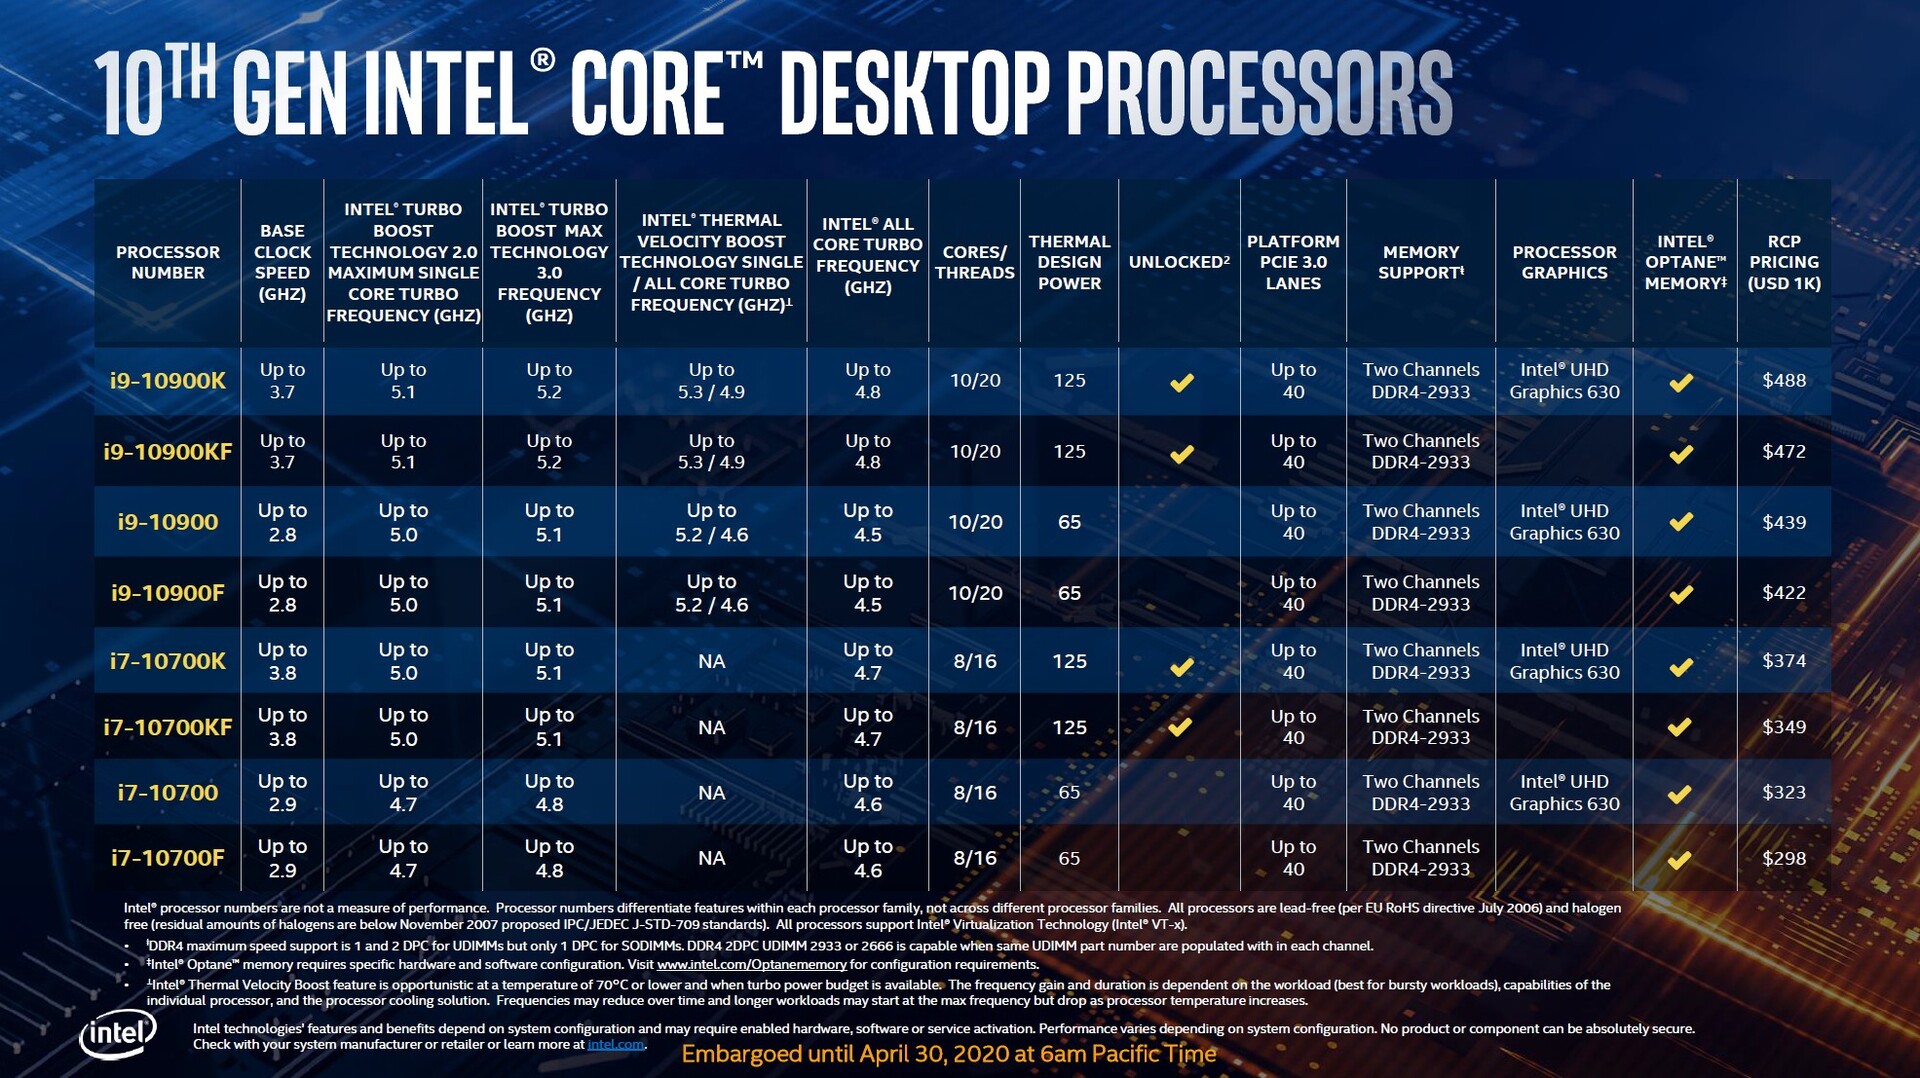
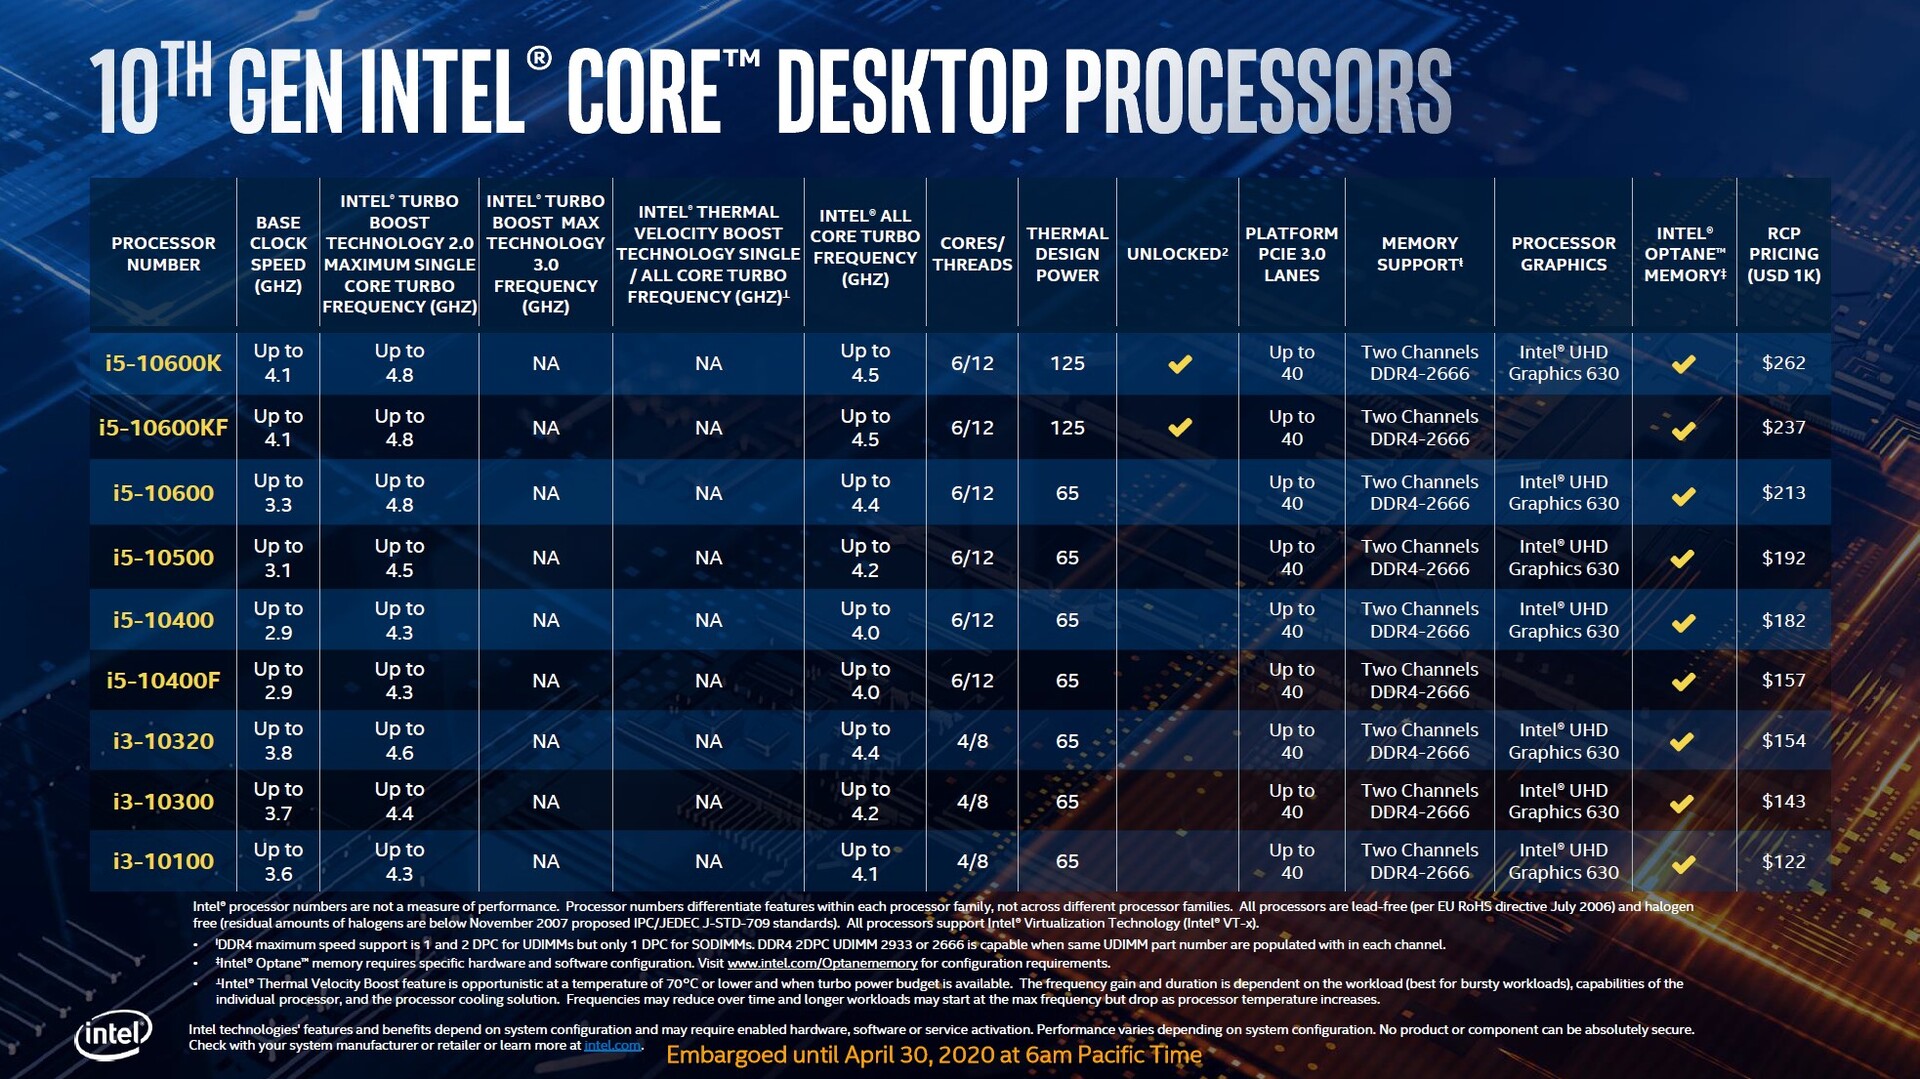
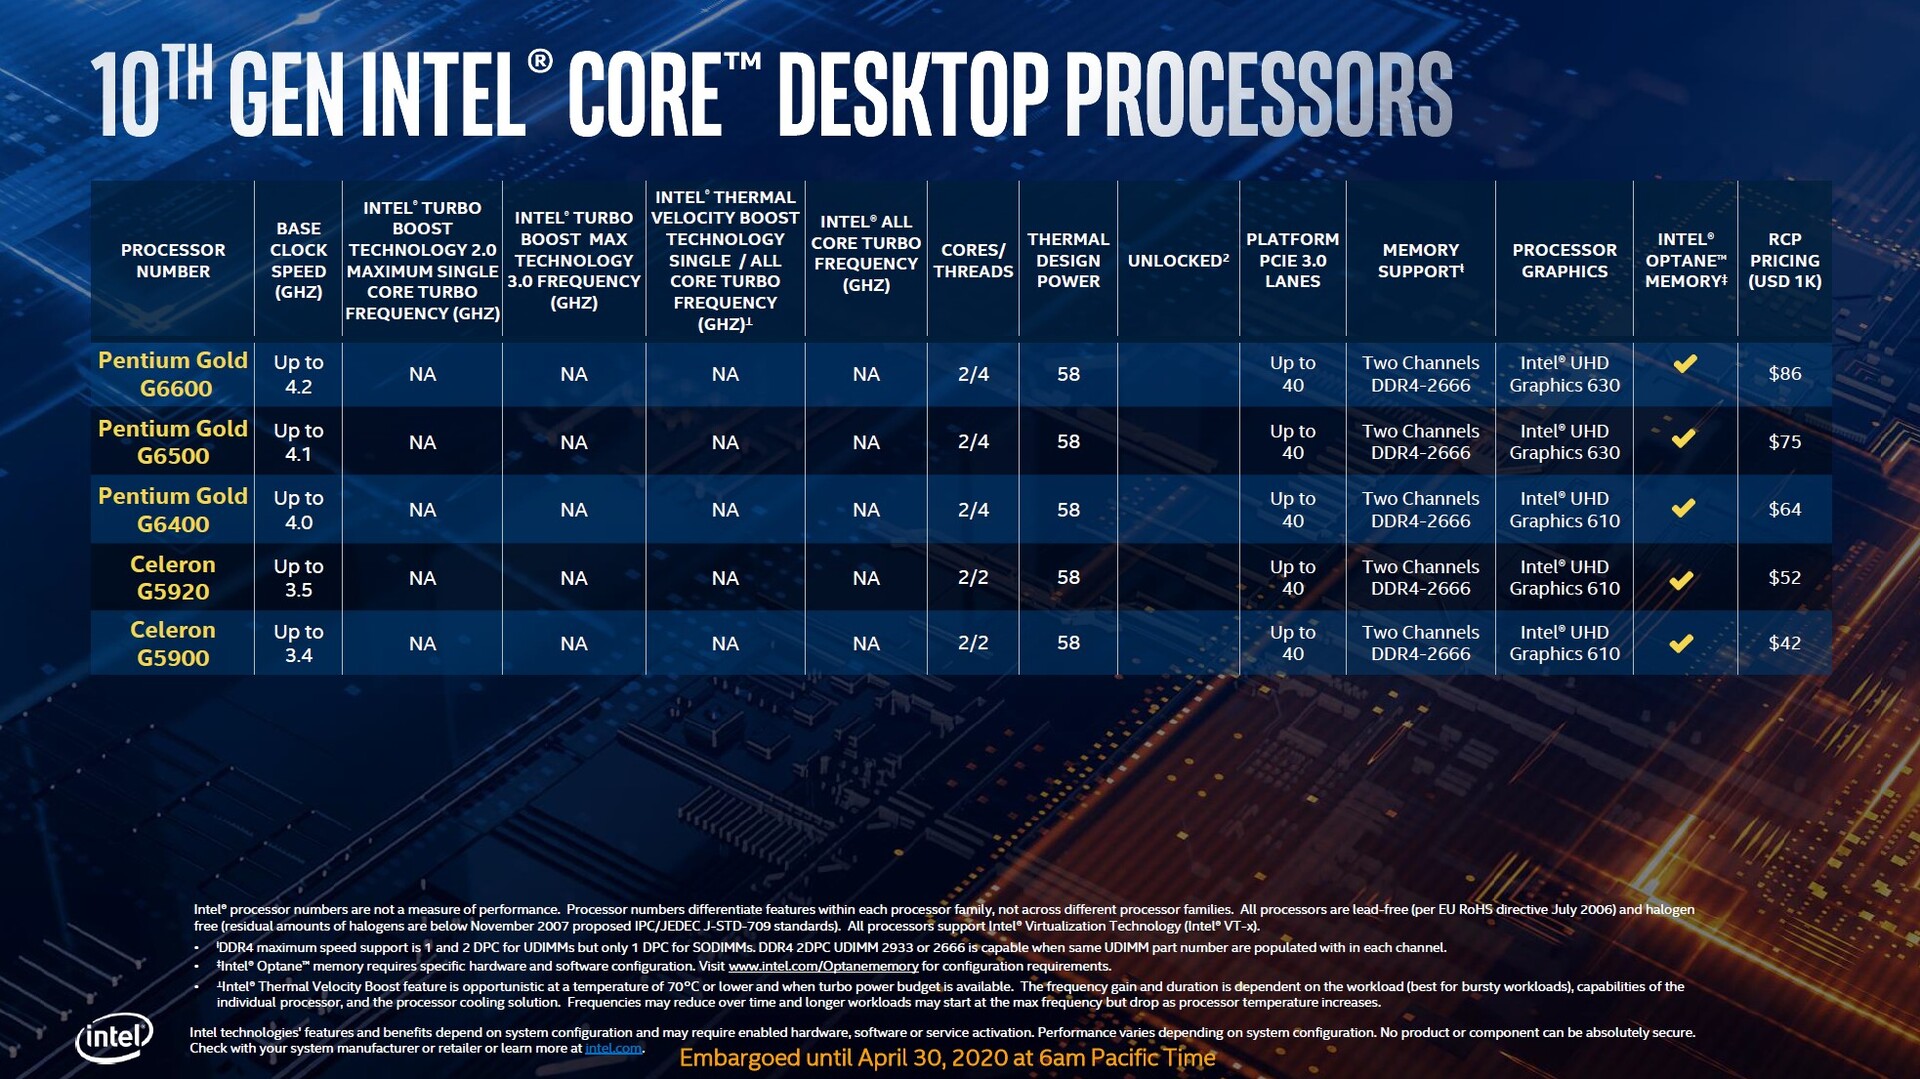
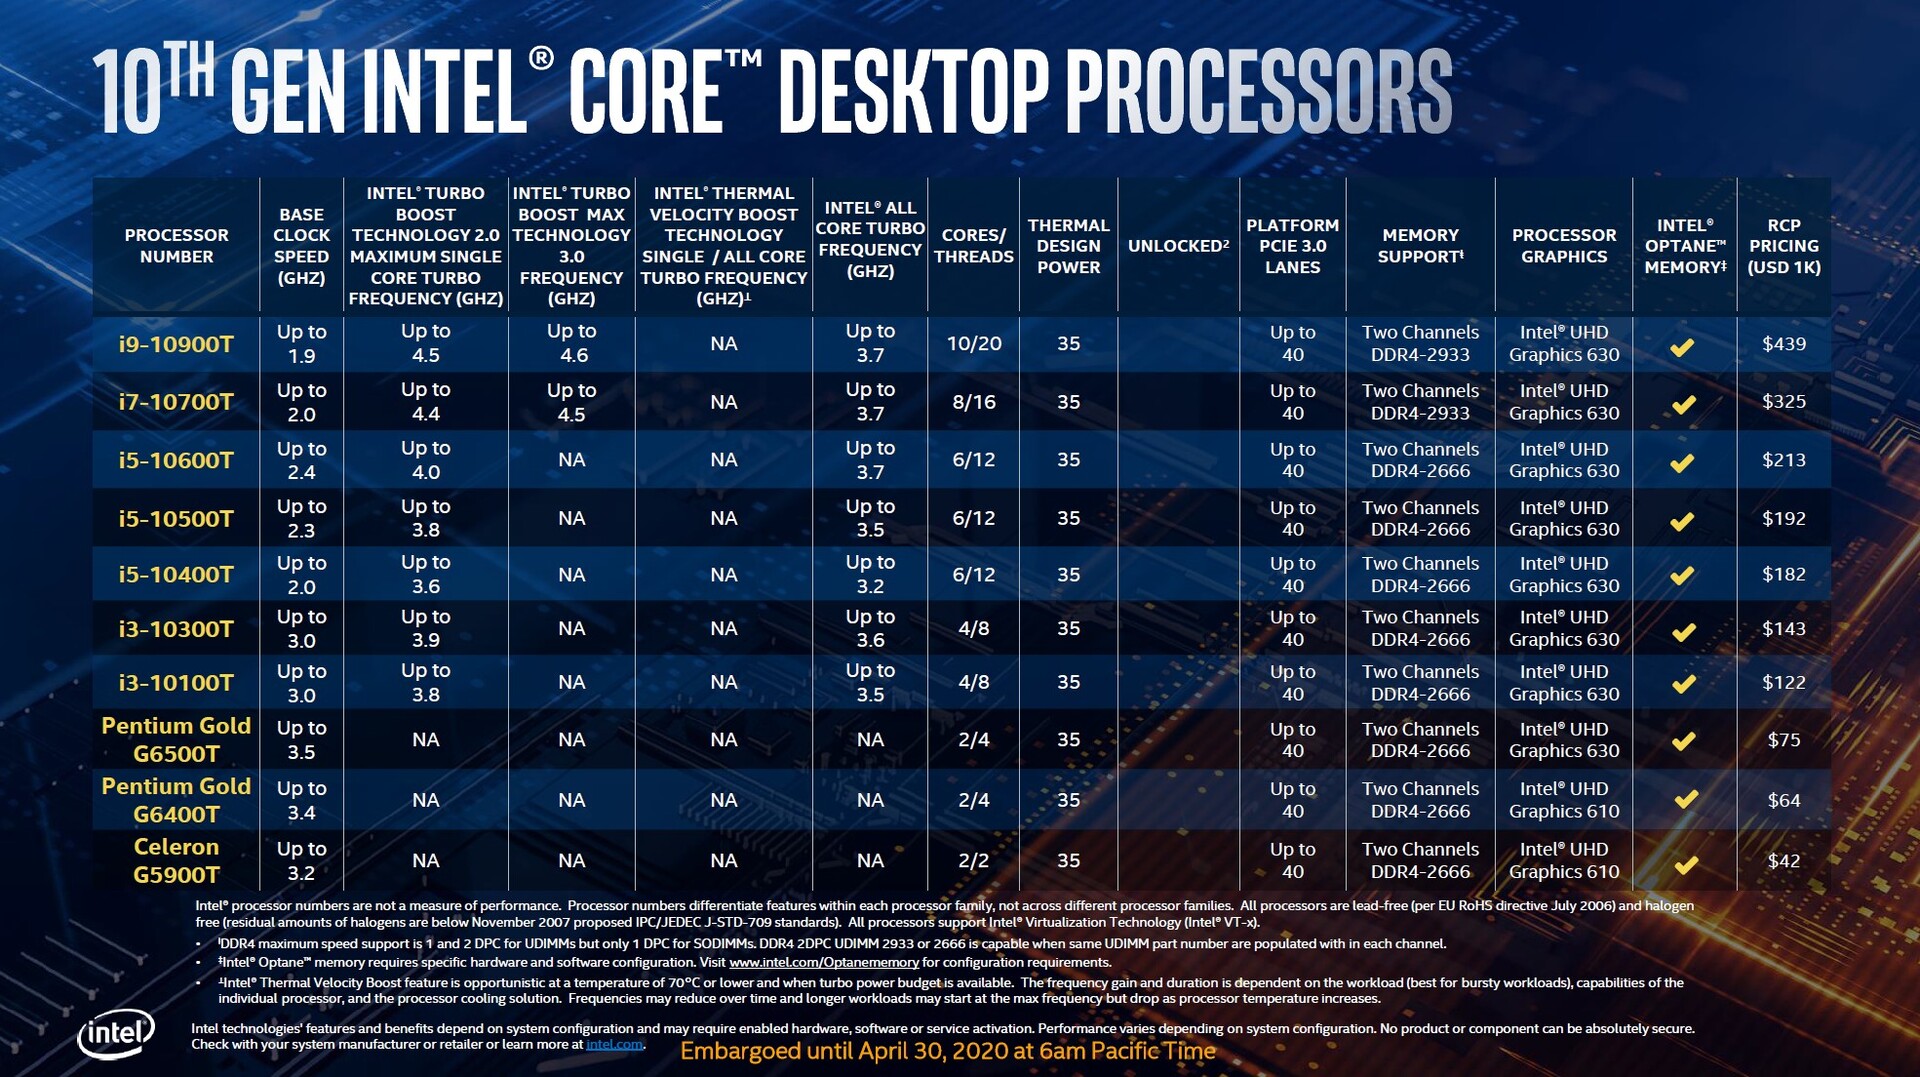
When compared to the 9th generation, the highest-end model offers two more cores. This is the first 10-core consumer chip. Intel has been selling 10-core chips for its HEDT platform for years, though. In the chart below, you can see all new processors in Intel’s mainstream Core series. Intel has kept the letters at the end of processor names to help distinguish different models. For example, the letter T at the end of the CPU name means that the part has a 35-watt TDP, and the names of all overclockable CPUs end with the letter K.
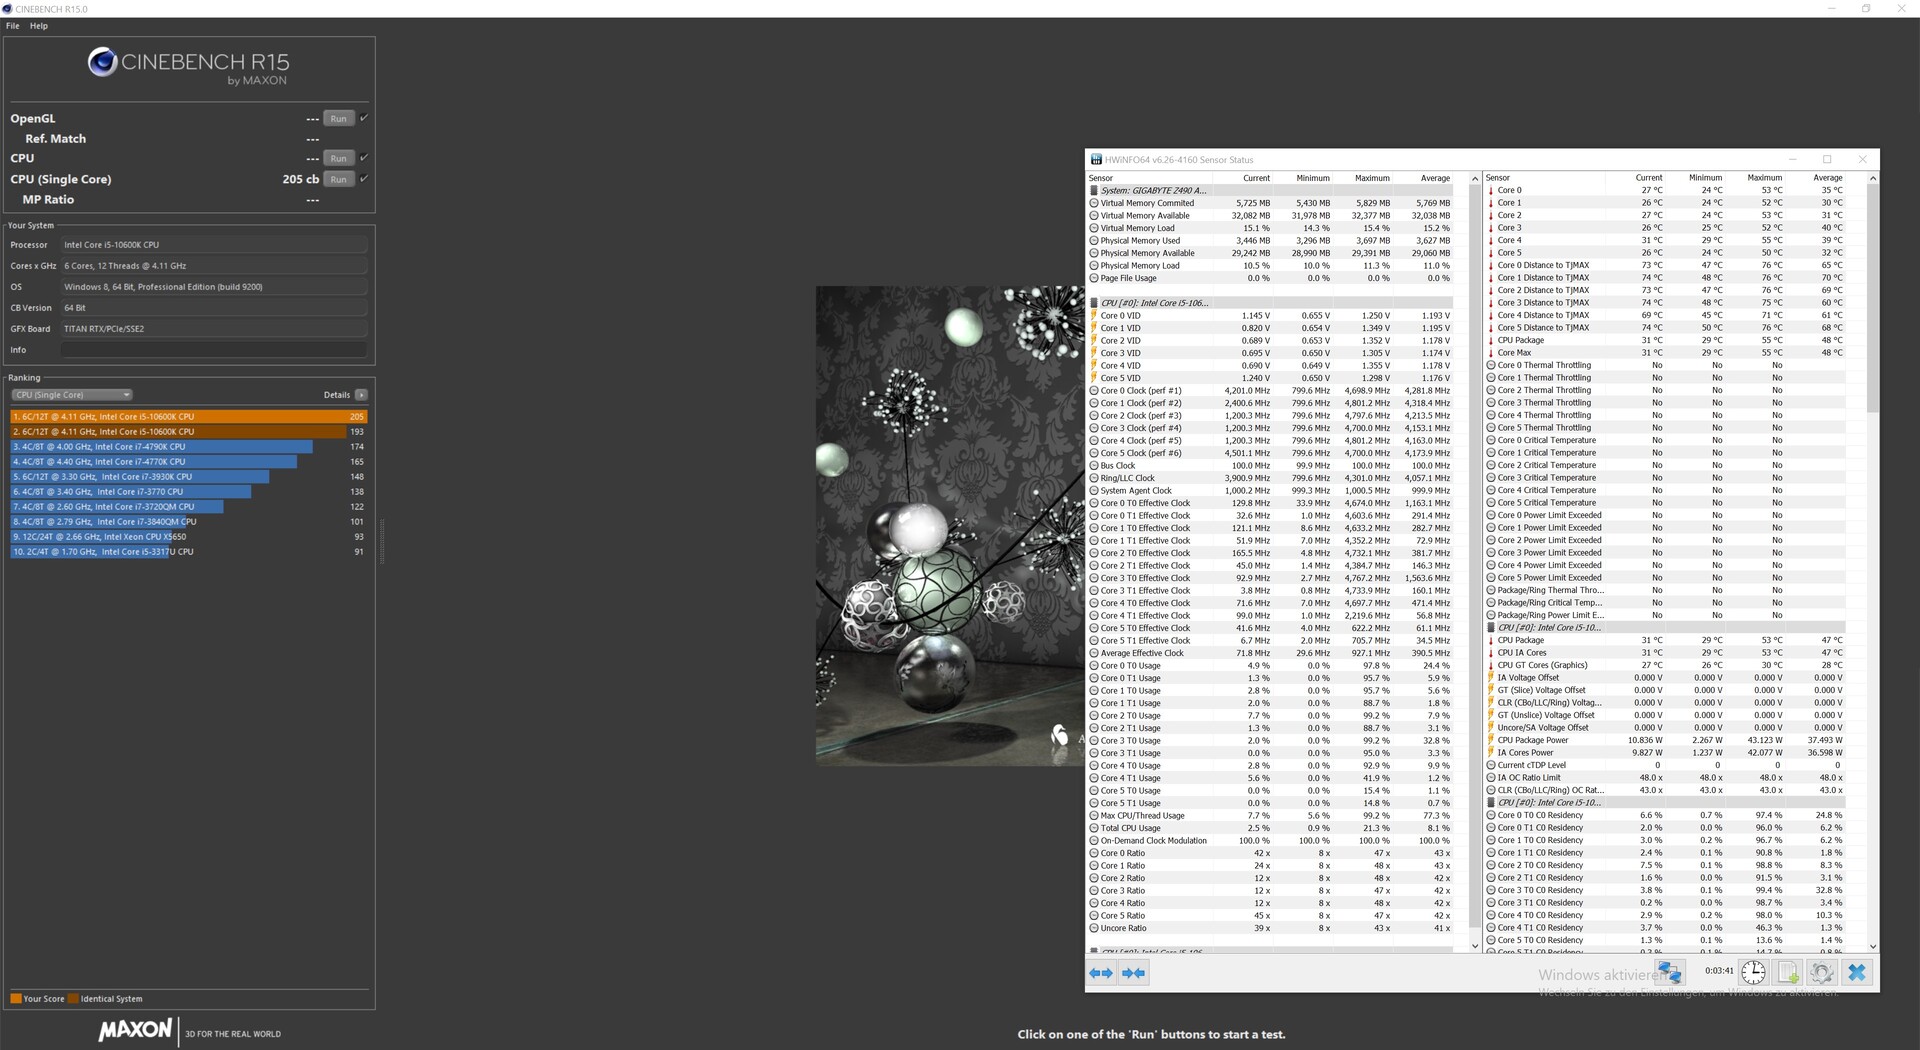
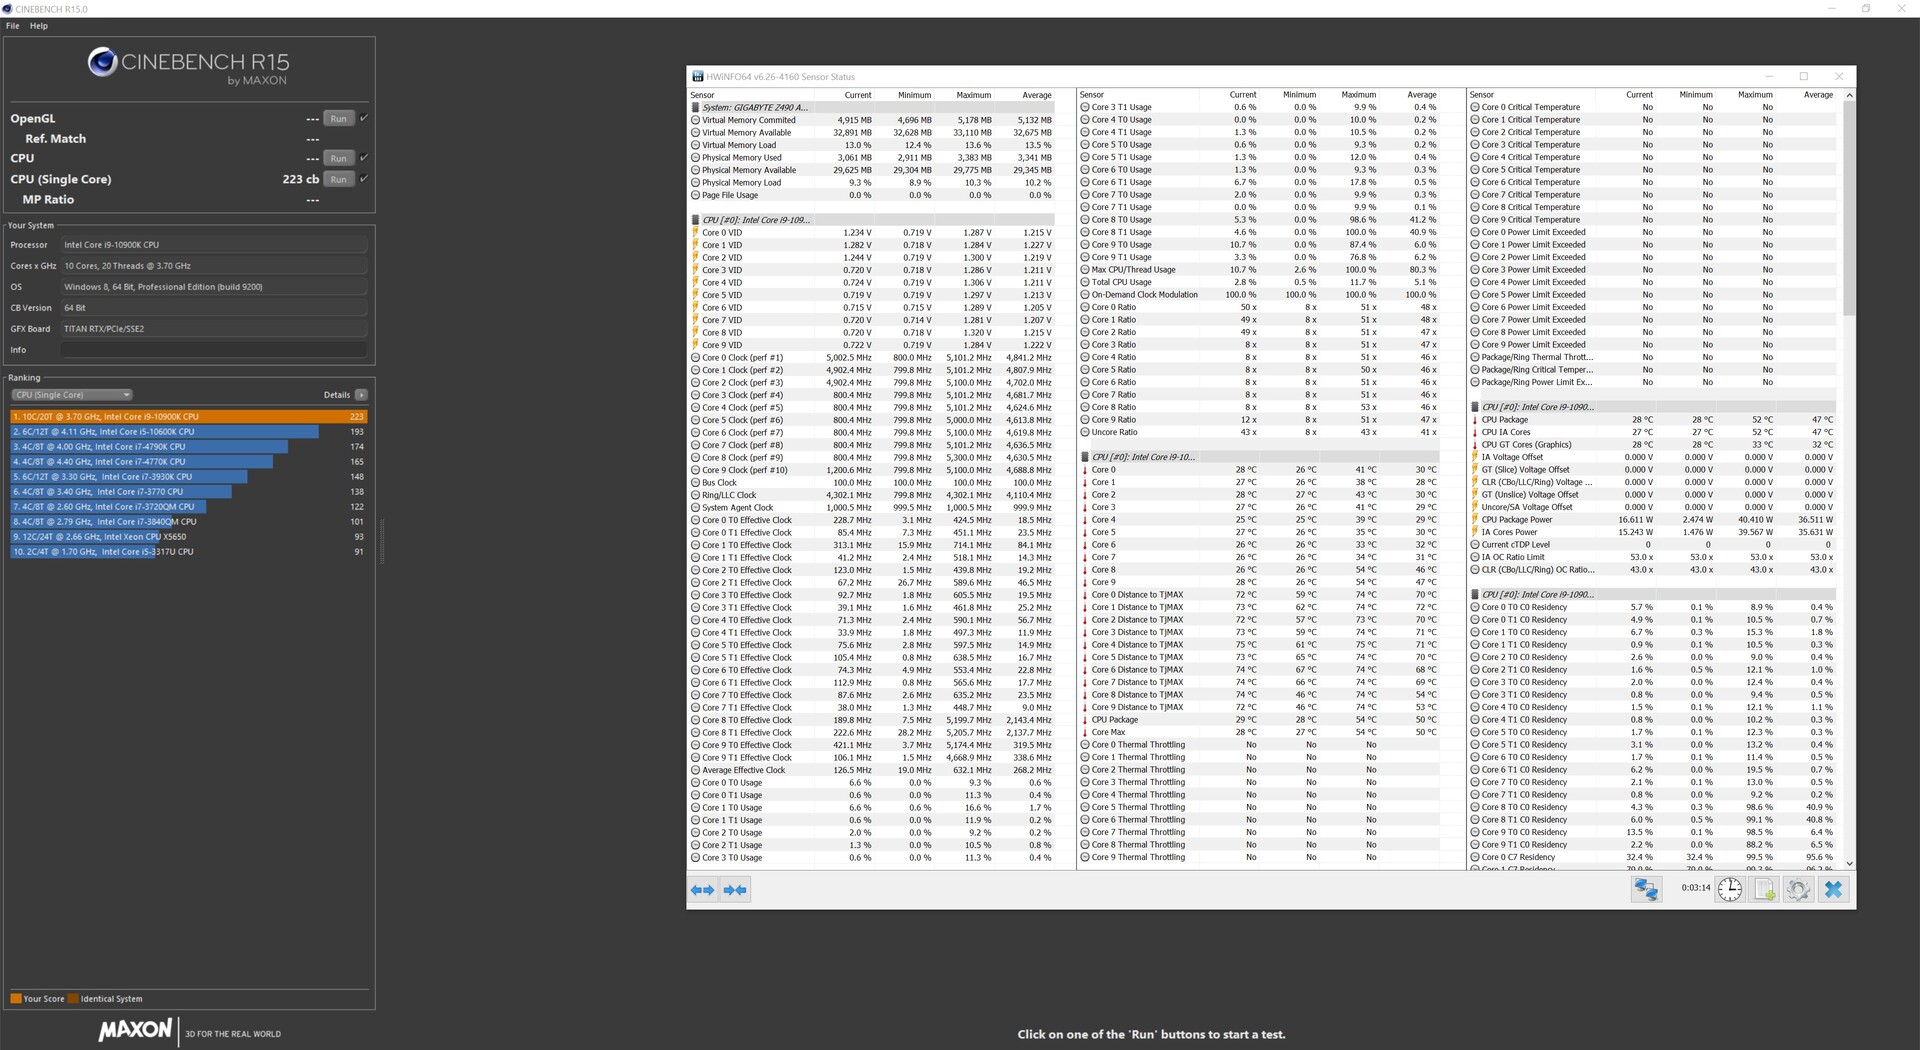
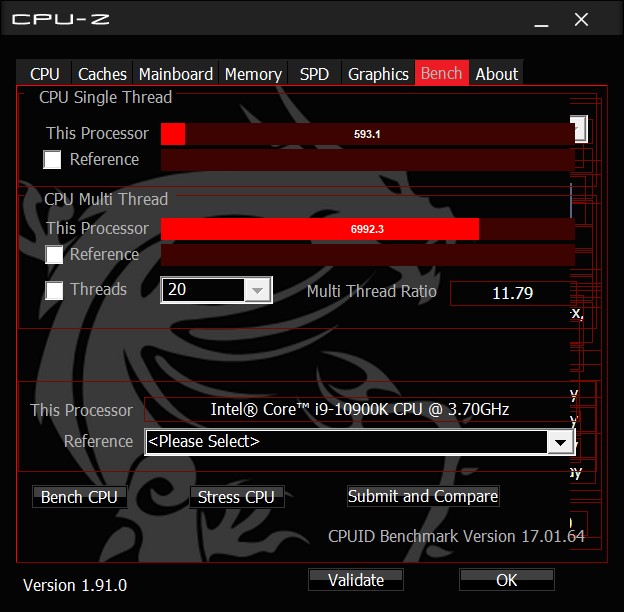
In terms of clock rates, Intel has made some changes when compared to the previous generation. The latest parts feature Turbo Boost Max Technology 3.0. It allows the CPU to achieve higher clock rates under certain circumstances. The same can also be said about Intel’s Thermal Velocity Boost technology, which allows the Core i9-10900K to hit up to 5.3 GHz. However, buyers must beware because all Boost specifications are theoretical highest frequencies, which depend on a whole range of factors such as the type of workload, the number of utilised cores, the calculated power draw and the CPU temperature. In our review, we were able to observe the Core i9-10900K hitting 5.3 GHz in Cinebench R15. However, the CPU was not able to maintain such a high clock rate over an extended period. Therefore, it would be unrealistic to assume that the CPU would be able to maintain a 5.3 GHz boost clock over a prolonged period without any overclocking.
When compared to the 9th generation CPUs, the TDP has increased significantly. The Turbo Boost duration has also been increased, which is why the new chips perform significantly better in many benchmarks. All in all, there are two power states: PL1 (Power Level 1) and PL2 (Power Level 2).
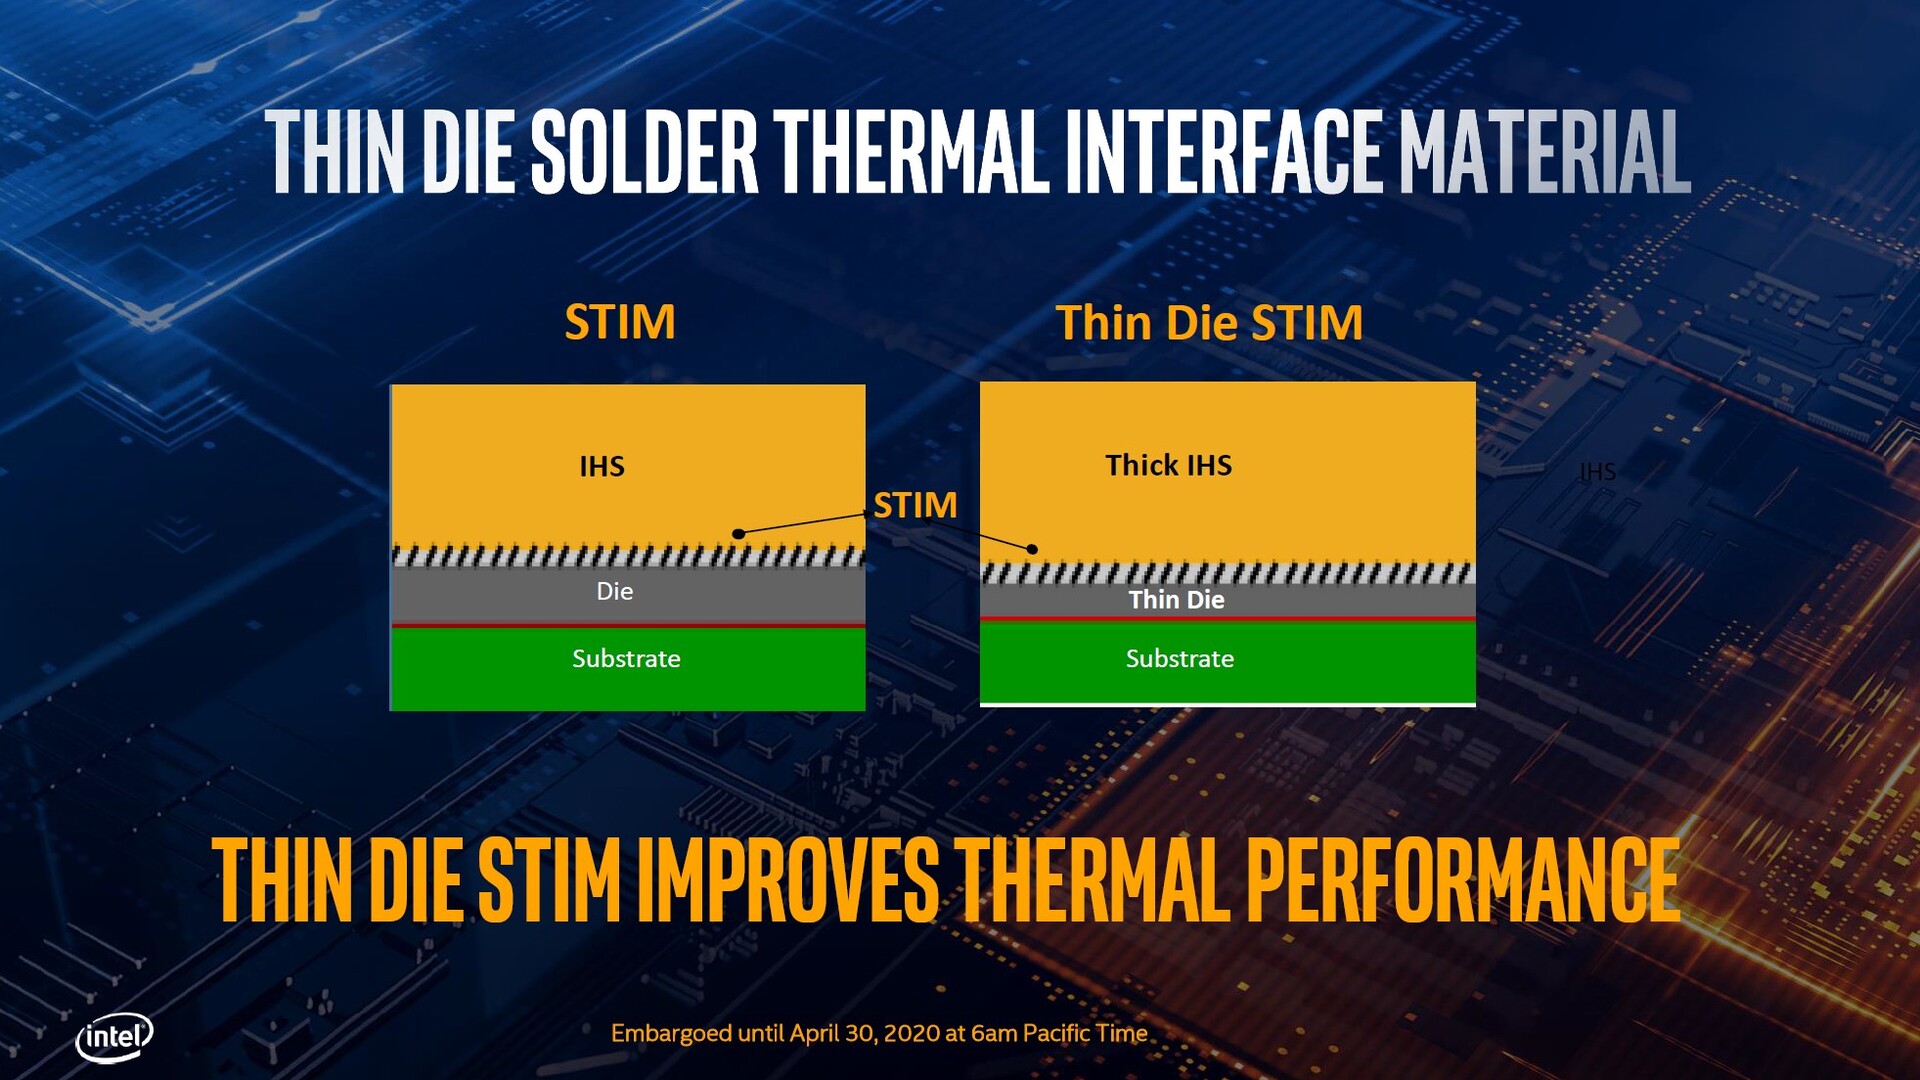
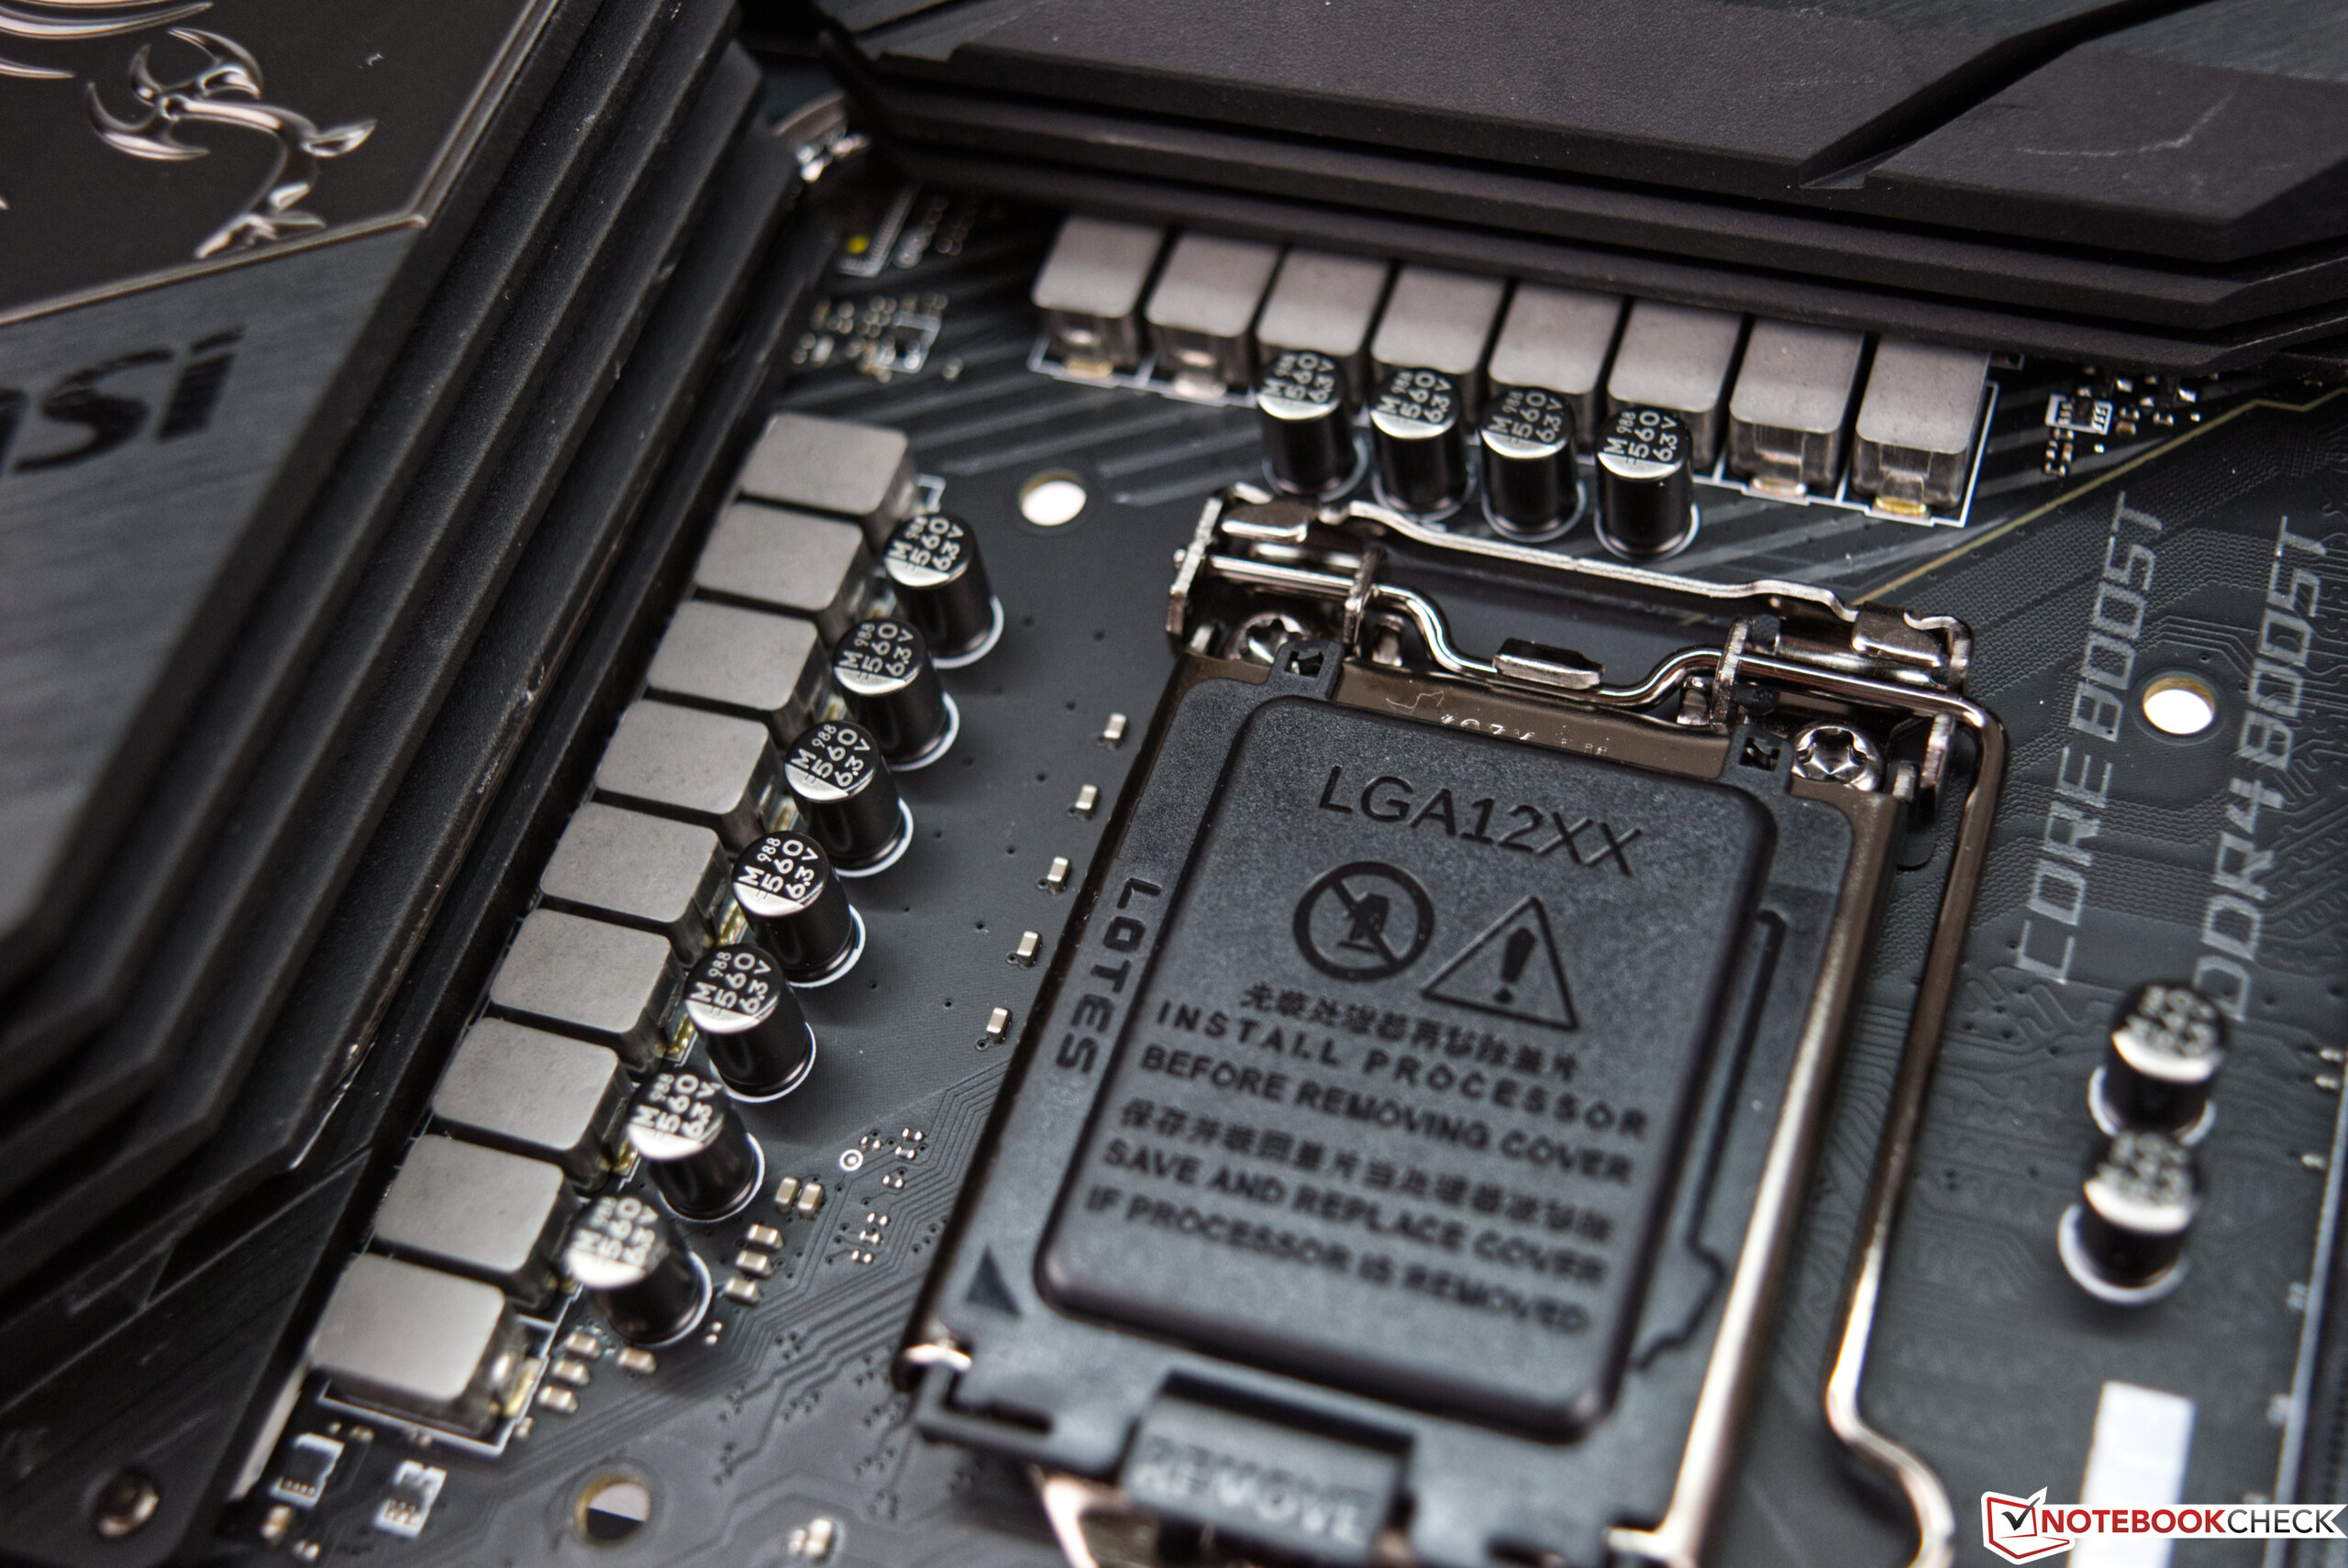
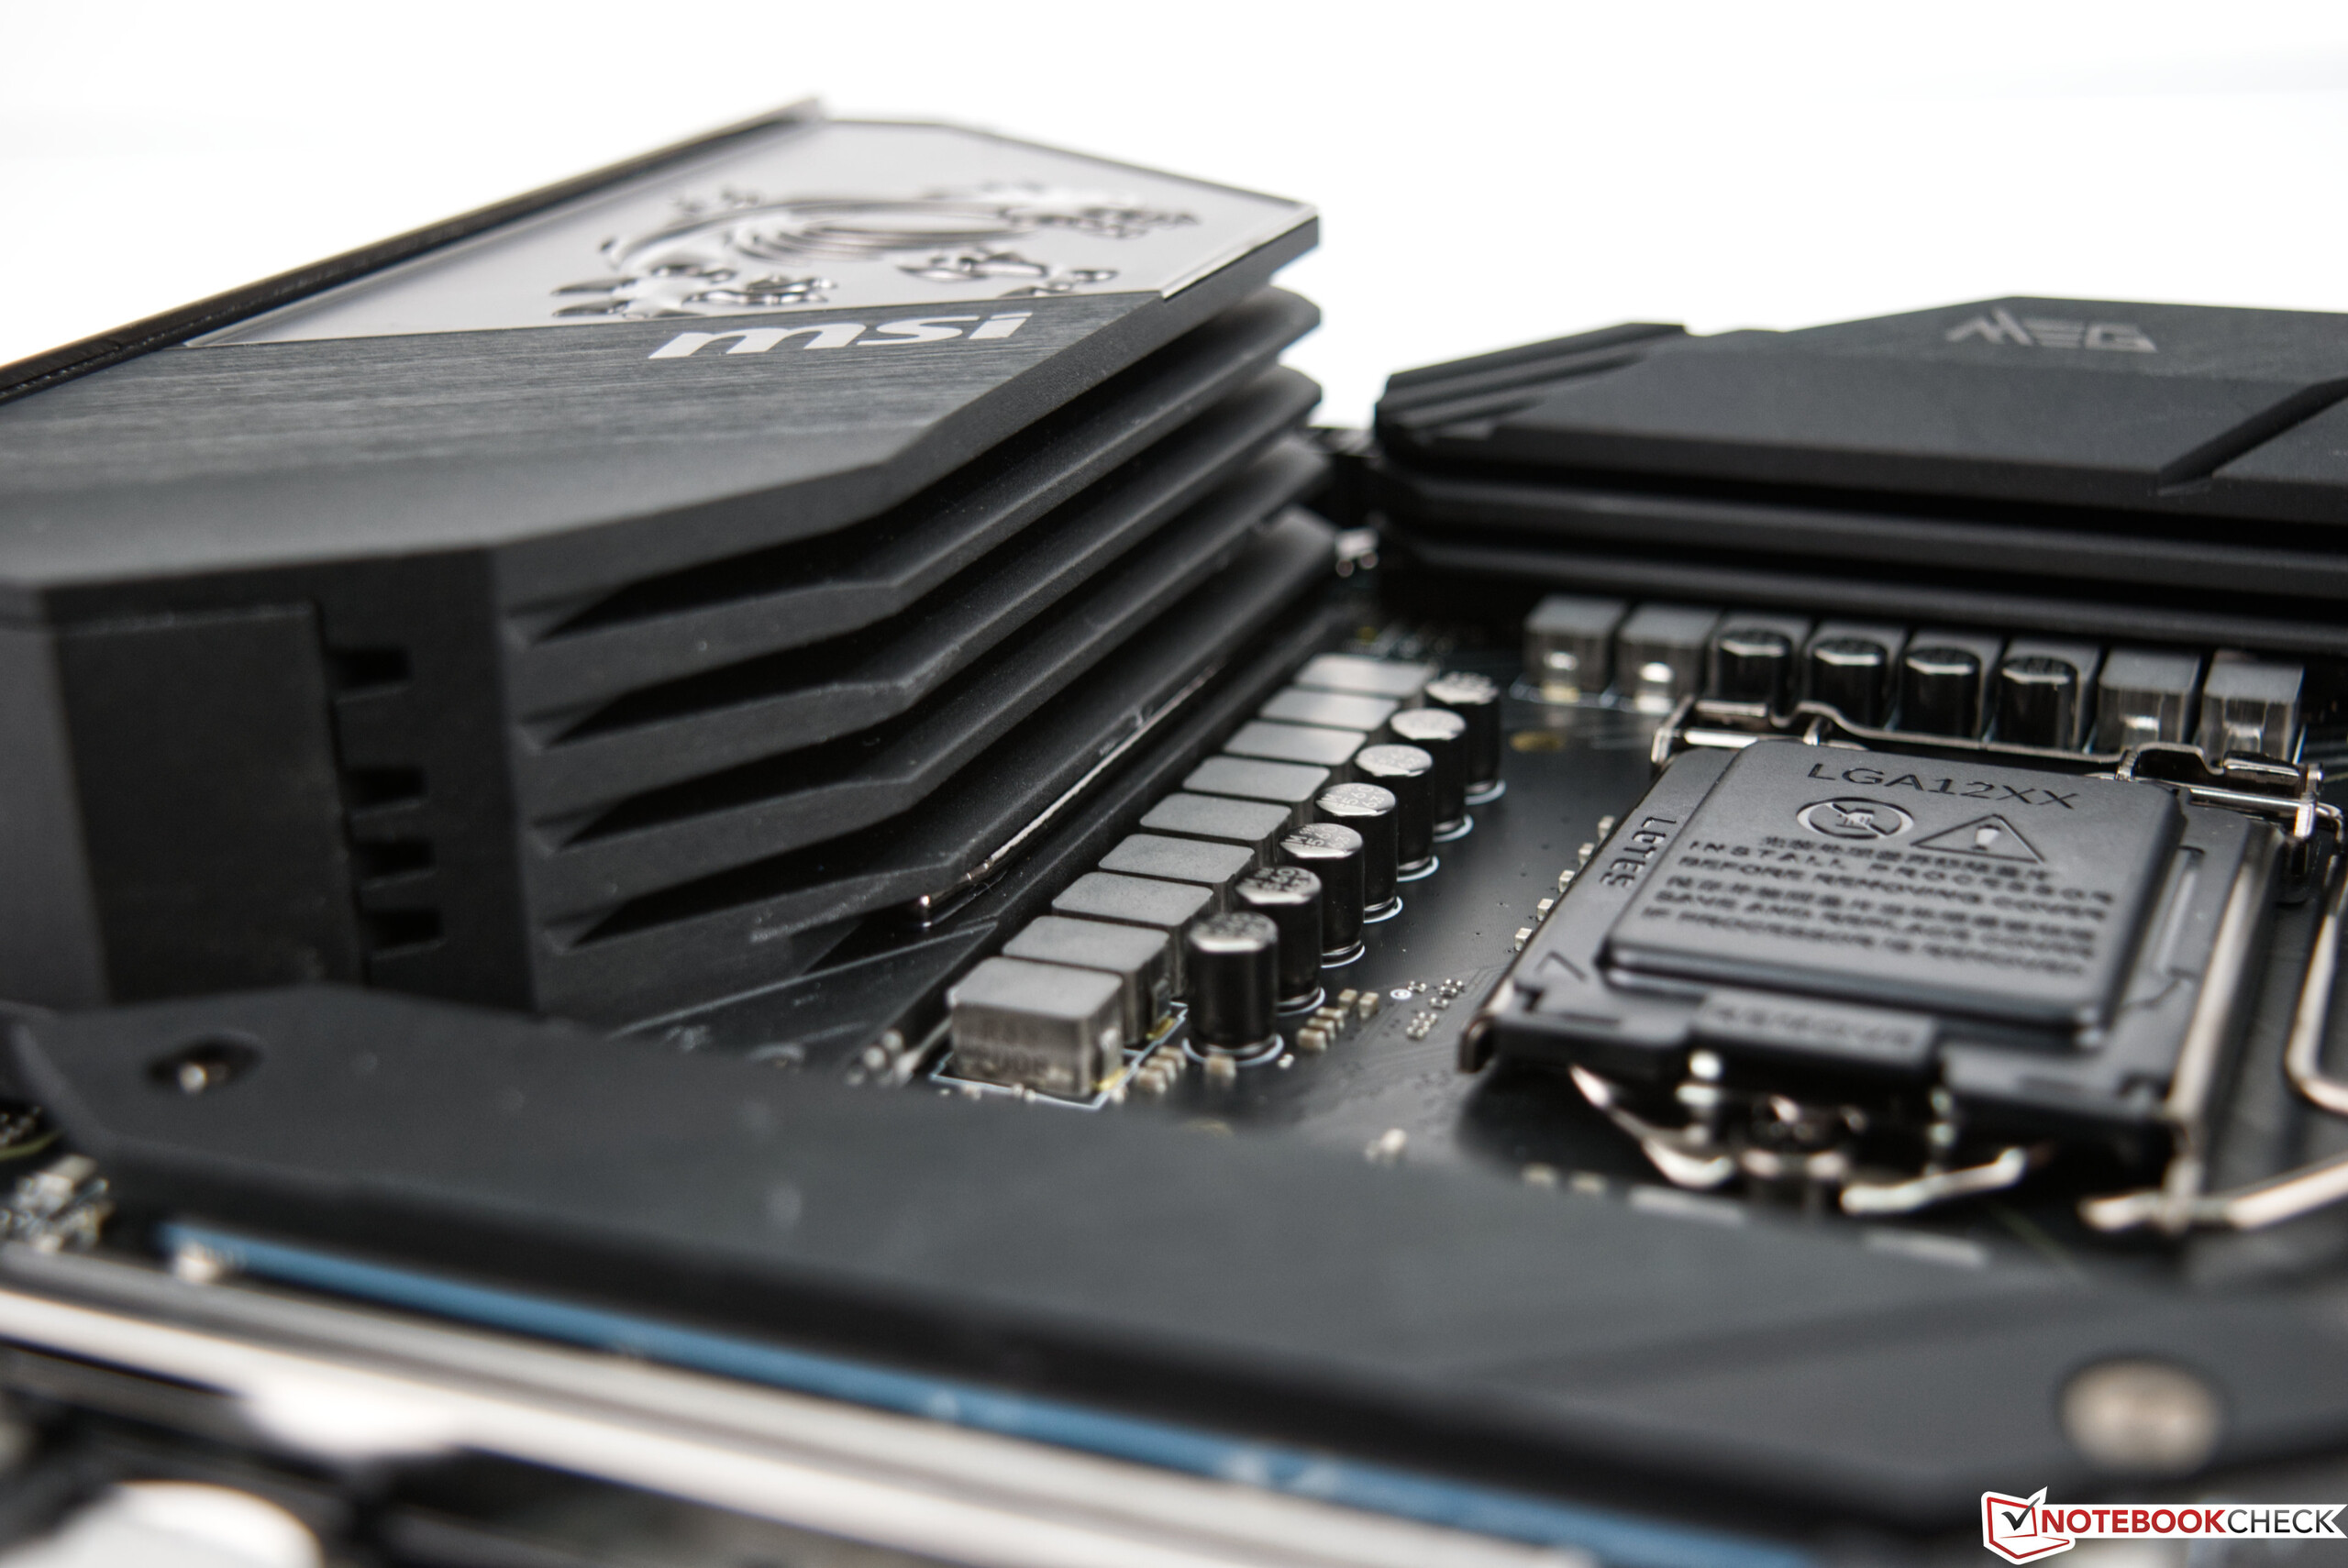
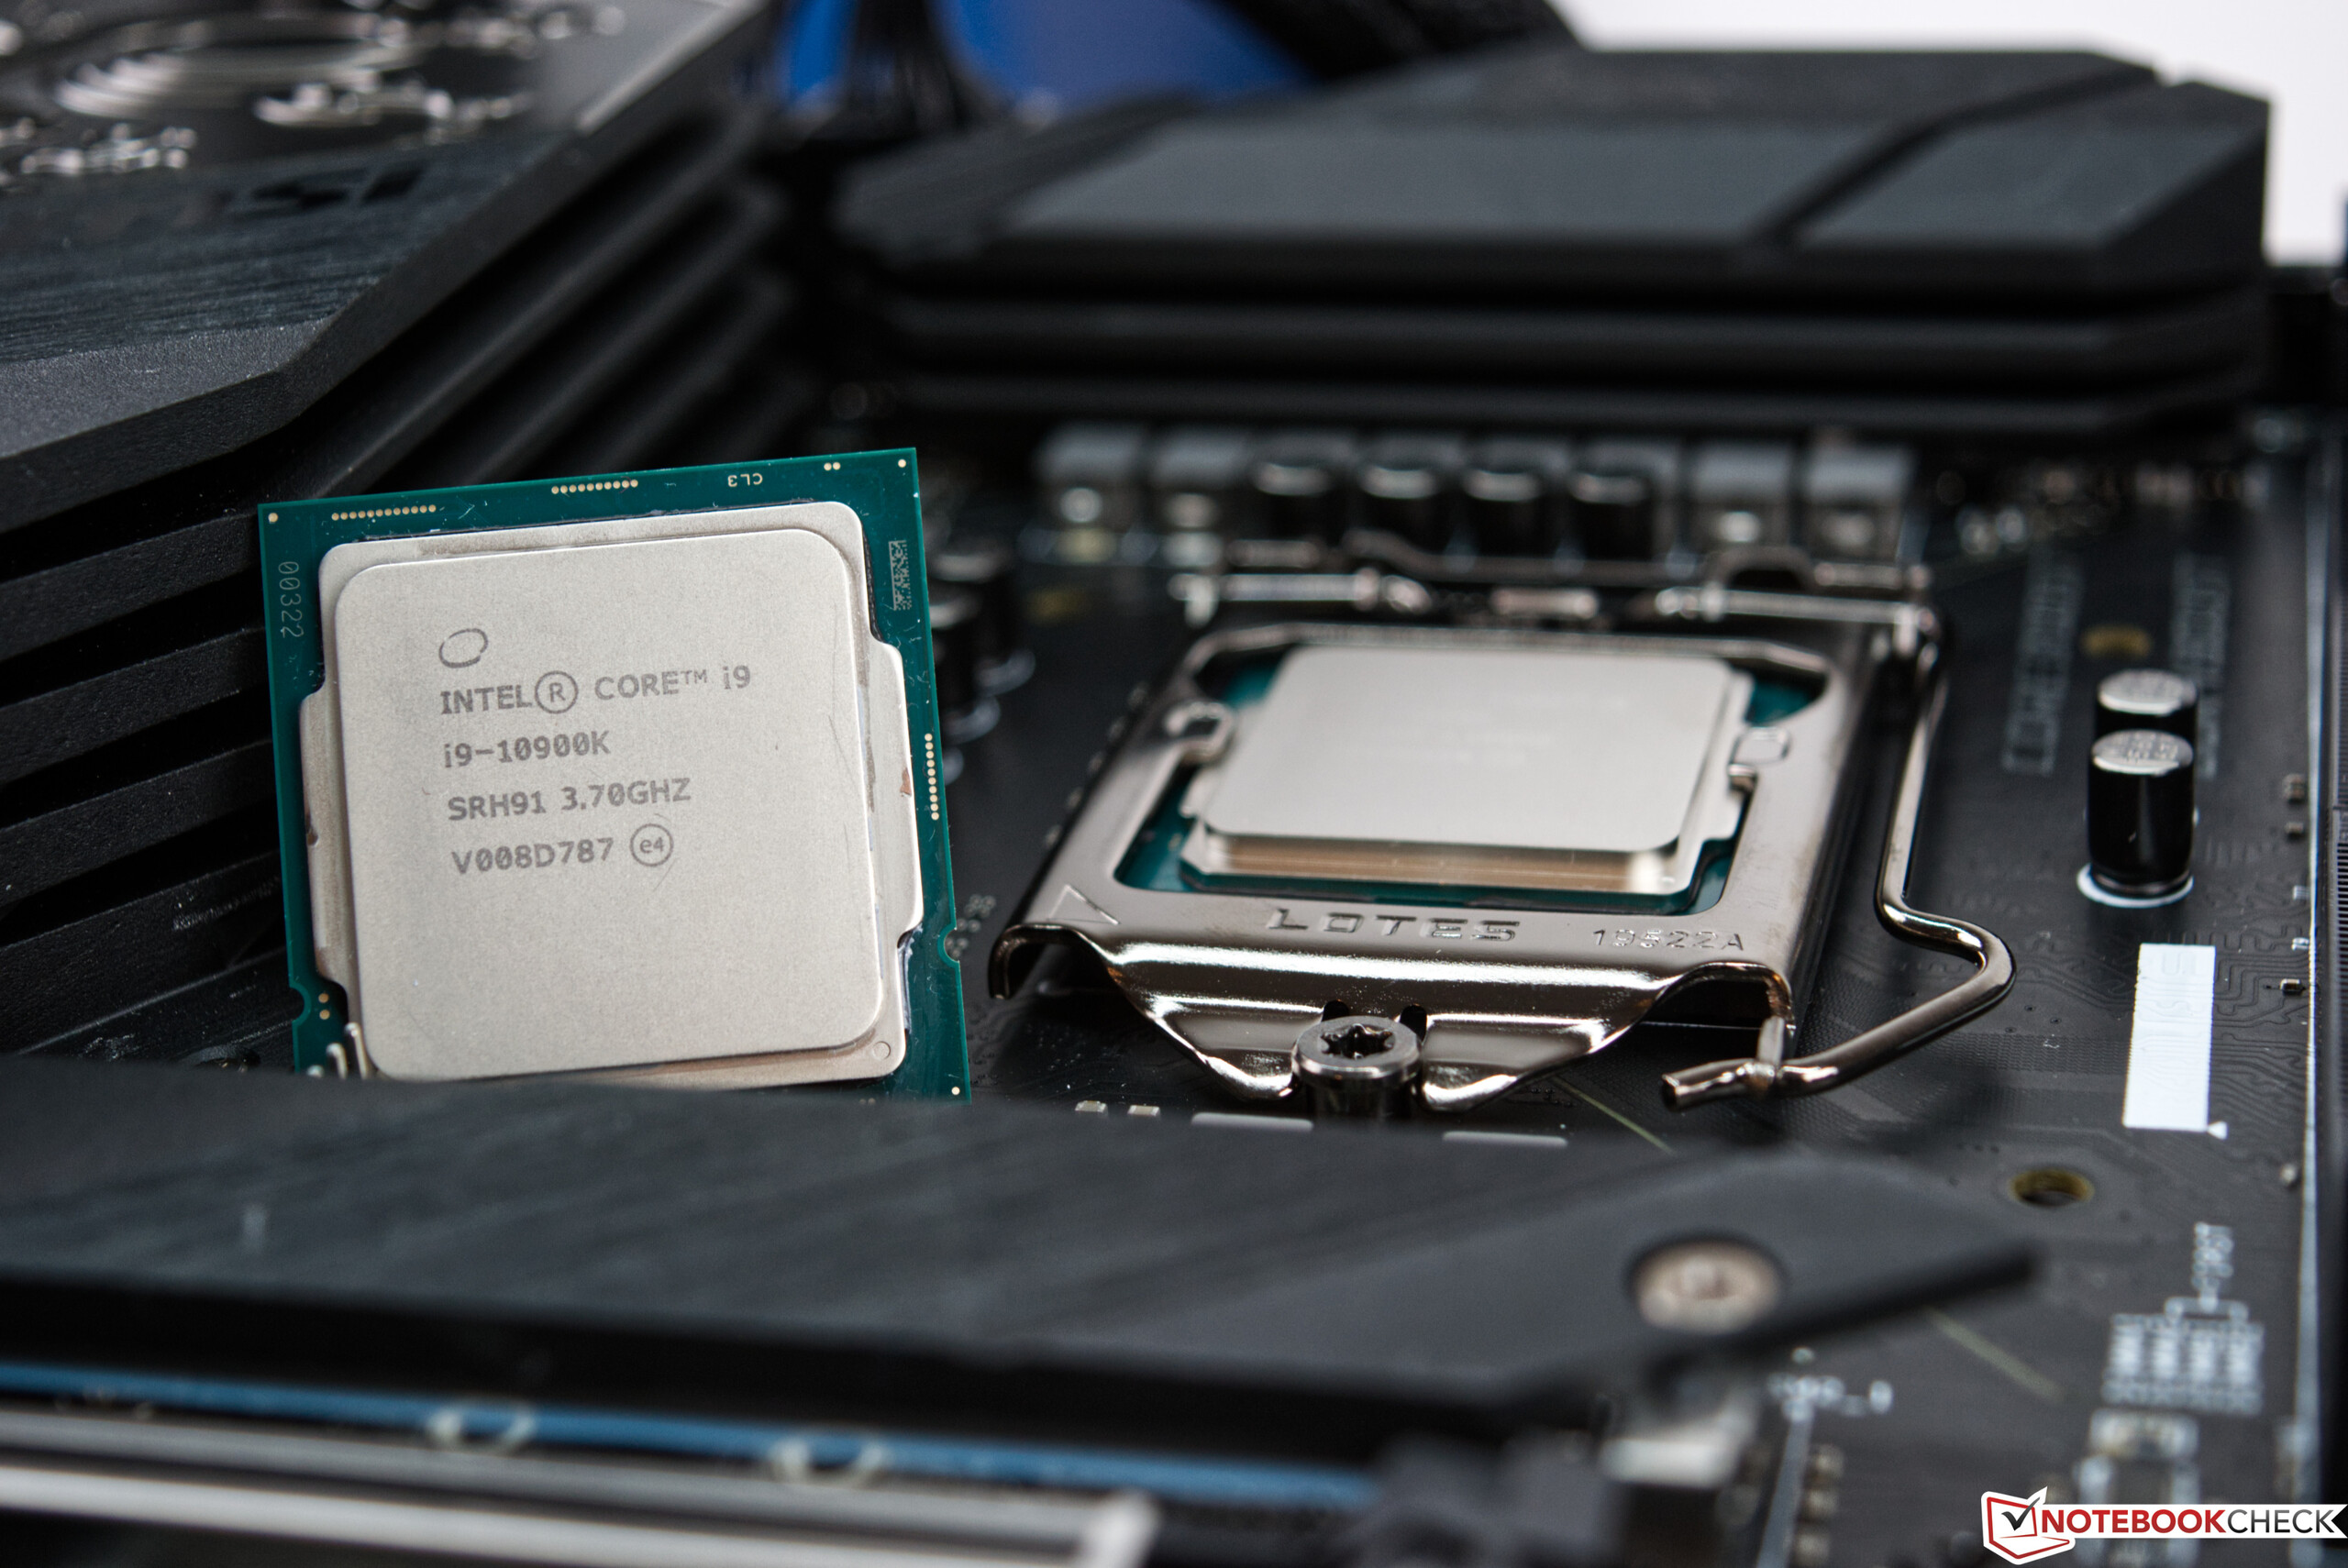
Intel has sanded the die to achieve better thermal performance. This also means that the integrated heat spreader is now a little thicker because the processor still has the same dimensions. This is why all the coolers that are compatible with the LGA 1151 socket are also compatible with the new socket. Intel said that a new socket was needed because of higher power requirements. That being said, the new chipsets (Z490, H470, B460, H410) do not support PCI Express 4.0 when used with the new processors.
The overview of the mainstream Comet Lake-S parts
| Model | Cores / Threads |
Base clock | Turbo 2.0 | Turbo 3.0 | TVB 1C/xC | All-core boost clock | Memory | Graphics | TDP | Launch price |
|---|---|---|---|---|---|---|---|---|---|---|
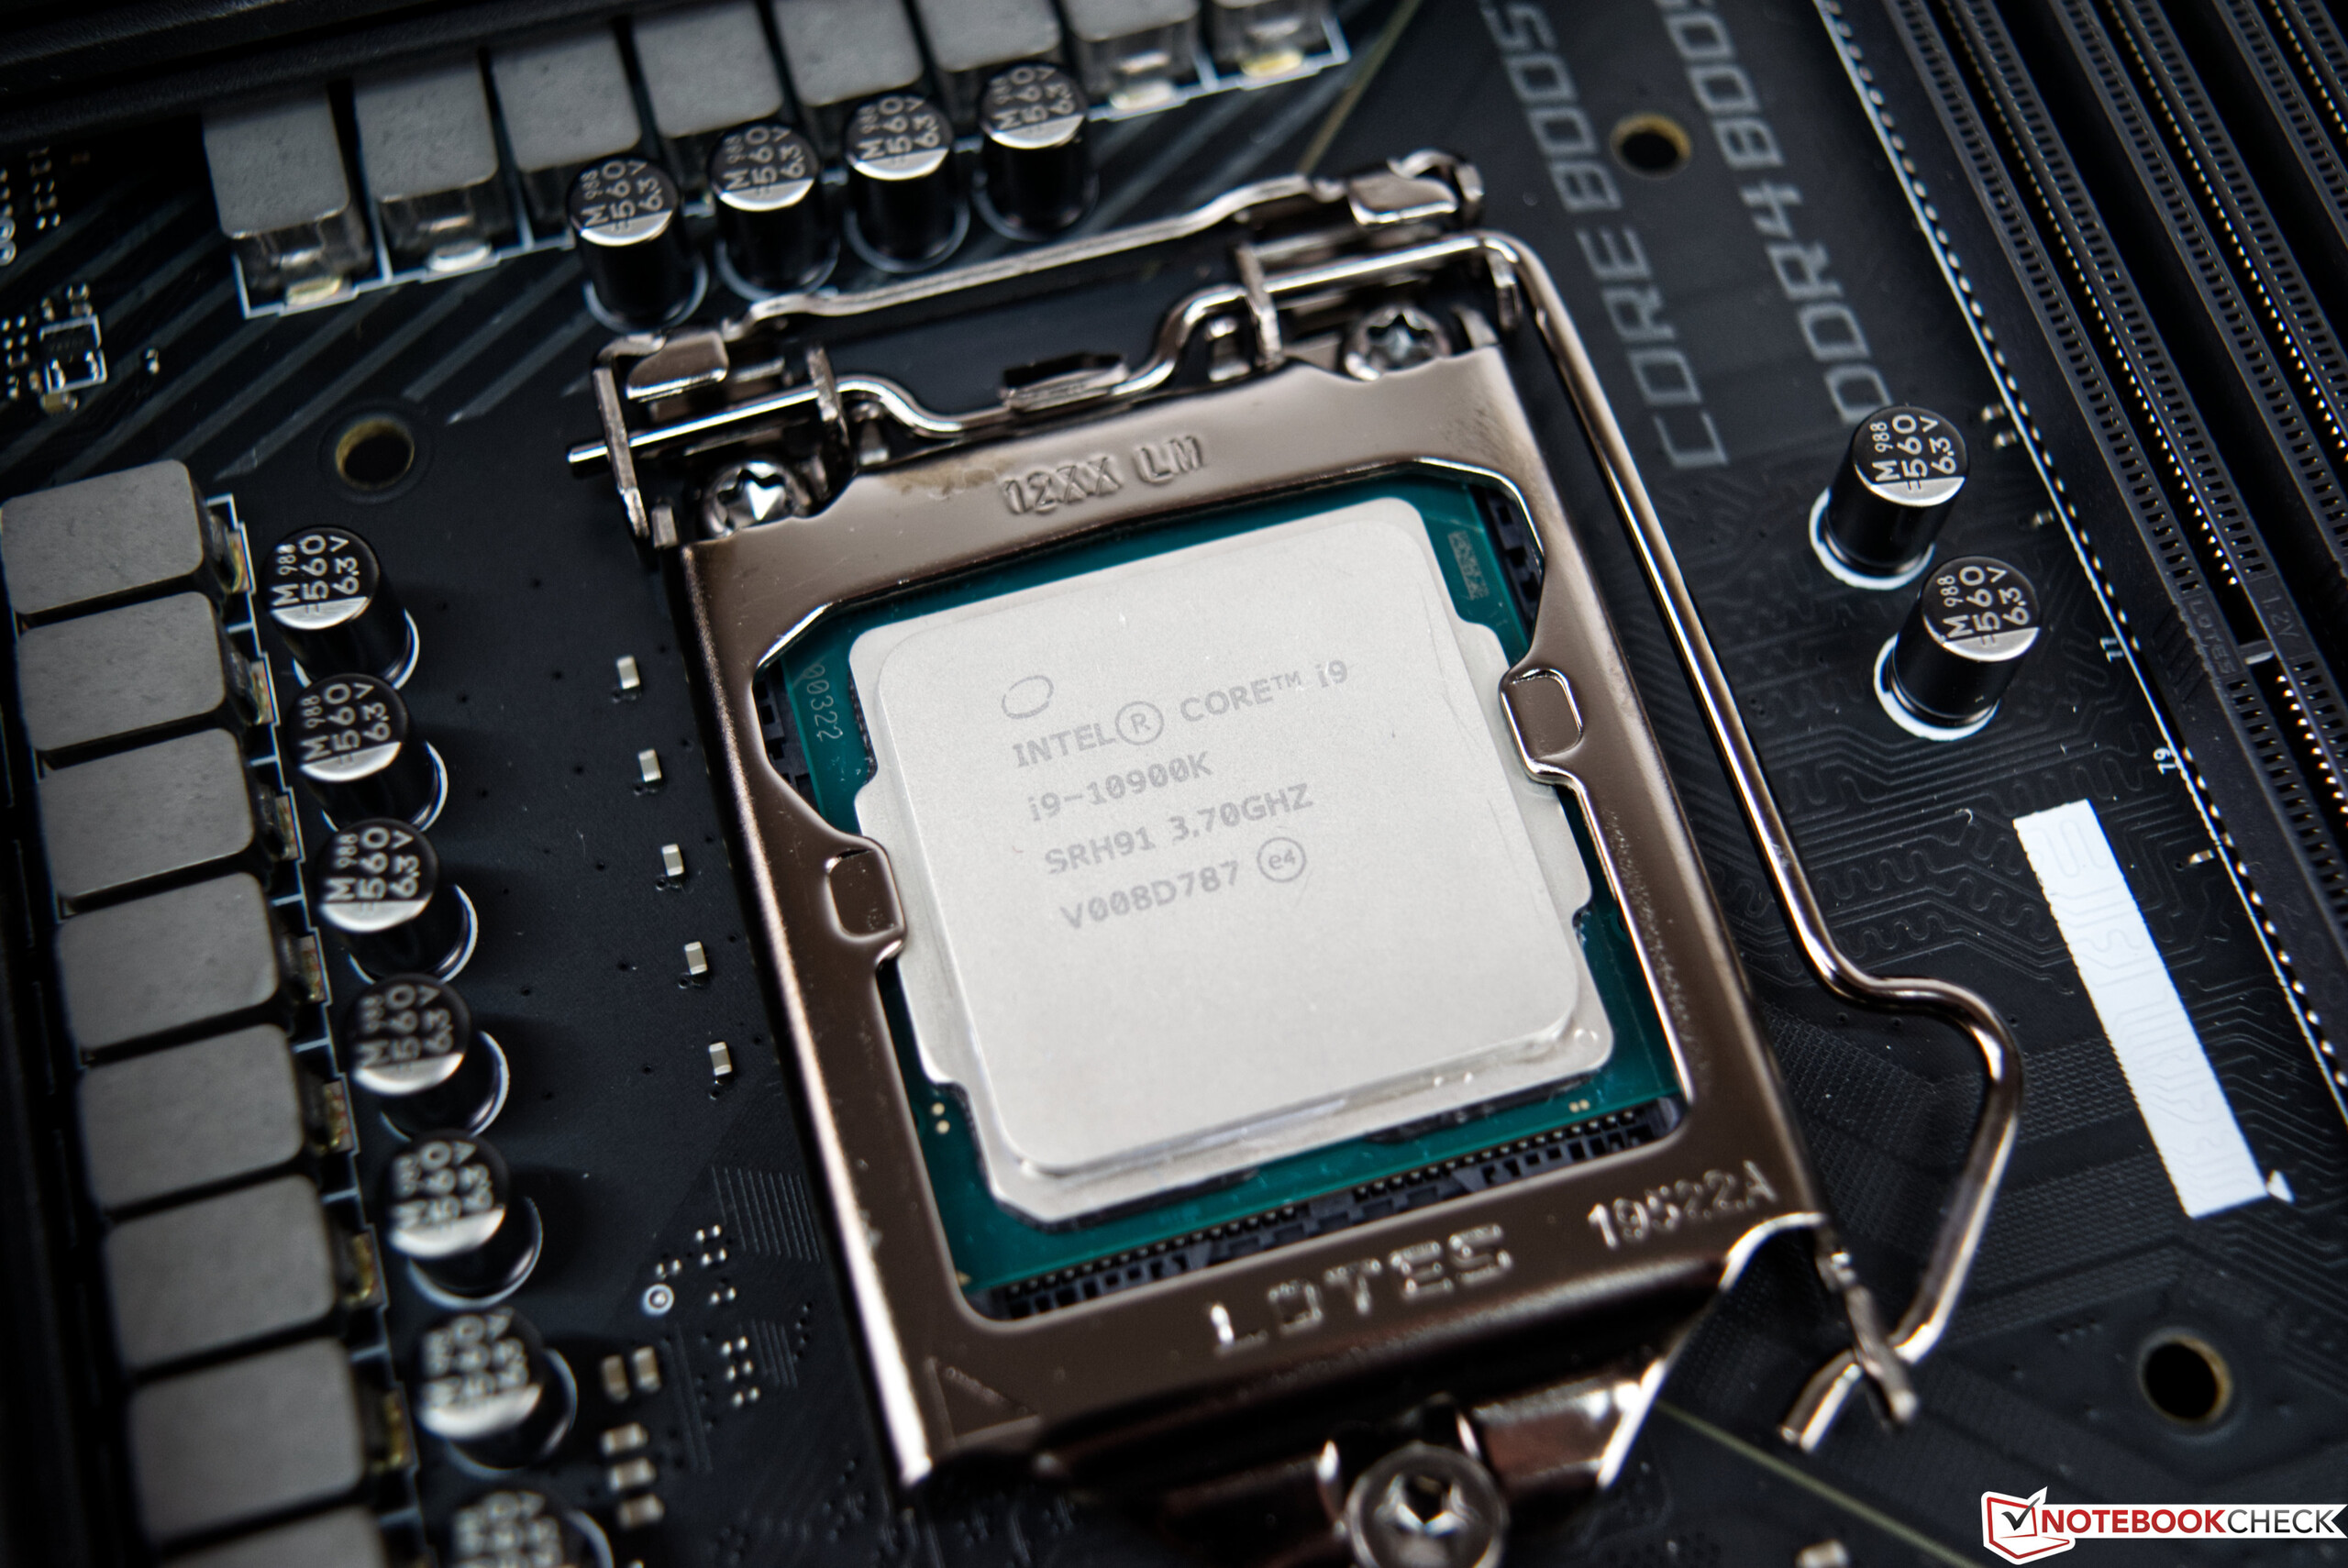
| Core i9-10900K | 10/20 | 3.7 GHz | 5.1 GHz | 5.2 GHz | 5.3 / 4.9 GHz | 4.8 GHz | DDR4-2933 | UHD 630 | 125 watts | 488 Dollar |
| Core i9-10900KF | 10/20 | 3.7 GHz | 5.1 GHz | 5.2 GHz | 5.3 / 4.9 GHz | 4.8 GHz | DDR4-2933 | - | 125 watts | 472 dollars |
| Core i9-10900 | 10/20 | 2.8 GHz | 5.0 GHz | 5.1 GHz | 5.2 / 4.6 GHz | 4.5 GHz | DDR4-2933 | UHD 630 | 65 watts | 439 dollars |
| Core i9-10900F | 10/20 | 2.8 GHz | 5.0 GHz | 5.1 GHz | 5.2 / 4.6 GHz | 4.5 GHz | DDR4-2933 | - | 65 watts | 422 dollars |
| Core i9-10900T | 10/20 | 1.9 GHz | 4.5 GHz | 4.6 GHz | - | 3.7 GHz | DDR4-2933 | UHD 630 | 35 watts | 439 dollars |
| Core i7-10700K | 8/16 | 3.8 GHz | 5.0 GHz | 5.1 GHz | - | 4.7 GHz | DDR4-2933 | UHD 630 | 125 watts | 374 dollars |
| Core i7-10700KF | 8/16 | 3.8 GHz | 5.0 GHz | 5.1 GHz | - | 4.7 GHz | DDR4-2933 | - | 125 watts | 349 dollars |
| Core i7-10700 | 8/16 | 2.9 GHz | 4.7 GHz | 4.8 GHz | - | 4.6 GHz | DDR4-2933 | UHD 630 | 65 watts | 323 dollars |
| Core i7-10700F | 8/16 | 2.9 GHz | 4.7 GHz | 4.8 GHz | - | 4.6 GHz | DDR4-2933 | - | 65 watts | 298 dollars |
| Core i7-10700T | 8/16 | 2.0 GHz | 4.4 GHz | 4.5 GHz | - | 3.7 GHz | DDR4-2933 | UHD 630 | 35 watts | 325 dollars |
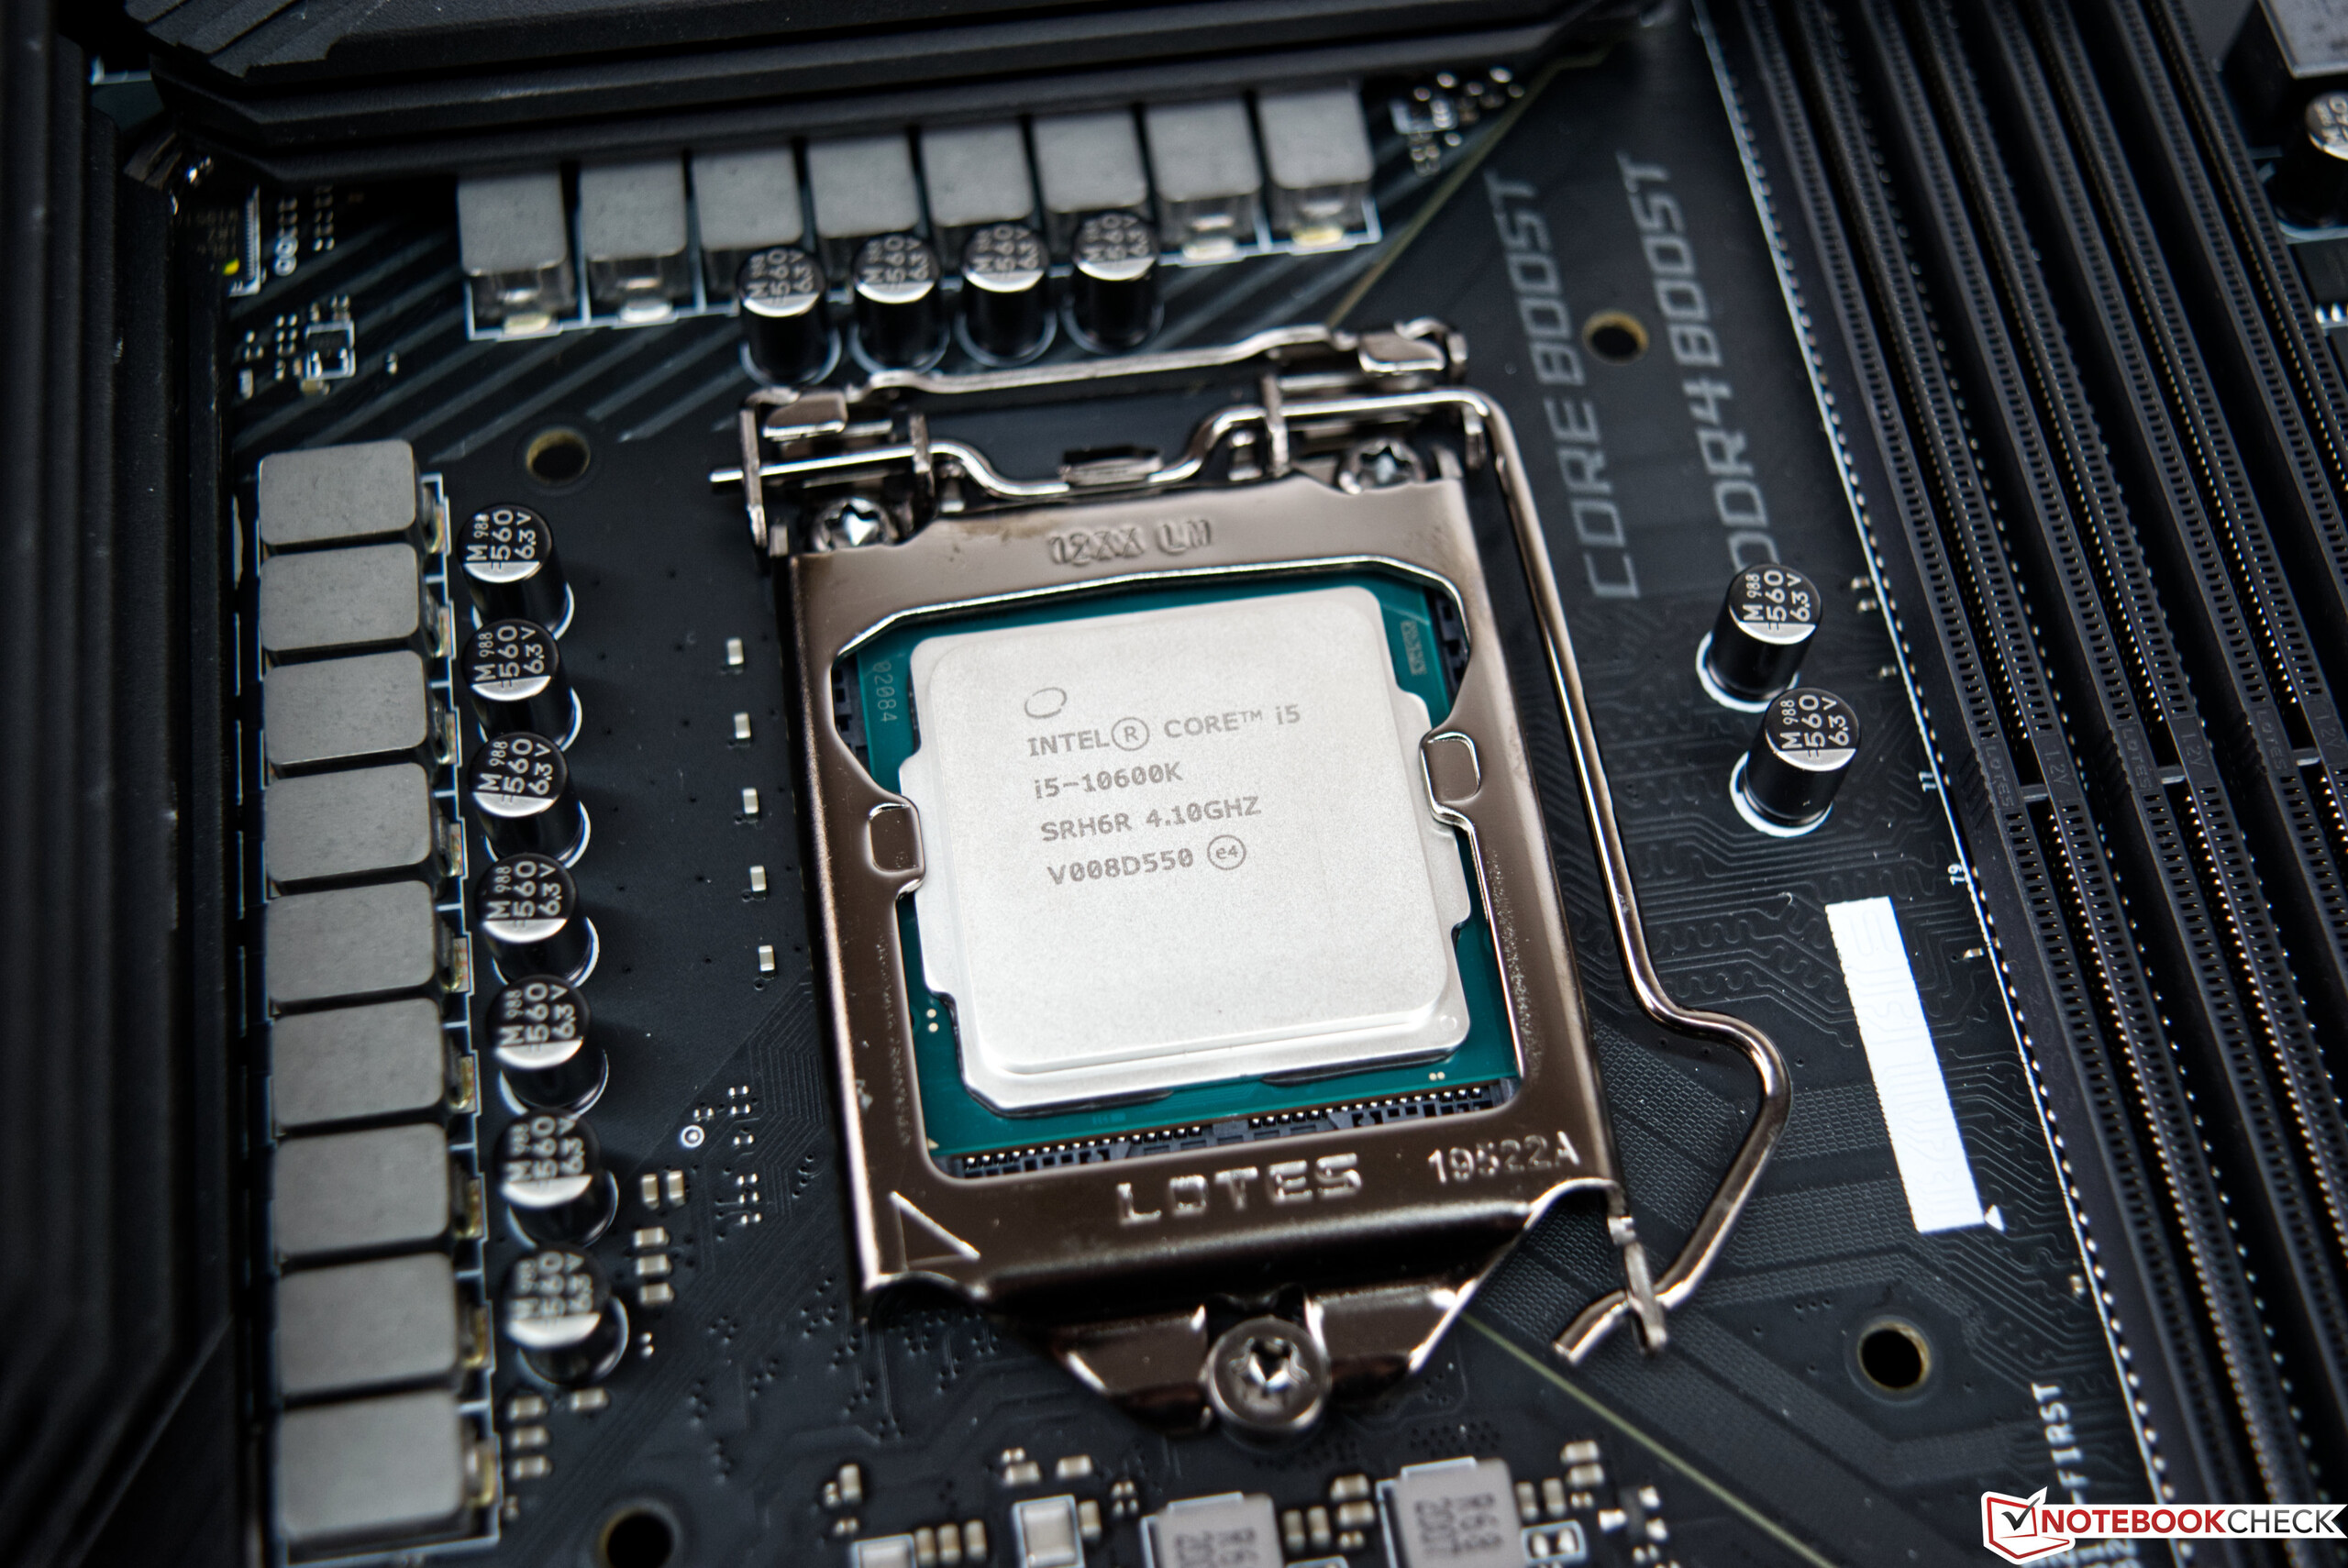
| Core i5-10600K | 6/12 | 4.1 GHz | 4.8 GHz | - | - | 4.5 GHz | DDR4-2666 | UHD 630 | 125 watts | 262 dollars |
| Core i5-10600KF | 6/12 | 4.1 GHz | 4.8 GHz | - | - | 4.5 GHz | DDR4-2666 | - | 125 watts | 237 dollars |
| Core i5-10600 | 6/12 | 3.3 GHz | 4.8 GHz | - | - | 4.4 GHz | DDR4-2666 | UHD 630 | 65 watts | 213 dollars |
| Core i5-10600T | 6/12 | 2.4 GHz | 4.0 GHz | - | - | 3.7 GHz | DDR4-2666 | UHD 630 | 35 watts | 213 dollars |
| Core i5-10500 | 6/12 | 3.1 GHz | 4.5 GHz | - | - | 4.2 GHz | DDR4-2666 | UHD 630 | 65 watts | 192 dollars |
| Core i5-10500T | 6/12 | 2.3 GHz | 3.8 GHz | - | - | 3.5 GHz | DDR4-2666 | UHD 630 | 35 watts | 192 dollars |
| Core i5-10400 | 6/12 | 2.9 GHz | 4.3 GHz | - | - | 4.0 GHz | DDR4-2666 | UHD 630 | 65 watts | 182 dollars |
| Core i5-10400F | 6/12 | 2.9 GHz | 4.3 GHz | - | - | 4.0 GHz | DDR4-2666 | - | 65 watts | 157 dollars |
| Core i5-10400T | 6/12 | 2.0 GHz | 3.6 GHz | - | - | 3.2 GHz | DDR4-2666 | UHD 630 | 35 watts | 182 dollars |
| Core i3-10320 | 4/8 | 3.8 GHz | 4.4 GHz | - | - | 4.4 GHz | DDR4-2666 | UHD 630 | 65 watts | 154 dollars |
| Core i3-10300 | 4/8 | 3.7 GHz | 4.4 GHz | - | - | 4.2 GHz | DDR4-2666 | UHD 630 | 65 watts | 143 dollars |
| Core i3-10300T | 4/8 | 3.0 GHz | 3.9 GHz | - | - | 3.6 GHz | DDR4-2666 | UHD 630 | 35 watts | 143 dollars |
| Core i3-10100 | 4/8 | 3.6 GHz | 4.3 GHz | - | - | 4.1 GHz | DDR4-2666 | UHD 630 | 65 watts | 122 dollars |
| Core i3-10100T | 4/8 | 3.0 GHz | 3.8 GHz | - | - | 3.5 GHz | DDR4-2666 | UHD 630 | 35 watts | 122 dollars |
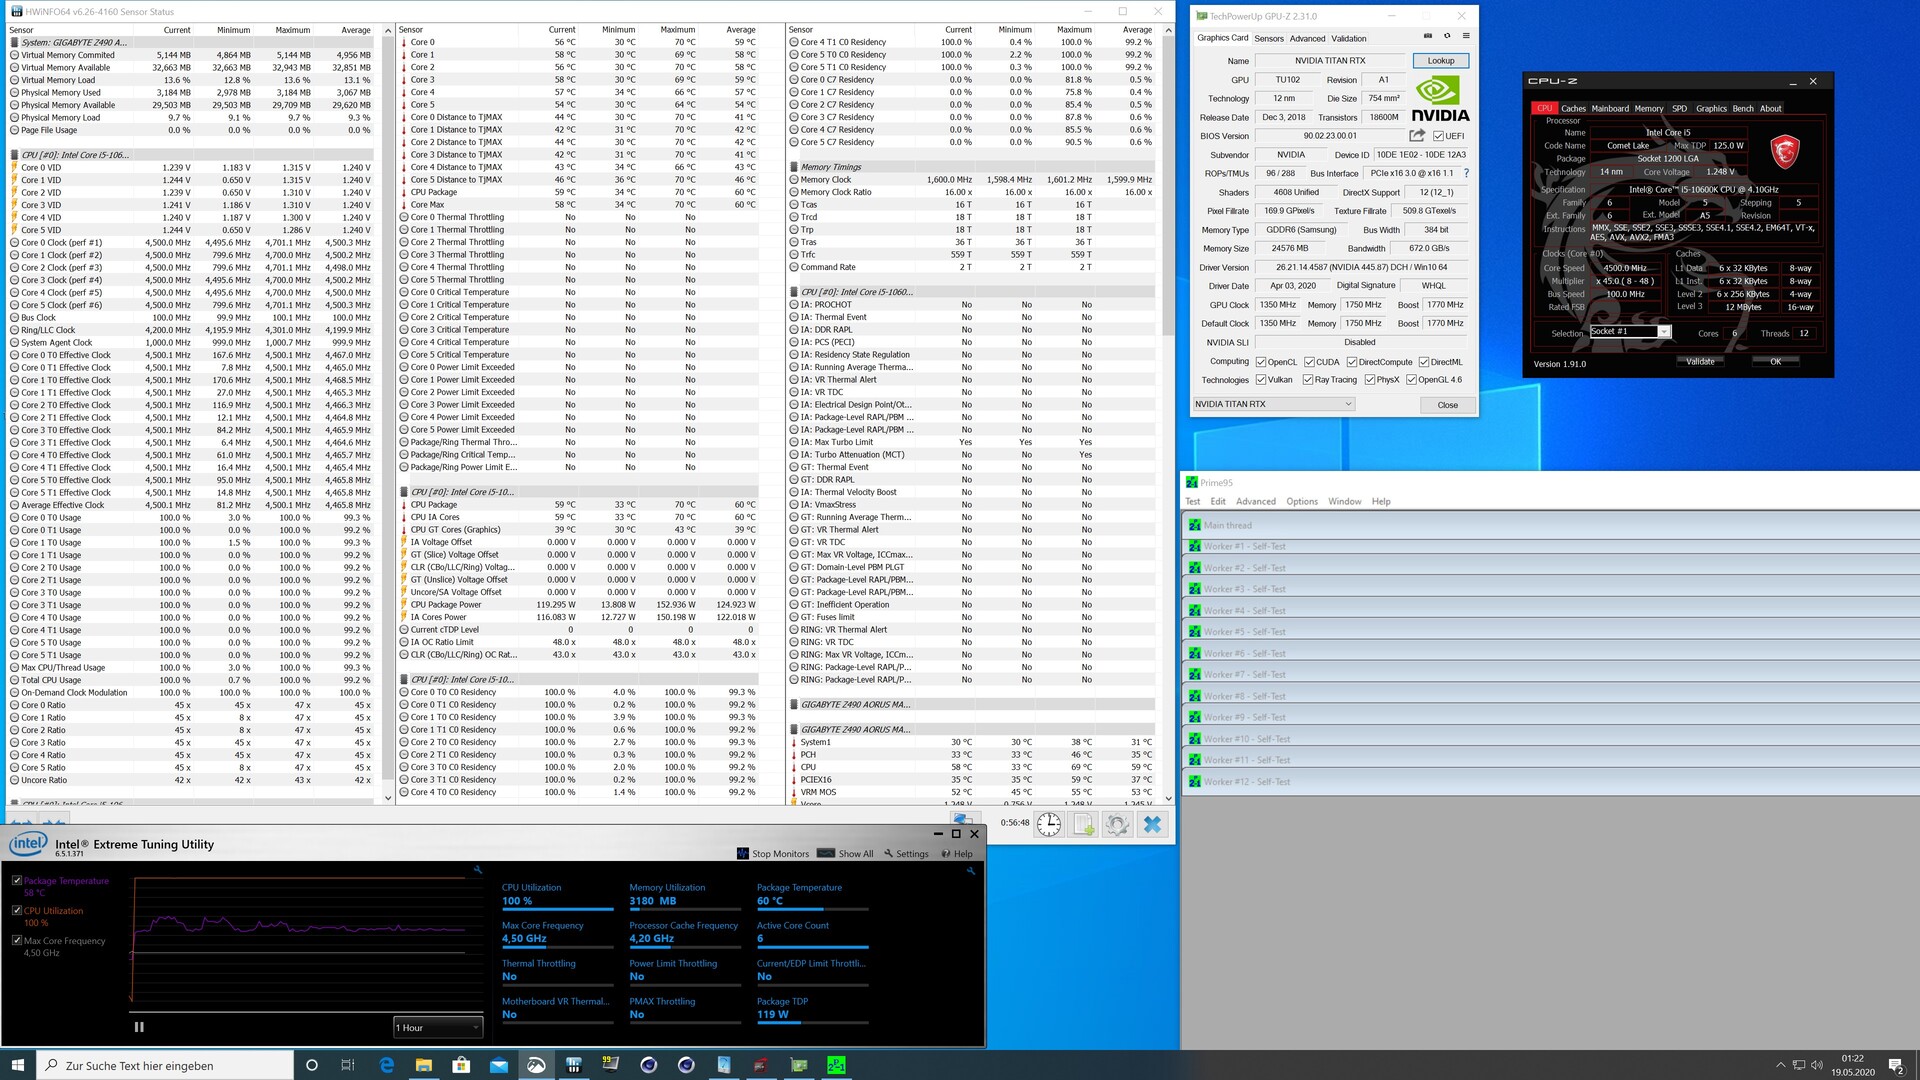
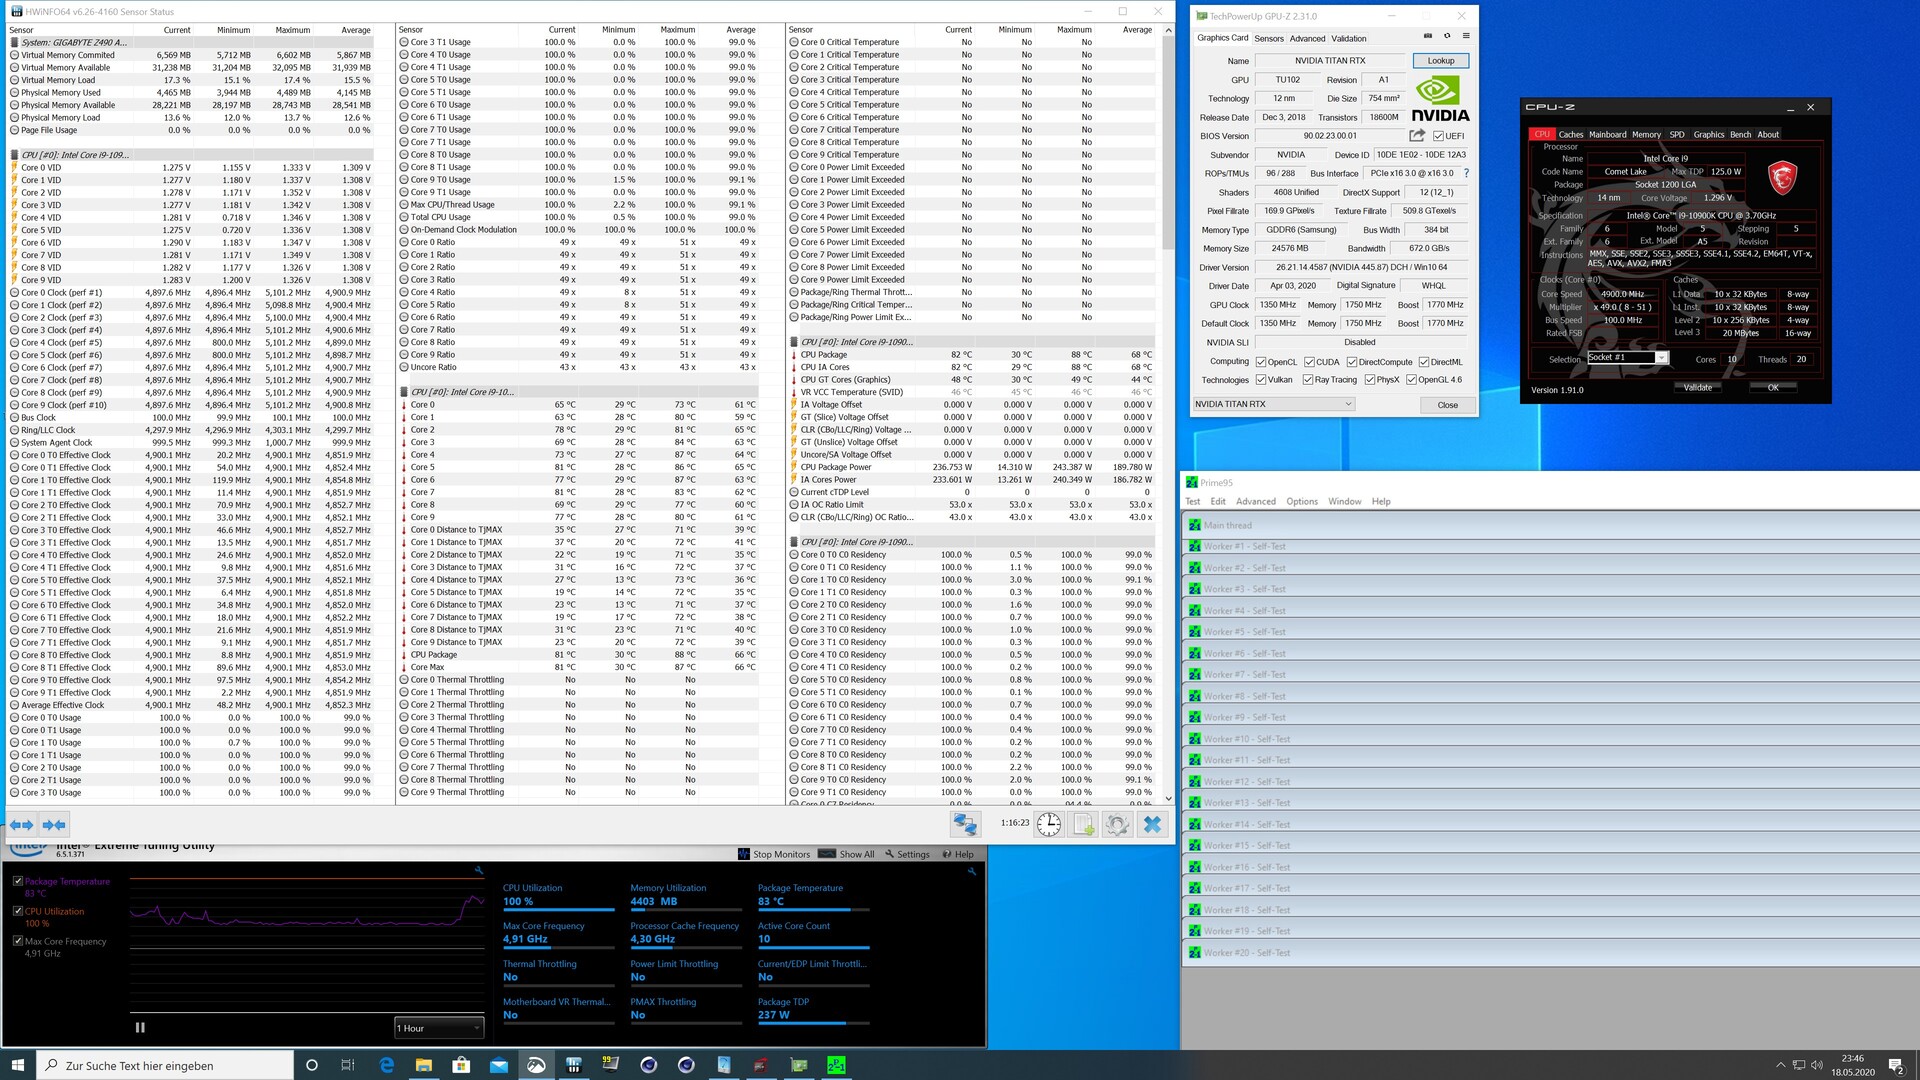
Test Bench
We used the following system for our benchmarks:
- Raijintek Paean Benchtable
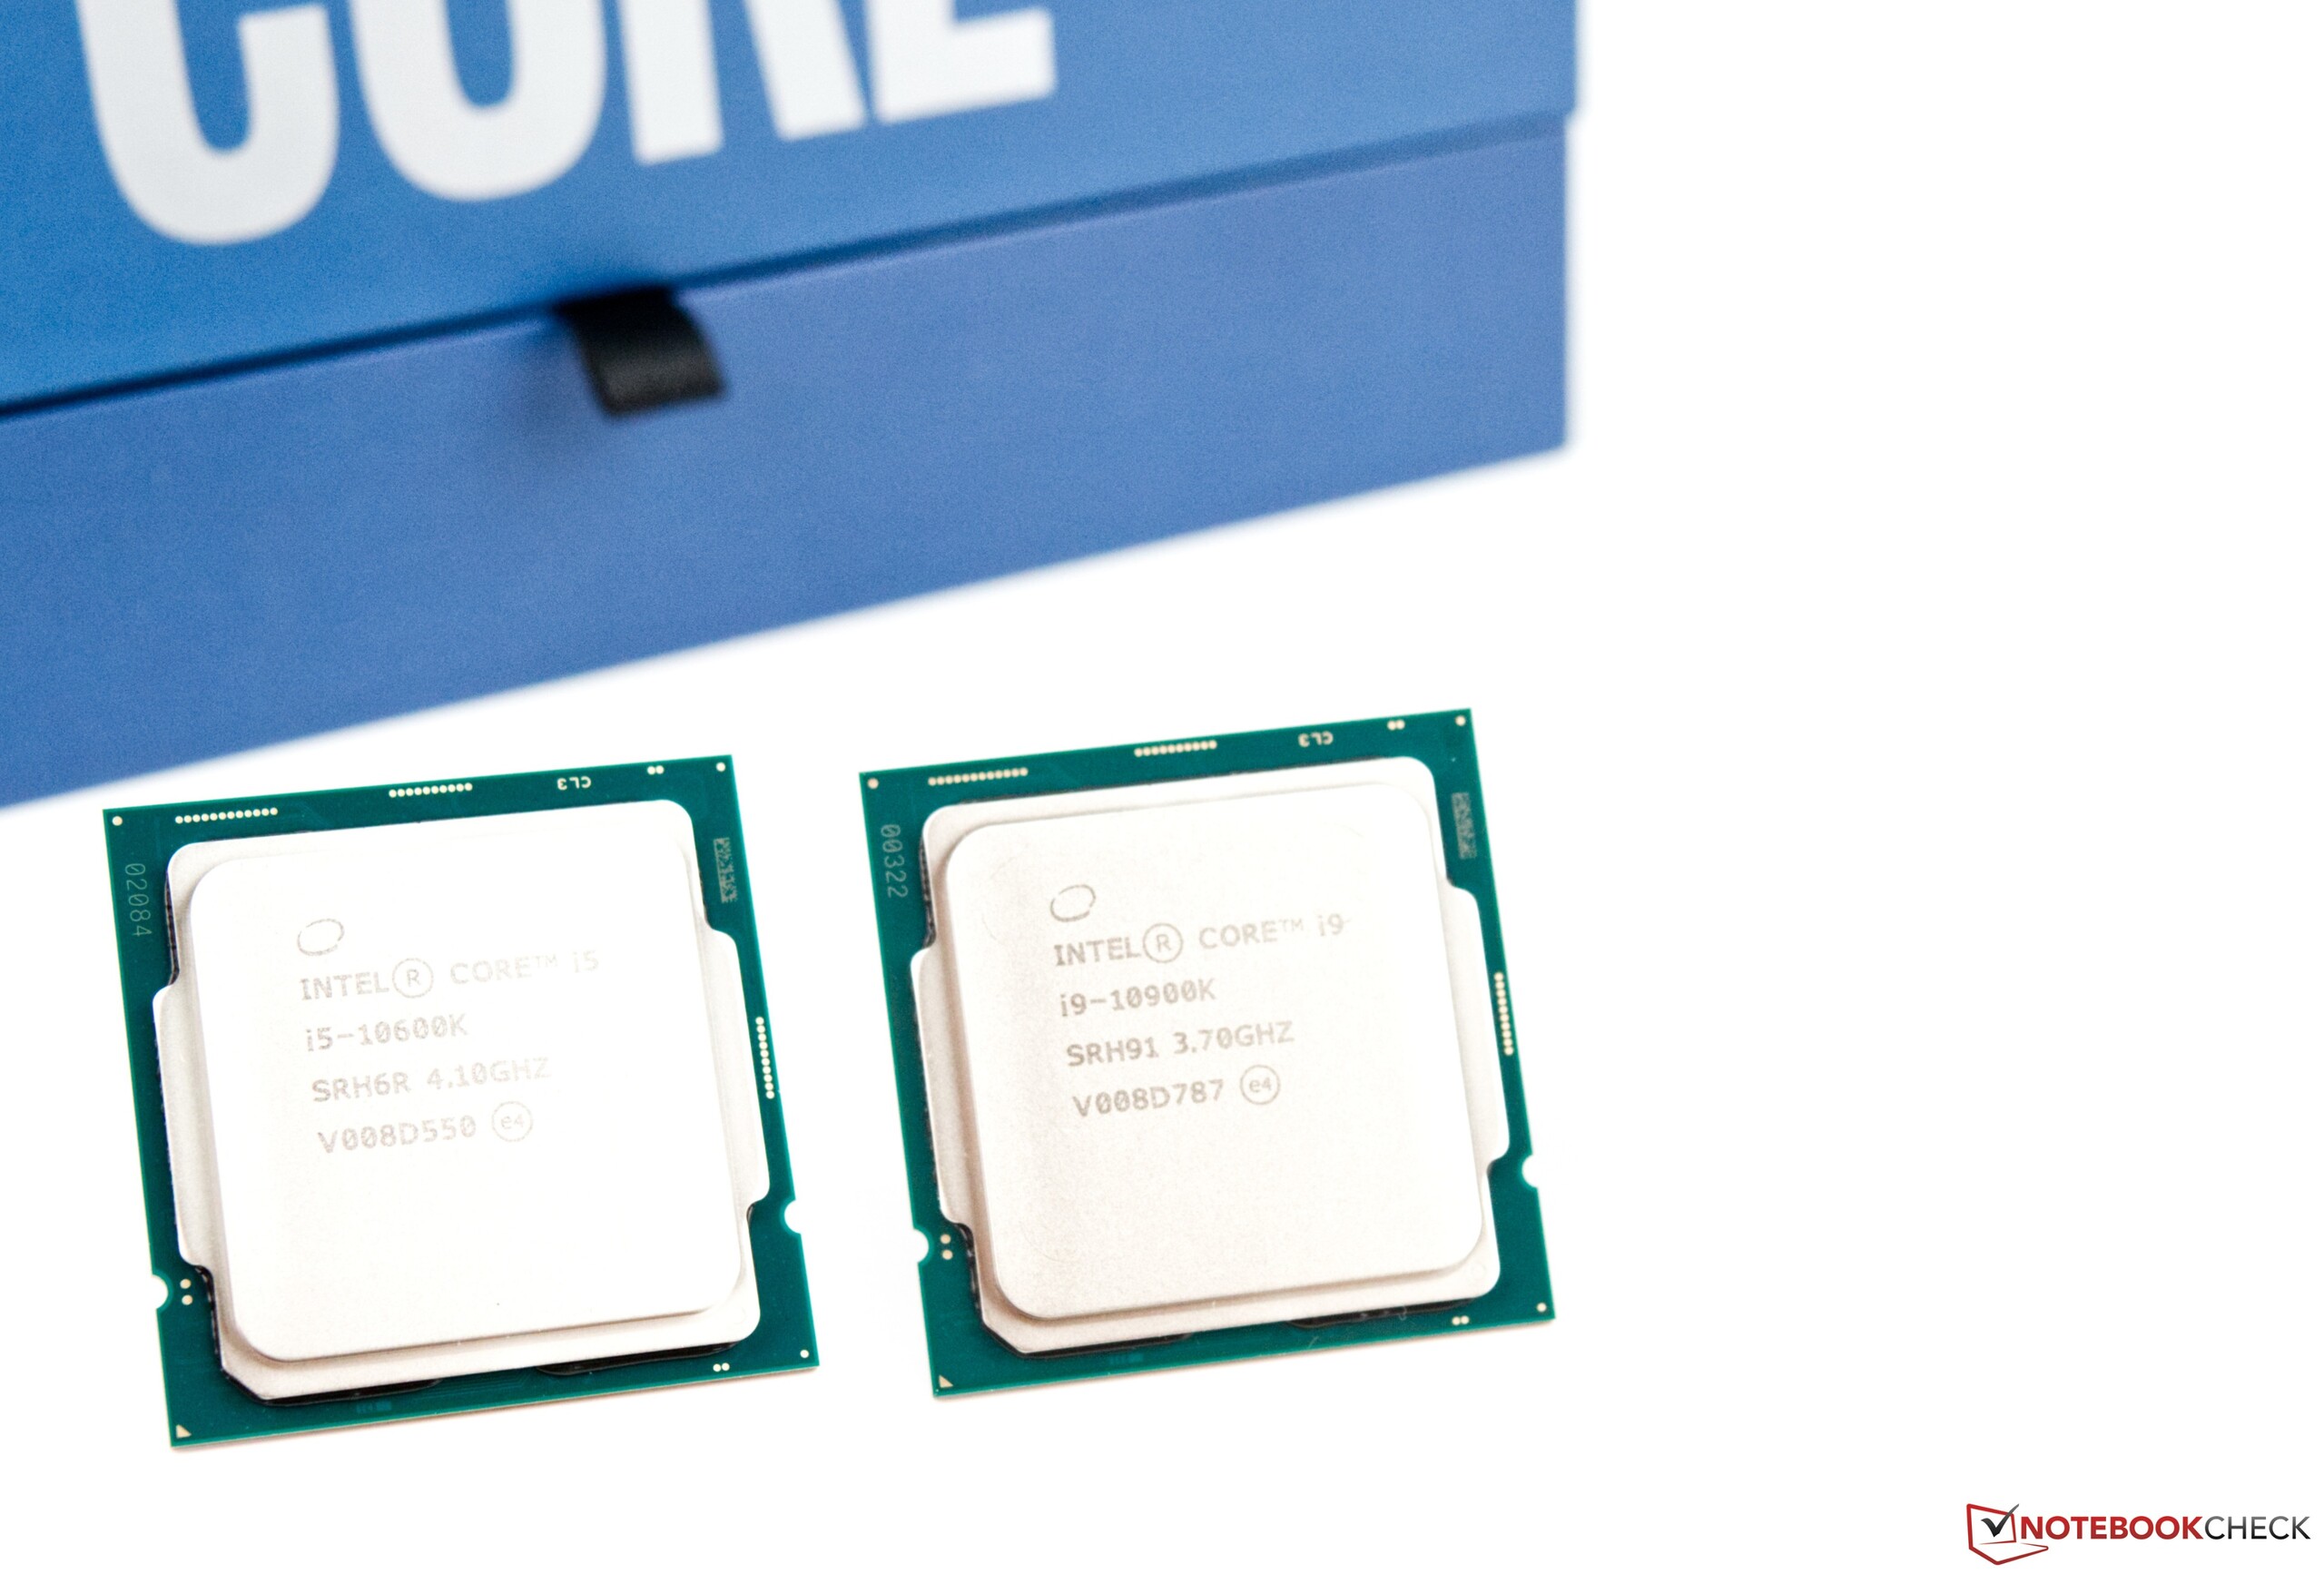
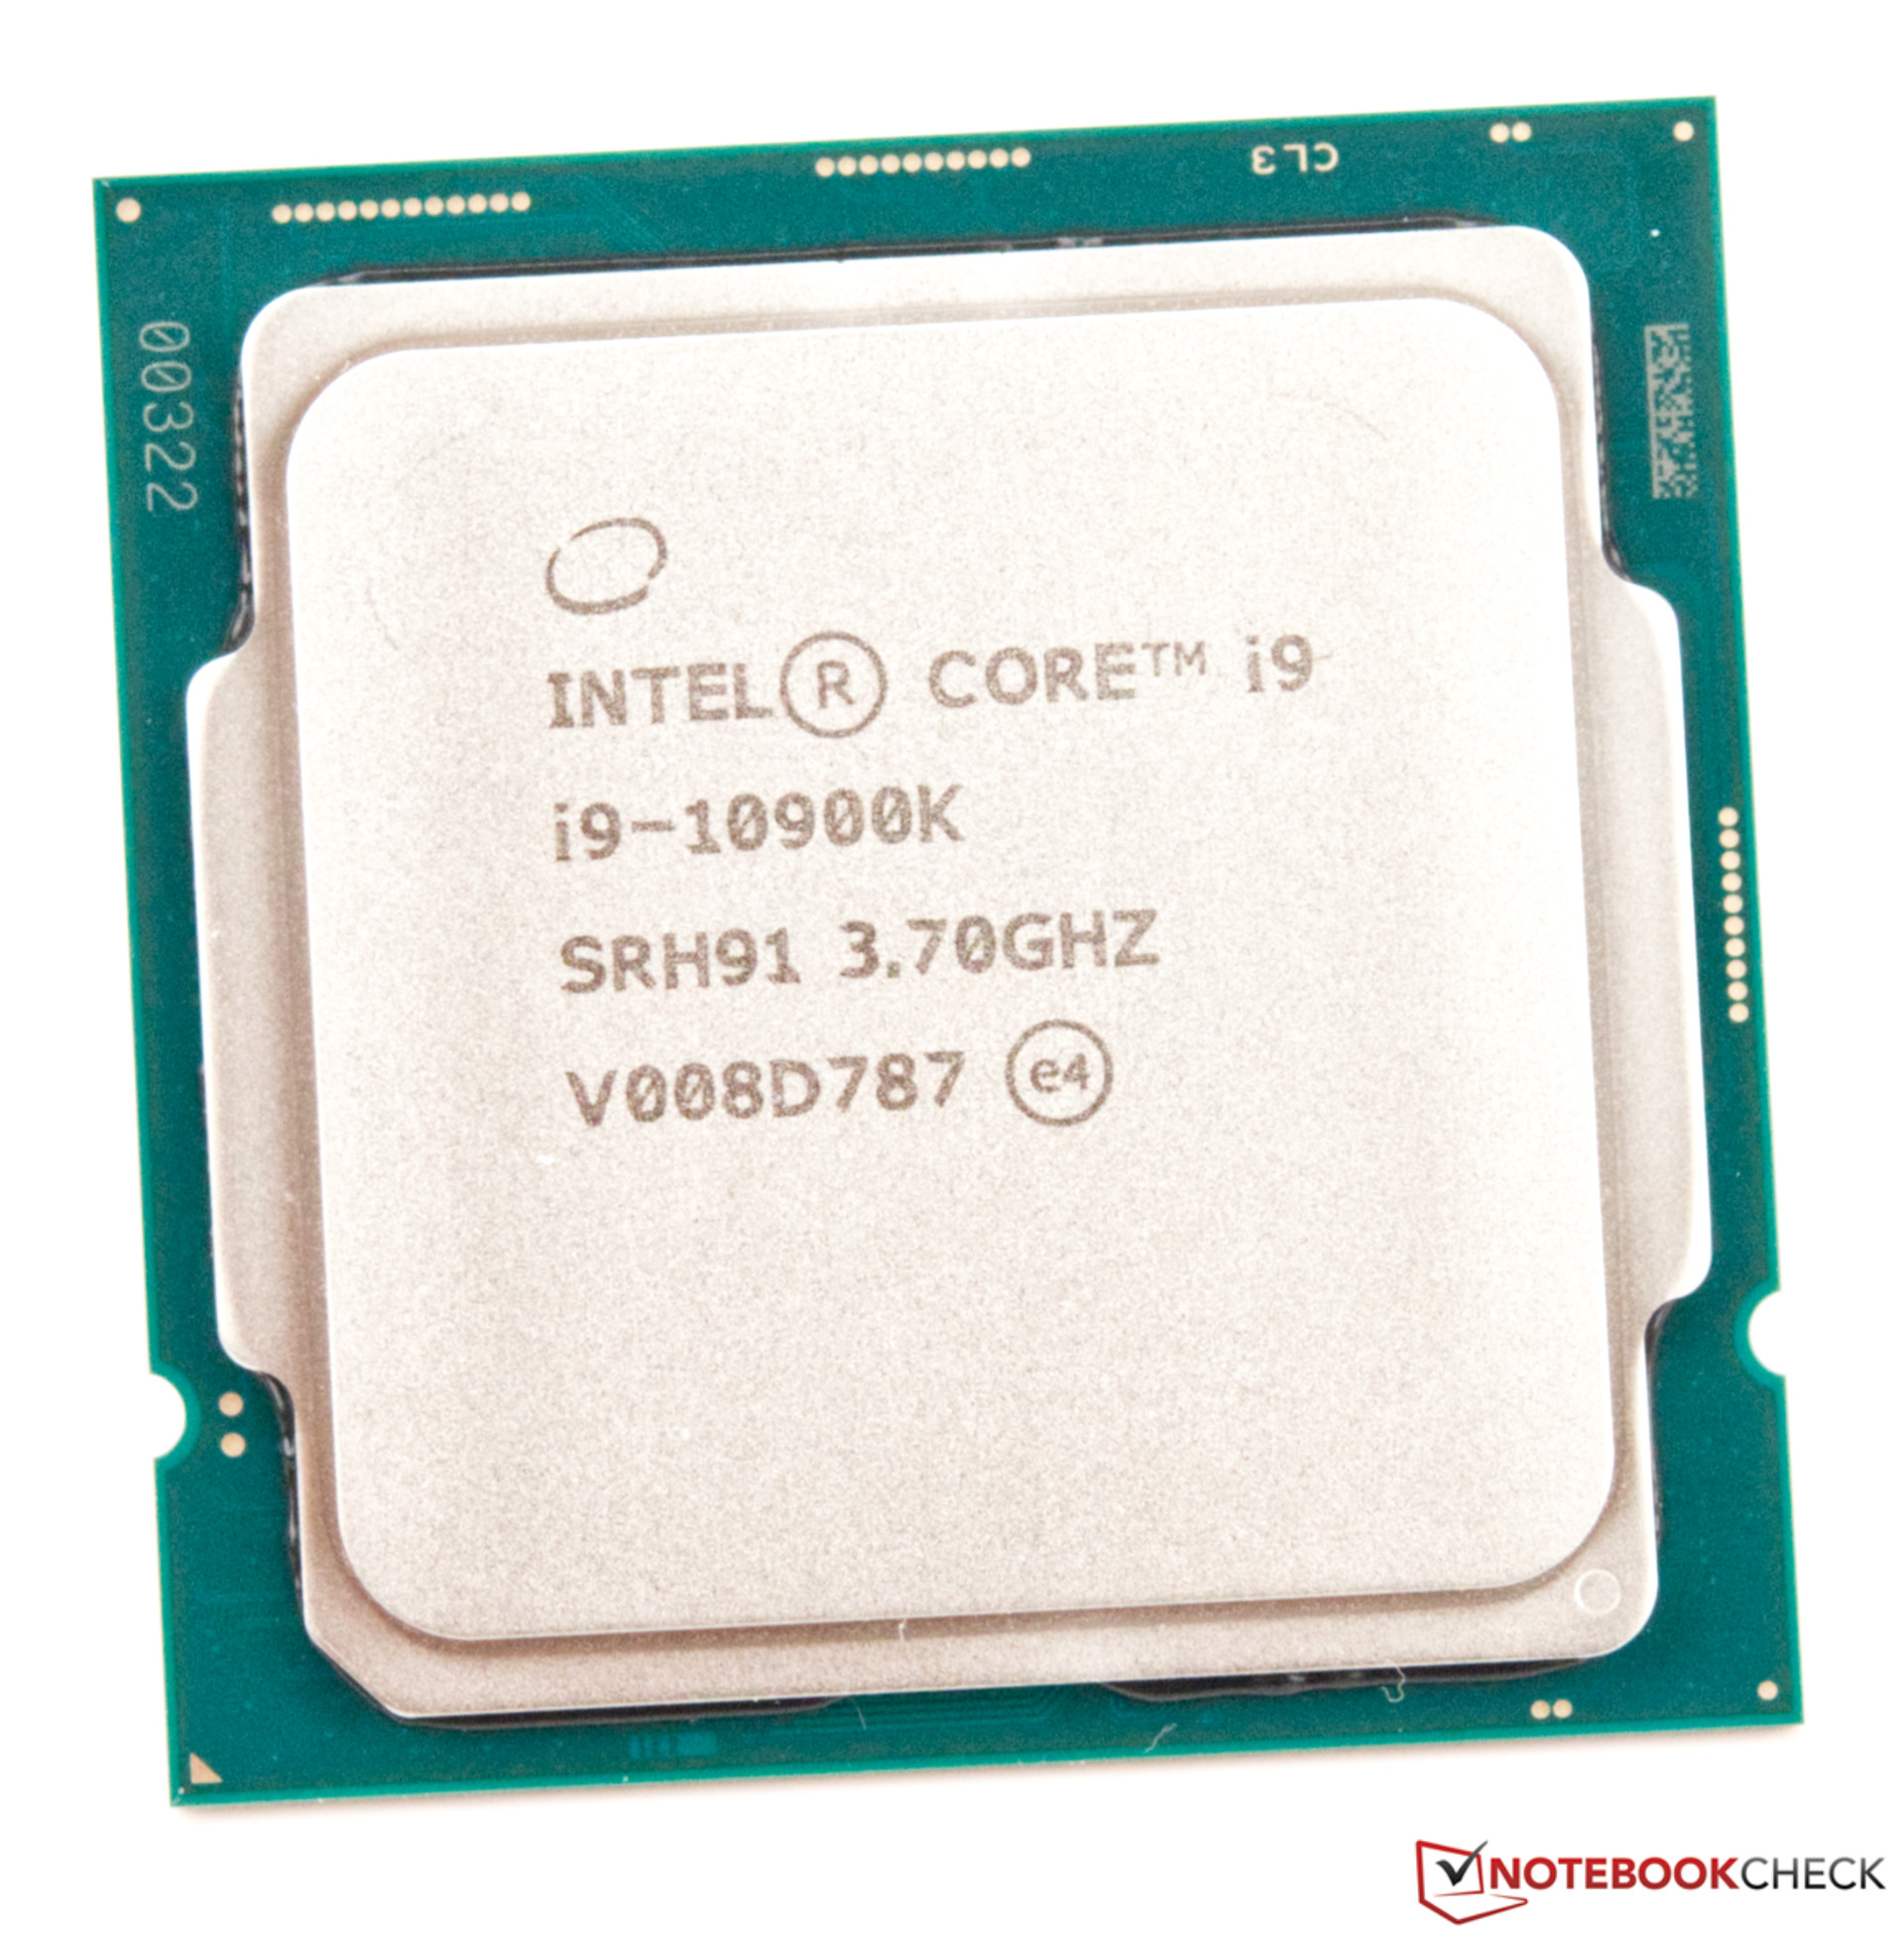
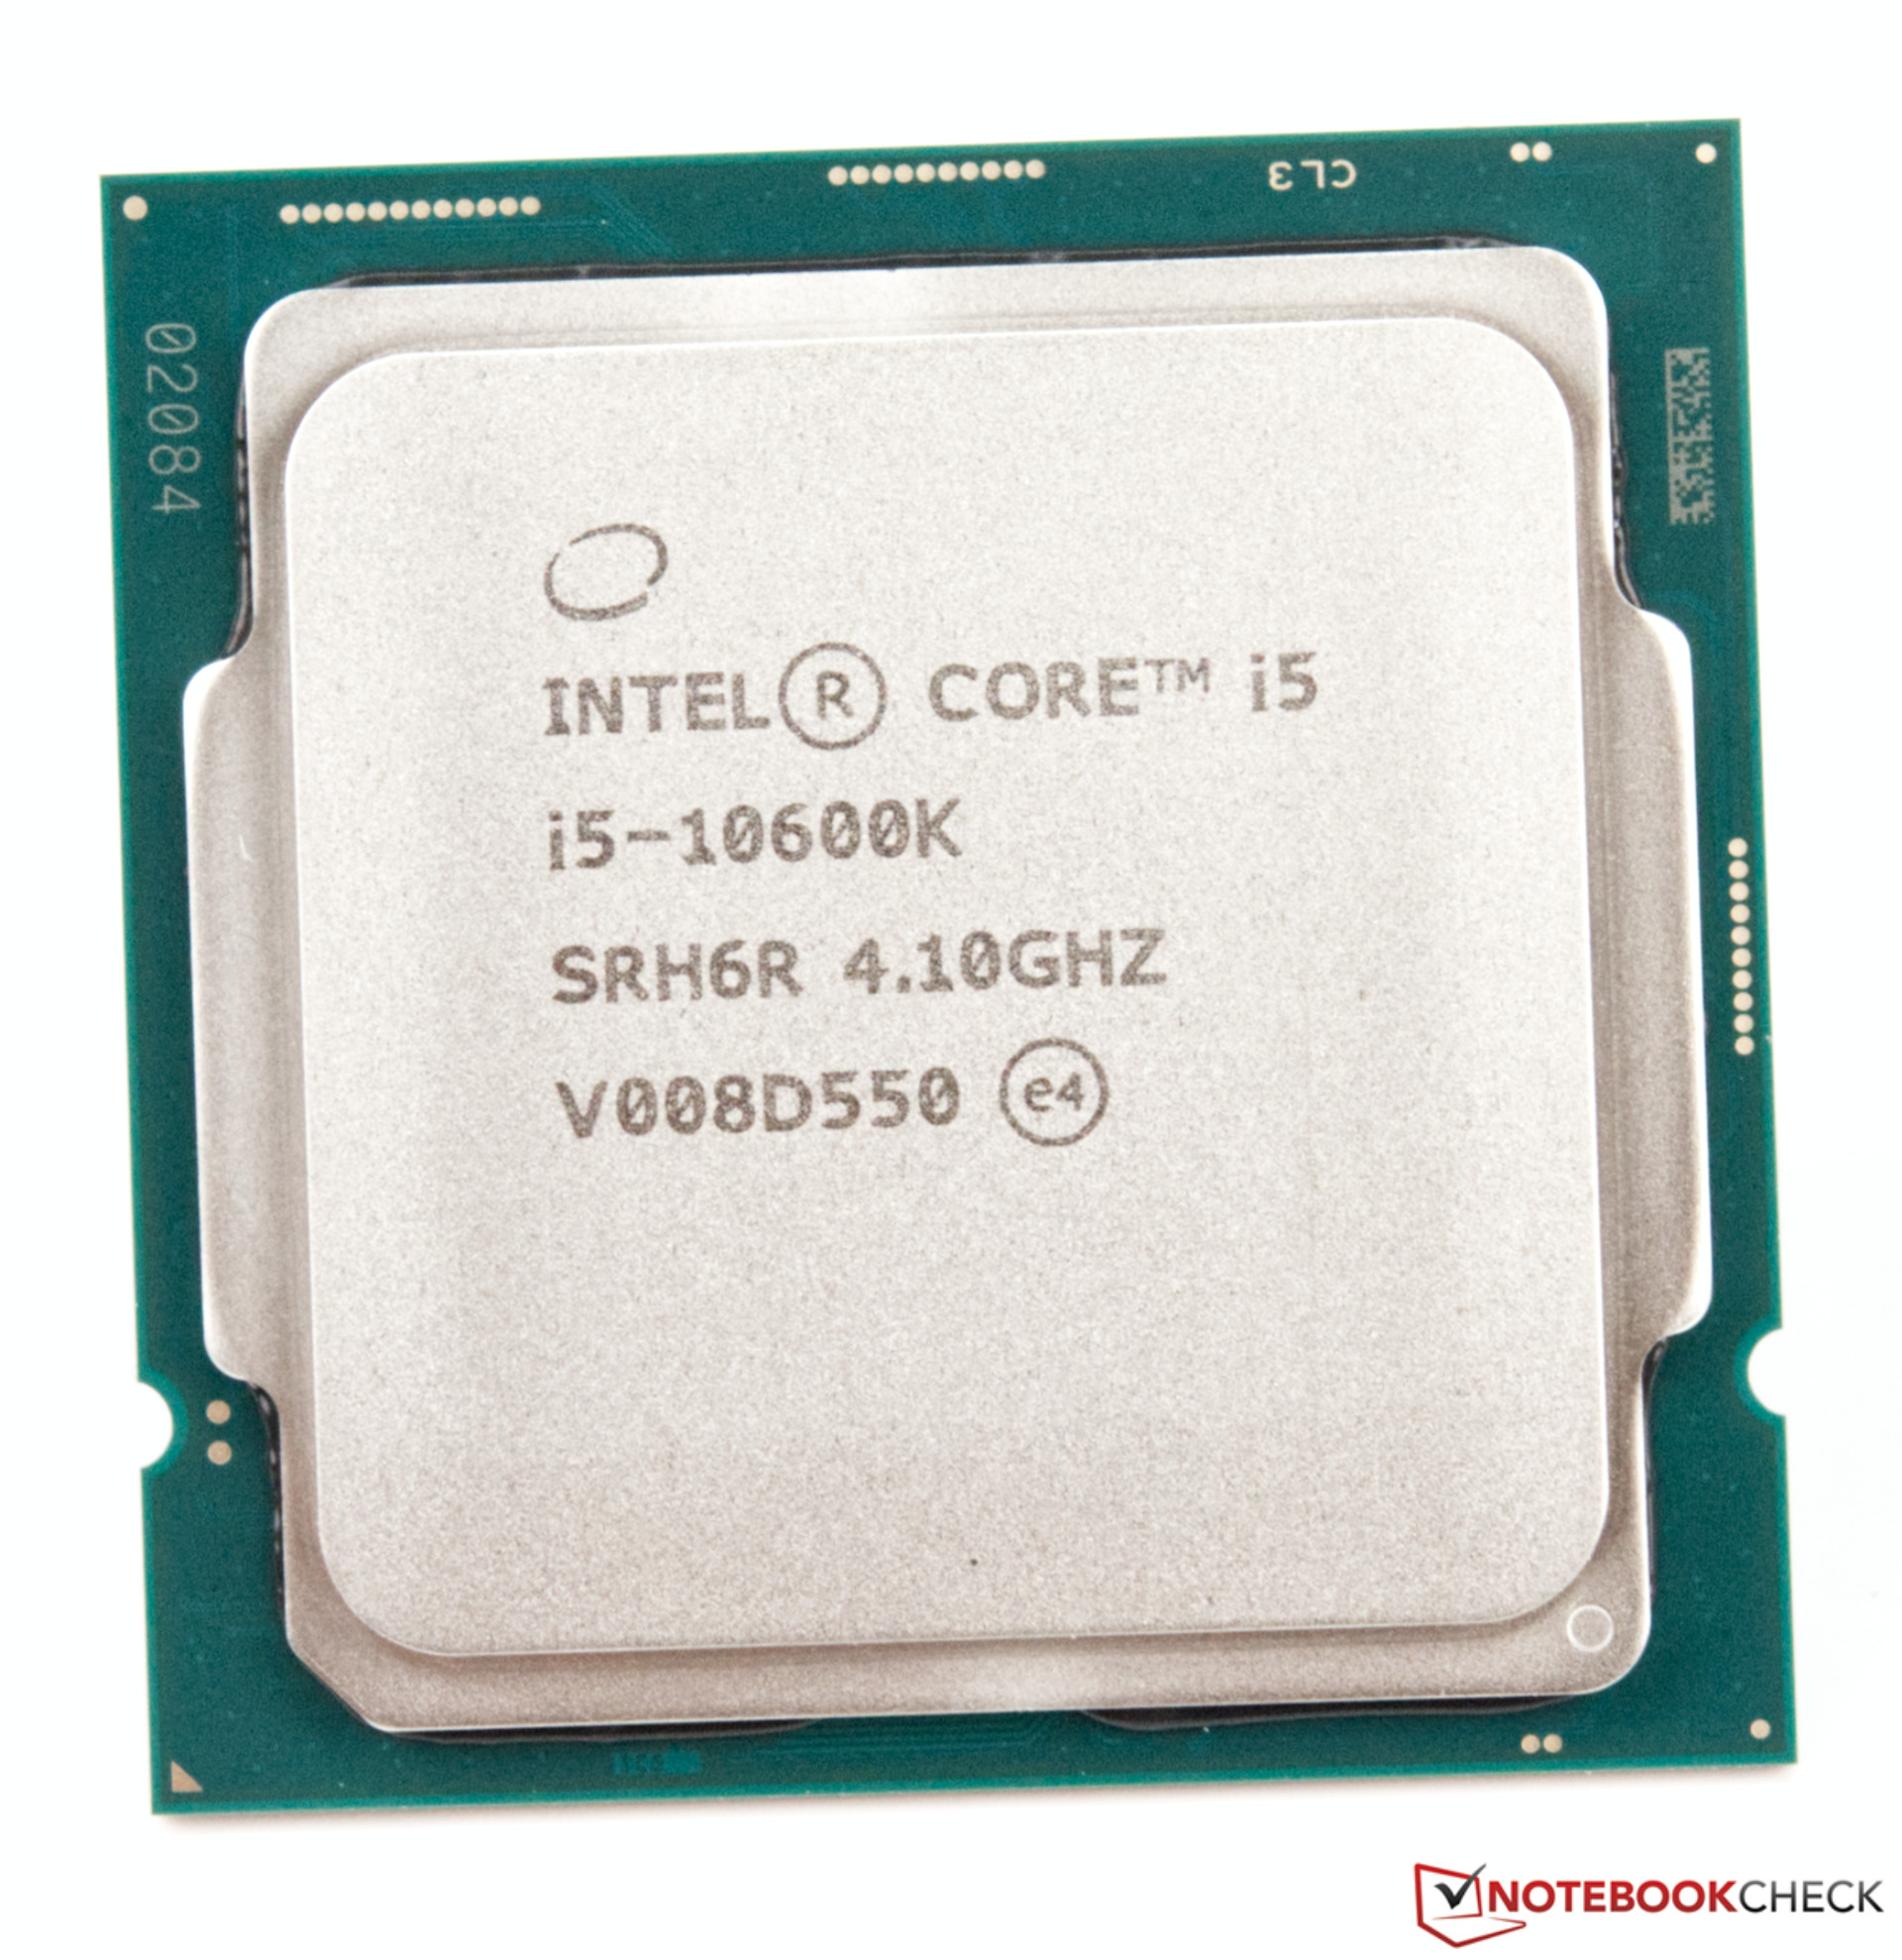
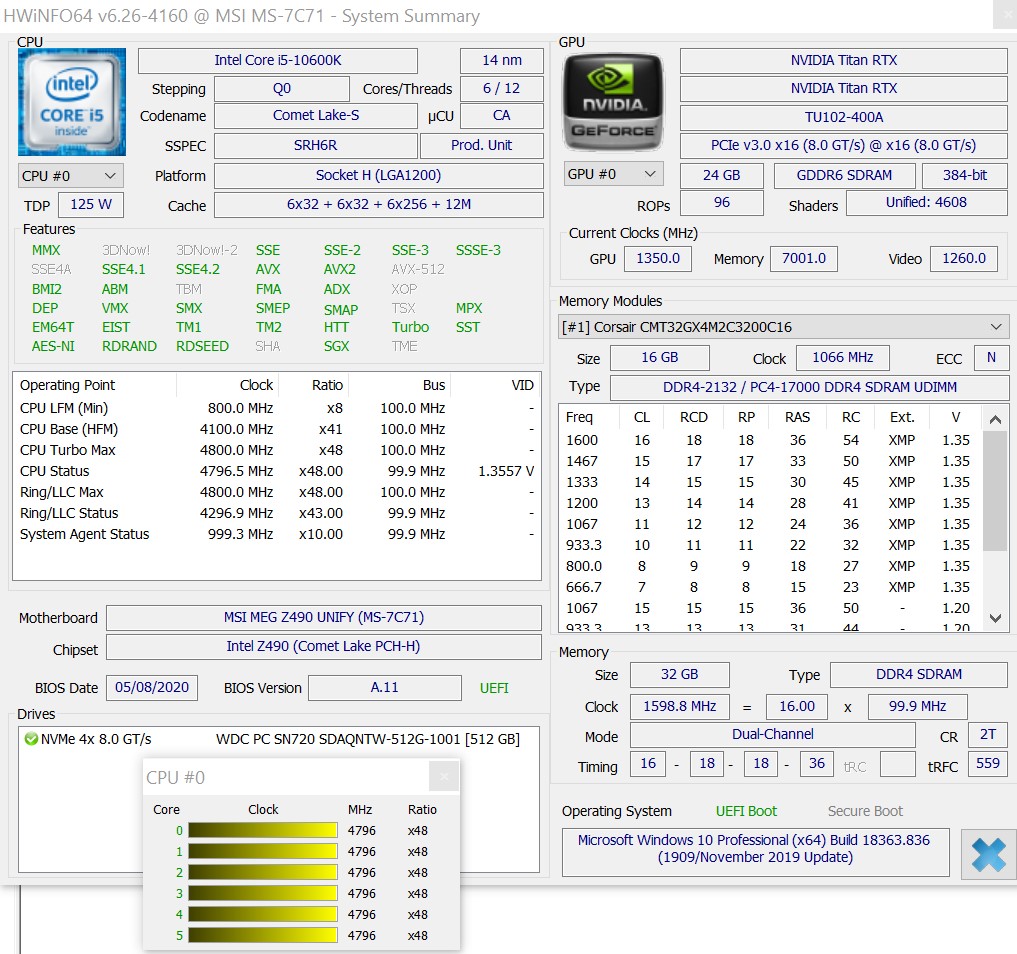
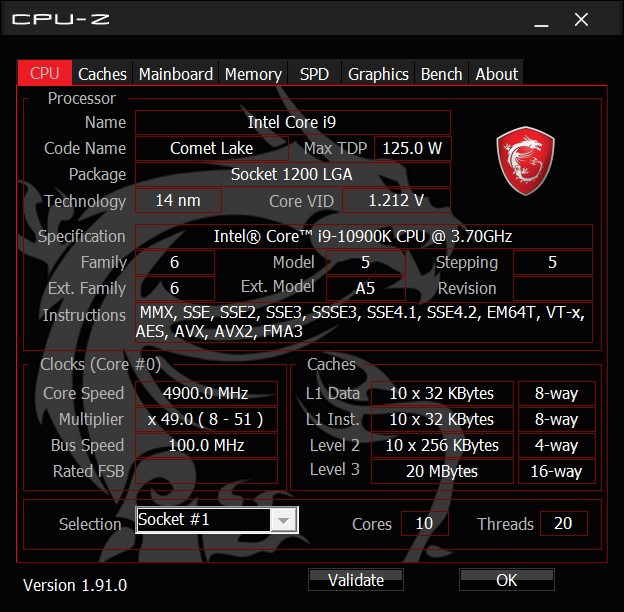
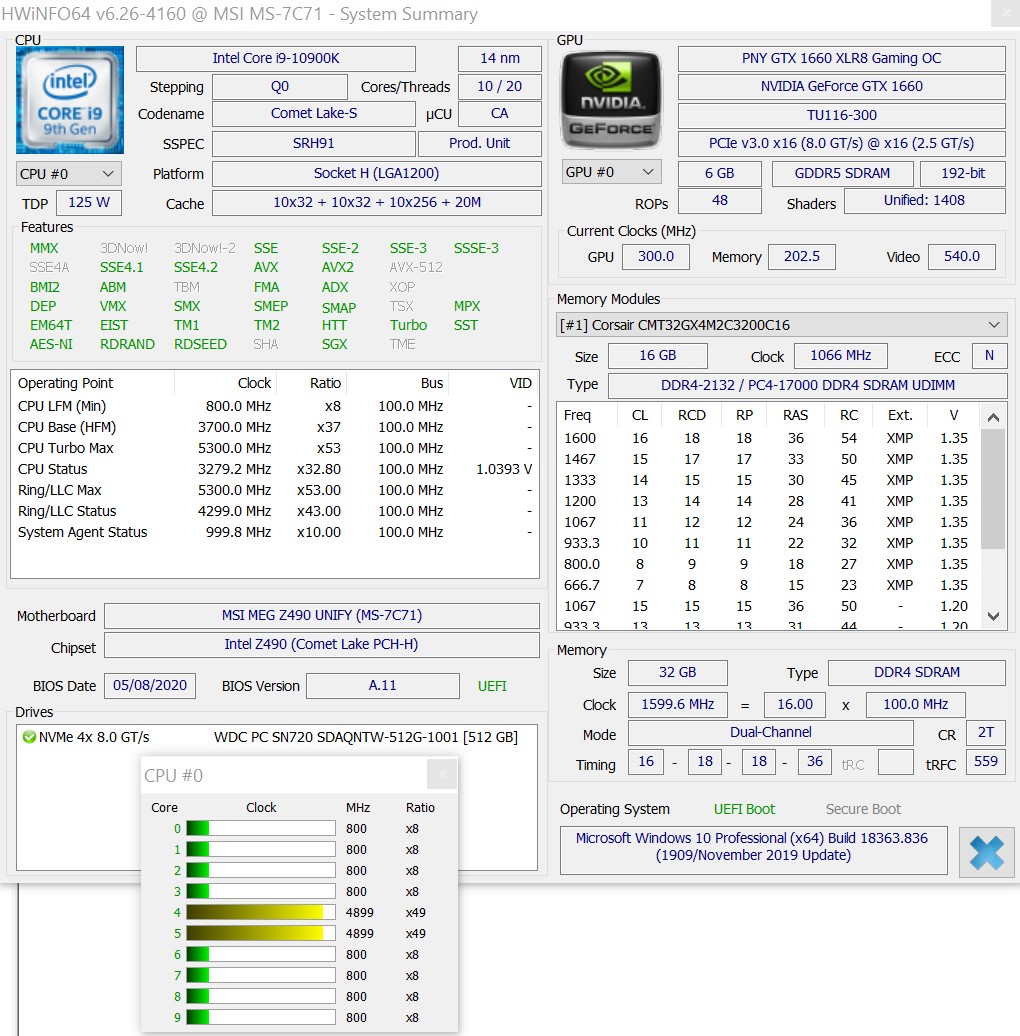
- Intel Core i9-10900K, Intel Core i5-10600K
- MSI Z490 Unify
- Alphacool Eisbaer 280 AiO
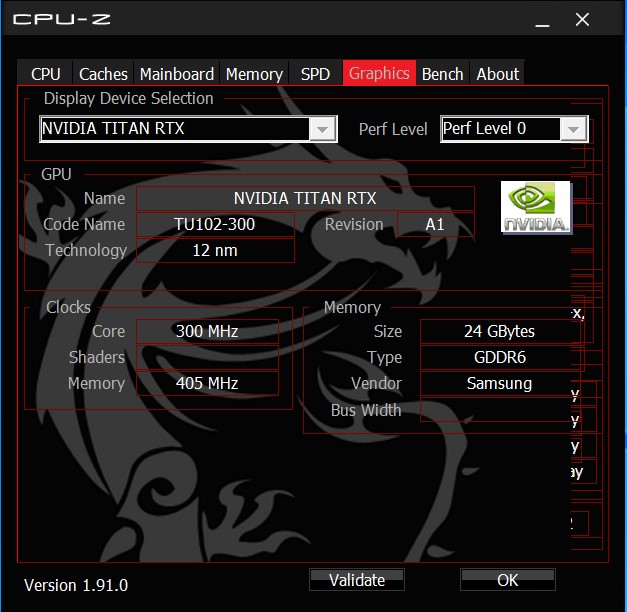
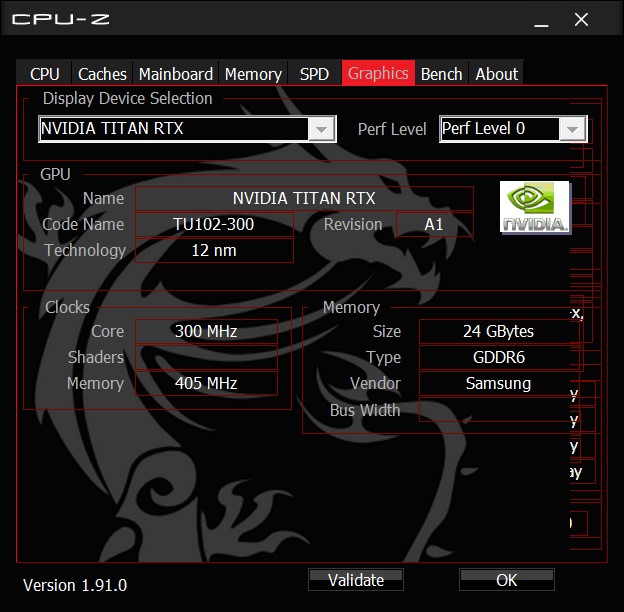
- Nvidia Titan RTX
- Corsair RM 1000X Netzteil
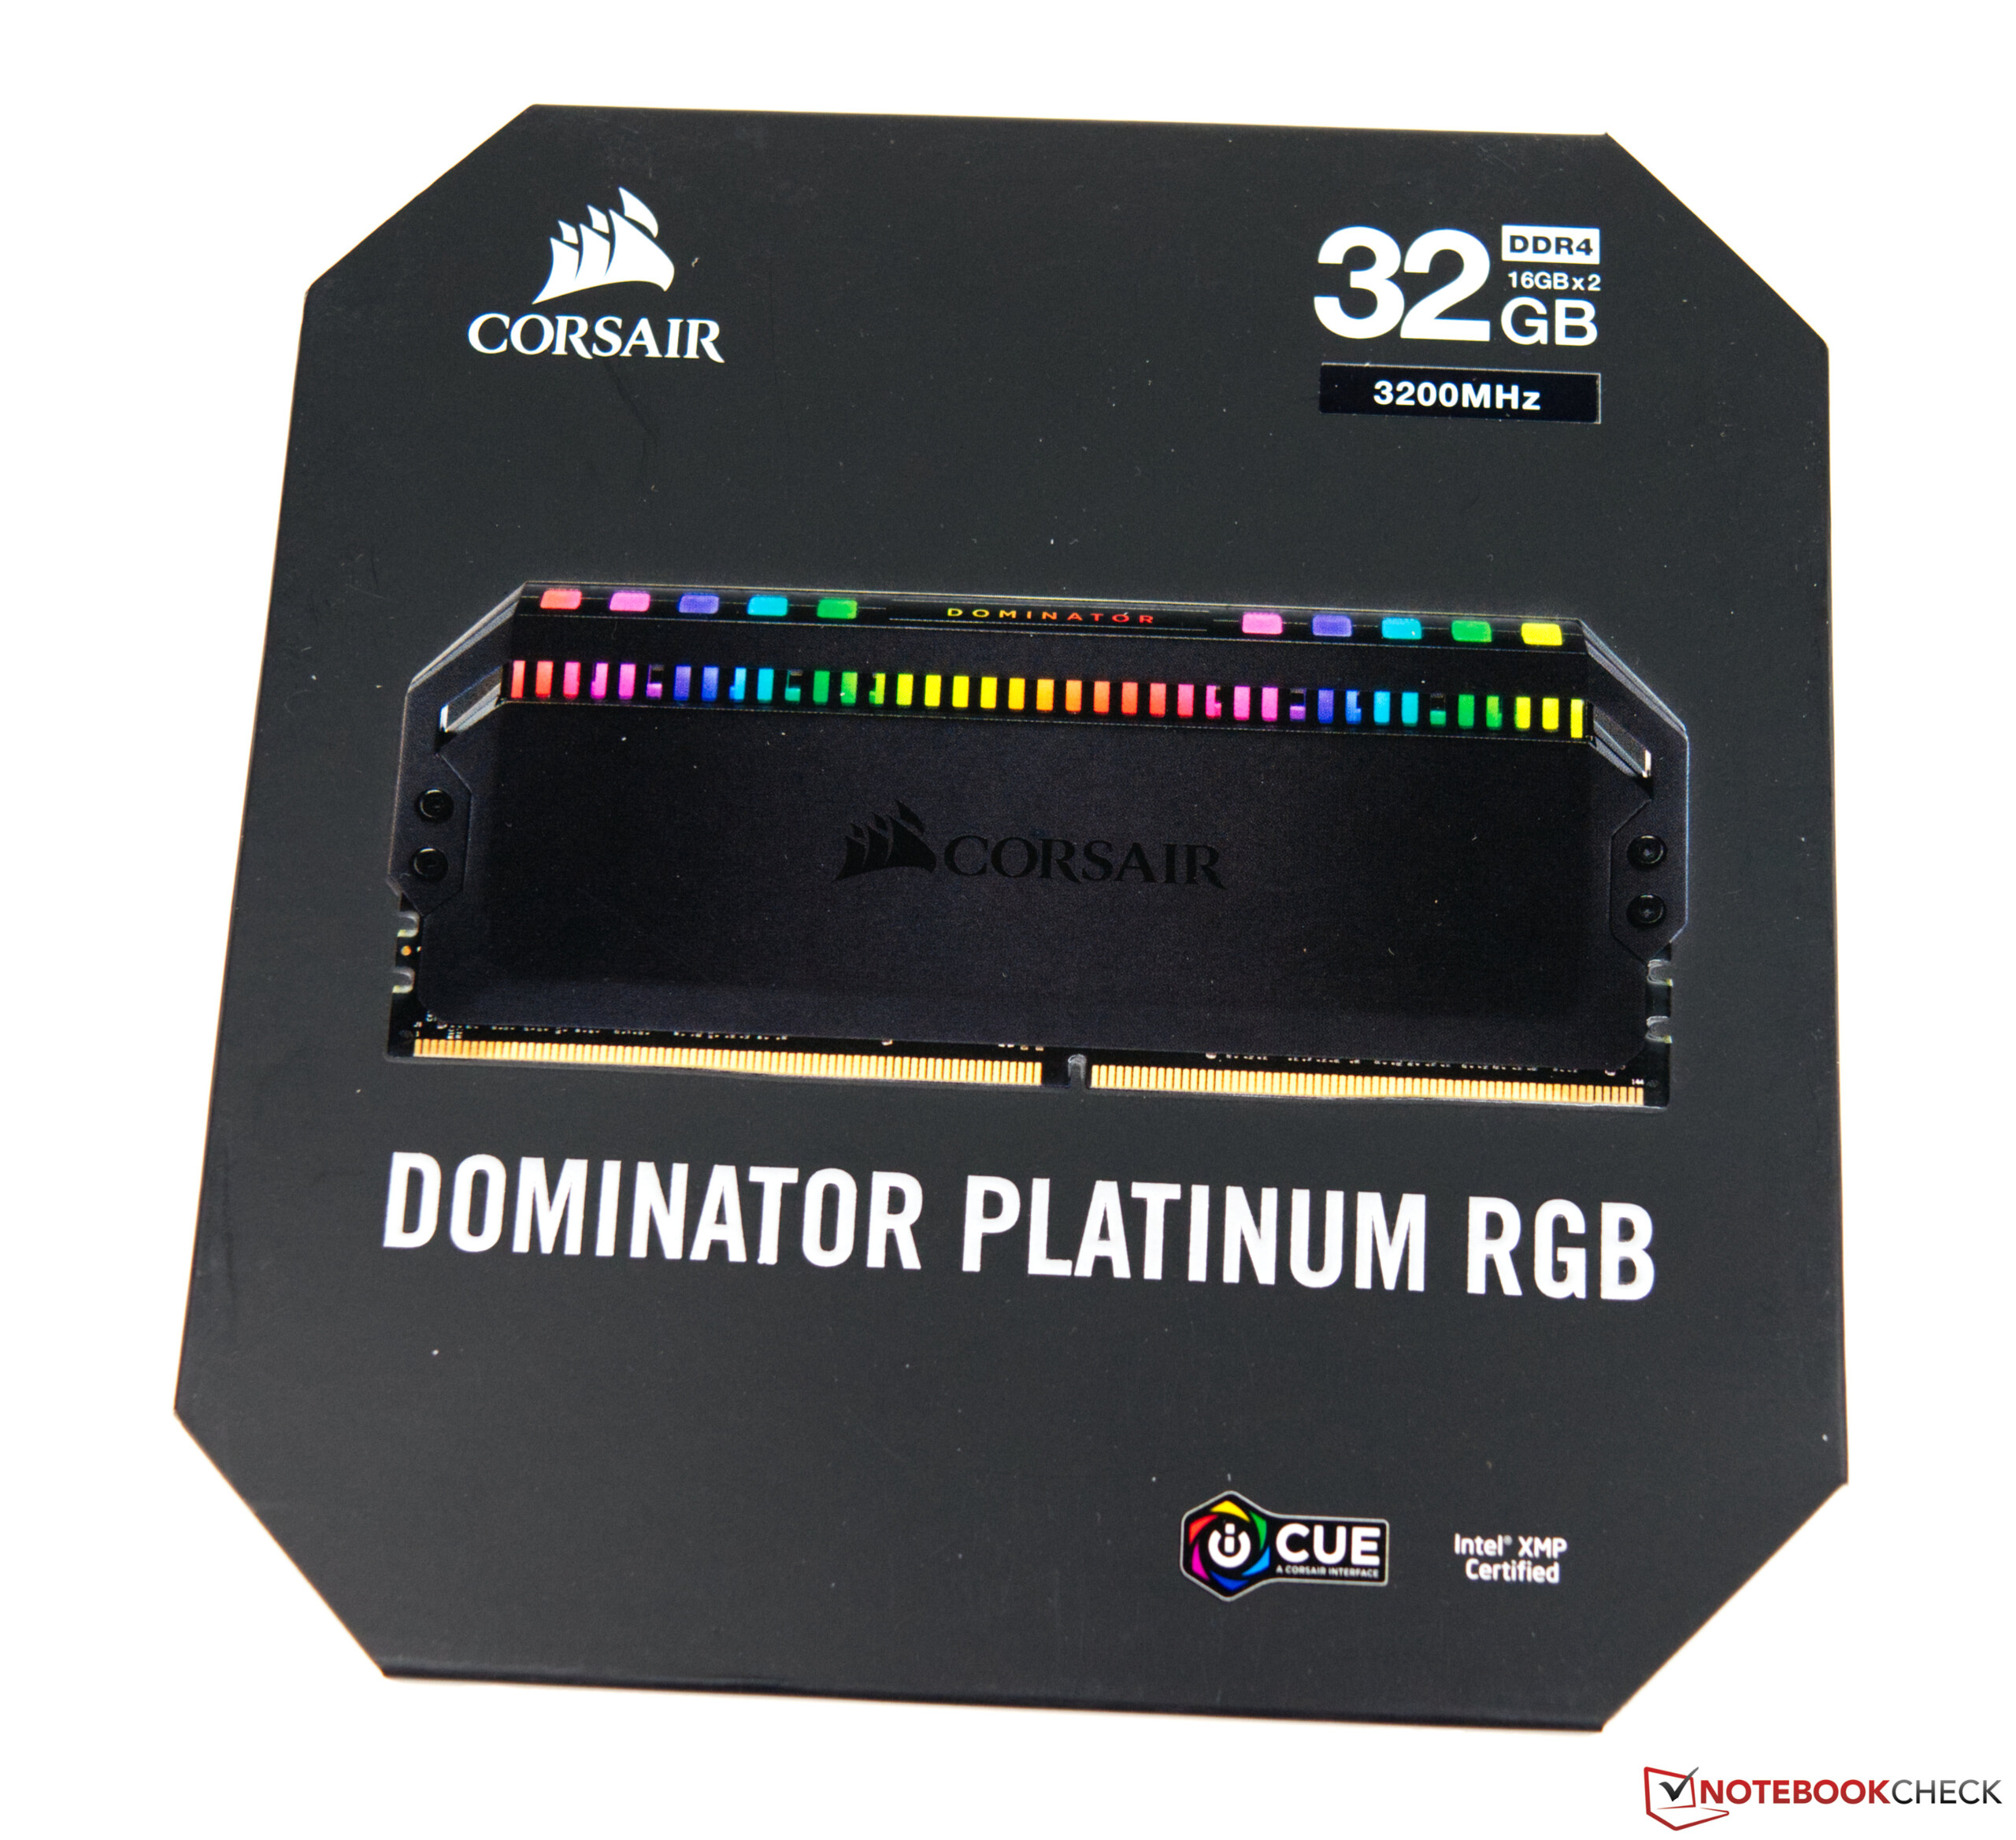
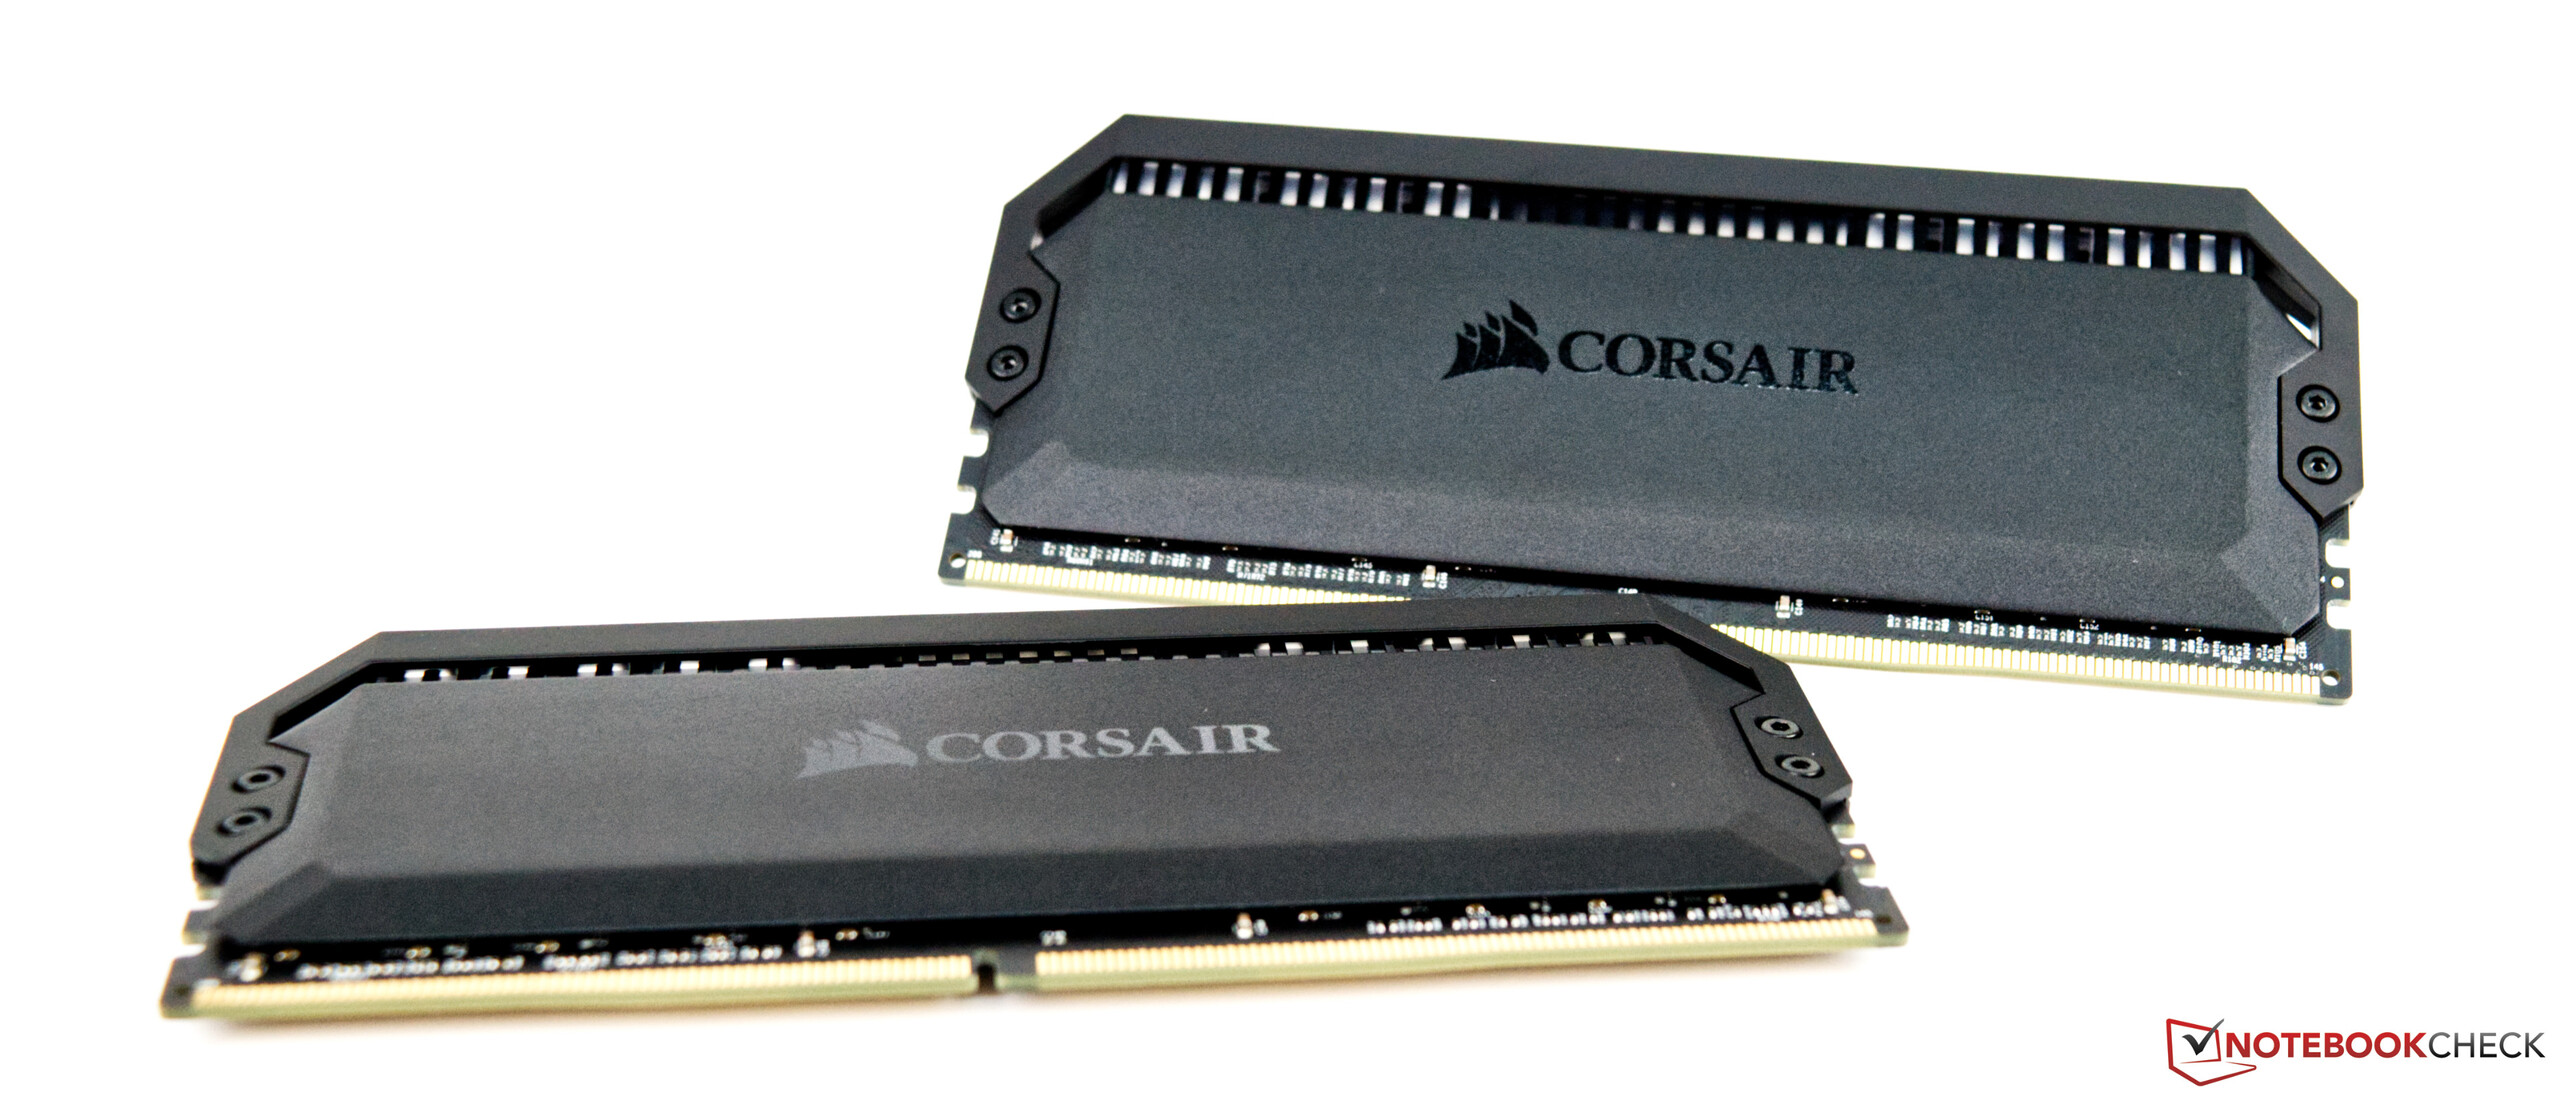
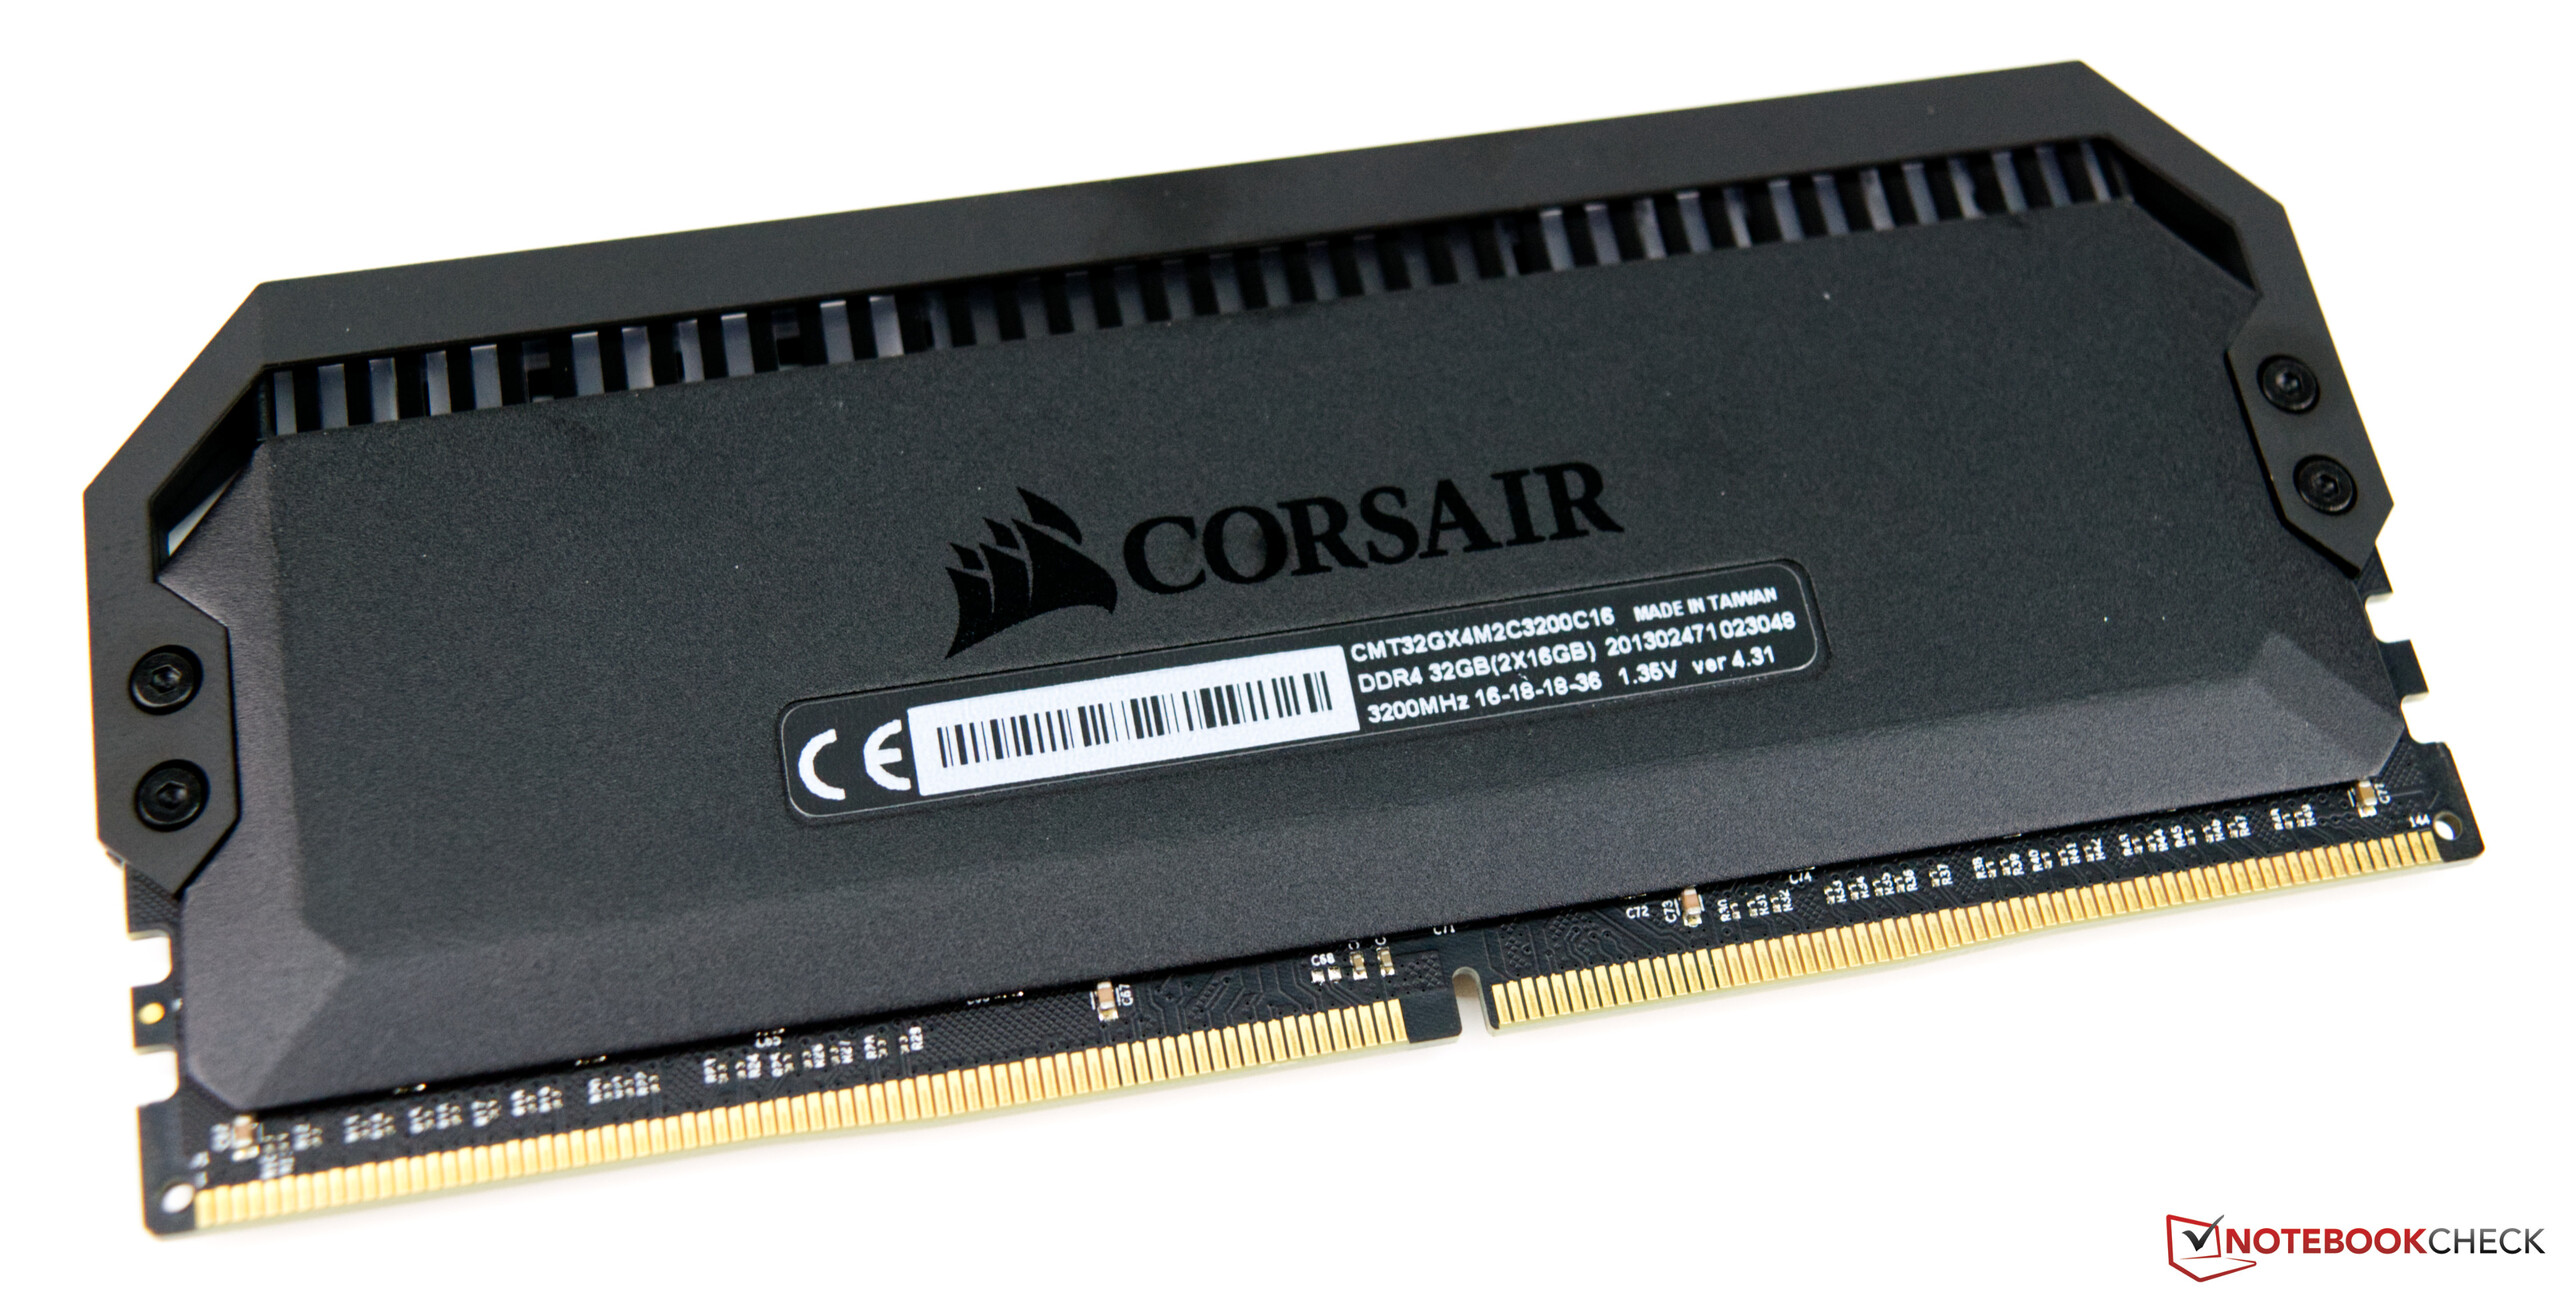
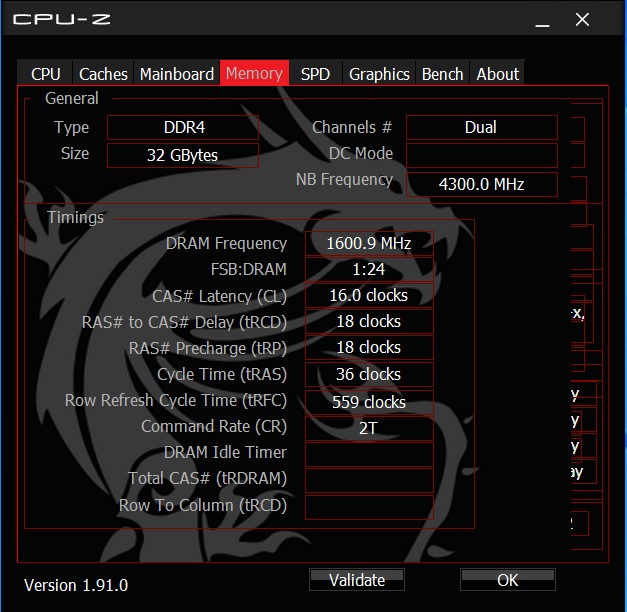
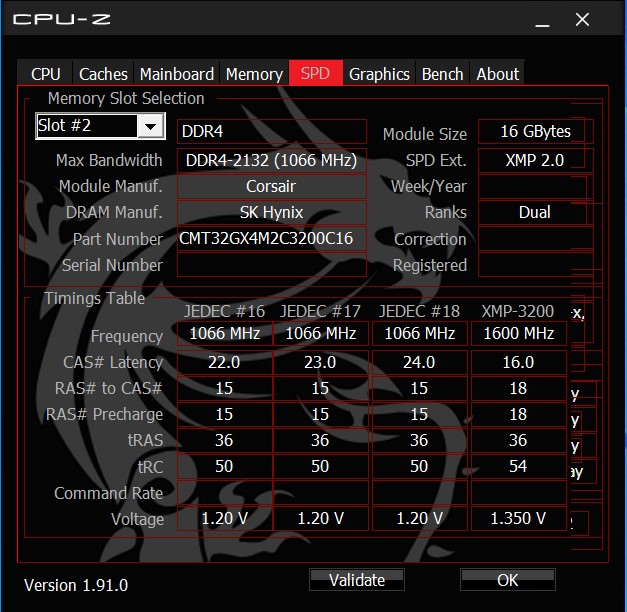
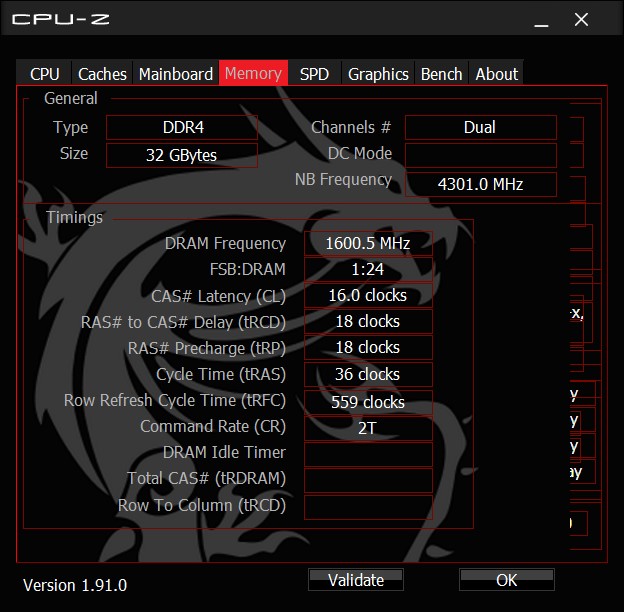
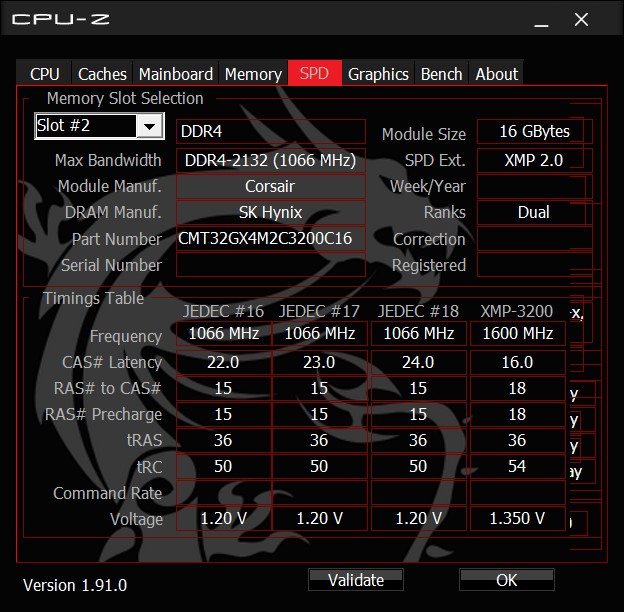
- Corsair Dominator Platinum RGB (2x 16GB - DDR4-3200)
- Western Digital PC SN720 NVMe SSD 512GB
- Microsoft Windows 10 Professional 64-Bit (Version 1909)
Intel supplied us with both CPUs and the RAM. MSI provided us with the motherboard and our case comes from Raijintek Paean. For our cooling solution, we used the Alphacool Eisbaer 280 AiO.
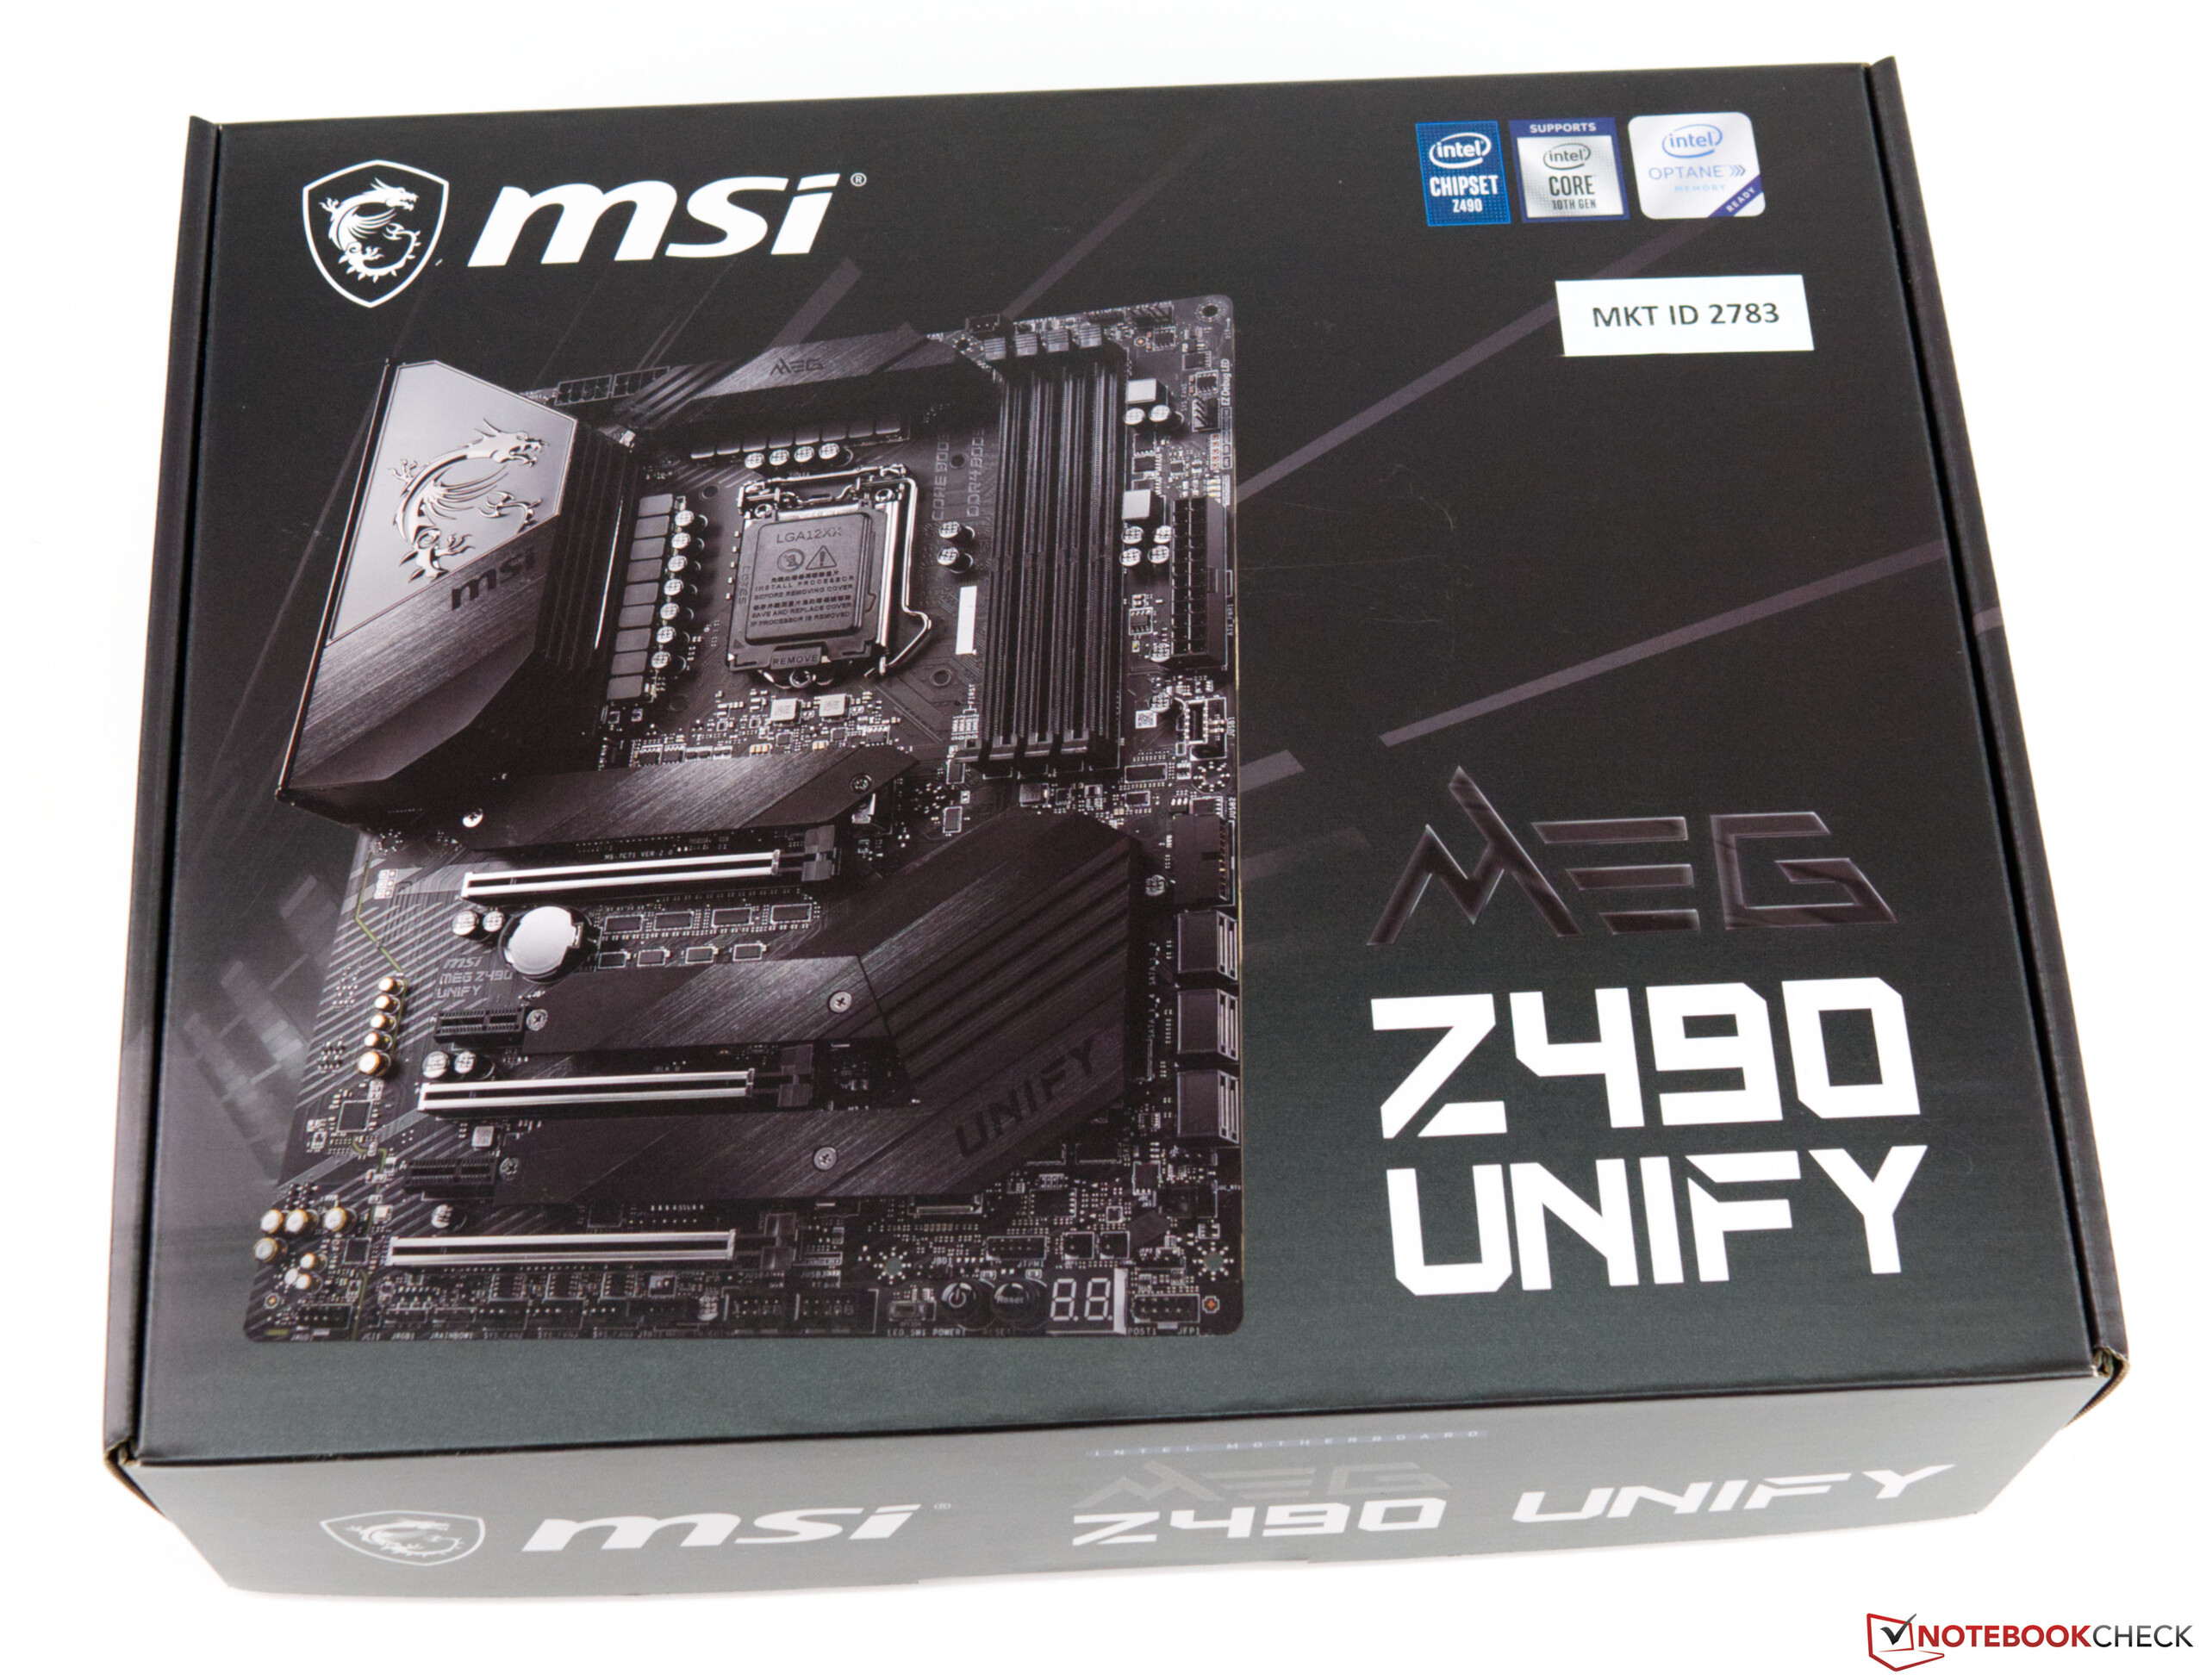
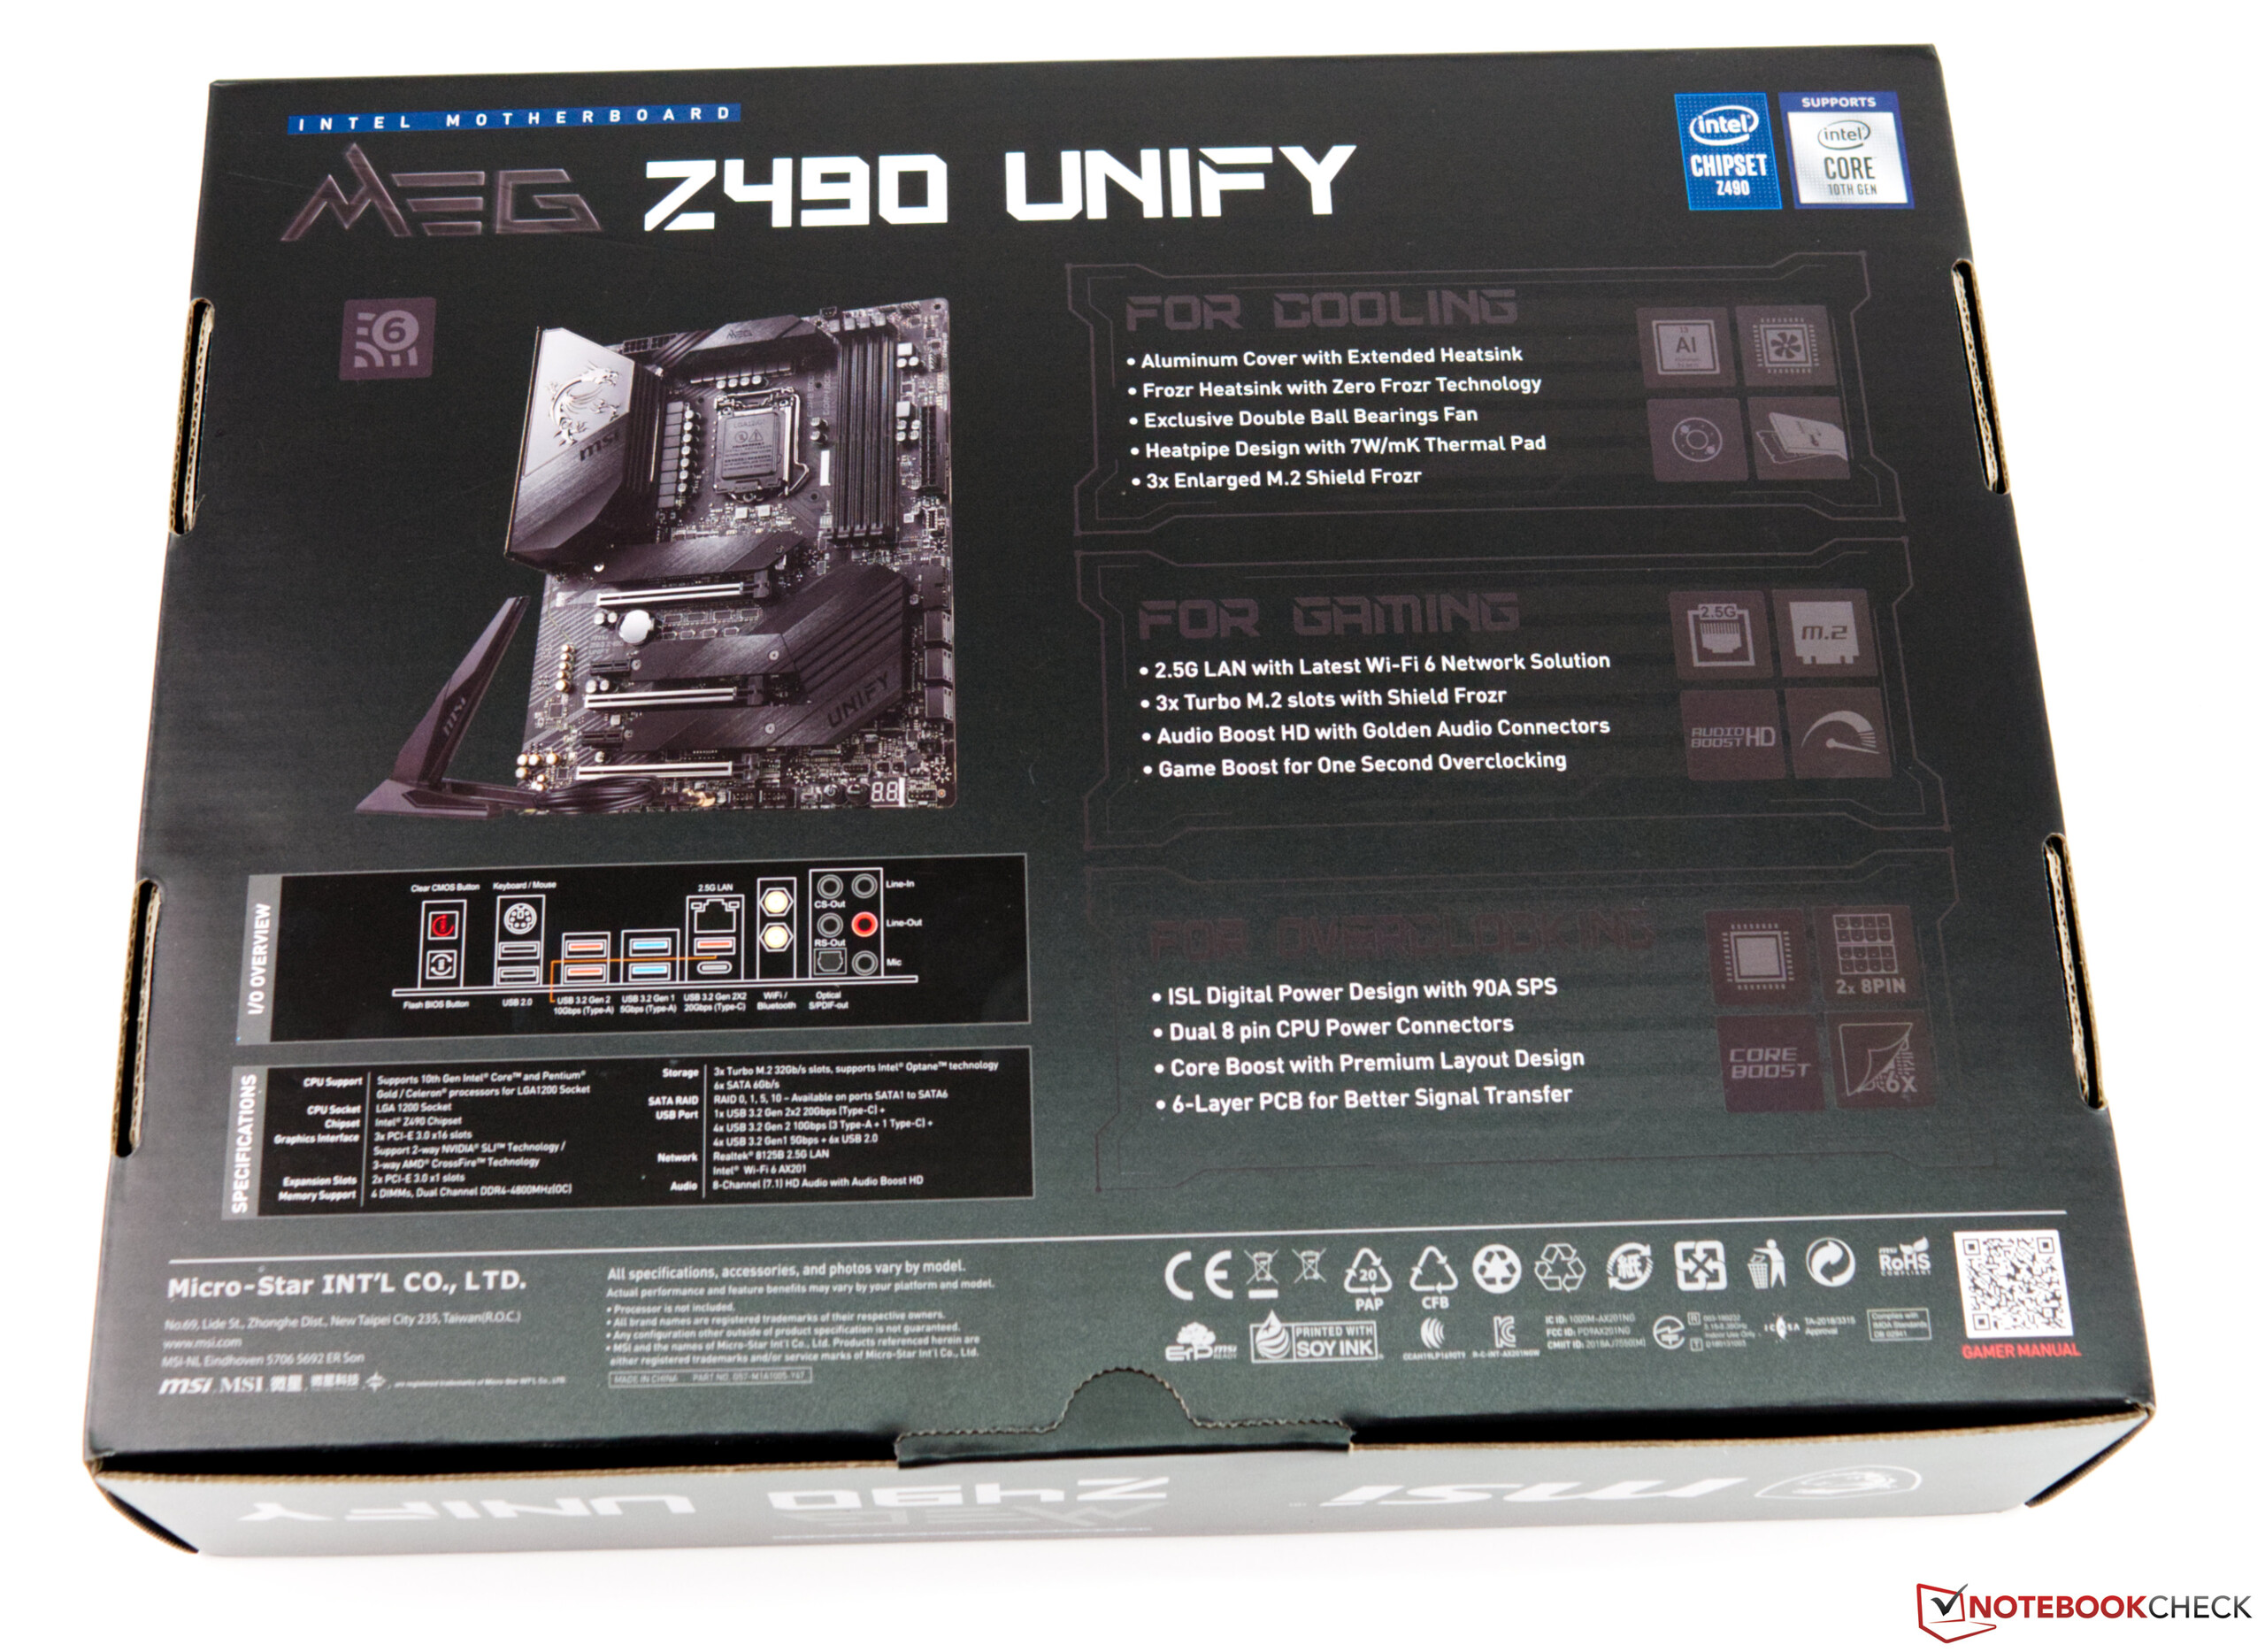
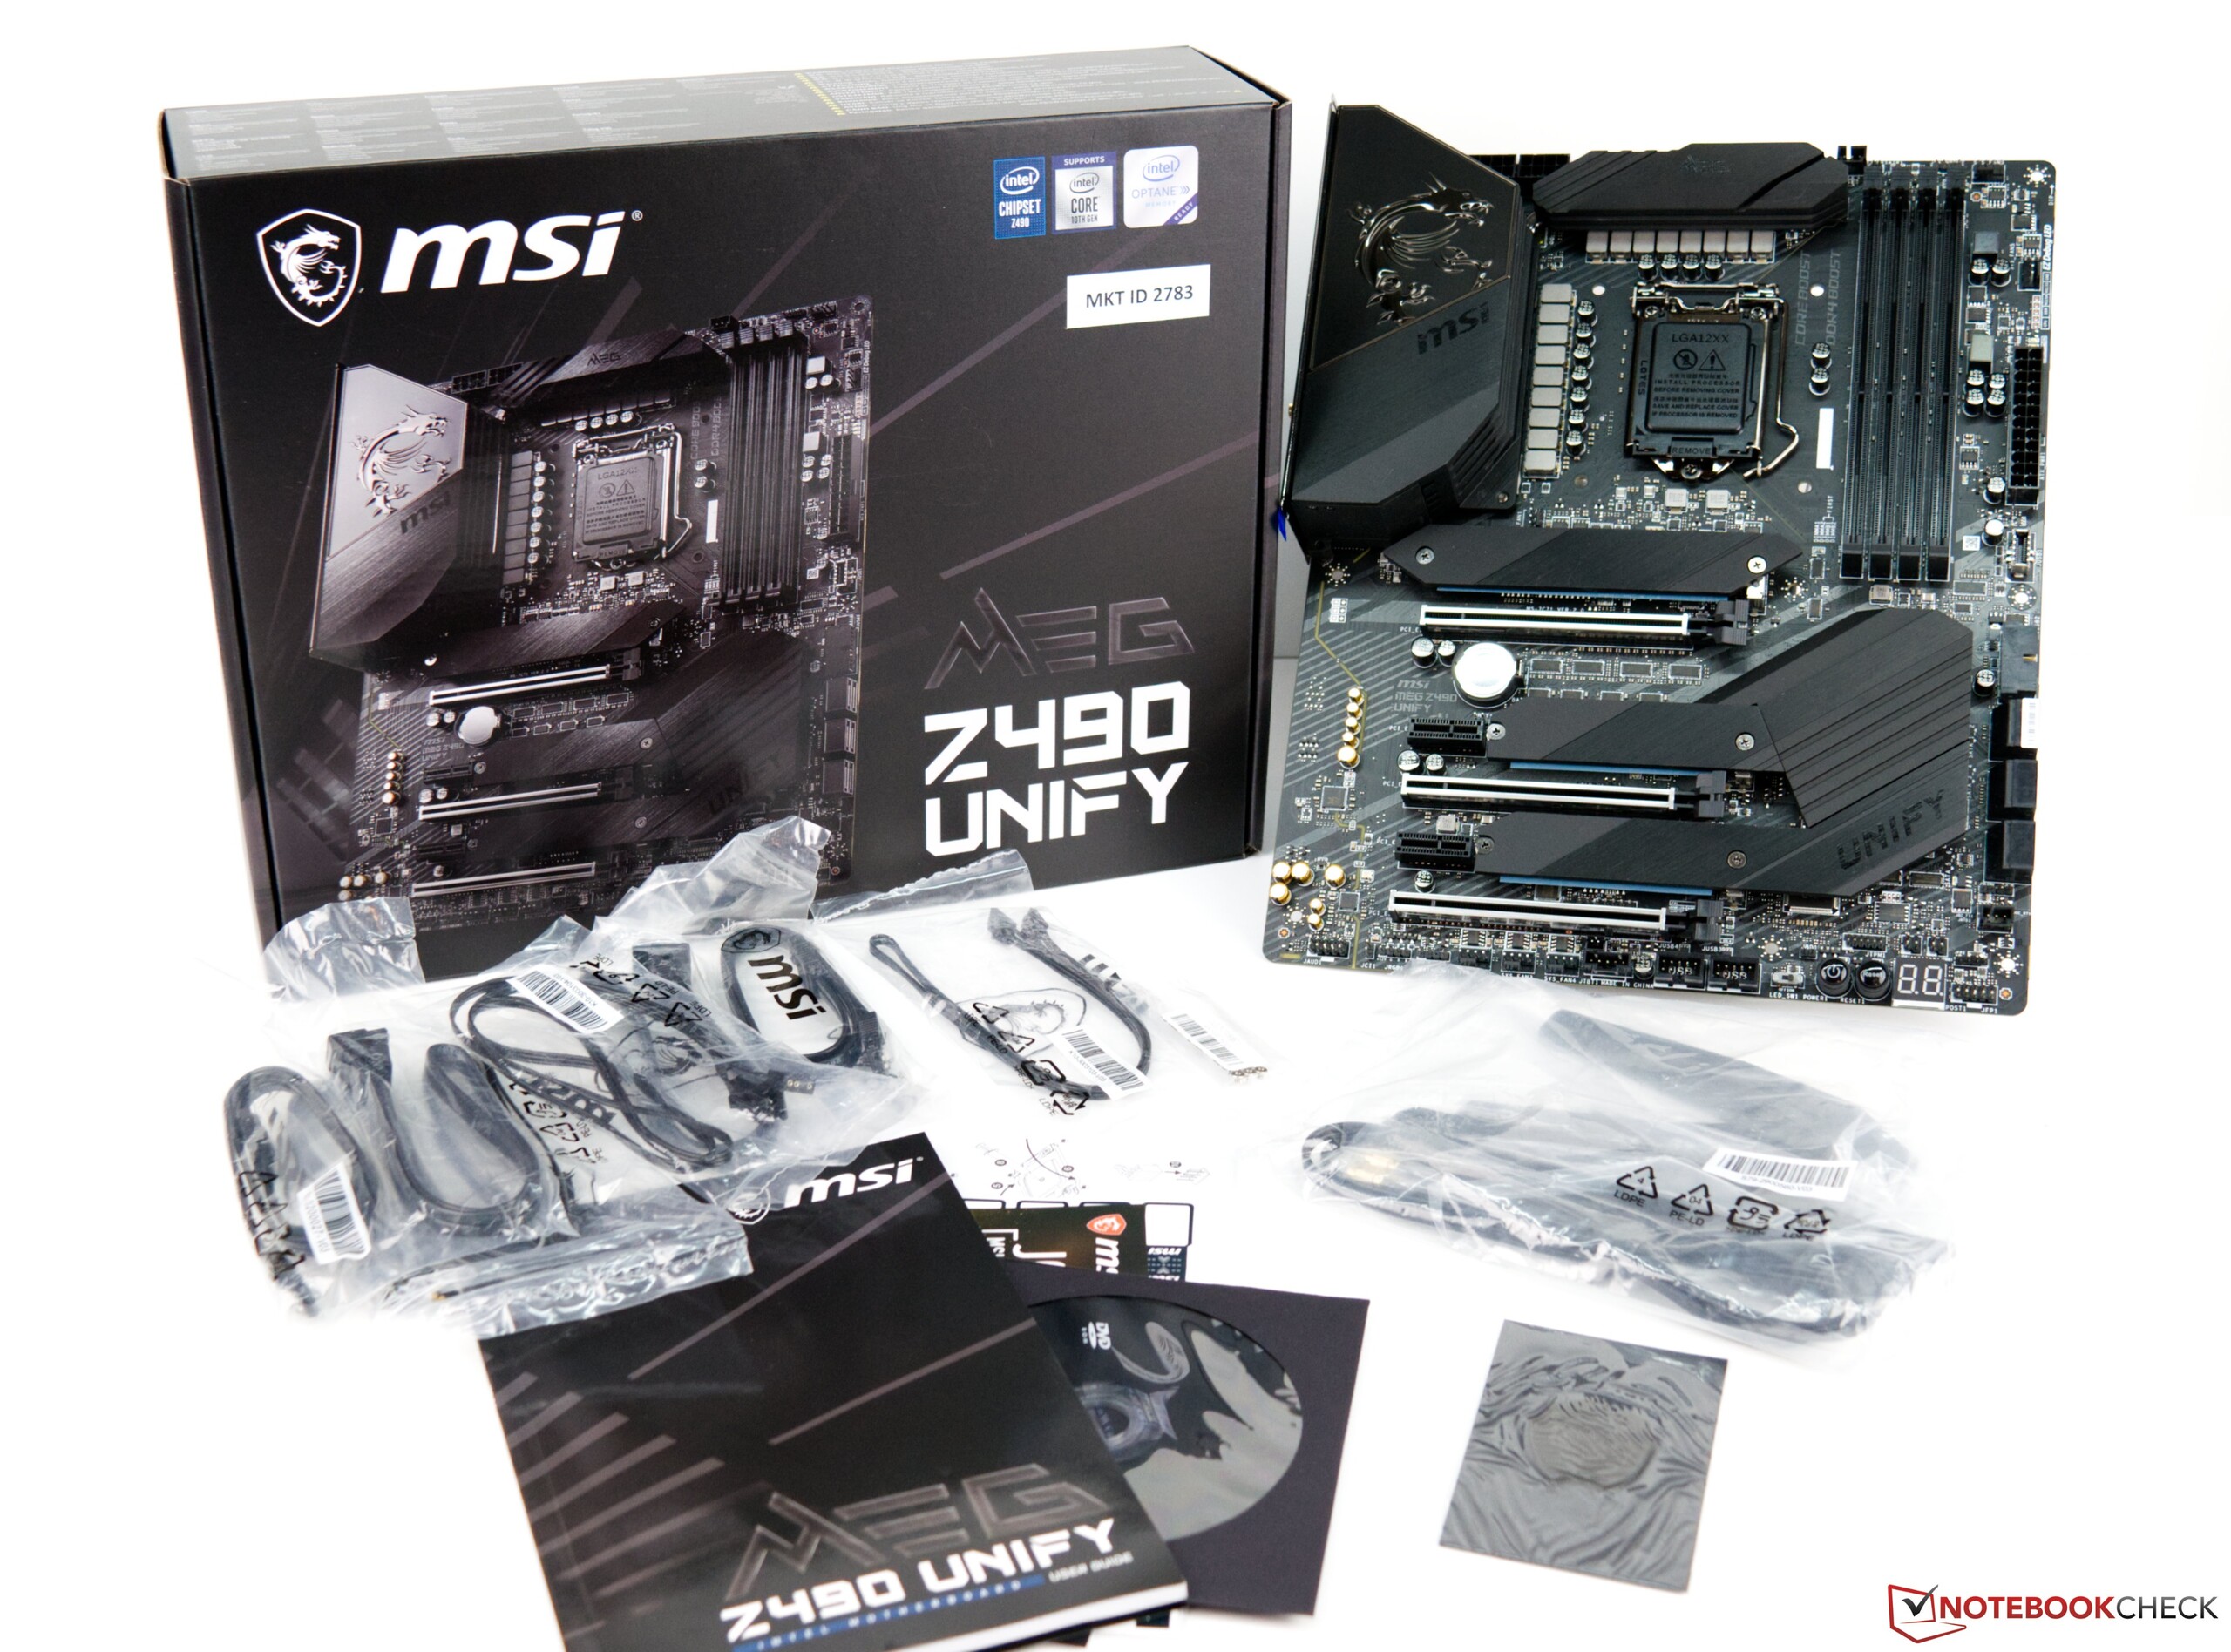
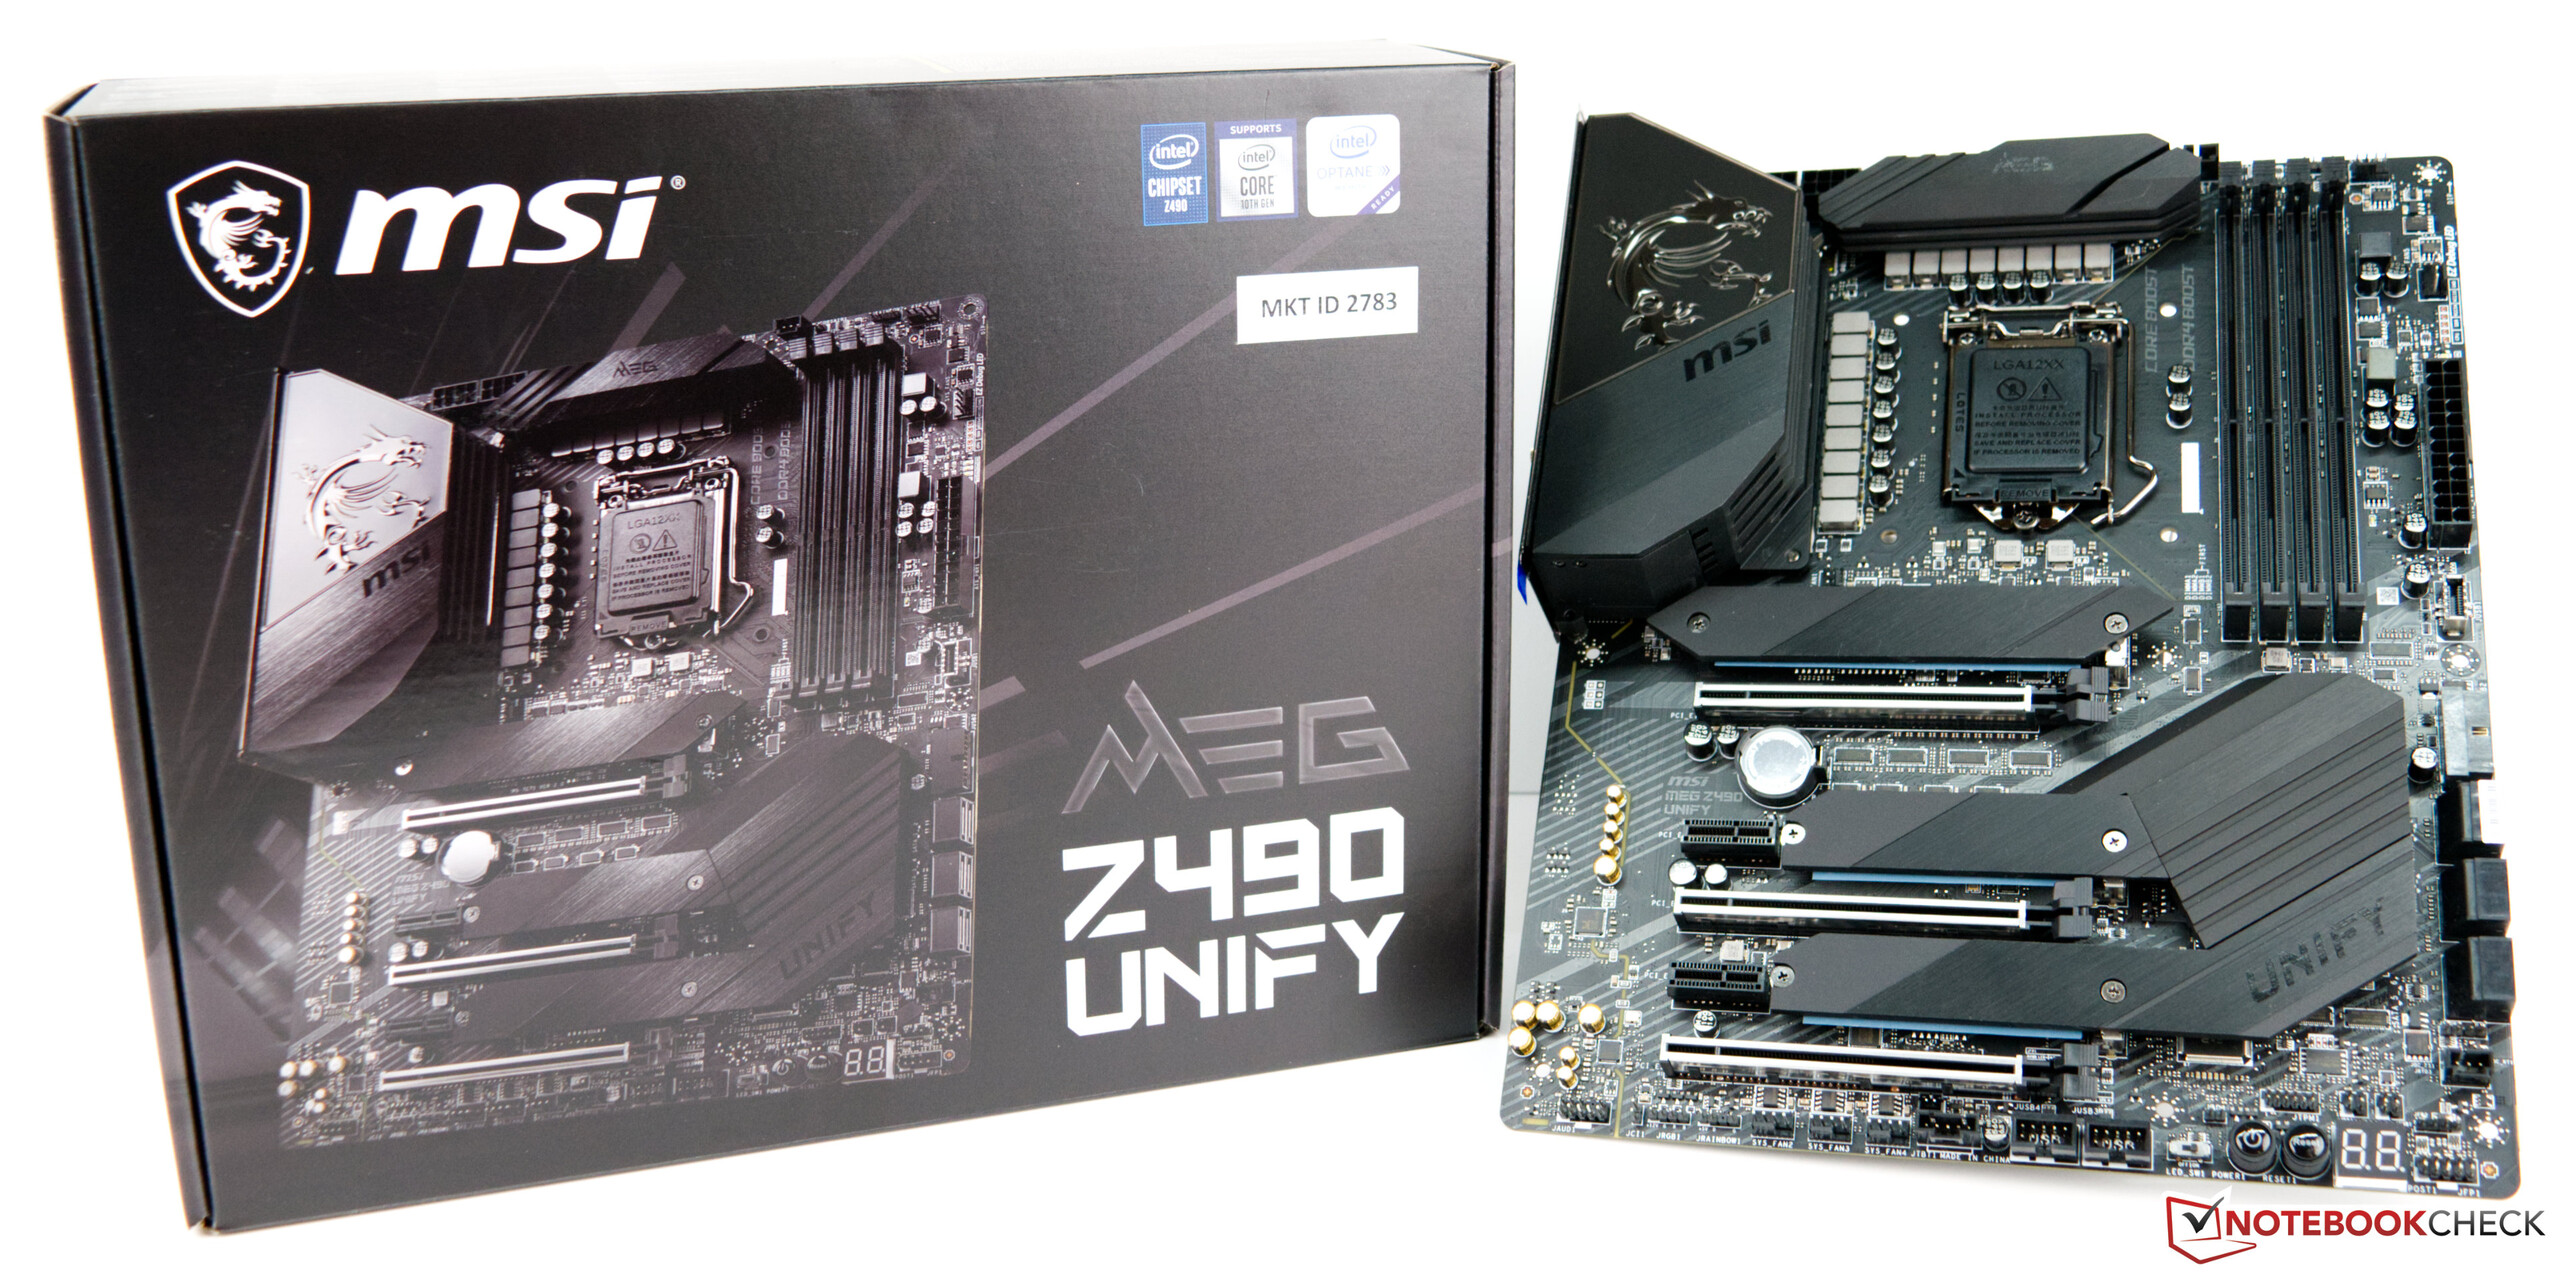
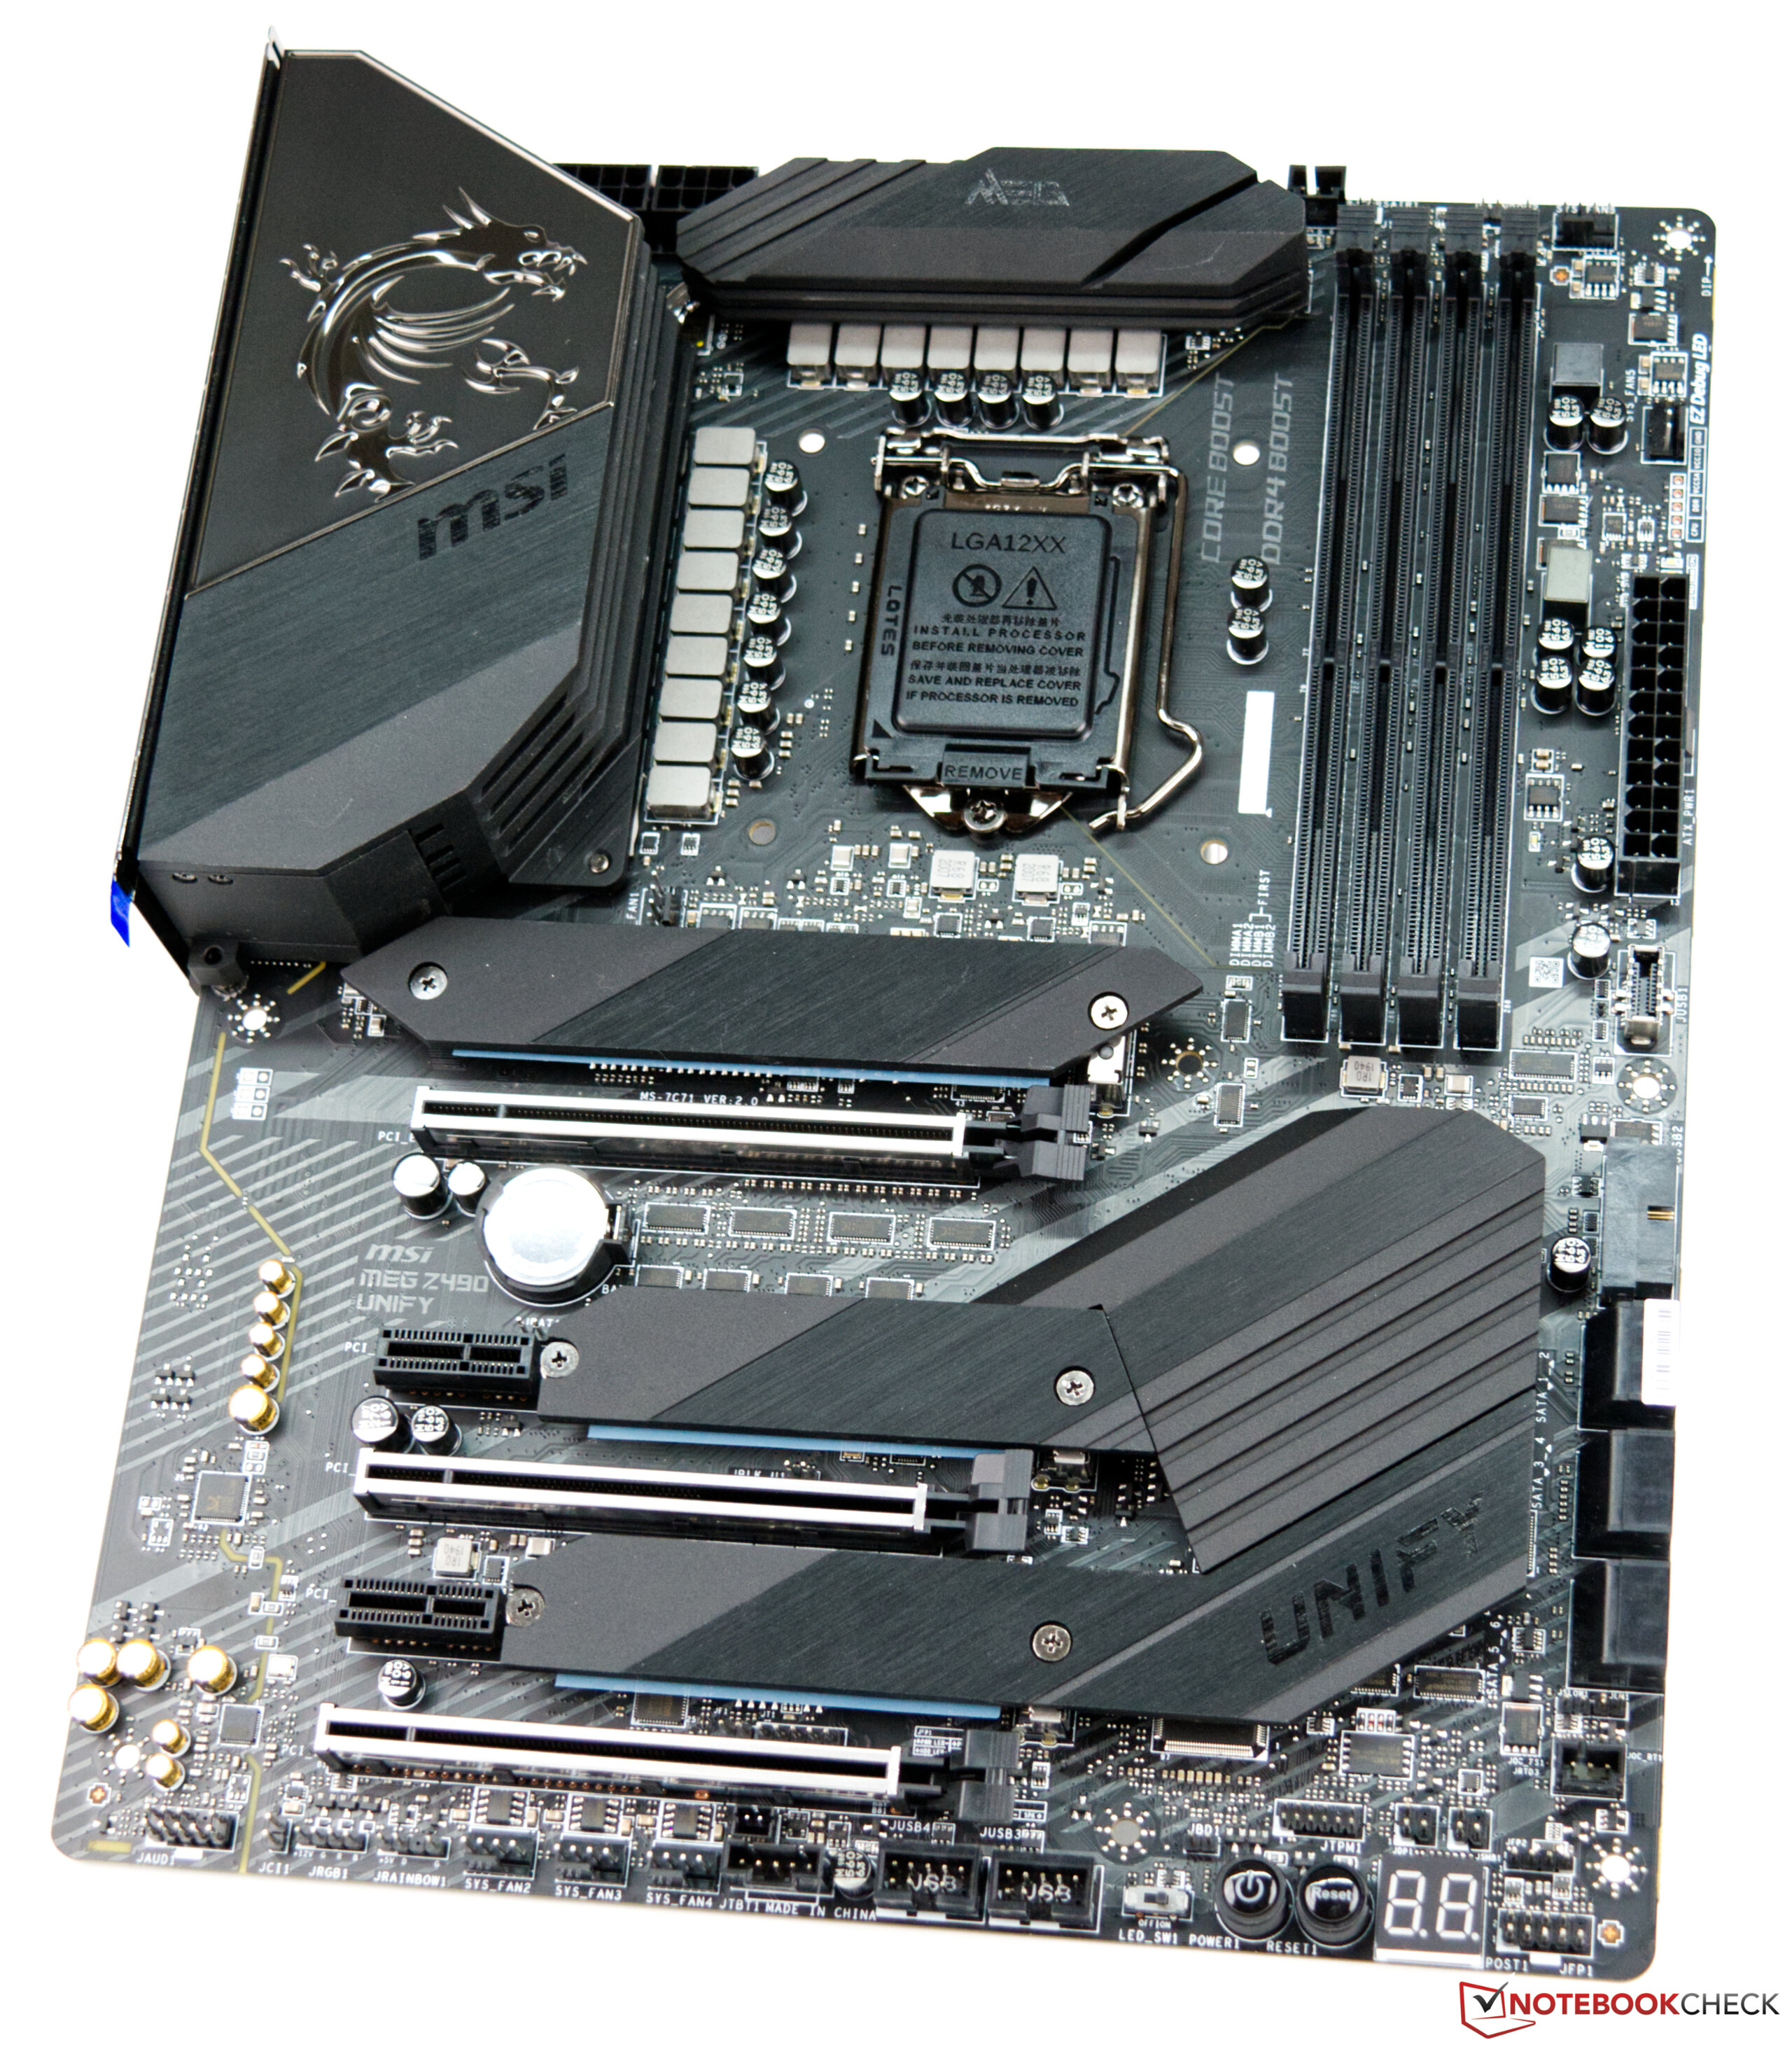
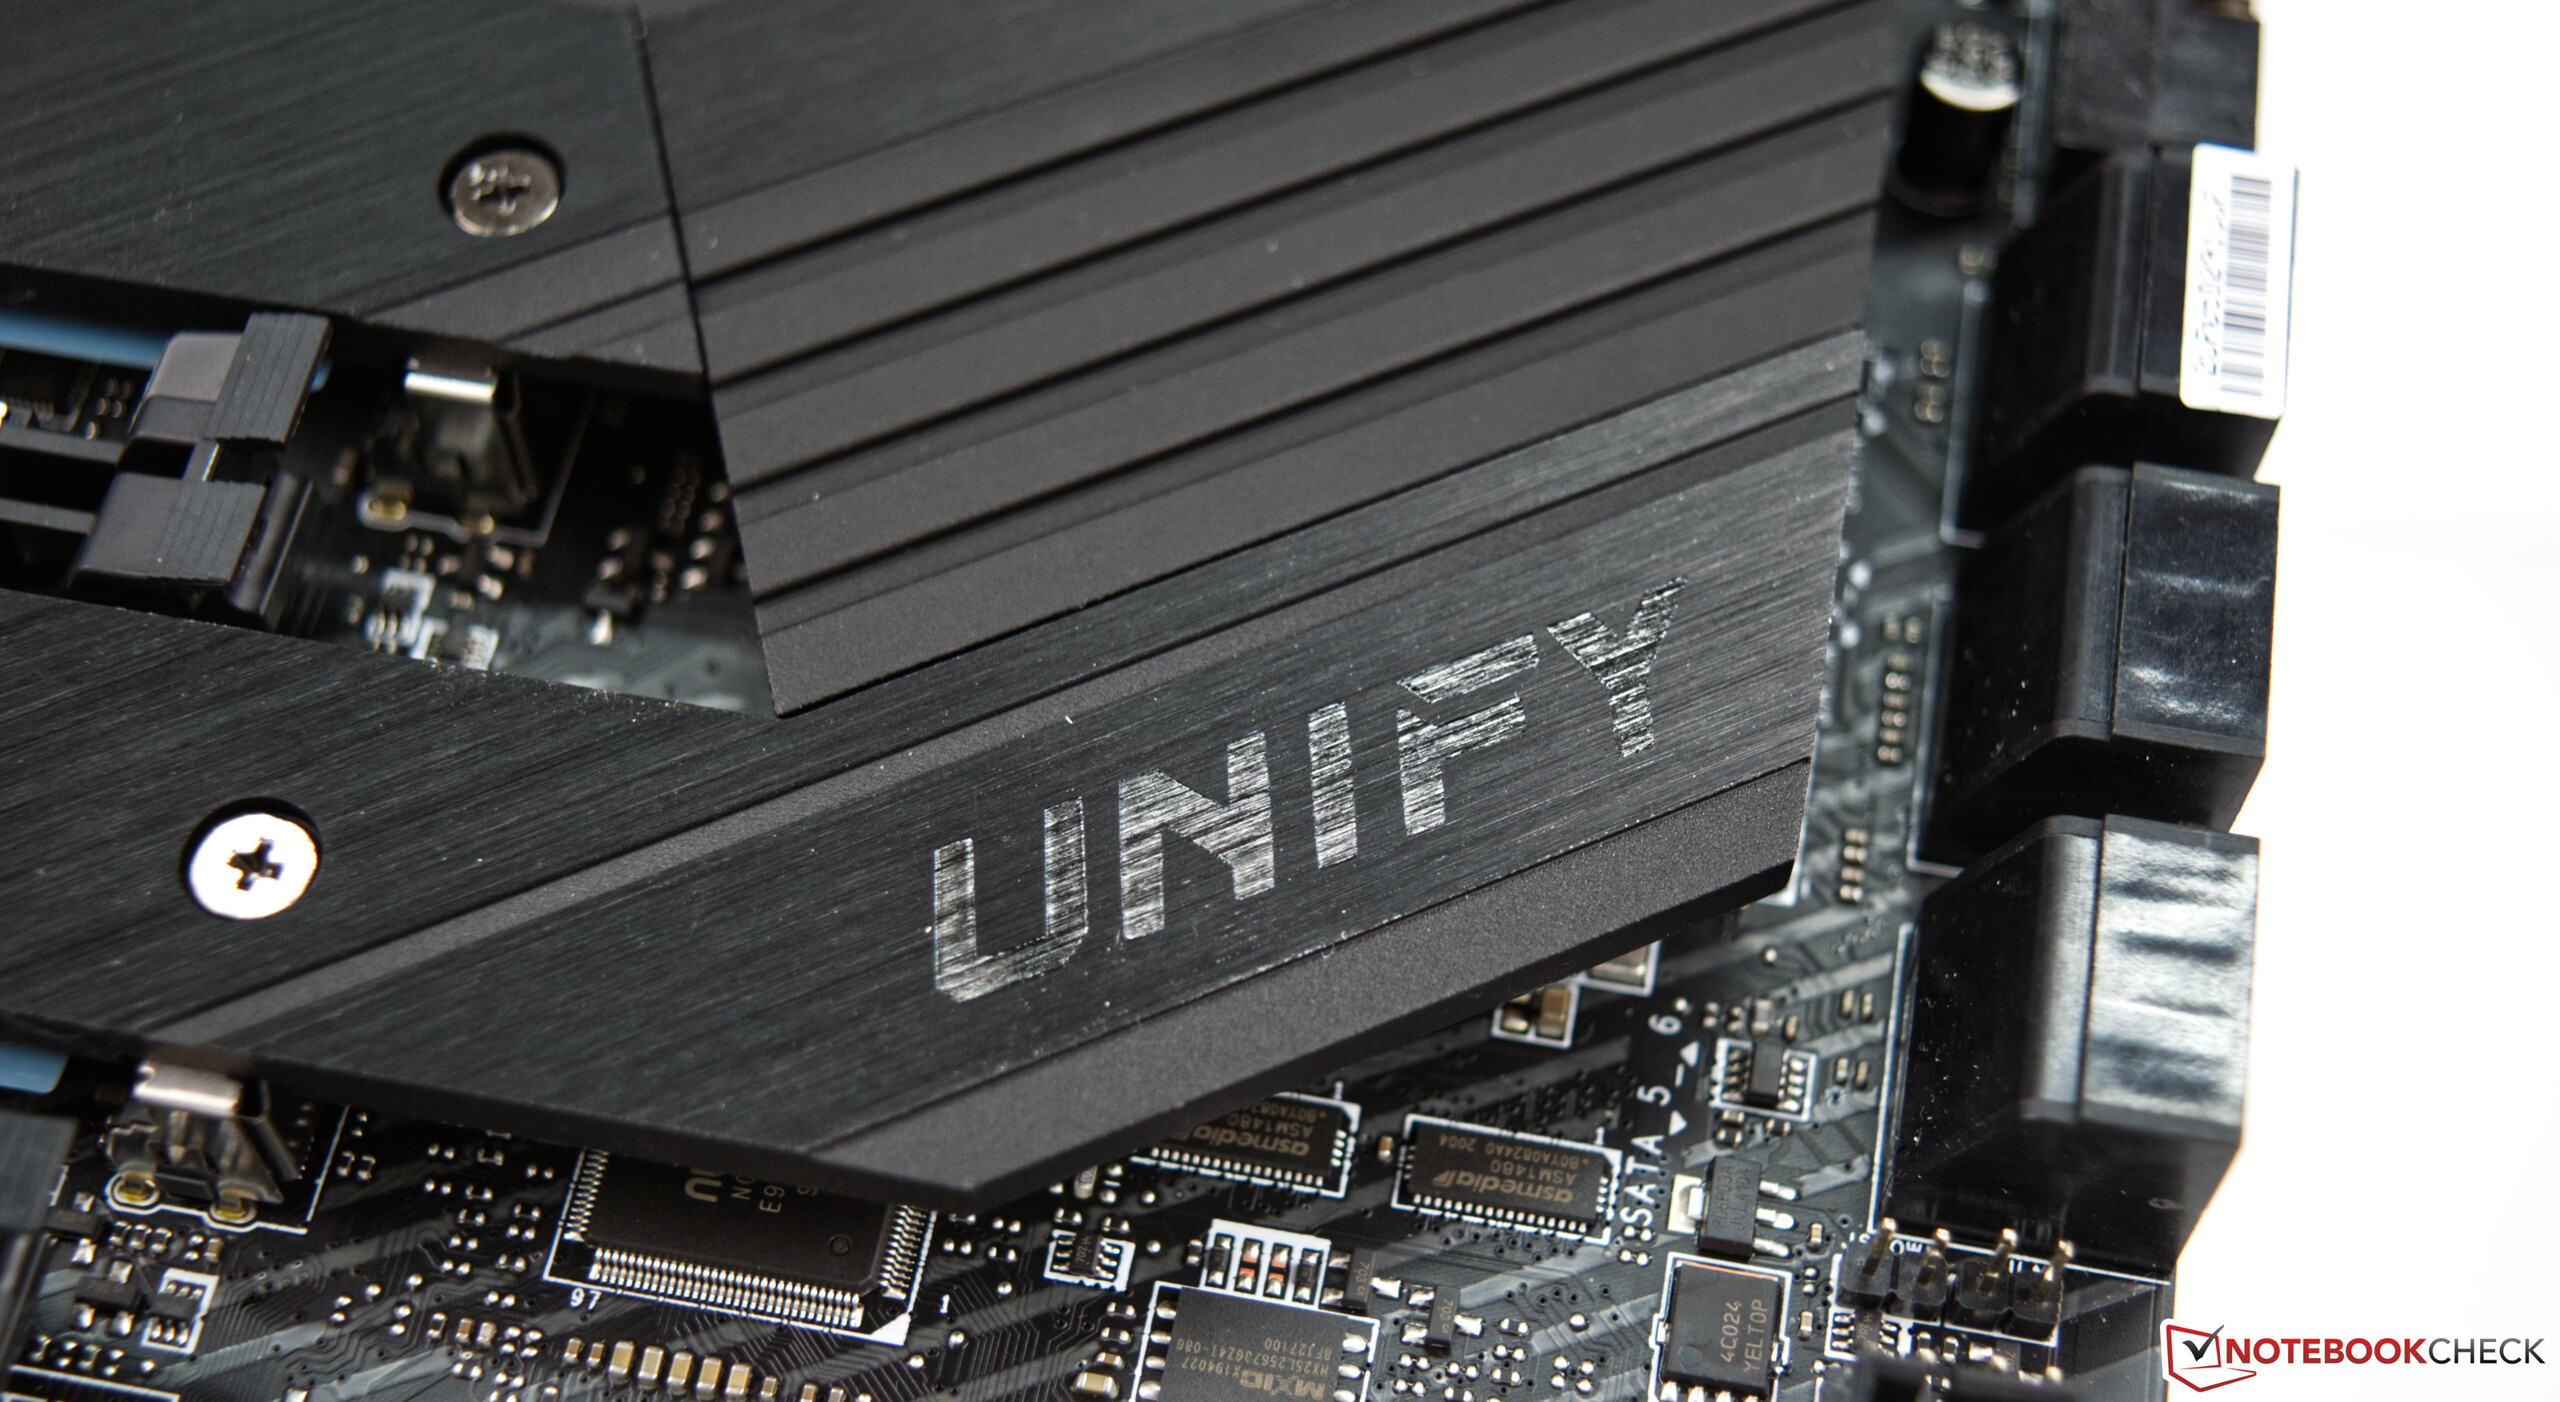
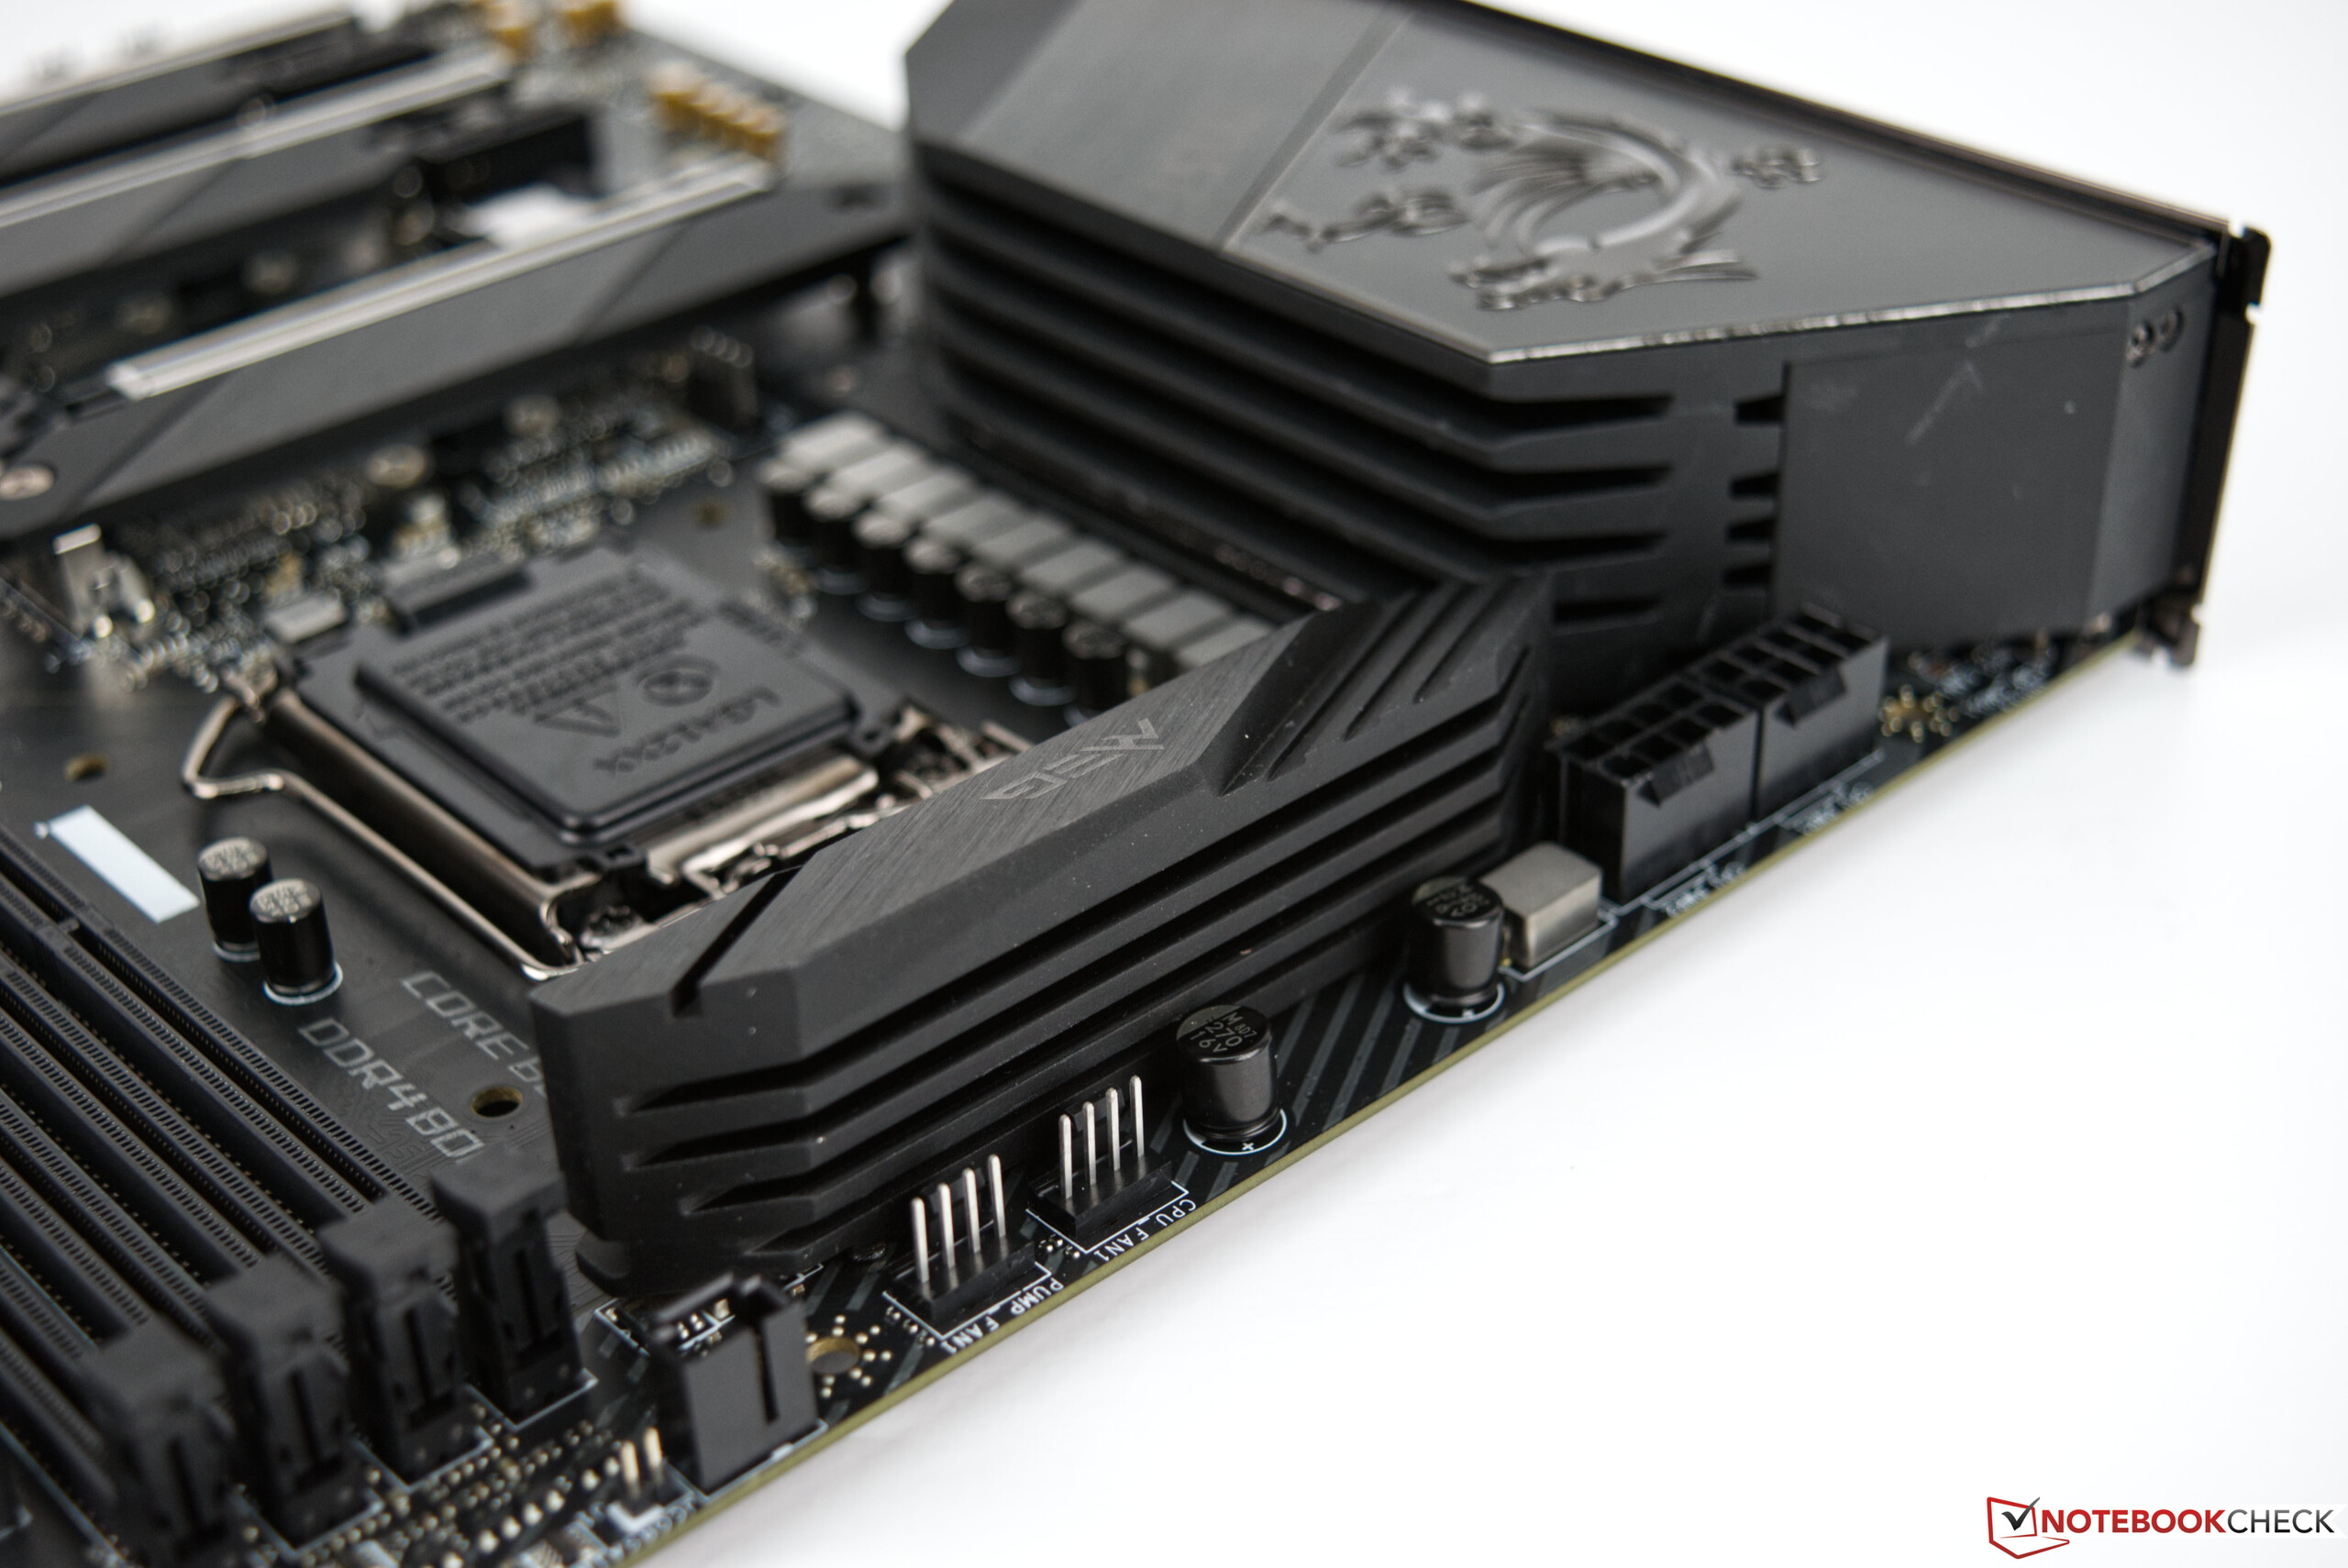
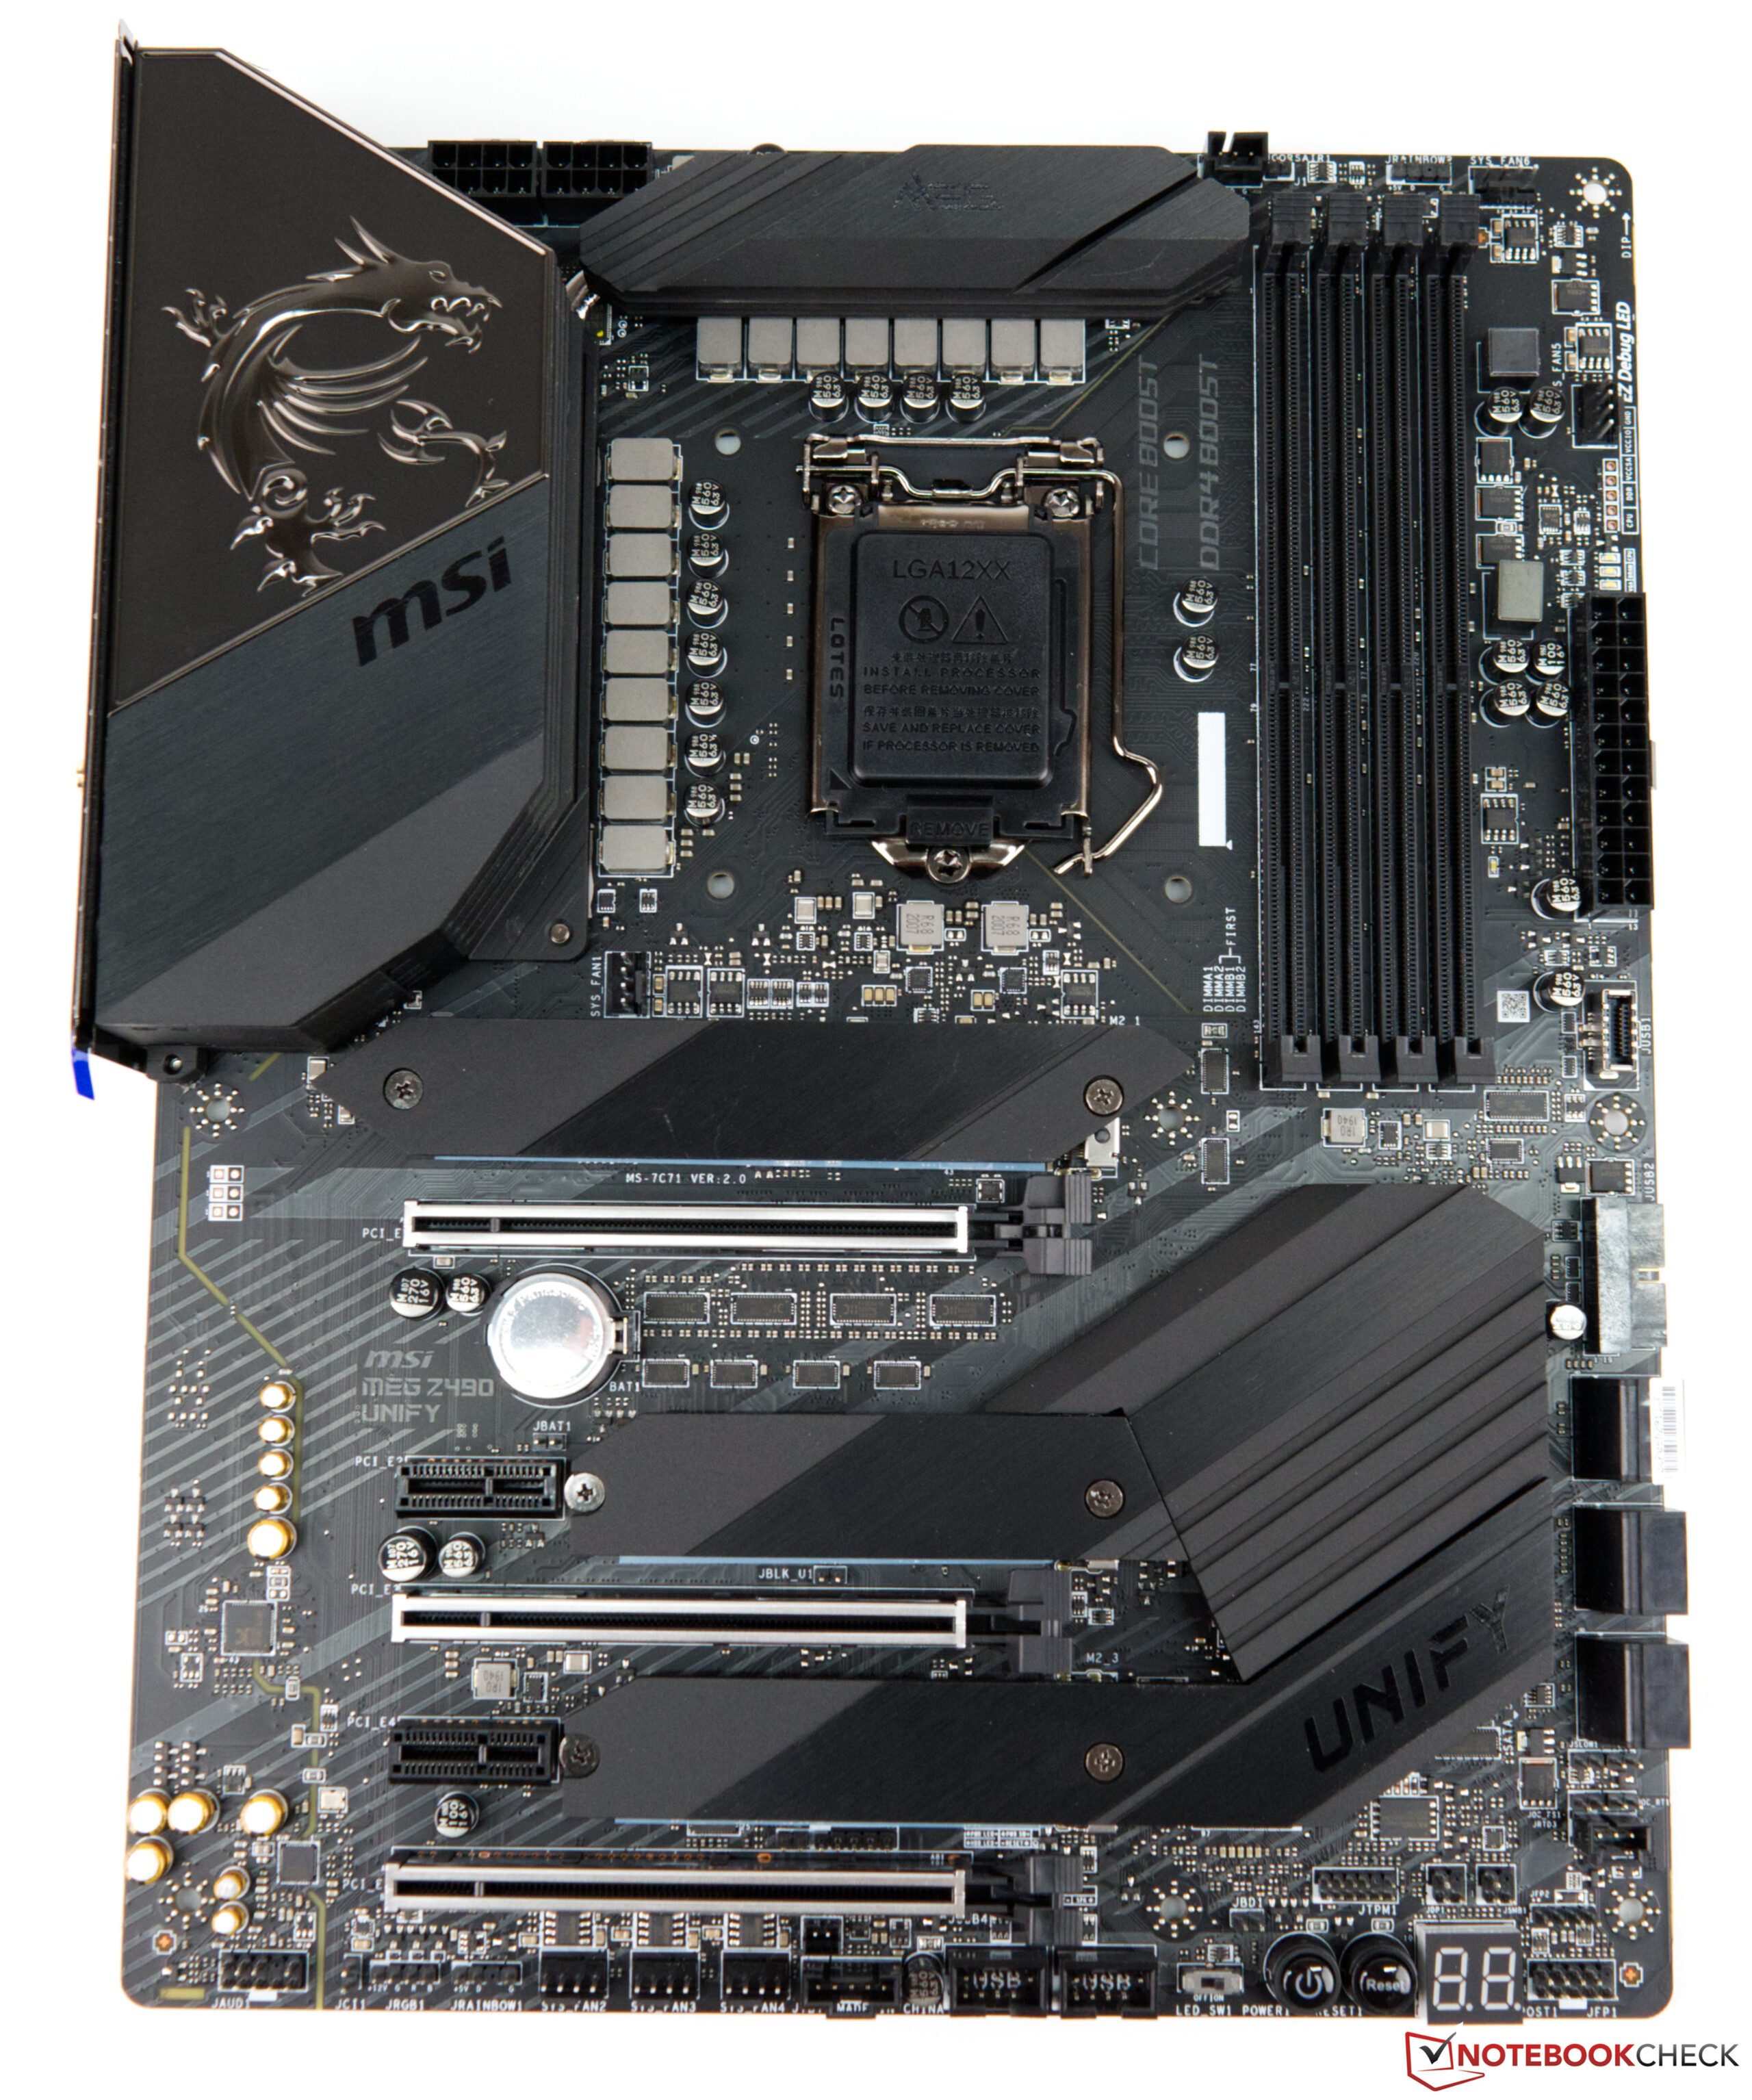
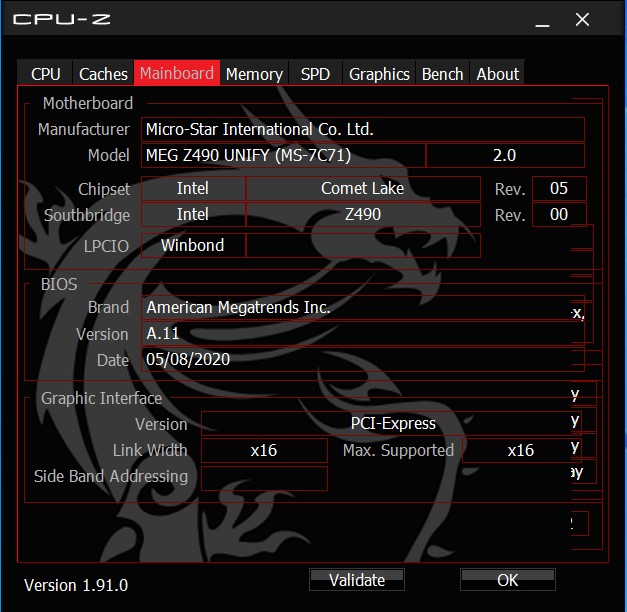
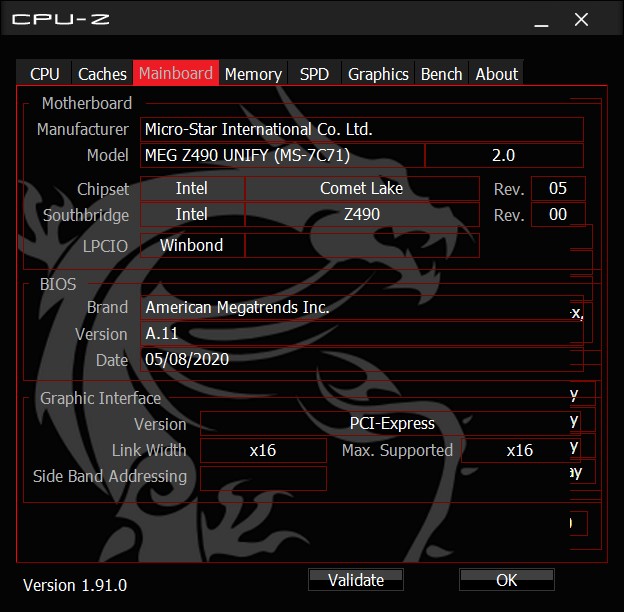
Overview of the MSI Z490 Unify
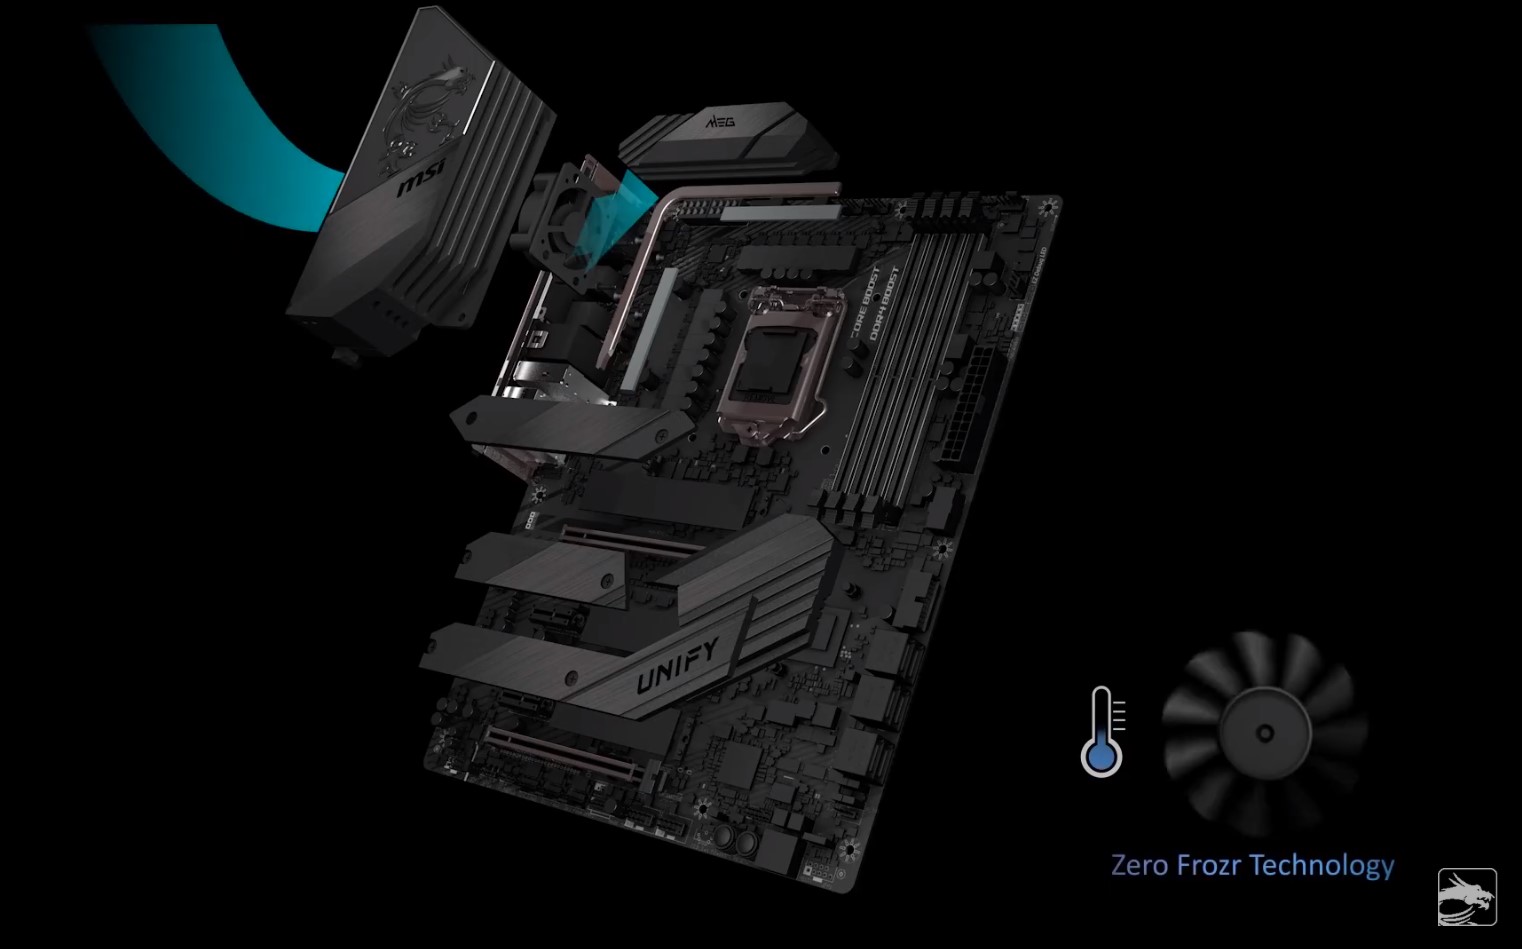
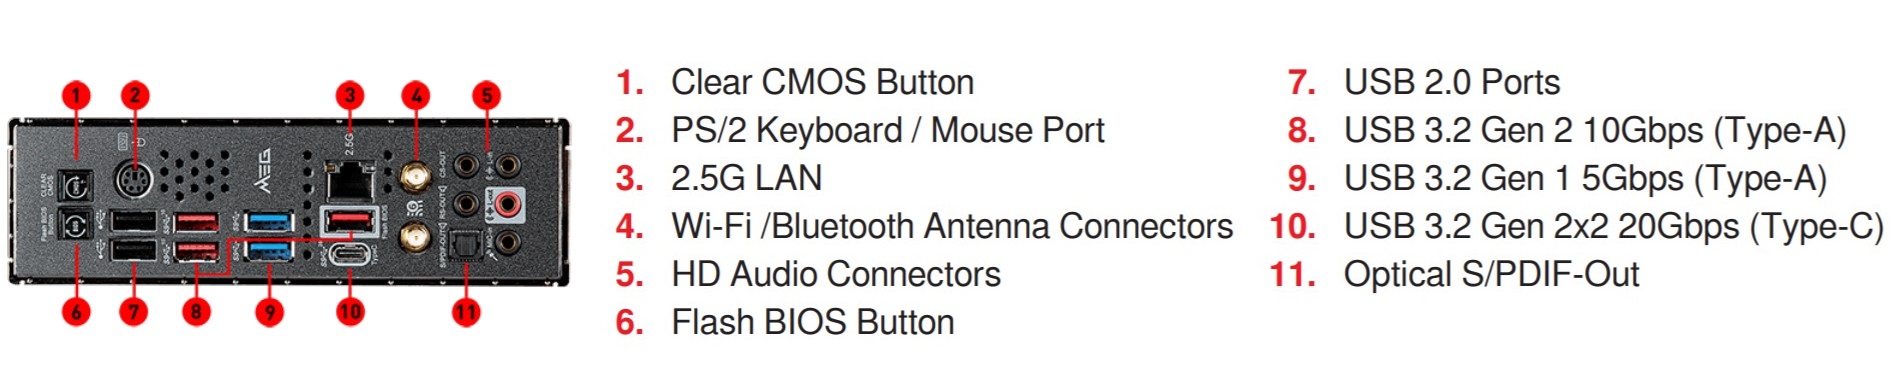
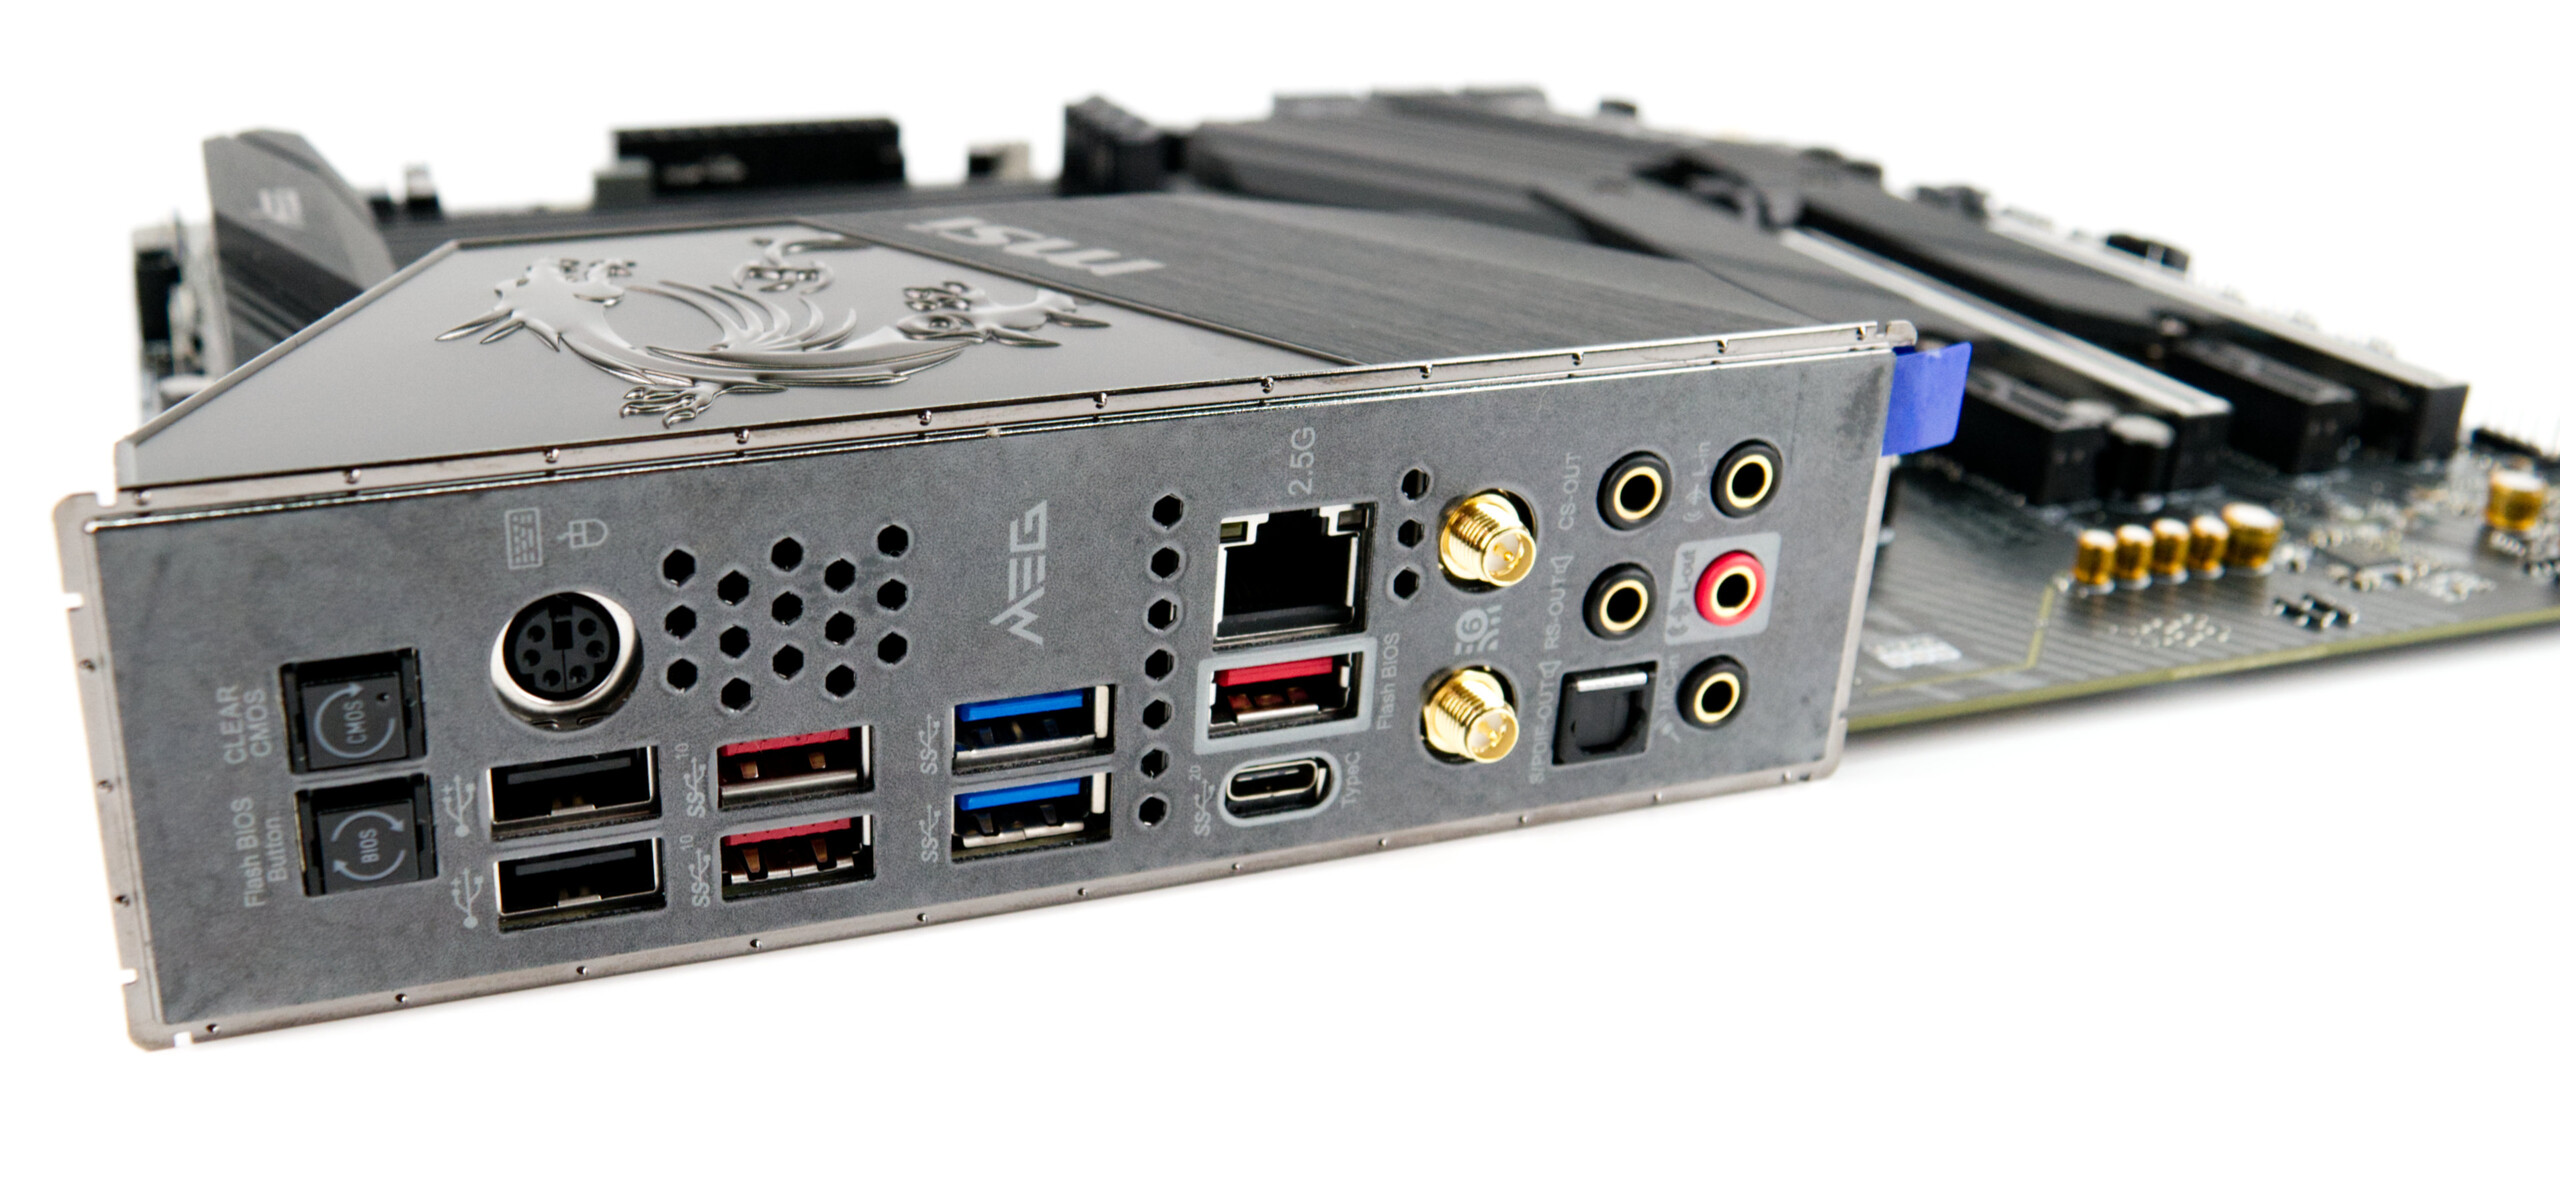
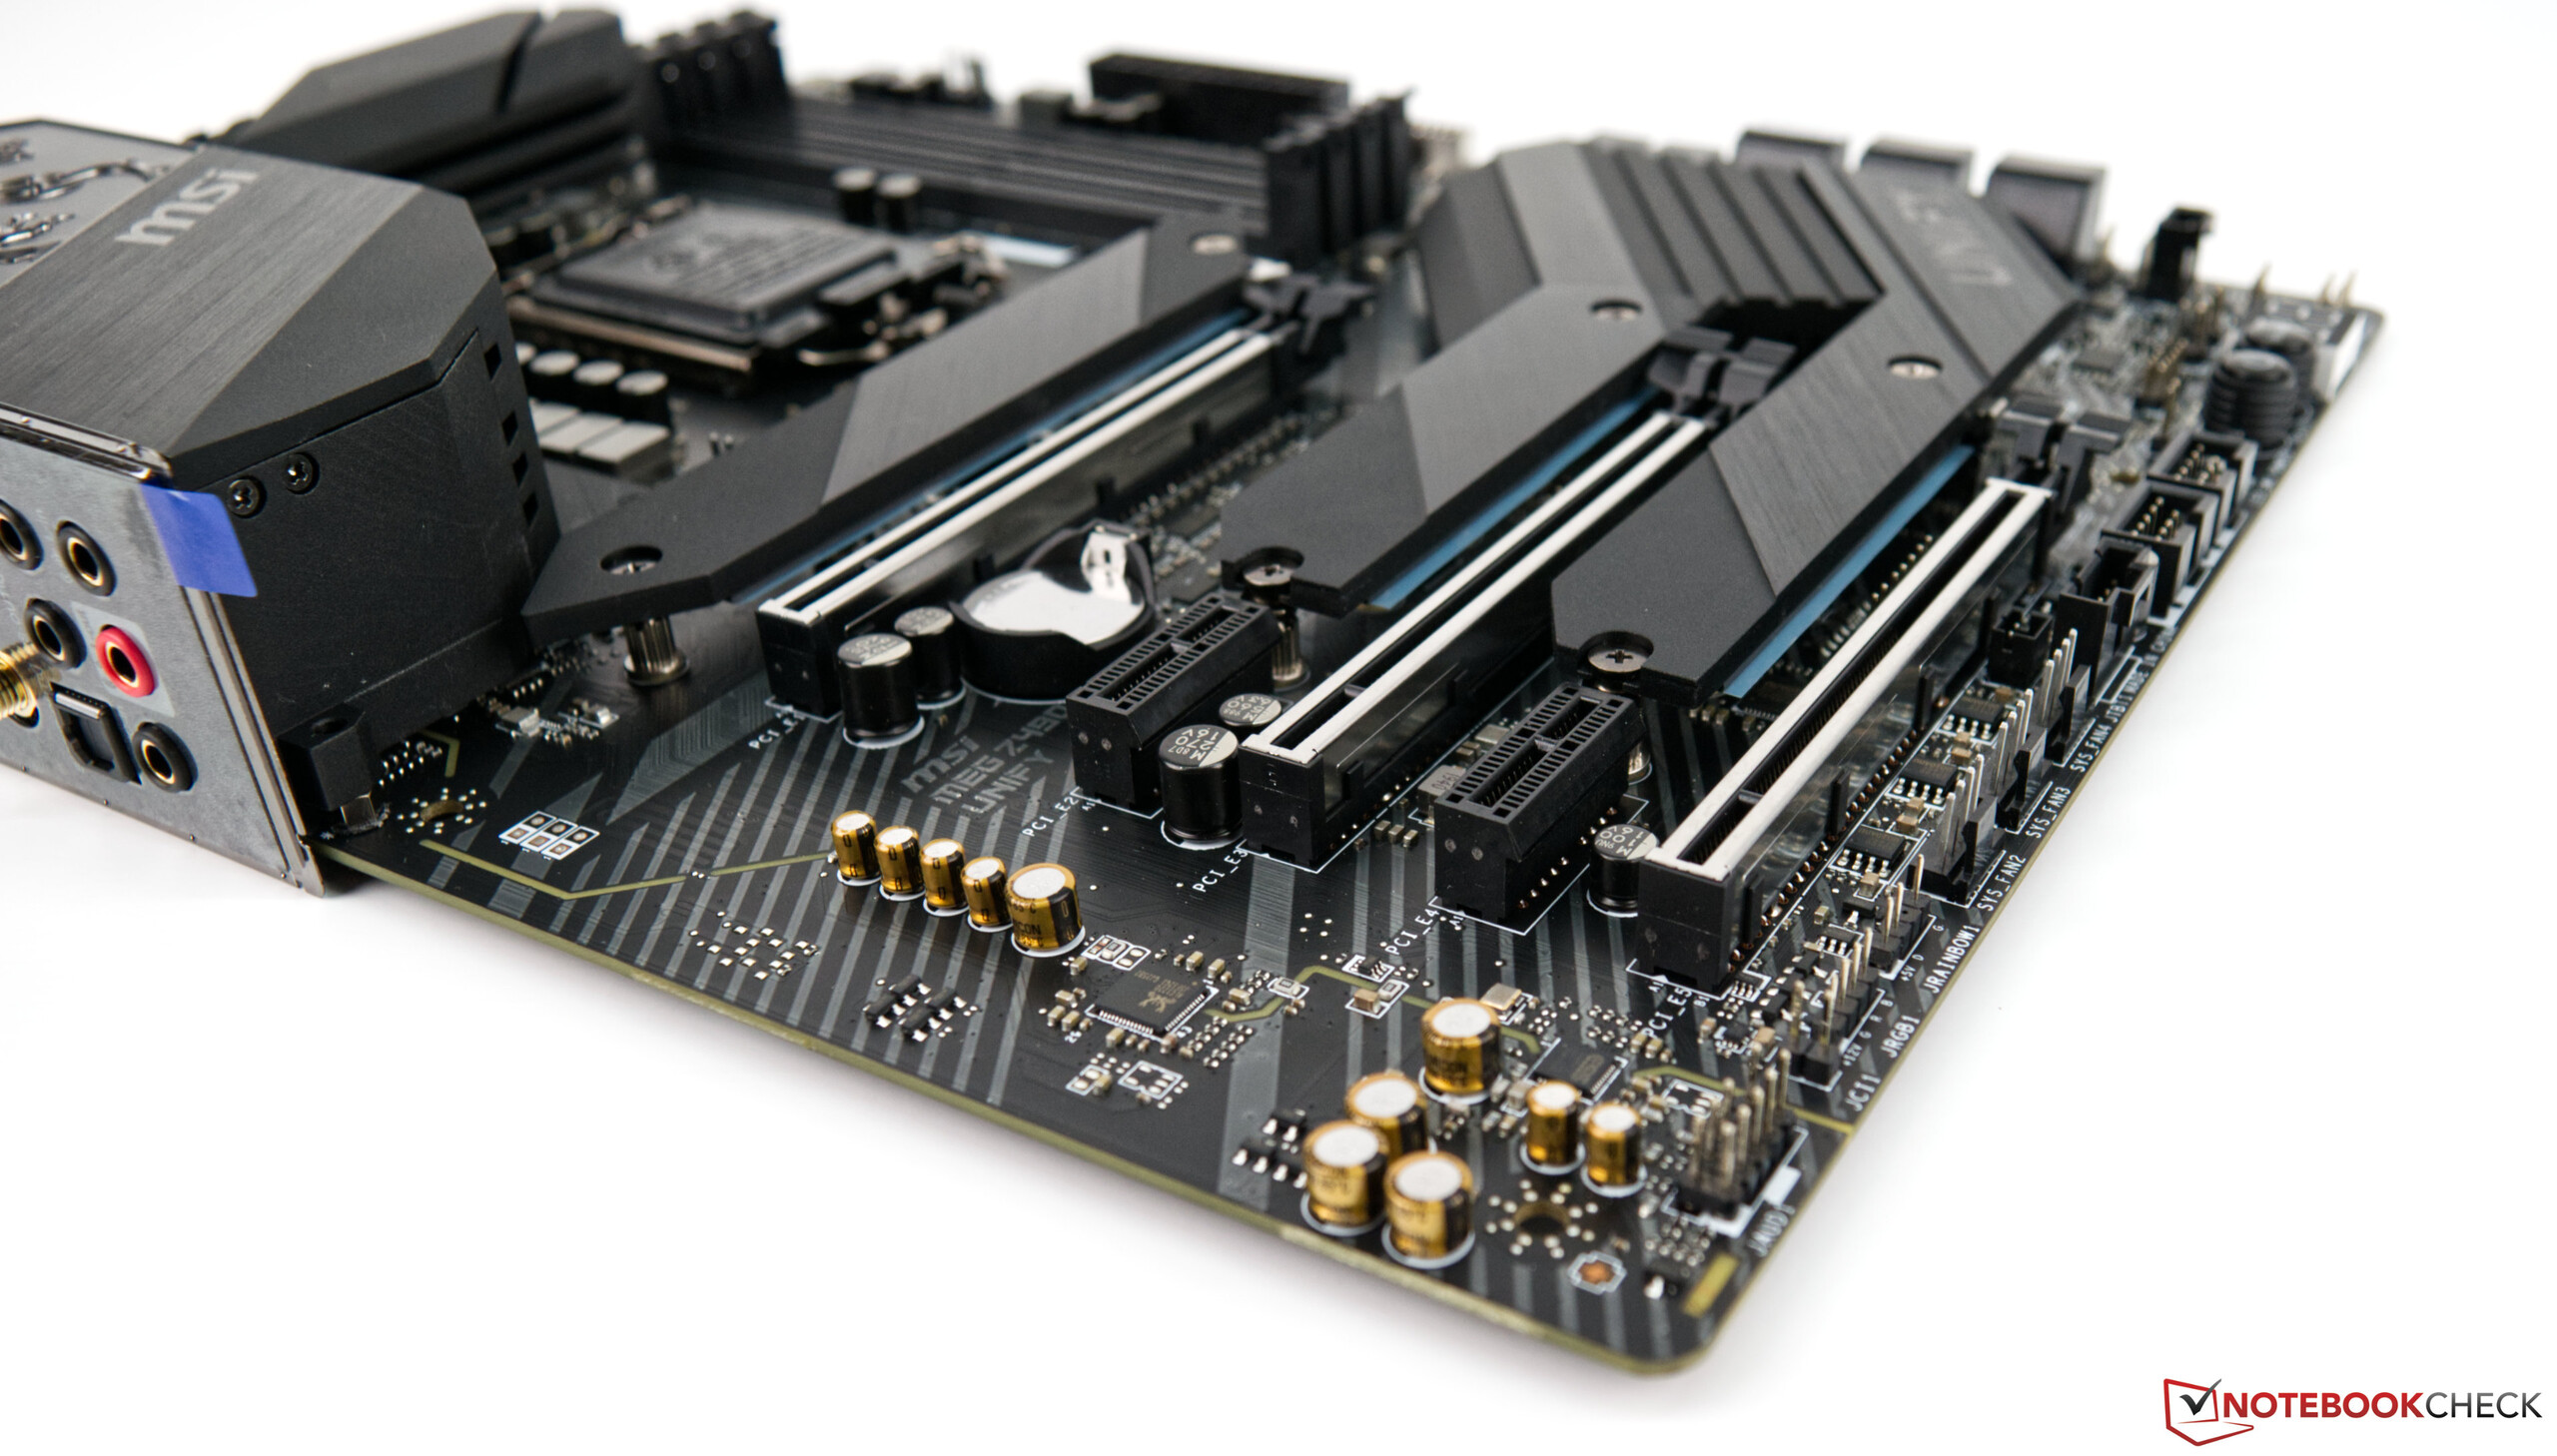
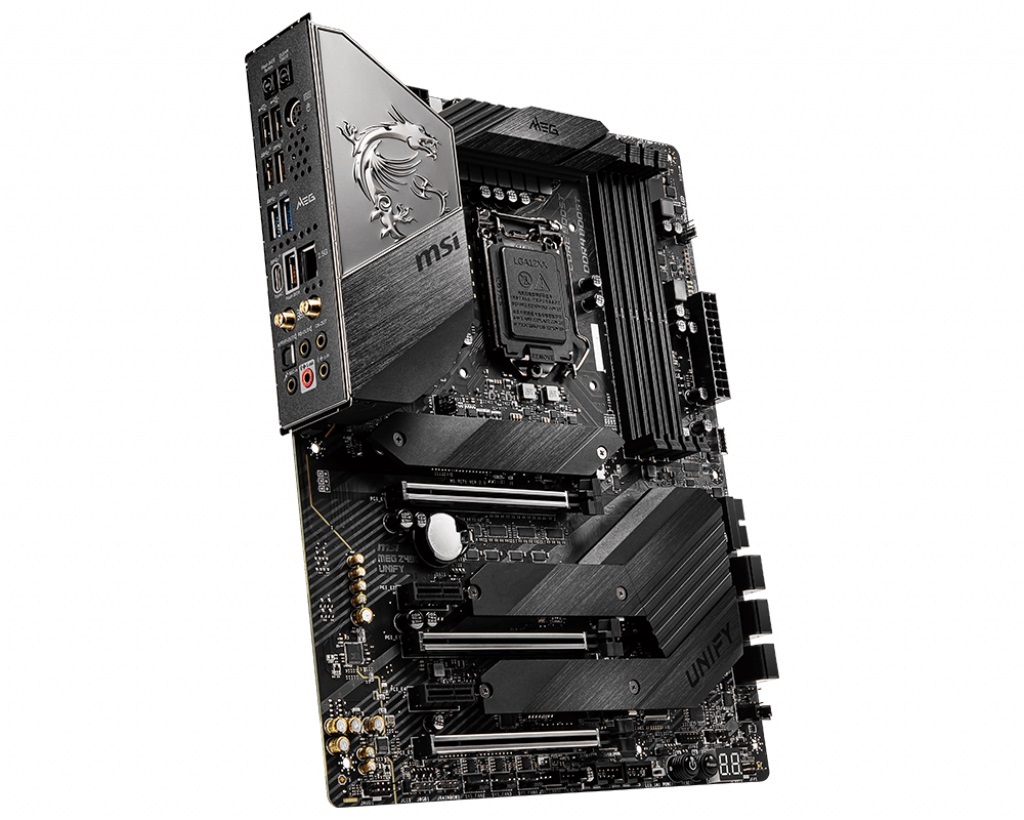
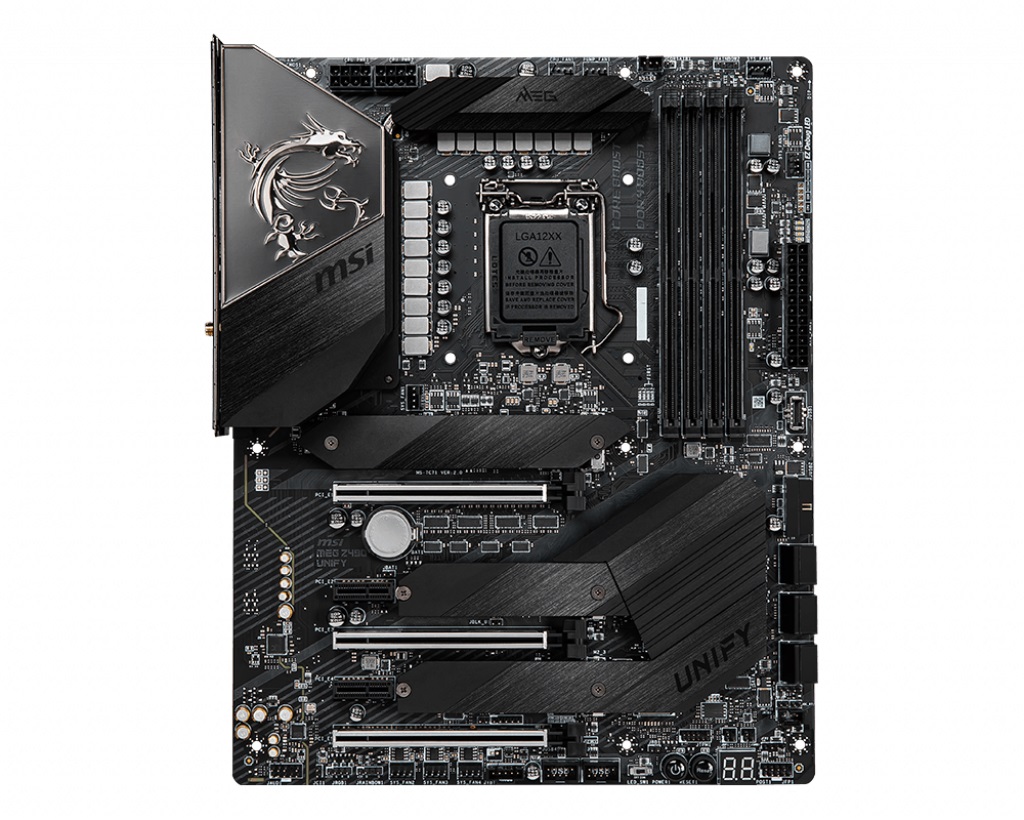
We received the Z490 Unify motherboard from our partner MSI just in time to review the new Comet Lake-S processors. We are very thankful that MSI lent us this motherboard. The motherboard impresses with its simplicity and completely forgoes RGB lighting, which is something that quite a few users can appreciate. The box contains the motherboard, a couple of cables, Wi-Fi antennas, a quick start guide and a DVD with drivers. The ATX motherboard has three slots for M.2 solid state drives and three PCI Express 3.0 x16 slots. According to MSI, the upper two slots support PCI Express 4.0, but we shall not know for certain whether this is actually the case until the Rocket Lake-S CPUs come out. Comet Lake-S chips still do not support PCIe 4.0. The four RAM slots support DDR4 modules clocked at up to 4800 MHz. Moreover, users can also connect up to six additional SATA drives to the motherboard.
There are 8 USB ports in total, one of which actually operates at USB 3.2 Gen 2x2 speeds (20 GBit/s). Extreme overclockers will be very pleased to see a PS2 port on the motherboard. Users can transfer data over the Ethernet port at 2.5 GBit/s. When it comes to wireless networking, the Z490 Unify is very future-proof, because it supports Wi-Fi 6.
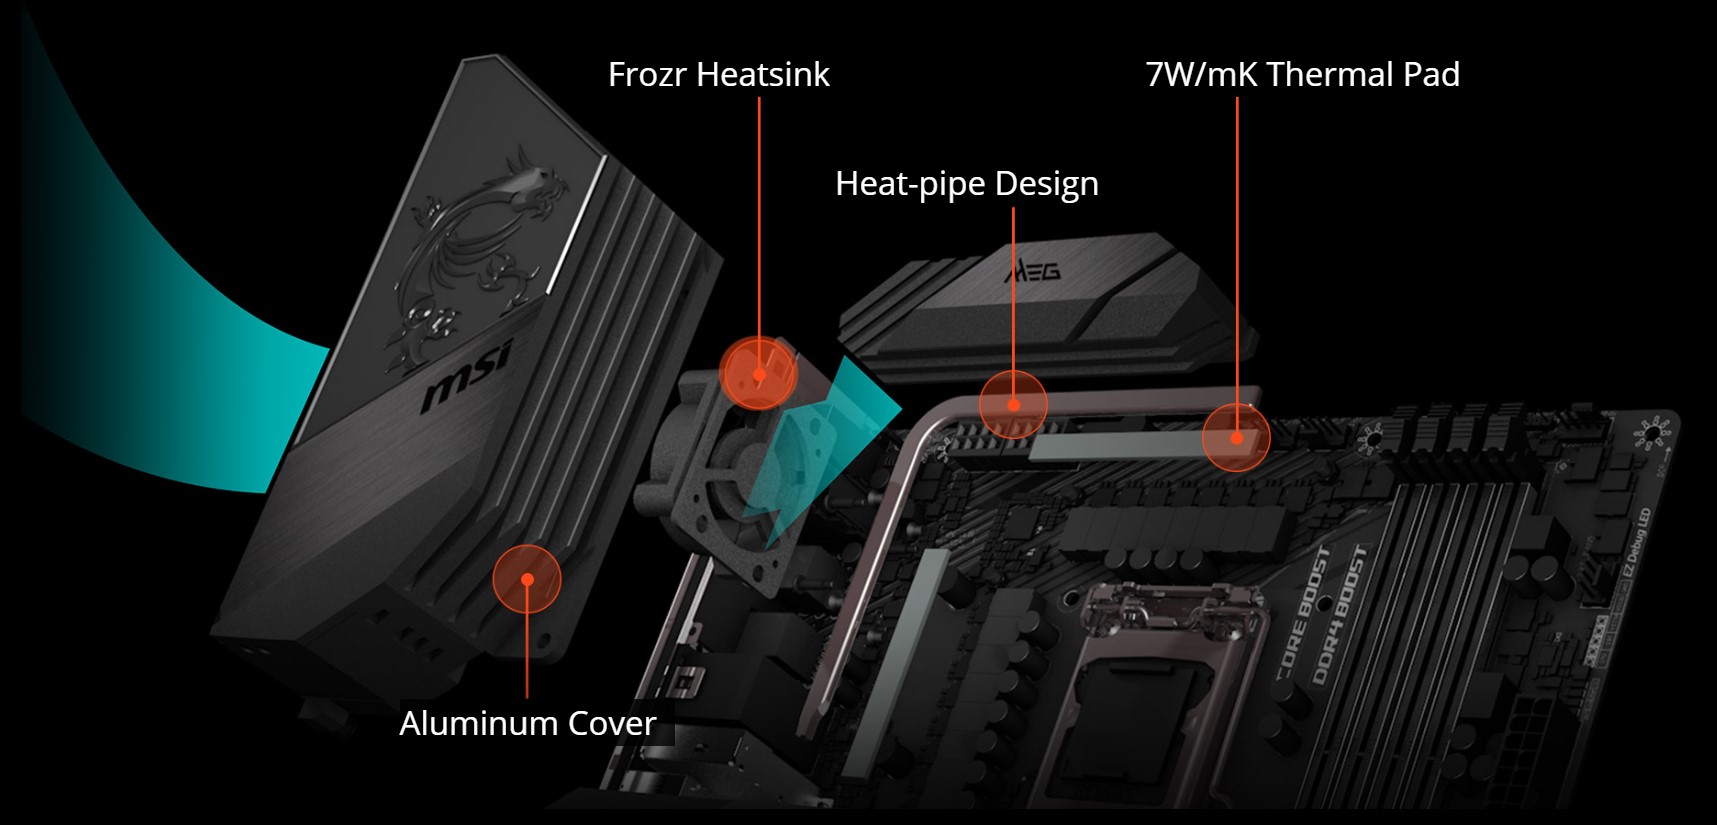
The motherboard features a 16+1-phase power delivery system and two 8-pin power connectors. A massive heatsink with a heat pipe is attached to the voltage regulator modules, which are responsible for maintaining a steady supply of power. In addition, there is a small fan behind the I/O shield, which is meant to cool the VRMs. It is basically inaudible during operation. Fans of the X570 chipset are significantly louder.
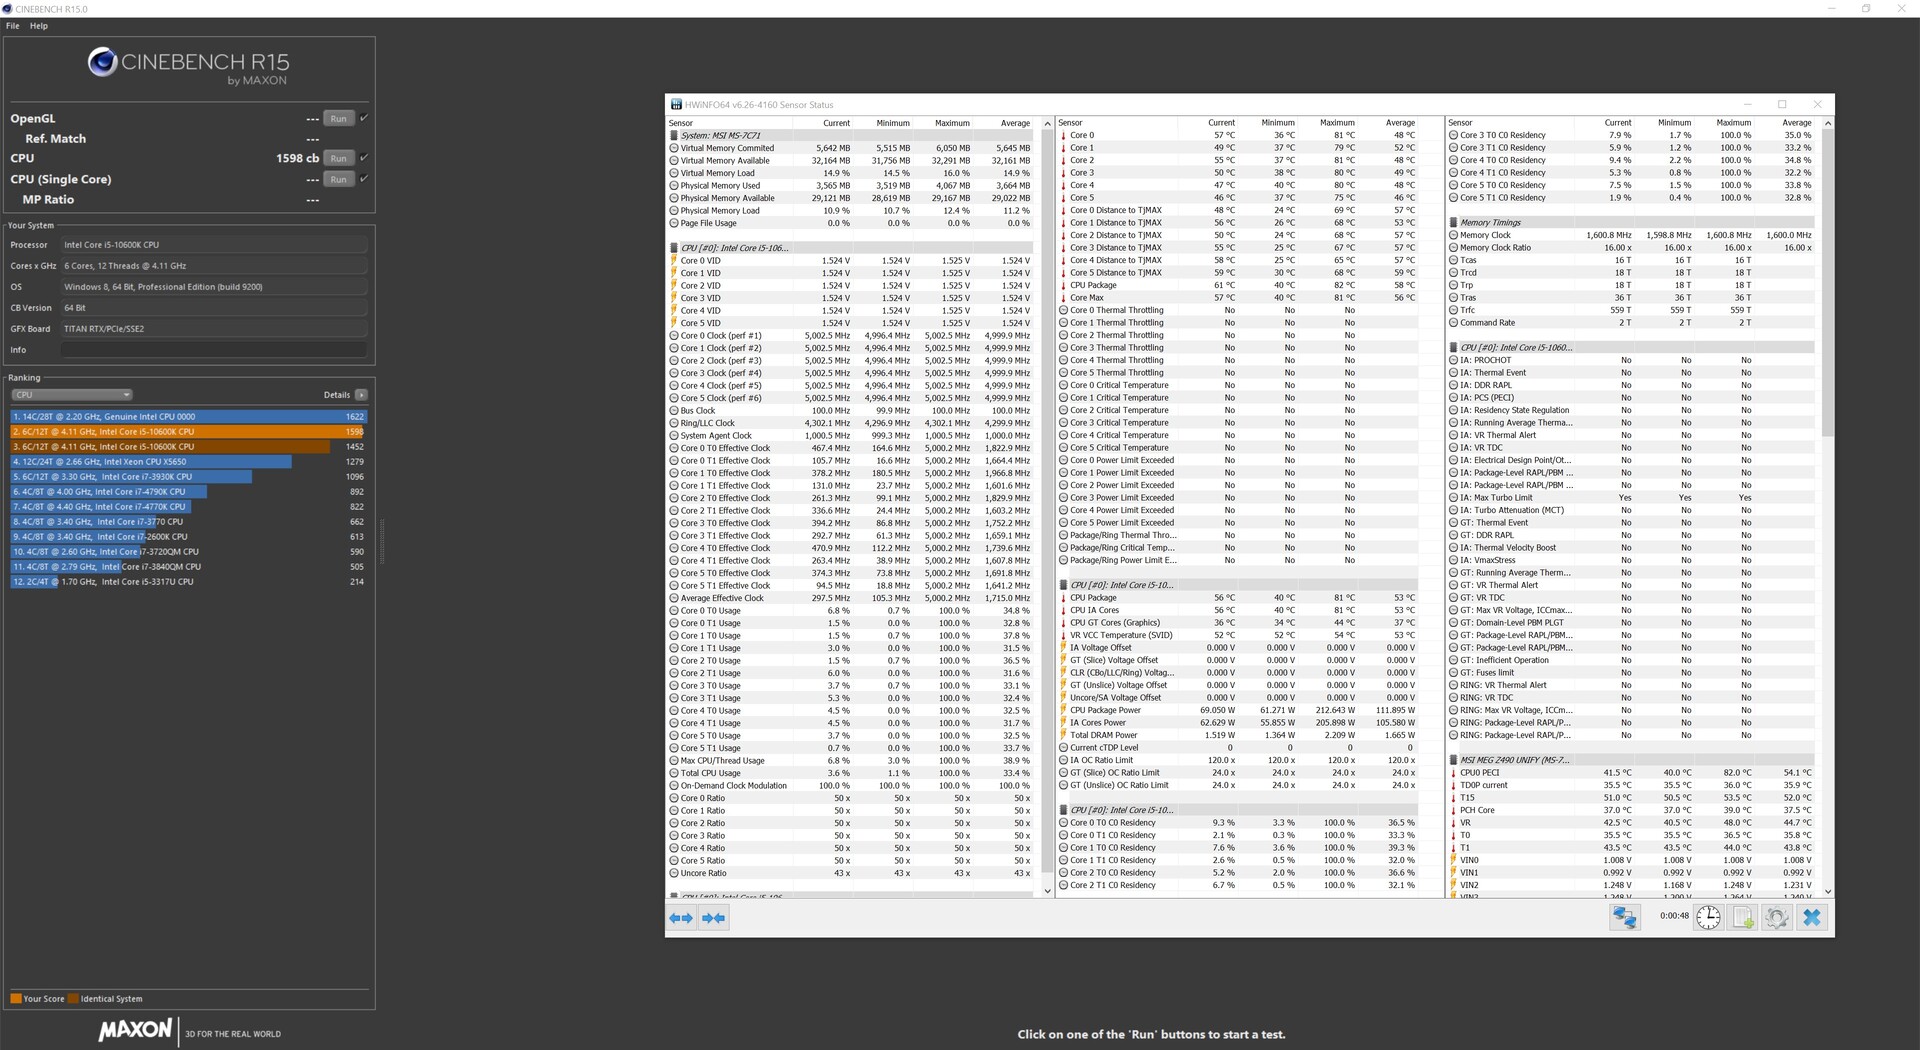
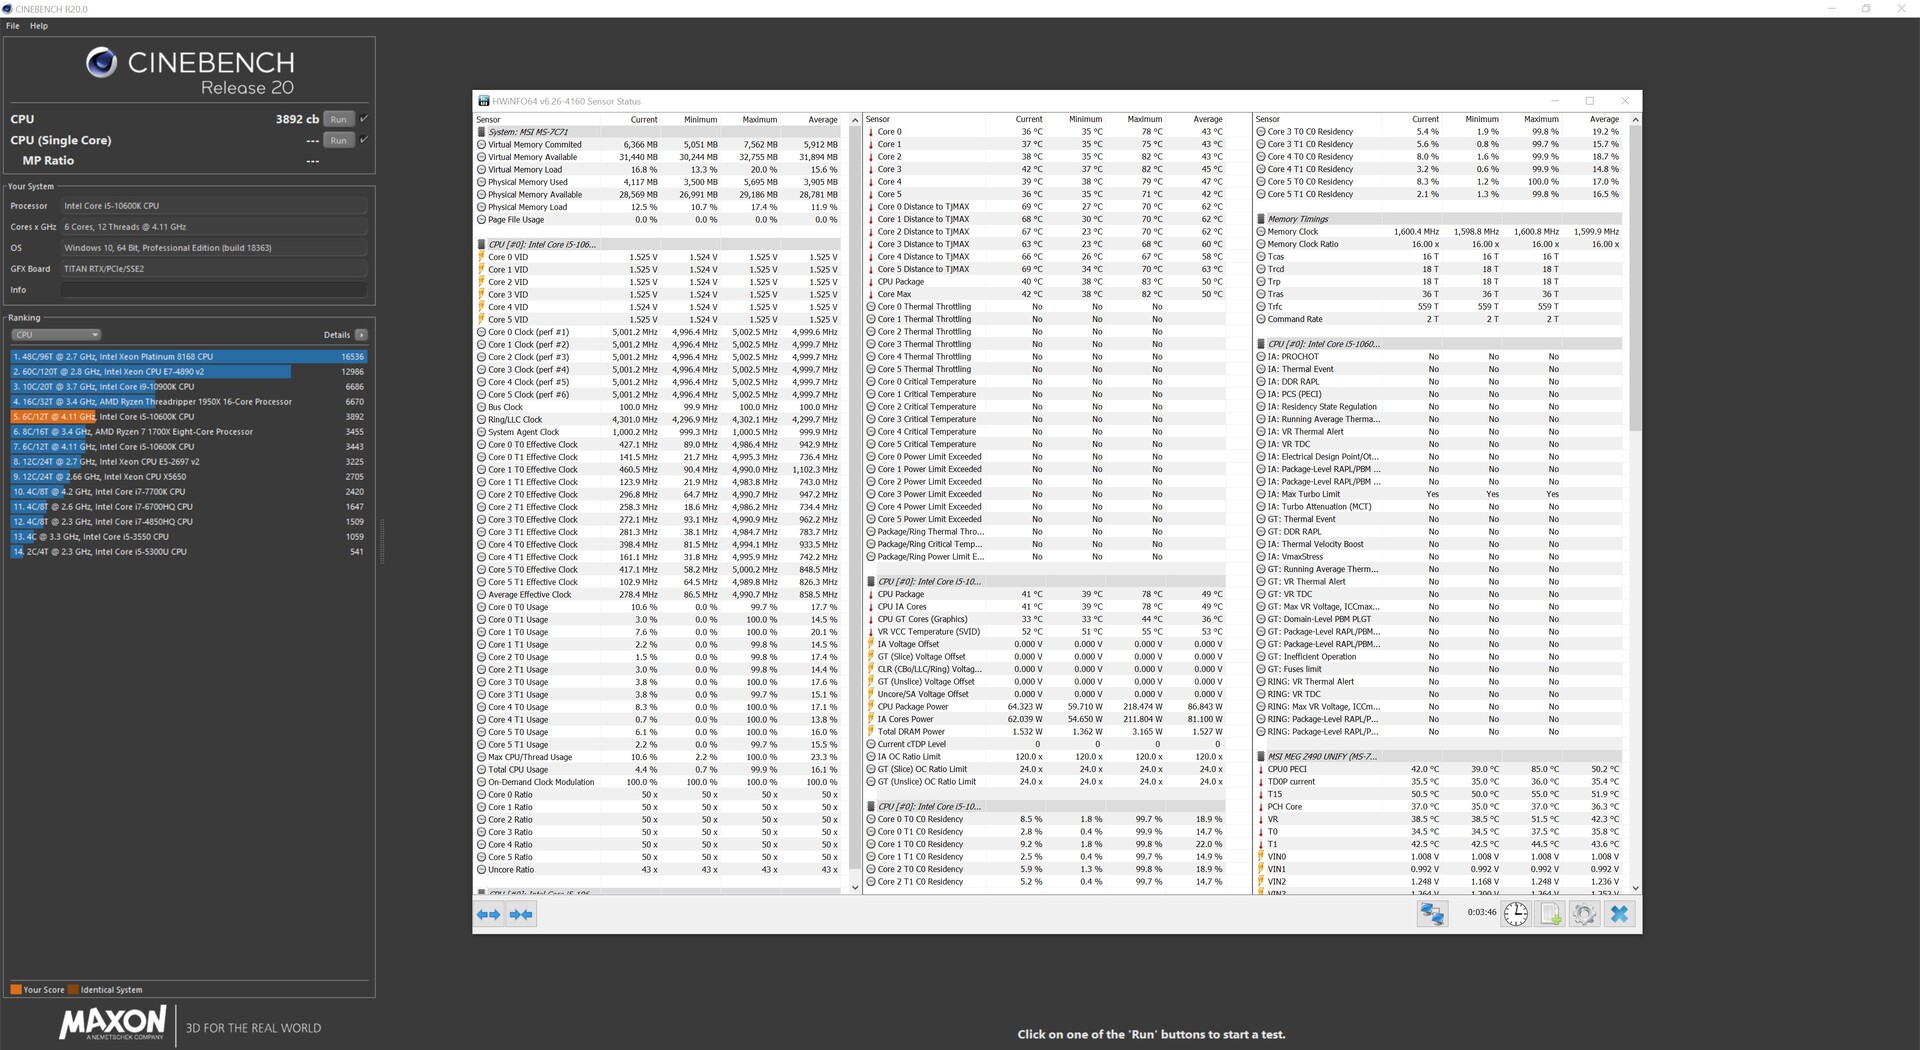
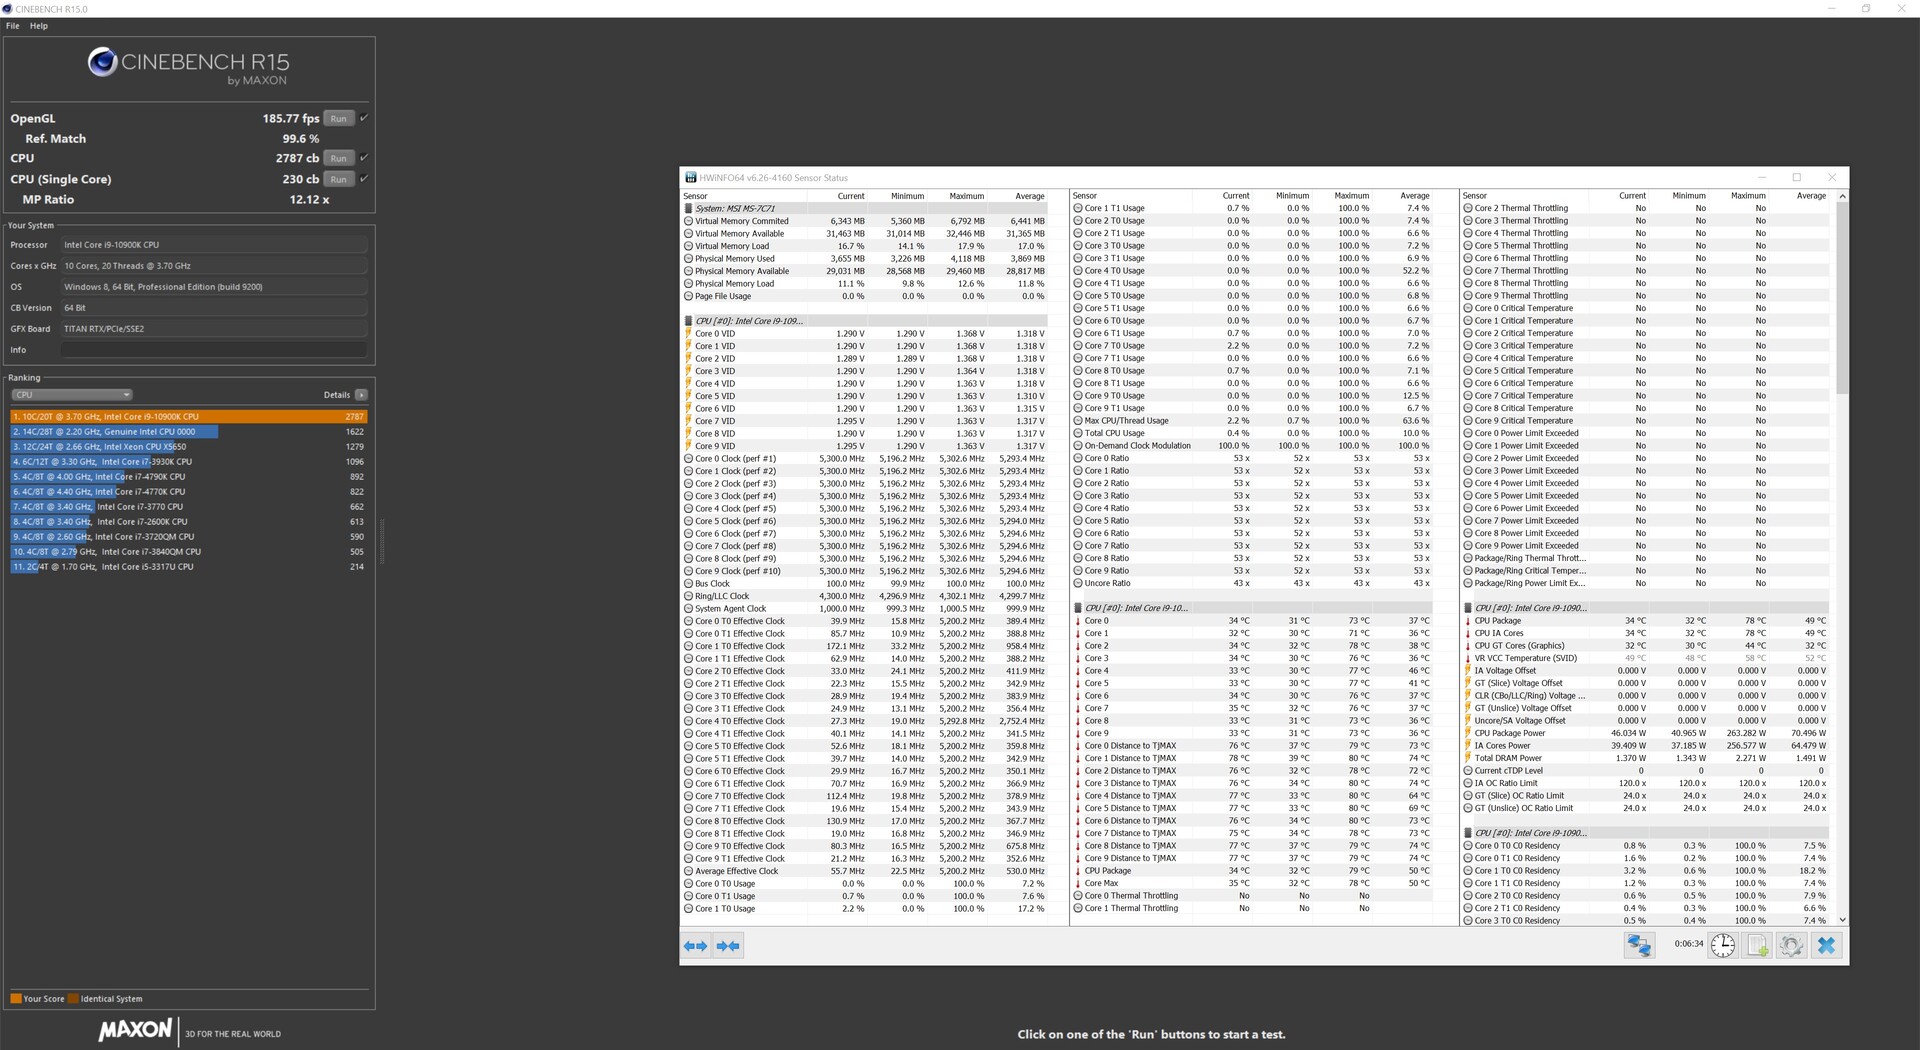
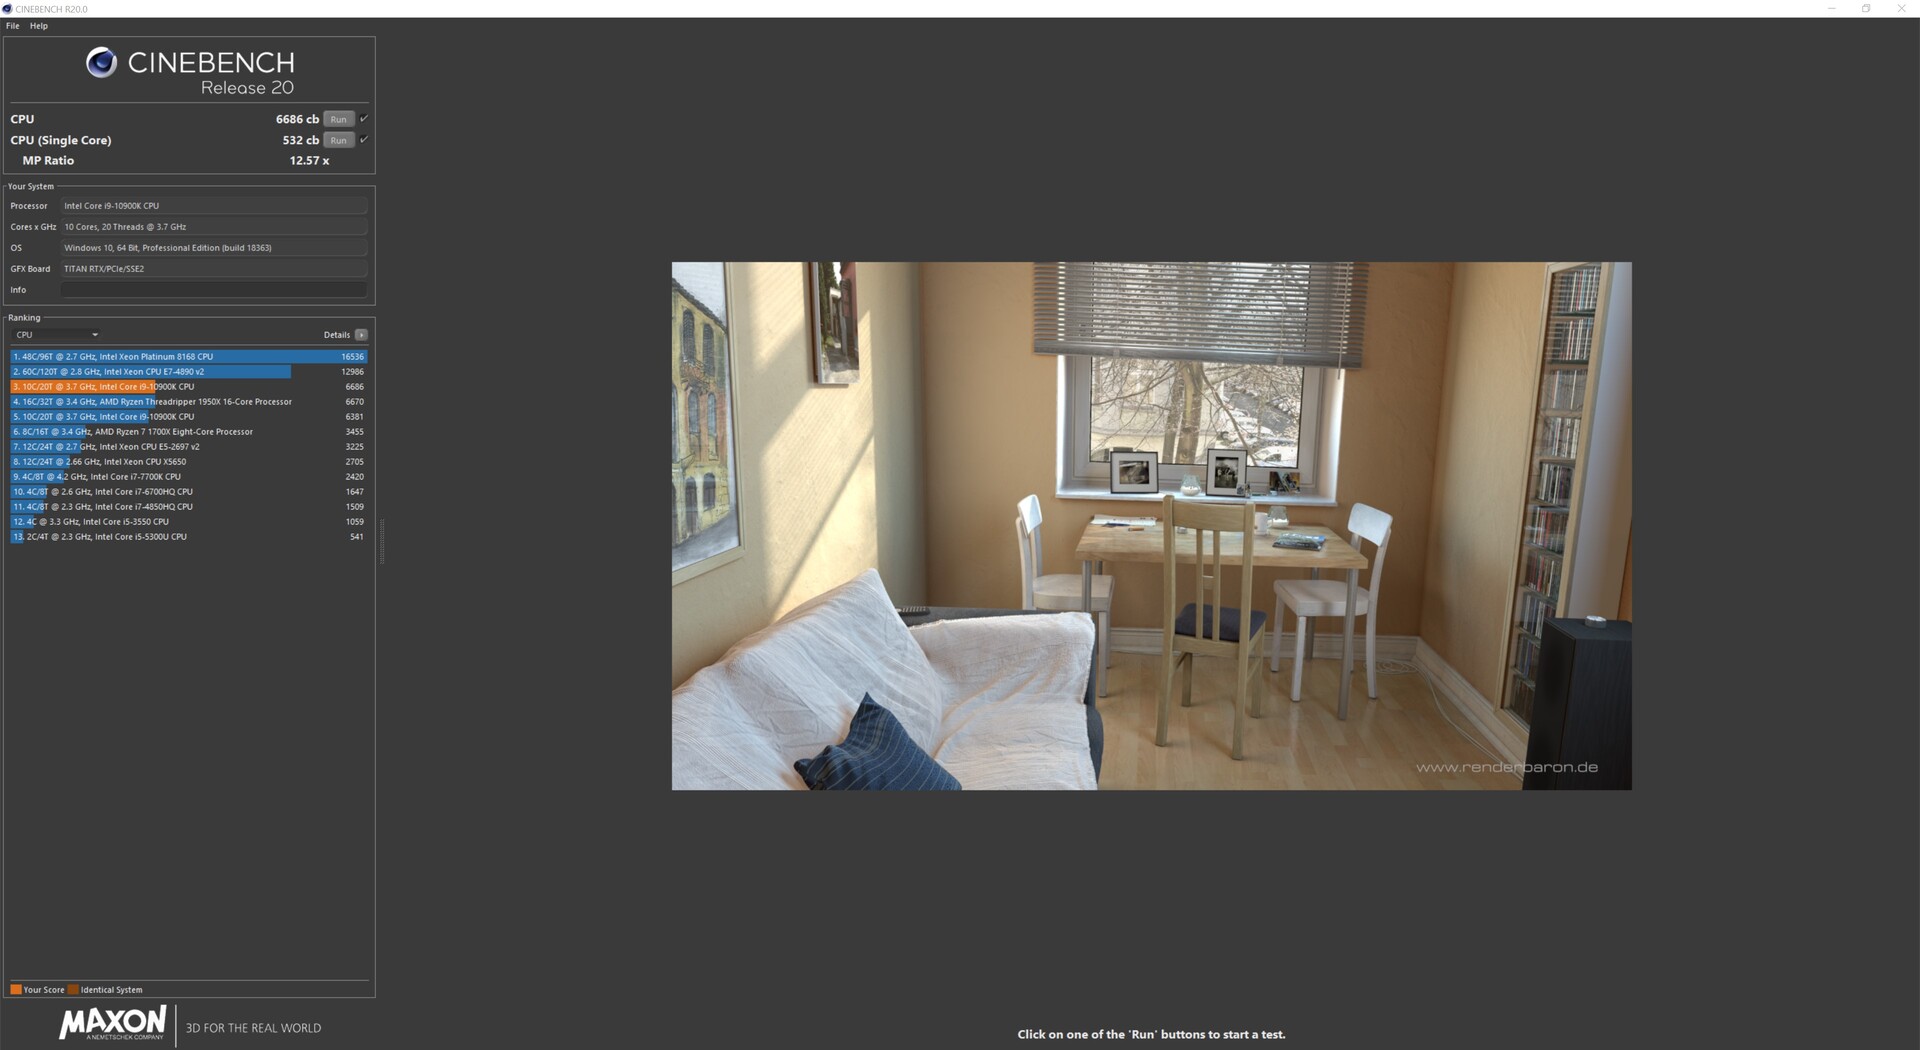
CPU Benchmarks
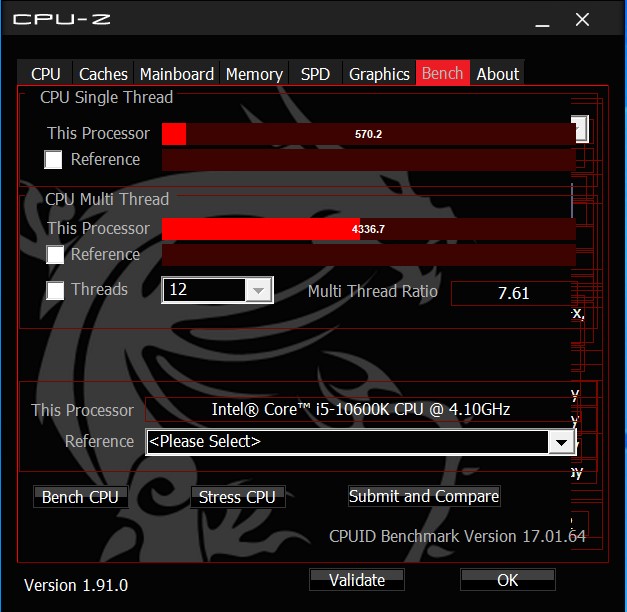
The lower base clock of the Intel Core i9-10900K, when compared to the Intel Core i9-9900KS, is offset by its higher boost clock. In our single-core benchmarks, the 10-core CPU took first place, but with a rather slim margin. Here, the 6-core Intel Core i5-10600K is tied with its direct predecessor.
The difference in performance is much easier to see in multi-threaded applications. Here, the Intel Core i9-10900K benefits greatly from two additional cores. The Intel Core i5-10600K is also able to beat its direct predecessor (Intel Core i5-9600K) in thread-heavy applications. Here, Hyper-threading support makes a real difference. However, the 16-core Ryzen 9 3950X, AMD’s flagship mainstream chip, handily beats the Intel Core i9-10900K.
Intel Core i5-10600K
Intel Core i9-10900K
| Cinebench R15 | |
| CPU Single 64Bit | |
| Intel Core i9-10900K | |
| Intel Core i9-9900KS | |
| AMD Ryzen 9 3950X | |
| AMD Ryzen 9 3900X | |
| Intel Core i5-10600K | |
| Intel Core i5-9600K | |
| CPU Multi 64Bit | |
| AMD Ryzen 9 3950X | |
| AMD Ryzen 9 3900X | |
| Intel Core i9-10900K | |
| Intel Core i9-9900KS | |
| Intel Core i5-10600K | |
| Intel Core i5-9600K | |
| Cinebench R20 | |
| CPU (Single Core) | |
| Intel Core i9-10900K | |
| AMD Ryzen 9 3950X | |
| AMD Ryzen 9 3900X | |
| Intel Core i9-9900KS | |
| Intel Core i5-10600K | |
| CPU (Multi Core) | |
| AMD Ryzen 9 3950X | |
| AMD Ryzen 9 3900X | |
| Intel Core i9-10900K | |
| Intel Core i9-9900KS | |
| Intel Core i5-10600K | |
| Cinebench R11.5 | |
| CPU Single 64Bit | |
| Intel Core i9-10900K | |
| Intel Core i9-9900KS | |
| AMD Ryzen 9 3950X | |
| AMD Ryzen 9 3900X | |
| Intel Core i5-9600K | |
| Intel Core i5-10600K | |
| CPU Multi 64Bit | |
| AMD Ryzen 9 3950X | |
| AMD Ryzen 9 3900X | |
| Intel Core i9-10900K | |
| Intel Core i9-9900KS | |
| Intel Core i5-10600K | |
| Intel Core i5-9600K | |
| Cinebench R10 | |
| Rendering Single CPUs 64Bit | |
| Intel Core i9-9900KS | |
| Intel Core i9-10900K | |
| AMD Ryzen 9 3950X | |
| AMD Ryzen 9 3900X | |
| Intel Core i5-10600K | |
| Intel Core i5-9600K | |
| Rendering Multiple CPUs 64Bit | |
| AMD Ryzen 9 3950X | |
| Intel Core i9-10900K | |
| AMD Ryzen 9 3900X | |
| Intel Core i9-9900KS | |
| Intel Core i5-10600K | |
| Intel Core i5-9600K | |
| Blender - v2.79 BMW27 CPU | |
| Intel Core i5-9600K | |
| Intel Core i5-10600K | |
| Intel Core i9-9900KS | |
| Intel Core i9-10900K | |
| AMD Ryzen 9 3900X | |
| AMD Ryzen 9 3950X | |
| wPrime 2.10 | |
| 32m | |
| Intel Core i5-9600K | |
| Intel Core i5-10600K | |
| AMD Ryzen 9 3950X | |
| Intel Core i9-9900KS | |
| Intel Core i9-10900K | |
| AMD Ryzen 9 3900X | |
| 1024m | |
| Intel Core i5-9600K | |
| Intel Core i5-10600K | |
| Intel Core i9-9900KS | |
| AMD Ryzen 9 3900X | |
| Intel Core i9-10900K | |
| AMD Ryzen 9 3950X | |
| X264 HD Benchmark 4.0 | |
| Pass 1 | |
| Intel Core i9-10900K | |
| Intel Core i9-9900KS | |
| AMD Ryzen 9 3950X | |
| Intel Core i5-10600K | |
| Intel Core i5-9600K | |
| Pass 2 | |
| AMD Ryzen 9 3950X | |
| Intel Core i9-10900K | |
| Intel Core i9-9900KS | |
| Intel Core i5-10600K | |
| Intel Core i5-9600K | |
| WinRAR - Result | |
| Intel Core i9-10900K | |
| Intel Core i9-9900KS | |
| AMD Ryzen 9 3900X | |
| AMD Ryzen 9 3950X | |
| Intel Core i5-10600K | |
| Intel Core i5-9600K | |
| TrueCrypt | |
| AES Mean 100MB | |
| Intel Core i9-10900K | |
| Intel Core i9-9900KS | |
| AMD Ryzen 9 3950X | |
| AMD Ryzen 9 3900X | |
| Intel Core i5-10600K | |
| Intel Core i5-9600K | |
| Twofish Mean 100MB | |
| AMD Ryzen 9 3950X | |
| AMD Ryzen 9 3900X | |
| Intel Core i9-10900K | |
| Intel Core i9-9900KS | |
| Intel Core i5-10600K | |
| Intel Core i5-9600K | |
| Serpent Mean 100MB | |
| AMD Ryzen 9 3950X | |
| AMD Ryzen 9 3900X | |
| Intel Core i9-10900K | |
| Intel Core i9-9900KS | |
| Intel Core i5-10600K | |
| Intel Core i5-9600K | |
| Geekbench 5.5 | |
| Multi-Core | |
| AMD Ryzen 9 3950X | |
| Intel Core i9-10900K | |
| AMD Ryzen 9 3900X | |
| Intel Core i5-10600K | |
| Intel Core i5-9600K | |
| Single-Core | |
| Intel Core i9-10900K | |
| AMD Ryzen 9 3950X | |
| Intel Core i5-10600K | |
| AMD Ryzen 9 3900X | |
| Intel Core i5-9600K | |
| Geekbench 5.0 | |
| 5.0 Multi-Core | |
| AMD Ryzen 9 3950X | |
| Intel Core i9-10900K | |
| AMD Ryzen 9 3900X | |
| Intel Core i5-10600K | |
| 5.0 Single-Core | |
| Intel Core i9-10900K | |
| AMD Ryzen 9 3950X | |
| Intel Core i5-10600K | |
| AMD Ryzen 9 3900X | |
| Geekbench 4.4 | |
| 64 Bit Single-Core Score | |
| Intel Core i9-10900K | |
| Intel Core i9-9900KS | |
| Intel Core i5-9600K | |
| Intel Core i5-10600K | |
| AMD Ryzen 9 3950X | |
| AMD Ryzen 9 3900X | |
| 64 Bit Multi-Core Score | |
| AMD Ryzen 9 3950X | |
| Intel Core i9-10900K | |
| AMD Ryzen 9 3900X | |
| Intel Core i9-9900KS | |
| Intel Core i5-10600K | |
| Intel Core i5-9600K | |
| 3DMark 11 - 1280x720 Performance Physics | |
| Intel Core i9-10900K | |
| AMD Ryzen 9 3950X | |
| AMD Ryzen 9 3900X | |
| Intel Core i9-9900KS | |
| Intel Core i5-10600K | |
| Intel Core i5-9600K | |
| 7-Zip 18.03 | |
| 7z b 4 | |
| AMD Ryzen 9 3950X | |
| AMD Ryzen 9 3900X | |
| Intel Core i9-10900K | |
| Intel Core i9-9900KS | |
| Intel Core i5-10600K | |
| 7z b 4 -mmt1 | |
| Intel Core i9-10900K | |
| Intel Core i9-9900KS | |
| AMD Ryzen 9 3950X | |
| Intel Core i5-10600K | |
| AMD Ryzen 9 3900X | |
| HWBOT x265 Benchmark v2.2 - 4k Preset | |
| Intel Core i9-10900K | |
| Intel Core i9-9900KS | |
| AMD Ryzen 9 3950X | |
| Intel Core i5-10600K | |
| Intel Core i5-9600K | |
| R Benchmark 2.5 - Overall mean | |
| Intel Core i5-10600K | |
| AMD Ryzen 9 3900X | |
| Intel Core i9-10900K | |
| AMD Ryzen 9 3950X | |
| LibreOffice - 20 Documents To PDF | |
| Intel Core i9-10900K | |
| AMD Ryzen 9 3900X | |
| AMD Ryzen 9 3950X | |
| Intel Core i5-10600K | |
| WebXPRT 3 - Overall | |
| Intel Core i9-10900K | |
| AMD Ryzen 9 3950X | |
| Intel Core i5-10600K | |
| Mozilla Kraken 1.1 - Total | |
| Intel Core i5-10600K | |
| Intel Core i9-10900K | |
| AMD Ryzen 9 3950X | |
| 3DMark | |
| 3840x2160 Fire Strike Ultra Physics | |
| AMD Ryzen 9 3950X | |
| Intel Core i9-10900K | |
| AMD Ryzen 9 3900X | |
| Intel Core i9-9900KS | |
| Intel Core i5-10600K | |
| Intel Core i5-9600K | |
| 1920x1080 Fire Strike Physics | |
| AMD Ryzen 9 3950X | |
| Intel Core i9-10900K | |
| AMD Ryzen 9 3900X | |
| Intel Core i9-9900KS | |
| Intel Core i5-10600K | |
| Intel Core i5-9600K | |
| 2560x1440 Time Spy CPU | |
| Intel Core i9-10900K | |
| AMD Ryzen 9 3950X | |
| AMD Ryzen 9 3900X | |
| Intel Core i9-9900KS | |
| Intel Core i5-10600K | |
| Intel Core i5-9600K | |
* ... smaller is better
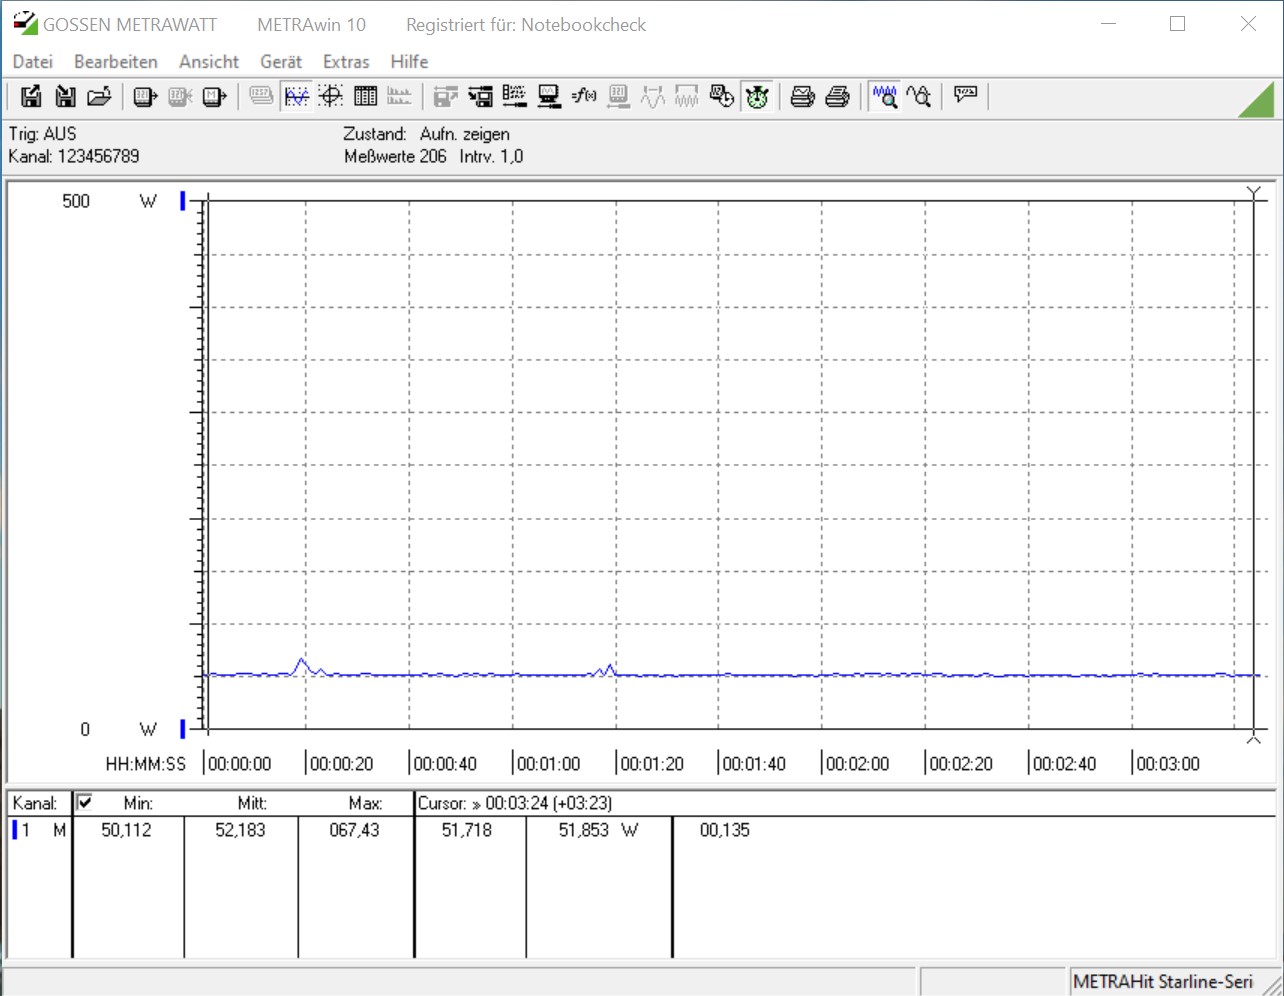
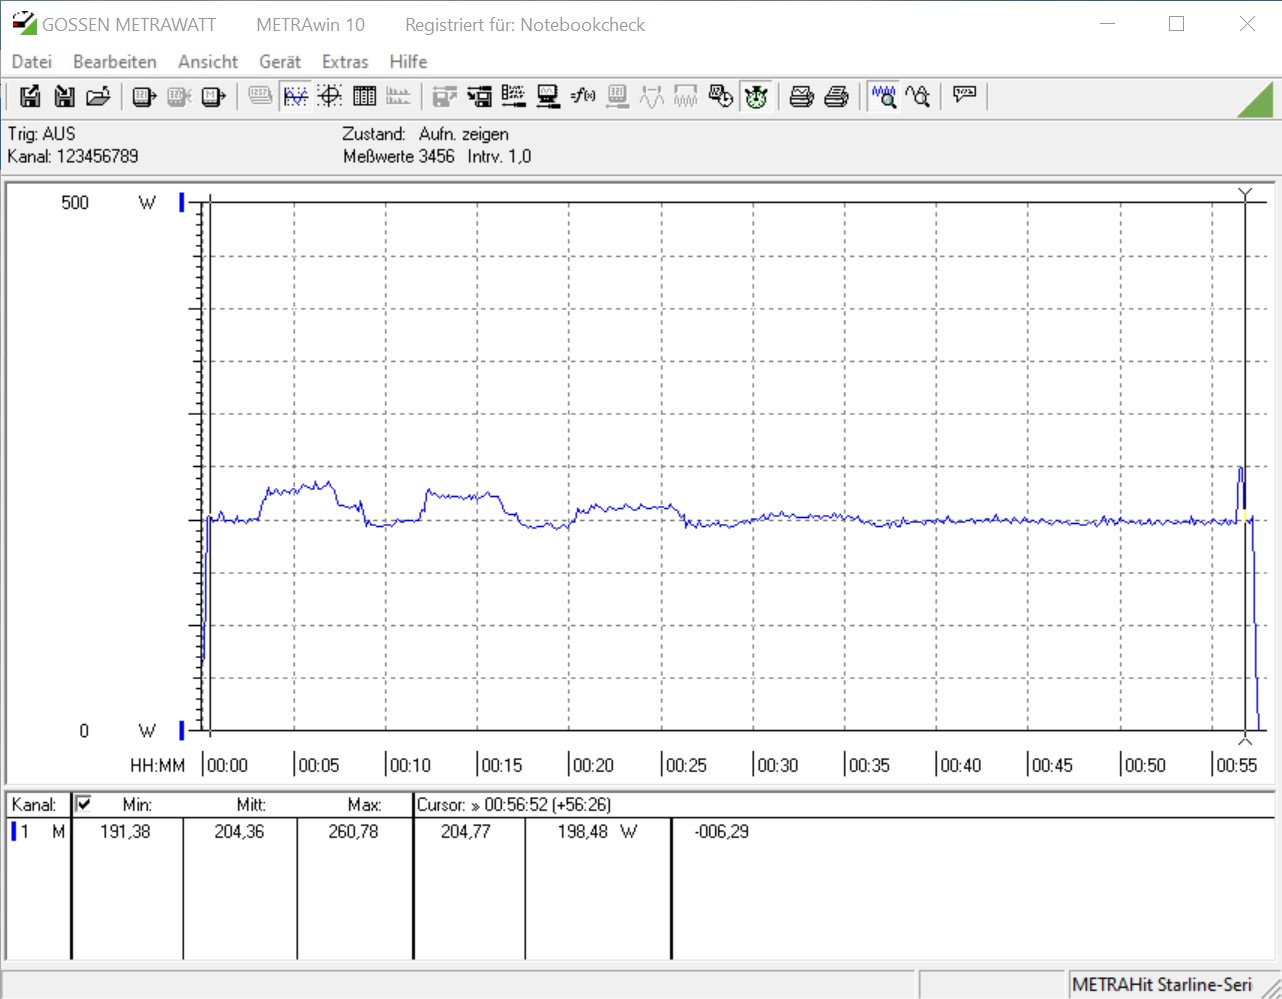
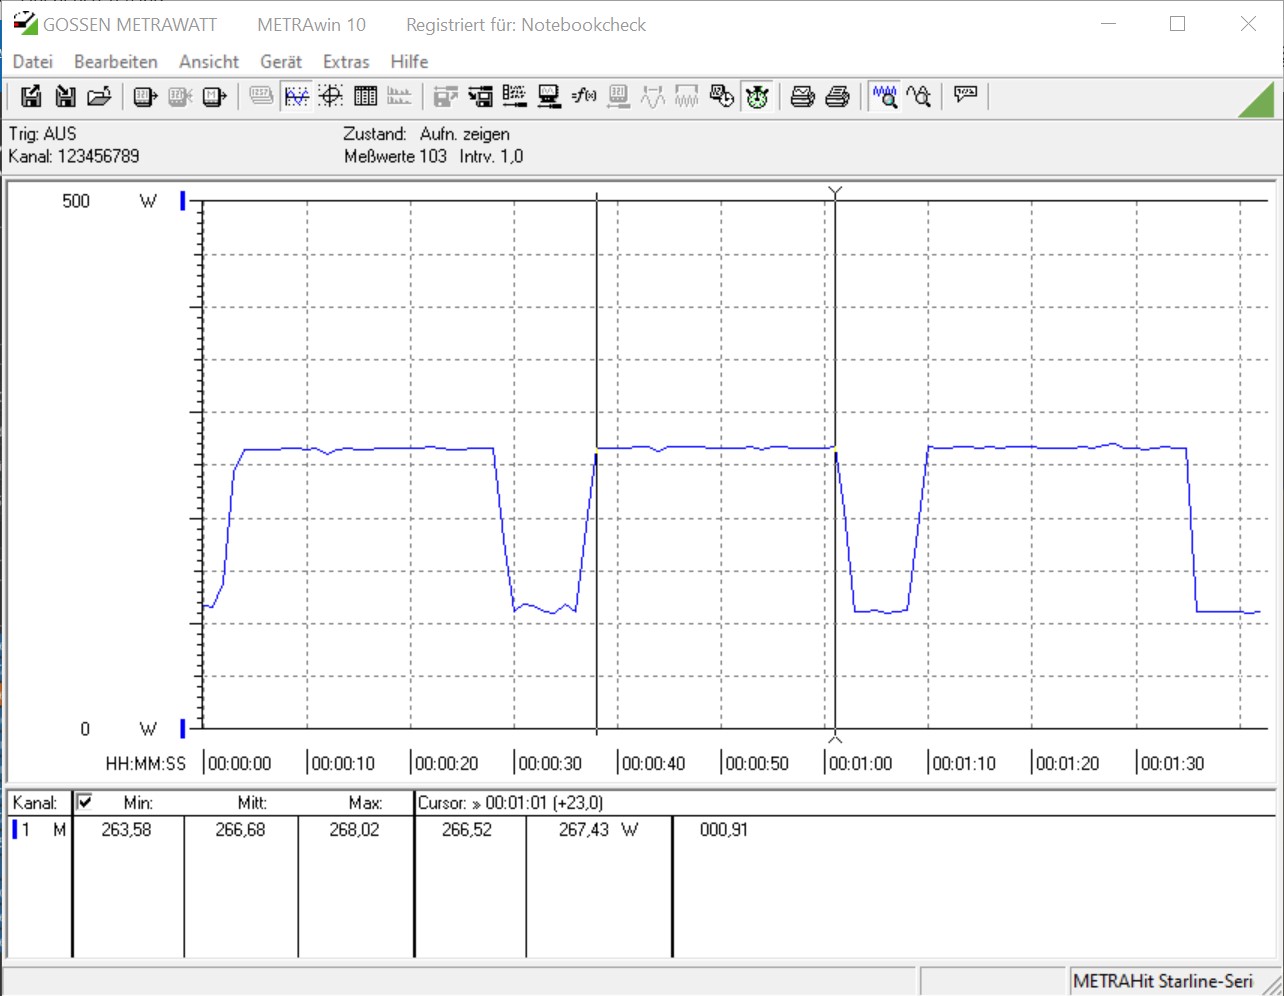
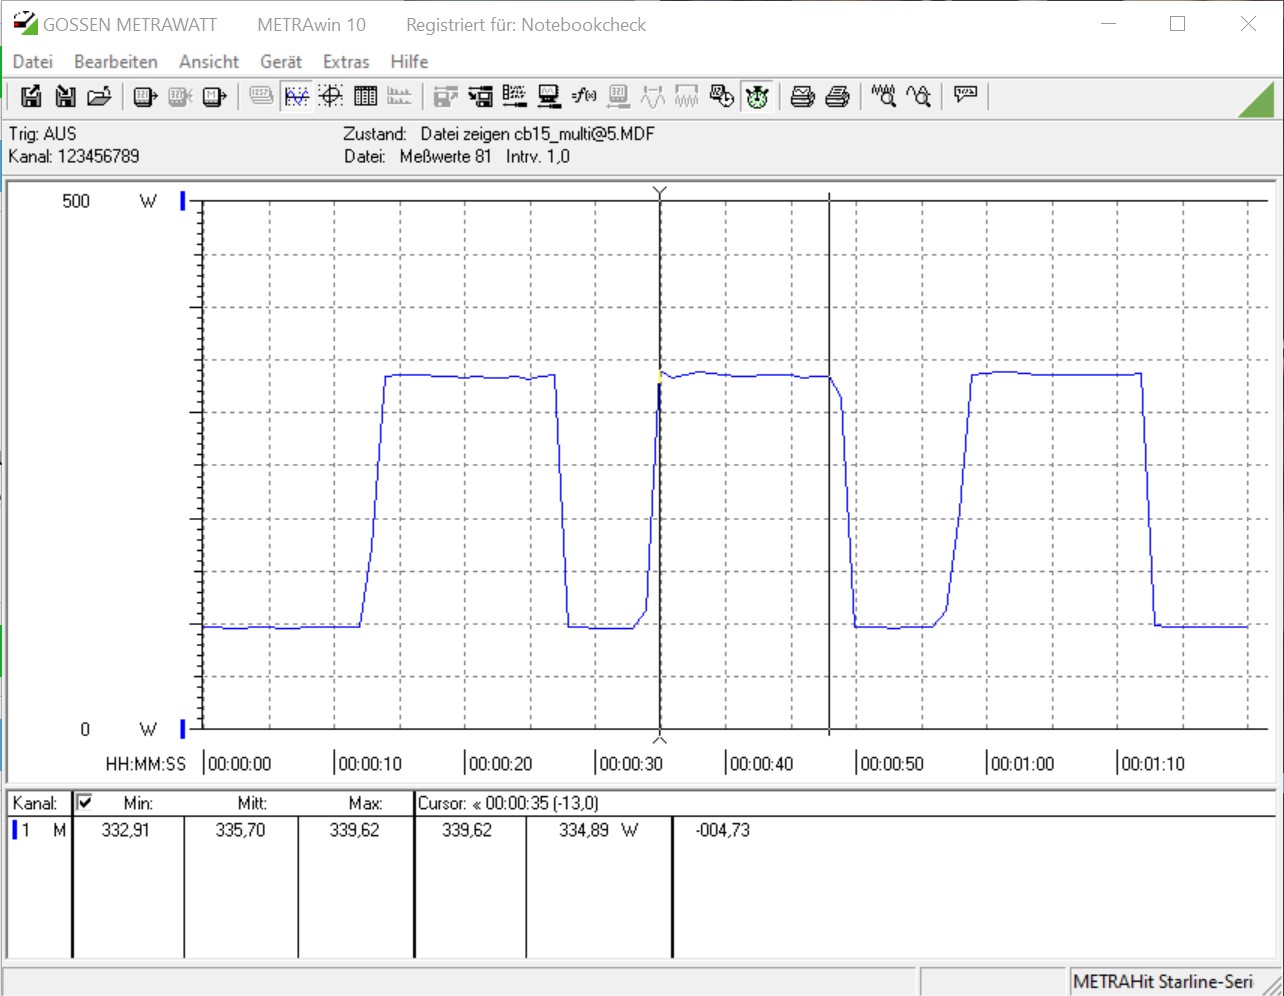
Comet Lake-S vs. Cinebench R15 Loop
Our first look at the stability of the new Intel parts comes from running the multi-core version of Cinebench R15 in a continuous loop. The all-in-one liquid cooler from Alphacool has no trouble keeping the CPUs cool in our open-air test bench. The benchmark results are relatively stable and there are no drops in performance to speak of. The results of the Intel Core i5-10600K are a bit more closely bunched together.
Productivity Benchmarks
Here, both chips perform equally well. In daily use, you will not be able to tell whether you are using the Intel Core i5-10600K or the Intel Core i9-10900K. There are no clear winners or losers in the synthetic benchmarks.
| PCMark 10 - Score | |
| Intel Core i9-9900KS | |
| AMD Ryzen 9 3950X | |
| Intel Core i9-10900K | |
| AMD Ryzen 9 3900X | |
| Intel Core i5-10600K | |
| Intel Core i5-9600K | |
| PCMark 8 | |
| Work Score Accelerated v2 | |
| AMD Ryzen 9 3950X | |
| Intel Core i9-9900KS | |
| AMD Ryzen 9 3900X | |
| Intel Core i5-10600K | |
| Intel Core i9-10900K | |
| Intel Core i5-9600K | |
| Creative Score Accelerated v2 | |
| Intel Core i9-9900KS | |
| AMD Ryzen 9 3950X | |
| AMD Ryzen 9 3900X | |
| Intel Core i5-10600K | |
| Intel Core i9-10900K | |
| Intel Core i5-9600K | |
| Home Score Accelerated v2 | |
| Intel Core i9-9900KS | |
| AMD Ryzen 9 3950X | |
| AMD Ryzen 9 3900X | |
| Intel Core i5-10600K | |
| Intel Core i9-10900K | |
| Intel Core i5-9600K | |
Still the Fastest Gaming CPU
Intel still offers the world’s fastest gaming CPU. The Intel Core i9-10900K can achieve very high frame rates as long as it is not GPU-bound. However, once you introduce a GPU bottleneck by increasing the resolution or graphics settings the performance advantage that it has evaporates. Nevertheless, the Intel Core i9-10900K is still the CPU of choice for those who need or want the highest frame rates possible. The Intel Core i5-10600K falls slightly behind the highest-end model, but it is still an exceptional gaming CPU. Both Intel chips deliver better gaming performance with an Nvidia Titan RTX than the two Ryzen 9 CPUs from AMD.
| Performance rating - Percent | |
| Intel Core i9-10900K | |
| Intel Core i9-9900KS, Nvidia Titan RTX | |
| Intel Core i5-10600K | |
| AMD Ryzen 9 3900X | |
| AMD Ryzen 9 3950X | |
| Borderlands 3 | |
| 1280x720 Very Low Overall Quality (DX11) | |
| Intel Core i9-10900K | |
| Intel Core i5-10600K | |
| Intel Core i9-9900KS, Nvidia Titan RTX | |
| AMD Ryzen 9 3900X | |
| AMD Ryzen 9 3950X | |
| 1920x1080 Badass Overall Quality (DX11) | |
| Intel Core i9-10900K | |
| Intel Core i5-10600K | |
| Intel Core i9-9900KS, Nvidia Titan RTX | |
| AMD Ryzen 9 3900X | |
| AMD Ryzen 9 3950X | |
| Metro Exodus | |
| 1280x720 Low Quality AF:4x | |
| Intel Core i9-10900K | |
| Intel Core i5-10600K | |
| Intel Core i9-9900KS, Nvidia Titan RTX | |
| AMD Ryzen 9 3900X | |
| AMD Ryzen 9 3950X | |
| 1920x1080 Ultra Quality AF:16x | |
| Intel Core i9-10900K | |
| Intel Core i5-10600K | |
| Intel Core i9-9900KS, Nvidia Titan RTX | |
| AMD Ryzen 9 3900X | |
| AMD Ryzen 9 3950X | |
| Far Cry New Dawn | |
| 1280x720 Low Preset | |
| Intel Core i9-10900K | |
| Intel Core i9-9900KS, Nvidia Titan RTX | |
| Intel Core i5-10600K | |
| AMD Ryzen 9 3900X | |
| AMD Ryzen 9 3950X | |
| 1920x1080 Ultra Preset | |
| Intel Core i9-9900KS, Nvidia Titan RTX | |
| Intel Core i5-10600K | |
| Intel Core i9-10900K | |
| AMD Ryzen 9 3950X | |
| AMD Ryzen 9 3900X | |
| Forza Horizon 4 | |
| 1280x720 Very Low Preset | |
| Intel Core i9-10900K | |
| Intel Core i9-9900KS, Nvidia Titan RTX | |
| Intel Core i5-10600K | |
| AMD Ryzen 9 3950X | |
| AMD Ryzen 9 3900X | |
| 1920x1080 Ultra Preset AA:2xMS | |
| Intel Core i9-10900K | |
| Intel Core i5-10600K | |
| Intel Core i9-9900KS, Nvidia Titan RTX | |
| AMD Ryzen 9 3950X | |
| AMD Ryzen 9 3900X | |
| Far Cry 5 | |
| 1280x720 Low Preset AA:T | |
| Intel Core i9-10900K | |
| Intel Core i9-9900KS, Nvidia Titan RTX | |
| Intel Core i5-10600K | |
| AMD Ryzen 9 3900X | |
| AMD Ryzen 9 3950X | |
| 1920x1080 Ultra Preset AA:T | |
| Intel Core i9-10900K | |
| Intel Core i9-9900KS, Nvidia Titan RTX | |
| Intel Core i5-10600K | |
| AMD Ryzen 9 3900X | |
| AMD Ryzen 9 3950X | |
| X-Plane 11.11 | |
| 1280x720 low (fps_test=1) | |
| Intel Core i9-10900K | |
| Intel Core i9-9900KS, Nvidia Titan RTX | |
| Intel Core i5-10600K | |
| AMD Ryzen 9 3900X | |
| AMD Ryzen 9 3950X | |
| 1920x1080 high (fps_test=3) | |
| Intel Core i9-9900KS, Nvidia Titan RTX | |
| Intel Core i9-10900K | |
| Intel Core i5-10600K | |
| AMD Ryzen 9 3900X | |
| AMD Ryzen 9 3950X | |
| Final Fantasy XV Benchmark | |
| 1280x720 Lite Quality | |
| Intel Core i9-10900K | |
| Intel Core i9-9900KS, Nvidia Titan RTX | |
| Intel Core i5-10600K | |
| AMD Ryzen 9 3950X | |
| AMD Ryzen 9 3900X | |
| 1920x1080 High Quality | |
| Intel Core i9-10900K | |
| Intel Core i5-10600K | |
| Intel Core i9-9900KS, Nvidia Titan RTX | |
| AMD Ryzen 9 3950X | |
| AMD Ryzen 9 3900X | |
| Dota 2 Reborn | |
| 1280x720 min (0/3) fastest | |
| Intel Core i9-10900K | |
| Intel Core i9-9900KS, Nvidia Titan RTX | |
| Intel Core i5-10600K | |
| AMD Ryzen 9 3900X | |
| AMD Ryzen 9 3950X | |
| 1920x1080 ultra (3/3) best looking | |
| Intel Core i9-10900K | |
| Intel Core i9-9900KS, Nvidia Titan RTX | |
| Intel Core i5-10600K | |
| AMD Ryzen 9 3900X | |
| AMD Ryzen 9 3950X | |
| The Witcher 3 | |
| 1024x768 Low Graphics & Postprocessing | |
| Intel Core i9-10900K | |
| Intel Core i9-9900KS, Nvidia Titan RTX | |
| Intel Core i5-10600K | |
| AMD Ryzen 9 3900X | |
| AMD Ryzen 9 3950X | |
| 1920x1080 Ultra Graphics & Postprocessing (HBAO+) | |
| Intel Core i5-10600K | |
| Intel Core i9-10900K | |
| AMD Ryzen 9 3900X | |
| Intel Core i9-9900KS, Nvidia Titan RTX | |
| AMD Ryzen 9 3950X | |
Intel Core i9-10900K + Nvidia Titan RTX
| low | med. | high | ultra | QHD | 4K | |
|---|---|---|---|---|---|---|
| The Witcher 3 (2015) | 518 | 400 | 265 | 139 | 103 | |
| Dota 2 Reborn (2015) | 198.8 | 181 | 174.2 | 172.2 | 158.9 | |
| Final Fantasy XV Benchmark (2018) | 221 | 187 | 142 | 65.4 | ||
| X-Plane 11.11 (2018) | 149 | 130 | 106 | 91.9 | ||
| Far Cry 5 (2018) | 193 | 169 | 159 | 149 | 137 | 83 |
| Shadow of the Tomb Raider (2018) | 204 | 180 | 173 | 165 | 122 | 67 |
| Forza Horizon 4 (2018) | 246 | 218 | 216 | 193 | 164 | 117 |
| Far Cry New Dawn (2019) | 151 | 120 | 113 | 98 | 97 | 85 |
| Metro Exodus (2019) | 220 | 175 | 136 | 109 | 86.4 | 55.1 |
| Borderlands 3 (2019) | 191.1 | 166.7 | 139 | 117 | 85 | 46.5 |
Intel Core i5-10600K + Nvidia Titan RTX
| low | med. | high | ultra | QHD | 4K | |
|---|---|---|---|---|---|---|
| The Witcher 3 (2015) | 413 | 371 | 258 | 140 | 101 | |
| Dota 2 Reborn (2015) | 171.6 | 160.6 | 155.2 | 148.1 | 146.1 | |
| Final Fantasy XV Benchmark (2018) | 201 | 176 | 140 | 64.5 | ||
| X-Plane 11.11 (2018) | 133 | 118 | 96.8 | 83.7 | ||
| Far Cry 5 (2018) | 157 | 139 | 132 | 126 | 121 | 81 |
| Shadow of the Tomb Raider (2018) | 178 | 161 | 156 | 149 | 122 | 66 |
| Forza Horizon 4 (2018) | 222 | 200 | 200 | 187 | 164 | 117 |
| Far Cry New Dawn (2019) | 147 | 125 | 120 | 109 | 113 | 83 |
| Metro Exodus (2019) | 210 | 164 | 135 | 109 | 86.3 | 53.9 |
| Borderlands 3 (2019) | 166 | 143 | 130 | 114 | 86 | 47.9 |
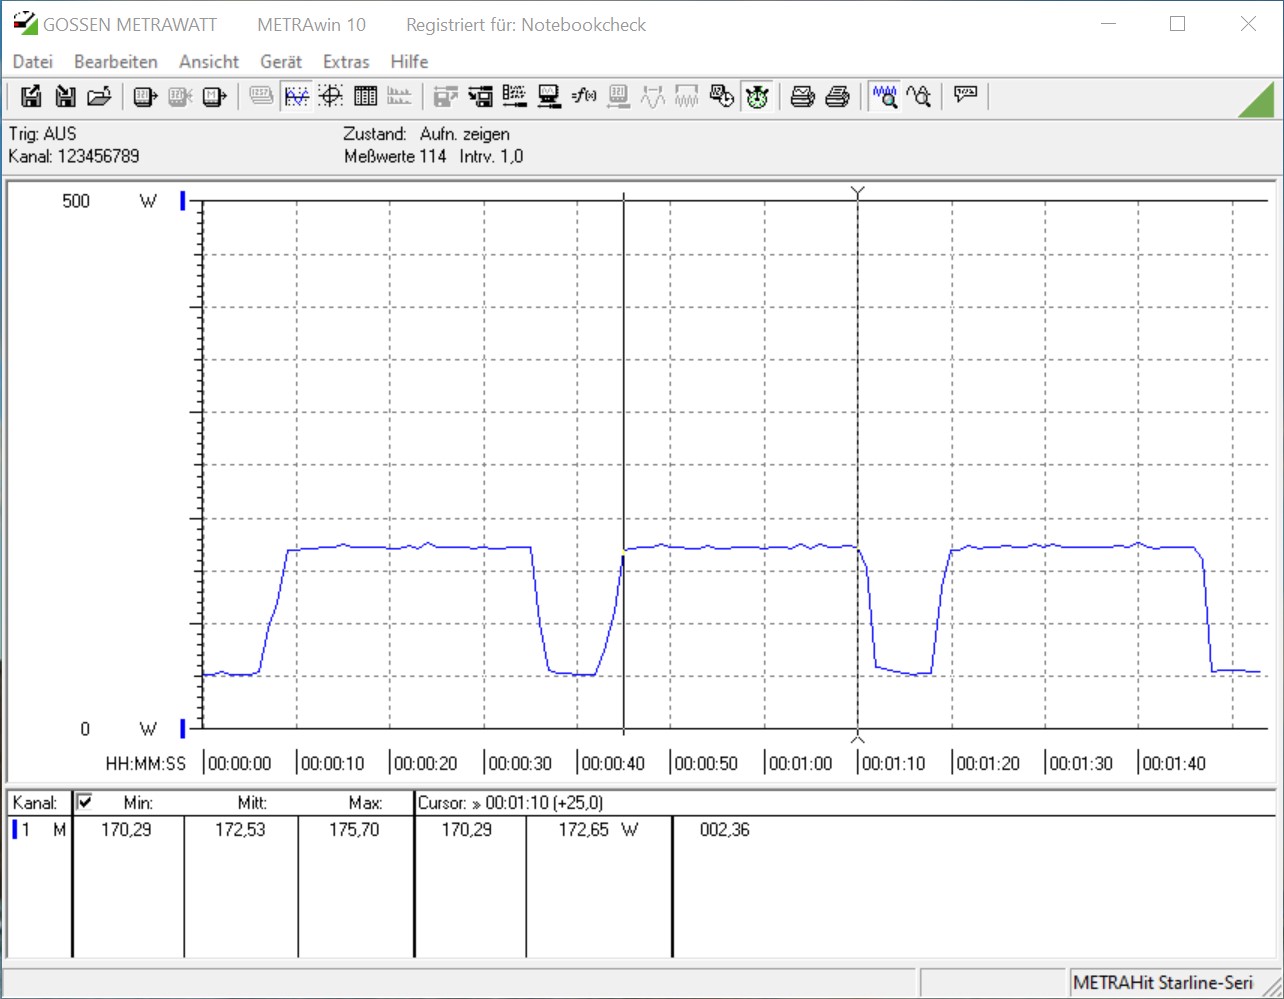
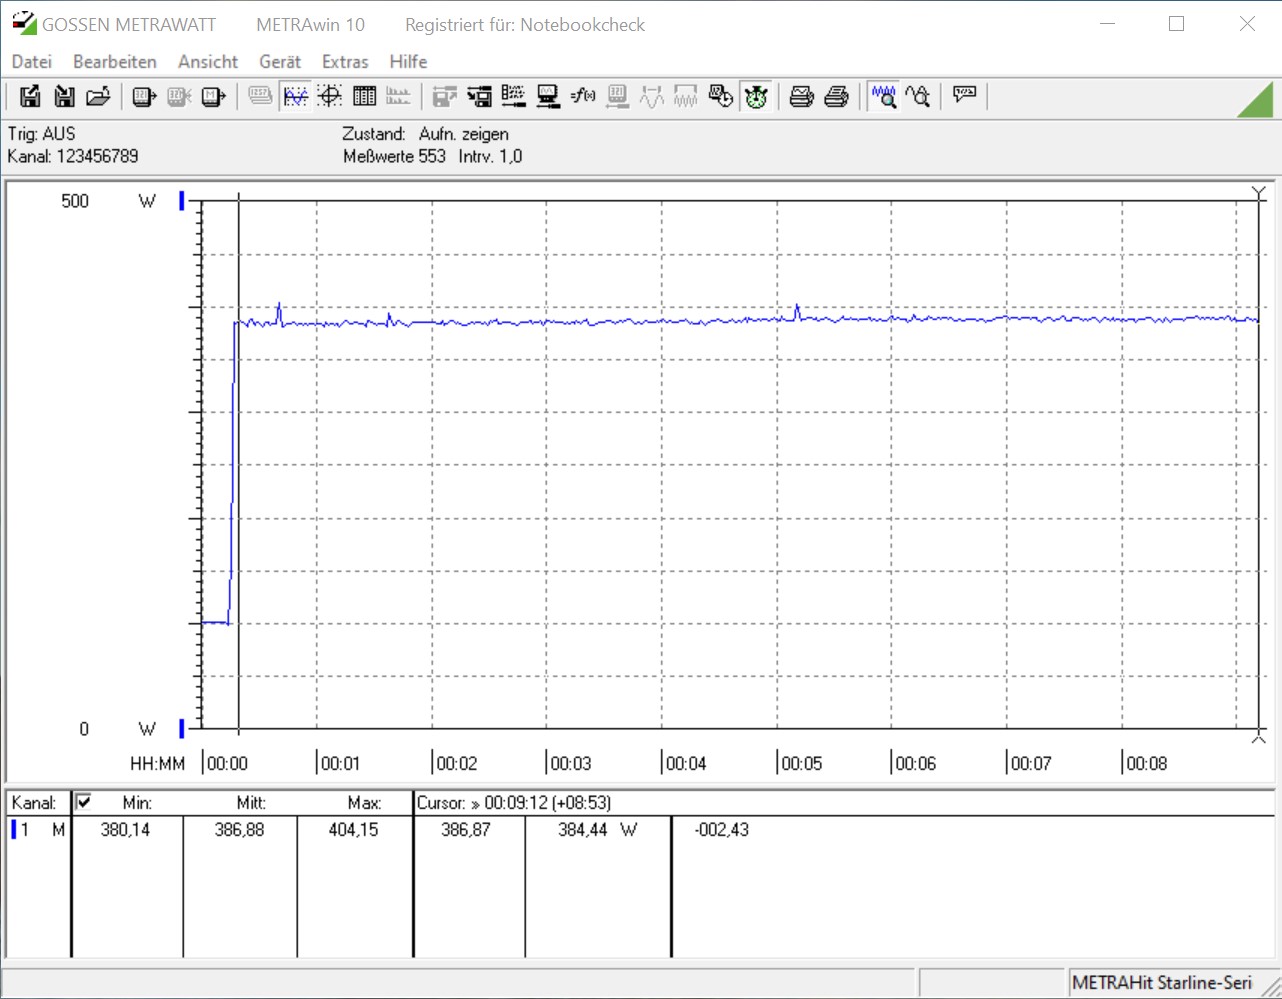
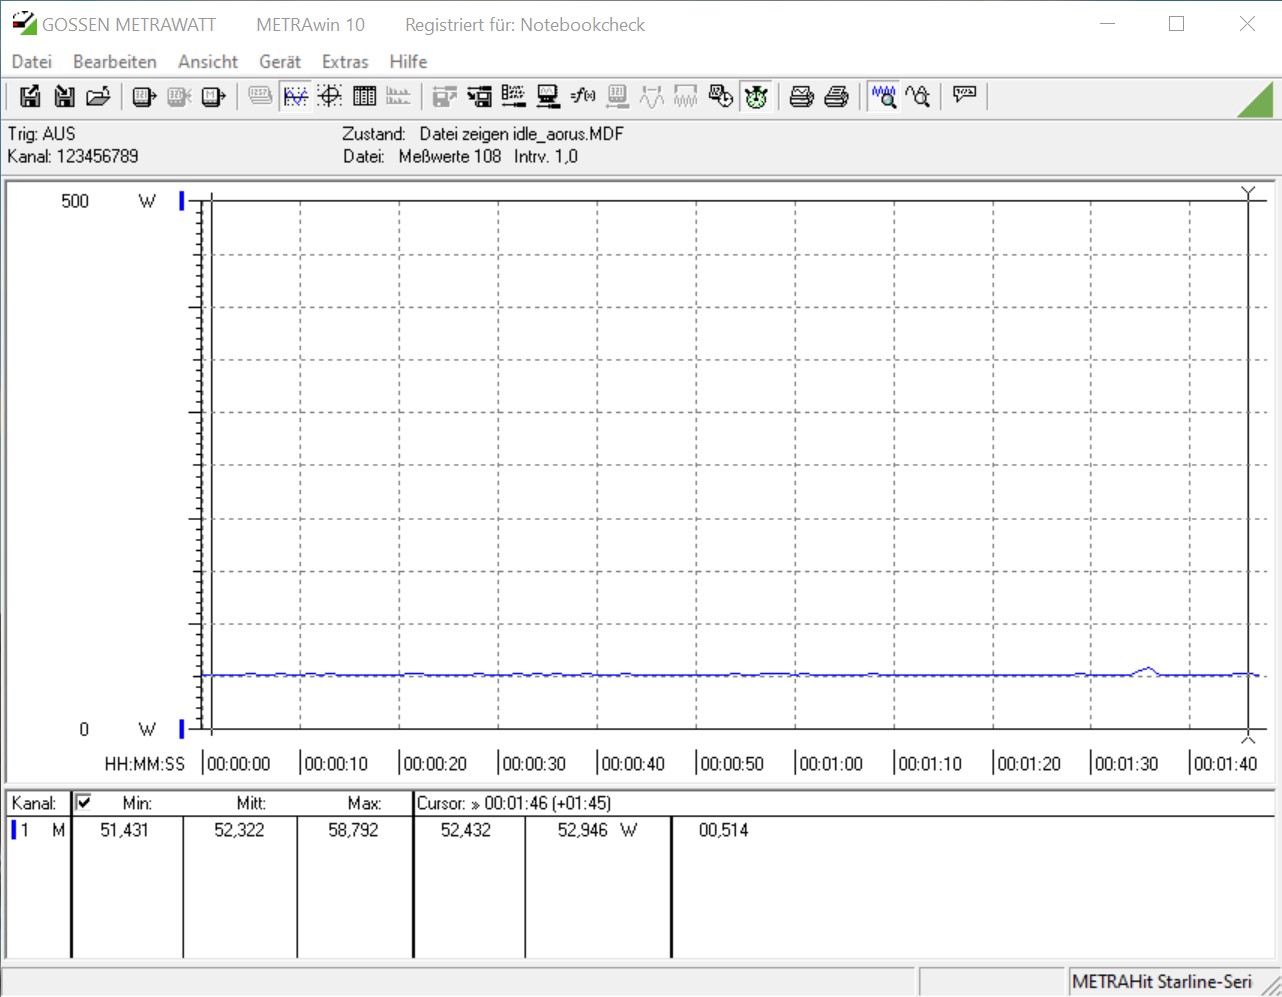
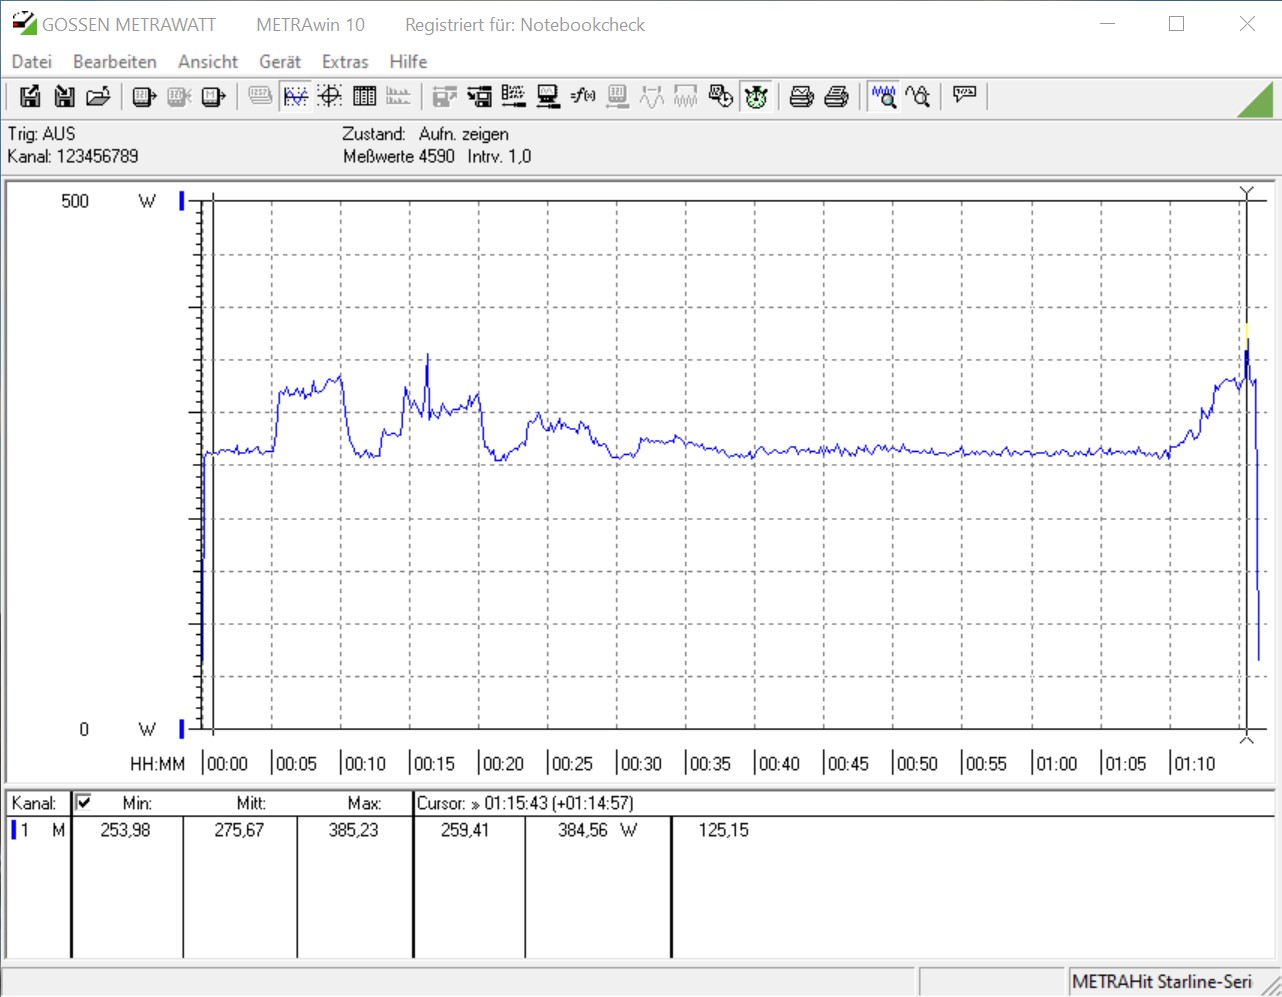
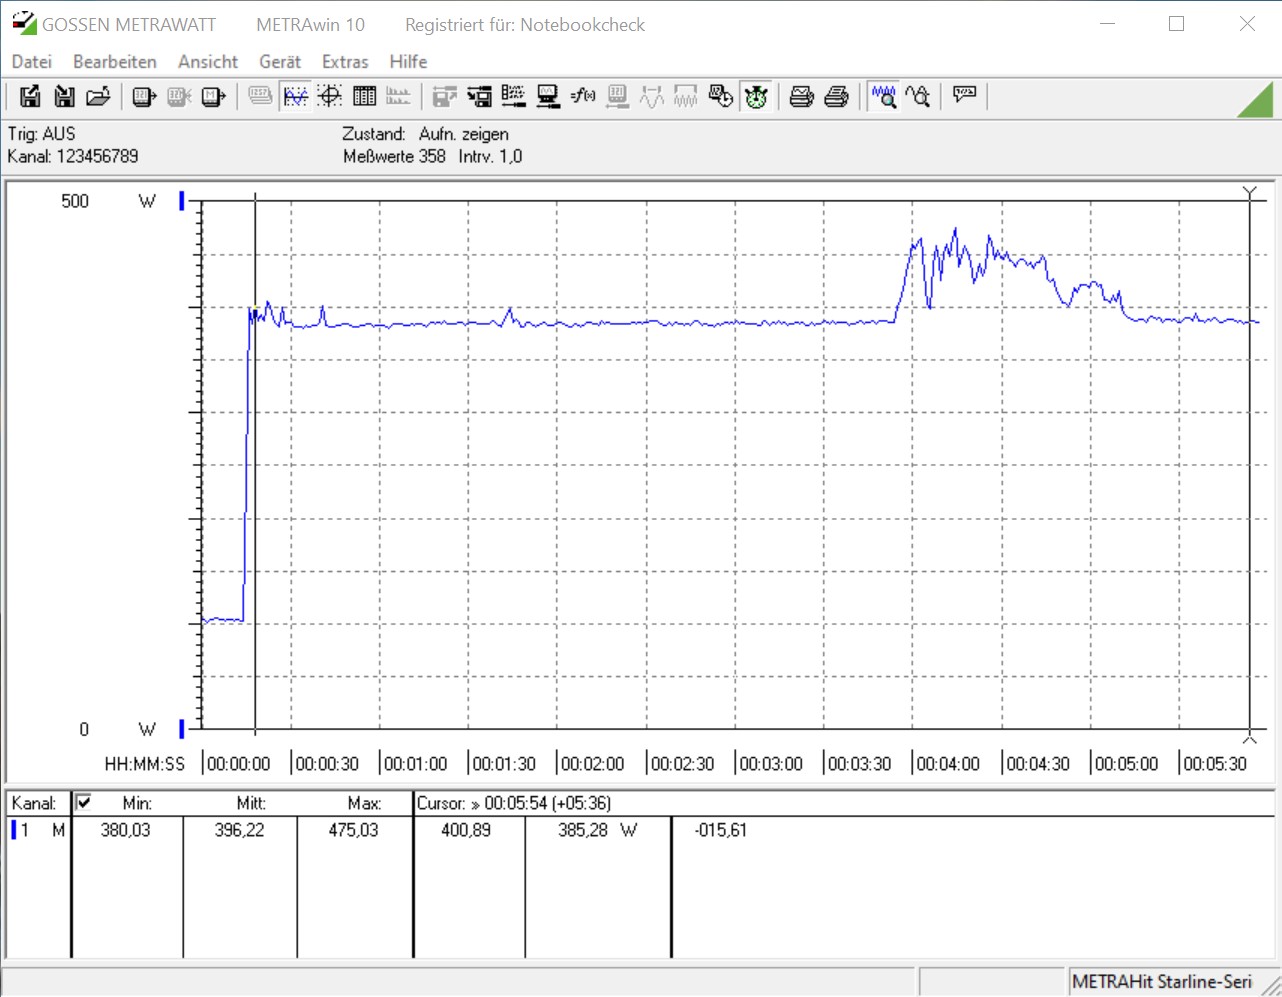
Energy Consumption - 10 Cores Exact Their Toll
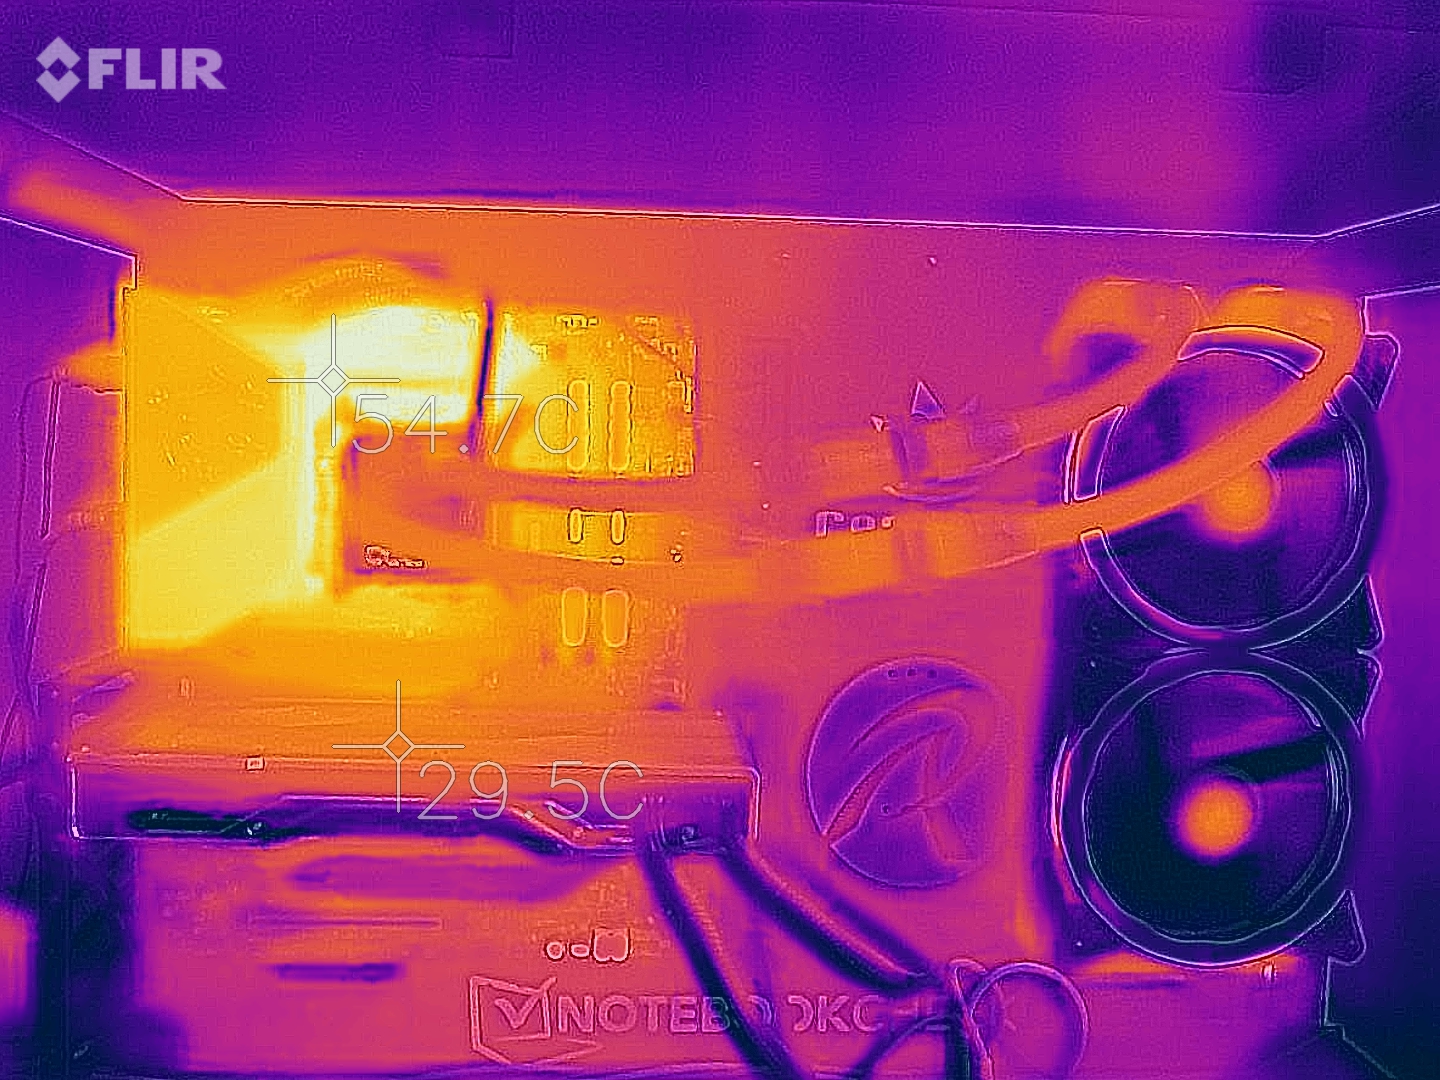
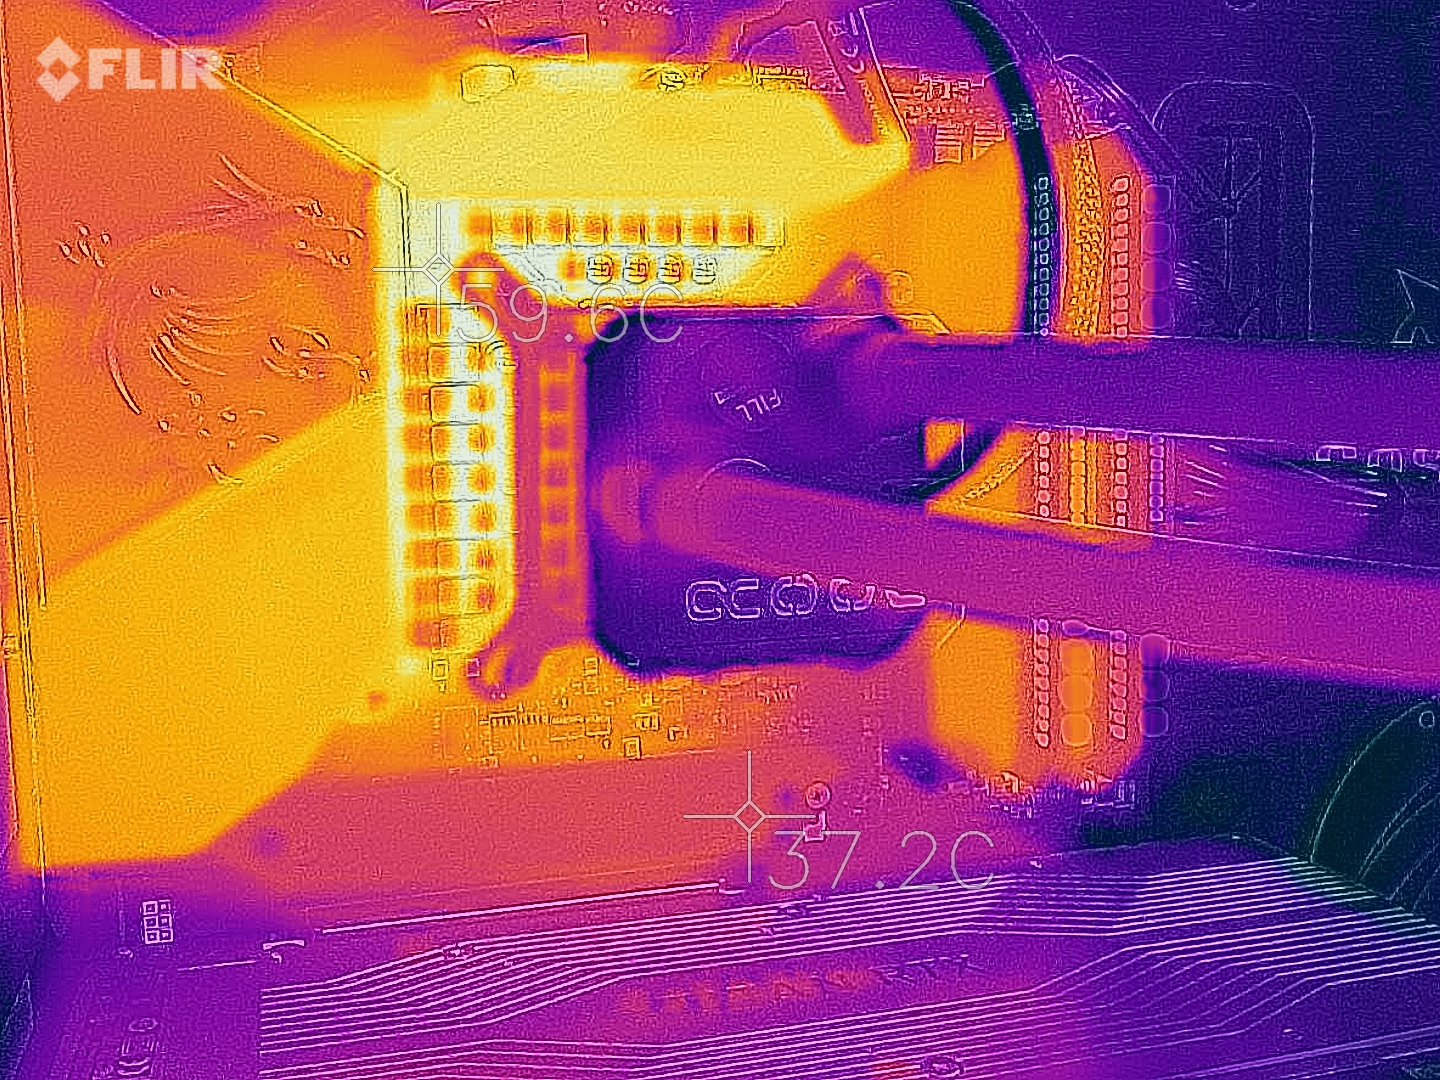
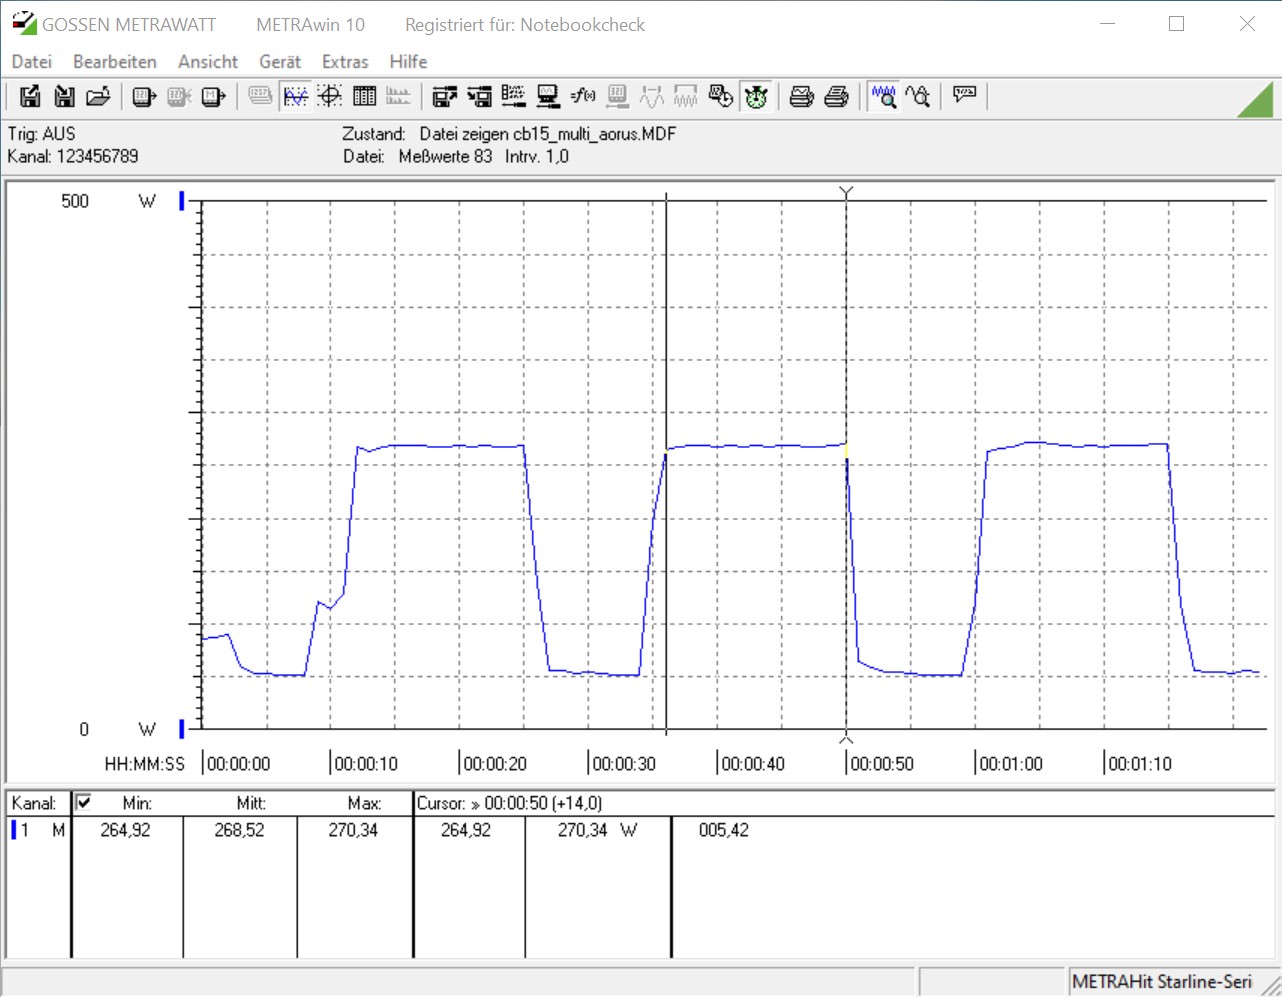
The energy consumption is what most people talk about when they talk about the new Comet Lake-S processors. The Intel Core i9-10900K can draw up to 250 watts for 56 seconds. The power consumption of the Core i9-10900K in the multi-core Cinebench R15 continuous loop amounts to approximately 269 watts. This result means that Intel’s 10-core chip draws more power than AMD’s 16-core processor in the same benchmark. Here, the energy consumption of the mid-range Core i5-10600K is much lower, amounting to 173 watts.
In the Prime95 stress test, the 10-core chip drew 275 watts and the 6-core part consumed 204 watts. Here, Intel outdid itself. The Core i9-10900K draws more power than the Core i9-9900KS, but this should not come as a surprise to anyone.
Under load, even an all-in-one liquid cooler from Alphacool struggles to keep the Intel Core i9-10900K cool enough. The ten-core chip reached 88 °C (190.4°F) in our stress test. The Core i5-10600K ( 158°F) is easier to cool. During the stress test, it only got up to about 70 °C.
Please Note:
Because the power consumption varied greatly on the MSI Z490 Unify, we used the Gigabyte Aorus Z490 Master to measure the power draw.
| Power Consumption | |
| 1920x1080 The Witcher 3 ultra (external Monitor) | |
| AMD Ryzen 9 3950X (Idle: 95 W) | |
| AMD Ryzen 9 3900X (Idle: 87.4 W) | |
| Intel Core i9-10900K (Idle: 52.3 W) | |
| Intel Core i9-9900KS, Nvidia Titan RTX (Idle: 48.6 W) | |
| Intel Core i5-10600K (Idle: 52.2 W) | |
| Intel Core i5-9600K, AMD Radeon RX Vega 64 | |
| Prime95 V2810 Stress (external Monitor) | |
| Intel Core i9-10900K (Idle: 52.3 W) | |
| Intel Core i9-9900KS, Nvidia Titan RTX (Idle: 48.6 W) | |
| Intel Core i5-10600K (Idle: 52.2 W) | |
| AMD Ryzen 9 3950X (Idle: 95 W) | |
| AMD Ryzen 9 3900X (Idle: 87.4 W) | |
| Intel Core i5-9600K, AMD Radeon RX Vega 64 | |
| Cinebench R15 Multi (external Monitor) | |
| Intel Core i9-9900KS, Nvidia Titan RTX (Idle: 48.6 W) | |
| Intel Core i9-10900K (Idle: 52.3 W) | |
| AMD Ryzen 9 3950X (Idle: 95 W) | |
| AMD Ryzen 9 3900X (Idle: 87.4 W) | |
| Intel Core i5-10600K (Idle: 52.2 W) | |
| Intel Core i5-9600K, AMD Radeon RX Vega 64 | |
| Temperatures - CPU Temperature Prime95 | |
| Intel Core i9-10900K | |
| AMD Ryzen 9 3950X | |
| AMD Ryzen 9 3900X | |
| Intel Core i5-10600K | |
* ... smaller is better
Overclocking - Not Recommend
Despite the fact that the Intel CPUs are built for maximum performance, we made a few overclocking attempts. All “K” chips offer an unlocked multiplier, which greatly simplifies the overclocking process. In our case, we were able to achieve a stable 5.3-GHz overclock with the Intel Core i9-10900K. However, with this overclock, our system drew 336 watts in the Cinebench R15 multi-core loop, which is 67 watts more than what the stock configuration consumed. When overclocking the Intel Core i5-10600K we saw very similar results. Here, we were able to achieve a 5.0-GHz all-core overclock, with the power draw jumping from 173 watts to 266 watts in the Cinebench R15 multi-core loop.
Intel Core i9-10900K
Pros
Cons
Intel Core i5-10600K
Pros
Cons
Verdict — Still the world’s fastest gaming CPU

With Comet Lake-S CPUs, Intel brings 10-core chips to the mainstream for the first time. However, those who would like to upgrade will have to get a new motherboard, because the LGA 1151 socket has been replaced with LGA 1200. There are four new chipsets, with the Z490 being the top offering.
Both the Intel Core i9-10900K and the Intel Core i5-10600K did very well in our review. The Core i9-10900K is Intel’s flagship chip on the new socket. It offers a very high level of performance in video games. Thanks to 10 physical cores, the processor performs very well in multi-threaded applications, which gives it an edge over the Intel Core i9-9900KS. However, Intel’s chip fails to outperform its AMD counterparts in many thread-heavy workloads.
The Intel Core i9-10900K is the fastest gaming CPU. However, this is a pyrrhic victory for Intel, because its 10-core CPU draws 250 watts during its 56-second Turbo Boost period.
All in all, Intel brought 32 new processors to the market. We were also able to take a look at the Core i5-10600K, which is Intel’s mid-range offering. It has 6 cores and supports Hyper-threading, which was previously reserved only to high-end models. When compared to the Intel Core i5-9600K, the Core i5-10600K offers a greater level of performance. The mid-range Comet Lake-S chip did very well in our gaming benchmarks as well.
There is a major drawback, though, which has to do with the fact that new CPUs consume a lot of power. Moreover, Intel still uses the 14-nm node to make these chips, which is starting to show its age. We shall see whether Rocket Lake-S chips will be built using the same process or not.
