Notebookcheck Logo

Intel NUC 9 Extreme with Core i9 and RTX 2070 in Review

The devil is in the details! Intel's NUC systems have been around for many years and are known for their compact build. The new Intel NUC 9 Extreme even offers enough room for a full-fledged desktop GPU. While this increases the device's size noticeably, it still remains fairly compact. Find out in our extensive review how much performance you can expect.

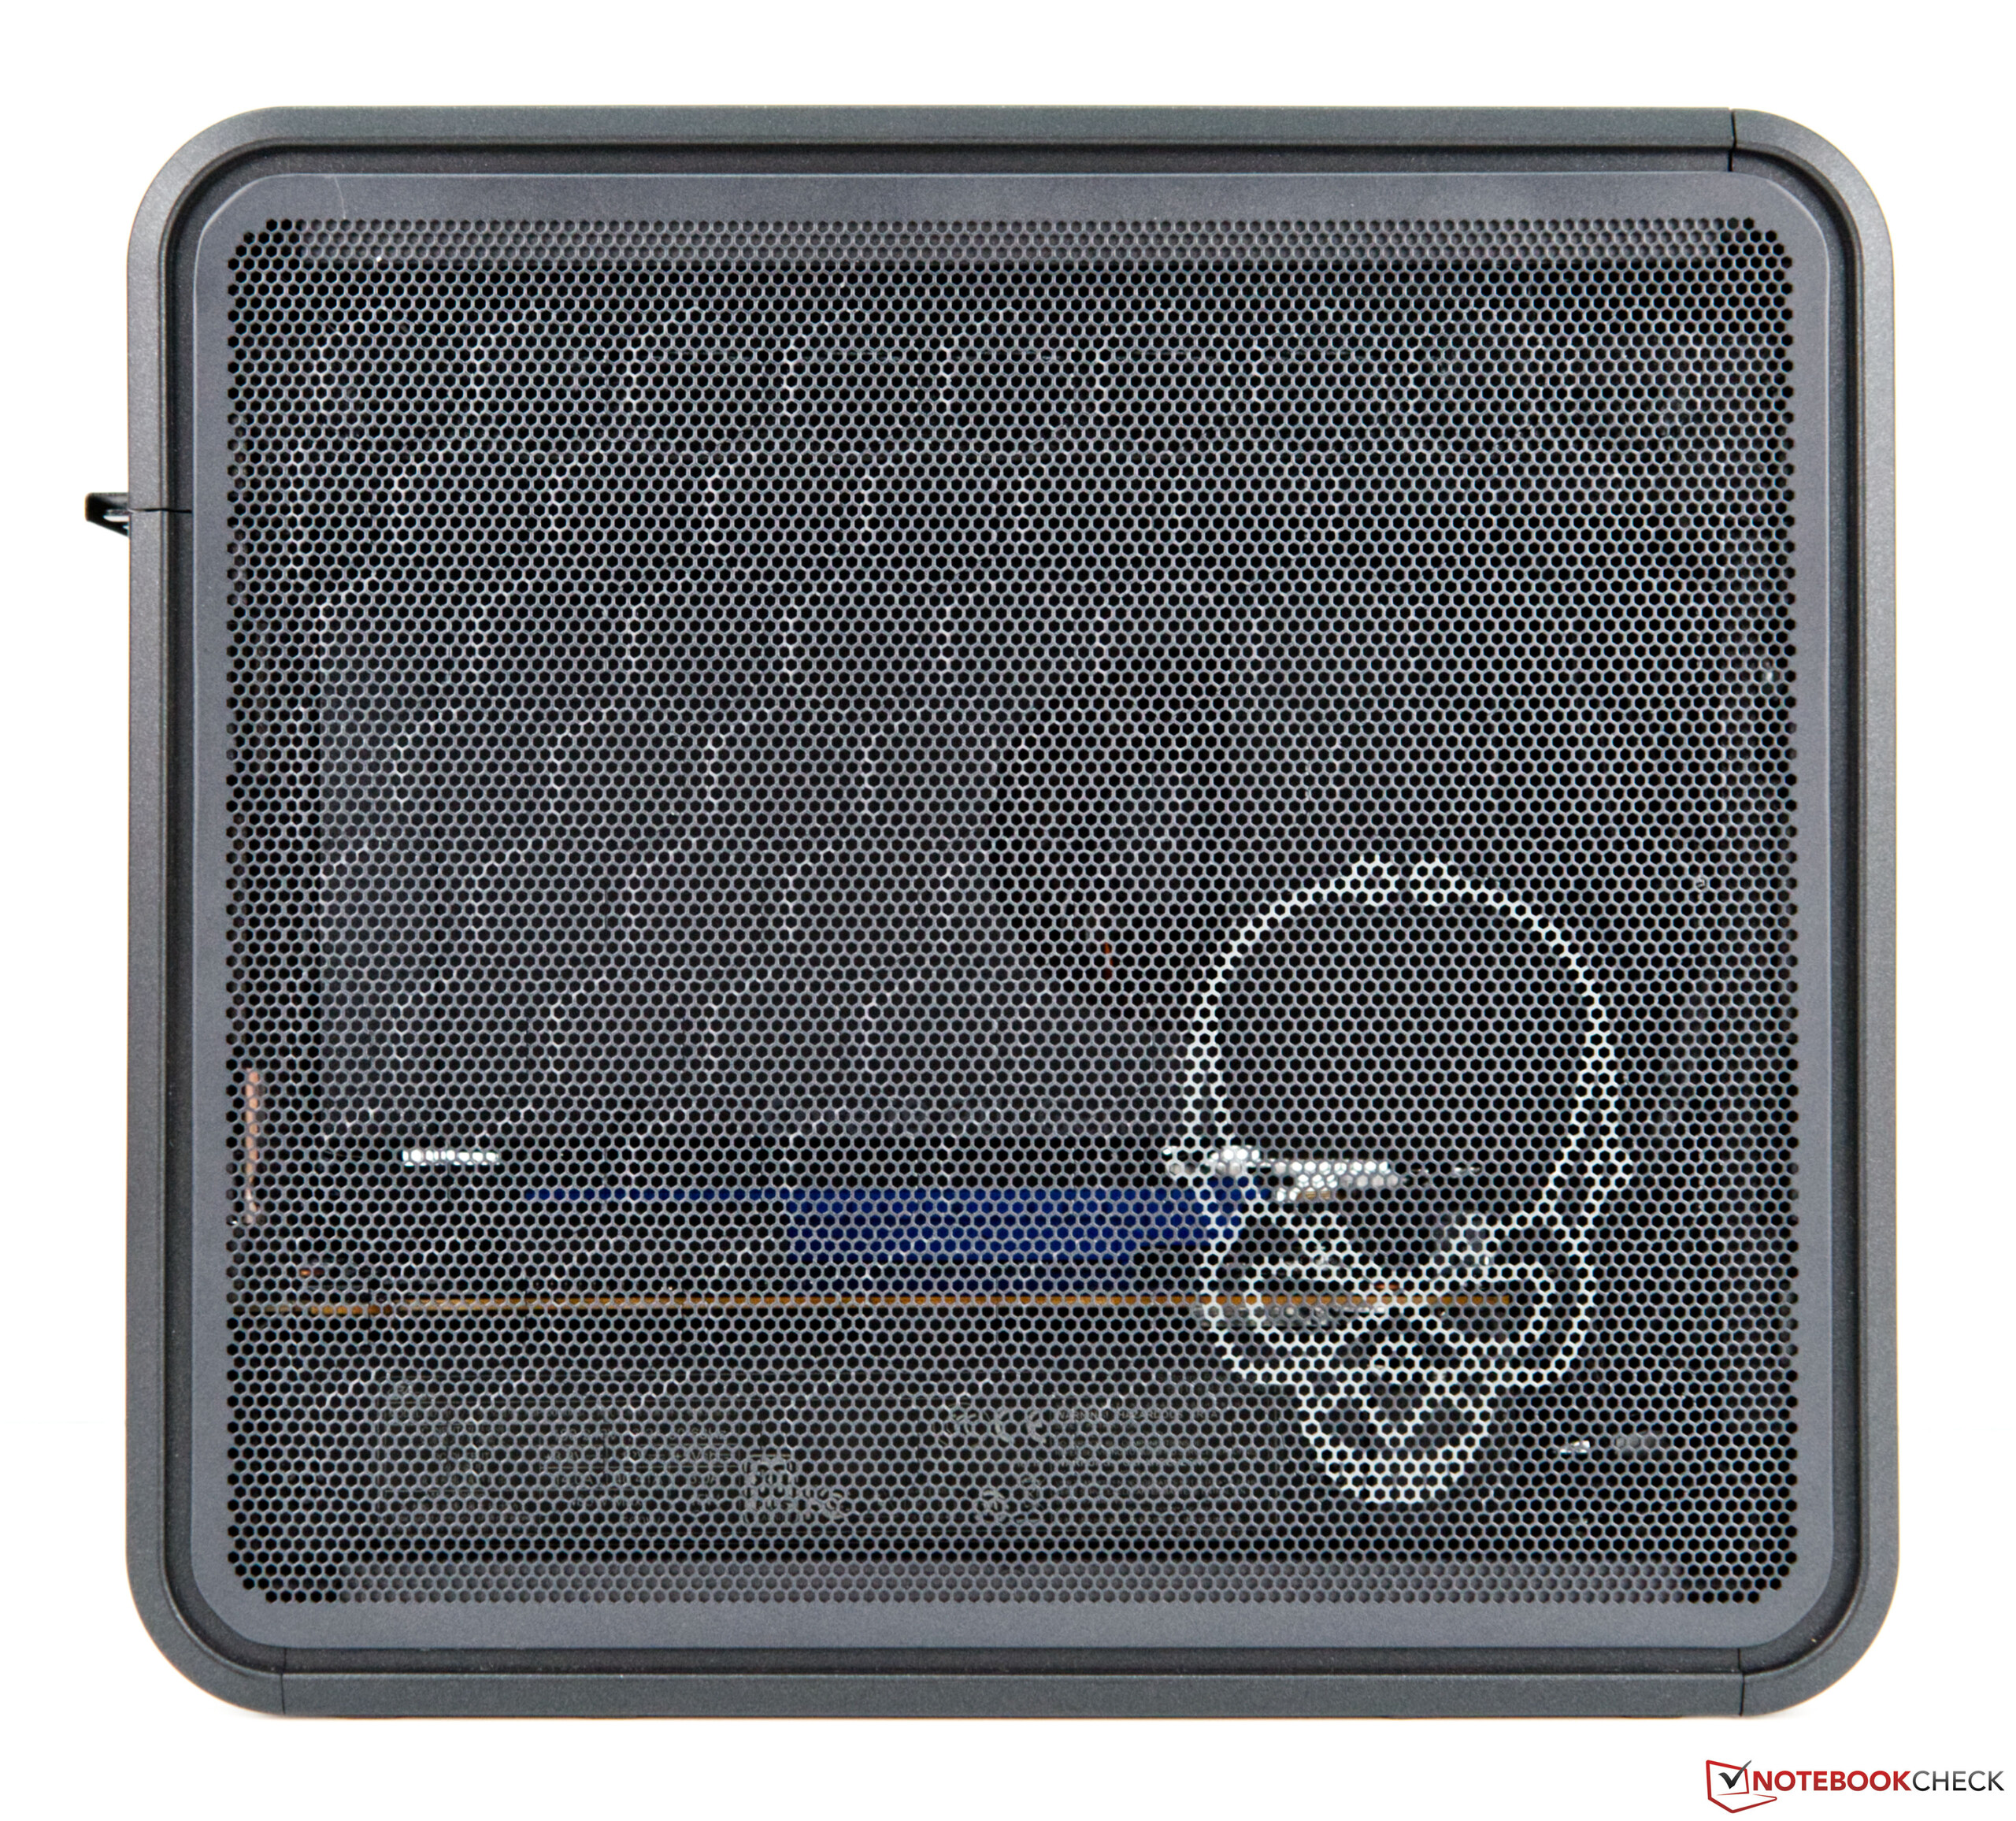
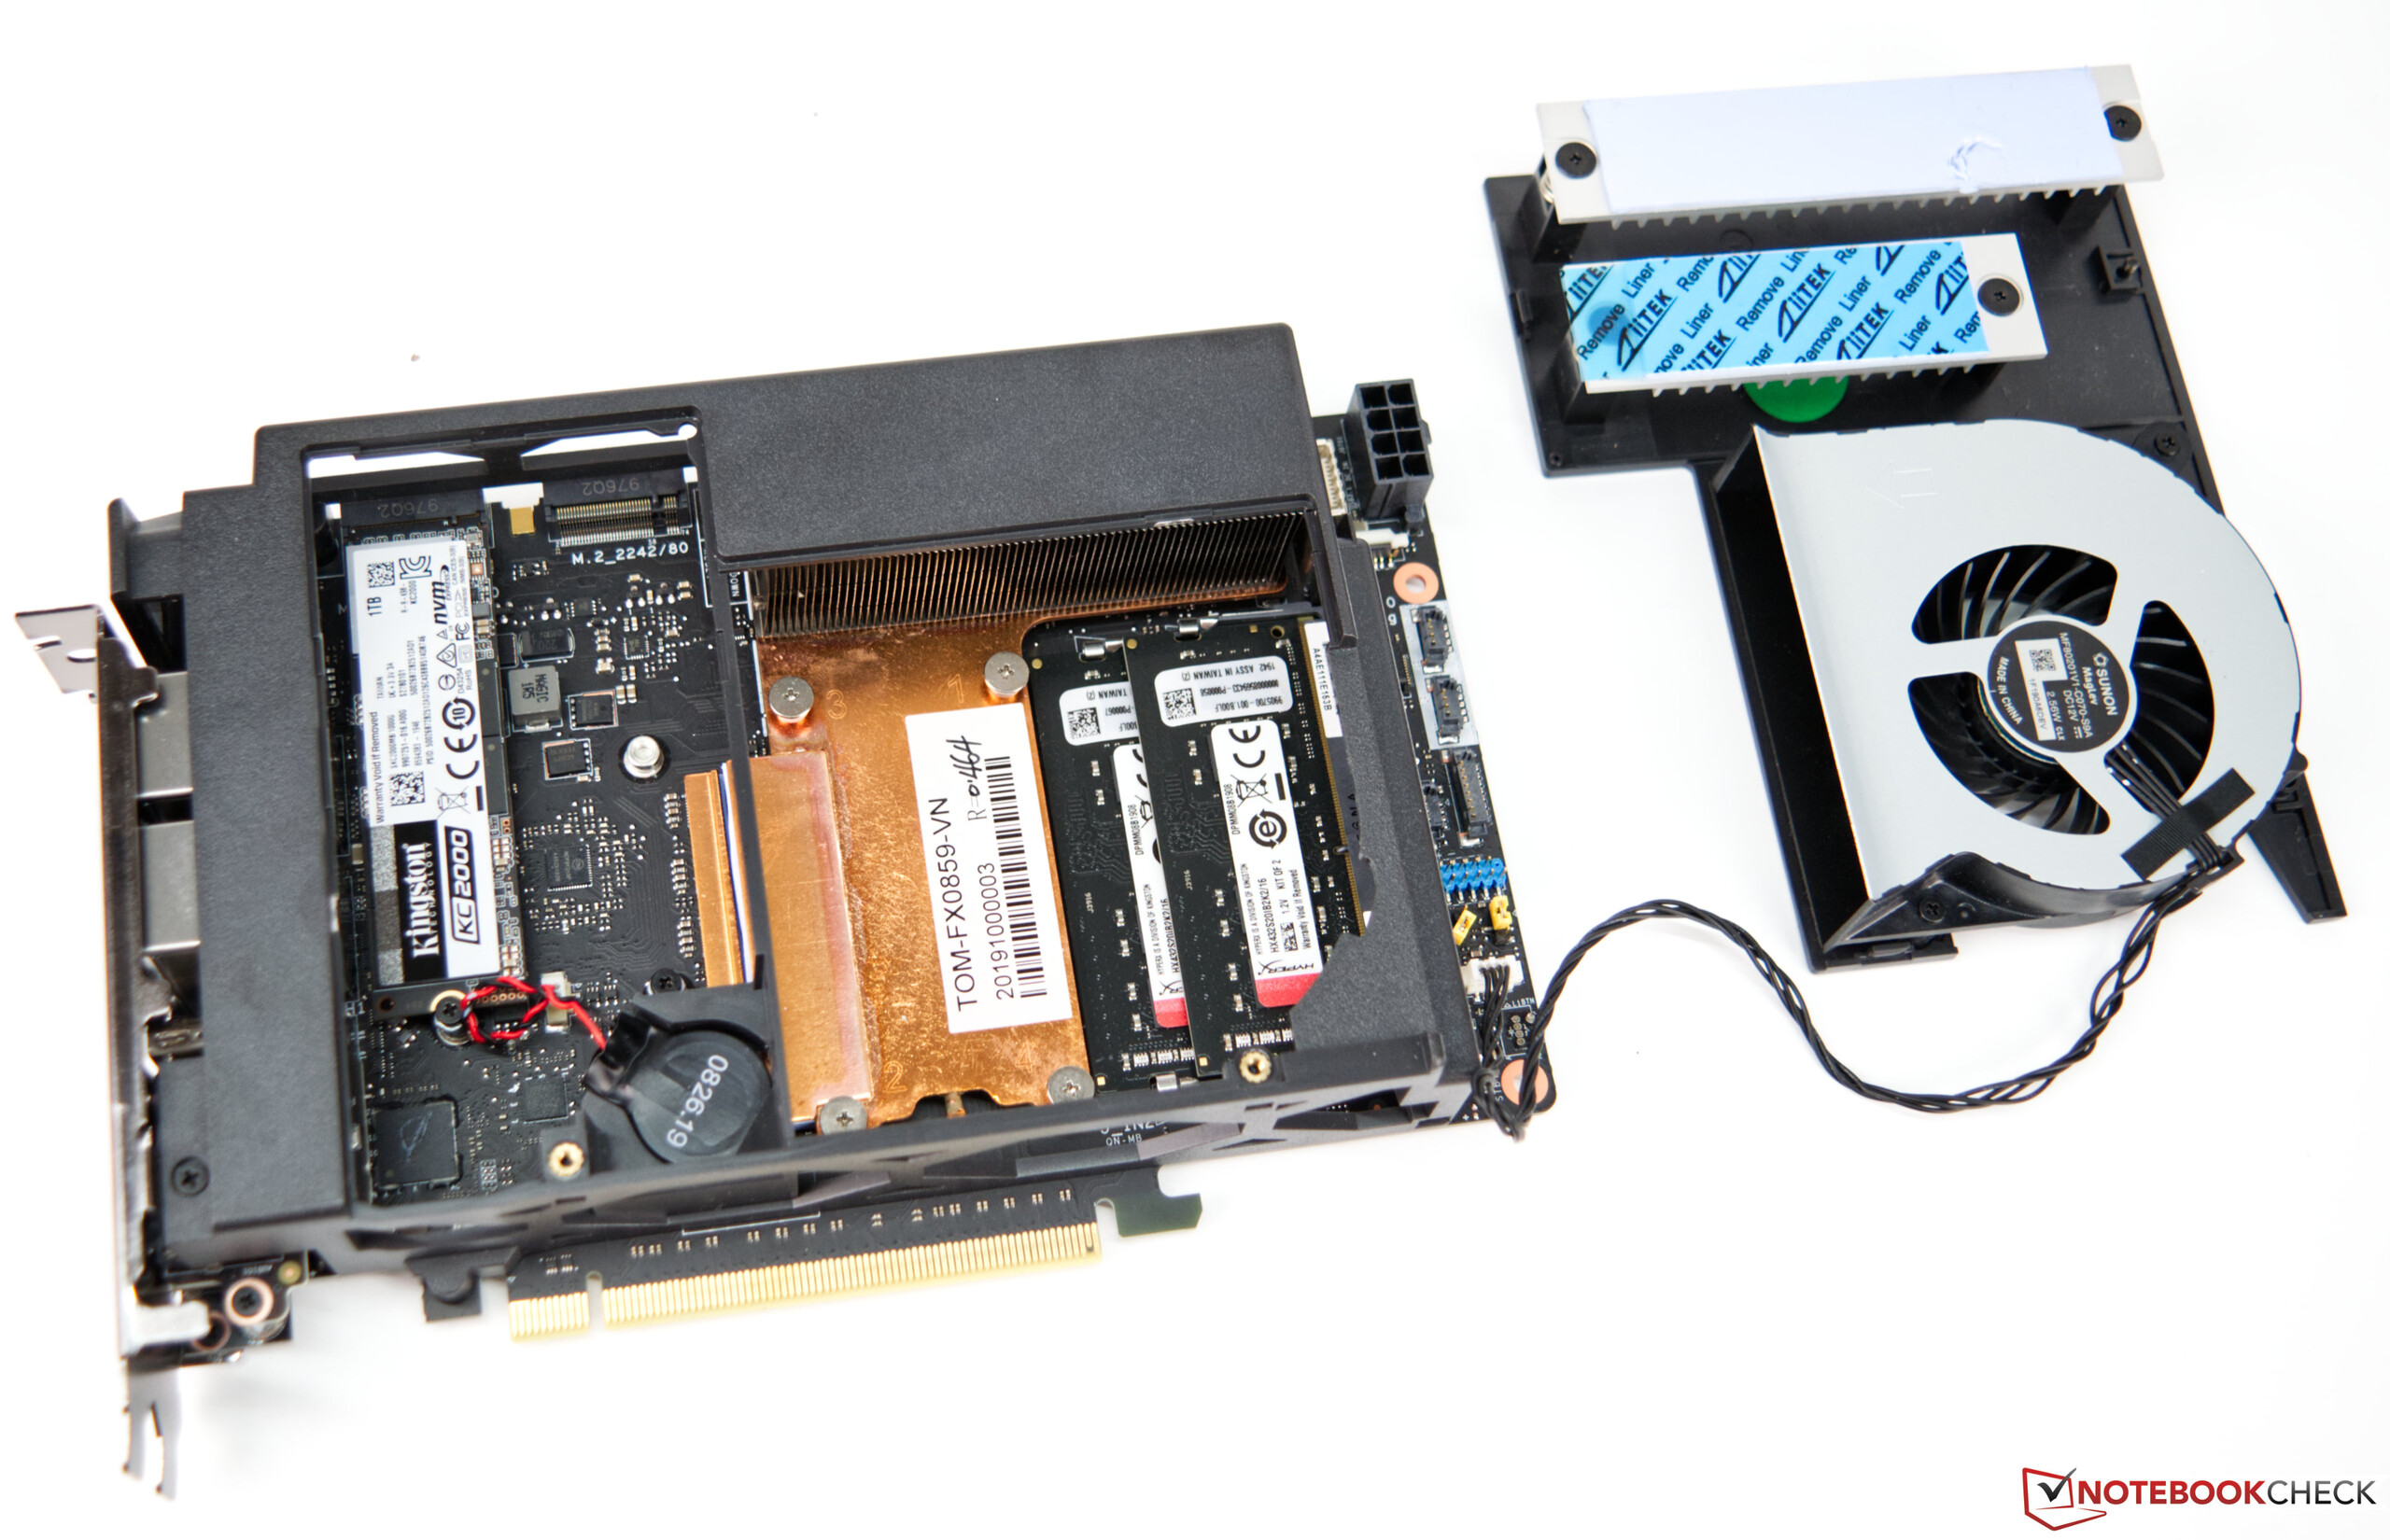
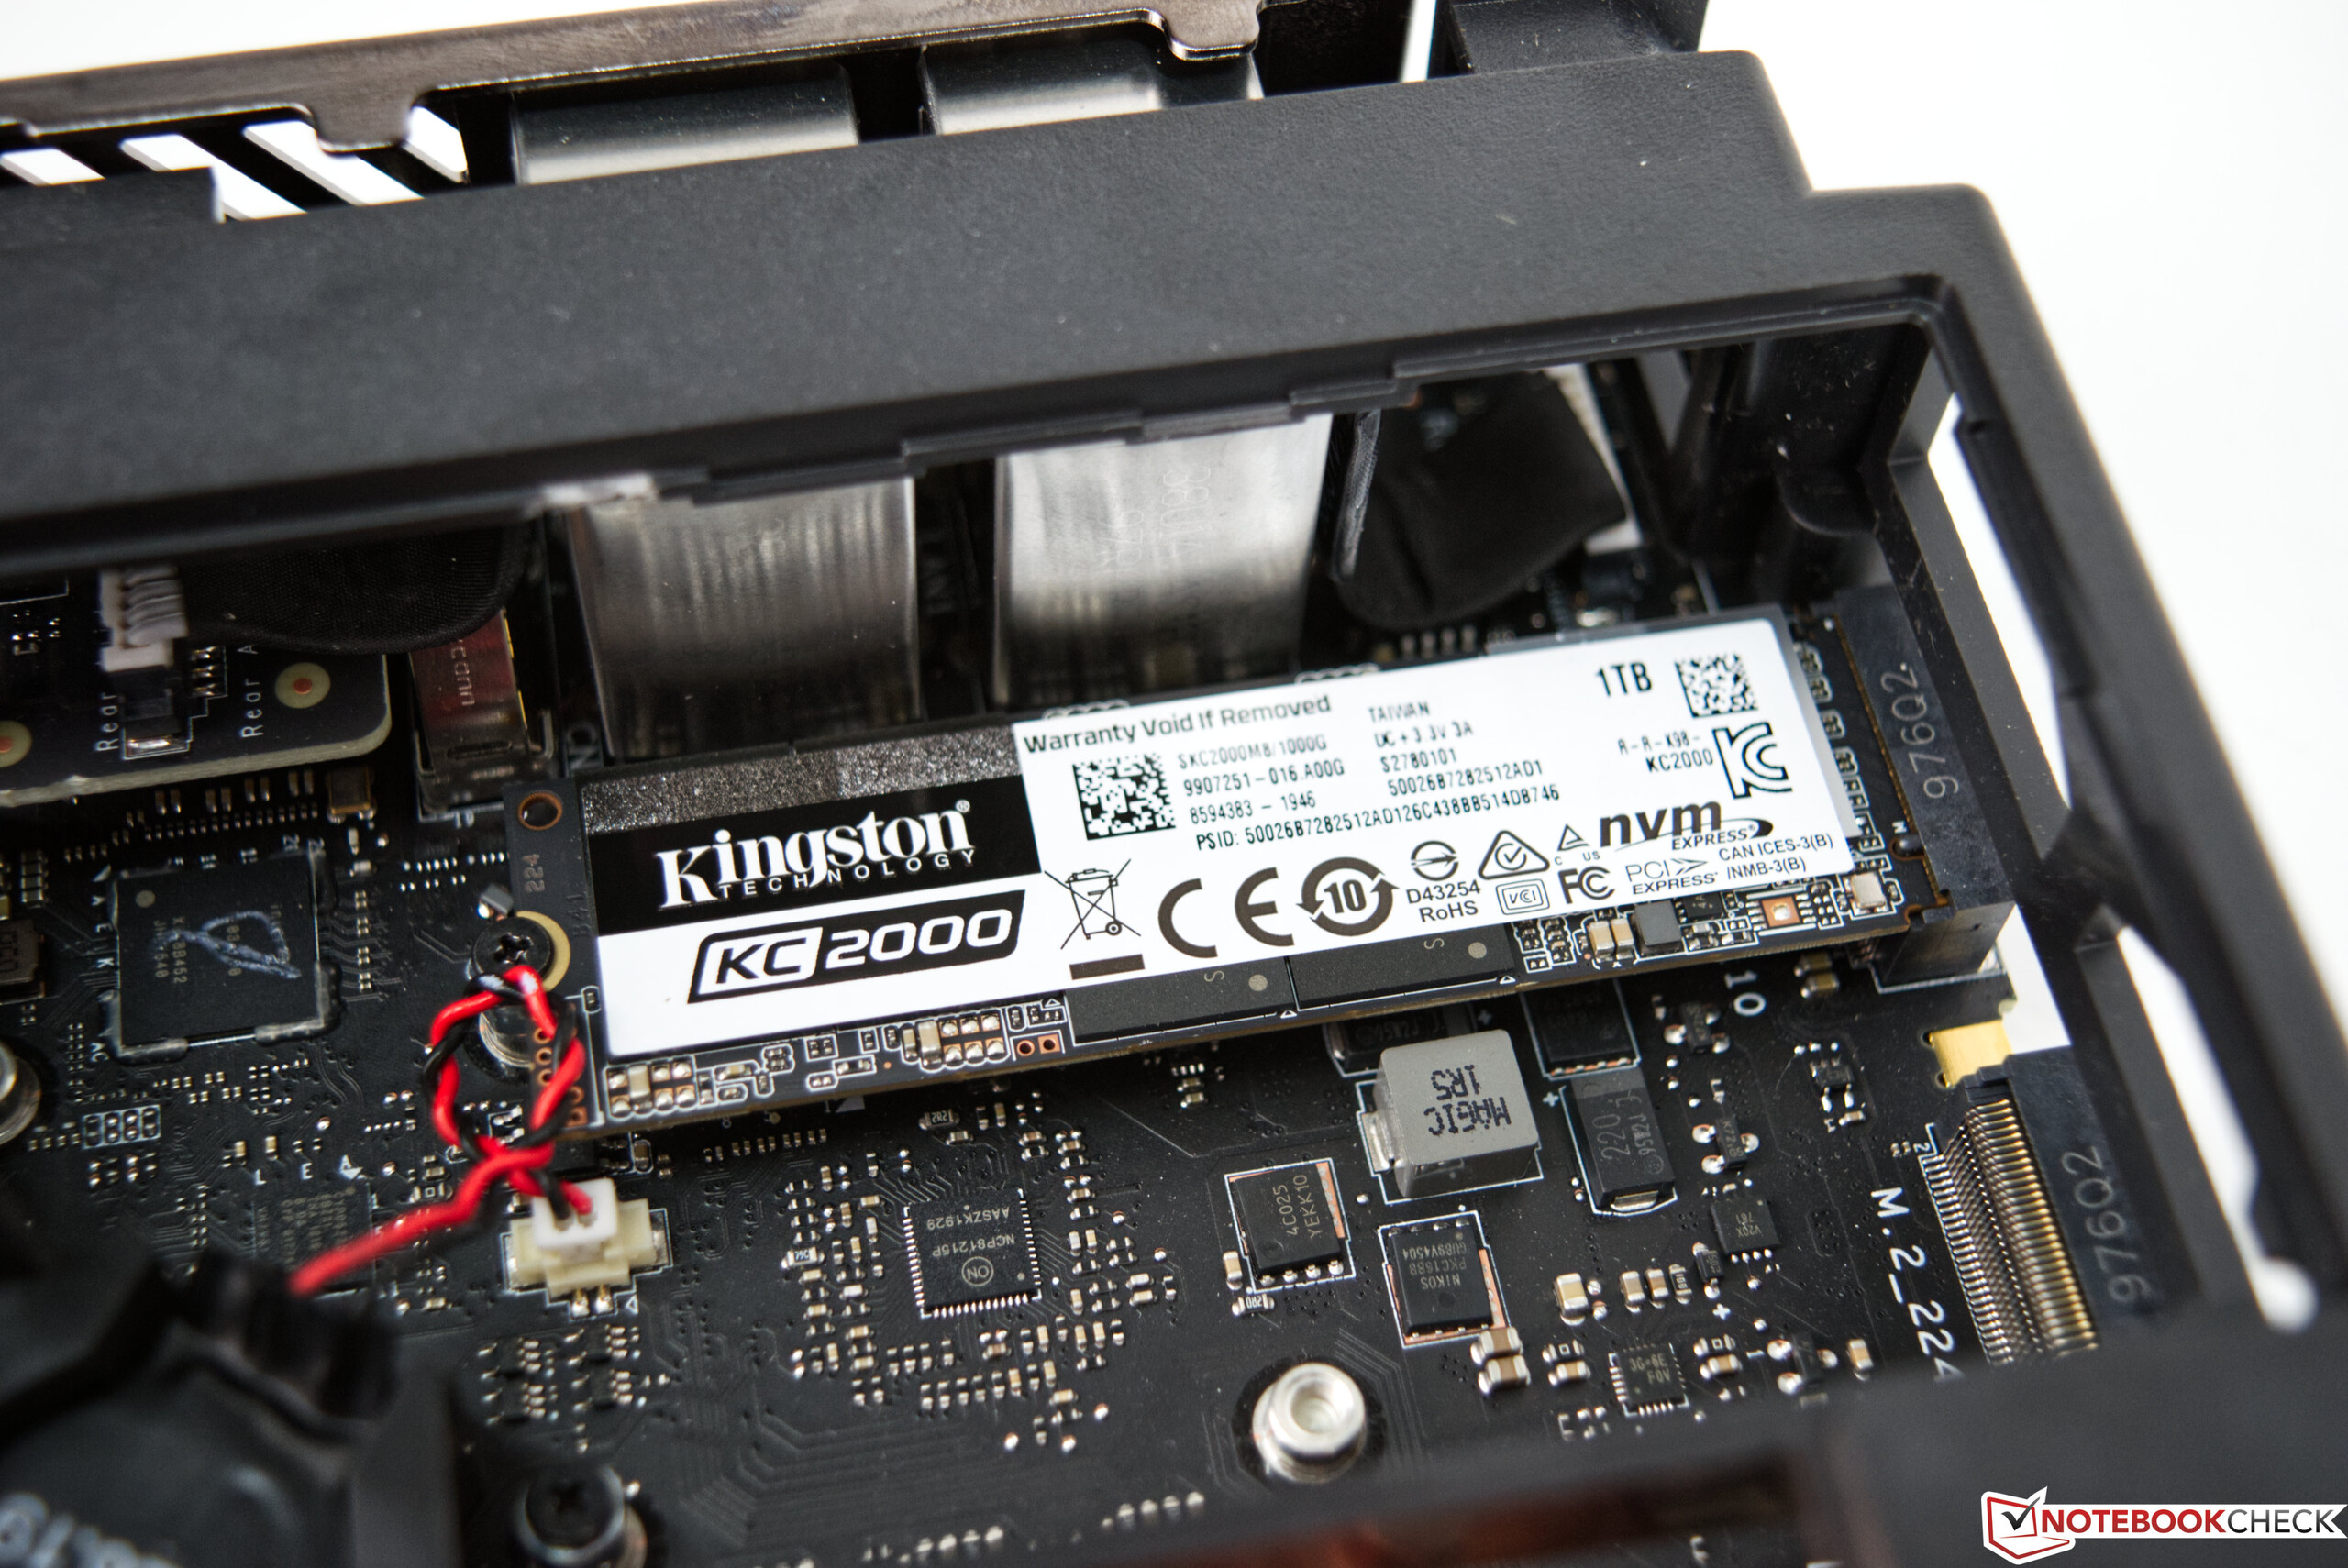
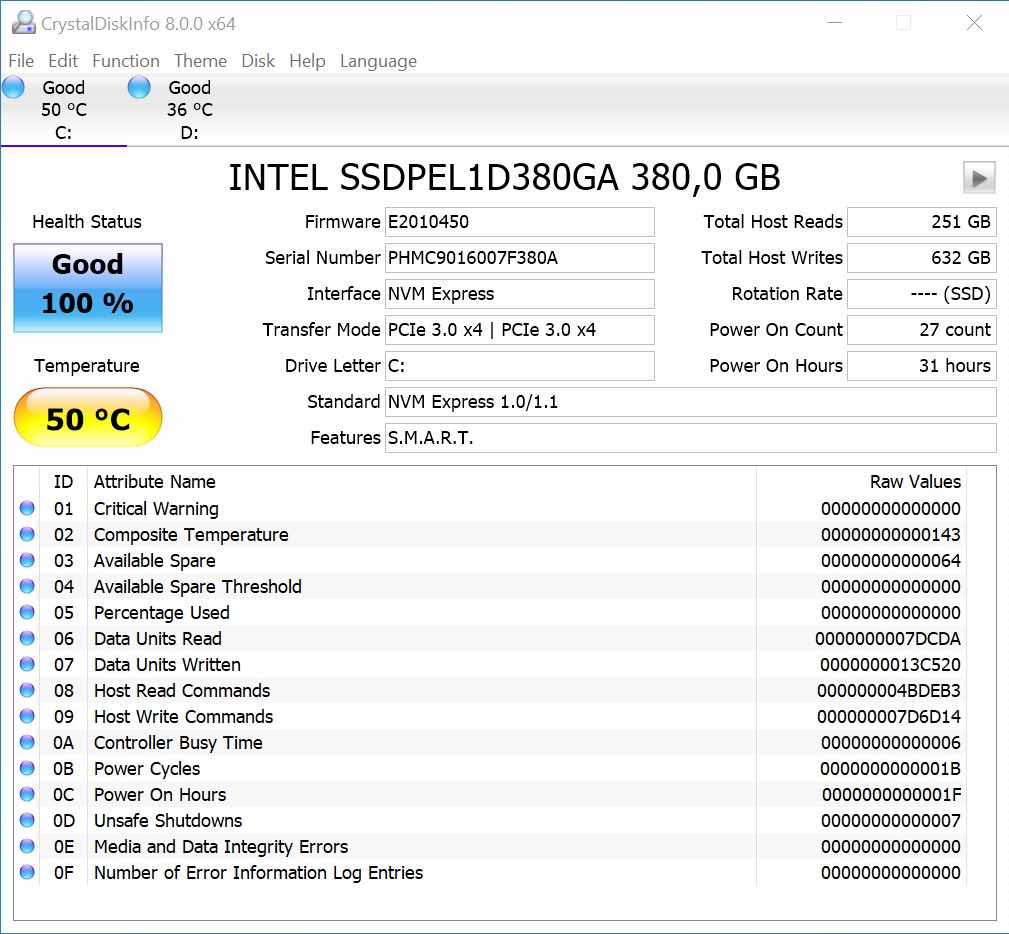
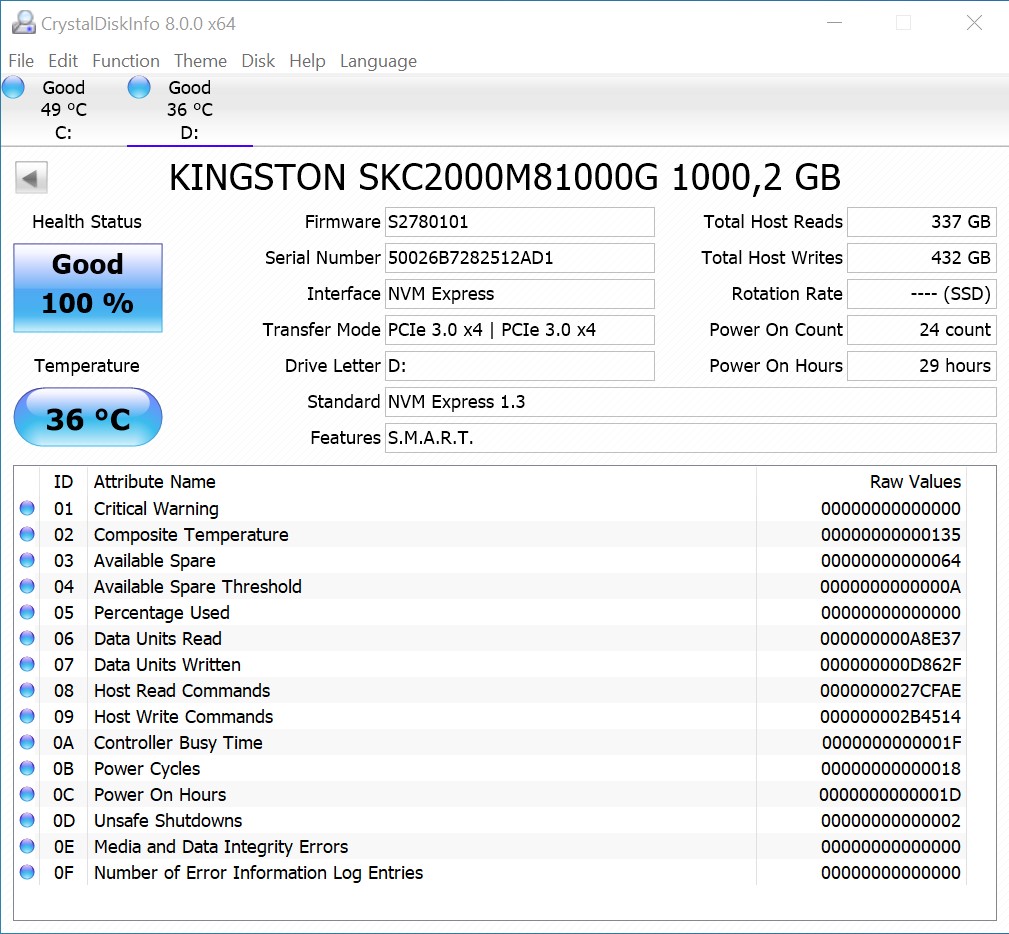
Intel NUC computers have been around for quite a while, and most of the time these miniature PCs are used as small office computers. One notable example was the Intel NUC Hades Canyon that was created in collaboration with AMD and aimed at gamers looking for a compact machine. This is exactly where the new Ghost Canyon enters the arena, as it offers a case smaller than 5 liters (1.3 gallons) without sacrificing performance. The model reviewed by us features an Intel Core i9-9980HK, 16 GB of RAM, and two SSDs with a combined storage capacity of 1.38 TB. 3D acceleration is provided by an Nvidia GeForce RTX 2070. This combination should be more than powerful enough to run even current games smoothly and without any issues.

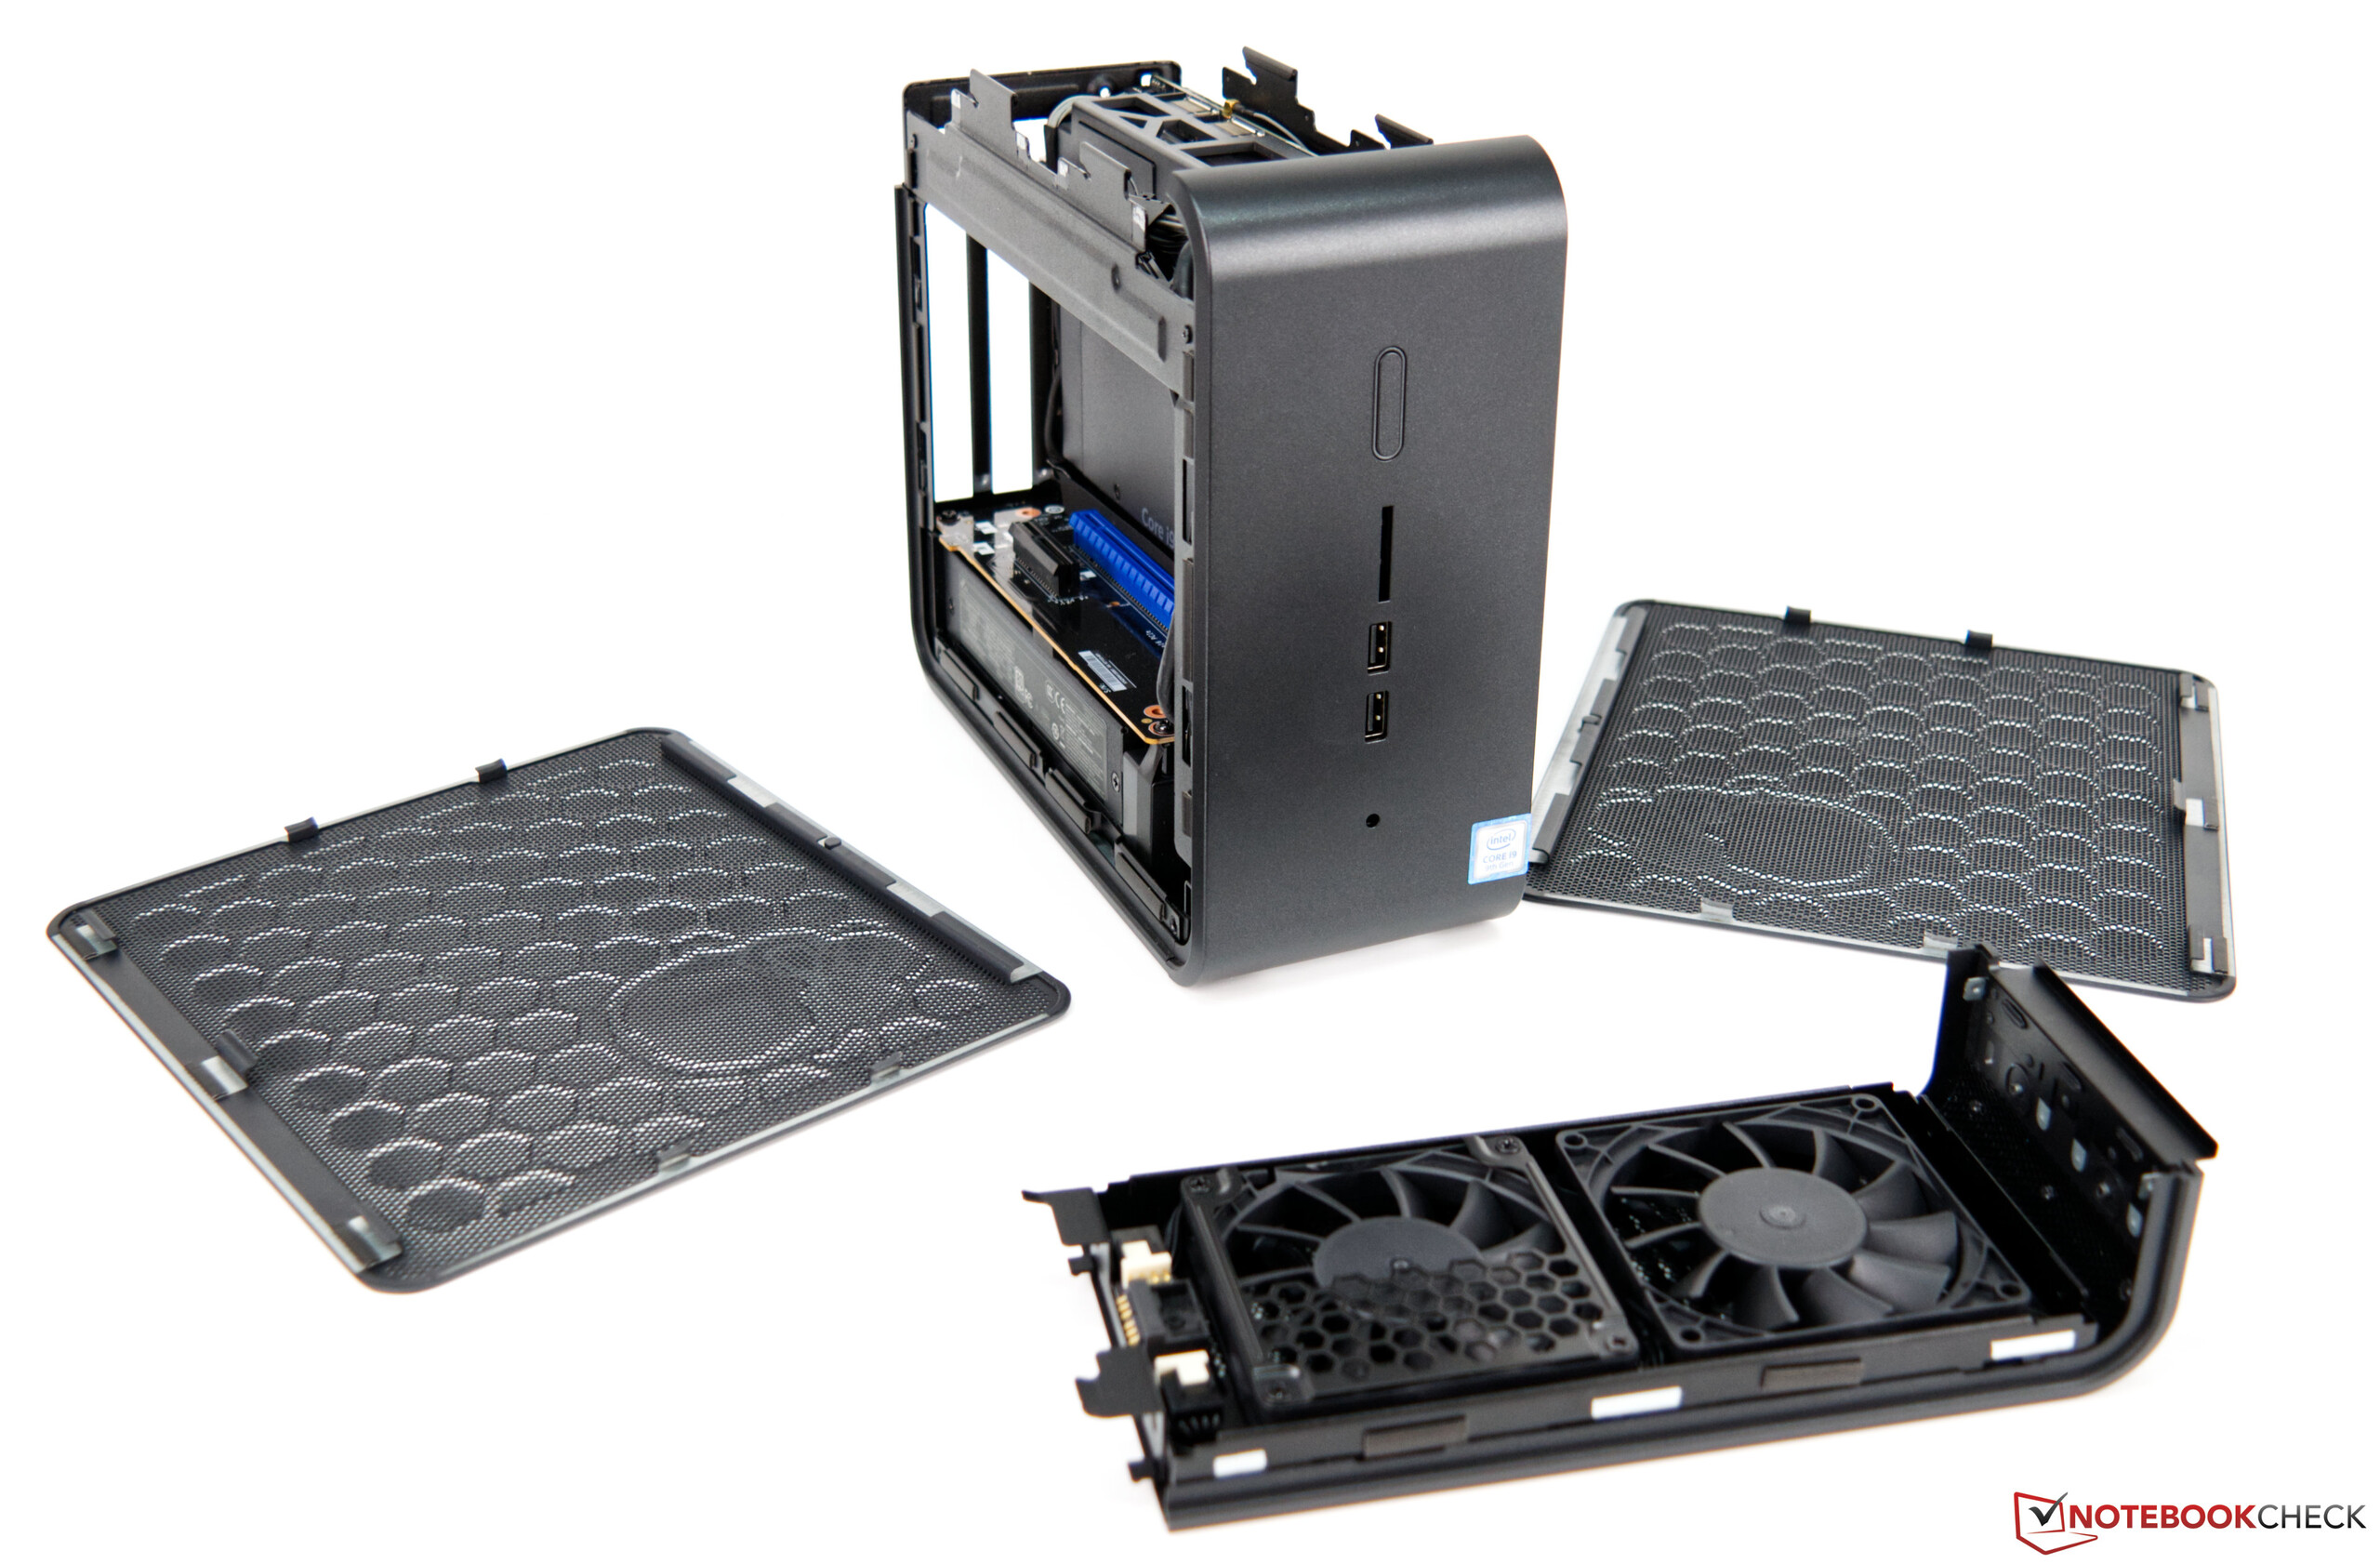
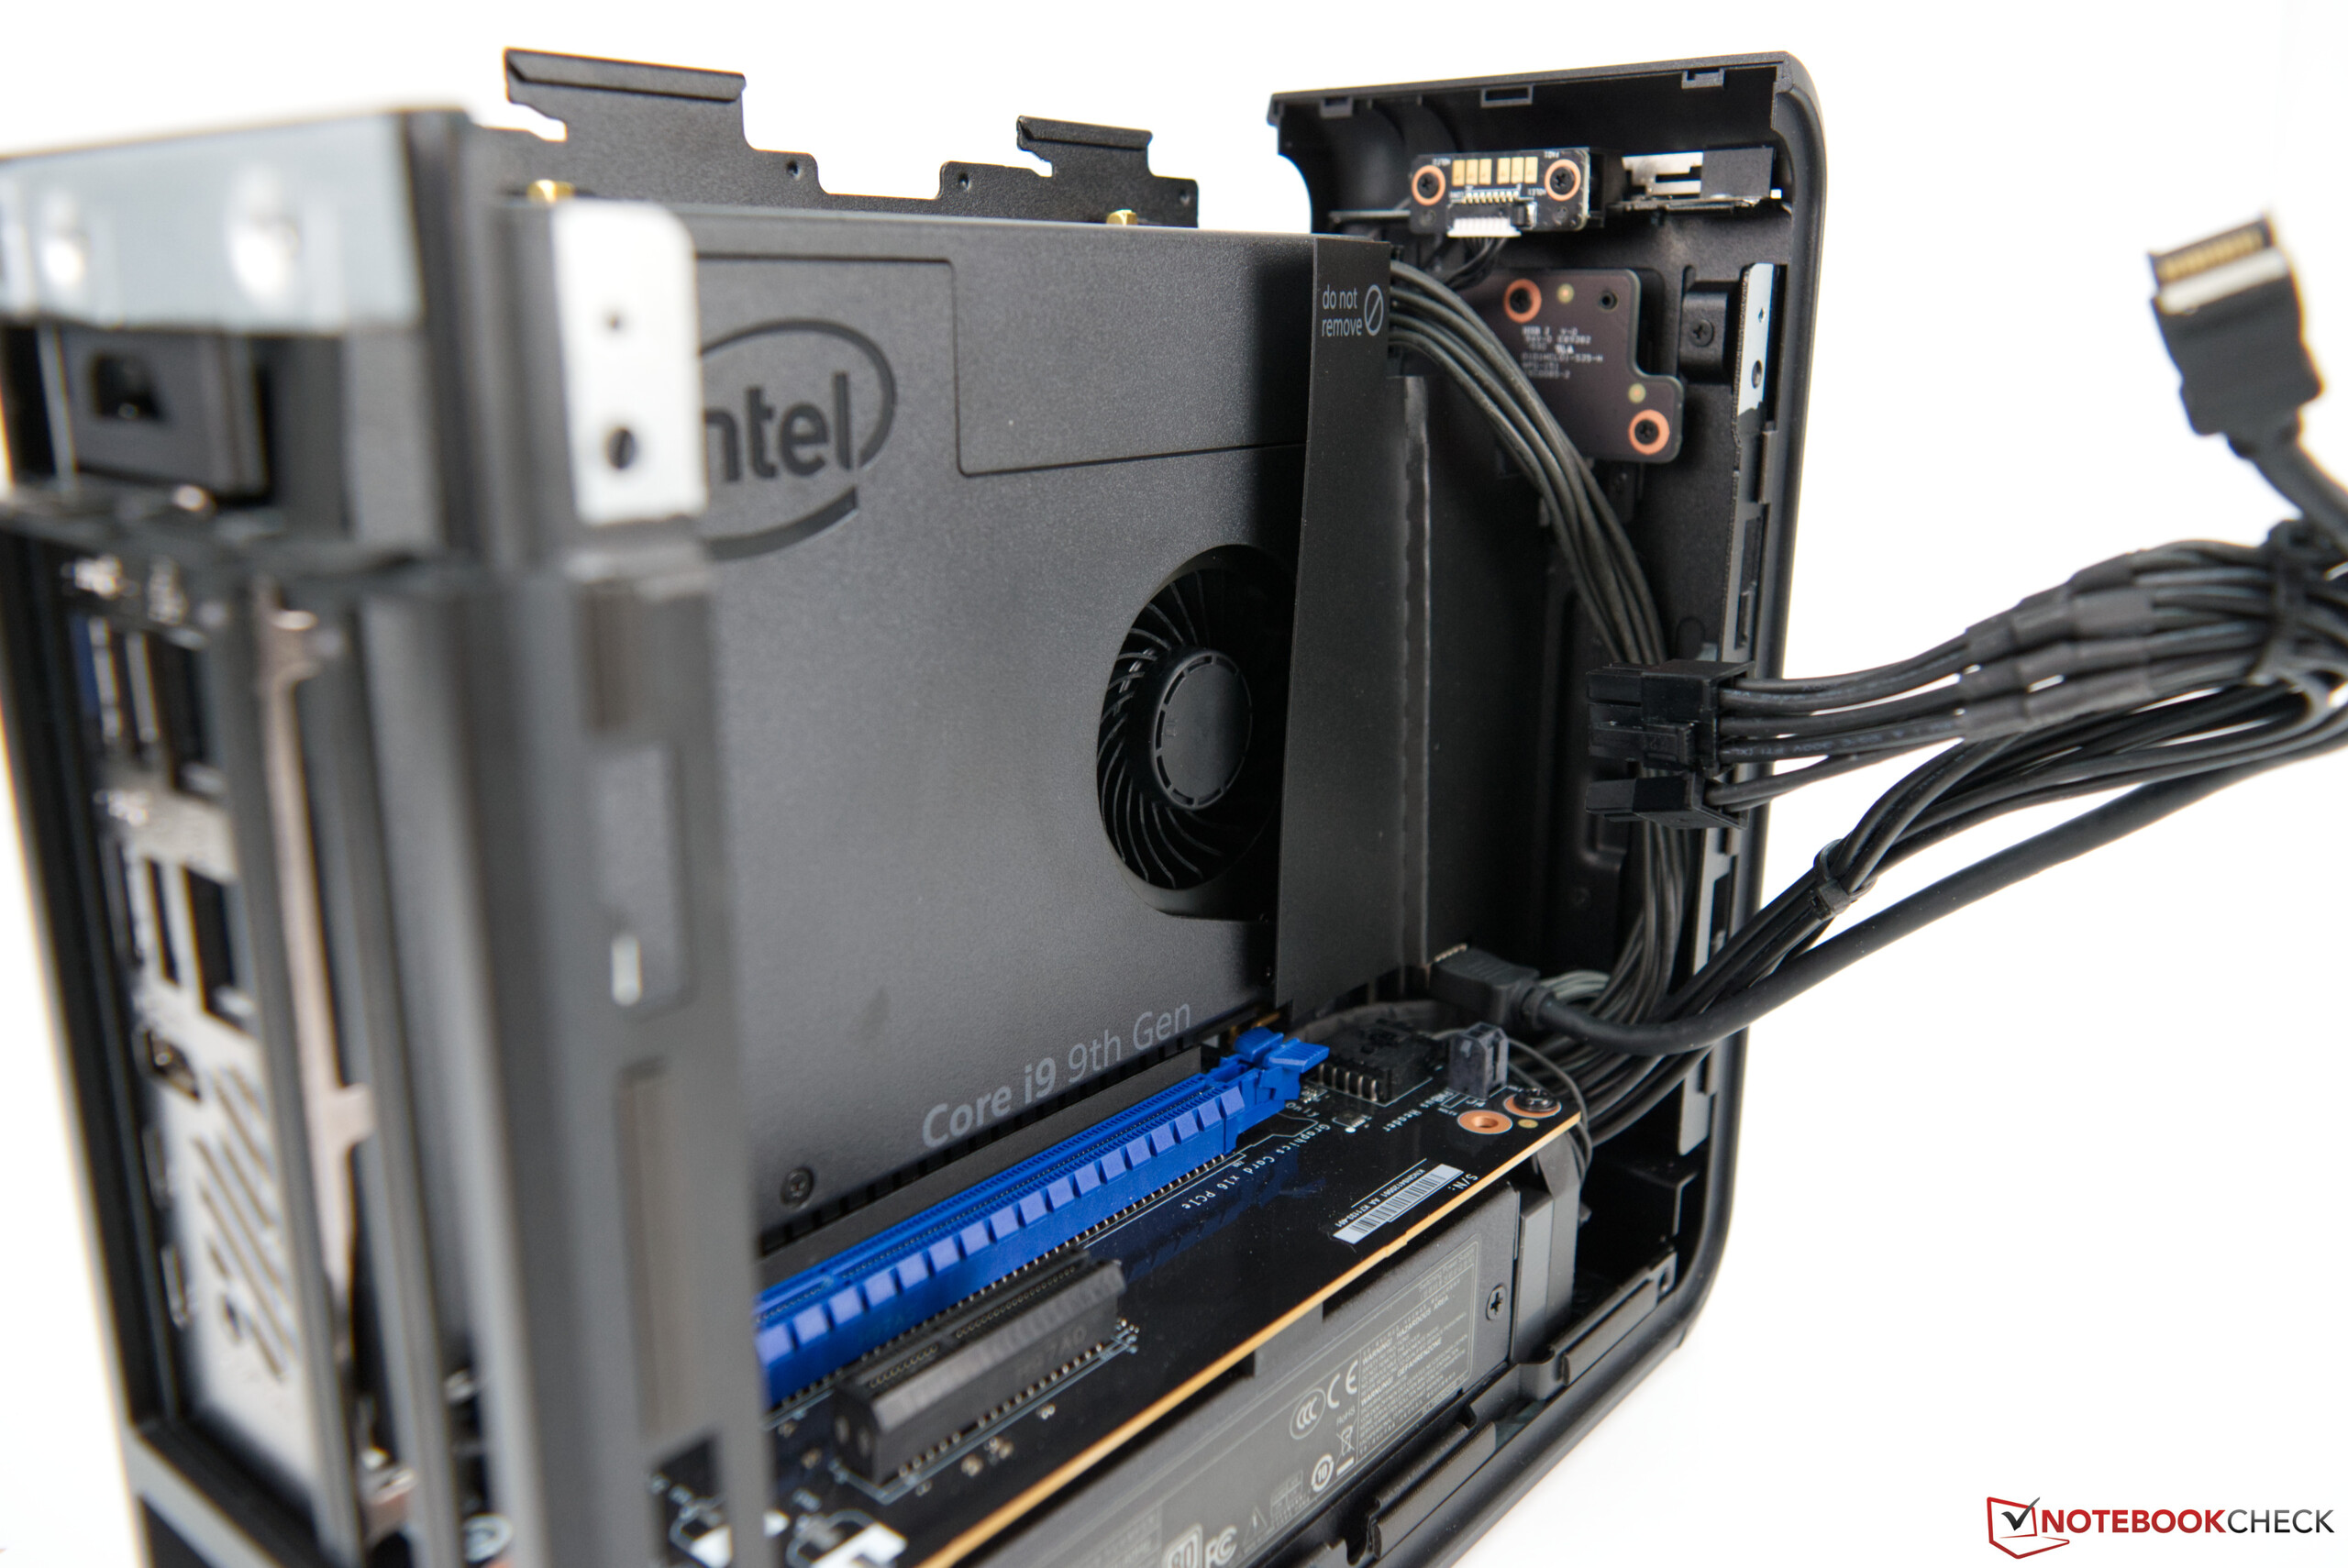
If you are considering purchasing this device keep in mind that RAM, storage, and dedicated graphics card are optional and not included with the NUC. Regardless, the Core i9-9980HK equipped SKU will set you back almost $1,700. Alternatively, the Ghost Canyon NUC can also be equipped with an Intel Core i5-9300H for around $1,000, or a Intel Core i7-9750H for around $1,300. In each case you will need to add RAM and at least one storage device. The compute element itself is not too complicated to take apart.

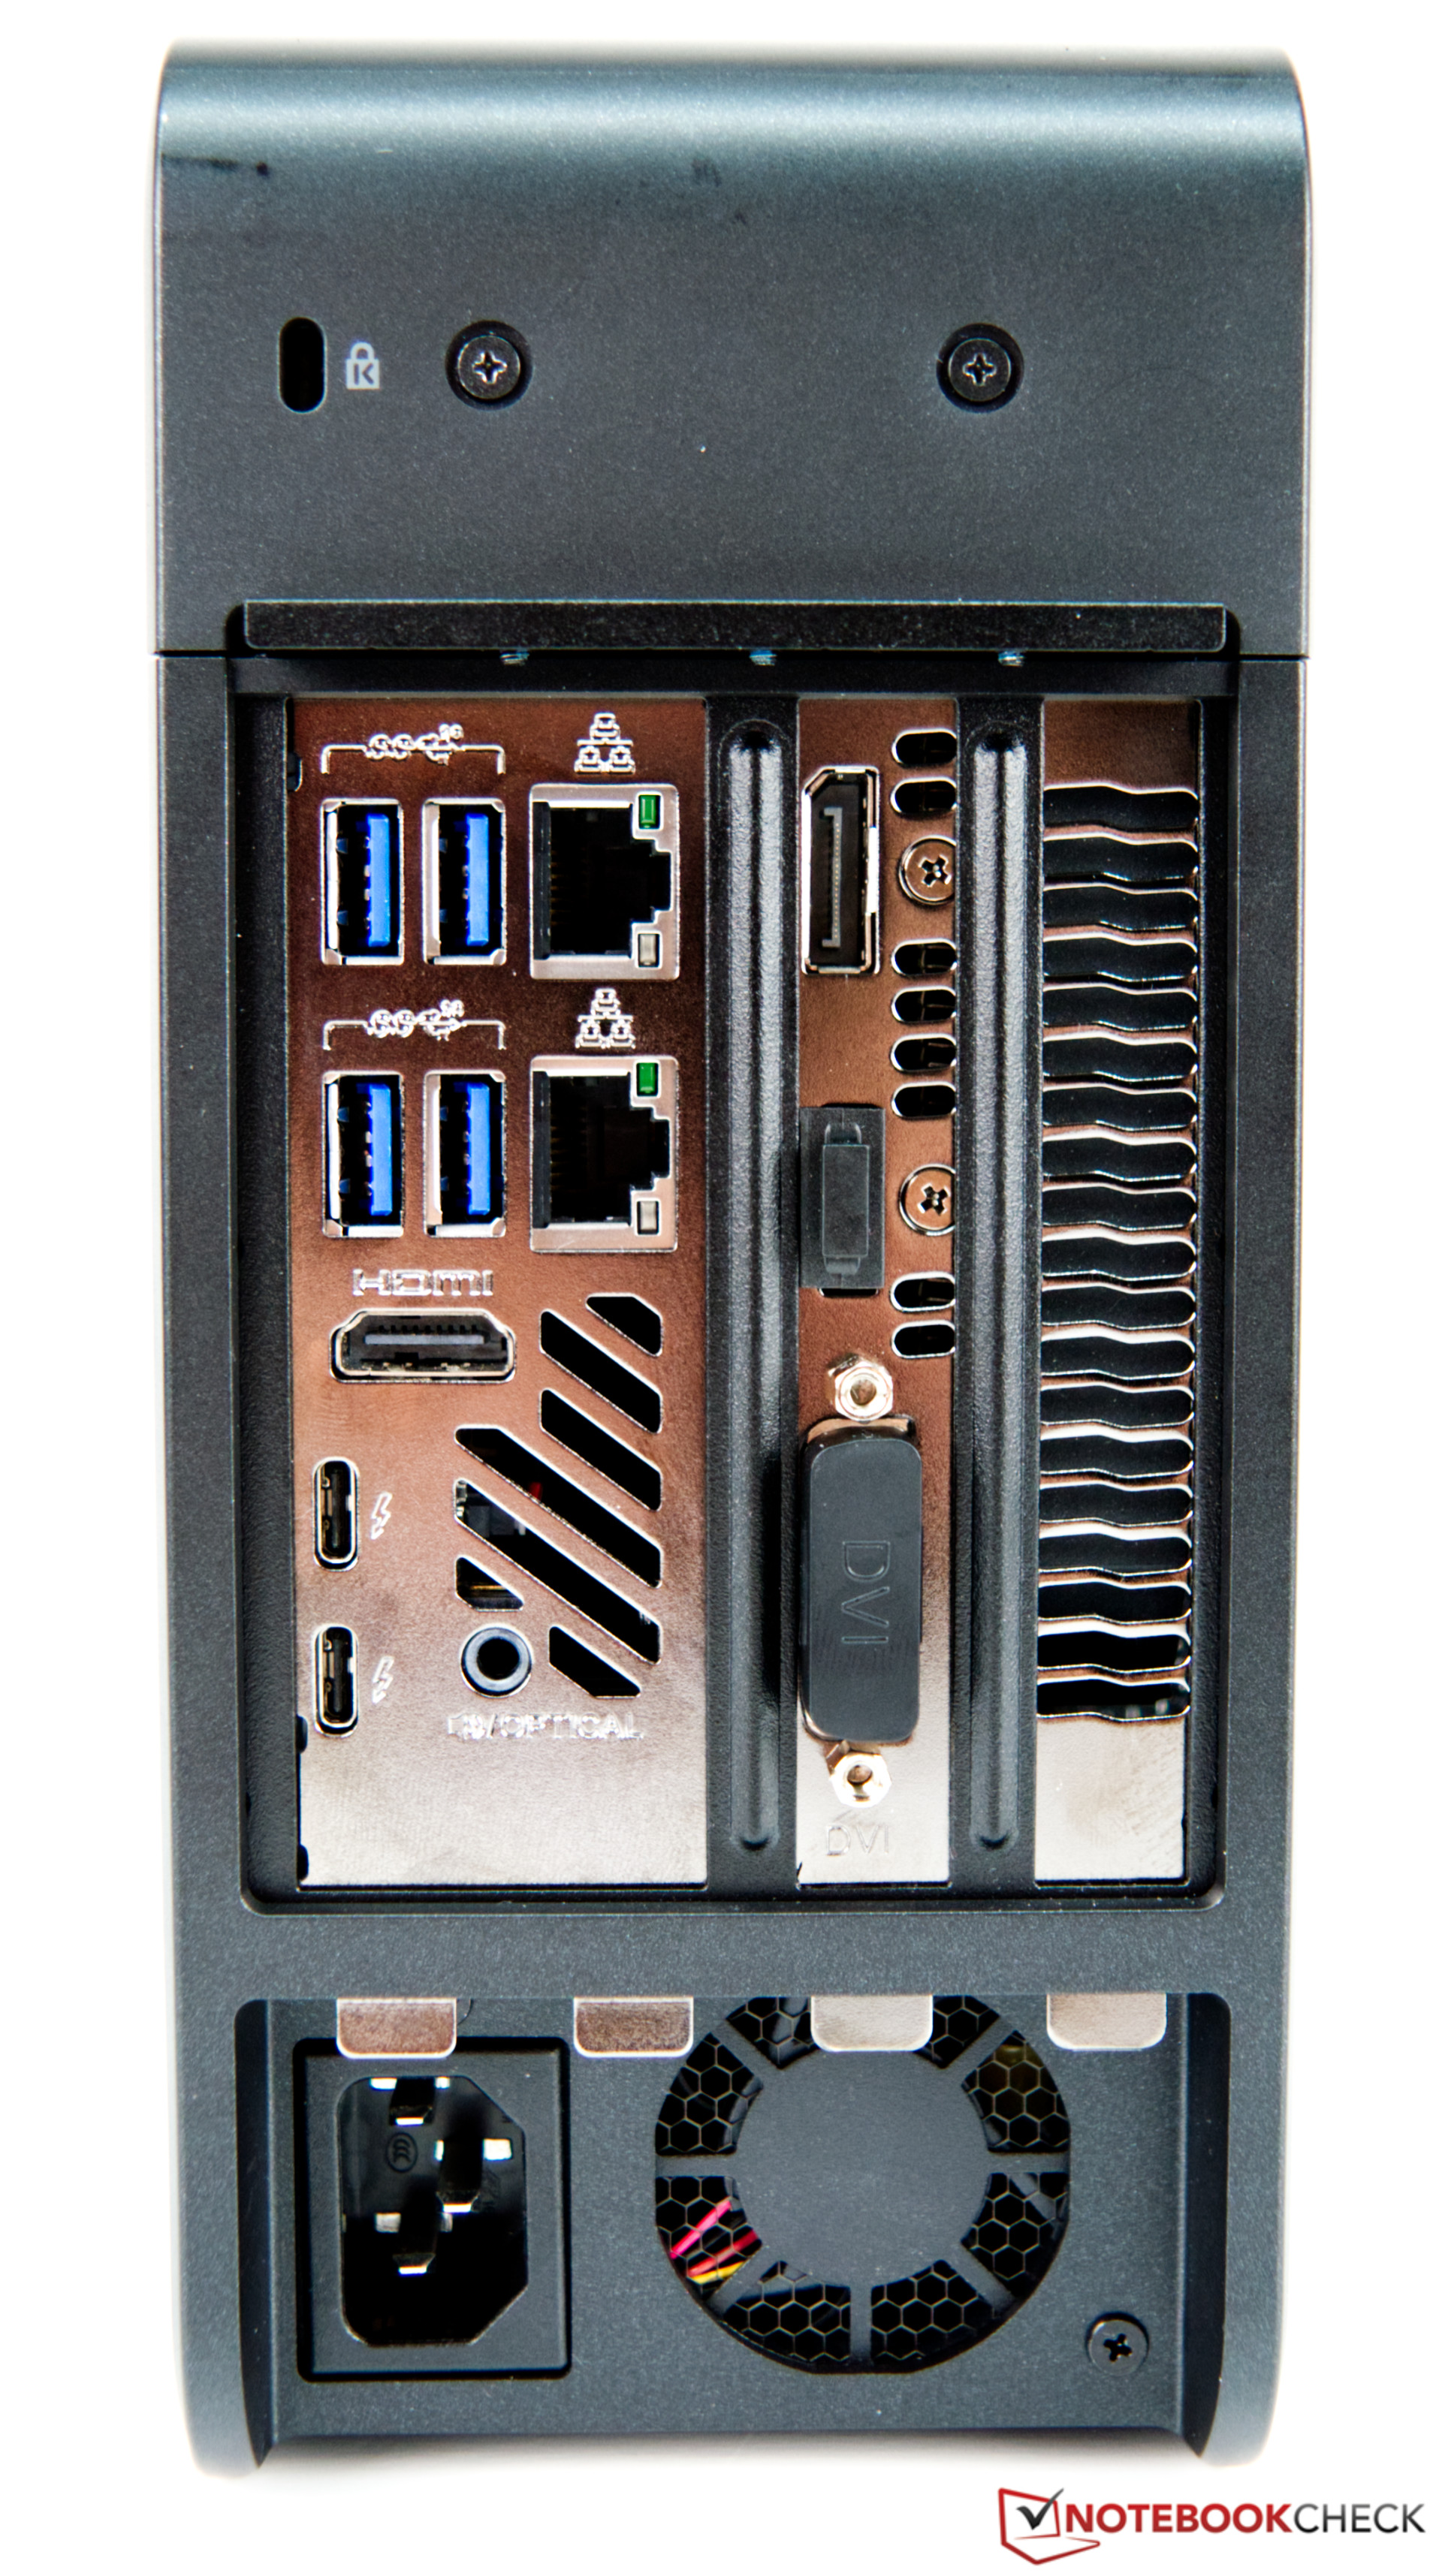
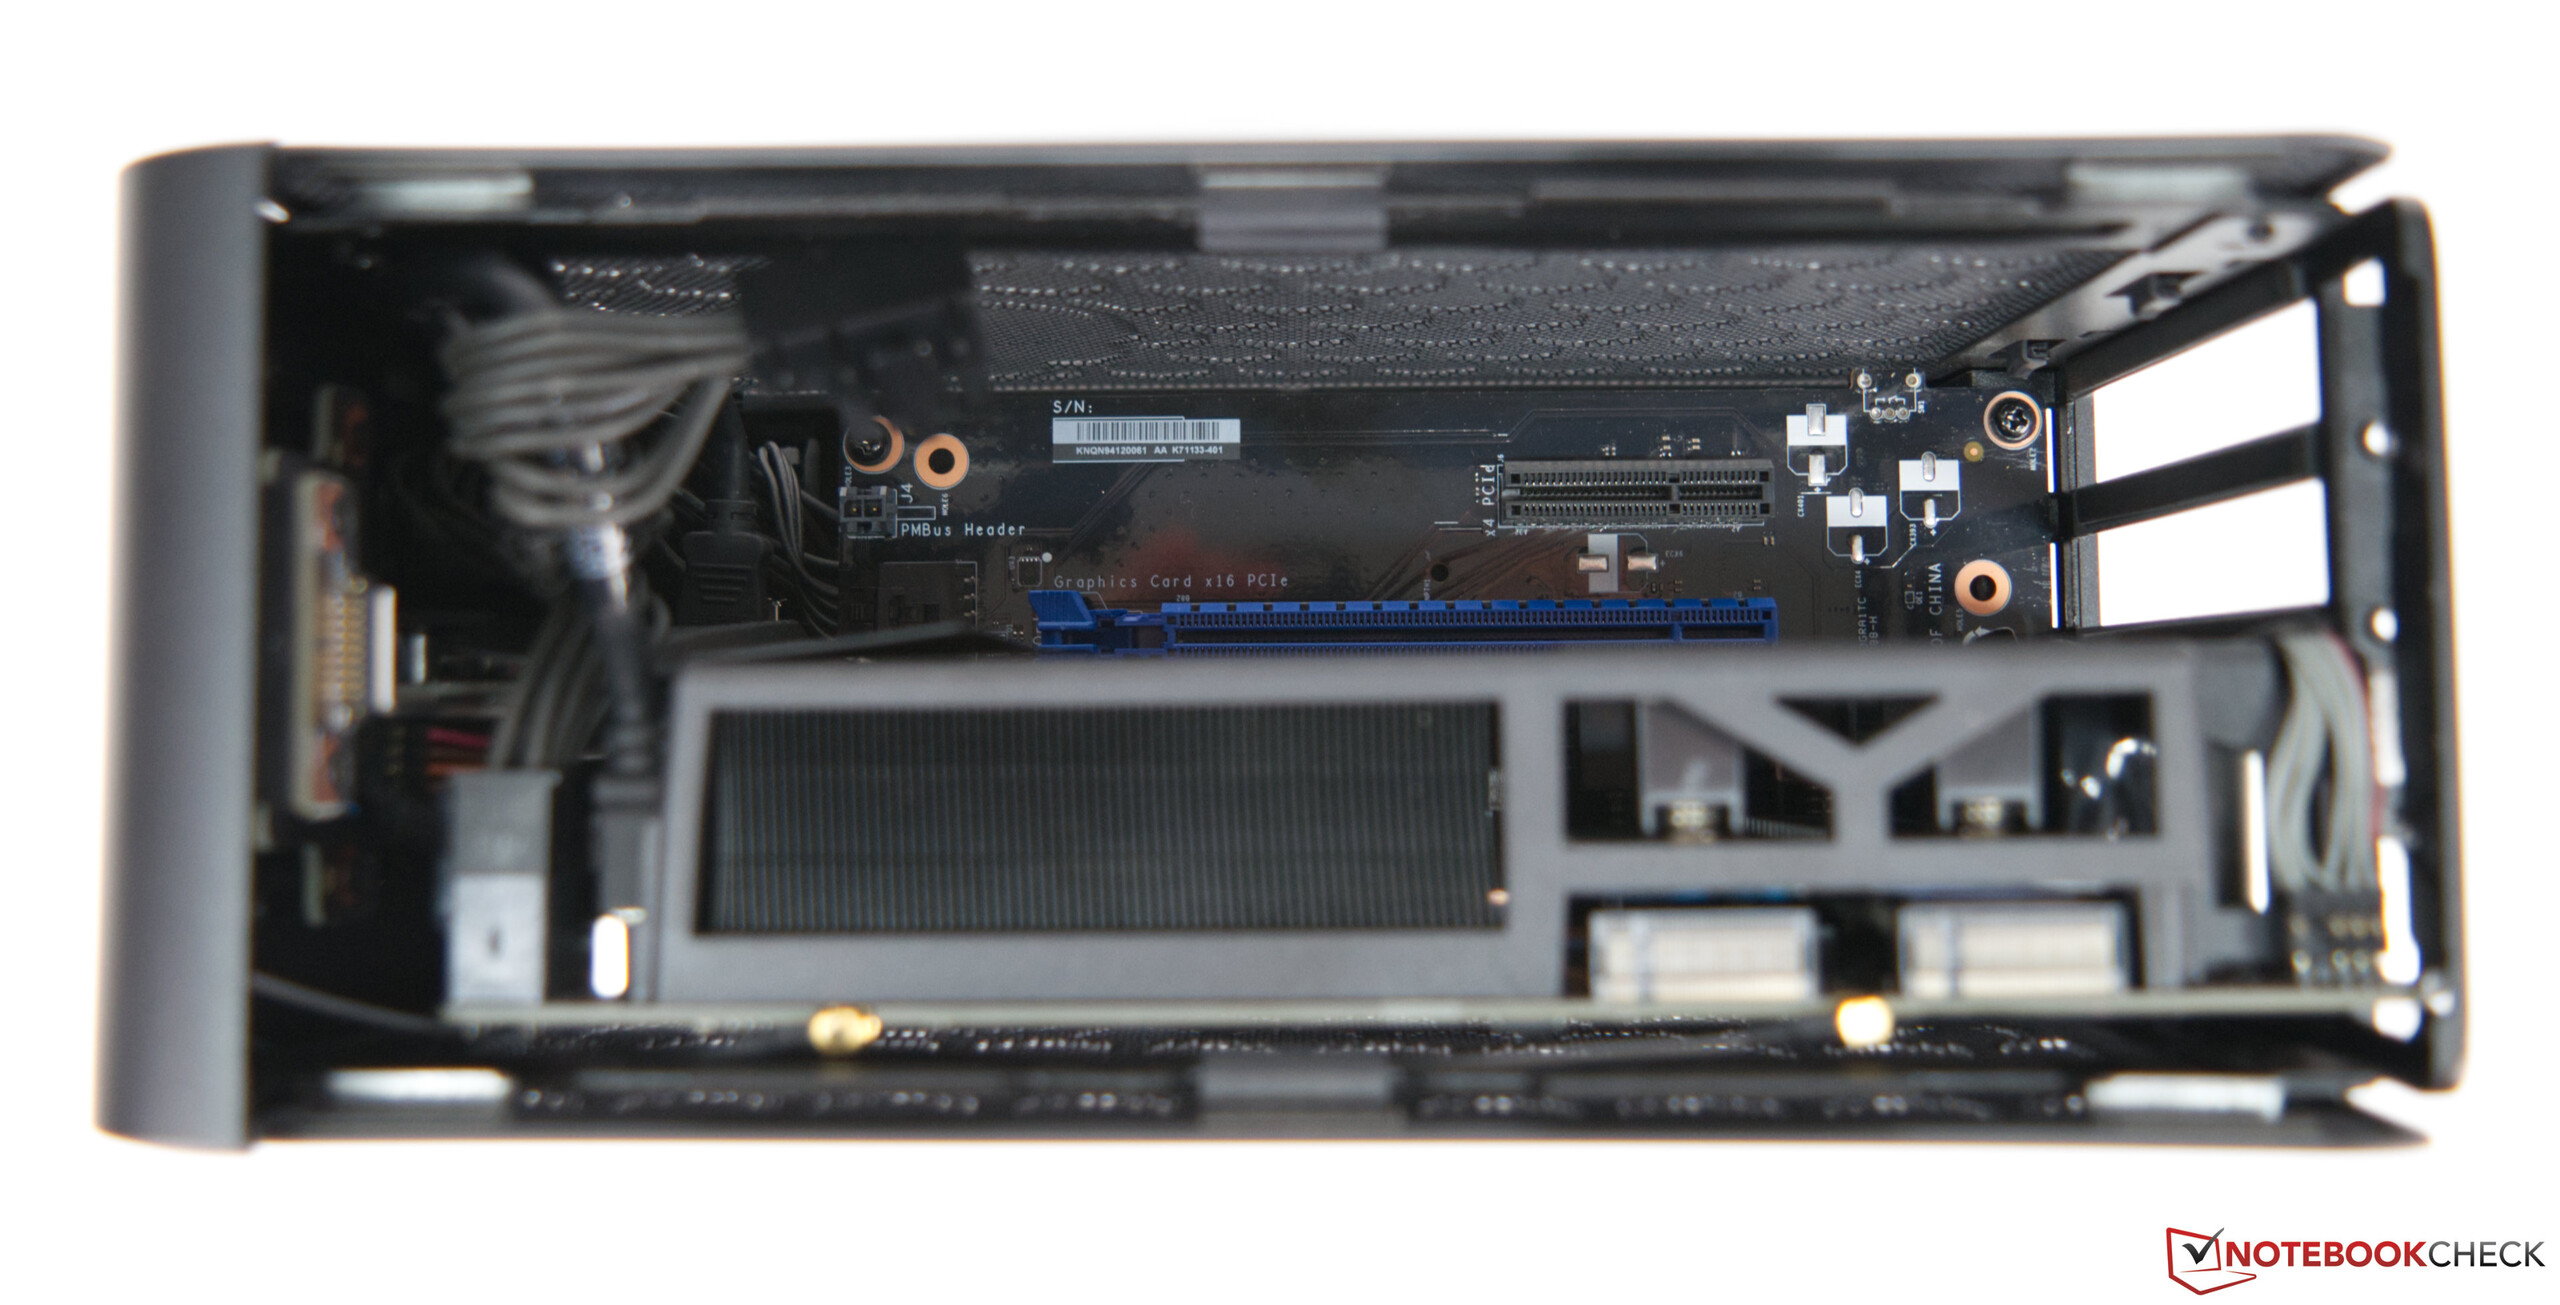
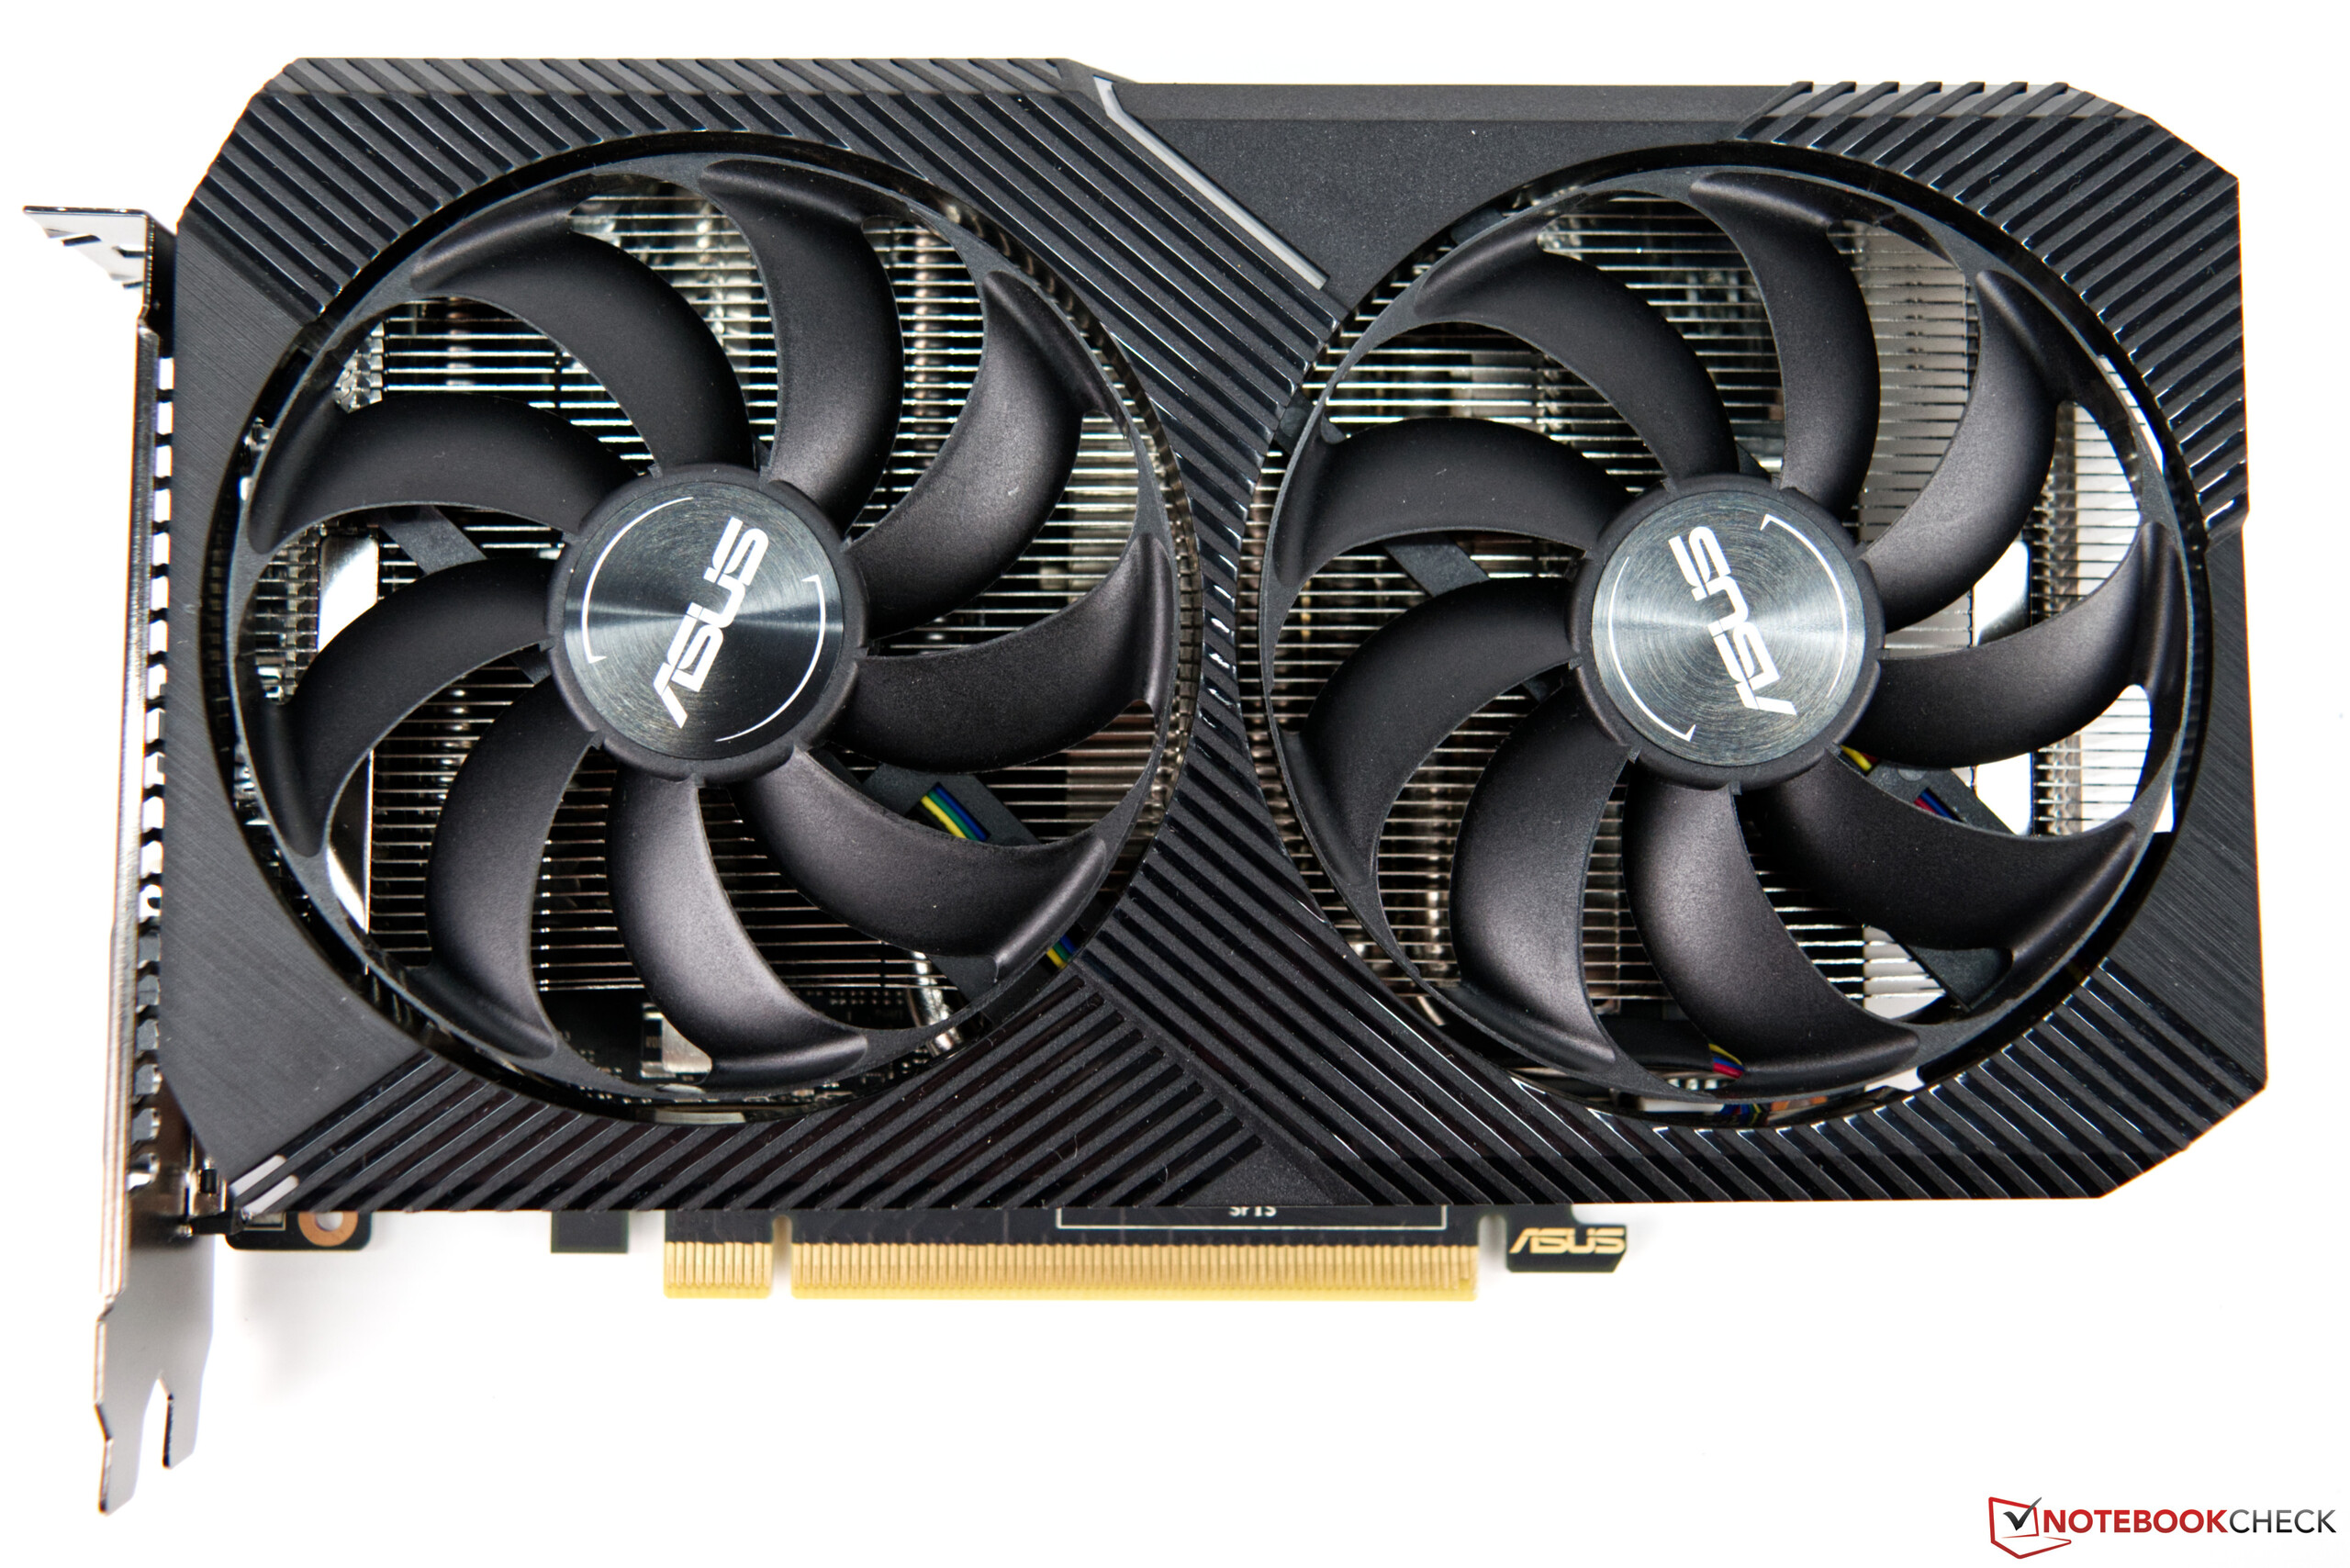
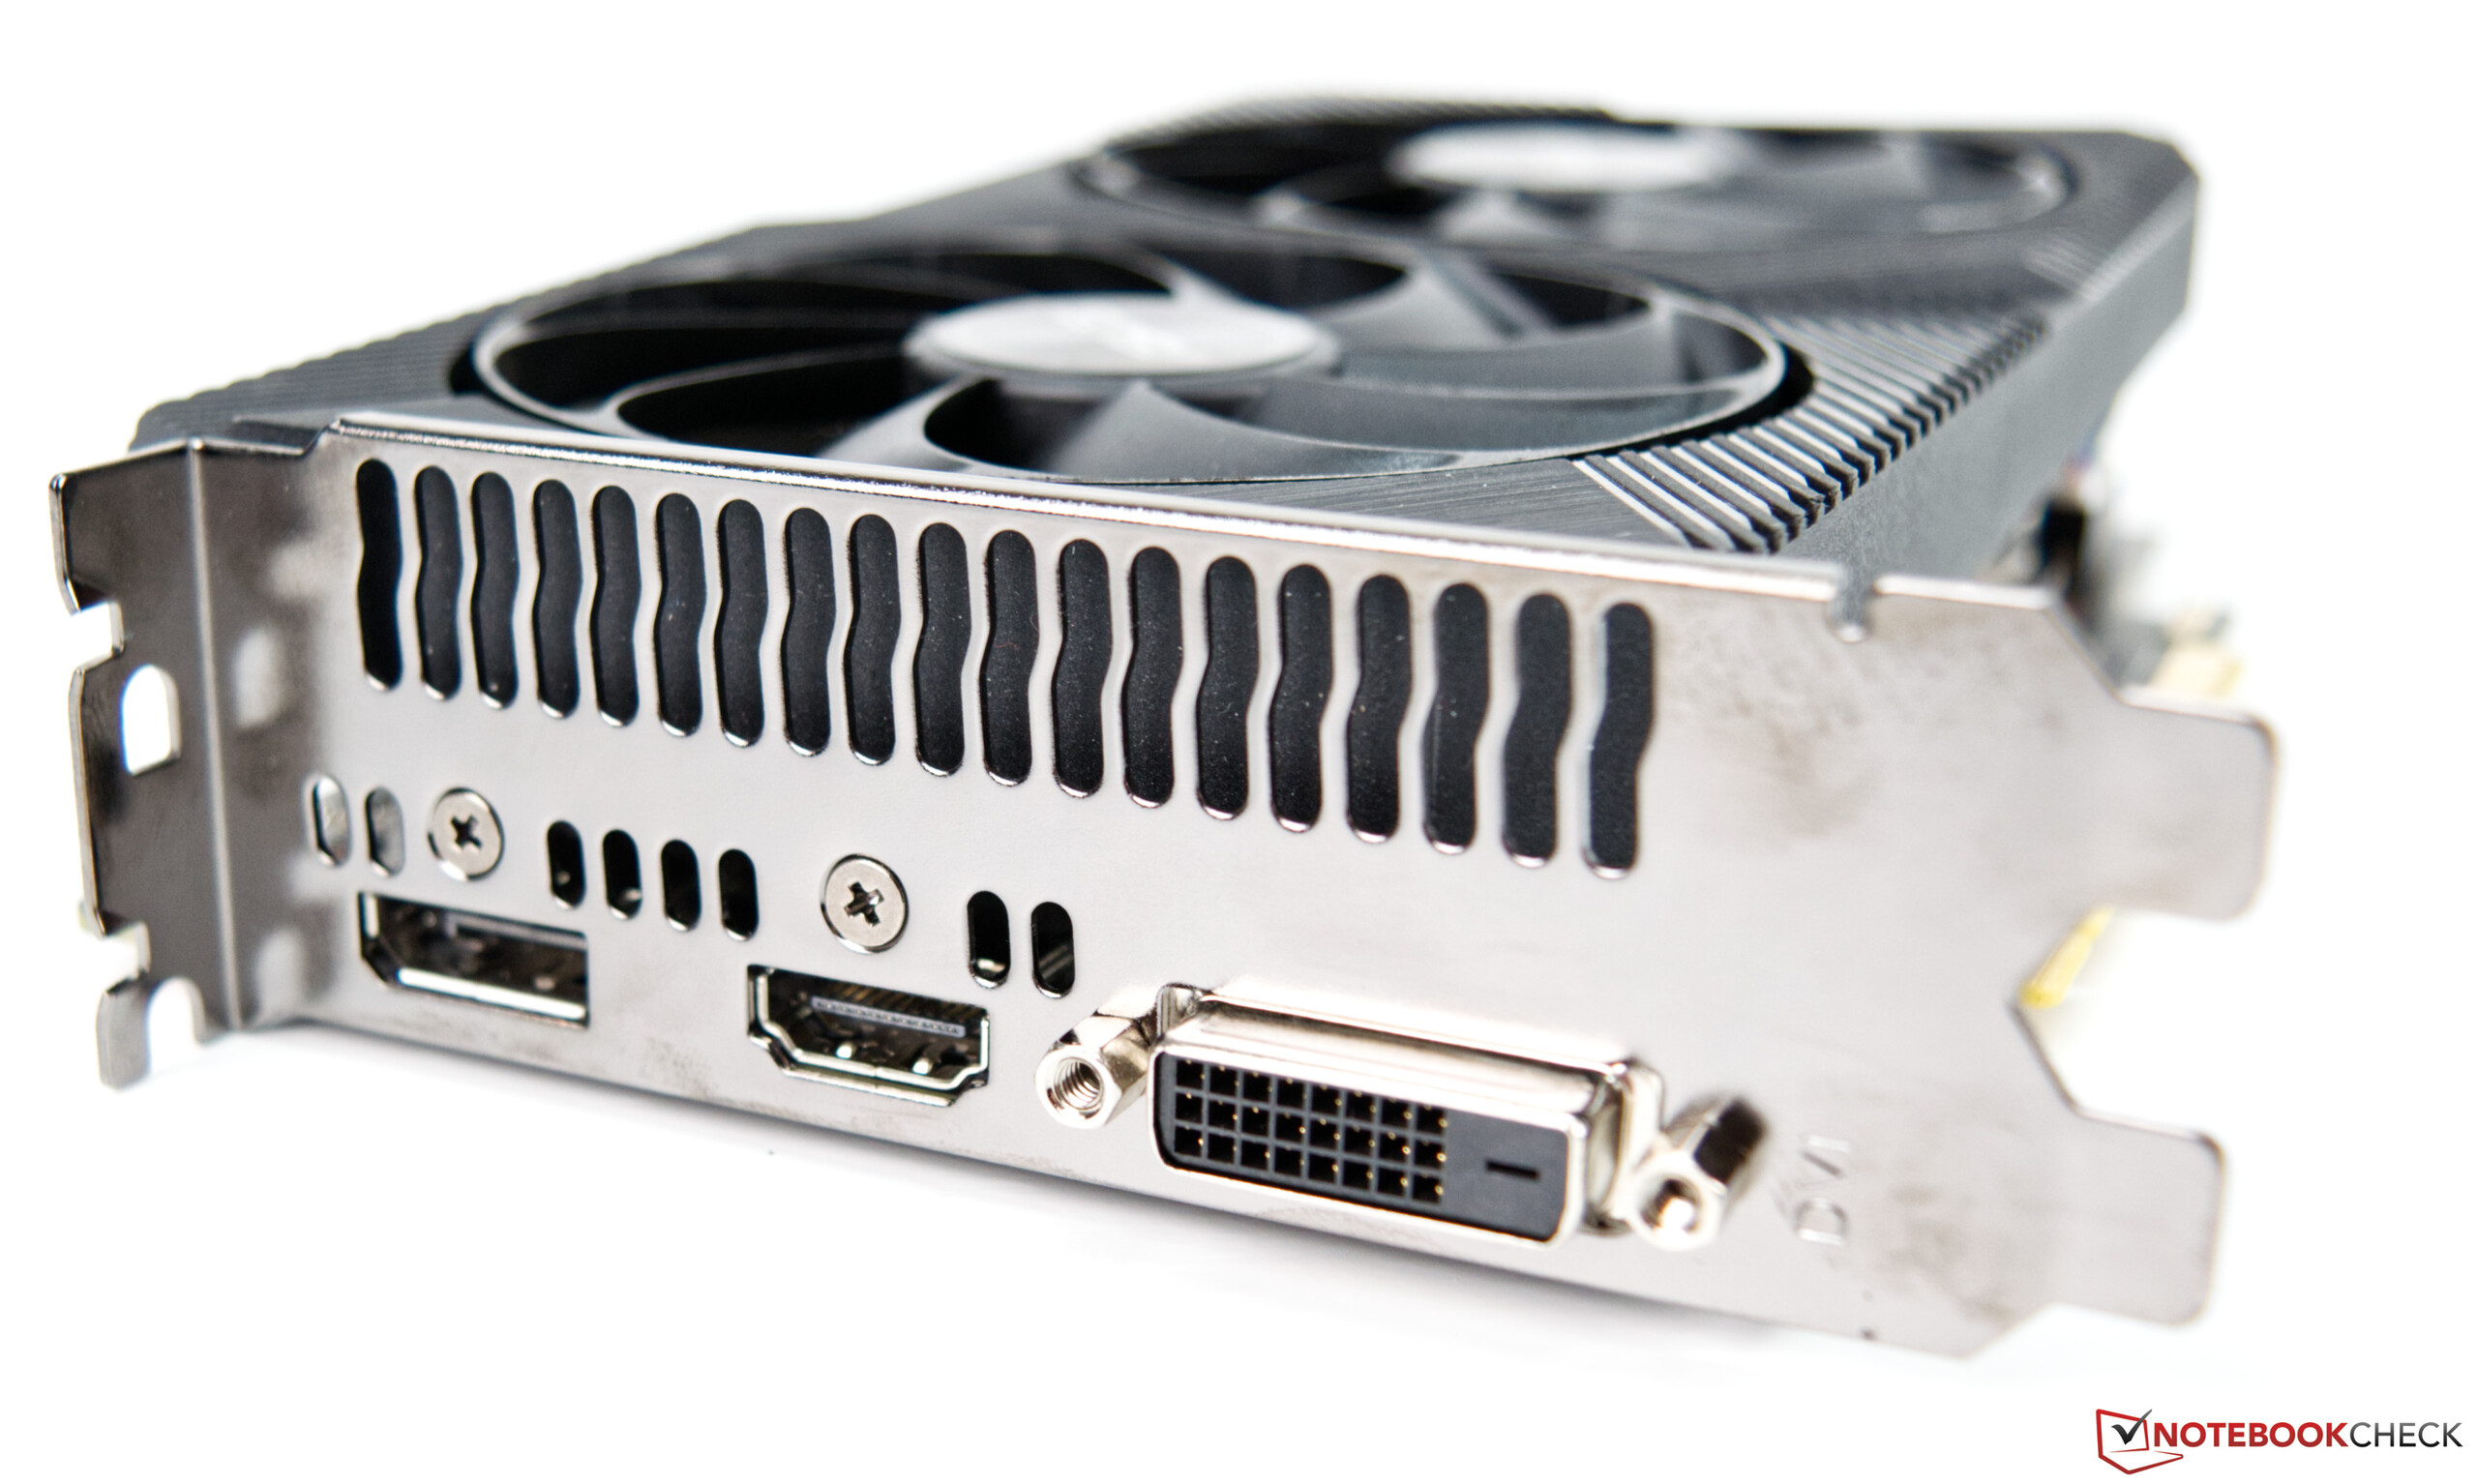
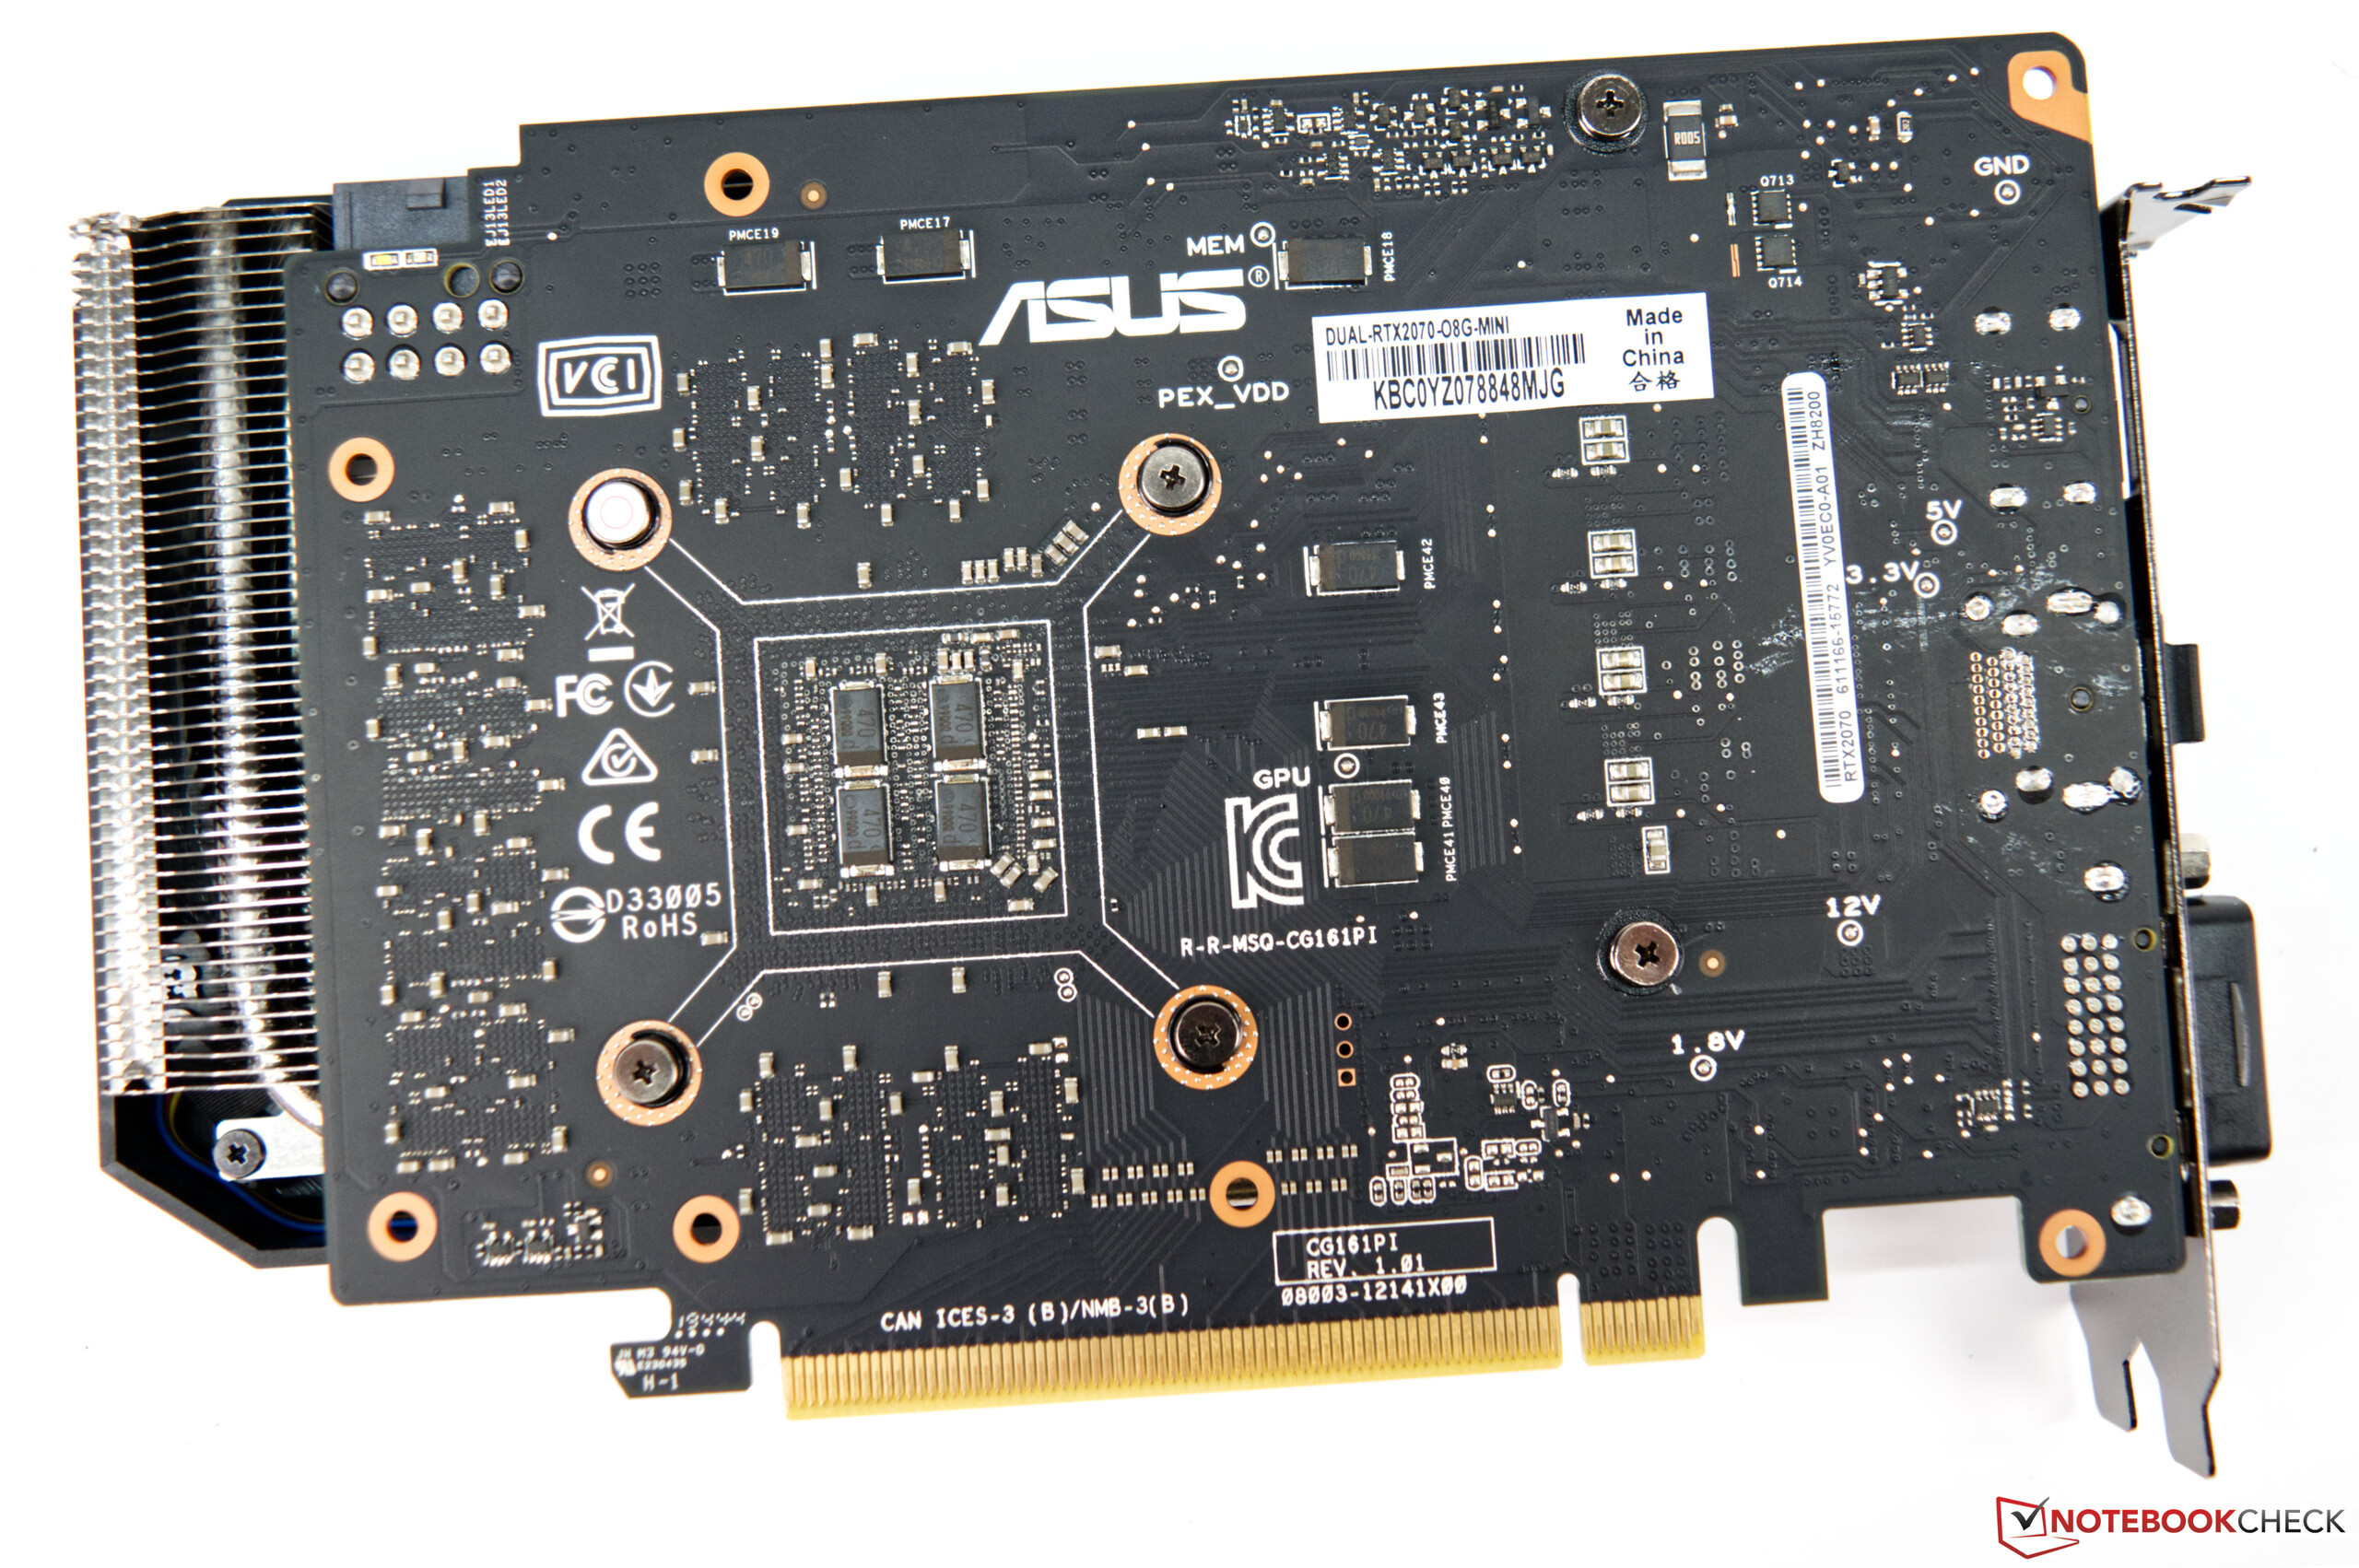
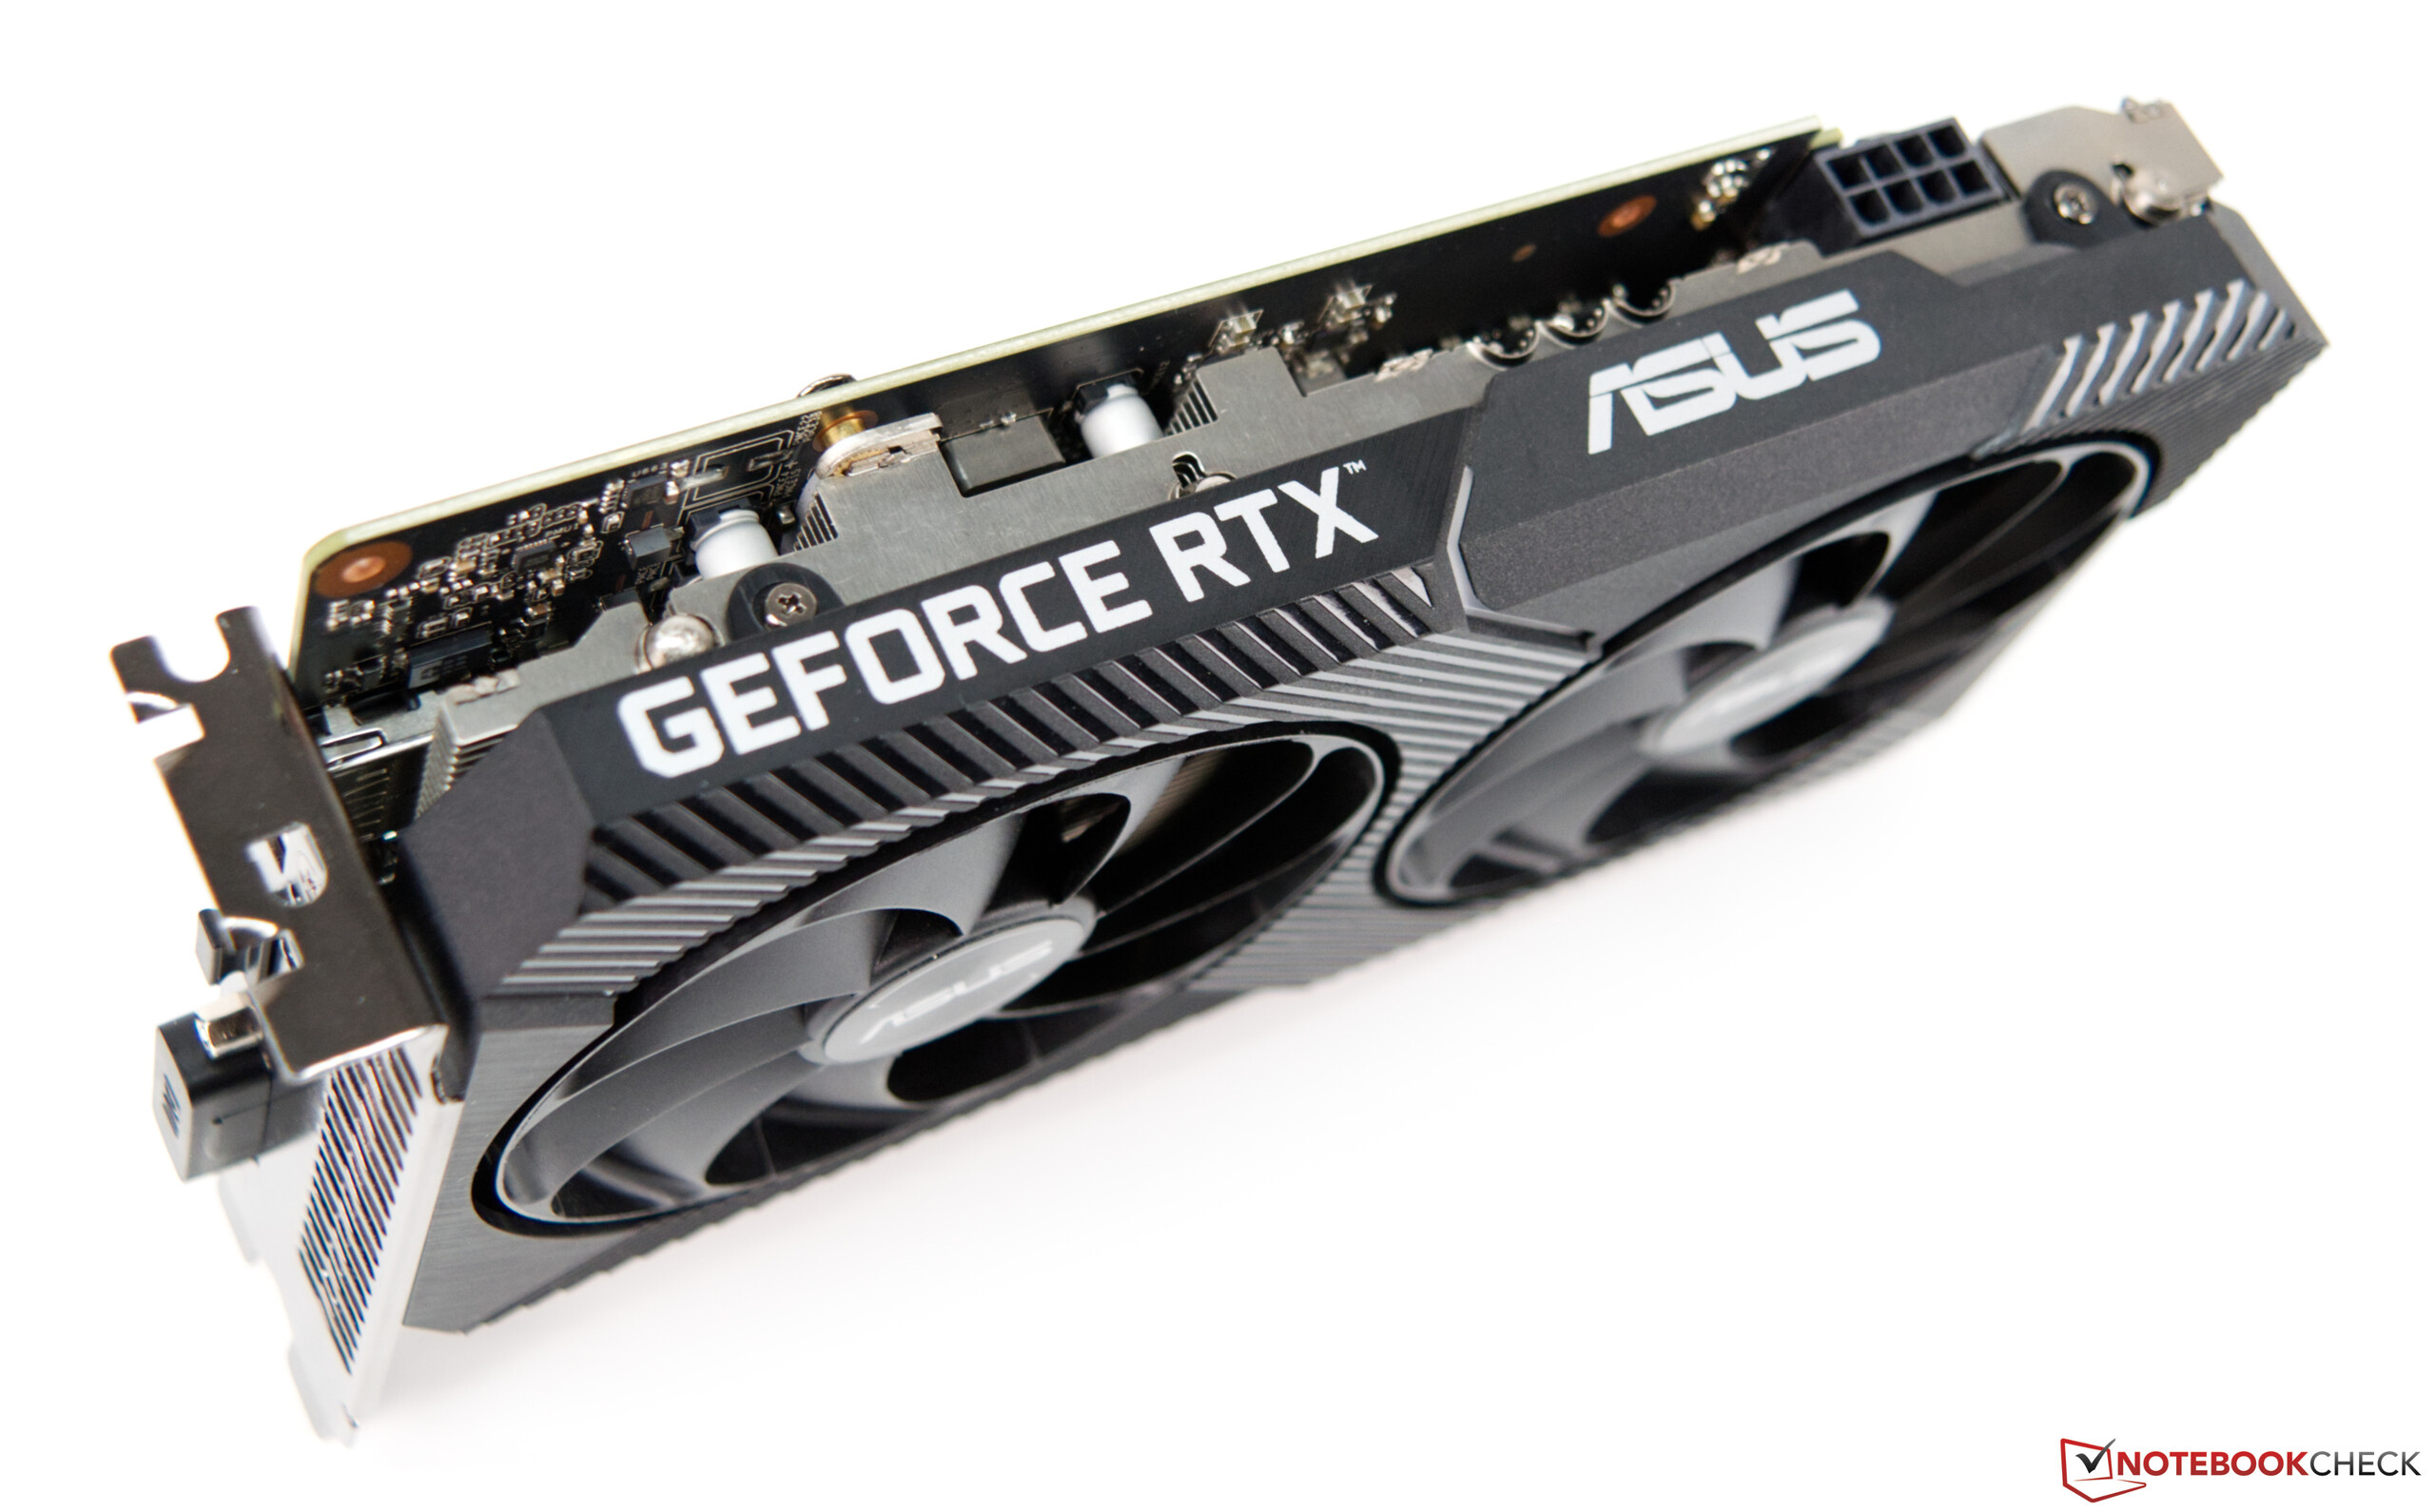
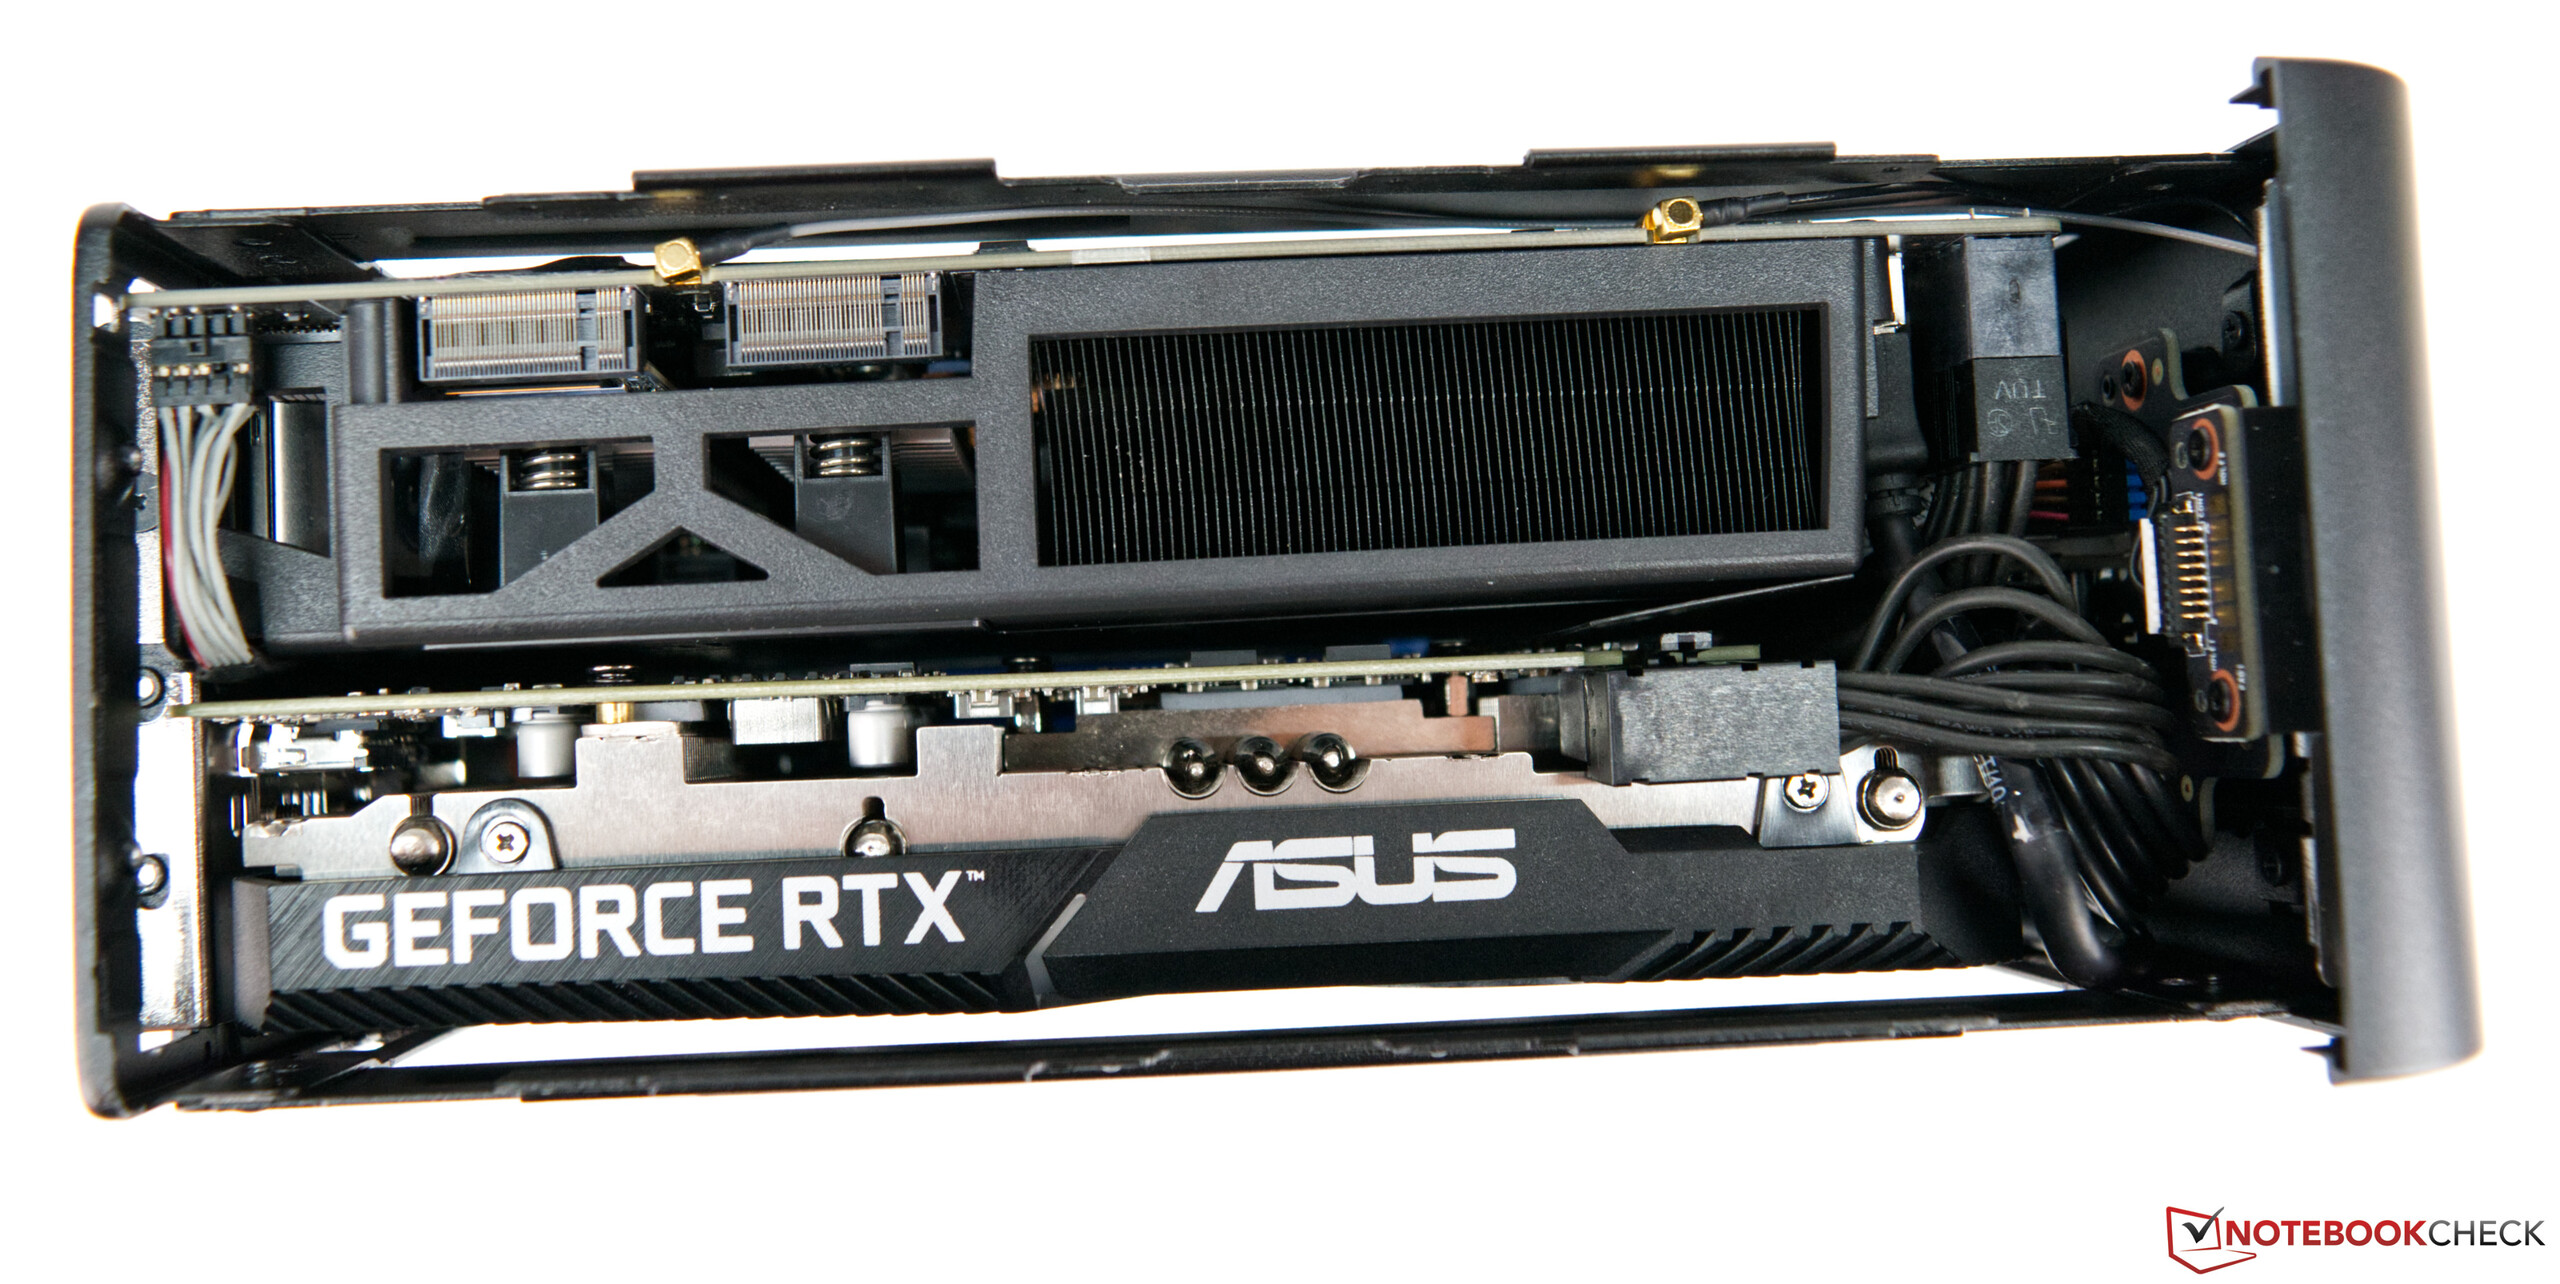
Should you also want to add a dedicated graphics card you need to pay special attention to size. Our review unit was equipped with a miniature GeForce RTX 2070 made by Asus. Intel maintains a Ghost Canyon NUC compatibility list.

Intel NUC 9 Extreme Kit
Intel NUC 9 Extreme Kit mit GeForce RTX 2070
Intel NUC 9 Extreme Kit
Intel NUC 9 Extreme Kit Compute Element
Intel NUC 9 Extreme Kit WLAN-Modul
Intel NUC 9 Extreme Kit Compute Element (cooler)
Intel NUC 9 Extreme Kit
Asus GeForce RTX 2070 Mini
Intel NUC 9 Extreme Kit

Intel NUC 9 Extreme in Detail

Intel NUC 9 Extreme Kit Compute Element

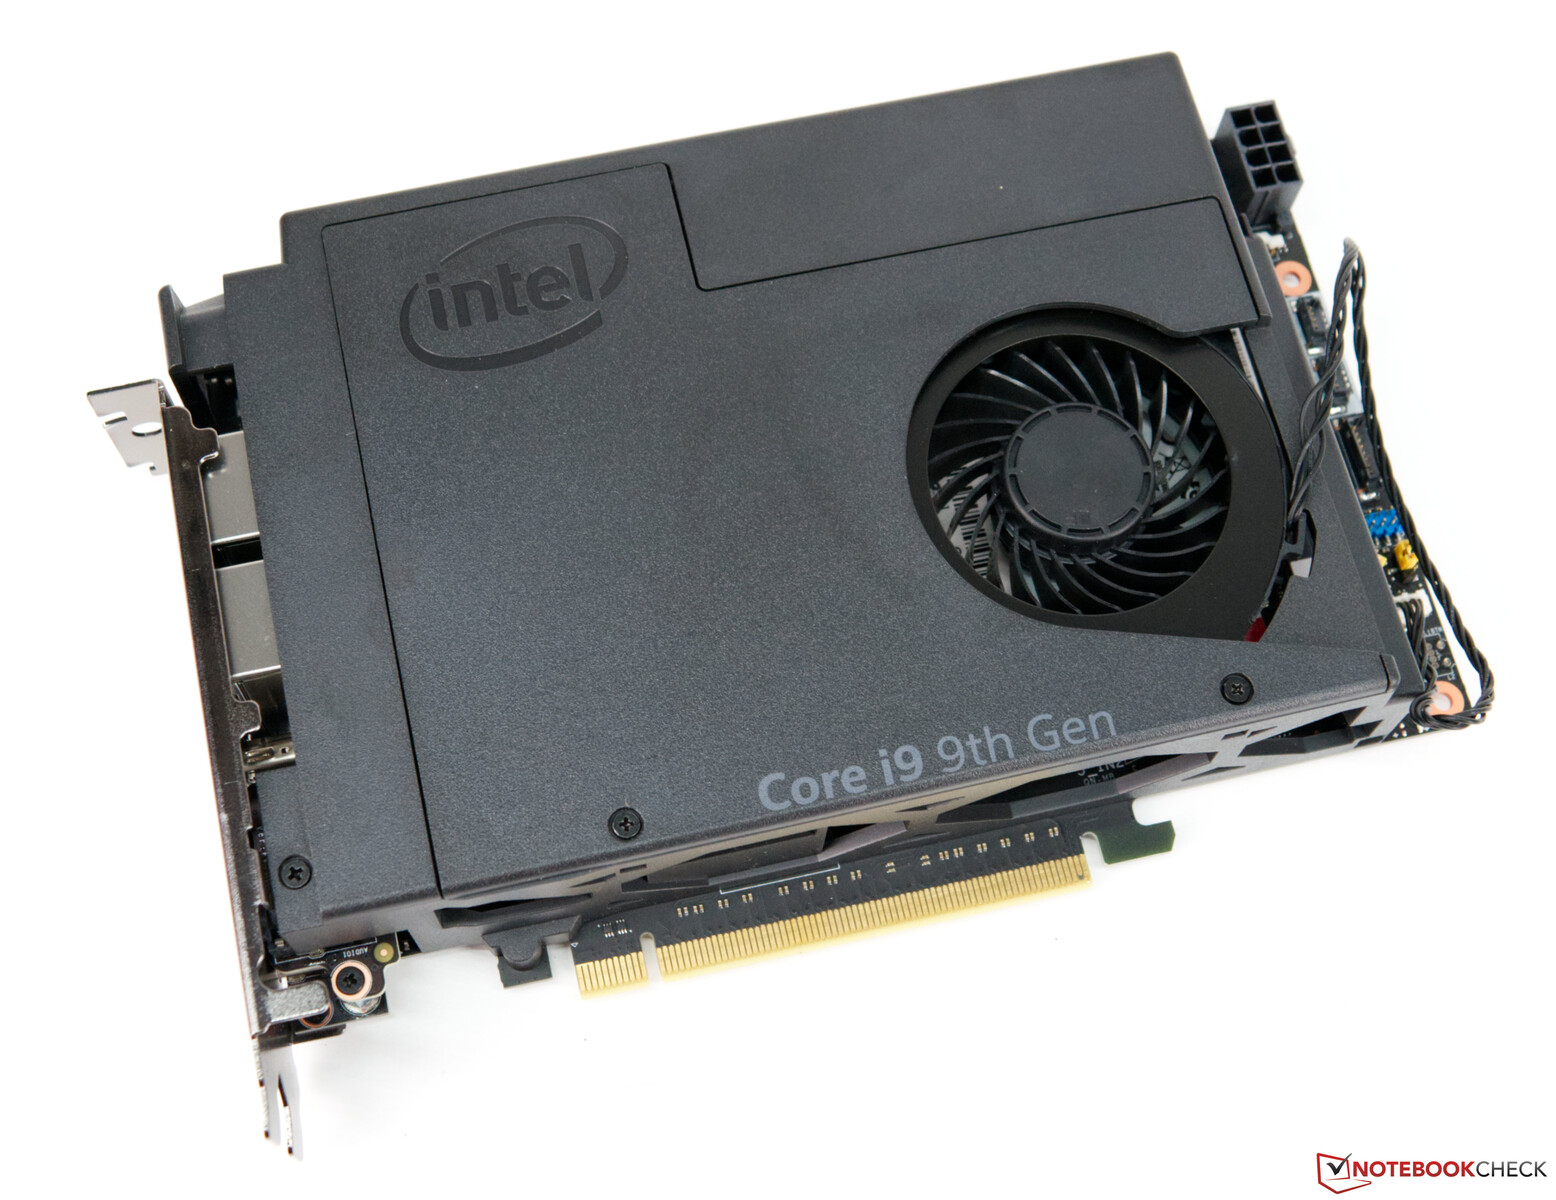
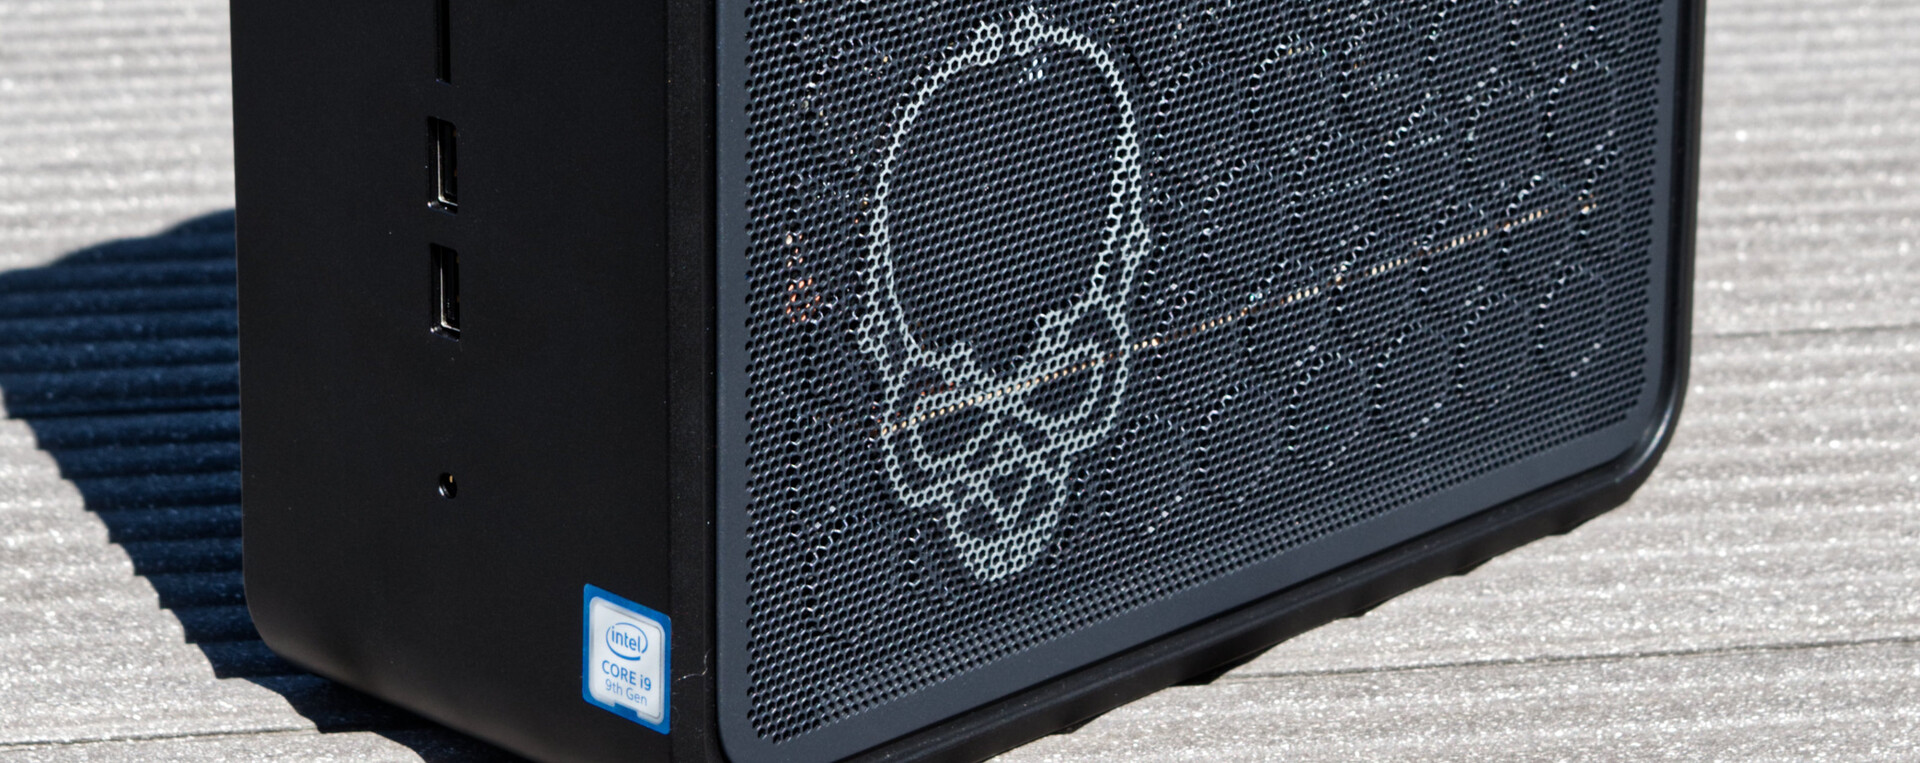
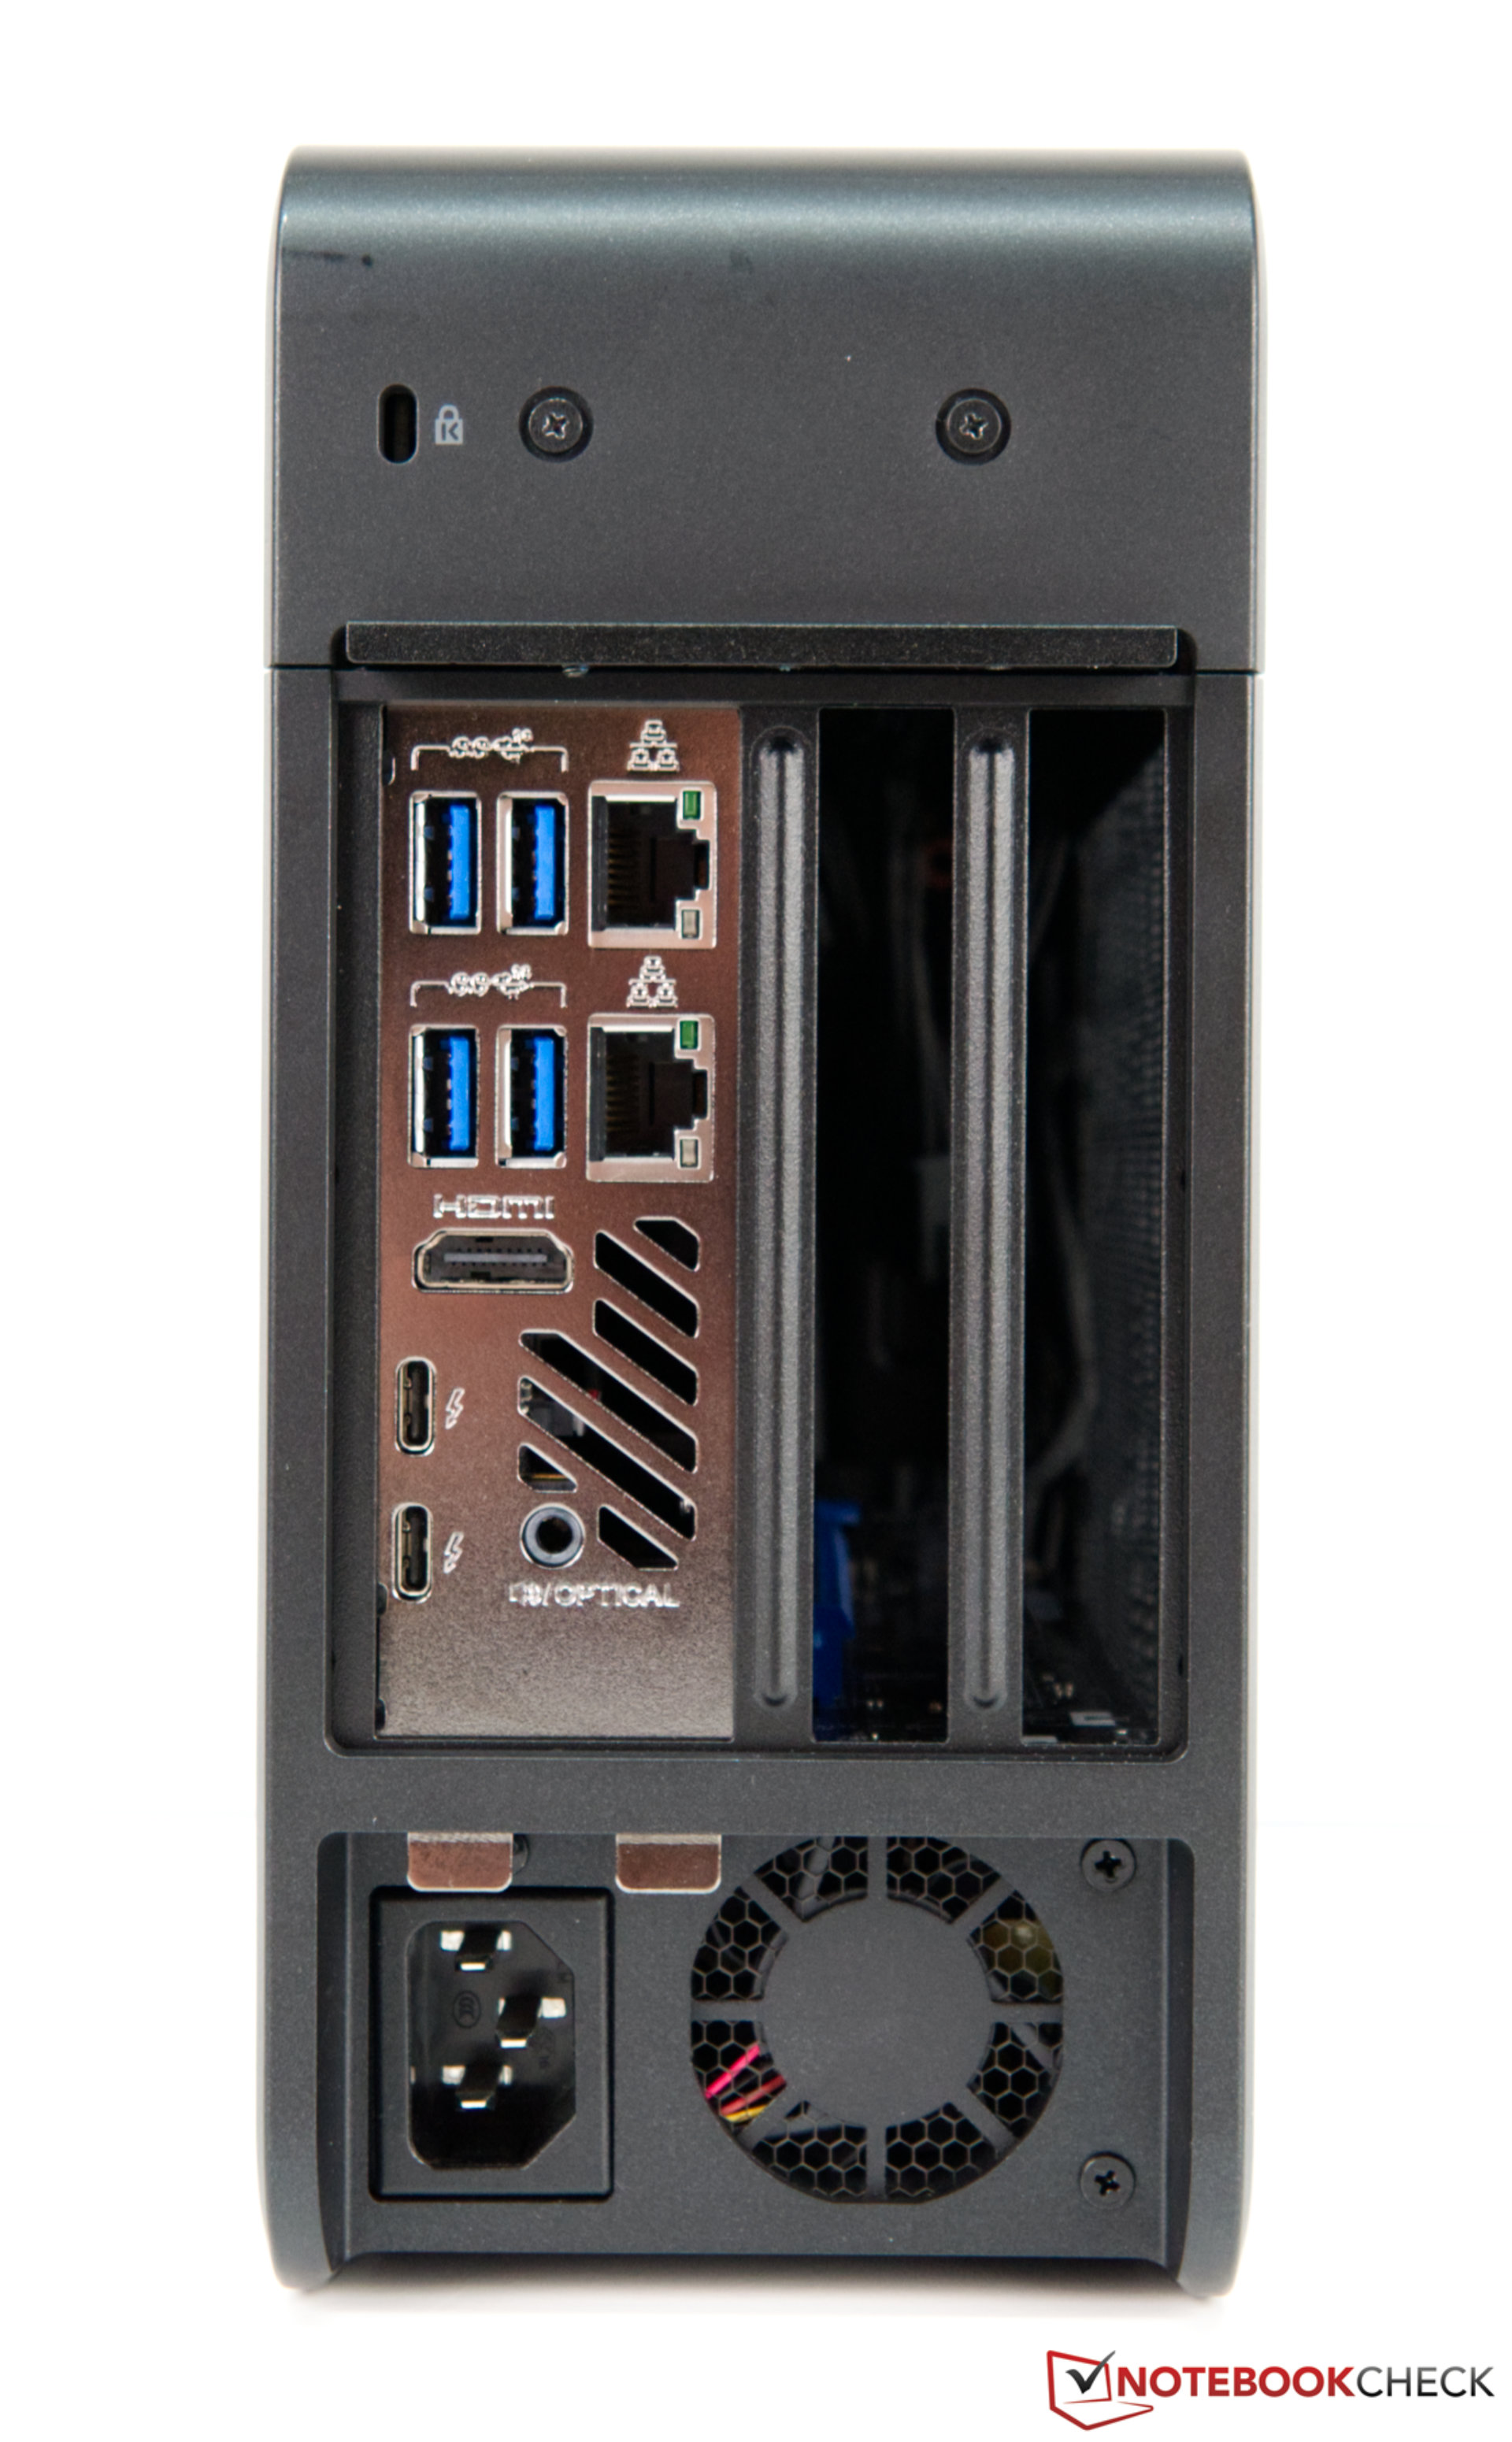
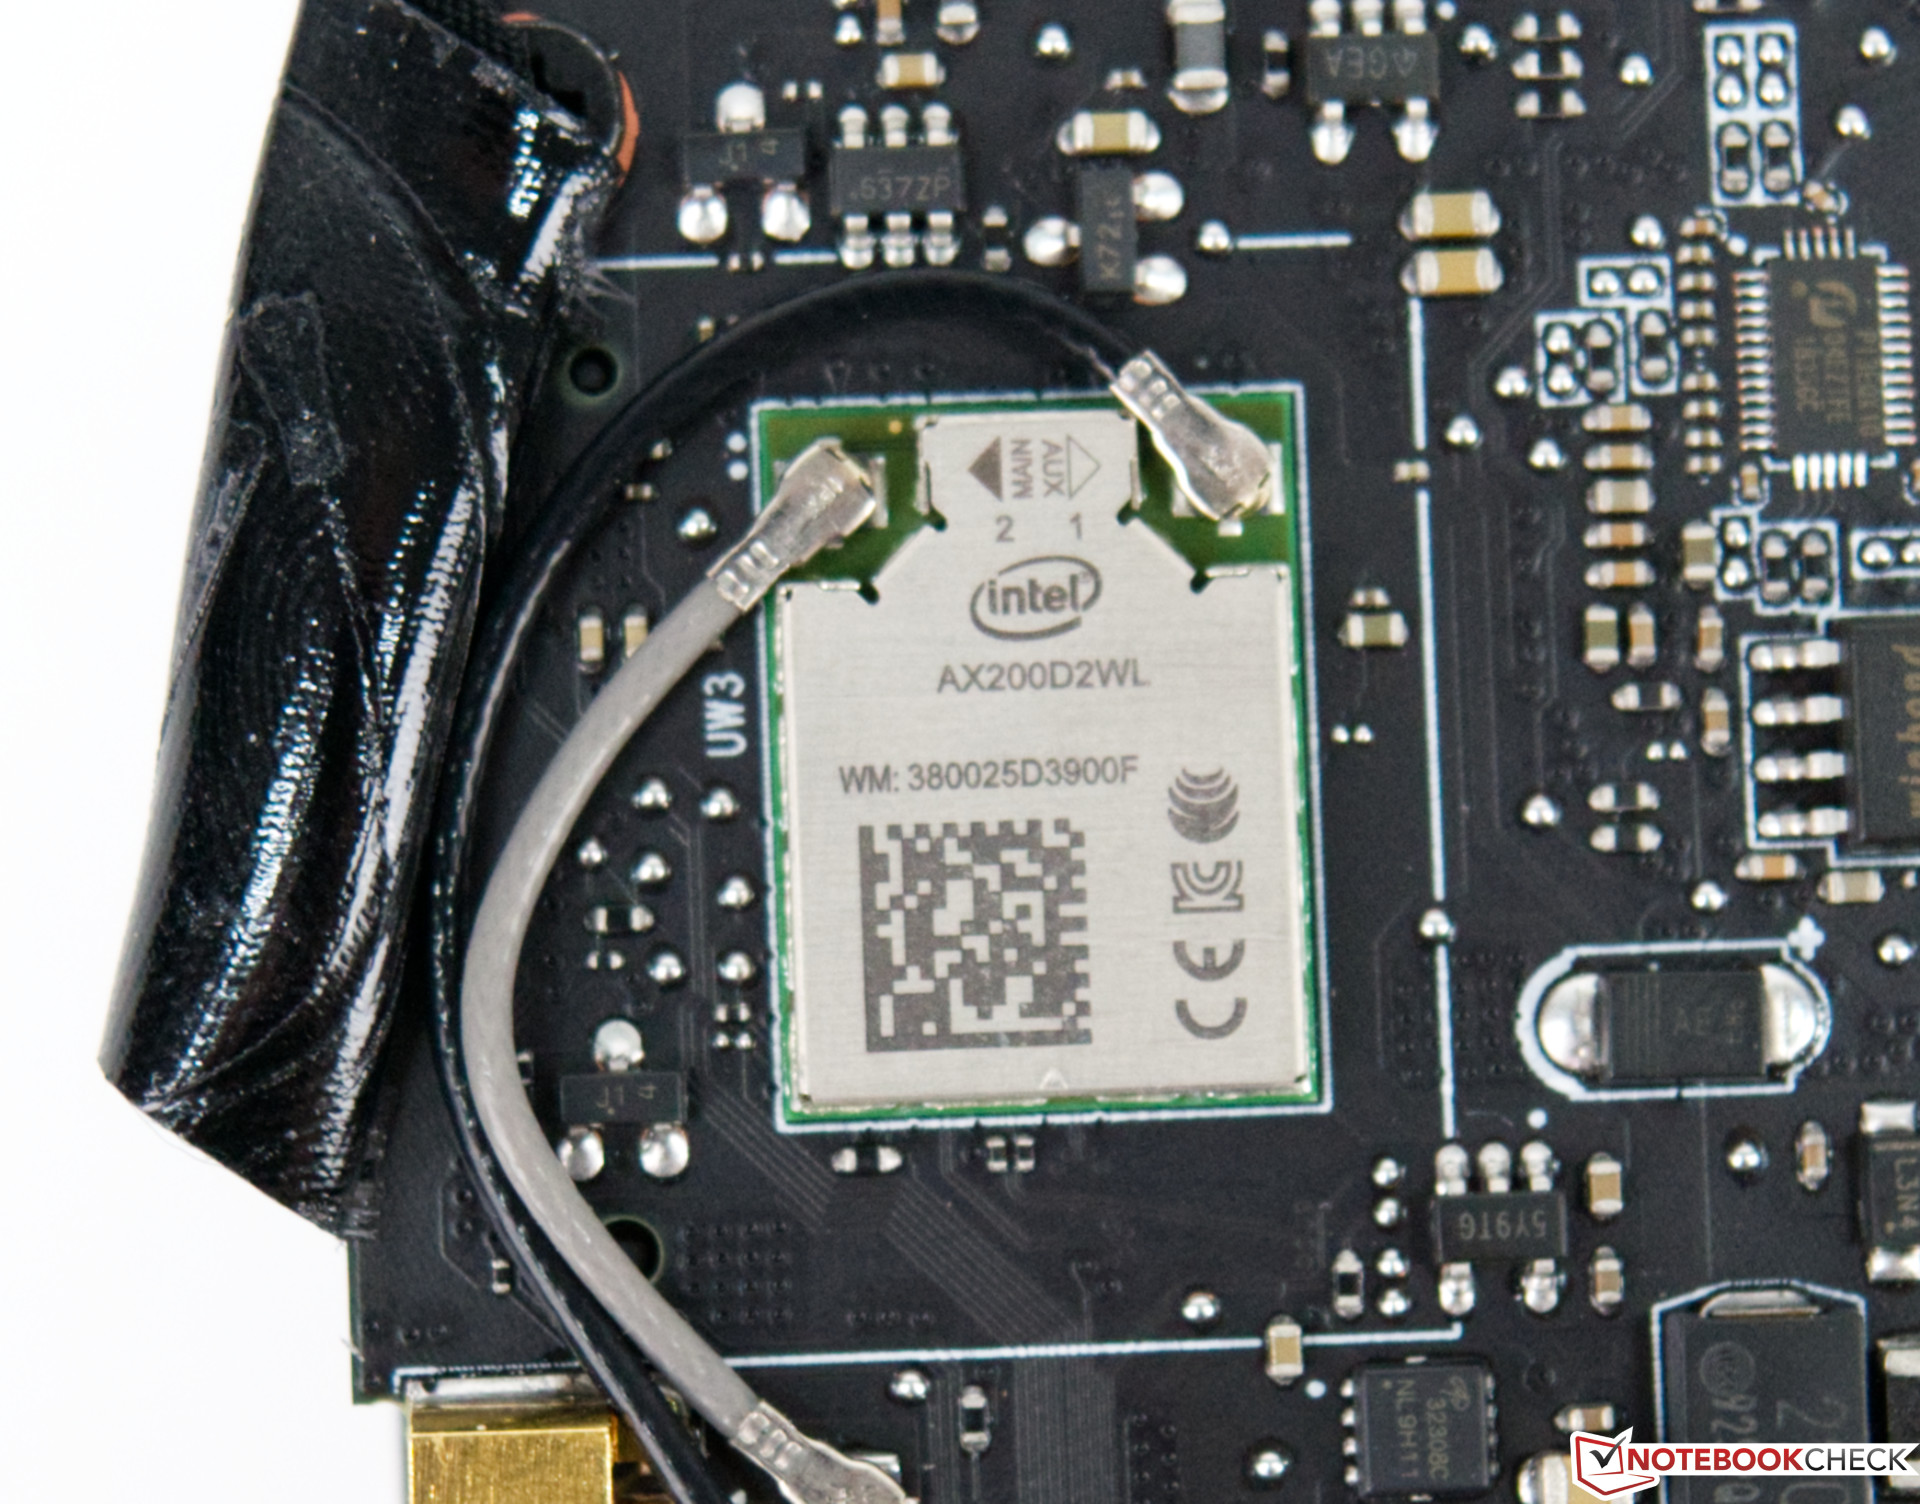
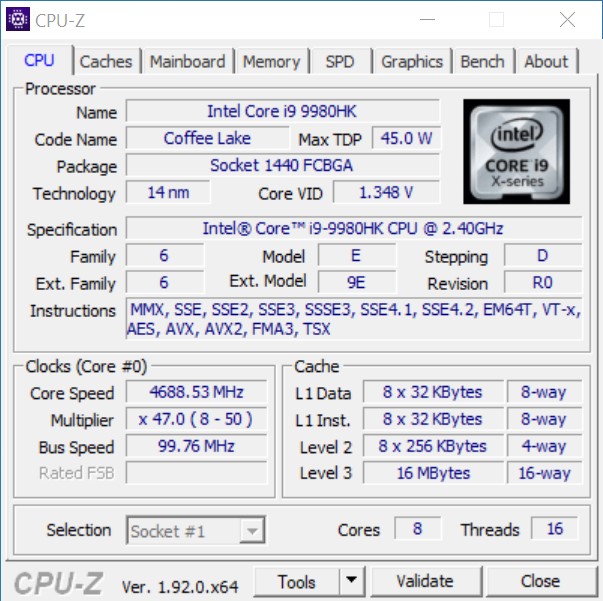
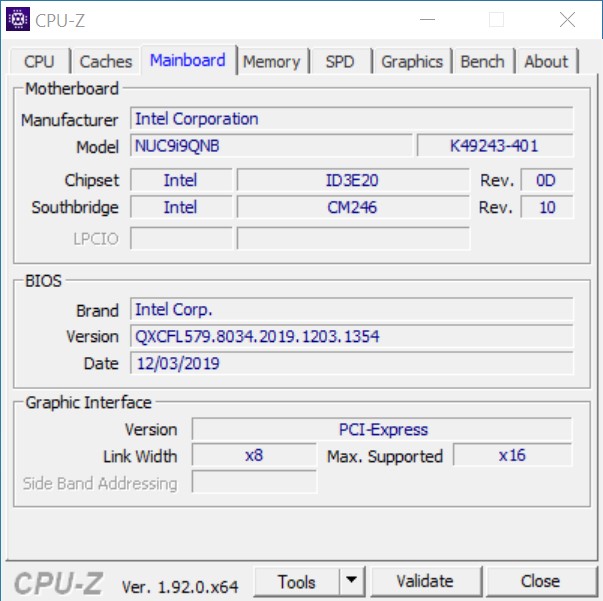
The NUC 9 Extreme offers an 8-core/16-thread Intel Core i9-9980HK processor. The mobile CPU is soldered onto the compute element’s mainboard, which also includes all external ports such as USB, LAN, and HDMI. Combined with the two USB ports at the front the NUC features a total of eight USB ports, two of which are USB-C ports with support for Thunderbolt that also carry a DisplayPort signal. Thus, you can connect a total of three displays to the SoC’s iGPU, two via USB-C and one via HDMI 2.0b. Furthermore, two SO-DIMM and two M.2 slots are available. Network connectivity can be achieved either via one of the two Ethernet ports or the Wi-Fi 6 module. One of said Ethernet ports even supports speeds of up to 2.5 Gbps.

Processor Benchmarks

All things considered the Intel Core i9-9980HK performed admirably, albeit not necessarily any faster than the average notebook equipped with the same processor. To spice things up and provide you with a broader picture we also added three desktop CPUs into the mix: an Intel Core i5-10600K, an Intel Core i9-10900K, and an AMD Ryzen 9 3950X. Compared to these, the Core i9-9980HK performed similarly to the Core i5-10600K, and it was unable to keep up with 10 or even 16 core CPUs. Single-core performance, on the other hand, was the Core i9-9980HK’s strong suit, and it performed only a few percentage points below the Core i9-10900K. In multi-thread benchmarks the CPU failed to compensate for its missing cores when compared to desktop CPUs. Given that the Ghost Canyon NUC can also be equipped with an Intel Core i5-9300H and an Intel Core i7-9750H we added these two to our comparison group as well. That way you get a bigger and more complete picture of what to expect of those two SoCs.

CPU-Z
CPU-Z
CPU-Z
CPU-Z
CPU-Z
CPU-Z
CPU-Z
Cinebench R15
CPU Single 64Bit
Intel Core i9-10900K, NVIDIA Titan RTX
i9-10900K, 3700 MHz
224 Points +4%
Intel Core i9-9980HK, NVIDIA GeForce RTX 2070 (Desktop)
i9-9980HK, 2400 MHz
215 Points
AMD Ryzen 9 3950X, NVIDIA Titan RTX
R9 3950X, 3500 MHz
209 Points -3%
Intel Core i5-10600K, NVIDIA Titan RTX
i5-10600K, 4100 MHz
205 Points -5%
Average Intel Core i9-9980HK
  (181 - 215, n=13)
198.8 Points -8%
Average Intel Core i7-9750H
  (170 - 194, n=82)
183.7 Points -15%
Average Intel Core i5-9300H
  (169 - 176, n=11)
172.6 Points -20%
CPU Multi 64Bit
AMD Ryzen 9 3950X, NVIDIA Titan RTX
R9 3950X, 3500 MHz
4002 Points +149%
Intel Core i9-10900K, NVIDIA Titan RTX
i9-10900K, 3700 MHz
2620 Points +63%
Average Intel Core i9-9980HK
  (1327 - 1930, n=14)
1656 Points +3%
Intel Core i9-9980HK, NVIDIA GeForce RTX 2070 (Desktop)
i9-9980HK, 2400 MHz
1607 Points
Intel Core i5-10600K, NVIDIA Titan RTX
i5-10600K, 4100 MHz
1452 Points -10%
Average Intel Core i7-9750H
  (952 - 1306, n=85)
1182 Points -26%
Average Intel Core i5-9300H
  (717 - 850, n=11)
784 Points -51%
Cinebench R20
CPU (Single Core)
Intel Core i9-10900K, NVIDIA Titan RTX
i9-10900K, 3700 MHz
532 Points +6%
AMD Ryzen 9 3950X, NVIDIA Titan RTX
R9 3950X, 3500 MHz
520 Points +3%
Intel Core i9-9980HK, NVIDIA GeForce RTX 2070 (Desktop)
i9-9980HK, 2400 MHz
504 Points
Average Intel Core i9-9980HK
  (431 - 505, n=10)
471 Points -7%
Intel Core i5-10600K, NVIDIA Titan RTX
i5-10600K, 4100 MHz
464 Points -8%
Average Intel Core i7-9750H
  (416 - 486, n=55)
443 Points -12%
Average Intel Core i5-9300H
  (398 - 427, n=9)
415 Points -18%
CPU (Multi Core)
AMD Ryzen 9 3950X, NVIDIA Titan RTX
R9 3950X, 3500 MHz
9075 Points +170%
Intel Core i9-10900K, NVIDIA Titan RTX
i9-10900K, 3700 MHz
6381 Points +90%
Average Intel Core i9-9980HK
  (2974 - 4150, n=10)
3530 Points +5%
Intel Core i5-10600K, NVIDIA Titan RTX
i5-10600K, 4100 MHz
3443 Points +3%
Intel Core i9-9980HK, NVIDIA GeForce RTX 2070 (Desktop)
i9-9980HK, 2400 MHz
3357 Points
Average Intel Core i7-9750H
  (2017 - 3133, n=55)
2564 Points -24%
Average Intel Core i5-9300H
  (1530 - 1877, n=9)
1727 Points -49%
Cinebench R11.5
CPU Single 64Bit
Intel Core i9-10900K, NVIDIA Titan RTX
i9-10900K, 3700 MHz
2.56 Points +7%
Intel Core i9-9980HK, NVIDIA GeForce RTX 2070 (Desktop)
i9-9980HK, 2400 MHz
2.4 Points
AMD Ryzen 9 3950X, NVIDIA Titan RTX
R9 3950X, 3500 MHz
2.37 Points -1%
Average Intel Core i9-9980HK
  (2.25 - 2.4, n=3)
2.31 Points -4%
Intel Core i5-10600K, NVIDIA Titan RTX
i5-10600K, 4100 MHz
2.19 Points -9%
Average Intel Core i7-9750H
  (1.96 - 2.19, n=10)
2.1 Points -12%
CPU Multi 64Bit
AMD Ryzen 9 3950X, NVIDIA Titan RTX
R9 3950X, 3500 MHz
43.68 Points +142%
Intel Core i9-10900K, NVIDIA Titan RTX
i9-10900K, 3700 MHz
29.03 Points +61%
Intel Core i9-9980HK, NVIDIA GeForce RTX 2070 (Desktop)
i9-9980HK, 2400 MHz
18.04 Points
Average Intel Core i9-9980HK
  (14.8 - 18, n=3)
16.7 Points -7%
Intel Core i5-10600K, NVIDIA Titan RTX
i5-10600K, 4100 MHz
15.76 Points -13%
Average Intel Core i7-9750H
  (11.3 - 14.1, n=10)
13 Points -28%
Cinebench R10
Rendering Single CPUs 64Bit
Intel Core i9-10900K, NVIDIA Titan RTX
i9-10900K, 3700 MHz
10625 Points +3%
AMD Ryzen 9 3950X, NVIDIA Titan RTX
R9 3950X, 3500 MHz
10580 Points +2%
Intel Core i9-9980HK, NVIDIA GeForce RTX 2070 (Desktop)
i9-9980HK, 2400 MHz
10359 Points
Average Intel Core i9-9980HK
 
10359 Points 0%
Intel Core i5-10600K, NVIDIA Titan RTX
i5-10600K, 4100 MHz
9594 Points -7%
Average Intel Core i7-9750H
  (9069 - 9346, n=3)
9165 Points -12%
Rendering Multiple CPUs 64Bit
AMD Ryzen 9 3950X, NVIDIA Titan RTX
R9 3950X, 3500 MHz
86232 Points +55%
Intel Core i9-10900K, NVIDIA Titan RTX
i9-10900K, 3700 MHz
80495 Points +44%
Intel Core i9-9980HK, NVIDIA GeForce RTX 2070 (Desktop)
i9-9980HK, 2400 MHz
55742 Points
Average Intel Core i9-9980HK
 
55742 Points 0%
Intel Core i5-10600K, NVIDIA Titan RTX
i5-10600K, 4100 MHz
51816 Points -7%
Average Intel Core i7-9750H
  (37188 - 44238, n=3)
40129 Points -28%
Blender - v2.79 BMW27 CPU
Average Intel Core i5-9300H
  (588 - 643, n=3)
611 Seconds * -93%
Average Intel Core i7-9750H
  (342 - 495, n=21)
433 Seconds * -36%
Average Intel Core i9-9980HK
  (317 - 527, n=3)
398 Seconds * -25%
Intel Core i9-9980HK, NVIDIA GeForce RTX 2070 (Desktop)
i9-9980HK, 2400 MHz
317.4 Seconds *
Intel Core i5-10600K, NVIDIA Titan RTX
i5-10600K, 4100 MHz
302.4 Seconds * +5%
Intel Core i9-10900K, NVIDIA Titan RTX
i9-10900K, 3700 MHz
167.3 Seconds * +47%
AMD Ryzen 9 3950X, NVIDIA Titan RTX
R9 3950X, 3500 MHz
125.8 Seconds * +60%
wPrime 2.10
32m
Average Intel Core i7-9750H
 
4.93 s * -30%
Intel Core i5-10600K, NVIDIA Titan RTX
i5-10600K, 4100 MHz
4.648 s * -23%
Average Intel Core i9-9980HK
  (3.79 - 4.94, n=2)
4.36 s * -15%
AMD Ryzen 9 3950X, NVIDIA Titan RTX
R9 3950X, 3500 MHz
4.112 s * -9%
Intel Core i9-9980HK, NVIDIA GeForce RTX 2070 (Desktop)
i9-9980HK, 2400 MHz
3.788 s *
Intel Core i9-10900K, NVIDIA Titan RTX
i9-10900K, 3700 MHz
3.582 s * +5%
1024m
Average Intel Core i7-9750H
 
154.4 s * -28%
Intel Core i9-9980HK, NVIDIA GeForce RTX 2070 (Desktop)
i9-9980HK, 2400 MHz
120.2 s *
Average Intel Core i9-9980HK
  (110.4 - 120.2, n=2)
115.3 s * +4%
Intel Core i5-10600K, NVIDIA Titan RTX
i5-10600K, 4100 MHz
113.2 s * +6%
Intel Core i9-10900K, NVIDIA Titan RTX
i9-10900K, 3700 MHz
66.3 s * +45%
AMD Ryzen 9 3950X, NVIDIA Titan RTX
R9 3950X, 3500 MHz
44.86 s * +63%
X264 HD Benchmark 4.0
Pass 1
Intel Core i9-10900K, NVIDIA Titan RTX
i9-10900K, 3700 MHz
289.5 (289min - 291max) fps +22%
AMD Ryzen 9 3950X, NVIDIA Titan RTX
R9 3950X, 3500 MHz
265 (265min - 266max) fps +12%
Intel Core i5-10600K, NVIDIA Titan RTX
i5-10600K, 4100 MHz
251.5 (250min - 253max) fps +6%
Average Intel Core i9-9980HK
  (238 - 239, n=2)
238 fps 0%
Intel Core i9-9980HK, NVIDIA GeForce RTX 2070 (Desktop)
i9-9980HK, 2400 MHz
237.5 (236min - 239max) fps
Average Intel Core i7-9750H
  (211 - 219, n=2)
215 fps -9%
Average Intel Core i5-9300H
 
193.7 fps -18%
Pass 2
AMD Ryzen 9 3950X, NVIDIA Titan RTX
R9 3950X, 3500 MHz
168 (168min - 169max) fps +81%
Intel Core i9-10900K, NVIDIA Titan RTX
i9-10900K, 3700 MHz
149 (149min - 149max) fps +61%
Average Intel Core i9-9980HK
  (92.8 - 94.8, n=2)
93.8 fps +1%
Intel Core i9-9980HK, NVIDIA GeForce RTX 2070 (Desktop)
i9-9980HK, 2400 MHz
92.8 (89.1min - 100max) fps
Intel Core i5-10600K, NVIDIA Titan RTX
i5-10600K, 4100 MHz
88.2 (88min - 88.2max) fps -5%
Average Intel Core i7-9750H
  (69.6 - 70.9, n=2)
70.3 fps -24%
Average Intel Core i5-9300H
 
49.4 fps -47%
WinRAR - Result
Intel Core i9-10900K, NVIDIA Titan RTX
i9-10900K, 3700 MHz
9739 KB/s +34%
AMD Ryzen 9 3950X, NVIDIA Titan RTX
R9 3950X, 3500 MHz
7409 KB/s +2%
Average Intel Core i9-9980HK
  (7266 - 7436, n=2)
7351 KB/s +1%
Intel Core i9-9980HK, NVIDIA GeForce RTX 2070 (Desktop)
i9-9980HK, 2400 MHz
7266 KB/s
Intel Core i5-10600K, NVIDIA Titan RTX
i5-10600K, 4100 MHz
6536 KB/s -10%
Average Intel Core i7-9750H
  (6160 - 6631, n=2)
6396 KB/s -12%
Average Intel Core i5-9300H
 
5663 KB/s -22%
TrueCrypt
AES Mean 100MB
Intel Core i9-10900K, NVIDIA Titan RTX
i9-10900K, 3700 MHz
14.6 GB/s +45%
AMD Ryzen 9 3950X, NVIDIA Titan RTX
R9 3950X, 3500 MHz
10.8 GB/s +7%
Average Intel Core i9-9980HK
  (10.1 - 10.3, n=2)
10.2 GB/s +1%
Intel Core i9-9980HK, NVIDIA GeForce RTX 2070 (Desktop)
i9-9980HK, 2400 MHz
10.1 GB/s
Intel Core i5-10600K, NVIDIA Titan RTX
i5-10600K, 4100 MHz
8 GB/s -21%
Average Intel Core i7-9750H
  (7.3 - 7.4, n=2)
7.35 GB/s -27%
Average Intel Core i5-9300H
 
4.7 GB/s -53%
Twofish Mean 100MB
AMD Ryzen 9 3950X, NVIDIA Titan RTX
R9 3950X, 3500 MHz
3.6 GB/s +112%
Intel Core i9-10900K, NVIDIA Titan RTX
i9-10900K, 3700 MHz
2.6 GB/s +53%
Intel Core i9-9980HK, NVIDIA GeForce RTX 2070 (Desktop)
i9-9980HK, 2400 MHz
1.7 GB/s
Average Intel Core i9-9980HK
  (1.7 - 1.7, n=2)
1.7 GB/s 0%
Intel Core i5-10600K, NVIDIA Titan RTX
i5-10600K, 4100 MHz
1.4 GB/s -18%
Average Intel Core i7-9750H
  (1.2 - 1.3, n=2)
1.25 GB/s -26%
Average Intel Core i5-9300H
 
0.84 GB/s -51%
Serpent Mean 100MB
AMD Ryzen 9 3950X, NVIDIA Titan RTX
R9 3950X, 3500 MHz
2.3 GB/s +130%
Intel Core i9-10900K, NVIDIA Titan RTX
i9-10900K, 3700 MHz
1.5 GB/s +50%
Intel Core i9-9980HK, NVIDIA GeForce RTX 2070 (Desktop)
i9-9980HK, 2400 MHz
1 GB/s
Average Intel Core i9-9980HK
  (1 - 1, n=2)
1 GB/s 0%
Intel Core i5-10600K, NVIDIA Titan RTX
i5-10600K, 4100 MHz
0.82 GB/s -18%
Average Intel Core i7-9750H
  (0.7 - 0.75, n=2)
0.725 GB/s -27%
Average Intel Core i5-9300H
 
0.5 GB/s -50%
Geekbench 5.5
Multi-Core
AMD Ryzen 9 3950X, NVIDIA Titan RTX
R9 3950X, 3500 MHz
12363 Points +63%
Intel Core i9-10900K, NVIDIA Titan RTX
i9-10900K, 3700 MHz
11414 Points +51%
Intel Core i9-9980HK, NVIDIA GeForce RTX 2070 (Desktop)
i9-9980HK, 2400 MHz
7568 Points
Average Intel Core i9-9980HK
  (6945 - 7703, n=3)
7405 Points -2%
Intel Core i5-10600K, NVIDIA Titan RTX
i5-10600K, 4100 MHz
7248 Points -4%
Average Intel Core i7-9750H
  (4859 - 6262, n=13)
5597 Points -26%
Single-Core
Intel Core i9-10900K, NVIDIA Titan RTX
i9-10900K, 3700 MHz
1449 Points +5%
Intel Core i9-9980HK, NVIDIA GeForce RTX 2070 (Desktop)
i9-9980HK, 2400 MHz
1378 Points
Average Intel Core i9-9980HK
  (1314 - 1378, n=2)
1346 Points -2%
AMD Ryzen 9 3950X, NVIDIA Titan RTX
R9 3950X, 3500 MHz
1306 Points -5%
Intel Core i5-10600K, NVIDIA Titan RTX
i5-10600K, 4100 MHz
1286 Points -7%
Average Intel Core i7-9750H
  (1117 - 1251, n=13)
1190 Points -14%
Geekbench 5.0
5.0 Multi-Core
AMD Ryzen 9 3950X, NVIDIA Titan RTX
R9 3950X, 3500 MHz
12976 Points +72%
Intel Core i9-10900K, NVIDIA Titan RTX
i9-10900K, 3700 MHz
11407 Points +51%
Intel Core i9-9980HK, NVIDIA GeForce RTX 2070 (Desktop)
i9-9980HK, 2400 MHz
7540 Points
Average Intel Core i9-9980HK
  (7072 - 7805, n=4)
7421 Points -2%
Intel Core i5-10600K, NVIDIA Titan RTX
i5-10600K, 4100 MHz
7237 Points -4%
Average Intel Core i7-9750H
  (4812 - 6230, n=15)
5575 Points -26%
Average Intel Core i5-9300H
  (3697 - 4200, n=3)
4014 Points -47%
5.0 Single-Core
Intel Core i9-10900K, NVIDIA Titan RTX
i9-10900K, 3700 MHz
1440 Points +6%
Intel Core i9-9980HK, NVIDIA GeForce RTX 2070 (Desktop)
i9-9980HK, 2400 MHz
1355 Points
AMD Ryzen 9 3950X, NVIDIA Titan RTX
R9 3950X, 3500 MHz
1315 Points -3%
Intel Core i5-10600K, NVIDIA Titan RTX
i5-10600K, 4100 MHz
1281 Points -5%
Average Intel Core i9-9980HK
  (1171 - 1355, n=4)
1273 Points -6%
Average Intel Core i7-9750H
  (1105 - 1248, n=15)
1179 Points -13%
Average Intel Core i5-9300H
  (1095 - 1137, n=3)
1118 Points -17%
Geekbench 4.4
64 Bit Single-Core Score
Intel Core i9-10900K, NVIDIA Titan RTX
i9-10900K, 3700 MHz
6348 Points +6%
Intel Core i9-9980HK, NVIDIA GeForce RTX 2070 (Desktop)
i9-9980HK, 2400 MHz
5969 Points
Average Intel Core i9-9980HK
  (5617 - 5972, n=3)
5853 Points -2%
Intel Core i5-10600K, NVIDIA Titan RTX
i5-10600K, 4100 MHz
5821 Points -2%
AMD Ryzen 9 3950X, NVIDIA Titan RTX
R9 3950X, 3500 MHz
5749 Points -4%
Average Intel Core i7-9750H
  (4440 - 5511, n=27)
5238 Points -12%
Average Intel Core i5-9300H
  (4704 - 5089, n=7)
4898 Points -18%
64 Bit Multi-Core Score
AMD Ryzen 9 3950X, NVIDIA Titan RTX
R9 3950X, 3500 MHz
48962 Points +67%
Intel Core i9-10900K, NVIDIA Titan RTX
i9-10900K, 3700 MHz
43058 Points +47%
Average Intel Core i9-9980HK
  (28625 - 30849, n=3)
29620 Points +1%
Intel Core i9-9980HK, NVIDIA GeForce RTX 2070 (Desktop)
i9-9980HK, 2400 MHz
29385 Points
Intel Core i5-10600K, NVIDIA Titan RTX
i5-10600K, 4100 MHz
28391 Points -3%
Average Intel Core i7-9750H
  (17054 - 25043, n=27)
22076 Points -25%
Average Intel Core i5-9300H
  (14853 - 17684, n=7)
16246 Points -45%
3DMark 11 - 1280x720 Performance Physics
Intel Core i9-10900K, NVIDIA Titan RTX
i9-10900K, 3700 MHz
22140 Points +35%
AMD Ryzen 9 3950X, NVIDIA Titan RTX
R9 3950X, 3500 MHz
21016 Points +28%
Intel Core i9-9980HK, NVIDIA GeForce RTX 2070 (Desktop)
i9-9980HK, 2400 MHz
16422 Points
Intel Core i5-10600K, NVIDIA Titan RTX
i5-10600K, 4100 MHz
15961 Points -3%
Average Intel Core i9-9980HK
  (9056 - 18260, n=12)
15688 Points -4%
Average Intel Core i7-9750H
  (9704 - 14337, n=80)
12766 Points -22%
Intel Core i9-9980HK, Intel UHD Graphics 630
i9-9980HK, 2400 MHz
9056 Points -45%
Average Intel Core i5-9300H
  (7499 - 10557, n=12)
8987 Points -45%
7-Zip 18.03
7z b 4
AMD Ryzen 9 3950X, NVIDIA Titan RTX
R9 3950X, 3500 MHz
99467 MIPS +126%
Intel Core i9-10900K, NVIDIA Titan RTX
i9-10900K, 3700 MHz
70968 MIPS +61%
Intel Core i9-9980HK, NVIDIA GeForce RTX 2070 (Desktop)
i9-9980HK, 2400 MHz
44081 MIPS
Average Intel Core i9-9980HK
  (39566 - 44081, n=4)
41756 MIPS -5%
Intel Core i5-10600K, NVIDIA Titan RTX
i5-10600K, 4100 MHz
40379 MIPS -8%
Average Intel Core i7-9750H
  (28512 - 35174, n=21)
32357 MIPS -27%
Average Intel Core i5-9300H
  (20736 - 23155, n=3)
22008 MIPS -50%
7z b 4 -mmt1
Intel Core i9-10900K, NVIDIA Titan RTX
i9-10900K, 3700 MHz
5954 MIPS +6%
Intel Core i9-9980HK, NVIDIA GeForce RTX 2070 (Desktop)
i9-9980HK, 2400 MHz
5642 MIPS
Average Intel Core i9-9980HK
  (5283 - 5642, n=4)
5426 MIPS -4%
AMD Ryzen 9 3950X, NVIDIA Titan RTX
R9 3950X, 3500 MHz
5340 MIPS -5%
Intel Core i5-10600K, NVIDIA Titan RTX
i5-10600K, 4100 MHz
5289 MIPS -6%
Average Intel Core i7-9750H
  (4580 - 5090, n=21)
4846 MIPS -14%
Average Intel Core i5-9300H
  (4542 - 4626, n=3)
4592 MIPS -19%
HWBOT x265 Benchmark v2.2 - 4k Preset
Intel Core i9-10900K, NVIDIA Titan RTX
i9-10900K, 3700 MHz
21 fps +84%
AMD Ryzen 9 3950X, NVIDIA Titan RTX
R9 3950X, 3500 MHz
15.8 fps +39%
Intel Core i5-10600K, NVIDIA Titan RTX
i5-10600K, 4100 MHz
12.2 fps +7%
Average Intel Core i9-9980HK
  (10.8 - 12.4, n=3)
11.5 fps +1%
Intel Core i9-9980HK, NVIDIA GeForce RTX 2070 (Desktop)
i9-9980HK, 2400 MHz
11.4 fps
Average Intel Core i7-9750H
  (7.1 - 10.7, n=21)
8.72 fps -24%
Average Intel Core i5-9300H
  (5.7 - 6.5, n=3)
6.07 fps -47%
R Benchmark 2.5 - Overall mean
Average Intel Core i7-9750H
  (0.608 - 0.695, n=14)
0.643 sec * -19%
Intel Core i5-10600K, NVIDIA Titan RTX
i5-10600K, 4100 MHz
0.593 sec * -10%
Intel Core i9-9980HK, NVIDIA GeForce RTX 2070 (Desktop)
i9-9980HK, 2400 MHz
0.541 sec *
Average Intel Core i9-9980HK
 
0.541 sec * -0%
Intel Core i9-10900K, NVIDIA Titan RTX
i9-10900K, 3700 MHz
0.528 sec * +2%
AMD Ryzen 9 3950X, NVIDIA Titan RTX
R9 3950X, 3500 MHz
0.524 sec * +3%
LibreOffice - 20 Documents To PDF
Intel Core i9-10900K, NVIDIA Titan RTX
i9-10900K, 3700 MHz
76 s * -68%
Average Intel Core i7-9750H
  (54.5 - 64.7, n=9)
59 s * -30%
AMD Ryzen 9 3950X, NVIDIA Titan RTX
R9 3950X, 3500 MHz
53.6 s * -19%
Average Intel Core i9-9980HK
  (45.2 - 57.5, n=2)
51.4 s * -14%
Intel Core i5-10600K, NVIDIA Titan RTX
i5-10600K, 4100 MHz
46.06 s * -2%
Intel Core i9-9980HK, NVIDIA GeForce RTX 2070 (Desktop)
i9-9980HK, 2400 MHz
45.23 s *
WebXPRT 3 - Overall
Intel Core i9-10900K, NVIDIA Titan RTX
i9-10900K, 3700 MHz
255 Points +9%
AMD Ryzen 9 3950X, NVIDIA Titan RTX
R9 3950X, 3500 MHz
239 Points +3%
Intel Core i5-10600K, NVIDIA Titan RTX
i5-10600K, 4100 MHz
239 Points +3%
Intel Core i9-9980HK, NVIDIA GeForce RTX 2070 (Desktop)
i9-9980HK, 2400 MHz
233 Points
Average Intel Core i9-9980HK
 
233 Points 0%
Average Intel Core i5-9300H
 
222 Points -5%
Average Intel Core i7-9750H
  (199 - 231, n=10)
211 Points -9%
Mozilla Kraken 1.1 - Total
Average Intel Core i5-9300H
  (1079 - 1349, n=8)
1138 ms * -51%
Average Intel Core i7-9750H
  (845 - 1713, n=54)
1048 ms * -39%
Average Intel Core i9-9980HK
  (705 - 999, n=9)
878 ms * -16%
Intel Core i5-10600K, NVIDIA Titan RTX
i5-10600K, 4100 MHz
760 ms * -1%
Intel Core i9-9980HK, NVIDIA GeForce RTX 2070 (Desktop)
i9-9980HK, 2400 MHz
754 ms *
Intel Core i9-10900K, NVIDIA Titan RTX
i9-10900K, 3700 MHz
709 ms * +6%
AMD Ryzen 9 3950X, NVIDIA Titan RTX
R9 3950X, 3500 MHz
706 ms * +6%
3DMark
3840x2160 Fire Strike Ultra Physics
AMD Ryzen 9 3950X, NVIDIA Titan RTX
R9 3950X, 3500 MHz
31881 Points +46%
Intel Core i9-10900K, NVIDIA Titan RTX
i9-10900K, 3700 MHz
29374 Points +34%
Intel Core i9-9980HK, NVIDIA GeForce RTX 2070 (Desktop)
i9-9980HK, 2400 MHz
21864 Points
Average Intel Core i9-9980HK
  (19832 - 22568, n=8)
21323 Points -2%
Intel Core i5-10600K, NVIDIA Titan RTX
i5-10600K, 4100 MHz
19942 Points -9%
Intel Core i9-9980HK, Intel UHD Graphics 630
i9-9980HK, 2400 MHz
19832 Points -9%
Average Intel Core i7-9750H
  (12628 - 17820, n=51)
16437 Points -25%
Average Intel Core i5-9300H
  (9749 - 12343, n=6)
11357 Points -48%
1920x1080 Fire Strike Physics
AMD Ryzen 9 3950X, NVIDIA Titan RTX
R9 3950X, 3500 MHz
32004 Points +47%
Intel Core i9-10900K, NVIDIA Titan RTX
i9-10900K, 3700 MHz
29805 Points +37%
Intel Core i9-9980HK, NVIDIA GeForce RTX 2070 (Desktop)
i9-9980HK, 2400 MHz
21706 Points
Intel Core i9-9980HK, Intel UHD Graphics 630
i9-9980HK, 2400 MHz
20357 Points -6%
Intel Core i5-10600K, NVIDIA Titan RTX
i5-10600K, 4100 MHz
20040 Points -8%
Average Intel Core i9-9980HK
  (11758 - 22463, n=11)
19893 Points -8%
Average Intel Core i7-9750H
  (12438 - 17788, n=76)
16332 Points -25%
Average Intel Core i5-9300H
  (9387 - 12349, n=12)
11376 Points -48%
2560x1440 Time Spy CPU
Intel Core i9-10900K, NVIDIA Titan RTX
i9-10900K, 3700 MHz
14326 Points +52%
AMD Ryzen 9 3950X, NVIDIA Titan RTX
R9 3950X, 3500 MHz
12404 Points +32%
Intel Core i9-9980HK, NVIDIA GeForce RTX 2070 (Desktop)
i9-9980HK, 2400 MHz
9417 Points
Average Intel Core i9-9980HK
  (5540 - 10162, n=12)
8487 Points -10%
Intel Core i5-10600K, NVIDIA Titan RTX
i5-10600K, 4100 MHz
8290 Points -12%
Intel Core i9-9980HK, Intel UHD Graphics 630
i9-9980HK, 2400 MHz
7243 Points -23%
Average Intel Core i7-9750H
  (4620 - 7171, n=70)
6334 Points -33%
Average Intel Core i5-9300H
  (3165 - 4861, n=10)
4074 Points -57%

* ... smaller is better

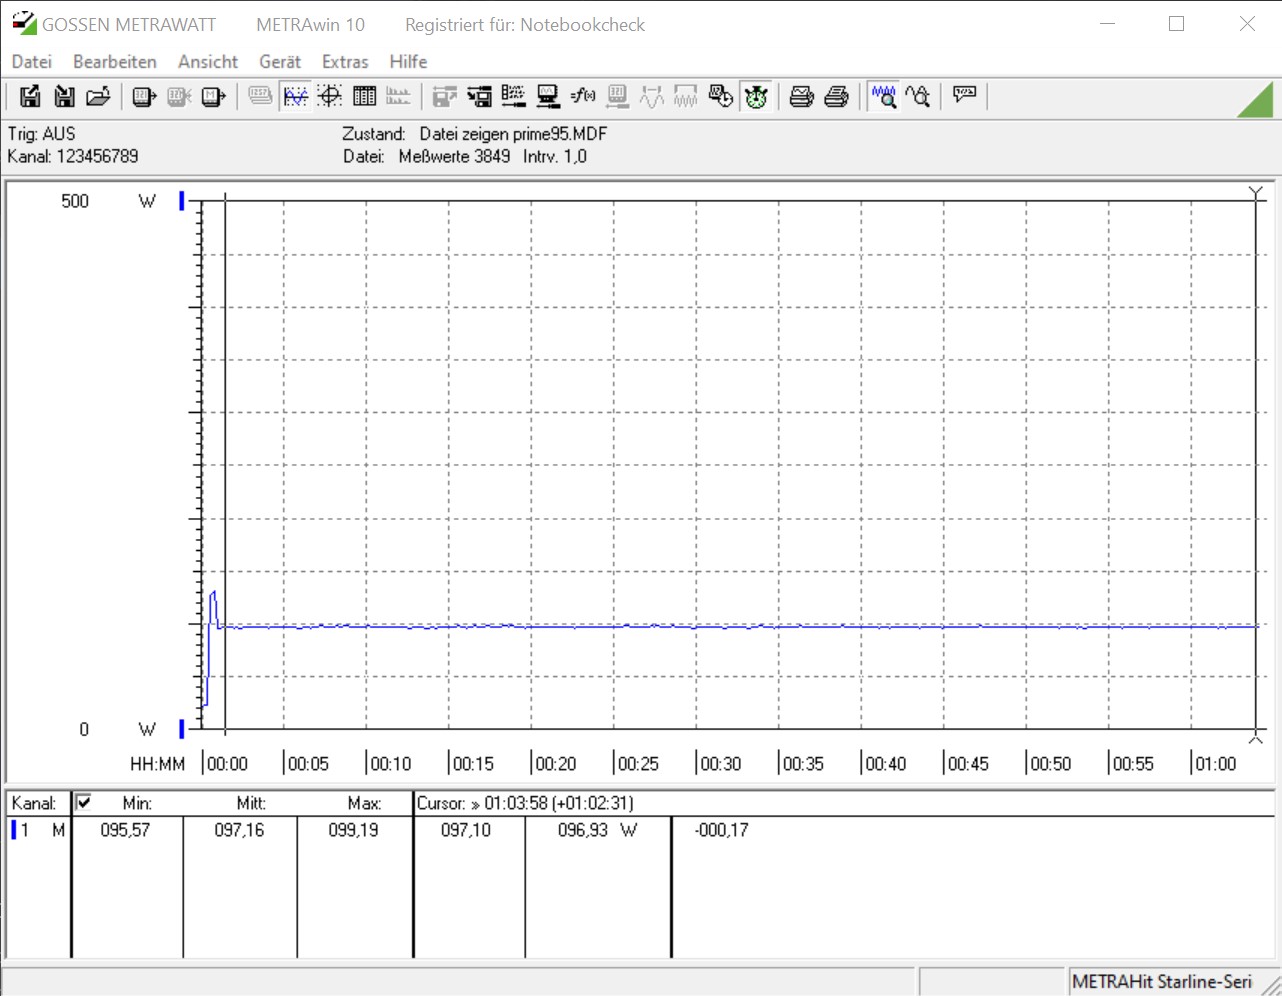
Intel NUC 9 Extreme Kit in the Cinebench R15 Loop

Despite its compact build the cooling solution worked very well and managed to cool the CPU adequately enough to ensure consistently high scores in our Cinebench R15 multi-thread loop. Scores dropped by around 150 points after the initial run during which the Core i9-9980HK was able to fully take advantage of its high turbo boost capabilities and remained stable afterwards. On average, our test sample scored 1,463 points. We ran the same test with the GeForce RTX 2070 removed in order to determine whether or not it blocked airflow in the case and are happy to report this was not the case. Minor deviations aside the results were identical.

1410.81460.81510.81560.8Tooltip
Intel Ghost Canyon NUC (RTX 2070) Intel Core i9-9980HK, Intel Core i9-9980HK: Ø1463 (1410.79-1593.44)

Application Performance

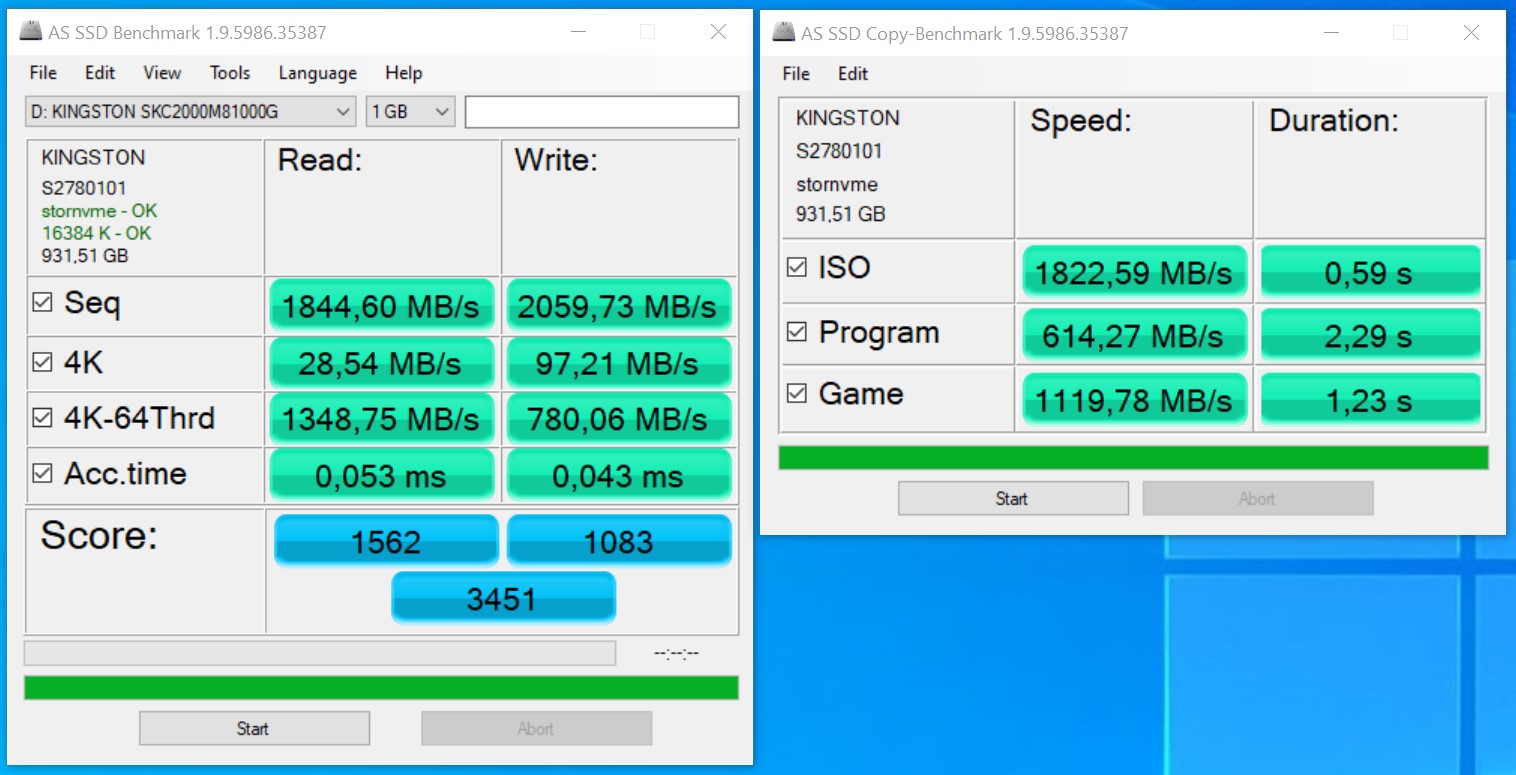
Our test sample performed just shy of the three desktop processors in our application performance benchmarks. Once again, we ran the same tests with the dedicated GPU removed, and the results were identical save for the graphics tests. To nobody’s surprise the RTX2070 turned out to be much more powerful than the 630. Consequently, the Intel NUC 9 is a great device for everyday work. The installed SSDs performed very well, which reduced waiting times to a minimum. The gaming tests were no big challenge for the device either. Kudos to Intel for creating an all-flash NUC.

Intel Optane SSD 905P (380 GB)
Kingston KC2000 NVMe SSD (1.024 GB)
PCMark 10 - Score
AMD Ryzen 9 3950X, AMD Ryzen 9 3950X
NVIDIA Titan RTX
7869 Points +13%
Intel Core i9-10900K, Intel Core i9-10900K
NVIDIA Titan RTX
7641 Points +10%
Corsair One i160, Intel Core i9-9900K
NVIDIA GeForce RTX 2080 Ti (Desktop)
7329 Points +6%
Intel Core i5-10600K, Intel Core i5-10600K
NVIDIA Titan RTX
7279 Points +5%
Intel Ghost Canyon NUC (RTX 2070), Intel Core i9-9980HK
NVIDIA GeForce RTX 2070 (Desktop)
6939 Points
Intel Ghost Canyon NUC, Intel Core i9-9980HK
Intel UHD Graphics 630
4806 Points -31%
PCMark 8
Work Score Accelerated v2
AMD Ryzen 9 3950X, AMD Ryzen 9 3950X
NVIDIA Titan RTX
5388 Points +6%
Corsair One i160, Intel Core i9-9900K
NVIDIA GeForce RTX 2080 Ti (Desktop)
5296 Points +5%
Intel Core i5-10600K, Intel Core i5-10600K
NVIDIA Titan RTX
5148 Points +2%
Intel Core i9-10900K, Intel Core i9-10900K
NVIDIA Titan RTX
5115 Points +1%
Intel Ghost Canyon NUC (RTX 2070), Intel Core i9-9980HK
NVIDIA GeForce RTX 2070 (Desktop)
5066 Points
Intel Ghost Canyon NUC, Intel Core i9-9980HK
Intel UHD Graphics 630
4814 Points -5%
Creative Score Accelerated v2
Corsair One i160, Intel Core i9-9900K
NVIDIA GeForce RTX 2080 Ti (Desktop)
10550 Points +18%
AMD Ryzen 9 3950X, AMD Ryzen 9 3950X
NVIDIA Titan RTX
10402 Points +16%
Intel Core i5-10600K, Intel Core i5-10600K
NVIDIA Titan RTX
10349 Points +15%
Intel Core i9-10900K, Intel Core i9-10900K
NVIDIA Titan RTX
10245 Points +14%
Intel Ghost Canyon NUC (RTX 2070), Intel Core i9-9980HK
NVIDIA GeForce RTX 2070 (Desktop)
8969 Points
Intel Ghost Canyon NUC, Intel Core i9-9980HK
Intel UHD Graphics 630
5572 Points -38%
Home Score Accelerated v2
Corsair One i160, Intel Core i9-9900K
NVIDIA GeForce RTX 2080 Ti (Desktop)
5418 Points +3%
AMD Ryzen 9 3950X, AMD Ryzen 9 3950X
NVIDIA Titan RTX
5404 Points +3%
Intel Ghost Canyon NUC (RTX 2070), Intel Core i9-9980HK
NVIDIA GeForce RTX 2070 (Desktop)
5247 Points
Intel Core i5-10600K, Intel Core i5-10600K
NVIDIA Titan RTX
5212 Points -1%
Intel Core i9-10900K, Intel Core i9-10900K
NVIDIA Titan RTX
5185 Points -1%
Intel Ghost Canyon NUC, Intel Core i9-9980HK
Intel UHD Graphics 630
4075 Points -22%
SPECviewperf 12
1900x1060 Solidworks (sw-03)
Intel Core i9-10900K, Intel Core i9-10900K
NVIDIA Titan RTX
172.2 fps +191%
Intel Core i5-10600K, Intel Core i5-10600K
NVIDIA Titan RTX
158.2 fps +167%
AMD Ryzen 9 3950X, AMD Ryzen 9 3950X
NVIDIA Titan RTX
157.6 fps +166%
Corsair One i160, Intel Core i9-9900K
NVIDIA GeForce RTX 2080 Ti (Desktop)
83.7 fps +41%
Intel Ghost Canyon NUC (RTX 2070), Intel Core i9-9980HK
NVIDIA GeForce RTX 2070 (Desktop)
59.2 fps
Intel Ghost Canyon NUC, Intel Core i9-9980HK
Intel UHD Graphics 630
29.03 fps -51%
1900x1060 Siemens NX (snx-02)
Intel Core i9-10900K, Intel Core i9-10900K
NVIDIA Titan RTX
263.3 fps +2800%
Intel Core i5-10600K, Intel Core i5-10600K
NVIDIA Titan RTX
259.1 fps +2754%
AMD Ryzen 9 3950X, AMD Ryzen 9 3950X
NVIDIA Titan RTX
254.8 fps +2706%
Corsair One i160, Intel Core i9-9900K
NVIDIA GeForce RTX 2080 Ti (Desktop)
12.72 fps +40%
Intel Ghost Canyon NUC (RTX 2070), Intel Core i9-9980HK
NVIDIA GeForce RTX 2070 (Desktop)
9.08 fps
Intel Ghost Canyon NUC, Intel Core i9-9980HK
Intel UHD Graphics 630
3.37 fps -63%
1900x1060 Showcase (showcase-01)
Intel Core i5-10600K, Intel Core i5-10600K
NVIDIA Titan RTX
196.1 fps +65%
Intel Core i9-10900K, Intel Core i9-10900K
NVIDIA Titan RTX
192.4 fps +62%
AMD Ryzen 9 3950X, AMD Ryzen 9 3950X
NVIDIA Titan RTX
188.3 fps +59%
Corsair One i160, Intel Core i9-9900K
NVIDIA GeForce RTX 2080 Ti (Desktop)
182.3 fps +54%
Intel Ghost Canyon NUC (RTX 2070), Intel Core i9-9980HK
NVIDIA GeForce RTX 2070 (Desktop)
118.5 fps
Intel Ghost Canyon NUC, Intel Core i9-9980HK
Intel UHD Graphics 630
8.38 fps -93%
1900x1060 Medical (medical-01)
Intel Core i5-10600K, Intel Core i5-10600K
NVIDIA Titan RTX
94.6 fps +136%
Intel Core i9-10900K, Intel Core i9-10900K
NVIDIA Titan RTX
94.5 fps +135%
AMD Ryzen 9 3950X, AMD Ryzen 9 3950X
NVIDIA Titan RTX
88.1 fps +119%
Corsair One i160, Intel Core i9-9900K
NVIDIA GeForce RTX 2080 Ti (Desktop)
56.6 fps +41%
Intel Ghost Canyon NUC (RTX 2070), Intel Core i9-9980HK
NVIDIA GeForce RTX 2070 (Desktop)
40.14 fps
Intel Ghost Canyon NUC, Intel Core i9-9980HK
Intel UHD Graphics 630
2.96 fps -93%
1900x1060 Maya (maya-04)
Corsair One i160, Intel Core i9-9900K
NVIDIA GeForce RTX 2080 Ti (Desktop)
190.9 fps +12%
Intel Core i9-10900K, Intel Core i9-10900K
NVIDIA Titan RTX
188.7 fps +10%
AMD Ryzen 9 3950X, AMD Ryzen 9 3950X
NVIDIA Titan RTX
172.2 fps +1%
Intel Ghost Canyon NUC (RTX 2070), Intel Core i9-9980HK
NVIDIA GeForce RTX 2070 (Desktop)
171 fps
Intel Core i5-10600K, Intel Core i5-10600K
NVIDIA Titan RTX
169.4 fps -1%
Intel Ghost Canyon NUC, Intel Core i9-9980HK
Intel UHD Graphics 630
15.67 fps -91%
1900x1060 Energy (energy-01)
Intel Core i5-10600K, Intel Core i5-10600K
NVIDIA Titan RTX
28.77 fps +150%
Intel Core i9-10900K, Intel Core i9-10900K
NVIDIA Titan RTX
28.72 fps +150%
AMD Ryzen 9 3950X, AMD Ryzen 9 3950X
NVIDIA Titan RTX
28.18 fps +145%
Corsair One i160, Intel Core i9-9900K
NVIDIA GeForce RTX 2080 Ti (Desktop)
16.72 fps +46%
Intel Ghost Canyon NUC (RTX 2070), Intel Core i9-9980HK
NVIDIA GeForce RTX 2070 (Desktop)
11.49 fps
Intel Ghost Canyon NUC, Intel Core i9-9980HK
Intel UHD Graphics 630
0.29 fps -97%
1900x1060 Creo (creo-01)
Intel Core i9-10900K, Intel Core i9-10900K
NVIDIA Titan RTX
157.2 fps +201%
Intel Core i5-10600K, Intel Core i5-10600K
NVIDIA Titan RTX
142.7 fps +173%
AMD Ryzen 9 3950X, AMD Ryzen 9 3950X
NVIDIA Titan RTX
134.8 fps +158%
Corsair One i160, Intel Core i9-9900K
NVIDIA GeForce RTX 2080 Ti (Desktop)
72.2 fps +38%
Intel Ghost Canyon NUC (RTX 2070), Intel Core i9-9980HK
NVIDIA GeForce RTX 2070 (Desktop)
52.2 fps
Intel Ghost Canyon NUC, Intel Core i9-9980HK
Intel UHD Graphics 630
14.51 fps -72%
1900x1060 Catia (catia-04)
Intel Core i9-10900K, Intel Core i9-10900K
NVIDIA Titan RTX
225.2 fps +188%
AMD Ryzen 9 3950X, AMD Ryzen 9 3950X
NVIDIA Titan RTX
218.4 fps +179%
Intel Core i5-10600K, Intel Core i5-10600K
NVIDIA Titan RTX
215.5 fps +175%
Corsair One i160, Intel Core i9-9900K
NVIDIA GeForce RTX 2080 Ti (Desktop)
120.8 fps +54%
Intel Ghost Canyon NUC (RTX 2070), Intel Core i9-9980HK
NVIDIA GeForce RTX 2070 (Desktop)
78.3 fps
Intel Ghost Canyon NUC, Intel Core i9-9980HK
Intel UHD Graphics 630
16.61 fps -79%
1900x1060 3ds Max (3dsmax-05)
Intel Core i9-10900K, Intel Core i9-10900K
NVIDIA Titan RTX
297.4 fps +64%
Intel Core i5-10600K, Intel Core i5-10600K
NVIDIA Titan RTX
296.9 fps +64%
AMD Ryzen 9 3950X, AMD Ryzen 9 3950X
NVIDIA Titan RTX
274.5 fps +52%
Corsair One i160, Intel Core i9-9900K
NVIDIA GeForce RTX 2080 Ti (Desktop)
271.8 fps +50%
Intel Ghost Canyon NUC (RTX 2070), Intel Core i9-9980HK
NVIDIA GeForce RTX 2070 (Desktop)
180.8 fps
Intel Ghost Canyon NUC, Intel Core i9-9980HK
Intel UHD Graphics 630
11.27 fps -94%
SPECviewperf 13
Solidworks (sw-04)
Intel Core i9-10900K, Intel Core i9-10900K
NVIDIA Titan RTX
166.2 fps +95%
Intel Core i5-10600K, Intel Core i5-10600K
NVIDIA Titan RTX
153.9 fps +80%
AMD Ryzen 9 3950X, AMD Ryzen 9 3950X
NVIDIA Titan RTX
153.2 fps +79%
Corsair One i160, Intel Core i9-9900K
NVIDIA GeForce RTX 2080 Ti (Desktop)
116.3 fps +36%
Intel Ghost Canyon NUC (RTX 2070), Intel Core i9-9980HK
NVIDIA GeForce RTX 2070 (Desktop)
85.4 fps
Intel Ghost Canyon NUC, Intel Core i9-9980HK
Intel UHD Graphics 630
37.96 fps -56%
Siemens NX (snx-03)
Intel Core i9-10900K, Intel Core i9-10900K
NVIDIA Titan RTX
472.9 fps +2796%
Intel Core i5-10600K, Intel Core i5-10600K
NVIDIA Titan RTX
469.1 fps +2773%
AMD Ryzen 9 3950X, AMD Ryzen 9 3950X
NVIDIA Titan RTX
460 fps +2717%
Corsair One i160, Intel Core i9-9900K
NVIDIA GeForce RTX 2080 Ti (Desktop)
23.03 fps +41%
Intel Ghost Canyon NUC (RTX 2070), Intel Core i9-9980HK
NVIDIA GeForce RTX 2070 (Desktop)
16.33 fps
Intel Ghost Canyon NUC, Intel Core i9-9980HK
Intel UHD Graphics 630
6.07 fps -63%
Showcase (showcase-02)
Intel Core i5-10600K, Intel Core i5-10600K
NVIDIA Titan RTX
195.1 fps +65%
Intel Core i9-10900K, Intel Core i9-10900K
NVIDIA Titan RTX
194.1 fps +64%
AMD Ryzen 9 3950X, AMD Ryzen 9 3950X
NVIDIA Titan RTX
186.8 fps +58%
Corsair One i160, Intel Core i9-9900K
NVIDIA GeForce RTX 2080 Ti (Desktop)
182.6 fps +54%
Intel Ghost Canyon NUC (RTX 2070), Intel Core i9-9980HK
NVIDIA GeForce RTX 2070 (Desktop)
118.5 fps
Intel Ghost Canyon NUC, Intel Core i9-9980HK
Intel UHD Graphics 630
8.34 fps -93%
Medical (medical-02)
AMD Ryzen 9 3950X, AMD Ryzen 9 3950X
NVIDIA Titan RTX
90.3 fps +60%
Intel Core i5-10600K, Intel Core i5-10600K
NVIDIA Titan RTX
89.7 fps +59%
Intel Core i9-10900K, Intel Core i9-10900K
NVIDIA Titan RTX
88.7 fps +57%
Corsair One i160, Intel Core i9-9900K
NVIDIA GeForce RTX 2080 Ti (Desktop)
85 fps +51%
Intel Ghost Canyon NUC (RTX 2070), Intel Core i9-9980HK
NVIDIA GeForce RTX 2070 (Desktop)
56.4 fps
Intel Ghost Canyon NUC, Intel Core i9-9980HK
Intel UHD Graphics 630
2.28 fps -96%
Maya (maya-05)
Intel Core i9-10900K, Intel Core i9-10900K
NVIDIA Titan RTX
405.9 fps +44%
Corsair One i160, Intel Core i9-9900K
NVIDIA GeForce RTX 2080 Ti (Desktop)
402 fps +43%
AMD Ryzen 9 3950X, AMD Ryzen 9 3950X
NVIDIA Titan RTX
394.9 fps +41%
Intel Core i5-10600K, Intel Core i5-10600K
NVIDIA Titan RTX
387.5 fps +38%
Intel Ghost Canyon NUC (RTX 2070), Intel Core i9-9980HK
NVIDIA GeForce RTX 2070 (Desktop)
281 fps
Intel Ghost Canyon NUC, Intel Core i9-9980HK
Intel UHD Graphics 630
23.03 fps -92%
Energy (energy-02)
Intel Core i5-10600K, Intel Core i5-10600K
NVIDIA Titan RTX
53.3 fps +144%
Intel Core i9-10900K, Intel Core i9-10900K
NVIDIA Titan RTX
53.2 fps +144%
AMD Ryzen 9 3950X, AMD Ryzen 9 3950X
NVIDIA Titan RTX
52.4 fps +140%
Corsair One i160, Intel Core i9-9900K
NVIDIA GeForce RTX 2080 Ti (Desktop)
31.93 fps +46%
Intel Ghost Canyon NUC (RTX 2070), Intel Core i9-9980HK
NVIDIA GeForce RTX 2070 (Desktop)
21.83 fps
Intel Ghost Canyon NUC, Intel Core i9-9980HK
Intel UHD Graphics 630
0.77 fps -96%
Creo (creo-02)
Intel Core i9-10900K, Intel Core i9-10900K
NVIDIA Titan RTX
336.3 fps +83%
Intel Core i5-10600K, Intel Core i5-10600K
NVIDIA Titan RTX
331.7 fps +80%
AMD Ryzen 9 3950X, AMD Ryzen 9 3950X
NVIDIA Titan RTX
328.8 fps +79%
Corsair One i160, Intel Core i9-9900K
NVIDIA GeForce RTX 2080 Ti (Desktop)
286.1 fps +56%
Intel Ghost Canyon NUC (RTX 2070), Intel Core i9-9980HK
NVIDIA GeForce RTX 2070 (Desktop)
183.8 fps
Intel Ghost Canyon NUC, Intel Core i9-9980HK
Intel UHD Graphics 630
18.83 fps -90%
Catia (catia-05)
Intel Core i9-10900K, Intel Core i9-10900K
NVIDIA Titan RTX
362.1 fps +218%
AMD Ryzen 9 3950X, AMD Ryzen 9 3950X
NVIDIA Titan RTX
355.2 fps +212%
Intel Core i5-10600K, Intel Core i5-10600K
NVIDIA Titan RTX
341.7 fps +201%
Corsair One i160, Intel Core i9-9900K
NVIDIA GeForce RTX 2080 Ti (Desktop)
177.3 fps +56%
Intel Ghost Canyon NUC (RTX 2070), Intel Core i9-9980HK
NVIDIA GeForce RTX 2070 (Desktop)
113.7 fps
Intel Ghost Canyon NUC, Intel Core i9-9980HK
Intel UHD Graphics 630
23.36 fps -79%
3ds Max (3dsmax-06)
Intel Core i5-10600K, Intel Core i5-10600K
NVIDIA Titan RTX
294.4 fps +65%
Intel Core i9-10900K, Intel Core i9-10900K
NVIDIA Titan RTX
292.5 fps +64%
AMD Ryzen 9 3950X, AMD Ryzen 9 3950X
NVIDIA Titan RTX
274.5 fps +54%
Corsair One i160, Intel Core i9-9900K
NVIDIA GeForce RTX 2080 Ti (Desktop)
265.9 fps +49%
Intel Ghost Canyon NUC (RTX 2070), Intel Core i9-9980HK
NVIDIA GeForce RTX 2070 (Desktop)
178.6 fps
Intel Ghost Canyon NUC, Intel Core i9-9980HK
Intel UHD Graphics 630
14.98 fps -92%

3D and Gaming Performance

3D performance depends on what GPU the system is equipped with. Given that the NUC comes without a dedicated GPU by default we repeated all benchmarks on the Core i9-9980HK's integrated GPU. Our review unit performed much better than the average Intel UHD Graphics 630. Nevertheless, it remained too slow for demanding games. Those in turn ran perfectly fine in QHD using the Asus GeForce RTX 2070 Mini. Keep in mind that more powerful GPUs might be too much for the NUC’s 500 W power supply.

Borderlands 3
1280x720 Very Low Overall Quality (DX11)
Intel Ghost Canyon NUC (RTX 2070)
GeForce RTX 2070 (Desktop), i9-9980HK, Kingston KC2500 1 TB SKC2500M81000G
152 fps
Average NVIDIA GeForce RTX 2070 (Desktop)
  (138 - 152, n=2)
145 fps -5%
Average NVIDIA GeForce RTX 2070 Mobile
  (94 - 125, n=2)
109.5 fps -28%
Average Intel UHD Graphics 630
 
17.8 fps -88%
1920x1080 Badass Overall Quality (DX11)
Average NVIDIA GeForce RTX 2070 (Desktop)
  (70.9 - 74.4, n=2)
72.7 fps +3%
Intel Ghost Canyon NUC (RTX 2070)
GeForce RTX 2070 (Desktop), i9-9980HK, Kingston KC2500 1 TB SKC2500M81000G
70.9 fps
Average NVIDIA GeForce RTX 2070 Mobile
  (61 - 64.5, n=3)
62.9 fps -11%
Metro Exodus
1280x720 Low Quality AF:4x
Intel Ghost Canyon NUC (RTX 2070)
GeForce RTX 2070 (Desktop), i9-9980HK, Kingston KC2500 1 TB SKC2500M81000G
181 (100.48min - 268.67max) fps
Average NVIDIA GeForce RTX 2070 (Desktop)
  (82.7 - 181, n=4)
131.1 fps -28%
Average NVIDIA GeForce RTX 2070 Mobile
  (91.1 - 98, n=2)
94.6 fps -48%
Average Intel UHD Graphics 630
 
15.4 fps -91%
1920x1080 Ultra Quality AF:16x
Intel Ghost Canyon NUC (RTX 2070)
GeForce RTX 2070 (Desktop), i9-9980HK, Kingston KC2500 1 TB SKC2500M81000G
60.9 (33.61min - 92.62max) fps
Average NVIDIA GeForce RTX 2070 (Desktop)
  (33.4 - 62.8, n=4)
54.4 fps -11%
Average NVIDIA GeForce RTX 2070 Mobile
  (53.3 - 54.6, n=5)
53.9 fps -11%
Far Cry New Dawn
1280x720 Low Preset
Intel Ghost Canyon NUC (RTX 2070)
GeForce RTX 2070 (Desktop), i9-9980HK, Kingston KC2500 1 TB SKC2500M81000G
128 (92min - 190max) fps
Average NVIDIA GeForce RTX 2070 (Desktop)
  (117 - 128, n=3)
121.7 fps -5%
Average Intel UHD Graphics 630
 
17 fps -87%
1920x1080 Ultra Preset
Average NVIDIA GeForce RTX 2070 (Desktop)
  (79 - 94, n=3)
87.7 fps +11%
Average NVIDIA GeForce RTX 2070 Mobile
  (82 - 83, n=2)
82.5 fps +4%
Intel Ghost Canyon NUC (RTX 2070)
GeForce RTX 2070 (Desktop), i9-9980HK, Kingston KC2500 1 TB SKC2500M81000G
79 (61min - 99max) fps
Forza Horizon 4
1280x720 Very Low Preset
Intel Ghost Canyon NUC (RTX 2070)
GeForce RTX 2070 (Desktop), i9-9980HK, Kingston KC2500 1 TB SKC2500M81000G
198 fps
Average NVIDIA GeForce RTX 2070 (Desktop)
  (169 - 198, n=4)
183.3 fps -7%
Average NVIDIA GeForce RTX 2070 Mobile
 
137 fps -31%
1920x1080 Ultra Preset AA:2xMS
Average NVIDIA GeForce RTX 2070 (Desktop)
  (106 - 118, n=4)
111 fps +5%
Intel Ghost Canyon NUC (RTX 2070)
GeForce RTX 2070 (Desktop), i9-9980HK, Kingston KC2500 1 TB SKC2500M81000G
106 fps
Average NVIDIA GeForce RTX 2070 Mobile
 
94 fps -11%
Far Cry 5
1280x720 Low Preset AA:T
Intel Ghost Canyon NUC (RTX 2070)
GeForce RTX 2070 (Desktop), i9-9980HK, Kingston KC2500 1 TB SKC2500M81000G
147 (119min - 193max) fps
Average NVIDIA GeForce RTX 2070 Mobile
 
147 fps 0%
Average NVIDIA GeForce RTX 2070 (Desktop)
  (126 - 147, n=4)
132.5 fps -10%
Average Intel UHD Graphics 630
  (13 - 15, n=3)
14 fps -90%
1920x1080 Ultra Preset AA:T
Average NVIDIA GeForce RTX 2070 Mobile
  (103 - 109, n=2)
106 fps +23%
Average NVIDIA GeForce RTX 2070 (Desktop)
  (86 - 105, n=4)
99.8 fps +16%
Intel Ghost Canyon NUC (RTX 2070)
GeForce RTX 2070 (Desktop), i9-9980HK, Kingston KC2500 1 TB SKC2500M81000G
86 (68min - 111max) fps
X-Plane 11.11
1280x720 low (fps_test=1)
Intel Ghost Canyon NUC (RTX 2070)
GeForce RTX 2070 (Desktop), i9-9980HK, Kingston KC2500 1 TB SKC2500M81000G
127 fps
Average NVIDIA GeForce RTX 2070 (Desktop)
 
127 fps 0%
Average NVIDIA GeForce RTX 2070 Mobile
  (96.1 - 128.4, n=8)
107.9 fps -15%
Average Intel UHD Graphics 630
  (11.6 - 31.3, n=10)
21 fps -83%
1920x1080 high (fps_test=3)
Intel Ghost Canyon NUC (RTX 2070)
GeForce RTX 2070 (Desktop), i9-9980HK, Kingston KC2500 1 TB SKC2500M81000G
92.7 fps
Average NVIDIA GeForce RTX 2070 (Desktop)
 
92.7 fps 0%
Average NVIDIA GeForce RTX 2070 Mobile
  (71.9 - 92.5, n=8)
79.9 fps -14%
Average Intel UHD Graphics 630
  (10.3 - 18.3, n=10)
13.8 fps -85%
Final Fantasy XV Benchmark
1280x720 Lite Quality
Intel Ghost Canyon NUC (RTX 2070)
GeForce RTX 2070 (Desktop), i9-9980HK, Kingston KC2500 1 TB SKC2500M81000G
193 (94min - 237max) fps
Average NVIDIA GeForce RTX 2070 Mobile
  (151 - 158, n=2)
154.5 fps -20%
Average NVIDIA GeForce RTX 2070 (Desktop)
  (106.5 - 193, n=5)
154.4 fps -20%
Average Intel UHD Graphics 630
  (9.5 - 14, n=3)
11.6 fps -94%
1920x1080 High Quality
Intel Ghost Canyon NUC (RTX 2070)
GeForce RTX 2070 (Desktop), i9-9980HK, Kingston KC2500 1 TB SKC2500M81000G
90.6 (56min - 138max) fps
Average NVIDIA GeForce RTX 2070 (Desktop)
  (60.8 - 90.6, n=5)
81.9 fps -10%
Average NVIDIA GeForce RTX 2070 Mobile
  (77 - 80.6, n=3)
78.6 fps -13%
Dota 2 Reborn
1280x720 min (0/3) fastest
Intel Ghost Canyon NUC (RTX 2070)
GeForce RTX 2070 (Desktop), i9-9980HK, Kingston KC2500 1 TB SKC2500M81000G
155.6 (135.2min) fps
Average NVIDIA GeForce RTX 2070 (Desktop)
 
155.6 fps 0%
Average NVIDIA GeForce RTX 2070 Mobile
  (129.7 - 153, n=9)
144.4 fps -7%
Average Intel UHD Graphics 630
  (70.4 - 99.1, n=11)
80.6 fps -48%
1920x1080 ultra (3/3) best looking
Intel Ghost Canyon NUC (RTX 2070)
GeForce RTX 2070 (Desktop), i9-9980HK, Kingston KC2500 1 TB SKC2500M81000G
130.3 (114.9min) fps
Average NVIDIA GeForce RTX 2070 (Desktop)
 
130.3 fps 0%
Average NVIDIA GeForce RTX 2070 Mobile
  (98.4 - 124, n=9)
115.9 fps -11%
Average Intel UHD Graphics 630
  (6.8 - 21, n=11)
17.8 fps -86%
The Witcher 3
1024x768 Low Graphics & Postprocessing
Average NVIDIA GeForce RTX 2070 Mobile
  (193.9 - 357, n=12)
290 fps +1%
Intel Ghost Canyon NUC (RTX 2070)
GeForce RTX 2070 (Desktop), i9-9980HK, Kingston KC2500 1 TB SKC2500M81000G
286 (243min - 334max) fps
Average NVIDIA GeForce RTX 2070 (Desktop)
  (151.4 - 315, n=5)
271 fps -5%
Average Intel UHD Graphics 630
  (15.2 - 17.3, n=3)
16.2 fps -94%
1920x1080 Ultra Graphics & Postprocessing (HBAO+)
Intel Ghost Canyon NUC (RTX 2070)
GeForce RTX 2070 (Desktop), i9-9980HK, Kingston KC2500 1 TB SKC2500M81000G
83.1 (72min - 93max) fps
Average NVIDIA GeForce RTX 2070 (Desktop)
  (40.9 - 95, n=5)
79.2 fps -5%
Average NVIDIA GeForce RTX 2070 Mobile
  (64 - 82.1, n=21)
74.3 fps -11%
3DMark
Fire Strike Extreme Graphics
Average NVIDIA GeForce RTX 2070 (Desktop)
  (9979 - 11423, n=5)
10987 Points +10%
Intel Ghost Canyon NUC (RTX 2070)
GeForce RTX 2070 (Desktop), i9-9980HK, Kingston KC2500 1 TB SKC2500M81000G
9979 Points
Average NVIDIA GeForce RTX 2070 Mobile
  (9042 - 9335, n=3)
9179 Points -8%
Intel Ghost Canyon NUC
UHD Graphics 630, i9-9980HK, Kingston KC2500 1 TB SKC2500M81000G
657 Points -93%
Average Intel UHD Graphics 630
  (600 - 657, n=2)
629 Points -94%
1920x1080 Fire Strike Graphics
Average NVIDIA GeForce RTX 2070 (Desktop)
  (16770 - 24242, n=6)
21999 Points +6%
Intel Ghost Canyon NUC (RTX 2070)
GeForce RTX 2070 (Desktop), i9-9980HK, Kingston KC2500 1 TB SKC2500M81000G
20775 Points
Average NVIDIA GeForce RTX 2070 Mobile
  (18169 - 21138, n=19)
20123 Points -3%
Intel Ghost Canyon NUC
UHD Graphics 630, i9-9980HK, Kingston KC2500 1 TB SKC2500M81000G
1472 Points -93%
Average Intel UHD Graphics 630
  (722 - 1472, n=11)
1228 Points -94%
2560x1440 Time Spy Graphics
Average NVIDIA GeForce RTX 2070 (Desktop)
  (7445 - 9656, n=6)
8952 Points +4%
Intel Ghost Canyon NUC (RTX 2070)
GeForce RTX 2070 (Desktop), i9-9980HK, Kingston KC2500 1 TB SKC2500M81000G
8631 Points
Average NVIDIA GeForce RTX 2070 Mobile
  (7006 - 8028, n=18)
7651 Points -11%
Intel Ghost Canyon NUC
UHD Graphics 630, i9-9980HK, Kingston KC2500 1 TB SKC2500M81000G
459 Points -95%
Average Intel UHD Graphics 630
  (367 - 459, n=10)
410 Points -95%
3DMark 11
1280x720 Performance GPU
Average NVIDIA GeForce RTX 2070 (Desktop)
  (22174 - 32373, n=7)
29866 Points +4%
Intel Ghost Canyon NUC (RTX 2070)
GeForce RTX 2070 (Desktop), i9-9980HK, Kingston KC2500 1 TB SKC2500M81000G
28828 Points
Average NVIDIA GeForce RTX 2070 Mobile
  (23335 - 27298, n=21)
25775 Points -11%
Intel Ghost Canyon NUC
UHD Graphics 630, i9-9980HK, Kingston KC2500 1 TB SKC2500M81000G
2025 Points -93%
Average Intel UHD Graphics 630
  (642 - 2025, n=12)
1742 Points -94%
1280x720 Performance
Intel Ghost Canyon NUC (RTX 2070)
GeForce RTX 2070 (Desktop), i9-9980HK, Kingston KC2500 1 TB SKC2500M81000G
24131 Points
Average NVIDIA GeForce RTX 2070 (Desktop)
  (15341 - 27206, n=7)
23703 Points -2%
Average NVIDIA GeForce RTX 2070 Mobile
  (17817 - 23447, n=21)
20620 Points -15%
Intel Ghost Canyon NUC
UHD Graphics 630, i9-9980HK, Kingston KC2500 1 TB SKC2500M81000G
2259 Points -91%
Average Intel UHD Graphics 630
  (790 - 2326, n=12)
1990 Points -92%
low med. high ultraQHD4K
The Witcher 3 (2015) 286 216 142 83.1 55.9
Dota 2 Reborn (2015) 155.6 141.8 137.6 130.3 116.1
Final Fantasy XV Benchmark (2018) 193 122 90.6 37.1
X-Plane 11.11 (2018) 127 115 92.7 82.2
Far Cry 5 (2018) 147 106 82 86 71 46
Forza Horizon 4 (2018) 198 141 132 106 88 61
Far Cry New Dawn (2019) 128 92 87 79 63 49
Metro Exodus (2019) 181 104 77 60.9 48.4 30.5
Borderlands 3 (2019) 152 126 91.7 70.9 49.8 26.7

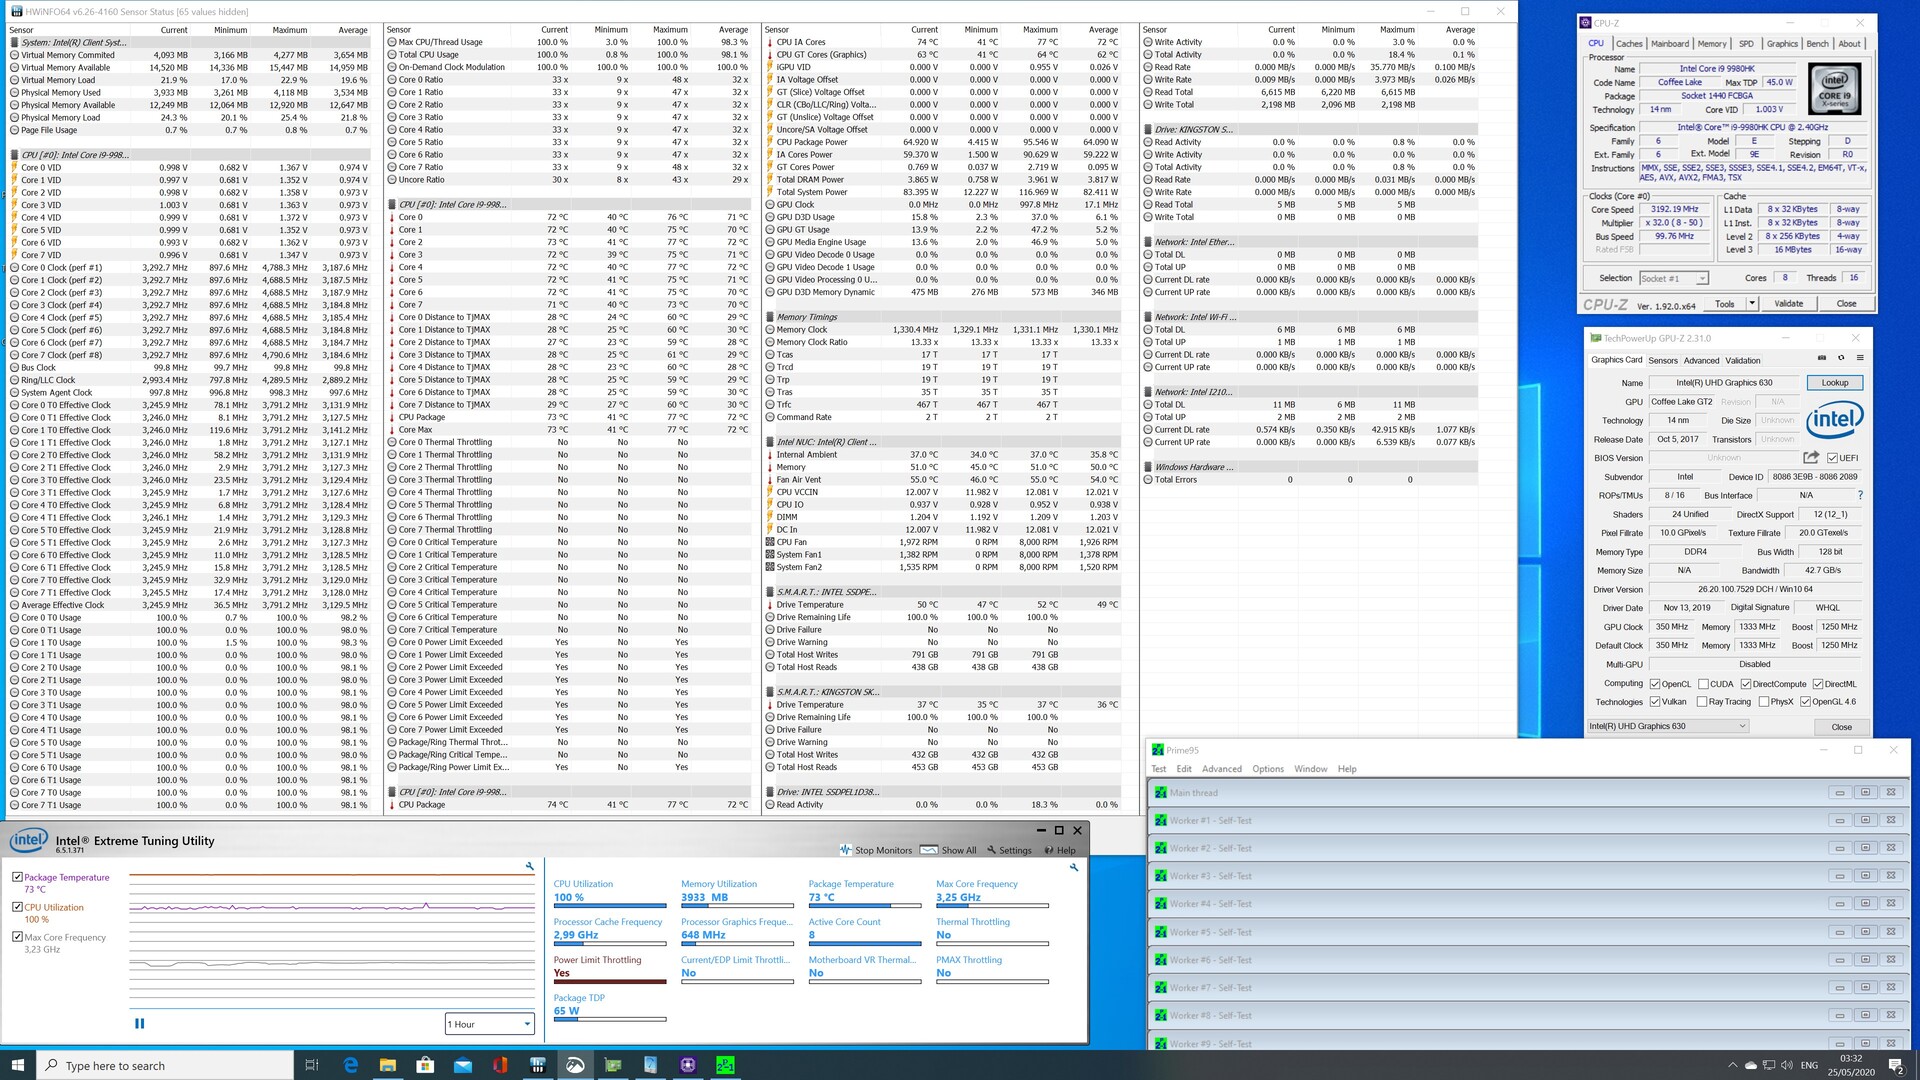
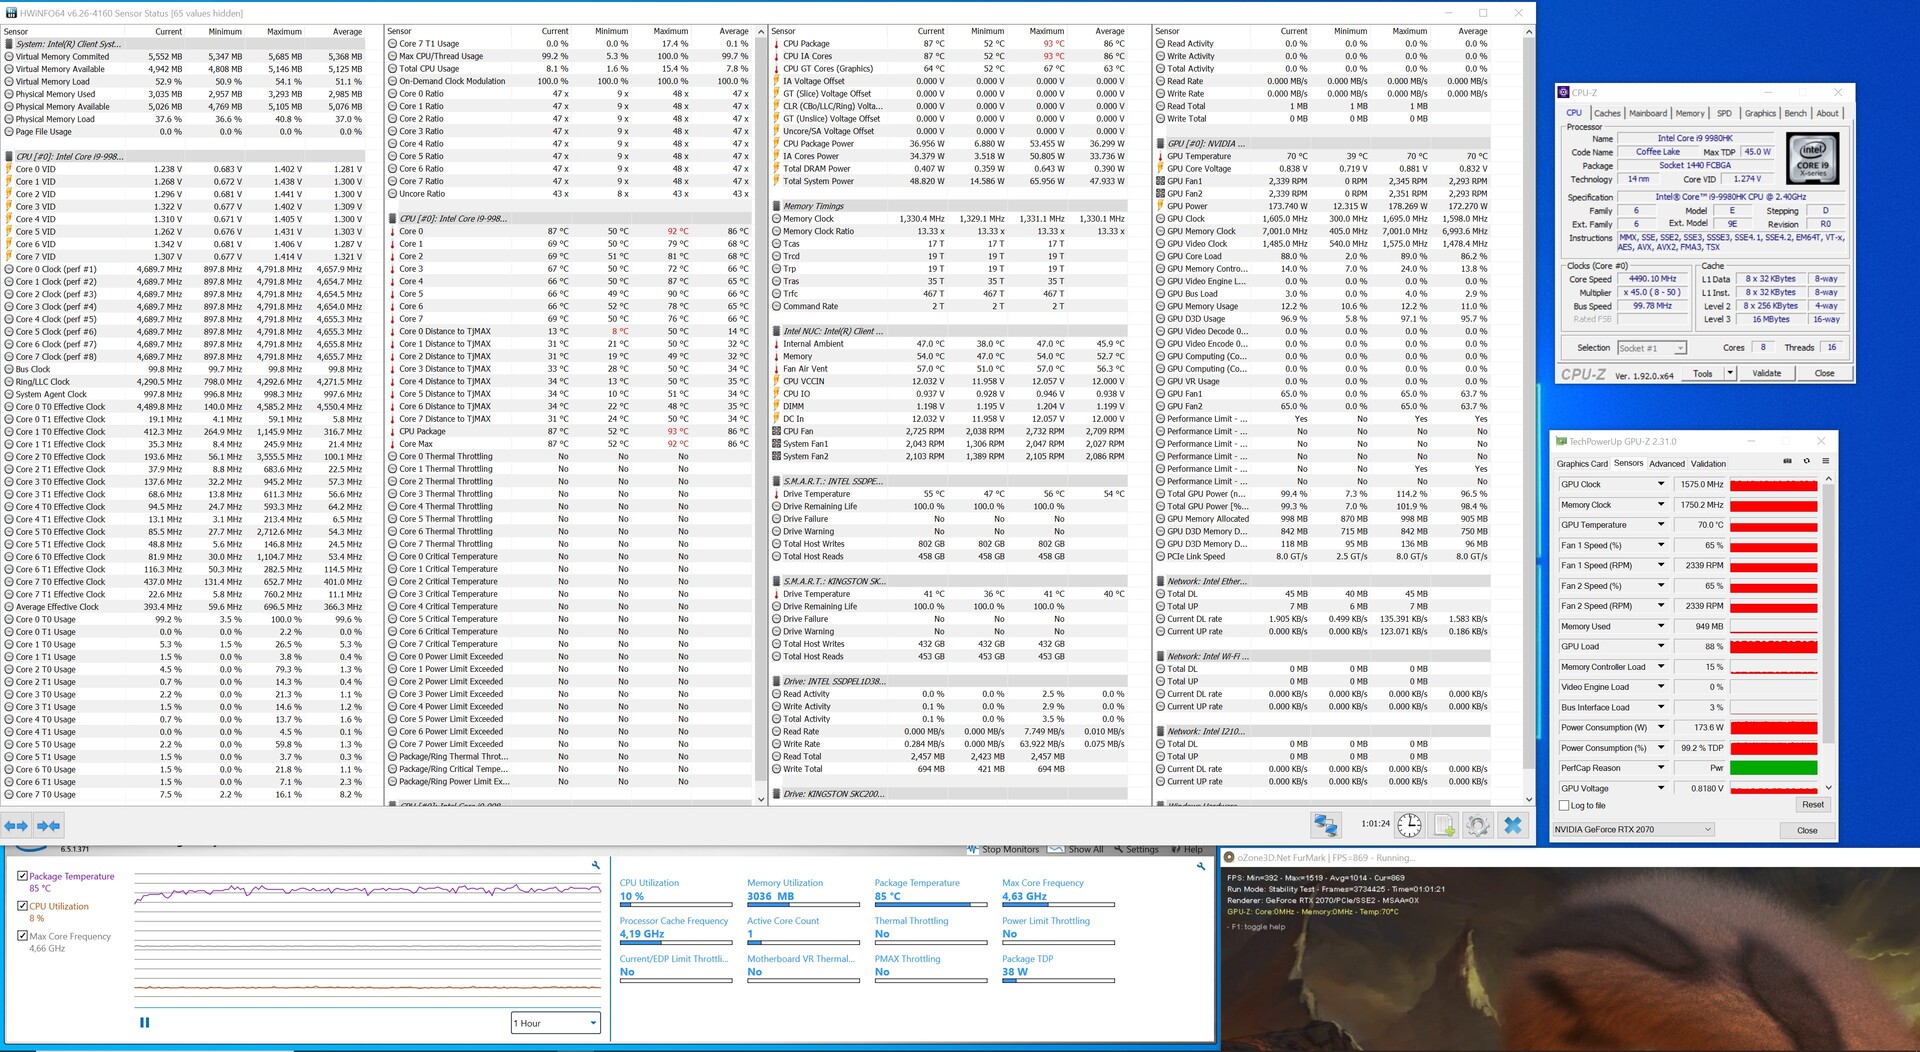
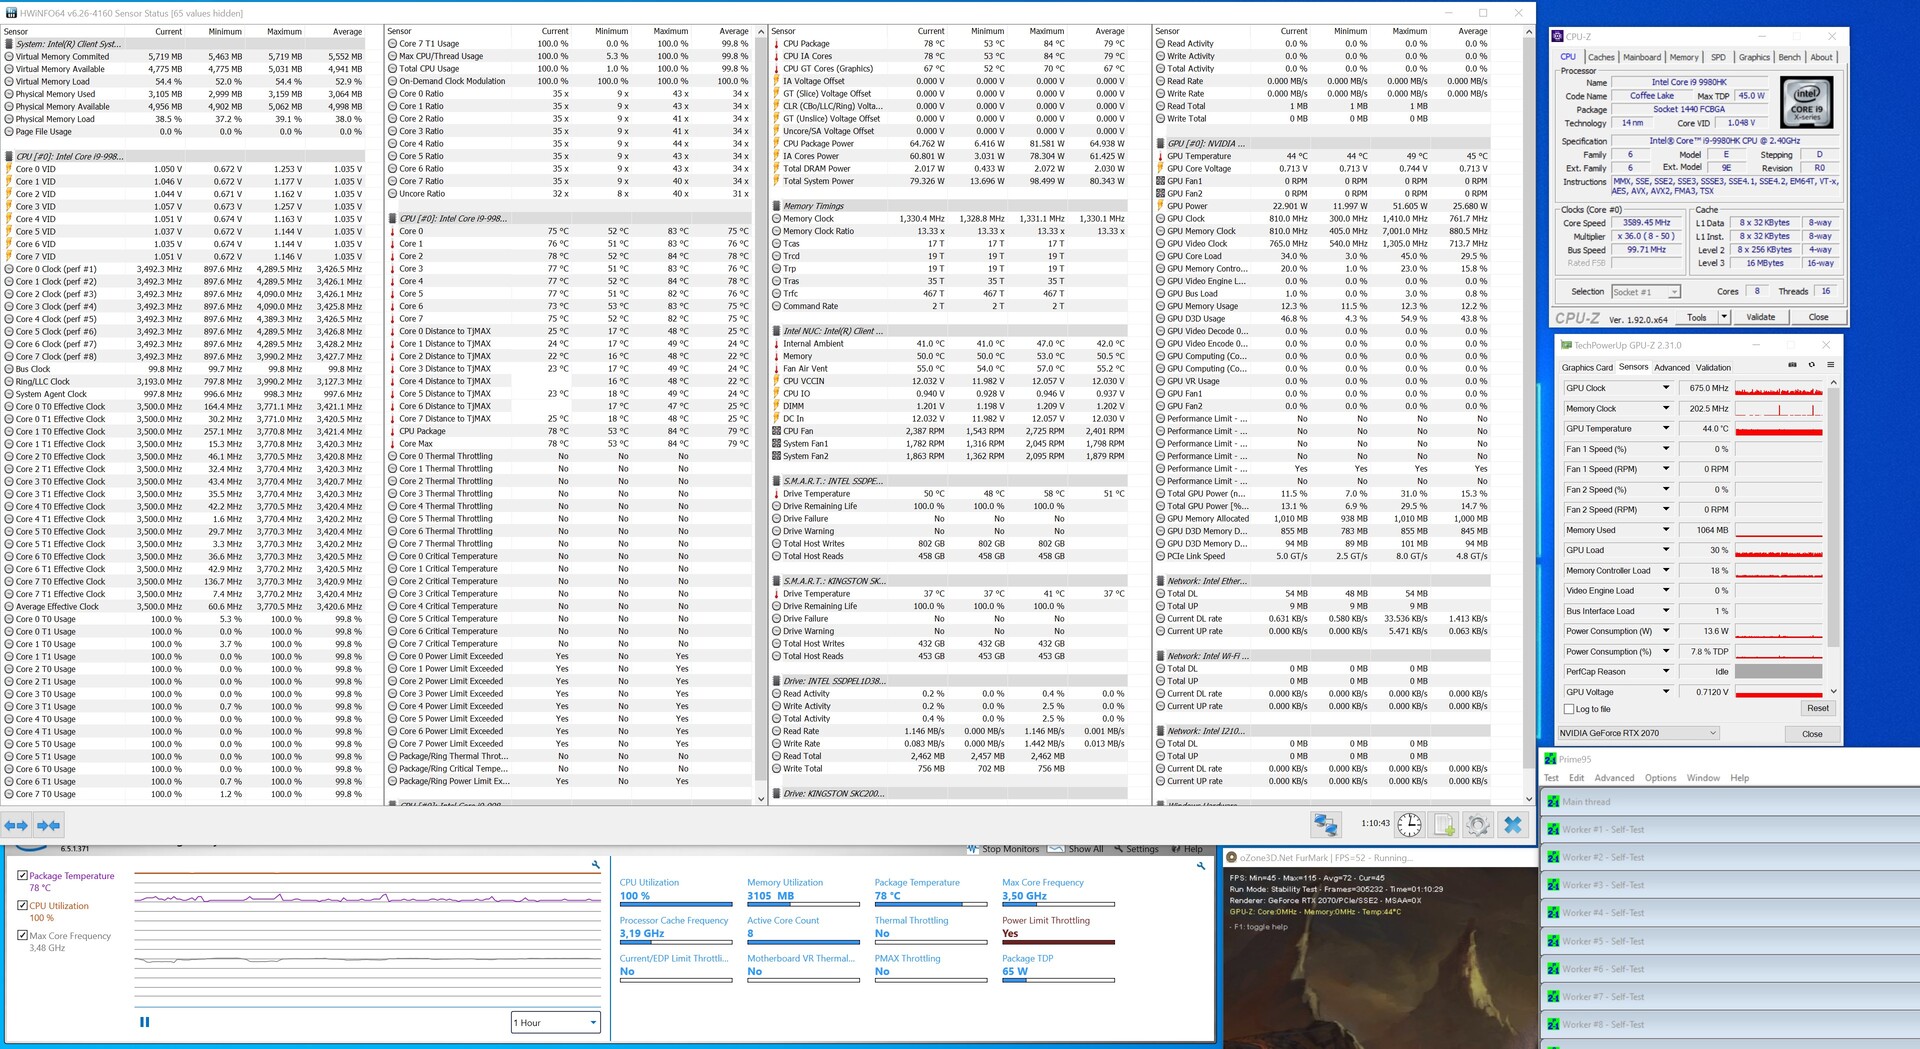
NUC 9 Extreme Power Consumption and Heat Emissions

Intel NUC 9 Extreme Kit stress test

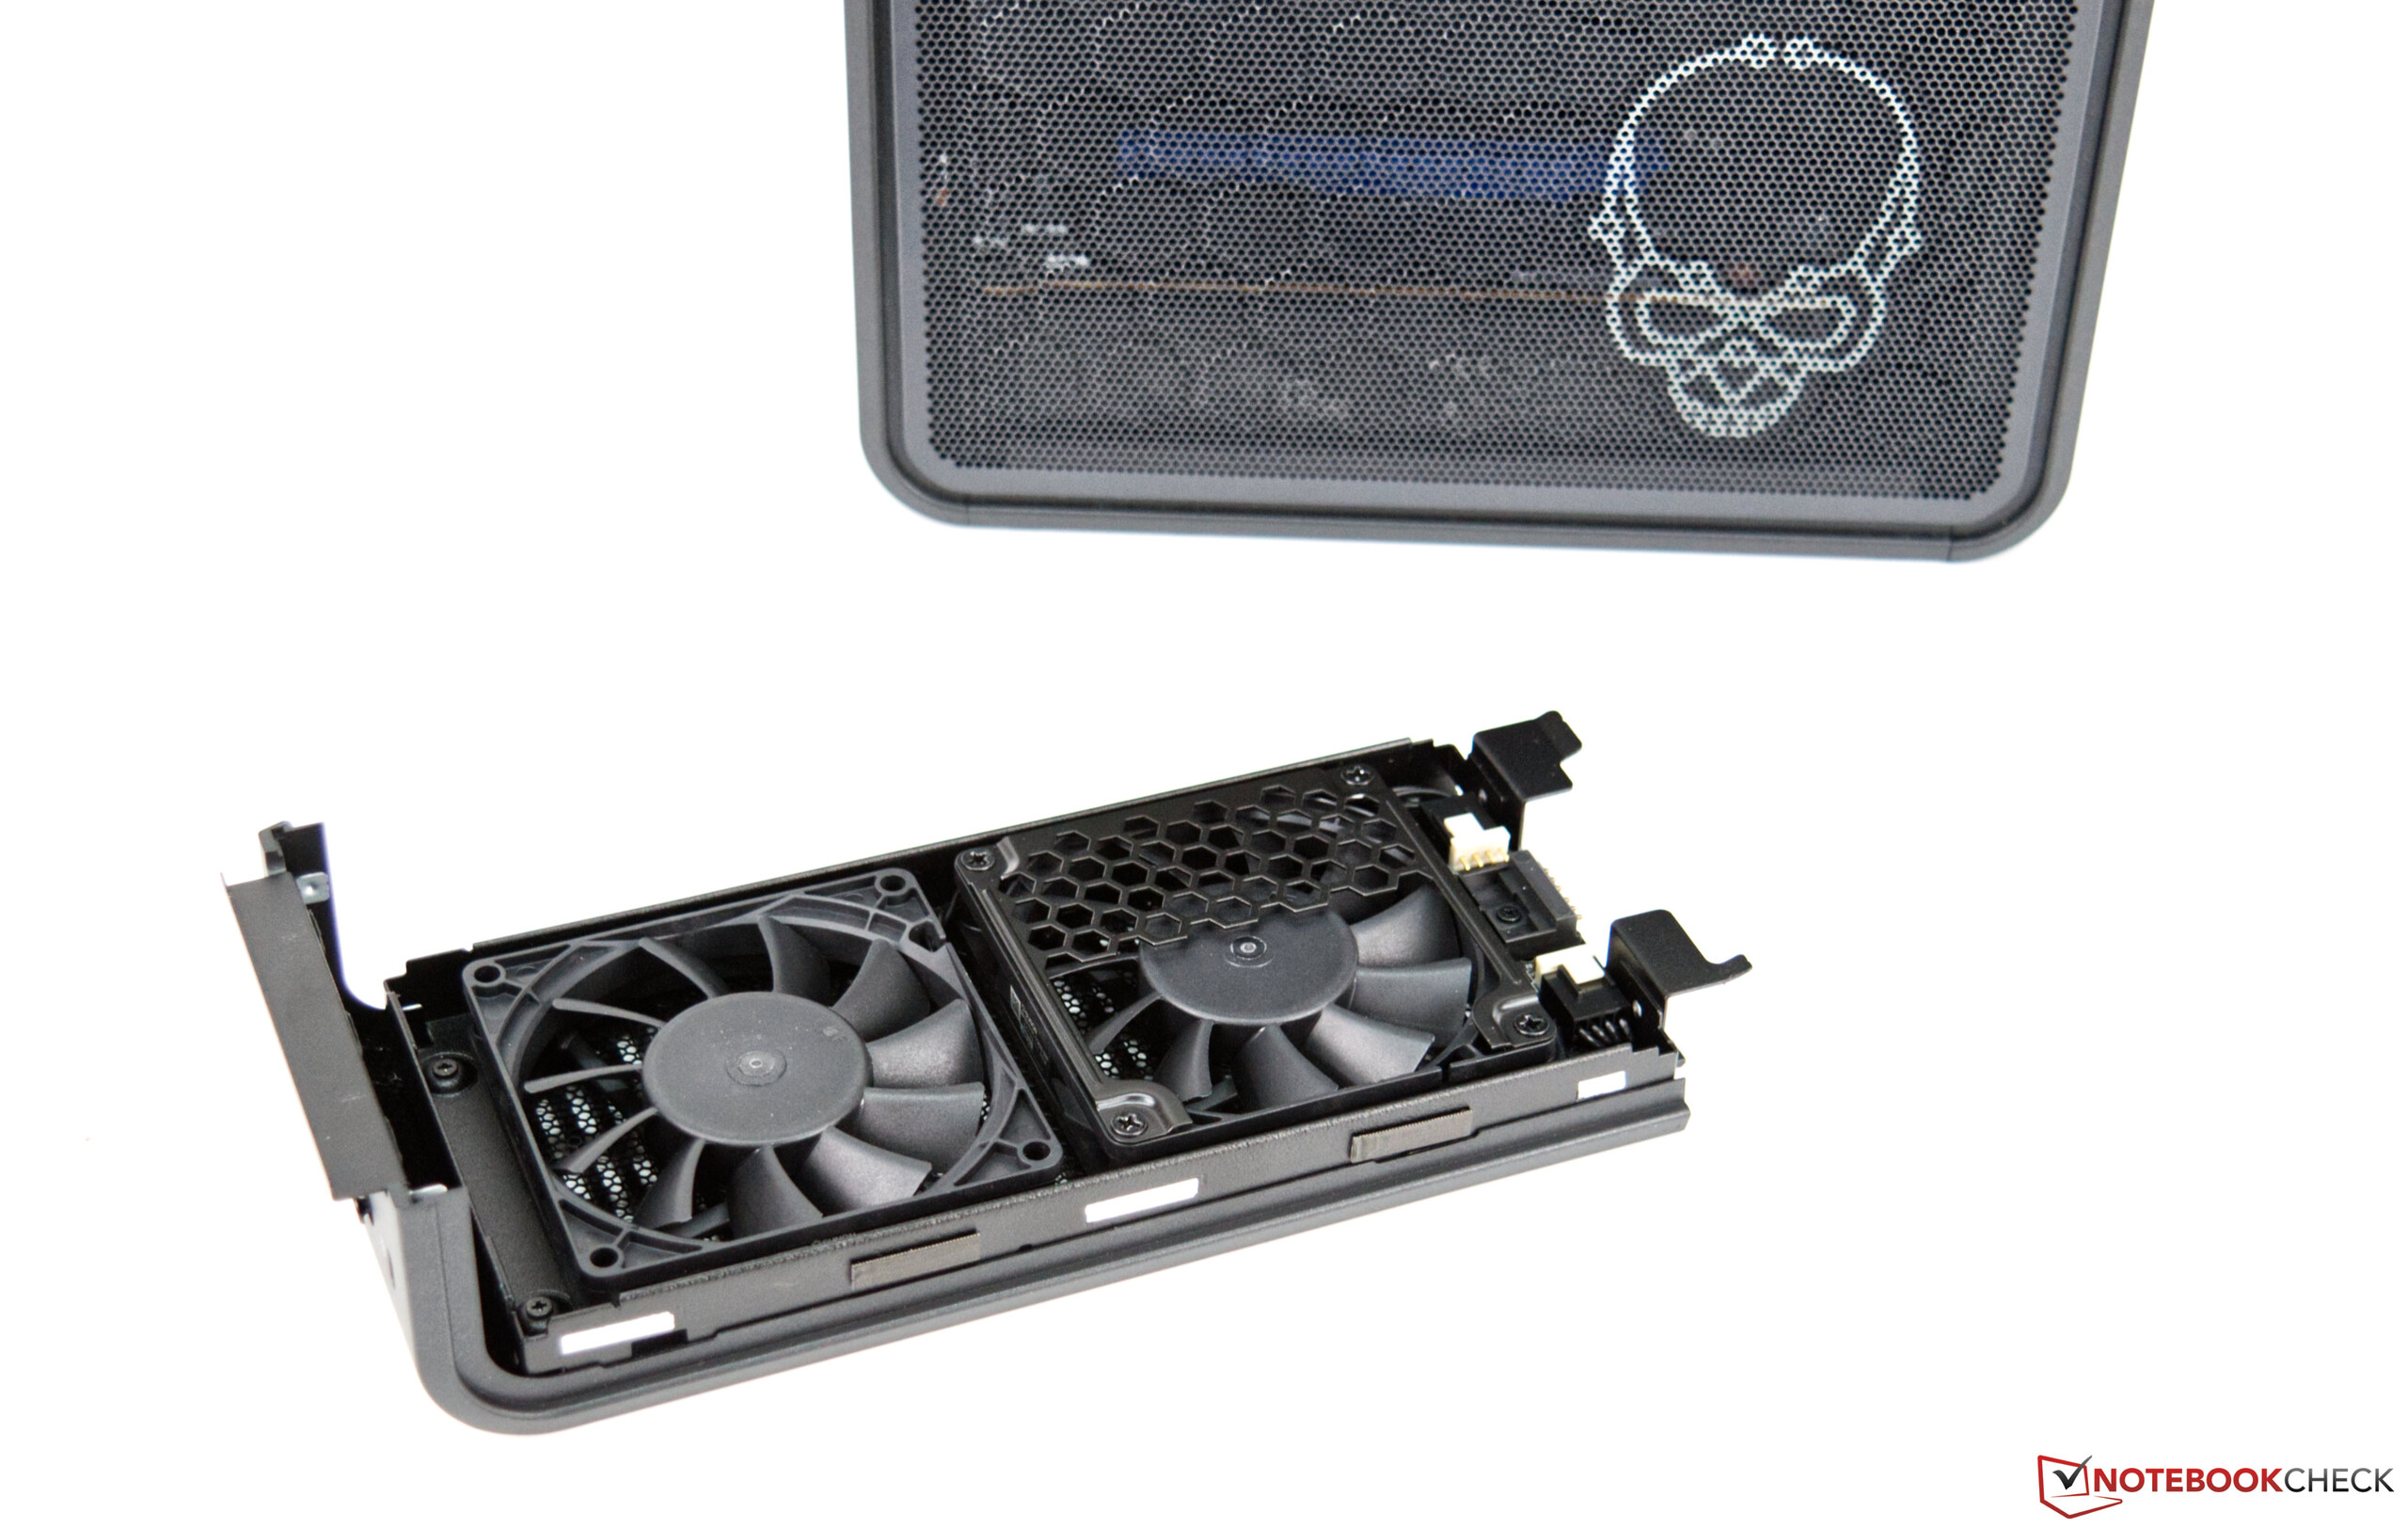
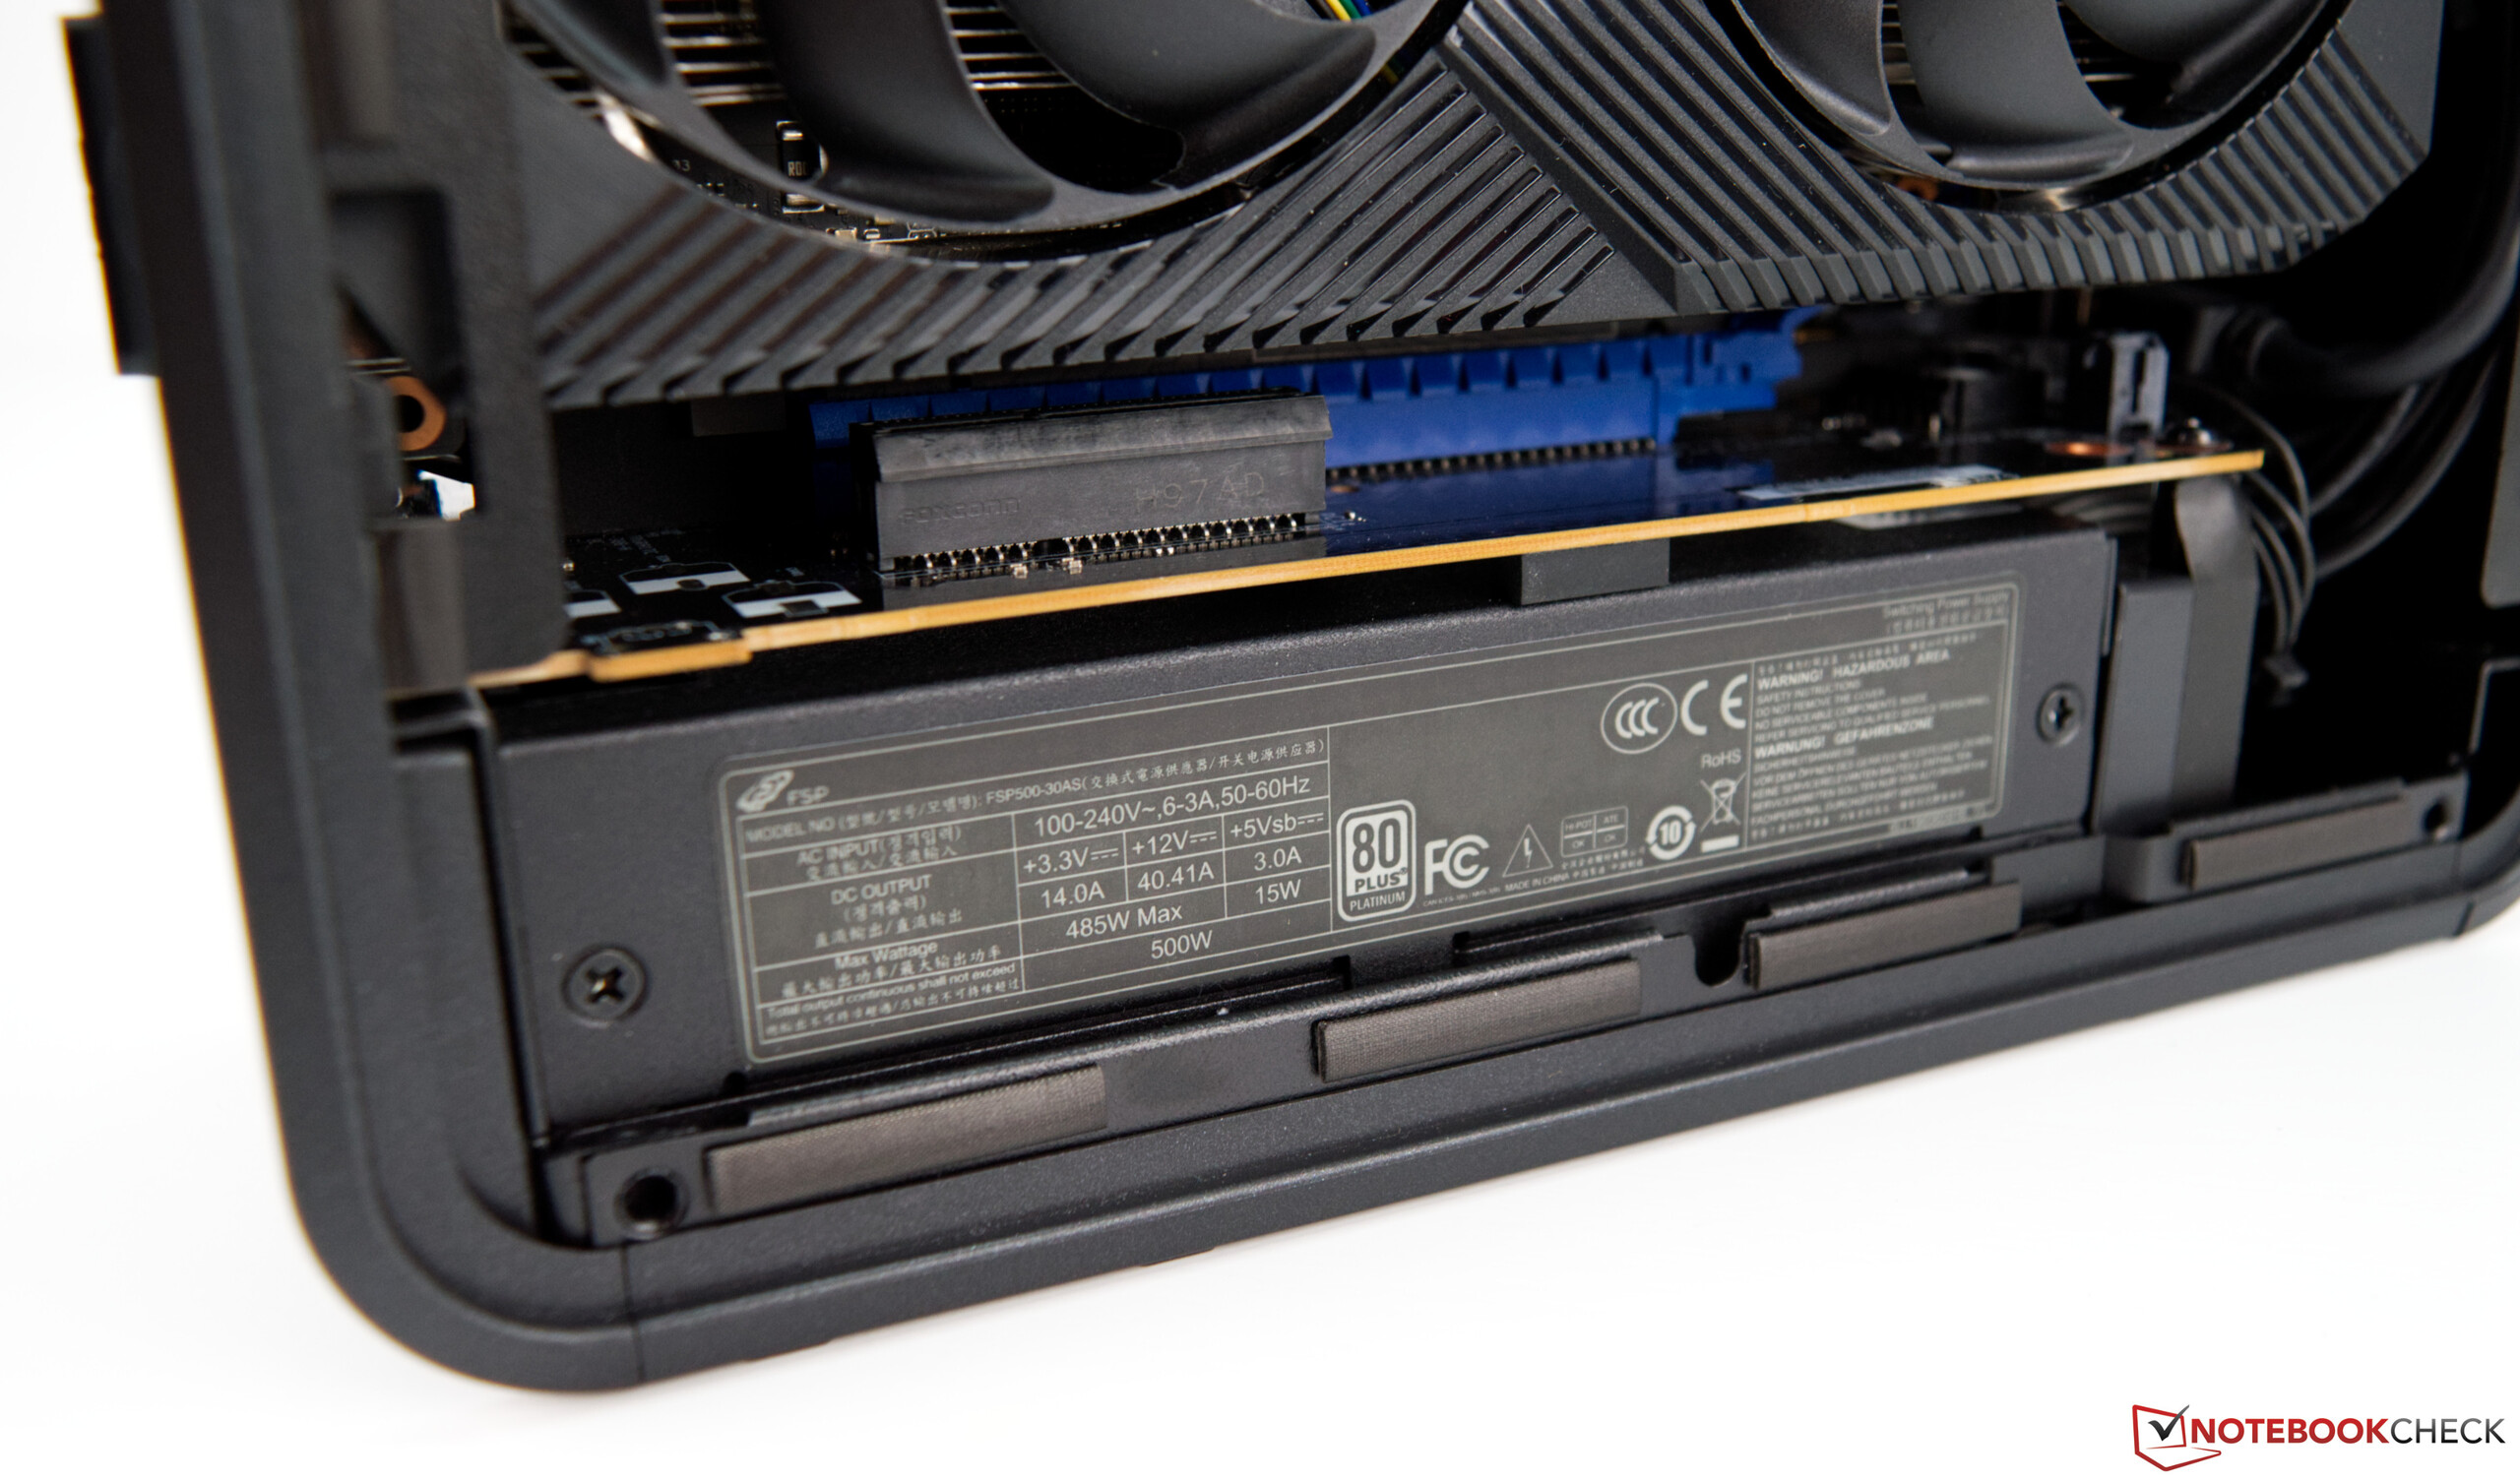
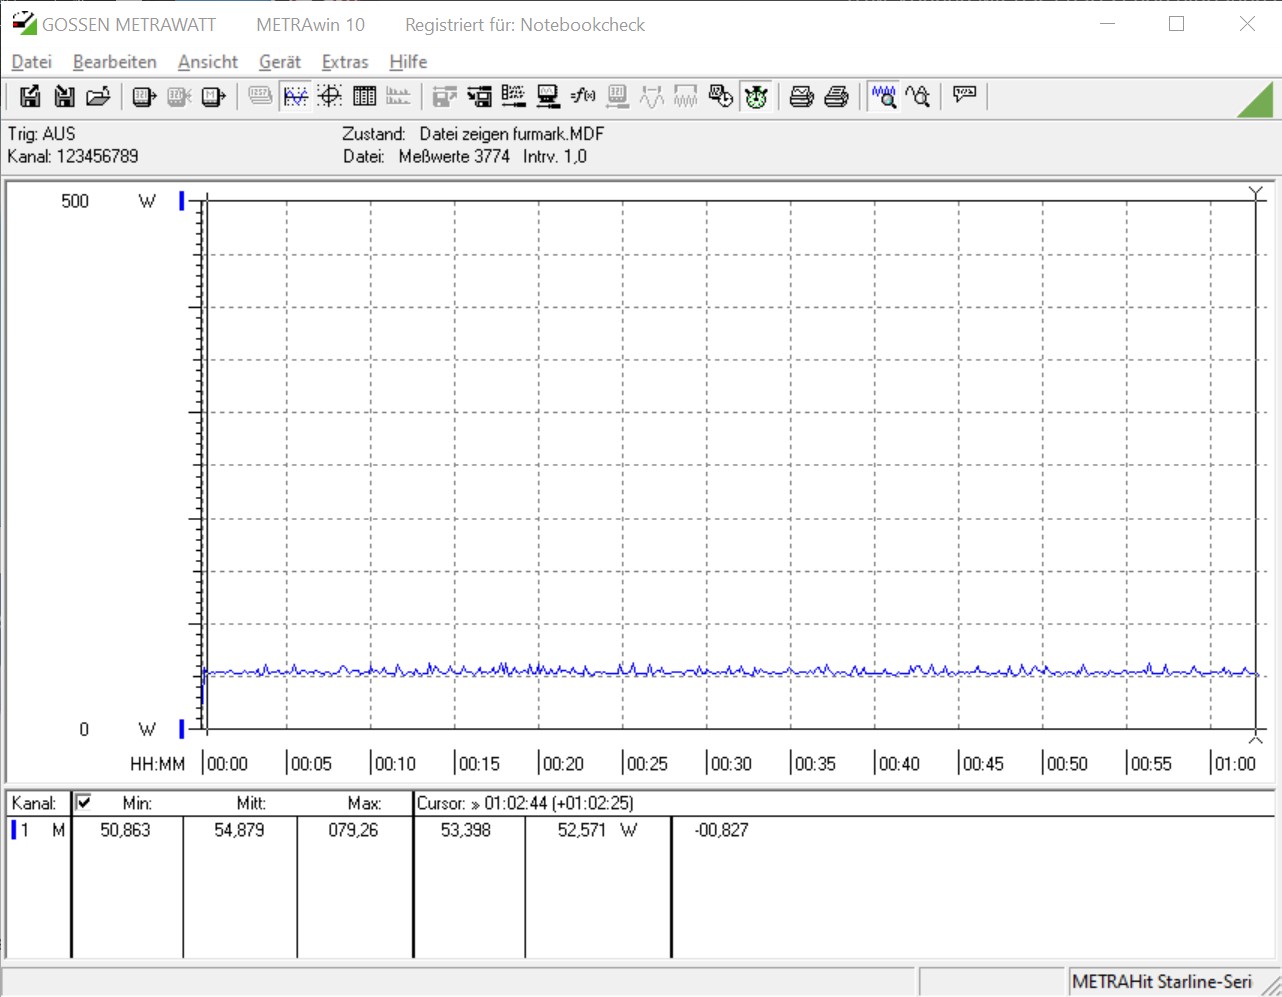
Intel heavily relies on the stack effect to keep temperatures in check. This means that cold air is sucked in on the sides and travels upwards through the case and out. This all works remarkably well as long as there is no GPU blocking airflow. During our stress test we were able to determine that performance does not suffer from the reduced cooling effects, however noise emissions were significantly increased with a GPU installed. In Prime95 they increased from 38.8 dB(A) to 39.8 dB(A). Why Intel did not simply move the fan over to the other side remains a mystery to us. The mesh covers would have ensured proper ventilation. Running the GPU stress test (FurMark) resulted in 48.5 dB(A), which was at least partly due to the RTX 2070’s fans. The GPU reached a temperature of around 70 °C (158 °F), and both its fans were spinning at around 58% of their maximum speed. We also noticed very clearly audible electrical noise that did not sound like typical coil whine GPUs are known for but mostly made itself noticeable when we accessed the storage devices and occasionally in between.

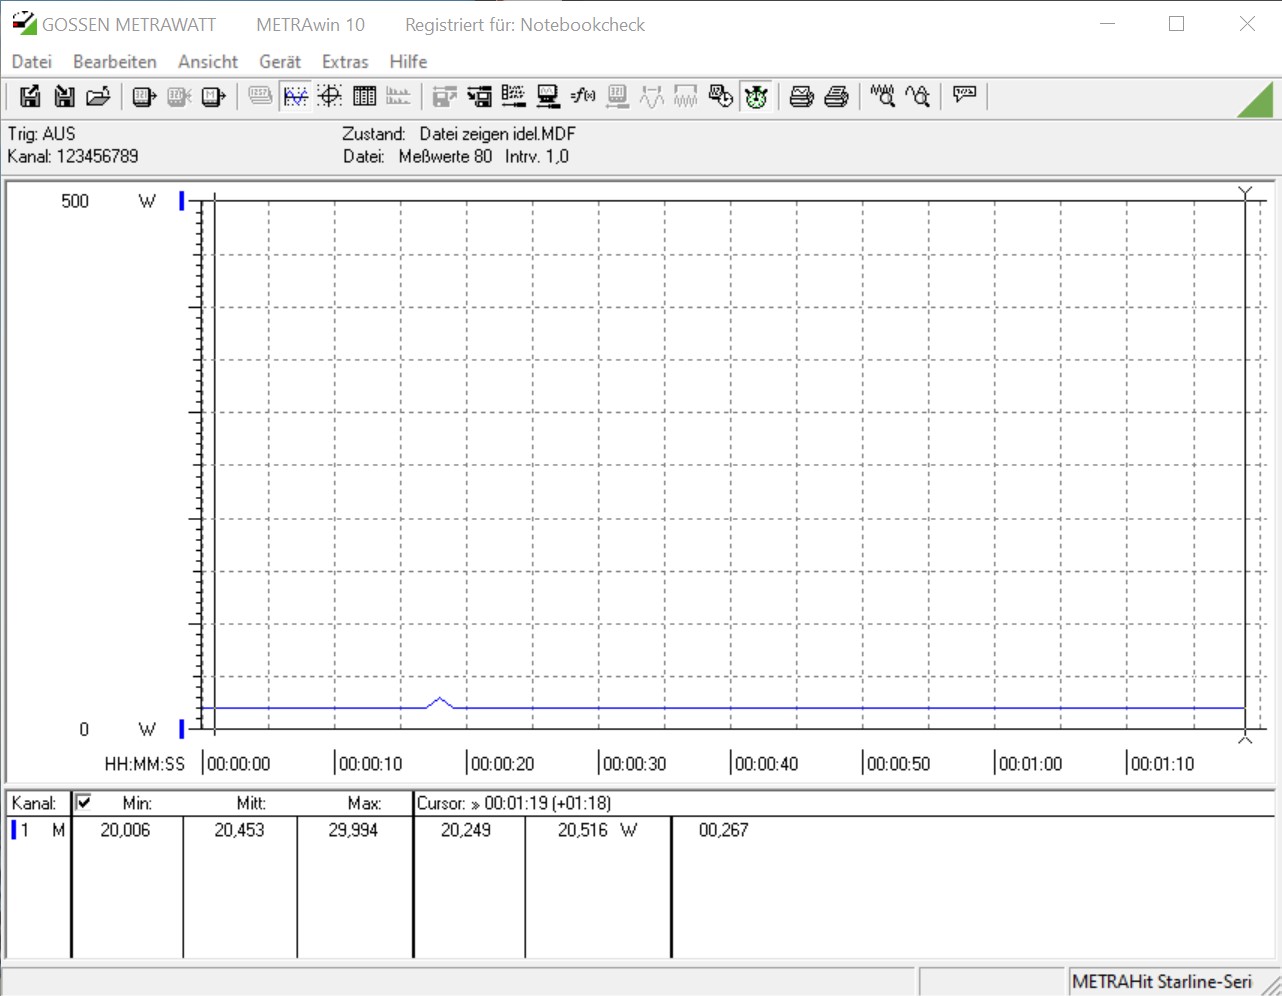
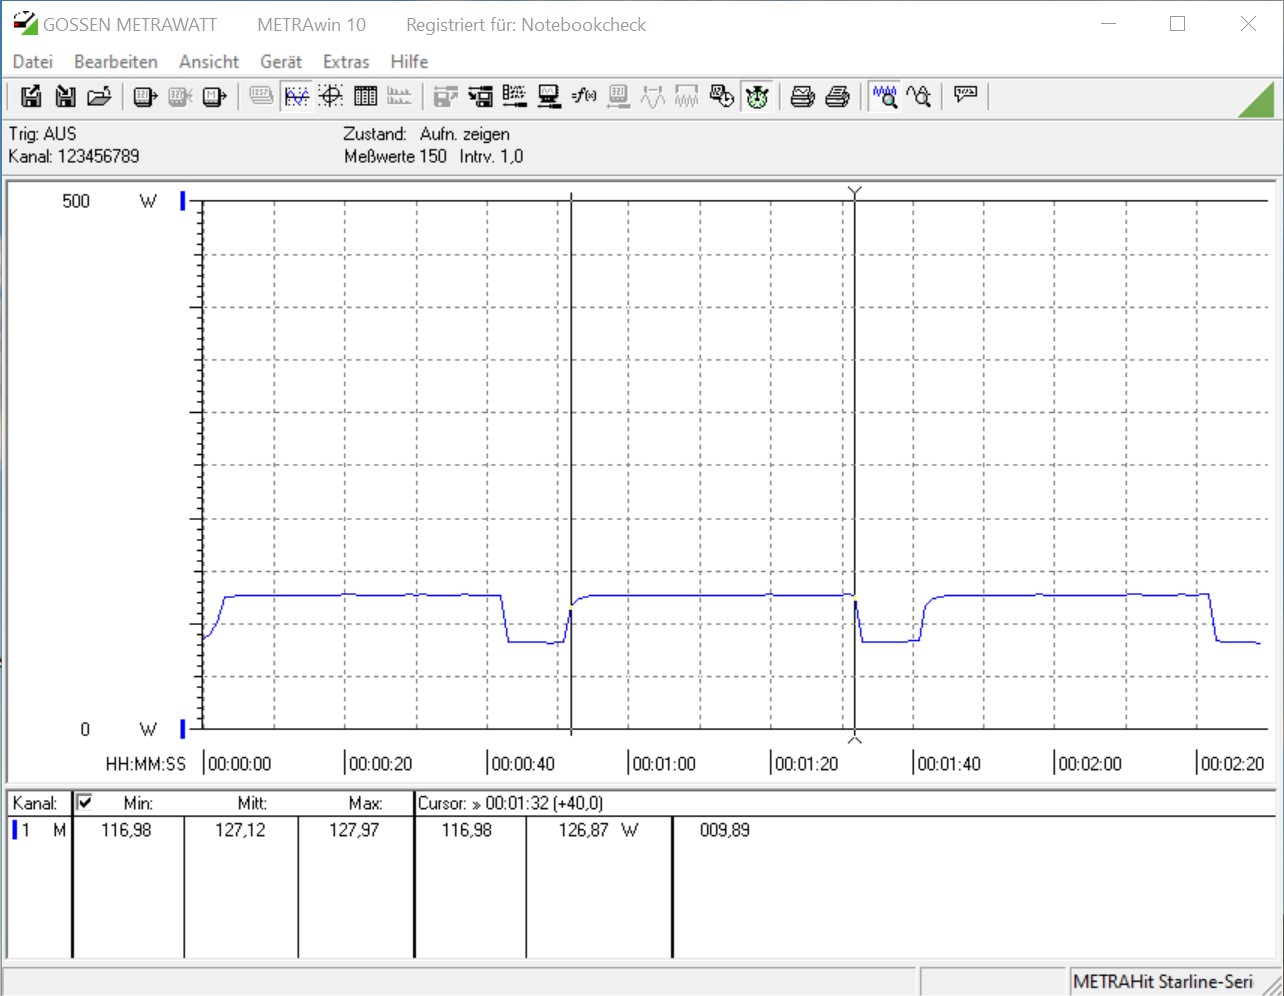
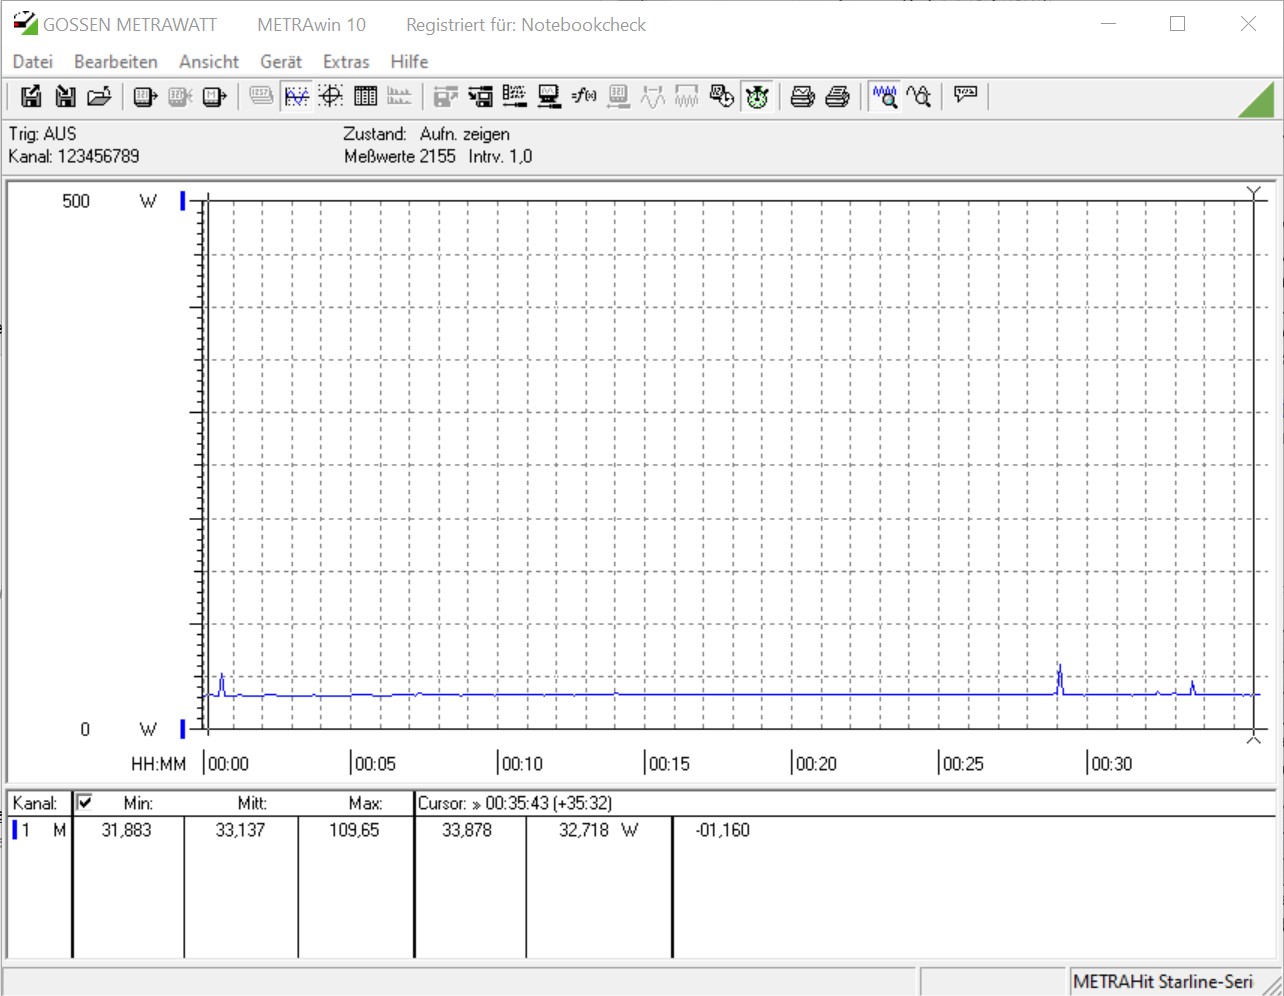
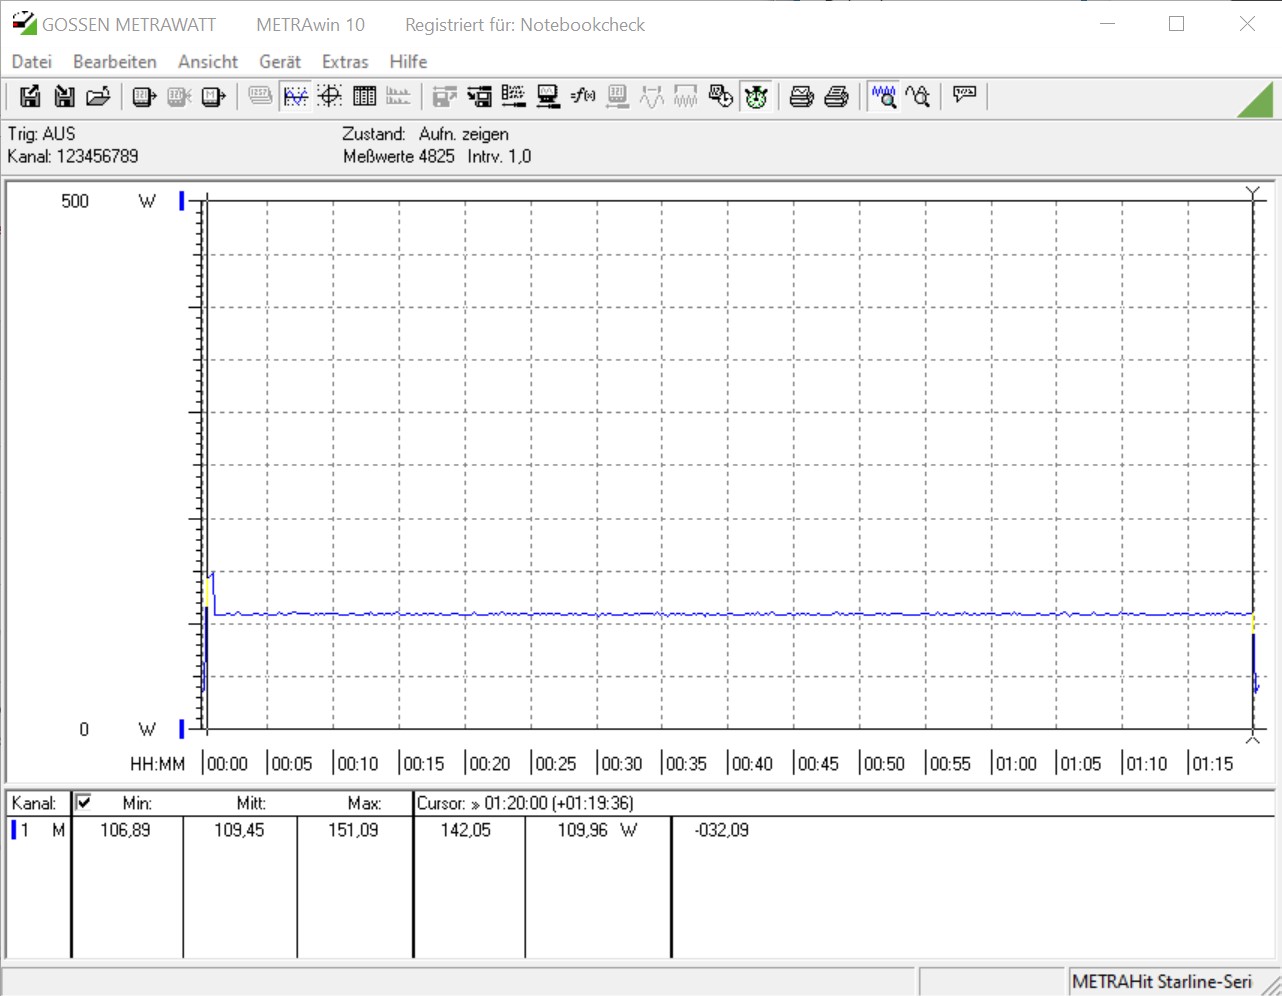
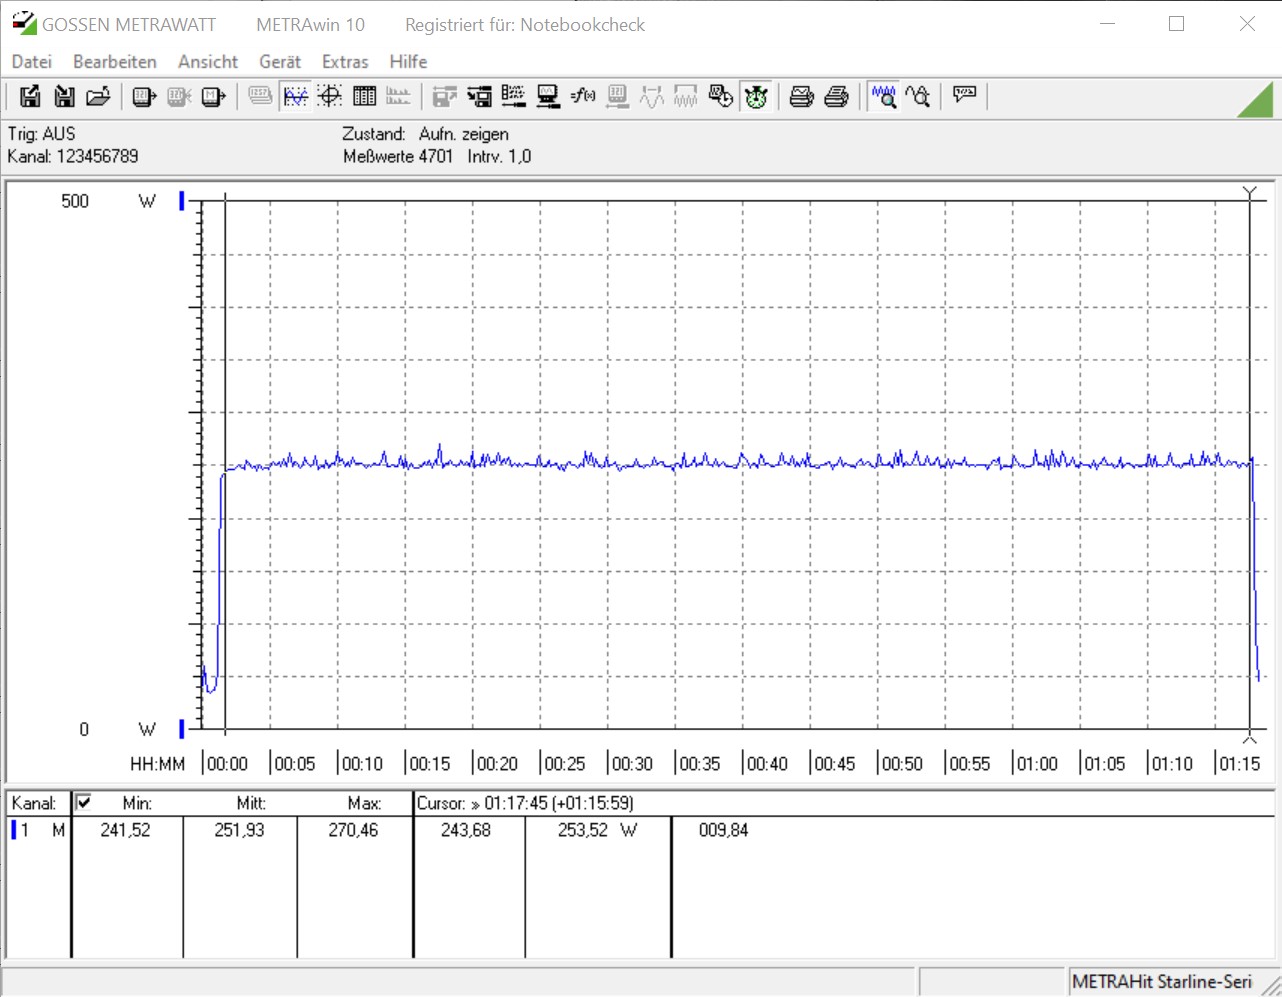
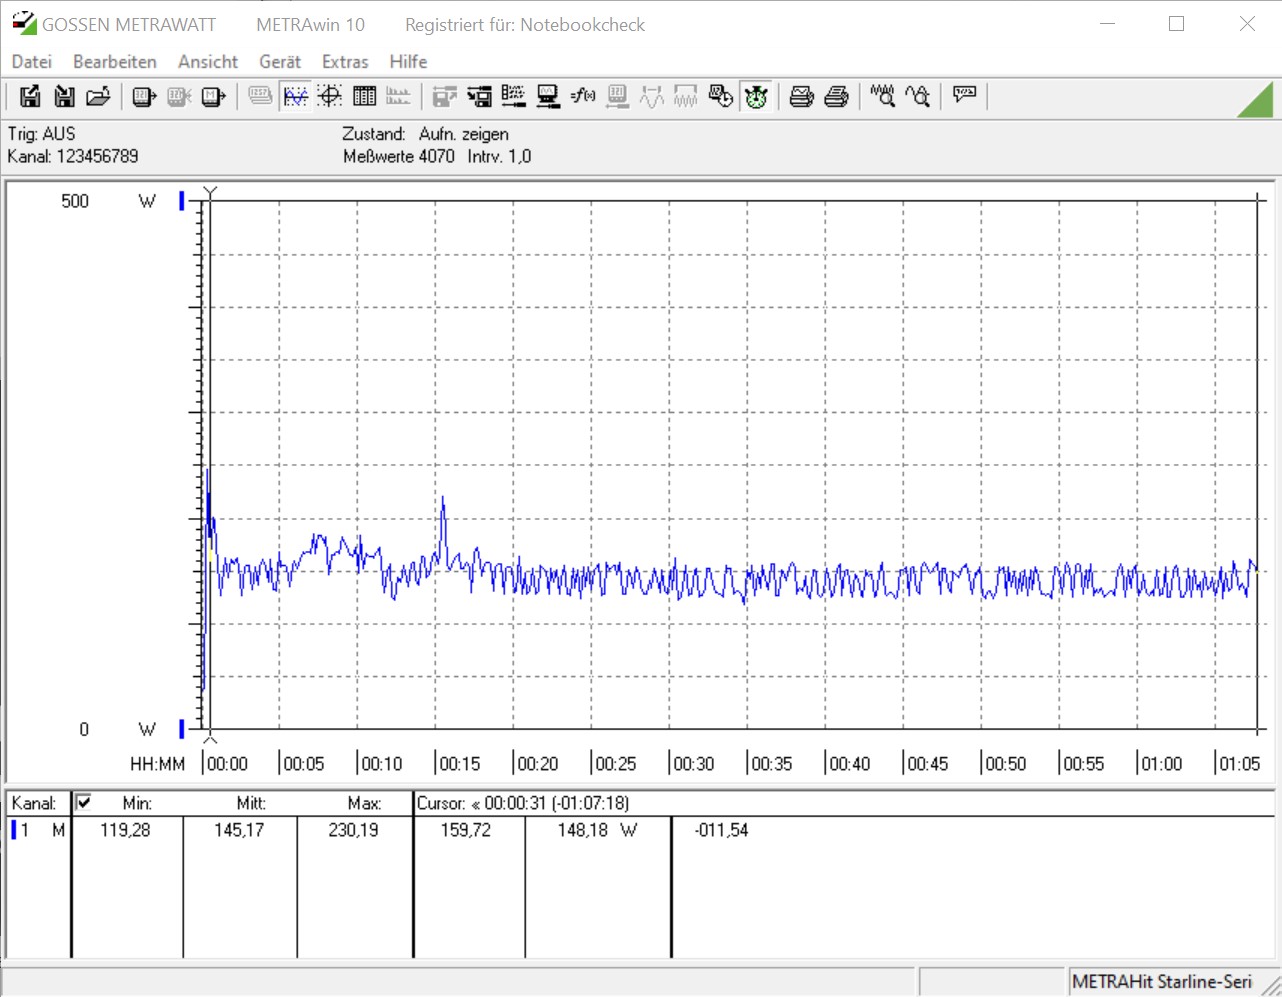
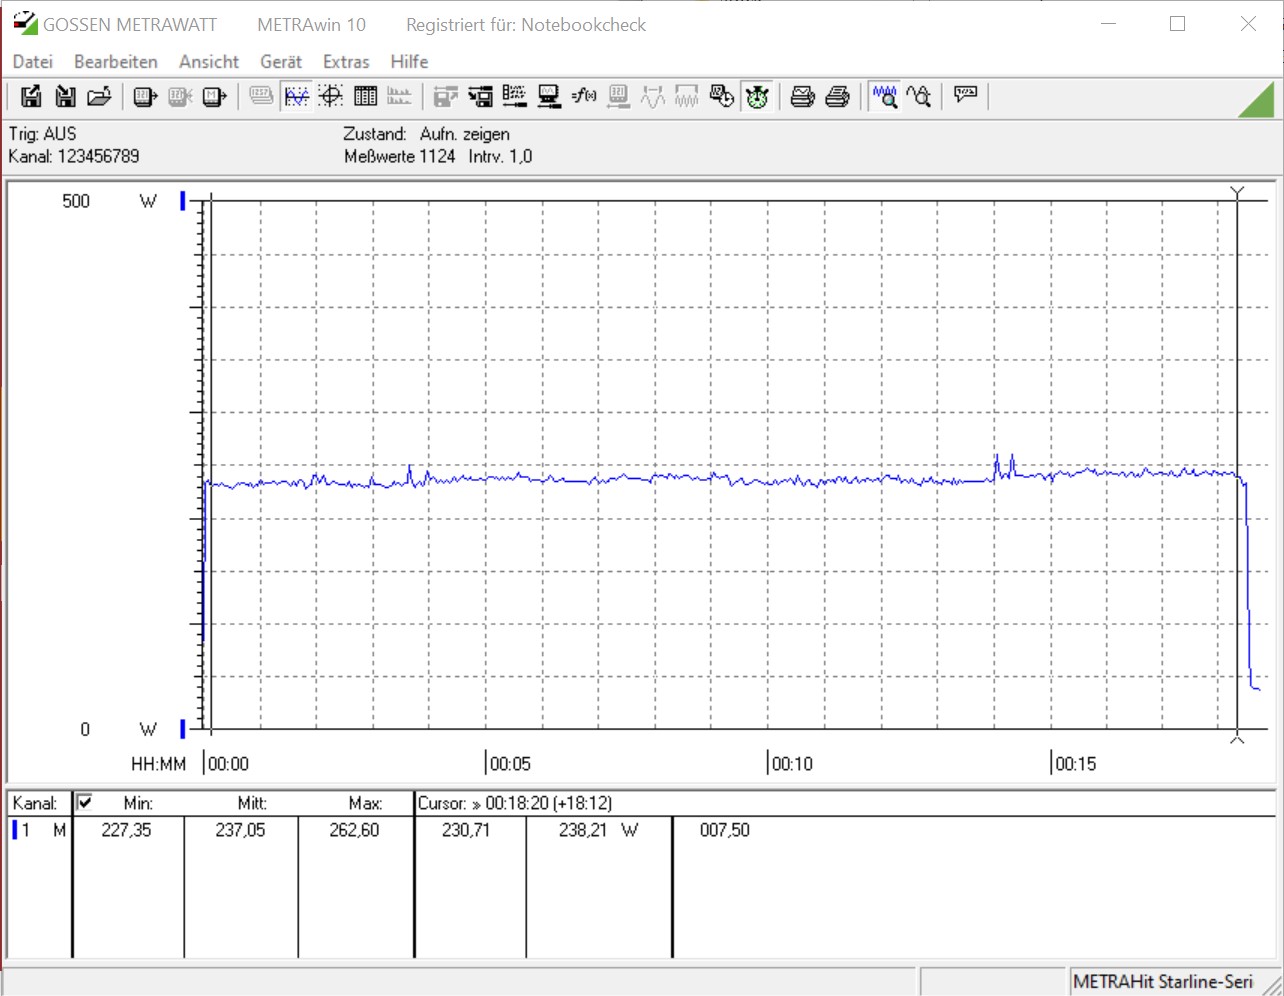
Power consumption was pretty low overall. When idle, the device consumed as little as 20 W. The highest power consumption recorded without dedicated GPU occurred during our Cinebench R15 multi-thread loop at 127 W. Installing the GeForce RTX 2070 increased idle power consumption to 33 W, and up to 251 W during our FurMark stress test. An acceptable power consumption considering that an NUC equipped as such is basically a full-fledged gaming PC. The maximum that the 500 W power supply had to provide for a short period of time was 270 W. While gaming power consumption was significantly lower and settled at around 237 W on average.

Power Consumption
1920x1080 The Witcher 3 ultra (external Monitor)
AMD Ryzen 9 3950X
NVIDIA Titan RTX, R9 3950X, Intel Optane 905P 480GB 2.5 (Idle: 95 W)
423.6 (400min - 442max) Watt * -79%
Intel Core i9-10900K
NVIDIA Titan RTX, i9-10900K, WDC PC SN720 SDAQNTW-512G (Idle: 52.3 W)
396.2 (380min - 475max) Watt * -67%
Intel Core i5-10600K
NVIDIA Titan RTX, i5-10600K (Idle: 52.2 W)
386.9 (380min - 404max) Watt * -63%
Intel Ghost Canyon NUC (RTX 2070)
GeForce RTX 2070 (Desktop), i9-9980HK, Kingston KC2500 1 TB SKC2500M81000G (Idle: 33.1 W)
237.1 (227min - 263max) Watt *
Prime95 V2810 Stress (external Monitor)
Intel Core i9-10900K
NVIDIA Titan RTX, i9-10900K, WDC PC SN720 SDAQNTW-512G (Idle: 52.3 W)
275.7 (254min - 385max) Watt * -152%
Intel Core i5-10600K
NVIDIA Titan RTX, i5-10600K (Idle: 52.2 W)
204.4 (191min - 261max) Watt * -87%
AMD Ryzen 9 3950X
NVIDIA Titan RTX, R9 3950X, Intel Optane 905P 480GB 2.5 (Idle: 95 W)
198.8 (185min - 240max) Watt * -82%
Intel Ghost Canyon NUC (RTX 2070)
GeForce RTX 2070 (Desktop), i9-9980HK, Kingston KC2500 1 TB SKC2500M81000G (Idle: 33.1 W)
109.4 (107min - 151max) Watt *
Intel Ghost Canyon NUC
UHD Graphics 630, i9-9980HK, Kingston KC2500 1 TB SKC2500M81000G (Idle: 20.45 W)
97.2 (96min - 99max) Watt * +11%
Cinebench R15 Multi (external Monitor)
Intel Core i9-10900K
NVIDIA Titan RTX, i9-10900K, WDC PC SN720 SDAQNTW-512G (Idle: 52.3 W)
268.5 (265min - 270max) Watt *
AMD Ryzen 9 3950X
NVIDIA Titan RTX, R9 3950X, Intel Optane 905P 480GB 2.5 (Idle: 95 W)
219.5 (218min - 225max) Watt *
Intel Core i5-10600K
NVIDIA Titan RTX, i5-10600K (Idle: 52.2 W)
172.5 (170min - 176max) Watt *
Intel Ghost Canyon NUC
UHD Graphics 630, i9-9980HK, Kingston KC2500 1 TB SKC2500M81000G (Idle: 20.45 W)
127.1 (117min - 128max) Watt *
Temperatures - CPU Temperature Prime95
Intel Core i9-10900K
NVIDIA Titan RTX, i9-10900K, WDC PC SN720 SDAQNTW-512G
88 °C
AMD Ryzen 9 3950X
NVIDIA Titan RTX, R9 3950X, Intel Optane 905P 480GB 2.5
83.8 °C
Intel Ghost Canyon NUC
UHD Graphics 630, i9-9980HK, Kingston KC2500 1 TB SKC2500M81000G
77 °C
Intel Core i5-10600K
NVIDIA Titan RTX, i5-10600K
70 °C

* ... smaller is better

Intel NUC 9 Extreme Kit without RTX 2070

Intel NUC 9 Extreme Kit - power consumption idle
Intel NUC 9 Extreme Kit - power consumption Prime95
Intel NUC 9 Extreme Kit - power consumption FurMark
Intel NUC 9 Extreme Kit - power consumption Prime95 and FurMark
Intel NUC 9 Extreme Kit - power consumption Cinebench-R15-Multi
Intel NUC 9 Extreme Kit - stress test Prime95 solo
Intel NUC 9 Extreme Kit - stress test FurMark solo
Intel NUC 9 Extreme Kit - stress test Prime95 and FurMark


Intel NUC 9 Extreme Kit with RTX 2070

Intel NUC 9 Extreme Kit - power consumption idle
Intel NUC 9 Extreme Kit - power consumption Prime95
Intel NUC 9 Extreme Kit - power consumption FurMark
Intel NUC 9 Extreme Kit - power consumption Prime95 and FurMark
Intel NUC 9 Extreme Kit - power consumption The Witcher 3 (Ultra)
Intel NUC 9 Extreme Kit - stress test Prime95 solo
Intel NUC 9 Extreme Kit - stress test FurMark solo
Intel NUC 9 Extreme Kit - stress test Prime95 and FurMark


Pros

+ very small
+ well built
+ 8-core Core i9
+ high system performance
+ plentiful connectivity
+ Thunderbolt 3
+ Wi-Fi 6
+ three M.2 slots
+ 500 W power supply

Cons

- high price
- not ready to use OOB
- suboptimal cooler
- limited card compatibility
- very audible under load

Verdict – Tiny Powerhouse at a High Price

Intel NUC 9 Extreme Kit. Review unit provided by Intel Germany

Intel’s NUC 9 Extreme kit is a small yet very powerful system. At its current price of $1,700 it is anything but a great deal, and you need to keep in mind that you will need to provide RAM, storage, and if desired a dedicated GPU separately. In return, you get a very well equipped and modern device. Equipped with a high-performance GPU the miniature PC turns into a full-fledged gaming PC capable of running even the latest and greatest games smoothly.

If you do not need the 8-core performance of Intel’s Core i9-9980HK you can also purchase SKUs with slower i7-9750H or i5-9300H processors. Both can frequently be found in gaming laptops and proven themselves with a very solid and adequate performance in the past. Nevertheless, the Core i9-9980HK remains the ultimate kingpin for this NUC.

Despite its great performance the tiny powerhouse will have a hard time getting into gamer’s shopping carts due to its high price.

There are a few shortcomings with Intel’s Ghost Canyon NUC as well, particularly regarding noise emissions with an installed dedicated graphics card. Due to its compact build the fan is almost completely covered in this case, and the air blown onto the SoC’s heat pipe is warm due to the fan’s proximity to the graphics card. Which in turn increases noise emissions dramatically. A slightly different design with the fan on the outer side of the case would have most likely been a better alternative.

All things considered Intel’s NUC 9 Extreme is the smallest PC under 1.3 gallons that can take a GeForce RTX 2070. It features high-quality components and a great build quality. Corsair took a very similar approach with its similarly priced (comparable to a fully equipped Intel Ghost Canyon NUC 9 Extreme) One series that we have already had in review (see One i160). Zotac’s MEK Mini is yet another miniature PC that can be equipped with an RTX 2070.

Read all 2 comments / answer
static version load dynamic
Loading comments
Comment on this article
Please share our article, every link counts!
> Expert Reviews and News on Laptops, Smartphones and Tech Innovations > Reviews > Intel NUC 9 Extreme with Core i9 and RTX 2070 in Review
Sebastian Bade, 2020-06-11 (Update: 2020-06-13)