Intel NUC11PAQi7 Panther Canyon Mini PC Review: Tiger Lake Done Right
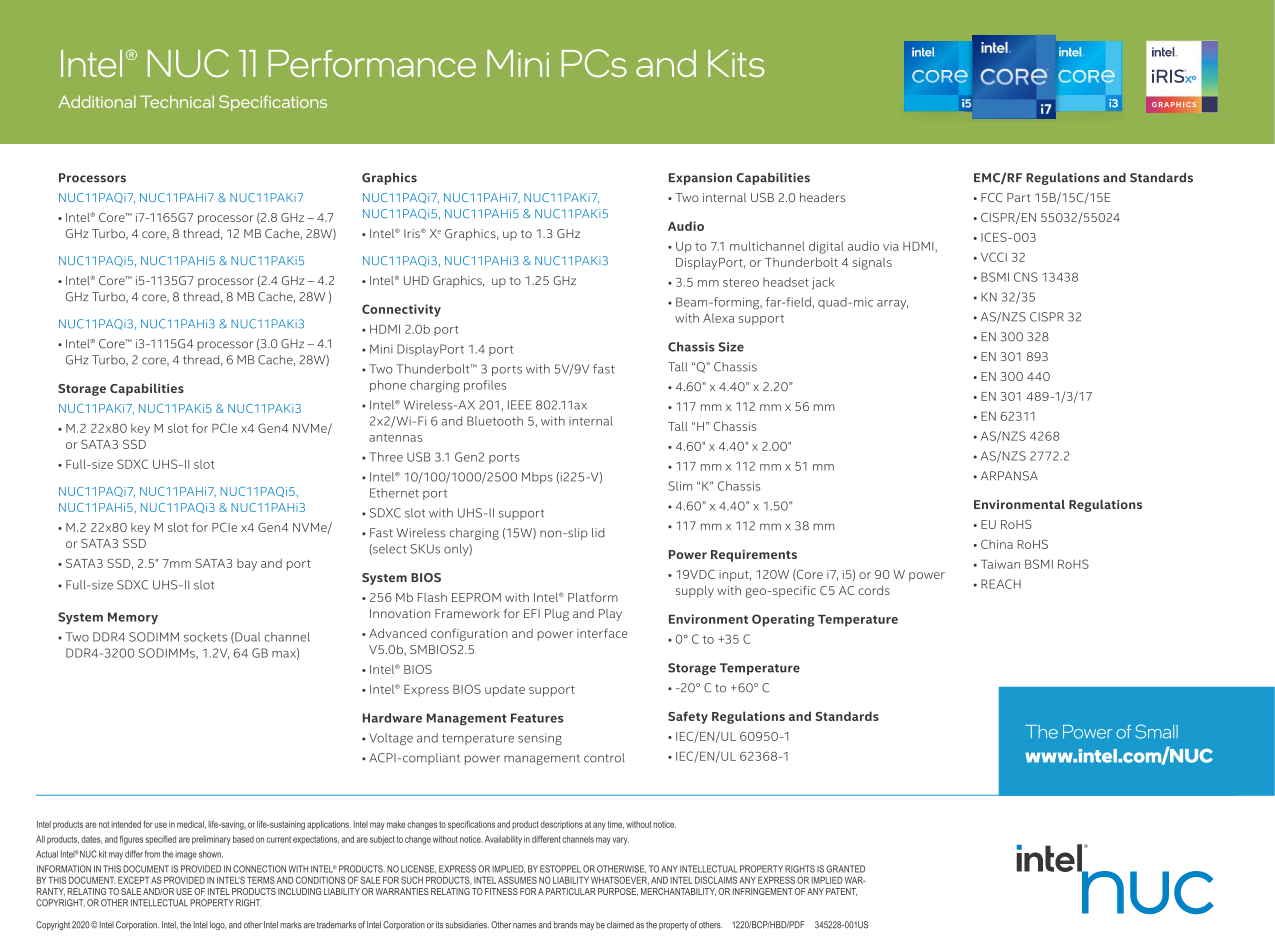
The NUC 11 series succeeds last year's NUC 10 by introducing new chassis designs and updating the processor options to Tiger Lake-U. Three models are available in different sizes: the large NUC11PAQ, medium NUC11PAH, and small NUC11PAK. The physical differences and features are all detailed by Intel's official product brief below.
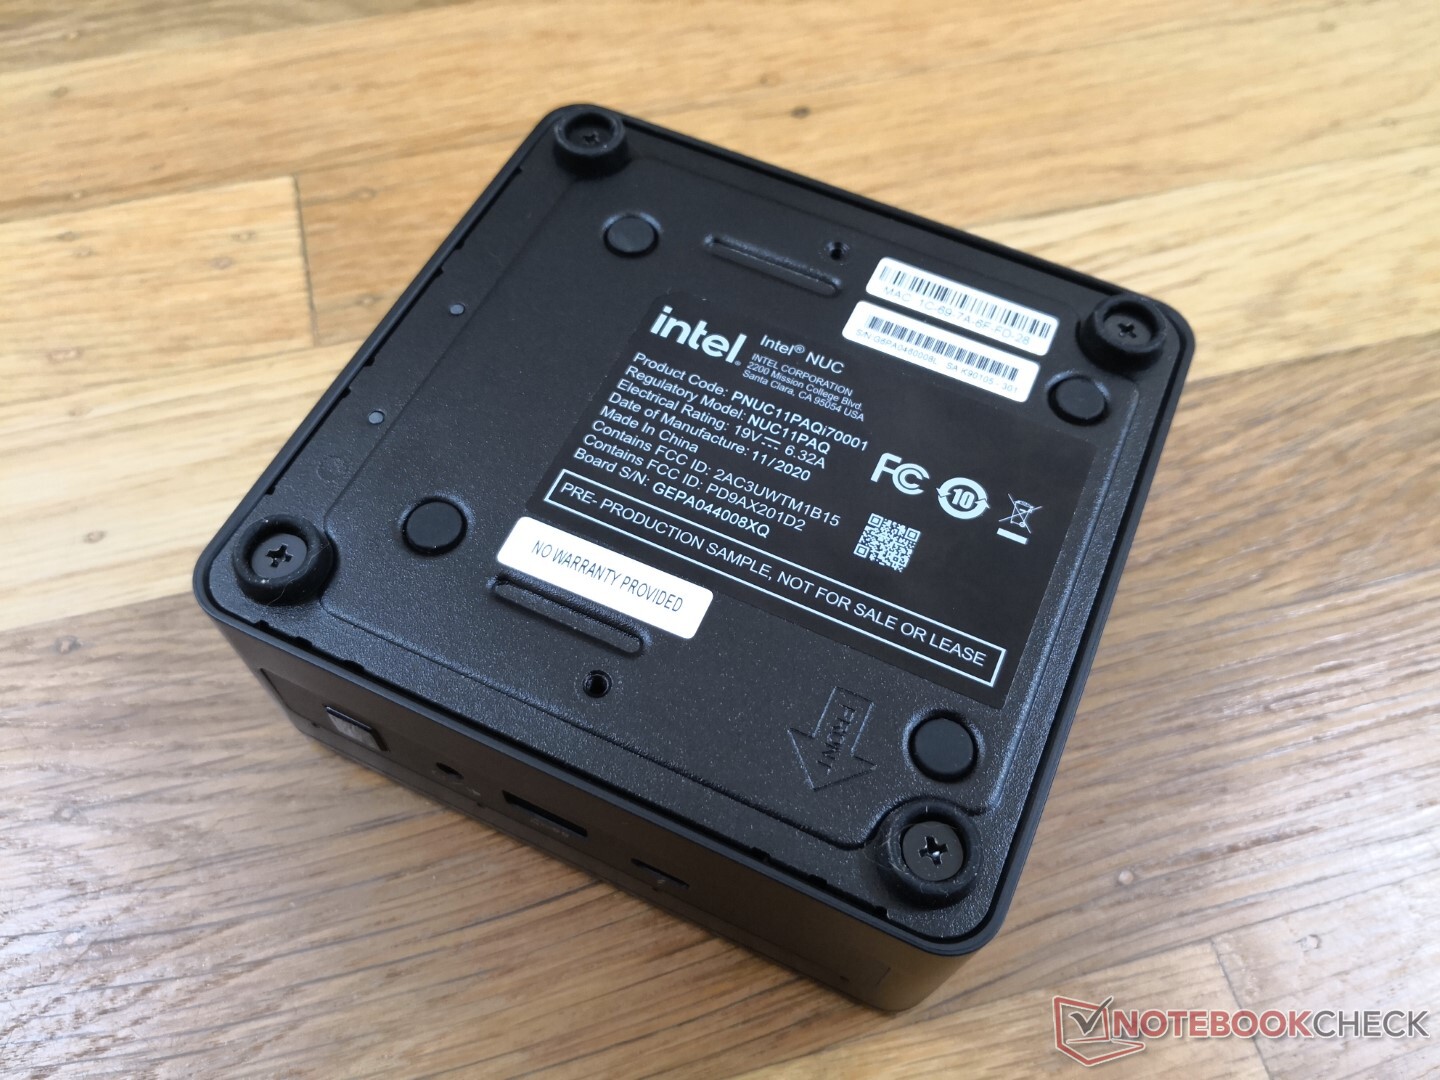
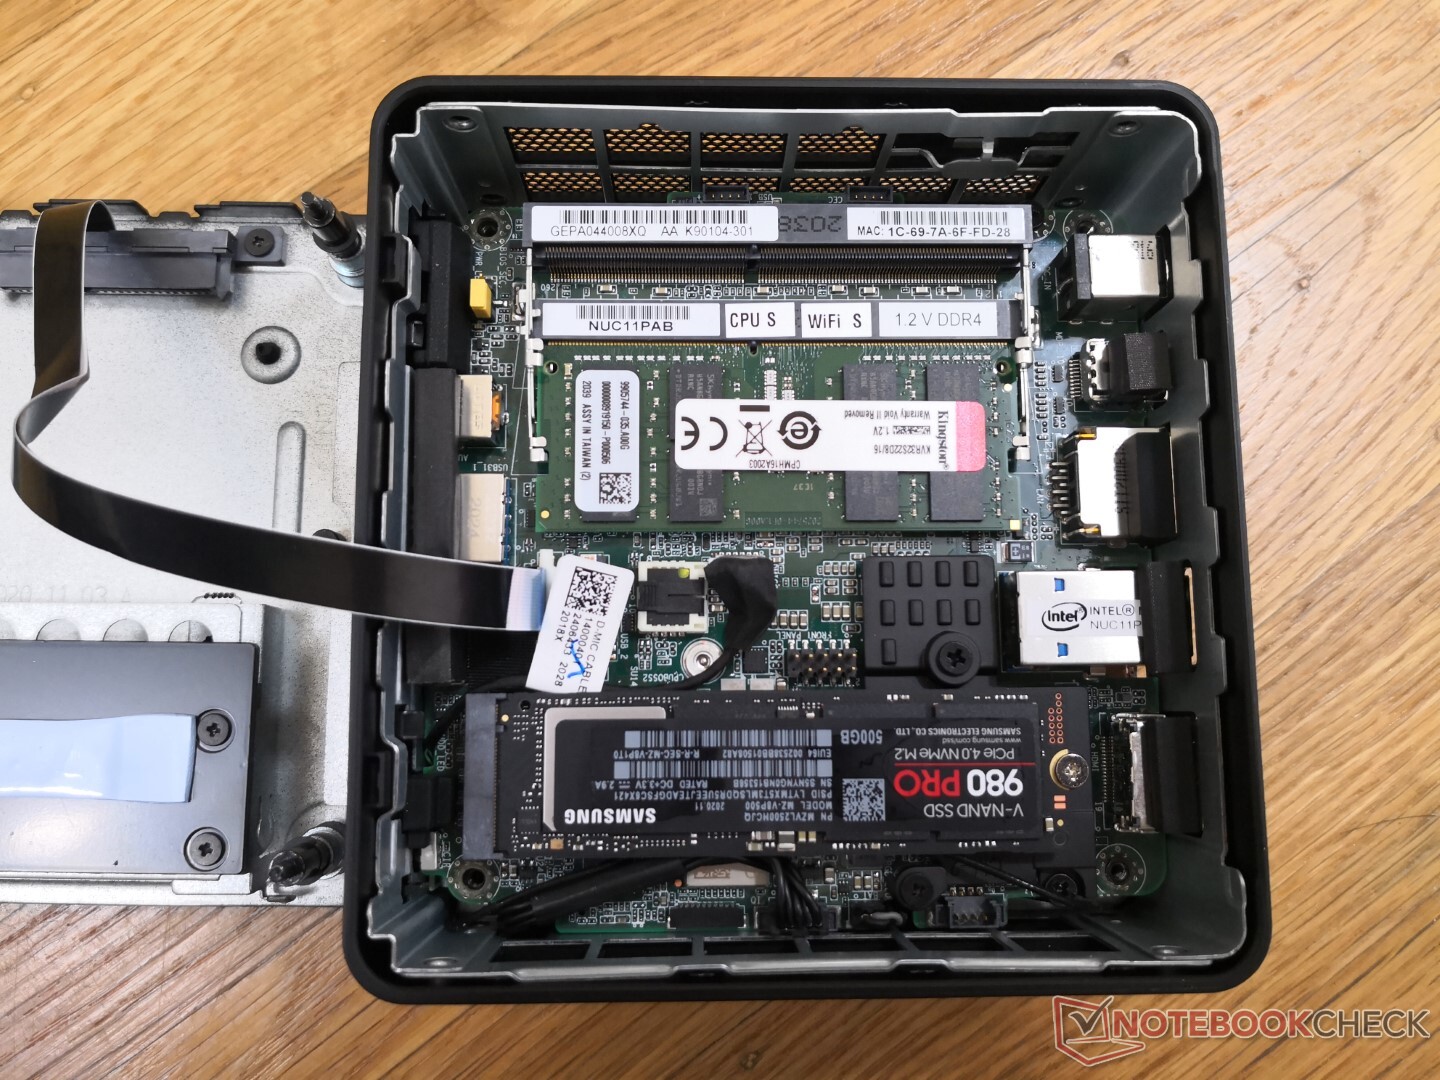
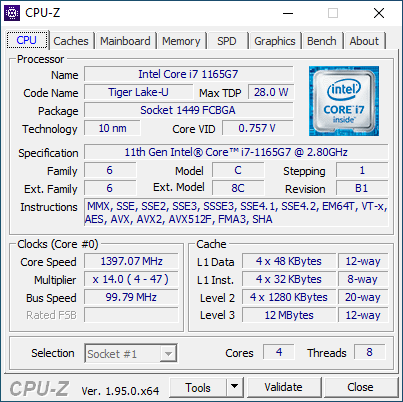
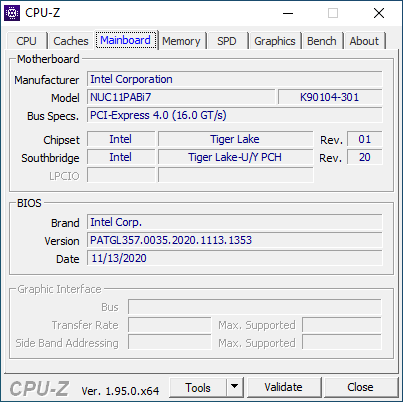
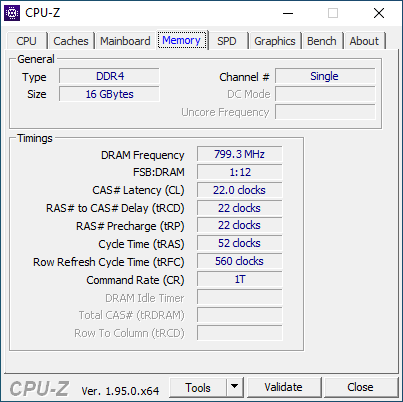
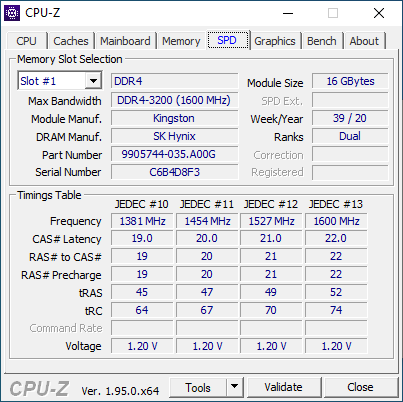
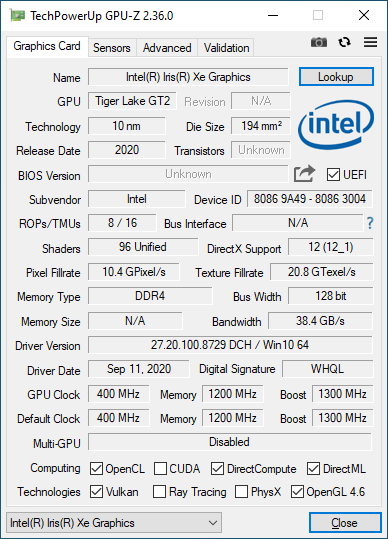
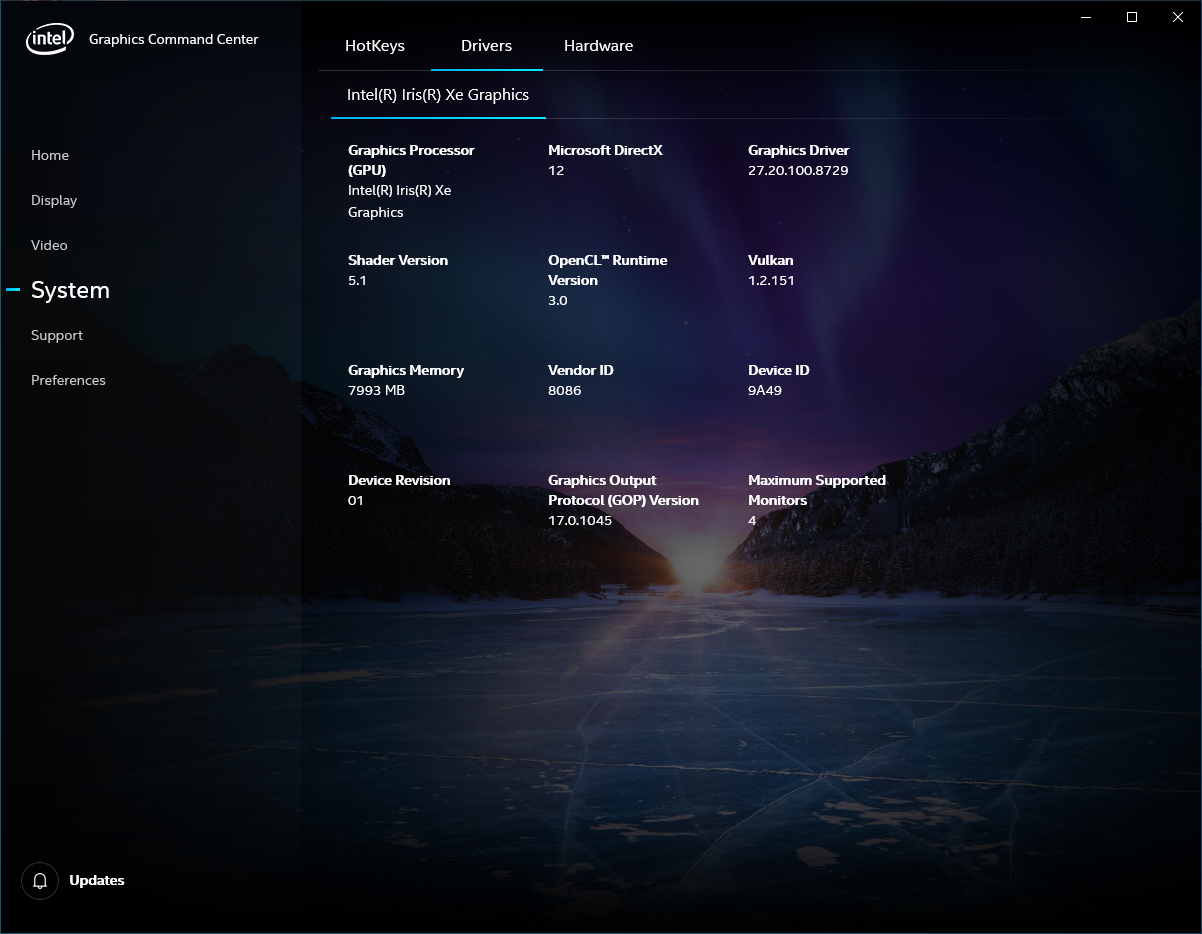
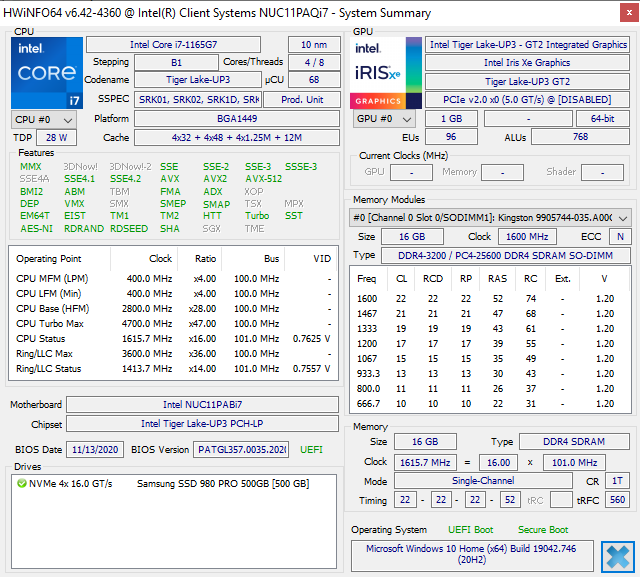
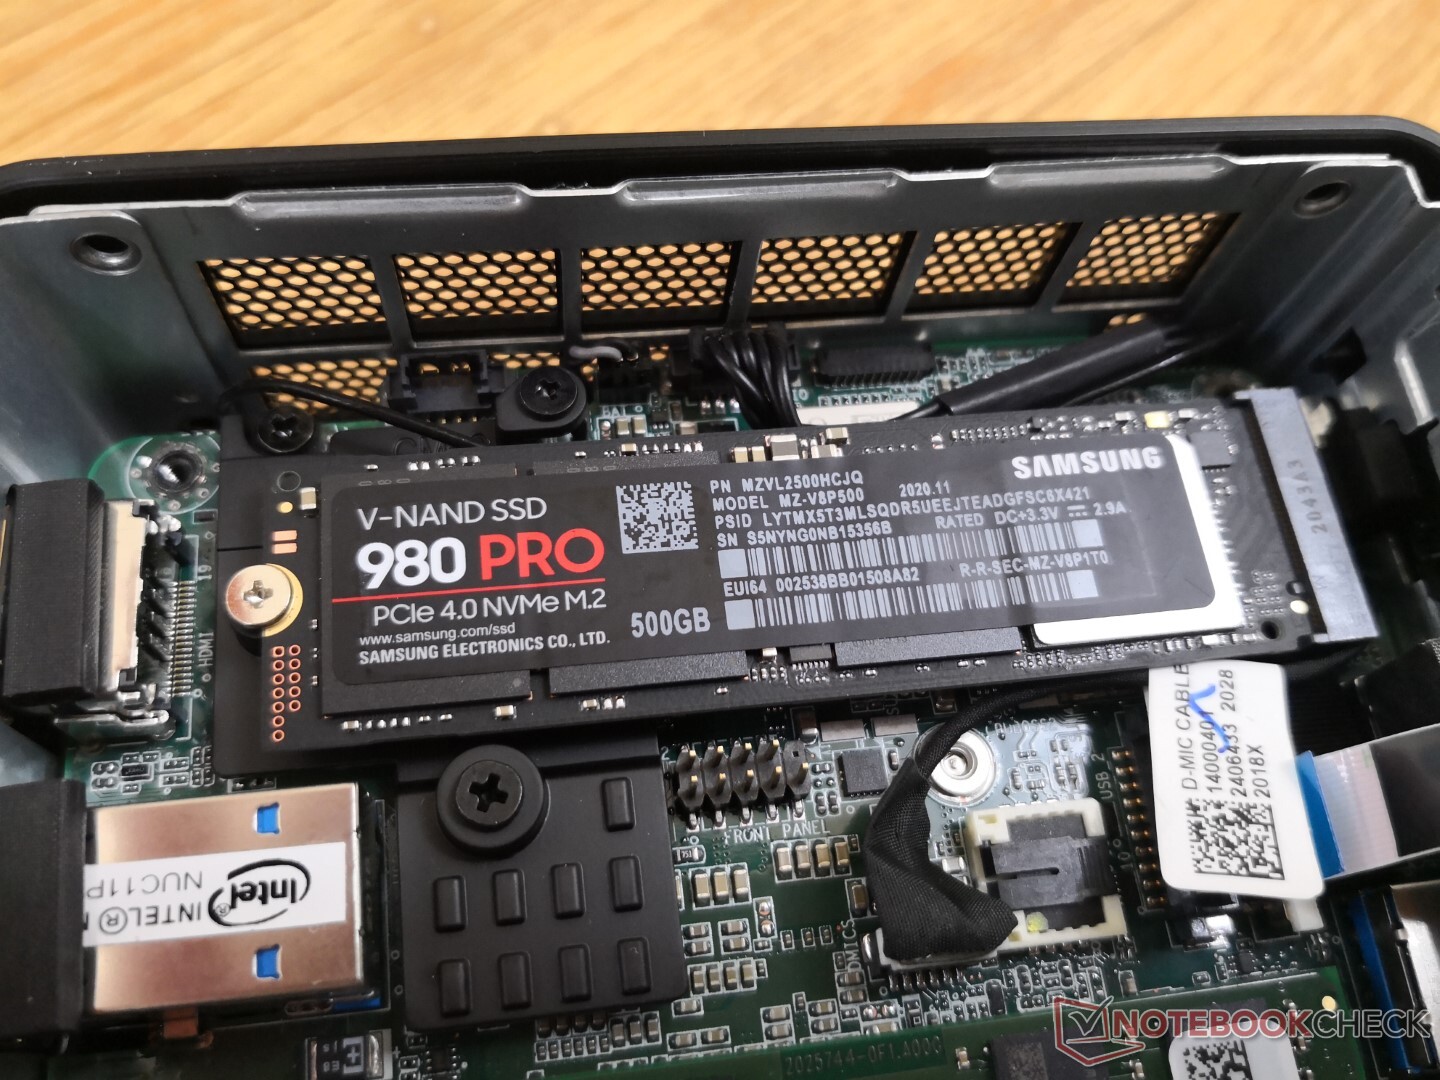
Our review unit here is the NUC11PAQ equipped with the Core i7-1165G7 CPU, 16 GB of single-channel RAM, and 500 GB PCIe 4.0 Samsung 980 Pro NVMe SSD. Lesser Core i5-1135G7 and Core i3-1115G4 SKUs are also available all with integrated Iris Xe graphics.
More Intel NUC reviews:
potential competitors in comparison
Rating | Date | Model | Weight | Height | Size | Resolution | Price |
|---|---|---|---|---|---|---|---|
v (old) | 02 / 2021 | Intel NUC11PAQi7 i7-1165G7, Iris Xe G7 96EUs | 647 g | 56 mm | x | ||
v (old) | 02 / 2020 | Intel NUC10i7FNH i7-10710U, UHD Graphics 620 | 697 g | 51 mm | 0.00" | 0x0 | |
v (old) | 11 / 2018 | Intel NUC8i7BE i7-8559U, Iris Plus Graphics 655 | 683 g | 51 mm | x | ||
v (old) | 03 / 2018 | Intel Hades Canyon NUC8i7HVK i7-8809G, Vega M GH | 1.3 kg | 39 mm | x | ||
v (old) | 12 / 2020 | Beelink SEi10 i3-1005G1, UHD Graphics G1 (Ice Lake 32 EU) | 350 g | 41 mm | x | ||
v (old) | 07 / 2020 | Zotac ZBox MI643 i5-10210U, UHD Graphics 620 | 550 g | 28.5 mm | x |
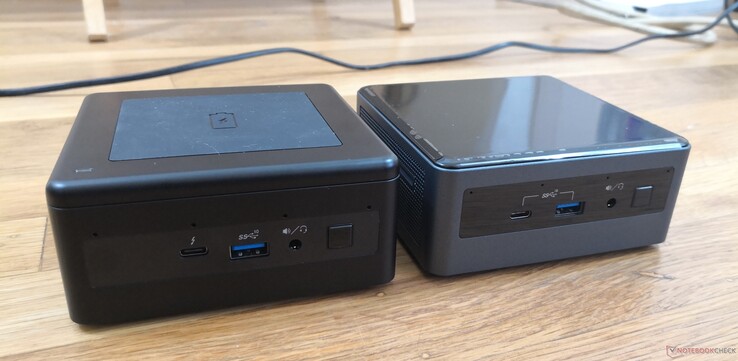
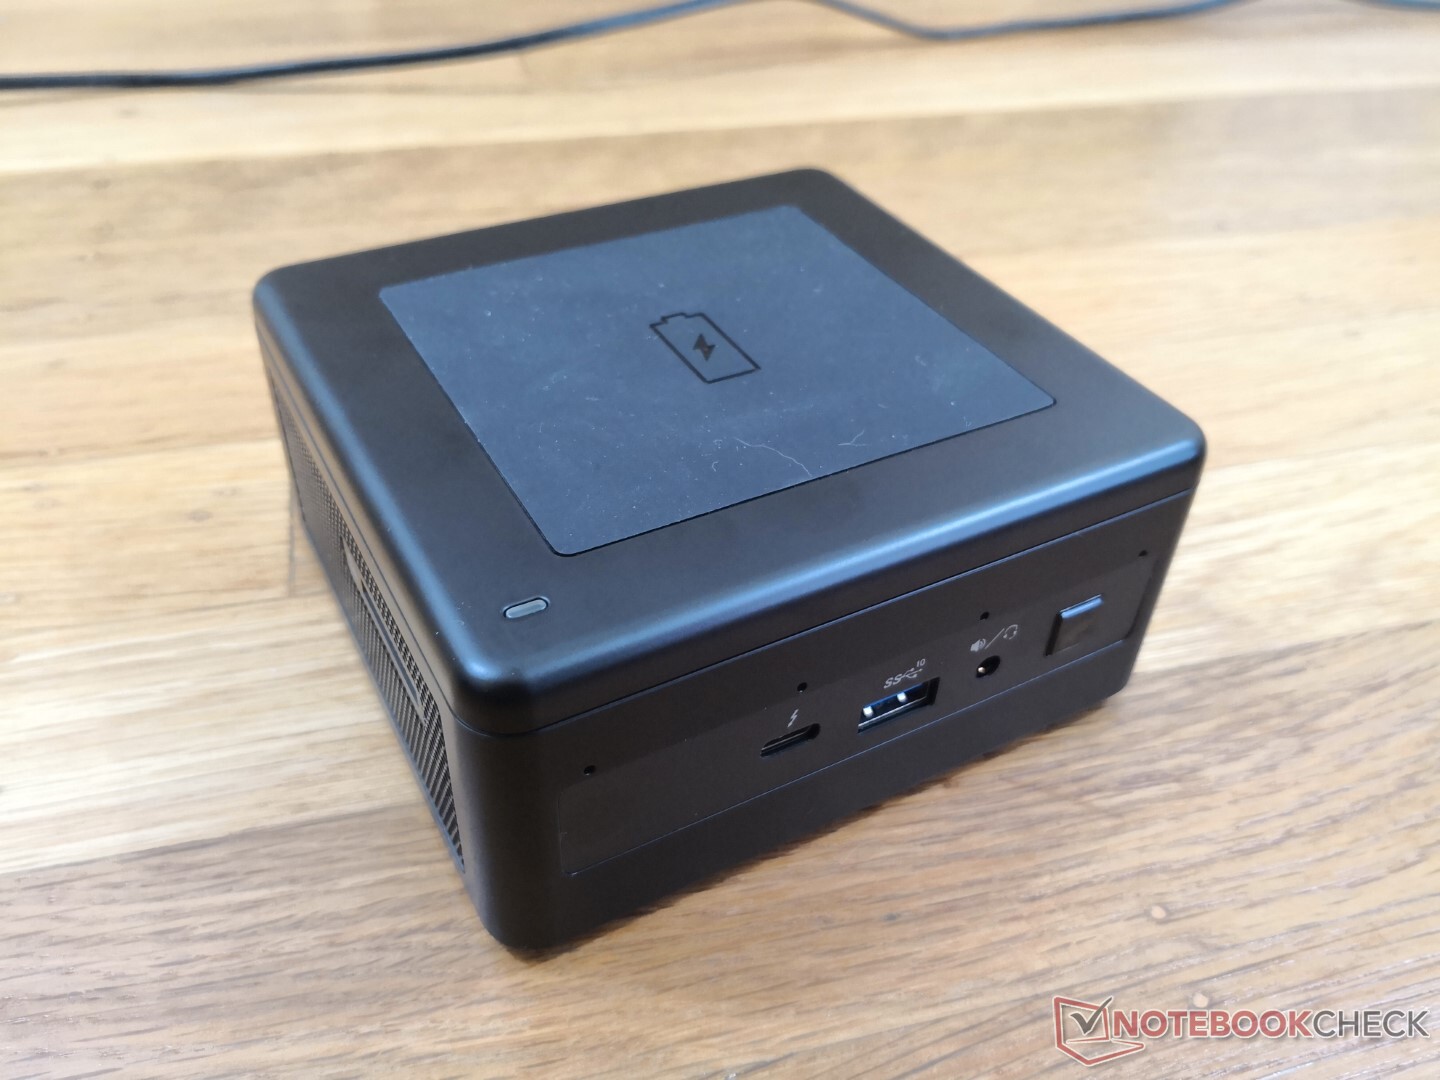
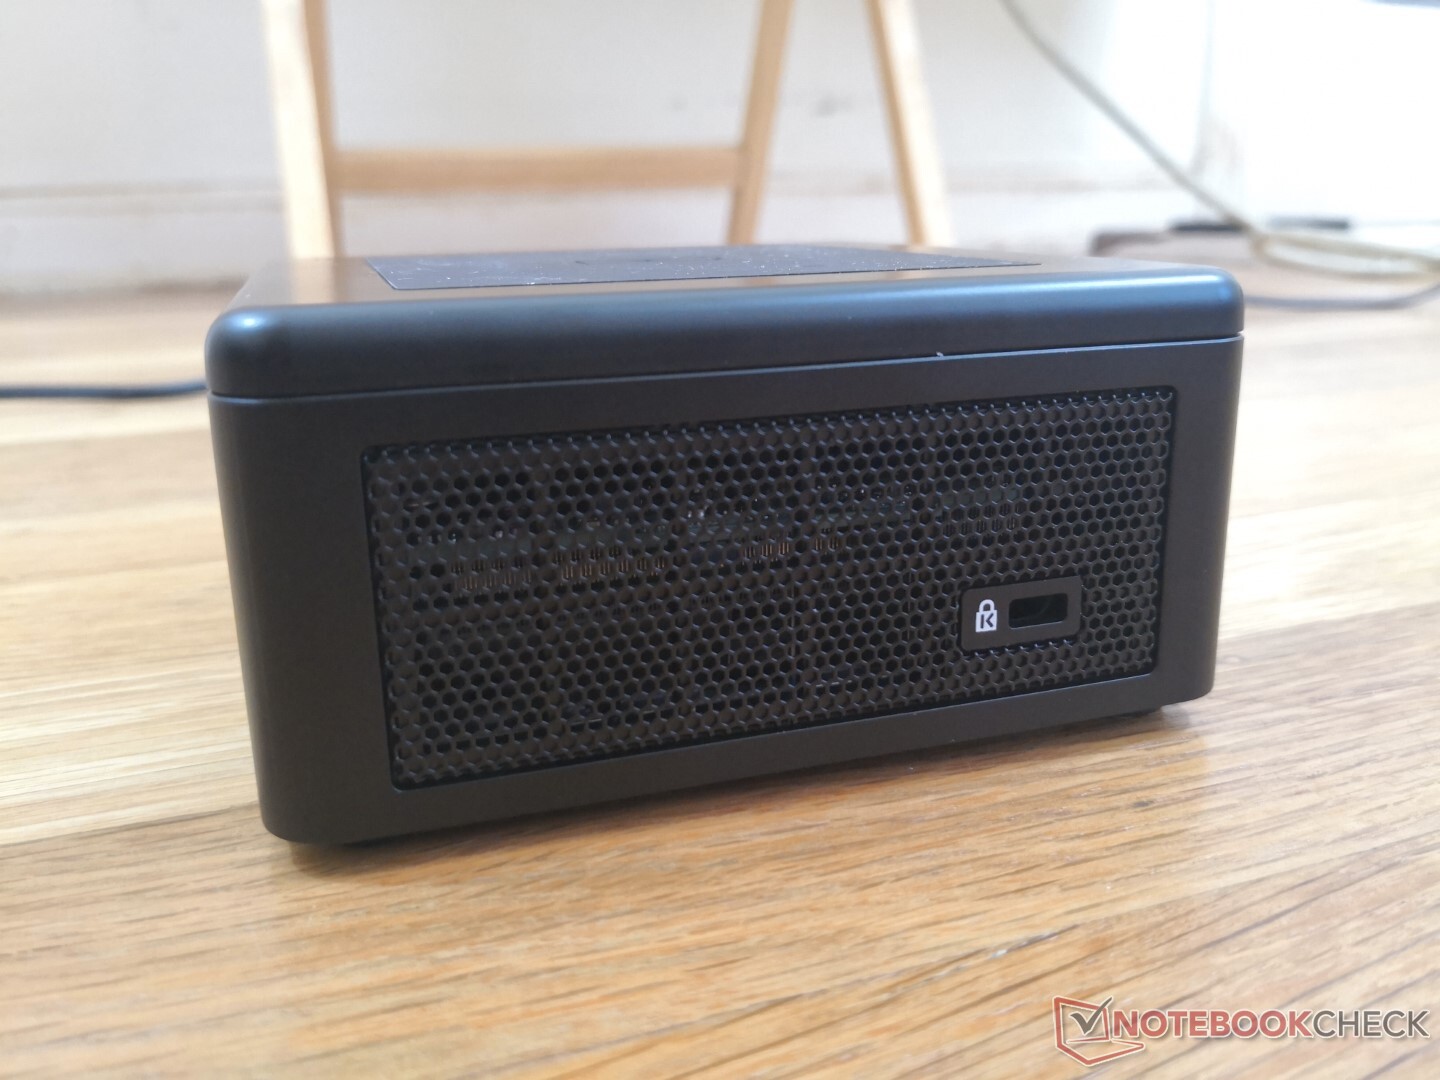
Case
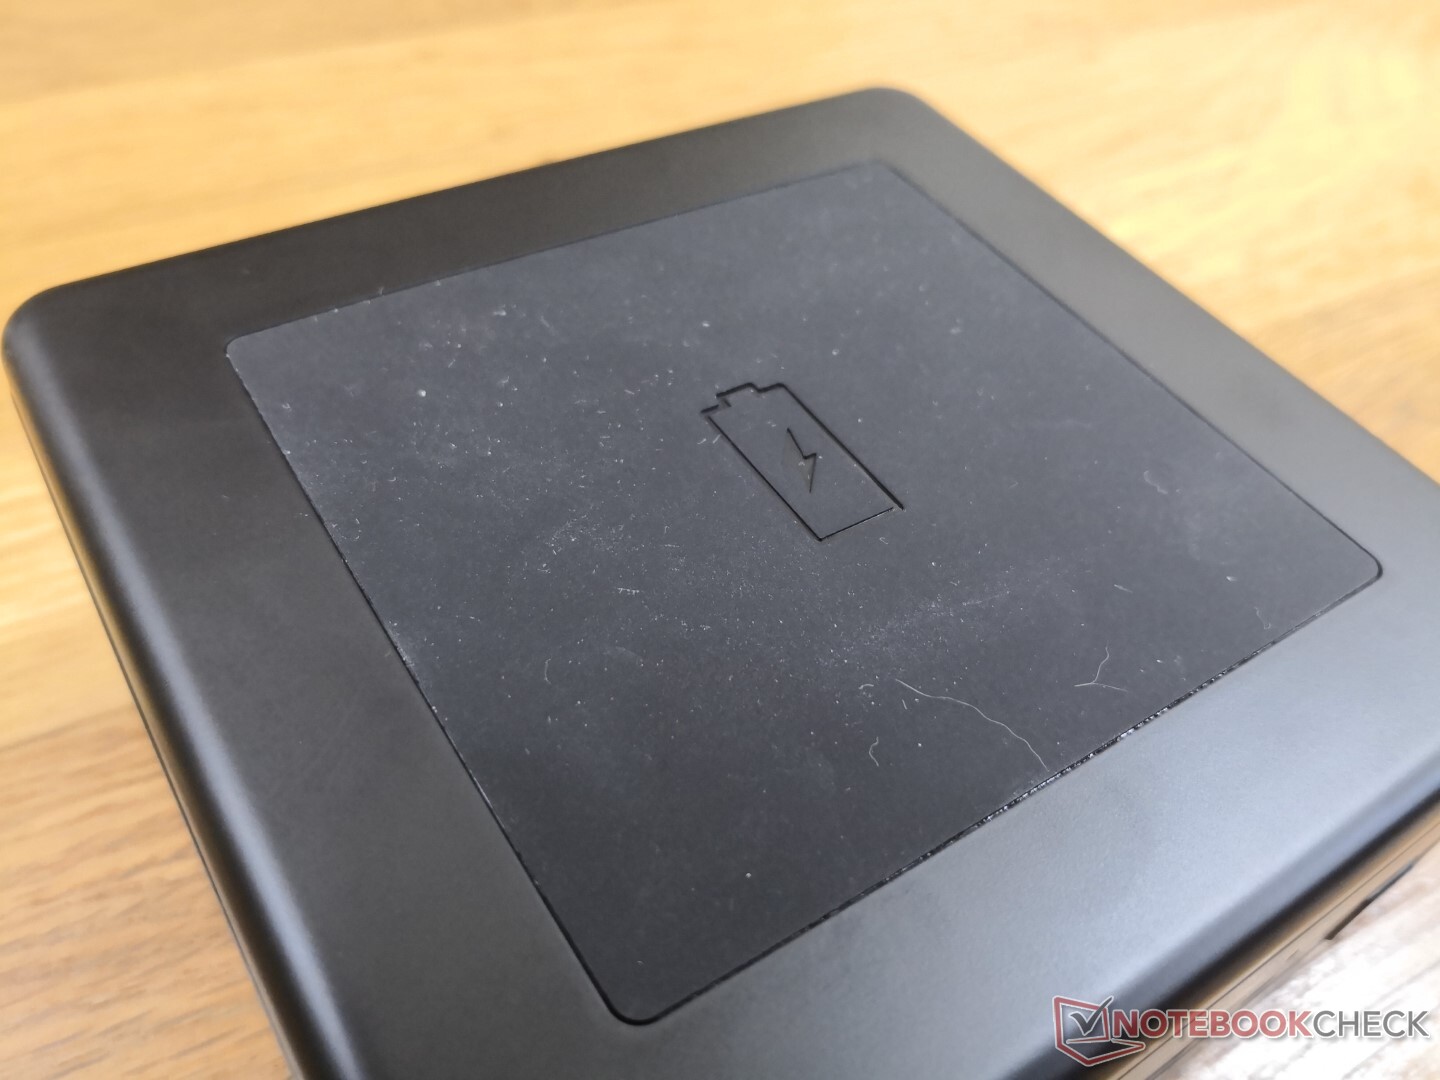
The NUC 11PAQ takes on the familiar shape and materials of previous NUC designs but with a new rubber Qi charging "mat" on top. It looks classier than the smooth glossy plastic on last year's NUC 10, but the rubber surface will attract dust and fur like no tomorrow. The new feature will also be useless for owners who intend to hide their NUC units under tables or mount them vertically behind monitors.
Connectivity
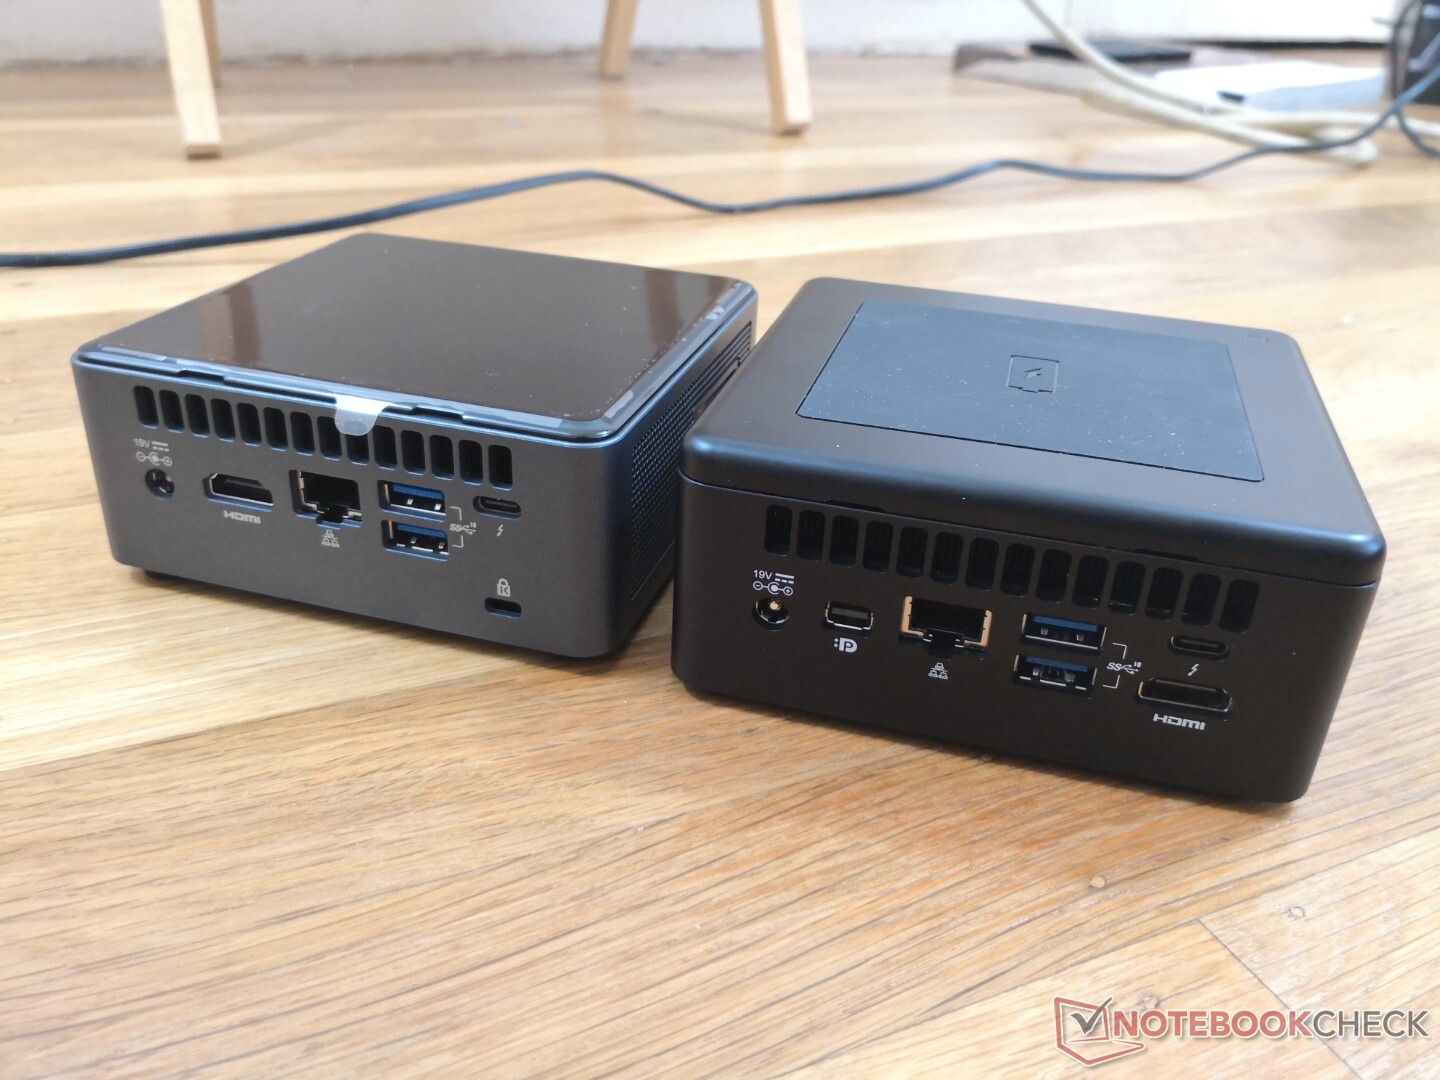
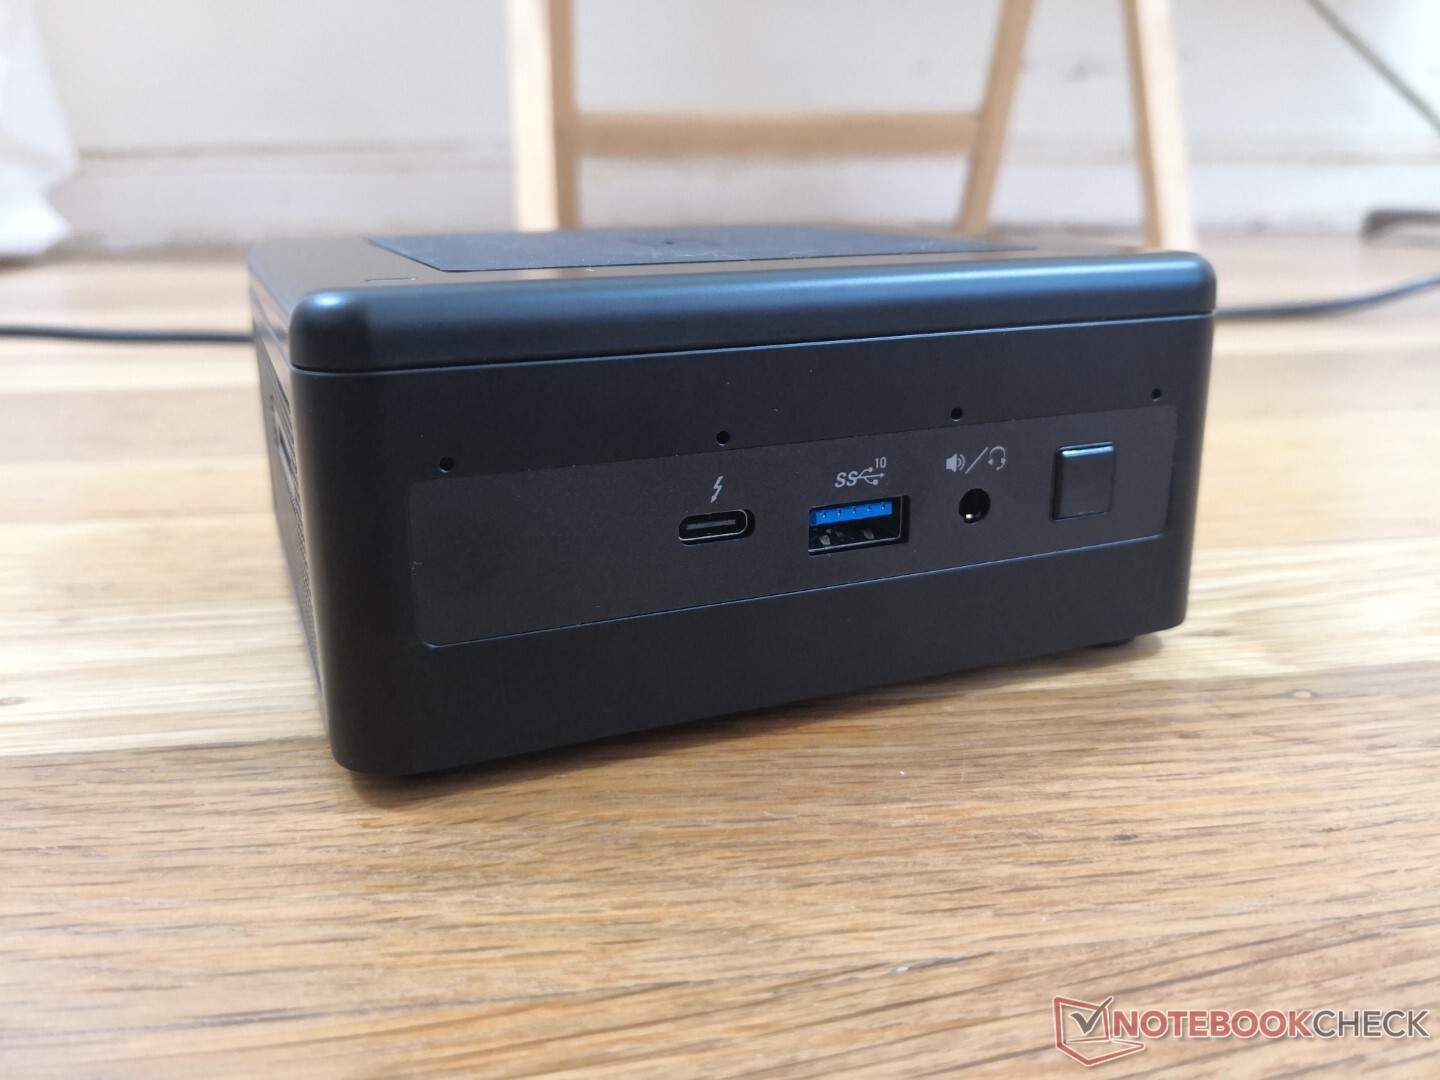
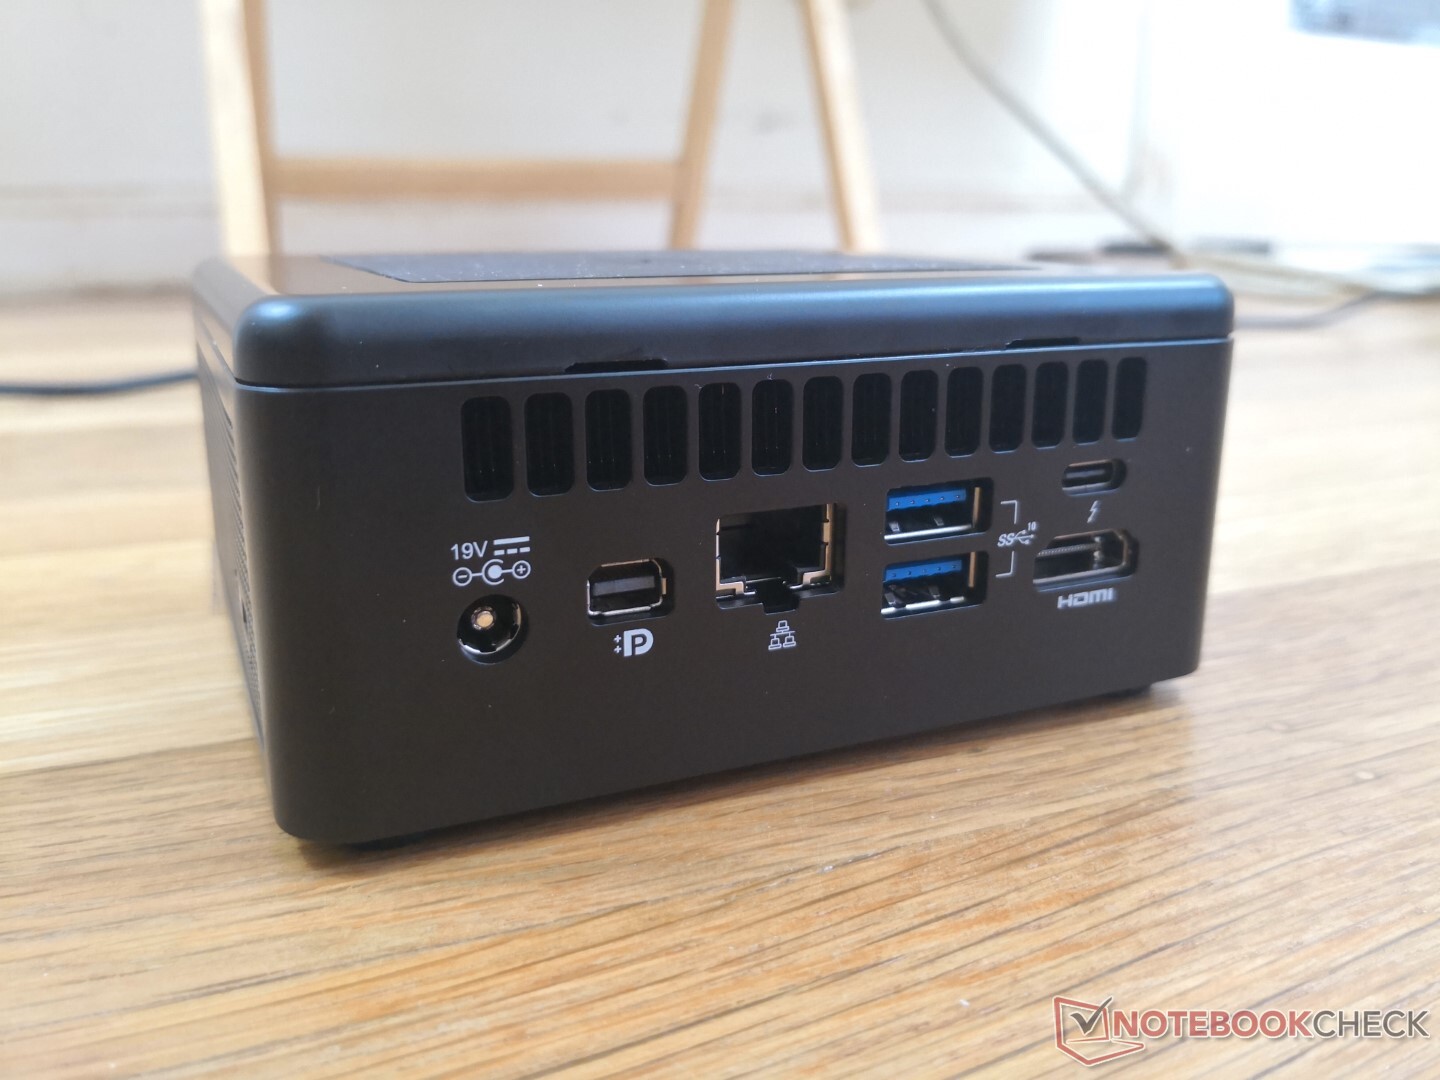
The NUC 11 includes all the ports found on the NUC 10 albeit slightly rearranged. A new addition is mini DisplayPort 1.4 as a fourth video output option to the existing HDMI and 2x Thunderbolt 3 ports.
Unfortunately, the proprietary AC adapter is still required to power the NUC as neither of the USB-C ports support power-in.
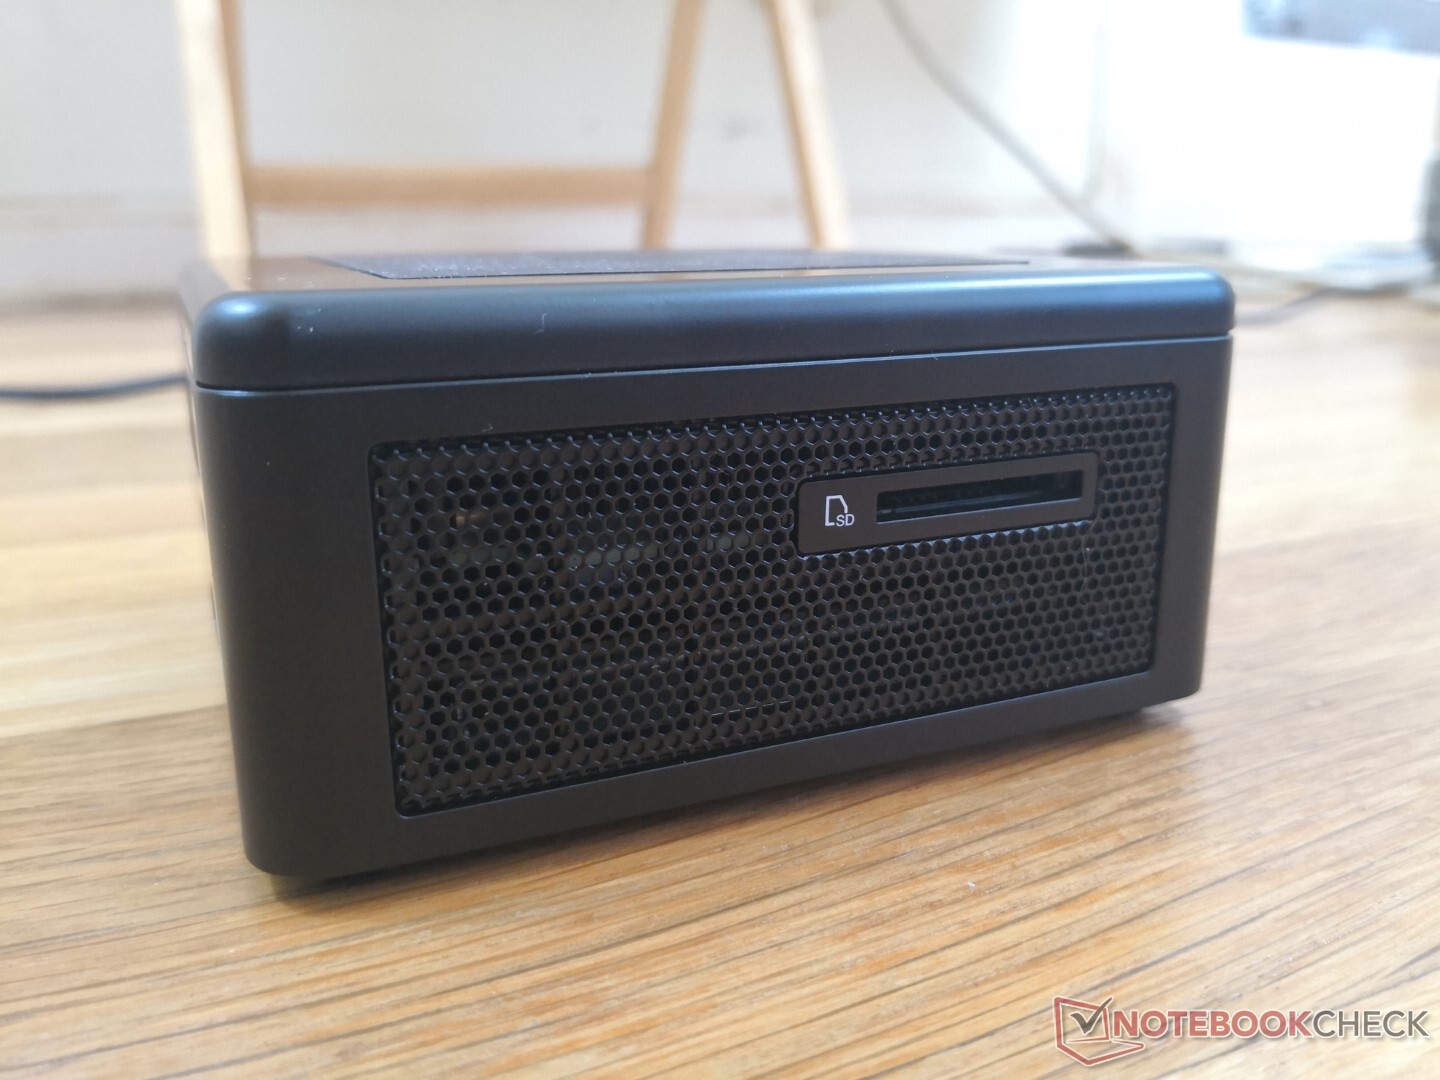
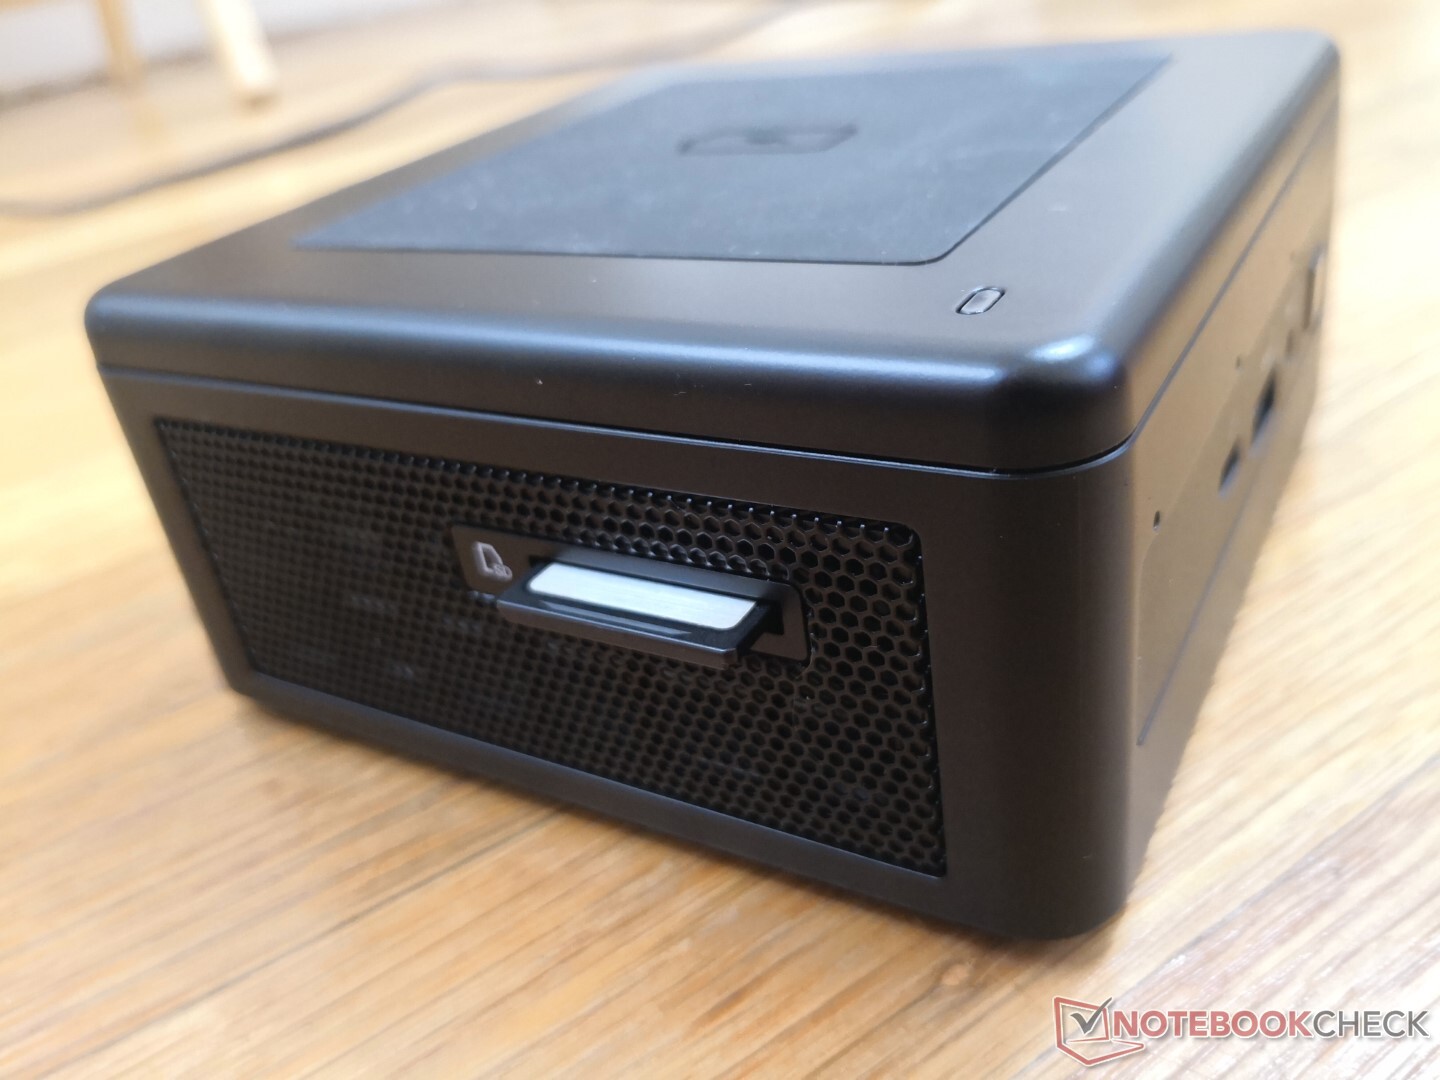
SD Card Reader
Transfer rates from the integrated card reader are over two times faster than on the older Hades Canyon NUC. Moving 1 GB of files from our UHS-II test card takes about 5 to 6 seconds compared to 12 seconds on the Hades Canyon.
| SD Card Reader | |
| average JPG Copy Test (av. of 3 runs) | |
| Intel NUC11PAQi7 (Toshiba Exceria Pro SDXC 64 GB UHS-II) | |
| Intel Hades Canyon NUC8i7HVK (Toshiba Exceria Pro SDXC 64 GB UHS-II) | |
| Intel NUC8i7BE (Toshiba Exceria Pro M501 UHS-II) | |
| Zotac ZBox MI643 (Toshiba Exceria Pro M501 UHS-II) | |
| Beelink SEi10 (Toshiba Exceria Pro M501 UHS-II) | |
| maximum AS SSD Seq Read Test (1GB) | |
| Intel NUC11PAQi7 (Toshiba Exceria Pro SDXC 64 GB UHS-II) | |
| Intel Hades Canyon NUC8i7HVK (Toshiba Exceria Pro SDXC 64 GB UHS-II) | |
| Intel NUC8i7BE (Toshiba Exceria Pro M501 UHS-II) | |
| Zotac ZBox MI643 (Toshiba Exceria Pro M501 UHS-II) | |
| Beelink SEi10 (Toshiba Exceria Pro M501 UHS-II) | |
Communication
Wi-Fi 6 and Bluetooth 5.1 come standard via the Intel AX201. Though we didn't experience any connectivity issues, raw transfer rates are slower than expected when compared to laptops with the same AX201 module by about half. We suspect this may be due to weaker antenna in the NUC.
| Networking | |
| iperf3 transmit AX12 | |
| Beelink SEi10 | |
| Intel NUC8i7BE | |
| Intel NUC11PAQi7 | |
| Intel Hades Canyon NUC8i7HVK | |
| Zotac ZBox MI643 | |
| iperf3 receive AX12 | |
| Beelink SEi10 | |
| Intel NUC11PAQi7 | |
| Intel NUC8i7BE | |
| Intel Hades Canyon NUC8i7HVK | |
| Zotac ZBox MI643 | |
Maintenance
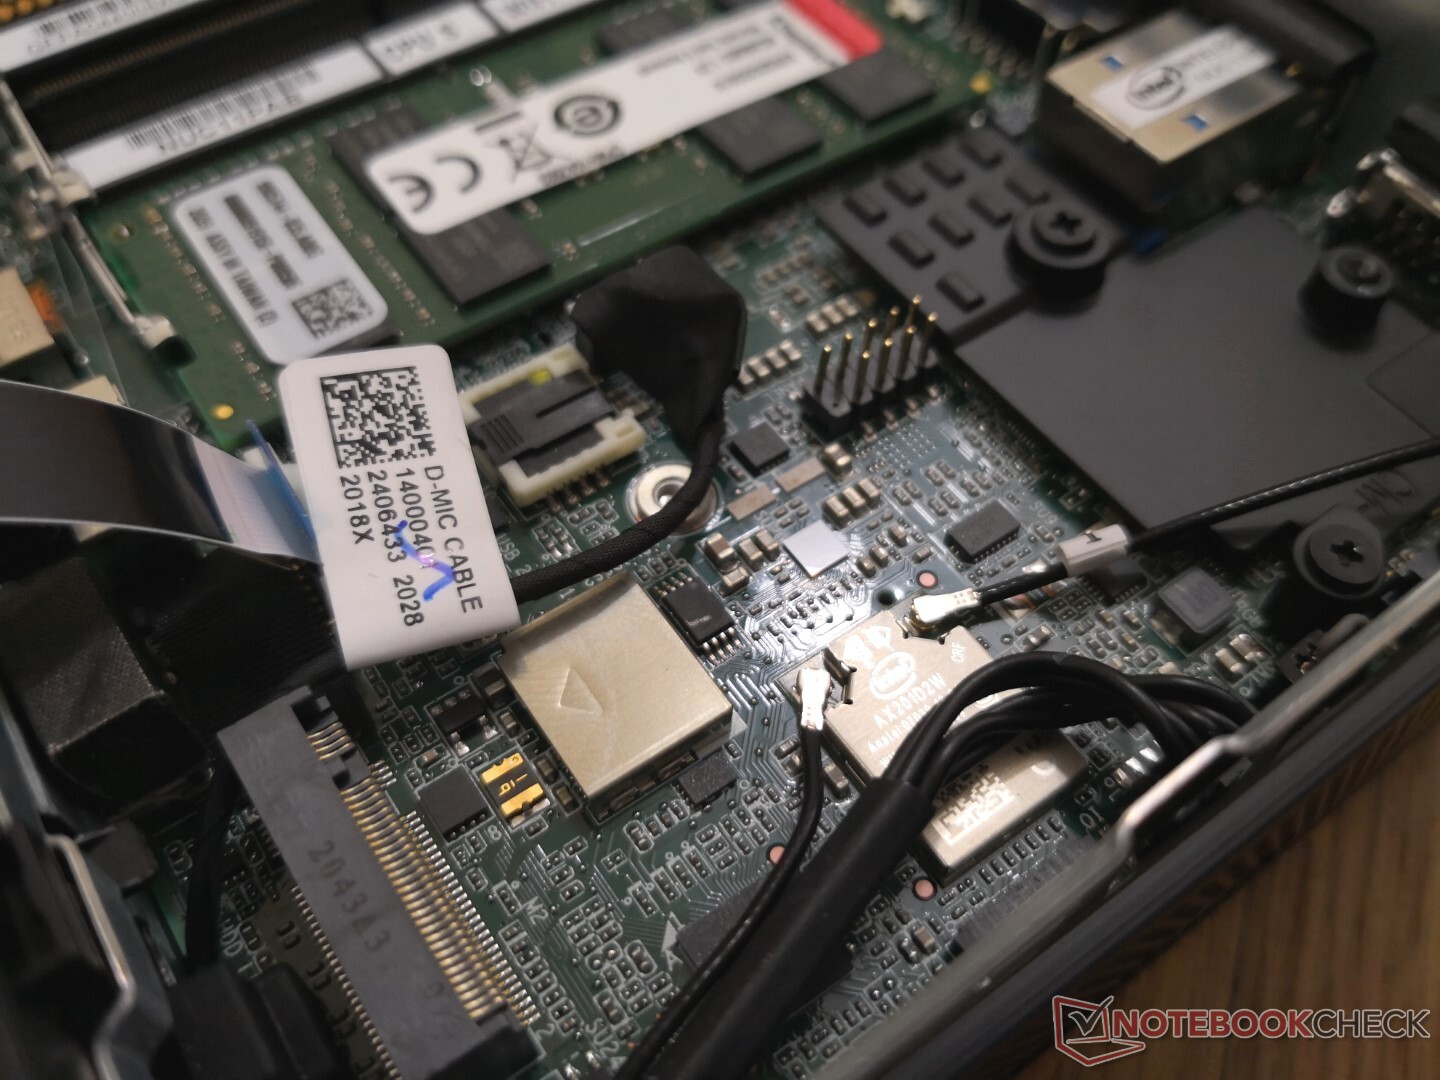
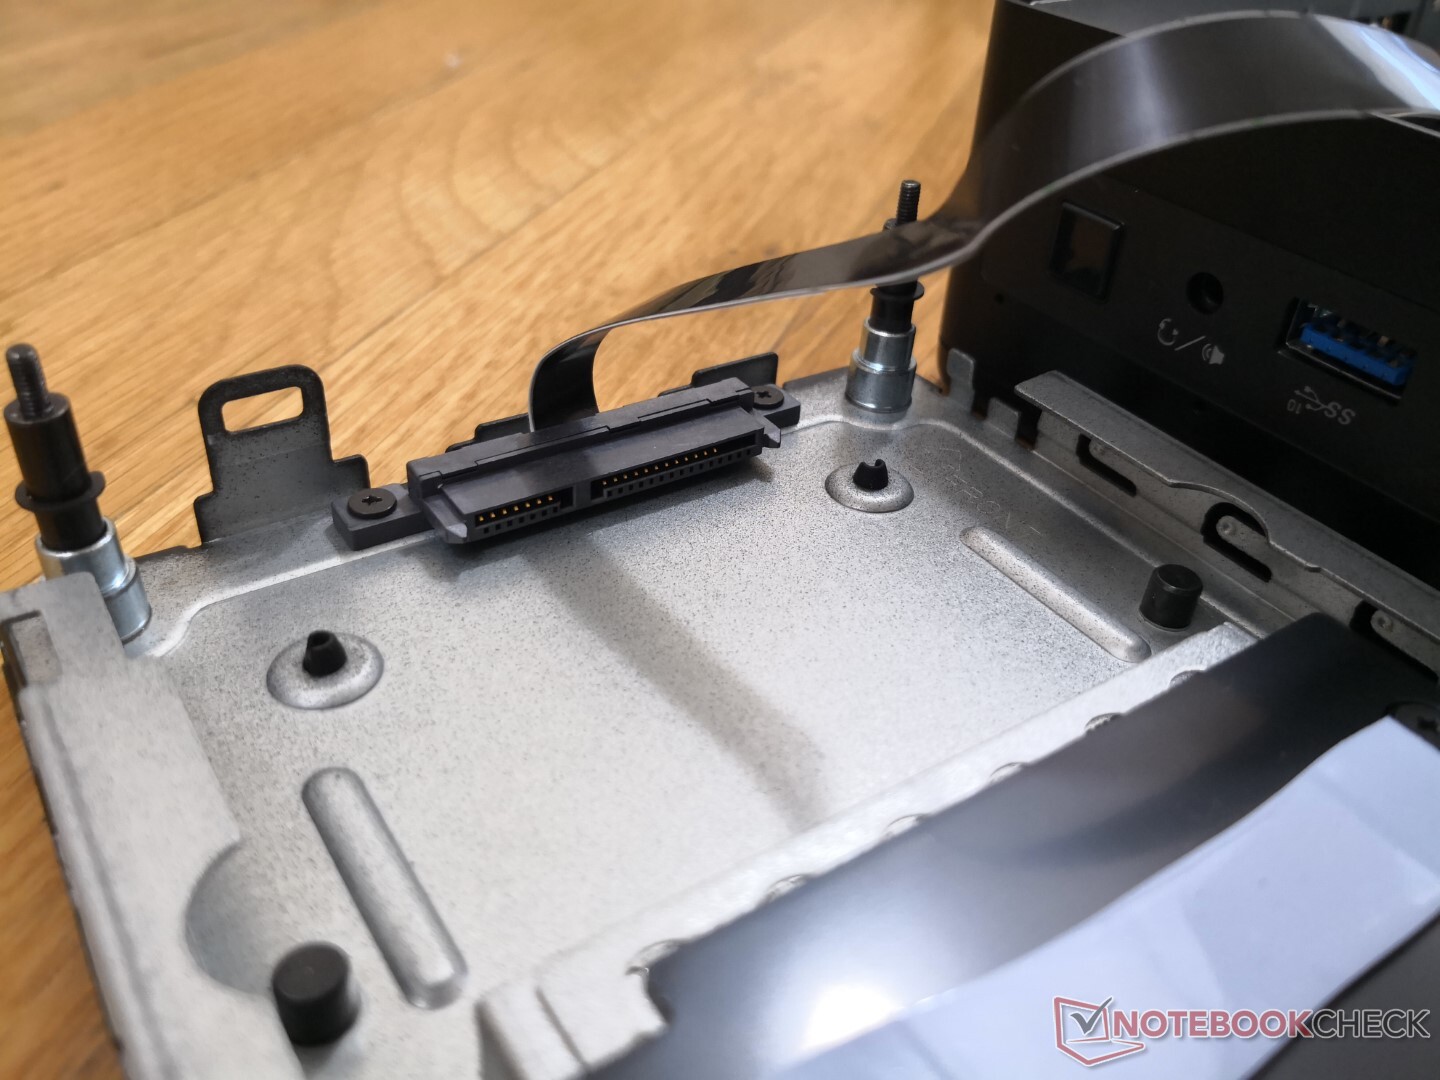
The bottom panel provides direct access to the M.2 2280 slot, 2.5-inch SATA III slot, and both SODIMM slots. Additional disassembly is required to access the fan and charging pad. Intel made the 2.5-inch SATA III ribbon longer this time for easier servicing.
Accessories and Warranty
The retail box includes four mounting screws and the usual manuals. A mounting bracket is not included.
Three-year limited warranty comes standard with all new purchases.
Performance
Processor
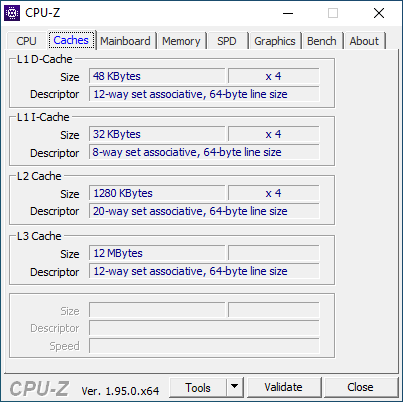
CPU performance is excellent with a CineBench R15 xT score well above the average Core i7-1165G7 in our database by at least 15 percent. This delta widens when comparing CineBench R20 xT results because the Intel NUC is better at sustaining higher clock rates for longer than most laptops with the same CPU. Less expensive AMD Zen 2 processors like the Ryzen 5 4500U or Ryzen 7 4700U are able to rival our Intel albeit with slower single-thread performance.
Opting for the lesser Core i3-1115G4 or Core i5-1135G7 NUC SKUs will entail a multi-thread performance deficit of 30 percent and 65 percent, respectively.
Cinebench R15: CPU Multi 64Bit | CPU Single 64Bit
Blender: v2.79 BMW27 CPU
7-Zip 18.03: 7z b 4 -mmt1 | 7z b 4
Geekbench 5.5: Single-Core | Multi-Core
HWBOT x265 Benchmark v2.2: 4k Preset
LibreOffice : 20 Documents To PDF
R Benchmark 2.5: Overall mean
Cinebench R15: CPU Multi 64Bit | CPU Single 64Bit
Blender: v2.79 BMW27 CPU
7-Zip 18.03: 7z b 4 -mmt1 | 7z b 4
Geekbench 5.5: Single-Core | Multi-Core
HWBOT x265 Benchmark v2.2: 4k Preset
LibreOffice : 20 Documents To PDF
R Benchmark 2.5: Overall mean
* ... smaller is better
System Performance
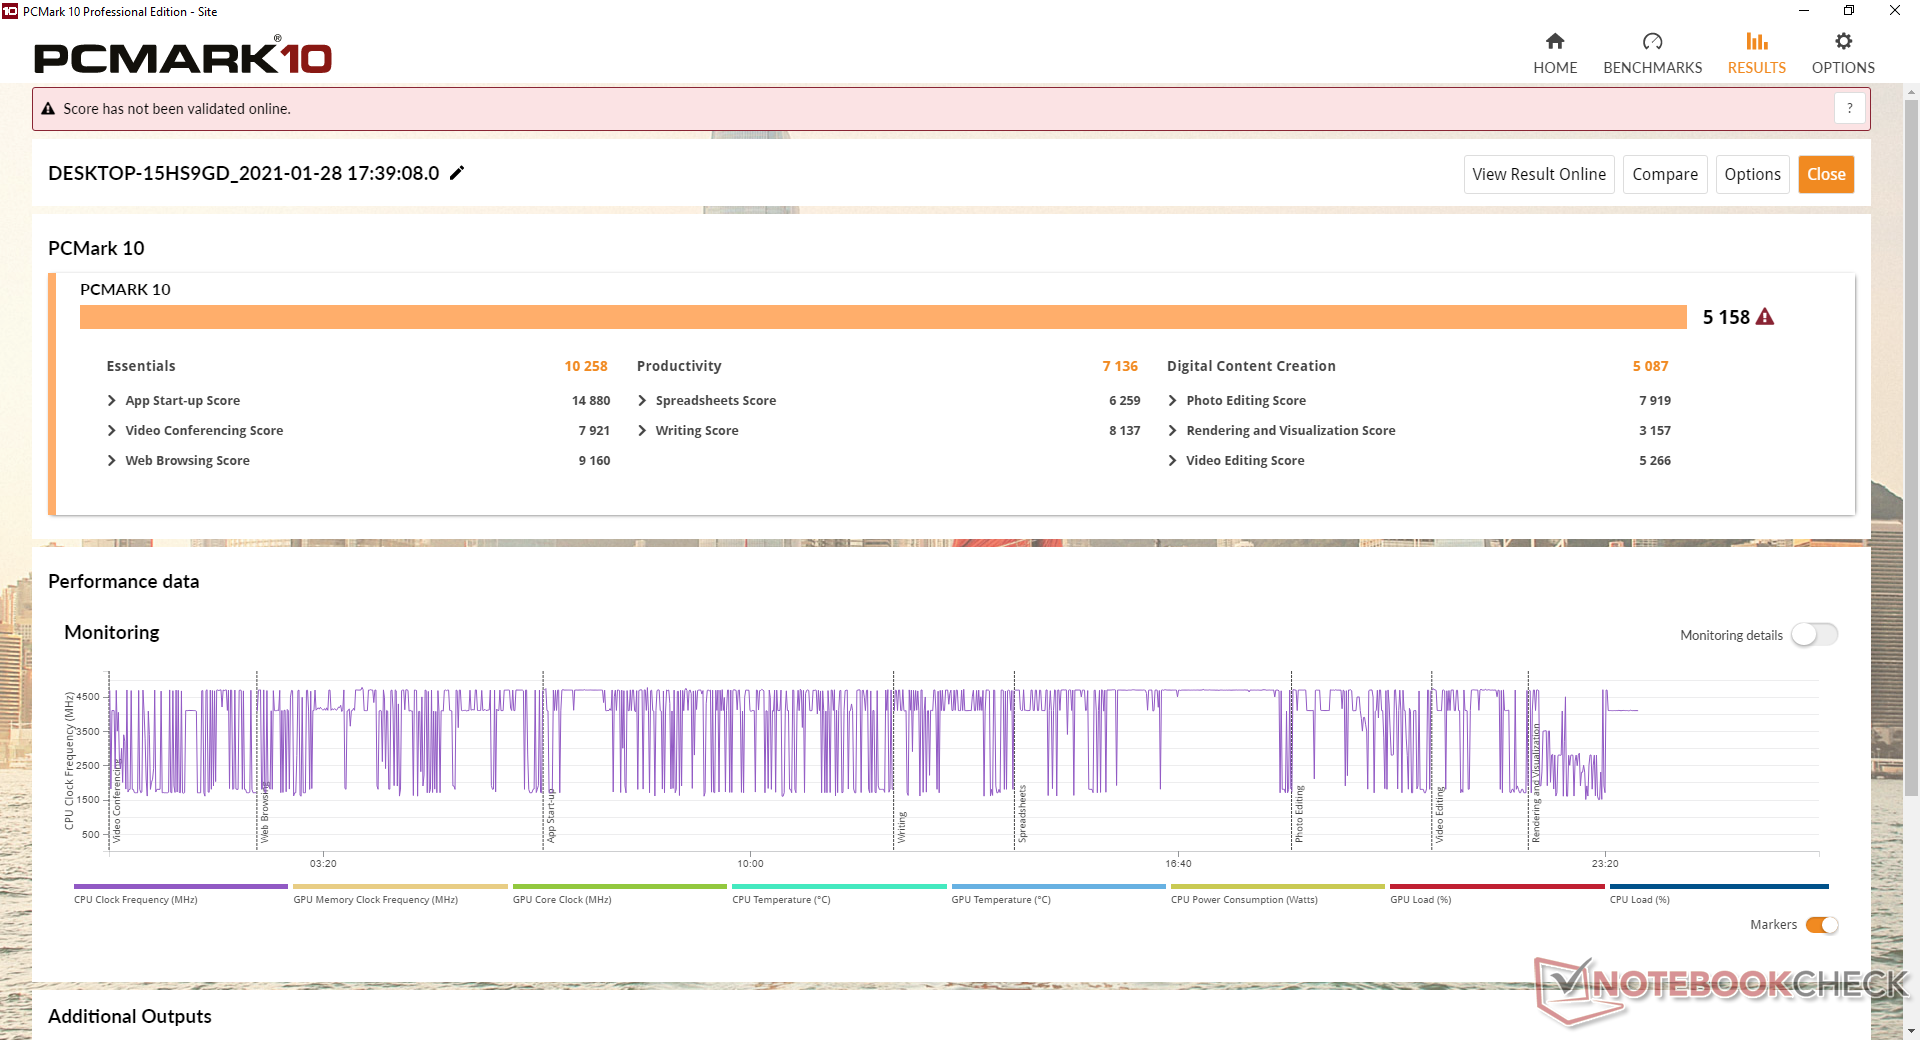
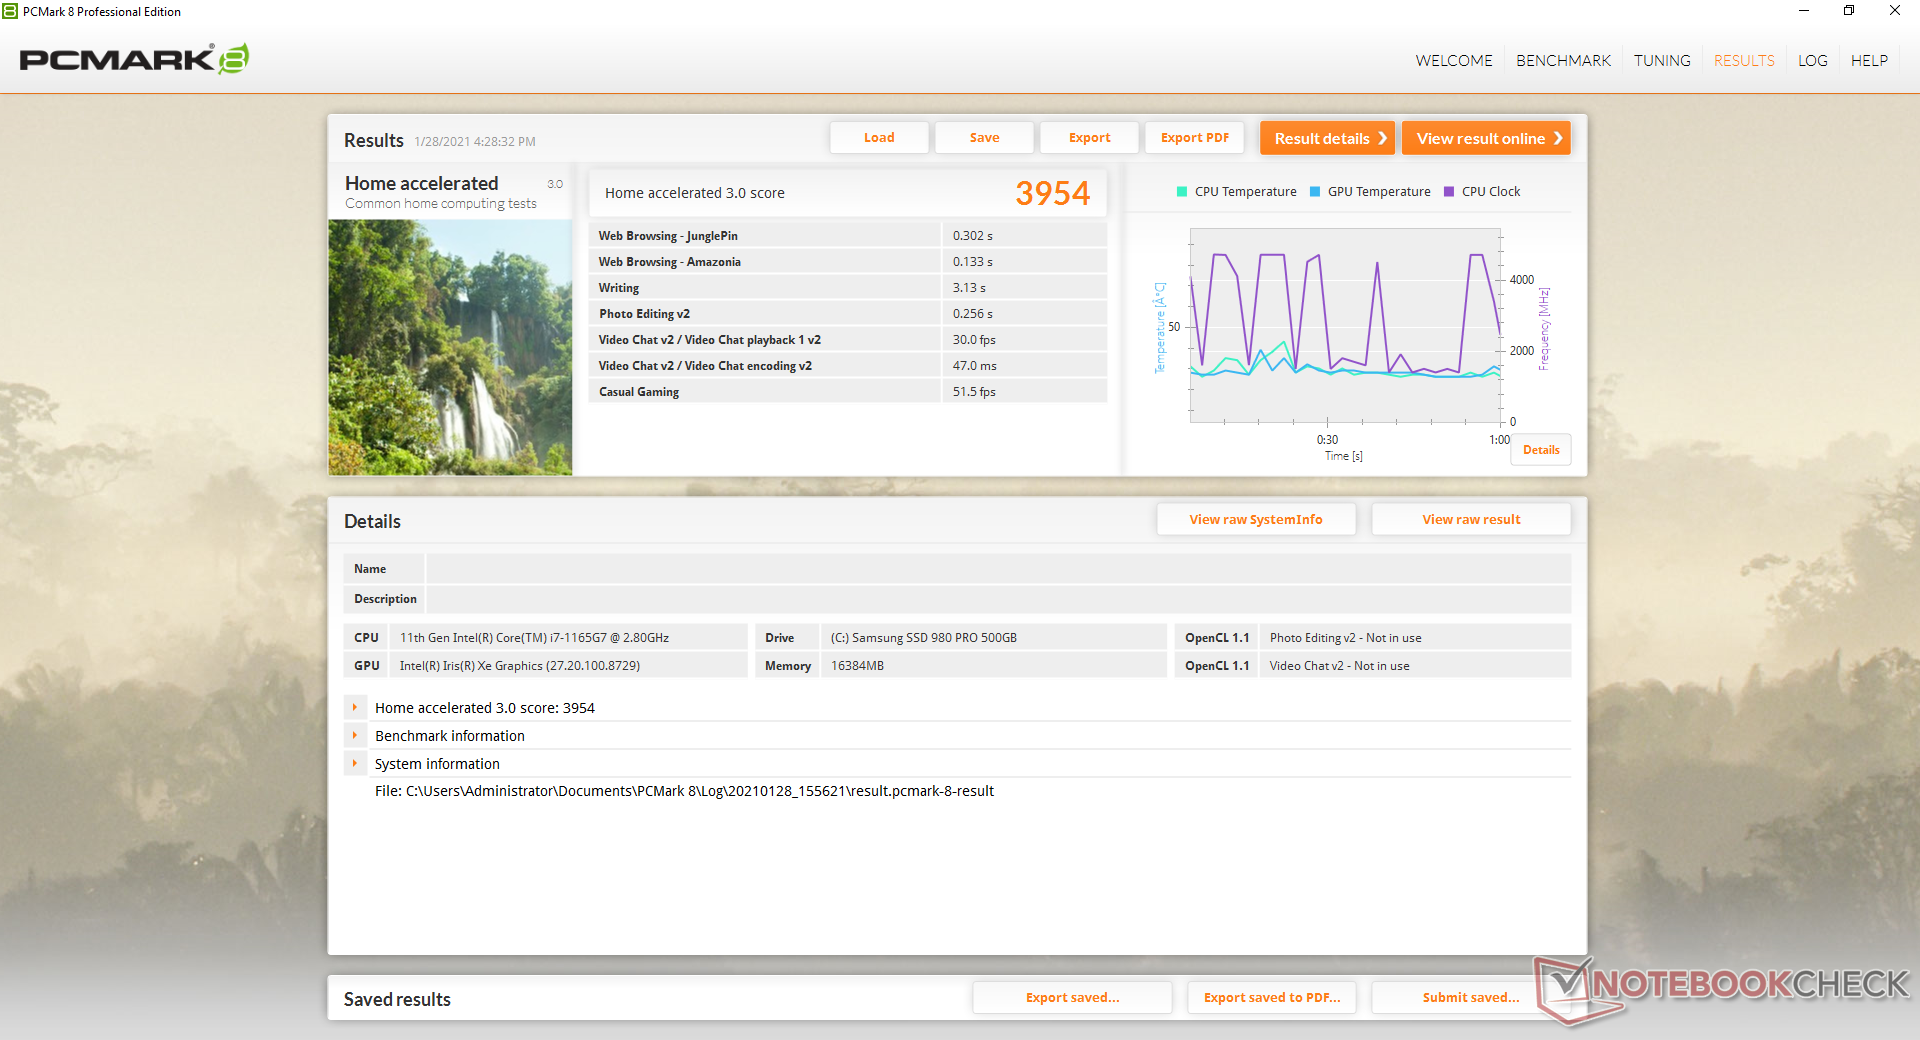
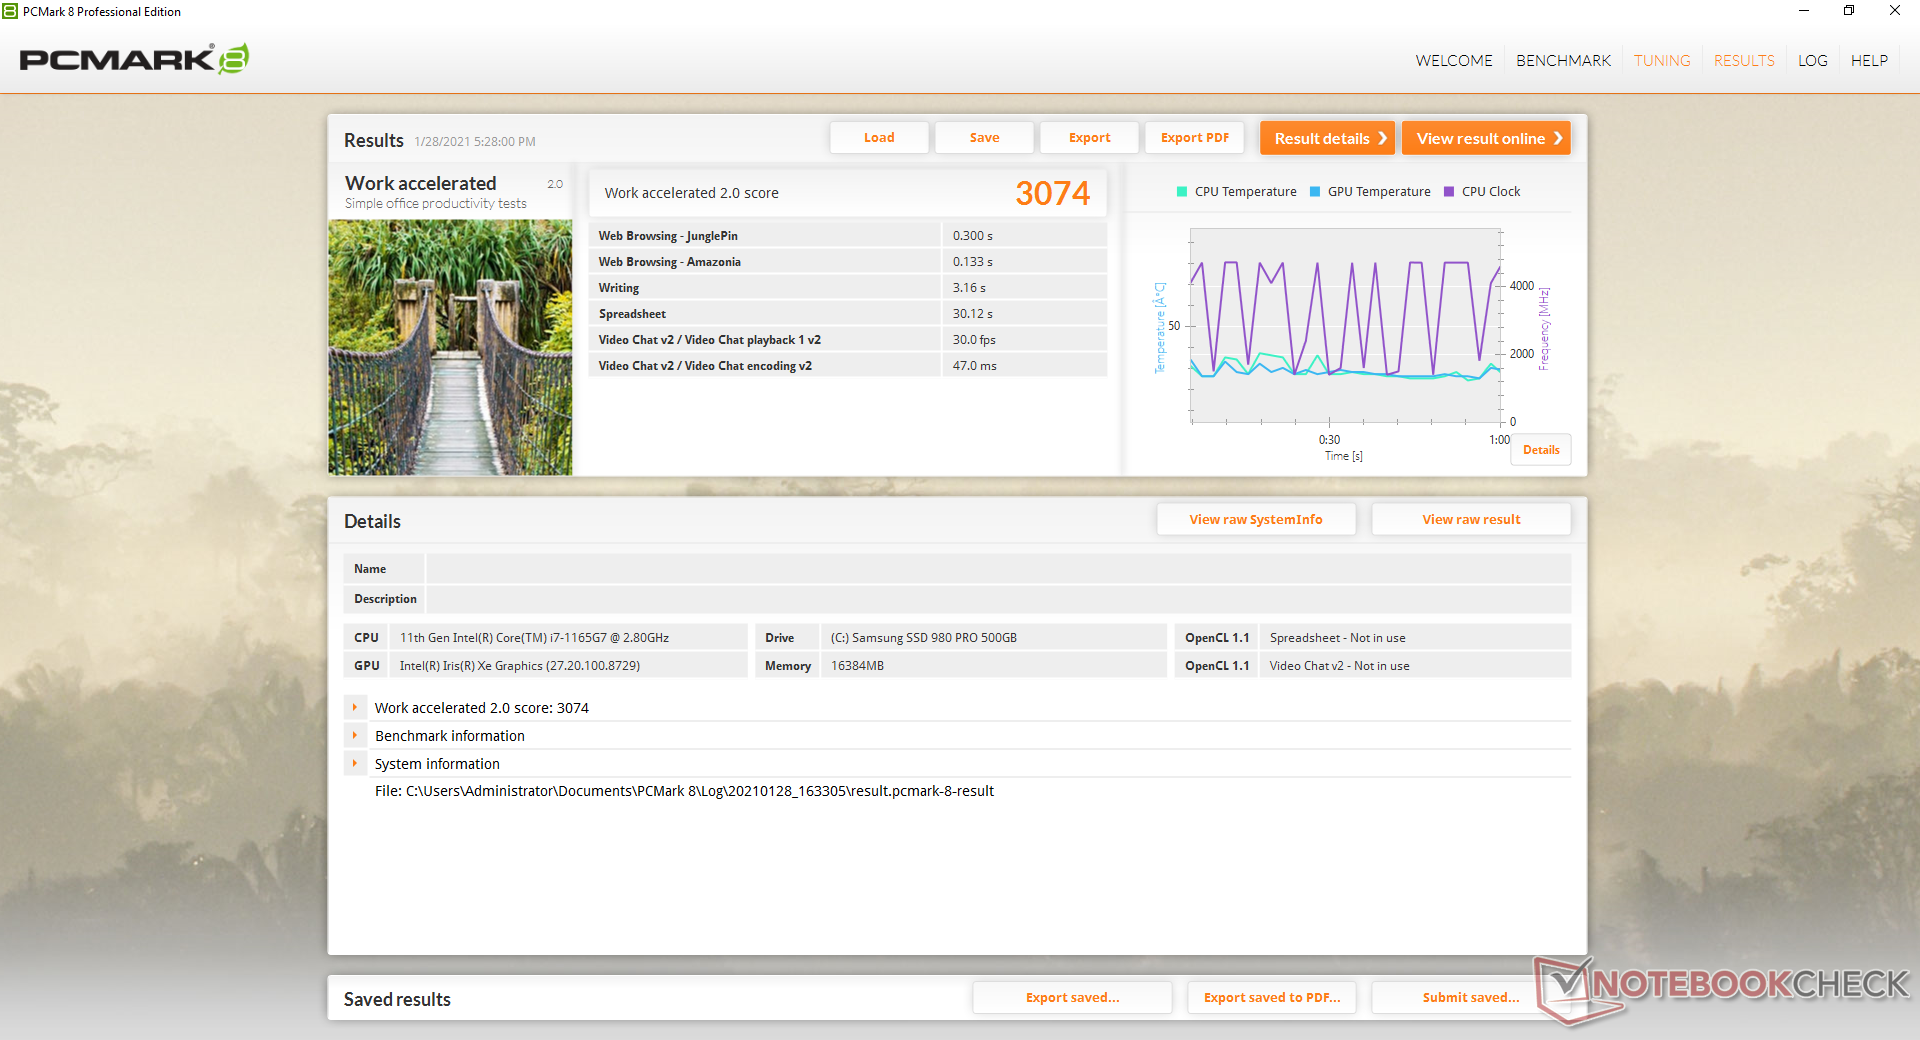
| PCMark 8 Home Score Accelerated v2 | 3954 points | |
| PCMark 8 Work Score Accelerated v2 | 3074 points | |
| PCMark 10 Score | 5158 points | |
Help | ||
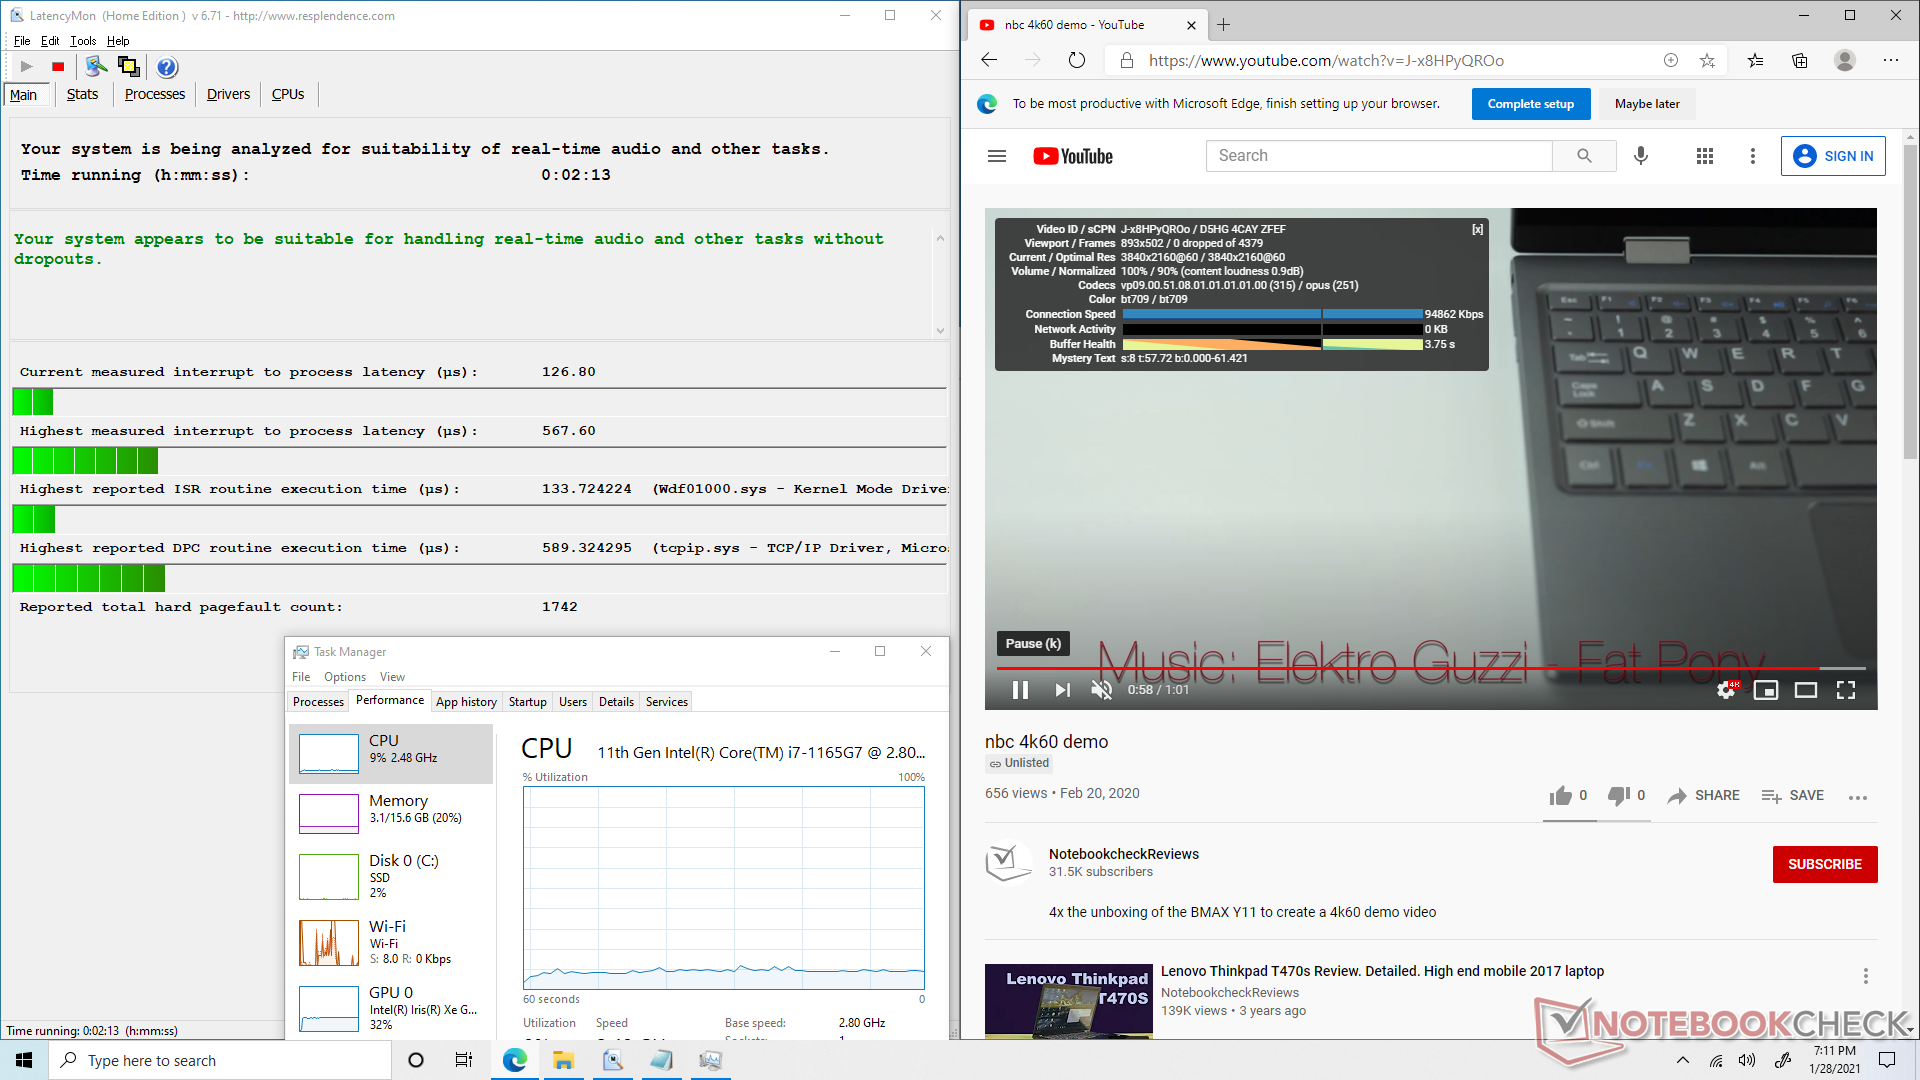
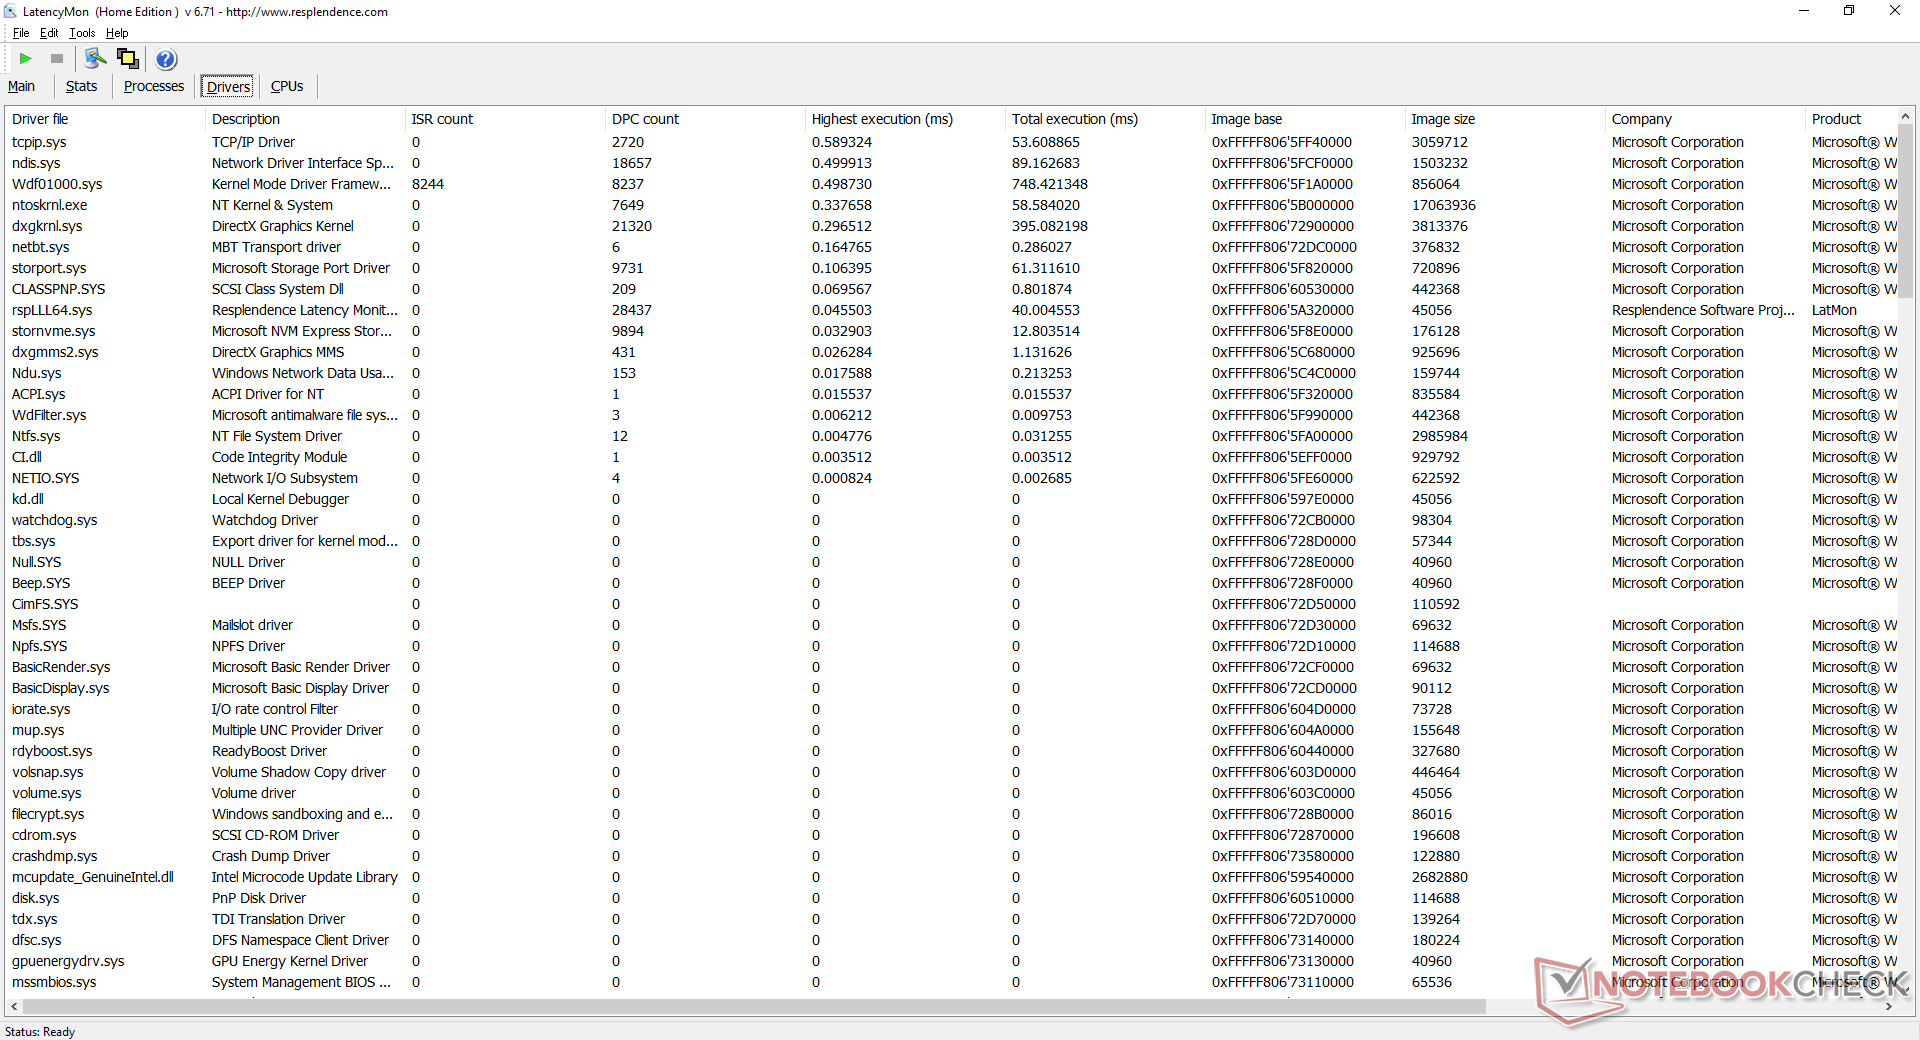
DPC Latency
LatencyMon shows no DPC latency issues. 4K video playback at 60 FPS is also smooth and with no dropped frames. The Iris Xe GPU is stable at 32 percent utilization compared to ~50 percent on the older Iris Plus G7.
| DPC Latencies / LatencyMon - interrupt to process latency (max), Web, Youtube, Prime95 | |
| Beelink SEi10 | |
| Zotac ZBox MI643 | |
| Intel NUC11PAQi7 | |
* ... smaller is better
Storage Devices
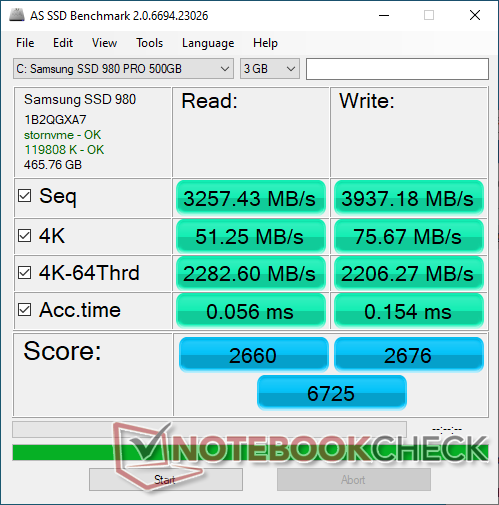
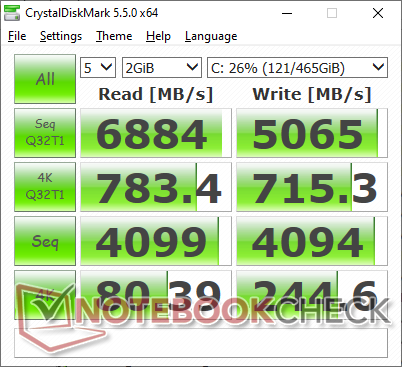
Our unit comes with a 500 GB Samsung SSD 980 Pro for theoretical read and write rates of up to 6900 MB/s and 5000 MB/s, respectively. We're able to confirm these advertised numbers when running DiskSpd in a loop as shown by the graph below. Note that thermal padding and a thin heat spreader are included.
| Intel NUC11PAQi7 Samsung SSD 980 Pro 500GB MZ-V8P500BW | Intel NUC10i7FNH Kingston RBUSNS8154P3256GJ1 | Intel Hades Canyon NUC8i7HVK Intel Optane 120 GB SSDPEK1W120GA | Beelink SEi10 Silicon Motion AZW 256G M.2280 NVMe 4X 200725 D | Zotac ZBox MI643 Lexar NM610 1TB | |
|---|---|---|---|---|---|
| AS SSD | -58% | -20% | -83% | -40% | |
| Seq Read (MB/s) | 3257 | 1306 -60% | 1379 -58% | 1111 -66% | 1511 -54% |
| Seq Write (MB/s) | 3937 | 611 -84% | 553 -86% | 323.5 -92% | 1558 -60% |
| 4K Read (MB/s) | 51.3 | 21.53 -58% | 127.9 149% | 33.1 -35% | 43.77 -15% |
| 4K Write (MB/s) | 75.7 | 53.5 -29% | 103.5 37% | 66.2 -13% | 119.5 58% |
| 4K-64 Read (MB/s) | 2283 | 652 -71% | 1258 -45% | 357.3 -84% | 839 -63% |
| 4K-64 Write (MB/s) | 2206 | 648 -71% | 556 -75% | 154.8 -93% | 909 -59% |
| Access Time Read * (ms) | 0.056 | 0.114 -104% | 0.025 55% | 0.066 -18% | 0.032 43% |
| Access Time Write * (ms) | 0.154 | 0.07 55% | 0.033 79% | 0.616 -300% | 0.242 -57% |
| Score Read (Points) | 2660 | 804 -70% | 1524 -43% | 501 -81% | 1034 -61% |
| Score Write (Points) | 2676 | 762 -72% | 714 -73% | 253 -91% | 1185 -56% |
| Score Total (Points) | 6725 | 1944 -71% | 3023 -55% | 983 -85% | 2760 -59% |
| Copy ISO MB/s (MB/s) | 2030 | 976 -52% | 1125 -45% | 1160 -43% | 1373 -32% |
| Copy Program MB/s (MB/s) | 883 | 346 -61% | 342.4 -61% | 121.1 -86% | 280.4 -68% |
| Copy Game MB/s (MB/s) | 1817 | 735 -60% | 768 -58% | 364.4 -80% | 531 -71% |
| CrystalDiskMark 5.2 / 6 | 6% | -45% | -51% | -48% | |
| Write 4K (MB/s) | 244.6 | 442.4 81% | 133.7 -45% | 203 -17% | 214.1 -12% |
| Read 4K (MB/s) | 80.4 | 371.1 362% | 178.6 122% | 63.2 -21% | 62.1 -23% |
| Write Seq (MB/s) | 4094 | 900 -78% | 608 -85% | 1114 -73% | 1664 -59% |
| Read Seq (MB/s) | 4099 | 1582 -61% | 1428 -65% | 1765 -57% | 1797 -56% |
| Write 4K Q32T1 (MB/s) | 715 | 373.8 -48% | 323.6 -55% | 423.9 -41% | 421.8 -41% |
| Read 4K Q32T1 (MB/s) | 783 | 374.9 -52% | 282.3 -64% | 389.2 -50% | 512 -35% |
| Write Seq Q32T1 (MB/s) | 5065 | 893 -82% | 627 -88% | 1104 -78% | 564 -89% |
| Read Seq Q32T1 (MB/s) | 6884 | 1582 -77% | 1521 -78% | 1990 -71% | 2073 -70% |
| Write 4K Q8T8 (MB/s) | 399.1 | ||||
| Read 4K Q8T8 (MB/s) | 688 | ||||
| Total Average (Program / Settings) | -26% /
-35% | -33% /
-29% | -67% /
-72% | -44% /
-43% |
* ... smaller is better

Disk Throttling: DiskSpd Read Loop, Queue Depth 8
GPU Performance
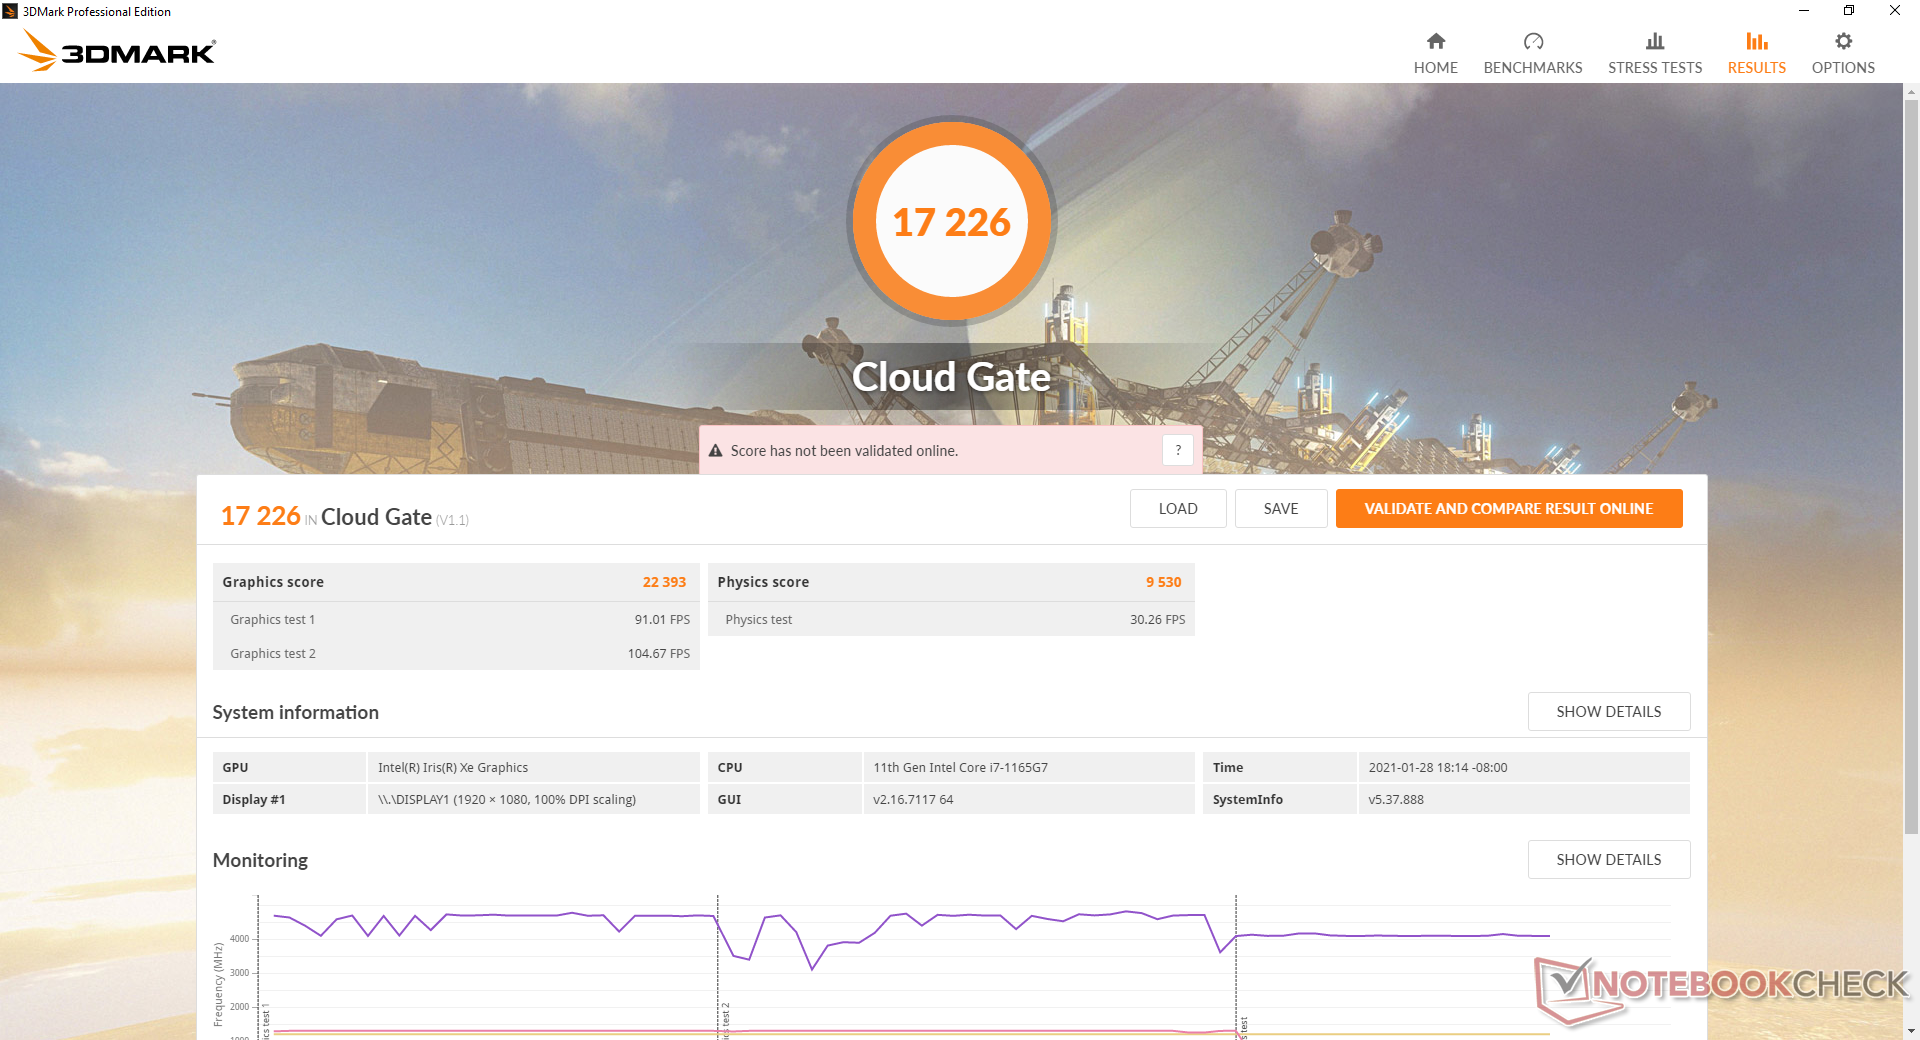
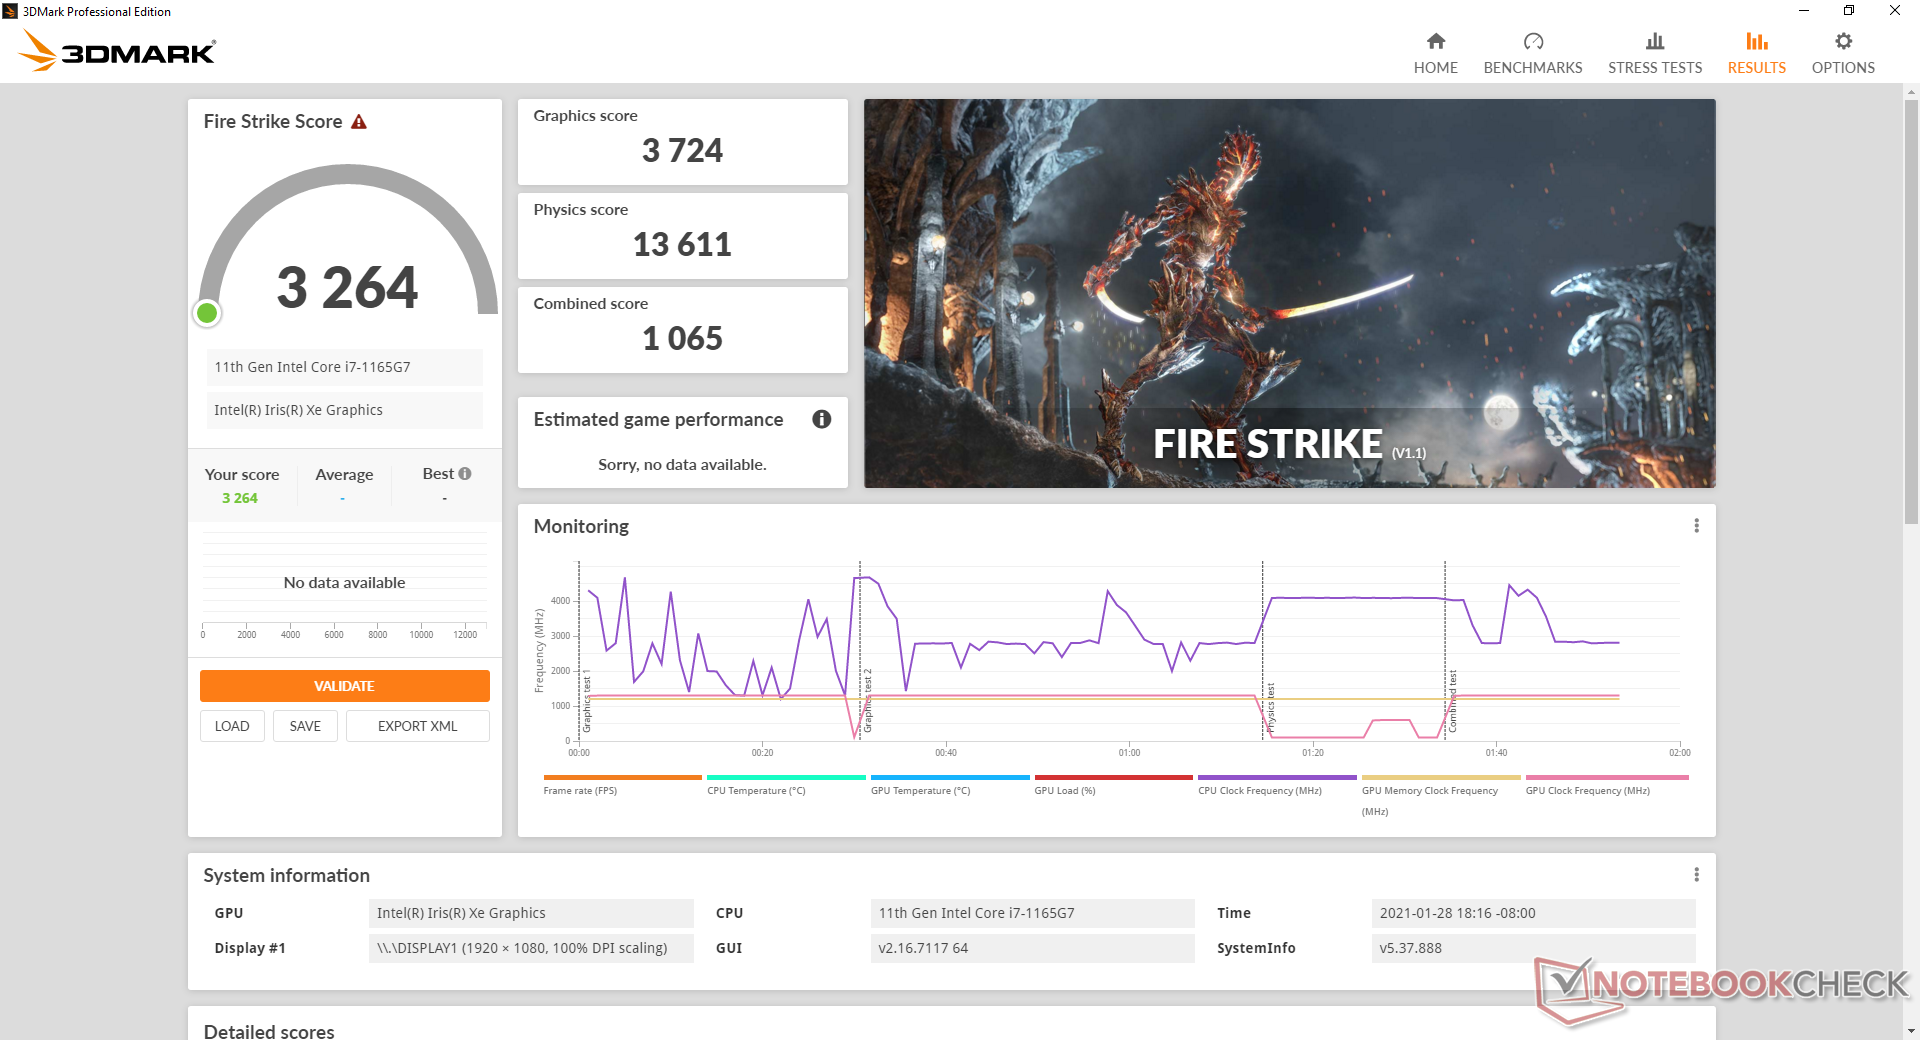
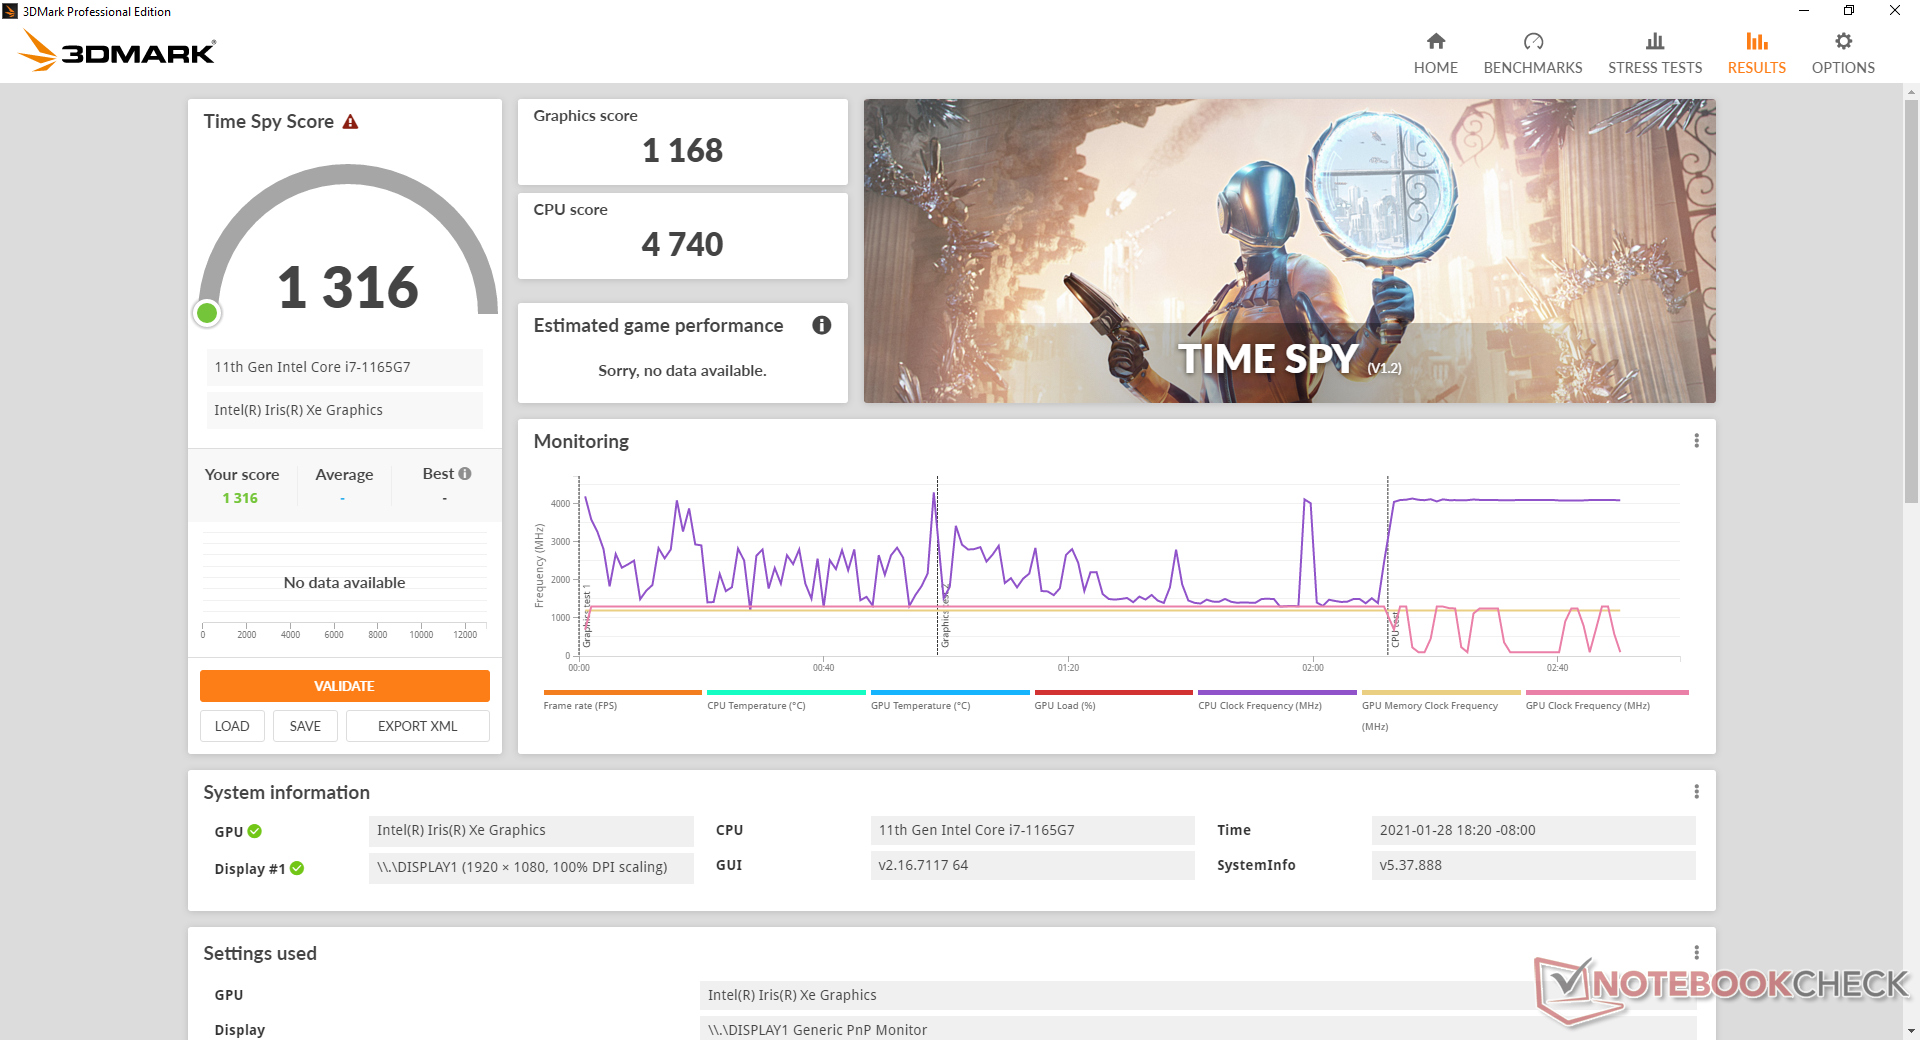
3DMark scores are about 15 percent slower than the average Iris Xe 96 EUs in our database despite the faster-than-average CPU performance recorded above. The discrepancy is likely attributed to the single-channel RAM in our review unit. Had it been dual-channel, then results would likely be higher by 30 percent or more much like what we observed on the Lenovo IdeaPad Slim 9i.
More benchmarks and technical information on the Iris Xe 96 EUs can be found here. Opting for the lesser Core i5 Iris Xe 80 EUs may not necessarily mean slower graphics performance depending on the RAM setup. However, expect the Core i3 UHD Graphics 620 (or Iris Xe 48 EUs) option to be significantly slower.
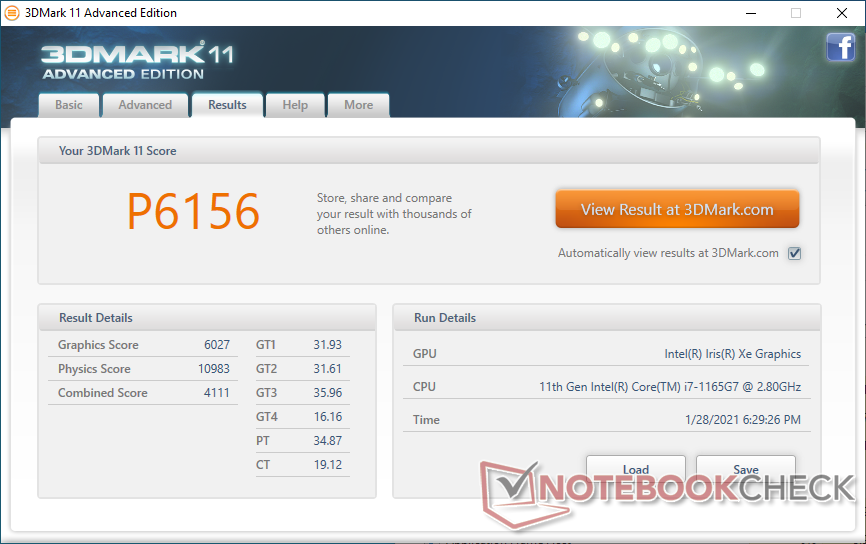
| 3DMark 11 Performance | 6156 points | |
| 3DMark Cloud Gate Standard Score | 17226 points | |
| 3DMark Fire Strike Score | 3264 points | |
| 3DMark Time Spy Score | 1316 points | |
Help | ||
| low | med. | high | ultra | |
|---|---|---|---|---|
| GTA V (2015) | 67.6 | 52.5 | 12.6 | 5.72 |
| The Witcher 3 (2015) | 70.3 | 43.7 | 20.7 | 10.3 |
| Dota 2 Reborn (2015) | 78.8 | 61.8 | 37.7 | 35 |
| Final Fantasy XV Benchmark (2018) | 30.3 | 15.6 | 12.7 | |
| X-Plane 11.11 (2018) | 42.3 | 32.7 | 28.8 | |
| Strange Brigade (2018) | 66.2 | 23.8 | 20.1 | 16.9 |
Emissions
System Noise
The internal fan will pulse between idle and 33.6 dB(A) even when simply web browsing or idling on desktop. Though not loud enough to be bothersome or too noticeable, a steadier approach would have been preferable. Fan noise when running Witcher 3 is stable at 33.6 dB(A) to be quieter than initially expected. Running other games at lower settings for higher frame rates will cause fan noise to jump slightly.
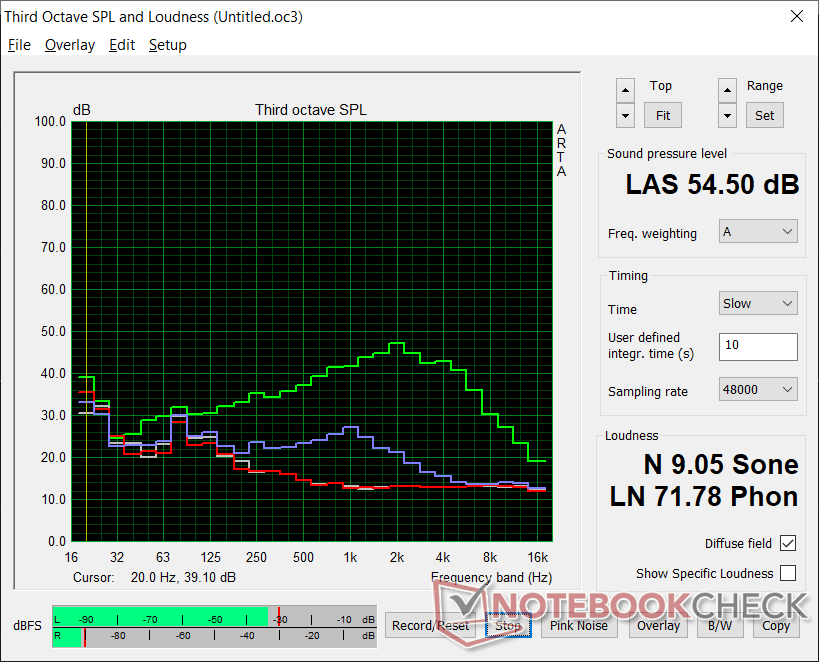
Extreme loads like Prime95 will bump fan noise up to 49.2 dB(A) and even 54.5 dB(A) to be much louder than most other mini PCs when under similar conditions. The CPU may be fast, but the fan will be putting in work to maintain those impressive performance levels.
We can notice minor coil whine or electronic noise from our test unit.
| Intel NUC11PAQi7 Iris Xe G7 96EUs, i7-1165G7, Samsung SSD 980 Pro 500GB MZ-V8P500BW | Intel NUC8i7BE Iris Plus Graphics 655, i7-8559U | Intel Hades Canyon NUC8i7HVK Vega M GH, i7-8809G, Intel Optane 120 GB SSDPEK1W120GA | Beelink SEi10 UHD Graphics G1 (Ice Lake 32 EU), i3-1005G1, Silicon Motion AZW 256G M.2280 NVMe 4X 200725 D | Zotac ZBox MI643 UHD Graphics 620, i5-10210U, Lexar NM610 1TB | GMK NucBox K1 UHD Graphics 600, Celeron J4125, HIKVision C100 NGFF SSD 128GB | |
|---|---|---|---|---|---|---|
| Noise | -10% | -11% | -17% | 2% | -10% | |
| off / environment * (dB) | 25.6 | 28.7 -12% | 28.7 -12% | 27.5 -7% | 26.1 -2% | 27.8 -9% |
| Idle Minimum * (dB) | 25.6 | 28.7 -12% | 29 -13% | 30.9 -21% | 27.5 -7% | 27.8 -9% |
| Idle Average * (dB) | 25.6 | 29.3 -14% | 29 -13% | 33.5 -31% | 27.5 -7% | 27.8 -9% |
| Idle Maximum * (dB) | 25.6 | 31.8 -24% | 29 -13% | 33.5 -31% | 27.5 -7% | 27.8 -9% |
| Load Average * (dB) | 33.6 | 39 -16% | 36 -7% | 38.5 -15% | 28.9 14% | 46.8 -39% |
| Witcher 3 ultra * (dB) | 33.6 | 39 -16% | 42 -25% | |||
| Load Maximum * (dB) | 54.5 | 41.4 24% | 49.4 9% | 51.6 5% | 42 23% | 46.8 14% |
* ... smaller is better
Noise level
| Idle |
| 25.6 / 25.6 / 25.6 dB(A) |
| Load |
| 33.6 / 54.5 dB(A) |
 | ||
30 dB silent 40 dB(A) audible 50 dB(A) loud |
||
min: | ||
Temperature
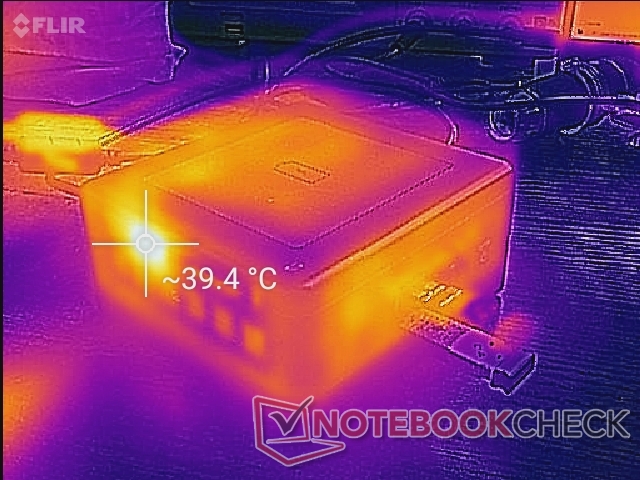
Surface temperatures aren't an issue even when under load. The unit will run just fine sitting on its side, but this isn't recommended since ventilation grilles will be blocked.
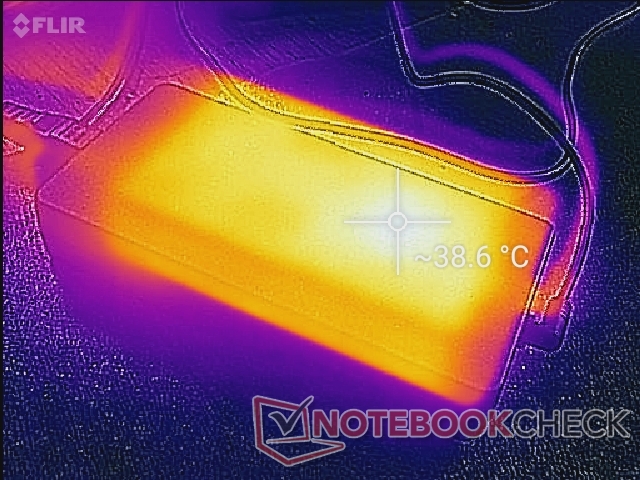
The AC adapter can be noticeably warmer than the mini PC itself at about 40 C when gaming.


Stress Test
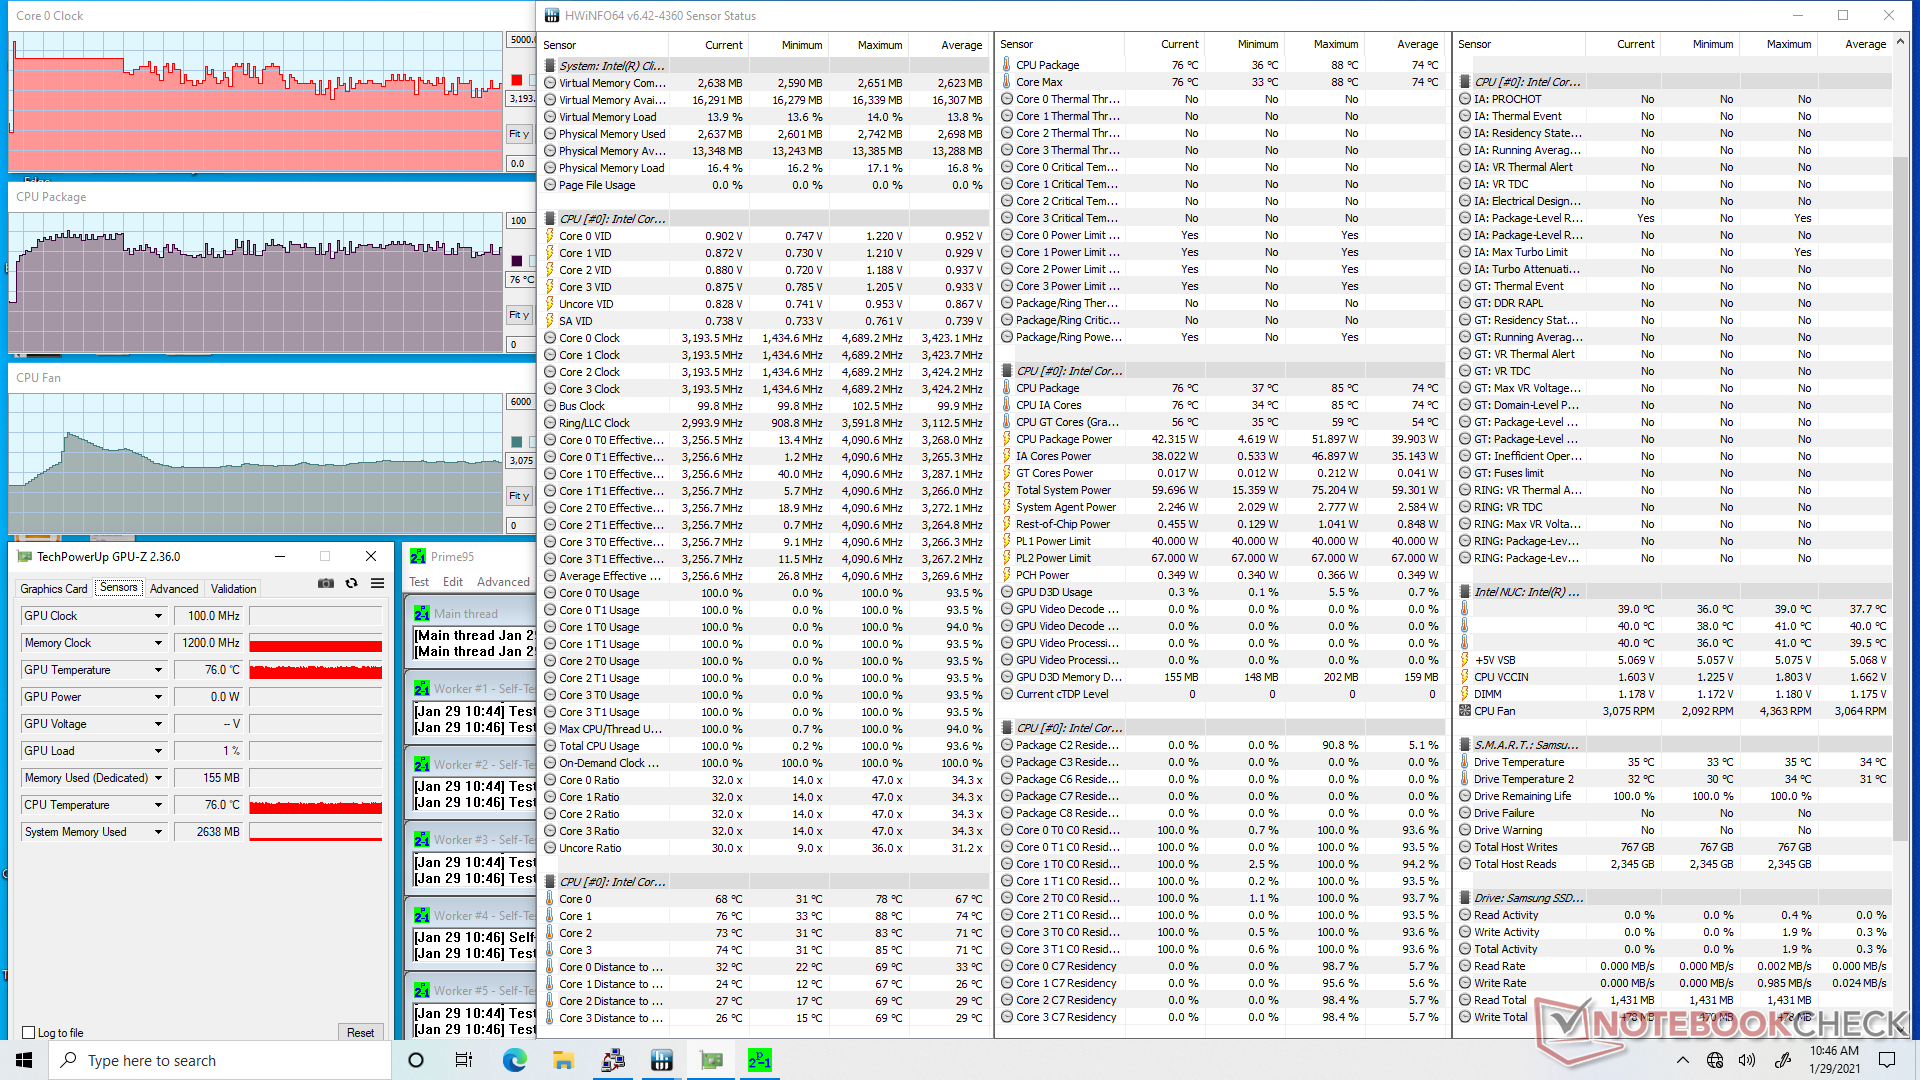
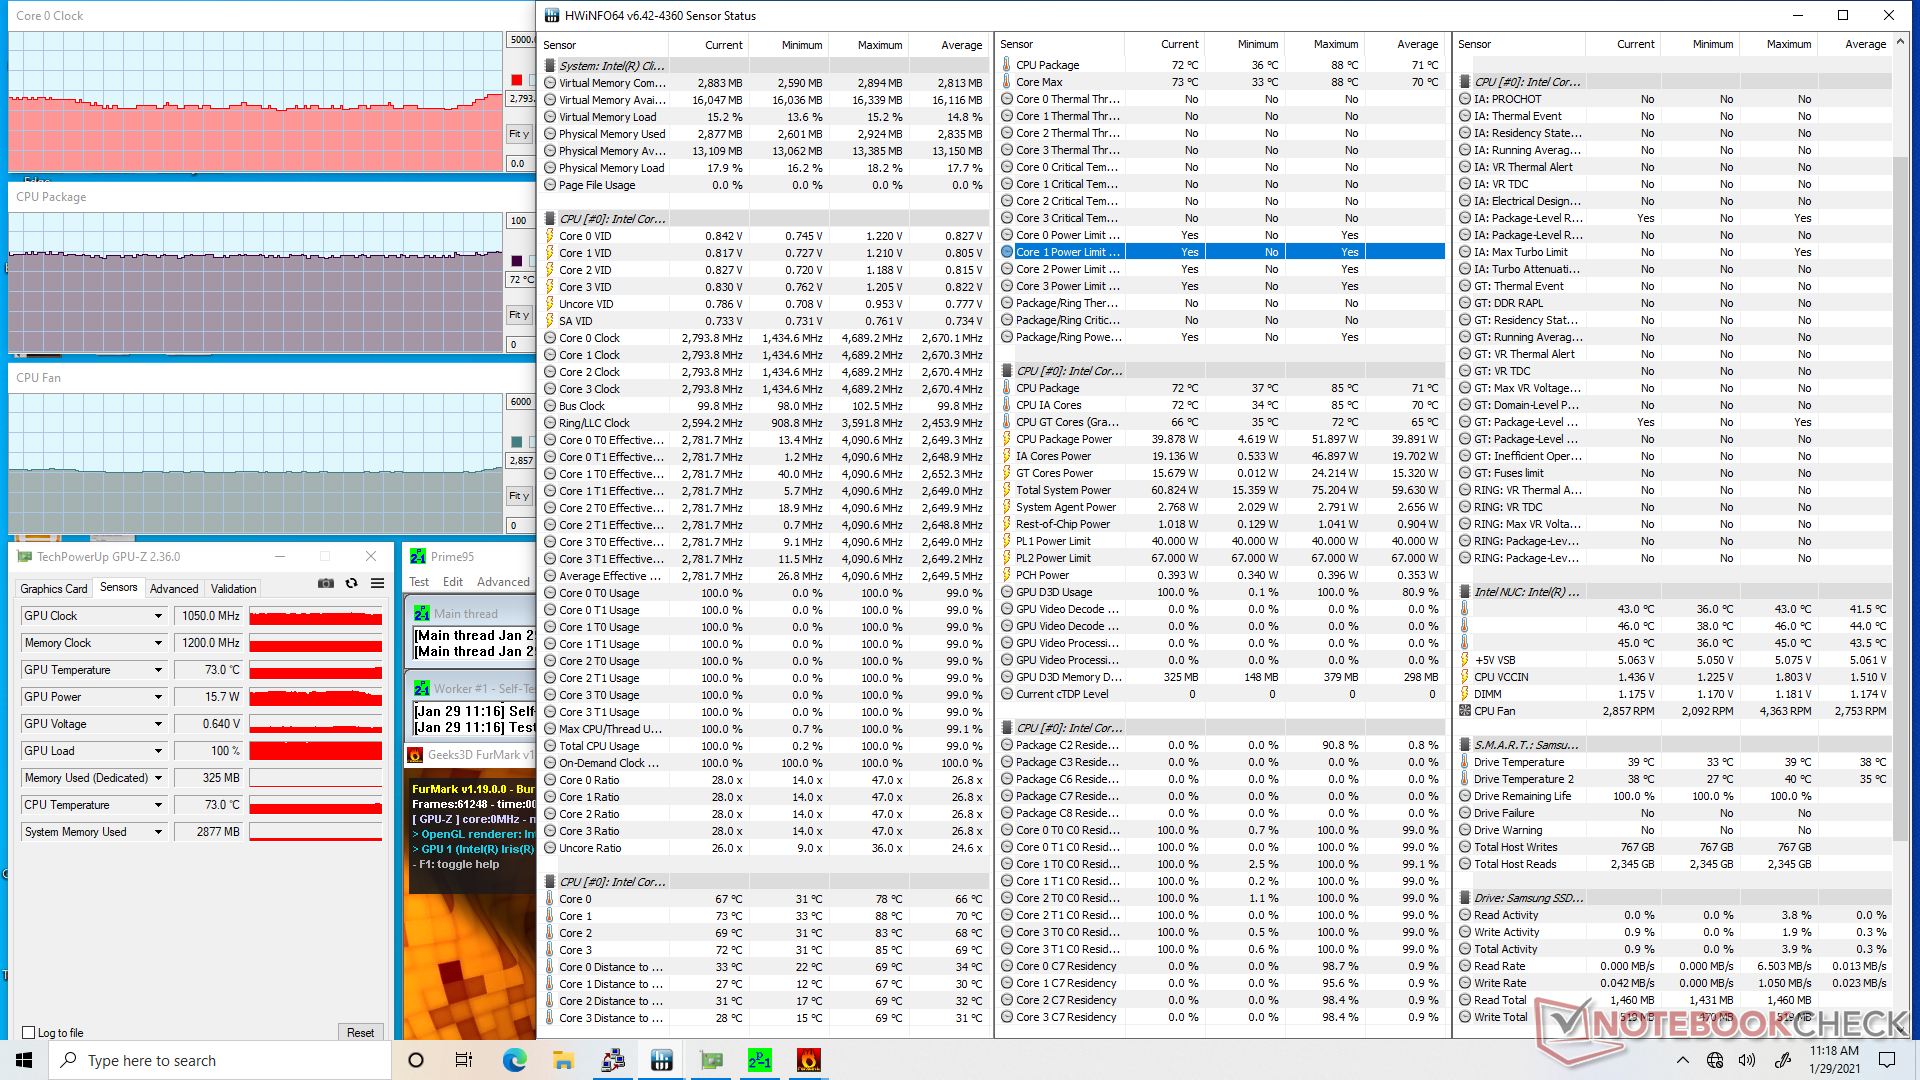
We stress the NUC to identify for any potential throttling issues. When running Prime95, clock rates would boost to 4.1 GHz for the first couple of minutes and at a stable core temperature of 86 C. Eventually, however, both clock rates and temperature automatically fall and fluctuate between 2.7 to 3.4 GHz and 71 C to 79 C, respectively. An option to run at 4.1 GHz and 86 C indefinitely for maximum sustained performance would have been great for power users. When running Witcher 3 to represent real-world gaming loads, clock rates and temperature are much lower at only 57 C.
Note that fan RPM fluctuates between 0 and 2000 even when the system is idling as shown by the screenshot below.
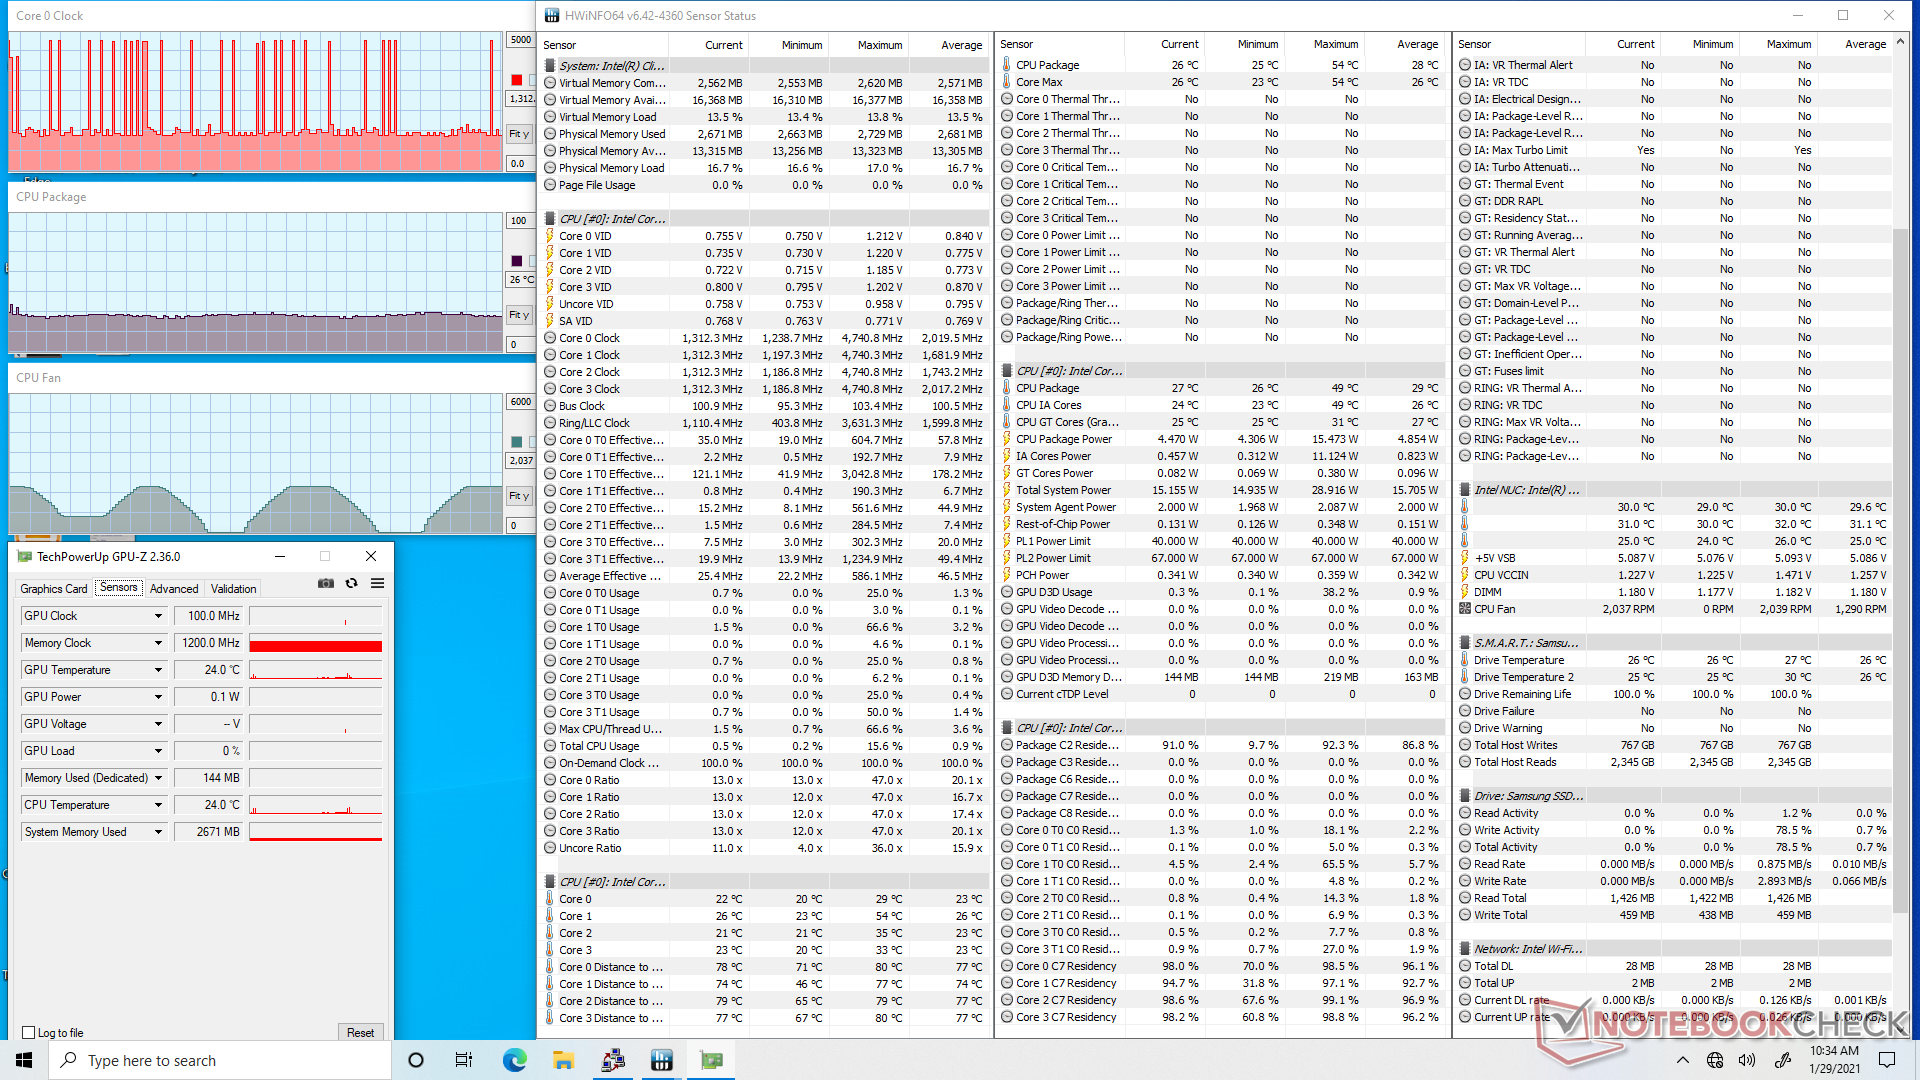
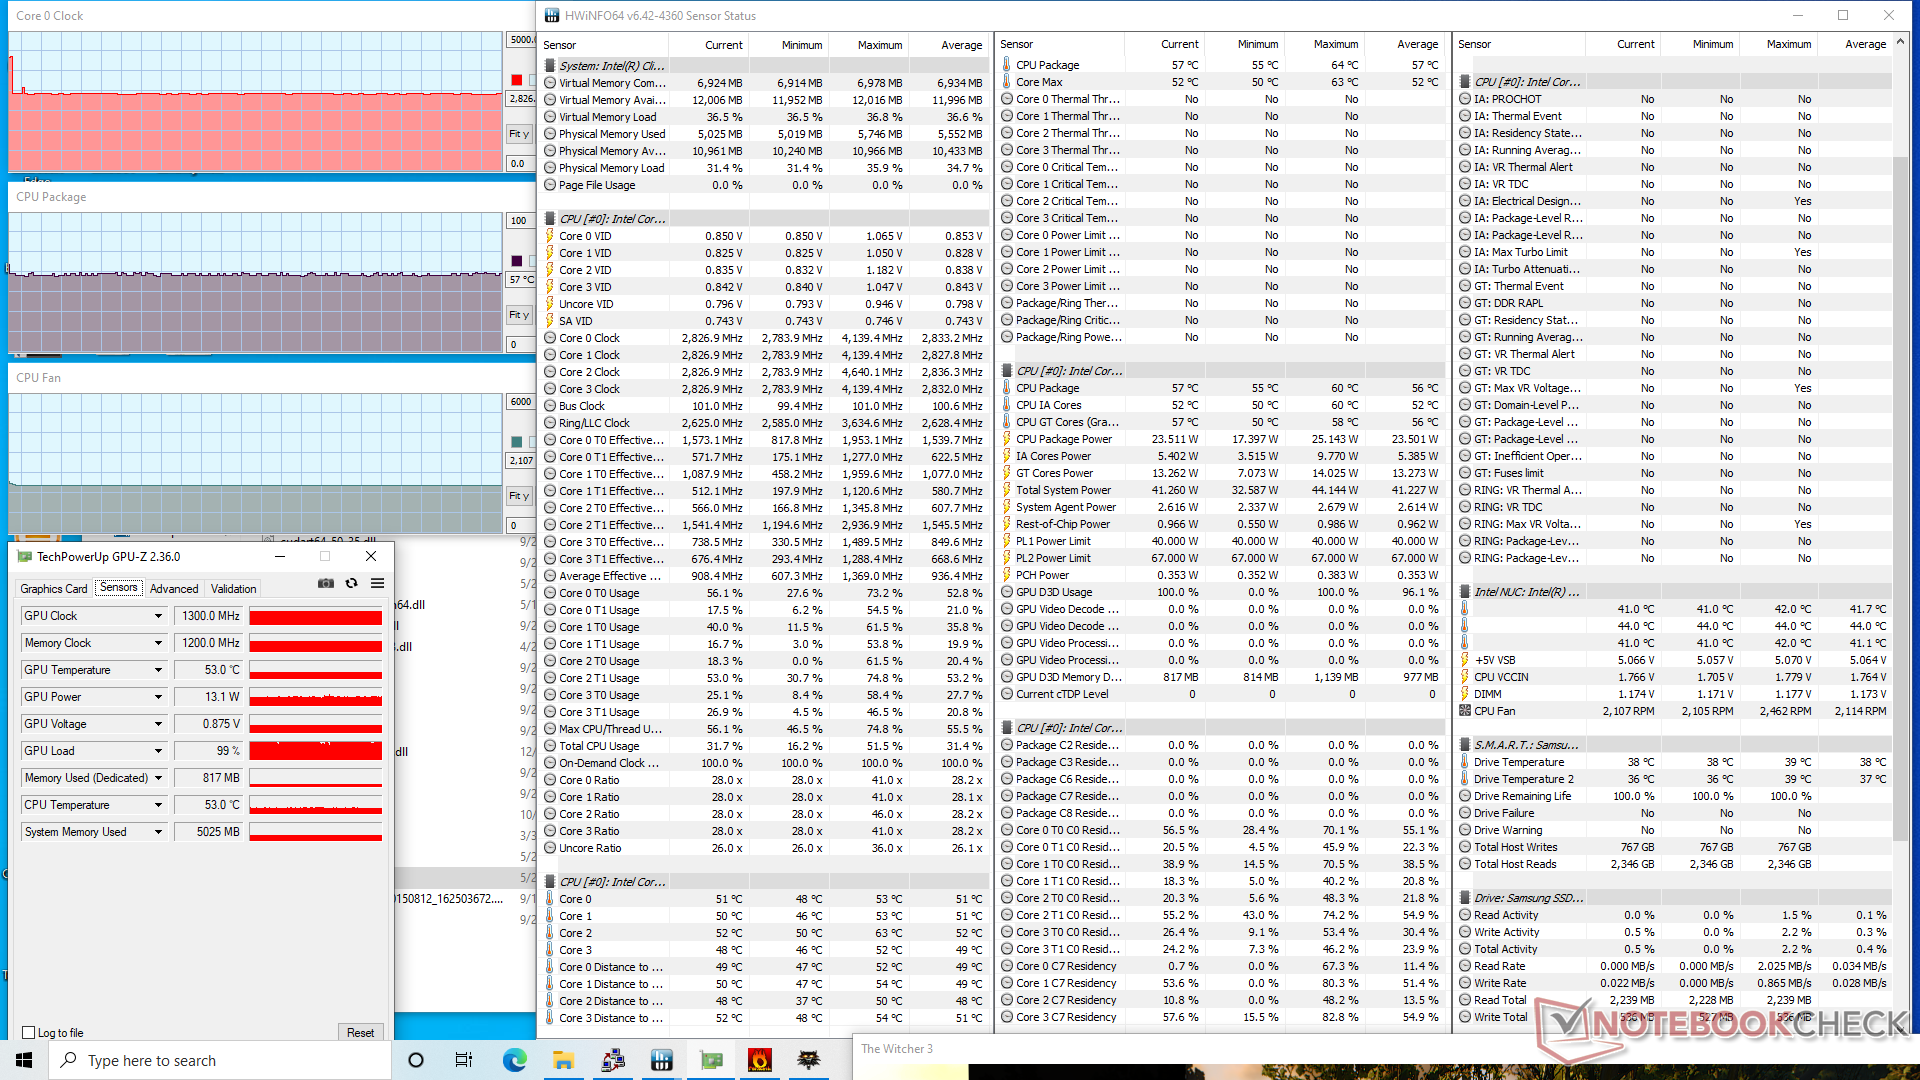
| CPU Clock (GHz) | GPU Clock (MHz) | Average CPU Temperature (°C) | |
| System Idle | -- | -- | 26 |
| Prime95 Stress | 2.7 - 3.4 | -- | 71 - 79 |
| Prime95 + FurMark Stress | 2.1 - 2.8 | ~1050 | 72 |
| Witcher 3 Stress | 2.8 | 1300 | 57 |
Energy Management
Power Consumption
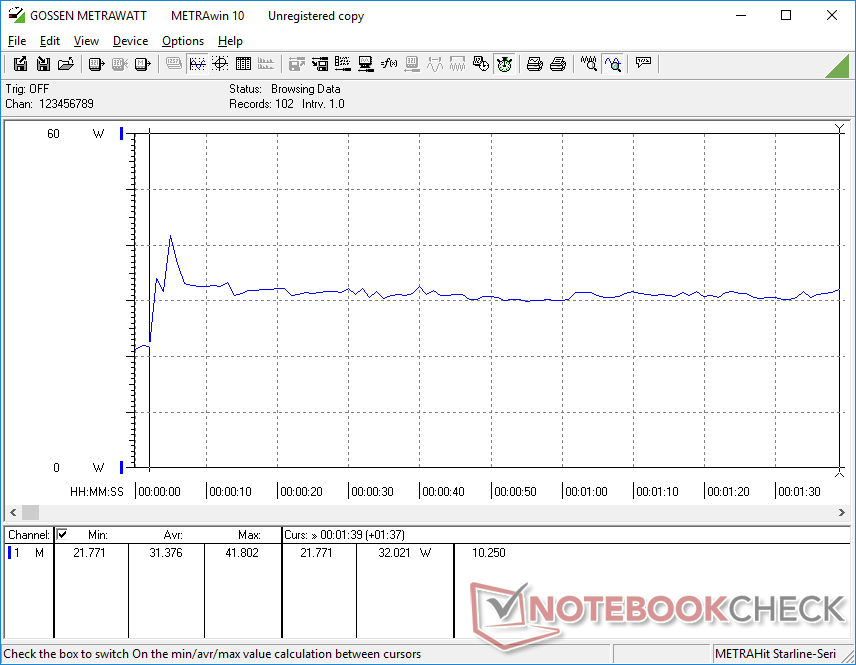
NUC models have always been very power efficient and the NUC 11 continues the trend. The system consumes just 31 W to 39 W when gaming compared to 63 W and 50 W on the Skull Canyon NUC and competing Beelink GT-R35, respectively, all while providing significantly faster CPU and GPU performance than both. Hades Canyon is still over two times more powerful when it comes to graphics performance, but it also consumes 3 times more power in the process.
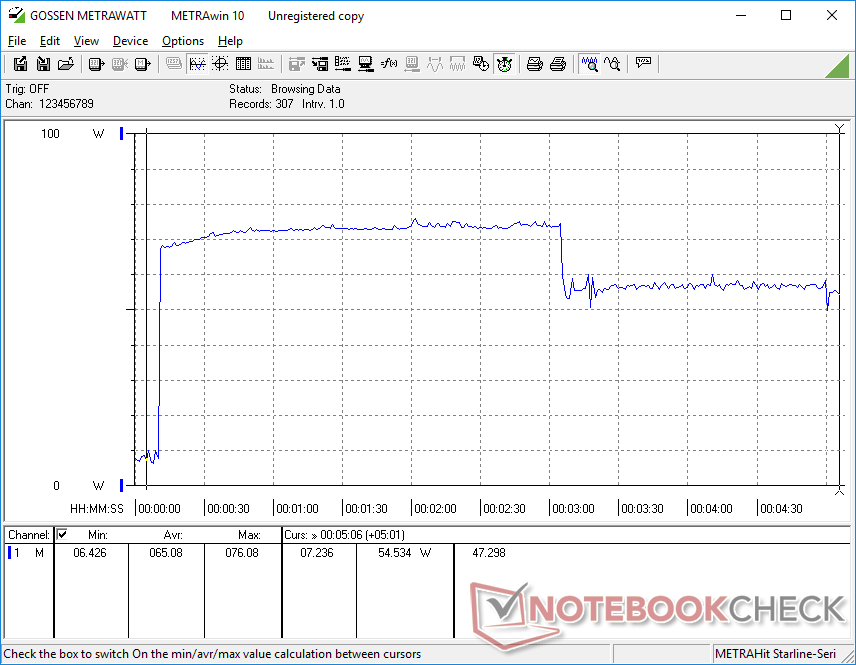
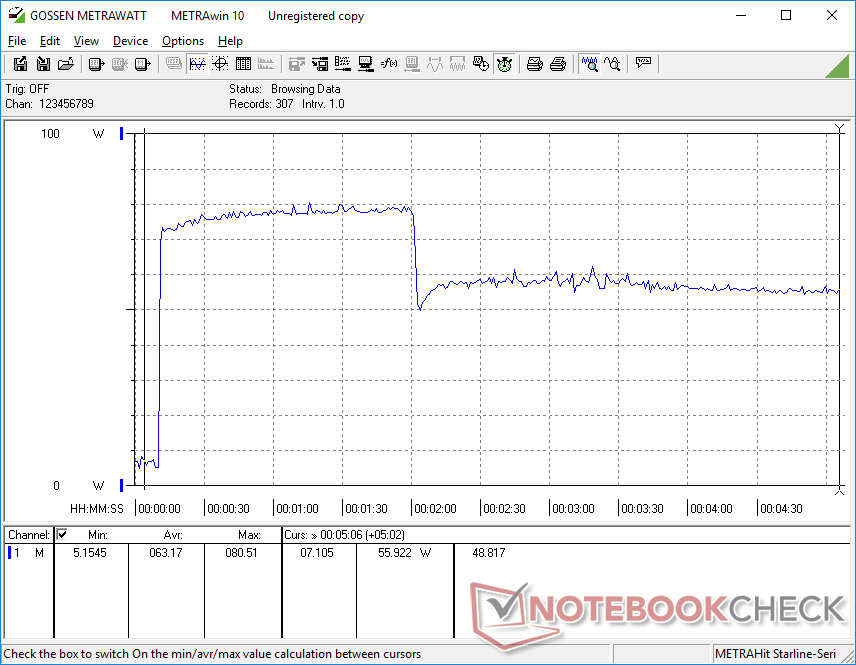
We're able to measure a maximum consumption of 80.5 W when running extreme loads as shown by the graphs below. This draw is only temporary and it matches our clock rate observations when running Prime95 in the Stress Test section above.
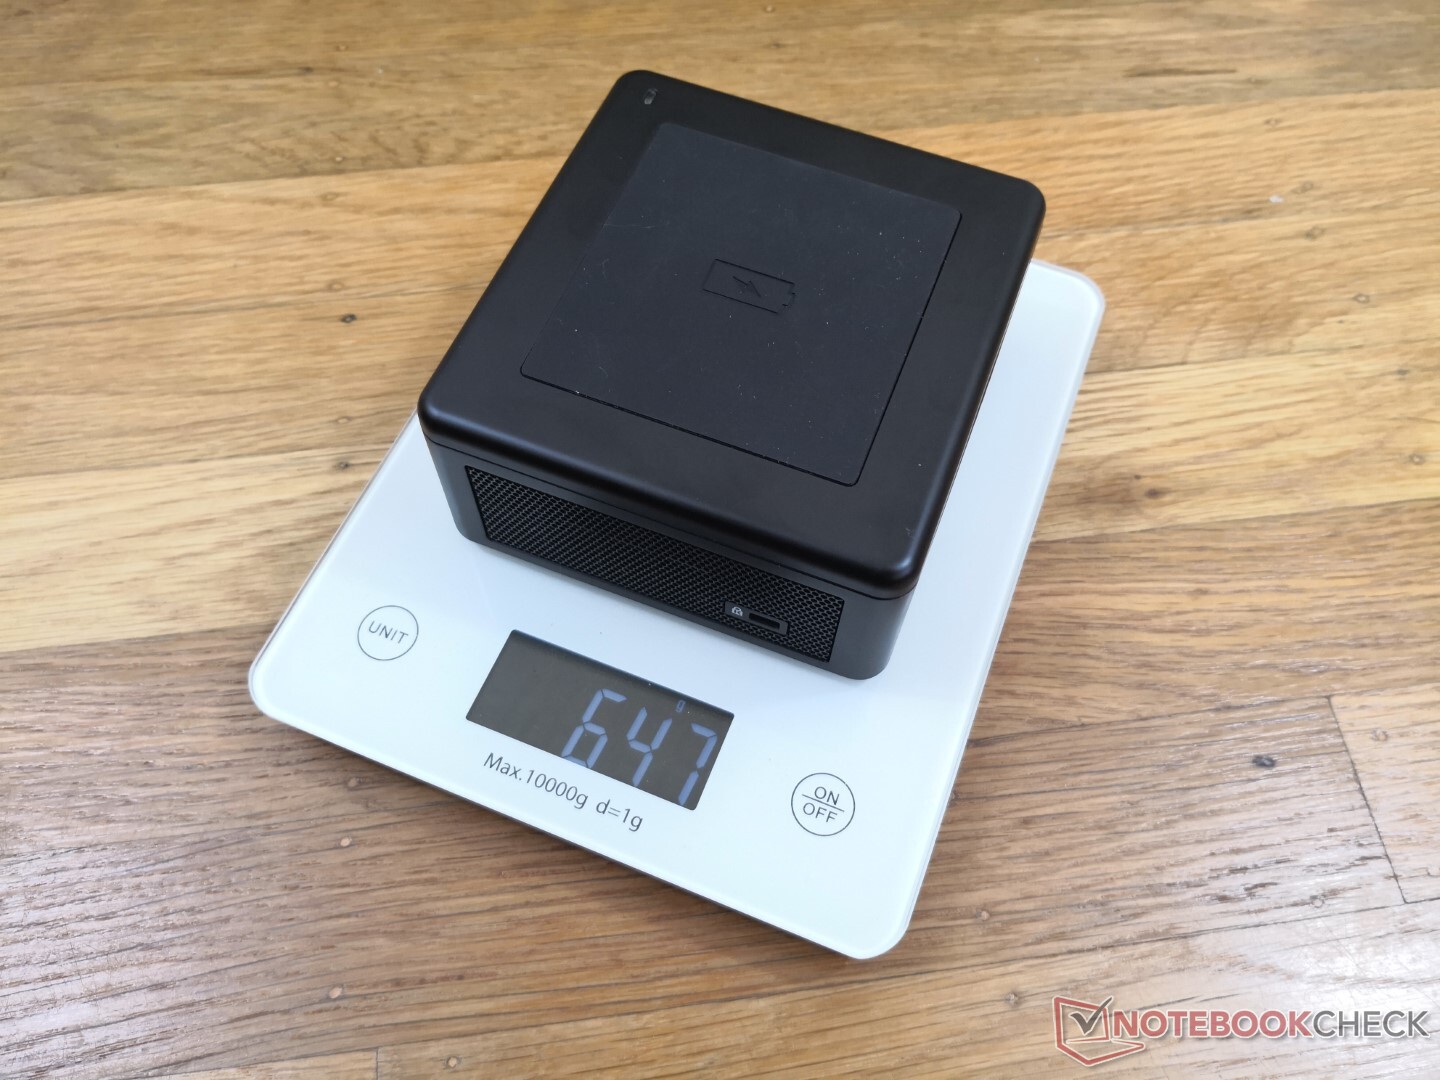
It's worth noting that the external 120 W AC adapter is relatively large (~15 x 7.5 x 2.5 cm) and at over two-thirds the weight of the NUC unit (448 g vs. 647 g).

| Off / Standby | |
| Idle | |
| Load |
|
Key:
min: | |
| Intel NUC11PAQi7 i7-1165G7, Iris Xe G7 96EUs, Samsung SSD 980 Pro 500GB MZ-V8P500BW, , x, | Intel NUC8i7BE i7-8559U, Iris Plus Graphics 655, , , x, | Intel Hades Canyon NUC8i7HVK i7-8809G, Vega M GH, Intel Optane 120 GB SSDPEK1W120GA, , x, | Zotac ZBox MI643 i5-10210U, UHD Graphics 620, Lexar NM610 1TB, , x, | Beelink GTR35 II-G-16512D00W64PRO-1T R5 3550H, Vega 8, Silicon Motion AZW 512G NV428, , x, | |
|---|---|---|---|---|---|
| Power Consumption | -3% | -173% | -29% | -44% | |
| Idle Minimum * (Watt) | 5.6 | 2.7 52% | 15.5 -177% | 7.5 -34% | 8.8 -57% |
| Idle Average * (Watt) | 5.6 | 3.1 45% | 16.2 -189% | 9.2 -64% | 9.1 -63% |
| Idle Maximum * (Watt) | 6 | 6.3 -5% | 16.5 -175% | 9.6 -60% | 9.6 -60% |
| Load Average * (Watt) | 31.4 | 59.7 -90% | 83.4 -166% | 34.4 -10% | 55.3 -76% |
| Witcher 3 ultra * (Watt) | 39 | 47.2 -21% | 121.7 -212% | 50.3 -29% | |
| Load Maximum * (Watt) | 80.5 | 78 3% | 173.5 -116% | 60.6 25% | 65.6 19% |
* ... smaller is better
Pros
Cons
Verdict
In terms of performance, our Tiger Lake Core i7 is roughly on par with the Comet Lake NUC 10 in multi-threaded loads while being about 20 percent faster in single-threaded loads. Its biggest advantage, however, lies in graphics performance where the Iris Xe can be over 3x faster than the UHD Graphics 620 without even needing to consume all that much more power. If GPU power and efficiency are most important, then the NUC 11 will be the better investment. Otherwise, users intending to run mostly HTPC loads like 4K streaming or video browsing would be just fine with an older NUC 10 while the Hades Canyon NUC will still be the better option for raw gaming.
The NUC puts Tiger Lake in a better light than what most laptops have managed to do with the same processor series. It'll cost you more than most other Core U-series mini PCs, but the quality and 3-year warranty make it a safer investment.
It's highly recommended to configure the NUC 11 with dual-channel memory to boost graphics performance. Our single-channel kit provided by Intel returned slower-than-expected 3DMark scores and frame rates which don't do Iris Xe any justice.
On future NUCs, we would like to see an integrated fingerprint reader and support for USB-C AC adapters. The competing Beelink GT-R mini PC includes a fingerprint reader while an external USB-C power source would be more universal solution moving forward.
Price and availability
The NUC 11 series is not expected to ship until March 2021 and so it is not yet widely available at the time of writing.
Price comparison
