GPD Win 3 Review: The Unofficial Microsoft Switch
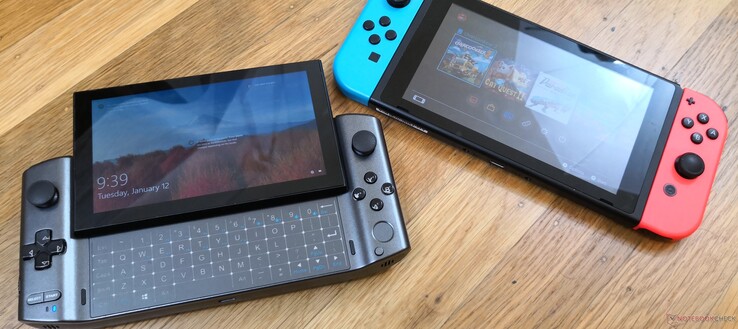
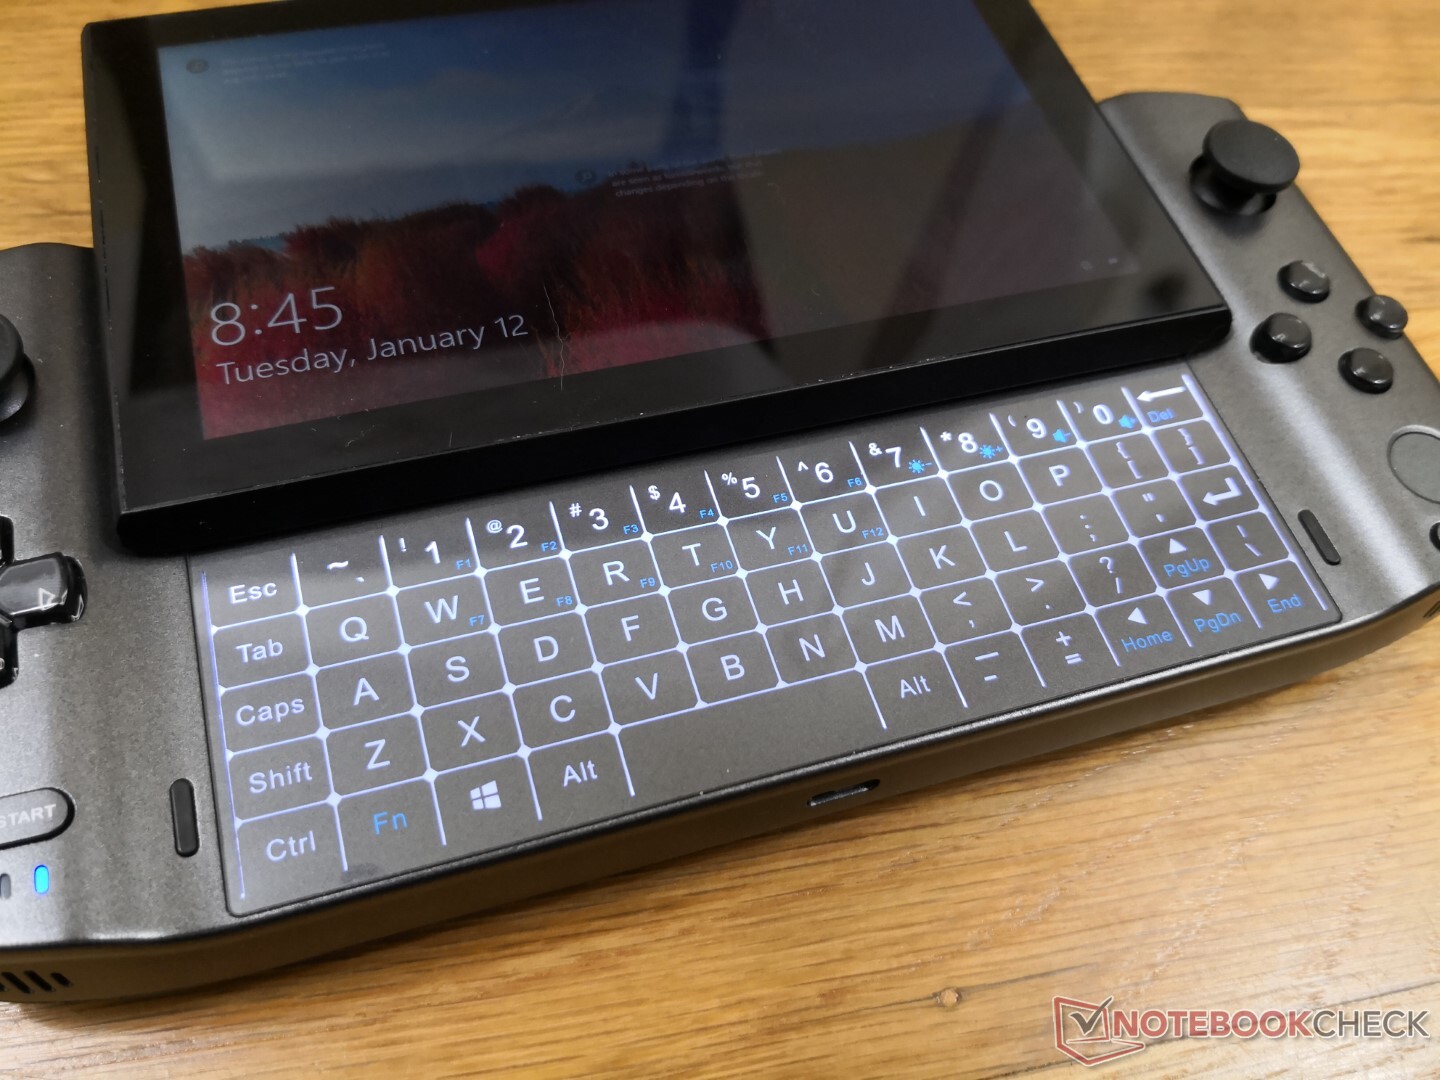
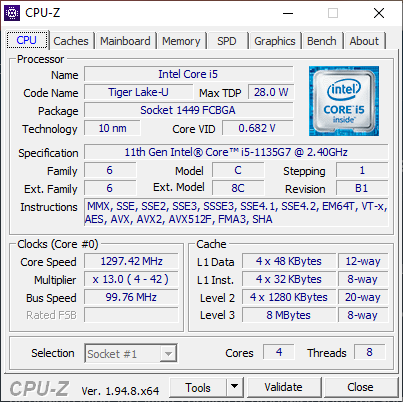
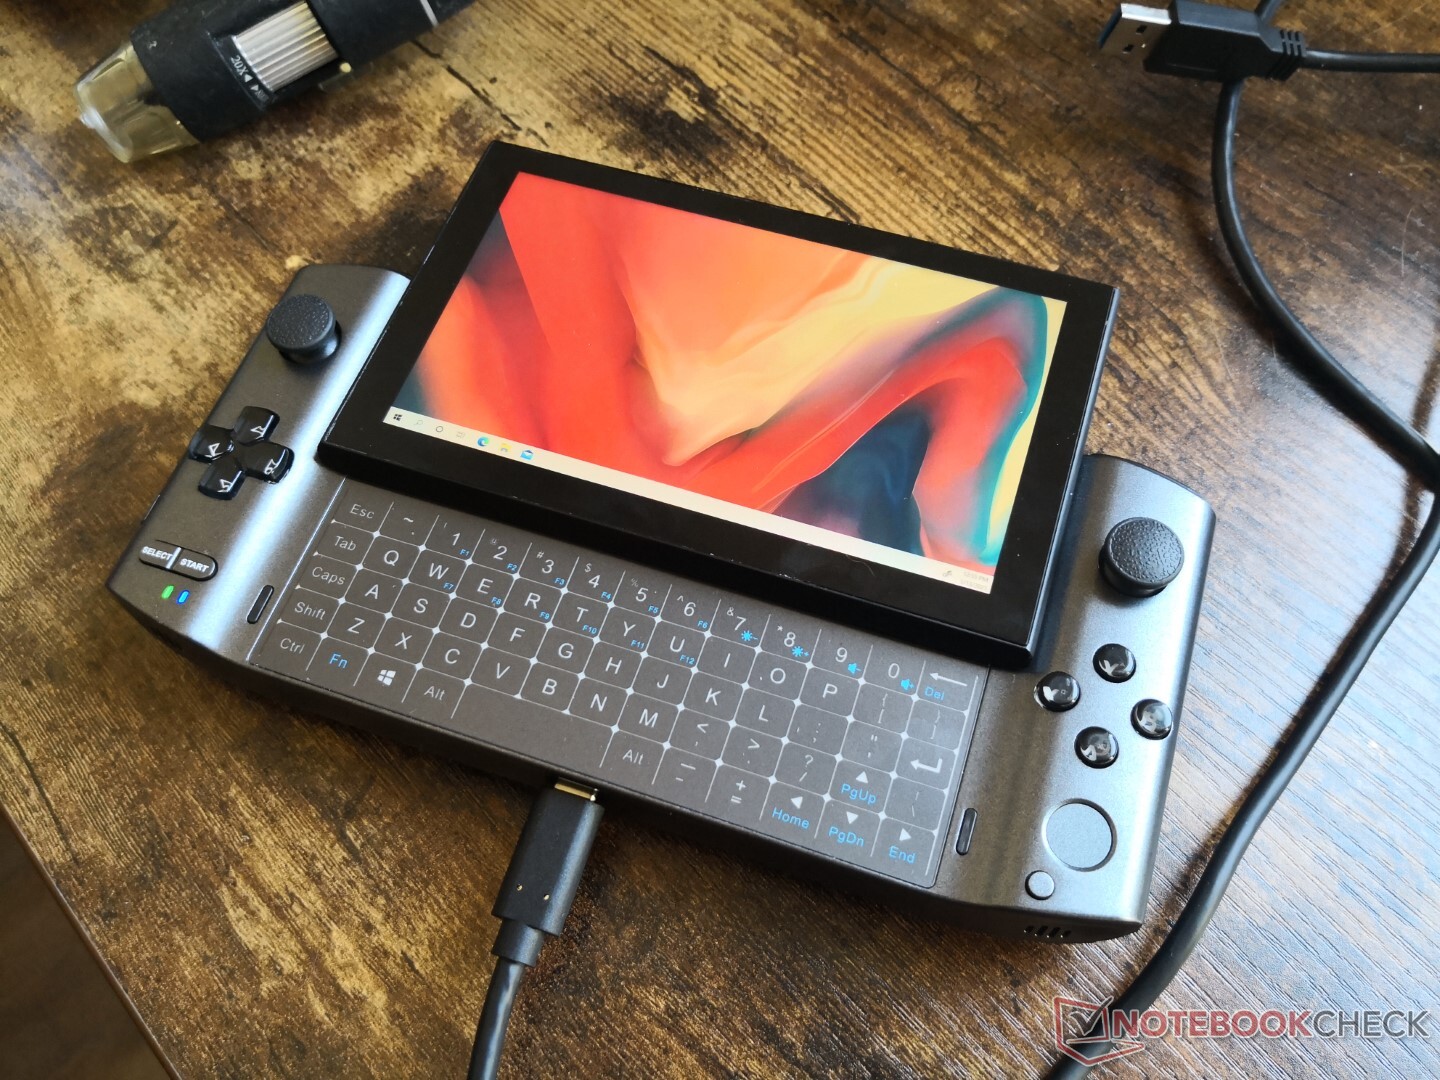
The GPD Win 3 is a portable Windows PC with a 5.5-inch 720p touchscreen and an integrated controller. It succeeds the Win Max by introducing a new sliding screen design and an upgraded 11th gen Tiger Lake CPU to replace last year's 10th gen Ice Lake series.
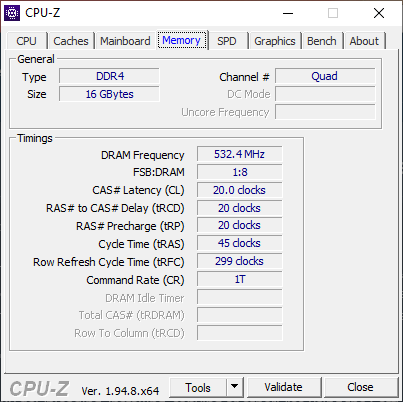
Core specifications read like a high-end Ultrabook including the Core i5-1135G7 or Core i7-1165G7 processor, 16 GB of LPDDR4X RAM, 1 TB NVMe 1.4 M.2 SSD, Wi-Fi 6, and even Thunderbolt 4 support. We'll be comparing the performance of the Win 3 to Ultrabooks sporting similar Intel U-series CPUs to see how much of a performance deficit, if any, the Win 3 may be hiding under its small form factor. It's worth mentioning that Dell teased a similar project last year at CES 2020 that has yet to become available.
Read more about the GPD Win 3 on its official Indiegogo page here. Our review unit is a pre-production sample that should hopefully represent what buyers will eventually get less any major bugs.
potential competitors in comparison
Rating | Date | Model | Weight | Height | Size | Resolution | Price |
|---|---|---|---|---|---|---|---|
v (old) | 01 / 2021 | GPD Win 3 i5-1135G7, Iris Xe G7 80EUs | 553 g | 27 mm | 5.50" | 1280x720 | |
| 88.1 % v7 (old) | 10 / 2020 | Dell XPS 13 9310 Core i7 FHD i7-1165G7, Iris Xe G7 96EUs | 1.3 kg | 14.8 mm | 13.40" | 1920x1200 | |
| 91.1 % v7 (old) | 12 / 2020 | Apple MacBook Air 2020 M1 Entry M1, M1 7-Core GPU | 1.3 kg | 16.1 mm | 13.30" | 2560x1600 | |
| 88.4 % v7 (old) | 12 / 2019 | HP Spectre x360 13-aw0013dx i7-1065G7, Iris Plus Graphics G7 (Ice Lake 64 EU) | 1.2 kg | 16.9 mm | 13.30" | 1920x1080 | |
| 87.5 % v7 (old) | 08 / 2020 | Asus ZenBook 13 UX325JA i7-1065G7, Iris Plus Graphics G7 (Ice Lake 64 EU) | 1.1 kg | 13.9 mm | 13.30" | 1920x1080 | |
| 84 % v7 (old) | 02 / 2020 | Microsoft Surface Laptop 3 13 Core i5-1035G7 i5-1035G7, Iris Plus Graphics G7 (Ice Lake 64 EU) | 1.3 kg | 14.5 mm | 13.50" | 2256x1504 |
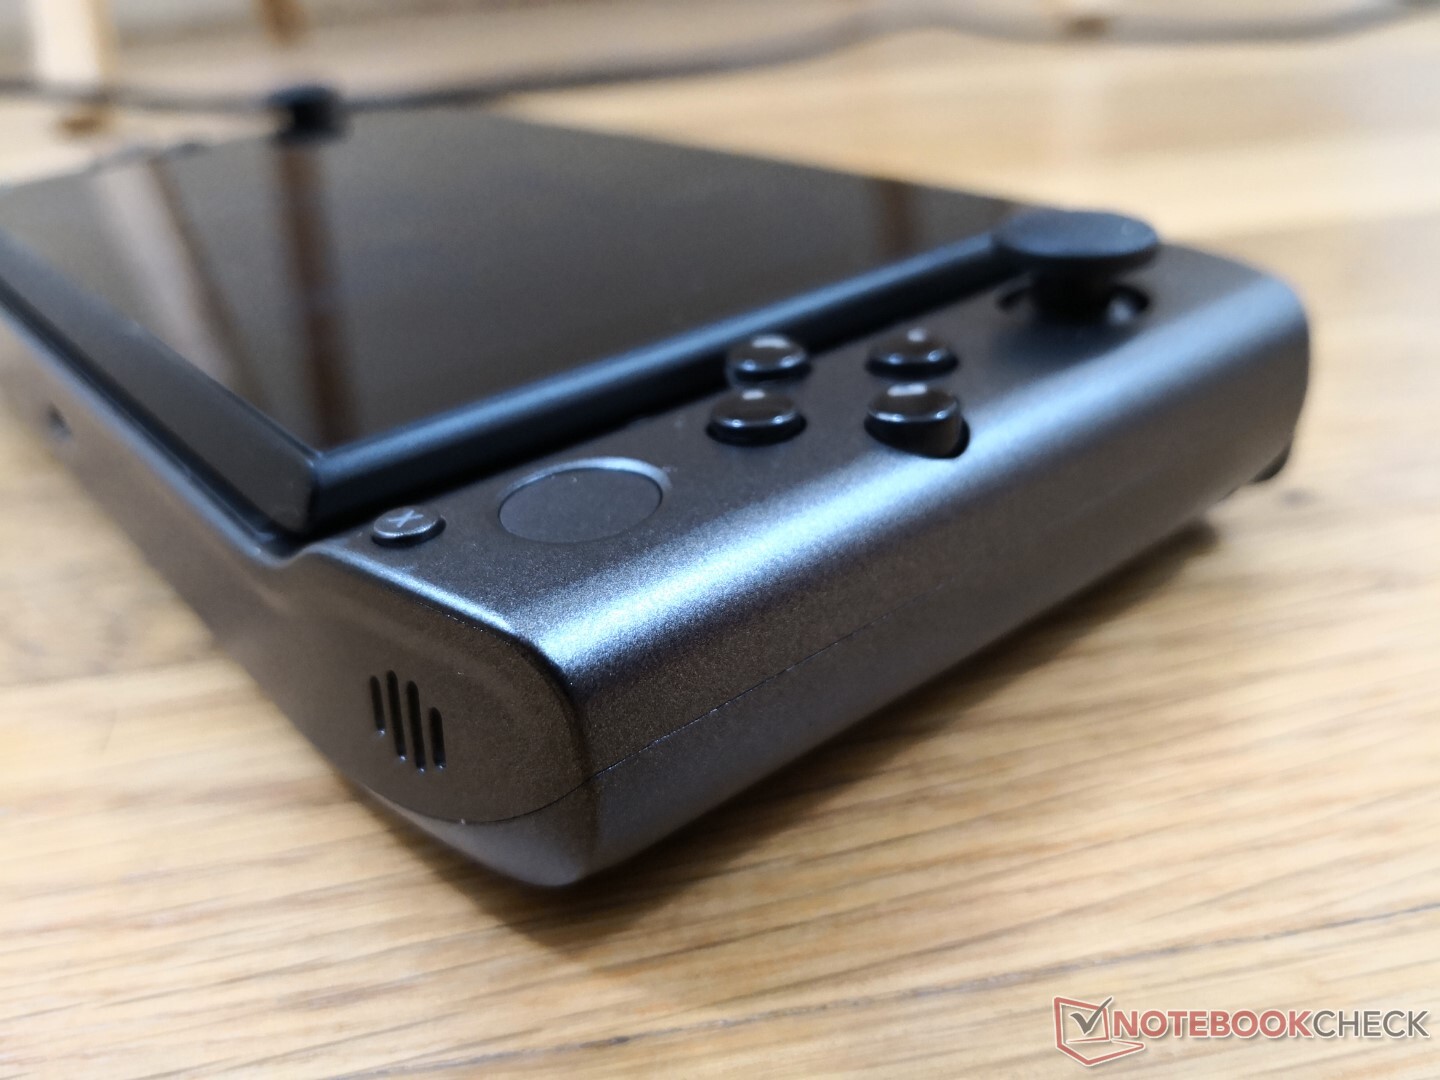
Case
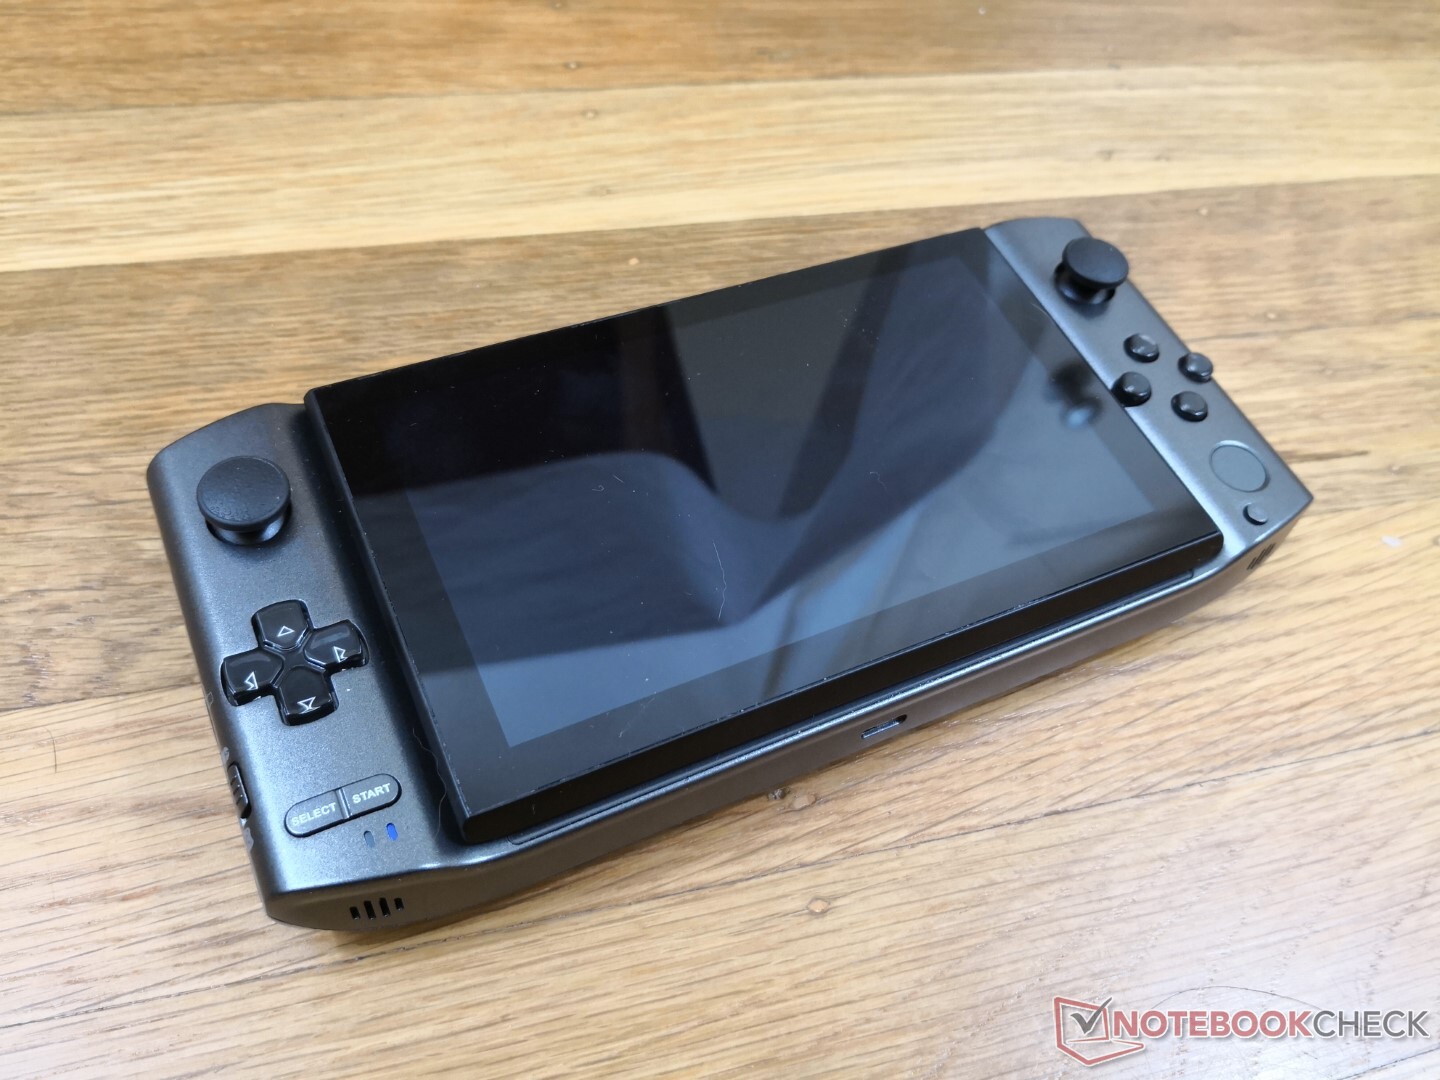
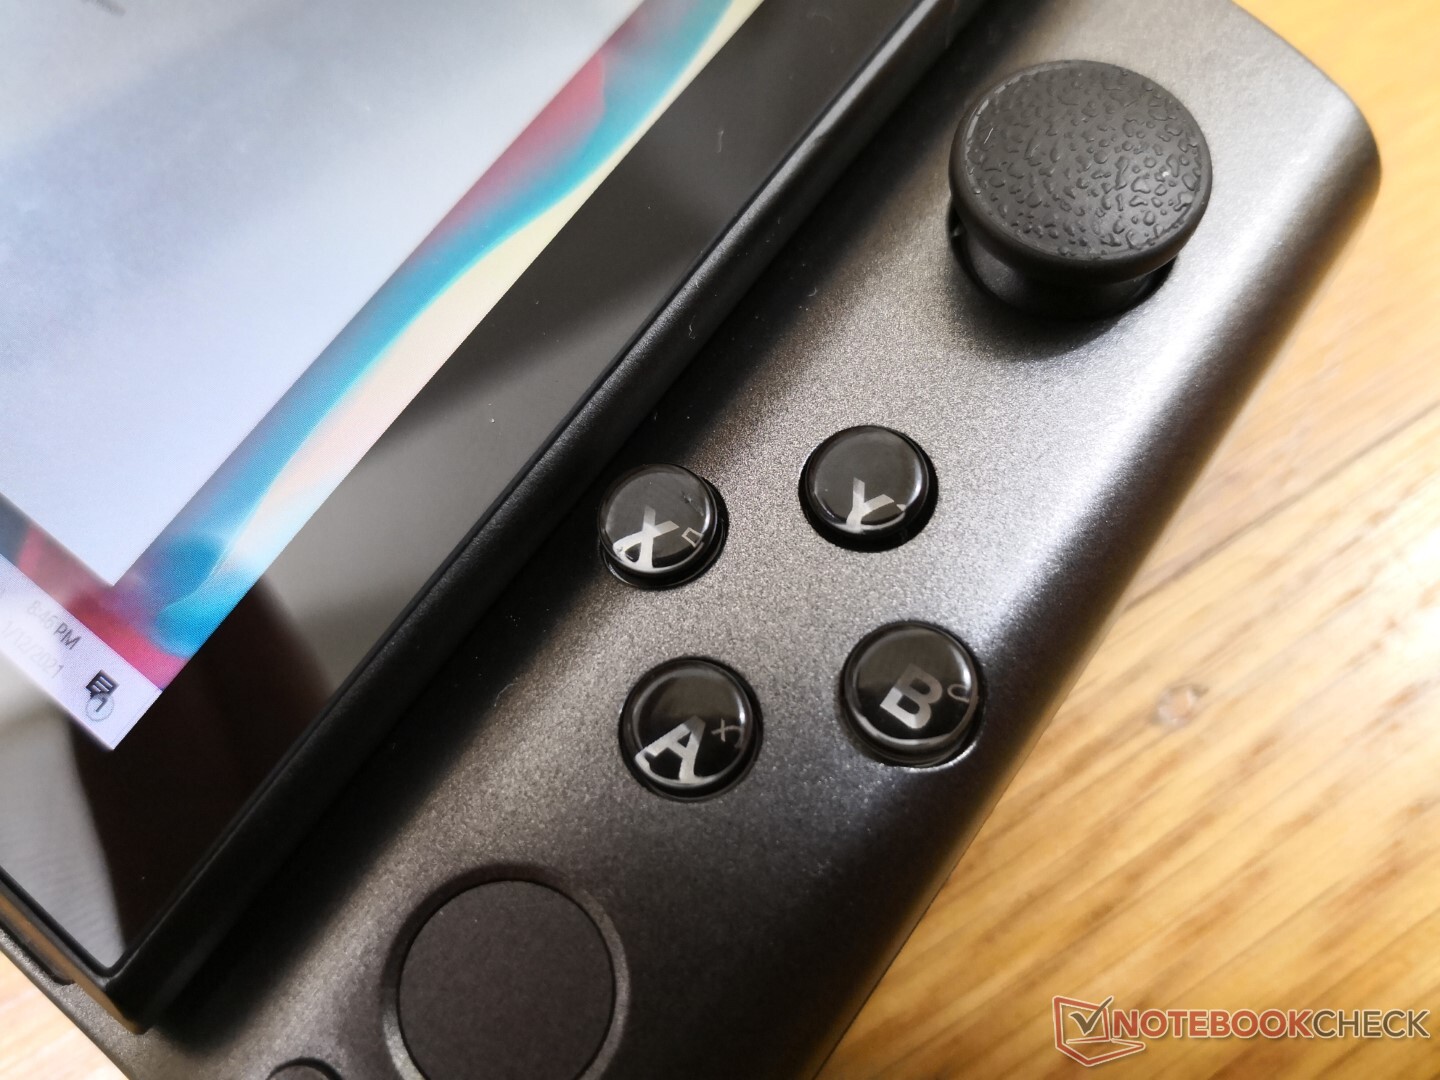
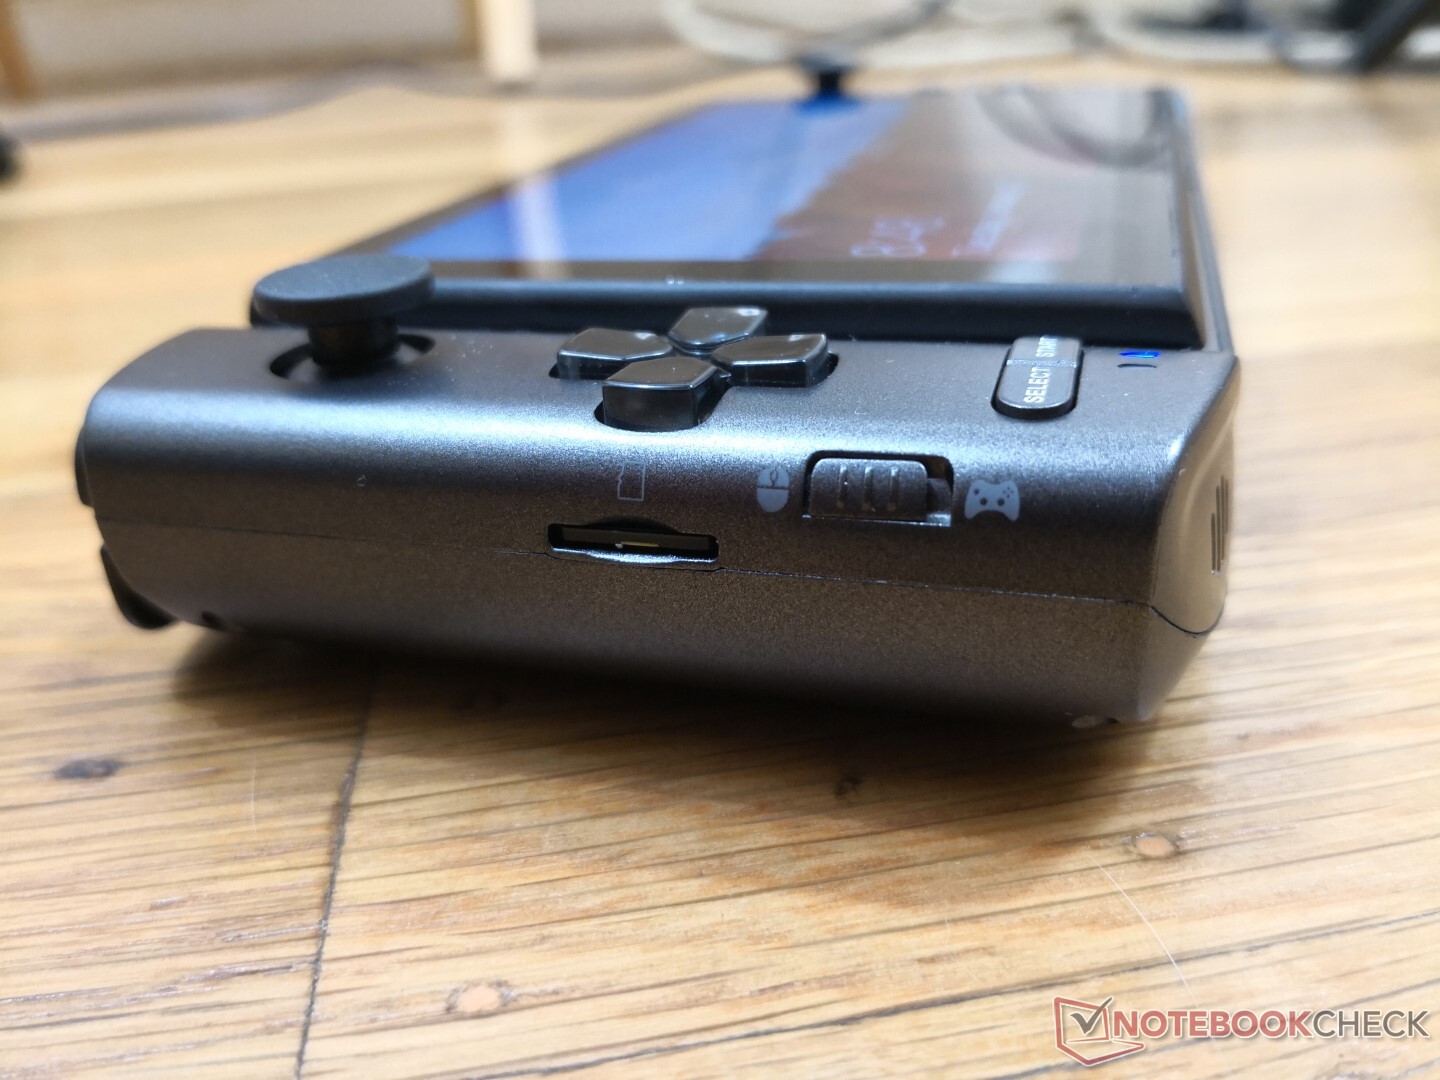
The chassis consists of both ABS plastic and magnesium alloy. It looks and feels sturdy enough, but the devil is in the details. In particular, the controller arrow keys and shoulder buttons are weak and shallow in feedback when compared to the same keys on a Sony DualShock or Nintendo Switch. They're serviceable, but they could definitely be better.
A second issue we noticed was that some buttons can sometimes be stuck and so the screen will continuously register the input until that button is pressed again. Though this occurred only a few times during our tests, it was a few times too many.
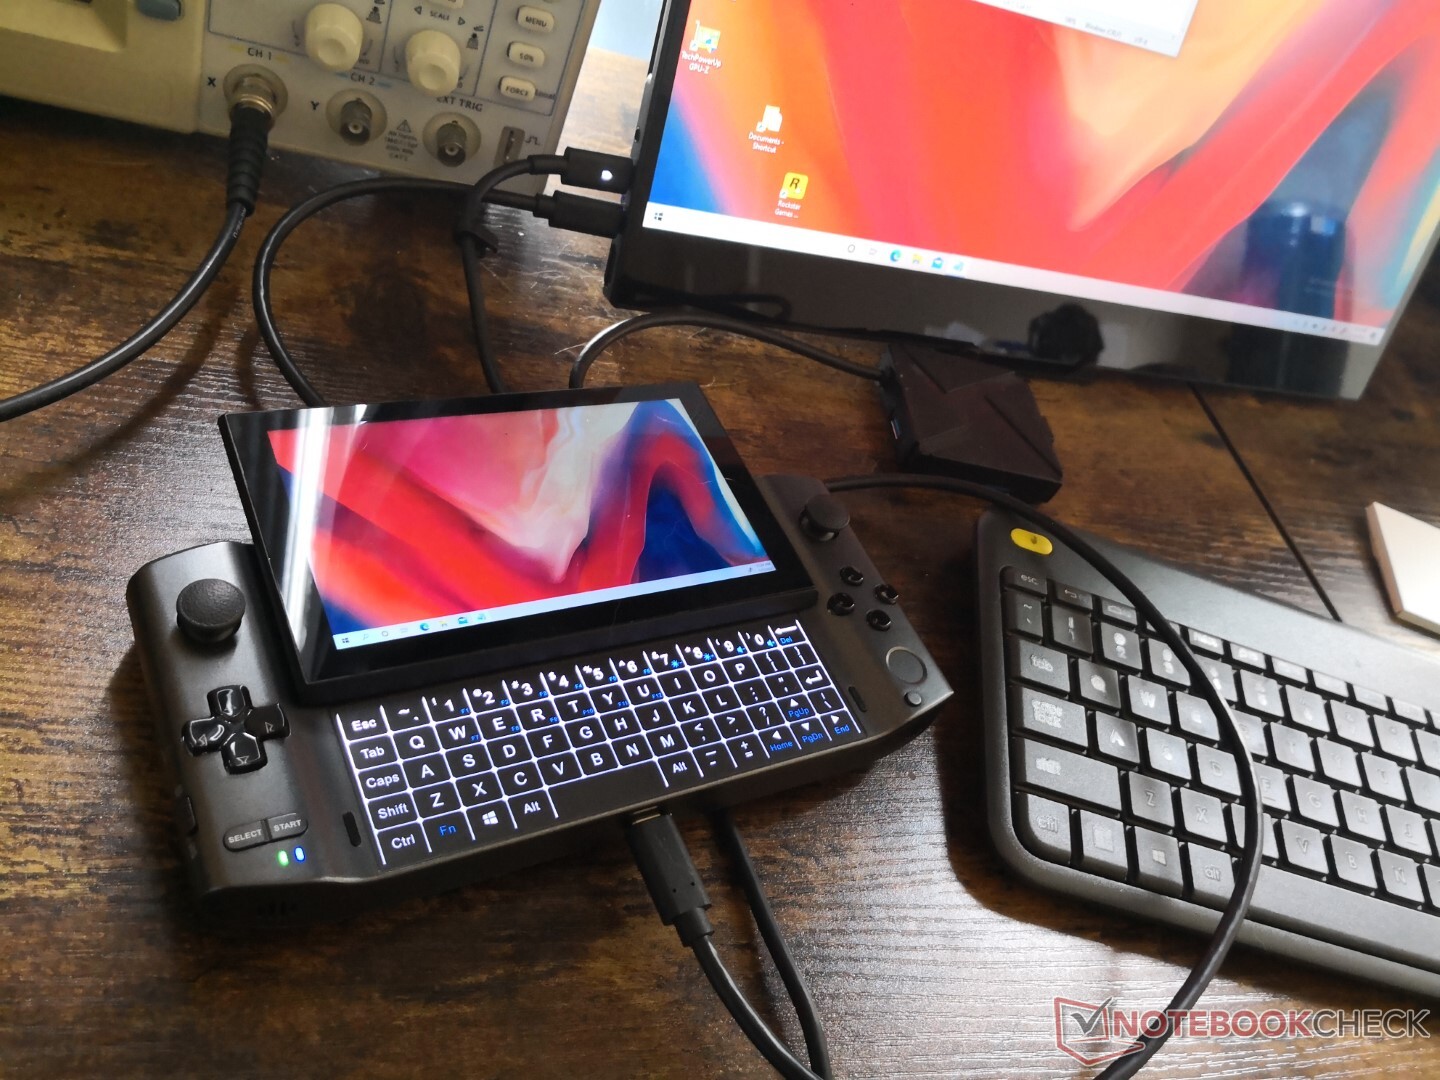
And finally, a third issue on our unit relates to the sliding mechanism of the touchscreen. Sliding the display upwards reveals the touch-sensitive keyboard, but the sliding display will almost always inadvertently hit and register some keys in the process. It's very annoying to slide the display down only to see "29999" suddenly typed up in the email you were working on.
Another downside to the GPD is its relatively heavy weight of 553 g to be heavier than even the 10.2-inch Apple iPad Air. The device is much more comfortable to use when sitting down than when standing up as a result.
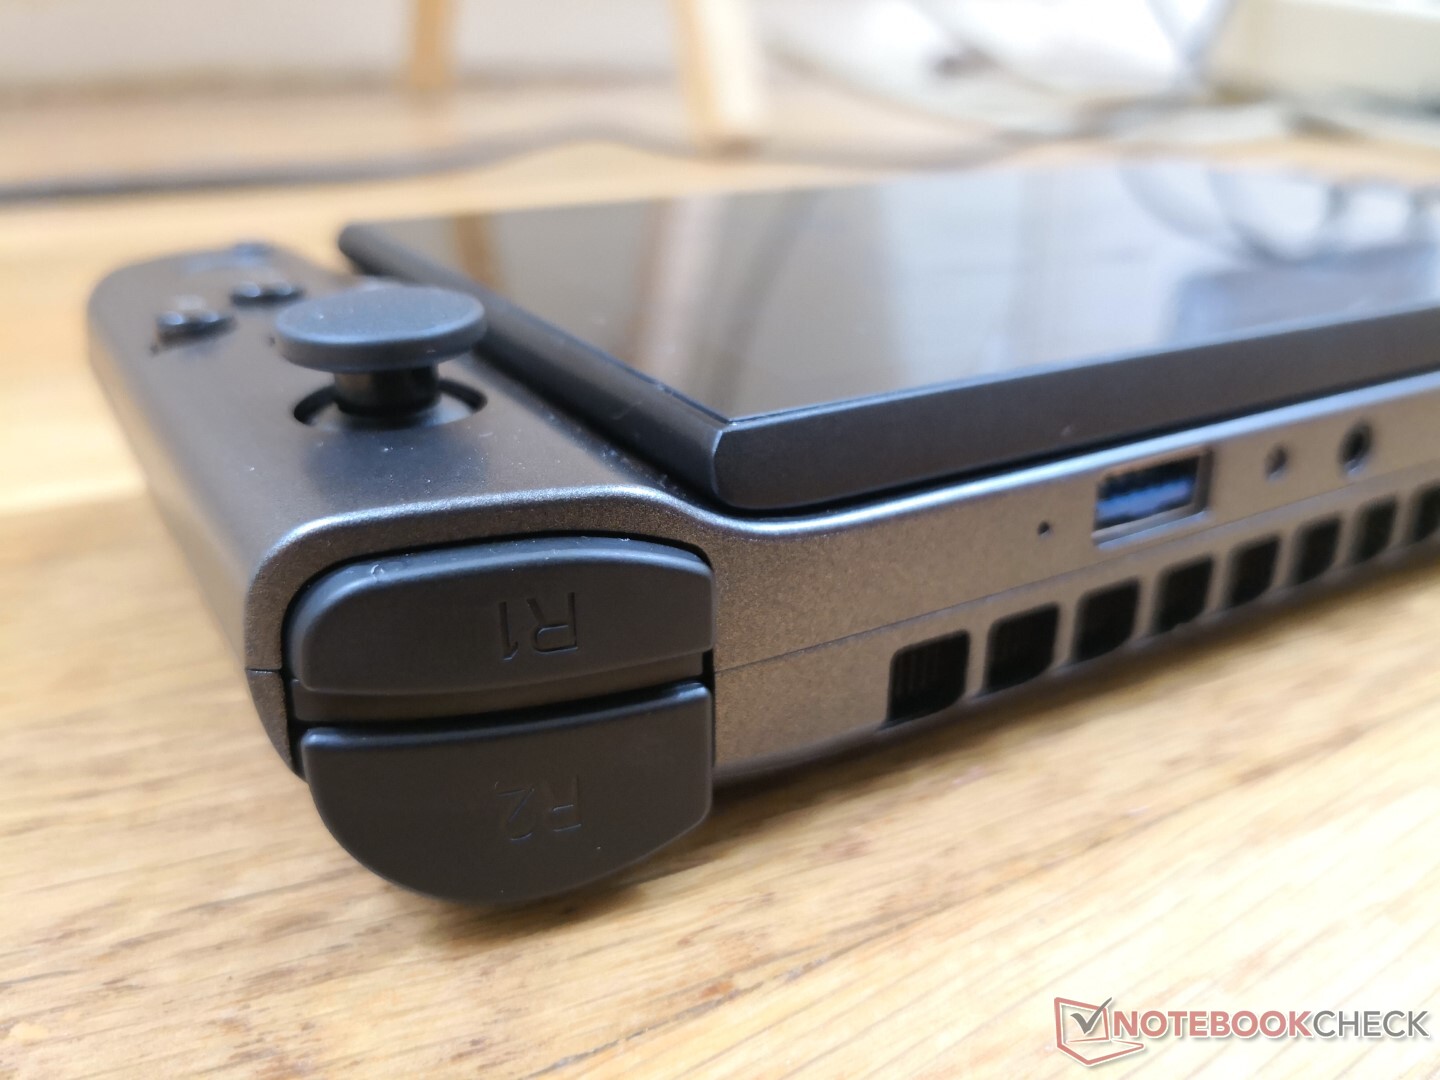
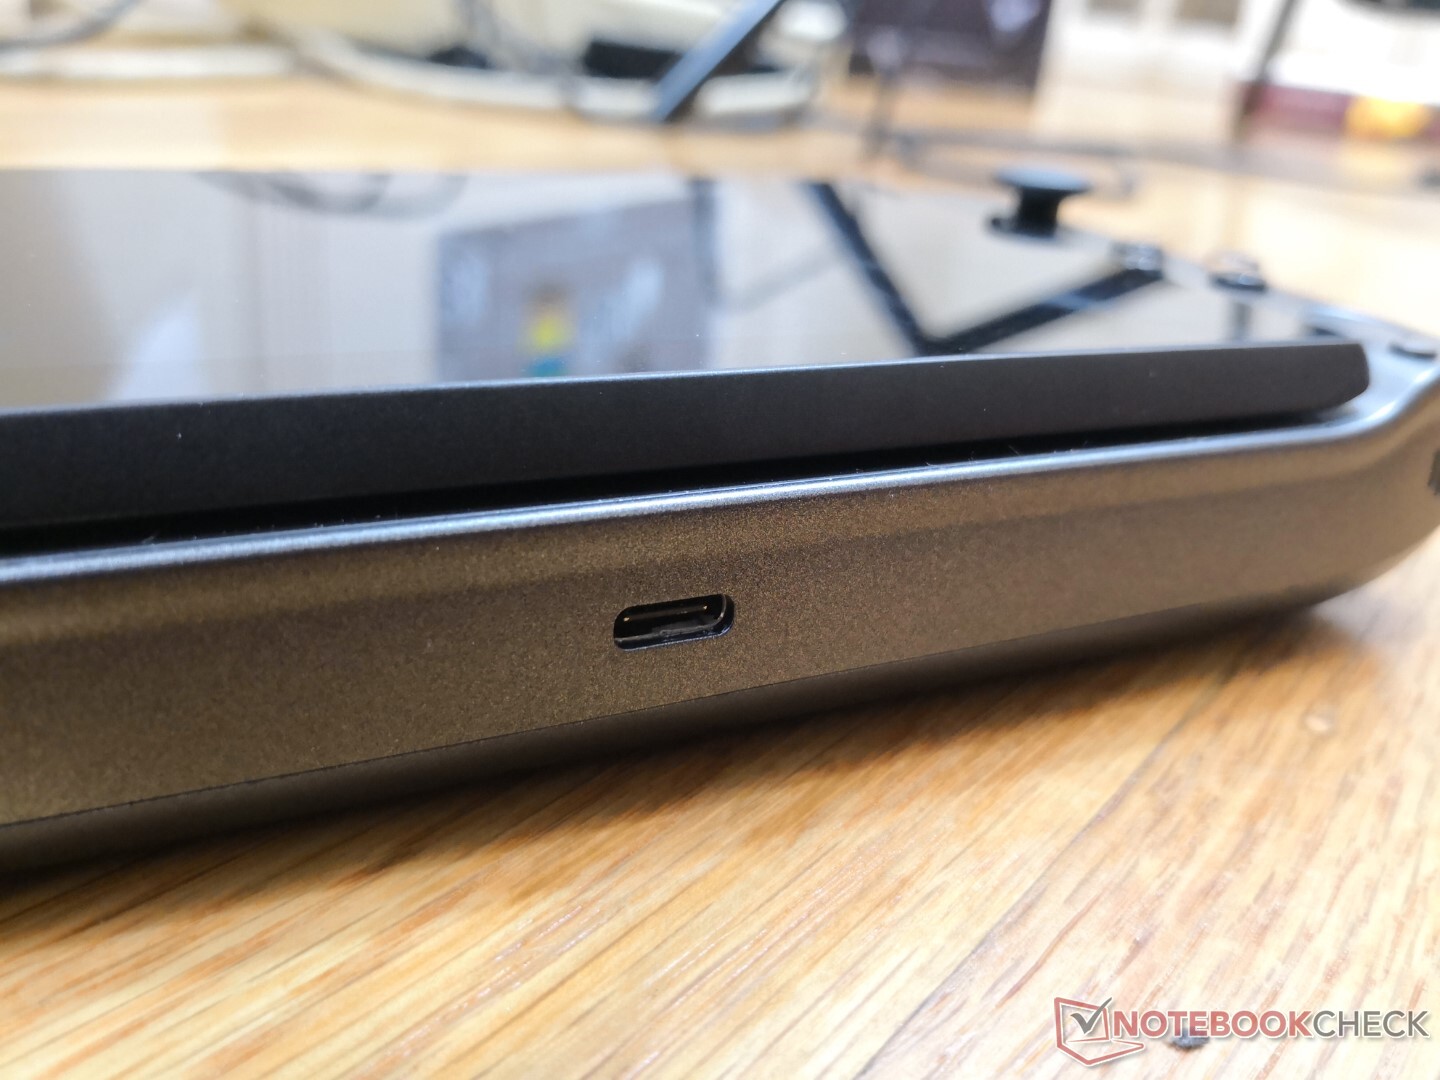
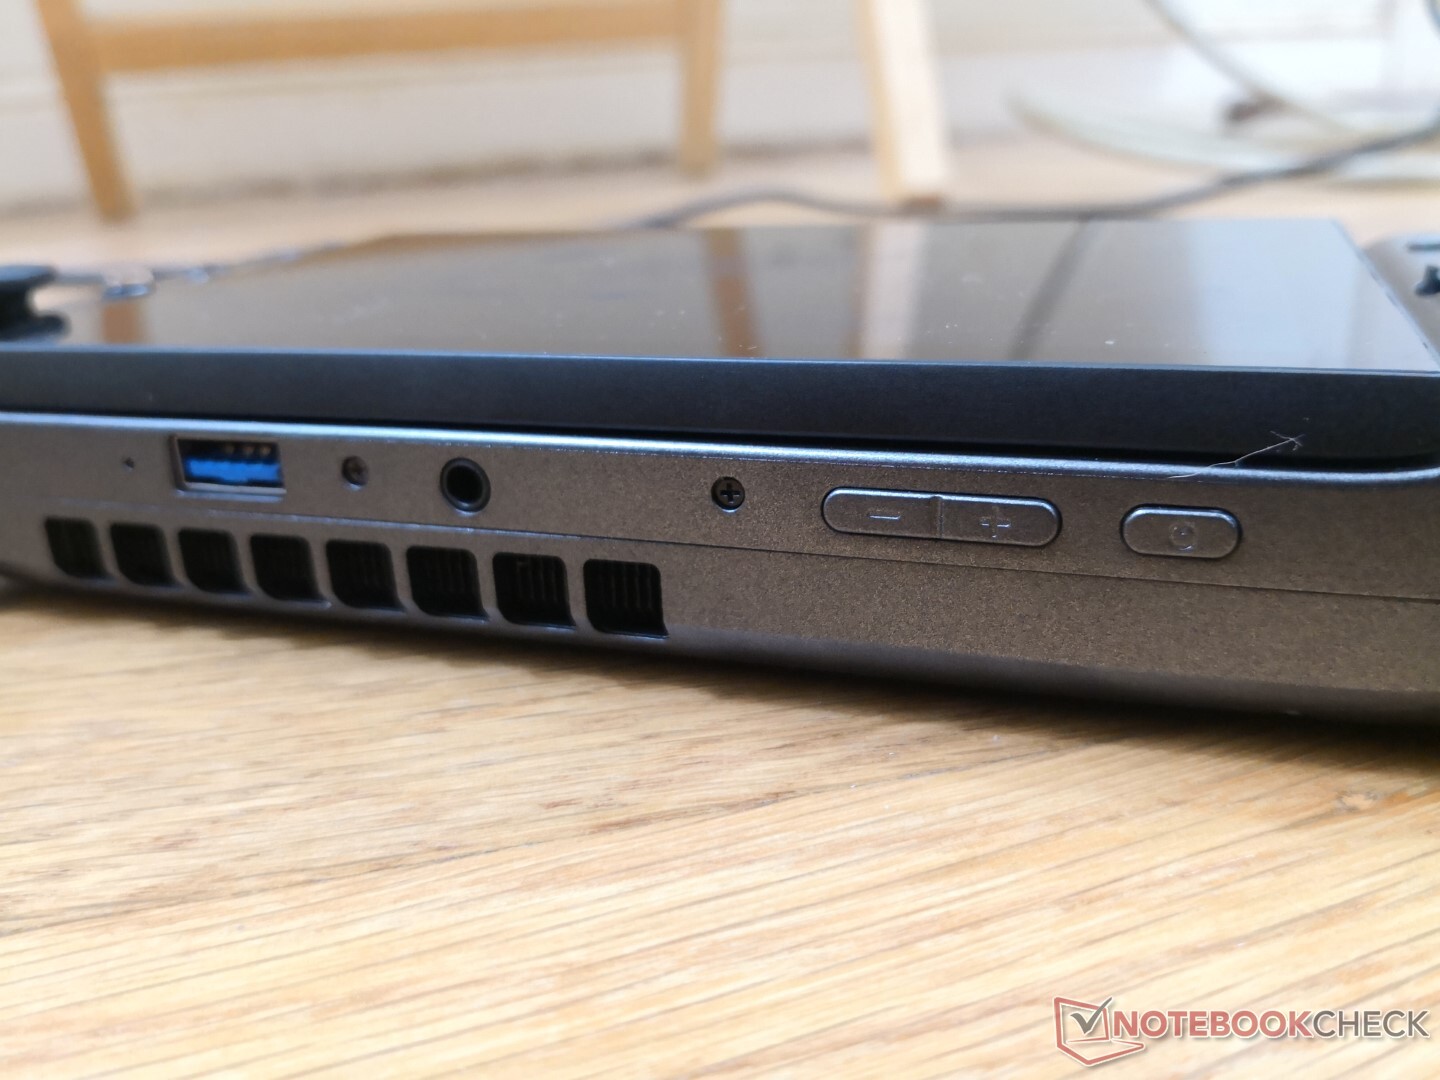
Connectivity
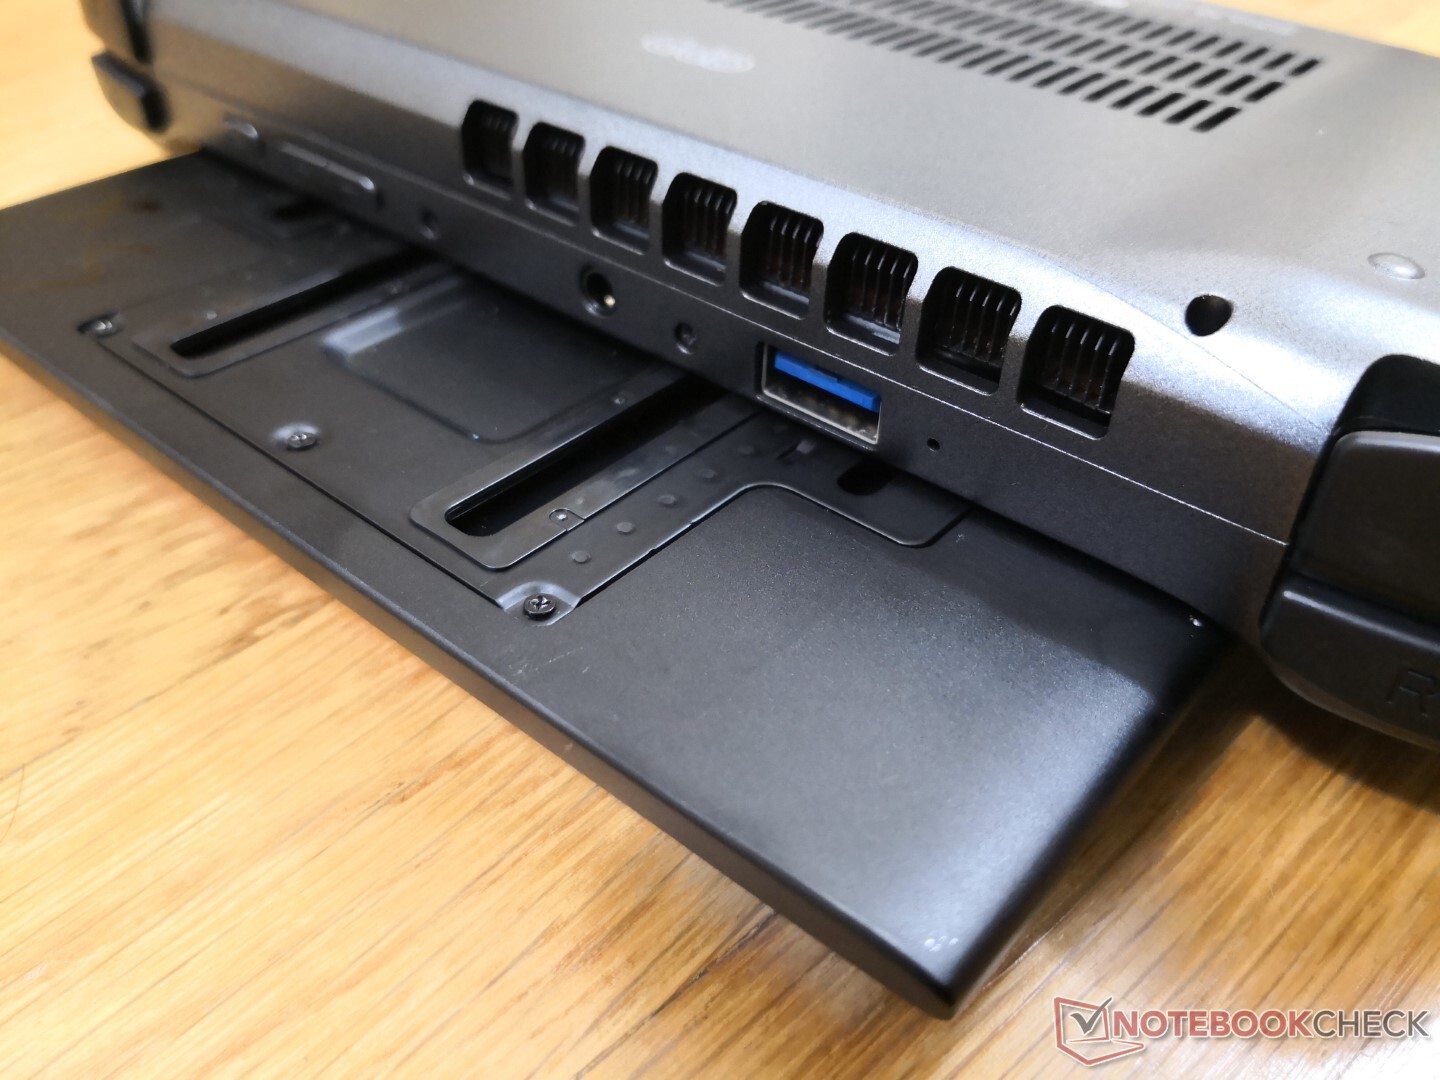
Integrated ports include USB-A and, most importantly, USB-C with Thunderbolt 4 support. Users can connect external monitors or docking stations, charge through external devices via passthrough, and even connect eGPUs. Users will need to adjust the scaling if connecting external monitors since the scaling is high by default for the main display.
SD Card Reader
The spring-loaded MicroSD reader is relatively fast. Transferring 1 GB of pictures from our UHS-II card to desktop takes about 13 seconds.
| SD Card Reader | |
| average JPG Copy Test (av. of 3 runs) | |
| Dell XPS 13 9310 Core i7 FHD (Toshiba Exceria Pro M501 64 GB UHS-II) | |
| HP Spectre x360 13-aw0013dx (Toshiba Exceria Pro M501 microSDXC 64GB) | |
| GPD Win 3 (Toshiba Exceria Pro M501 32 GB UHS-II) | |
| Asus ZenBook 13 UX325JA (Toshiba Exceria Pro M501 microSDXC 64GB) | |
| maximum AS SSD Seq Read Test (1GB) | |
| Dell XPS 13 9310 Core i7 FHD (Toshiba Exceria Pro M501 64 GB UHS-II) | |
| HP Spectre x360 13-aw0013dx (Toshiba Exceria Pro M501 microSDXC 64GB) | |
| GPD Win 3 (Toshiba Exceria Pro M501 32 GB UHS-II) | |
| Asus ZenBook 13 UX325JA (Toshiba Exceria Pro M501 microSDXC 64GB) | |
Communication
Wi-Fi 6 and Bluetooth 5 connectivity come standard. We experienced no issues when connected to our Netgear RAX200 test router.
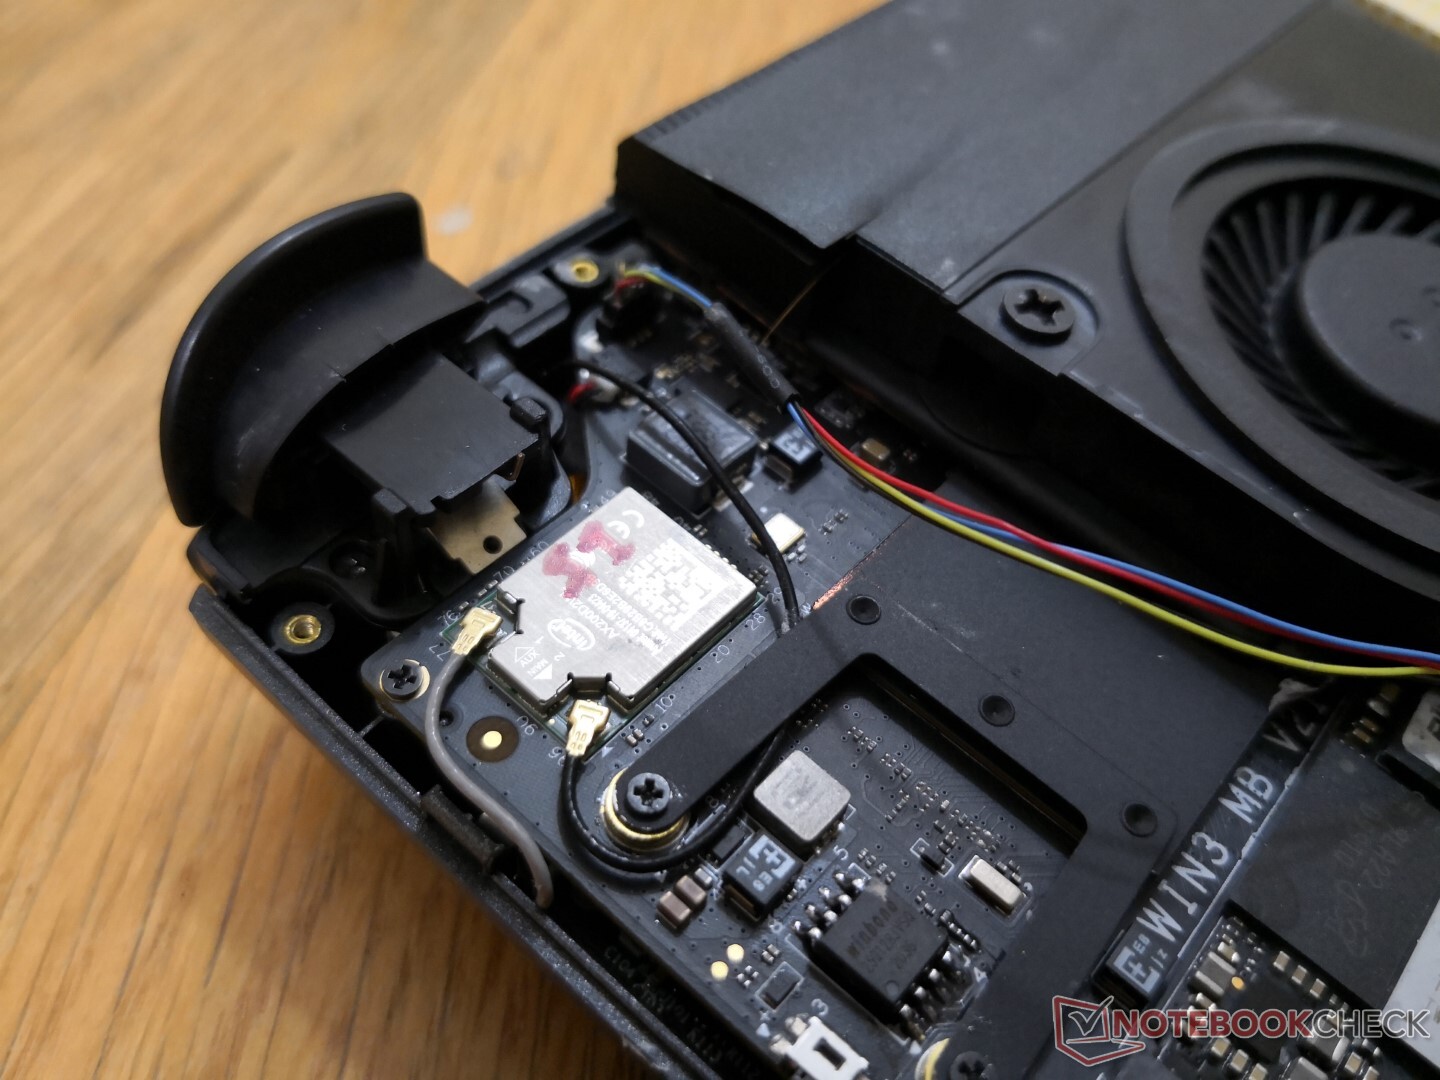
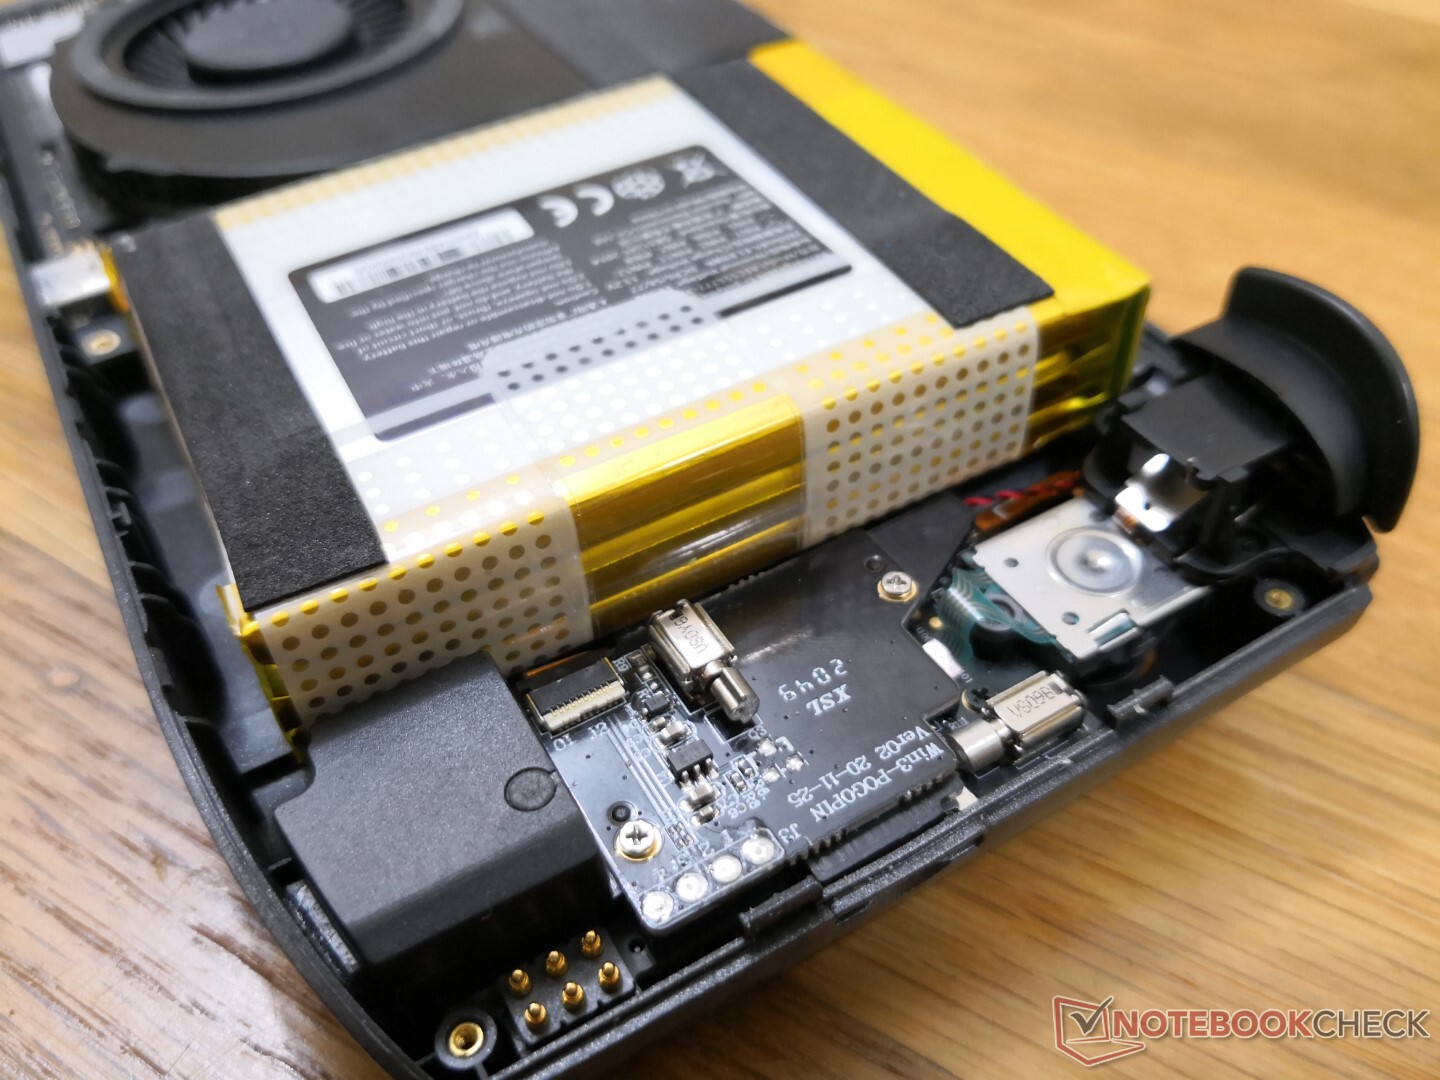
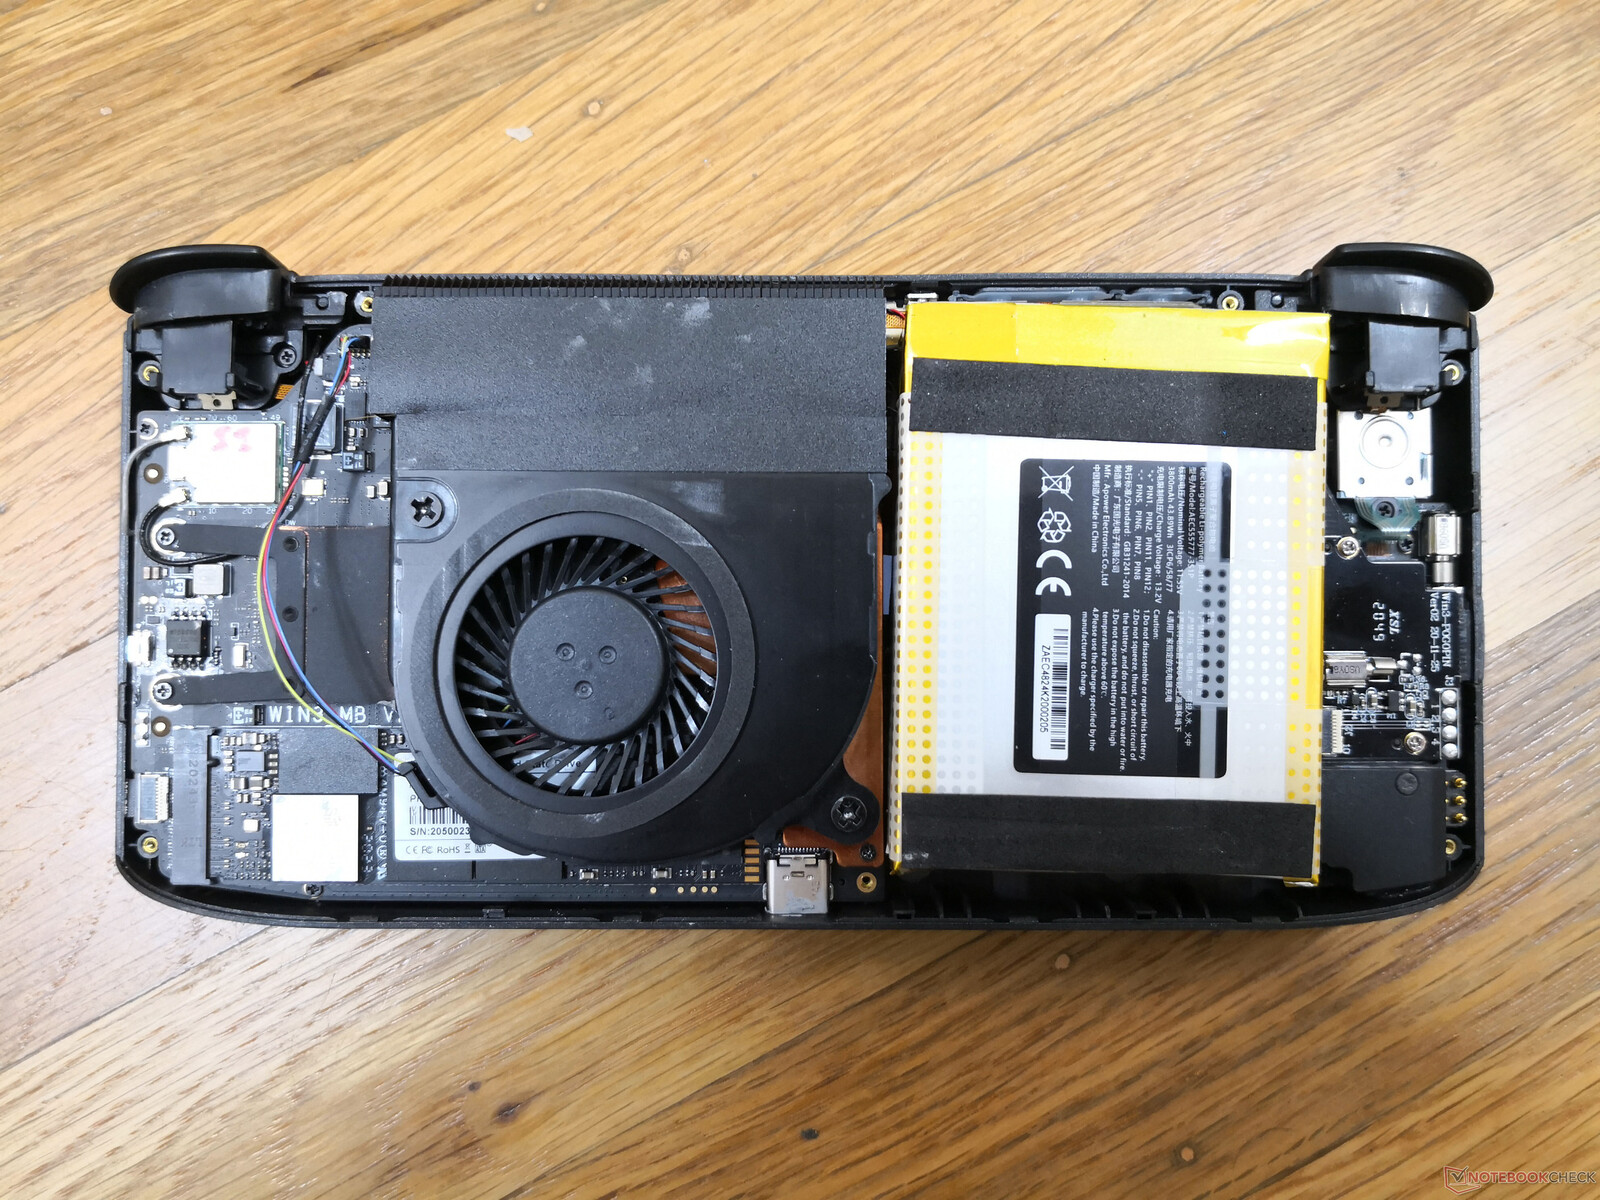
Maintenance
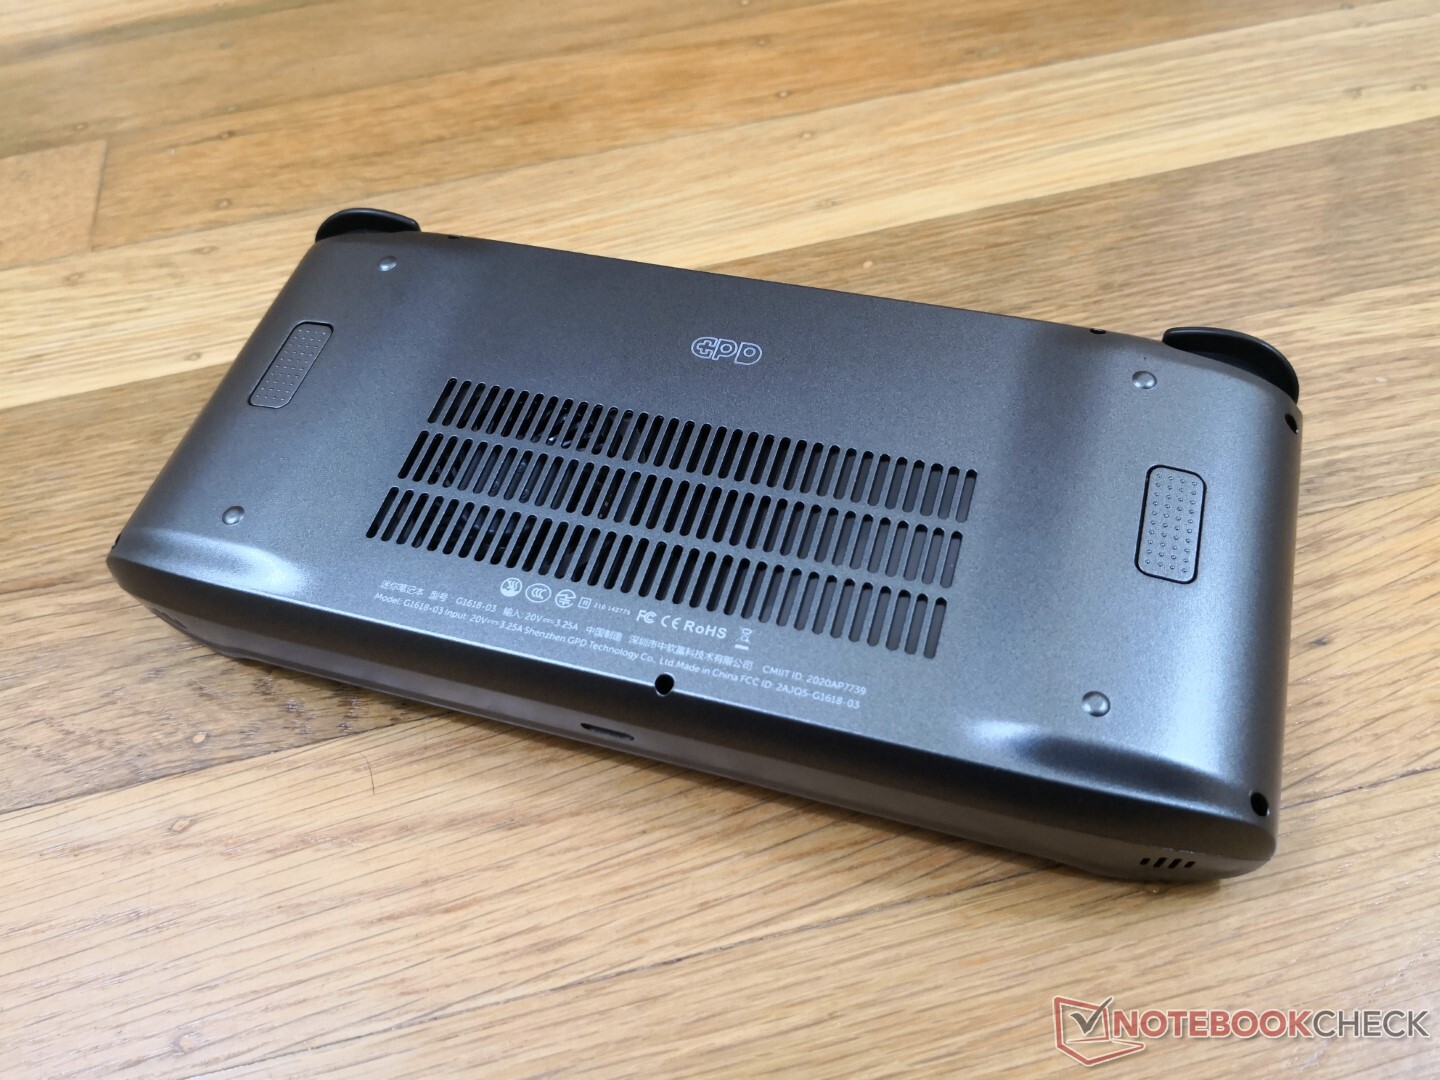
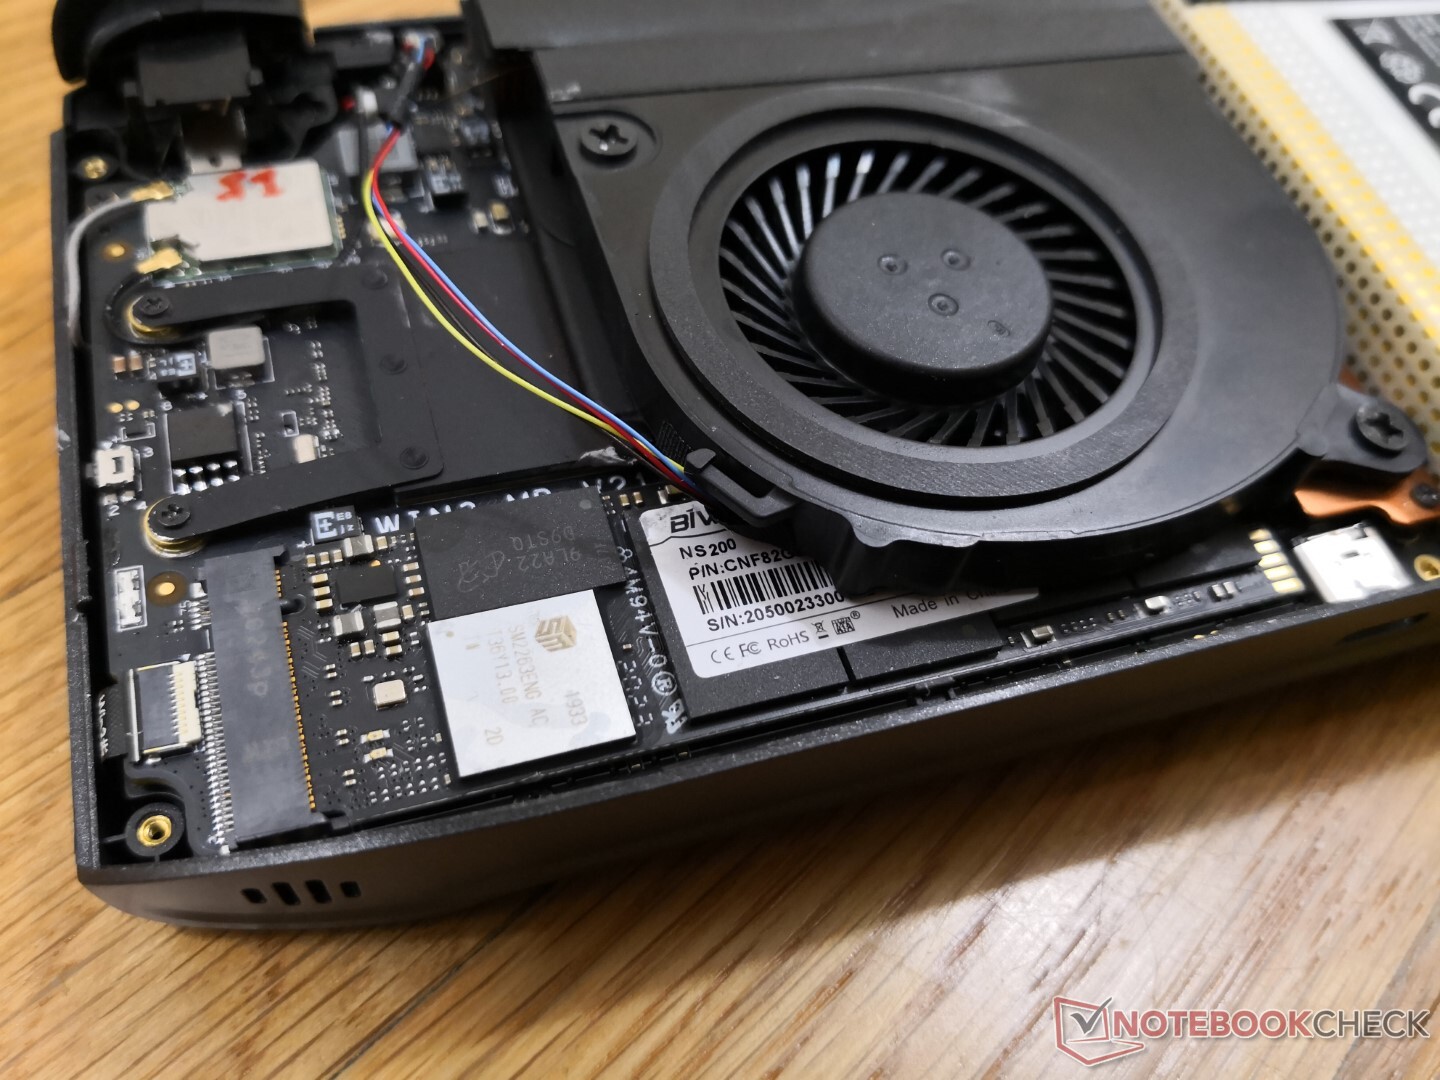
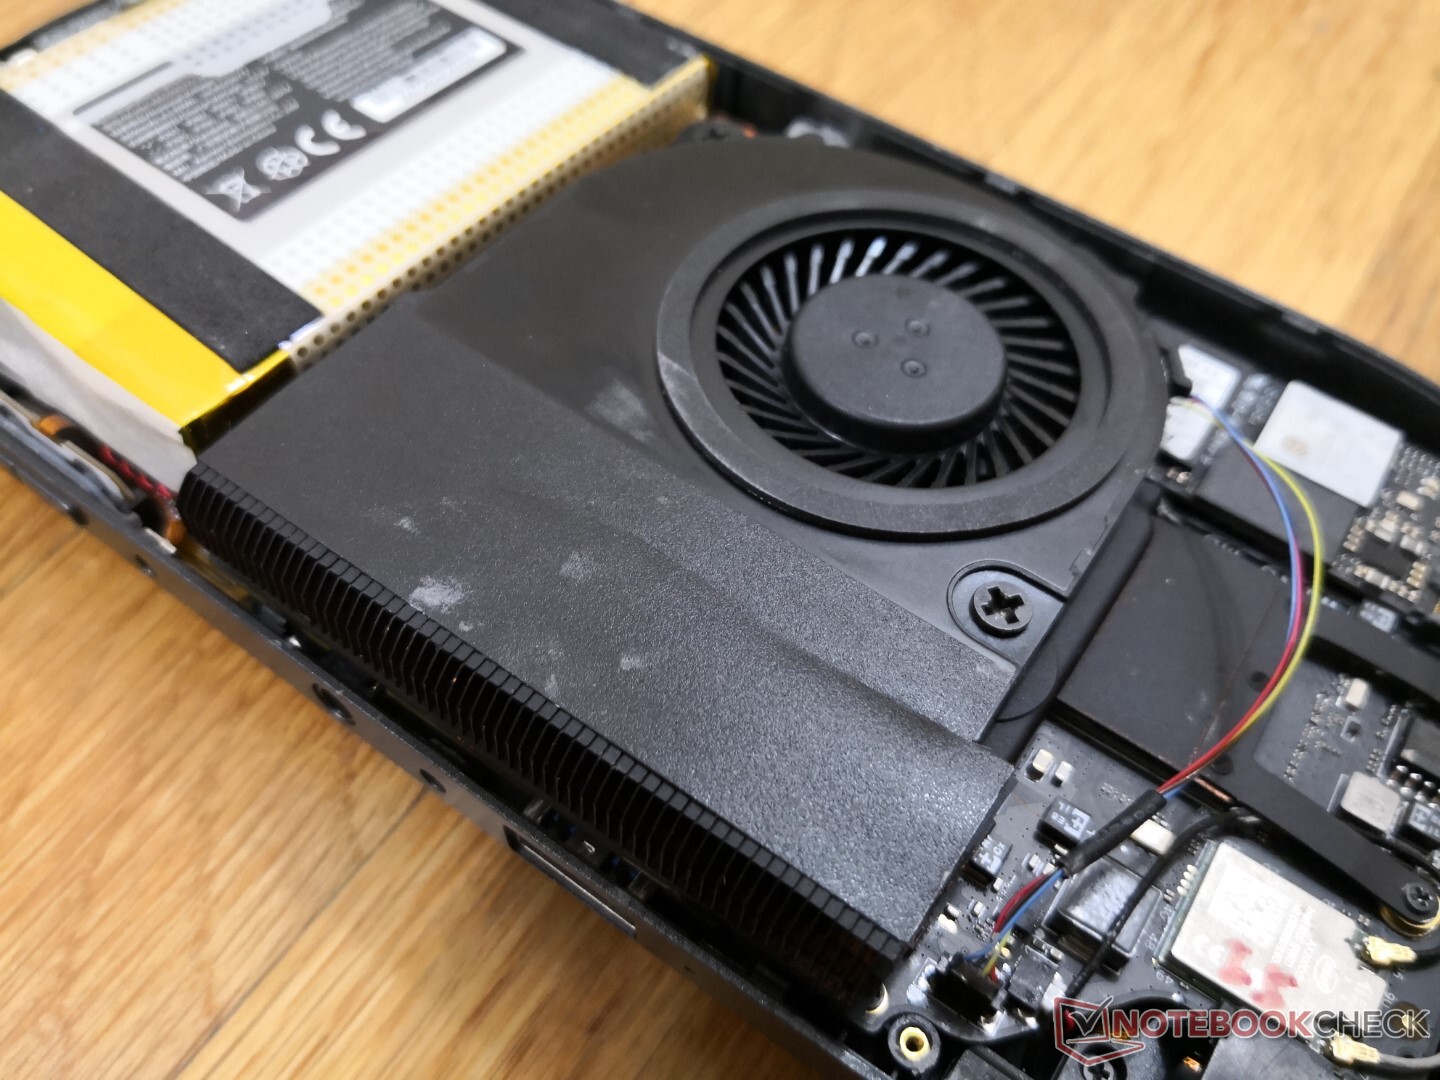
The bottom panel is secured by seven Philips screws. Removal is relatively easy for fan cleaning or SSD upgrades. Both WLAN and RAM are soldered.
Accessories and Warranty
There are no extras in the box outside of the paperwork and AC adapter. GPD sells an optional docking station for the device, but owners can use almost any USB or Thunderbolt-based docking station of their own. A screen protector or screen wipe would have been nice additions.
The standard one-year limited warranty applies. Claiming the warranty may be not be very timely due to international shipping.
Input Devices
Keyboard
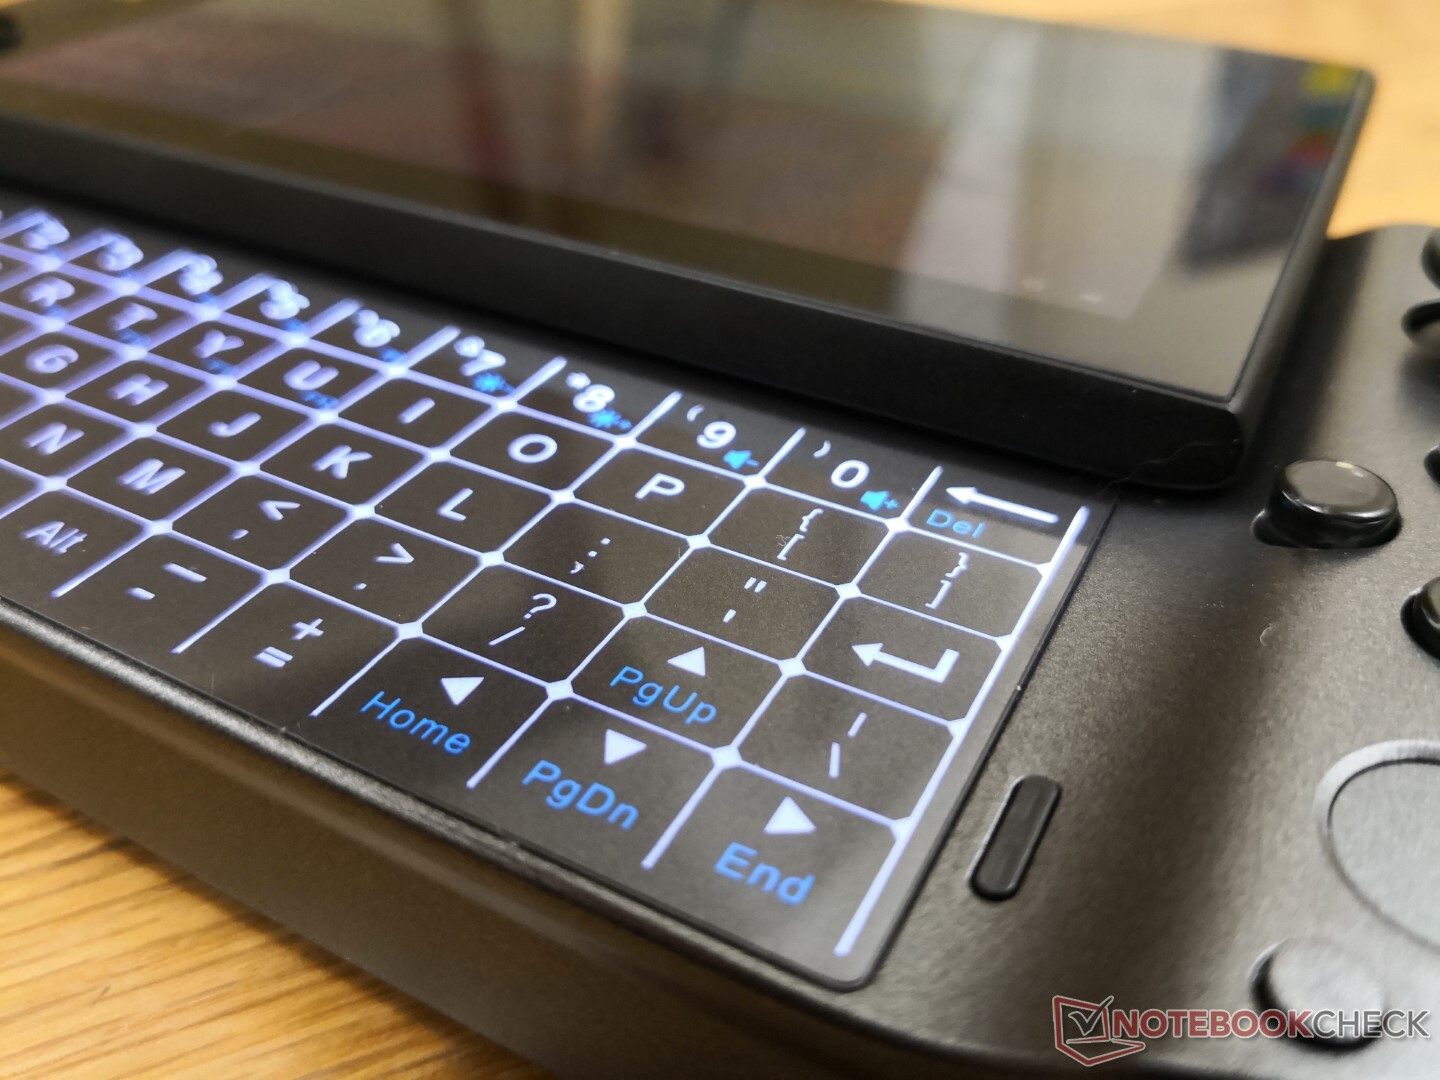
BlackBerry users may find the whole sliding display concept and keyboard design all too familiar. On the Win 3, however, the backlit keyboard is essentially virtual and with no tactile keys. There is some haptic feedback rumble when registering inputs, but it is far too weak especially when compared to touch-typing on smartphones. It's serviceable considering the limited real estate available.
Annoyingly, pressing a controller button or shoulder button will wake the screen from sleep mode and there appears to be no way to disable this. It's therefore almost impossible to keep the Win 3 in a bag or backpack without accidentally waking it.
Display
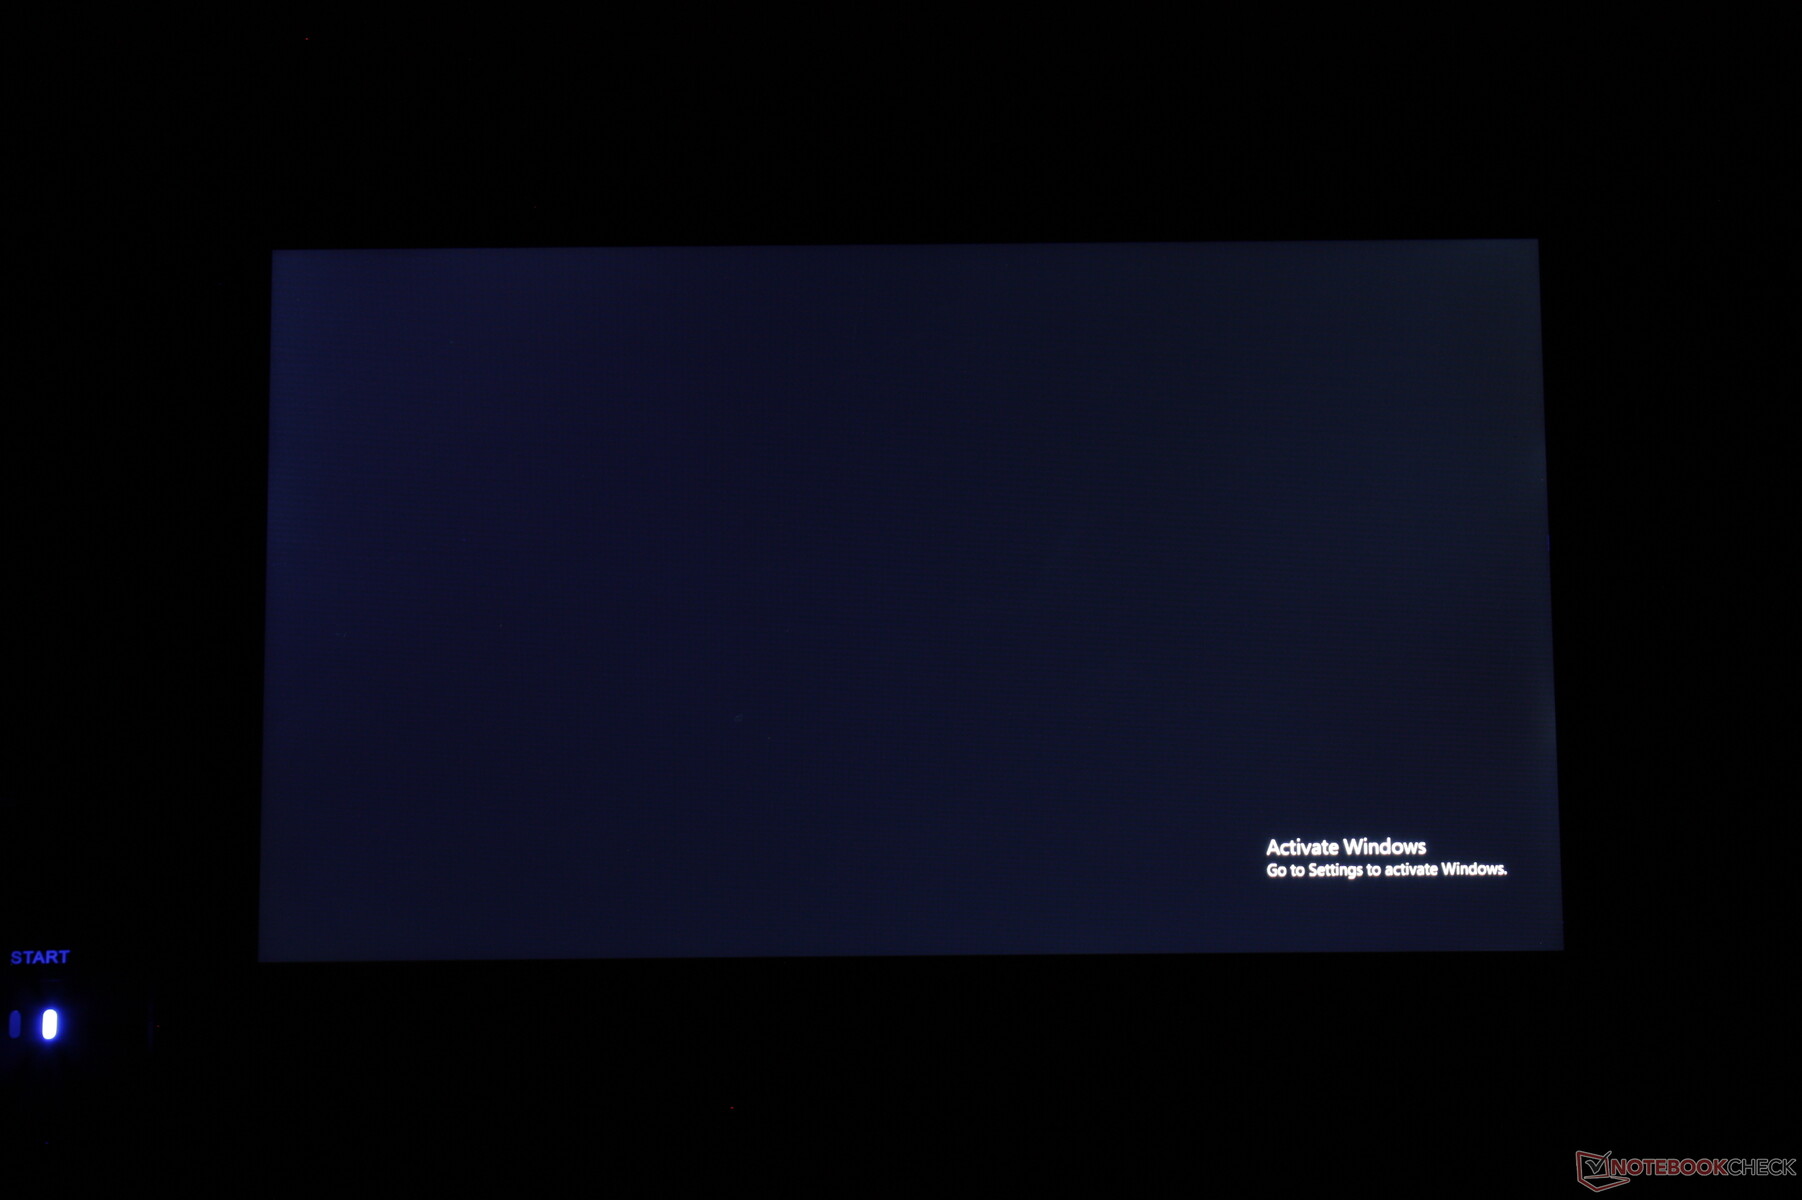
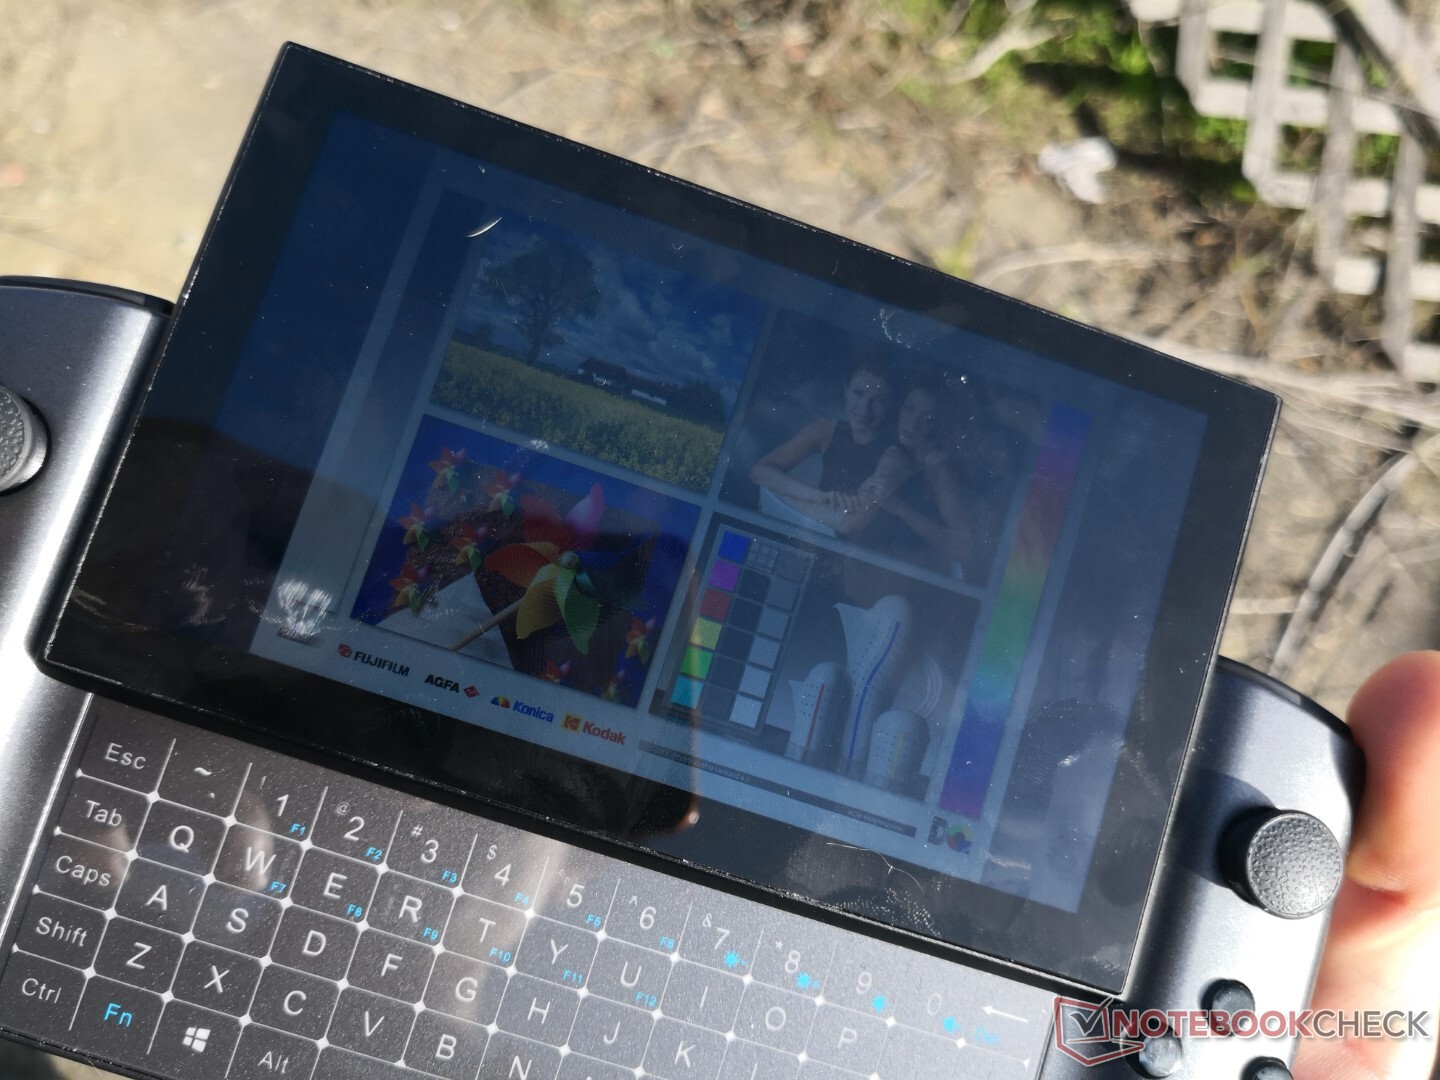
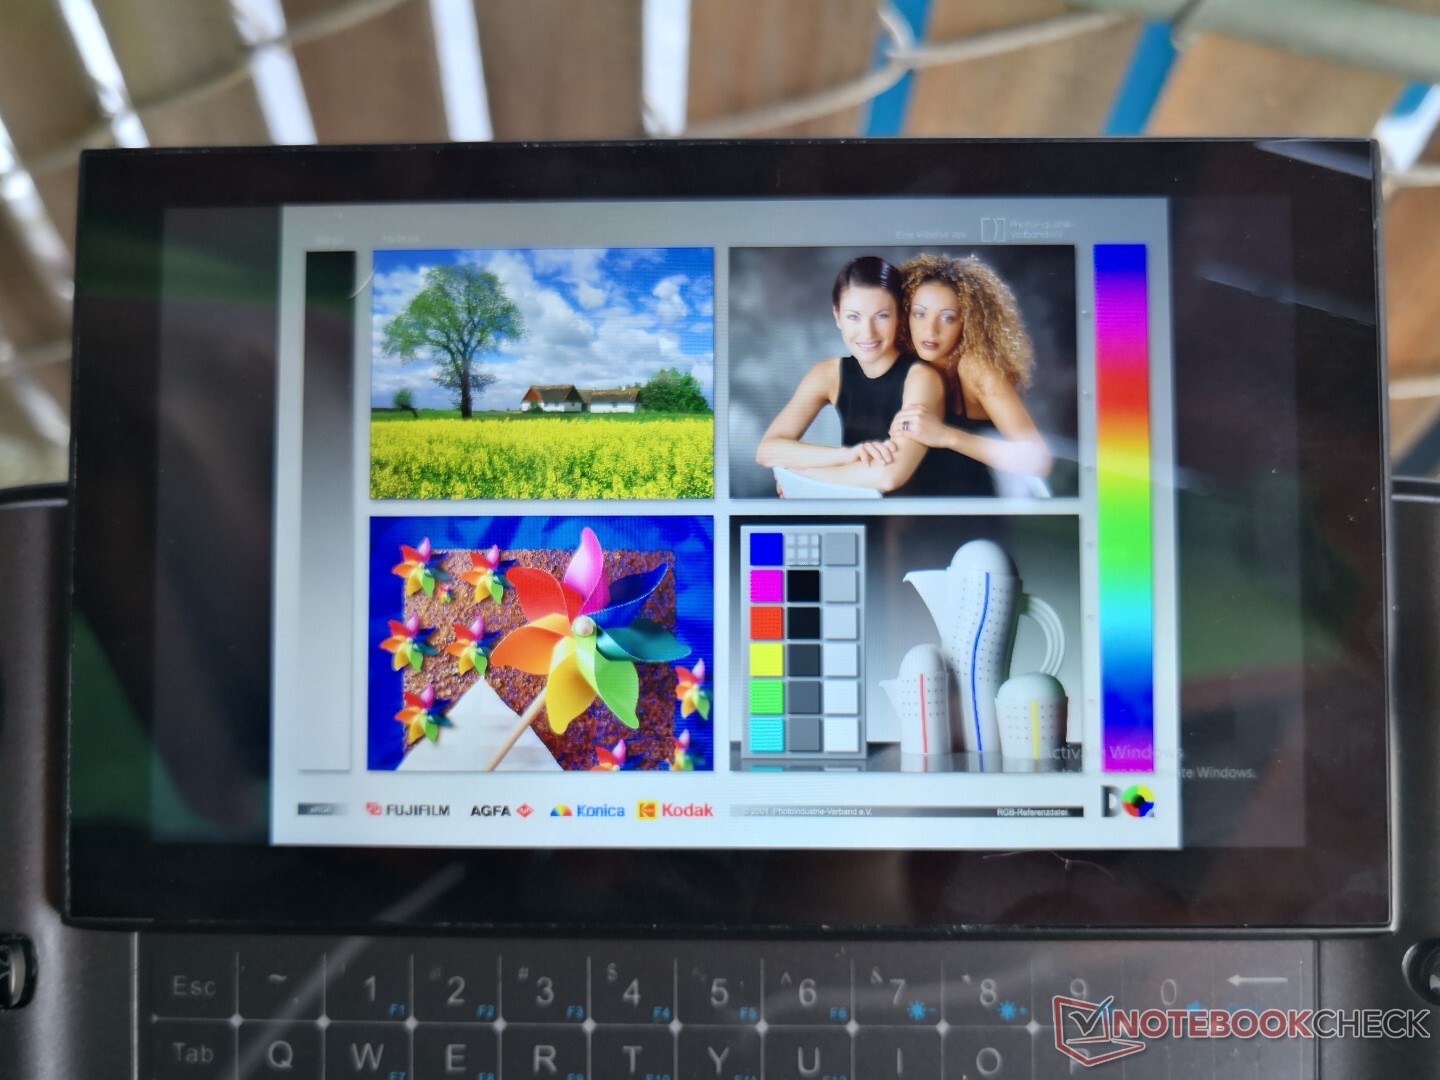
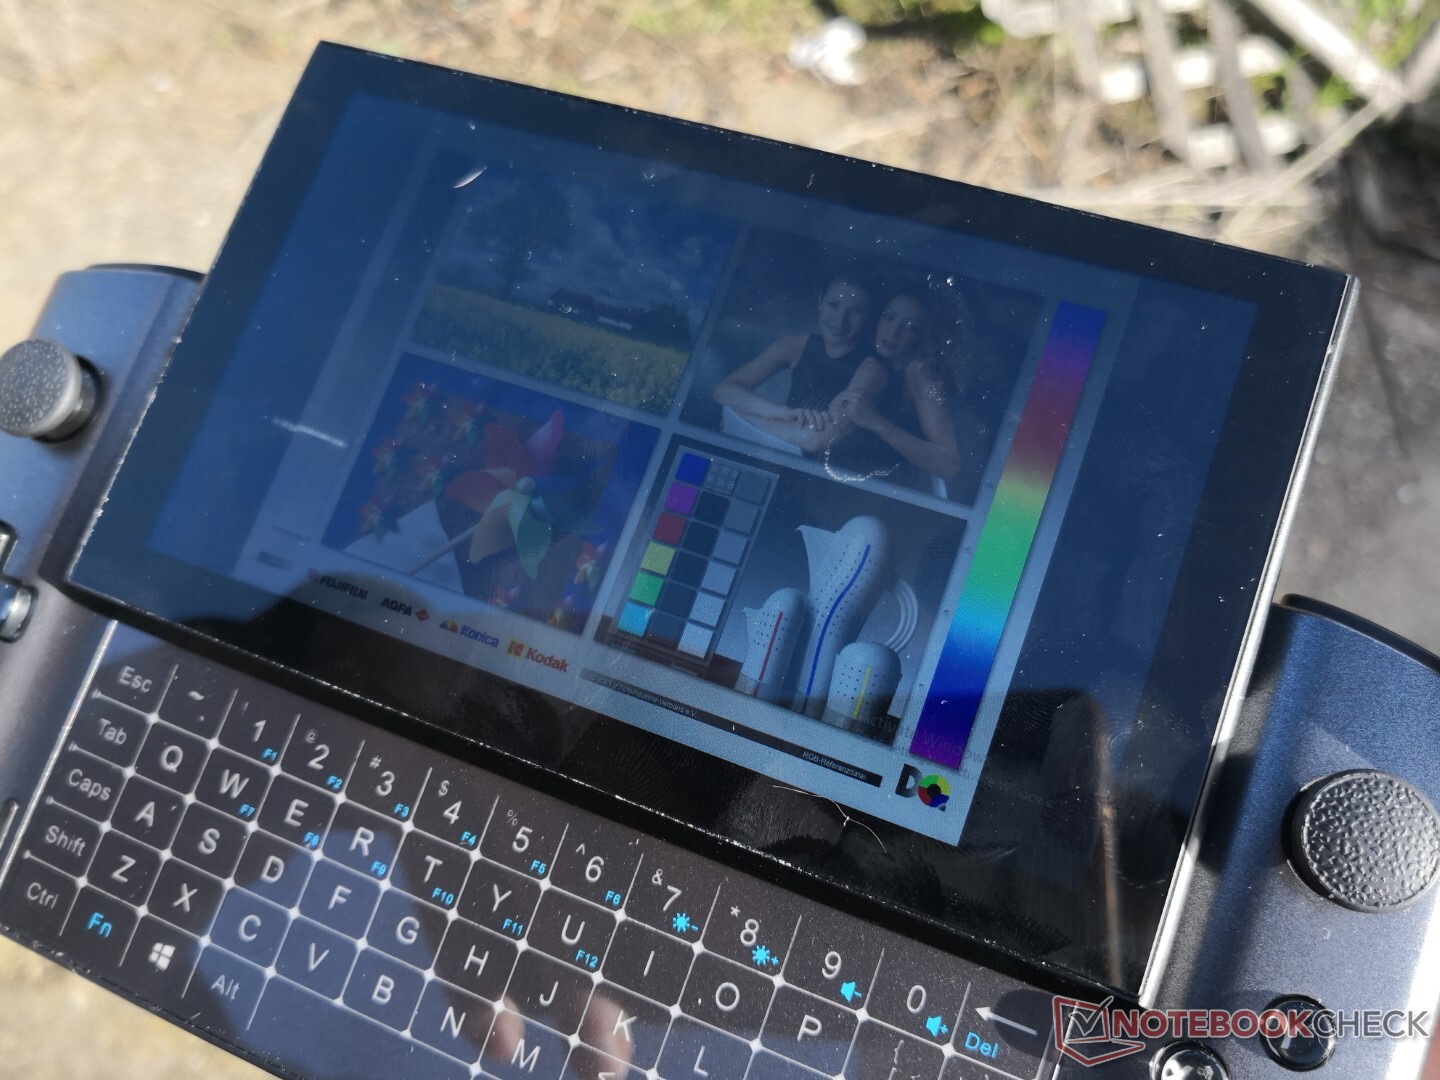
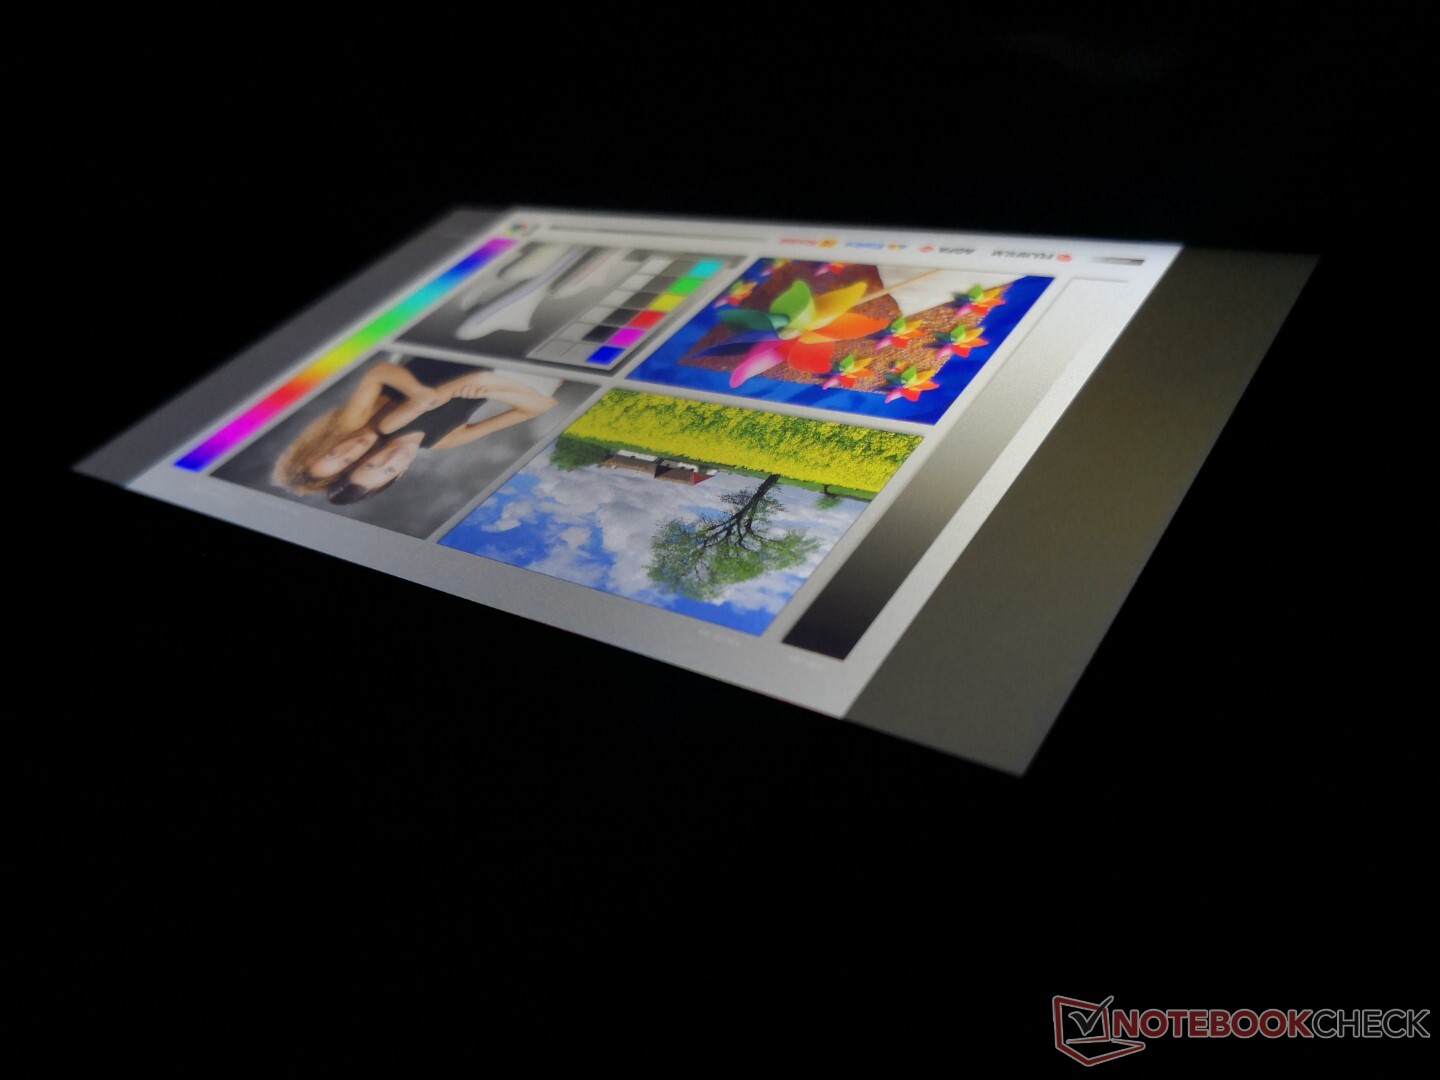
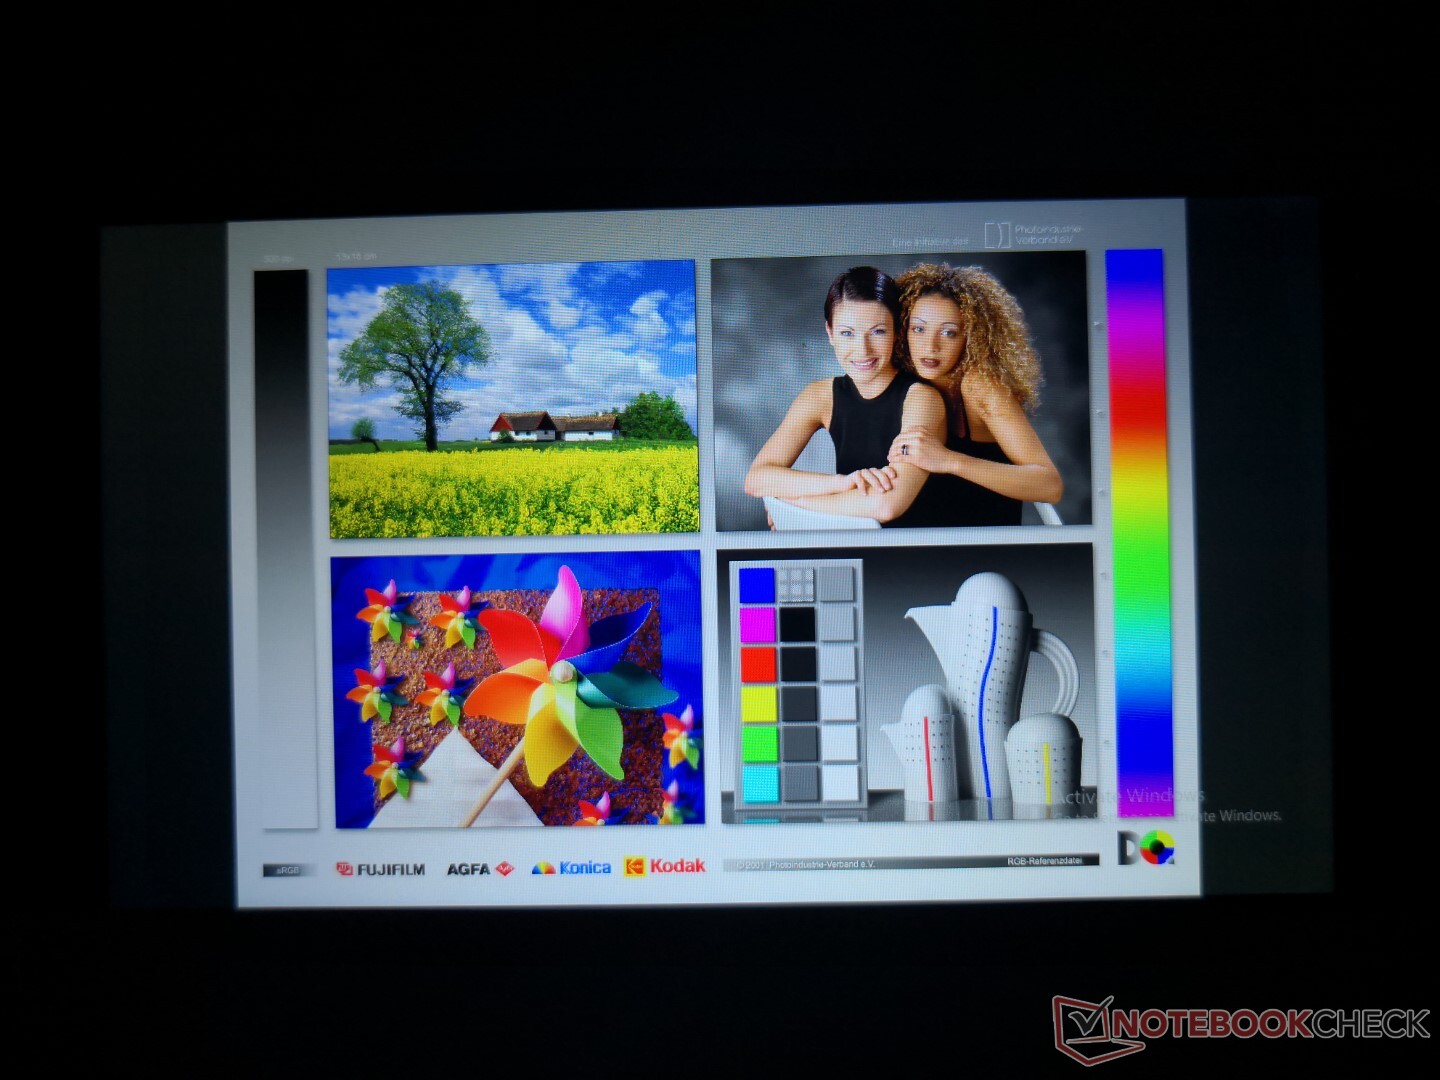
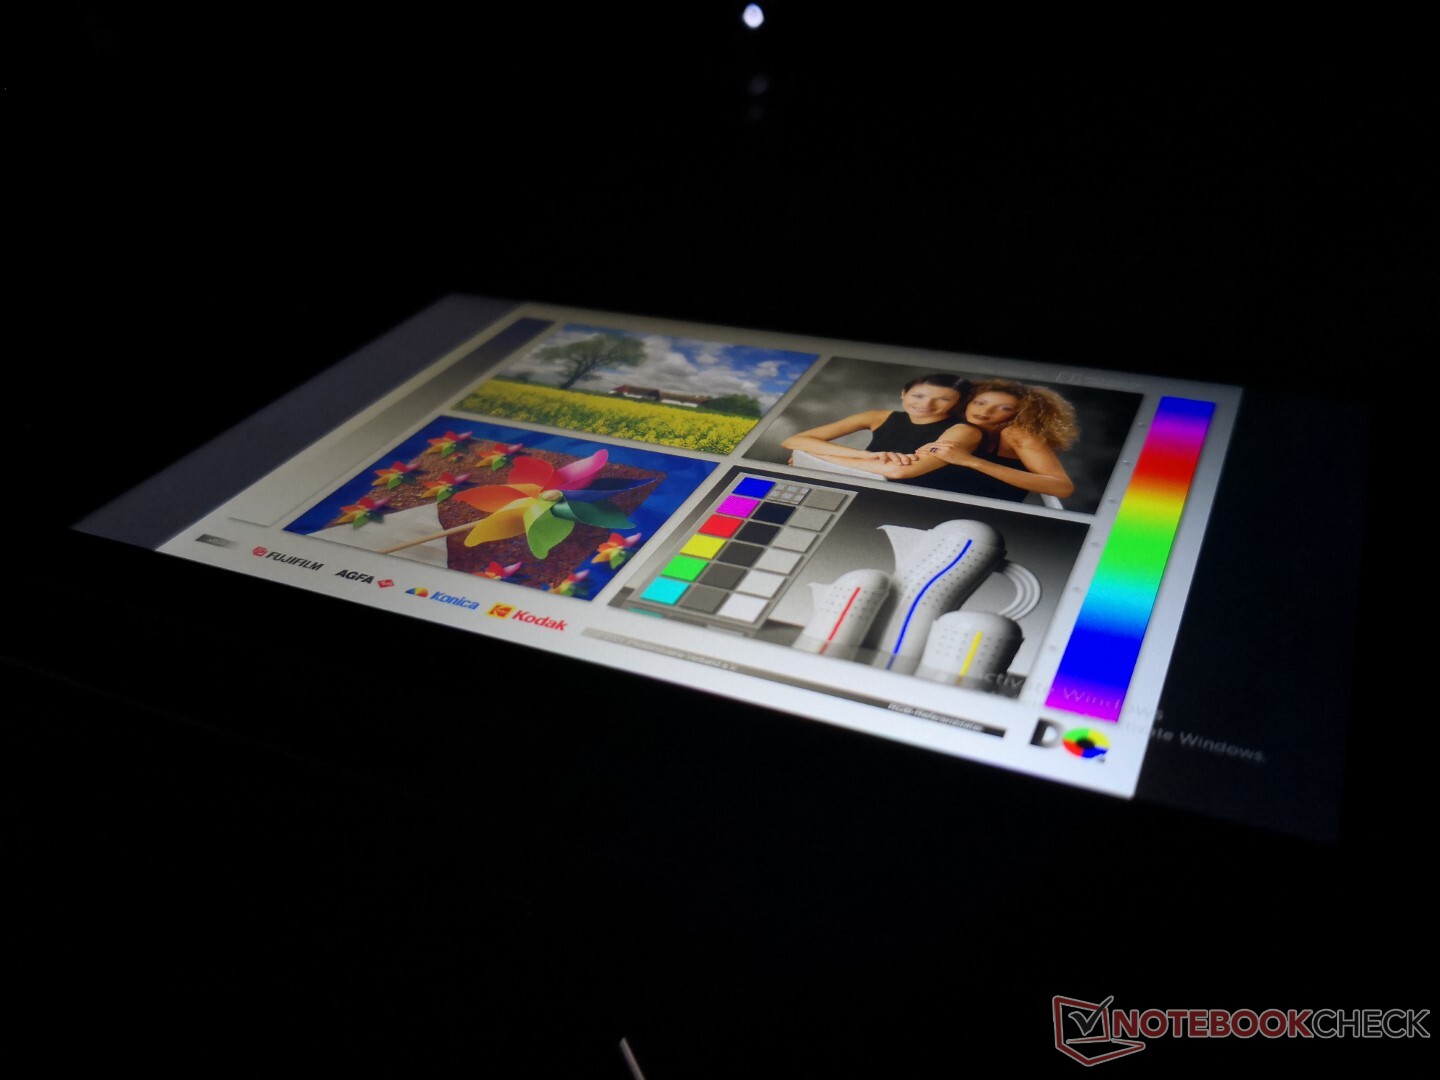
The touchscreen is bright and with excellent contrast. Black-white response times are only average, however, and there will be a bit of ghosting when gaming. We thankfully didn't find it to be much of an issue during our time with the unit.
Native resolution is identical to the Nintendo Switch at 720p which pairs perfectly with the Iris Xe GPU. In fact, games appear even crisper on the GPD than on the Switch because of the higher PPI here.
A notable drawback to the display is that the actual pixels are underneath a relatively thick layer of Gorilla Glass. Colors consequently don't "pop" or appear as colorful as they do as on a Galaxy Tab or iPad tablet where the overlying glass layer is thinner. It's not a deal breaker so long as users aren't expecting iPhone-level display quality.
The backlight does not utilize pulse-width modulation even if at the lowest brightness setting which should prove useful if gaming in dimly-lit environments.

| |||||||||||||||||||||||||
Brightness Distribution: 93 %
Center on Battery: 468.8 cd/m²
Contrast: 1042:1 (Black: 0.45 cd/m²)
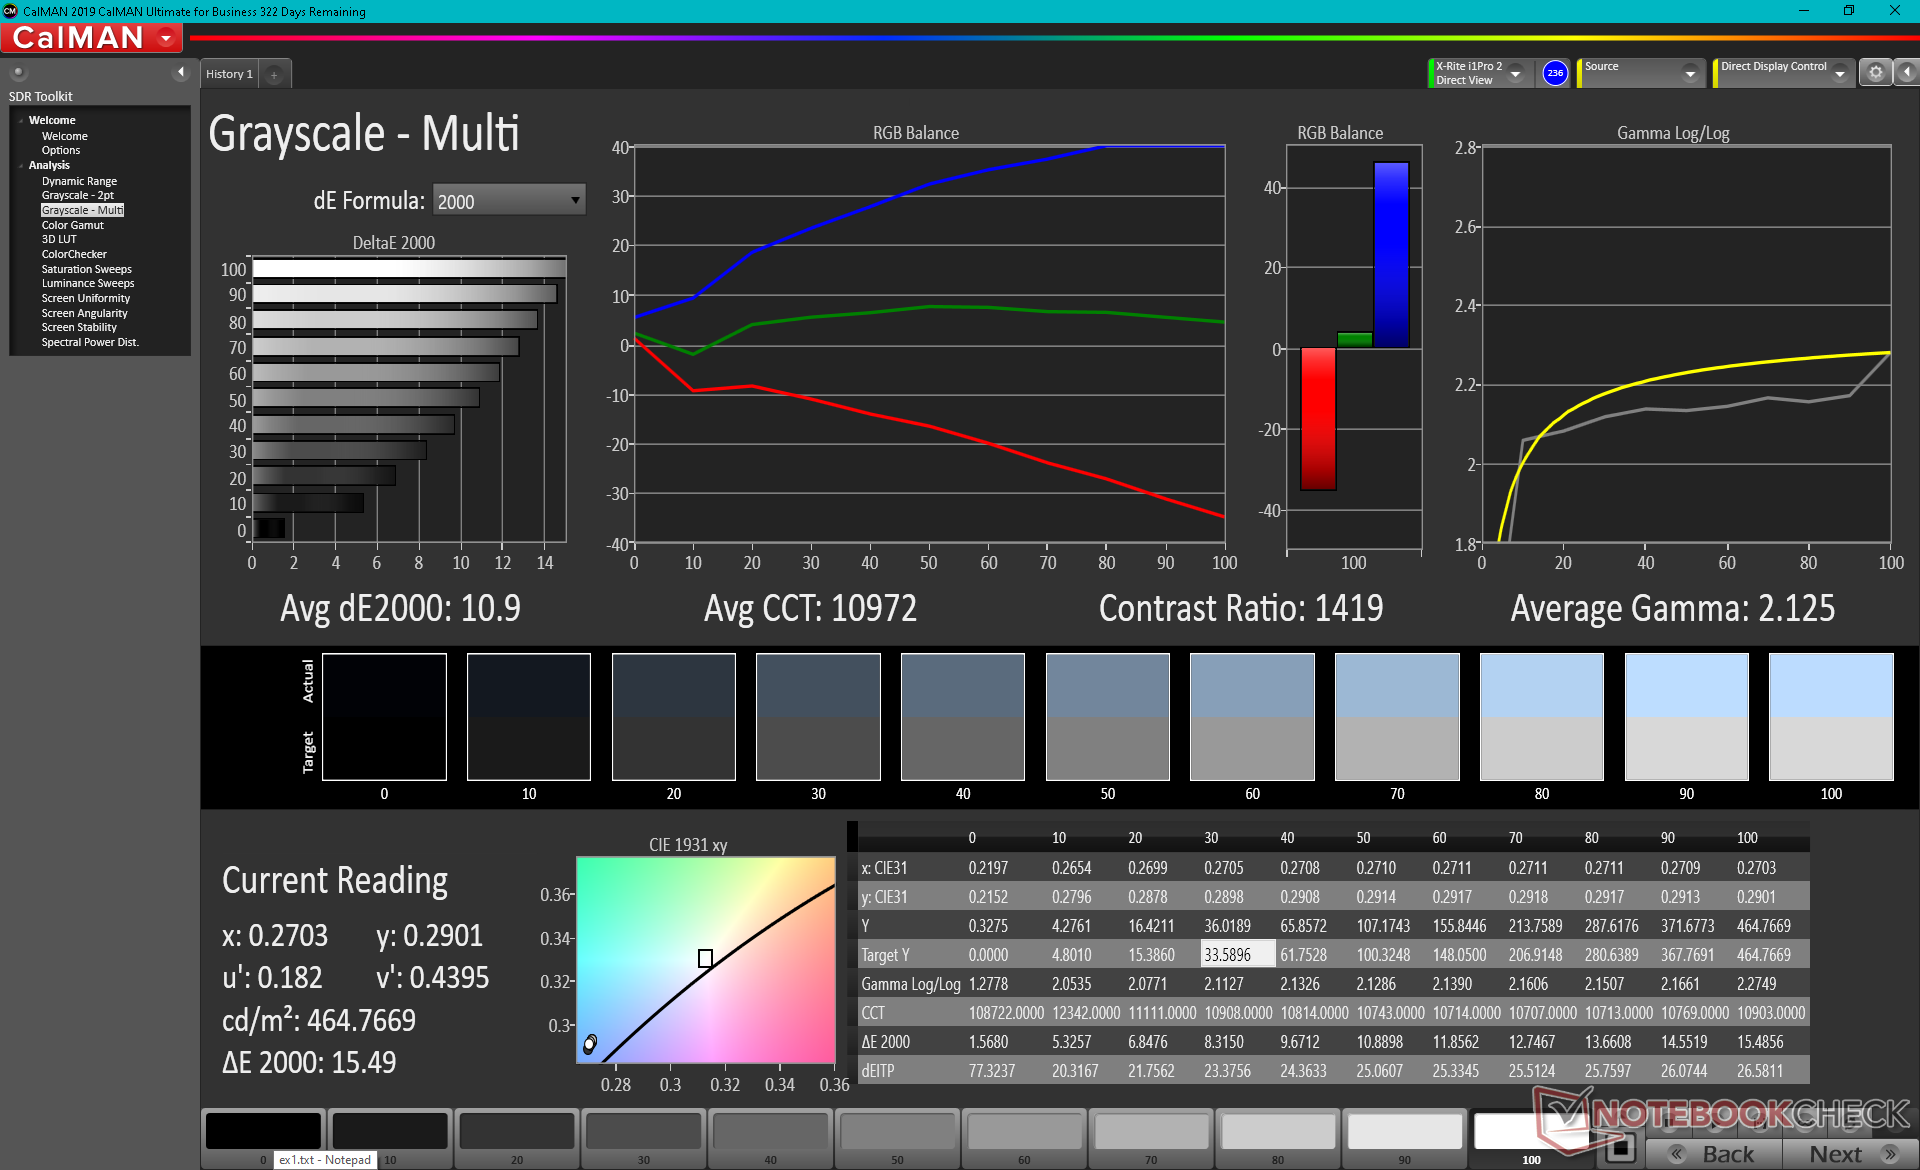
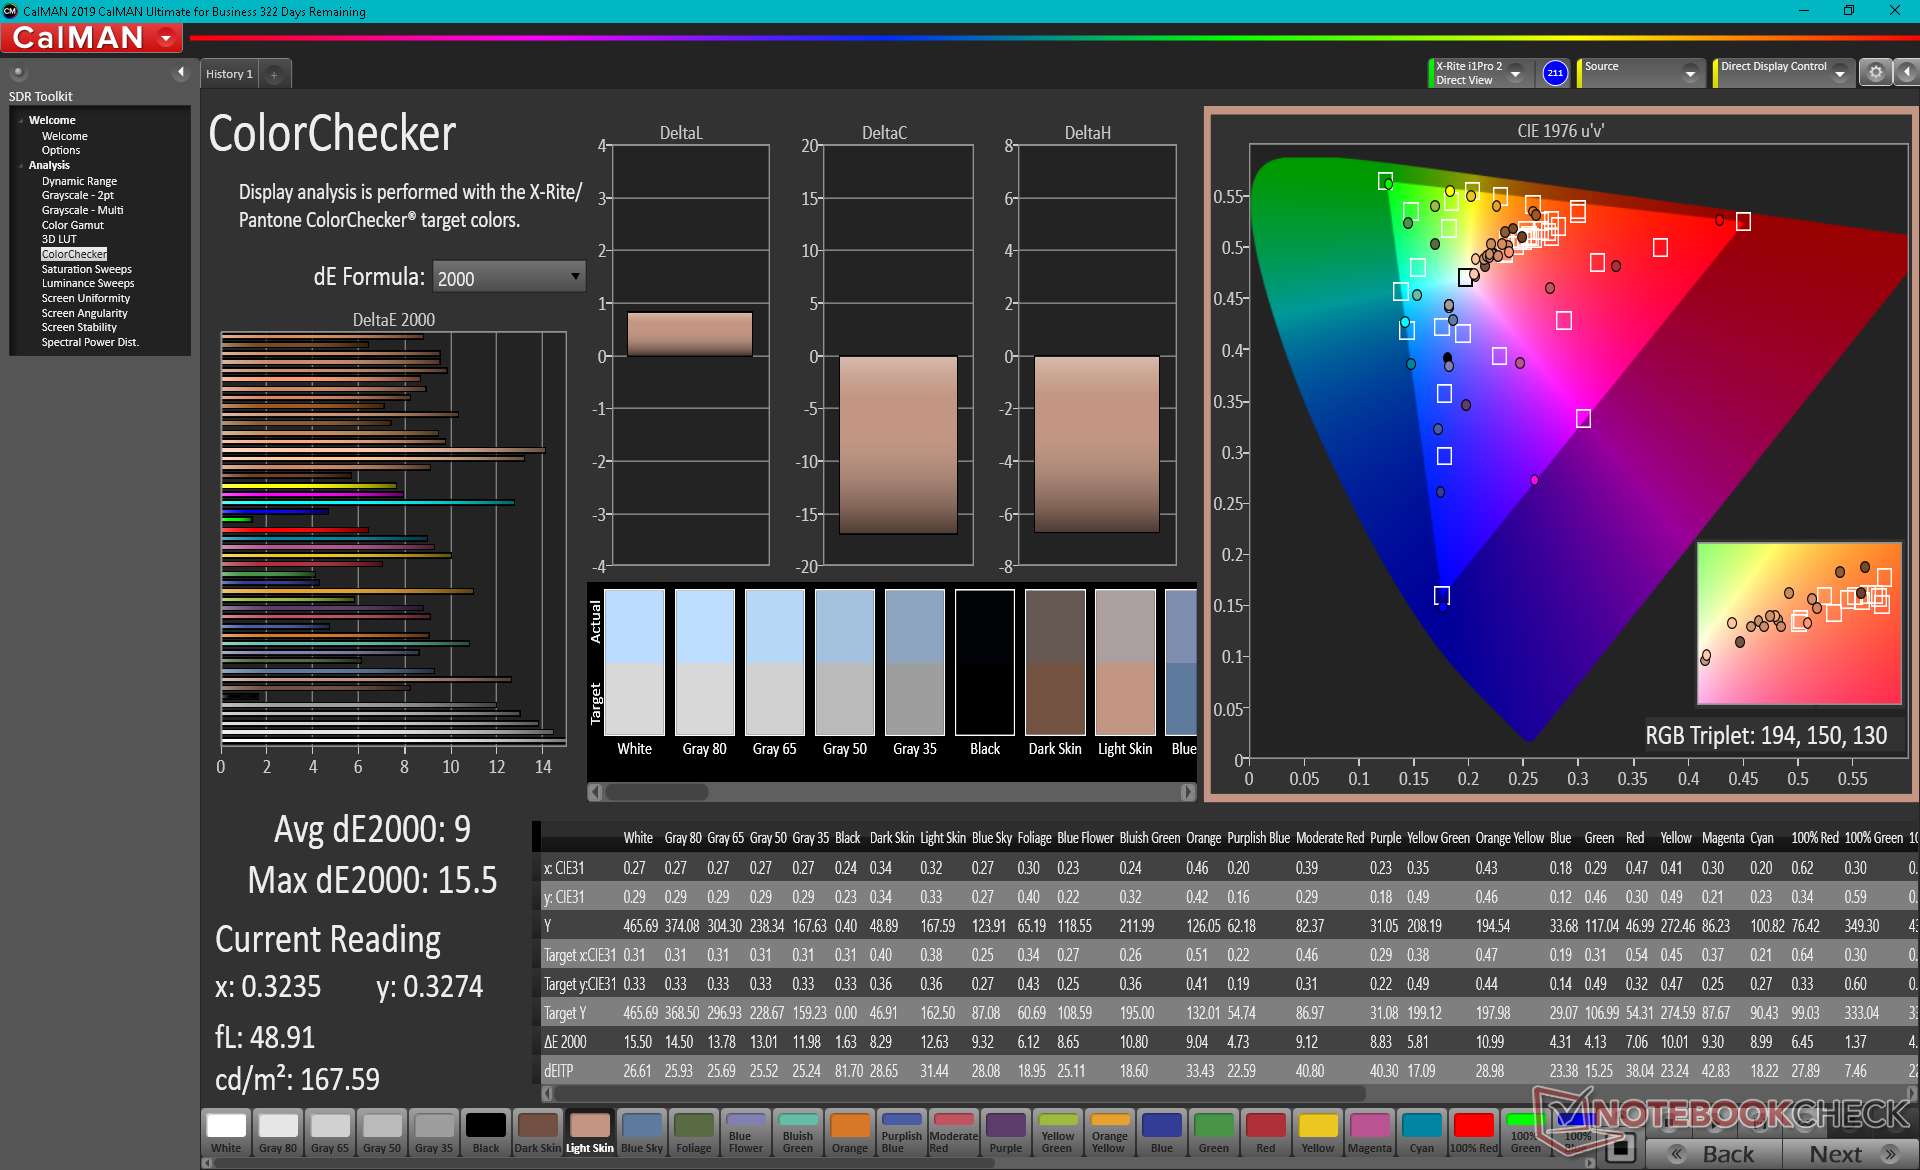
ΔE ColorChecker Calman: 9 | ∀{0.5-29.43 Ø4.71}
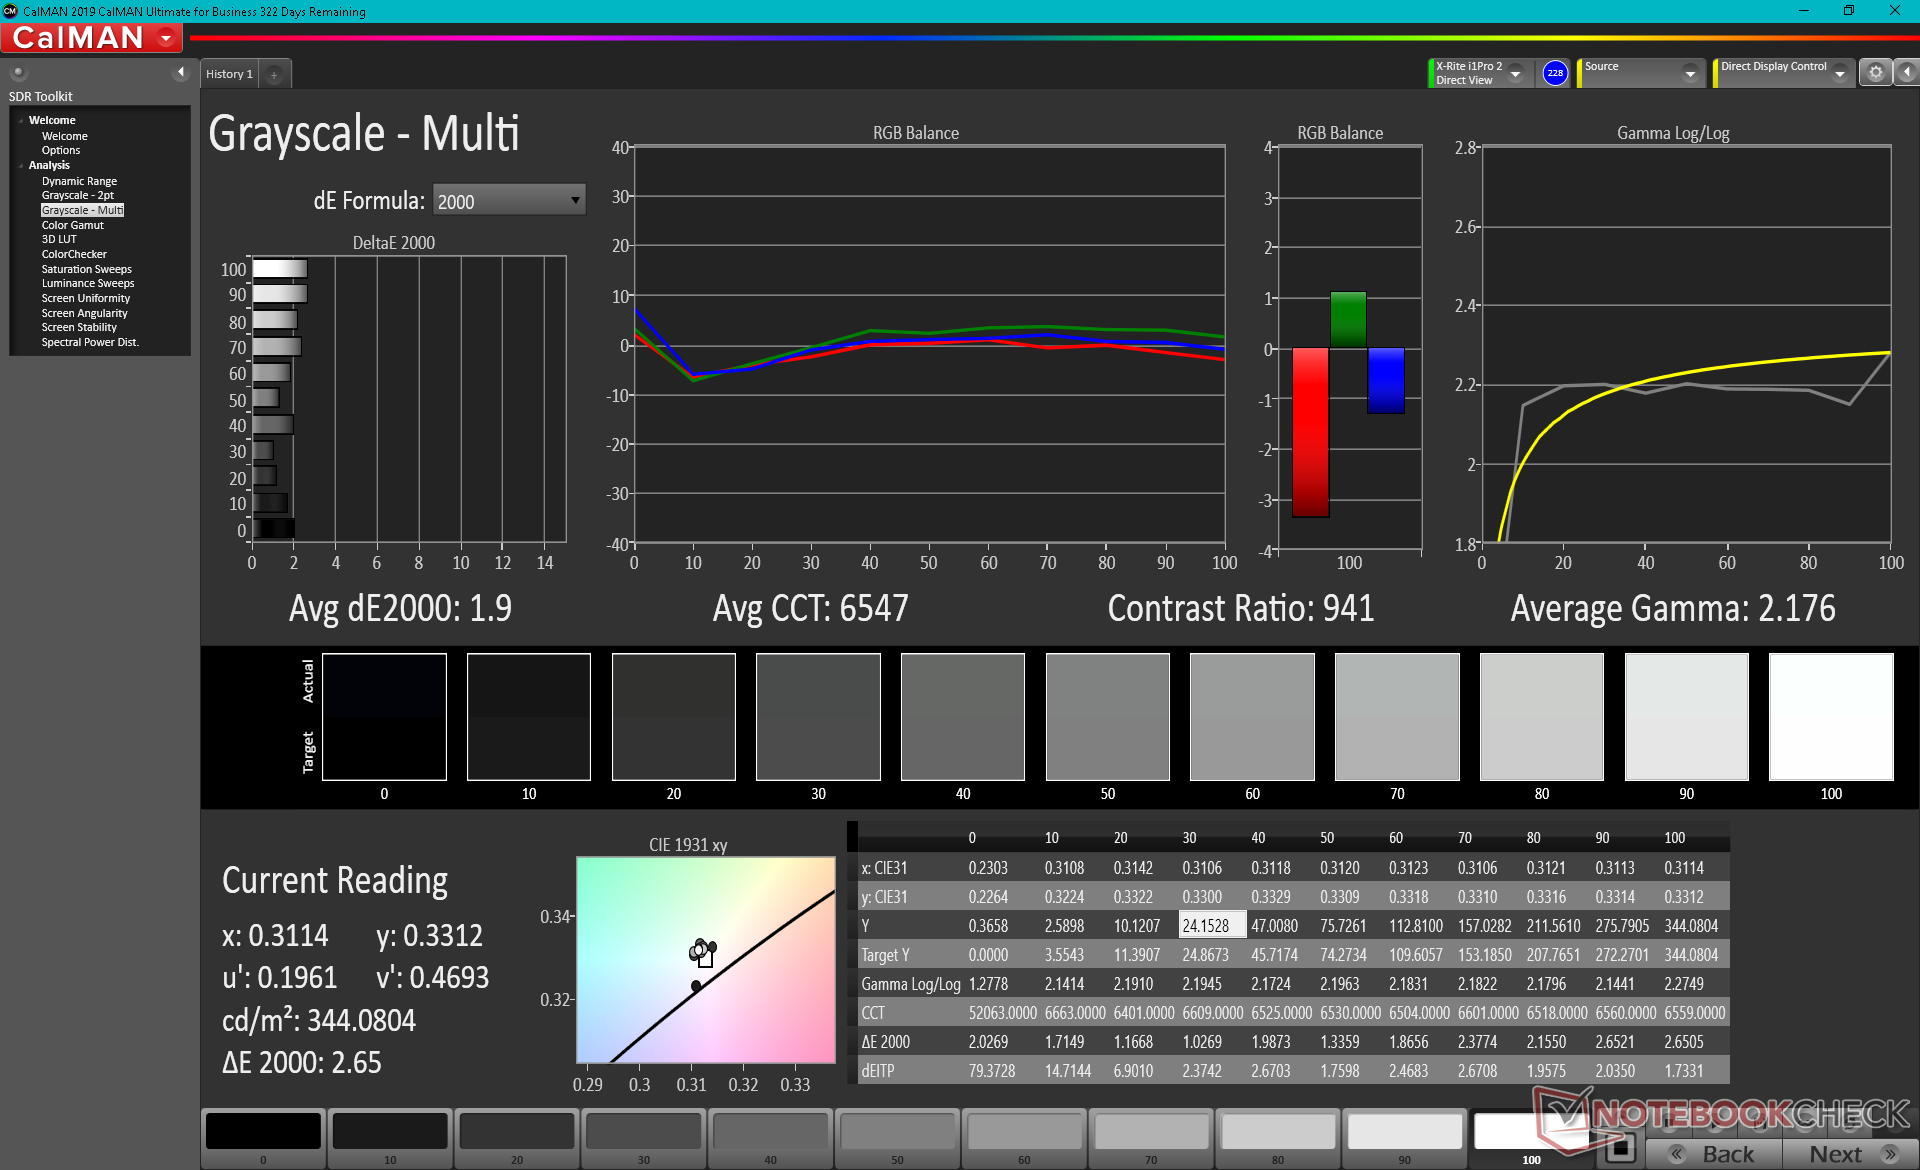
calibrated: 1.91
ΔE Greyscale Calman: 10.9 | ∀{0.09-98 Ø4.96}
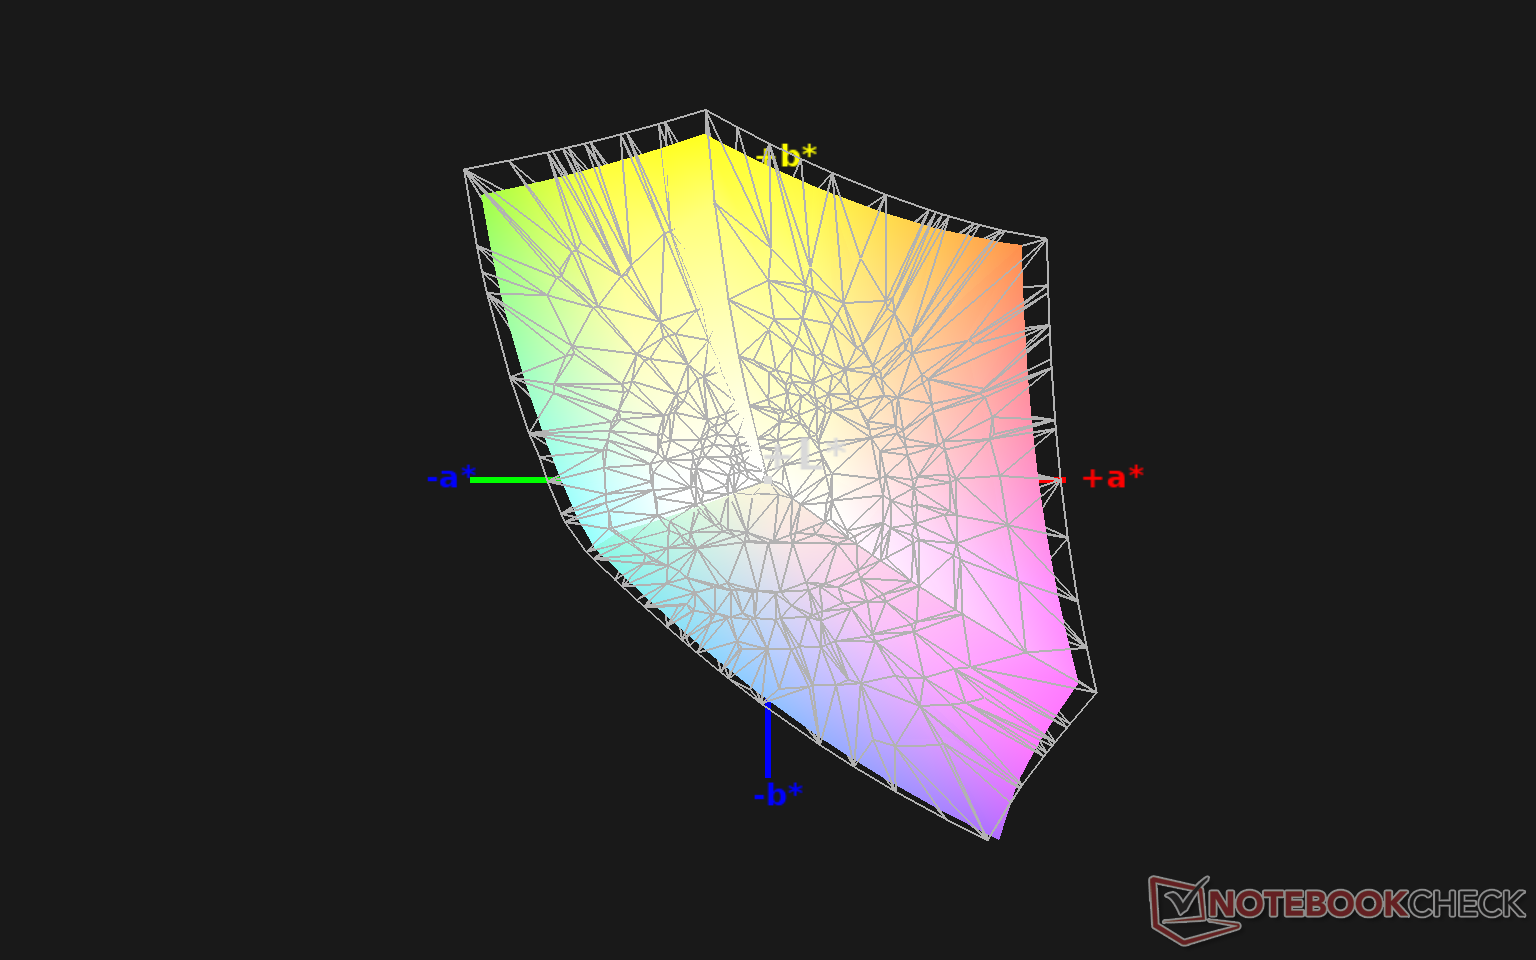
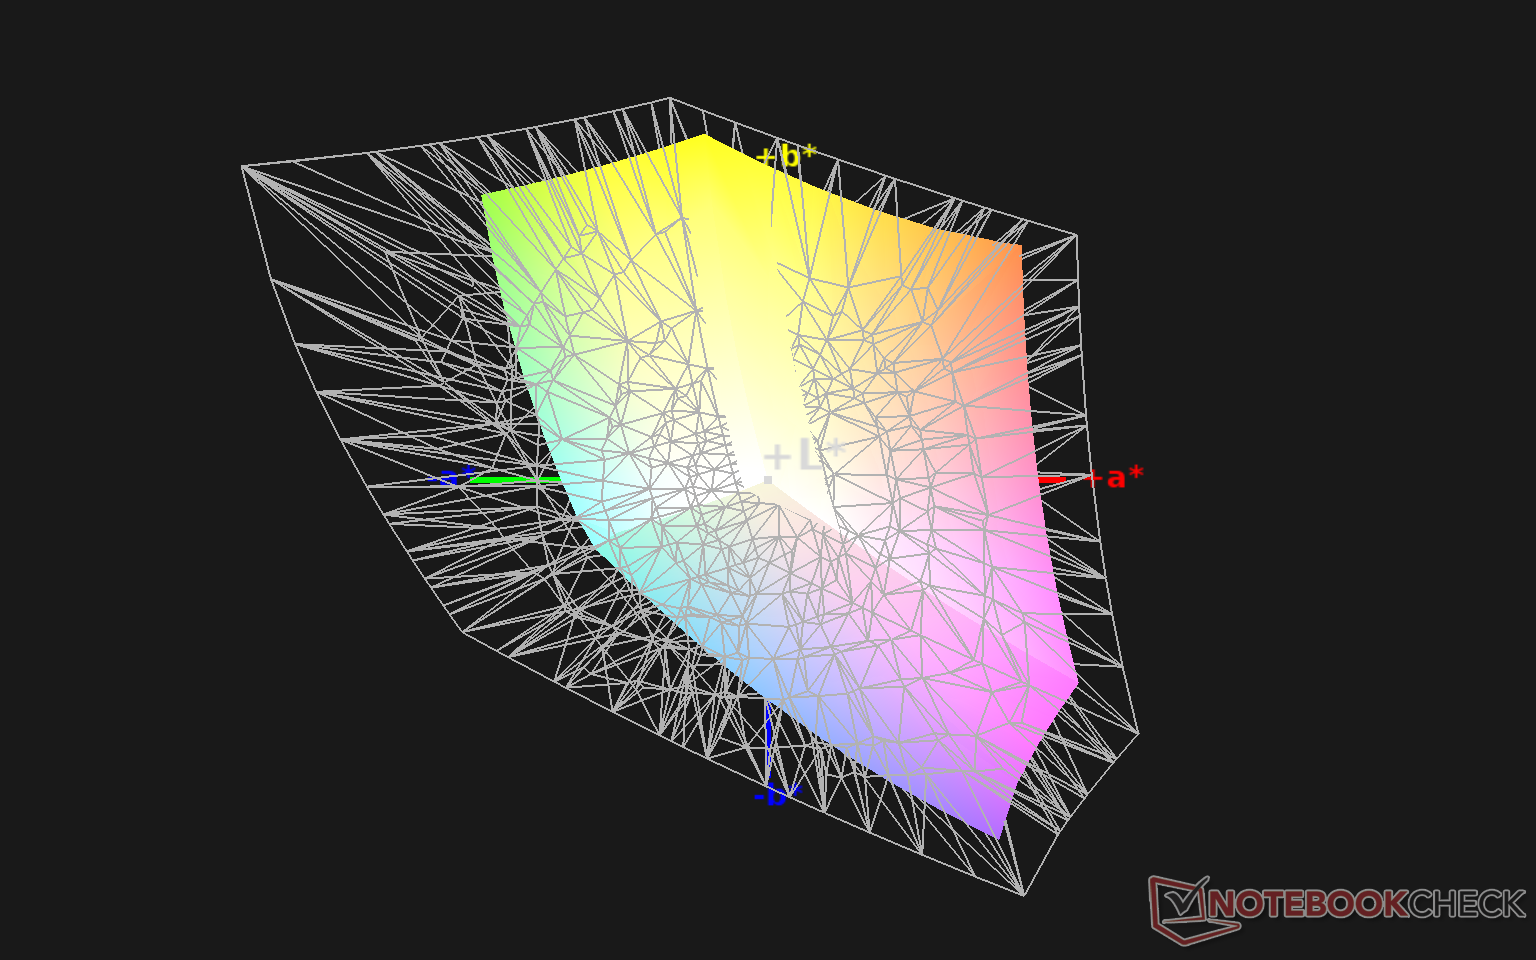
89.2% sRGB (Argyll 1.6.3 3D)
56.6% AdobeRGB 1998 (Argyll 1.6.3 3D)
61.4% AdobeRGB 1998 (Argyll 3D)
89.6% sRGB (Argyll 3D)
59.5% Display P3 (Argyll 3D)
Gamma: 2.13
CCT: 10972 K
| GPD Win 3 IPS, 5.5", 1280x720 | Dell XPS 13 9310 Core i7 FHD Sharp LQ134N1, IPS, 13.4", 1920x1200 | Apple MacBook Air 2020 M1 Entry IPS, 13.3", 2560x1600 | HP Spectre x360 13-aw0013dx AU Optronics AUO5E2D, IPS, 13.3", 1920x1080 | Asus ZenBook 13 UX325JA Sharp LQ133M1JW40, IPS, 13.3", 1920x1080 | Microsoft Surface Laptop 3 13 Core i5-1035G7 Sharp LQ135P1JX51, IPS, 13.5", 2256x1504 | |
|---|---|---|---|---|---|---|
| Display | 16% | 39% | 14% | 6% | 10% | |
| Display P3 Coverage (%) | 59.5 | 70.9 19% | 98.6 66% | 69.6 17% | 63.8 7% | 65.7 10% |
| sRGB Coverage (%) | 89.6 | 99.1 11% | 100 12% | 98.9 10% | 94.5 5% | 98.6 10% |
| AdobeRGB 1998 Coverage (%) | 61.4 | 72.9 19% | 85.9 40% | 71.5 16% | 64.9 6% | 67.8 10% |
| Response Times | -30% | 10% | -48% | 0% | -56% | |
| Response Time Grey 50% / Grey 80% * (ms) | 40 ? | 52 ? -30% | 31 ? 22% | 60.8 ? -52% | 47 ? -18% | 59.2 ? -48% |
| Response Time Black / White * (ms) | 25.6 ? | 33.2 ? -30% | 26.1 ? -2% | 36.8 ? -44% | 21 ? 18% | 41.6 ? -63% |
| PWM Frequency (Hz) | 2475 ? | 118000 ? | 250 ? | 21740 ? | ||
| Screen | 29% | 34% | 22% | 16% | 31% | |
| Brightness middle (cd/m²) | 468.8 | 543.3 16% | 417 -11% | 447.4 -5% | 435 -7% | 403.4 -14% |
| Brightness (cd/m²) | 460 | 524 14% | 395 -14% | 420 -9% | 404 -12% | 397 -14% |
| Brightness Distribution (%) | 93 | 92 -1% | 91 -2% | 85 -9% | 83 -11% | 89 -4% |
| Black Level * (cd/m²) | 0.45 | 0.38 16% | 0.39 13% | 0.31 31% | 0.565 -26% | 0.34 24% |
| Contrast (:1) | 1042 | 1430 37% | 1069 3% | 1443 38% | 770 -26% | 1186 14% |
| Colorchecker dE 2000 * | 9 | 3.02 66% | 1.12 88% | 4.23 53% | 2.66 70% | 0.94 90% |
| Colorchecker dE 2000 max. * | 15.5 | 7.61 51% | 2.71 83% | 9.34 40% | 4.73 69% | 2.92 81% |
| Colorchecker dE 2000 calibrated * | 1.91 | 1.23 36% | 0.77 60% | 1.32 31% | 1.19 38% | 0.99 48% |
| Greyscale dE 2000 * | 10.9 | 5 54% | 1.7 84% | 6.1 44% | 3.65 67% | 0.9 92% |
| Gamma | 2.13 103% | 2.02 109% | 2207 0% | 2.11 104% | 2.34 94% | 2.13 103% |
| CCT | 10972 59% | 6550 99% | 6870 95% | 6136 106% | 7109 91% | 6620 98% |
| Color Space (Percent of AdobeRGB 1998) (%) | 56.6 | 66.8 18% | 64.8 14% | 60 6% | 62.3 10% | |
| Color Space (Percent of sRGB) (%) | 89.2 | 99.6 12% | 98.9 11% | 95 7% | 98.7 11% | |
| Total Average (Program / Settings) | 5% /
19% | 28% /
32% | -4% /
12% | 7% /
12% | -5% /
16% |
* ... smaller is better
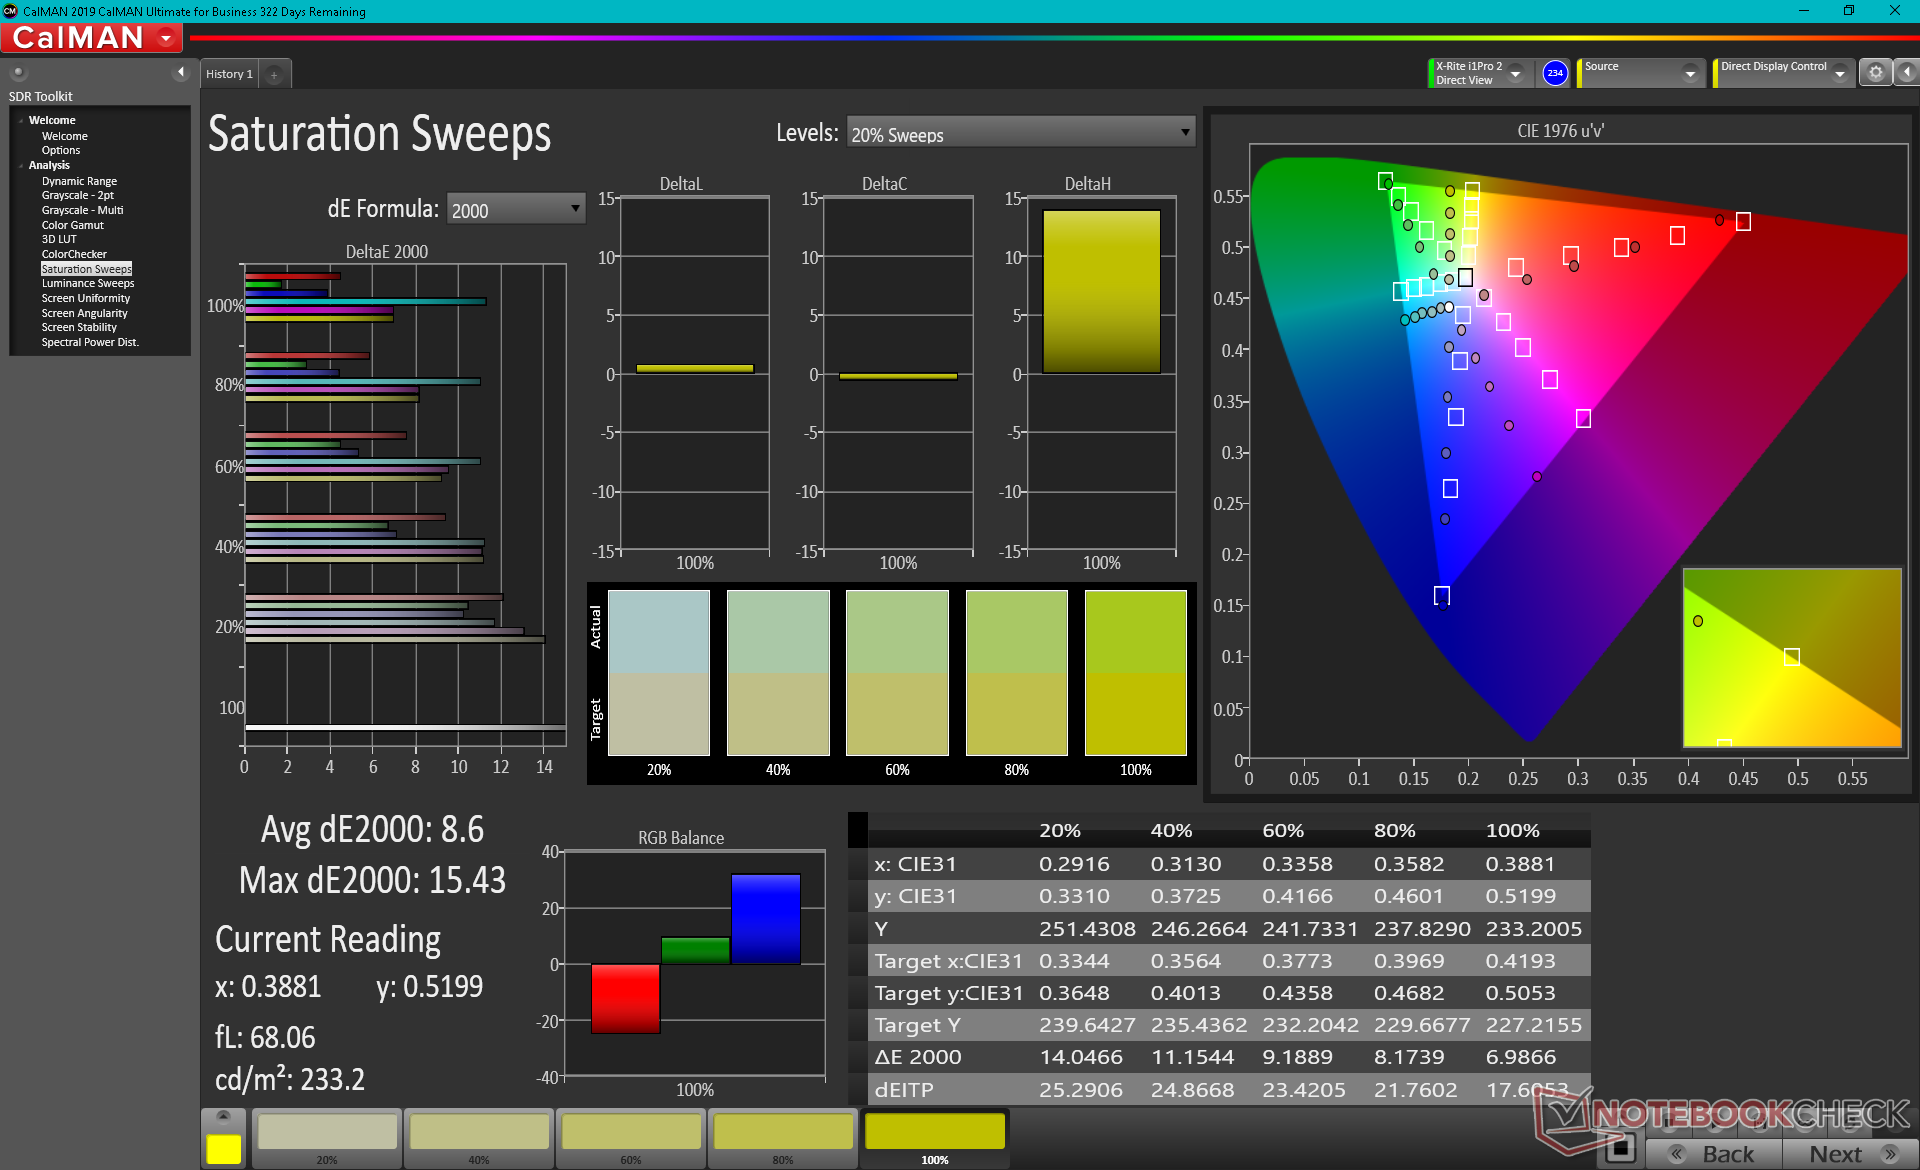
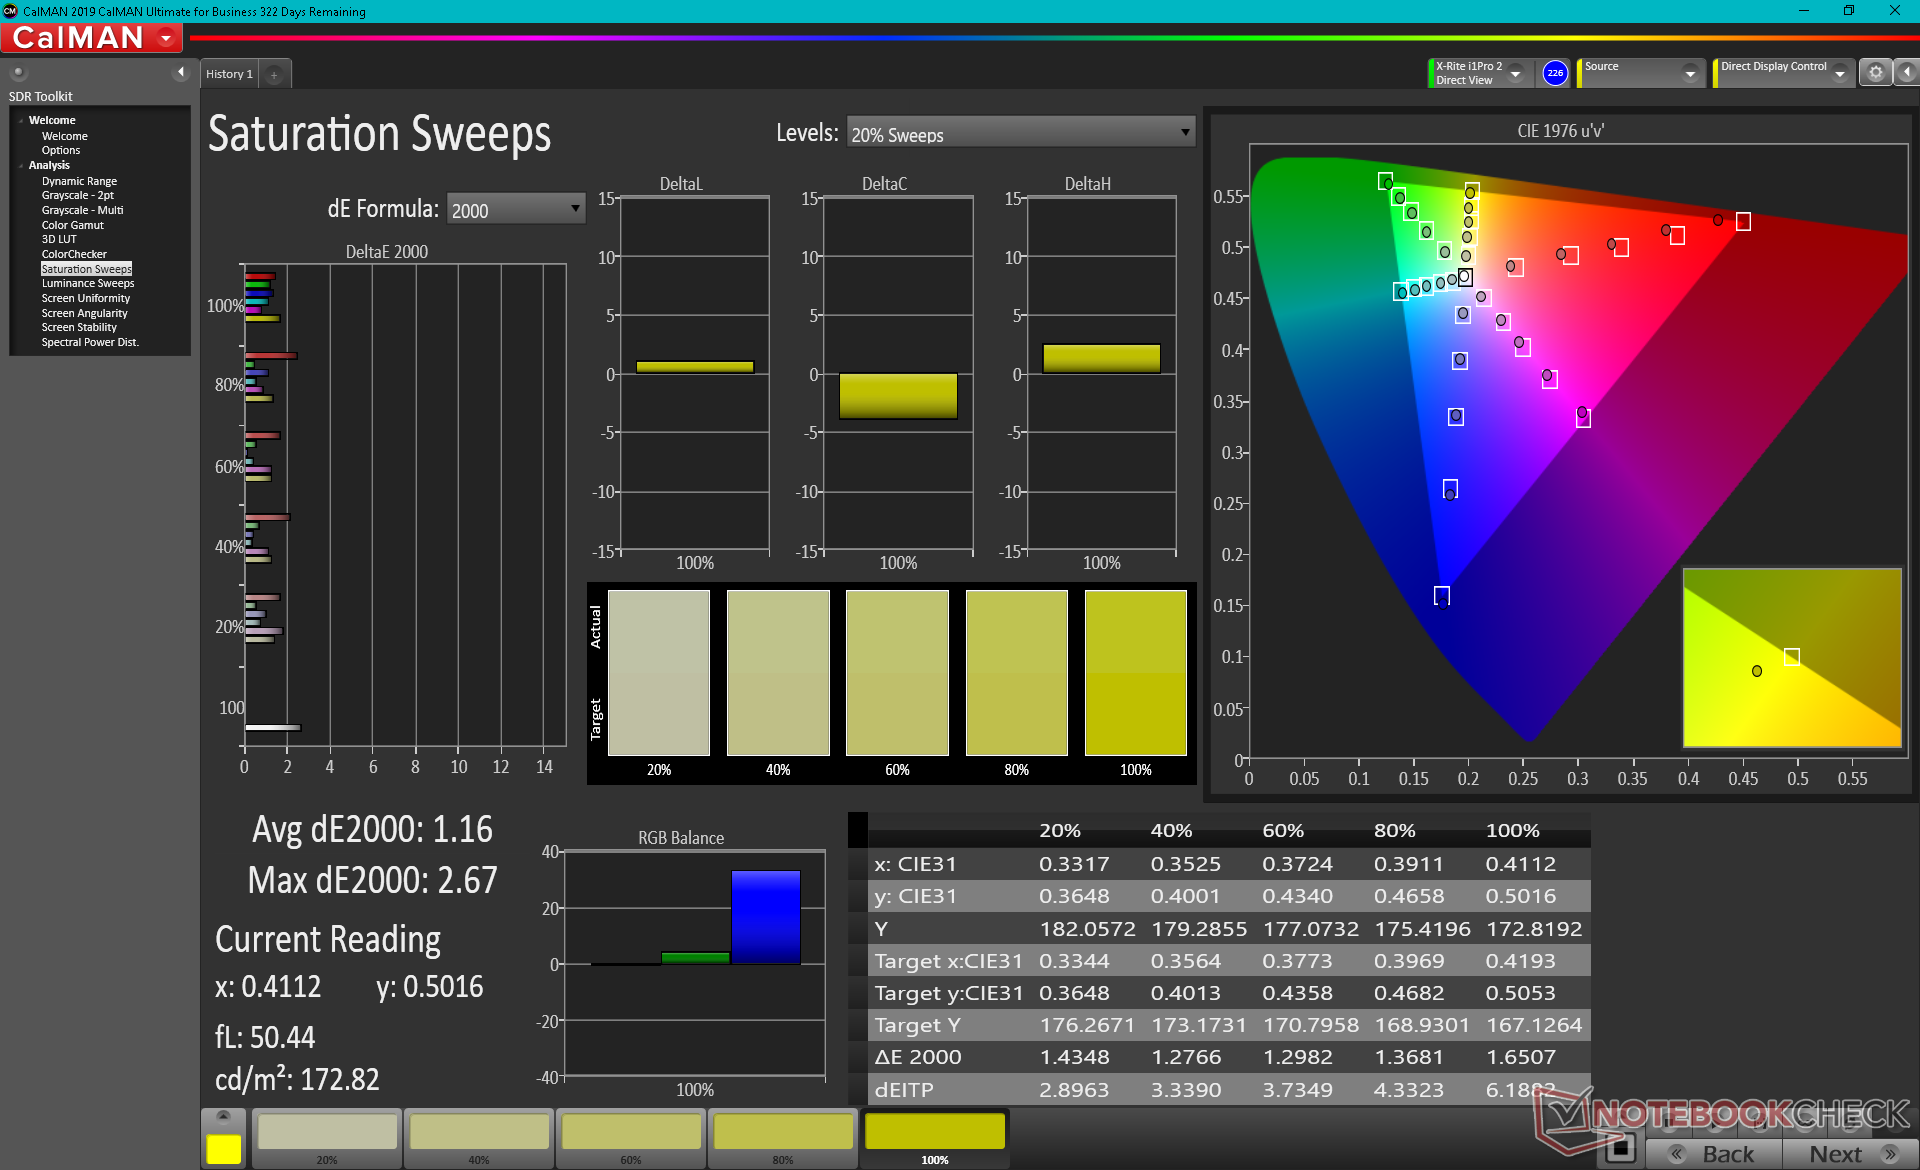
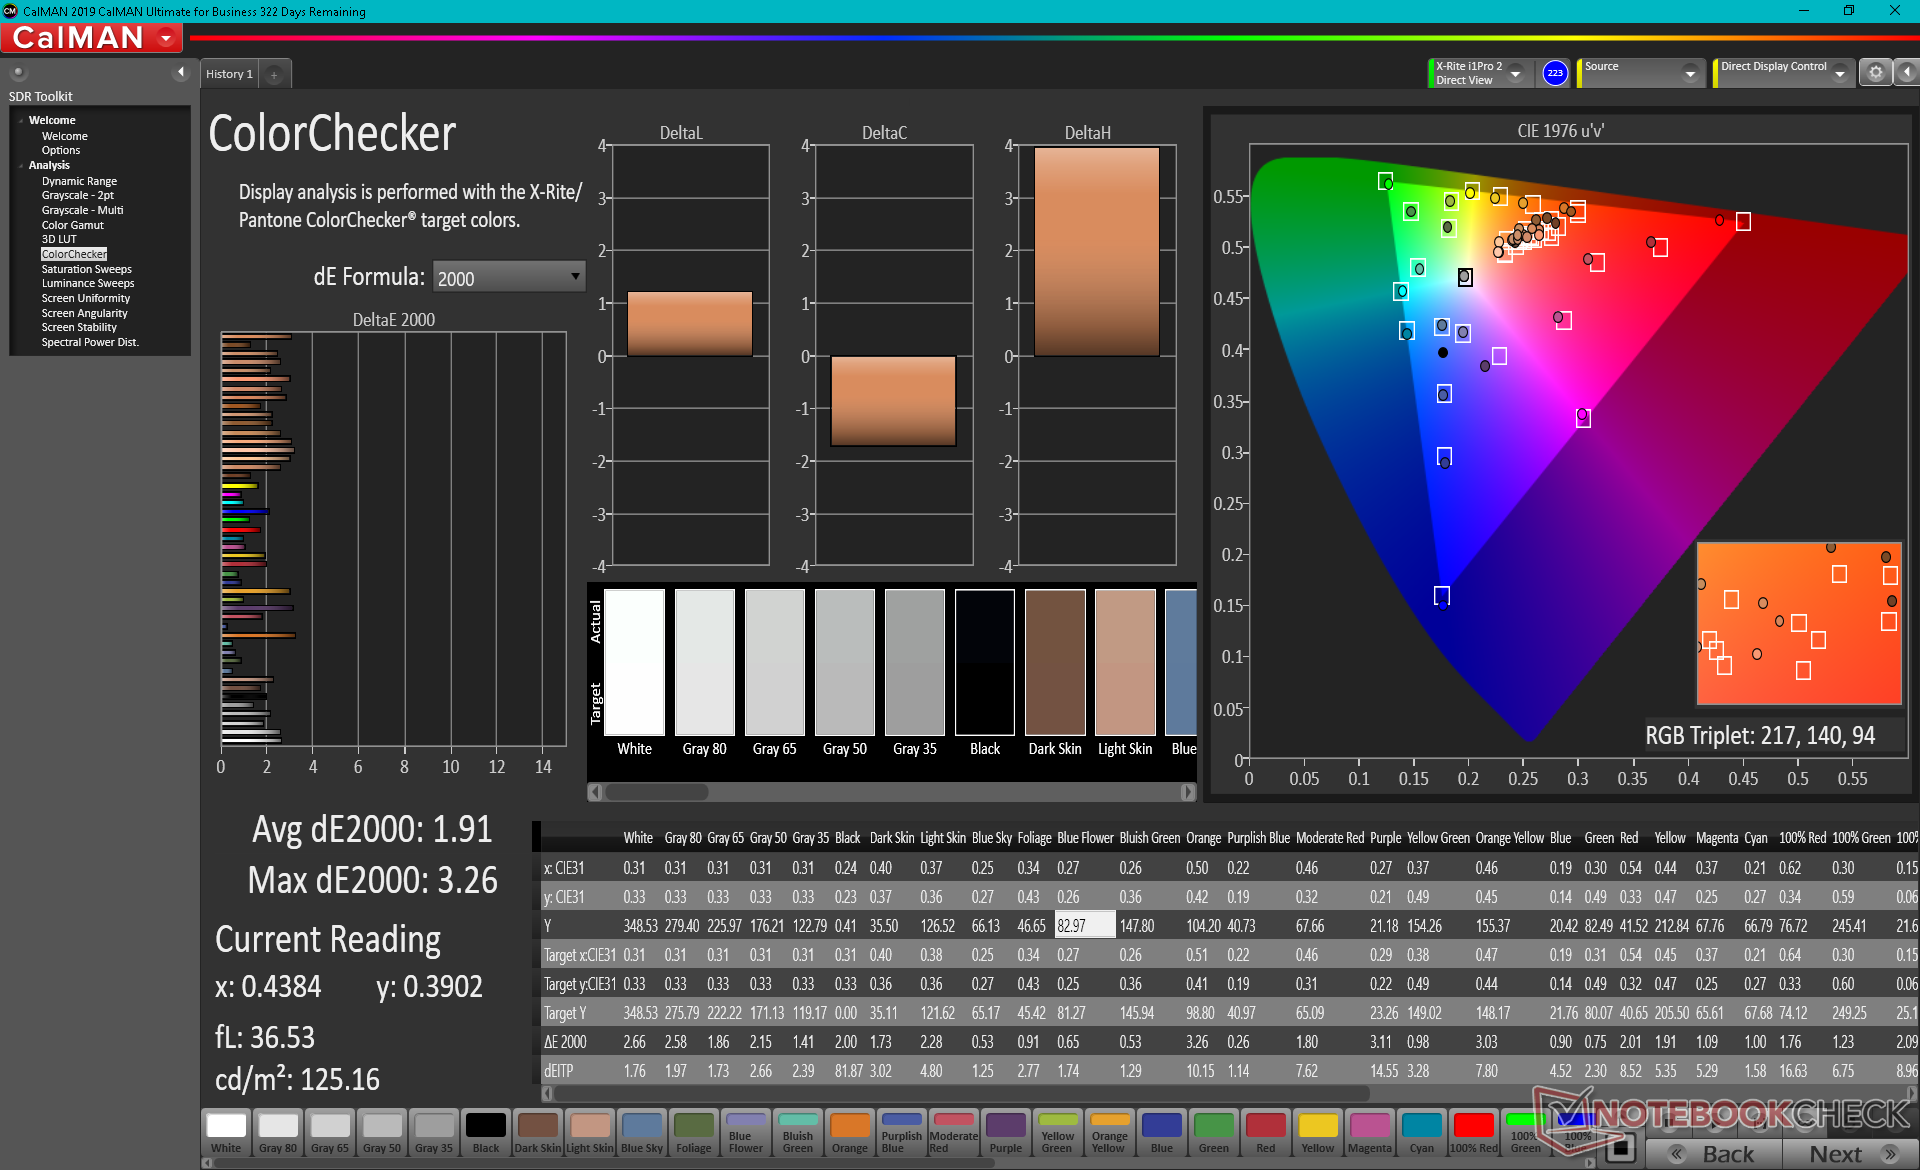
Color space covers approximately 89 percent of sRGB and 57 percent of AdobeRGB to be a bit narrower than the displays of most mid-range Ultrabooks but still much greater than low-end laptops that typically cover 60 percent of sRGB only. The deeper colors are welcomed even though the GPD isn't designed for any sort of professional editing.
X-Rite colorimeter measurements show a very poorly calibrated display out of the box to the point where even the naked eye can notice the imbalance. Color temperature in particular is far too cool for a bluish tint. Colors and grayscale improve dramatically after calibrating the panel ourselves as shown by the CalMan screenshots below. We recommend applying our calibrated ICM profile above if possible.
Display Response Times
| ↔ Response Time Black to White | ||
|---|---|---|
| 25.6 ms ... rise ↗ and fall ↘ combined | ↗ 13.6 ms rise | 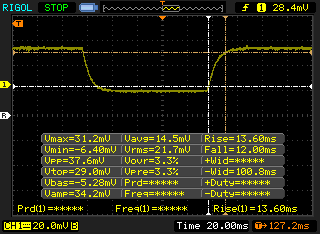 |
| ↘ 12 ms fall | ||
| The screen shows relatively slow response rates in our tests and may be too slow for gamers. In comparison, all tested devices range from 0.1 (minimum) to 240 (maximum) ms. » 61 % of all devices are better. This means that the measured response time is worse than the average of all tested devices (19.8 ms). | ||
| ↔ Response Time 50% Grey to 80% Grey | ||
| 40 ms ... rise ↗ and fall ↘ combined | ↗ 22 ms rise | 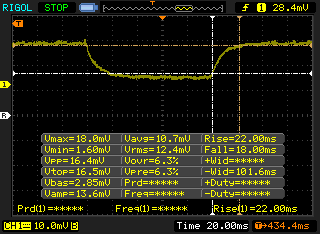 |
| ↘ 18 ms fall | ||
| The screen shows slow response rates in our tests and will be unsatisfactory for gamers. In comparison, all tested devices range from 0.165 (minimum) to 636 (maximum) ms. » 61 % of all devices are better. This means that the measured response time is worse than the average of all tested devices (30.9 ms). | ||
Screen Flickering / PWM (Pulse-Width Modulation)
| Screen flickering / PWM not detected |  | ||
In comparison: 52 % of all tested devices do not use PWM to dim the display. If PWM was detected, an average of 7744 (minimum: 5 - maximum: 343500) Hz was measured. | |||
Performance
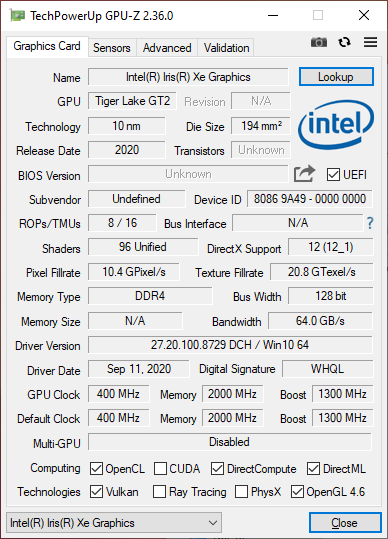
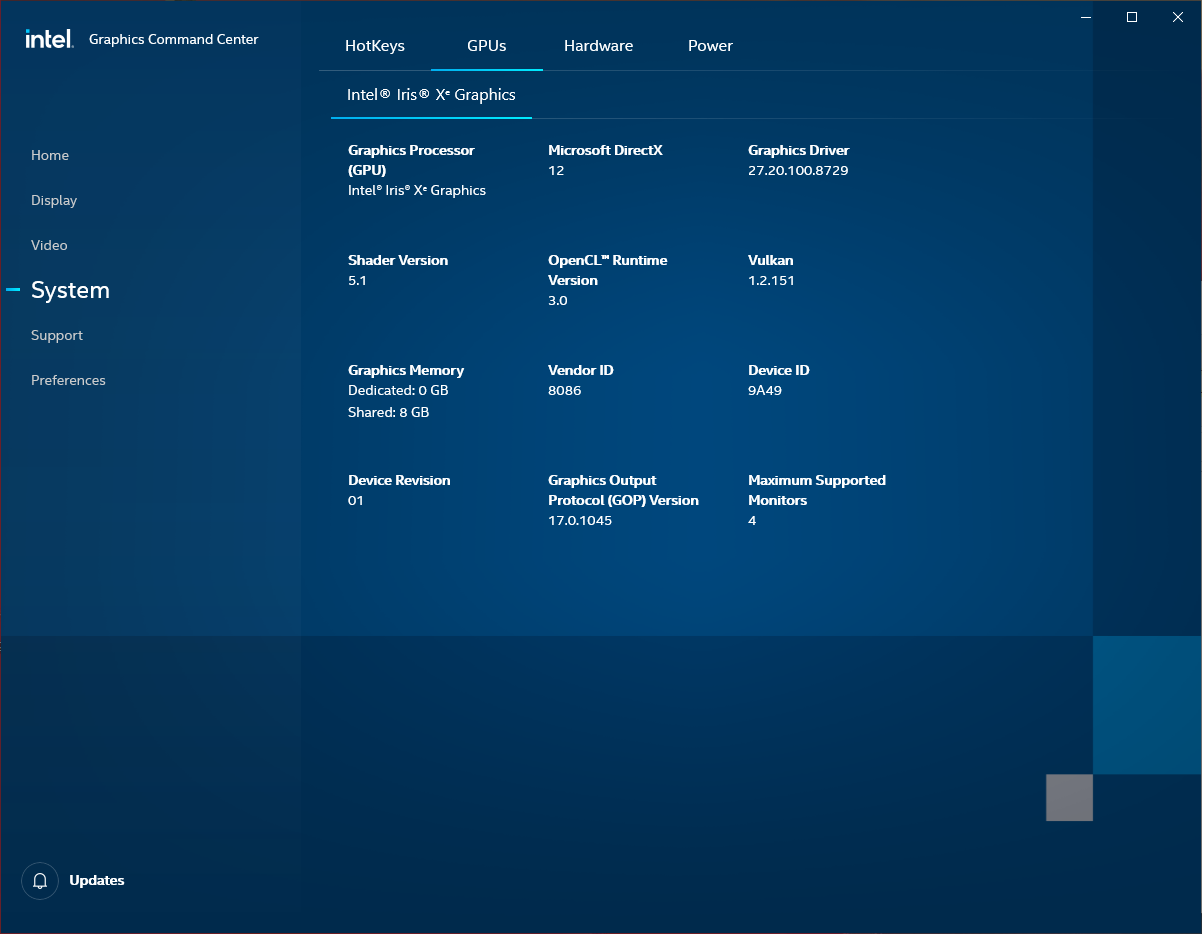
GPD offers two SKUs at the moment: one with the Core i5-1135G7 and the other with the Core i7-1165G7. The latter includes a faster Iris Xe 96EUs GPU while the former uses a slightly slower Iris Xe 80 EUs GPU. All our benchmarks reflect the Core i5 SKU.
Processor
CPU performance is excellent despite the small and portable design as benchmark results are where we expect them to be relative to laptops with the same Core i5-1135G7 CPU. Though Turbo Boost sustainability is limited, we appreciate that performance throttling isn't an issue which was our biggest fear going in to this review.
Upgrading to the more expensive Core i7-1165G7 SKU is only expected to increase raw CPU performance by just a few percentage points.
Cinebench R15: CPU Multi 64Bit | CPU Single 64Bit
Blender: v2.79 BMW27 CPU
7-Zip 18.03: 7z b 4 -mmt1 | 7z b 4
Geekbench 5.5: Single-Core | Multi-Core
HWBOT x265 Benchmark v2.2: 4k Preset
LibreOffice : 20 Documents To PDF
R Benchmark 2.5: Overall mean
| Cinebench R20 / CPU (Multi Core) | |
| Lenovo Yoga Slim 7 14ARE05 82A20008GE | |
| Razer Book 13 FHD | |
| Average Intel Core i7-1165G7 (1060 - 2657, n=81) | |
| Dell XPS 13 9310 Core i7 4K | |
| GPD Win 3 | |
| Average Intel Core i5-1135G7 (979 - 2382, n=62) | |
| Acer Swift 3 SF314-42-R27B | |
| Asus ZenBook 13 UX325JA | |
| Samsung Galaxy Book Flex 13.3 | |
| Lenovo ThinkBook 13s-20R90071GE | |
| HP Envy 13-aq0003ng | |
| Dynabook Portege A30-E-174 | |
| Cinebench R20 / CPU (Single Core) | |
| Razer Book 13 FHD | |
| Dell XPS 13 9310 Core i7 4K | |
| Average Intel Core i7-1165G7 (442 - 589, n=81) | |
| GPD Win 3 | |
| Average Intel Core i5-1135G7 (375 - 527, n=62) | |
| Lenovo Yoga Slim 7 14ARE05 82A20008GE | |
| Asus ZenBook 13 UX325JA | |
| Acer Swift 3 SF314-42-R27B | |
| Samsung Galaxy Book Flex 13.3 | |
| Lenovo ThinkBook 13s-20R90071GE | |
| Dynabook Portege A30-E-174 | |
| HP Envy 13-aq0003ng | |
| Cinebench R15 / CPU Multi 64Bit | |
| Lenovo Yoga Slim 7 14ARE05 82A20008GE | |
| Razer Book 13 FHD | |
| Dell XPS 13 9310 Core i7 4K | |
| Average Intel Core i7-1165G7 (553 - 1027, n=86) | |
| Average Intel Core i5-1135G7 (431 - 941, n=65) | |
| Asus ZenBook 13 UX325JA | |
| GPD Win 3 | |
| Lenovo ThinkBook 13s-20R90071GE | |
| Acer Swift 3 SF314-42-R27B | |
| Samsung Galaxy Book Flex 13.3 | |
| HP Envy 13-aq0003ng | |
| Dynabook Portege A30-E-174 | |
| Cinebench R15 / CPU Single 64Bit | |
| Razer Book 13 FHD | |
| Dell XPS 13 9310 Core i7 4K | |
| Average Intel Core i7-1165G7 (115 - 230, n=78) | |
| GPD Win 3 | |
| Average Intel Core i5-1135G7 (141.4 - 205, n=61) | |
| Asus ZenBook 13 UX325JA | |
| Lenovo Yoga Slim 7 14ARE05 82A20008GE | |
| HP Envy 13-aq0003ng | |
| Acer Swift 3 SF314-42-R27B | |
| Samsung Galaxy Book Flex 13.3 | |
| Lenovo ThinkBook 13s-20R90071GE | |
| Dynabook Portege A30-E-174 | |
| Blender / v2.79 BMW27 CPU | |
| Samsung Galaxy Book Flex 13.3 | |
| Asus ZenBook 13 UX325JA | |
| Acer Swift 3 SF314-42-R27B | |
| Lenovo ThinkBook 13s-20R90071GE | |
| HP Envy x360 13-ay0359ng | |
| Average Intel Core i5-1135G7 (499 - 1044, n=60) | |
| Dell XPS 13 9310 Core i7 4K | |
| GPD Win 3 | |
| Average Intel Core i7-1165G7 (468 - 1138, n=80) | |
| Razer Book 13 FHD | |
| Lenovo Yoga Slim 7 14ARE05 82A20008GE | |
| 7-Zip 18.03 / 7z b 4 -mmt1 | |
| Razer Book 13 FHD | |
| Average Intel Core i7-1165G7 (4478 - 5507, n=80) | |
| Dell XPS 13 9310 Core i7 4K | |
| GPD Win 3 | |
| Average Intel Core i5-1135G7 (3924 - 4921, n=62) | |
| Lenovo Yoga Slim 7 14ARE05 82A20008GE | |
| Asus ZenBook 13 UX325JA | |
| HP Envy x360 13-ay0359ng | |
| Samsung Galaxy Book Flex 13.3 | |
| Acer Swift 3 SF314-42-R27B | |
| Lenovo ThinkBook 13s-20R90071GE | |
| 7-Zip 18.03 / 7z b 4 | |
| Lenovo Yoga Slim 7 14ARE05 82A20008GE | |
| Razer Book 13 FHD | |
| Average Intel Core i7-1165G7 (15347 - 27405, n=80) | |
| HP Envy x360 13-ay0359ng | |
| GPD Win 3 | |
| Average Intel Core i5-1135G7 (14745 - 24873, n=62) | |
| Dell XPS 13 9310 Core i7 4K | |
| Lenovo ThinkBook 13s-20R90071GE | |
| Acer Swift 3 SF314-42-R27B | |
| Asus ZenBook 13 UX325JA | |
| Samsung Galaxy Book Flex 13.3 | |
| Geekbench 5.5 / Single-Core | |
| Razer Book 13 FHD | |
| Dell XPS 13 9310 Core i7 4K | |
| Average Intel Core i7-1165G7 (1302 - 1595, n=77) | |
| GPD Win 3 | |
| Average Intel Core i5-1135G7 (1147 - 1428, n=58) | |
| Asus ZenBook 13 UX325JA | |
| Samsung Galaxy Book Flex 13.3 | |
| Lenovo Yoga Slim 7 14ARE05 82A20008GE | |
| Acer Swift 3 SF314-42-R27B | |
| Geekbench 5.5 / Multi-Core | |
| Lenovo Yoga Slim 7 14ARE05 82A20008GE | |
| Razer Book 13 FHD | |
| Dell XPS 13 9310 Core i7 4K | |
| Average Intel Core i7-1165G7 (3078 - 5926, n=77) | |
| GPD Win 3 | |
| Average Intel Core i5-1135G7 (3475 - 5472, n=58) | |
| Asus ZenBook 13 UX325JA | |
| Samsung Galaxy Book Flex 13.3 | |
| Acer Swift 3 SF314-42-R27B | |
| HWBOT x265 Benchmark v2.2 / 4k Preset | |
| Lenovo Yoga Slim 7 14ARE05 82A20008GE | |
| Razer Book 13 FHD | |
| Average Intel Core i7-1165G7 (1.39 - 8.47, n=80) | |
| GPD Win 3 | |
| HP Envy x360 13-ay0359ng | |
| Average Intel Core i5-1135G7 (3.57 - 7.6, n=57) | |
| Dell XPS 13 9310 Core i7 4K | |
| Lenovo ThinkBook 13s-20R90071GE | |
| Acer Swift 3 SF314-42-R27B | |
| Asus ZenBook 13 UX325JA | |
| Samsung Galaxy Book Flex 13.3 | |
| LibreOffice / 20 Documents To PDF | |
| HP Envy x360 13-ay0359ng | |
| Lenovo Yoga Slim 7 14ARE05 82A20008GE | |
| Acer Swift 3 SF314-42-R27B | |
| Samsung Galaxy Book Flex 13.3 | |
| Average Intel Core i5-1135G7 (44.2 - 62.9, n=60) | |
| Asus ZenBook 13 UX325JA | |
| Razer Book 13 FHD | |
| Average Intel Core i7-1165G7 (21.5 - 88.1, n=78) | |
| GPD Win 3 | |
| Dell XPS 13 9310 Core i7 4K | |
| R Benchmark 2.5 / Overall mean | |
| Samsung Galaxy Book Flex 13.3 | |
| Acer Swift 3 SF314-42-R27B | |
| Asus ZenBook 13 UX325JA | |
| Average Intel Core i5-1135G7 (0.619 - 0.727, n=59) | |
| HP Envy x360 13-ay0359ng | |
| GPD Win 3 | |
| Lenovo Yoga Slim 7 14ARE05 82A20008GE | |
| Dell XPS 13 9310 Core i7 4K | |
| Average Intel Core i7-1165G7 (0.552 - 1.002, n=80) | |
| Razer Book 13 FHD | |
* ... smaller is better
System Performance
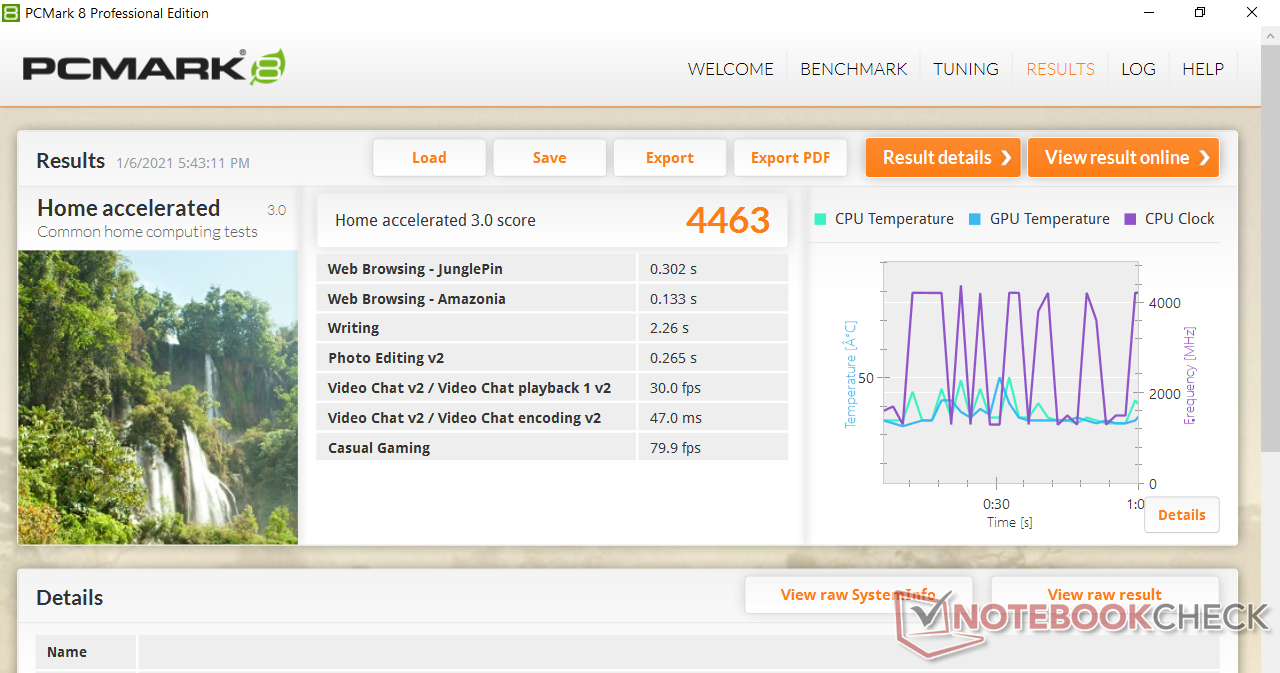
| PCMark 8 Home Score Accelerated v2 | 4463 points | |
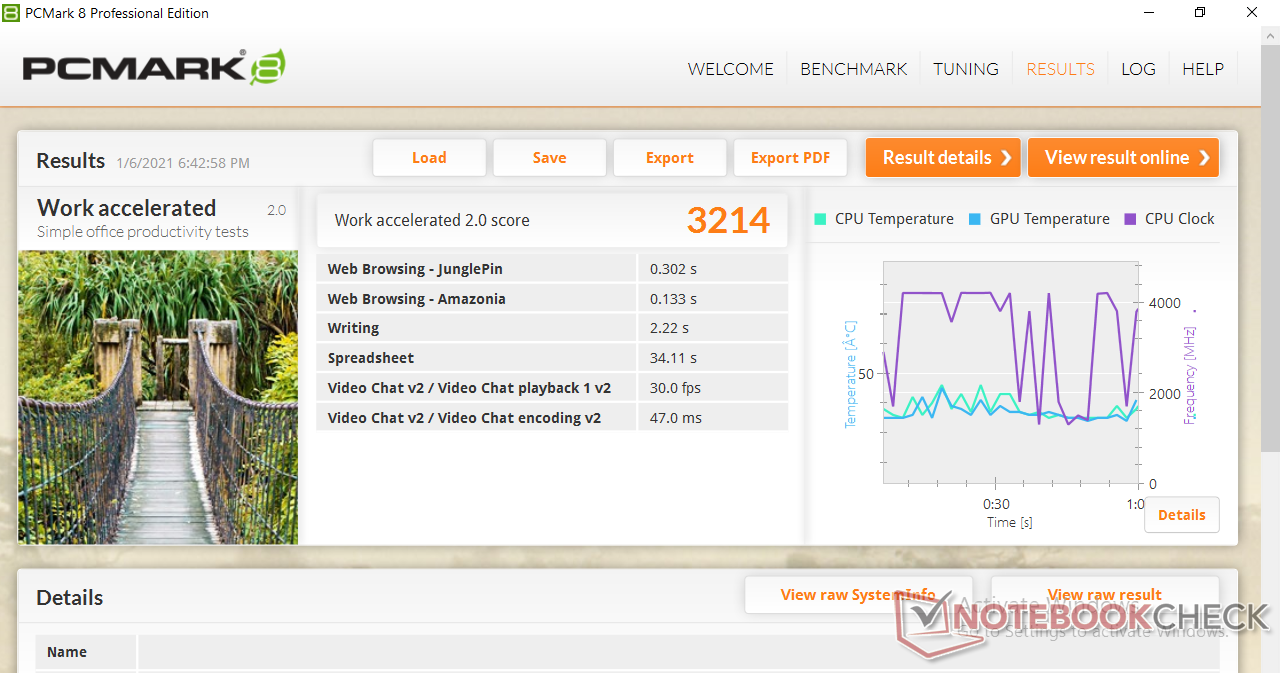
| PCMark 8 Work Score Accelerated v2 | 3214 points | |
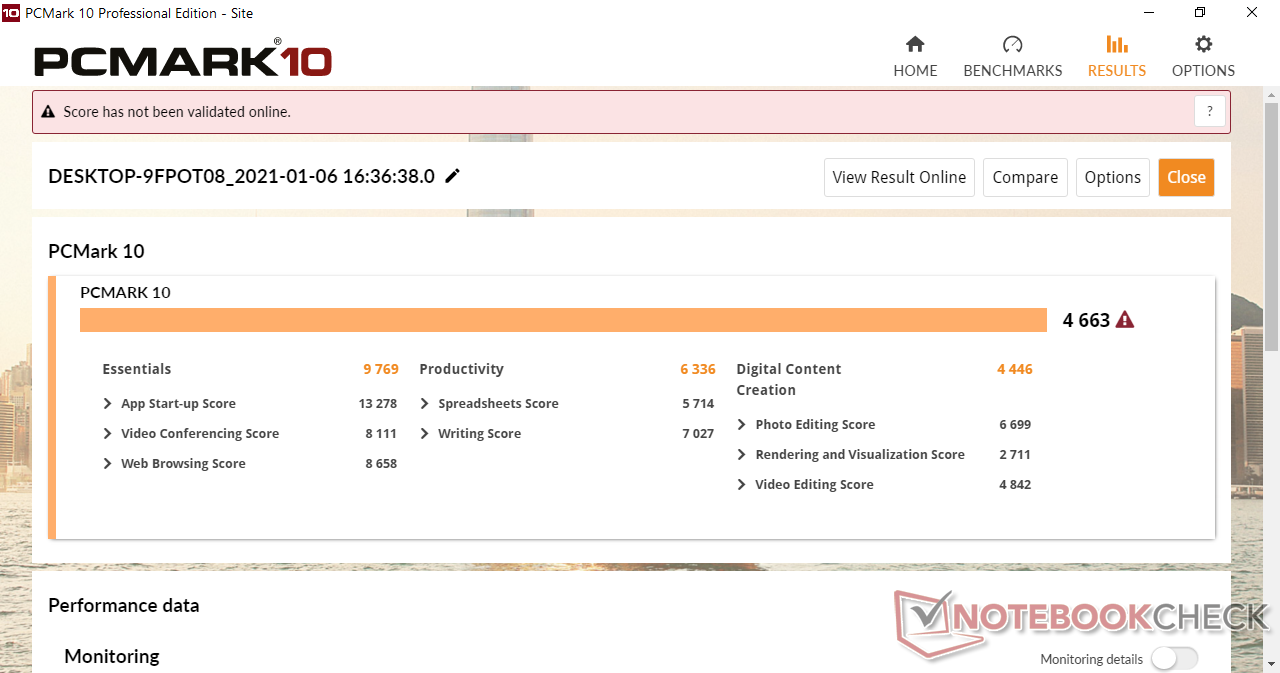
| PCMark 10 Score | 4663 points | |
Help | ||
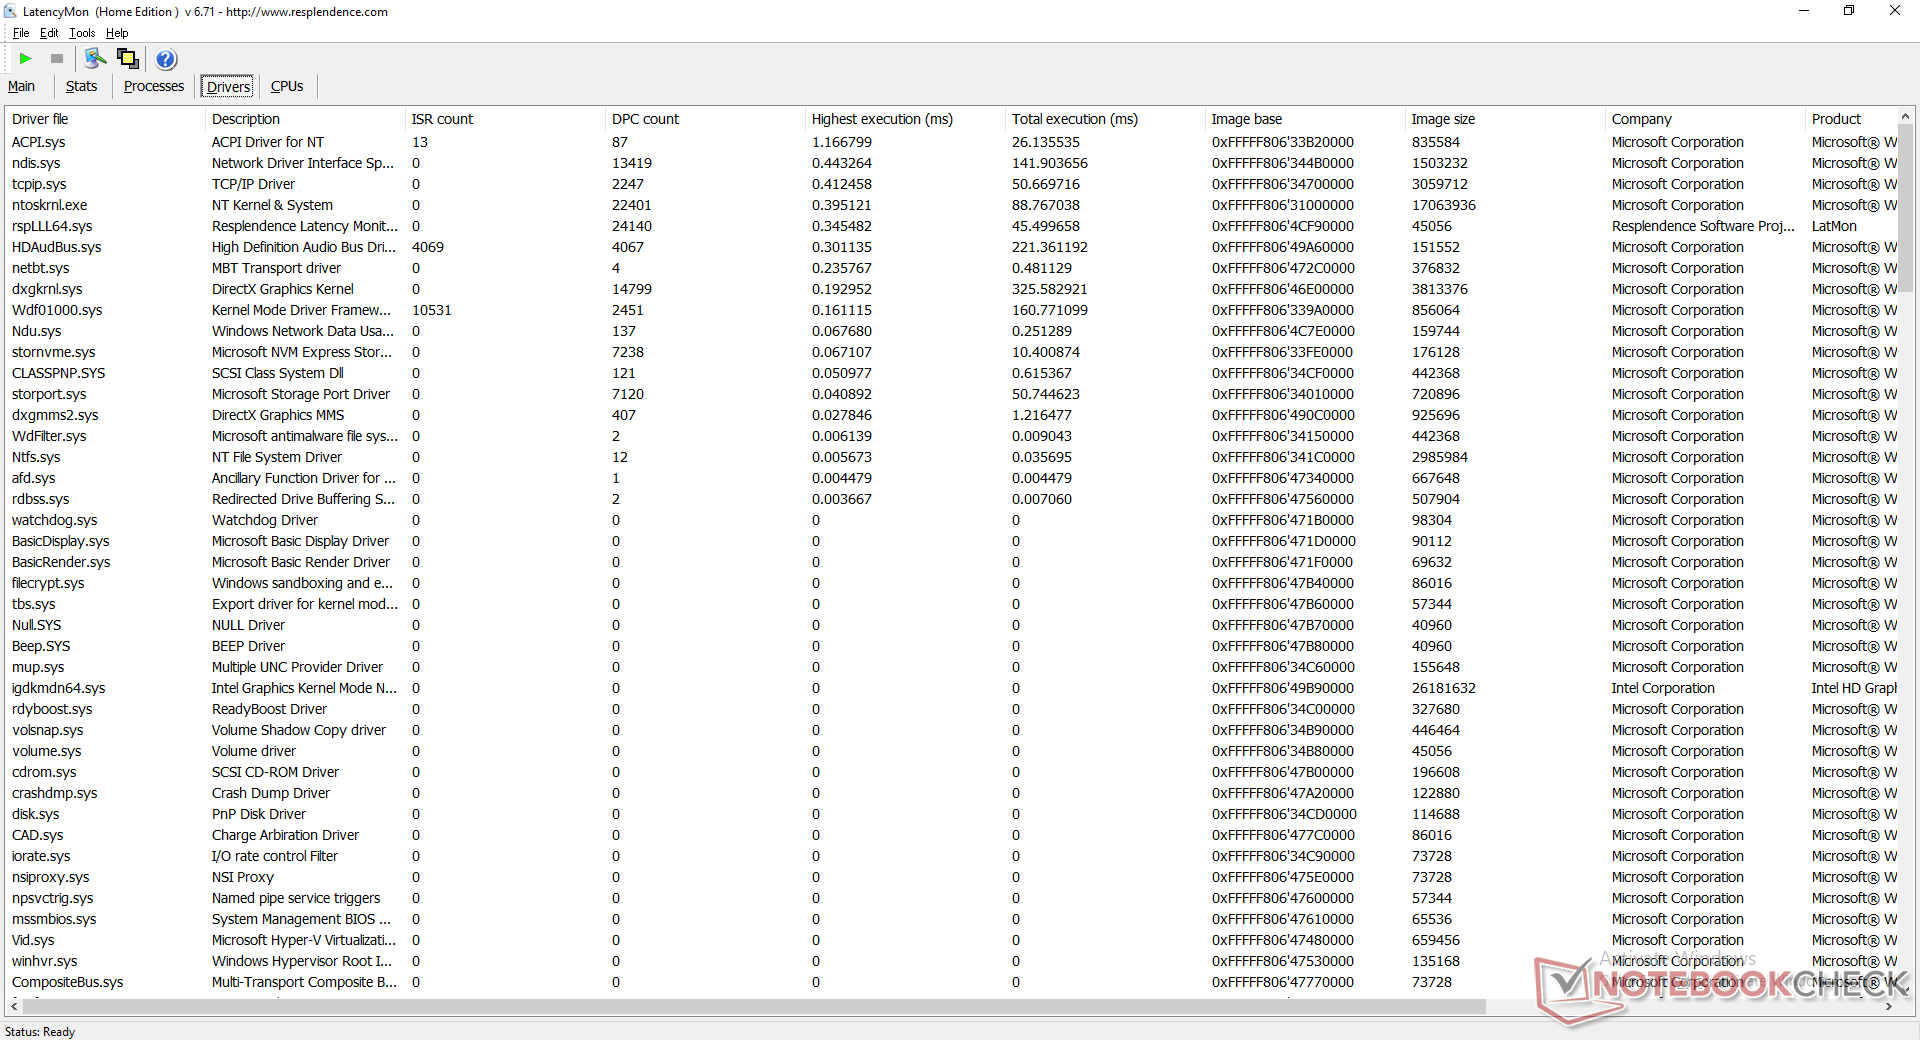
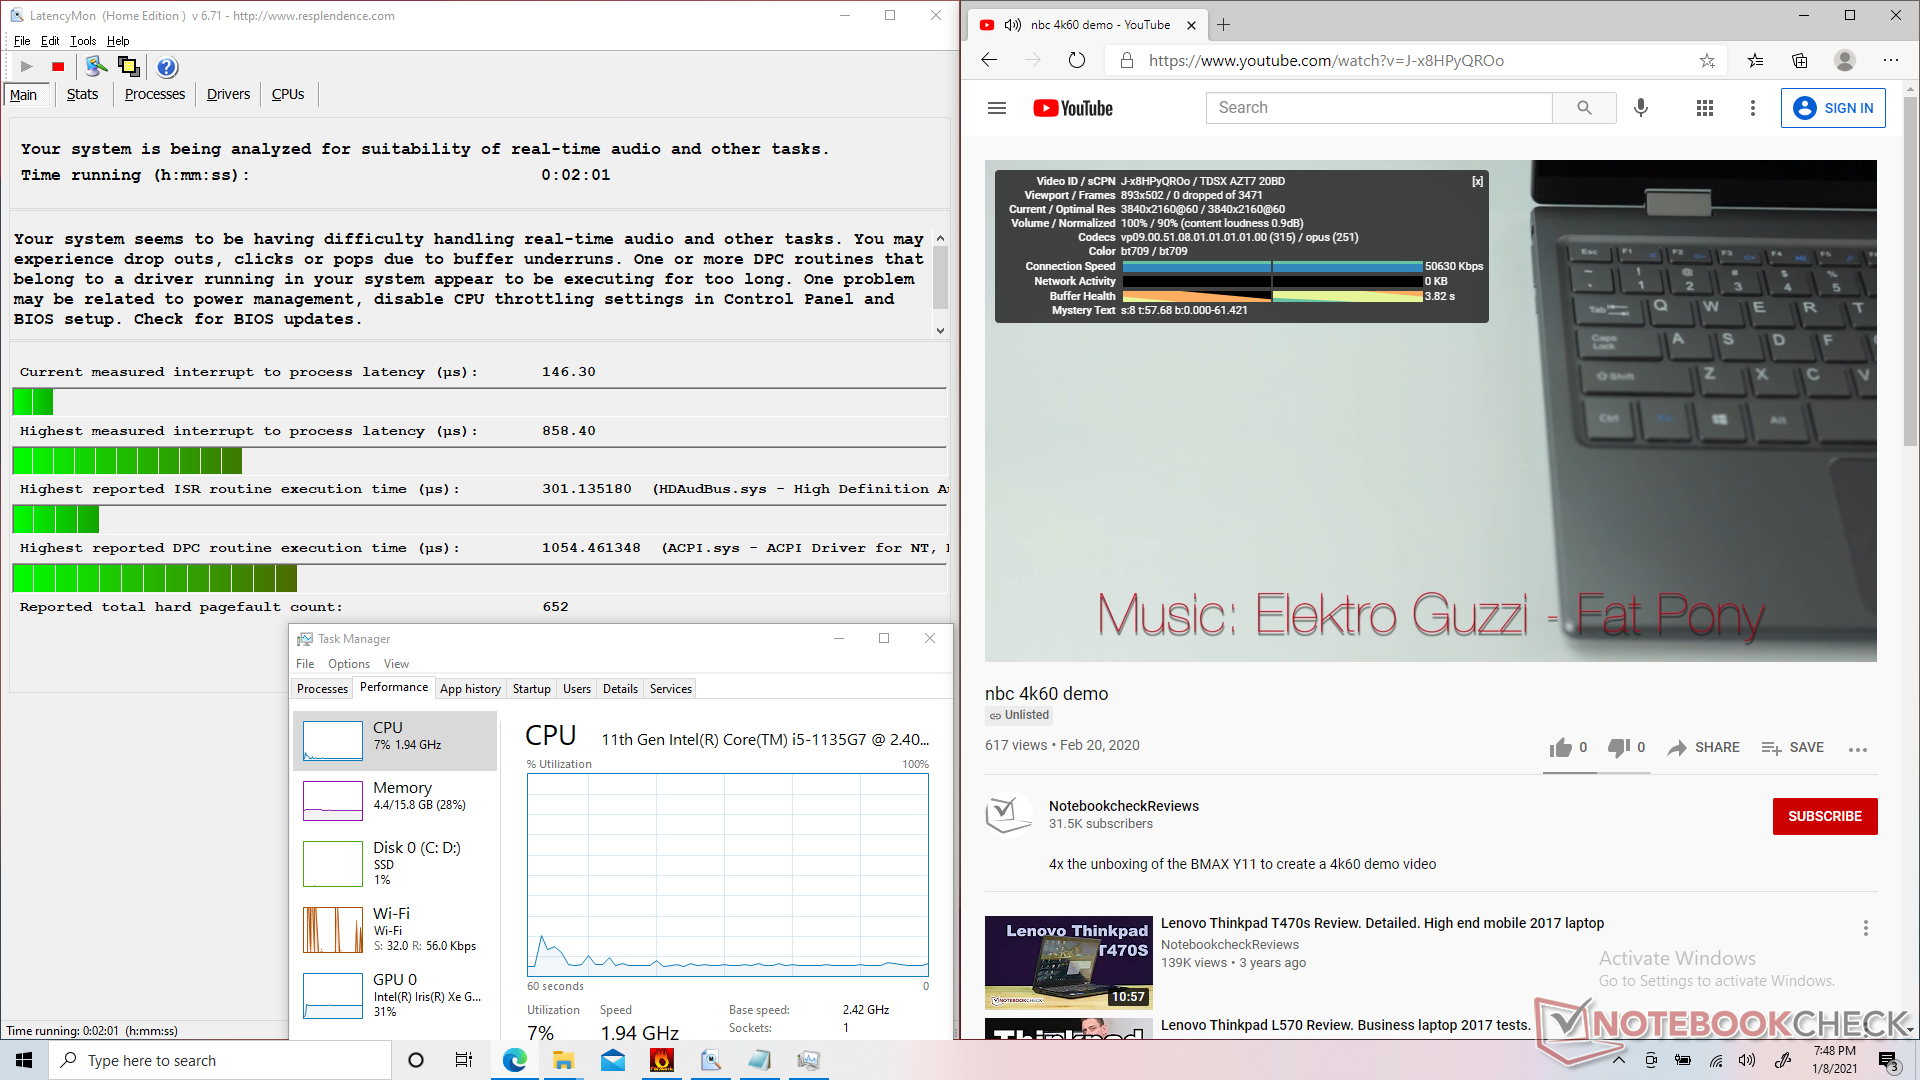
DPC Latency
LatencyMon shows DPC latency issues related to ACPI.sys when opening multiple browser tabs on our home page. 4K UHD video playback at 60 FPS is otherwise smooth and with no dropped frames during our minute-long YouTube test.
| DPC Latencies / LatencyMon - interrupt to process latency (max), Web, Youtube, Prime95 | |
| Asus ZenBook 13 UX325JA | |
| Razer Book 13 FHD | |
| Dell XPS 13 9310 Core i7 4K | |
| Lenovo Yoga 9i 14ITL5 | |
| Dell XPS 13 9310 Core i7 FHD | |
| Samsung Galaxy Book Flex 13.3 | |
| GPD Win 3 | |
| Lenovo ThinkBook 13s-ITL-20V90003GE | |
| Acer Swift 3 SF314-42-R27B | |
| Lenovo Yoga 7 14ITL5 | |
* ... smaller is better
Storage Devices
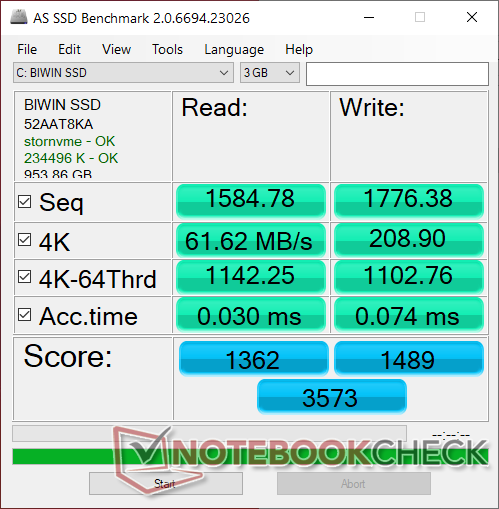
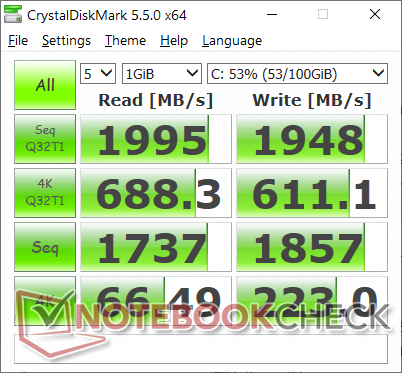
A roomy 1 TB M.2 2280 SSD comes standard for storing all those inevitable games. Instead of the usual Samsung, SK Hynix, Micron, or Western Digital SSD, however, the GPD uses BIWIN drives. Transfer rates are still excellent with sequential read and write rates of about 2000 MB/s according to our own tests.
| GPD Win 3 BIWIN NS200 1TB CNF82GS1G02-1TB | Dell XPS 13 9310 Core i7 FHD Micron 2300 512GB MTFDHBA512TDV | HP Spectre x360 13-aw0013dx Intel Optane Memory H10 with Solid State Storage 32GB + 512GB HBRPEKNX0202A(L/H) | Asus ZenBook 13 UX325JA Intel SSD 660p 1TB SSDPEKNW010T8 | Microsoft Surface Laptop 3 13 Core i5-1035G7 SK hynix BC501 HFM256GDGTNG | |
|---|---|---|---|---|---|
| AS SSD | -38% | -54% | -40% | -53% | |
| Seq Read (MB/s) | 1585 | 2091 32% | 1039 -34% | 1587 0% | 1387 -12% |
| Seq Write (MB/s) | 1776 | 1396 -21% | 310.1 -83% | 938 -47% | 504 -72% |
| 4K Read (MB/s) | 61.6 | 49.29 -20% | 76 23% | 51 -17% | 42.35 -31% |
| 4K Write (MB/s) | 208.9 | 104.2 -50% | 118 -44% | 141.9 -32% | 120 -43% |
| 4K-64 Read (MB/s) | 1142 | 827 -28% | 371.8 -67% | 576 -50% | 497.4 -56% |
| 4K-64 Write (MB/s) | 1103 | 1636 48% | 469.5 -57% | 584 -47% | 354.9 -68% |
| Access Time Read * (ms) | 0.03 | 0.066 -120% | 0.067 -123% | 0.083 -177% | 0.055 -83% |
| Access Time Write * (ms) | 0.074 | 0.365 -393% | 0.138 -86% | 0.04 46% | 0.093 -26% |
| Score Read (Points) | 1362 | 1086 -20% | 552 -59% | 785 -42% | 678 -50% |
| Score Write (Points) | 1489 | 1880 26% | 618 -58% | 820 -45% | 525 -65% |
| Score Total (Points) | 3573 | 3499 -2% | 1448 -59% | 1990 -44% | 1520 -57% |
| Copy ISO MB/s (MB/s) | 1741 | 1544 -11% | 764 -56% | 1311 -25% | 764 -56% |
| Copy Program MB/s (MB/s) | 543 | 613 13% | 465.8 -14% | 310.3 -43% | 256.1 -53% |
| Copy Game MB/s (MB/s) | 1318 | 1451 10% | 764 -42% | 801 -39% | 368.4 -72% |
| CrystalDiskMark 5.2 / 6 | -4% | -20% | -25% | -42% | |
| Write 4K (MB/s) | 223 | 97.5 -56% | 112.6 -50% | 139.7 -37% | 112.3 -50% |
| Read 4K (MB/s) | 66.5 | 50.9 -23% | 131 97% | 56.4 -15% | 42.13 -37% |
| Write Seq (MB/s) | 1857 | 1811 -2% | 458.9 -75% | 1265 -32% | 630 -66% |
| Read Seq (MB/s) | 1737 | 1836 6% | 1355 -22% | 1492 -14% | 1023 -41% |
| Write 4K Q32T1 (MB/s) | 611 | 521 -15% | 341.3 -44% | 402.5 -34% | 336.6 -45% |
| Read 4K Q32T1 (MB/s) | 688 | 357.5 -48% | 320.6 -53% | 329.3 -52% | 399.6 -42% |
| Write Seq Q32T1 (MB/s) | 1948 | 2879 48% | 1219 -37% | 1786 -8% | 821 -58% |
| Read Seq Q32T1 (MB/s) | 1995 | 3204 61% | 2462 23% | 1923 -4% | 2030 2% |
| Total Average (Program / Settings) | -21% /
-26% | -37% /
-42% | -33% /
-34% | -48% /
-49% |
* ... smaller is better

Disk Throttling: DiskSpd Read Loop, Queue Depth 8
GPU Performance
Gaming performance is generally close to the GeForce MX250 albeit with some exceptions where the Iris Xe can fall behind much further. However, users will be running most games at 720p anyway which is where the Win 3 really shines. We highly recommend enabling v-sync whenever possible as screen tearing is rampant. It's very unfortunate that the integrated display does not support adaptive sync.
The integrated controller is automatically recognized as an XBox controller when launching Steam games. It would have been nice to be able to quickly spoof the controller into a PS4 DualShock for quick compatibility with Sony Remote Play.
See our dedicated pages on the Iris Xe 80 EUs and Iris Xe 96 EUs for additional benchmarks. In short, most games run well and look sharp on the small native 720p display.
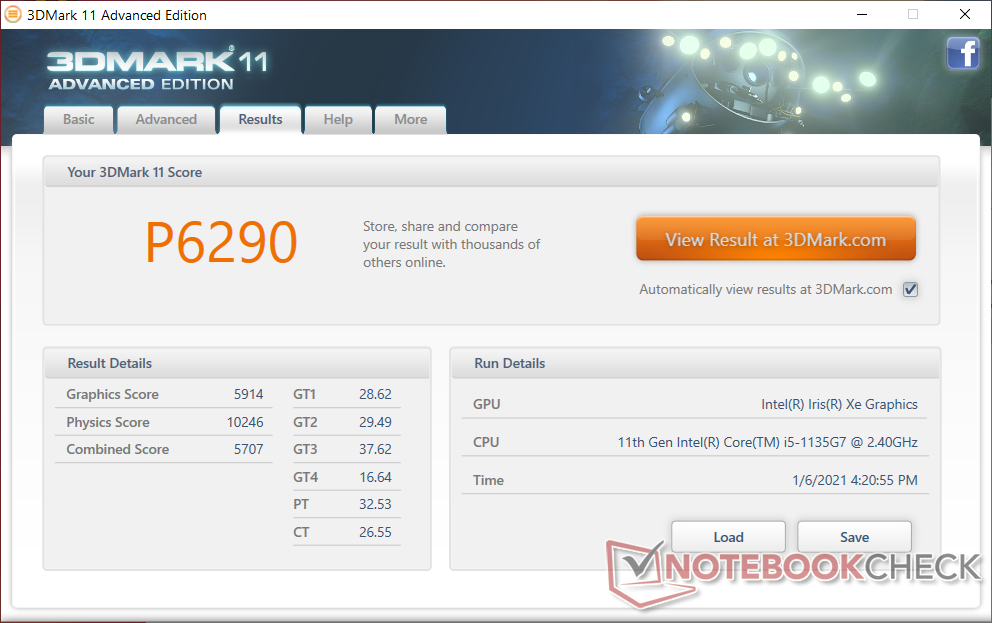

| 3DMark 11 Performance | 6290 points | |
| 3DMark Cloud Gate Standard Score | 18709 points | |
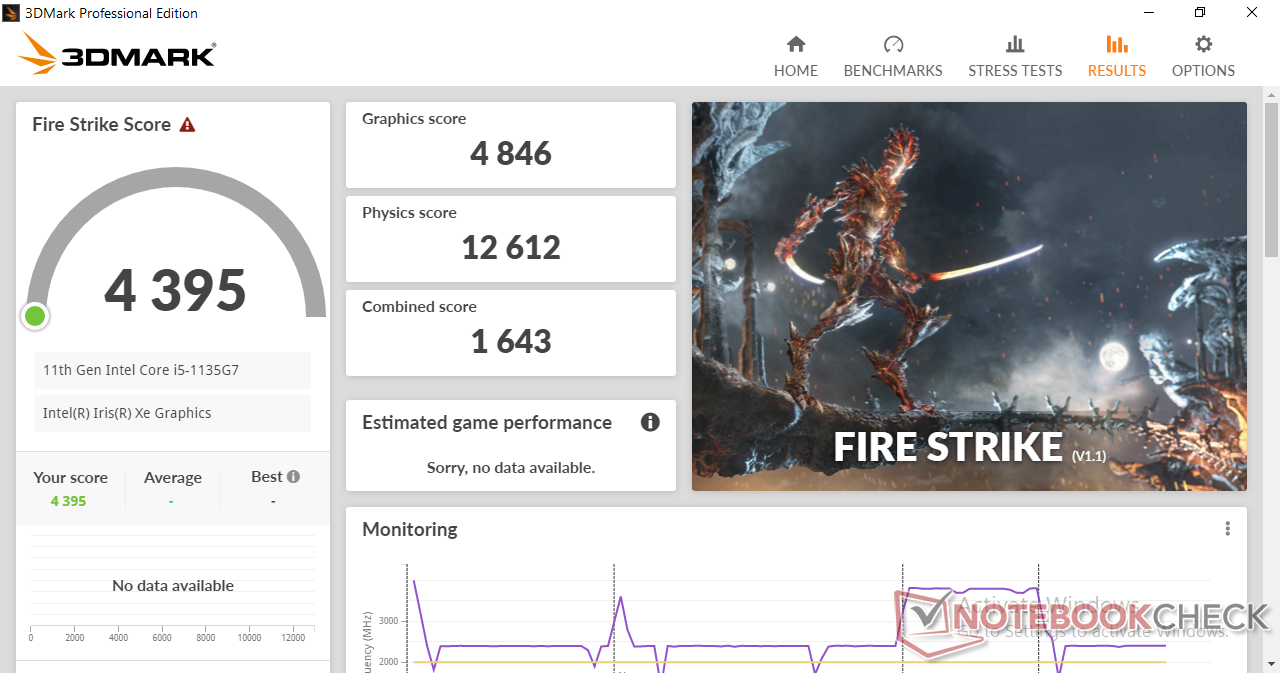
| 3DMark Fire Strike Score | 4395 points | |
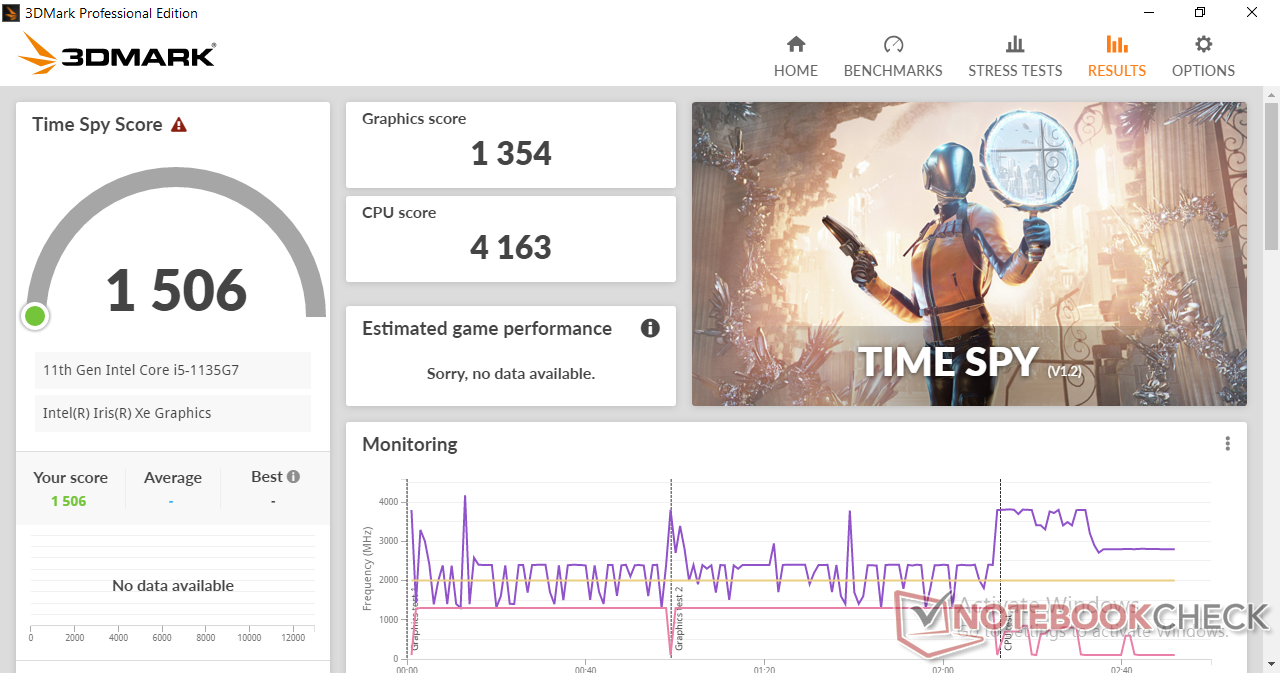
| 3DMark Time Spy Score | 1506 points | |
Help | ||
| low | med. | high | ultra | |
|---|---|---|---|---|
| GTA V (2015) | 73.6 | 60.9 | 23.5 | |
| The Witcher 3 (2015) | 90.6 | 55.6 | 31.7 | 14.1 |
| Dota 2 Reborn (2015) | 81.4 | 64.2 | 44.3 | 44.2 |
| Final Fantasy XV Benchmark (2018) | 38.9 | 21 | 16.5 | |
| X-Plane 11.11 (2018) | 26.6 | 35.6 | 31.6 | |
| Strange Brigade (2018) | 87.7 | 36.2 | 28 | 22.8 |
Emissions
System Noise
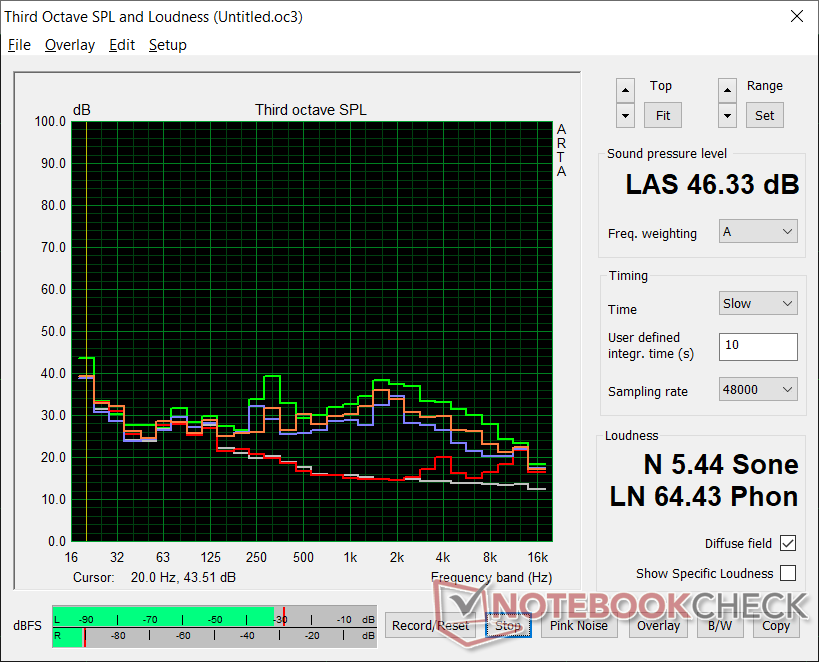
The internal fan is quiet when under low loads but will occasionally rise to 34.9 dB(A) against a background of 27.4 dB(A) if web browsing or video streaming. RPM changes are thankfully steady instead of abrupt to not be vexing.
Higher loads like gaming will bump fan noise up to the 42 to 46 dB(A) range to be louder than most Ultrabooks powered by similar U-series CPUs. This is indubitably louder than the Switch and enough to be noticeable in quiet rooms or lecture halls. In public areas like buses or trains, however, the fan isn't bothersome at all.
| GPD Win 3 Iris Xe G7 80EUs, i5-1135G7, BIWIN NS200 1TB CNF82GS1G02-1TB | Dell XPS 13 9310 Core i7 FHD Iris Xe G7 96EUs, i7-1165G7, Micron 2300 512GB MTFDHBA512TDV | HP Spectre x360 13-aw0013dx Iris Plus Graphics G7 (Ice Lake 64 EU), i7-1065G7, Intel Optane Memory H10 with Solid State Storage 32GB + 512GB HBRPEKNX0202A(L/H) | Asus ZenBook 13 UX325JA Iris Plus Graphics G7 (Ice Lake 64 EU), i7-1065G7, Intel SSD 660p 1TB SSDPEKNW010T8 | Microsoft Surface Laptop 3 13 Core i5-1035G7 Iris Plus Graphics G7 (Ice Lake 64 EU), i5-1035G7, SK hynix BC501 HFM256GDGTNG | |
|---|---|---|---|---|---|
| Noise | 16% | 11% | 4% | 7% | |
| off / environment * (dB) | 27.4 | 25.7 6% | 28.5 -4% | 30.1 -10% | 28.5 -4% |
| Idle Minimum * (dB) | 29.1 | 25.7 12% | 28.5 2% | 30.1 -3% | 28.5 2% |
| Idle Average * (dB) | 29.1 | 25.7 12% | 28.5 2% | 30.1 -3% | 28.5 2% |
| Idle Maximum * (dB) | 29.1 | 25.9 11% | 28.5 2% | 30.1 -3% | 28.5 2% |
| Load Average * (dB) | 40.7 | 26.2 36% | 28.5 30% | 32.7 20% | 28.5 30% |
| Witcher 3 ultra * (dB) | 42.8 | 36.5 15% | 35.3 18% | 38.6 10% | 40.4 6% |
| Load Maximum * (dB) | 46.3 | 36.6 21% | 35.3 24% | 38.5 17% | 40.4 13% |
* ... smaller is better
Noise level
| Idle |
| 29.1 / 29.1 / 29.1 dB(A) |
| Load |
| 40.7 / 46.3 dB(A) |
 | ||
30 dB silent 40 dB(A) audible 50 dB(A) loud |
||
min: | ||
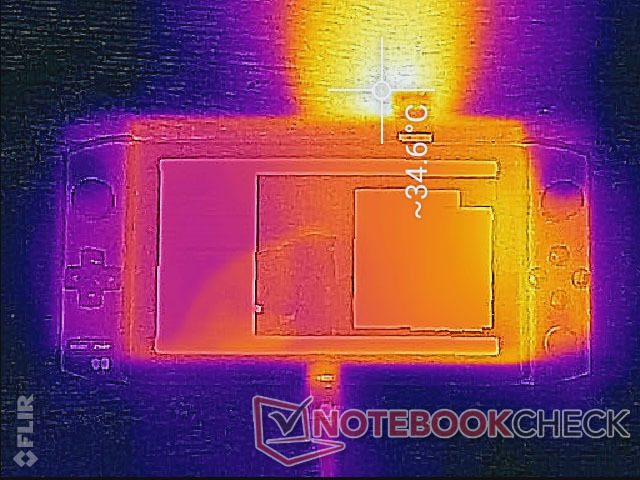
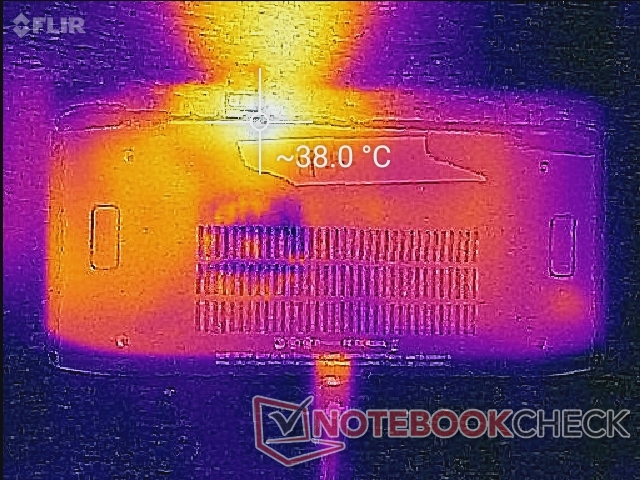
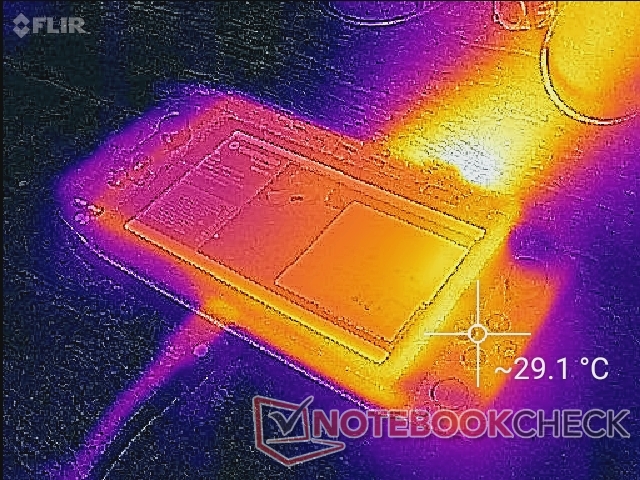
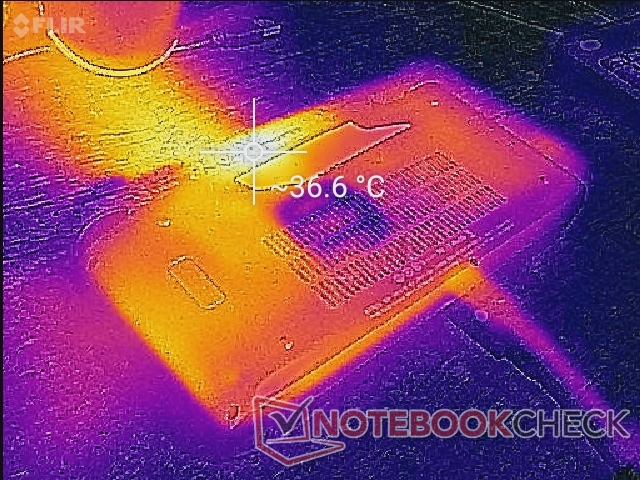
Temperature
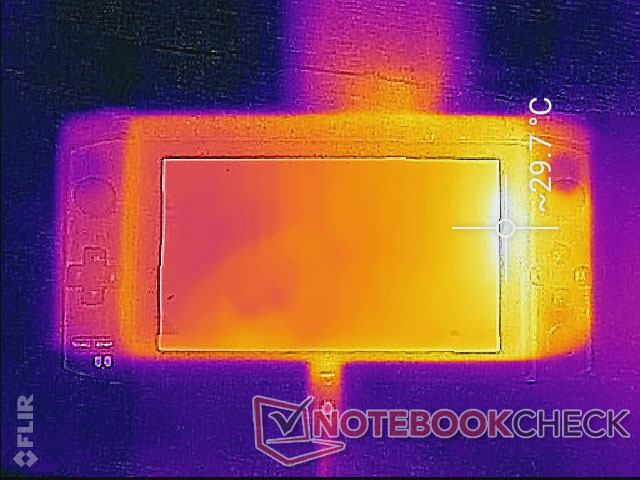
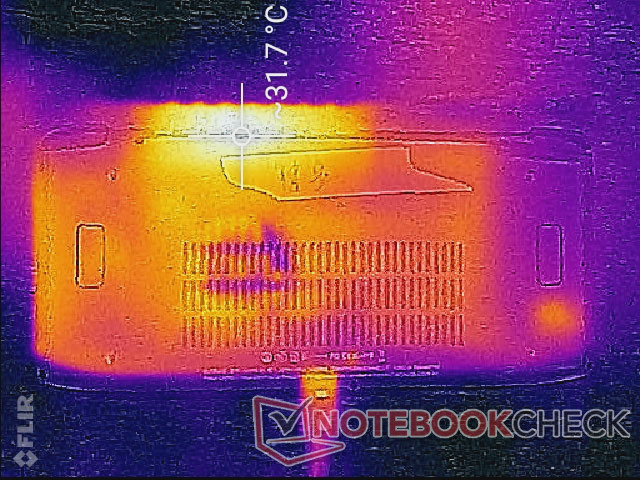
Surface temperatures are never uncomfortable. The hot spot is closest to the ventilation grilles along the top where it can reach 38 C when under load, but users won't be touching this area when gaming.
Stress Test
Running Prime95 to stress the CPU would cause clock rates to spike to 3 GHz for about 30 seconds with temperatures plateauing at 67 C. Afterwards, clock rates would settle at about 2.7 GHz for a slightly cooler core temperature of 62 C. Core temperature would also remain stable at 62 C when gaming which is similar to what we've observed on some Ultrabooks including the Razer Blade Stealth.
Running on battery will not significantly impact performance. A 3DMark 11 test on batteries would return Physics and Graphics scores of 10374 and 5766 points compared to 10246 and 5916 points when on mains.
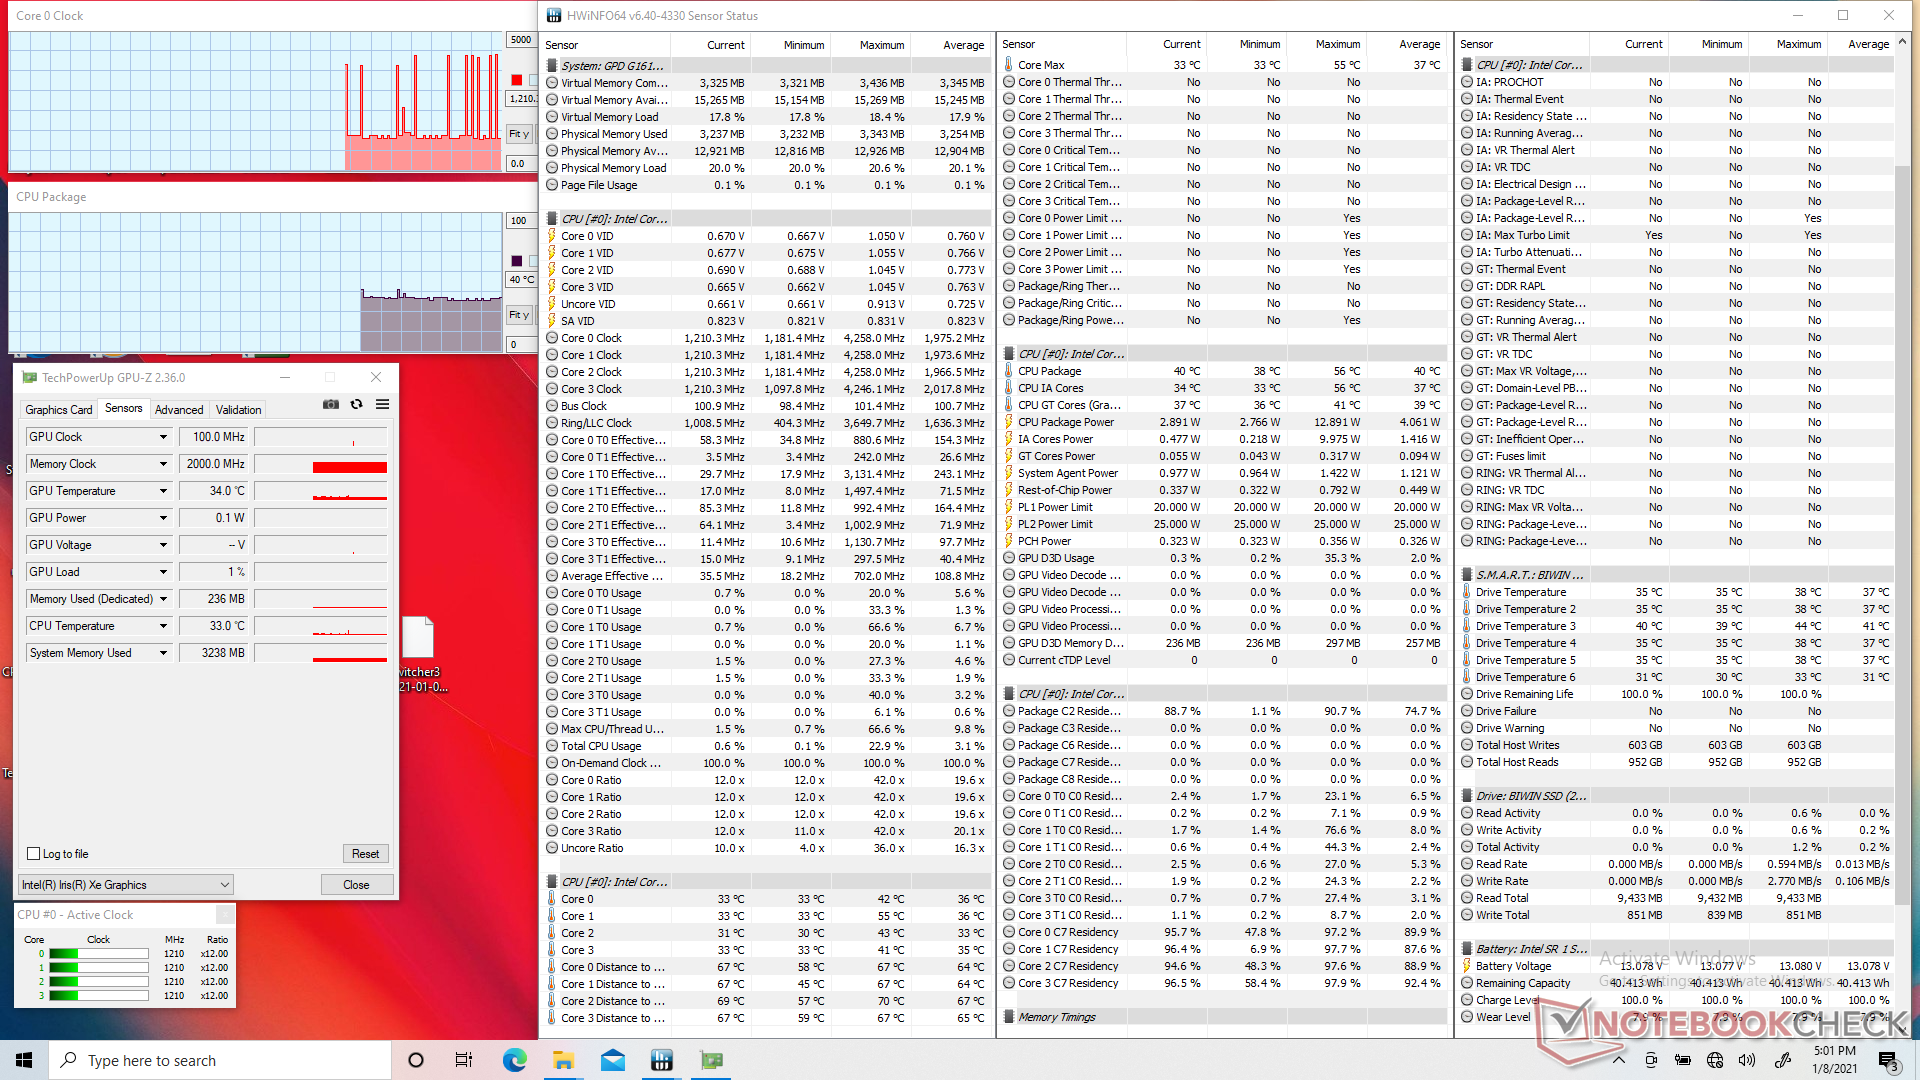
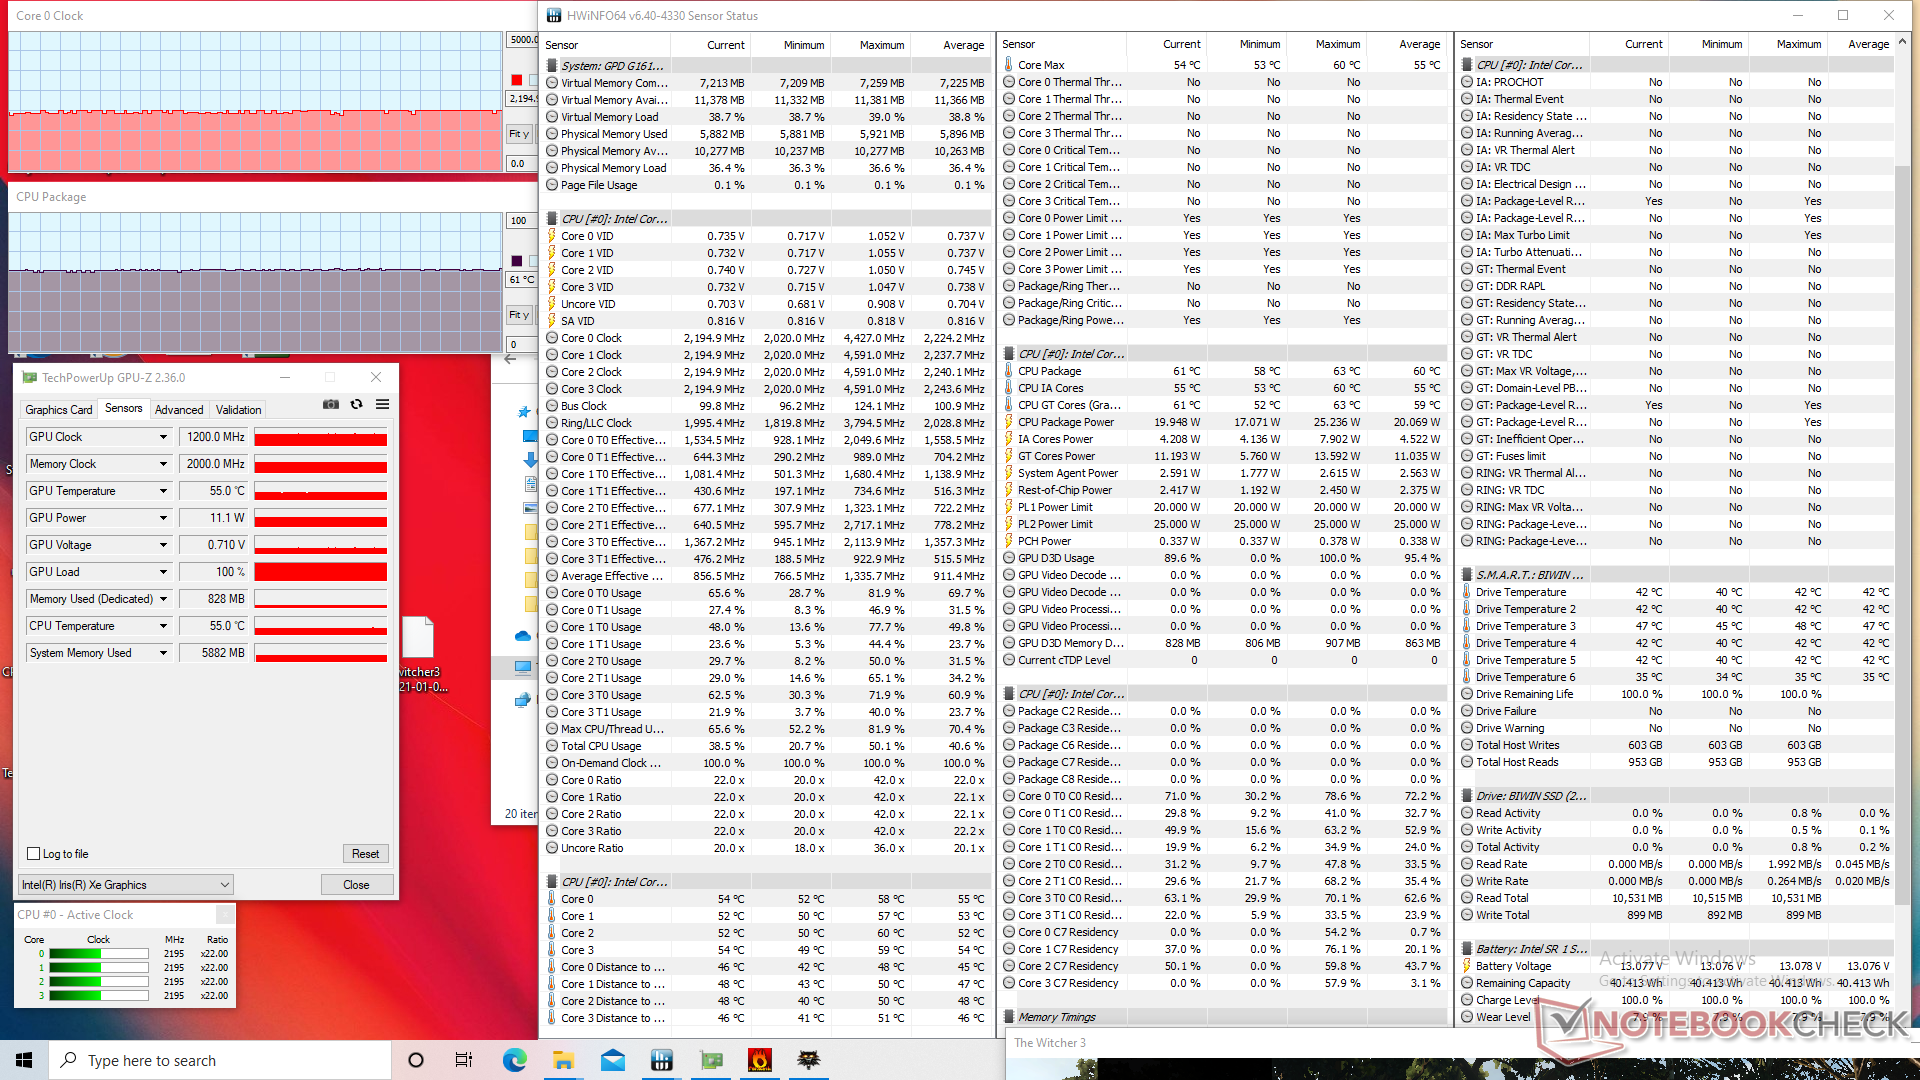
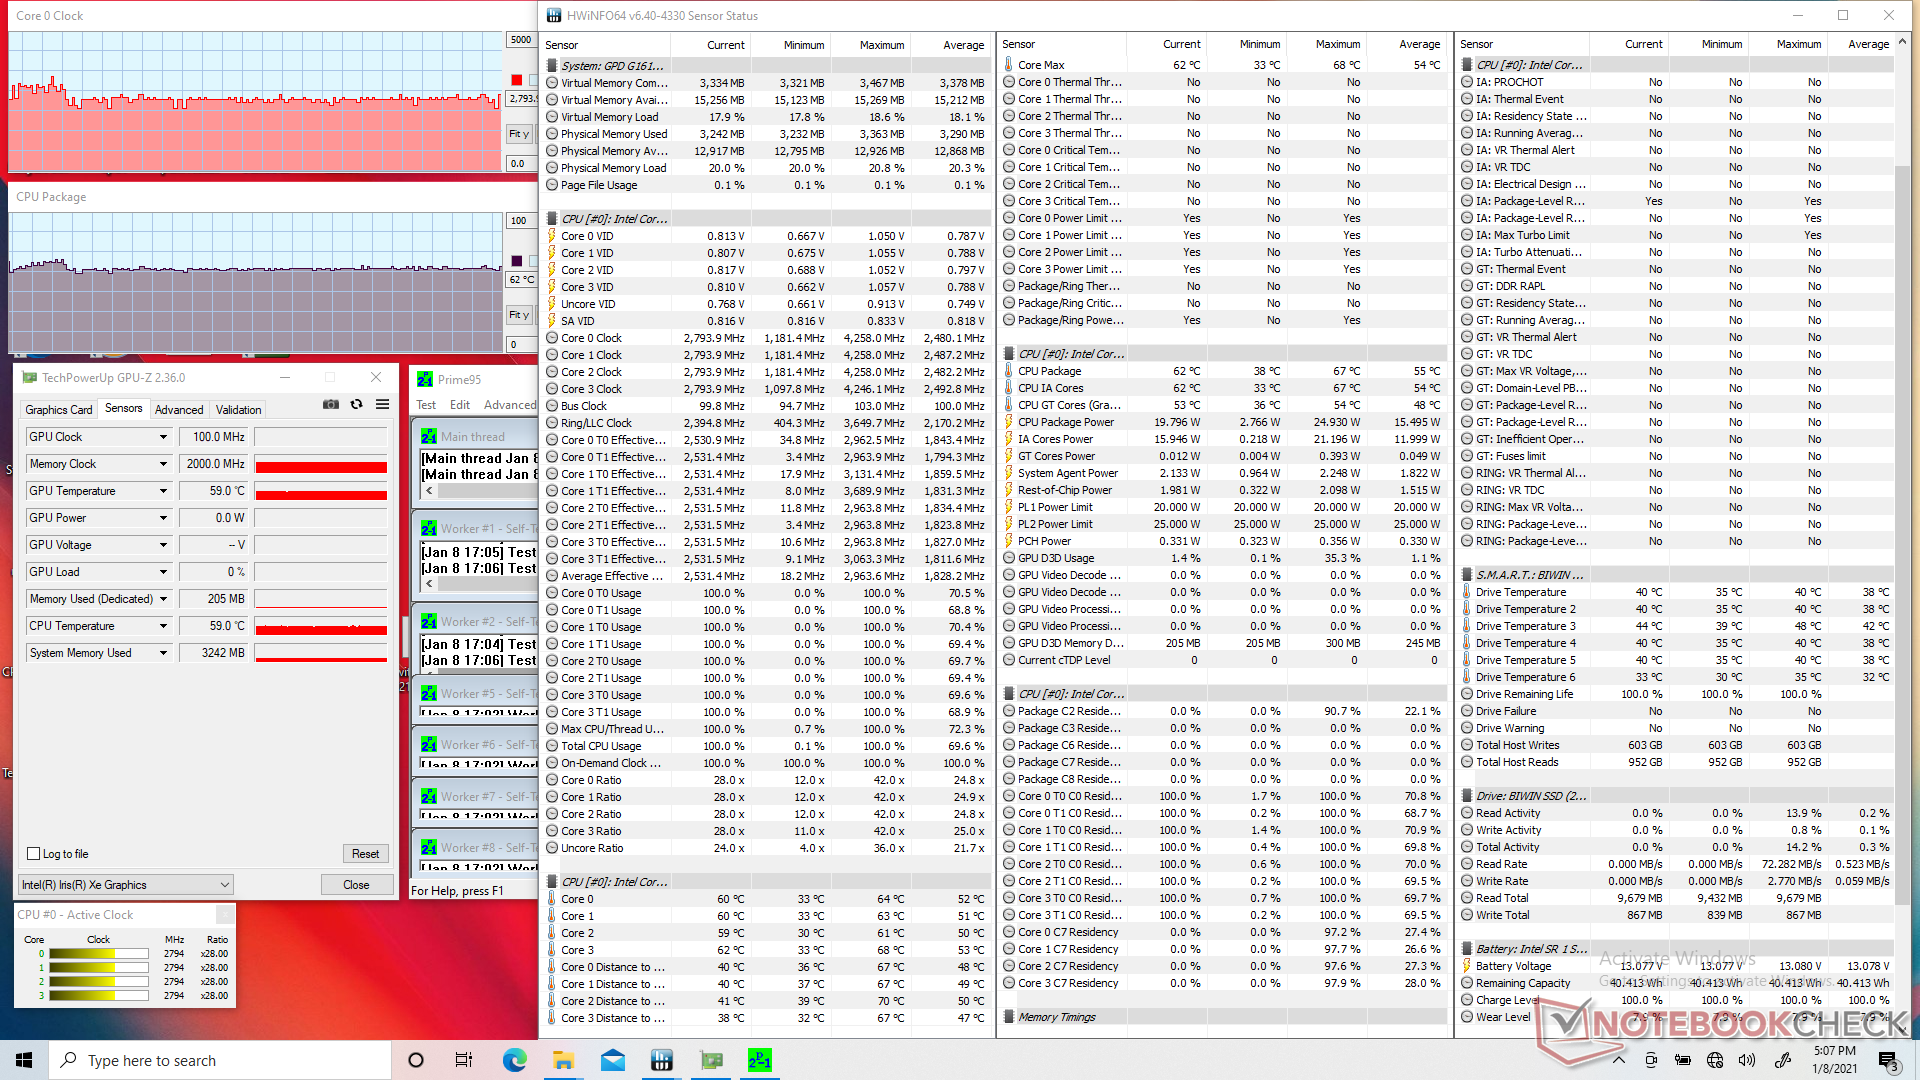
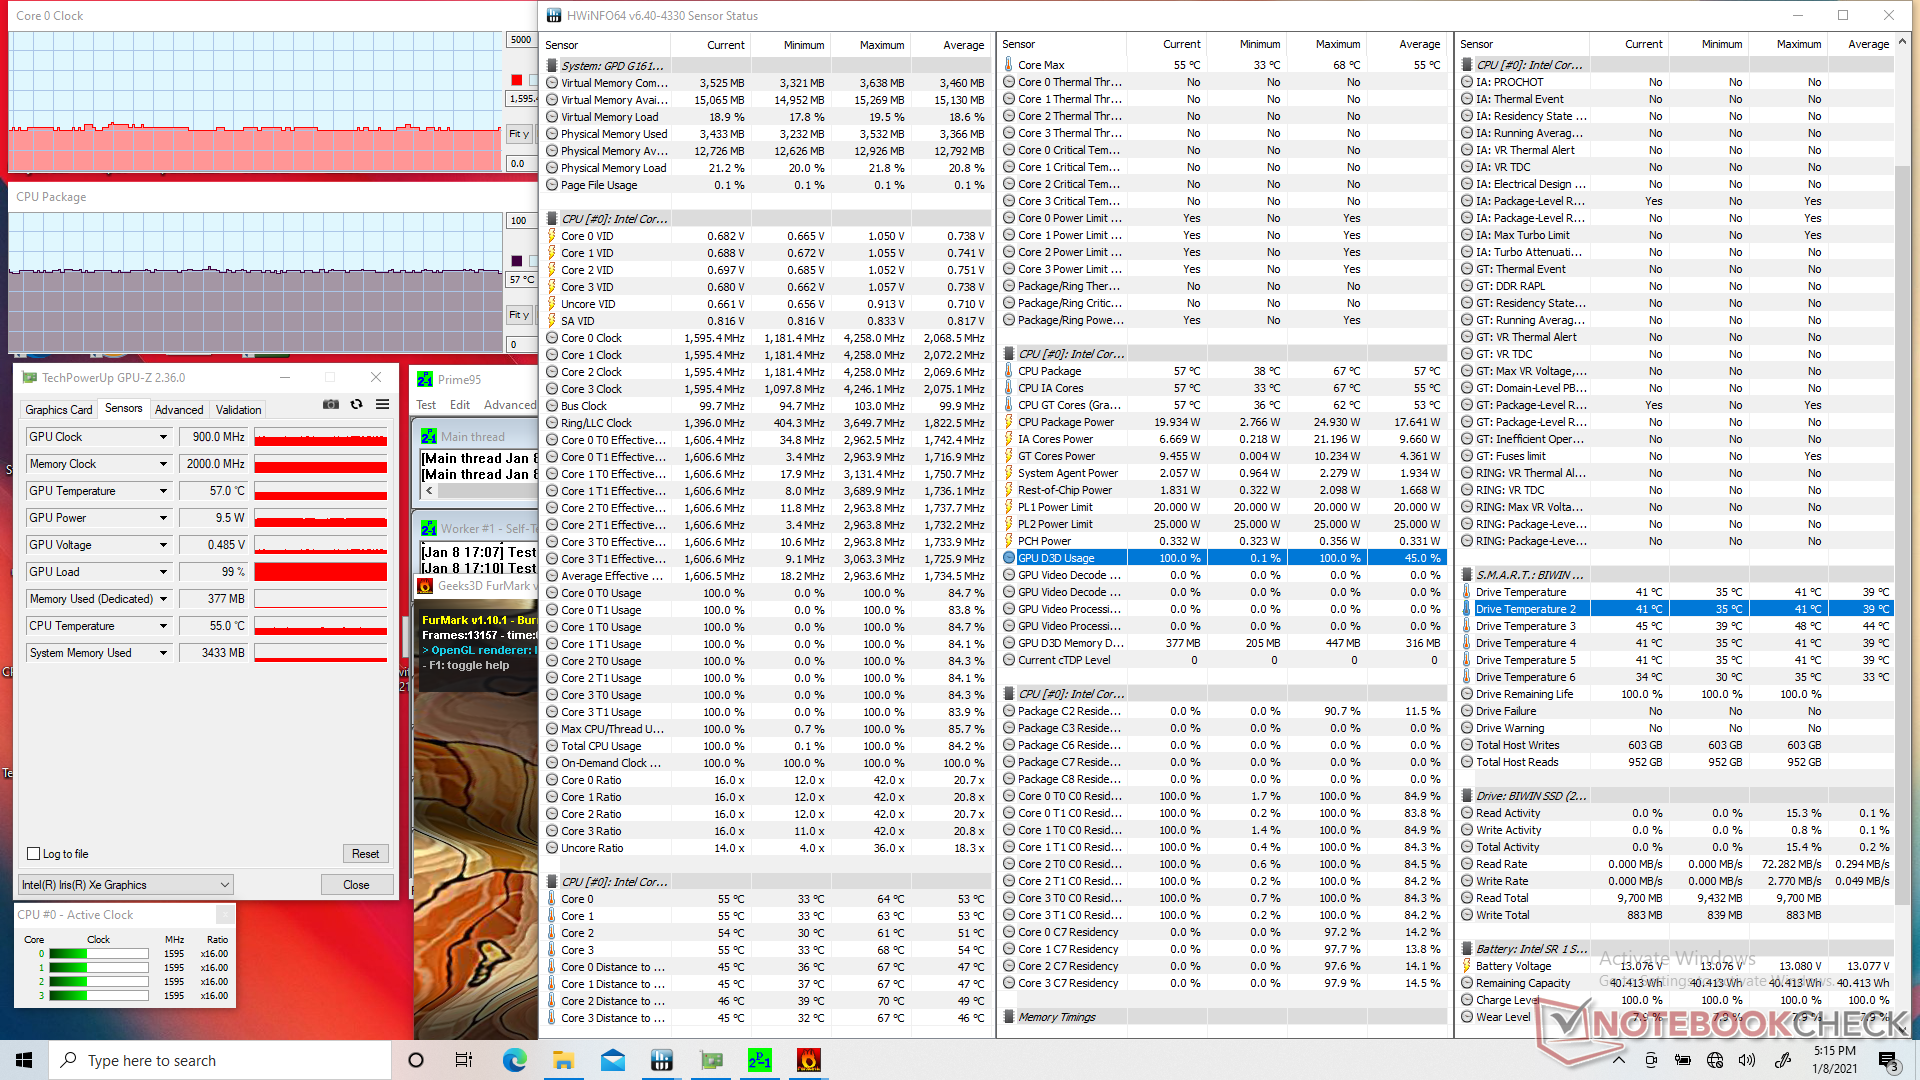
| CPU Clock (GHz) | GPU Clock (MHz) | Average CPU Temperature (°C) | |
| System Idle | -- | -- | 40 |
| Prime95 Stress | ~2.6 | -- | 62 |
| Prime95 + FurMark Stress | 1.5 - 1.6 | 900 | 58 |
| Witcher 3 Stress | 2.1 - 2.2 | 1200 | 61 |
Speakers

GPD Win 3 audio analysis
(+) | speakers can play relatively loud (92.6 dB)
Bass 100 - 315 Hz
(-) | nearly no bass - on average 22.3% lower than median
(+) | bass is linear (5.8% delta to prev. frequency)
Mids 400 - 2000 Hz
(±) | higher mids - on average 6% higher than median
(+) | mids are linear (6% delta to prev. frequency)
Highs 2 - 16 kHz
(±) | higher highs - on average 7.5% higher than median
(±) | linearity of highs is average (7.4% delta to prev. frequency)
Overall 100 - 16.000 Hz
(±) | linearity of overall sound is average (21.6% difference to median)
Compared to same class
» 83% of all tested devices in this class were better, 8% similar, 8% worse
» The best had a delta of 12%, average was 17%, worst was 23%
Compared to all devices tested
» 61% of all tested devices were better, 7% similar, 32% worse
» The best had a delta of 4%, average was 23%, worst was 134%
Apple MacBook 12 (Early 2016) 1.1 GHz audio analysis
(+) | speakers can play relatively loud (83.6 dB)
Bass 100 - 315 Hz
(±) | reduced bass - on average 11.3% lower than median
(±) | linearity of bass is average (14.2% delta to prev. frequency)
Mids 400 - 2000 Hz
(+) | balanced mids - only 2.4% away from median
(+) | mids are linear (5.5% delta to prev. frequency)
Highs 2 - 16 kHz
(+) | balanced highs - only 2% away from median
(+) | highs are linear (4.5% delta to prev. frequency)
Overall 100 - 16.000 Hz
(+) | overall sound is linear (10.2% difference to median)
Compared to same class
» 7% of all tested devices in this class were better, 2% similar, 90% worse
» The best had a delta of 5%, average was 18%, worst was 53%
Compared to all devices tested
» 5% of all tested devices were better, 1% similar, 94% worse
» The best had a delta of 4%, average was 23%, worst was 134%
Energy Management
Power Consumption
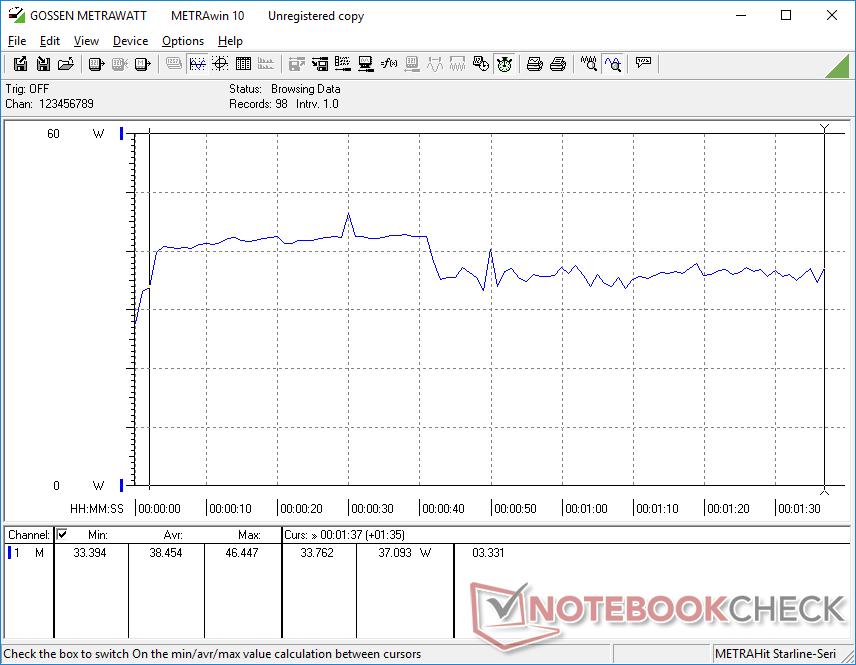
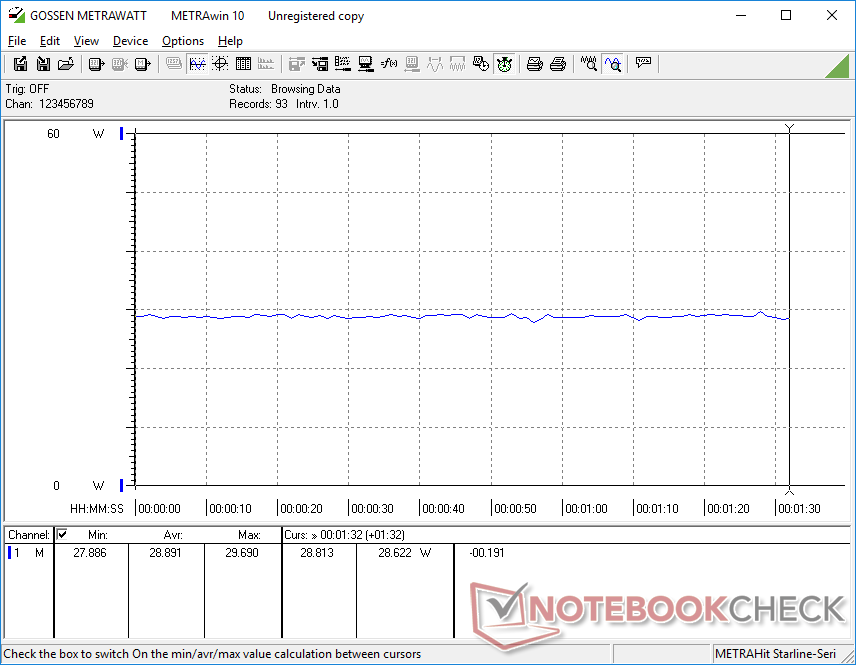
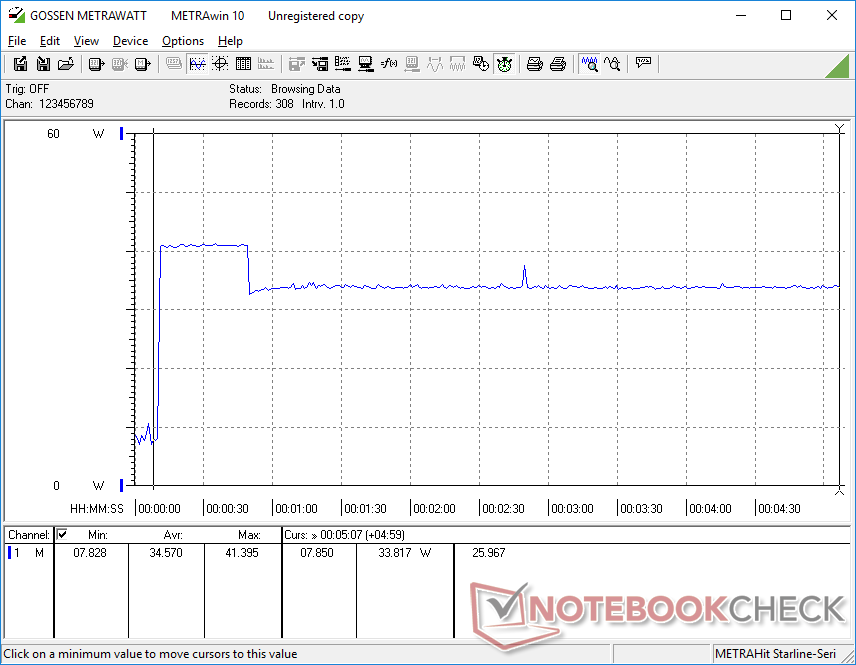
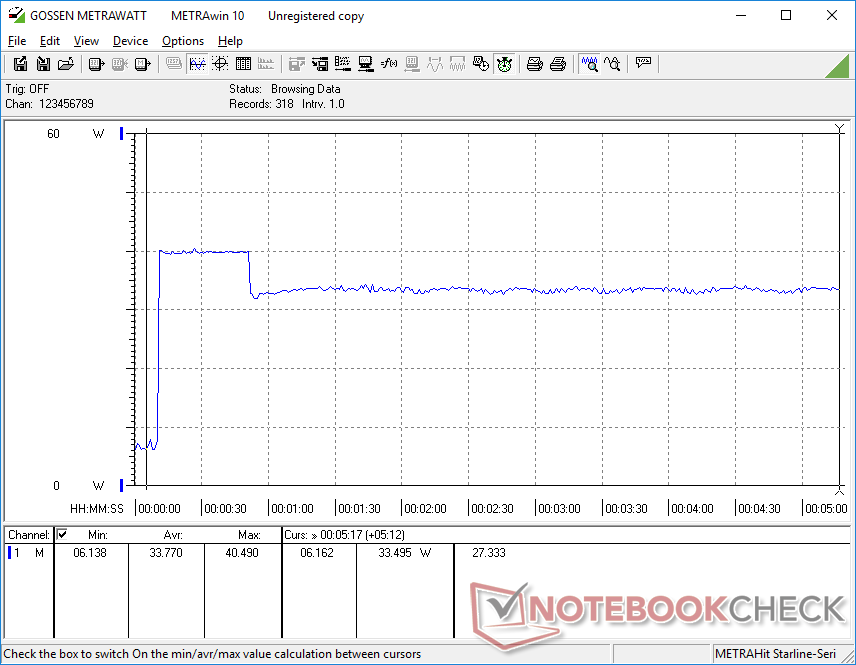
Idling on desktop at the lowest brightness setting draws just under 3 W while the maximum brightness setting demands about 1.5 W more. Gaming draws between 29 W and 39 W to be even greater than many laptops running on Core i7 Ice Lake CPUs like the HP Spectre x360 13 or ZenBook 13. Results are also close to what we observed on the XPS 13 9310 with a higher-end Core i7-1165G7 CPU. This can be quite the power-hungry machine in spite of its diminutive size.
| Off / Standby | |
| Idle | |
| Load |
|
Key:
min: | |
| GPD Win 3 i5-1135G7, Iris Xe G7 80EUs, BIWIN NS200 1TB CNF82GS1G02-1TB, IPS, 1280x720, 5.5" | Dell XPS 13 9310 Core i7 FHD i7-1165G7, Iris Xe G7 96EUs, Micron 2300 512GB MTFDHBA512TDV, IPS, 1920x1200, 13.4" | Apple MacBook Air 2020 M1 Entry M1, M1 7-Core GPU, Apple SSD AP0256Q, IPS, 2560x1600, 13.3" | HP Spectre x360 13-aw0013dx i7-1065G7, Iris Plus Graphics G7 (Ice Lake 64 EU), Intel Optane Memory H10 with Solid State Storage 32GB + 512GB HBRPEKNX0202A(L/H), IPS, 1920x1080, 13.3" | Asus ZenBook 13 UX325JA i7-1065G7, Iris Plus Graphics G7 (Ice Lake 64 EU), Intel SSD 660p 1TB SSDPEKNW010T8, IPS, 1920x1080, 13.3" | Microsoft Surface Laptop 3 13 Core i5-1035G7 i5-1035G7, Iris Plus Graphics G7 (Ice Lake 64 EU), SK hynix BC501 HFM256GDGTNG, IPS, 2256x1504, 13.5" | |
|---|---|---|---|---|---|---|
| Power Consumption | -24% | -0% | -24% | -10% | -49% | |
| Idle Minimum * (Watt) | 2.9 | 3.9 -34% | 1.9 34% | 3.9 -34% | 2.4 17% | 4.4 -52% |
| Idle Average * (Watt) | 4.5 | 5.9 -31% | 6.4 -42% | 6.3 -40% | 4.6 -2% | 7.5 -67% |
| Idle Maximum * (Watt) | 4.5 | 6.3 -40% | 7 -56% | 6.8 -51% | 9 -100% | 7.8 -73% |
| Load Average * (Watt) | 38.5 | 39.7 -3% | 25 35% | 32.6 15% | 36 6% | 41.9 -9% |
| Witcher 3 ultra * (Watt) | 28.9 | 34.8 -20% | 25.6 11% | 27 7% | 40.8 -41% | |
| Load Maximum * (Watt) | 41.4 | 47.5 -15% | 30.3 27% | 59 -43% | 36 13% | 63.9 -54% |
* ... smaller is better
Battery Life
The integrated 44 Wh battery relatively large for a 5.5-inch portable. Standard WLAN loads can last just over 11 hours before automatic shutdown. If running 3D games, however, expect no more than 1.5 hours of play time.
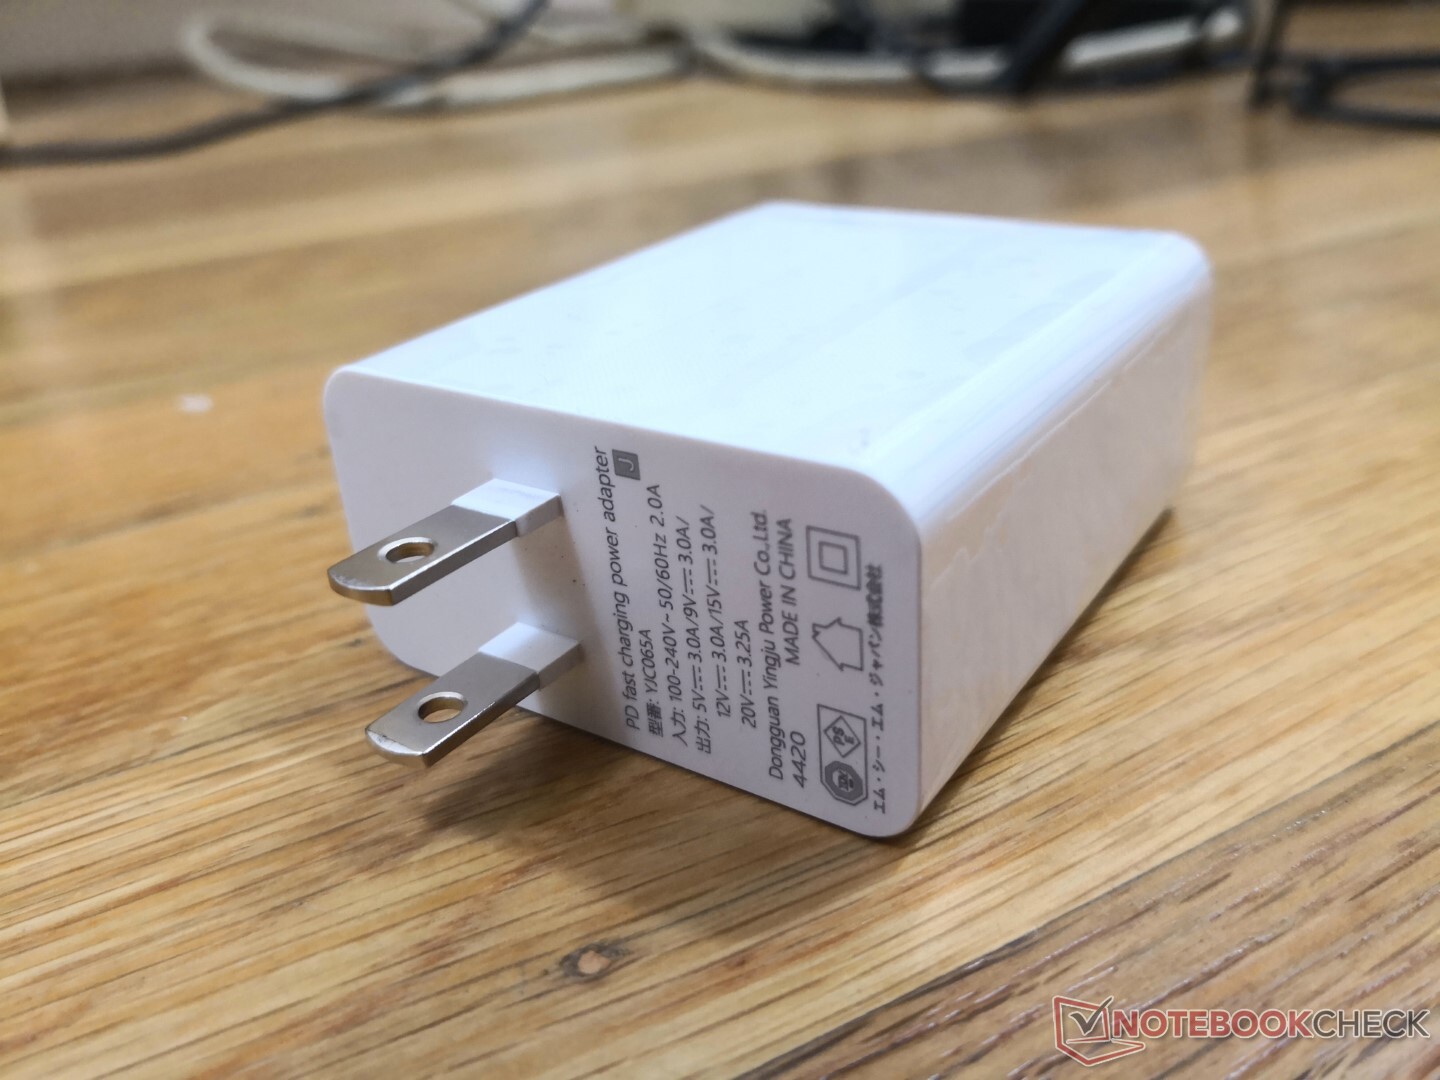
Charging from empty to full capacity takes about 1.5 hours with the included 65 W AC adapter. Almost any USB-C charger will work, but low watt adapters will charge at a much slower rate.
| GPD Win 3 i5-1135G7, Iris Xe G7 80EUs, 44 Wh | Dell XPS 13 9310 Core i7 FHD i7-1165G7, Iris Xe G7 96EUs, 52 Wh | Apple MacBook Air 2020 M1 Entry M1, M1 7-Core GPU, 49.9 Wh | HP Spectre x360 13-aw0013dx i7-1065G7, Iris Plus Graphics G7 (Ice Lake 64 EU), 60 Wh | Asus ZenBook 13 UX325JA i7-1065G7, Iris Plus Graphics G7 (Ice Lake 64 EU), 67 Wh | Microsoft Surface Laptop 3 13 Core i5-1035G7 i5-1035G7, Iris Plus Graphics G7 (Ice Lake 64 EU), 45 Wh | |
|---|---|---|---|---|---|---|
| Battery runtime | 72% | 42% | 48% | 80% | 10% | |
| WiFi v1.3 (h) | 11.3 | 11 -3% | 16 42% | 9.9 -12% | 13.8 22% | 8.3 -27% |
| Load (h) | 1.3 | 3.2 146% | 2.7 108% | 3.1 138% | 1.9 46% | |
| Reader / Idle (h) | 30 | 37.1 | 26.6 | 34.4 |
Pros
Cons
Verdict
The Win 3 is more powerful than it looks since it is essentially running on the same hardware that powers the latest full-size Intel Evo Ultrabooks. Its integrated Thunderbolt 4 docking capabilities and upgradeable M.2 NVMe SSD only add to the versatility of the handheld.
A powerful handheld that could use some better buttons.
There are features we would love to see on potential revisions. Adaptive sync support, XBox-DualShock controller recognition toggle, higher screen-to-body ratio, webcam, and lighter weight would make the handheld even better to use.
With that said, there are a handful of annoyances that should be addressed. The random keyboard inputs, spongy controller buttons, random wake-from-sleep, and occasional stuck button make the Win 3 feel like a bargain bin controller in spite of its capable hardware within. It's not impossible to get used to, but if you're already accustomed to a standard XBox, Playstation, or Switch controller, then you'll likely wish these Win 3 buttons could have more depth and feedback.
Price and availability
The GPD Win 3 is still on Indiegogo and not yet widely available.
Price comparison
