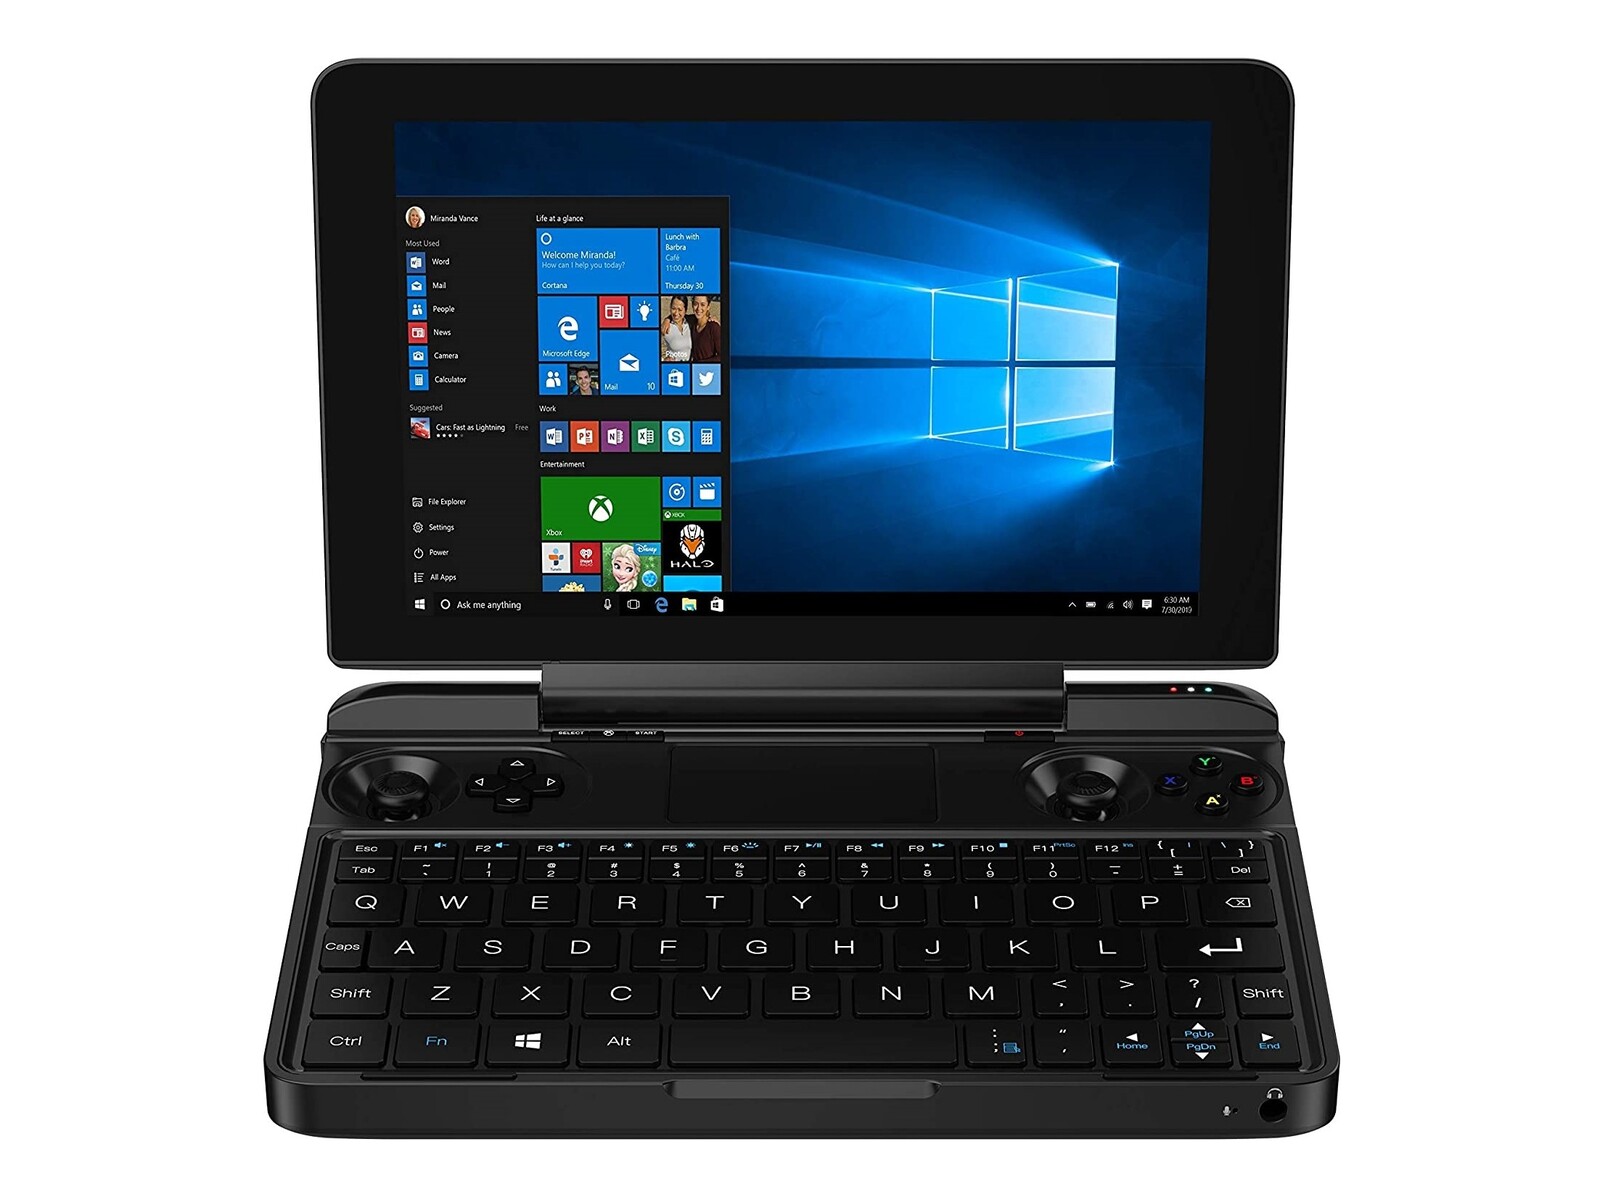
GPD Win Max 2021 handheld gaming laptop review: Ryzen 7 slower than Core i7 ↺

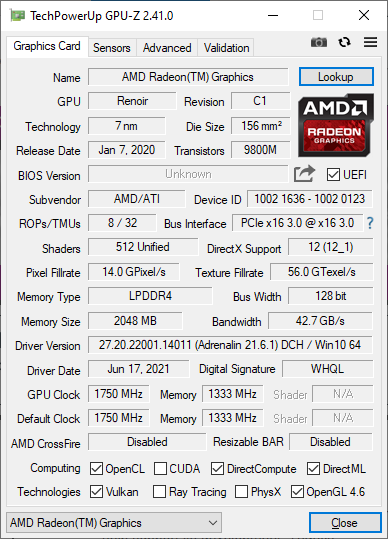
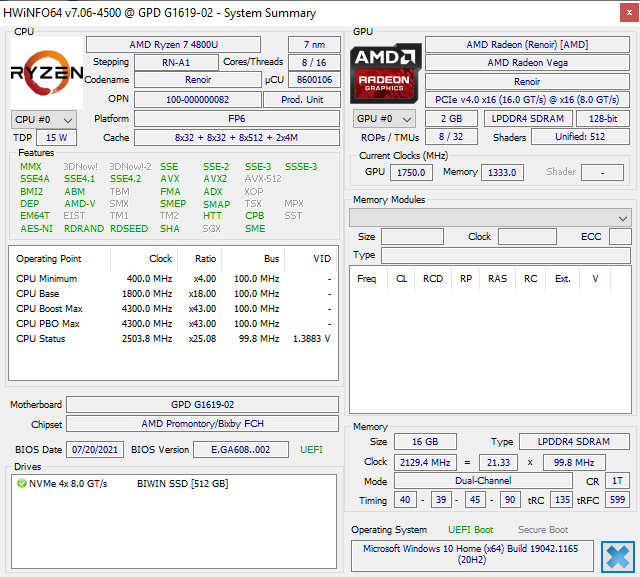
The GPD Win Max launched late last year with 10th gen Intel Ice Lake options. For 2021, the manufacturer has refreshed the model with newer and faster 11th gen Tiger Lake CPUs and even Zen 2 options for AMD fans. The test unit we have here comes with the Ryzen 7 4800U and integrated Radeon RX Vega 8 GPU. Though AMD has since moved on to mobile Zen 3 CPUs like the Ryzen 7 5800U, the older Ryzen 7 4800U is still one of the fastest U-series CPUs available.
See the official Indiegogo page here to learn more about the Win Max and its features. The $1000 USD price tag is in the same ballpark as many traditional Ultrabooks since the Win Max is essentially a UMPC with modern Ultrabook performance and ports.
More GPD reviews:
potential competitors in comparison
Rating | Date | Model | Weight | Height | Size | Resolution | Price |
|---|---|---|---|---|---|---|---|
| 79.3 % v7 (old) | 08 / 2021 | GPD Win Max 2021 R7 4800U, Vega 8 | 850 g | 26 mm | 8.00" | 1280x800 | |
v (old) | 01 / 2021 | GPD Win 3 i5-1135G7, Iris Xe G7 80EUs | 553 g | 27 mm | 5.50" | 1280x720 | |
| 84.4 % v7 (old) | 08 / 2021 | HP Pavilion Aero 13 be0097nr R7 5800U, Vega 8 | 953 g | 17 mm | 13.30" | 1920x1200 | |
| 84.7 % v7 (old) | 07 / 2021 | Lenovo Yoga 6 13 82ND0009US R5 5500U, Vega 7 | 1.3 kg | 18.2 mm | 13.30" | 1920x1080 | |
| 86.3 % v7 (old) | 07 / 2021 | Asus ZenBook Flip 13 UX363EA-HP069T i7-1165G7, Iris Xe G7 96EUs | 1.2 kg | 13 mm | 13.30" | 1920x1080 | |
| 88.9 % v7 (old) | 05 / 2021 | Asus ZenBook 13 UX325EA i7-1165G7, Iris Xe G7 96EUs | 1.2 kg | 13.9 mm | 13.30" | 1920x1080 |
Case
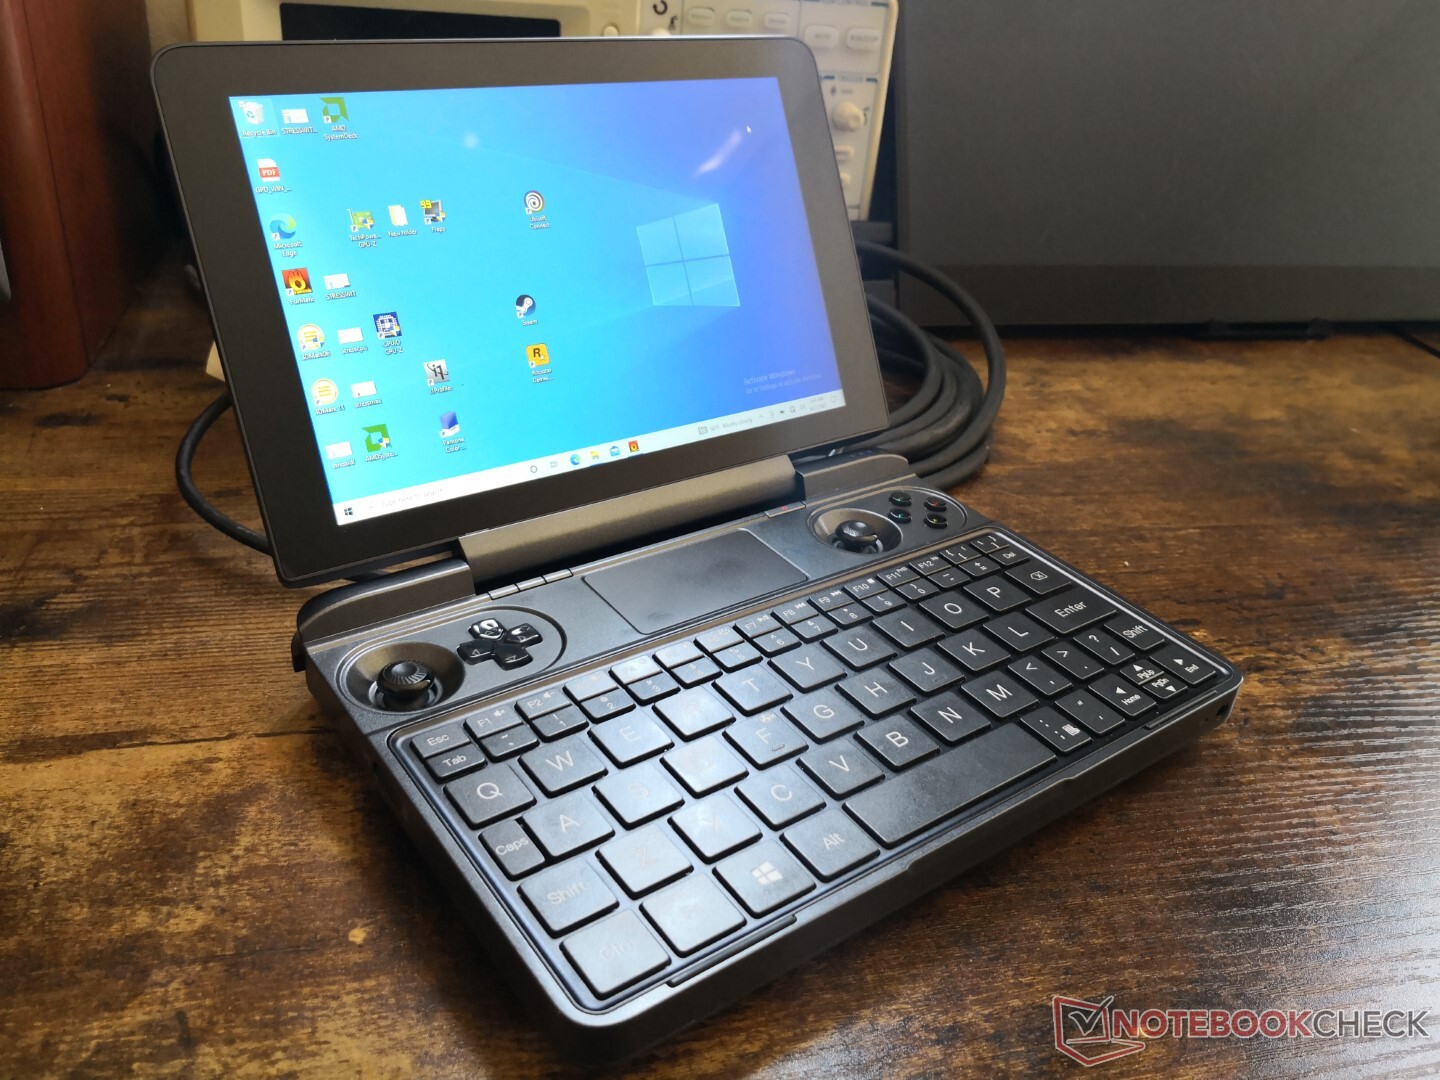
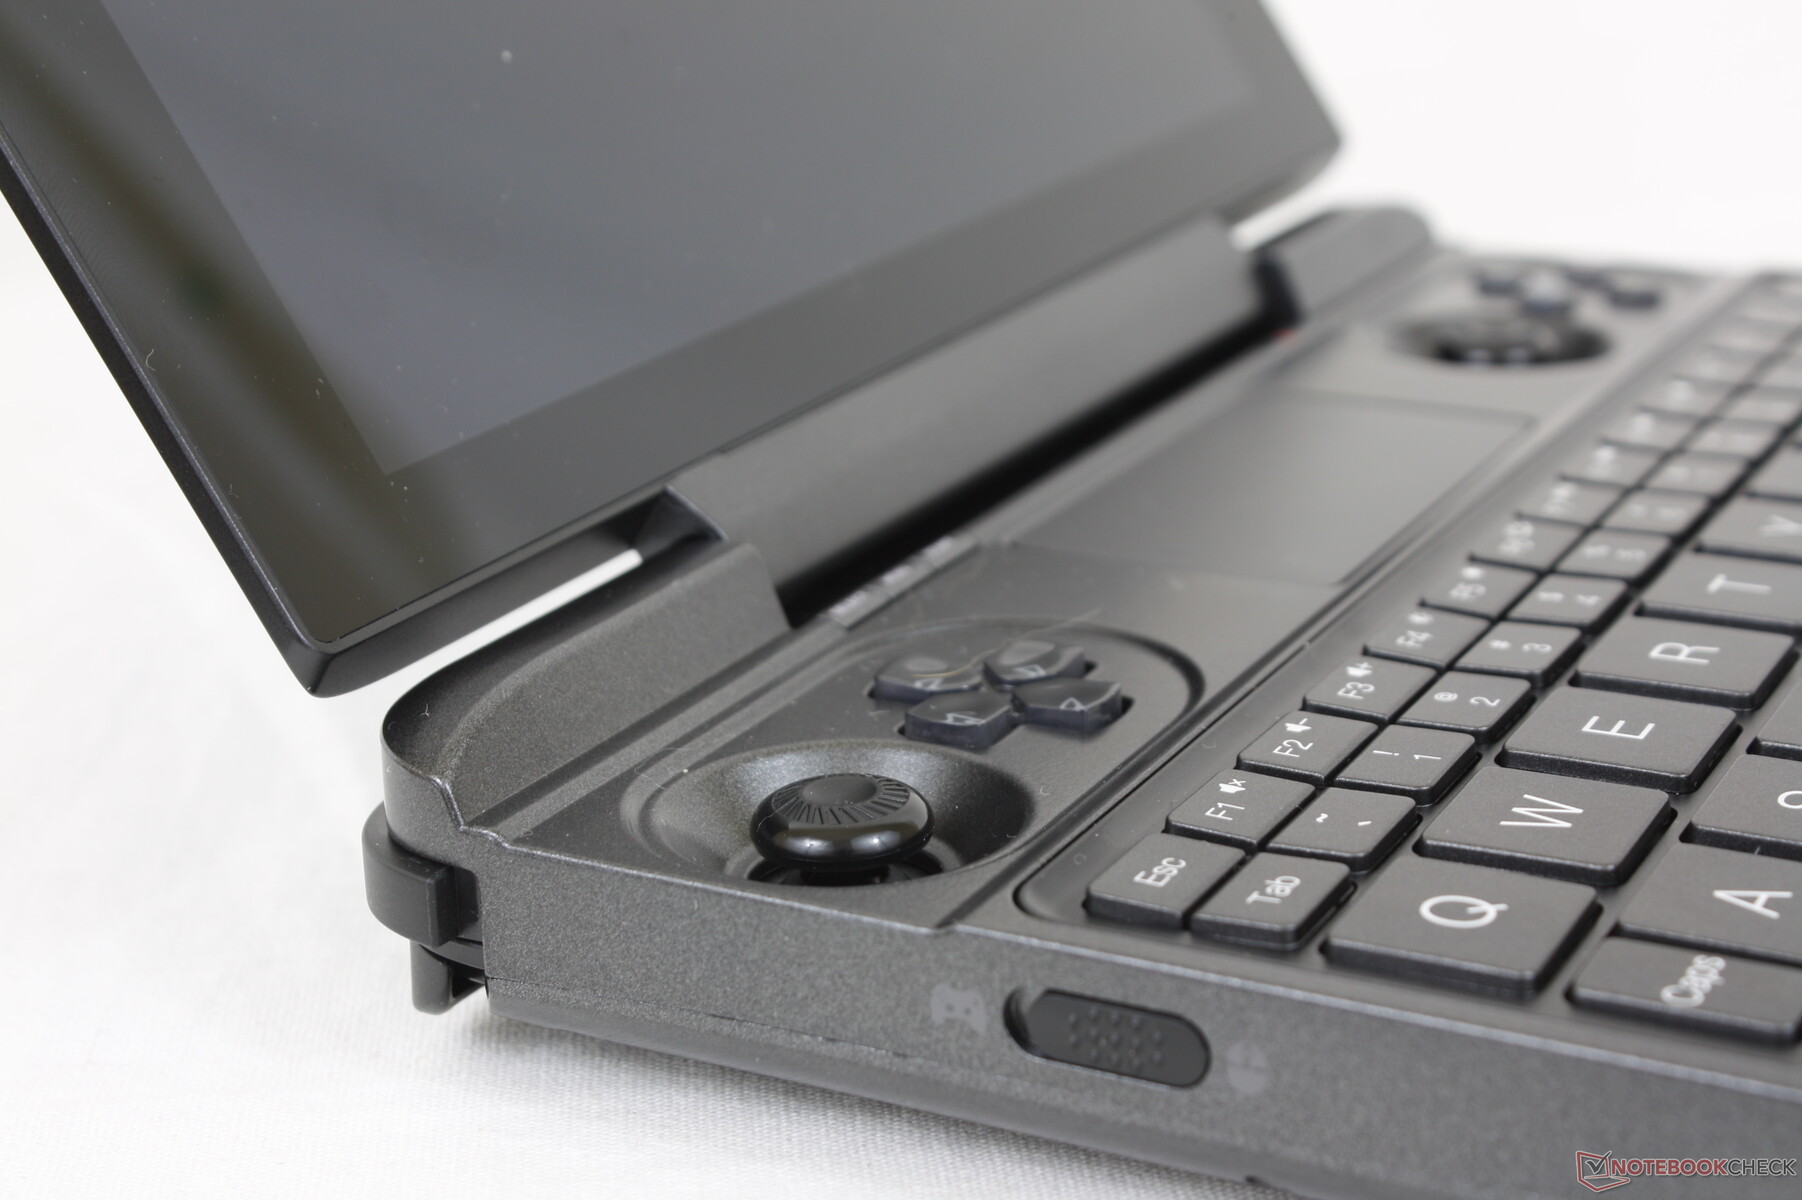
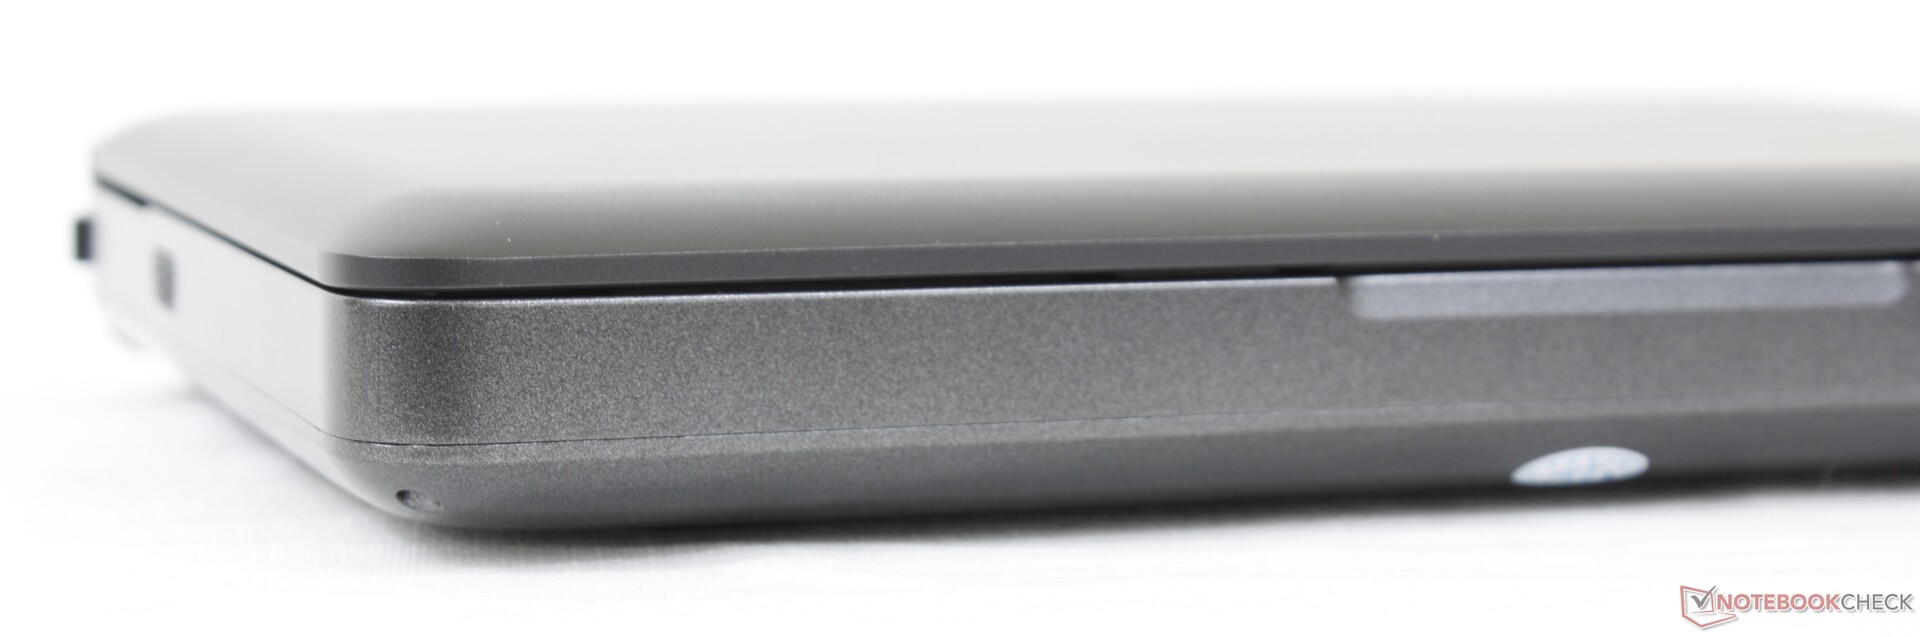
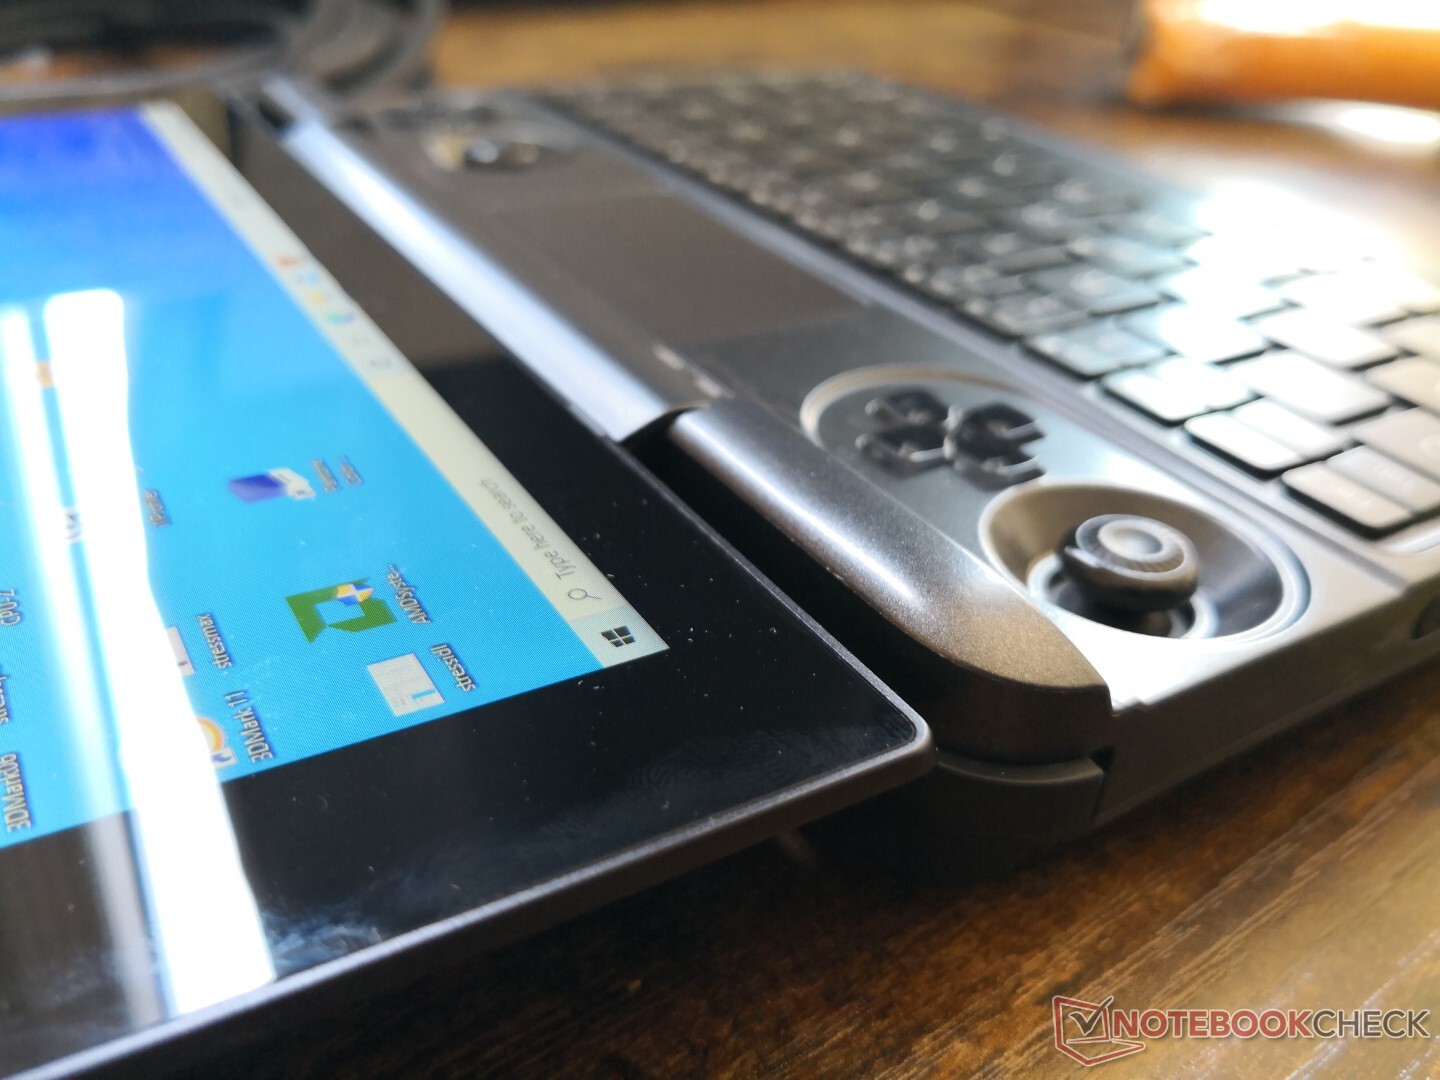
Visually, the chassis is compact with smooth gray metal surfaces and an excellent visual design. In hand, however, the system creaks very easily even from simple actions like opening the lid or gripping the sides of the base. The chassis doesn't carry a strong sense of luxuriousness as a result of all the creaking. For over a grand, the manufacturer could certainly do a lot better in this regard.
Connectivity
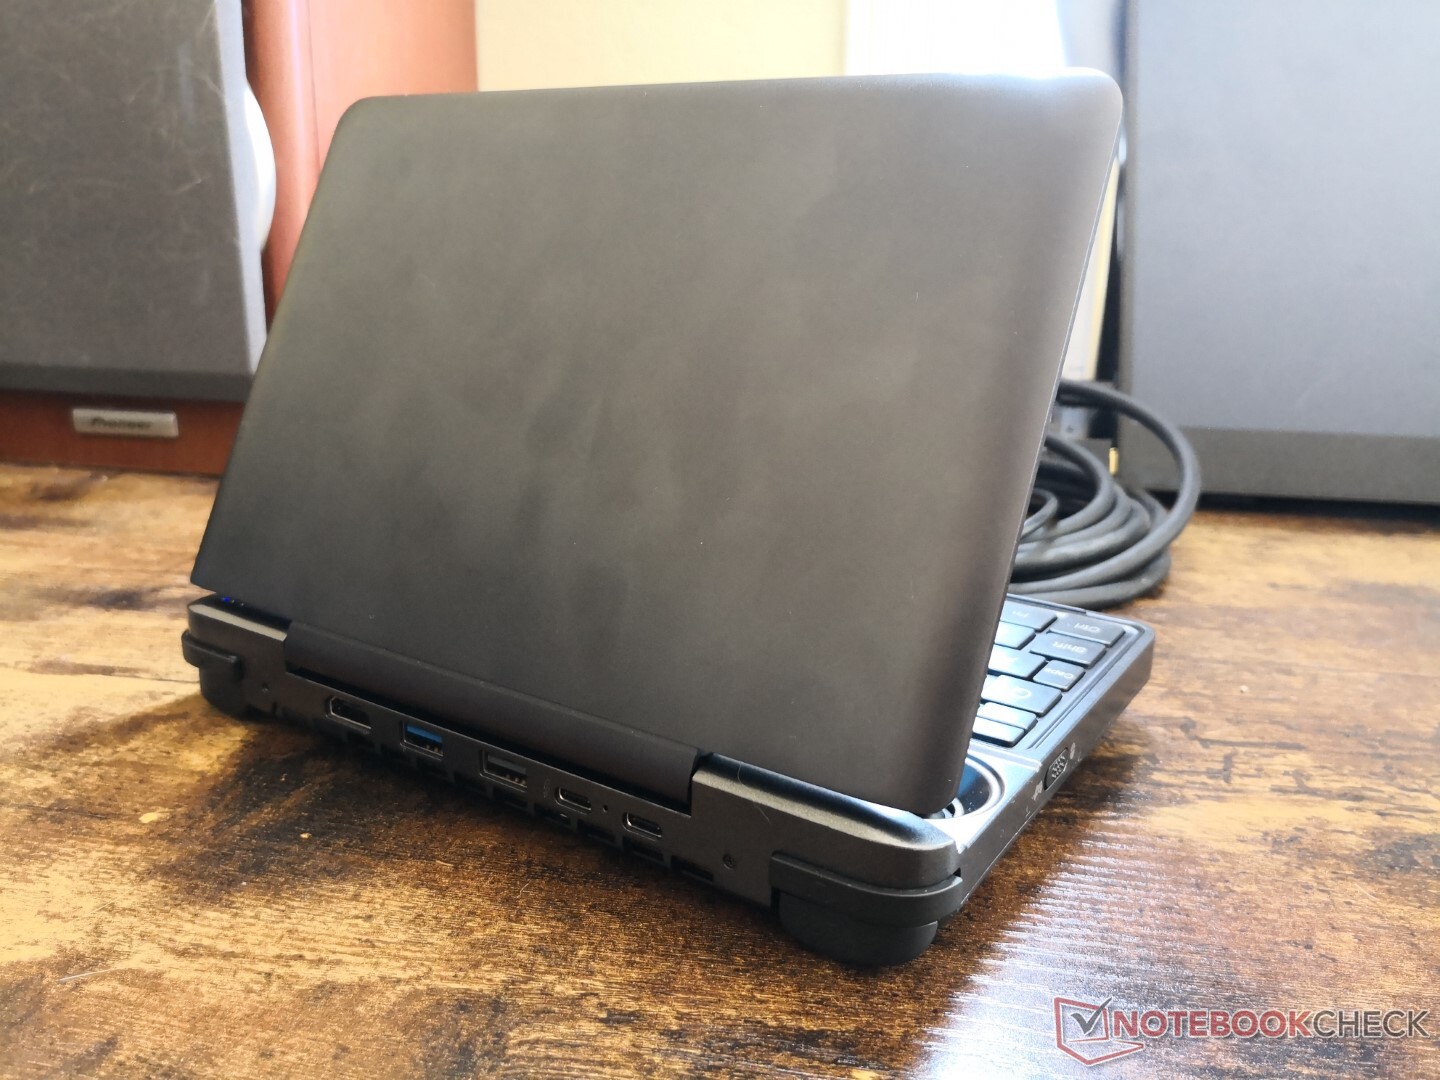
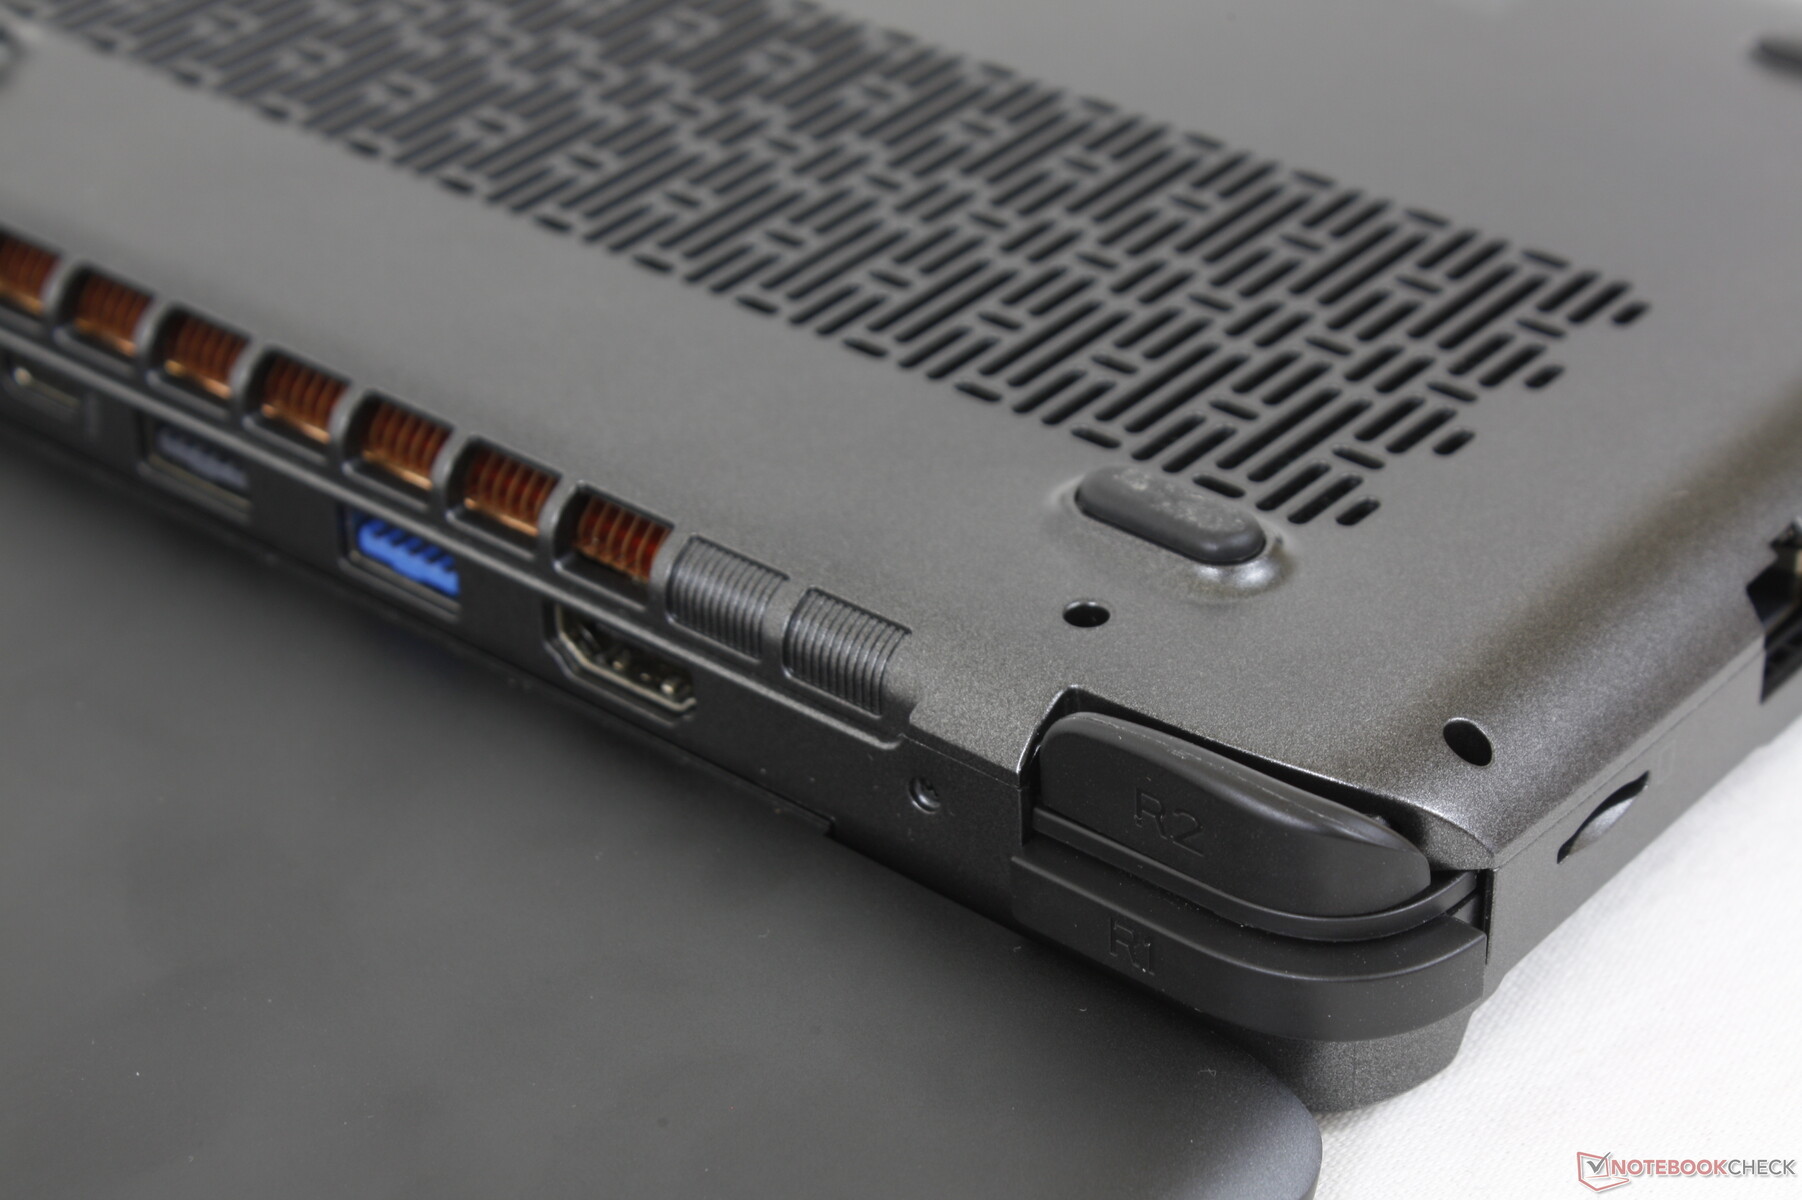
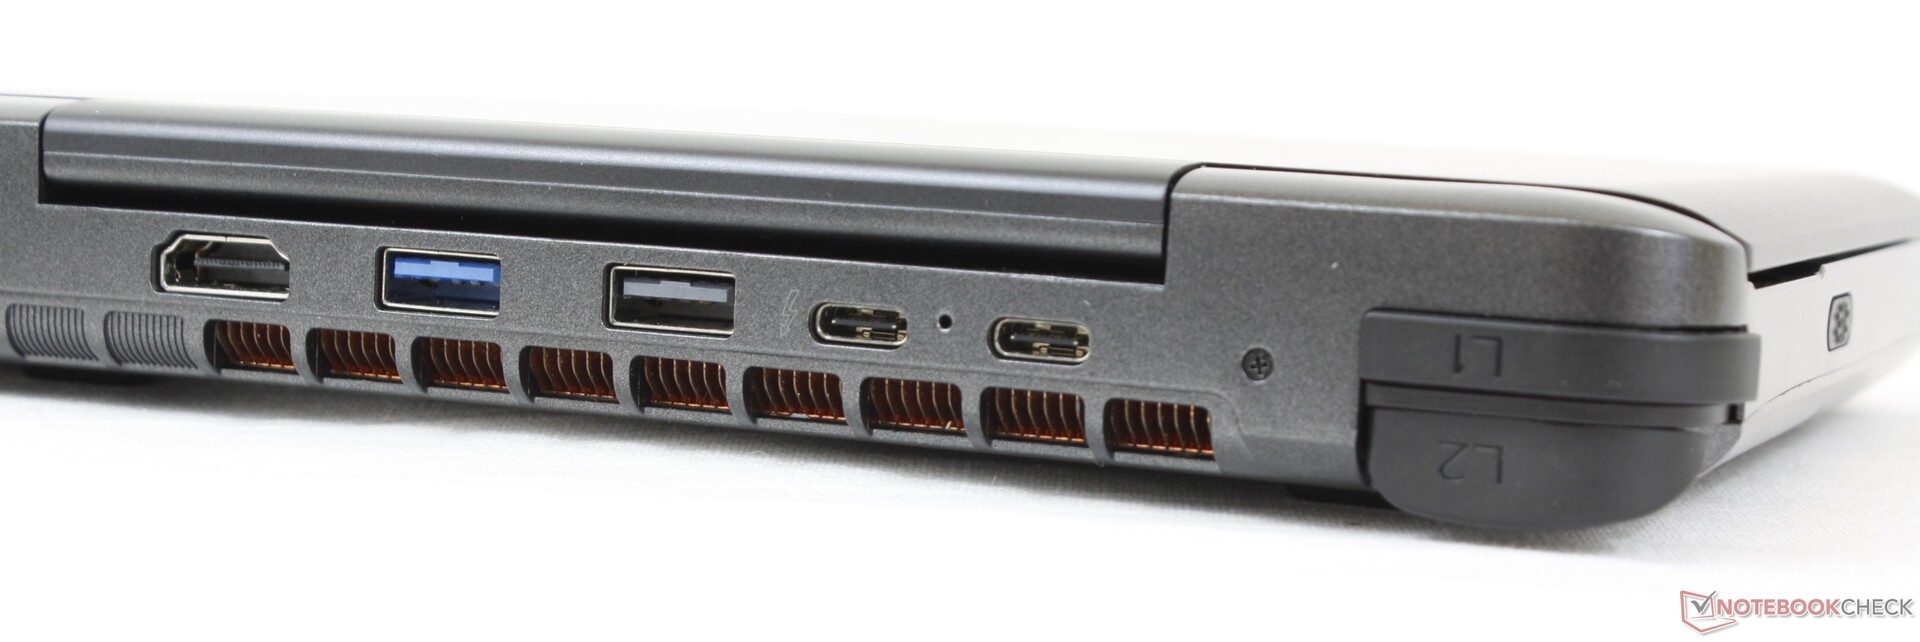
Port options are plentiful for such a small design. Unfortunately, DisplayPort-over-USB-C is not supported on our AMD unit meaning owners must use the HDMI port for connecting external monitors.
Opting for the Intel version of the Win Max will grant Thunderbolt 4 compatibility across the two USB-C ports.
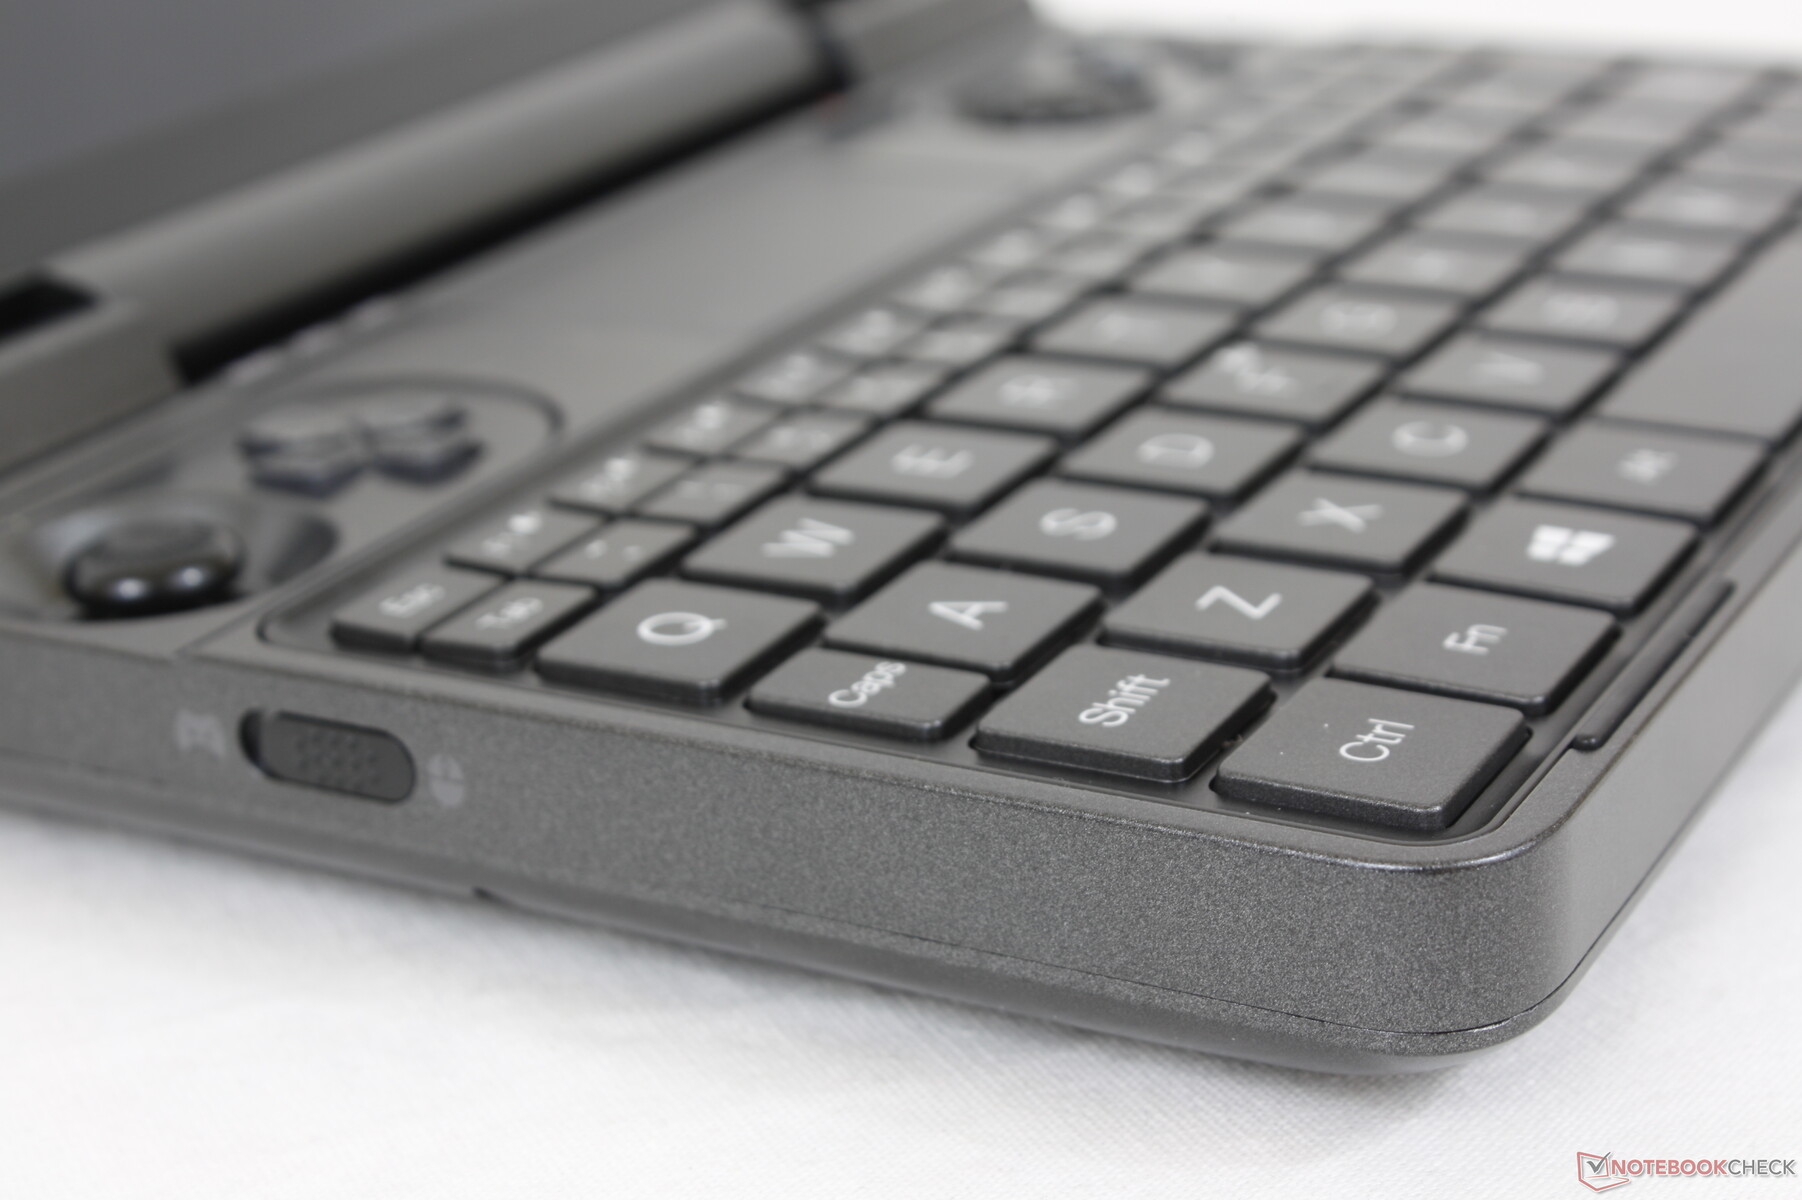
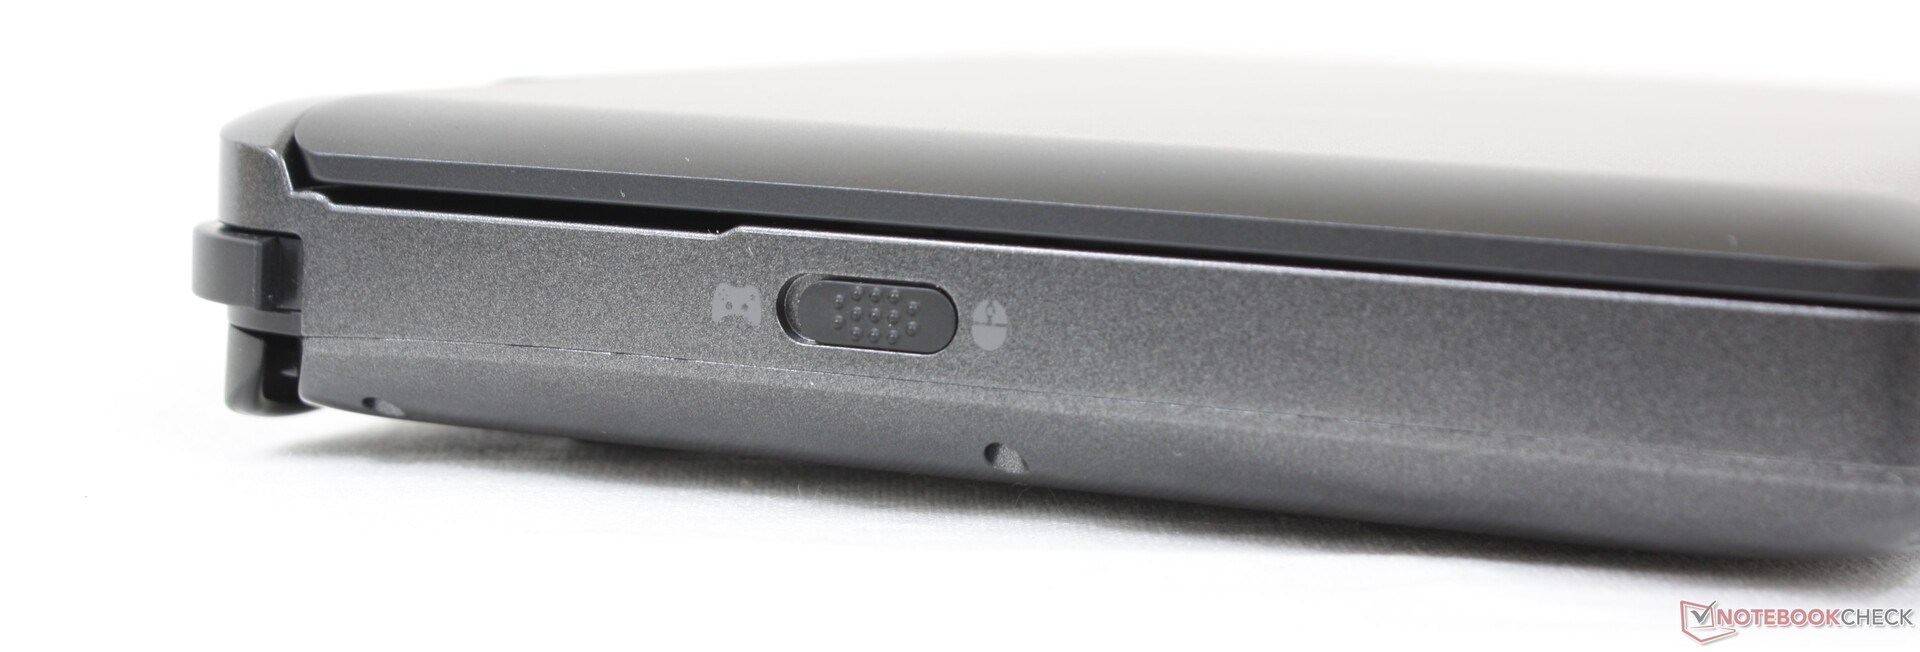
The switch along the left edge toggles the controller inputs as detailed here on the Win 3.
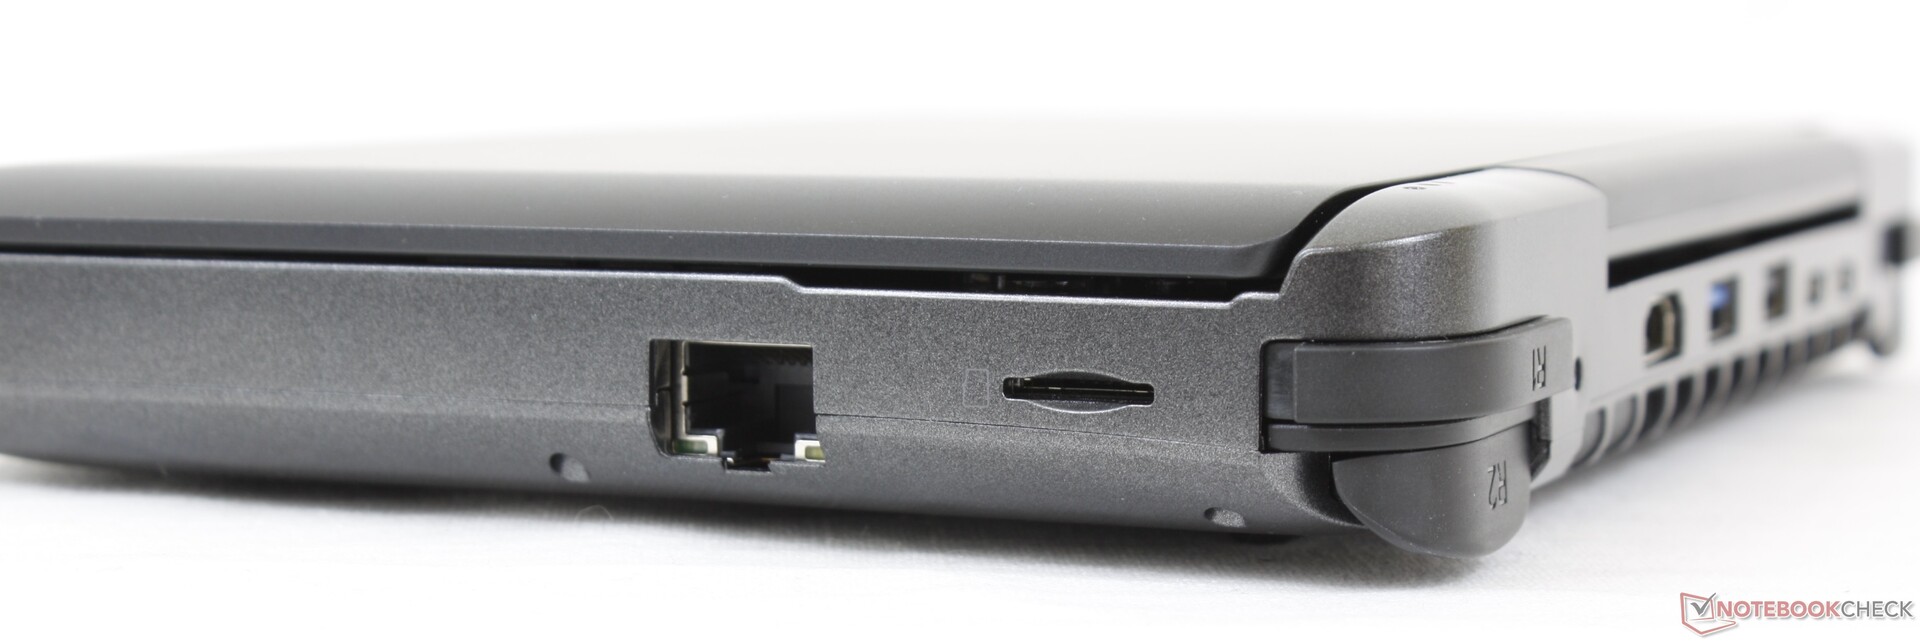
SD Card Reader
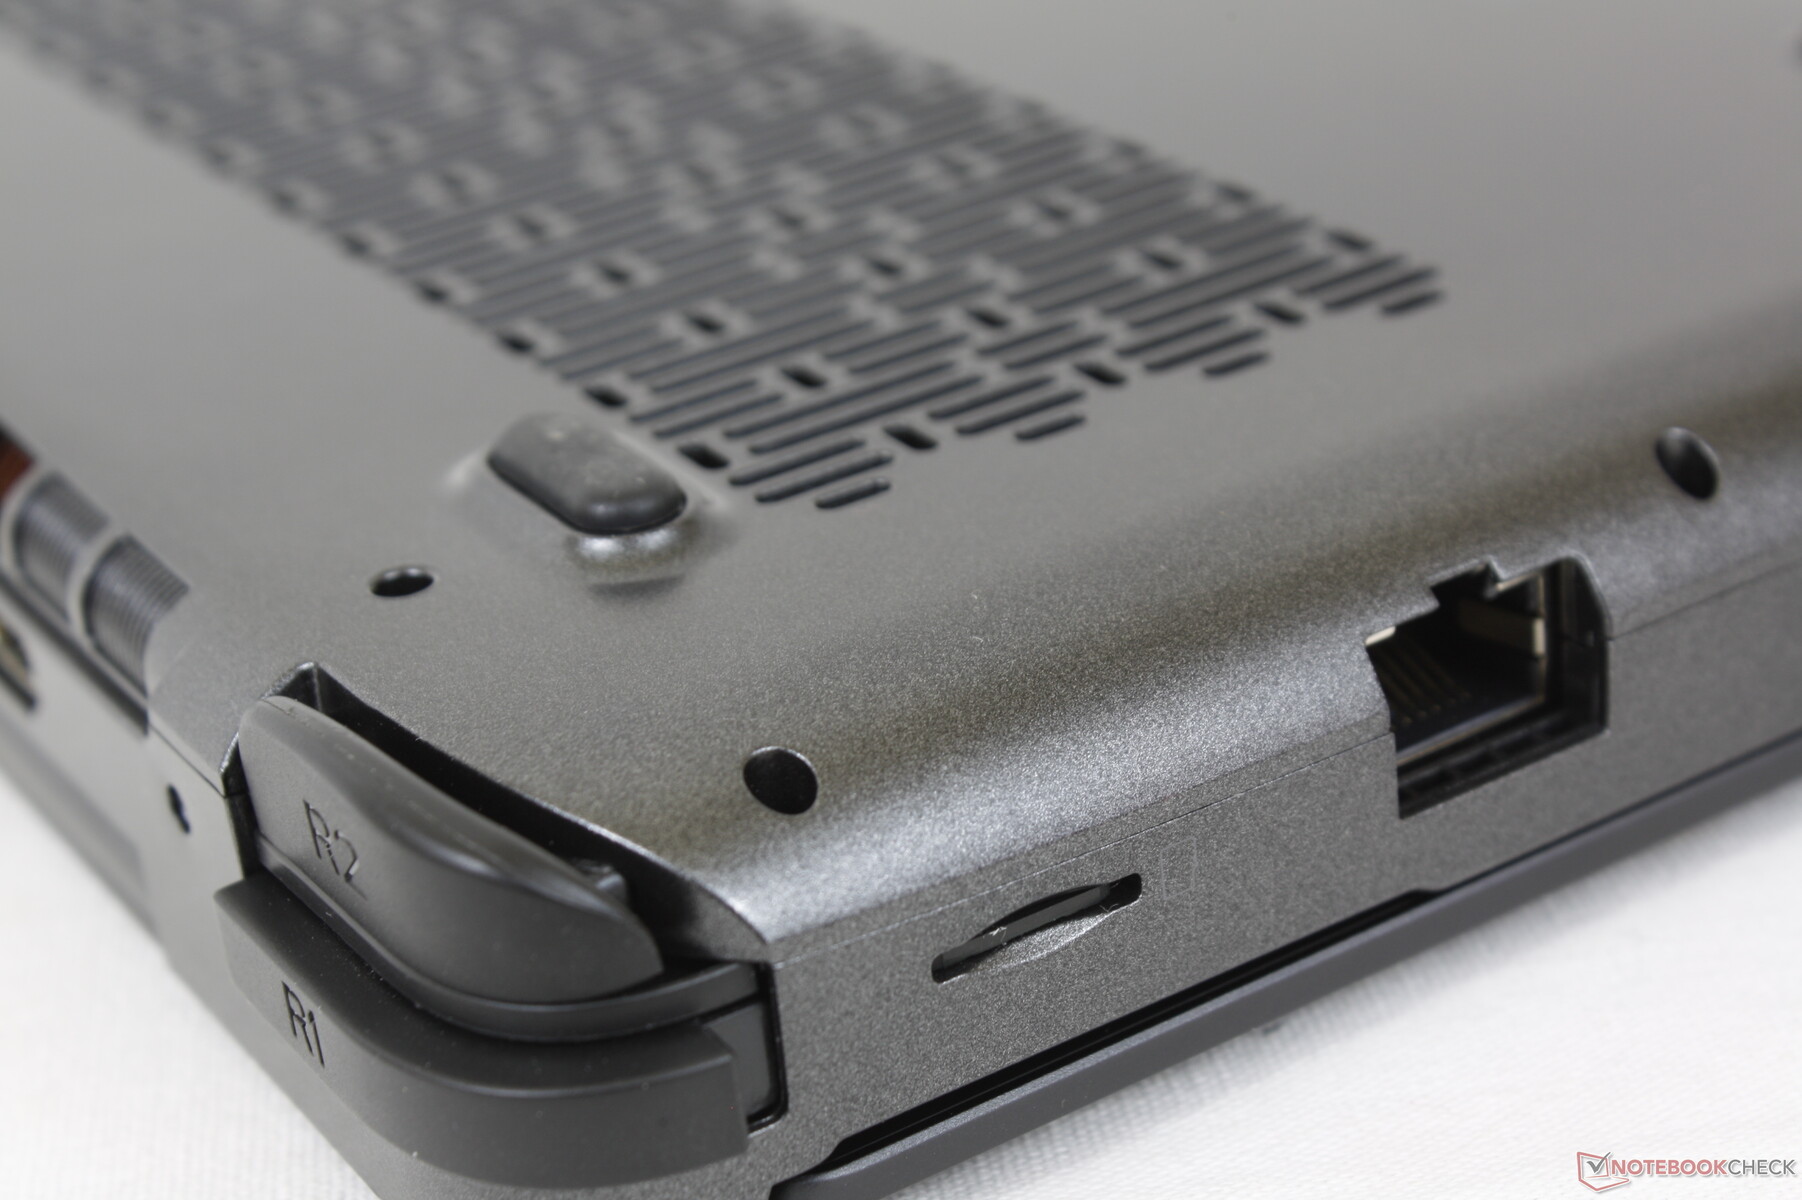
Though the system integrates a MicroSD reader, it would not work at all on our pre-production unit. We tried inserting both UHS-I and UHS-II cards and none were recognized. We recommend users test out the MicroSD card slot immediately upon purchasing.
Communication
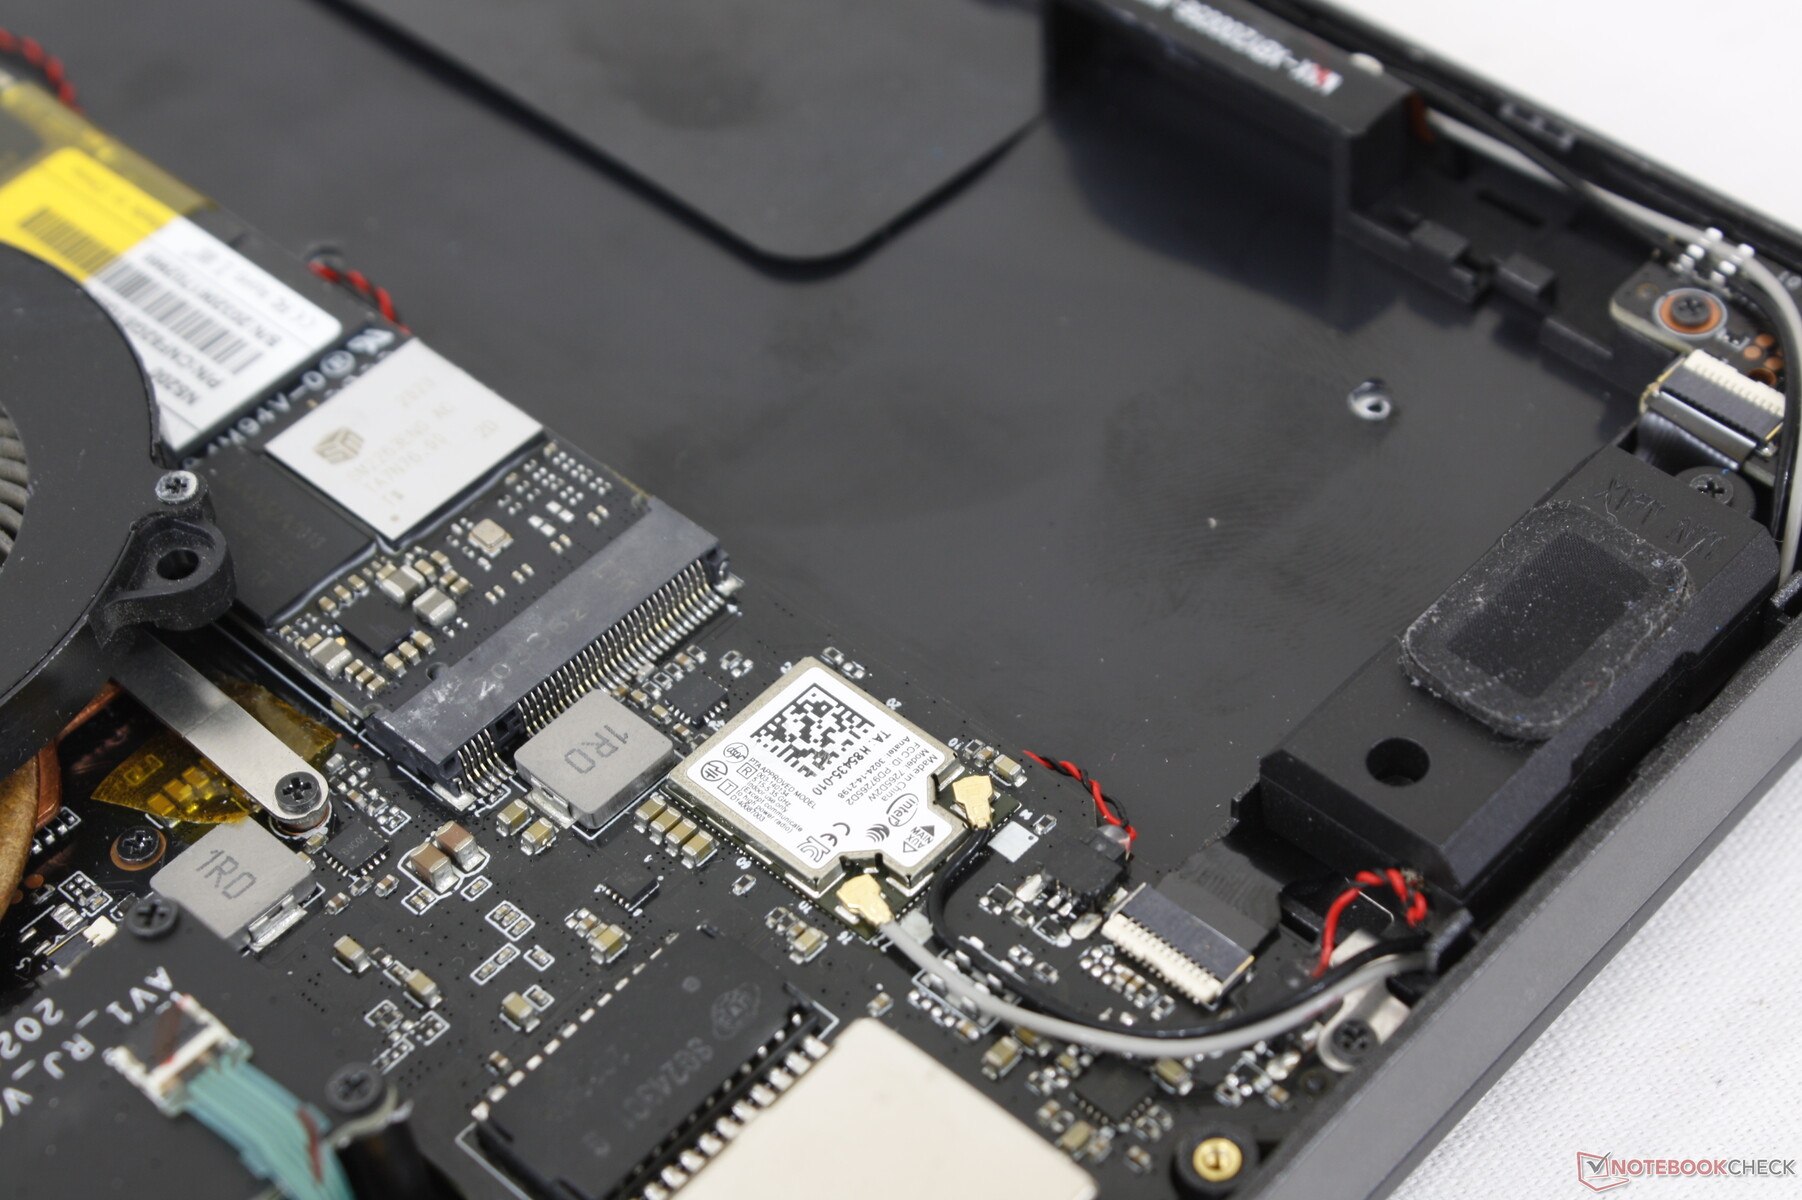
Disappointingly, the Win Max comes with an Intel 7265 instead of the newer and faster Intel AX200/201. This means that the system does not support Wi-Fi 6 speeds and it shows when comparing the Win Max to Intel-powered devices like the Win 3.
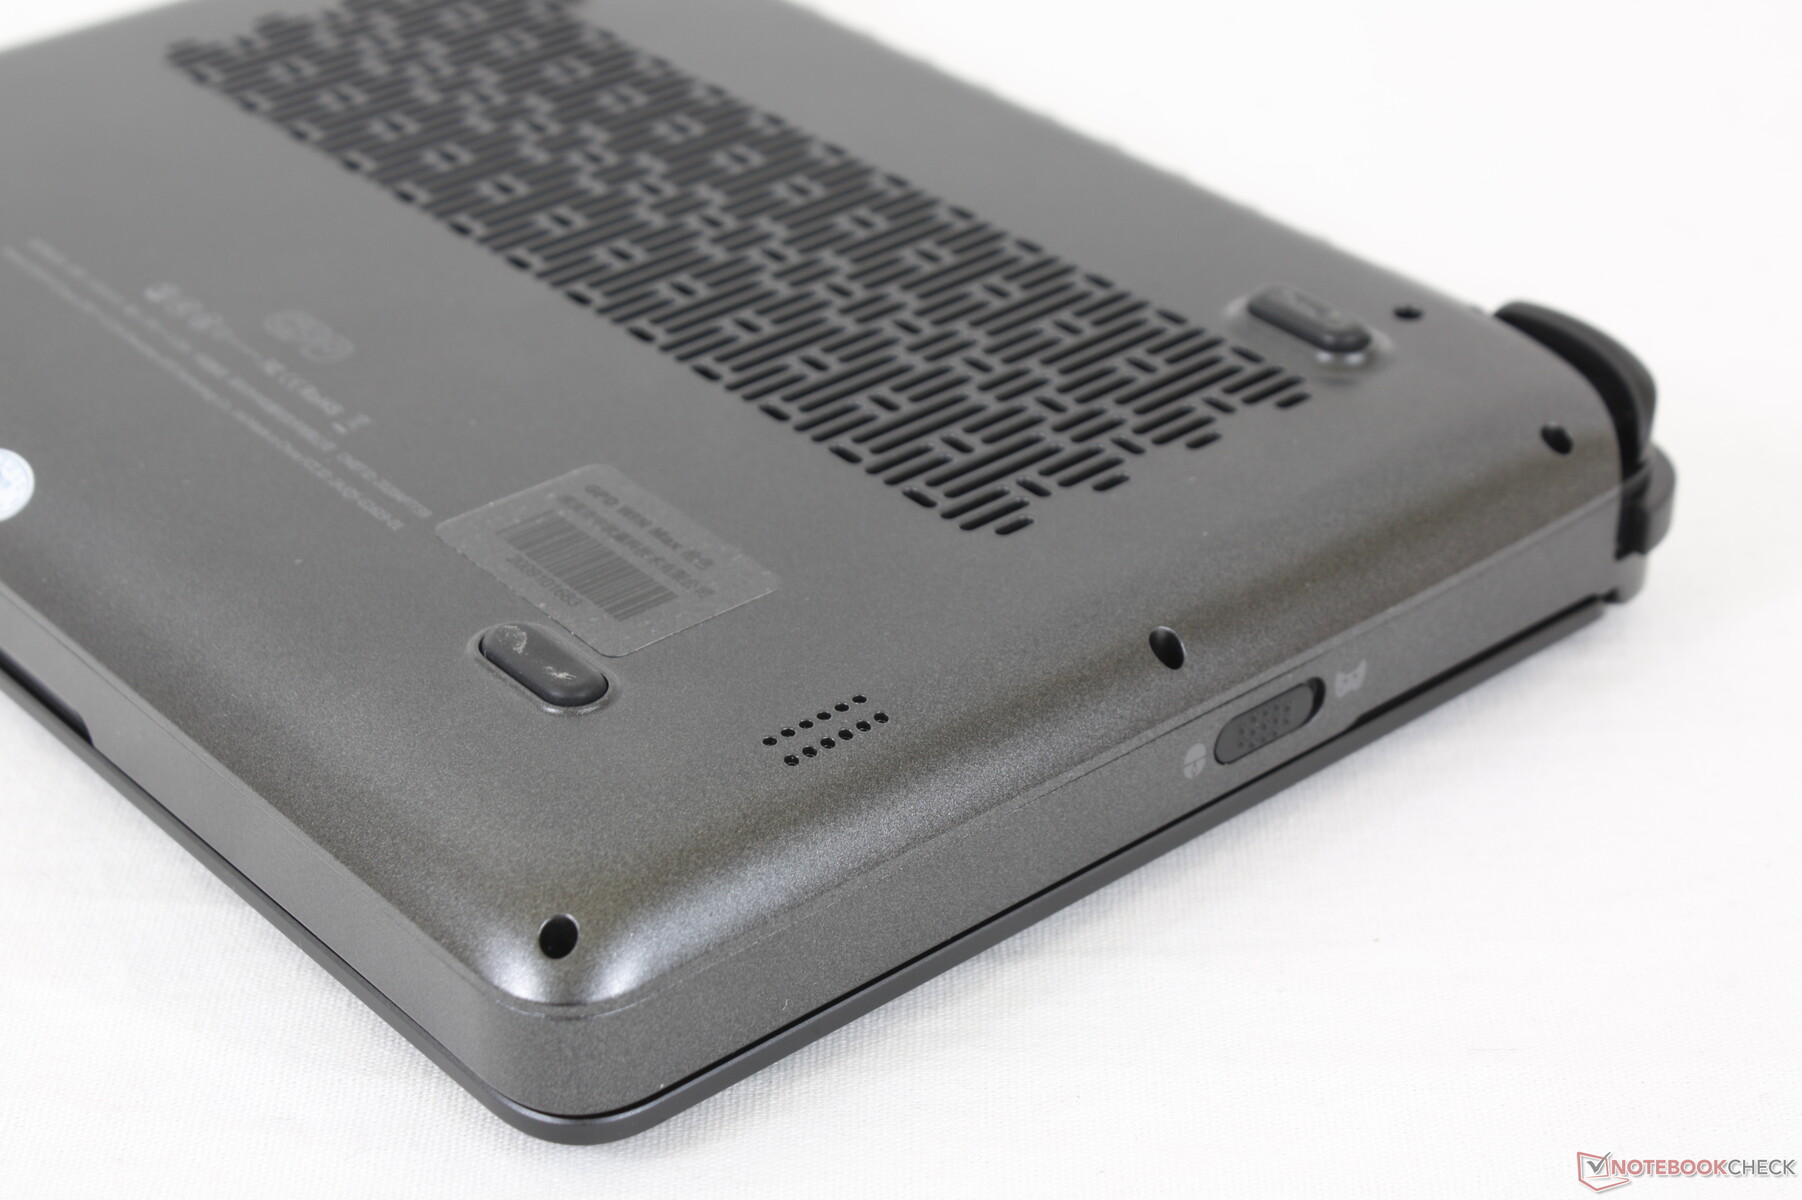
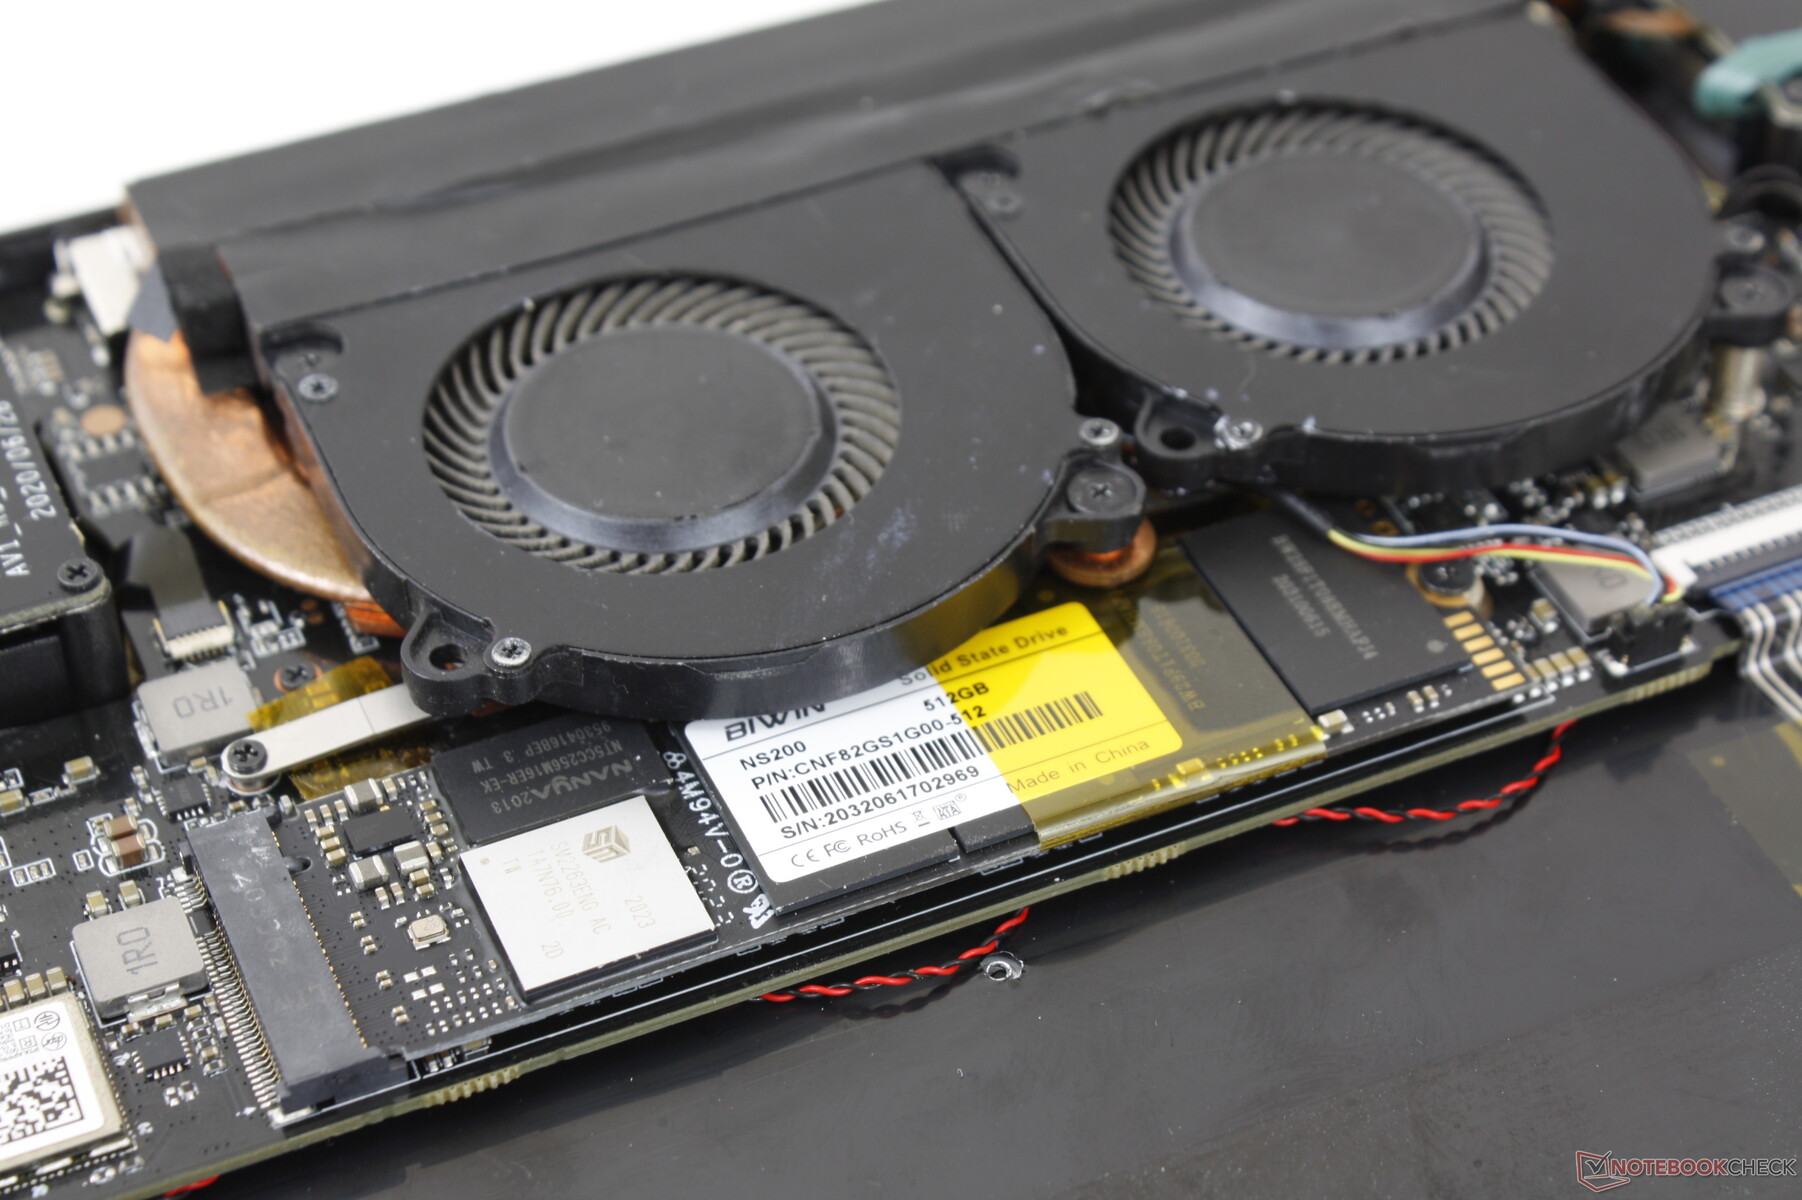
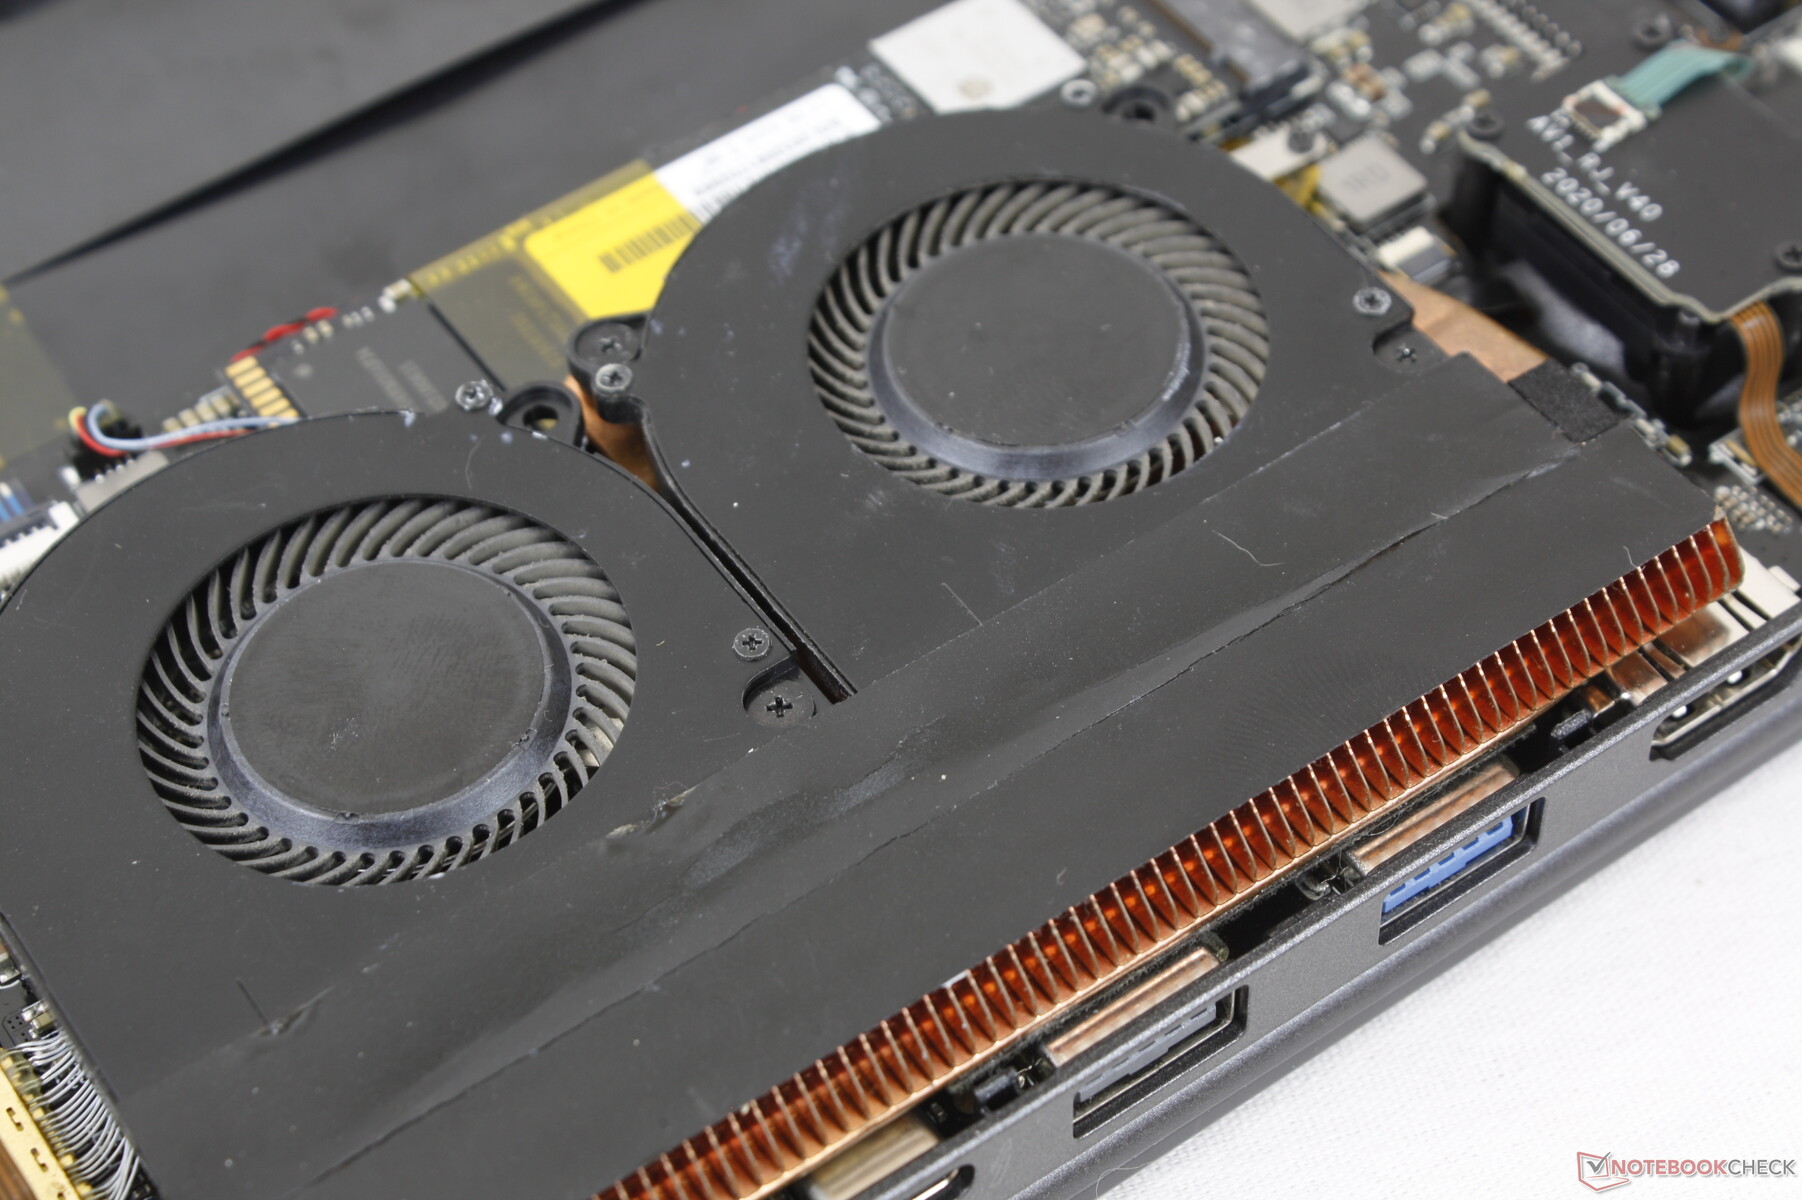
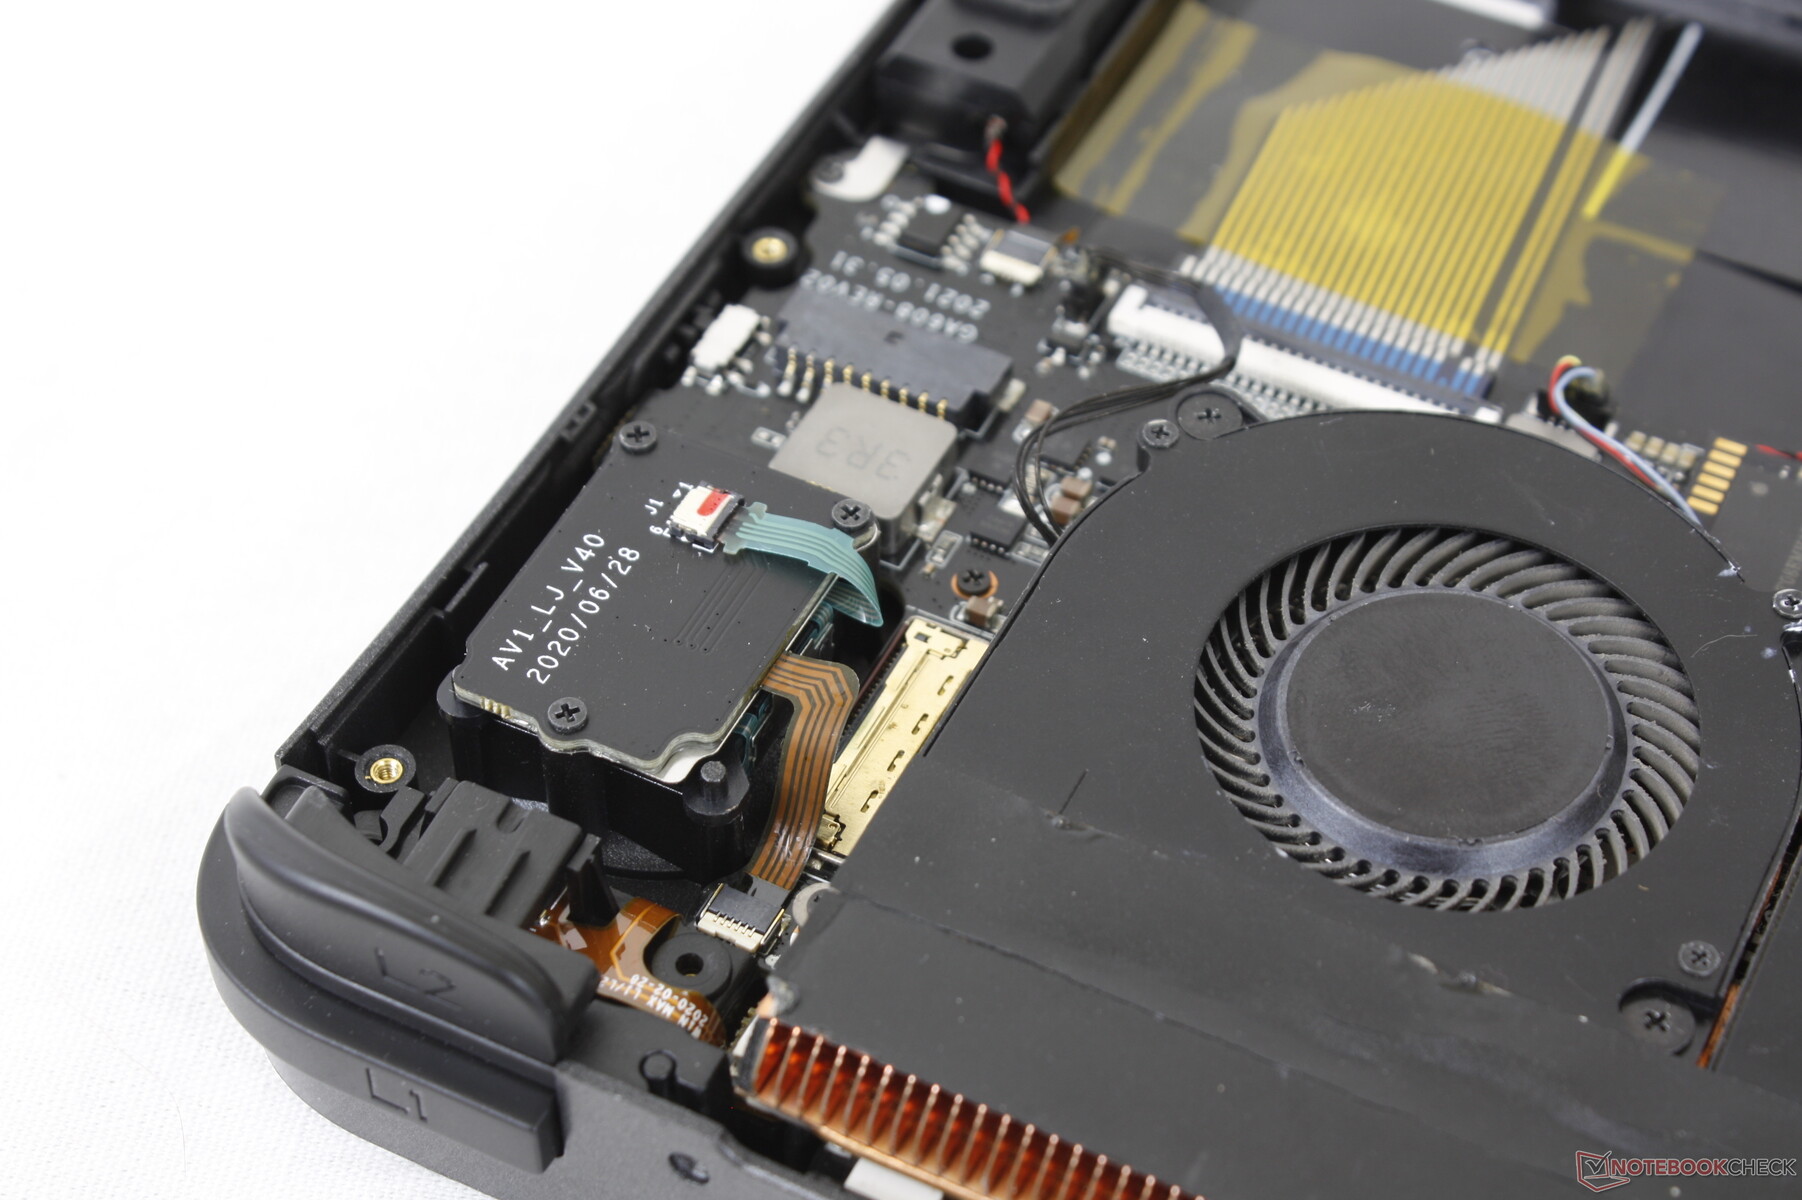
Maintenance
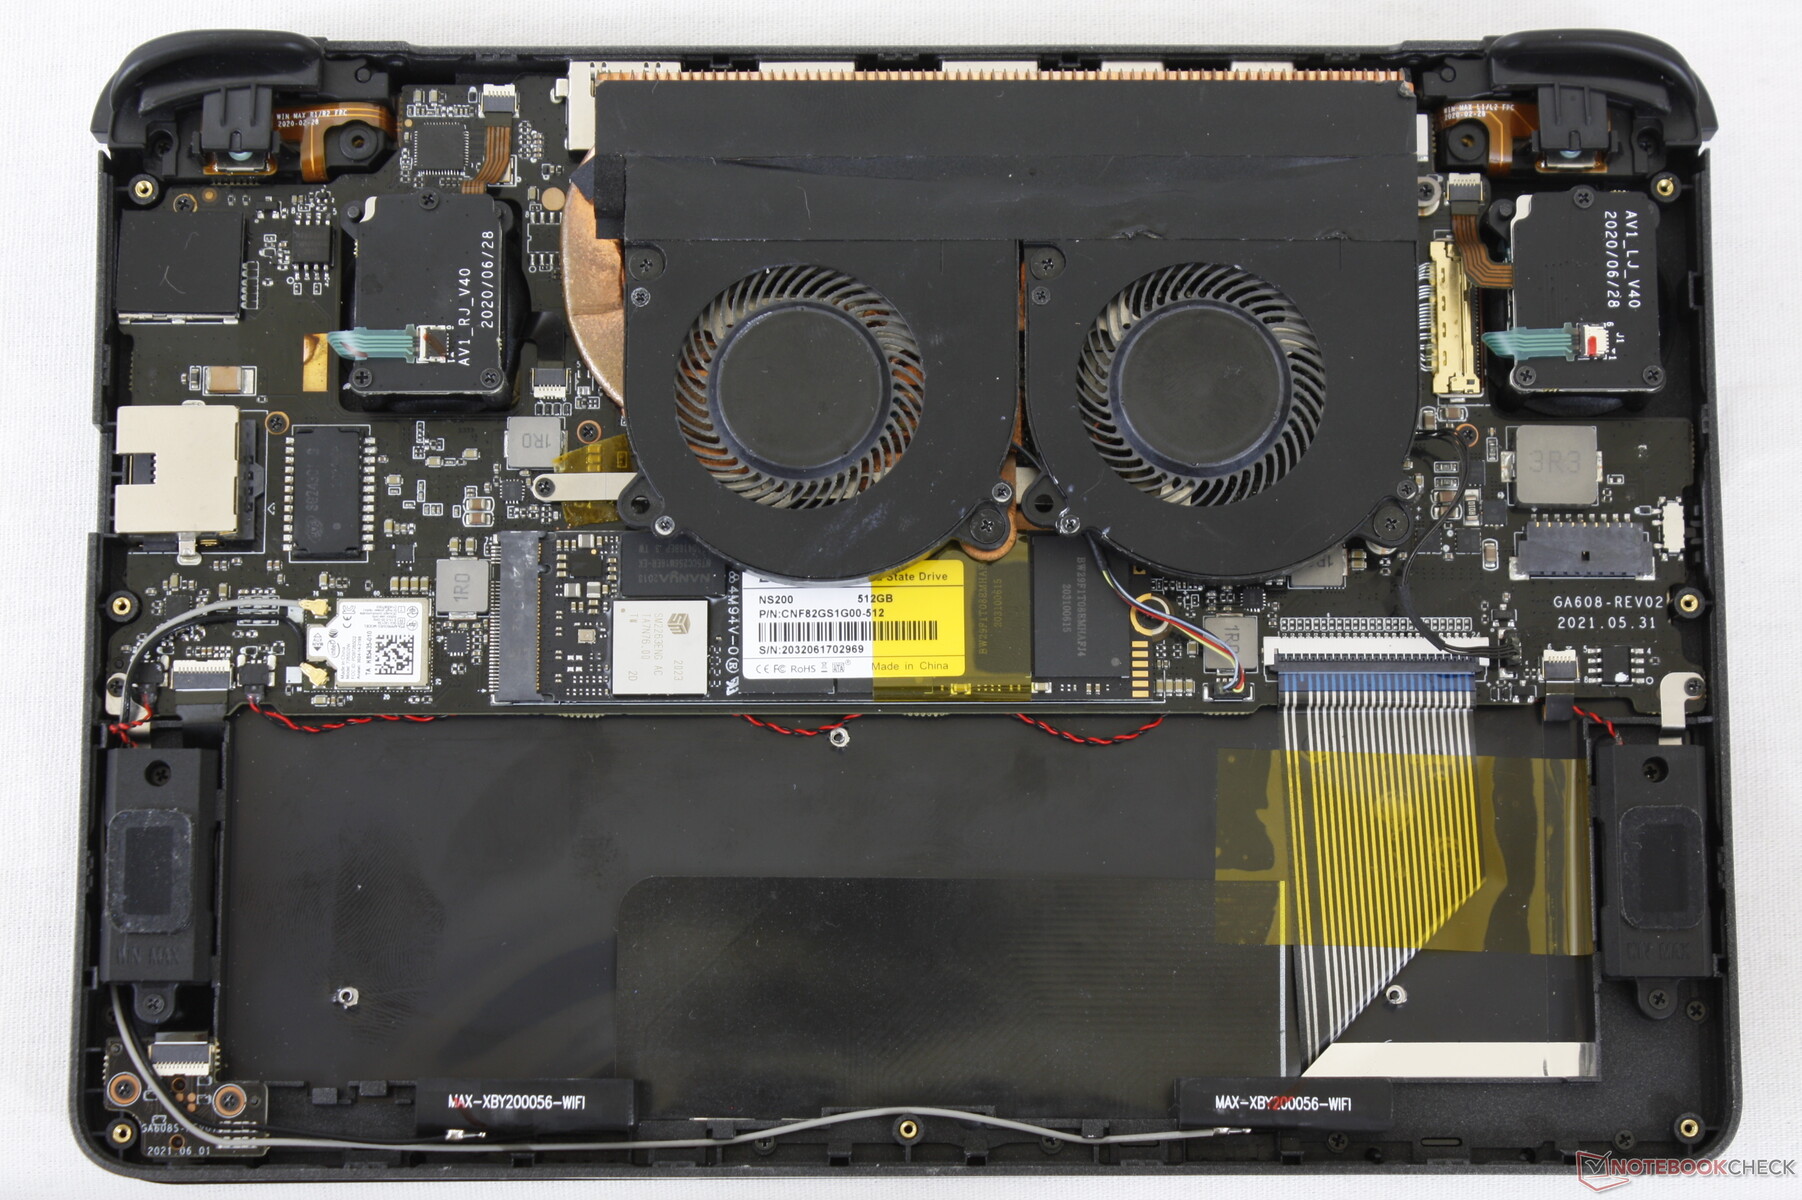
The bottom panel requires an extra-small Philips screwdriver to remove. Both RAM and WLAN are soldered meaning users can only upgrade the SSD or replace the battery if needed.
Accessories and Warranty
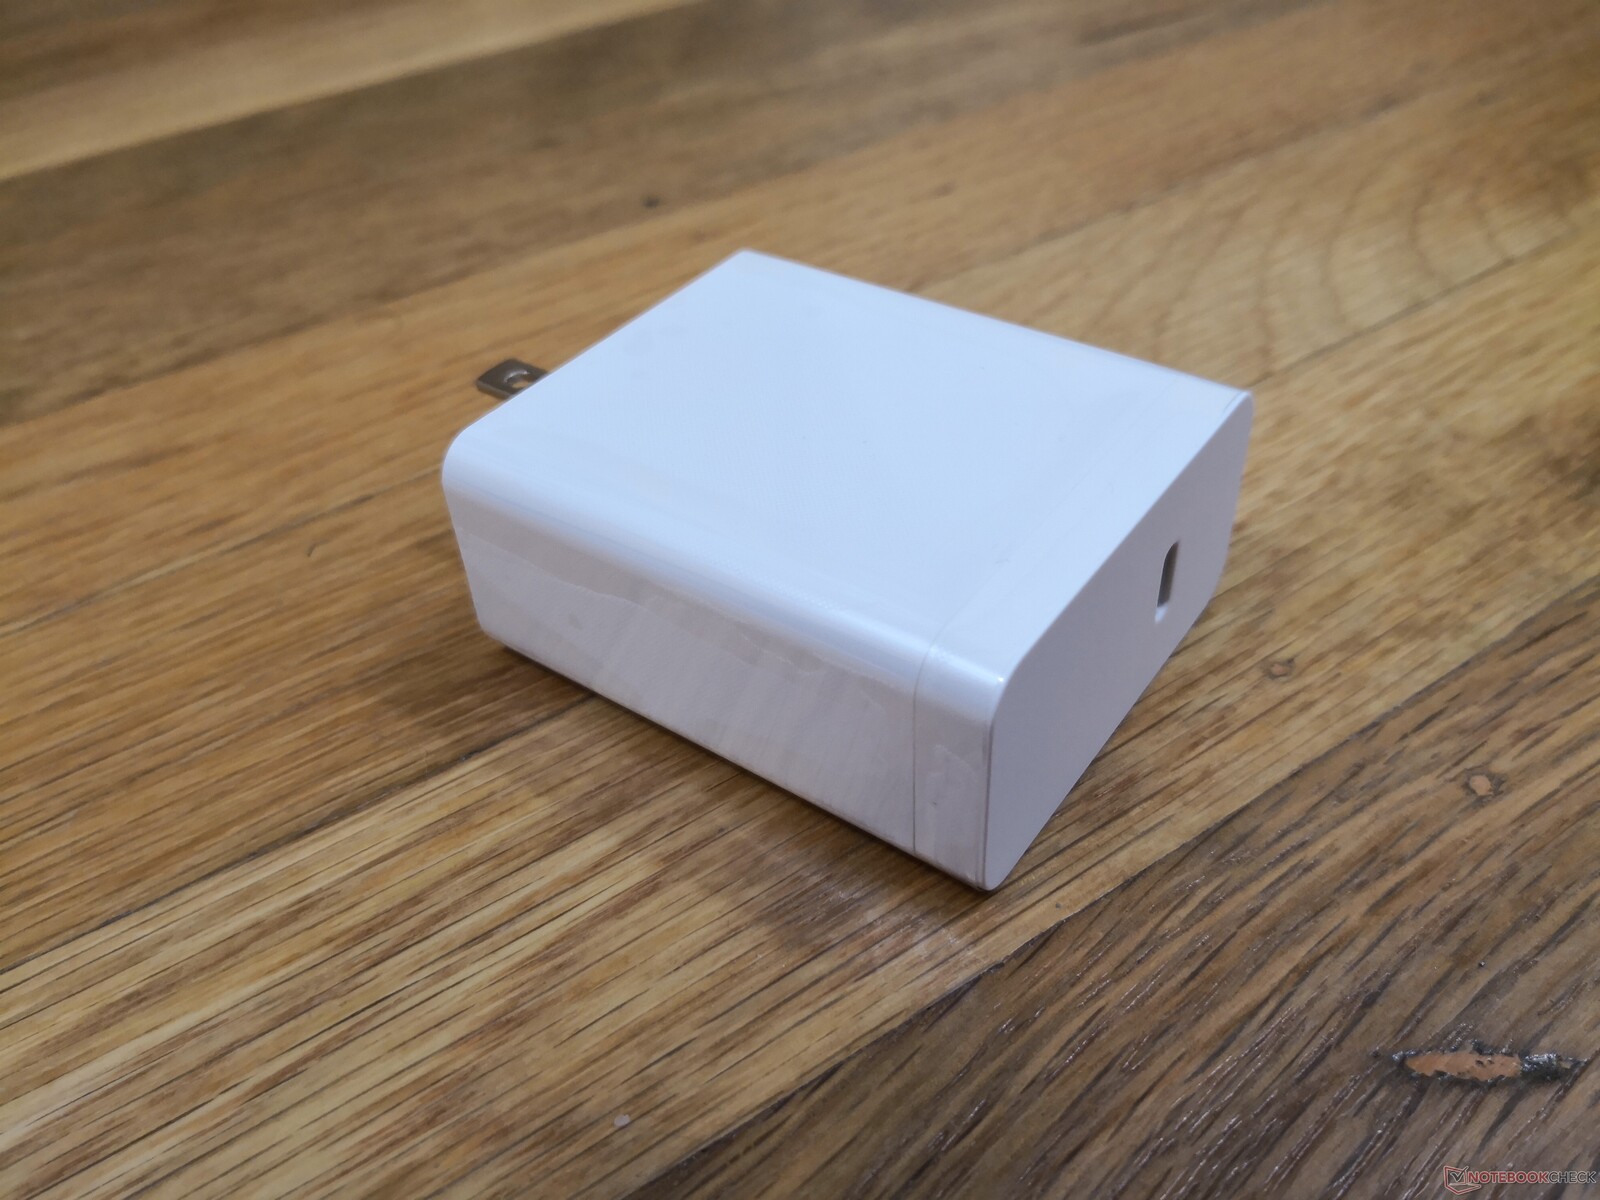
There are no extras in the box outside of the USB-C AC adapter. The standard one-year limited manufacturer warranty applies. Claiming warranty may be a long wait for buyers overseas.
Input Devices
Keyboard
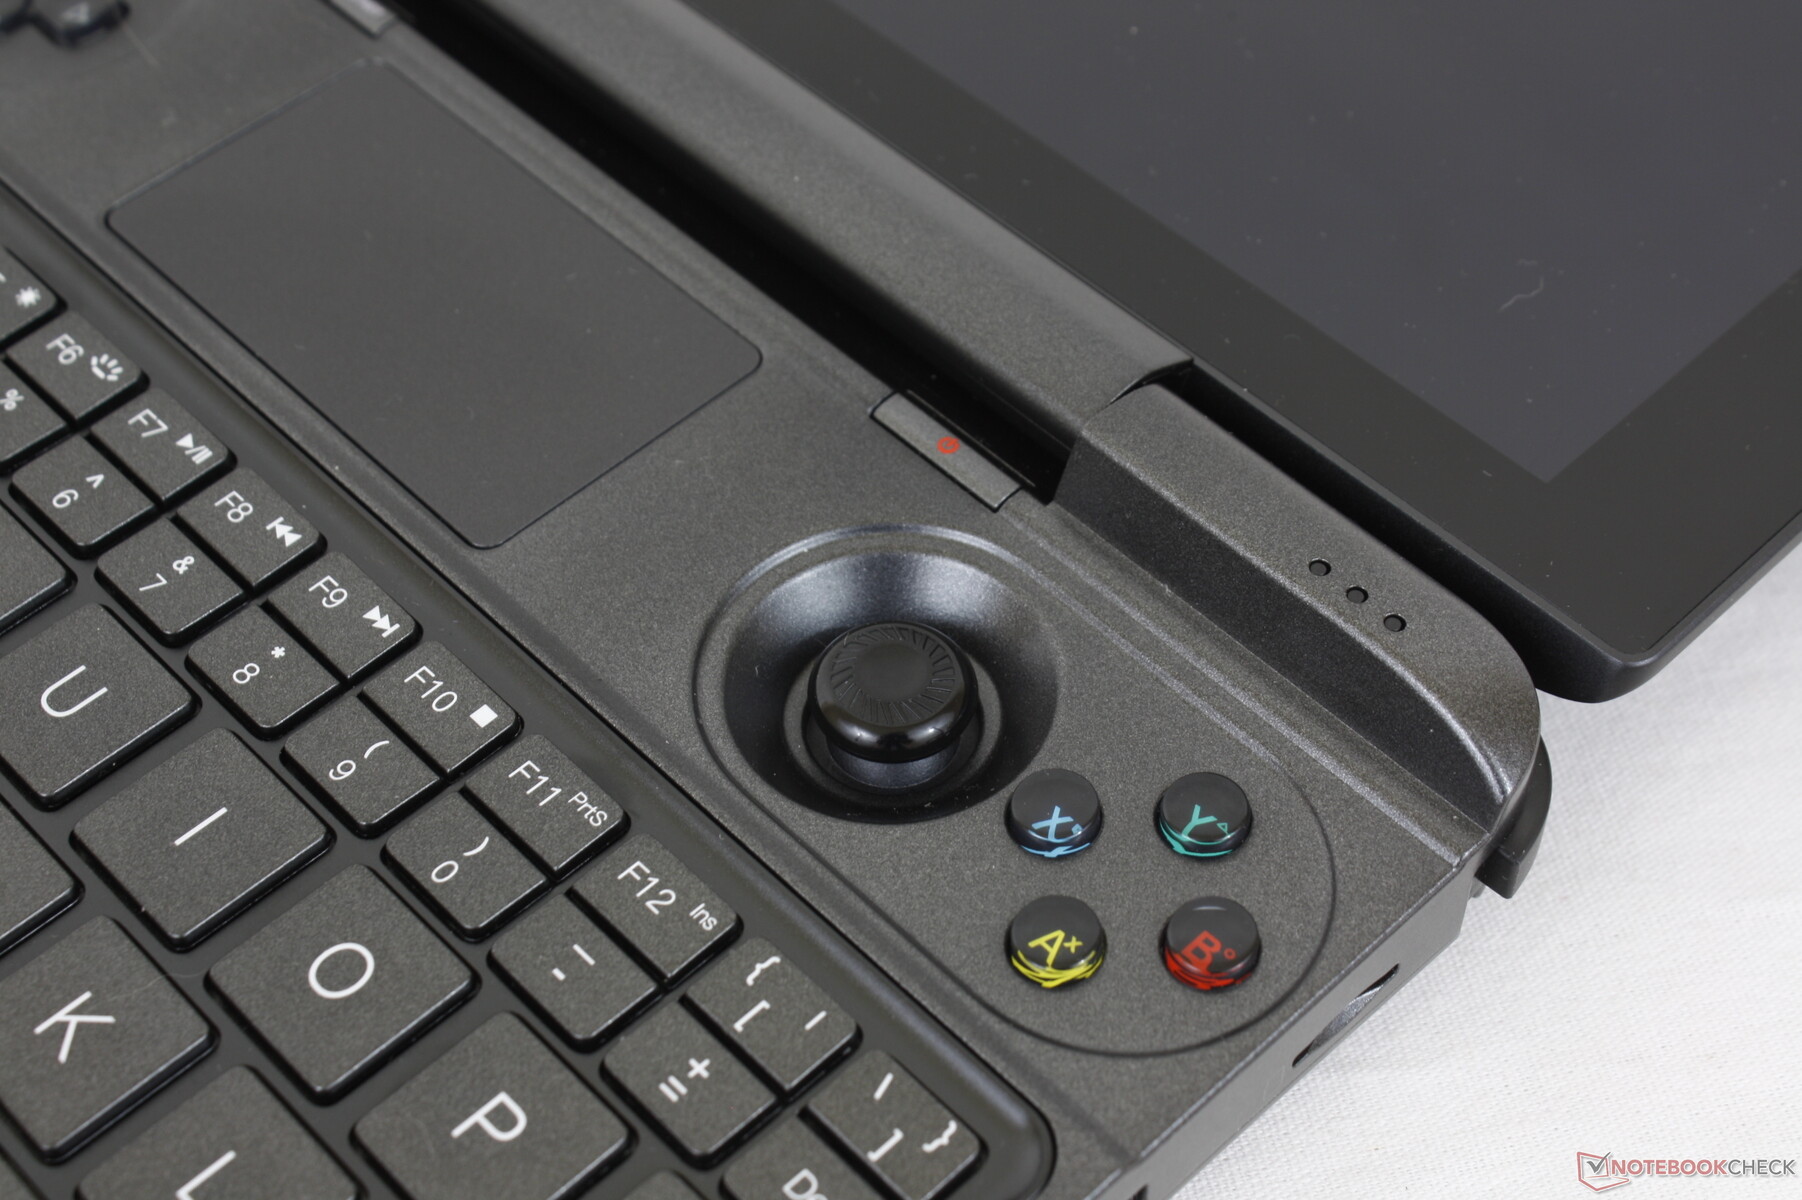
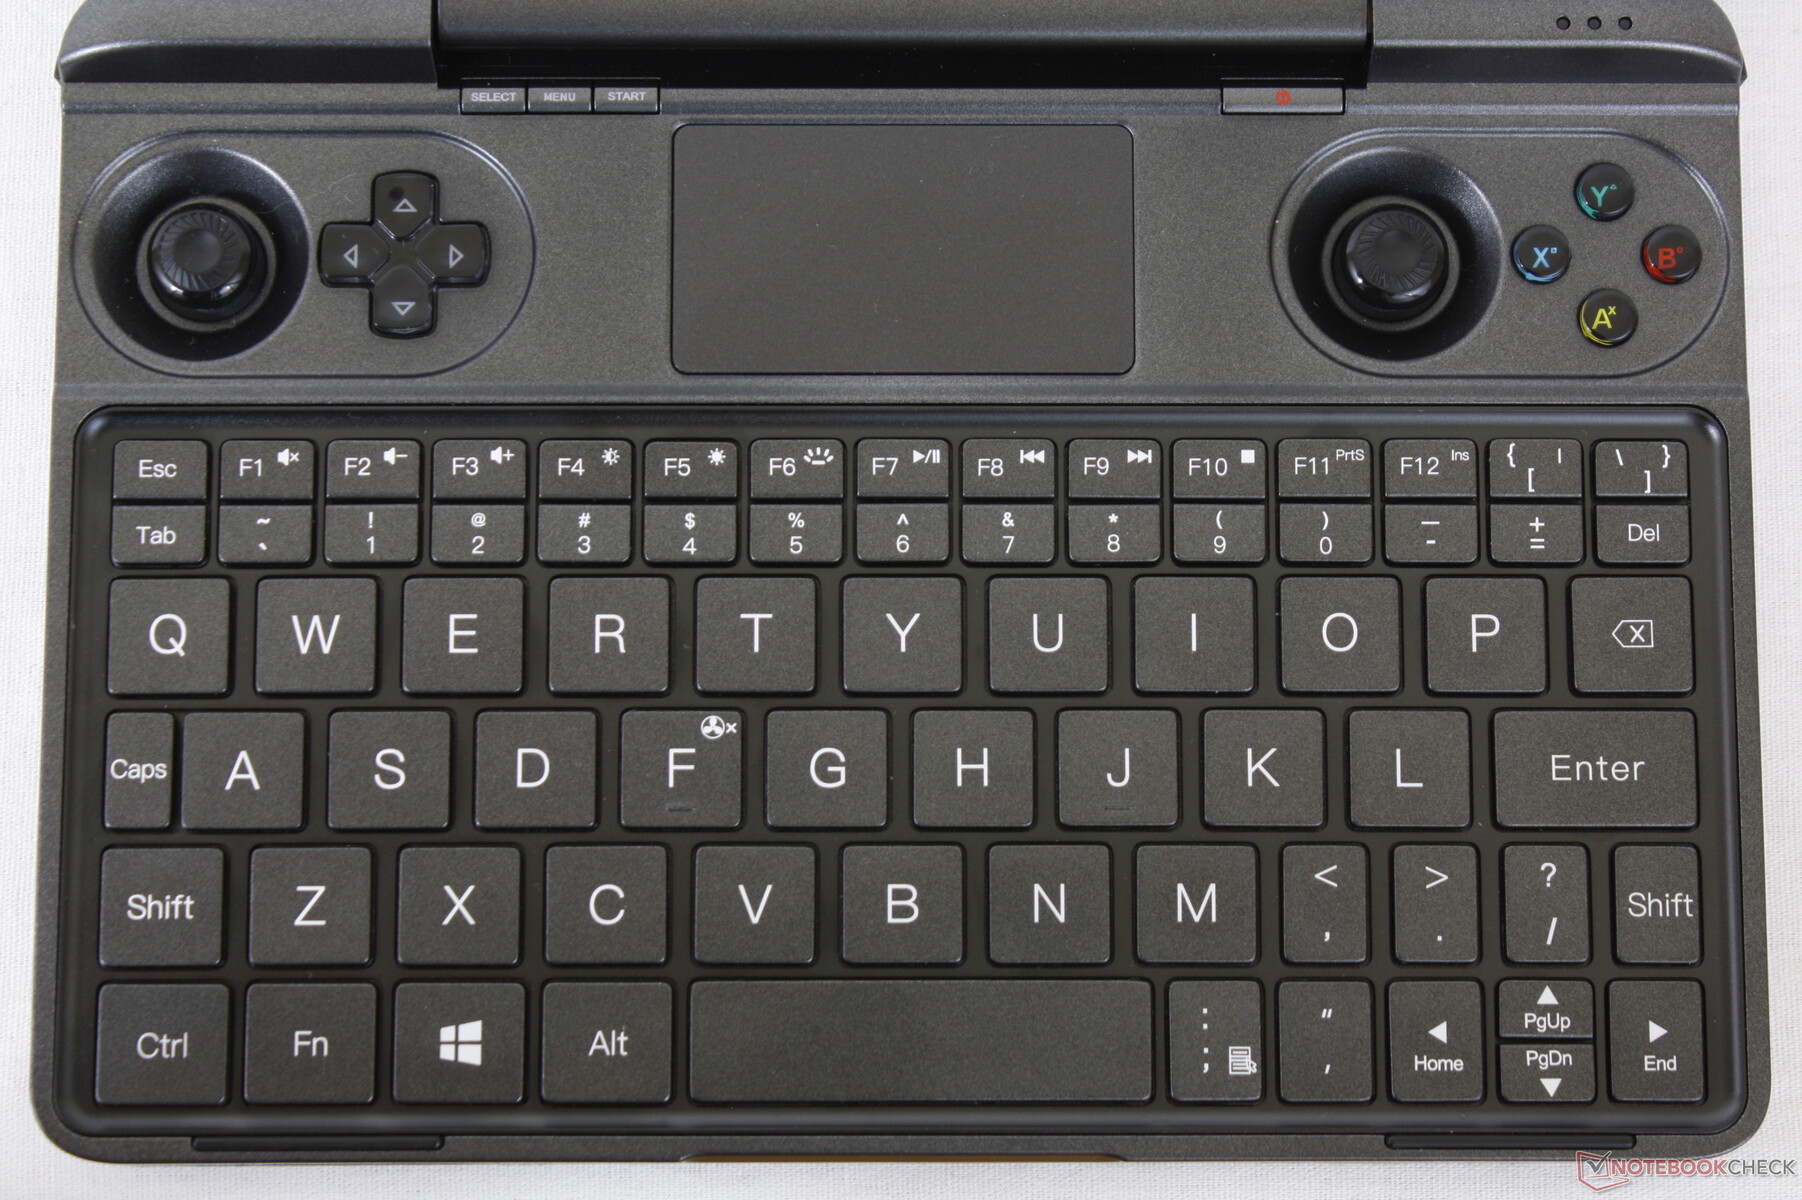
We can't fault the backlit keyboard for being cramped as that is to be expected for its 8-inch form factor. It'll definitely take some time to get used to the odd layout and small keys if you plan on typing regularly on the Win Max.
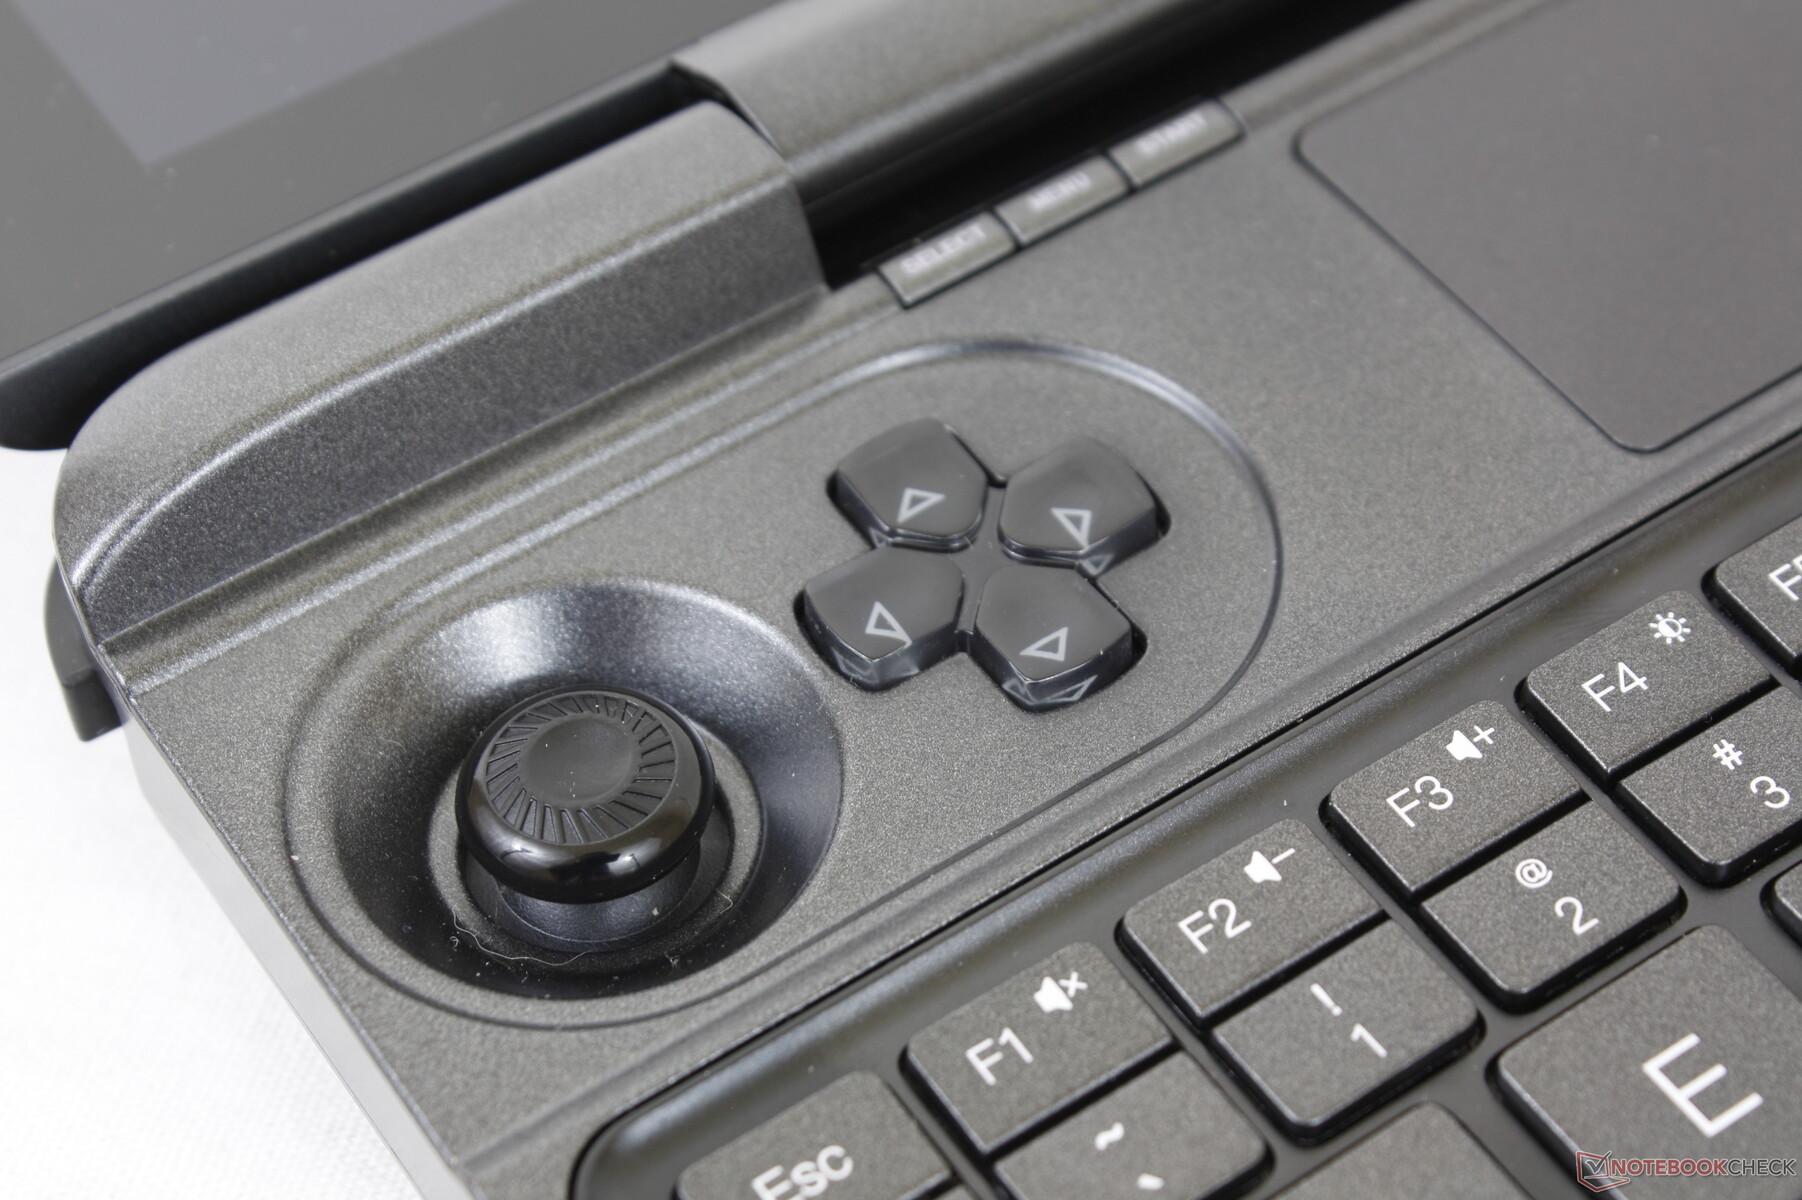
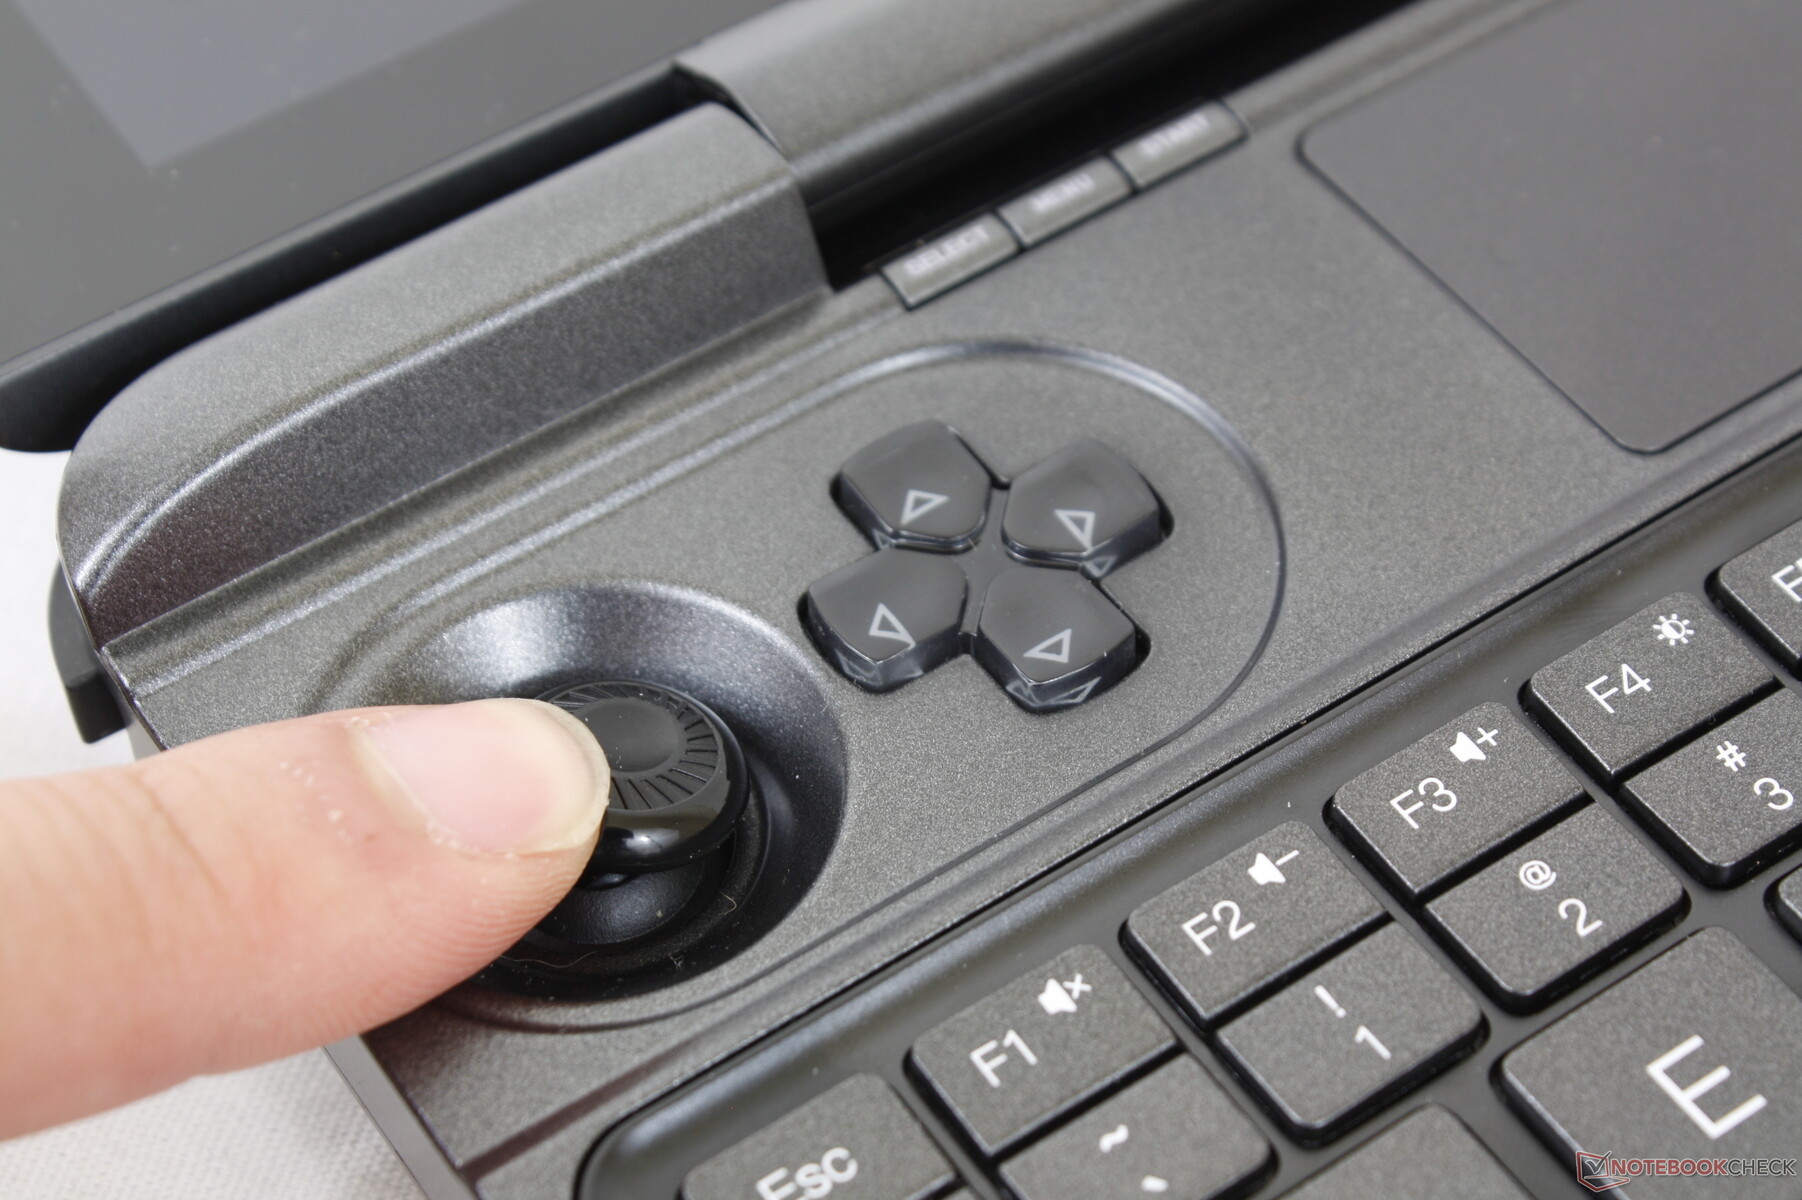
The controller buttons are not very comfortable to use. The travel and feedback on the shoulder buttons in particular are too narrow and soft, respectively. Additionally, the joysticks have a very narrow range of motion that is even smaller than on the Nintendo Joy Cons. Precise movements are therefore difficult to pull off here especially for users with larger thumbs.
The Turbo fan mode can be toggled with the Fn+F key. However, there is no onscreen indicator to show if Turbo mode is active or not meaning it can sometimes be difficult to know the fan mode at any given moment.
Touchpad
The small Precision-enabled clickpad (5.8 x 3.3 cm) has excellent traction with a bit of sticking at slower speeds. Unfortunately, the cursor can be jumpy and unresponsive when gliding slowly which can make precision clicks annoyingly difficult.

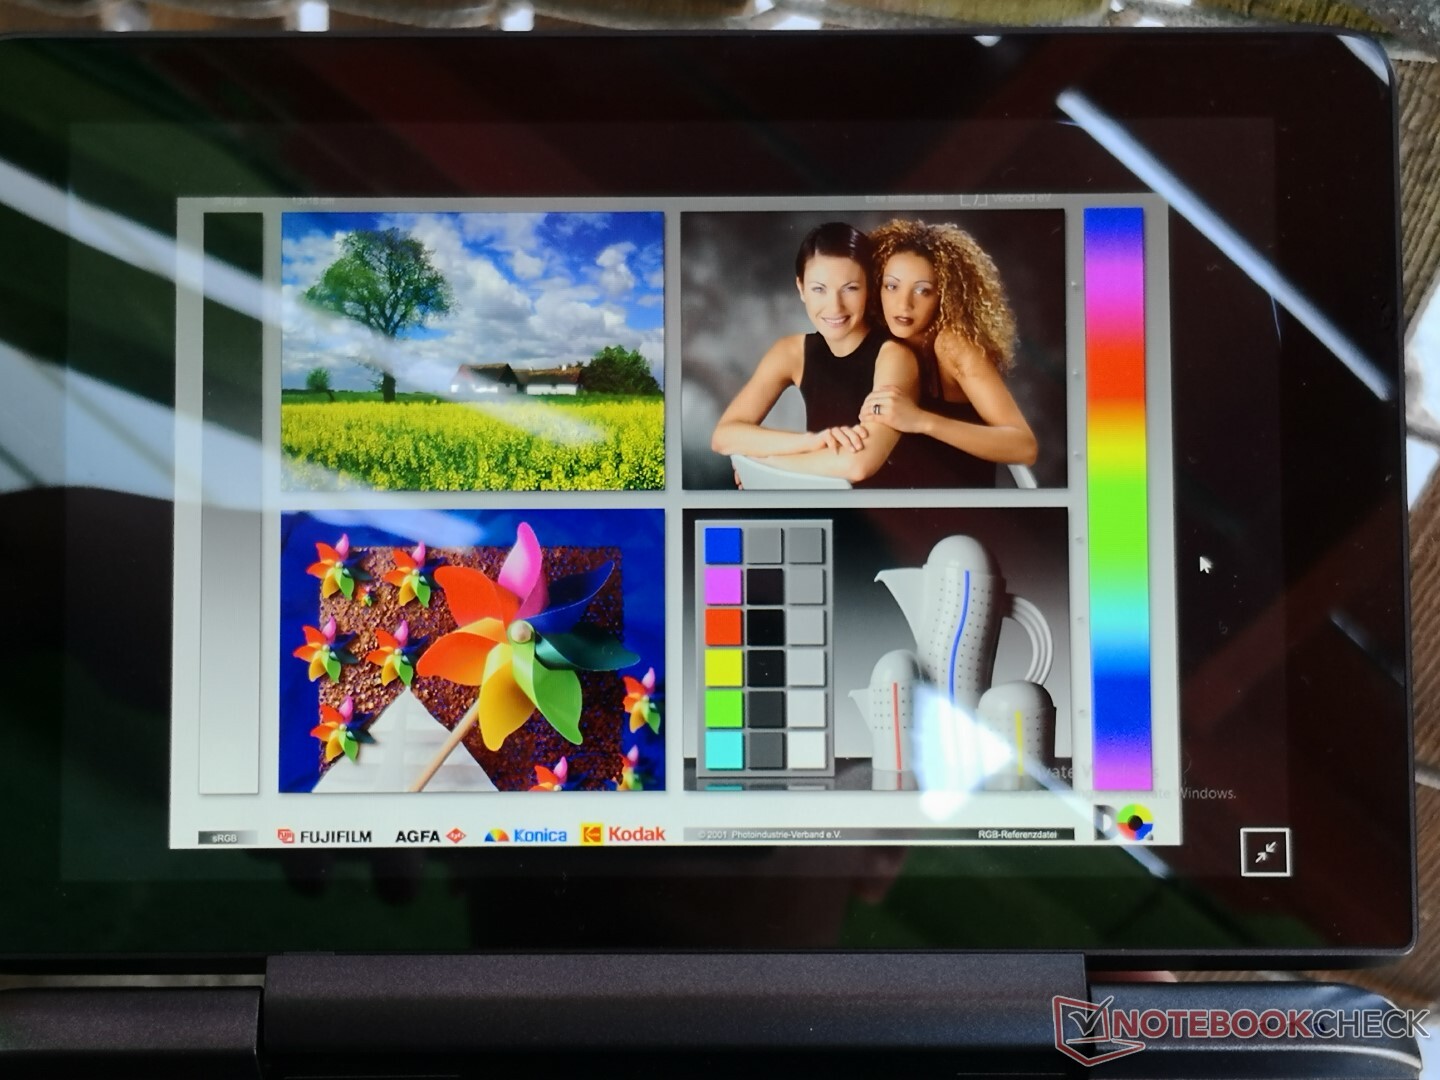
Display
The 8-inch touchscreen is obviously larger than the 5.5-inch touchscreen of the Win 3, but that is where the advantages end. Everything else from response times, brightness, and colors are measurably slower, dimmer, and shallower, respectively, than the display on the Win 3. It's not a poor display by any means, but it's a step down from what we know the manufacturer is capable of based on what we've experienced on the Win 3. A switch to OLED would actually address the ghosting, color, and contrast concerns that we have with this particular IPS panel.

| |||||||||||||||||||||||||
Brightness Distribution: 92 %
Center on Battery: 374.6 cd/m²
Contrast: 832:1 (Black: 0.45 cd/m²)
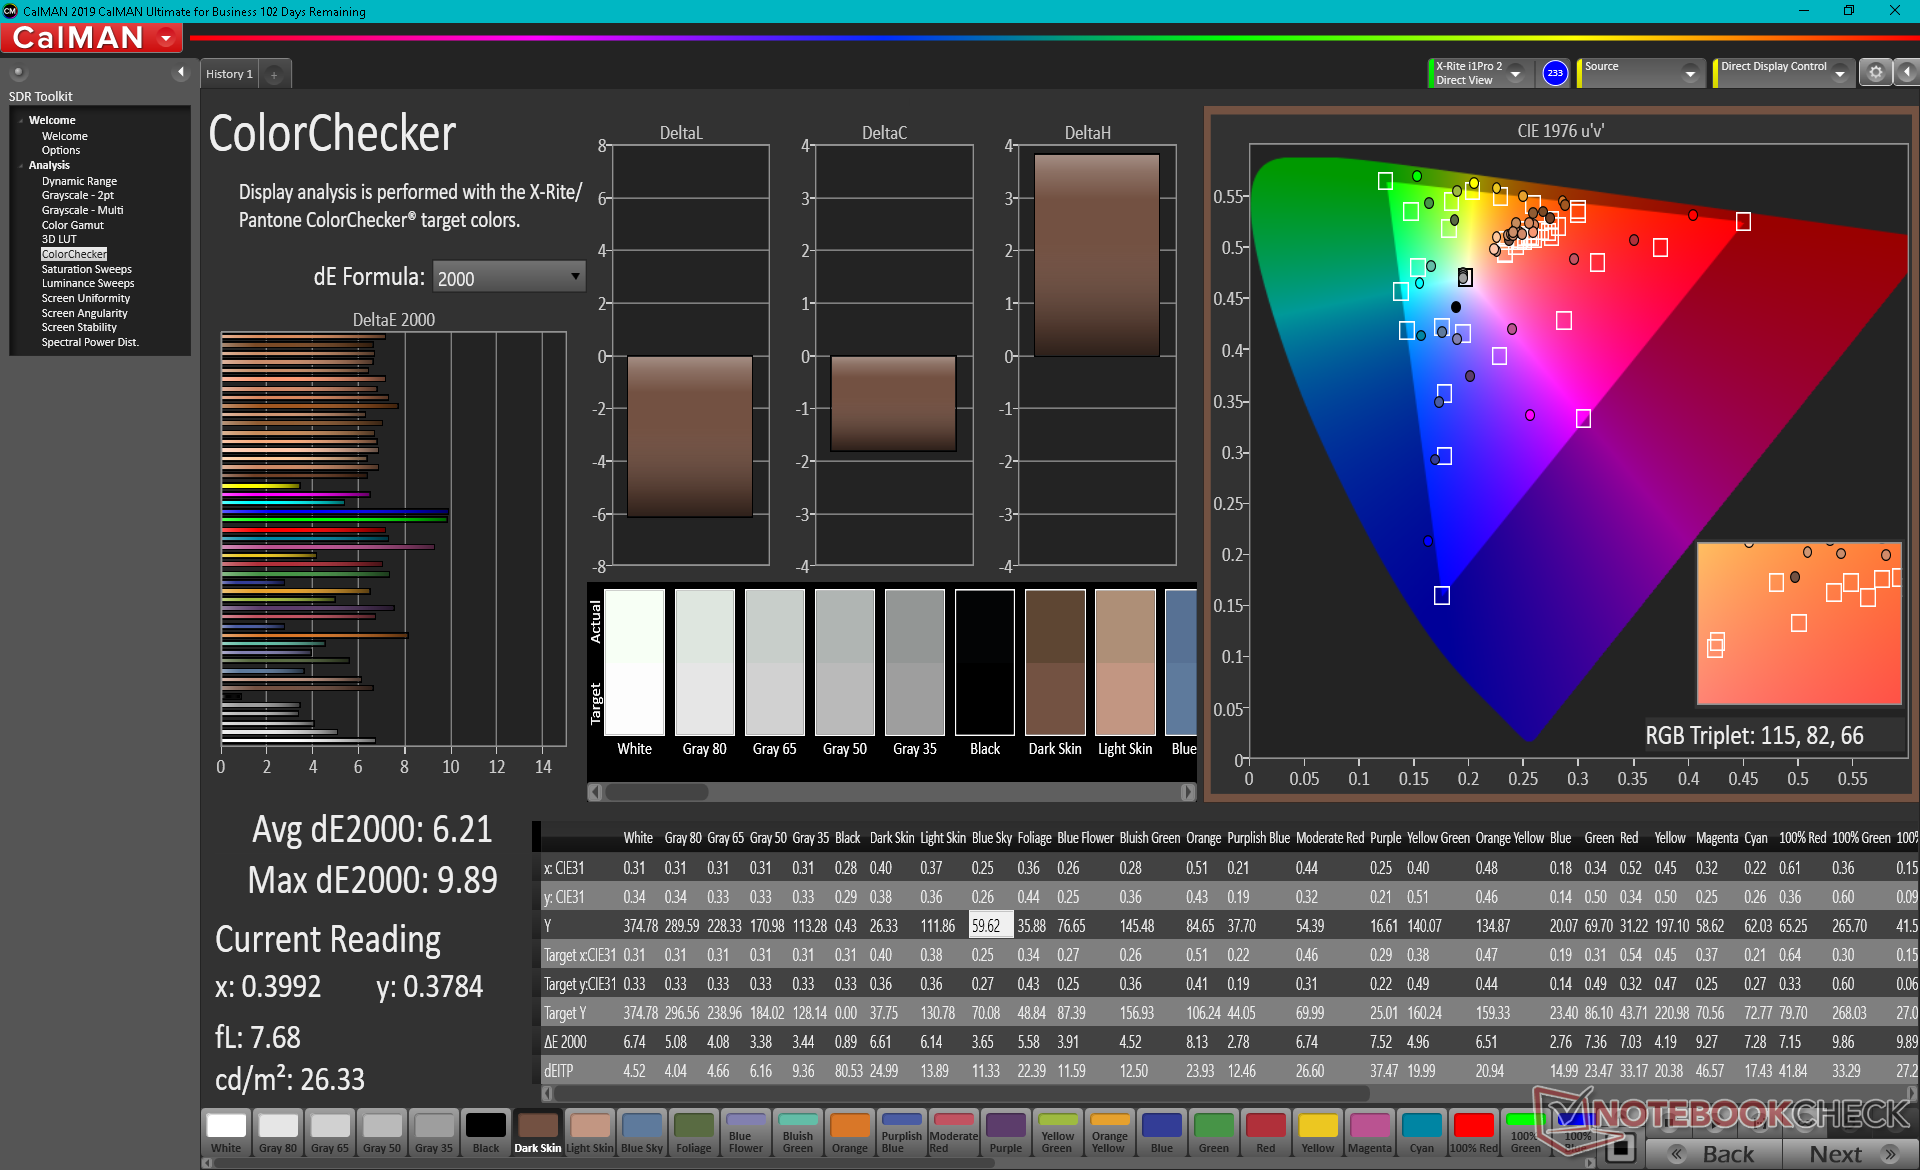
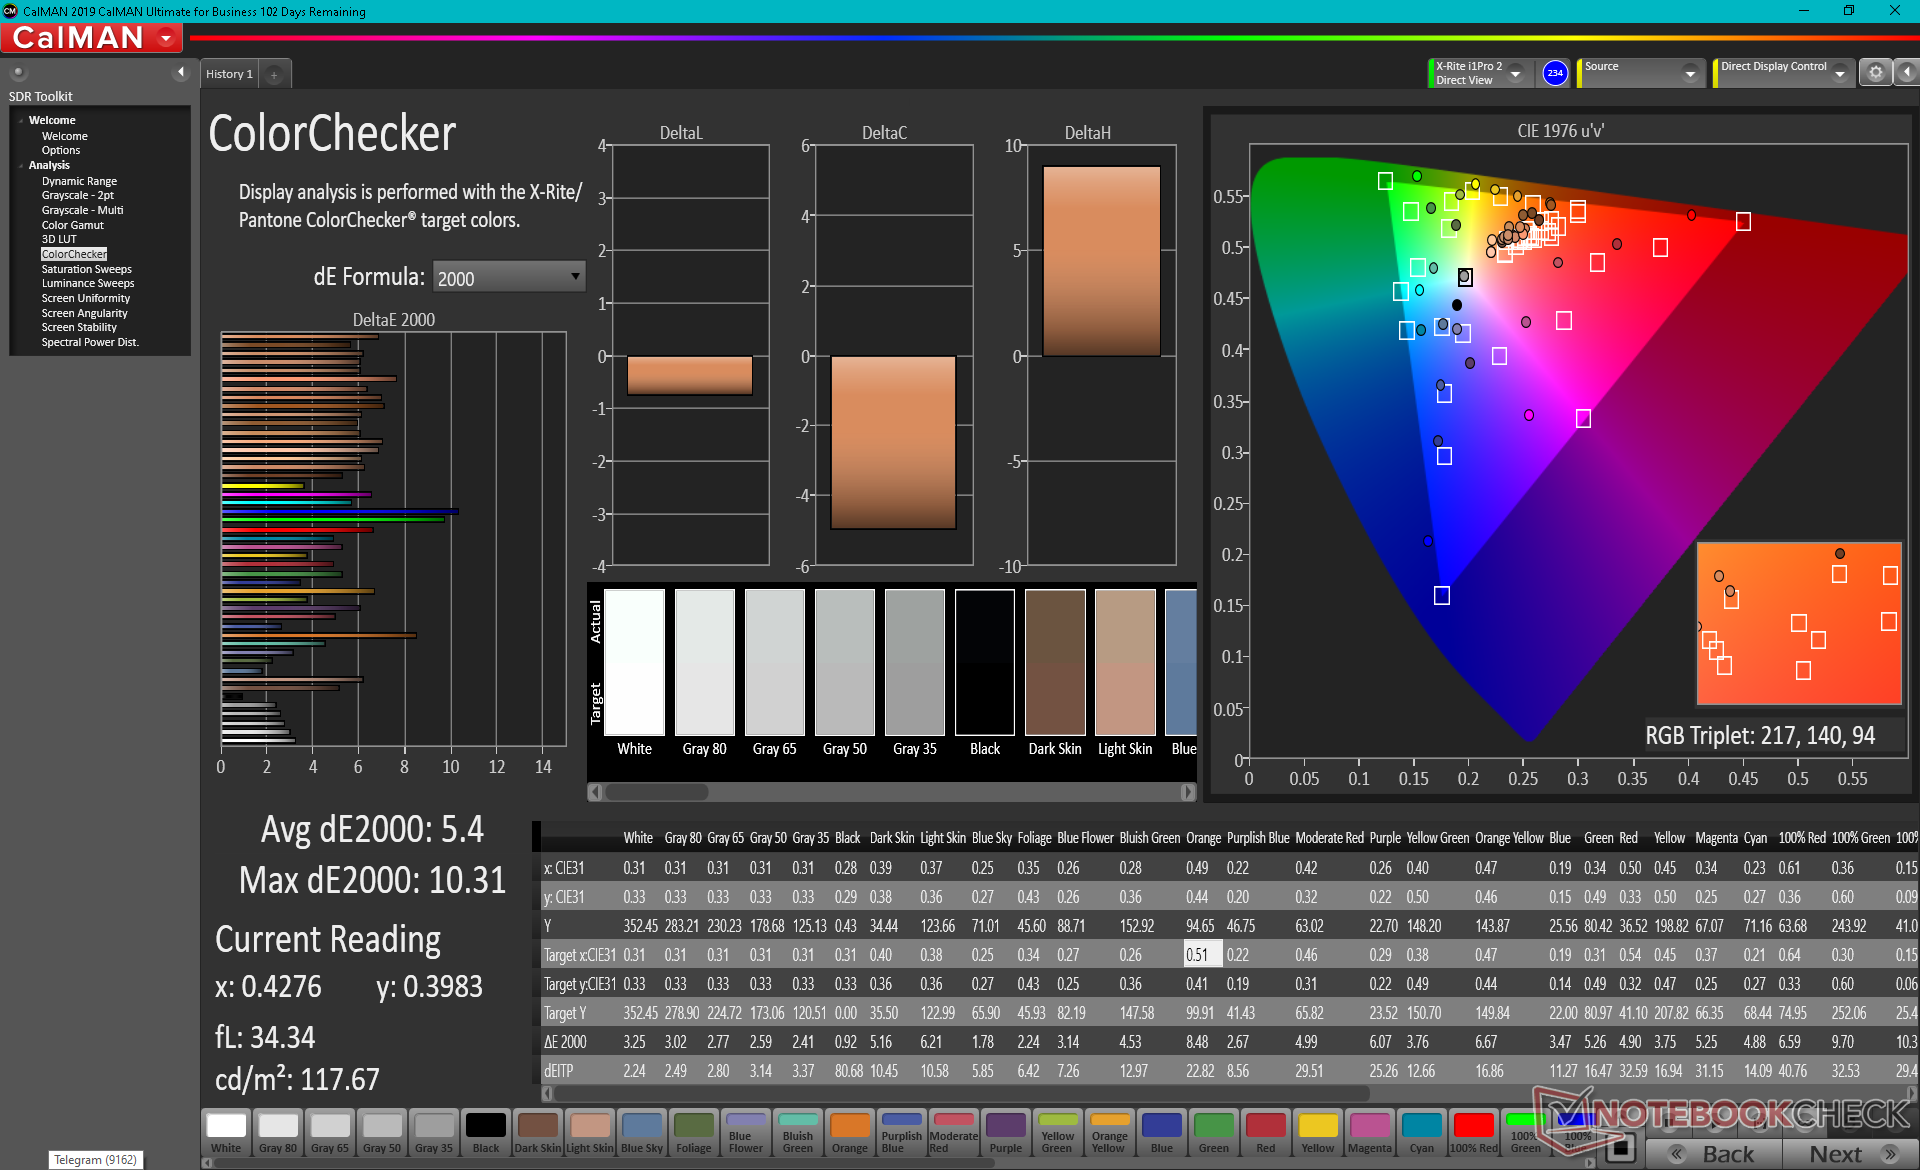
ΔE ColorChecker Calman: 6.21 | ∀{0.5-29.43 Ø4.71}
calibrated: 5.4
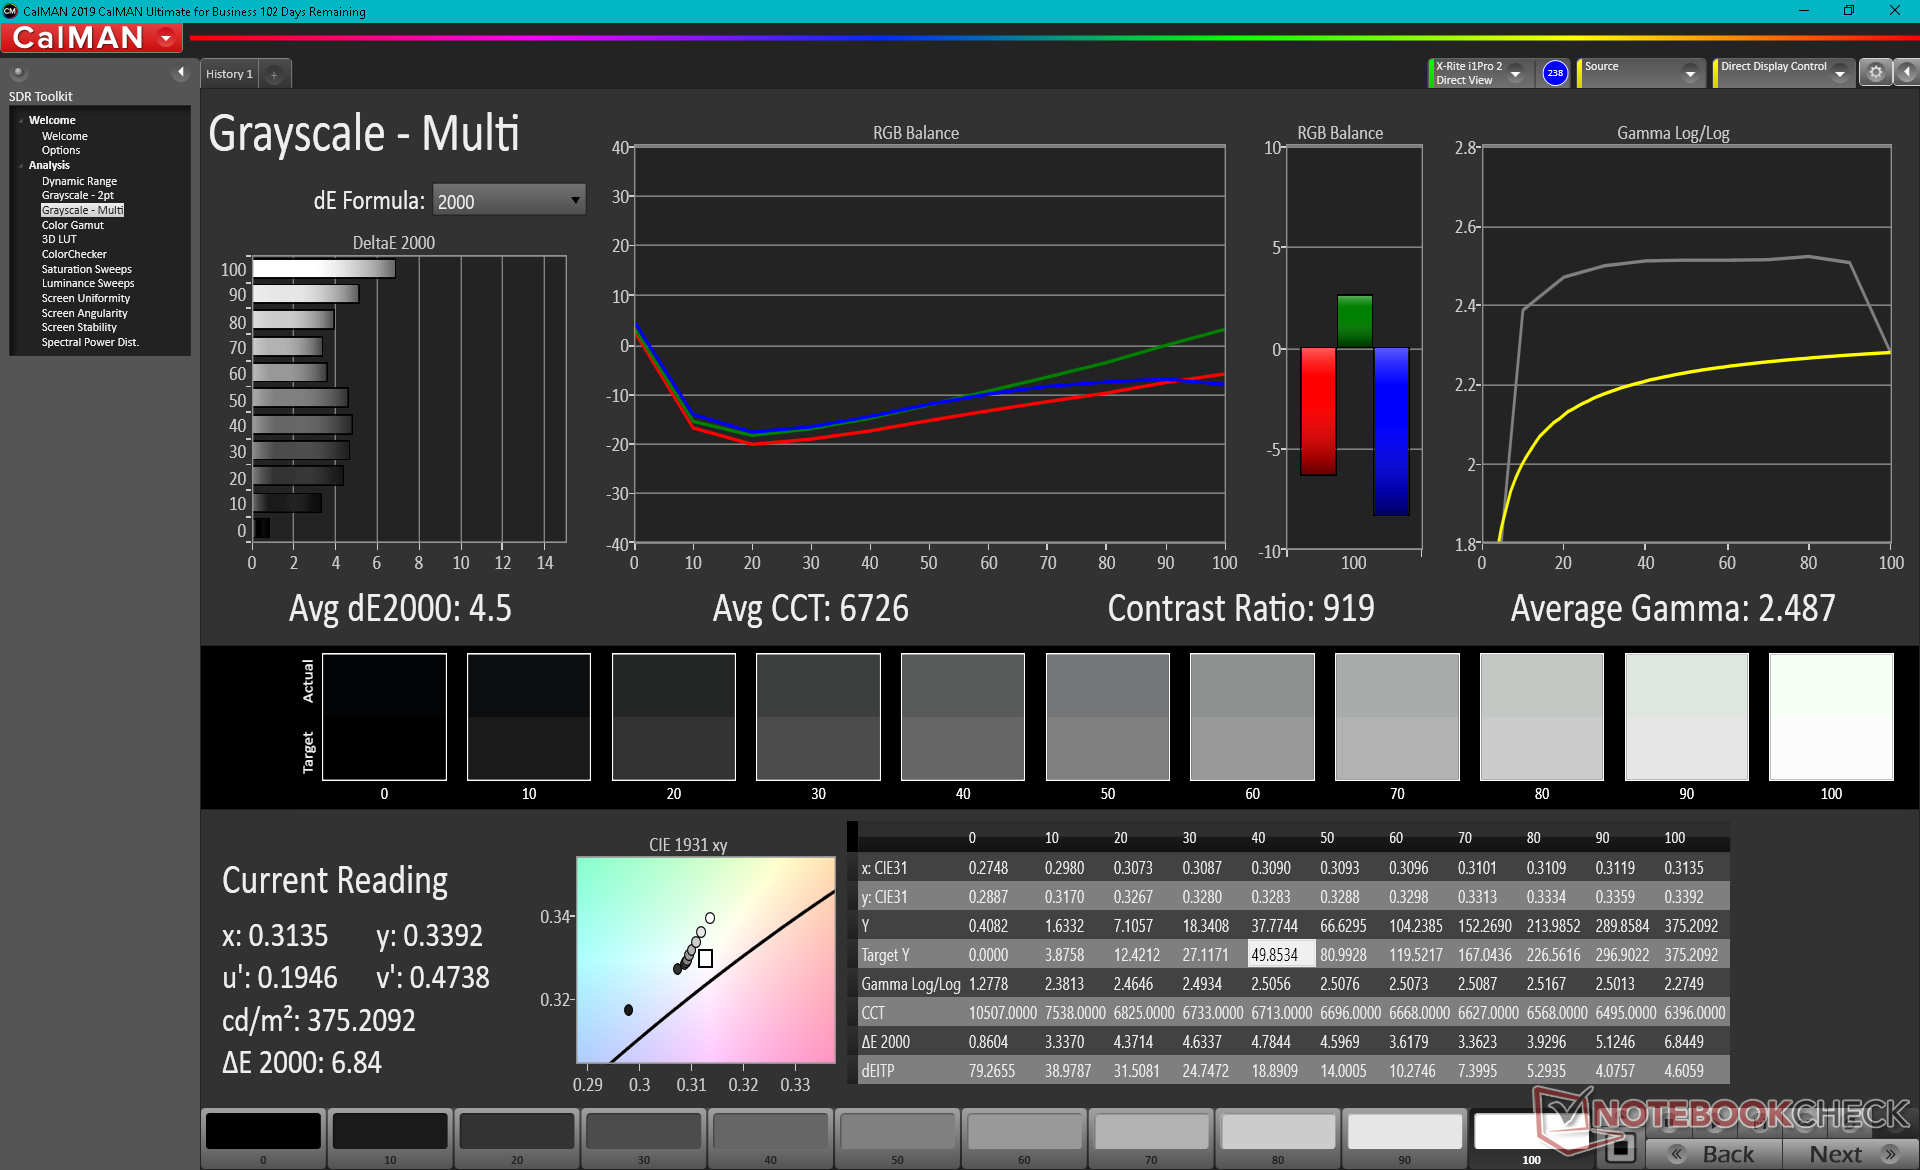
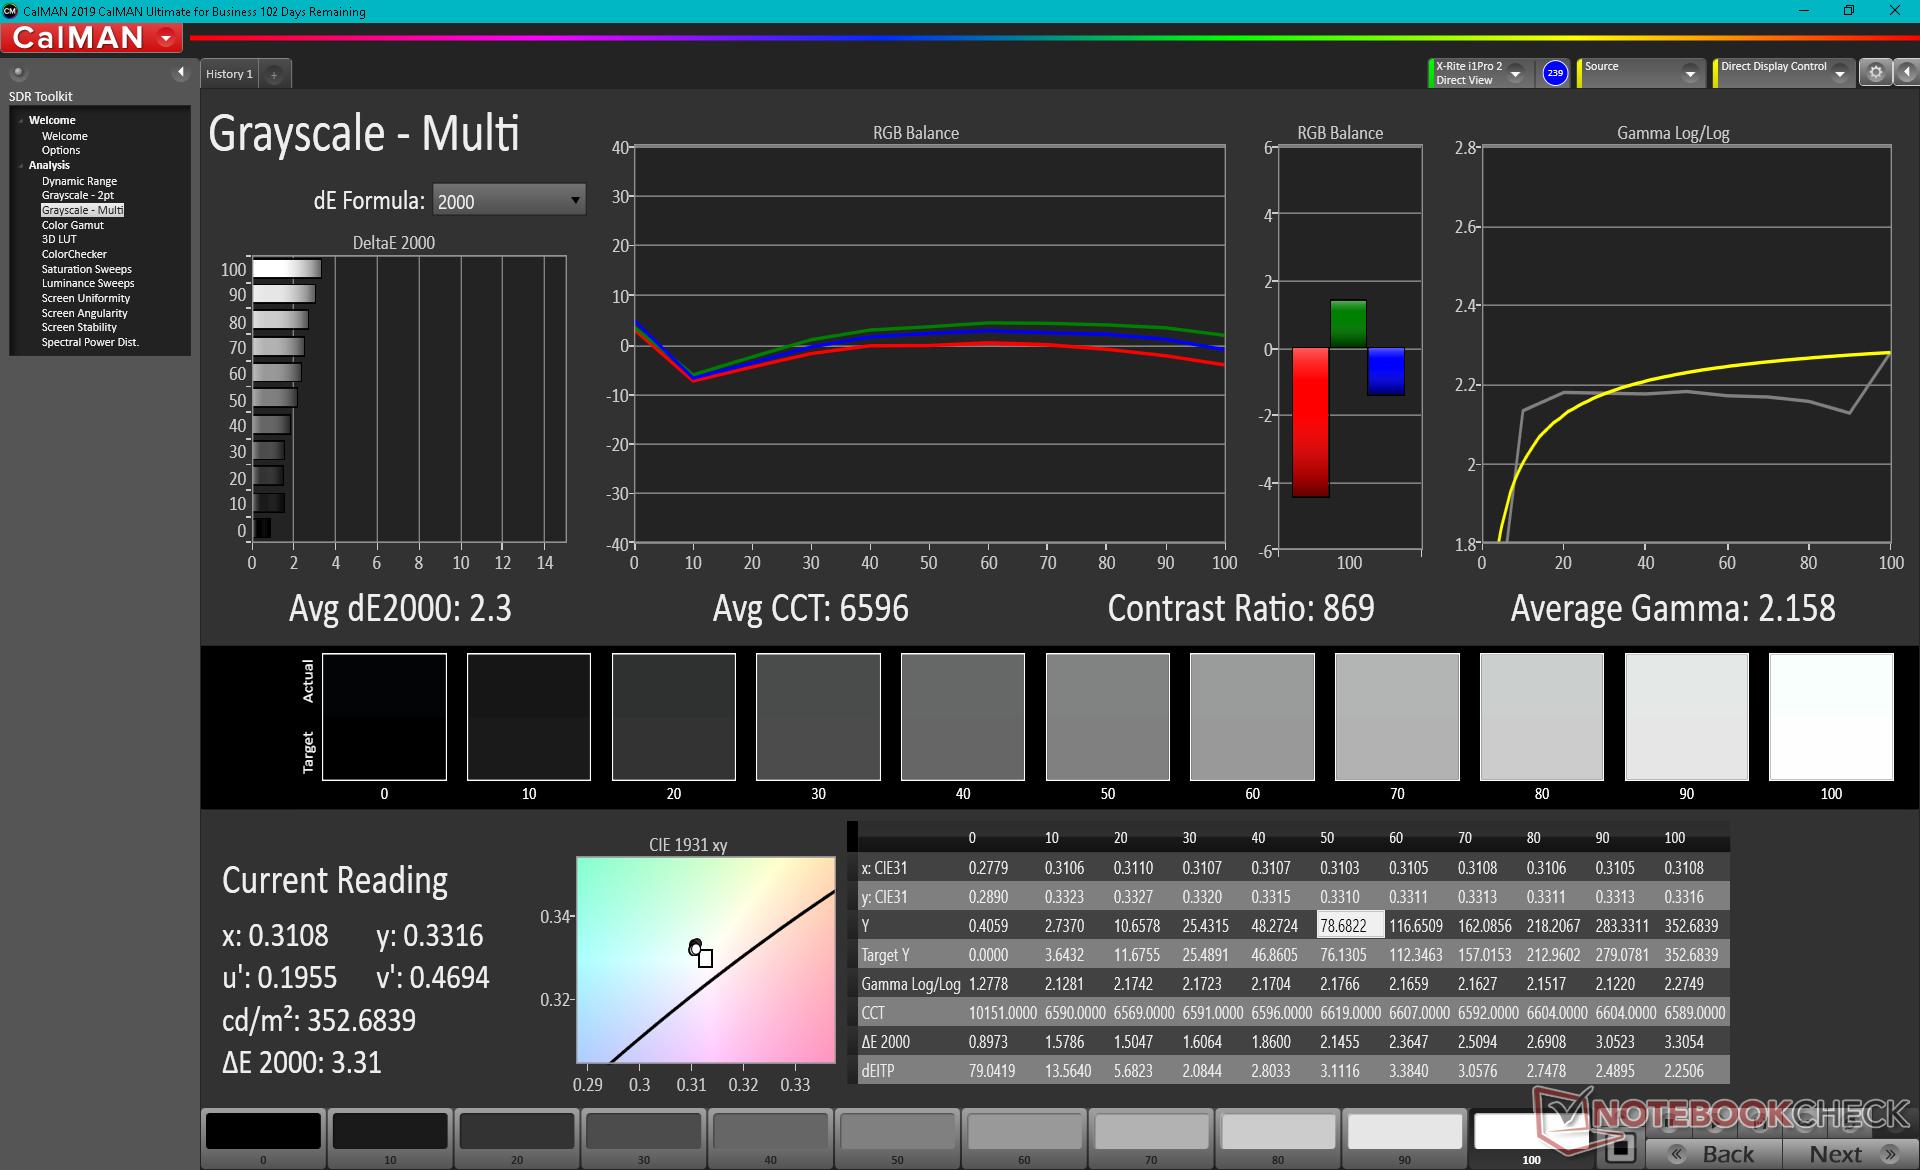
ΔE Greyscale Calman: 4.5 | ∀{0.09-98 Ø4.96}
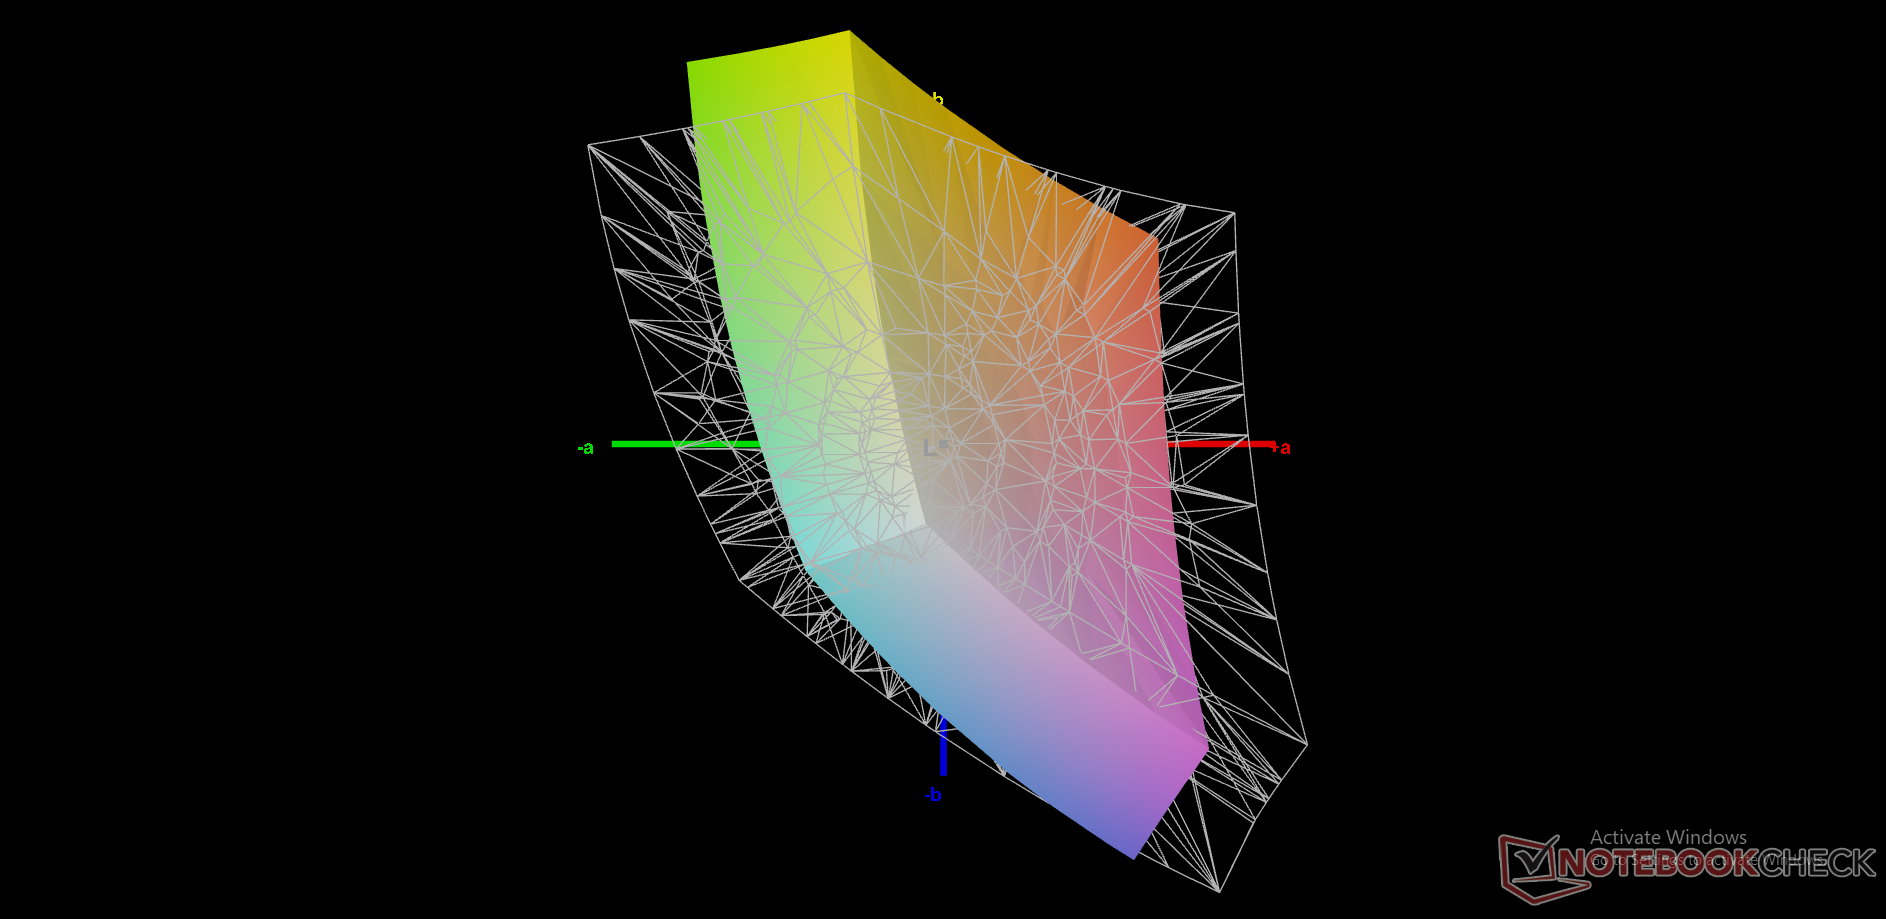
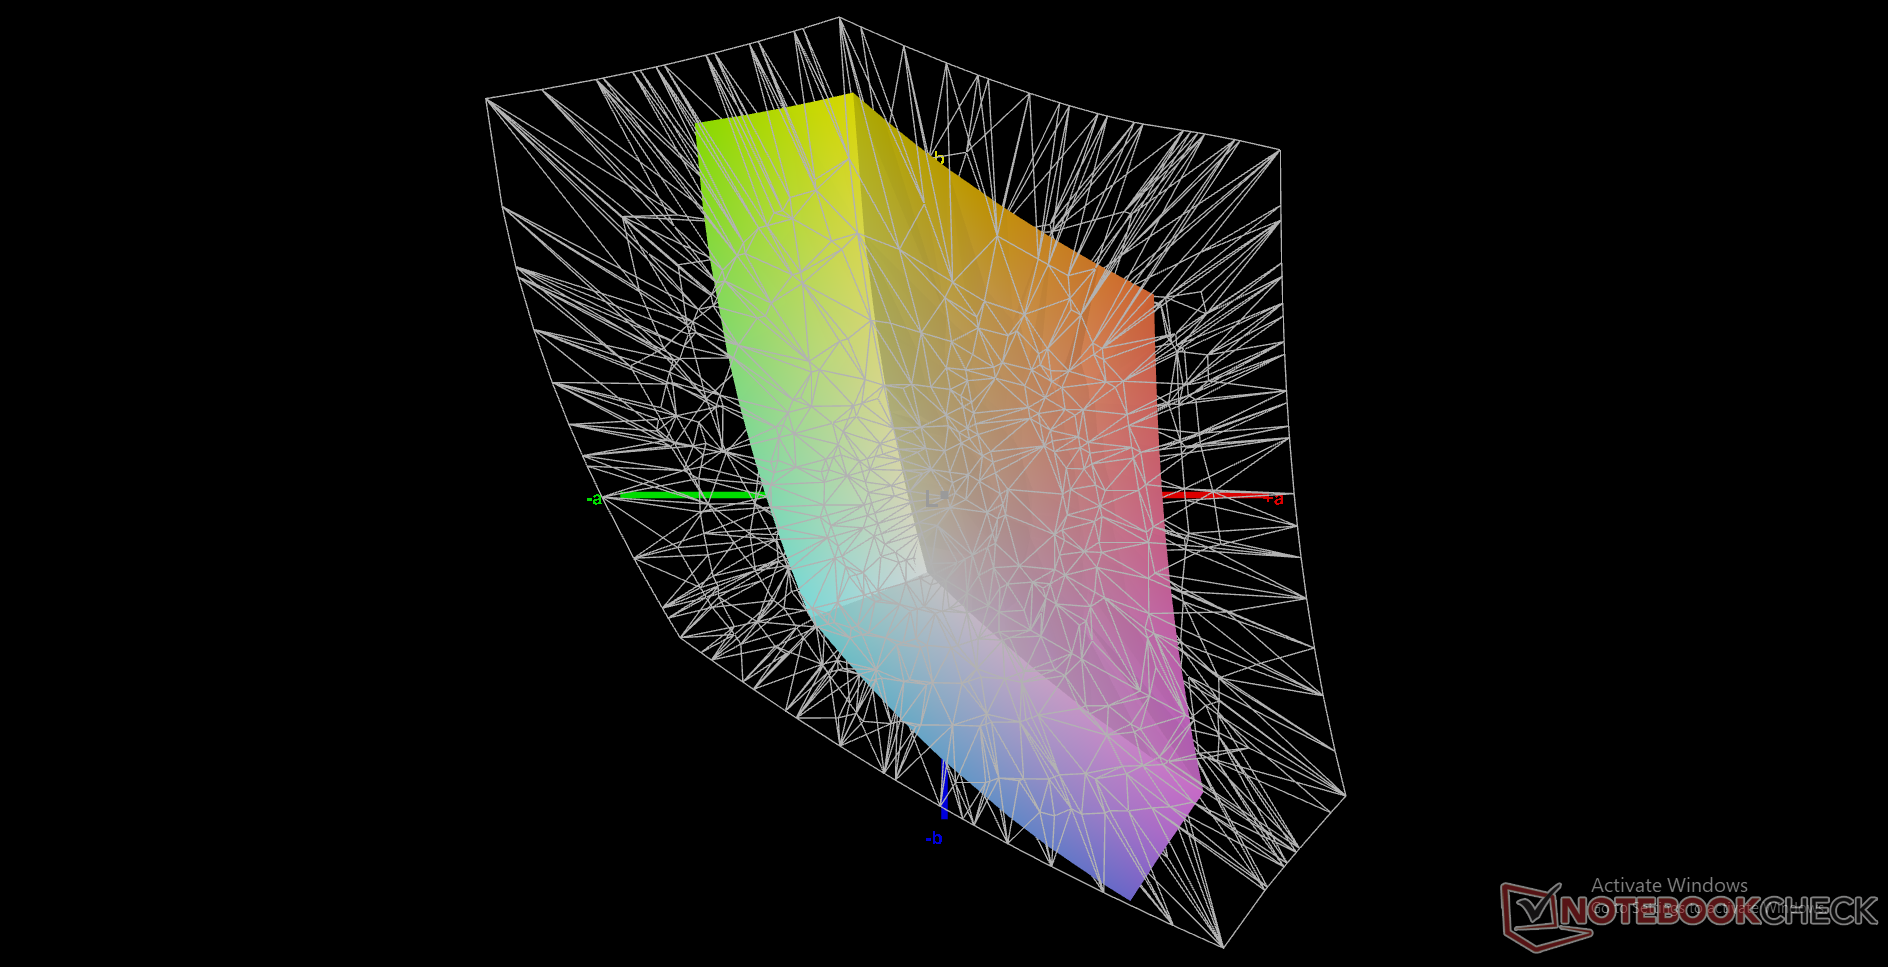
47.6% AdobeRGB 1998 (Argyll 3D)
65.2% sRGB (Argyll 3D)
47.2% Display P3 (Argyll 3D)
Gamma: 2.49
CCT: 6726 K
| GPD Win Max 2021 LT7911D, IPS, 8", 1280x800 | GPD Win 3 IPS, 5.5", 1280x720 | HP Pavilion Aero 13 be0097nr AU Optronics AUO6496, IPS, 13.3", 1920x1200 | Lenovo Yoga 6 13 82ND0009US AU Optronics B133HAN05.F, IPS, 13.3", 1920x1080 | Asus ZenBook Flip 13 UX363EA-HP069T Samsung, SDC414A, OLED, 13.3", 1920x1080 | Asus ZenBook 13 UX325EA Samsung SDC4155 (ATNA33XC09-0), OLED, 13.3", 1920x1080 | |
|---|---|---|---|---|---|---|
| Display | 31% | 55% | 50% | 90% | ||
| Display P3 Coverage (%) | 47.2 | 59.5 26% | 73.4 56% | 69.7 48% | 99.9 112% | |
| sRGB Coverage (%) | 65.2 | 89.6 37% | 99.8 53% | 99.2 52% | 100 53% | |
| AdobeRGB 1998 Coverage (%) | 47.6 | 61.4 29% | 74.8 57% | 71.4 50% | 97.5 105% | |
| Response Times | 31% | 21% | 21% | 96% | 96% | |
| Response Time Grey 50% / Grey 80% * (ms) | 56.8 ? | 40 ? 30% | 42.4 ? 25% | 46.8 ? 18% | 2 ? 96% | 2 ? 96% |
| Response Time Black / White * (ms) | 37.6 ? | 25.6 ? 32% | 31.6 ? 16% | 28.8 ? 23% | 2 ? 95% | 2 ? 95% |
| PWM Frequency (Hz) | 201.6 ? | 60 | 60 ? | |||
| Screen | -11% | 37% | 22% | 8% | 33% | |
| Brightness middle (cd/m²) | 374.6 | 468.8 25% | 473.9 27% | 291.5 -22% | 353 -6% | 390 4% |
| Brightness (cd/m²) | 361 | 460 27% | 458 27% | 294 -19% | 359 -1% | 368 2% |
| Brightness Distribution (%) | 92 | 93 1% | 91 -1% | 93 1% | 95 3% | 66 -28% |
| Black Level * (cd/m²) | 0.45 | 0.45 -0% | 0.36 20% | 0.19 58% | 0.1 78% | |
| Contrast (:1) | 832 | 1042 25% | 1316 58% | 1534 84% | 3530 324% | |
| Colorchecker dE 2000 * | 6.21 | 9 -45% | 2.99 52% | 3.83 38% | 3.98 36% | 2.03 67% |
| Colorchecker dE 2000 max. * | 9.89 | 15.5 -57% | 4.35 56% | 8.43 15% | 53.07 -437% | 3.14 68% |
| Colorchecker dE 2000 calibrated * | 5.4 | 1.91 65% | 1.1 80% | 1.07 80% | 3.1 43% | |
| Greyscale dE 2000 * | 4.5 | 10.9 -142% | 4 11% | 6.2 -38% | 1.41 69% | 1.28 72% |
| Gamma | 2.49 88% | 2.13 103% | 2.35 94% | 2.2 100% | 2.39 92% | 2.4 92% |
| CCT | 6726 97% | 10972 59% | 6269 104% | 6469 100% | 6346 102% | 6359 102% |
| Color Space (Percent of AdobeRGB 1998) (%) | 56.6 | 87 | ||||
| Color Space (Percent of sRGB) (%) | 89.2 | 100 | ||||
| Total Average (Program / Settings) | 17% /
4% | 38% /
38% | 31% /
28% | 52% /
26% | 73% /
57% |
* ... smaller is better
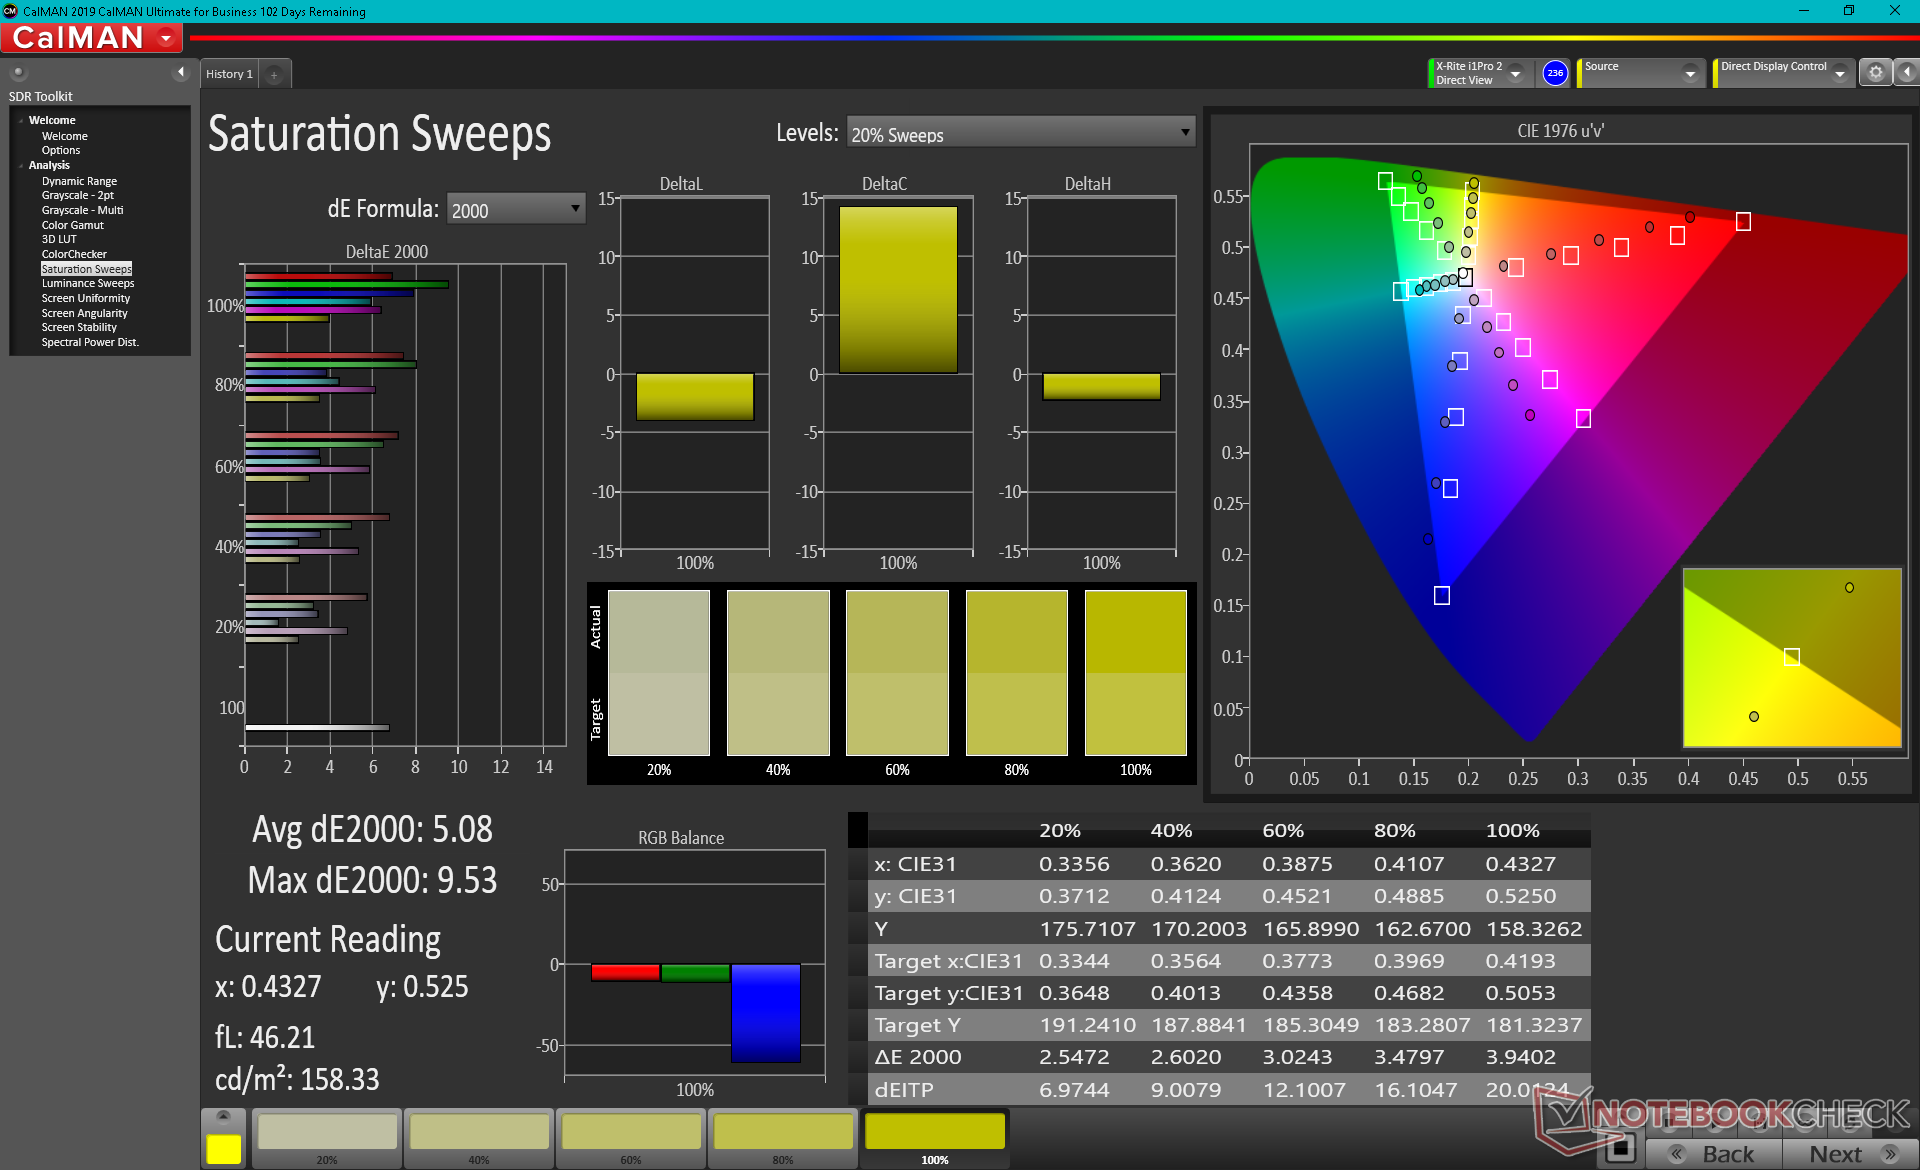
Color space covers just 65 percent of sRGB compared to 89 percent on the Win 3. Thus, while the Win Max has the larger display than the Win 3, the latter has deeper and more accurate colors.
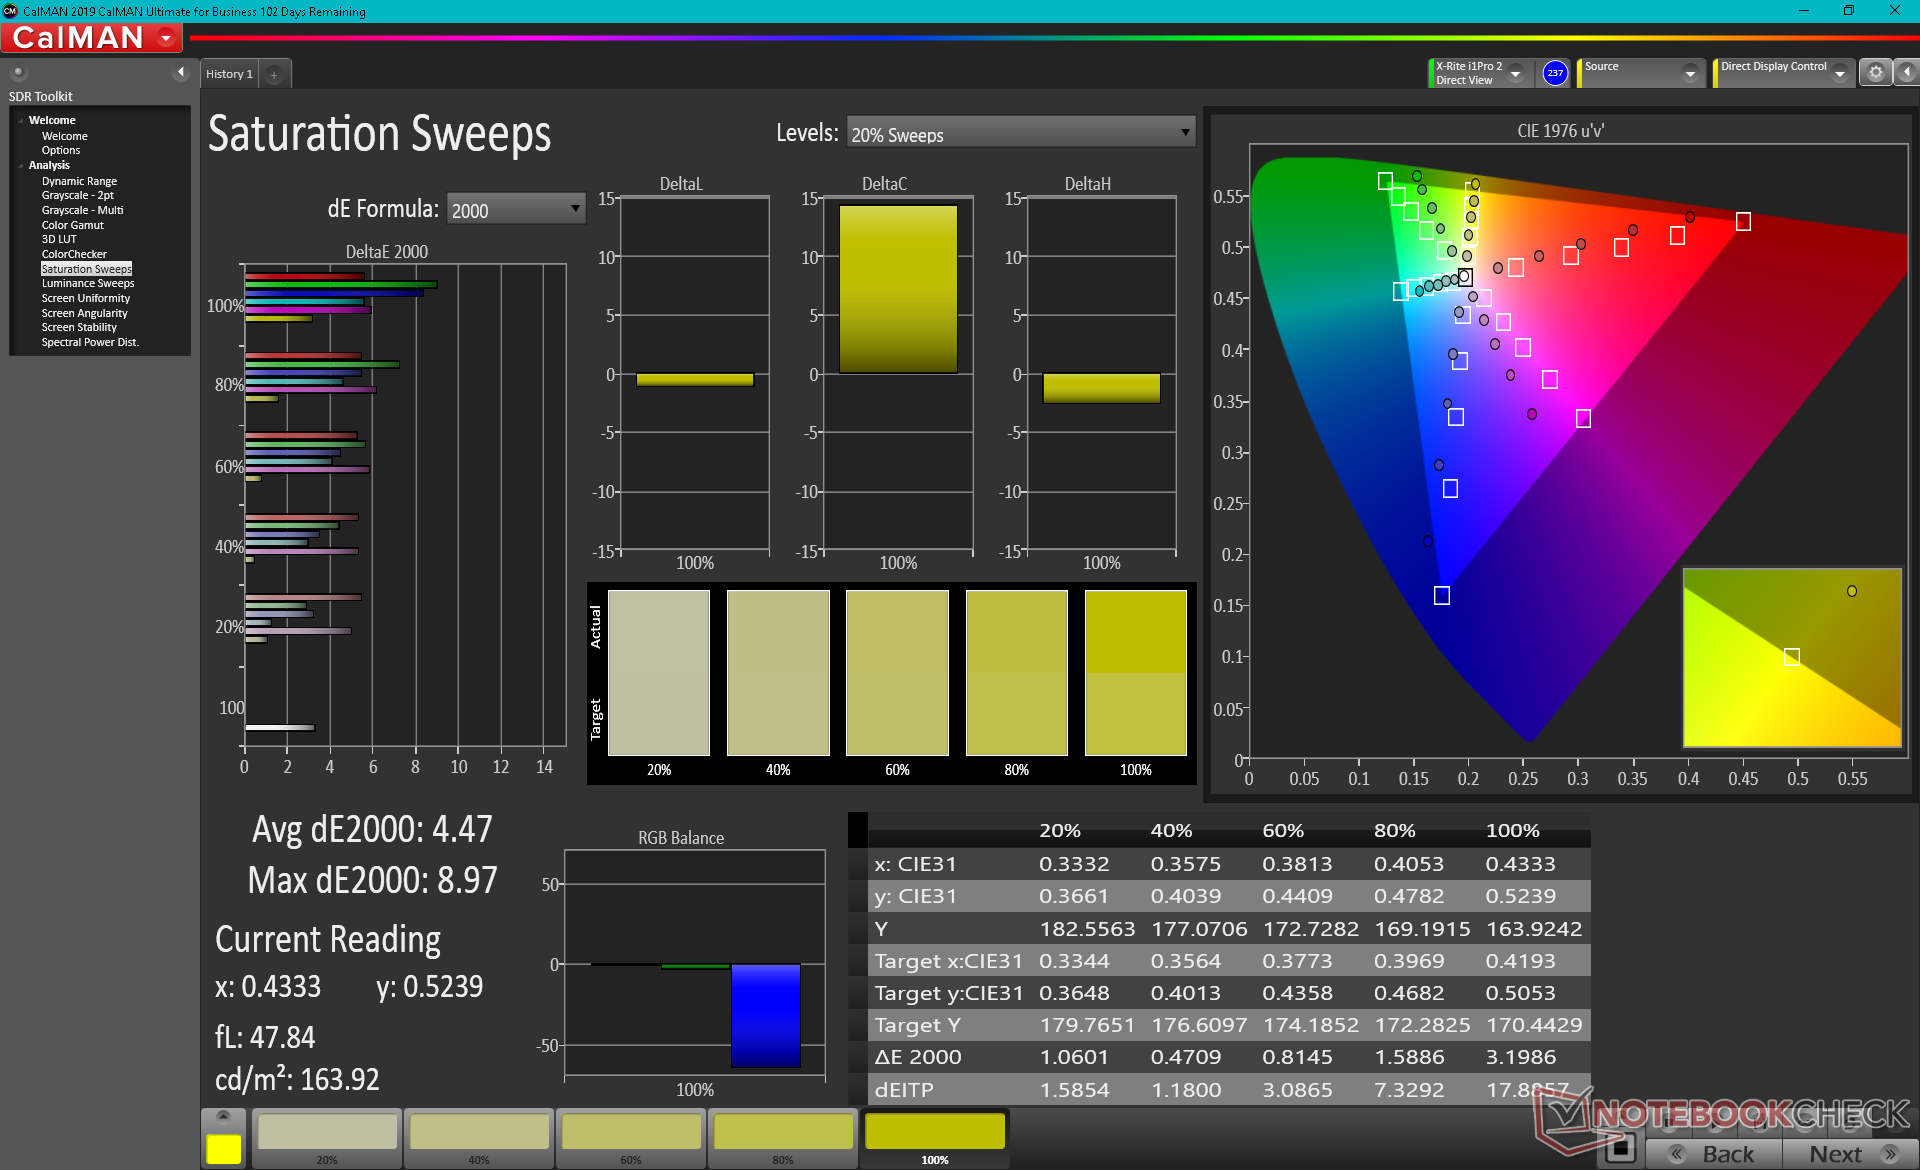
X-Rite colorimeter measurements reveal color temperature to be slightly on the cool side. Once properly calibrated, average grayscale and ColorChecker DeltaE values would improve from 4.5 to 2.3 and 6.2 to 5.4, respectively. Colors still become increasingly inaccurate at higher saturation levels due to the limited color space of the panel.
Display Response Times
| ↔ Response Time Black to White | ||
|---|---|---|
| 37.6 ms ... rise ↗ and fall ↘ combined | ↗ 22 ms rise | 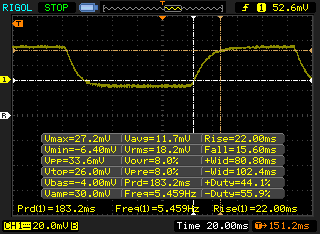 |
| ↘ 15.6 ms fall | ||
| The screen shows slow response rates in our tests and will be unsatisfactory for gamers. In comparison, all tested devices range from 0.1 (minimum) to 240 (maximum) ms. » 95 % of all devices are better. This means that the measured response time is worse than the average of all tested devices (19.8 ms). | ||
| ↔ Response Time 50% Grey to 80% Grey | ||
| 56.8 ms ... rise ↗ and fall ↘ combined | ↗ 28.4 ms rise | 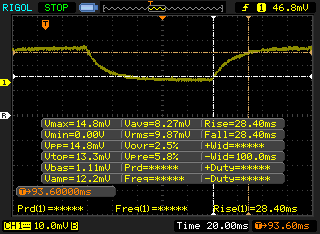 |
| ↘ 28.4 ms fall | ||
| The screen shows slow response rates in our tests and will be unsatisfactory for gamers. In comparison, all tested devices range from 0.165 (minimum) to 636 (maximum) ms. » 94 % of all devices are better. This means that the measured response time is worse than the average of all tested devices (31 ms). | ||
Screen Flickering / PWM (Pulse-Width Modulation)
| Screen flickering / PWM detected | 201.6 Hz | ≤ 99 % brightness setting | 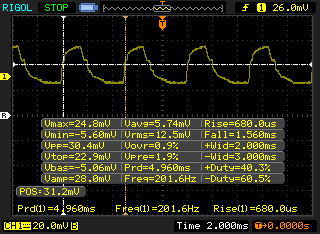 |
The display backlight flickers at 201.6 Hz (worst case, e.g., utilizing PWM) Flickering detected at a brightness setting of 99 % and below. There should be no flickering or PWM above this brightness setting. The frequency of 201.6 Hz is relatively low, so sensitive users will likely notice flickering and experience eyestrain at the stated brightness setting and below. In comparison: 52 % of all tested devices do not use PWM to dim the display. If PWM was detected, an average of 7757 (minimum: 5 - maximum: 343500) Hz was measured. | |||
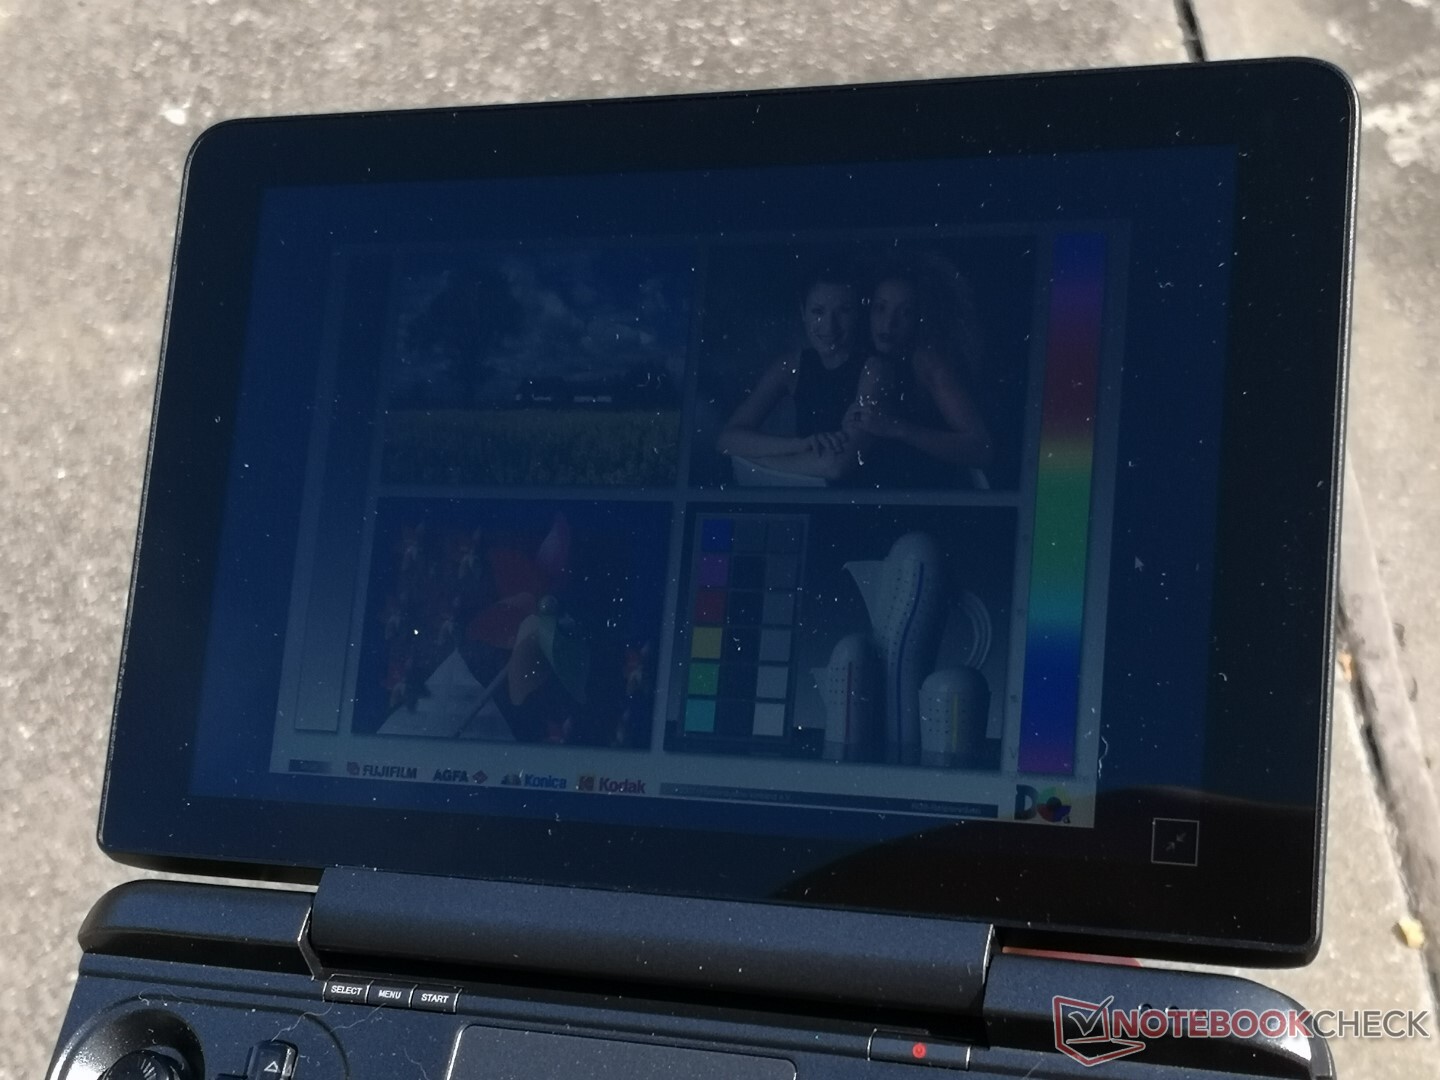
Outdoor visibility is good only when under shade where glare is more controllable. We recommend disabling AMD Vari-Bright or else maximum brightness will automatically drop from 374 nits to 300 nits when running on battery power.


Performance

Processor
The AMD Ryzen 7 4800U was designed for larger Ultrabooks and so it's uncommon to see it here on a smaller 8-inch form factor. Raw multi-thread performance is excellent and essentially on neck-to-neck with the Ryzen 7 4700U or even Ryzen 7 5800U. On the other hand, single-thread performance is about 15 to 20 percent slower than the competing Core i7-1165G7.
Cinebench R15 Multi Loop
Cinebench R23: Multi Core | Single Core
Cinebench R15: CPU Multi 64Bit | CPU Single 64Bit
Blender: v2.79 BMW27 CPU
7-Zip 18.03: 7z b 4 -mmt1 | 7z b 4
Geekbench 5.5: Single-Core | Multi-Core
HWBOT x265 Benchmark v2.2: 4k Preset
LibreOffice : 20 Documents To PDF
R Benchmark 2.5: Overall mean
| Cinebench R20 / CPU (Multi Core) | |
| Average AMD Ryzen 7 4800U (2943 - 3306, n=4) | |
| Lenovo Yoga Slim 7 14ARE05 82A20008GE | |
| HP Pavilion Aero 13 be0097nr | |
| GPD Win Max 2021 | |
| Lenovo Yoga 6 13 82ND0009US | |
| Honor MagicBook 15 4500U | |
| Framework Laptop 13.5 | |
| GPD Win 3 | |
| Infinix INBook X1 Pro | |
| Cinebench R20 / CPU (Single Core) | |
| Framework Laptop 13.5 | |
| HP Pavilion Aero 13 be0097nr | |
| GPD Win 3 | |
| GPD Win Max 2021 | |
| Average AMD Ryzen 7 4800U (474 - 488, n=4) | |
| Lenovo Yoga Slim 7 14ARE05 82A20008GE | |
| Infinix INBook X1 Pro | |
| Lenovo Yoga 6 13 82ND0009US | |
| Honor MagicBook 15 4500U | |
| Cinebench R23 / Multi Core | |
| Average AMD Ryzen 7 4800U (7558 - 9762, n=3) | |
| HP Pavilion Aero 13 be0097nr | |
| Lenovo Yoga Slim 7 14ARE05 82A20008GE | |
| GPD Win Max 2021 | |
| Lenovo Yoga 6 13 82ND0009US | |
| Framework Laptop 13.5 | |
| GPD Win 3 | |
| Infinix INBook X1 Pro | |
| Cinebench R23 / Single Core | |
| Framework Laptop 13.5 | |
| HP Pavilion Aero 13 be0097nr | |
| GPD Win 3 | |
| Average AMD Ryzen 7 4800U (1231 - 1240, n=3) | |
| GPD Win Max 2021 | |
| Lenovo Yoga Slim 7 14ARE05 82A20008GE | |
| Infinix INBook X1 Pro | |
| Lenovo Yoga 6 13 82ND0009US | |
| Cinebench R15 / CPU Multi 64Bit | |
| Average AMD Ryzen 7 4800U (1281 - 1639, n=3) | |
| HP Pavilion Aero 13 be0097nr | |
| GPD Win Max 2021 | |
| Lenovo Yoga Slim 7 14ARE05 82A20008GE | |
| Lenovo Yoga 6 13 82ND0009US | |
| Honor MagicBook 15 4500U | |
| Framework Laptop 13.5 | |
| GPD Win 3 | |
| Infinix INBook X1 Pro | |
| Cinebench R15 / CPU Single 64Bit | |
| HP Pavilion Aero 13 be0097nr | |
| Framework Laptop 13.5 | |
| GPD Win 3 | |
| Average AMD Ryzen 7 4800U (182 - 187, n=3) | |
| GPD Win Max 2021 | |
| Infinix INBook X1 Pro | |
| Lenovo Yoga Slim 7 14ARE05 82A20008GE | |
| Lenovo Yoga 6 13 82ND0009US | |
| Honor MagicBook 15 4500U | |
| Blender / v2.79 BMW27 CPU | |
| Infinix INBook X1 Pro | |
| GPD Win 3 | |
| Honor MagicBook 15 4500U | |
| Framework Laptop 13.5 | |
| Lenovo Yoga Slim 7 14ARE05 82A20008GE | |
| Lenovo Yoga 6 13 82ND0009US | |
| GPD Win Max 2021 | |
| Average AMD Ryzen 7 4800U (322 - 374, n=3) | |
| HP Pavilion Aero 13 be0097nr | |
| 7-Zip 18.03 / 7z b 4 -mmt1 | |
| Framework Laptop 13.5 | |
| HP Pavilion Aero 13 be0097nr | |
| GPD Win 3 | |
| Average AMD Ryzen 7 4800U (4420 - 4603, n=3) | |
| GPD Win Max 2021 | |
| Infinix INBook X1 Pro | |
| Lenovo Yoga Slim 7 14ARE05 82A20008GE | |
| Lenovo Yoga 6 13 82ND0009US | |
| Honor MagicBook 15 4500U | |
| Geekbench 5.5 / Single-Core | |
| GPD Win 3 | |
| Honor MagicBook 15 4500U | |
| Average AMD Ryzen 7 4800U (1150 - 1192, n=4) | |
| Lenovo Yoga Slim 7 14ARE05 82A20008GE | |
| Geekbench 5.5 / Multi-Core | |
| Average AMD Ryzen 7 4800U (5798 - 6950, n=4) | |
| Lenovo Yoga Slim 7 14ARE05 82A20008GE | |
| Honor MagicBook 15 4500U | |
| GPD Win 3 | |
| HWBOT x265 Benchmark v2.2 / 4k Preset | |
| HP Pavilion Aero 13 be0097nr | |
| Average AMD Ryzen 7 4800U (9.48 - 10.8, n=3) | |
| GPD Win Max 2021 | |
| Lenovo Yoga Slim 7 14ARE05 82A20008GE | |
| Lenovo Yoga 6 13 82ND0009US | |
| Honor MagicBook 15 4500U | |
| Framework Laptop 13.5 | |
| GPD Win 3 | |
| Infinix INBook X1 Pro | |
| LibreOffice / 20 Documents To PDF | |
| Lenovo Yoga Slim 7 14ARE05 82A20008GE | |
| Lenovo Yoga 6 13 82ND0009US | |
| Honor MagicBook 15 4500U | |
| GPD Win Max 2021 | |
| Average AMD Ryzen 7 4800U (57.8 - 62.6, n=3) | |
| Infinix INBook X1 Pro | |
| HP Pavilion Aero 13 be0097nr | |
| GPD Win 3 | |
| Framework Laptop 13.5 | |
| R Benchmark 2.5 / Overall mean | |
| Infinix INBook X1 Pro | |
| GPD Win 3 | |
| Lenovo Yoga 6 13 82ND0009US | |
| Honor MagicBook 15 4500U | |
| Lenovo Yoga Slim 7 14ARE05 82A20008GE | |
| GPD Win Max 2021 | |
| Average AMD Ryzen 7 4800U (0.576 - 0.613, n=3) | |
| Framework Laptop 13.5 | |
| HP Pavilion Aero 13 be0097nr | |
* ... smaller is better
System Performance
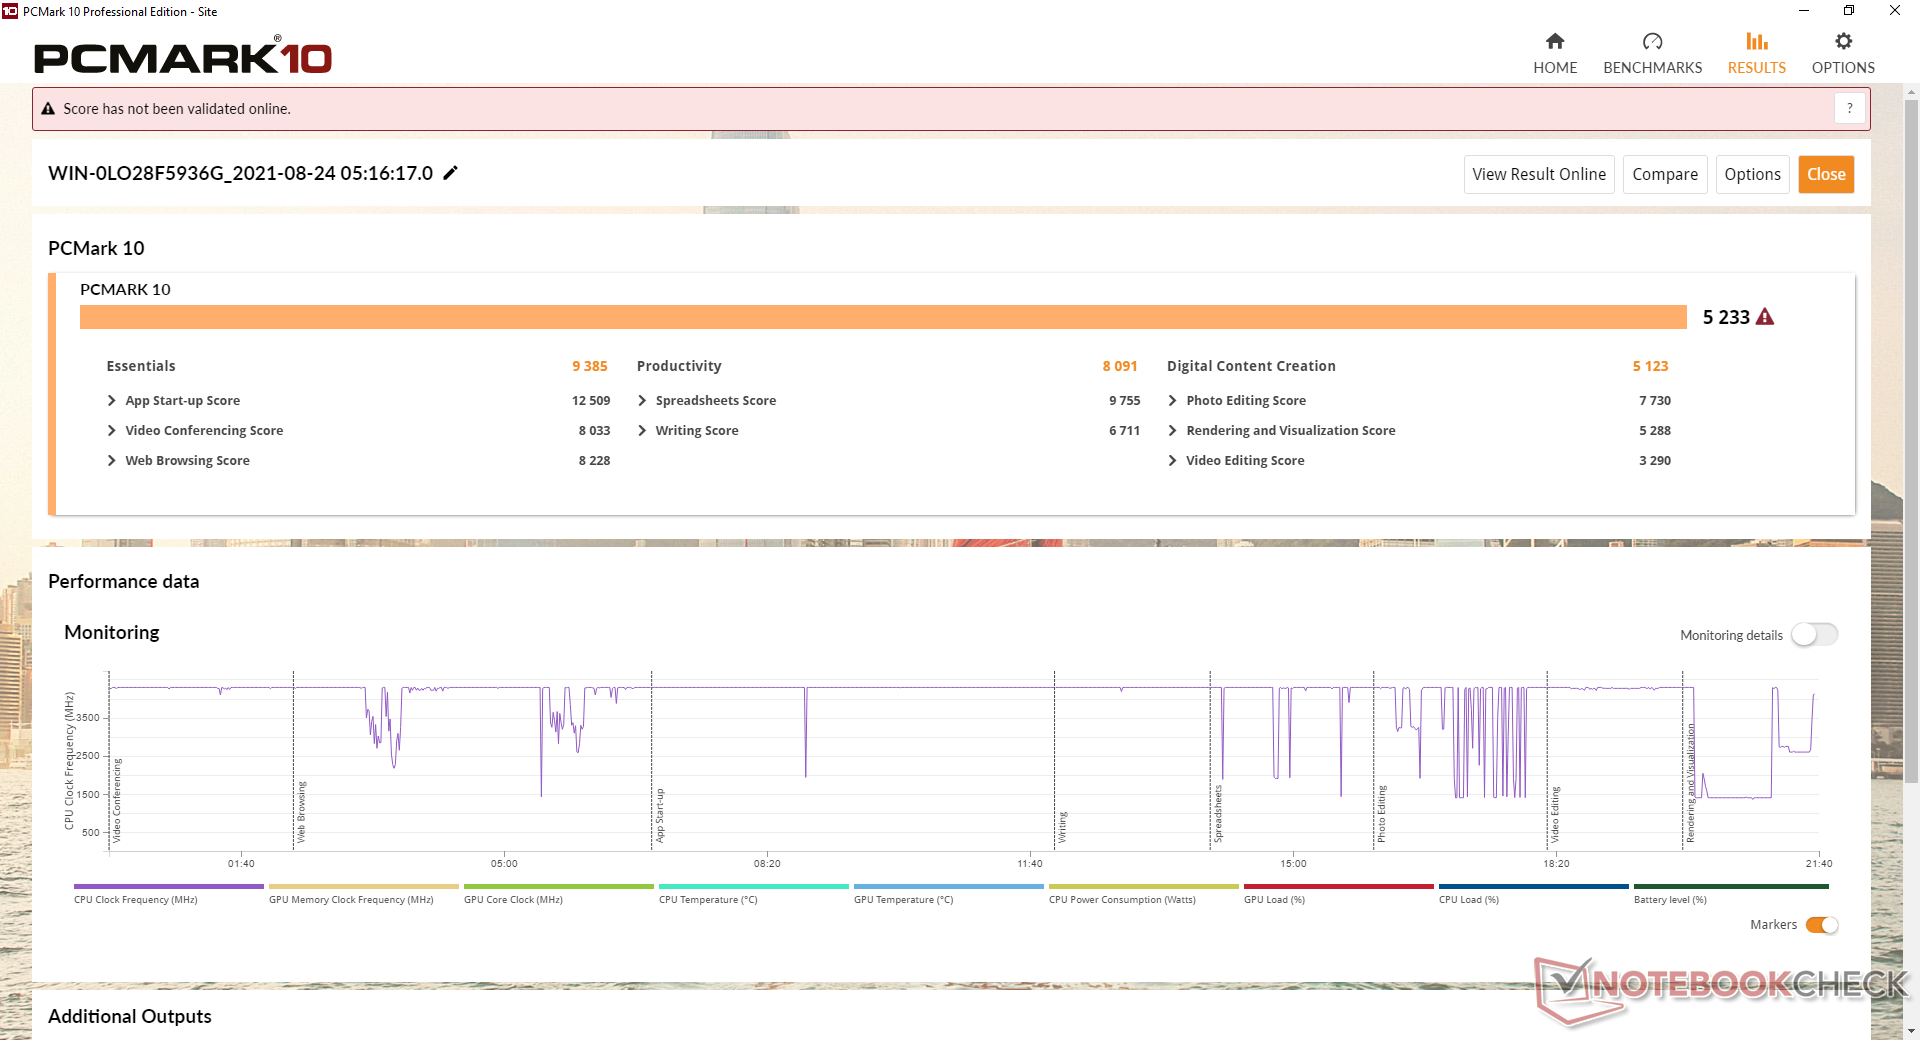
PCMark 10 results are slightly higher than our GPD Win 3 largely due to the additional cores on the Ryzen 7 4800U when compared to the Core i5-1135G7.
| PCMark 10 / Score | |
| HP Pavilion Aero 13 be0097nr | |
| Average AMD Ryzen 7 4800U, AMD Radeon RX Vega 8 (Ryzen 4000/5000) (5233 - 5383, n=3) | |
| GPD Win Max 2021 | |
| Lenovo Yoga 6 13 82ND0009US | |
| Asus ZenBook 13 UX325EA | |
| Asus ZenBook Flip 13 UX363EA-HP069T | |
| GPD Win 3 | |
| PCMark 10 / Essentials | |
| Asus ZenBook Flip 13 UX363EA-HP069T | |
| HP Pavilion Aero 13 be0097nr | |
| Asus ZenBook 13 UX325EA | |
| Lenovo Yoga 6 13 82ND0009US | |
| GPD Win 3 | |
| Average AMD Ryzen 7 4800U, AMD Radeon RX Vega 8 (Ryzen 4000/5000) (9188 - 9637, n=3) | |
| GPD Win Max 2021 | |
| PCMark 10 / Productivity | |
| HP Pavilion Aero 13 be0097nr | |
| GPD Win Max 2021 | |
| Average AMD Ryzen 7 4800U, AMD Radeon RX Vega 8 (Ryzen 4000/5000) (7631 - 8091, n=3) | |
| Lenovo Yoga 6 13 82ND0009US | |
| Asus ZenBook Flip 13 UX363EA-HP069T | |
| Asus ZenBook 13 UX325EA | |
| GPD Win 3 | |
| PCMark 10 / Digital Content Creation | |
| HP Pavilion Aero 13 be0097nr | |
| Average AMD Ryzen 7 4800U, AMD Radeon RX Vega 8 (Ryzen 4000/5000) (5123 - 5758, n=3) | |
| Lenovo Yoga 6 13 82ND0009US | |
| GPD Win Max 2021 | |
| Asus ZenBook 13 UX325EA | |
| GPD Win 3 | |
| Asus ZenBook Flip 13 UX363EA-HP069T | |
| PCMark 10 Score | 5233 points | |
Help | ||
DPC Latency
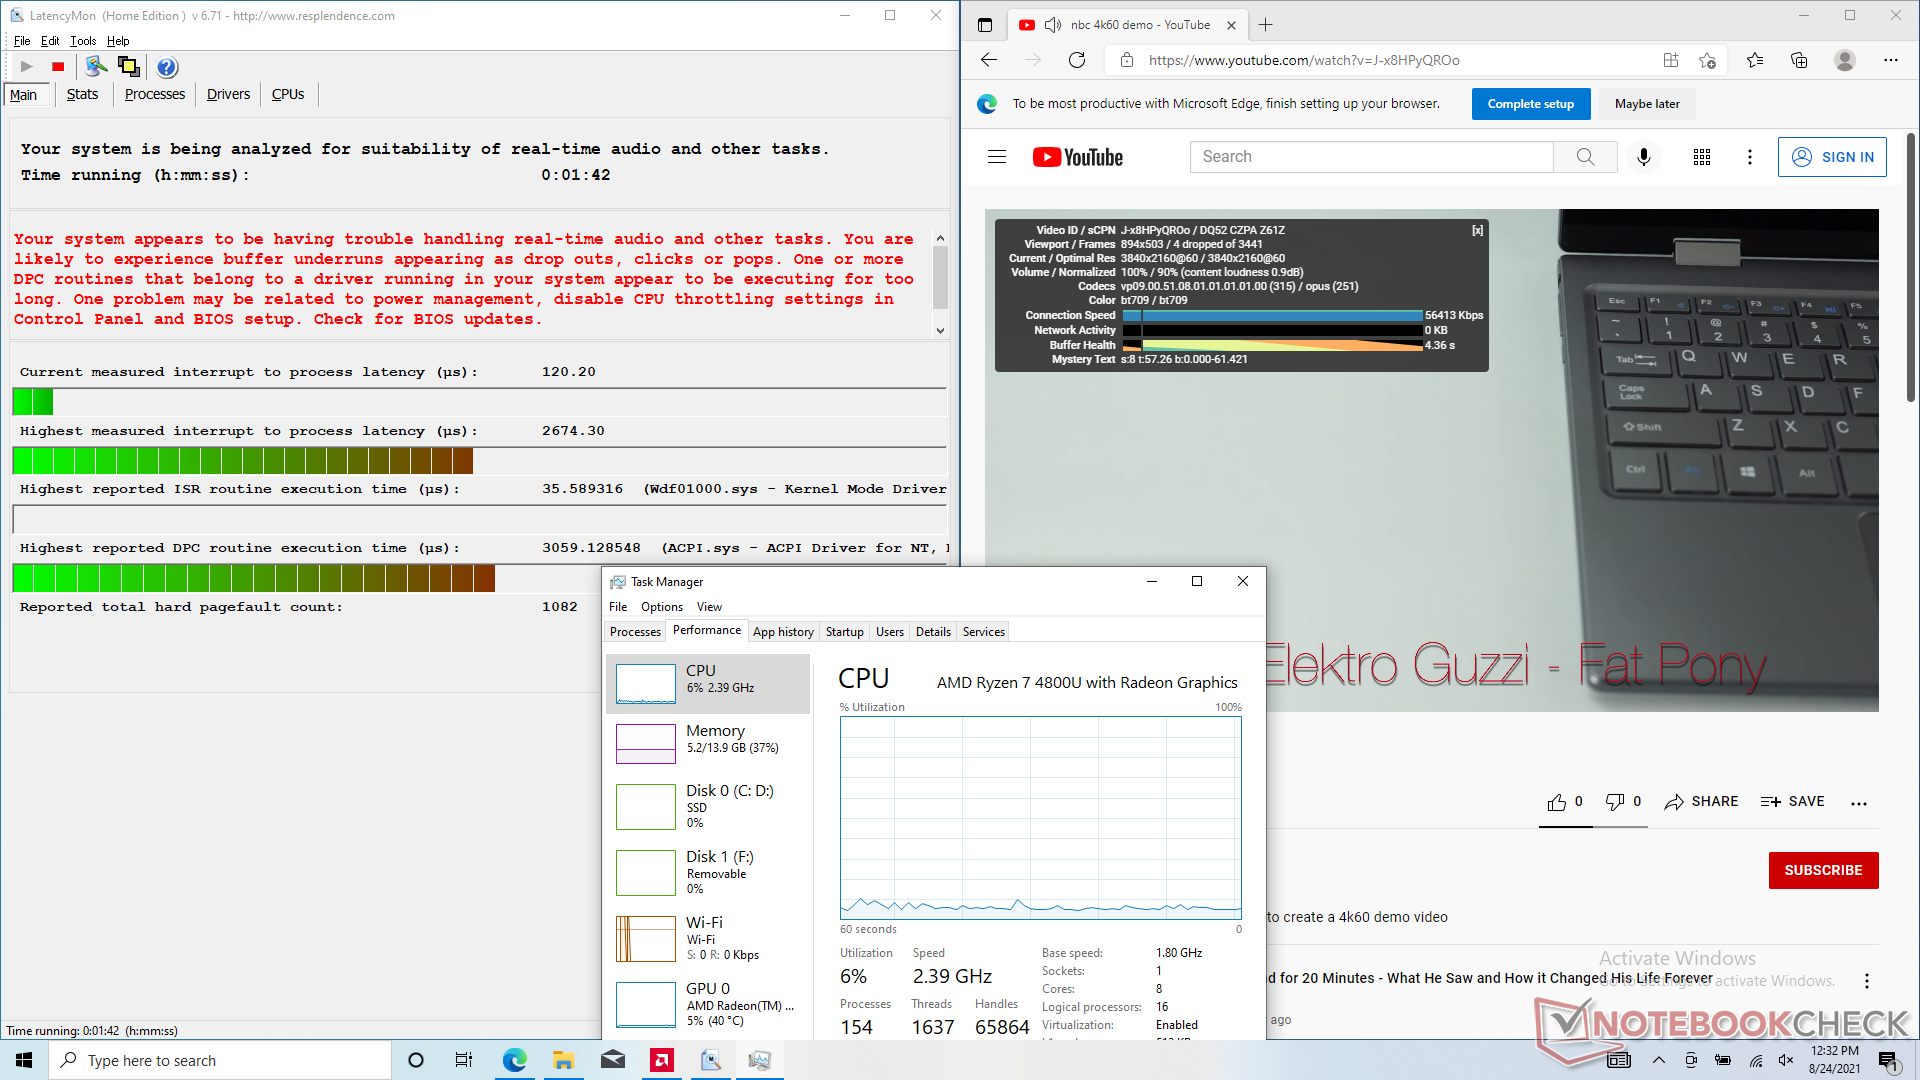
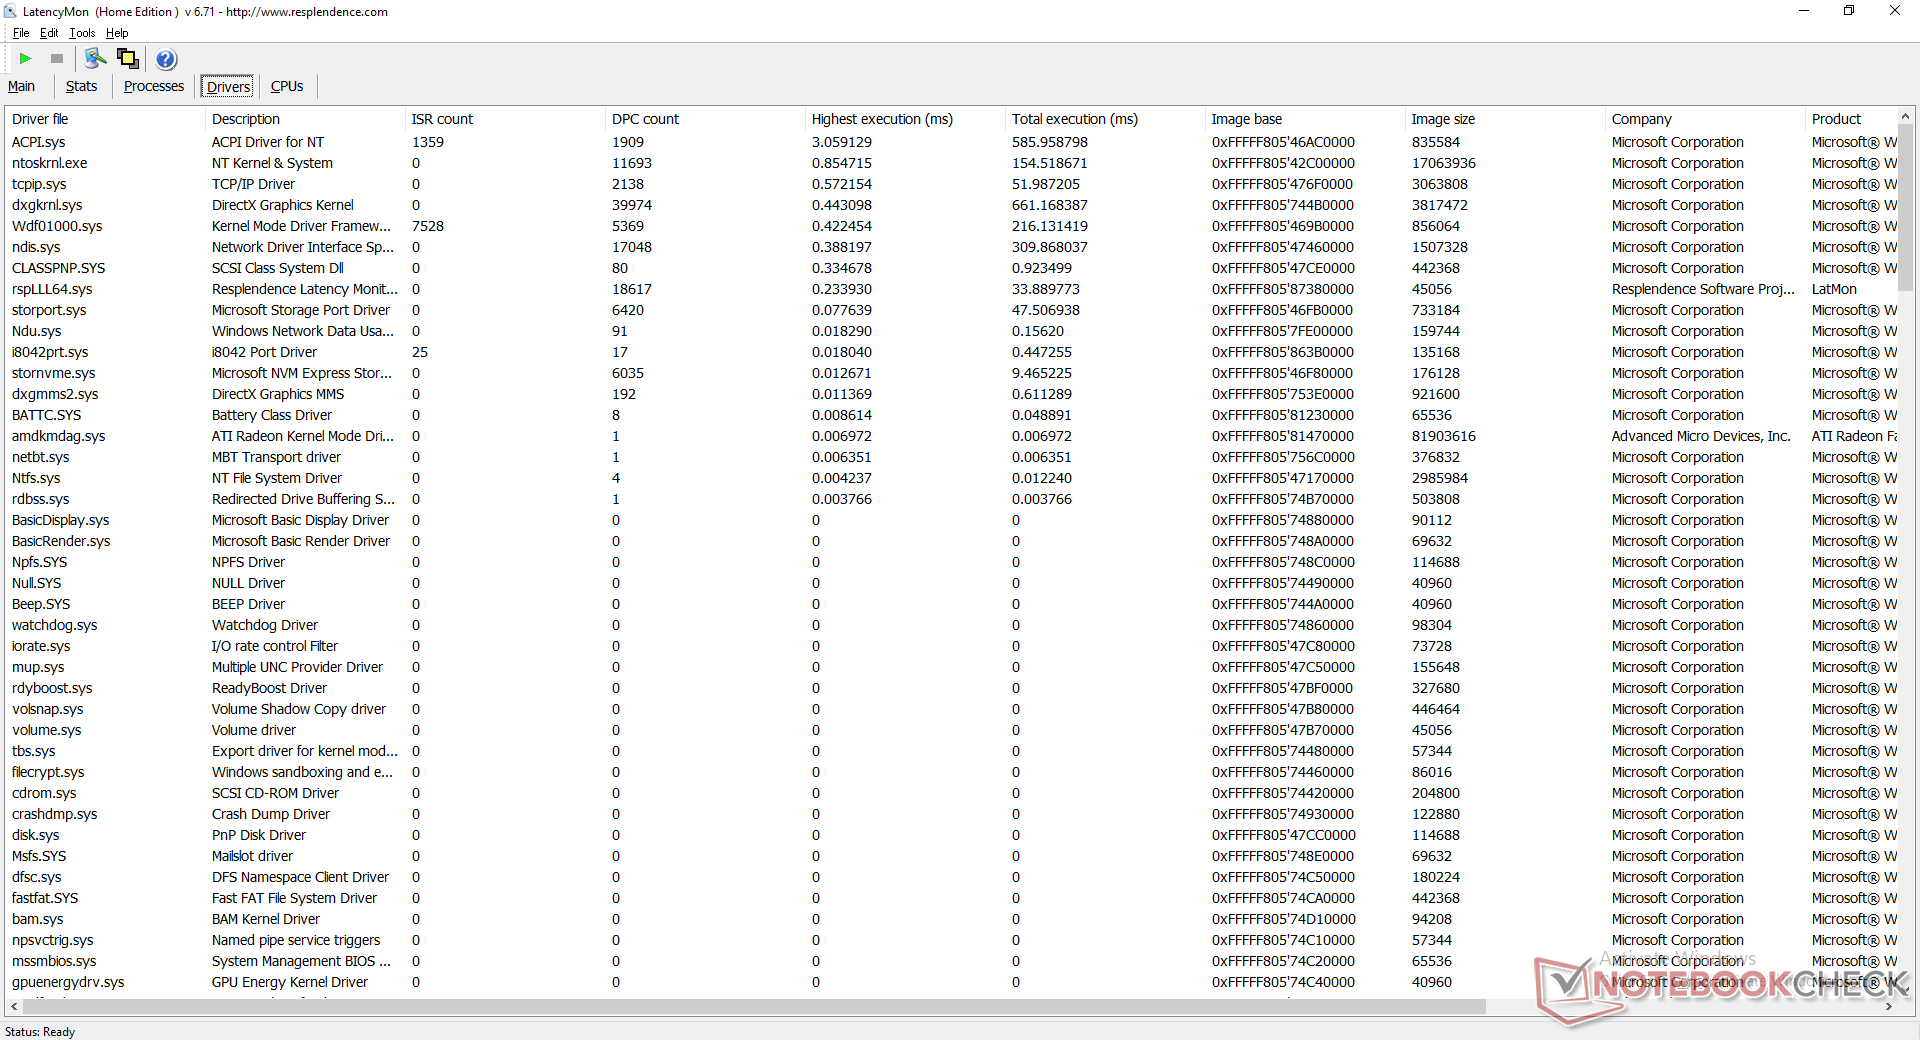
LatencyMon shows DPC latency issues when opening multiple browser tabs on our homepage. Video playback at 4K 60 FPS is otherwise smooth with just 4 dropped frames during our minute-long video test.
| DPC Latencies / LatencyMon - interrupt to process latency (max), Web, Youtube, Prime95 | |
| Asus ZenBook Flip 13 UX363EA-HP069T | |
| GPD Win Max 2021 | |
| Lenovo Yoga 6 13 82ND0009US | |
| Asus ZenBook 13 UX325EA | |
| HP Pavilion Aero 13 be0097nr | |
| GPD Win 3 | |
* ... smaller is better
Storage Devices
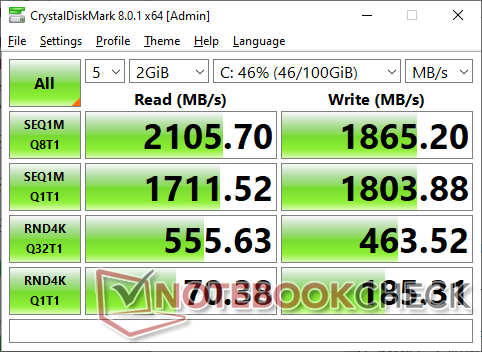
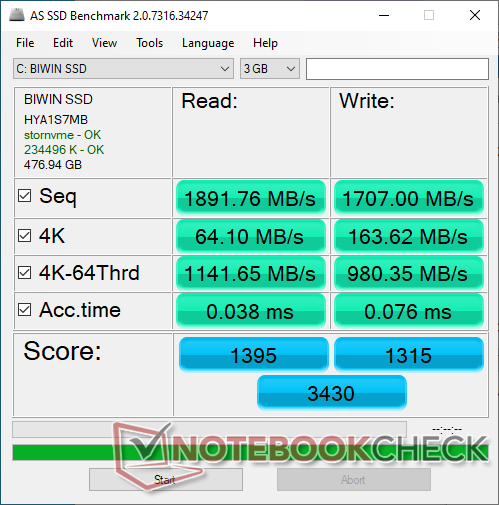
The Win Max comes with a BIWIN NS200 PCIe 3 SSD much like what we found on the Win 3. Performance is faster than on the Intel SSD 660p especially in terms of sequential write rates, but the pricier Samsung PM981a is still on top.
| GPD Win Max 2021 BIWIN NS200 512GB CNF82GS1G00-512 | GPD Win 3 BIWIN NS200 1TB CNF82GS1G02-1TB | HP Pavilion Aero 13 be0097nr Intel SSD 660p SSDPEKNW512G8 | Lenovo Yoga 6 13 82ND0009US WDC PC SN530 SDBPMPZ-265G | Asus ZenBook Flip 13 UX363EA-HP069T WDC PC SN730 SDBPNTY-1T00 | |
|---|---|---|---|---|---|
| AS SSD | 4% | -44% | -69% | 15% | |
| Seq Read (MB/s) | 1892 | 1585 -16% | 1616 -15% | 1860 -2% | 2767 46% |
| Seq Write (MB/s) | 1707 | 1776 4% | 761 -55% | 500 -71% | 1368 -20% |
| 4K Read (MB/s) | 64.1 | 61.6 -4% | 46.87 -27% | 36.26 -43% | 46.86 -27% |
| 4K Write (MB/s) | 163.6 | 208.9 28% | 126.6 -23% | 118.6 -28% | 140.1 -14% |
| 4K-64 Read (MB/s) | 1142 | 1142 0% | 324.6 -72% | 419 -63% | 954 -16% |
| 4K-64 Write (MB/s) | 980 | 1103 13% | 815 -17% | 219 -78% | 1361 39% |
| Access Time Read * (ms) | 0.038 | 0.03 21% | 0.074 -95% | 0.102 -168% | 0.051 -34% |
| Access Time Write * (ms) | 0.076 | 0.074 3% | 0.135 -78% | 0.17 -124% | 0.022 71% |
| Score Read (Points) | 1395 | 1362 -2% | 533 -62% | 641 -54% | 1277 -8% |
| Score Write (Points) | 1315 | 1489 13% | 1018 -23% | 388 -70% | 1638 25% |
| Score Total (Points) | 3430 | 3573 4% | 1798 -48% | 1300 -62% | 3507 2% |
| Copy ISO MB/s (MB/s) | 1520 | 1741 15% | 906 -40% | 880 -42% | 2767 82% |
| Copy Program MB/s (MB/s) | 654 | 543 -17% | 614 -6% | 185.3 -72% | 1072 64% |
| Copy Game MB/s (MB/s) | 1325 | 1318 -1% | 539 -59% | 212.7 -84% | 1319 0% |
| CrystalDiskMark 5.2 / 6 | 10% | -25% | -32% | 6% | |
| Write 4K (MB/s) | 183.6 | 223 21% | 128.3 -30% | 89.2 -51% | 143 -22% |
| Read 4K (MB/s) | 70.1 | 66.5 -5% | 50.9 -27% | 33.09 -53% | 50.2 -28% |
| Write Seq (MB/s) | 1815 | 1857 2% | 971 -47% | 988 -46% | 1963 8% |
| Read Seq (MB/s) | 1721 | 1737 1% | 1540 -11% | 1322 -23% | 1990 16% |
| Write 4K Q32T1 (MB/s) | 458.6 | 611 33% | 538 17% | 332.6 -27% | 375 -18% |
| Read 4K Q32T1 (MB/s) | 552 | 688 25% | 344.4 -38% | 389.3 -29% | 363.7 -34% |
| Write Seq Q32T1 (MB/s) | 1865 | 1948 4% | 980 -47% | 984 -47% | 3086 65% |
| Read Seq Q32T1 (MB/s) | 2106 | 1995 -5% | 1829 -13% | 2461 17% | 3382 61% |
| Write 4K Q8T8 (MB/s) | 405.6 | ||||
| Read 4K Q8T8 (MB/s) | 930 | ||||
| Total Average (Program / Settings) | 7% /
6% | -35% /
-37% | -51% /
-55% | 11% /
12% |
* ... smaller is better

Disk Throttling: DiskSpd Read Loop, Queue Depth 8
GPU Performance
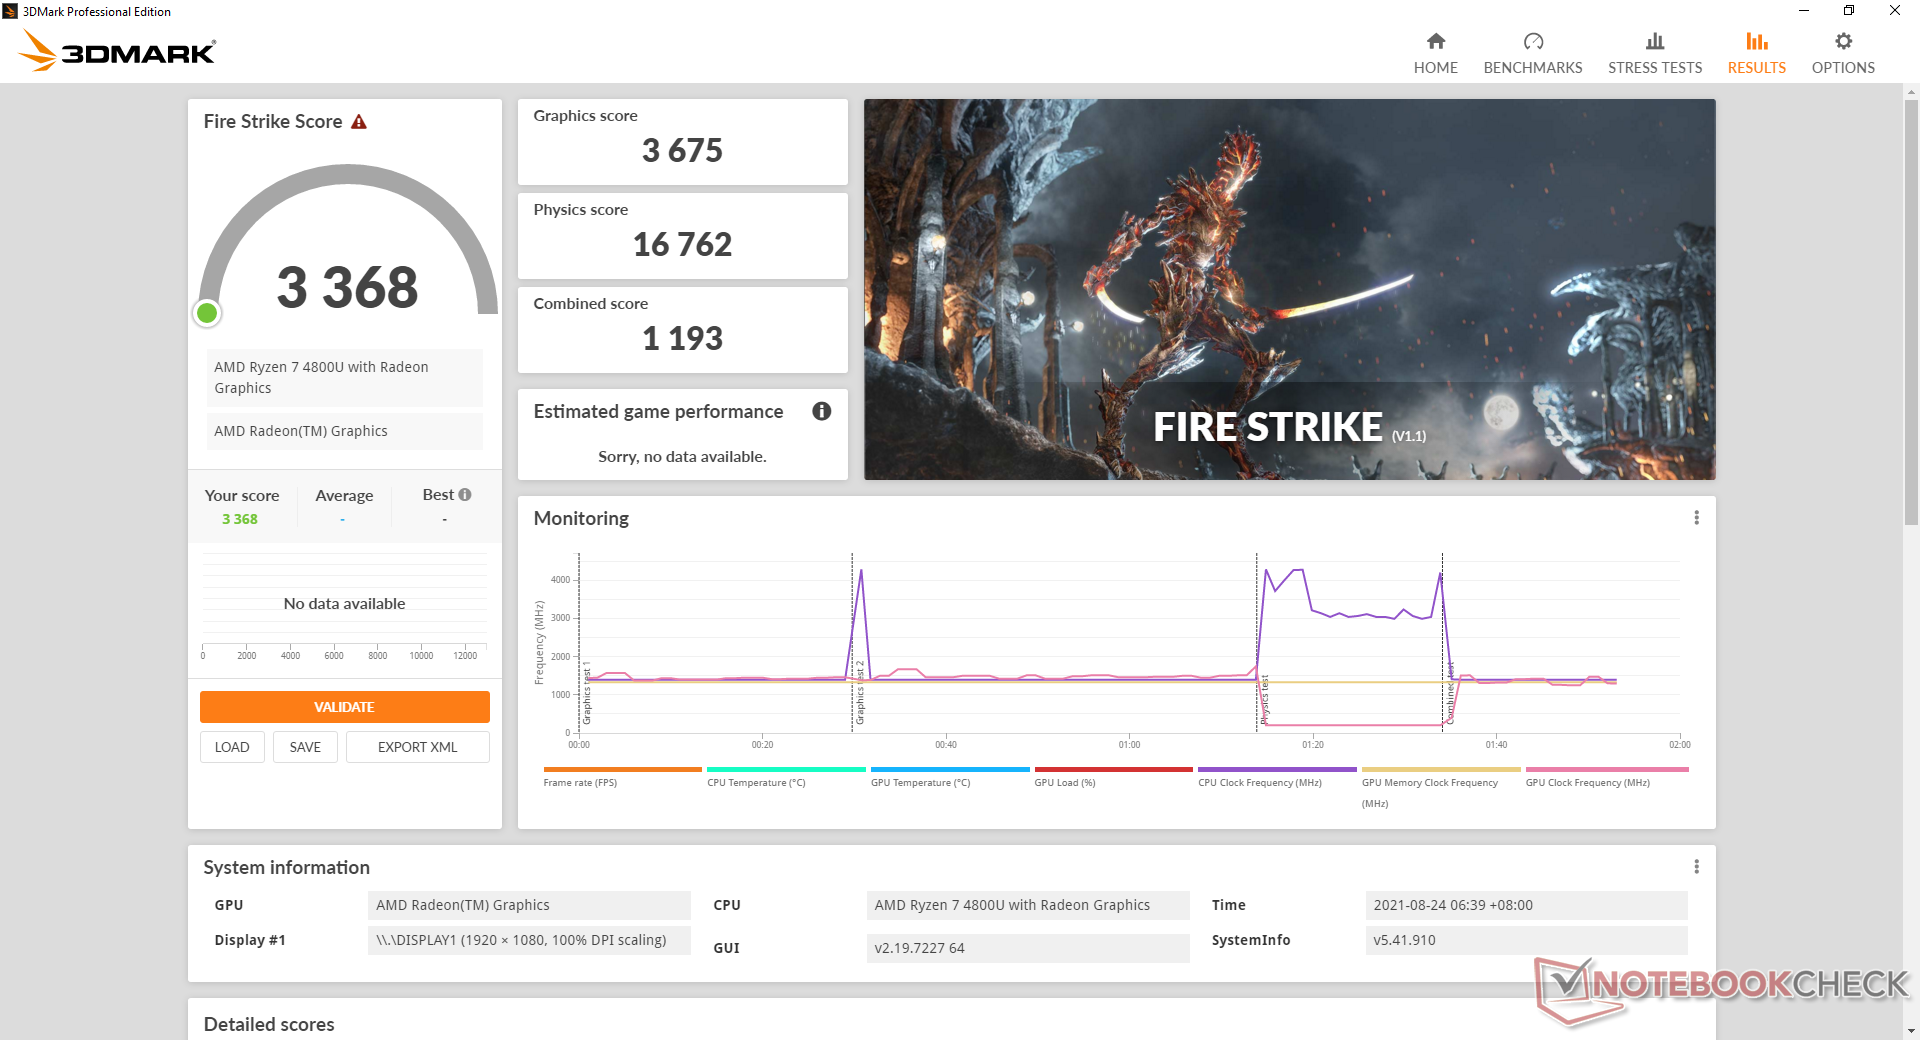
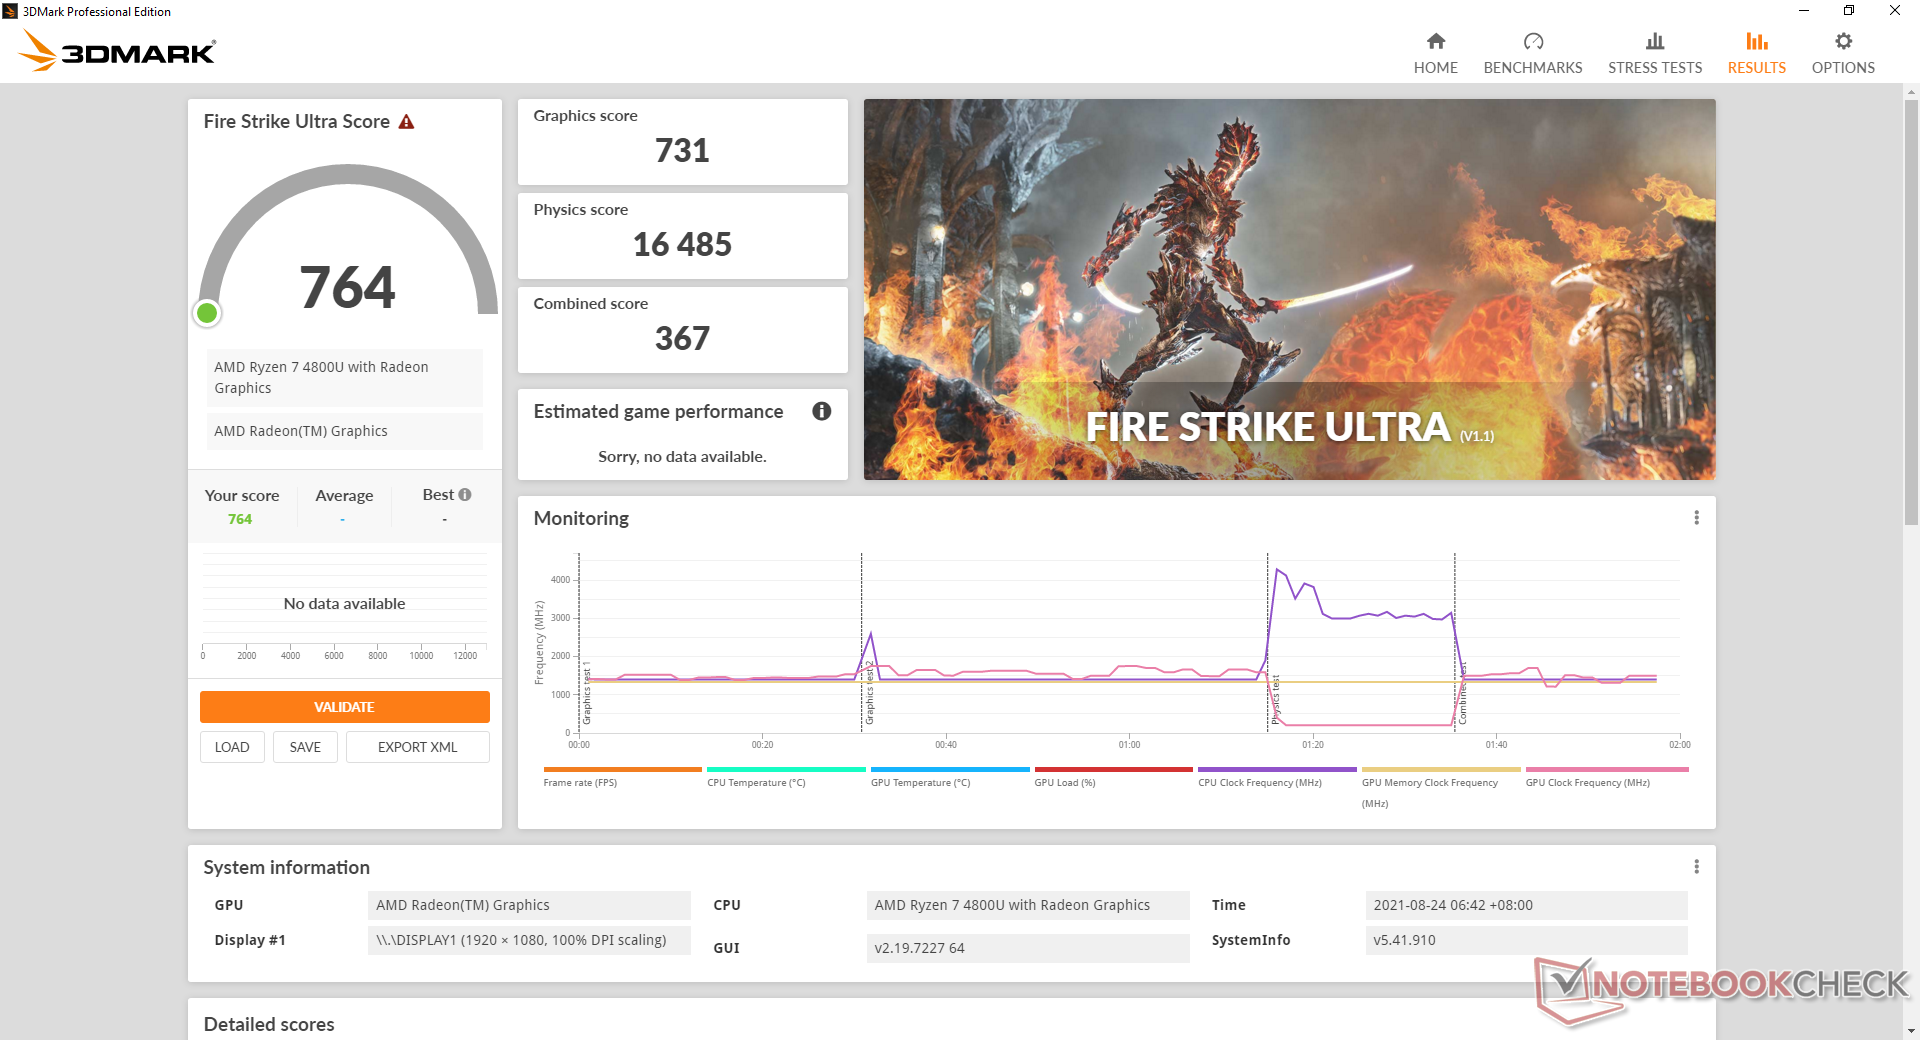
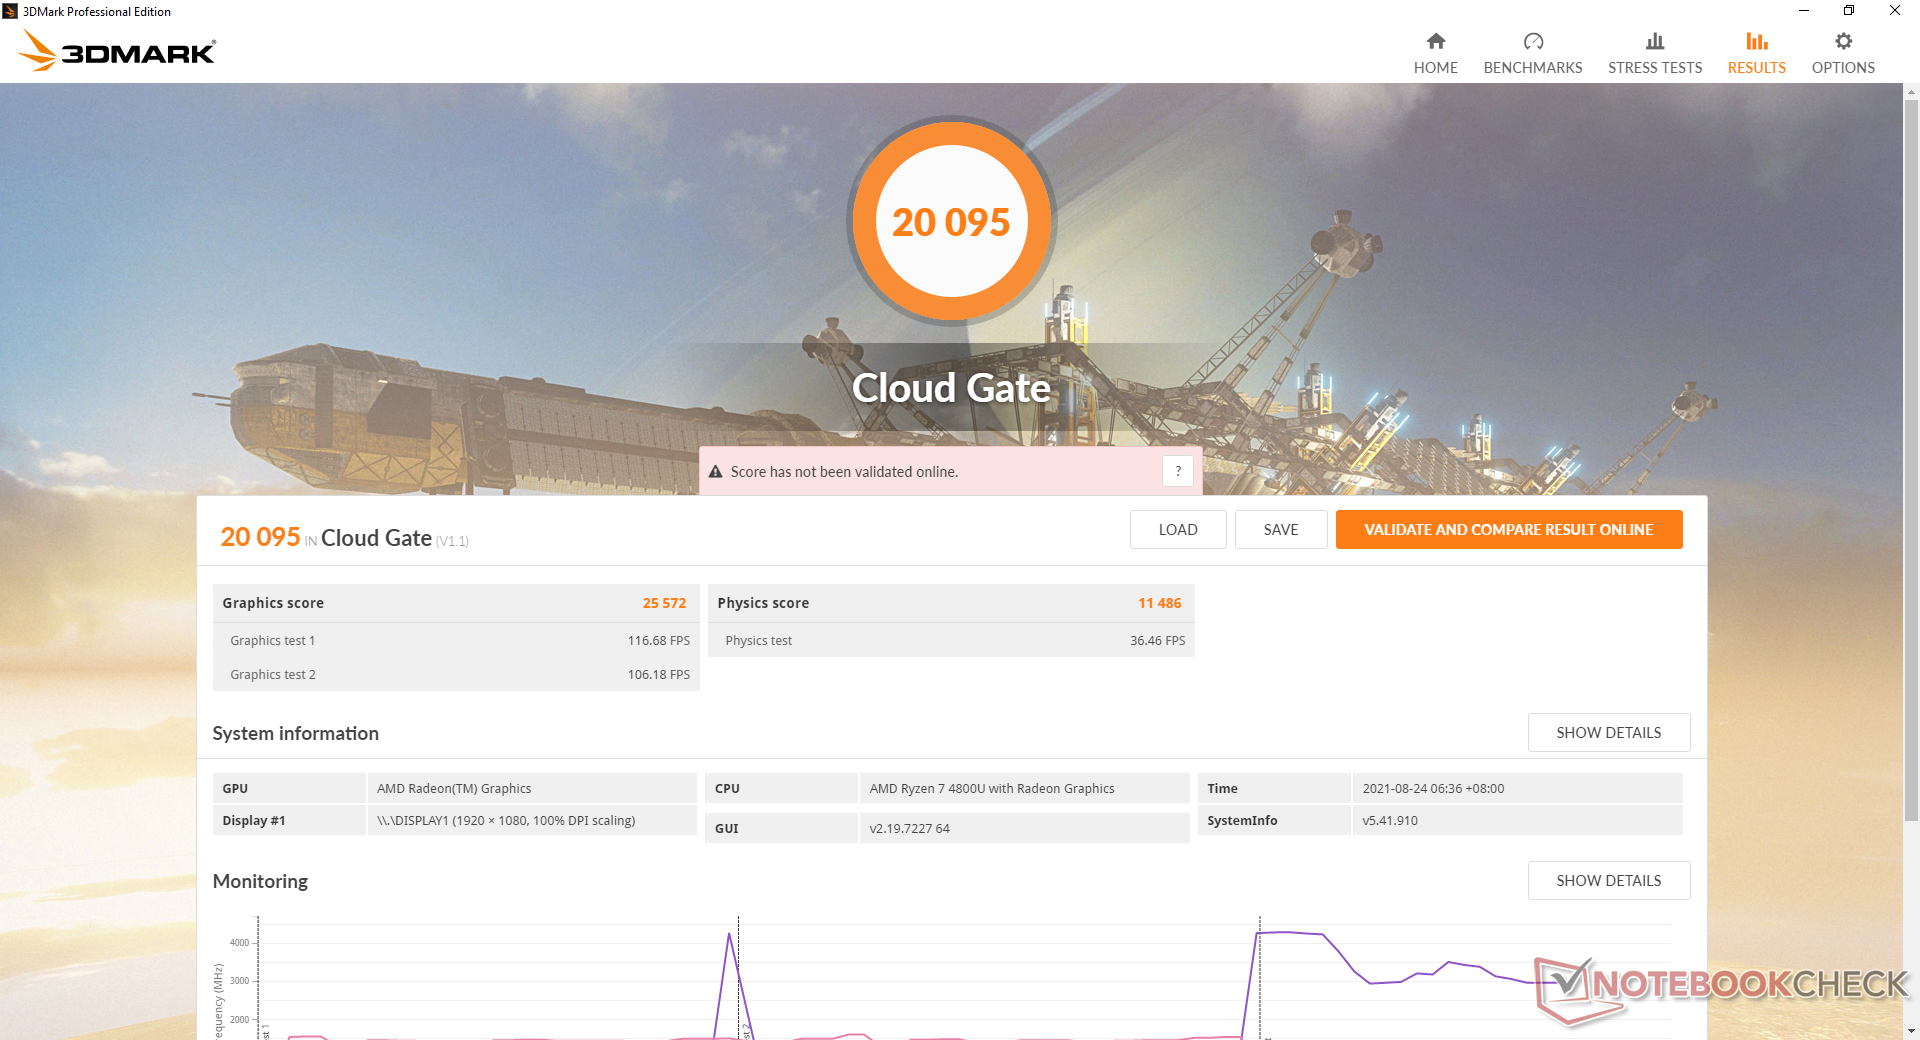
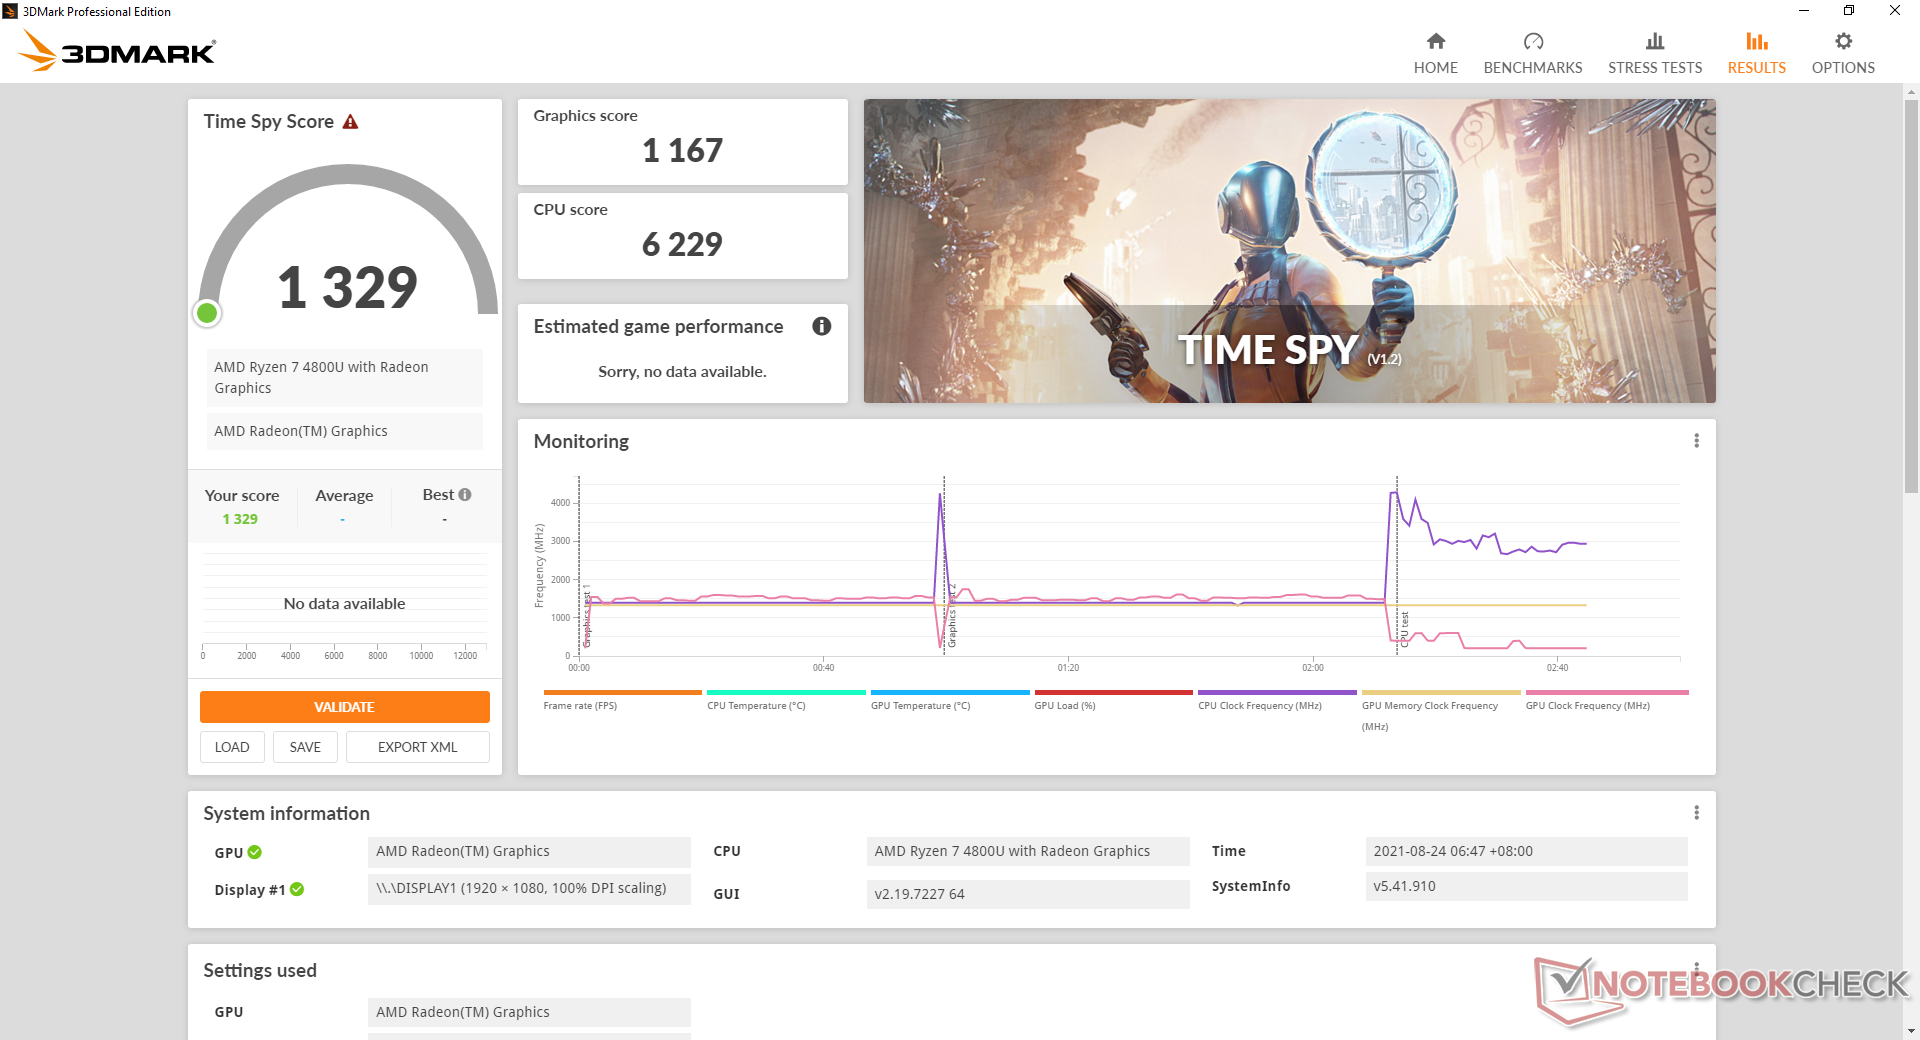
Graphics performance from our Radeon RX Vega 8 is about 30 to 40 percent faster than the Ryzen 5 4500U with the integrated RX Vega 6. However, it's still a step below both the Core i5 Iris Xe 80 EUs and Core i7 Iris Xe 96 EUs in most games as shown by our comparison charts below.
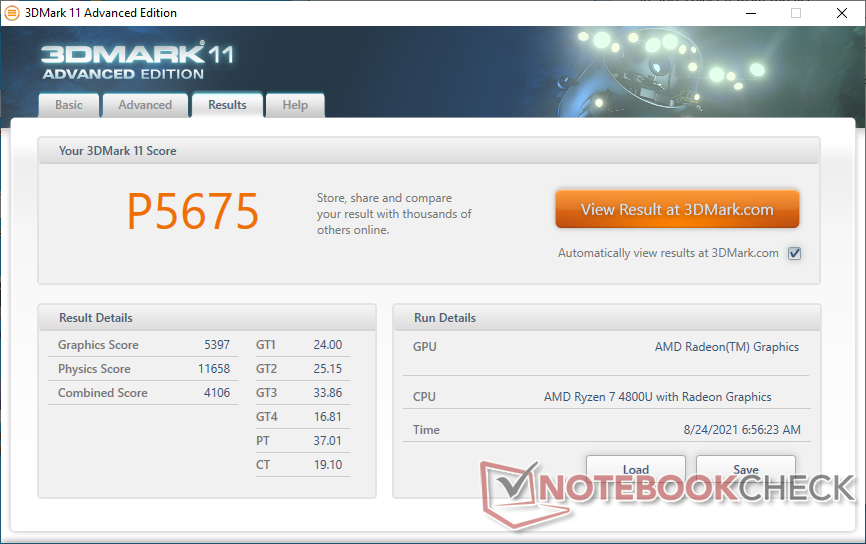
| 3DMark 11 Performance | 5675 points | |
| 3DMark Cloud Gate Standard Score | 20095 points | |
| 3DMark Fire Strike Score | 3368 points | |
| 3DMark Time Spy Score | 1329 points | |
Help | ||
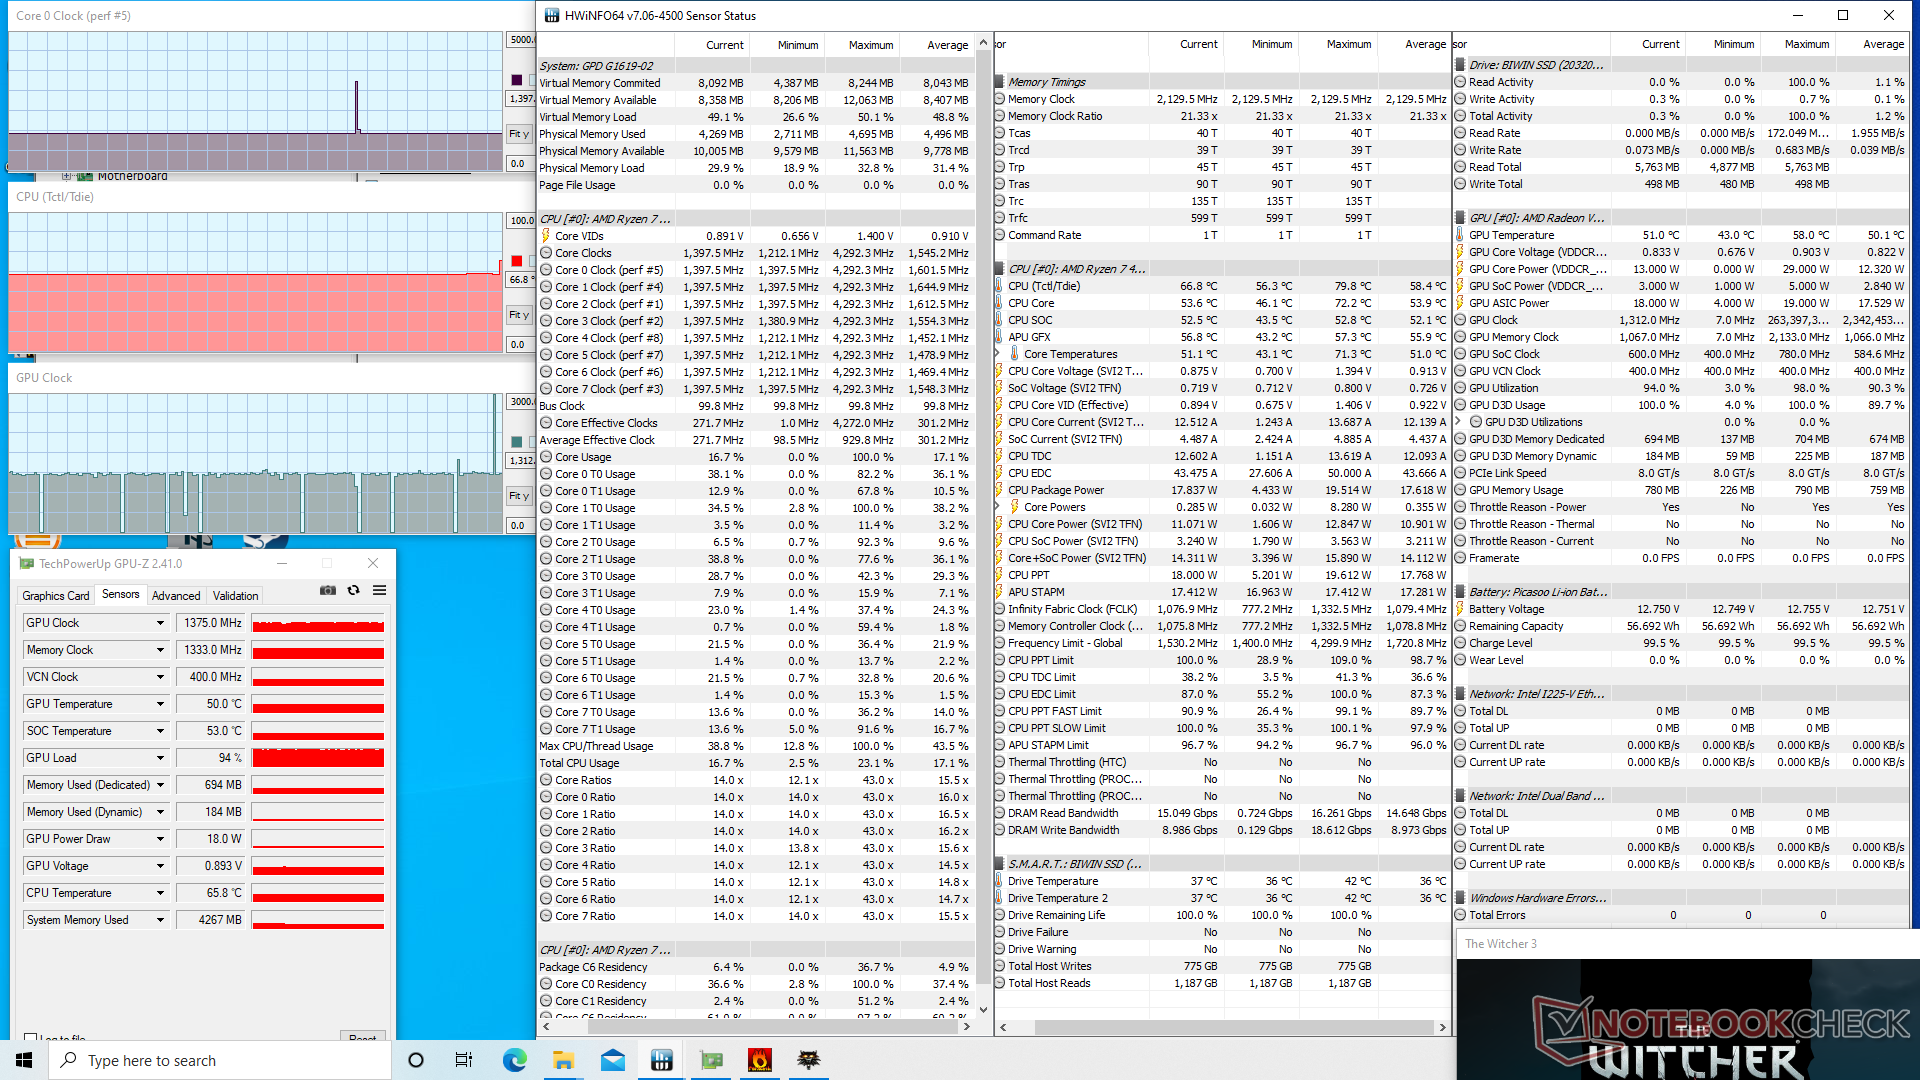
Idling on Witcher 3 at low settings shows relatively poor performance consistency. Frame rates would be as high as 55 FPS during the start of the test before falling to 45 FPS and then jumping back up. Performance even dropped to as low as 15 FPS momentarily to suggest background activity impacting gaming performance.
Witcher 3 FPS Chart
| low | med. | high | ultra | |
|---|---|---|---|---|
| GTA V (2015) | 102 | 89.9 | 28 | 12.7 |
| The Witcher 3 (2015) | 73.6 | 45.3 | 24 | 15.2 |
| Dota 2 Reborn (2015) | 97.7 | 80.7 | 50.8 | 48.1 |
| Final Fantasy XV Benchmark (2018) | 35.3 | 17.6 | 12.8 | |
| X-Plane 11.11 (2018) | 40 | 31.8 | 27.9 | |
| Far Cry 5 (2018) | 43 | 20 | 19 | 18 |
| Strange Brigade (2018) | 77.9 | 31.8 | 26.3 | 22.7 |
Emissions
System Noise
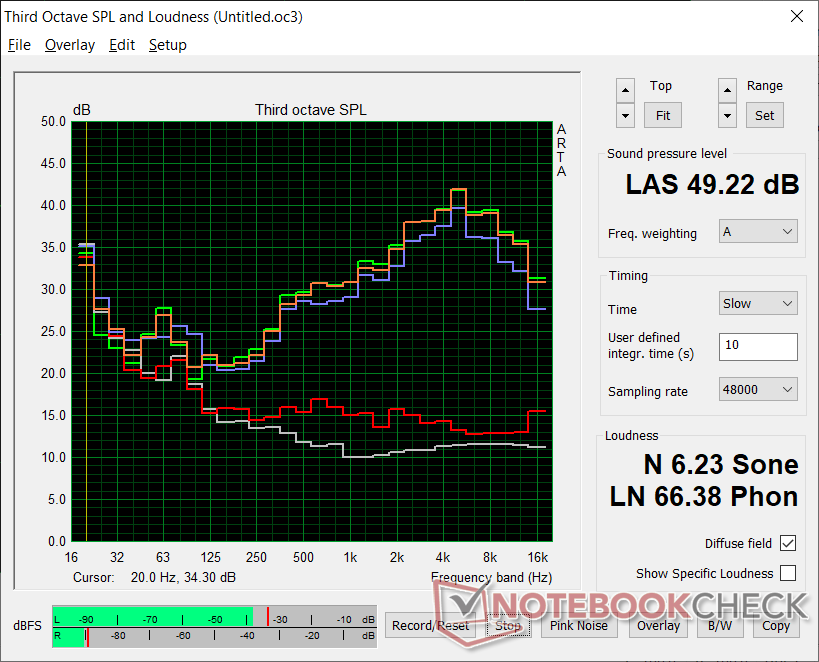
Fan noise is highly dependent on whether or not Turbo fan mode is toggled. If active, the fans will frequently pulse up to 35 dB(A) or higher during low to low-medium loads like web browsing or video streaming. Gaming on Turbo mode induces a fan noise of over 49 dB(A) to be louder than most ULV Ultrabooks.
If Turbo mode is toggled off, fan noise would max out at only 34 dB(A) even when gaming to be significantly quieter and more tolerable. Best of all, disabling Turbo mode will only impact temperatures and not performance meaning users can still get the full performance from the system without needing to force the fans to maximum.
| GPD Win Max 2021 Vega 8, R7 4800U, BIWIN NS200 512GB CNF82GS1G00-512 | GPD Win 3 Iris Xe G7 80EUs, i5-1135G7, BIWIN NS200 1TB CNF82GS1G02-1TB | HP Pavilion Aero 13 be0097nr Vega 8, R7 5800U, Intel SSD 660p SSDPEKNW512G8 | Lenovo Yoga 6 13 82ND0009US Vega 7, R5 5500U, WDC PC SN530 SDBPMPZ-265G | Asus ZenBook Flip 13 UX363EA-HP069T Iris Xe G7 96EUs, i7-1165G7, WDC PC SN730 SDBPNTY-1T00 | |
|---|---|---|---|---|---|
| Noise | -2% | 17% | 9% | -3% | |
| off / environment * (dB) | 23.3 | 27.4 -18% | 23.9 -3% | 25.1 -8% | 27 -16% |
| Idle Minimum * (dB) | 26.6 | 29.1 -9% | 23.9 10% | 25.1 6% | 27 -2% |
| Idle Average * (dB) | 26.6 | 29.1 -9% | 23.9 10% | 25.1 6% | 27 -2% |
| Idle Maximum * (dB) | 26.6 | 29.1 -9% | 23.9 10% | 25.1 6% | 27 -2% |
| Load Average * (dB) | 46.9 | 40.7 13% | 32.2 31% | 41 13% | 46 2% |
| Witcher 3 ultra * (dB) | 49 | 42.8 13% | 34.7 29% | 38.6 21% | |
| Load Maximum * (dB) | 49.2 | 46.3 6% | 34.8 29% | 38.7 21% | 46.6 5% |
* ... smaller is better
Noise level
| Idle |
| 26.6 / 26.6 / 26.6 dB(A) |
| Load |
| 46.9 / 49.2 dB(A) |
 | ||
30 dB silent 40 dB(A) audible 50 dB(A) loud |
||
min: | ||
Temperature
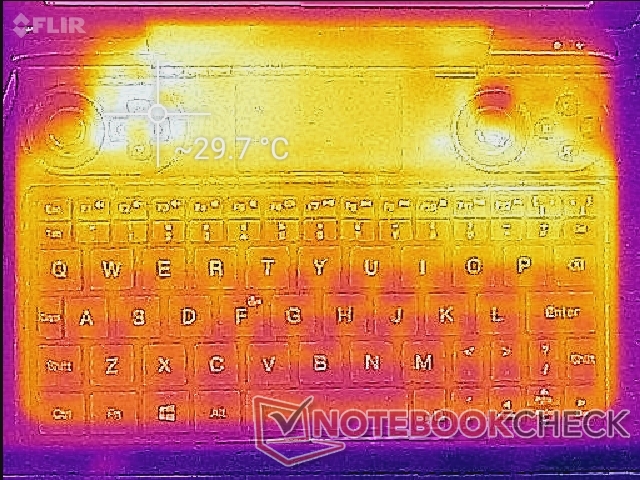
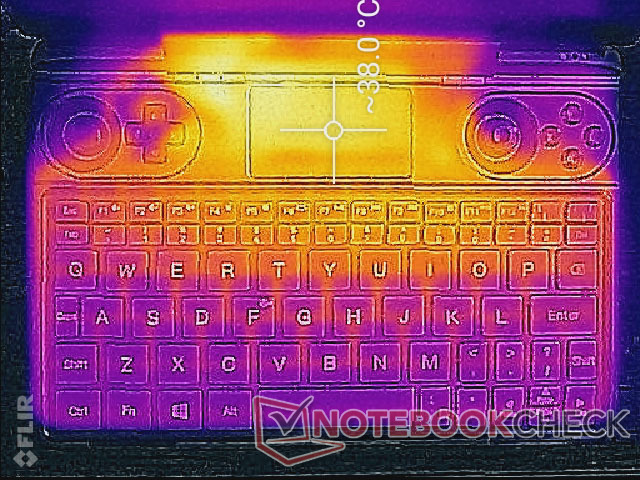
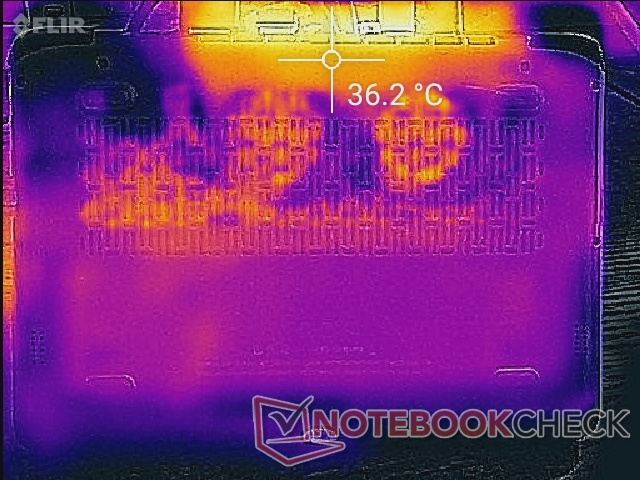
Hot spots when gaming are only around 38 C on the clickpad with Turbo fan mode active. Important areas like the keyboard and controller buttons near the rear corners remain cooler for comfort. Surface temperatures will be slightly warmer when Turbo fan is disabled.
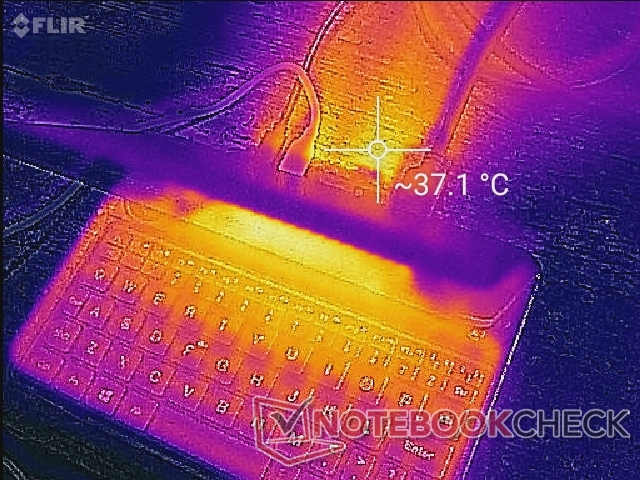
(+) The maximum temperature on the upper side is 38 °C / 100 F, compared to the average of 37.9 °C / 100 F, ranging from 26.6 to 55 °C for the class Handheld / UMPC.
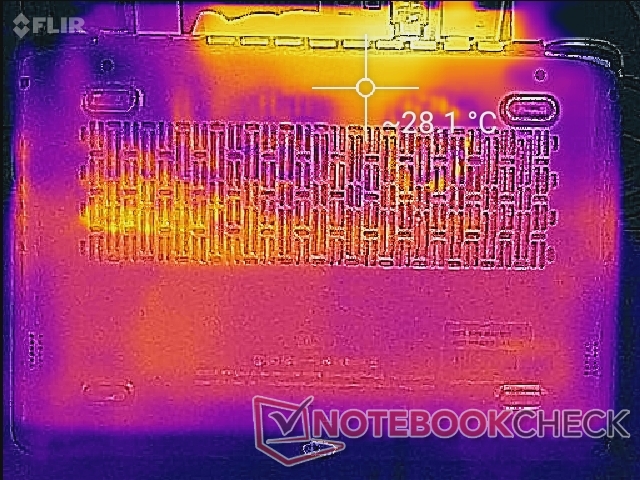
(+) The bottom heats up to a maximum of 36.4 °C / 98 F, compared to the average of 36.7 °C / 98 F
(+) In idle usage, the average temperature for the upper side is 27.7 °C / 82 F, compared to the device average of 32.8 °C / 91 F.
(+) The palmrests and touchpad are cooler than skin temperature with a maximum of 28.6 °C / 83.5 F and are therefore cool to the touch.
(+) The average temperature of the palmrest area of similar devices was 32.4 °C / 90.3 F (+3.8 °C / 6.8 F).
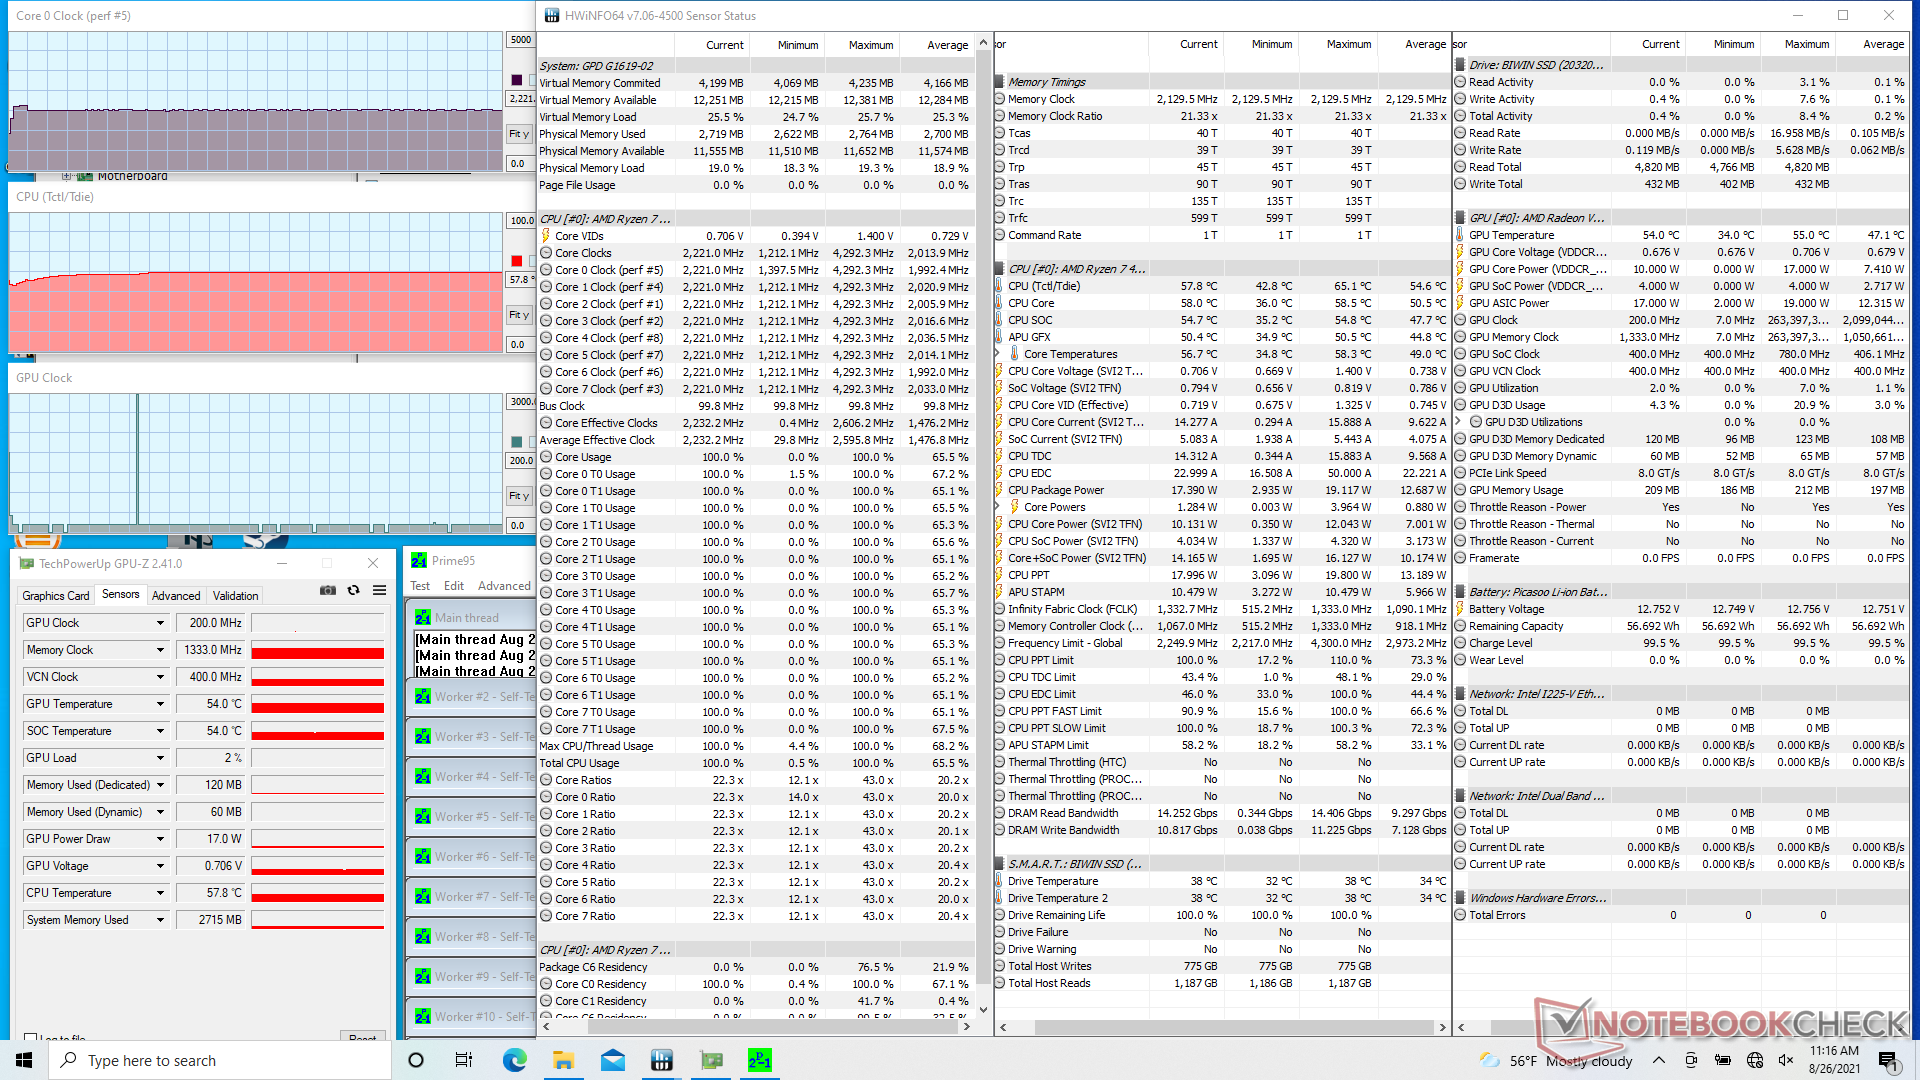
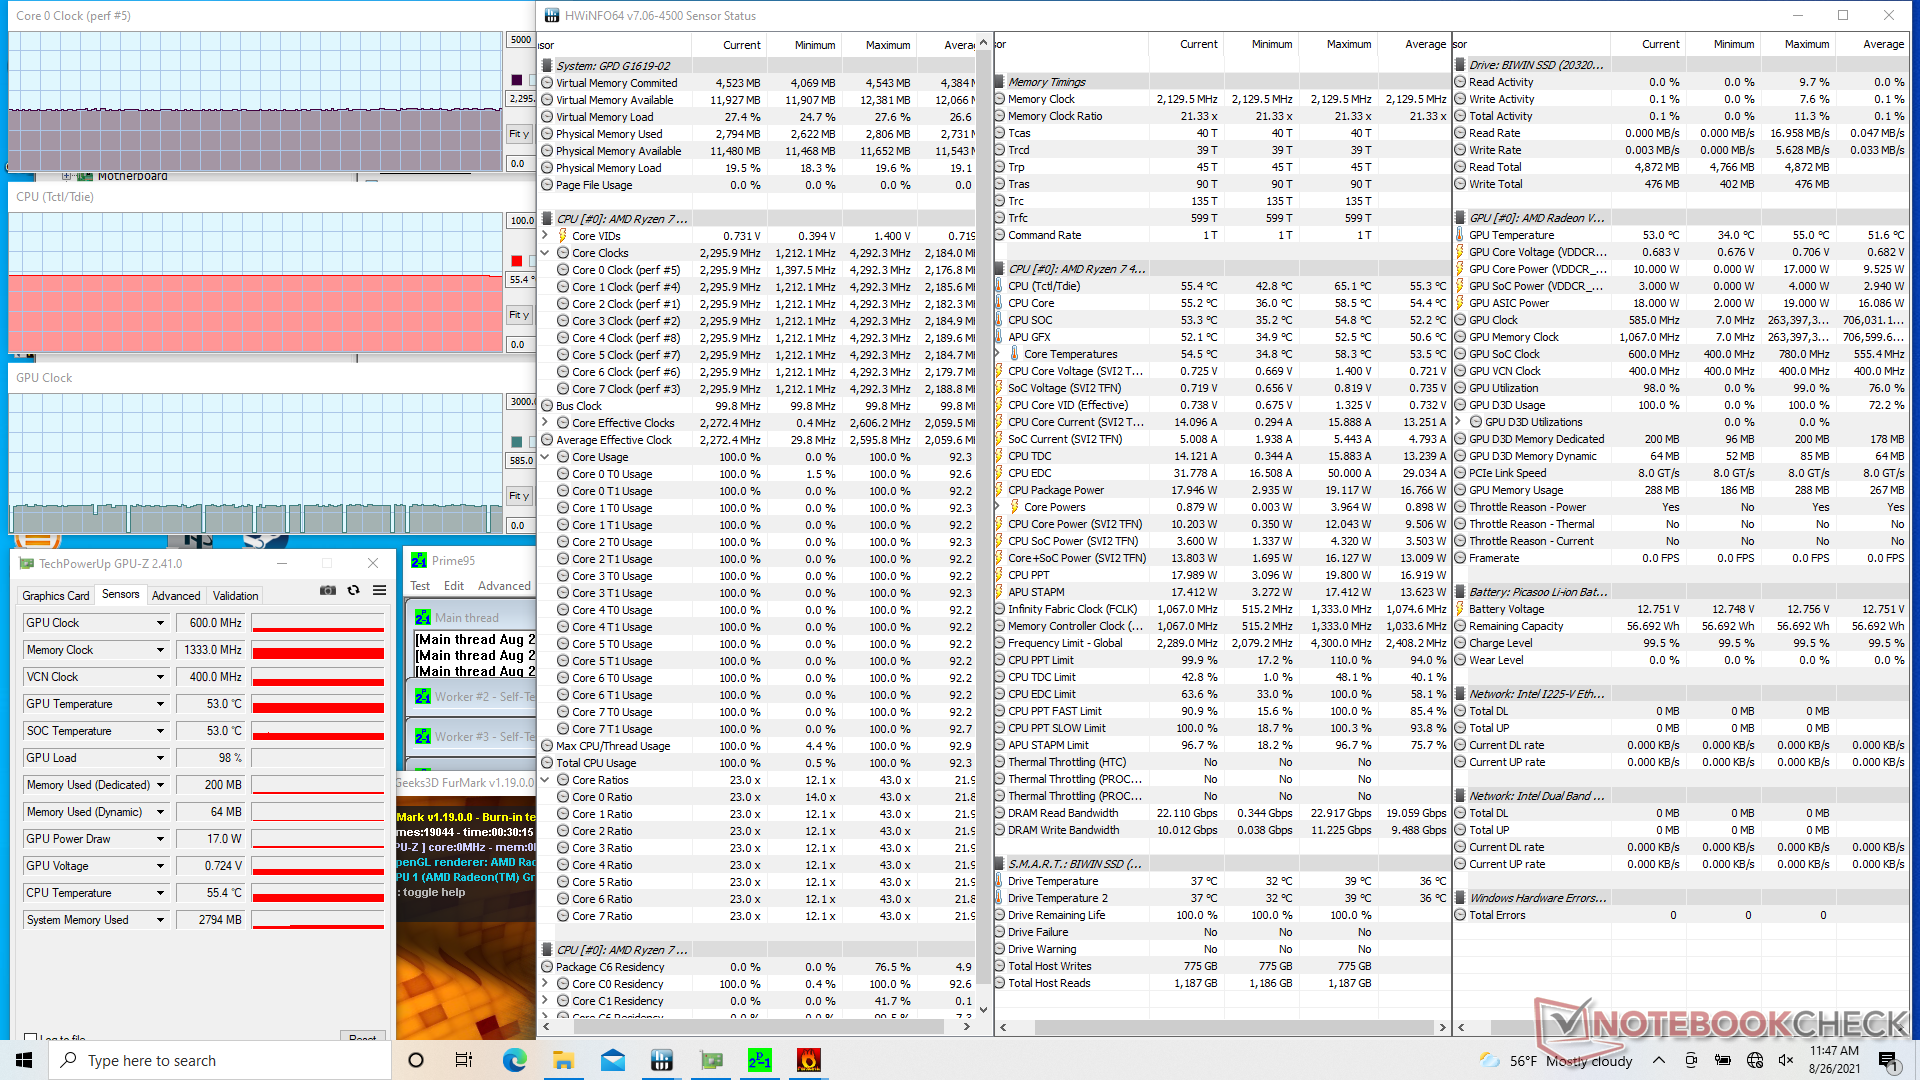
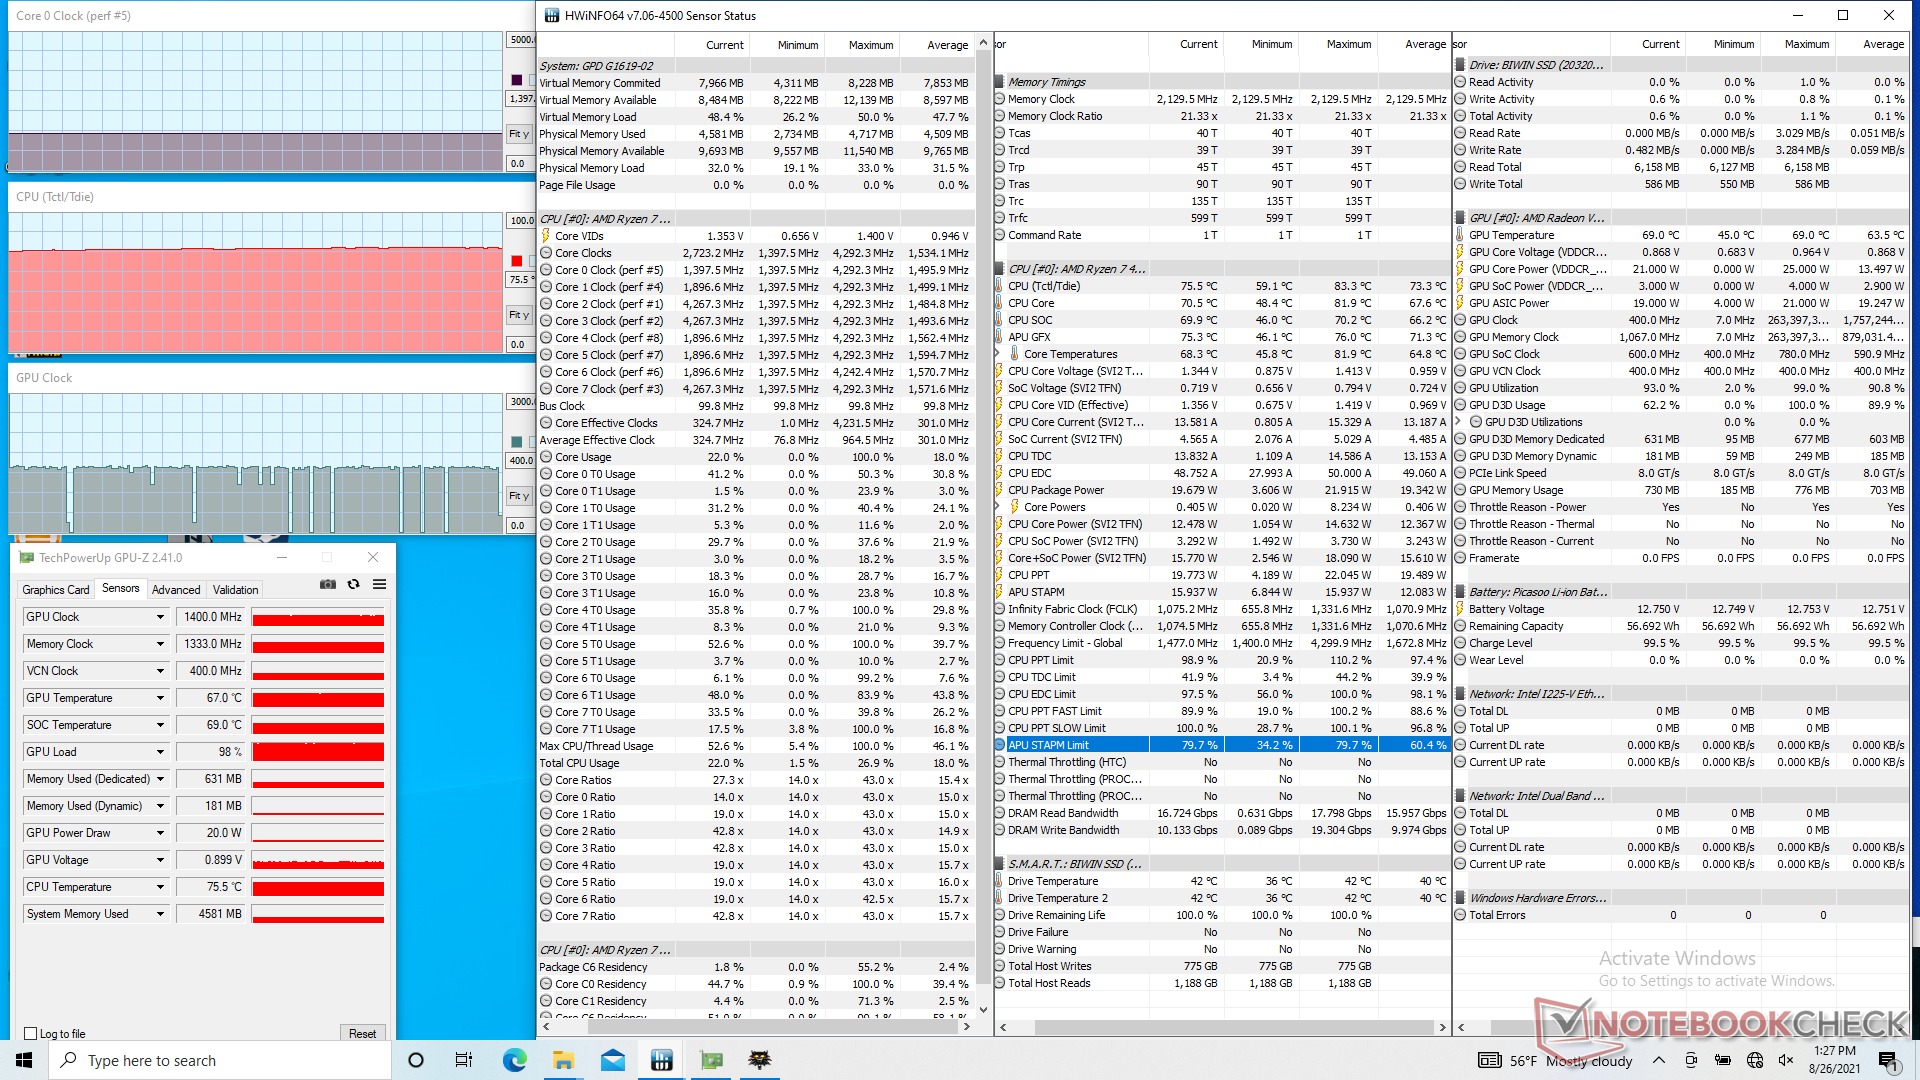
Stress Test
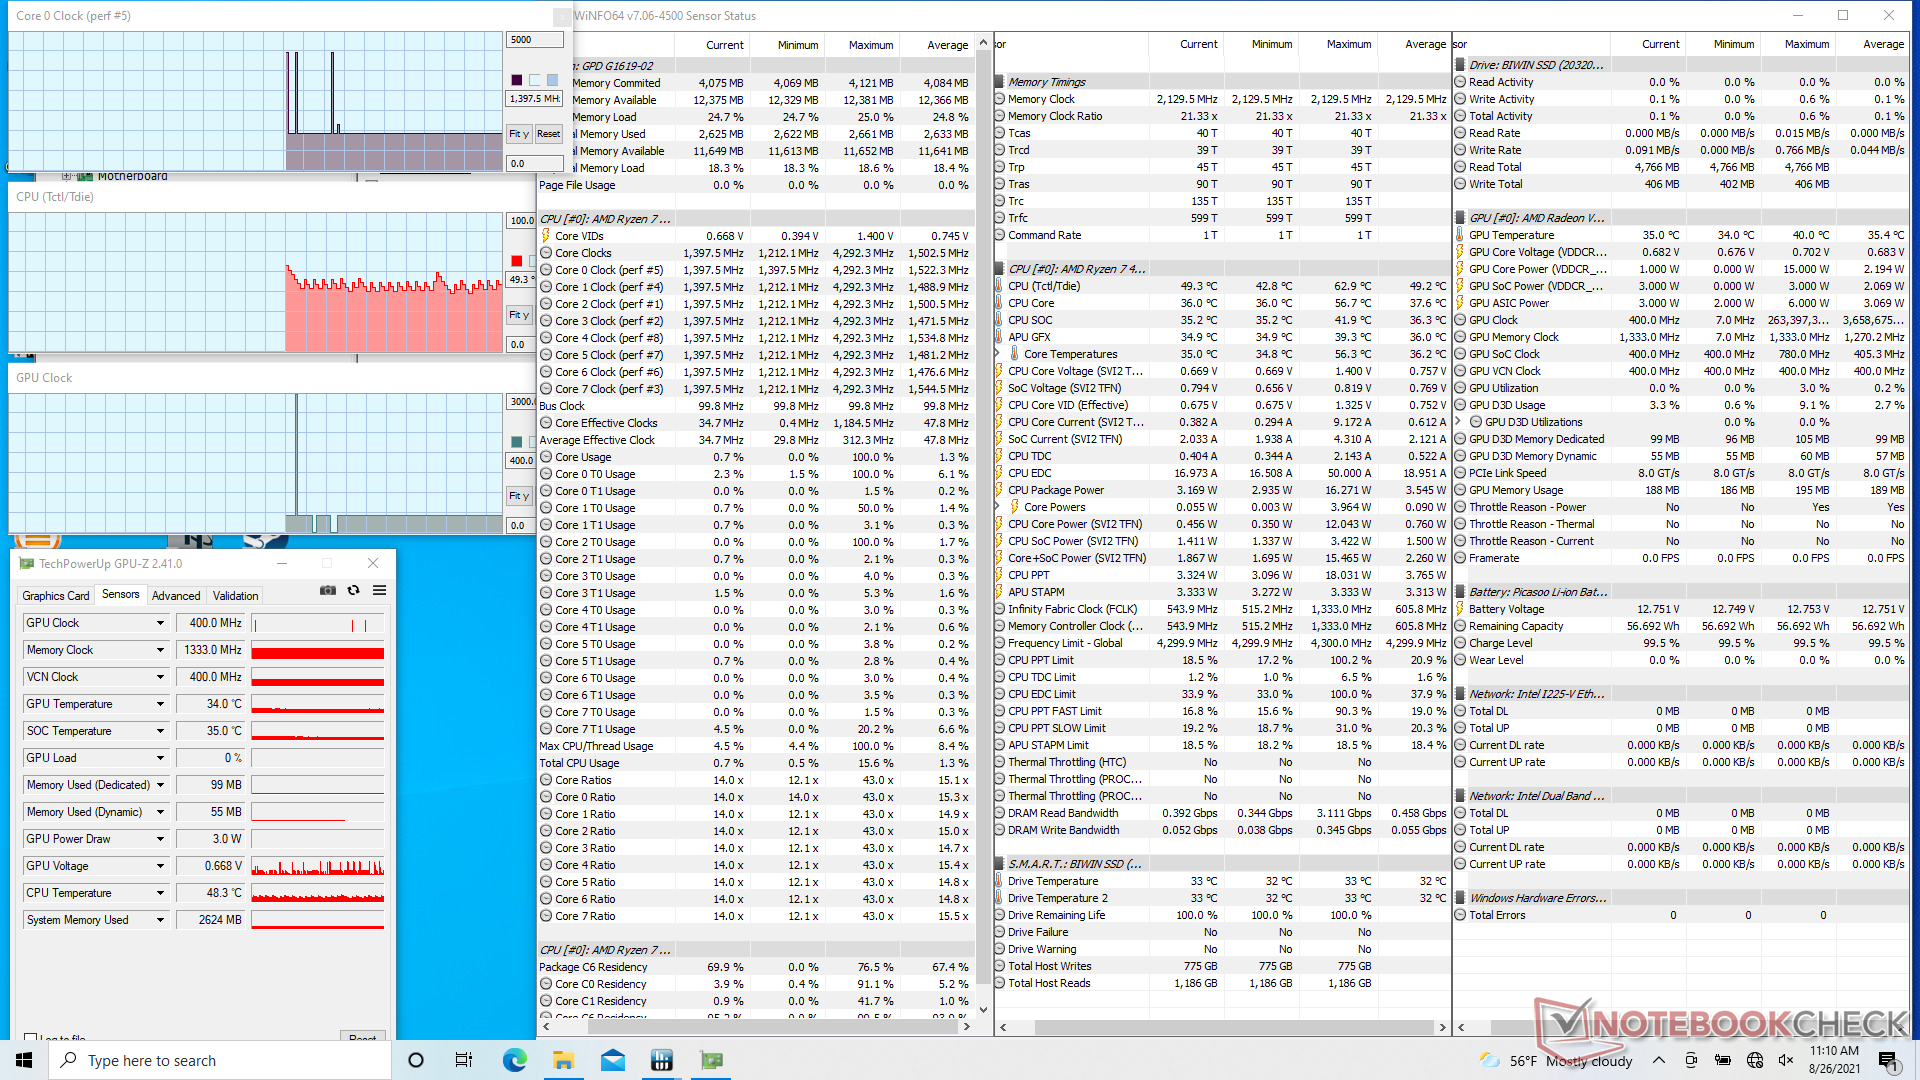
When running Prime95 to stress the CPU, clock rates would boost to 2.4 GHz for just the first few seconds before falling slightly and stabilizing at 2.2 GHz.
Interestingly, Turbo fan mode does not increase gaming performance as CPU and GPU clock rates remain unchanged. Instead, CPU temperature will drop by almost 10 C to give owners additional overclocking headroom if desired.
Running on battery power will not limit performance. A 3DMark 11 test on batteries would return Physics and Graphics scores of 11664 and 5492 points, respectively, compared to 11658 and 5397 points when on mains.
| CPU Clock (GHz) | GPU Clock (MHz) | Average CPU Temperature (°C) | |
| System Idle | -- | -- | 49 |
| Prime95 Stress | 2.2 | -- | 58 |
| Prime95 + FurMark Stress | 2.3 | 600 | 55 |
| Witcher 3 Stress (Turbo fan off) | 1.4 | 1400 | 76 |
| Witcher 3 Stress (Turbo fan on) | 1.4 | 1375 | 67 |
Speakers


GPD Win Max 2021 audio analysis
(±) | speaker loudness is average but good (81.1 dB)
Bass 100 - 315 Hz
(-) | nearly no bass - on average 25.9% lower than median
(±) | linearity of bass is average (7.2% delta to prev. frequency)
Mids 400 - 2000 Hz
(+) | balanced mids - only 4% away from median
(+) | mids are linear (6.9% delta to prev. frequency)
Highs 2 - 16 kHz
(±) | higher highs - on average 6.4% higher than median
(±) | linearity of highs is average (8.4% delta to prev. frequency)
Overall 100 - 16.000 Hz
(±) | linearity of overall sound is average (23.4% difference to median)
Compared to same class
» 92% of all tested devices in this class were better, 8% similar, 0% worse
» The best had a delta of 12%, average was 17%, worst was 23%
Compared to all devices tested
» 70% of all tested devices were better, 6% similar, 24% worse
» The best had a delta of 4%, average was 23%, worst was 134%
Apple MacBook 12 (Early 2016) 1.1 GHz audio analysis
(+) | speakers can play relatively loud (83.6 dB)
Bass 100 - 315 Hz
(±) | reduced bass - on average 11.3% lower than median
(±) | linearity of bass is average (14.2% delta to prev. frequency)
Mids 400 - 2000 Hz
(+) | balanced mids - only 2.4% away from median
(+) | mids are linear (5.5% delta to prev. frequency)
Highs 2 - 16 kHz
(+) | balanced highs - only 2% away from median
(+) | highs are linear (4.5% delta to prev. frequency)
Overall 100 - 16.000 Hz
(+) | overall sound is linear (10.2% difference to median)
Compared to same class
» 7% of all tested devices in this class were better, 2% similar, 90% worse
» The best had a delta of 5%, average was 18%, worst was 53%
Compared to all devices tested
» 5% of all tested devices were better, 1% similar, 94% worse
» The best had a delta of 4%, average was 23%, worst was 134%
Energy Management
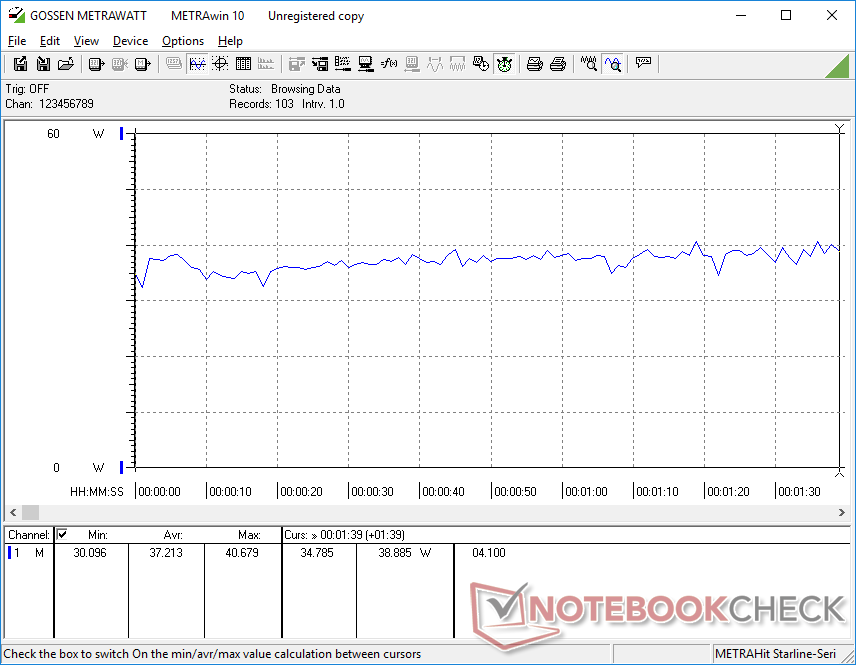
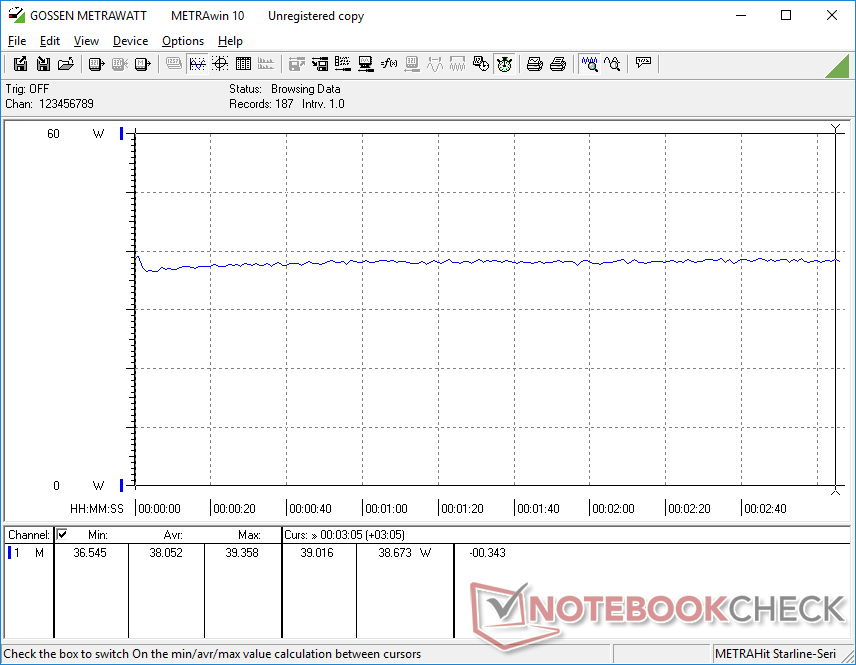
Power Consumption
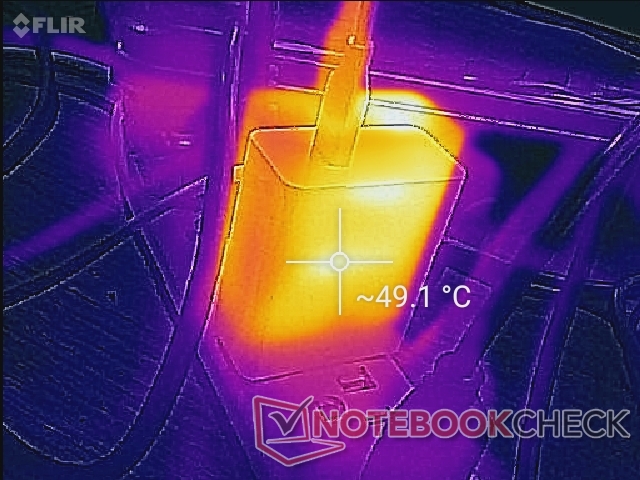
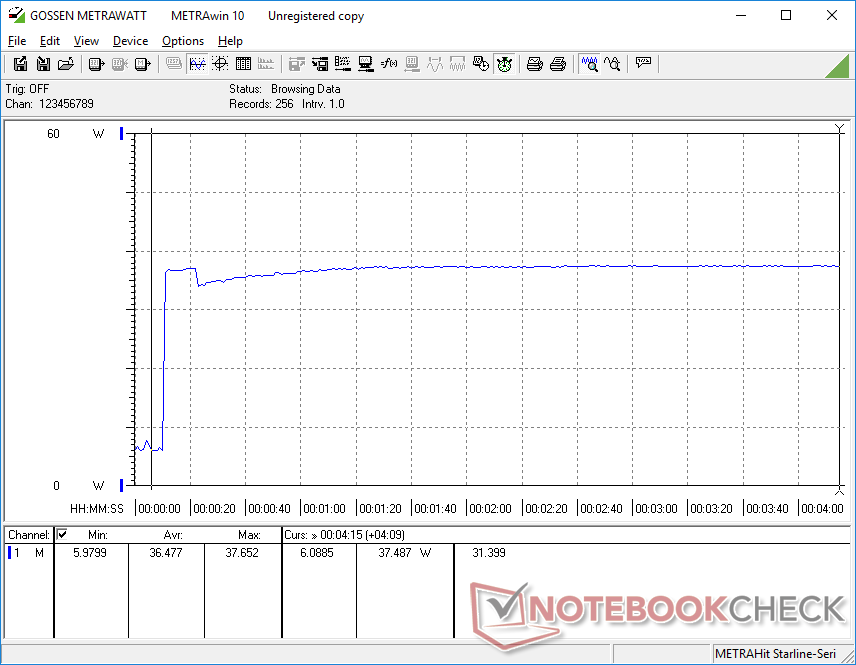
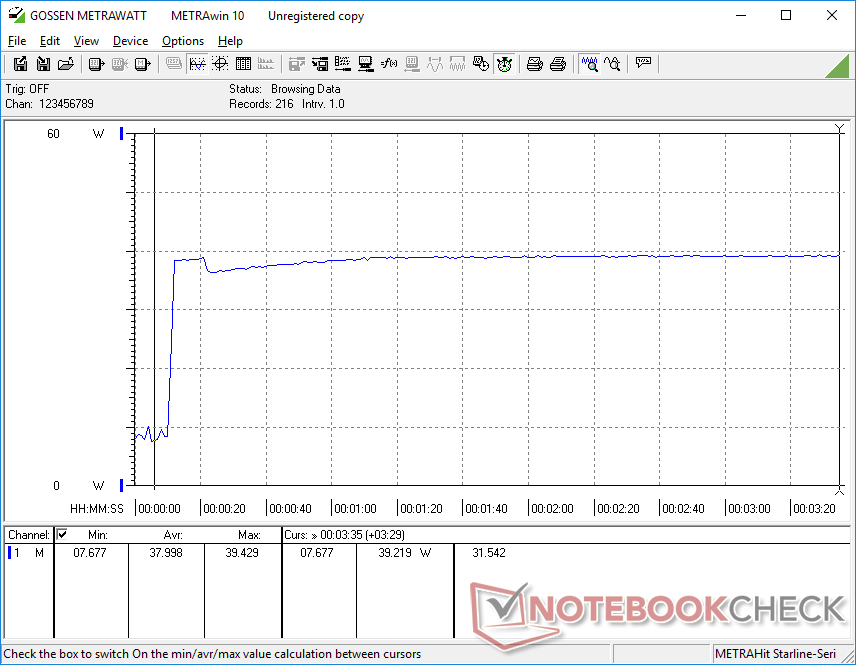
Idling on desktop with no running applications consumes between 5 W and 8 W depending on the brightness level and power profile which is surprisingly similar to many ULV laptops. Gaming consumes about 37 W from the small (~6.4 x 5.5 x 2.8 cm) 65 W USB-C AC adapter.
| Off / Standby | |
| Idle | |
| Load |
|
Key:
min: | |
| GPD Win Max 2021 R7 4800U, Vega 8, BIWIN NS200 512GB CNF82GS1G00-512, IPS, 1280x800, 8" | GPD Win 3 i5-1135G7, Iris Xe G7 80EUs, BIWIN NS200 1TB CNF82GS1G02-1TB, IPS, 1280x720, 5.5" | HP Pavilion Aero 13 be0097nr R7 5800U, Vega 8, Intel SSD 660p SSDPEKNW512G8, IPS, 1920x1200, 13.3" | Lenovo Yoga 6 13 82ND0009US R5 5500U, Vega 7, WDC PC SN530 SDBPMPZ-265G, IPS, 1920x1080, 13.3" | Asus ZenBook Flip 13 UX363EA-HP069T i7-1165G7, Iris Xe G7 96EUs, WDC PC SN730 SDBPNTY-1T00, OLED, 1920x1080, 13.3" | Asus ZenBook 13 UX325EA i7-1165G7, Iris Xe G7 96EUs, SK Hynix HFM001TD3JX013N, OLED, 1920x1080, 13.3" | |
|---|---|---|---|---|---|---|
| Power Consumption | 22% | 1% | -1% | 3% | 11% | |
| Idle Minimum * (Watt) | 5.2 | 2.9 44% | 3.4 35% | 5 4% | 4.4 15% | 3.6 31% |
| Idle Average * (Watt) | 6.5 | 4.5 31% | 6.9 -6% | 6.3 3% | 7.4 -14% | 6.3 3% |
| Idle Maximum * (Watt) | 7.4 | 4.5 39% | 8 -8% | 6.9 7% | 11.3 -53% | 7.6 -3% |
| Load Average * (Watt) | 37.2 | 38.5 -3% | 42.6 -15% | 41.5 -12% | 22 41% | 31 17% |
| Witcher 3 ultra * (Watt) | 38.1 | 28.9 24% | 35.2 8% | 33.2 13% | 22.8 40% | |
| Load Maximum * (Watt) | 39 | 41.4 -6% | 43.1 -11% | 46.5 -19% | 42.5 -9% | 36 8% |
* ... smaller is better
Power Consumption Witcher 3 / Stresstest
Battery Life
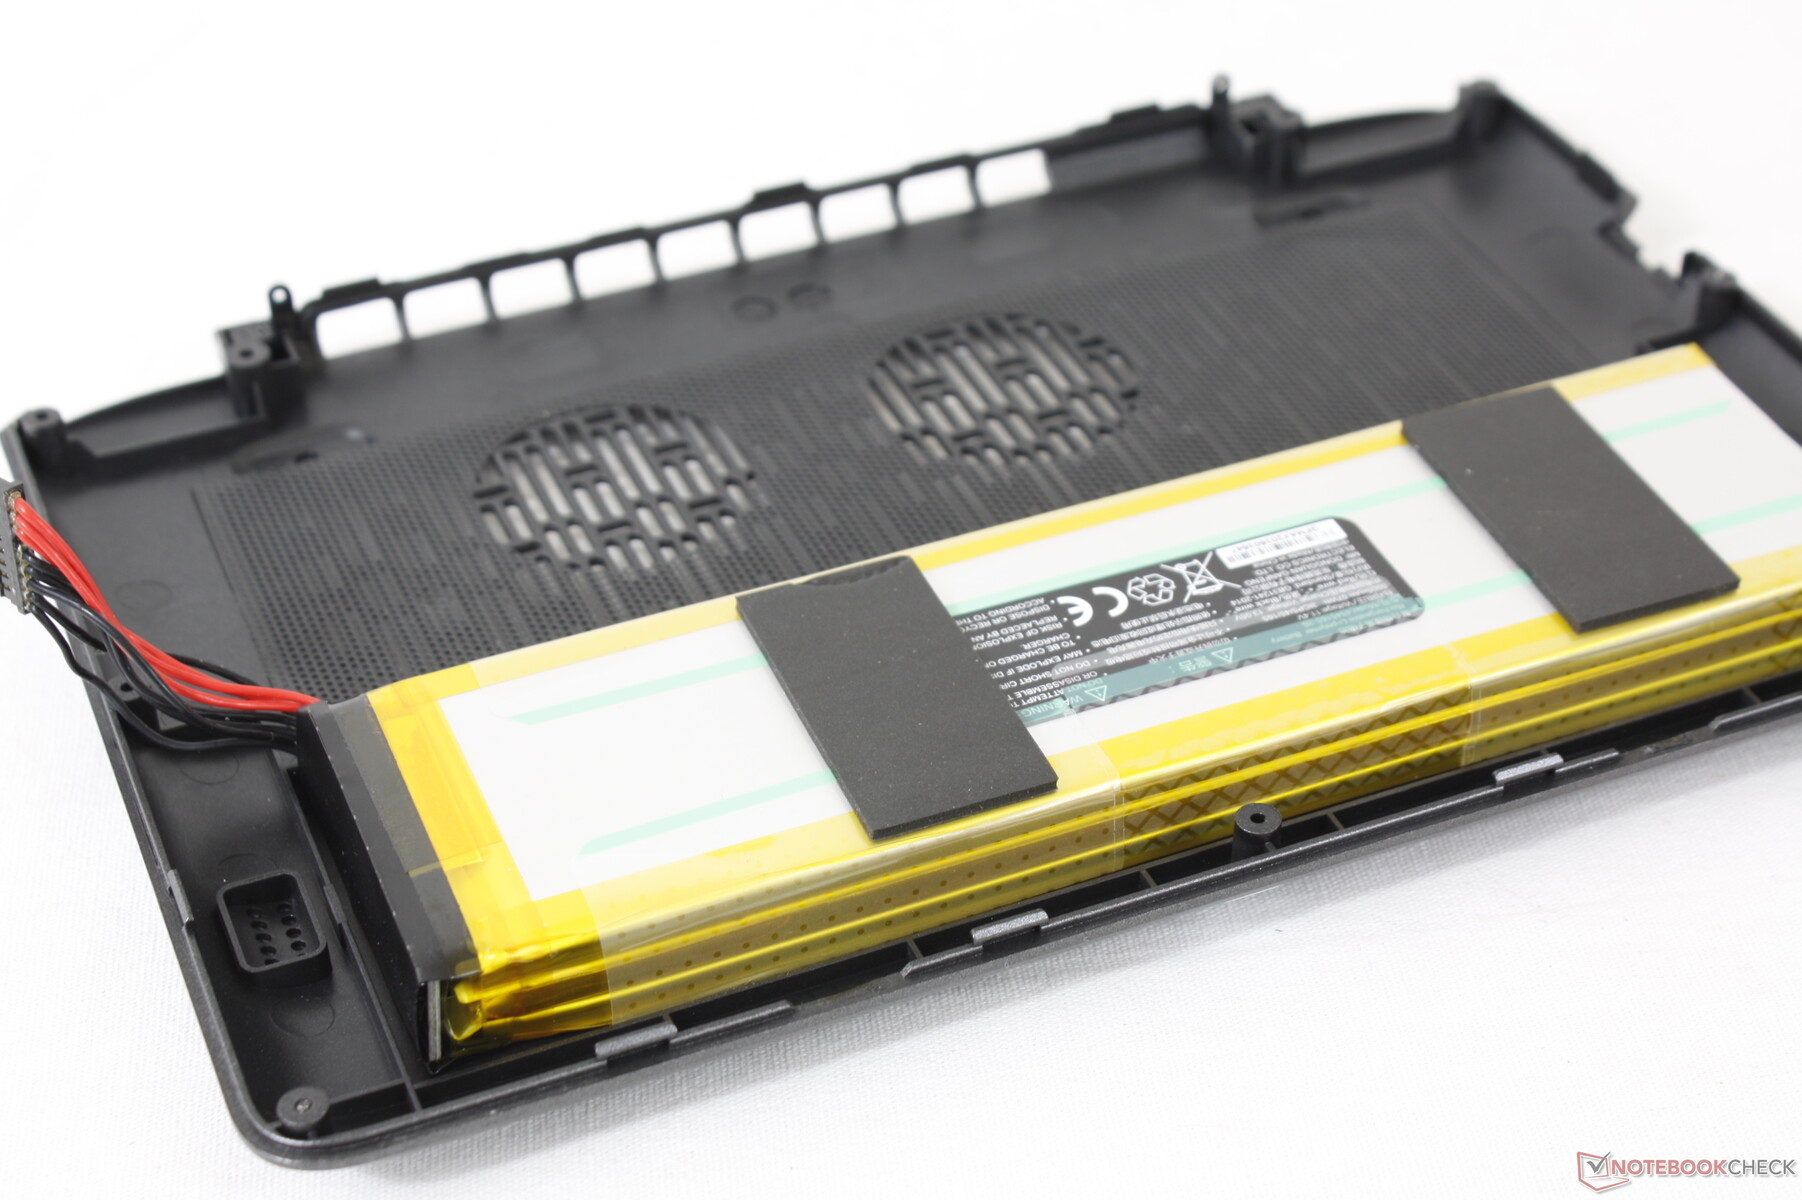
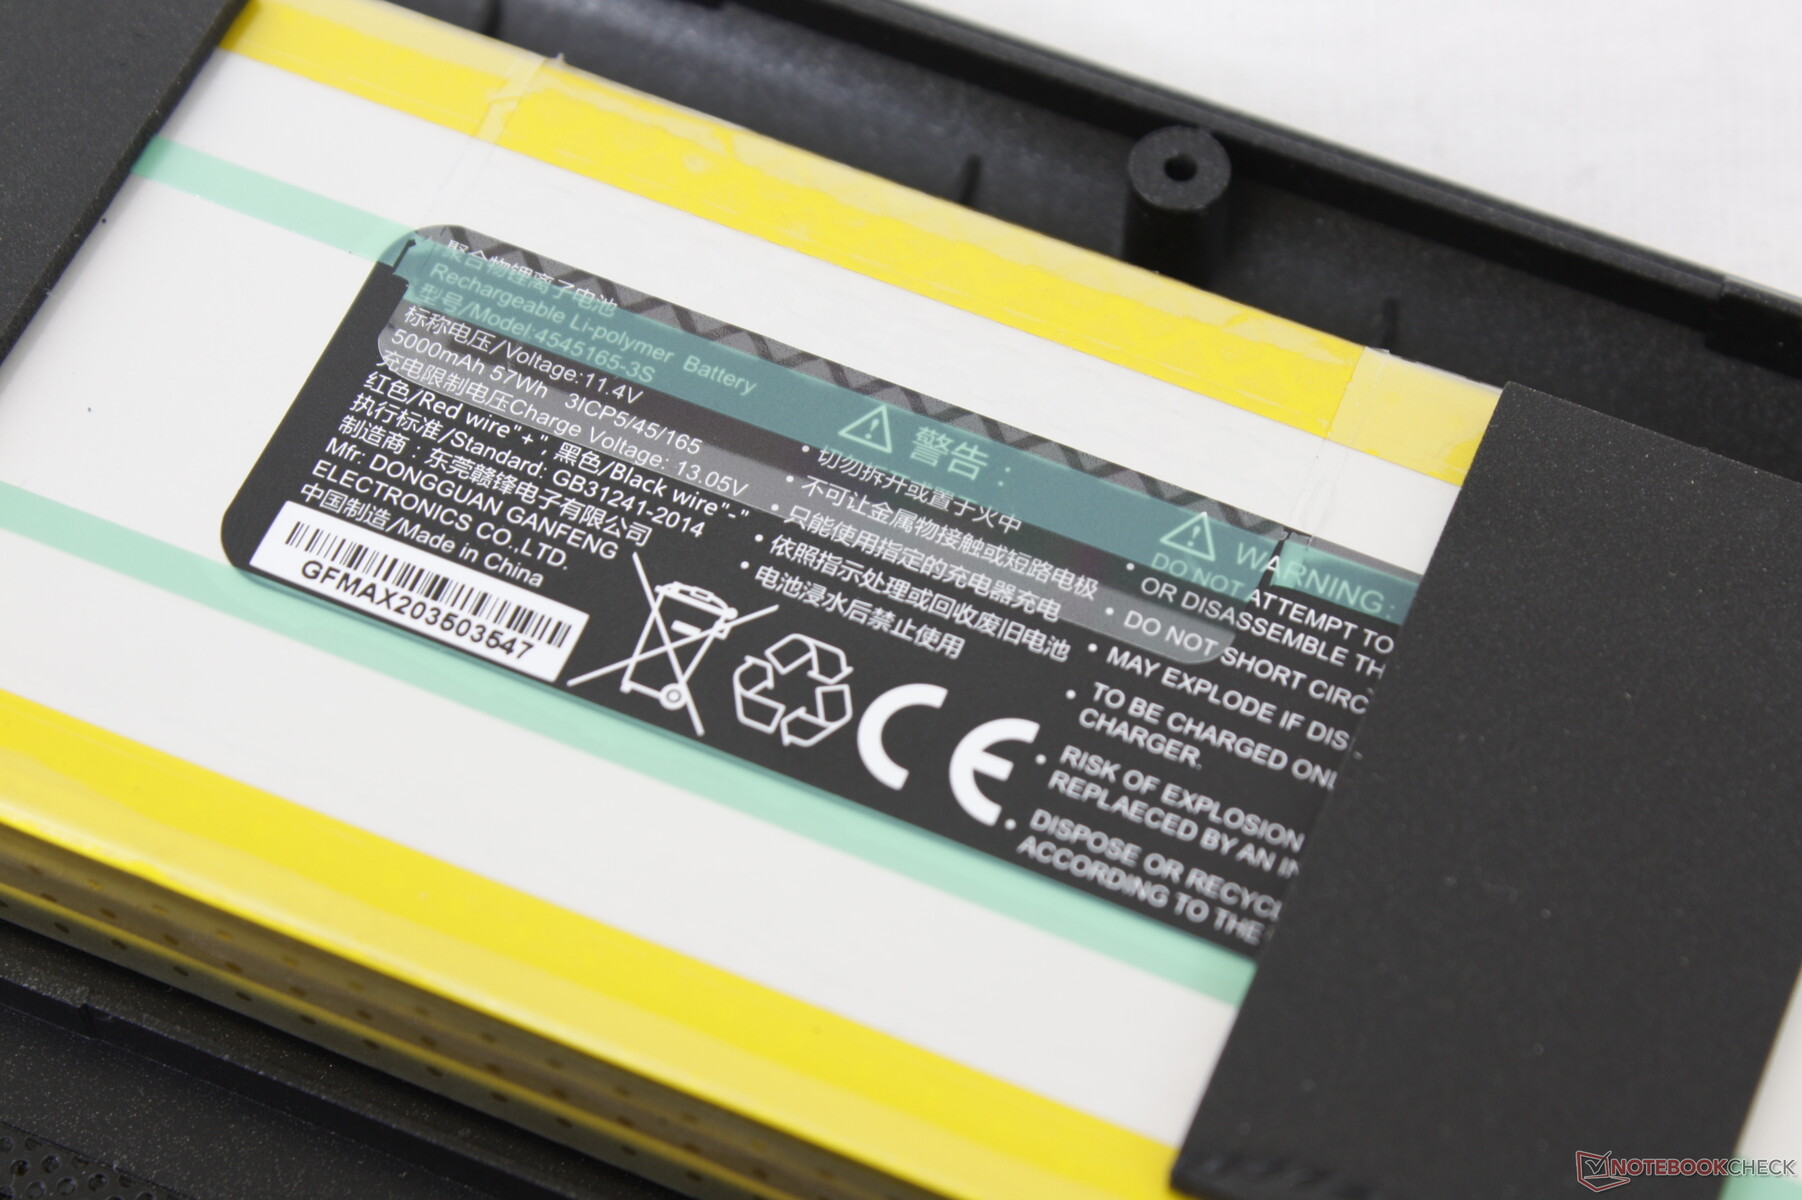
At 57 Wh, the internal battery is larger than expected for a handheld. We're able to squeeze just over 9 hours when browsing the web or about 2 to 3 hours when gaming nonstop.
Charging from empty to full capacity takes about 90 minutes.
| GPD Win Max 2021 R7 4800U, Vega 8, 57 Wh | GPD Win 3 i5-1135G7, Iris Xe G7 80EUs, 44 Wh | HP Pavilion Aero 13 be0097nr R7 5800U, Vega 8, 43 Wh | Lenovo Yoga 6 13 82ND0009US R5 5500U, Vega 7, 60 Wh | Asus ZenBook Flip 13 UX363EA-HP069T i7-1165G7, Iris Xe G7 96EUs, 67 Wh | Asus ZenBook 13 UX325EA i7-1165G7, Iris Xe G7 96EUs, 67 Wh | |
|---|---|---|---|---|---|---|
| Battery runtime | 22% | -3% | 42% | 15% | 15% | |
| WiFi v1.3 (h) | 9.3 | 11.3 22% | 9 -3% | 13.2 42% | 10.7 15% | 10.7 15% |
| Load (h) | 1.3 | 1.8 | 2 | 3.4 | 3 | |
| Reader / Idle (h) | 18.9 | 17.5 | 20.5 | |||
| Witcher 3 ultra (h) | 3.2 |
Pros
Cons
Verdict — Promising, But Could Use More Work
We love the concept of a Windows 10 UMPC that's powerful enough for 720p gaming and the Ryzen 7 4800U is able to deliver on that front. However, the actual package surrounding the processor needs sprucing up. The chassis creaks too much for comfort, the range of motion on the small joysticks is too narrow, the touchpad is jumpy, there is no integrated webcam, and our MicroSD reader doesn't even work. The integrated WLAN is slow by today's standards, DP-over-USB is not supported, and the display is more towards the budget range than the higher-end or mid-tier range with no support for adaptive sync.
Performance is admirable and even comparable to the latest crop of Tiger Lake Ultrabooks. The hardware and display surrounding the processor, however, needs more fine-tuning to really knock it out of the park.
The long battery life, relatively quiet fan noise out of Turbo mode, and satisfying key feedback deserve praise. However, the longer list of minor issues becomes harder to ignore the longer we spend time with the Win Max. It's recommended to go with the Core i7 version to maximize gaming performance while our Ryzen 7 SKU will be ideal for maximizing raw multi-thread CPU performance.
Price and availability
The Win Max 2021 is not yet widely available across online retailers as of this writing. GPD is planning for availability beginning this October according to the Indiegogo page.
GPD Win Max 2021
- 08/30/2021 v7 (old)
Allen Ngo
Price comparison
