

Framework Laptop 13.5 Review: If Microsoft Made A Repairable Surface Laptop, This Would Be It
Laptops will never be as upgradeable or repairable as desktops, but that doesn't mean they shouldn't try. A small team of developers at Framework have designed their very own ultrathin laptop to be as end-user-serviceable as possible. More details about their project and goals can be found on their website here.
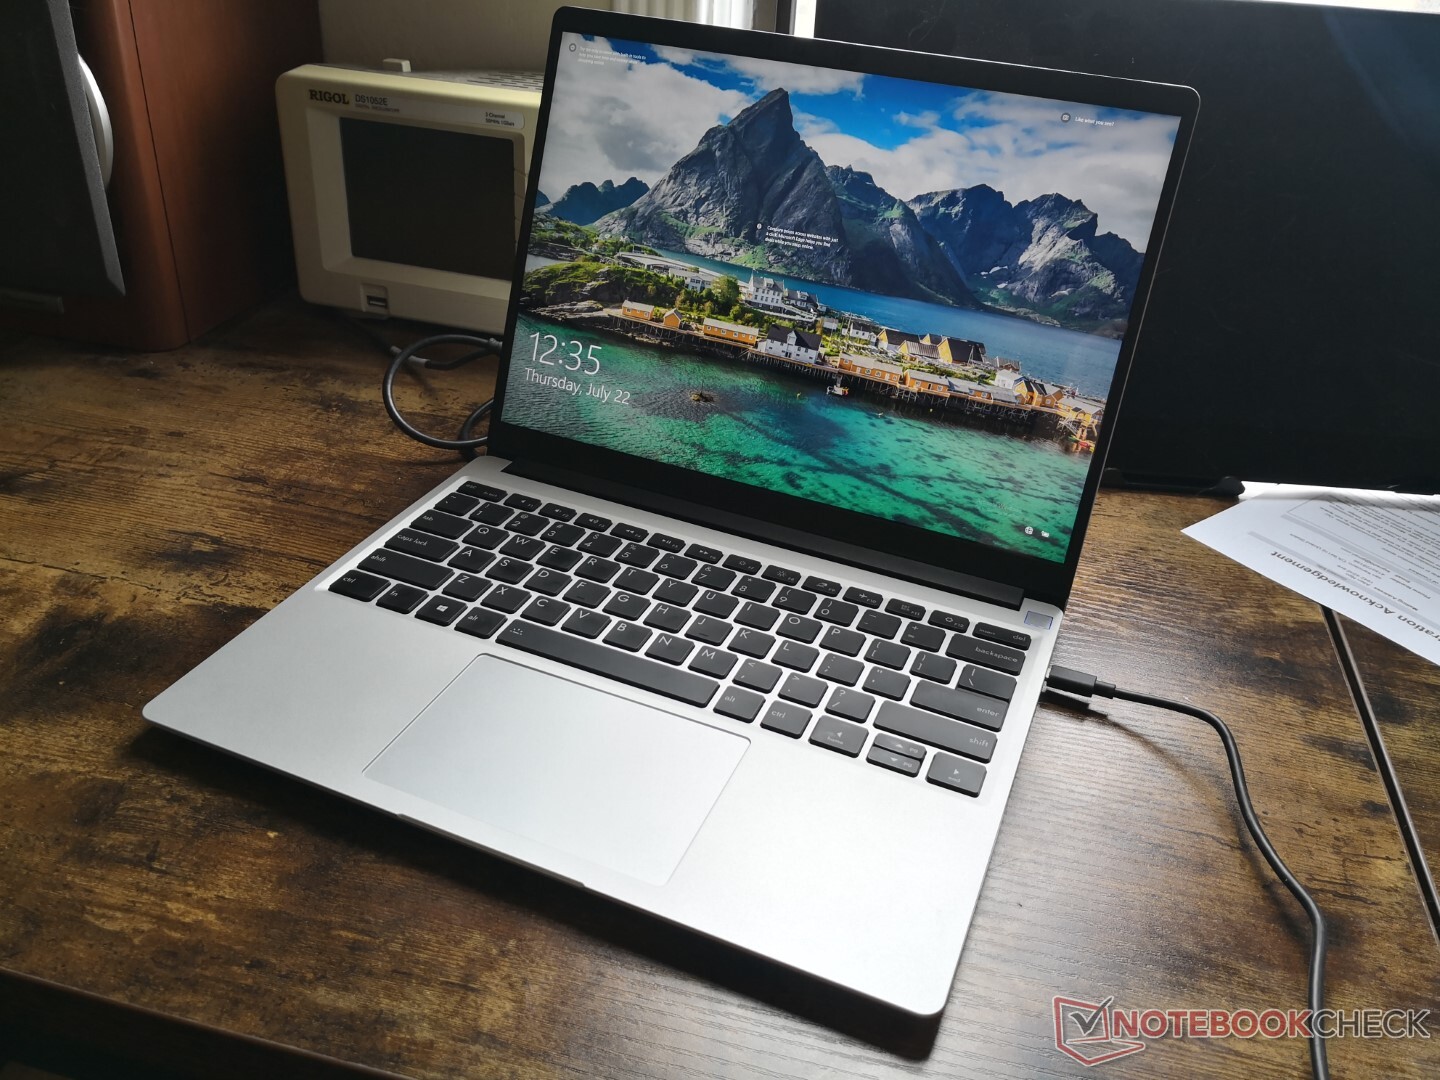
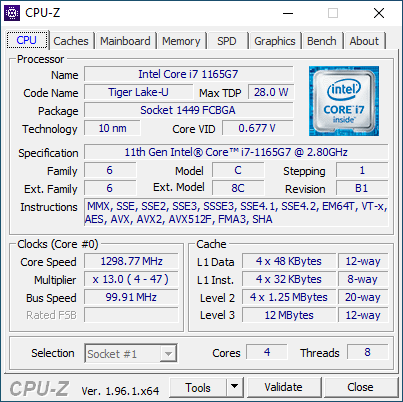
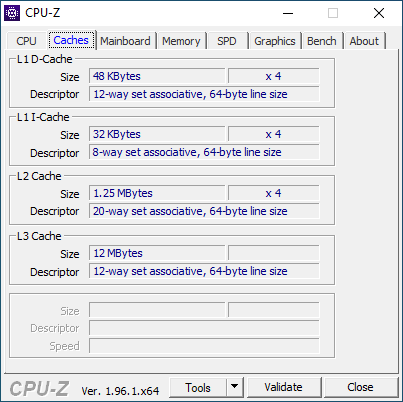
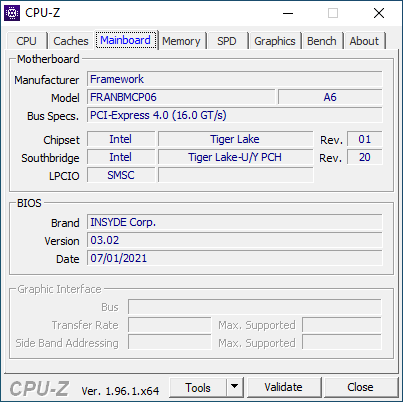
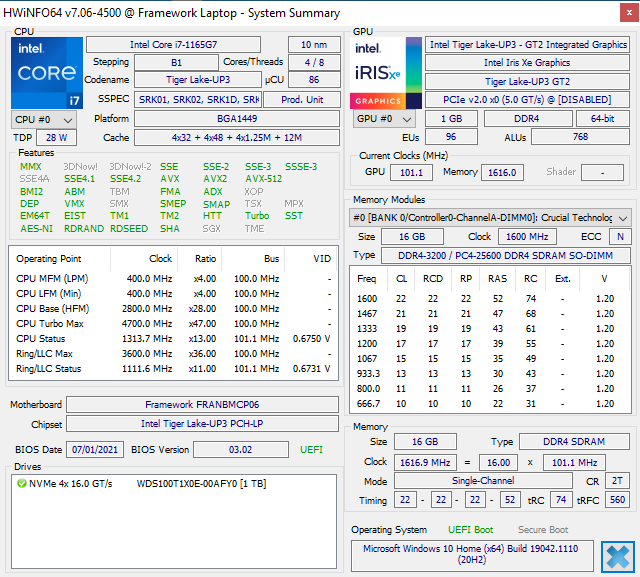
The 13.5-inch Framework Laptop is a 3:2 form factor system in the same vein as the HP Spectre x360 14 or Microsoft Surface Laptop 3. It runs on the same 11th gen Intel Tiger Lake-U platform that powers most of the latest Ultrabooks from more established OEMs. Tiger Lake is also key to many of the customizable features of the Framework Laptop. This review will explore the performance of the Core i7 Framework configuration to see how it compares to the big guns from HP, Lenovo, Microsoft, and others.
potential competitors in comparison
Rating | Date | Model | Weight | Height | Size | Resolution | Price |
|---|---|---|---|---|---|---|---|
| 85.4 % v7 (old) | 07 / 2021 | Framework Laptop 13.5 i7-1165G7, Iris Xe G7 96EUs | 1.3 kg | 15.85 mm | 13.50" | 2256x1504 | |
| 89.5 % v7 (old) | 05 / 2021 | HP Spectre x360 14-ea0378ng i7-1165G7, Iris Xe G7 96EUs | 1.3 kg | 16.9 mm | 13.50" | 3000x2000 | |
| 84.7 % v7 (old) | 05 / 2021 | Microsoft Surface Laptop 4 13 i7 i7-1185G7, Iris Xe G7 96EUs | 1.3 kg | 14.5 mm | 13.50" | 2256x1504 | |
| 87.3 % v7 (old) | 04 / 2021 | Lenovo ThinkPad X1 Titanium Yoga G1 20QA001RGE i7-1160G7, Iris Xe G7 96EUs | 1.2 kg | 11.5 mm | 13.50" | 2256x1504 | |
| 85.7 % v7 (old) | 08 / 2021 | HP ProBook x360 435 G8 R7-5800U R7 5800U, Vega 8 | 1.5 kg | 18 mm | 13.30" | 1920x1080 | |
| 84.7 % v7 (old) | 07 / 2021 | Lenovo Yoga 6 13 82ND0009US R5 5500U, Vega 7 | 1.3 kg | 18.2 mm | 13.30" | 1920x1080 |
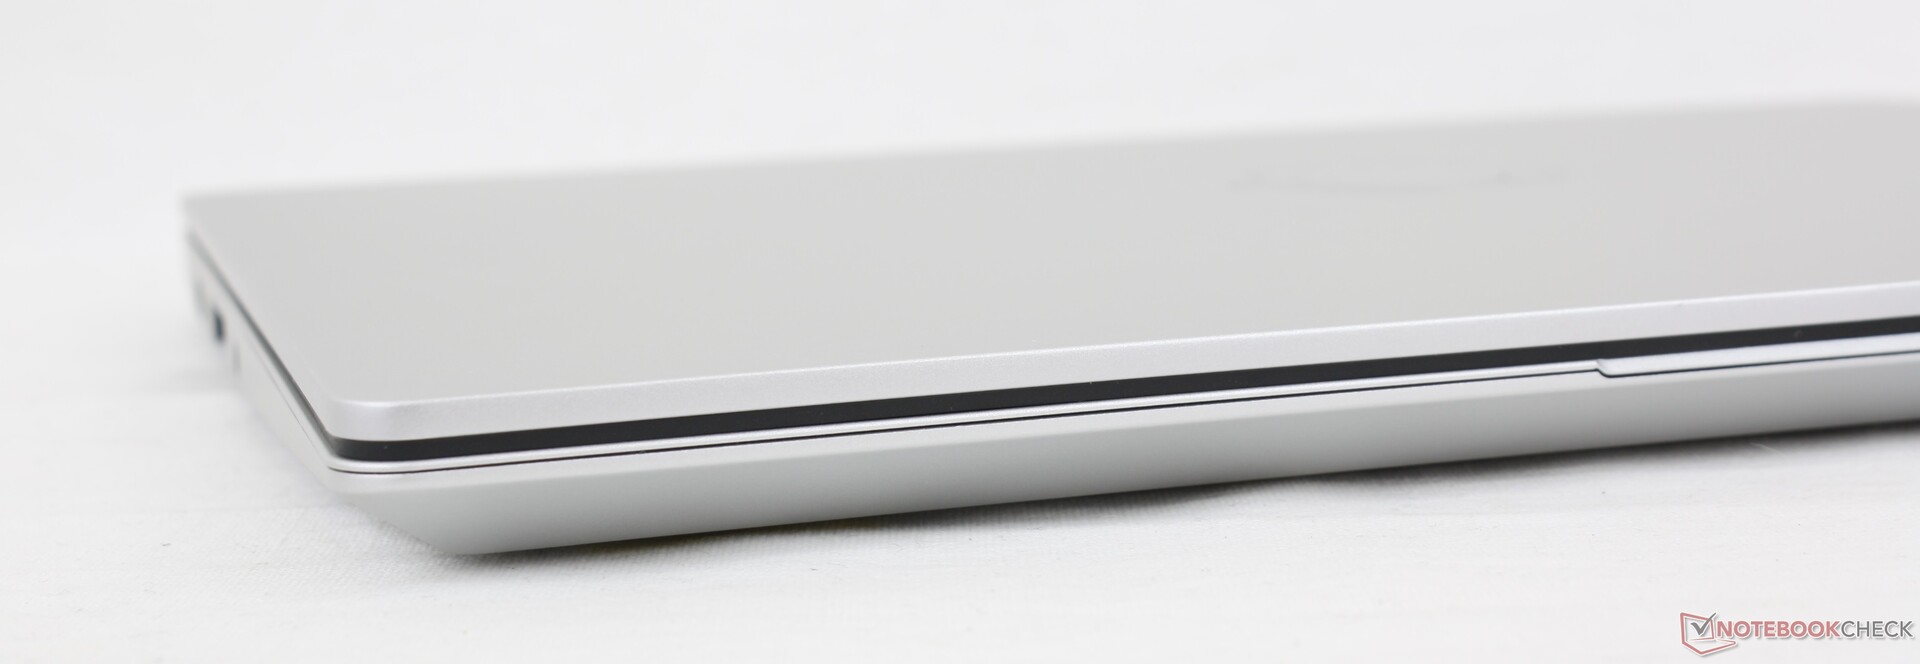
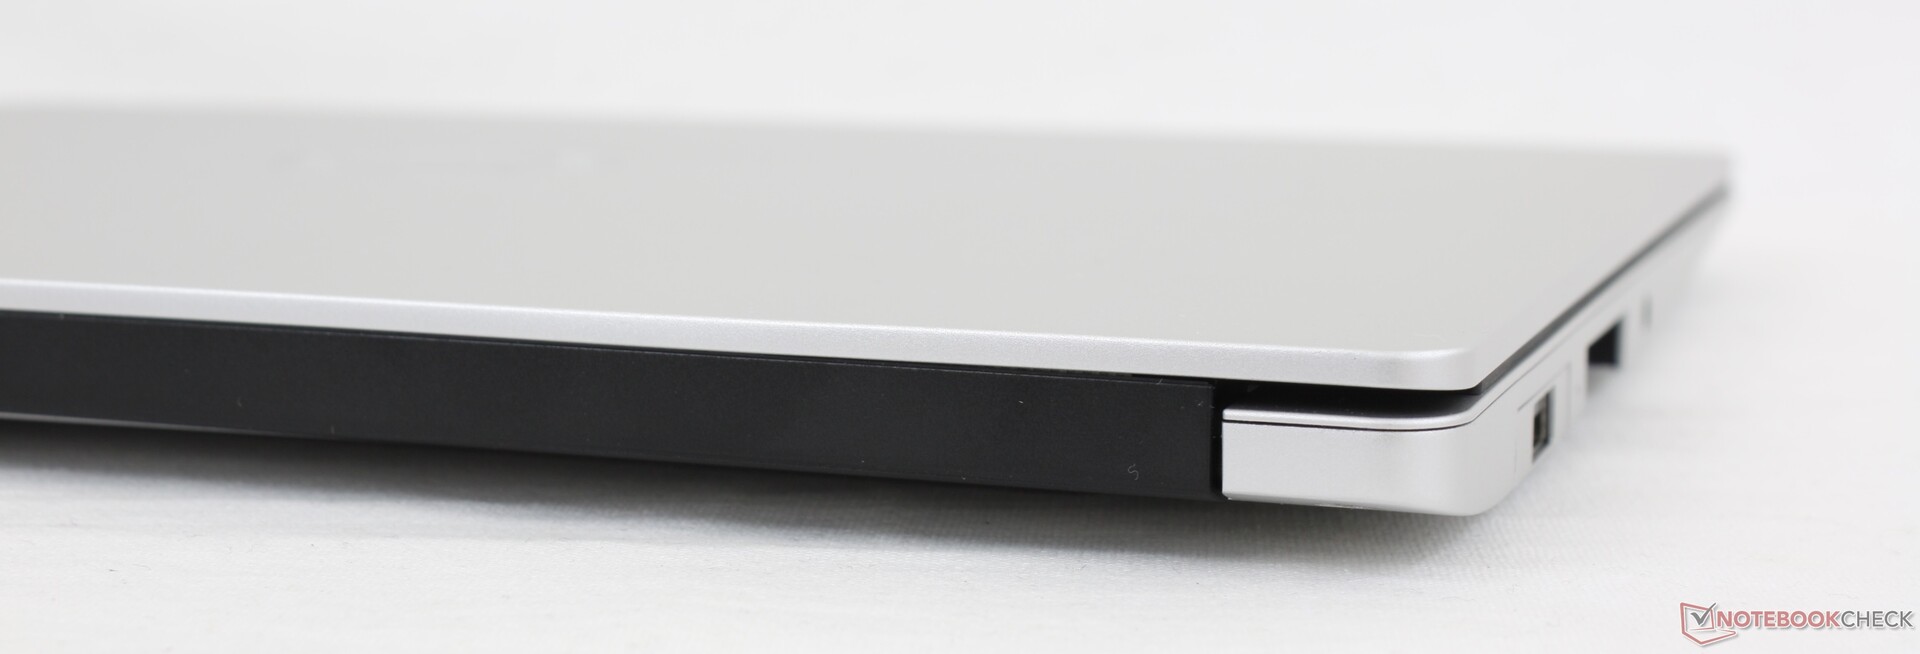
Case
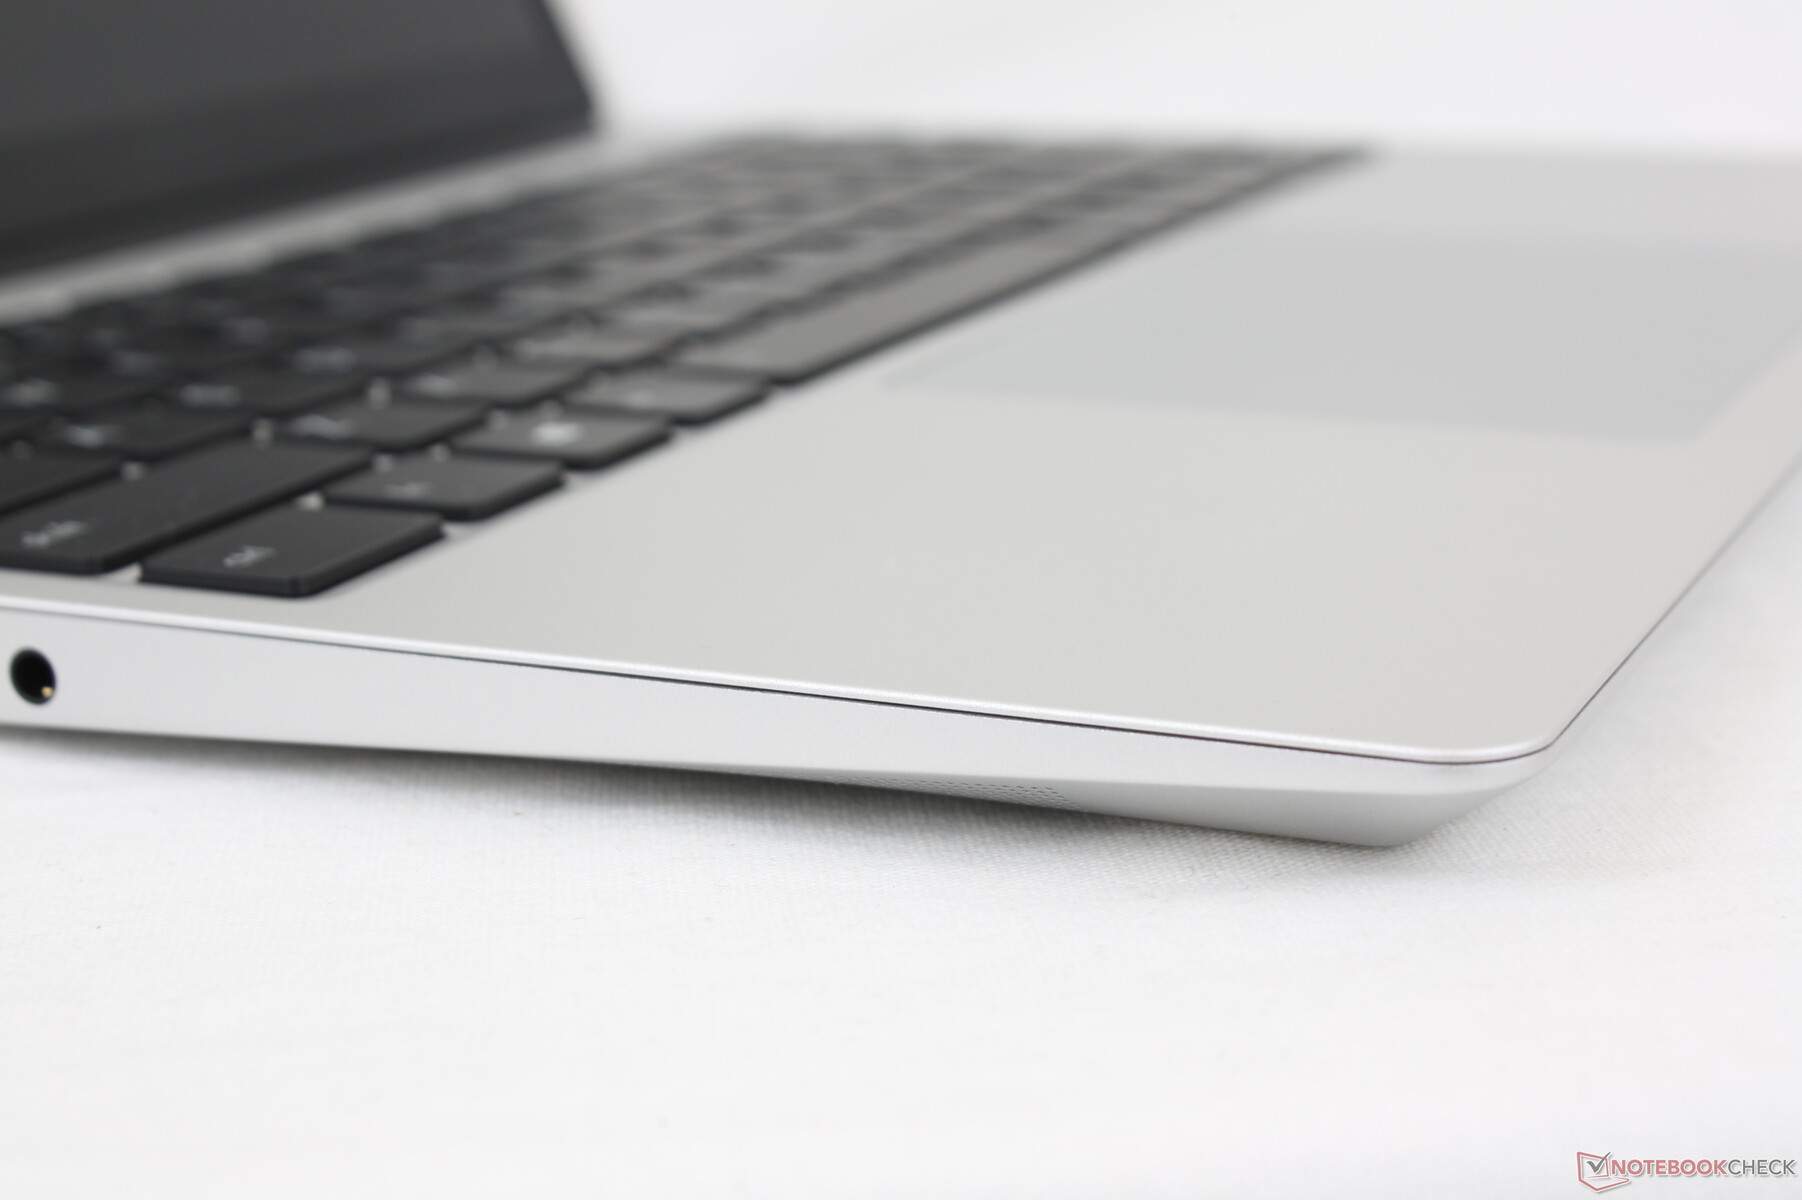
It's clear that the makers of the Framework Laptop took inspiration from the Apple MacBook when it came to the design of the chassis. Chassis rigidity, however, isn't nearly as solid on the Framework system. The display flexes very easily and the hinges could have been tauter to reduce teetering. Chassis size and weight are otherwise comparable to the 13.5-inch ThinkPad X1 Titanium Yoga G1 or slightly smaller than the Acer Swift 3 SF313.

Connectivity
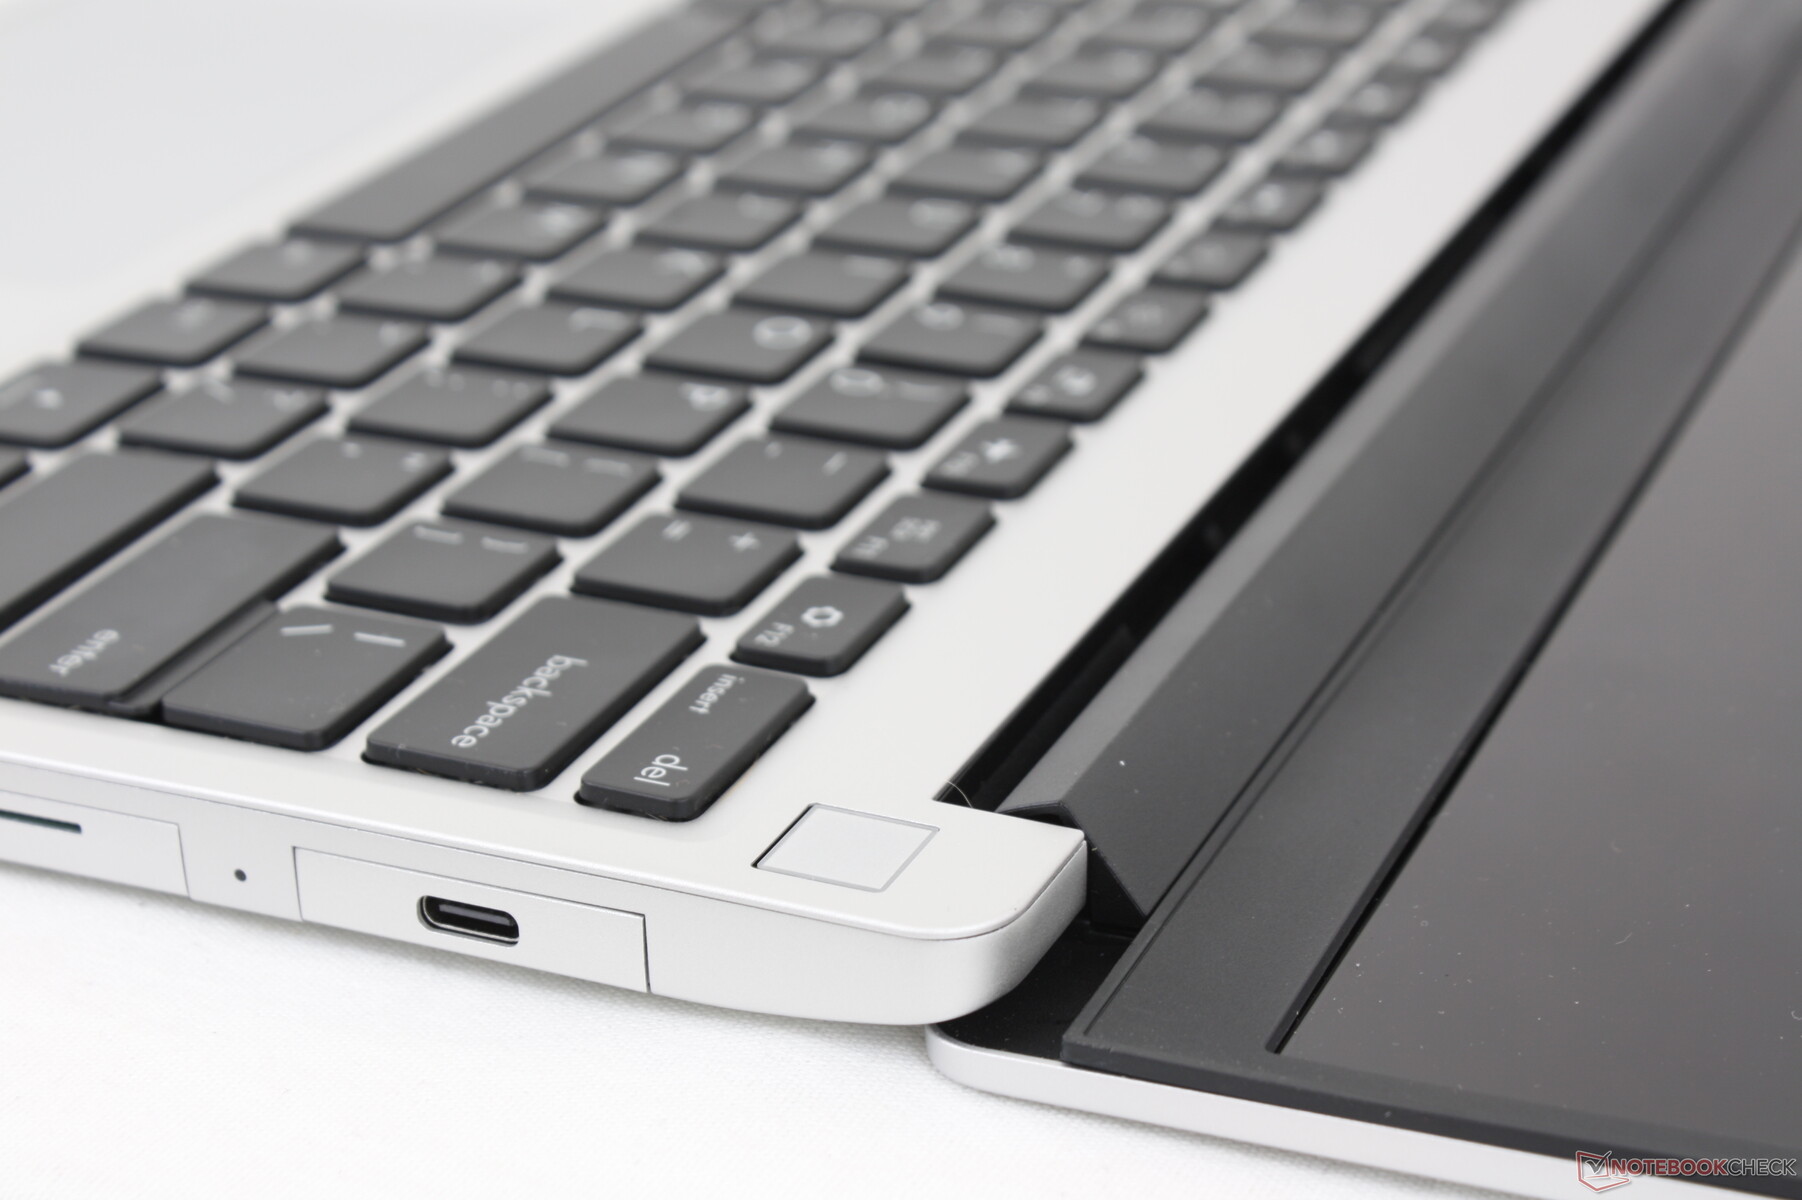
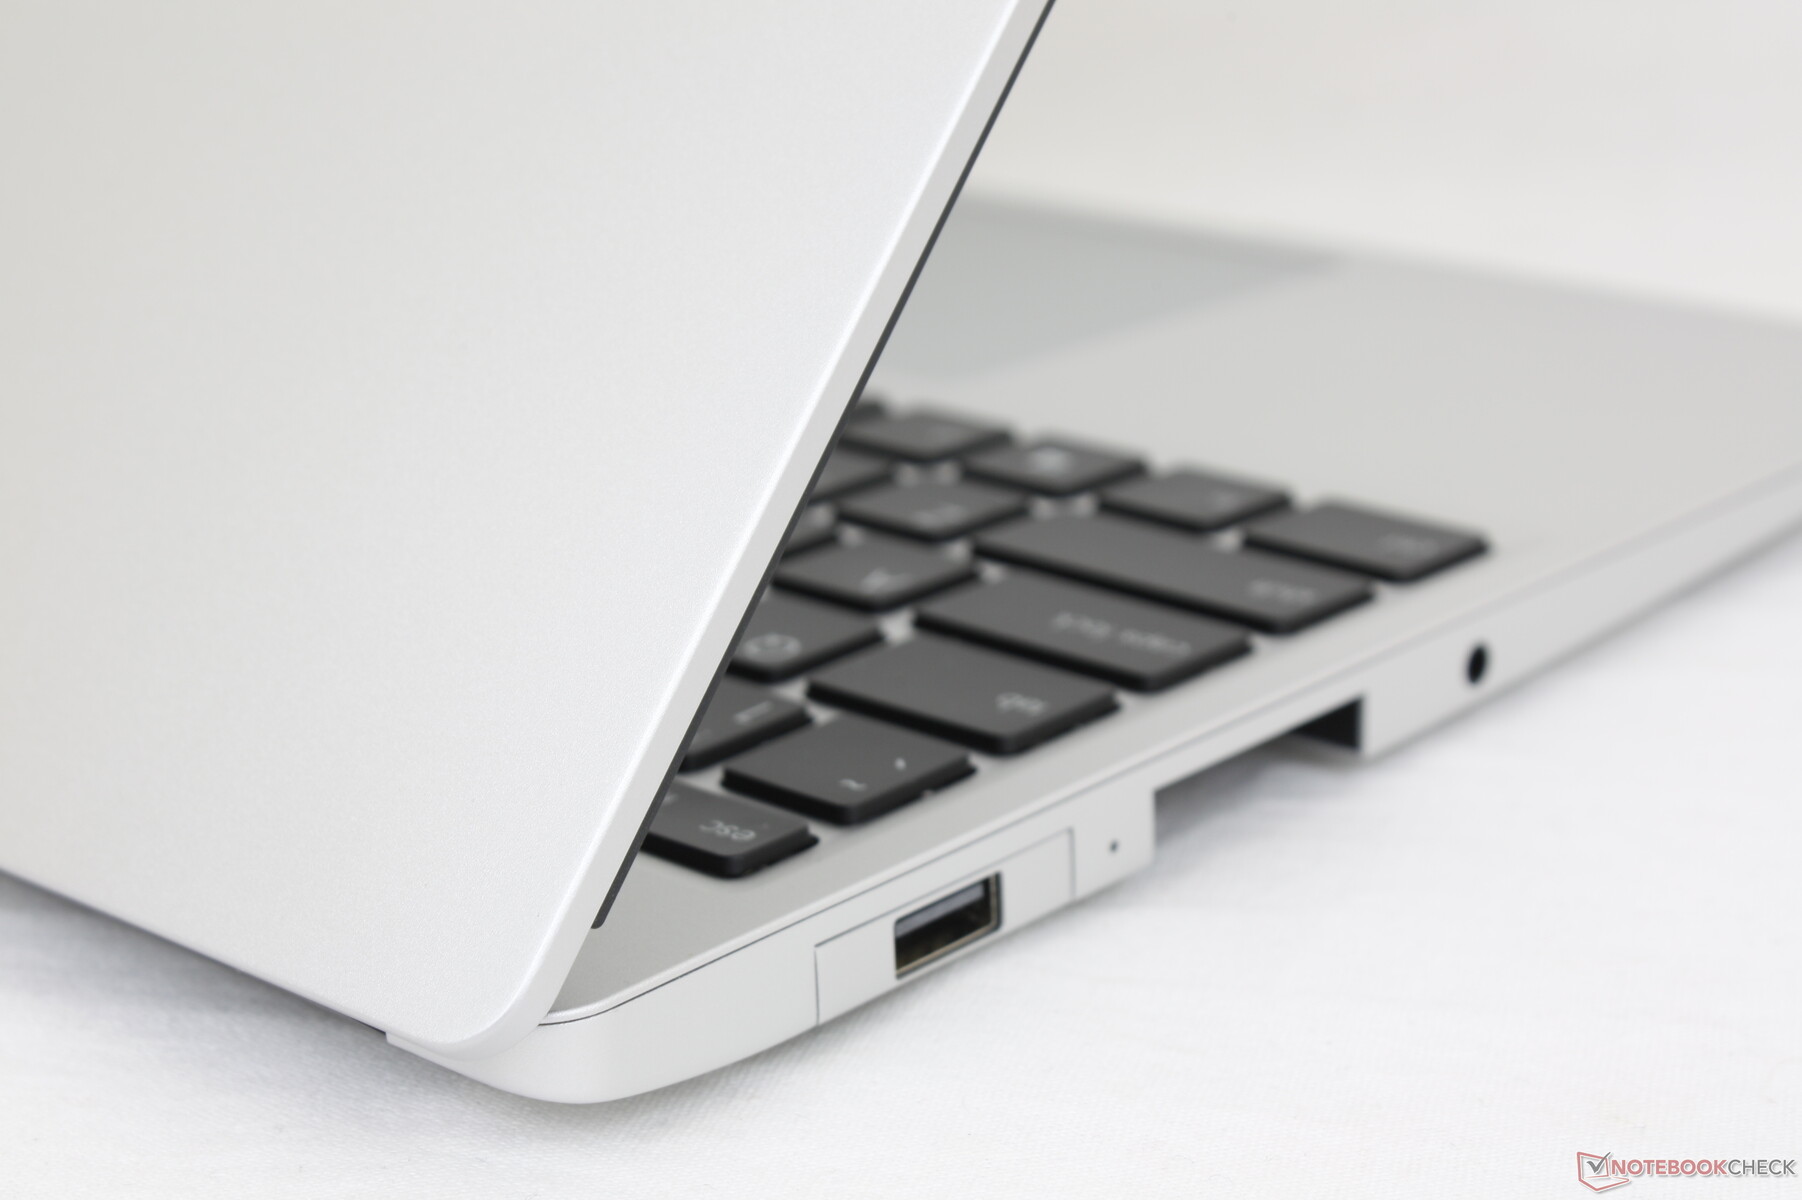
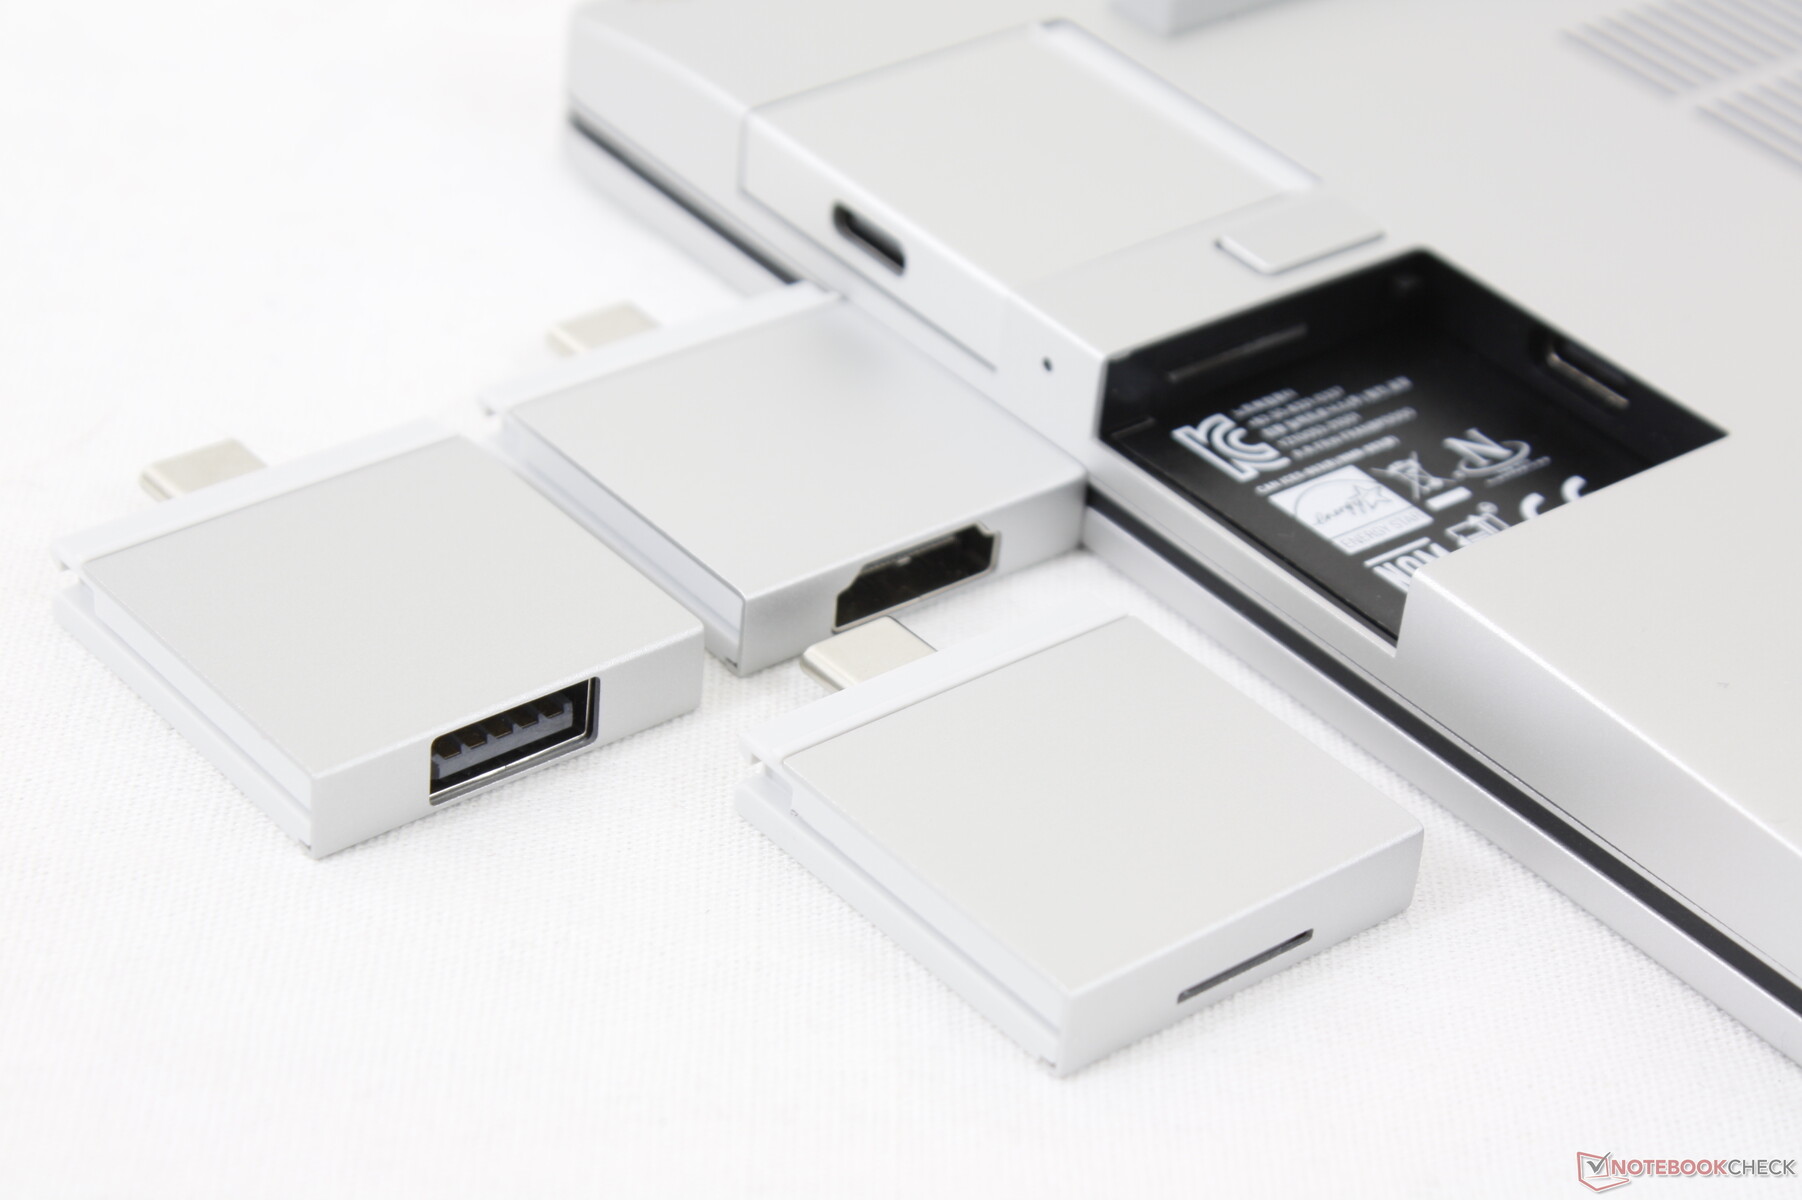
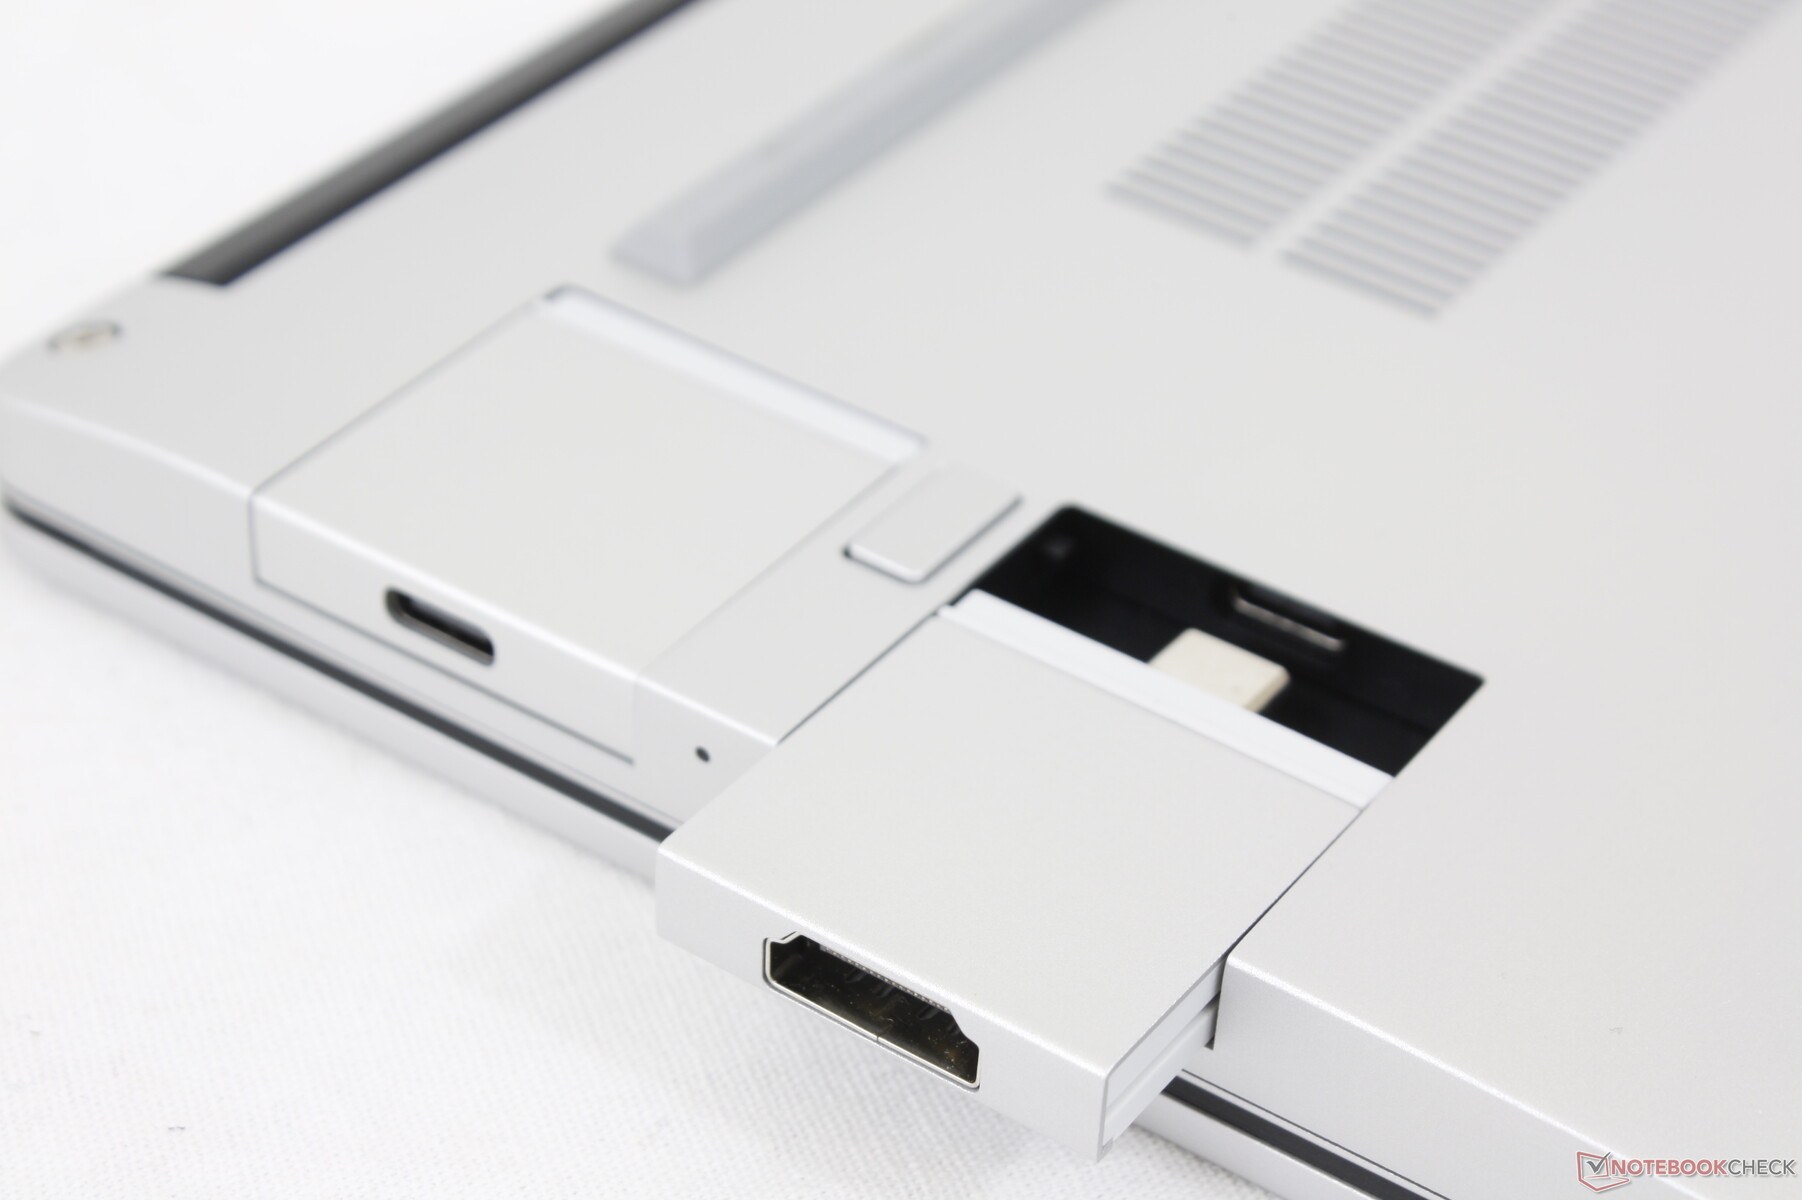
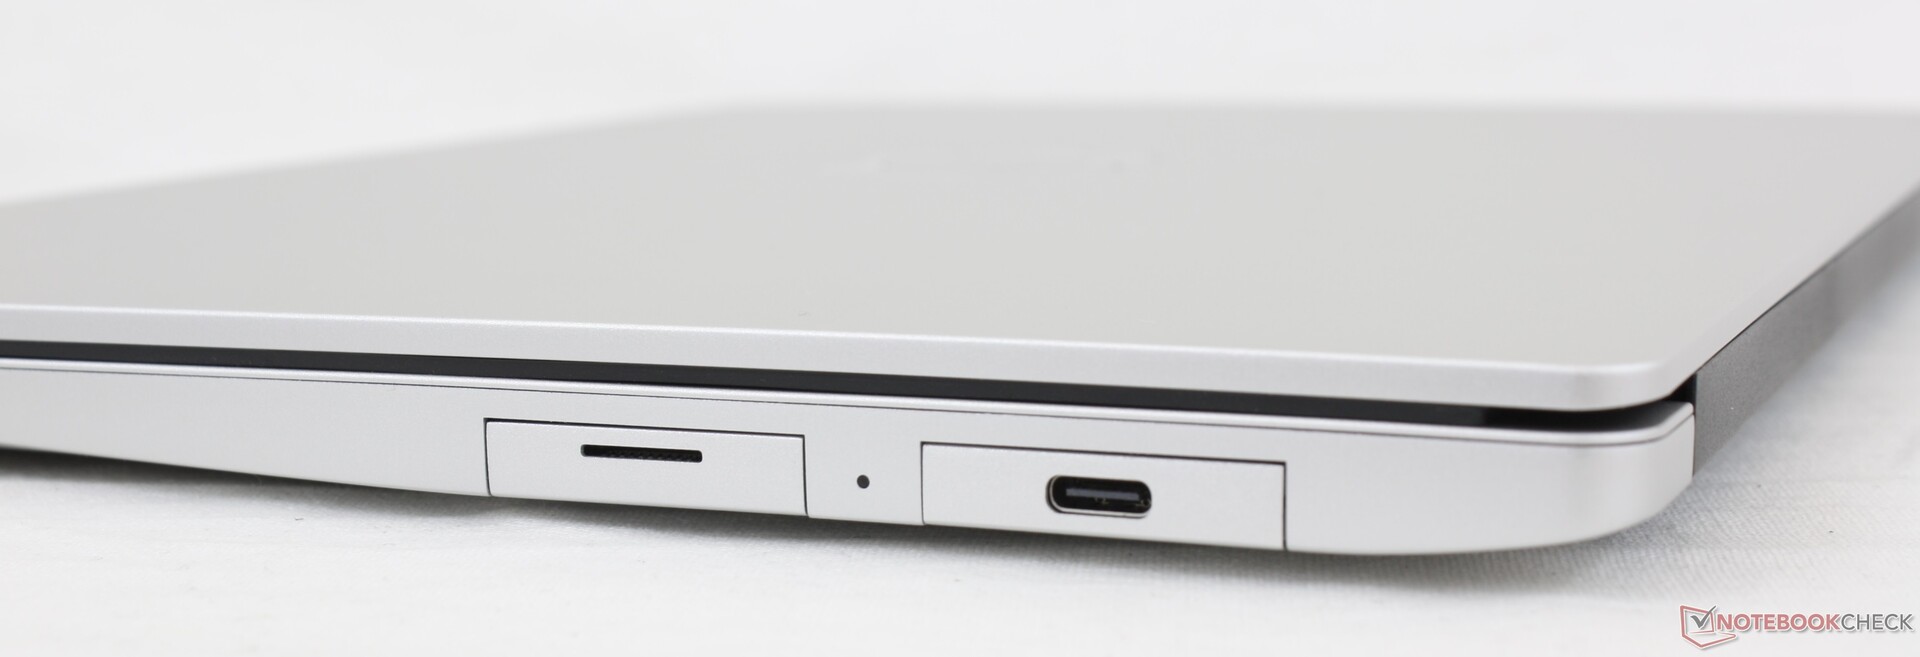
The Framework system features four identical USB-C ports evenly distributed along the left and right edges. All ports support USB 4 speeds and are technically compatible with Thunderbolt devices including our Aorus Gaming Box. As of this writing, however, the manufacturer officially supports USB devices only.
The four USB-C ports are recessed onto the chassis to allow for expansion card adapters. The physical adapters themselves are proprietary, but the ports and connectors are not. Users are then free to mix and match different expansion card adapters to turn the 4x USB-C ports into MicroSD, USB-A, HDMI, DisplayPort, or some combination thereof.
The recessed USB-C ports will behave like any USB-C port with both Power Delivery and DisplayPort if no adapters are connected at all.
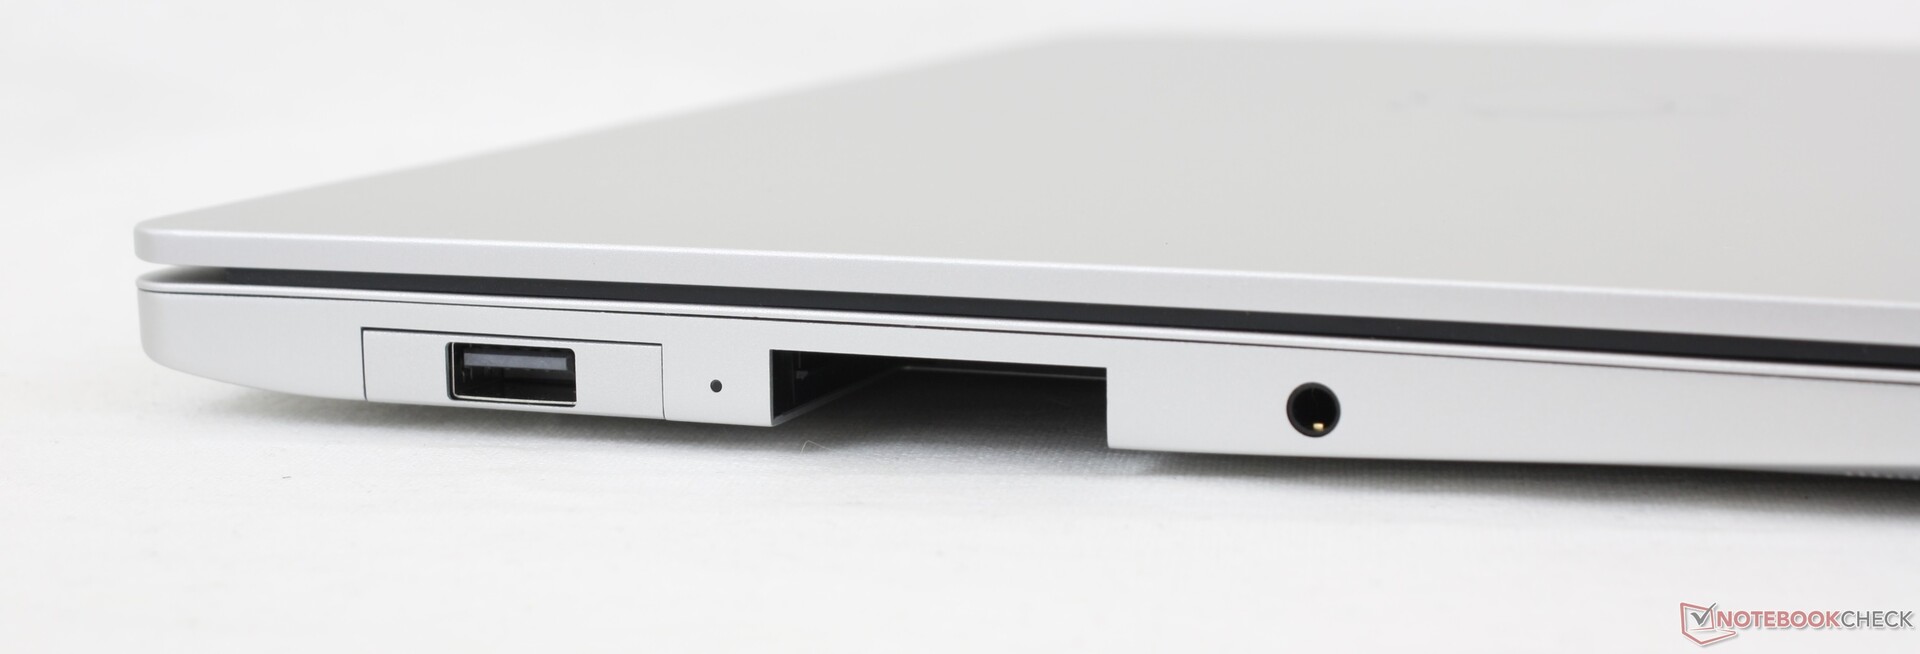
SD Card Reader
The MicroSD reader expansion card is a pain to use. The MicroSD slot is not spring loaded and so cards are difficult to insert and remove. It feels like our card is on the verge of breaking every time we use it here.
Transfer rates are decent but unimpressive. Moving 1 GB of pictures from our UHS-II test card takes about 14 seconds compared to less than half that on the Dell XPS 13.
| SD Card Reader | |
| average JPG Copy Test (av. of 3 runs) | |
| HP Spectre x360 14-ea0378ng (Toshiba Exceria Pro M501 microSDXC 64GB) | |
| Framework Laptop 13.5 (AV Pro UHS-II V60) | |
| HP ProBook x360 435 G8 R7-5800U (AV Pro UHS-II V60) | |
| maximum AS SSD Seq Read Test (1GB) | |
| HP Spectre x360 14-ea0378ng (Toshiba Exceria Pro M501 microSDXC 64GB) | |
| Framework Laptop 13.5 (AV Pro UHS-II V60) | |
| HP ProBook x360 435 G8 R7-5800U (AV Pro UHS-II V60) | |
Communication
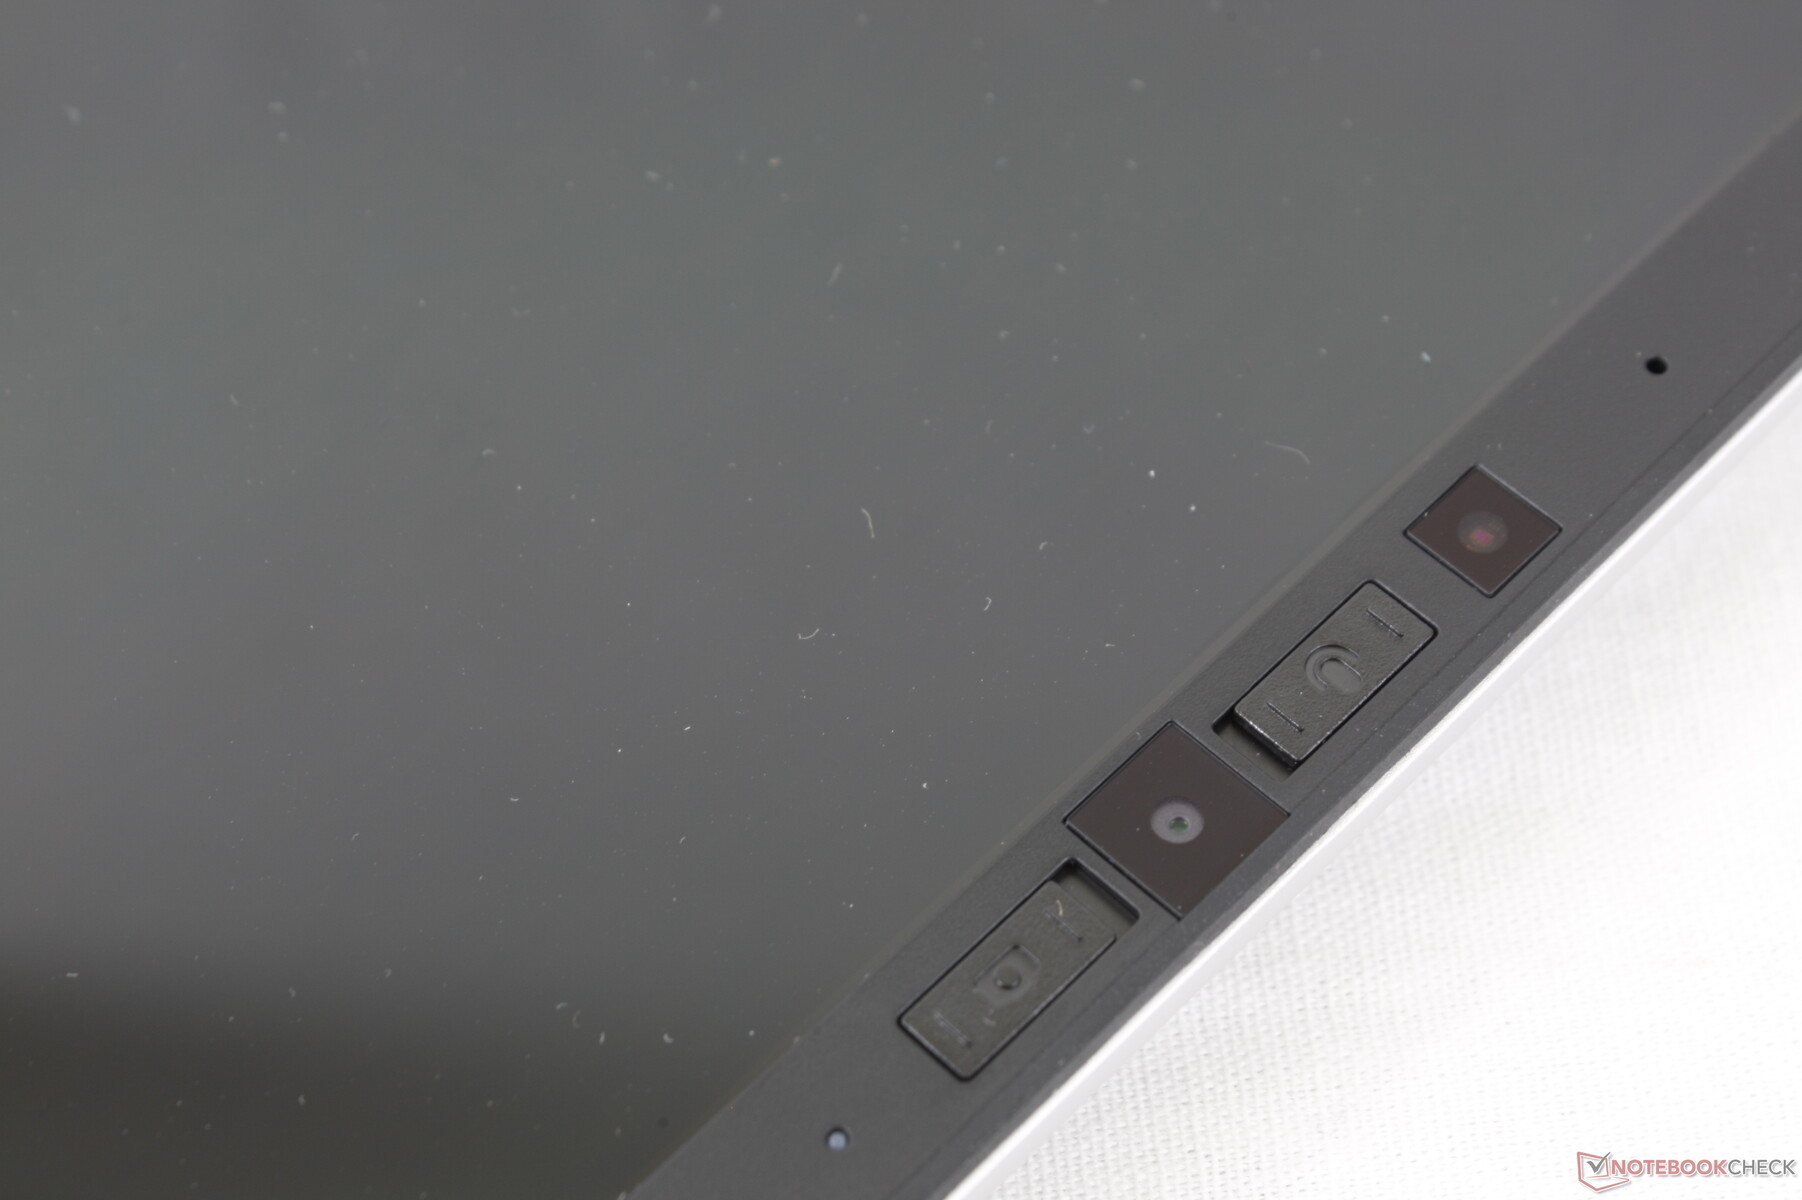
Webcam


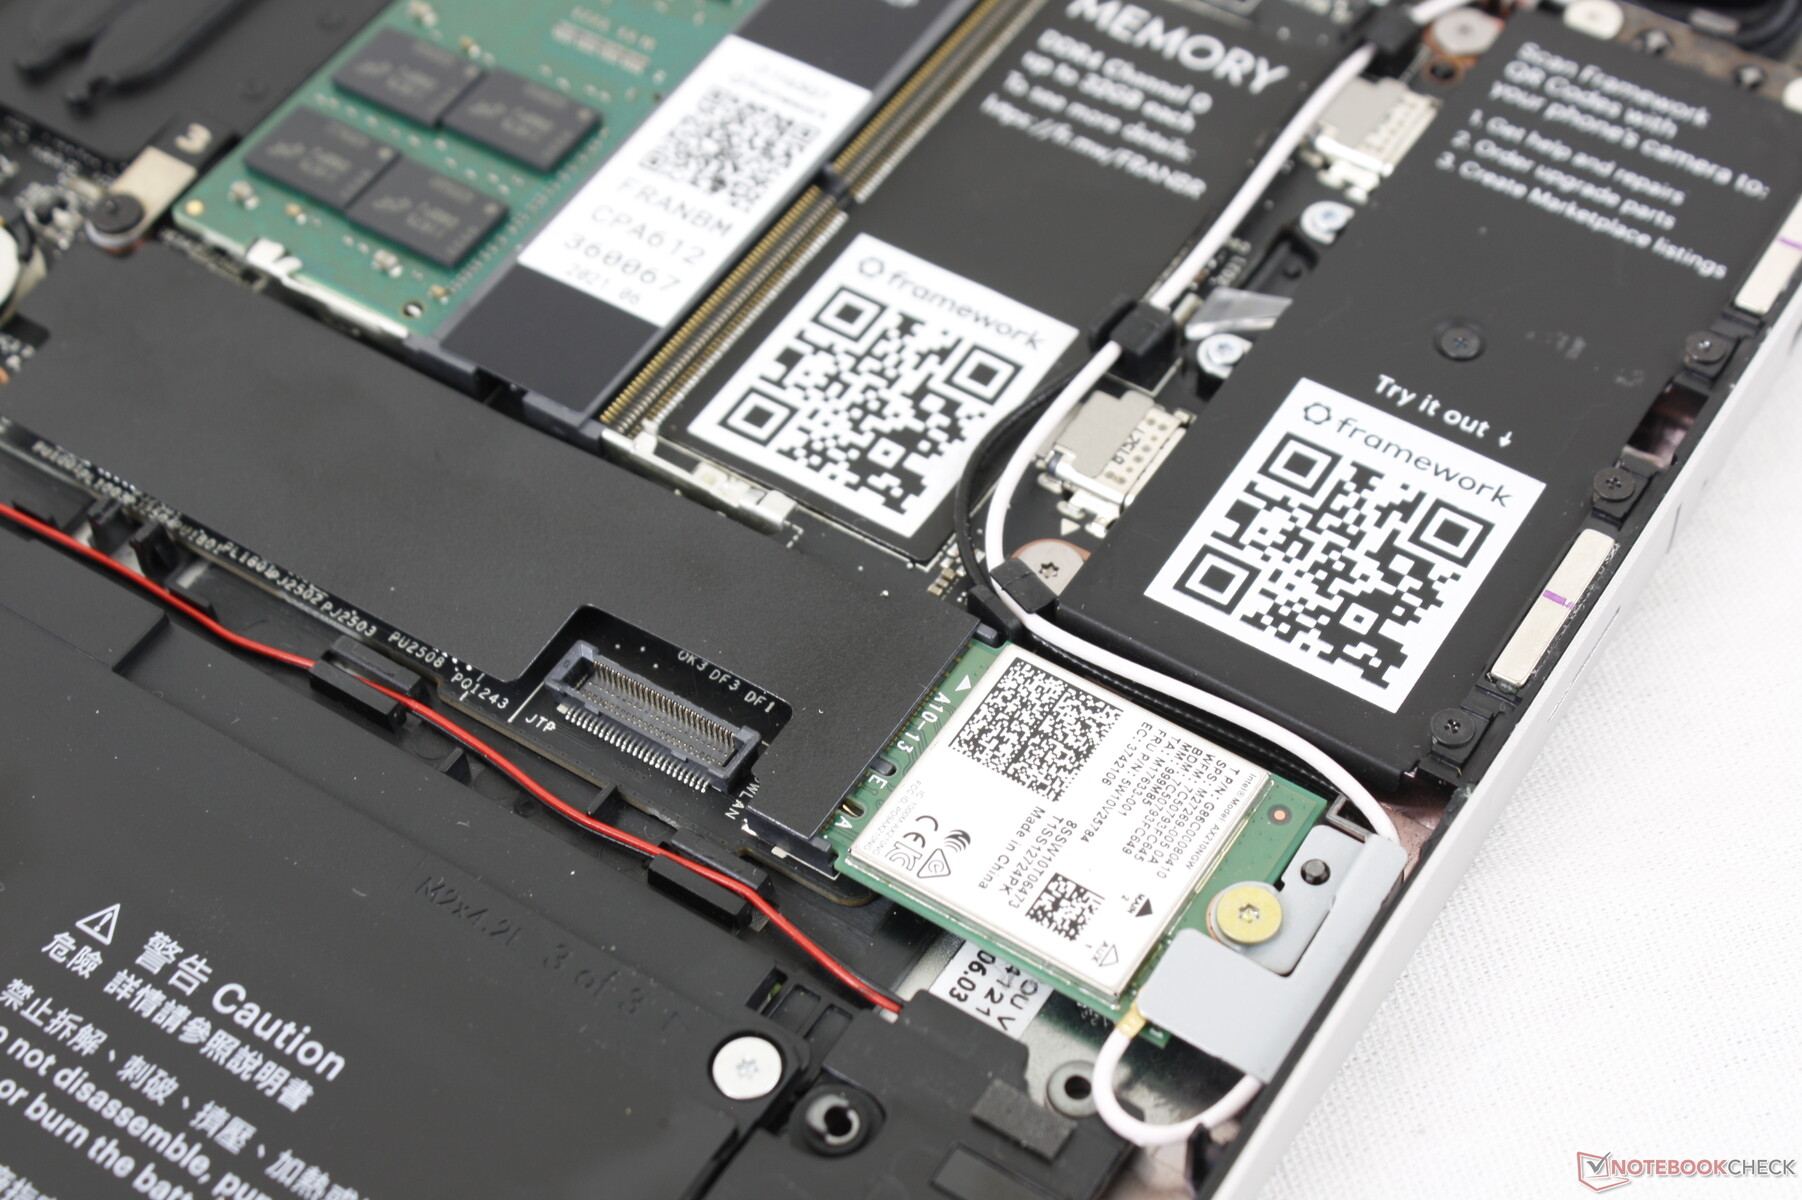
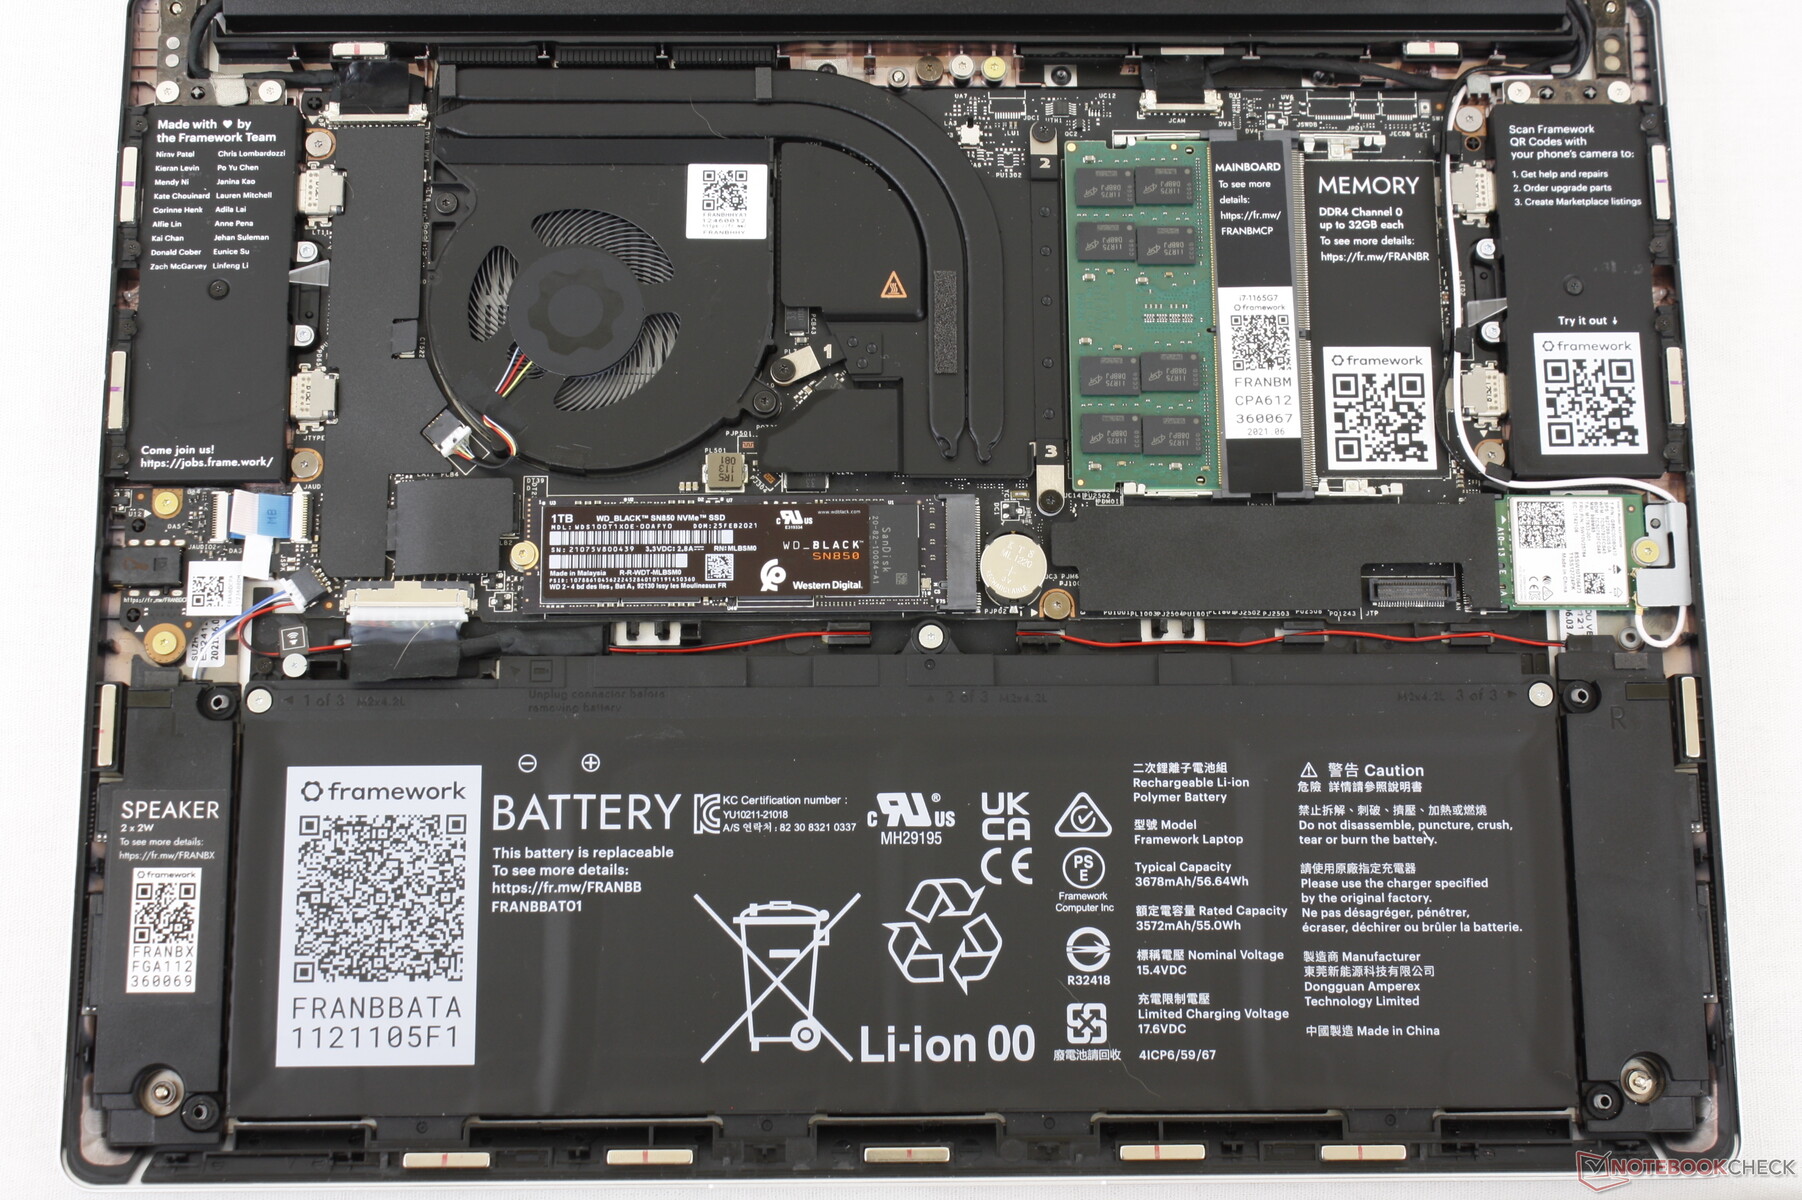
Maintenance
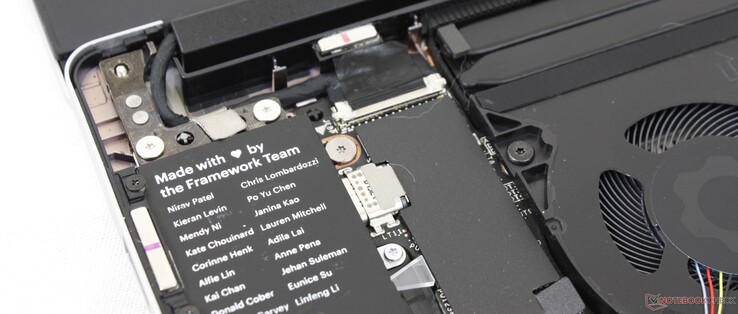
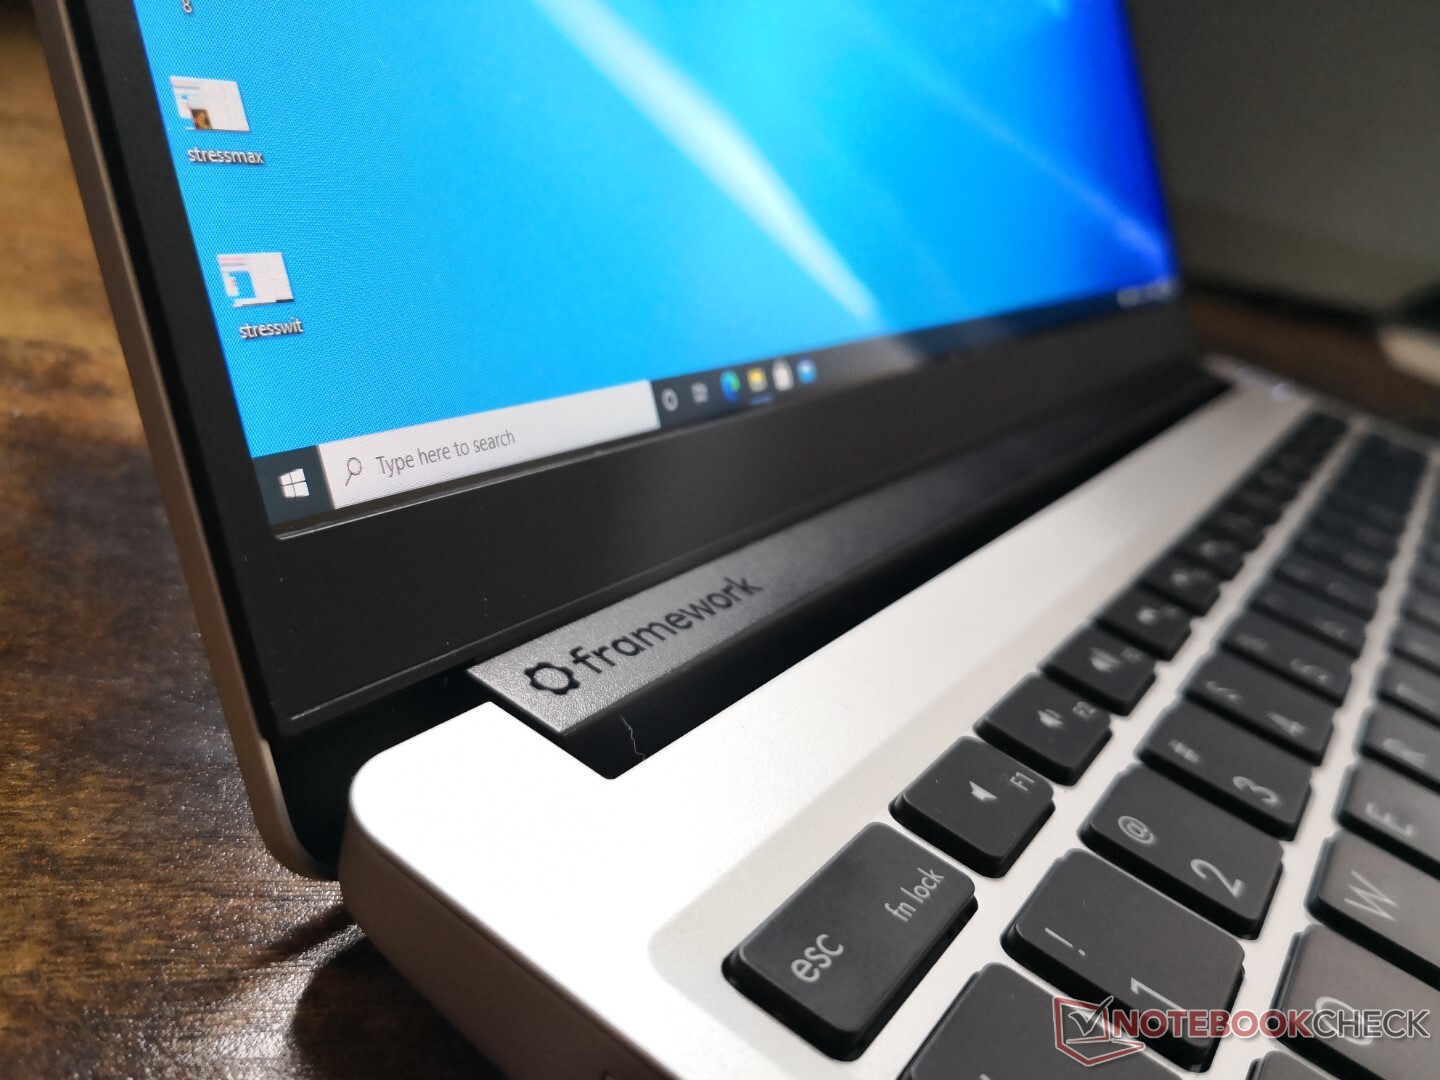
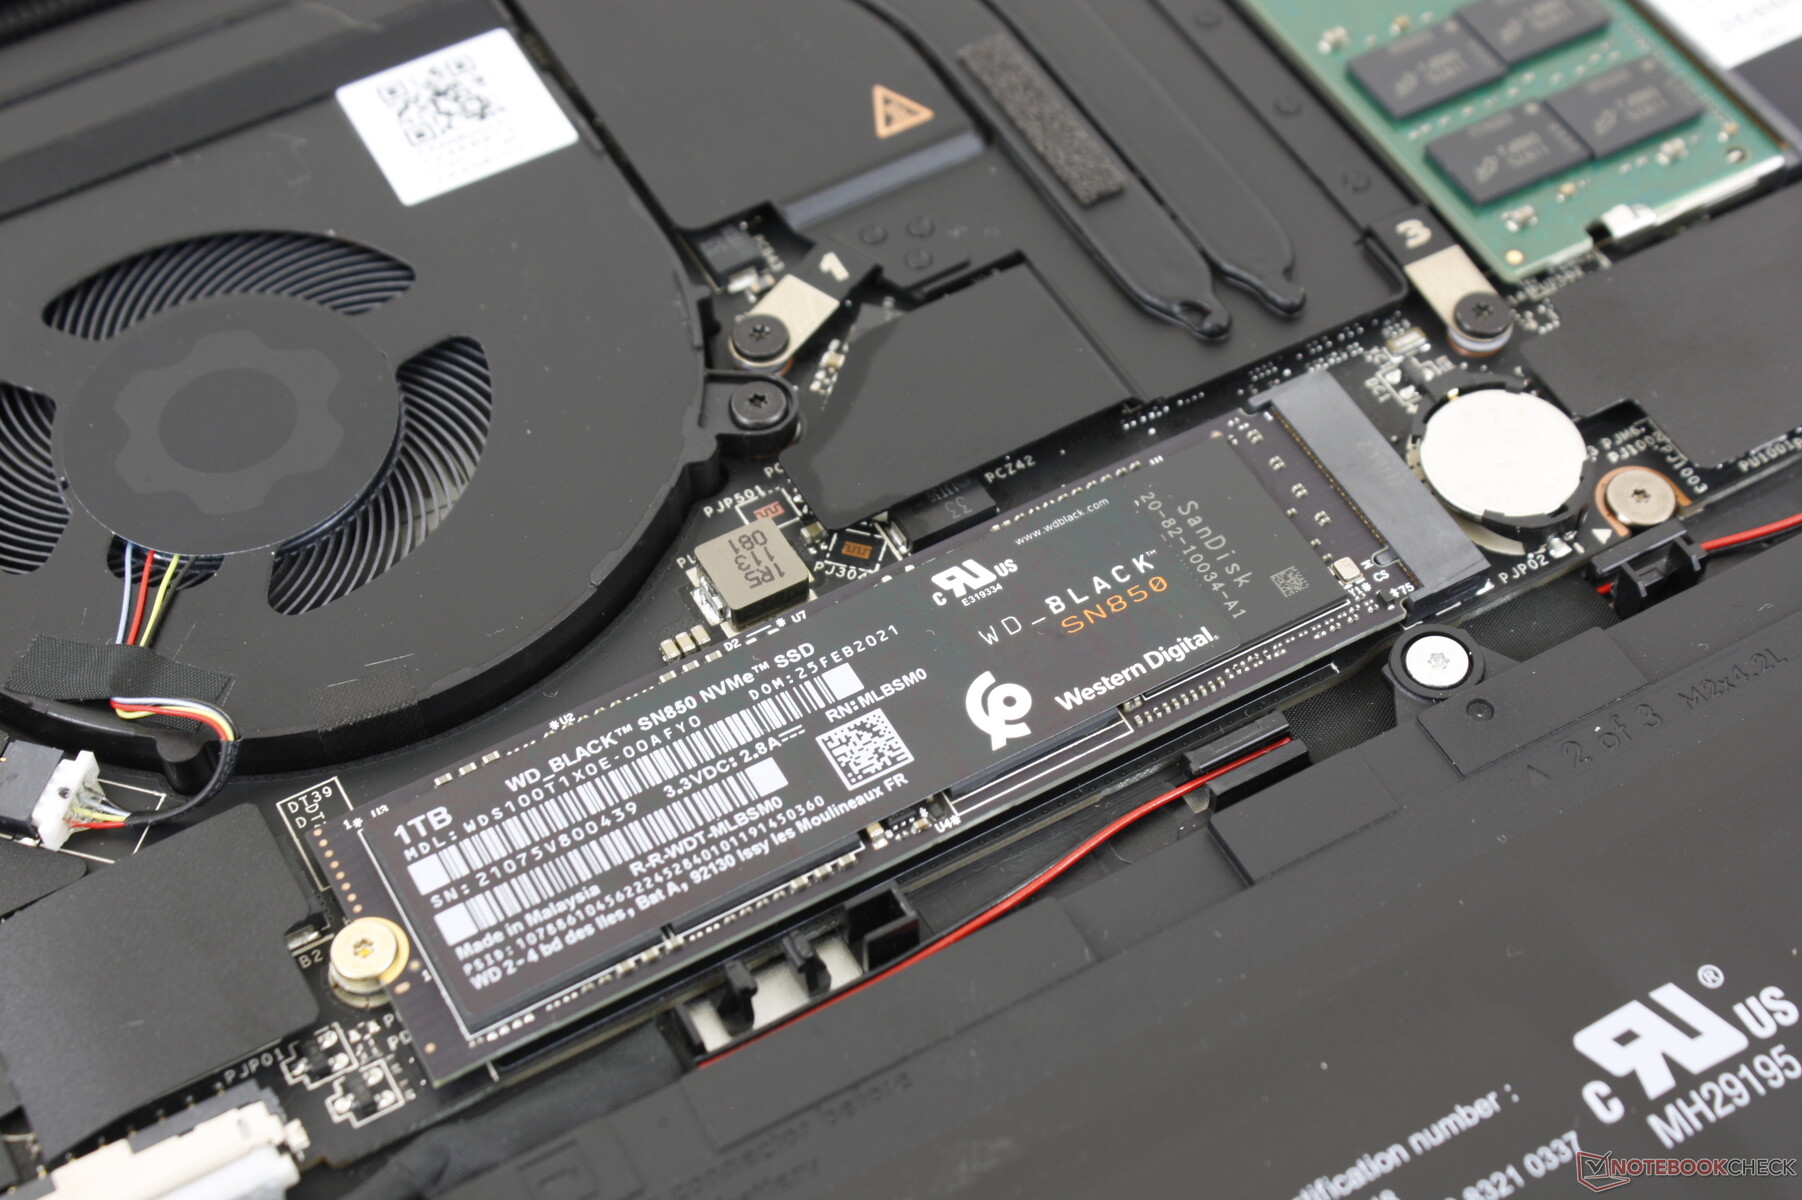
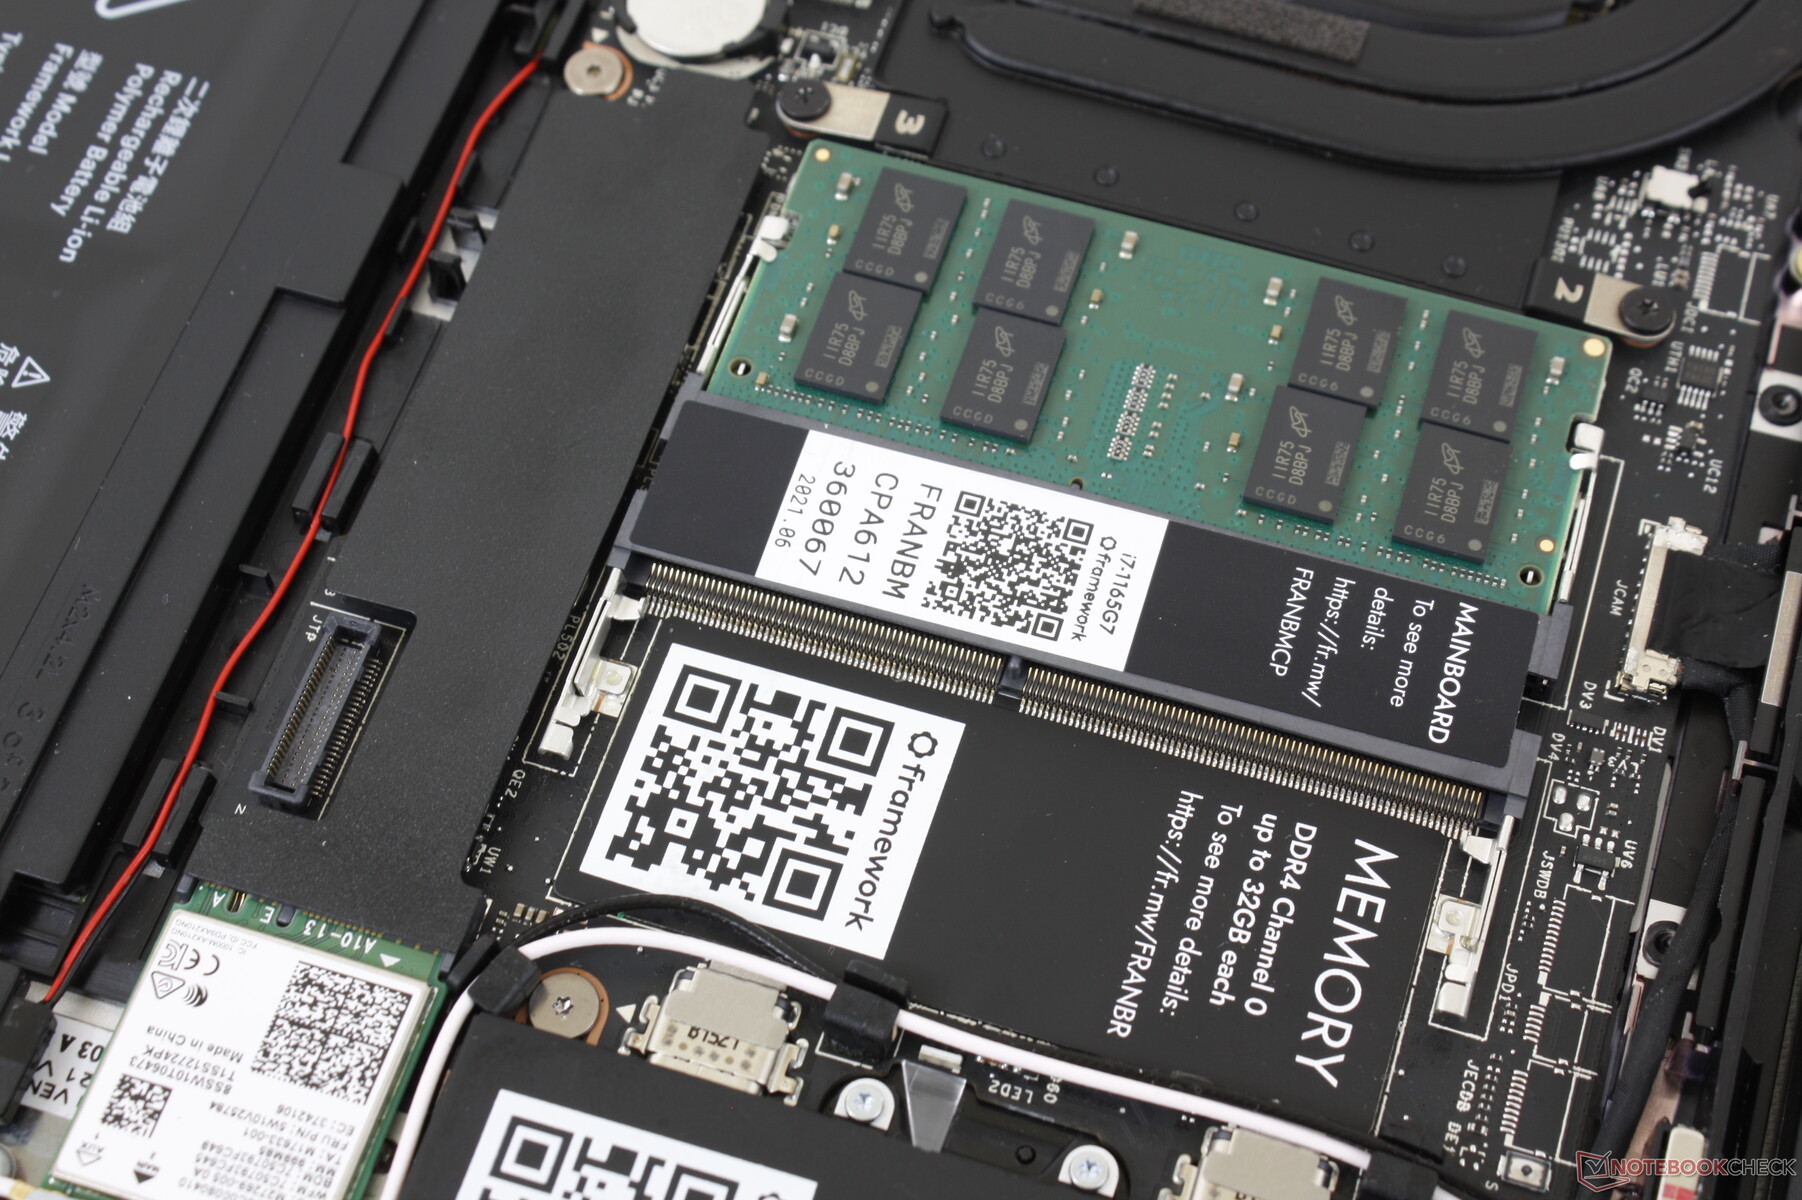
The motherboard is upside-down unlike on most other laptops. Consequently, users must remove the keyboard deck instead of the bottom panel for any upgrades. The process is fortunately quite easy so long as users have a T5 Torx wrench.
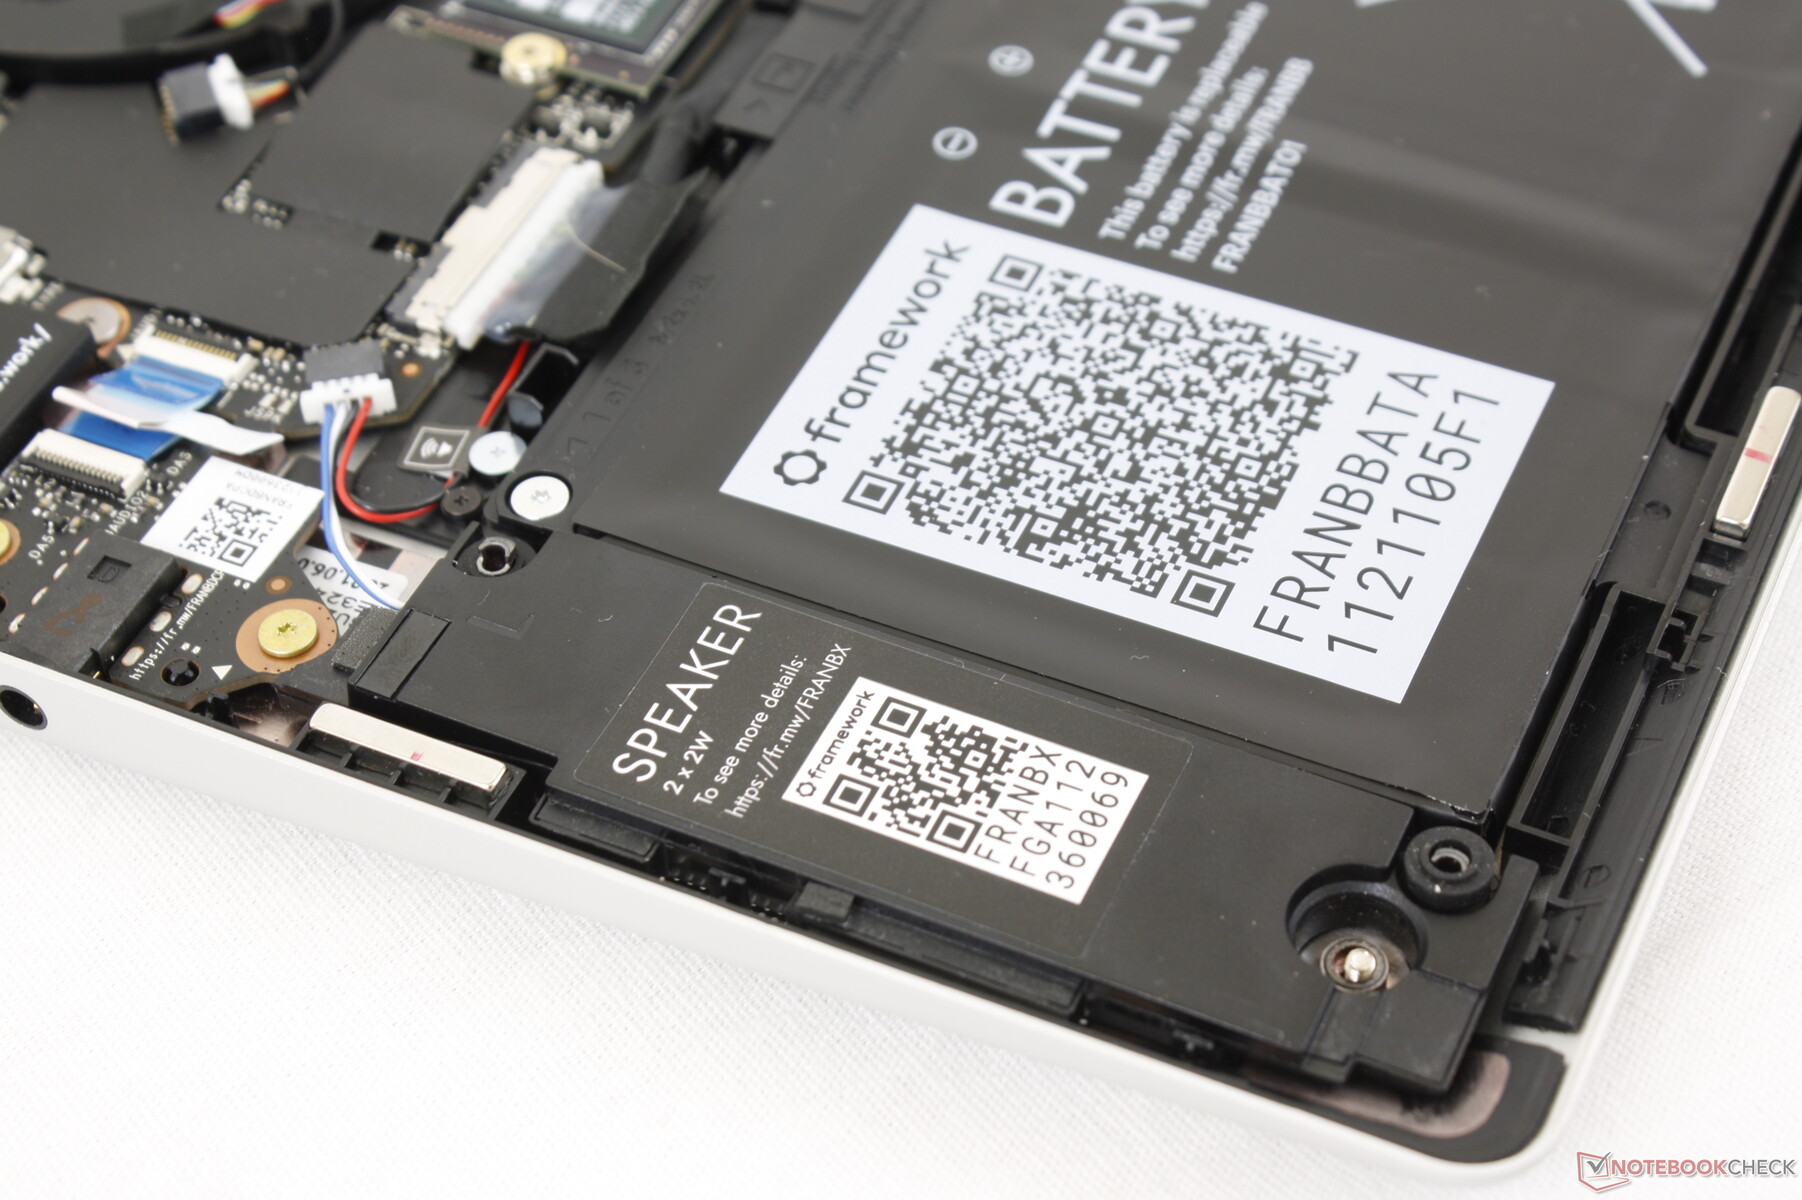
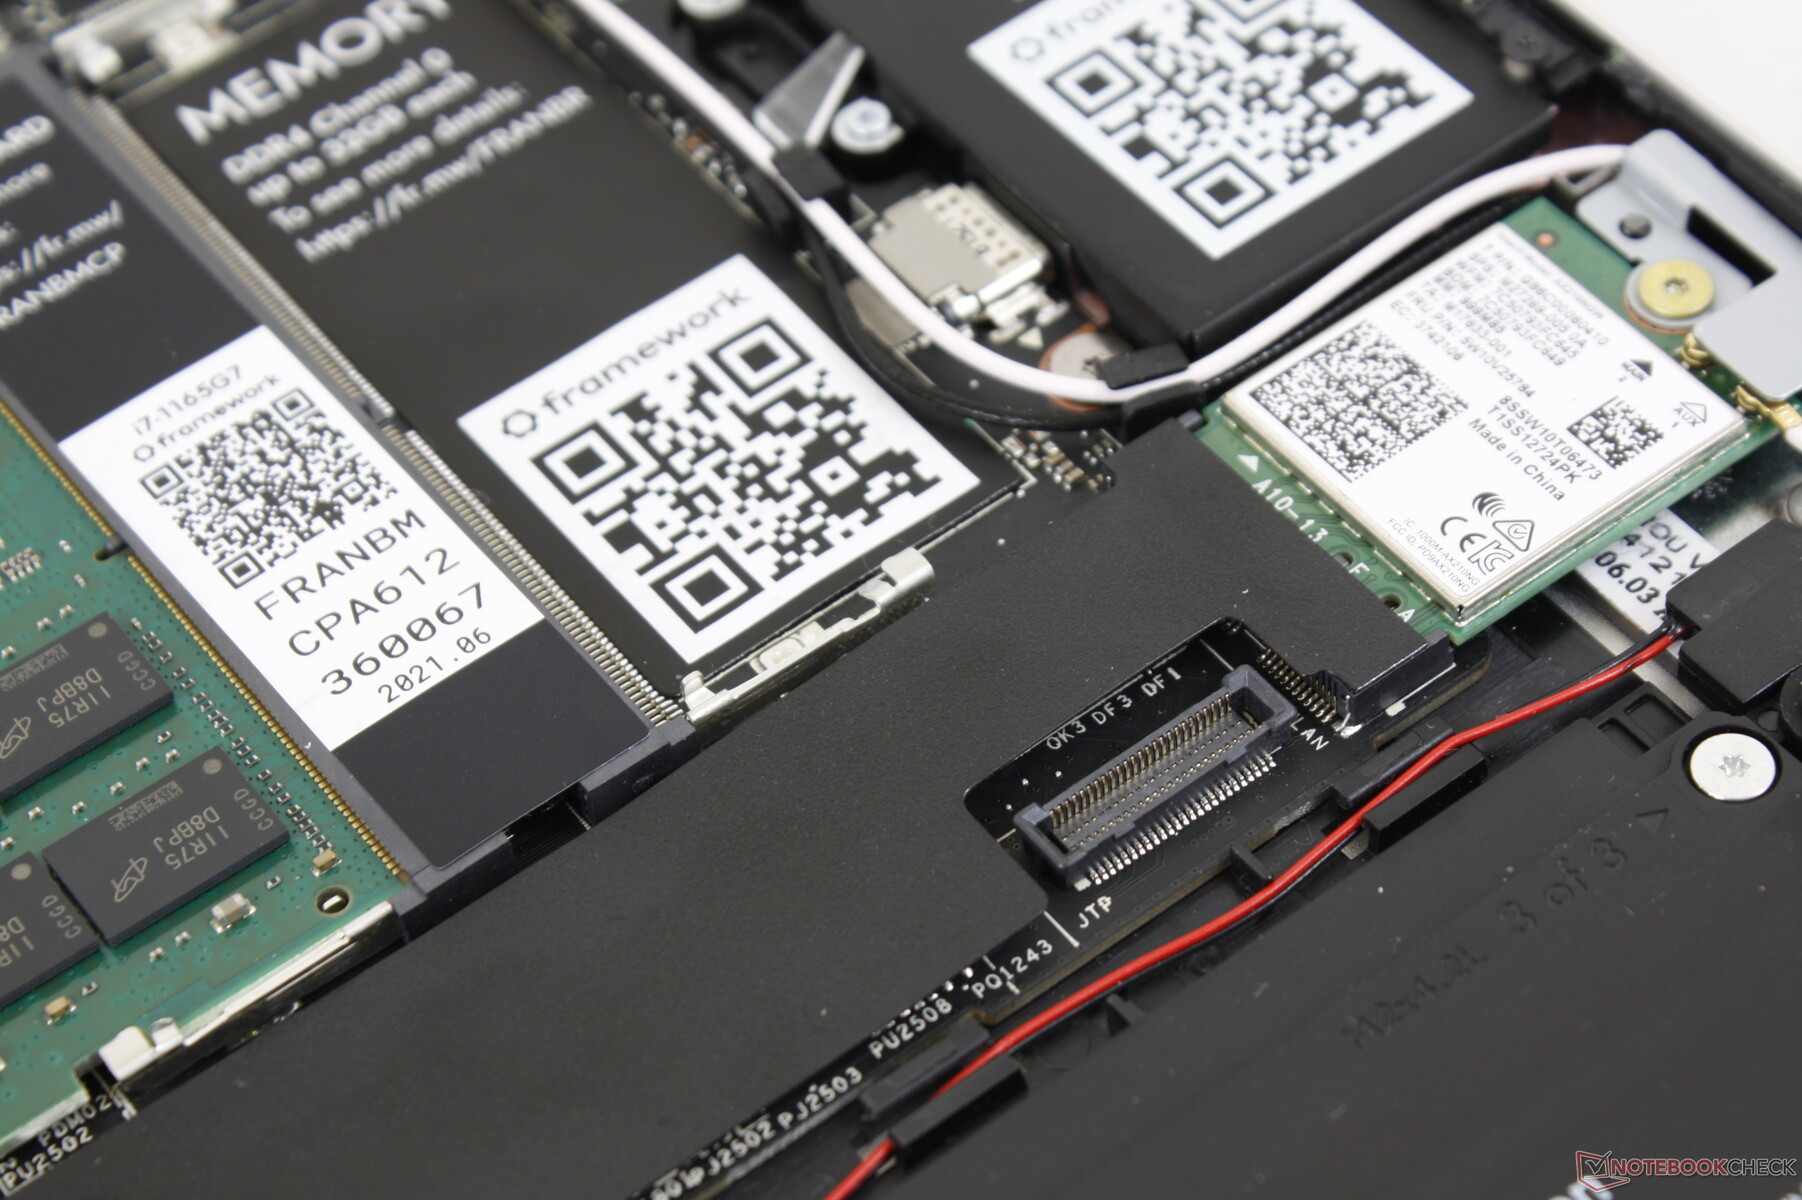
Users have direct access to 2x SODIMM slots, 1x M.2 PCIe 4 2280 SSD slot, 1x WLAN slot, and the battery.
Accessories and Warranty
The DIY kit includes a Torx wrench, USB stick with Windows drivers, and several expansion card adapters for HDMI, MicroSD, USB-C, USB-A, and mini DisplayPort.
The standard one-year limited manufacturer warranty applies.
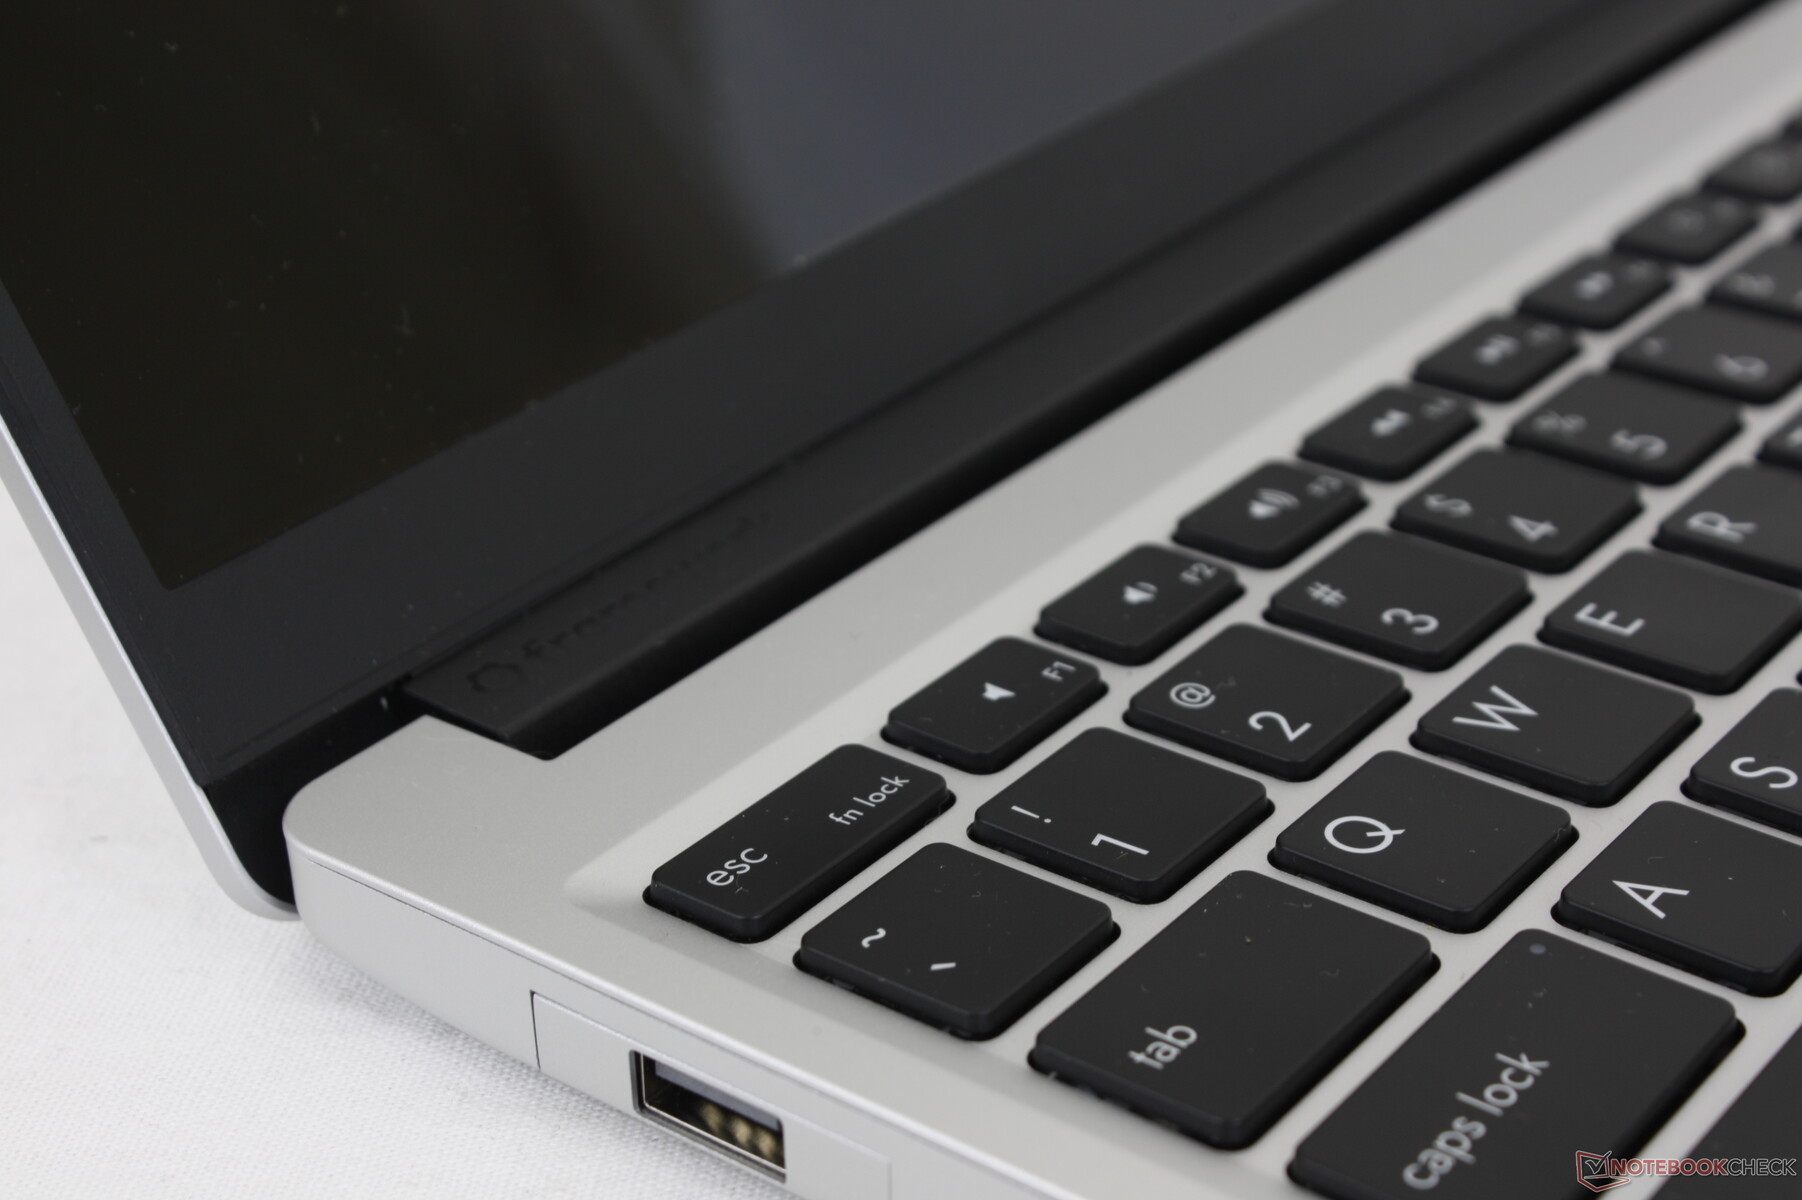
Input Devices
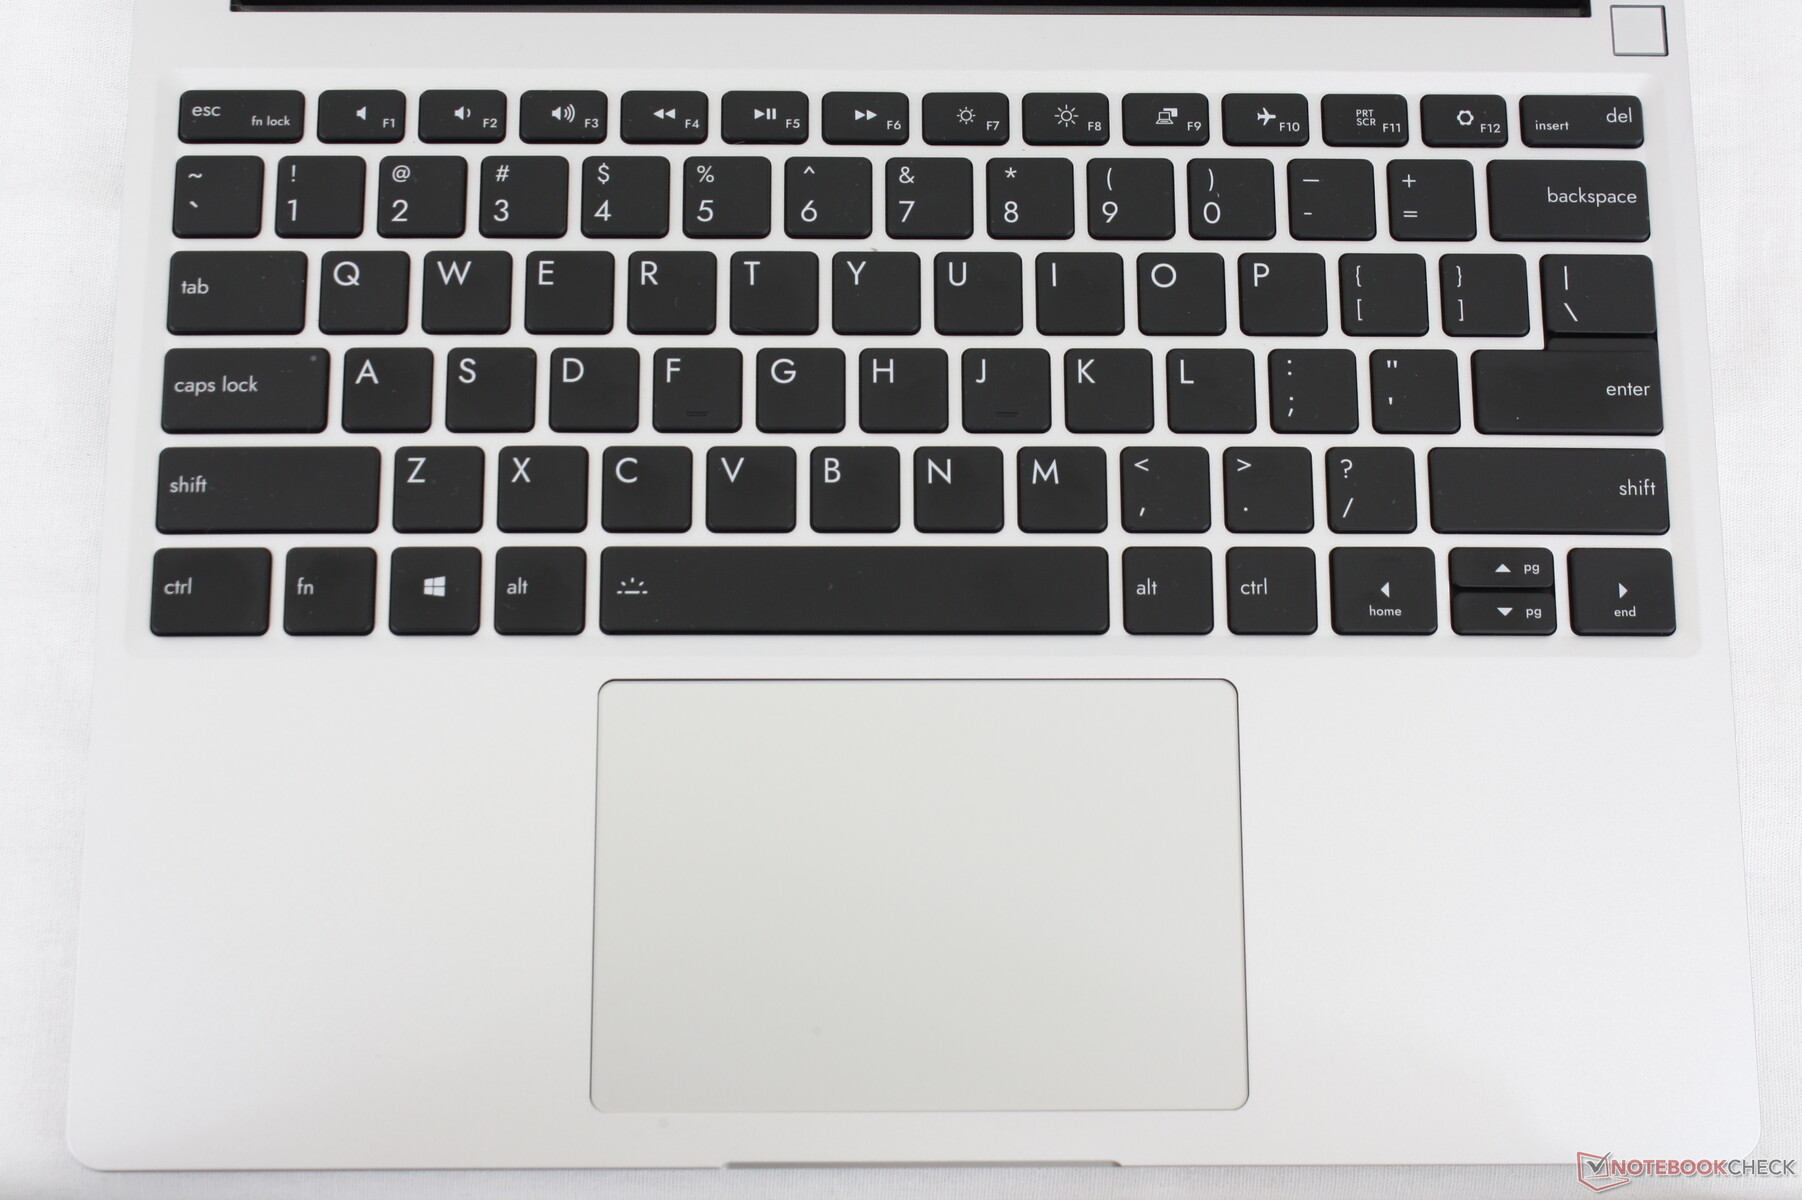
Keyboard
Key feedback is close to what HP offers on its EliteBook or Spectre laptops which happen to have some of our favorite keyboards. Both feedback and travel are firmer and deeper, respectively, than on most other Ultrabooks like the Asus ZenBook.
We would love to see dedicated user-programmable or customizable keys which would fit well with a laptop that centers so much on user customization.
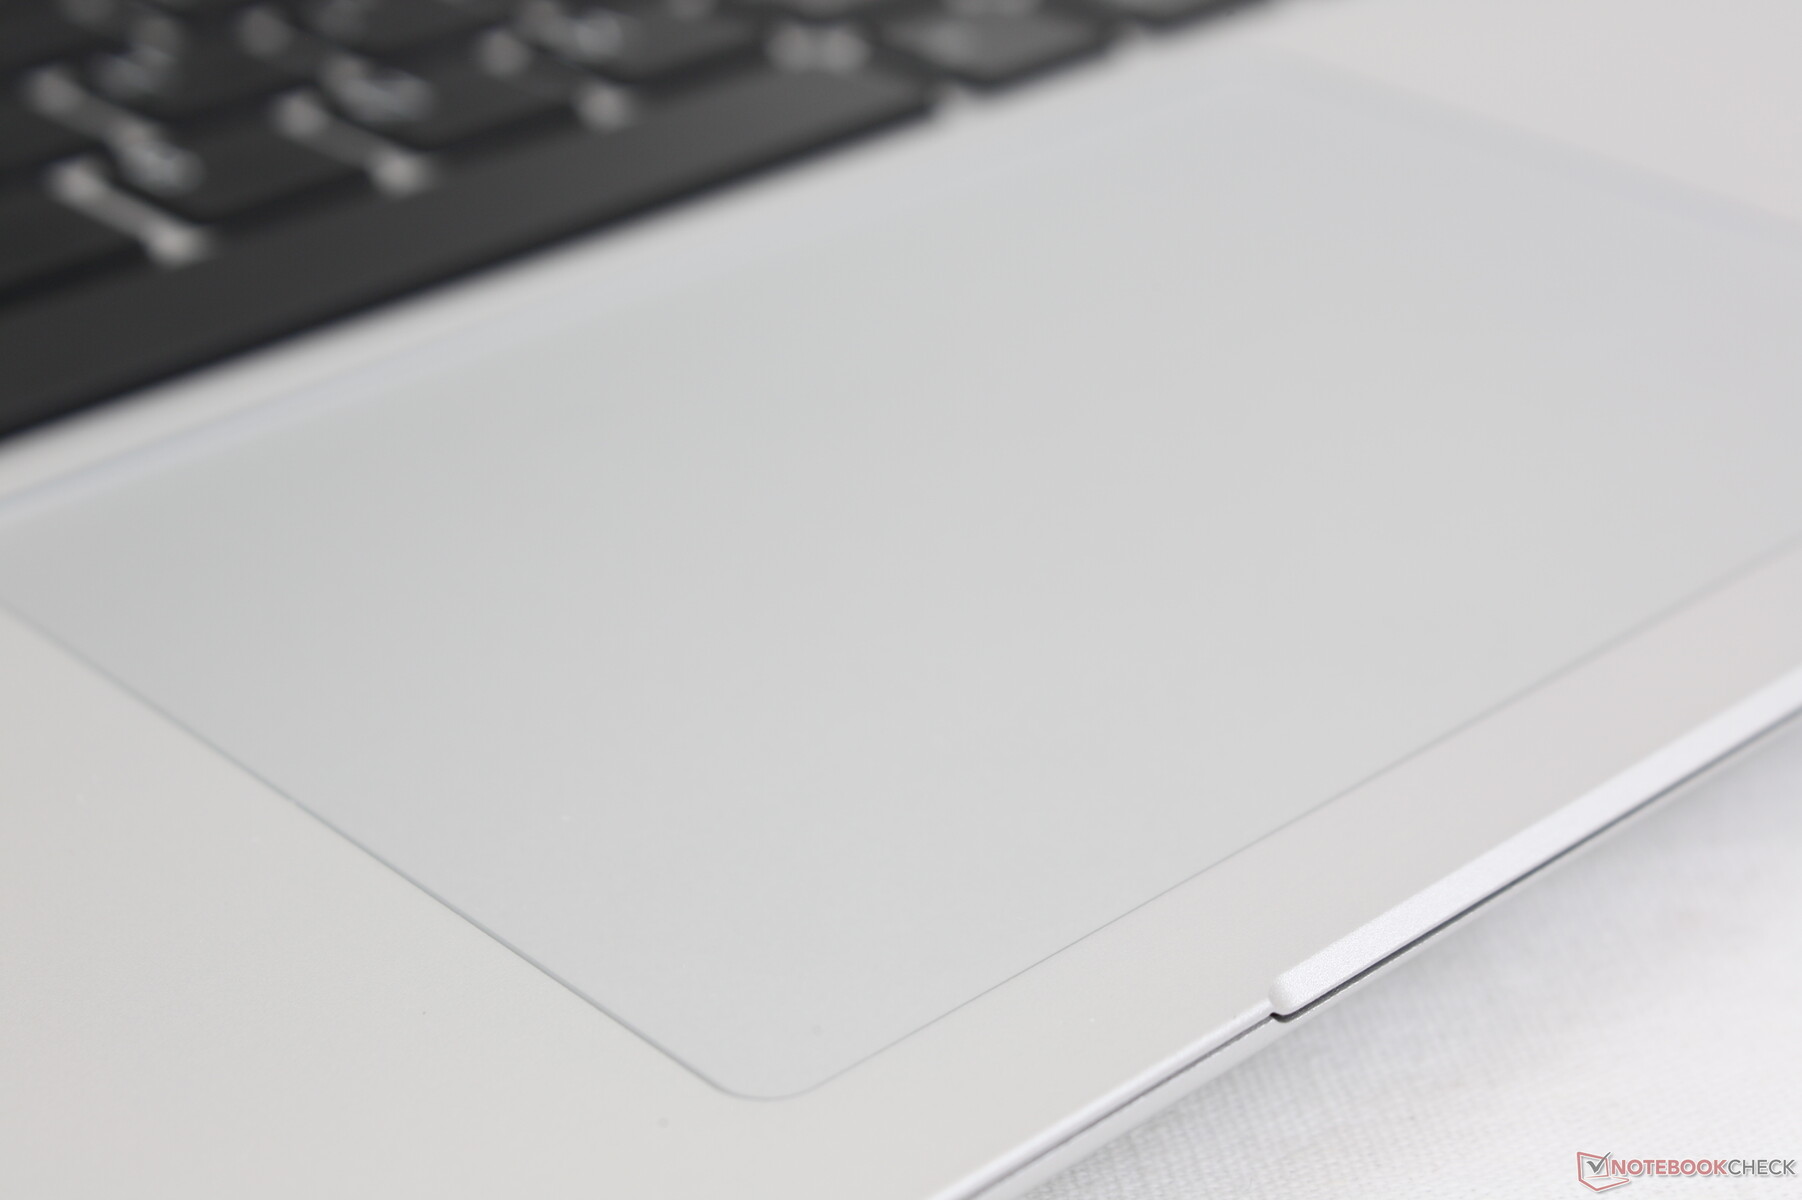
Touchpad
The Precision-enabled clickpad is the same size as the clickpad on the Surface Laptop 3 (11.5 x 7.6 cm). Unlike on the Microsoft model, however, the Framework clickpad is louder when pressed and slightly softer in feedback.


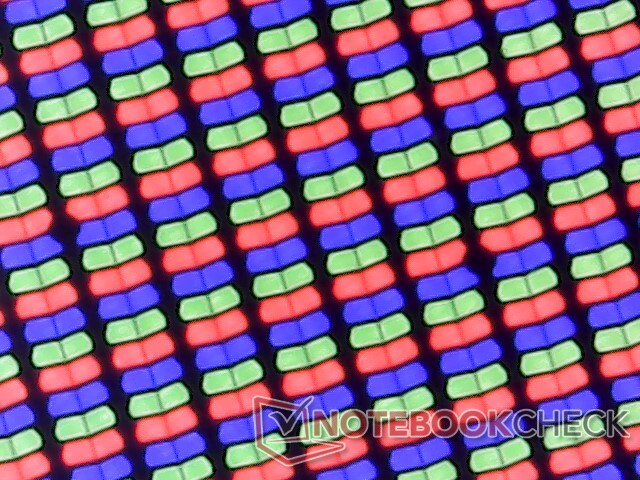
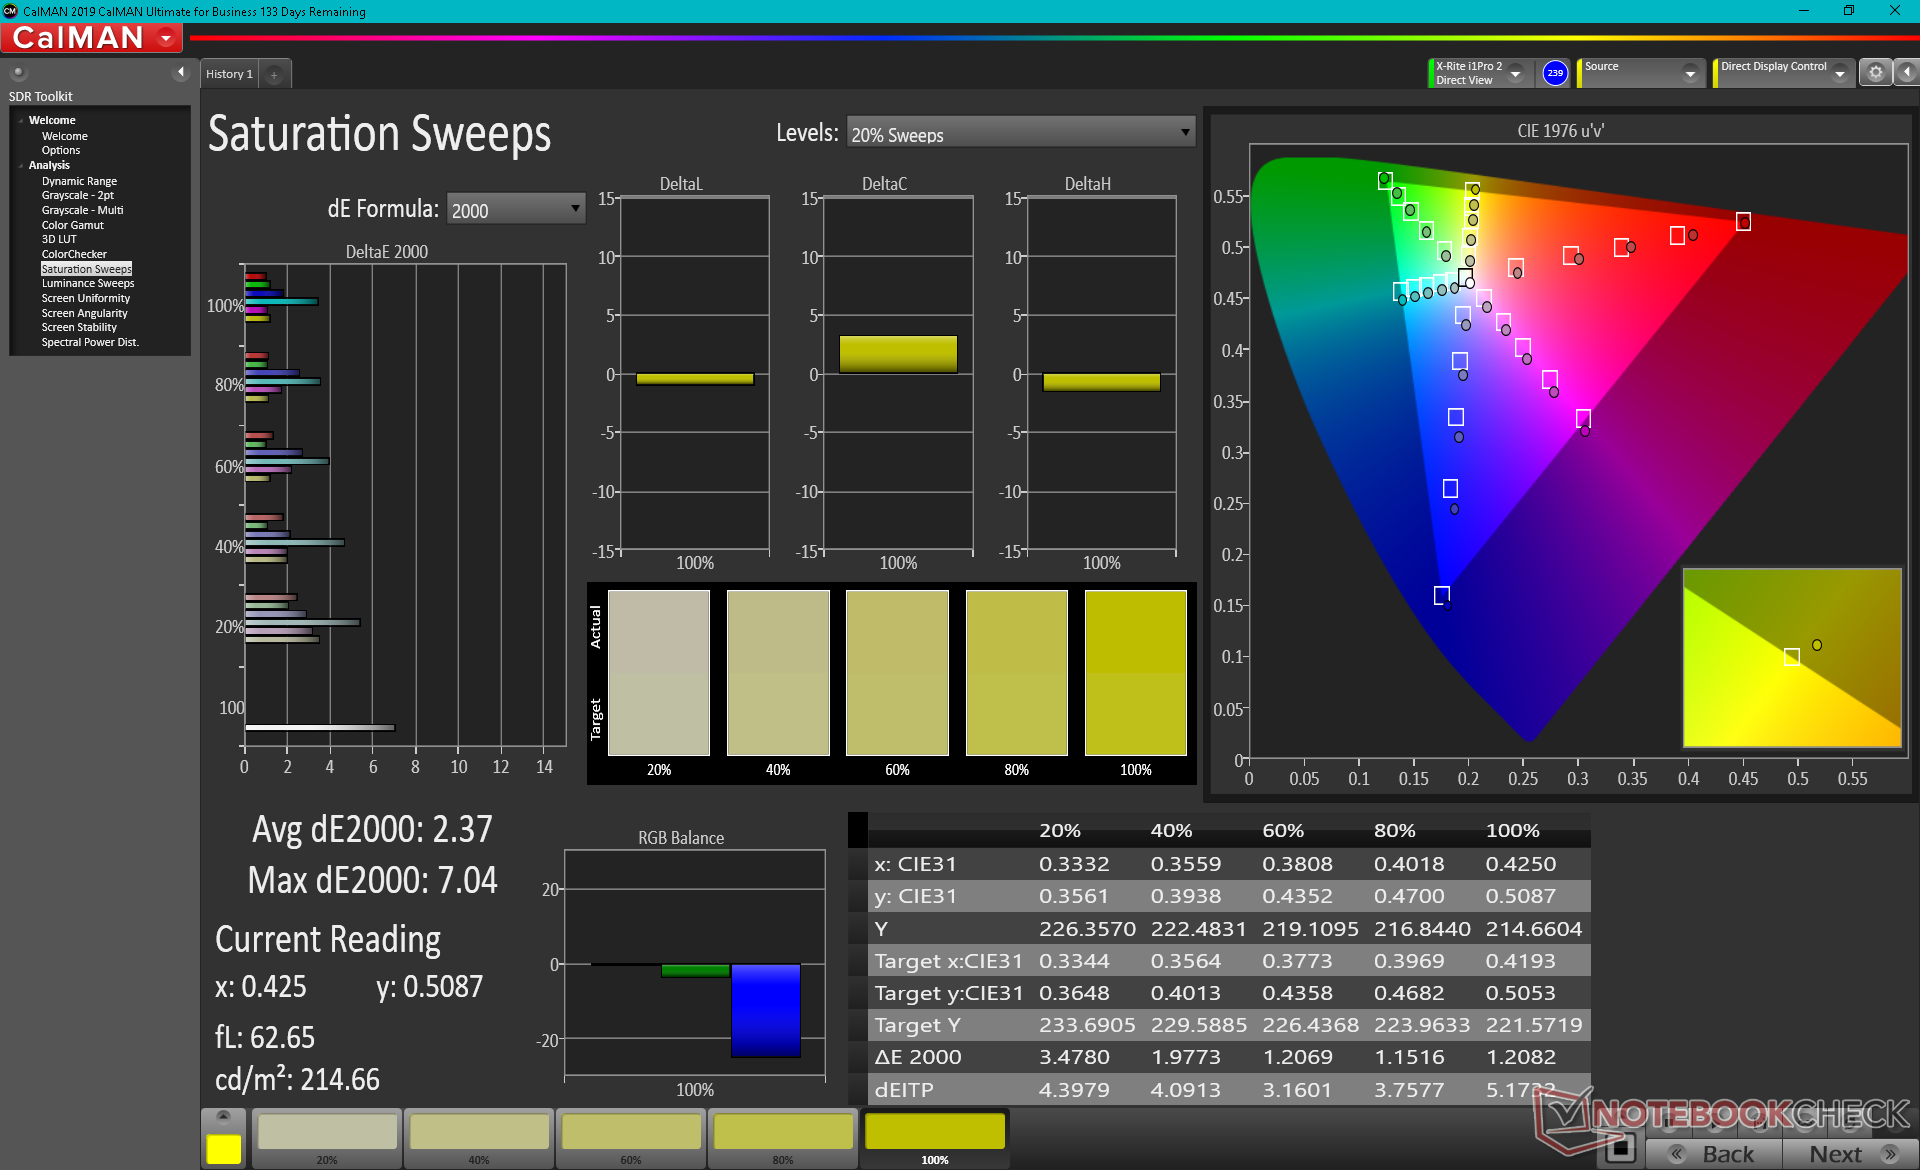
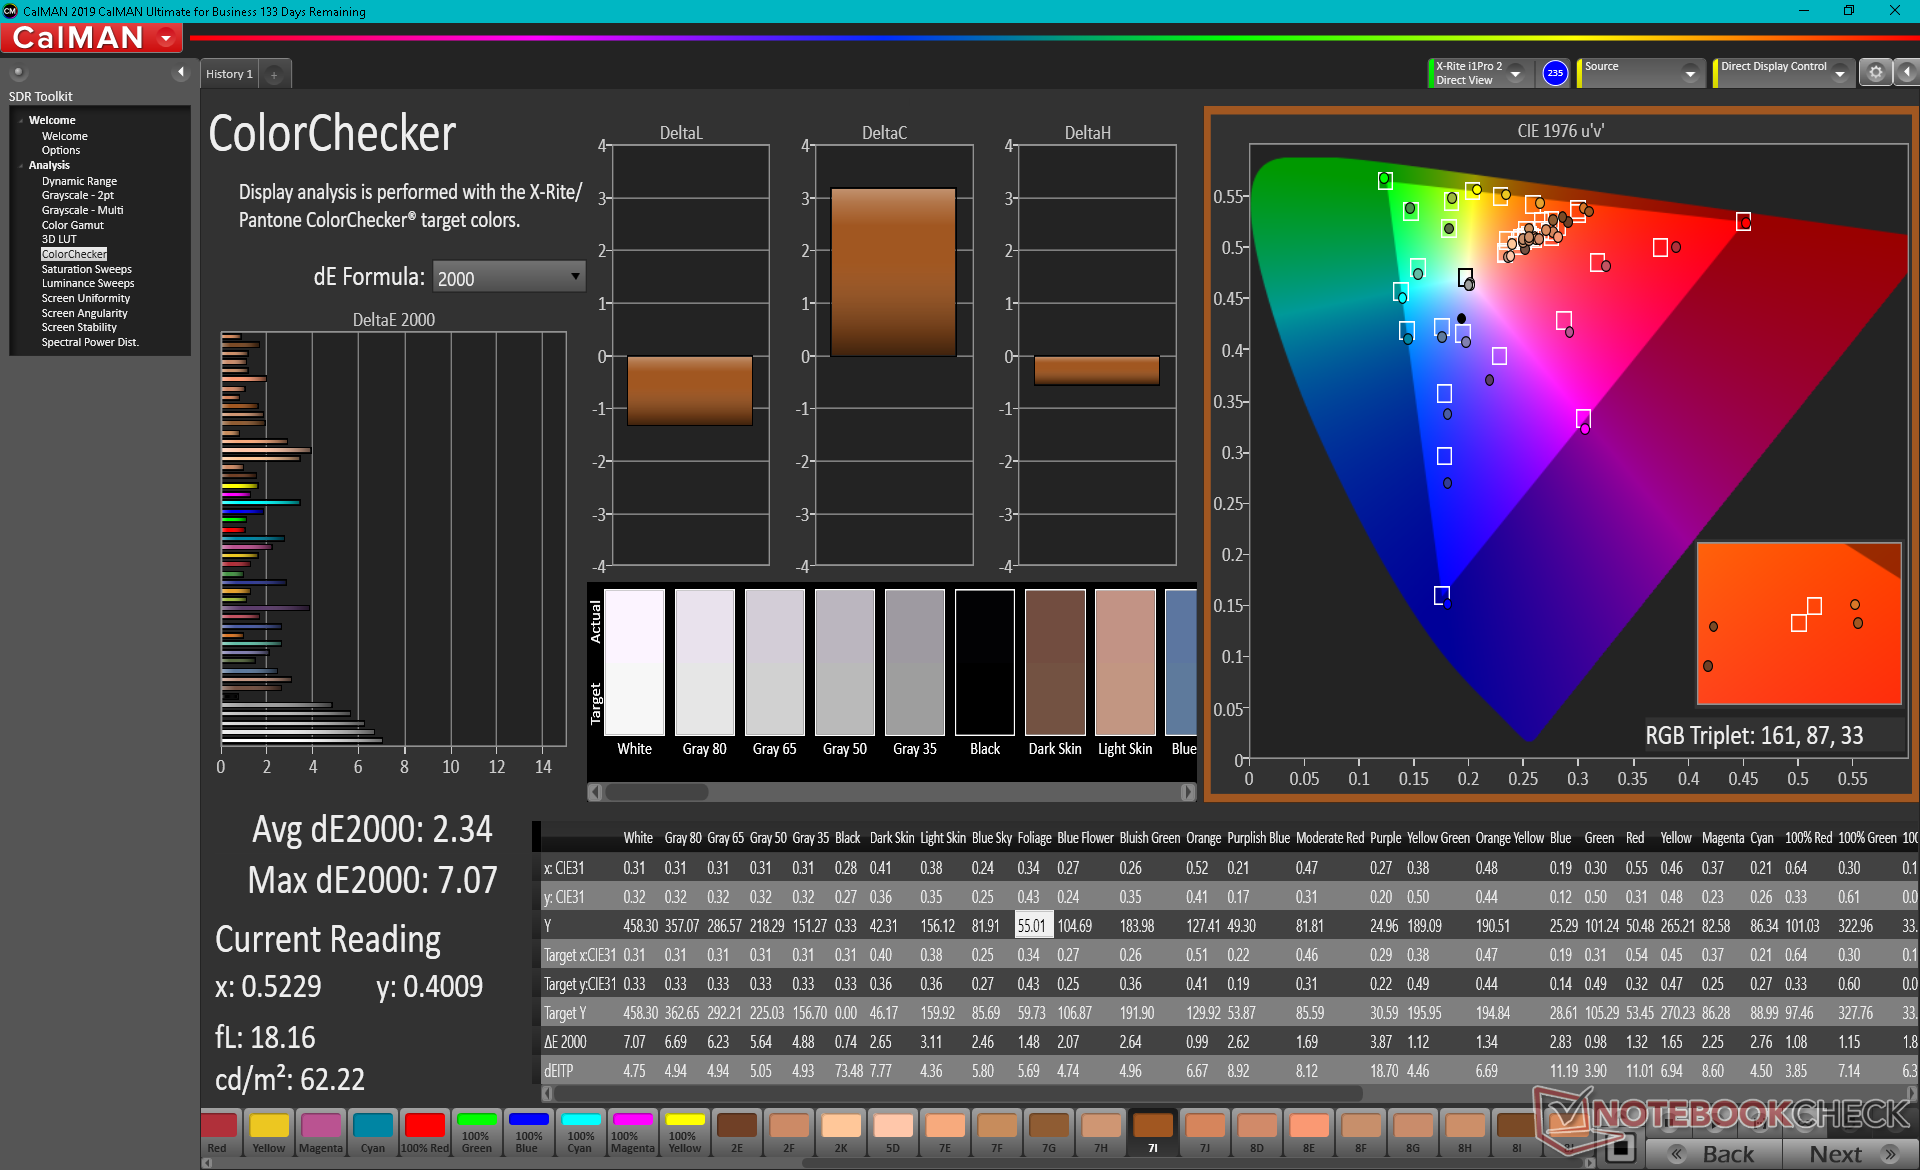
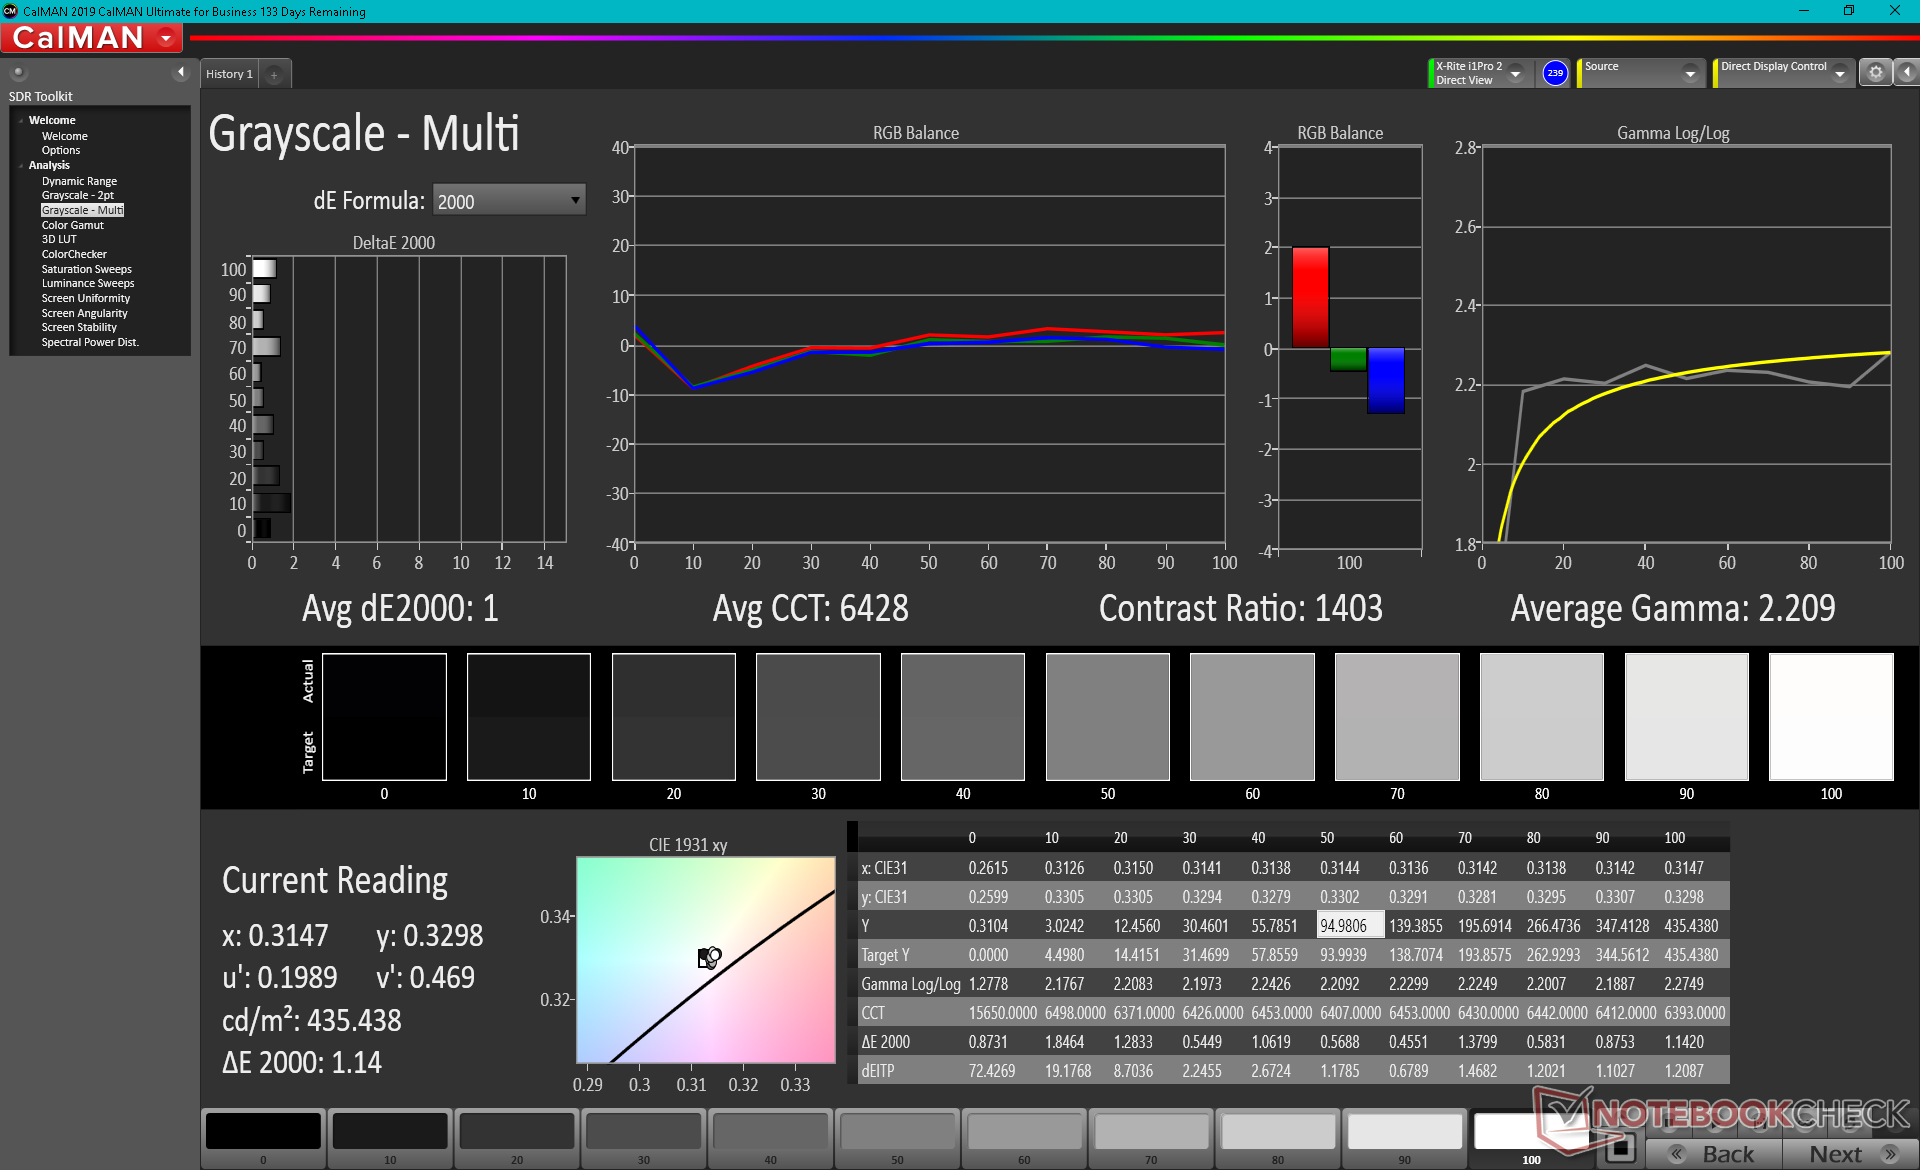
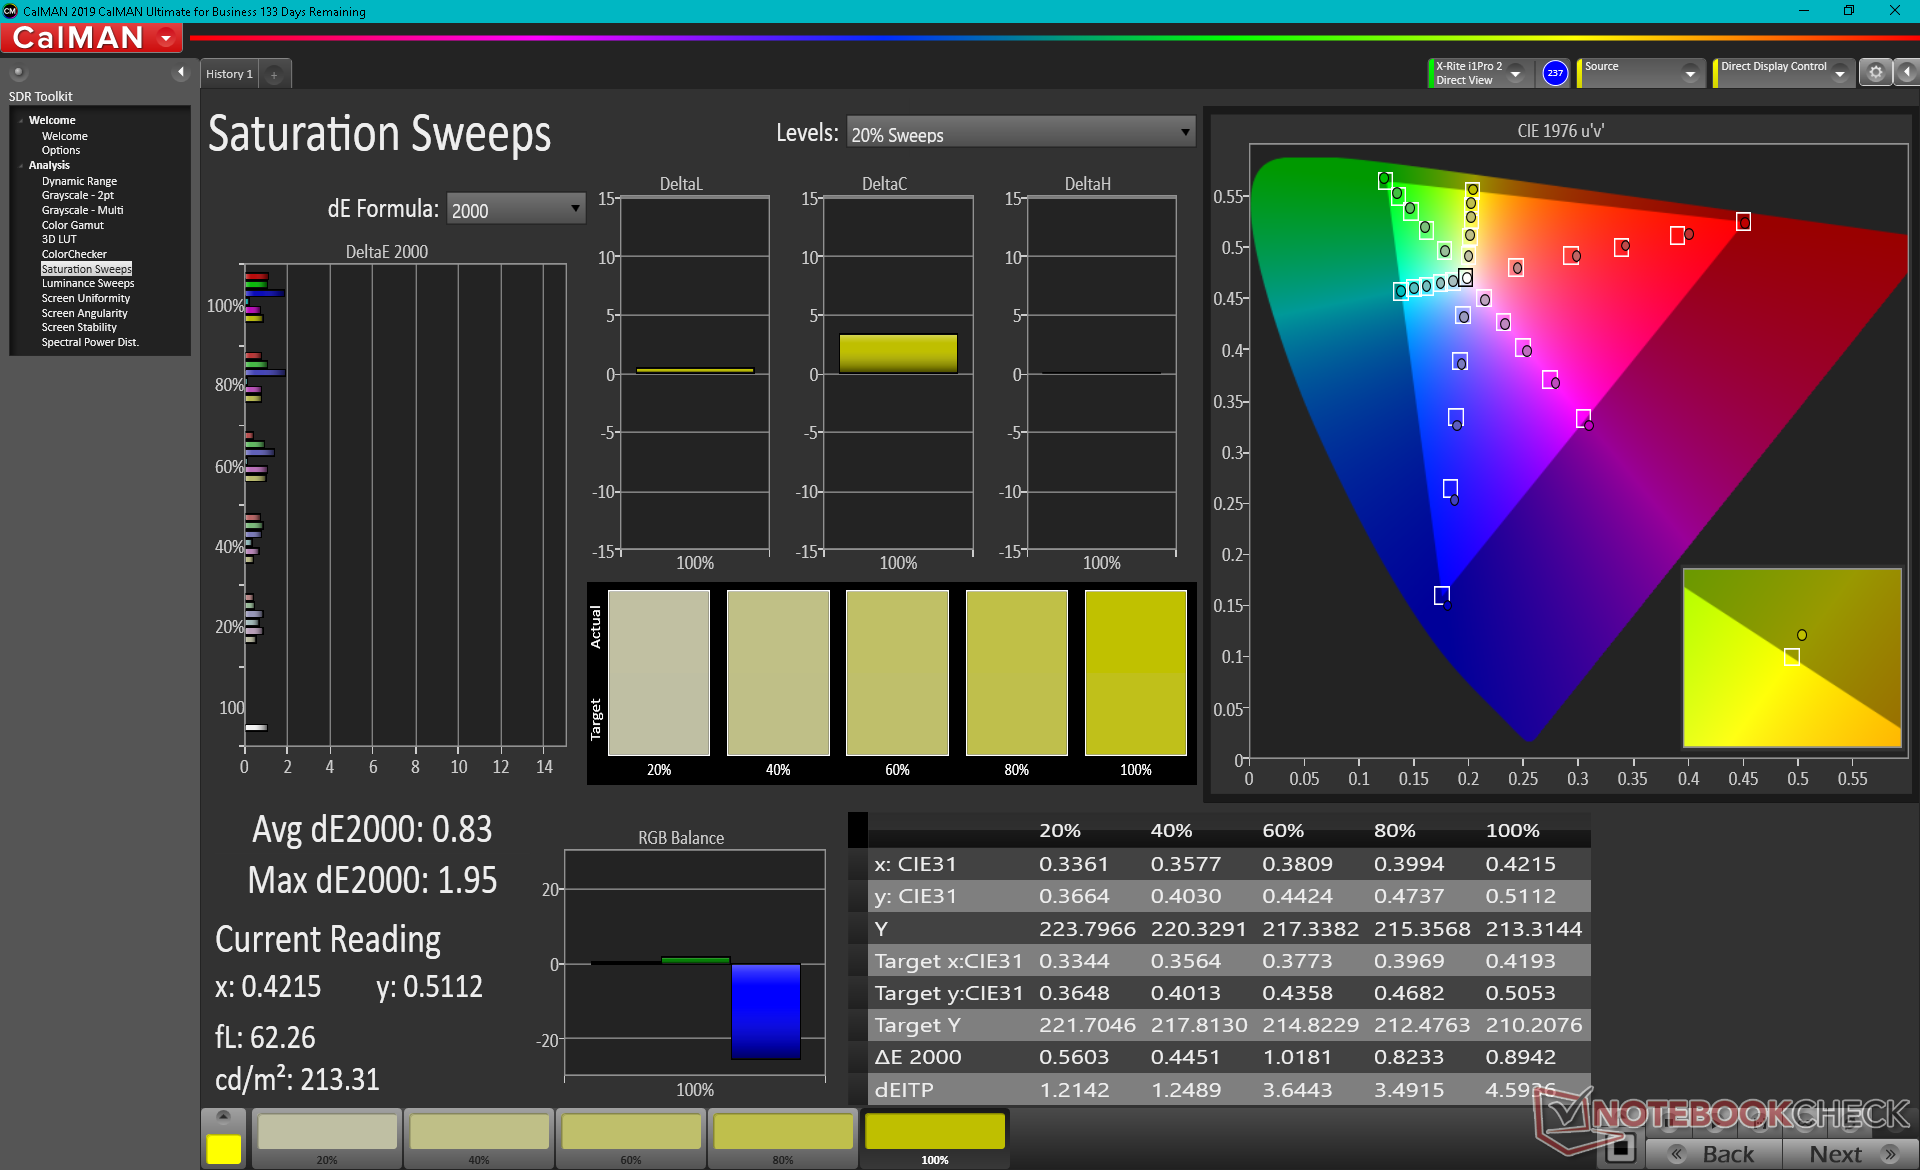
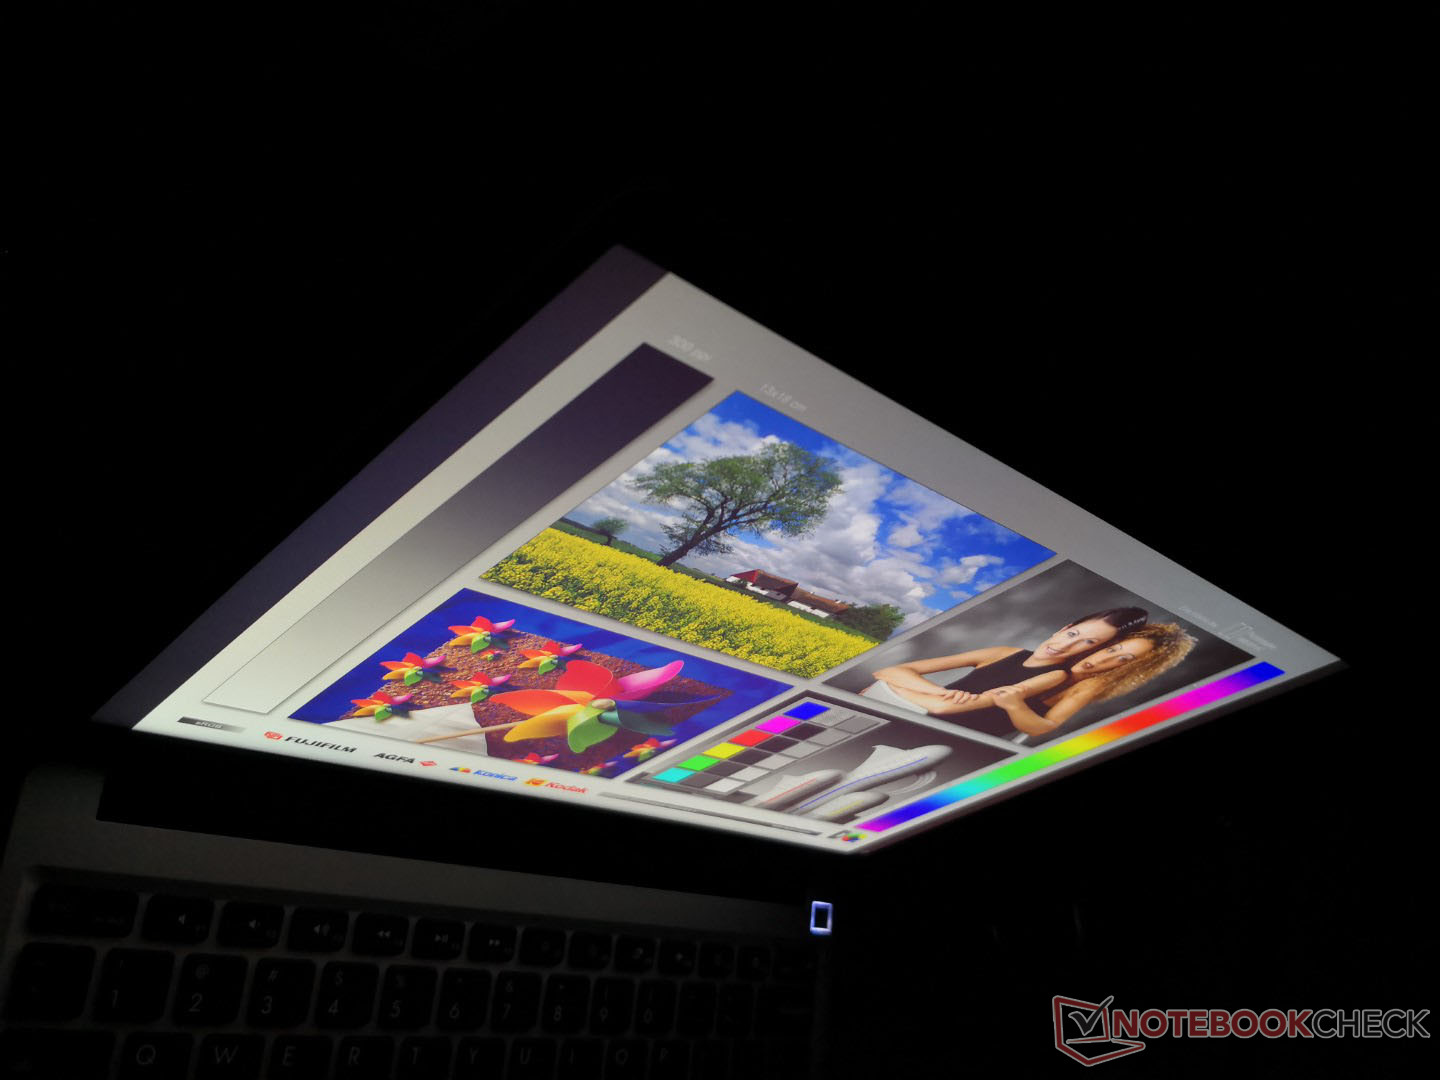
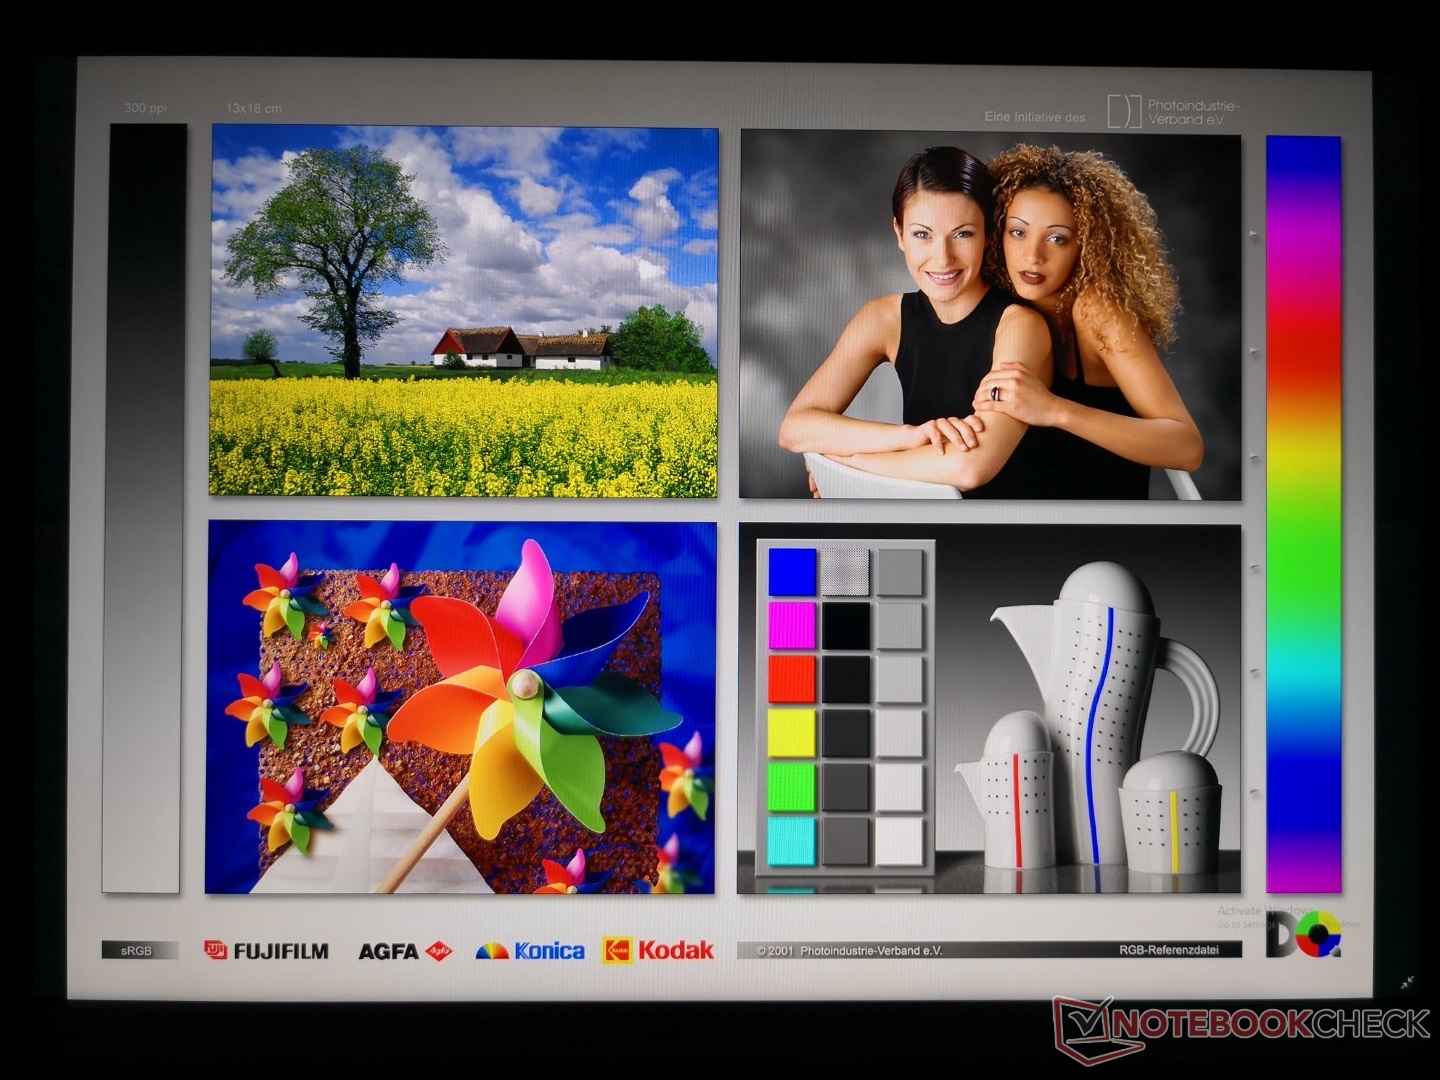
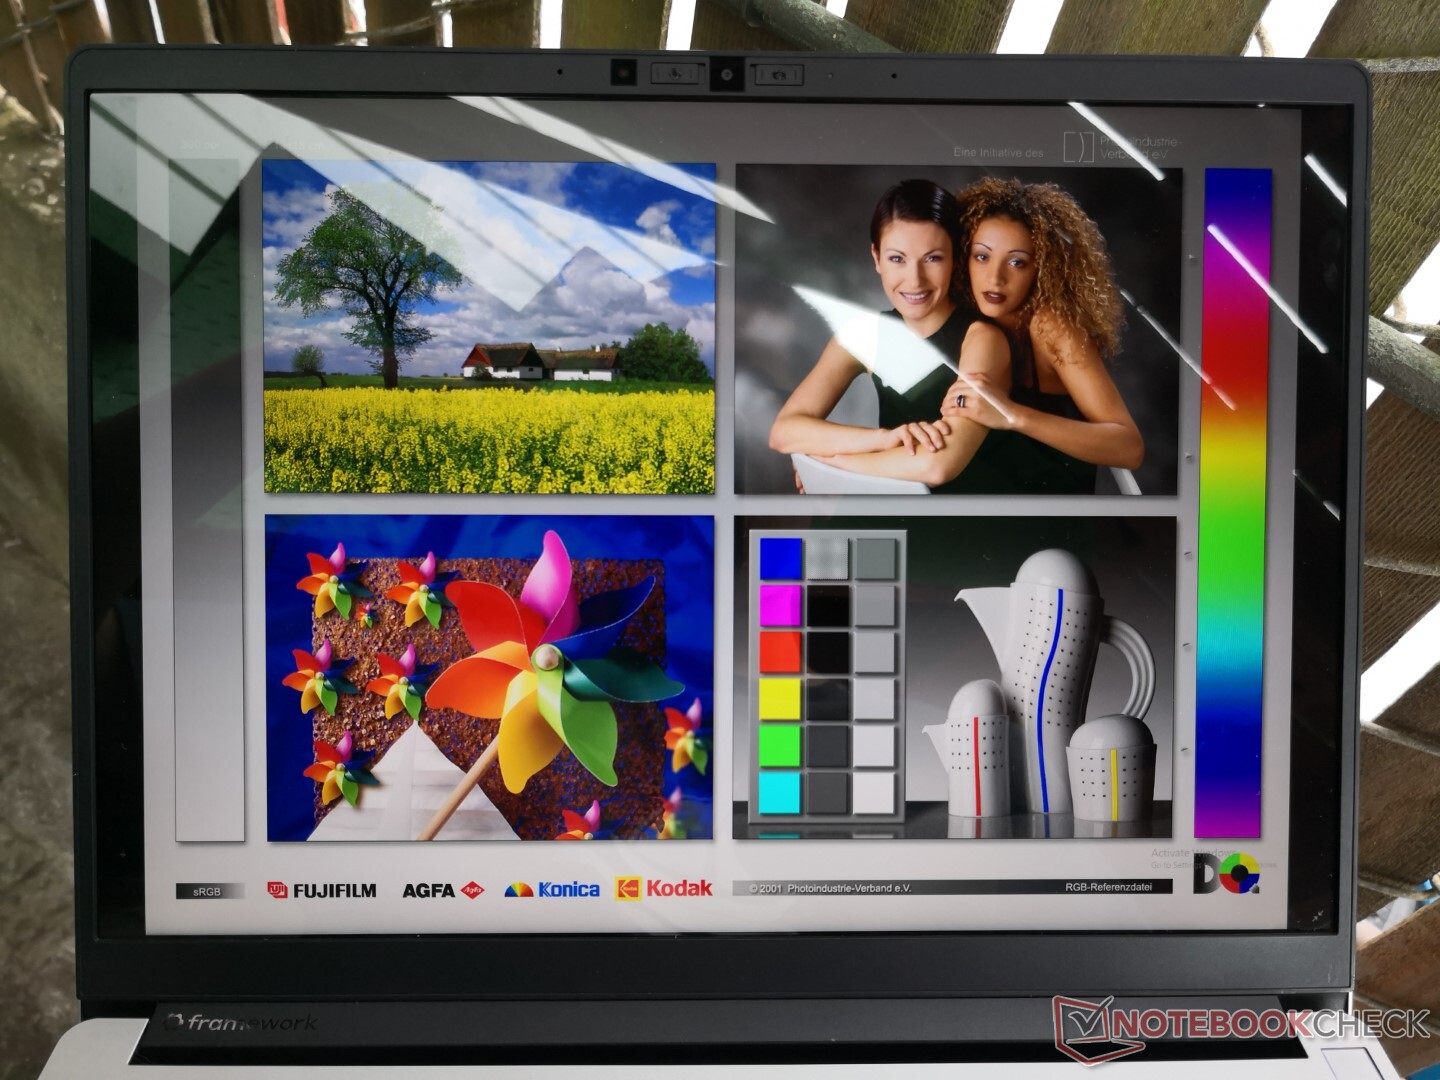
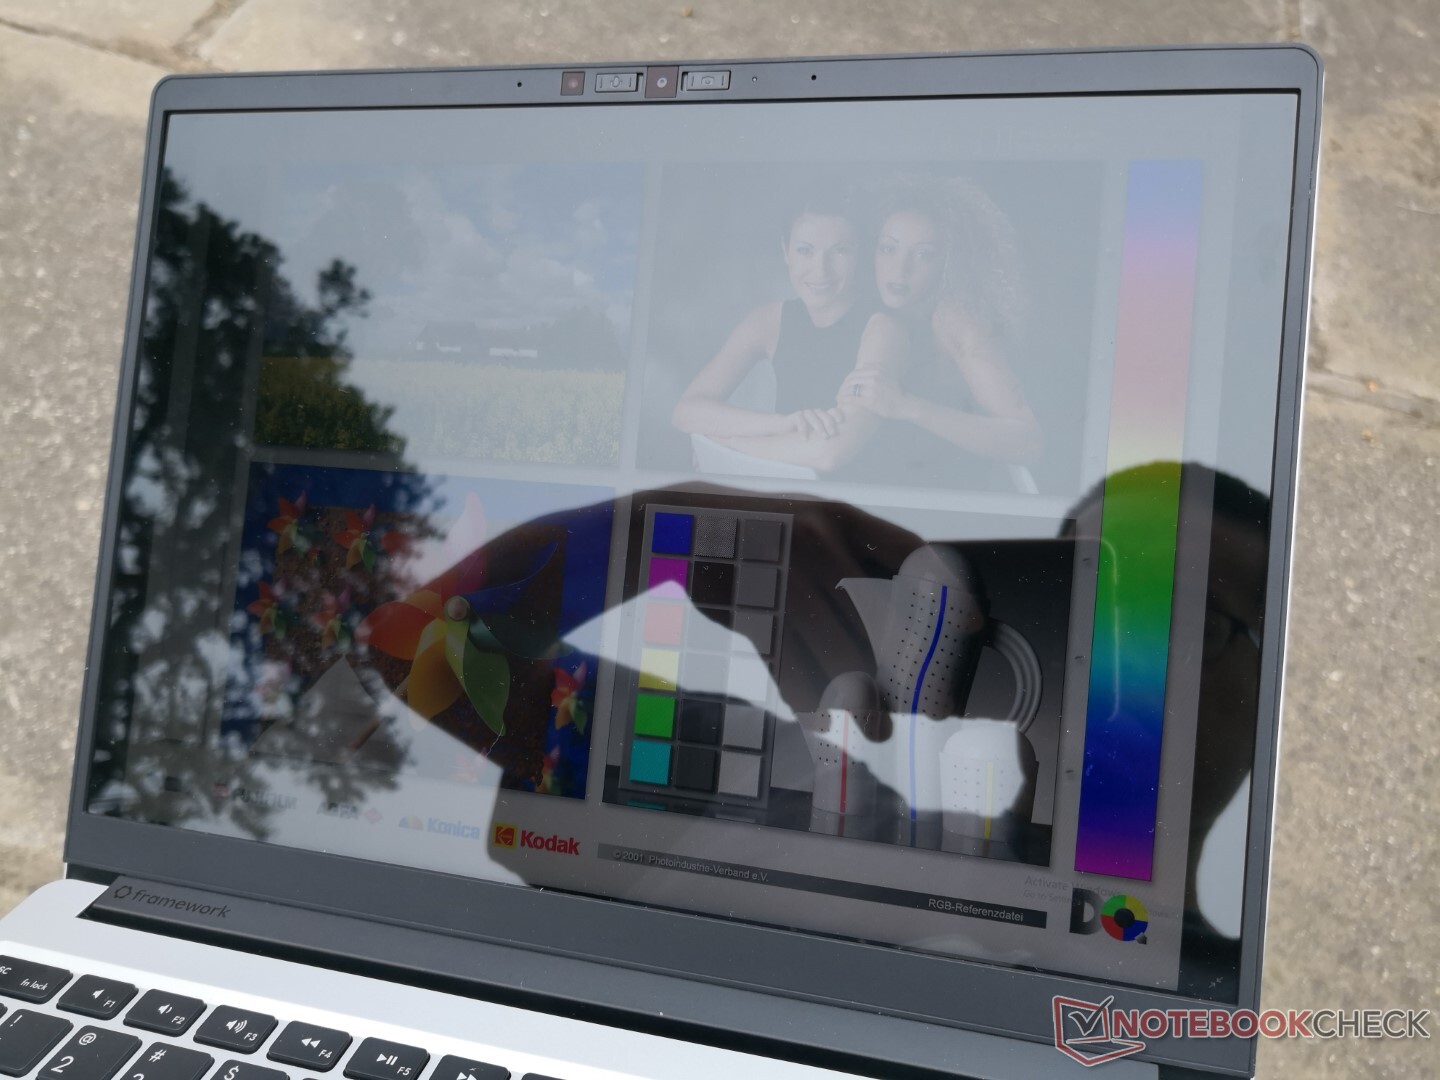
Display
Framework uses the exact same 13.5-inch BOE NE135FBM-N41 IPS panel for its laptop as found on the Acer Swift 3 SF313. Thus, these two models share similar characteristics including the wide color coverage and relatively high contrast ratio. Response times are slow, however, meaning users will experience a lot of ghosting and blurring when gaming. The slow response times are otherwise not an issue for office-type workloads.
| |||||||||||||||||||||||||
Brightness Distribution: 93 %
Center on Battery: 449 cd/m²
Contrast: 1151:1 (Black: 0.39 cd/m²)
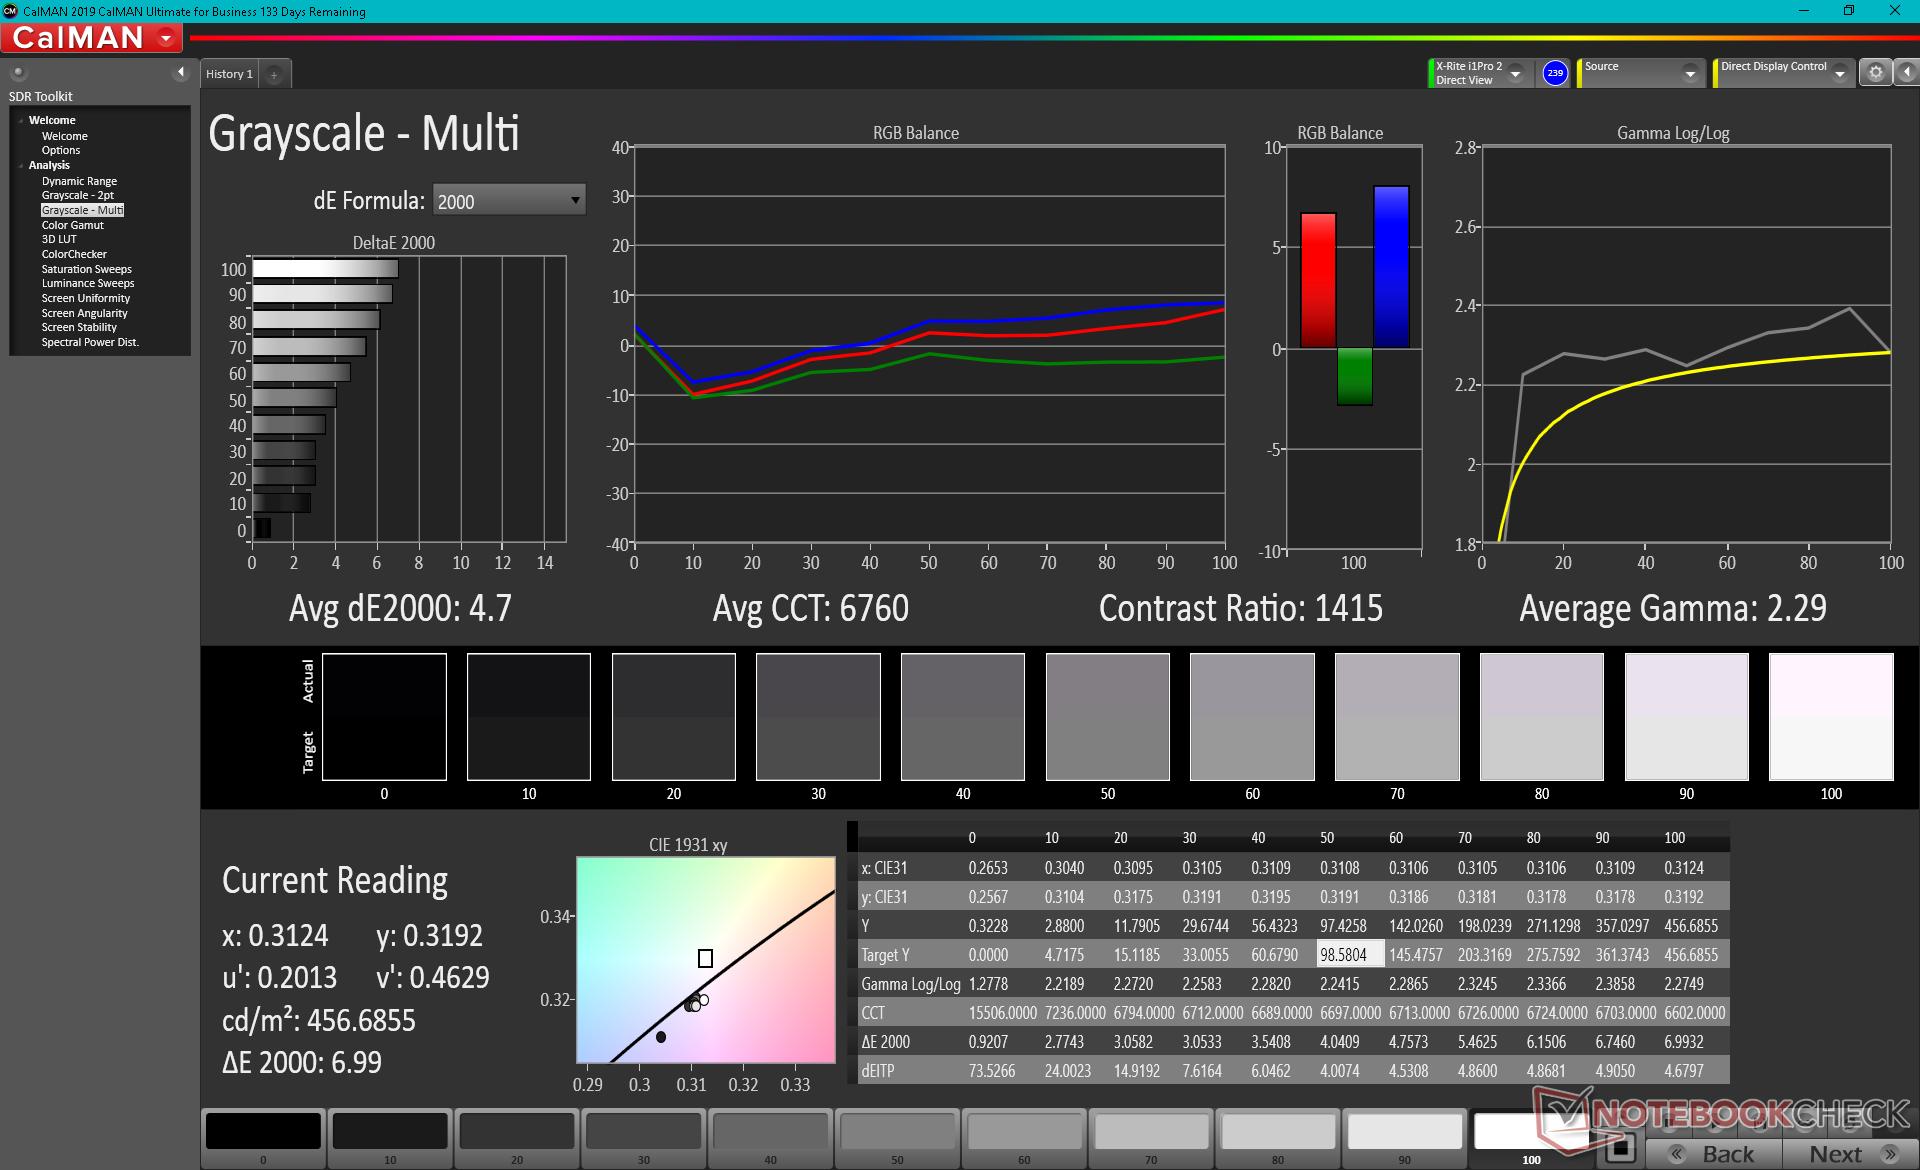
ΔE ColorChecker Calman: 2.34 | ∀{0.5-29.43 Ø4.83}
calibrated: 0.96
ΔE Greyscale Calman: 4.7 | ∀{0.09-98 Ø5.1}
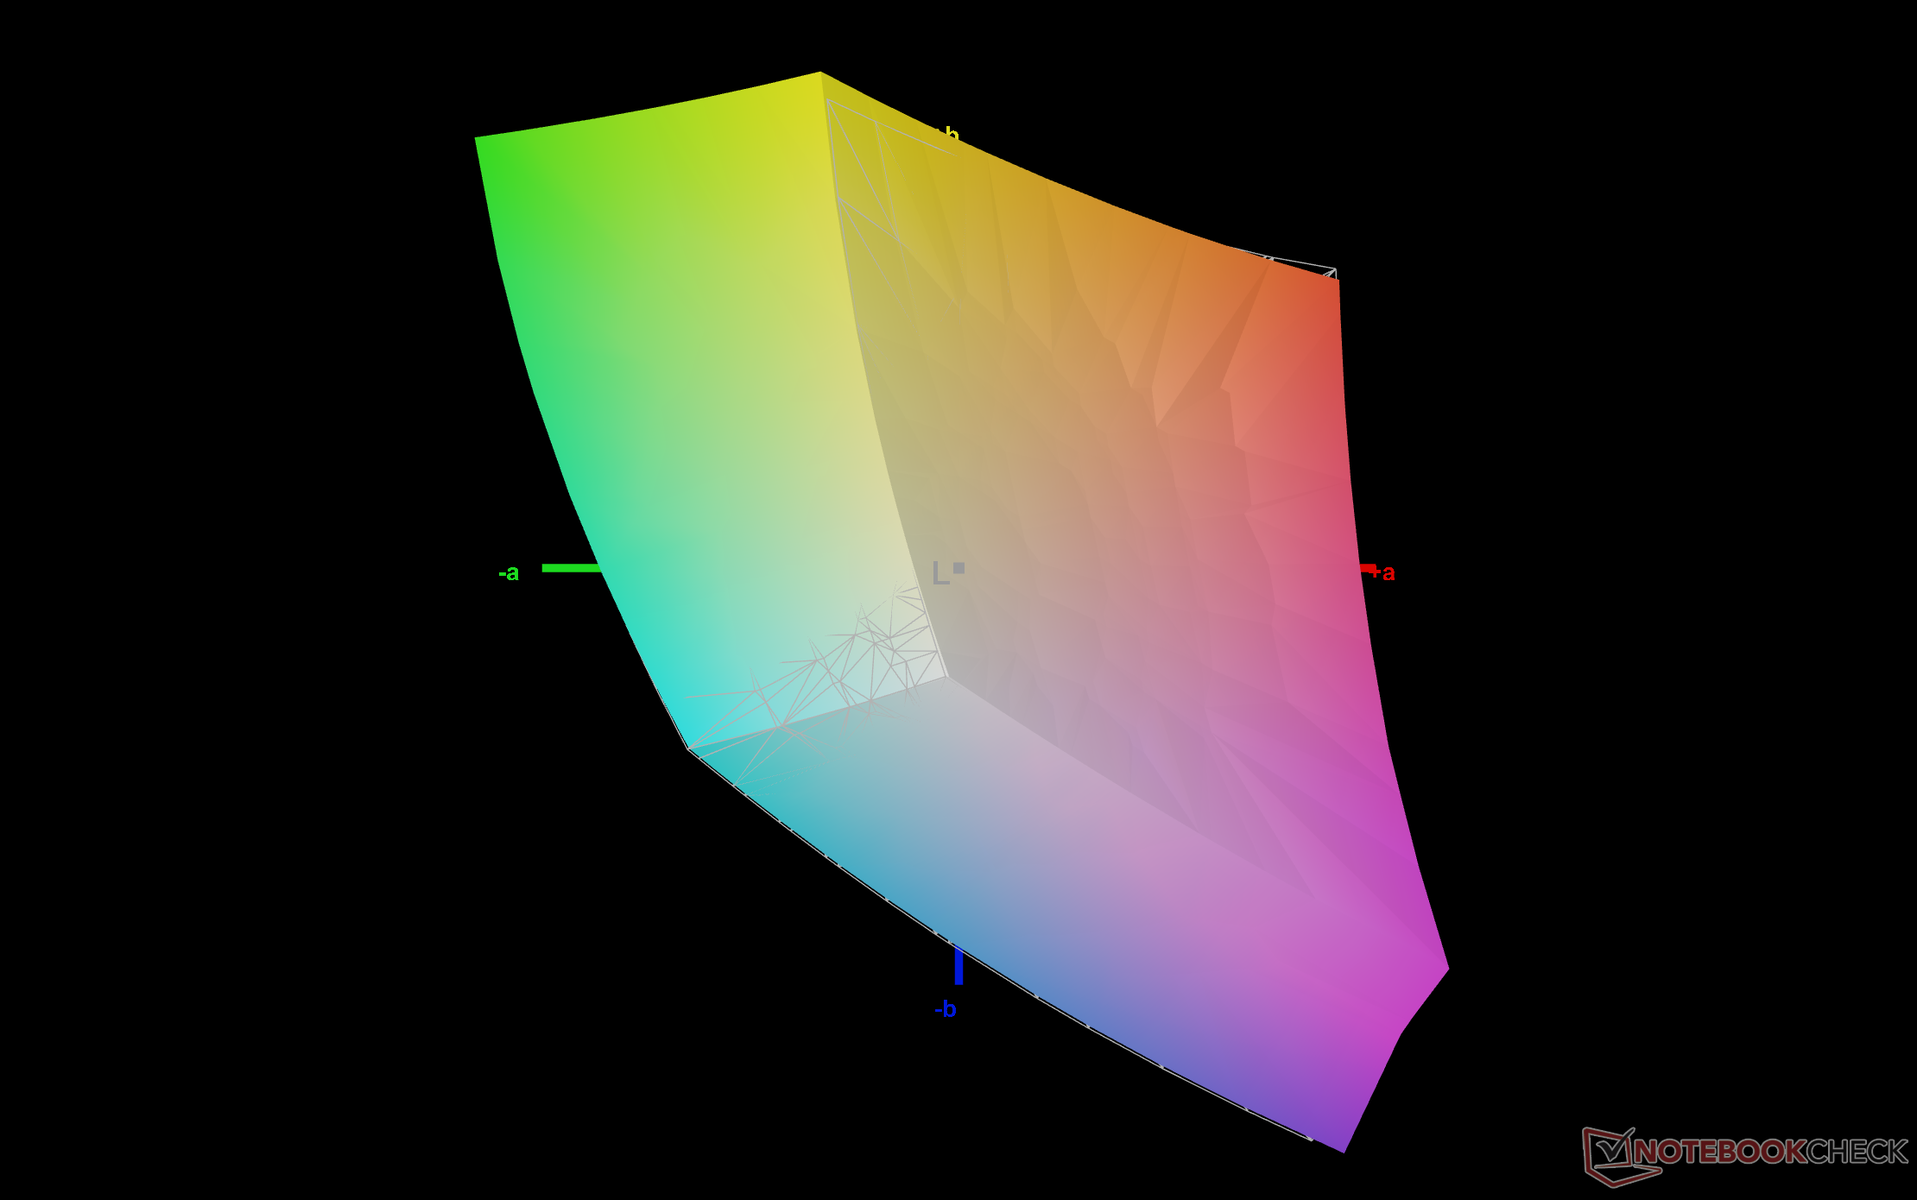
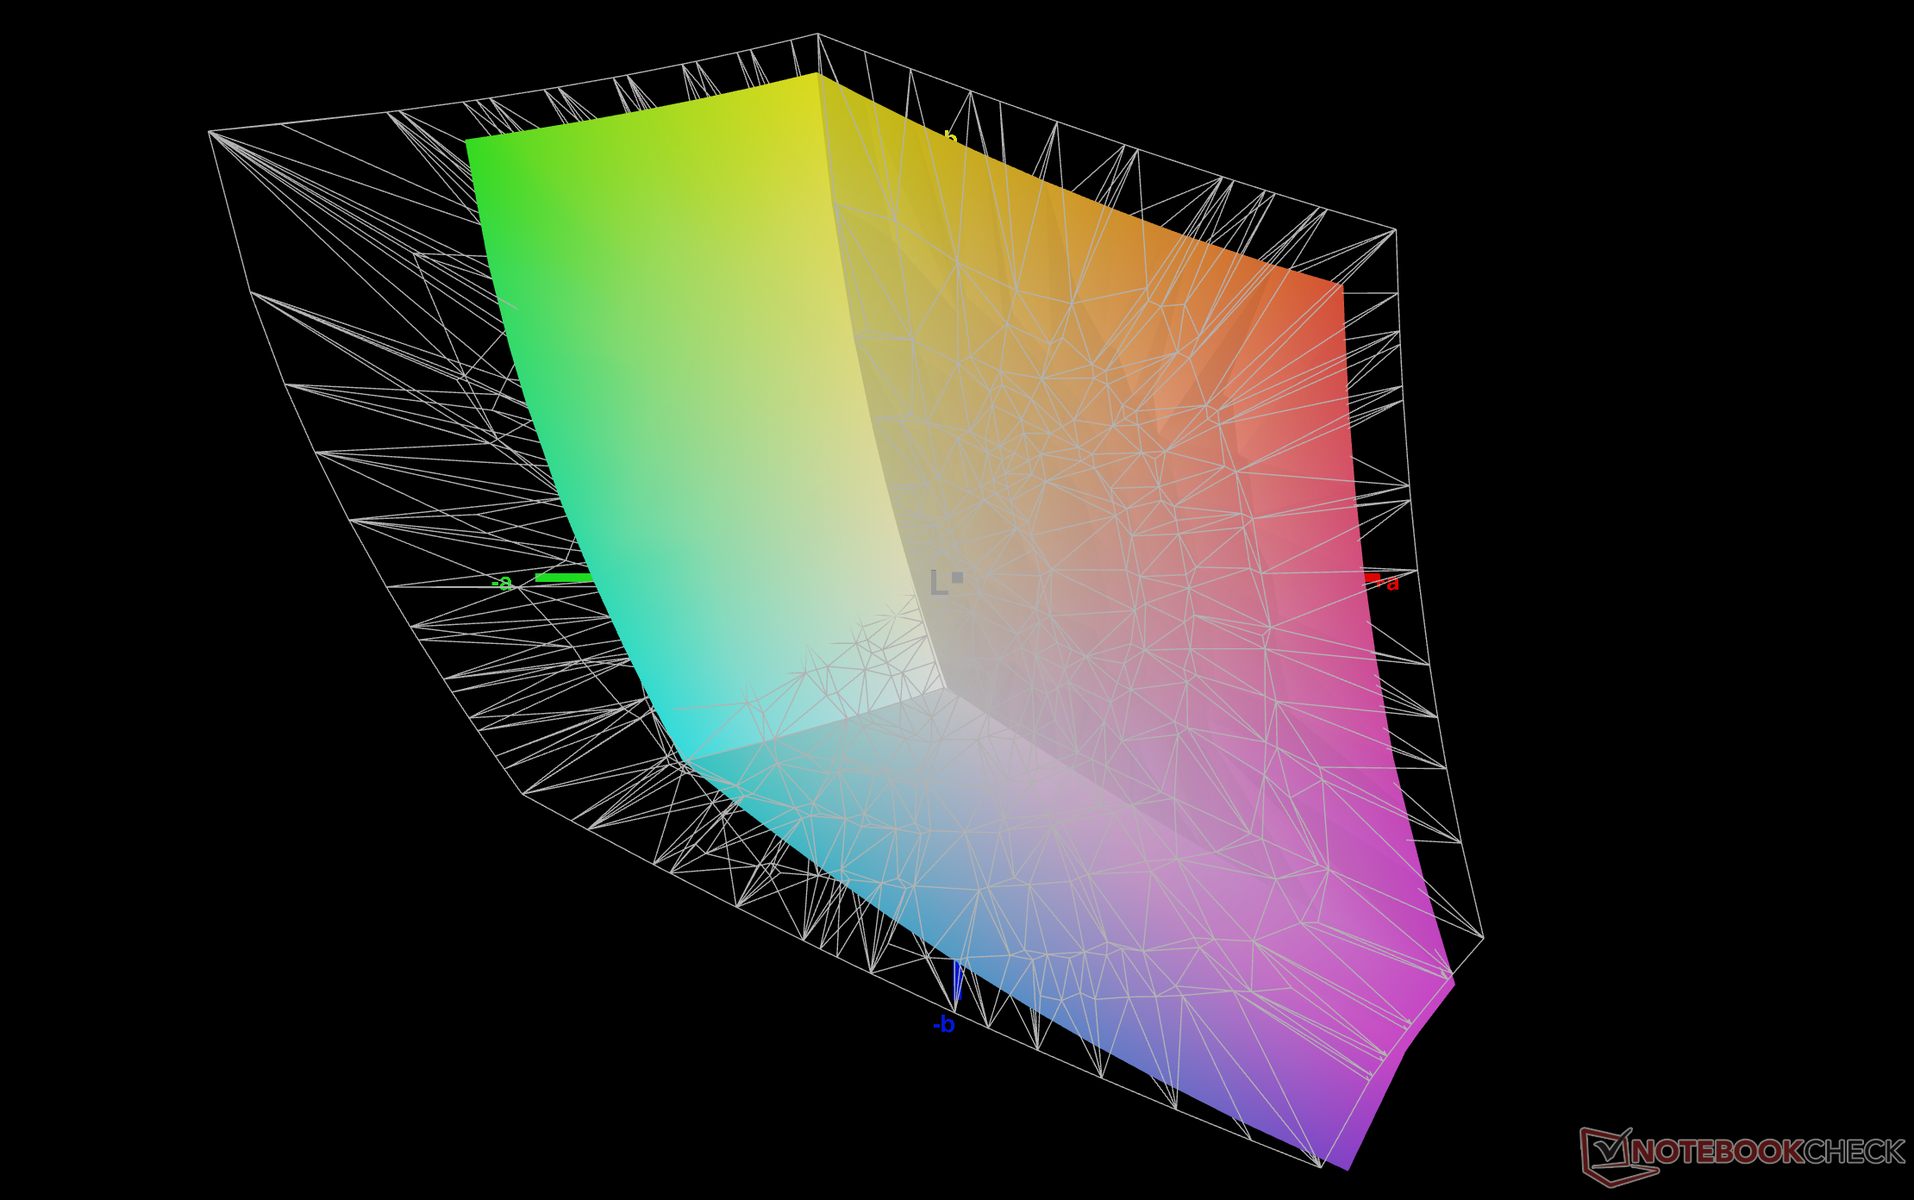
70.3% AdobeRGB 1998 (Argyll 3D)
99.3% sRGB (Argyll 3D)
69% Display P3 (Argyll 3D)
Gamma: 2.29
CCT: 6760 K
| Framework Laptop 13.5 BOE CQ NE135FBM-N41, IPS, 13.5", 2256x1504 | HP Spectre x360 14-ea0378ng Samsung SDC4148, OLED, 13.5", 3000x2000 | Microsoft Surface Laptop 4 13 i7 LQ135P1JX51, IPS, 13.5", 2256x1504 | Lenovo ThinkPad X1 Titanium Yoga G1 20QA001RGE LPM135M467, IPS, 13.5", 2256x1504 | HP ProBook x360 435 G8 R7-5800U AUO4B2D, IPS, 13.3", 1920x1080 | Lenovo Yoga 6 13 82ND0009US AU Optronics B133HAN05.F, IPS, 13.3", 1920x1080 | |
|---|---|---|---|---|---|---|
| Display | 28% | -4% | -41% | 1% | ||
| Display P3 Coverage | 69 | 99.9 45% | 64.7 -6% | 40.1 -42% | 69.7 1% | |
| sRGB Coverage | 99.3 | 100 1% | 97.2 -2% | 59.9 -40% | 99.2 0% | |
| AdobeRGB 1998 Coverage | 70.3 | 96.1 37% | 66.9 -5% | 41.4 -41% | 71.4 2% | |
| Response Times | 95% | -12% | 19% | 17% | 18% | |
| Response Time Grey 50% / Grey 80% * | 55.6 ? | 2 ? 96% | 62.8 ? -13% | 53.6 ? 4% | 42.8 ? 23% | 46.8 ? 16% |
| Response Time Black / White * | 36 ? | 2 ? 94% | 39.8 ? -11% | 24 ? 33% | 32 ? 11% | 28.8 ? 20% |
| PWM Frequency | 250 ? | 21930 ? | ||||
| Screen | 346% | 10% | 27% | -62% | -12% | |
| Brightness middle | 449 | 370 -18% | 413 -8% | 466 4% | 304 -32% | 291.5 -35% |
| Brightness | 435 | 374 -14% | 400 -8% | 454 4% | 292 -33% | 294 -32% |
| Brightness Distribution | 93 | 90 -3% | 94 1% | 94 1% | 89 -4% | 93 0% |
| Black Level * | 0.39 | 0.01 97% | 0.29 26% | 0.23 41% | 0.23 41% | 0.19 51% |
| Contrast | 1151 | 37000 3115% | 1424 24% | 2026 76% | 1322 15% | 1534 33% |
| Colorchecker dE 2000 * | 2.34 | 2.57 -10% | 2.8 -20% | 2.1 10% | 5 -114% | 3.83 -64% |
| Colorchecker dE 2000 max. * | 7.07 | 4.52 36% | 7.2 -2% | 4.5 36% | 17.7 -150% | 8.43 -19% |
| Colorchecker dE 2000 calibrated * | 0.96 | 2.31 -141% | 0.8 17% | 4.2 -338% | 1.07 -11% | |
| Greyscale dE 2000 * | 4.7 | 2.2 53% | 1.9 60% | 2.7 43% | 2.1 55% | 6.2 -32% |
| Gamma | 2.29 96% | 2.36 93% | 2.12 104% | 2.08 106% | 2.03 108% | 2.2 100% |
| CCT | 6760 96% | 6154 106% | 6510 100% | 6210 105% | 6443 101% | 6469 100% |
| Color Space (Percent of AdobeRGB 1998) | 85.8 | 61.6 | 61.1 | |||
| Color Space (Percent of sRGB) | 100 | 97.2 | 94.9 | |||
| Total Average (Program / Settings) | 156% /
242% | -2% /
4% | 23% /
25% | -29% /
-46% | 2% /
-5% |
* ... smaller is better
The panel covers sRGB in its entirety much like most other mid-range to high-end Ultrabooks. For full P3 coverage, users would have to consider other models with certain 4K or OLED panels.
The manufacturer does not calibrate at factory as evident by our X-Rite colorimeter results. Once calibrated, average grayscale and color deltaE values would improve dramatically from 4.7 and 2.34 to just 1.0 and 0.96, respectively. We recommend an end-user calibration to get the most out of the display. Alternatively, users can also apply our calibrated ICM profile above.
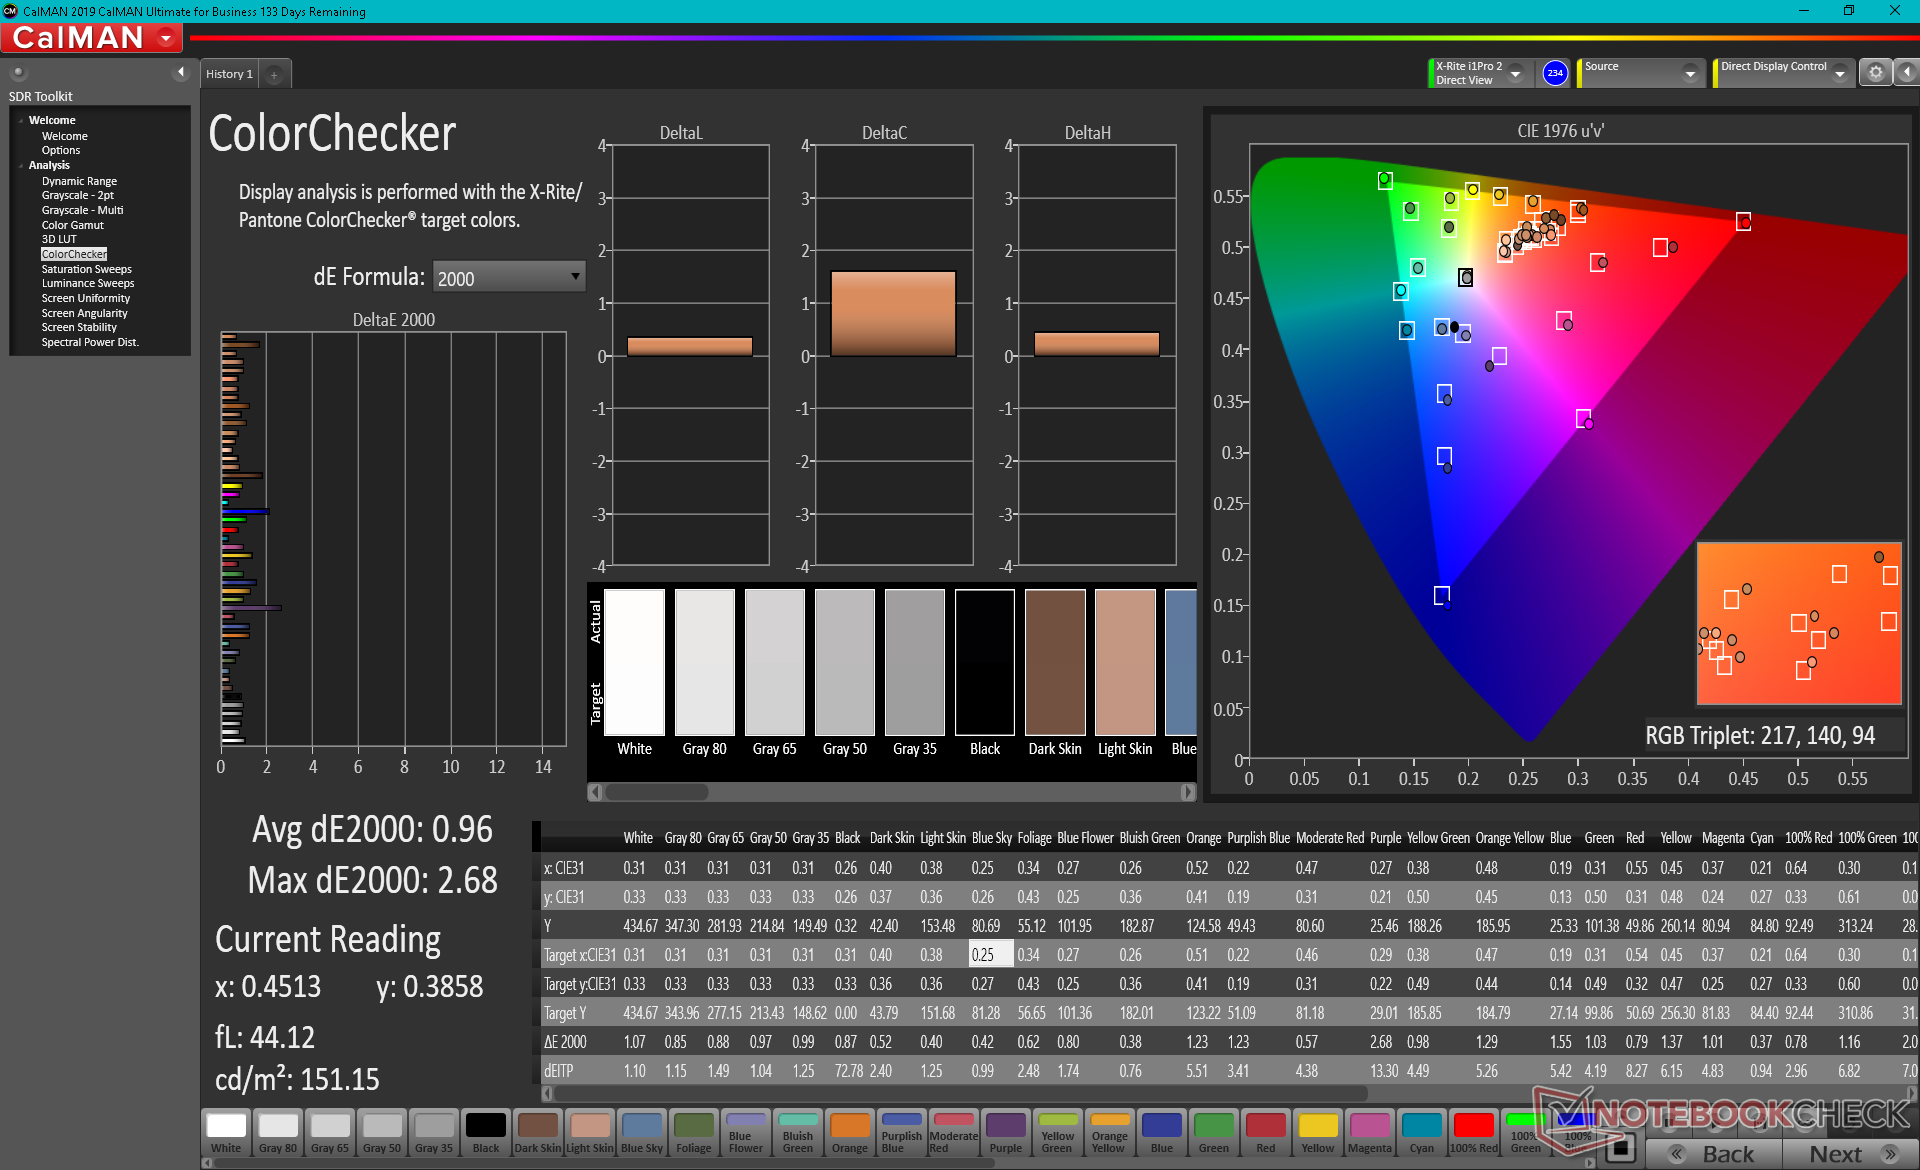
Display Response Times
| ↔ Response Time Black to White | ||
|---|---|---|
| 36 ms ... rise ↗ and fall ↘ combined | ↗ 21.2 ms rise | 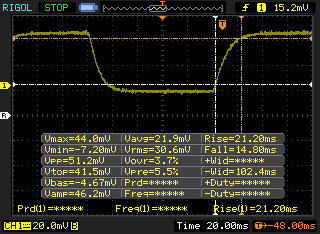 |
| ↘ 14.8 ms fall | ||
| The screen shows slow response rates in our tests and will be unsatisfactory for gamers. In comparison, all tested devices range from 0.1 (minimum) to 240 (maximum) ms. » 93 % of all devices are better. This means that the measured response time is worse than the average of all tested devices (20.5 ms). | ||
| ↔ Response Time 50% Grey to 80% Grey | ||
| 55.6 ms ... rise ↗ and fall ↘ combined | ↗ 27.2 ms rise | 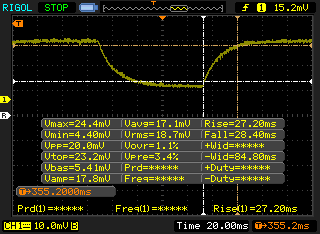 |
| ↘ 28.4 ms fall | ||
| The screen shows slow response rates in our tests and will be unsatisfactory for gamers. In comparison, all tested devices range from 0.165 (minimum) to 636 (maximum) ms. » 92 % of all devices are better. This means that the measured response time is worse than the average of all tested devices (32.1 ms). | ||
Screen Flickering / PWM (Pulse-Width Modulation)
| Screen flickering / PWM not detected |  | ||
In comparison: 53 % of all tested devices do not use PWM to dim the display. If PWM was detected, an average of 8327 (minimum: 5 - maximum: 343500) Hz was measured. | |||
Performance
Processor
CPU performance is within 5 percent of the average Core i7-1165G7 laptop in our database. The i7-1185G7 is slightly slower due to its innate support for vPro security features. Certain AMD CPUs like the Ryzen 5 5500U or Ryzen 7 5700U are able to offer even faster multi-thread performance at the cost of single-thread performance.
Downgrading to the Core i5-1135G7 SKU will net users a 10 to 15 percent loss in multi-thread performance when compared to our i7-1165G7 SKU.
Cinebench R15 Multi Loop
Cinebench R23: Multi Core | Single Core
Cinebench R15: CPU Multi 64Bit | CPU Single 64Bit
Blender: v2.79 BMW27 CPU
7-Zip 18.03: 7z b 4 -mmt1 | 7z b 4
Geekbench 5.5: Single-Core | Multi-Core
HWBOT x265 Benchmark v2.2: 4k Preset
LibreOffice : 20 Documents To PDF
R Benchmark 2.5: Overall mean
| Cinebench R23 / Multi Core | |
| Asus ZenBook 13 OLED UM325UA | |
| VAIO Z VJZ141C11L | |
| Lenovo Yoga 6 13 82ND0009US | |
| Framework Laptop 13.5 | |
| Microsoft Surface Laptop 4 13 i7 | |
| Average Intel Core i7-1165G7 (2525 - 6862, n=64) | |
| HP Spectre x360 13-aw2003dx | |
| Asus VivoBook S13 S333JA-DS51 | |
| Cinebench R23 / Single Core | |
| VAIO Z VJZ141C11L | |
| Microsoft Surface Laptop 4 13 i7 | |
| Framework Laptop 13.5 | |
| Average Intel Core i7-1165G7 (1110 - 1539, n=59) | |
| HP Spectre x360 13-aw2003dx | |
| Asus ZenBook 13 OLED UM325UA | |
| Lenovo Yoga 6 13 82ND0009US | |
| Asus VivoBook S13 S333JA-DS51 | |
| Geekbench 5.5 / Single-Core | |
| VAIO Z VJZ141C11L | |
| Microsoft Surface Laptop 4 13 i7 | |
| Average Intel Core i7-1165G7 (1302 - 1595, n=77) | |
| HP Spectre x360 13-aw2003dx | |
| Acer Spin 5 SP513-54N-79EY | |
| Asus ZenBook 13 OLED UM325UA | |
| Asus VivoBook S13 S333JA-DS51 | |
| HP Envy x360 13-ay0010nr | |
| Geekbench 5.5 / Multi-Core | |
| Asus ZenBook 13 OLED UM325UA | |
| VAIO Z VJZ141C11L | |
| Microsoft Surface Laptop 4 13 i7 | |
| HP Spectre x360 13-aw2003dx | |
| Average Intel Core i7-1165G7 (3078 - 5926, n=77) | |
| HP Envy x360 13-ay0010nr | |
| Asus VivoBook S13 S333JA-DS51 | |
| Acer Spin 5 SP513-54N-79EY | |
| HWBOT x265 Benchmark v2.2 / 4k Preset | |
| Asus ZenBook 13 OLED UM325UA | |
| VAIO Z VJZ141C11L | |
| Lenovo Yoga 6 13 82ND0009US | |
| Framework Laptop 13.5 | |
| HP Envy x360 13-ay0010nr | |
| Average Intel Core i7-1165G7 (1.39 - 8.47, n=80) | |
| HP Spectre x360 13-aw2003dx | |
| Microsoft Surface Laptop 4 13 i7 | |
| Asus VivoBook S13 S333JA-DS51 | |
| LibreOffice / 20 Documents To PDF | |
| Lenovo Yoga 6 13 82ND0009US | |
| HP Envy x360 13-ay0010nr | |
| Asus VivoBook S13 S333JA-DS51 | |
| Asus ZenBook 13 OLED UM325UA | |
| HP Spectre x360 13-aw2003dx | |
| Acer Spin 5 SP513-54N-79EY | |
| Microsoft Surface Laptop 4 13 i7 | |
| Average Intel Core i7-1165G7 (21.5 - 88.1, n=78) | |
| VAIO Z VJZ141C11L | |
| Framework Laptop 13.5 | |
| R Benchmark 2.5 / Overall mean | |
| Asus VivoBook S13 S333JA-DS51 | |
| HP Spectre x360 13-aw2003dx | |
| Lenovo Yoga 6 13 82ND0009US | |
| HP Envy x360 13-ay0010nr | |
| Asus ZenBook 13 OLED UM325UA | |
| Average Intel Core i7-1165G7 (0.552 - 1.002, n=80) | |
| Microsoft Surface Laptop 4 13 i7 | |
| Framework Laptop 13.5 | |
| VAIO Z VJZ141C11L | |
* ... smaller is better
System Performance
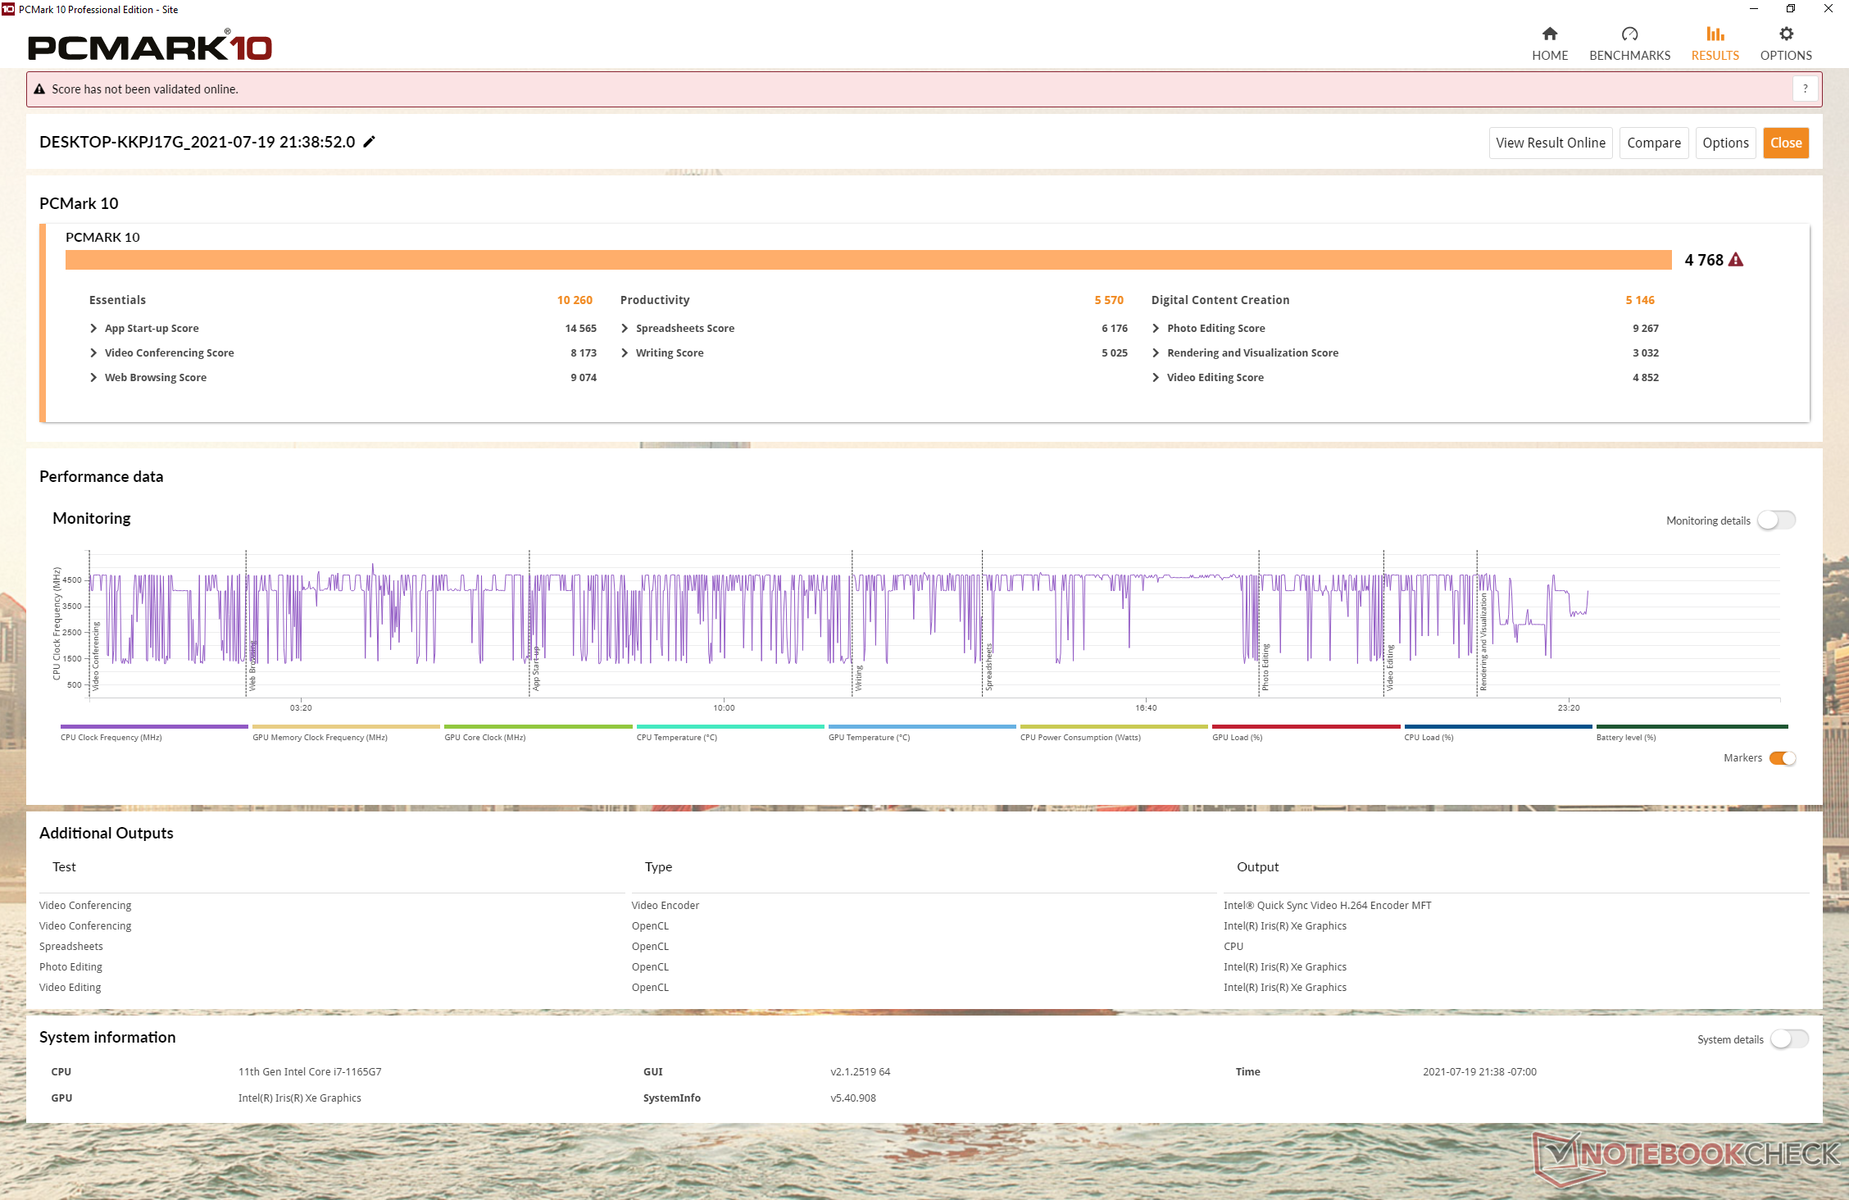
Average PCMark 10 results are where we expect them to be relative to other laptops with the same Core i7-1165G7 CPU. The Productivity benchmark score, however, is a bit lower expected.
| PCMark 10 / Score | |
| HP ProBook x360 435 G8 R7-5800U | |
| Lenovo Yoga 6 13 82ND0009US | |
| Average Intel Core i7-1165G7, Intel Iris Xe Graphics G7 96EUs (4531 - 5454, n=50) | |
| Microsoft Surface Laptop 4 13 i7 | |
| Framework Laptop 13.5 | |
| Lenovo ThinkPad X1 Titanium Yoga G1 20QA001RGE | |
| HP Spectre x360 14-ea0378ng | |
| PCMark 10 / Essentials | |
| Lenovo ThinkPad X1 Titanium Yoga G1 20QA001RGE | |
| Framework Laptop 13.5 | |
| Average Intel Core i7-1165G7, Intel Iris Xe Graphics G7 96EUs (8997 - 11505, n=50) | |
| Lenovo Yoga 6 13 82ND0009US | |
| HP ProBook x360 435 G8 R7-5800U | |
| HP Spectre x360 14-ea0378ng | |
| Microsoft Surface Laptop 4 13 i7 | |
| PCMark 10 / Productivity | |
| HP ProBook x360 435 G8 R7-5800U | |
| Lenovo Yoga 6 13 82ND0009US | |
| Average Intel Core i7-1165G7, Intel Iris Xe Graphics G7 96EUs (5570 - 7136, n=50) | |
| Microsoft Surface Laptop 4 13 i7 | |
| Lenovo ThinkPad X1 Titanium Yoga G1 20QA001RGE | |
| HP Spectre x360 14-ea0378ng | |
| Framework Laptop 13.5 | |
| PCMark 10 / Digital Content Creation | |
| Lenovo Yoga 6 13 82ND0009US | |
| HP ProBook x360 435 G8 R7-5800U | |
| Framework Laptop 13.5 | |
| Average Intel Core i7-1165G7, Intel Iris Xe Graphics G7 96EUs (4083 - 5550, n=50) | |
| Microsoft Surface Laptop 4 13 i7 | |
| HP Spectre x360 14-ea0378ng | |
| Lenovo ThinkPad X1 Titanium Yoga G1 20QA001RGE | |
| PCMark 10 Score | 4768 points | |
Help | ||
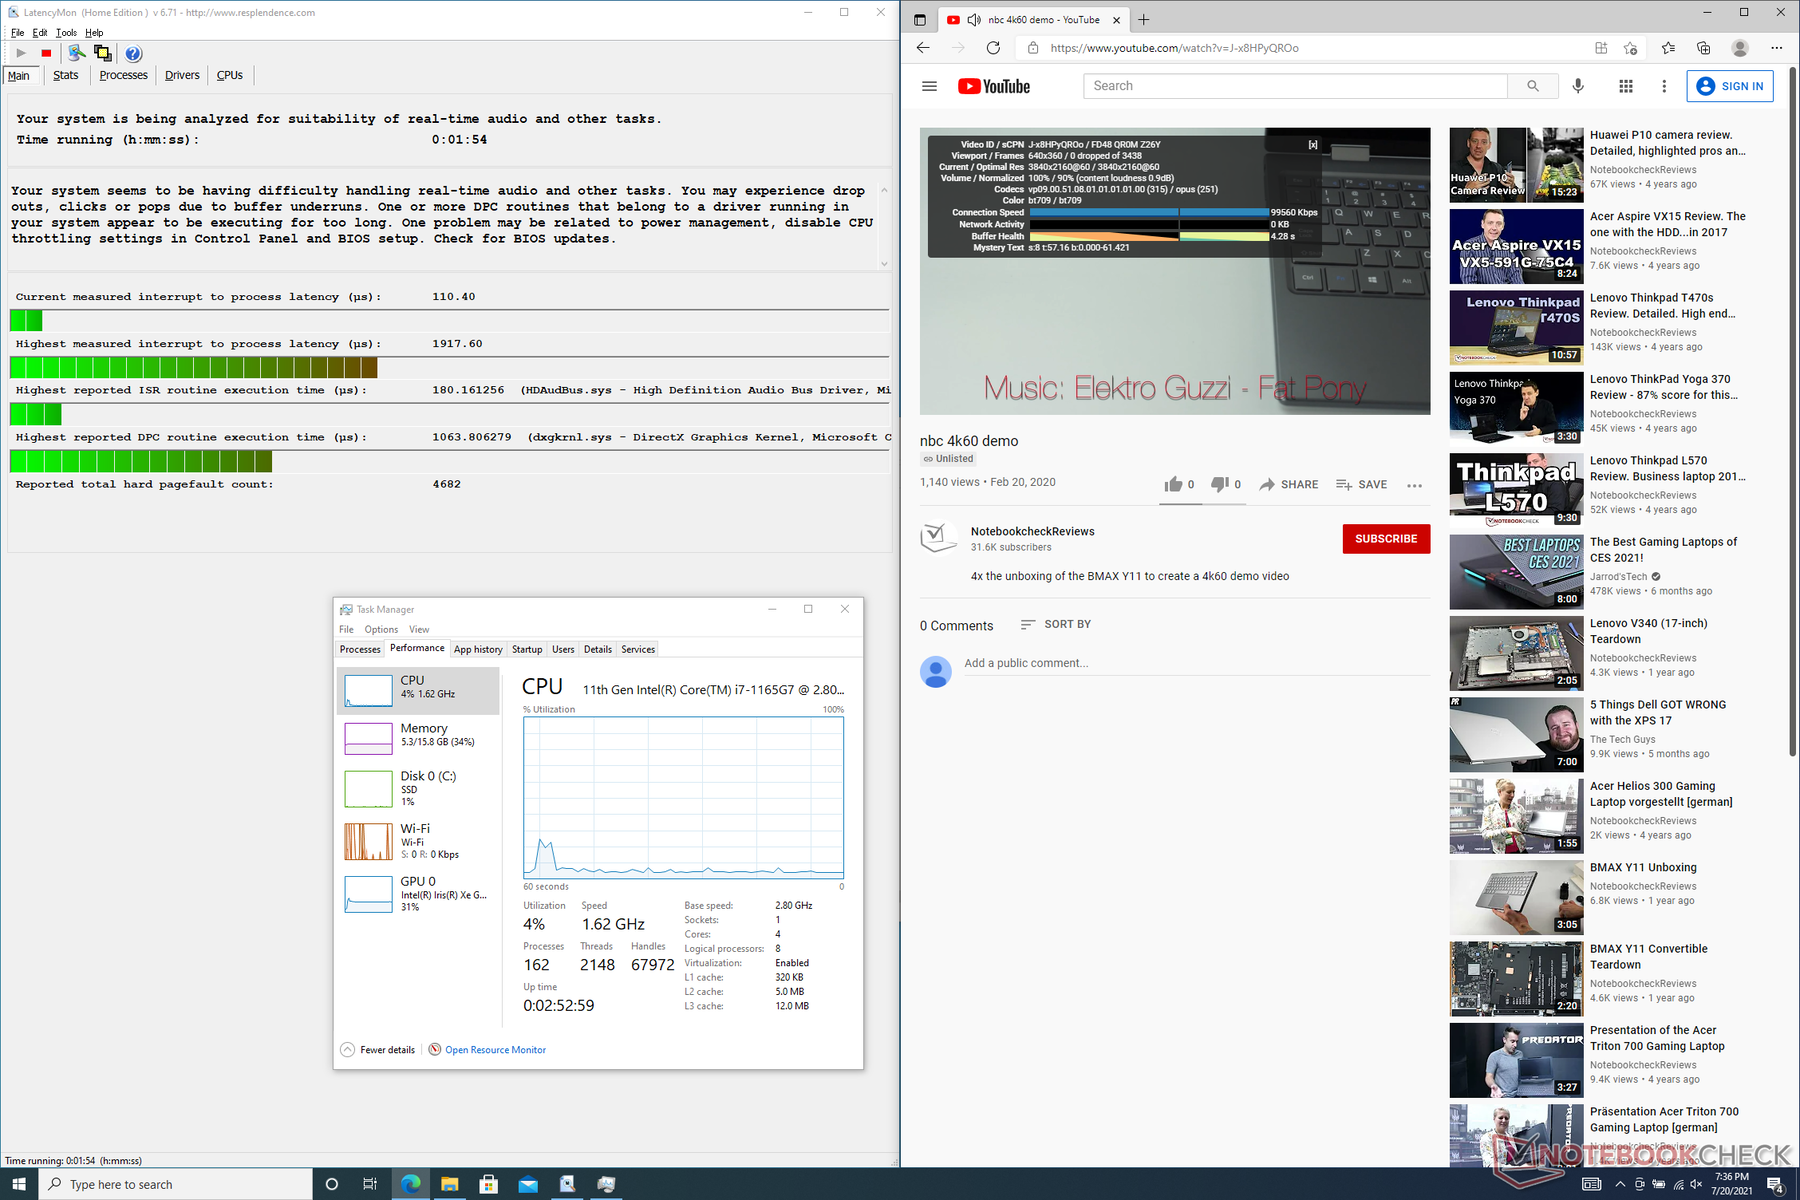
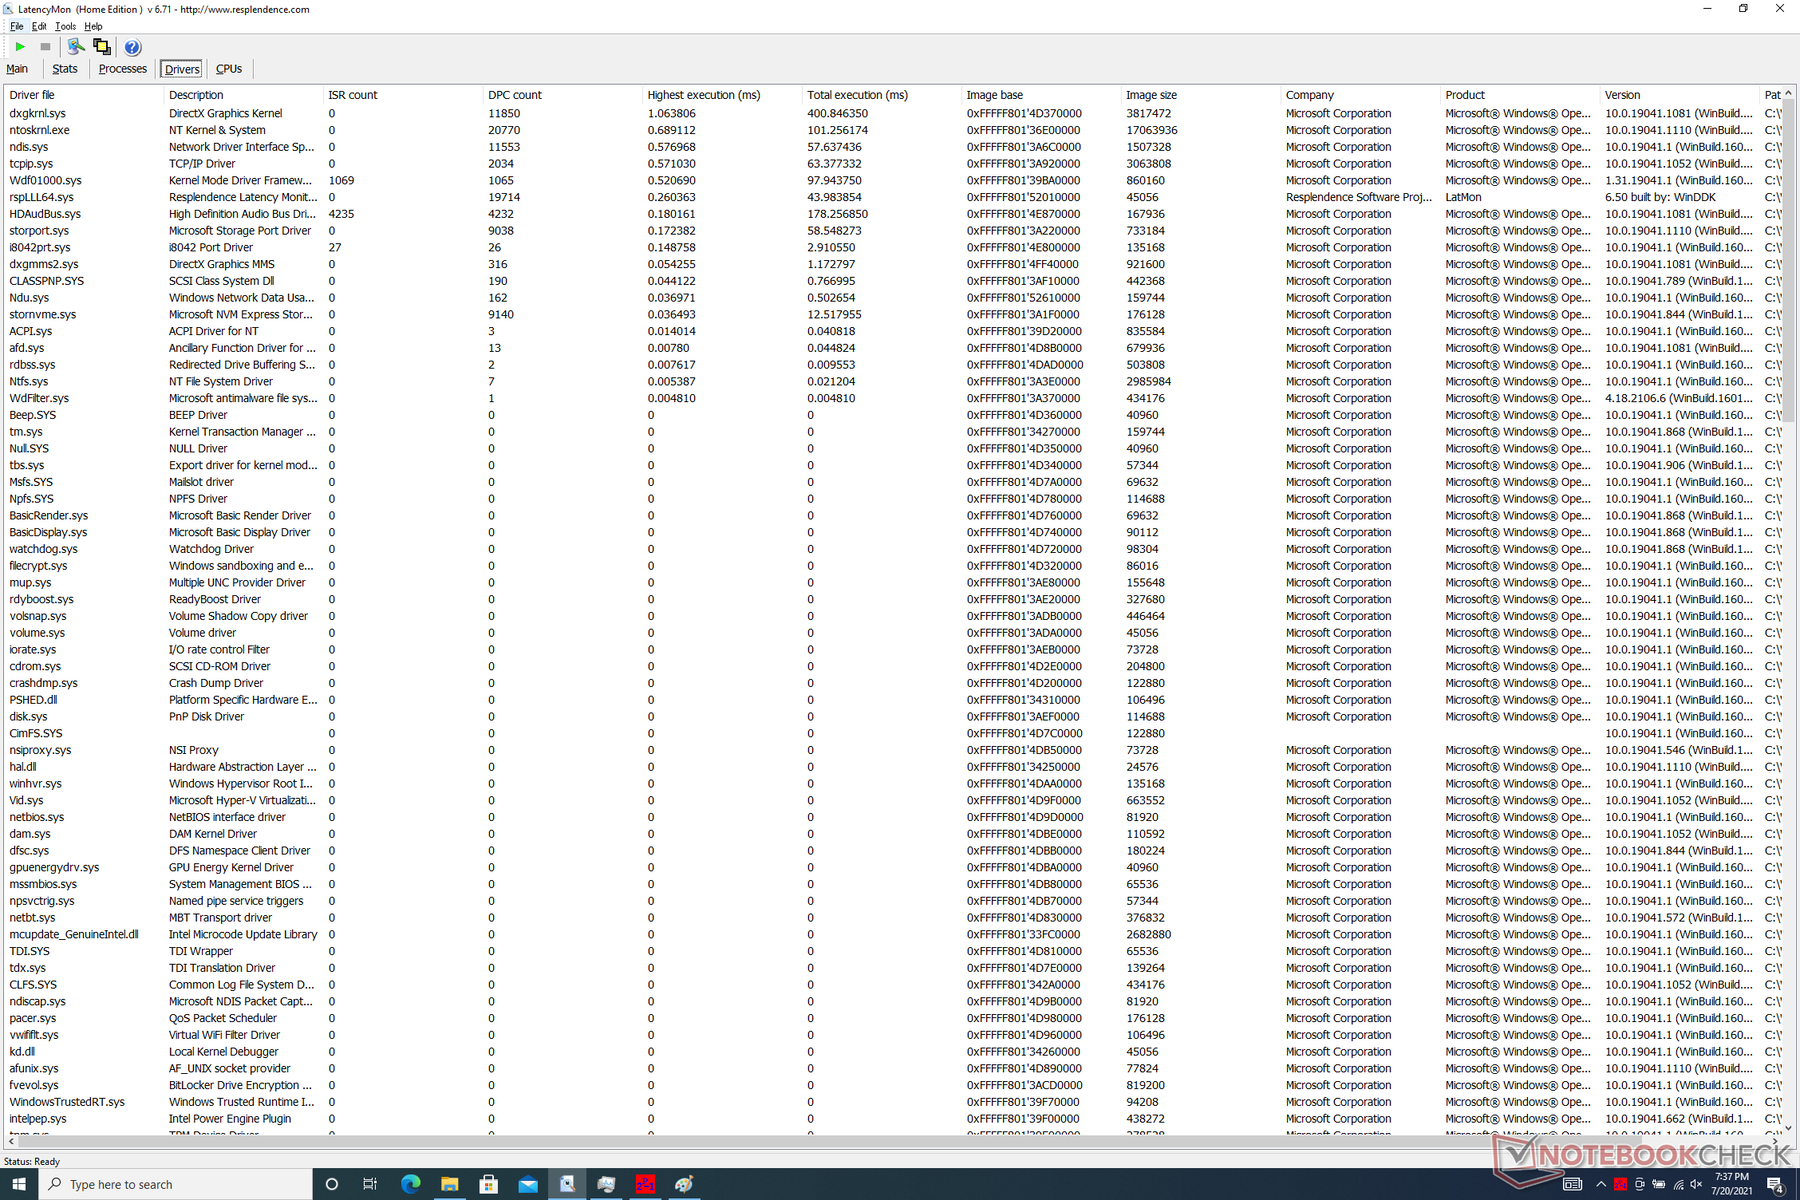
DPC Latency
LatencyMon reveals slight DPC latency issues when opening multiple browser tabs on our homepage. Video playback at 4K 60 FPS is otherwise smooth and without any dropped frames.
| DPC Latencies / LatencyMon - interrupt to process latency (max), Web, Youtube, Prime95 | |
| Framework Laptop 13.5 | |
| HP Spectre x360 14-ea0378ng | |
| Lenovo ThinkPad X1 Titanium Yoga G1 20QA001RGE | |
| Lenovo Yoga 6 13 82ND0009US | |
| Microsoft Surface Laptop 4 13 i7 | |
| HP ProBook x360 435 G8 R7-5800U | |
* ... smaller is better
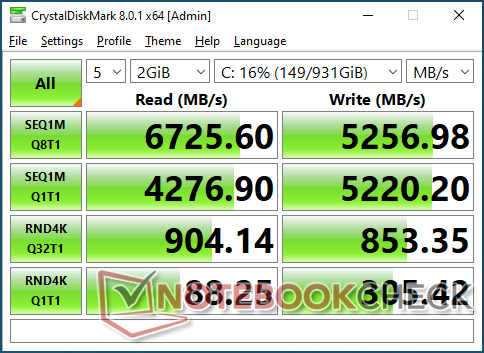
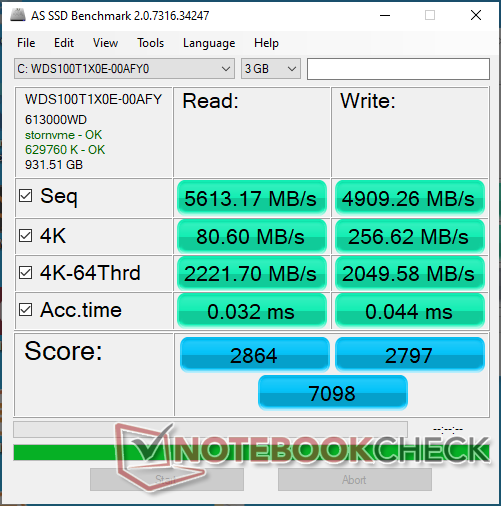
Storage Devices
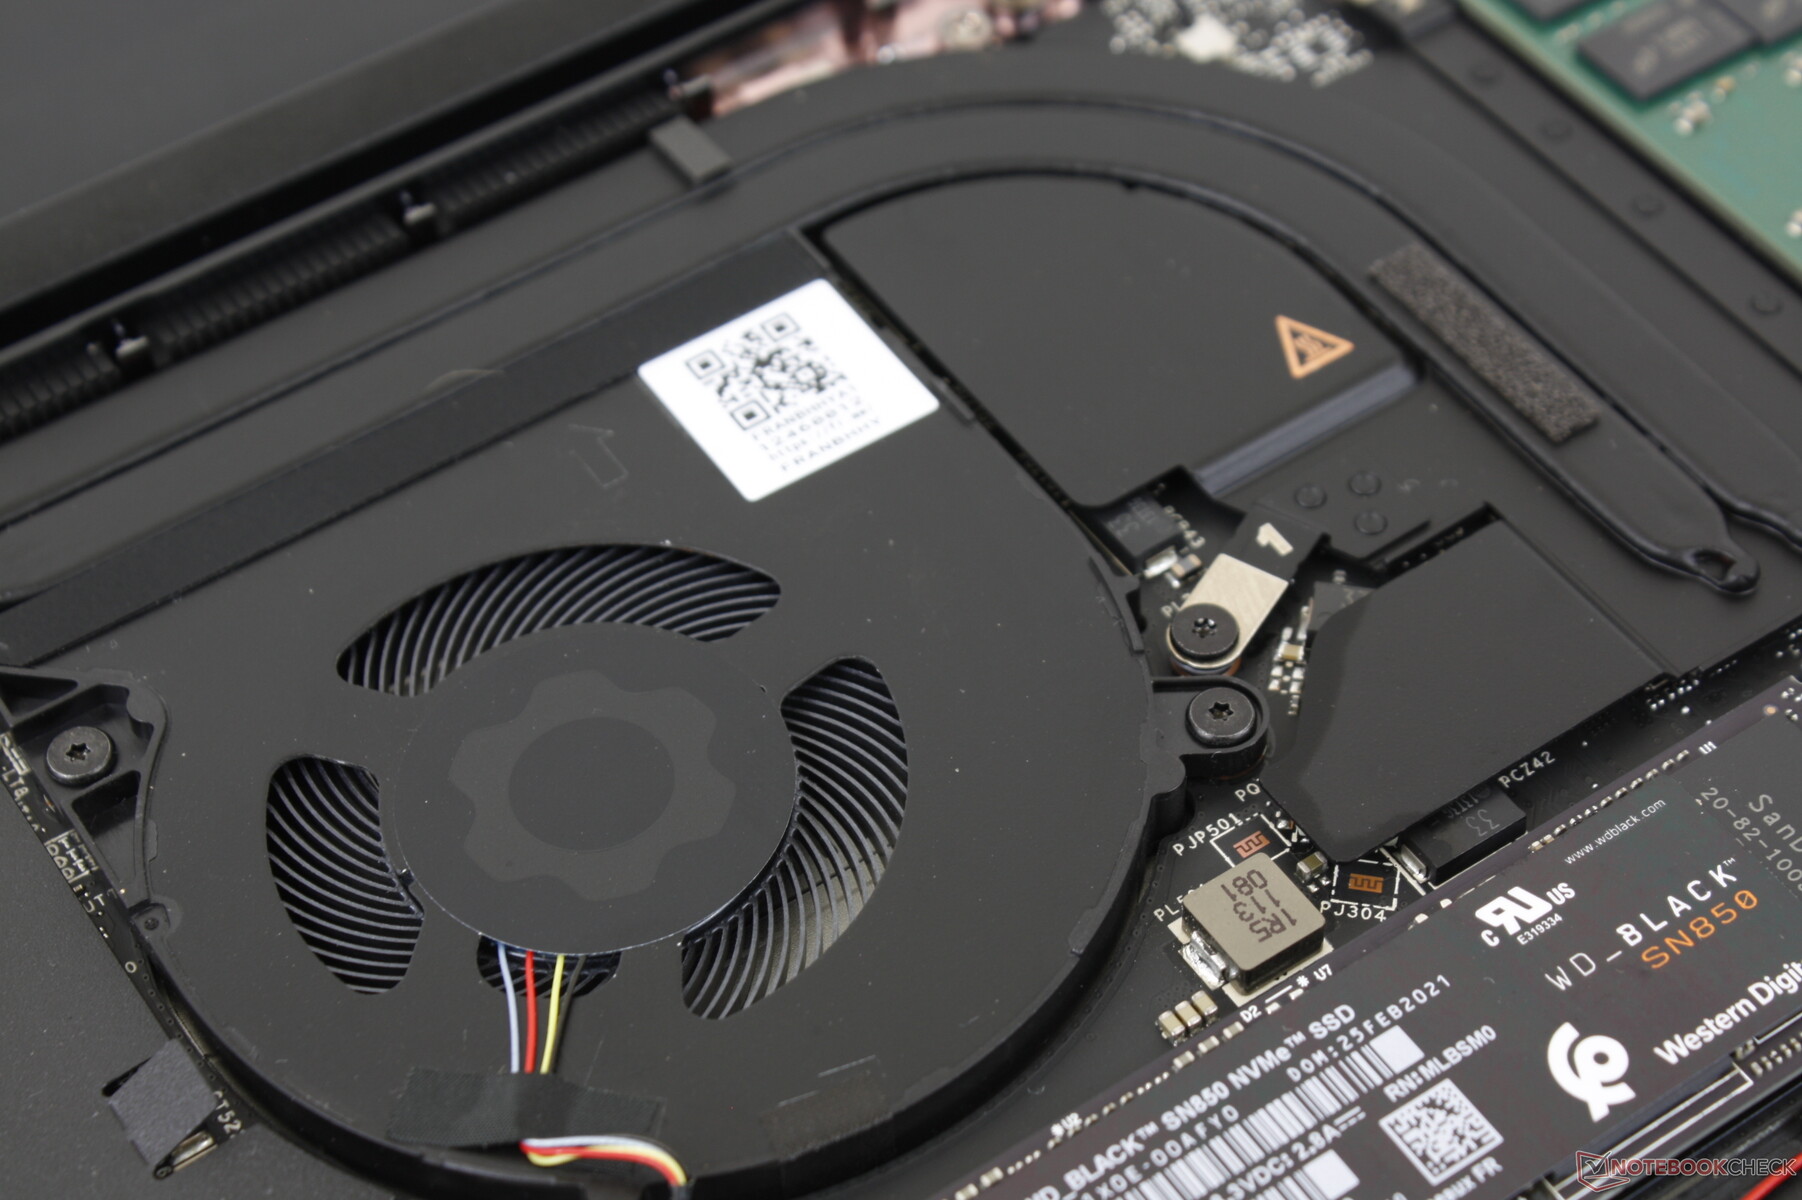
Users can install their own M.2 NVMe SSD up to a PCIe 4 part. The SSDs Framework will provide are all Western Digital Black drives ranging from the 250 GB SN750 to the 2 TB SN850.
| Framework Laptop 13.5 Western Digital WD_BLACK SN850 WDS100T1X0E | HP Spectre x360 14-ea0378ng Intel Optane Memory H10 with Solid State Storage 32GB + 1TB HBRPEKNX0203AH(L/H) | Microsoft Surface Laptop 4 13 i7 Samsung PM991 MZ9LQ512HALU | Lenovo ThinkPad X1 Titanium Yoga G1 20QA001RGE Toshiba BG4 KBG40ZNT512G | HP ProBook x360 435 G8 R7-5800U Samsung PM991 MZVLQ512HALU | Lenovo Yoga 6 13 82ND0009US WDC PC SN530 SDBPMPZ-265G | |
|---|---|---|---|---|---|---|
| AS SSD | -76% | -81% | -69% | -76% | -101% | |
| Seq Read | 5613 | 1343 -76% | 1821 -68% | 1898 -66% | 1936 -66% | 1860 -67% |
| Seq Write | 4909 | 1222 -75% | 794 -84% | 1065 -78% | 1237 -75% | 500 -90% |
| 4K Read | 80.6 | 63.6 -21% | 47.54 -41% | 58 -28% | 40.35 -50% | 36.26 -55% |
| 4K Write | 256.6 | 107.8 -58% | 141.6 -45% | 200.7 -22% | 99.5 -61% | 118.6 -54% |
| 4K-64 Read | 2222 | 417.5 -81% | 782 -65% | 580 -74% | 645 -71% | 419 -81% |
| 4K-64 Write | 2050 | 496 -76% | 766 -63% | 779 -62% | 365.8 -82% | 219 -89% |
| Access Time Read * | 0.032 | 0.103 -222% | 0.191 -497% | 0.052 -63% | 0.104 -225% | 0.102 -219% |
| Access Time Write * | 0.044 | 0.043 2% | 0.027 39% | 0.16 -264% | 0.038 14% | 0.17 -286% |
| Score Read | 2864 | 615 -79% | 1012 -65% | 828 -71% | 879 -69% | 641 -78% |
| Score Write | 2797 | 726 -74% | 987 -65% | 1087 -61% | 589 -79% | 388 -86% |
| Score Total | 7098 | 1675 -76% | 2477 -65% | 2316 -67% | 1892 -73% | 1300 -82% |
| Copy ISO MB/s | 1926 | 334.9 -83% | 1243 -35% | 1659 -14% | 708 -63% | 880 -54% |
| Copy Program MB/s | 947 | 276.3 -71% | 628 -34% | 519 -45% | 132.1 -86% | 185.3 -80% |
| Copy Game MB/s | 1880 | 433.2 -77% | 976 -48% | 872 -54% | 326.7 -83% | 212.7 -89% |
| CrystalDiskMark 5.2 / 6 | -42% | -67% | -49% | -67% | -68% | |
| Write 4K | 299.4 | 128.9 -57% | 118.2 -61% | 226.6 -24% | 86.7 -71% | 89.2 -70% |
| Read 4K | 87.6 | 140 60% | 37.54 -57% | 62.8 -28% | 32.45 -63% | 33.09 -62% |
| Write Seq | 5205 | 1422 -73% | 1017 -80% | 1296 -75% | 1235 -76% | 988 -81% |
| Read Seq | 4276 | 1660 -61% | 926 -78% | 1445 -66% | 1417 -67% | 1322 -69% |
| Write 4K Q32T1 | 846 | 475.1 -44% | 354.2 -58% | 545 -36% | 390.8 -54% | 332.6 -61% |
| Read 4K Q32T1 | 905 | 581 -36% | 352.6 -61% | 687 -24% | 291 -68% | 389.3 -57% |
| Write Seq Q32T1 | 5189 | 1793 -65% | 1174 -77% | 1483 -71% | 1384 -73% | 984 -81% |
| Read Seq Q32T1 | 6921 | 2536 -63% | 2261 -67% | 2334 -66% | 2350 -66% | 2461 -64% |
| Total Average (Program / Settings) | -59% /
-64% | -74% /
-76% | -59% /
-62% | -72% /
-73% | -85% /
-89% |
* ... smaller is better

Disk Throttling: DiskSpd Read Loop, Queue Depth 8
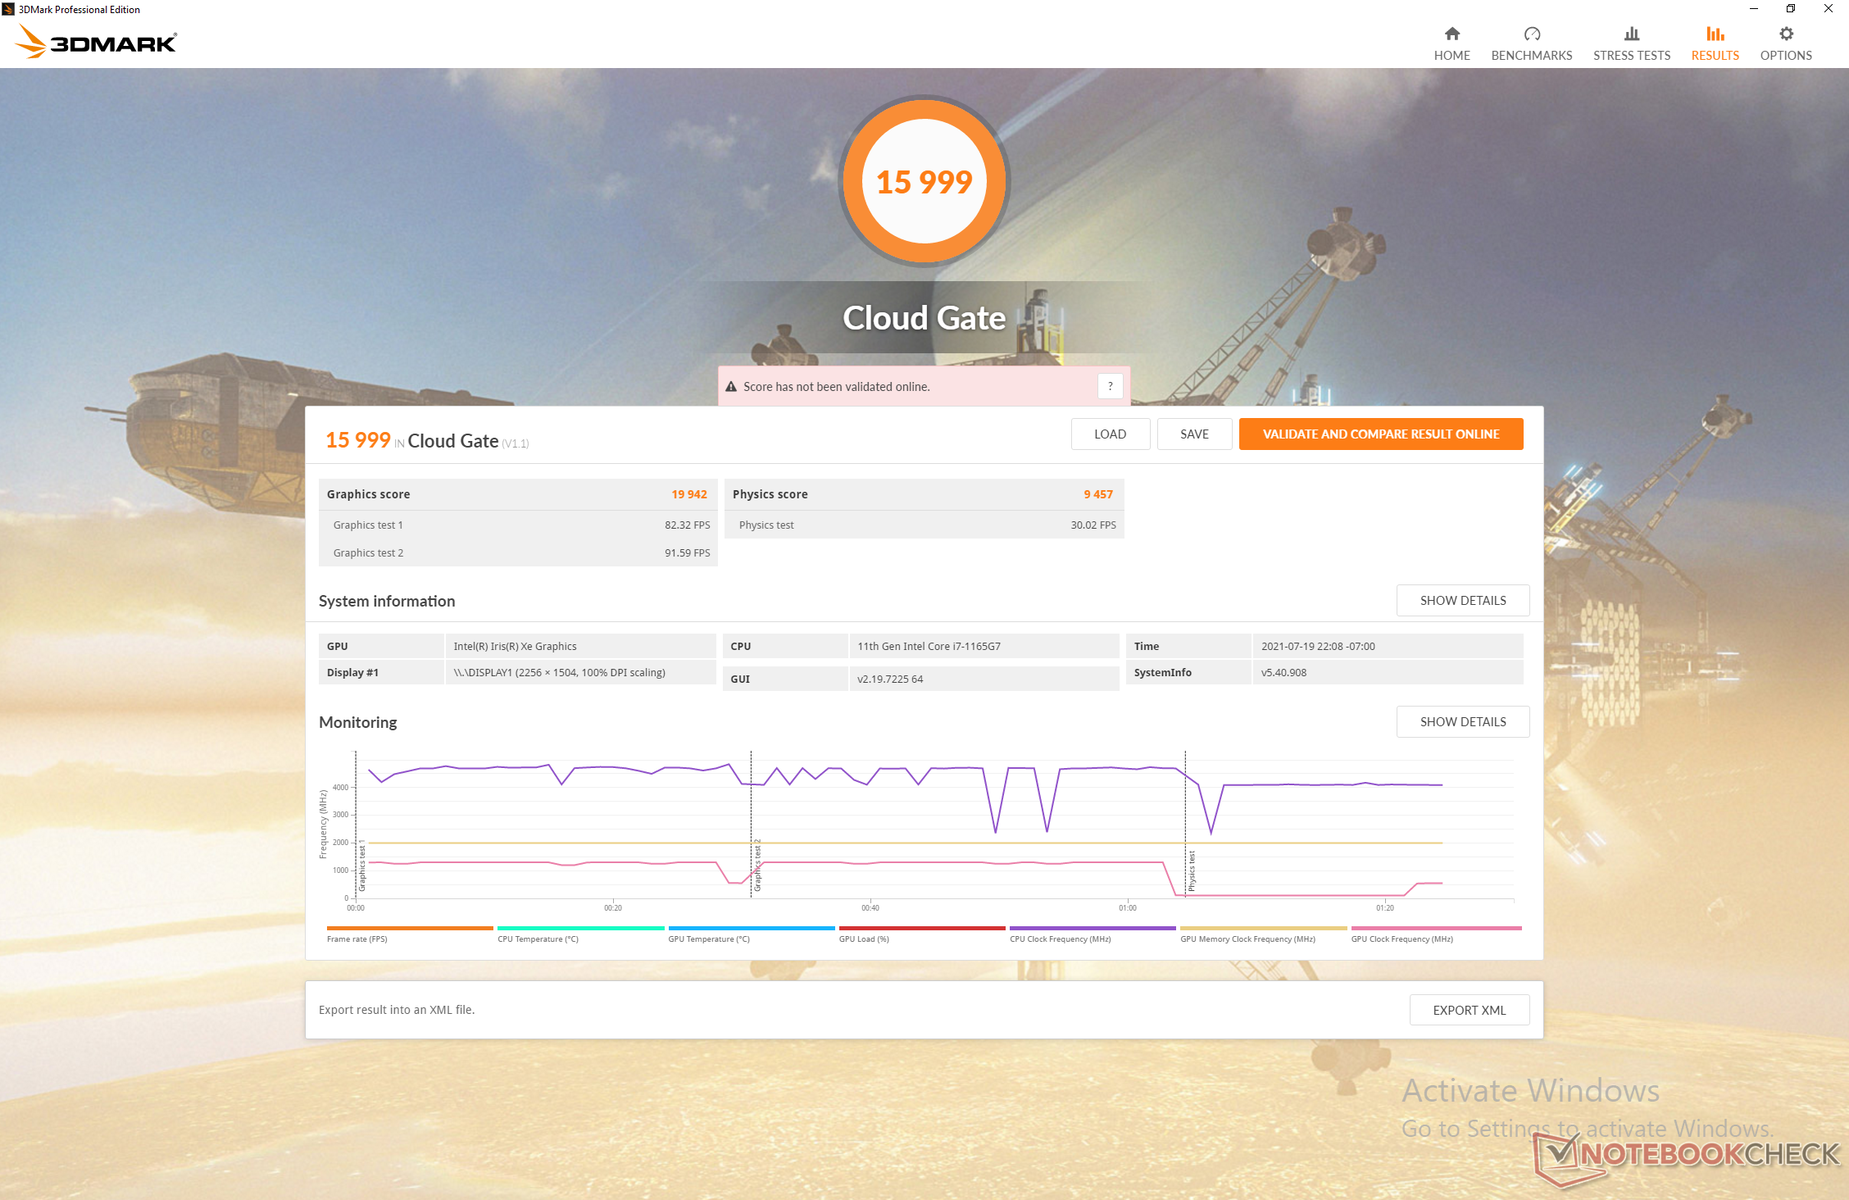
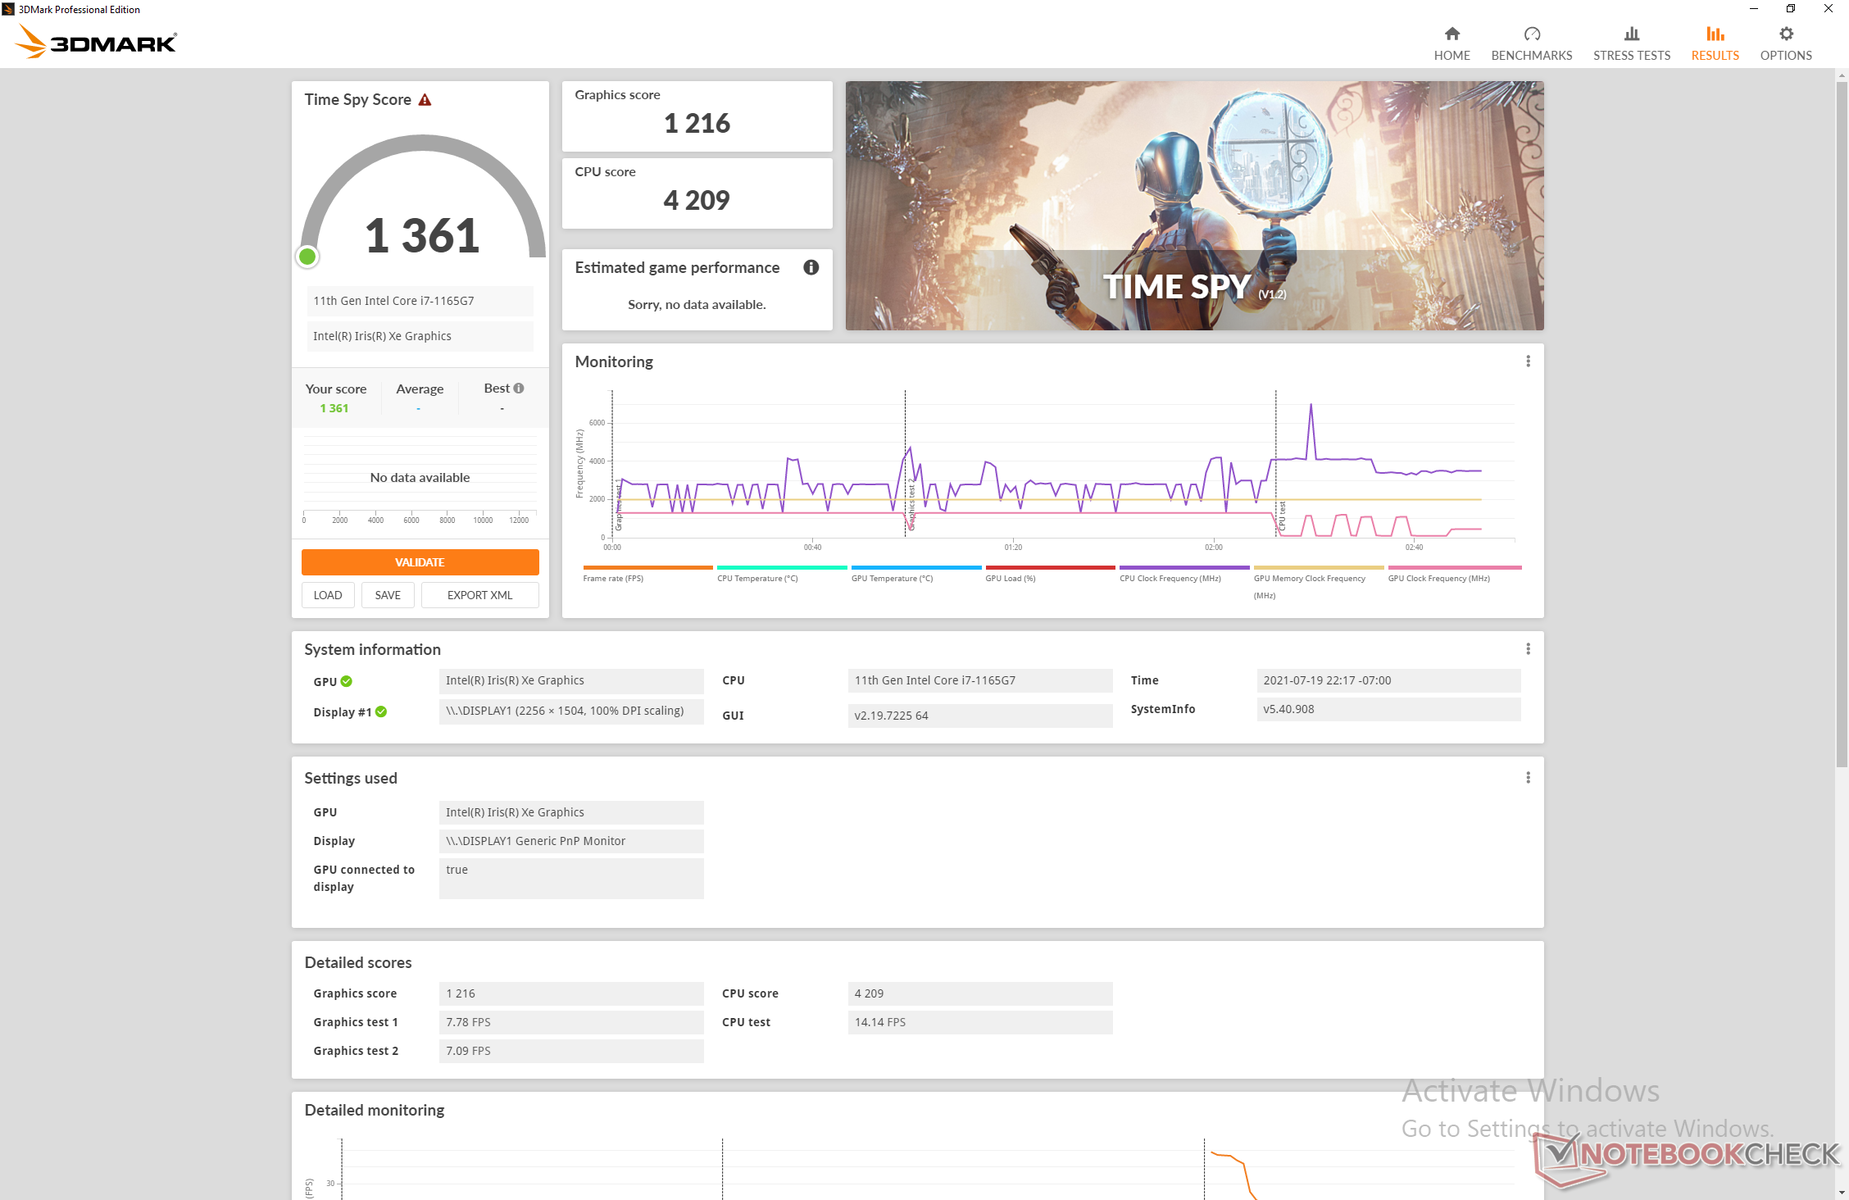
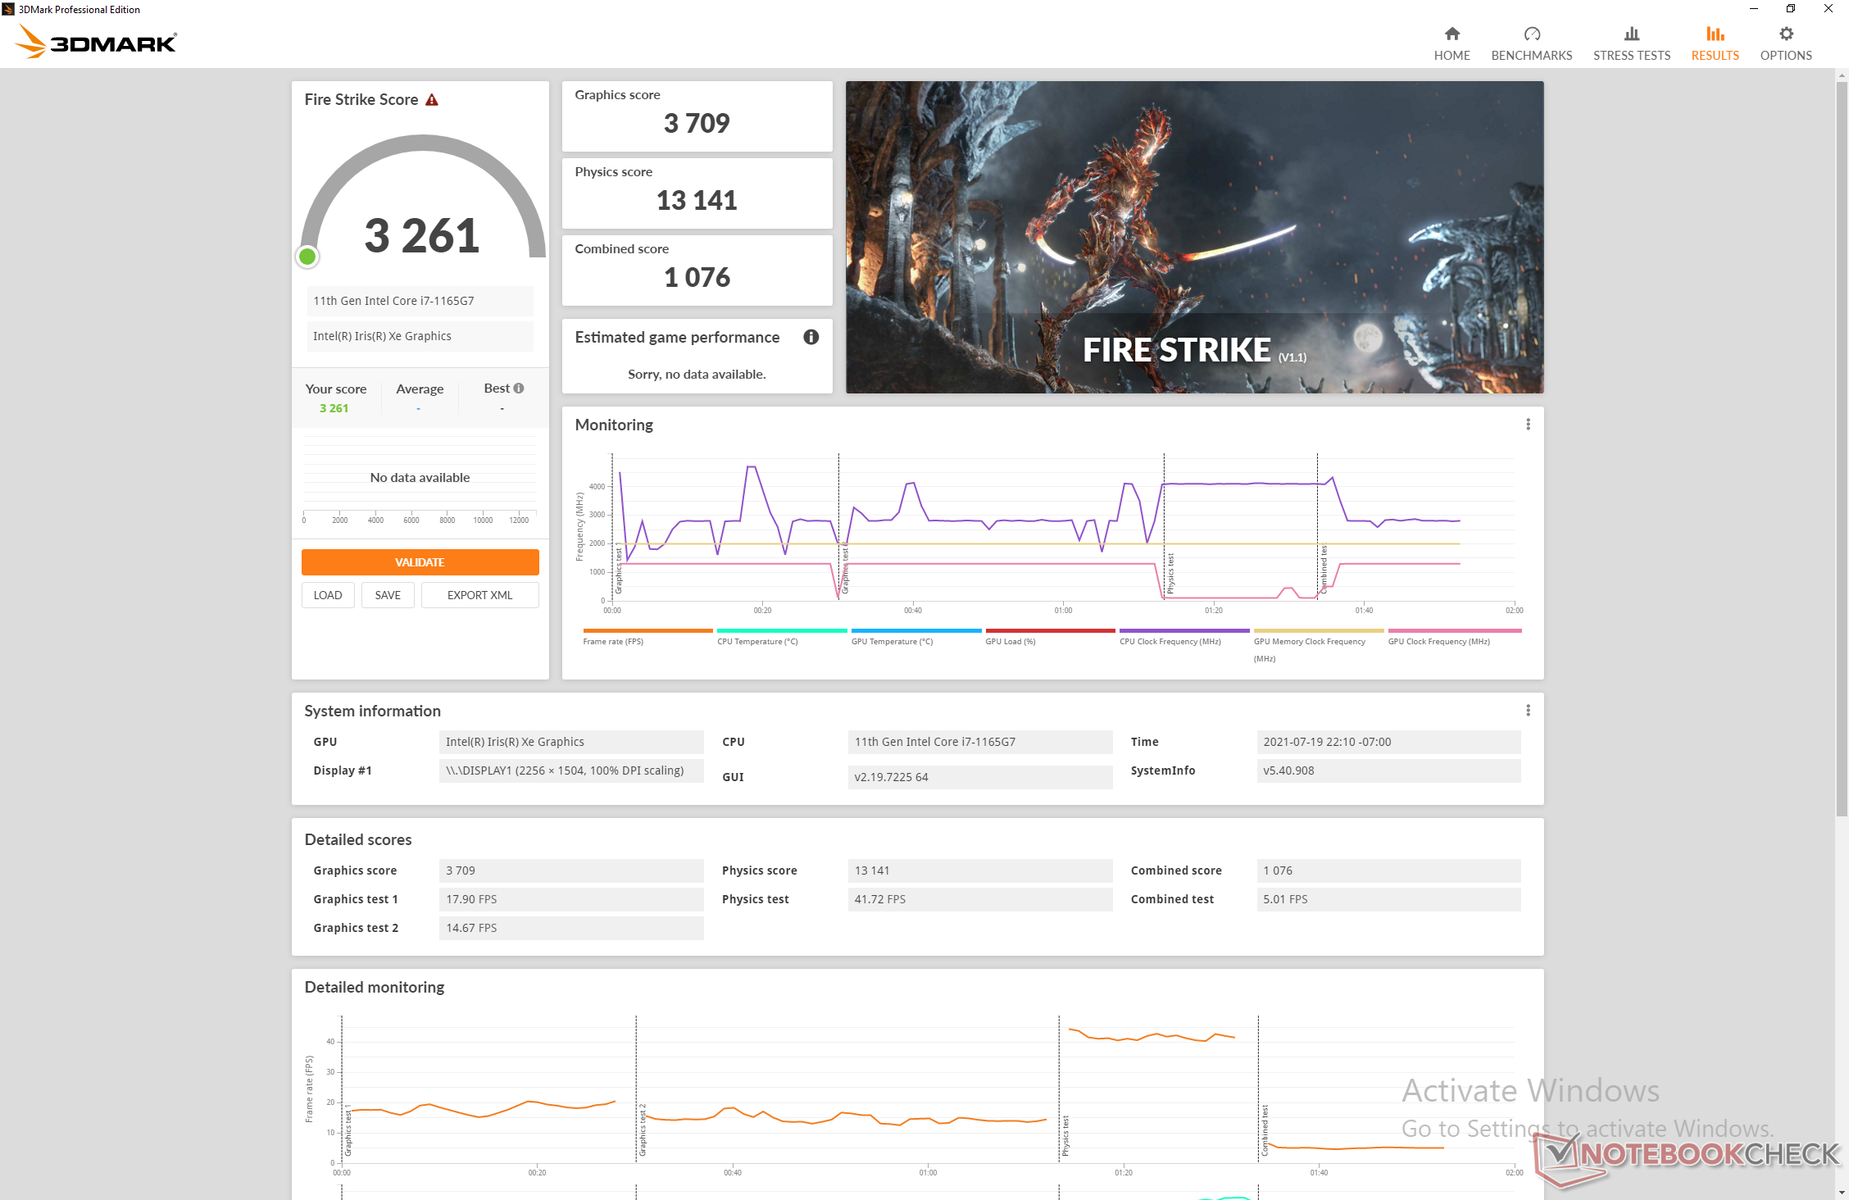
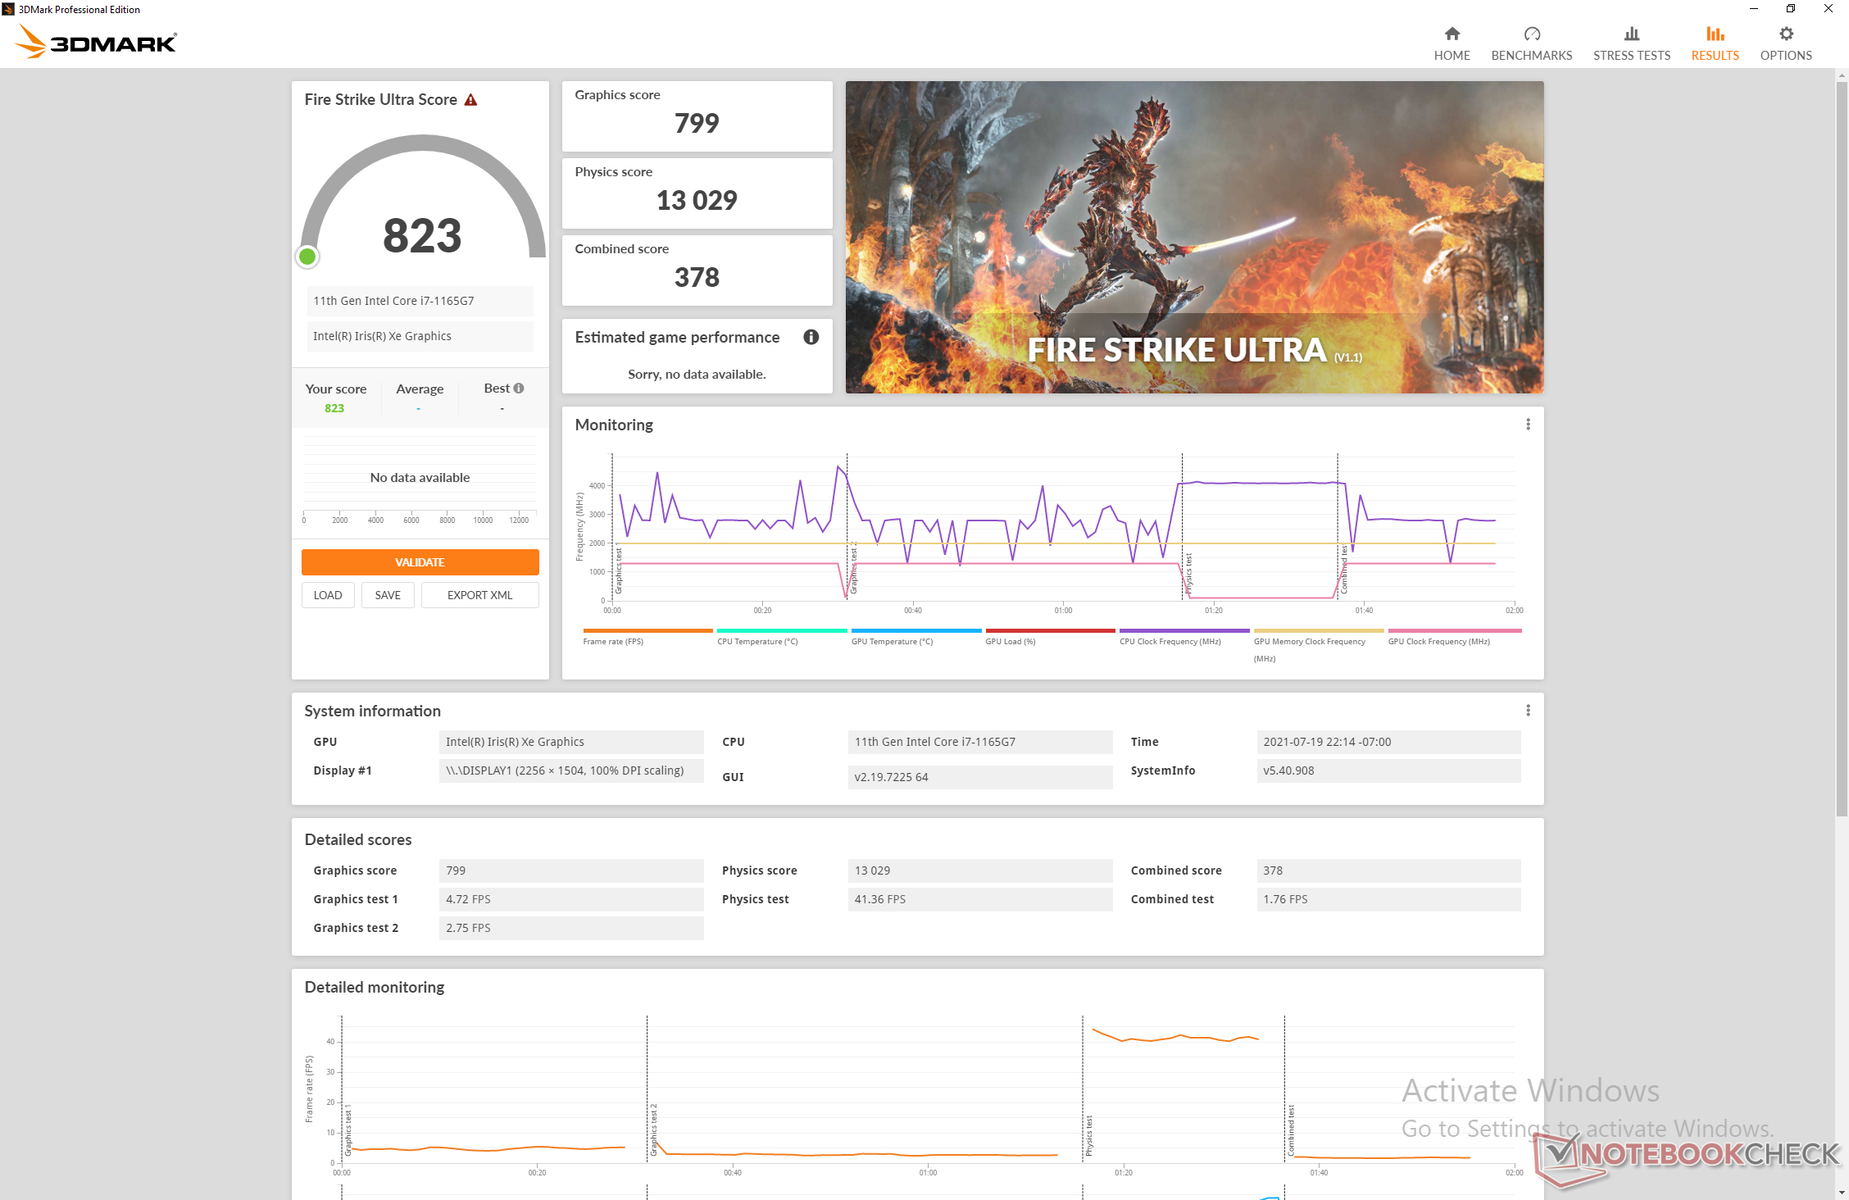
GPU Performance
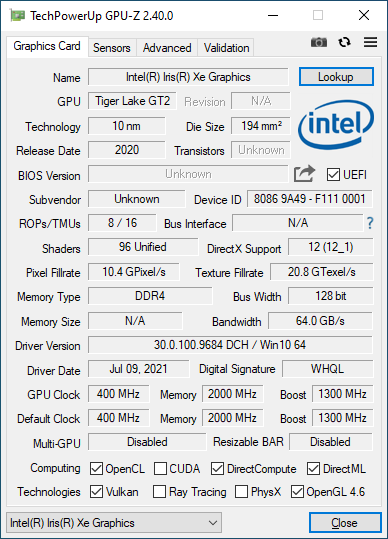
Graphics performance is 15 to 25 percent slower than the average Iris Xe 96 EUs in our database due to the single-channel RAM on our test unit. Users can easily close this gap by installing dual-channel RAM.
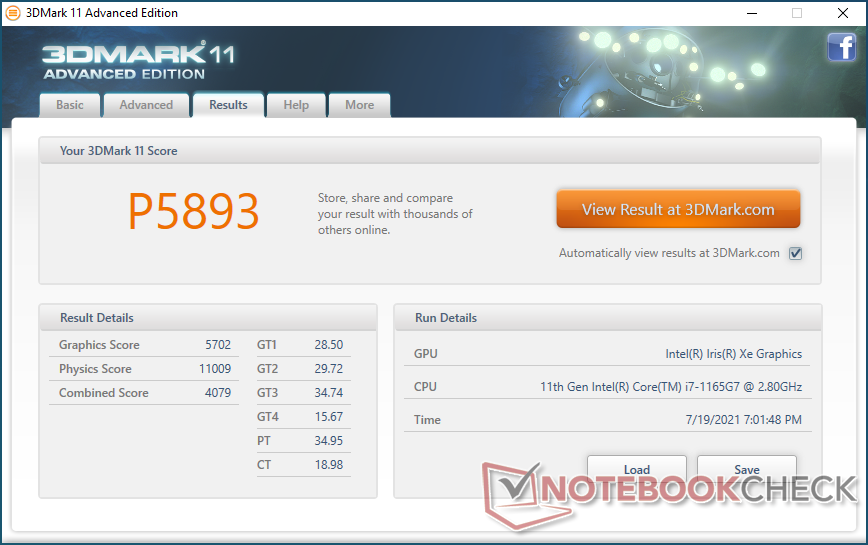
| 3DMark 11 Performance | 5893 points | |
| 3DMark Cloud Gate Standard Score | 15999 points | |
| 3DMark Fire Strike Score | 2361 points | |
| 3DMark Time Spy Score | 1361 points | |
Help | ||
Witcher 3 FPS Chart
| low | med. | high | ultra | |
|---|---|---|---|---|
| The Witcher 3 (2015) | 75.9 | 45.1 | 22.1 | 12 |
| Dota 2 Reborn (2015) | 109 | 66.1 | 41.2 | 38.2 |
| Final Fantasy XV Benchmark (2018) | 29.4 | 15.7 | 12.1 | |
| X-Plane 11.11 (2018) | 41.3 | 36.5 | 29.5 |
Emissions
System Noise
While quiet when simply browsing or word processing, the fan in the Framework can get louder more quickly than on most other Ultrabooks. Running the first 90-second benchmark scene of 3DMark 06 would cause the fan to rise to 45.6 dB(A) compared to only 37.5 dB(A) or 39.5 dB(A) on the HP Spectre x360 14 or Surface Laptop 4 13, respectively. The fan will be even louder when running games.
| Framework Laptop 13.5 Iris Xe G7 96EUs, i7-1165G7, Western Digital WD_BLACK SN850 WDS100T1X0E | HP Spectre x360 14-ea0378ng Iris Xe G7 96EUs, i7-1165G7, Intel Optane Memory H10 with Solid State Storage 32GB + 1TB HBRPEKNX0203AH(L/H) | Microsoft Surface Laptop 4 13 i7 Iris Xe G7 96EUs, i7-1185G7, Samsung PM991 MZ9LQ512HALU | Lenovo ThinkPad X1 Titanium Yoga G1 20QA001RGE Iris Xe G7 96EUs, i7-1160G7, Toshiba BG4 KBG40ZNT512G | Lenovo Yoga 6 13 82ND0009US Vega 7, R5 5500U, WDC PC SN530 SDBPMPZ-265G | Asus Zenbook 14 UX433FN-A6023T GeForce MX150, i7-8565U, Intel SSD 660p SSDPEKNW512G8 | |
|---|---|---|---|---|---|---|
| Noise | 1% | 5% | 8% | 4% | -13% | |
| off / environment * | 23.9 | 26 -9% | 24.2 -1% | 25.1 -5% | 25.1 -5% | 30.7 -28% |
| Idle Minimum * | 23.9 | 26 -9% | 24.2 -1% | 25.1 -5% | 25.1 -5% | 30.7 -28% |
| Idle Average * | 23.9 | 26 -9% | 24.2 -1% | 25.1 -5% | 25.1 -5% | 30.7 -28% |
| Idle Maximum * | 23.9 | 26 -9% | 24.2 -1% | 27.1 -13% | 25.1 -5% | 30.7 -28% |
| Load Average * | 45.6 | 37.5 18% | 39.5 13% | 32.7 28% | 41 10% | 38.8 15% |
| Witcher 3 ultra * | 47.1 | 32.7 31% | 38.6 18% | |||
| Load Maximum * | 47.9 | 36.3 24% | 39.5 18% | 35.8 25% | 38.7 19% | 39.3 18% |
* ... smaller is better
Noise Level
| Idle |
| 23.9 / 23.9 / 23.9 dB(A) |
| Load |
| 45.6 / 47.9 dB(A) |
 | ||
30 dB silent 40 dB(A) audible 50 dB(A) loud |
||
min: | ||
Temperature
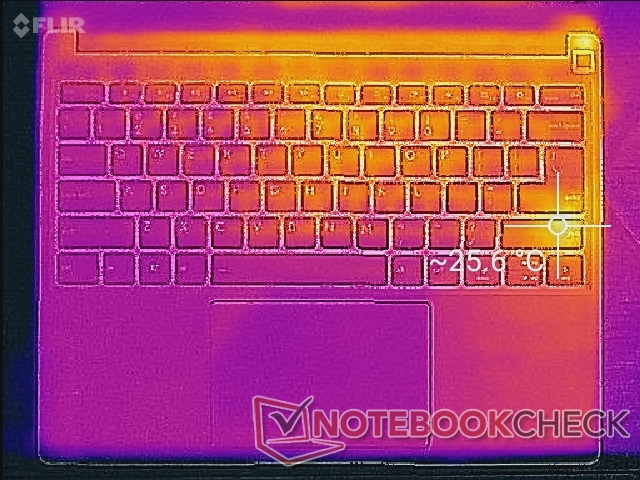
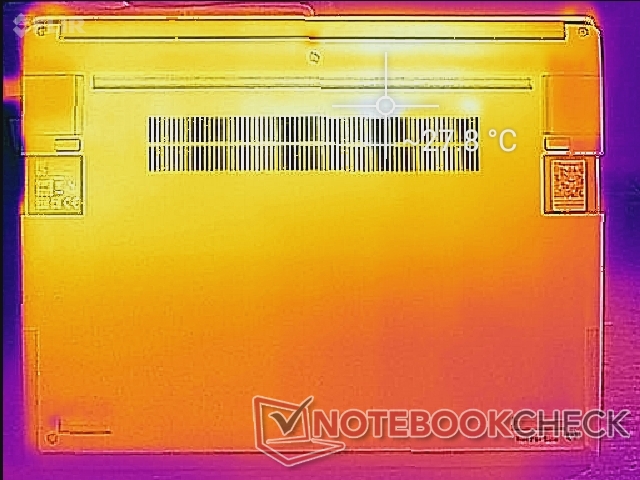
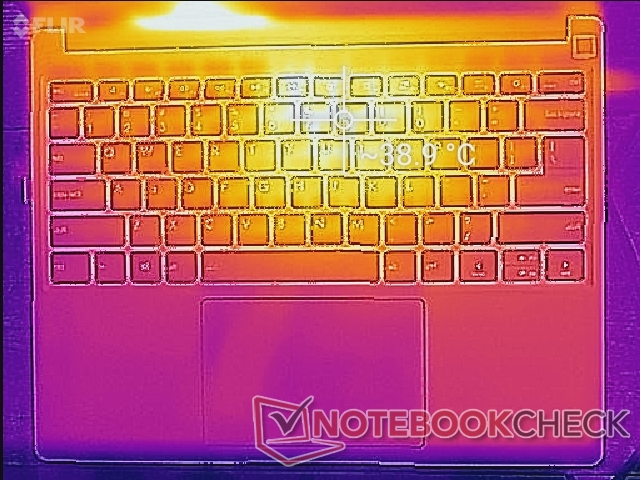
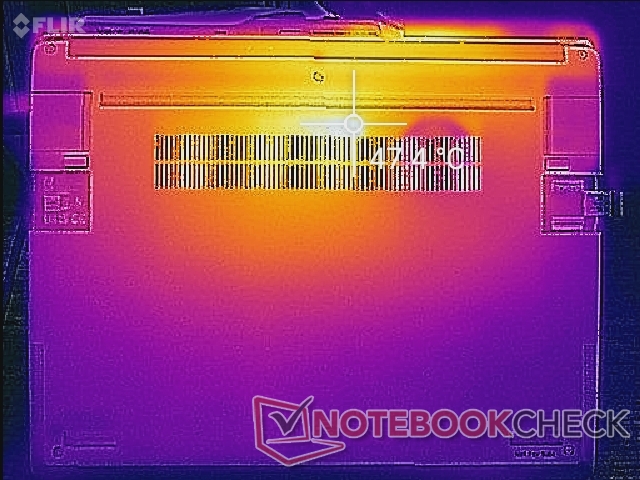
Hot spots are nearest the center rear of the chassis where they can reach up to 39 C on top or 48 C on the bottom as shown by the temperature maps below. The palm rest areas remain cool for comfortable use no matter the load.
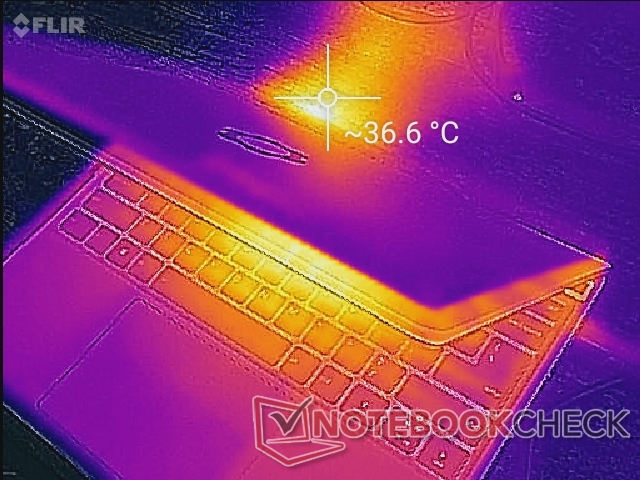
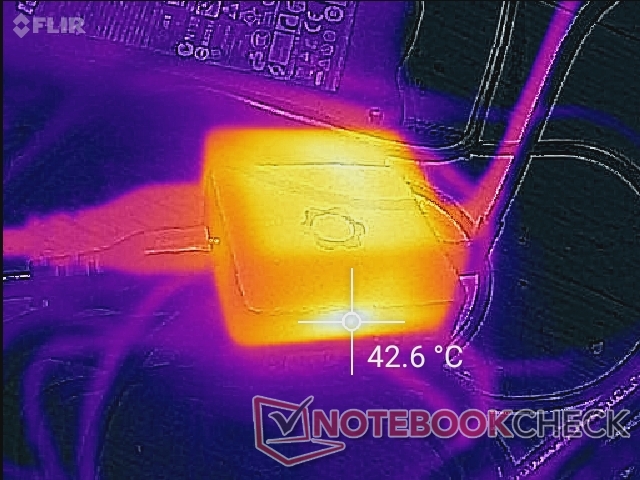
(-) The maximum temperature on the upper side is 47.2 °C / 117 F, compared to the average of 34.3 °C / 94 F, ranging from 21.2 to 62.5 °C for the class Office.
(+) The bottom heats up to a maximum of 39.4 °C / 103 F, compared to the average of 36.8 °C / 98 F
(+) In idle usage, the average temperature for the upper side is 23.5 °C / 74 F, compared to the device average of 29.5 °C / 85 F.
(+) The palmrests and touchpad are cooler than skin temperature with a maximum of 28.2 °C / 82.8 F and are therefore cool to the touch.
(±) The average temperature of the palmrest area of similar devices was 27.6 °C / 81.7 F (-0.6 °C / -1.1 F).
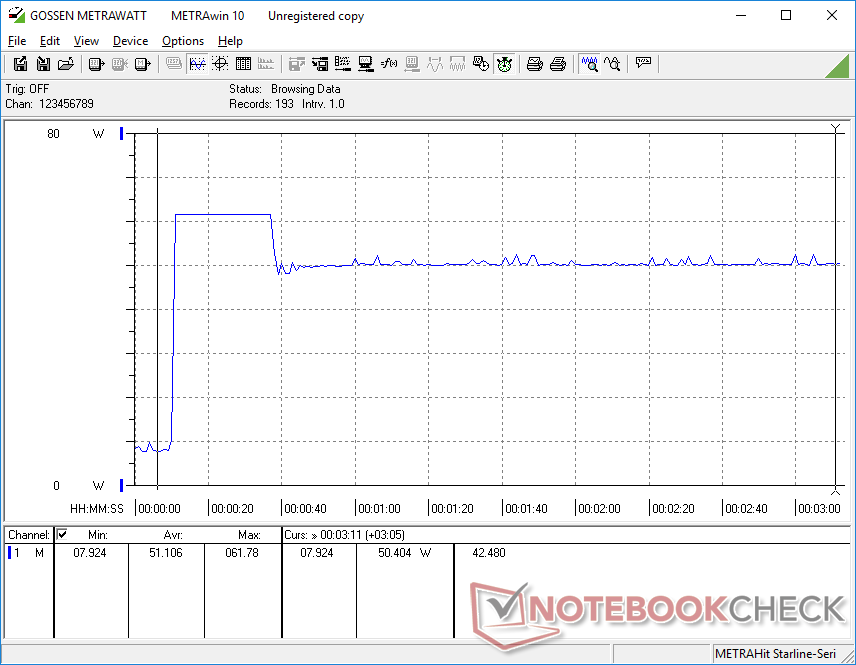
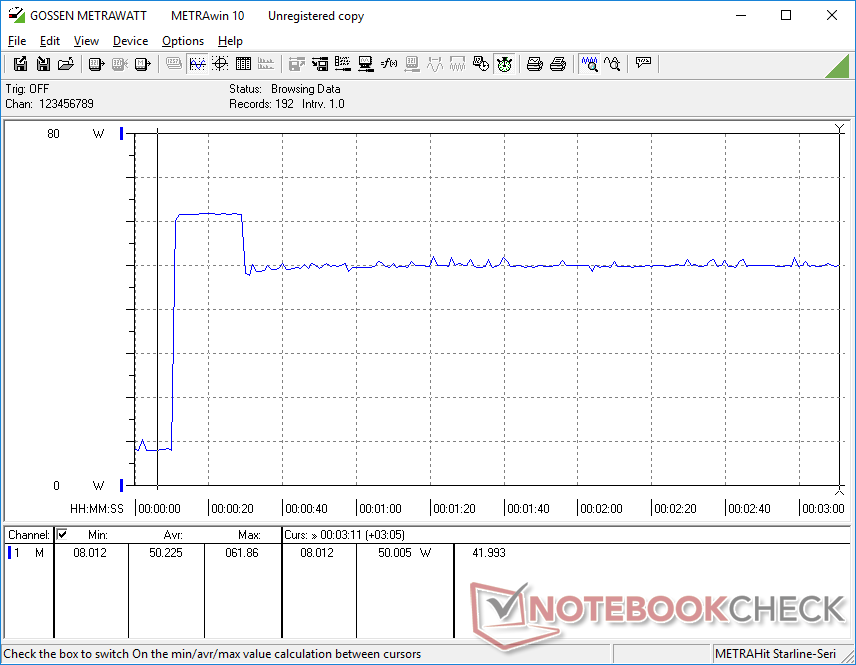
Stress Test
Running Prime95 causes the CPU to boost to 4.1 GHz for only a few seconds until hitting a core temperature of 101 C. Clock rates would then fall and stabilize at around 3.0 GHz in order to maintain a cooler core temperature of 82 C. Running this same test on the ADATA XPG Xenia 14 with the exact same Core i7 CPU results in both higher core clock rates and higher temperatures.
Running on battery power will limit performance slightly. A 3DMark 11 test on batteries would return Physics and Graphics scores of 10095 and 5563 points, respectively, compared to 11009 and 5702 points when on mains.
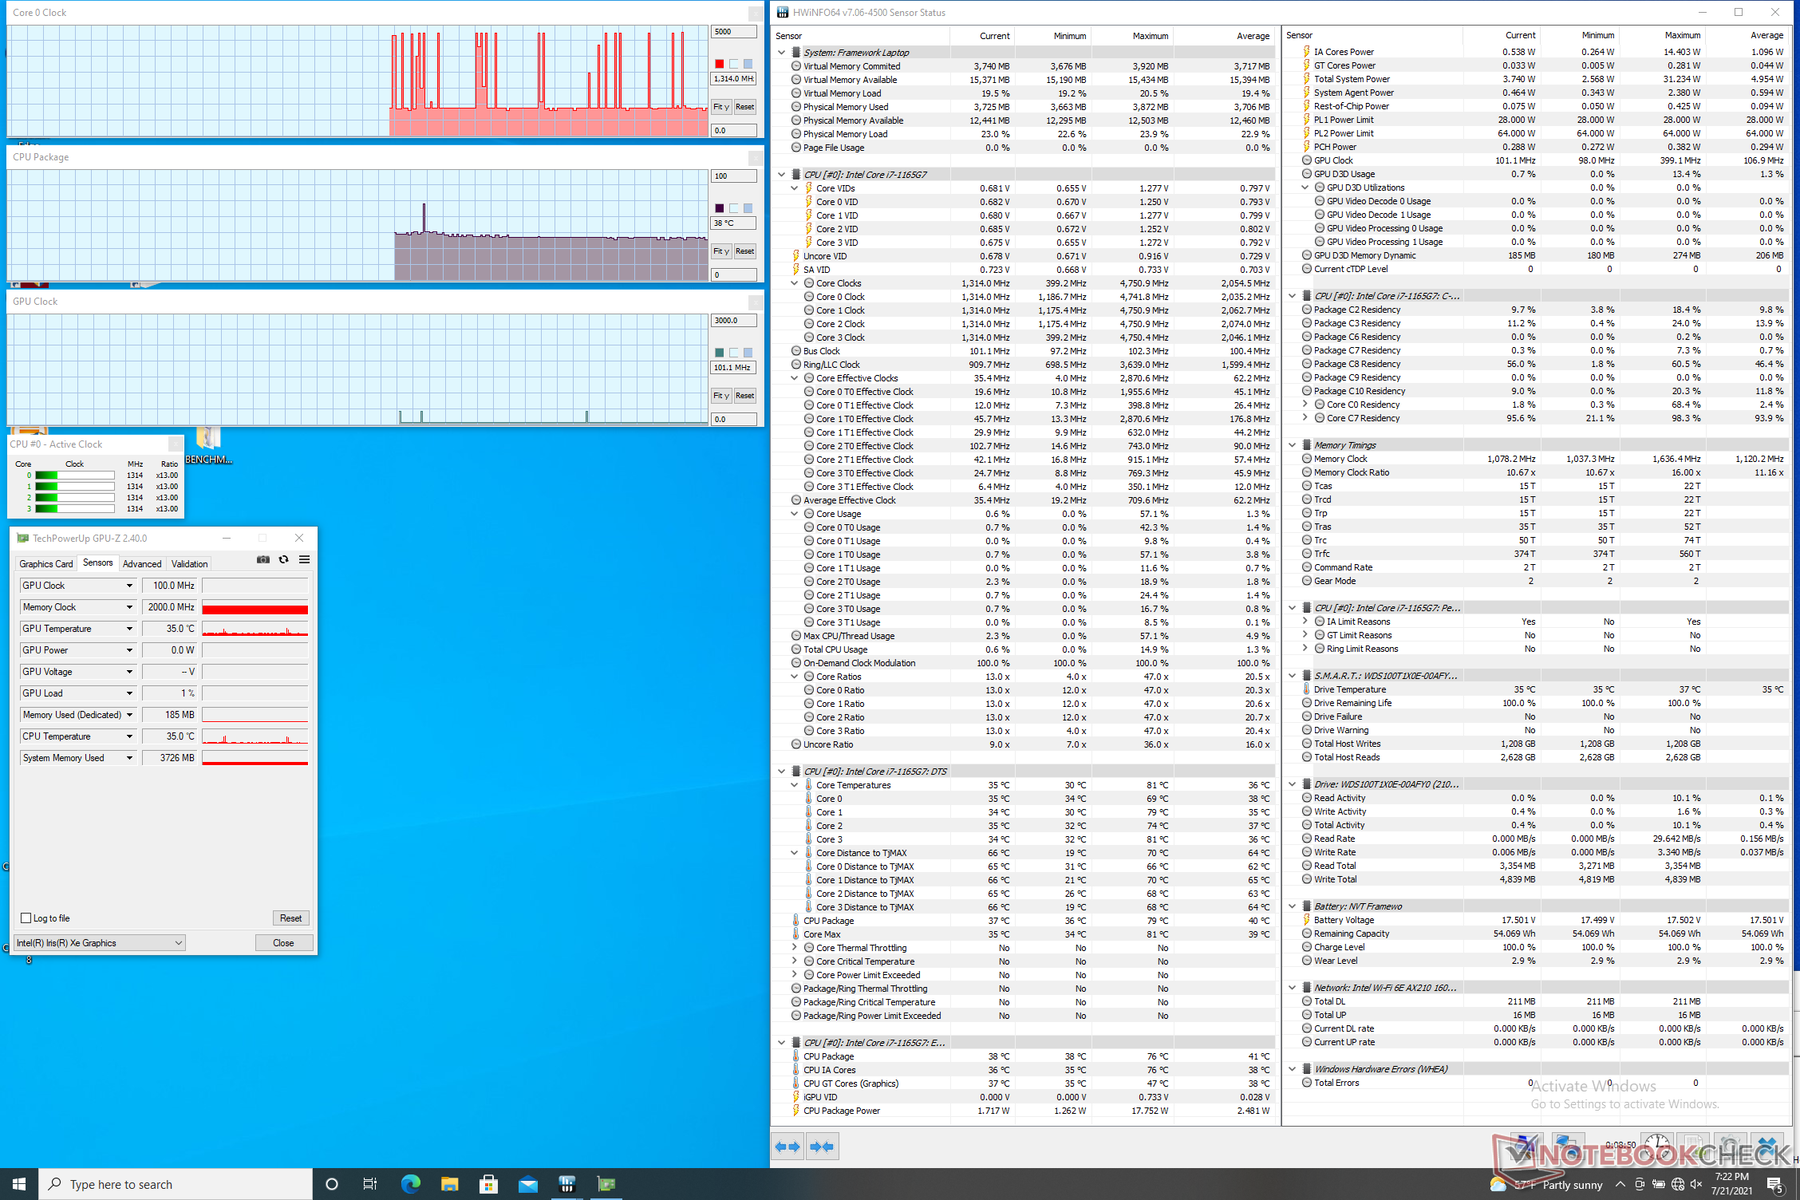
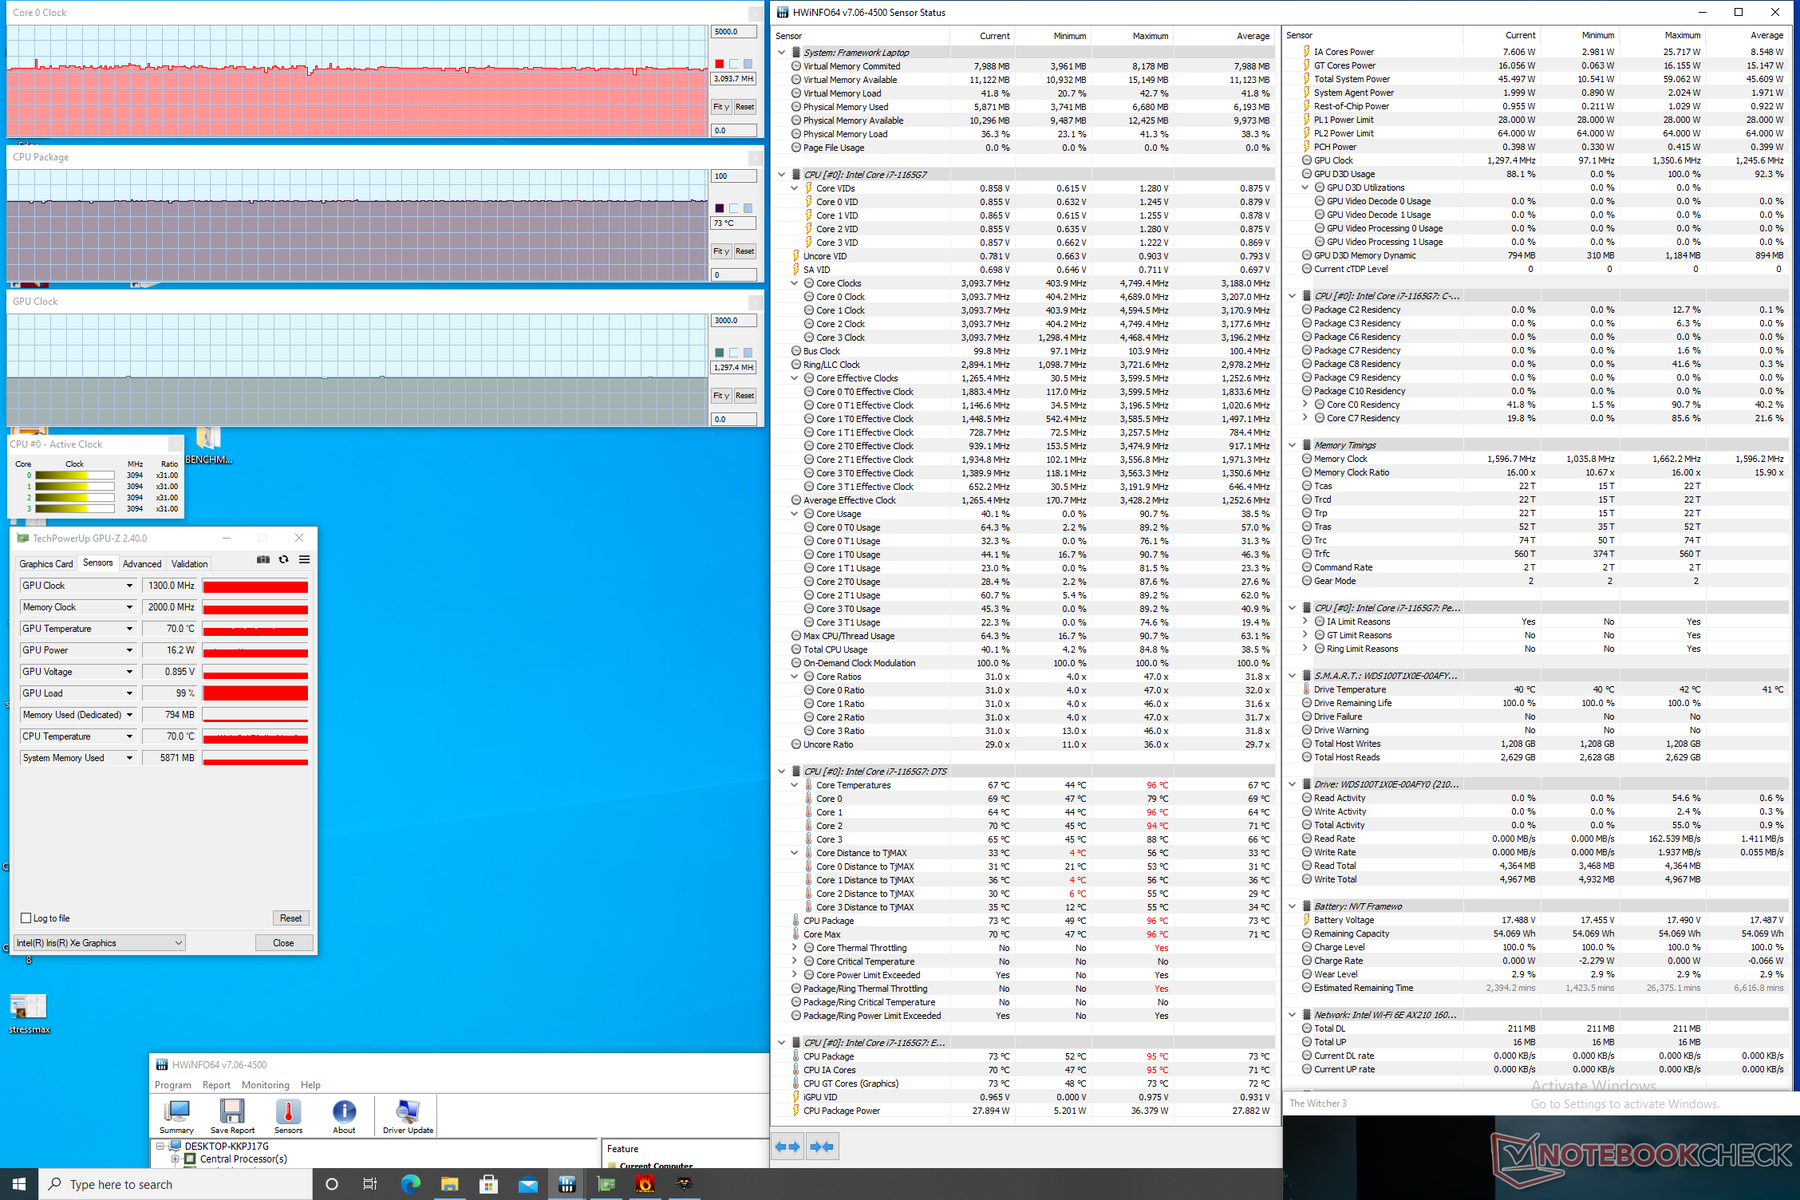
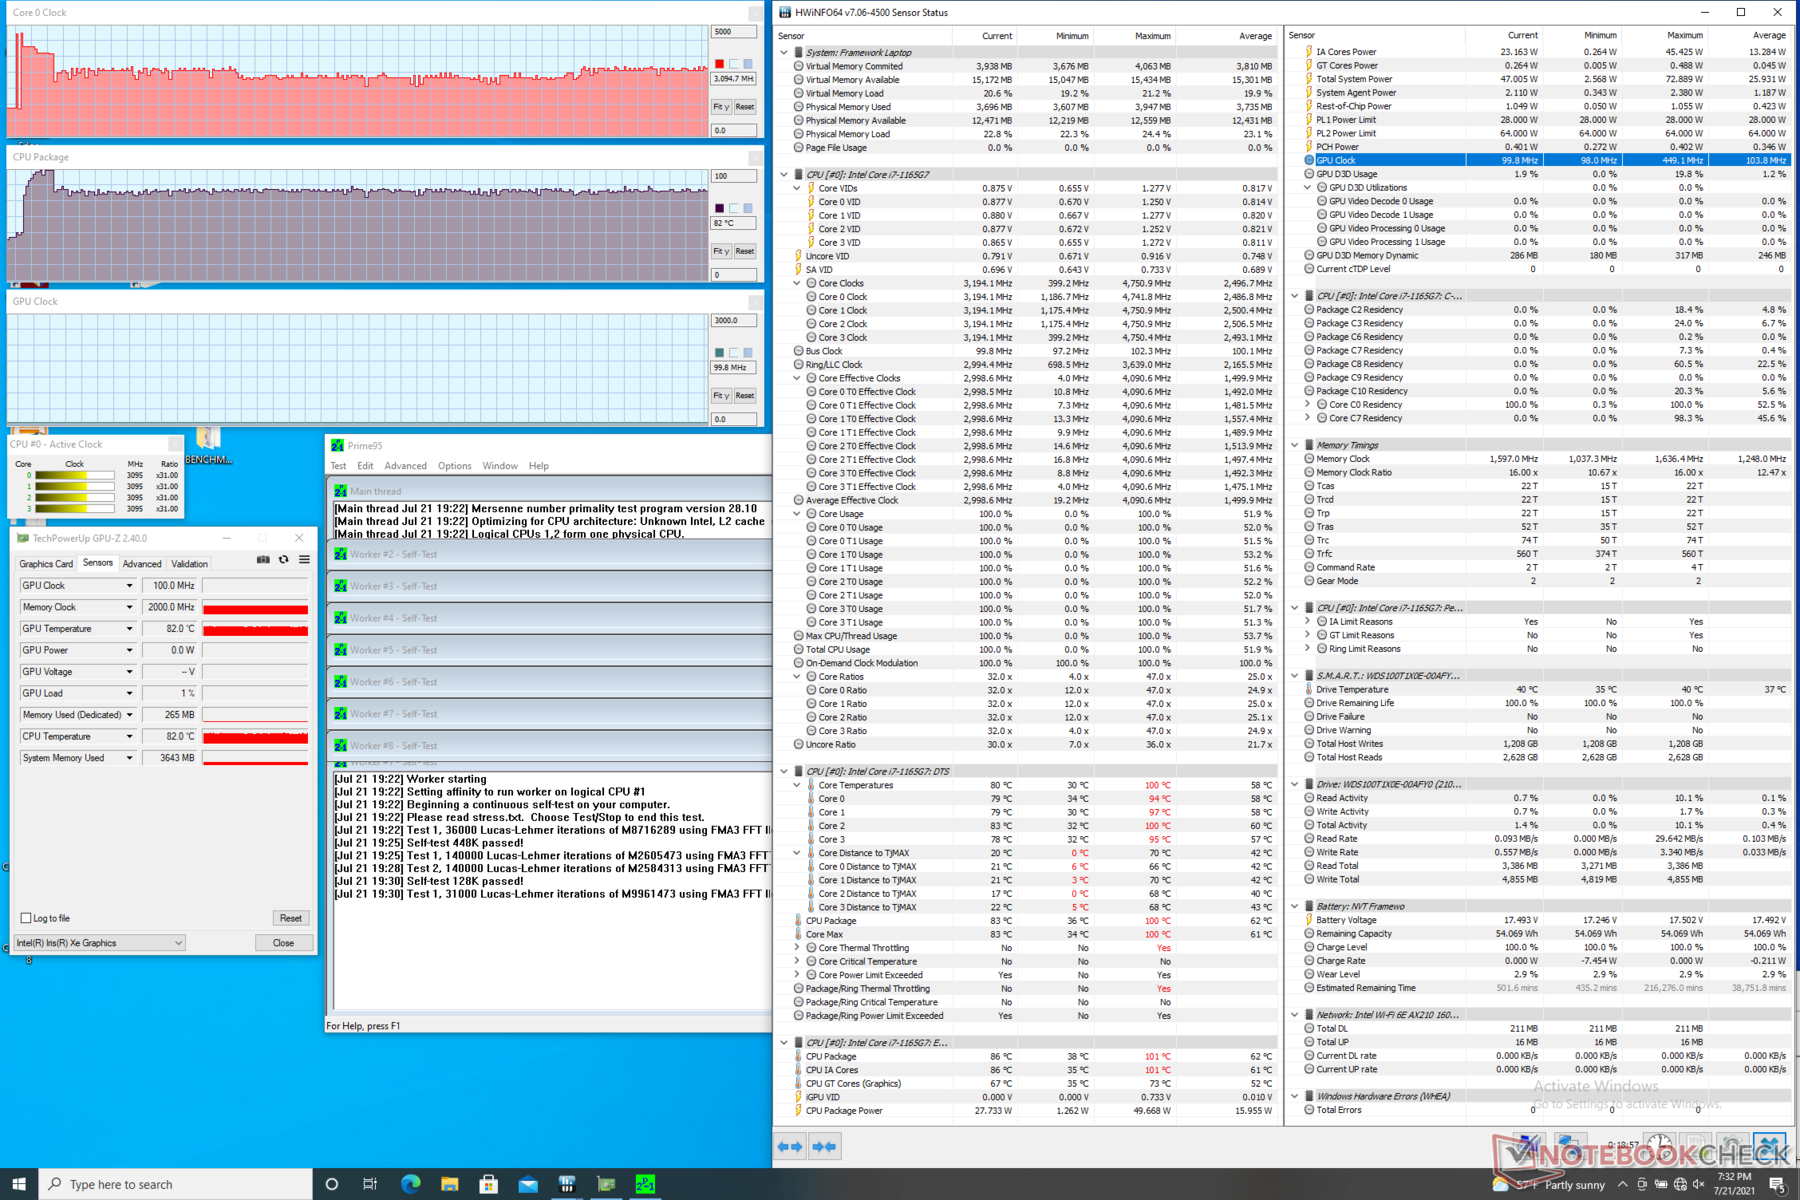
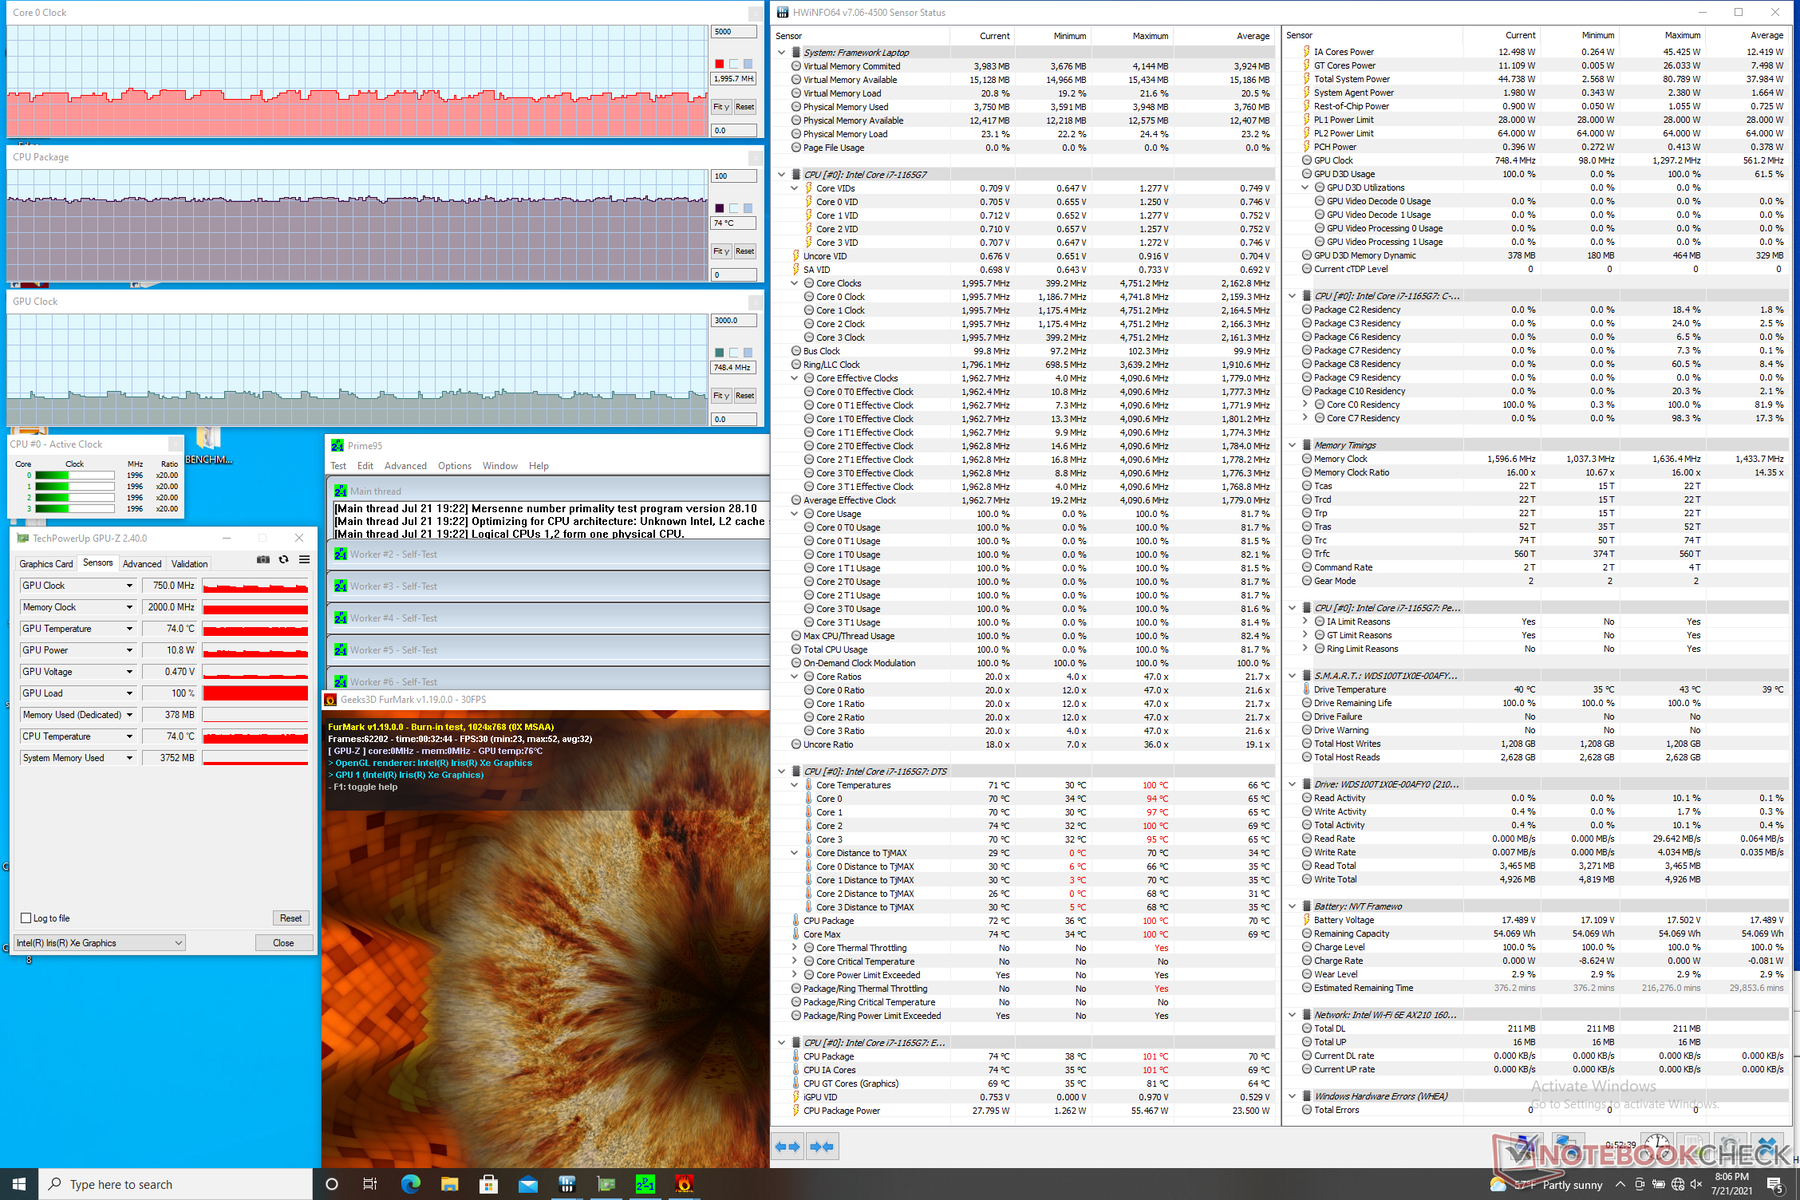
| CPU Clock (GHz) | GPU Clock (MHz) | Average CPU Temperature (°C) | |
| System Idle | -- | -- | 38 |
| Prime95 Stress | ~3.0 | -- | 82 |
| Prime95 + FurMark Stress | 1.6 - 2.0 | 750 - 1000 | 74 |
| Witcher 3 Stress | 3.1 | 1300 | 73 |
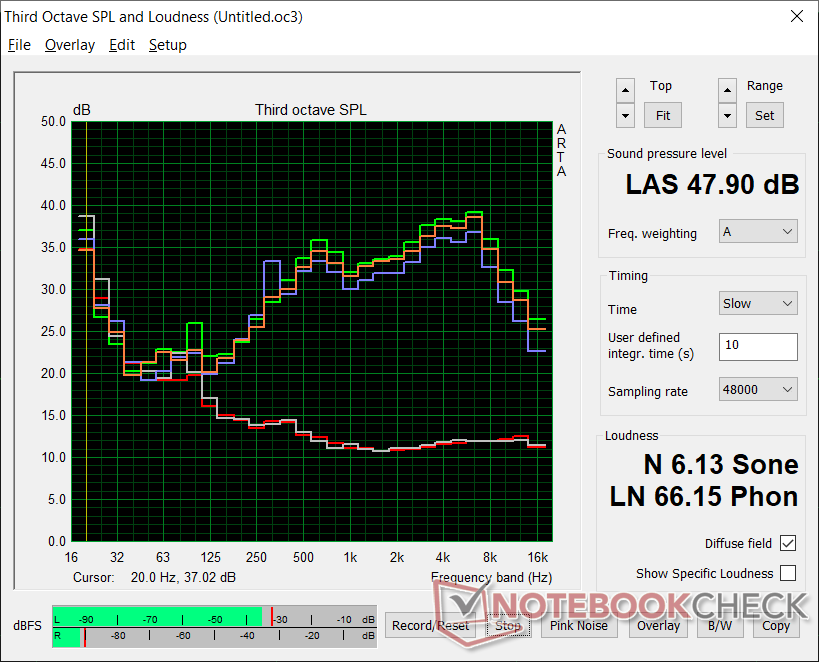
Speakers

Framework Laptop 13.5 audio analysis
(±) | speaker loudness is average but good (78.2 dB)
Bass 100 - 315 Hz
(±) | reduced bass - on average 13.9% lower than median
(±) | linearity of bass is average (10.1% delta to prev. frequency)
Mids 400 - 2000 Hz
(+) | balanced mids - only 4% away from median
(+) | mids are linear (6% delta to prev. frequency)
Highs 2 - 16 kHz
(±) | higher highs - on average 5.2% higher than median
(+) | highs are linear (6.1% delta to prev. frequency)
Overall 100 - 16.000 Hz
(±) | linearity of overall sound is average (17.3% difference to median)
Compared to same class
» 23% of all tested devices in this class were better, 7% similar, 69% worse
» The best had a delta of 7%, average was 21%, worst was 53%
Compared to all devices tested
» 31% of all tested devices were better, 8% similar, 61% worse
» The best had a delta of 4%, average was 24%, worst was 134%
Apple MacBook 12 (Early 2016) 1.1 GHz audio analysis
(+) | speakers can play relatively loud (83.6 dB)
Bass 100 - 315 Hz
(±) | reduced bass - on average 11.3% lower than median
(±) | linearity of bass is average (14.2% delta to prev. frequency)
Mids 400 - 2000 Hz
(+) | balanced mids - only 2.4% away from median
(+) | mids are linear (5.5% delta to prev. frequency)
Highs 2 - 16 kHz
(+) | balanced highs - only 2% away from median
(+) | highs are linear (4.5% delta to prev. frequency)
Overall 100 - 16.000 Hz
(+) | overall sound is linear (10.2% difference to median)
Compared to same class
» 6% of all tested devices in this class were better, 2% similar, 91% worse
» The best had a delta of 5%, average was 19%, worst was 53%
Compared to all devices tested
» 4% of all tested devices were better, 1% similar, 95% worse
» The best had a delta of 4%, average was 24%, worst was 134%
Energy Management
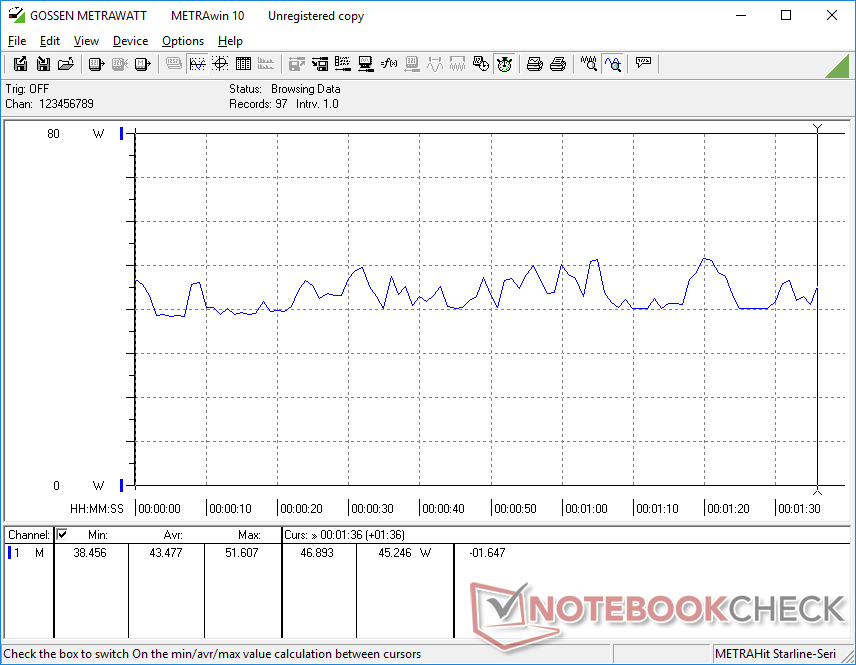
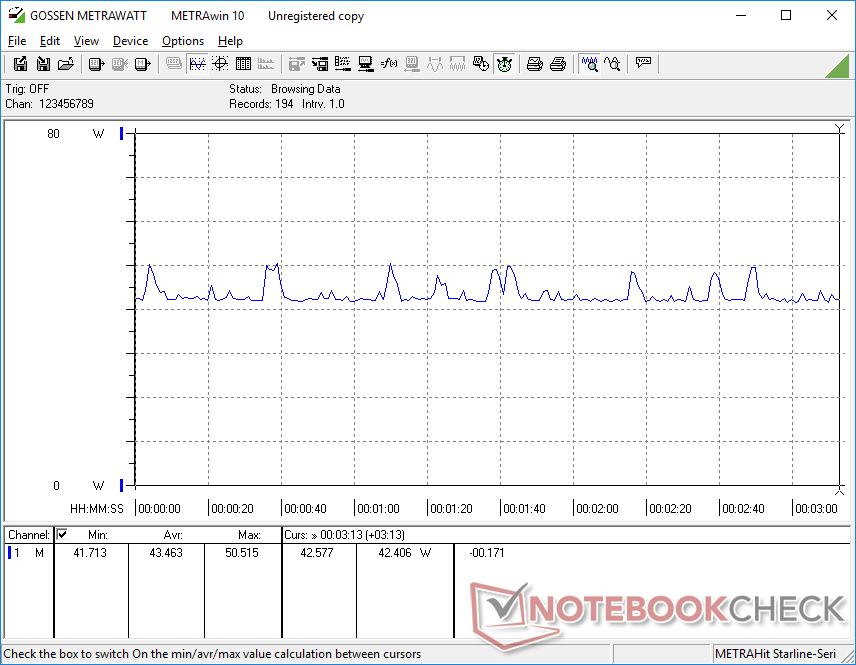
Power Consumption
Power consumption is very similar to the Surface Laptop 4 13 since they share similar processors and display size.
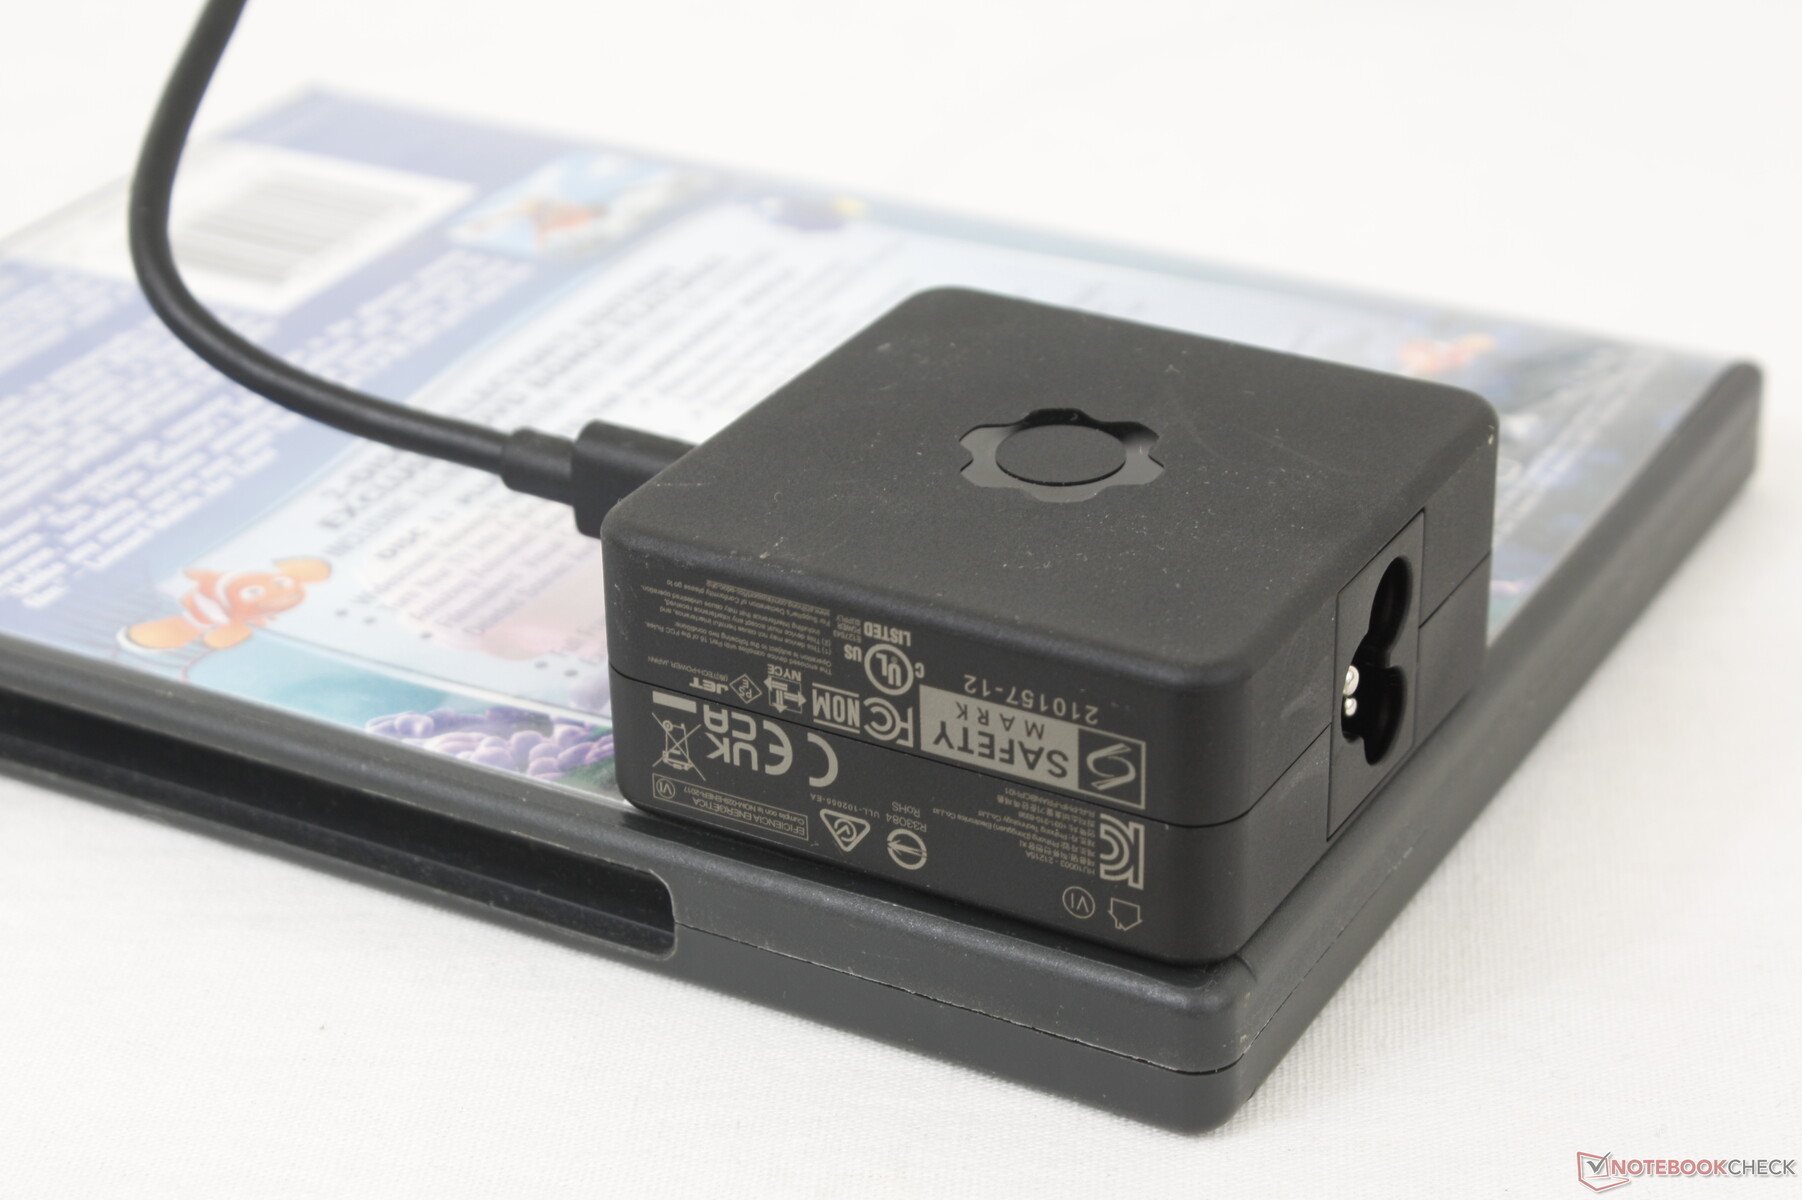
We're able to measure a maximum consumption of 61.8 W from the small (~5.8 x 5.8 x 2.7 cm) 60 W AC adapter. This rate is only temporary due to the limited Turbo Boost of the chassis.
| Off / Standby | |
| Idle | |
| Load |
|
Key:
min: | |
| Framework Laptop 13.5 i7-1165G7, Iris Xe G7 96EUs, Western Digital WD_BLACK SN850 WDS100T1X0E, IPS, 2256x1504, 13.5" | HP Spectre x360 14-ea0378ng i7-1165G7, Iris Xe G7 96EUs, Intel Optane Memory H10 with Solid State Storage 32GB + 1TB HBRPEKNX0203AH(L/H), OLED, 3000x2000, 13.5" | Microsoft Surface Laptop 4 13 i7 i7-1185G7, Iris Xe G7 96EUs, Samsung PM991 MZ9LQ512HALU, IPS, 2256x1504, 13.5" | Lenovo ThinkPad X1 Titanium Yoga G1 20QA001RGE i7-1160G7, Iris Xe G7 96EUs, Toshiba BG4 KBG40ZNT512G, IPS, 2256x1504, 13.5" | HP ProBook x360 435 G8 R7-5800U R7 5800U, Vega 8, Samsung PM991 MZVLQ512HALU, IPS, 1920x1080, 13.3" | Lenovo Yoga 6 13 82ND0009US R5 5500U, Vega 7, WDC PC SN530 SDBPMPZ-265G, IPS, 1920x1080, 13.3" | |
|---|---|---|---|---|---|---|
| Power Consumption | -14% | 15% | 14% | 24% | 14% | |
| Idle Minimum * | 4.3 | 6.3 -47% | 2.6 40% | 3.9 9% | 3.2 26% | 5 -16% |
| Idle Average * | 8.2 | 11.2 -37% | 6 27% | 7.3 11% | 5.5 33% | 6.3 23% |
| Idle Maximum * | 8.7 | 13.3 -53% | 8.2 6% | 10.3 -18% | 6.4 26% | 6.9 21% |
| Load Average * | 43.5 | 32 26% | 41.4 5% | 30.6 30% | 35.5 18% | 41.5 5% |
| Witcher 3 ultra * | 43.5 | 25.5 41% | 36.4 16% | 33.2 24% | ||
| Load Maximum * | 61.8 | 35.6 42% | 64.1 -4% | 57.1 8% | 47.5 23% | 46.5 25% |
* ... smaller is better
Power Consumption Witcher 3 / Stresstest
Battery Life
WLAN runtimes are comparable to the Spectre x360 14 or Surface Laptop 4 13 at almost 8 hours of real-world browsing.
Charging from empty to full capacity takes a little less than 2 hours. Charging is done via USB-C meaning the system cannot be recharged should you decide to turn all four ports into something other than USB-C.
| Framework Laptop 13.5 i7-1165G7, Iris Xe G7 96EUs, 55 Wh | HP Spectre x360 14-ea0378ng i7-1165G7, Iris Xe G7 96EUs, 66 Wh | Microsoft Surface Laptop 4 13 i7 i7-1185G7, Iris Xe G7 96EUs, 47.4 Wh | Lenovo ThinkPad X1 Titanium Yoga G1 20QA001RGE i7-1160G7, Iris Xe G7 96EUs, 44.5 Wh | HP ProBook x360 435 G8 R7-5800U R7 5800U, Vega 8, 45 Wh | Lenovo Yoga 6 13 82ND0009US R5 5500U, Vega 7, 60 Wh | |
|---|---|---|---|---|---|---|
| Battery Runtime | -3% | -5% | 6% | 19% | 65% | |
| WiFi v1.3 | 478 | 466 -3% | 454 -5% | 506 6% | 567 19% | 791 65% |
| Reader / Idle | 803 | 1050 | ||||
| Load | 157 | 81 | 112 | 68 | 121 |
Pros
Cons
Verdict
Oftentimes, manufacturers will design thin and attractive laptops that are annoyingly difficult if not impossible to repair. Even simple upgrades like RAM or storage are usually discouraged. The Framework laptop is proof that thin-and-light models don't necessarily have to sacrifice end-user serviceability or unique features like swappable ports for portability or size.
The Framework Laptop beats the Surface Laptop at its own game. It manages to be smaller, significantly easier to service, and with more integrated ports without sacrificing performance or portability.
A few things about the Framework laptop could be improved. The lid and hinges in particular are weaker than on competing Dell XPS 13, HP Spectre x360 14, Microsoft Surface Laptop, or Lenovo ThinkBook models. Furthermore, fan noise is louder when running higher loads. They're not deal breakers, but stiffer hinges, a larger and quieter cooling solution, and edge-to-edge glass reinforcement for the display would make the Framework even better.
Price and availability
Framework is now shipping its laptop to consumers starting at $749 USD for the Core i5 configuration.
Framework Laptop 13.5
- 07/26/2021 v7 (old)
Allen Ngo


Price comparison
