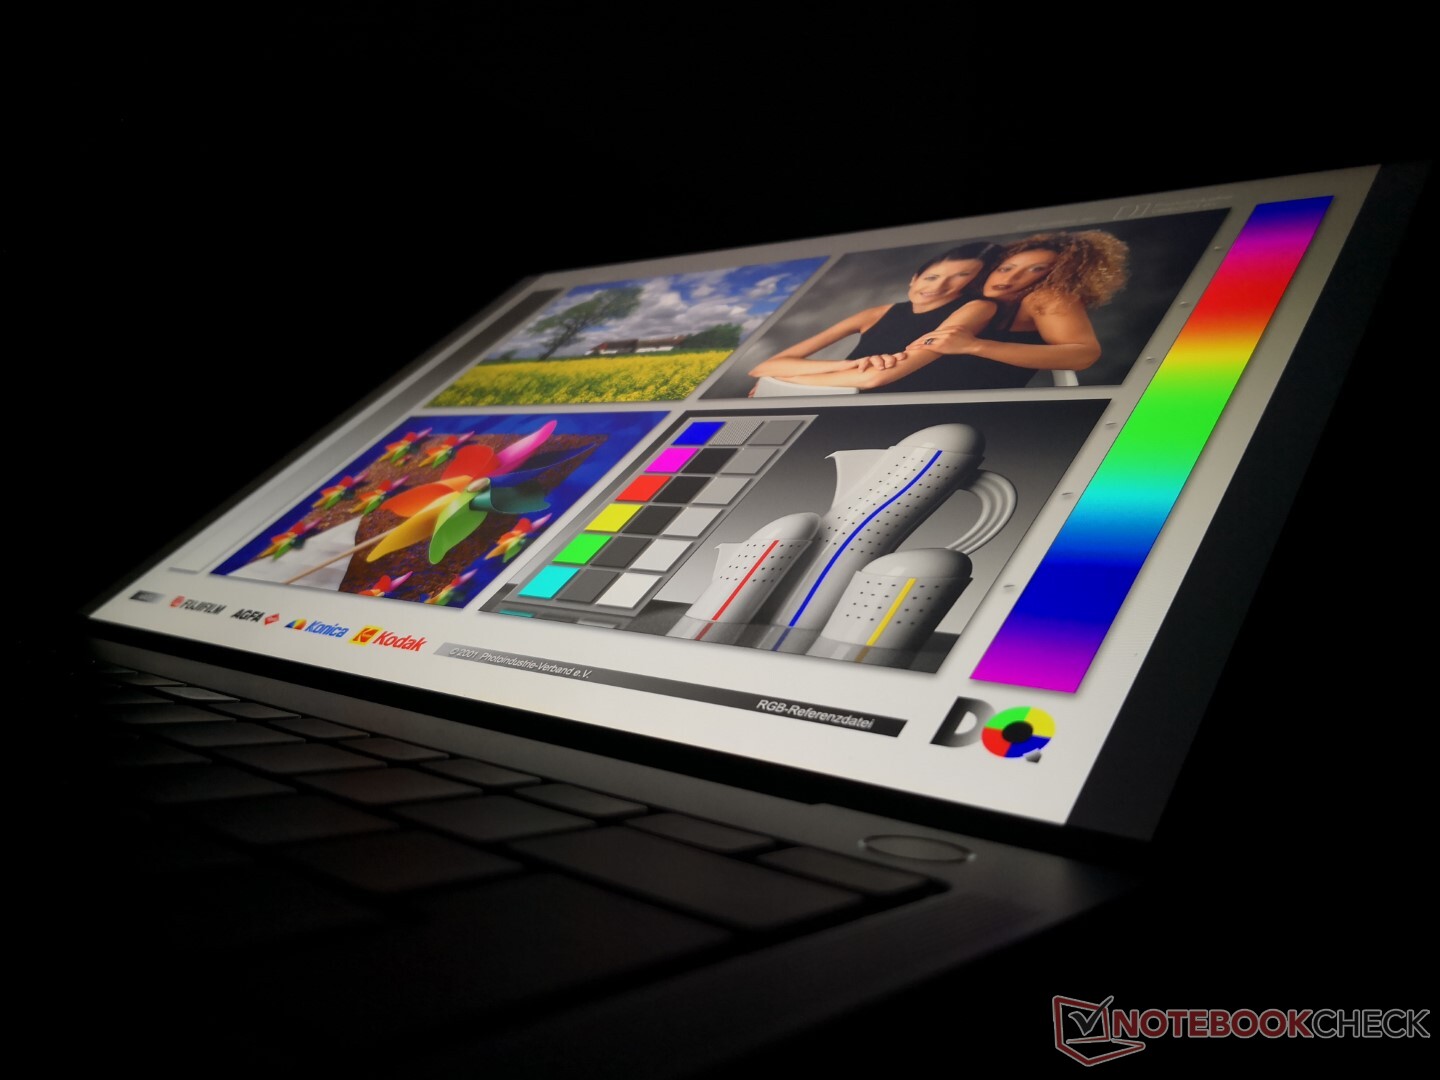
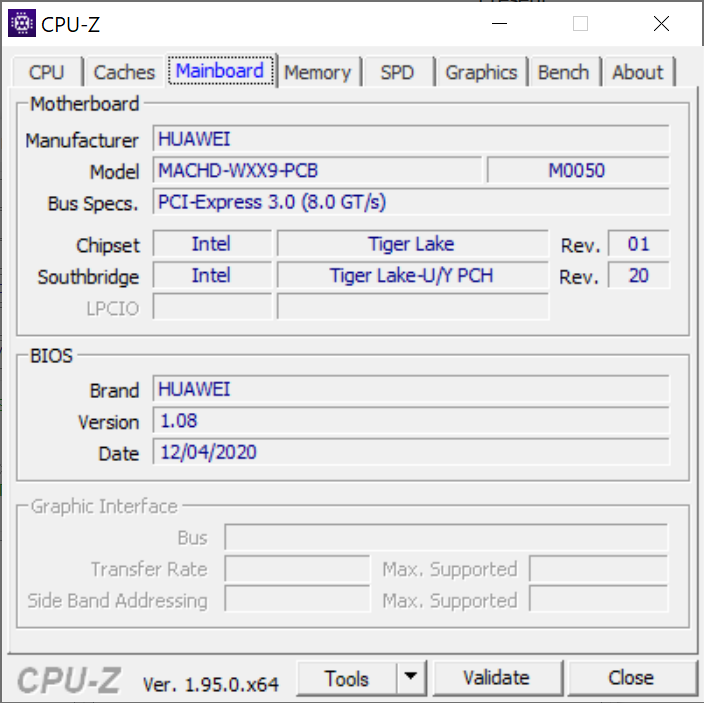
Huawei MateBook X Pro 2021 Tiger Lake Laptop Review: Now Shipping Worldwide ↺
In contrast to the budget MateBook D series, the higher-end 3:2 MateBook X series is Huawei's flagship lineup of ultrathin prosumer laptops akin to the Dell XPS, HP Spectre, Asus ZenBook, or Lenovo Yoga series. Its latest 2021 model is an internal revision of the 2020 model with both a new cooling solution and a new Intel 11th gen processor to replace the older Comet Lake-U and GeForce MX options, respectively.
We recommend checking out our reviews on the 2020 and 2019 MateBook X Pro models as the 2021 model is visually very similar to its immediate predecessors. Direct competitors include the XPS 13 9310, HP Spectre x360 13, Asus ZenBook 13, or Lenovo Yoga Slim 7.
More Huawei reviews:
potential competitors in comparison
Rating | Date | Model | Weight | Height | Size | Resolution | Price |
|---|---|---|---|---|---|---|---|
| 87.8 % v7 (old) | 03 / 2021 | Huawei MateBook X Pro 2021 i7-1165G7, Iris Xe G7 96EUs | 1.3 kg | 14.6 mm | 13.90" | 3000x2000 | |
| 87.4 % v7 (old) | 06 / 2020 | Huawei MateBook X Pro 2020 i7 i7-10510U, GeForce MX250 | 1.3 kg | 14.6 mm | 13.90" | 3000x2000 | |
| 87.4 % v7 (old) | 12 / 2020 | Dell XPS 13 9310 Core i7 4K i7-1185G7, Iris Xe G7 96EUs | 1.3 kg | 14.8 mm | 13.40" | 3840x2400 | |
| 84 % v7 (old) | 02 / 2020 | Microsoft Surface Laptop 3 13 Core i5-1035G7 i5-1035G7, Iris Plus Graphics G7 (Ice Lake 64 EU) | 1.3 kg | 14.5 mm | 13.50" | 2256x1504 | |
| 85.5 % v7 (old) | 10 / 2020 | Razer Blade Stealth i7-1165G7 GTX 1650 Ti Max-Q i7-1165G7, GeForce GTX 1650 Ti Max-Q | 1.4 kg | 15.3 mm | 13.30" | 1920x1080 | |
| 85.3 % v7 (old) | 08 / 2020 | Lenovo Yoga Slim 7-14ARE R7 4800U, Vega 8 | 1.4 kg | 14.9 mm | 14.00" | 1920x1080 |
Case
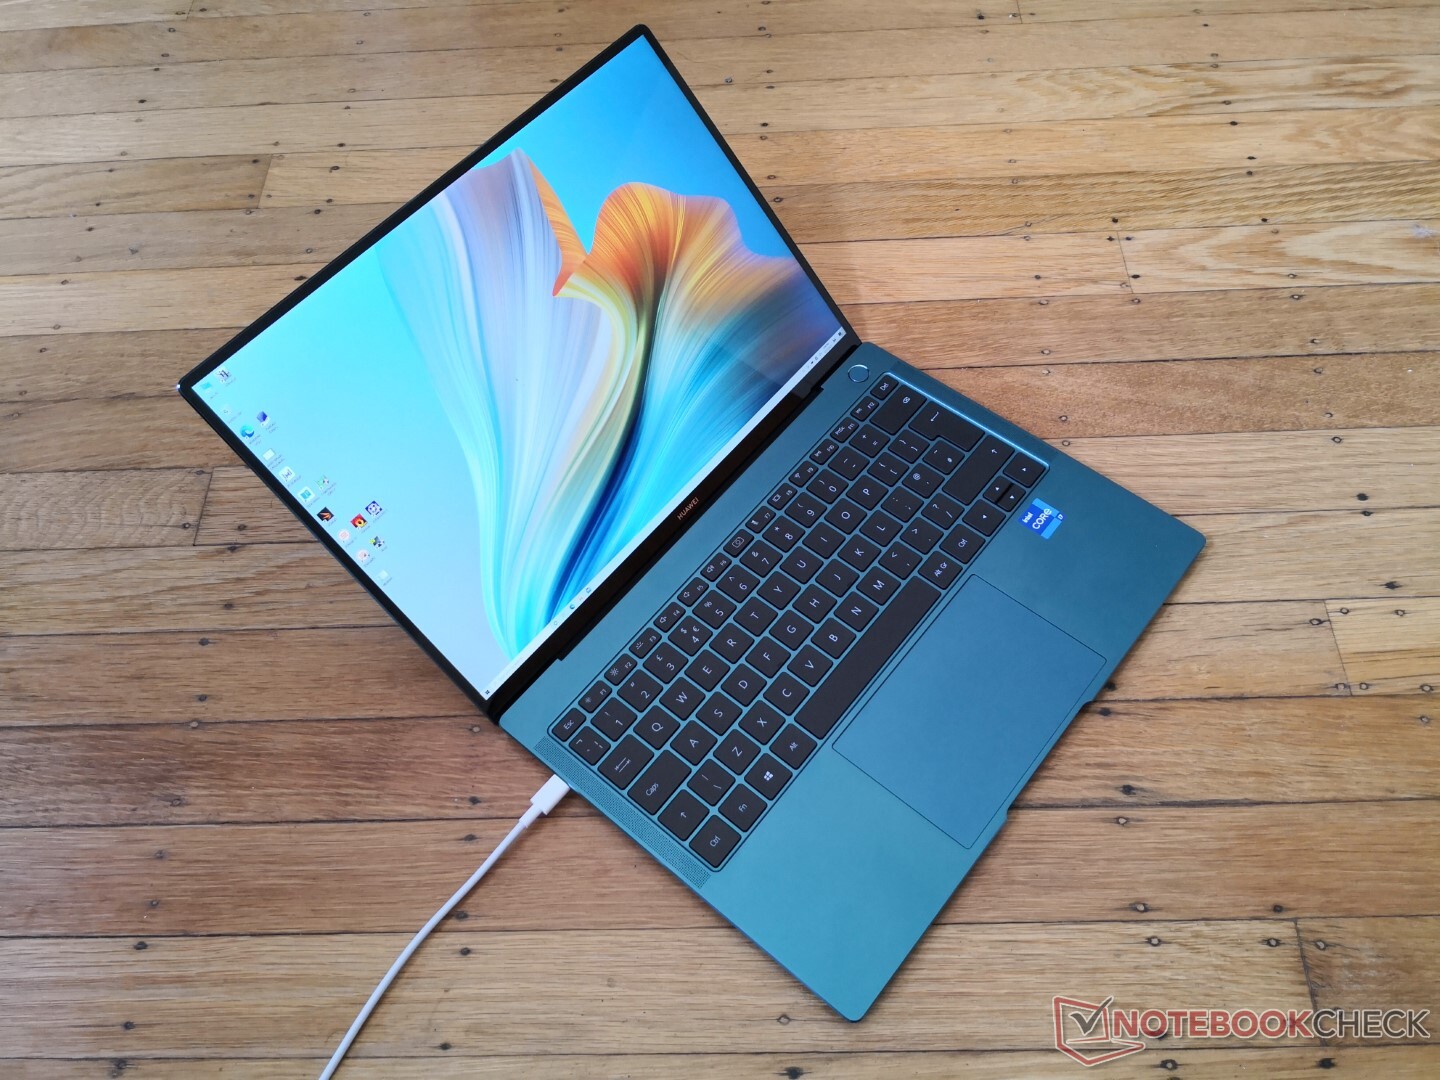
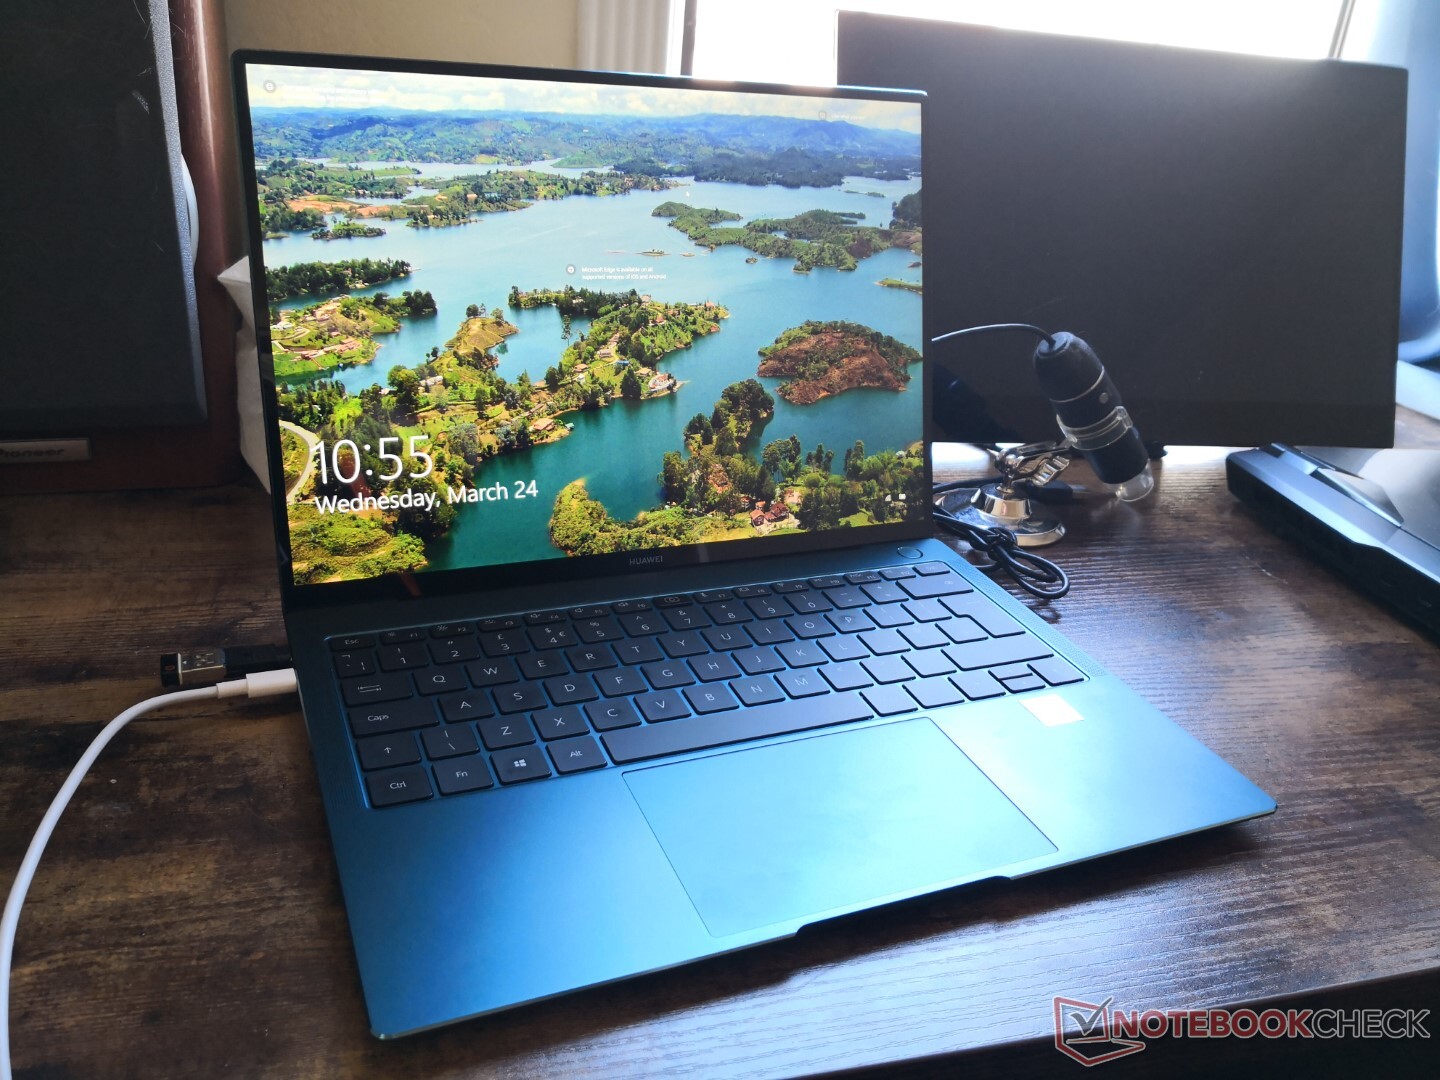
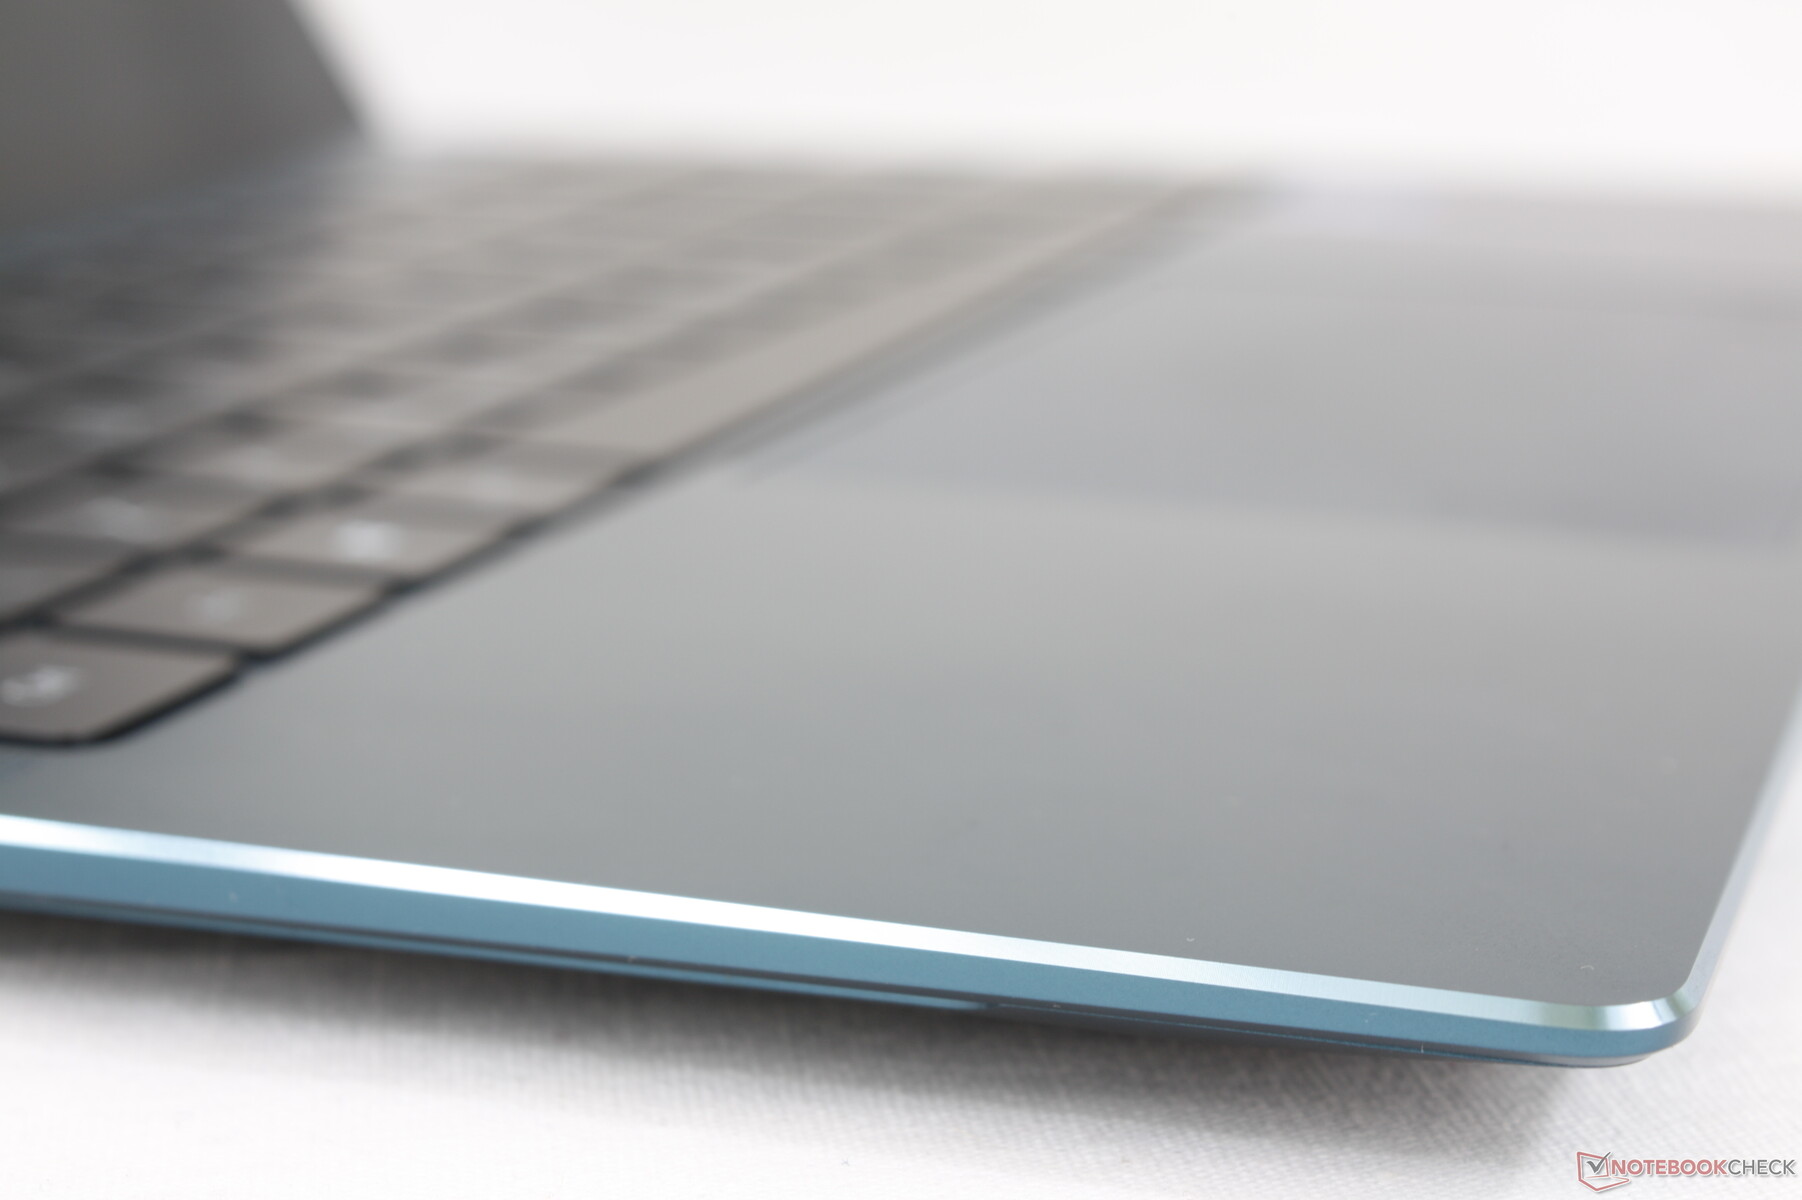
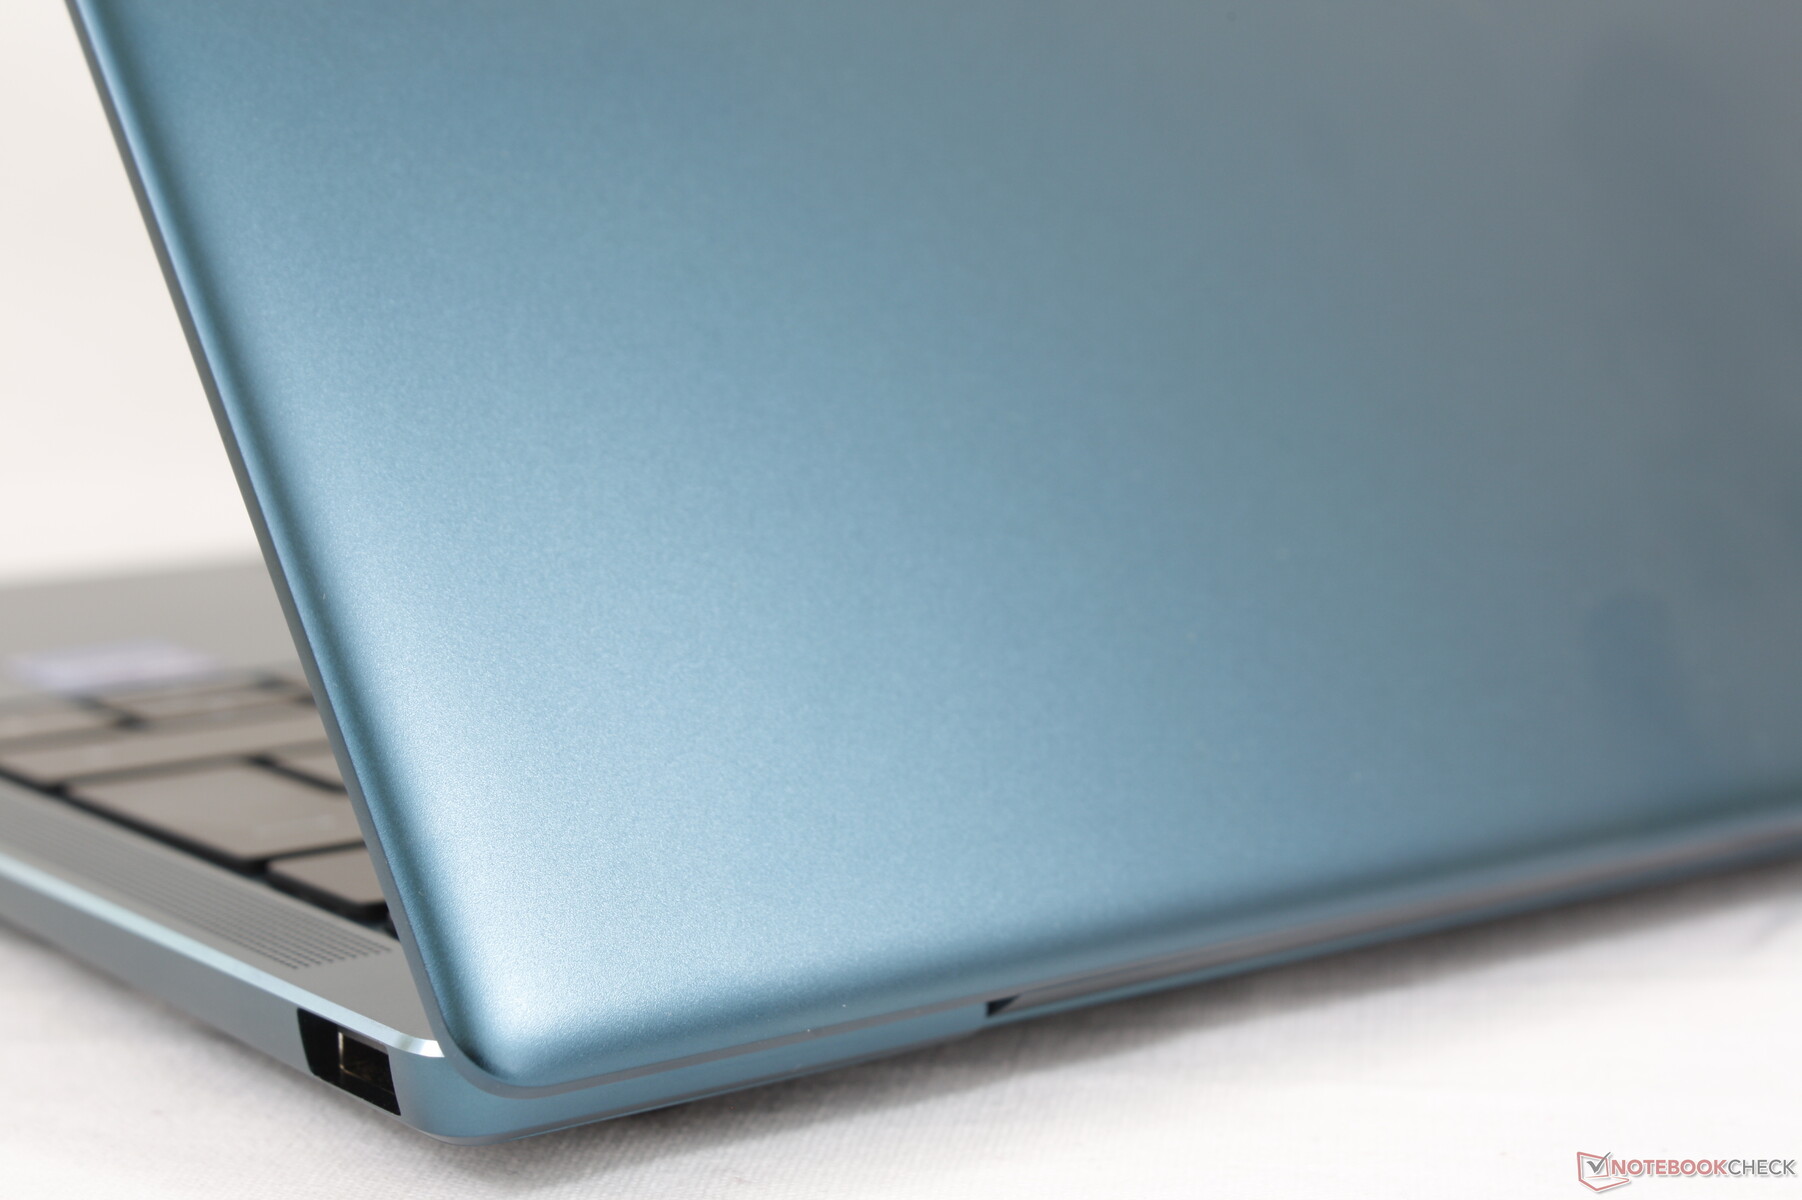
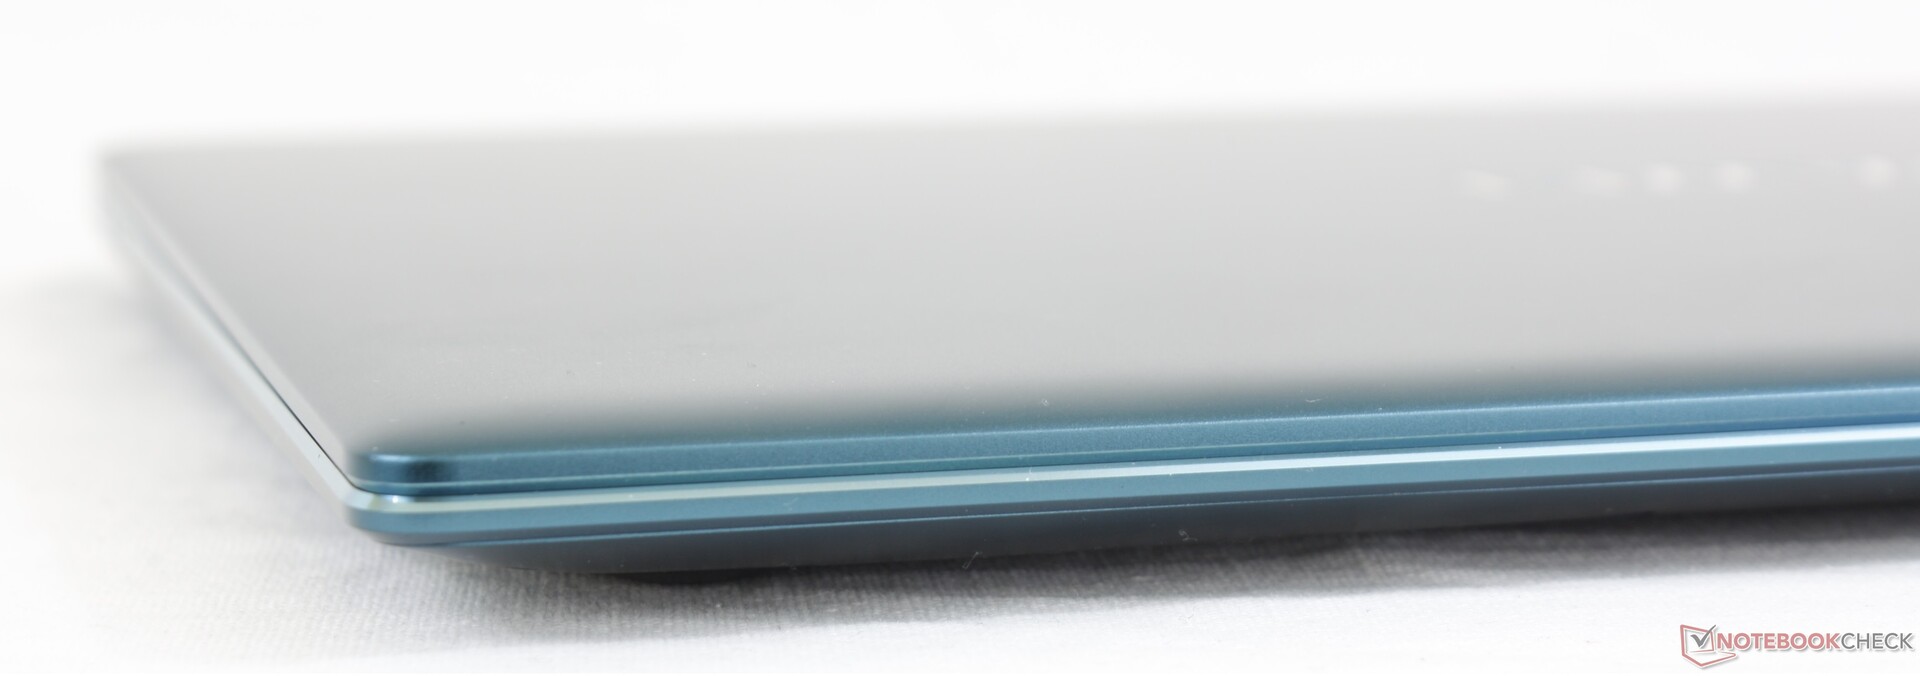
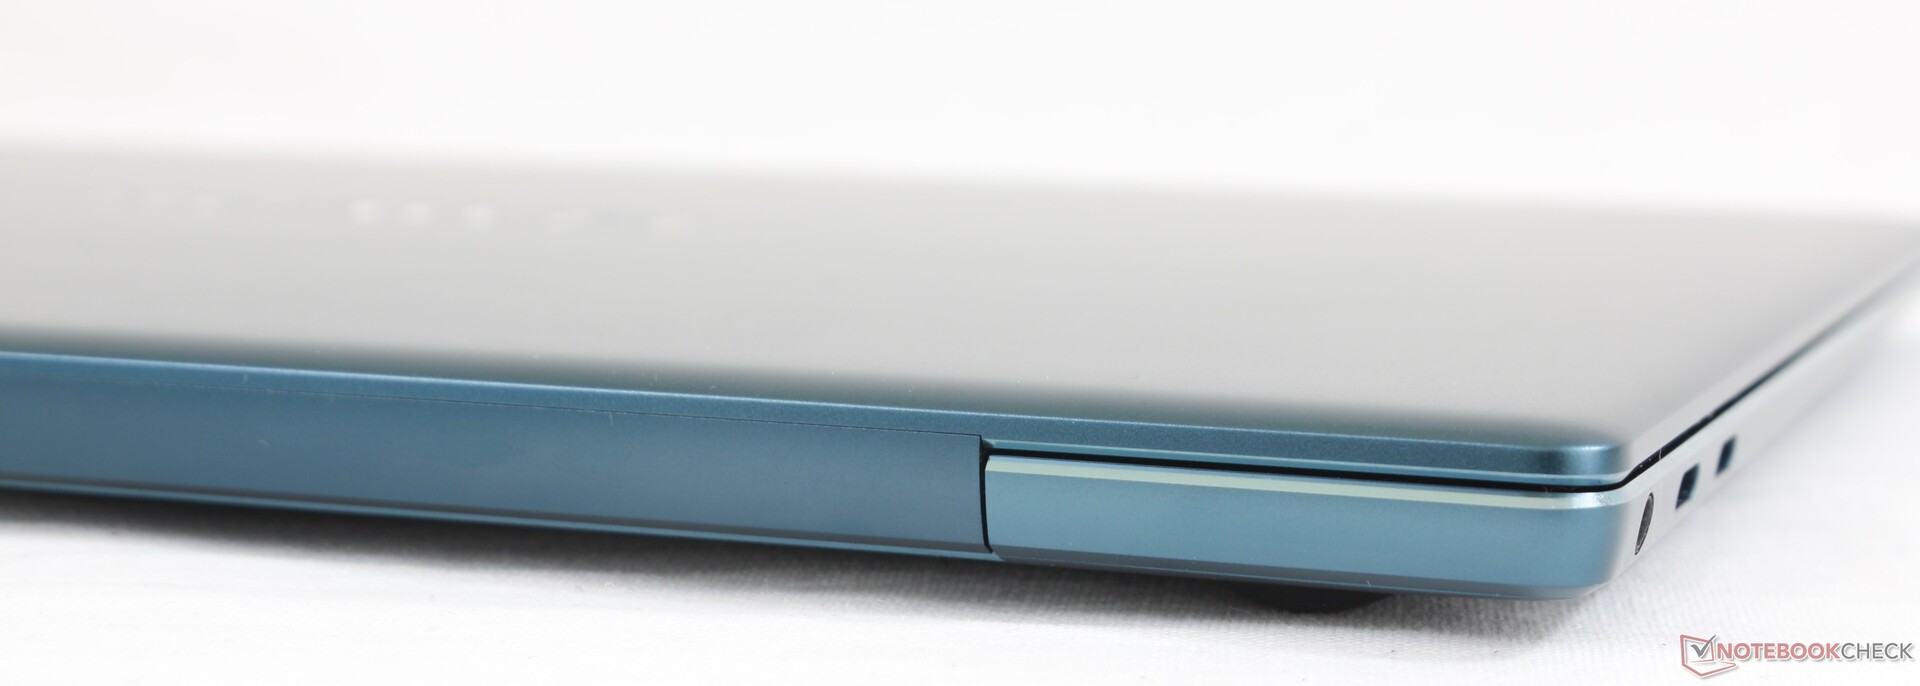
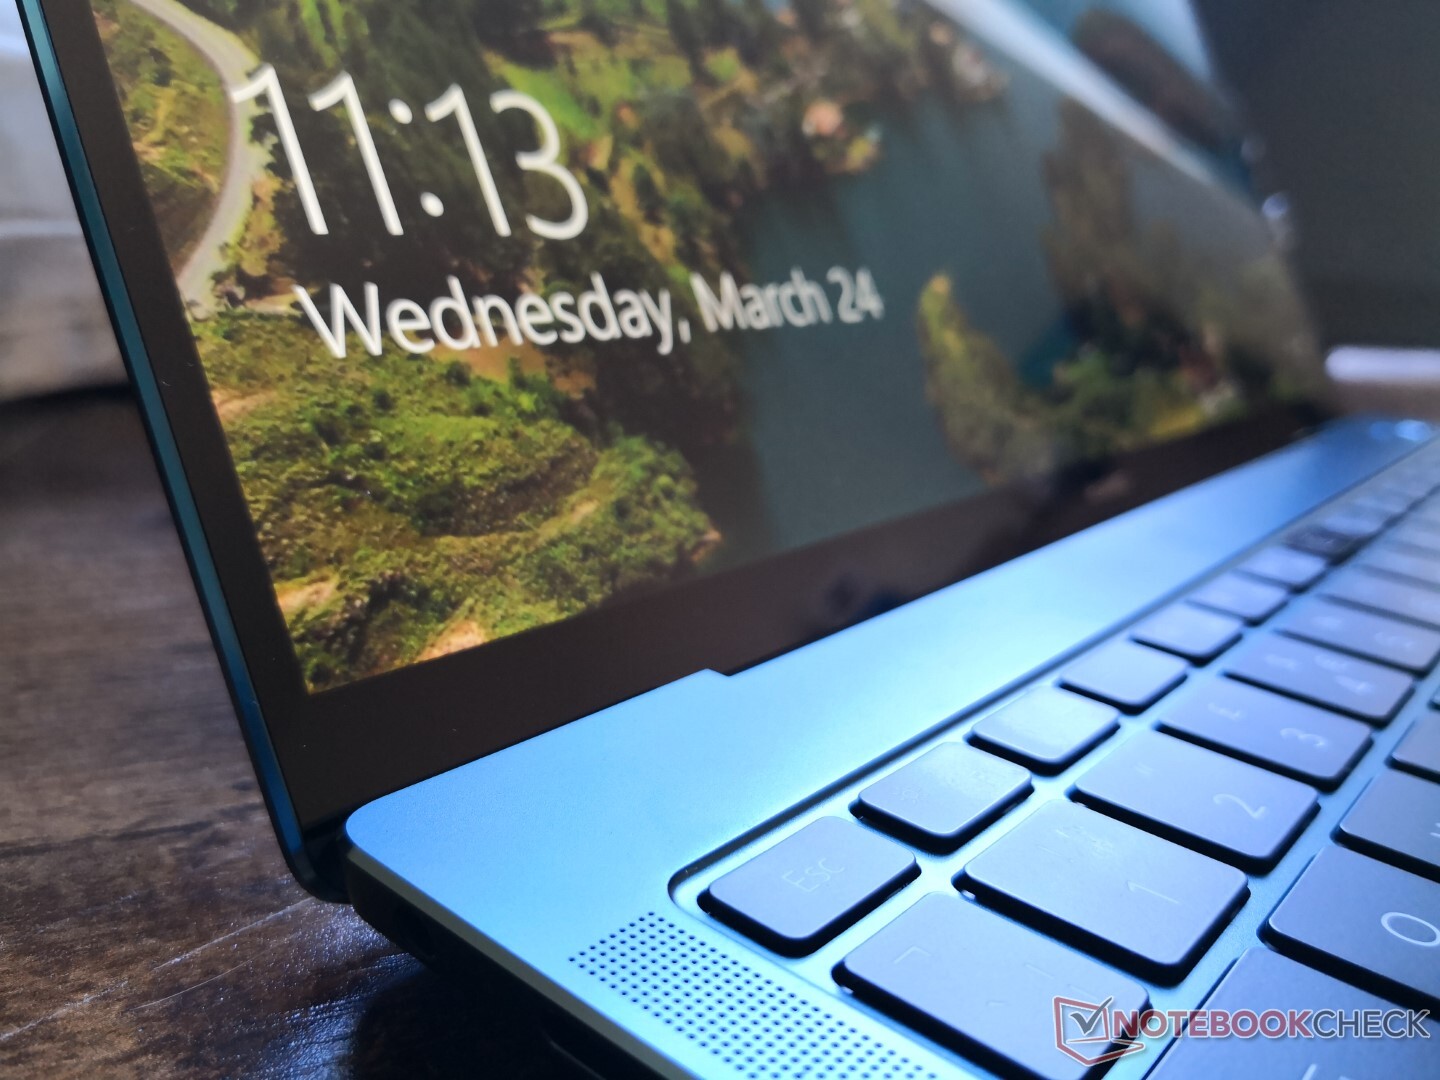
The 2021 model is externally identical to the 2020 model and so our existing comments still apply. Despite the hand-me-down chassis design, the MateBook X Pro is still as thin and light as any other flagship Ultrabook available. The newer 13.5-inch HP Spectre x360 14, for example, is thicker and with nearly the same footprint even though the Huawei carries a slightly larger display. Chassis rigidity is still good, but it's definitely not as firm as the Razer Blade Stealth or aforementioned Spectre.

Connectivity
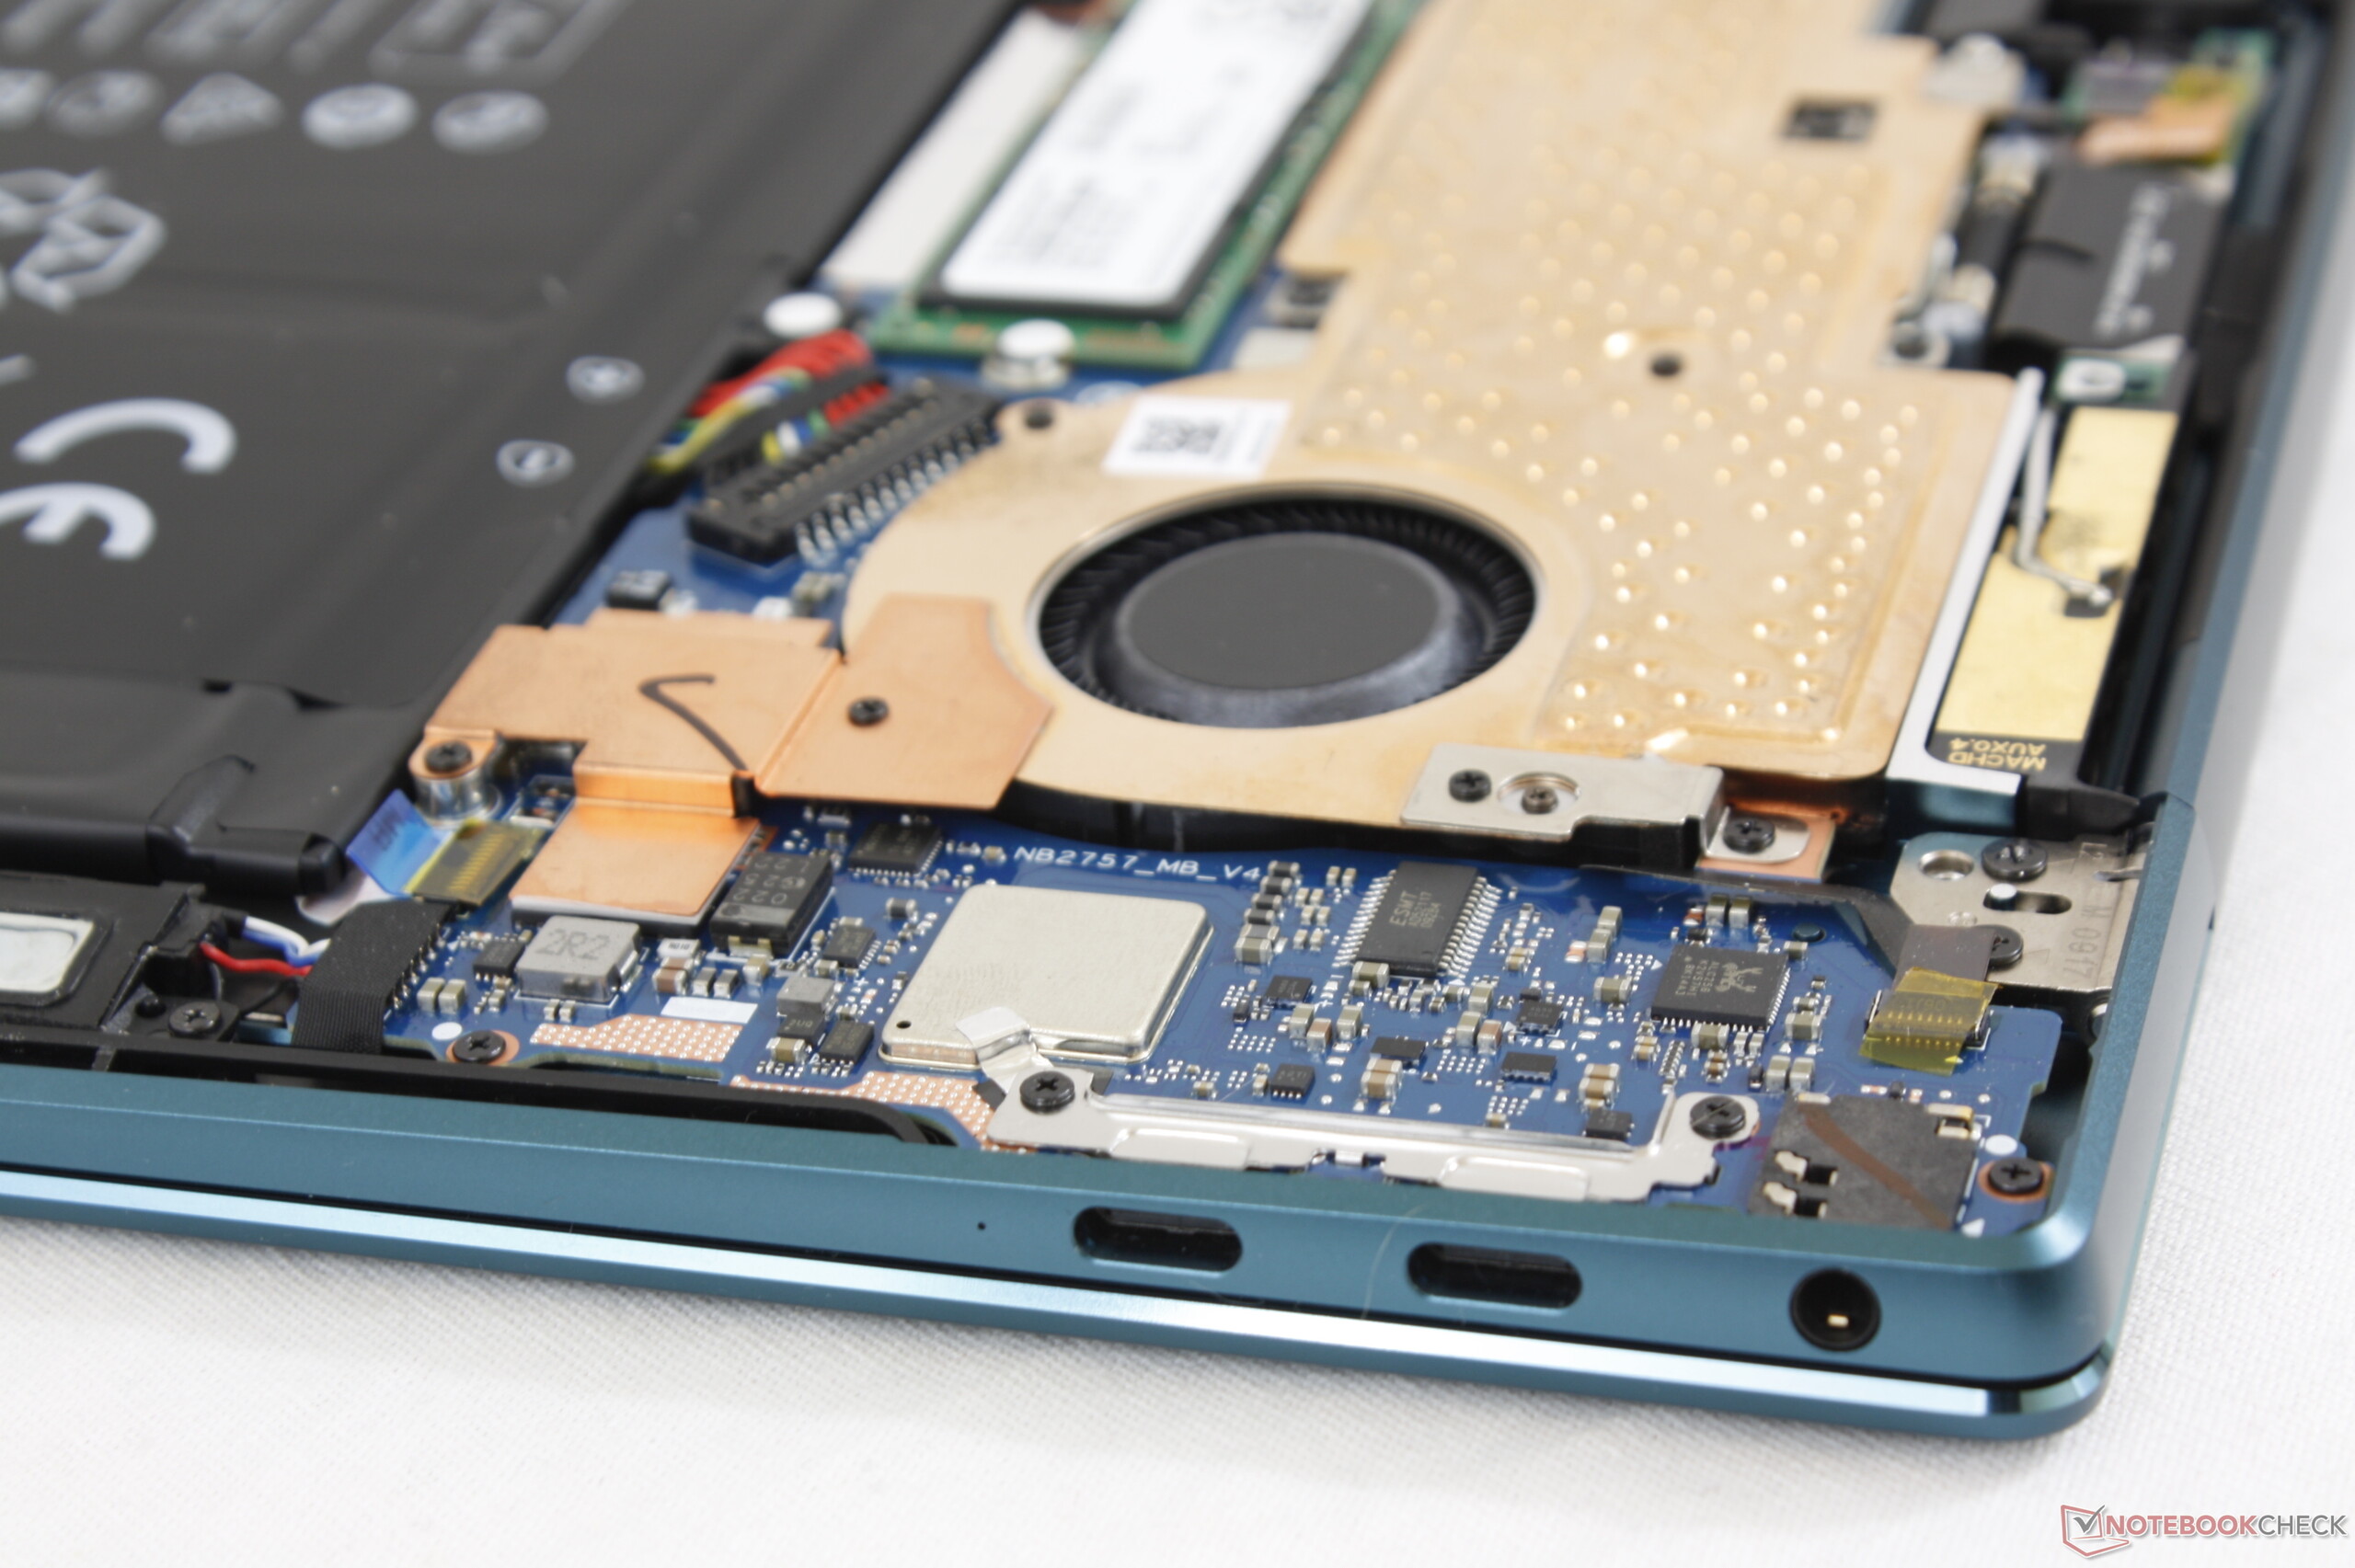
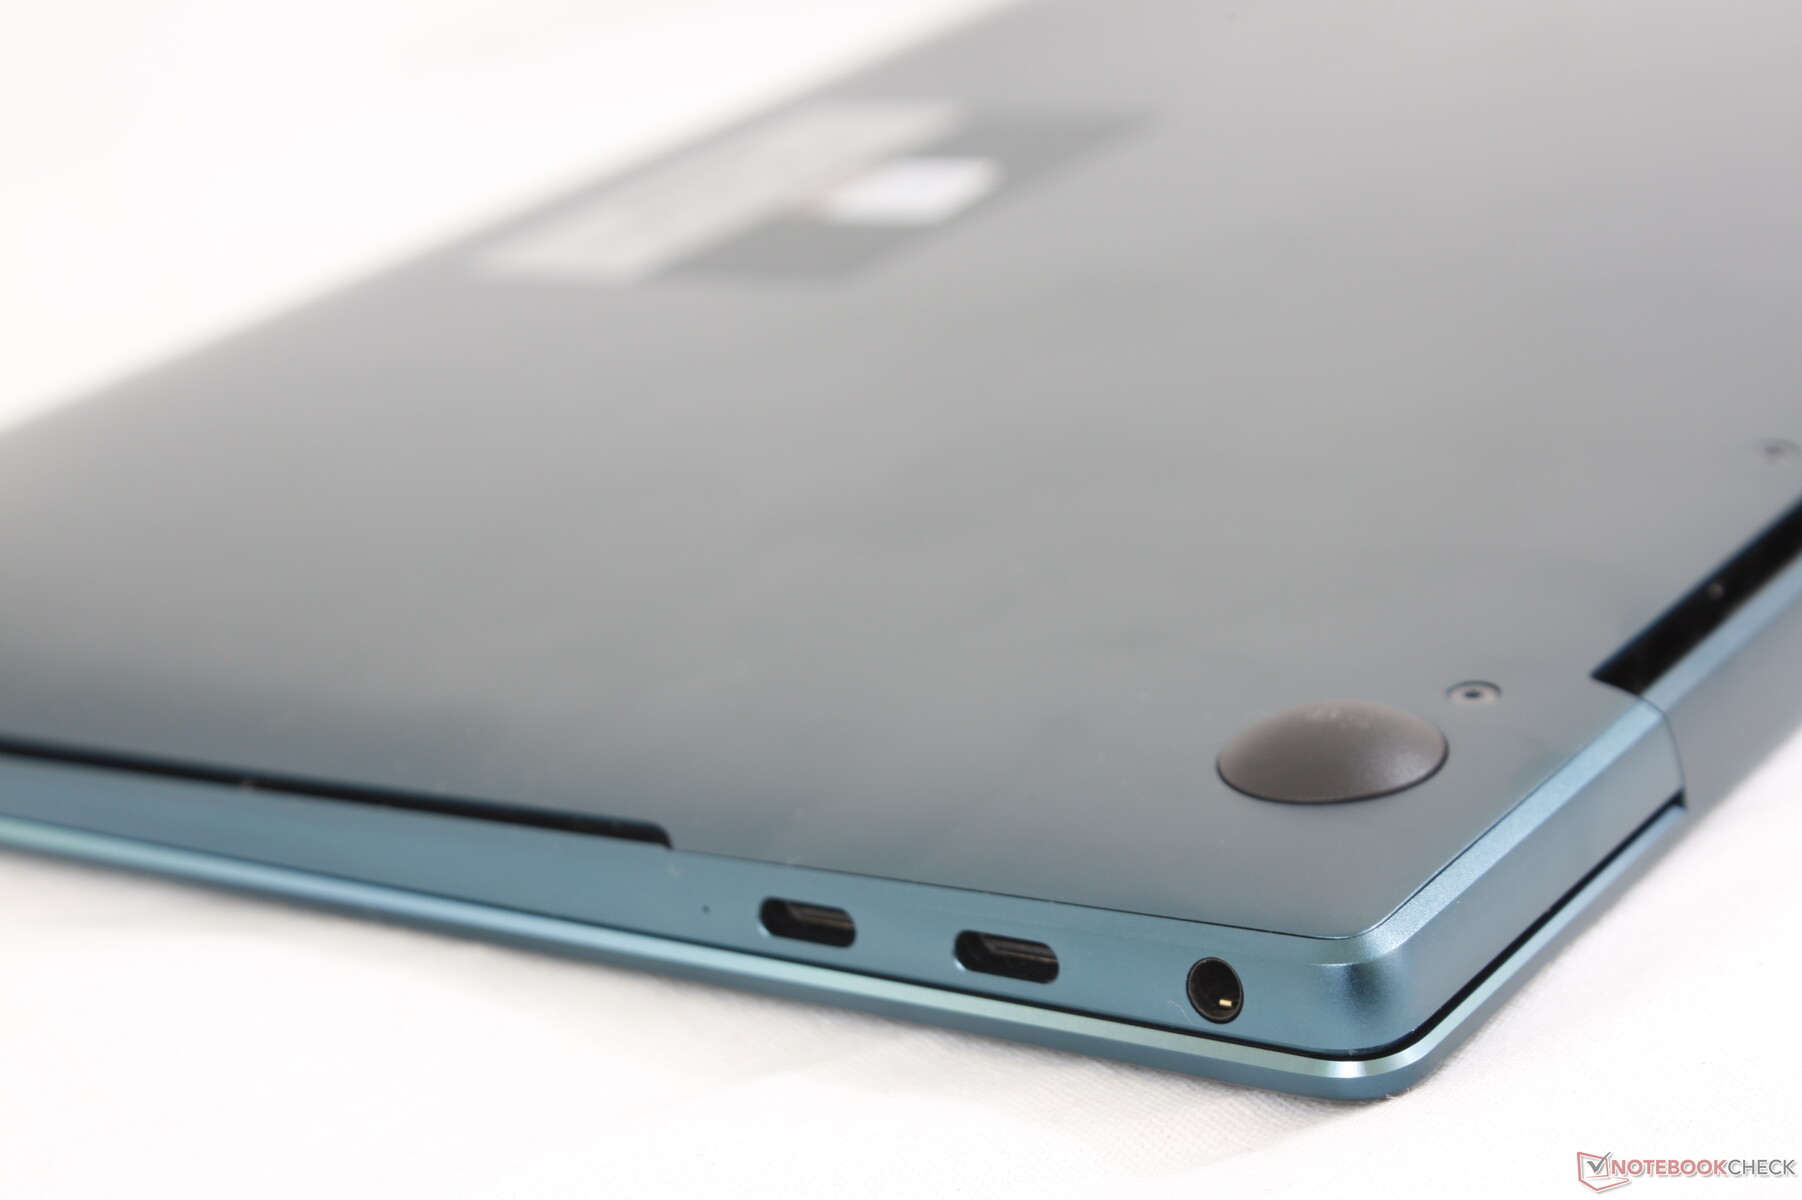
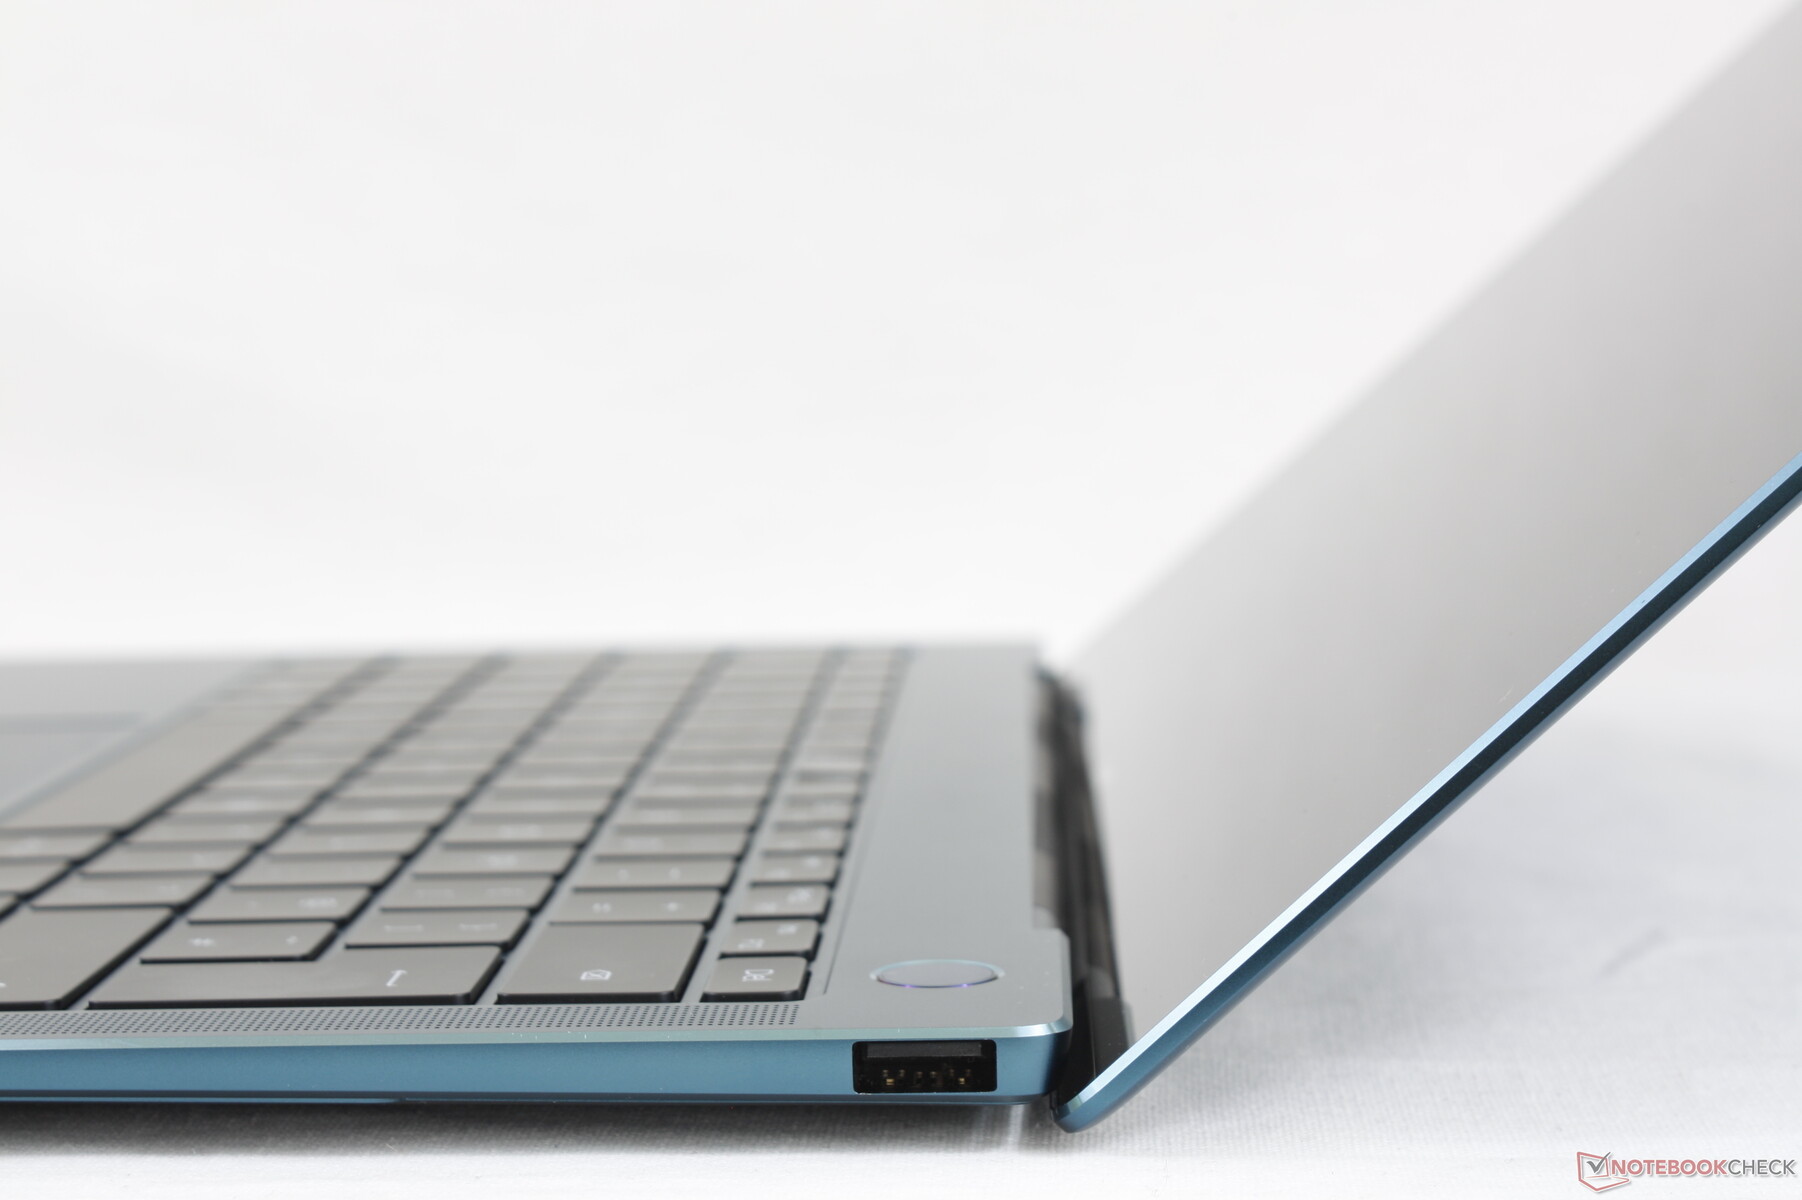
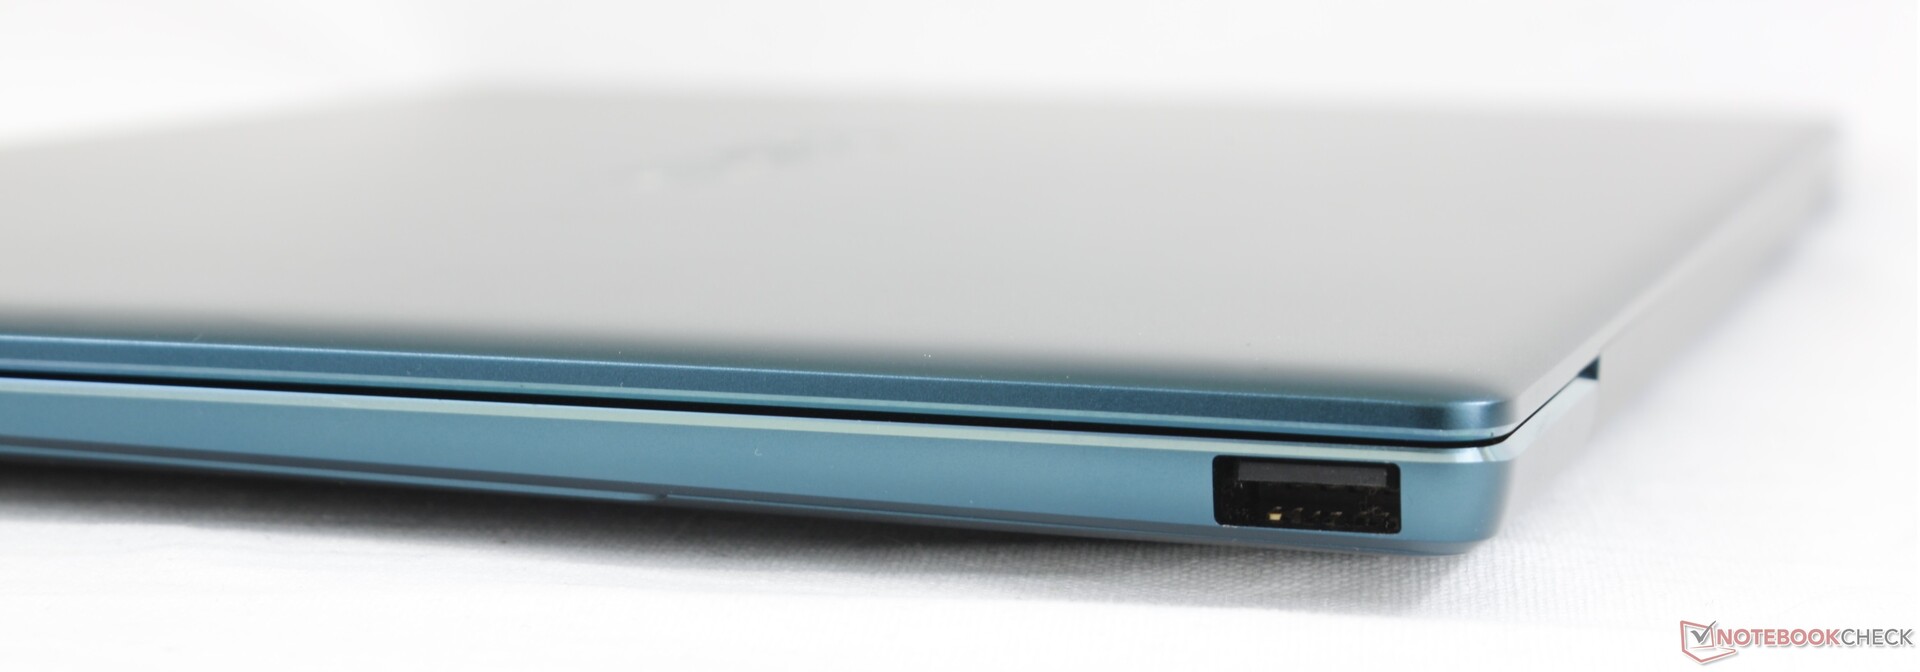
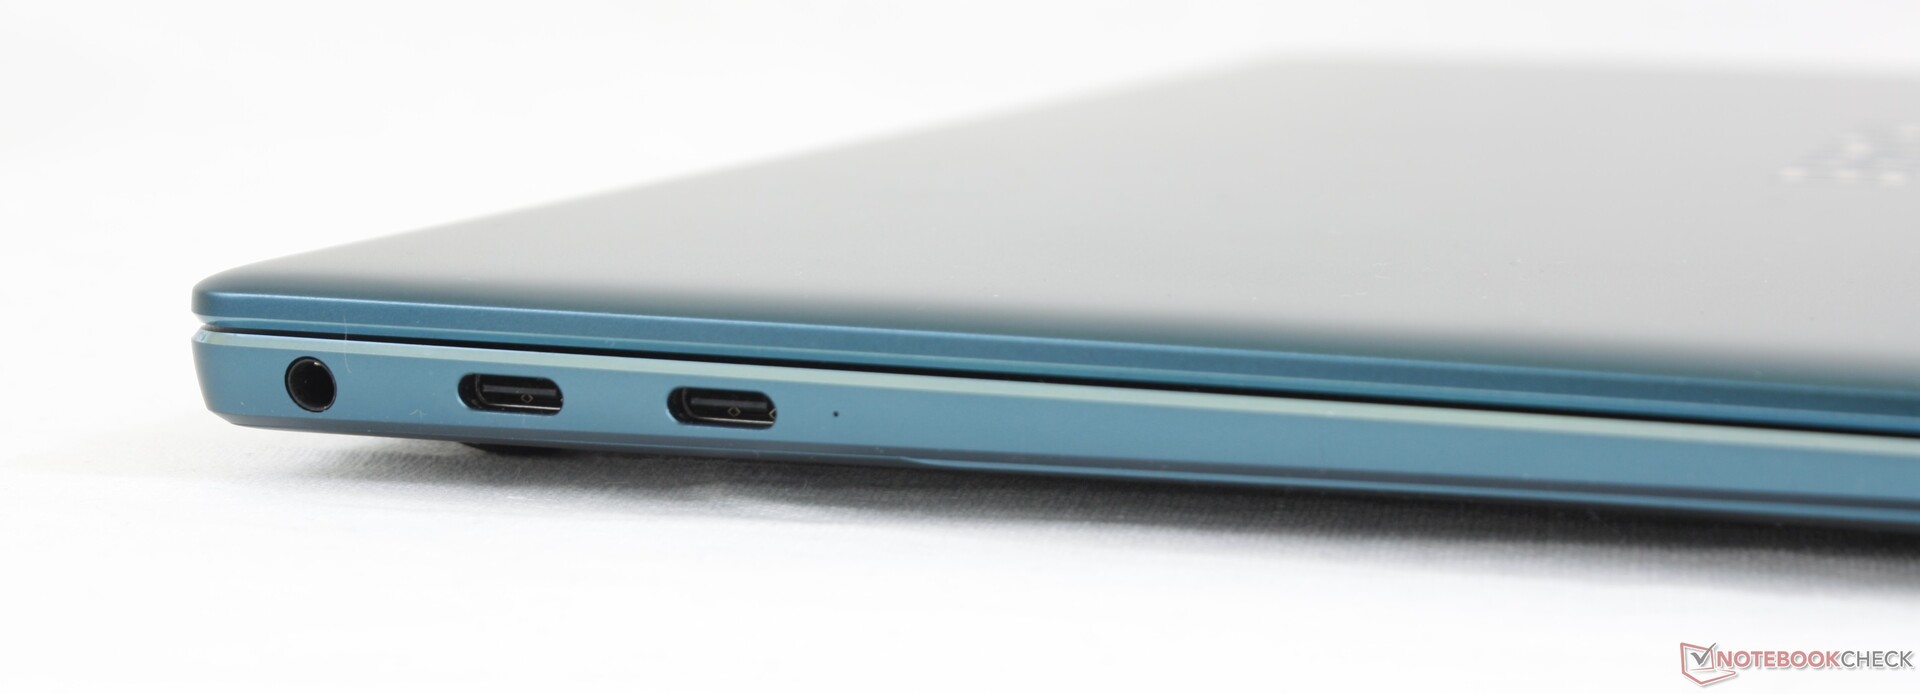
Both USB-C ports have been upgraded to support Thunderbolt speeds. However, we're currently waiting on confirmation from Huawei to find out if the laptop supports Thunderbolt 4 or only Thunderbolt 3. Port options are otherwise the same as on last year's model. The integrated USB-A port is great especially since it is becoming more uncommon, but the lack of a Kensington Lock is a downer.
Communication
Wi-Fi 6 and Bluetooth 5.1 are provided by the Intel AX201. Transfer rates are steady and we experienced no connectivity issues during our time with the test unit.
Killer USB-C Ethernet Adapter - Upgrade to a stable connection
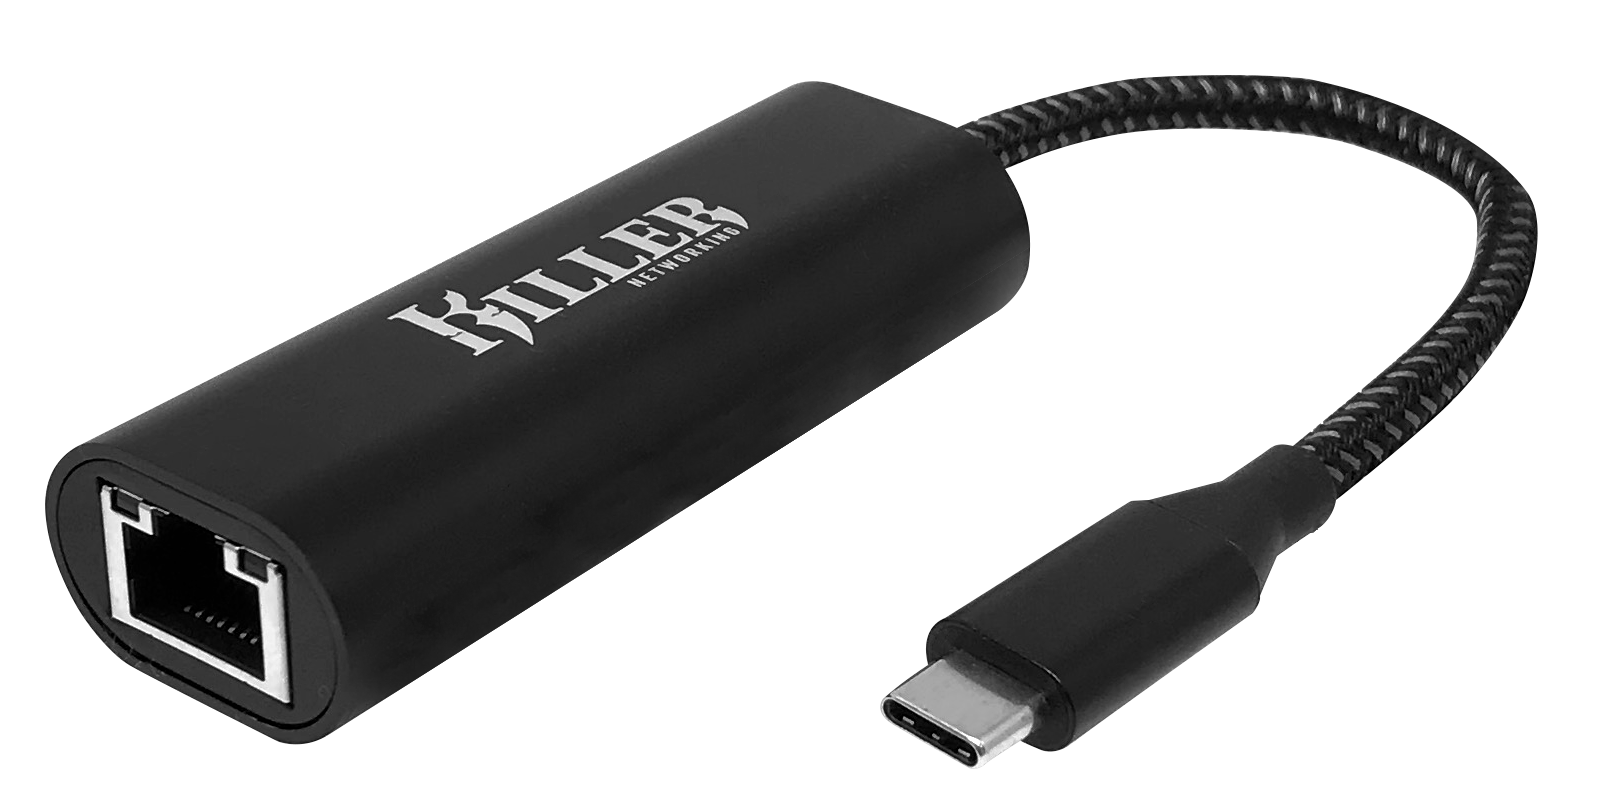
Despite advances in wireless networking, Ethernet is still the top choice for gamers and power users. The Killer 2.5G Ethernet to USB-C Adapter enables seamless Ethernet connectivity with full 2.5 Gbps throughput. It also brings the best of Killer technologies including the much acclaimed Killer Prioritization Engine, GameFast, Extreme Mode, and Intelligence Engine that ensure your favorite game or app gets the bandwidth and priority it deserves. For laptops already equipped with a Killer wireless card, Killer DoubleShot Pro offers bandwidth doubling and fine-grained control over network packets passing through each connection.
In our testing, the Killer 2.5G Ethernet Adapter lived up to the advertised speeds consistently throughout testing. You can read more about performance comparison with other USB Ethernet Adapters in our article.
The Killer 2.5G Ethernet to USB-C adapter can be purchased on Amazon for US$ 49.99
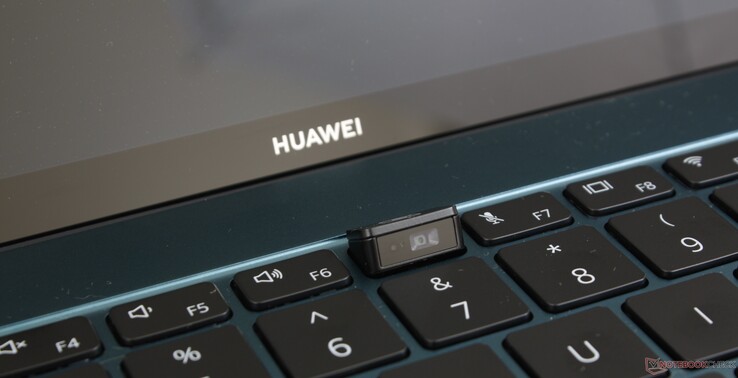
Webcam

Huawei has been using the same pop-up webcam for over three years. Not only is the video quality poor, but the angle is awful. The webcam becomes unusable if the laptop is on one's lap, for example. The "pop-up" design is embarrassingly outdated at this point when compared to the latest Ultrabooks from Dell or HP.


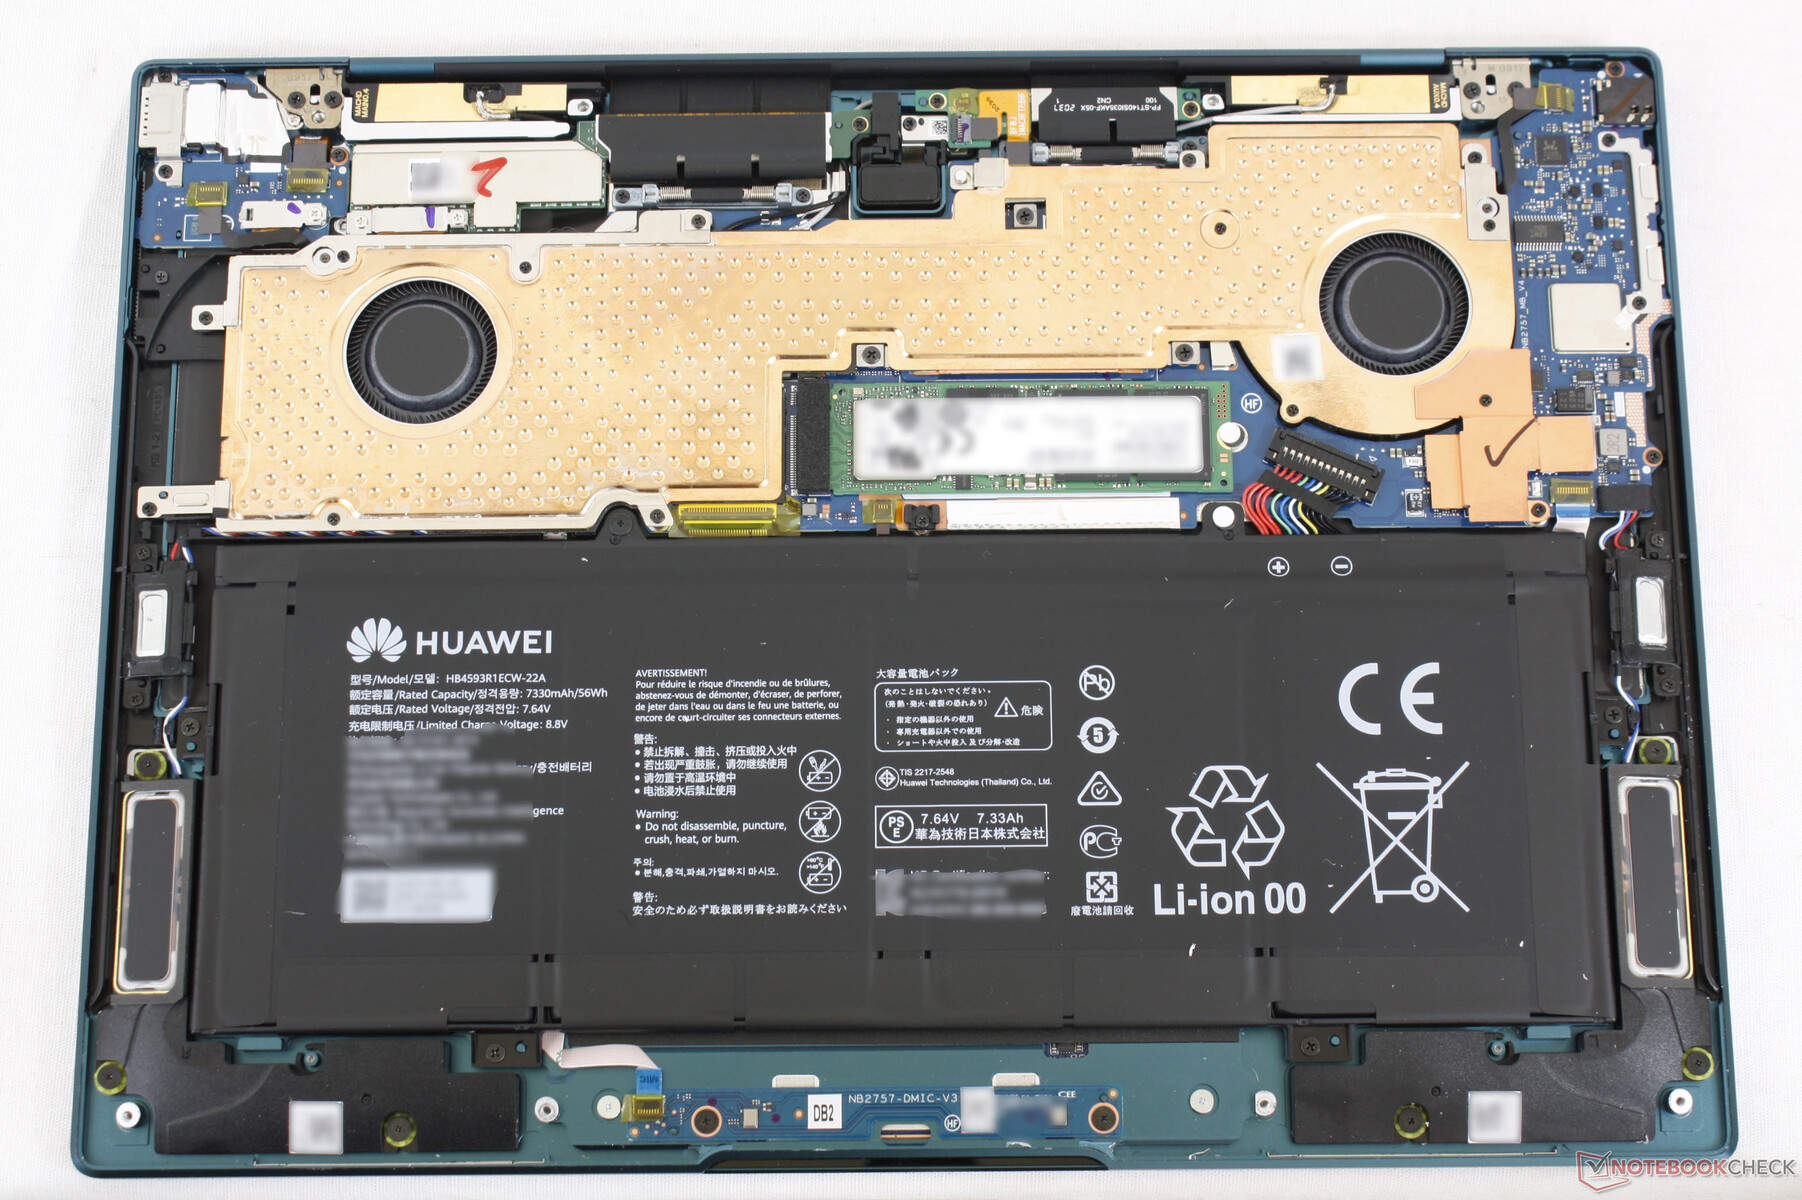
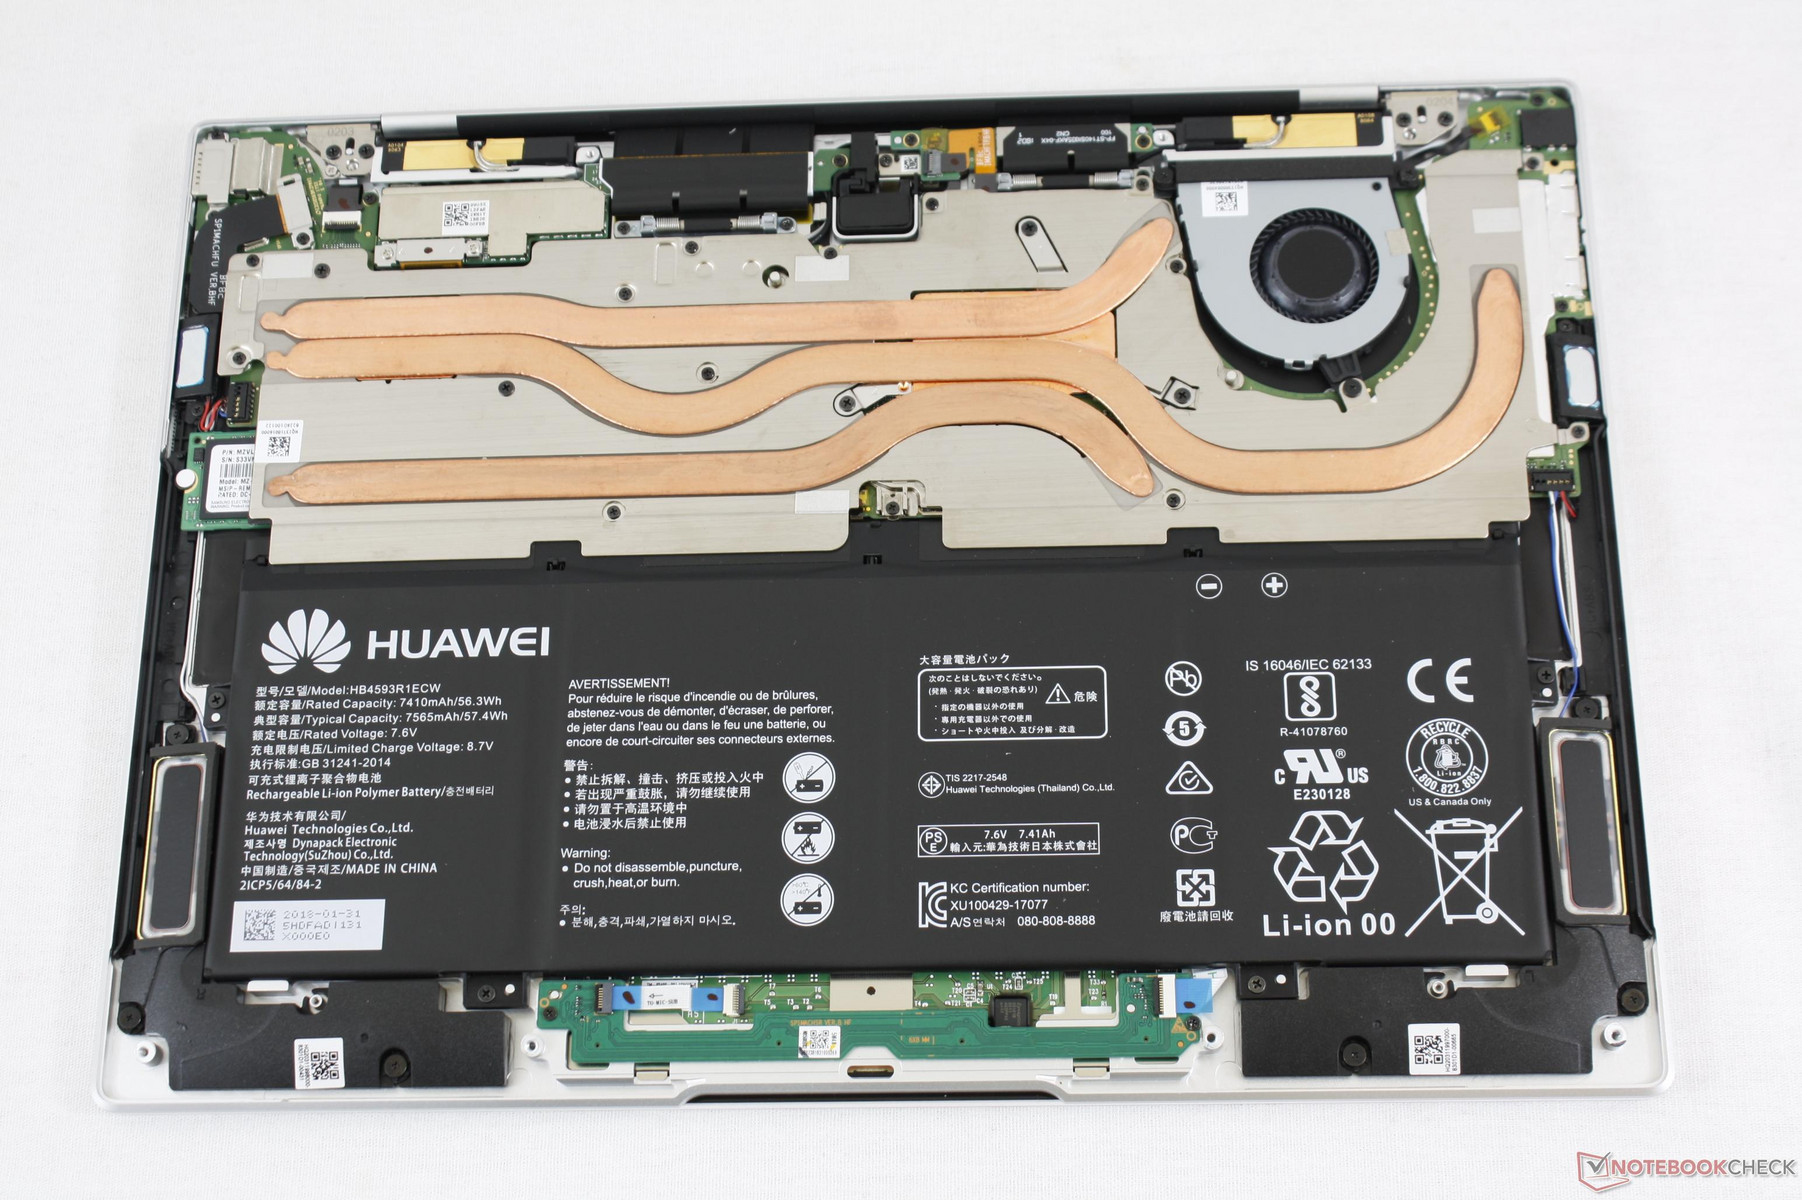
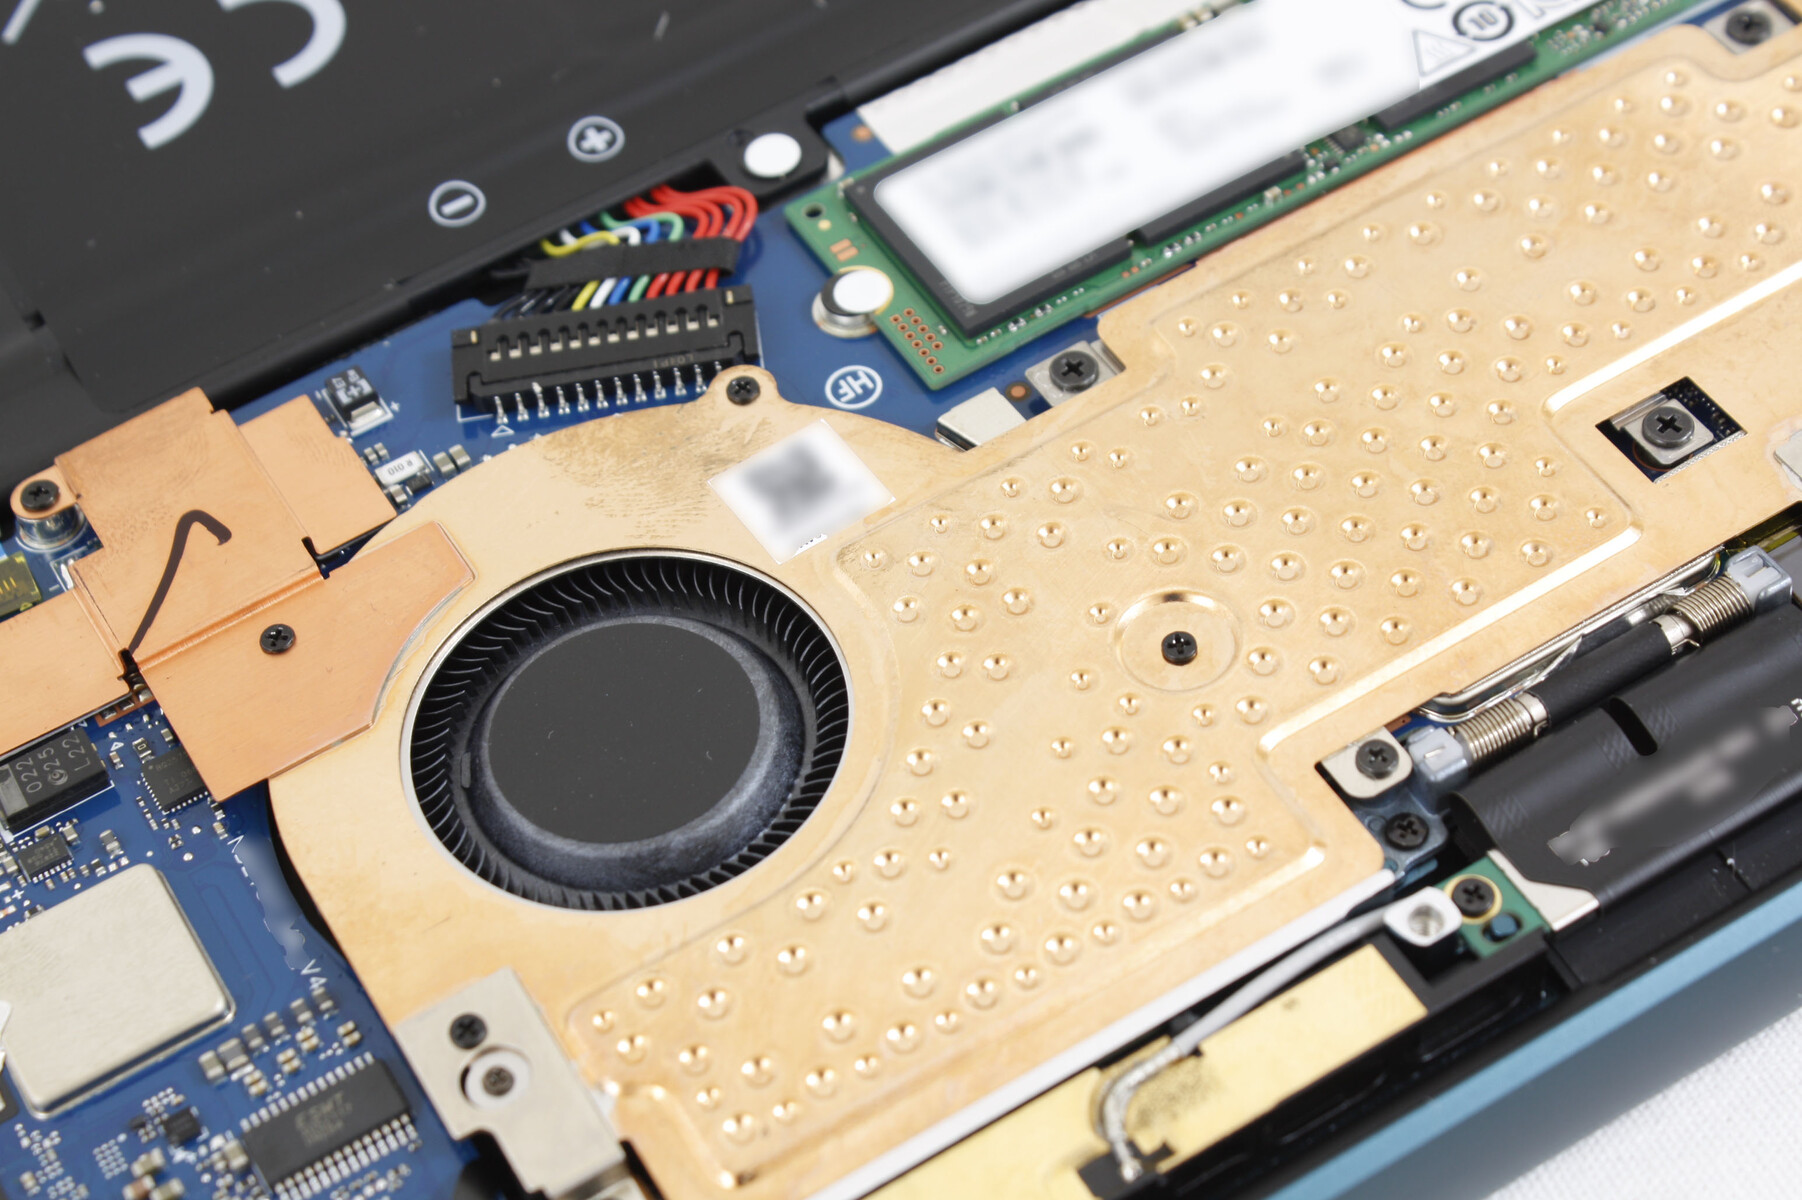
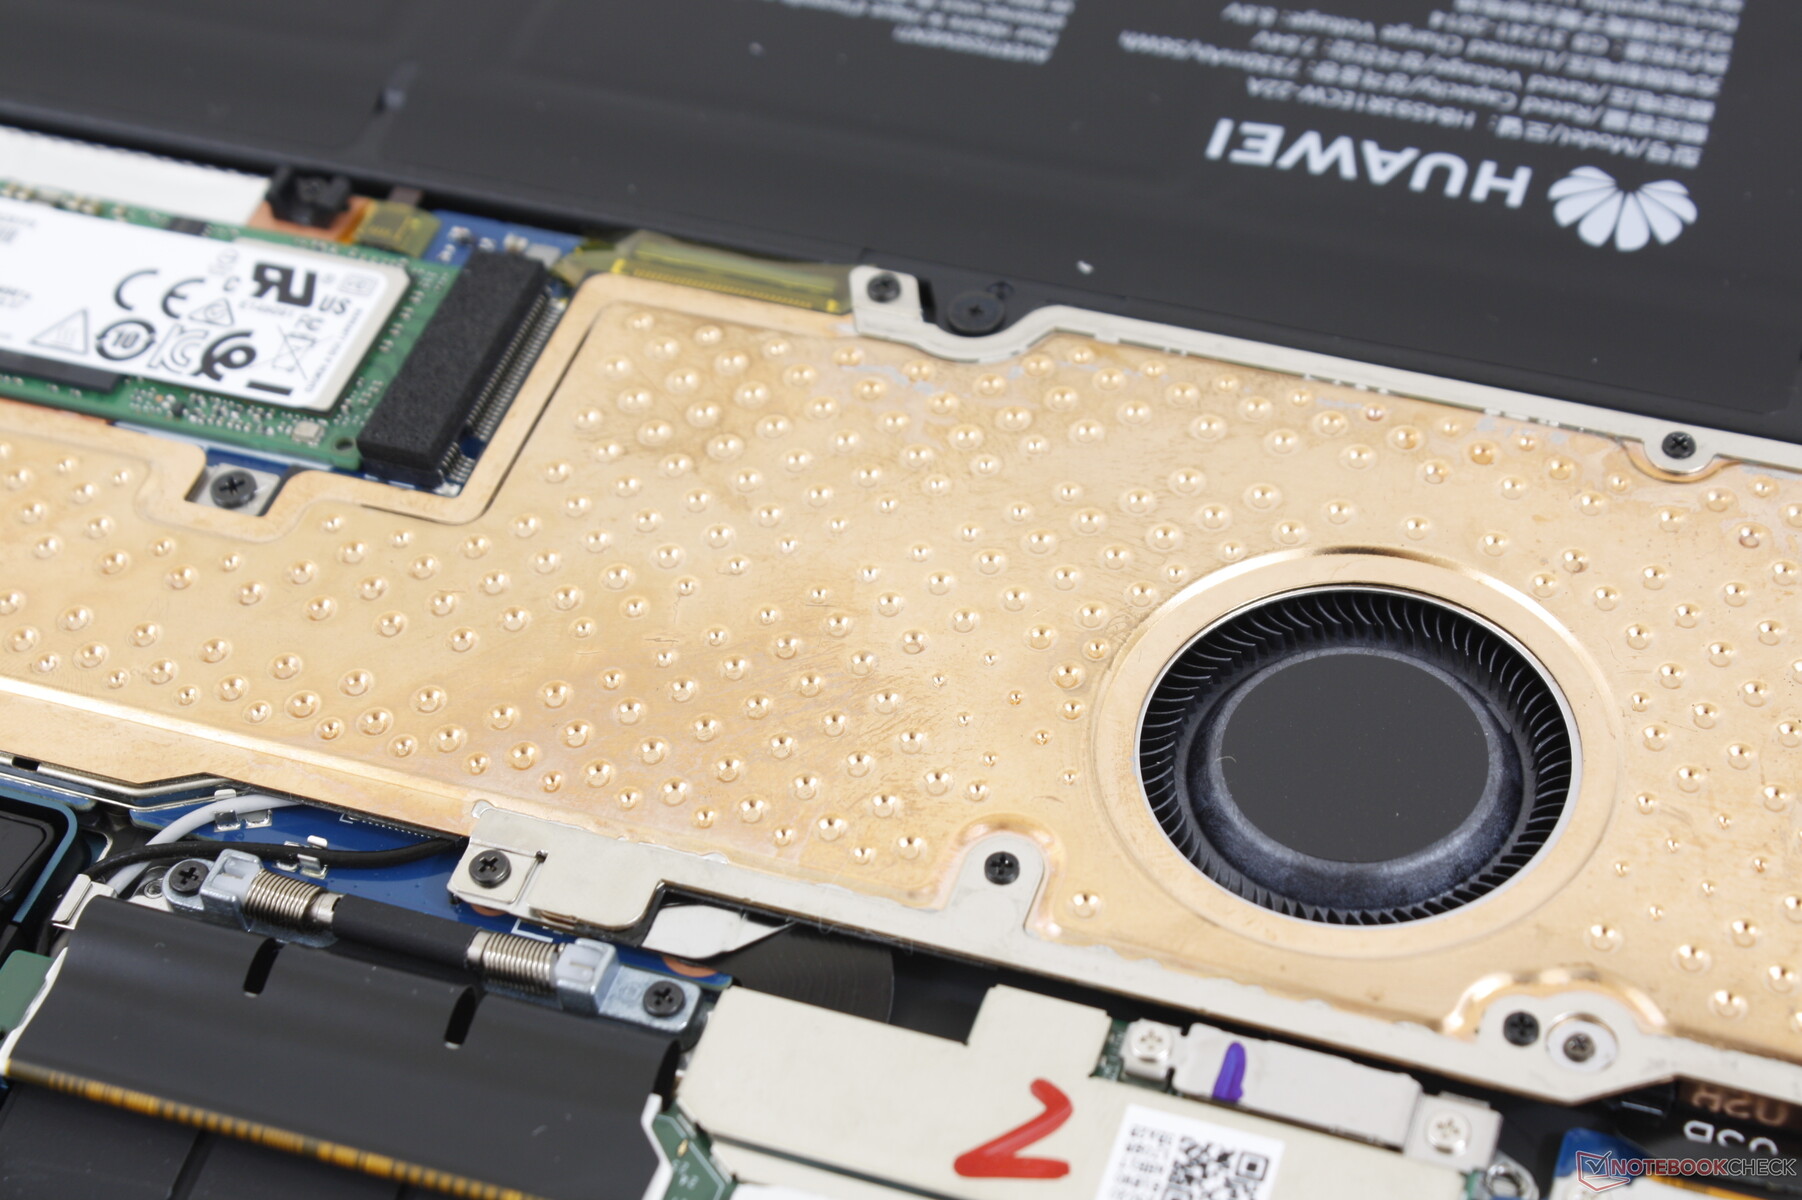
Maintenance
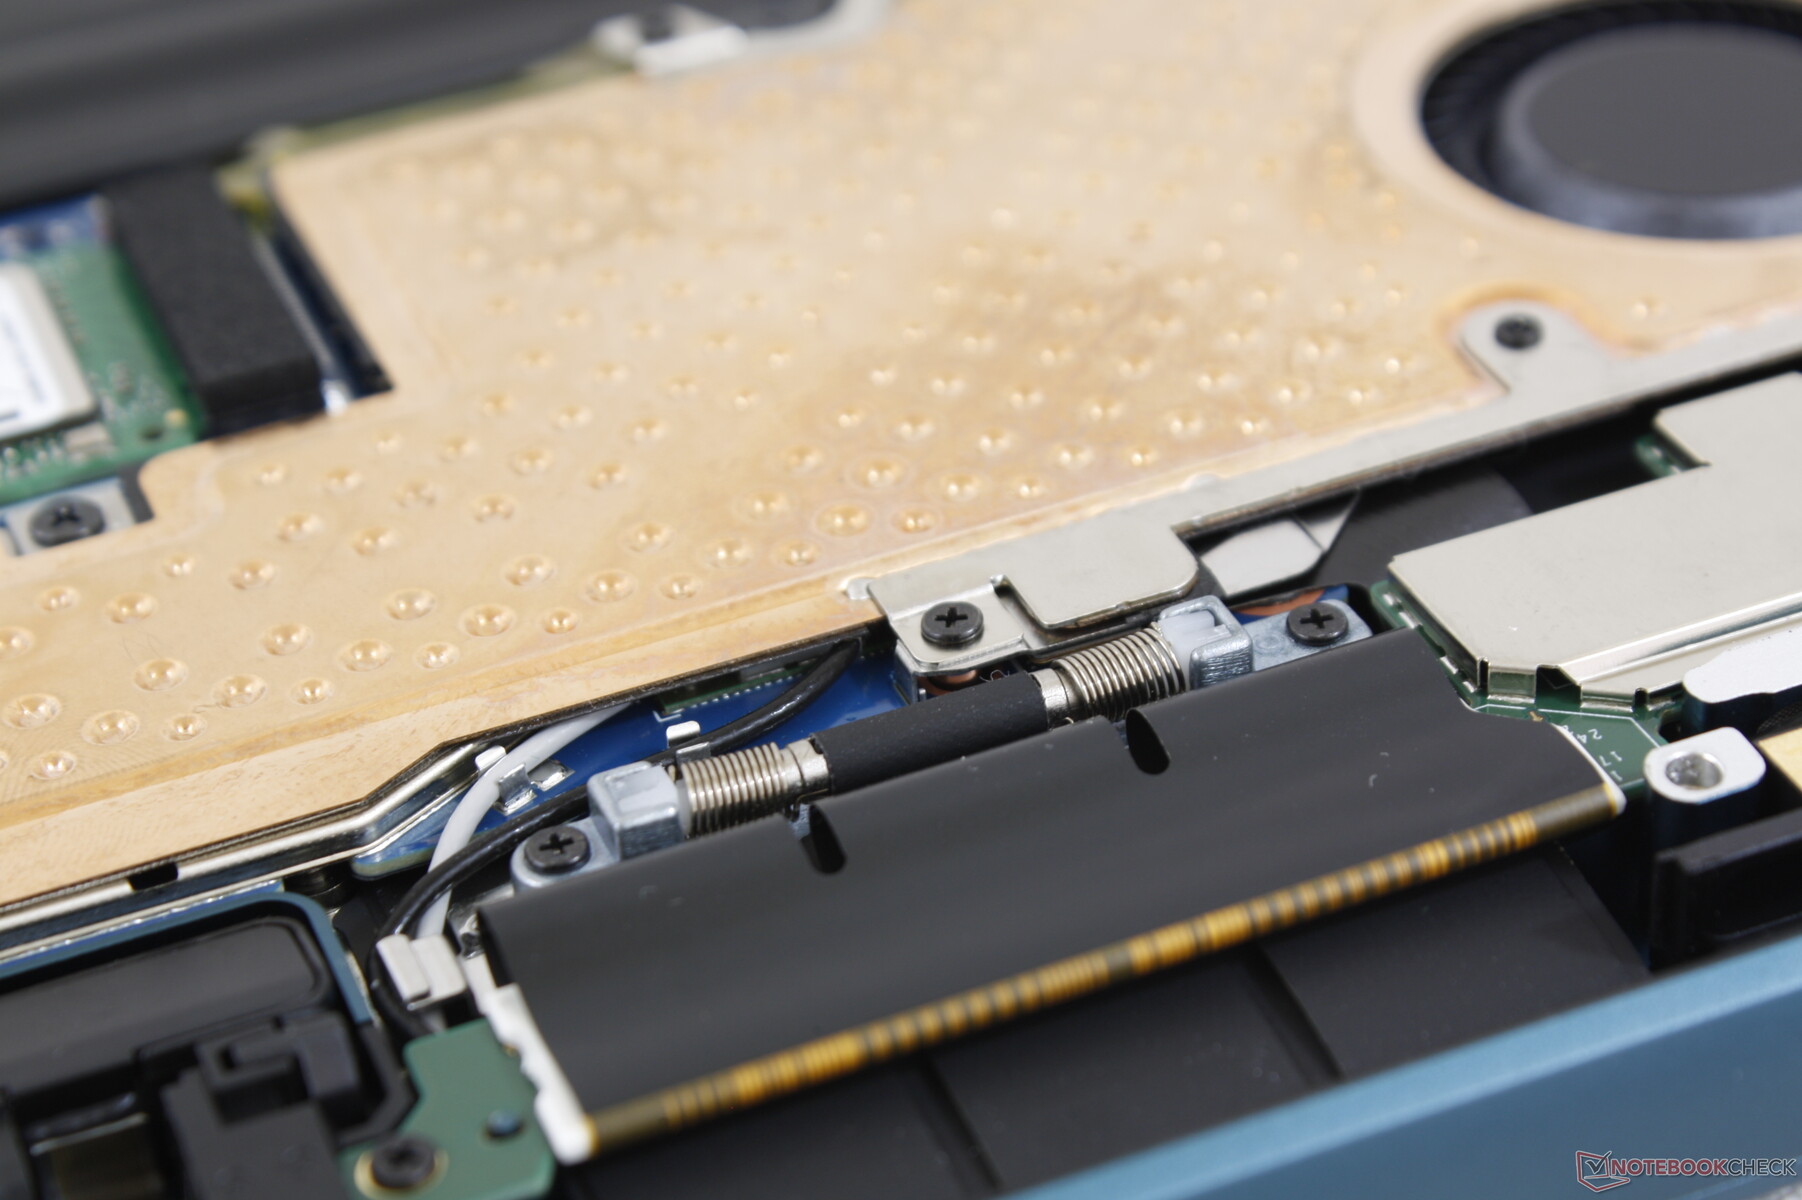
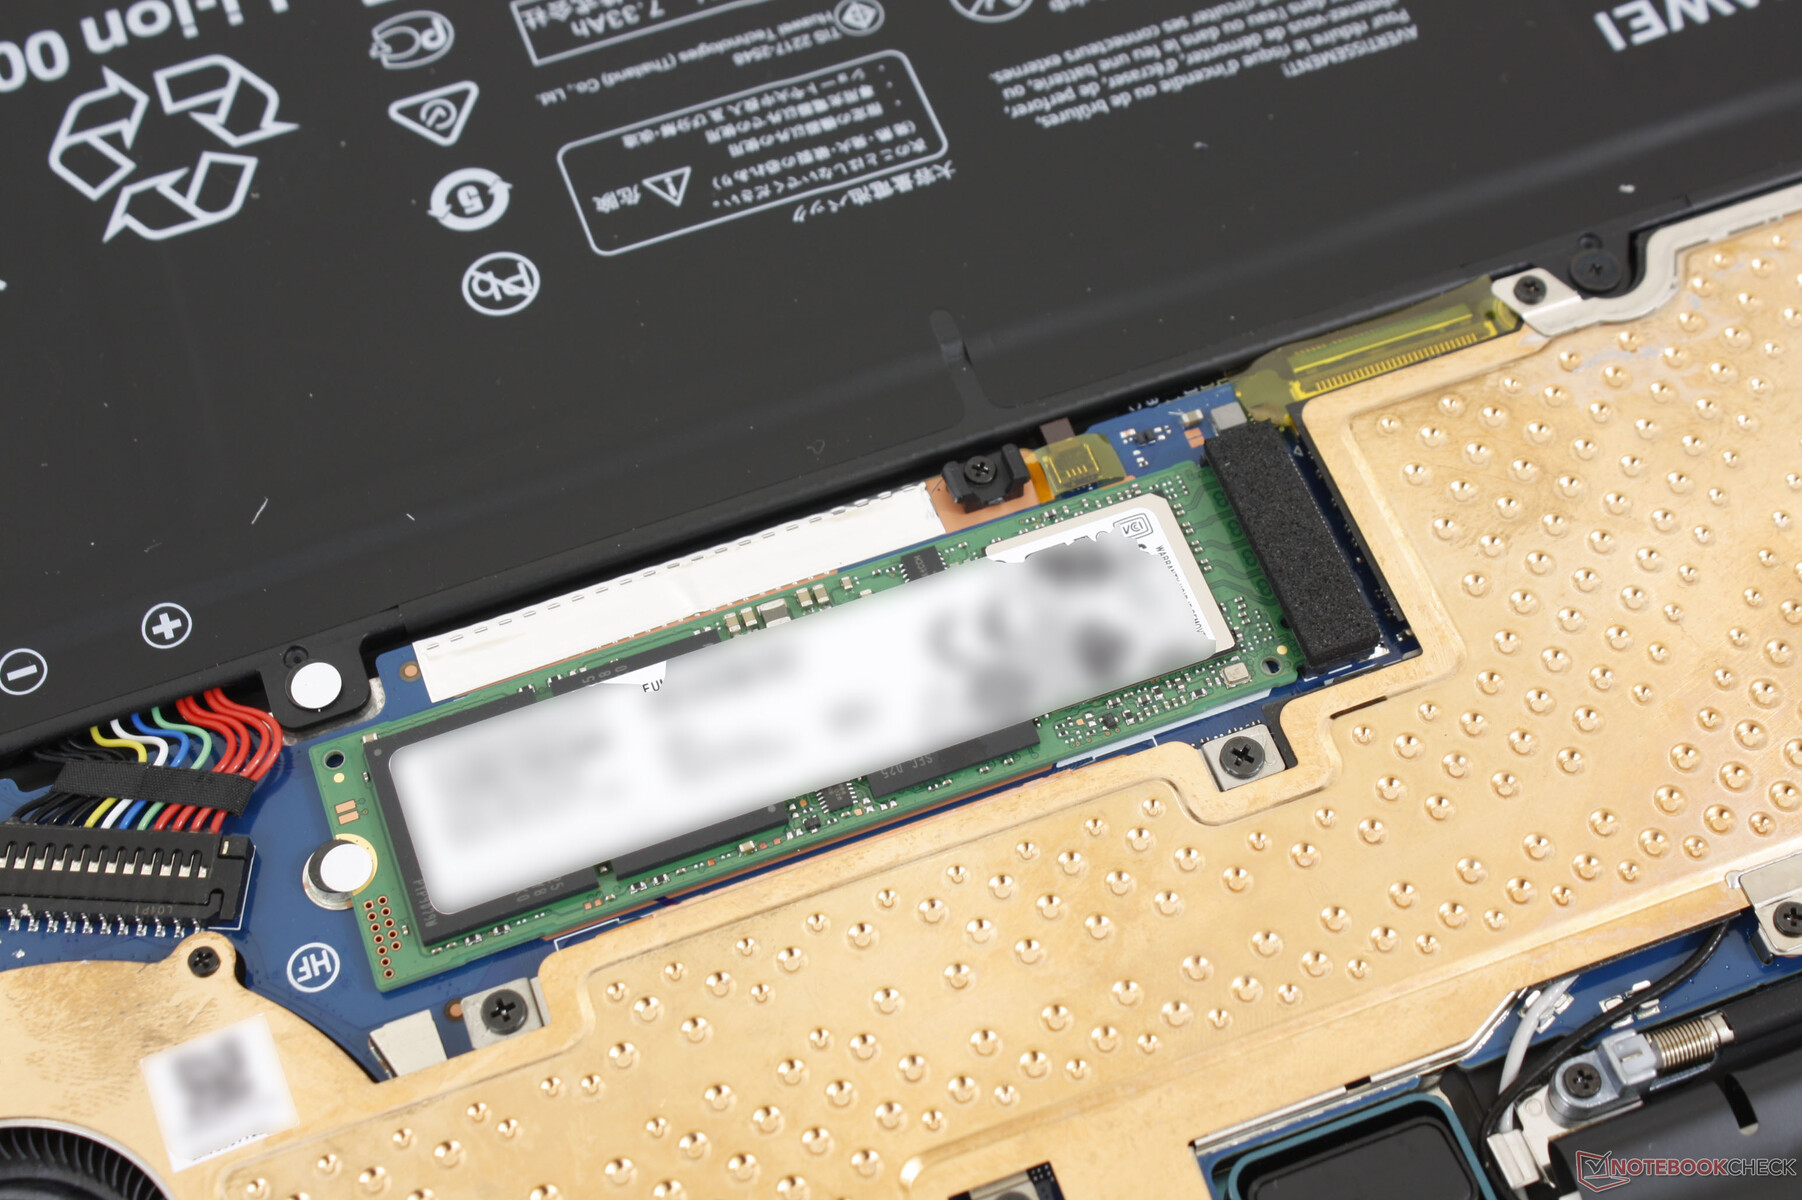
The bottom panel is secured by T5 Torx screws with none hidden underneath the rubber footing. Servicing is difficult because of the tight latches and very sharp edges; a plastic edge like a credit card is absolutely recommended for this reason. Once inside, users can only upgrade the M.2 SSD as both the WLAN and RAM modules are soldered.
Accessories and Warranty
There are no extras in the box other than the AC adapter and paperwork. The usual manufacturer warranty applies, but claiming said warranty may be difficult if you live in regions where the MateBook X Pro is not officially sold.
Input Devices
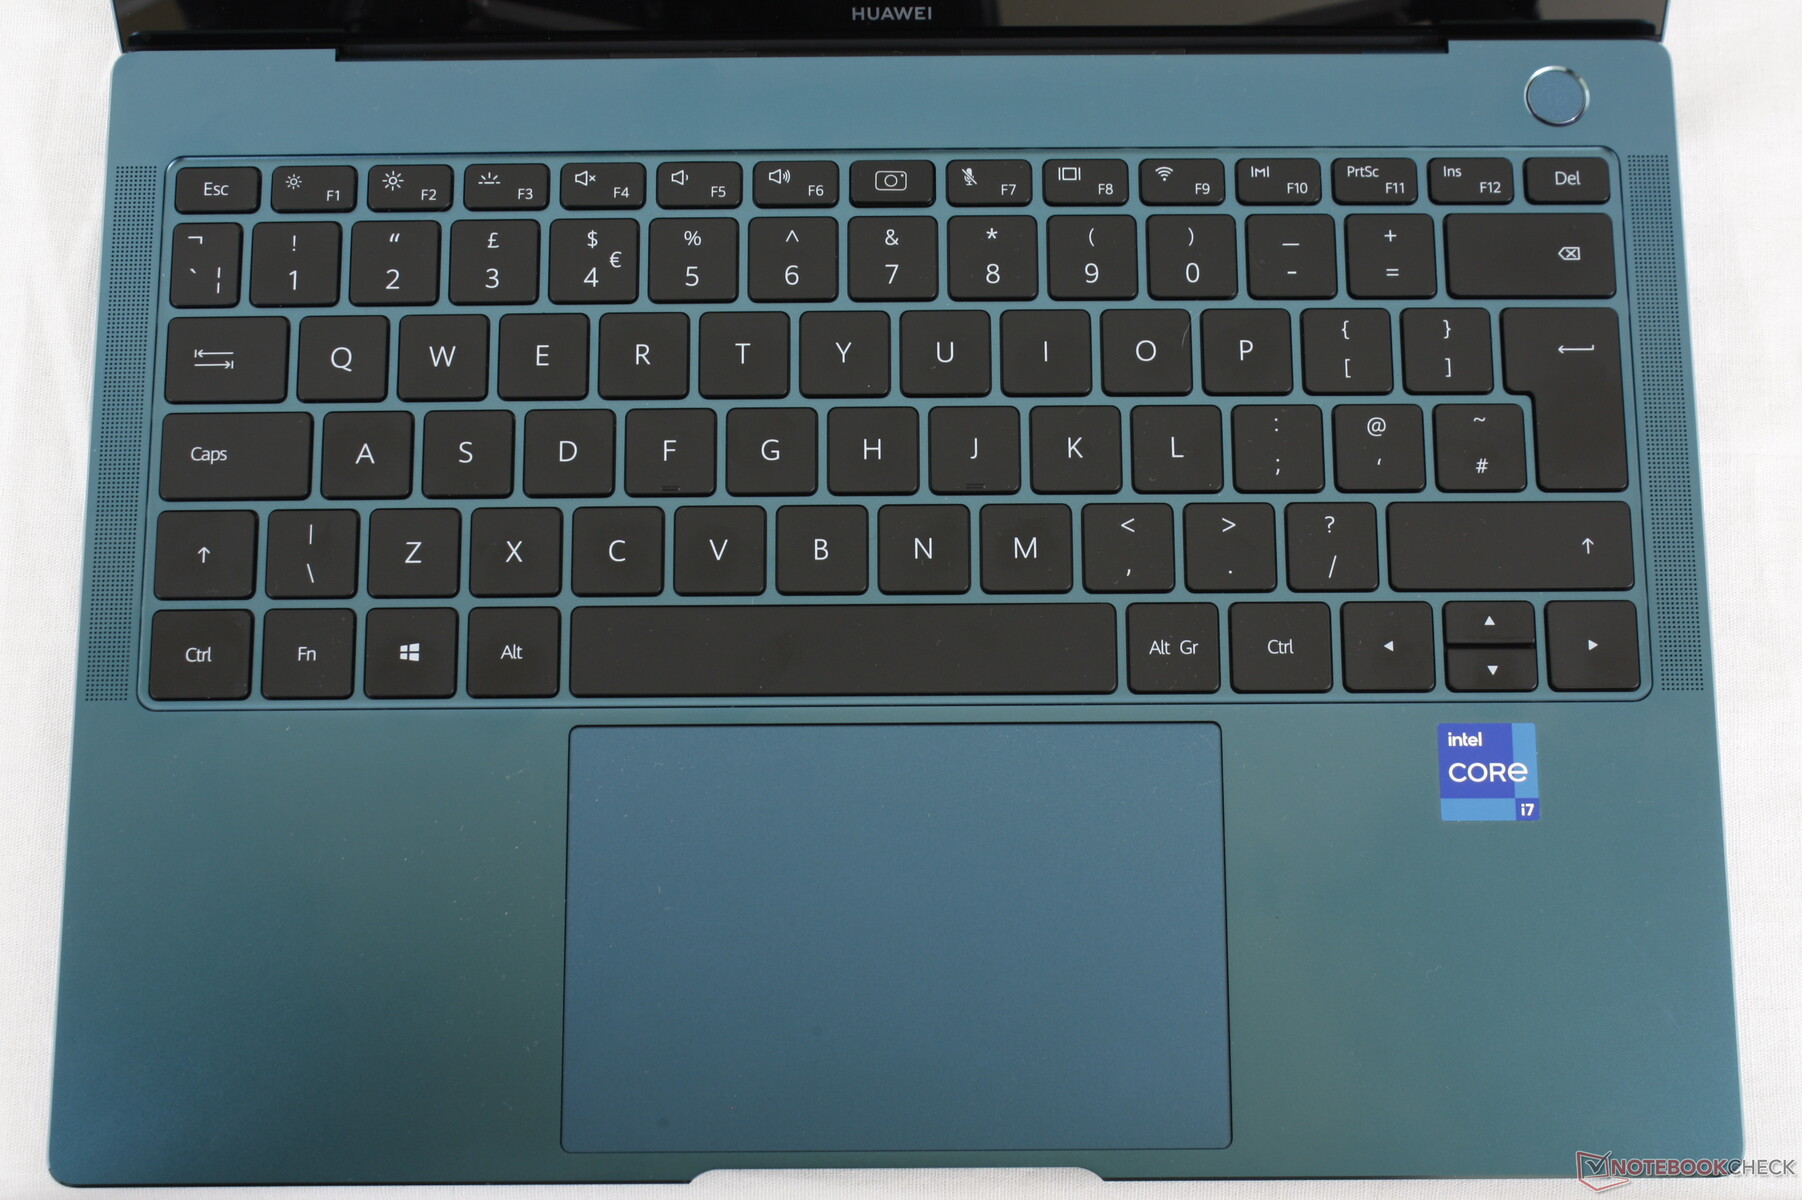
Keyboard
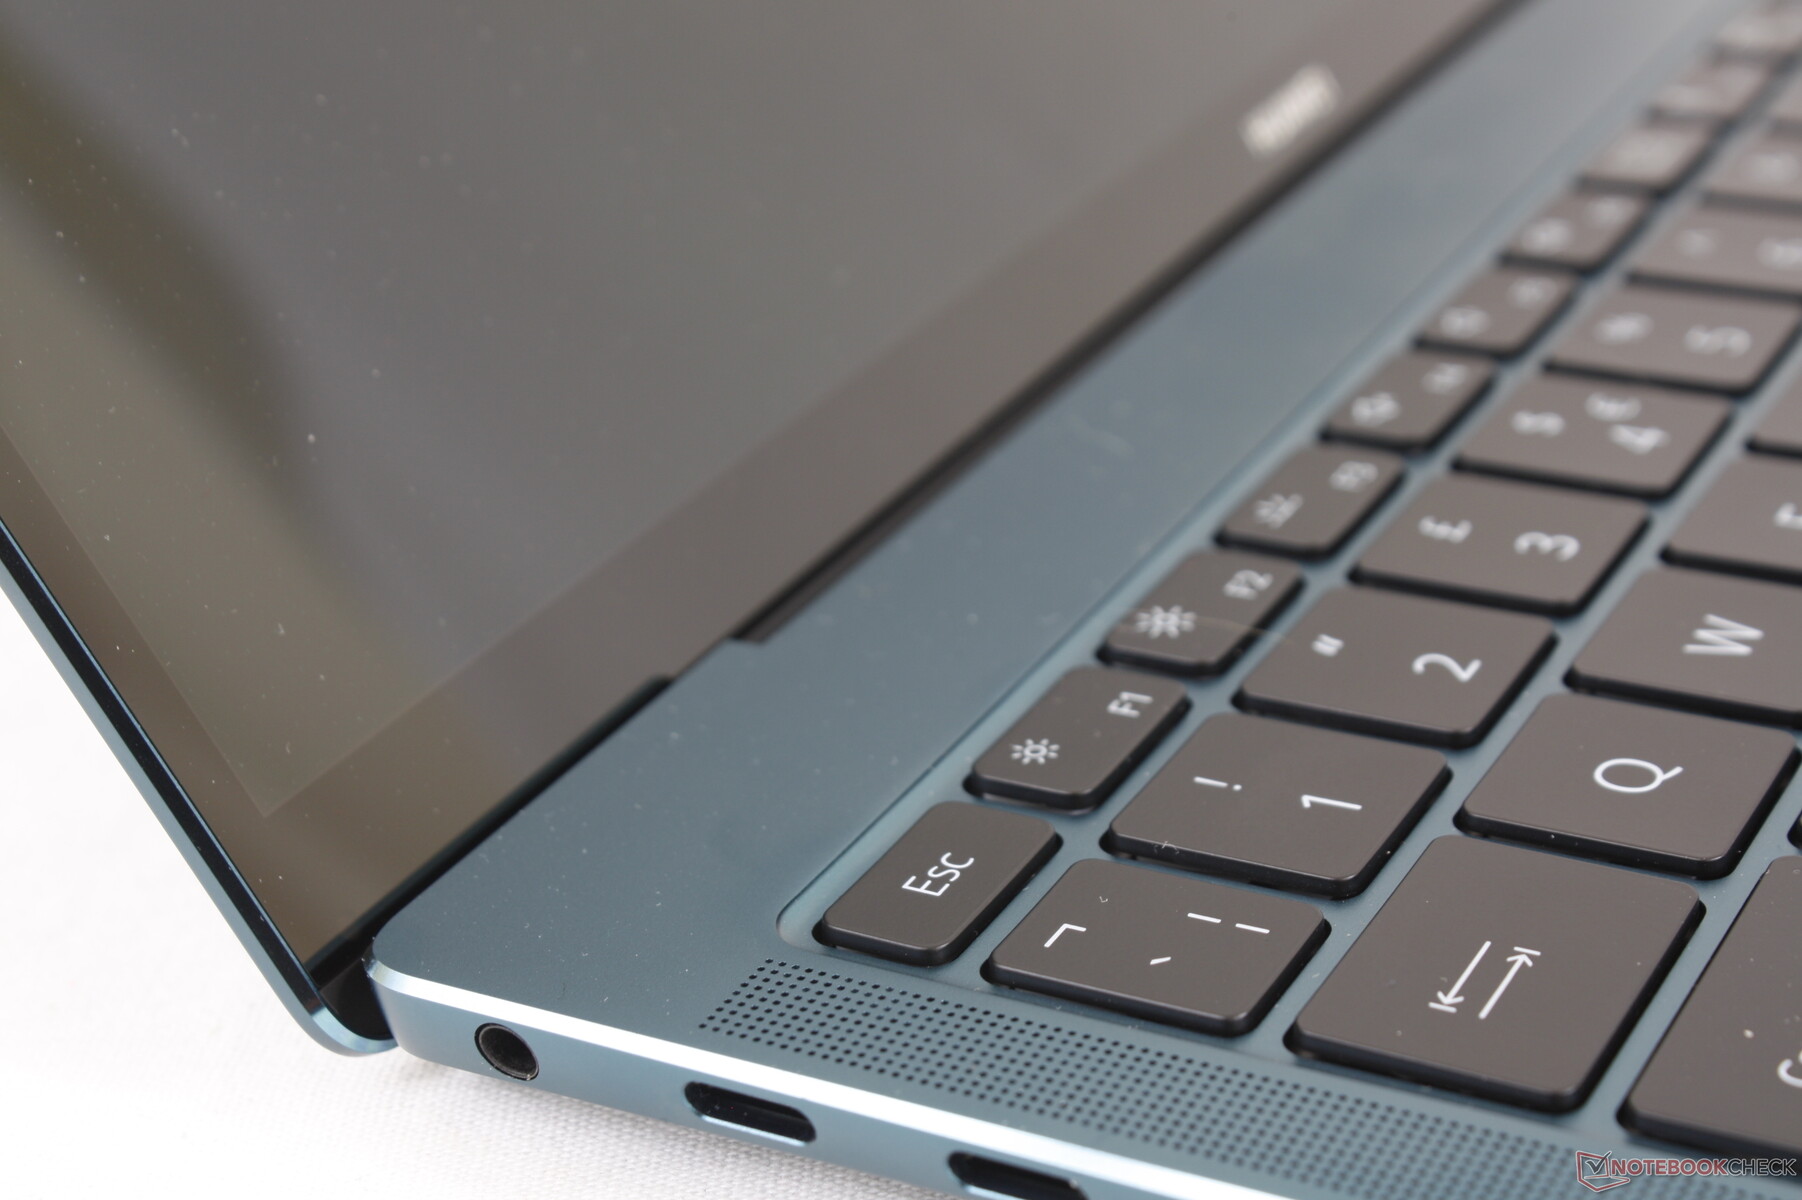
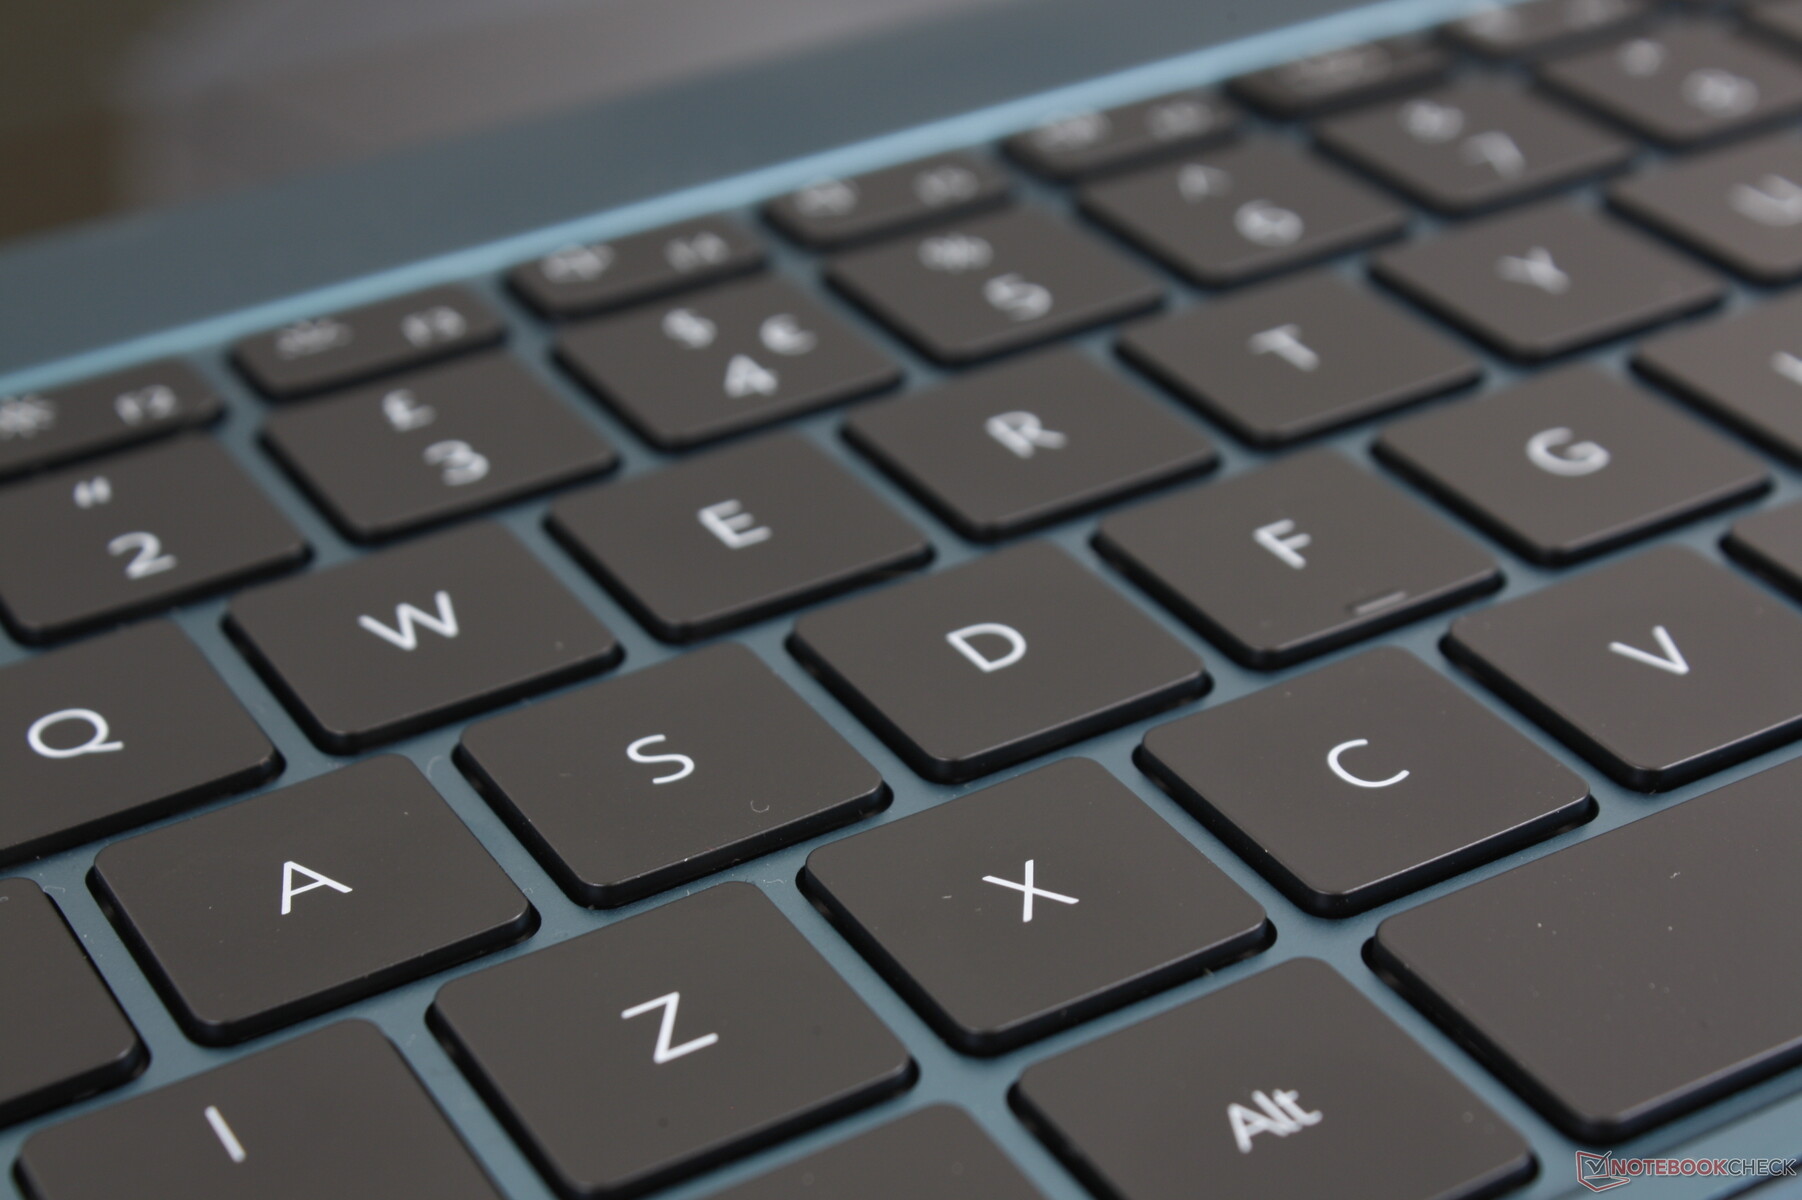
The keyboard suffers from the same drawbacks as most other Ultrabooks: shallow travel and somewhat soft feedback. Its Space key in particular could have benefited from stronger feedback. The overall feel of the keyboard is most similar to the Lenovo IdeaPad Slim 9i. Other laptops like the Lenovo ThinkPad T series or HP Spectre/EliteBook are slightly thicker, but they also carry more comfortable keyboards with deeper travel and more satisfying feedback.
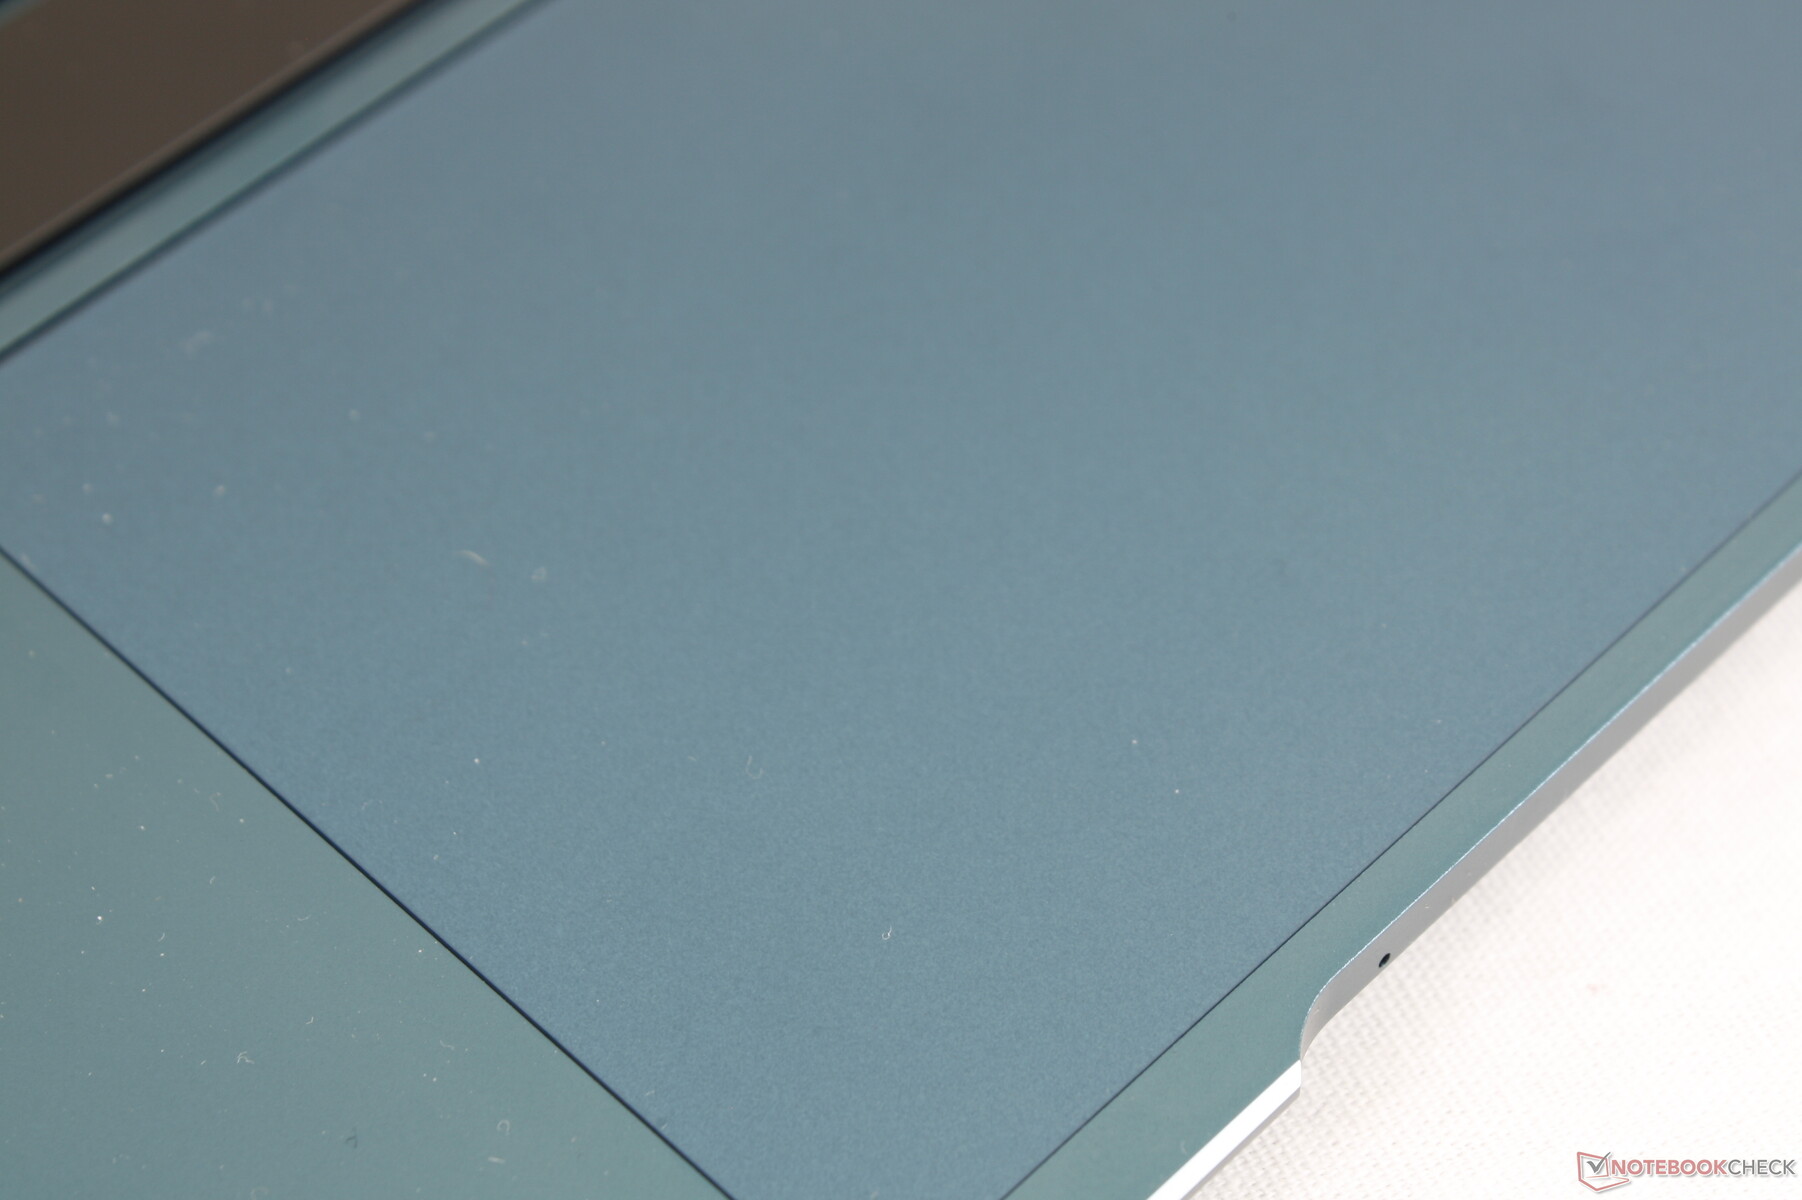
Touchpad
The roomy clickpad is larger than the clickpad on the XPS 13 9310 (12 x 7.7 cm vs. 11.2 x 6.5 cm) for comfortable cursor control and multi-touch inputs. Its gliding properties are extremely smooth with essentially no sticking even when moving at very slow speeds. This may not be ideal, however, as some users may find the clickpad to be too slippery as a result.
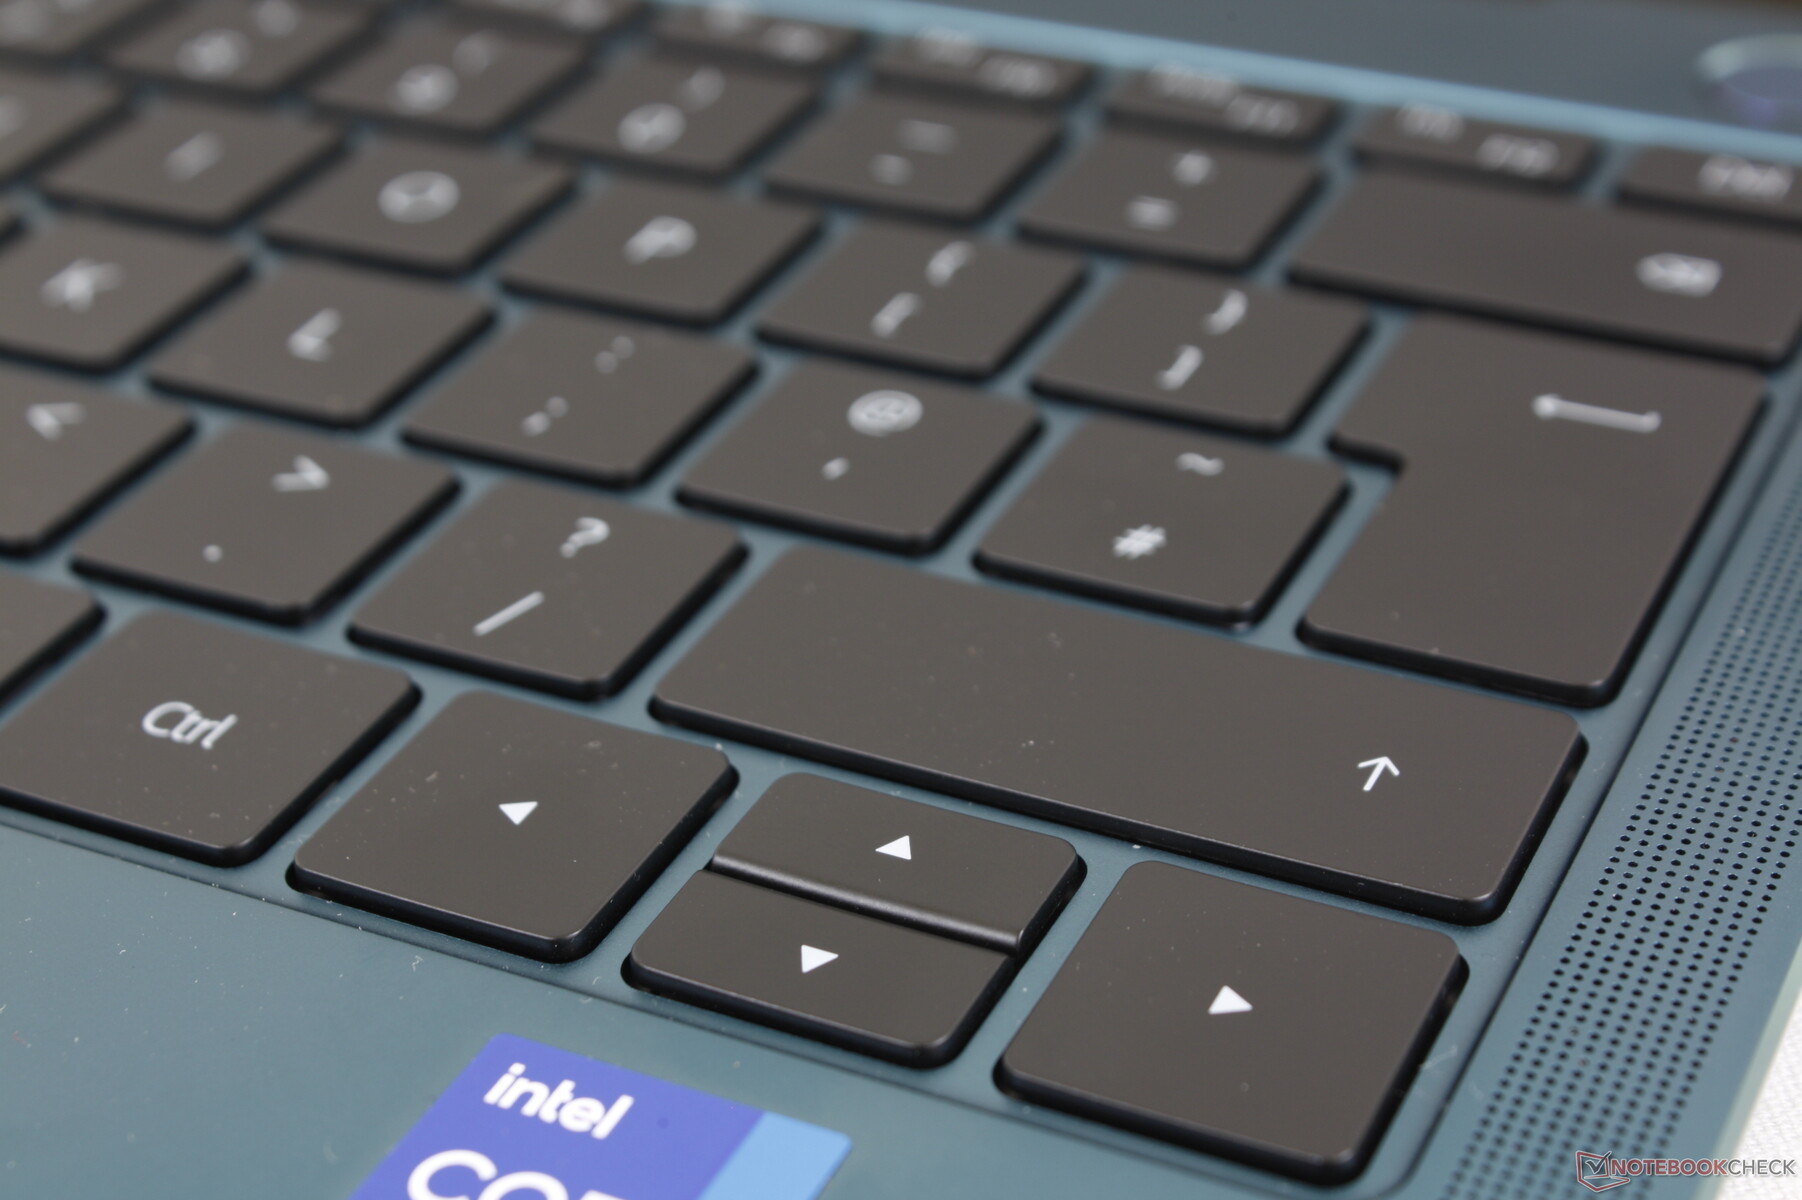
The integrated click keys are difficult to use. Travel is probably the shallowest we've ever seen on any laptop and usability suffers because of it. Feedback is spongy and the auditory click is so soft that it's difficult to know if our inputs are even being registered. Huawei definitely dropped the bomb in this aspect.
Display
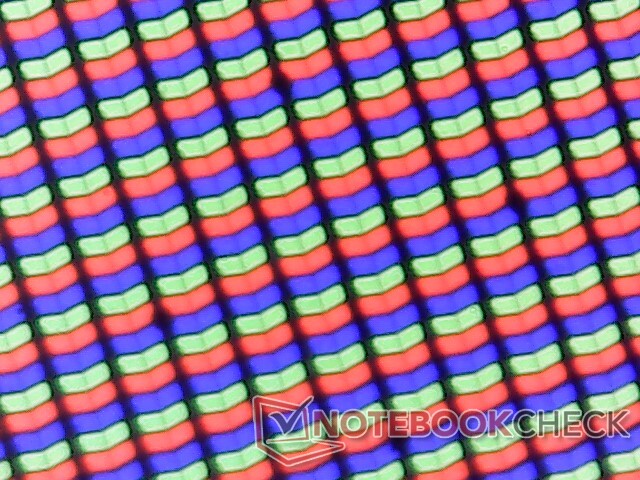
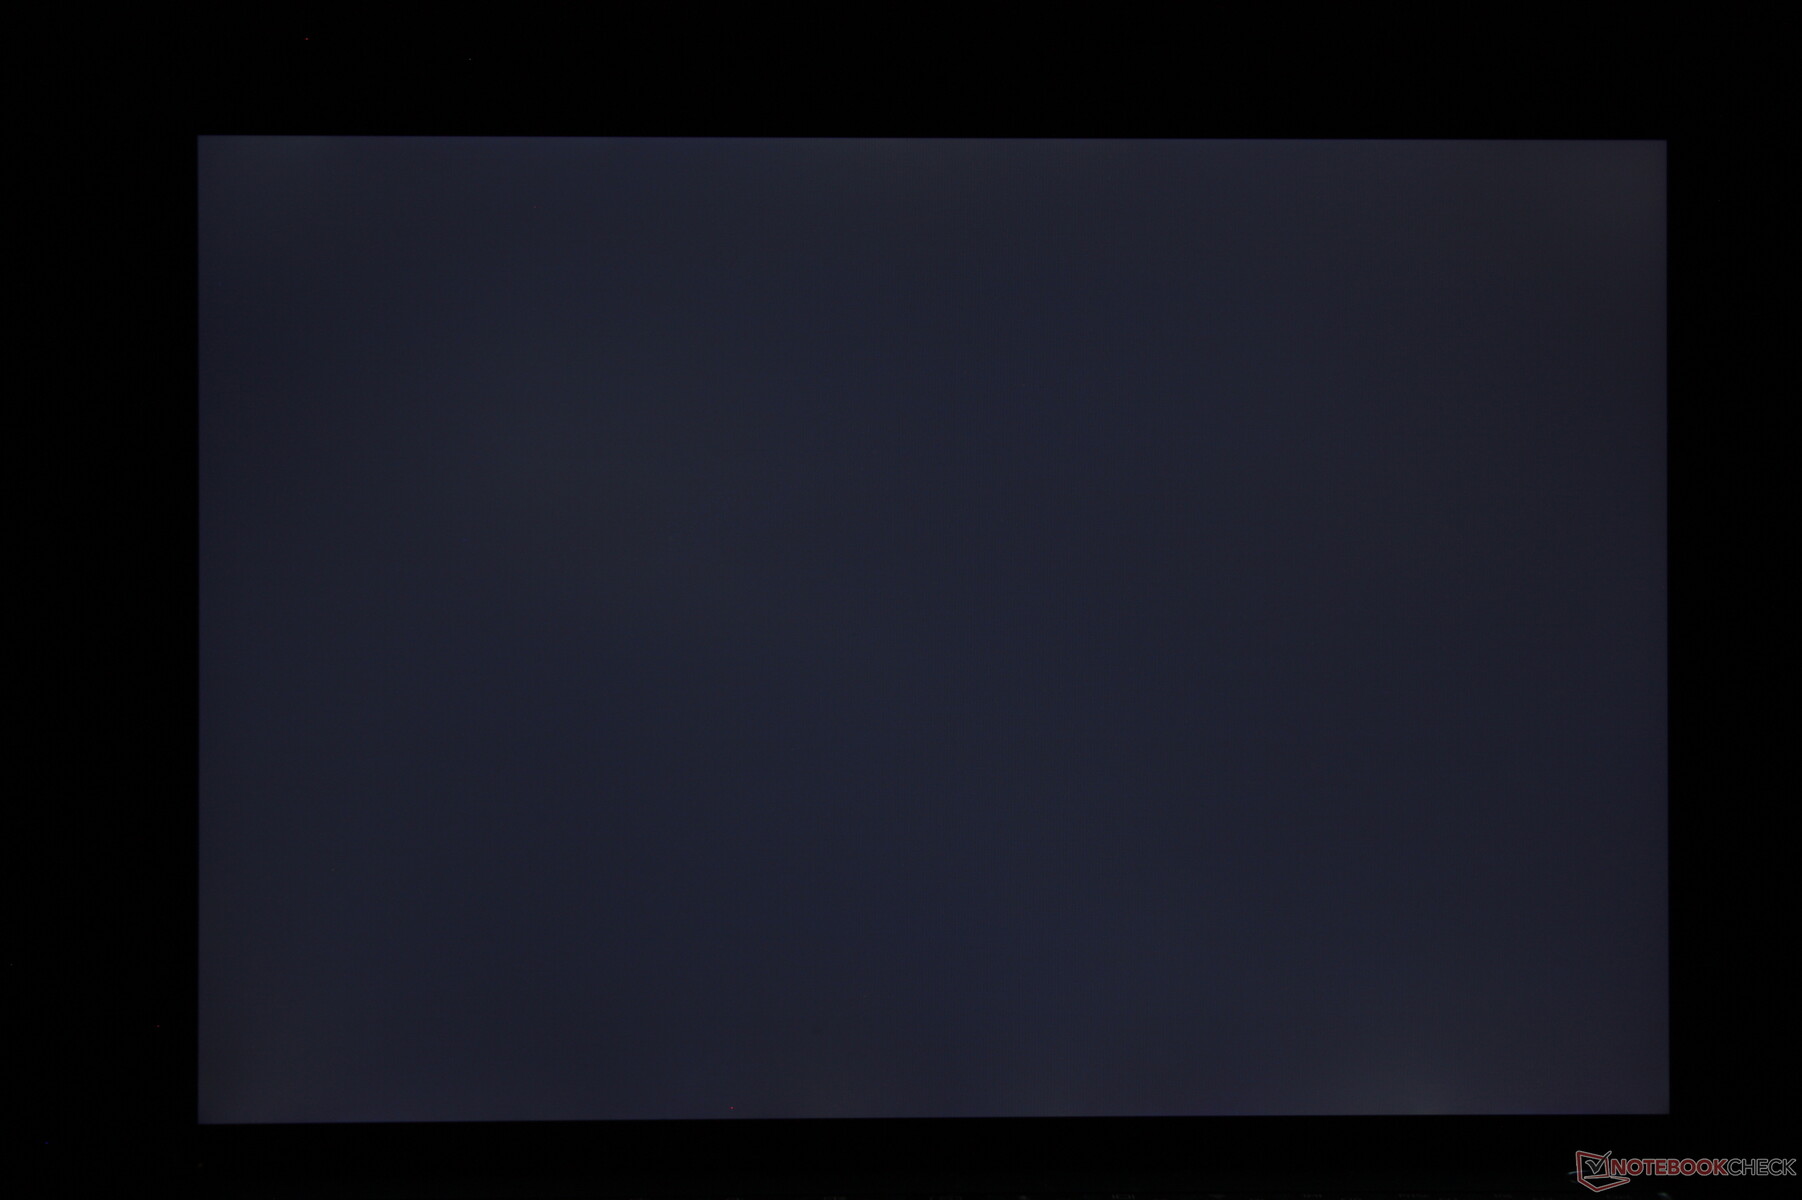
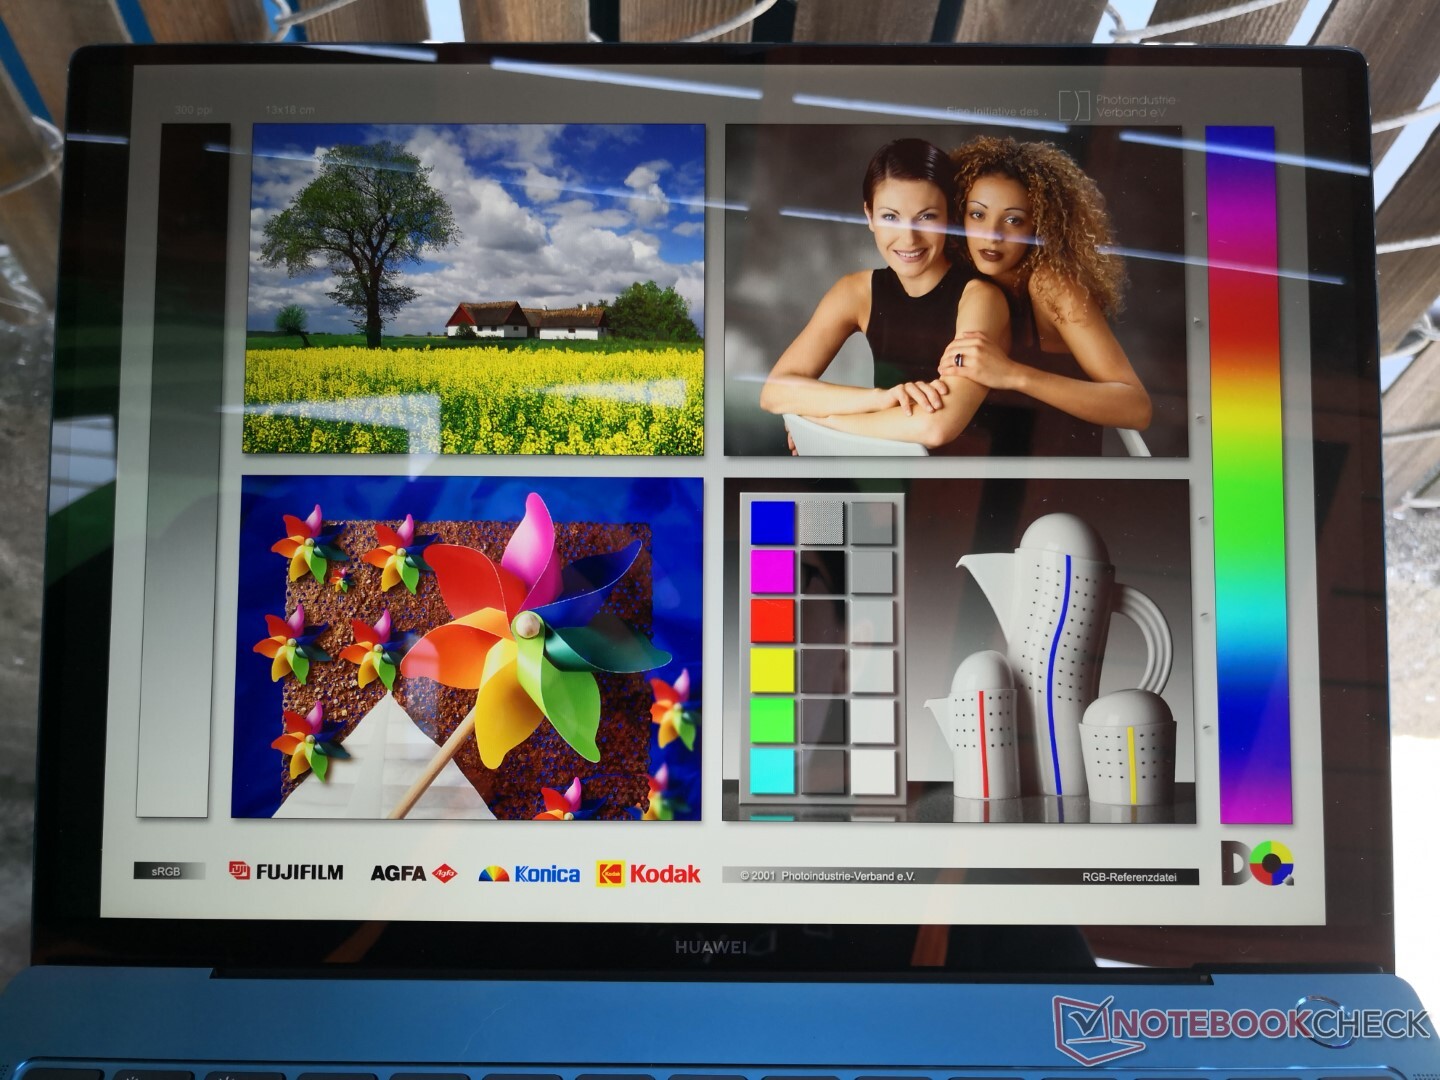
The 2021 MateBook X Pro is using the same 3000 x 2000 TIANMA XM IPS touchscreen as the 2018 model. Both laptops even share the same TLX1388 controller. Despite its age, this is still a high-end panel worthy of any flagship Ultrabook with its high contrast ratio, bright backlight, vibrant colors, and excellent color accuracy. Its main disadvantage continues to be the slow response times meaning ghosting is particularly noticeable especially if gaming. Fortunately, the target audience won't be using this machine for much gaming, anyway.

| |||||||||||||||||||||||||
Brightness Distribution: 89 %
Center on Battery: 502 cd/m²
Contrast: 1521:1 (Black: 0.33 cd/m²)
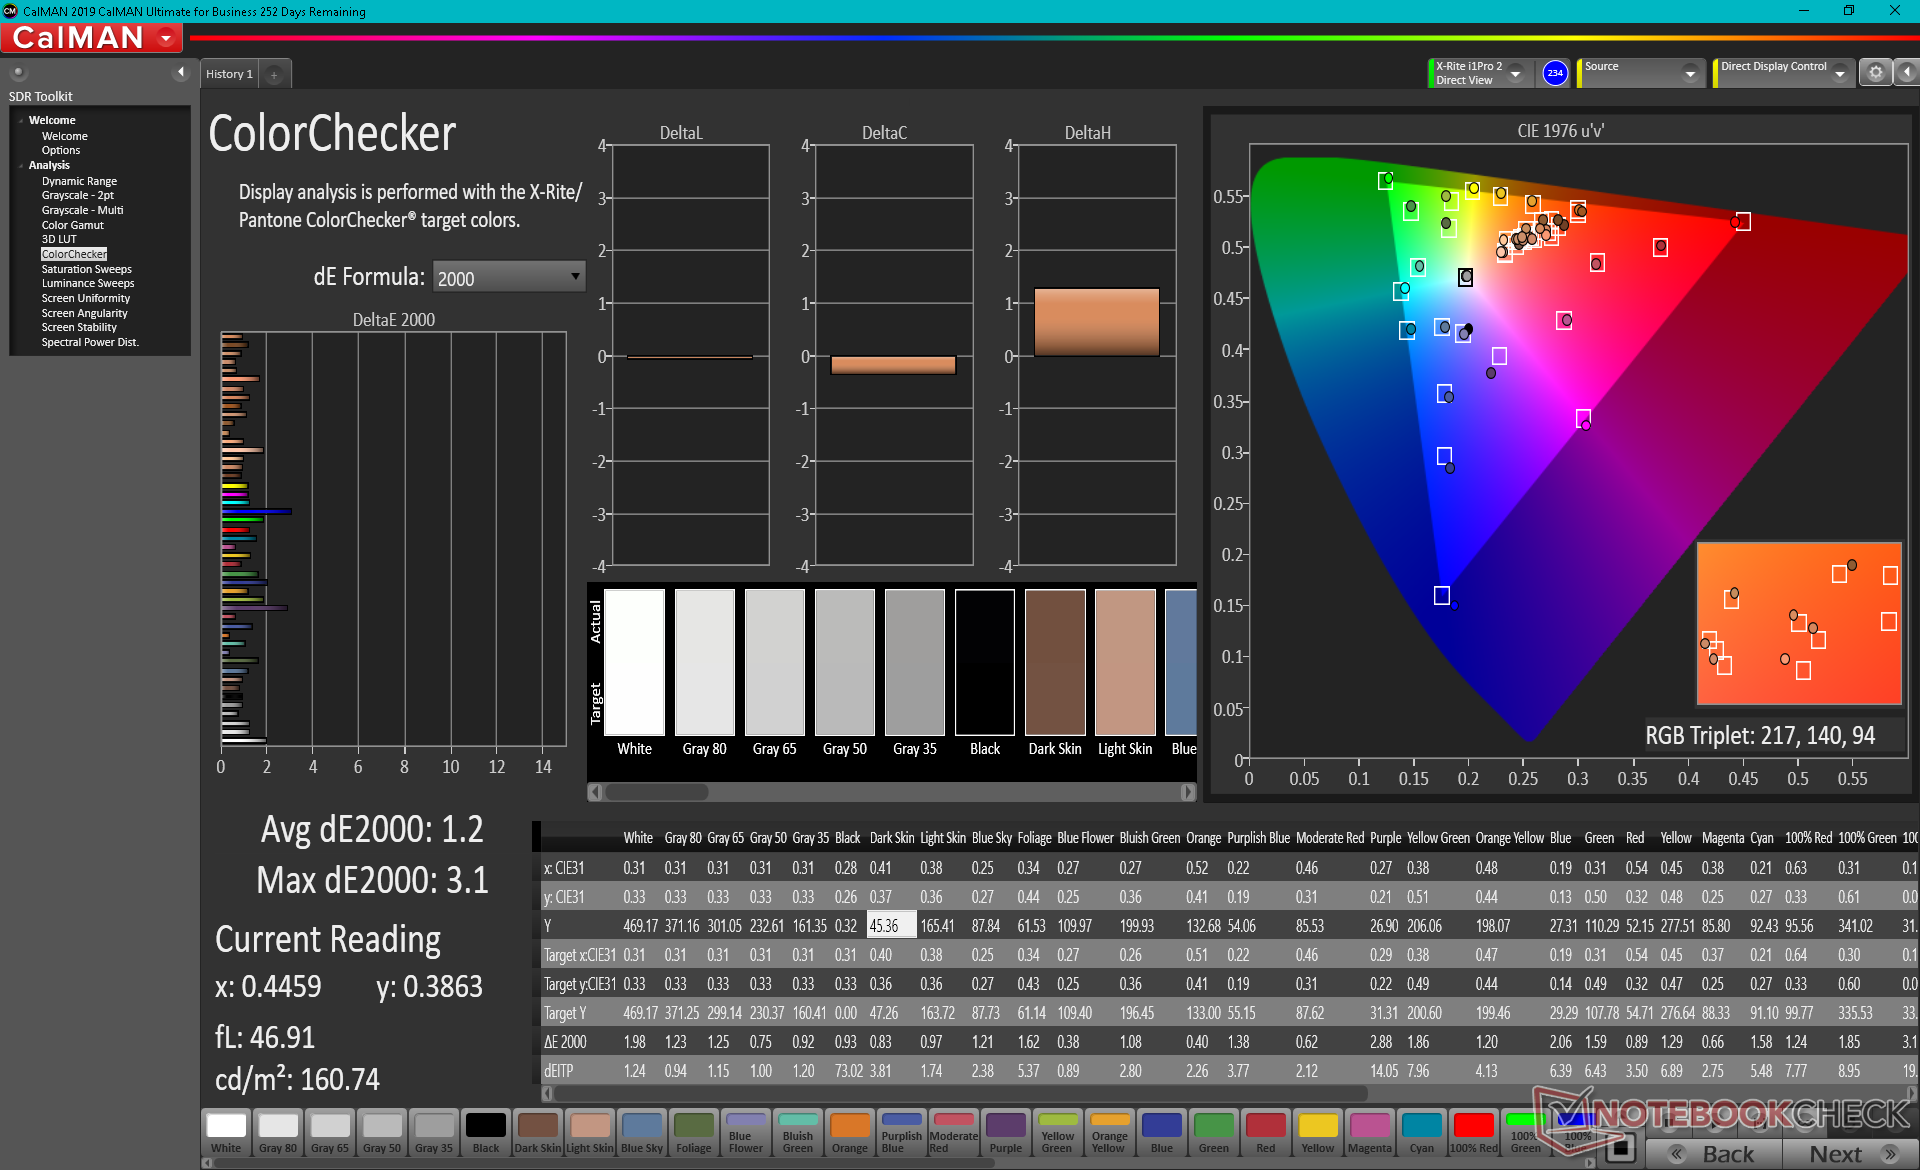
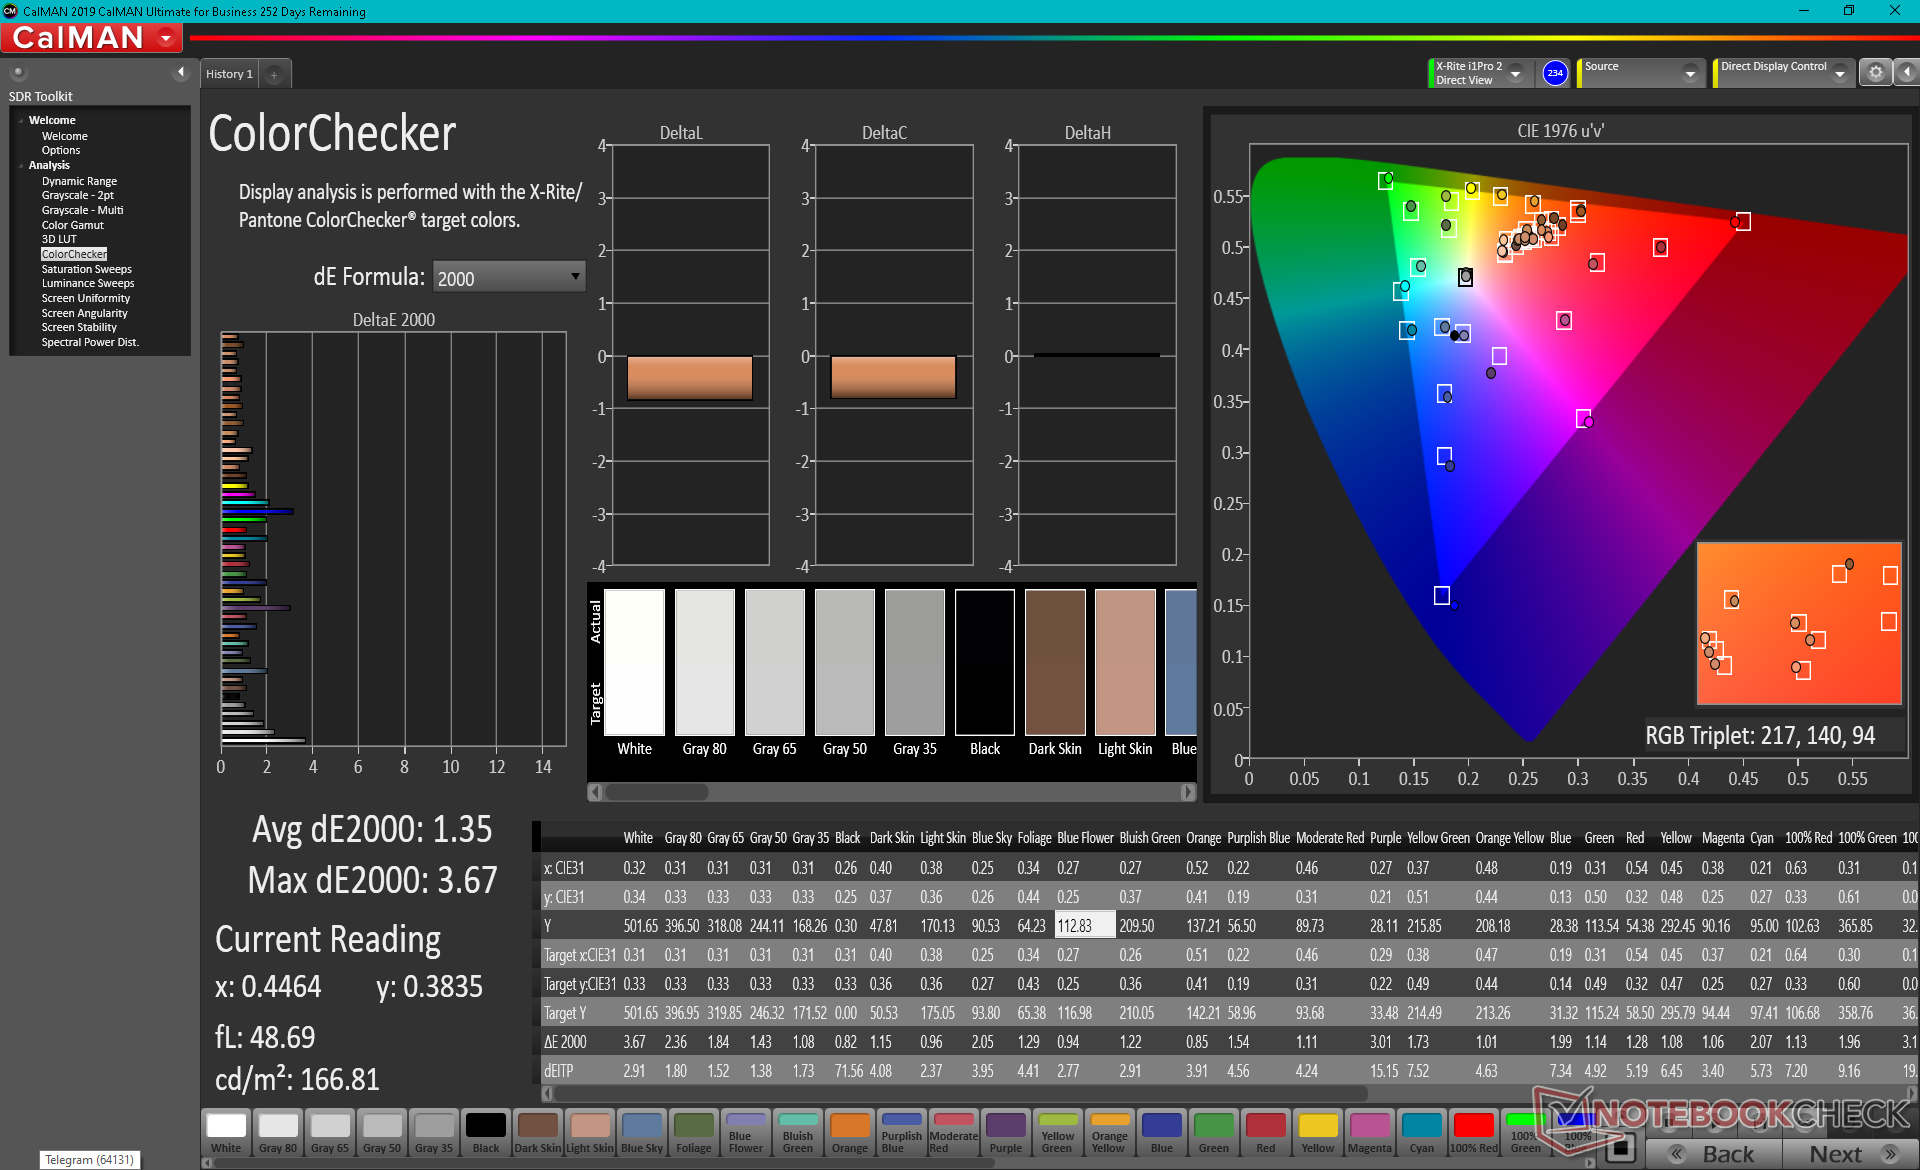
ΔE ColorChecker Calman: 1.35 | ∀{0.5-29.43 Ø4.72}
calibrated: 1.2
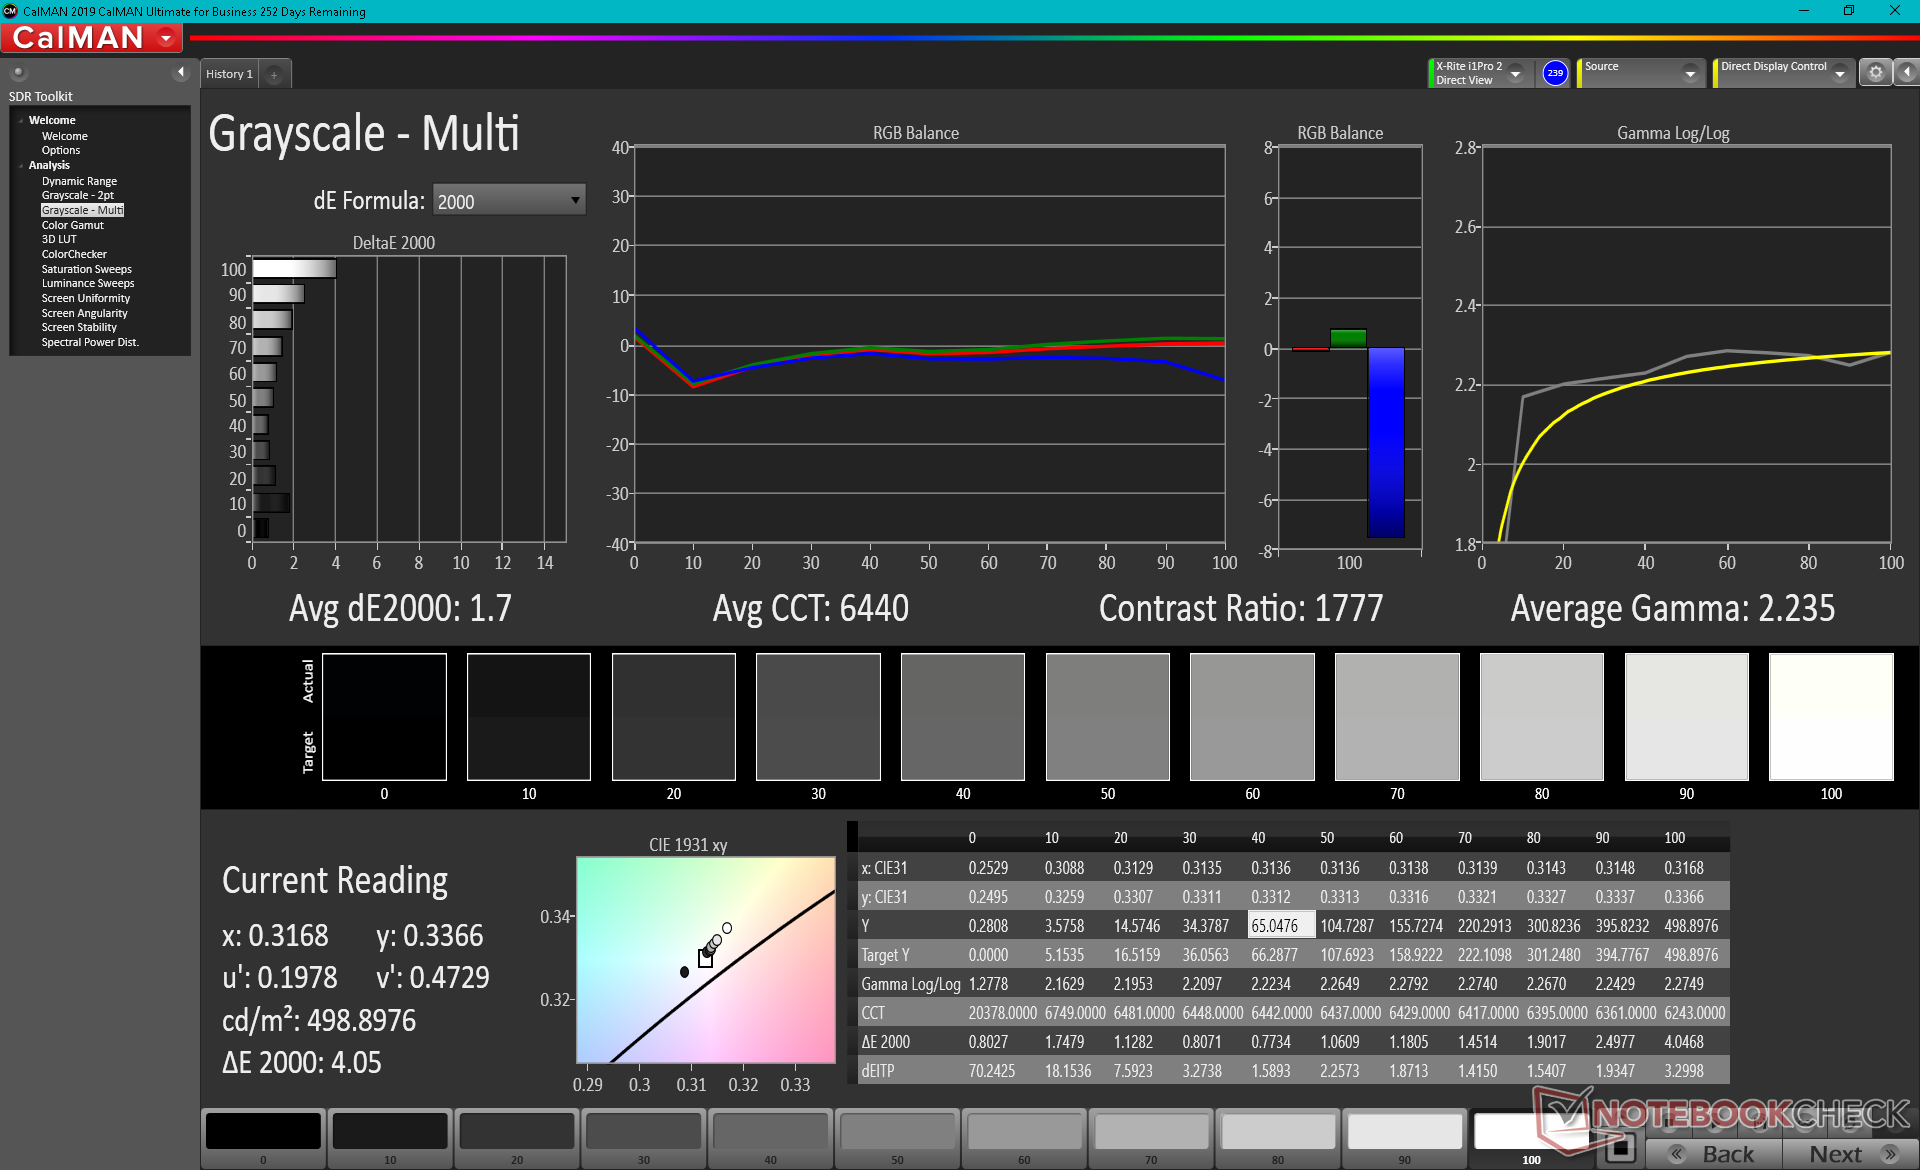
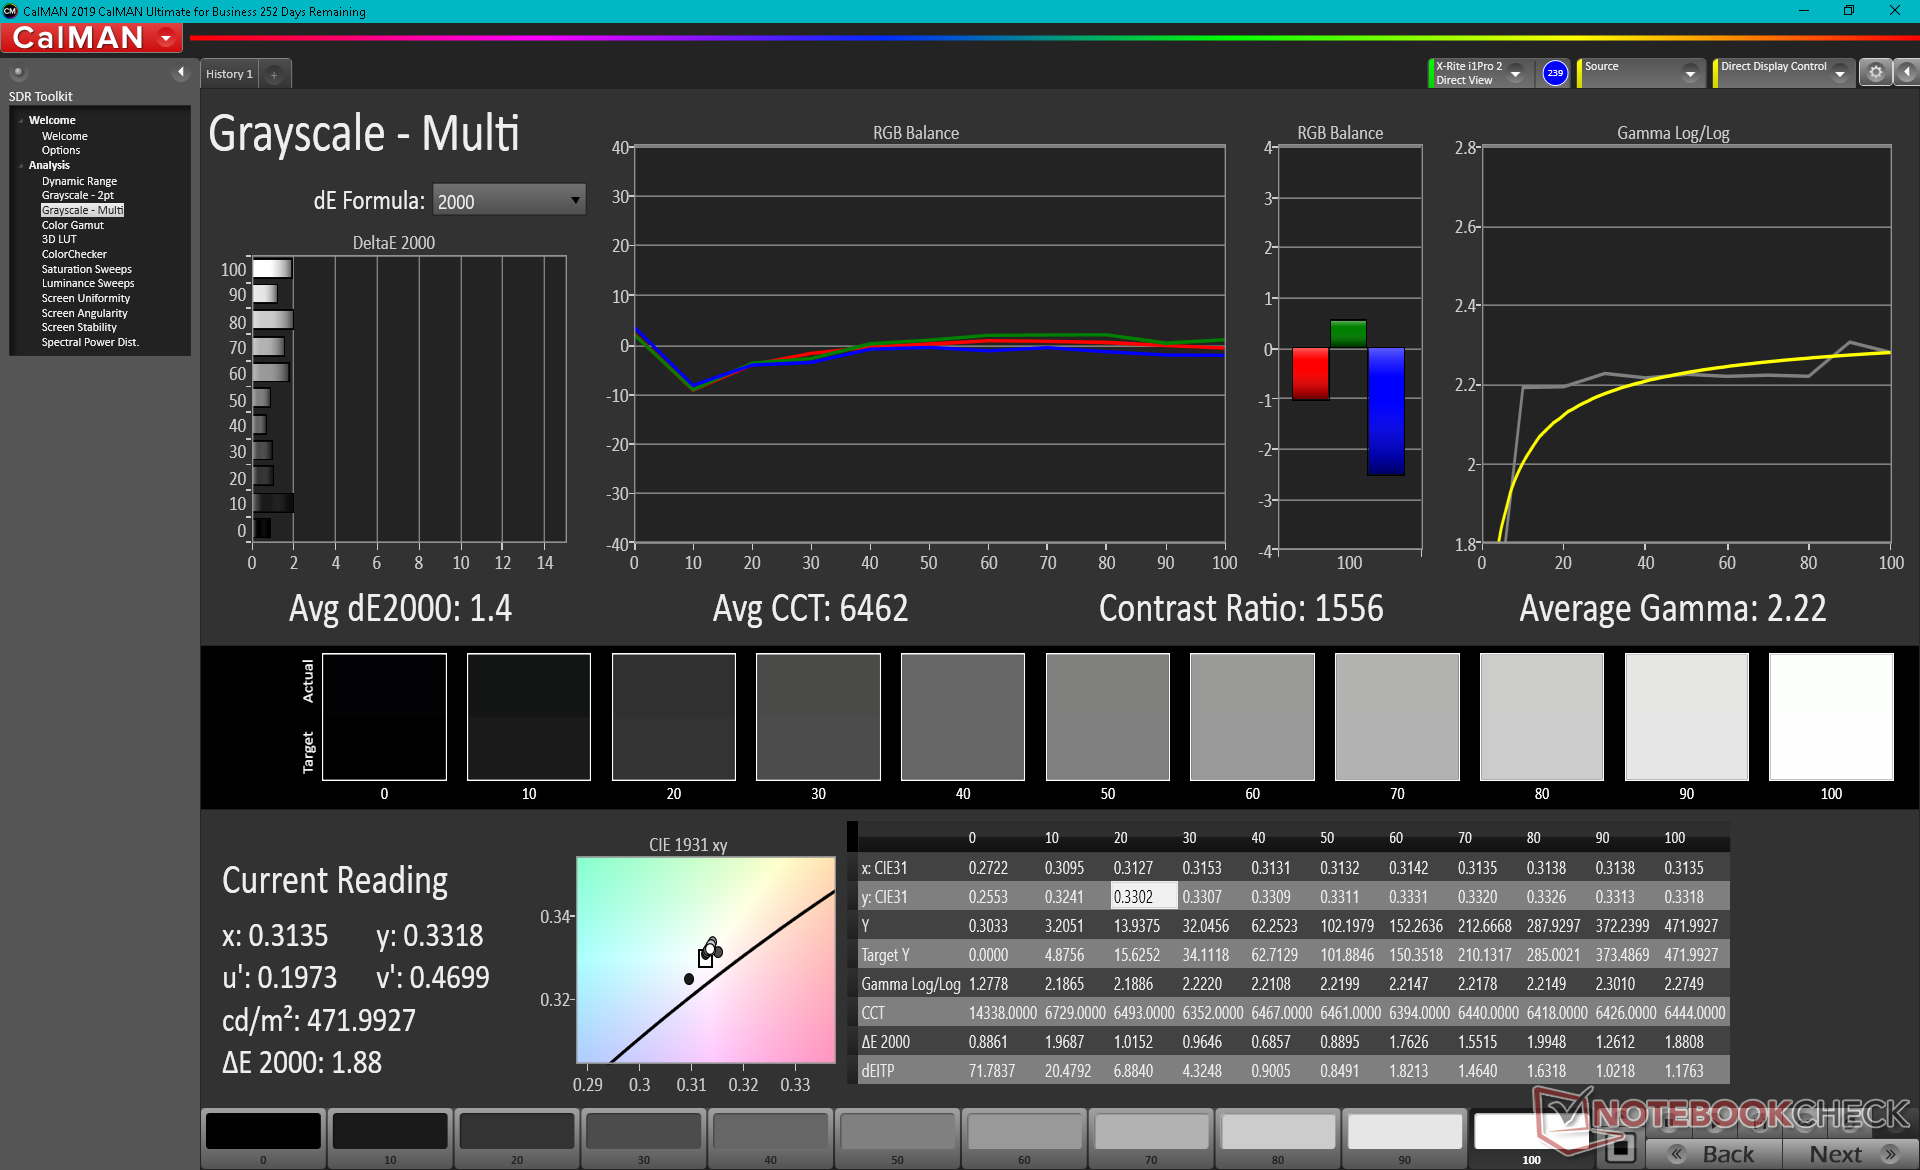
ΔE Greyscale Calman: 1.7 | ∀{0.09-98 Ø4.97}
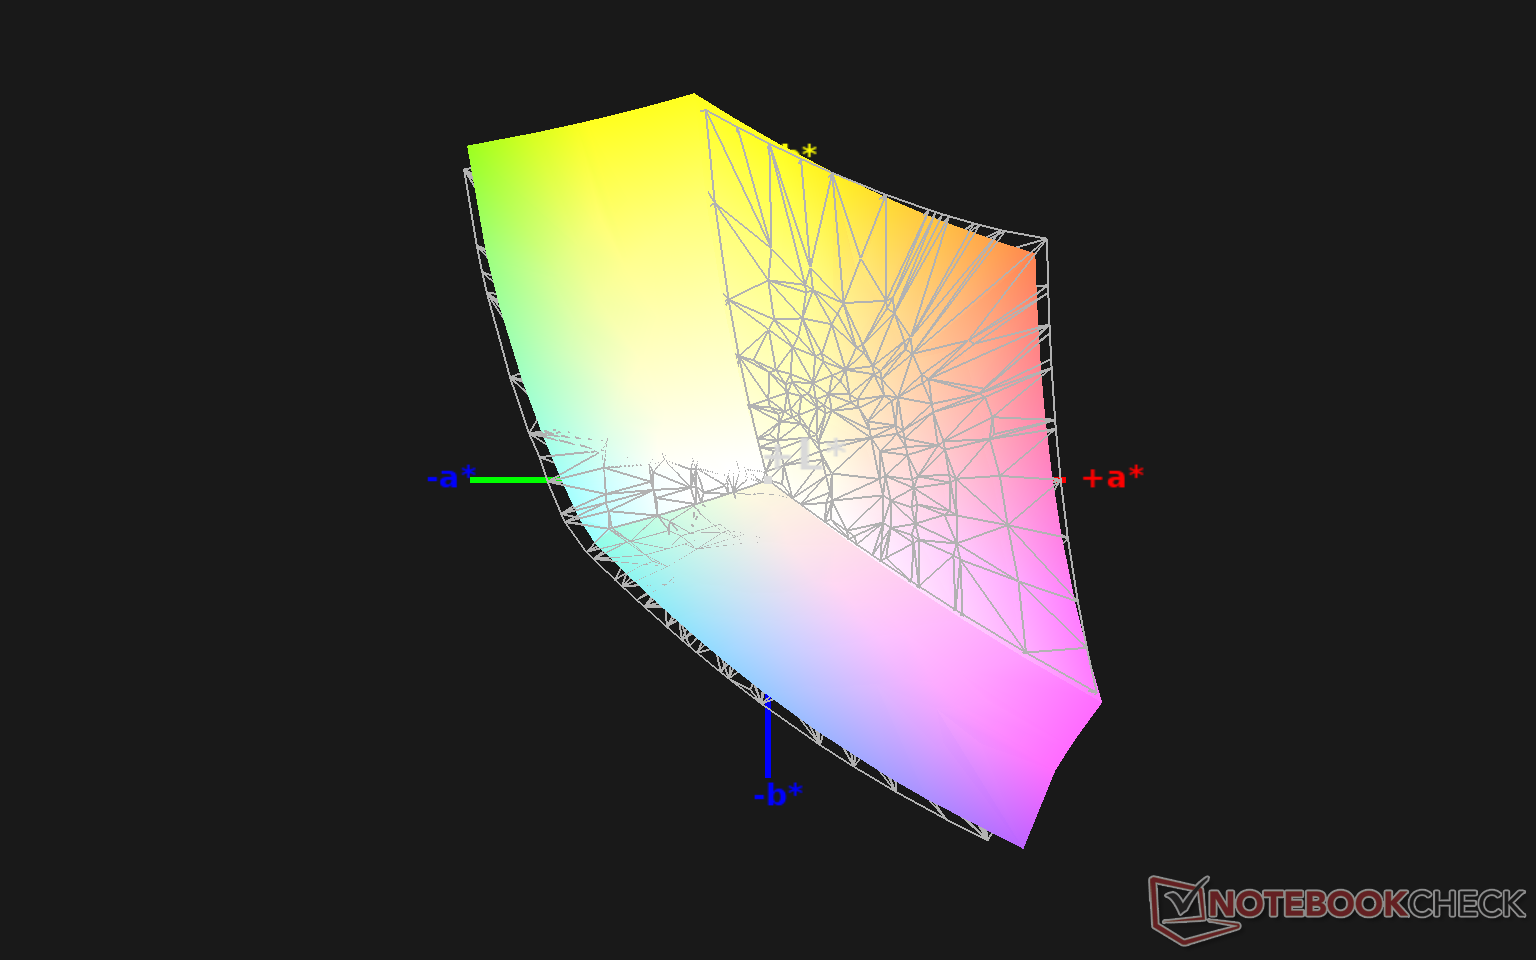
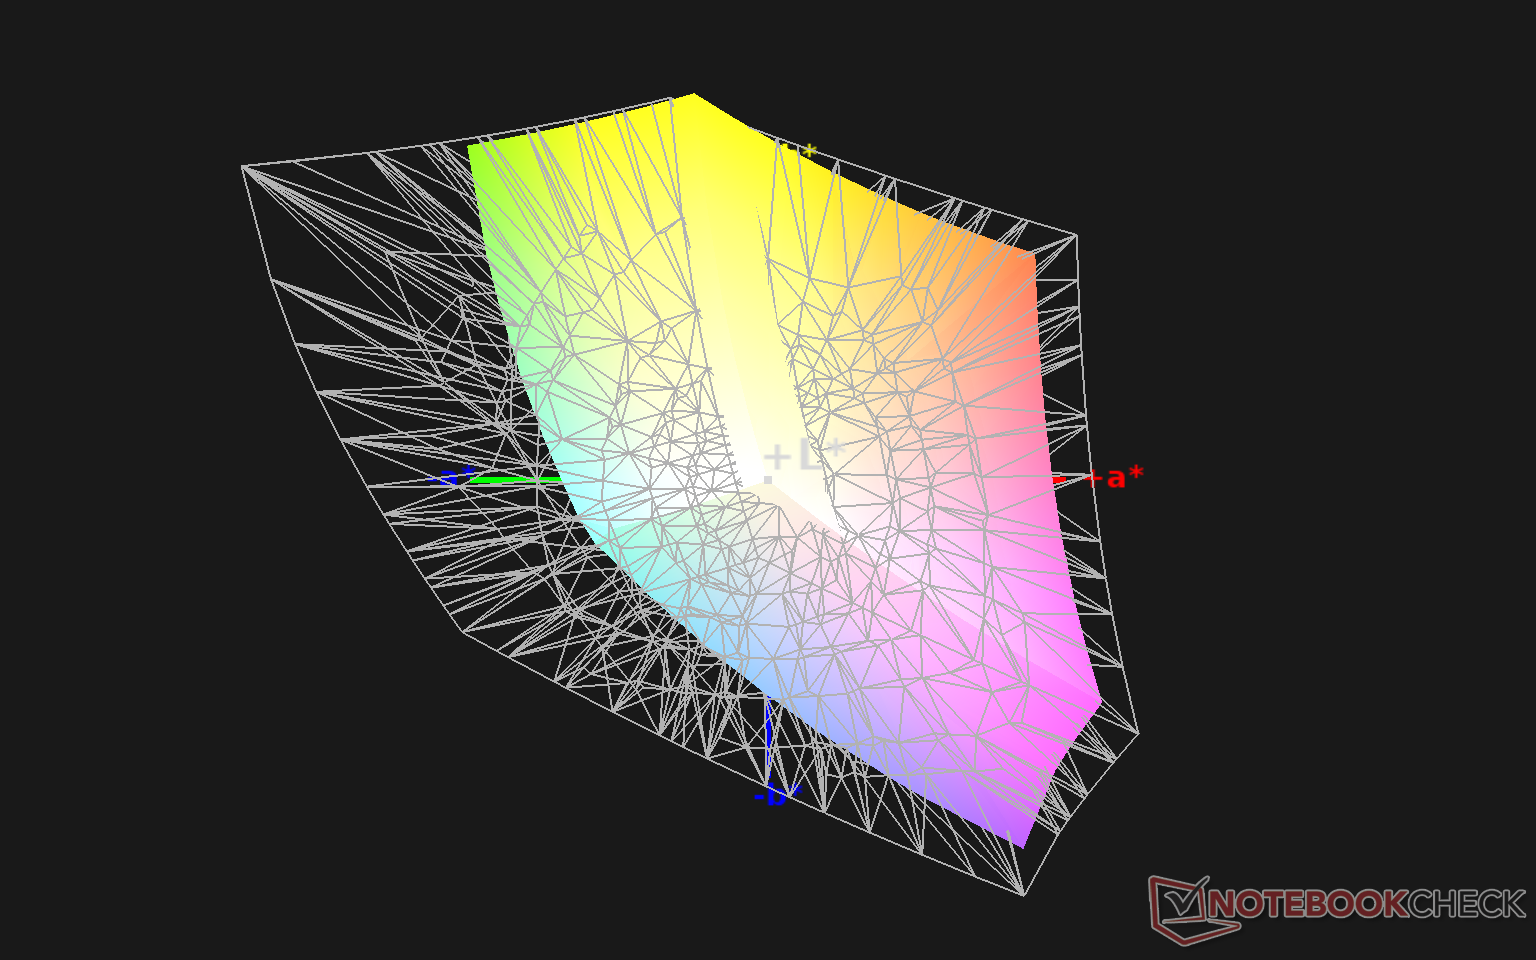
94.3% sRGB (Argyll 1.6.3 3D)
61.1% AdobeRGB 1998 (Argyll 1.6.3 3D)
66.3% AdobeRGB 1998 (Argyll 3D)
94.4% sRGB (Argyll 3D)
64.9% Display P3 (Argyll 3D)
Gamma: 2.24
CCT: 6440 K
| Huawei MateBook X Pro 2021 TIANMA XM, IPS, 13.9", 3000x2000 | Huawei MateBook X Pro 2020 i7 JDI LPM139M422A, LTPS, 13.9", 3000x2000 | Dell XPS 13 9310 Core i7 4K Sharp LQ134R1, IPS, 13.4", 3840x2400 | Microsoft Surface Laptop 3 13 Core i5-1035G7 Sharp LQ135P1JX51, IPS, 13.5", 2256x1504 | Razer Blade Stealth i7-1165G7 GTX 1650 Ti Max-Q Sharp LQ133M1JW46, IPS, 13.3", 1920x1080 | Lenovo Yoga Slim 7-14ARE AU Optronics B140HAN06.8, IPS, 14", 1920x1080 | |
|---|---|---|---|---|---|---|
| Display | 4% | 16% | 2% | 2% | 8% | |
| Display P3 Coverage (%) | 64.9 | 66.6 3% | 80.2 24% | 65.7 1% | 66 2% | 71.7 10% |
| sRGB Coverage (%) | 94.4 | 99.4 5% | 100 6% | 98.6 4% | 97.4 3% | 99.3 5% |
| AdobeRGB 1998 Coverage (%) | 66.3 | 68.6 3% | 78.9 19% | 67.8 2% | 67.1 1% | 72.9 10% |
| Response Times | -25% | -55% | -58% | -48% | -17% | |
| Response Time Grey 50% / Grey 80% * (ms) | 37.6 ? | 49.6 ? -32% | 59.2 ? -57% | 59.2 ? -57% | 57.6 ? -53% | 45.6 ? -21% |
| Response Time Black / White * (ms) | 26.4 ? | 30.8 ? -17% | 40.4 ? -53% | 41.6 ? -58% | 37.6 ? -42% | 29.6 ? -12% |
| PWM Frequency (Hz) | 29070 ? | 2137 ? | 21740 ? | |||
| Screen | 8% | -23% | 5% | -19% | -45% | |
| Brightness middle (cd/m²) | 502 | 557 11% | 508.7 1% | 403.4 -20% | 356.8 -29% | 399.6 -20% |
| Brightness (cd/m²) | 474 | 532 12% | 479 1% | 397 -16% | 336 -29% | 385 -19% |
| Brightness Distribution (%) | 89 | 87 -2% | 84 -6% | 89 0% | 88 -1% | 89 0% |
| Black Level * (cd/m²) | 0.33 | 0.33 -0% | 0.3 9% | 0.34 -3% | 0.34 -3% | 0.37 -12% |
| Contrast (:1) | 1521 | 1688 11% | 1696 12% | 1186 -22% | 1049 -31% | 1080 -29% |
| Colorchecker dE 2000 * | 1.35 | 1.4 -4% | 2.72 -101% | 0.94 30% | 1.63 -21% | 3.2 -137% |
| Colorchecker dE 2000 max. * | 3.67 | 2.5 32% | 4.7 -28% | 2.92 20% | 5.03 -37% | 6.44 -75% |
| Colorchecker dE 2000 calibrated * | 1.2 | 0.7 42% | 1.92 -60% | 0.99 17% | 1.08 10% | 1.73 -44% |
| Greyscale dE 2000 * | 1.7 | 2 -18% | 3.4 -100% | 0.9 47% | 3 -76% | 4.7 -176% |
| Gamma | 2.24 98% | 2.14 103% | 2.11 104% | 2.13 103% | 2.23 99% | 2.21 100% |
| CCT | 6440 101% | 6689 97% | 6245 104% | 6620 98% | 6434 101% | 7184 90% |
| Color Space (Percent of AdobeRGB 1998) (%) | 61.1 | 62.5 2% | 70.7 16% | 62.3 2% | 62 1% | 66.3 9% |
| Color Space (Percent of sRGB) (%) | 94.3 | 99.5 6% | 100 6% | 98.7 5% | 97.6 3% | 99.5 6% |
| Total Average (Program / Settings) | -4% /
3% | -21% /
-19% | -17% /
-3% | -22% /
-19% | -18% /
-32% |
* ... smaller is better
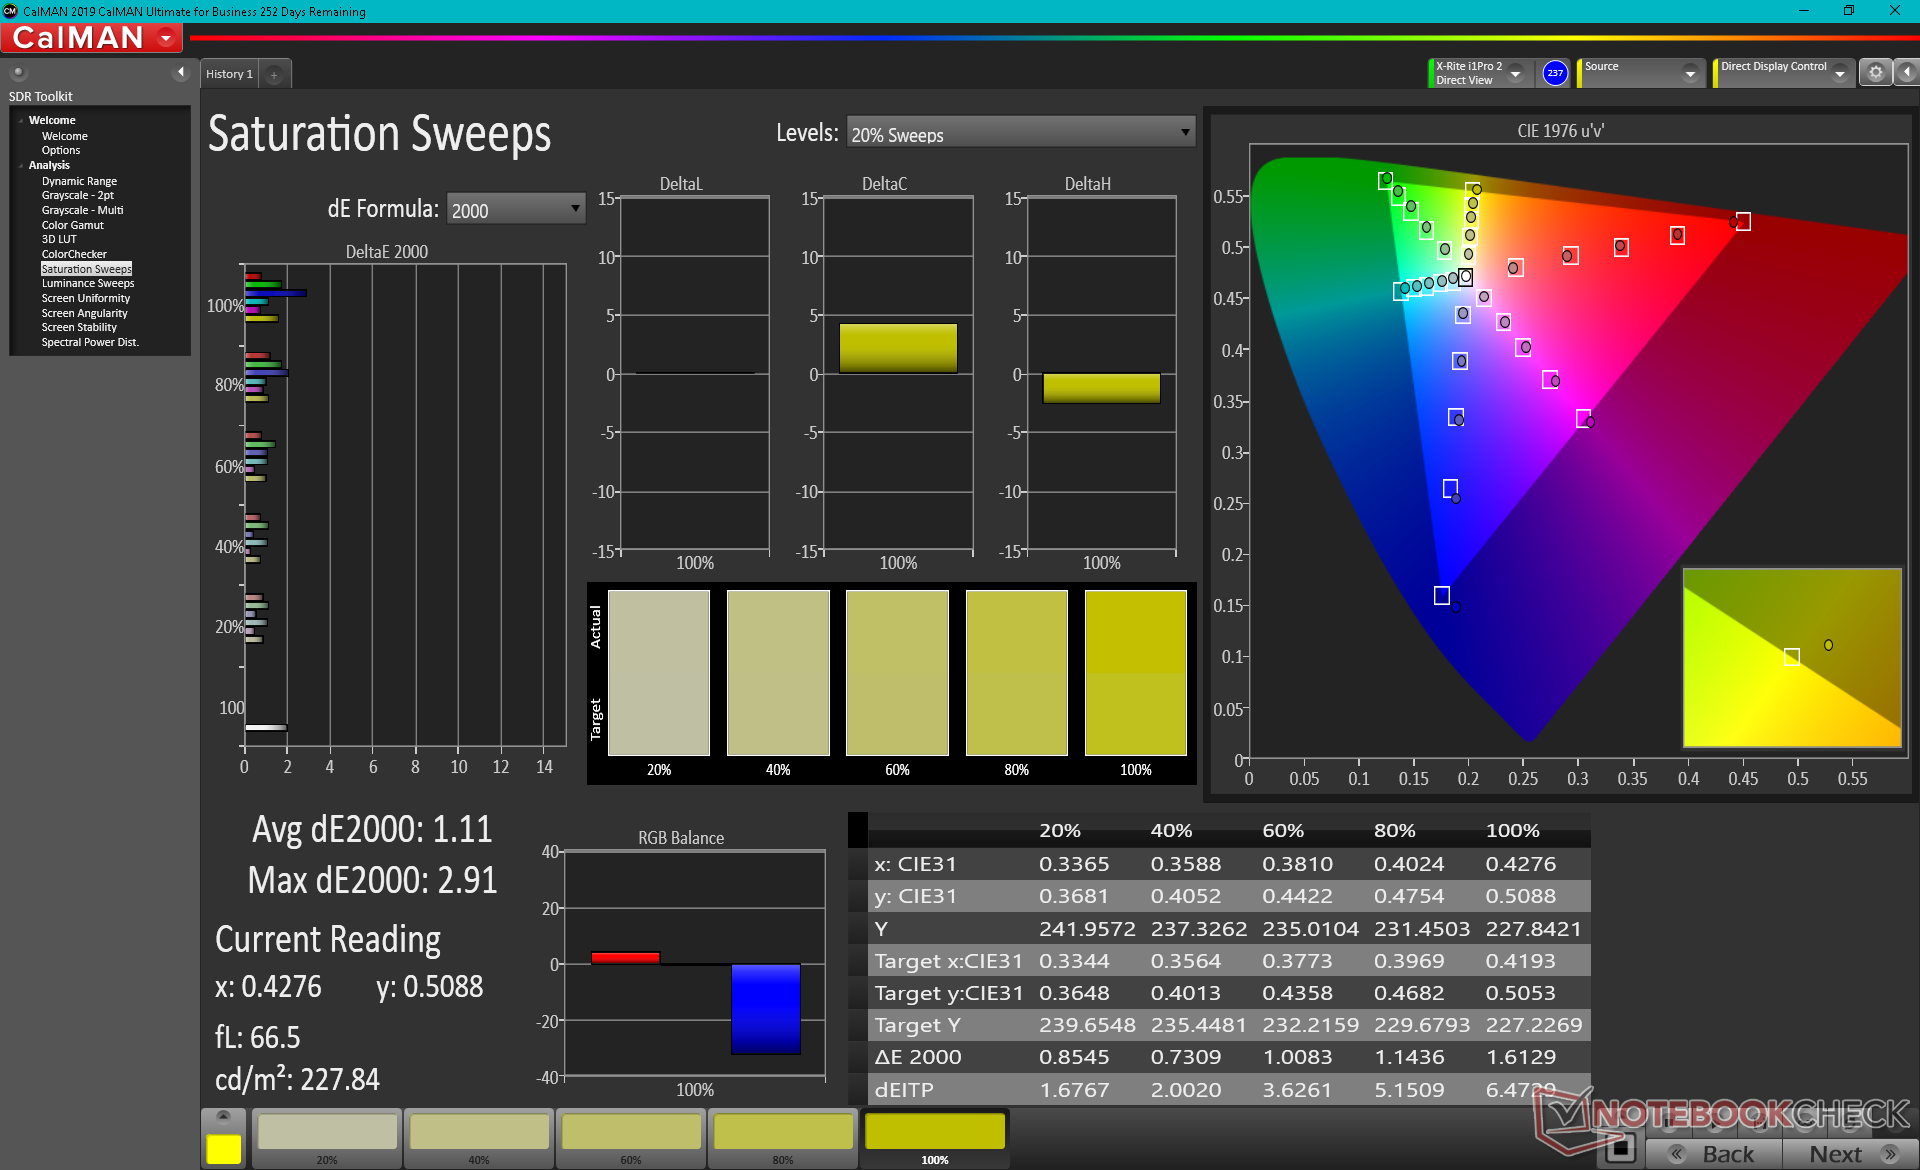
Color space covers >95 percent of sRGB not unlike most high-end Ultrabooks. We hope to see OLED options in the future for even deeper AdobeRGB and DCI-P3 colors.
X-Rite colorimeter measurements show a well-calibrated display out of the box with average grayscale and ColorChecker deltaE values of just 1.7 and 1.2, respectively. An end-user calibration is not necessary.

Display Response Times
| ↔ Response Time Black to White | ||
|---|---|---|
| 26.4 ms ... rise ↗ and fall ↘ combined | ↗ 11.6 ms rise | 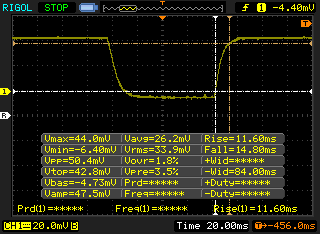 |
| ↘ 14.8 ms fall | ||
| The screen shows relatively slow response rates in our tests and may be too slow for gamers. In comparison, all tested devices range from 0.1 (minimum) to 240 (maximum) ms. » 66 % of all devices are better. This means that the measured response time is worse than the average of all tested devices (19.8 ms). | ||
| ↔ Response Time 50% Grey to 80% Grey | ||
| 37.6 ms ... rise ↗ and fall ↘ combined | ↗ 17.6 ms rise | 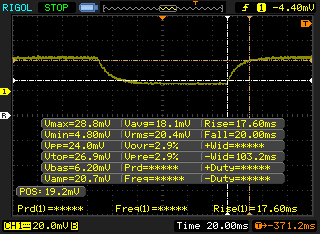 |
| ↘ 20 ms fall | ||
| The screen shows slow response rates in our tests and will be unsatisfactory for gamers. In comparison, all tested devices range from 0.165 (minimum) to 636 (maximum) ms. » 55 % of all devices are better. This means that the measured response time is worse than the average of all tested devices (31 ms). | ||
Screen Flickering / PWM (Pulse-Width Modulation)
| Screen flickering / PWM not detected | 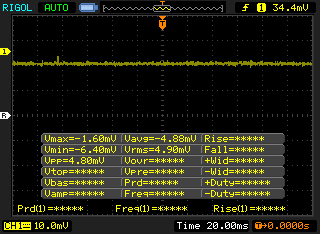 | ||
In comparison: 52 % of all tested devices do not use PWM to dim the display. If PWM was detected, an average of 7750 (minimum: 5 - maximum: 343500) Hz was measured. | |||
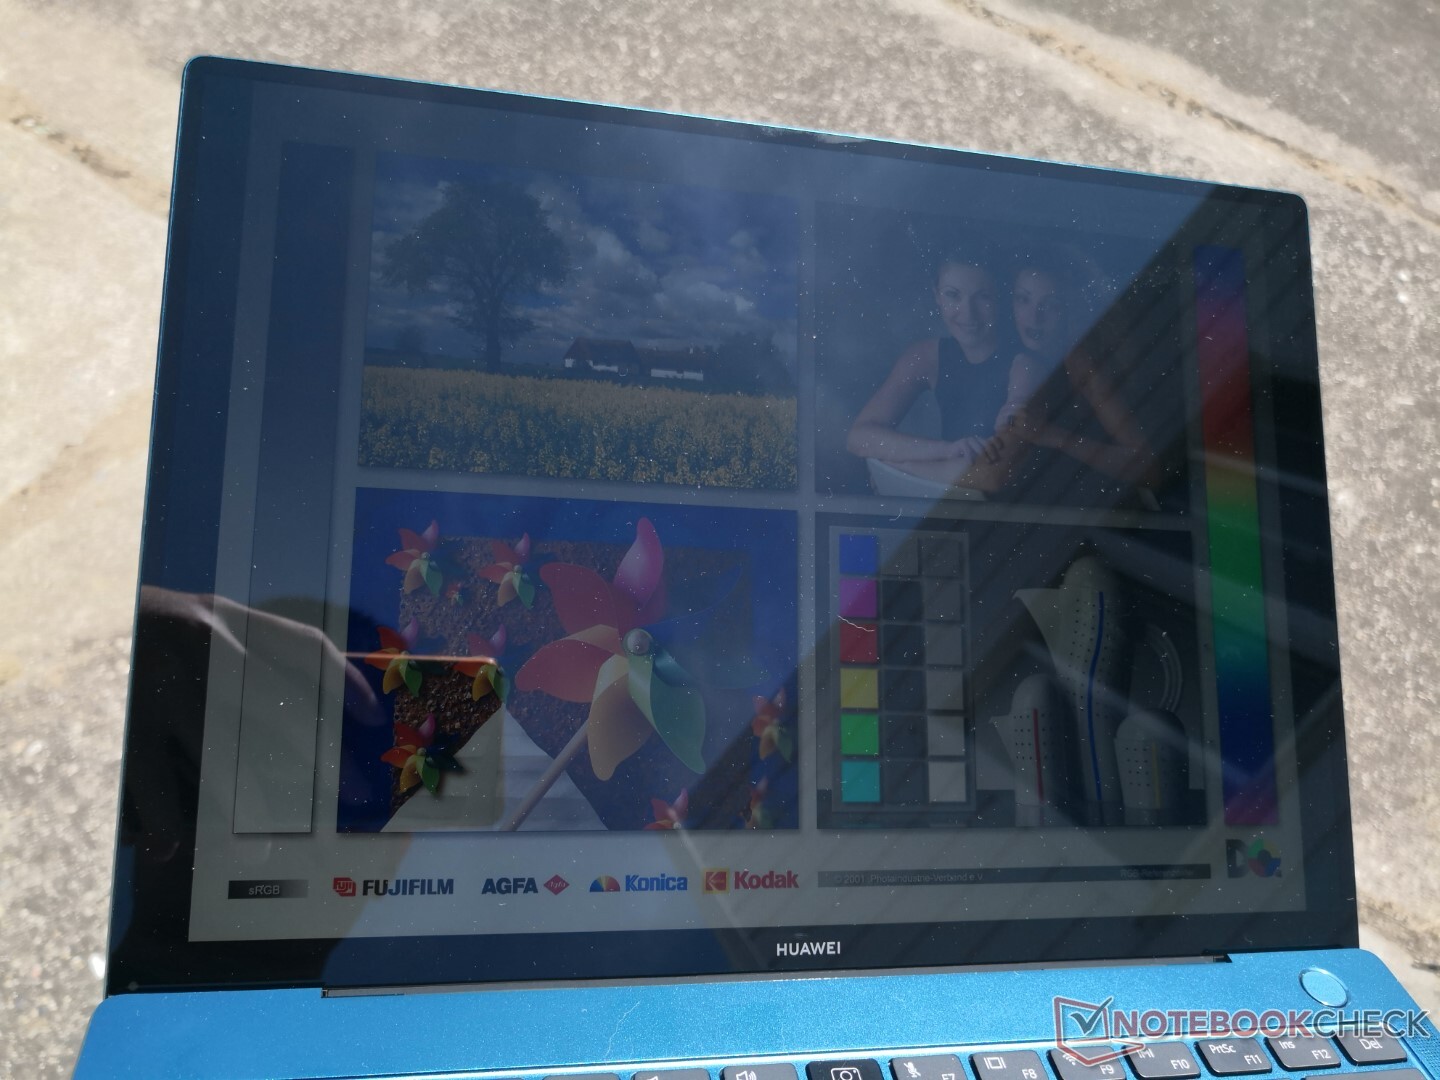
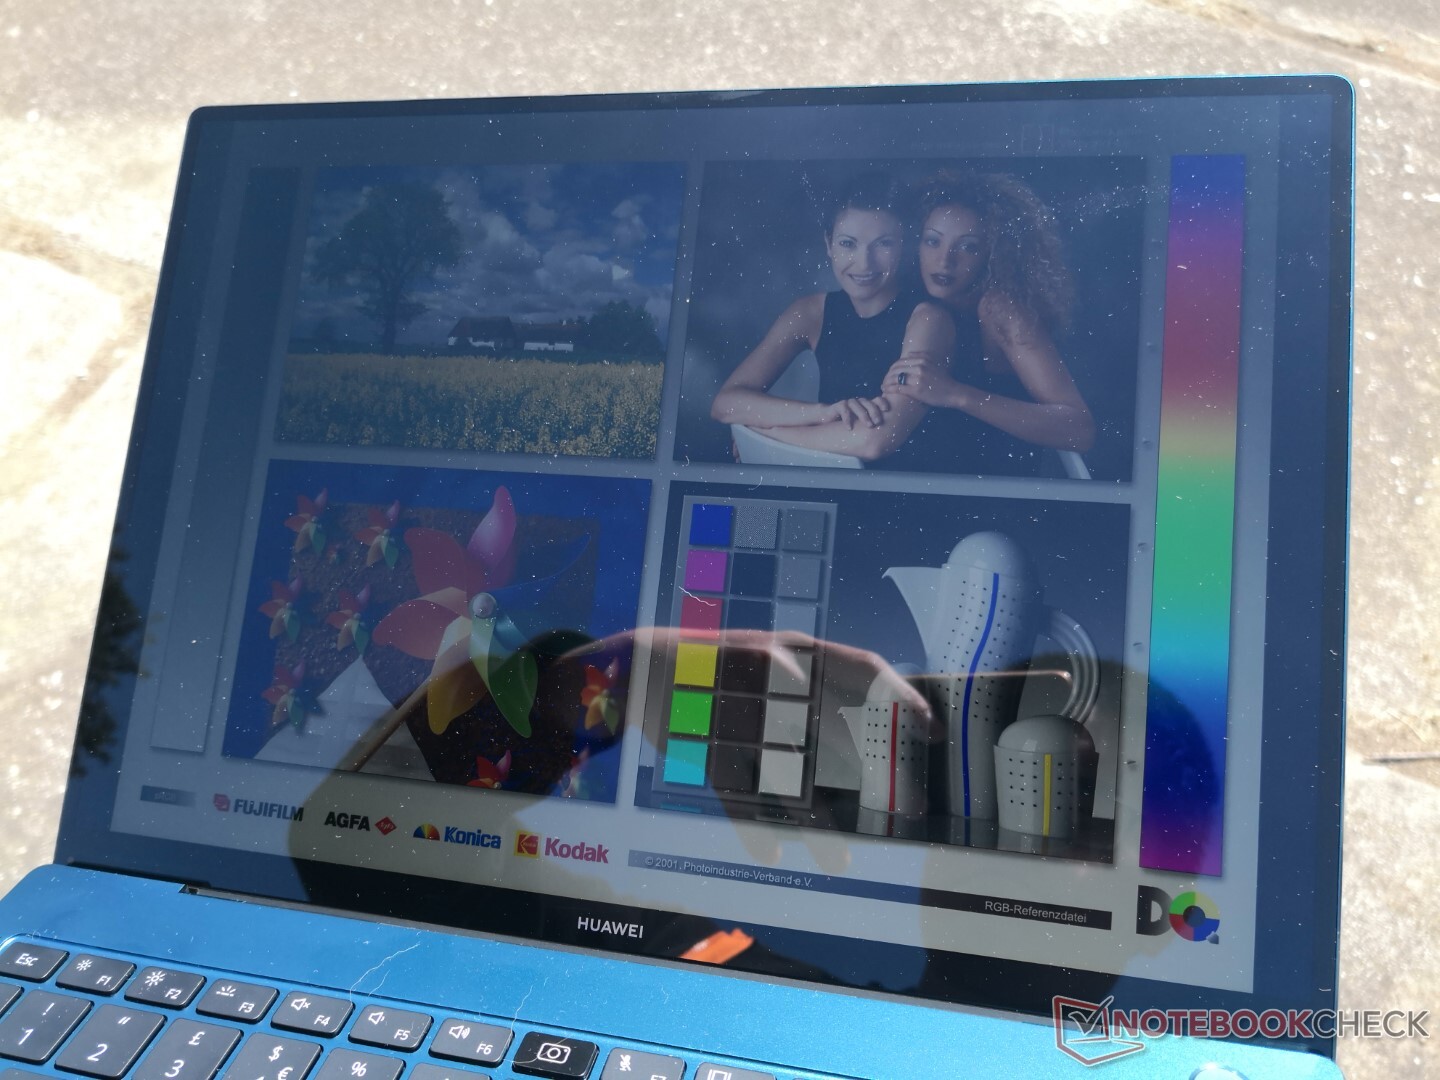
Outdoor visibility is most similar to the XPS 13 9310 while being better than the Razer Blade Stealth and Lenovo Yoga Slim 7 since the Huawei display is much brighter. Maximum brightness will not drop even if running on battery power.
Performance
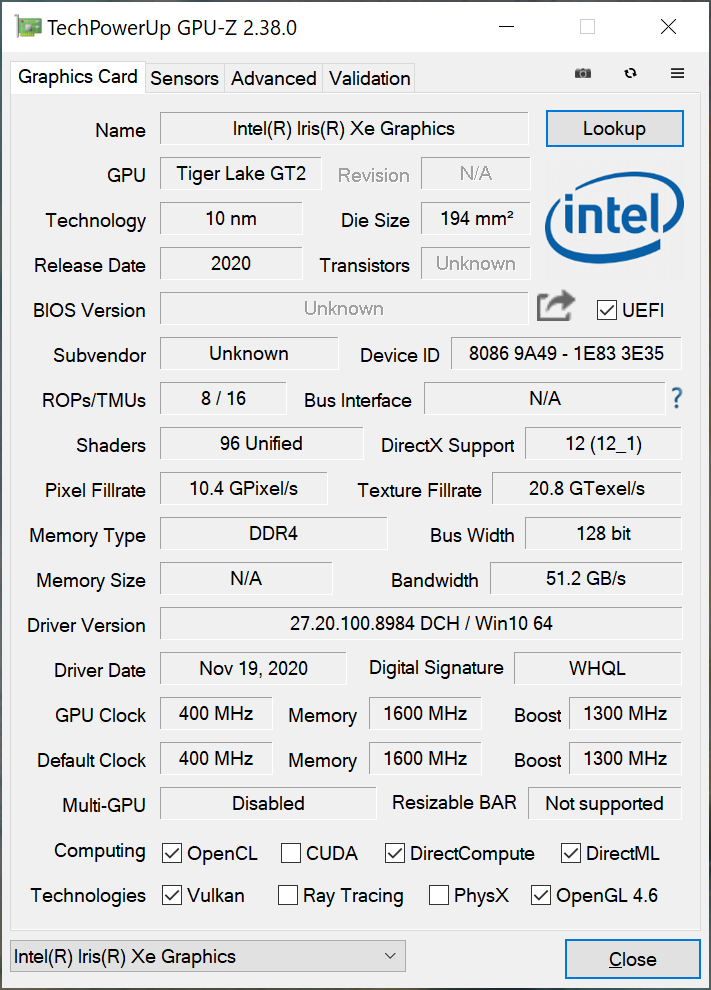
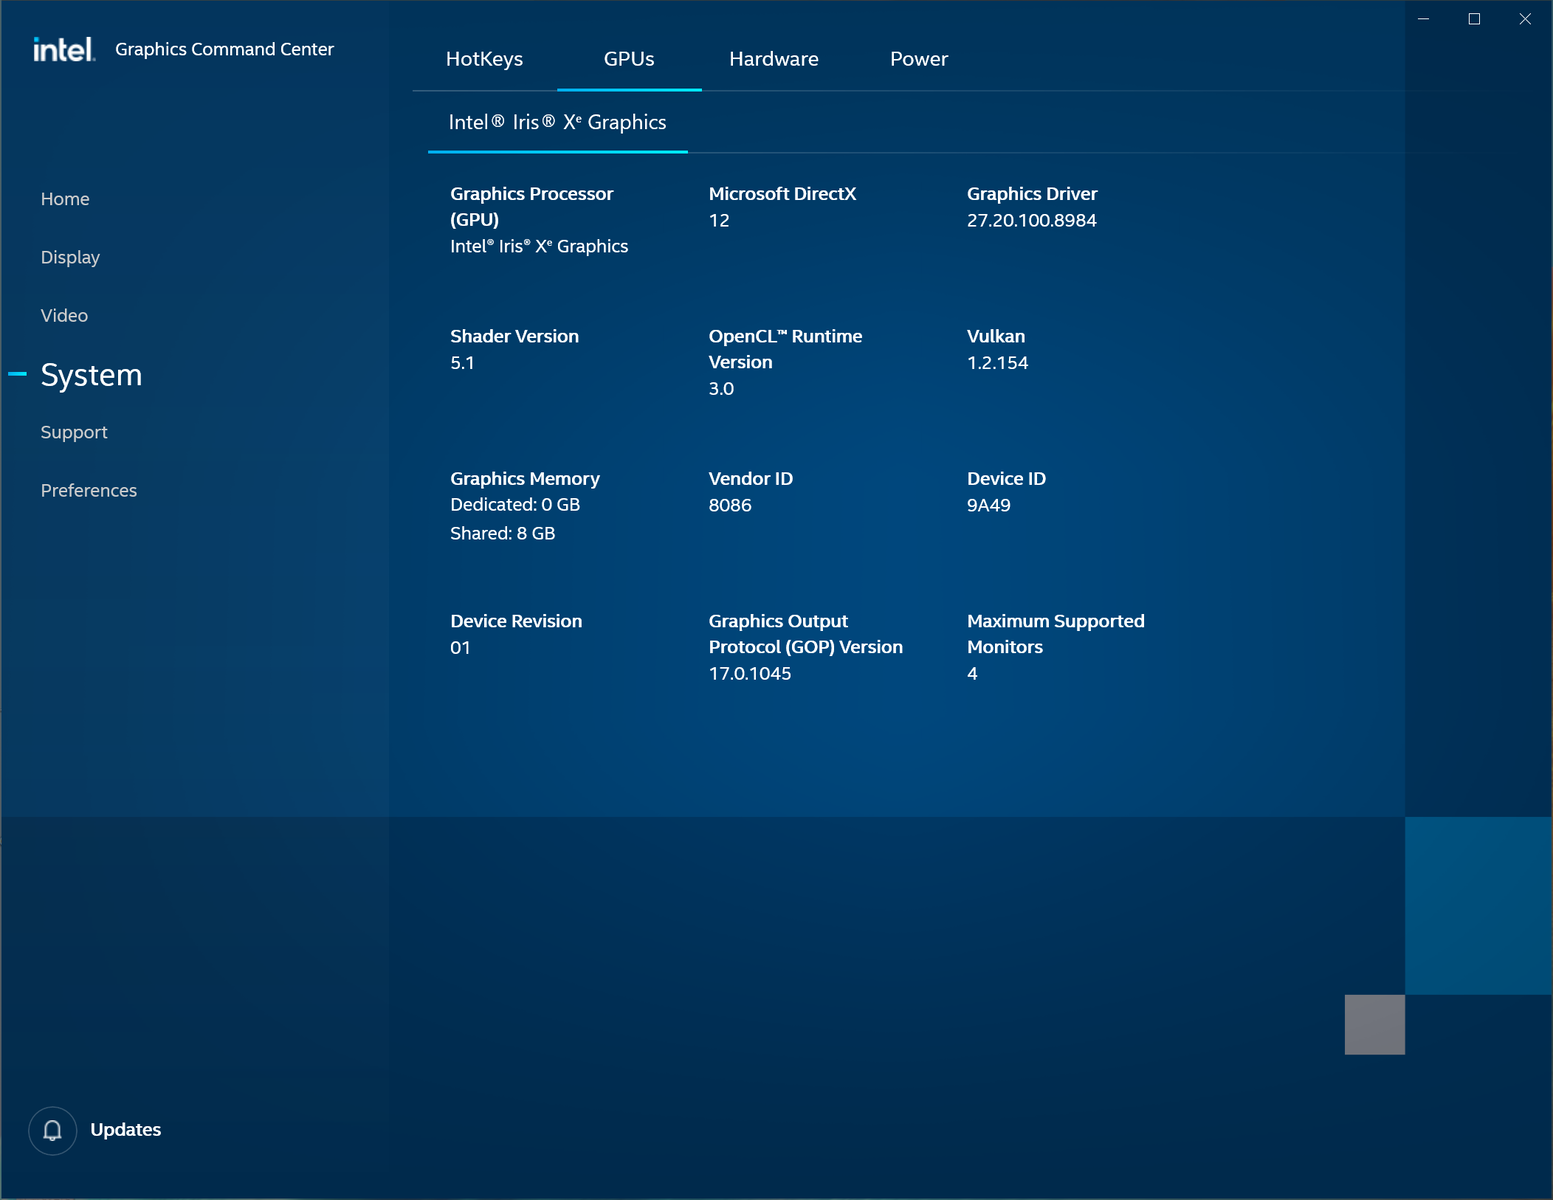
Older MateBook X Pro models would ship with Intel Core U-series CPUs and optional GeForce MX graphics. Thus, it was only natural that the 2021 model would move on to Tiger Lake-U and integrated Iris Xe graphics. The new Intel iGPU solution is significantly more powerful than any UHD Graphics laptop while being more power efficient than the GeForce MX. Huawei offers no AMD options except on the lesser MateBook D or MagicBook series.
SKUs with the slower Core i5-1135G7 are available which should be more affordable than our costlier Core i7 configuration.
We appreciate the clean OS and lack of bloatware or manufacturer software on the Huawei. Other major OEMs like Lenovo and Dell often have a handful of specialized software on top of the usual Windows settings.
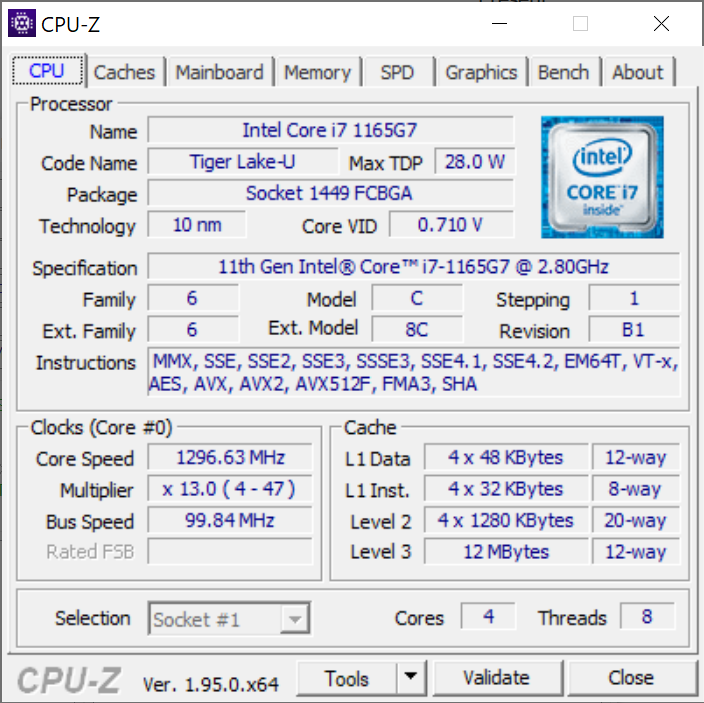
Processor
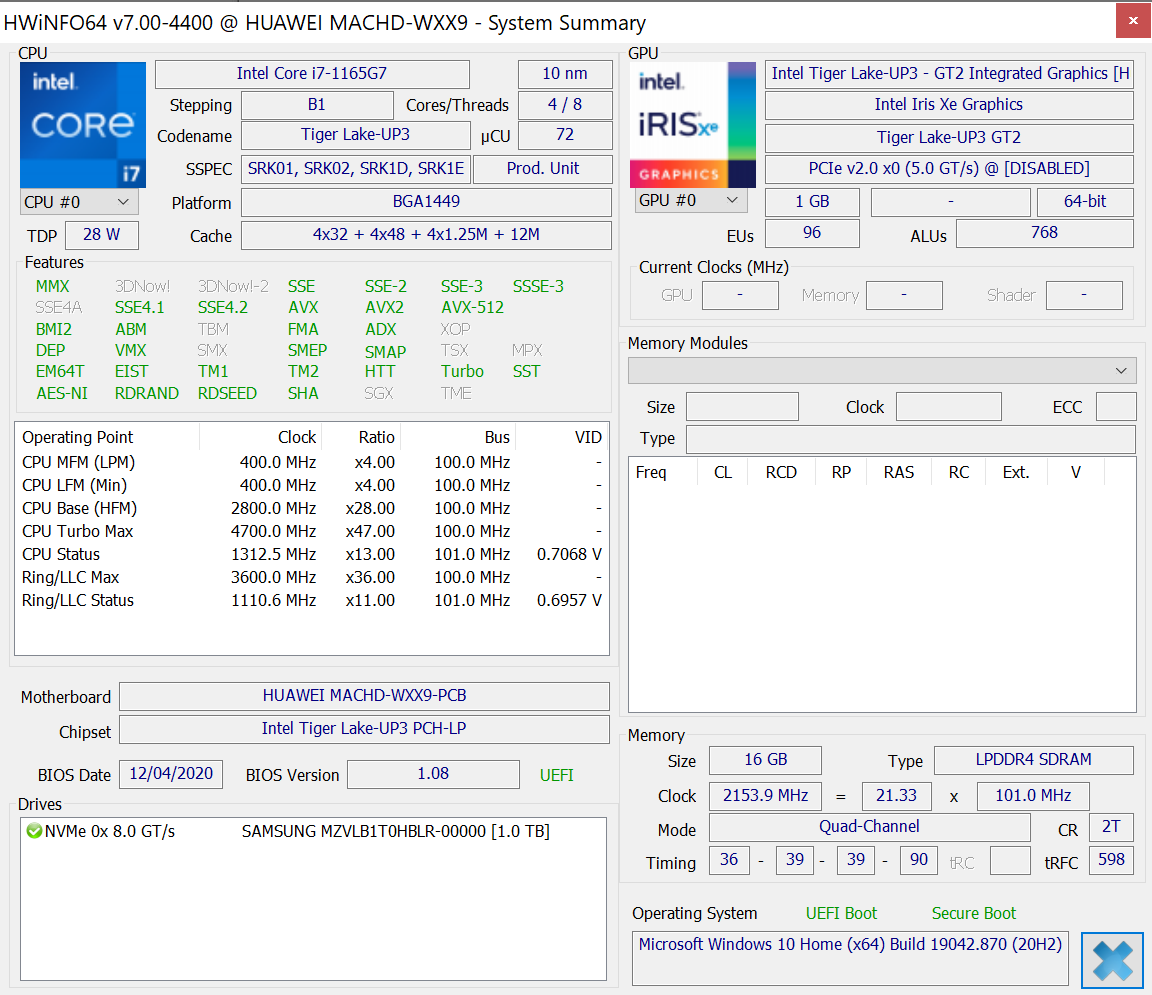
CPU performance is a mixed bag. On one hand, the new Core i7-1165G7 processor is certainly faster than the older Comet Lake-U Core i7-10510U and Whiskey Lake-U Core i7-8550U as found on older MateBook X Pro models especially in terms of single-thread performance. On the other hand, the Core i7-1165G7 in the 2021 MateBook X Pro is noticeably slower than other laptops equipped with the same CPU. Multi-thread CineBench scores are 20 to 25 percent lower than the average Core i7-1165G7 laptop in our database to be slower than even the cheaper Ice Lake Core i5-1035G7. This is disappointing but perhaps unsurprising given that previous MateBook X Pro models also had underperforming CPUs.
Cinebench R15: CPU Multi 64Bit | CPU Single 64Bit
Blender: v2.79 BMW27 CPU
7-Zip 18.03: 7z b 4 -mmt1 | 7z b 4
Geekbench 5.5: Single-Core | Multi-Core
HWBOT x265 Benchmark v2.2: 4k Preset
LibreOffice : 20 Documents To PDF
R Benchmark 2.5: Overall mean
Cinebench R15: CPU Multi 64Bit | CPU Single 64Bit
Blender: v2.79 BMW27 CPU
7-Zip 18.03: 7z b 4 -mmt1 | 7z b 4
Geekbench 5.5: Single-Core | Multi-Core
HWBOT x265 Benchmark v2.2: 4k Preset
LibreOffice : 20 Documents To PDF
R Benchmark 2.5: Overall mean
* ... smaller is better
System Performance
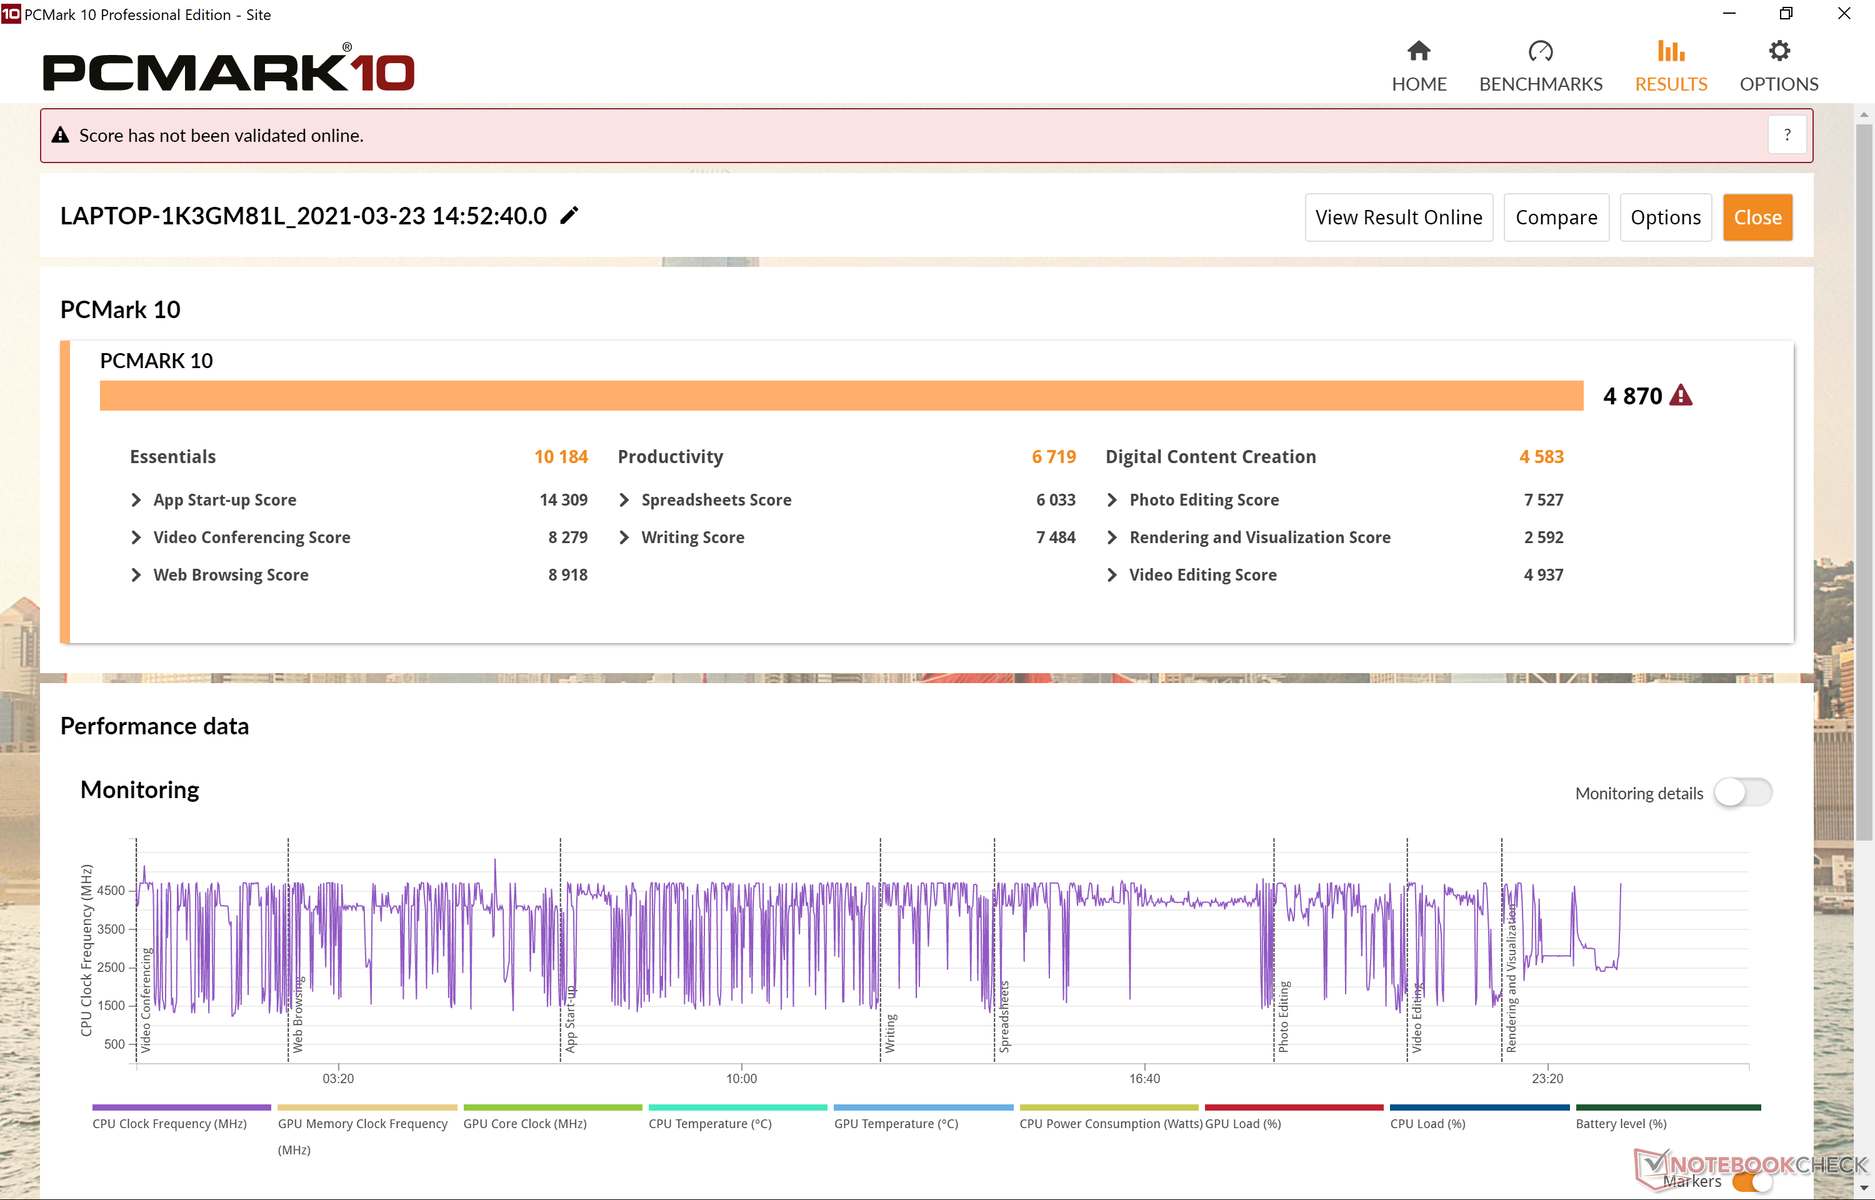
| PCMark 10 Score | 4870 points | |
Help | ||
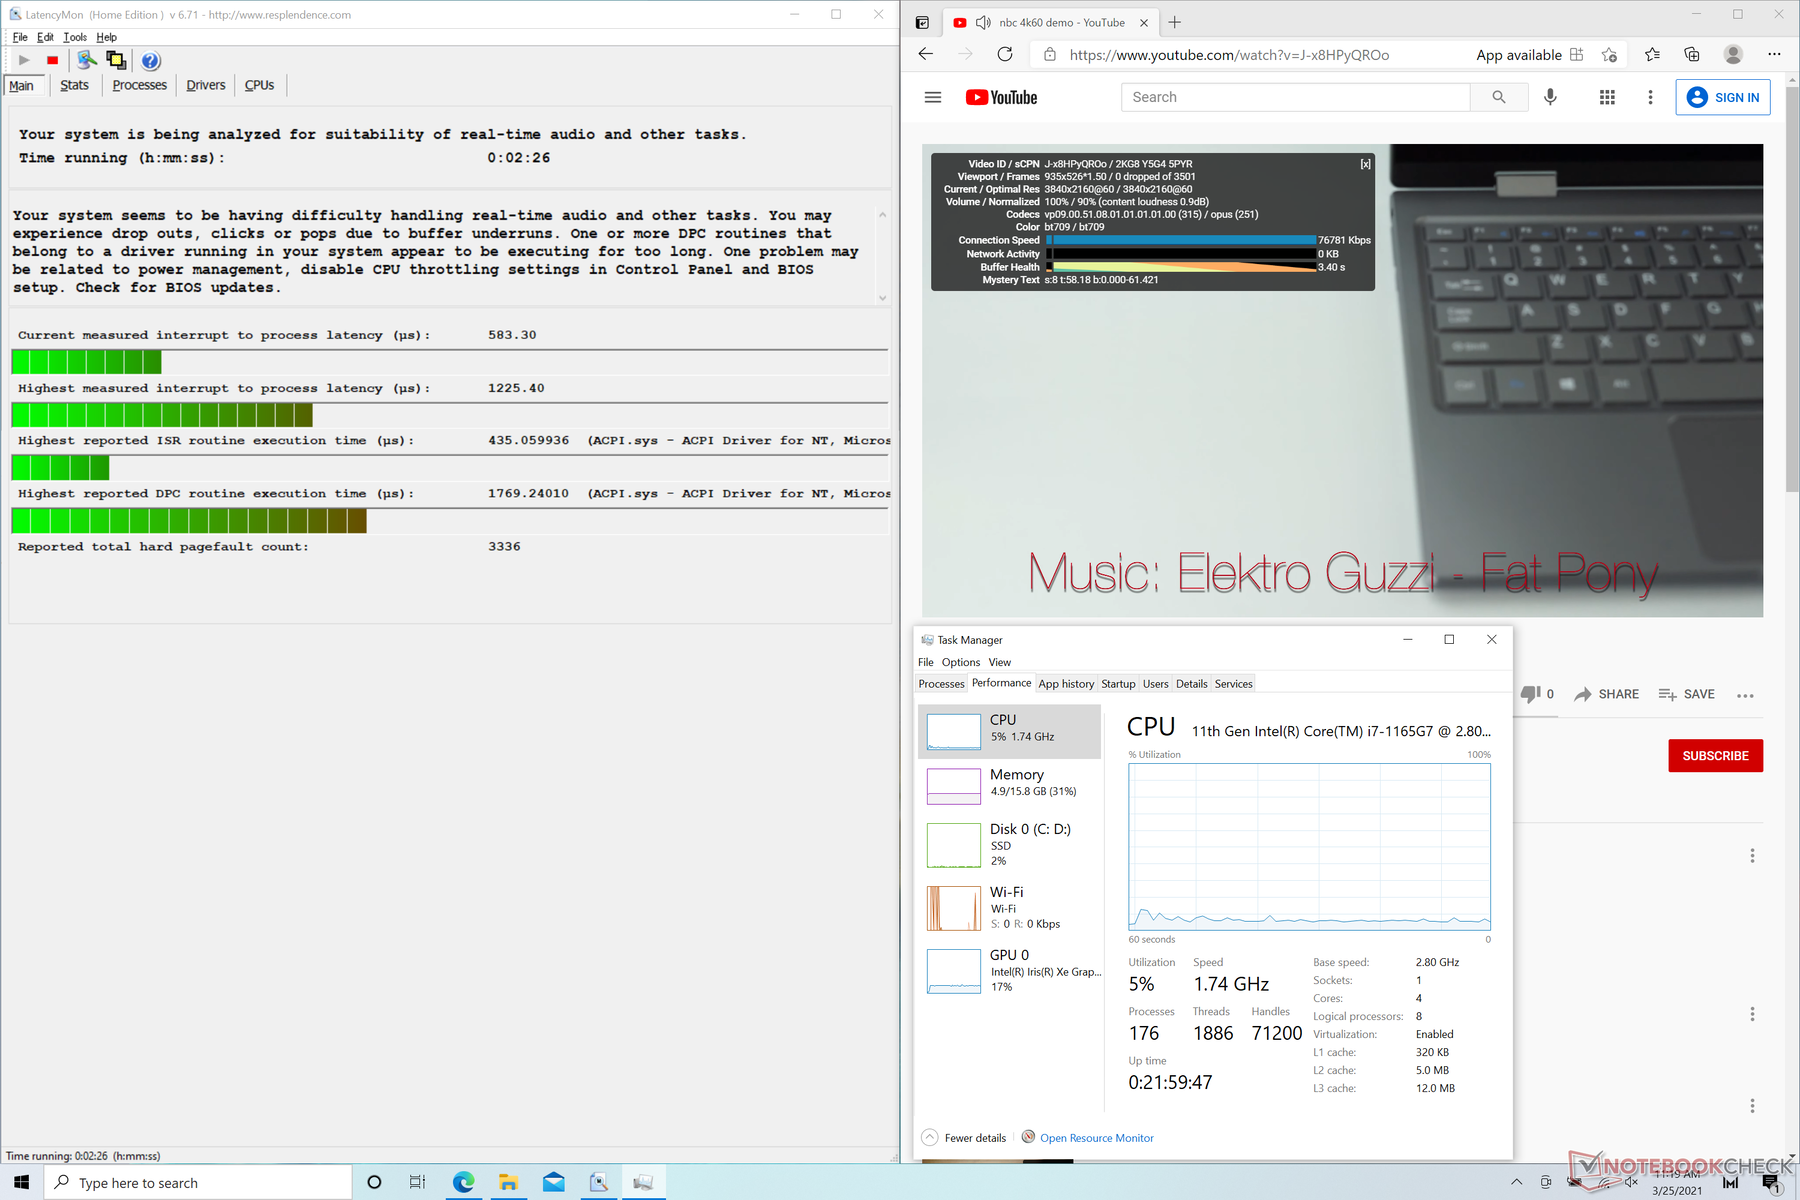
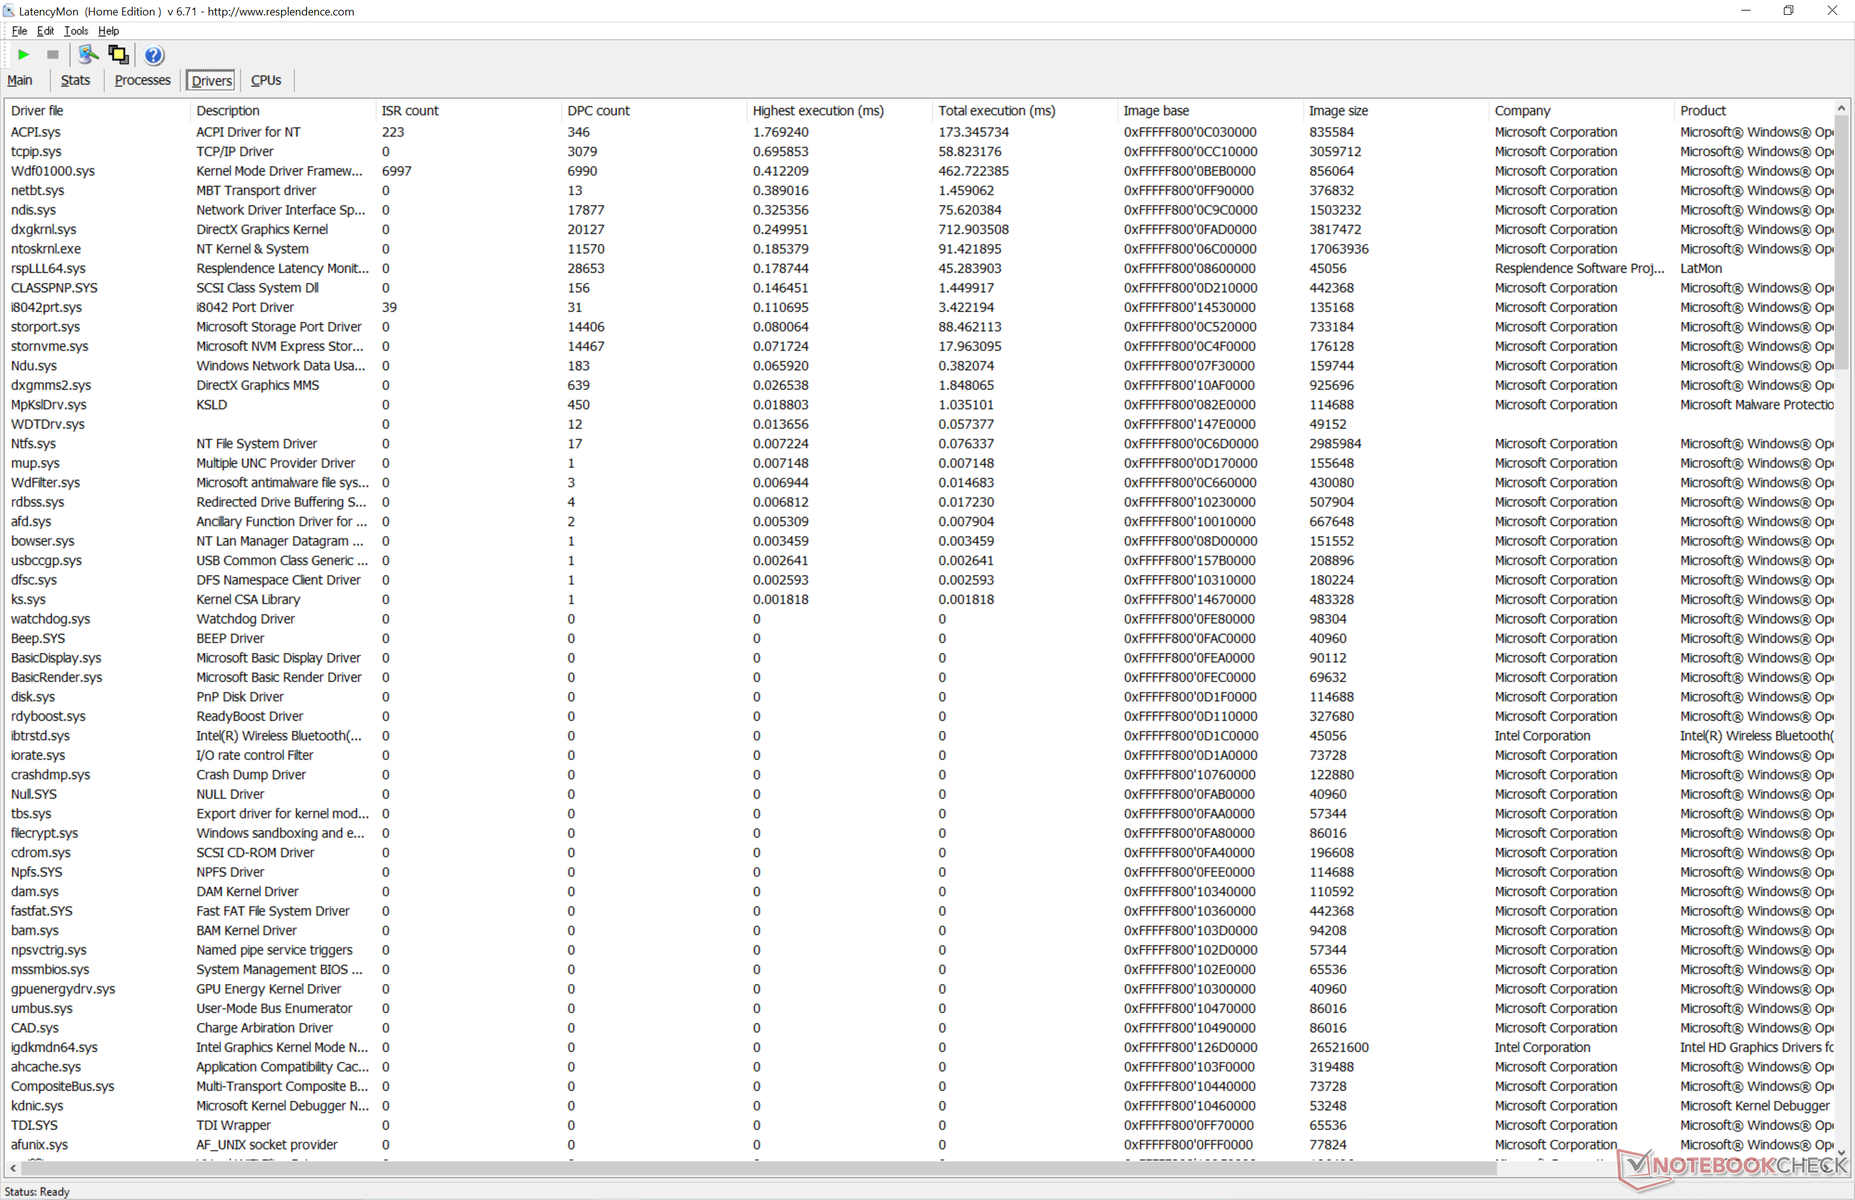
DPC Latency
LatencyMon shows slight DPC latency issues when opening multiple tabs on our homepage. 4K video playback at 60 FPS is otherwise smooth with very low GPU utilization and no dropped frames during our minute-long YouTube test.
| DPC Latencies / LatencyMon - interrupt to process latency (max), Web, Youtube, Prime95 | |
| Lenovo Yoga Slim 7-14ARE | |
| Dell XPS 13 9310 Core i7 4K | |
| Huawei MateBook X Pro 2021 | |
| Razer Blade Stealth i7-1165G7 GTX 1650 Ti Max-Q | |
* ... smaller is better
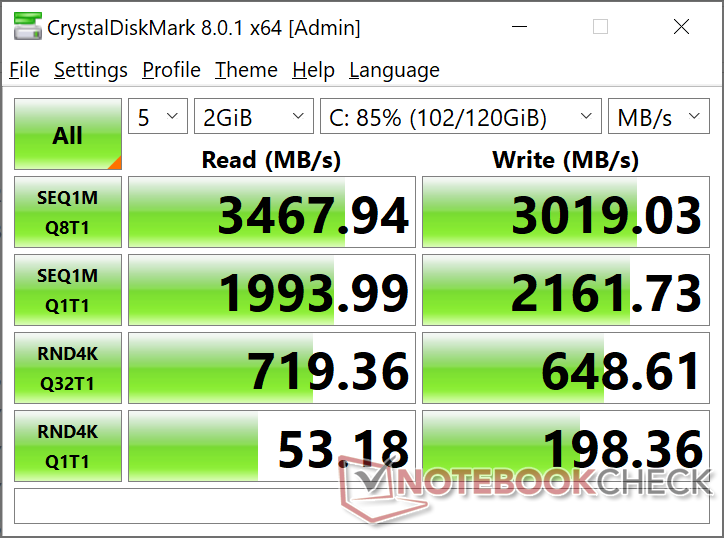
Storage Devices
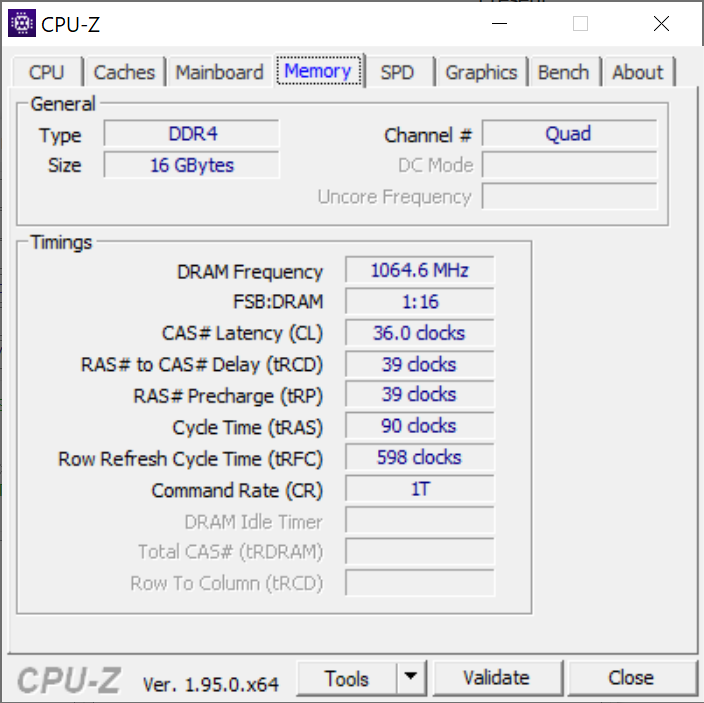
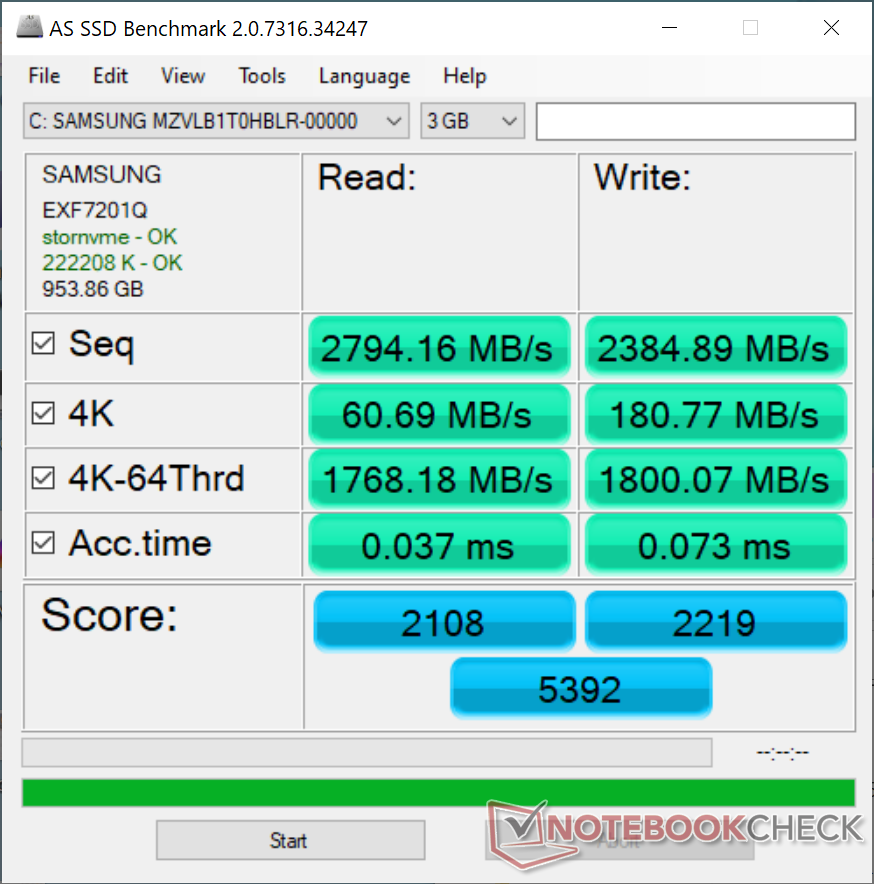
Huawei sources multiple SSD manufacturers for its MateBook series including Samsung, Western Digital, Lite-On, and Toshiba. Our test unit comes with the Samsung PM981a which is a common NVMe SSD on high-end gaming laptops. We're hopeful that future MateBook X Pro models will support PCIe 4.0 much like on the Vaio Z.
| Huawei MateBook X Pro 2021 Samsung PM981a MZVLB1T0HBLR | Huawei MateBook X Pro 2020 i7 Samsung PM981a MZVLB1T0HBLR | Dell XPS 13 9310 Core i7 4K Micron 2300 512GB MTFDHBA512TDV | Microsoft Surface Laptop 3 13 Core i5-1035G7 SK hynix BC501 HFM256GDGTNG | Razer Blade Stealth i7-1165G7 GTX 1650 Ti Max-Q Samsung SSD PM981a MZVLB512HBJQ | Lenovo Yoga Slim 7-14ARE Samsung SSD PM981a MZVLB512HBJQ | |
|---|---|---|---|---|---|---|
| AS SSD | -6% | -41% | -60% | -12% | -14% | |
| Seq Read (MB/s) | 2794 | 2737 -2% | 2144 -23% | 1387 -50% | 2353 -16% | 1658 -41% |
| Seq Write (MB/s) | 2385 | 2530 6% | 1389 -42% | 504 -79% | 1625 -32% | 2464 3% |
| 4K Read (MB/s) | 60.7 | 54 -11% | 49.77 -18% | 42.35 -30% | 57.5 -5% | 59.5 -2% |
| 4K Write (MB/s) | 180.8 | 152.5 -16% | 105 -42% | 120 -34% | 189.3 5% | 128.6 -29% |
| 4K-64 Read (MB/s) | 1768 | 2011 14% | 855 -52% | 497.4 -72% | 1169 -34% | 1576 -11% |
| 4K-64 Write (MB/s) | 1800 | 1260 -30% | 1660 -8% | 354.9 -80% | 1778 -1% | 1986 10% |
| Access Time Read * (ms) | 0.037 | 0.066 -78% | 0.058 -57% | 0.055 -49% | 0.05 -35% | 0.049 -32% |
| Access Time Write * (ms) | 0.073 | 0.024 67% | 0.272 -273% | 0.093 -27% | 0.058 21% | 0.087 -19% |
| Score Read (Points) | 2108 | 2339 11% | 1119 -47% | 678 -68% | 1462 -31% | 1802 -15% |
| Score Write (Points) | 2219 | 1666 -25% | 1904 -14% | 525 -76% | 2130 -4% | 2361 6% |
| Score Total (Points) | 5392 | 5191 -4% | 3570 -34% | 1520 -72% | 4316 -20% | 5133 -5% |
| Copy ISO MB/s (MB/s) | 2065 | 1929 -7% | 764 -63% | 2073 0% | 1588 -23% | |
| Copy Program MB/s (MB/s) | 734 | 1012 38% | 256.1 -65% | 673 -8% | 550 -25% | |
| Copy Game MB/s (MB/s) | 1629 | 1737 7% | 368.4 -77% | 1568 -4% | 1329 -18% | |
| CrystalDiskMark 5.2 / 6 | -14% | -27% | -49% | -13% | -5% | |
| Write 4K (MB/s) | 197.5 | 165.6 -16% | 86 -56% | 112.3 -43% | 151.1 -23% | 146.1 -26% |
| Read 4K (MB/s) | 52.9 | 50.2 -5% | 40.11 -24% | 42.13 -20% | 35.78 -32% | 47.18 -11% |
| Write Seq (MB/s) | 2174 | 1905 -12% | 1738 -20% | 630 -71% | 2122 -2% | 2896 33% |
| Read Seq (MB/s) | 2156 | 1669 -23% | 1553 -28% | 1023 -53% | 2403 11% | 2754 28% |
| Write 4K Q32T1 (MB/s) | 632 | 474.6 -25% | 454.9 -28% | 336.6 -47% | 528 -16% | 425.8 -33% |
| Read 4K Q32T1 (MB/s) | 694 | 508 -27% | 385.4 -44% | 399.6 -42% | 430.2 -38% | 514 -26% |
| Write Seq Q32T1 (MB/s) | 3017 | 3007 0% | 2784 -8% | 821 -73% | 2986 -1% | 2989 -1% |
| Read Seq Q32T1 (MB/s) | 3561 | 3556 0% | 3217 -10% | 2030 -43% | 3540 -1% | 3568 0% |
| Total Average (Program / Settings) | -10% /
-9% | -34% /
-36% | -55% /
-56% | -13% /
-12% | -10% /
-11% |
* ... smaller is better

Disk Throttling: DiskSpd Read Loop, Queue Depth 8
GPU Performance
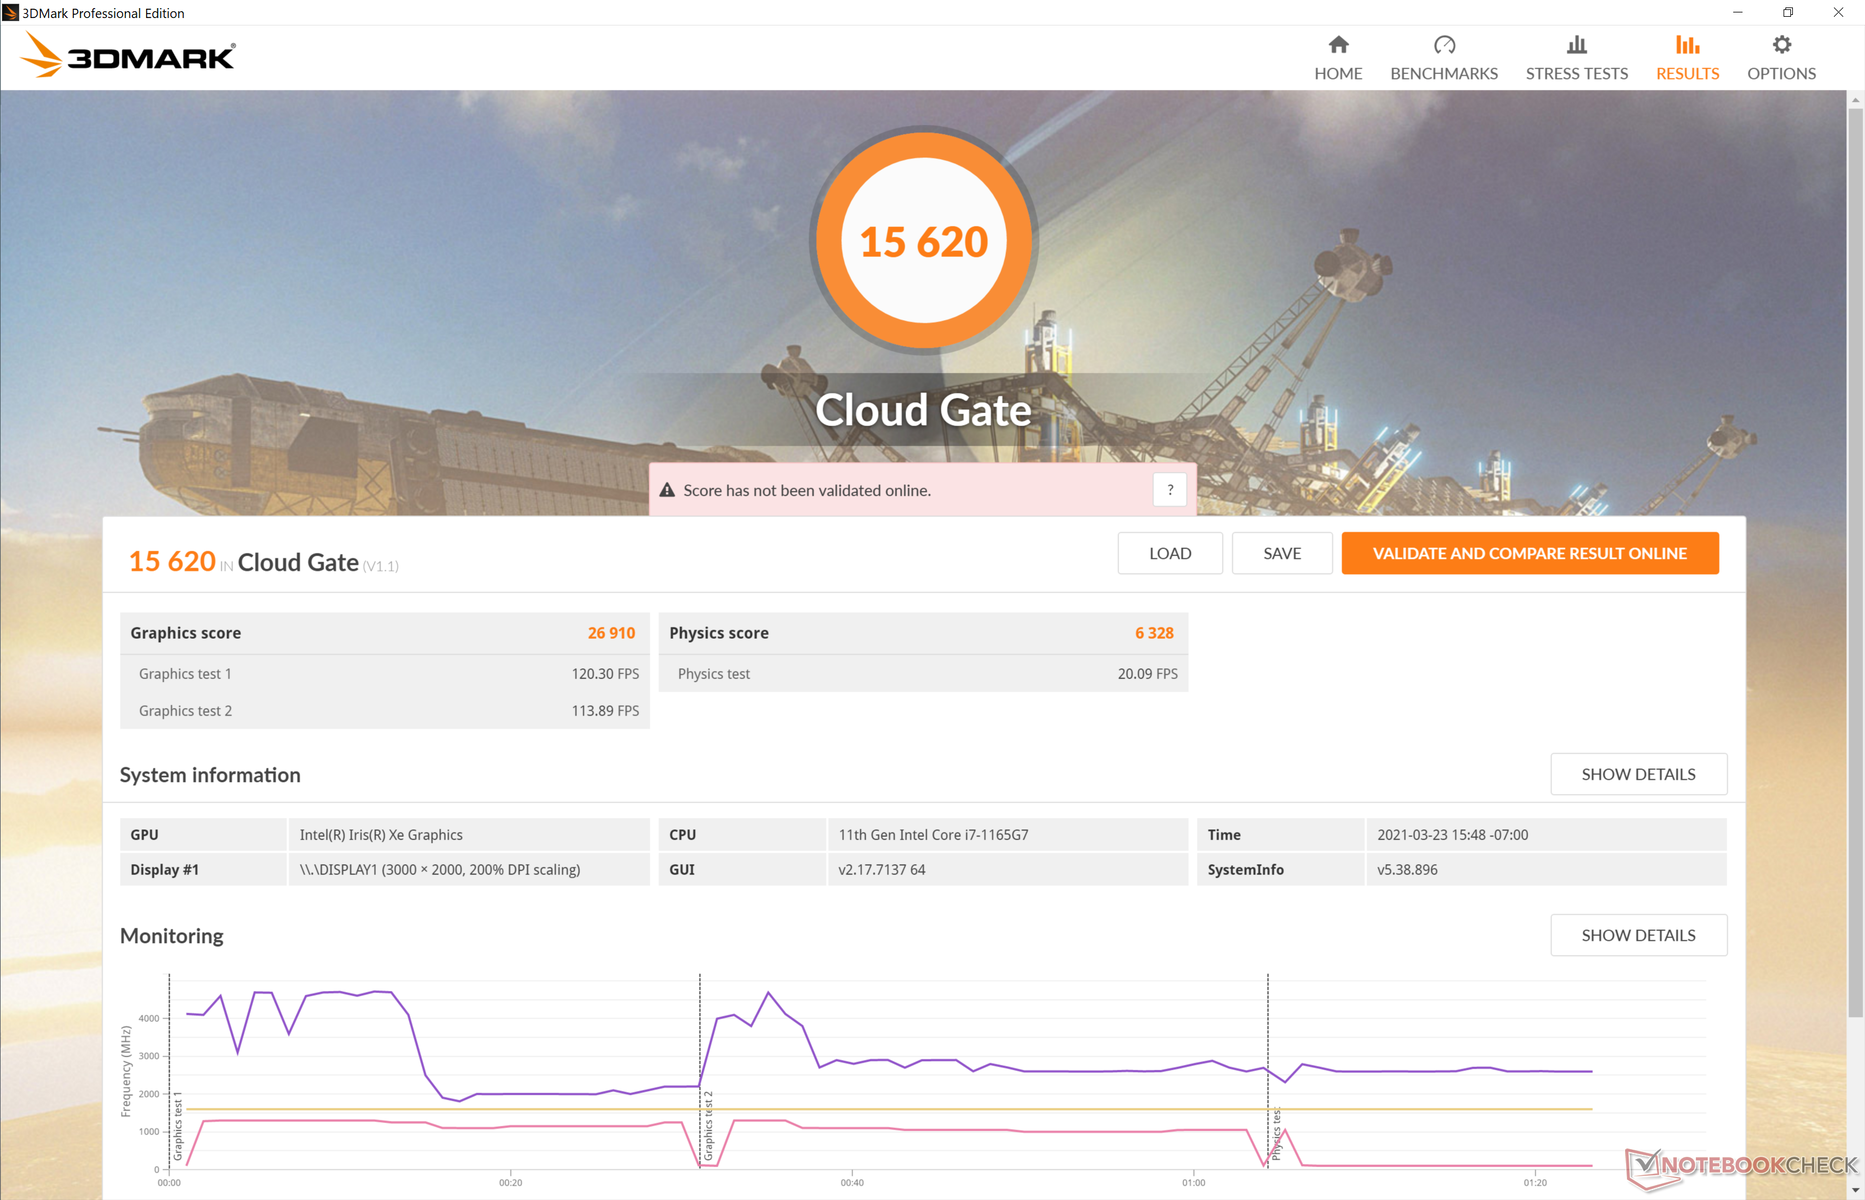
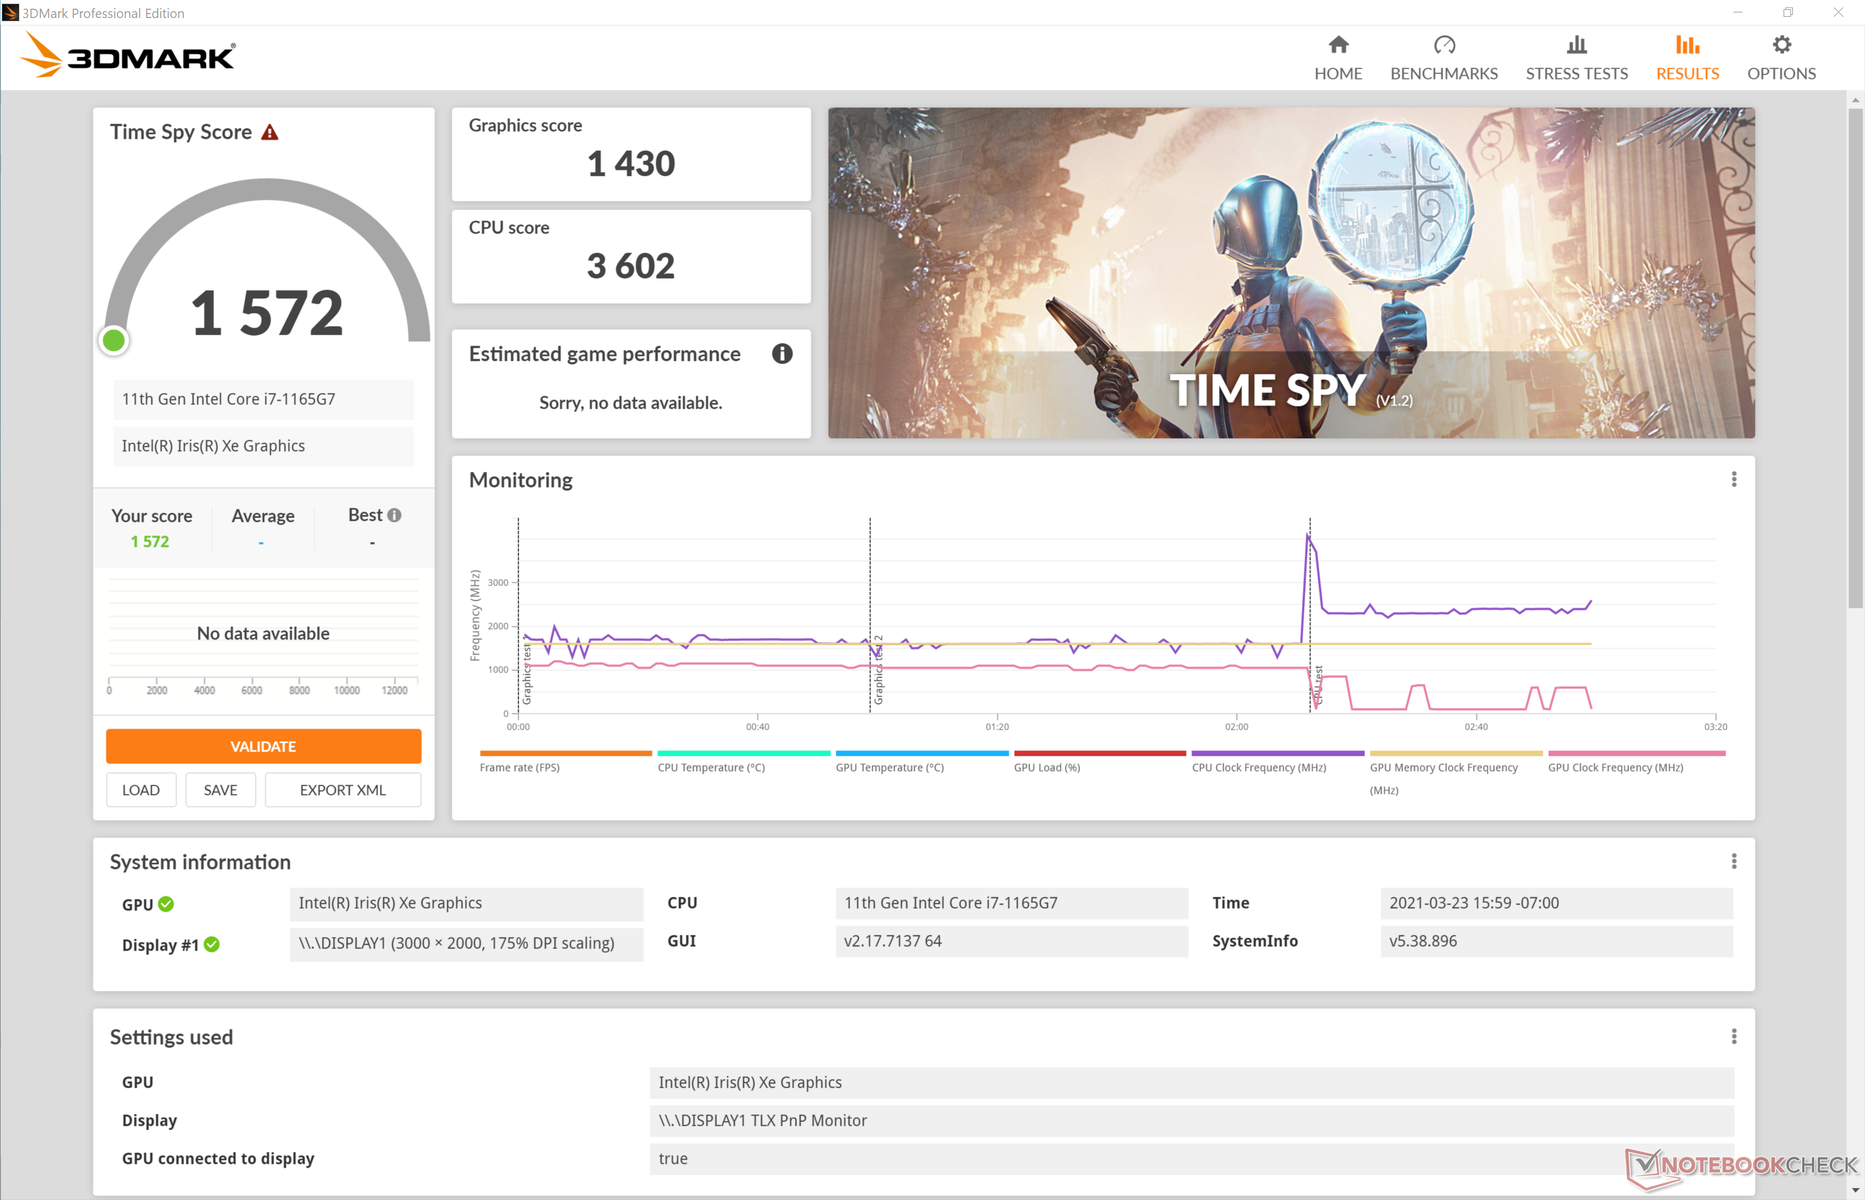
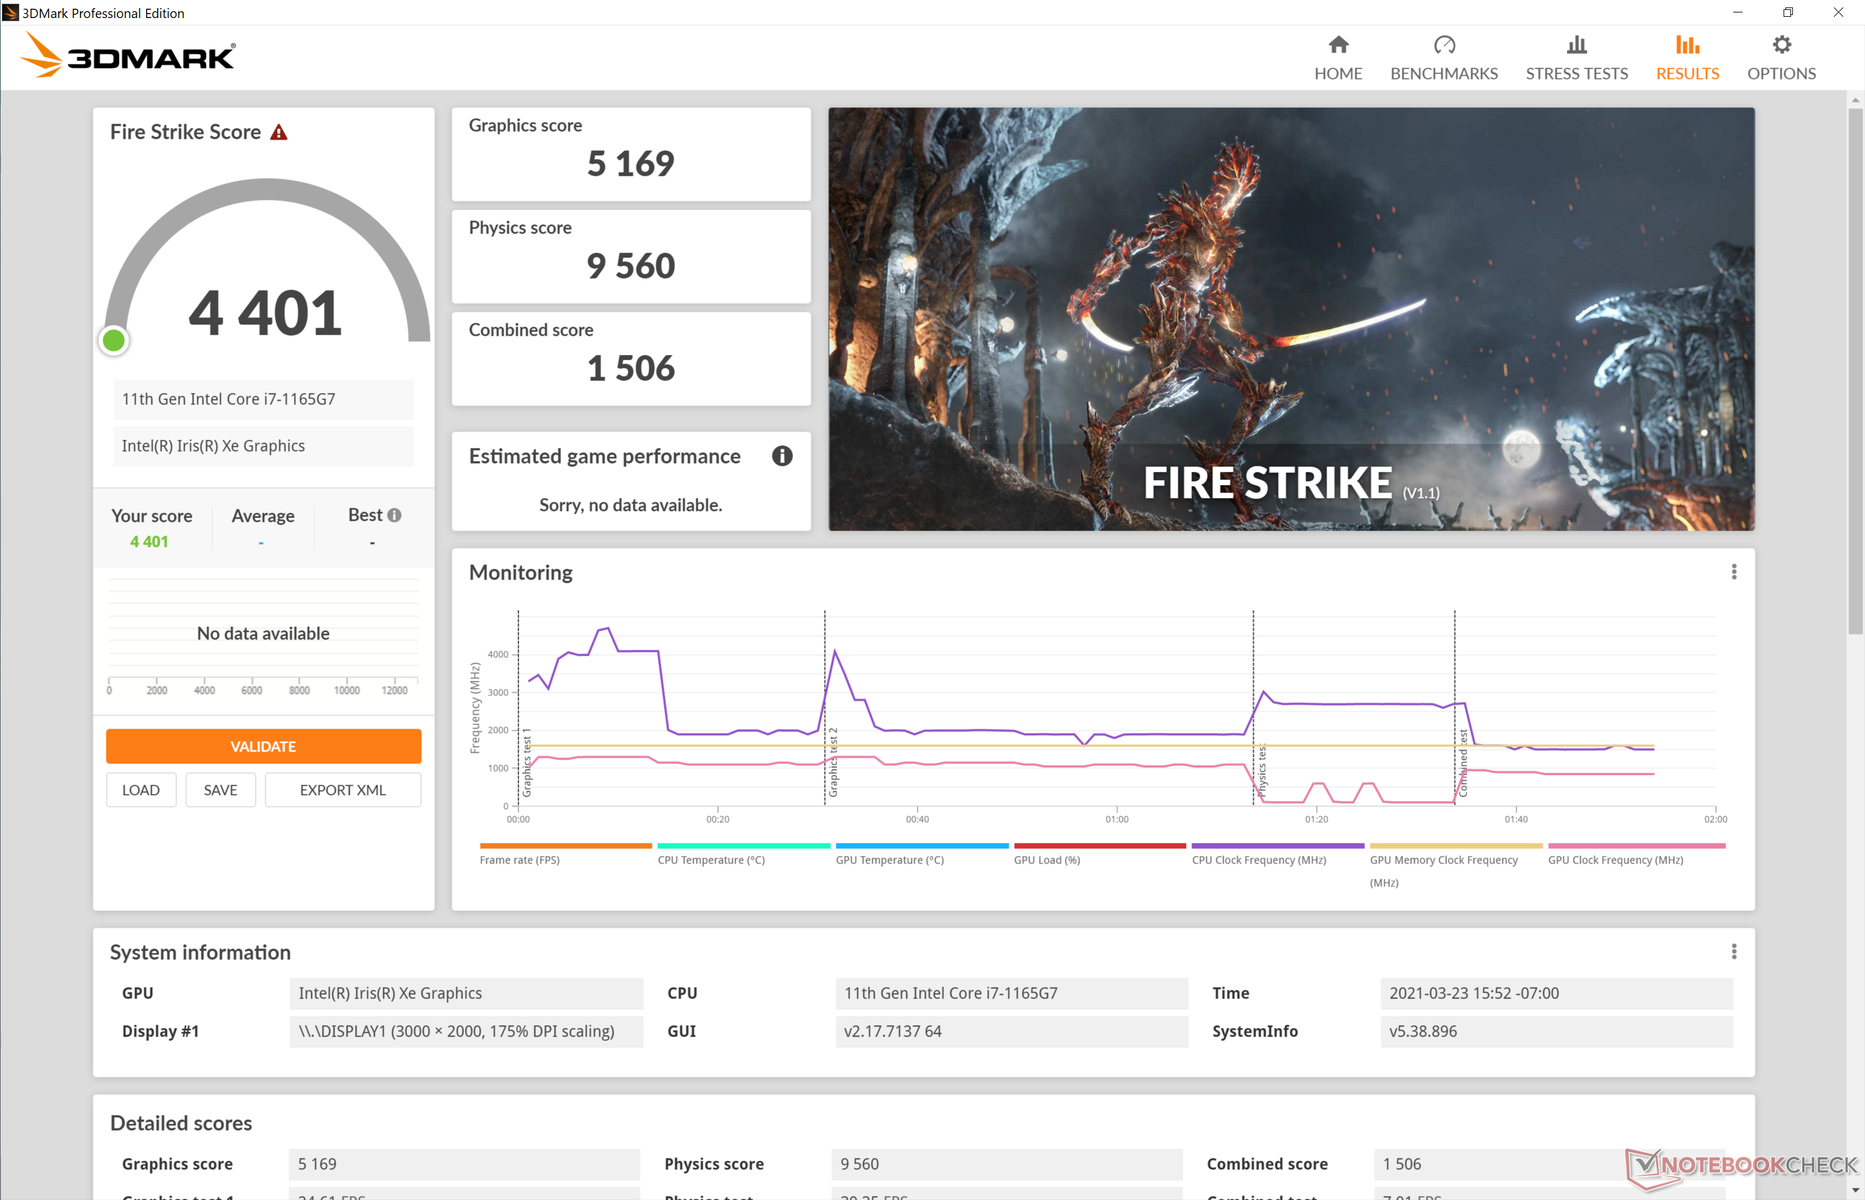
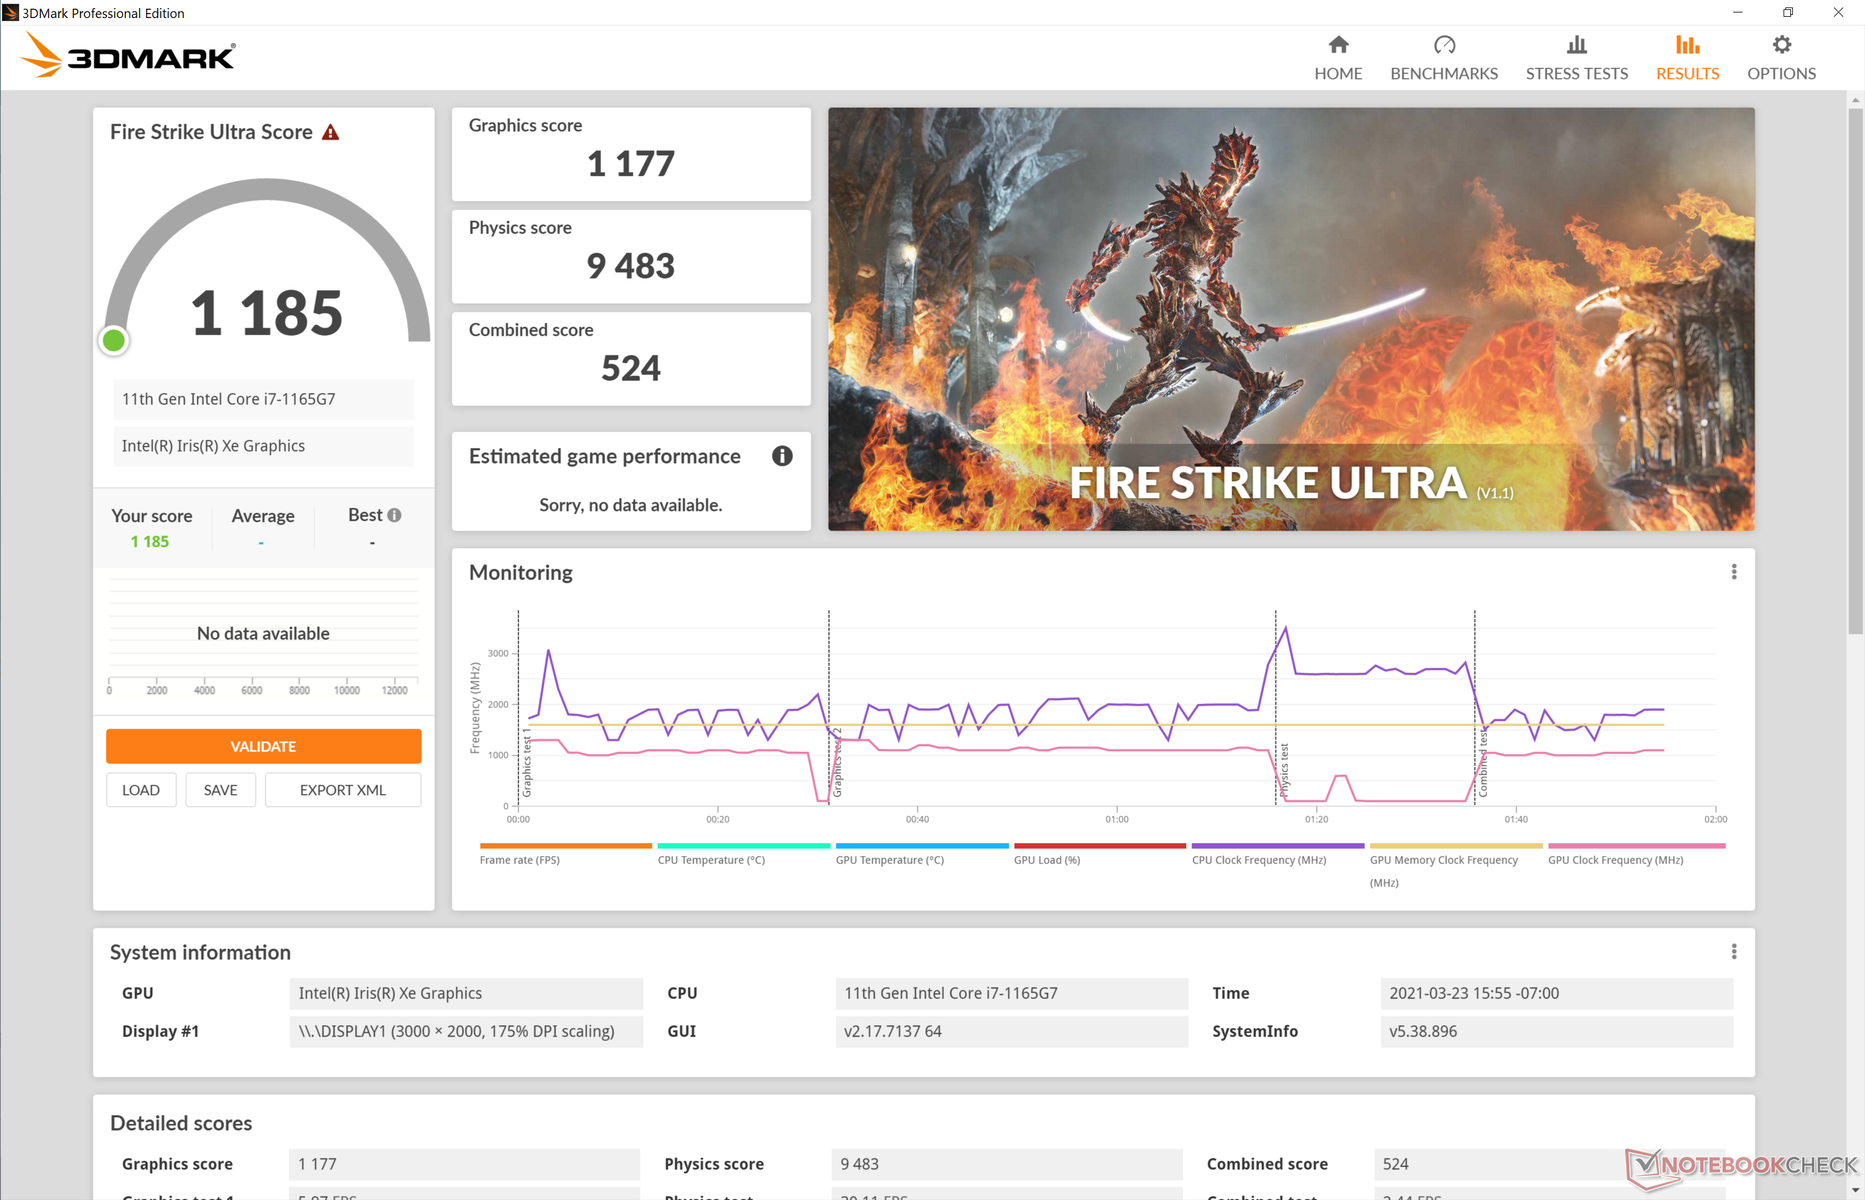
Iris Xe graphics performance is where we expect it to be which is a relief considering the below-average CPU performance recorded above. Users upgrading from laptops with UHD Graphics will see large improvements in all aspects especially for light graphics editing. For gaming, however, the discrete GeForce MX150 or MX250 will still be the superior options for more consistent frame rates and better compatibility. 3DMark results are particularly misleading here as they show our Huawei significantly outperforming the GeForce MX250 even though real-world gaming performance tells a completely different story.
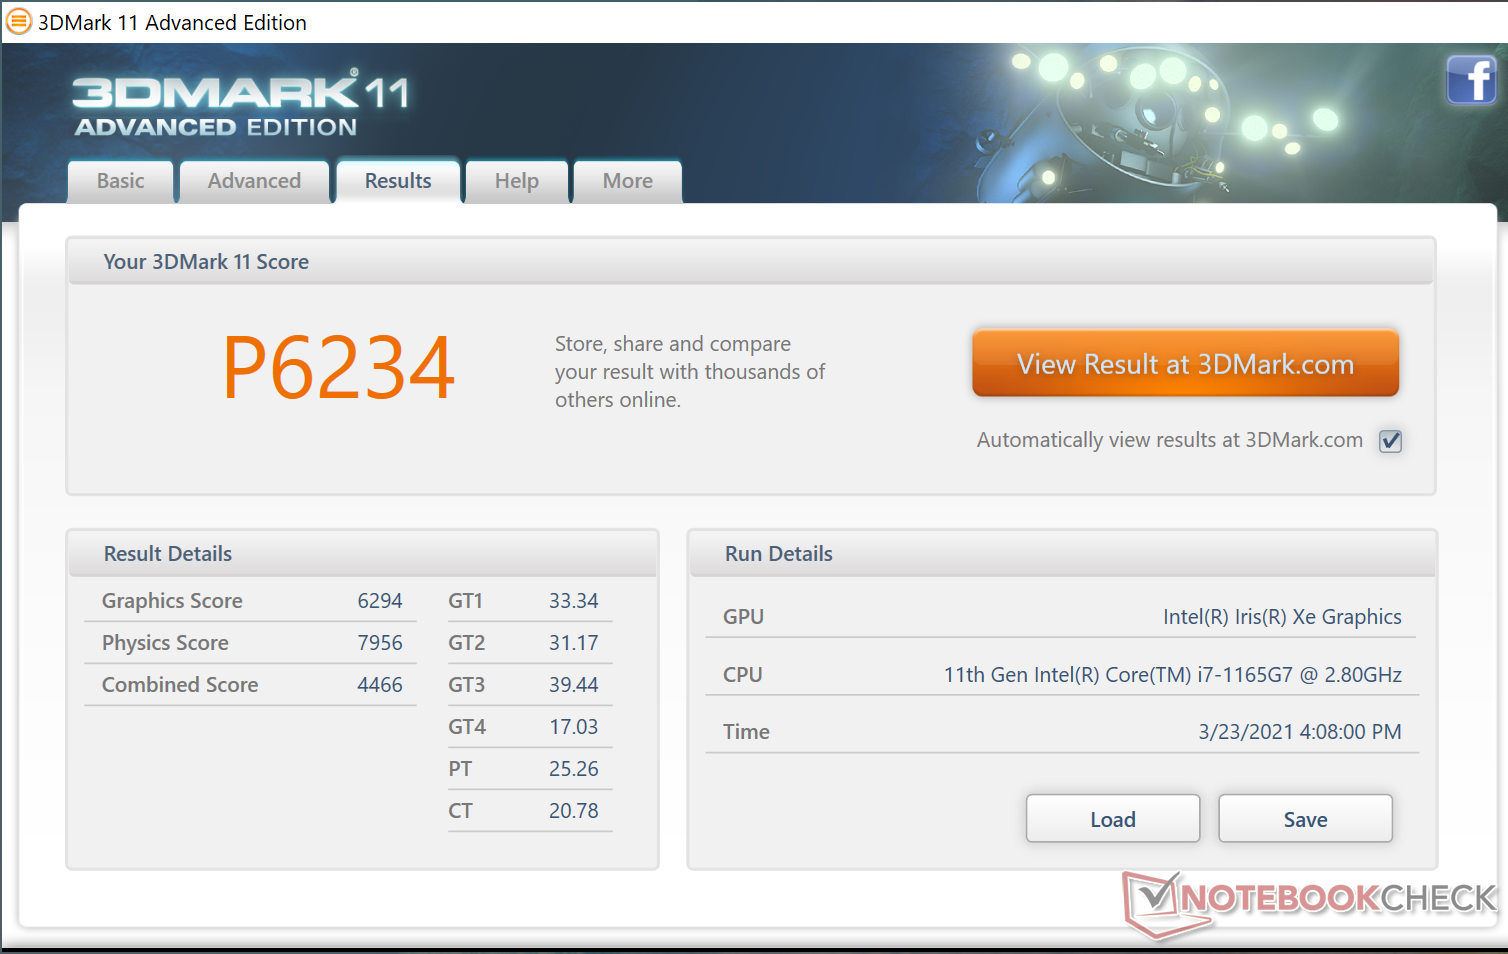
| 3DMark 11 Performance | 6234 points | |
| 3DMark Cloud Gate Standard Score | 15620 points | |
| 3DMark Fire Strike Score | 4401 points | |
| 3DMark Time Spy Score | 1572 points | |
Help | ||
| low | med. | high | ultra | |
|---|---|---|---|---|
| GTA V (2015) | 70.6 | 61.4 | 22.8 | 10 |
| The Witcher 3 (2015) | 69.5 | 46.6 | 27.1 | 12.8 |
| Dota 2 Reborn (2015) | 77.3 | 47.6 | 38.2 | 37.7 |
| Final Fantasy XV Benchmark (2018) | 31.4 | 18.1 | 13.8 | |
| X-Plane 11.11 (2018) | 23.2 | 31.8 | 29.2 | |
| Far Cry 5 (2018) | 39 | 21 | 20 | 18 |
| Strange Brigade (2018) | 79.5 | 34.6 | 27.4 | 22.5 |
Emissions
System Noise
Fan noise is quieter on the 2021 model when compared to the GeForce-powered 2020 model due in part to having no more discrete GPU to cool. Running Witcher 3 on Ultra settings, for example, causes fan noise to stabilize at just 32 dB(A) compared to 38 dB(A) on the GeForce model. However, users aiming for lower settings and higher frame rates will still see fan noise slowly rise to its 38 dB(A) maximum after a few minutes of gaming.
We can notice very slight coil whine on our test unit. The system is otherwise quiet during most low to low-medium loads. In fact, the fans are able to remain silent throughout the entire 90-second 3DMark 06 benchmark scene until the very last few seconds.
| Huawei MateBook X Pro 2021 Iris Xe G7 96EUs, i7-1165G7, Samsung PM981a MZVLB1T0HBLR | Huawei MateBook X Pro 2020 i7 GeForce MX250, i7-10510U, Samsung PM981a MZVLB1T0HBLR | Dell XPS 13 9310 Core i7 4K Iris Xe G7 96EUs, i7-1185G7, Micron 2300 512GB MTFDHBA512TDV | Microsoft Surface Laptop 3 13 Core i5-1035G7 Iris Plus Graphics G7 (Ice Lake 64 EU), i5-1035G7, SK hynix BC501 HFM256GDGTNG | Razer Blade Stealth i7-1165G7 GTX 1650 Ti Max-Q GeForce GTX 1650 Ti Max-Q, i7-1165G7, Samsung SSD PM981a MZVLB512HBJQ | Lenovo Yoga Slim 7-14ARE Vega 8, R7 4800U, Samsung SSD PM981a MZVLB512HBJQ | |
|---|---|---|---|---|---|---|
| Noise | -17% | -5% | -11% | -16% | -5% | |
| off / environment * (dB) | 25.4 | 29.6 -17% | 27.7 -9% | 28.5 -12% | 25.3 -0% | 26.3 -4% |
| Idle Minimum * (dB) | 25.6 | 29.6 -16% | 27.8 -9% | 28.5 -11% | 25.3 1% | 26.5 -4% |
| Idle Average * (dB) | 25.6 | 29.6 -16% | 27.8 -9% | 28.5 -11% | 25.3 1% | 26.5 -4% |
| Idle Maximum * (dB) | 25.6 | 30.3 -18% | 27.8 -9% | 28.5 -11% | 27 -5% | 26.5 -4% |
| Load Average * (dB) | 28.7 | 38 -32% | 27.9 3% | 28.5 1% | 47.9 -67% | 31.8 -11% |
| Witcher 3 ultra * (dB) | 32 | 38 -19% | 32.8 -2% | 40.4 -26% | 38.4 -20% | 35.9 -12% |
| Load Maximum * (dB) | 38.2 | 38 1% | 37 3% | 40.4 -6% | 45.9 -20% | 35.9 6% |
* ... smaller is better
Noise level
| Idle |
| 25.6 / 25.6 / 25.6 dB(A) |
| Load |
| 28.7 / 38.2 dB(A) |
 | ||
30 dB silent 40 dB(A) audible 50 dB(A) loud |
||
min: | ||
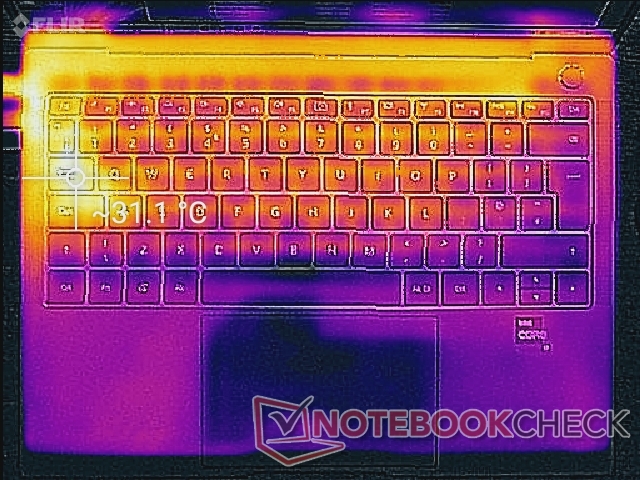
Temperature
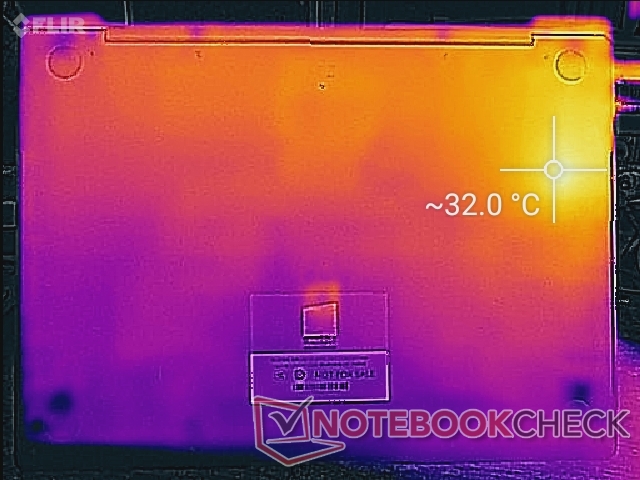
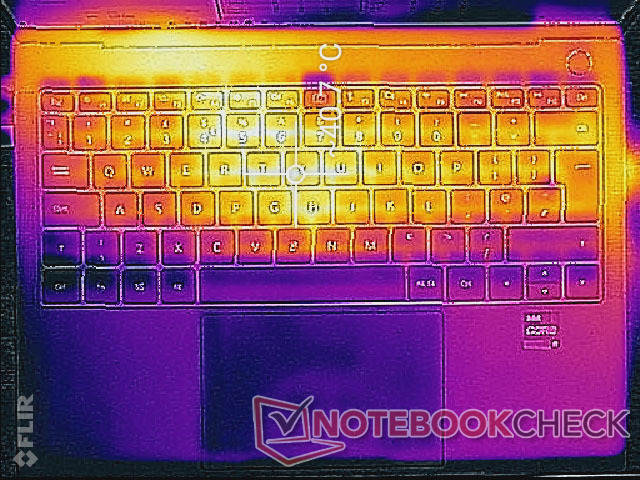
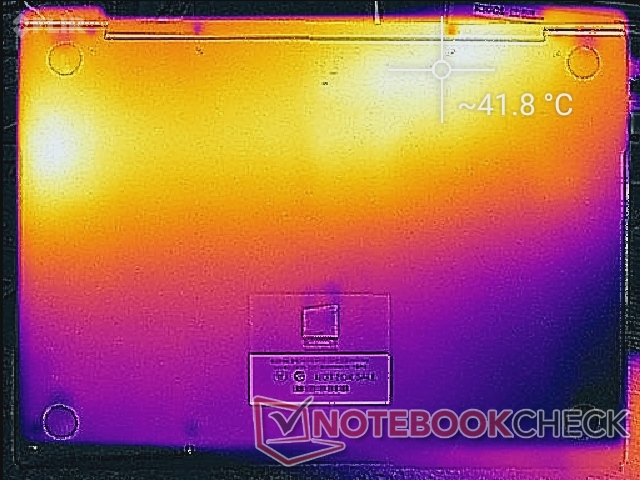
Surface temperatures are warmest at the center of the keyboard and rear of the bottom similar to what we recorded on the 2018 MateBook X Pro even though they don't share the same cooling solution. However, maximum temperatures are cooler on the newer model at just 42 C compared to 51 C on the 2018 version.
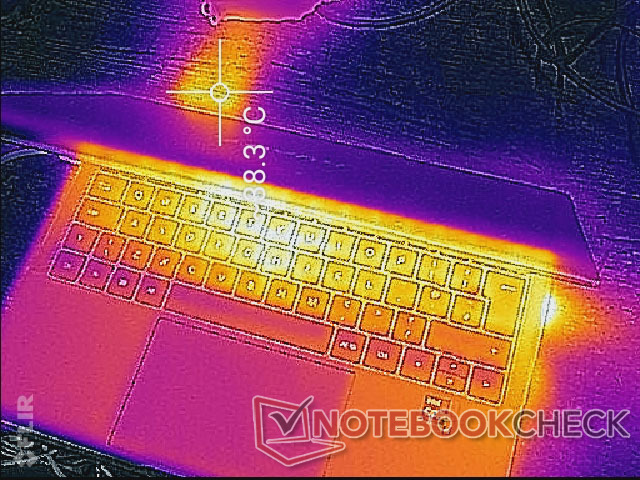
(±) The maximum temperature on the upper side is 42.2 °C / 108 F, compared to the average of 35.9 °C / 97 F, ranging from 21.4 to 59 °C for the class Subnotebook.
(±) The bottom heats up to a maximum of 40.4 °C / 105 F, compared to the average of 39.2 °C / 103 F
(+) In idle usage, the average temperature for the upper side is 29.2 °C / 85 F, compared to the device average of 30.8 °C / 87 F.
(+) The palmrests and touchpad are reaching skin temperature as a maximum (35.8 °C / 96.4 F) and are therefore not hot.
(-) The average temperature of the palmrest area of similar devices was 28.2 °C / 82.8 F (-7.6 °C / -13.6 F).
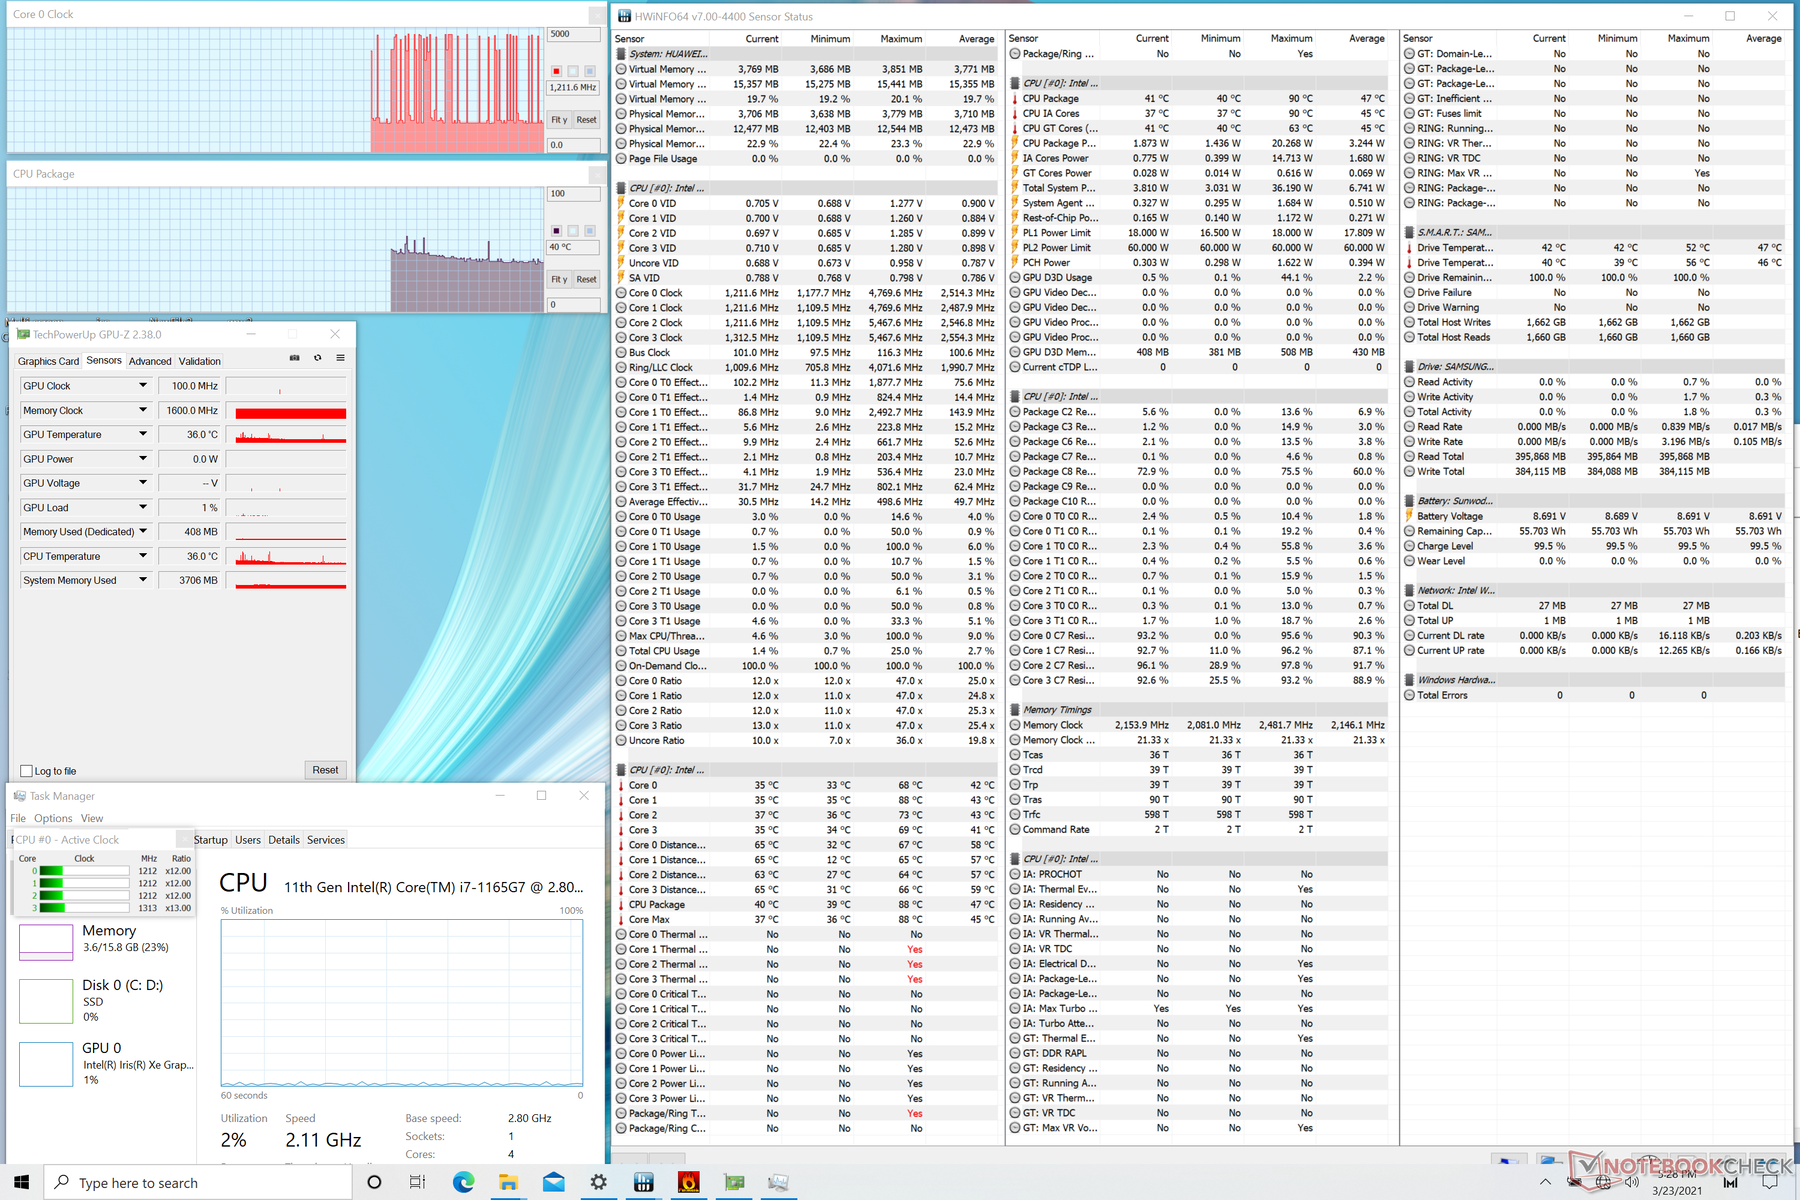
Stress Test
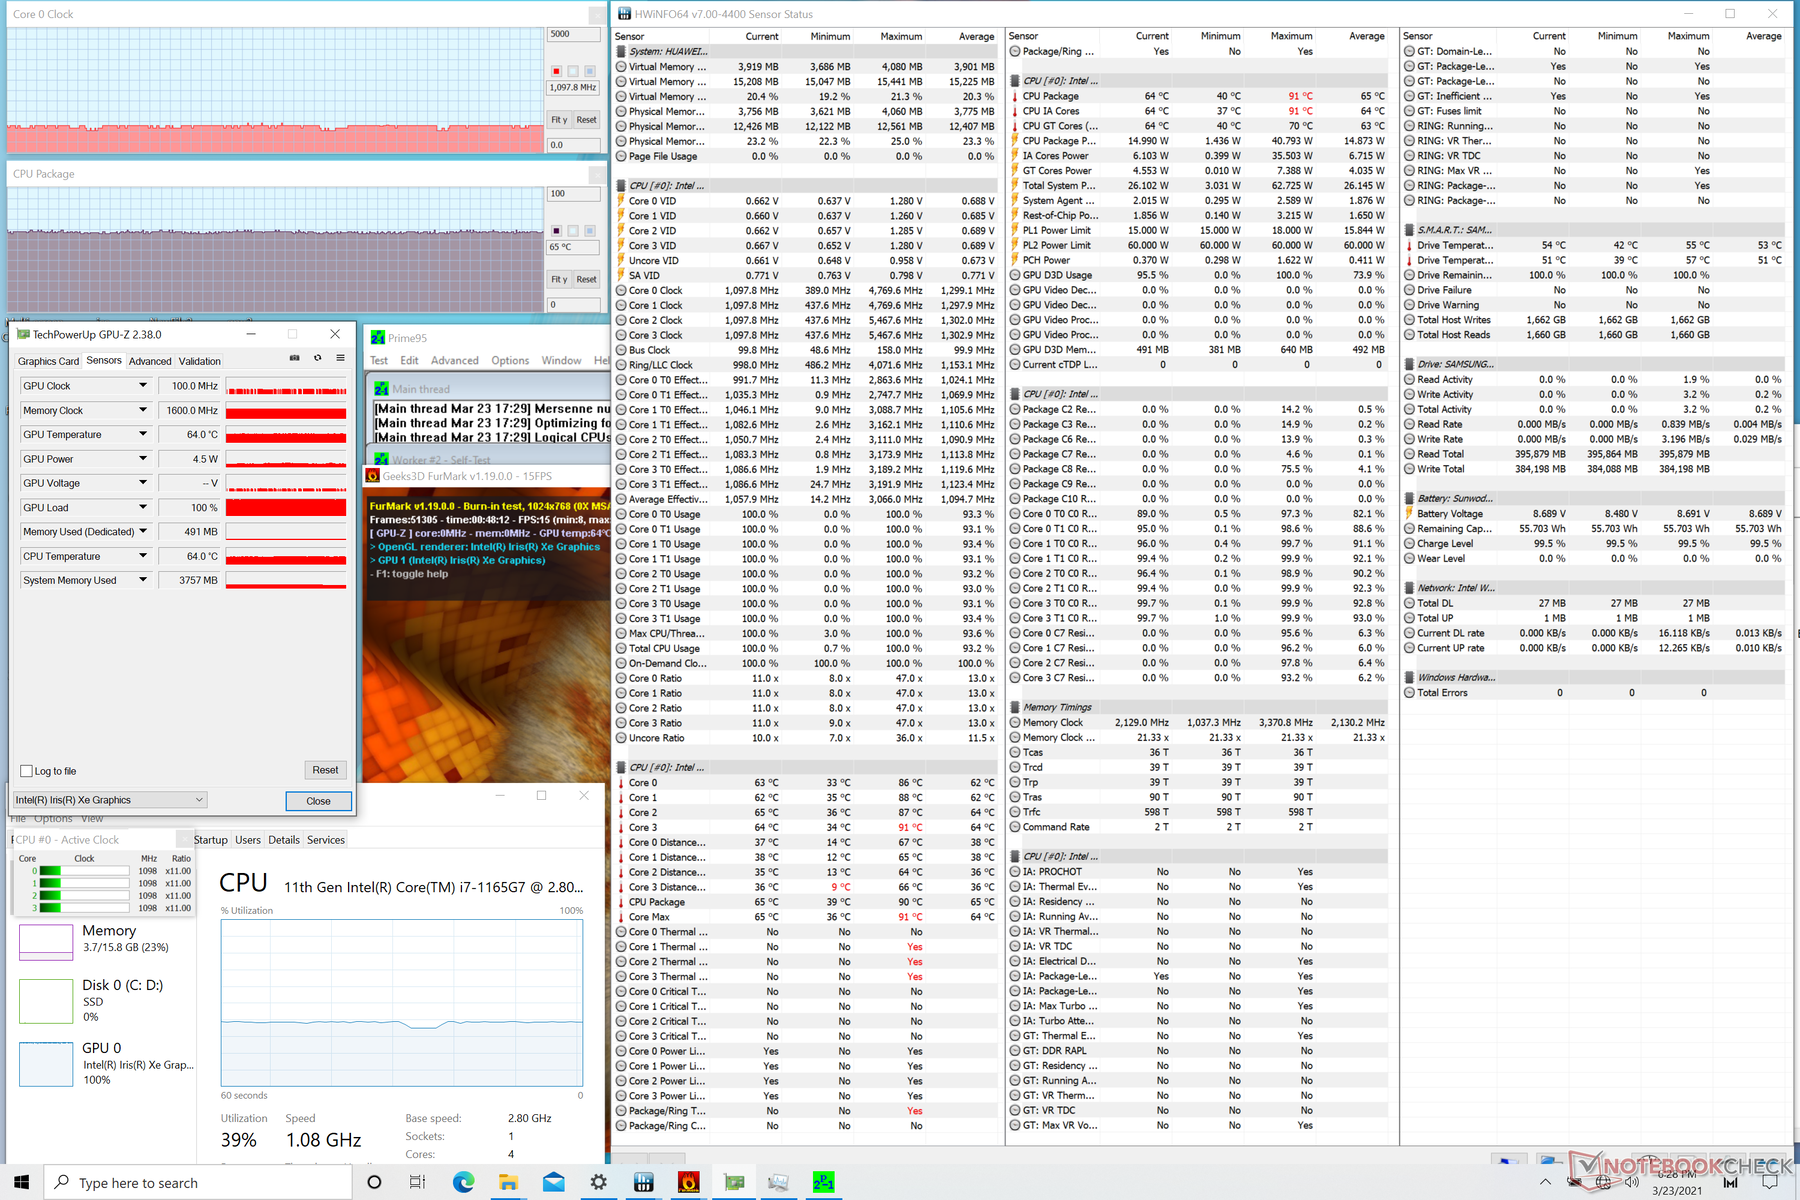
Running Prime95 reveals exactly why the CPU performs so slowly in the MateBook X Pro. Clock rates would boost to only 2.6 GHz for the first few seconds before hitting 89 C and then dropping sharply to 1.8 GHz in order to maintain a cooler core temperature of 68 C. In comparison, the same CPU in the Razer Book 13 would settle at the 2.5 to 2.7 GHz range when under similar testing conditions. The Core i7-1165G7 in the Dell XPS 13 would stabilize at much faster clock rates as well albeit at higher core temperatures. It's clear that Huawei is favoring cooler temperatures at the cost of lower clock rates even when the system is set to High performance mode.
Running on battery power will limit graphics performance. A Fire Strike run on batteries would return Physics and Graphics scores of 9851 and 3917 points, respectively, compared to 9560 and 5169 points when on mains.
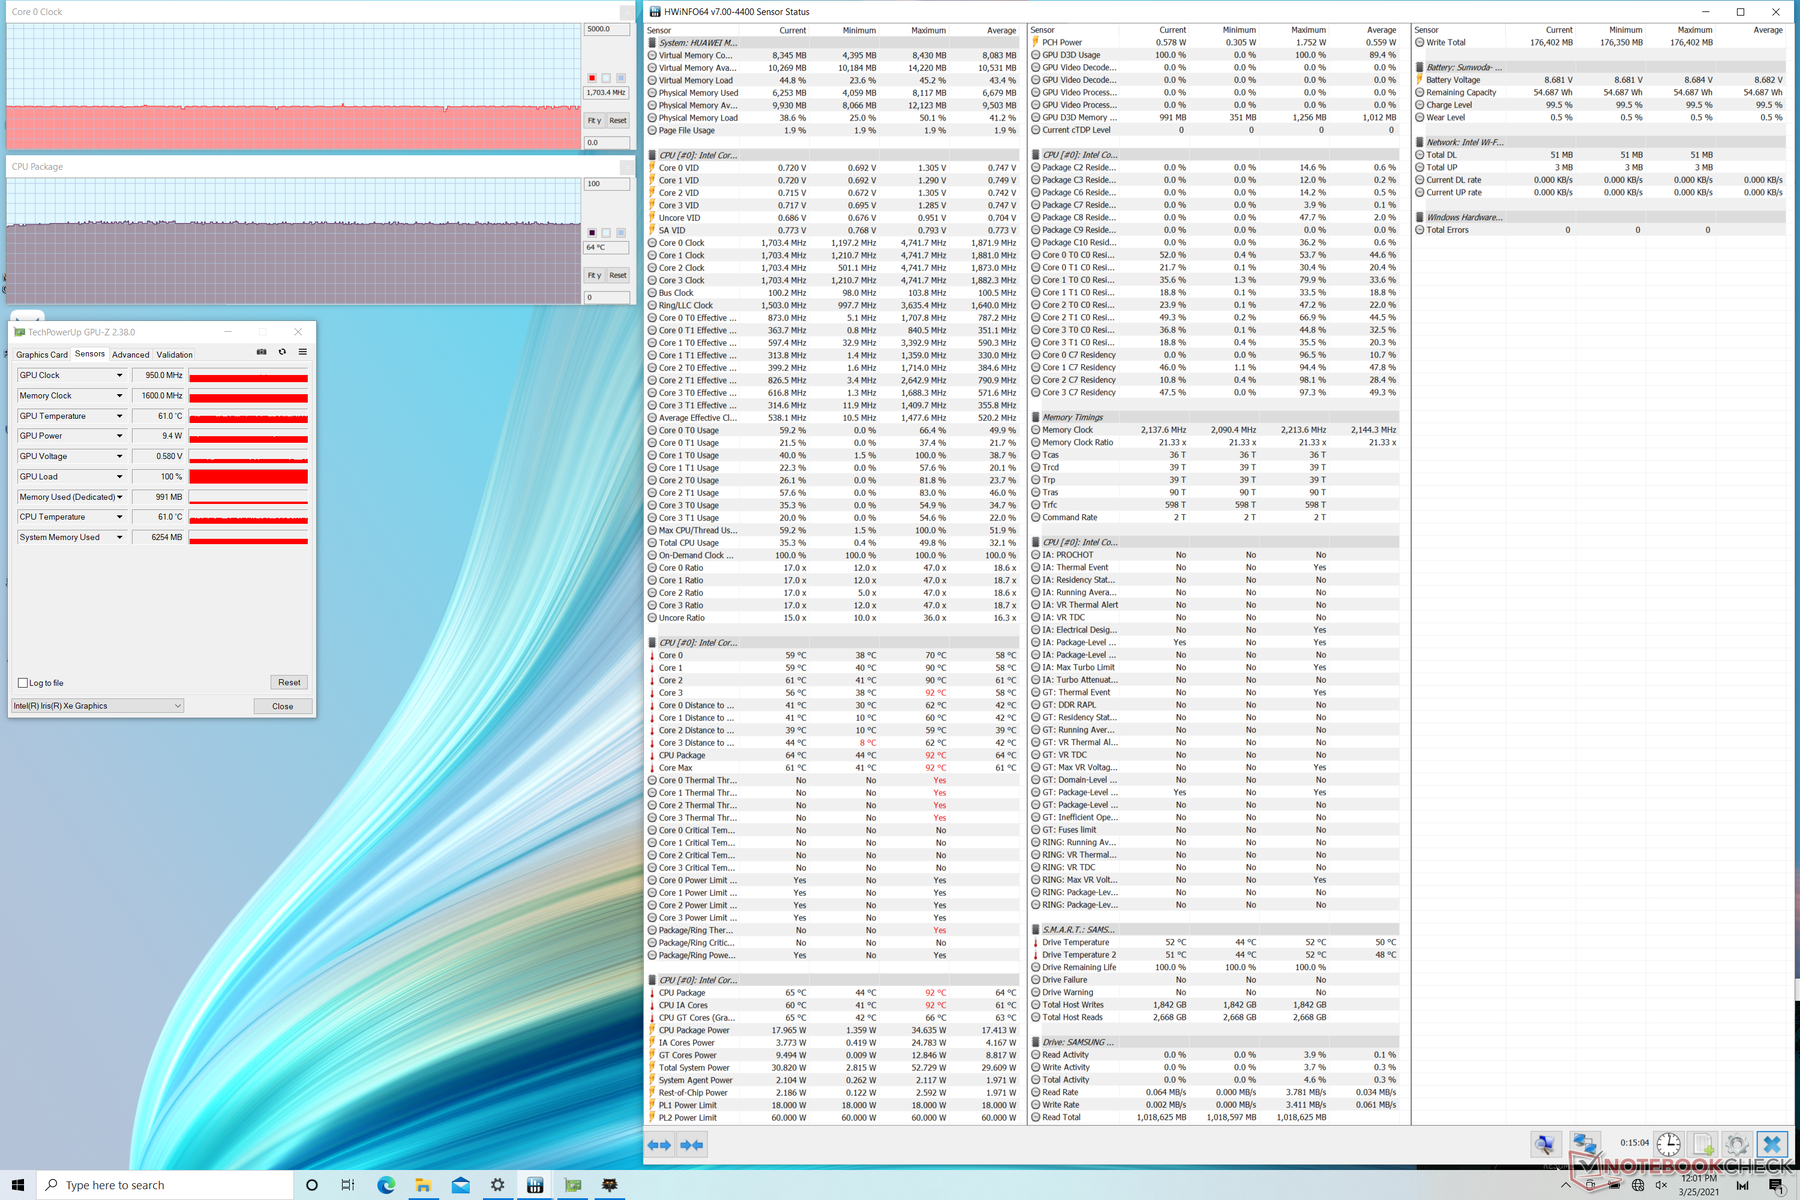
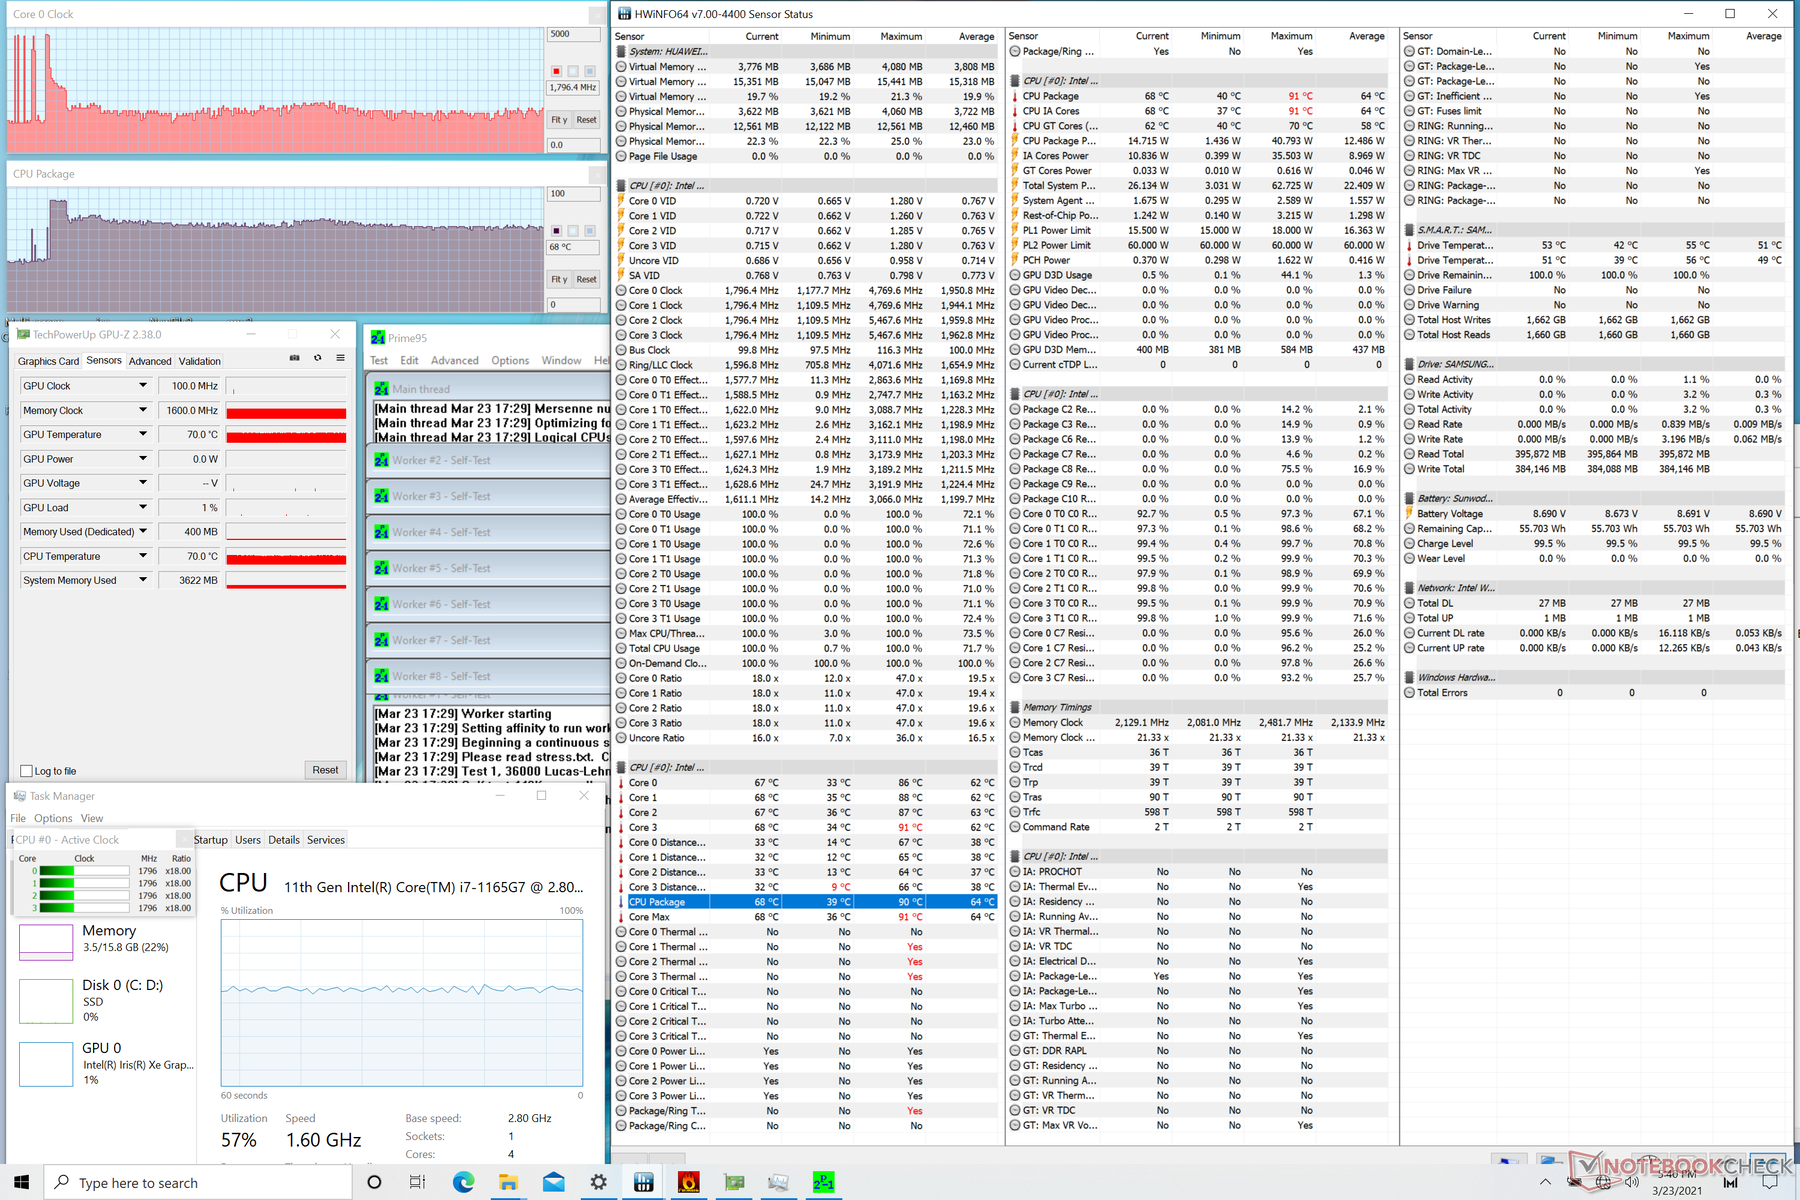
| CPU Clock (GHz) | GPU Clock (MHz) | Average CPU Temperature (°C) | |
| System Idle | -- | -- | 40 |
| Prime95 Stress | ~1.7 | -- | 68 |
| Prime95 + FurMark Stress | 0.8 - 1.1 | 650 - 700 | 65 |
| Witcher 3 Stress | 1.8 | 950 | 64 |
Speakers


Huawei MateBook X Pro 2021 audio analysis
(+) | speakers can play relatively loud (82.7 dB)
Bass 100 - 315 Hz
(±) | reduced bass - on average 13.6% lower than median
(±) | linearity of bass is average (10.1% delta to prev. frequency)
Mids 400 - 2000 Hz
(+) | balanced mids - only 2.9% away from median
(+) | mids are linear (3.3% delta to prev. frequency)
Highs 2 - 16 kHz
(+) | balanced highs - only 4.6% away from median
(±) | linearity of highs is average (8.2% delta to prev. frequency)
Overall 100 - 16.000 Hz
(+) | overall sound is linear (11.8% difference to median)
Compared to same class
» 13% of all tested devices in this class were better, 4% similar, 83% worse
» The best had a delta of 5%, average was 18%, worst was 53%
Compared to all devices tested
» 8% of all tested devices were better, 3% similar, 89% worse
» The best had a delta of 4%, average was 23%, worst was 134%
Apple MacBook 12 (Early 2016) 1.1 GHz audio analysis
(+) | speakers can play relatively loud (83.6 dB)
Bass 100 - 315 Hz
(±) | reduced bass - on average 11.3% lower than median
(±) | linearity of bass is average (14.2% delta to prev. frequency)
Mids 400 - 2000 Hz
(+) | balanced mids - only 2.4% away from median
(+) | mids are linear (5.5% delta to prev. frequency)
Highs 2 - 16 kHz
(+) | balanced highs - only 2% away from median
(+) | highs are linear (4.5% delta to prev. frequency)
Overall 100 - 16.000 Hz
(+) | overall sound is linear (10.2% difference to median)
Compared to same class
» 7% of all tested devices in this class were better, 2% similar, 91% worse
» The best had a delta of 5%, average was 18%, worst was 53%
Compared to all devices tested
» 5% of all tested devices were better, 1% similar, 94% worse
» The best had a delta of 4%, average was 23%, worst was 134%
Energy Management
Power Consumption
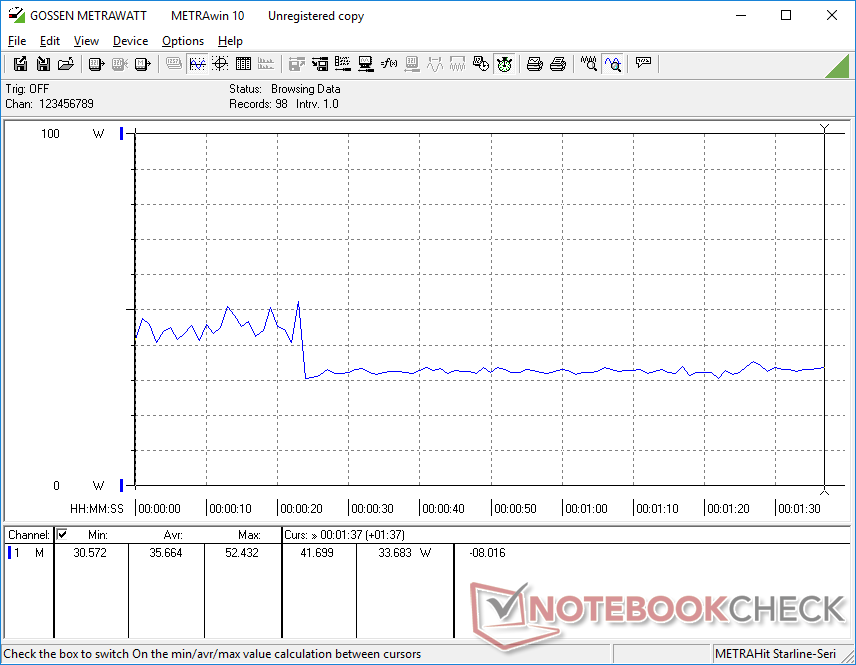
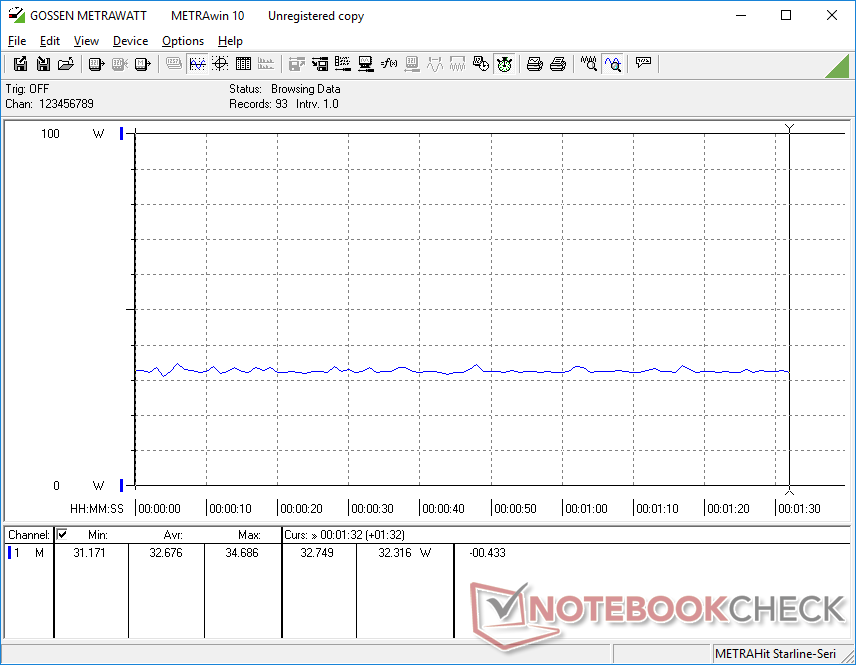
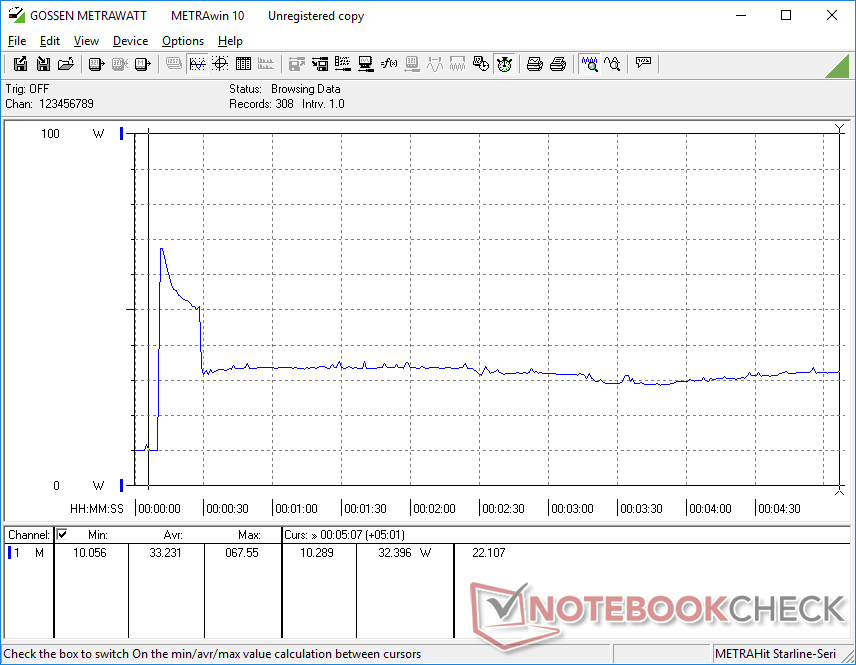
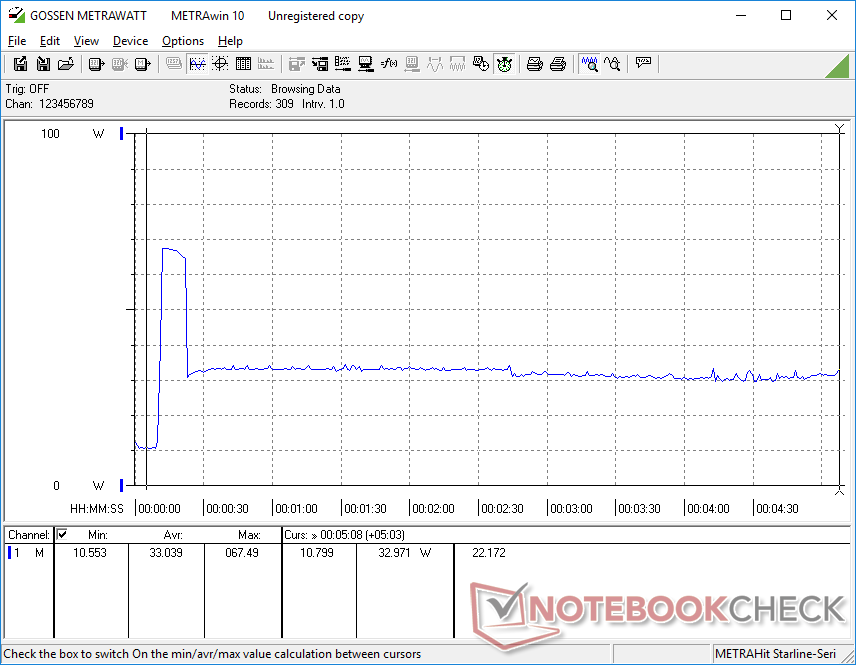
Idling on desktop consumes between 6 W and 11 W depending on the brightness setting and power profile. Running higher loads like games will consume around 33 W to be several watts lower than competing Ultrabooks with the same CPU like the Dell XPS 13, Razer Book 13, or Lenovo Yoga Slim 7. The data makes sense given that the MateBook X Pro also performs slower than all of these aforementioned laptops.
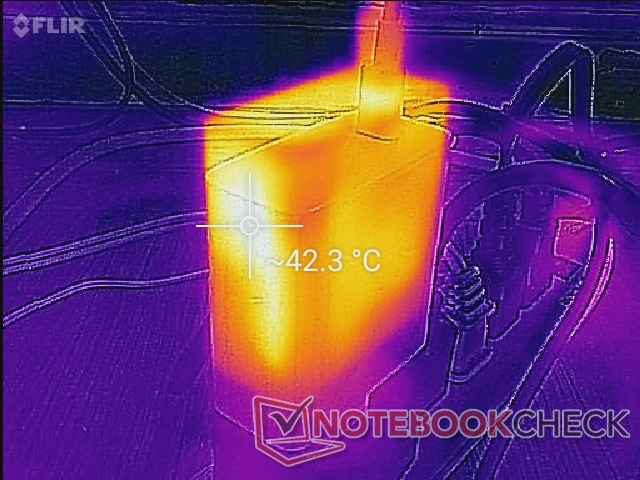
We're able to record a temporary maximum draw of 67.6 W from the small-medium (9.6 x 6 x 2.8 cm) 65 W AC adapter when running extreme processing loads. Thermal limitations prevent the laptop from drawing too much power over long periods.
| Off / Standby | |
| Idle | |
| Load |
|
Key:
min: | |
| Huawei MateBook X Pro 2021 i7-1165G7, Iris Xe G7 96EUs, Samsung PM981a MZVLB1T0HBLR, IPS, 3000x2000, 13.9" | Huawei MateBook X Pro 2020 i7 i7-10510U, GeForce MX250, Samsung PM981a MZVLB1T0HBLR, LTPS, 3000x2000, 13.9" | Dell XPS 13 9310 Core i7 4K i7-1185G7, Iris Xe G7 96EUs, Micron 2300 512GB MTFDHBA512TDV, IPS, 3840x2400, 13.4" | Microsoft Surface Laptop 3 13 Core i5-1035G7 i5-1035G7, Iris Plus Graphics G7 (Ice Lake 64 EU), SK hynix BC501 HFM256GDGTNG, IPS, 2256x1504, 13.5" | Razer Blade Stealth i7-1165G7 GTX 1650 Ti Max-Q i7-1165G7, GeForce GTX 1650 Ti Max-Q, Samsung SSD PM981a MZVLB512HBJQ, IPS, 1920x1080, 13.3" | Lenovo Yoga Slim 7-14ARE R7 4800U, Vega 8, Samsung SSD PM981a MZVLB512HBJQ, IPS, 1920x1080, 14" | |
|---|---|---|---|---|---|---|
| Power Consumption | -9% | 7% | 8% | -40% | 5% | |
| Idle Minimum * (Watt) | 6.7 | 4.3 36% | 4.3 36% | 4.4 34% | 4 40% | 4 40% |
| Idle Average * (Watt) | 10 | 8.5 15% | 8.3 17% | 7.5 25% | 6.3 37% | 6.3 37% |
| Idle Maximum * (Watt) | 10.3 | 12 -17% | 8.8 15% | 7.8 24% | 14.5 -41% | 7.7 25% |
| Load Average * (Watt) | 35.7 | 54.8 -54% | 46.2 -29% | 41.9 -17% | 79.2 -122% | 48.3 -35% |
| Witcher 3 ultra * (Watt) | 32.7 | 47.1 -44% | 42.2 -29% | 40.8 -25% | 68.2 -109% | 49 -50% |
| Load Maximum * (Watt) | 67.6 | 61.5 9% | 47.3 30% | 63.9 5% | 99.4 -47% | 57.6 15% |
* ... smaller is better
Battery Life
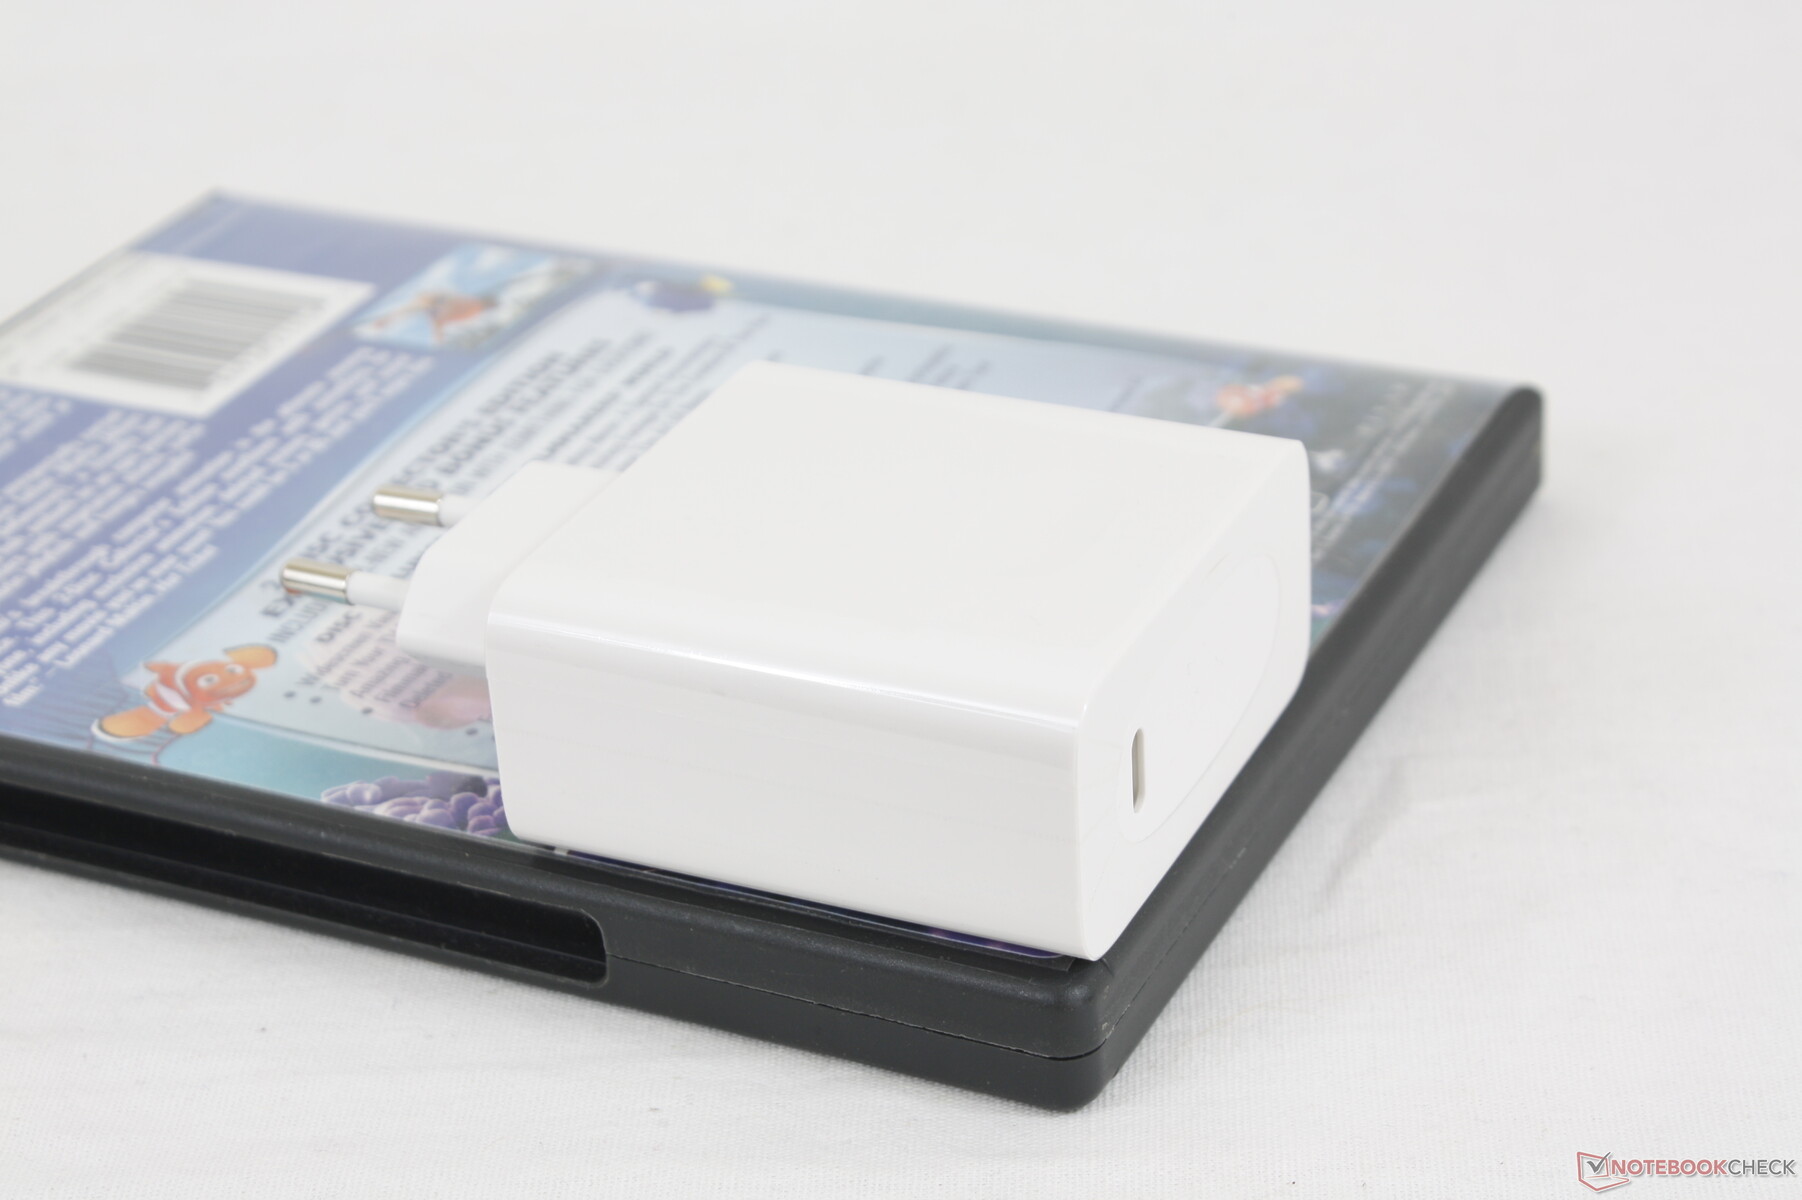
Runtimes are nearly identical to what we recorded on last year's MateBook X Pro at about 10.5 hours of real-world WLAN use. Charging from empty to full capacity takes about 90 minutes. The included USB-C charger can also be used to quickly charge other USB-C devices and laptops.
| Huawei MateBook X Pro 2021 i7-1165G7, Iris Xe G7 96EUs, 56 Wh | Huawei MateBook X Pro 2020 i7 i7-10510U, GeForce MX250, 57.4 Wh | Dell XPS 13 9310 Core i7 4K i7-1185G7, Iris Xe G7 96EUs, 52 Wh | Microsoft Surface Laptop 3 13 Core i5-1035G7 i5-1035G7, Iris Plus Graphics G7 (Ice Lake 64 EU), 45 Wh | Razer Blade Stealth i7-1165G7 GTX 1650 Ti Max-Q i7-1165G7, GeForce GTX 1650 Ti Max-Q, 53.1 Wh | Lenovo Yoga Slim 7-14ARE R7 4800U, Vega 8, 61 Wh | |
|---|---|---|---|---|---|---|
| Battery runtime | -11% | -31% | 6% | -4% | -7% | |
| Reader / Idle (h) | 19.5 | 34.4 76% | 20.6 6% | 27.1 39% | ||
| WiFi v1.3 (h) | 10.5 | 10.4 -1% | 7.2 -31% | 8.3 -21% | 9 -14% | 10.3 -2% |
| Load (h) | 3 | 2.4 -20% | 1.9 -37% | 1.3 -57% |
Pros
Cons
Verdict
We were hoping that the vapor chamber cooler would allow for better CPU performance, but this does not appear to be the case; the Core i7-1165G7 runs about 20 percent slower in the Huawei laptop when compared to most other laptops with the exact same CPU. Similar results were observed on the 2018, 2019, and 2020 MateBook X Pro models as well. This won't be an issue for users who simply want an ultrathin notebook for browsing, streaming, and light editing workloads, but users who want the best that Intel Tiger Lake can offer will want to look elsewhere.
Excellent visual design held back by the slower-than-average CPU, suboptimal webcam positioning, and soft clickpad.
The clickpad is also divisive. Though large, its integrated mouse buttons are spongy, shallow, and difficult to click accurately. An external mouse is highly recommended.
Lastly, the pop-up webcam definitely needs to go. Its concept made sense in 2018 when normal webcams couldn't fit in ultra-narrow bezels, but the newest Dell XPS and HP Spectre webcams have made Huawei's webcam obsolete.
Almost everything else about the laptop is good to excellent for its category including the low fan noise, polished visual design, relatively cool running temperatures, respectable battery life, and great 3:2 display. It's a shame that the disappointing CPU, soft clickpad, and outdated webcam are holding it back.
Price and availability
The 2021 MateBook X Pro is not available through most brick-and-mortar retailers in the United States. Interested users in North America can still import the laptop from online retailers including Amazon or Banggood.com when it becomes available this April worldwide. Huawei will launch the model starting from 1399 Euros in major markets including Germany, Italy, France, UK and Spain.
Huawei MateBook X Pro 2021
- 03/27/2021 v7 (old)
Allen Ngo
Price comparison
