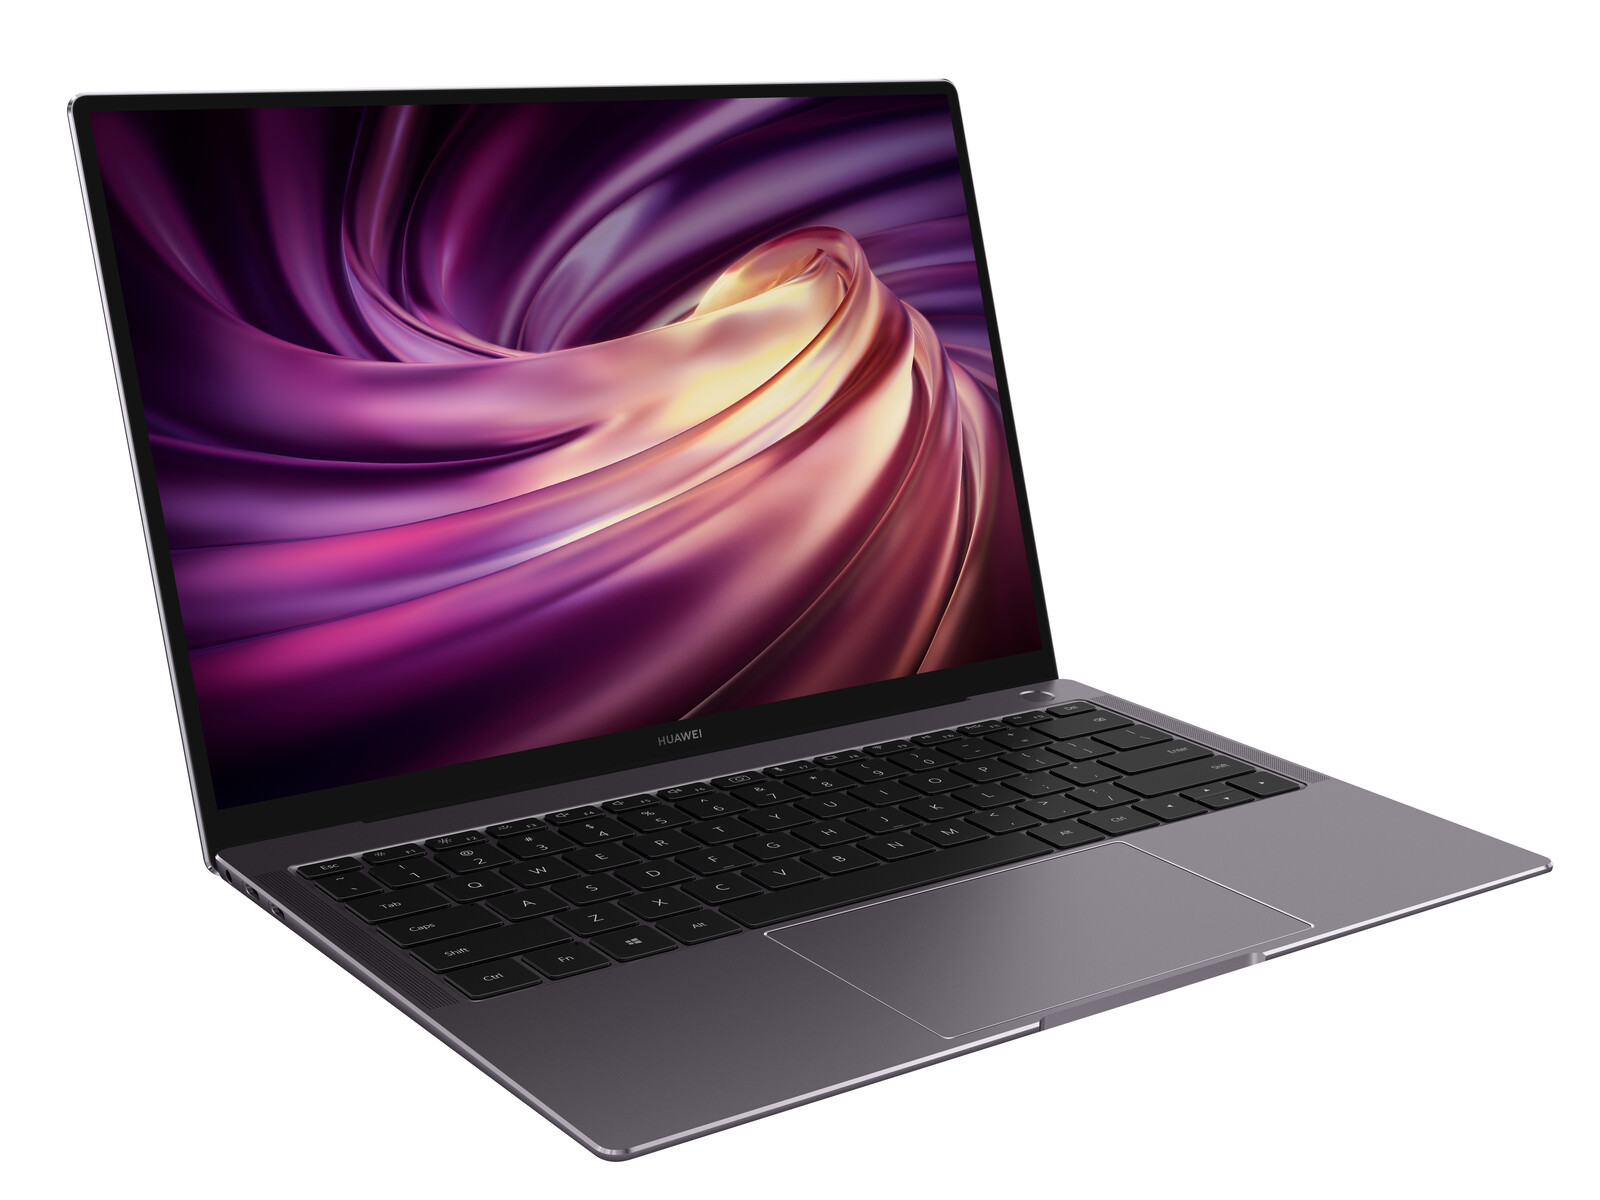
Huawei MateBook X Pro 2020 in Review – Compact Laptop with Performance Issues
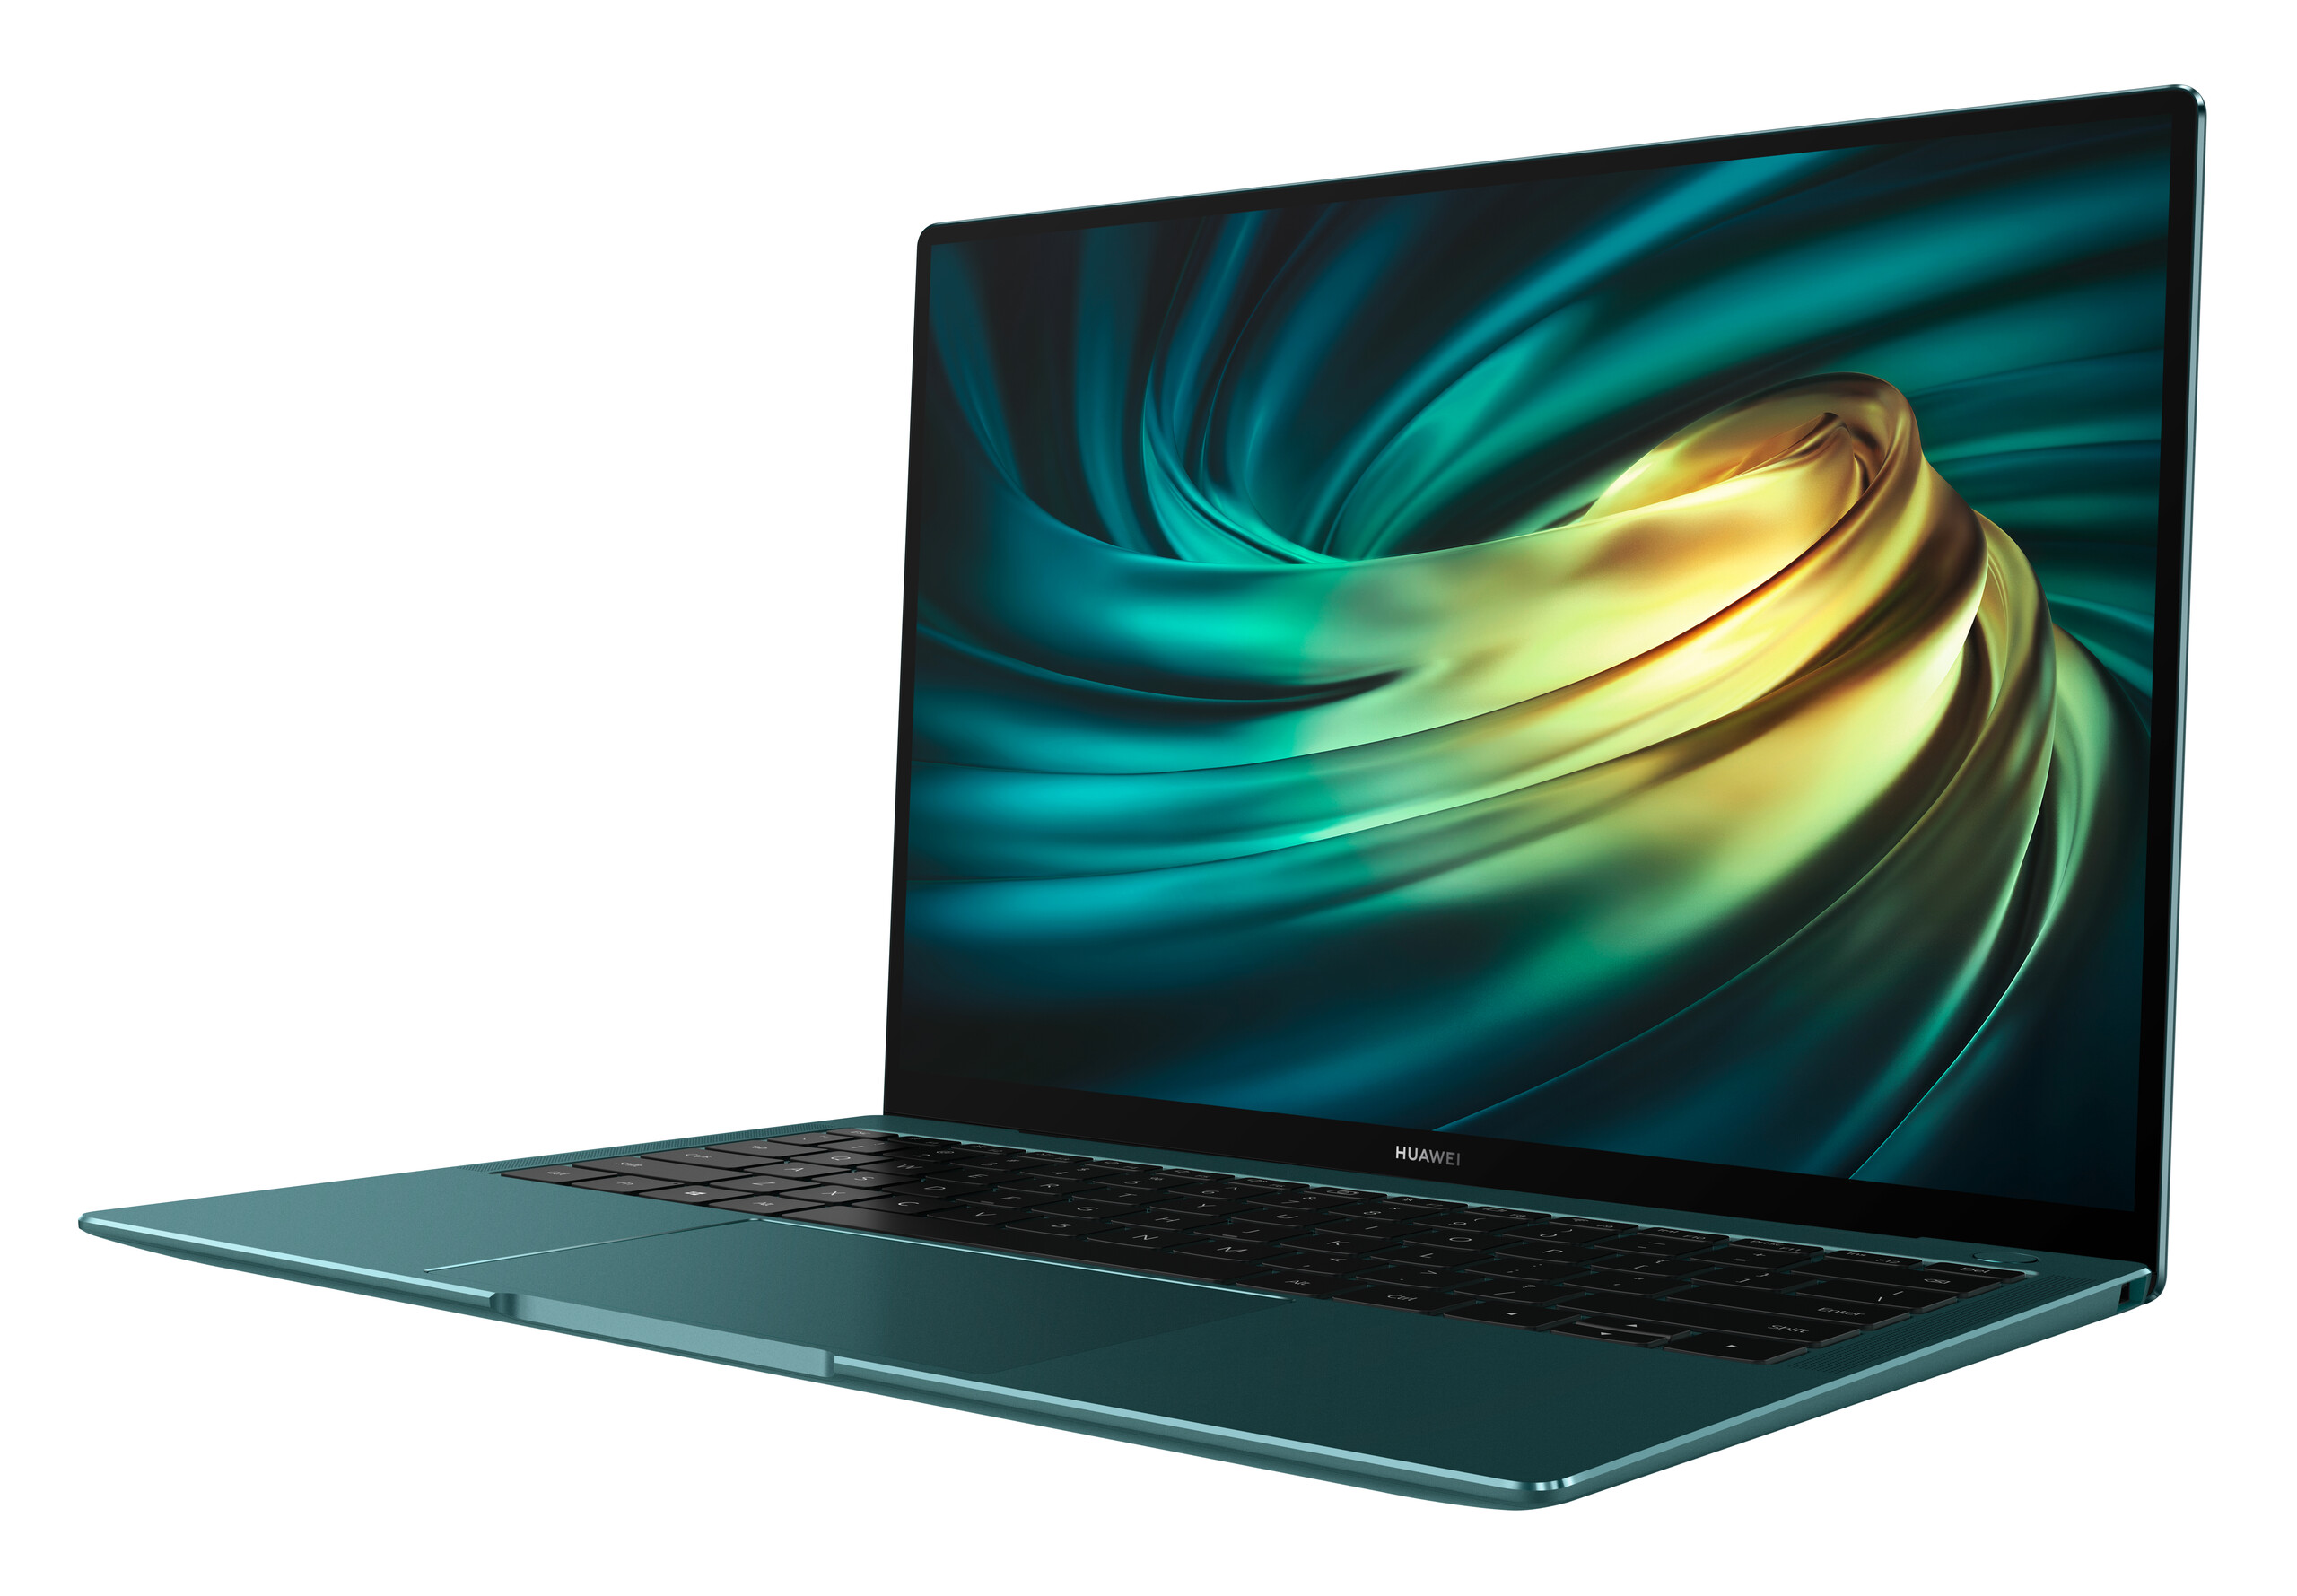
Huawei’s MateBook X Pro is a compact subnotebook with a 13.9-inch touchscreen display. The 2020 model comes in the exact same case as before, and all the Chinese manufacturer updated are the processor (Intel Comet Lake) and the dedicated Nvidia graphics card (GeForce MX 250). According to a press briefing upgrading to Intel Ice Lake was never an option.
In Germany, two different configurations starting at 1,599 Euros (~$1,805) will be available at launch. The base model features a Core i5 CPU, aforementioned GeForce GPU, 16 GB of RAM, and a 512 GB SSD. Our review unit, the higher-end tier, features a Core i7 CPU and a 1 TB SSD instead and sells for 1,899 Euros (~$2,143). This top-level SKU is also available in the new Emerald Green color in addition to Space Gray.
Given that case, connectivity, and input devices remained identical to the devices already reviewed back in 2018 we would like to refer you to our previous reviews for a more detailed look at these components:
Rating | Date | Model | Weight | Height | Size | Resolution | Price |
|---|---|---|---|---|---|---|---|
| 87.4 % v7 (old) | 06 / 2020 | Huawei MateBook X Pro 2020 i7 i7-10510U, GeForce MX250 | 1.3 kg | 14.6 mm | 13.90" | 3000x2000 | |
| 88 % v7 (old) | 05 / 2020 | Dell XPS 13 9300 4K UHD i7-1065G7, Iris Plus Graphics G7 (Ice Lake 64 EU) | 1.2 kg | 14.8 mm | 13.40" | 3840x2400 | |
| 83.7 % v7 (old) | 11 / 2019 | Razer Blade Stealth 13, Core i7-1065G7 i7-1065G7, GeForce GTX 1650 Max-Q | 1.5 kg | 15.3 mm | 13.30" | 3840x2160 | |
| 92.1 % v7 (old) | 06 / 2020 | Apple MacBook Pro 13 2020 2GHz i5 10th-Gen i5-1038NG7, Iris Plus Graphics G7 (Ice Lake 64 EU) | 1.4 kg | 15.6 mm | 13.30" | 2560x1600 | |
| 87 % v7 (old) | 12 / 2019 | Lenovo Yoga C940-14IIL 81Q9 i7-1065G7, Iris Plus Graphics G7 (Ice Lake 64 EU) | 1.4 kg | 15.7 mm | 14.00" | 3840x2160 | |
| 86.8 % v6 (old) | 08 / 2018 | Huawei MateBook X Pro, i7 i5-8550U, GeForce MX150 | 1.3 kg | 14.6 mm | 13.90" | 3000x2000 |
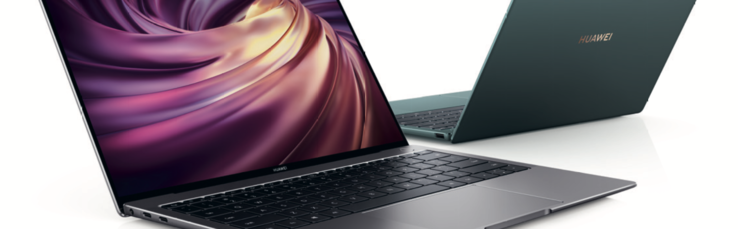
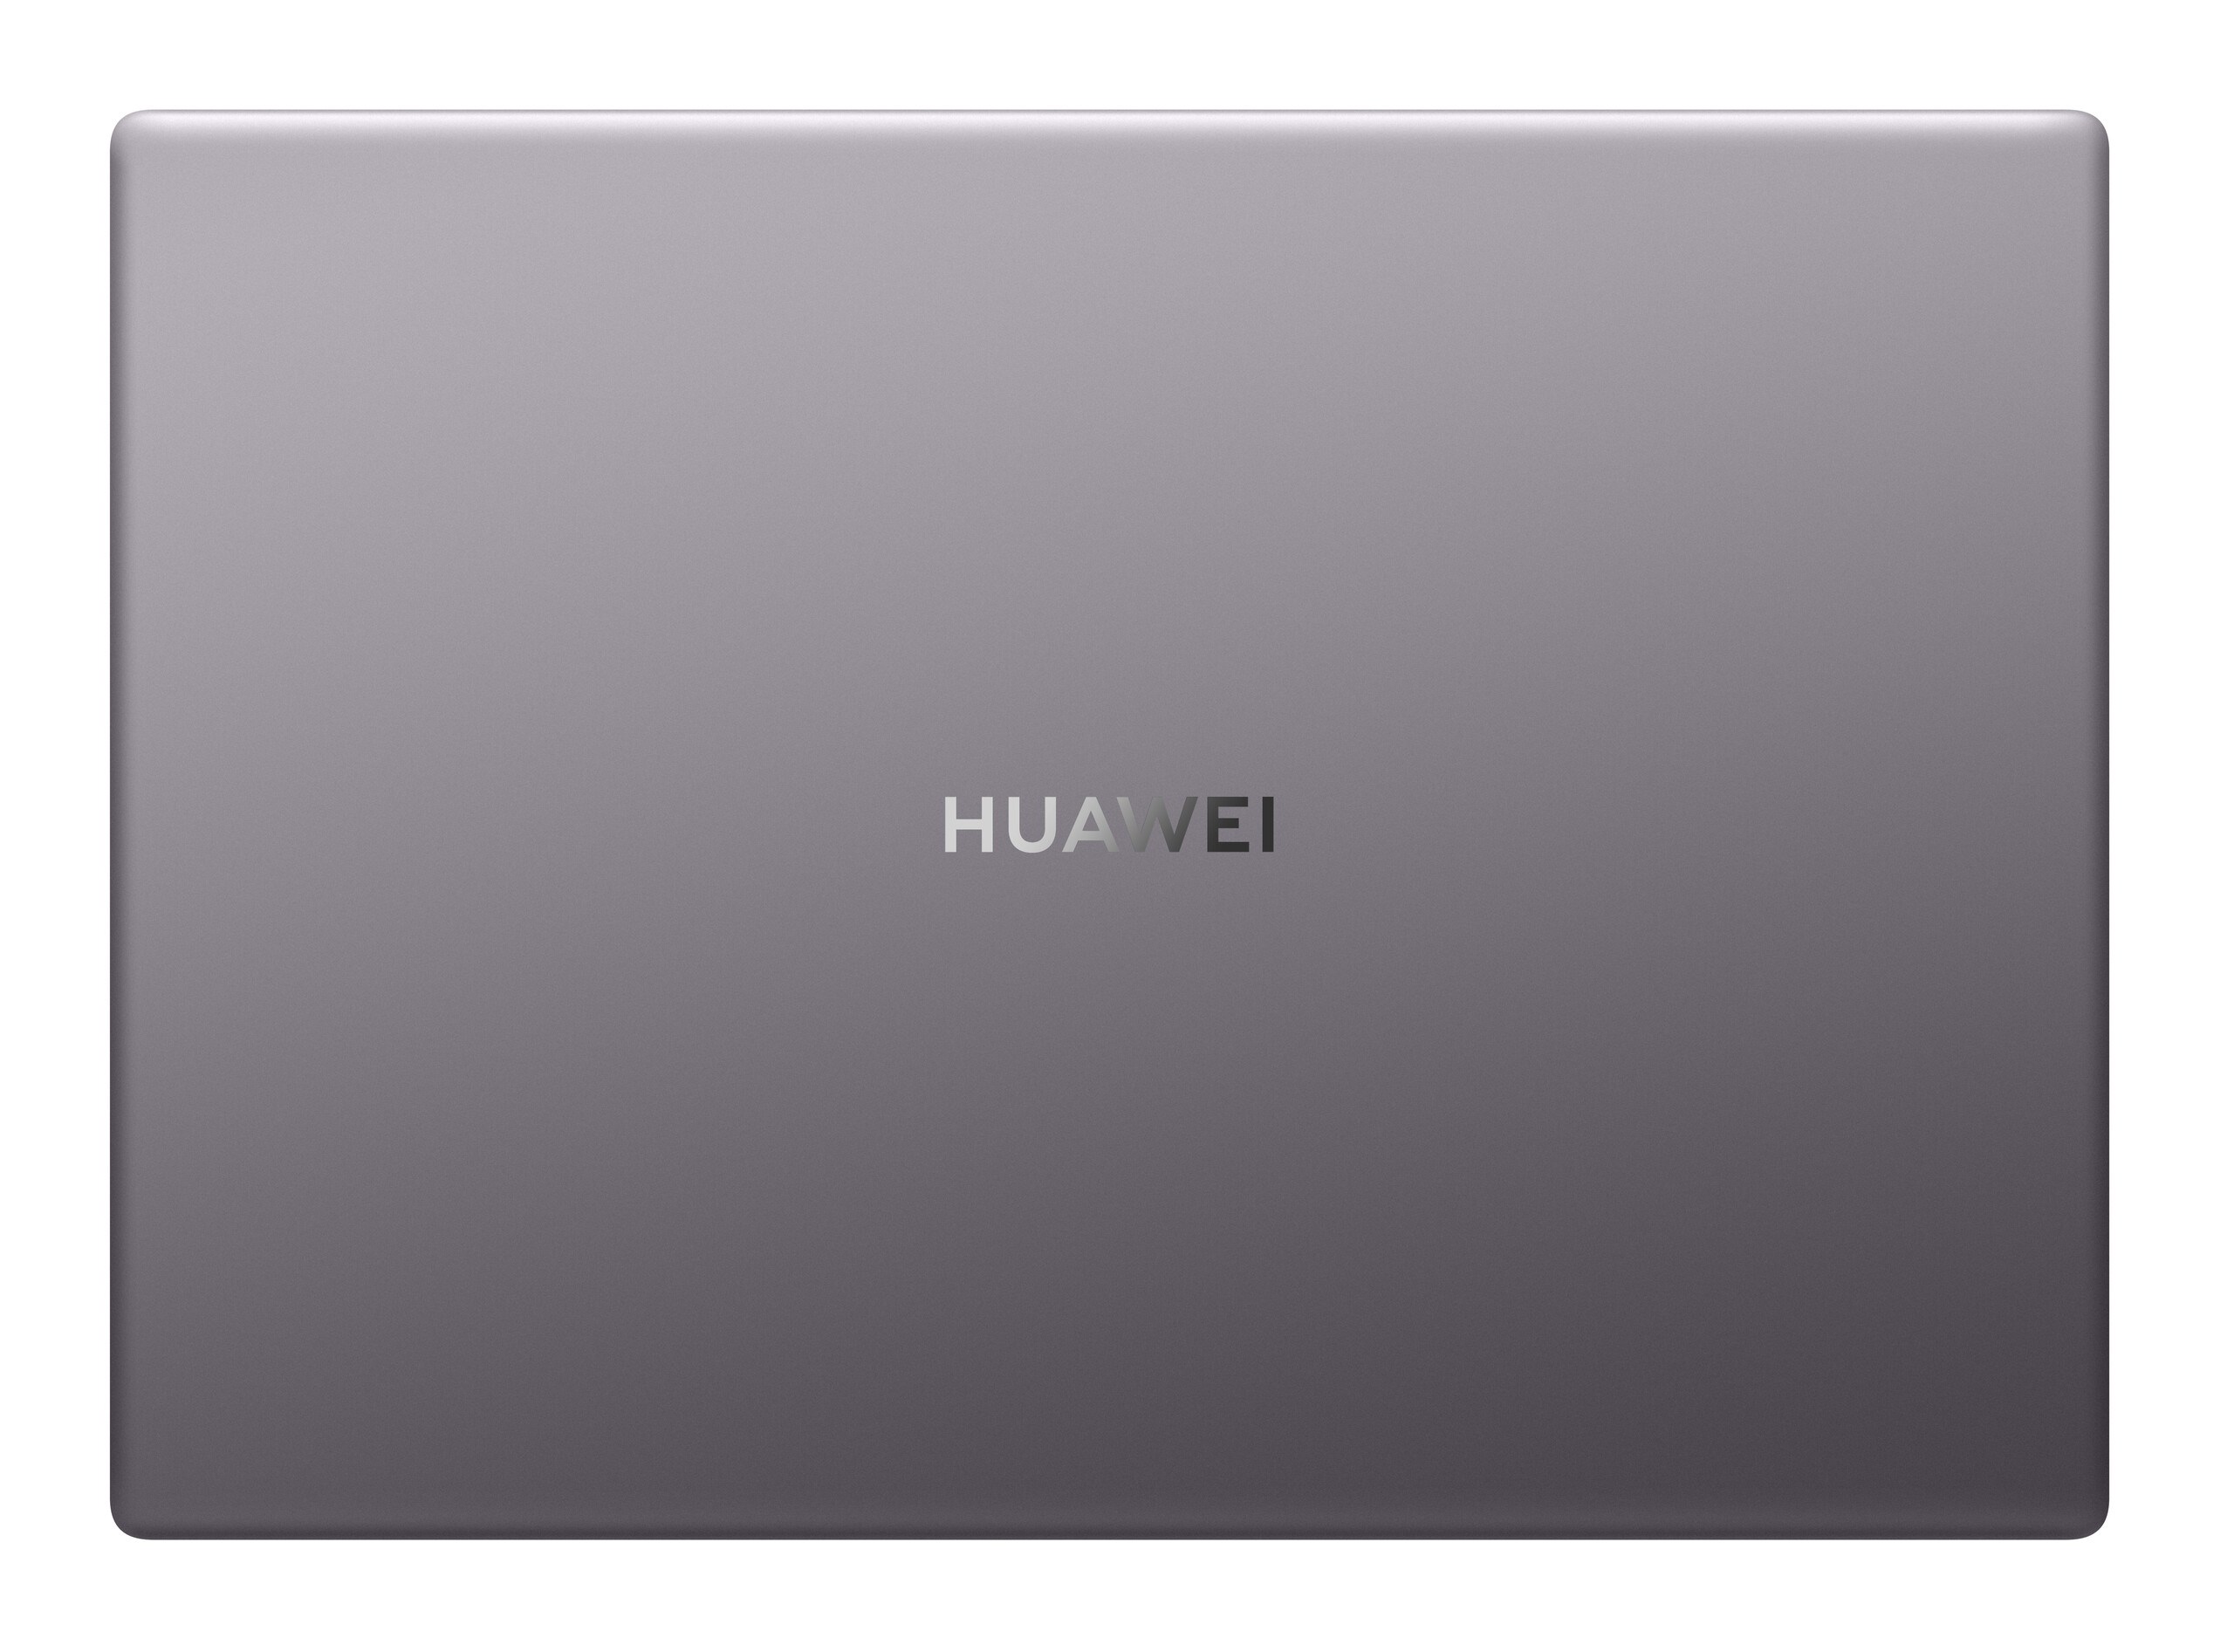
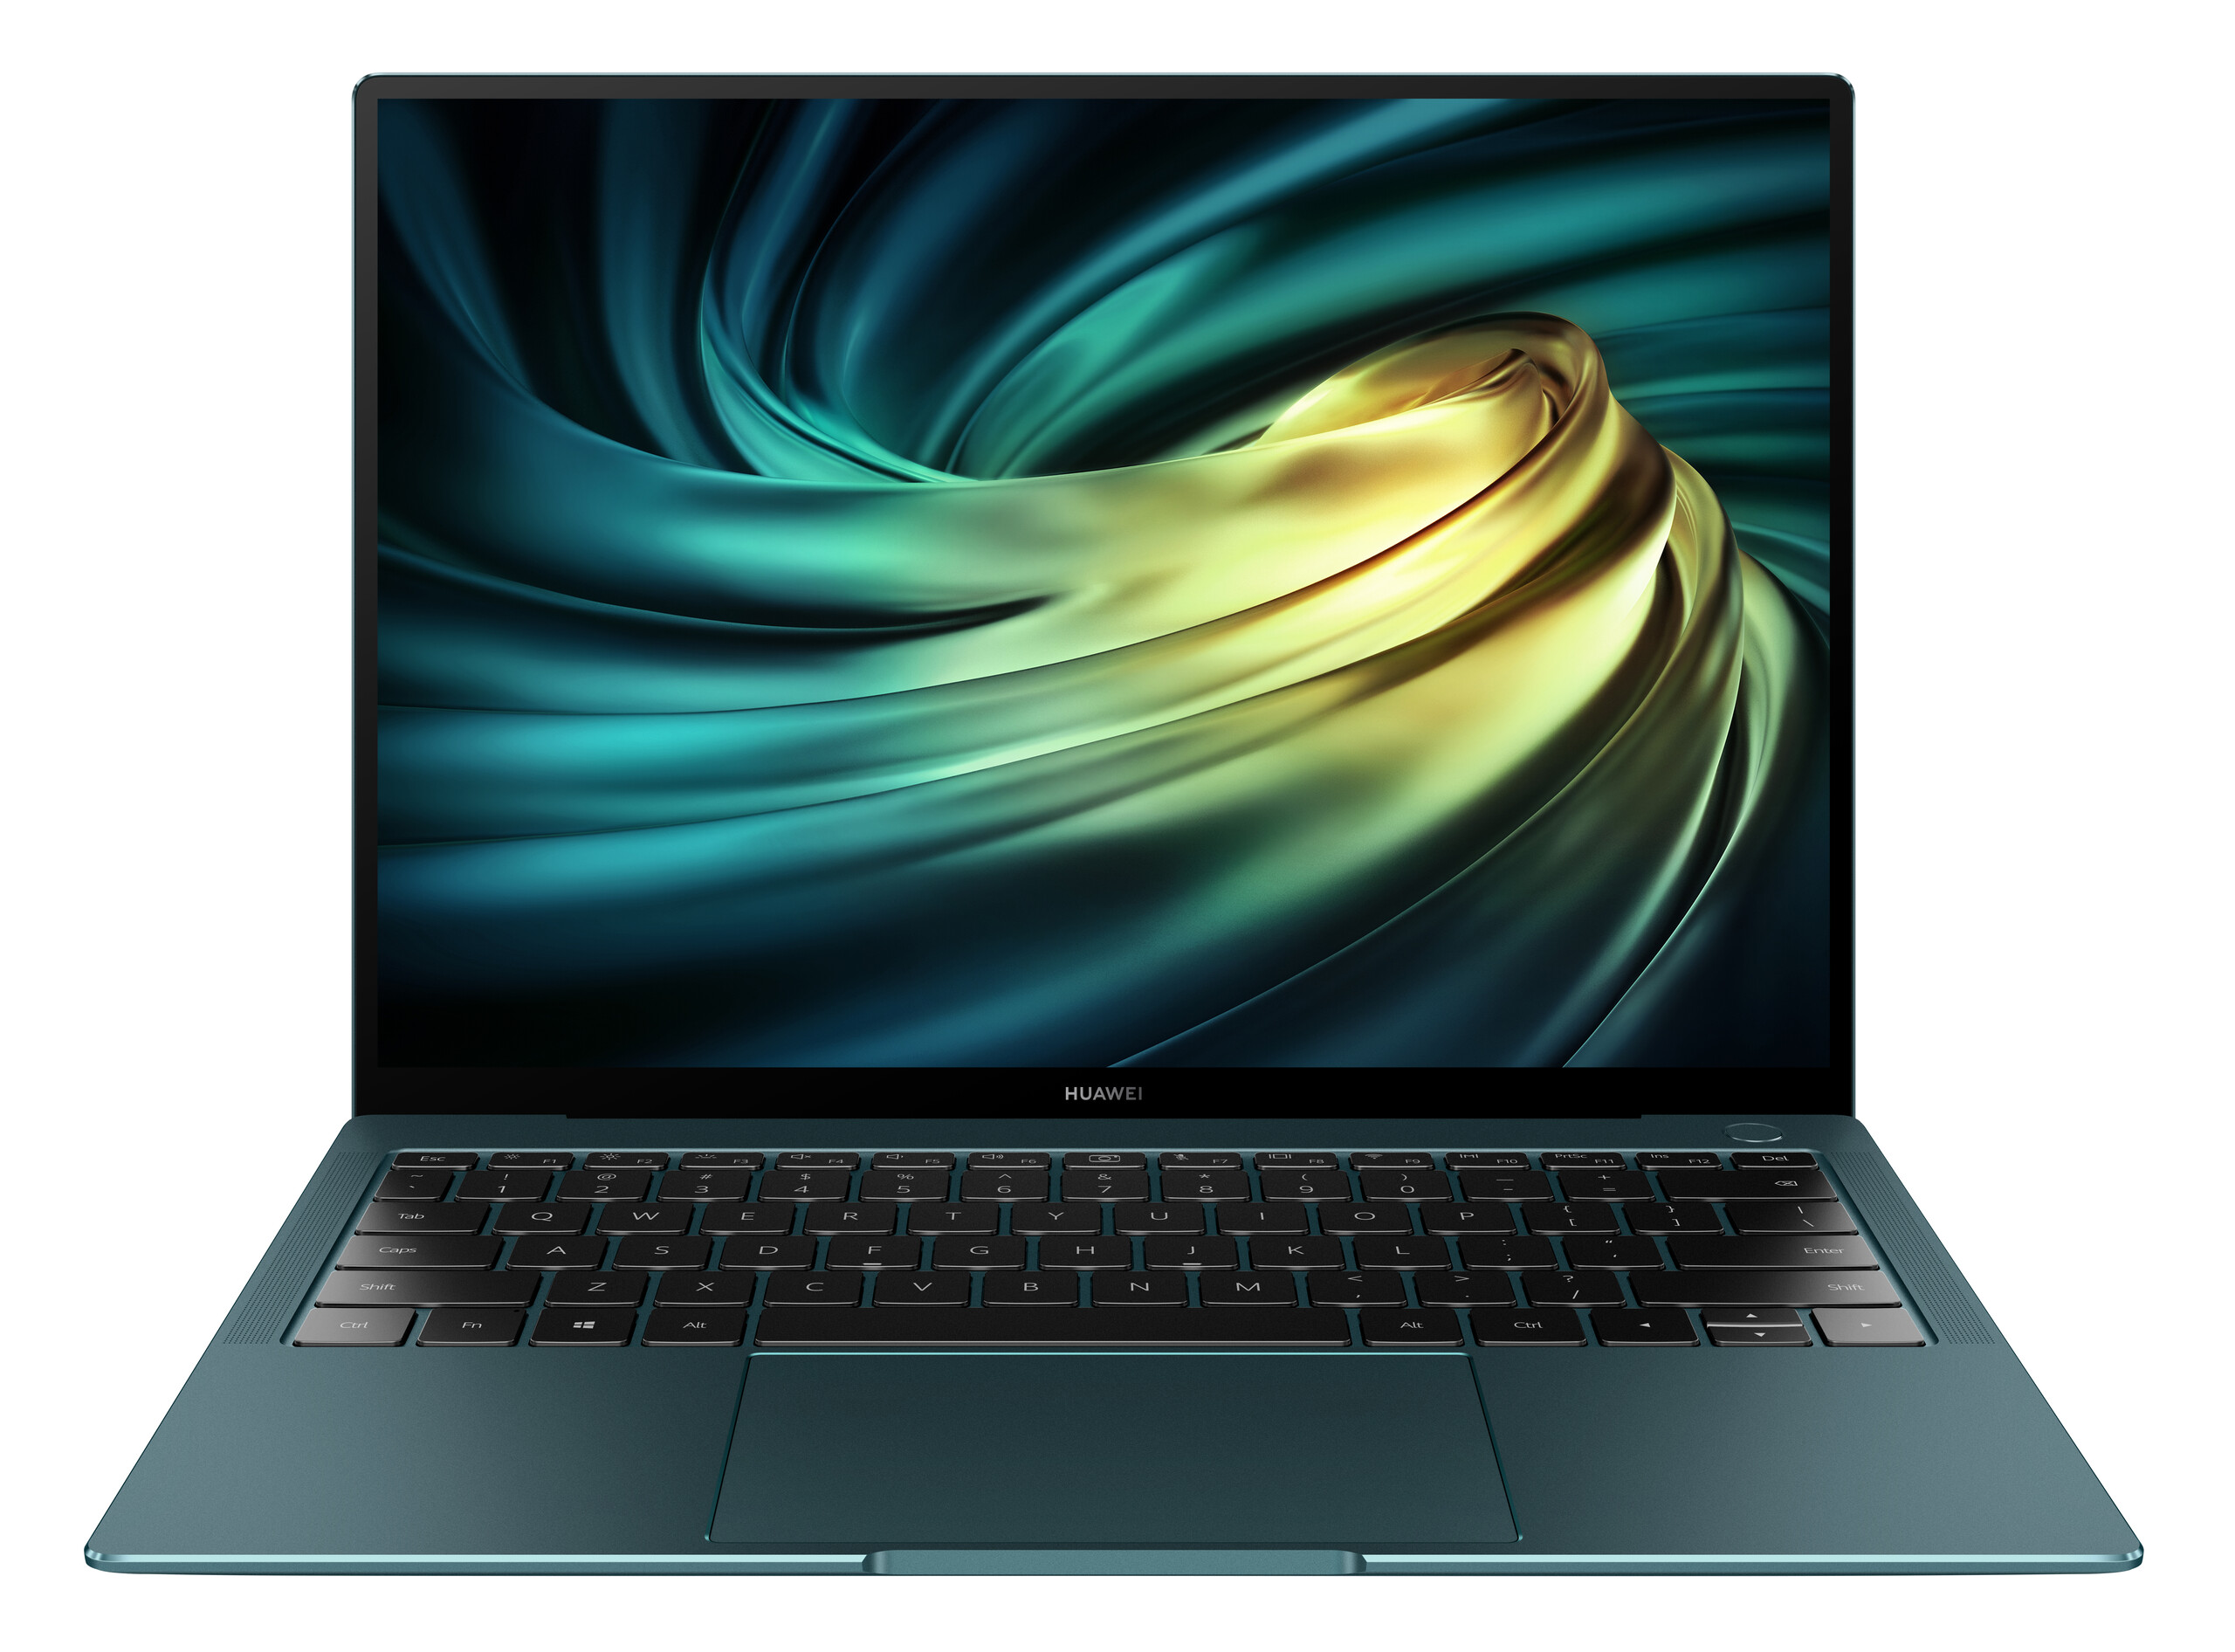
Case – MateBook in Space Gray or Emerald Green

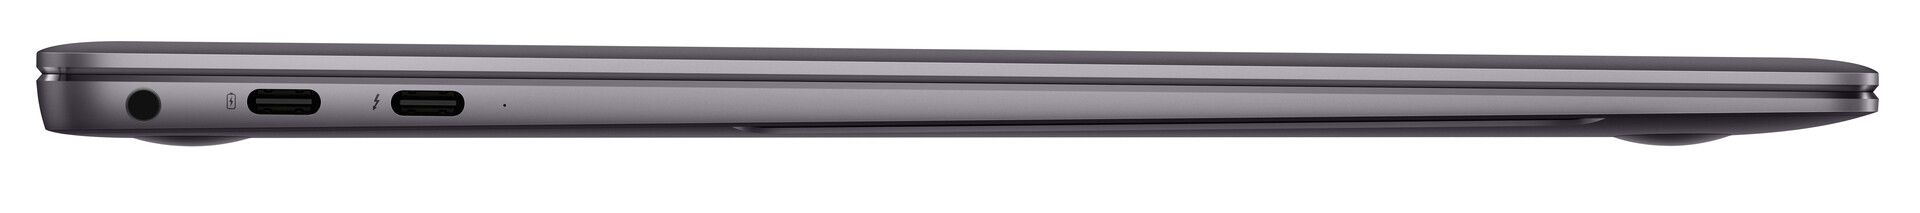
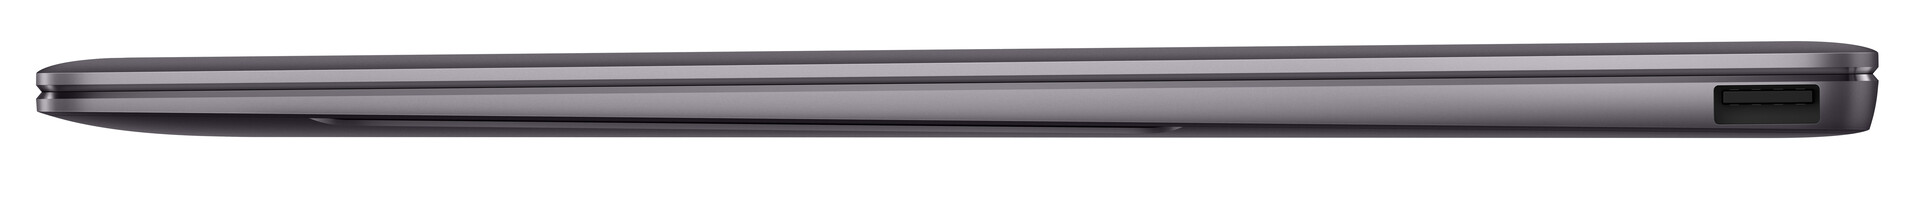
Connectivity – MateBook with USB-C and USB-A
Even though the ports remained identical, a quick glance at the specs sheet revealed that Thunderbolt 3 is not mentioned anywhere, and there is no Thunderbolt 3 symbol next to the USB-C port either. From a technical point of view the front USB-C port supports all Thunderbolt 3 features, it’s just that Huawei decided not to purchase a license for its 2020 model and thus cannot display the Thunderbolt name or symbol on this device. The battery can be charged via both USB-C ports at the left-hand side. The compact port replicator MateDock 2 with 1x USB-A, 1x USB-C, HDMI, and VGA is included in the box.
Communication – Very Fast Without Wi-Fi 6
Huawei’s wireless module of choice is the Intel Wireless-AC 9560. When connected to our Netgear Nighthawk RAX 120 we managed to achieve data transfer rates of up to 1.3 Gb/s. We did not encounter any connectivity issues or sudden loss of signal during our review period.
Webcam


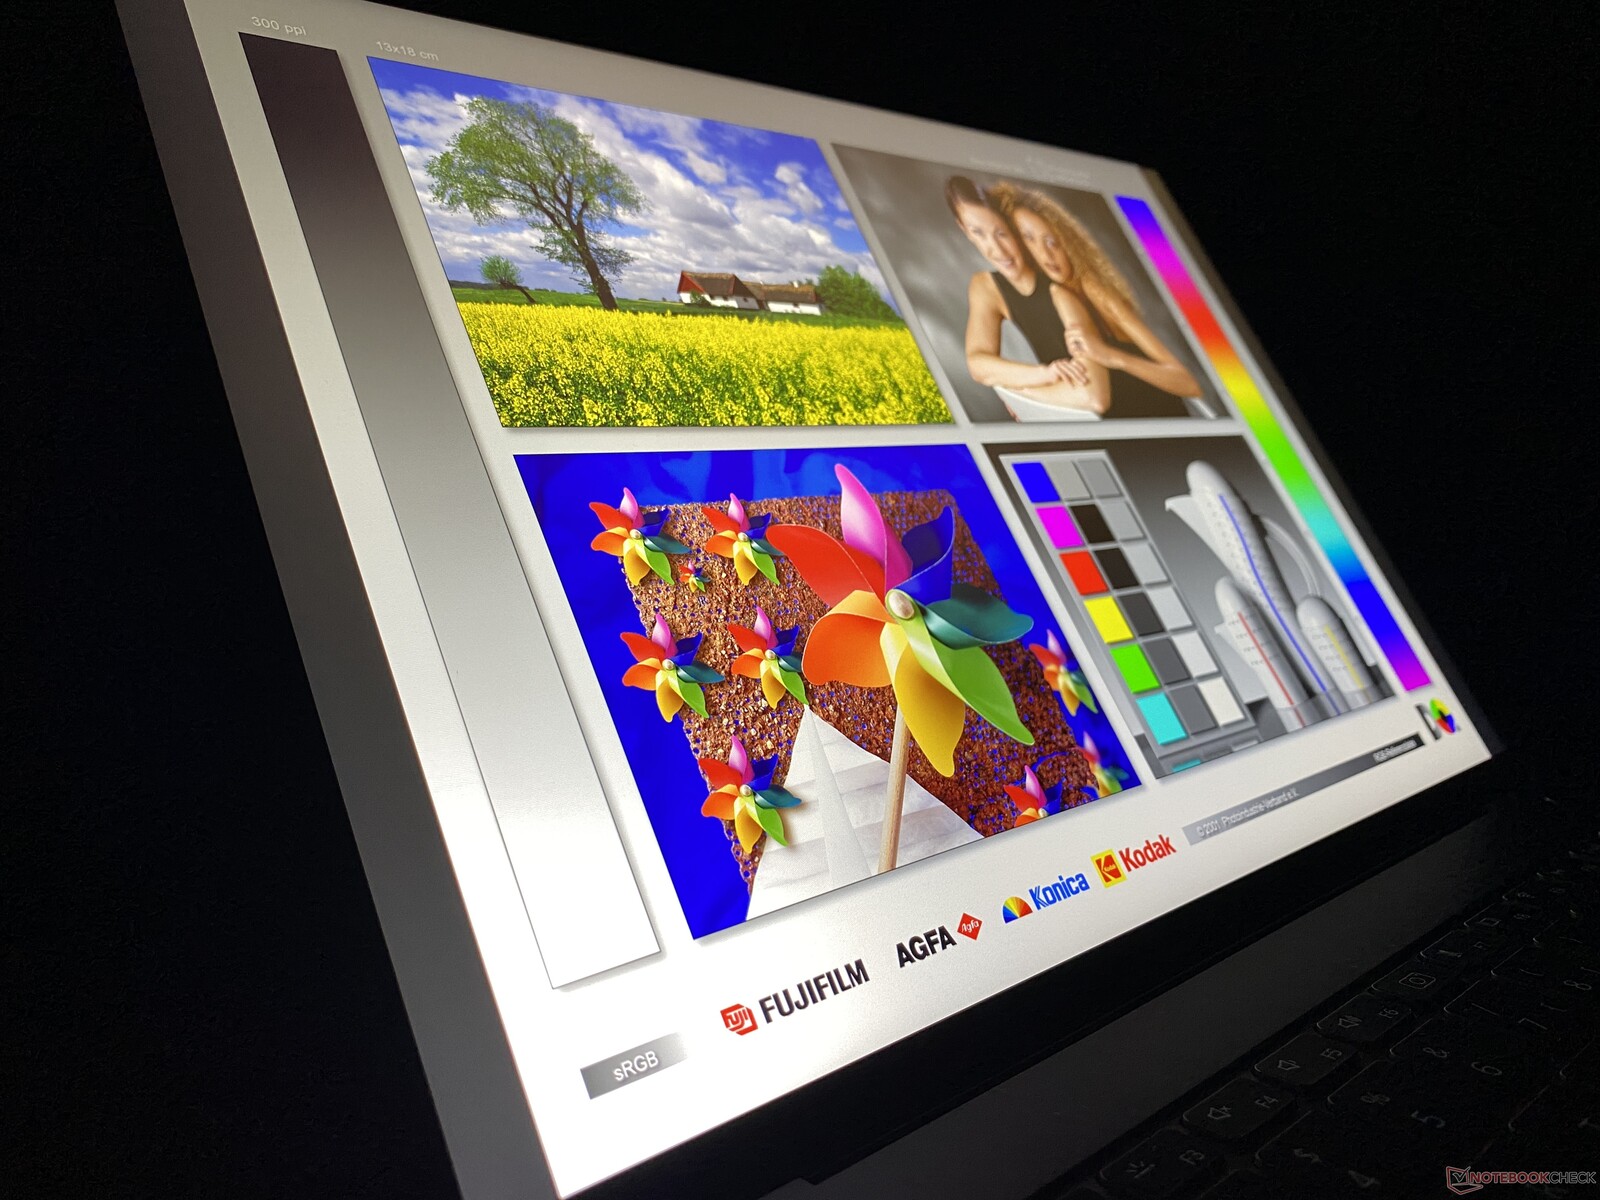
Display – Bright 3K Touchscreen

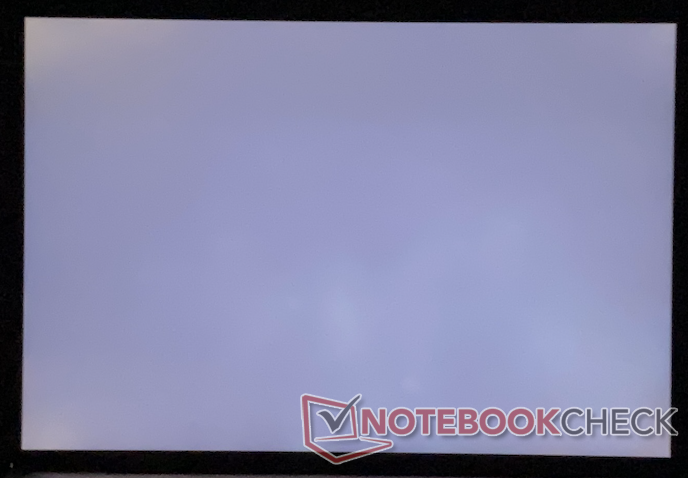
Only one display option is available for the MateBook X Pro: A reflective capacitive 3:2 touchscreen running at a native resolution of 3000x2000. Subjectively, image quality was superb thanks to popping colors and crisp display content. The display is without a doubt the MateBook X Pro’s highlight. The display used is a so-called LTPS, or low-temperature polycrystalline silicone, panel without the need for a backlight. Thanks to its compact nature this technology allows for very high resolutions.
The display’s theoretical maximum brightness of 450 nits was far surpassed by the 530 nits our review unit achieved. Contrast ratio was excellent at almost 1700:1, and we did not notice any screen bleeding at maximum brightness with the naked eye. What we did find is PWM flickering at brightness levels of 40% and below. However, at 29 kHz we do not expect any issues or other consequences.
| |||||||||||||||||||||||||
Brightness Distribution: 87 %
Center on Battery: 555 cd/m²
Contrast: 1688:1 (Black: 0.33 cd/m²)
ΔE ColorChecker Calman: 1.4 | ∀{0.5-29.43 Ø4.73}
calibrated: 0.7
ΔE Greyscale Calman: 2 | ∀{0.09-98 Ø4.97}
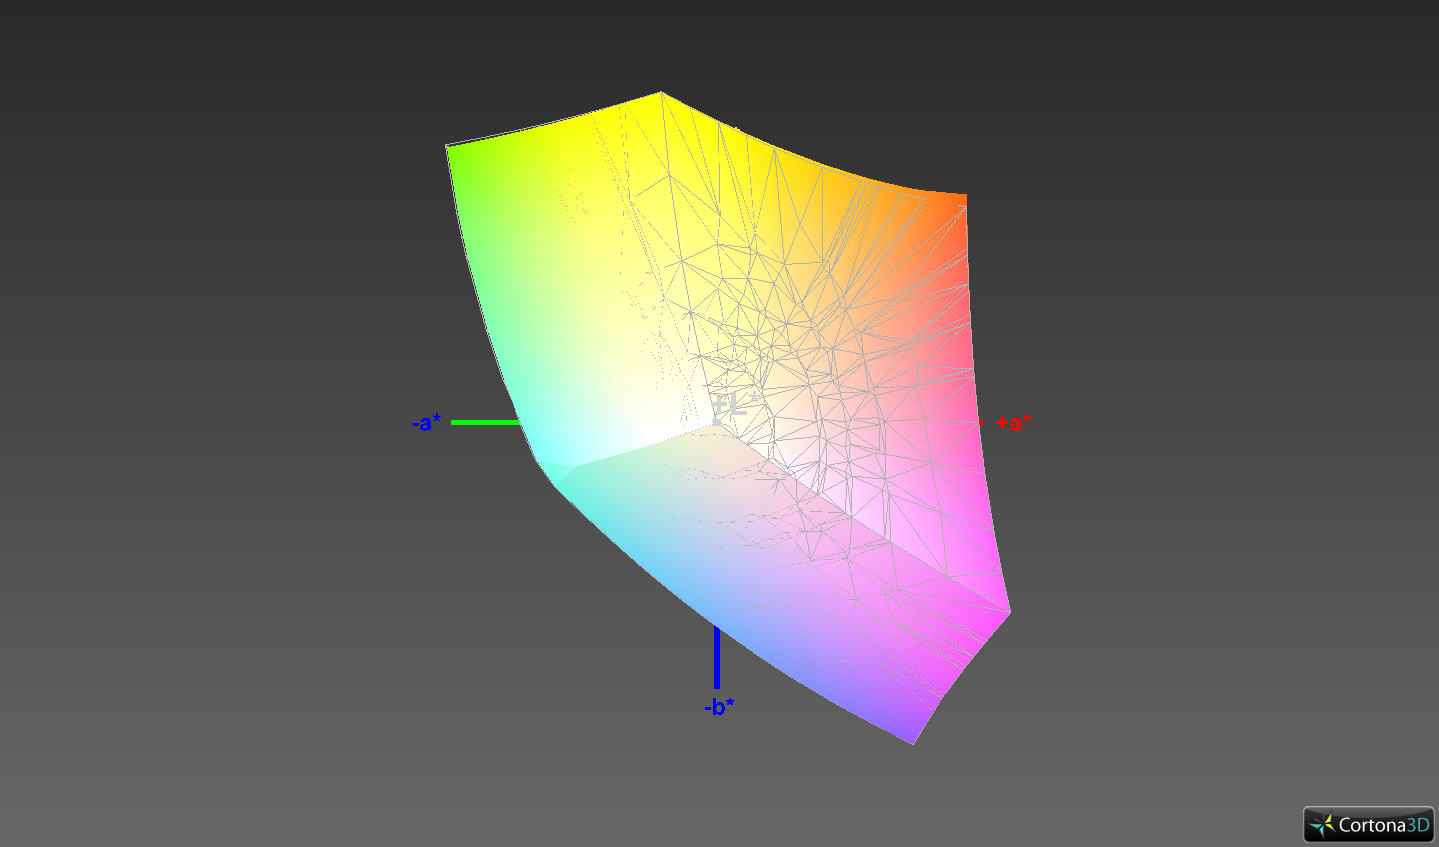
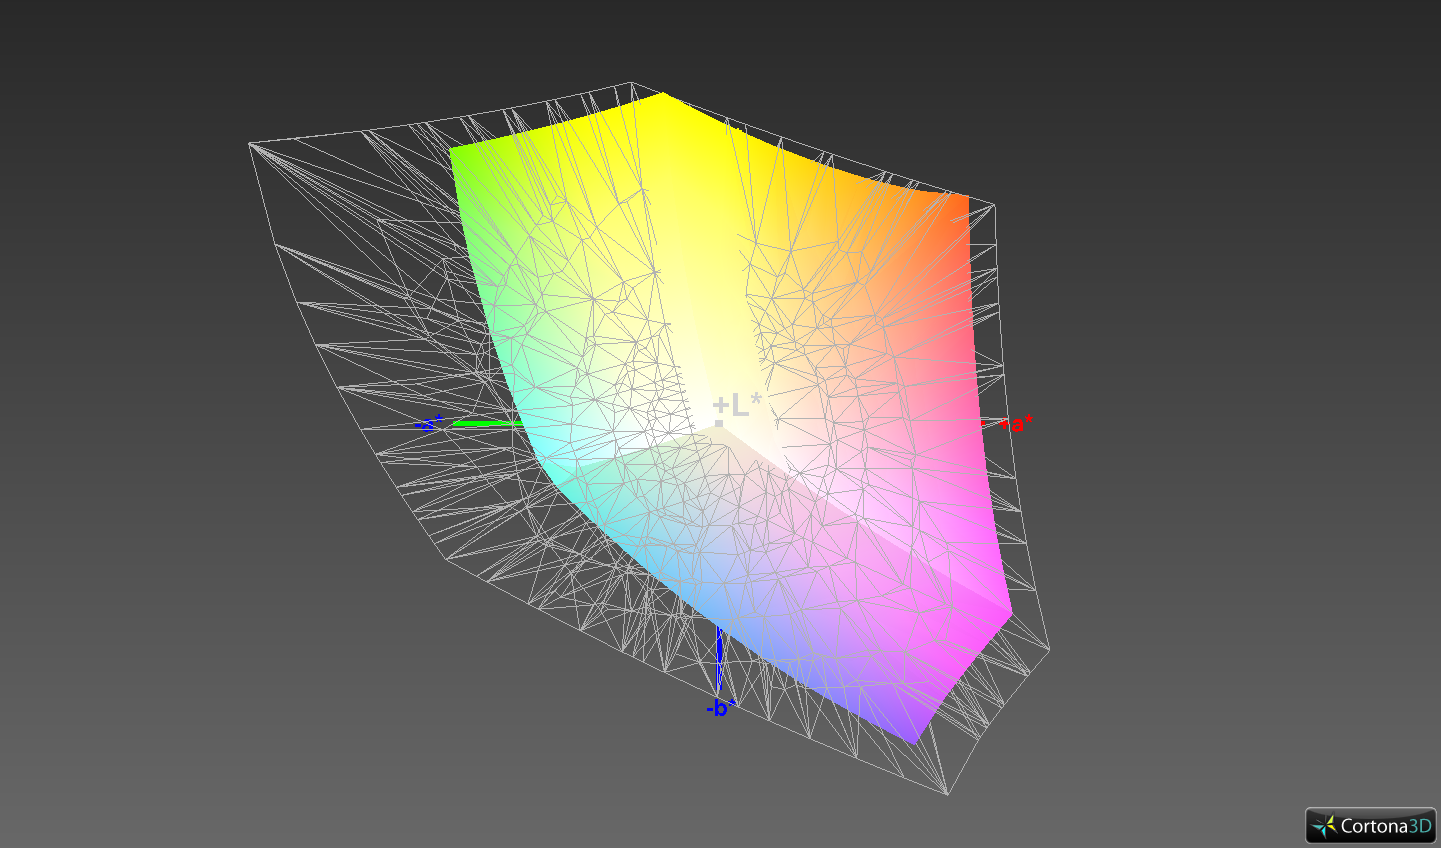
99.5% sRGB (Argyll 1.6.3 3D)
62.5% AdobeRGB 1998 (Argyll 1.6.3 3D)
68.6% AdobeRGB 1998 (Argyll 3D)
99.4% sRGB (Argyll 3D)
66.6% Display P3 (Argyll 3D)
Gamma: 2.14
CCT: 6689 K
| Huawei MateBook X Pro 2020 i7 JDI LPM139M422A, LTPS, 3000x2000, 13.9" | Dell XPS 13 9300 4K UHD Sharp LQ134R1, IPS, 3840x2400, 13.4" | Razer Blade Stealth 13, Core i7-1065G7 AUO202B, IPS LED, 3840x2160, 13.3" | Apple MacBook Pro 13 2020 2GHz i5 10th-Gen APPA03D, IPS, 2560x1600, 13.3" | Lenovo Yoga C940-14IIL 81Q9 BOE HF NV140QUM-N54, IPS, 3840x2160, 14" | Huawei MateBook X Pro, i7 JDI LPM139M422A, LTPS, 3000x2000, 13.9" | |
|---|---|---|---|---|---|---|
| Display | -5% | -4% | 25% | 16% | -2% | |
| Display P3 Coverage (%) | 66.6 | 64.5 -3% | 64.3 -3% | 98.8 48% | 83.8 26% | 65.8 -1% |
| sRGB Coverage (%) | 99.4 | 91.4 -8% | 95.8 -4% | 99.9 1% | 99.9 1% | 97.7 -2% |
| AdobeRGB 1998 Coverage (%) | 68.6 | 66.6 -3% | 65.7 -4% | 86.4 26% | 83.3 21% | 67.5 -2% |
| Response Times | 17% | -26% | 1% | 11% | 17% | |
| Response Time Grey 50% / Grey 80% * (ms) | 49.6 ? | 41.6 ? 16% | 62 ? -25% | 46 ? 7% | 44.4 ? 10% | 42 ? 15% |
| Response Time Black / White * (ms) | 30.8 ? | 25.6 ? 17% | 39 ? -27% | 32.4 ? -5% | 27.2 ? 12% | 25 ? 19% |
| PWM Frequency (Hz) | 29070 ? | 113600 ? | ||||
| Screen | -71% | -64% | -8% | -102% | -20% | |
| Brightness middle (cd/m²) | 557 | 414 -26% | 353 -37% | 512 -8% | 501.7 -10% | 550 -1% |
| Brightness (cd/m²) | 532 | 401 -25% | 335 -37% | 491 -8% | 501 -6% | 512 -4% |
| Brightness Distribution (%) | 87 | 94 8% | 90 3% | 91 5% | 82 -6% | 88 1% |
| Black Level * (cd/m²) | 0.33 | 0.28 15% | 0.25 24% | 0.32 3% | 0.32 3% | 0.32 3% |
| Contrast (:1) | 1688 | 1479 -12% | 1412 -16% | 1600 -5% | 1568 -7% | 1719 2% |
| Colorchecker dE 2000 * | 1.4 | 3.06 -119% | 4.4 -214% | 1.7 -21% | 5.48 -291% | 2.28 -63% |
| Colorchecker dE 2000 max. * | 2.5 | 6.5 -160% | 7.21 -188% | 3.4 -36% | 10.03 -301% | 4.36 -74% |
| Colorchecker dE 2000 calibrated * | 0.7 | 3.5 -400% | 1.1 -57% | 1 -43% | 2.22 -217% | 0.8 -14% |
| Greyscale dE 2000 * | 2 | 3 -50% | 5.49 -175% | 1.9 5% | 8.1 -305% | 3.27 -64% |
| Gamma | 2.14 103% | 2.42 91% | 2.26 97% | 2.19 100% | 2.07 106% | 2.35 94% |
| CCT | 6689 97% | 6840 95% | 7689 85% | 6817 95% | 6730 97% | 6819 95% |
| Color Space (Percent of AdobeRGB 1998) (%) | 62.5 | 61.1 -2% | 61 -2% | 77.4 24% | 74.1 19% | 62 -1% |
| Color Space (Percent of sRGB) (%) | 99.5 | 91.4 -8% | 96 -4% | 99.9 0% | 100 1% | 98 -2% |
| Total Average (Program / Settings) | -20% /
-48% | -31% /
-48% | 6% /
-0% | -25% /
-66% | -2% /
-12% |
* ... smaller is better
Using the professional CalMAN software in combination with our X-Rite i1 Pro2 spectrophotometer we were able to determine that the display is almost perfectly calibrated ex-factory. There is no visible color tint and DeltaE deviations for both grayscale and colors were all below the magic threshold of 3. We were able to improve upon these slightly through manual calibration; however, this will not be necessary for the user.
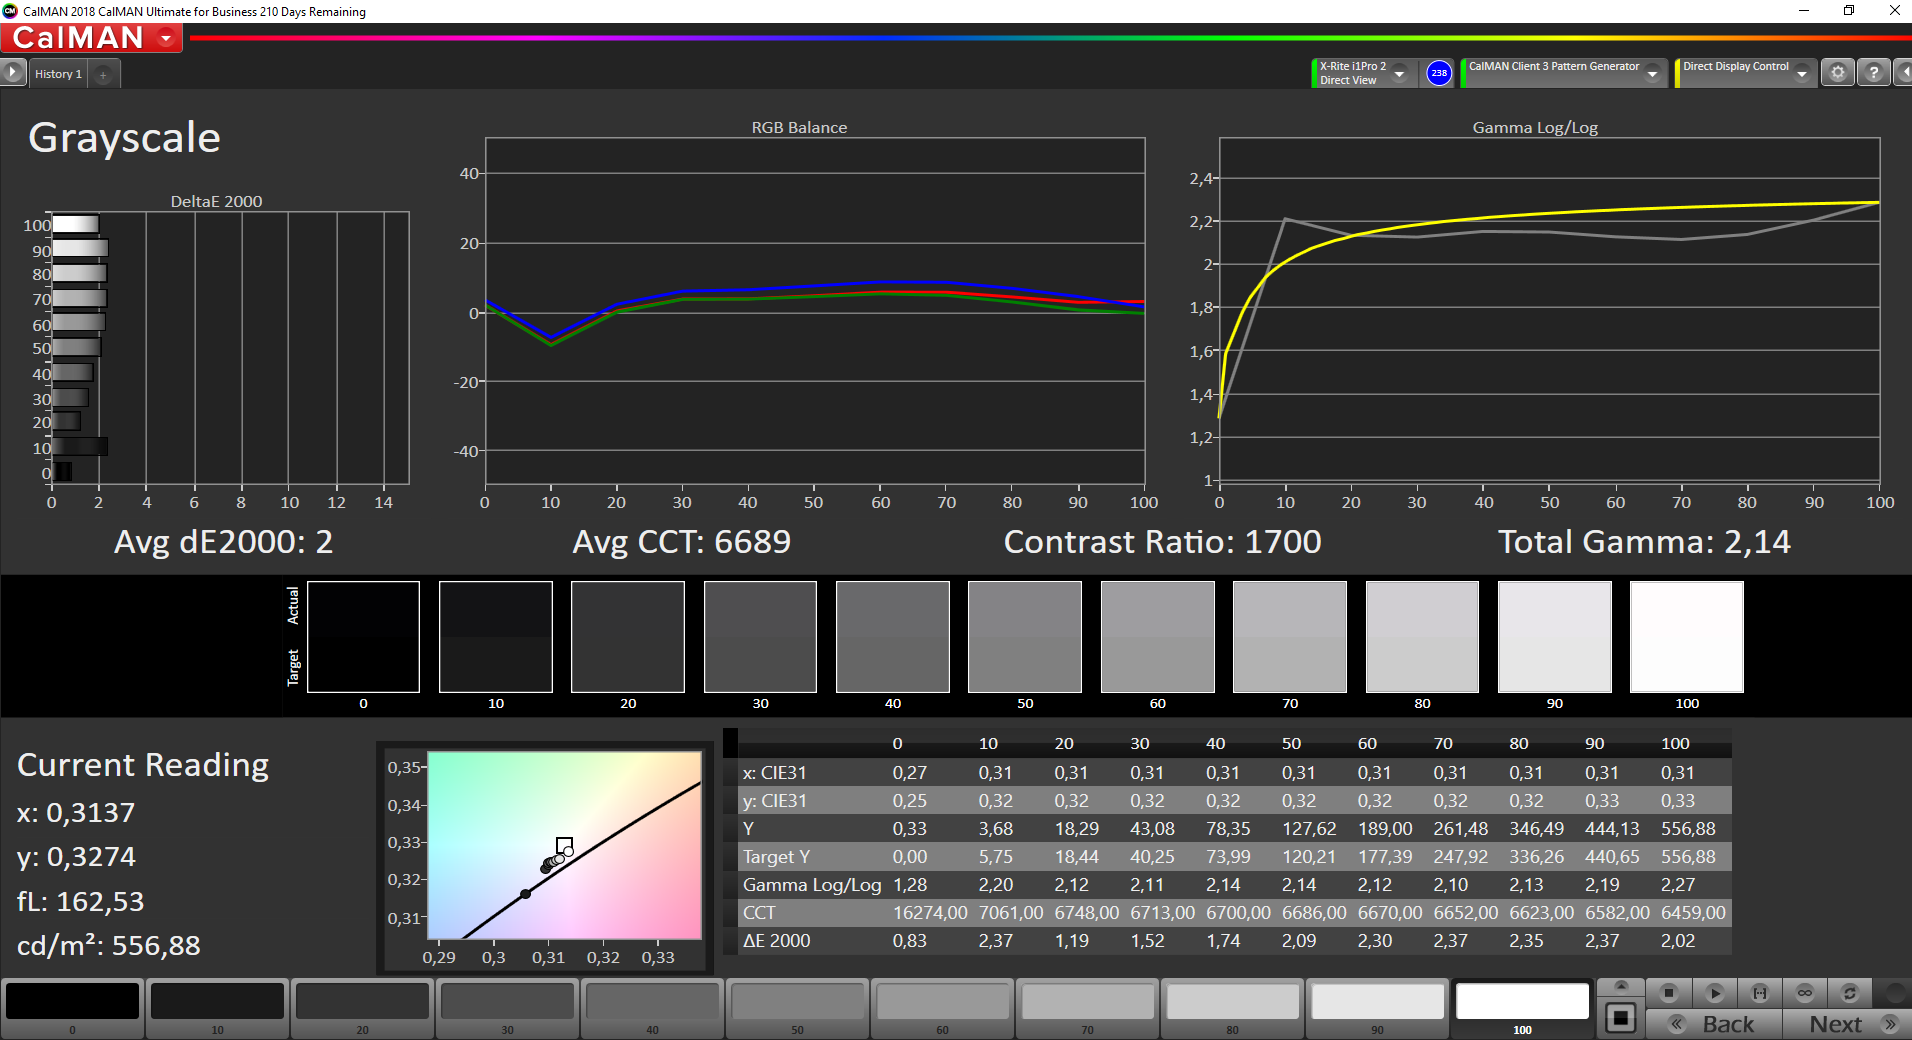
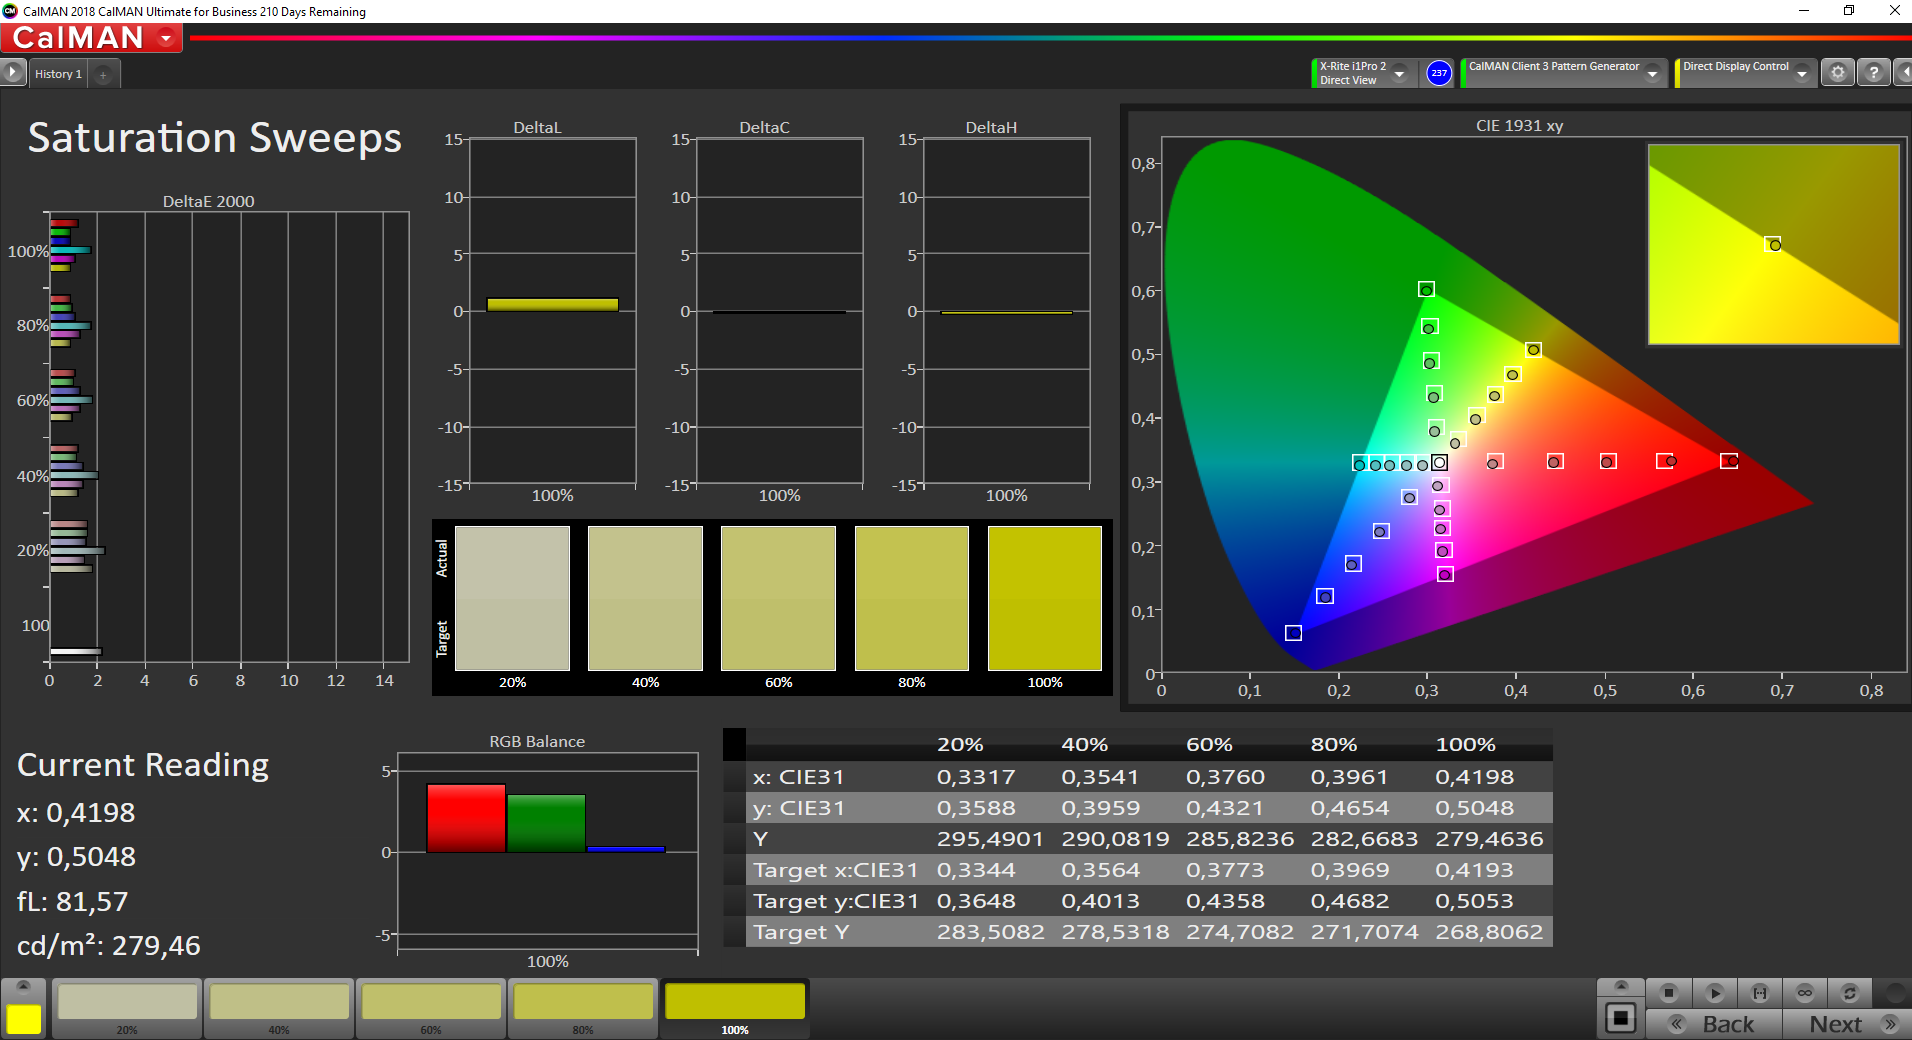
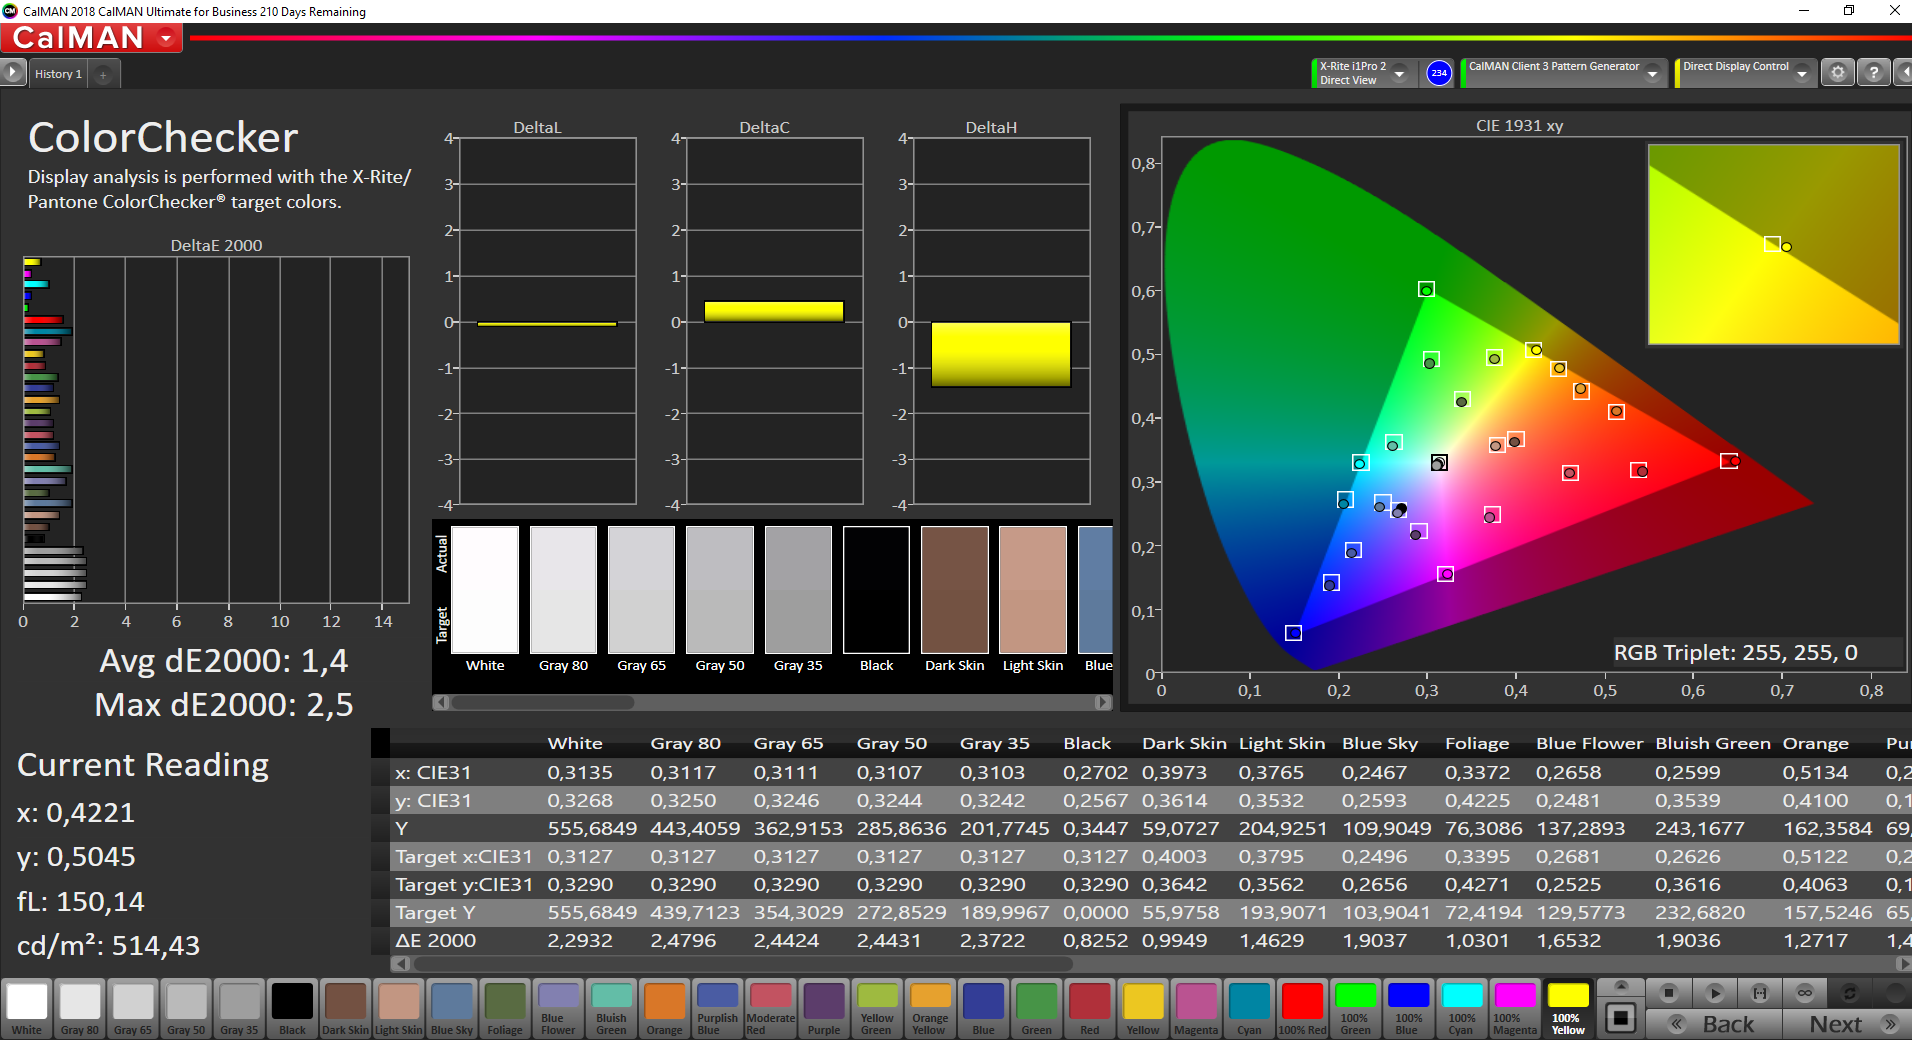
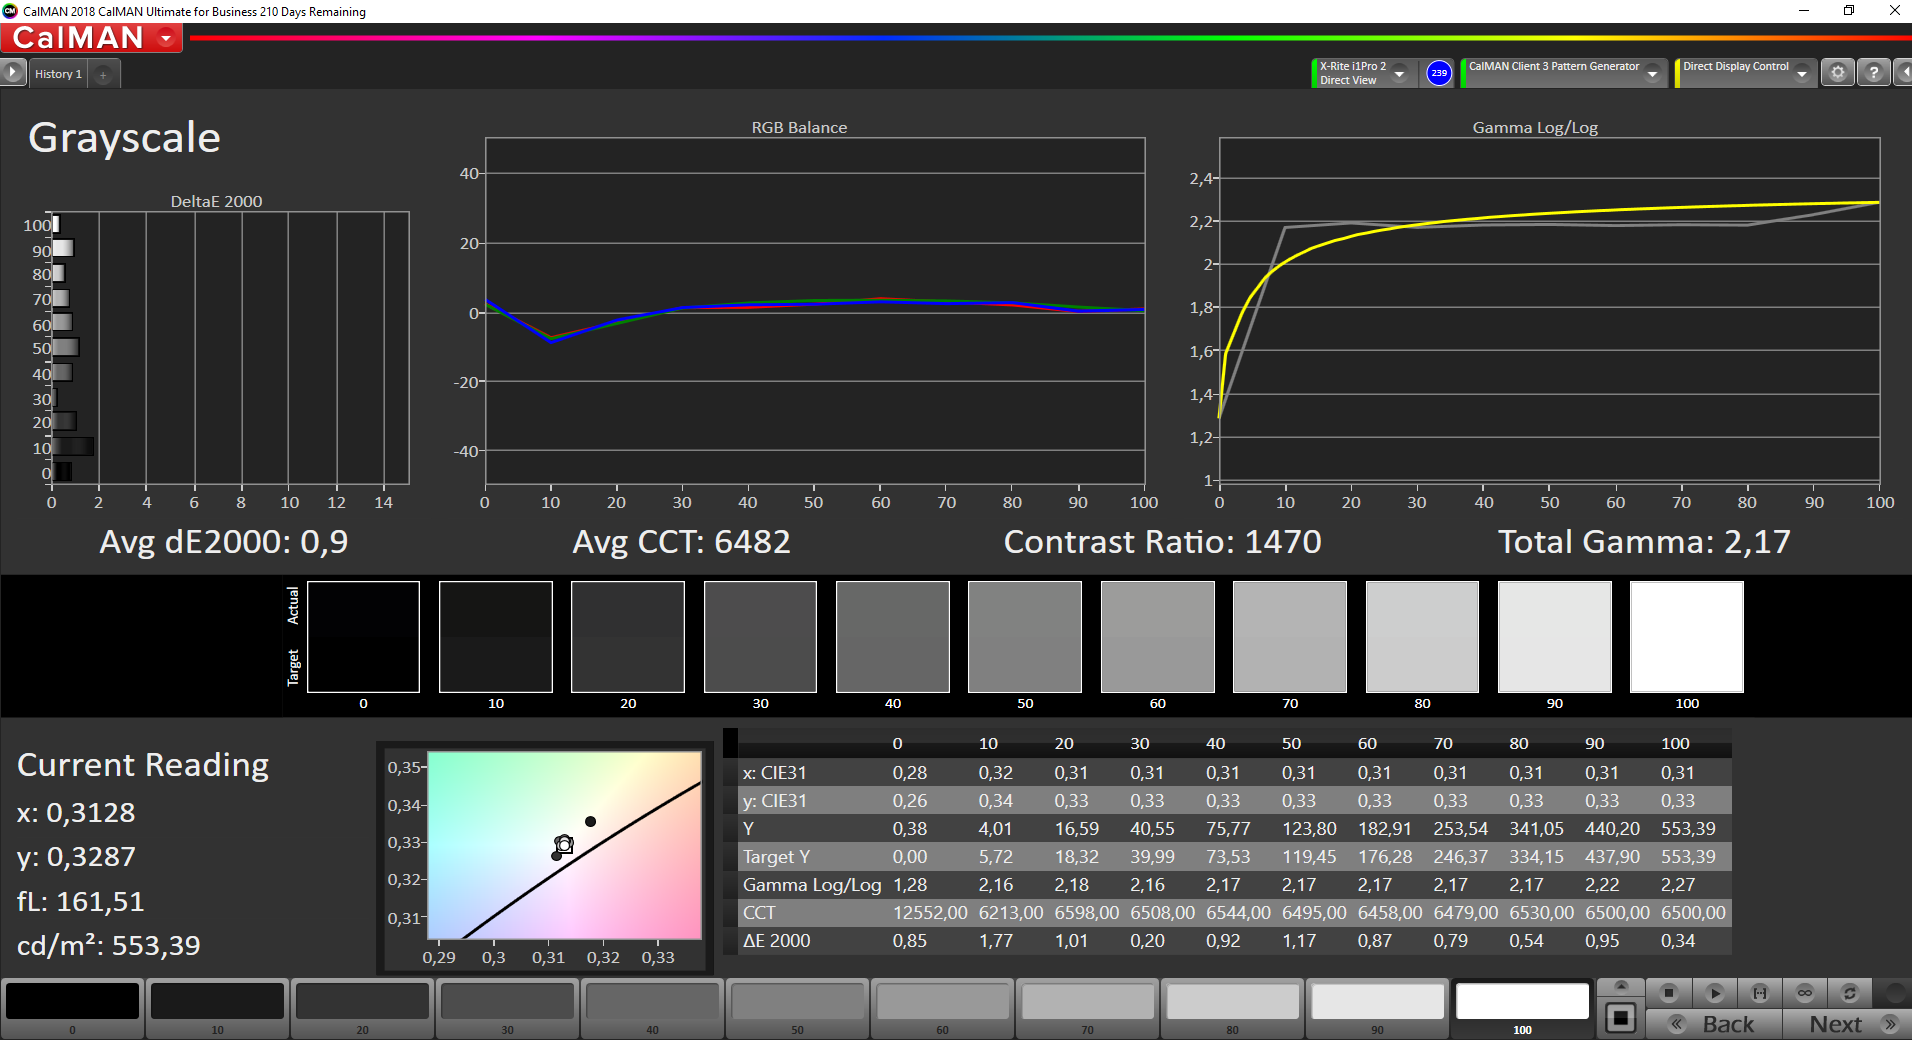
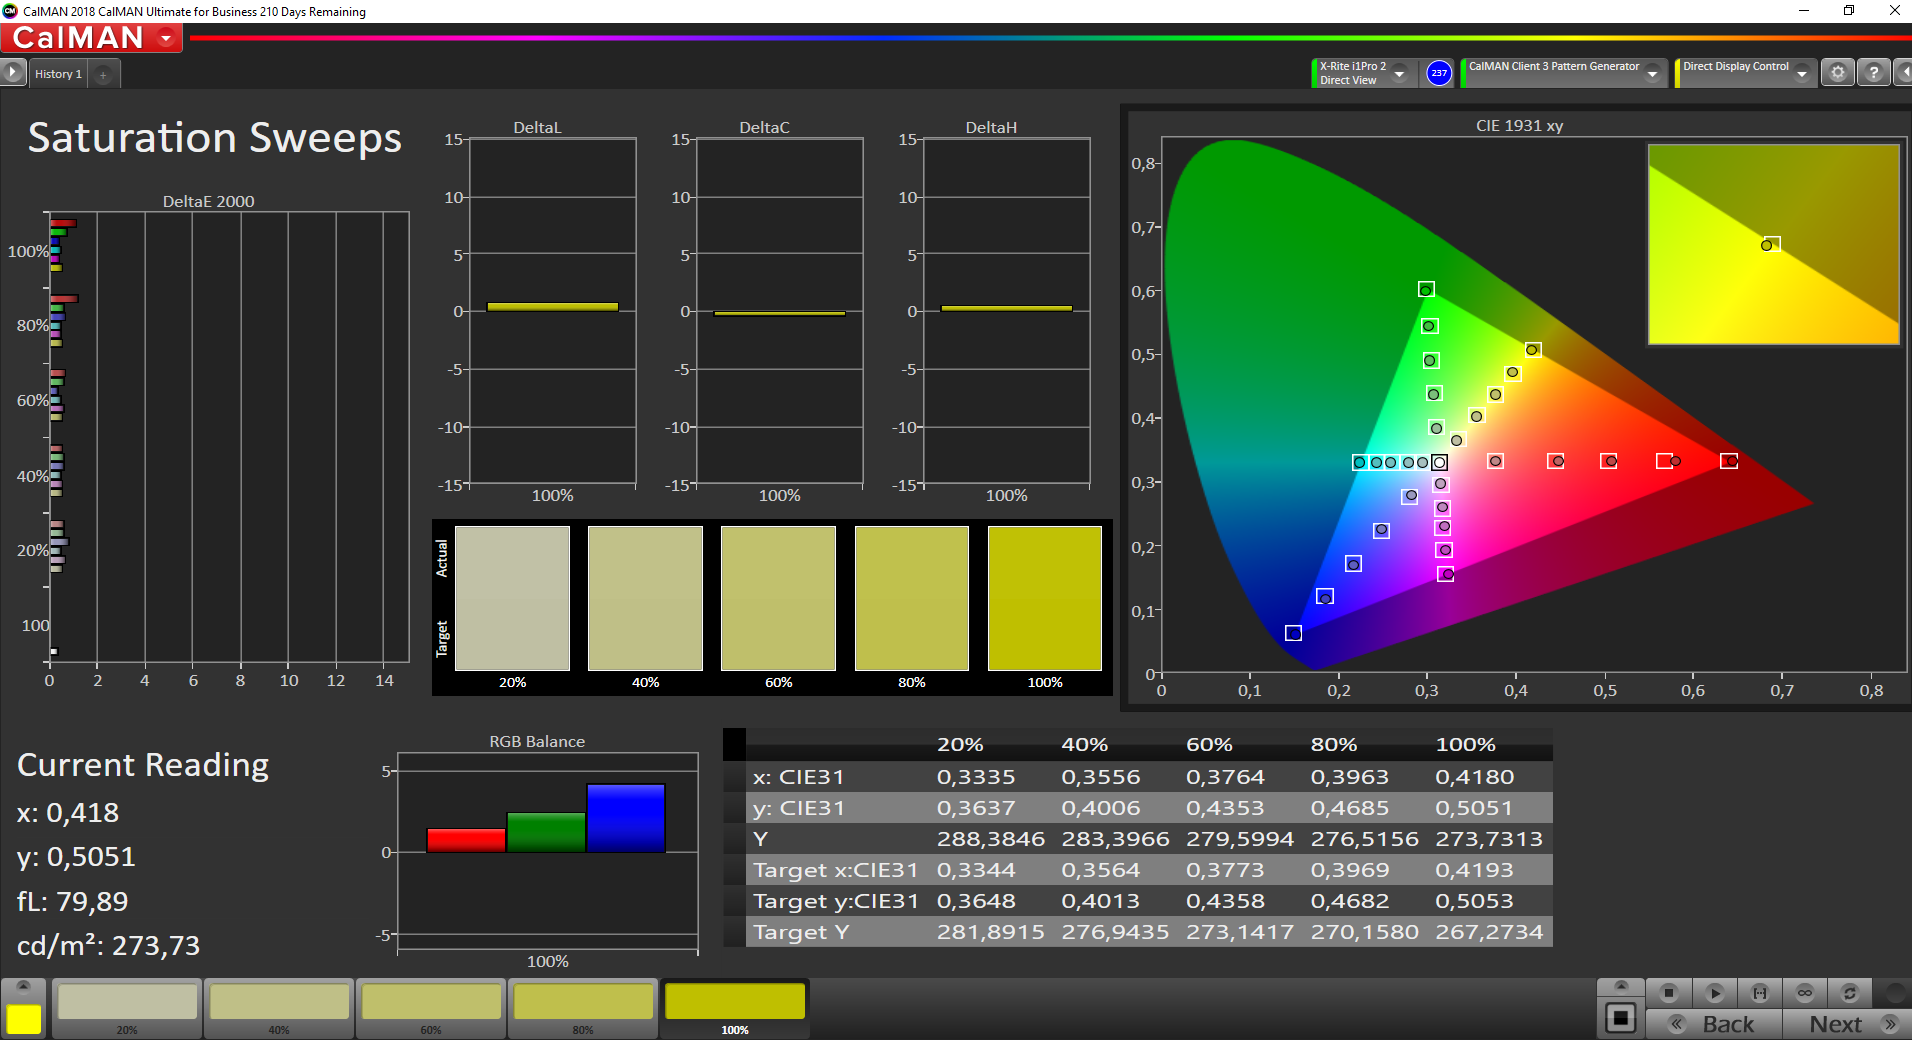
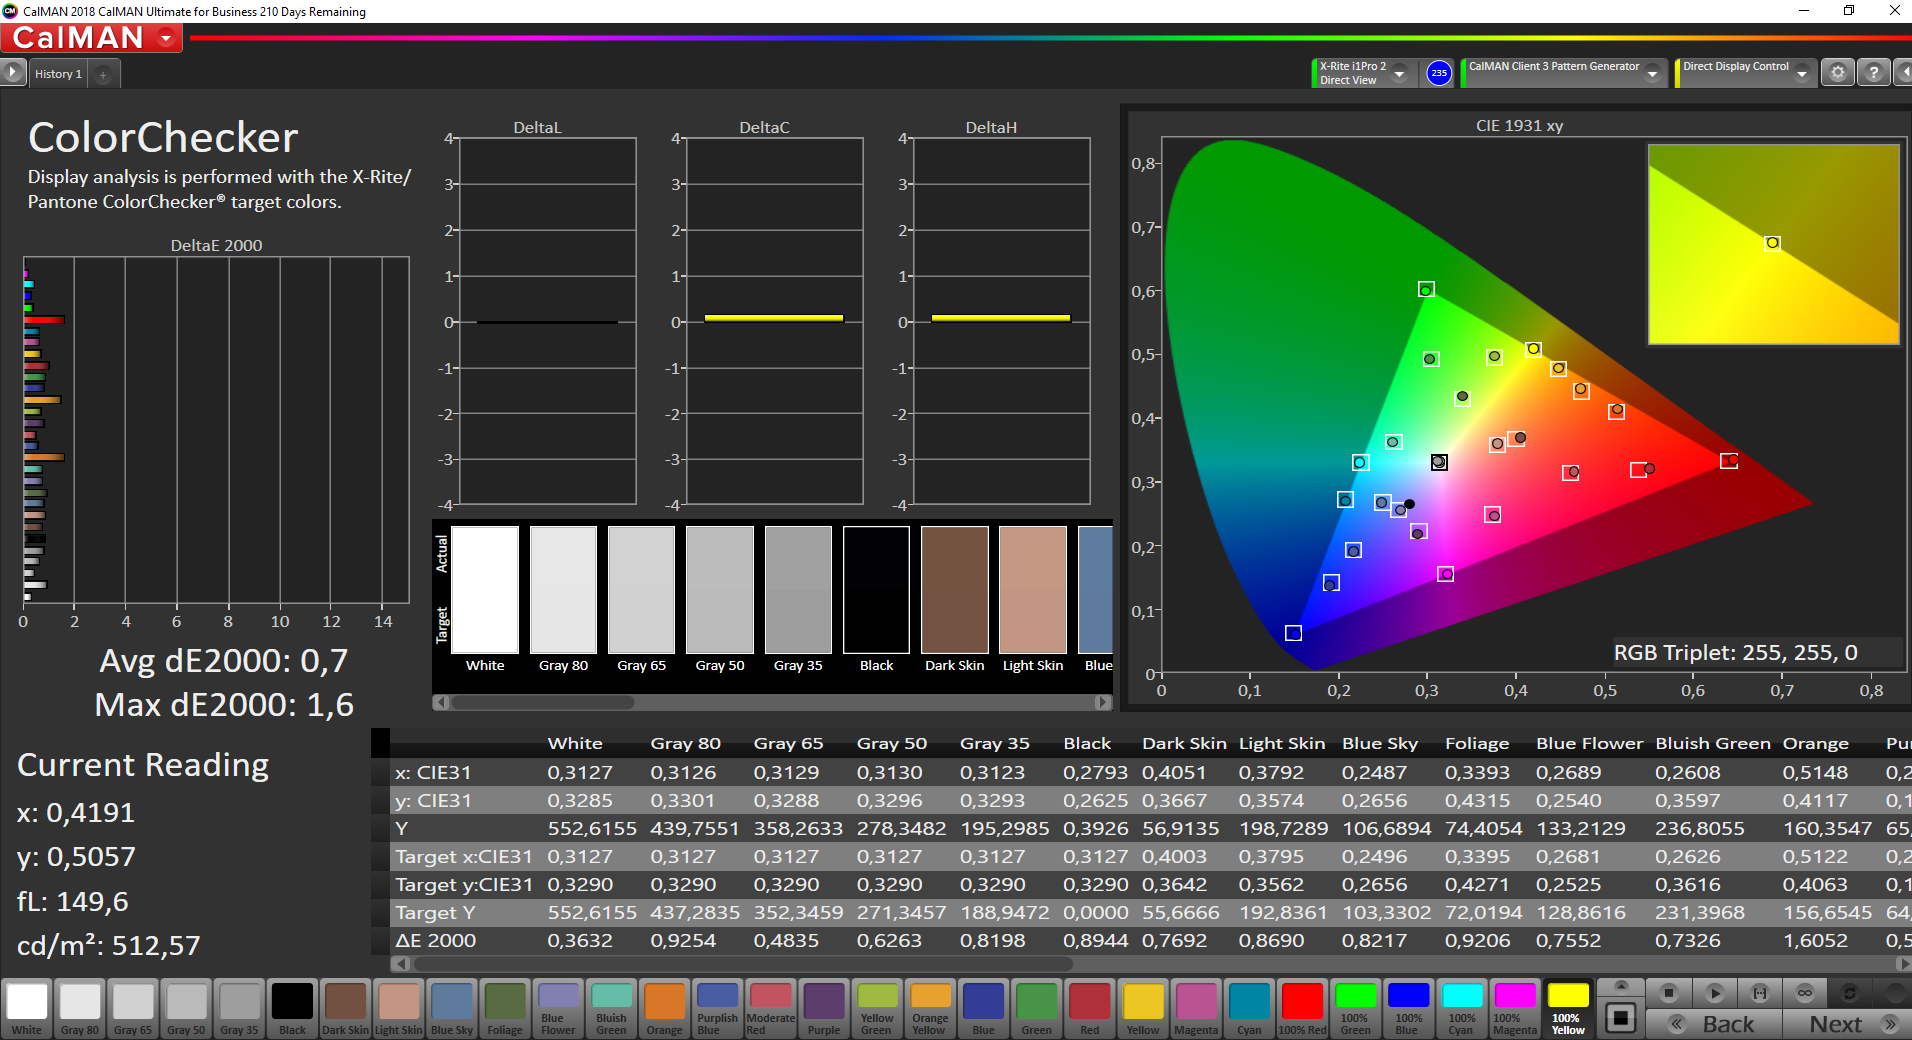
The smaller sRGB color space is covered almost entirely by the display panel, and AdobeRGB is covered by 62.5%. Combined with its low color deviations the MateBook X Pro’s display is very well suited for photo and video-editing purposes with high color accuracy demands.
Display Response Times
| ↔ Response Time Black to White | ||
|---|---|---|
| 30.8 ms ... rise ↗ and fall ↘ combined | ↗ 14 ms rise | 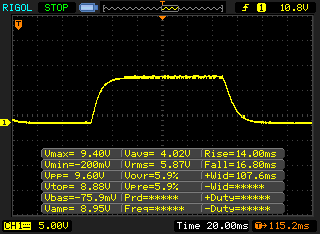 |
| ↘ 16.8 ms fall | ||
| The screen shows slow response rates in our tests and will be unsatisfactory for gamers. In comparison, all tested devices range from 0.1 (minimum) to 240 (maximum) ms. » 83 % of all devices are better. This means that the measured response time is worse than the average of all tested devices (19.9 ms). | ||
| ↔ Response Time 50% Grey to 80% Grey | ||
| 49.6 ms ... rise ↗ and fall ↘ combined | ↗ 23.6 ms rise | 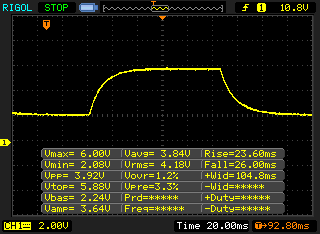 |
| ↘ 26 ms fall | ||
| The screen shows slow response rates in our tests and will be unsatisfactory for gamers. In comparison, all tested devices range from 0.165 (minimum) to 636 (maximum) ms. » 85 % of all devices are better. This means that the measured response time is worse than the average of all tested devices (31.1 ms). | ||
Screen Flickering / PWM (Pulse-Width Modulation)
| Screen flickering / PWM detected | 29070 Hz | ≤ 40 % brightness setting | 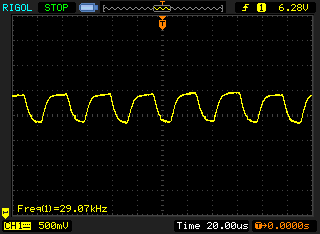 |
The display backlight flickers at 29070 Hz (worst case, e.g., utilizing PWM) Flickering detected at a brightness setting of 40 % and below. There should be no flickering or PWM above this brightness setting. The frequency of 29070 Hz is quite high, so most users sensitive to PWM should not notice any flickering. In comparison: 52 % of all tested devices do not use PWM to dim the display. If PWM was detected, an average of 7797 (minimum: 5 - maximum: 343500) Hz was measured. | |||
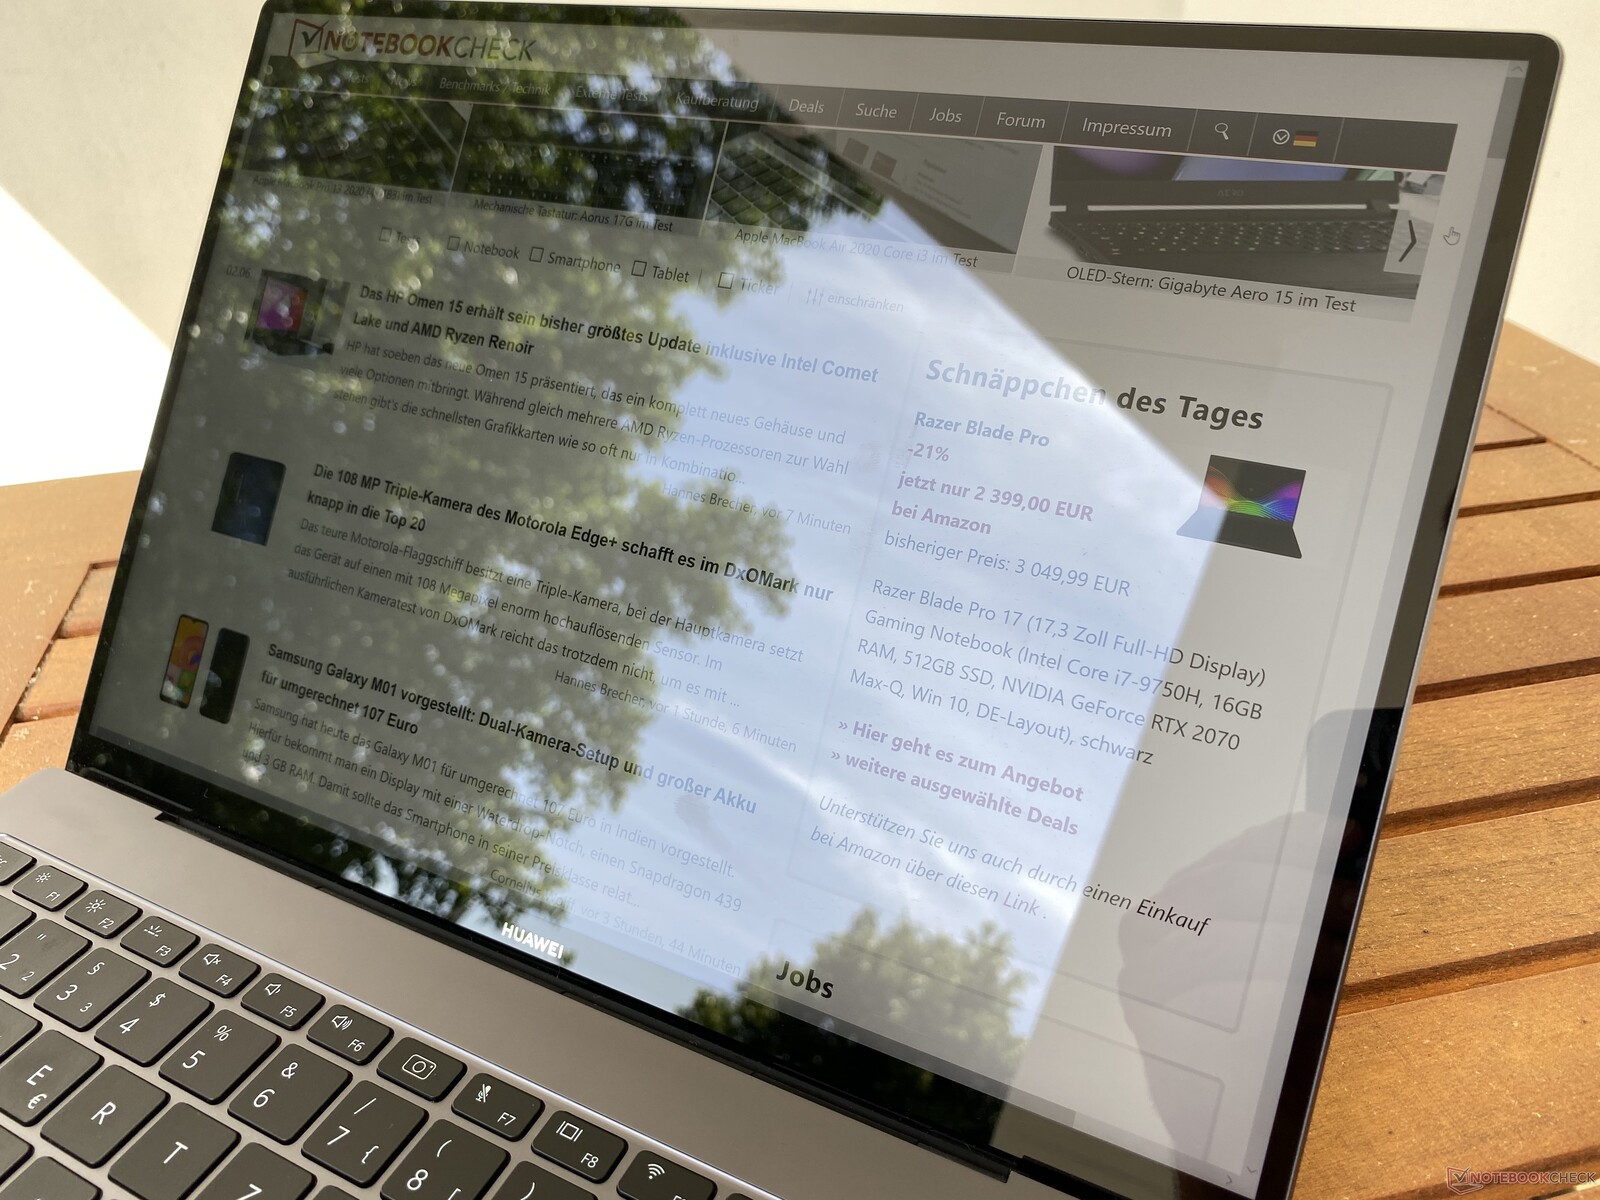
The LTPS panel’s viewing angles were excellent. That being said, outdoor usability is somewhat thwarted by the highly reflective nature of the touchscreen surface. Even without direct reflections from light sources the reflections seen on the display are very annoying, particularly in bright areas where working with the device can get incredibly cumbersome.
Performance – i7 and MX250 in Slow Mode

Processor – MateBook with Comet Lake
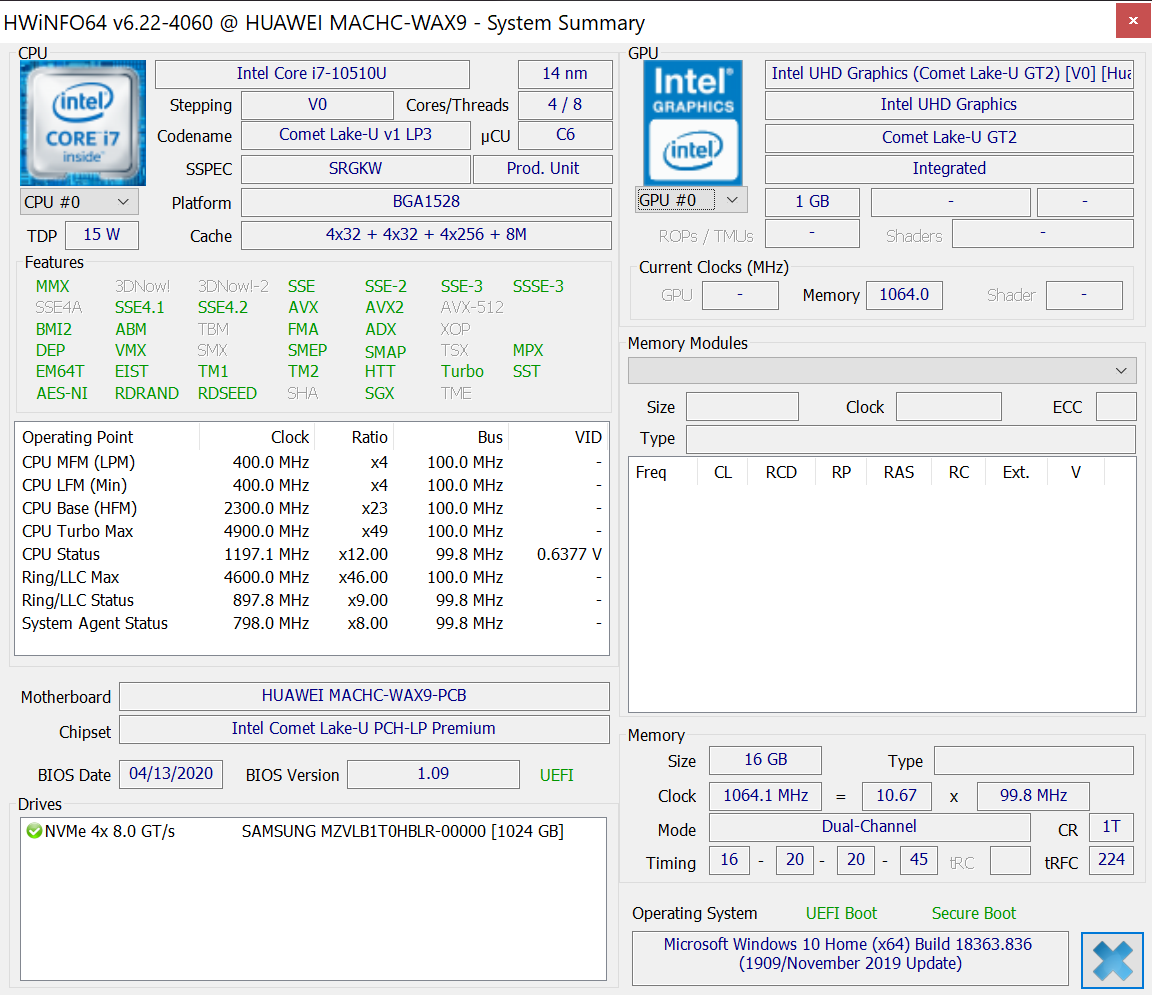
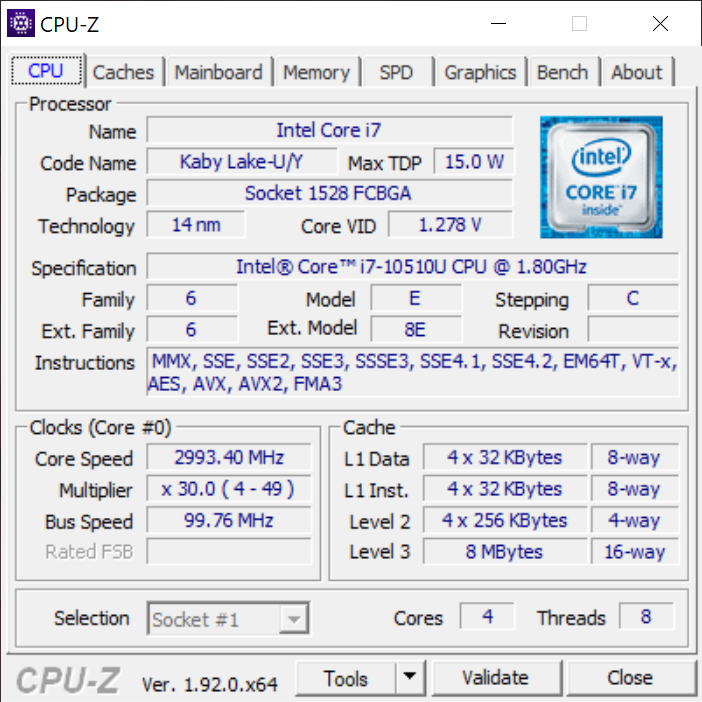
Huawei’s hardware of choice for the 2020 model are an Intel Comet Lake CPU paired with an Nvidia GeForce GPU. The latter may be the reason why Huawei opted against Intel’s Ice Lake chips. Their more powerful integrated GPU is simply not required in this case, at least in theory. The Core i7-10510U is an old friend at this point, and more details on this processor can be found in our technology section.
The main issue with the MateBook X Pro is its poor performance characteristics, or rather its low TDP threshold of just 15 W for sustained load. When subjected to short bursts of load this might be okay, but under sustained load the new MateBook X Pro turned out to be even slower than its own Core i7-8550U-powered predecessor and ended up being the slowest device in our test group. Even though the dedicated GPU runs idle in this particular test, the GPU cooler seems incapable of helping out. Another phenomenon that Huawei will have difficulties to explain is the fact that the MateBook 13 for around than 1,000 Euros (~$1,129) less and equipped with the arguably slower Core i5-10210U was faster both in short bursts and under sustained load. Nevertheless, the quad-core processor delivered adequate everyday performance that was not throttled on battery either.
Cinebench R15: CPU Single 64Bit | CPU Multi 64Bit
Blender: v2.79 BMW27 CPU
7-Zip 18.03: 7z b 4 -mmt1 | 7z b 4
Geekbench 5.5: Single-Core | Multi-Core
HWBOT x265 Benchmark v2.2: 4k Preset
LibreOffice : 20 Documents To PDF
R Benchmark 2.5: Overall mean
| Cinebench R20 / CPU (Single Core) | |
| Average of class Subnotebook (128 - 832, n=57, last 2 years) | |
| Dell XPS 13 9300 4K UHD | |
| Lenovo Yoga C940-14IIL 81Q9 | |
| Apple MacBook Pro 13 2020 2GHz i5 10th-Gen | |
| Average Intel Core i7-10510U (362 - 497, n=37) | |
| Huawei MateBook X Pro 2020 i7 | |
| Cinebench R20 / CPU (Multi Core) | |
| Average of class Subnotebook (579 - 8541, n=57, last 2 years) | |
| Apple MacBook Pro 13 2020 2GHz i5 10th-Gen | |
| Lenovo Yoga C940-14IIL 81Q9 | |
| Average Intel Core i7-10510U (1015 - 1897, n=38) | |
| Dell XPS 13 9300 4K UHD | |
| Huawei MateBook X Pro 2020 i7 | |
| Cinebench R15 / CPU Single 64Bit | |
| Average of class Subnotebook (72.4 - 322, n=57, last 2 years) | |
| Dell XPS 13 9300 4K UHD | |
| Lenovo Yoga C940-14IIL 81Q9 | |
| Average Intel Core i7-10510U (113 - 202, n=42) | |
| Razer Blade Stealth 13, Core i7-1065G7 | |
| Huawei MateBook X Pro 2020 i7 | |
| Apple MacBook Pro 13 2020 2GHz i5 10th-Gen | |
| Huawei MateBook X Pro, i7 | |
| Cinebench R15 / CPU Multi 64Bit | |
| Average of class Subnotebook (327 - 3345, n=57, last 2 years) | |
| Apple MacBook Pro 13 2020 2GHz i5 10th-Gen | |
| Dell XPS 13 9300 4K UHD | |
| Lenovo Yoga C940-14IIL 81Q9 | |
| Average Intel Core i7-10510U (482 - 856, n=45) | |
| Huawei MateBook X Pro 2020 i7 | |
| Razer Blade Stealth 13, Core i7-1065G7 | |
| Huawei MateBook X Pro, i7 | |
| Blender / v2.79 BMW27 CPU | |
| Huawei MateBook X Pro 2020 i7 | |
| Average Intel Core i7-10510U (628 - 1051, n=31) | |
| Dell XPS 13 9300 4K UHD | |
| Average of class Subnotebook (159 - 2271, n=58, last 2 years) | |
| Apple MacBook Pro 13 2020 2GHz i5 10th-Gen | |
| 7-Zip 18.03 / 7z b 4 -mmt1 | |
| Average of class Subnotebook (2643 - 6699, n=59, last 2 years) | |
| Huawei MateBook X Pro 2020 i7 | |
| Average Intel Core i7-10510U (3747 - 4981, n=31) | |
| Dell XPS 13 9300 4K UHD | |
| Apple MacBook Pro 13 2020 2GHz i5 10th-Gen | |
| 7-Zip 18.03 / 7z b 4 | |
| Average of class Subnotebook (11668 - 77867, n=57, last 2 years) | |
| Dell XPS 13 9300 4K UHD | |
| Apple MacBook Pro 13 2020 2GHz i5 10th-Gen | |
| Average Intel Core i7-10510U (12196 - 21298, n=31) | |
| Huawei MateBook X Pro 2020 i7 | |
| Geekbench 5.5 / Single-Core | |
| Average of class Subnotebook (726 - 2224, n=48, last 2 years) | |
| Dell XPS 13 9300 4K UHD | |
| Apple MacBook Pro 13 2020 2GHz i5 10th-Gen | |
| Average Intel Core i7-10510U (977 - 1287, n=31) | |
| Huawei MateBook X Pro 2020 i7 | |
| Geekbench 5.5 / Multi-Core | |
| Average of class Subnotebook (2557 - 17218, n=48, last 2 years) | |
| Dell XPS 13 9300 4K UHD | |
| Apple MacBook Pro 13 2020 2GHz i5 10th-Gen | |
| Average Intel Core i7-10510U (2474 - 4484, n=31) | |
| Huawei MateBook X Pro 2020 i7 | |
| HWBOT x265 Benchmark v2.2 / 4k Preset | |
| Average of class Subnotebook (0.97 - 25.1, n=57, last 2 years) | |
| Dell XPS 13 9300 4K UHD | |
| Apple MacBook Pro 13 2020 2GHz i5 10th-Gen | |
| Average Intel Core i7-10510U (3.41 - 6.04, n=31) | |
| Huawei MateBook X Pro 2020 i7 | |
| LibreOffice / 20 Documents To PDF | |
| Apple MacBook Pro 13 2020 2GHz i5 10th-Gen | |
| Dell XPS 13 9300 4K UHD | |
| Average Intel Core i7-10510U (50.7 - 77.8, n=27) | |
| Average of class Subnotebook (39.9 - 220, n=56, last 2 years) | |
| Huawei MateBook X Pro 2020 i7 | |
| R Benchmark 2.5 / Overall mean | |
| Apple MacBook Pro 13 2020 2GHz i5 10th-Gen | |
| Dell XPS 13 9300 4K UHD | |
| Average Intel Core i7-10510U (0.637 - 0.81, n=28) | |
| Huawei MateBook X Pro 2020 i7 | |
| Average of class Subnotebook (0.4024 - 1.456, n=58, last 2 years) | |
* ... smaller is better
System Performance – Very Fast in Everyday Situations
Everyday performance was pretty decent overall, and the MateBook X Pro performed admirably thanks to among other things its very fast Samsung PCIe SSD. Input is processed almost instantaneously, and we did not encounter any issues during our test period. What we were not particularly fond of is the default partition scheme of our SSD. The system partition was so small that it had just 35.4 GB of free space left with an empty 858 GB large data partition sitting idle right next to it.
| PCMark 8 Home Score Accelerated v2 | 3841 points | |
| PCMark 8 Creative Score Accelerated v2 | 5617 points | |
| PCMark 8 Work Score Accelerated v2 | 4599 points | |
| PCMark 10 Score | 3861 points | |
Help | ||

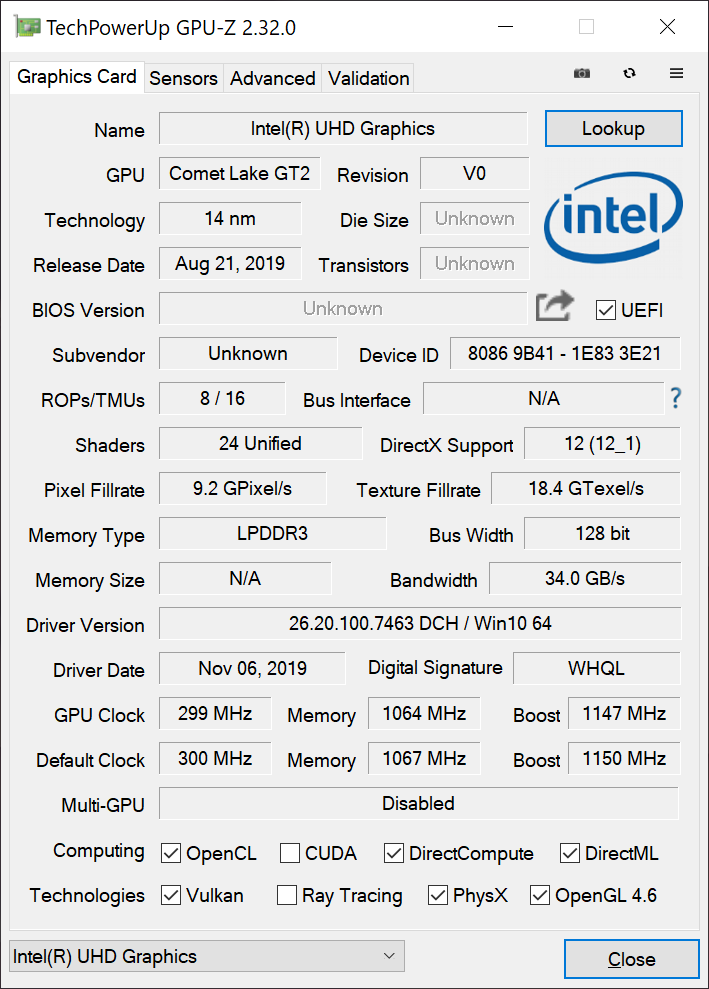
Graphics Card – GeForce MX250 as fast as MX150
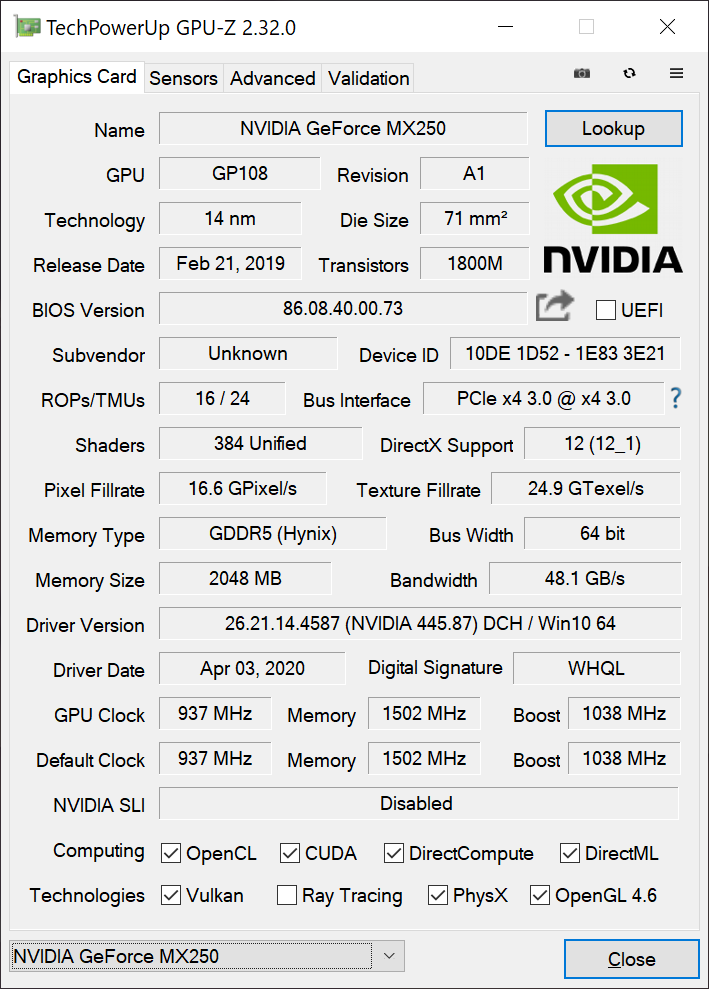
Without any demanding tasks, graphics are handled by the processor’s integrated GPU. Once you start stressing the device, for example by running a game, the dedicated GPU is automatically activated and switched to. Keep in mind though that the MX250 is an entry-level GPU and barely faster than the integrated GPUs of Intel’s Ice Lake-generation processors. In addition, the MateBook X Pro’s specific MX250 implementation remained far behind its theoretical potential and performed around 20% slower than a “normal” MX250. Some integrated GPUs managed to outperform this MX250 even in games. Last but not least, GPU performance was anything but consistent. The MateBook X Pro failed to pass the 3DMark Fire Strike stress test with 86%, and when gaming performance dropped by around 15% after 1-2 minutes (which was also observed while running our The Witcher 3 loop on medium). All in all, the MateBook X Pro 2020’s graphics performance was only slightly better than its predecessor’s, and many games will have to be set to minimum details in order to run smoothly.
| 3DMark 11 Performance | 3963 points | |
| 3DMark Ice Storm Standard Score | 40917 points | |
| 3DMark Cloud Gate Standard Score | 13104 points | |
| 3DMark Fire Strike Score | 2741 points | |
| 3DMark Time Spy Score | 980 points | |
Help | ||
| low | med. | high | ultra | |
|---|---|---|---|---|
| The Witcher 3 (2015) | 52 | 30 | 16.3 | 9 |
| Dota 2 Reborn (2015) | 112 | 92.6 | 59.7 | 52.7 |
| X-Plane 11.11 (2018) | 55.6 | 40.8 | 37.9 | |
| Far Cry 5 (2018) | 38 | 17 | 14 | |
| Shadow of the Tomb Raider (2018) | 38 | 14 |
Emissions – Cooler Has Become Quieter
System Noise
One of the benefits of the new cooler design that became instantly noticeable was the reduced peak noise level. At 38 dB(A) the fans were noticeable when gaming or putting the system under maximum stress but managed to remain unobtrusive, and we failed to notice any annoying high frequencies. Unfortunately, the device also failed to remain completely silent at all times when subjected to low load as the fan kept ramping up irregularly for no apparent reason. Fortunately, this was only noticeable in quiet environments. We found no evidence of coil whine.
Noise level
| Idle |
| 29.6 / 29.6 / 30.3 dB(A) |
| Load |
| 38 / 38 dB(A) |
 | ||
30 dB silent 40 dB(A) audible 50 dB(A) loud |
||
min: | ||
| Huawei MateBook X Pro 2020 i7 GeForce MX250, i7-10510U, Samsung PM981a MZVLB1T0HBLR | Dell XPS 13 9300 4K UHD Iris Plus Graphics G7 (Ice Lake 64 EU), i7-1065G7, Intel SSDPEMKF512G8 NVMe SSD | Razer Blade Stealth 13, Core i7-1065G7 GeForce GTX 1650 Max-Q, i7-1065G7, Lite-On CA3-8D512 | Apple MacBook Pro 13 2020 2GHz i5 10th-Gen Iris Plus Graphics G7 (Ice Lake 64 EU), i5-1038NG7, Apple SSD SM0512F | Lenovo Yoga C940-14IIL 81Q9 Iris Plus Graphics G7 (Ice Lake 64 EU), i7-1065G7, Samsung PM981a MZVLB1T0HBLR | Huawei MateBook X Pro, i7 GeForce MX150, i5-8550U, Toshiba XG5 KXG50ZNV512G | |
|---|---|---|---|---|---|---|
| Noise | 1% | 1% | 1% | 3% | -3% | |
| off / environment * (dB) | 29.6 | 29 2% | 30 -1% | 29.6 -0% | 28.5 4% | 30.3 -2% |
| Idle Minimum * (dB) | 29.6 | 29 2% | 30 -1% | 29.6 -0% | 28.5 4% | 30.3 -2% |
| Idle Average * (dB) | 29.6 | 29 2% | 30 -1% | 29.6 -0% | 28.5 4% | 30.3 -2% |
| Idle Maximum * (dB) | 30.3 | 29 4% | 30 1% | 29.6 2% | 29 4% | 31.3 -3% |
| Load Average * (dB) | 38 | 33.5 12% | 33.9 11% | 34.4 9% | 33 13% | 39.3 -3% |
| Witcher 3 ultra * (dB) | 38 | 40.5 -7% | 38.1 -0% | 36.1 5% | 40.7 -7% | |
| Load Maximum * (dB) | 38 | 40.5 -7% | 38.1 -0% | 42.1 -11% | 39.5 -4% | 41.2 -8% |
* ... smaller is better
Temperature
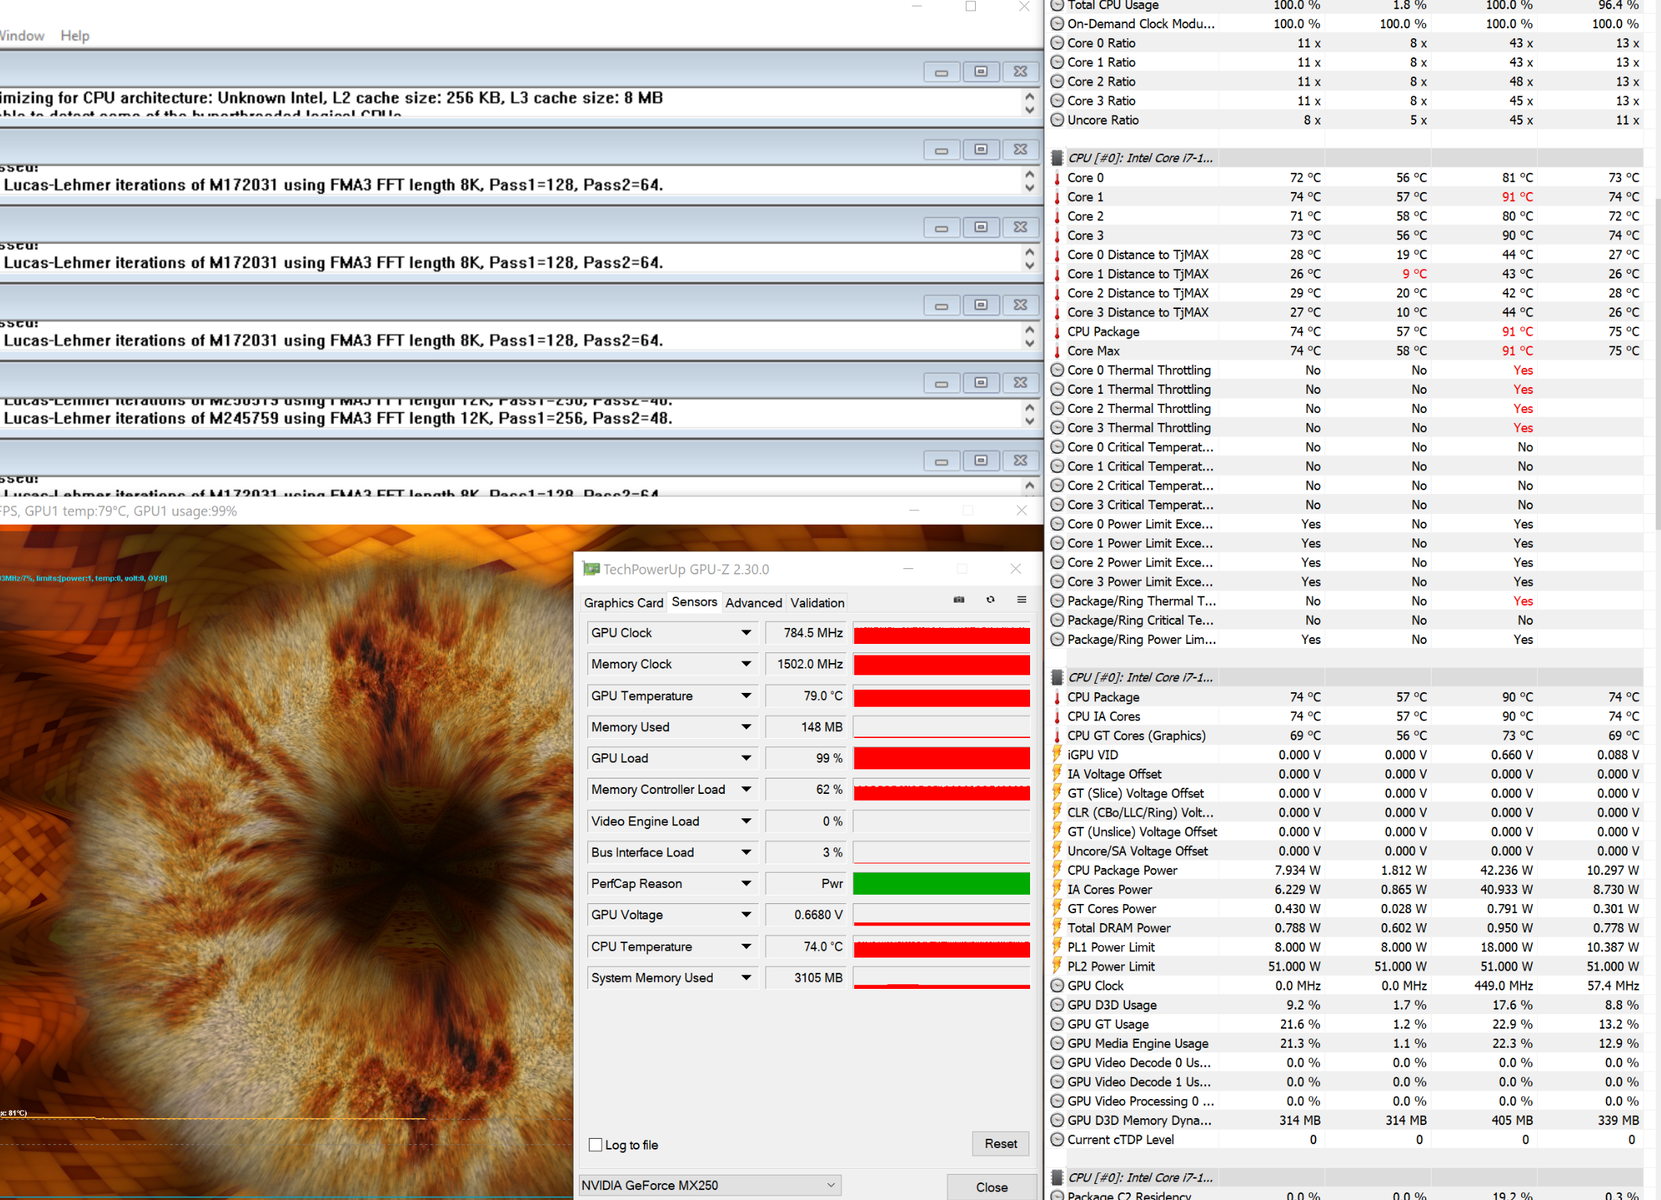
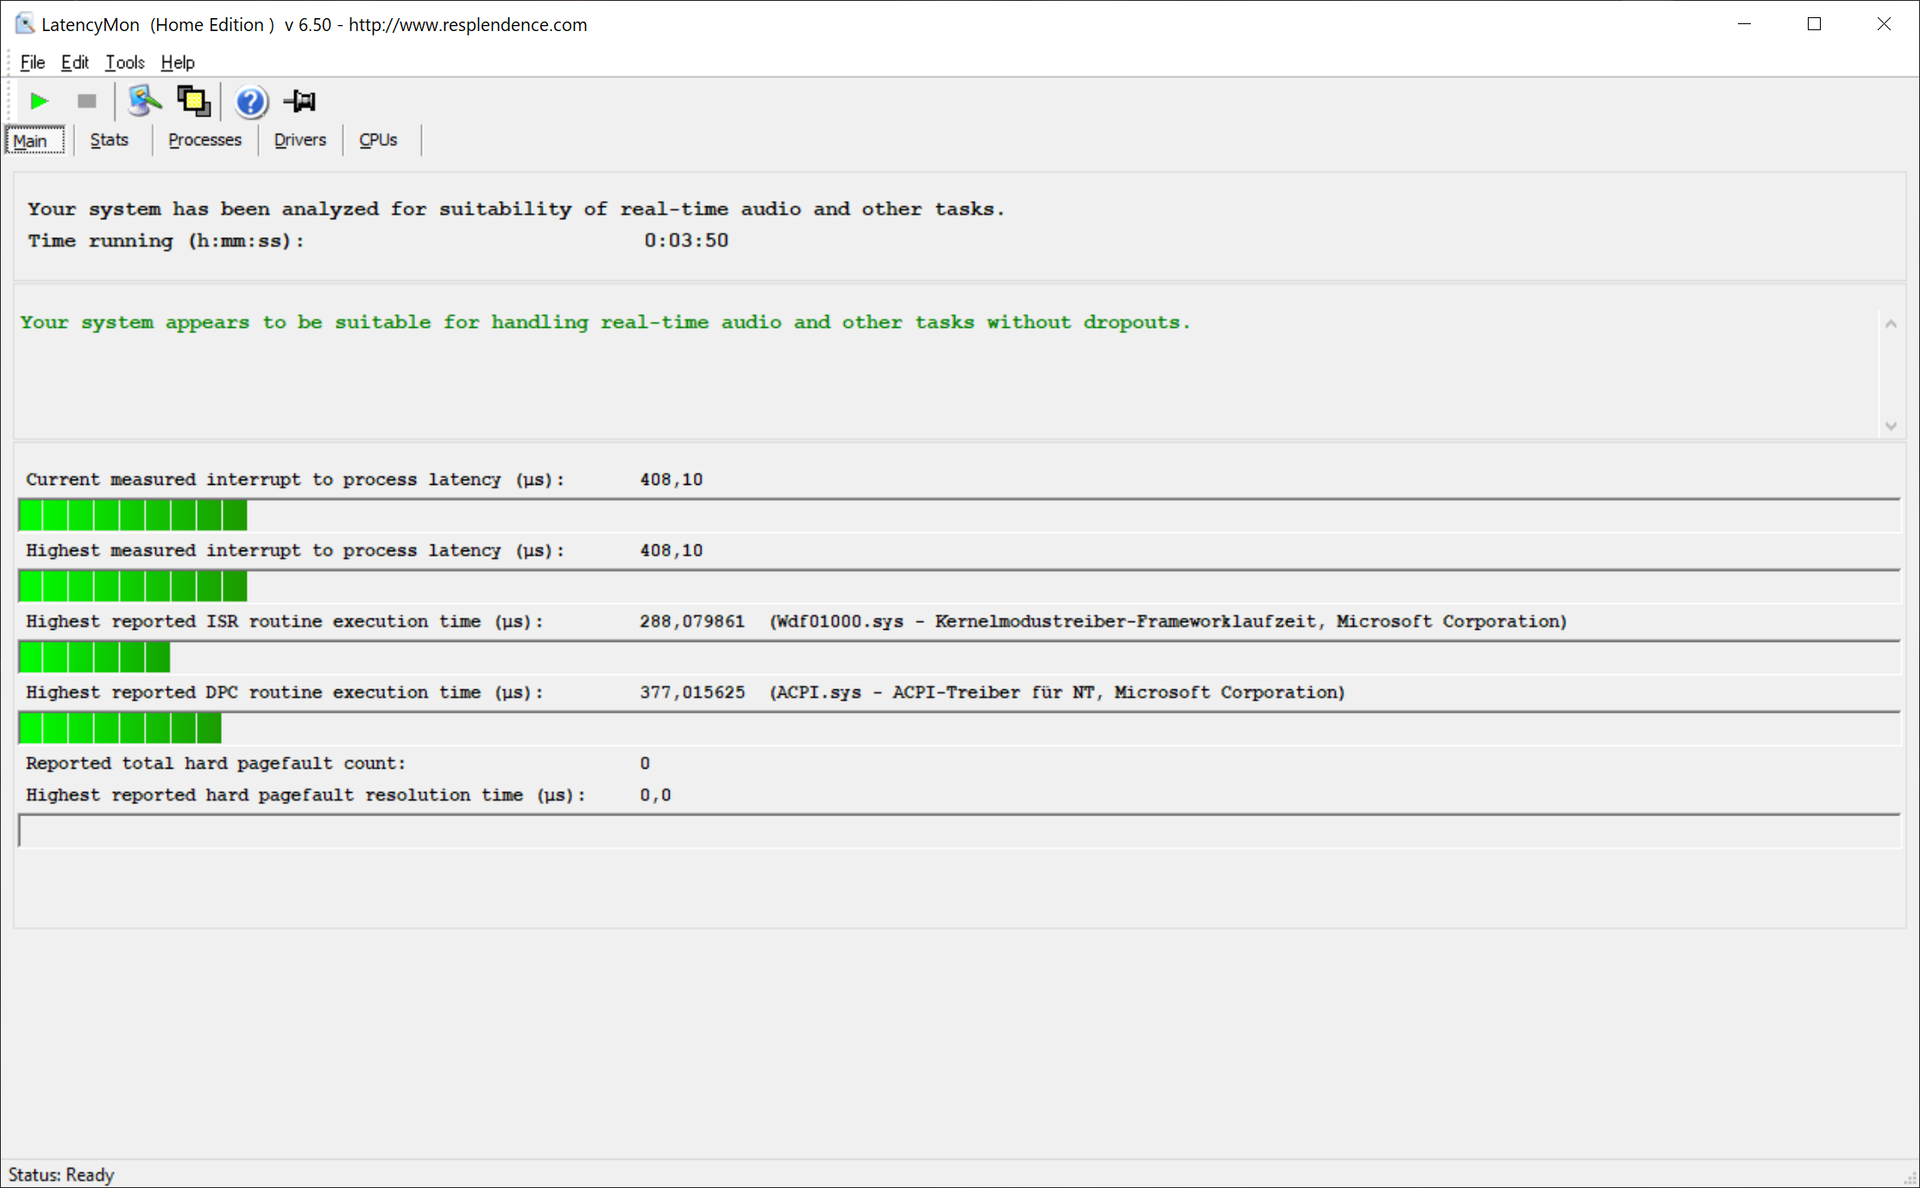
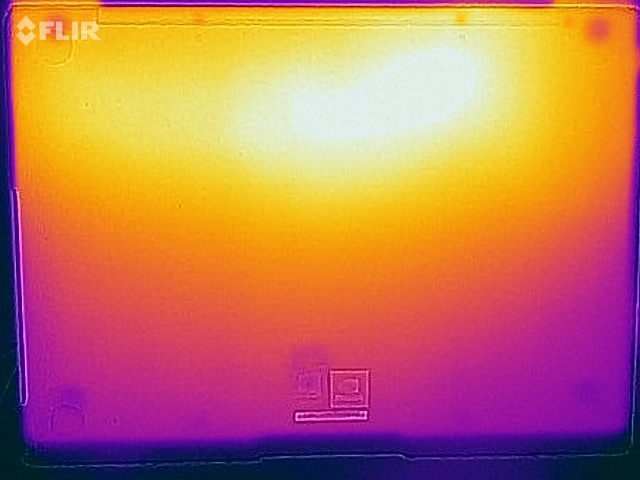
The aluminum case got noticeably warm under load to a point where our fingers got warm and the bottom became uncomfortably hot during lap use. There were no limitations or restrictions otherwise. The insufficient cooling solution reared its ugly head once again in our stress test. The processor was forced to thermal throttle drastically to just 4x 1.1 GHz (8 W) with the GPU running at just around 780 MHz. Performance was restored to its previous level immediately after running our stress test.
(±) The maximum temperature on the upper side is 44.7 °C / 112 F, compared to the average of 35.9 °C / 97 F, ranging from 21.4 to 59 °C for the class Subnotebook.
(±) The bottom heats up to a maximum of 42.6 °C / 109 F, compared to the average of 39.2 °C / 103 F
(+) In idle usage, the average temperature for the upper side is 26.5 °C / 80 F, compared to the device average of 30.8 °C / 87 F.
(-) Playing The Witcher 3, the average temperature for the upper side is 41.7 °C / 107 F, compared to the device average of 30.8 °C / 87 F.
(+) The palmrests and touchpad are reaching skin temperature as a maximum (34.8 °C / 94.6 F) and are therefore not hot.
(-) The average temperature of the palmrest area of similar devices was 28.2 °C / 82.8 F (-6.6 °C / -11.8 F).

Speakers
Compared to its predecessor, the MateBook X Pro’s quad-speaker array’s maximum volume is now slightly higher. In return, our extensive tests revealed weaker mids and highs. The speakers are certainly not bad but nothing to write home about either and pretty average overall. Watching movies or listening to music was not particularly enjoyable, and there are various other compact notebooks with significantly better speakers. The 3.5-mm headphone jack worked perfectly fine without any issues.
Huawei MateBook X Pro 2020 i7 audio analysis
(±) | speaker loudness is average but good (77.5 dB)
Bass 100 - 315 Hz
(±) | reduced bass - on average 12.8% lower than median
(±) | linearity of bass is average (9.7% delta to prev. frequency)
Mids 400 - 2000 Hz
(±) | higher mids - on average 6.1% higher than median
(+) | mids are linear (4.8% delta to prev. frequency)
Highs 2 - 16 kHz
(±) | higher highs - on average 5.2% higher than median
(+) | highs are linear (5.9% delta to prev. frequency)
Overall 100 - 16.000 Hz
(±) | linearity of overall sound is average (20.2% difference to median)
Compared to same class
» 64% of all tested devices in this class were better, 9% similar, 27% worse
» The best had a delta of 5%, average was 18%, worst was 53%
Compared to all devices tested
» 52% of all tested devices were better, 8% similar, 39% worse
» The best had a delta of 4%, average was 24%, worst was 134%
Lenovo Yoga C940-14IIL 81Q9 audio analysis
(+) | speakers can play relatively loud (90.3 dB)
Bass 100 - 315 Hz
(±) | reduced bass - on average 11.2% lower than median
(±) | linearity of bass is average (10.9% delta to prev. frequency)
Mids 400 - 2000 Hz
(+) | balanced mids - only 2.2% away from median
(+) | mids are linear (3.2% delta to prev. frequency)
Highs 2 - 16 kHz
(±) | reduced highs - on average 6% lower than median
(±) | linearity of highs is average (8.9% delta to prev. frequency)
Overall 100 - 16.000 Hz
(+) | overall sound is linear (14.9% difference to median)
Compared to same class
» 23% of all tested devices in this class were better, 5% similar, 72% worse
» The best had a delta of 6%, average was 20%, worst was 57%
Compared to all devices tested
» 20% of all tested devices were better, 4% similar, 76% worse
» The best had a delta of 4%, average was 24%, worst was 134%
Energy Management – Long Battery Life Thanks to LTPS Display
Power Consumption
Our power consumption tests did not reveal any big surprises, and the very bright LTPS display without active backlight had little influence on our readings at large. Despite its dedicated GPU, power consumption under load was similar to its competitors’. Given that the device’s power consumption peaked at 61.5 W for a short period of time, and then settled at just 40 W, the 65 W power supply is more than sufficiently dimensioned.
| Off / Standby | |
| Idle | |
| Load |
|
Key:
min: | |
| Huawei MateBook X Pro 2020 i7 i7-10510U, GeForce MX250, Samsung PM981a MZVLB1T0HBLR, LTPS, 3000x2000, 13.9" | Dell XPS 13 9300 4K UHD i7-1065G7, Iris Plus Graphics G7 (Ice Lake 64 EU), Intel SSDPEMKF512G8 NVMe SSD, IPS, 3840x2400, 13.4" | Razer Blade Stealth 13, Core i7-1065G7 i7-1065G7, GeForce GTX 1650 Max-Q, Lite-On CA3-8D512, IPS LED, 3840x2160, 13.3" | Apple MacBook Pro 13 2020 2GHz i5 10th-Gen i5-1038NG7, Iris Plus Graphics G7 (Ice Lake 64 EU), Apple SSD SM0512F, IPS, 2560x1600, 13.3" | Lenovo Yoga C940-14IIL 81Q9 i7-1065G7, Iris Plus Graphics G7 (Ice Lake 64 EU), Samsung PM981a MZVLB1T0HBLR, IPS, 3840x2160, 14" | Huawei MateBook X Pro, i7 i5-8550U, GeForce MX150, Toshiba XG5 KXG50ZNV512G, LTPS, 3000x2000, 13.9" | Average NVIDIA GeForce MX250 | Average of class Subnotebook | |
|---|---|---|---|---|---|---|---|---|
| Power Consumption | 8% | -50% | 4% | -9% | 14% | 1% | 17% | |
| Idle Minimum * (Watt) | 4.3 | 5.3 -23% | 10.7 -149% | 3.8 12% | 5.6 -30% | 4.7 -9% | 4.1 ? 5% | 3.82 ? 11% |
| Idle Average * (Watt) | 8.5 | 7.8 8% | 13.6 -60% | 8.6 -1% | 10.5 -24% | 8.7 -2% | 7.91 ? 7% | 6.61 ? 22% |
| Idle Maximum * (Watt) | 12 | 9.8 18% | 15.7 -31% | 10.3 14% | 12 -0% | 9.8 18% | 10.4 ? 13% | 7.99 ? 33% |
| Load Average * (Watt) | 54.8 | 46 16% | 60 -9% | 52.1 5% | 53.3 3% | 39.4 28% | 58.6 ? -7% | 41.9 ? 24% |
| Witcher 3 ultra * (Watt) | 47.1 | 43 9% | 64 -36% | 48.2 -2% | 46.9 -0% | |||
| Load Maximum * (Watt) | 61.5 | 48.3 21% | 71 -15% | 65.2 -6% | 64.6 -5% | 40.4 34% | 68.9 ? -12% | 64.1 ? -4% |
* ... smaller is better
Battery Life
The 57.4 Wh battery allows for good battery life, and the high-resolution LTPS display turned out to be fairly energy efficient overall. In our two real-world tests with brightness normalized at 150 nits, the MateBook X Pro ran for 12 (video) and 10.5 (Wi-Fi) hours, respectively, and it performed pretty well within its comparison group. Those results were also very close to what Huawei claims for the device (11 hours web-browsing, 13 hours video). When running the Wi-Fi test on maximum brightness the device ran out of juice after 6.5 hours. Charging the laptop from near empty to full takes around 140 minutes with the device powered up and running. Fast charging is not supported.
| Huawei MateBook X Pro 2020 i7 i7-10510U, GeForce MX250, 57.4 Wh | Dell XPS 13 9300 4K UHD i7-1065G7, Iris Plus Graphics G7 (Ice Lake 64 EU), 52 Wh | Razer Blade Stealth 13, Core i7-1065G7 i7-1065G7, GeForce GTX 1650 Max-Q, 53.1 Wh | Apple MacBook Pro 13 2020 2GHz i5 10th-Gen i5-1038NG7, Iris Plus Graphics G7 (Ice Lake 64 EU), 58 Wh | Lenovo Yoga C940-14IIL 81Q9 i7-1065G7, Iris Plus Graphics G7 (Ice Lake 64 EU), 60 Wh | Huawei MateBook X Pro, i7 i5-8550U, GeForce MX150, 57 Wh | Average of class Subnotebook | |
|---|---|---|---|---|---|---|---|
| Battery runtime | 10% | -38% | 7% | -30% | -6% | 16% | |
| H.264 (h) | 11.9 | 6.3 -47% | 11.5 -3% | 15.6 ? 31% | |||
| WiFi v1.3 (h) | 10.4 | 11.4 10% | 5.5 -47% | 12.1 16% | 7.3 -30% | 8.4 -19% | 14 ? 35% |
| Load (h) | 2.4 | 1.9 -21% | 2.6 8% | 1.946 ? -19% |
Pros
Cons
Verdict – Poor Performance Prevents a Better Rating
After reviewing the 2020 revision of the MateBook X Pro we are under the impression that Huawei simply transplanted new and improved hardware components into an existing design without giving much thought to optimization and fine-tuning. We have no other explanation for why the CPU performed even worse than on its two-year old predecessor, and why the GPU remained far behind its capabilities. Comparing the device to modern integrated GPUs shows that combining a ULV processor with a dedicated entry-level GPU has become a moot point, and opting for Intel’s Ice Lake CPU with its integrated G7 GPU would have been a far better choice. Not only would this have eliminated some components, it would have also made improving and optimizing cooling much easier. While performance is still adequate for a compact subnotebook you have to keep in mind that the MateBook X Pro’s competitors manage to achieve the same level of performance without dedicated graphics.
The good news is that this is pretty much all the bad news we have. In all other aspects, Huawei’s subnotebook left a great impression, starting with the beautiful and well-made high-quality aluminum case, the high-resolution display (albeit outdoor usability was somewhat limited by its massively reflective surface coating), and the more than adequate battery life.
Despite the fact that its CPU performance was somewhat poor the MateBook X Pro remains a decent subnotebook. You can confidently opt for the cheaper Core i5 model without hesitation though. Its various qualities include, among other things, the good-looking case and the excellent display.
At 1,600 Euros (~$1,806) the MateBook X Pro is no bargain, and we simply cannot understand why and how Huawei failed to notice the performance problems during development. Real life experiences are comprised of much more than just performance, though, and all things considered the device deserves our endorsement. However, you can confidently scrap the Core i7 processor from your wish list as it fails to make any dent on performance at all.
Huawei MateBook X Pro 2020 i7
- 06/03/2020 v7 (old)
Andreas Osthoff
Price comparison

