MacBook Pro 13 2020 in Review: Apple's subnotebook only gets the mandatory update
We had high hopes for a major refresh of Apple's popular subnotebook this year following the switch from the MacBook Pro 15 to the new MacBook Pro 16 at the end of 2019. However, only the new Magic keyboard was carried over to the new 2020 MacBook Pro 13, so the controversial butterfly keyboard has now been replaced in every MacBook on sale.
Otherwise, there are not many new features, and only the more expensive MBP 13 SKU with 4x Thunderbolt 3 also gets updated Ice Lake processors from Intel; the smaller SKU (2x Thunderbolt 3) on the other hand is still equipped with the old 8th gen processors. Our test unit is the model for 2,129 Euros in Germany, so it is the entry-level spec with 4x TB3 (the corresponding U.S. model starts at $1799). This configuration also includes 16 GB LPDDR4X-RAM and 512 GB PCIe-SSD storage.
Rating | Date | Model | Weight | Height | Size | Resolution | Price |
|---|---|---|---|---|---|---|---|
| 92.1 % v7 (old) | 06 / 2020 | Apple MacBook Pro 13 2020 2GHz i5 10th-Gen i5-1038NG7, Iris Plus Graphics G7 (Ice Lake 64 EU) | 1.4 kg | 15.6 mm | 13.30" | 2560x1600 | |
| 90.7 % v7 (old) | 10 / 2019 | Apple MacBook Pro 13 2019 i5 4TB3 i5-8279U, Iris Plus Graphics 655 | 1.4 kg | 14.9 mm | 13.30" | 2560x1600 | |
| 87 % v7 (old) | 02 / 2020 | Acer Swift 3 SF313-52-71Y7 i7-1065G7, Iris Plus Graphics G7 (Ice Lake 64 EU) | 1.2 kg | 16.6 mm | 13.50" | 2256x1504 | |
| 88 % v7 (old) | 05 / 2020 | Dell XPS 13 9300 4K UHD i7-1065G7, Iris Plus Graphics G7 (Ice Lake 64 EU) | 1.2 kg | 14.8 mm | 13.40" | 3840x2400 | |
| 88.4 % v7 (old) | 12 / 2019 | HP Spectre x360 13-aw0013dx i7-1065G7, Iris Plus Graphics G7 (Ice Lake 64 EU) | 1.2 kg | 16.9 mm | 13.30" | 1920x1080 | |
| 84 % v7 (old) | 02 / 2020 | Microsoft Surface Laptop 3 13 Core i5-1035G7 i5-1035G7, Iris Plus Graphics G7 (Ice Lake 64 EU) | 1.3 kg | 14.5 mm | 13.50" | 2256x1504 |
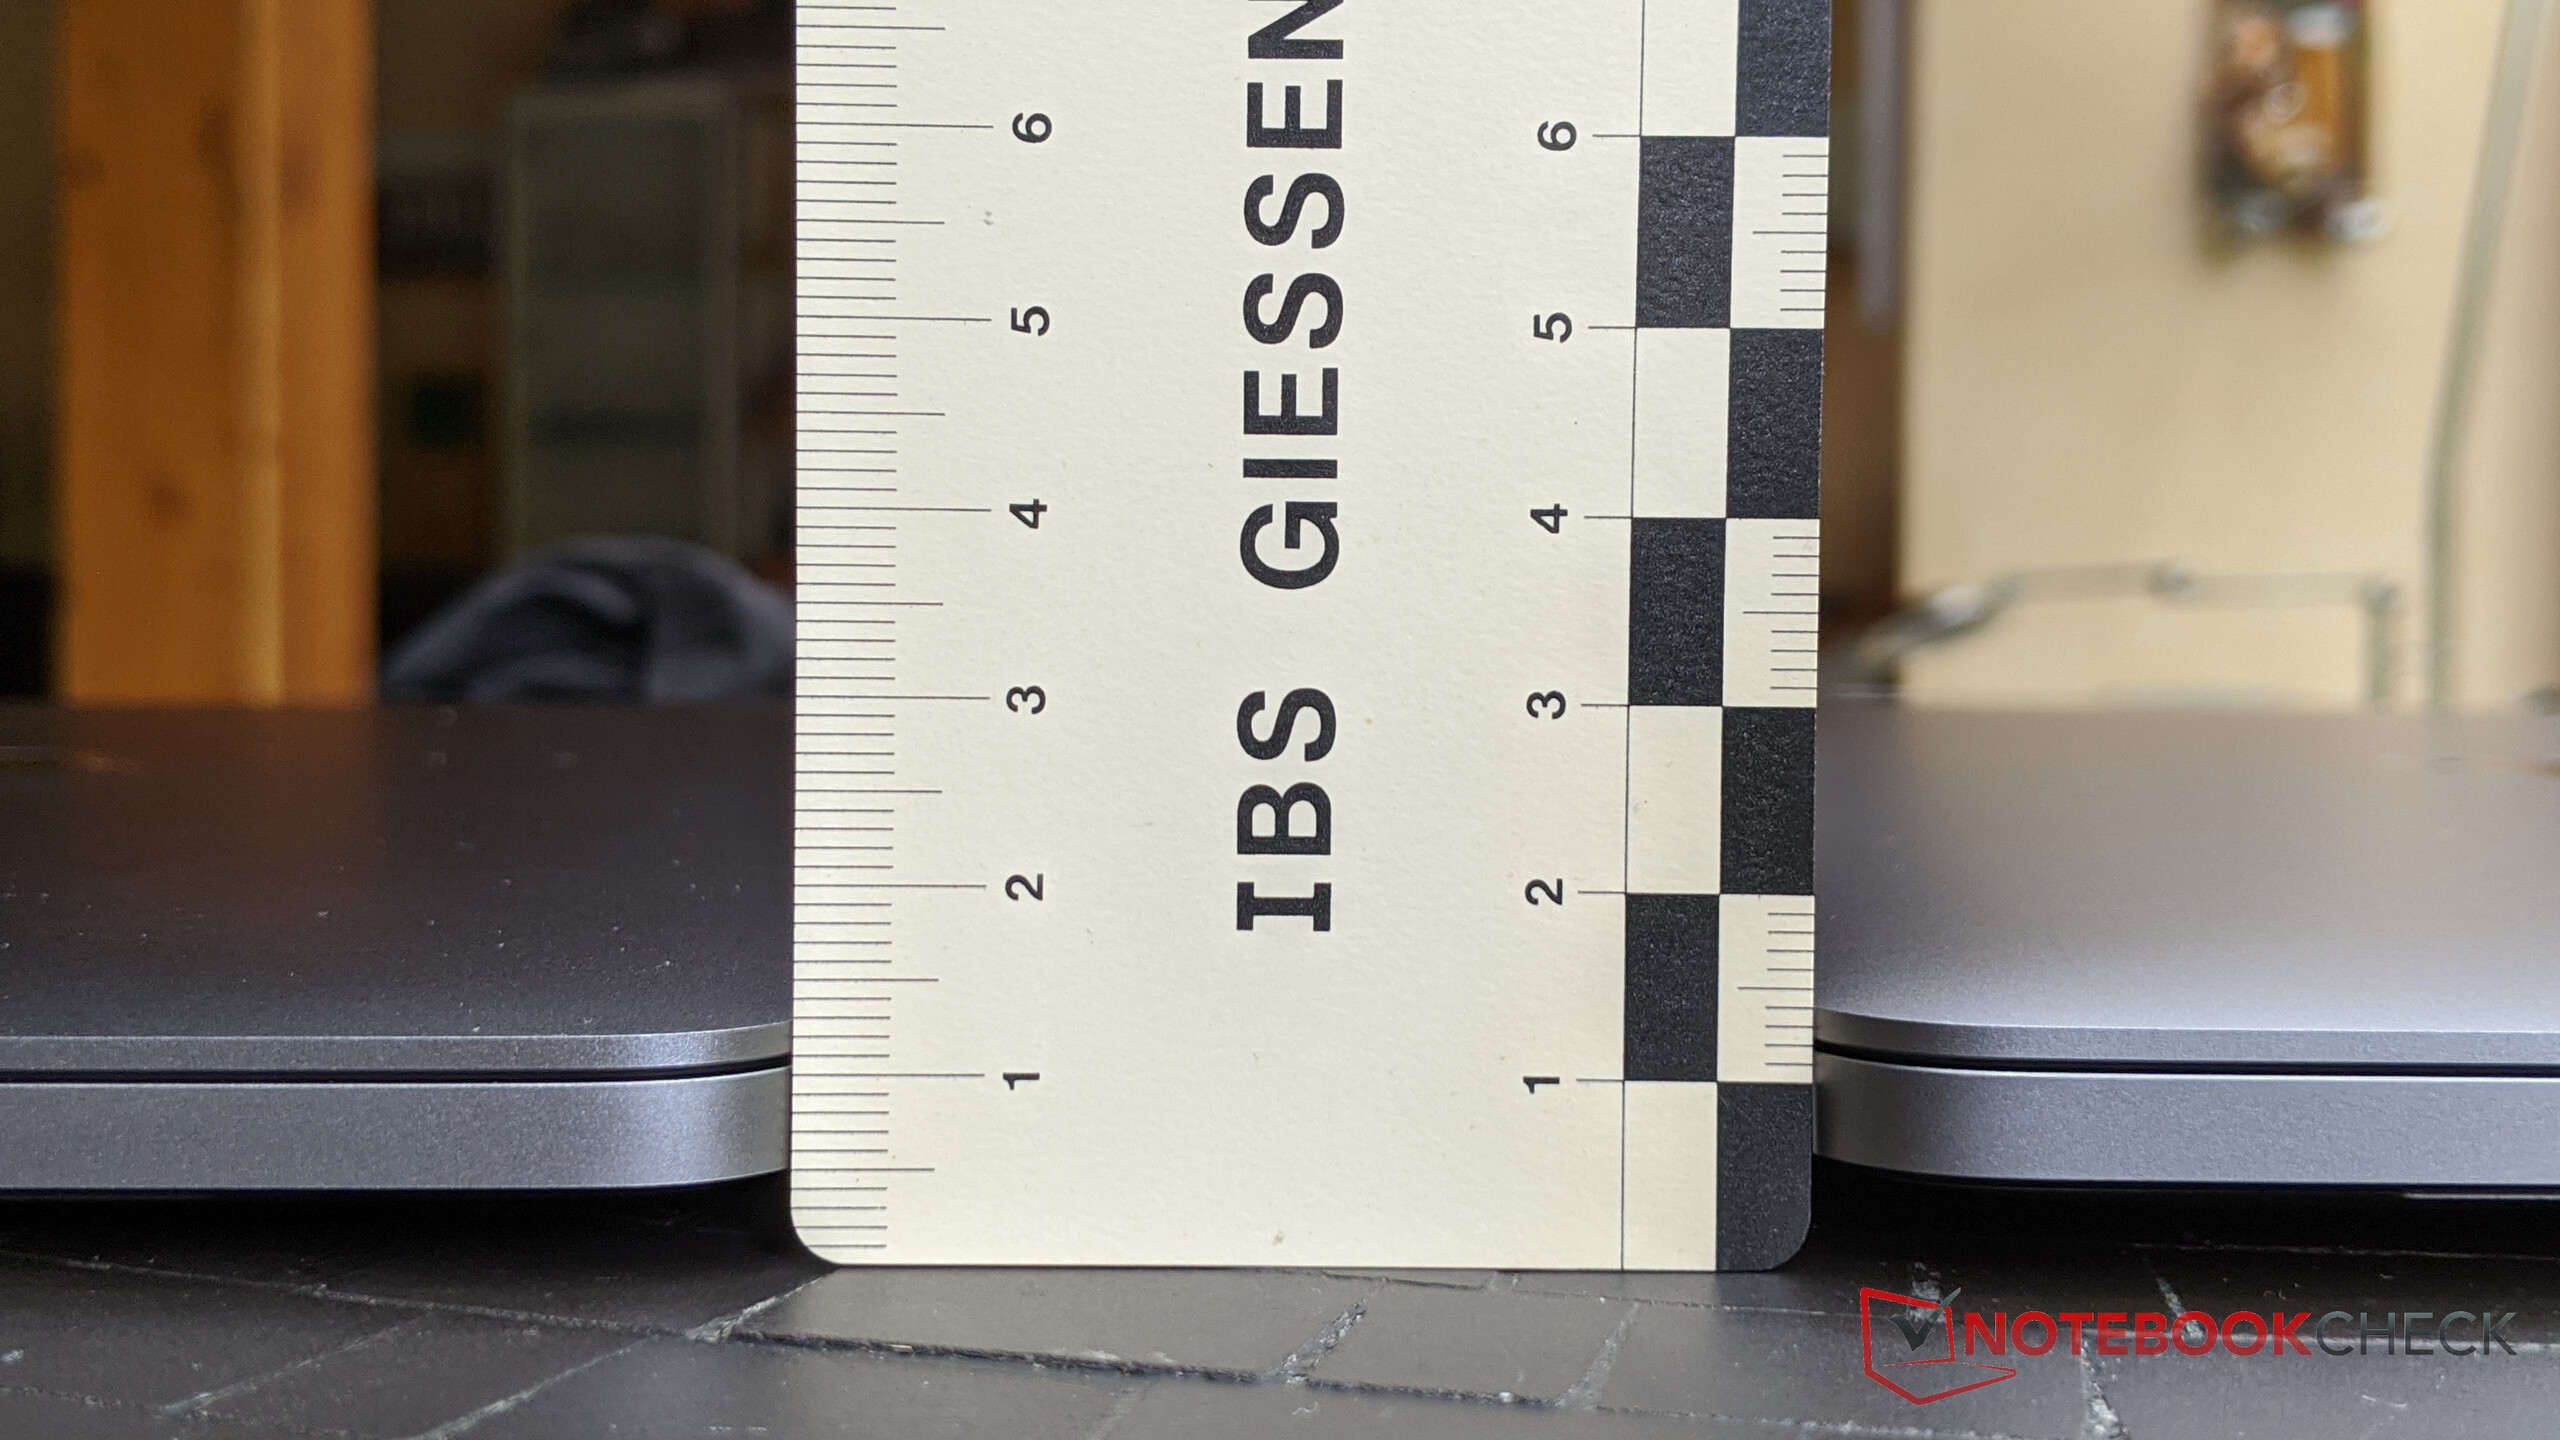
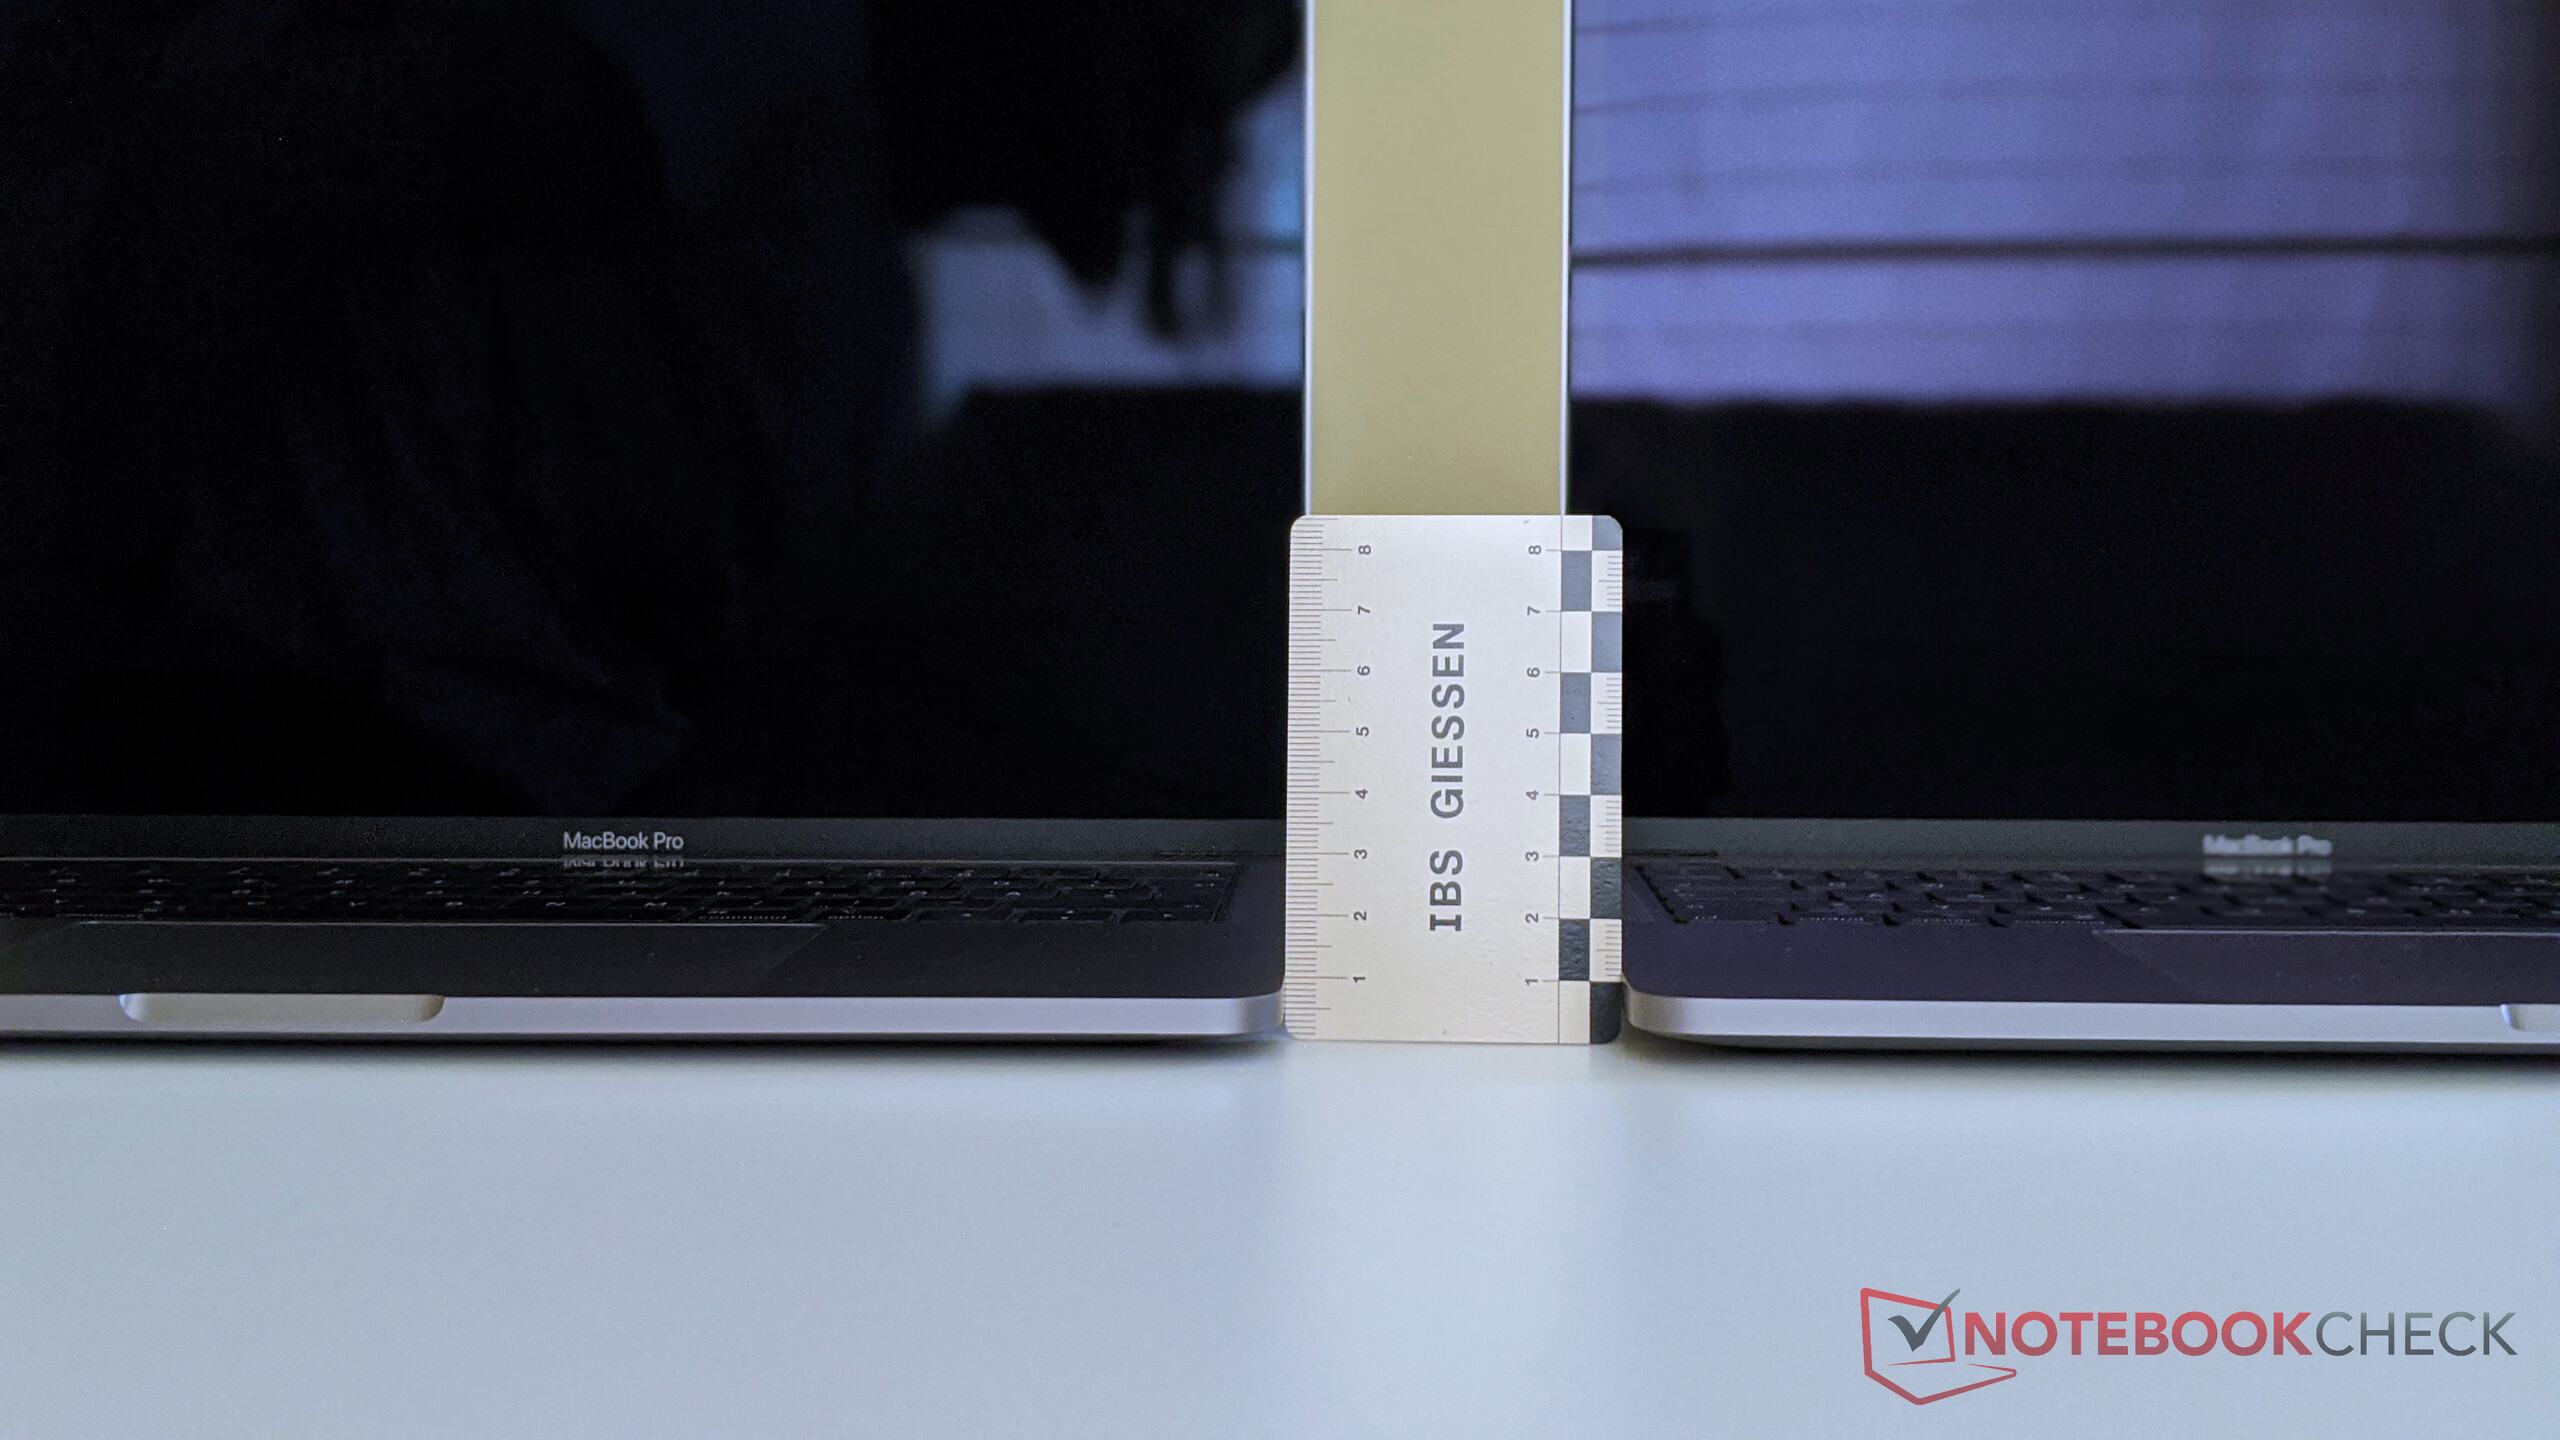
Case – MBP 13 is a bit thicker than before
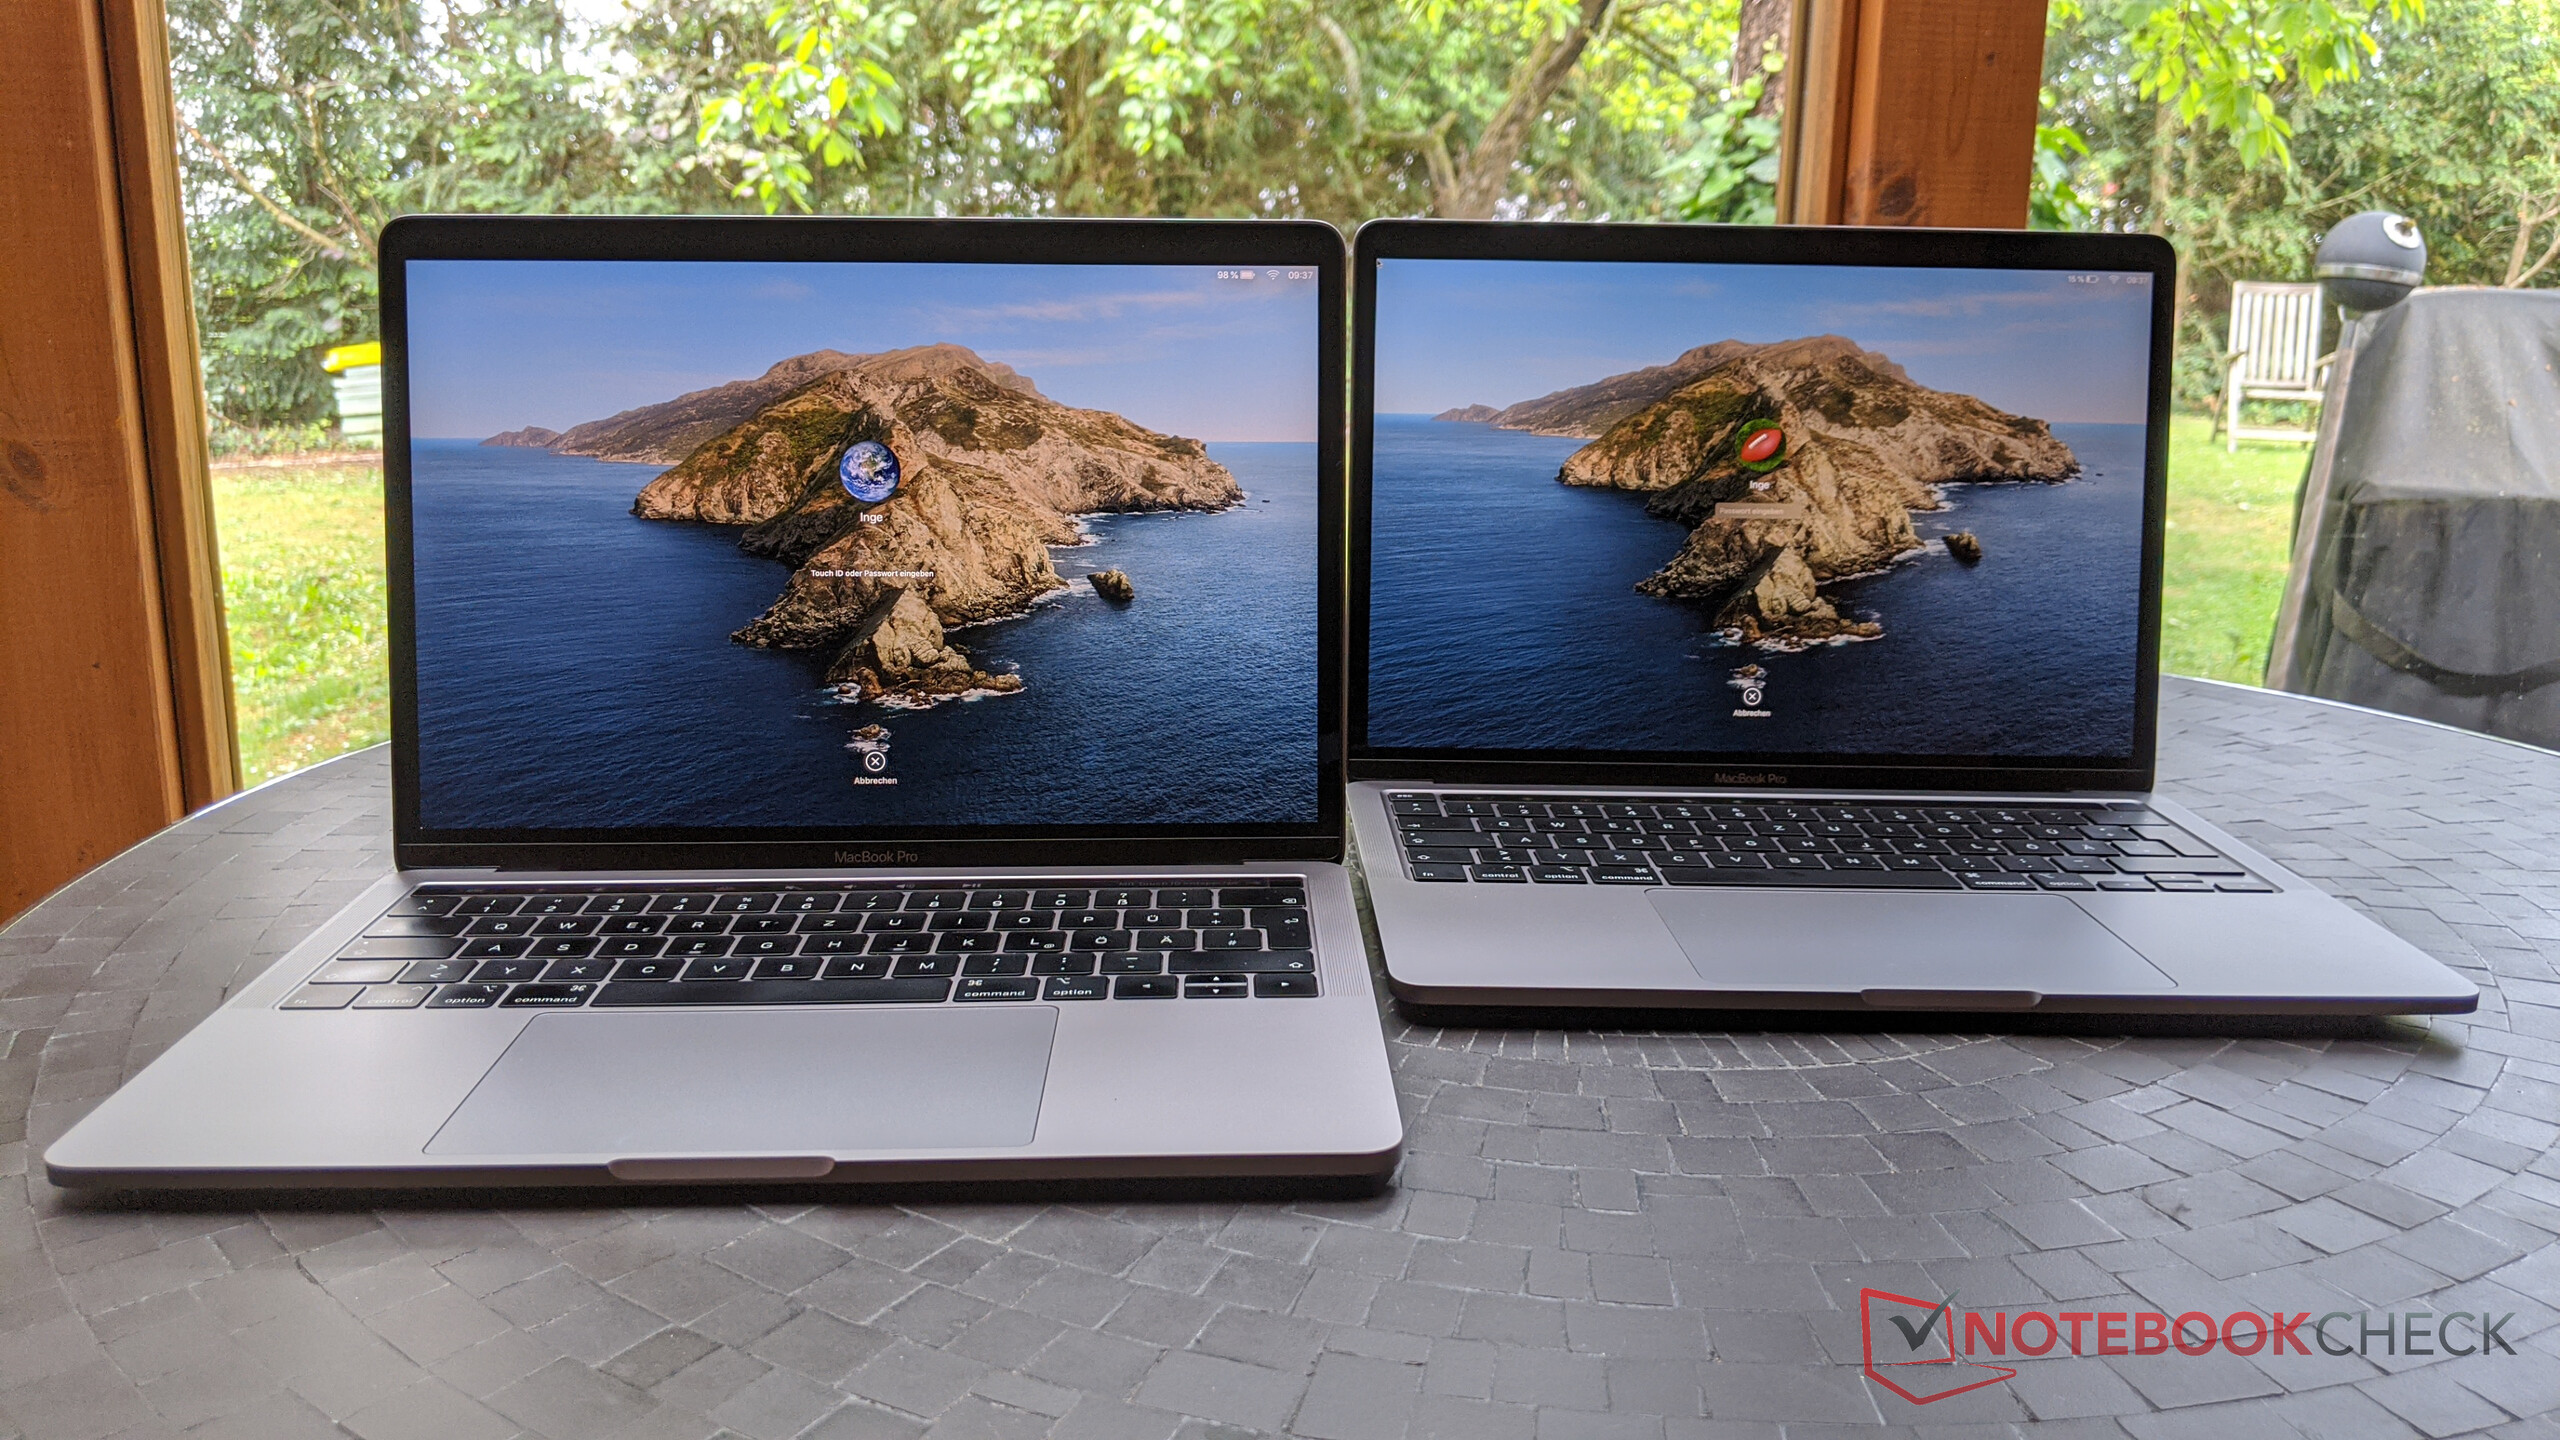
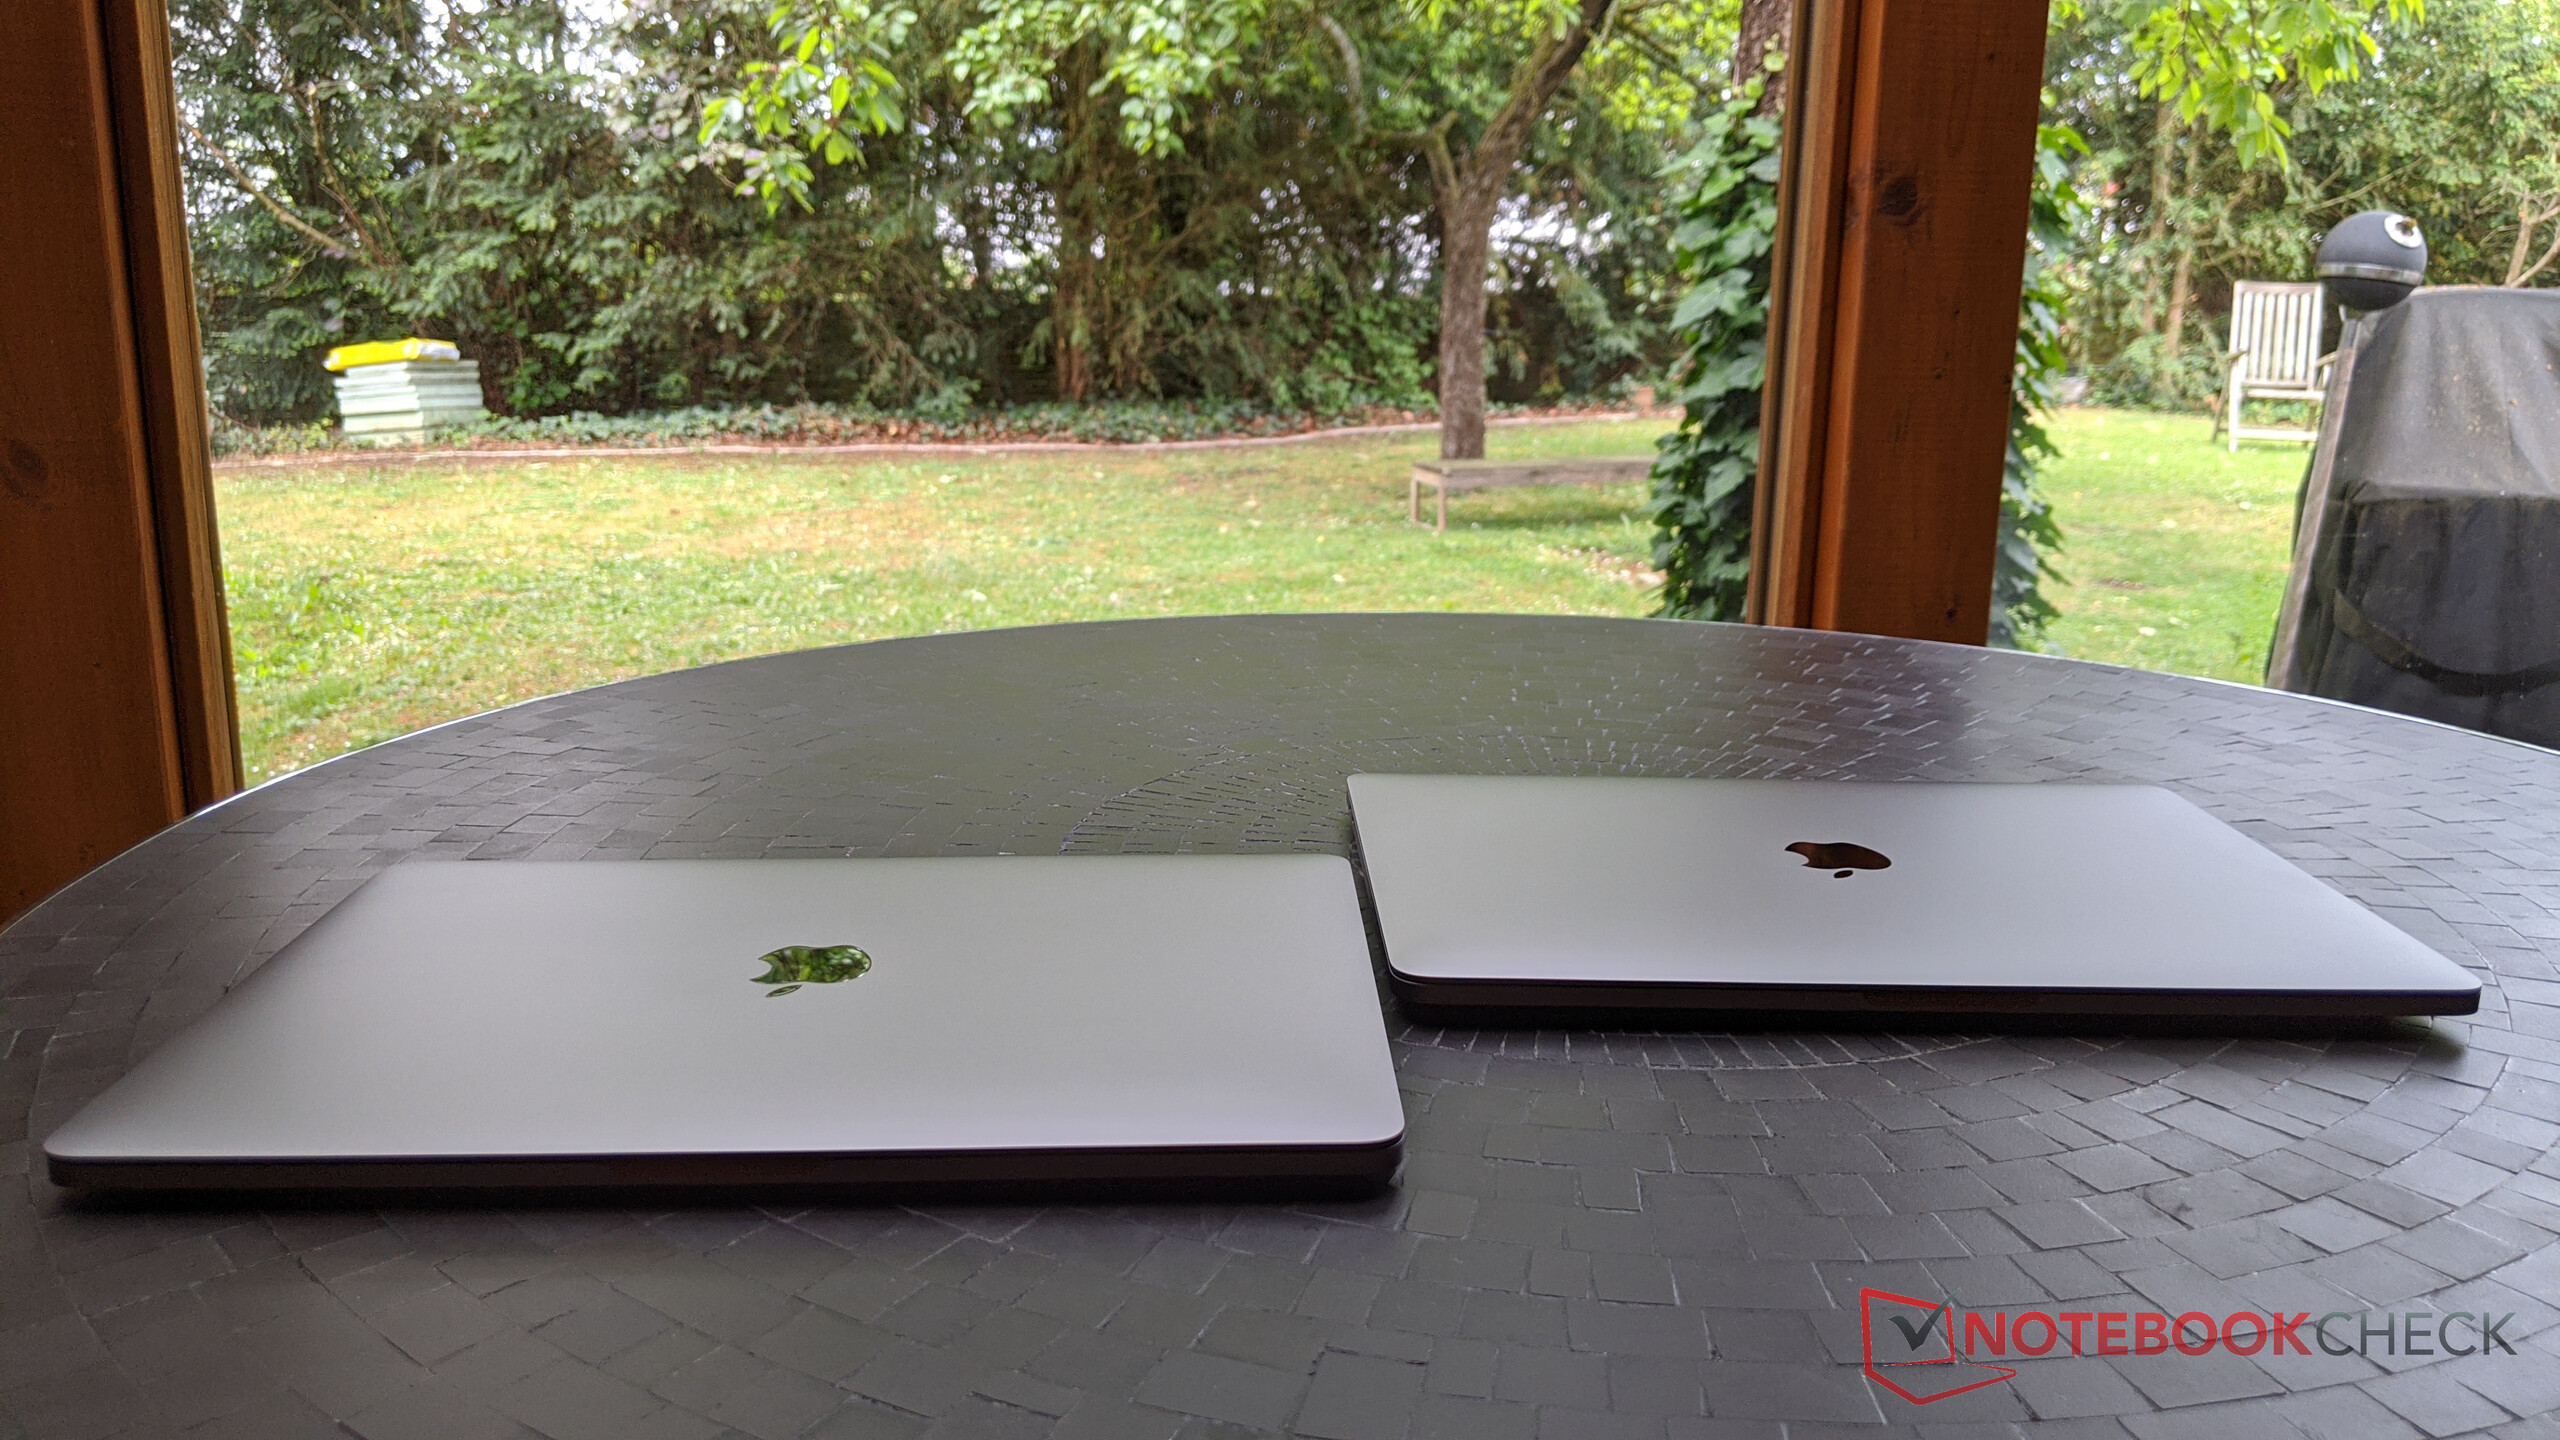
The chassis design has not changed and you can still choose between two color options (Silver and Space Gray). Only a direct comparison with last year's model shows the slightly thicker base unit of the new MacBook. The additional height of ~0.7 mm is required for the new keyboard, which has returned to a more traditional scissor mechanism. The case quality is still top-notch. There are even slimmer and lighter competitors by now, but the unibody metal construction is still great in terms of quality as well as stability.
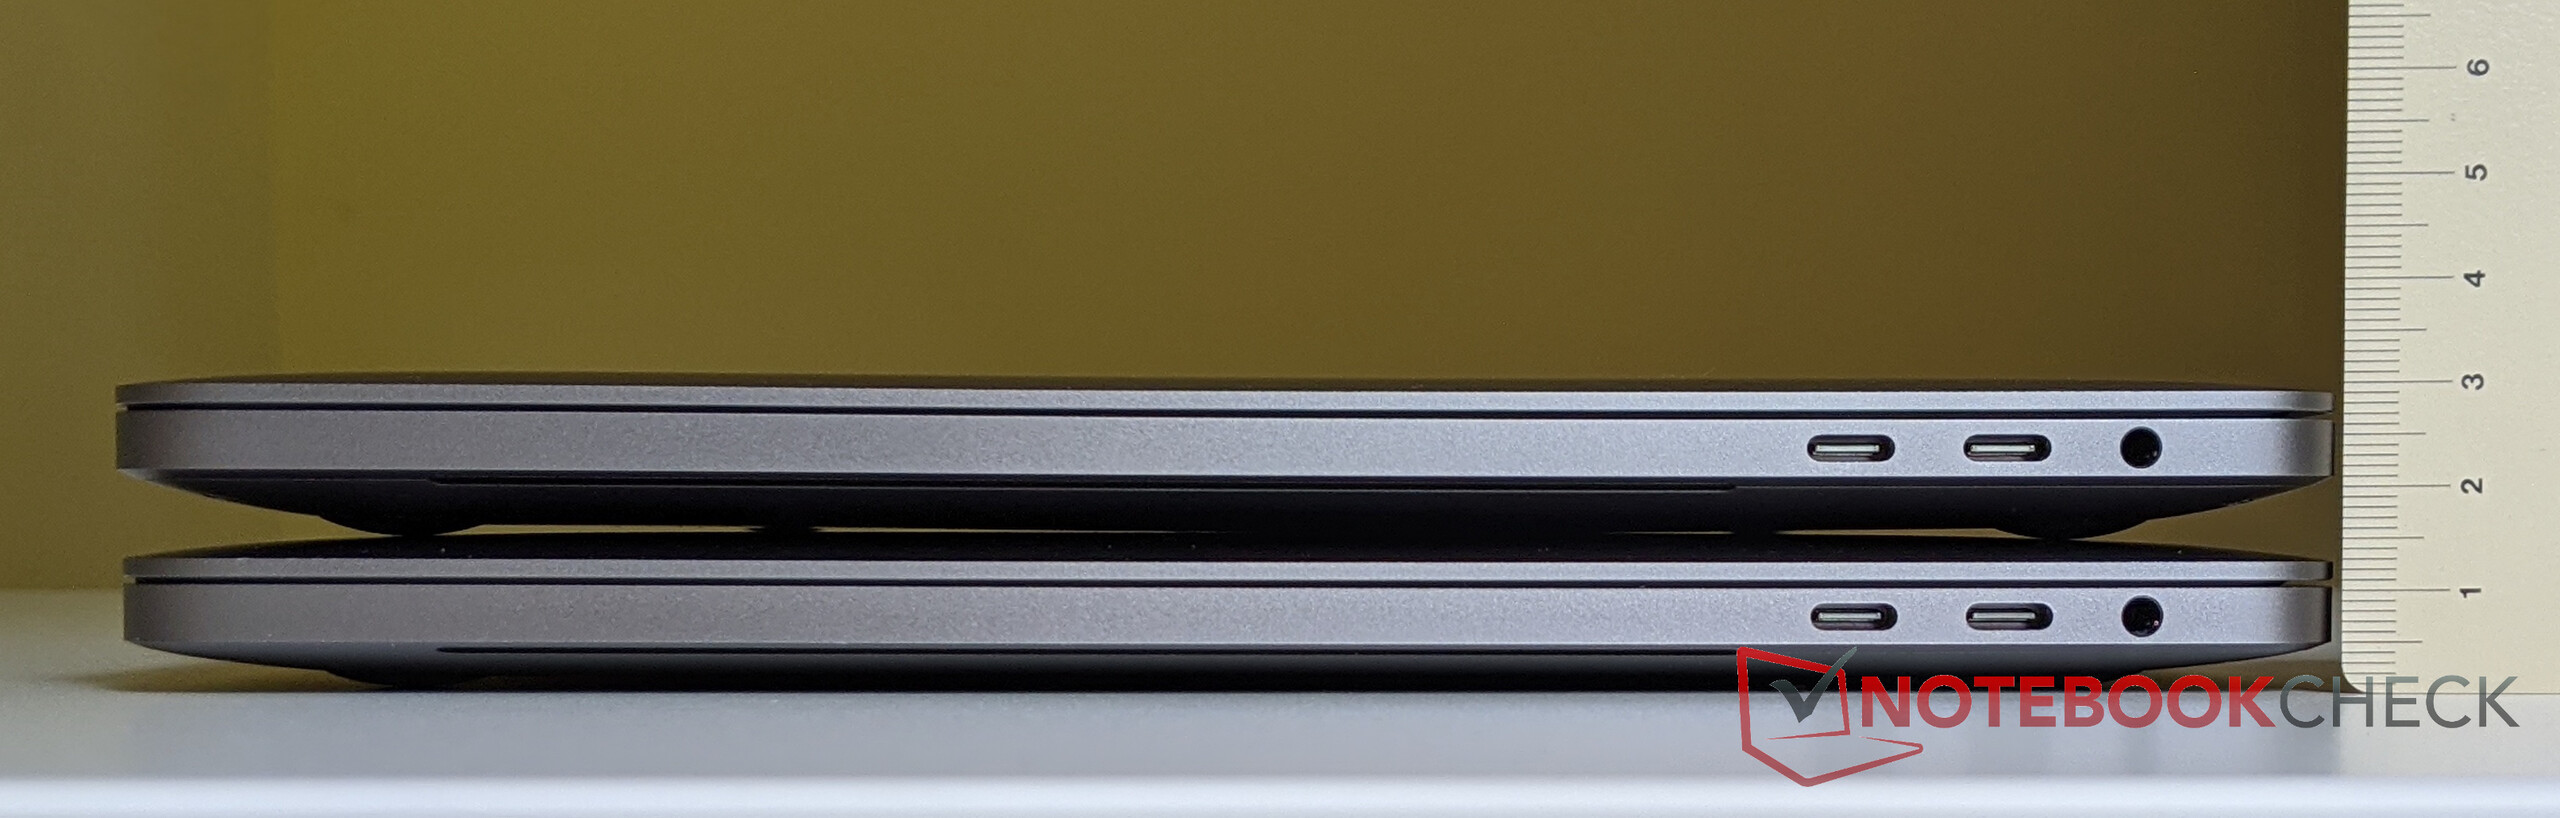
Connectivity – MacBook Pro without Wi-Fi 6
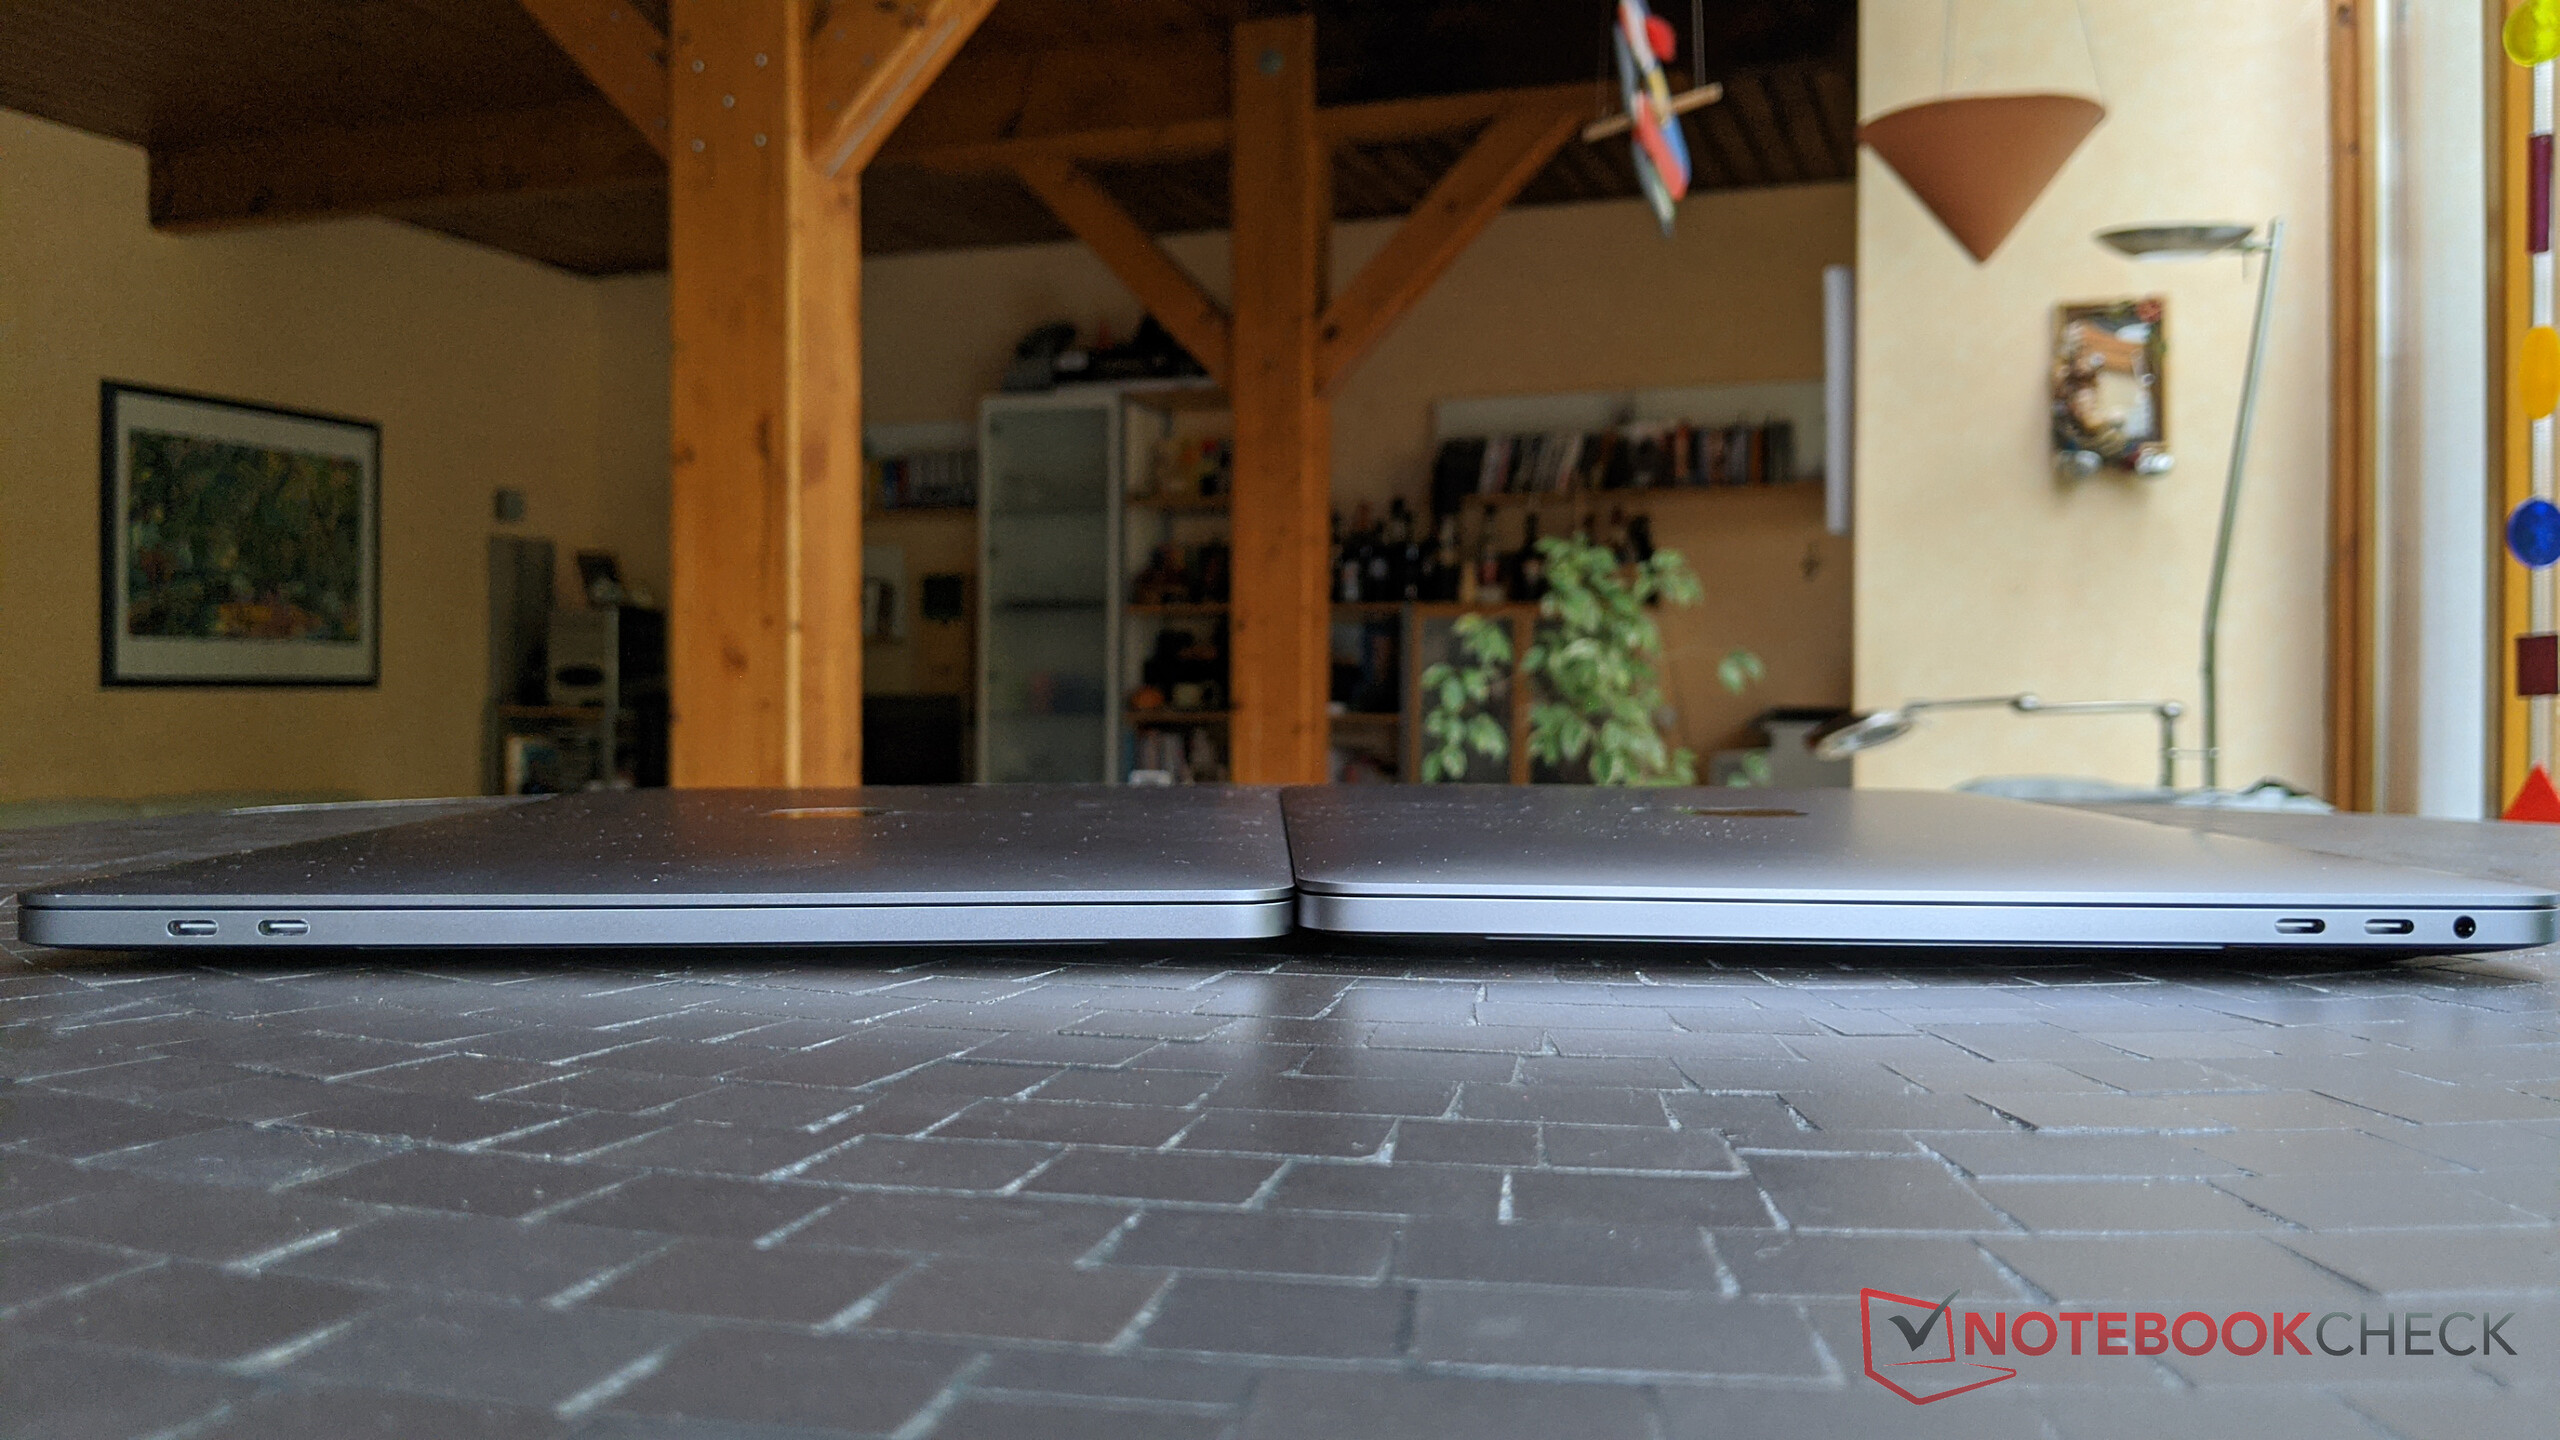
The port situation has not changed; you either get two or four Thunderbolt 3 ports w/ USB-C connectors. The processor of our test unit is based on Intel's current Ice Lake architecture, but Apple still does not include the faster Wi-Fi 6 standard. Our standardized test with the Netgear router Nighthawk RAX 120 shows good transfer rates for a Wi-Fi 5 module.
Webcam – Old 720p FaceTime-HD Camera
The "old" design of the MacBook Pro 13 does not include slim bezels, but you still have to wait for a good webcam. It seems the quality of the FaceTime HD camera has not changed over the last couple of years. We think the manufacturer should start to implement better cameras, especially with the current home office situation in mind.

, i5-1038NG7, Apple SSD SM0512F")
, i5-1038NG7, Apple SSD SM0512F")
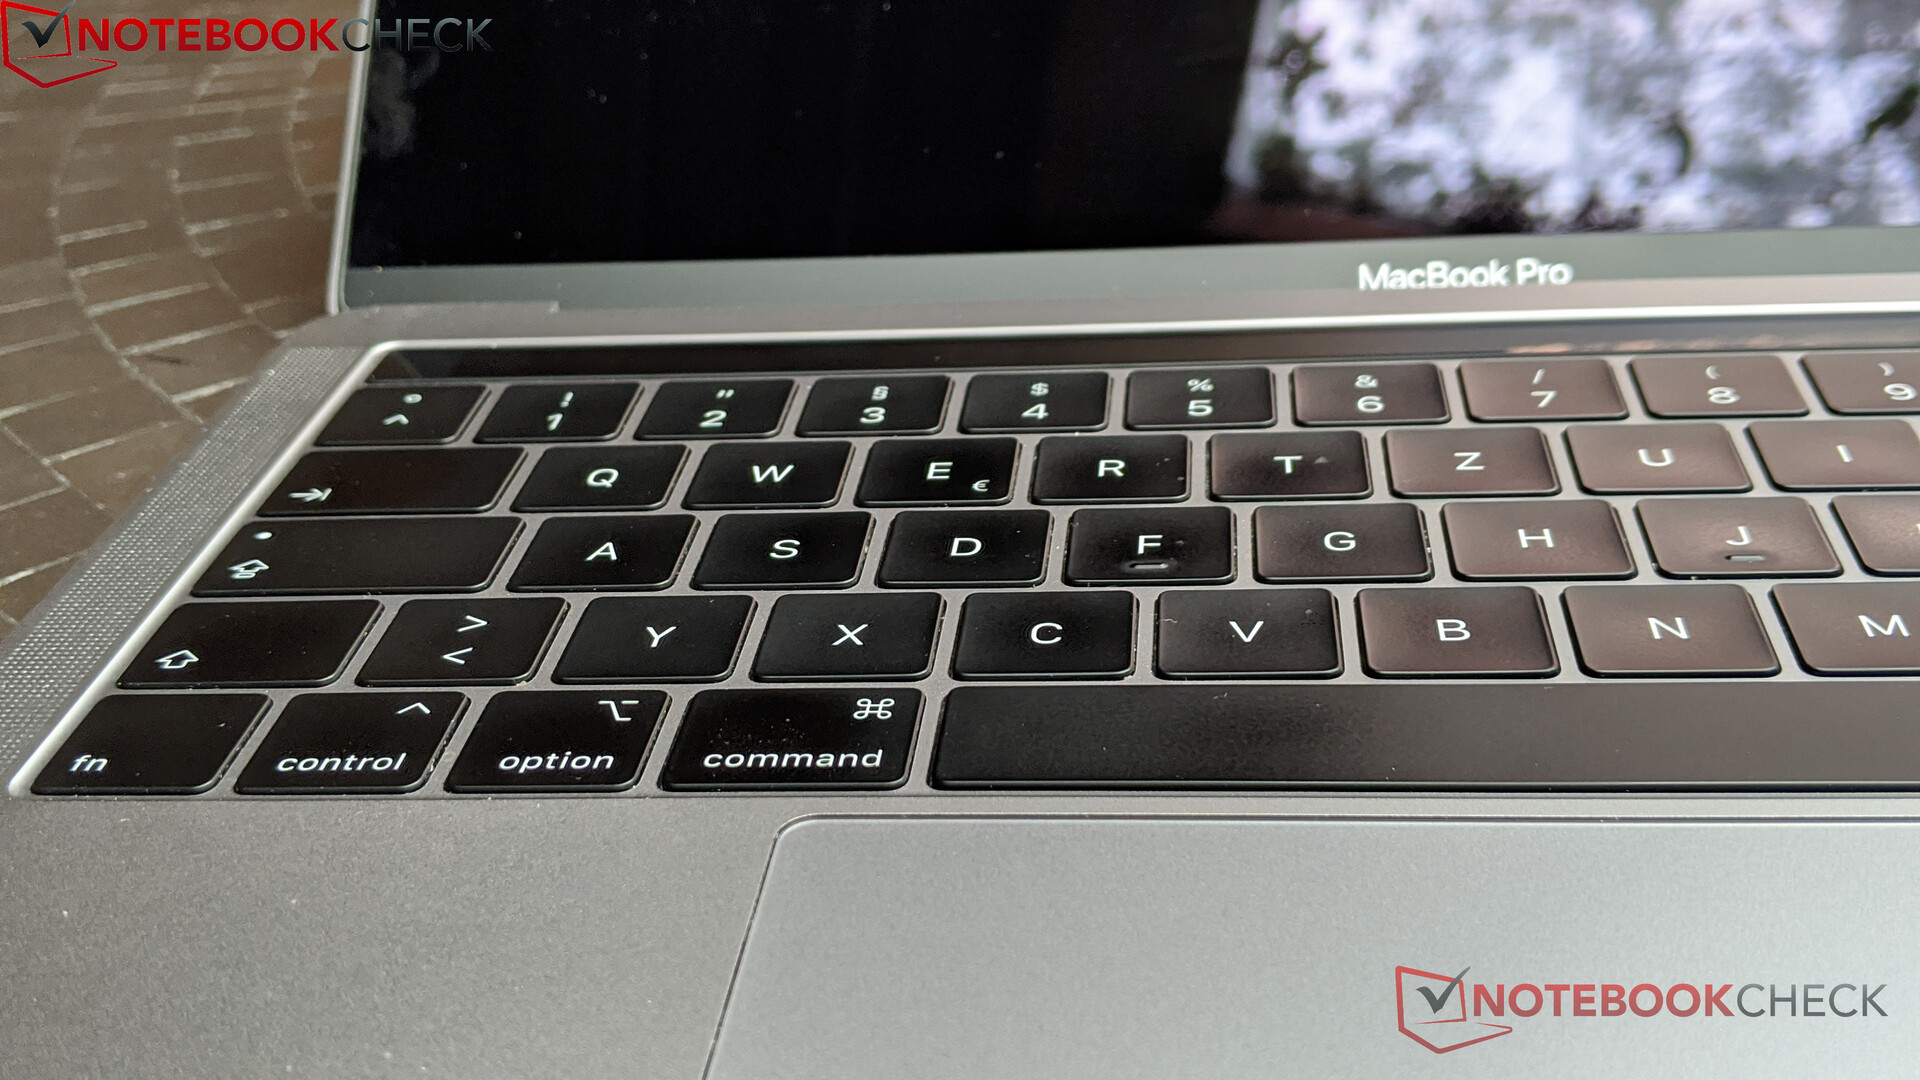
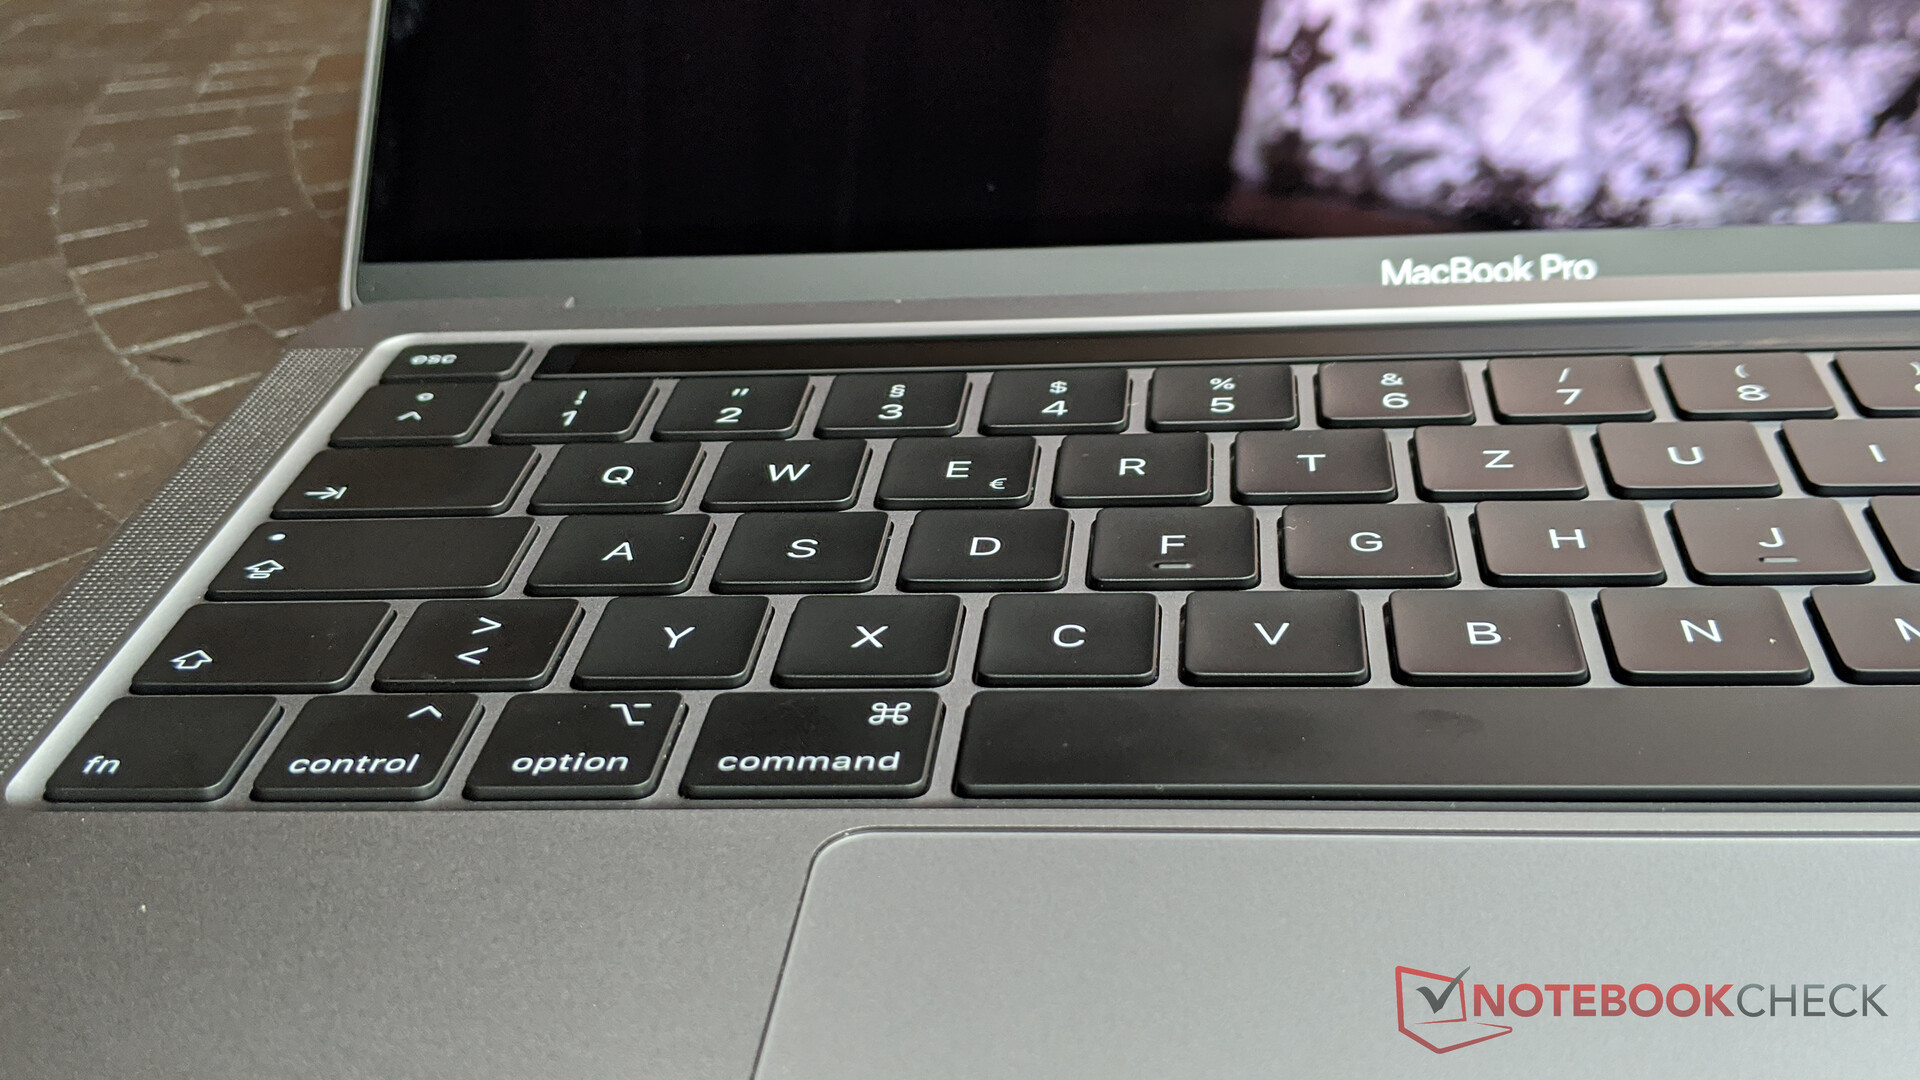
Input Devices – Magic Keyboard now in the small MacBook Pro
Keyboard
After both the MacBook Pro 16 as well as the MacBook Air have already received keyboard upgrades, the MacBook Pro 13 is the last product to get the new Magic keyboard. The very shallow, yet very precise butterfly keyboard, which was often criticized for reliability issues over the last couple of years, has now been replaced with a more conventional scissor mechanism. The key travel is 1 mm and the typing experience reminds us of more of the old MacBook models (MY 2015 and older). If you did not like the butterfly keyboard of the old models, you should definitely have a look at the new Magic keyboard.
There are other small improvements like the half-sized arrow keys (easier to locate with the fingers), the dedicated Esc button as well as the slightly separated power button. You once again get the Touch Bar instead of conventional function keys, but you can still debate about the benefit of the small touch display. It depends heavily on the software support, but the Touch Bar is often still more of a gimmick.
Touchpad
The large trackpad has not been changed, but this is no problem. Apple's trackpads have been the benchmark for laptops for many years now if you talk about precision, gliding capabilities and handling. You obviously benefit from the good optimization for macOS and we cannot criticize anything here. The trackpad also works pretty well when you use Windows, and only drag-n-drop commands are limited, but this is more of a software issue.
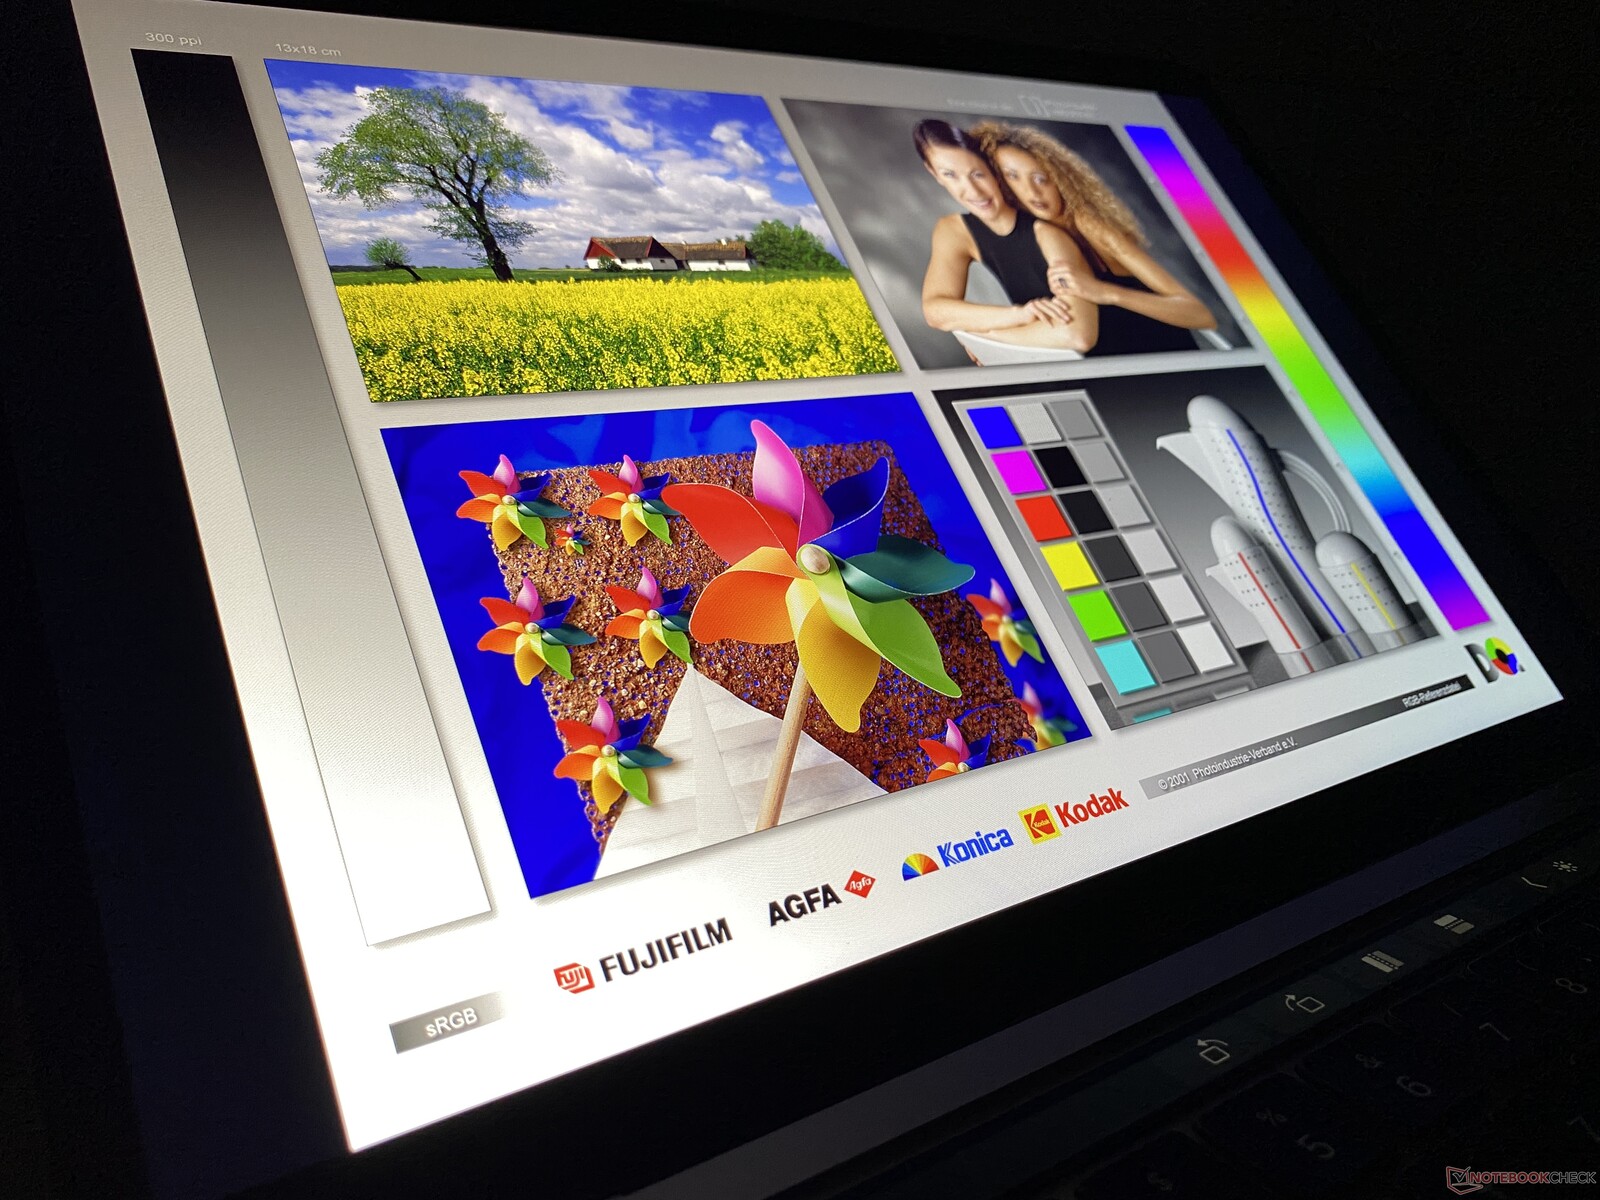
Display – MacBook still with 13-inch screen
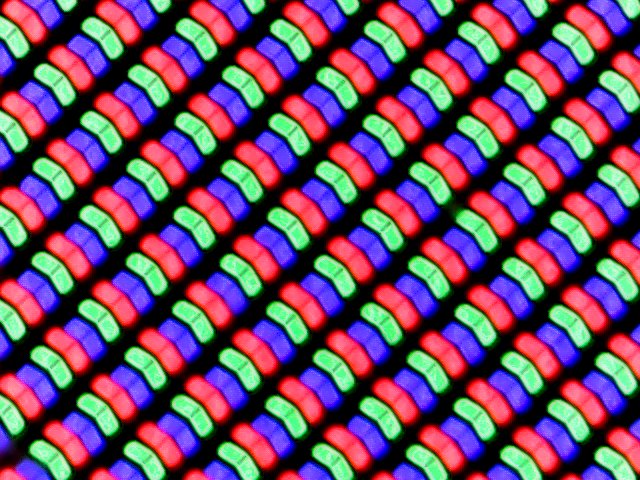
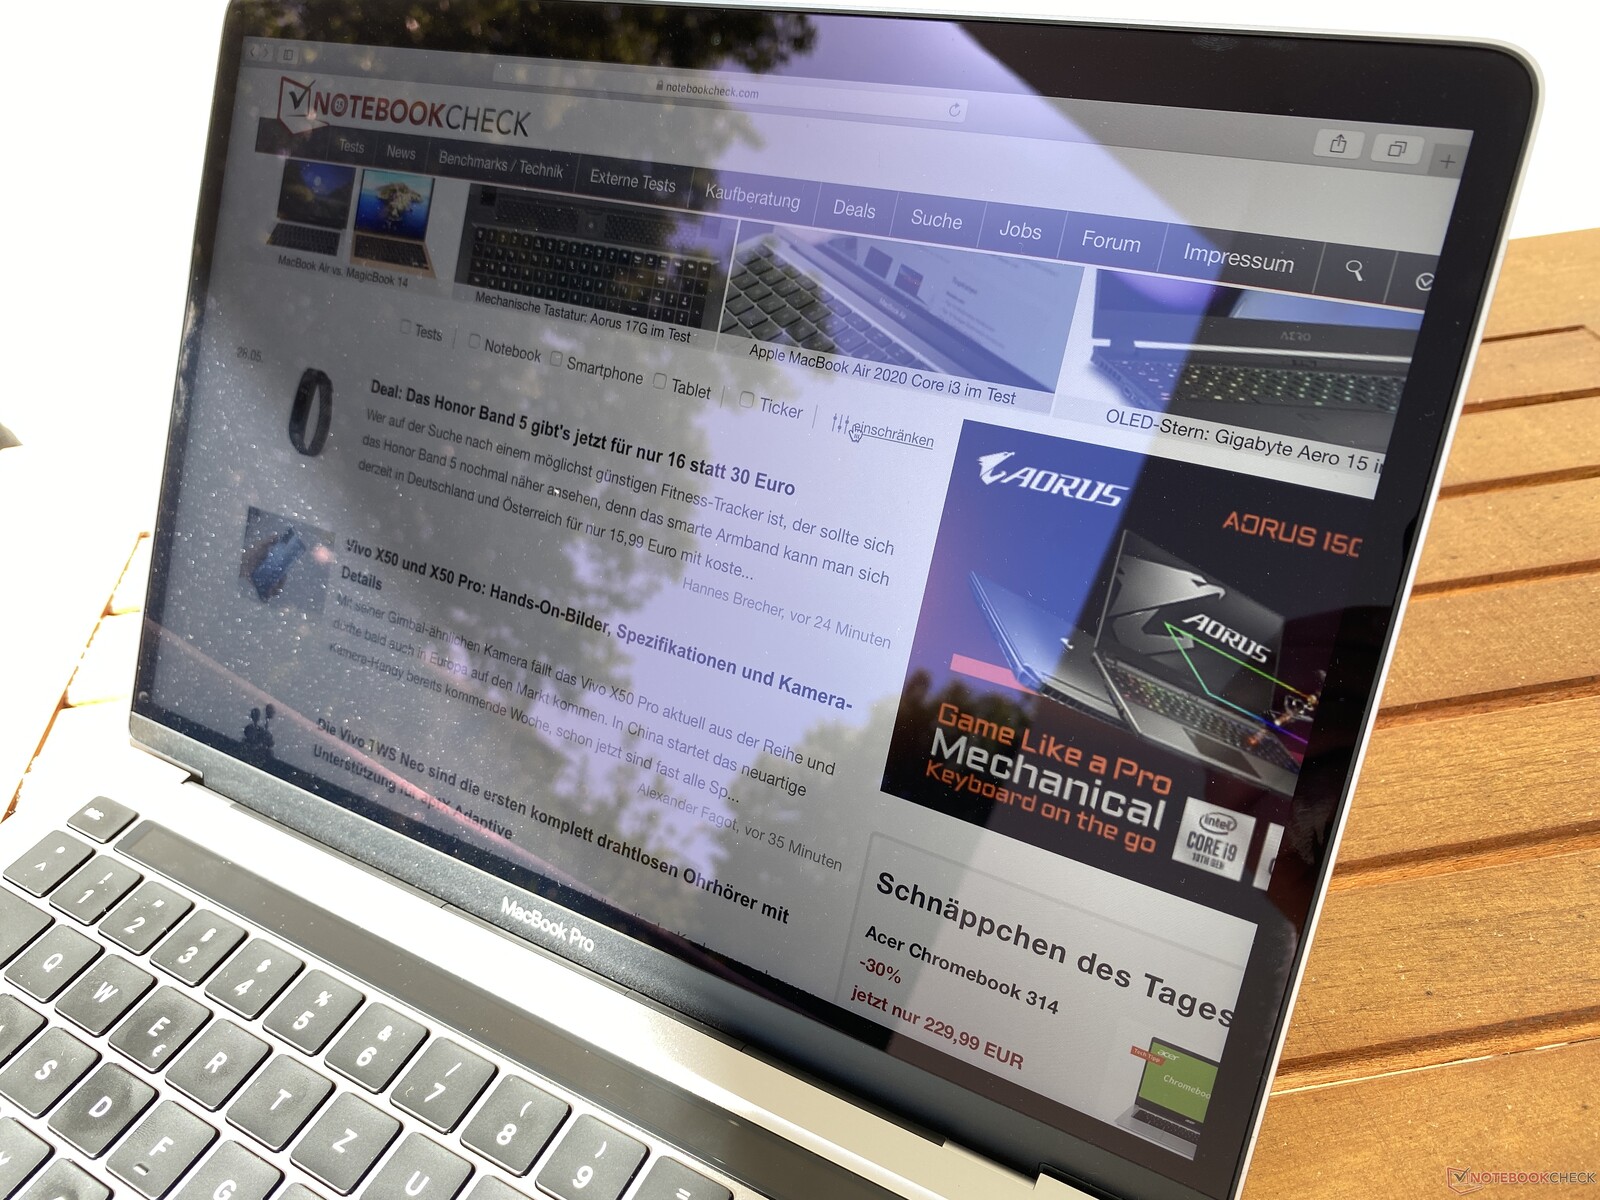
The 16:10 display still has the same specs with 2560x1600 pixels and the subjective picture impression is once again excellent. Contrary to Windows, macOS does not suffer from any scaling issues, either. The brightness is automatically adjusted very gently and we also like the TrueTone feature (automatic adjustment of the color temperature based on the ambient lighting). Compared to the MacBook Air, the IPS screen of the MacBook Pro covers the larger P3 color gamut.
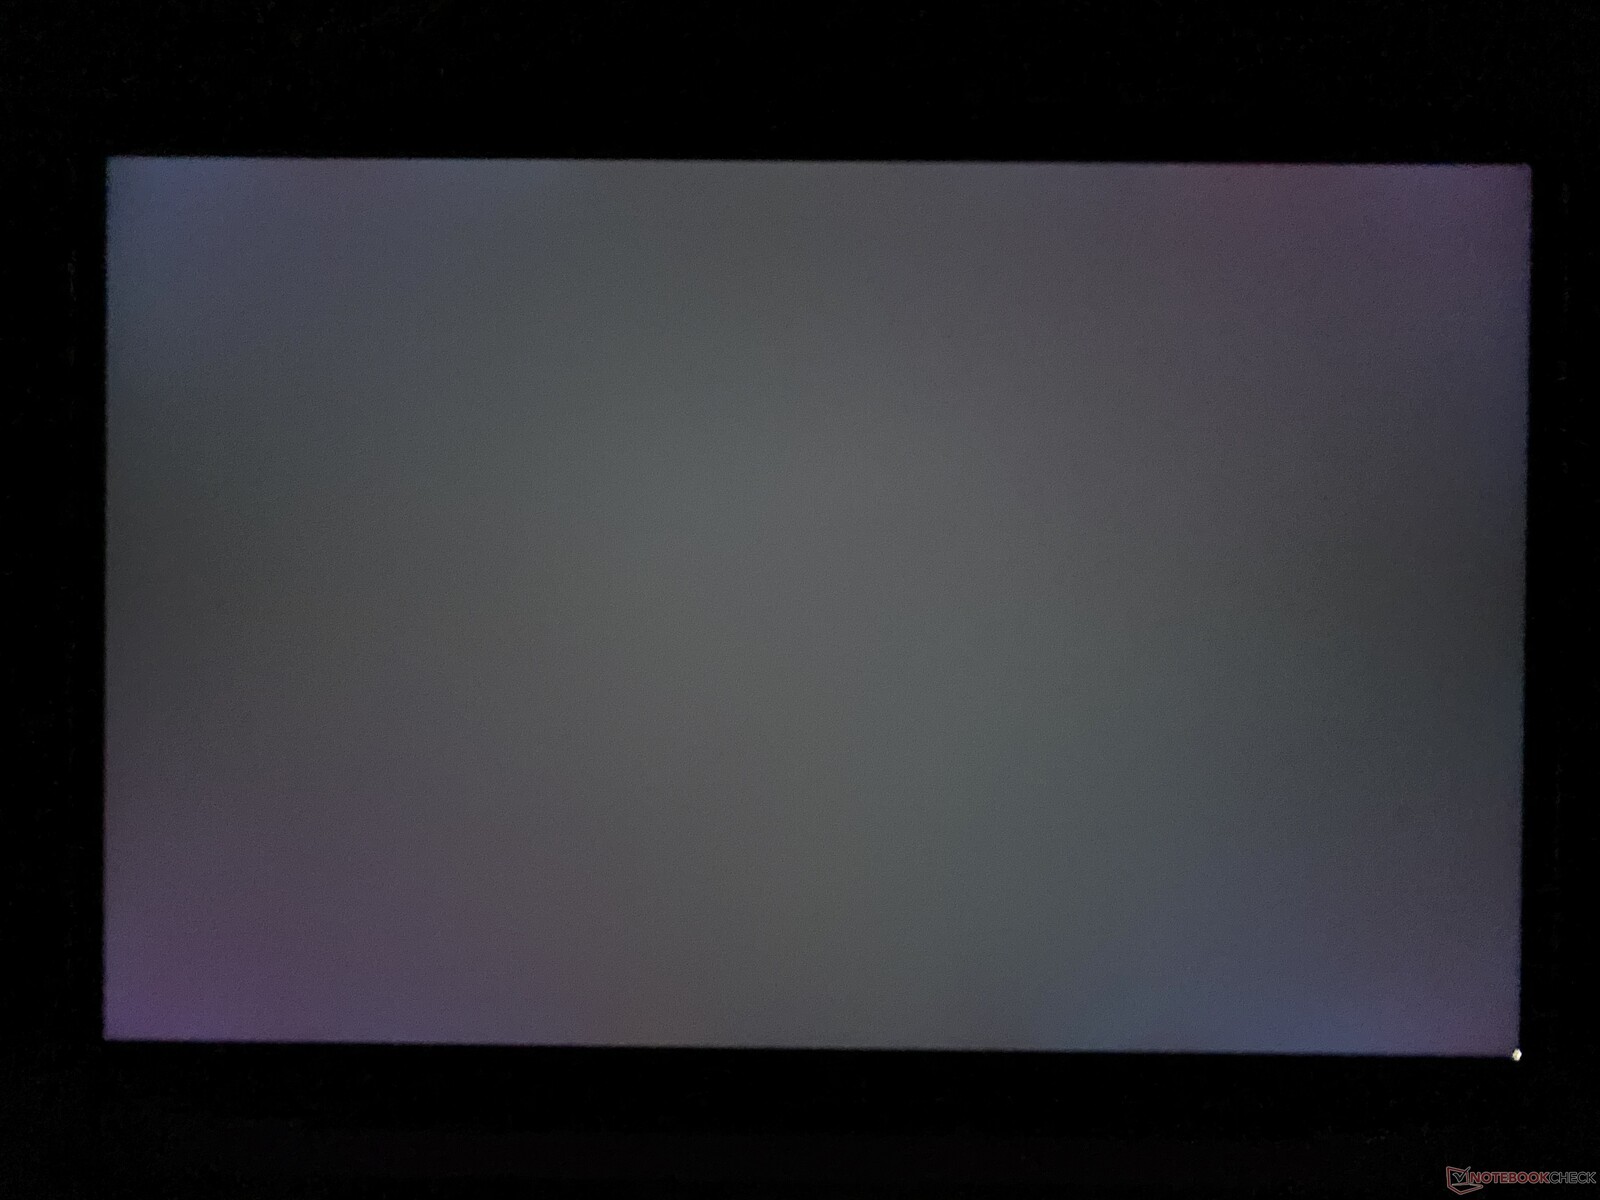
We can detect PWM at a brightness of 75% and lower, but the frequency is extremely high at 113 kHz and should not result in any problems. We cannot notice any backlight bleeding despite the high brightness.
| |||||||||||||||||||||||||
Brightness Distribution: 91 %
Center on Battery: 510 cd/m²
Contrast: 1600:1 (Black: 0.32 cd/m²)
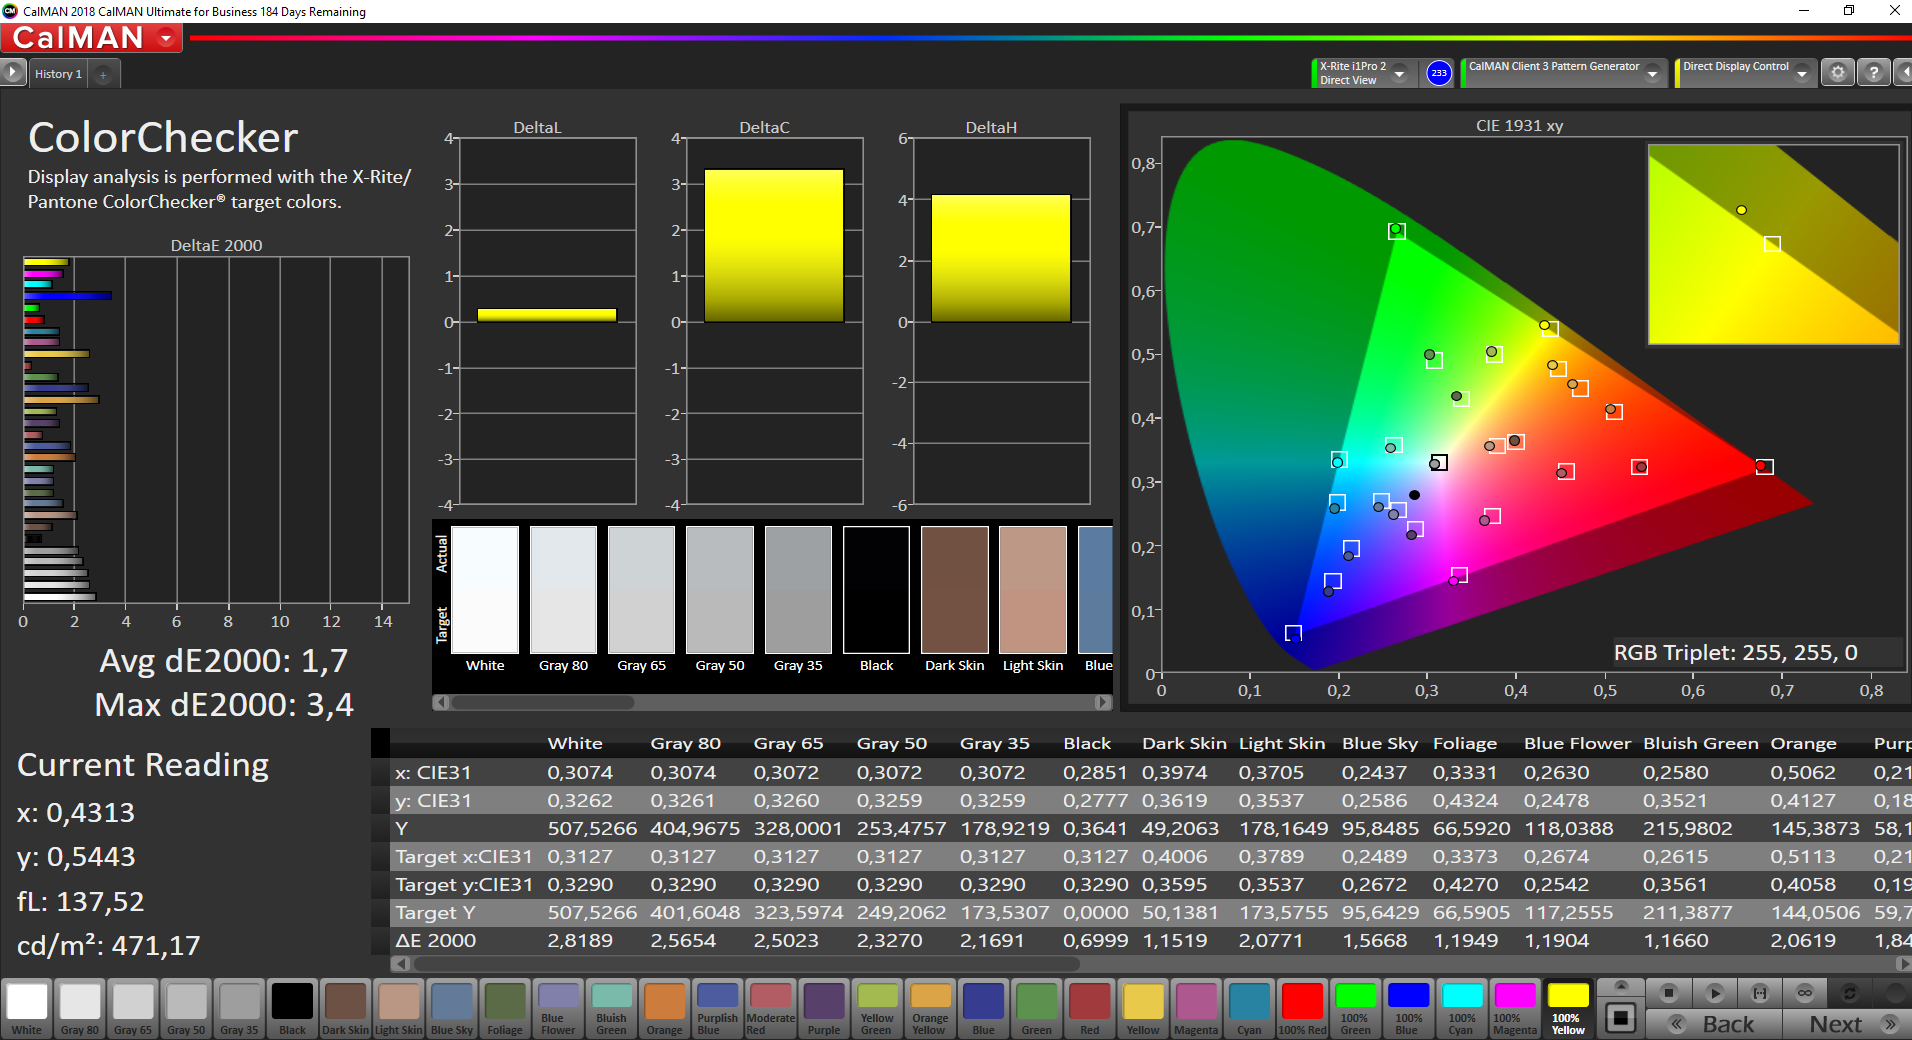
ΔE ColorChecker Calman: 1.7 | ∀{0.5-29.43 Ø4.73}
calibrated: 1
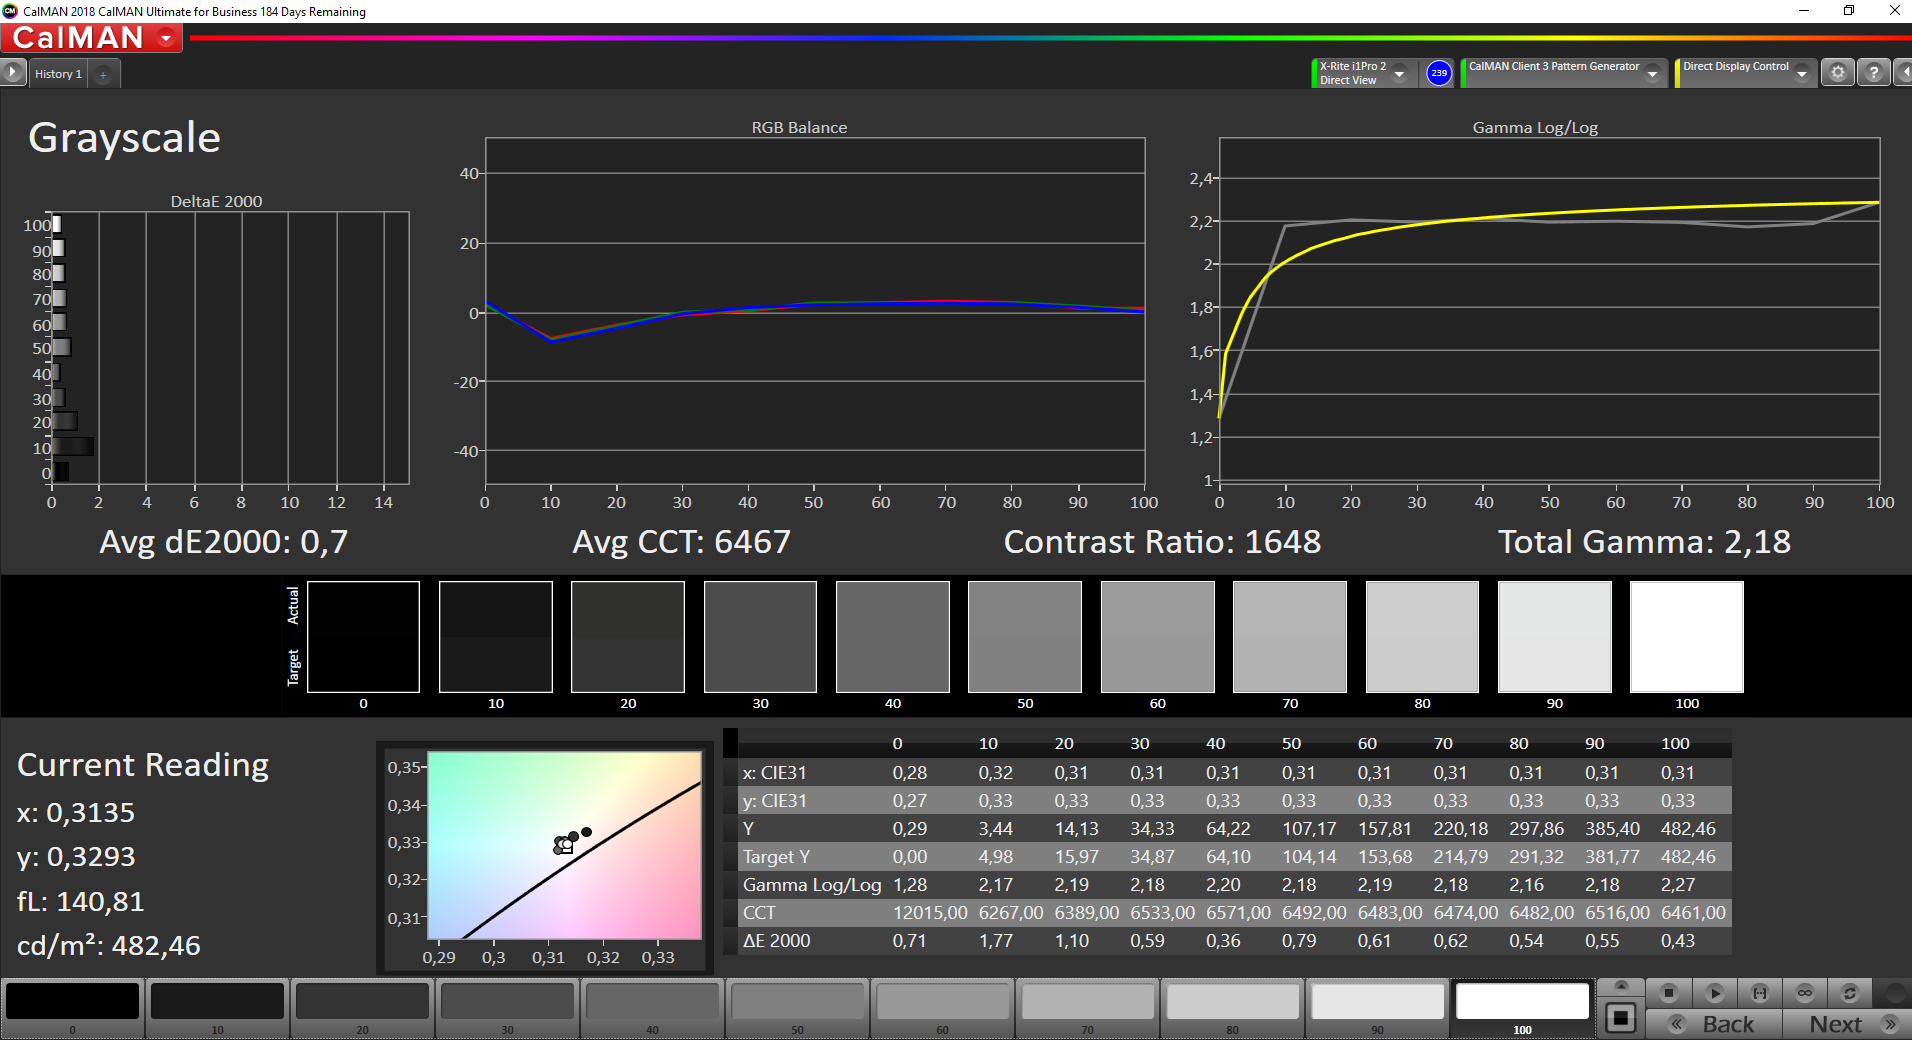
ΔE Greyscale Calman: 1.9 | ∀{0.09-98 Ø4.97}
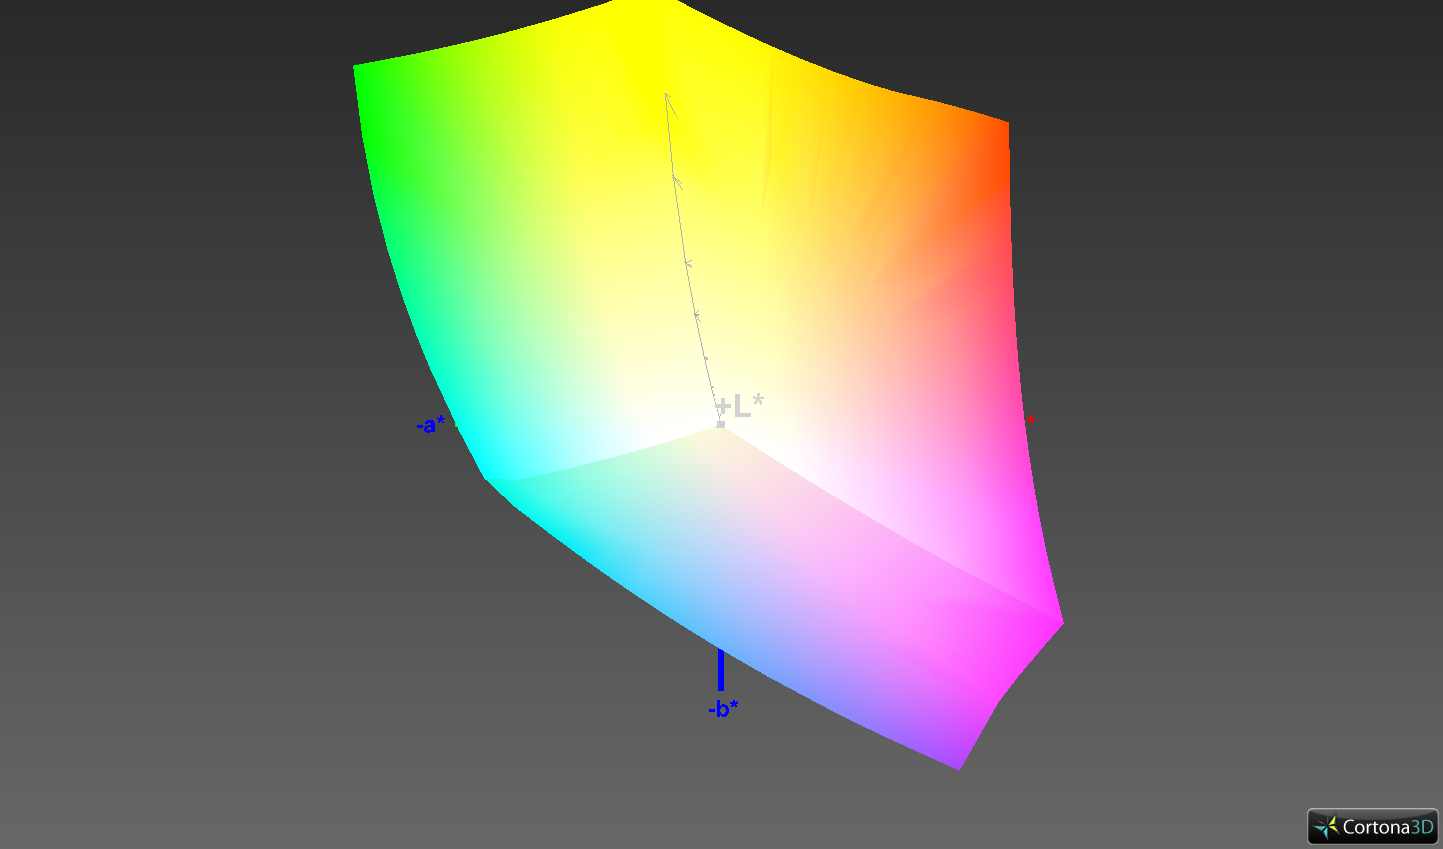
99.9% sRGB (Argyll 1.6.3 3D)
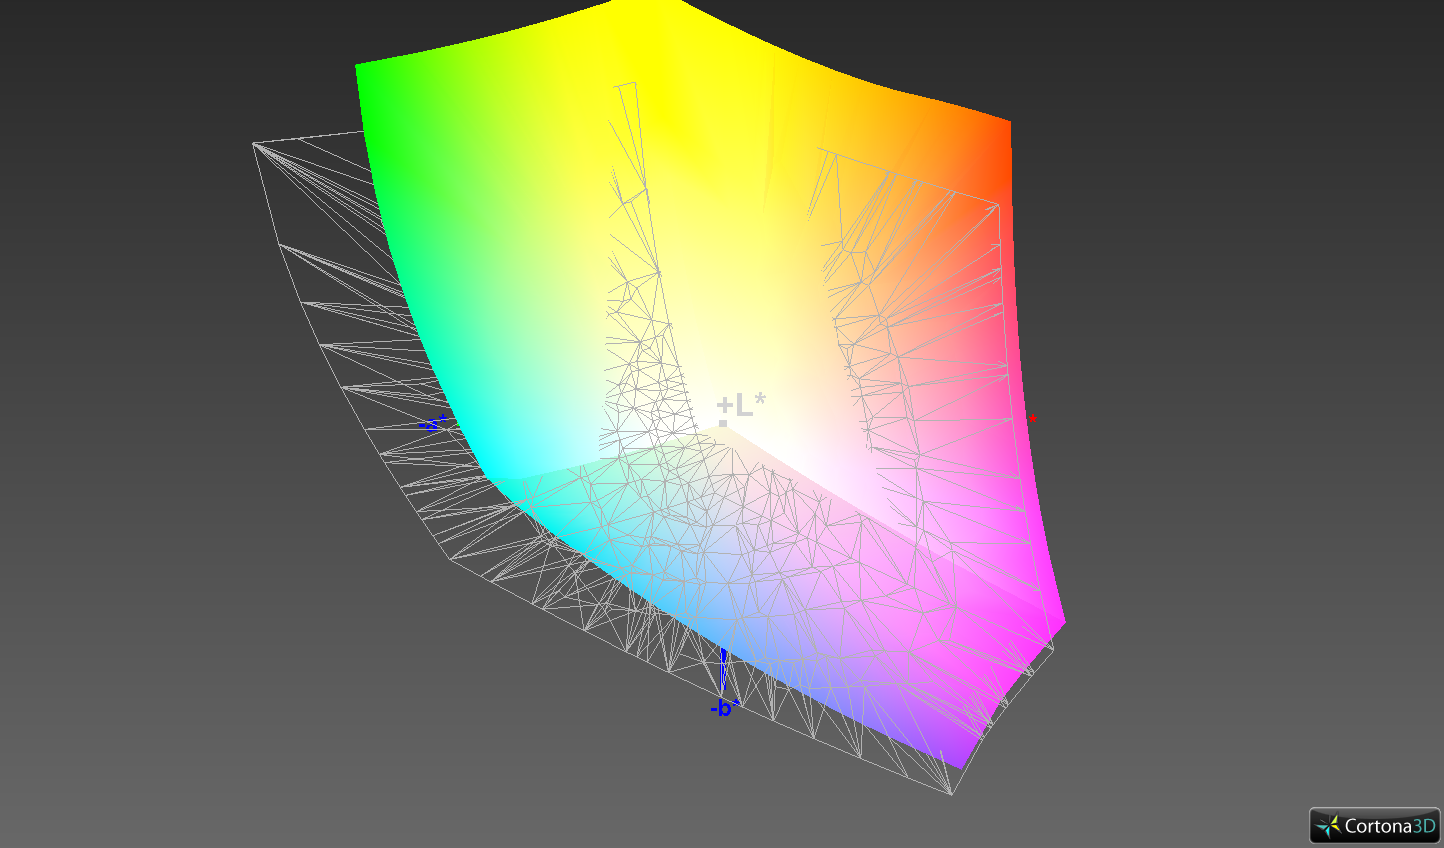
77.4% AdobeRGB 1998 (Argyll 1.6.3 3D)
86.4% AdobeRGB 1998 (Argyll 3D)
99.9% sRGB (Argyll 3D)
98.8% Display P3 (Argyll 3D)
Gamma: 2.19
CCT: 6817 K
| Apple MacBook Pro 13 2020 2GHz i5 10th-Gen APPA03D, IPS, 2560x1600, 13.3" | Apple MacBook Pro 13 2019 i5 4TB3 APPA03E, IPS, 2560x1600, 13.3" | Acer Swift 3 SF313-52-71Y7 BOE, NE135FBM-N41, IPS, 2256x1504, 13.5" | Dell XPS 13 9300 4K UHD Sharp LQ134R1, IPS, 3840x2400, 13.4" | HP Spectre x360 13-aw0013dx AU Optronics AUO5E2D, IPS, 1920x1080, 13.3" | Microsoft Surface Laptop 3 13 Core i5-1035G7 Sharp LQ135P1JX51, IPS, 2256x1504, 13.5" | |
|---|---|---|---|---|---|---|
| Display | 1% | -16% | -22% | -16% | -19% | |
| Display P3 Coverage (%) | 98.8 | 98.7 0% | 70.1 -29% | 64.5 -35% | 69.6 -30% | 65.7 -34% |
| sRGB Coverage (%) | 99.9 | 100 0% | 99.8 0% | 91.4 -9% | 98.9 -1% | 98.6 -1% |
| AdobeRGB 1998 Coverage (%) | 86.4 | 87.7 2% | 71.2 -18% | 66.6 -23% | 71.5 -17% | 67.8 -22% |
| Response Times | 8% | -8% | 16% | -23% | -29% | |
| Response Time Grey 50% / Grey 80% * (ms) | 46 ? | 43.2 ? 6% | 55 ? -20% | 41.6 ? 10% | 60.8 ? -32% | 59.2 ? -29% |
| Response Time Black / White * (ms) | 32.4 ? | 29.6 ? 9% | 31 ? 4% | 25.6 ? 21% | 36.8 ? -14% | 41.6 ? -28% |
| PWM Frequency (Hz) | 113600 ? | 208 ? | 21740 ? | |||
| Screen | -14% | -38% | -49% | -58% | 2% | |
| Brightness middle (cd/m²) | 512 | 518 1% | 474 -7% | 414 -19% | 447.4 -13% | 403.4 -21% |
| Brightness (cd/m²) | 491 | 480 -2% | 426 -13% | 401 -18% | 420 -14% | 397 -19% |
| Brightness Distribution (%) | 91 | 87 -4% | 82 -10% | 94 3% | 85 -7% | 89 -2% |
| Black Level * (cd/m²) | 0.32 | 0.34 -6% | 0.29 9% | 0.28 12% | 0.31 3% | 0.34 -6% |
| Contrast (:1) | 1600 | 1524 -5% | 1634 2% | 1479 -8% | 1443 -10% | 1186 -26% |
| Colorchecker dE 2000 * | 1.7 | 1.5 12% | 2.38 -40% | 3.06 -80% | 4.23 -149% | 0.94 45% |
| Colorchecker dE 2000 max. * | 3.4 | 2.8 18% | 5.88 -73% | 6.5 -91% | 9.34 -175% | 2.92 14% |
| Colorchecker dE 2000 calibrated * | 1 | 2.6 -160% | 2.69 -169% | 3.5 -250% | 1.32 -32% | 0.99 1% |
| Greyscale dE 2000 * | 1.9 | 2 -5% | 3.75 -97% | 3 -58% | 6.1 -221% | 0.9 53% |
| Gamma | 2.19 100% | 2.22 99% | 2.37 93% | 2.42 91% | 2.11 104% | 2.13 103% |
| CCT | 6817 95% | 6898 94% | 6466 101% | 6840 95% | 6136 106% | 6620 98% |
| Color Space (Percent of AdobeRGB 1998) (%) | 77.4 | 78.4 1% | 65 -16% | 61.1 -21% | 64.8 -16% | 62.3 -20% |
| Color Space (Percent of sRGB) (%) | 99.9 | 99.9 0% | 100 0% | 91.4 -9% | 98.9 -1% | 98.7 -1% |
| Total Average (Program / Settings) | -2% /
-8% | -21% /
-30% | -18% /
-36% | -32% /
-46% | -15% /
-6% |
* ... smaller is better
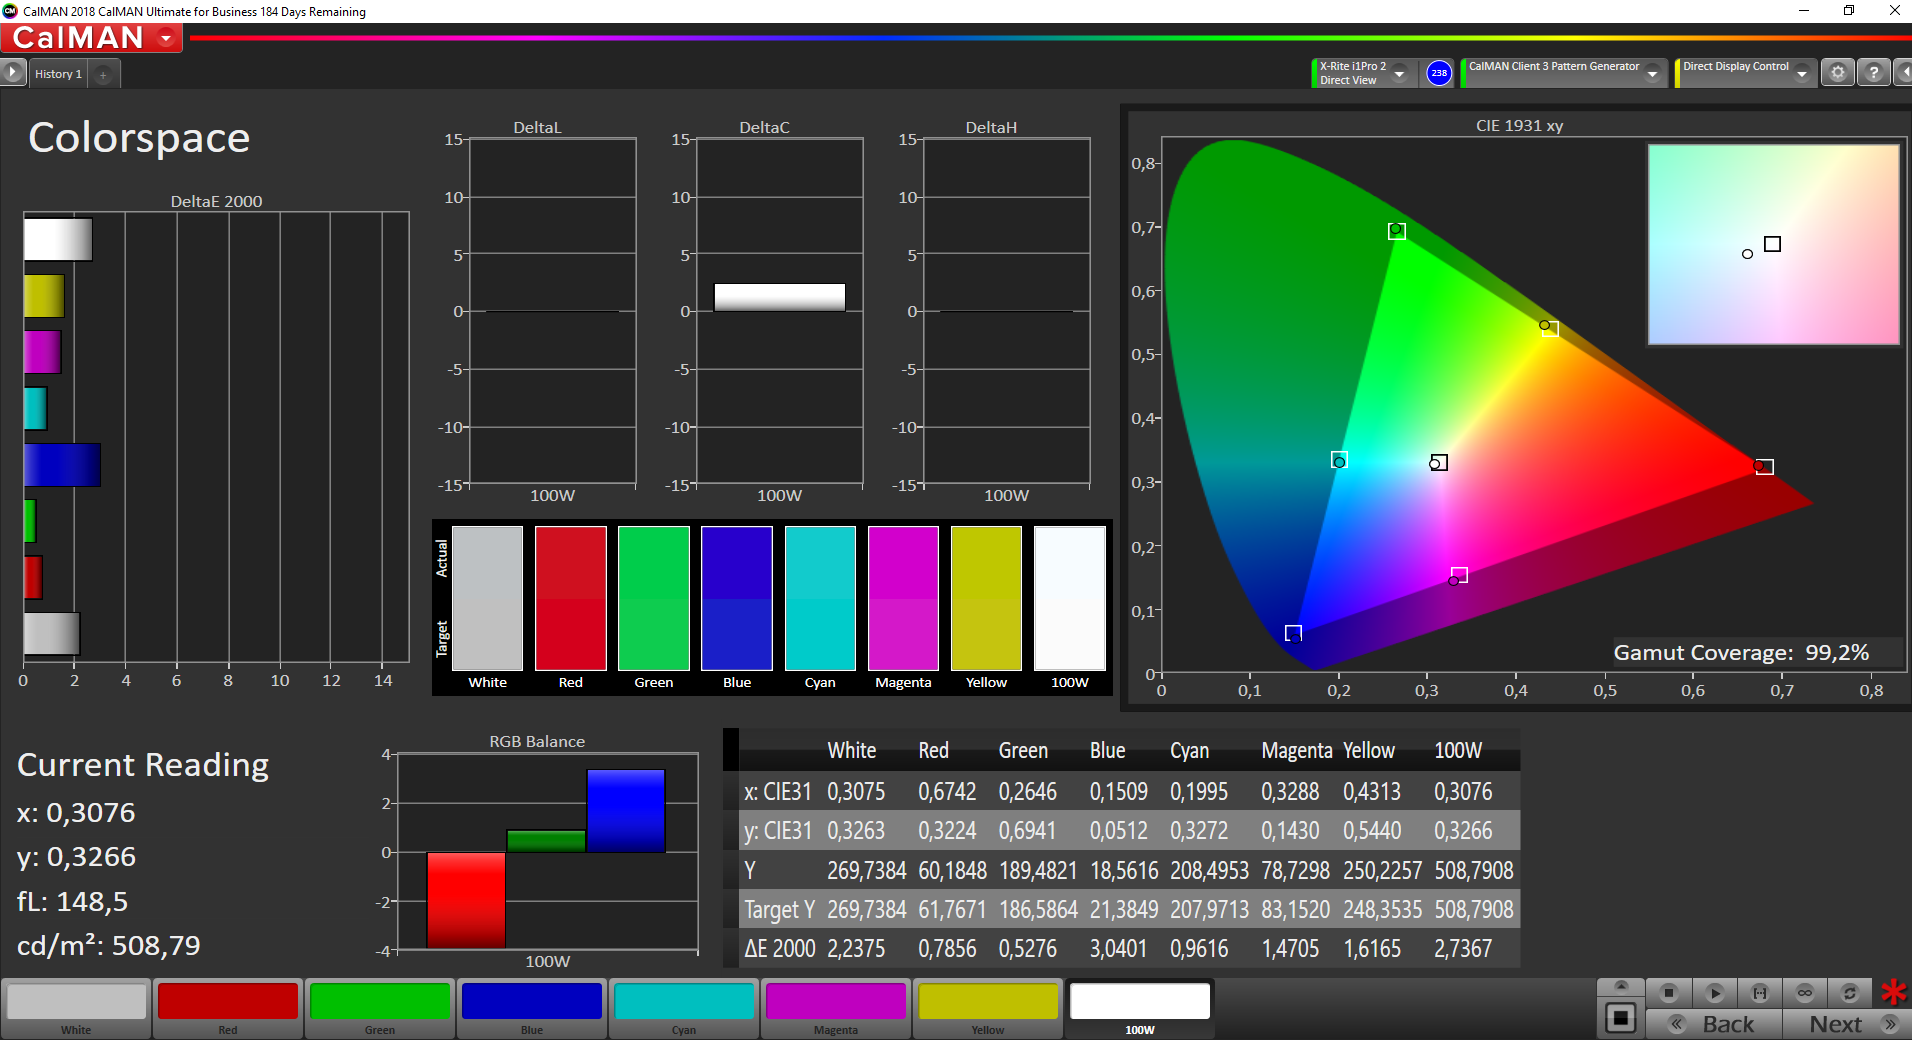
The panel ID differs from the previous model, but the measurement results are basically identical. The brightness reaches more than 500 nits and the contrast ratio is excellent at 1600:1. Our measurements with the professional CalMAN software and the X-Rite i1 Pro2 spectrophotometer reveal very accurate colors out of the box, so an additional calibration is not really necessary. Similar to our review unit of the MacBook Air, we once again measured a much higher maximum brightness when we used Windows (>600 nits).
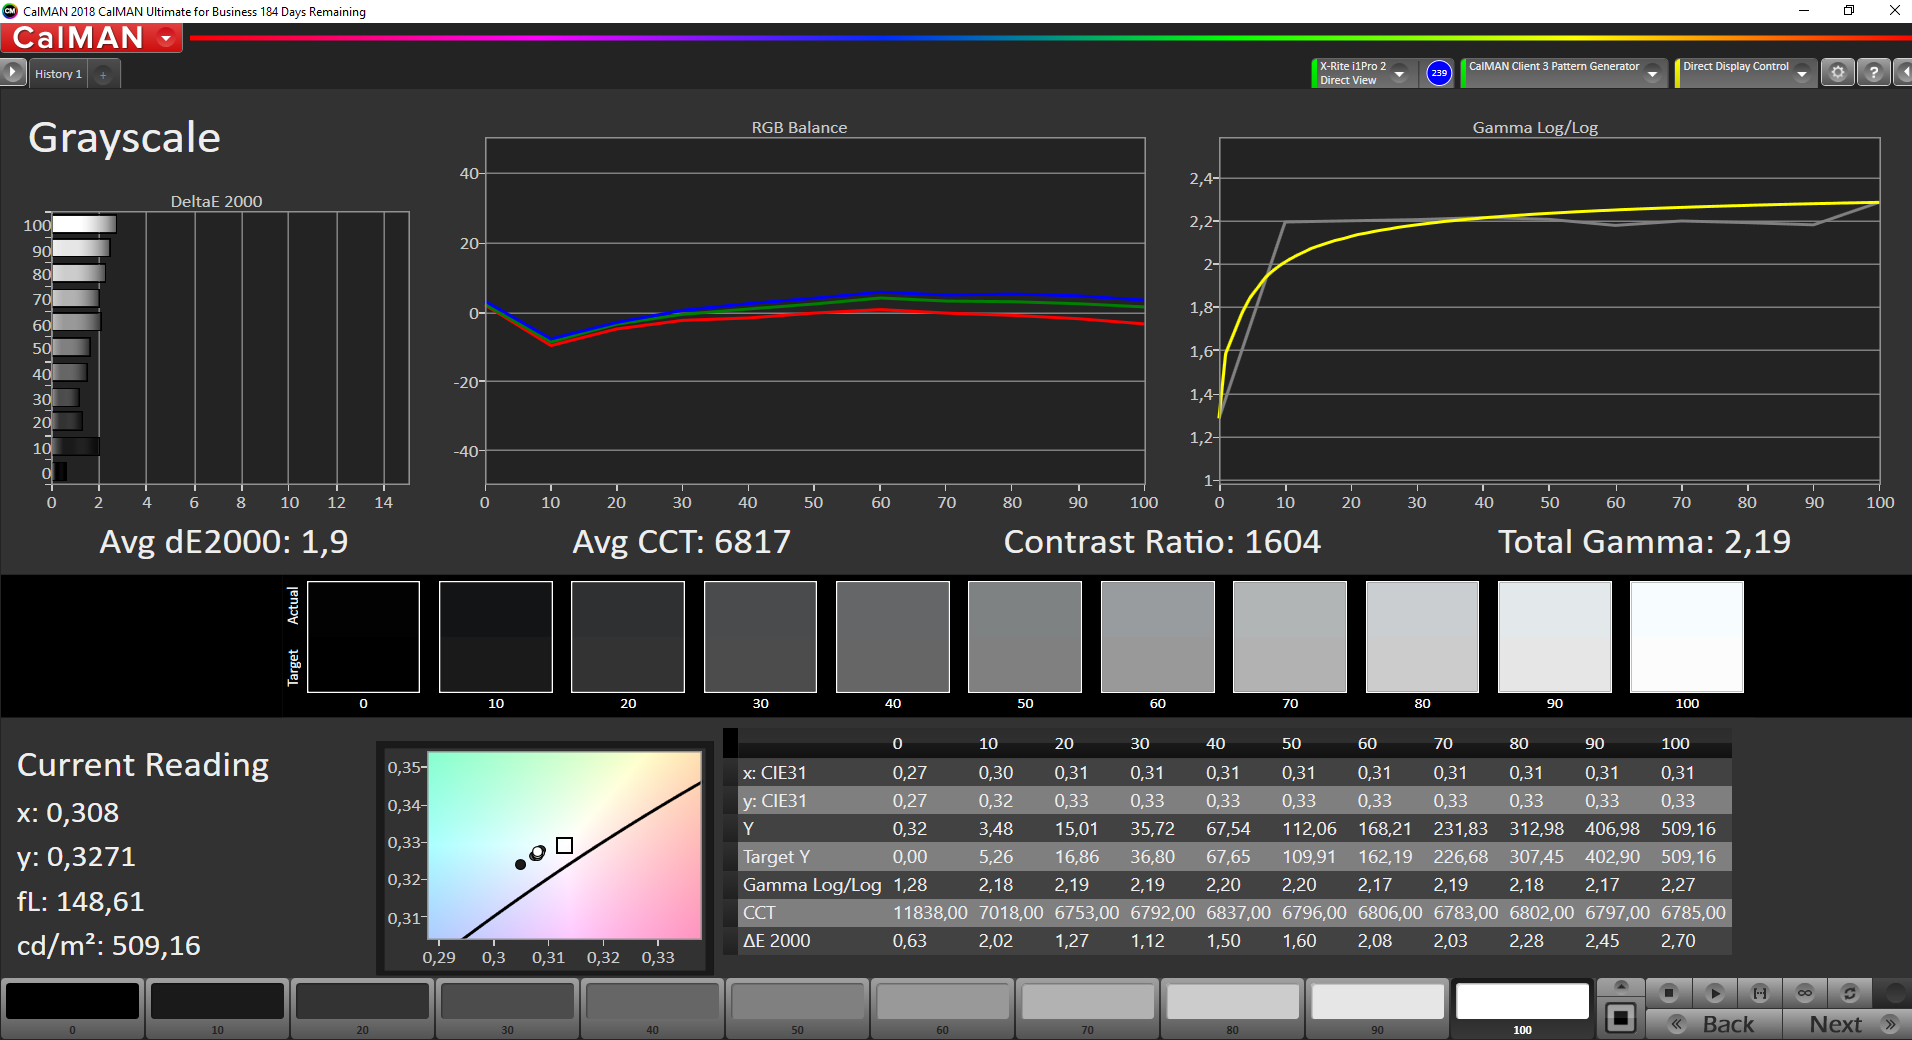
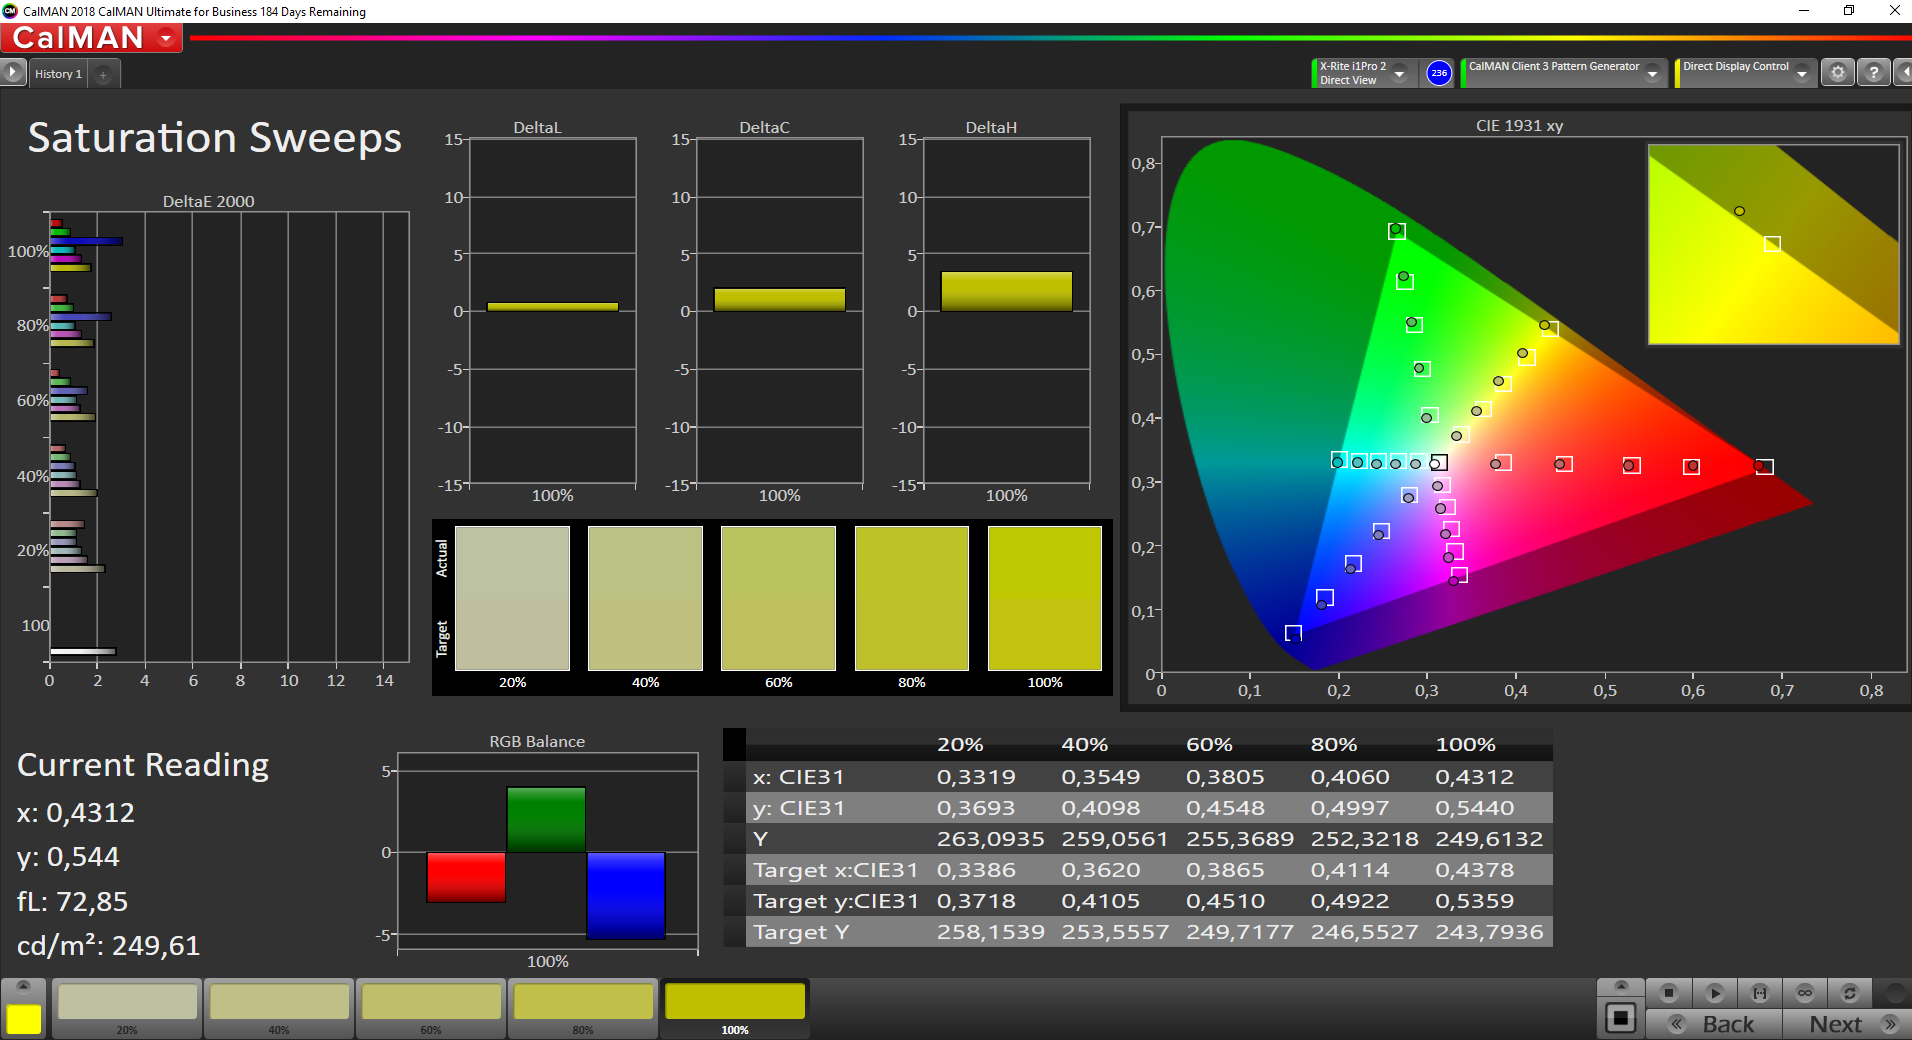
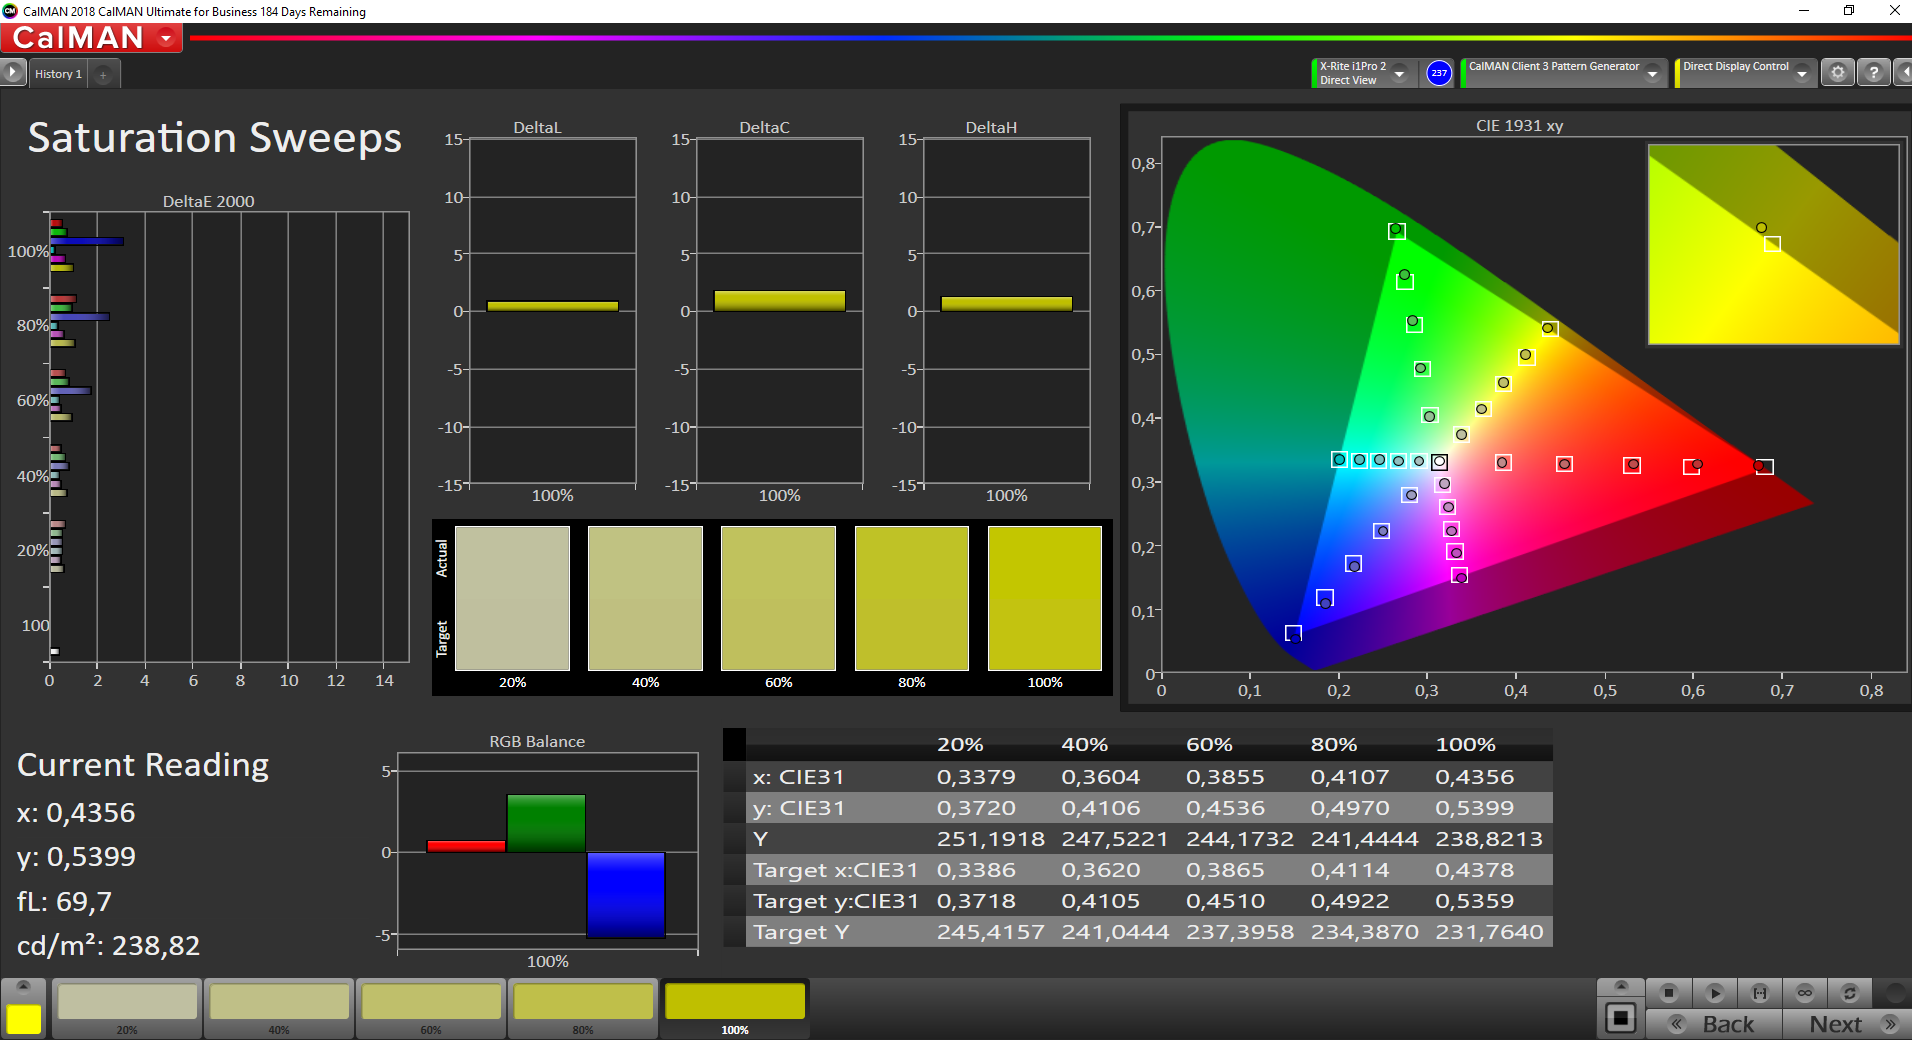
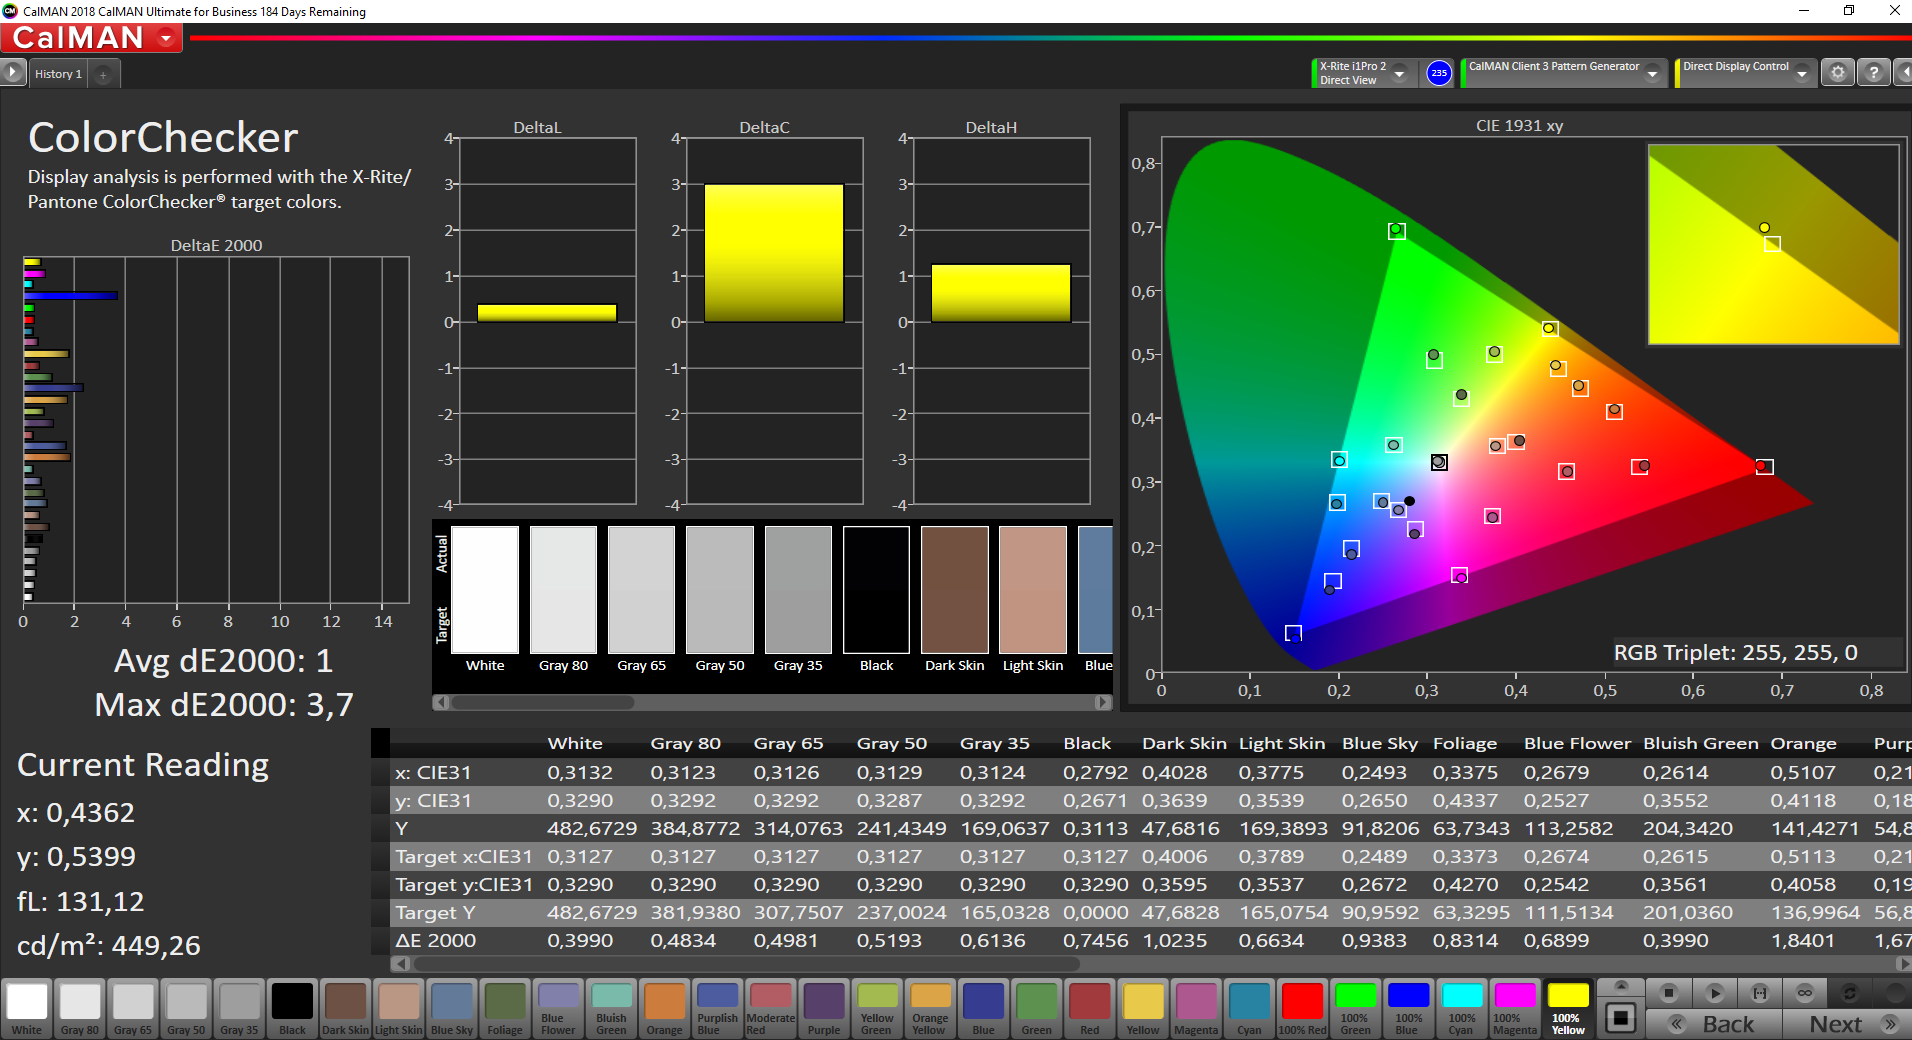
Both the small sRGB gamut as well as the larger P3 gamut are covered completely, so the display is also suited for picture/video-editing. You will only have to use an external monitor if you require the wider AdobeRGB color gamut.
Display Response Times
| ↔ Response Time Black to White | ||
|---|---|---|
| 32.4 ms ... rise ↗ and fall ↘ combined | ↗ 18.4 ms rise | 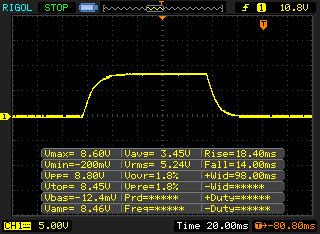 |
| ↘ 14 ms fall | ||
| The screen shows slow response rates in our tests and will be unsatisfactory for gamers. In comparison, all tested devices range from 0.1 (minimum) to 240 (maximum) ms. » 88 % of all devices are better. This means that the measured response time is worse than the average of all tested devices (19.9 ms). | ||
| ↔ Response Time 50% Grey to 80% Grey | ||
| 46 ms ... rise ↗ and fall ↘ combined | ↗ 22 ms rise | 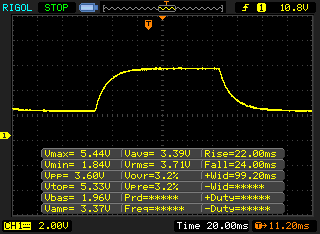 |
| ↘ 24 ms fall | ||
| The screen shows slow response rates in our tests and will be unsatisfactory for gamers. In comparison, all tested devices range from 0.165 (minimum) to 636 (maximum) ms. » 79 % of all devices are better. This means that the measured response time is worse than the average of all tested devices (31.1 ms). | ||
Screen Flickering / PWM (Pulse-Width Modulation)
| Screen flickering / PWM detected | 113600 Hz | ≤ 75 % brightness setting | 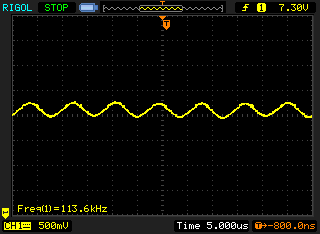 |
The display backlight flickers at 113600 Hz (worst case, e.g., utilizing PWM) Flickering detected at a brightness setting of 75 % and below. There should be no flickering or PWM above this brightness setting. The frequency of 113600 Hz is quite high, so most users sensitive to PWM should not notice any flickering. In comparison: 52 % of all tested devices do not use PWM to dim the display. If PWM was detected, an average of 7798 (minimum: 5 - maximum: 343500) Hz was measured. | |||
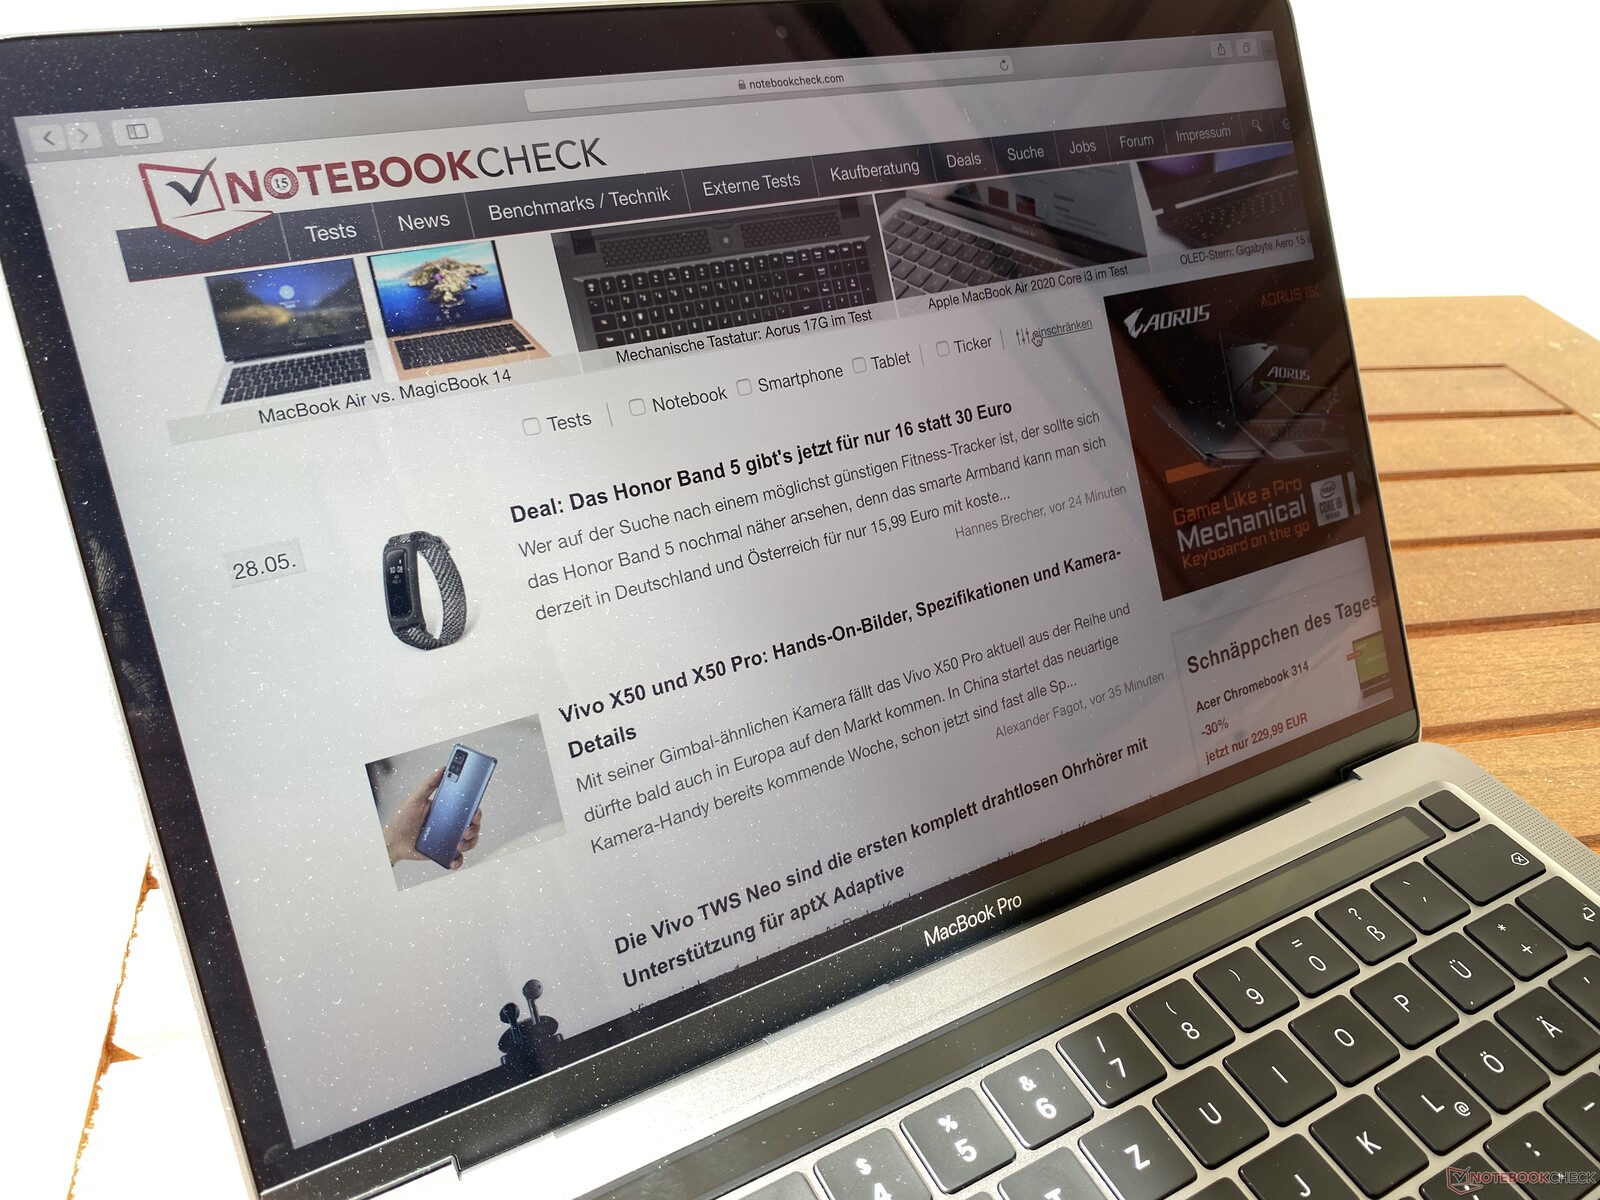
The viewing-angle stability is excellent. The MacBook also performs pretty well outdoors, despite the glossy surface. The display is not as reflective as many competitors, so you can also work pretty comfortably in bright environments.
Performance – MBP 13 with Intel Ice Lake
The new MacBook Pro 13 2020 (4x Thunderbolt 3) is available with two different Intel processors: a Core i5 and a Core i7. Both chips are equipped with the same iGPU, and only the maximum core clock differs slightly. Customers can also choose between 16 and 32 GB RAM, as well as storage sizes from 512 GB, 1 TB, 2 TB, and even 4 TB. The large SSDs are obviously a big advantage over many rivals, but you will have to pay Apple a lot of money in return: The biggest spec of the 13-inch MacBook Pro retails for 4,379 Euros (~$4,900).
Processor – Ice Lake does not really improve the performance
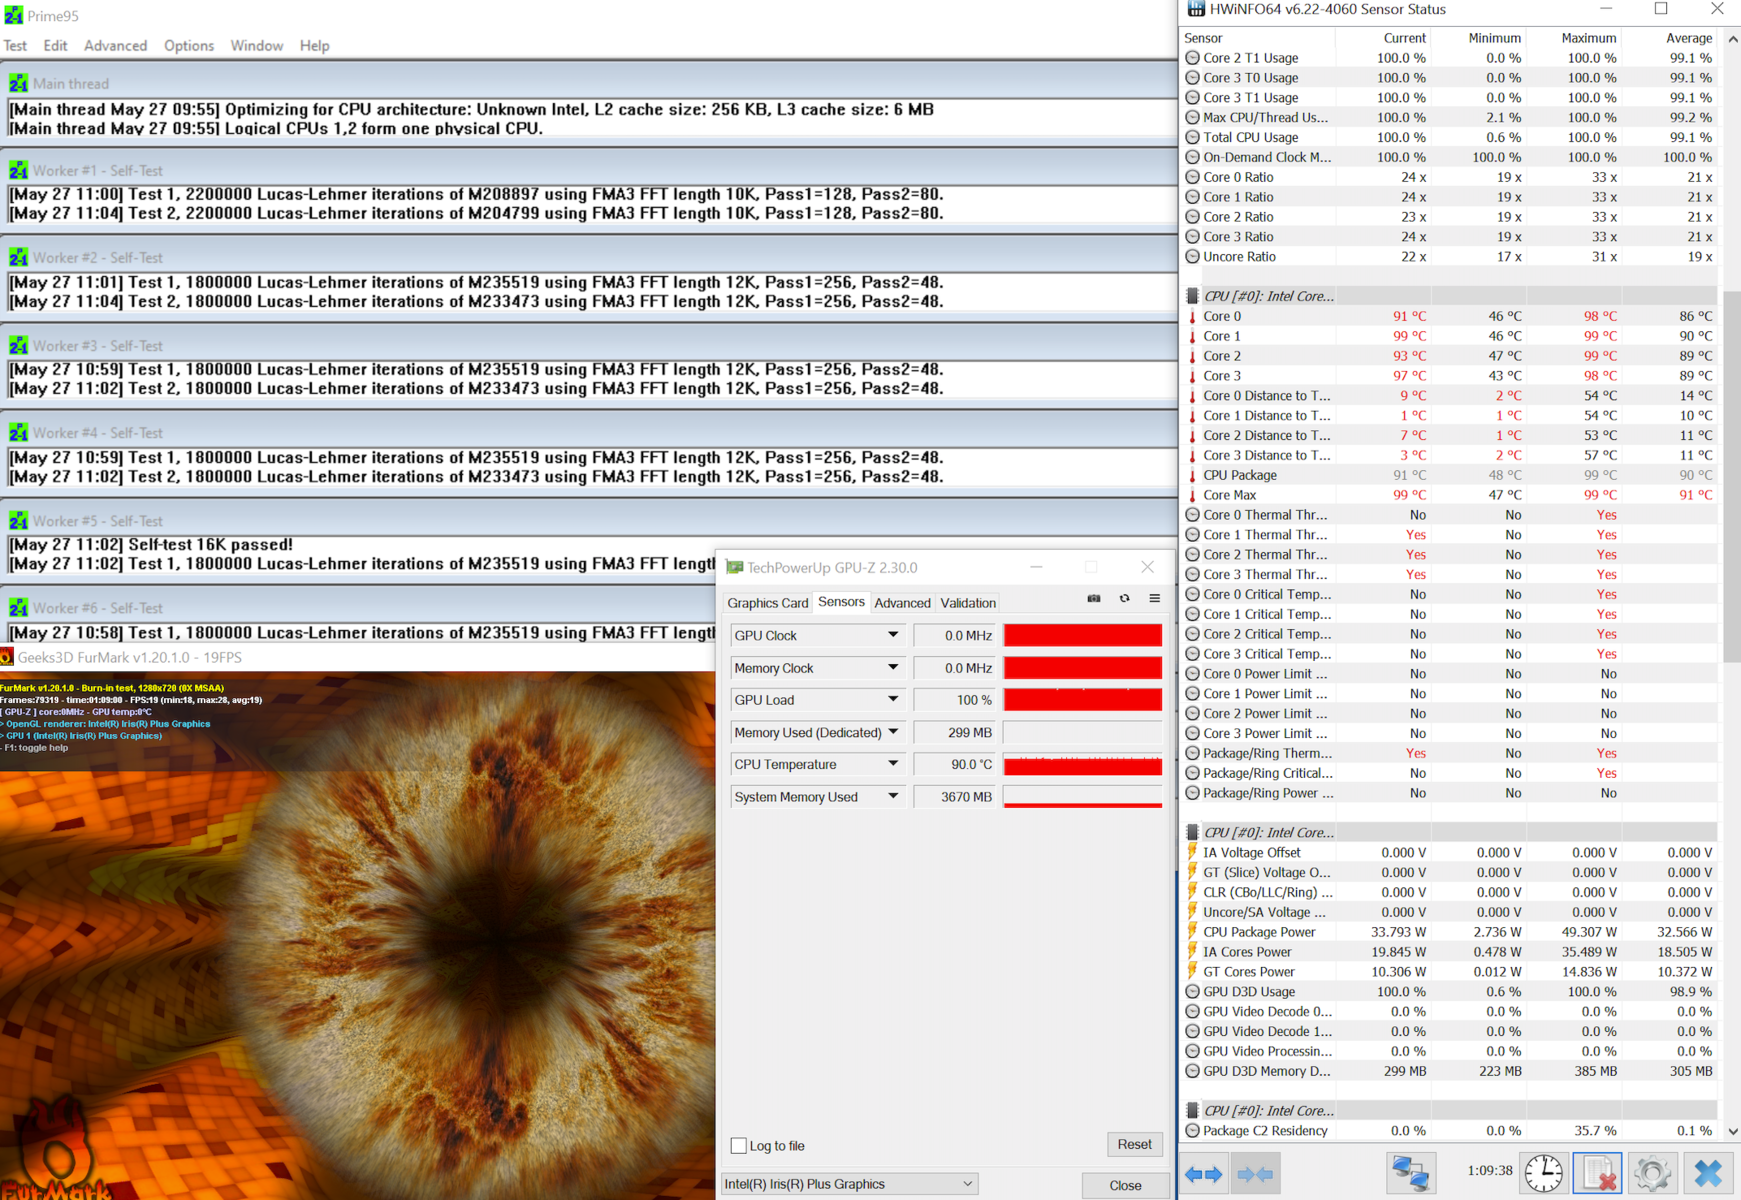
Similar to the smaller MacBook Air, Apple uses custom Intel processors, which are exclusive for the MacBook and can be recognized with the "N" in the model designation. The Core i5-1038NG7 has a higher TDP rating of 28 W compared to the regular mobile chips, but this value does not really matter in Apple devices anyway. Apple does not restrict the power consumption of the processor, which means the performance of the cooling solution is the only restriction for the CPU performance. We can see a slight improvement for the 2020 model: While the previous model managed to cool ~33 W, the new model now handles ~35 W.
This is where the good news stops though, because we can once again see that Intel still has some problems with its 10nm process. While the old Core i5-8279U ran at around 3.3-3.4 GHz at 33 W, the new Core i5-1038NG7 only manages 3.3 GHz at 35 W. The per-MHz performance of Ice Lake is a bit better, so the result is pretty similar with a small advantage for the new model. However, this is only noticeable in the benchmarks, but not in practice. The CPU performance is definitely no reason to upgrade from the previous model. The performance is not reduced on battery power.
Still, we have to be fair and the processor performance is ahead of the competition. This is mainly due to the cooling solution, but we don't know why Apple had to use custom CPUs from Intel to be honest. The "regular" Core i7 in the larger Surface Laptop 3 15, for example, is only marginally slower. We are also eager to see more laptops with AMD's new Ryzen processors; the Acer Swift 3 with the Ryzen 7 4700U is about 20% faster.
Cinebench R15: CPU Single 64Bit | CPU Multi 64Bit
Blender: v2.79 BMW27 CPU
7-Zip 18.03: 7z b 4 -mmt1 | 7z b 4
Geekbench 5.5: Single-Core | Multi-Core
HWBOT x265 Benchmark v2.2: 4k Preset
LibreOffice : 20 Documents To PDF
R Benchmark 2.5: Overall mean
| Cinebench R20 / CPU (Single Core) | |
| Average of class Subnotebook (128 - 832, n=59, last 2 years) | |
| Acer Swift 3 SF314-42-R4XJ | |
| Dell XPS 13 9300 4K UHD | |
| Acer Swift 3 SF313-52-71Y7 | |
| Microsoft Surface Laptop 3 13 Core i5-1035G7 | |
| Apple MacBook Pro 13 2020 2GHz i5 10th-Gen | |
| Average Intel Core i5-1038NG7 (n=1) | |
| Apple MacBook Pro 13 2019 i5 4TB3 | |
| HP Spectre x360 13-aw0013dx | |
| Cinebench R20 / CPU (Multi Core) | |
| Average of class Subnotebook (579 - 8541, n=59, last 2 years) | |
| Acer Swift 3 SF314-42-R4XJ | |
| Apple MacBook Pro 13 2020 2GHz i5 10th-Gen | |
| Average Intel Core i5-1038NG7 (n=1) | |
| Apple MacBook Pro 13 2019 i5 4TB3 | |
| HP Spectre x360 13-aw0013dx | |
| Microsoft Surface Laptop 3 13 Core i5-1035G7 | |
| Dell XPS 13 9300 4K UHD | |
| Acer Swift 3 SF313-52-71Y7 | |
| Cinebench R15 / CPU Single 64Bit | |
| Average of class Subnotebook (72.4 - 322, n=59, last 2 years) | |
| Dell XPS 13 9300 4K UHD | |
| Acer Swift 3 SF314-42-R4XJ | |
| HP Spectre x360 13-aw0013dx | |
| Acer Swift 3 SF313-52-71Y7 | |
| Microsoft Surface Laptop 3 13 Core i5-1035G7 | |
| Apple MacBook Pro 13 2019 i5 4TB3 | |
| Apple MacBook Pro 13 2019 i5 4TB3 | |
| Apple MacBook Pro 13 2020 2GHz i5 10th-Gen | |
| Average Intel Core i5-1038NG7 (n=1) | |
| Cinebench R15 / CPU Multi 64Bit | |
| Average of class Subnotebook (327 - 3345, n=59, last 2 years) | |
| Acer Swift 3 SF314-42-R4XJ | |
| Apple MacBook Pro 13 2020 2GHz i5 10th-Gen | |
| Average Intel Core i5-1038NG7 (n=1) | |
| Dell XPS 13 9300 4K UHD | |
| Apple MacBook Pro 13 2019 i5 4TB3 | |
| Apple MacBook Pro 13 2019 i5 4TB3 | |
| Microsoft Surface Laptop 3 13 Core i5-1035G7 | |
| HP Spectre x360 13-aw0013dx | |
| Acer Swift 3 SF313-52-71Y7 | |
| Blender / v2.79 BMW27 CPU | |
| Acer Swift 3 SF313-52-71Y7 | |
| Microsoft Surface Laptop 3 13 Core i5-1035G7 | |
| Dell XPS 13 9300 4K UHD | |
| Apple MacBook Pro 13 2019 i5 4TB3 | |
| Acer Swift 3 SF314-42-R4XJ | |
| Average of class Subnotebook (159 - 2271, n=60, last 2 years) | |
| Apple MacBook Pro 13 2020 2GHz i5 10th-Gen | |
| Average Intel Core i5-1038NG7 (n=1) | |
| 7-Zip 18.03 / 7z b 4 -mmt1 | |
| Average of class Subnotebook (2643 - 6699, n=61, last 2 years) | |
| Dell XPS 13 9300 4K UHD | |
| Acer Swift 3 SF313-52-71Y7 | |
| Acer Swift 3 SF314-42-R4XJ | |
| Apple MacBook Pro 13 2019 i5 4TB3 | |
| Microsoft Surface Laptop 3 13 Core i5-1035G7 | |
| Apple MacBook Pro 13 2020 2GHz i5 10th-Gen | |
| Average Intel Core i5-1038NG7 (n=1) | |
| 7-Zip 18.03 / 7z b 4 | |
| Average of class Subnotebook (11668 - 77867, n=59, last 2 years) | |
| Acer Swift 3 SF314-42-R4XJ | |
| Apple MacBook Pro 13 2019 i5 4TB3 | |
| Dell XPS 13 9300 4K UHD | |
| Apple MacBook Pro 13 2020 2GHz i5 10th-Gen | |
| Average Intel Core i5-1038NG7 (n=1) | |
| Microsoft Surface Laptop 3 13 Core i5-1035G7 | |
| Acer Swift 3 SF313-52-71Y7 | |
| Geekbench 5.5 / Single-Core | |
| Average of class Subnotebook (726 - 2224, n=50, last 2 years) | |
| Dell XPS 13 9300 4K UHD | |
| Acer Swift 3 SF313-52-71Y7 | |
| Apple MacBook Pro 13 2020 2GHz i5 10th-Gen | |
| Average Intel Core i5-1038NG7 (n=1) | |
| Acer Swift 3 SF314-42-R4XJ | |
| Geekbench 5.5 / Multi-Core | |
| Average of class Subnotebook (2557 - 17218, n=50, last 2 years) | |
| Dell XPS 13 9300 4K UHD | |
| Acer Swift 3 SF314-42-R4XJ | |
| Apple MacBook Pro 13 2020 2GHz i5 10th-Gen | |
| Average Intel Core i5-1038NG7 (n=1) | |
| Acer Swift 3 SF313-52-71Y7 | |
| HWBOT x265 Benchmark v2.2 / 4k Preset | |
| Average of class Subnotebook (0.97 - 25.1, n=59, last 2 years) | |
| Acer Swift 3 SF314-42-R4XJ | |
| Dell XPS 13 9300 4K UHD | |
| Apple MacBook Pro 13 2019 i5 4TB3 | |
| Apple MacBook Pro 13 2020 2GHz i5 10th-Gen | |
| Average Intel Core i5-1038NG7 (n=1) | |
| Acer Swift 3 SF313-52-71Y7 | |
| Microsoft Surface Laptop 3 13 Core i5-1035G7 | |
| LibreOffice / 20 Documents To PDF | |
| Apple MacBook Pro 13 2020 2GHz i5 10th-Gen | |
| Average Intel Core i5-1038NG7 (n=1) | |
| Dell XPS 13 9300 4K UHD | |
| Acer Swift 3 SF314-42-R4XJ | |
| Average of class Subnotebook (39.9 - 220, n=58, last 2 years) | |
| R Benchmark 2.5 / Overall mean | |
| Apple MacBook Pro 13 2020 2GHz i5 10th-Gen | |
| Average Intel Core i5-1038NG7 (n=1) | |
| Acer Swift 3 SF313-52-71Y7 | |
| Dell XPS 13 9300 4K UHD | |
| Acer Swift 3 SF314-42-R4XJ | |
| Average of class Subnotebook (0.4024 - 1.456, n=60, last 2 years) | |
* ... smaller is better
System Performance
The subjective performance impression of the MacBook Pro 13 is excellent. Thanks to SSD storage, sufficient RAM, and the fast quad-core processor, all your inputs are quickly executed and there are no noticeable delays, either. The PCIe-SSD is also a fast model with maximum transfer rates of around 2400 MB/s. There are even faster drives out there, but you won't notice the differences in practice.
We performed the synthetic PCMarks with Windows 10. The latter runs very well with the BootCamp drivers, but the performance still depends on the drivers you get from Apple. The comparatively low scores are not representative of the real performance or performance impression, respectively.
| PCMark 8 Home Score Accelerated v2 | 3928 points | |
| PCMark 8 Creative Score Accelerated v2 | 5715 points | |
| PCMark 8 Work Score Accelerated v2 | 2407 points | |
| PCMark 10 Score | 3222 points | |
Help | ||

GPU Performance – Iris Plus Graphics G7
The Ice Lake processor is equipped with the Iris Plus Graphics, which takes care of all the graphics calculations. It is the faster G7 version with 64 EUs. The performance is on the expected level, but the higher TDP classification is no advantage over the Windows rivals. Compared to the Iris Plus Graphics 655 (with eDRAM cache) of the previous MacBook Pro 13, the performance is about 30-40% higher.
The sustained performance is definitely an advantage, because neither the 3DMark stress test (Fire Strike) nor our The Witcher 3 loop (here with medium preset) shows a performance drop. Still, the MacBook Pro 13 is not great for gaming. Older titles are usually playable, but hardly with high settings. More modern titles are definitely limited to the lowest settings and resolution.
| 3DMark 06 Standard Score | 17100 points | |
| 3DMark 11 Performance | 4683 points | |
| 3DMark Ice Storm Standard Score | 56619 points | |
| 3DMark Cloud Gate Standard Score | 12647 points | |
| 3DMark Fire Strike Score | 2680 points | |
| 3DMark Fire Strike Extreme Score | 1329 points | |
| 3DMark Time Spy Score | 932 points | |
Help | ||
| low | med. | high | ultra | |
|---|---|---|---|---|
| The Witcher 3 (2015) | 54.2 | 33.1 | 18 | |
| Dota 2 Reborn (2015) | 94.7 | 62.8 | 38.5 | 35.7 |
| X-Plane 11.11 (2018) | 25.9 | 11.7 | 10.9 | |
| Far Cry 5 (2018) | 26 | 12 | ||
| F1 2019 (2019) | 62 | 27 | 25 | 21 |
Emissions – MBP is usually silent in practice
System Noise
The cooling solution with the two fans has not changed and the MacBook is usually silent when you only use simple applications. When the fan is running on the lowest setting, you can only hear a quiet murmur when you hold your ear directly next to the device. The fan behavior really depends on the CPU load. When we only stress the integrated GPU (like with the Unigine Valley benchmark, for example) it takes a couple of minutes before the fans will even start spinning. It gets much louder when you stress the processor. Medium workloads, including gaming, usually result in around 36 dB(A), and up to 42.1 dB(A) is measured under maximum load. Our measurement results are therefore pretty much identical to the previous model. We did not notice any other electronic sounds like coil whine.
Noise level
| Idle |
| 29.6 / 29.6 / 29.6 dB(A) |
| Load |
| 34.4 / 42.1 dB(A) |
 | ||
30 dB silent 40 dB(A) audible 50 dB(A) loud |
||
min: | ||
| Apple MacBook Pro 13 2020 2GHz i5 10th-Gen Iris Plus Graphics G7 (Ice Lake 64 EU), i5-1038NG7, Apple SSD SM0512F | Apple MacBook Pro 13 2019 i5 4TB3 Iris Plus Graphics 655, i5-8279U, Apple SSD AP0512 | Acer Swift 3 SF313-52-71Y7 Iris Plus Graphics G7 (Ice Lake 64 EU), i7-1065G7, Intel SSD 660p 1TB SSDPEKNW010T8 | Dell XPS 13 9300 4K UHD Iris Plus Graphics G7 (Ice Lake 64 EU), i7-1065G7, Intel SSDPEMKF512G8 NVMe SSD | HP Spectre x360 13-aw0013dx Iris Plus Graphics G7 (Ice Lake 64 EU), i7-1065G7, Intel Optane Memory H10 with Solid State Storage 32GB + 512GB HBRPEKNX0202A(L/H) | Microsoft Surface Laptop 3 13 Core i5-1035G7 Iris Plus Graphics G7 (Ice Lake 64 EU), i5-1035G7, SK hynix BC501 HFM256GDGTNG | |
|---|---|---|---|---|---|---|
| Noise | 2% | 4% | 0% | 7% | 4% | |
| off / environment * (dB) | 29.6 | 29 2% | 30.3 -2% | 29 2% | 28.5 4% | 28.5 4% |
| Idle Minimum * (dB) | 29.6 | 29 2% | 30.3 -2% | 29 2% | 28.5 4% | 28.5 4% |
| Idle Average * (dB) | 29.6 | 29 2% | 30.3 -2% | 29 2% | 28.5 4% | 28.5 4% |
| Idle Maximum * (dB) | 29.6 | 29 2% | 30.3 -2% | 29 2% | 28.5 4% | 28.5 4% |
| Load Average * (dB) | 34.4 | 33.9 1% | 31.7 8% | 33.5 3% | 28.5 17% | 28.5 17% |
| Witcher 3 ultra * (dB) | 36.1 | 40.5 -12% | 35.3 2% | 40.4 -12% | ||
| Load Maximum * (dB) | 42.1 | 41.8 1% | 32.7 22% | 40.5 4% | 35.3 16% | 40.4 4% |
* ... smaller is better
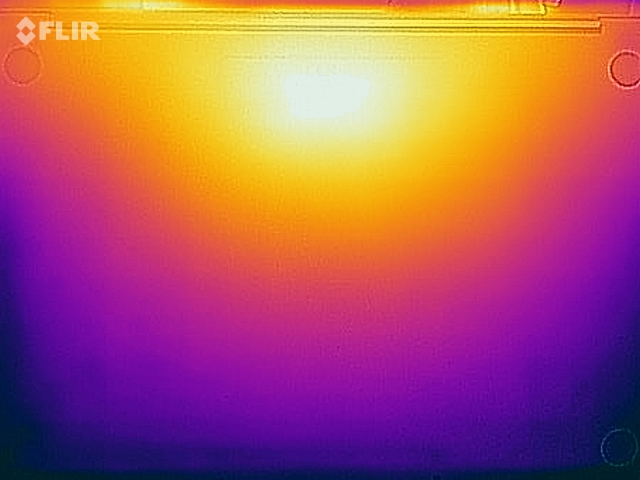
Temperature
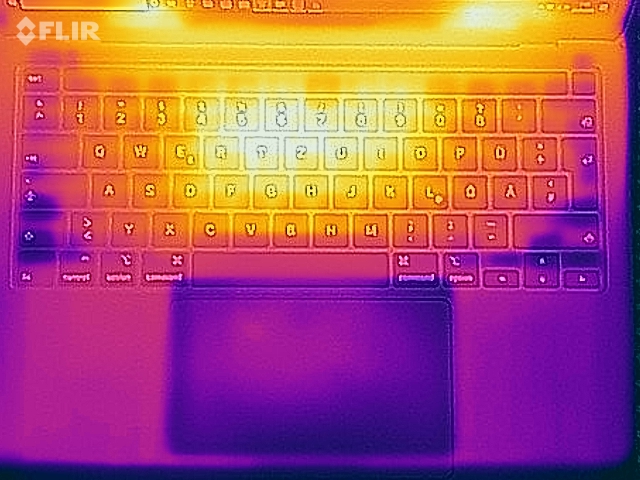
The 13-inch MacBook Pro (4x TB3) is still uncritical when it comes to the surface temperatures. The metal chassis hardly warms up at all during light workloads and the heat is concentrated to the rear portion of the base unit under load. Up to 40.7 °C is nothing to worry about and there are no limitations for the handling of the device.
The processor consumption levels off at around 33 W during our stress test, so the performance is still pretty steady in extreme scenarios. The processor runs at 4x 2.3-2.4 GHz in this case, but the Windows tools cannot detect the core clock of the iGPU reliably.
(±) The maximum temperature on the upper side is 40.7 °C / 105 F, compared to the average of 35.9 °C / 97 F, ranging from 21.4 to 59 °C for the class Subnotebook.
(+) The bottom heats up to a maximum of 39.4 °C / 103 F, compared to the average of 39.2 °C / 103 F
(+) In idle usage, the average temperature for the upper side is 24.2 °C / 76 F, compared to the device average of 30.8 °C / 87 F.
(+) The palmrests and touchpad are cooler than skin temperature with a maximum of 27 °C / 80.6 F and are therefore cool to the touch.
(±) The average temperature of the palmrest area of similar devices was 28.2 °C / 82.8 F (+1.2 °C / 2.2 F).
Speakers
Apple MacBook Pro 13 2020 2GHz i5 10th-Gen audio analysis
(±) | speaker loudness is average but good (80.1 dB)
Bass 100 - 315 Hz
(±) | reduced bass - on average 8.7% lower than median
(+) | bass is linear (5.7% delta to prev. frequency)
Mids 400 - 2000 Hz
(+) | balanced mids - only 2% away from median
(+) | mids are linear (3.4% delta to prev. frequency)
Highs 2 - 16 kHz
(+) | balanced highs - only 3.4% away from median
(+) | highs are linear (4.2% delta to prev. frequency)
Overall 100 - 16.000 Hz
(+) | overall sound is linear (11.7% difference to median)
Compared to same class
» 13% of all tested devices in this class were better, 3% similar, 84% worse
» The best had a delta of 5%, average was 18%, worst was 53%
Compared to all devices tested
» 8% of all tested devices were better, 3% similar, 89% worse
» The best had a delta of 4%, average was 24%, worst was 134%
Microsoft Surface Laptop 3 13 Core i5-1035G7 audio analysis
(±) | speaker loudness is average but good (79 dB)
Bass 100 - 315 Hz
(+) | good bass - only 4.2% away from median
(±) | linearity of bass is average (10.5% delta to prev. frequency)
Mids 400 - 2000 Hz
(+) | balanced mids - only 3.6% away from median
(±) | linearity of mids is average (7.1% delta to prev. frequency)
Highs 2 - 16 kHz
(+) | balanced highs - only 1.8% away from median
(+) | highs are linear (6.5% delta to prev. frequency)
Overall 100 - 16.000 Hz
(+) | overall sound is linear (11.4% difference to median)
Compared to same class
» 3% of all tested devices in this class were better, 2% similar, 95% worse
» The best had a delta of 7%, average was 21%, worst was 53%
Compared to all devices tested
» 7% of all tested devices were better, 2% similar, 91% worse
» The best had a delta of 4%, average was 24%, worst was 134%
Energy Management
Power Consumption
The idle power consumption is slightly higher than before, but the results are very similar under load. We can detect a maximum consumption of 65.2 W under load, but this will level off at around 57 Watts. The provided 61 W PSU is therefore just sufficient, even though there is not much headroom (for the charging of the battery, for example).
| Off / Standby | |
| Idle | |
| Load |
|
Key:
min: | |
| Apple MacBook Pro 13 2020 2GHz i5 10th-Gen i5-1038NG7, Iris Plus Graphics G7 (Ice Lake 64 EU), Apple SSD SM0512F, IPS, 2560x1600, 13.3" | Apple MacBook Pro 13 2019 i5 4TB3 i5-8279U, Iris Plus Graphics 655, Apple SSD AP0512, IPS, 2560x1600, 13.3" | Acer Swift 3 SF313-52-71Y7 i7-1065G7, Iris Plus Graphics G7 (Ice Lake 64 EU), Intel SSD 660p 1TB SSDPEKNW010T8, IPS, 2256x1504, 13.5" | Dell XPS 13 9300 4K UHD i7-1065G7, Iris Plus Graphics G7 (Ice Lake 64 EU), Intel SSDPEMKF512G8 NVMe SSD, IPS, 3840x2400, 13.4" | HP Spectre x360 13-aw0013dx i7-1065G7, Iris Plus Graphics G7 (Ice Lake 64 EU), Intel Optane Memory H10 with Solid State Storage 32GB + 512GB HBRPEKNX0202A(L/H), IPS, 1920x1080, 13.3" | Microsoft Surface Laptop 3 13 Core i5-1035G7 i5-1035G7, Iris Plus Graphics G7 (Ice Lake 64 EU), SK hynix BC501 HFM256GDGTNG, IPS, 2256x1504, 13.5" | Average Intel Iris Plus Graphics G7 (Ice Lake 64 EU) | Average of class Subnotebook | |
|---|---|---|---|---|---|---|---|---|
| Power Consumption | 15% | 49% | 4% | 25% | 10% | 14% | 14% | |
| Idle Minimum * (Watt) | 3.8 | 2.2 42% | 1.8 53% | 5.3 -39% | 3.9 -3% | 4.4 -16% | 3.91 ? -3% | 3.77 ? 1% |
| Idle Average * (Watt) | 8.6 | 7.2 16% | 4.6 47% | 7.8 9% | 6.3 27% | 7.5 13% | 7.33 ? 15% | 6.56 ? 24% |
| Idle Maximum * (Watt) | 10.3 | 8.2 20% | 6.1 41% | 9.8 5% | 6.8 34% | 7.8 24% | 9.16 ? 11% | 7.9 ? 23% |
| Load Average * (Watt) | 52.1 | 54 -4% | 27.4 47% | 46 12% | 32.6 37% | 41.9 20% | 39.2 ? 25% | 41.5 ? 20% |
| Witcher 3 ultra * (Watt) | 48.2 | 43 11% | 25.6 47% | 40.8 15% | ||||
| Load Maximum * (Watt) | 65.2 | 63.9 2% | 27 59% | 48.3 26% | 59 10% | 63.9 2% | 49.8 ? 24% | 64.1 ? 2% |
* ... smaller is better
Battery Runtime
We were quite surprised that the Wi-Fi runtime was a bit longer than the video runtime of our test unit. Both results, however, are still very good at 12 and 11.5 hours, respectively, and the MBP 13 also beats the rivals. If you use the maximum brightness, the Wi-Fi runtime will drop to around 7.5 hours.
| Apple MacBook Pro 13 2020 2GHz i5 10th-Gen i5-1038NG7, Iris Plus Graphics G7 (Ice Lake 64 EU), 58 Wh | Apple MacBook Pro 13 2019 i5 4TB3 i5-8279U, Iris Plus Graphics 655, 58 Wh | Acer Swift 3 SF313-52-71Y7 i7-1065G7, Iris Plus Graphics G7 (Ice Lake 64 EU), 54.5 Wh | Dell XPS 13 9300 4K UHD i7-1065G7, Iris Plus Graphics G7 (Ice Lake 64 EU), 52 Wh | HP Spectre x360 13-aw0013dx i7-1065G7, Iris Plus Graphics G7 (Ice Lake 64 EU), 60 Wh | Microsoft Surface Laptop 3 13 Core i5-1035G7 i5-1035G7, Iris Plus Graphics G7 (Ice Lake 64 EU), 45 Wh | Average of class Subnotebook | |
|---|---|---|---|---|---|---|---|
| Battery runtime | -1% | -12% | -6% | -18% | -31% | 26% | |
| H.264 (h) | 11.5 | 12 4% | 10.5 -9% | 15.6 ? 36% | |||
| WiFi v1.3 (h) | 12.1 | 11.5 -5% | 10.3 -15% | 11.4 -6% | 9.9 -18% | 8.3 -31% | 14 ? 16% |
Pros
Cons
Verdict – MacBook Pro 13 is better with the new keyboard
The 2020 MacBook Pro 13 is pretty much just a mandatory update, because it was the last MacBook with the old butterfly keyboard after both the MacBook Pro 16 and the MacBook Air already received an update. The switch to the Ice Lake processor is not really noticeable for the user to be honest. You get more GPU performance, but the CPU performance is pretty much unchanged. You can clearly see Intel's problem when you compare the results with the new AMD Renoir processors.
However, the MacBook Pro 13 still has an advantage over many other subnotebooks when it comes to the performance, because there is no big drop even under sustained workloads. The new Magic keyboard with the longer key travel will probably attract more customers. If you have avoided a new MacBook because of the keyboard, you should definitely try the new model.
The MacBook Pro 13 with the new keyboard should please more customers and it is also a better overall product than the predecessor. However, you have to pay a lot of money and accept the miserable repairability.
We expected more ahead of the launch to be honest (especially the switch to the rumored MacBook Pro 14) and there have not been any real advancements/innovations over the last couple of years, but the MacBook Pro 13 is a very good laptop nevertheless. The great unibody chassis and the excellent display are still two highlights. The rating also benefits from the new improved keyboard, but all of this comes at a steep price, because our review unit is very expensive at 2,129 Euros (~$2,382).
Apple MacBook Pro 13 2020 2GHz i5 10th-Gen
- 06/01/2020 v7 (old)
Andreas Osthoff
Price comparison
