

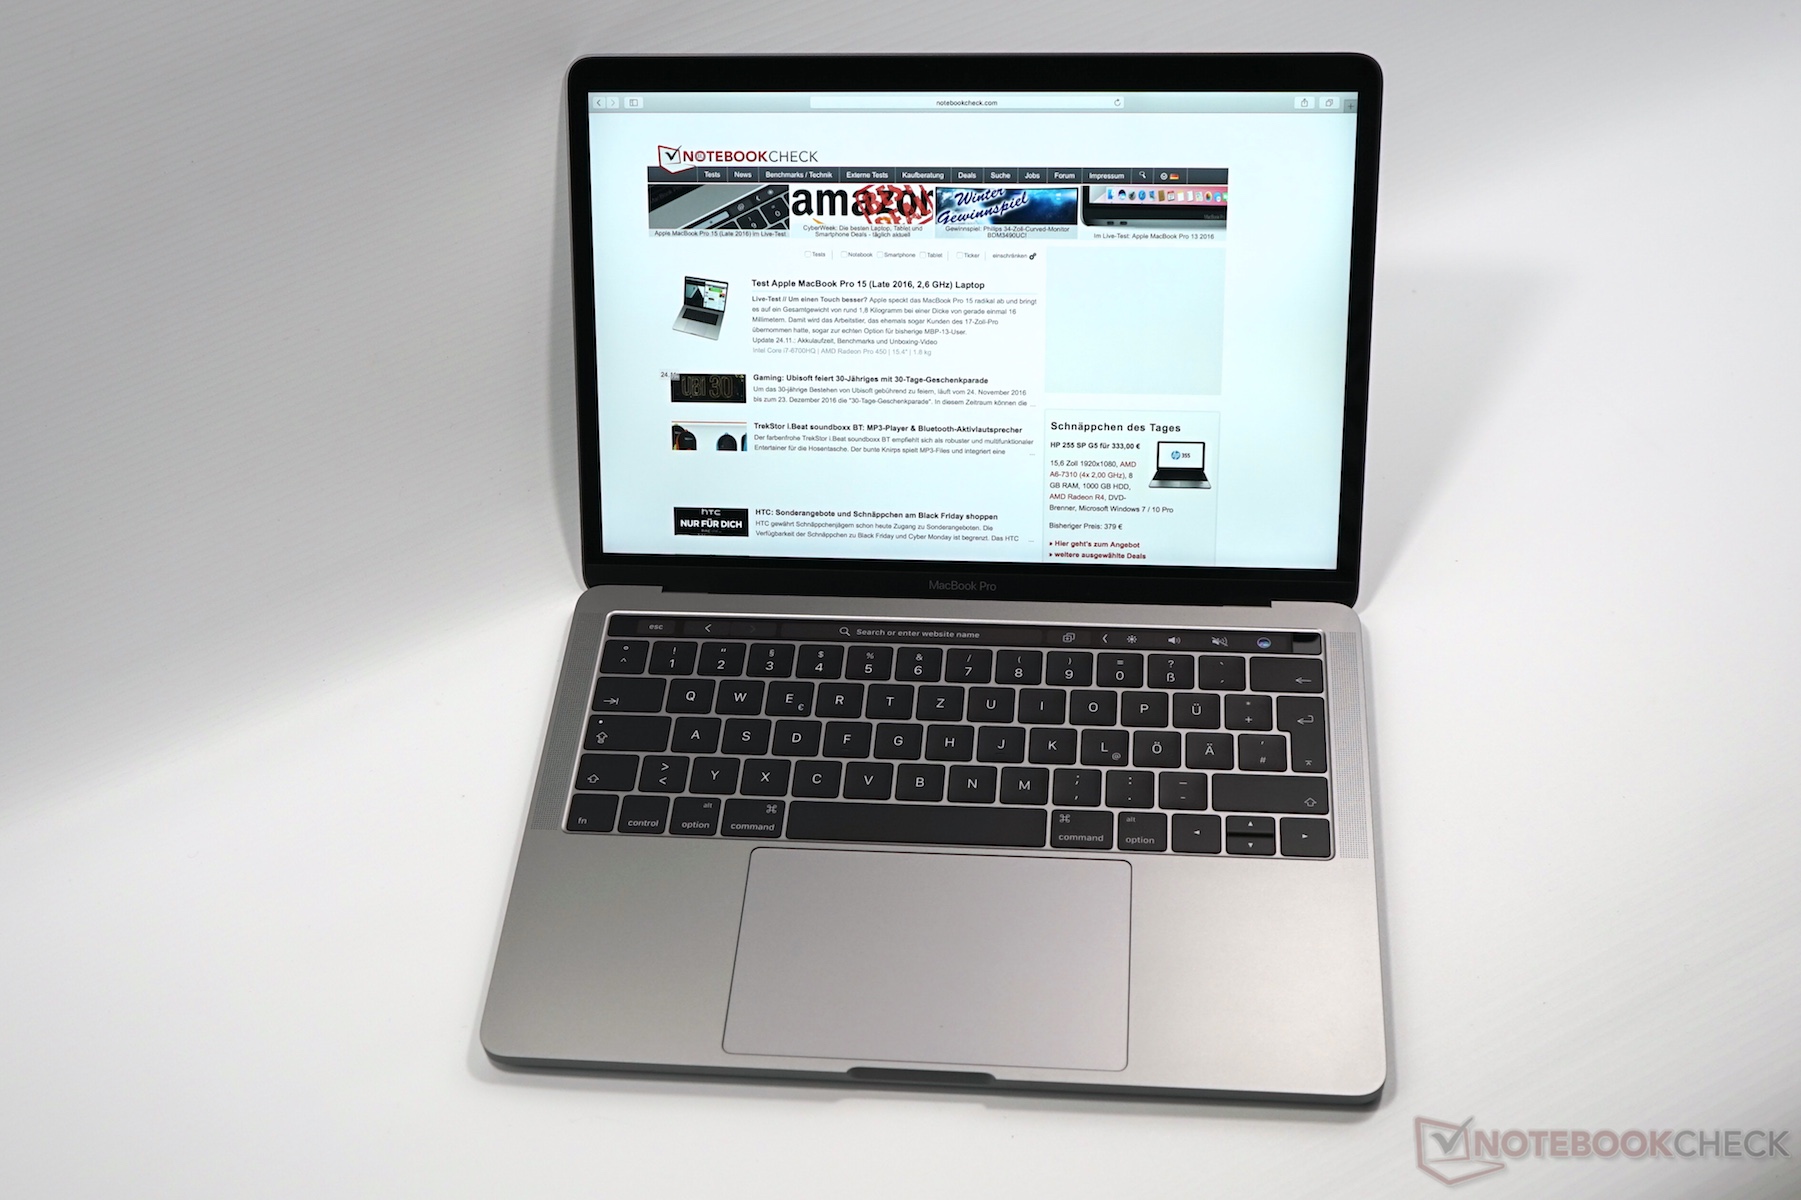
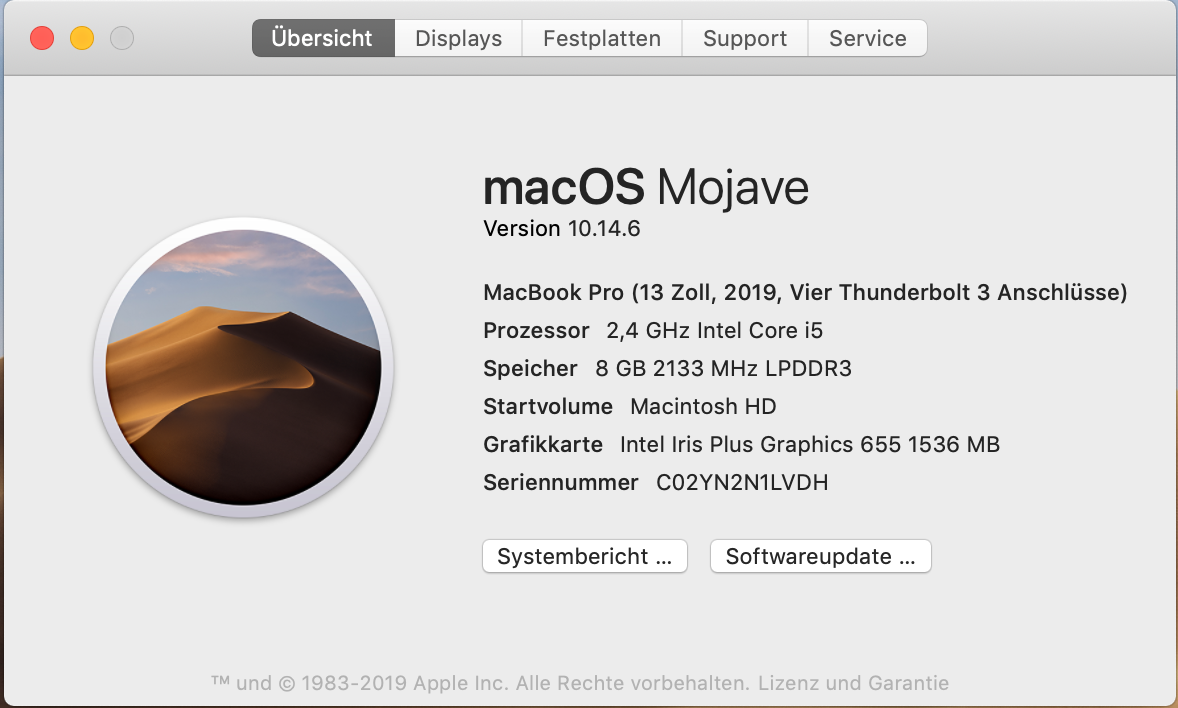
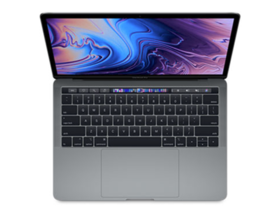
Apple MacBook Pro 13 2019 laptop review: Good performance, but no real innovation
Apple has modified its MacBook Pro 13 lineup a bit since the cheaper version has also received the touch bar now. Despite there still being significant differences on the inside, the two versions can only be distinguished externally by the number of Thunderbolt or USB-C ports. Today we'll take a look at the more expensive model with 4 TB3 ports, which has only been slightly updated though. Alongside the revised Butterfly keyboard, there's a new Intel processor with Iris graphics including eDRAM cache. But are the model updates enough for it to stay at the top of the subnotebook charts in 2019?
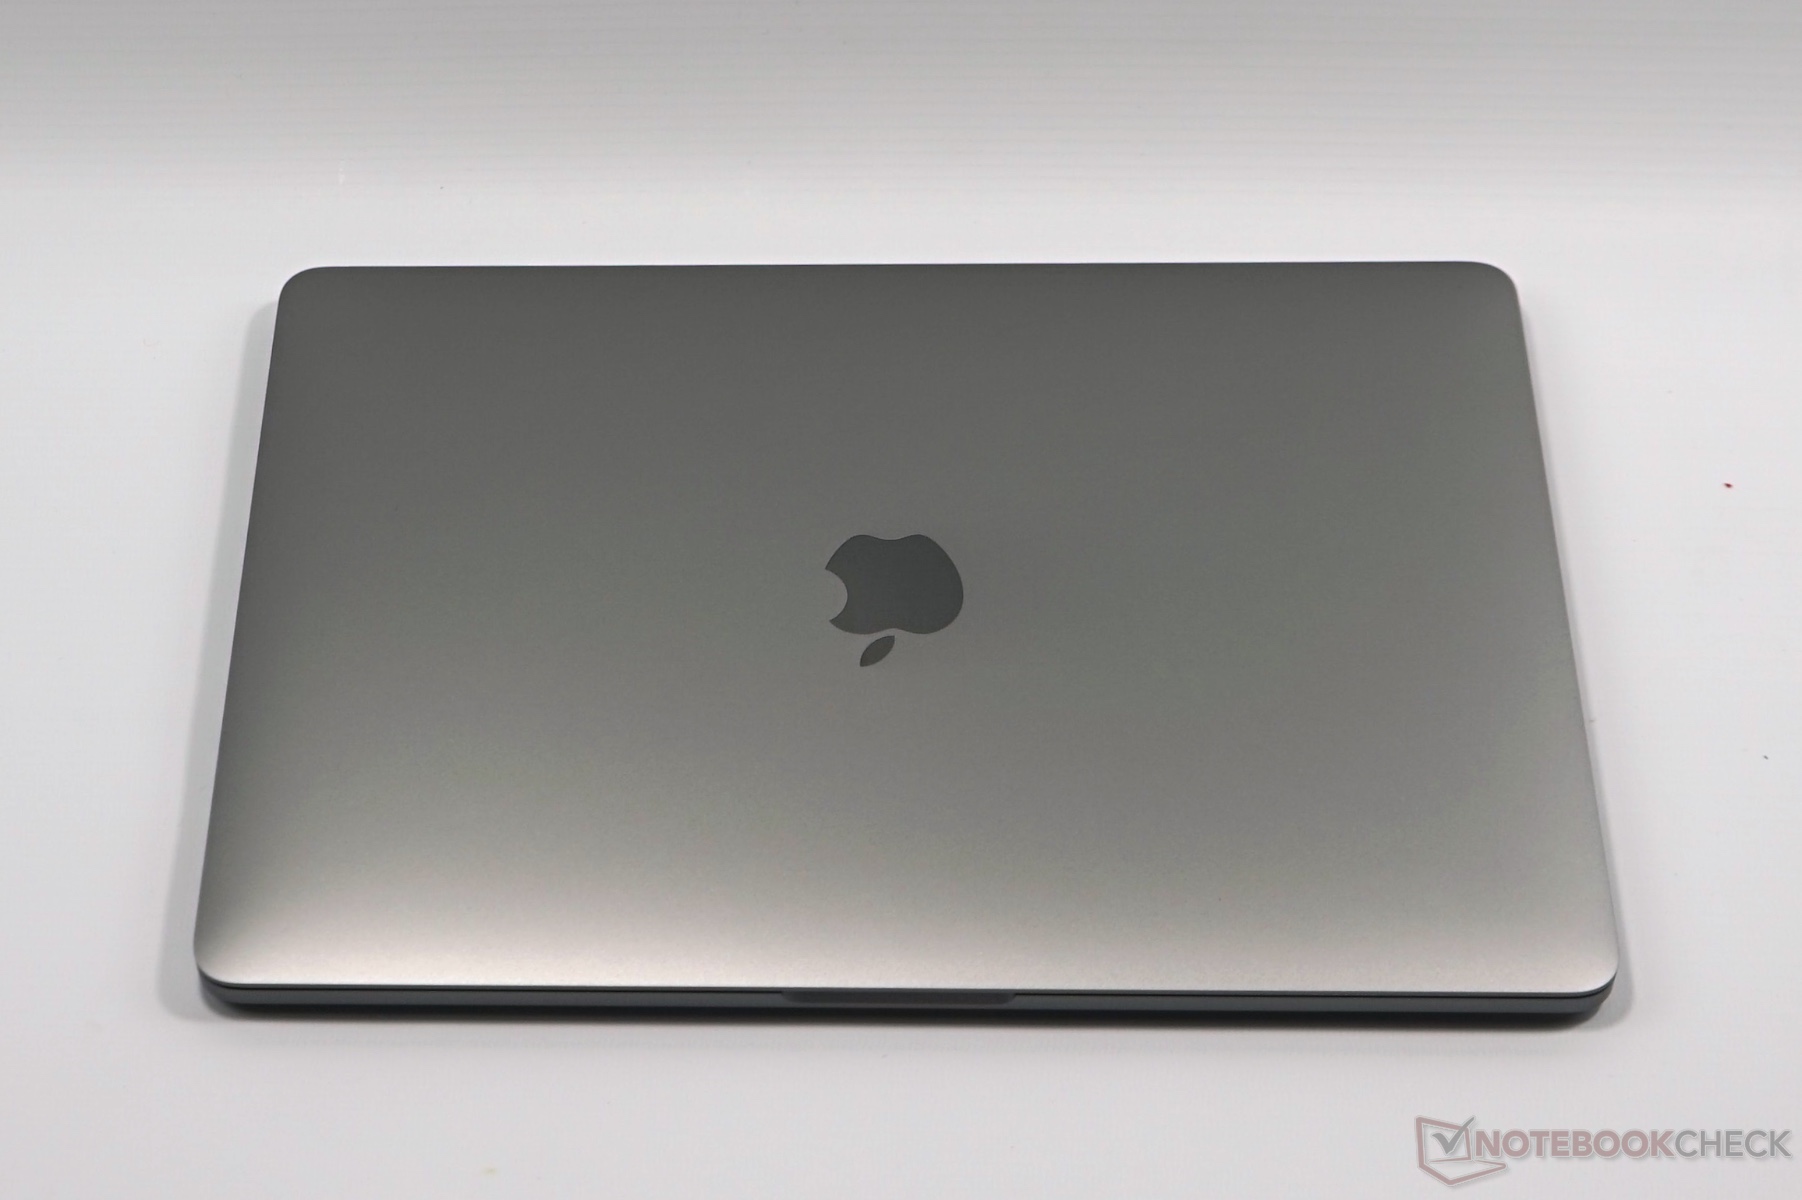
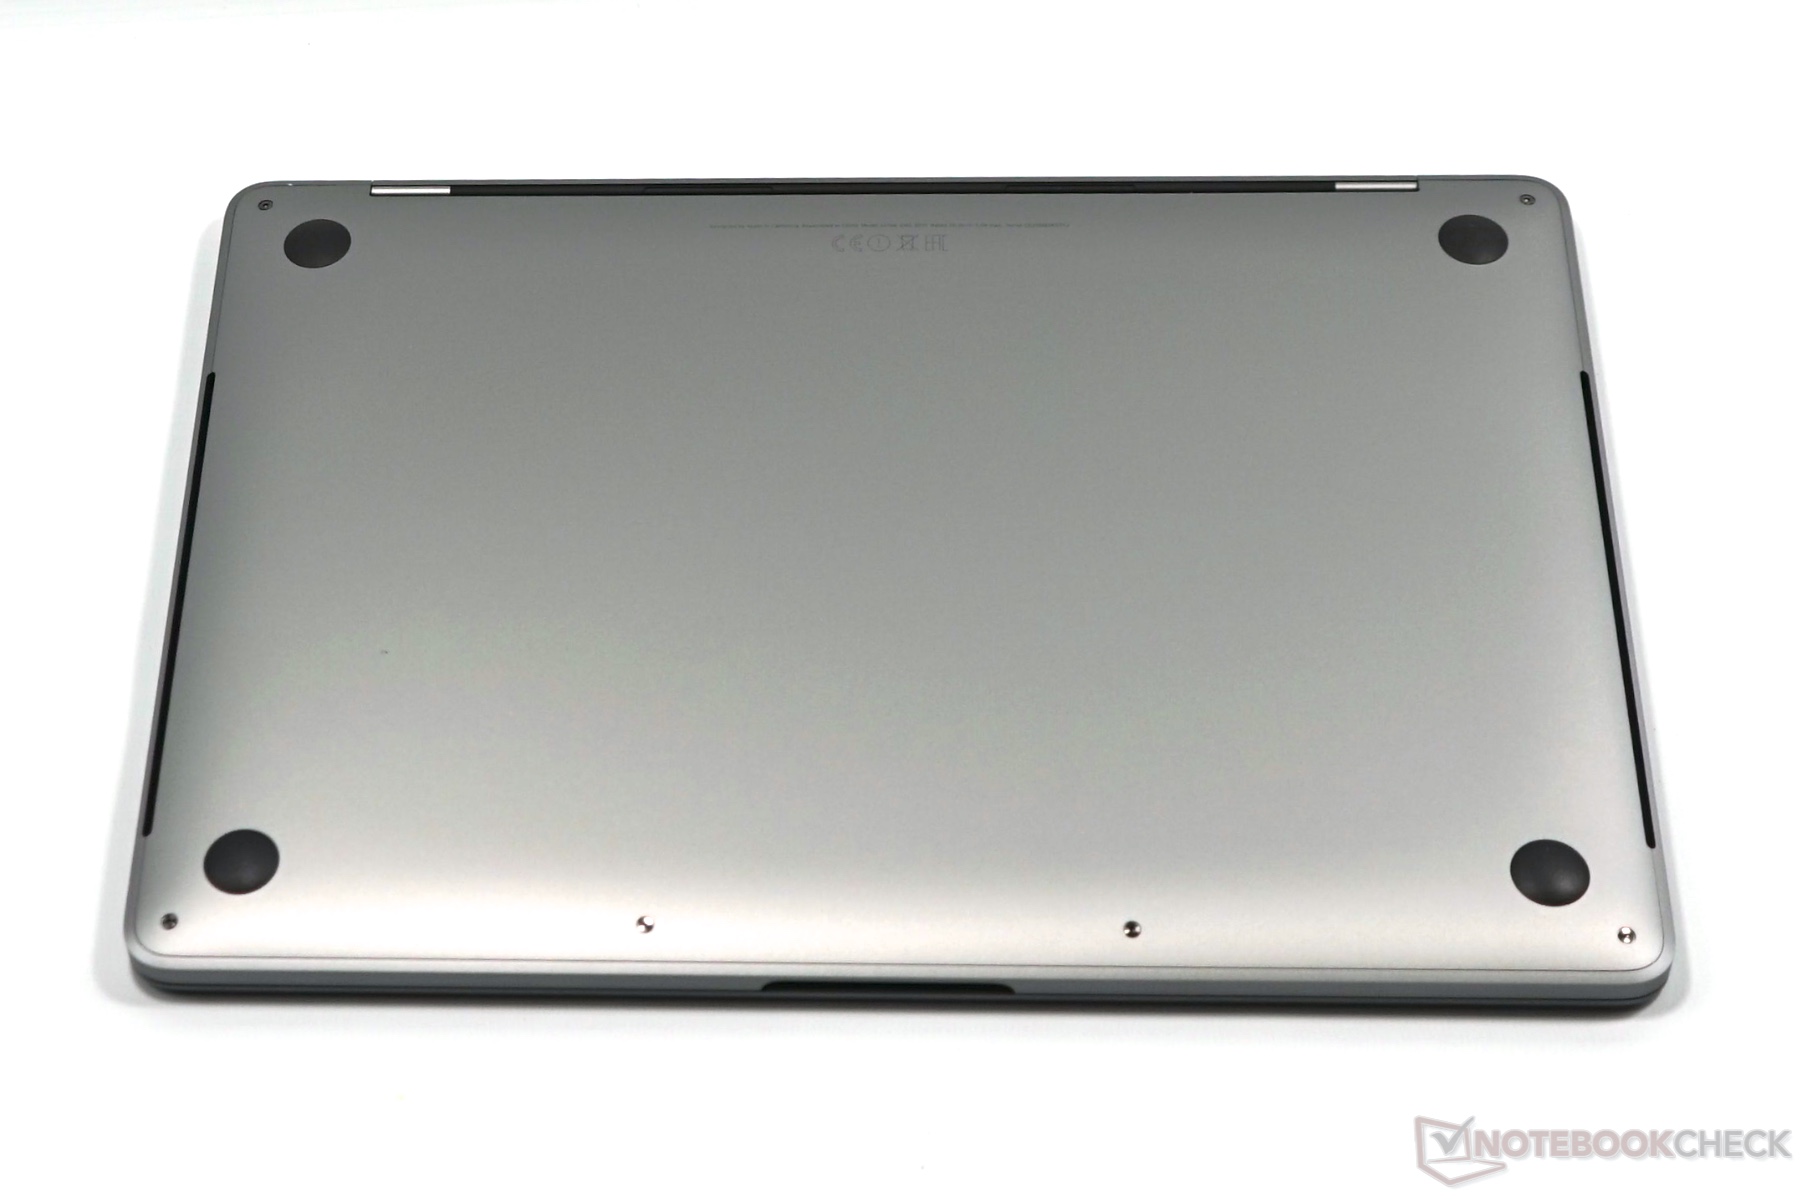
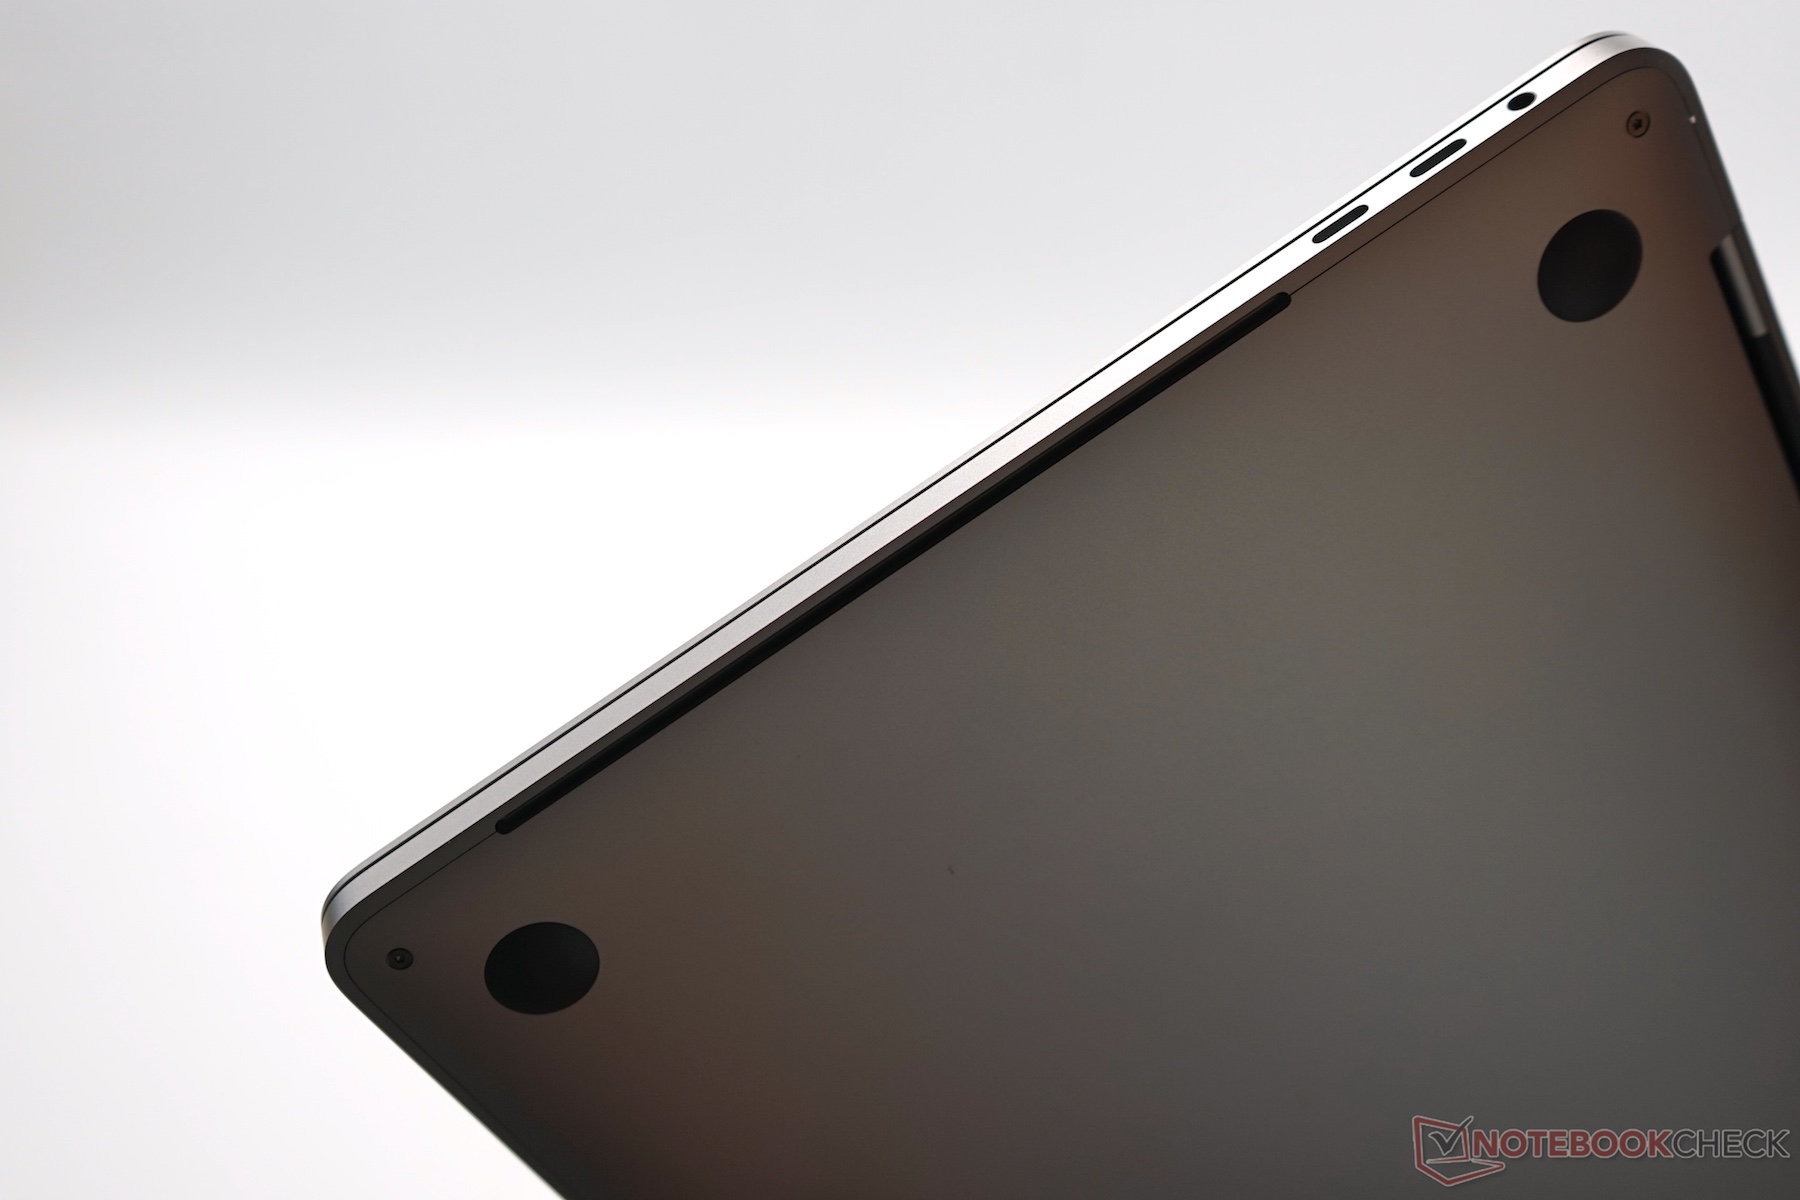
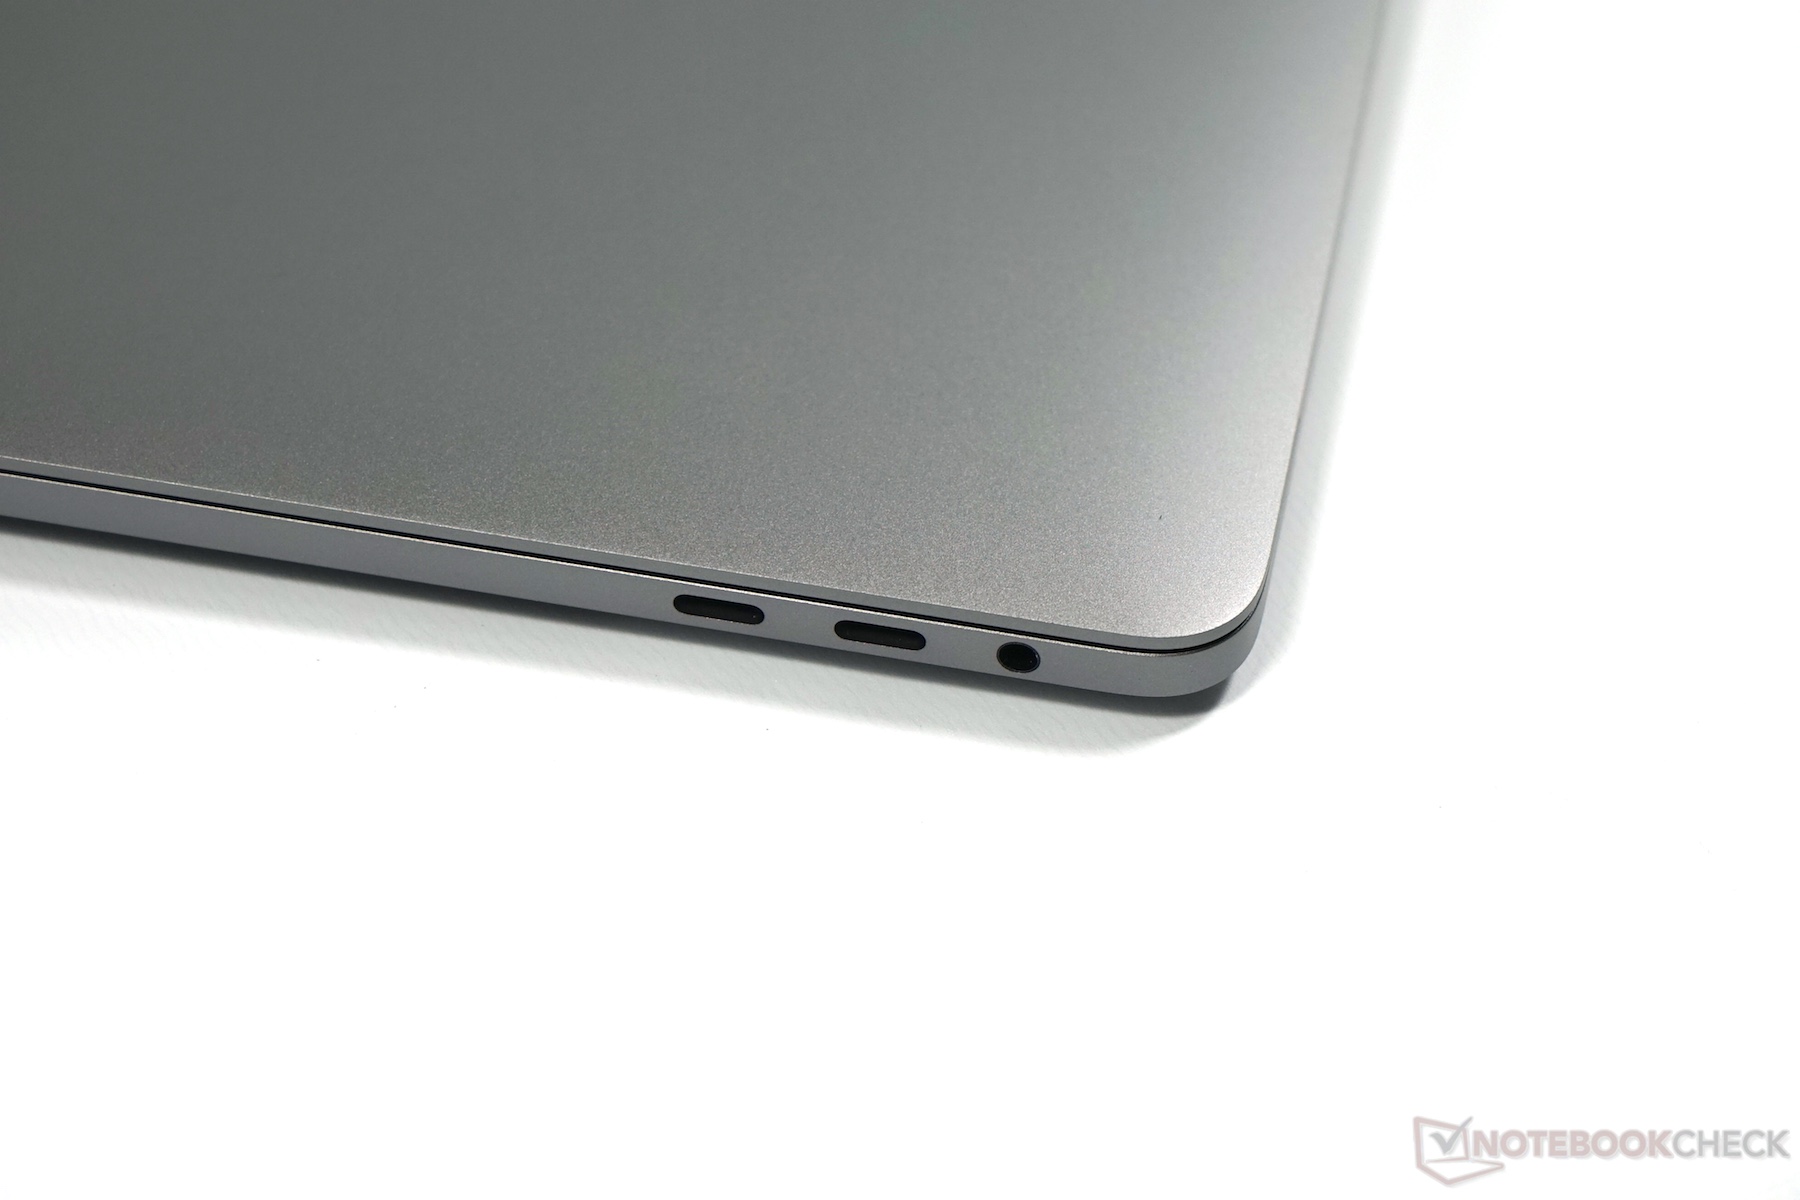
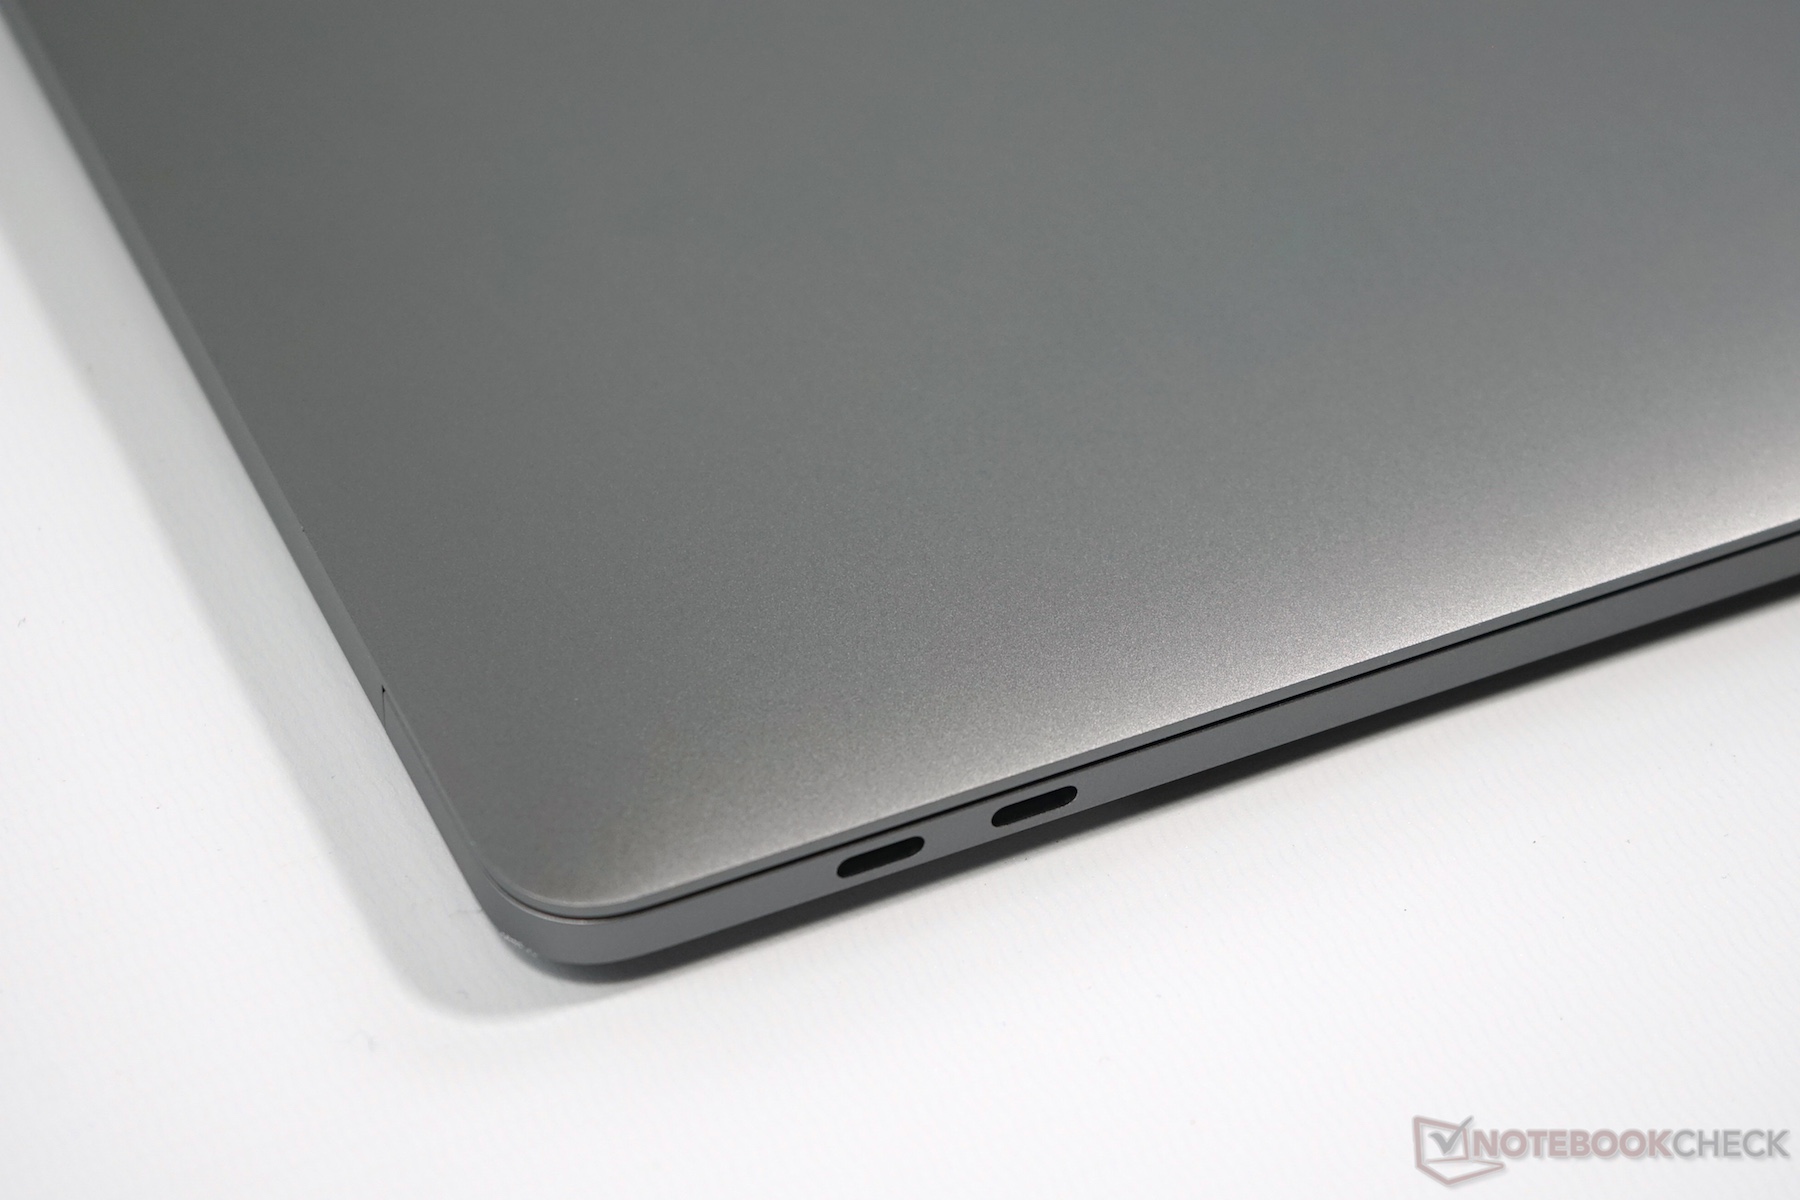
Since the construction of the MacBook Pro hasn't changed since 2016, please refer to our full review of the 2018 model for more information regarding the case and ports:
Rating | Date | Model | Weight | Height | Size | Resolution | Price |
|---|---|---|---|---|---|---|---|
| 90.7 % v7 (old) | 10 / 2019 | Apple MacBook Pro 13 2019 i5 4TB3 i5-8279U, Iris Plus Graphics 655 | 1.4 kg | 14.9 mm | 13.30" | 2560x1600 | |
| 90.1 % v7 (old) | 07 / 2019 | Lenovo ThinkPad X1 Carbon 2019-20QE000VGE i7-8665U, UHD Graphics 620 | 1.1 kg | 14.9 mm | 14.00" | 2560x1440 | |
| 87.7 % v6 (old) | 02 / 2019 | Dell XPS 13 9380 i7 4K i7-8565U, UHD Graphics 620 | 1.2 kg | 11.6 mm | 13.30" | 3840x2160 | |
| 85.6 % v7 (old) | 12 / 2018 | Razer Blade Stealth i7-8565U i7-8565U, GeForce MX150 | 1.3 kg | 14.8 mm | 13.30" | 1920x1080 | |
| 84.5 % v7 (old) | 08 / 2019 | HP Envy 13-aq0003ng i7-8565U, GeForce MX250 | 1.2 kg | 14.7 mm | 13.30" | 1920x1080 |
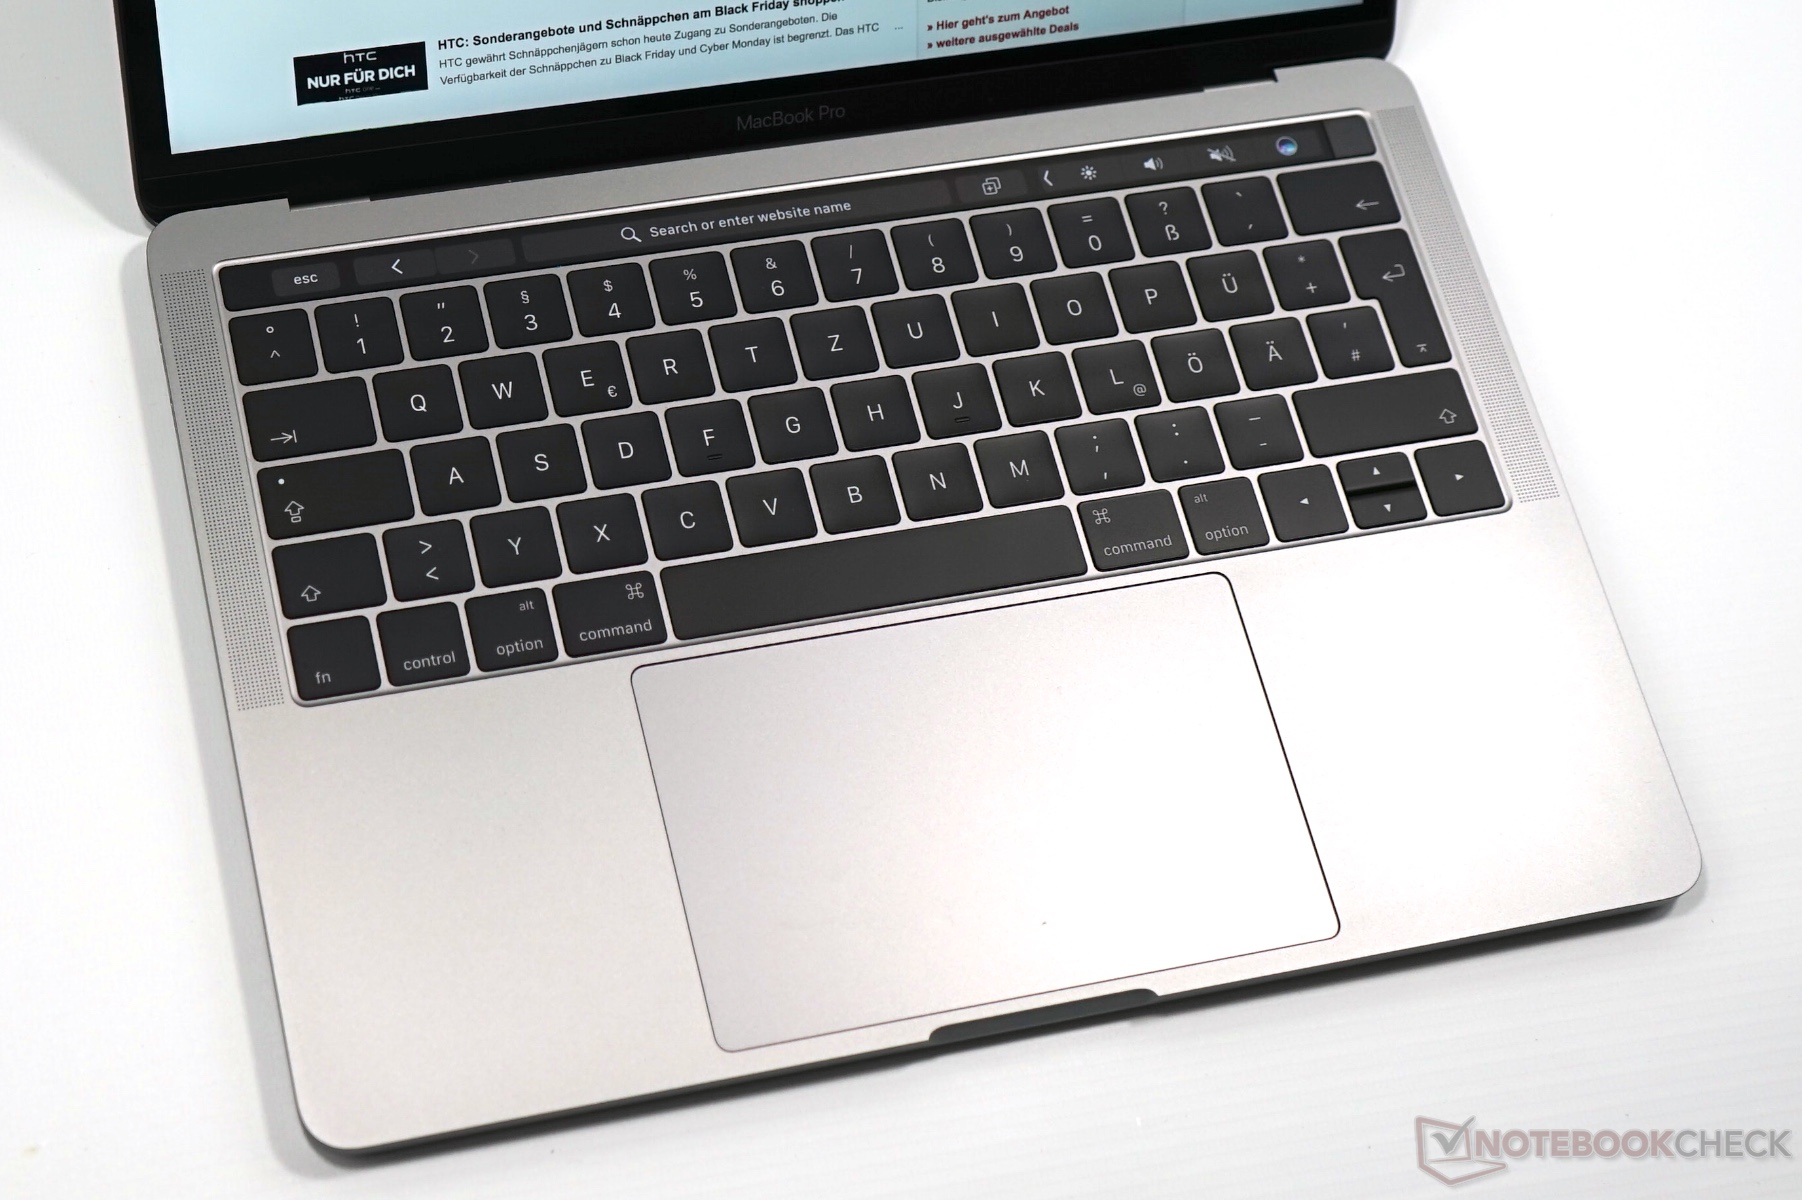
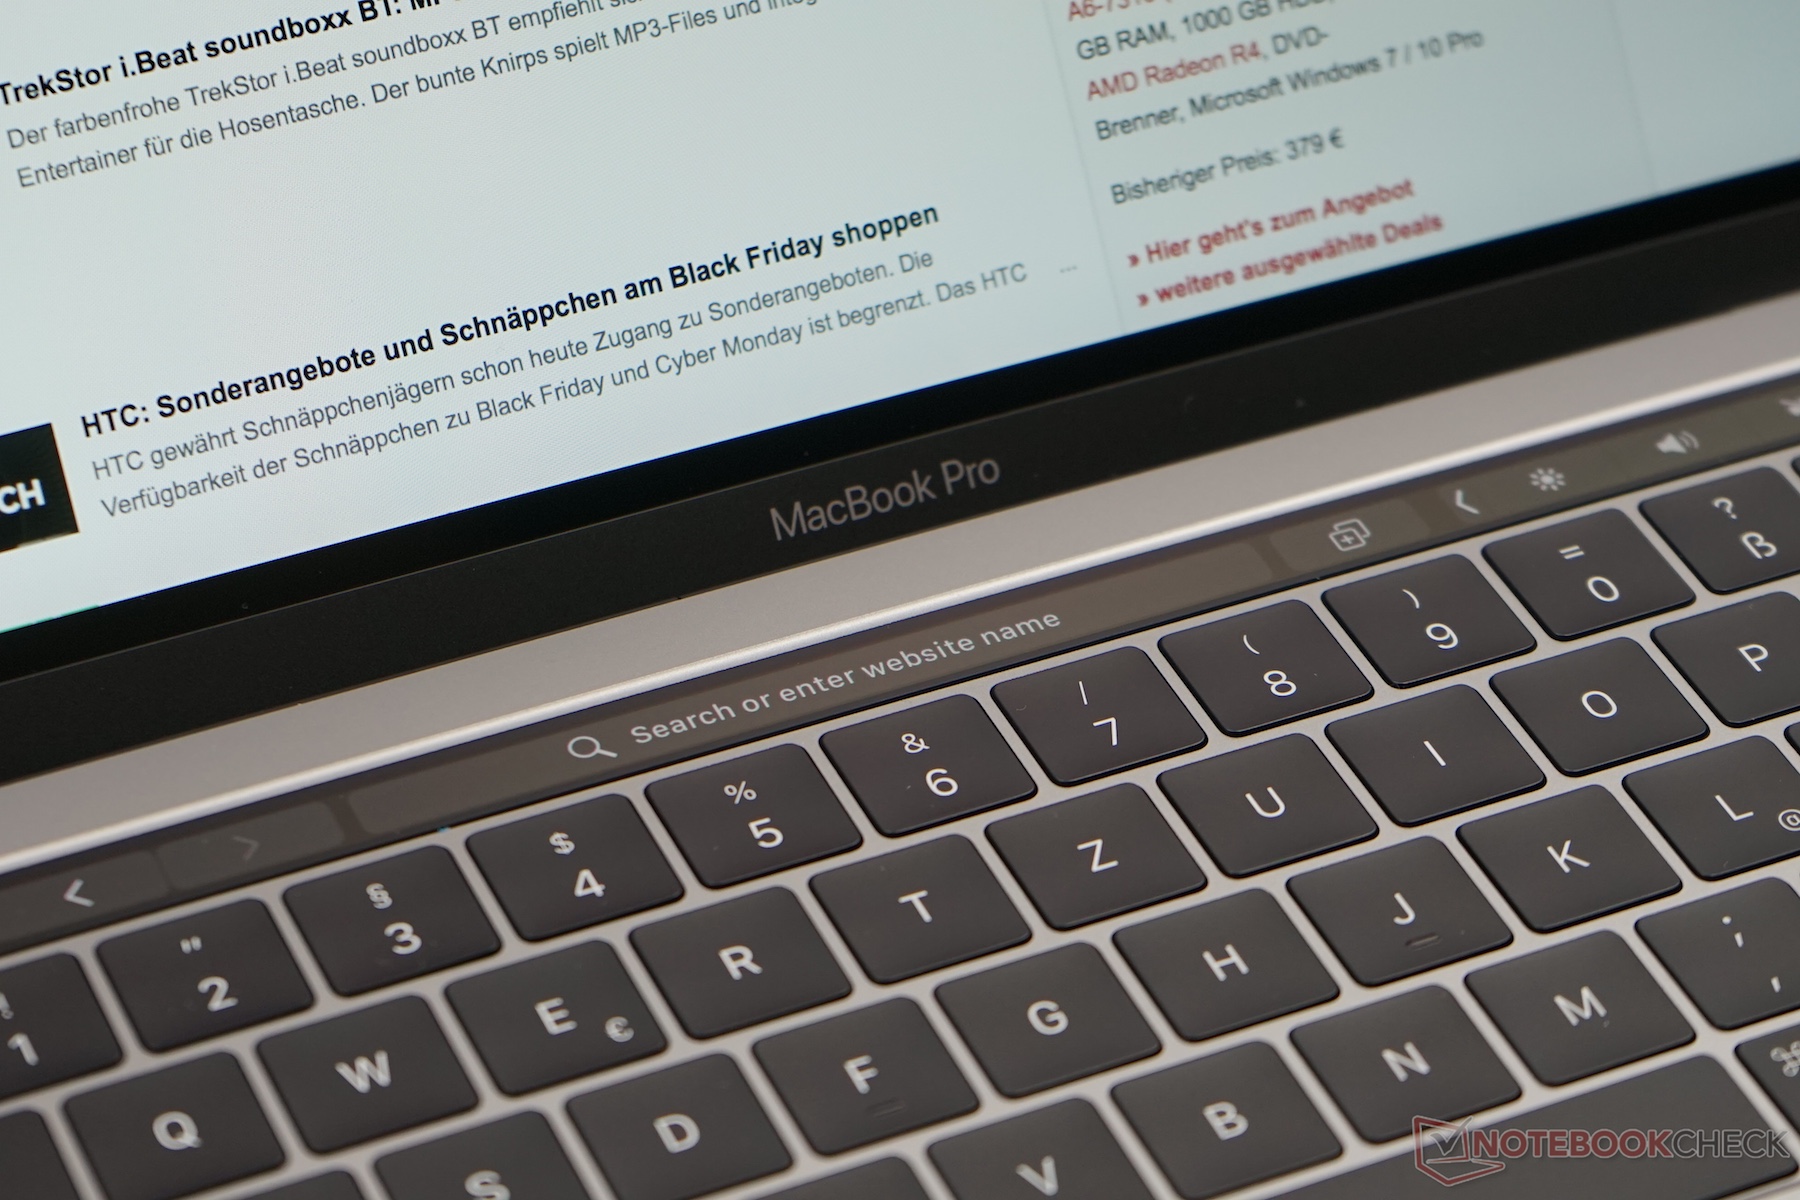
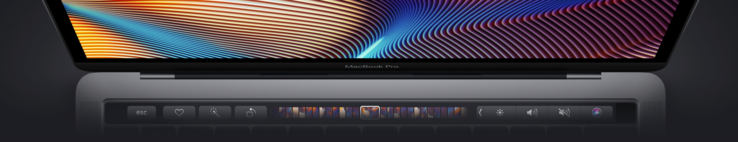
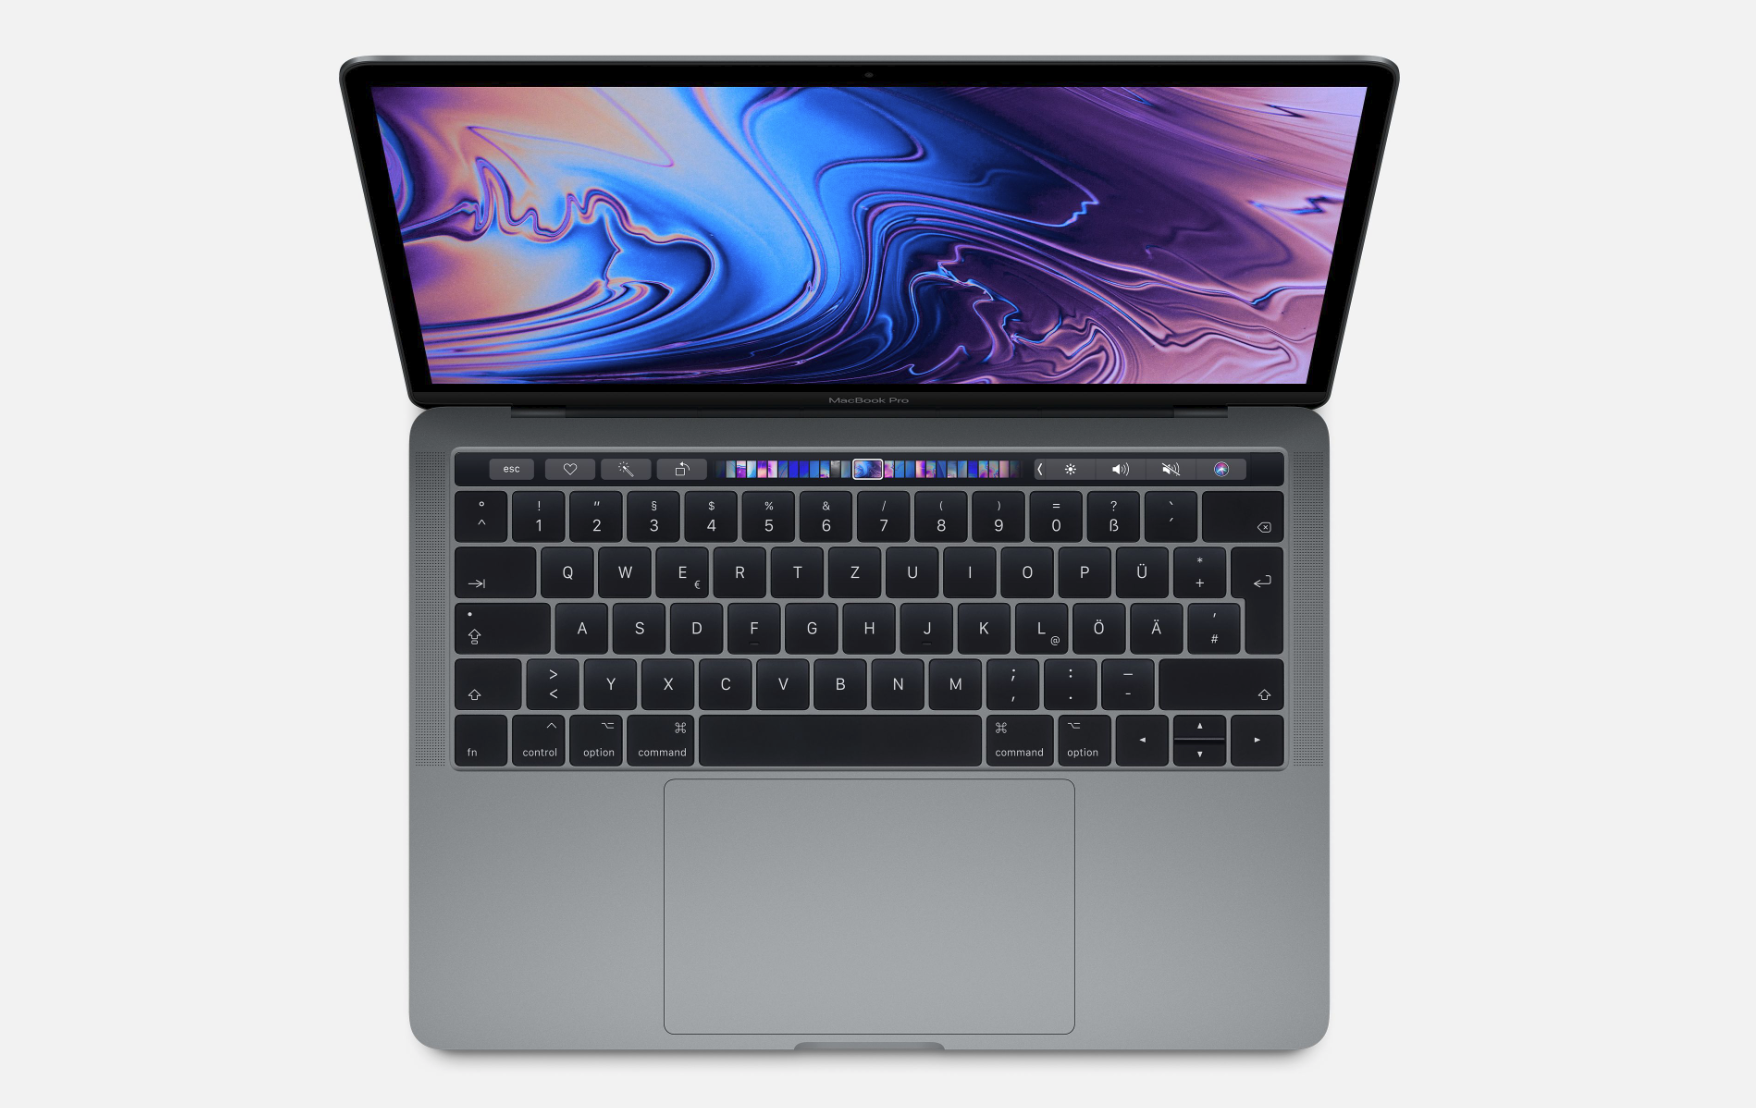
Input devices – MacBook Pro 13 with Butterfly keyboard
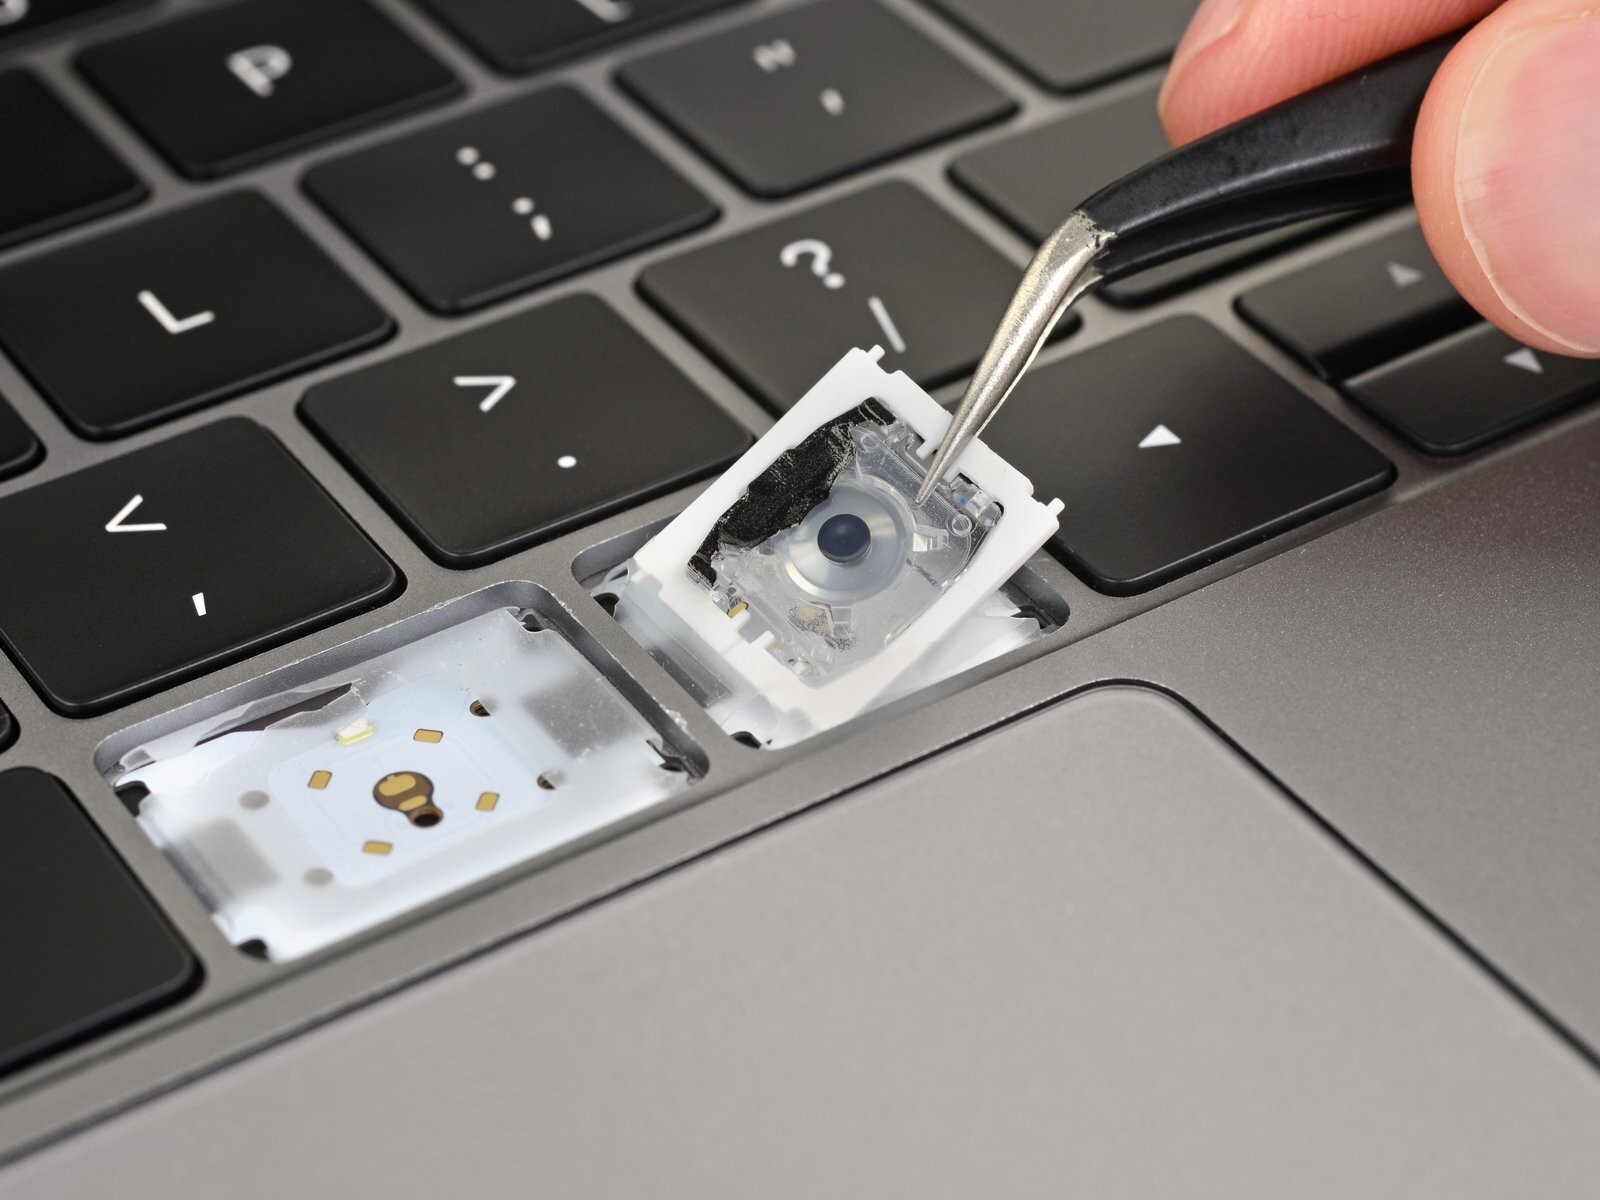
The keyboard remains a controversial topic among users. Apple presented the so-called Butterfly keys with the 2016 models for the first time. Through the special construction, the height was significantly reduced, but at the same time the key travel was massively reduced. Although the keystroke is very precise, not every user likes the typing feel due to the short travel.
More problematic, however, were the reliability problems, which we're not able to adequately test in the context of a review report. For each new generation, Apple has slightly modified the keys, with the biggest change definitely being the use of a silicon membrane. This allows a quieter typing noise but is especially intended to prevent the penetration of dirt. However, the problems have not disappeared as a result. This year, the material of the keys has been slightly modified, but the silicon membrane is preserved. The subjective typing feel hasn't changed with the 2019 models, but we can't say at this point how reliable this version of the keyboard will be. Due to the many problems, there are also rumors that the manufacturer will opt again for traditional scissor keys for future models.
Display – Apple laptop continues having a very good IPS panel
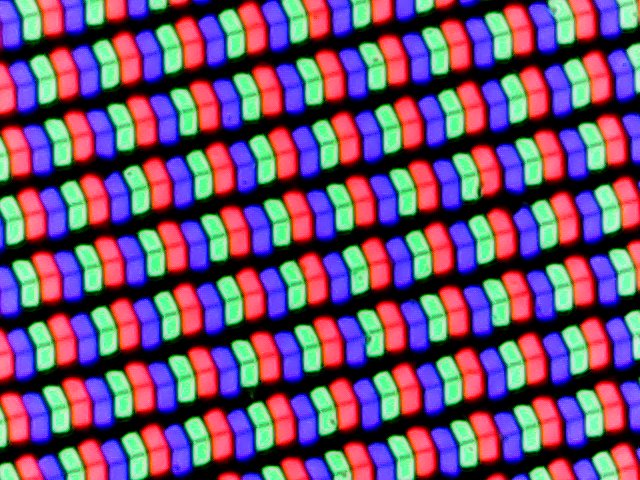
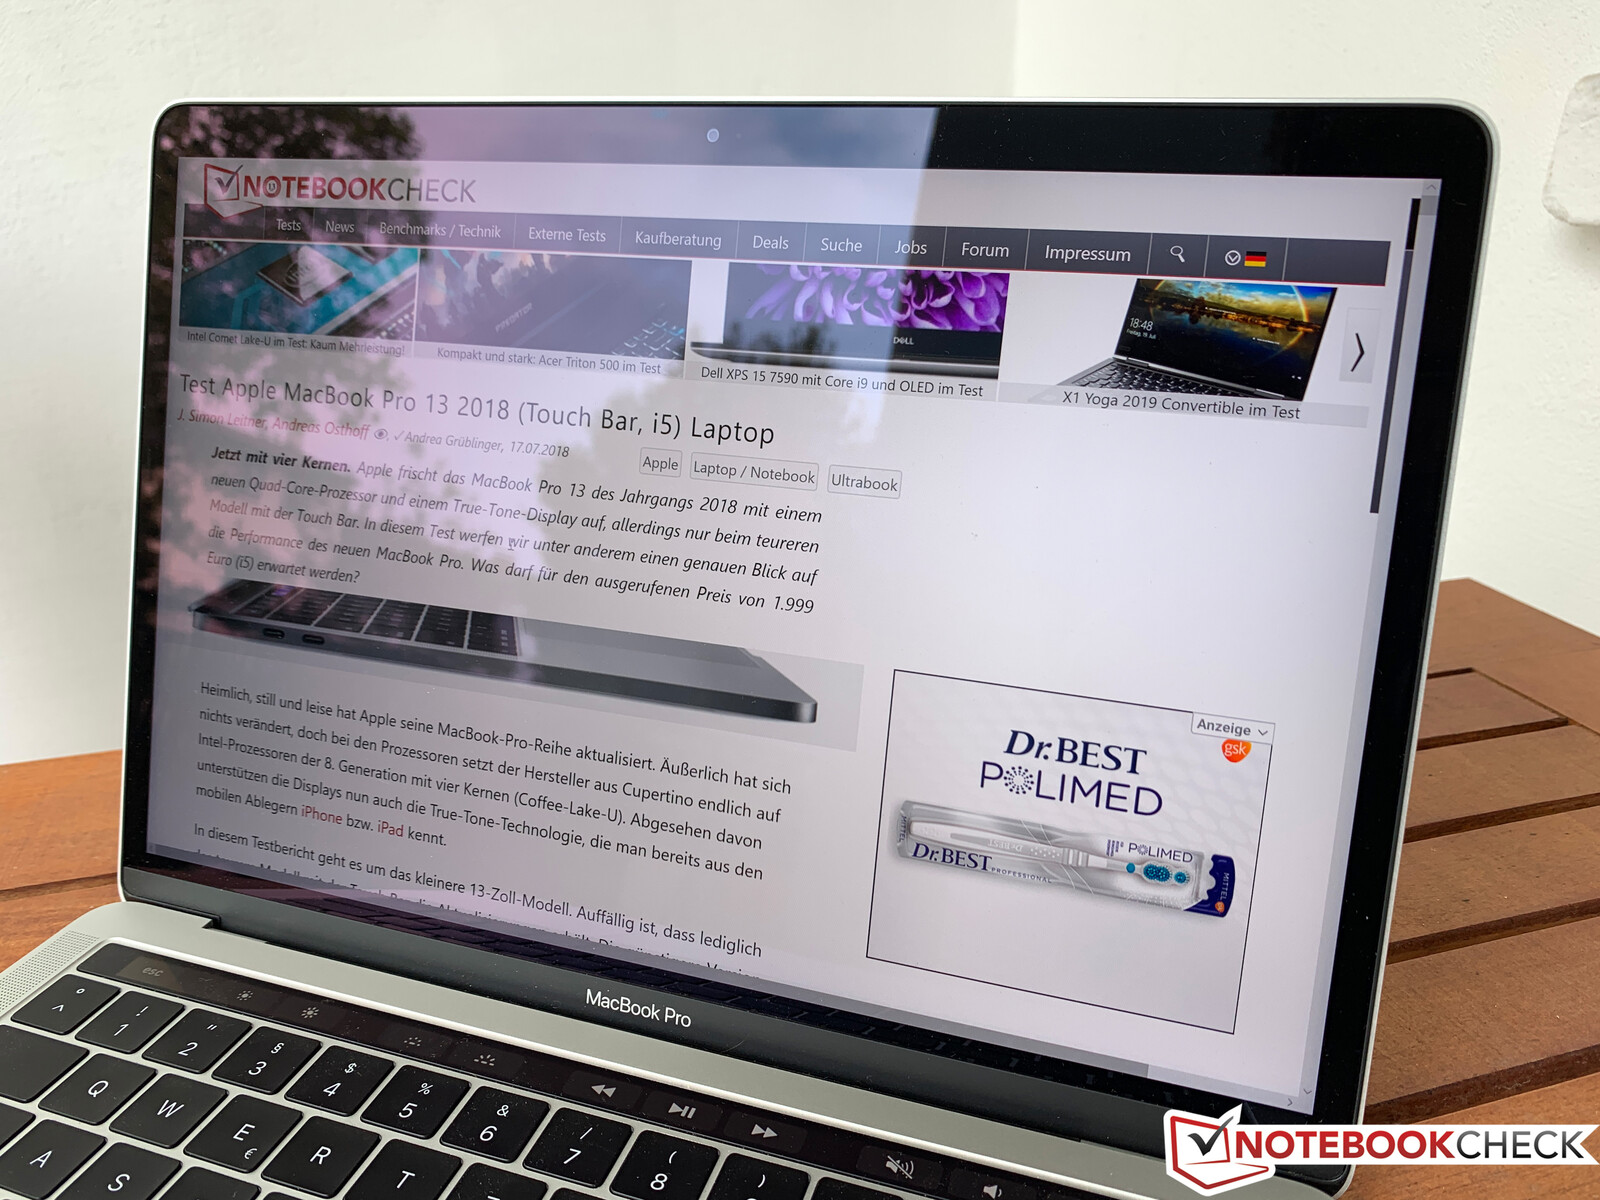
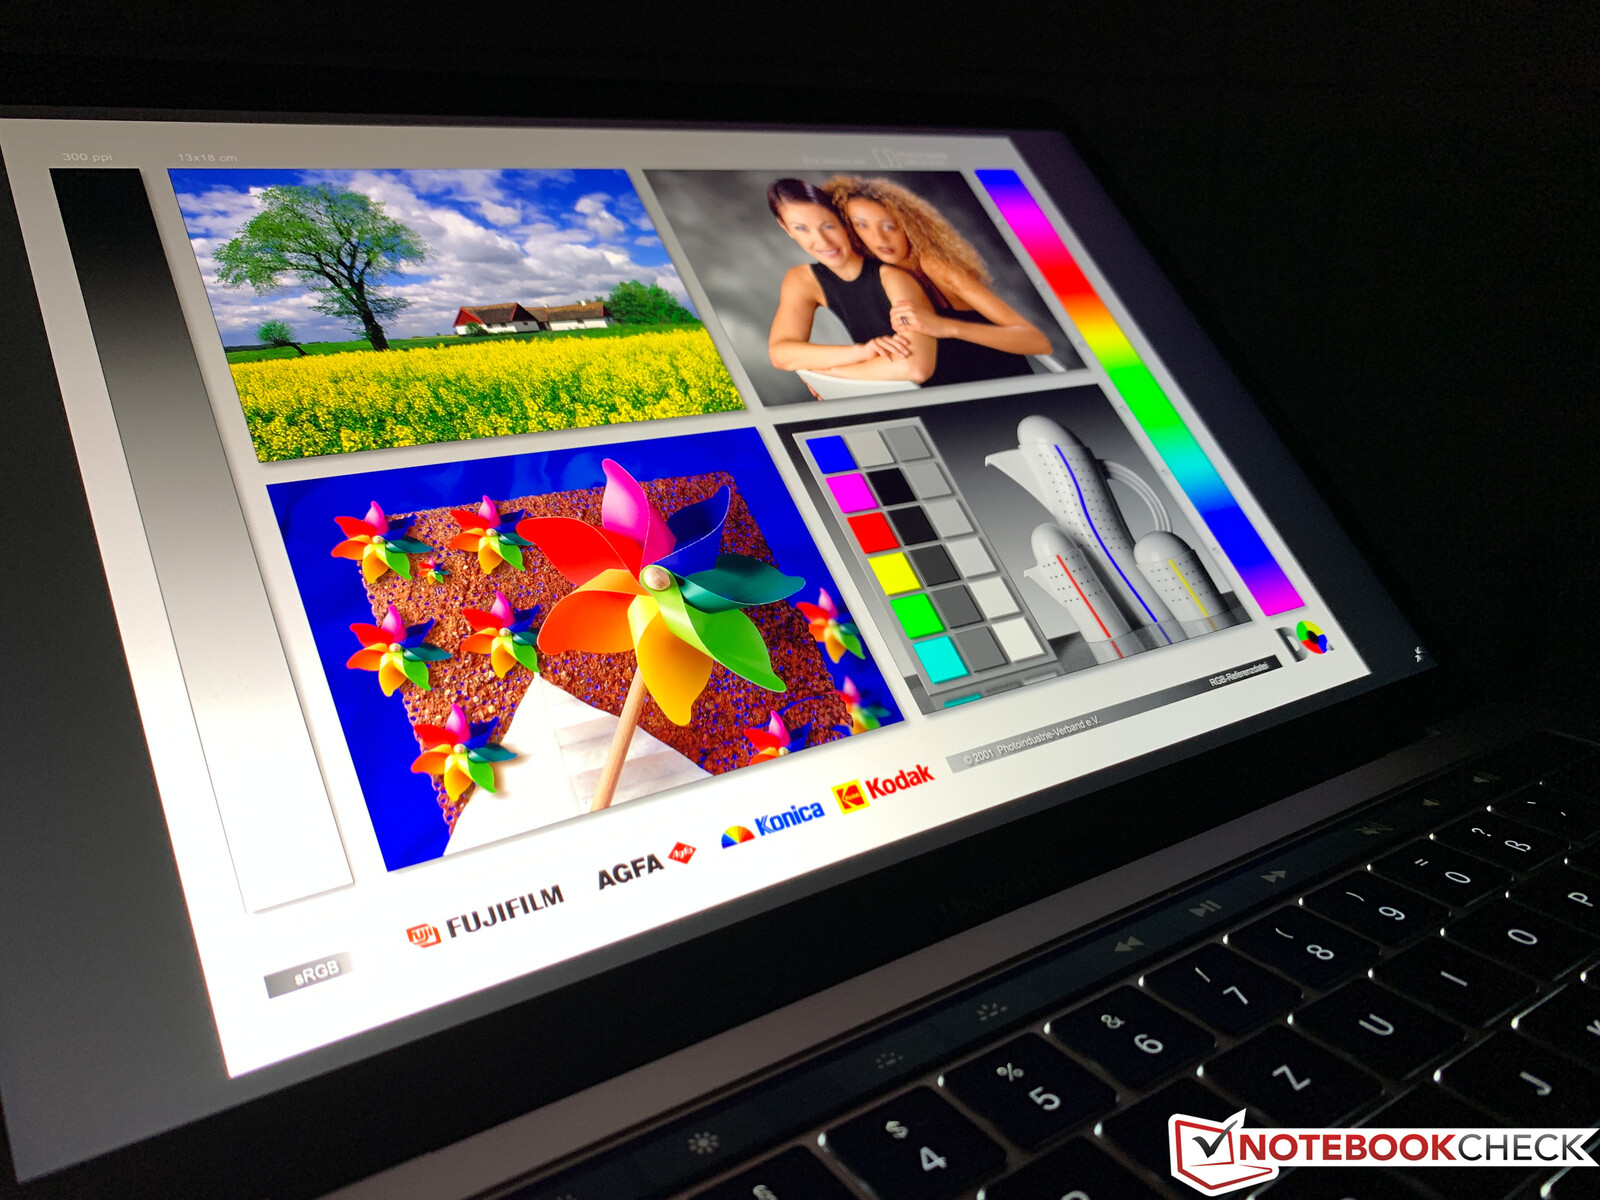
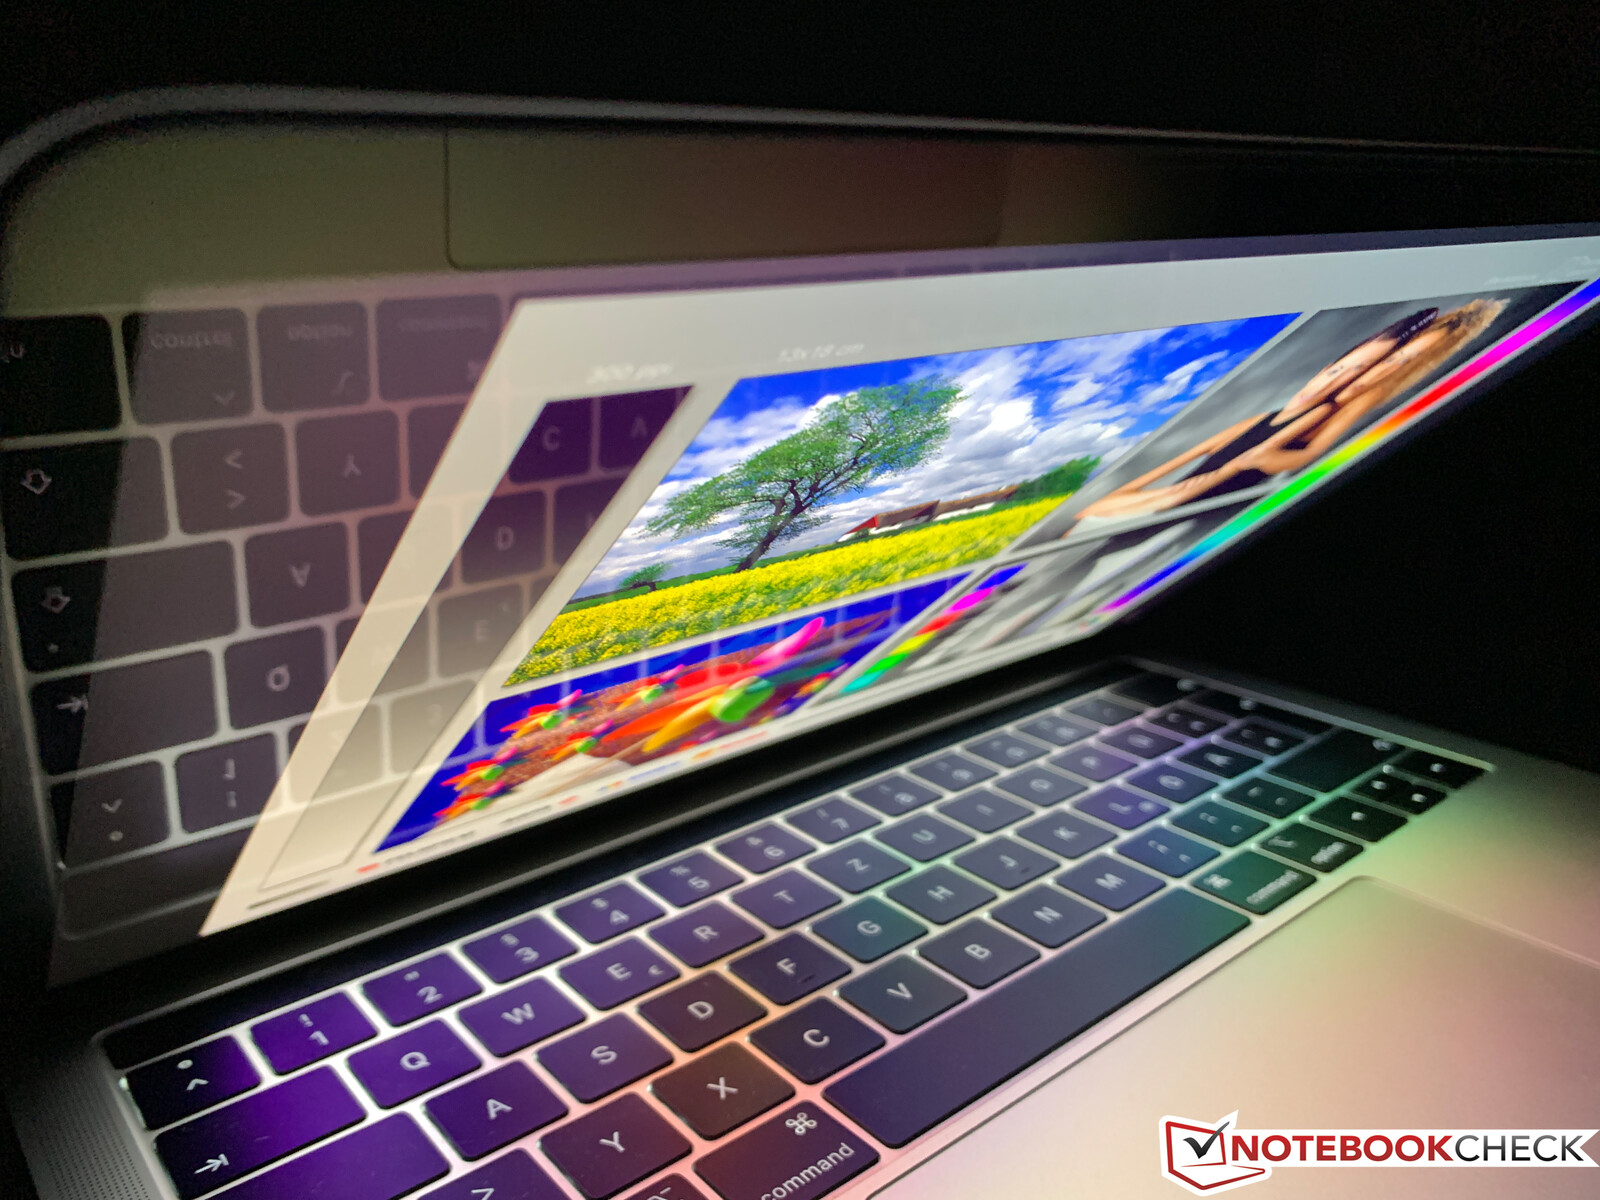
We can be brief about the display, because there are no fundamental changes and even the model number (APPA03E) matches last year's model. The 13.3-inch display (glossy) offers 2560 x 1600 pixels and still looks subjectively great. Thanks to TrueTone, the color temperature is automatically adjusted to the environment via a sensor, and as a user, you get used to it surprisingly quickly. Scaling issues are also a foreign word for macOS. In addition, the brightness is adjusted to the ambient light with a lot of sensitivity. Although some other manufacturers (e.g. HP) are doing this too, it's still rare in the Windows sector.
There are no problems with the measured values either. The average brightness is just under 500 nits, the contrast is very good at 1500:1, and there is no visible screen bleeding. With the predecessor, we could still measure a flicker of the backlight at an extremely high frequency. That was not the case this time, but that wasn't classic PWM either way.
| |||||||||||||||||||||||||
Brightness Distribution: 87 %
Center on Battery: 513 cd/m²
Contrast: 1524:1 (Black: 0.34 cd/m²)
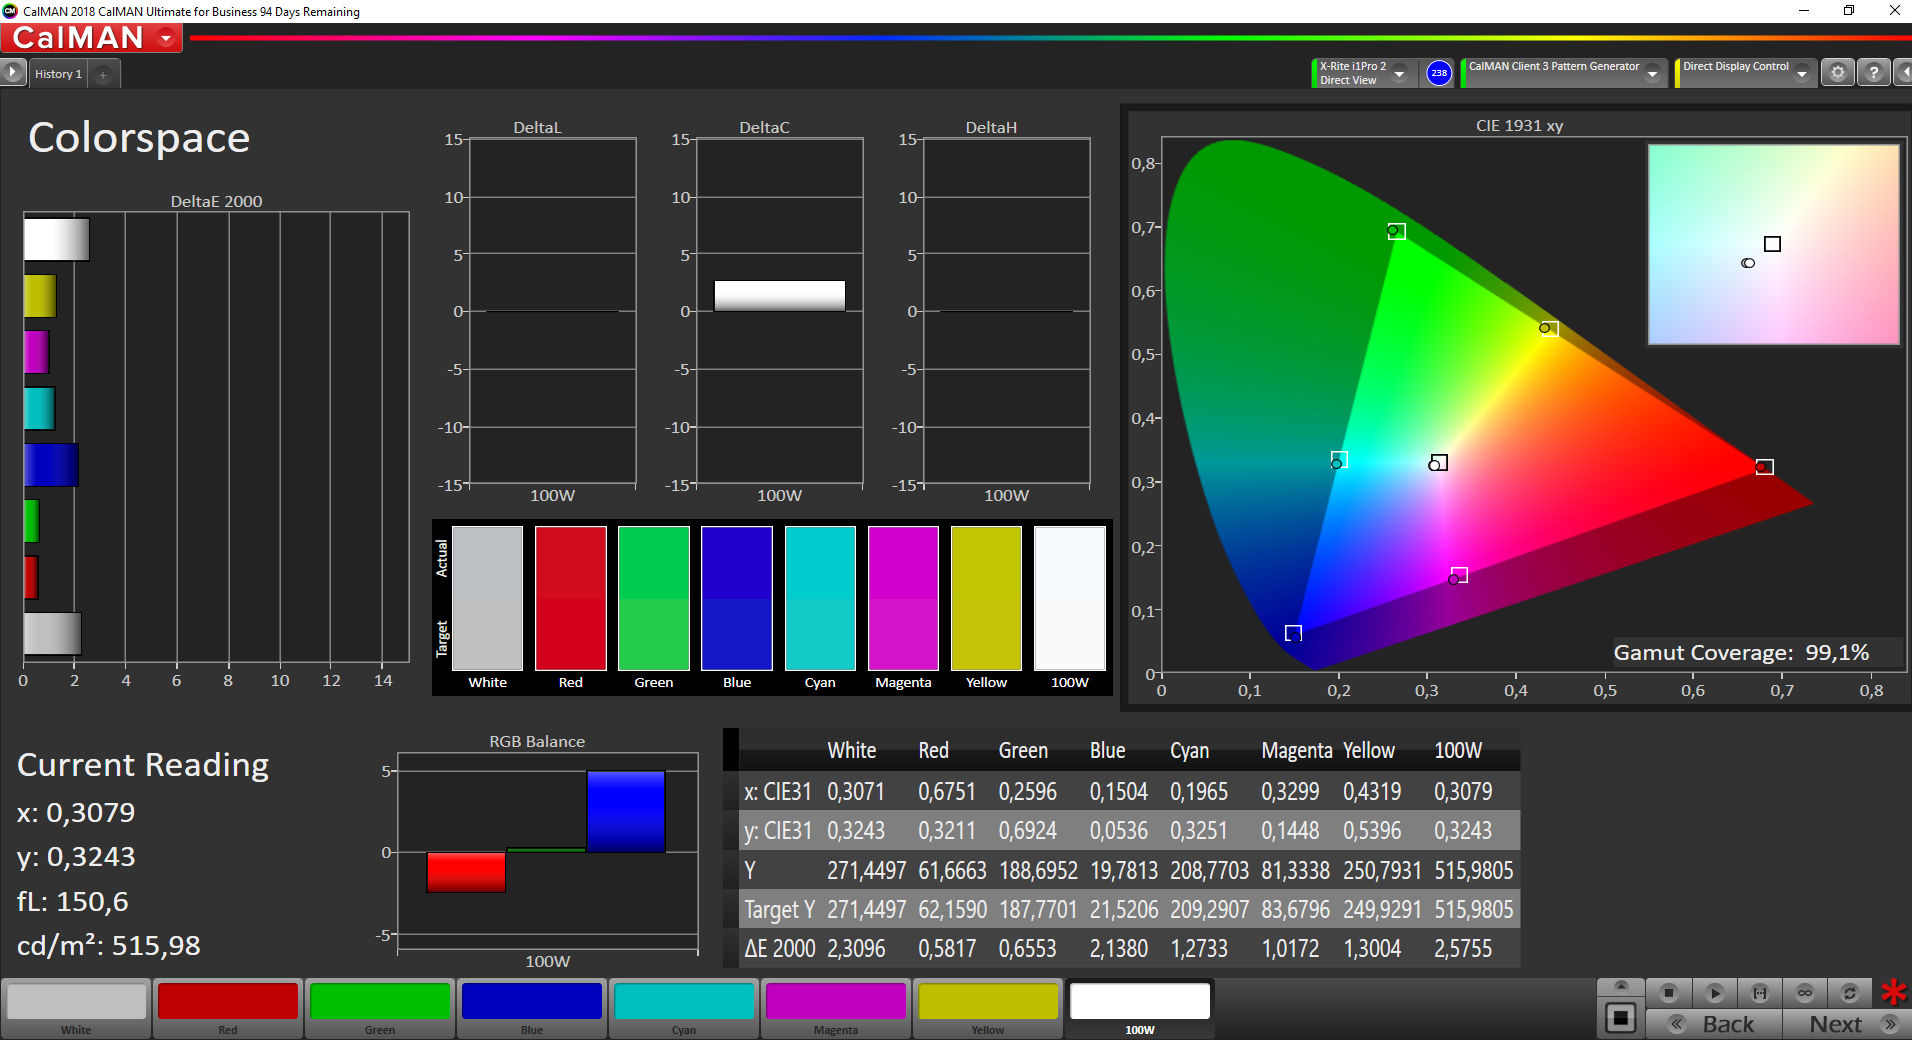
ΔE ColorChecker Calman: 1.5 | ∀{0.5-29.43 Ø4.83}
calibrated: 2.6
ΔE Greyscale Calman: 2 | ∀{0.09-98 Ø5.1}
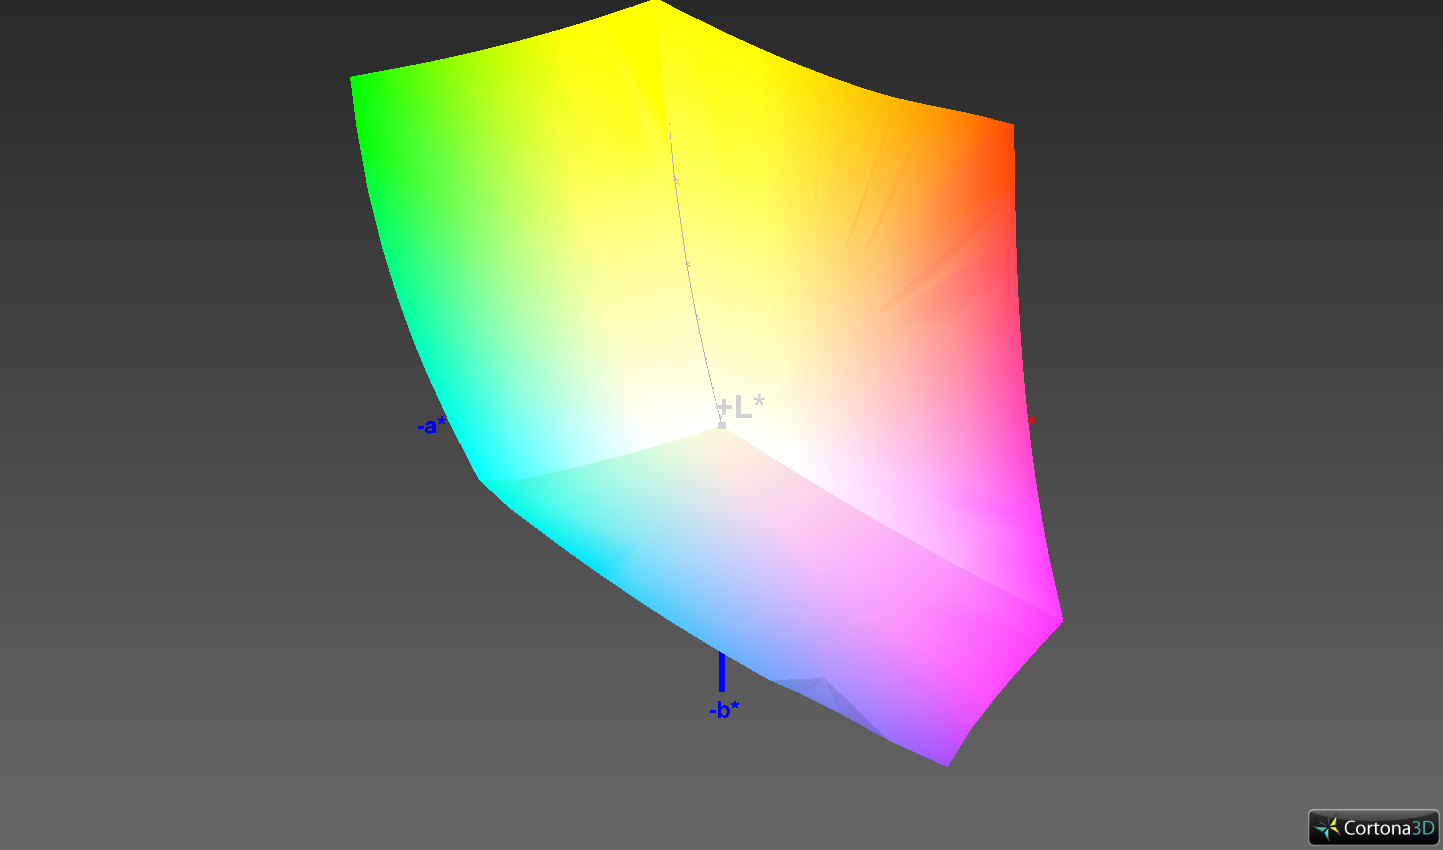
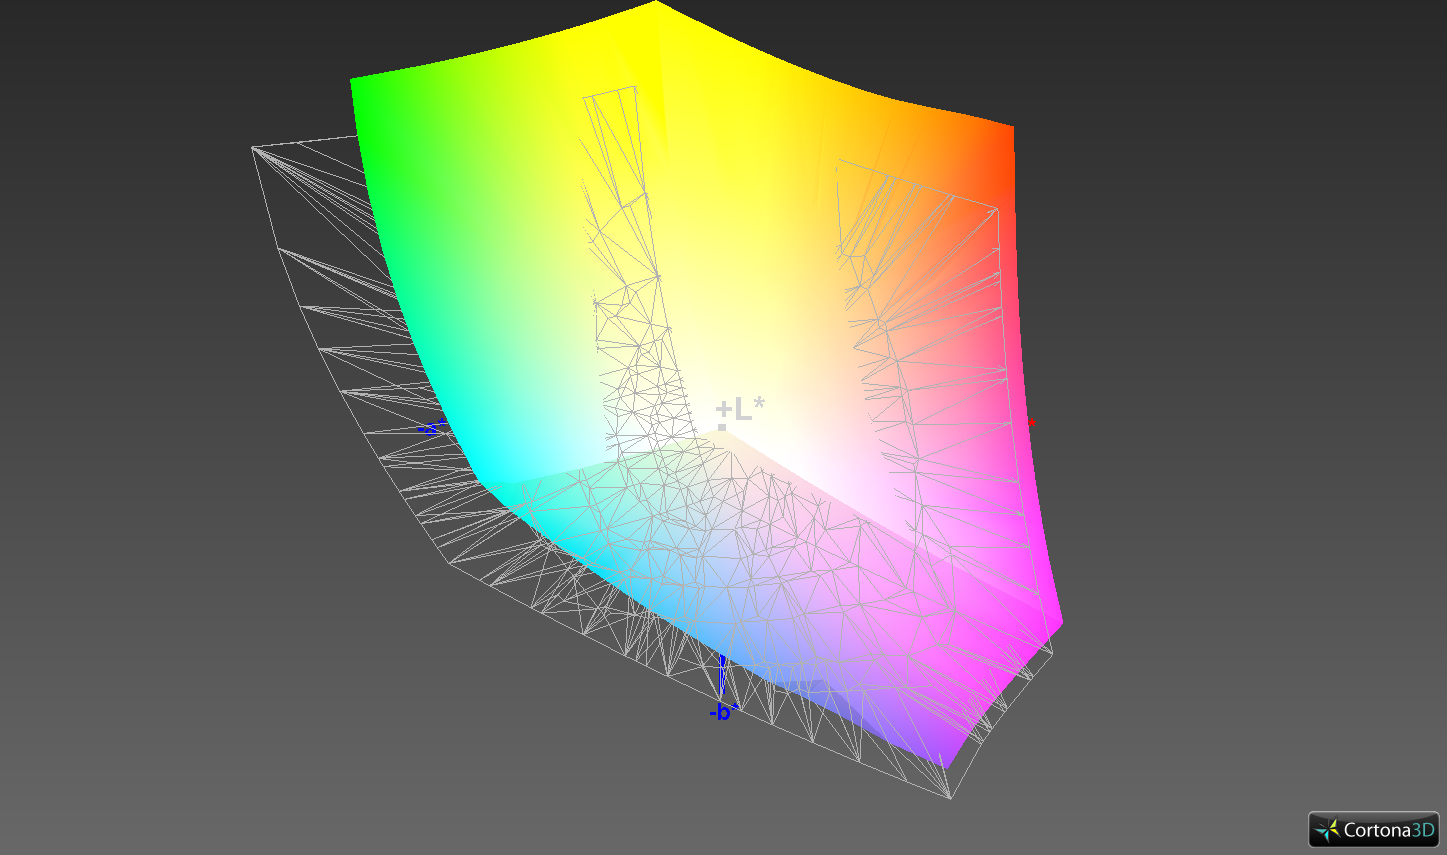
99.9% sRGB (Argyll 1.6.3 3D)
78.4% AdobeRGB 1998 (Argyll 1.6.3 3D)
87.7% AdobeRGB 1998 (Argyll 3D)
100% sRGB (Argyll 3D)
98.7% Display P3 (Argyll 3D)
Gamma: 2.22
CCT: 6898 K
| Apple MacBook Pro 13 2019 i5 4TB3 APPA03E, , 2560x1600, 13.3" | Apple MacBook Pro 13 2018 Touchbar i5 APPA03E, , 2560x1600, 13.3" | Lenovo ThinkPad X1 Carbon 2019-20QE000VGE LP140QH2-SPD1, , 2560x1440, 14" | Dell XPS 13 9380 i7 4K ID: AUO 282B B133ZAN Dell: 90NTH, , 3840x2160, 13.3" | Razer Blade Stealth i7-8565U Sharp LQ133M1JW41, , 1920x1080, 13.3" | HP Envy 13-aq0003ng InfoVision M133NVF3 R2, , 1920x1080, 13.3" | |
|---|---|---|---|---|---|---|
| Display | 0% | -15% | -22% | -21% | -23% | |
| Display P3 Coverage | 98.7 | 98.5 0% | 72.5 -27% | 64.8 -34% | 65.5 -34% | 64.4 -35% |
| sRGB Coverage | 100 | 99.9 0% | 97.8 -2% | 93.6 -6% | 96.3 -4% | 91.7 -8% |
| AdobeRGB 1998 Coverage | 87.7 | 87.3 0% | 73.8 -16% | 65.8 -25% | 66.3 -24% | 65.2 -26% |
| Response Times | -7% | 21% | -39% | -24% | 24% | |
| Response Time Grey 50% / Grey 80% * | 43.2 ? | 46 ? -6% | 33.6 ? 22% | 64.8 ? -50% | 57.6 ? -33% | 31 ? 28% |
| Response Time Black / White * | 29.6 ? | 32 ? -8% | 24 ? 19% | 38 ? -28% | 34 ? -15% | 24 ? 19% |
| PWM Frequency | 118000 ? | 22730 ? | 4000 ? | |||
| Screen | 2% | -62% | -27% | 1% | -31% | |
| Brightness middle | 518 | 519 0% | 338 -35% | 428.3 -17% | 429.8 -17% | 768 48% |
| Brightness | 480 | 504 5% | 315 -34% | 414 -14% | 403 -16% | 778 62% |
| Brightness Distribution | 87 | 95 9% | 88 1% | 88 1% | 89 2% | 82 -6% |
| Black Level * | 0.34 | 0.33 3% | 0.43 -26% | 0.27 21% | 0.32 6% | 0.48 -41% |
| Contrast | 1524 | 1573 3% | 786 -48% | 1586 4% | 1343 -12% | 1600 5% |
| Colorchecker dE 2000 * | 1.5 | 1.4 7% | 4 -167% | 2.69 -79% | 1.08 28% | 3.49 -133% |
| Colorchecker dE 2000 max. * | 2.8 | 2.8 -0% | 7.9 -182% | 6.19 -121% | 3.96 -41% | 7.41 -165% |
| Colorchecker dE 2000 calibrated * | 2.6 | 1.7 35% | 2.01 23% | 1.21 53% | 2.07 20% | |
| Greyscale dE 2000 * | 2 | 2.2 -10% | 6.2 -210% | 3.7 -85% | 1.3 35% | 4.09 -105% |
| Gamma | 2.22 99% | 2.22 99% | 2.13 103% | 2.1 105% | 2.23 99% | 2.54 87% |
| CCT | 6898 94% | 6908 94% | 6787 96% | 6706 97% | 6452 101% | 6452 101% |
| Color Space (Percent of AdobeRGB 1998) | 78.4 | 77.3 -1% | 68.1 -13% | 60.4 -23% | 61.4 -22% | 60 -23% |
| Color Space (Percent of sRGB) | 99.9 | 99.99 0% | 97.8 -2% | 93.5 -6% | 96.3 -4% | 92 -8% |
| Total Average (Program / Settings) | -2% /
0% | -19% /
-43% | -29% /
-27% | -15% /
-6% | -10% /
-23% |
* ... smaller is better
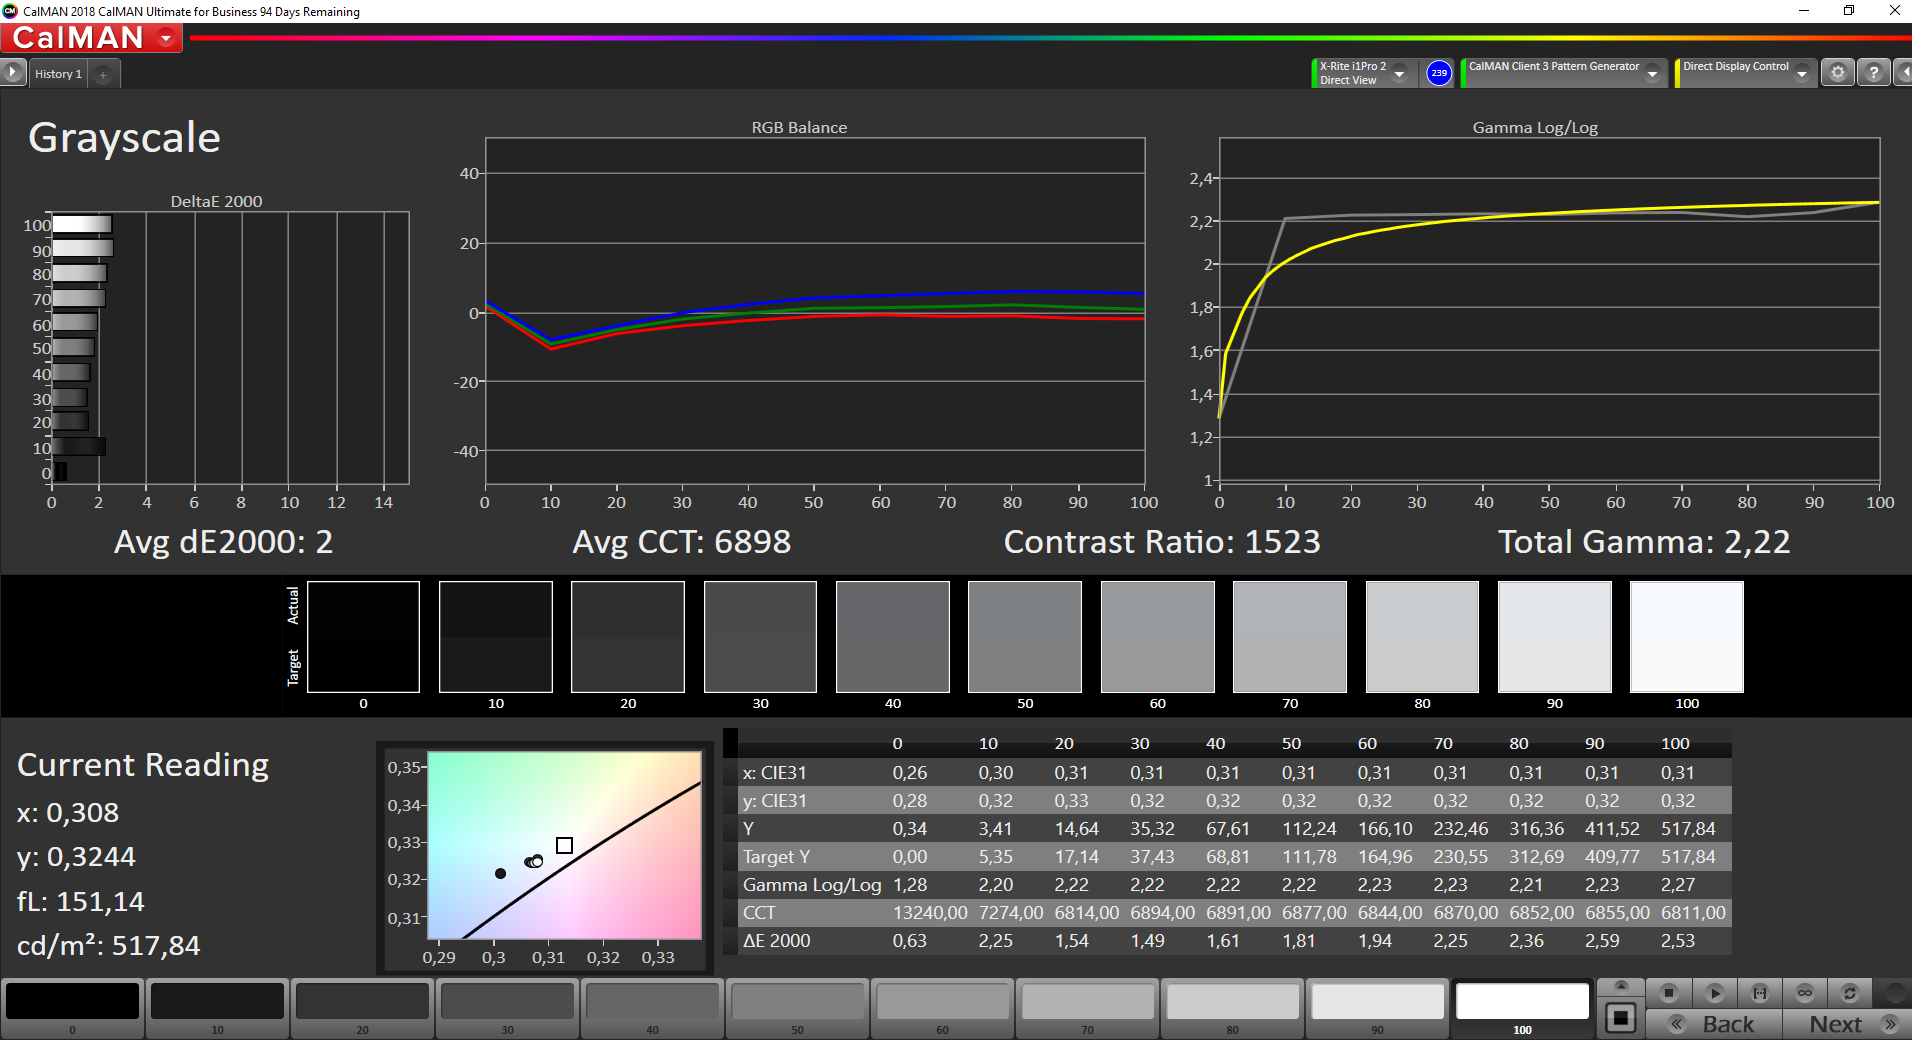
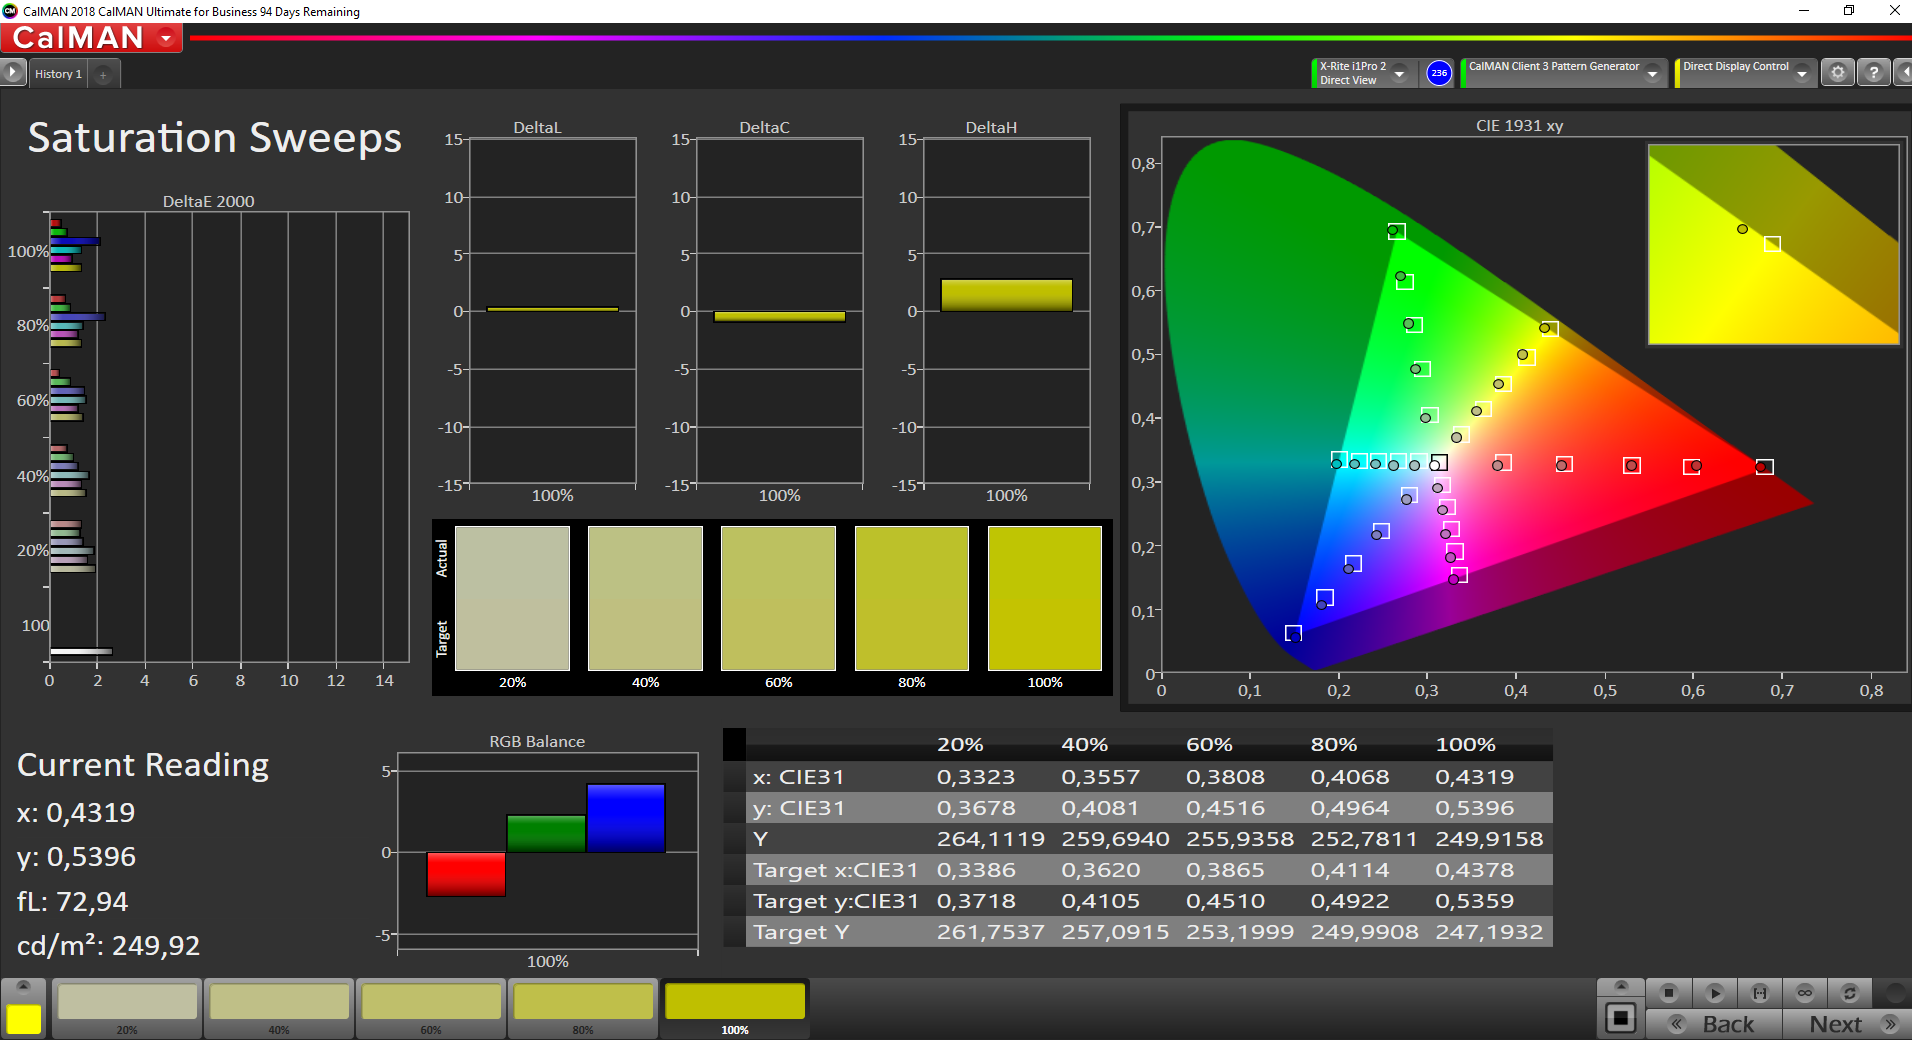
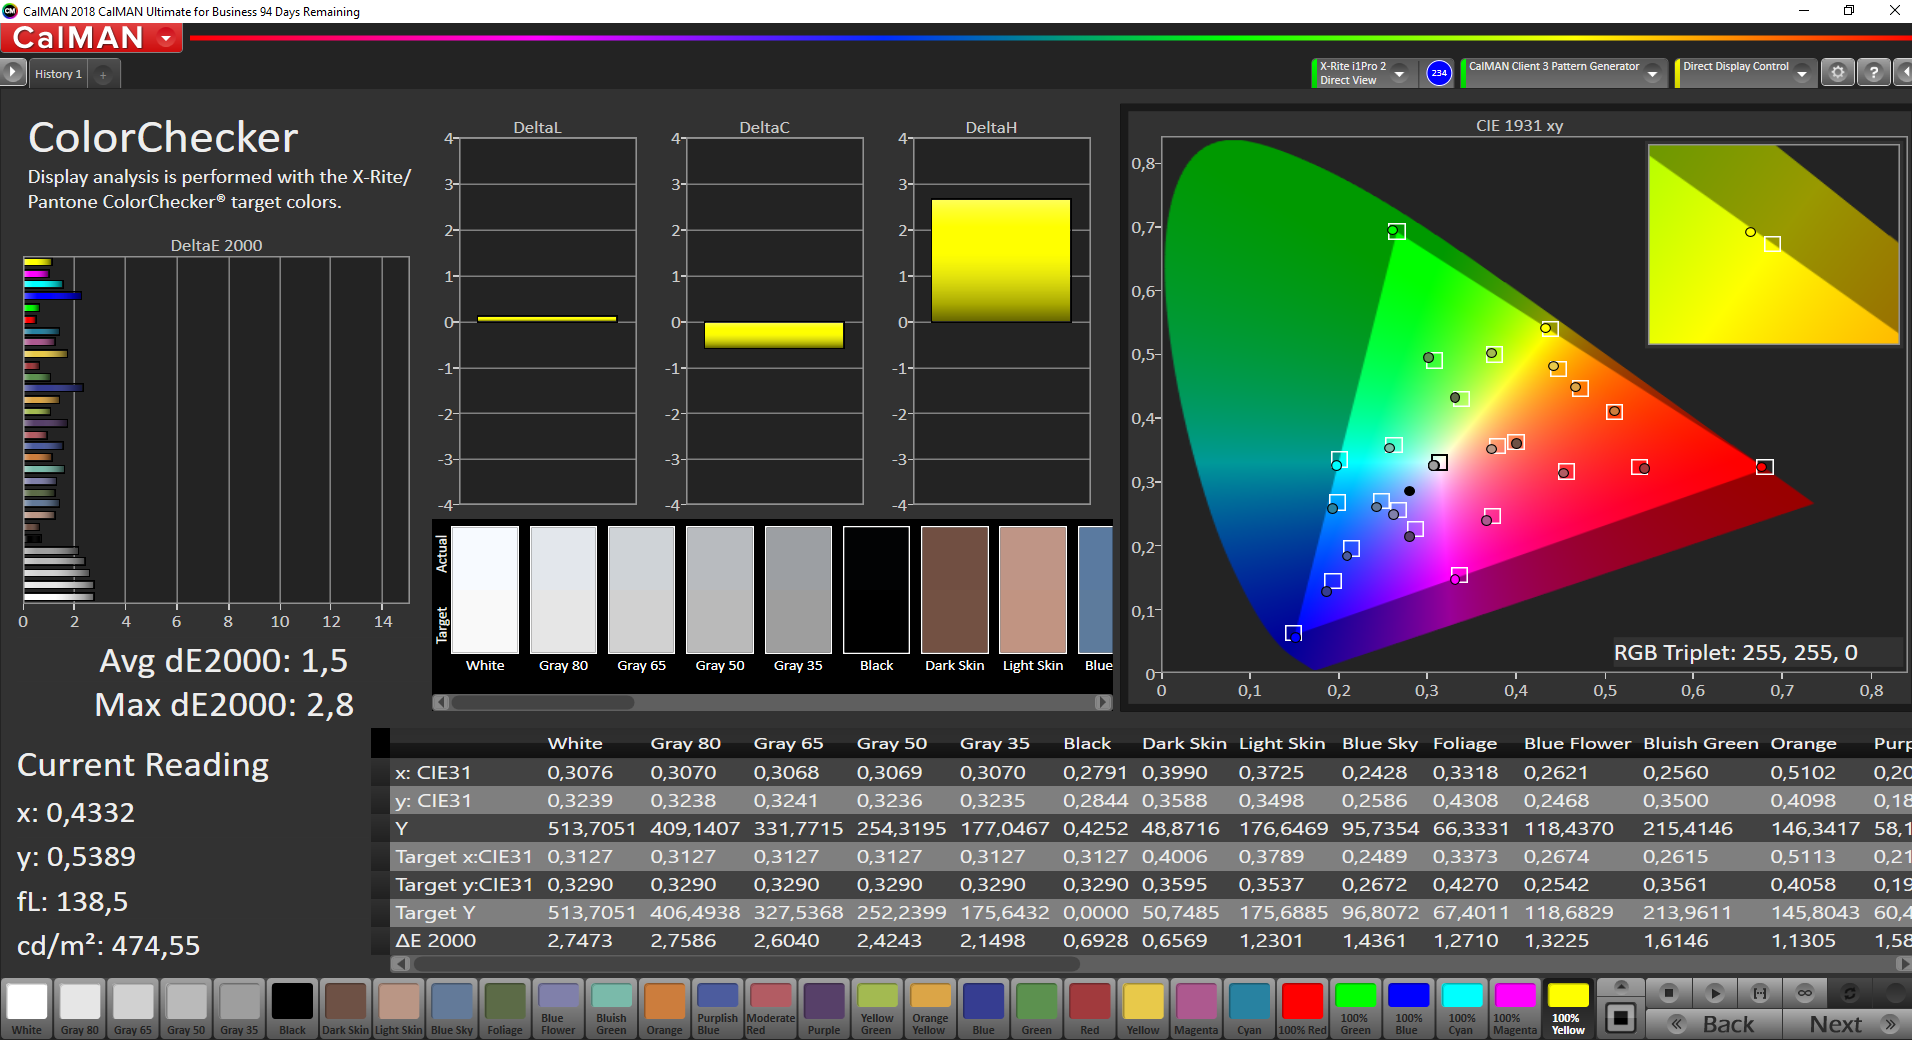
As usual, Apple displays are already very well calibrated out of the box, and you don't have to make any adjustments afterwards. This applies to both the grayscales and the colors, which are already below the target value of 3. This also allows image editing in both the sRGB and P3 color spaces, and you'll only need an external monitor for AdobeRGB.
Display Response Times
| ↔ Response Time Black to White | ||
|---|---|---|
| 29.6 ms ... rise ↗ and fall ↘ combined | ↗ 15.6 ms rise | 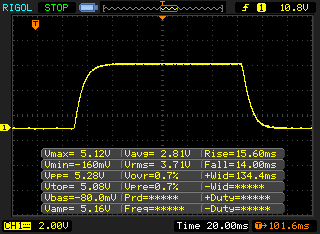 |
| ↘ 14 ms fall | ||
| The screen shows relatively slow response rates in our tests and may be too slow for gamers. In comparison, all tested devices range from 0.1 (minimum) to 240 (maximum) ms. » 78 % of all devices are better. This means that the measured response time is worse than the average of all tested devices (20.5 ms). | ||
| ↔ Response Time 50% Grey to 80% Grey | ||
| 43.2 ms ... rise ↗ and fall ↘ combined | ↗ 22 ms rise | 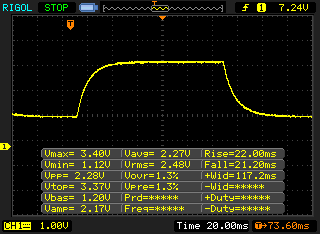 |
| ↘ 21.2 ms fall | ||
| The screen shows slow response rates in our tests and will be unsatisfactory for gamers. In comparison, all tested devices range from 0.165 (minimum) to 636 (maximum) ms. » 71 % of all devices are better. This means that the measured response time is worse than the average of all tested devices (32.1 ms). | ||
Screen Flickering / PWM (Pulse-Width Modulation)
| Screen flickering / PWM not detected | 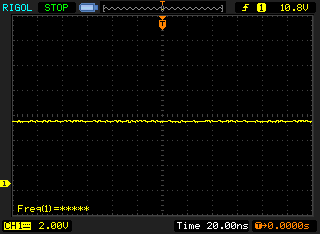 | ||
In comparison: 53 % of all tested devices do not use PWM to dim the display. If PWM was detected, an average of 8327 (minimum: 5 - maximum: 343500) Hz was measured. | |||
The display is still glossy, but the degree of reflection is not as high as with other competitors. Combined with its high display brightness, the MacBook Pro 13 can also be used outdoors as long as you can avoid reflections from direct light sources.
Performance – MacBook Pro with quad-core CPU and faster Iris GPU
With its quad-core processor and integrated Iris GPU, the MacBook Pro 13 offers plenty of power for a subnotebook and is equipped for all common applications used in everyday life. In order to be able to conduct our full benchmark package, we did some testing on Windows 10 (BootCamp). Performance may be slightly affected as it depends a lot on the optimization of Apple's own BootCamp drivers.
Processor
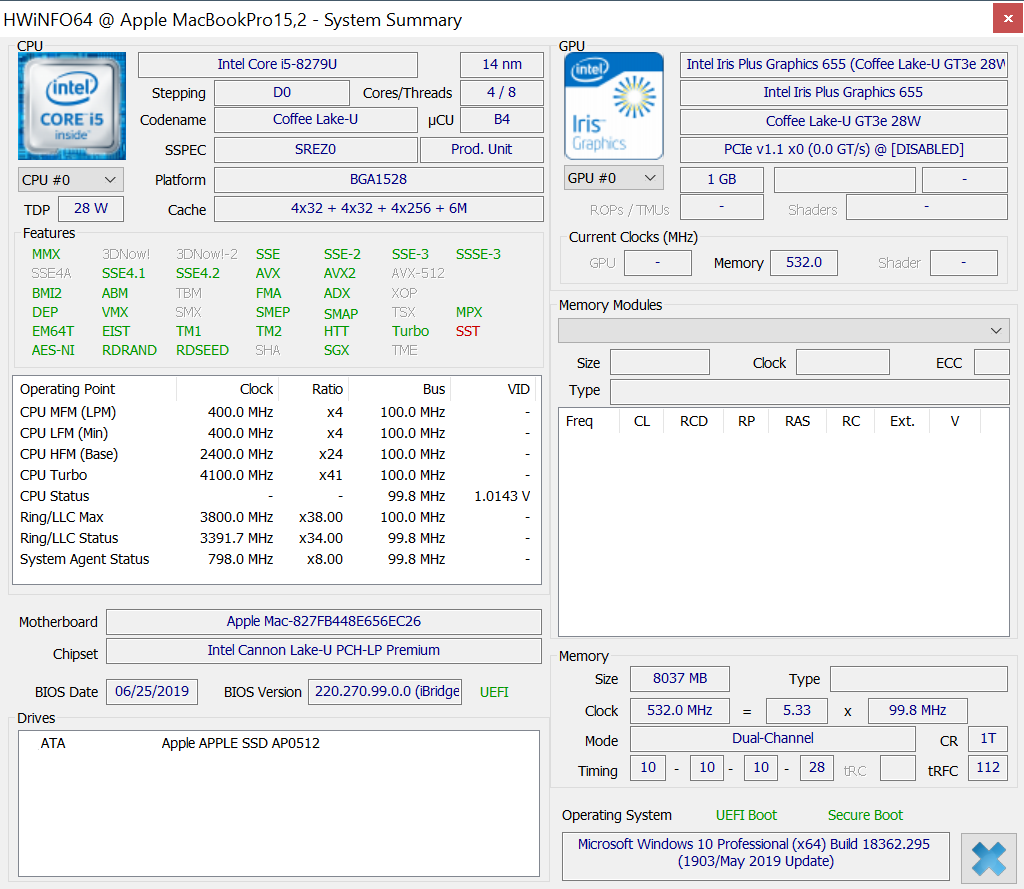
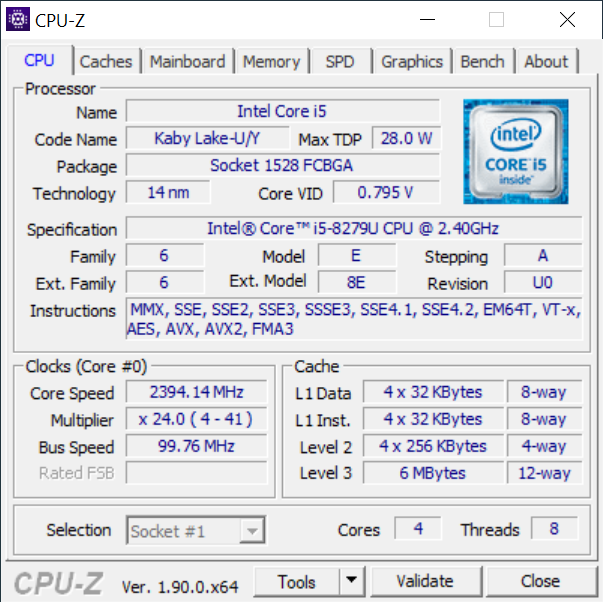
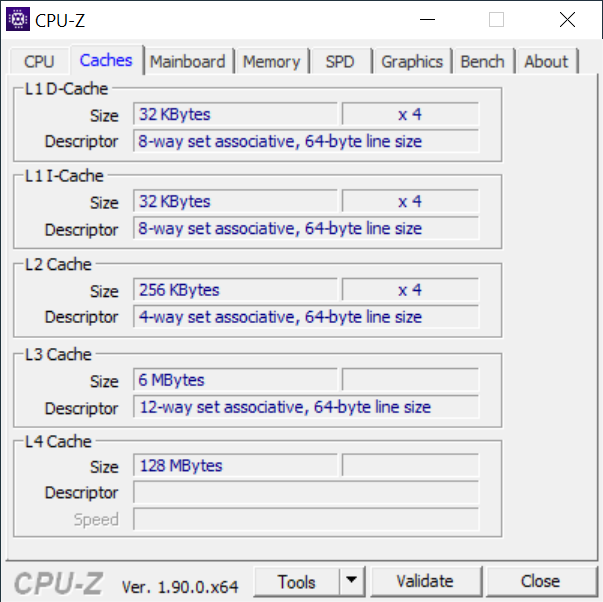
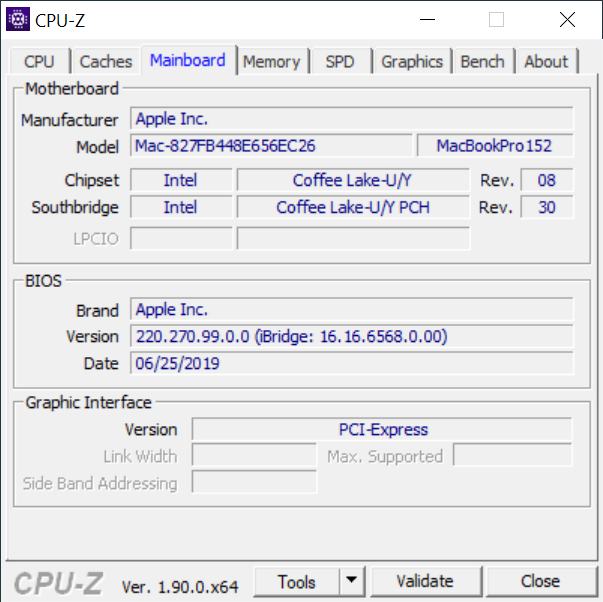
As in the past, Apple relies on special Intel processors that you don't actually find in other products. That's also the case here, because while virtually all current subnotebooks use Whiskey Lake U processors (or the newer Ice Lake chips), Apple uses Coffee Lake U processors. The special features are the increased TDP of 28 watts and the stronger Intel Iris Plus 655 GPU with its own eDRAM cache.
The Core i5 in our review device is the 8279U and can reach a maximum of 4.1 GHz via Turbo Boost. While last year's MacBook Pro 13 wasn't really able to convince us, the 2019 model leaves a much better impression now. In the single-core tests, the competition's mobile Core i7 chips still have an advantage, but the MBP 13 is clearly ahead in the multi-core test. At the beginning of the latter, we briefly see a maximum consumption of the processor of 46 watts (3.9 GHz), but this settles very quickly at ~33 watts. This corresponds to a clock speed between 3.3-3.4 GHz.
More technical information on the Core i5-8279U is available in our CPU section.
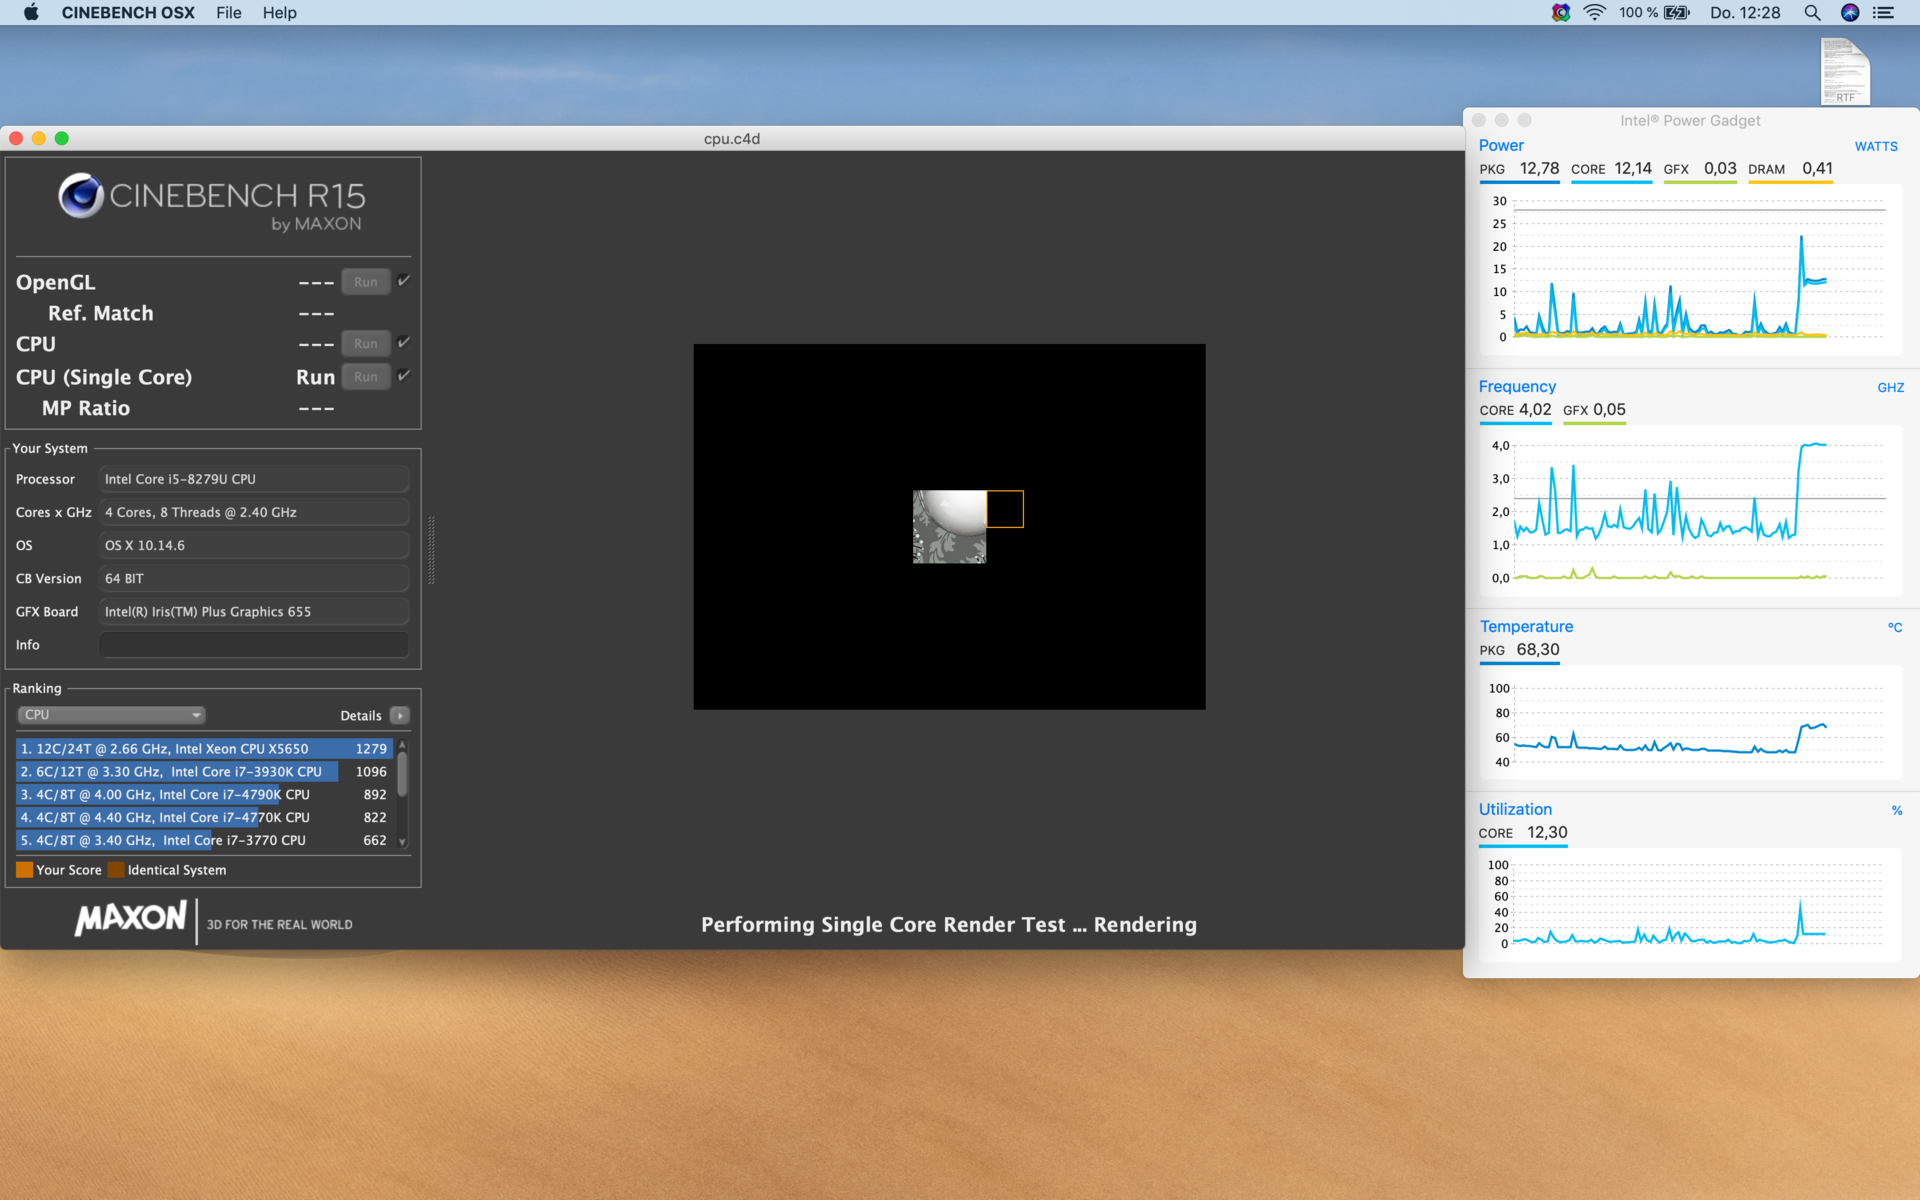
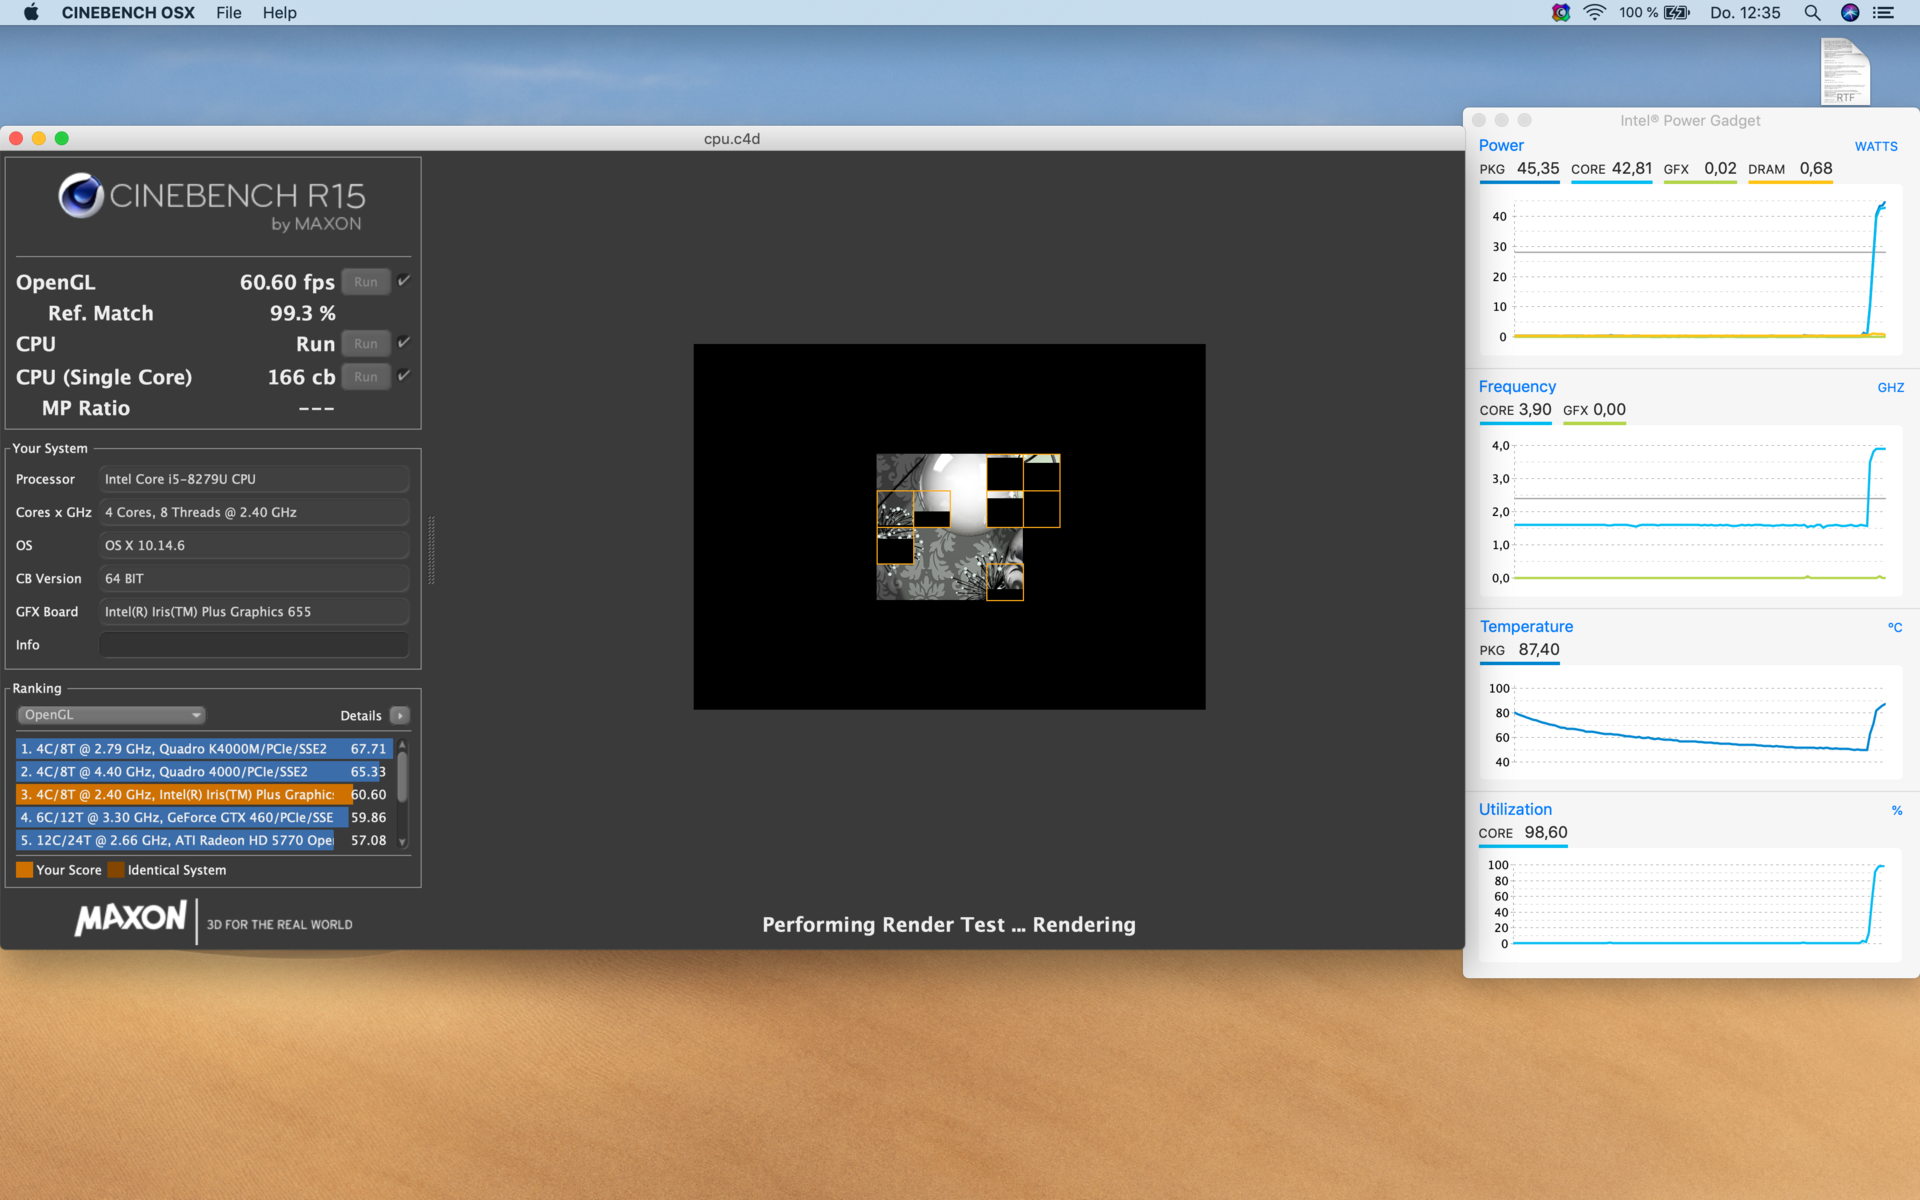
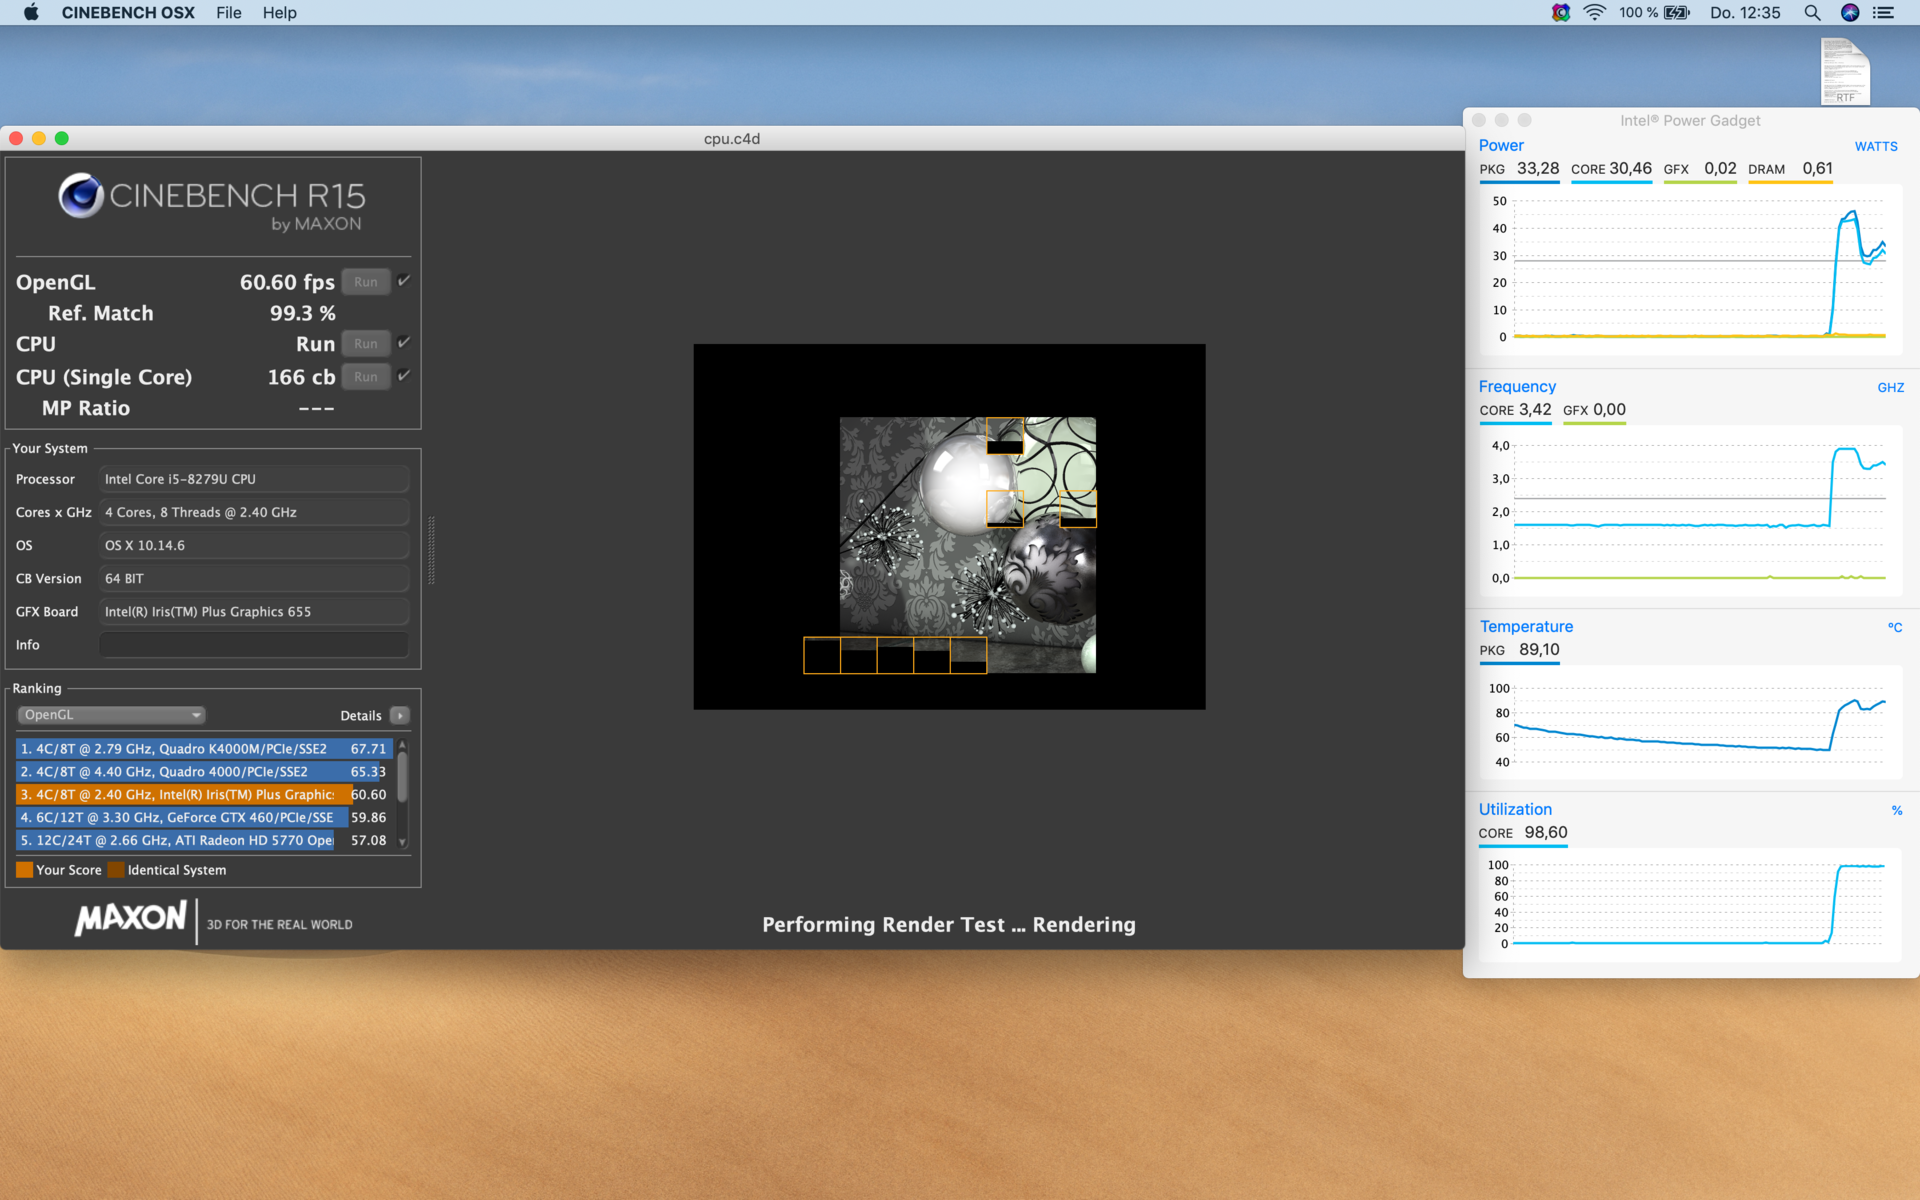
The small MacBook Pro also performs very well when it's under sustained stress, because there's practically no drop in performance. Even after 25 runs of the Cinebench loop, the value remains roughly constant. This is by no means common with a compact device. Even on Windows, there's only a brief drop before the result stabilizes again at about 740 points. There are no limitations on battery power.
System performance – MacBook Pro with fast PCIe SSD
The MacBook Pro 13 is a very fast and responsive system, which is mainly due to the fast PCIe SSD. All inputs are implemented quickly, and there are no long waiting times when opening applications. By the way, this also applies to Windows 10, which we installed via BootCamp. Our tests and benchmarks worked without any issues here too. So if you use some programs that don't exist for macOS, you don't need to worry about any problems.
| PCMark 8 Home Score Accelerated v2 | 4056 points | |
| PCMark 8 Creative Score Accelerated v2 | 5689 points | |
| PCMark 8 Work Score Accelerated v2 | 4537 points | |
| PCMark 10 Score | 3779 points | |
Help | ||

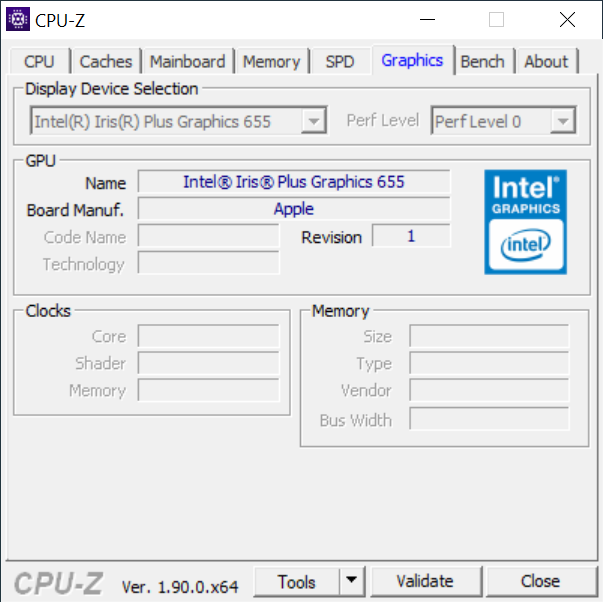
Graphics card – MacBook Pro 13 with Iris Plus 655
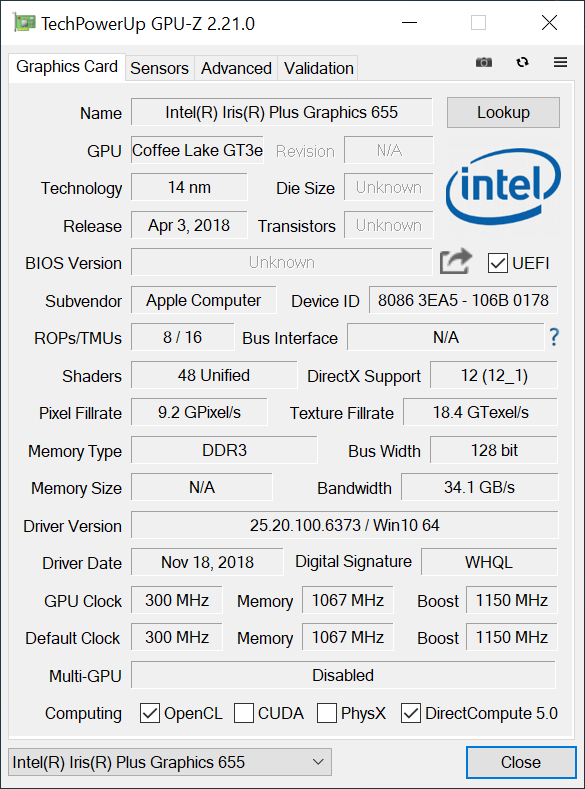
The Intel Iris Plus 655 is a powerful integrated graphics card that has a 128MB eDRAM cache. The maximum clock speed in combination with the core i5-8279U is 1150 MHz. More technical information on the Iris Plus 655 can be found on our GPU site.
Although performance is noticeably higher than with the popular UHD graphics GPUs of most subnotebooks, this model is also best qualified for the multimedia area. Thanks to the integrated video decoder, playing high-resolution videos is no problem at all. A little gaming is also possible, but the titles shouldn't be too demanding. An overview of the gaming benchmarks of the Iris Plus 655 can be found here.
While CPU performance has increased compared to the 2018 model of the MBP 13, the iGPU has stagnated since the benchmark results are virtually identical. This puts the Iris Plus 655 well ahead of the "normal" UHD Graphics 620, but behind AMD's iGPUs and also significantly behind the new Ice Lake GPU in the Lenovo Yoga C940. In the actual gaming benchmarks, however, the gap is either much smaller or the iGPUs are even on par. The MacBook Pro 13 benefits from the eDRAM cache here. Performance remains constant on battery power.
| 3DMark 06 Standard Score | 17176 points | |
| 3DMark Ice Storm Standard Score | 57033 points | |
| 3DMark Cloud Gate Standard Score | 11806 points | |
| 3DMark Fire Strike Score | 1903 points | |
| 3DMark Time Spy Score | 705 points | |
Help | ||
| low | med. | high | ultra | |
|---|---|---|---|---|
| BioShock Infinite (2013) | 78.4 | 54.3 | 49.4 | 15.5 |
| Dota 2 Reborn (2015) | 84 | 63 | 33.3 | 29.9 |
| X-Plane 11.11 (2018) | 42.8 | 29.5 | 25.1 |
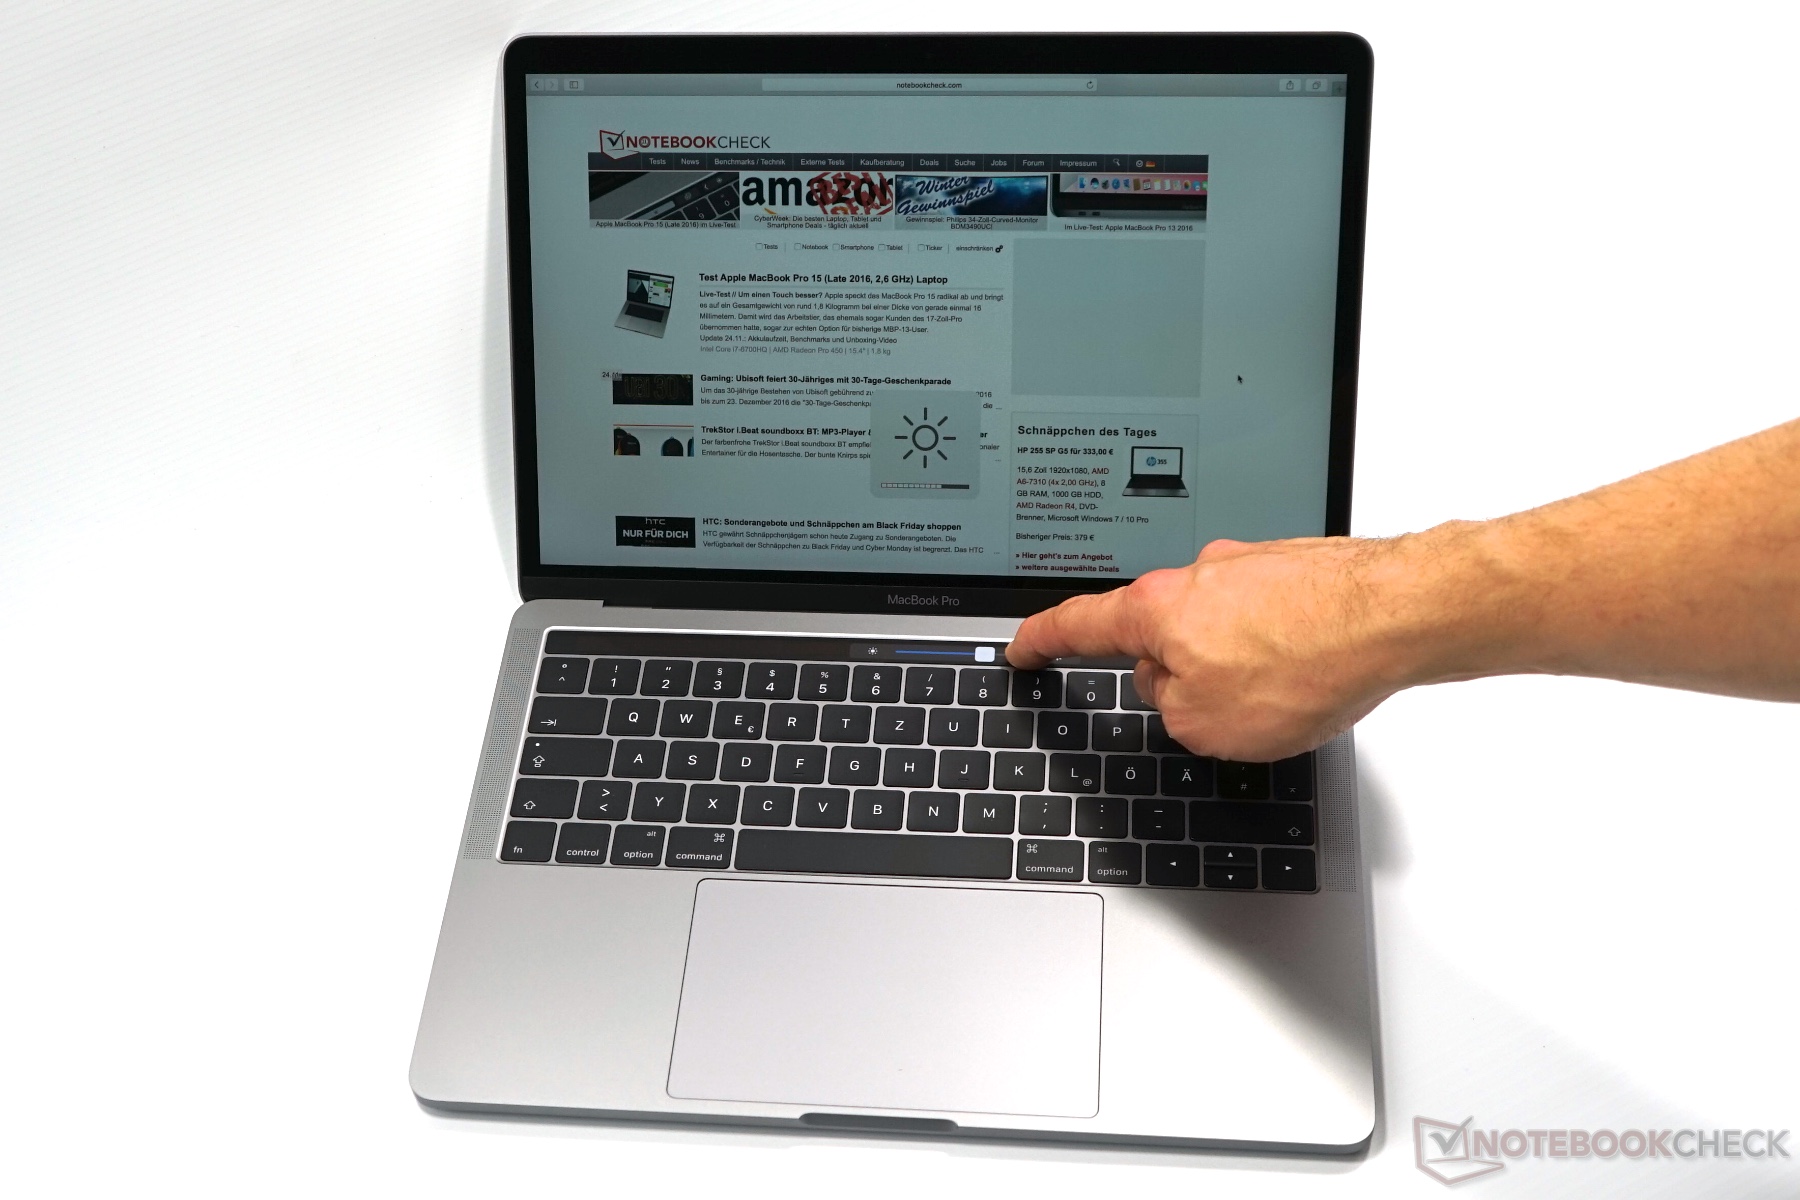
Emissions – MBP 13 is often quiet but loud and warm under load
Noise emissions
The two fans of the MacBook Pro 13 are often disabled in everyday use, and you can enjoy a silent system. It also takes some time under load for the fans to start. Under sustained load, the speed is continuously increased, and a maximum of 41.8 dB(A) is also clearly audible. Nevertheless, given the good performance, we still consider the value to be appropriate, and the fans have also become quieter compared to the 2018 model. We couldn't hear any other electronic noises.
Noise Level
| Idle |
| 29 / 29 / 29 dB(A) |
| Load |
| 33.9 / 41.8 dB(A) |
 | ||
30 dB silent 40 dB(A) audible 50 dB(A) loud |
||
min: | ||
| Apple MacBook Pro 13 2019 i5 4TB3 Iris Plus Graphics 655, i5-8279U, Apple SSD AP0512 | Apple MacBook Pro 13 2018 Touchbar i5 Iris Plus Graphics 655, i5-8259U | Lenovo ThinkPad X1 Carbon 2019-20QE000VGE UHD Graphics 620, i7-8665U, WDC PC SN720 SDAQNTW-512G | Dell XPS 13 9380 i7 4K UHD Graphics 620, i7-8565U, Samsung SSD PM981 MZVLB512HAJQ | Razer Blade Stealth i7-8565U GeForce MX150, i7-8565U, Lite-On CA3-8D256-Q11 | HP Envy 13-aq0003ng GeForce MX250, i7-8565U, Toshiba KBG30ZMV512G | |
|---|---|---|---|---|---|---|
| Noise | -5% | 6% | -3% | -4% | -1% | |
| off / environment * | 29 | 29.6 -2% | 28.4 2% | 28.4 2% | 28.4 2% | 30 -3% |
| Idle Minimum * | 29 | 29.6 -2% | 28.4 2% | 29.4 -1% | 28.5 2% | 30 -3% |
| Idle Average * | 29 | 29.6 -2% | 28.4 2% | 29.4 -1% | 29 -0% | 30 -3% |
| Idle Maximum * | 29 | 29.6 -2% | 28.6 1% | 29.4 -1% | 29.1 -0% | 30 -3% |
| Load Average * | 33.9 | 36.7 -8% | 31.5 7% | 34.6 -2% | 42.8 -26% | |
| Load Maximum * | 41.8 | 46.7 -12% | 33.1 21% | 46.8 -12% | 41.6 -0% | 39.5 6% |
| Witcher 3 ultra * | 32.5 | 41.4 |
* ... smaller is better
Temperature
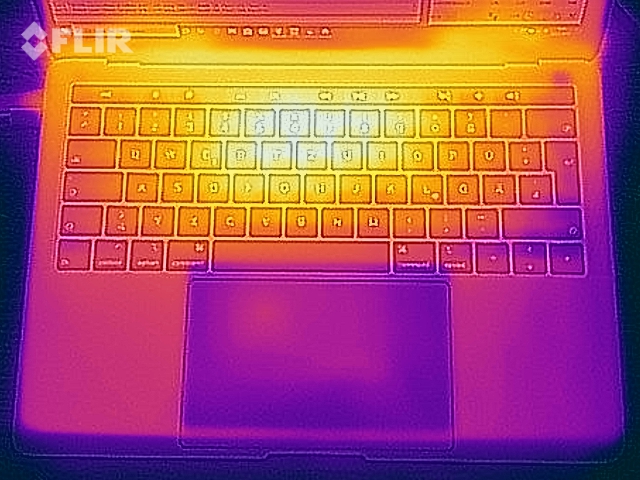
Due to the defensive fan control, the aluminum housing warms up a bit, even under low load, but remains in the noncritical range at ~28 °C (~82 °F). Even under load, the device doesn't get close to being really hot; But the approximately 45 °C (~ 113 °F) in the middle area of the top is noticeable when typing, and you shouldn't necessarily use the MacBook on the lap in this scenario.
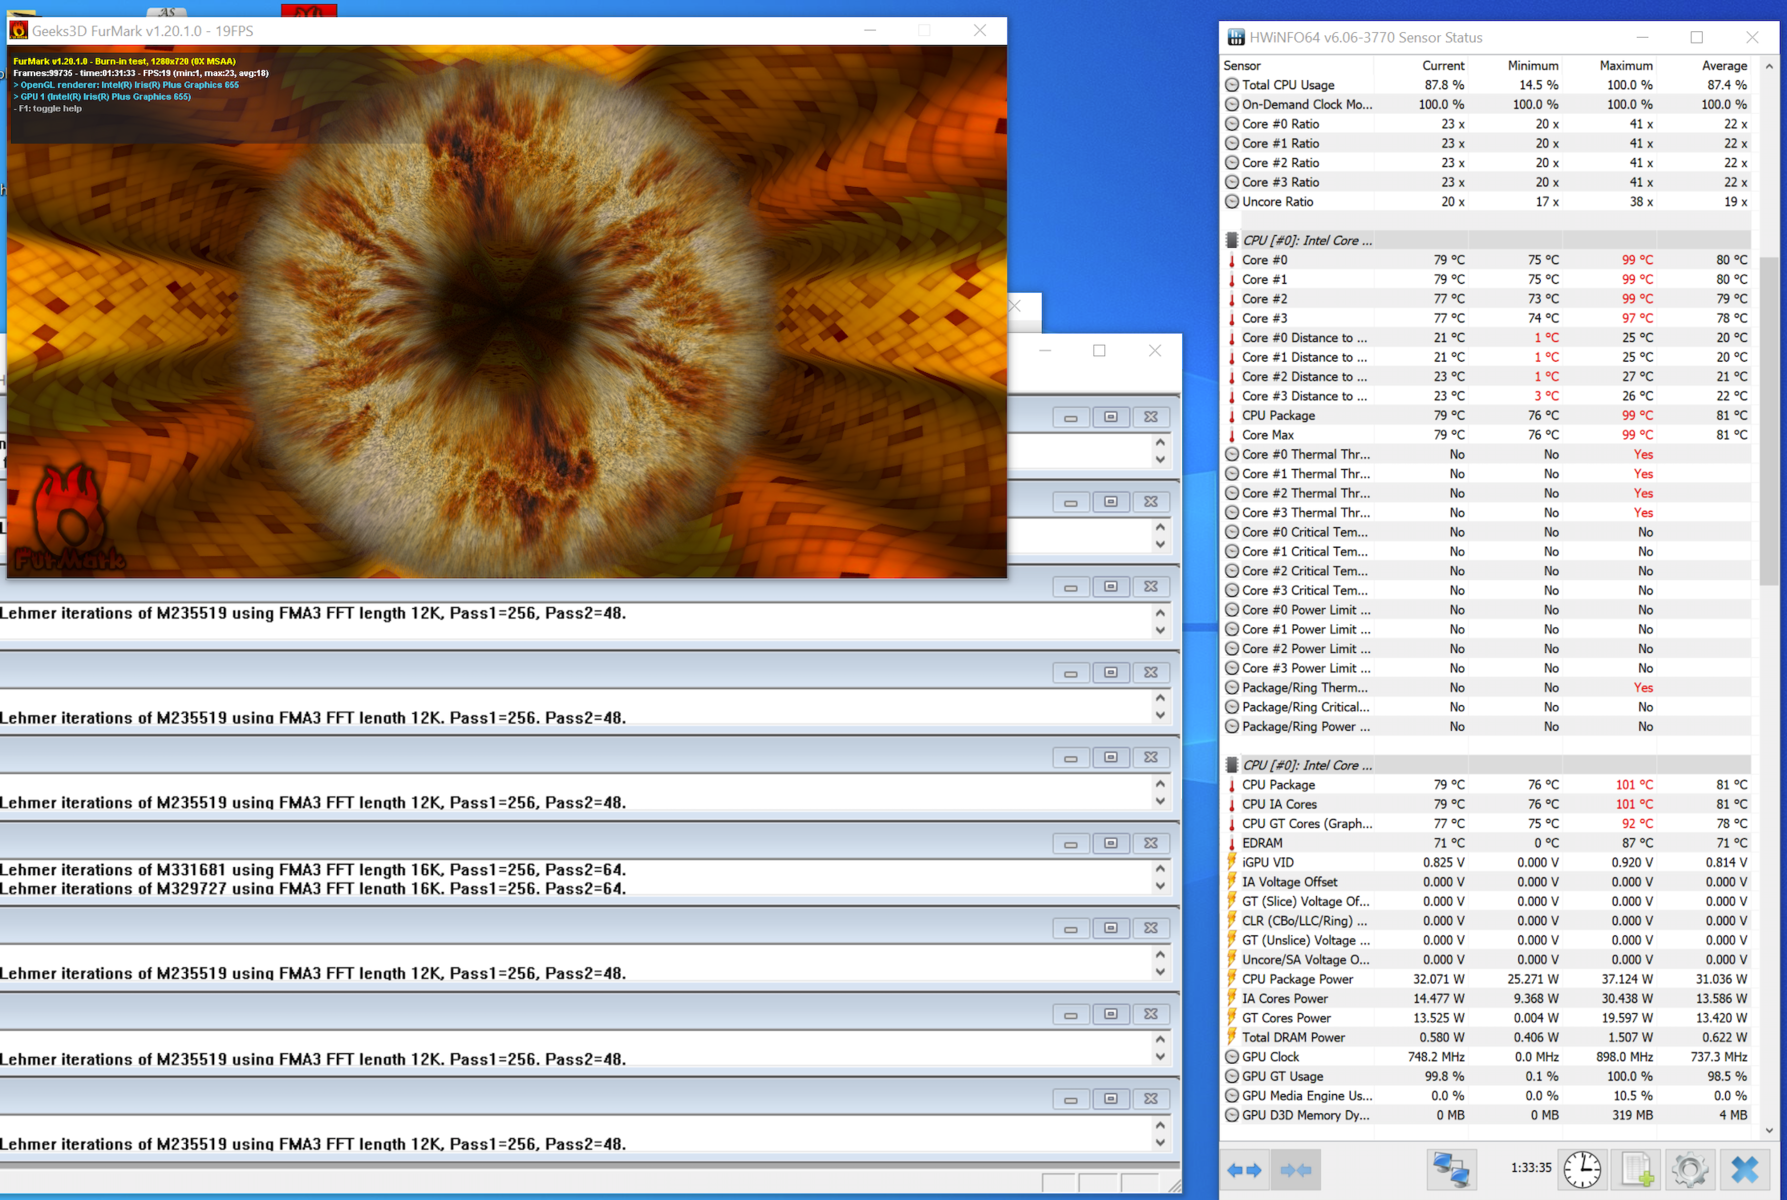
In the stress test with the two tools, Prime95 and FurMark (Win 10 BootCamp), the good performance from our CPU tests continues. We see a constant consumption of 32-33 watts here too, which the CPU and the GPU now have to share though. The four processor cores therefore work "only" at 2.3 GHz and the integrated graphics card at ~750 MHz. Compared to other subnotebooks, however, these are once again excellent values.
(-) The maximum temperature on the upper side is 45.7 °C / 114 F, compared to the average of 35.9 °C / 97 F, ranging from 21.4 to 59 °C for the class Subnotebook.
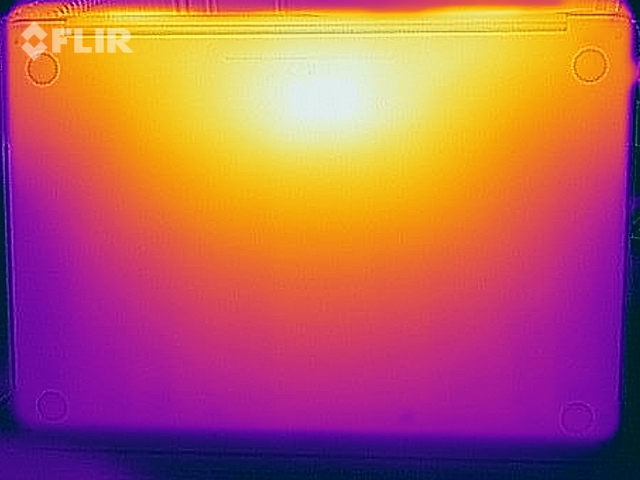
(±) The bottom heats up to a maximum of 44.2 °C / 112 F, compared to the average of 39.3 °C / 103 F
(+) In idle usage, the average temperature for the upper side is 28.3 °C / 83 F, compared to the device average of 30.8 °C / 87 F.
(+) The palmrests and touchpad are reaching skin temperature as a maximum (32.5 °C / 90.5 F) and are therefore not hot.
(-) The average temperature of the palmrest area of similar devices was 28.2 °C / 82.8 F (-4.3 °C / -7.7 F).
Speakers
Apple MacBook Pro 13 2019 i5 4TB3 audio analysis
(±) | speaker loudness is average but good (79.7 dB)
Bass 100 - 315 Hz
(±) | reduced bass - on average 12.8% lower than median
(±) | linearity of bass is average (11.2% delta to prev. frequency)
Mids 400 - 2000 Hz
(+) | balanced mids - only 3.2% away from median
(+) | mids are linear (4.6% delta to prev. frequency)
Highs 2 - 16 kHz
(+) | balanced highs - only 3.4% away from median
(+) | highs are linear (5.3% delta to prev. frequency)
Overall 100 - 16.000 Hz
(+) | overall sound is linear (13.7% difference to median)
Compared to same class
» 23% of all tested devices in this class were better, 5% similar, 72% worse
» The best had a delta of 5%, average was 19%, worst was 53%
Compared to all devices tested
» 14% of all tested devices were better, 4% similar, 83% worse
» The best had a delta of 4%, average was 24%, worst was 134%
Lenovo ThinkPad X1 Carbon 2019-20QE000VGE audio analysis
(±) | speaker loudness is average but good (76.8 dB)
Bass 100 - 315 Hz
(±) | reduced bass - on average 11.2% lower than median
(±) | linearity of bass is average (7.1% delta to prev. frequency)
Mids 400 - 2000 Hz
(±) | higher mids - on average 5.1% higher than median
(+) | mids are linear (5.4% delta to prev. frequency)
Highs 2 - 16 kHz
(+) | balanced highs - only 2.9% away from median
(±) | linearity of highs is average (9.1% delta to prev. frequency)
Overall 100 - 16.000 Hz
(±) | linearity of overall sound is average (16.7% difference to median)
Compared to same class
» 20% of all tested devices in this class were better, 7% similar, 73% worse
» The best had a delta of 7%, average was 21%, worst was 53%
Compared to all devices tested
» 27% of all tested devices were better, 7% similar, 66% worse
» The best had a delta of 4%, average was 24%, worst was 134%
Energy management
Energy consumption
Apple was again able to reduce idle power consumption a little compared to last year's model. Here you can also see that macOS works more efficiently or that the BootCamp drivers are not perfectly optimized, because we measure a maximum idle consumption of 10.2 watts on Windows compared to 8.2 watts for macOS. This briefly goes up to 63 watts under load, after which the consumption settles at 58 watts. This means that the 61-watt power adapter is just enough, but there's not much room for manoeuver.
| Off / Standby | |
| Idle | |
| Load |
|
Key:
min: | |
| Apple MacBook Pro 13 2019 i5 4TB3 i5-8279U, Iris Plus Graphics 655, Apple SSD AP0512, IPS, 2560x1600, 13.3" | Apple MacBook Pro 13 2018 Touchbar i5 i5-8259U, Iris Plus Graphics 655, , IPS, 2560x1600, 13.3" | Lenovo ThinkPad X1 Carbon 2019-20QE000VGE i7-8665U, UHD Graphics 620, WDC PC SN720 SDAQNTW-512G, IPS, 2560x1440, 14" | Dell XPS 13 9380 i7 4K i7-8565U, UHD Graphics 620, Samsung SSD PM981 MZVLB512HAJQ, IPS, 3840x2160, 13.3" | Razer Blade Stealth i7-8565U i7-8565U, GeForce MX150, Lite-On CA3-8D256-Q11, IPS, 1920x1080, 13.3" | HP Envy 13-aq0003ng i7-8565U, GeForce MX250, Toshiba KBG30ZMV512G, IPS, 1920x1080, 13.3" | Average Intel Iris Plus Graphics 655 | Average of class Subnotebook | |
|---|---|---|---|---|---|---|---|---|
| Power Consumption | -15% | -3% | -28% | -52% | -23% | -38% | -17% | |
| Idle Minimum * | 2.2 | 2.3 -5% | 3 -36% | 5.2 -136% | 6.7 -205% | 3.9 -77% | 5.96 ? -171% | 4.14 ? -88% |
| Idle Average * | 7.2 | 8.7 -21% | 6.3 12% | 8.6 -19% | 8.6 -19% | 7.8 -8% | 8.44 ? -17% | 7.22 ? -0% |
| Idle Maximum * | 8.2 | 12.2 -49% | 8.9 -9% | 10.5 -28% | 9.4 -15% | 10.8 -32% | 10.6 ? -29% | 8.83 ? -8% |
| Load Average * | 54 | 53.3 1% | 40.8 24% | 44.2 18% | 64.1 -19% | 53 2% | 46.5 ? 14% | 45.1 ? 16% |
| Load Maximum * | 63.9 | 64 -0% | 67.5 -6% | 47.5 26% | 64.1 -0% | 62.7 2% | 56.2 ? 12% | 68.3 ? -7% |
| Witcher 3 ultra * | 63.7 |
* ... smaller is better
Battery life
The battery capacity of 58 Wh hasn't changed, but there's an improvement in runtimes though. In addition to the increased efficiency, this can also be due to further software optimizations. In our two practical tests with the display brightness adjusted to 150 nits, the MacBook Pro 13 lasts around 11.5 hours (Wi-Fi test) and just under 12 hours (video test), respectively. Both values are very good and not only outperform the predecessor but also the other competitors by 1.5 hours at least.
| Apple MacBook Pro 13 2019 i5 4TB3 i5-8279U, Iris Plus Graphics 655, 58 Wh | Apple MacBook Pro 13 2018 Touchbar i5 i5-8259U, Iris Plus Graphics 655, 58 Wh | Lenovo ThinkPad X1 Carbon 2019-20QE000VGE i7-8665U, UHD Graphics 620, 51 Wh | Dell XPS 13 9380 i7 4K i7-8565U, UHD Graphics 620, 52 Wh | Razer Blade Stealth i7-8565U i7-8565U, GeForce MX150, 53.1 Wh | HP Envy 13-aq0003ng i7-8565U, GeForce MX250, 53.2 Wh | Average of class Subnotebook | |
|---|---|---|---|---|---|---|---|
| Battery Runtime | -13% | -24% | -32% | -17% | -25% | 25% | |
| H.264 | 721 | 651 -10% | 586 -19% | 980 ? 36% | |||
| WiFi v1.3 | 687 | 581 -15% | 493 -28% | 464 -32% | 571 -17% | 512 -25% | 782 ? 14% |
| Witcher 3 ultra | 94 |
Pros
Cons
Verdict
With the 2019 model of the MacBook Pro 13 with 4 Thunderbolt 3 ports, Apple has only done a light model update. The manufacturer's main focus this year was certainly the update of the cheaper MacBook Pro 13 (2x TB3), which has also been equipped with the Touch Bar now.
Somewhat surprisingly for us, the CPU performance has improved significantly despite the rather similar processor, and performance doesn't drop, even under sustained load. This is rare in the subnotebook category. Nothing has changed in terms of the display either, but the panel is still one of the best on the market and doesn't have to dread the comparison to the competition. In addition, it's also one of the few panels in the 16:10 format.
Increased CPU performance and a slightly revised keyboard: The changes to the 2019 MacBook Pro 13 with 4x Thunderbolt ports are minor and in no case justify an upgrade from last year's model. Nonetheless, the MBP 13 is still a great subnotebook.
In addition to the well-known advantages (great case, perfect touchpad, 4x Thunderbolt 3, long battery life), the disadvantages of the predecessor remain. The Thunderbolt ports are extremely versatile, but in everyday use you often need adapters. There is no SD card reader, and the keyboard is still a subjective matter, but the reliability problems of the past years have already left an unpleasant aftertaste. Finally, there's still the high price and the usually high price premiums for hardware upgrades. But none of this changes the fact that the 2019 version of the MacBook Pro 13 is also a great subnotebook.
Apple MacBook Pro 13 2019 i5 4TB3
- 10/02/2019 v7 (old)
Andreas Osthoff
More articles related to this device
Apple MacBook Pro 13 2019 i5 4TB3 (MacBook Pro 13 2019 Series)Related Articles

Price comparison
