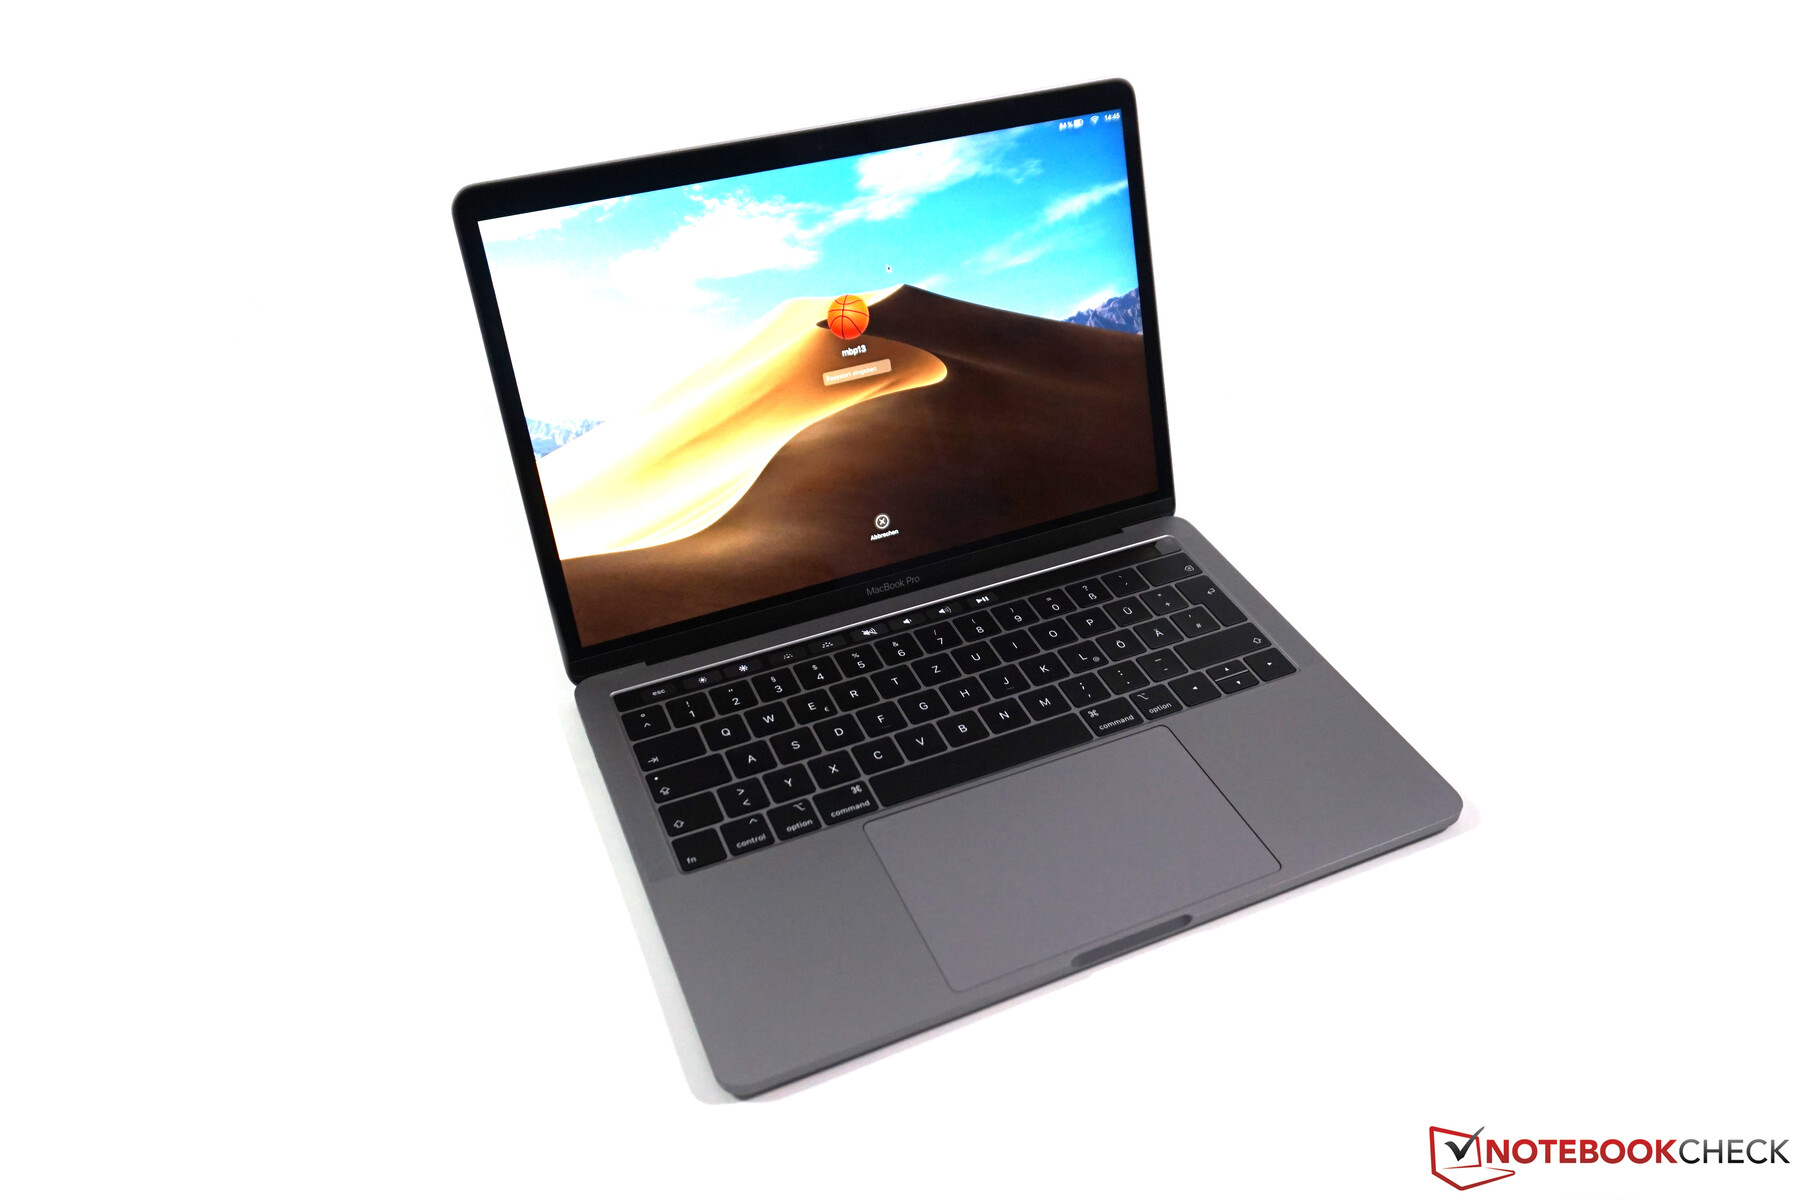
Apple MacBook Pro 13 2019: Entry-Level Pro with Touch Bar in review
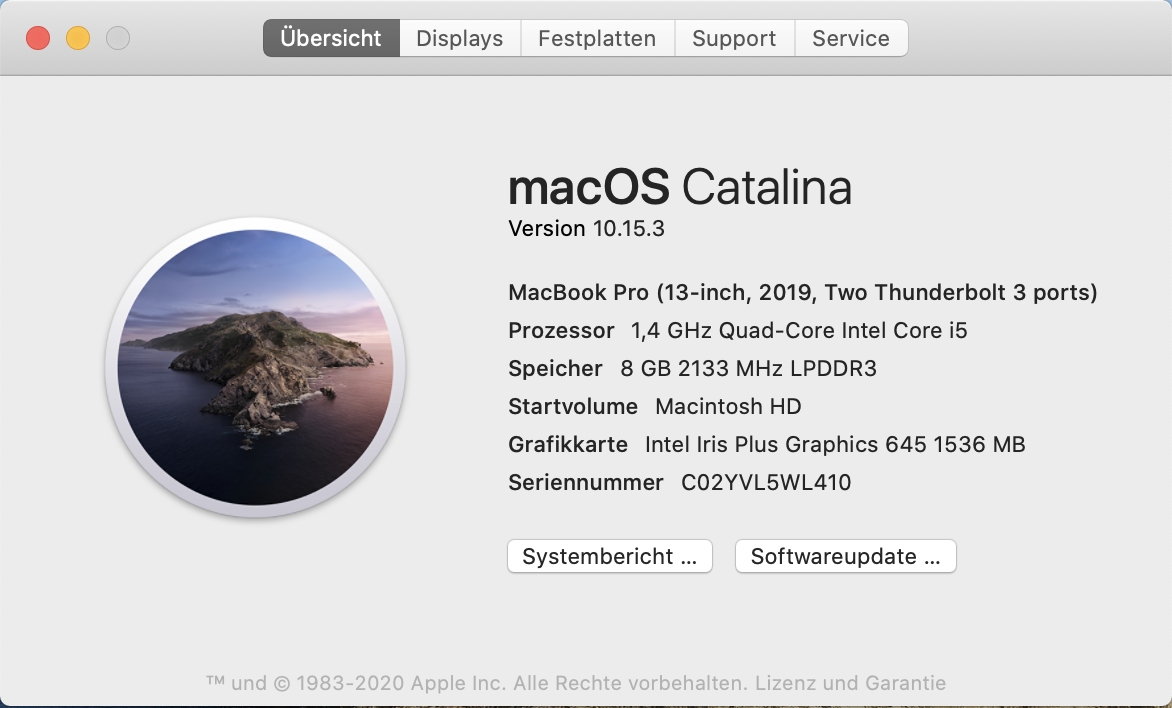
If you visit Apple's website, it looks like the manufacturer simplified the MacBook Pro 13 line-up. The old model with the physical function keys is gone, and both versions are now equipped with the Touch Bar above the keyboard as well as a quad-core processor. The only visible difference is the number of Thunderbolt 3 ports as well as the designation of the processor. On the inside, however, not much has changed, so there are still big differences between the MBP 13 with 4x Thunderbolt 3 and the MBP 13 with 2x Thunderbolt 3.
Our test unit is the SKU with the Core i5 and 256 GB SSD storage, which retails for 1749 Euros (~$1920) at Apple. However, many other shops often offer these devices from around 1500 Euros (~$1647). We want to see if the smaller MBP 13 might even be the better choice or if you should consider the premium for the MBP 13 with 4x Thunderbolt 3. We will also compare the device with the slightly lighter MacBook Air, which should fall behind especially in terms of performance. The case and the ports did not change, so we recommend our previous reviews for more information. The more expensive MBP 13 also uses the same chassis (except for two additional TB3 ports at the right side):
Rating | Date | Model | Weight | Height | Size | Resolution | Price |
|---|---|---|---|---|---|---|---|
| 90.6 % v7 (old) | 02 / 2020 | Apple MacBook Pro 13 2019 2TB3 i5-8257U, Iris Plus Graphics 645 | 1.4 kg | 14.9 mm | 13.30" | 2560x1600 | |
| 90.7 % v7 (old) | 10 / 2019 | Apple MacBook Pro 13 2019 i5 4TB3 i5-8279U, Iris Plus Graphics 655 | 1.4 kg | 14.9 mm | 13.30" | 2560x1600 | |
| 88.1 % v6 (old) | 07 / 2017 | Apple MacBook Pro 13 2017 i5-7360U, Iris Plus Graphics 640 | 1.4 kg | 14.9 mm | 13.30" | 2560x1600 | |
| 85.6 % v7 (old) | 01 / 2020 | Apple Macbook Air 2019 i5-8210Y, UHD Graphics 617 | 1.3 kg | 15.6 mm | 13.30" | 2560x1600 | |
| 87.7 % v6 (old) | 02 / 2019 | Dell XPS 13 9380 i7 4K i7-8565U, UHD Graphics 620 | 1.2 kg | 11.6 mm | 13.30" | 3840x2160 | |
| 86.3 % v7 (old) | 10 / 2019 | Razer Blade Stealth i7-1065G7 Iris Plus i7-1065G7, Iris Plus Graphics G7 (Ice Lake 64 EU) | 1.4 kg | 15.3 mm | 13.30" | 1920x1080 | |
| 84.5 % v7 (old) | 08 / 2019 | HP Envy 13-aq0003ng i7-8565U, GeForce MX250 | 1.2 kg | 14.7 mm | 13.30" | 1920x1080 |
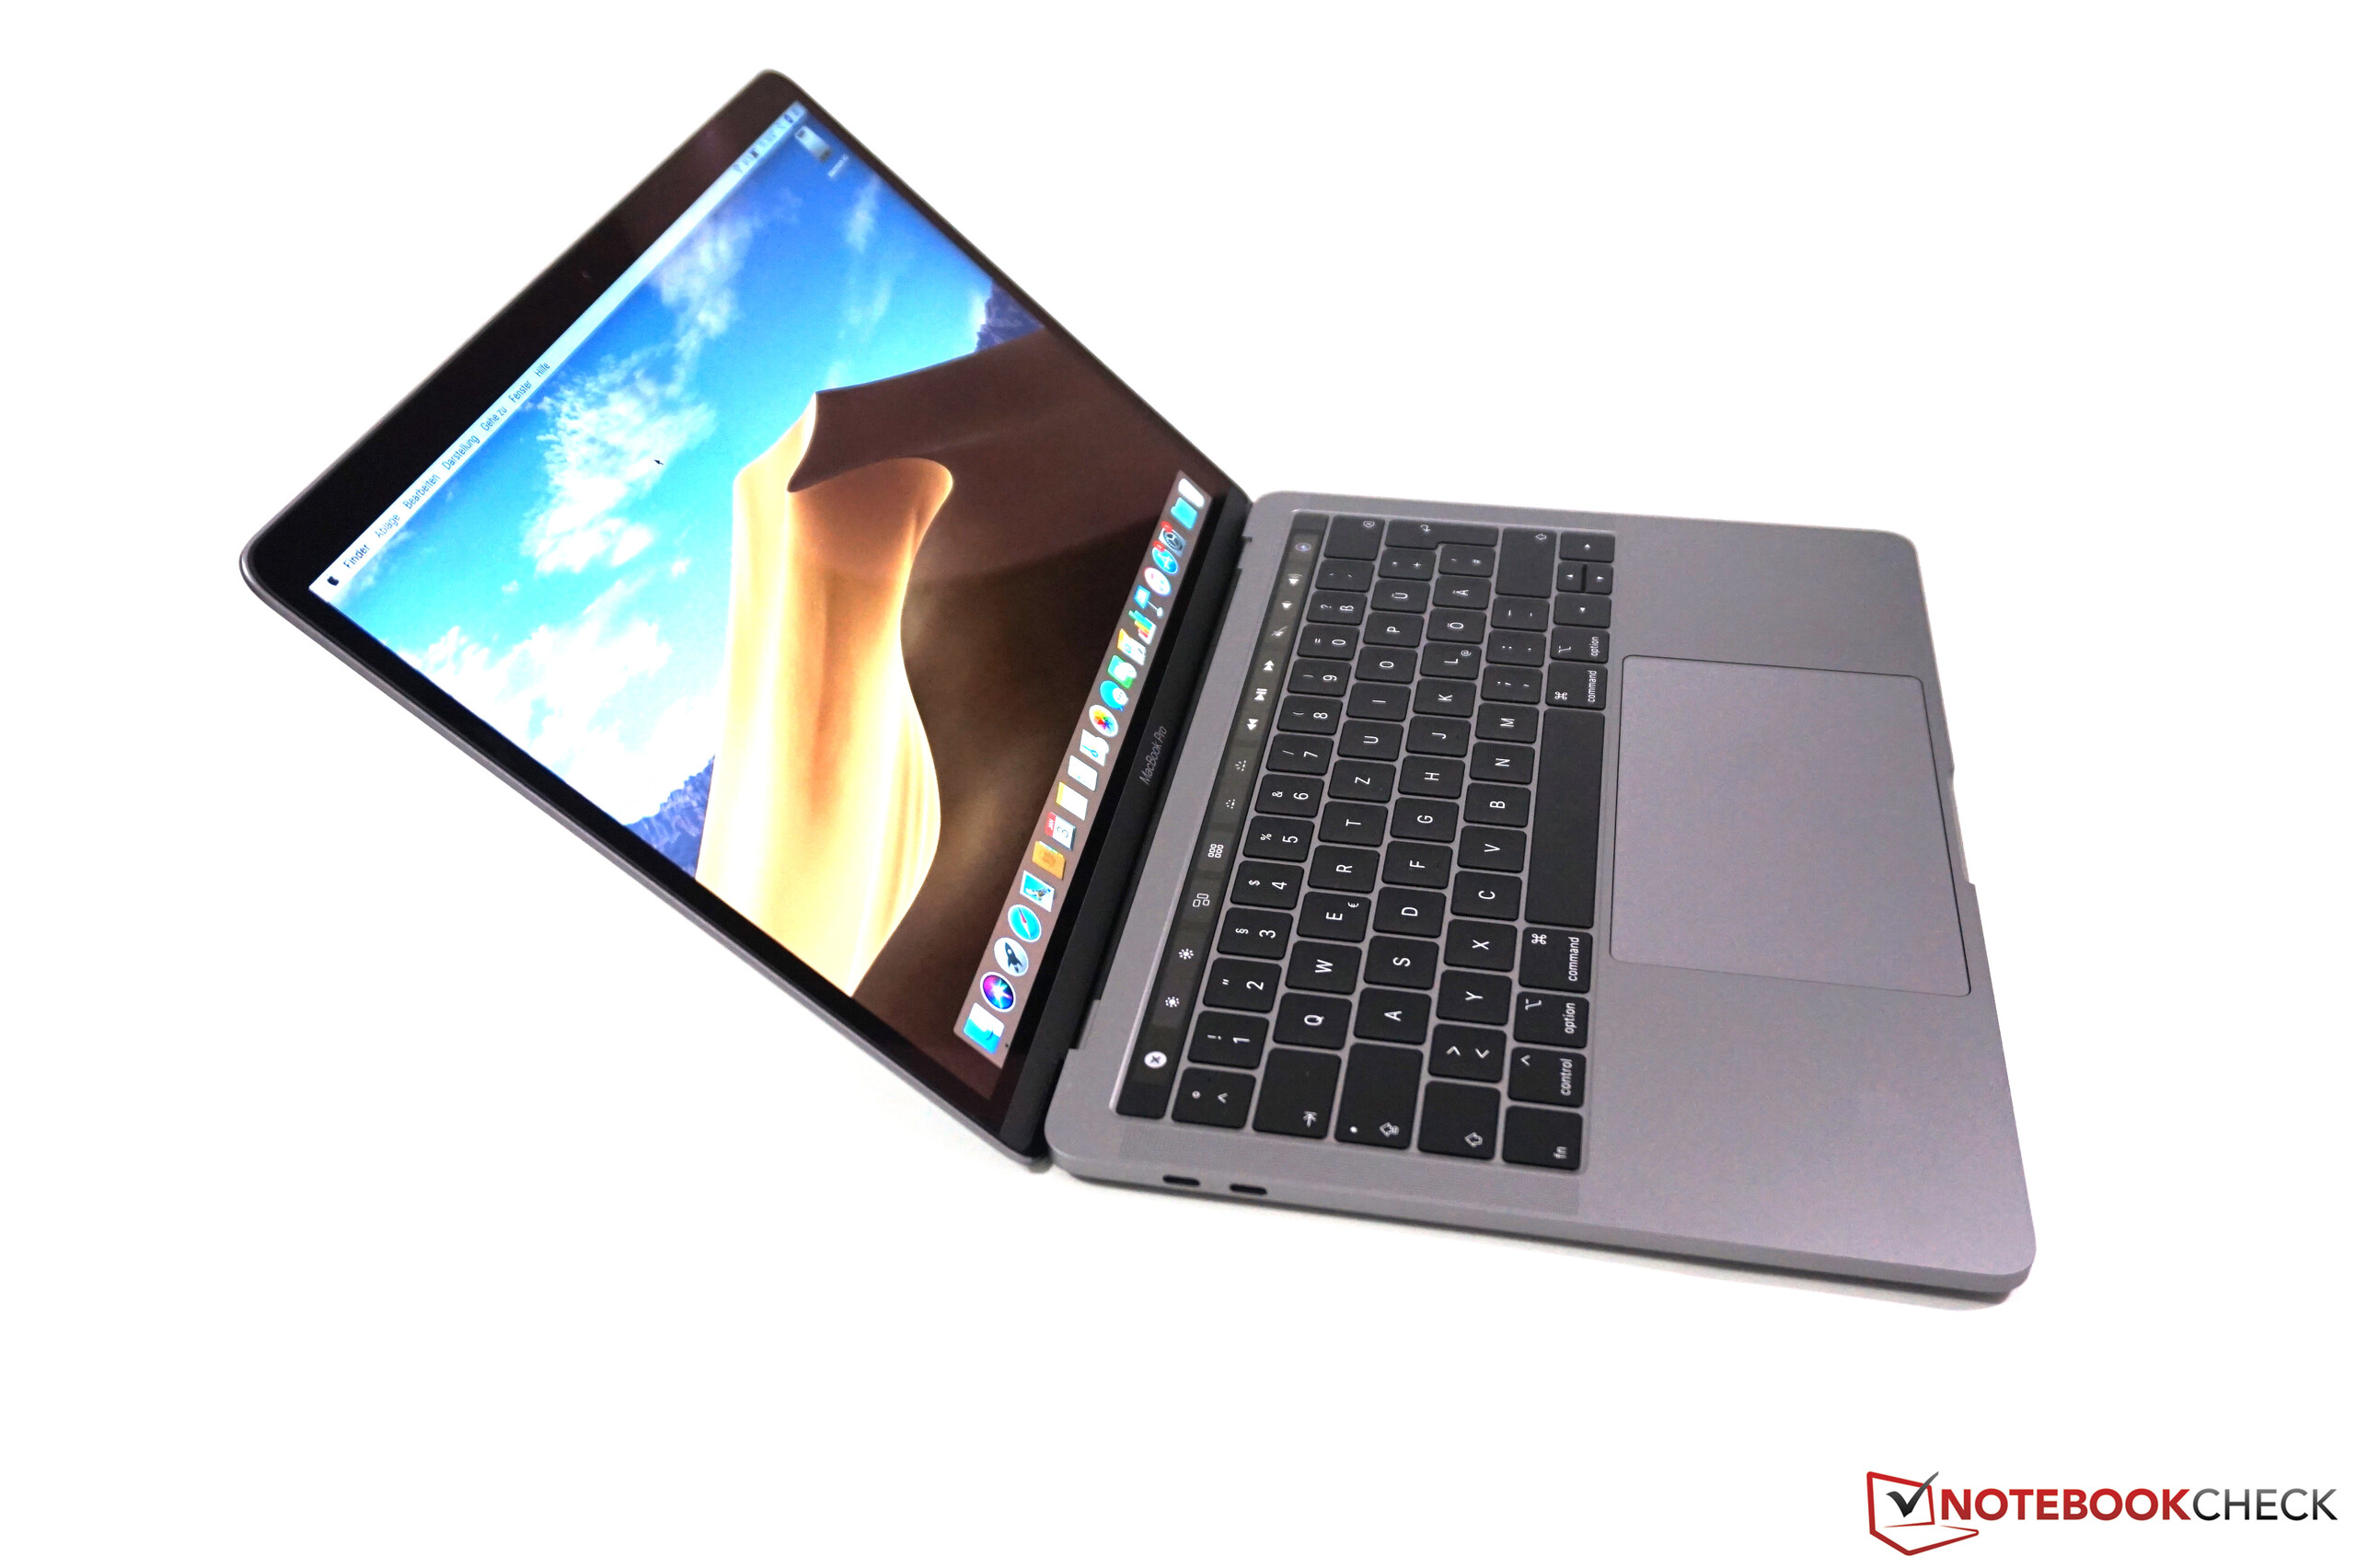
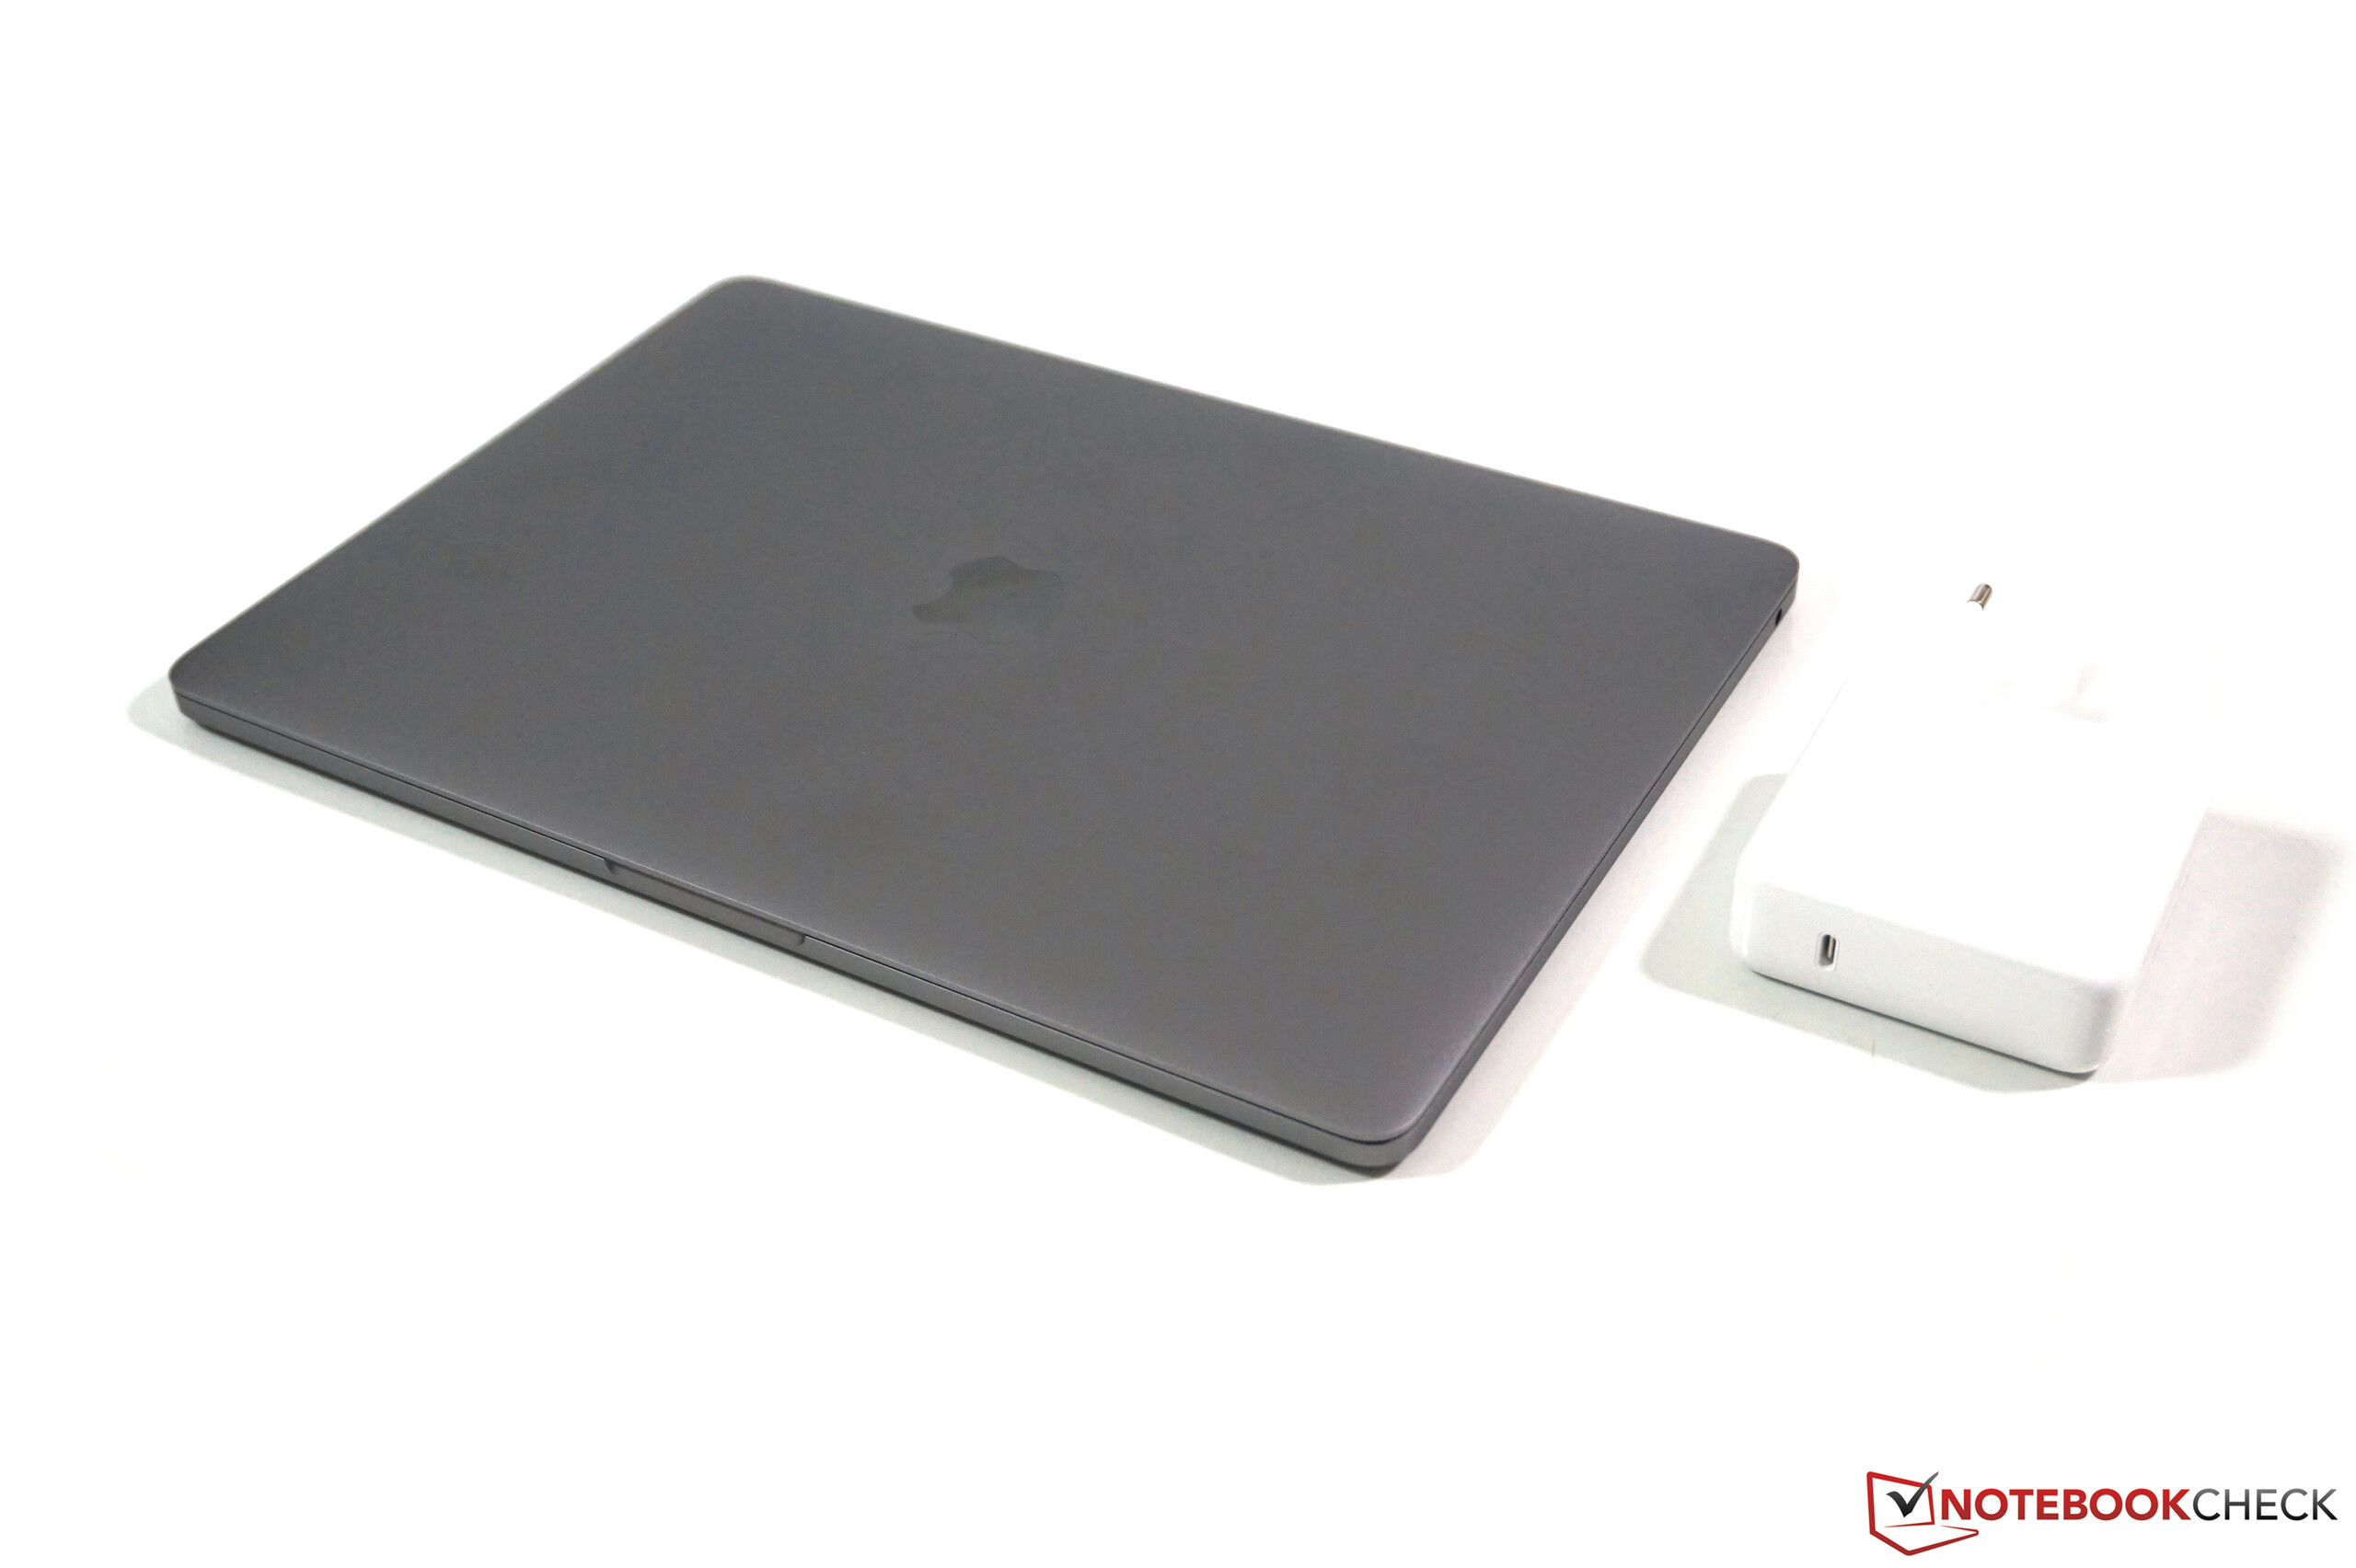
Case – MacBook Pro in the familiar shape
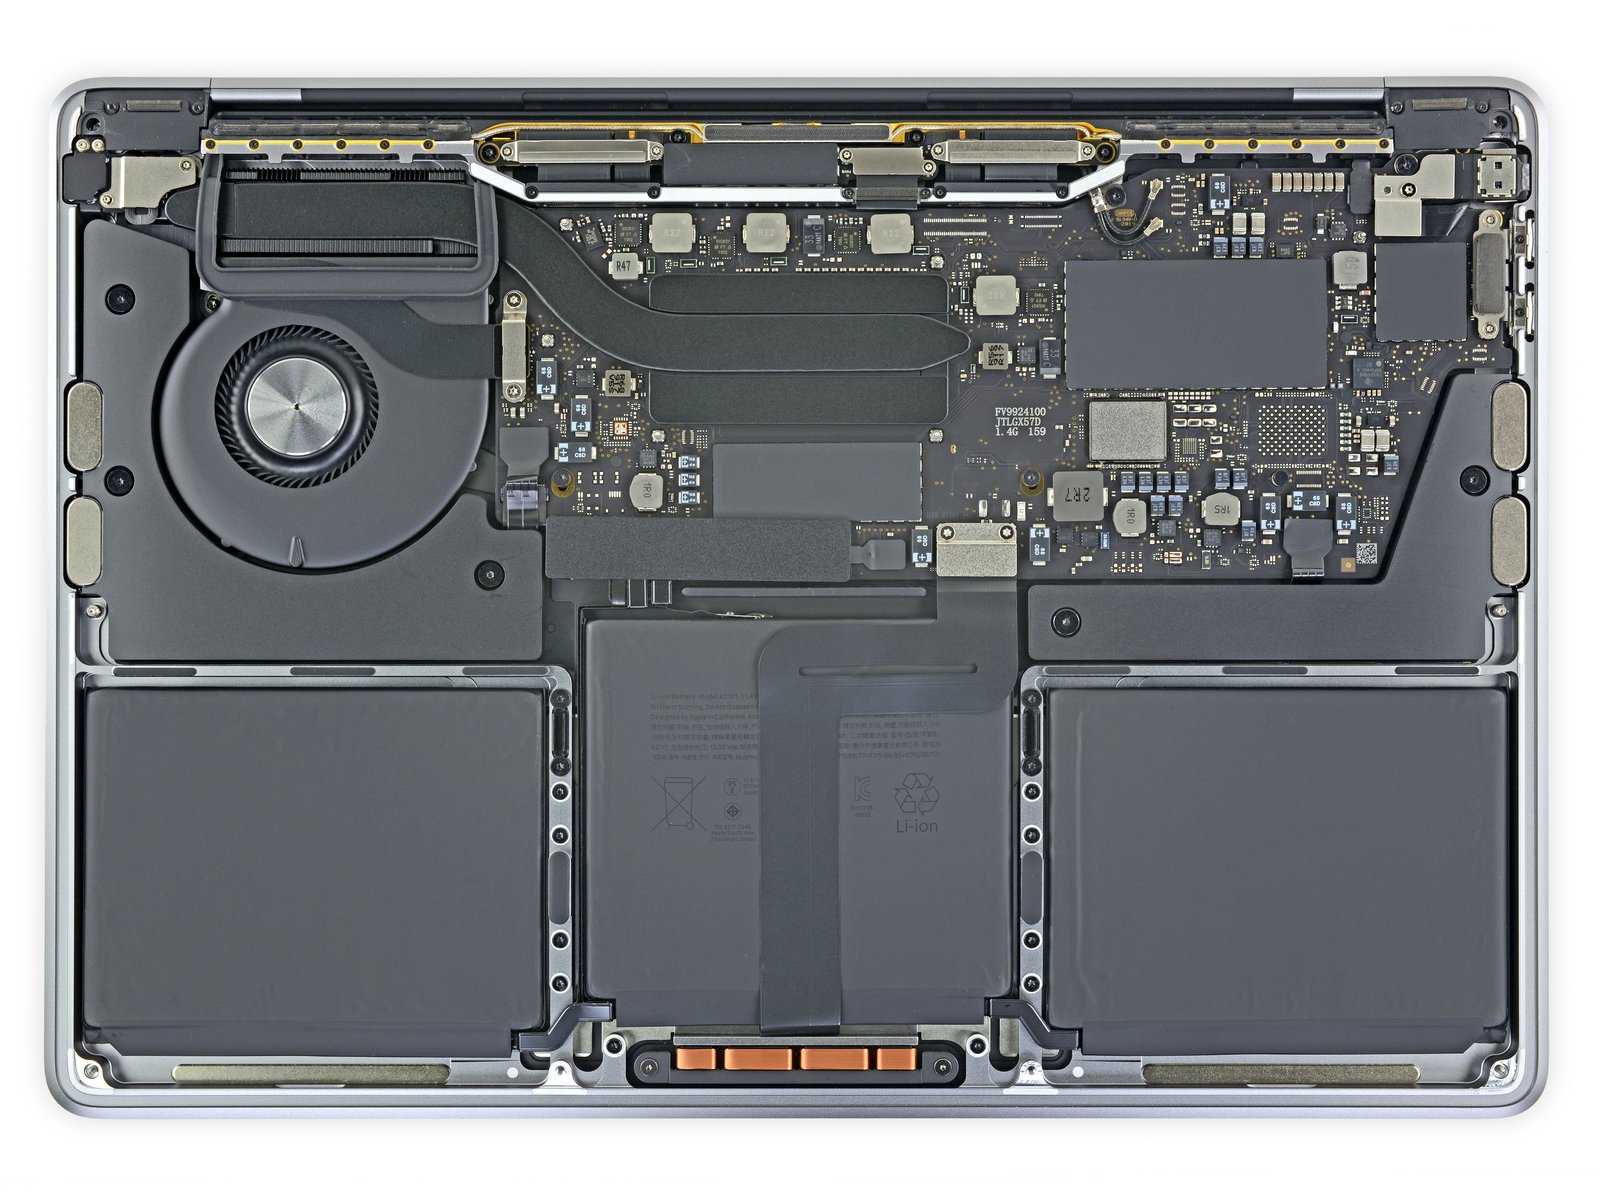
Except for the Touch Bar, the design has not changed. The only visible difference between the two 13-inch Pro models is the number of ports from now on. Inside, however, there have been minor changes compared to last year's model: The battery has a slightly higher capacity, the heat pipe of the CPU and the speakers on the other hand are a bit smaller. We will check the effects of these changes in the corresponding sections.
The case quality is still on an excellent level and identical to the more expensive MacBook Pro 13. It is pretty easy to remove the bottom panel (at least if you have the correct Pentalobe screwdriver), but there is not much to do. You can clean the fan; all the other components are either glued into the case or soldered onto the logic board.

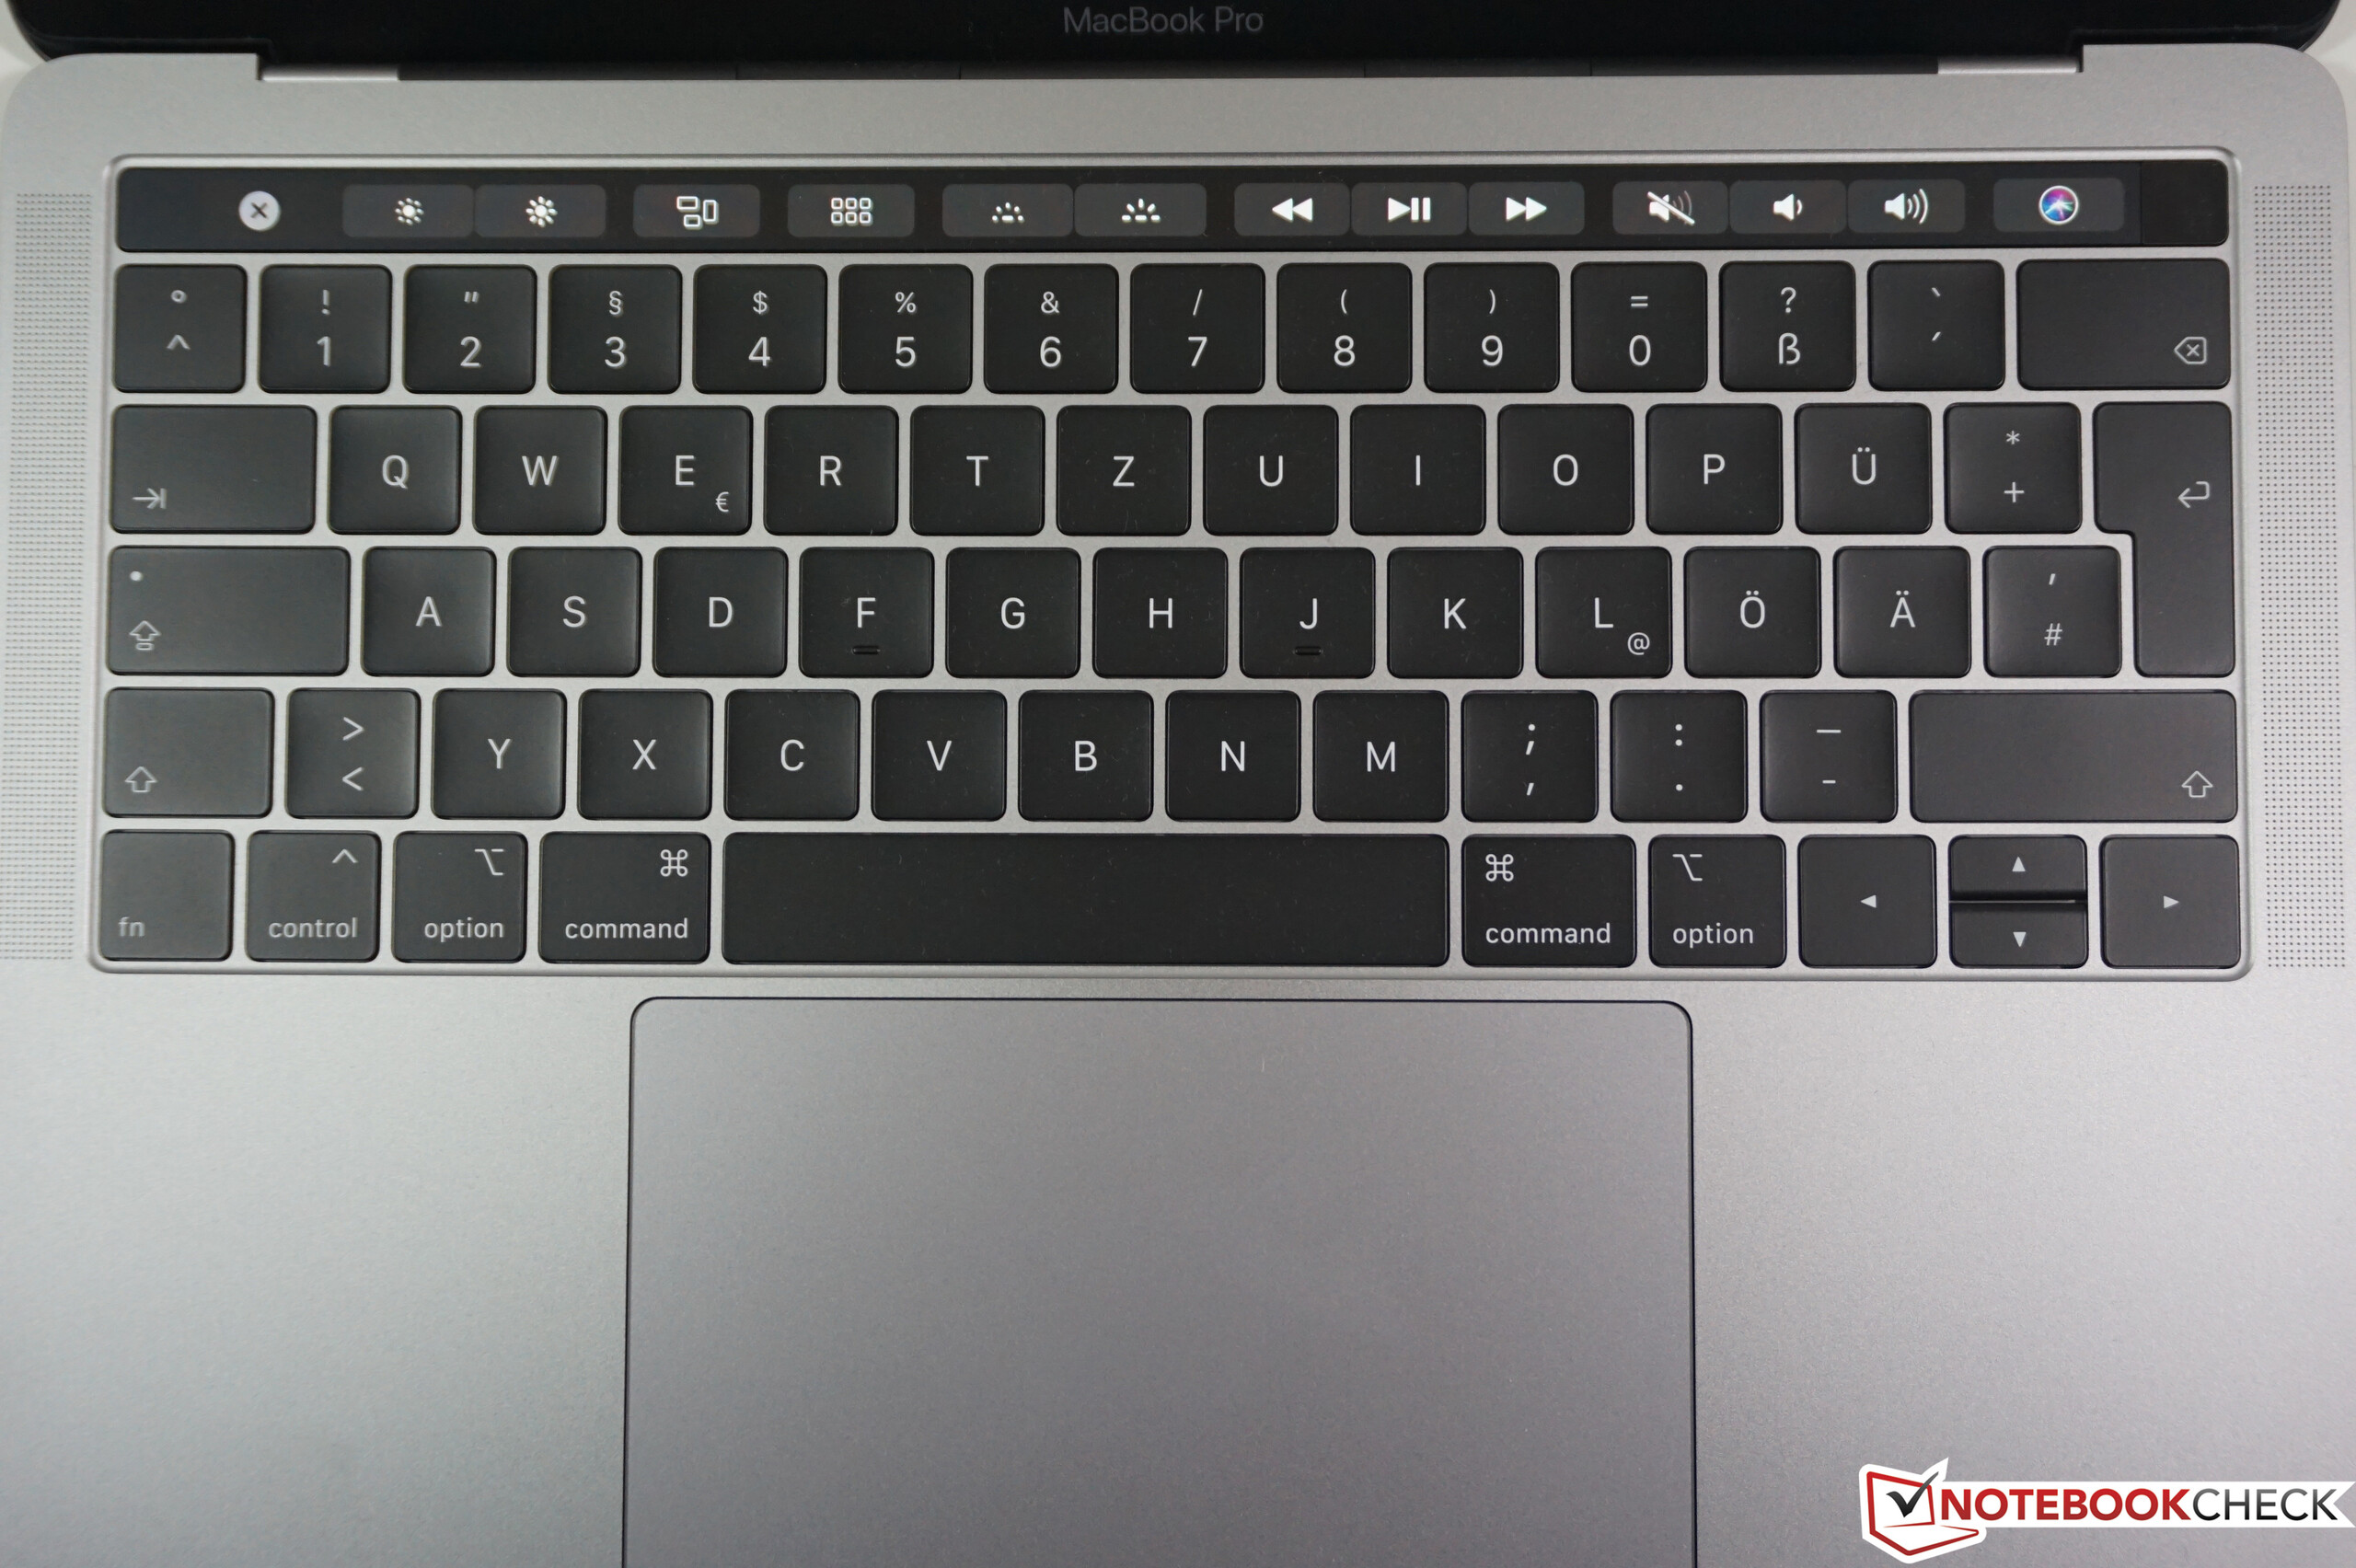
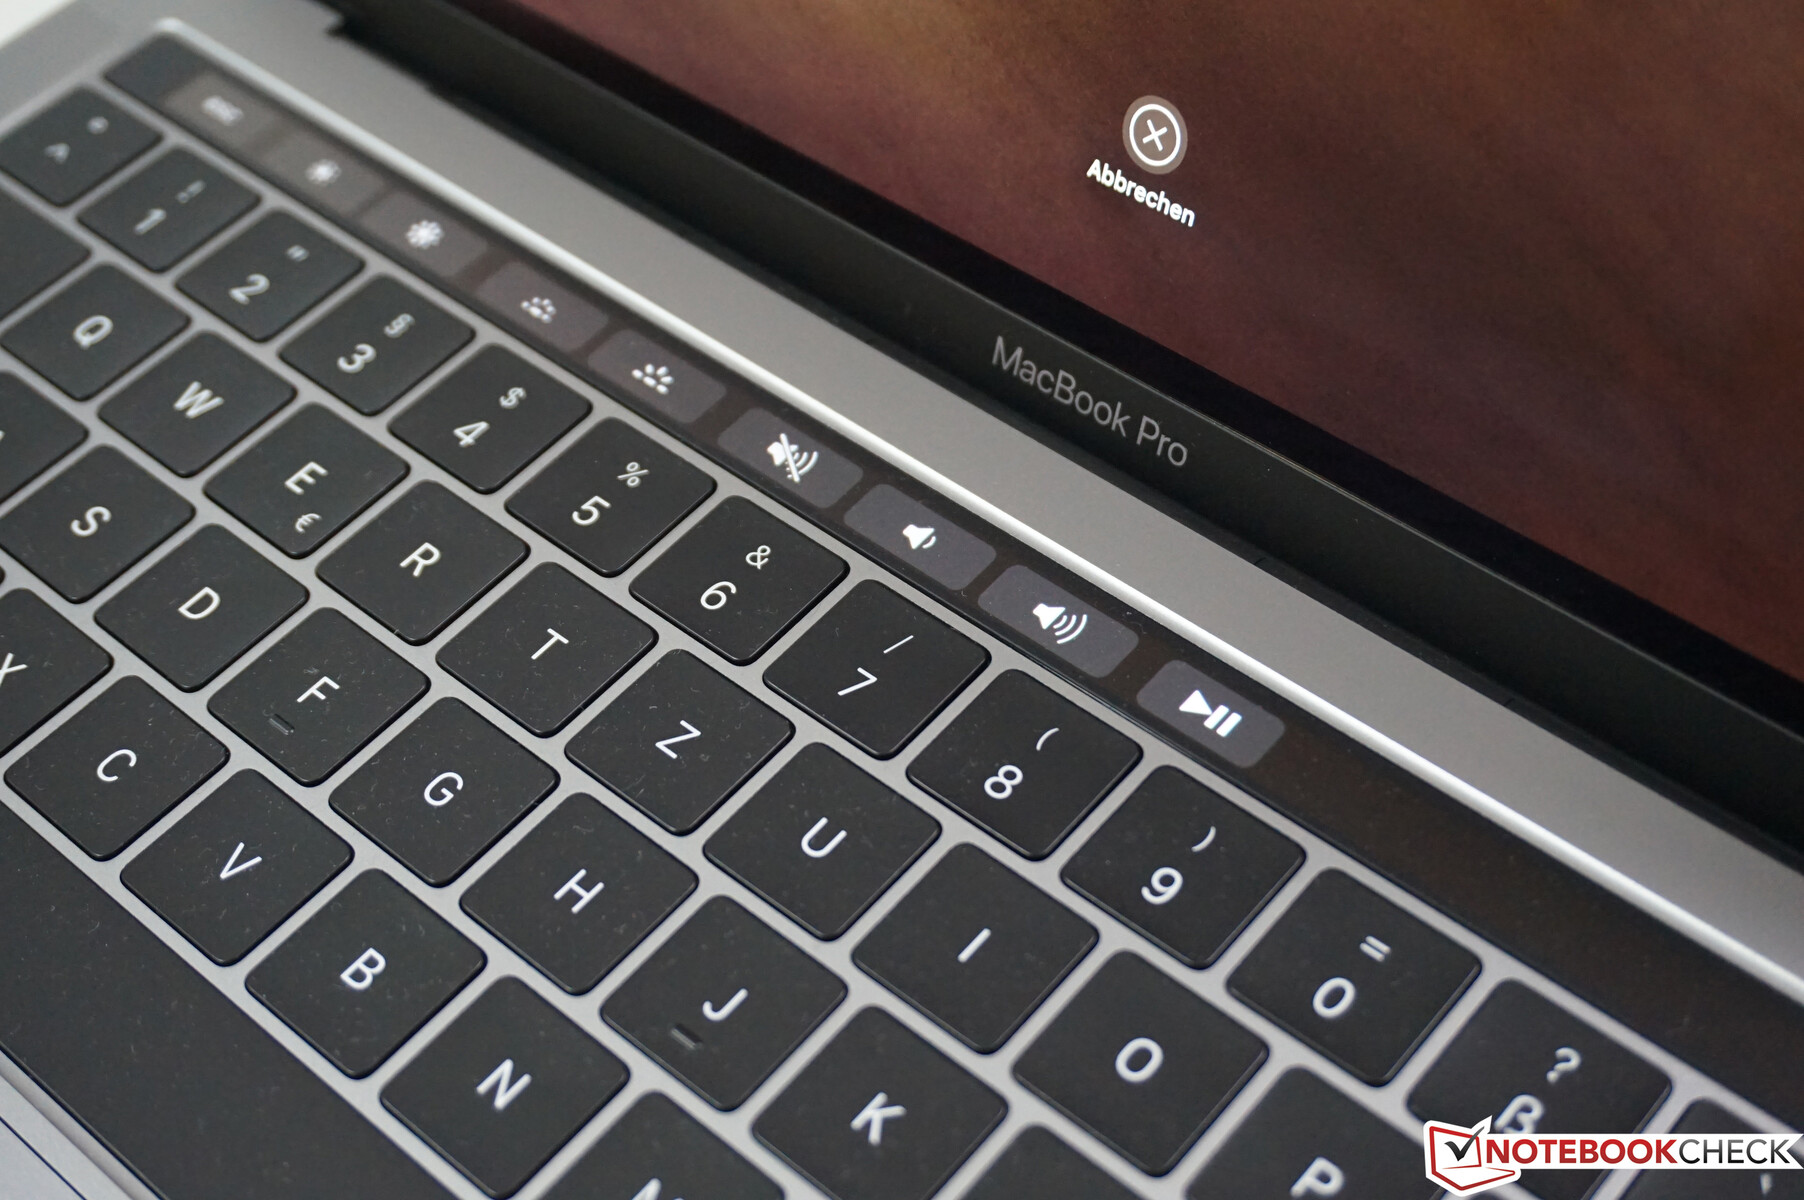
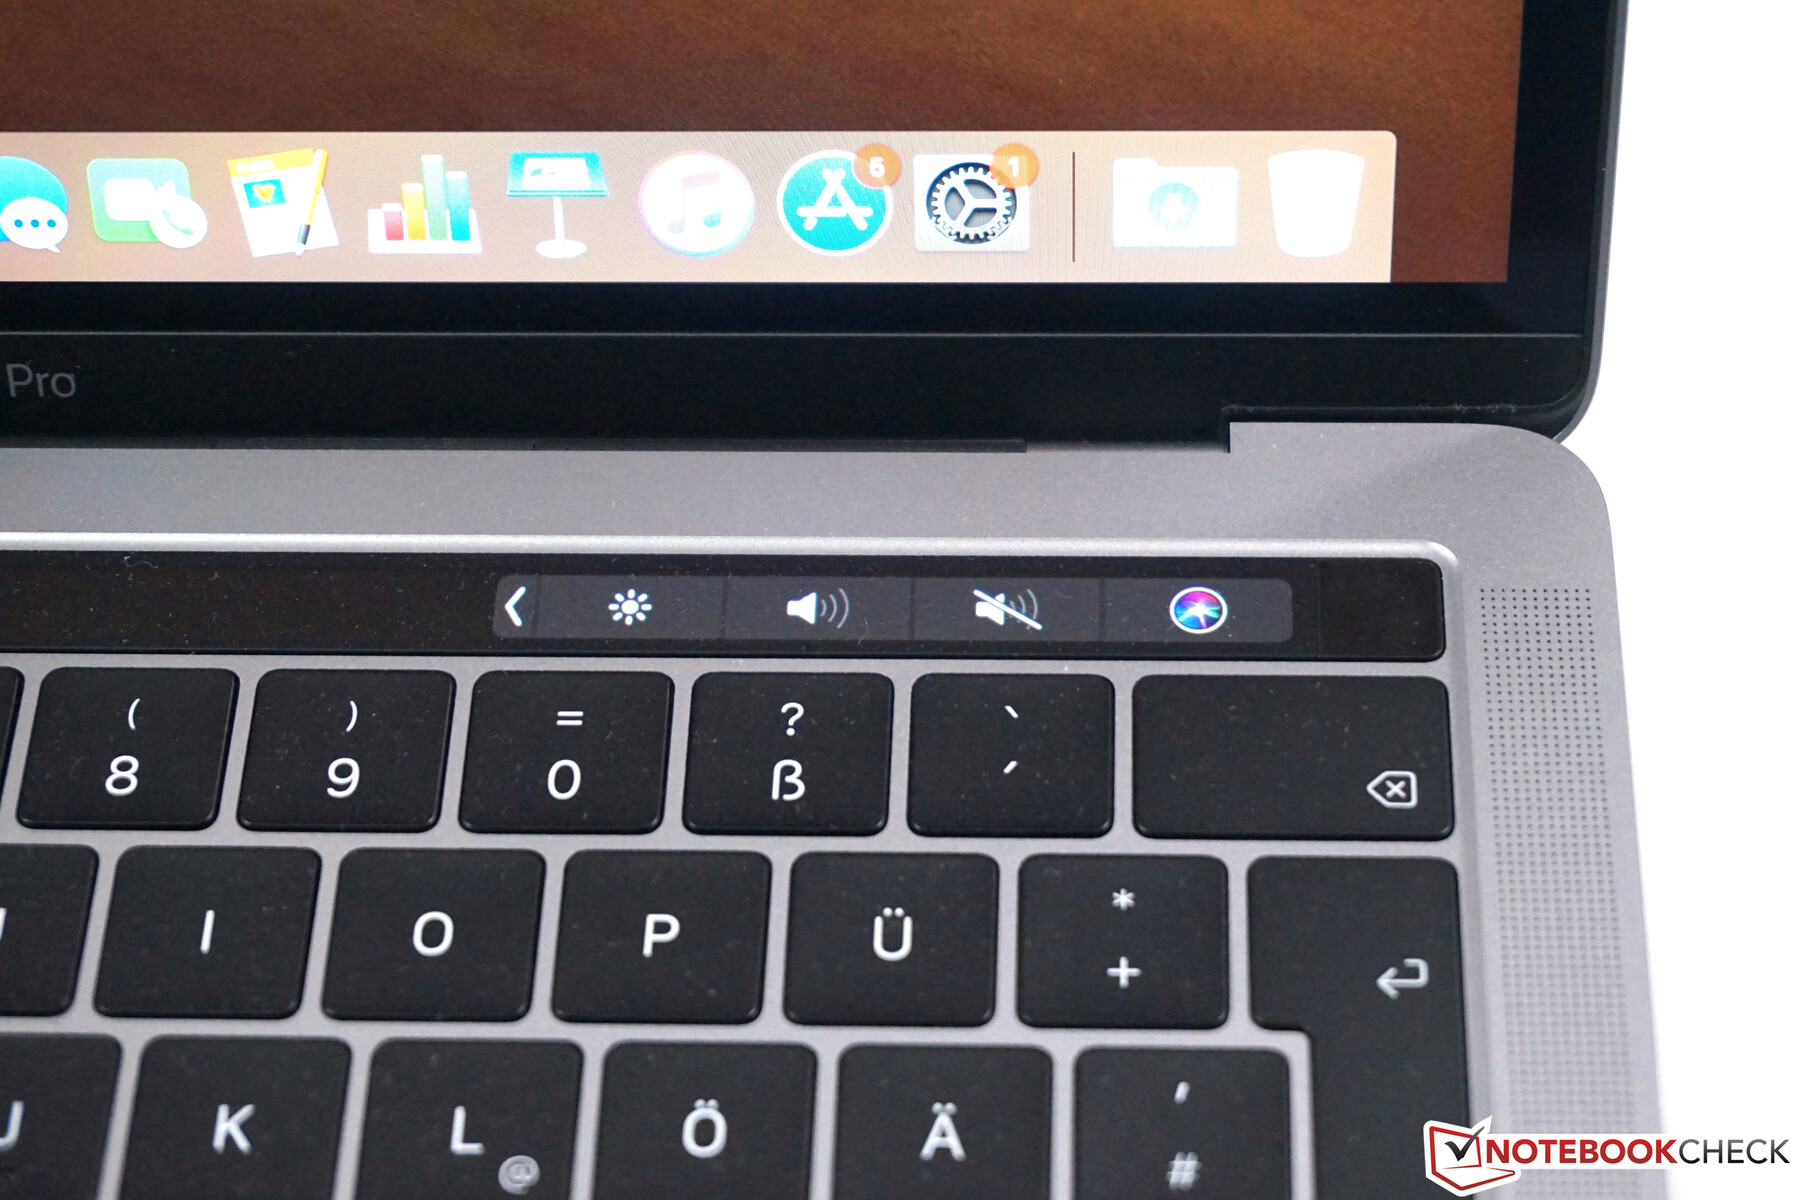
Input Devices – MacBook now with Touch Bar
It does not matter which model of the current MacBook Pro you get, all of them are equipped with the OLED Touch Bar above the keyboard. Depending on the application, the bar shows different information. Similar to previous years, if often depends on the software and the optimization for the Touch Bar. It can be a handy gadget in everyday situations (like switching between different Safari tabs), but sometimes it only doubles the content. It also requires one more input to change stuff like the brightness or the volume compared to the old model with dedicated function keys.
Display – MacBook with very good IPS screen
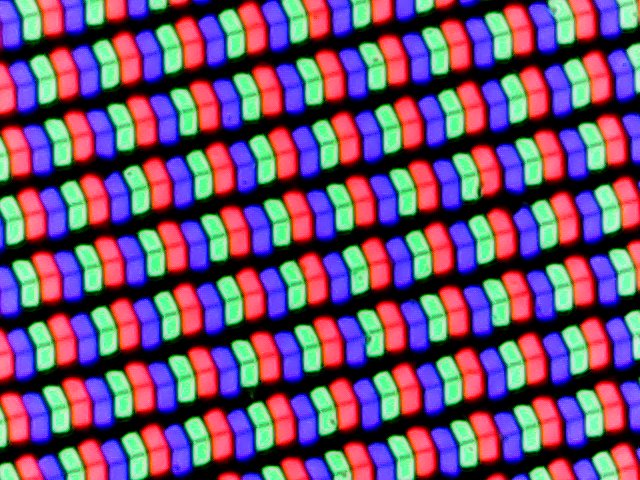
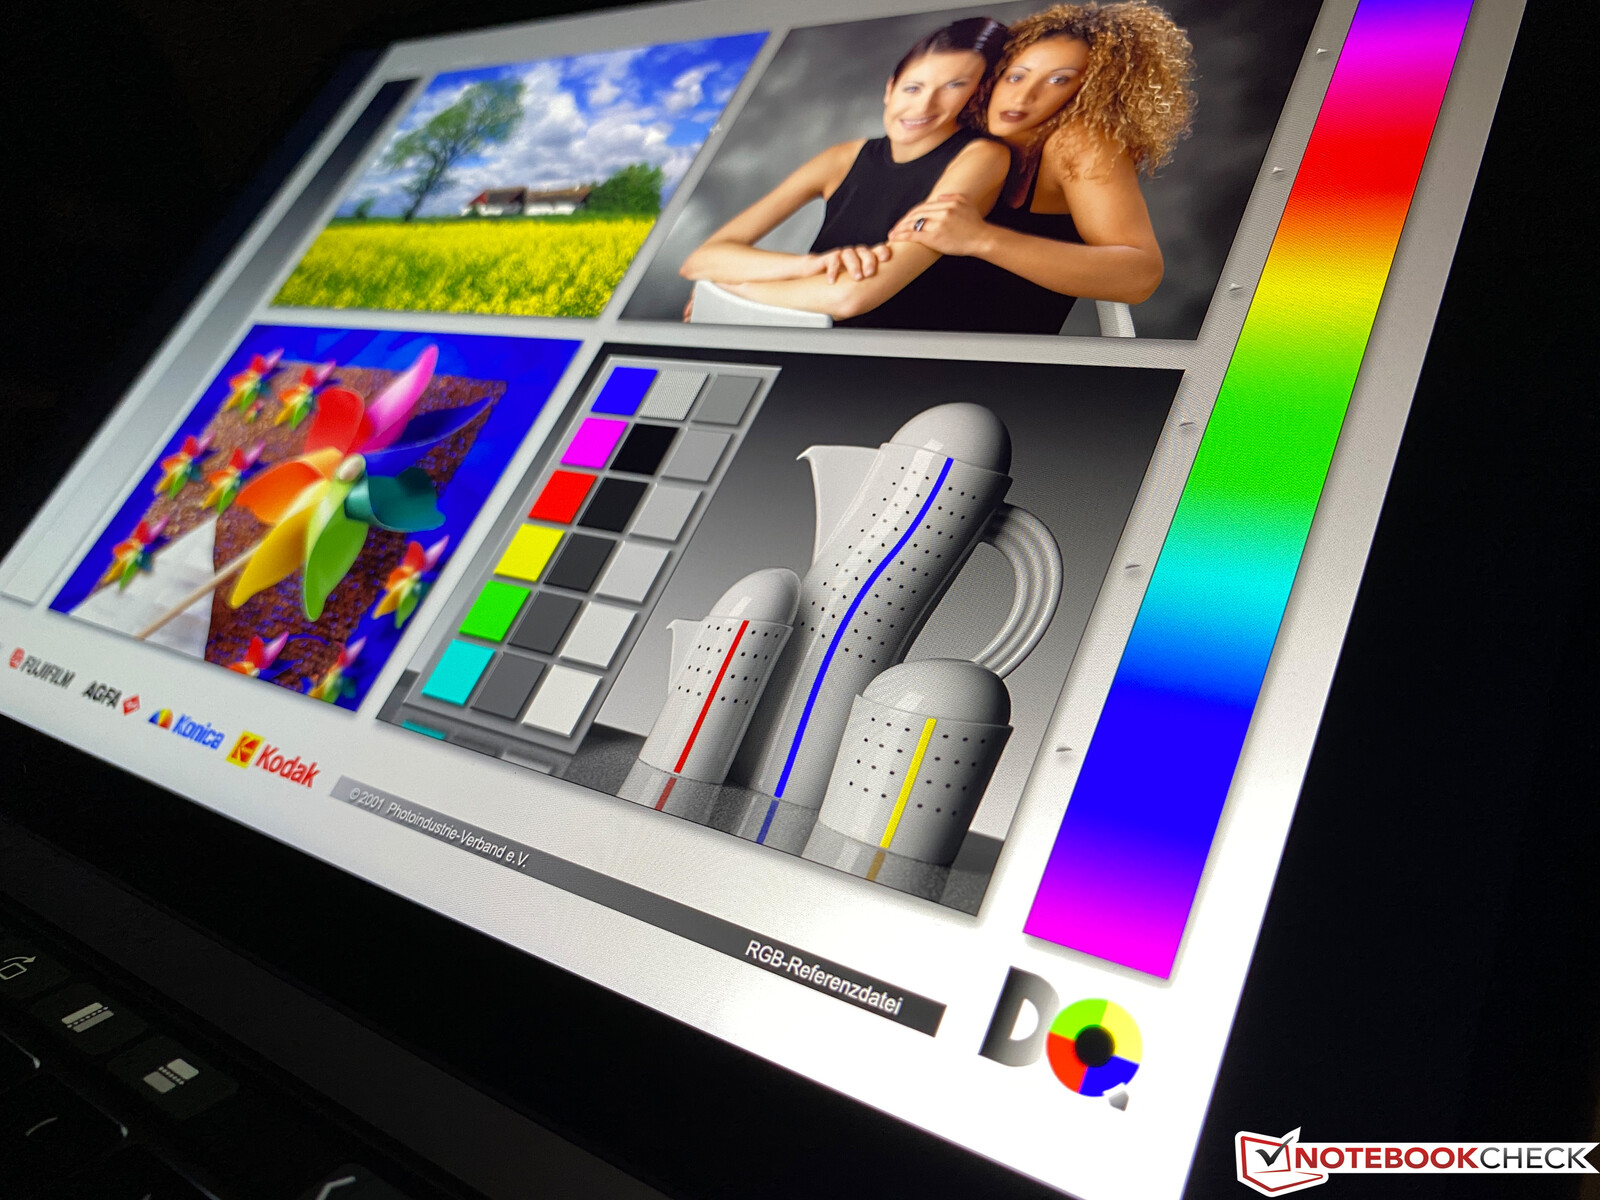
You don't have to worry about the display if you buy a MacBook Pro 13: The 13.3-inch IPS panel has a resolution of 2560x1600 pixels and offers excellent subjective picture quality without annoying backlight bleeding. Content is very sharp and appears very vivid. True Tone is also supported, and the brightness also adjusts to the ambient light very reliably.
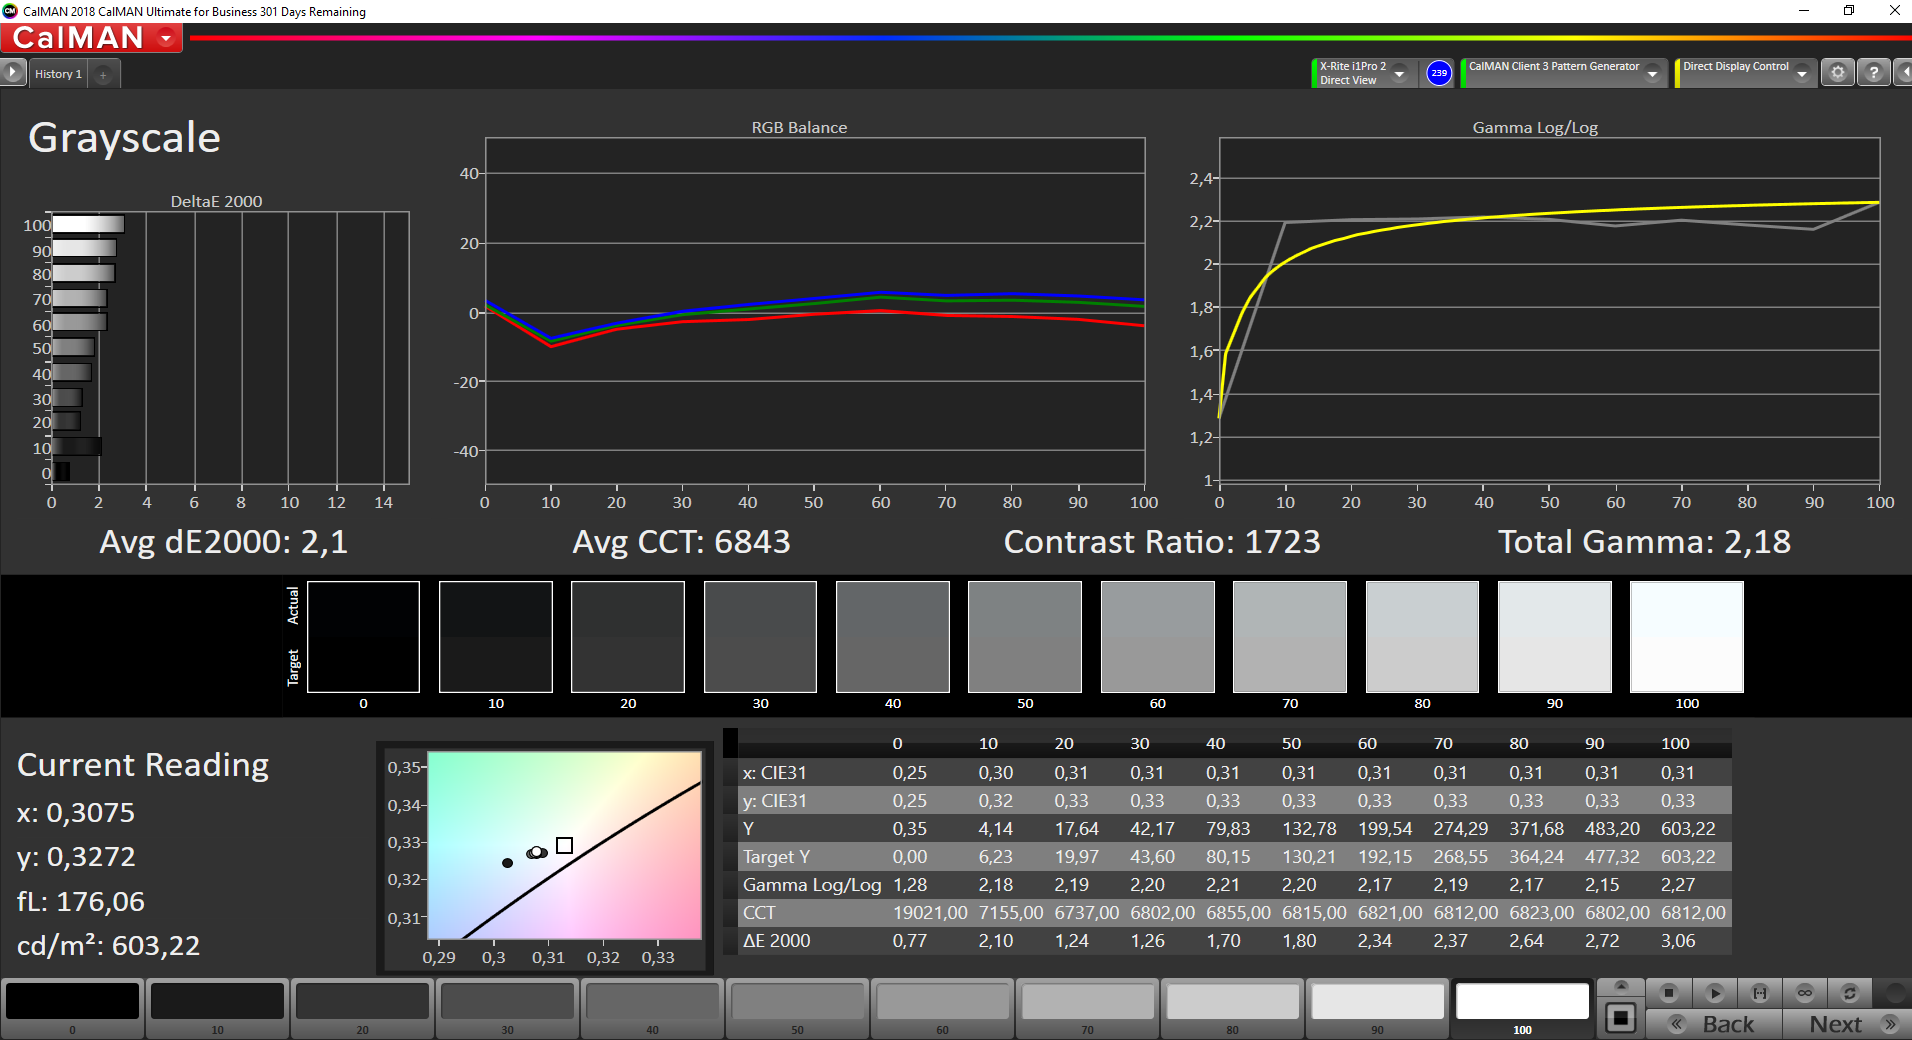
The average luminance is very good at 577 nits and even surpasses our test unit of the MacBook Pro 13 with four TB3 ports. The black value (0.35) is also still okay considering the high luminance and results in an excellent contrast ratio of more than 1700:1. PWM is not used to control the brightness; we can only measure a flickering of the background illumination at a very high 116 kHz. However, this cannot be compared with traditional PWM.
| |||||||||||||||||||||||||
Brightness Distribution: 92 %
Center on Battery: 602 cd/m²
Contrast: 1723:1 (Black: 0.35 cd/m²)
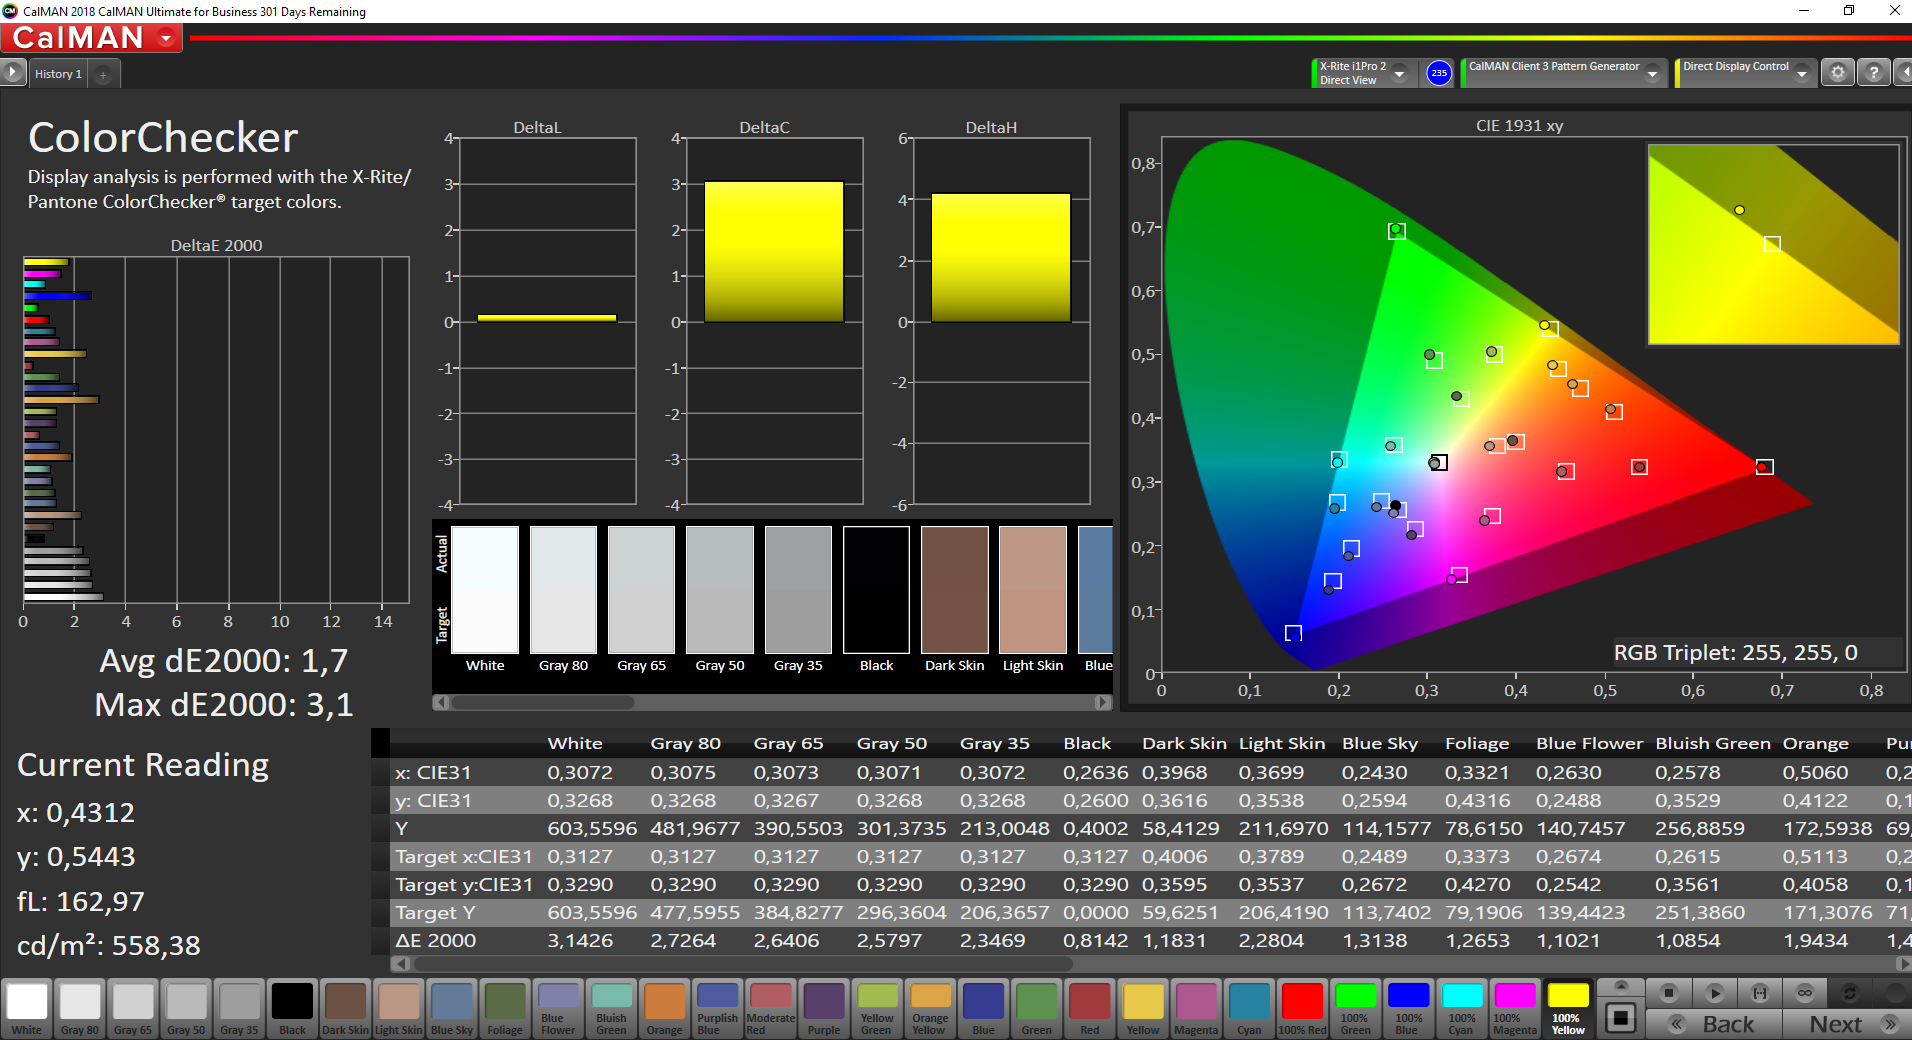
ΔE ColorChecker Calman: 1.7 | ∀{0.5-29.43 Ø4.72}
calibrated: 0.7
ΔE Greyscale Calman: 2.1 | ∀{0.09-98 Ø4.97}
99.4% sRGB (Argyll 1.6.3 3D)
76.7% AdobeRGB 1998 (Argyll 1.6.3 3D)
85.6% AdobeRGB 1998 (Argyll 3D)
99.4% sRGB (Argyll 3D)
96.1% Display P3 (Argyll 3D)
Gamma: 2.18
CCT: 6843 K
| Apple MacBook Pro 13 2019 2TB3 APPA03D, IPS, 2560x1600, 13.3" | Apple MacBook Pro 13 2019 i5 4TB3 APPA03E, IPS, 2560x1600, 13.3" | Apple MacBook Pro 13 2017 APPA033, IPS, 2560x1600, 13.3" | Apple Macbook Air 2019 APPA041, IPS, 2560x1600, 13.3" | Dell XPS 13 9380 i7 4K ID: AUO 282B B133ZAN Dell: 90NTH, IPS, 3840x2160, 13.3" | Razer Blade Stealth i7-1065G7 Iris Plus Sharp LQ133M1JW41, IPS, 1920x1080, 13.3" | HP Envy 13-aq0003ng InfoVision M133NVF3 R2, IPS, 1920x1080, 13.3" | |
|---|---|---|---|---|---|---|---|
| Display | 2% | 2% | -18% | -21% | -18% | -22% | |
| Display P3 Coverage (%) | 96.1 | 98.7 3% | 99.2 3% | 67.4 -30% | 64.8 -33% | 66.2 -31% | 64.4 -33% |
| sRGB Coverage (%) | 99.4 | 100 1% | 99.9 1% | 94.7 -5% | 93.6 -6% | 97.2 -2% | 91.7 -8% |
| AdobeRGB 1998 Coverage (%) | 85.6 | 87.7 2% | 87.1 2% | 69.1 -19% | 65.8 -23% | 67.1 -22% | 65.2 -24% |
| Response Times | 15% | 17% | 16% | -19% | 8% | 35% | |
| Response Time Grey 50% / Grey 80% * (ms) | 50.4 ? | 43.2 ? 14% | 42.8 ? 15% | 42.4 ? 16% | 64.8 ? -29% | 45.2 ? 10% | 31 ? 38% |
| Response Time Black / White * (ms) | 35.2 ? | 29.6 ? 16% | 28.8 ? 18% | 29.6 ? 16% | 38 ? -8% | 33.2 ? 6% | 24 ? 32% |
| PWM Frequency (Hz) | 116300 ? | 111100 ? | 22730 ? | 4000 ? | |||
| Screen | -26% | -6% | -8% | -45% | -5% | -51% | |
| Brightness middle (cd/m²) | 603 | 518 -14% | 588 -2% | 421 -30% | 428.3 -29% | 422.6 -30% | 768 27% |
| Brightness (cd/m²) | 577 | 480 -17% | 561 -3% | 393 -32% | 414 -28% | 404 -30% | 778 35% |
| Brightness Distribution (%) | 92 | 87 -5% | 92 0% | 88 -4% | 88 -4% | 87 -5% | 82 -11% |
| Black Level * (cd/m²) | 0.35 | 0.34 3% | 0.45 -29% | 0.34 3% | 0.27 23% | 0.35 -0% | 0.48 -37% |
| Contrast (:1) | 1723 | 1524 -12% | 1307 -24% | 1238 -28% | 1586 -8% | 1207 -30% | 1600 -7% |
| Colorchecker dE 2000 * | 1.7 | 1.5 12% | 1.7 -0% | 1.5 12% | 2.69 -58% | 1.02 40% | 3.49 -105% |
| Colorchecker dE 2000 max. * | 3.1 | 2.8 10% | 3.5 -13% | 3.8 -23% | 6.19 -100% | 3.06 1% | 7.41 -139% |
| Colorchecker dE 2000 calibrated * | 0.7 | 2.6 -271% | 2.01 -187% | 0.95 -36% | 2.07 -196% | ||
| Greyscale dE 2000 * | 2.1 | 2 5% | 1.9 10% | 1.2 43% | 3.7 -76% | 1 52% | 4.09 -95% |
| Gamma | 2.18 101% | 2.22 99% | 2.33 94% | 2.21 100% | 2.1 105% | 2.21 100% | 2.54 87% |
| CCT | 6843 95% | 6898 94% | 6738 96% | 6694 97% | 6706 97% | 6502 100% | 6452 101% |
| Color Space (Percent of AdobeRGB 1998) (%) | 76.7 | 78.4 2% | 77.92 2% | 61.3 -20% | 60.4 -21% | 62.1 -19% | 60 -22% |
| Color Space (Percent of sRGB) (%) | 99.4 | 99.9 1% | 99.94 1% | 94.6 -5% | 93.5 -6% | 97.1 -2% | 92 -7% |
| Total Average (Program / Settings) | -3% /
-16% | 4% /
-1% | -3% /
-7% | -28% /
-37% | -5% /
-6% | -13% /
-35% |
* ... smaller is better
The display calibration is already very good out of the box. Our measurements with the professional CalMAN software and the X-Rite i1 Pro 2 spectrophotometer do not show a visible color cast and all the color deviations are already below the important mark of 3. It is not really necessary to calibrate the display, but we still tried it and managed to improve the results even further.
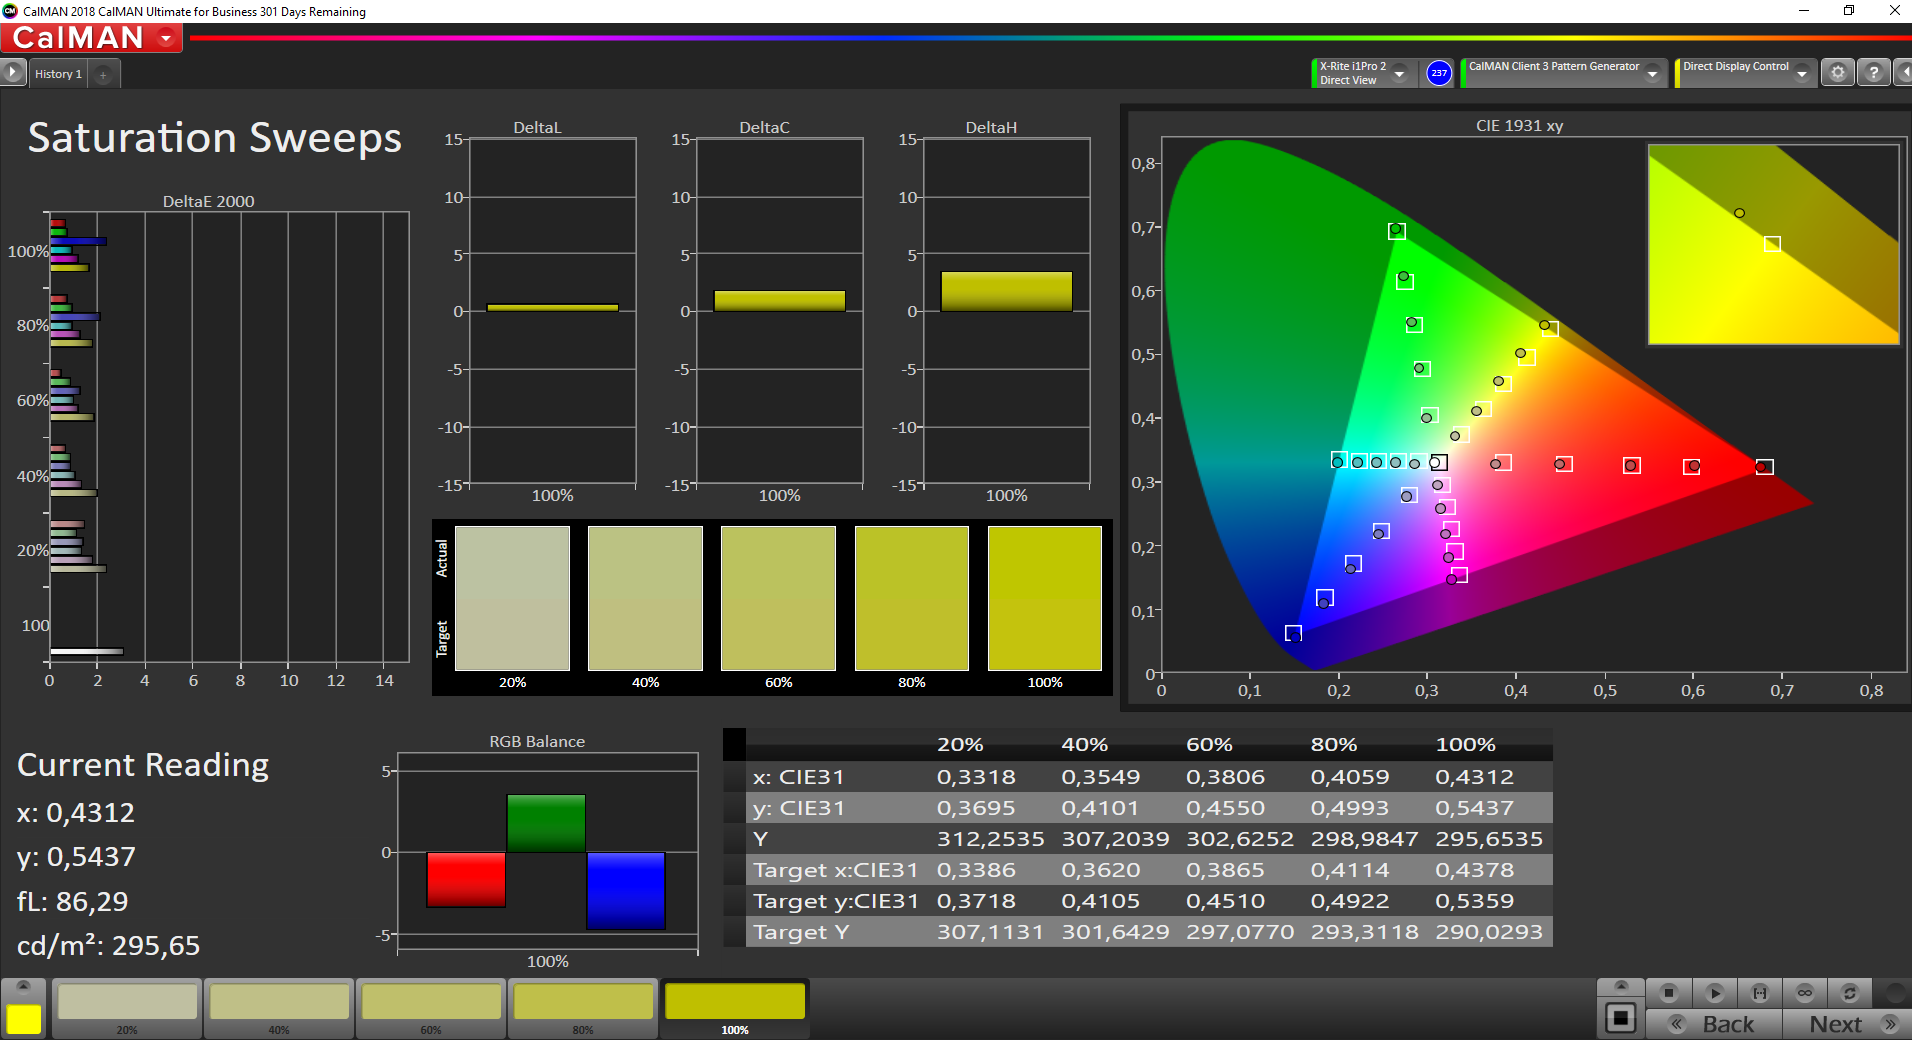

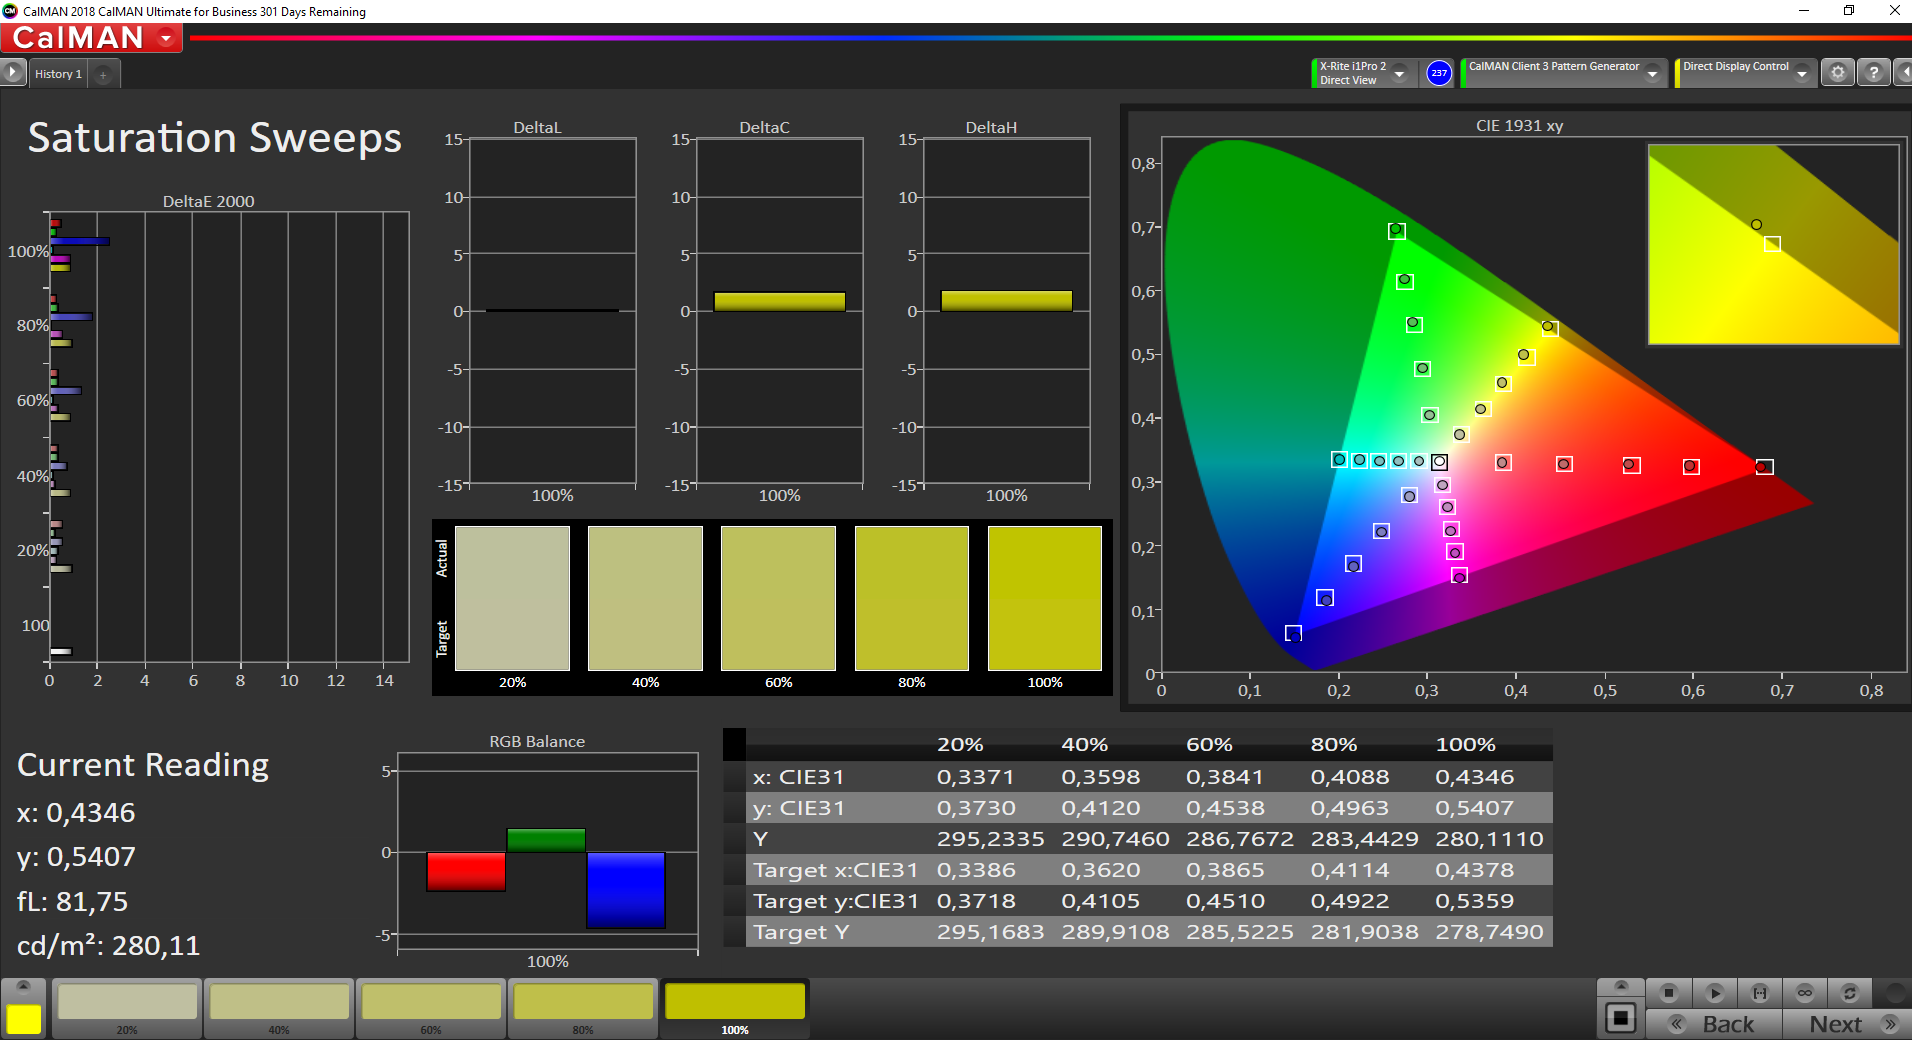
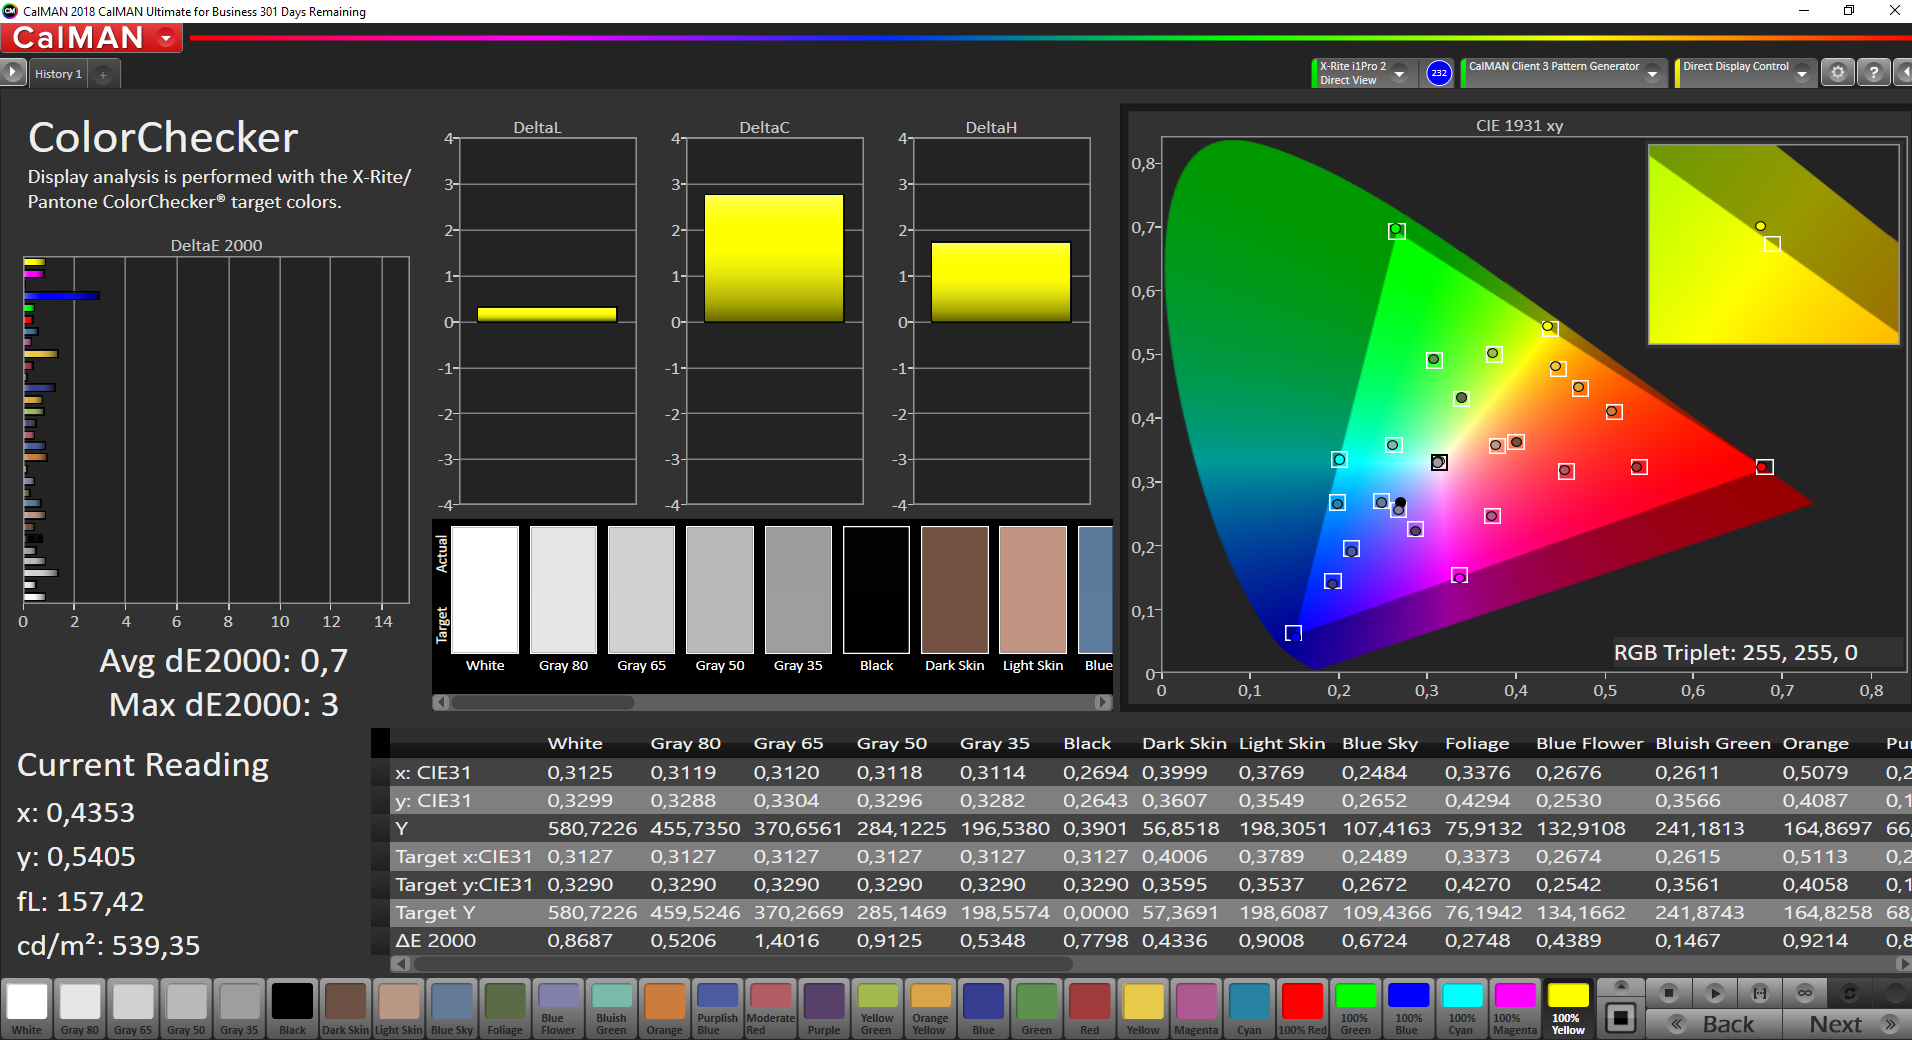
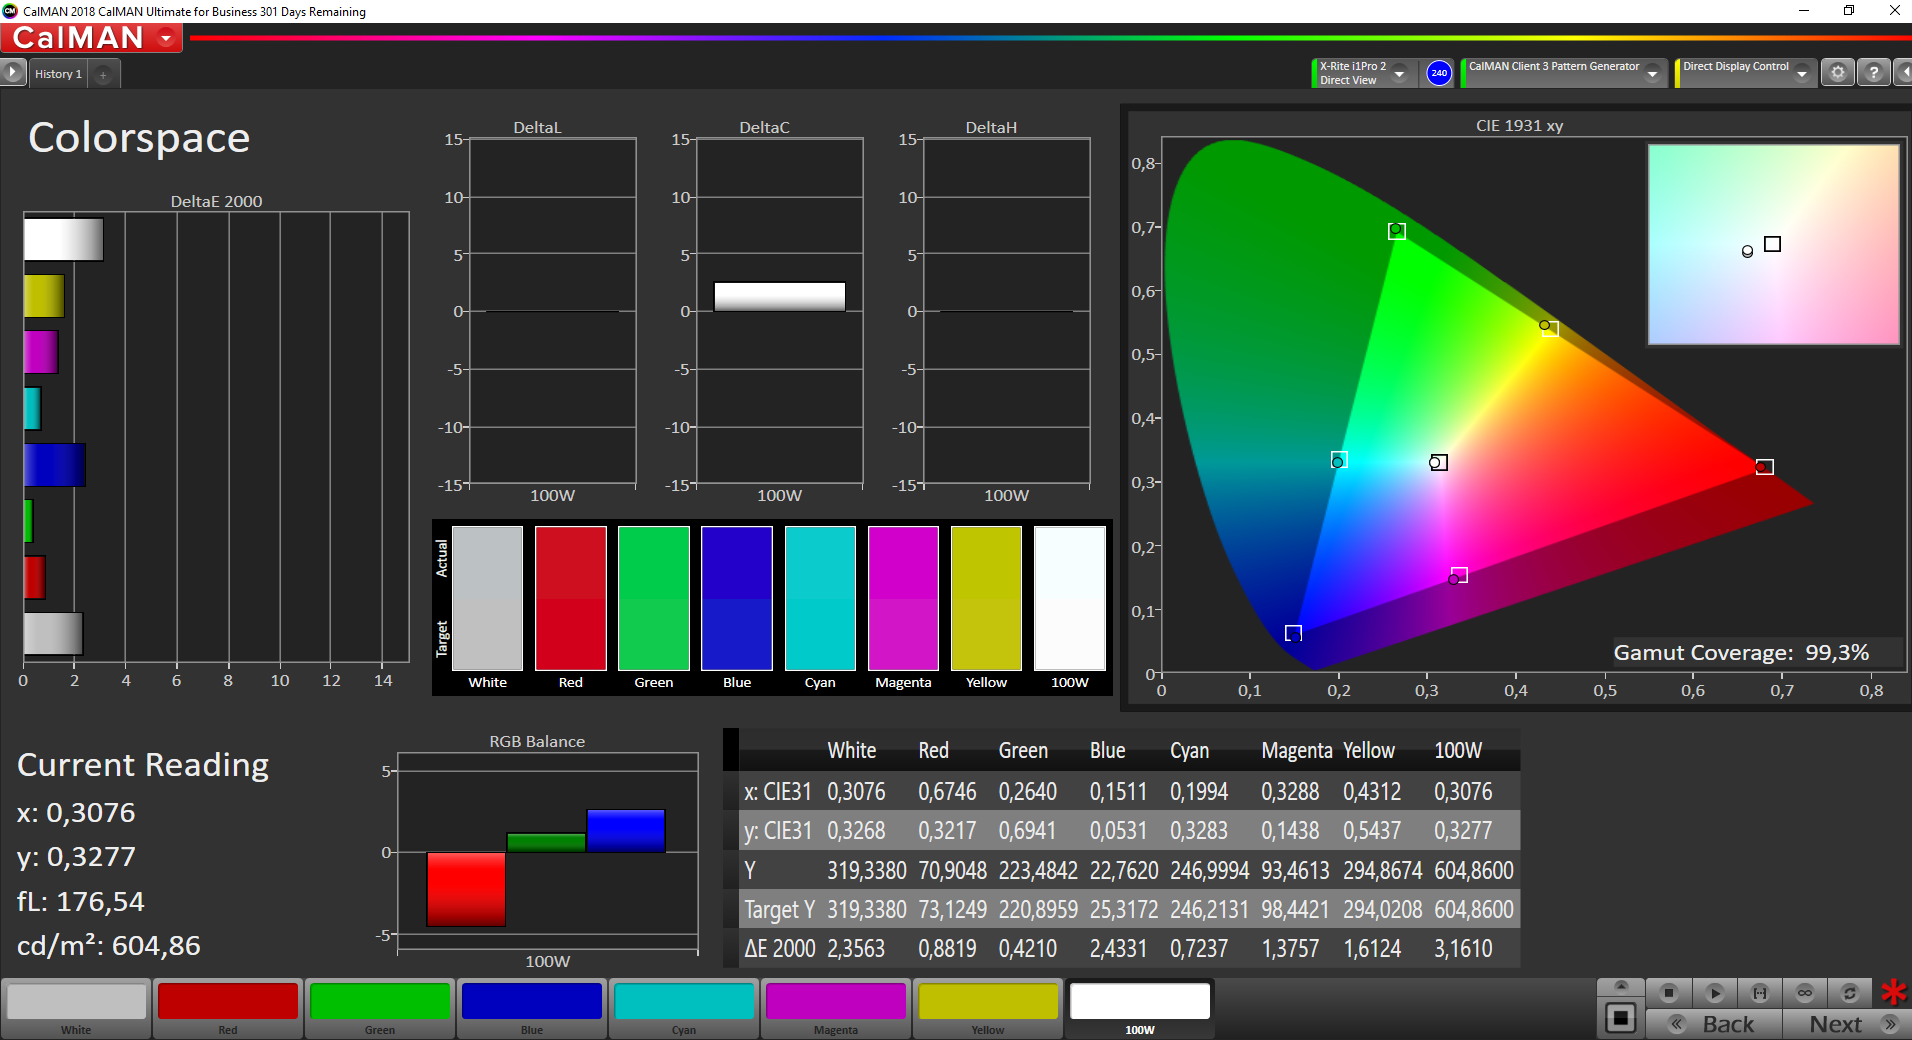
Apple advertises full P3 color gamut, which is supported by the CalMAN measurement (2D comparison). The smaller sRGB color gamut is also fully covered; AdobeRGB on the other hand is covered by 77%. Apple also offers a profile for sRGB. The high color-space coverage in combination with the accurate colors allows editing of pictures or videos.
Display Response Times
| ↔ Response Time Black to White | ||
|---|---|---|
| 35.2 ms ... rise ↗ and fall ↘ combined | ↗ 19.6 ms rise | 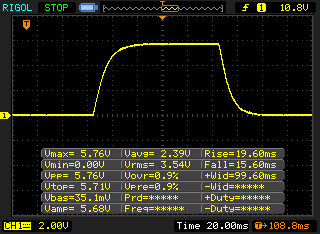 |
| ↘ 15.6 ms fall | ||
| The screen shows slow response rates in our tests and will be unsatisfactory for gamers. In comparison, all tested devices range from 0.1 (minimum) to 240 (maximum) ms. » 93 % of all devices are better. This means that the measured response time is worse than the average of all tested devices (19.8 ms). | ||
| ↔ Response Time 50% Grey to 80% Grey | ||
| 50.4 ms ... rise ↗ and fall ↘ combined | ↗ 24.4 ms rise | 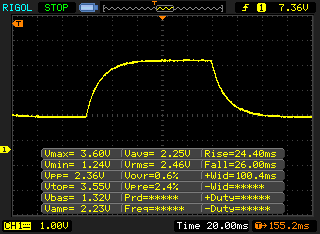 |
| ↘ 26 ms fall | ||
| The screen shows slow response rates in our tests and will be unsatisfactory for gamers. In comparison, all tested devices range from 0.165 (minimum) to 636 (maximum) ms. » 87 % of all devices are better. This means that the measured response time is worse than the average of all tested devices (31 ms). | ||
Screen Flickering / PWM (Pulse-Width Modulation)
| Screen flickering / PWM detected | 116300 Hz | ≤ 66 % brightness setting | 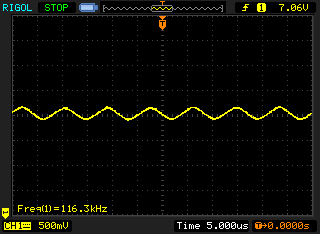 |
The display backlight flickers at 116300 Hz (worst case, e.g., utilizing PWM) Flickering detected at a brightness setting of 66 % and below. There should be no flickering or PWM above this brightness setting. The frequency of 116300 Hz is quite high, so most users sensitive to PWM should not notice any flickering. In comparison: 52 % of all tested devices do not use PWM to dim the display. If PWM was detected, an average of 7781 (minimum: 5 - maximum: 343500) Hz was measured. | |||
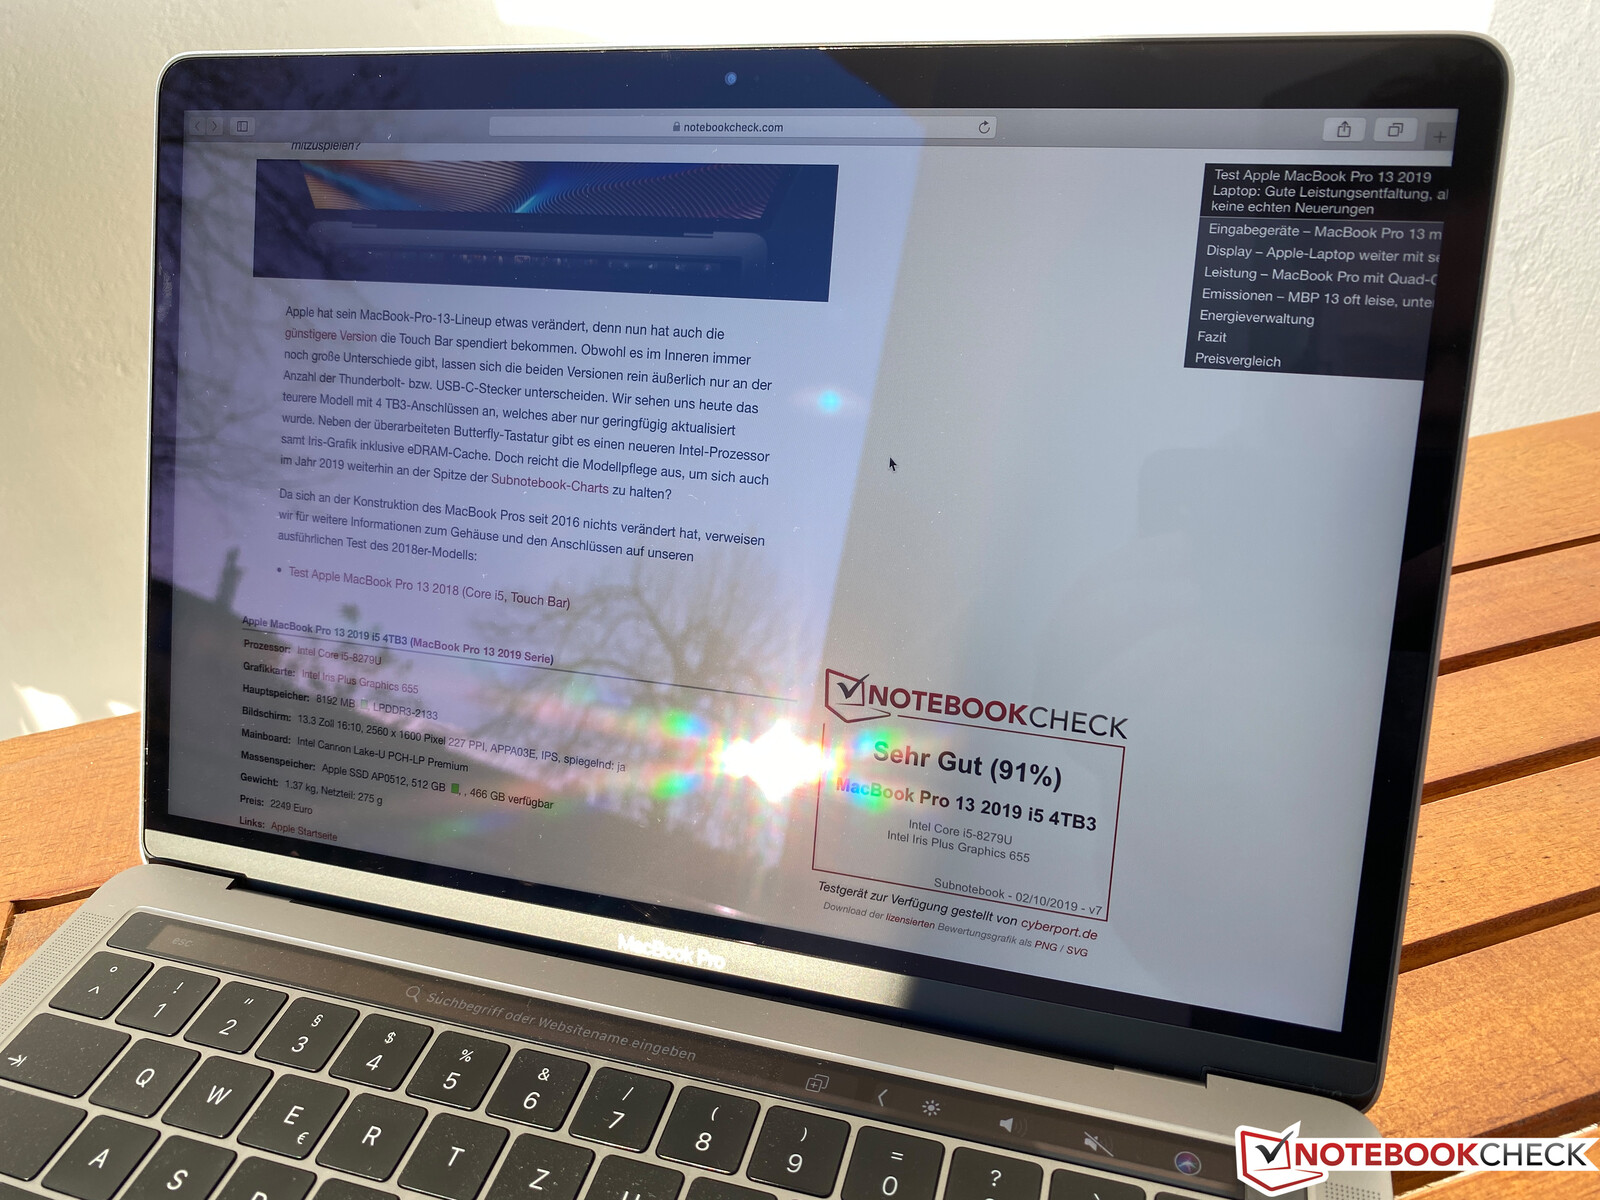
Thanks to the IPS technology, there are no limitations in terms of viewing angles. The outdoor performance of the MacBook Pro 13 is also pretty decent, despite the glossy surface. Even direct light sources only create a comparatively small reflection. This, in combination with the high brightness, means you can also use the device very comfortably on brighter days.
Performance – Quad-core and PCIe-SSD in the MBP 13
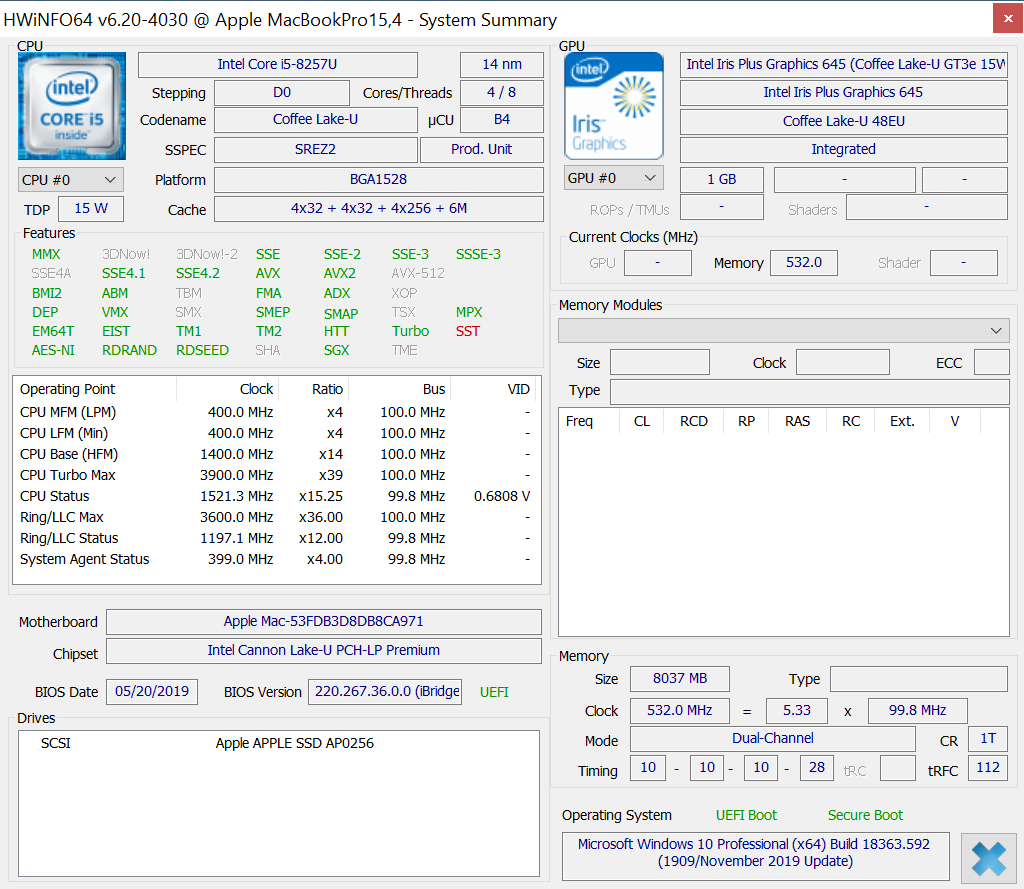
Processor – Core i5-8257U
In theory, Apple uses 15 W processors for the less expensive MBP 13, while the MBP 13 with 4x TB3 is equipped with 28 W chips. In theory, because Apple does not limit the consumption, the cooling performance is the only limitation for the actual performance. The processor also features a faster iGPU with its own eDRAM cache, but more on that later.
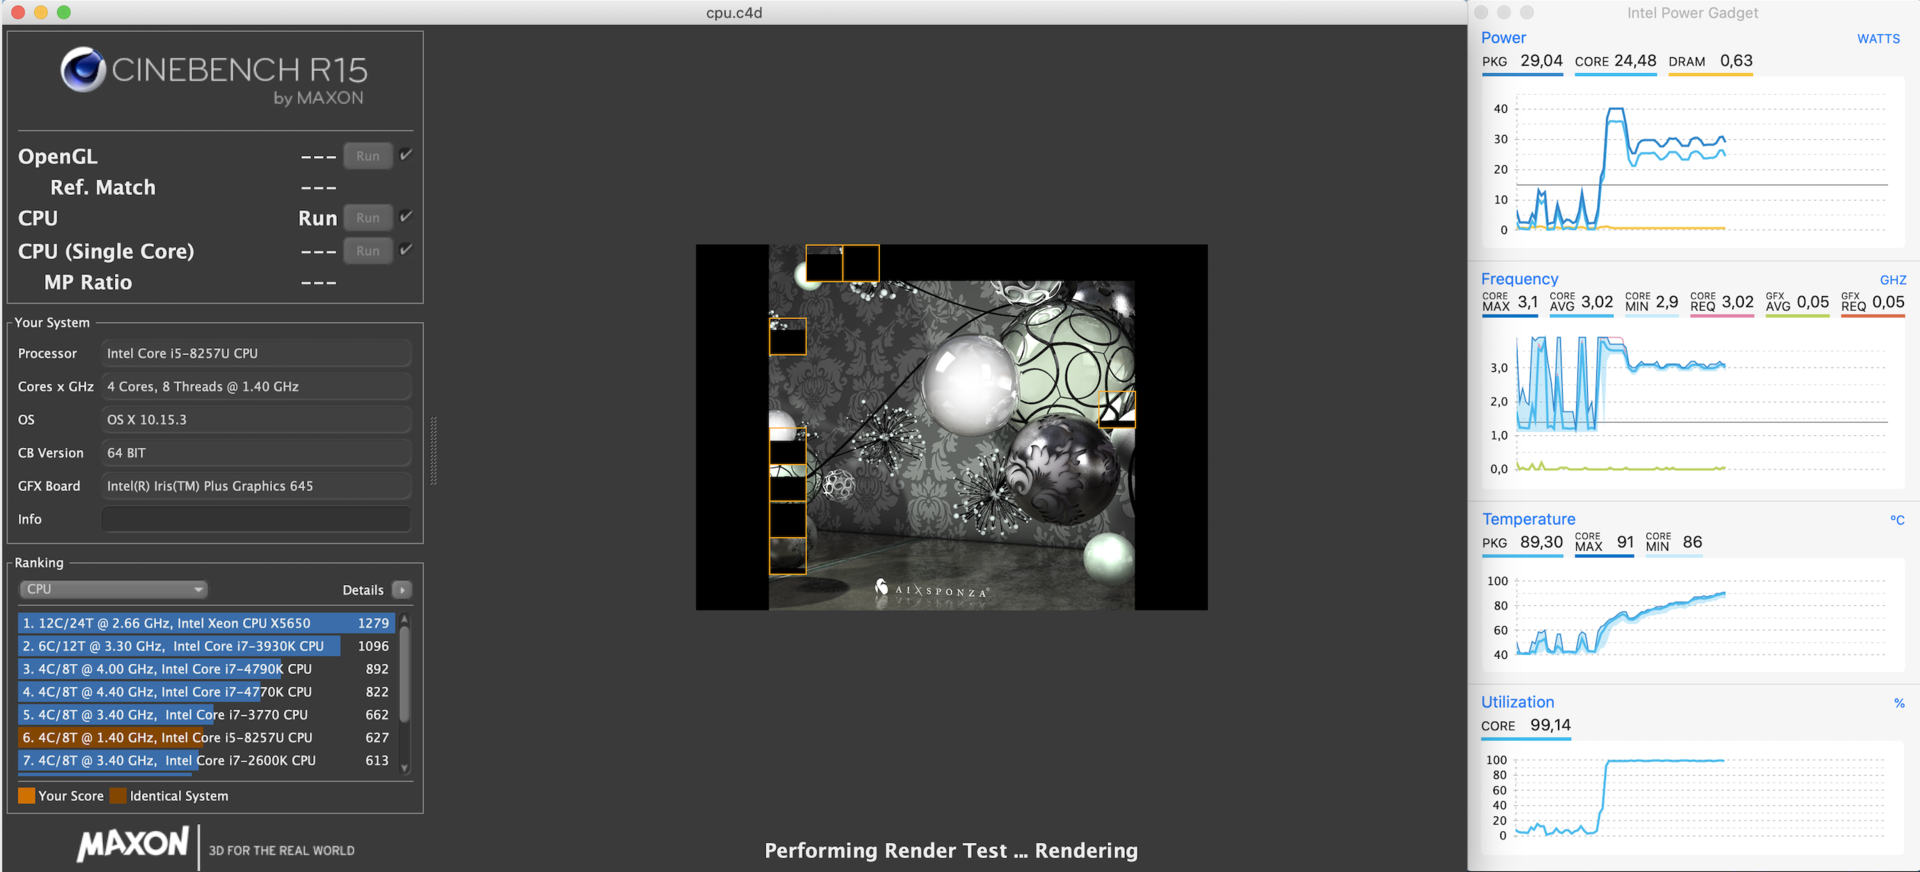
This is also the case for the Core i5-8257U in our test unit, which is advertised with a comparatively low nominal clock of 1.4 GHz. However, we were positively surprised by our tests, because the power consumption is steady at 27-29 W after the initial spike to ~40 W, which is sufficient for 4x ~3.0 GHz. The more expensive MBP 13 with two fans can handle around 33 W for longer periods, so the difference is actually pretty small and not noticeable in everyday scenarios. What you can notice is the performance advantage over the Apple MacBook Air with its passively cooled processor. The predecessor from 2017 with its dual-core processor is also clearly beaten. The performance is steady on battery power.
System Performance – Smooth operation with PCIe-SSD
The subjective performance impression of the Apple MacBook Pro 13 is very good, even though this is hardly surprising considering the fast processor and the SSD. Inputs are executed without delays and applications launch quickly. There is also performance headroom for the next couple of years, especially in comparison to the slightly less expensive MacBook Air.
It is also no problem to run the occasional Windows application: Bootcamp worked really well in our tests and even the Touch Bar with the special functions (brightness, volume control) works as intended.
| PCMark 8 Home Score Accelerated v2 | 3986 points | |
| PCMark 8 Creative Score Accelerated v2 | 5589 points | |
| PCMark 8 Work Score Accelerated v2 | 4238 points | |
| PCMark 10 Score | 3751 points | |
Help | ||

GPU Performance – Iris Plus 645
Contrary to the "regular" ULV processors, Apple uses chips with more powerful integrated GPUs. In this case the Iris Plus Graphics 645, which is equipped with 128 MB eDRAM cache just like the faster Iris Plus Graphics 655. The difference between the 645 and the 655 in the more expensive MBP 13 is not that big, while the standard UHD Graphics 620 is beaten by 30-40%. However, the new Ice Lake iGPUs are even noticeably faster.
The Iris Plus Graphics 645 is very well suited for normal multimedia applications and the playback of high-resolution videos, but gaming is not its strong suit. It can only handle simpler titles, like DOTA 2 at medium details, for instance.
| 3DMark 11 Performance | 3238 points | |
| 3DMark Fire Strike Score | 1736 points | |
| 3DMark Time Spy Score | 624 points | |
Help | ||
| low | med. | high | ultra | |
|---|---|---|---|---|
| BioShock Infinite (2013) | 104.6 | 60 | 51.6 | 22.1 |
| Dota 2 Reborn (2015) | 76.5 | 57.3 | 29 | 26.9 |
| X-Plane 11.11 (2018) | 37.4 | 26.1 | 22.5 |
Emissions
System Noise
The single fan does a pretty good job and the fan noise is similar to the old MacBook Pro 13 with function keys. The fan will slowly increase its speed under load and reaches up to 39 dB(A). At this level, you can clearly hear the fan and the frequency could be more pleasant as well. Short peak load (20-30 seconds), however, usually does not activate the fan, so the device is very often silent in everyday scenarios. The more expensive MacBook Pro 13 with two fans can get even louder. We did not notice any other electronic sounds/noises.
Noise level
| Idle |
| 29.5 / 29.5 / 29.5 dB(A) |
| Load |
| 31.1 / 39.3 dB(A) |
 | ||
30 dB silent 40 dB(A) audible 50 dB(A) loud |
||
min: | ||
| Apple MacBook Pro 13 2019 2TB3 Iris Plus Graphics 645, i5-8257U, Apple SSD AP0256 | Apple MacBook Pro 13 2019 i5 4TB3 Iris Plus Graphics 655, i5-8279U, Apple SSD AP0512 | Apple MacBook Pro 13 2017 Iris Plus Graphics 640, i5-7360U, Apple SSD AP0128 | Apple Macbook Air 2019 UHD Graphics 617, i5-8210Y, Apple SSD AP0256 | Dell XPS 13 9380 i7 4K UHD Graphics 620, i7-8565U, Samsung SSD PM981 MZVLB512HAJQ | Razer Blade Stealth i7-1065G7 Iris Plus Iris Plus Graphics G7 (Ice Lake 64 EU), i7-1065G7, Samsung SSD PM981 MZVLB256HAHQ | HP Envy 13-aq0003ng GeForce MX250, i7-8565U, Toshiba KBG30ZMV512G | |
|---|---|---|---|---|---|---|---|
| Noise | -1% | -2% | -2% | -4% | -3% | -2% | |
| off / environment * (dB) | 29.5 | 29 2% | 30.2 -2% | 29.5 -0% | 28.4 4% | 28.3 4% | 30 -2% |
| Idle Minimum * (dB) | 29.5 | 29 2% | 30.2 -2% | 29.5 -0% | 29.4 -0% | 28.3 4% | 30 -2% |
| Idle Average * (dB) | 29.5 | 29 2% | 30.2 -2% | 29.5 -0% | 29.4 -0% | 28.3 4% | 30 -2% |
| Idle Maximum * (dB) | 29.5 | 29 2% | 30.2 -2% | 29.5 -0% | 29.4 -0% | 28.3 4% | 30 -2% |
| Load Average * (dB) | 31.1 | 33.9 -9% | 32.9 -6% | 34 -9% | 34.6 -11% | 33.5 -8% | |
| Load Maximum * (dB) | 39.3 | 41.8 -6% | 39.3 -0% | 41 -4% | 46.8 -19% | 49.4 -26% | 39.5 -1% |
| Witcher 3 ultra * (dB) | 34.5 |
* ... smaller is better
Temperature
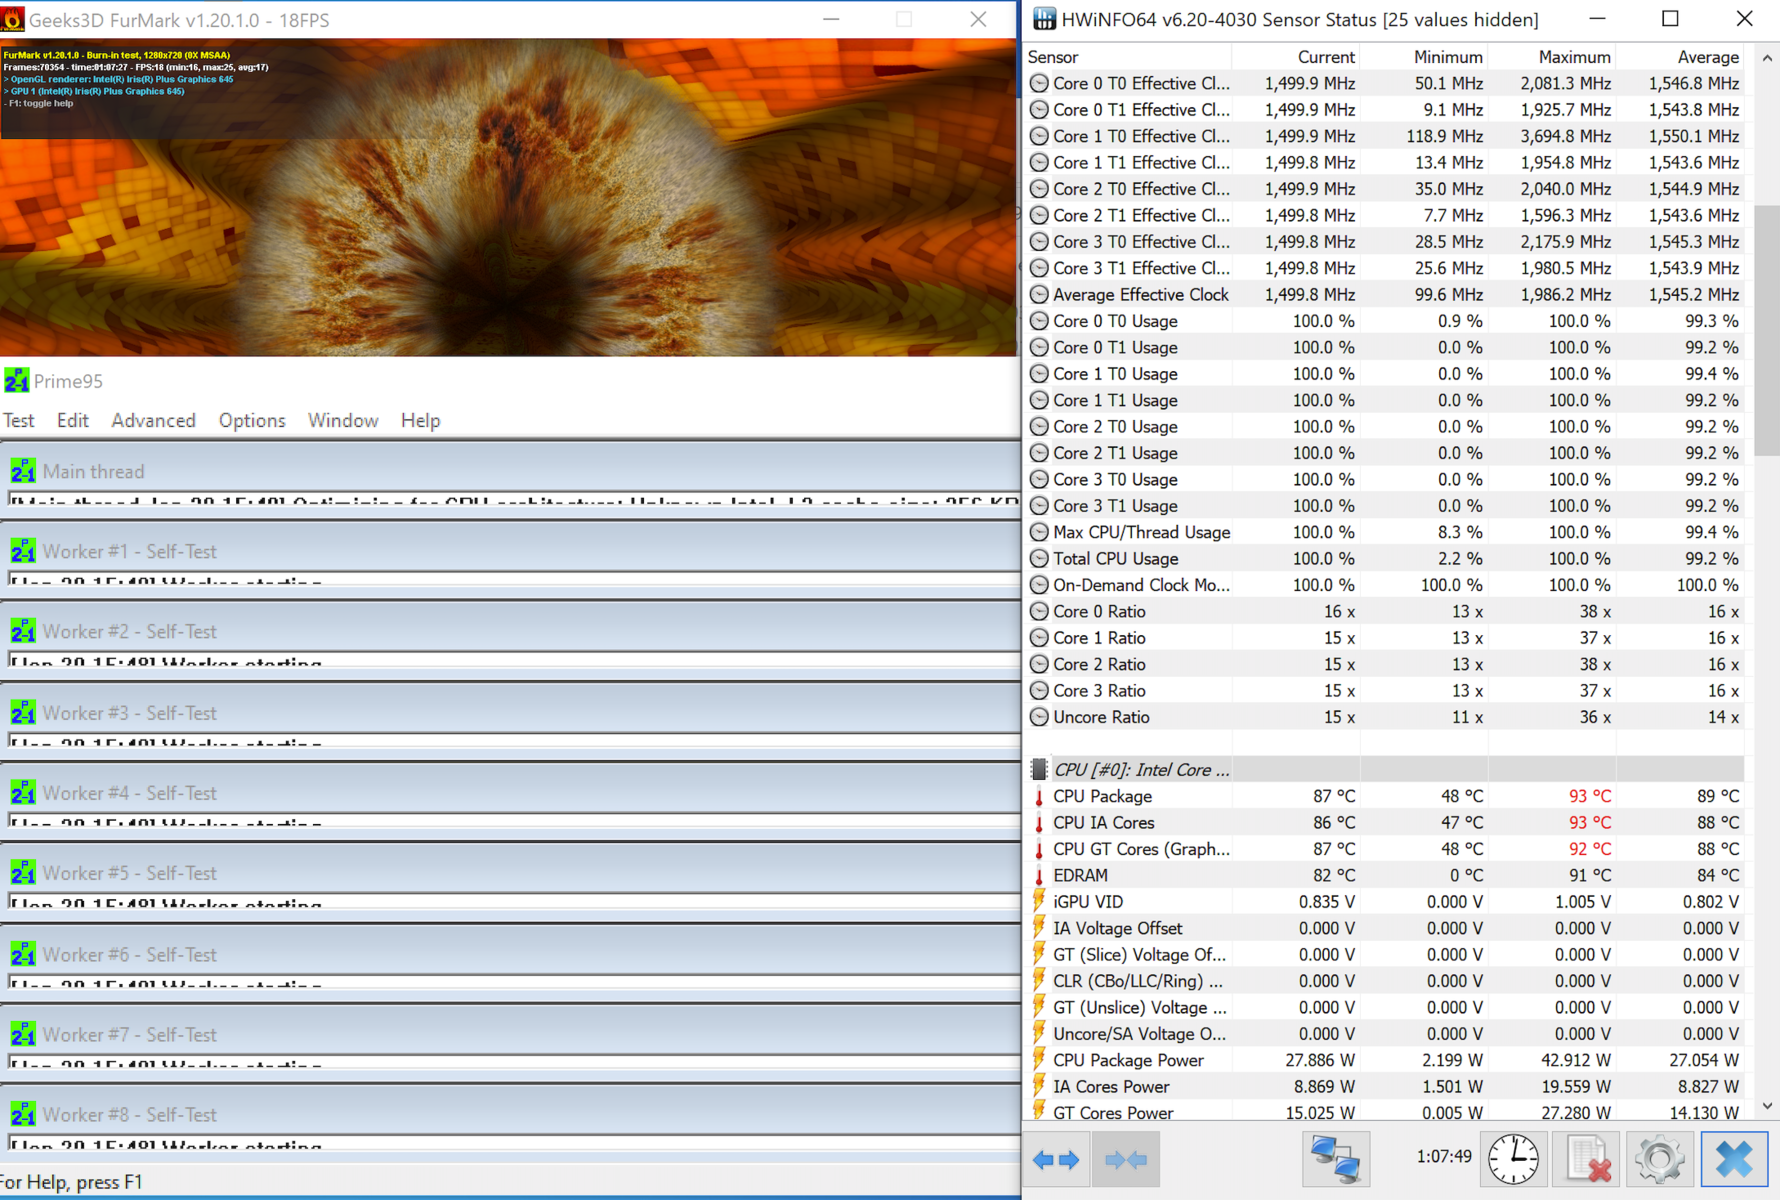
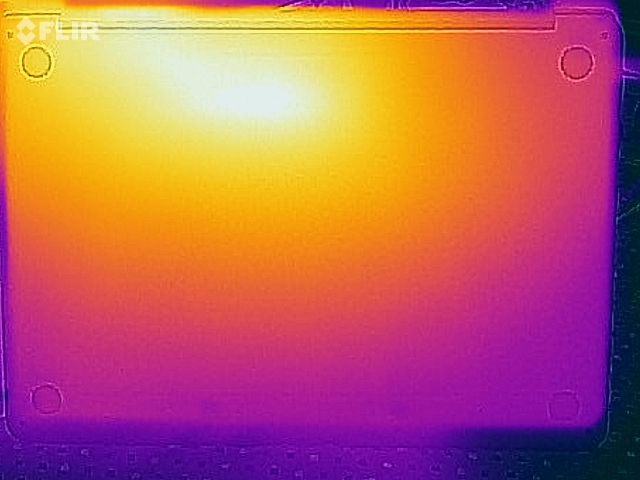
There are no surprises when it comes to the temperatures. The metal case does get noticeably warm and you should avoid direct skin contact (on your lap, for example), but up to 45 °C is not critical by any means. We can once again see a steady power consumption of around 28 W for the processor in the stress test with Prime95 and FurMark. The GPU now also uses a part of the TDP envelope, so the CPU clock is obviously lower. Still, at 1.5-1.6 GHz, it does not drop below its nominal clock, which is not a matter of course for compact laptops. The performance is also steady after the stress test, so there should not be any limitations. The power adapter does not get too hot at 39 °C, either.
(±) The maximum temperature on the upper side is 44.9 °C / 113 F, compared to the average of 35.9 °C / 97 F, ranging from 21.4 to 59 °C for the class Subnotebook.
(-) The bottom heats up to a maximum of 45.1 °C / 113 F, compared to the average of 39.2 °C / 103 F
(+) In idle usage, the average temperature for the upper side is 24.8 °C / 77 F, compared to the device average of 30.8 °C / 87 F.
(+) The palmrests and touchpad are reaching skin temperature as a maximum (32.1 °C / 89.8 F) and are therefore not hot.
(-) The average temperature of the palmrest area of similar devices was 28.2 °C / 82.8 F (-3.9 °C / -7 F).

Speakers
According to our measurement results, the speakers of the "small" MacBook Pro 13 are slightly worse compared to the more expensive version with 4x Thunderbolt 3. However, you cannot really notice the difference. The result is still very good for a compact laptop and you do not really need external speakers.
Apple MacBook Pro 13 2019 2TB3 audio analysis
(±) | speaker loudness is average but good (79.1 dB)
Bass 100 - 315 Hz
(±) | reduced bass - on average 10.7% lower than median
(±) | linearity of bass is average (8.7% delta to prev. frequency)
Mids 400 - 2000 Hz
(+) | balanced mids - only 4.6% away from median
(+) | mids are linear (3.8% delta to prev. frequency)
Highs 2 - 16 kHz
(+) | balanced highs - only 2.3% away from median
(+) | highs are linear (4.7% delta to prev. frequency)
Overall 100 - 16.000 Hz
(±) | linearity of overall sound is average (15.6% difference to median)
Compared to same class
» 36% of all tested devices in this class were better, 5% similar, 59% worse
» The best had a delta of 5%, average was 18%, worst was 53%
Compared to all devices tested
» 23% of all tested devices were better, 5% similar, 72% worse
» The best had a delta of 4%, average was 24%, worst was 134%
Apple MacBook Pro 13 2019 i5 4TB3 audio analysis
(±) | speaker loudness is average but good (79.7 dB)
Bass 100 - 315 Hz
(±) | reduced bass - on average 12.8% lower than median
(±) | linearity of bass is average (11.2% delta to prev. frequency)
Mids 400 - 2000 Hz
(+) | balanced mids - only 3.2% away from median
(+) | mids are linear (4.6% delta to prev. frequency)
Highs 2 - 16 kHz
(+) | balanced highs - only 3.4% away from median
(+) | highs are linear (5.3% delta to prev. frequency)
Overall 100 - 16.000 Hz
(+) | overall sound is linear (13.7% difference to median)
Compared to same class
» 24% of all tested devices in this class were better, 5% similar, 71% worse
» The best had a delta of 5%, average was 18%, worst was 53%
Compared to all devices tested
» 15% of all tested devices were better, 4% similar, 81% worse
» The best had a delta of 4%, average was 24%, worst was 134%
Energy Management – MBP 13 with plenty of stamina
Power Consumption
You once again notice the good optimization of macOS, because the maximum idle consumption is very low at 8 Watts, despite the high display brightness. The keyboard illumination on its maximum settings only increases the consumption by ~0.6 W. We see a short maximum consumption of almost 65 W, but it quickly levels off at around 42 W as soon as the TDP of the processor levels off at the aforementioned 28 W. This means the 61 W power adapter is sufficient.
| Off / Standby | |
| Idle | |
| Load |
|
Key:
min: | |
| Apple MacBook Pro 13 2019 2TB3 i5-8257U, Iris Plus Graphics 645, Apple SSD AP0256, IPS, 2560x1600, 13.3" | Apple MacBook Pro 13 2019 i5 4TB3 i5-8279U, Iris Plus Graphics 655, Apple SSD AP0512, IPS, 2560x1600, 13.3" | Apple MacBook Pro 13 2017 i5-7360U, Iris Plus Graphics 640, Apple SSD AP0128, IPS, 2560x1600, 13.3" | Dell XPS 13 9380 i7 4K i7-8565U, UHD Graphics 620, Samsung SSD PM981 MZVLB512HAJQ, IPS, 3840x2160, 13.3" | Razer Blade Stealth i7-1065G7 Iris Plus i7-1065G7, Iris Plus Graphics G7 (Ice Lake 64 EU), Samsung SSD PM981 MZVLB256HAHQ, IPS, 1920x1080, 13.3" | HP Envy 13-aq0003ng i7-8565U, GeForce MX250, Toshiba KBG30ZMV512G, IPS, 1920x1080, 13.3" | Average Intel Iris Plus Graphics 645 | Average of class Subnotebook | |
|---|---|---|---|---|---|---|---|---|
| Power Consumption | -8% | -5% | -37% | -45% | -32% | -4% | -17% | |
| Idle Minimum * (Watt) | 2.1 | 2.2 -5% | 3.7 -76% | 5.2 -148% | 5.9 -181% | 3.9 -86% | 2.2 ? -5% | 3.86 ? -84% |
| Idle Average * (Watt) | 6.9 | 7.2 -4% | 5.2 25% | 8.6 -25% | 8.1 -17% | 7.8 -13% | 7.4 ? -7% | 6.61 ? 4% |
| Idle Maximum * (Watt) | 7.8 | 8.2 -5% | 7.6 3% | 10.5 -35% | 11.2 -44% | 10.8 -38% | 8.2 ? -5% | 8 ? -3% |
| Load Average * (Watt) | 42 | 54 -29% | 41.6 1% | 44.2 -5% | 44.3 -5% | 53 -26% | 44 ? -5% | 42.2 ? -0% |
| Load Maximum * (Watt) | 64.5 | 63.9 1% | 50.5 22% | 47.5 26% | 50.2 22% | 62.7 3% | 64.3 ? -0% | 64.5 ? -0% |
| Witcher 3 ultra * (Watt) | 41.9 |
* ... smaller is better
Battery Runtime
Thanks to the Touch Bar, Apple was able to increase the battery capacity from 54.5 Wh to 58.2 Wh, which is even slightly more than the more expensive MBP 13 with 58 Wh. In combination with the slightly lower consumption values, the test unit manages very long battery runtimes. Our practical WLAN test at an adjusted luminance of 150 cd/m² results in an excellent runtime of almost 13 hours. Even at the maximum luminance of almost 600 cd/m², we can still record around 7.5 hours for the MBP 13.
| Apple MacBook Pro 13 2019 2TB3 i5-8257U, Iris Plus Graphics 645, 58.2 Wh | Apple MacBook Pro 13 2019 i5 4TB3 i5-8279U, Iris Plus Graphics 655, 58 Wh | Apple MacBook Pro 13 2017 i5-7360U, Iris Plus Graphics 640, 54.5 Wh | Apple Macbook Air 2019 i5-8210Y, UHD Graphics 617, 49.9 Wh | Dell XPS 13 9380 i7 4K i7-8565U, UHD Graphics 620, 52 Wh | Razer Blade Stealth i7-1065G7 Iris Plus i7-1065G7, Iris Plus Graphics G7 (Ice Lake 64 EU), 53.1 Wh | HP Envy 13-aq0003ng i7-8565U, GeForce MX250, 53.2 Wh | Average of class Subnotebook | |
|---|---|---|---|---|---|---|---|---|
| Battery Runtime | -12% | -12% | -9% | -41% | -25% | -35% | 12% | |
| WiFi Websurfing (h) | 13 | 11.5 -12% | 11.4 -12% | 11.5 -12% | 7.7 -41% | 9.7 -25% | 8.5 -35% | 14 ? 8% |
| WiFi Websurfing max. Brightness (h) | 7.4 | 7 -5% | 8.55 ? 16% |
Pros
Cons
Verdict – Cheaper is better
After our reviews of the two MacBook Pro 13 models, our verdict is pretty clear: The less expensive model is the better choice for most users. The only real drawback is the lower number of Thunderbolt 3 ports. The performance is slightly lower as well, but we are positively surprised by the smaller MBP 13 to be honest. Apple's official specs suggest a bigger gap, but the actual difference is very small and not noticeable in everyday situations.
The display is extremely good and all in all, the MacBook Pro 13 is a great overall package. The only issue is still the keyboard or the potential reliability issues, respectively. According to Apple, there have been improvements, but the bad experiences of the previous years do not paint a great picture for the Butterfly input. If you need a new subnotebook right now, you can definitely get this model, but rumors suggest that the next MBP 13 (or MBP 14) will get the new keyboard, so you might get an even better device in a couple of months from now.
The less expensive MacBook Pro 13 is the better choice in Apple's line-up. It is almost as fast as the more expensive model and much more powerful than the MacBook Air.
This leaves us with the comparison of the lightly more compact MacBook Air. The Air is a bit more affordable but still hardly a bargain for more than 1300 Euros (~$1427). The MacBook Pro 13 on the other hand is much more powerful and features an even better screen, so we clearly recommend the MacBook Pro 13. It should also perform much better in the upcoming years.
Apple MacBook Pro 13 2019 2TB3
- 02/04/2020 v7 (old)
Andreas Osthoff
Price comparison
