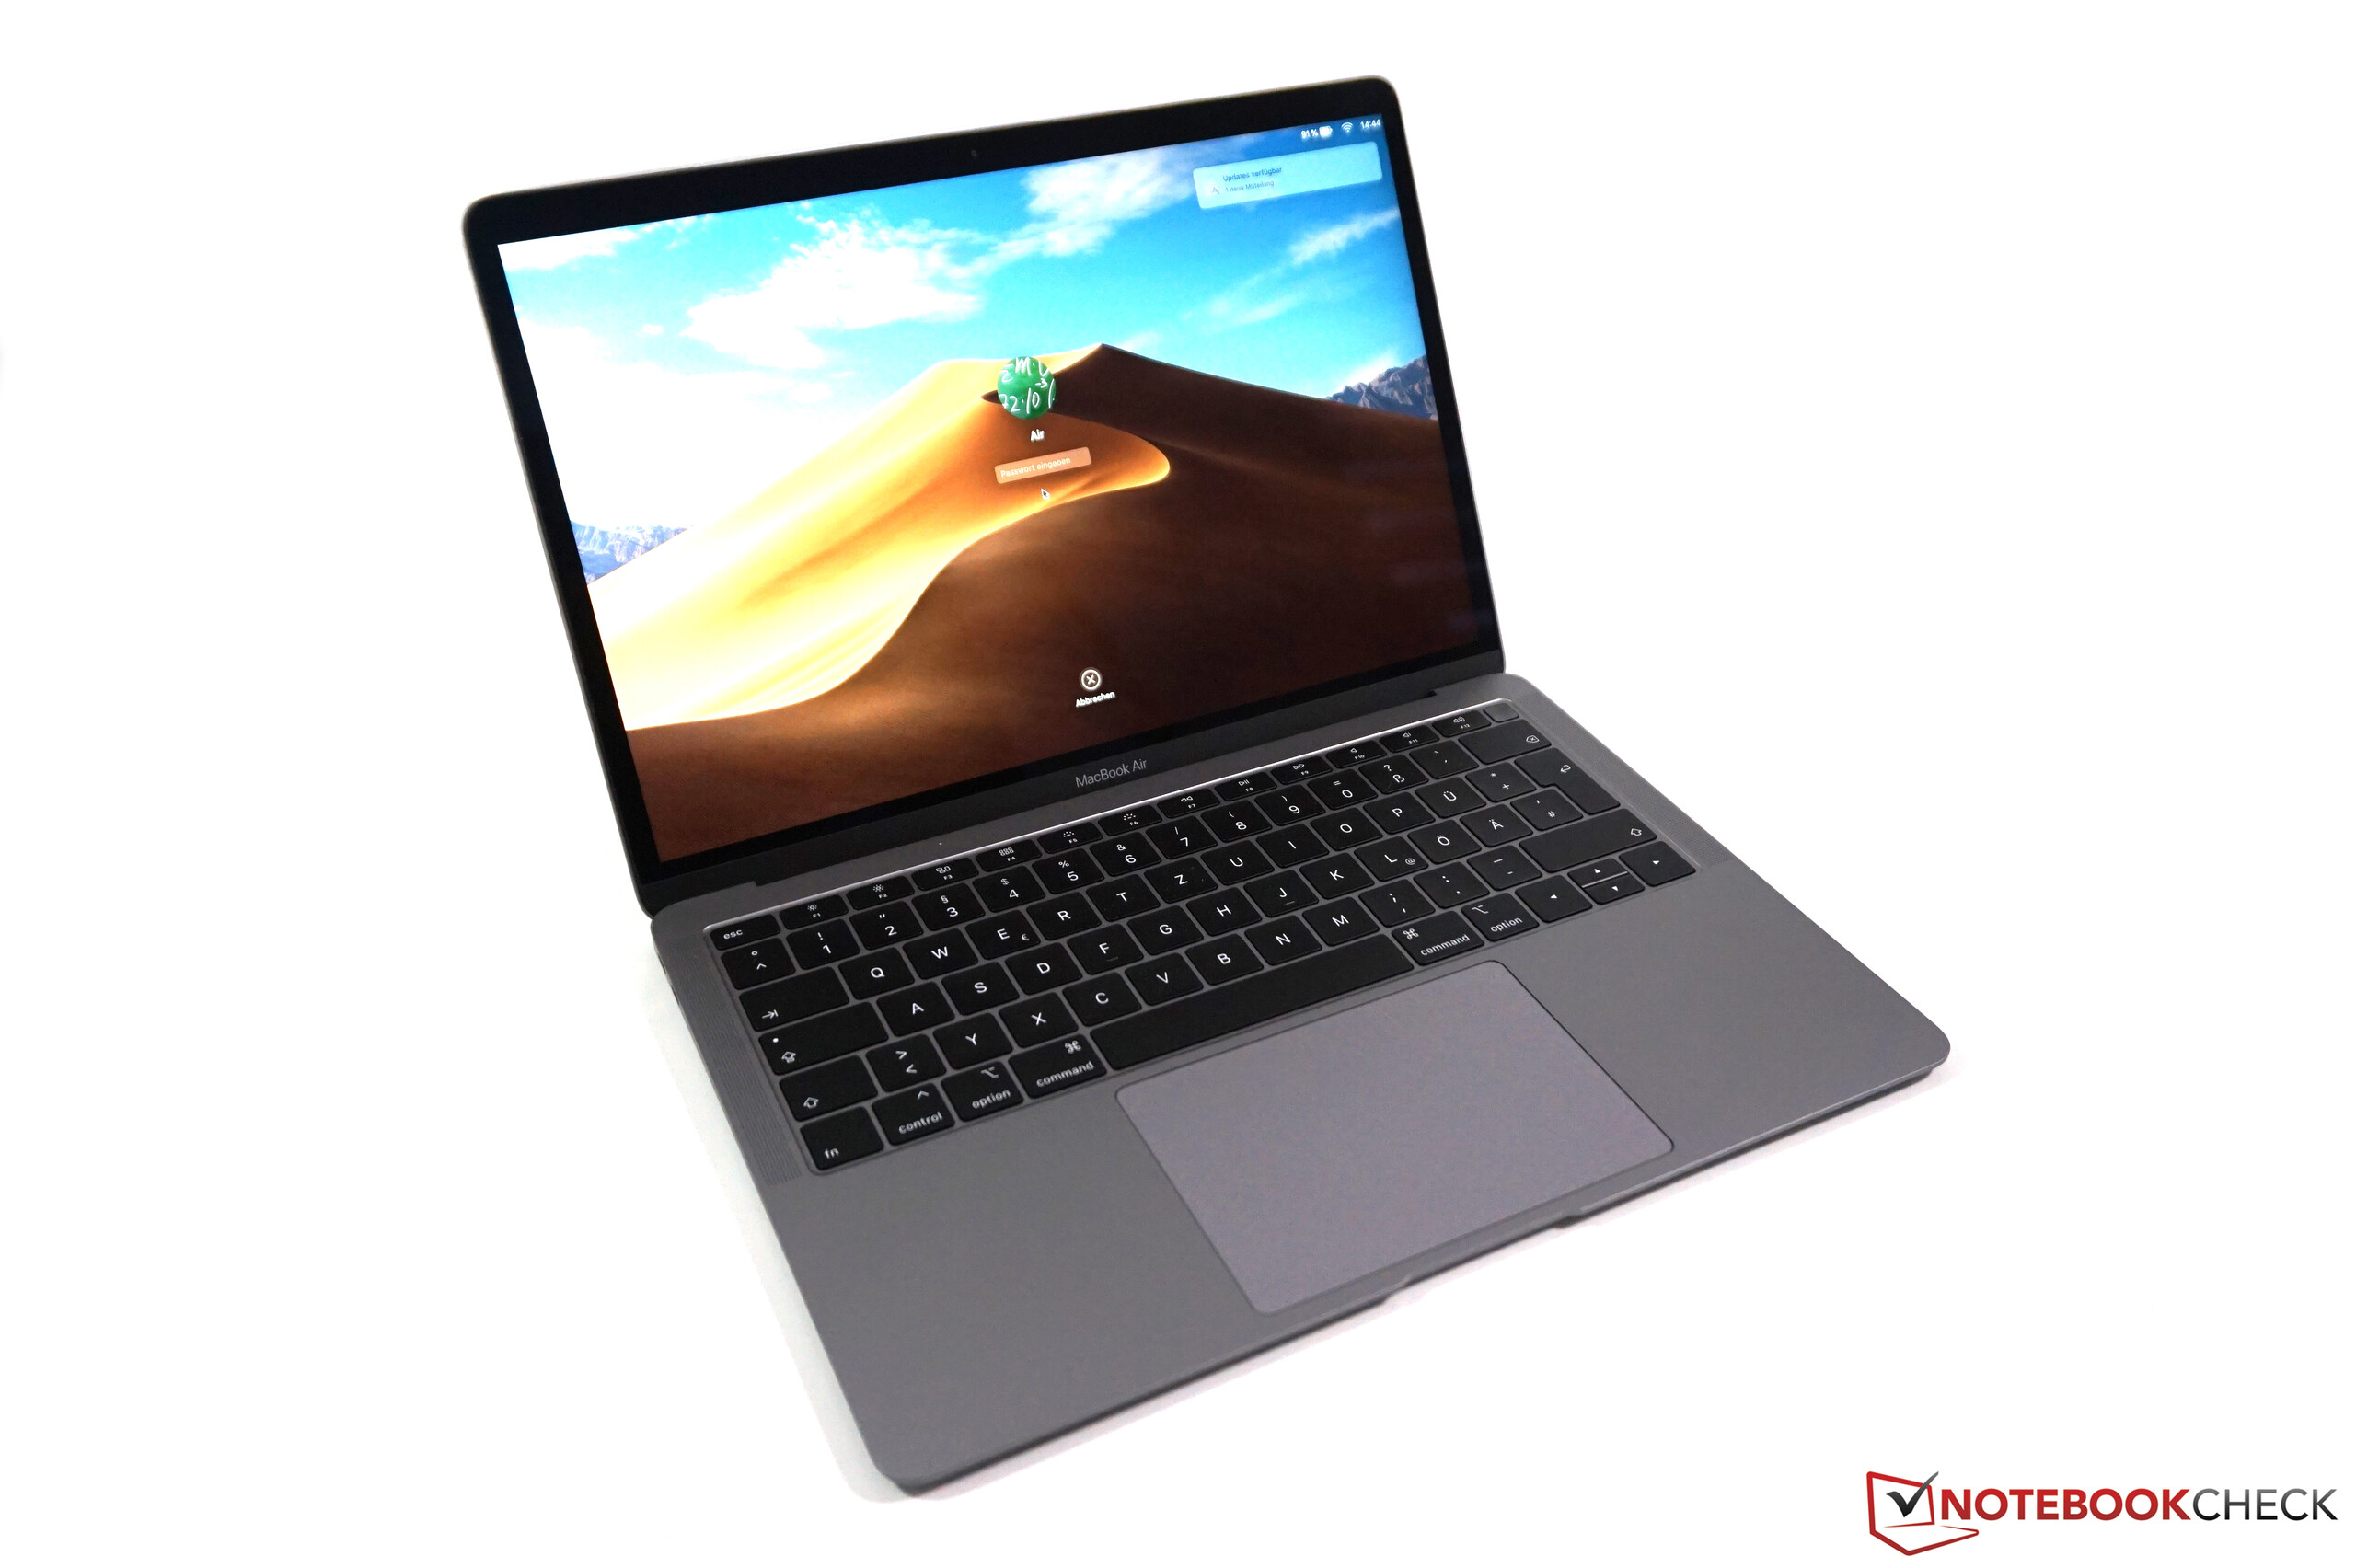
Apple Macbook Air 2019 in Review: Now with True Tone, but the fan is still annoying
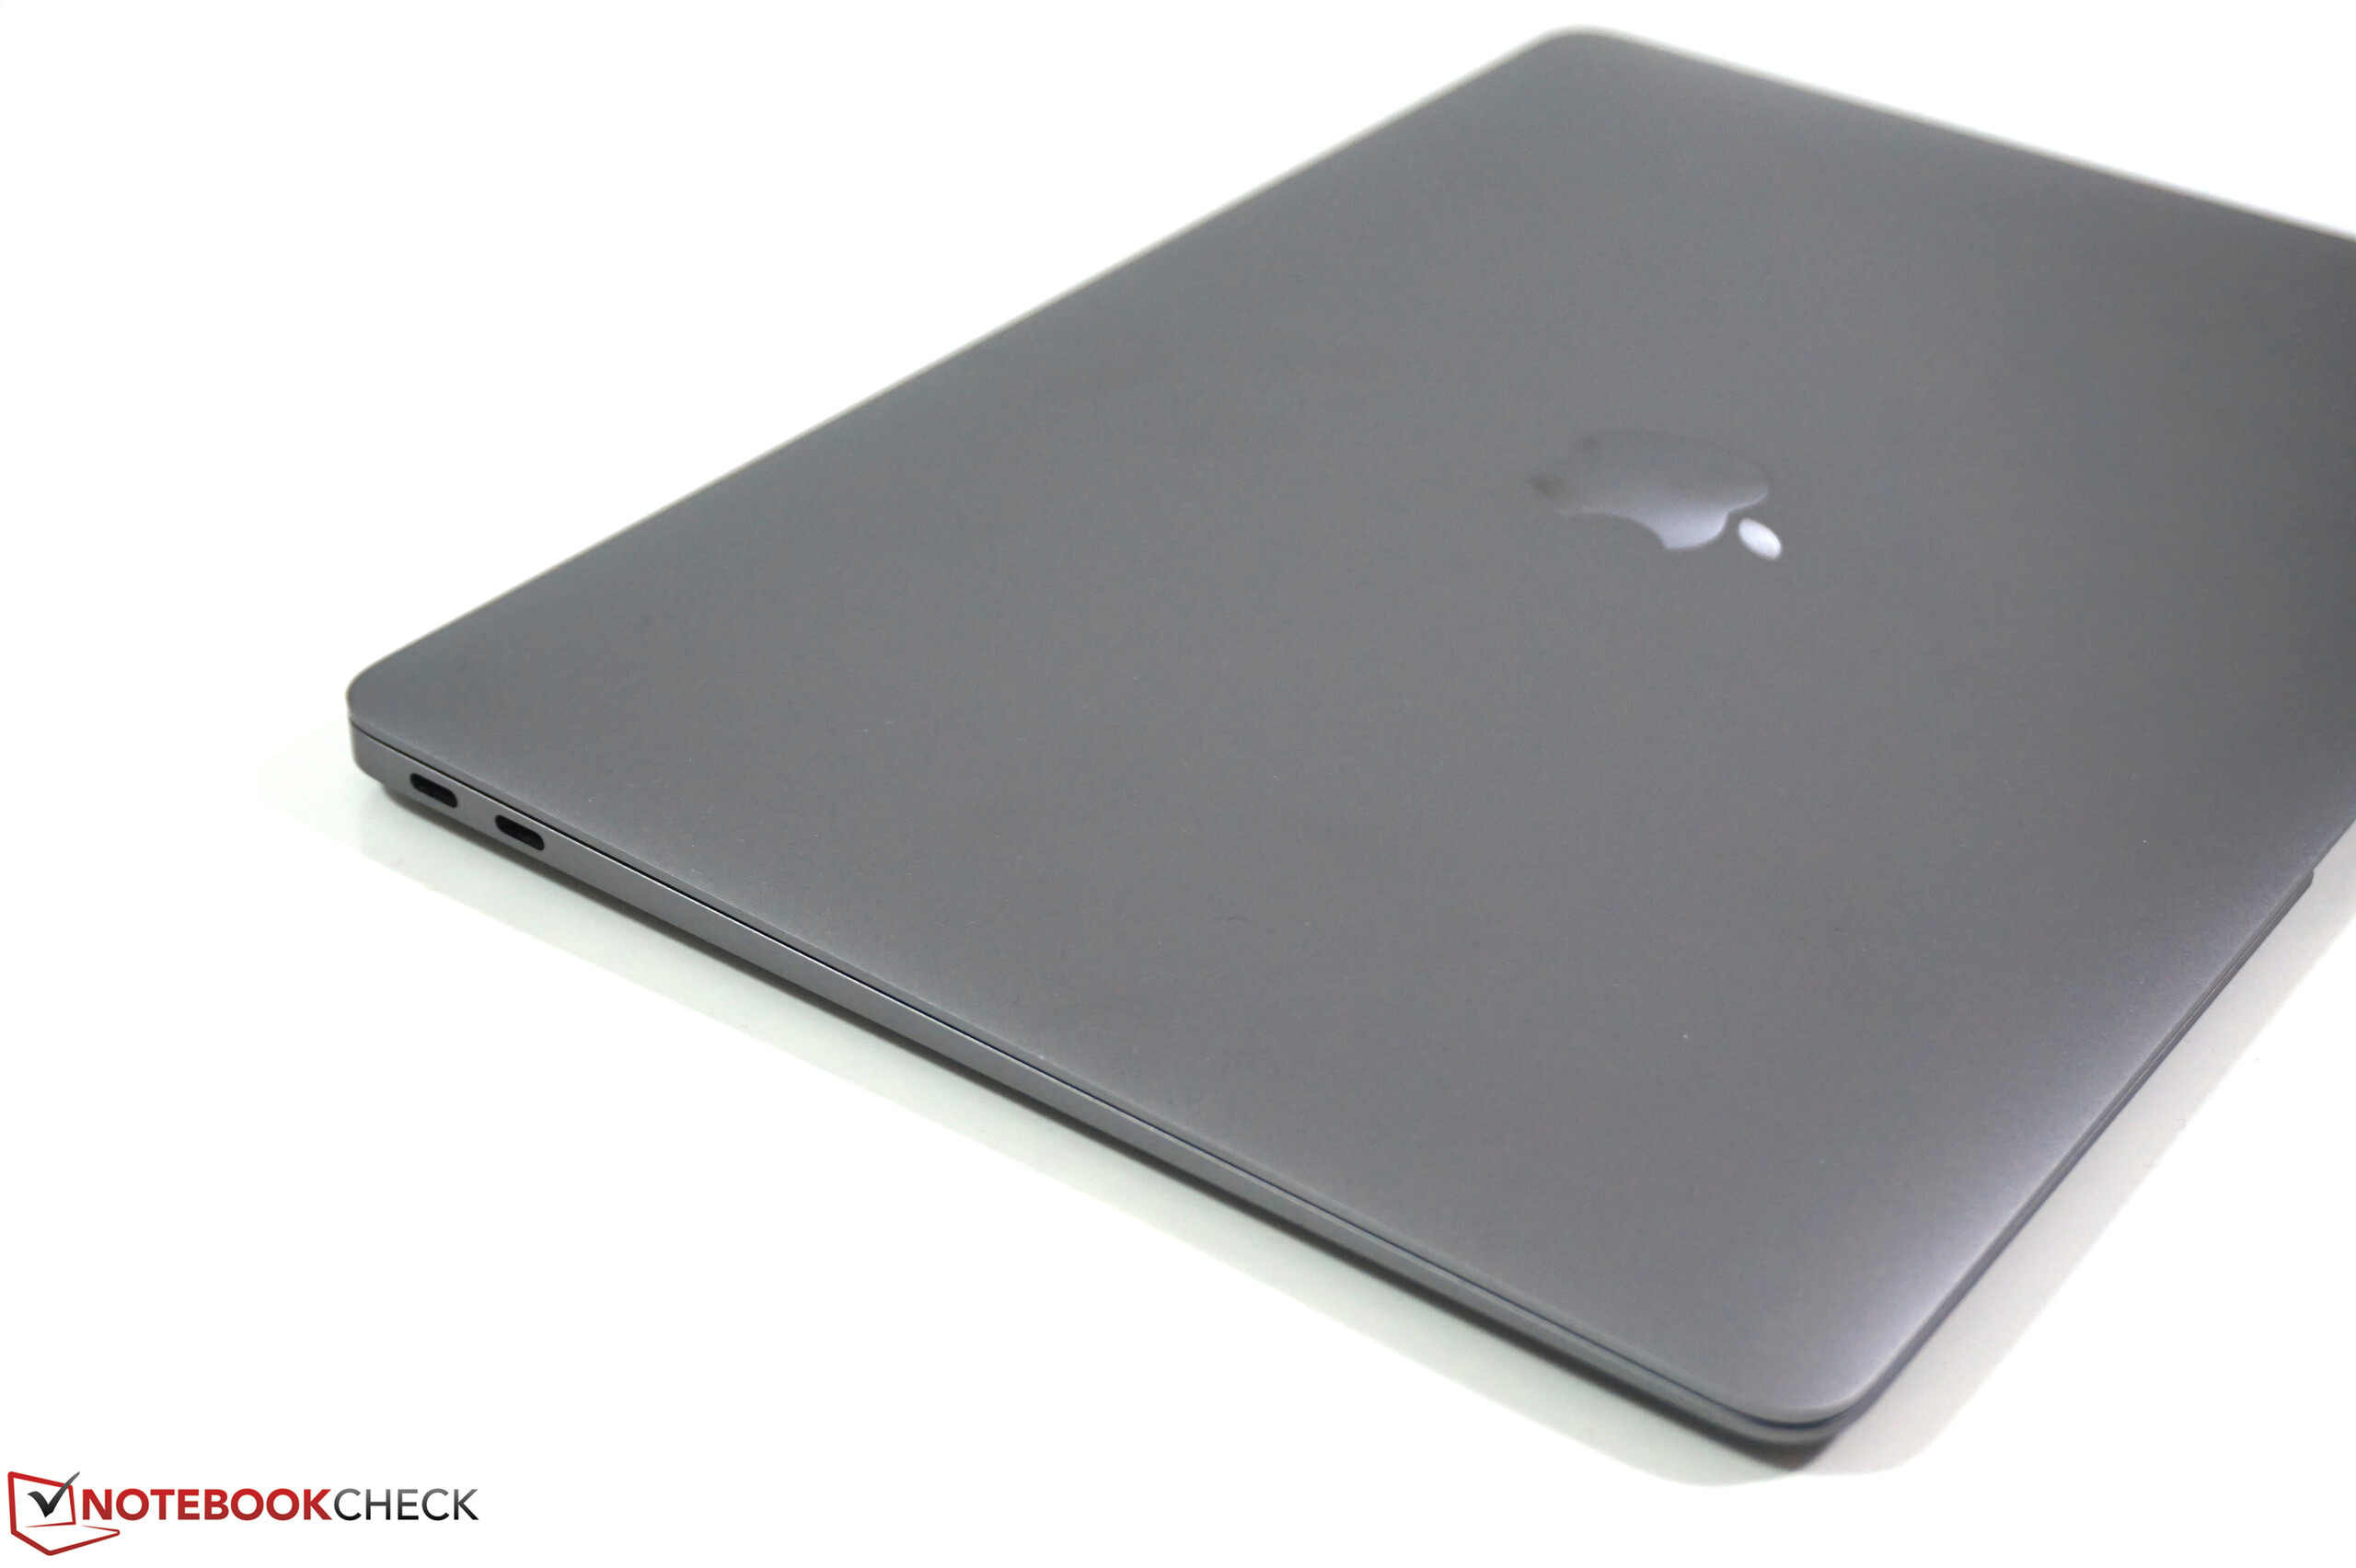
The MacBook Air is still the most compact laptop from Apple, but the MacBook Pro 13 is just slightly thicker and heavier. The 2019 model of the Air is also 100 Euros (~$110) cheaper than before and starts at 1249 Euros (~1380) in the official Apple store. Our test unit is the SKU with 256 GB storage for 1499 Euros (~$1657). However, other online retailers often sell this model for just 1299 Euros (~$1436).
Neither the chassis nor the processor have changed, so please have a look at our previous review of the 2018 model for more information:
Rating | Date | Model | Weight | Height | Size | Resolution | Price |
|---|---|---|---|---|---|---|---|
| 85.6 % v7 (old) | 01 / 2020 | Apple Macbook Air 2019 i5-8210Y, UHD Graphics 617 | 1.3 kg | 15.6 mm | 13.30" | 2560x1600 | |
| 88 % v6 (old) | 01 / 2019 | Dell XPS 13 9380 2019 i5-8265U, UHD Graphics 620 | 1.2 kg | 11.6 mm | 13.30" | 3840x2160 | |
| 86 % v7 (old) | 07 / 2019 | Lenovo ThinkBook 13s-20R90071GE i5-8265U, UHD Graphics 620 | 1.3 kg | 15.9 mm | 13.30" | 1920x1080 | |
| 85.4 % v7 (old) | 01 / 2019 | Microsoft Surface Laptop 2-LQN-00004 i5-8250U, UHD Graphics 620 | 1.3 kg | 14.5 mm | 13.50" | 2256x1504 | |
| 88.1 % v6 (old) | 07 / 2017 | Apple MacBook Pro 13 2017 i5-7360U, Iris Plus Graphics 640 | 1.4 kg | 14.9 mm | 13.30" | 2560x1600 |
Communication – MacBook Air without Wi-Fi 6
The MacBook Air supports all common WLAN standards, including 802.11ac, but unfortunately no Wi-Fi 6. The transfer rates are still decent at 550-600 Mbps and on par with the rivals. We did not notice any connection issues, either. Similar to the previous model, the device only supports the old Bluetooth standard 4.2.
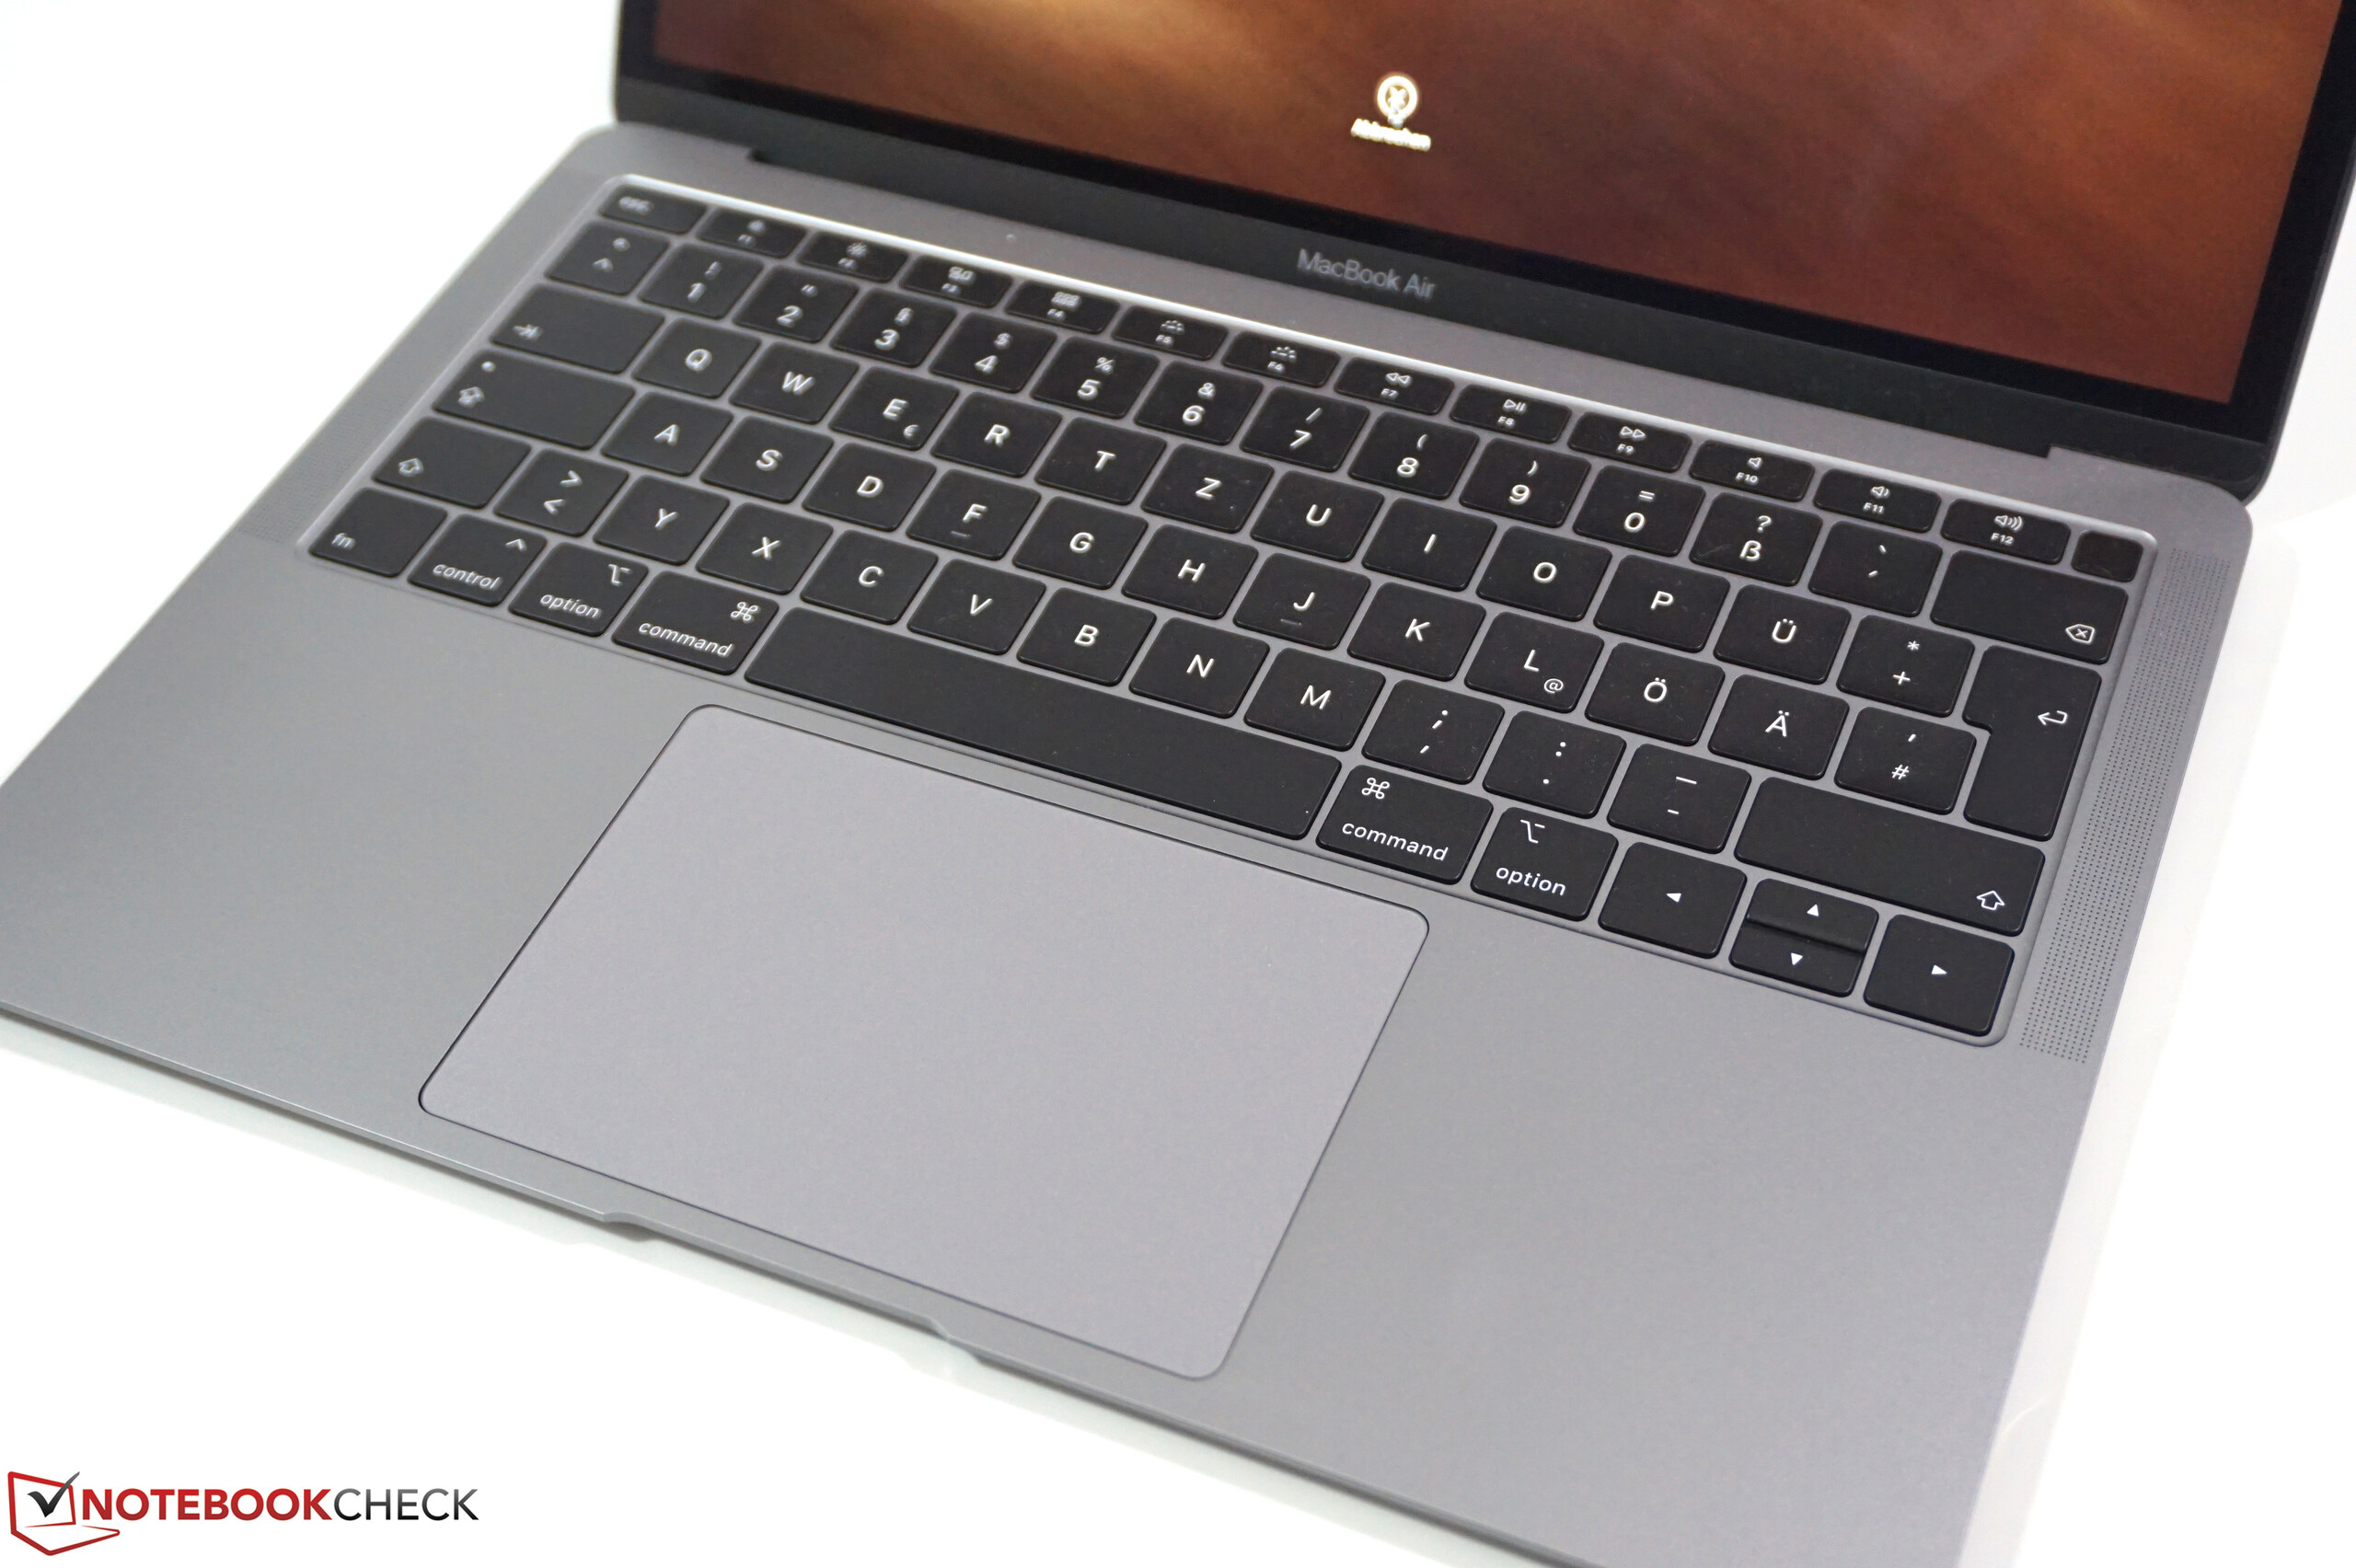
Input Devices – MacBook Air still with Butterfly
Apple has changed the keyboard of the MacBook Air slightly, but it is basically still the same familiar Butterfly keyboard with its very precise, but very shallow key travel. Apple has replaced the keyboard for the new MacBook Pro 16 and there are also hints that the upcoming MacBook Pro 13 will get the new input. However, the chassis height is more important for the MacBook Air, so we are not sure if the upcoming model will get the new keyboard (which requires more z-height). Right now, the MacBook Air is also the last notebook from Apple with physical function keys.

Display – MacBook Air with True Tone and sRGB
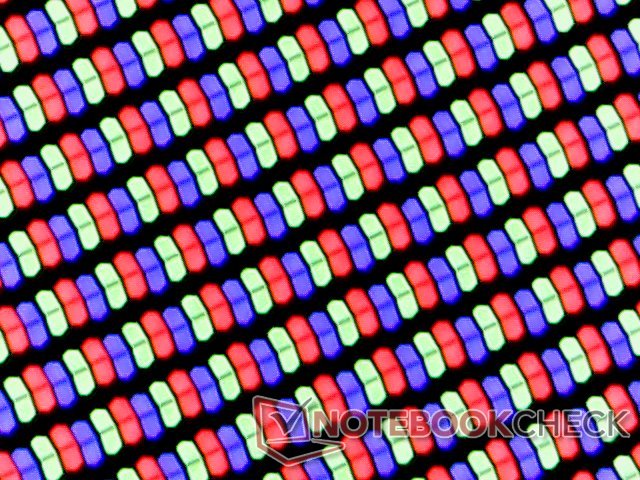
The display is one of the few components with new features for the 2019 model. After the 2018 MacBook Air initially had problems to reach the advertised luminance of 400 Nits, Apple later offered a software update to improve the situation a bit (we reported). This is not a problem anymore and our test unit is brighter than 400 Nits at some of the measuring points (393 Nits on average). Thanks to the high resolution, you get sharp images and the overall picture impression is subjectively very good.
The real new feature is the True Tone support, so the MacBook Air can automatically adjust the color temperature based on the environment. This is a nice feature and you will get used to it pretty quickly. However, you should deactivate True Tone if you need accurate colors (such as picture editing).
Despite the True Tone support, the display is still not identical to the 13-inch MacBook Pro, which supports the larger P3 color gamut, while the MacBook Air is targeting the smaller RGB standard.
| |||||||||||||||||||||||||
Brightness Distribution: 88 %
Center on Battery: 421 cd/m²
Contrast: 1238:1 (Black: 0.34 cd/m²)
ΔE ColorChecker Calman: 1.5 | ∀{0.5-29.43 Ø4.71}
ΔE Greyscale Calman: 1.2 | ∀{0.09-98 Ø4.96}
94.6% sRGB (Argyll 1.6.3 3D)
61.3% AdobeRGB 1998 (Argyll 1.6.3 3D)
69.1% AdobeRGB 1998 (Argyll 3D)
94.7% sRGB (Argyll 3D)
67.4% Display P3 (Argyll 3D)
Gamma: 2.21
CCT: 6694 K
| Apple Macbook Air 2019 APPA041, IPS, 2560x1600, 13.3" | Dell XPS 13 9380 2019 ID: AUO 282B B133ZAN Dell: 90NTH, IPS, 3840x2160, 13.3" | Lenovo ThinkBook 13s-20R90071GE N133HCE-EN2, a-Si IPS LED, 1920x1080, 13.3" | Microsoft Surface Laptop 2-LQN-00004 VVX14T092N00, IPS, 2256x1504, 13.5" | Apple MacBook Pro 13 2017 APPA033, IPS, 2560x1600, 13.3" | |
|---|---|---|---|---|---|
| Display | -4% | 1% | 0% | 26% | |
| Display P3 Coverage (%) | 67.4 | 64.7 -4% | 67 -1% | 68 1% | 99.2 47% |
| sRGB Coverage (%) | 94.7 | 93.1 -2% | 99.1 5% | 94.7 0% | 99.9 5% |
| AdobeRGB 1998 Coverage (%) | 69.1 | 65.3 -5% | 69.2 0% | 69.2 0% | 87.1 26% |
| Response Times | -30% | 4% | -60% | 1% | |
| Response Time Grey 50% / Grey 80% * (ms) | 42.4 ? | 58 ? -37% | 40.4 ? 5% | 69.2 ? -63% | 42.8 ? -1% |
| Response Time Black / White * (ms) | 29.6 ? | 36 ? -22% | 28.8 ? 3% | 46.4 ? -57% | 28.8 ? 3% |
| PWM Frequency (Hz) | 111100 ? | 25000 ? | |||
| Screen | -55% | -36% | -40% | 3% | |
| Brightness middle (cd/m²) | 421 | 404 -4% | 319 -24% | 392 -7% | 588 40% |
| Brightness (cd/m²) | 393 | 389 -1% | 309 -21% | 390 -1% | 561 43% |
| Brightness Distribution (%) | 88 | 85 -3% | 92 5% | 89 1% | 92 5% |
| Black Level * (cd/m²) | 0.34 | 0.37 -9% | 0.28 18% | 0.24 29% | 0.45 -32% |
| Contrast (:1) | 1238 | 1092 -12% | 1139 -8% | 1633 32% | 1307 6% |
| Colorchecker dE 2000 * | 1.5 | 3.72 -148% | 2.4 -60% | 3.2 -113% | 1.7 -13% |
| Colorchecker dE 2000 max. * | 3.8 | 7.38 -94% | 6.3 -66% | 6.3 -66% | 3.5 8% |
| Greyscale dE 2000 * | 1.2 | 4.44 -270% | 3.8 -217% | 4.5 -275% | 1.9 -58% |
| Gamma | 2.21 100% | 2.34 94% | 2.16 102% | 2.2 100% | 2.33 94% |
| CCT | 6694 97% | 7095 92% | 7335 89% | 7556 86% | 6738 96% |
| Color Space (Percent of AdobeRGB 1998) (%) | 61.3 | 60 -2% | 63.5 4% | 63.9 4% | 77.92 27% |
| Color Space (Percent of sRGB) (%) | 94.6 | 93 -2% | 99.1 5% | 95 0% | 99.94 6% |
| Colorchecker dE 2000 calibrated * | 2.06 | 0.6 | 1.4 | ||
| Total Average (Program / Settings) | -30% /
-41% | -10% /
-23% | -33% /
-34% | 10% /
7% |
* ... smaller is better
Display Response Times
| ↔ Response Time Black to White | ||
|---|---|---|
| 29.6 ms ... rise ↗ and fall ↘ combined | ↗ 16 ms rise | 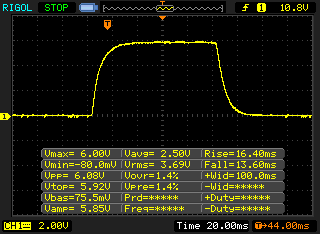 |
| ↘ 13.6 ms fall | ||
| The screen shows relatively slow response rates in our tests and may be too slow for gamers. In comparison, all tested devices range from 0.1 (minimum) to 240 (maximum) ms. » 79 % of all devices are better. This means that the measured response time is worse than the average of all tested devices (19.8 ms). | ||
| ↔ Response Time 50% Grey to 80% Grey | ||
| 42.4 ms ... rise ↗ and fall ↘ combined | ↗ 21.2 ms rise | 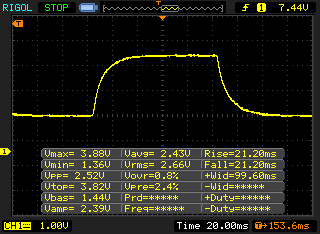 |
| ↘ 21.2 ms fall | ||
| The screen shows slow response rates in our tests and will be unsatisfactory for gamers. In comparison, all tested devices range from 0.165 (minimum) to 636 (maximum) ms. » 70 % of all devices are better. This means that the measured response time is worse than the average of all tested devices (31 ms). | ||
Screen Flickering / PWM (Pulse-Width Modulation)
| Screen flickering / PWM detected | 111100 Hz | ≤ 66 % brightness setting | 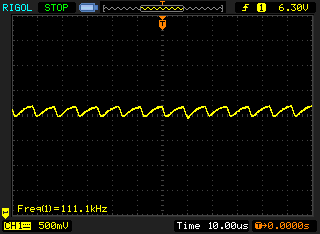 |
The display backlight flickers at 111100 Hz (worst case, e.g., utilizing PWM) Flickering detected at a brightness setting of 66 % and below. There should be no flickering or PWM above this brightness setting. The frequency of 111100 Hz is quite high, so most users sensitive to PWM should not notice any flickering. In comparison: 52 % of all tested devices do not use PWM to dim the display. If PWM was detected, an average of 7757 (minimum: 5 - maximum: 343500) Hz was measured. | |||
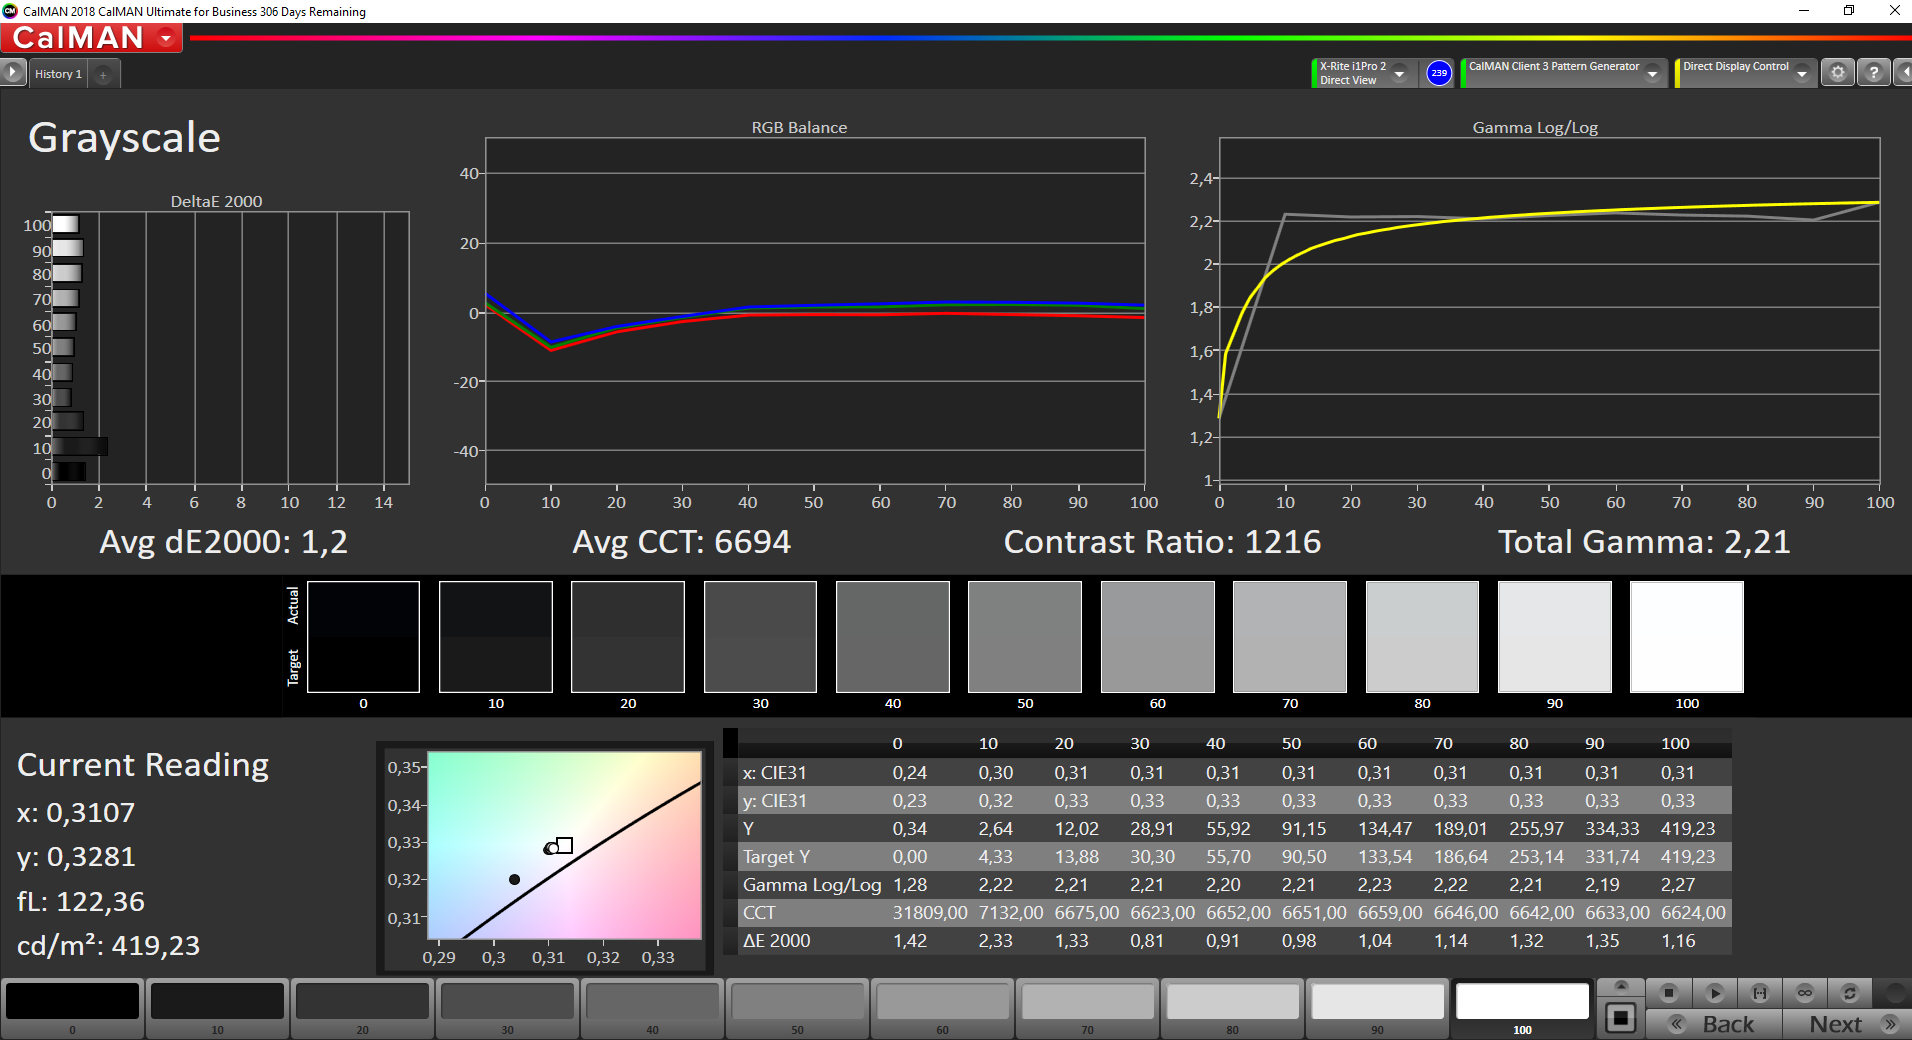
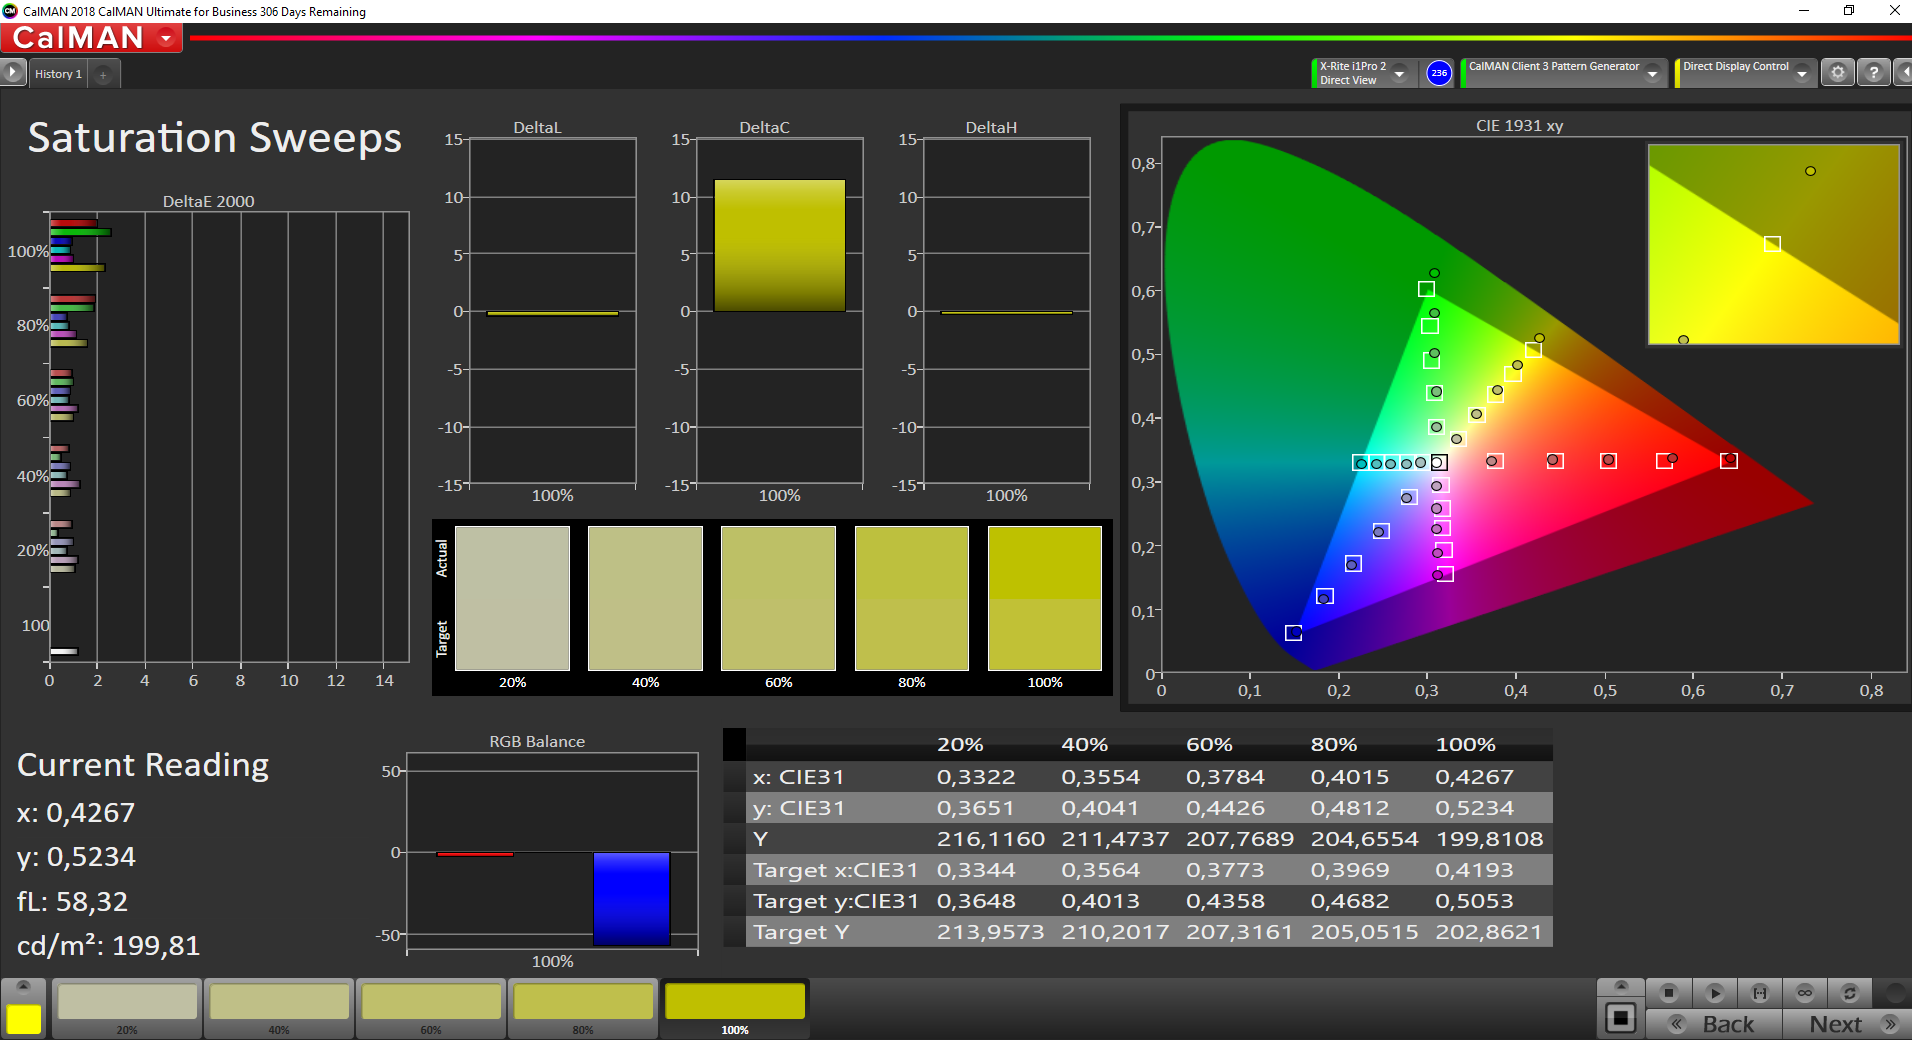
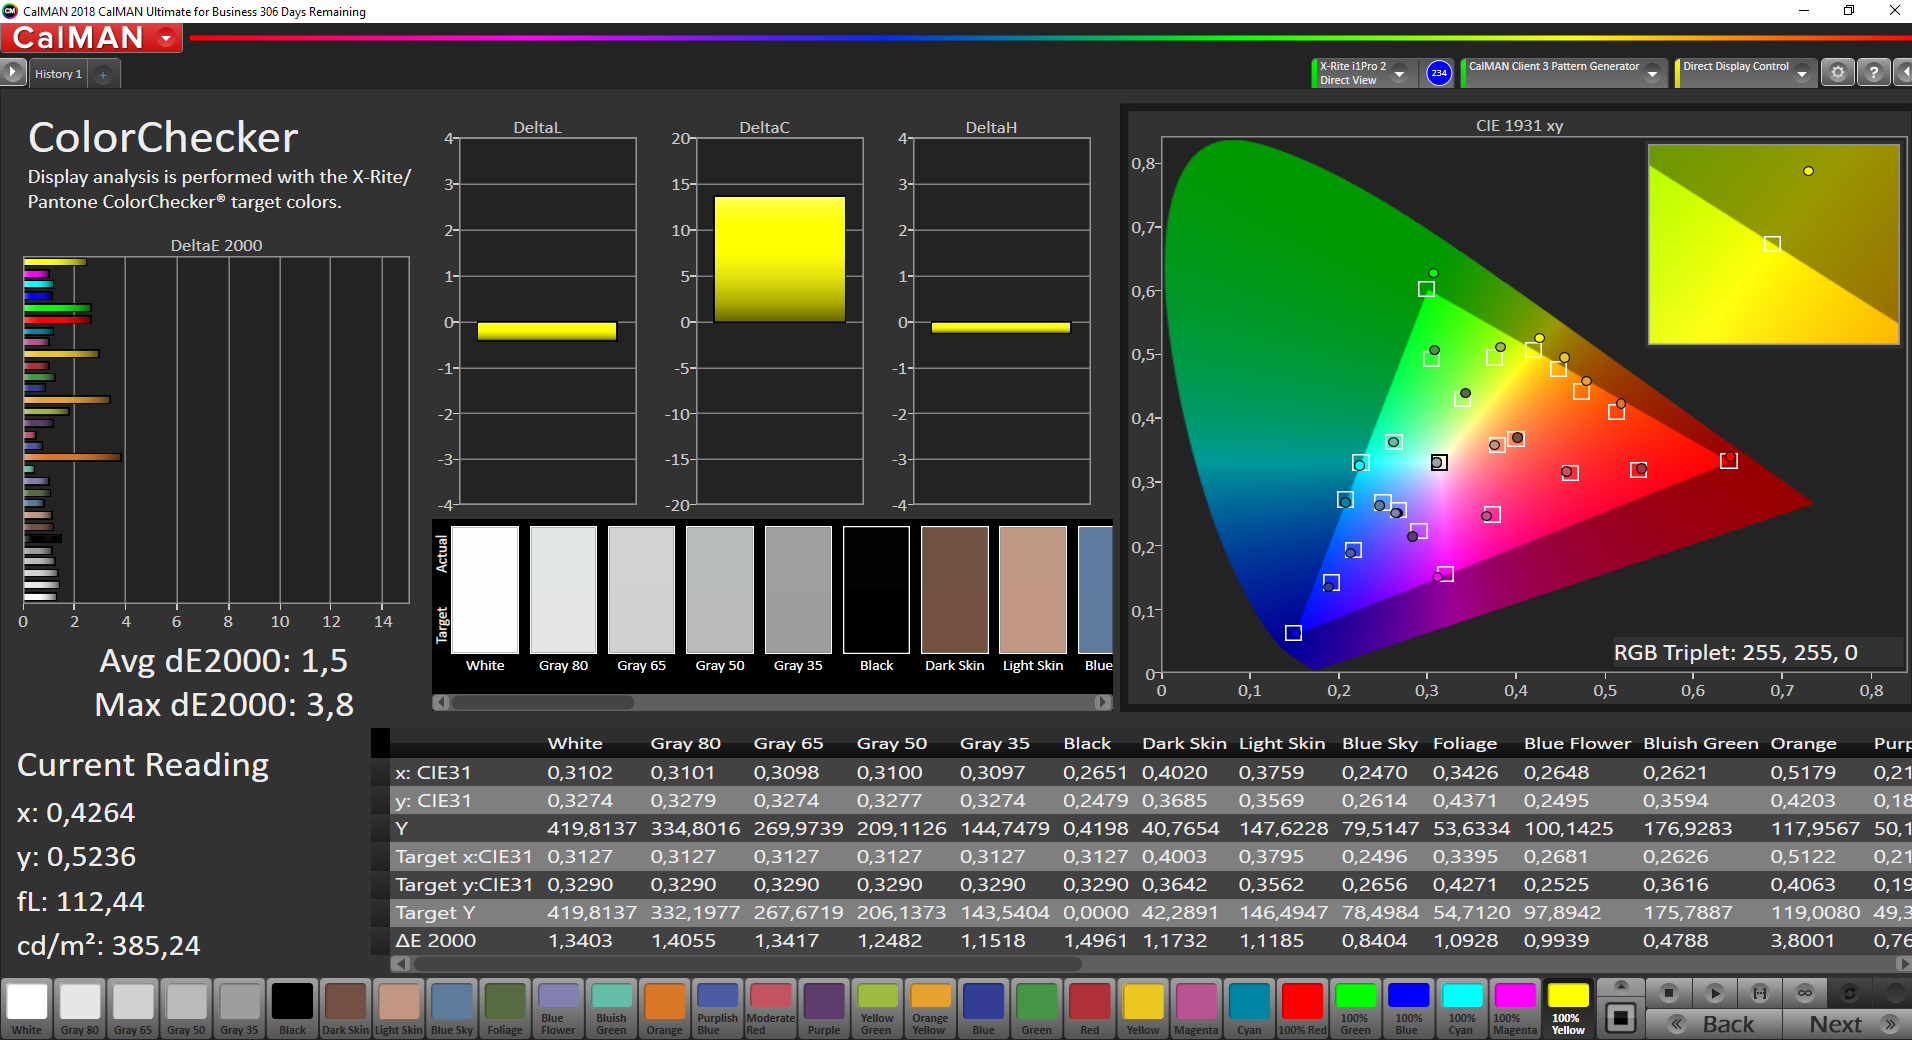
The MacBook Air is already well-calibrated out of the box. We checked the display with the professional CalMAN software and the X-Rite i1 Pro2 spectrophotometer, and there is no color cast. Most of the colors are also below the important mark of 3, only two values (brown/orange) are slightly higher. The panel also supports almost the full sRGB gamut, so you can edit pictures in this color space.
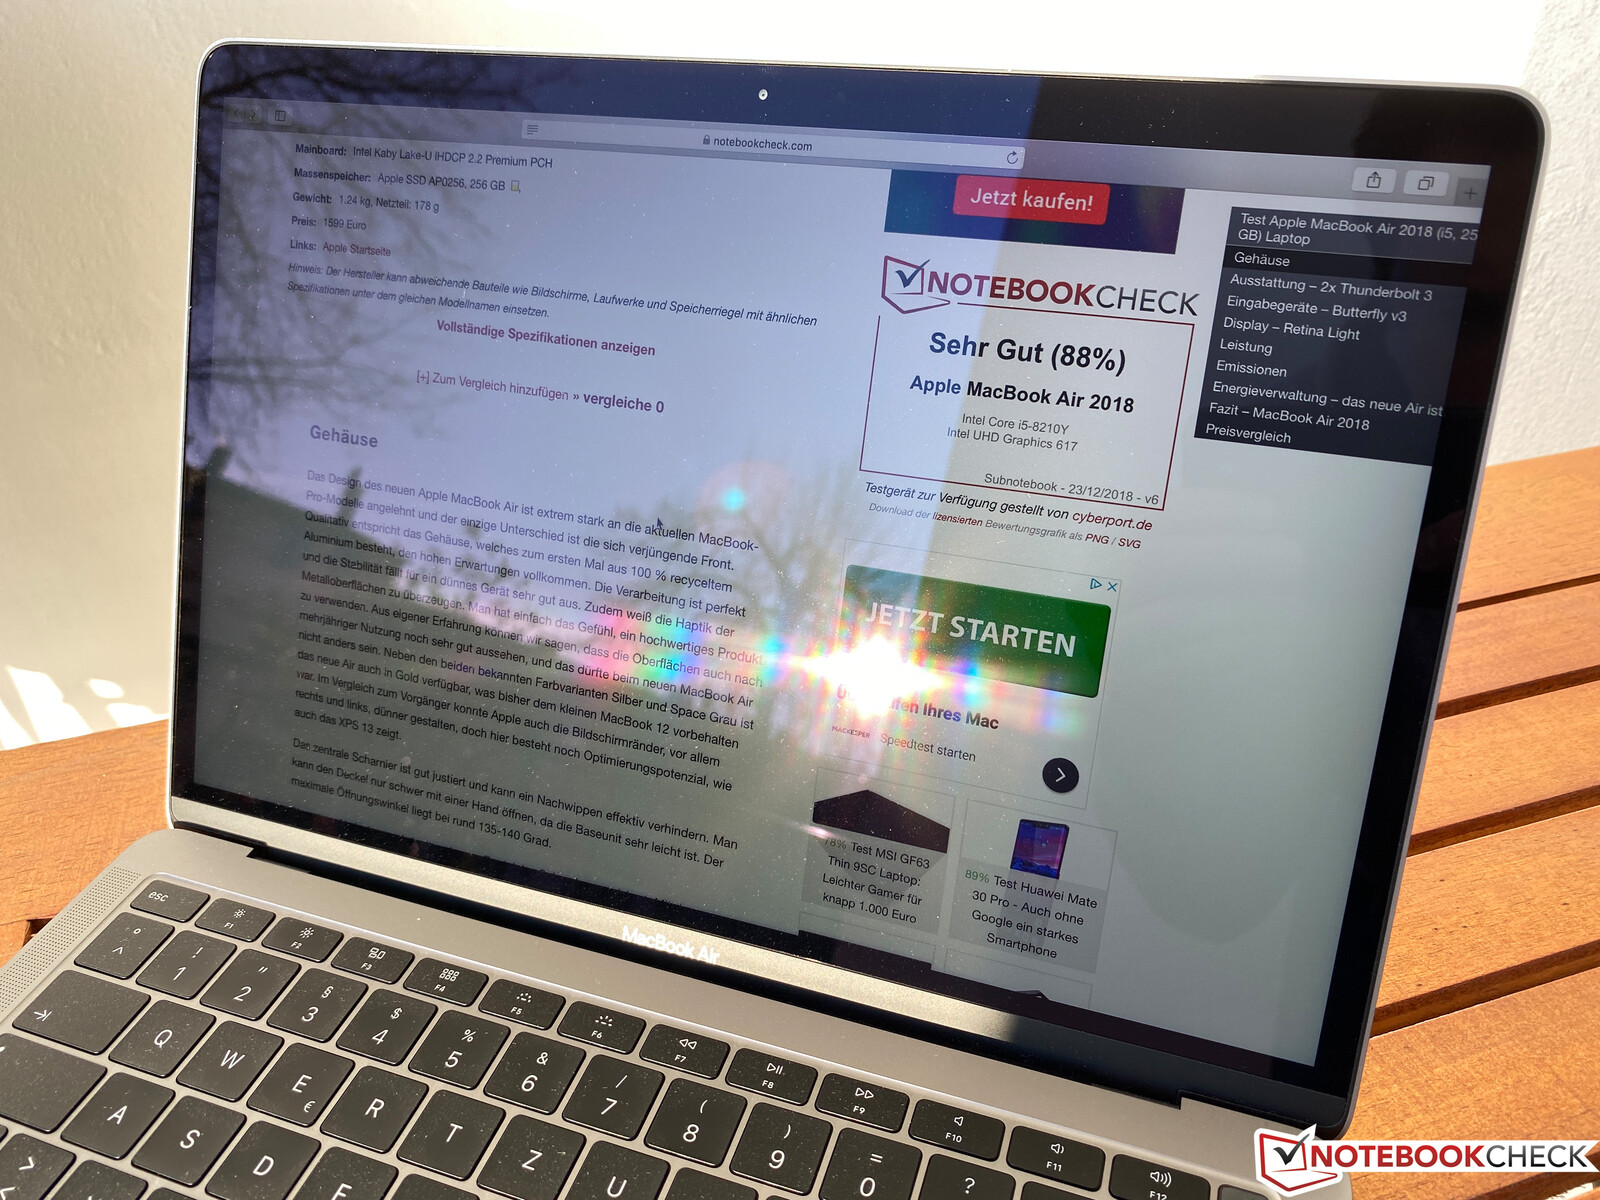
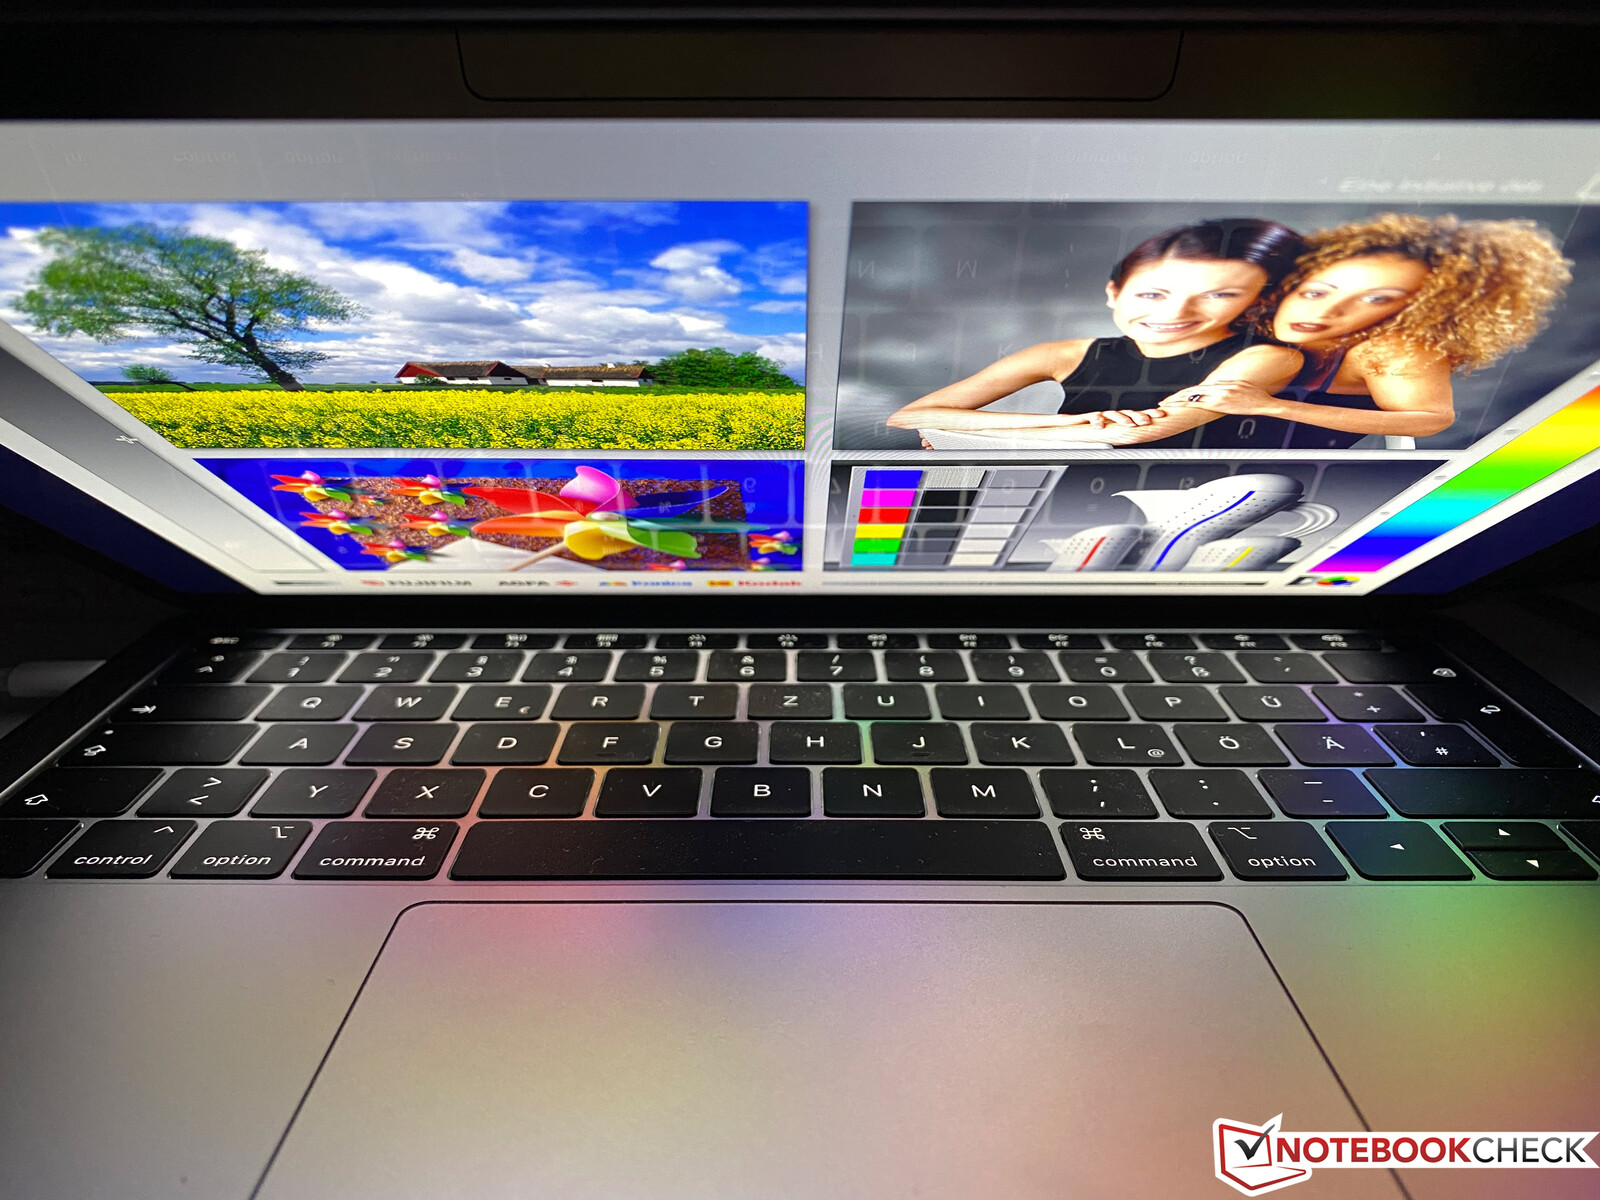
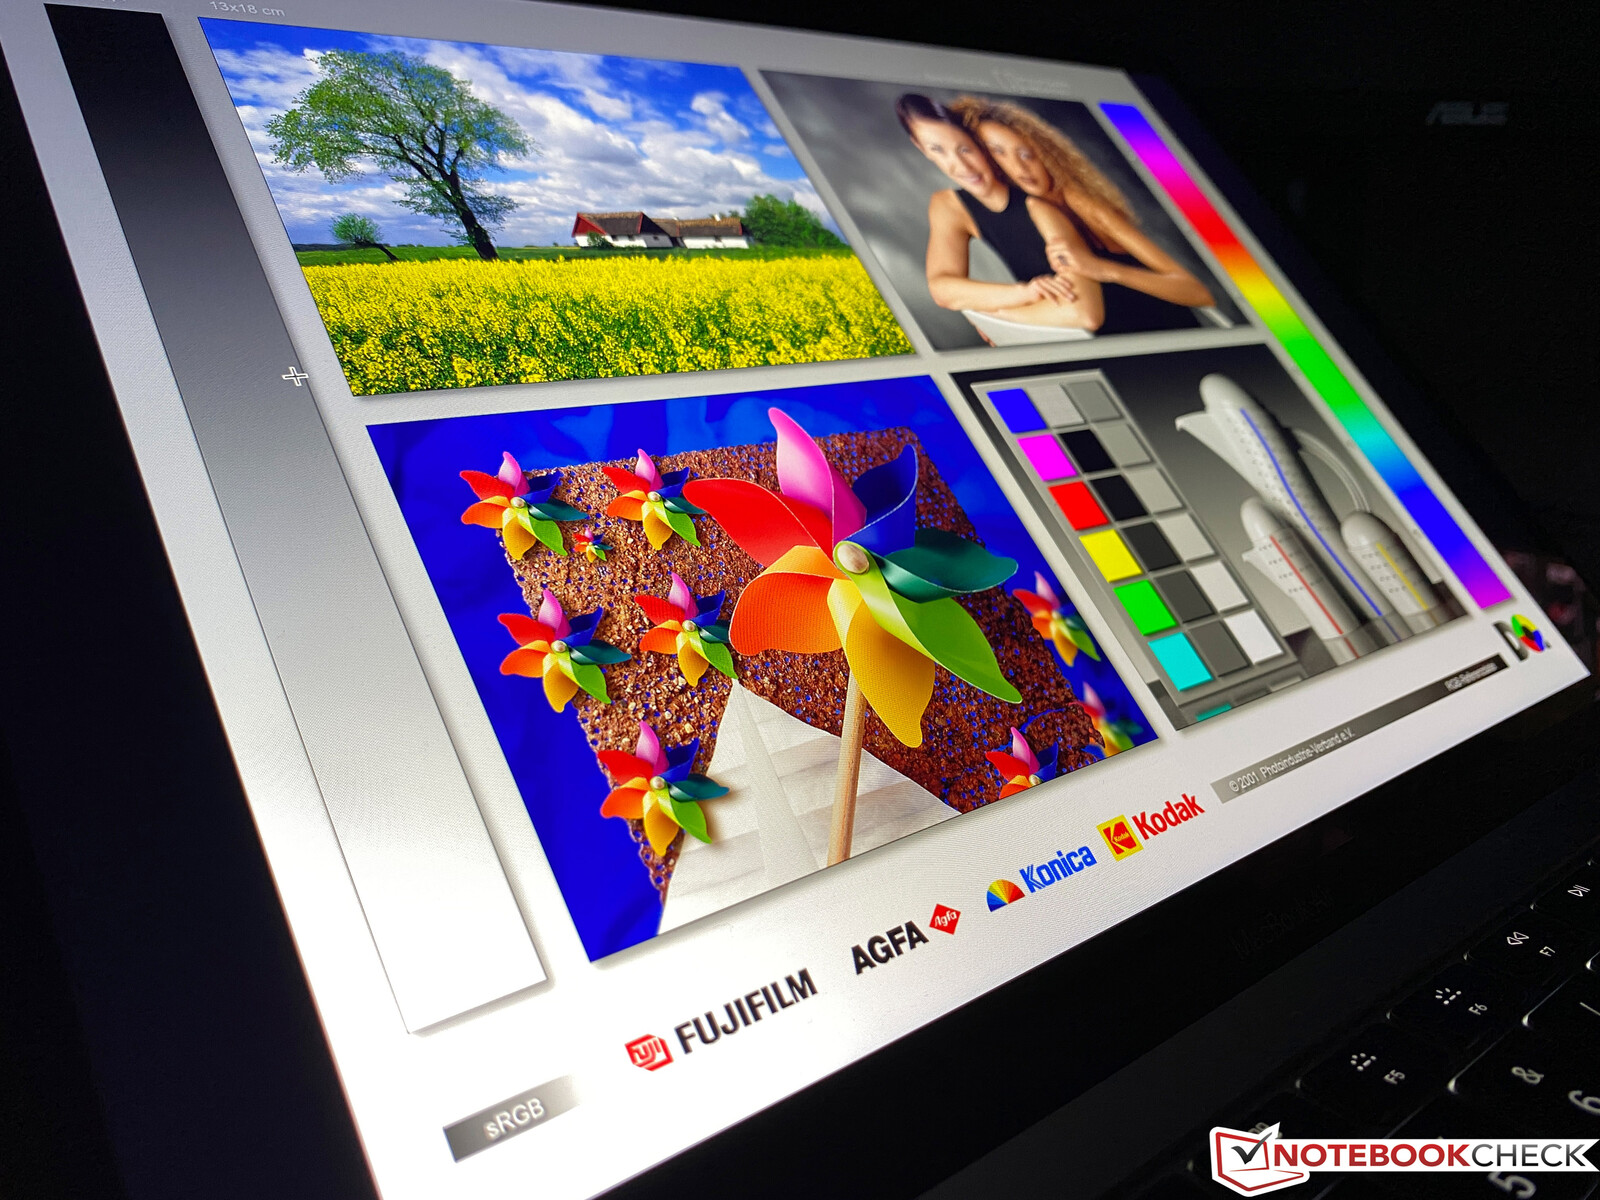
Outdoors, the MacBook Air performs pretty well despite the glossy surface. Even direct light sources only create a comparatively small reflection (see outdoor picture). The viewing angle stability of the IPS display is excellent.
Performance – MacBook Air still with slow Y-CPU
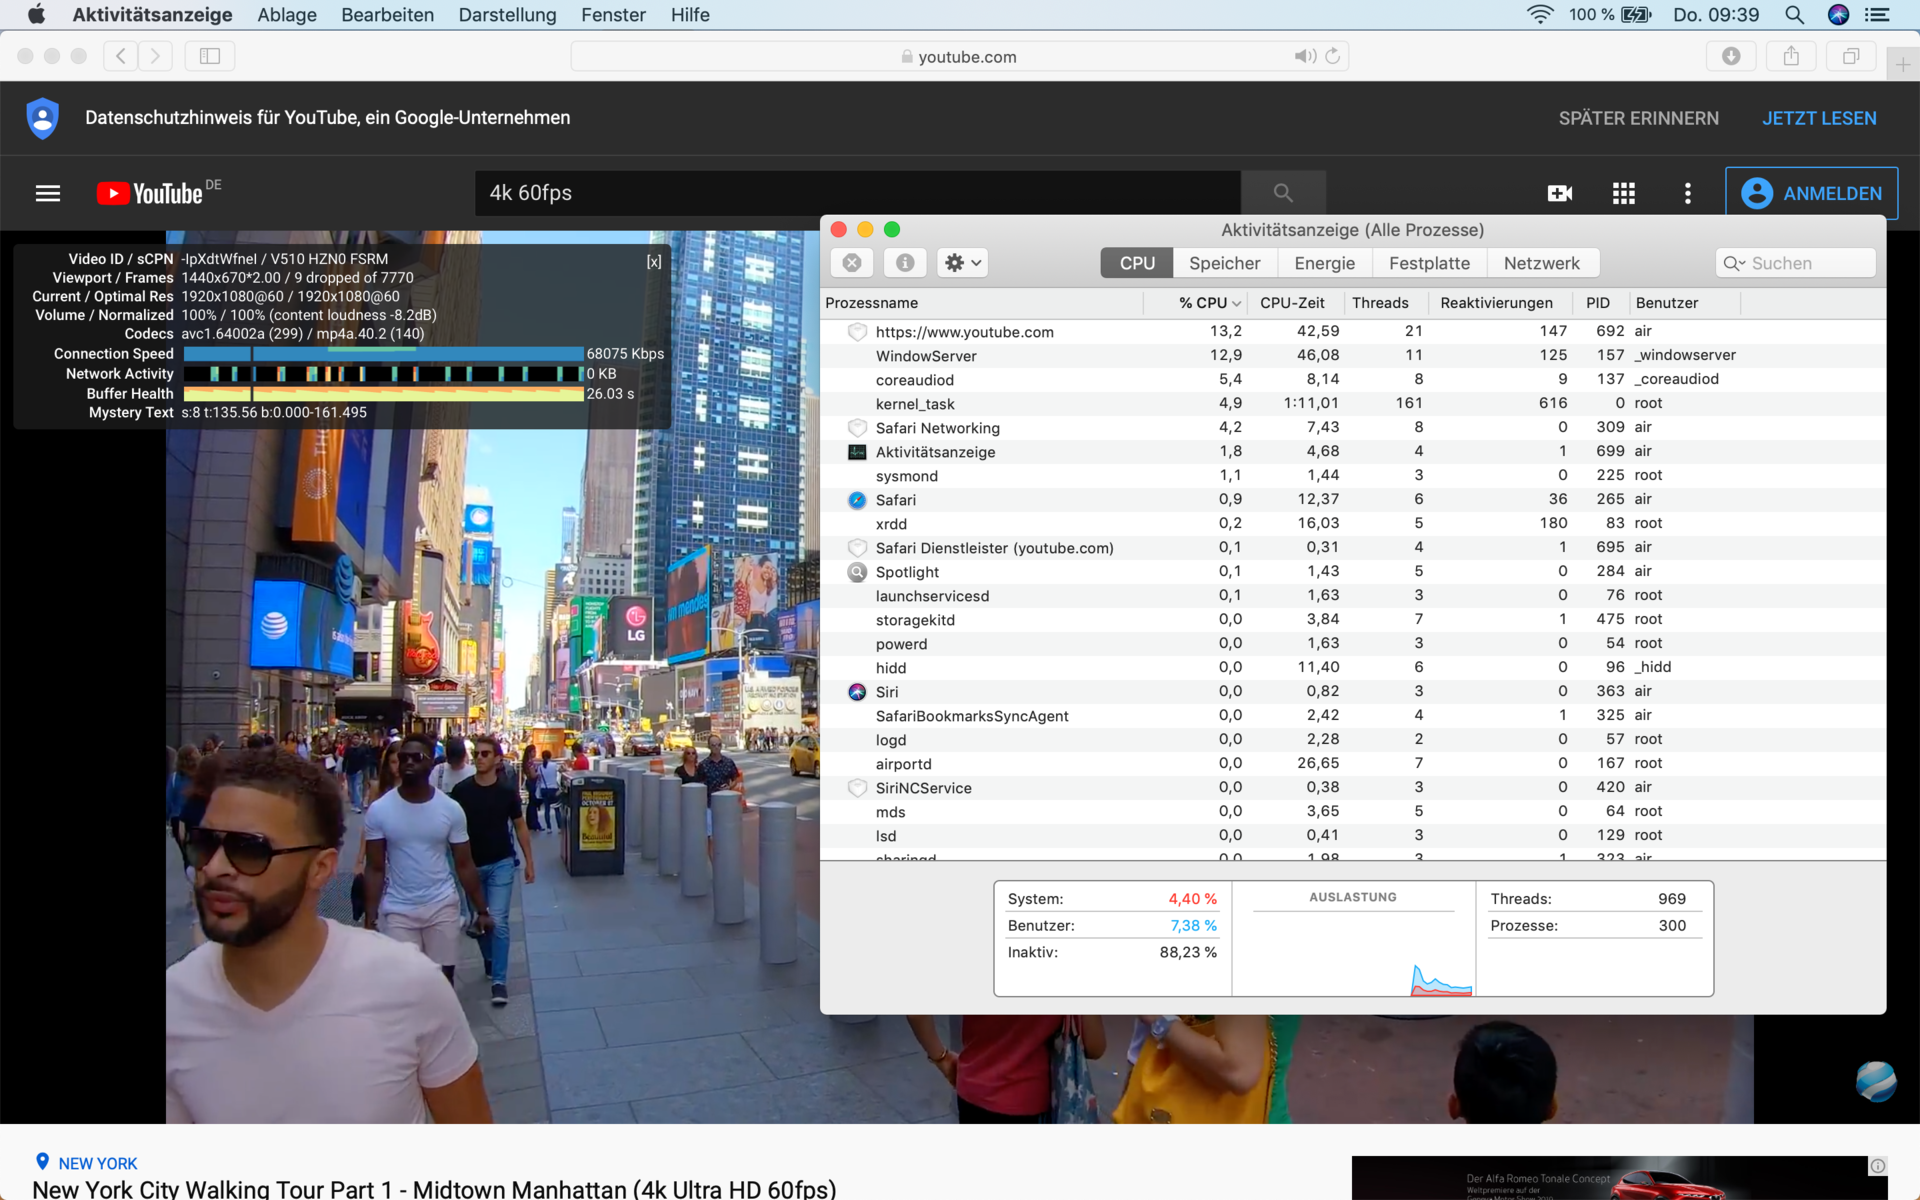
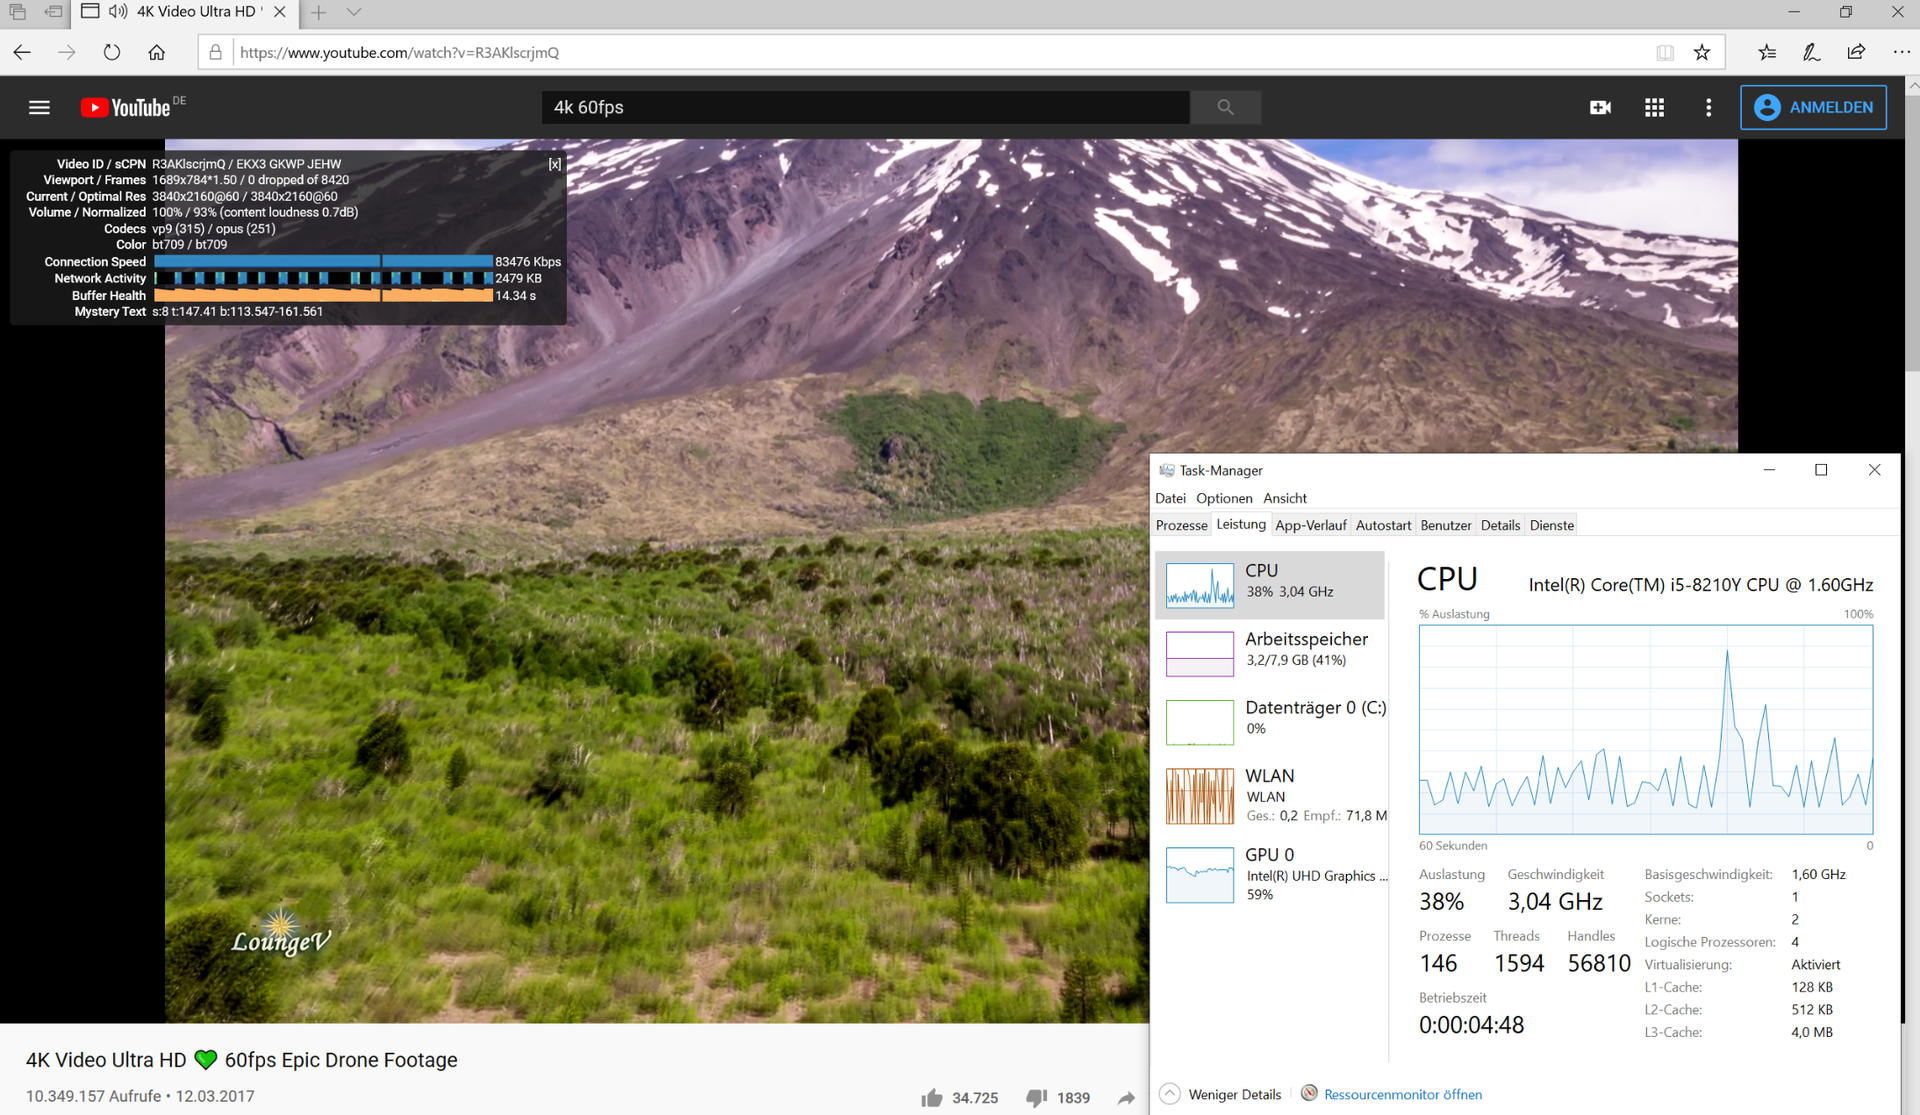
The performance has not changed, because Apple still uses the Core i5-8210Y. The designation Core i5 suggests a certain performance level, even though this is not the case. The "Y" behind the 8210 indicates an ultra-low voltage processor with a TDP of 4.5W (or 7W cTDP up, respectively), so it can be cooled passively like it is the case here. This means that the MBA is not suited for more demanding tasks or multi-tasking. Video playback (also high-res) on the other hand is no problem thanks to the integrated video decoder of the UHD Graphics. We have listed all our benchmarks scores for the 2019 MBA below, but we also recommend checking our comprehensive review of the 2018 MacBook Air. The performance is at least very stable after a small initial drop.
| Jetstream 2 - 2.0 Total | |
| Average of class Subnotebook (117 - 479, n=28, last 2 years) | |
| Apple Macbook Air 2019 | |
| Average Intel Core i5-8210Y (n=1) | |
| Blender - v2.79 BMW27 CPU | |
| Apple Macbook Air 2019 | |
| Average Intel Core i5-8210Y (n=1) | |
| Lenovo ThinkBook 13s-20R90071GE | |
| Average of class Subnotebook (159 - 2271, n=58, last 2 years) | |
* ... smaller is better

| low | med. | high | ultra | |
|---|---|---|---|---|
| Dota 2 Reborn (2015) | 67.2 | 28.2 | 14.6 | 13.6 |
| X-Plane 11.11 (2018) | 20.2 | 14.1 | 12.8 |
Emissions & Energy
System Noise – The fan of the MBA is annoying
Probably the biggest issue of the MacBook Air is the cooling. The processor itself is cooled passively. There is a fan inside the chassis, but it is not directly connected to the heat sink of the CPU. This fan is only supposed to improve the air circulation inside the case and help dissipate warm air.
To be fair, the fan is often deactivated when you perform simple tasks. Once you start to stress the CPU a bit more, however, which can be as simple as running multiple tabs in Safari, the fan will slowly and seamlessly increase its speed. More intense load scenarios (such as the installation of applications) or higher ambient temperatures, the noise level quickly reaches up to 41 dB(A), just like the previous model. Furthermore, the frequency starts getting annoying from 37-38 dB(A). Considering the very low performance, this is not really acceptable, and also results in a point deduction in this sub-rating.
Noise level
| Idle |
| 29.5 / 29.5 / 29.5 dB(A) |
| Load |
| 34 / 41 dB(A) |
 | ||
30 dB silent 40 dB(A) audible 50 dB(A) loud |
||
min: | ||
| Apple Macbook Air 2019 UHD Graphics 617, i5-8210Y, Apple SSD AP0256 | Dell XPS 13 9380 2019 UHD Graphics 620, i5-8265U, SK hynix PC401 HFS256GD9TNG | Lenovo ThinkBook 13s-20R90071GE UHD Graphics 620, i5-8265U, SK hynix BC501 HFM512GDHTNG-8310A | Microsoft Surface Laptop 2-LQN-00004 UHD Graphics 620, i5-8250U, SK Hynix BC501 NVMe 256 GB | Apple MacBook Pro 13 2019 i5 4TB3 Iris Plus Graphics 655, i5-8279U, Apple SSD AP0512 | |
|---|---|---|---|---|---|
| Noise | 0% | 4% | 7% | 1% | |
| off / environment * (dB) | 29.5 | 30.4 -3% | 28.8 2% | 28.7 3% | 29 2% |
| Idle Minimum * (dB) | 29.5 | 30.4 -3% | 28.8 2% | 28.7 3% | 29 2% |
| Idle Average * (dB) | 29.5 | 30.4 -3% | 28.8 2% | 28.7 3% | 29 2% |
| Idle Maximum * (dB) | 29.5 | 30.4 -3% | 29.7 -1% | 28.7 3% | 29 2% |
| Load Average * (dB) | 34 | 31.7 7% | 30.7 10% | 30 12% | 33.9 -0% |
| Load Maximum * (dB) | 41 | 38.1 7% | 38.3 7% | 32.9 20% | 41.8 -2% |
* ... smaller is better
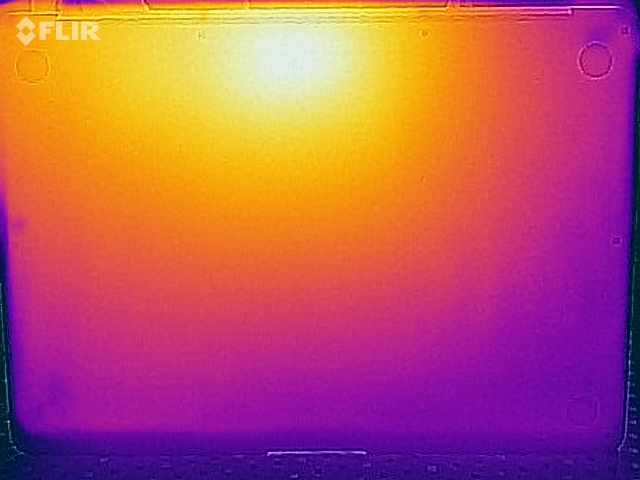
Temperature
(±) The maximum temperature on the upper side is 43.1 °C / 110 F, compared to the average of 35.9 °C / 97 F, ranging from 21.4 to 59 °C for the class Subnotebook.
(±) The bottom heats up to a maximum of 41 °C / 106 F, compared to the average of 39.2 °C / 103 F
(+) In idle usage, the average temperature for the upper side is 24.4 °C / 76 F, compared to the device average of 30.8 °C / 87 F.
(+) The palmrests and touchpad are cooler than skin temperature with a maximum of 28.7 °C / 83.7 F and are therefore cool to the touch.
(±) The average temperature of the palmrest area of similar devices was 28.2 °C / 82.8 F (-0.5 °C / -0.9 F).

Apple Macbook Air 2019 audio analysis
(±) | speaker loudness is average but good (75.8 dB)
Bass 100 - 315 Hz
(±) | reduced bass - on average 8.9% lower than median
(±) | linearity of bass is average (11.6% delta to prev. frequency)
Mids 400 - 2000 Hz
(+) | balanced mids - only 3% away from median
(+) | mids are linear (5.1% delta to prev. frequency)
Highs 2 - 16 kHz
(+) | balanced highs - only 2.9% away from median
(+) | highs are linear (4.7% delta to prev. frequency)
Overall 100 - 16.000 Hz
(+) | overall sound is linear (14.3% difference to median)
Compared to same class
» 28% of all tested devices in this class were better, 6% similar, 66% worse
» The best had a delta of 5%, average was 18%, worst was 53%
Compared to all devices tested
» 18% of all tested devices were better, 4% similar, 78% worse
» The best had a delta of 4%, average was 23%, worst was 134%
Dell XPS 13 9380 2019 audio analysis
(-) | not very loud speakers (70 dB)
Bass 100 - 315 Hz
(-) | nearly no bass - on average 20.4% lower than median
(±) | linearity of bass is average (9.4% delta to prev. frequency)
Mids 400 - 2000 Hz
(±) | higher mids - on average 6.9% higher than median
(±) | linearity of mids is average (10.2% delta to prev. frequency)
Highs 2 - 16 kHz
(+) | balanced highs - only 3.6% away from median
(+) | highs are linear (5% delta to prev. frequency)
Overall 100 - 16.000 Hz
(±) | linearity of overall sound is average (26.6% difference to median)
Compared to same class
» 88% of all tested devices in this class were better, 1% similar, 10% worse
» The best had a delta of 5%, average was 18%, worst was 53%
Compared to all devices tested
» 82% of all tested devices were better, 3% similar, 15% worse
» The best had a delta of 4%, average was 23%, worst was 134%
Battery Runtime
The battery runtime of the compact MacBook Air is very good and clearly ahead of the Windows competition. Our practical WLAN test at an adjusted luminance of 150 Nits runs for around 11.5 hours. If you use the maximum brightness, this result drops to 7 hours, which is still decent.
Pros
Cons
Verdict – MacBook Air appears outdated

Not a lot has changed in the 2019 version of the MacBook Air. The screen now manages the advertised luminance and the added True Tone support is certainly a benefit. There is not much criticism for the display in general, but the panels of the MacBook Pro are better thanks to the wider color gamut.
The biggest problem is still the slow processor in combination with the annoying fan (under load). The performance just cannot keep up with the rivals and you should not expect limitations when you run more demanding applications or multi-tasking. For simple stuff such as writing mails, Skype, common web browsing, or the playback of high resolution videos, however, is no problem.
The 2018 model of the MacBook Air was not very innovative to begin with, and the laptop just appears outdated in some regards. In isolation, the MacBook Air is certainly a good subnotebook, but Apple's own MacBook Pro 13 is a better alternative for a similar price.
The entry-level MacBook Pro 13 (2x TB3, review will follow soon) is a very serious rival for the MacBook Air. The case is just slightly thicker at the front, but you will hardly notice the difference in practice. In return, you get much more performance (and therefore better equipped for the upcoming years) for just a slightly higher price.
Apple Macbook Air 2019
- 04/08/2020 v7 (old)
Andreas Osthoff
Price comparison
