Apple MacBook Air 2020 Core i5 Review – The best MacBook you can get? – No
After the new MacBook Pro 16 was equipped with a conventional keyboard design, Apple now also replaces the problematic Butterfly keyboard on the compact MacBook Air. It requires more space though, so the case of the 2020 MacBook Air is actually a bit thicker than before. You also get custom processors from Intel, which are still based on the low-power Y-series, but they are now based on the newer Ice Lake architecture and it is the first time you can get a MacBook Air with a quad-core CPU. Apple also improved the speakers on the new model, doubled the storage capacity and slightly reduced the price.
Otherwise, not much has changed, so we also recommend our comprehensive reviews of the previous MacBook Air models for more information. We review the quad-core i5 SKU for 1499 Euros ($1299 US) we purchased in Apple's online store (no press sample). This model is equipped with the aforementioned Core i5 CPU with four cores, 8 GB RAM, and 512 GB SSD storage. So is the new MacBook Air really the best MacBook for most users right now, or should you just get a Pro model for this kind of money?
Rating | Date | Model | Weight | Height | Size | Resolution | Price |
|---|---|---|---|---|---|---|---|
| 88 % v7 (old) | 04 / 2020 | Apple MacBook Air 2020 i5 i5-1030NG7, Iris Plus Graphics G7 (Ice Lake 64 EU) | 1.3 kg | 16.1 mm | 13.30" | 2560x1600 | |
| 85.6 % v7 (old) | 01 / 2020 | Apple Macbook Air 2019 i5-8210Y, UHD Graphics 617 | 1.3 kg | 15.6 mm | 13.30" | 2560x1600 | |
| 90.6 % v7 (old) | 02 / 2020 | Apple MacBook Pro 13 2019 2TB3 i5-8257U, Iris Plus Graphics 645 | 1.4 kg | 14.9 mm | 13.30" | 2560x1600 | |
| 84 % v7 (old) | 02 / 2020 | Microsoft Surface Laptop 3 13 Core i5-1035G7 i5-1035G7, Iris Plus Graphics G7 (Ice Lake 64 EU) | 1.3 kg | 14.5 mm | 13.50" | 2256x1504 | |
| 87 % v7 (old) | 02 / 2020 | Acer Swift 3 SF313-52-71Y7 i7-1065G7, Iris Plus Graphics G7 (Ice Lake 64 EU) | 1.2 kg | 16.6 mm | 13.50" | 2256x1504 | |
| 88.8 % v7 (old) | 03 / 2020 | Dell XPS 13 9300 i5 FHD i5-1035G1, UHD Graphics G1 (Ice Lake 32 EU) | 1.2 kg | 14.8 mm | 13.40" | 1920x1200 |
Case – MacBook Air is thicker than before

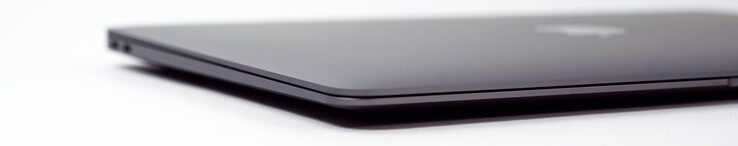
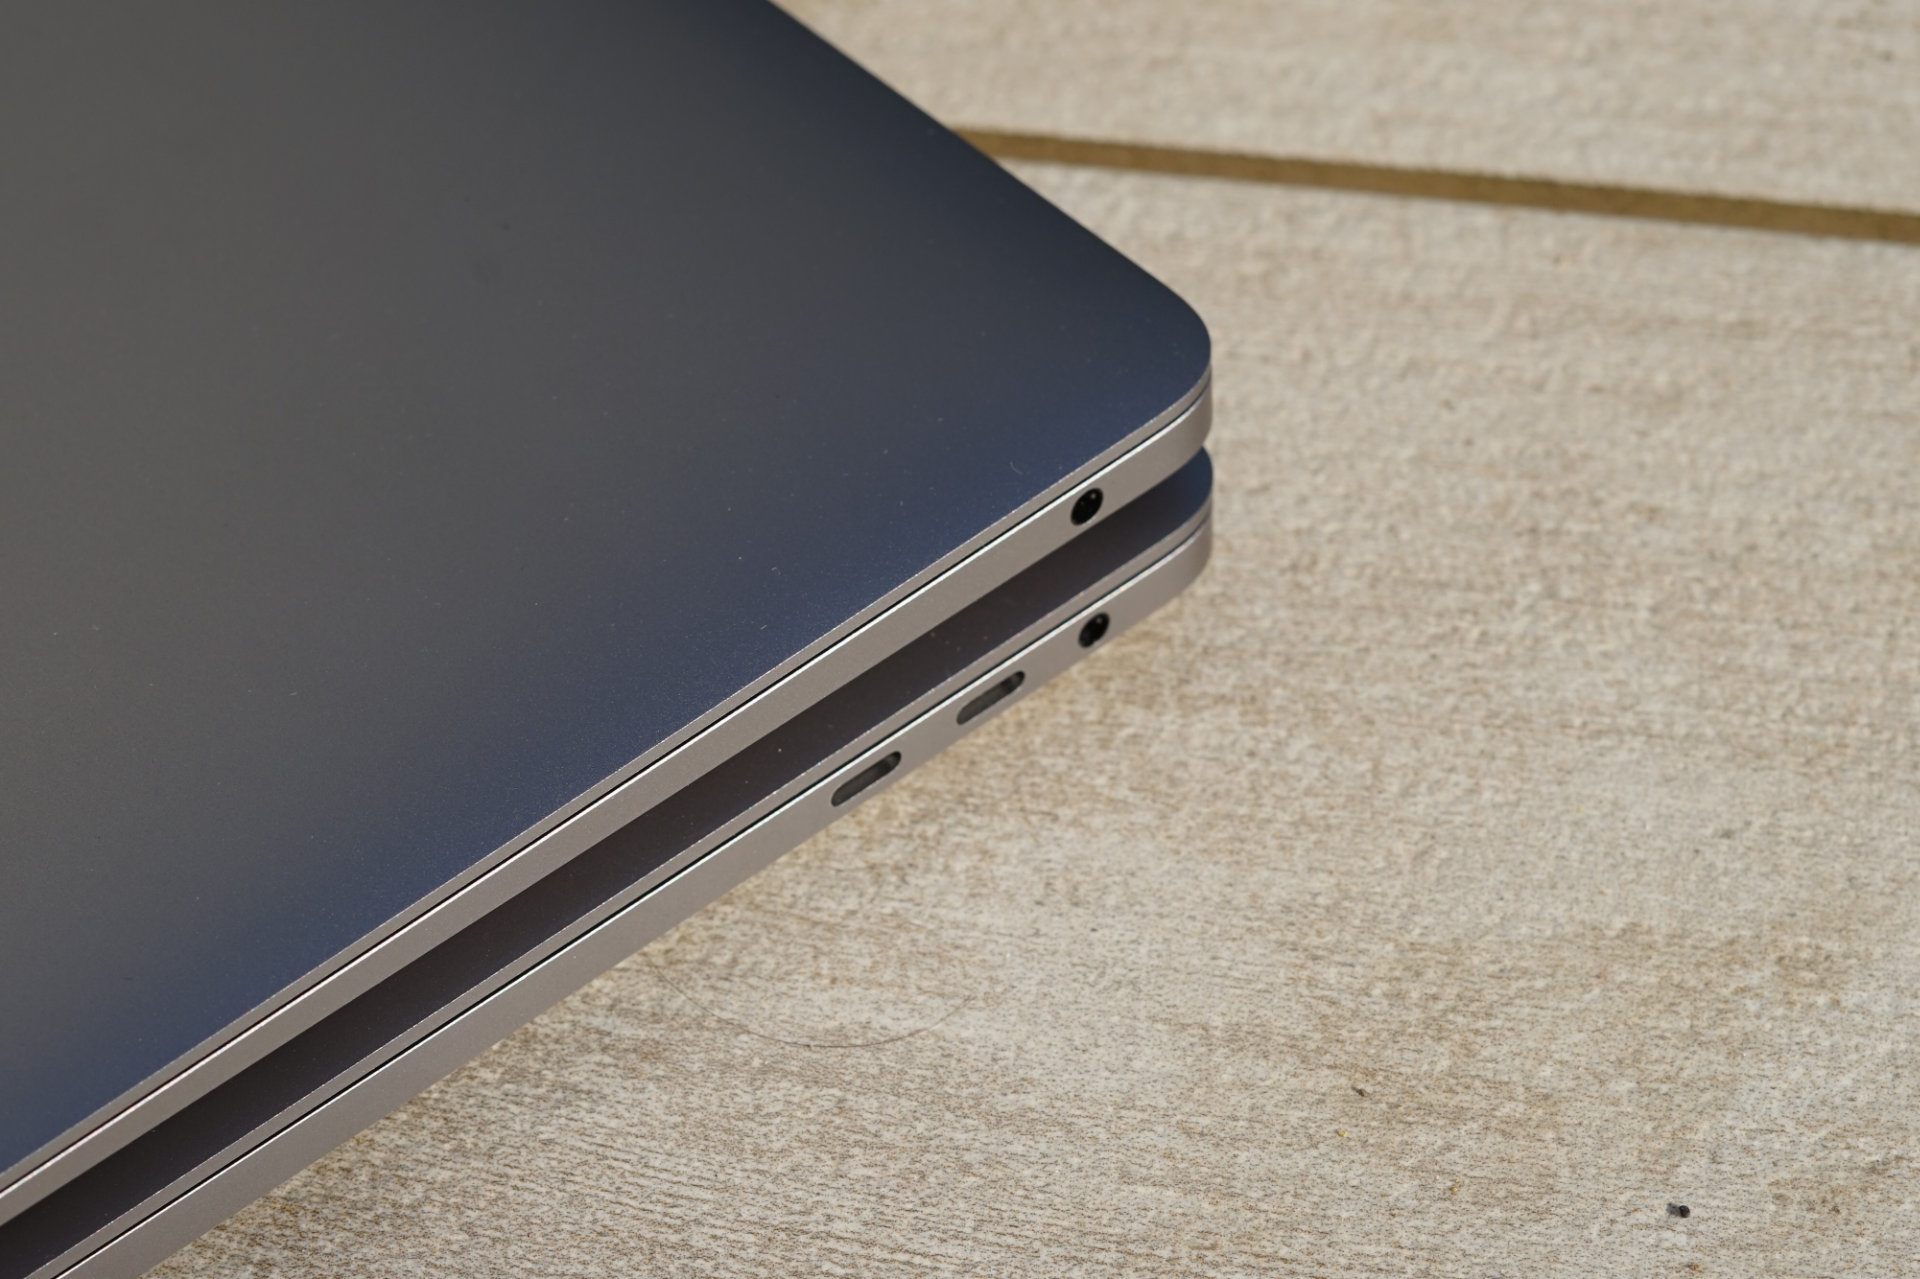
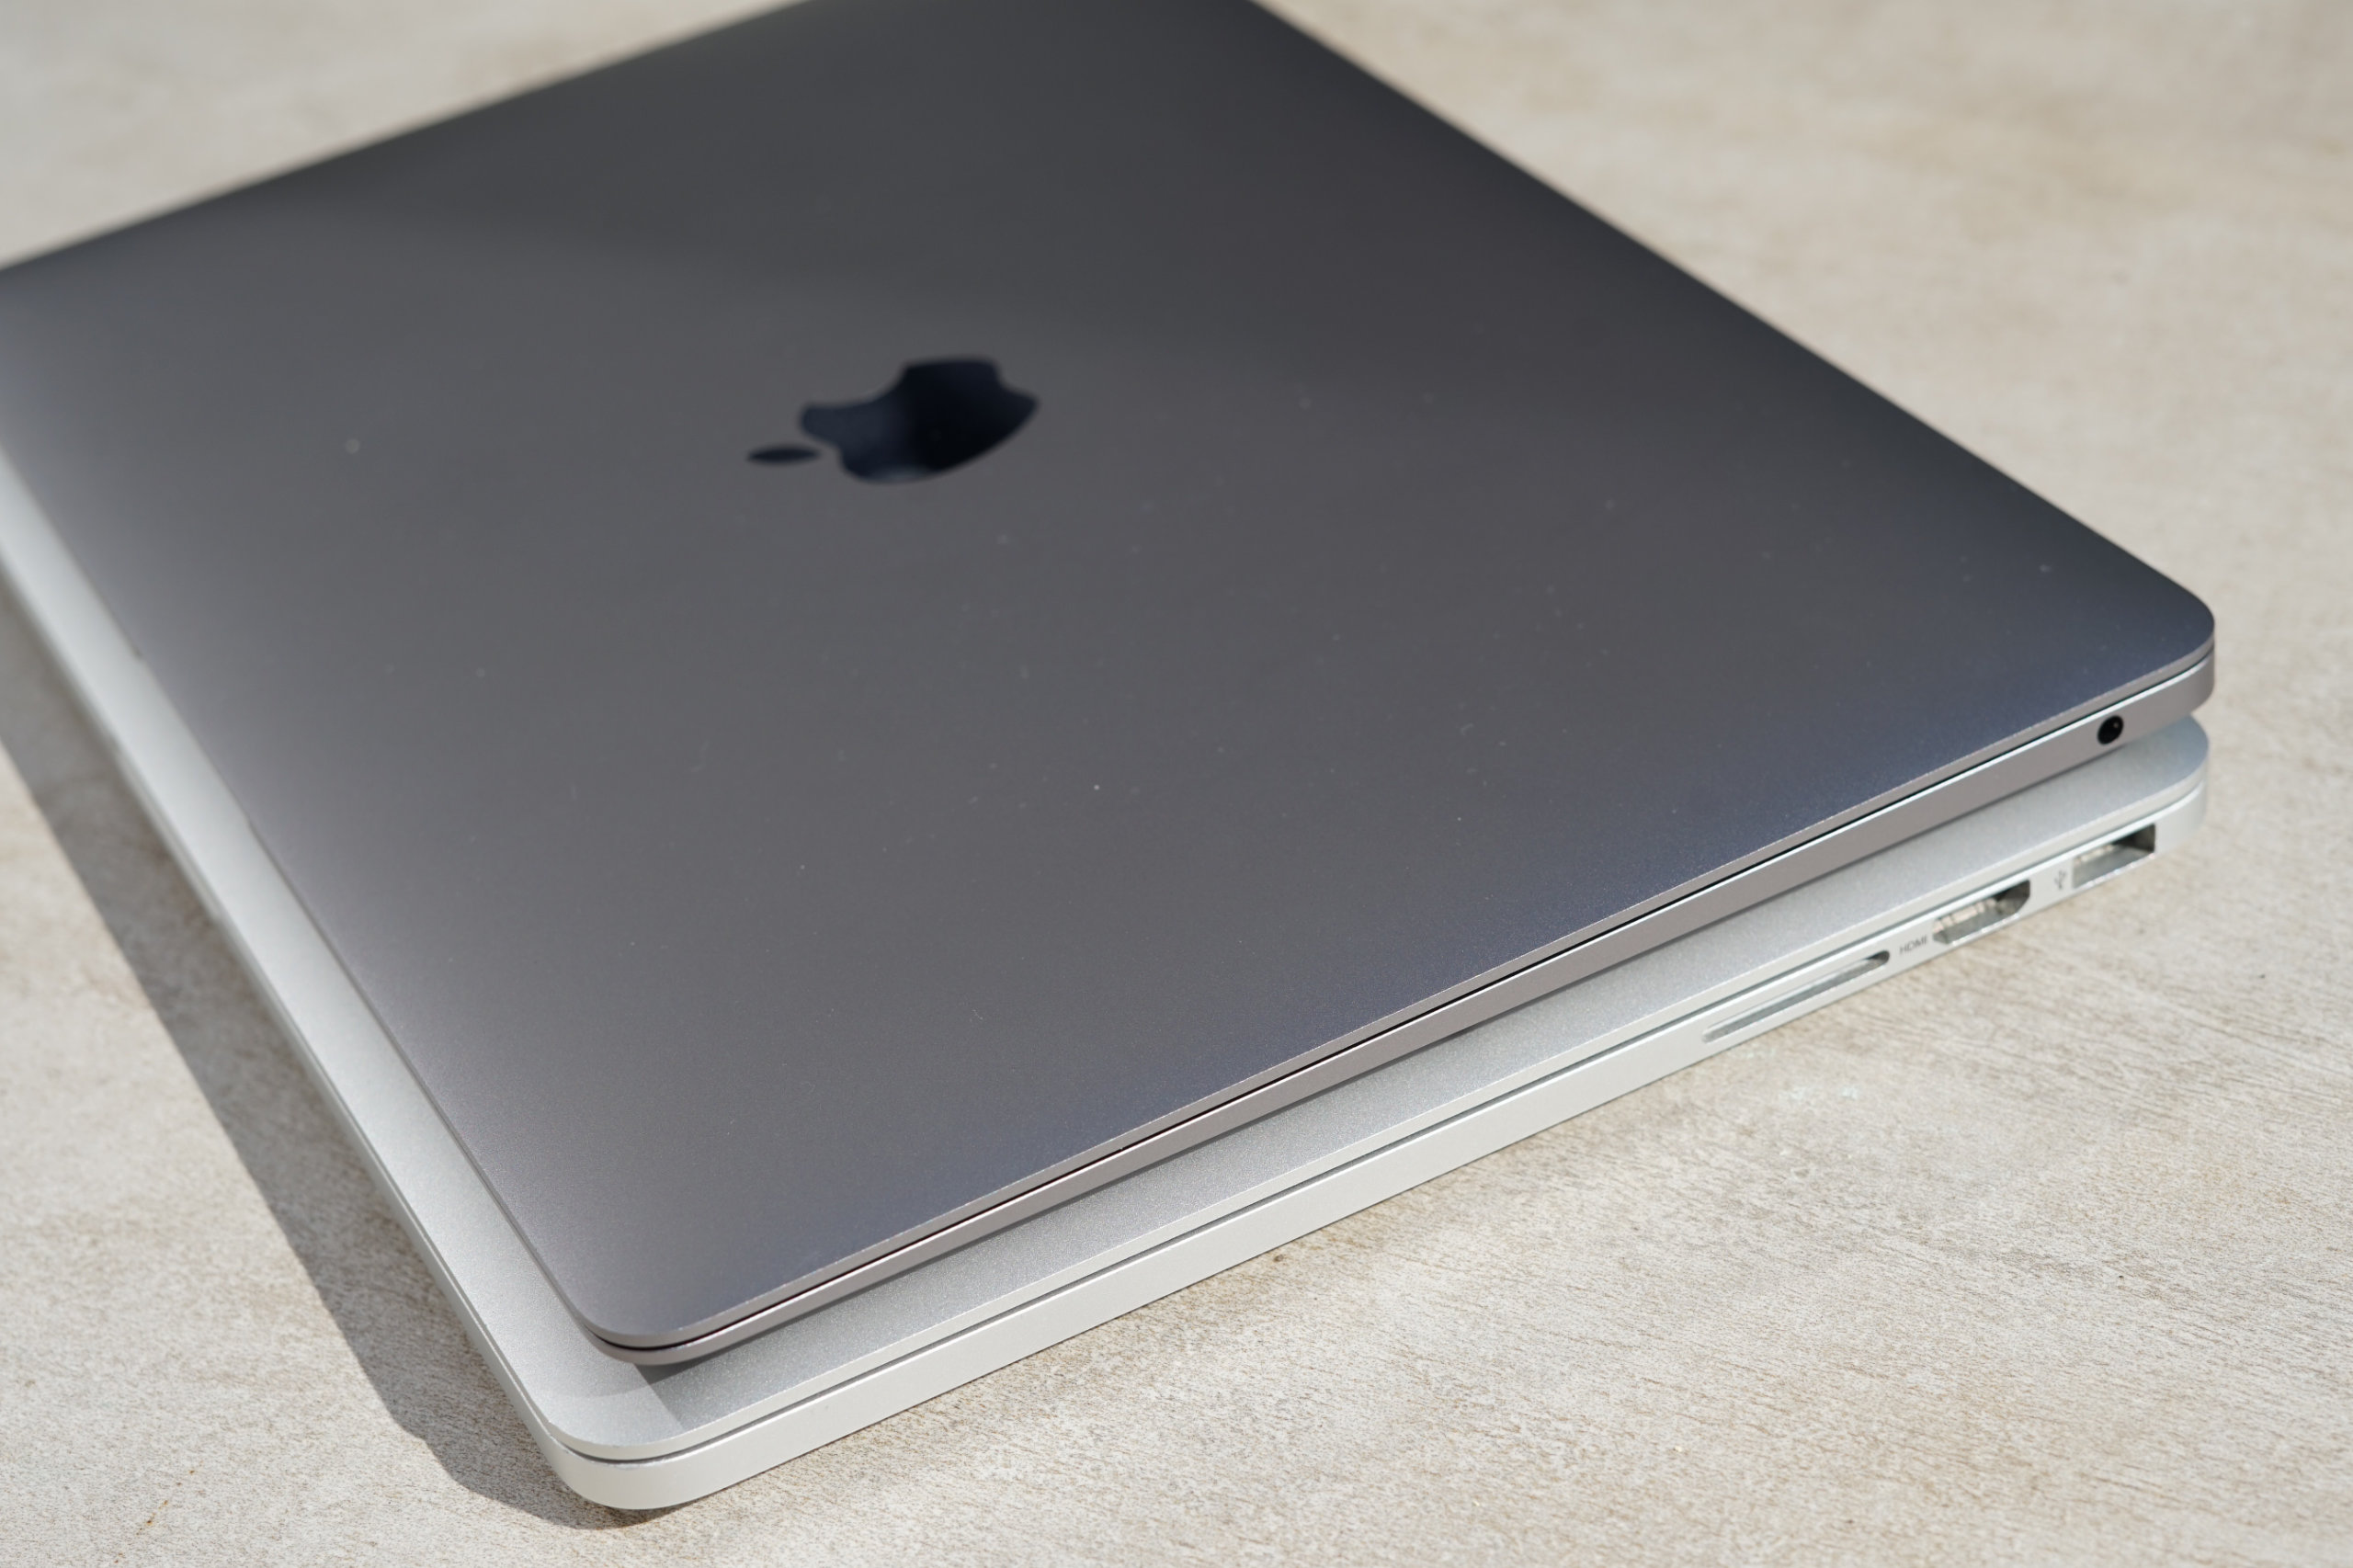
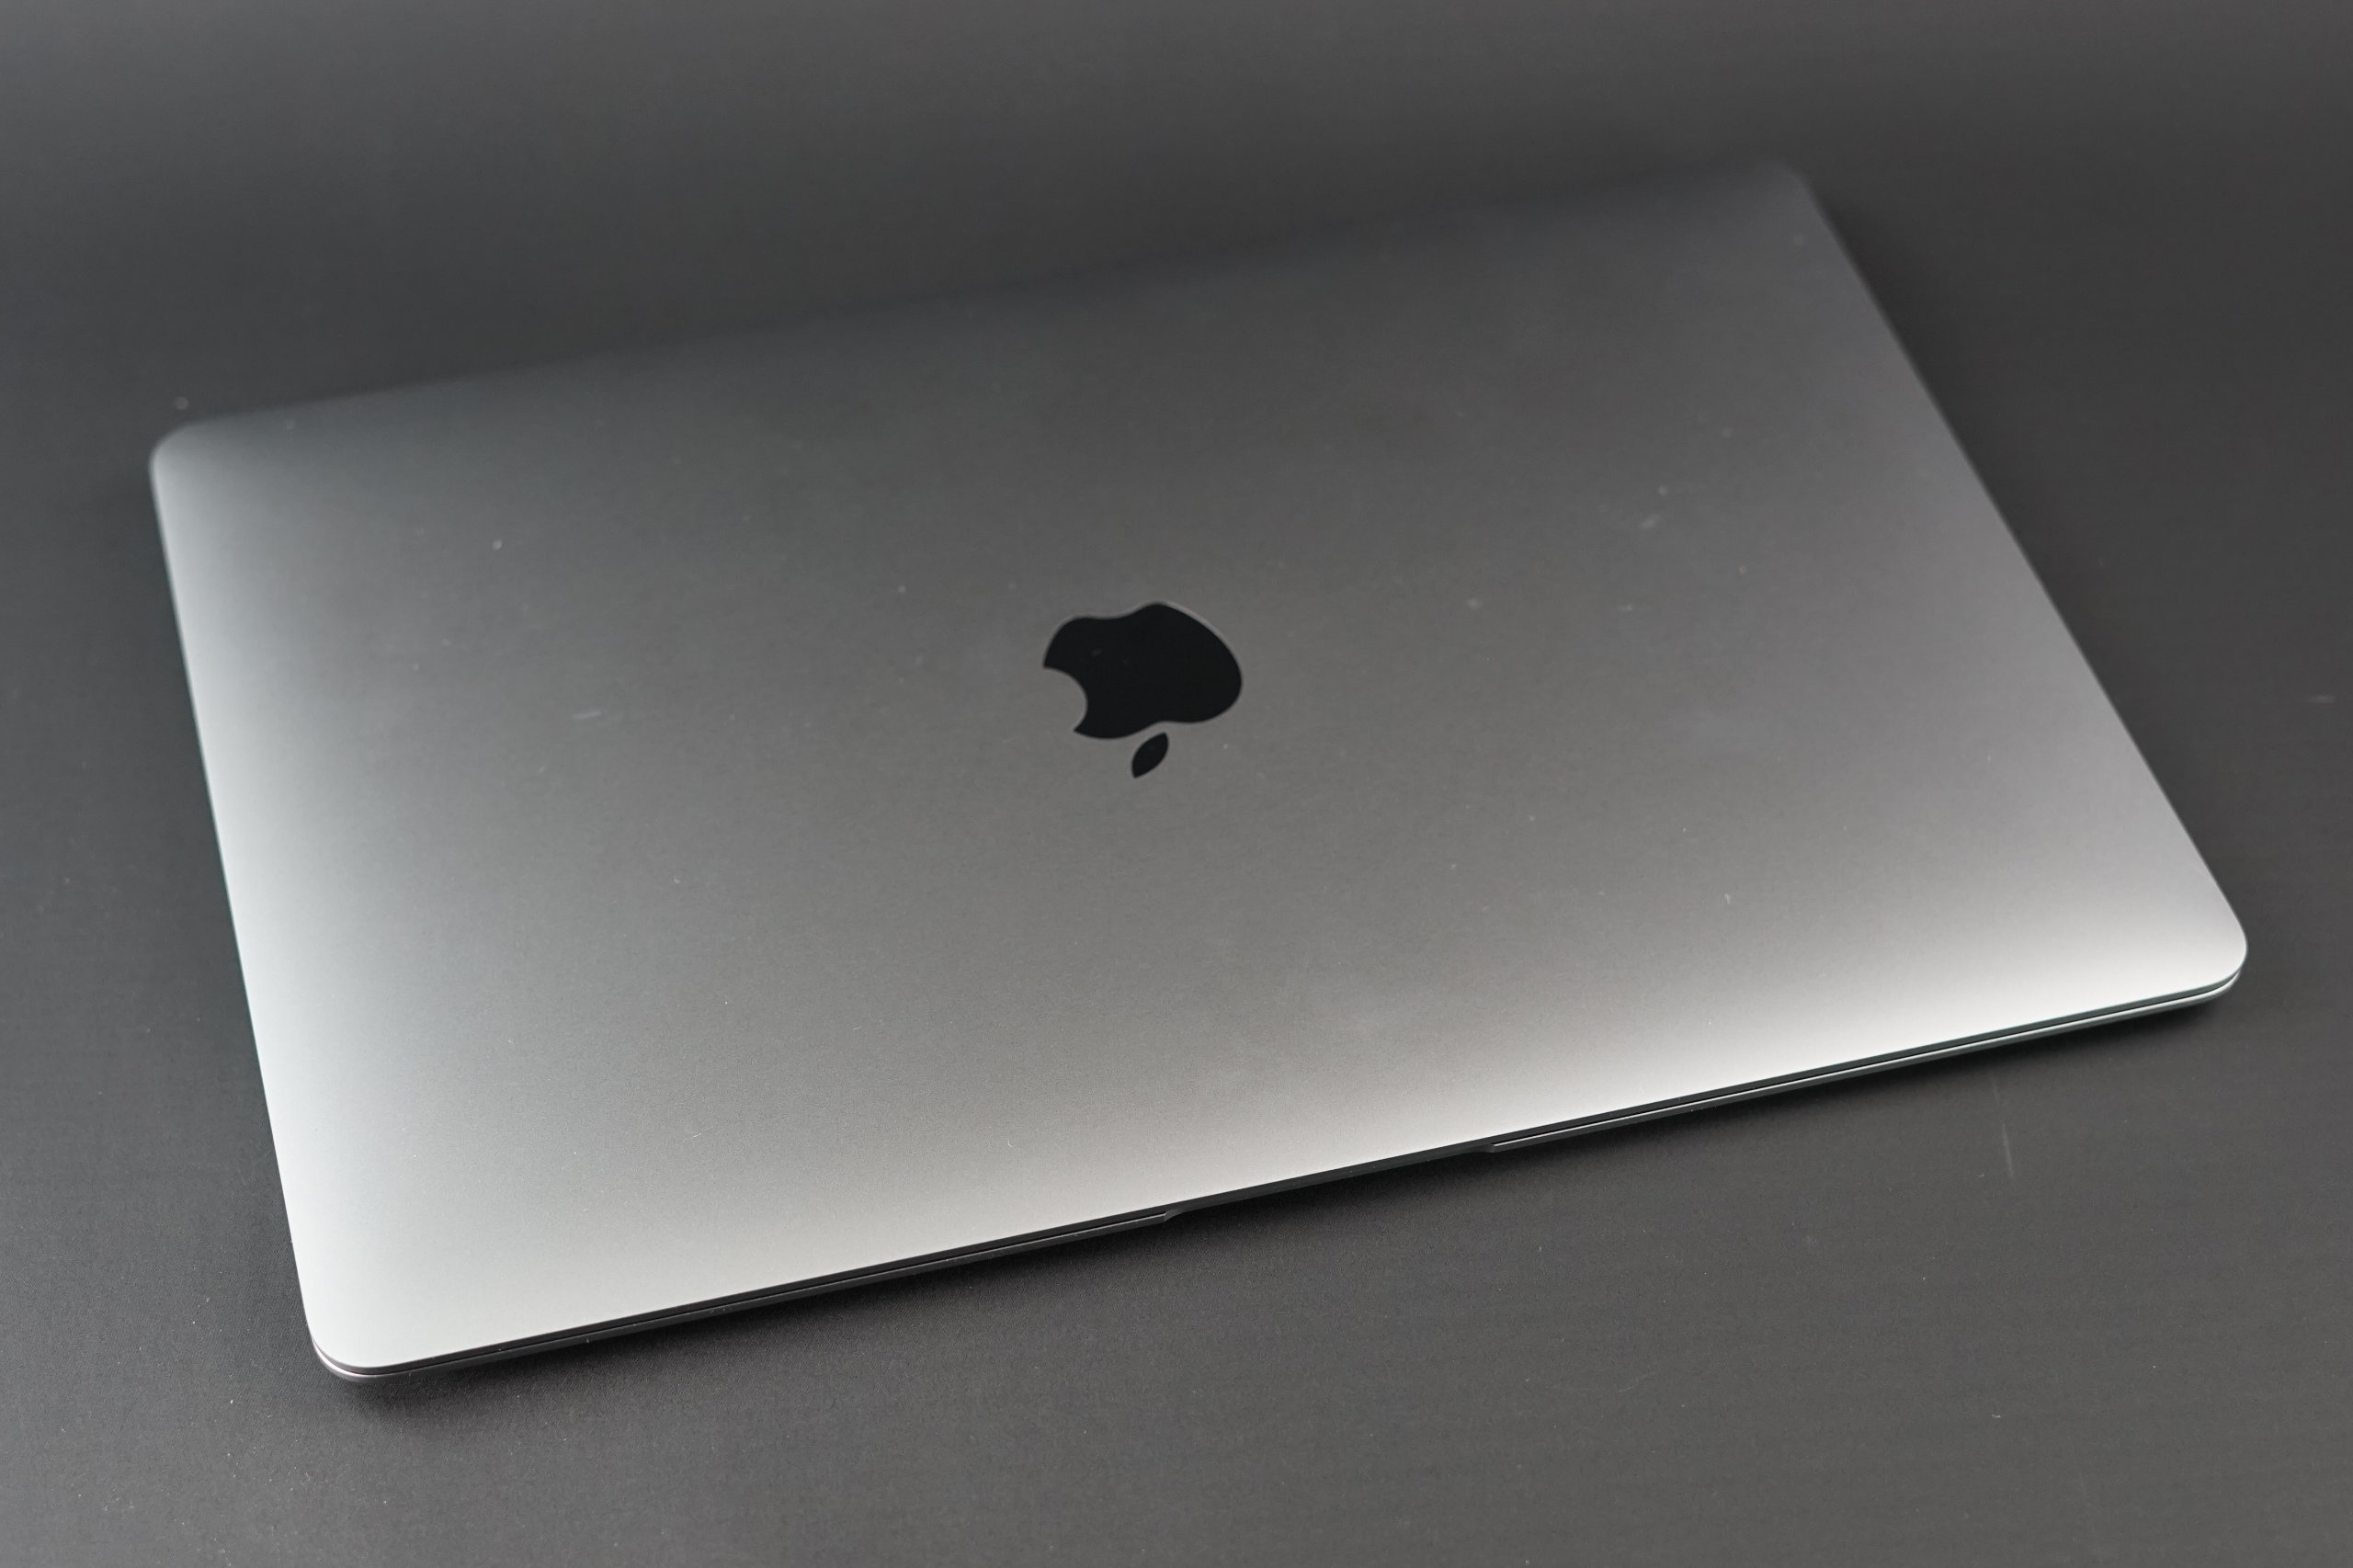
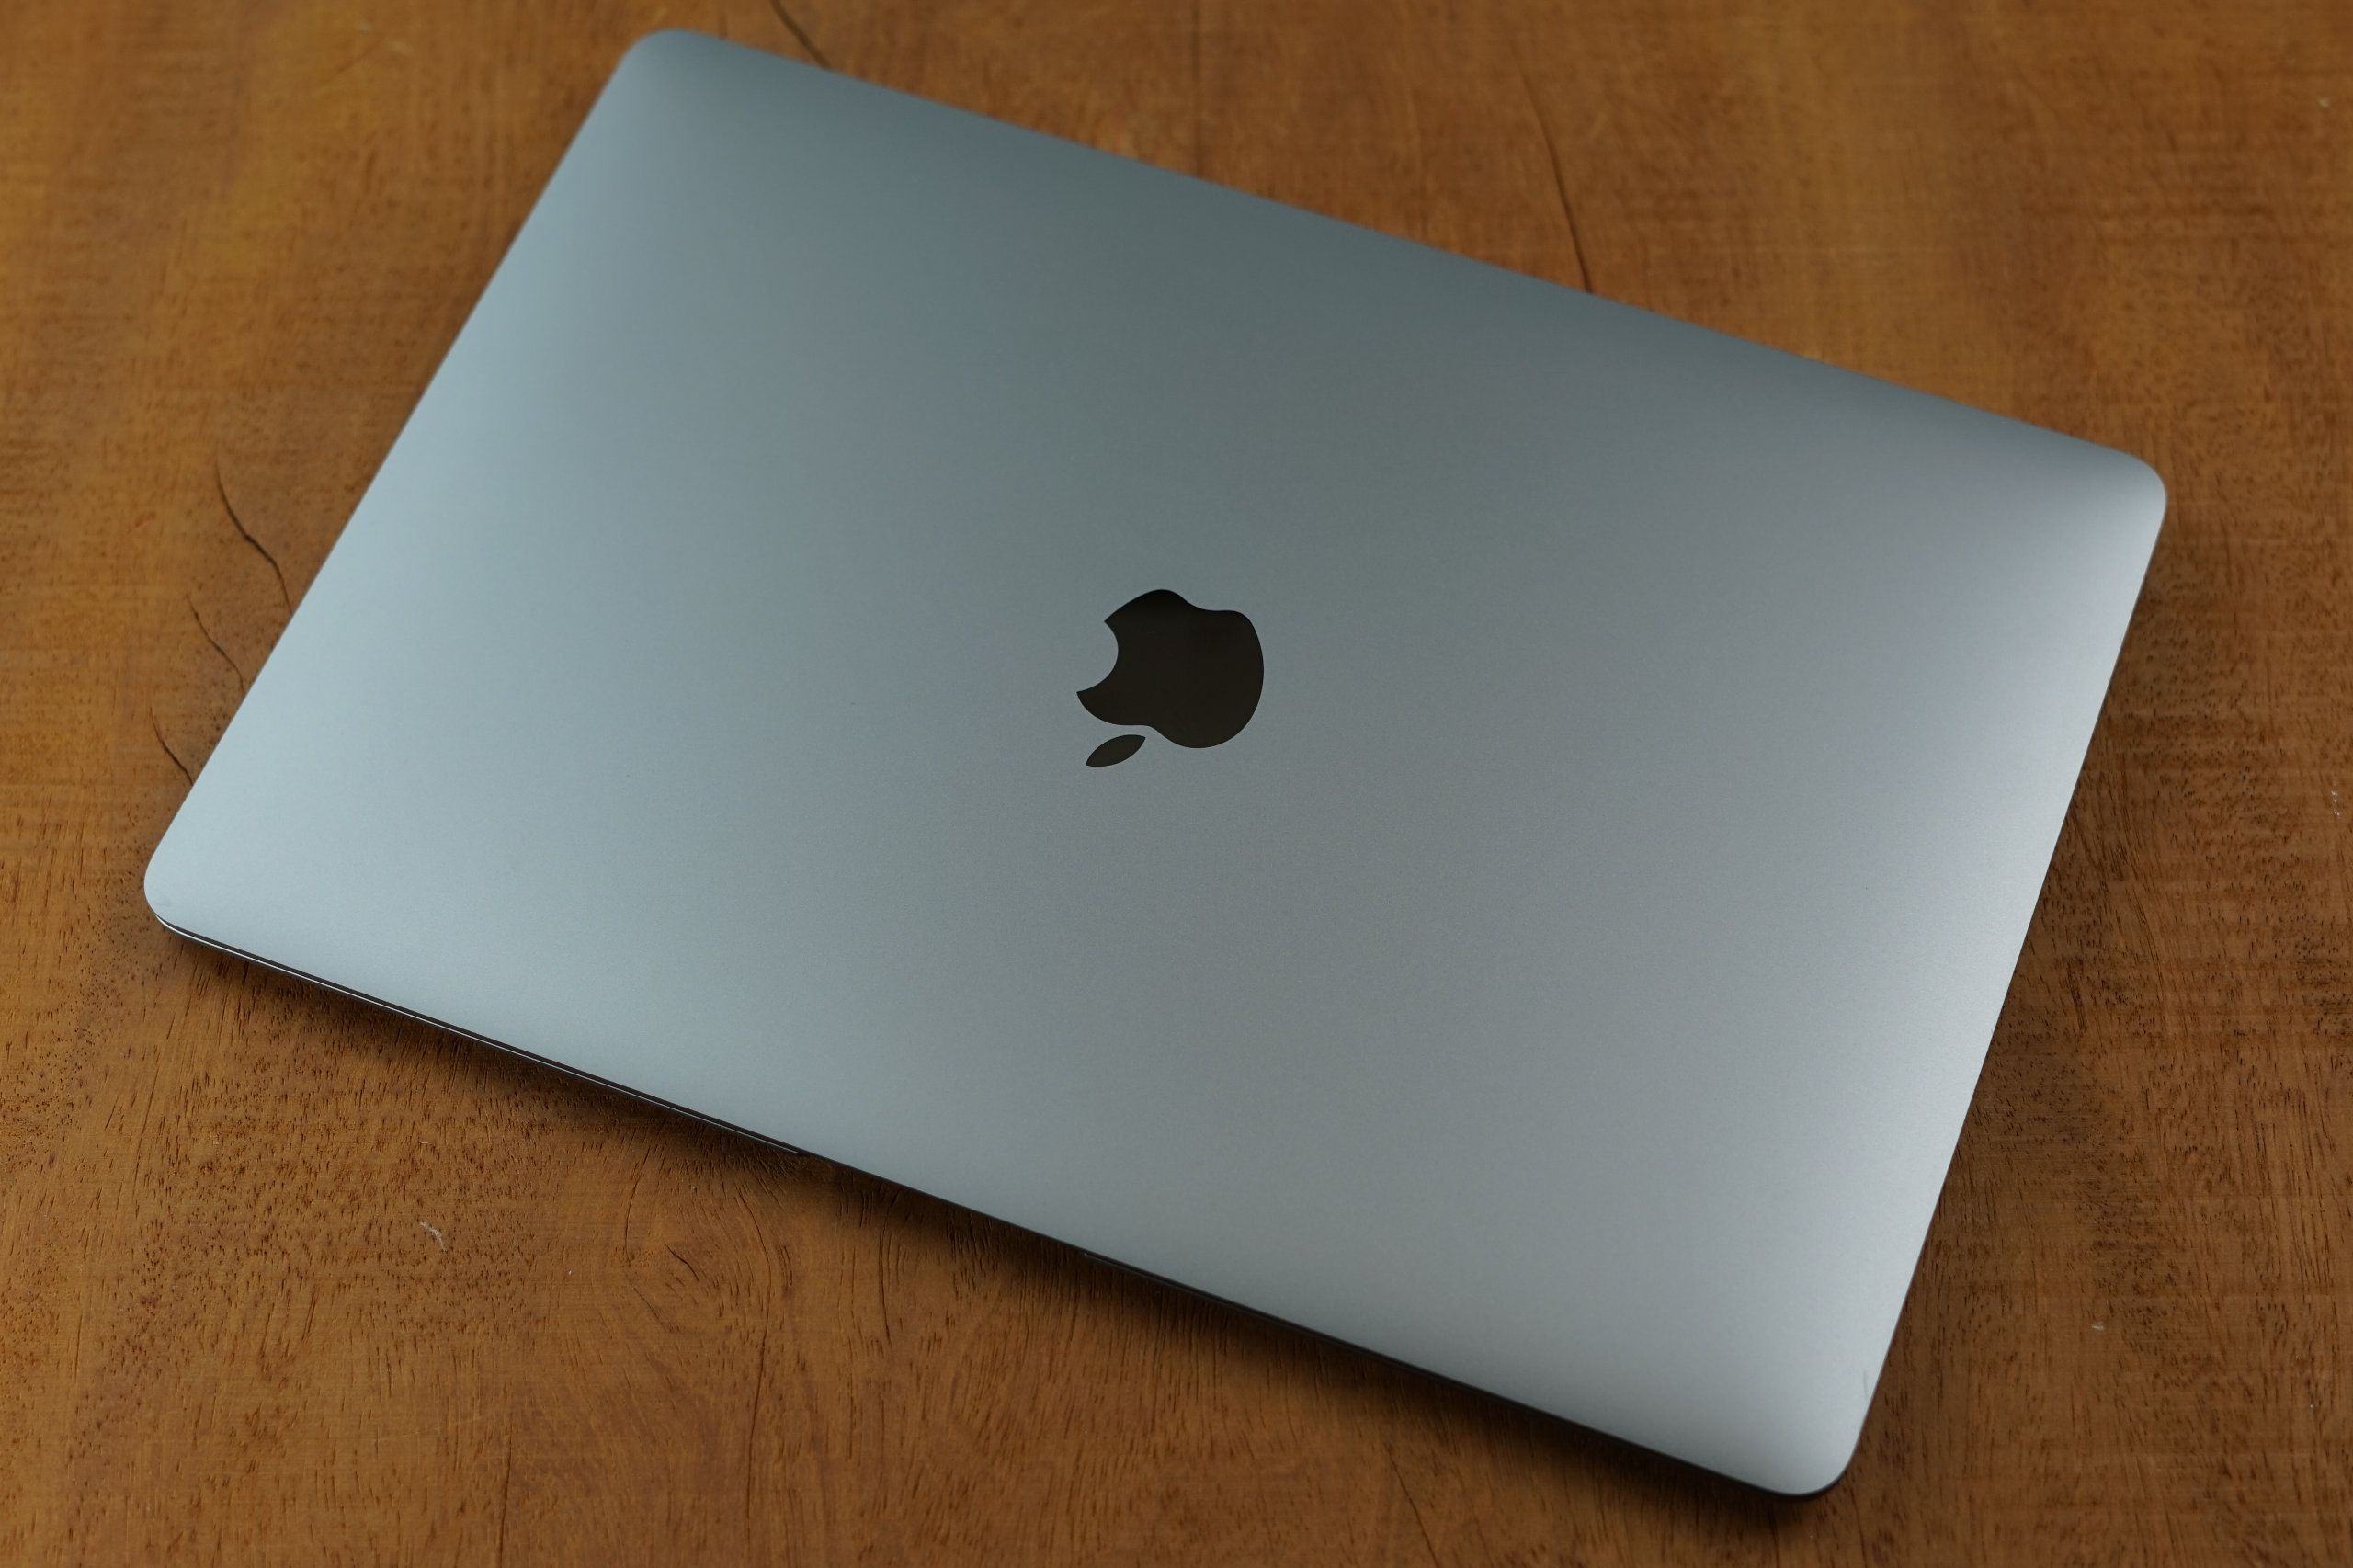
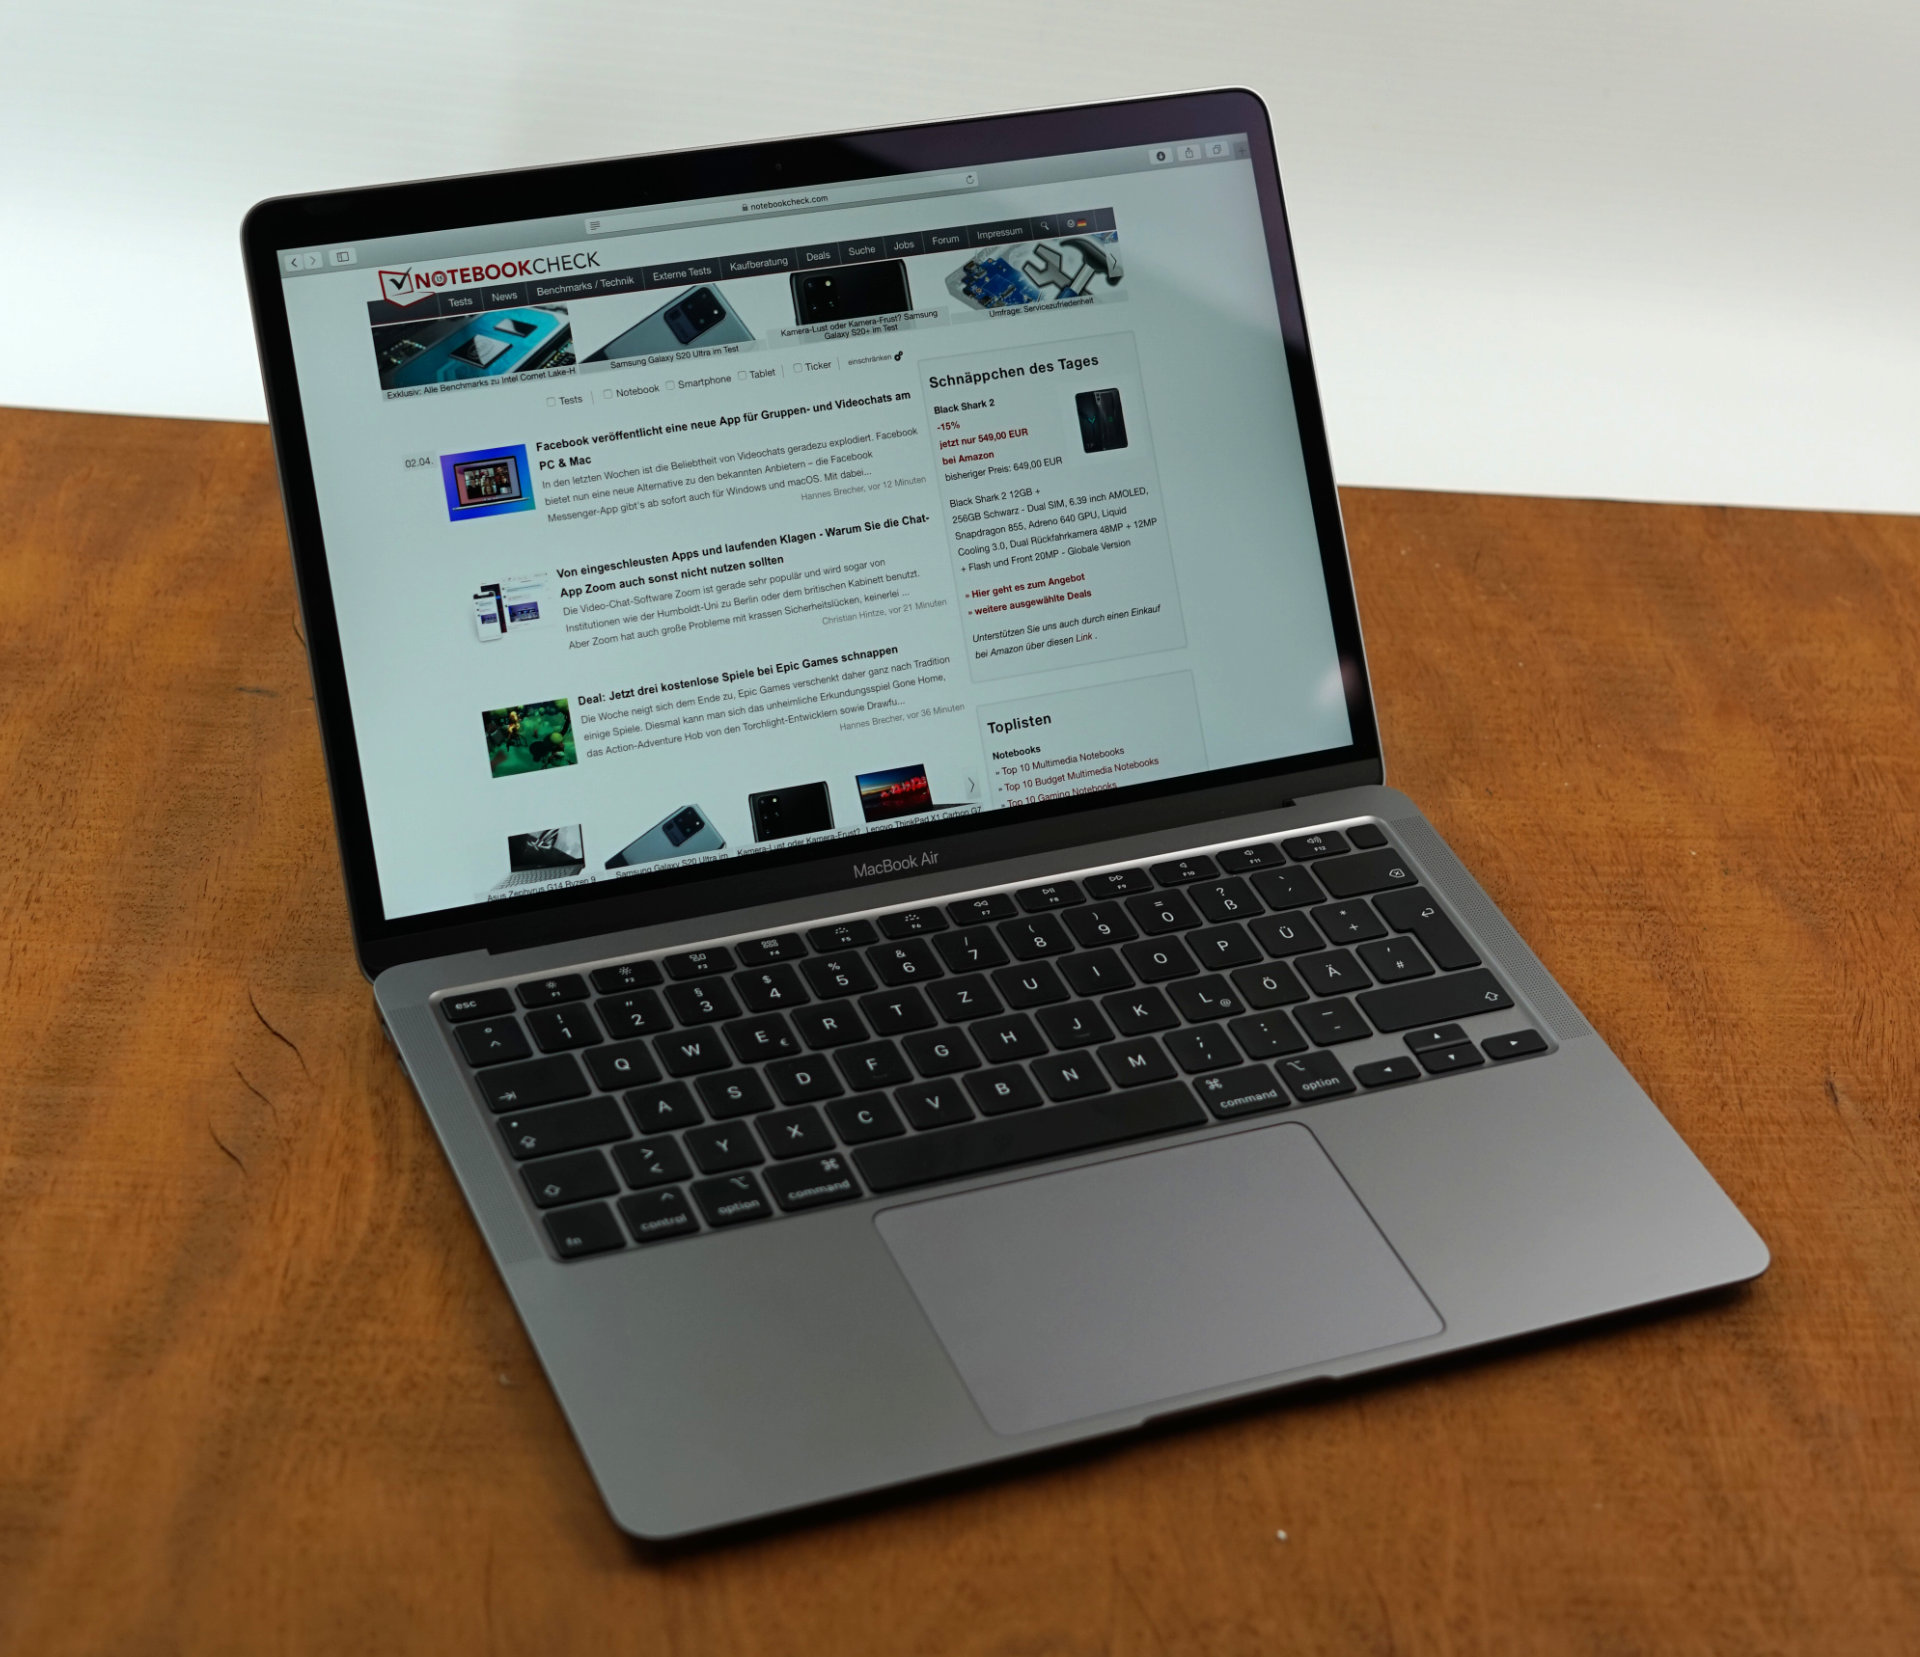
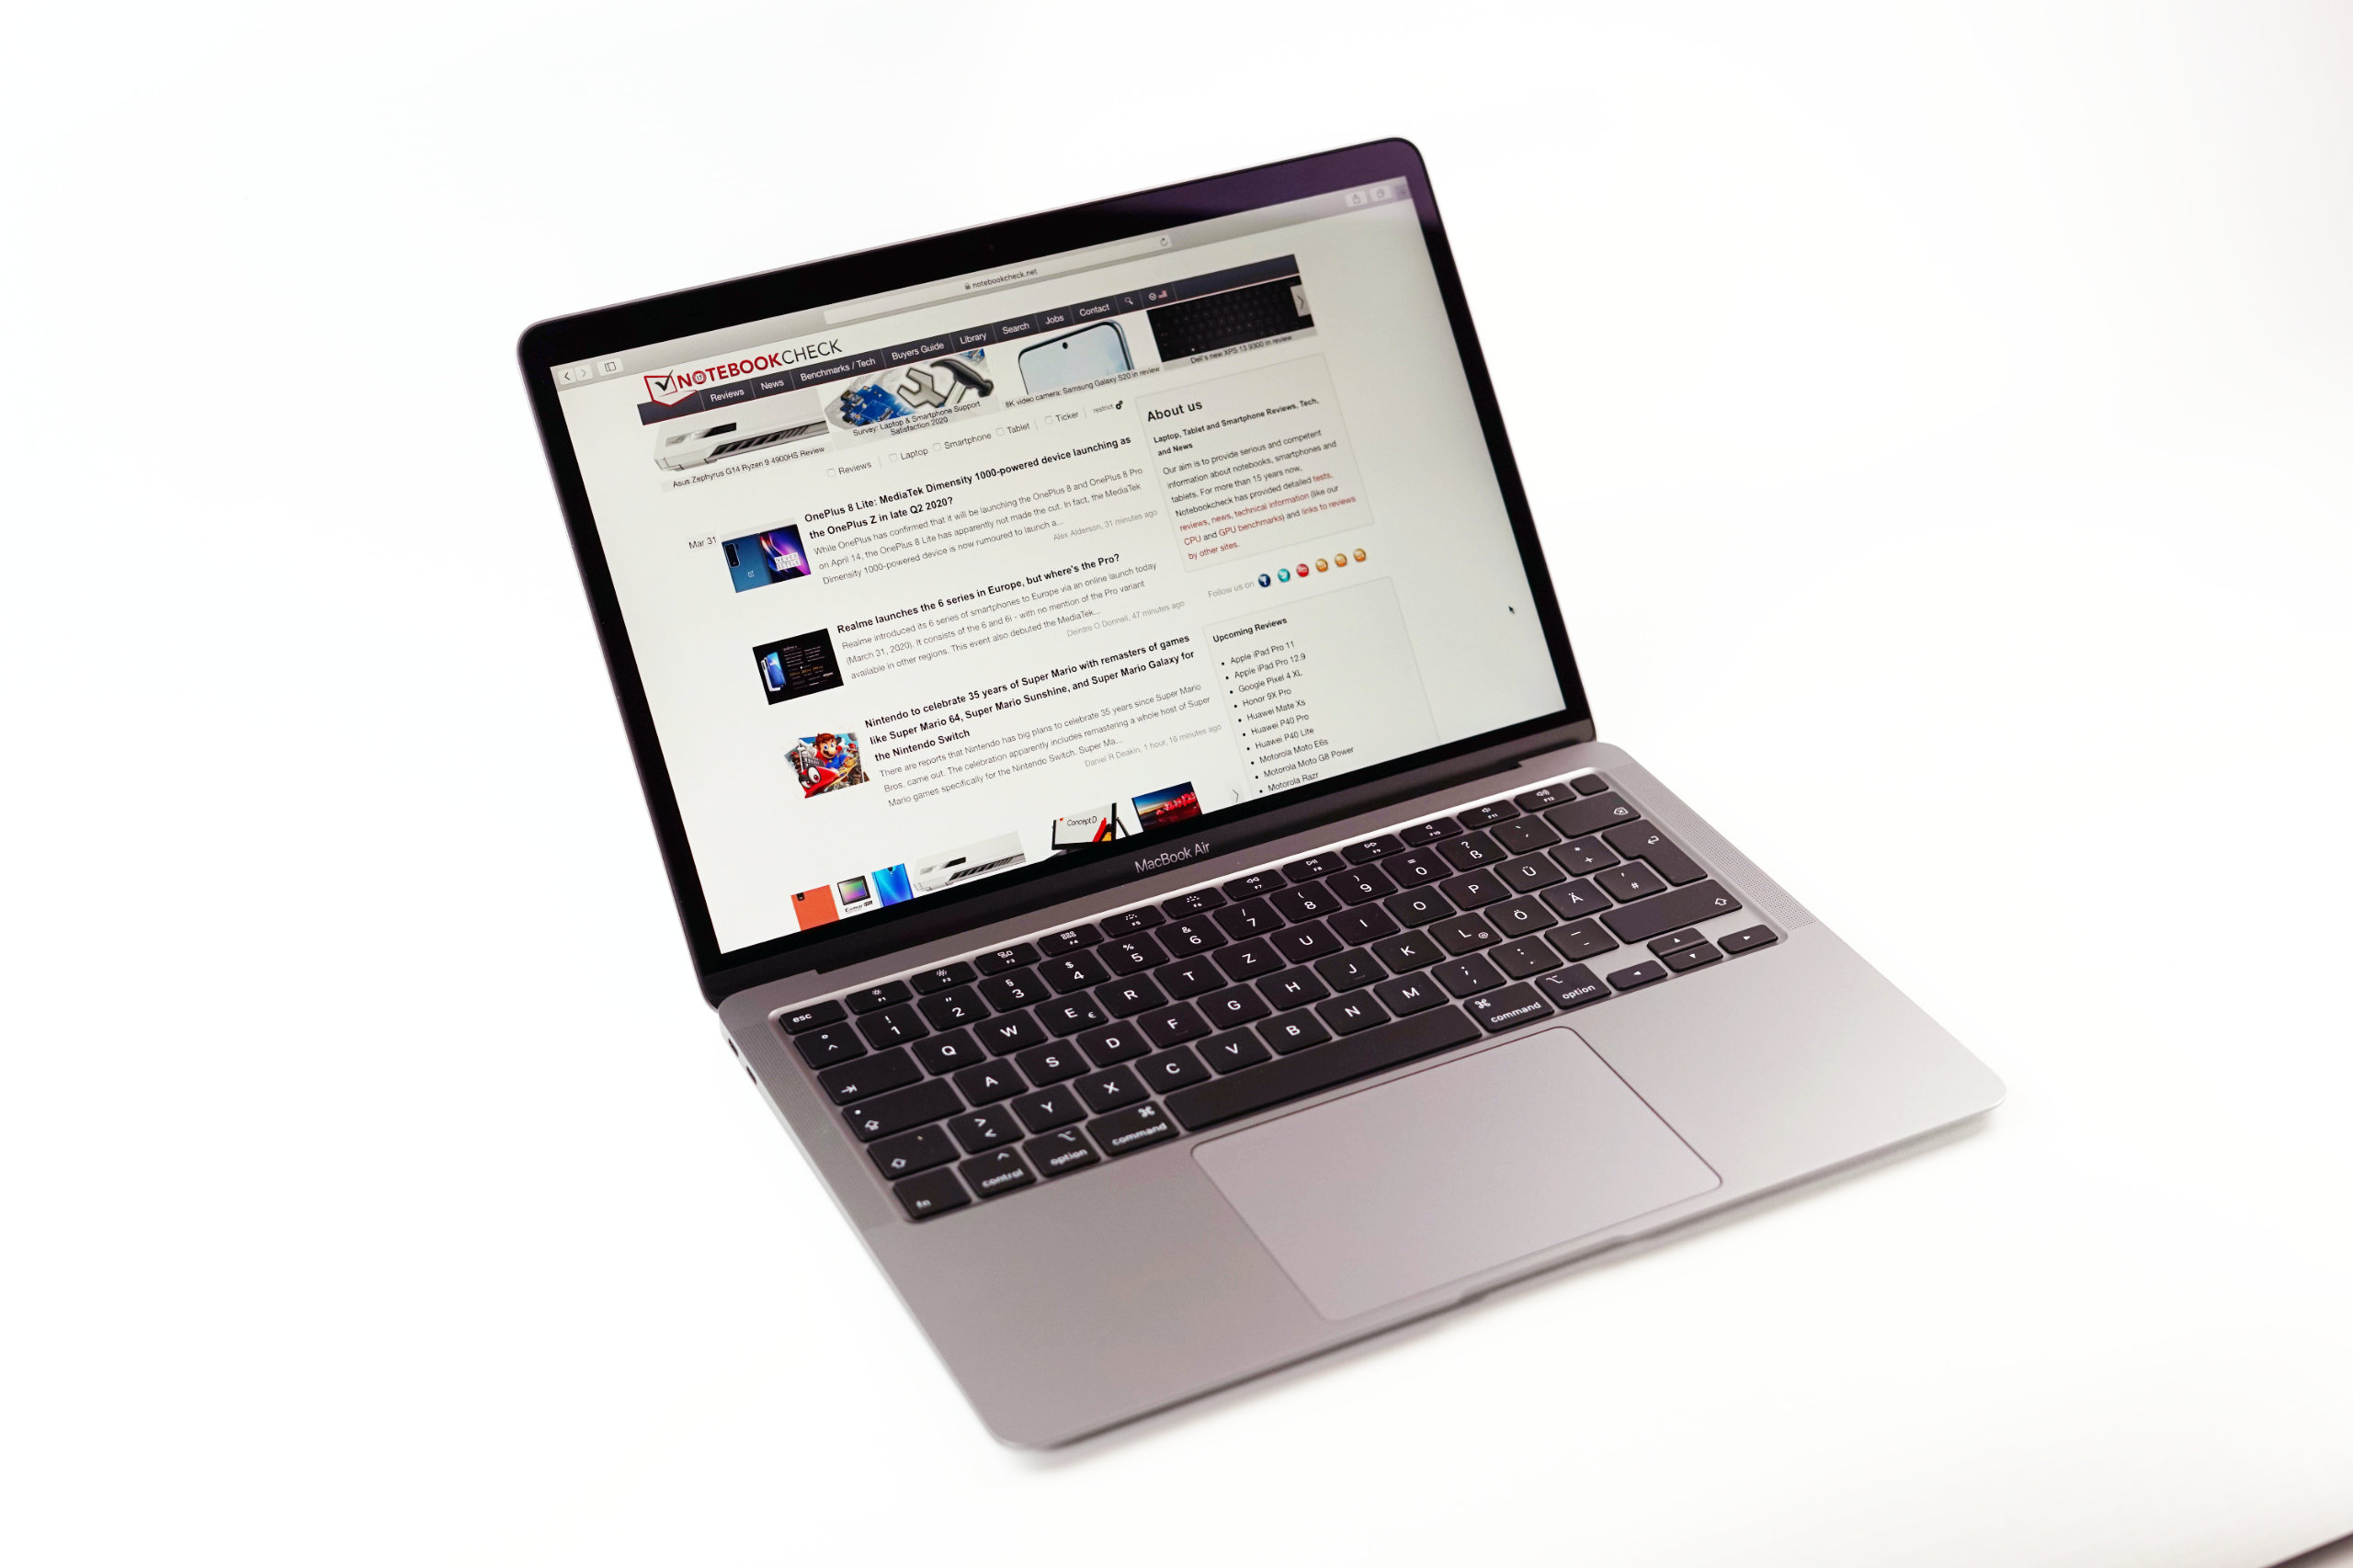
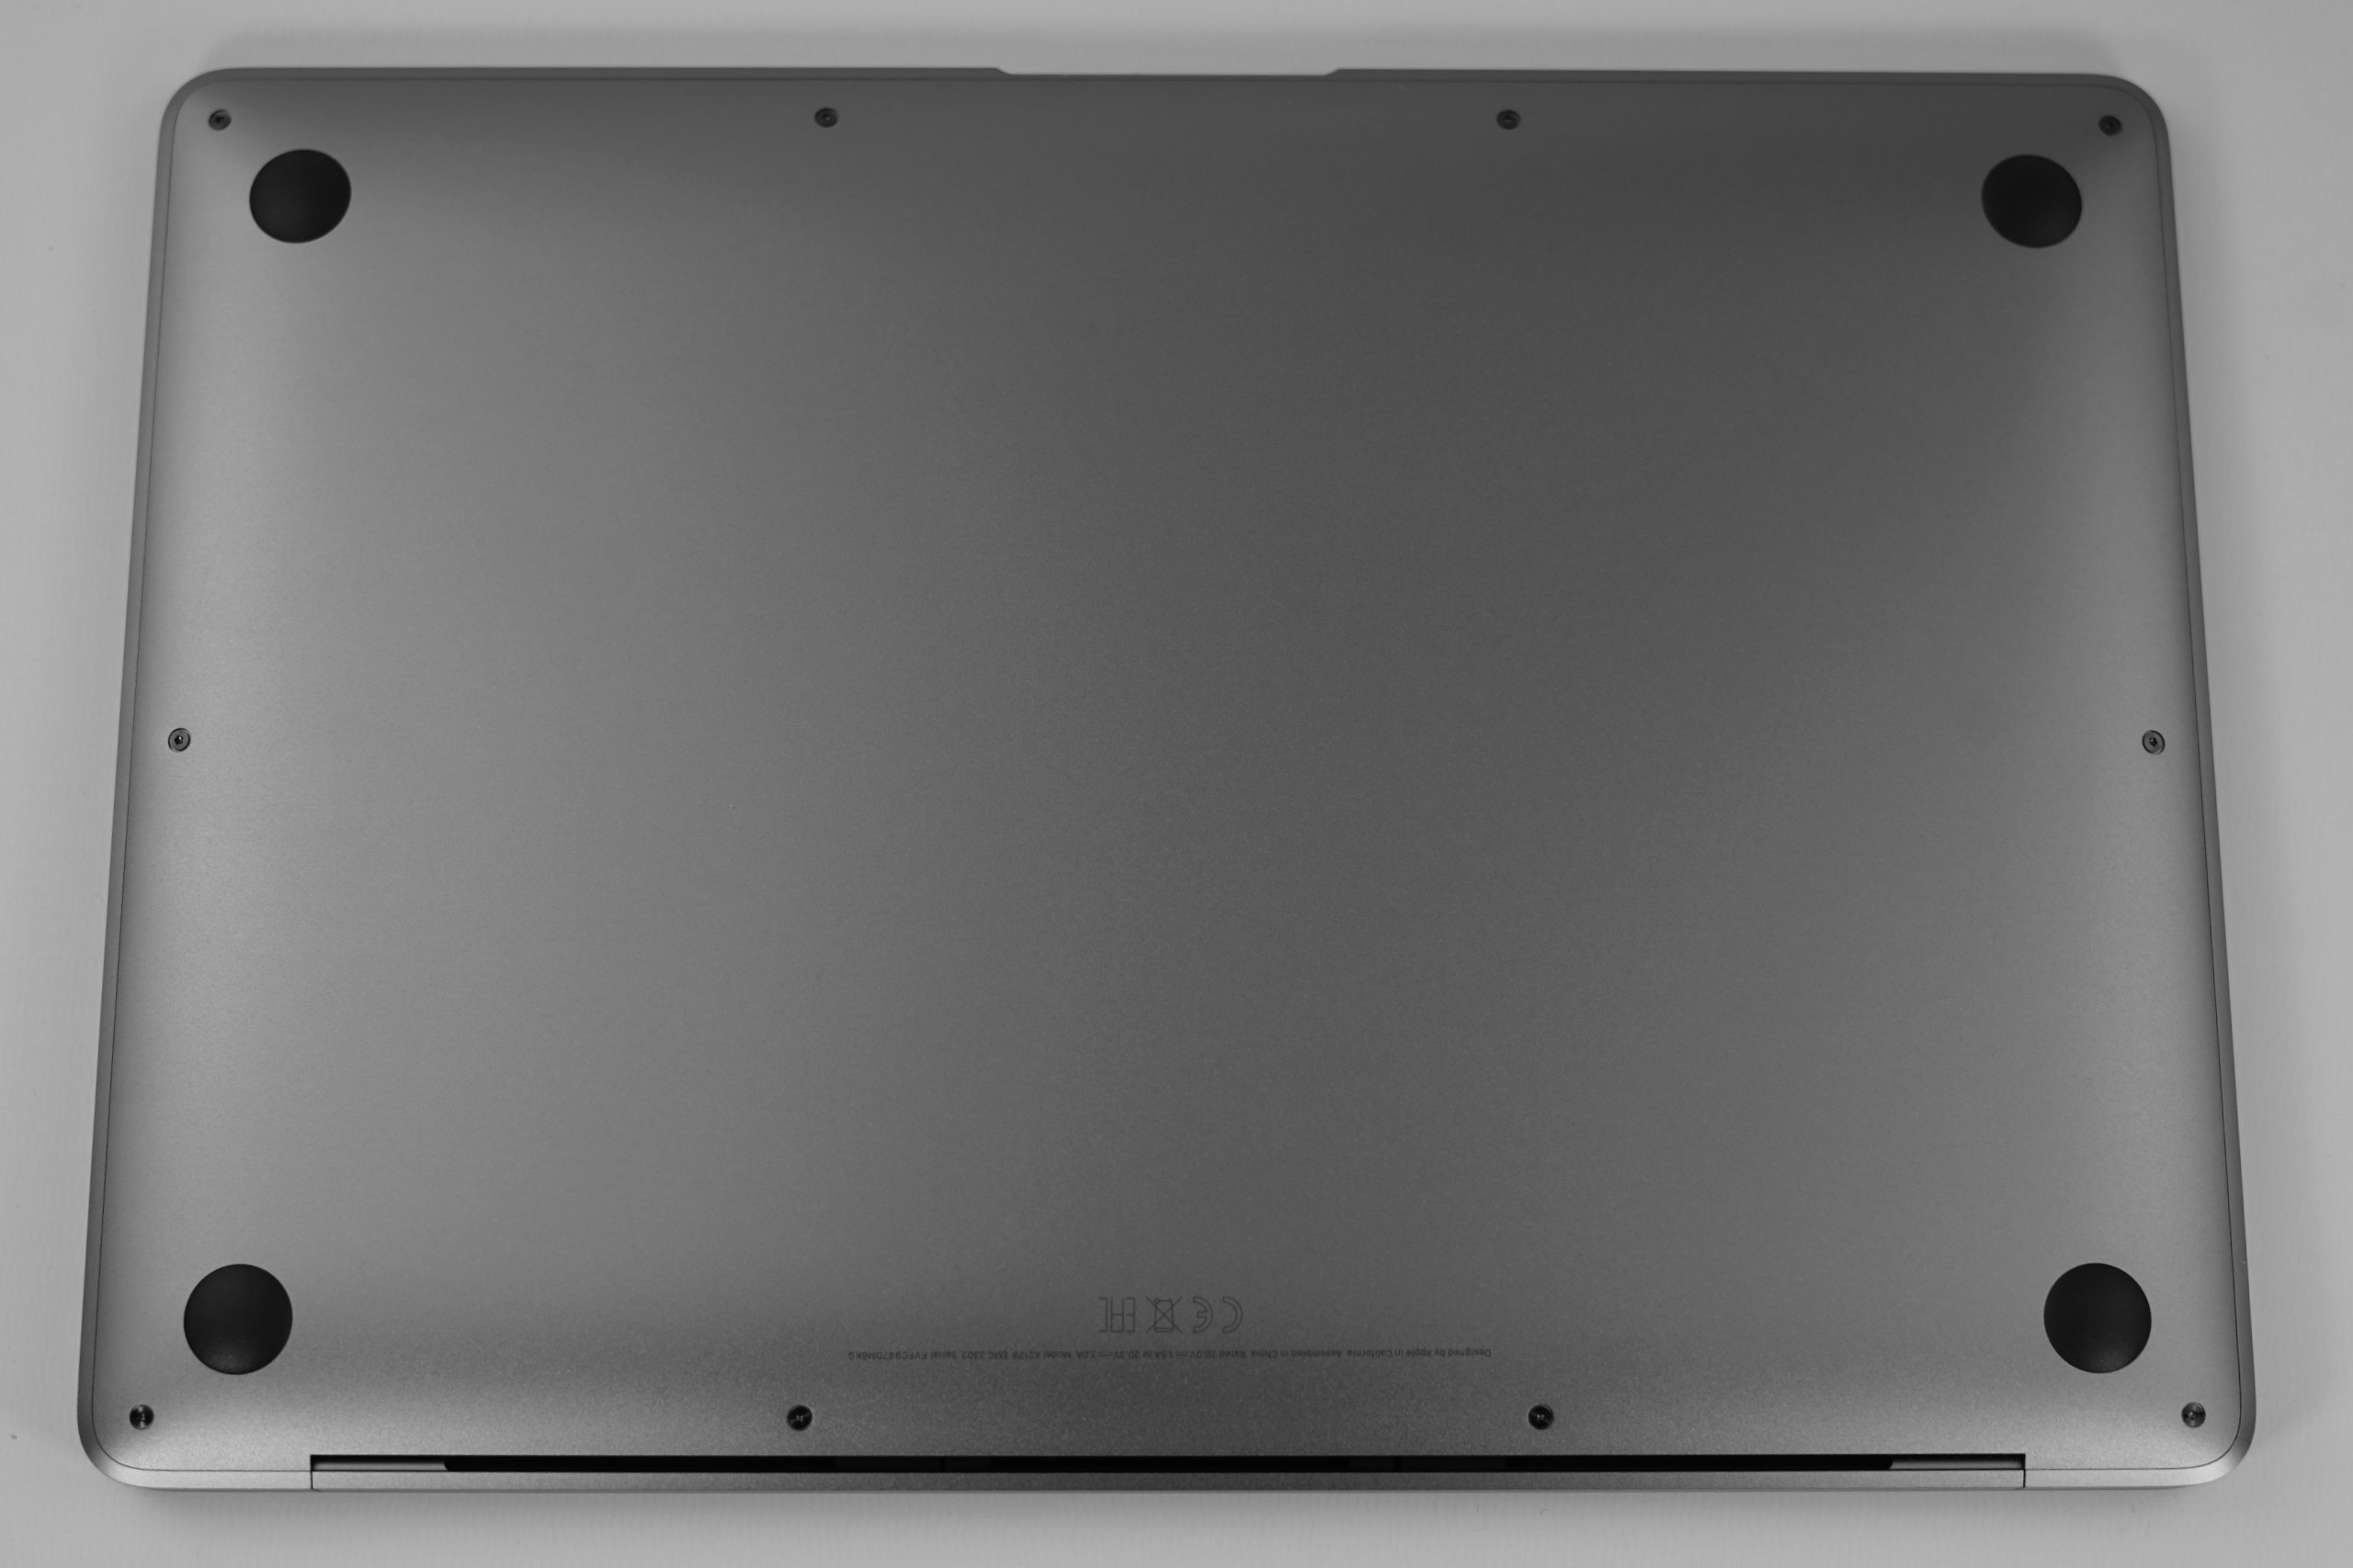
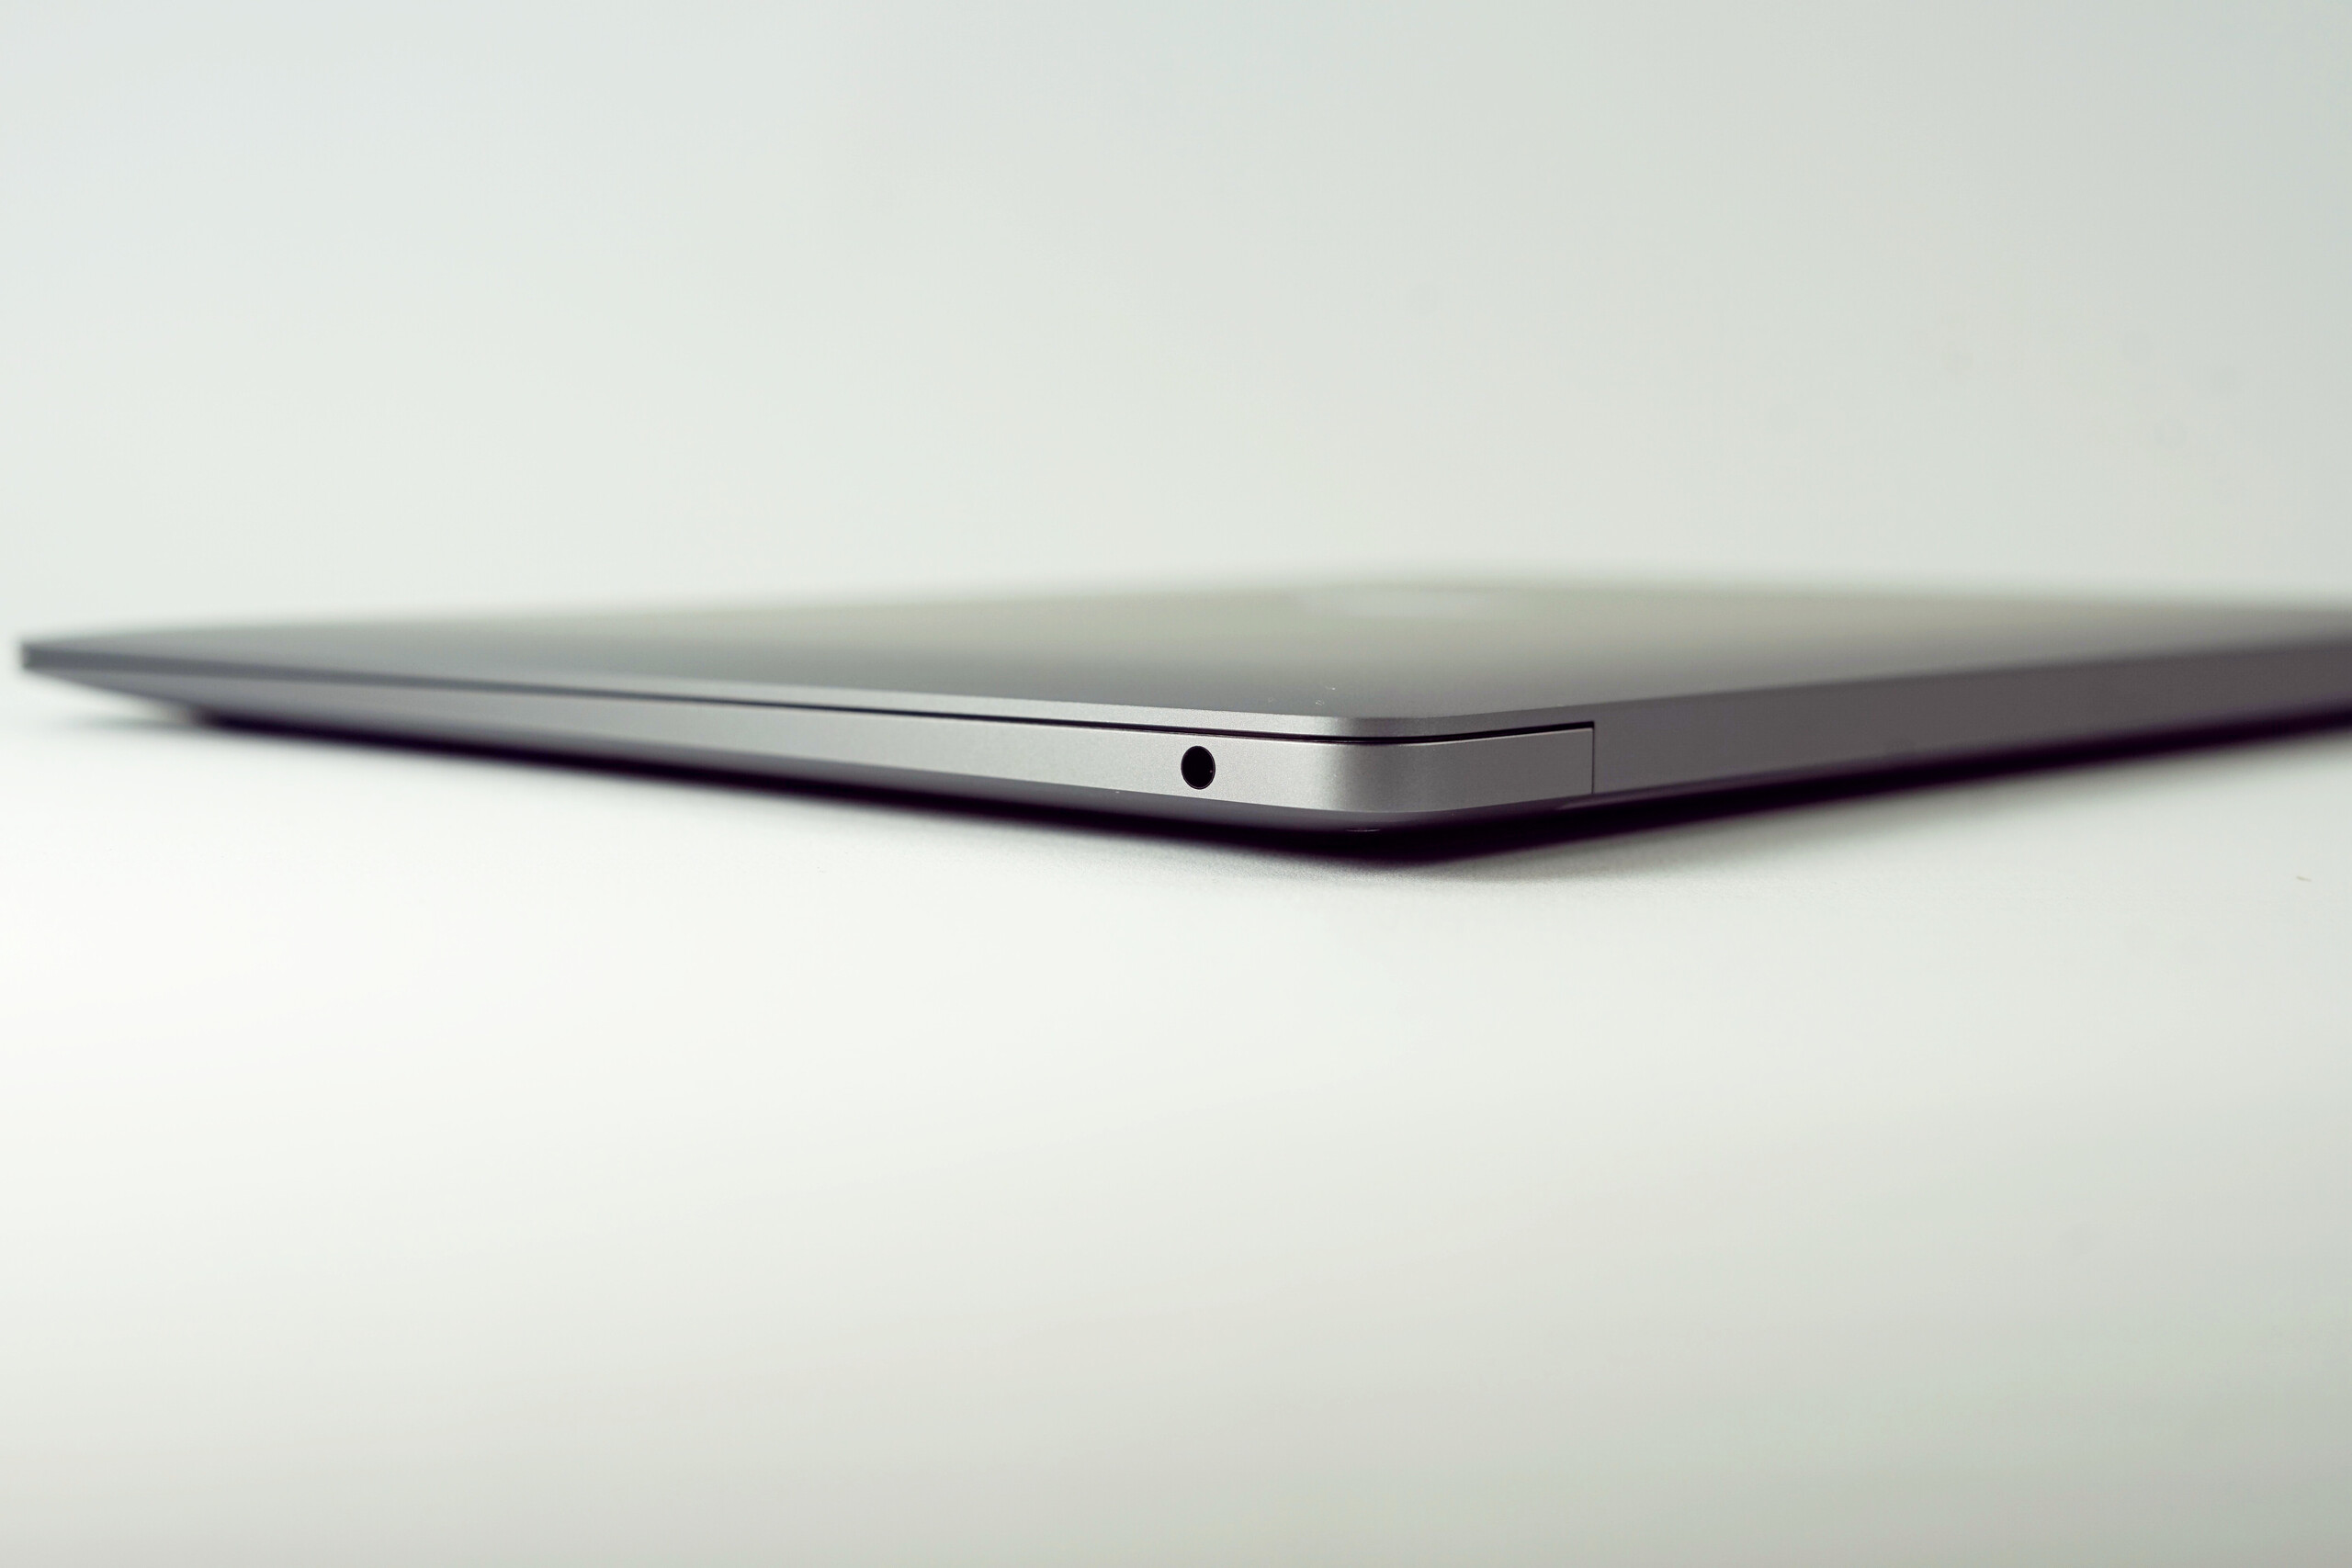
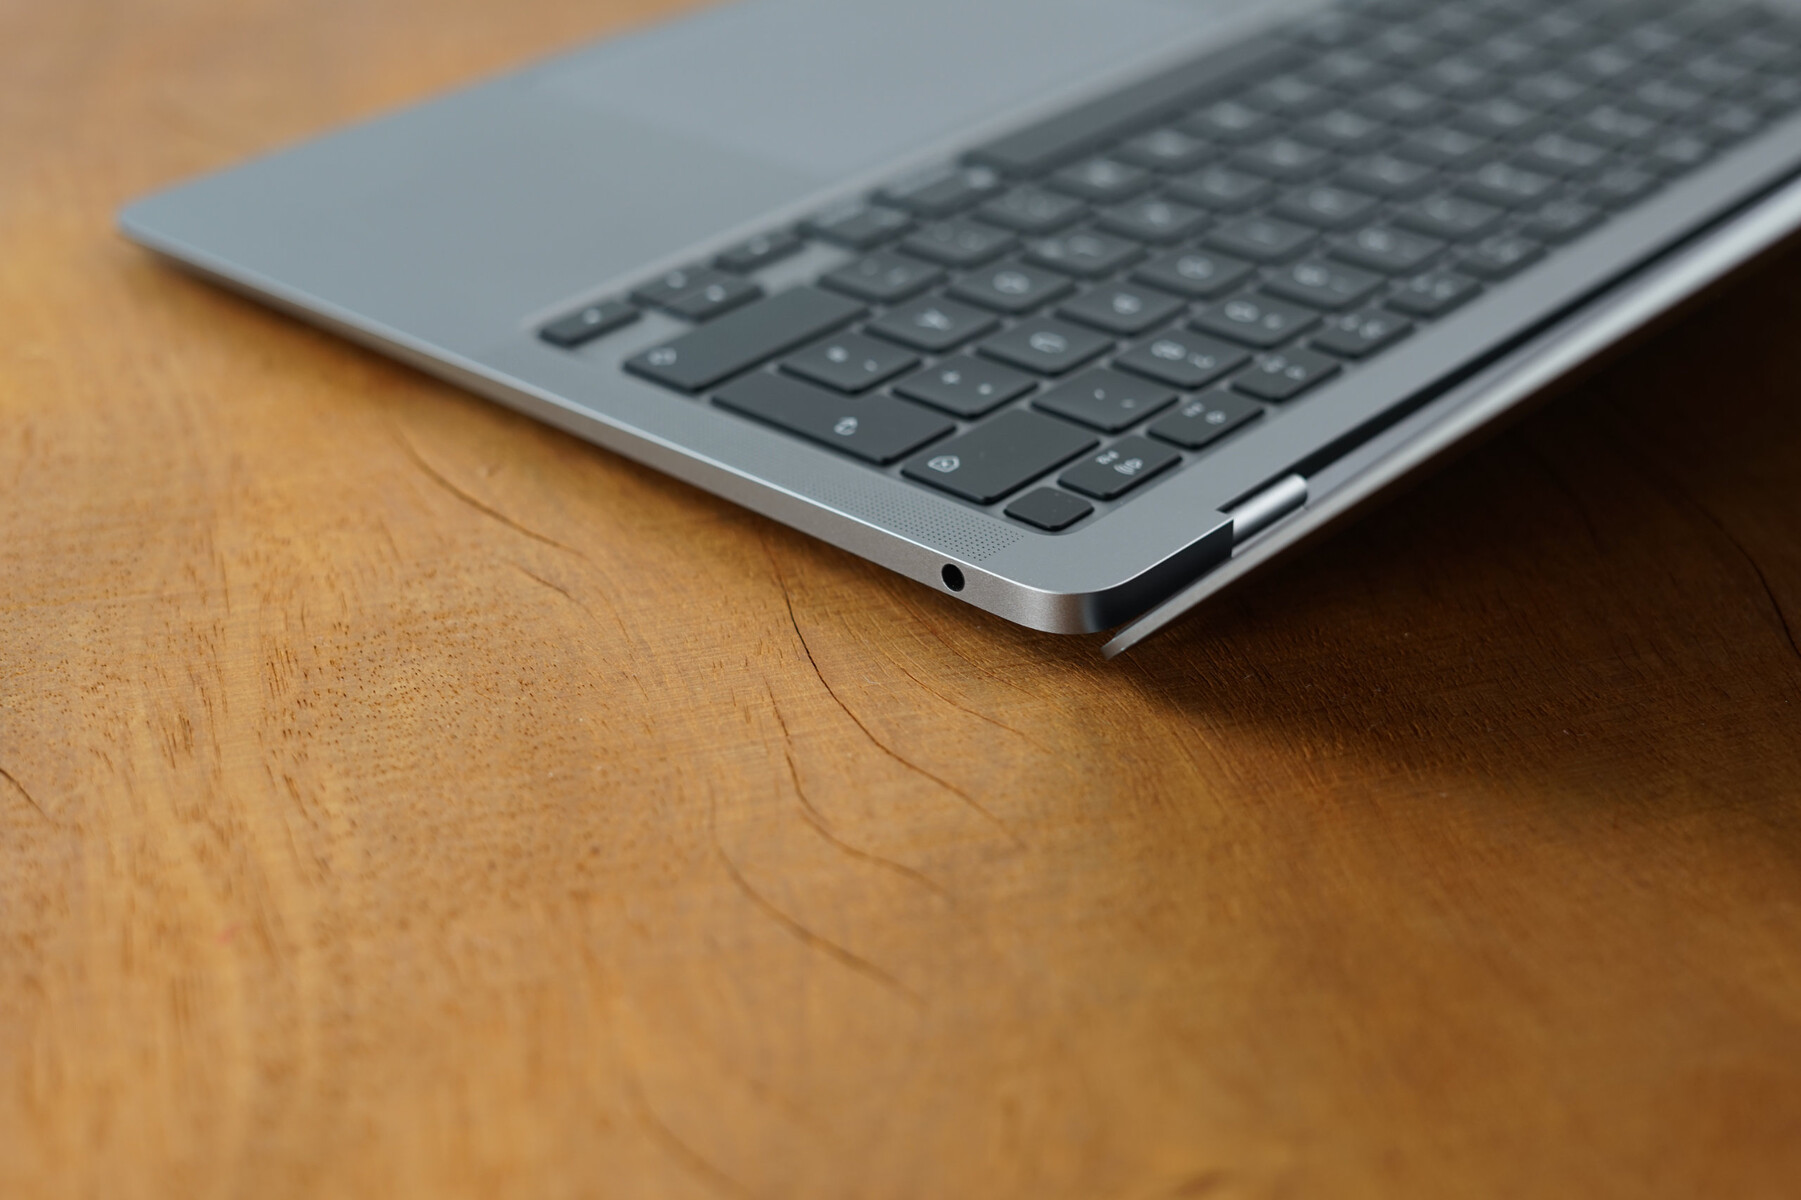
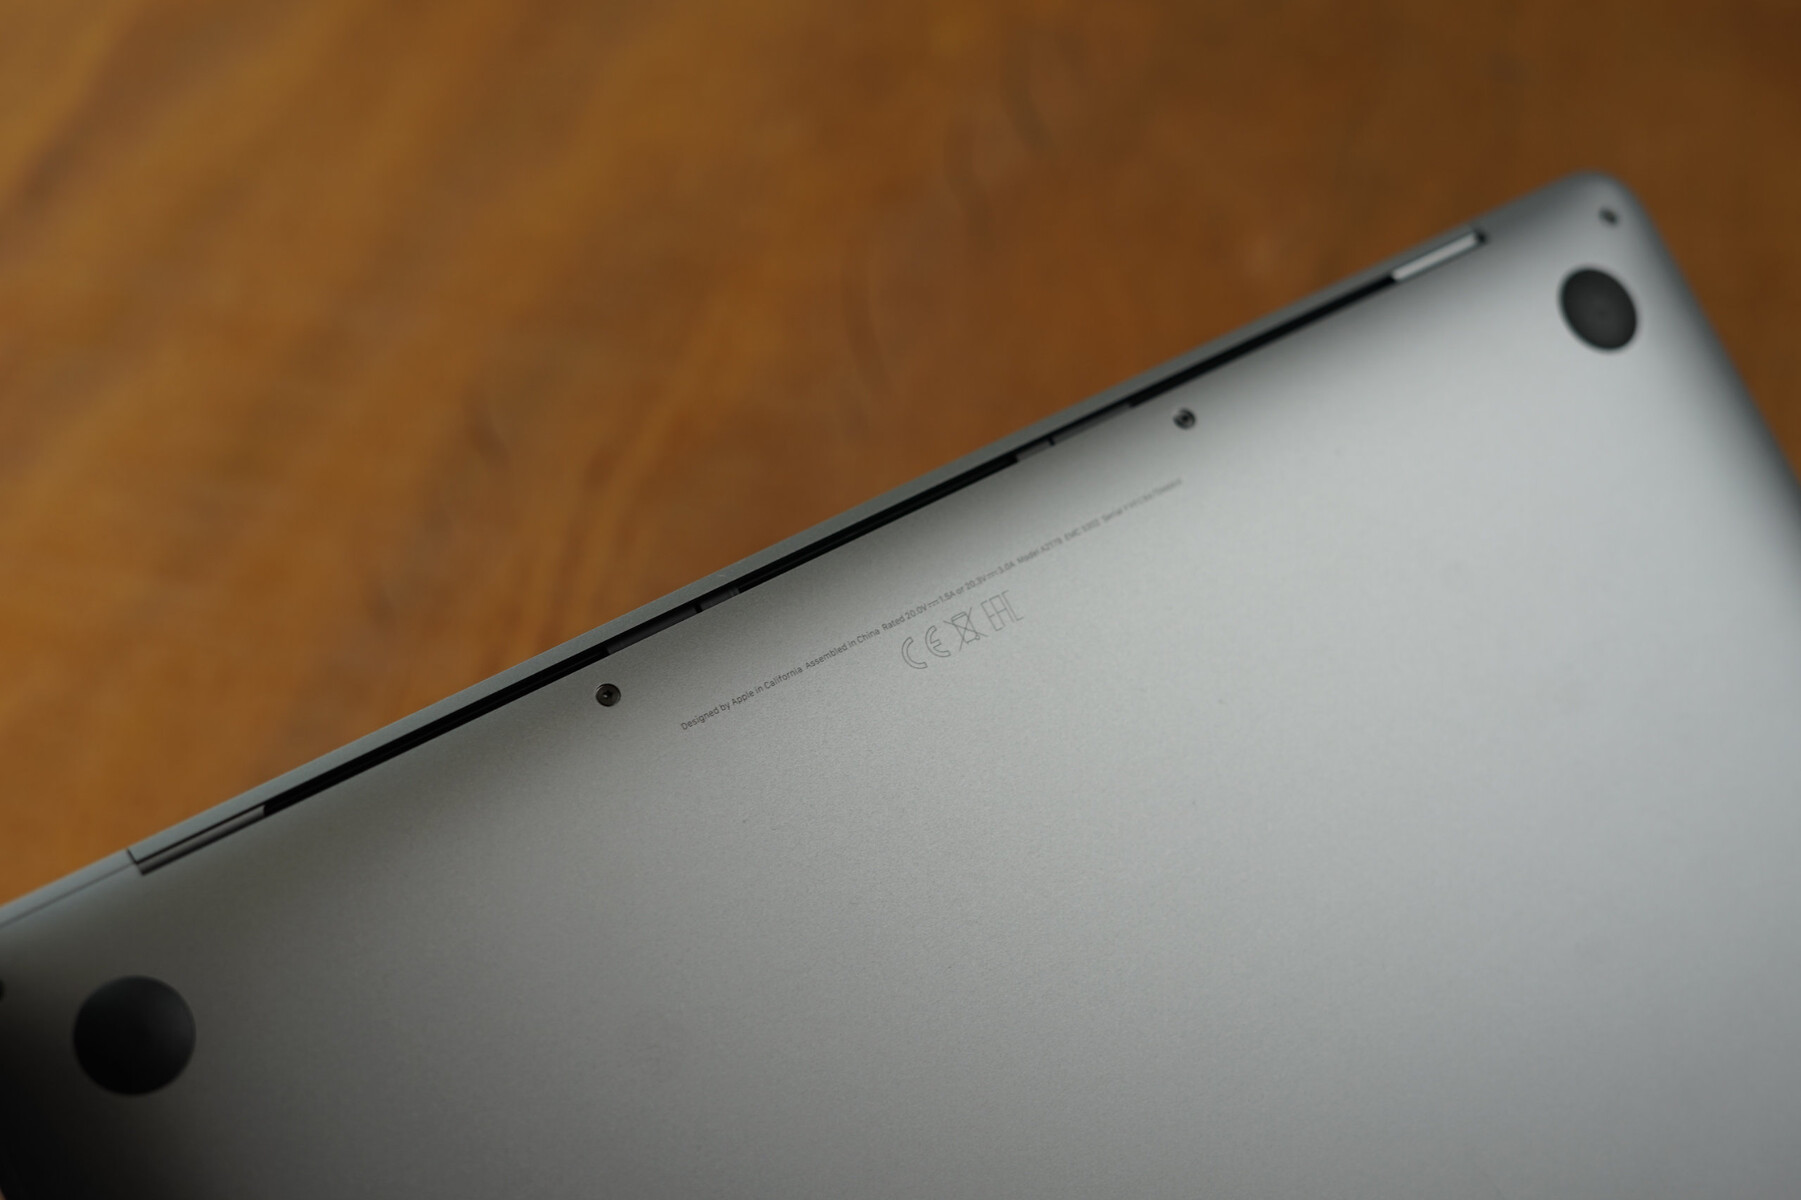
The case is basically identical to the previous version of the MacBook Air. it is still a very compact, lightweight, and slim laptop. However, the 2020 model is slightly thicker at the rear, but you will have a hard time noticing the difference between 16.1 vs. 15.9 mm (~0.634 x 0.625 inches) in the real world.
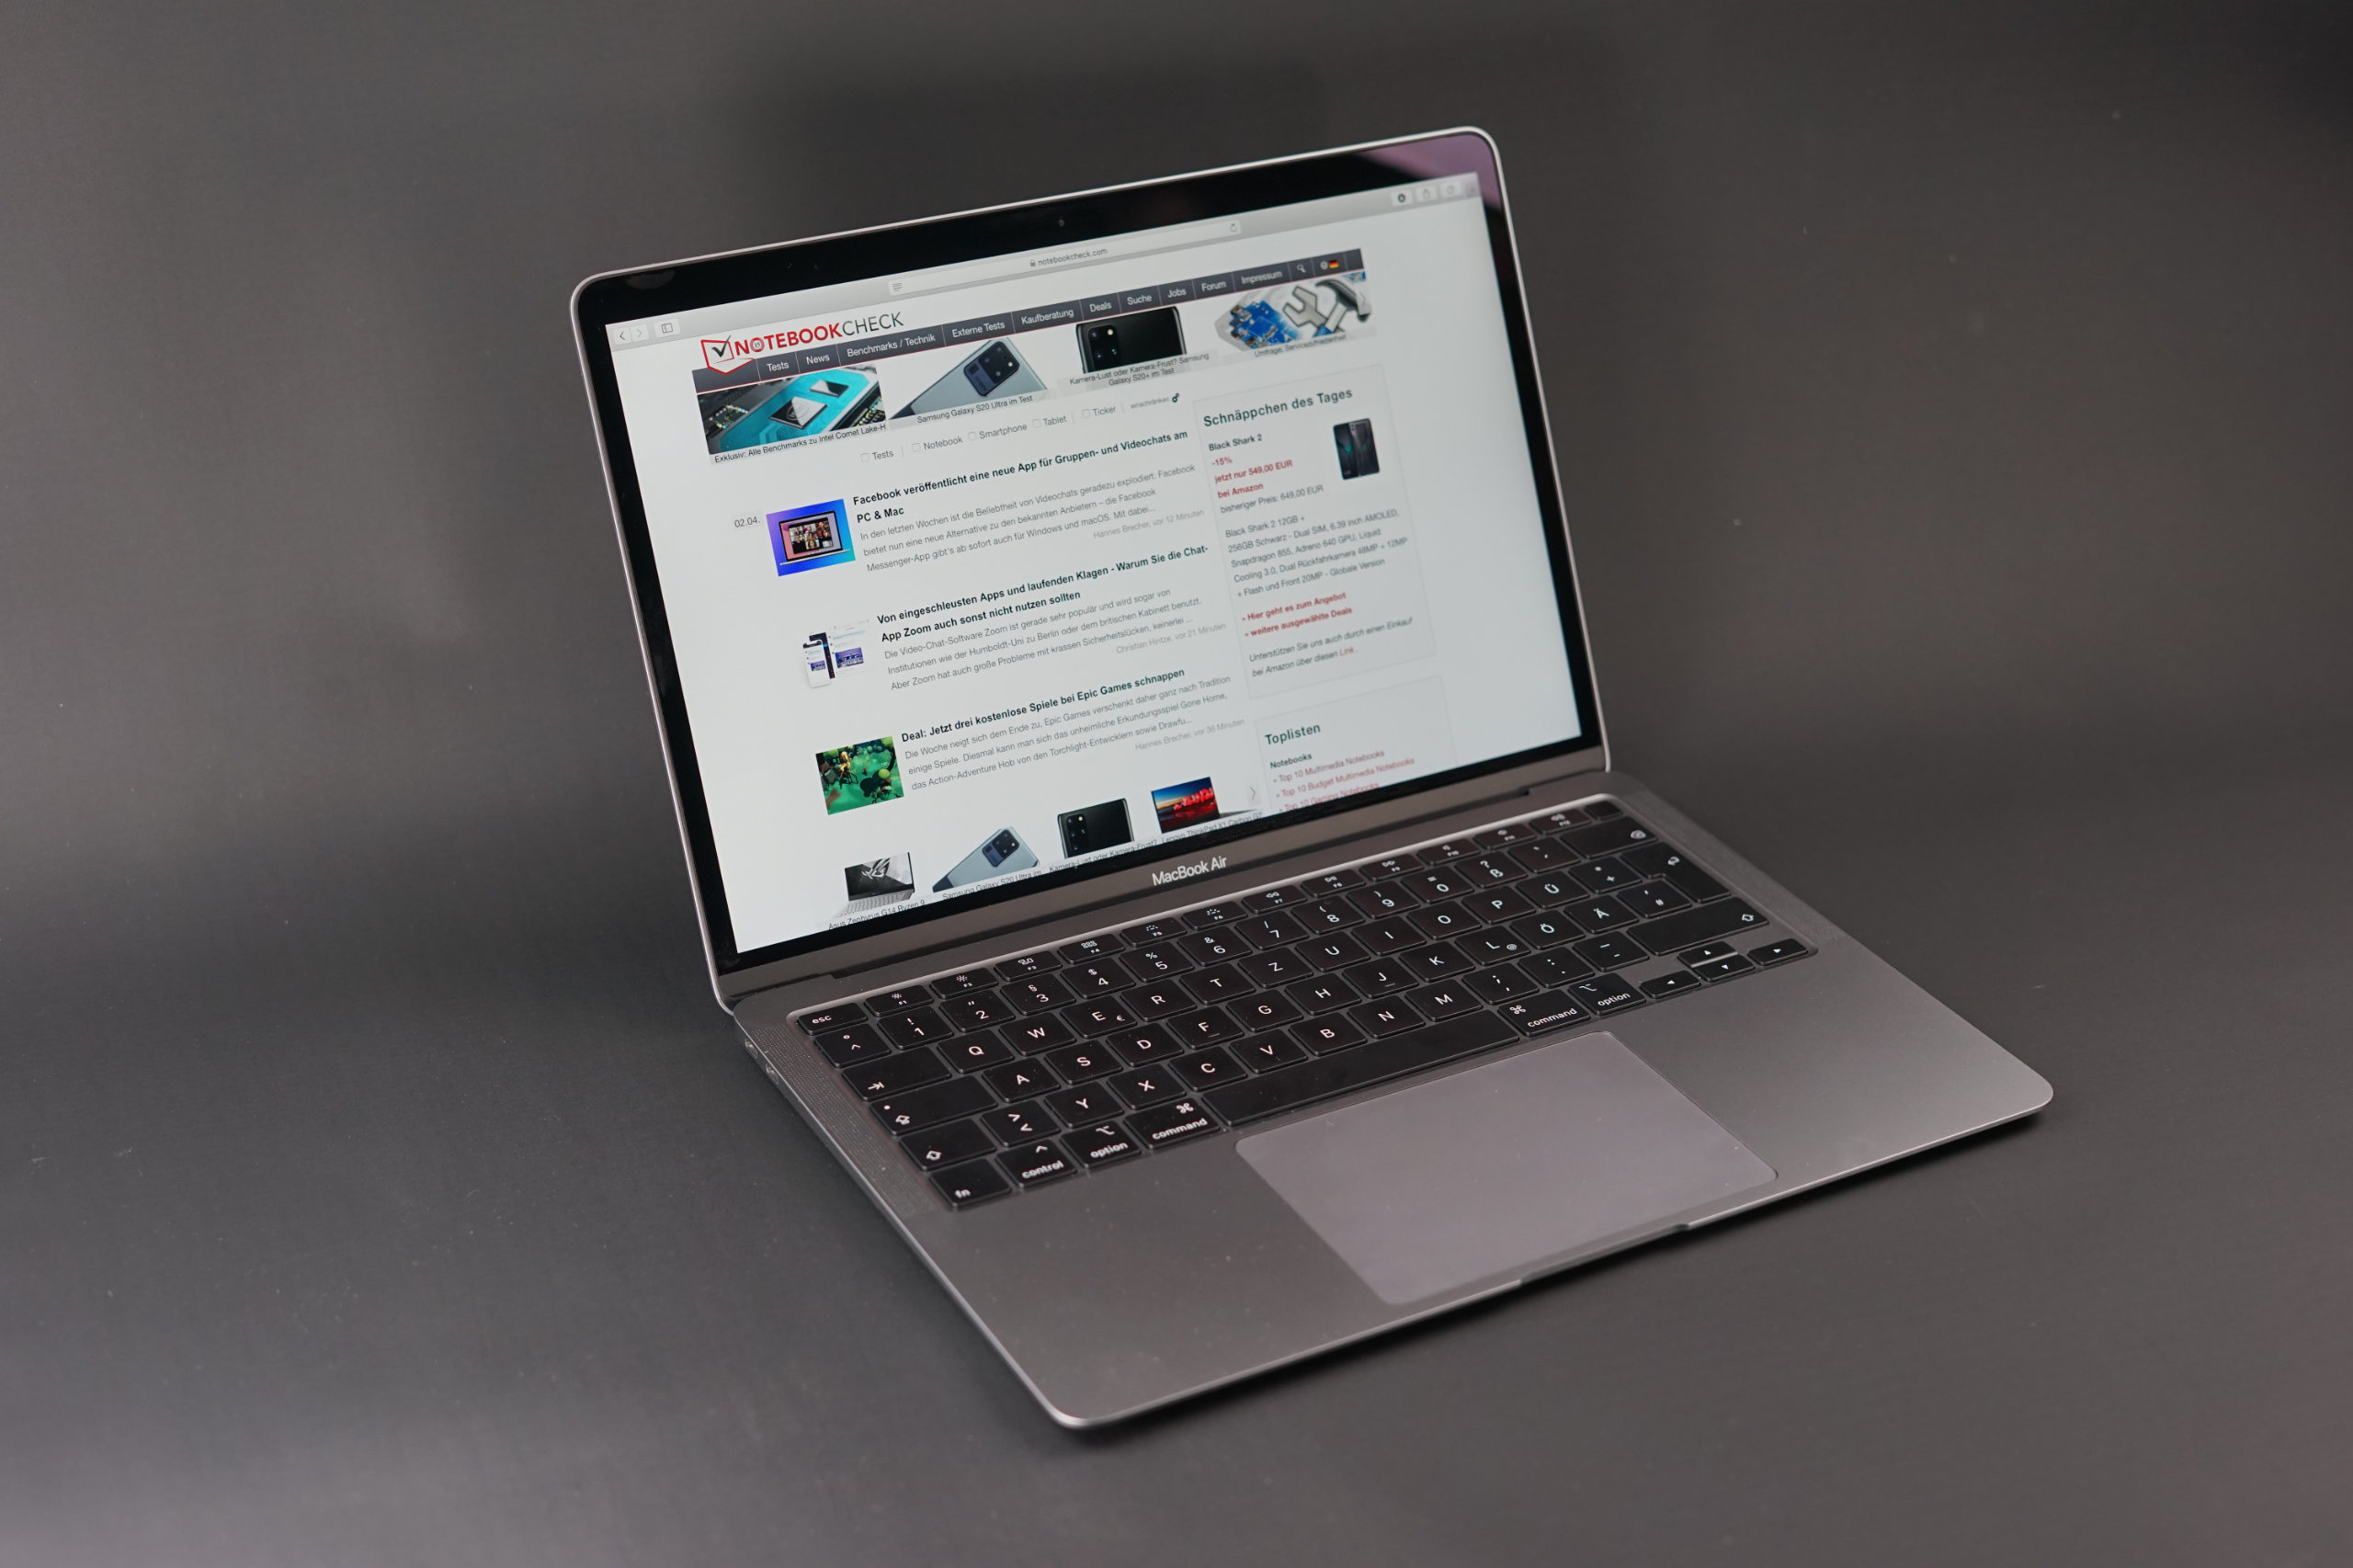
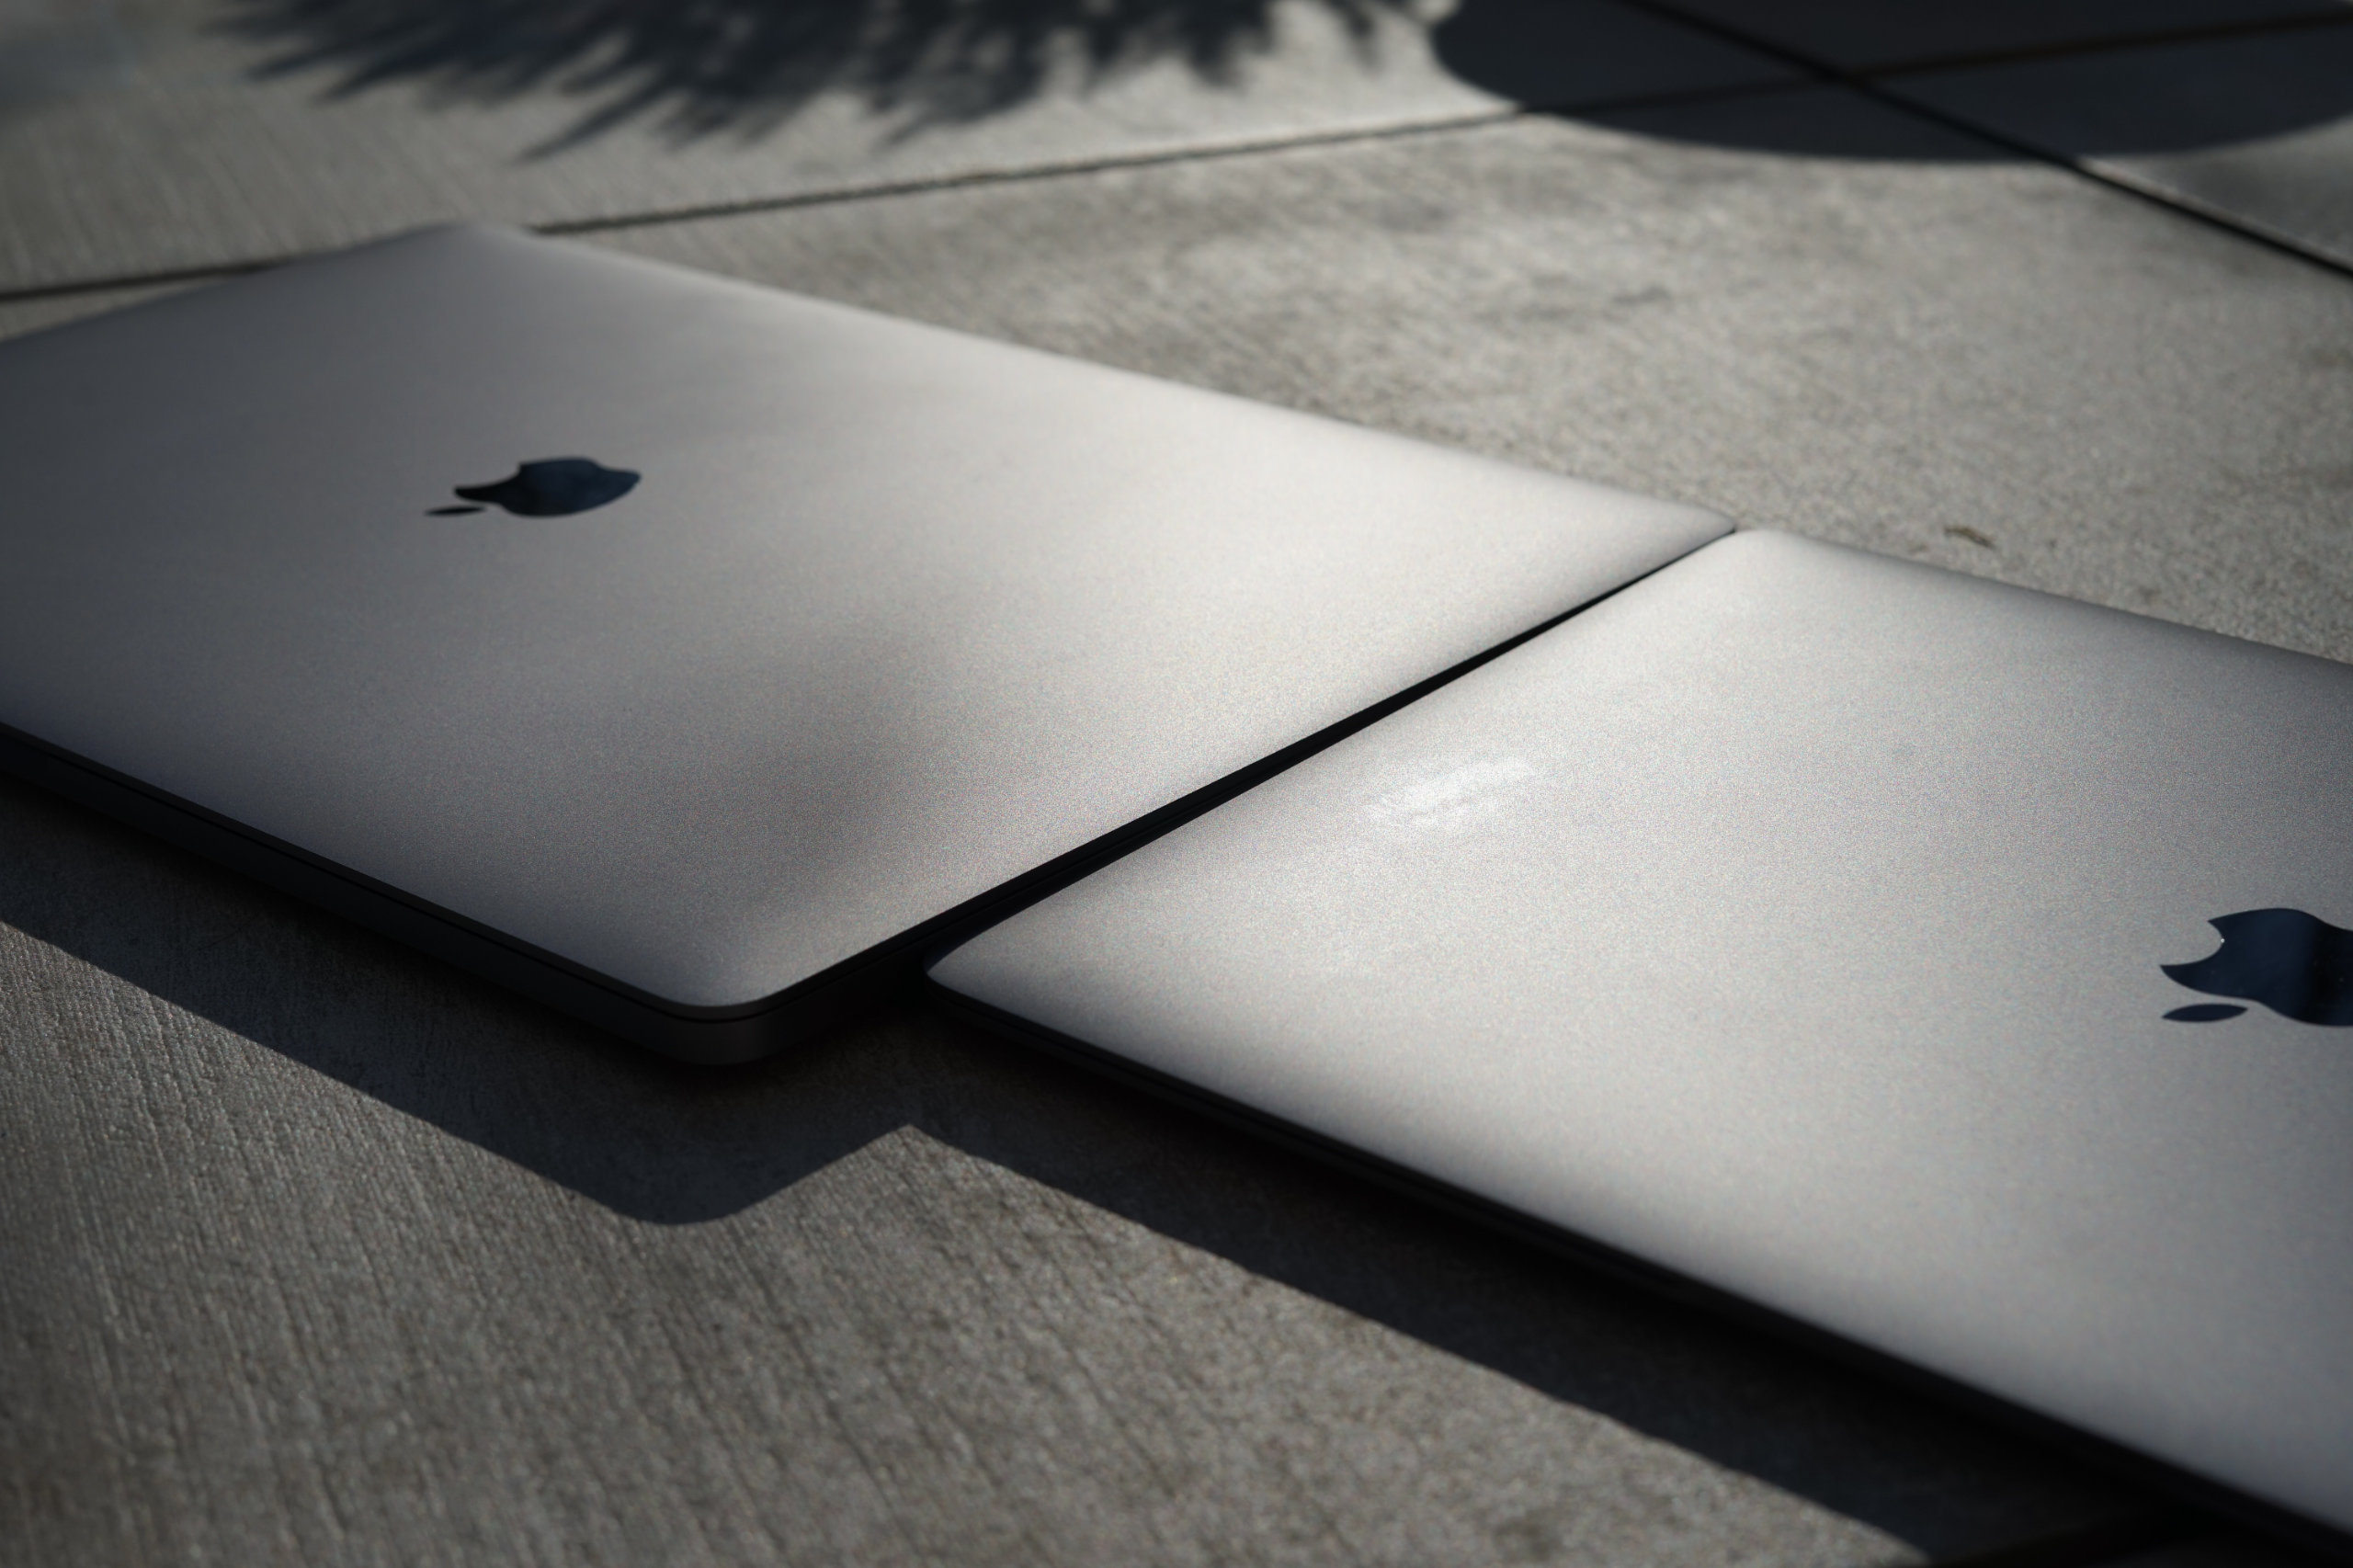
The quality of the aluminum chassis is once again excellent. Perfect build quality, sophisticated surfaces, and good stability. You can choose between the three familiar color options: Space Gray, Gold or Silver.
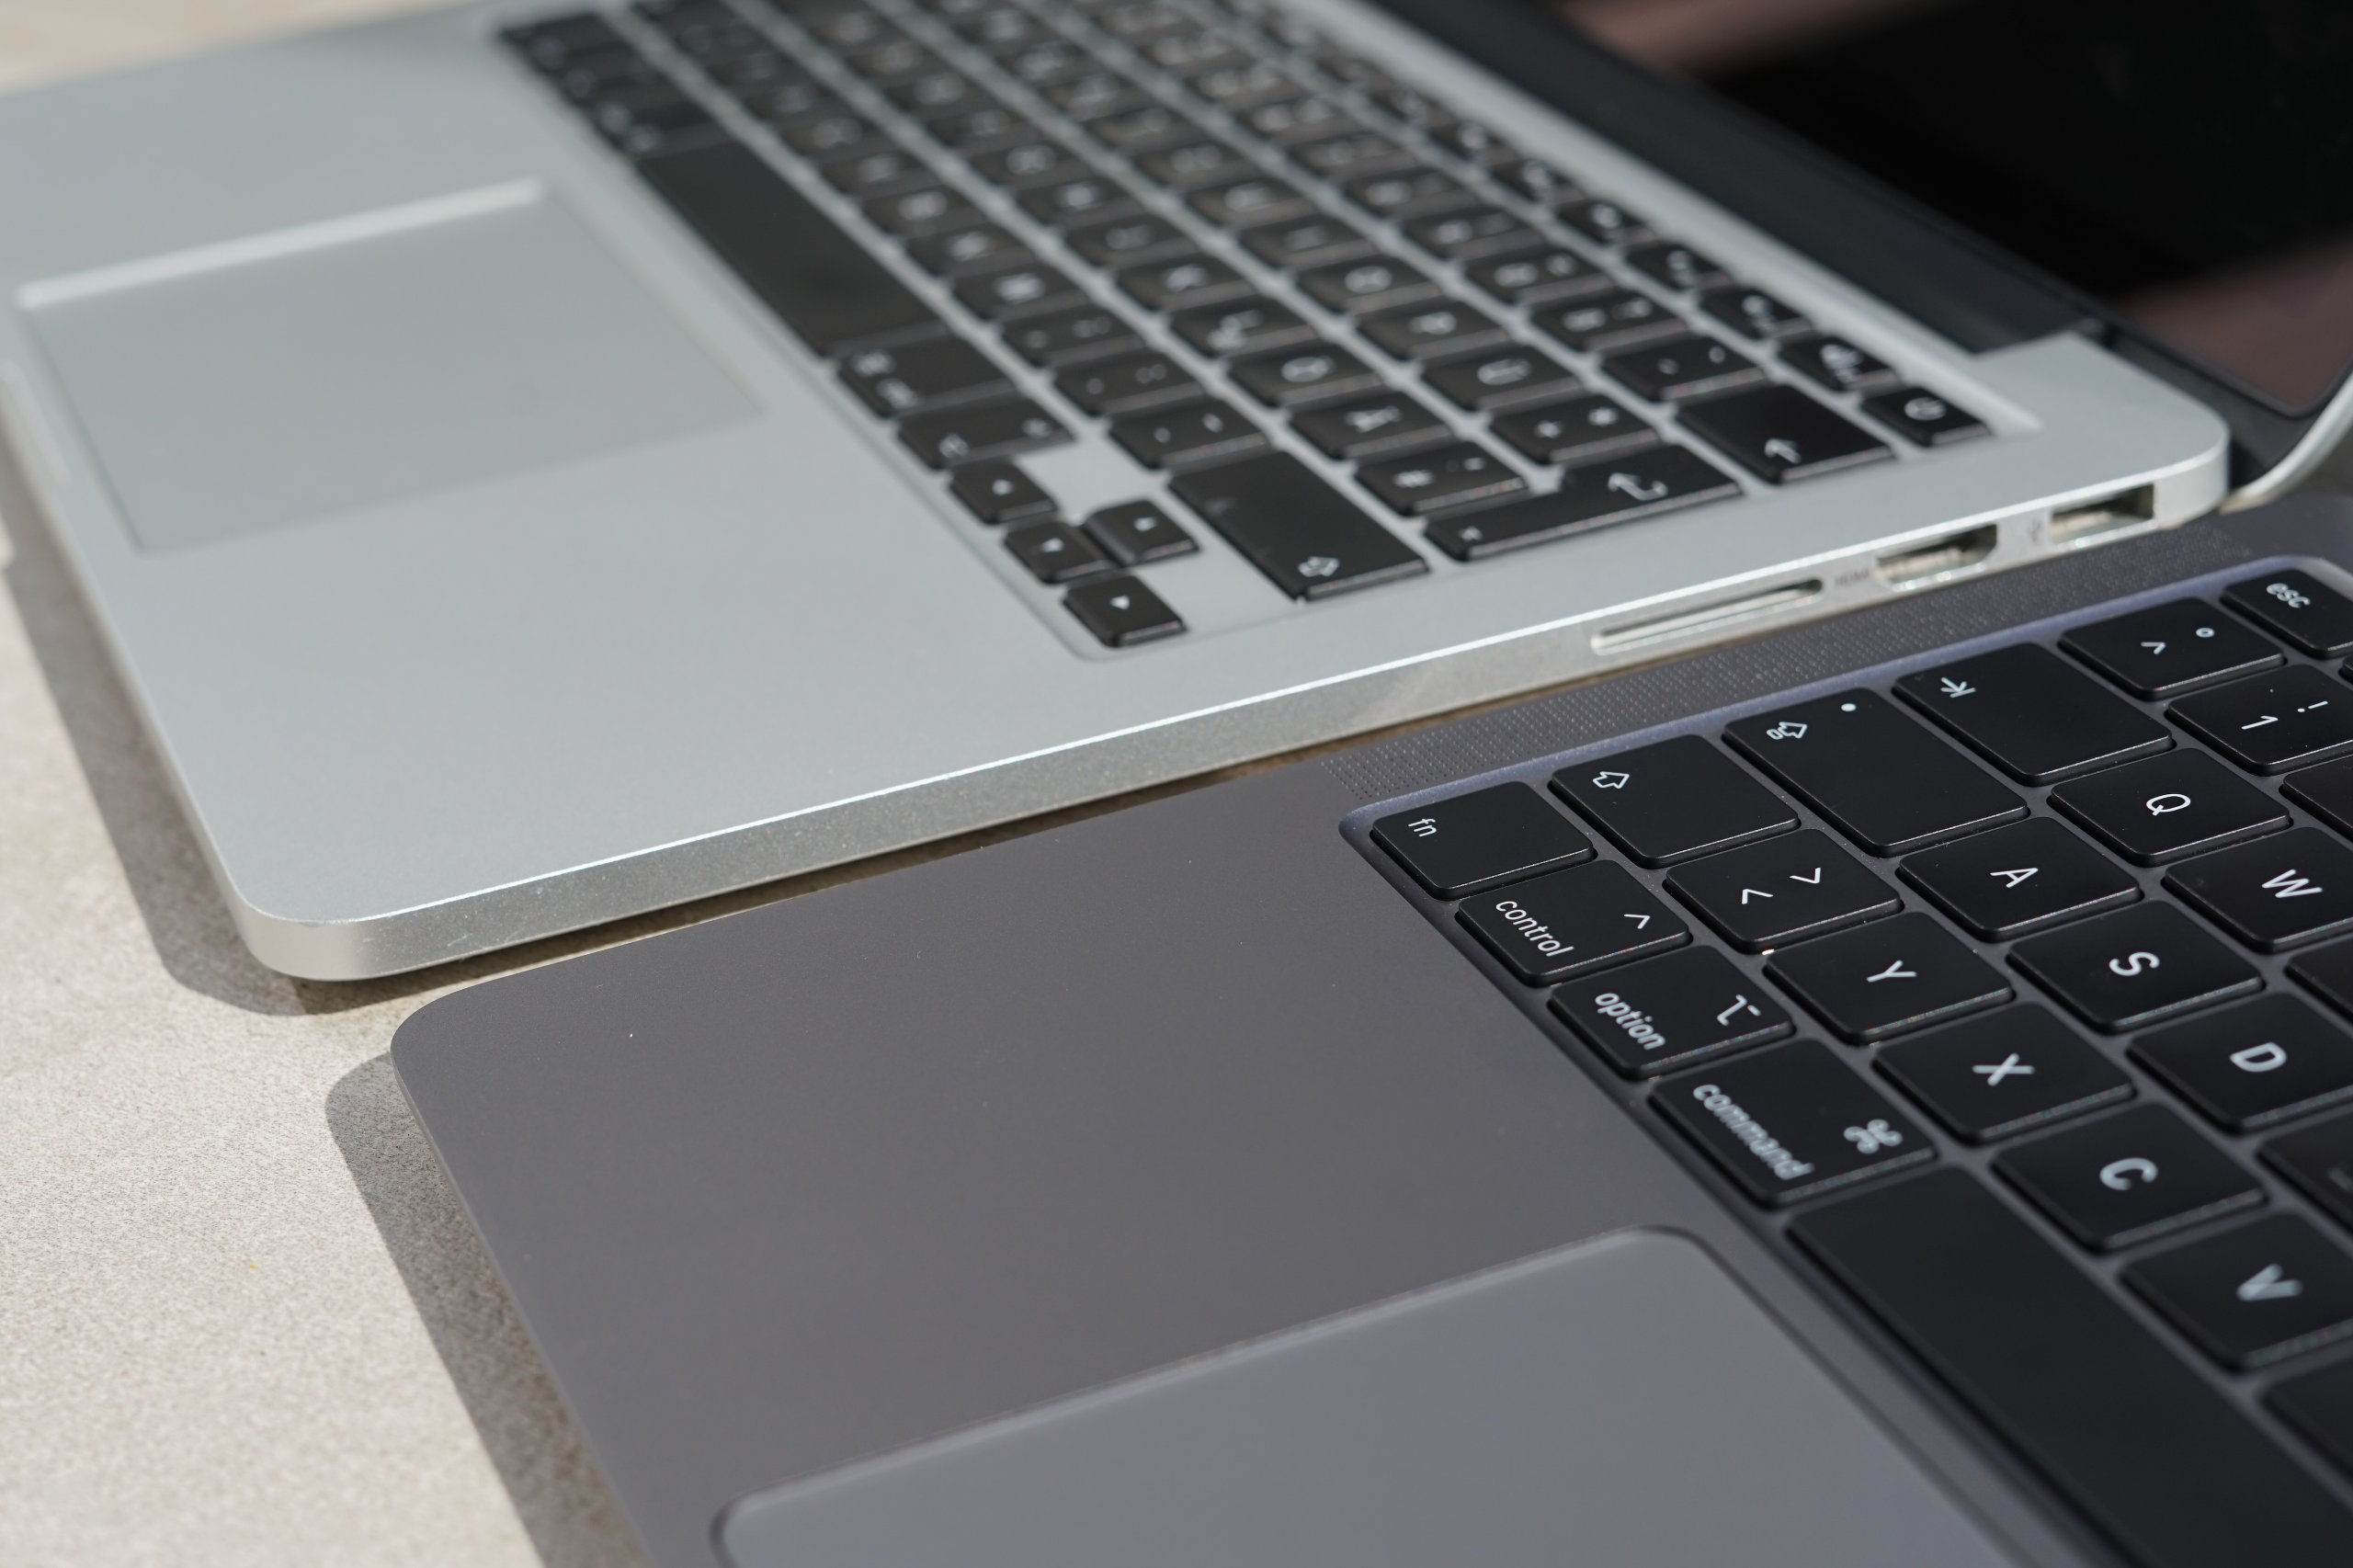
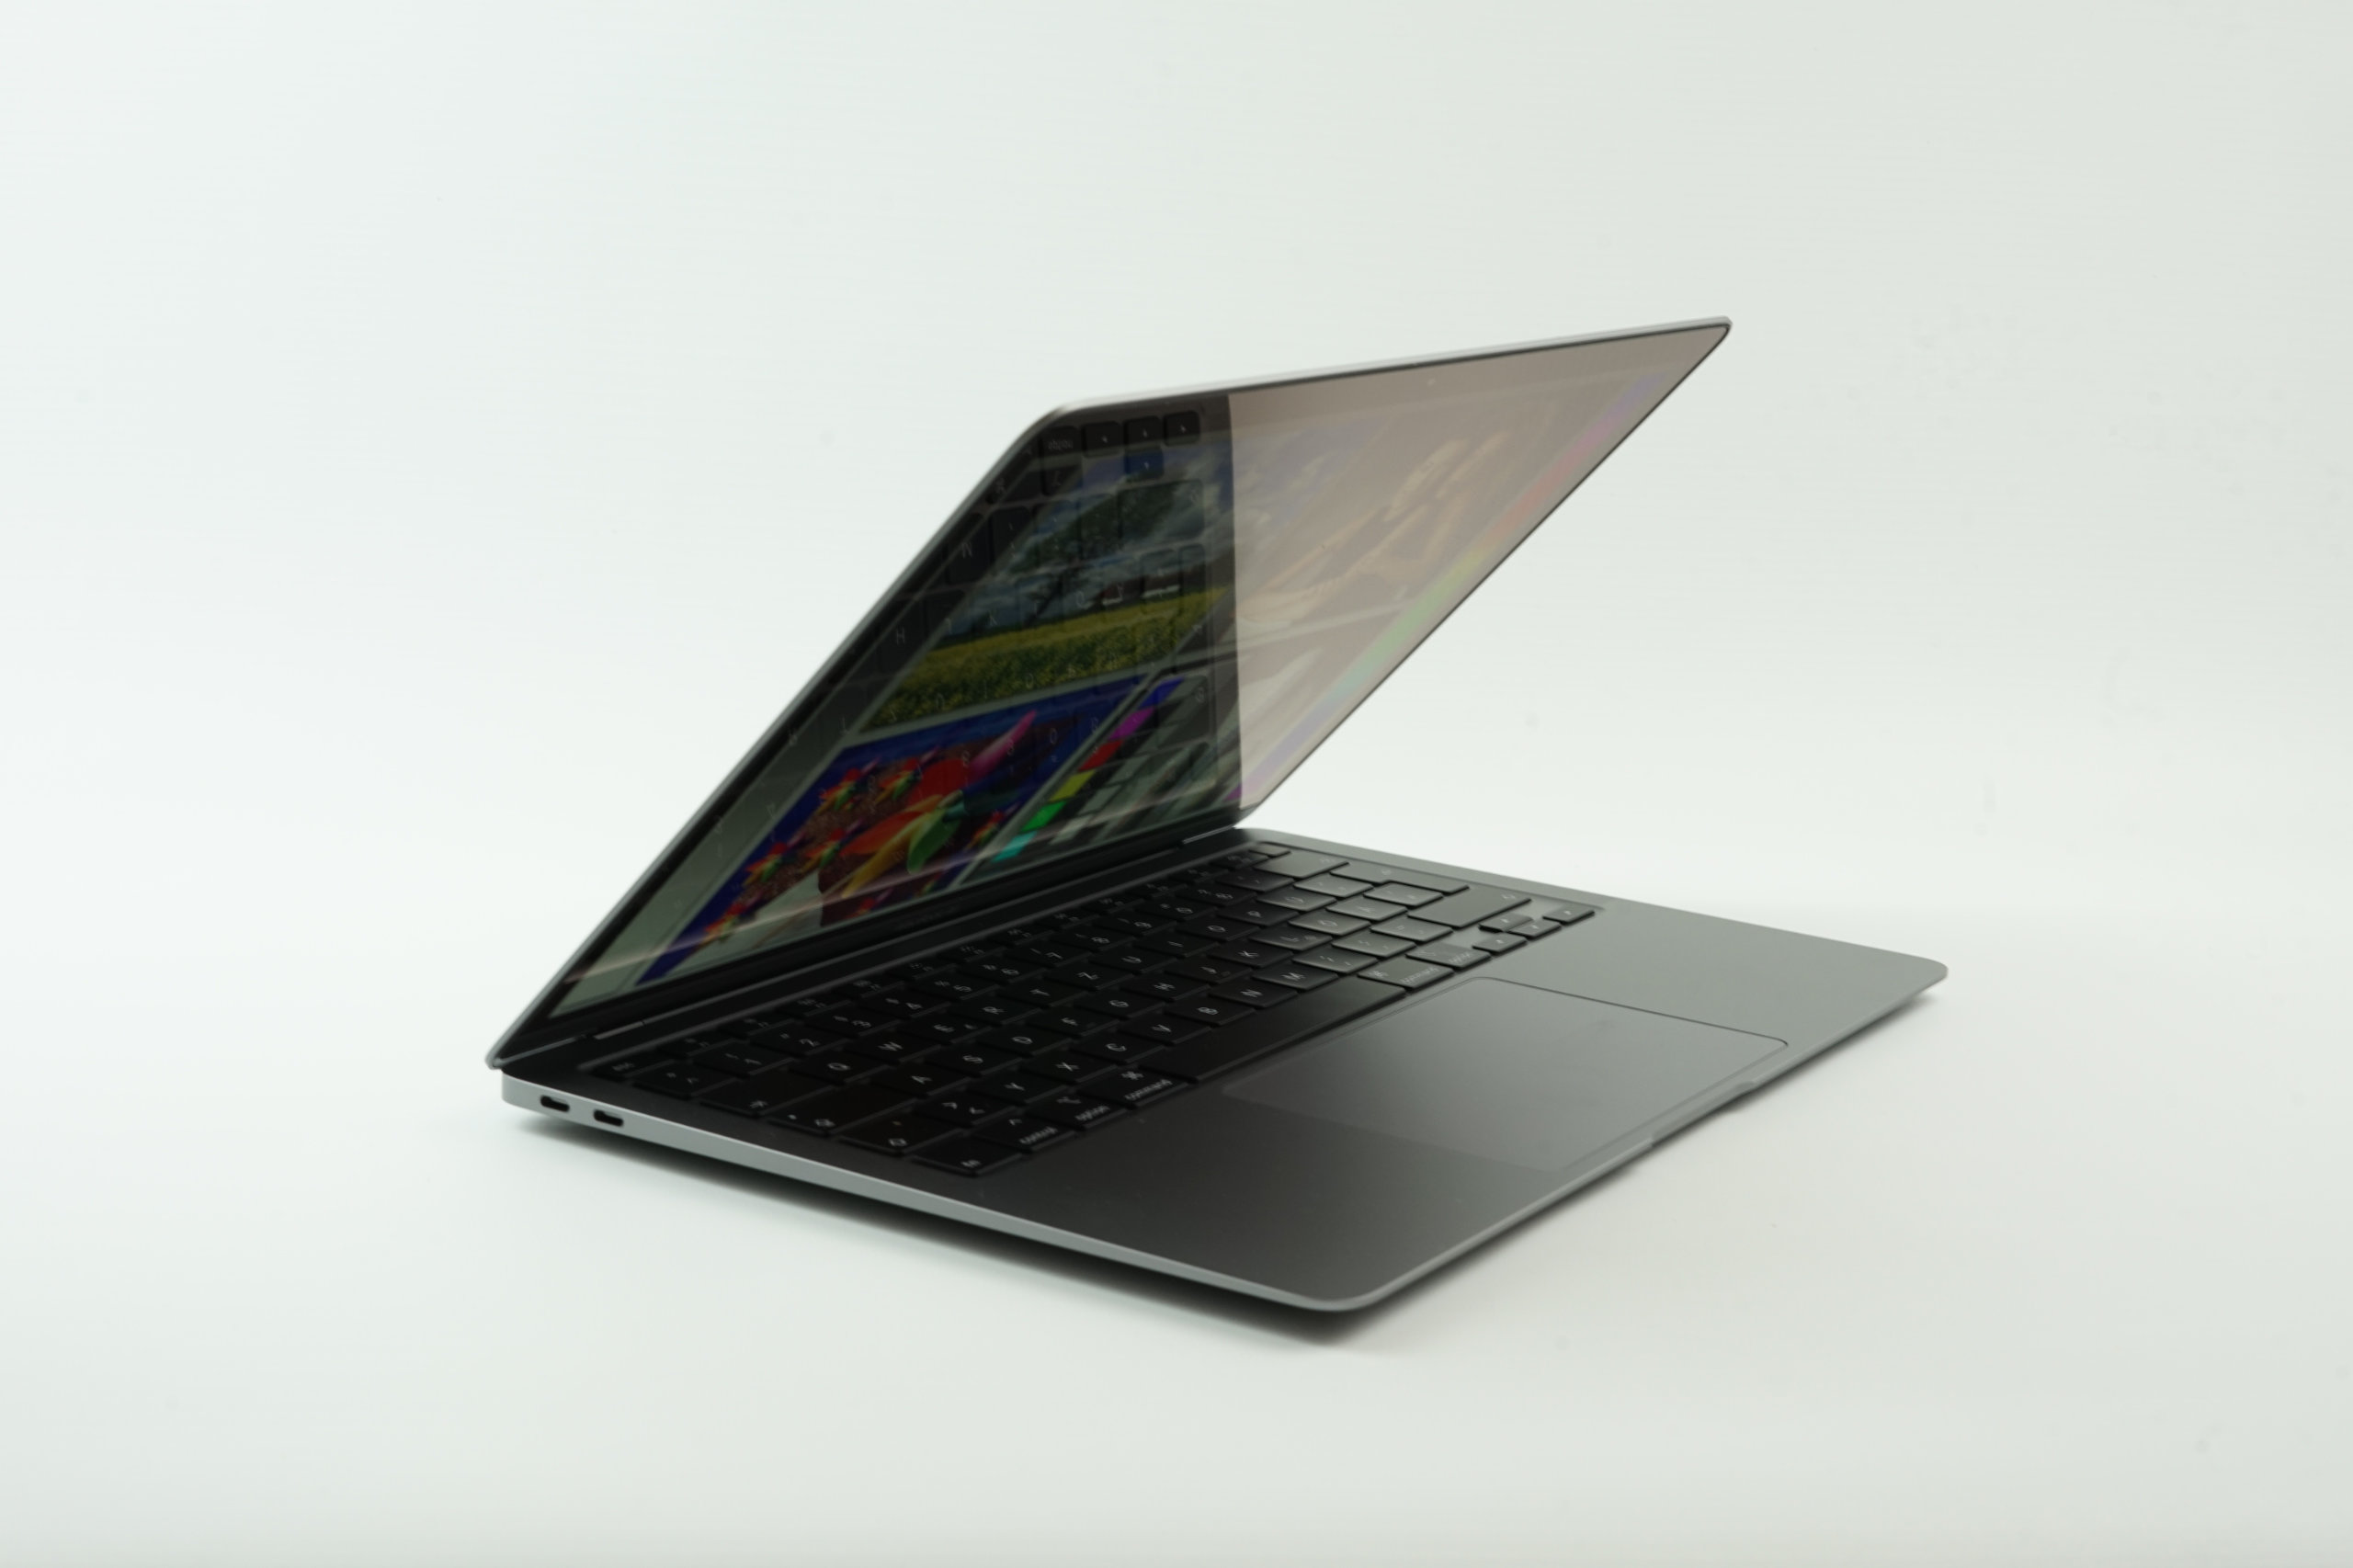
Compared to the more expensive Pro models, we like the tapered front of the chassis. The notebook appears even slimmer than it is, but more importantly, there is no sharp edge that could hurt your forearms during long typing sessions. The latter is actually an issue with the MacBook Pro models.
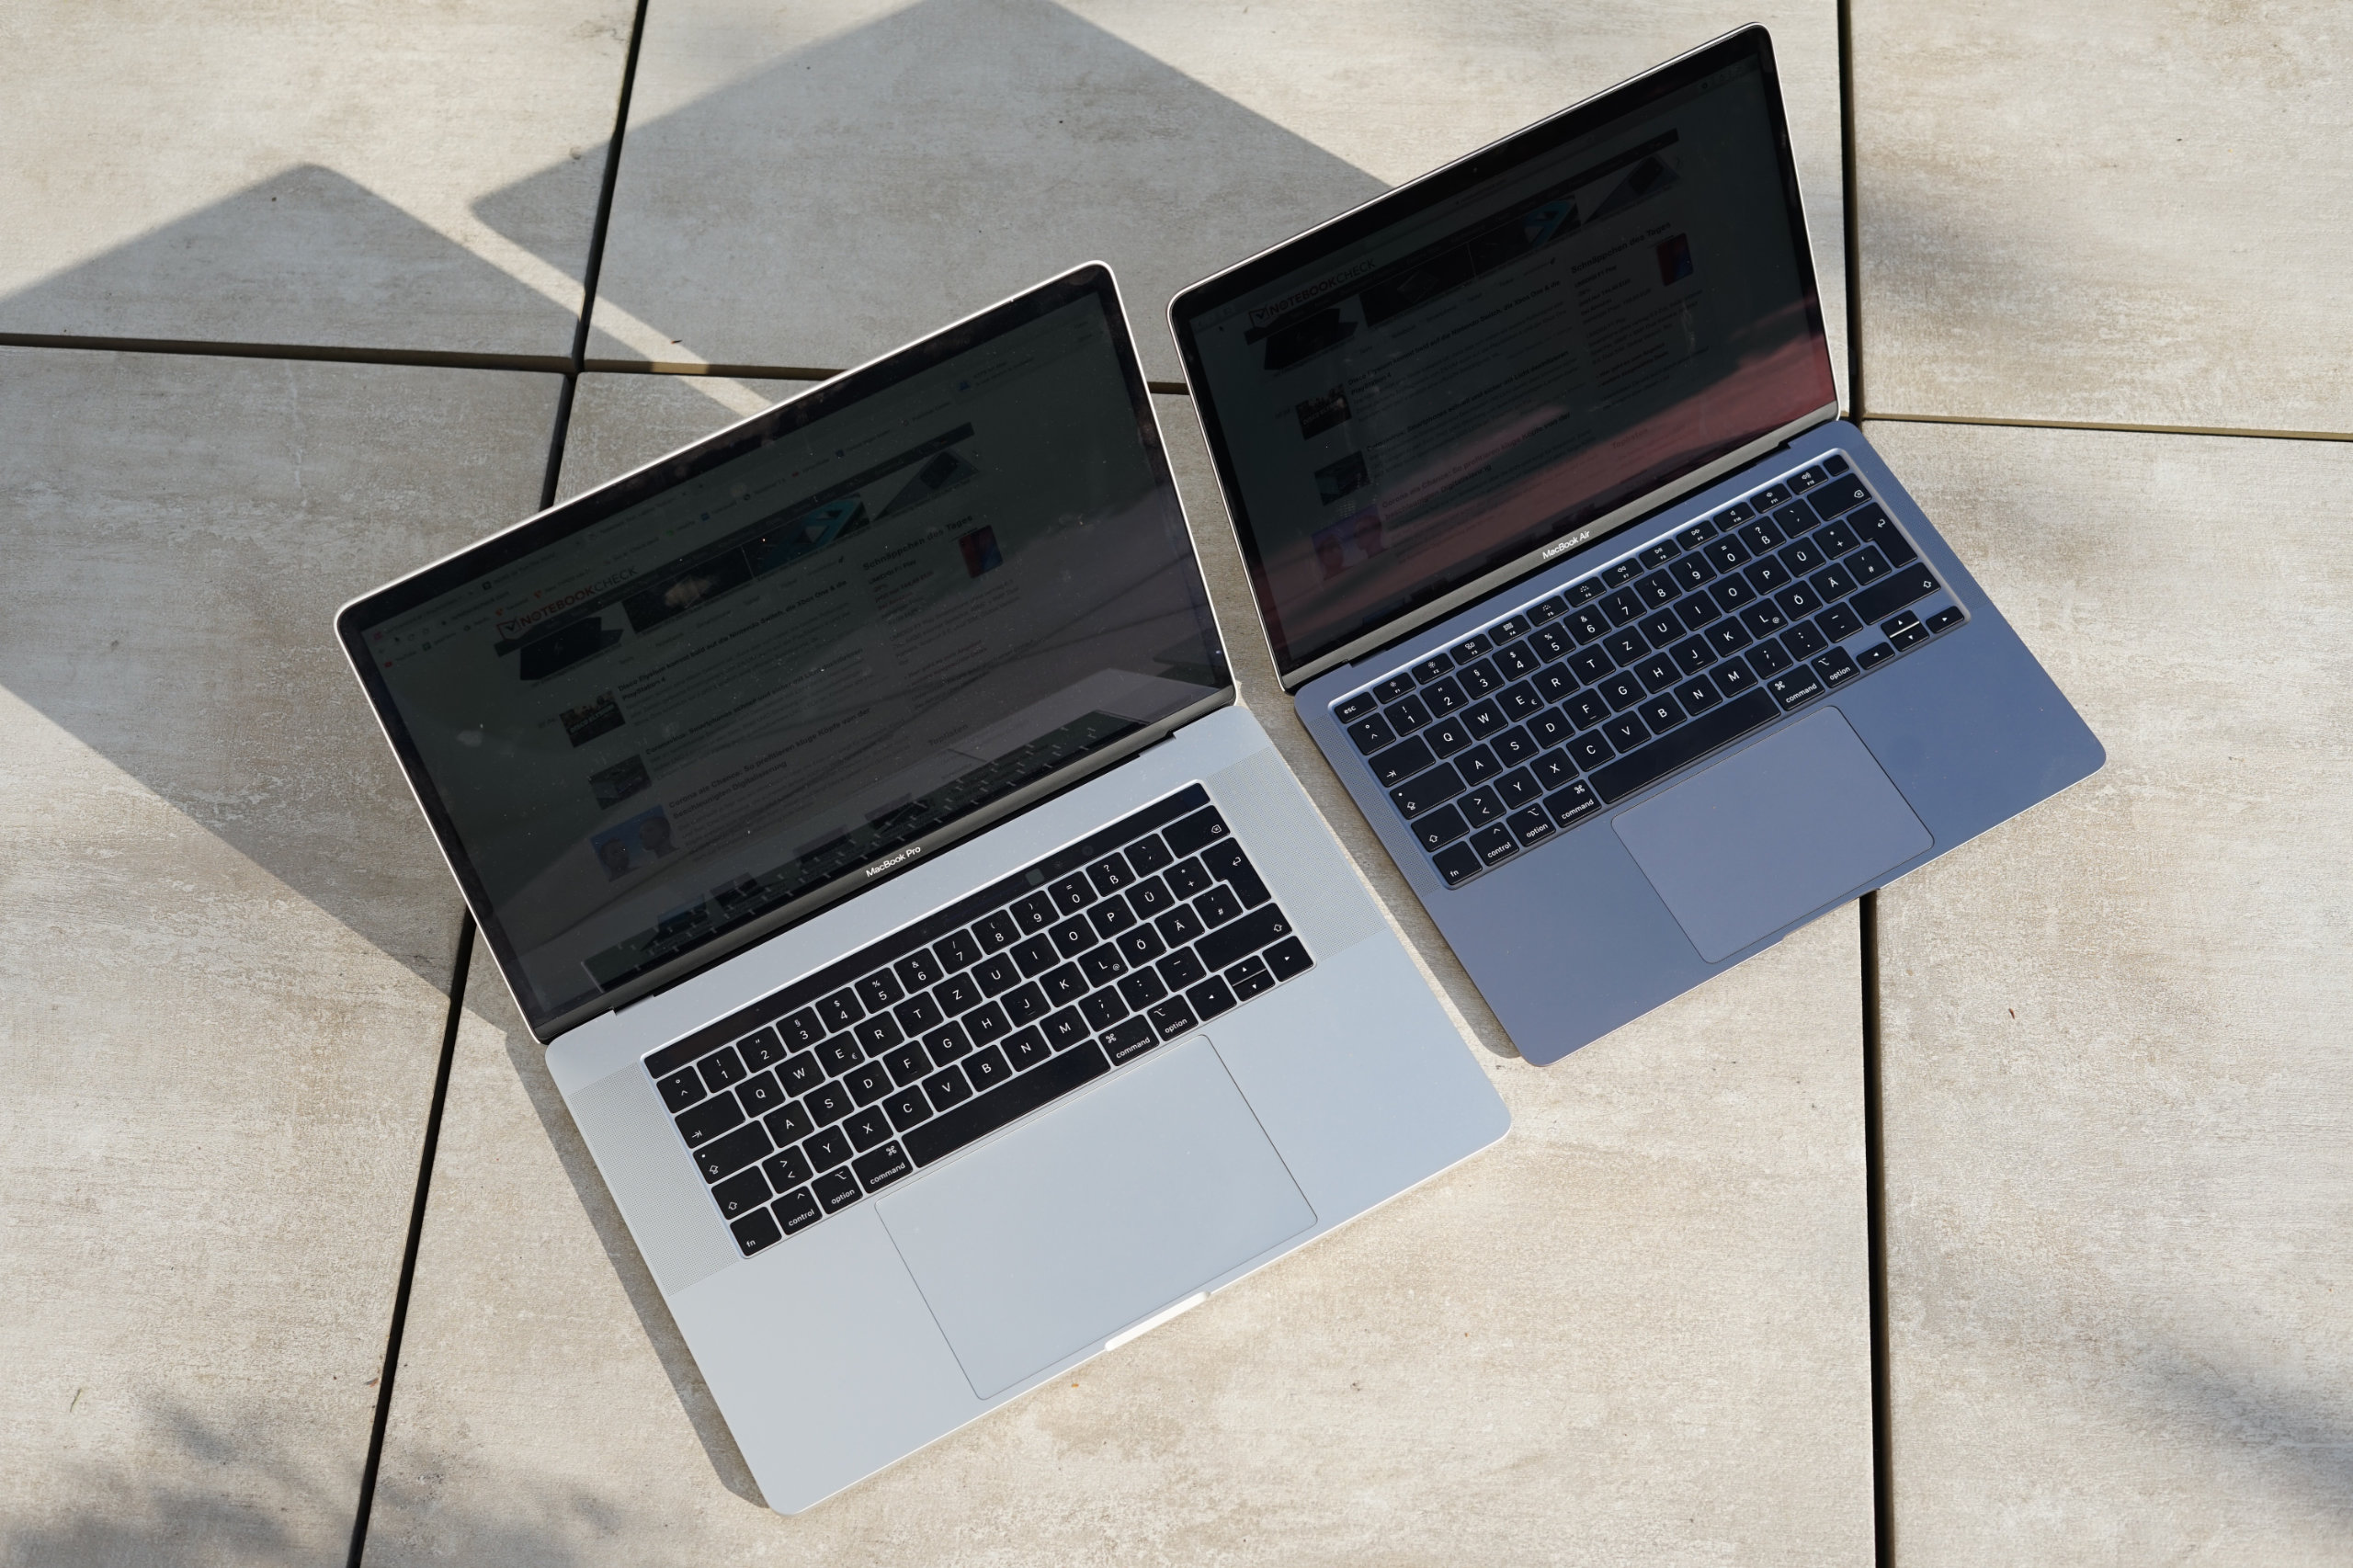
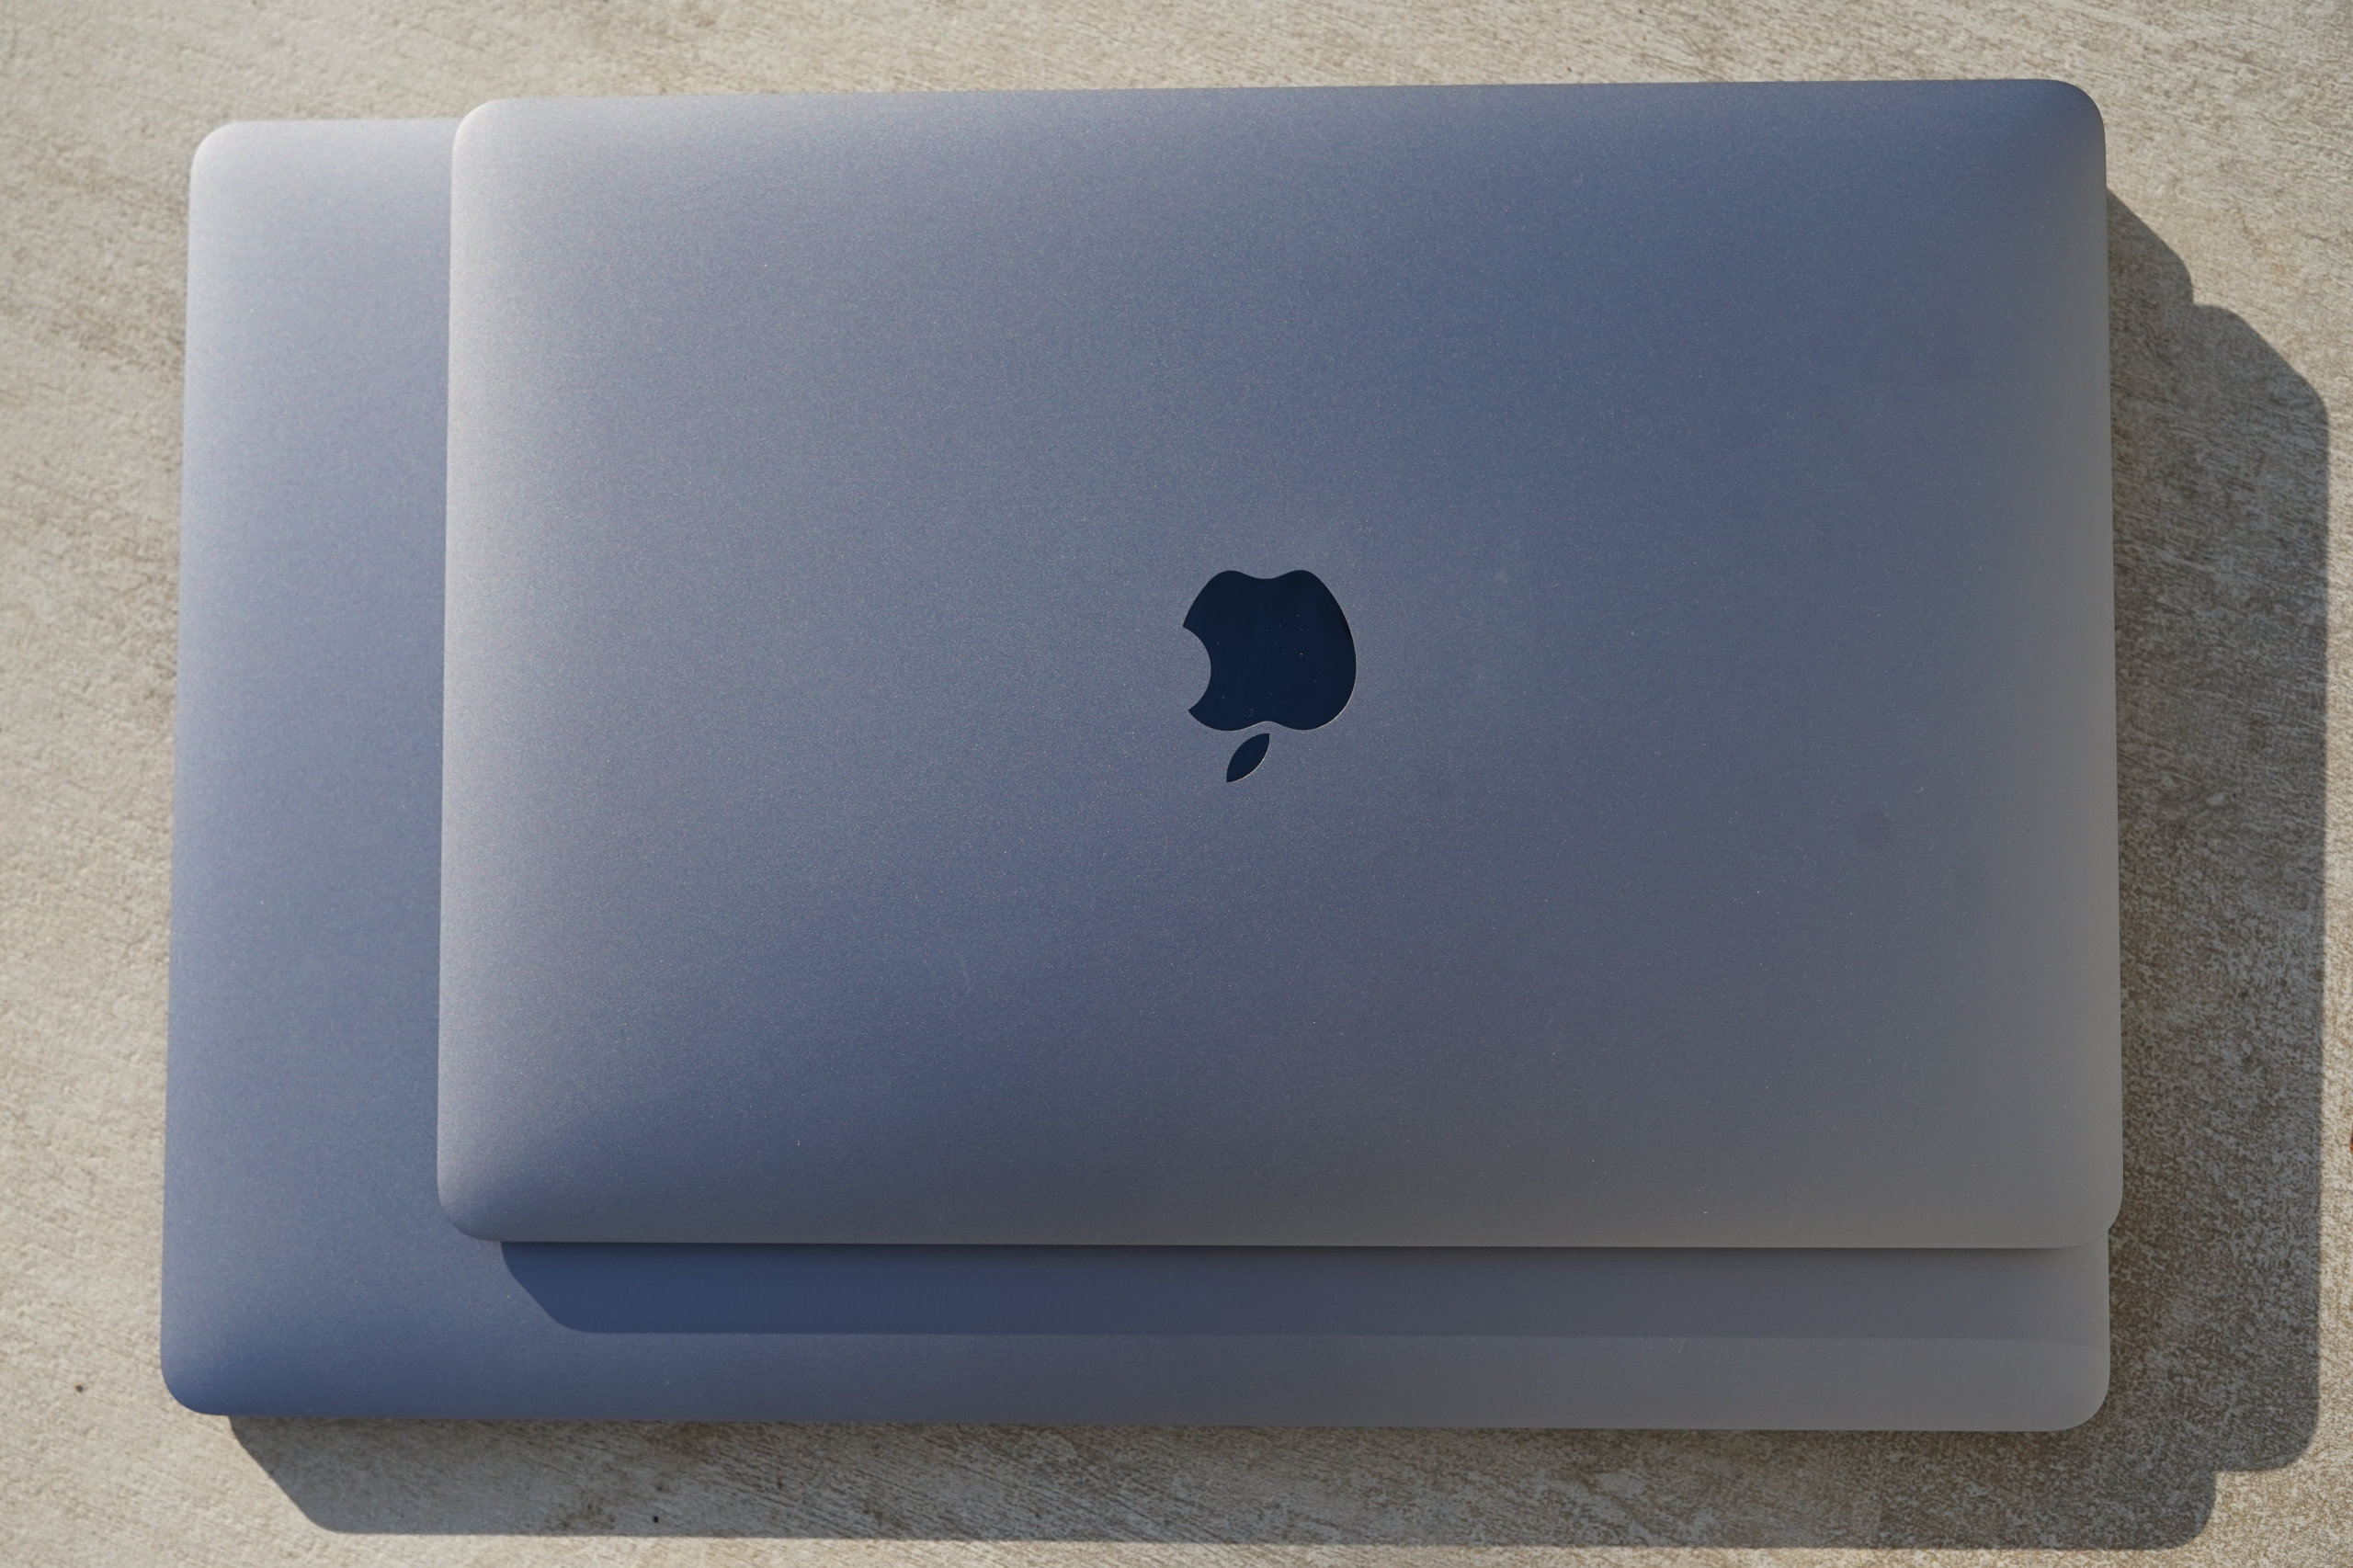

The footprint of the MacBook Air is still identical to the faster MacBook Pro 13. This is an area where the new Dell XPS 13 9300 definitely has an advantage, and the weight of both the Dell and the Acer Swift 3 are lower. The sturdy chassis made from a single piece of aluminum definitely comes at the cost of the higher weight.
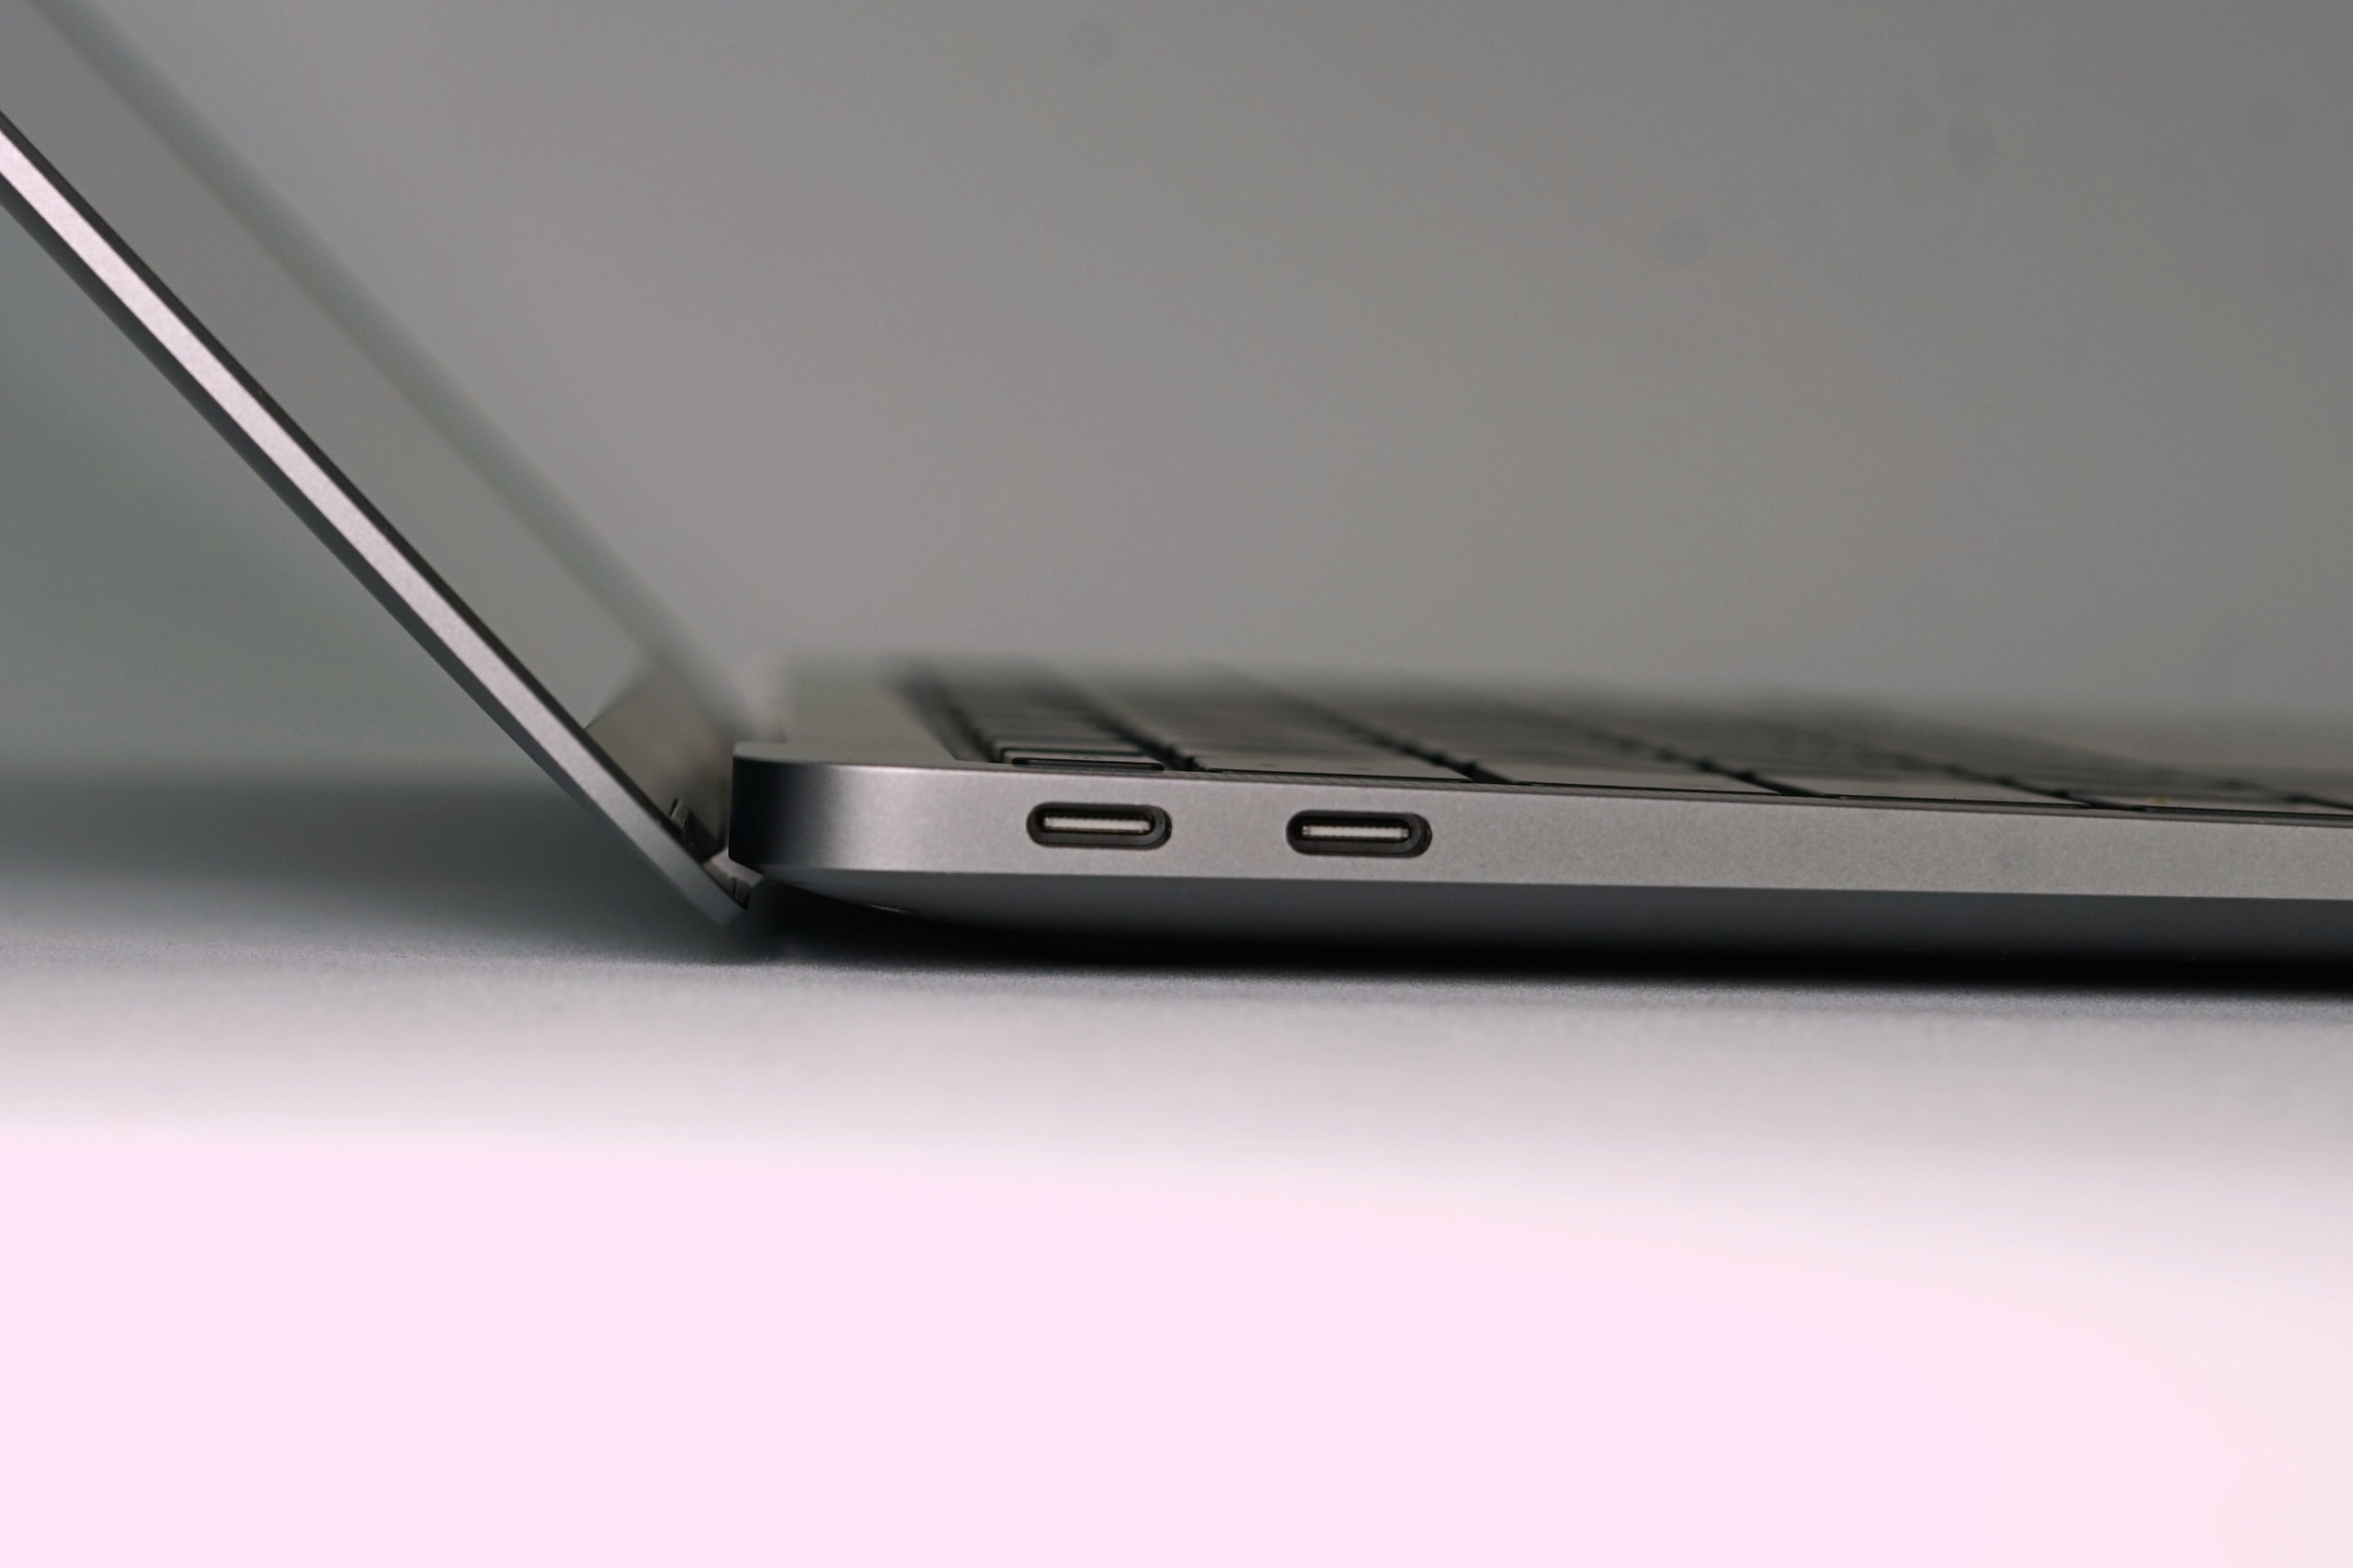
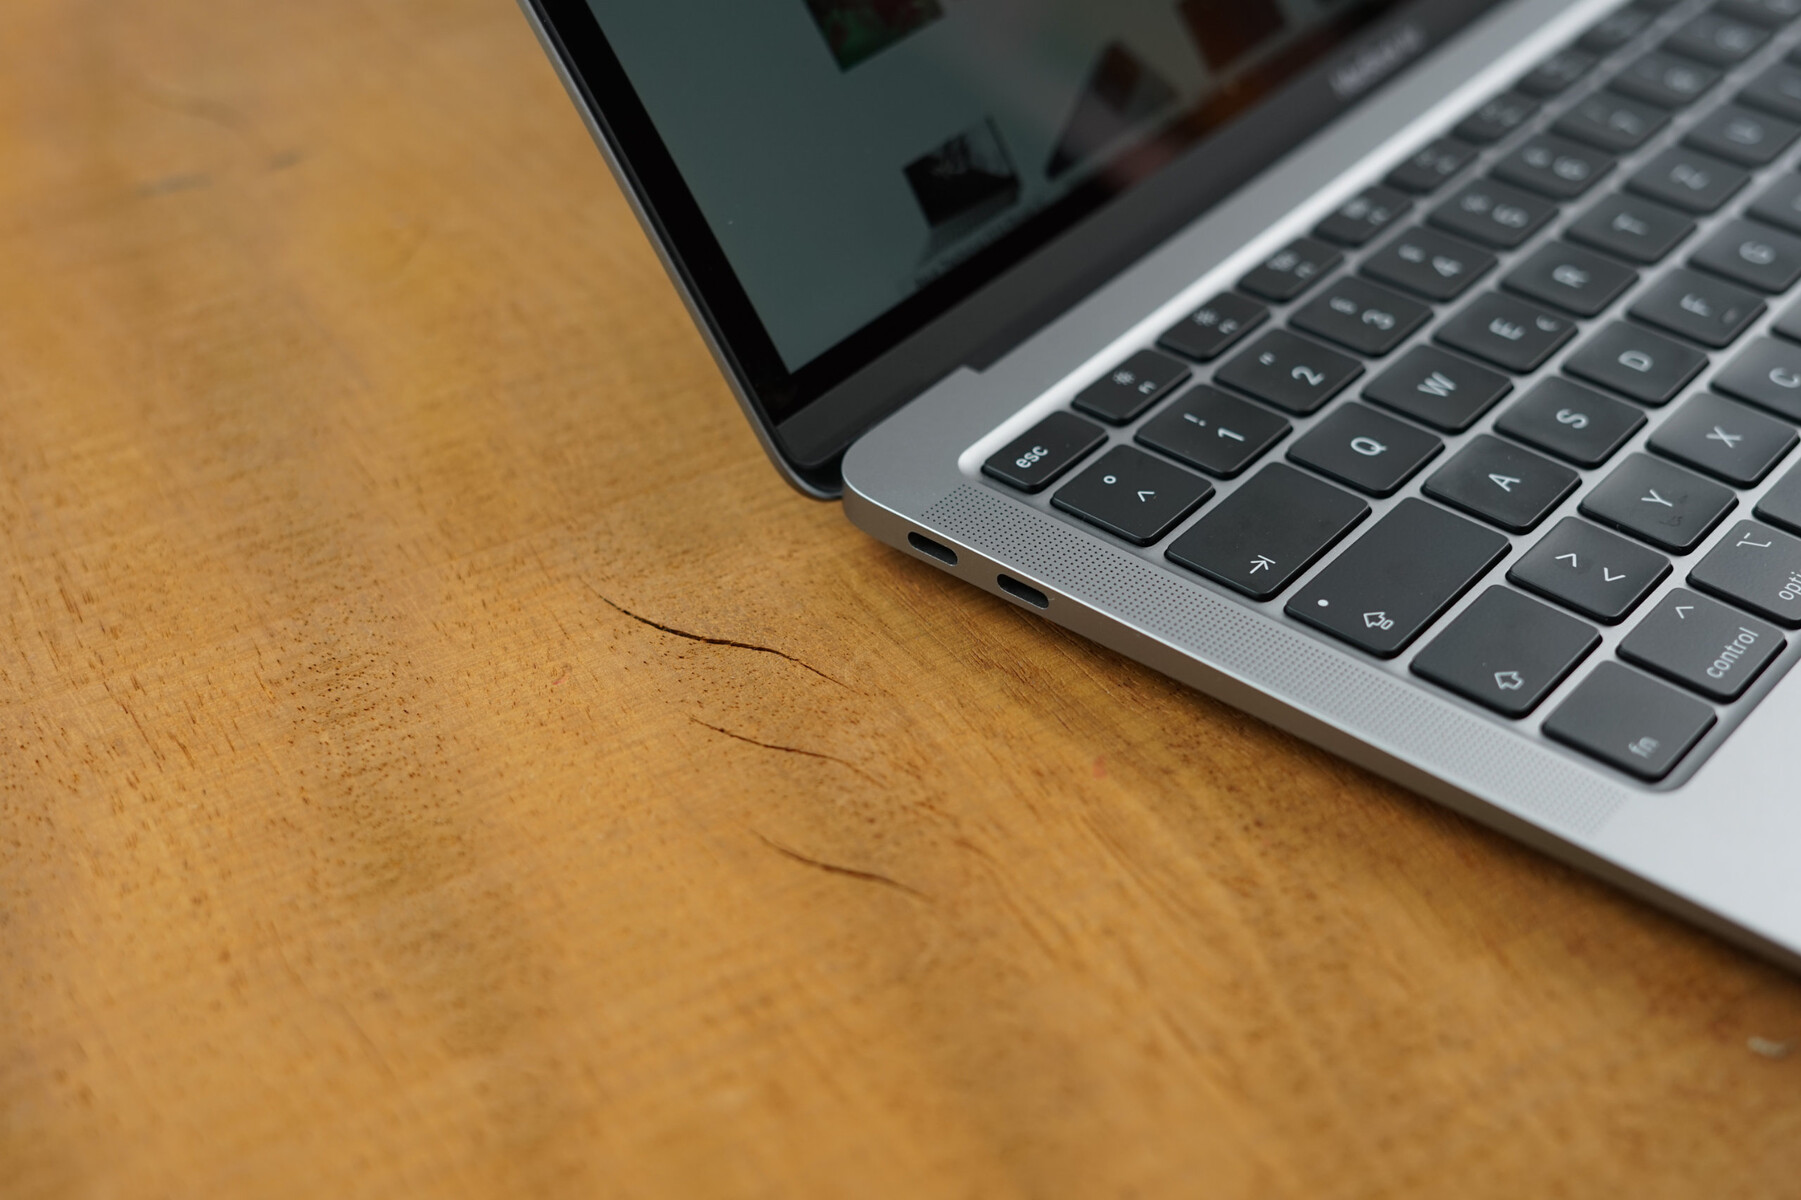
Connectivity – MacBook Air still without Wi-Fi 6
We can keep it short here, because there are no changes compared to the old MacBook Air. Two Thunderbolt 3 connectors are very versatile, but they also require adapters. The communication module still does not support the fast Wi-Fi 6 standard.
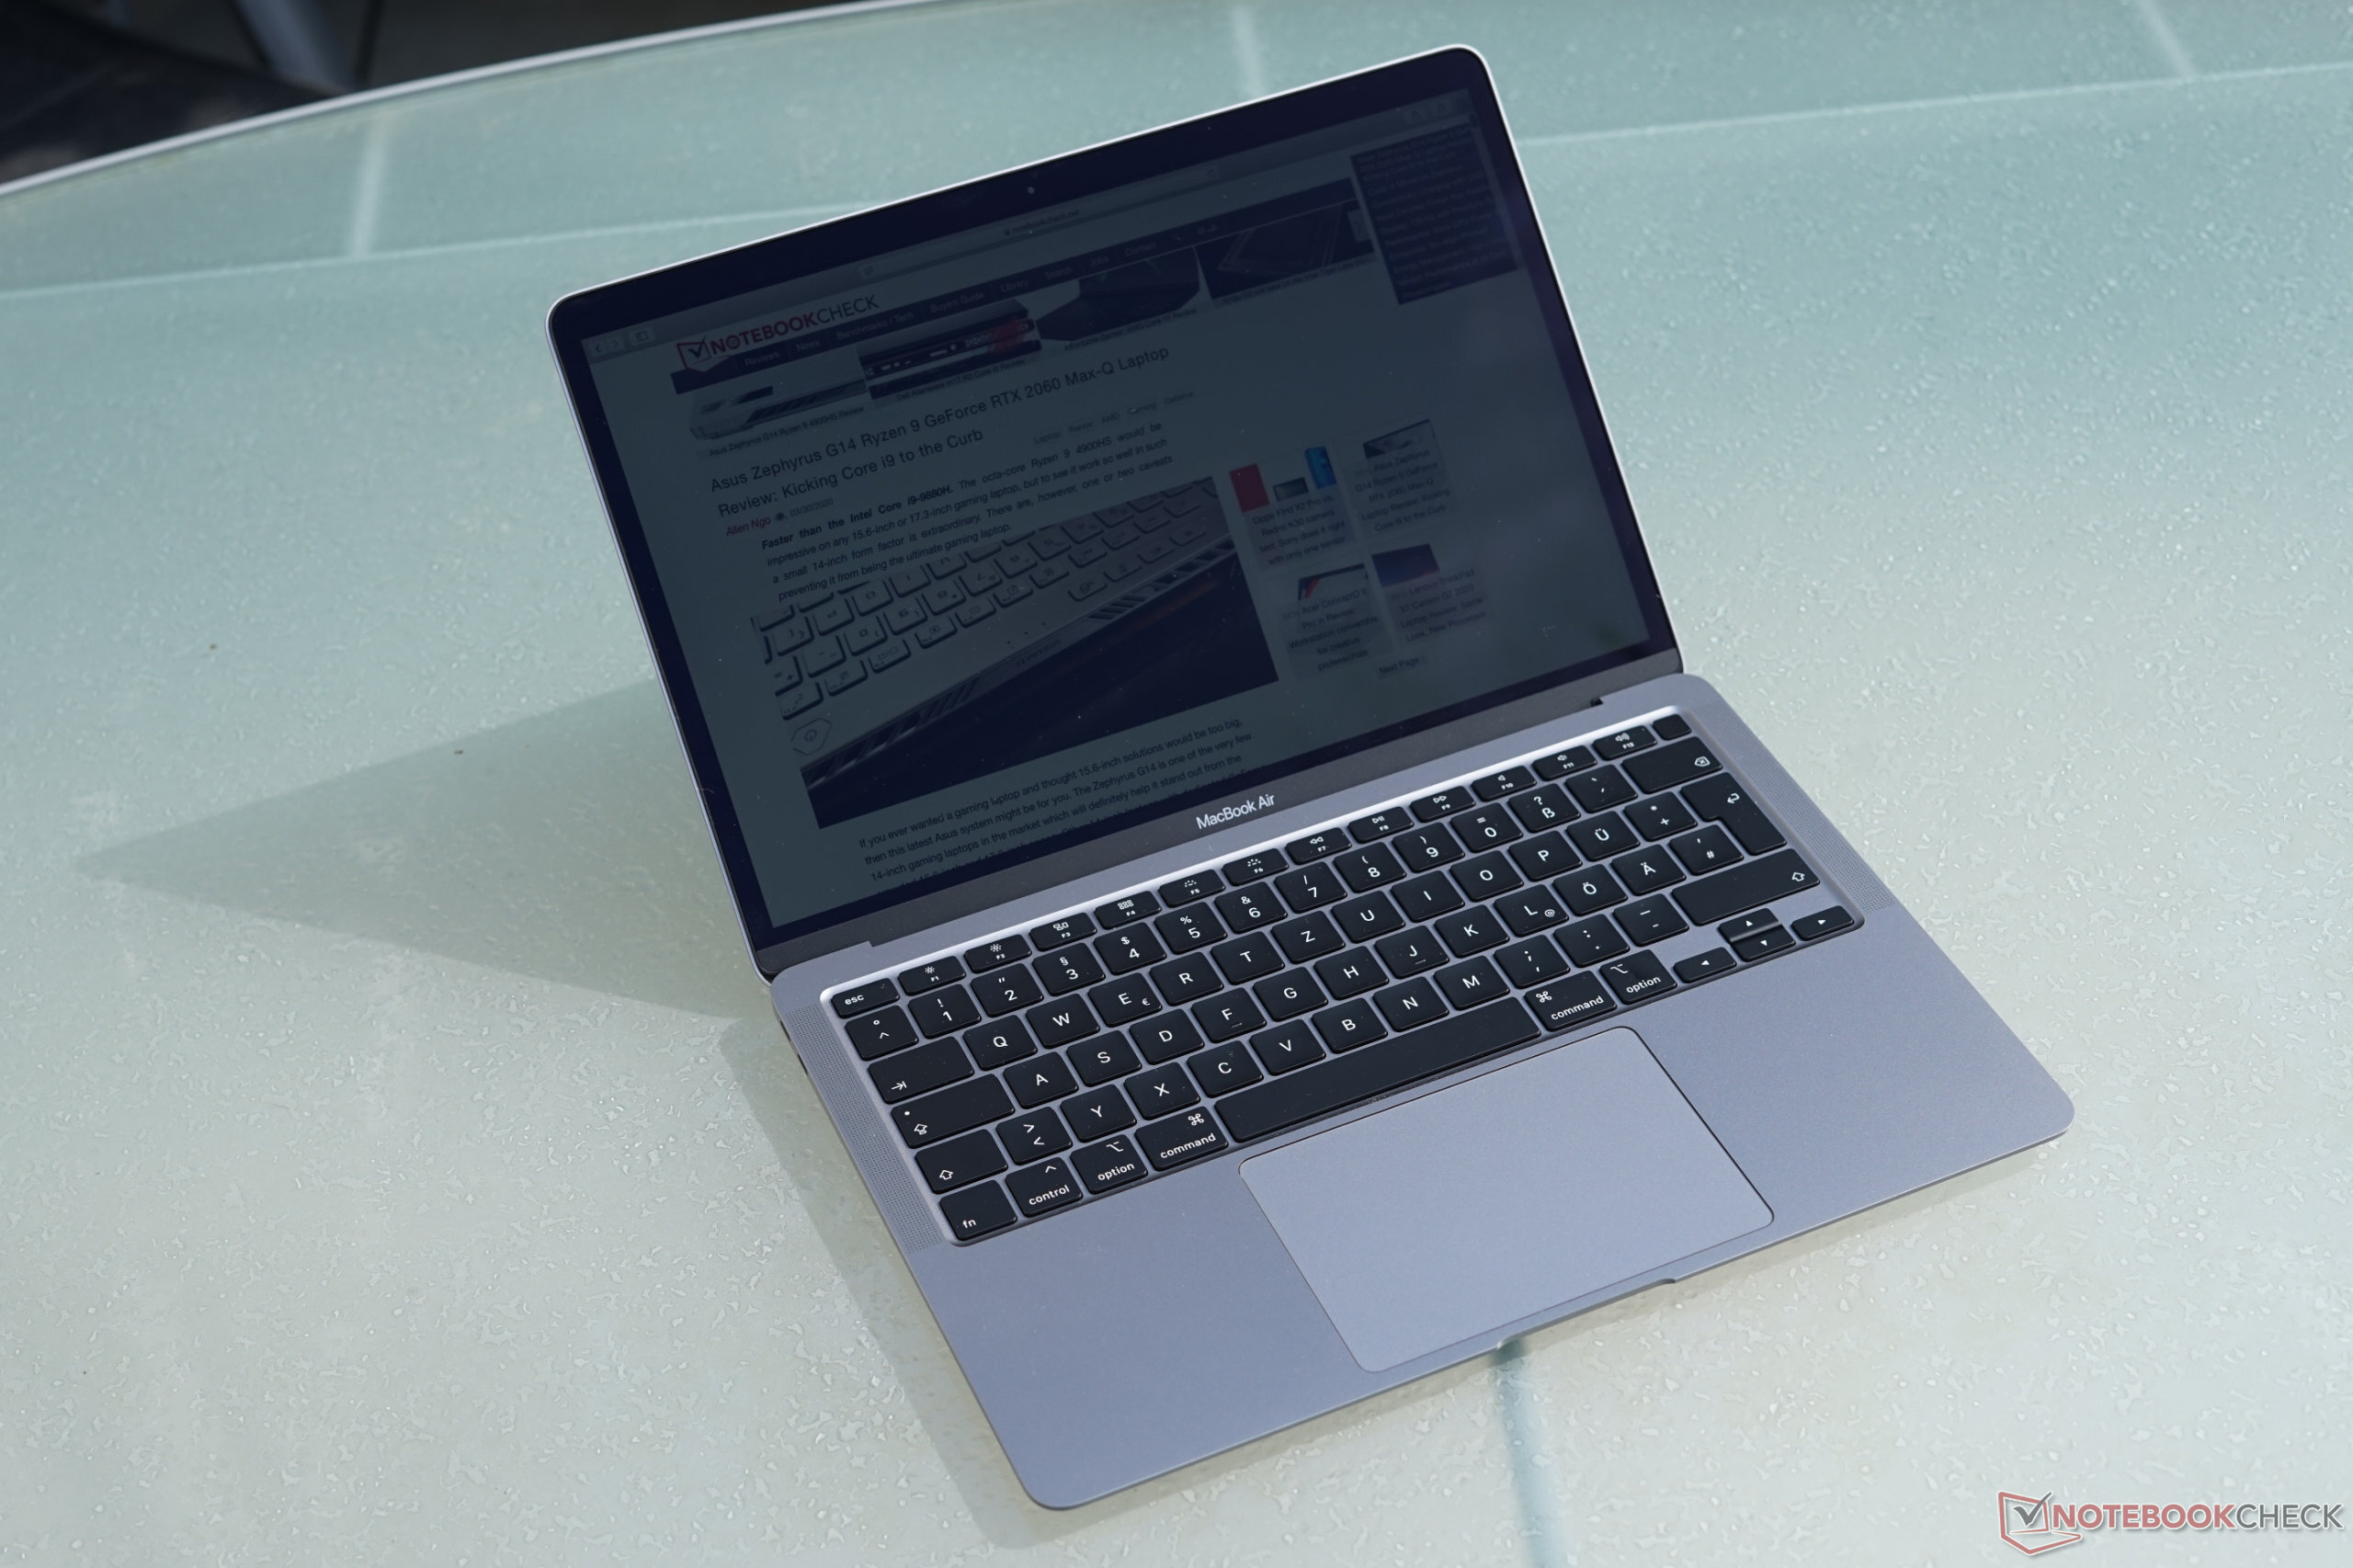
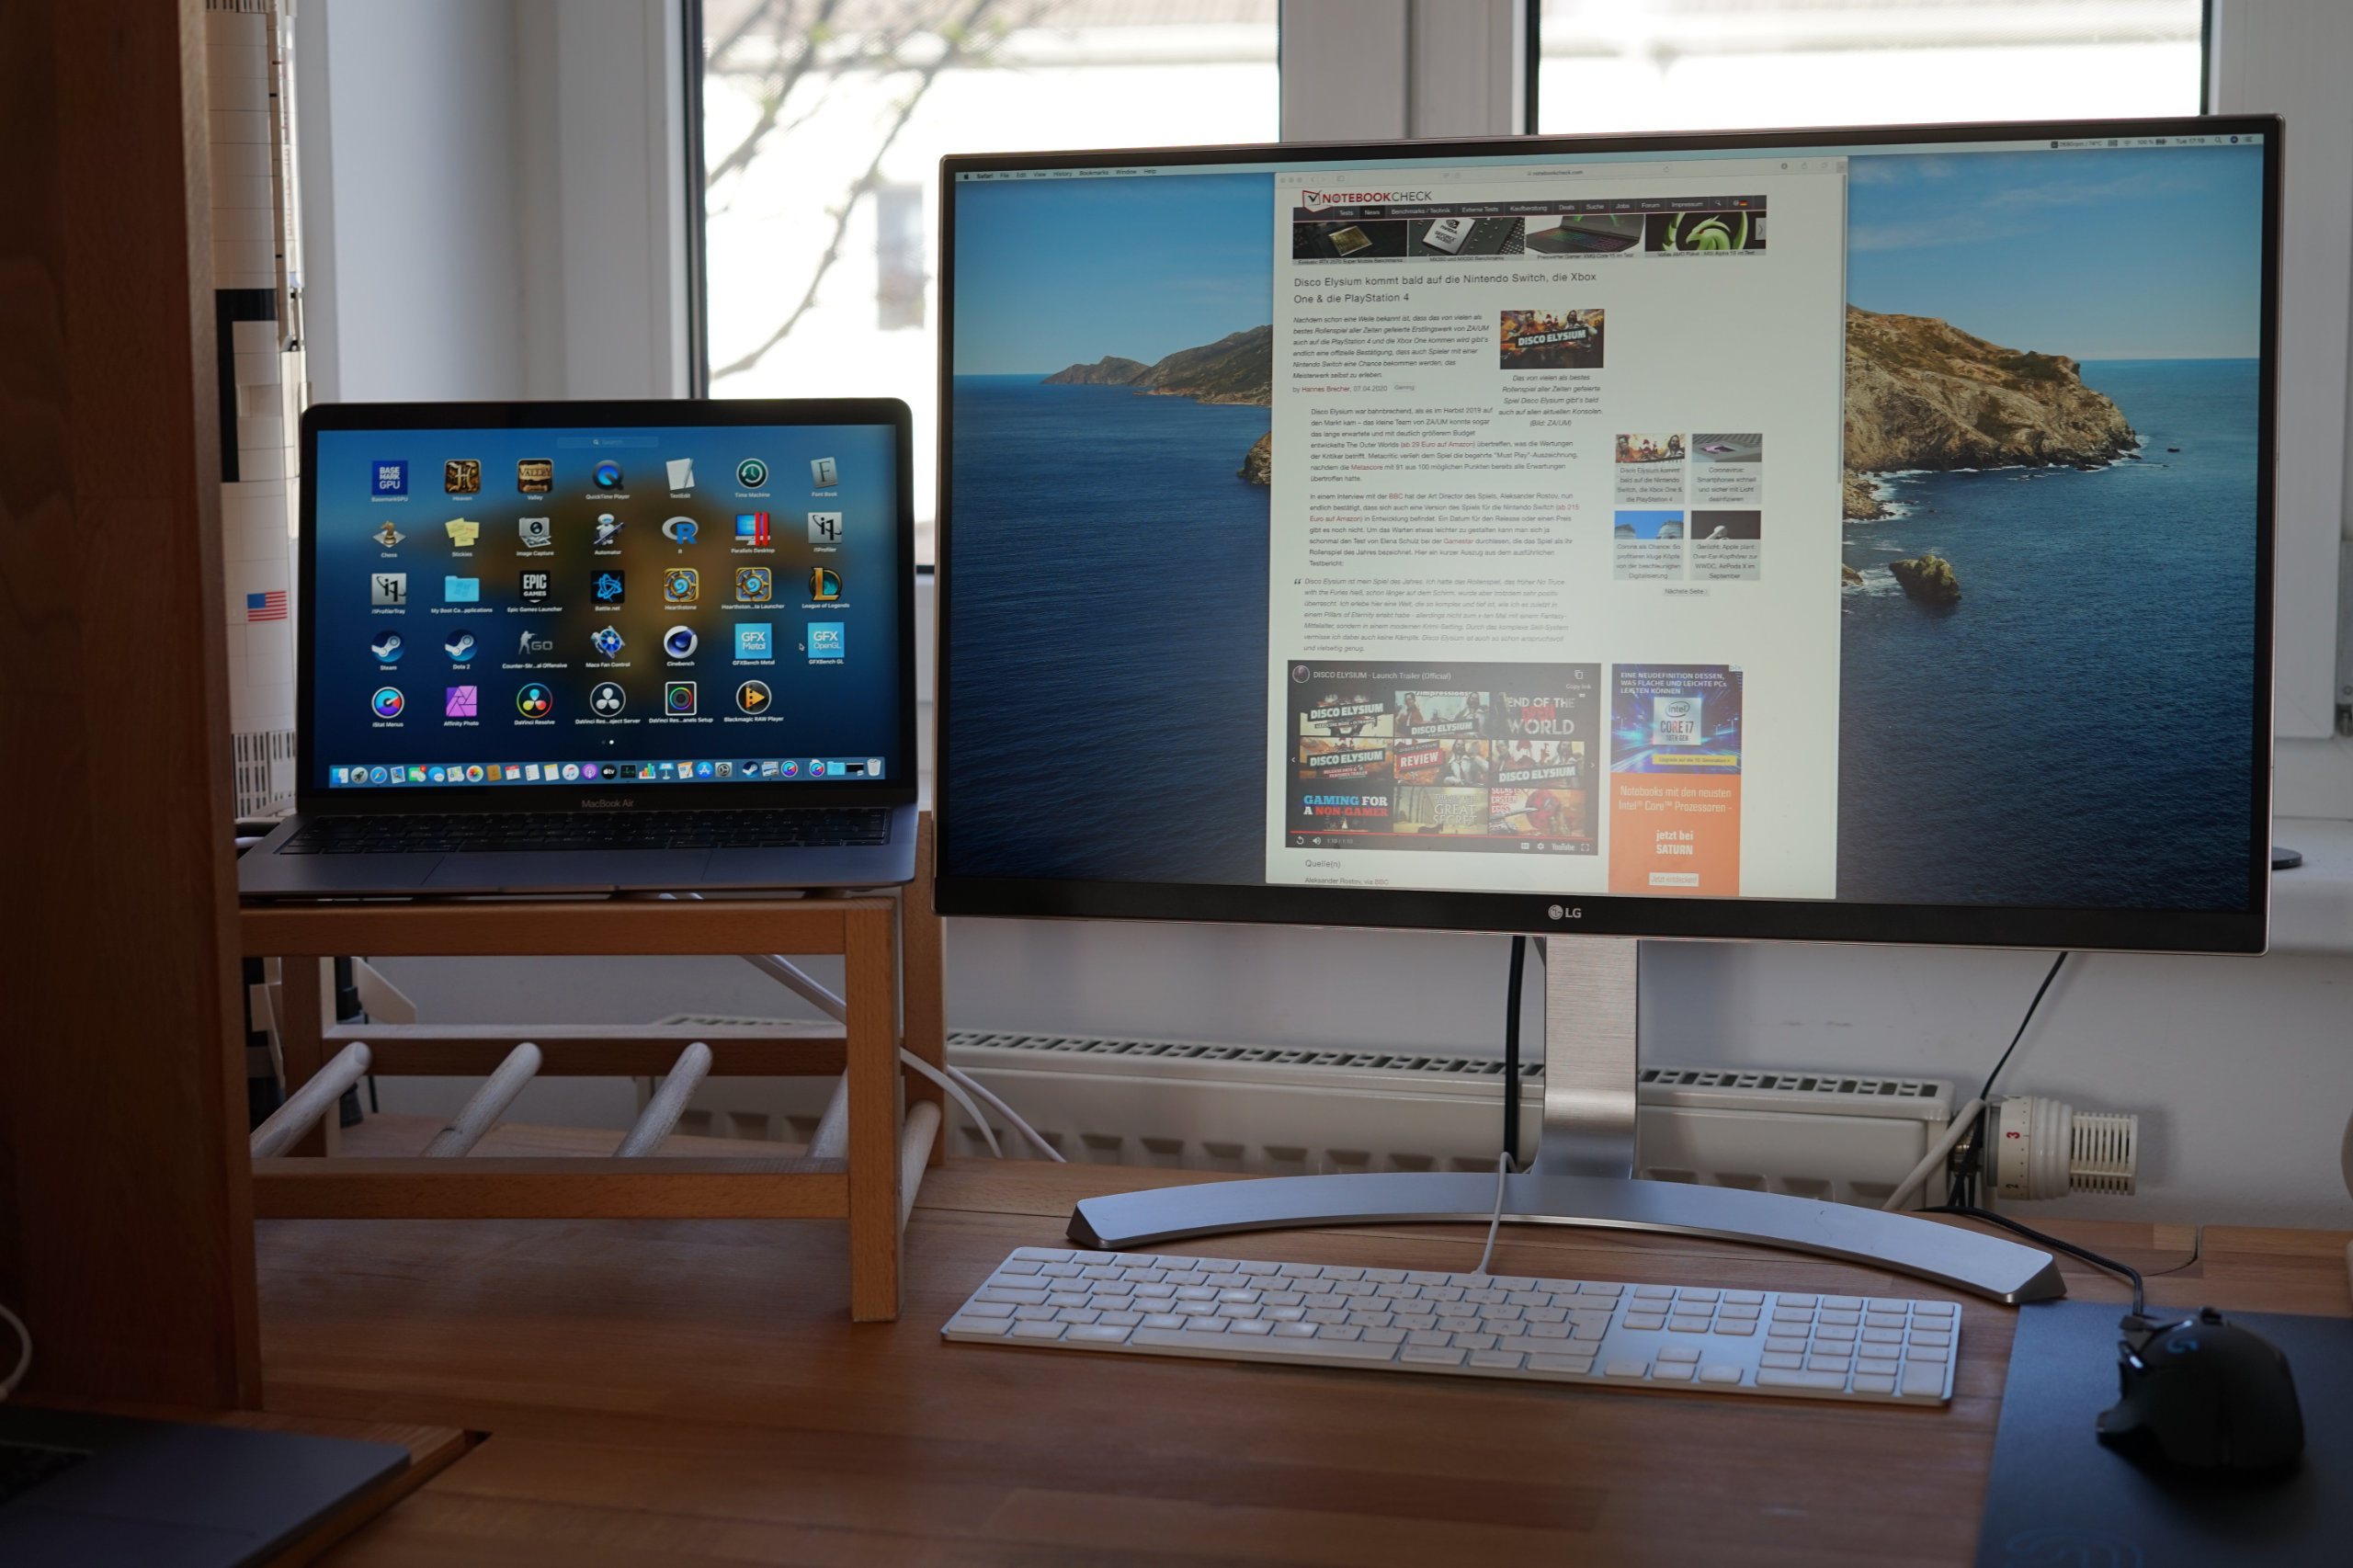
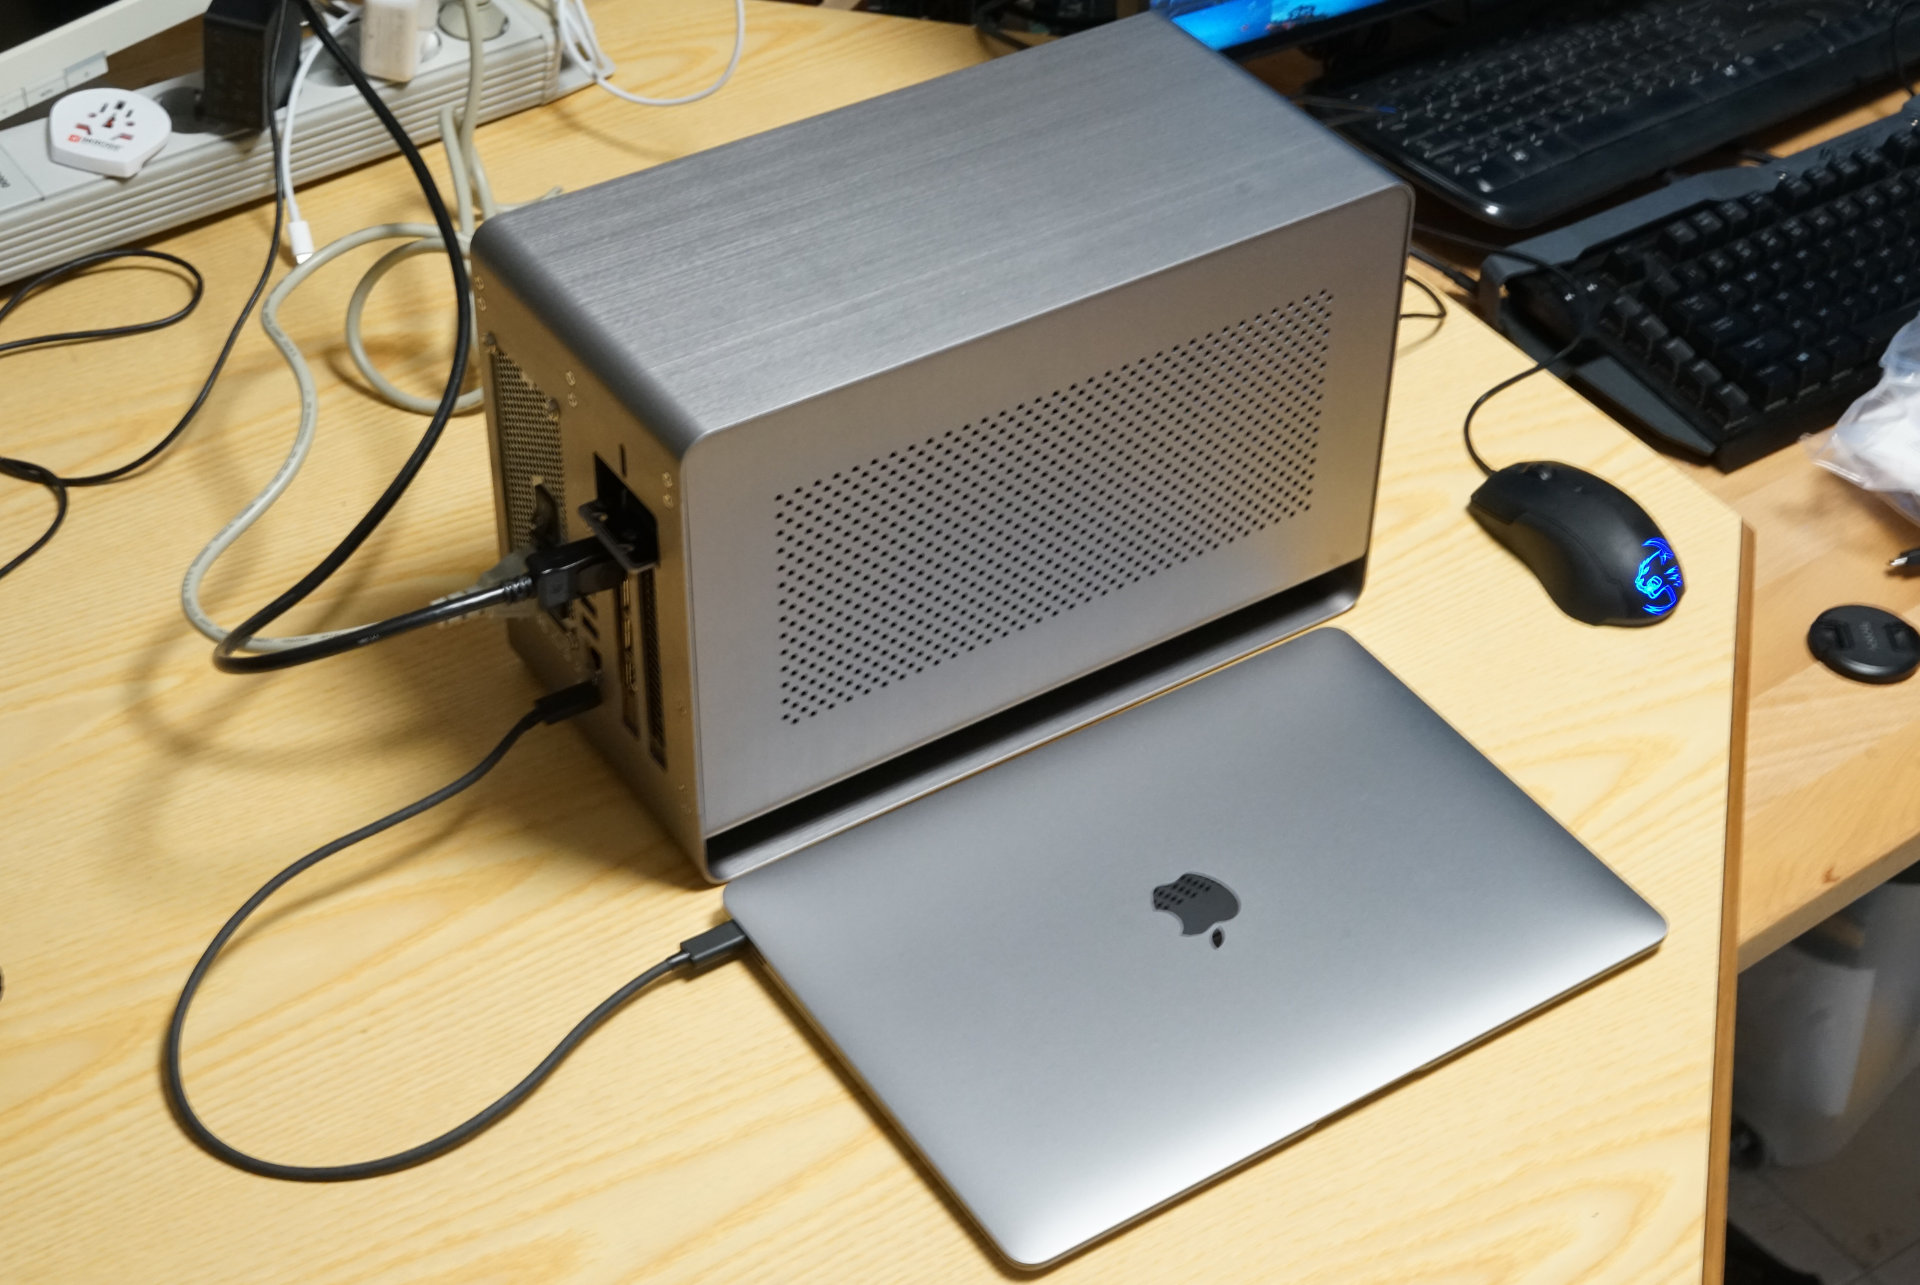
Both Thunderbolt 3 ports worked without any problems during our test period. We managed to copy a large 10 GB file from an external Samsung T5 2TB SSD at an average rate of 438 MB/s. The large Philips 329P9 worked well at 4K (60 Hz) including USB 2.0 hub and power delivery. The same goes for our LG 27UD88-W including hub and power delivery. The Mantiz Titan Thunderbolt Dock was also immediately recognized and we were able to use the Mantiz Venus eGPU in combination with the RX 480 to increase the graphics performance. However, the Ethernet port required additional drivers from Asix.
Communication
Similar to our MacBook Pro 16 review, we once again had some problems with the Wi-Fi 5 WLAN and the iperf test, where the data transfer was occasionally interrupted. However, the connection with a FritzBox 7590 worked well with good range. The results are just slightly below the MacBook Pro 13 from 2019 and are basically identical to the 2019 MacBook Air. Compared to current high-end WLAN modules like the Intel Wi-Fi 6 AX201 or the Killer AX1650, we can see a big difference and the Air is unfortunately just average in this notebook class.
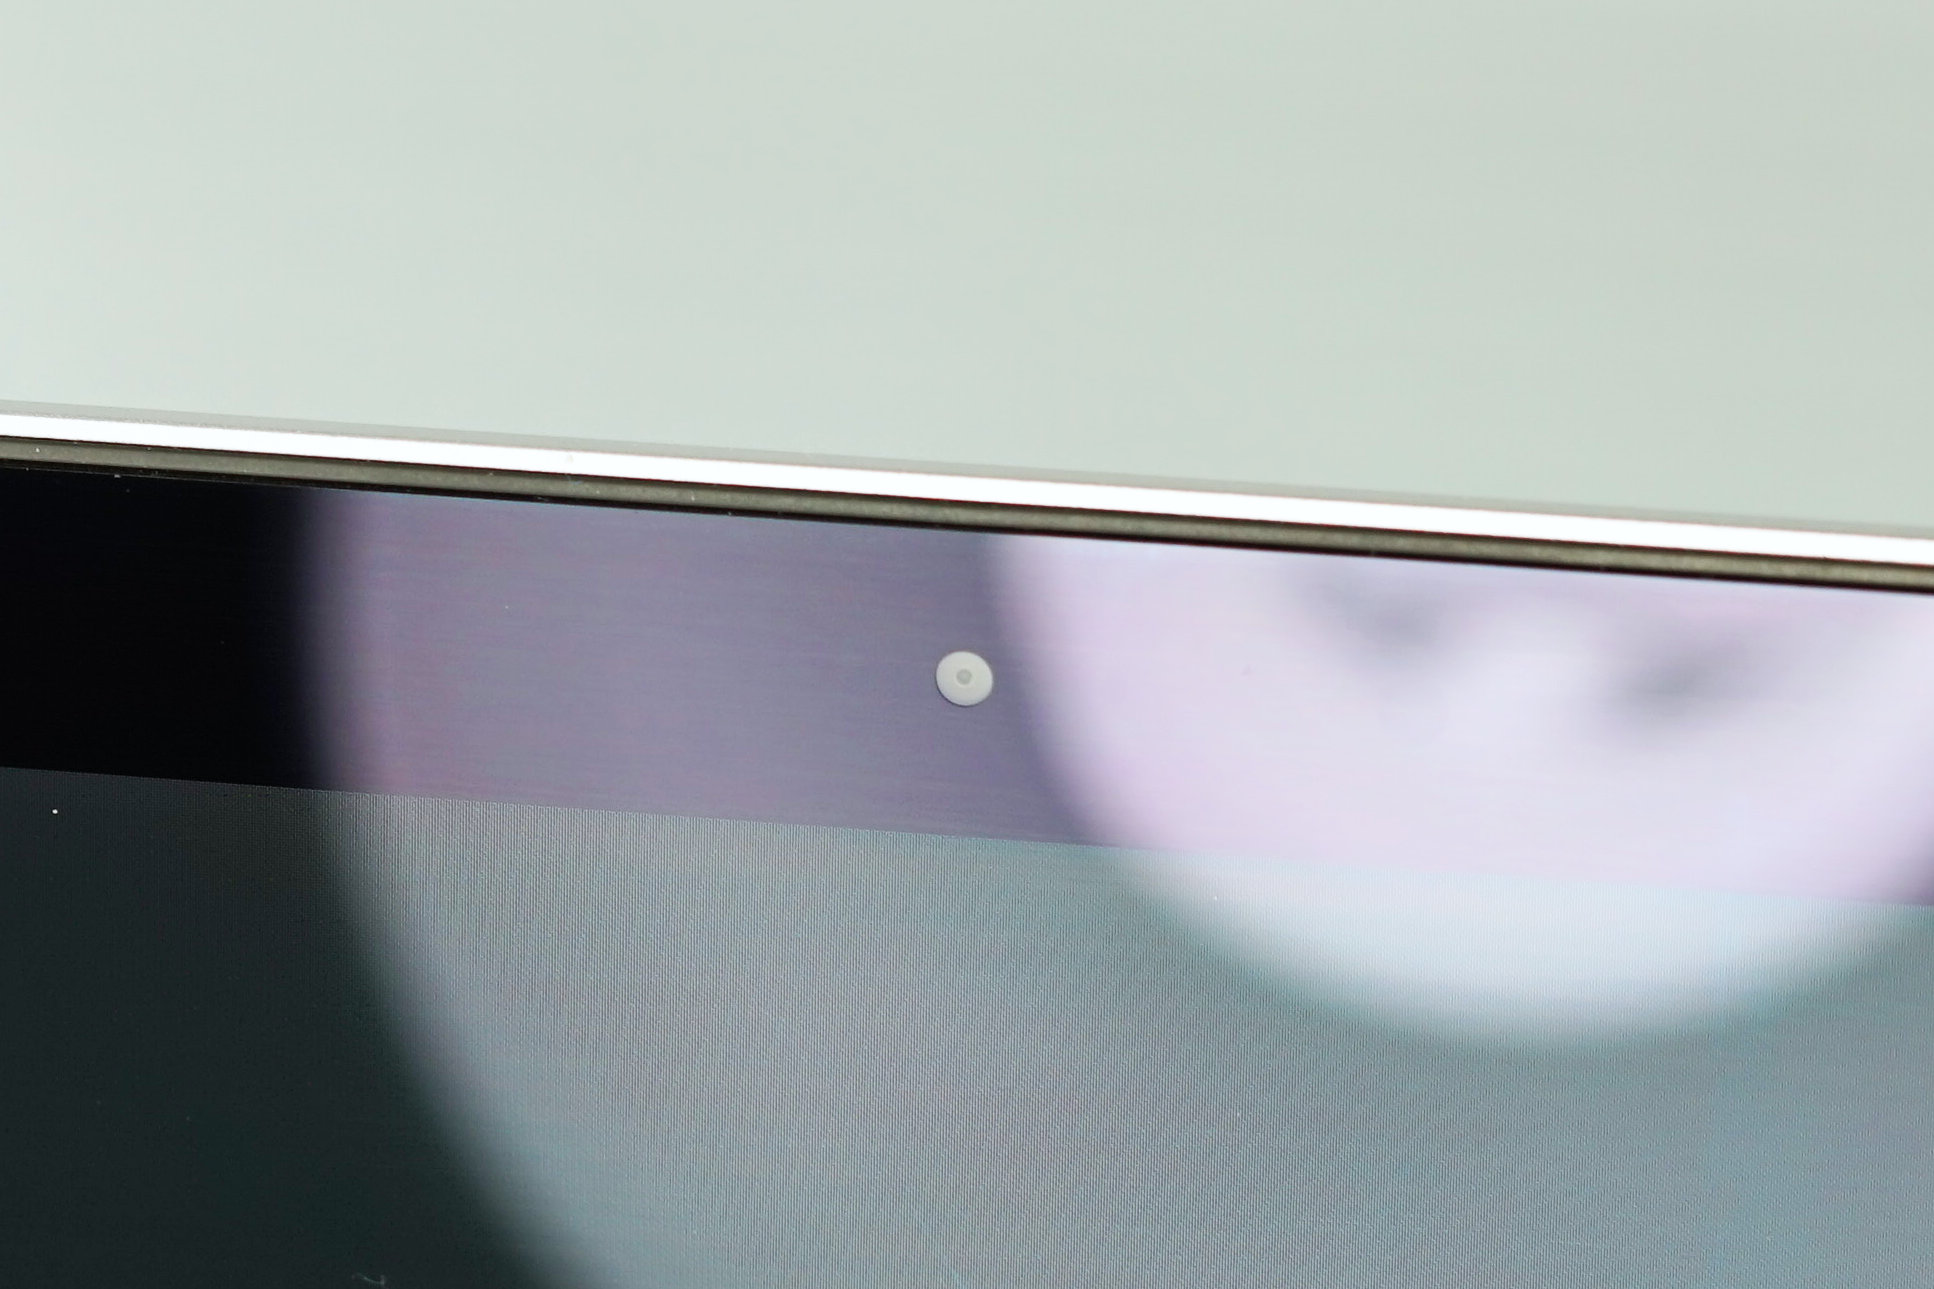
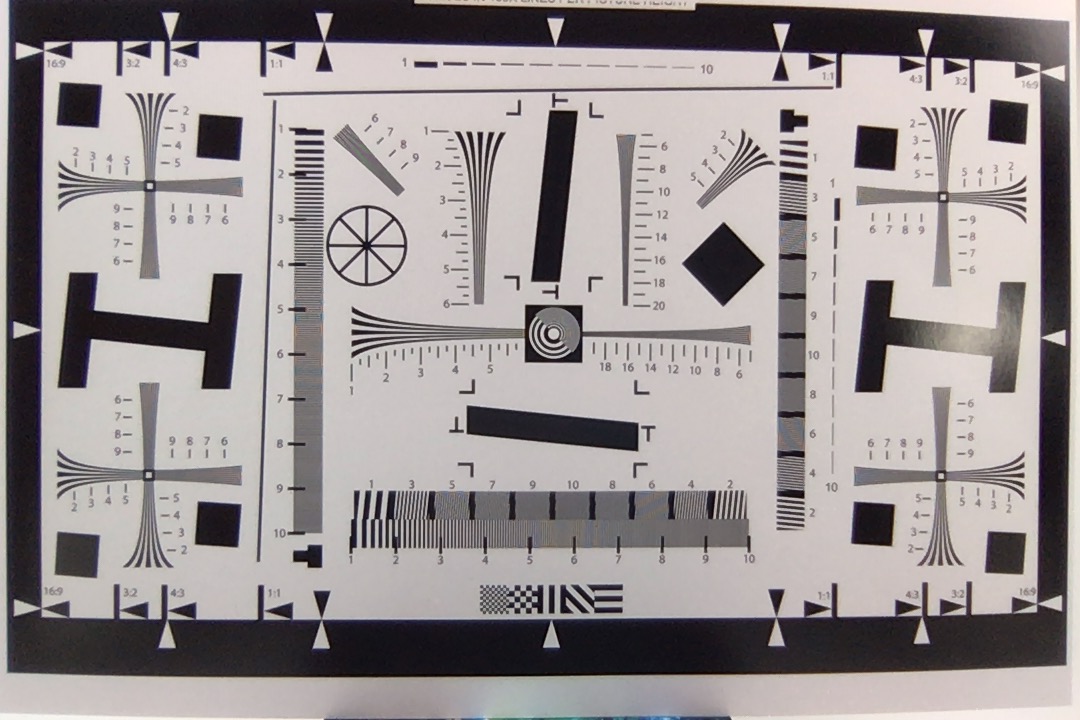
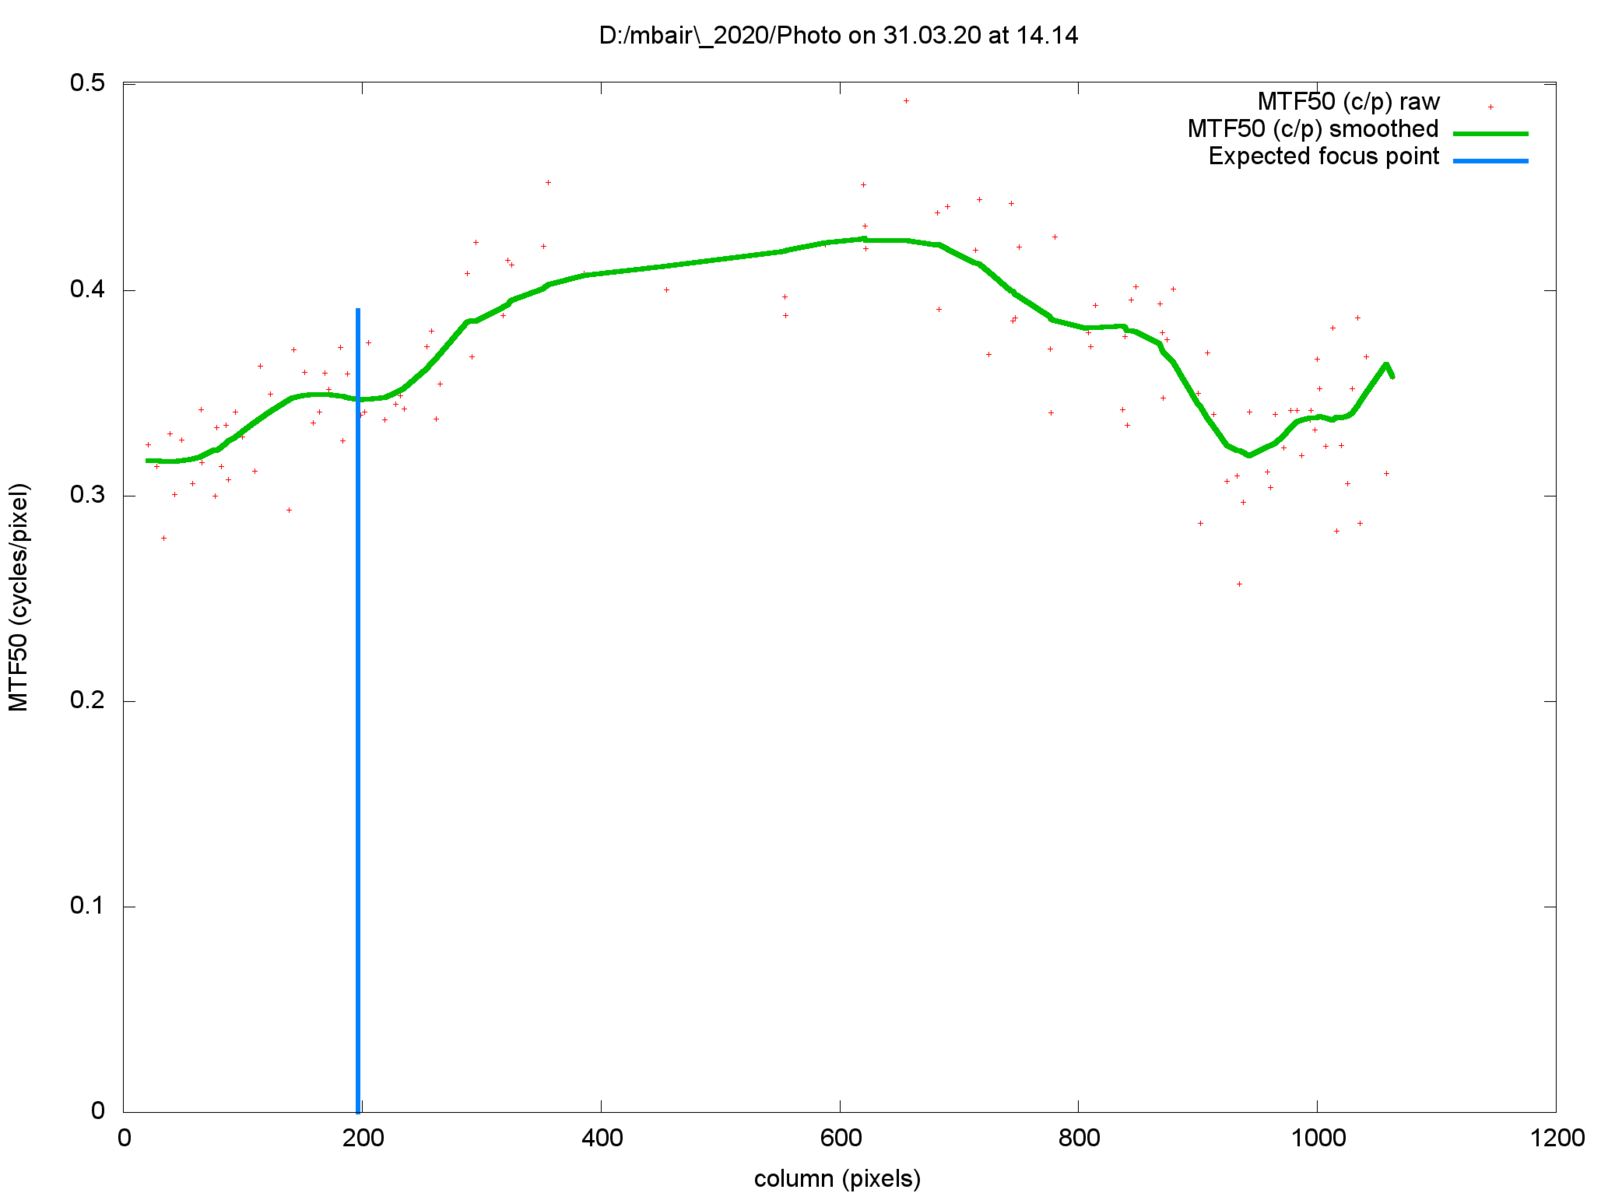
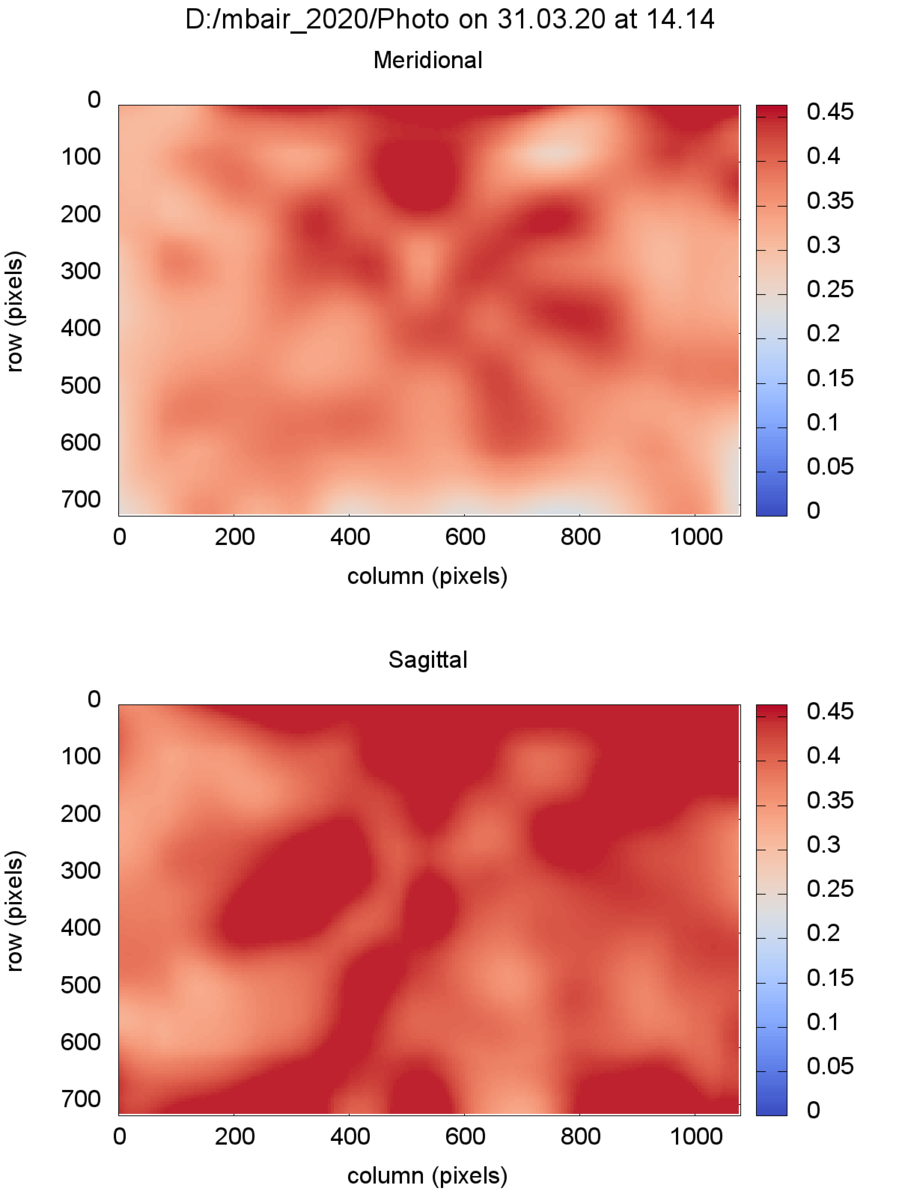
Webcam – Air with low 720p resolution
Apple offers smartphones with great cameras, but still pretty much ignores the cameras in its laptops. And we have the feeling that there has been no improvement since the introduction of the 720p camera. In times with more and more home office and video conferences, the picture quality is unfortunately very poor. Apple is still average among the notebook competition, but you cannot be satisfied with this performance.


, i5-1030NG7, Apple SSD AP0512")
, i5-1030NG7, Apple SSD AP0512")
Maintenance
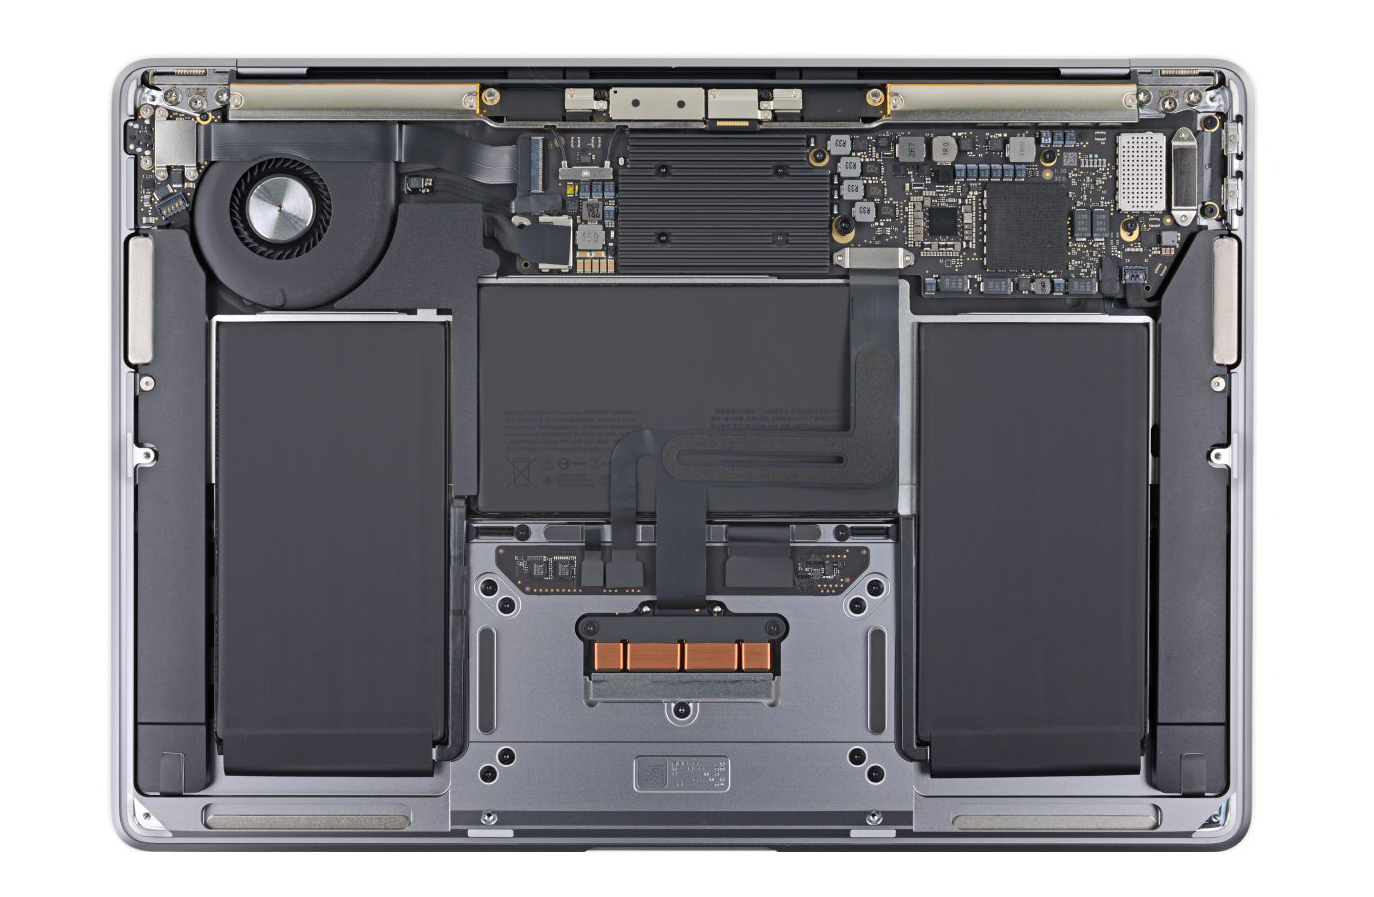
The teardown from our colleagues at iFixit shows that you cannot upgrade any parts of the MacBook Air. SSD, RAM, and Wi-Fi module are soldered onto the mainboard. You can at least clean the fan pretty easily (if you have the correct screw driver). The battery replacement, however, is easier than before, which is certainly a good thing.
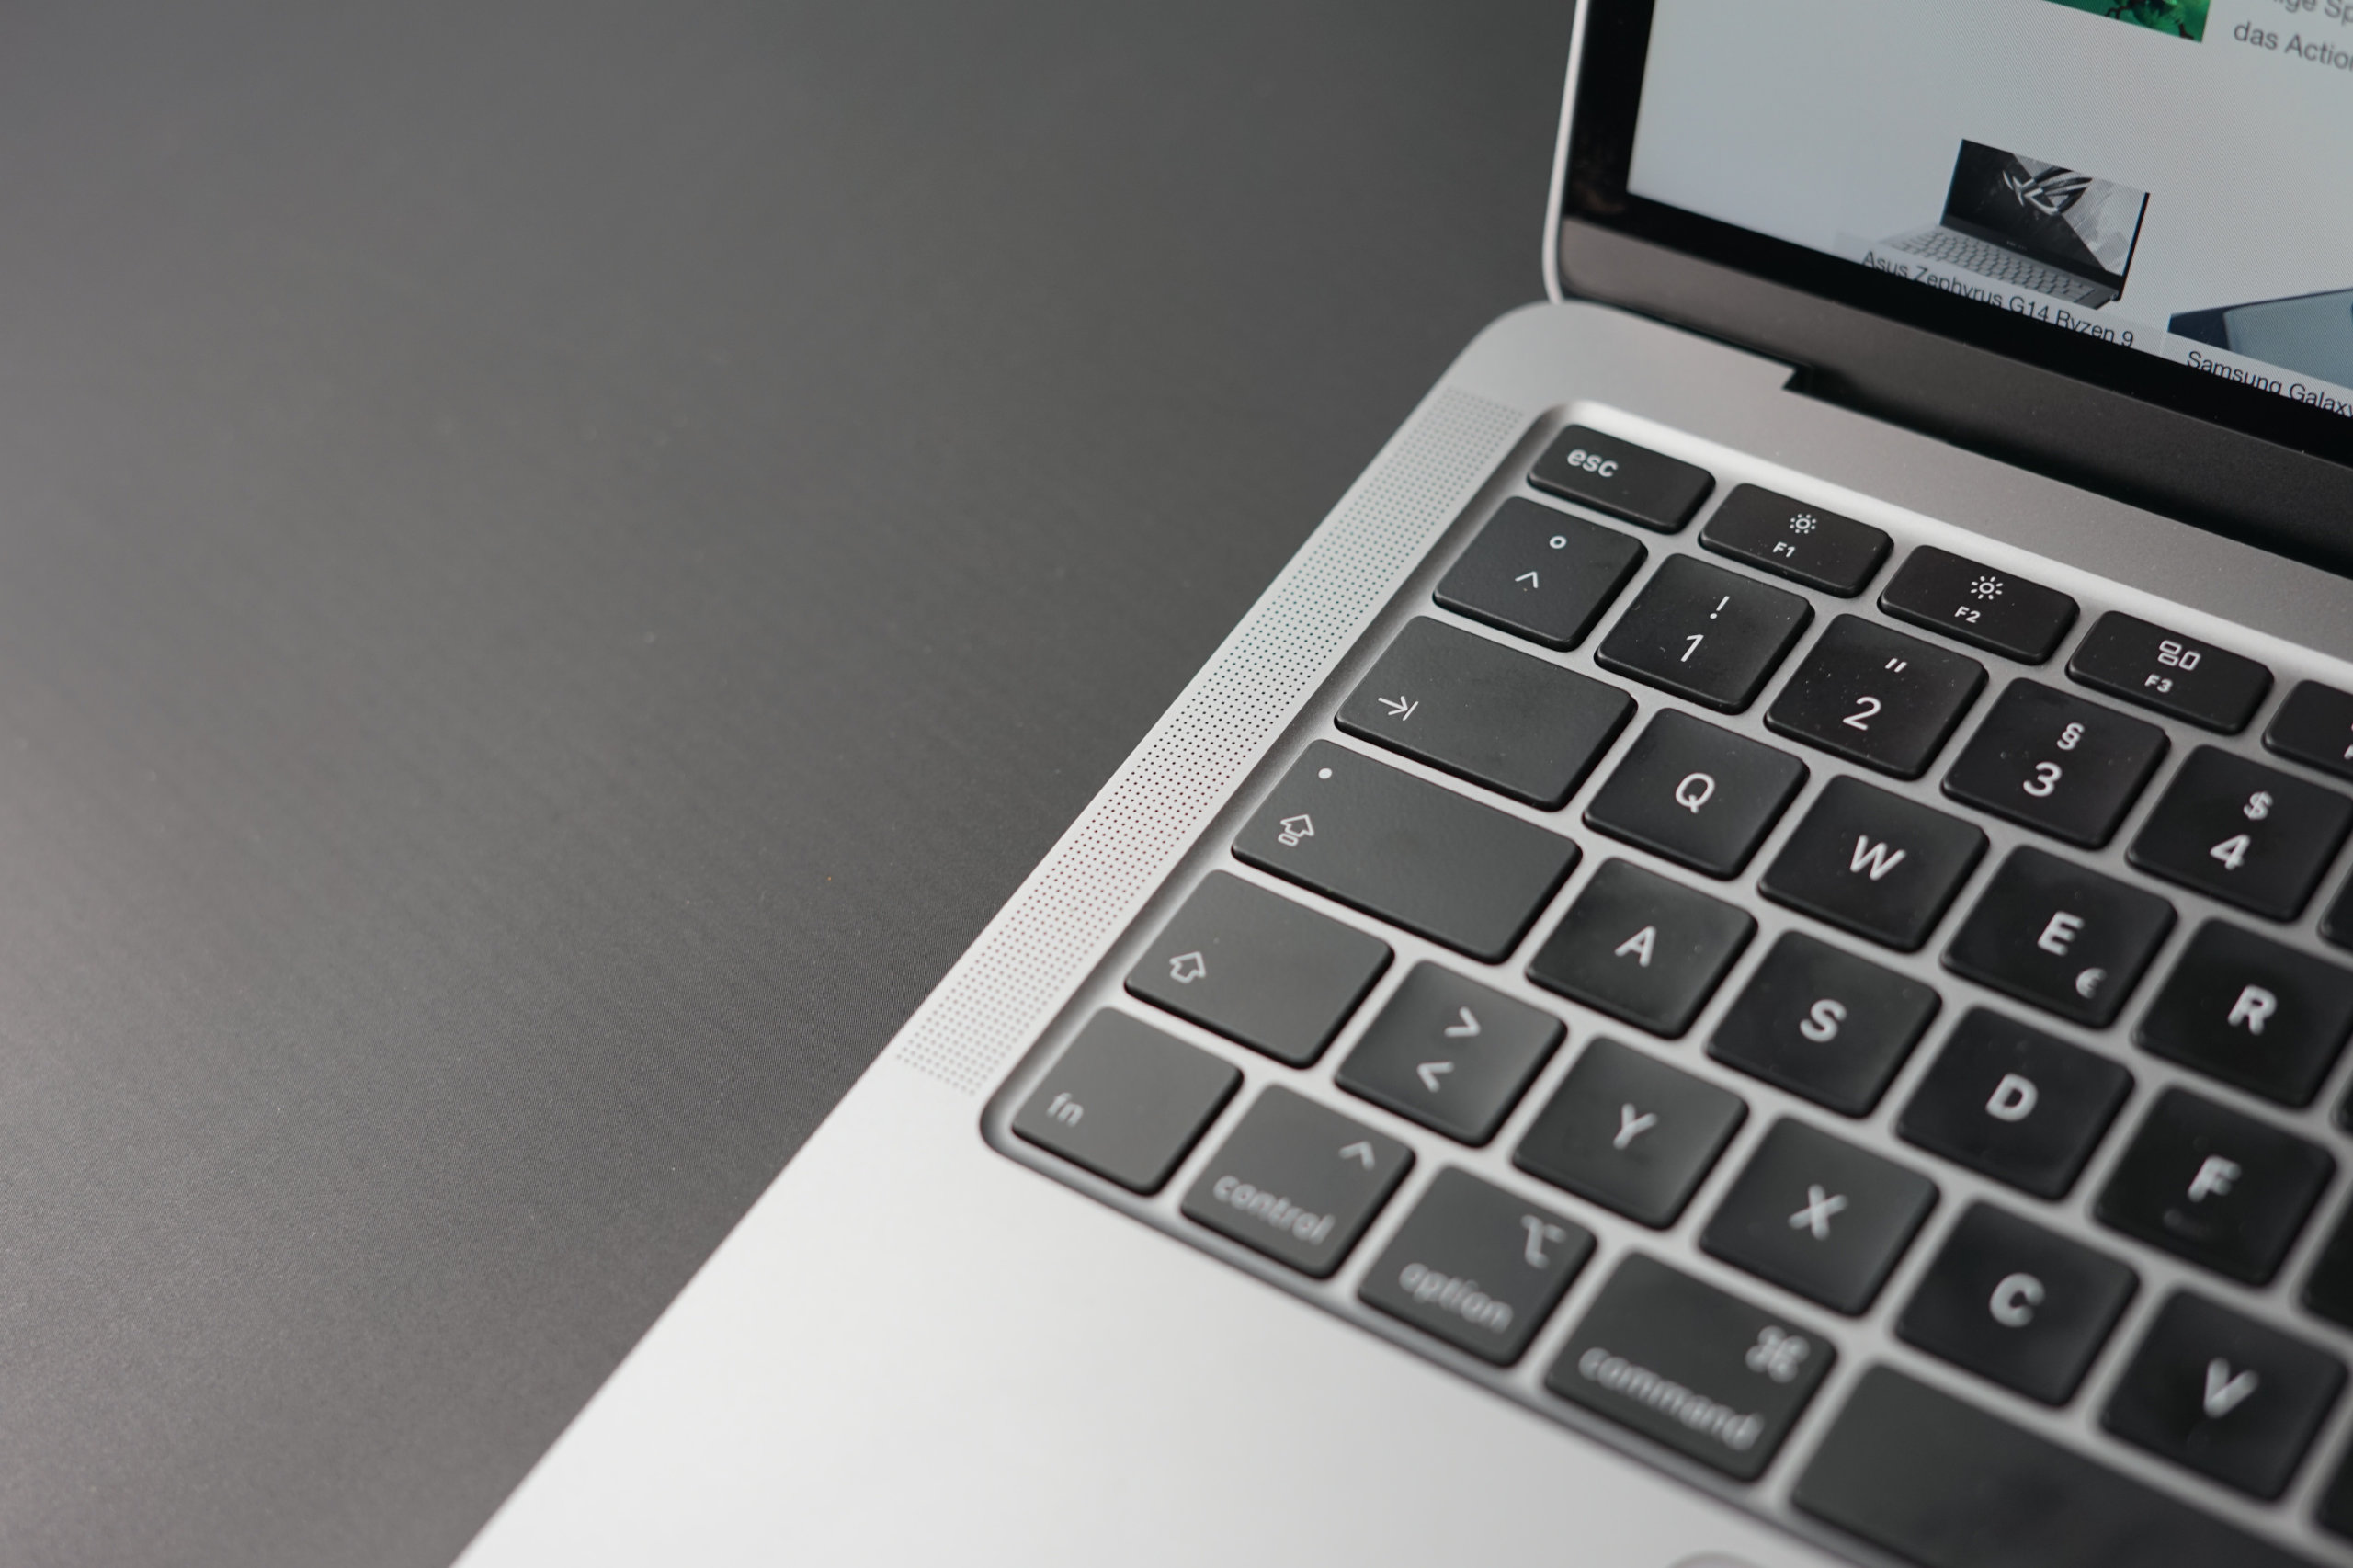
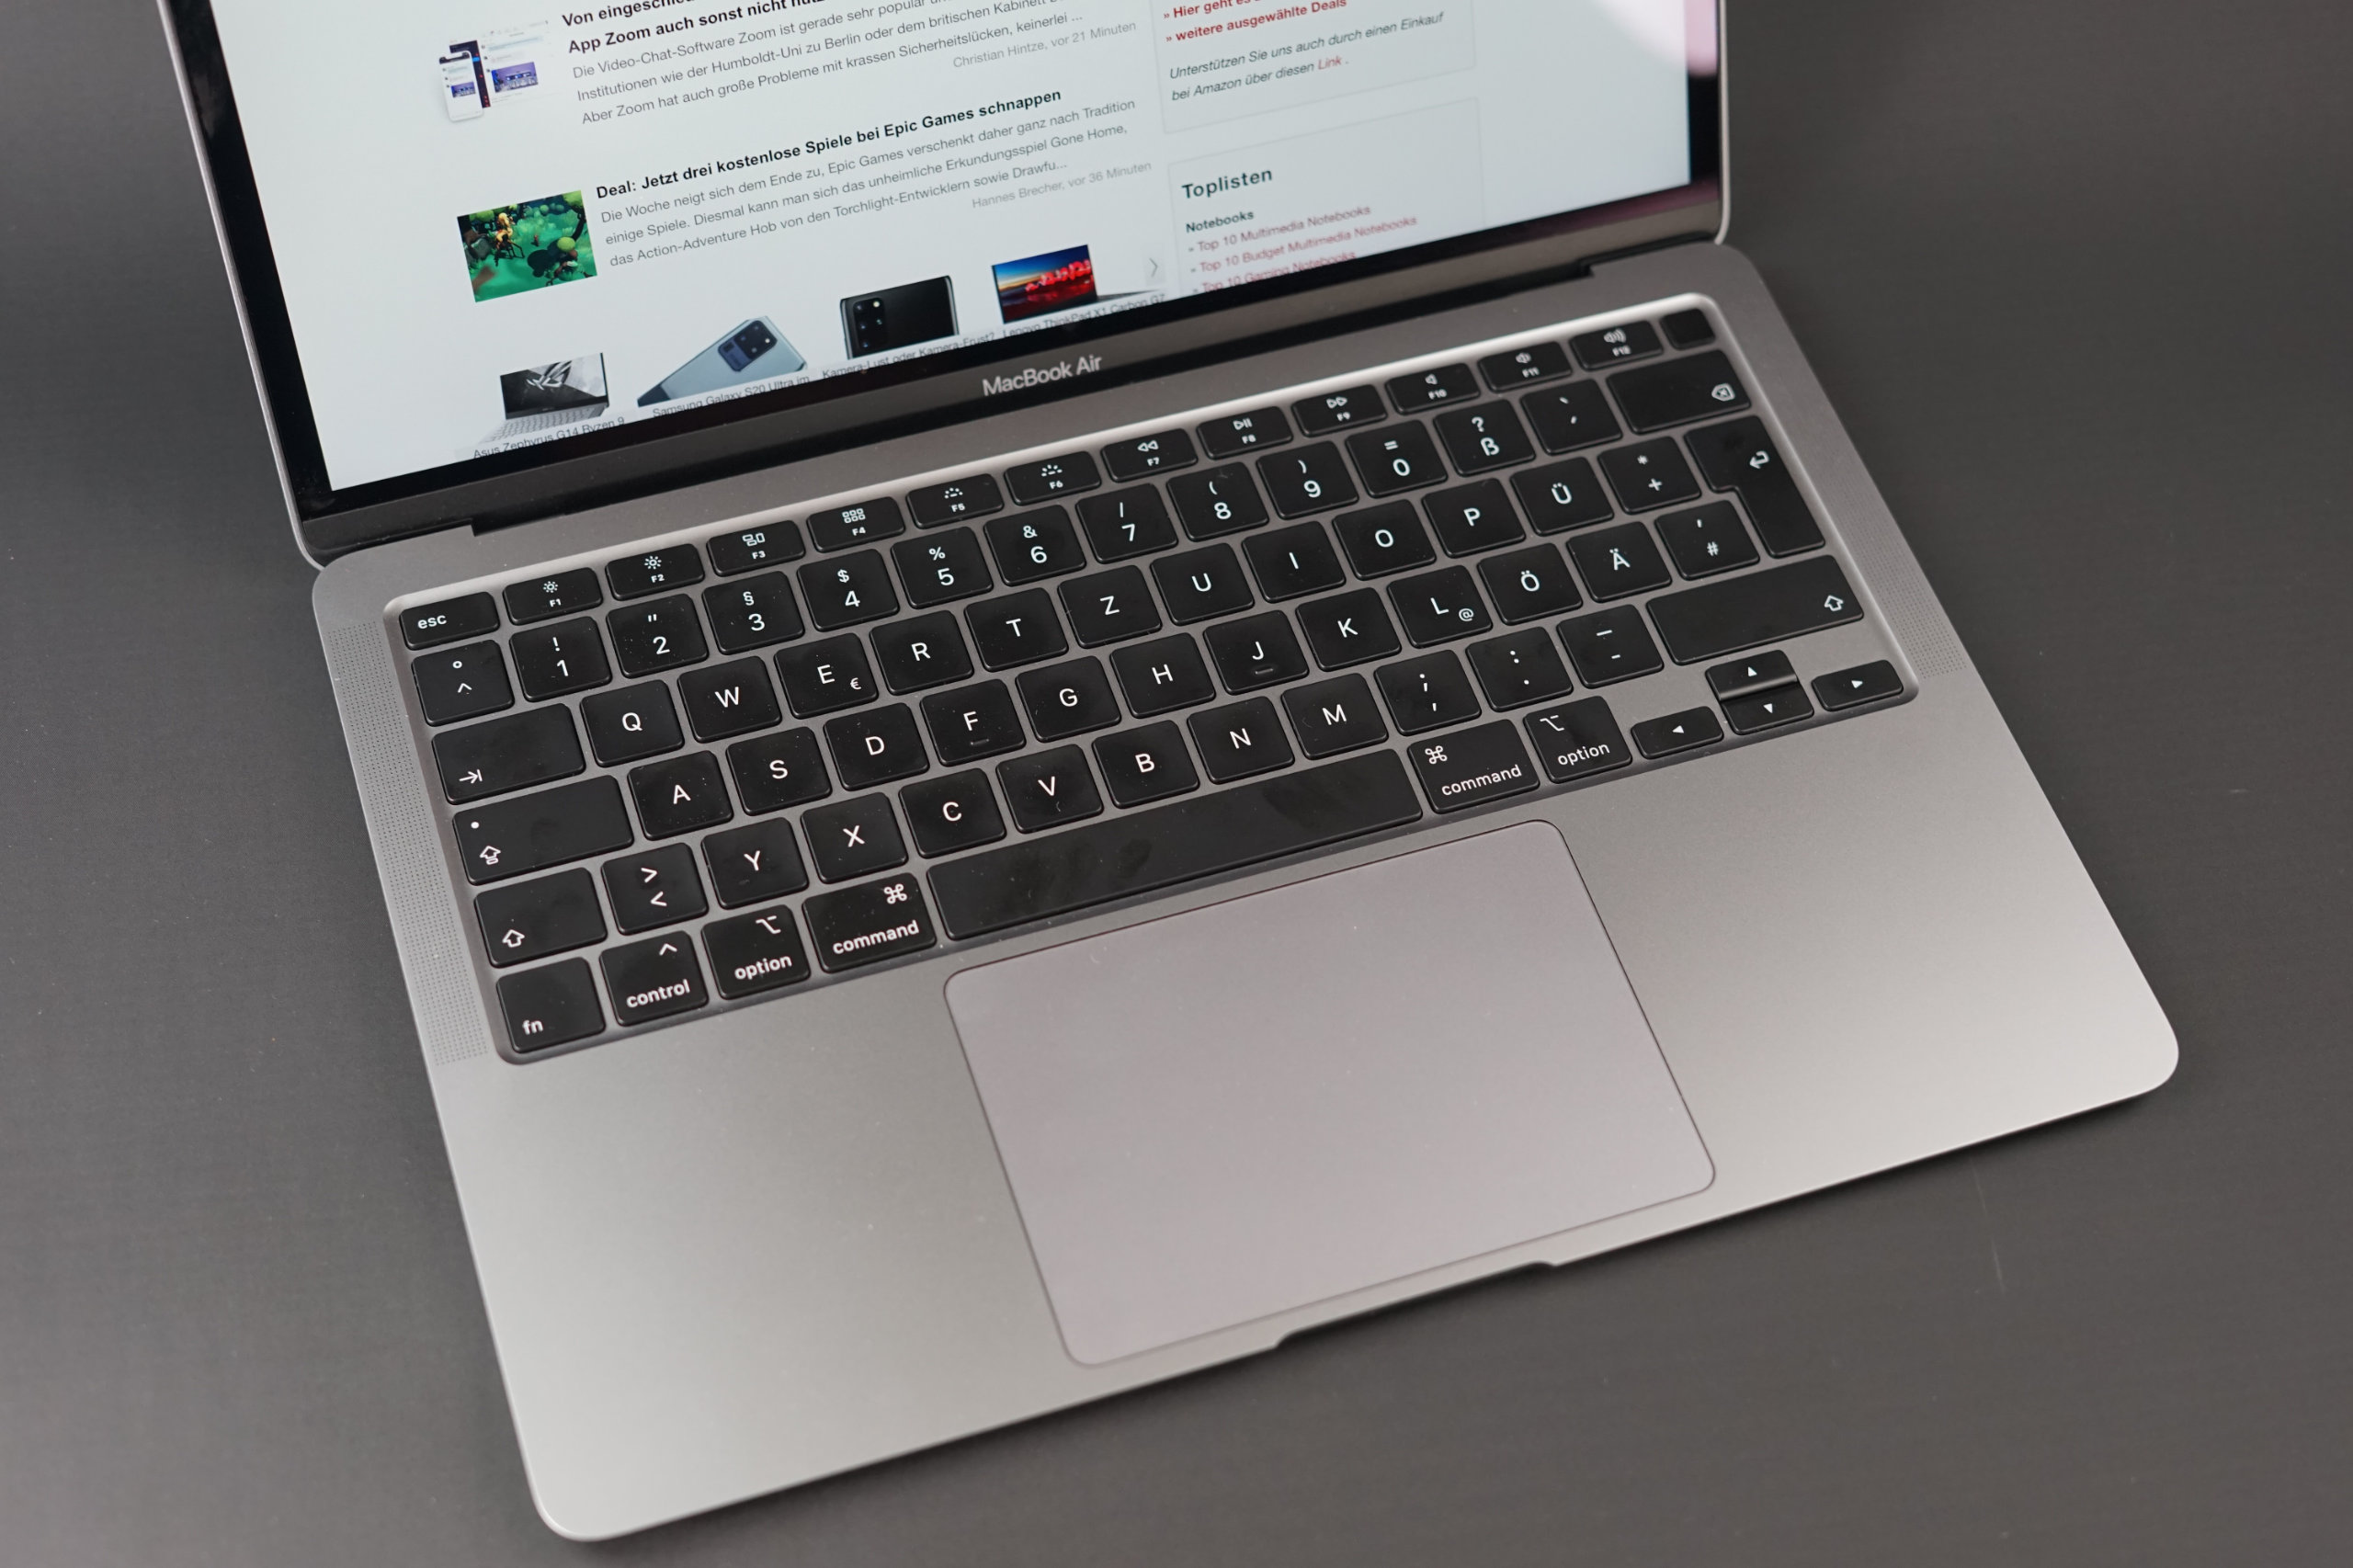
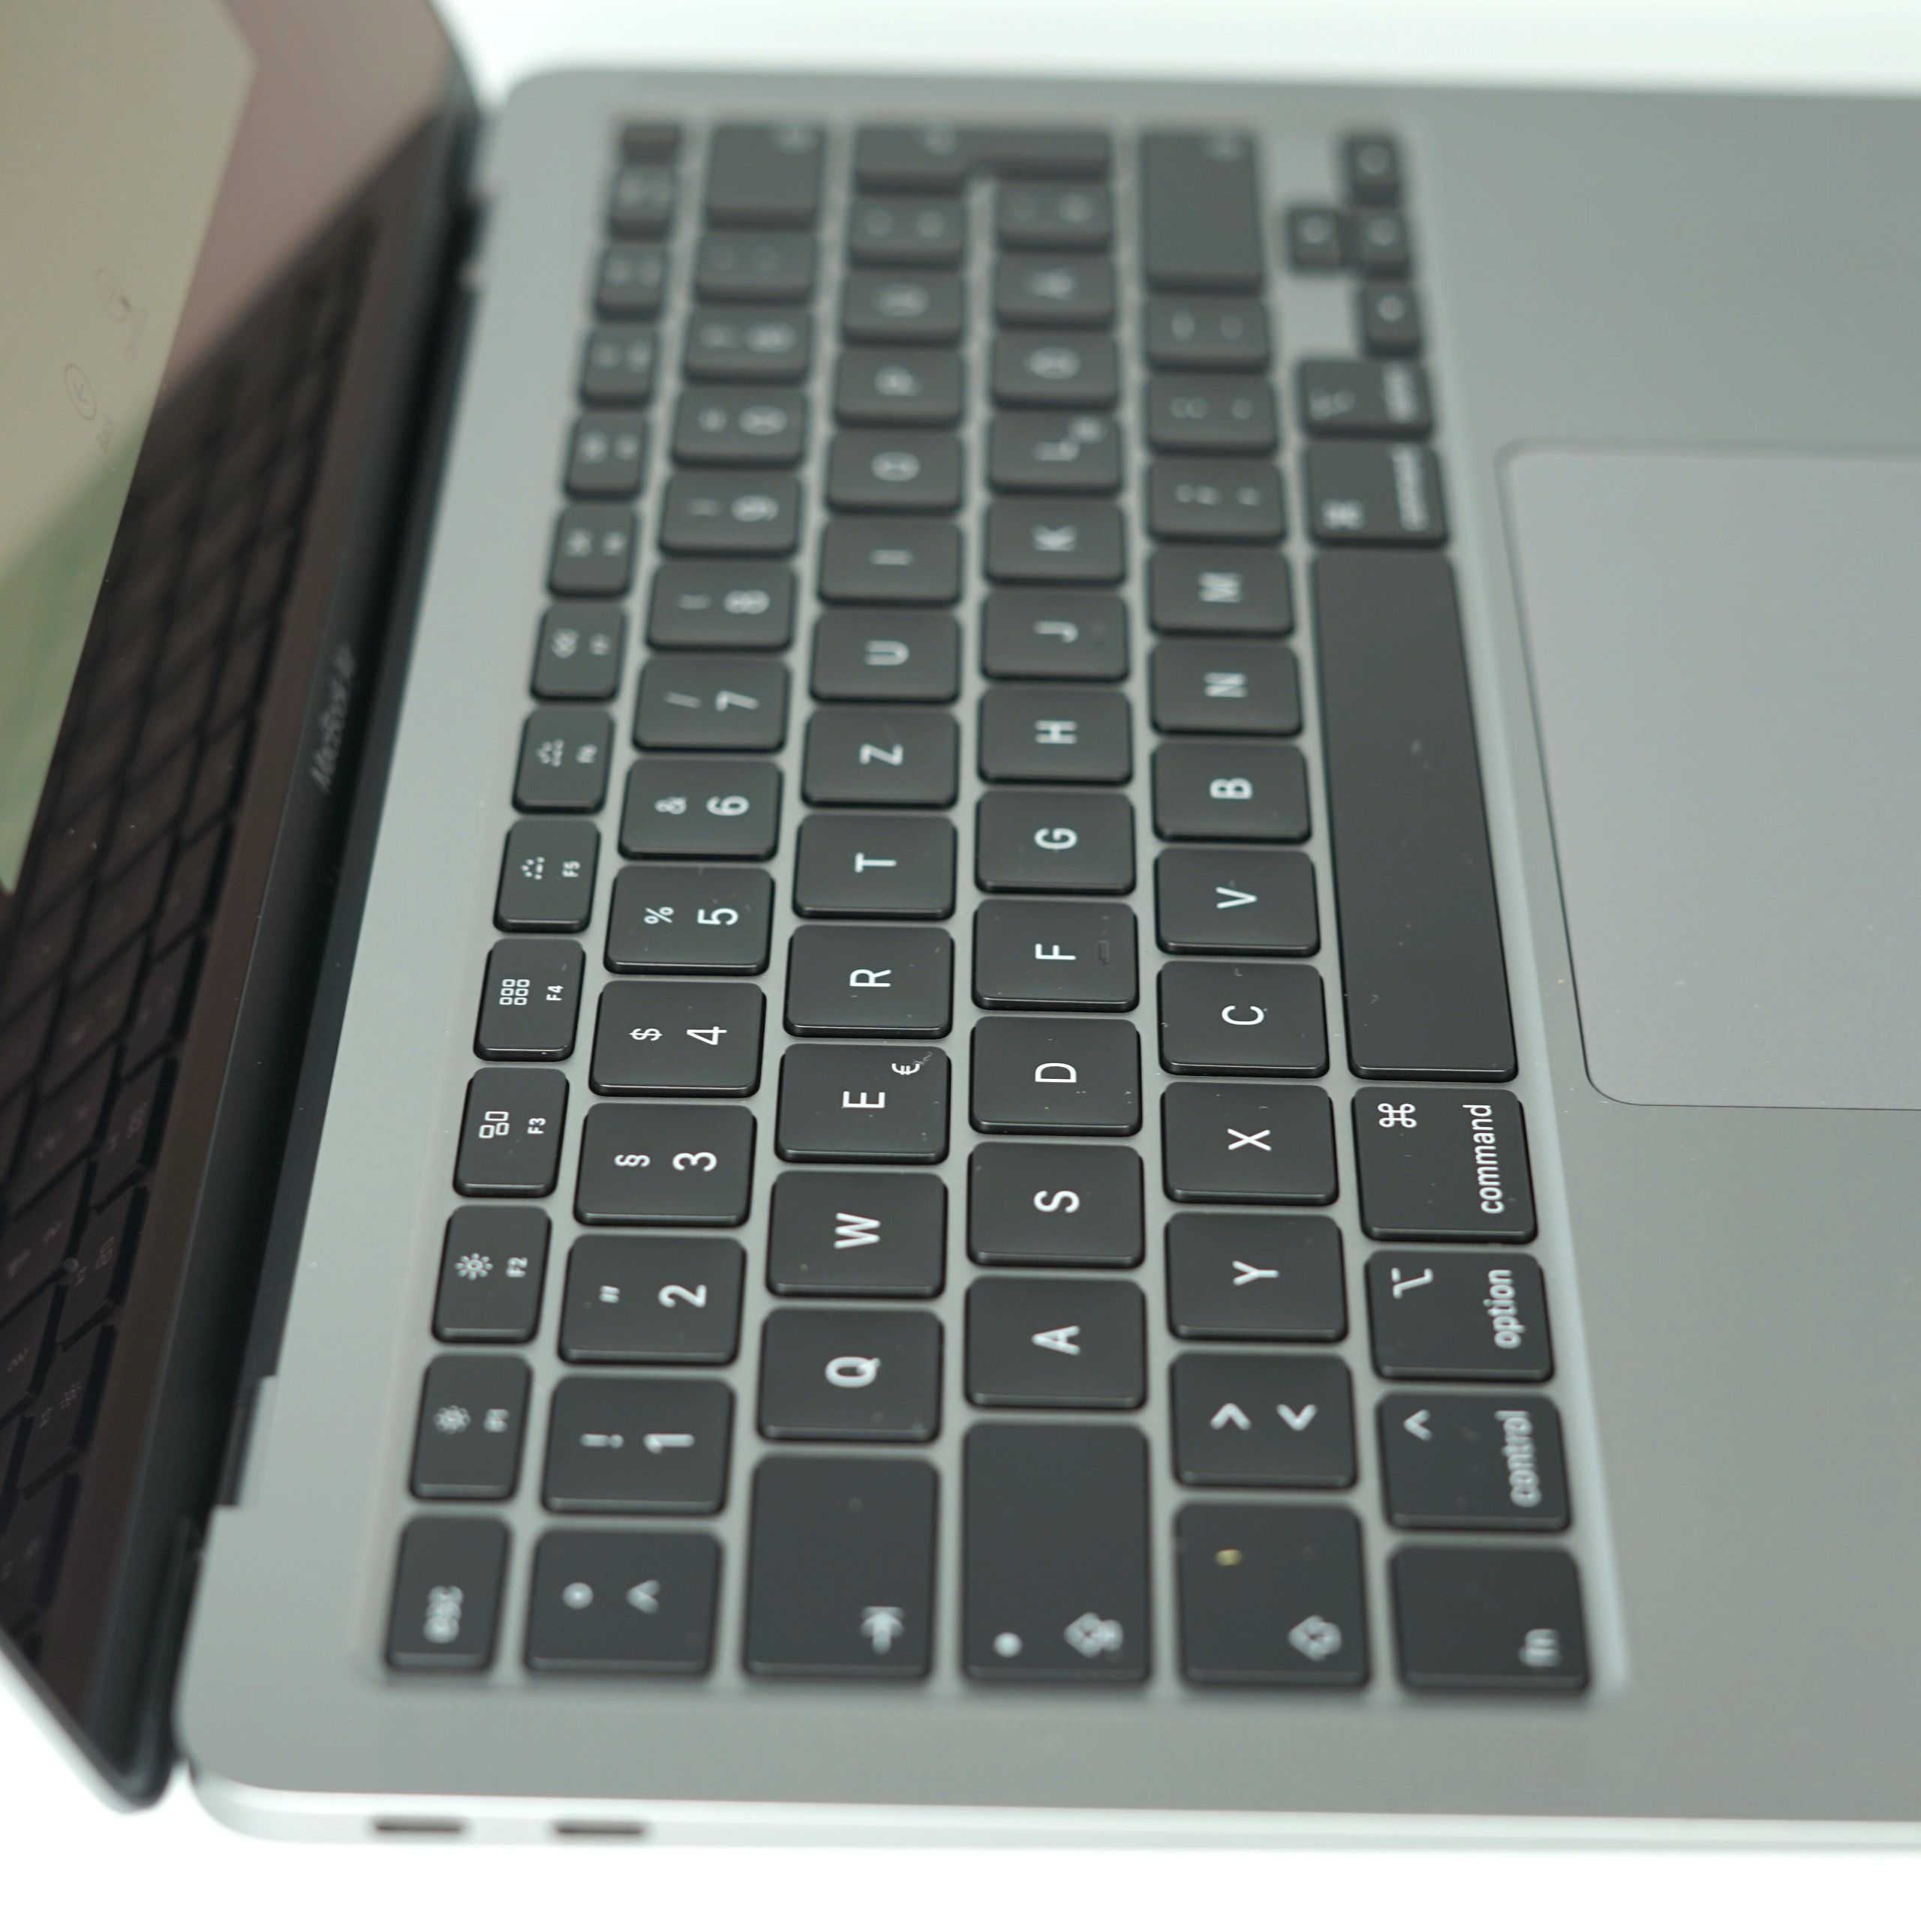
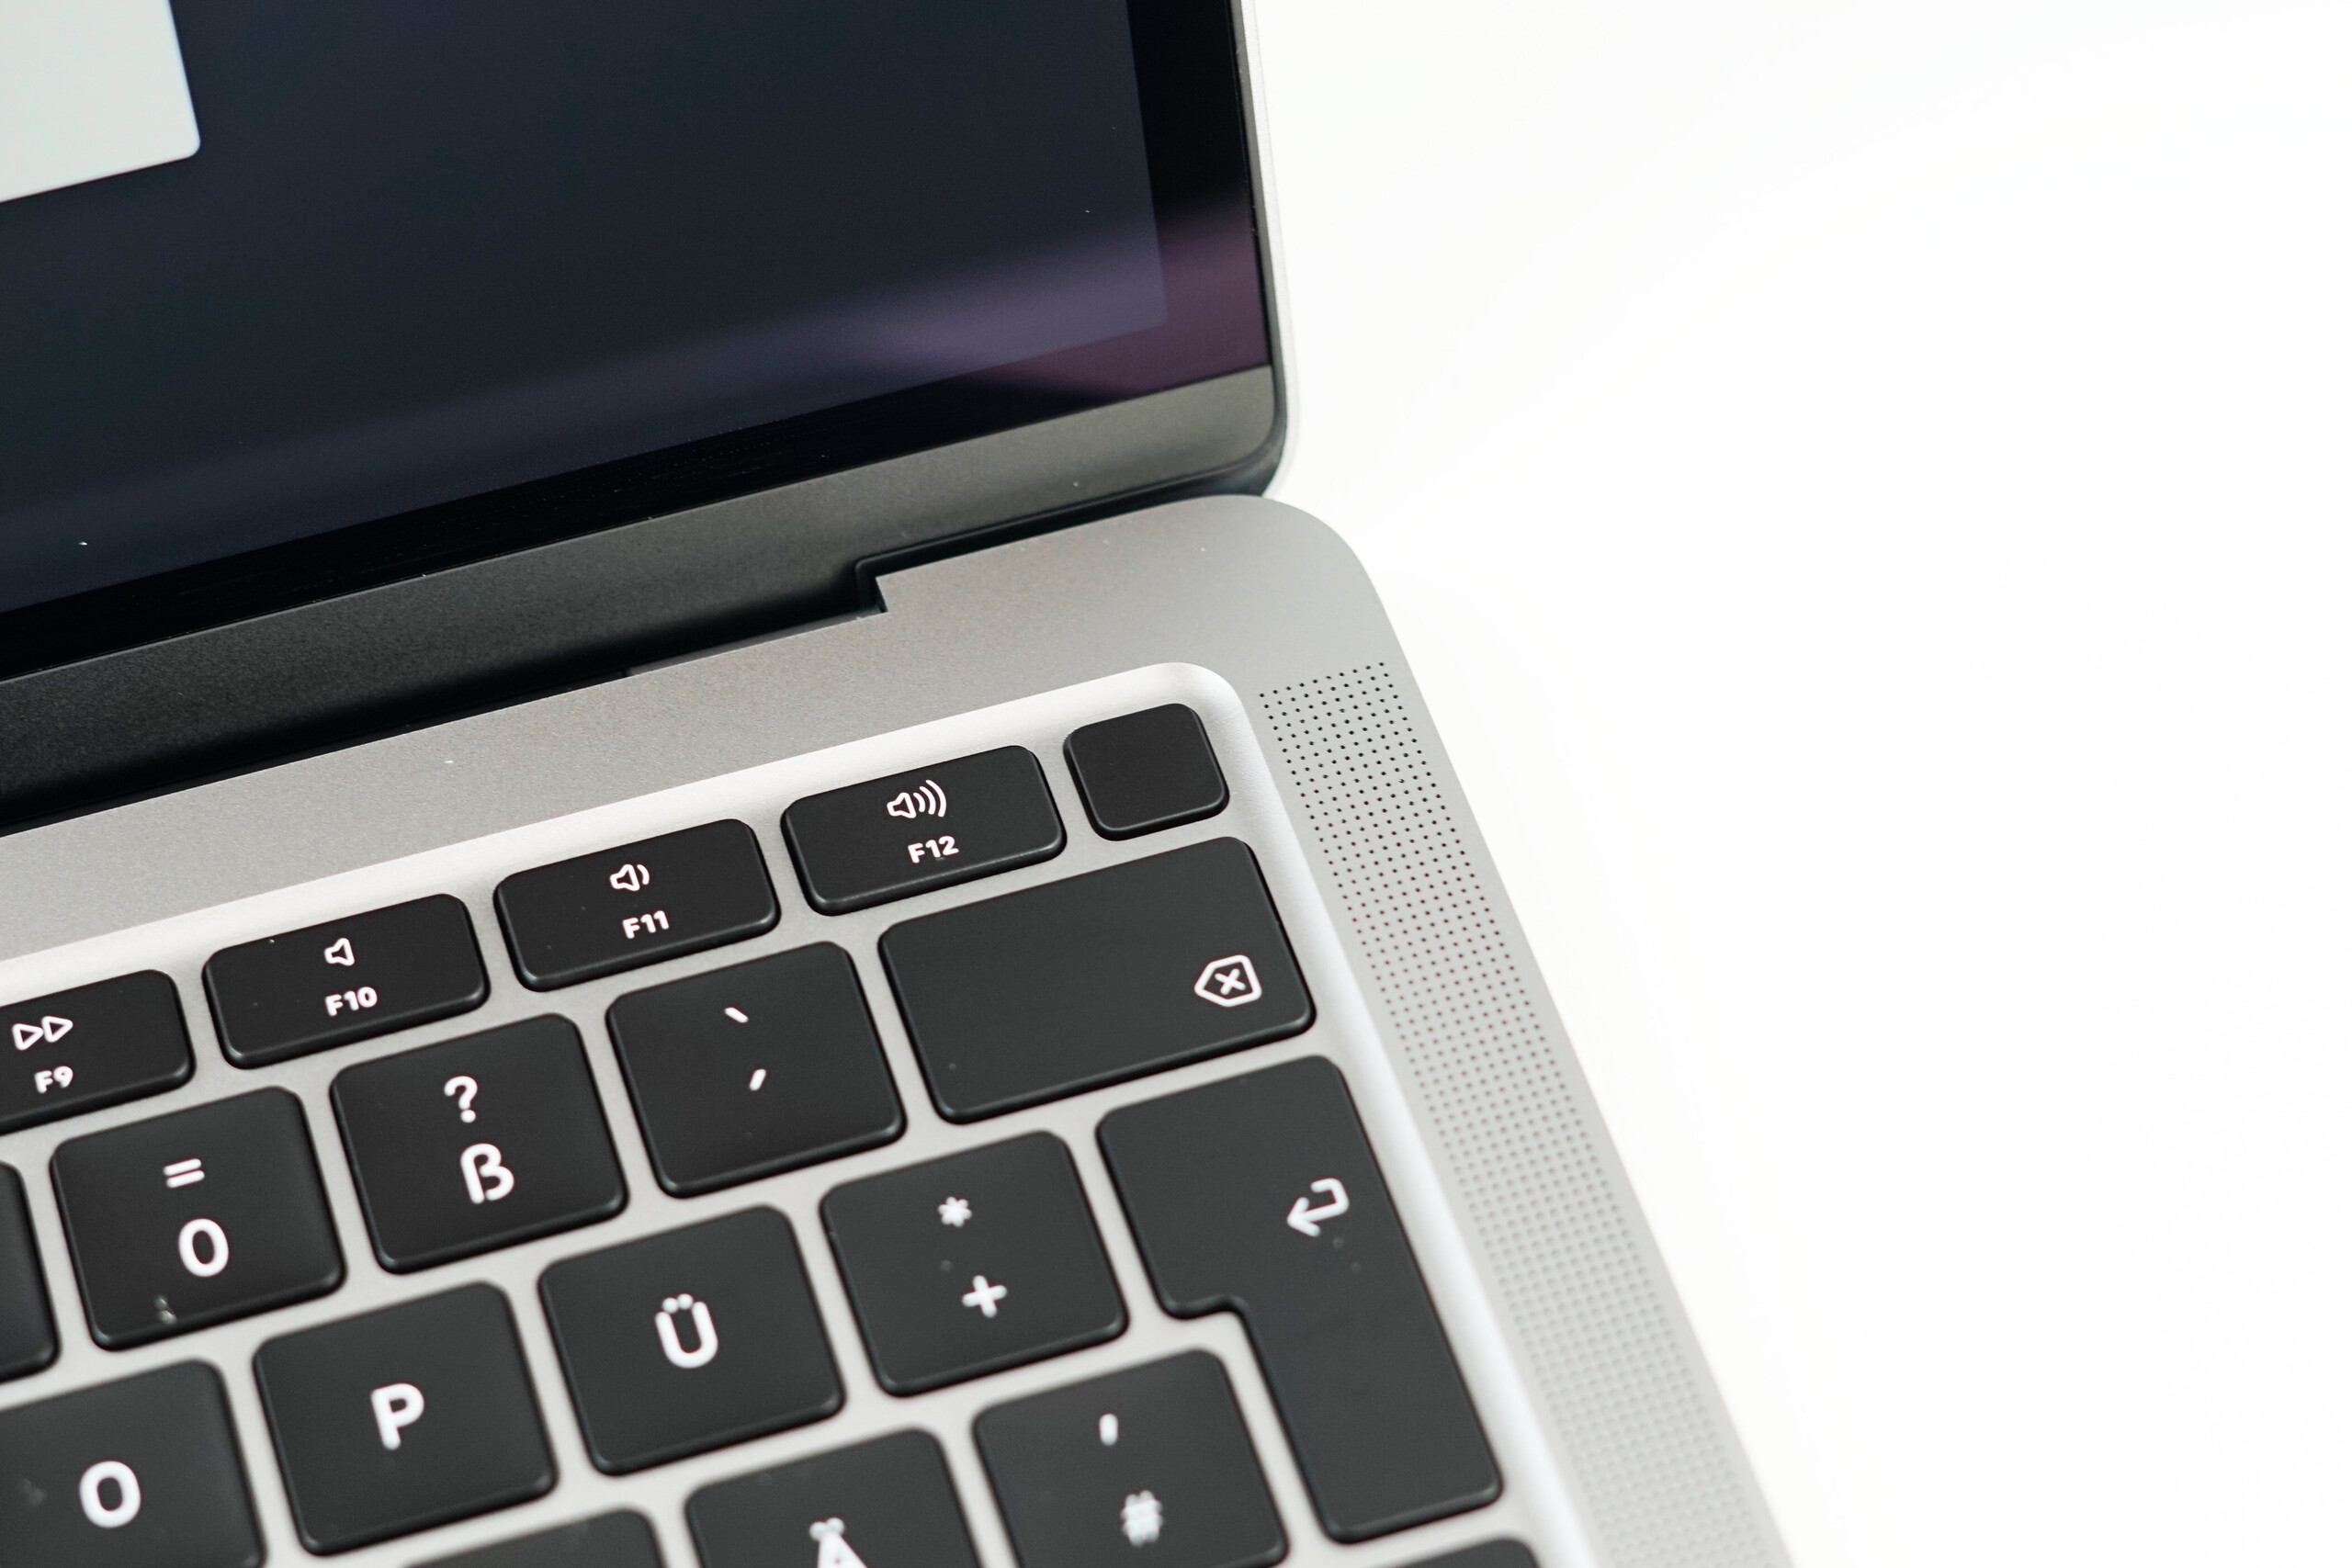
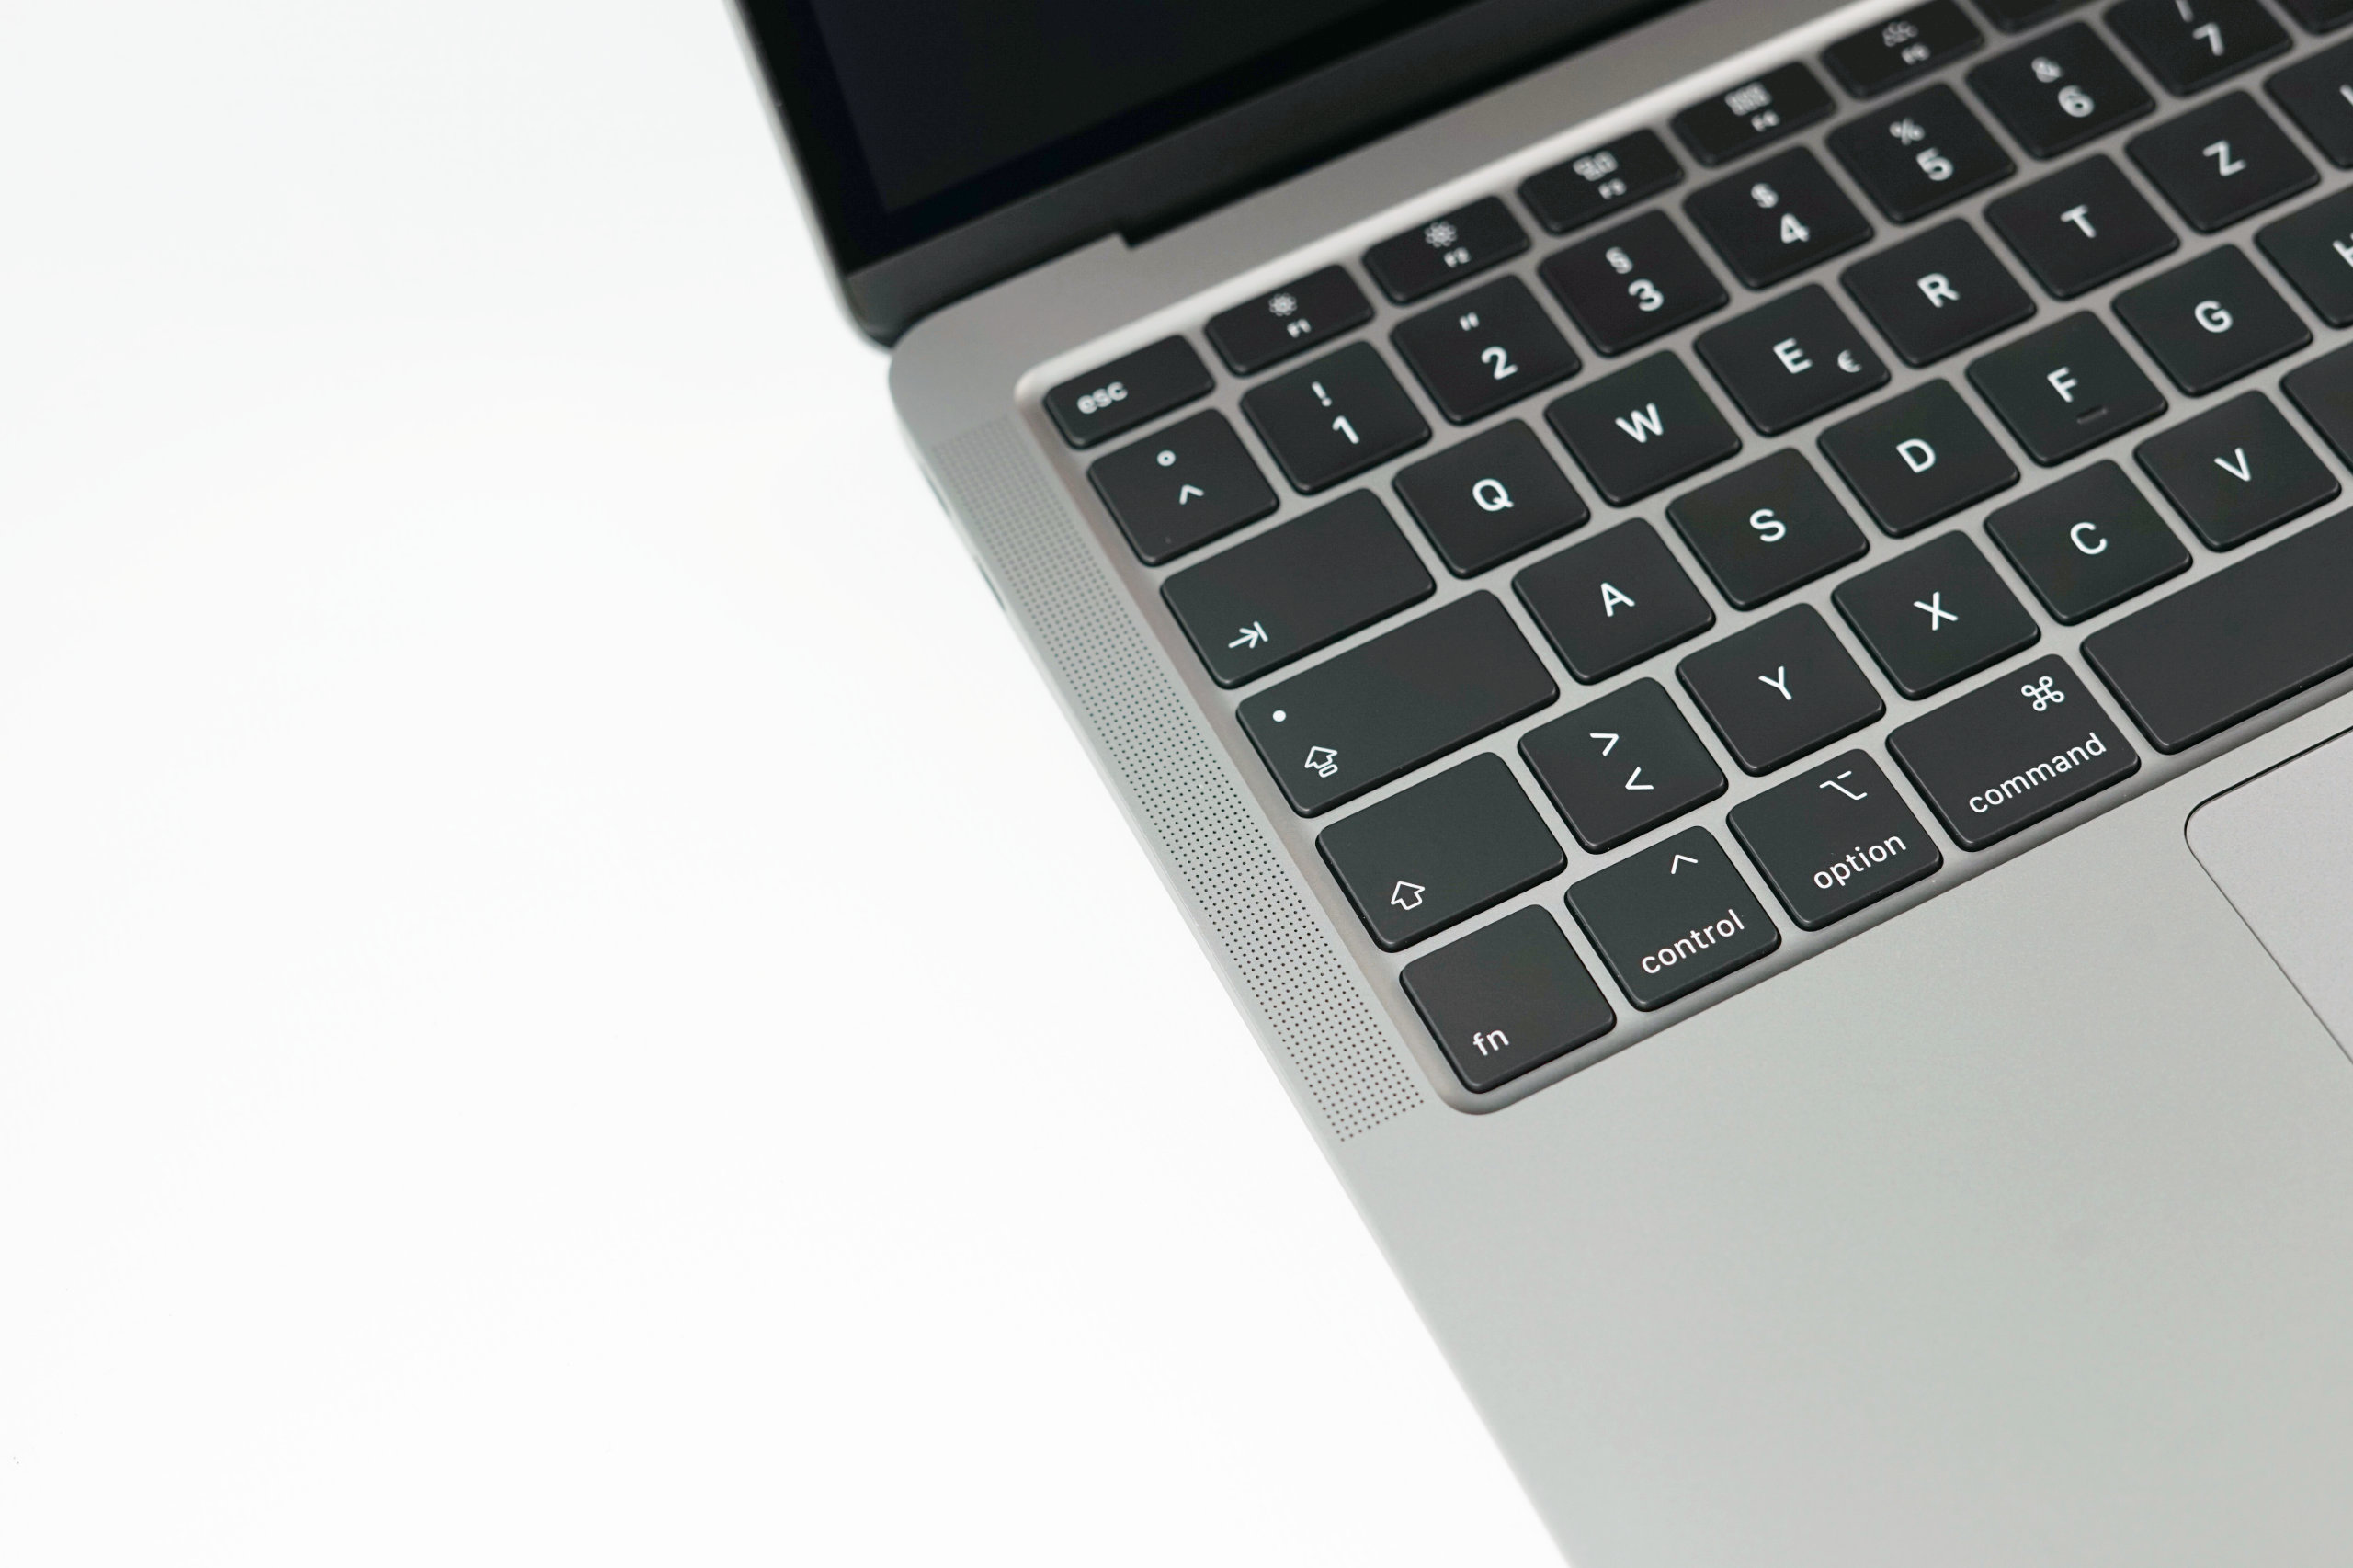
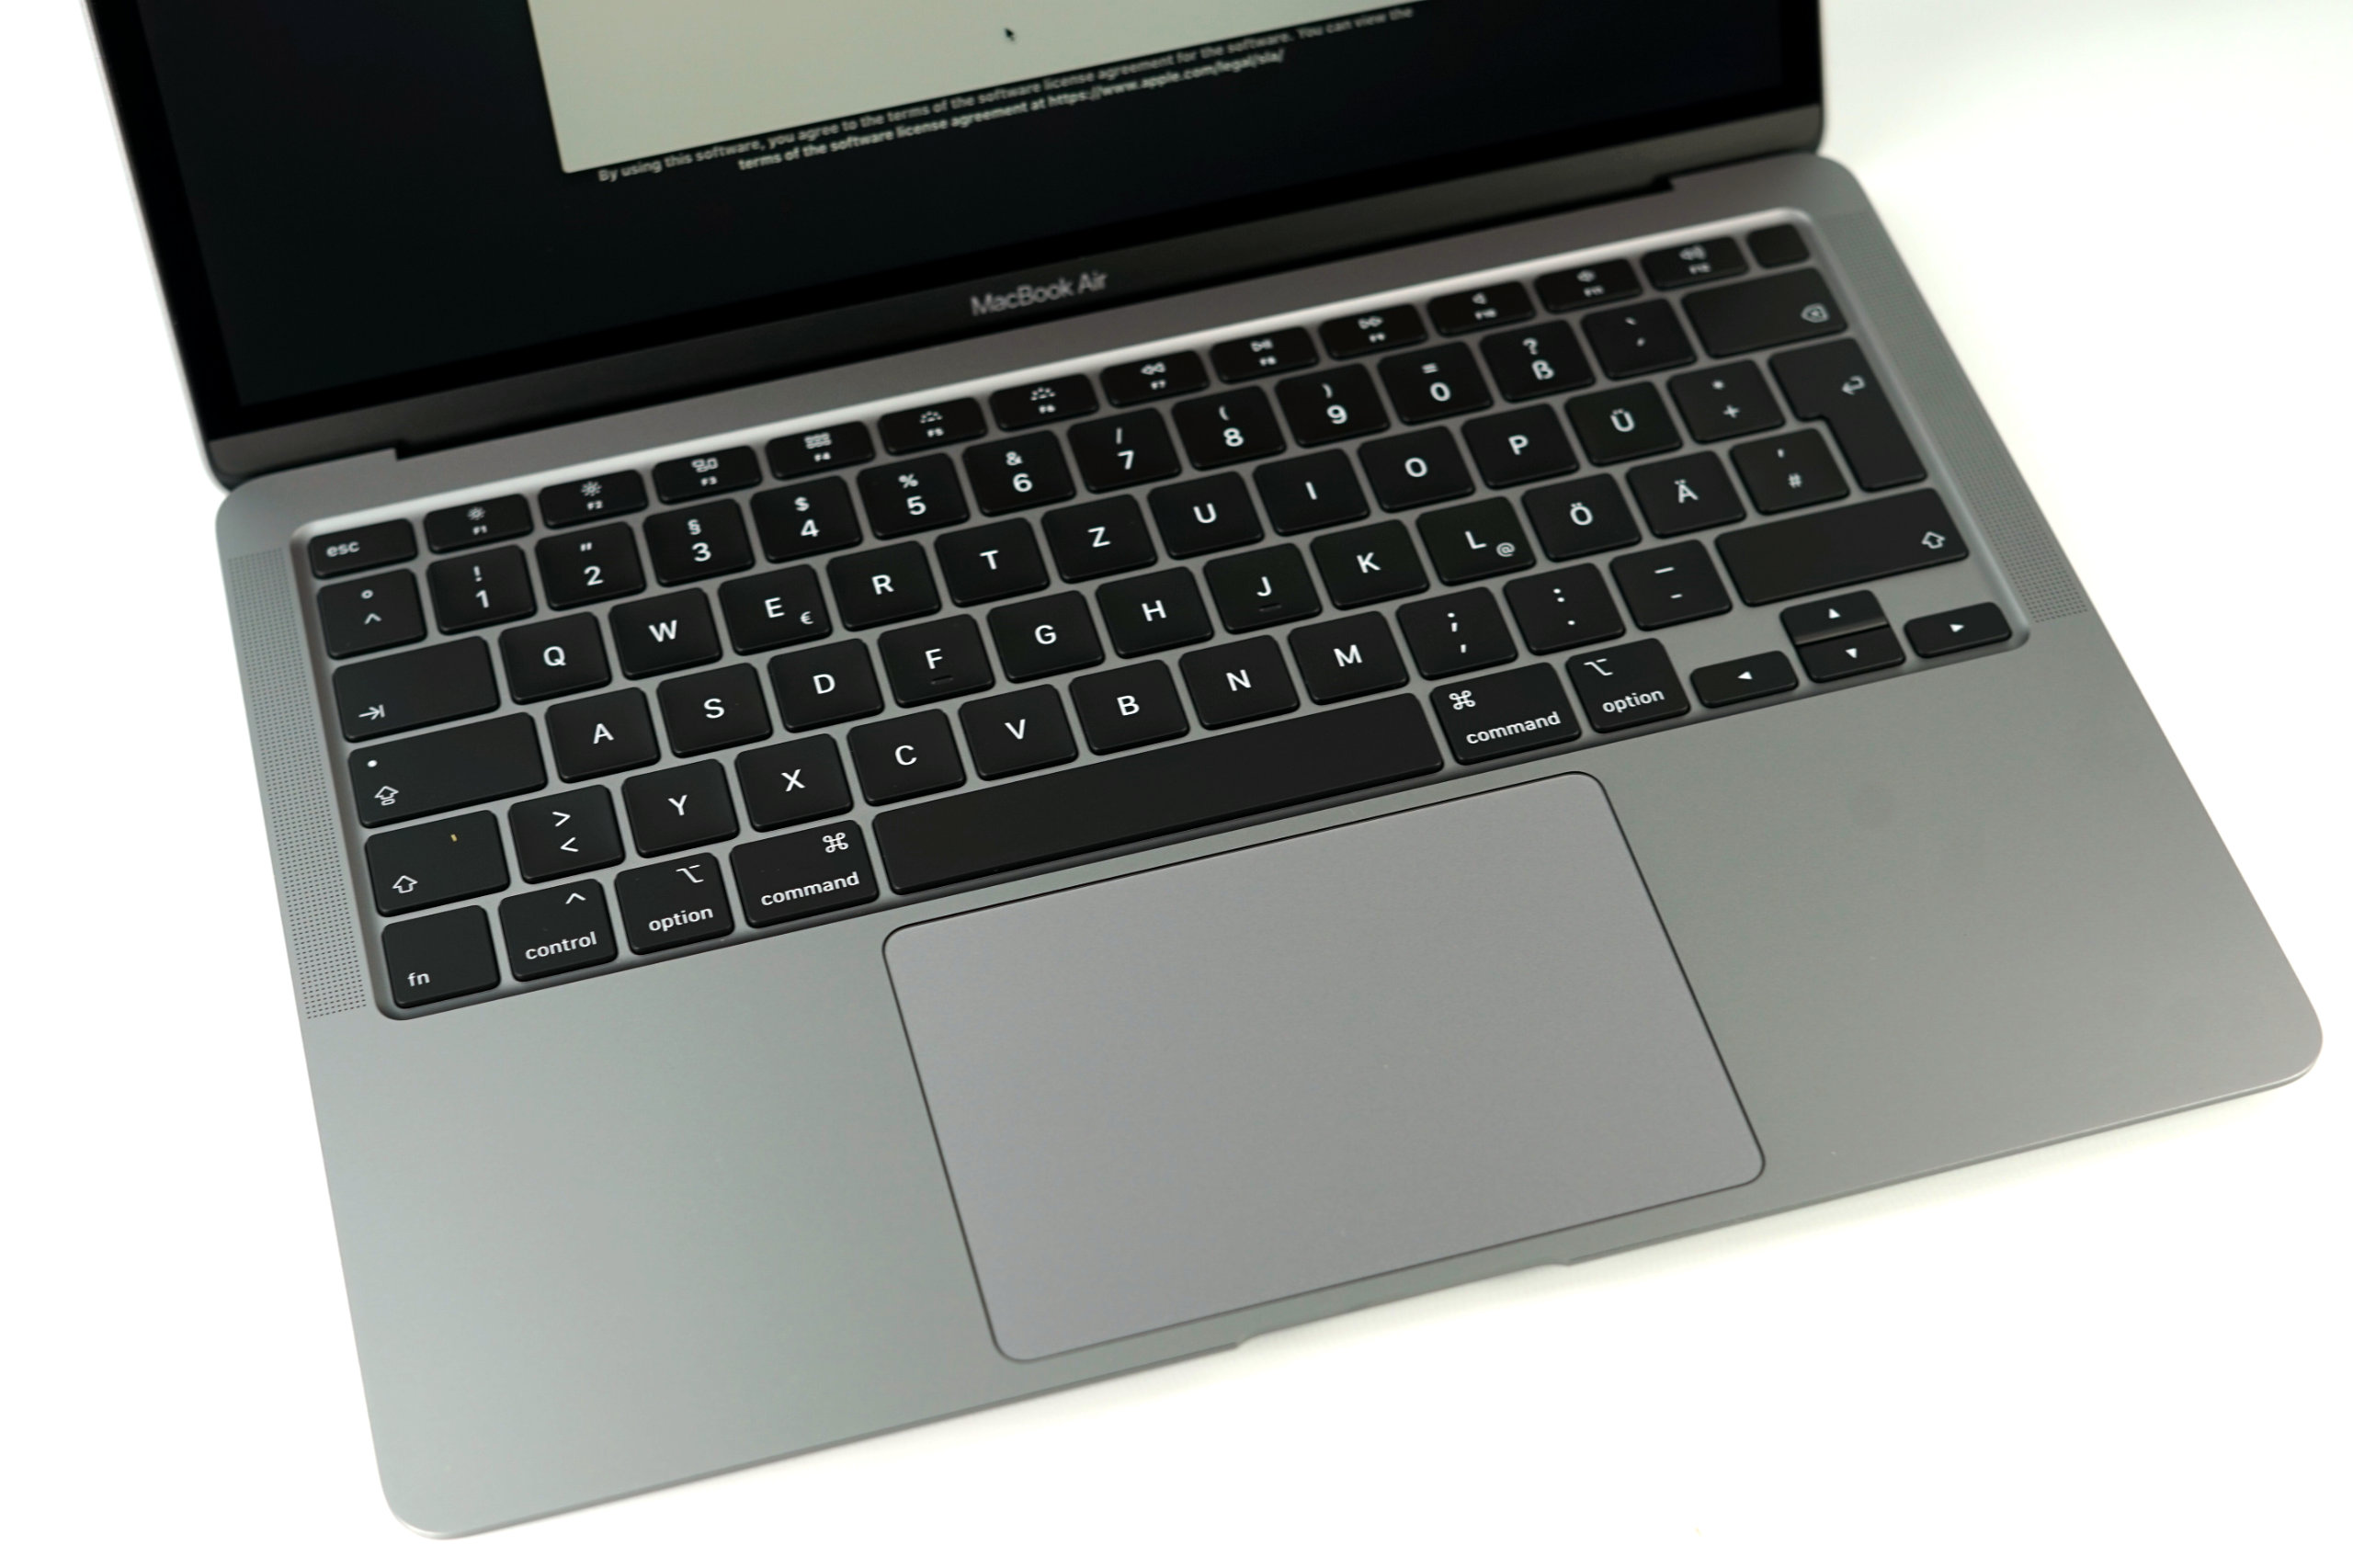
Input Devices – MacBook Air without Butterfly switches
Keyboard
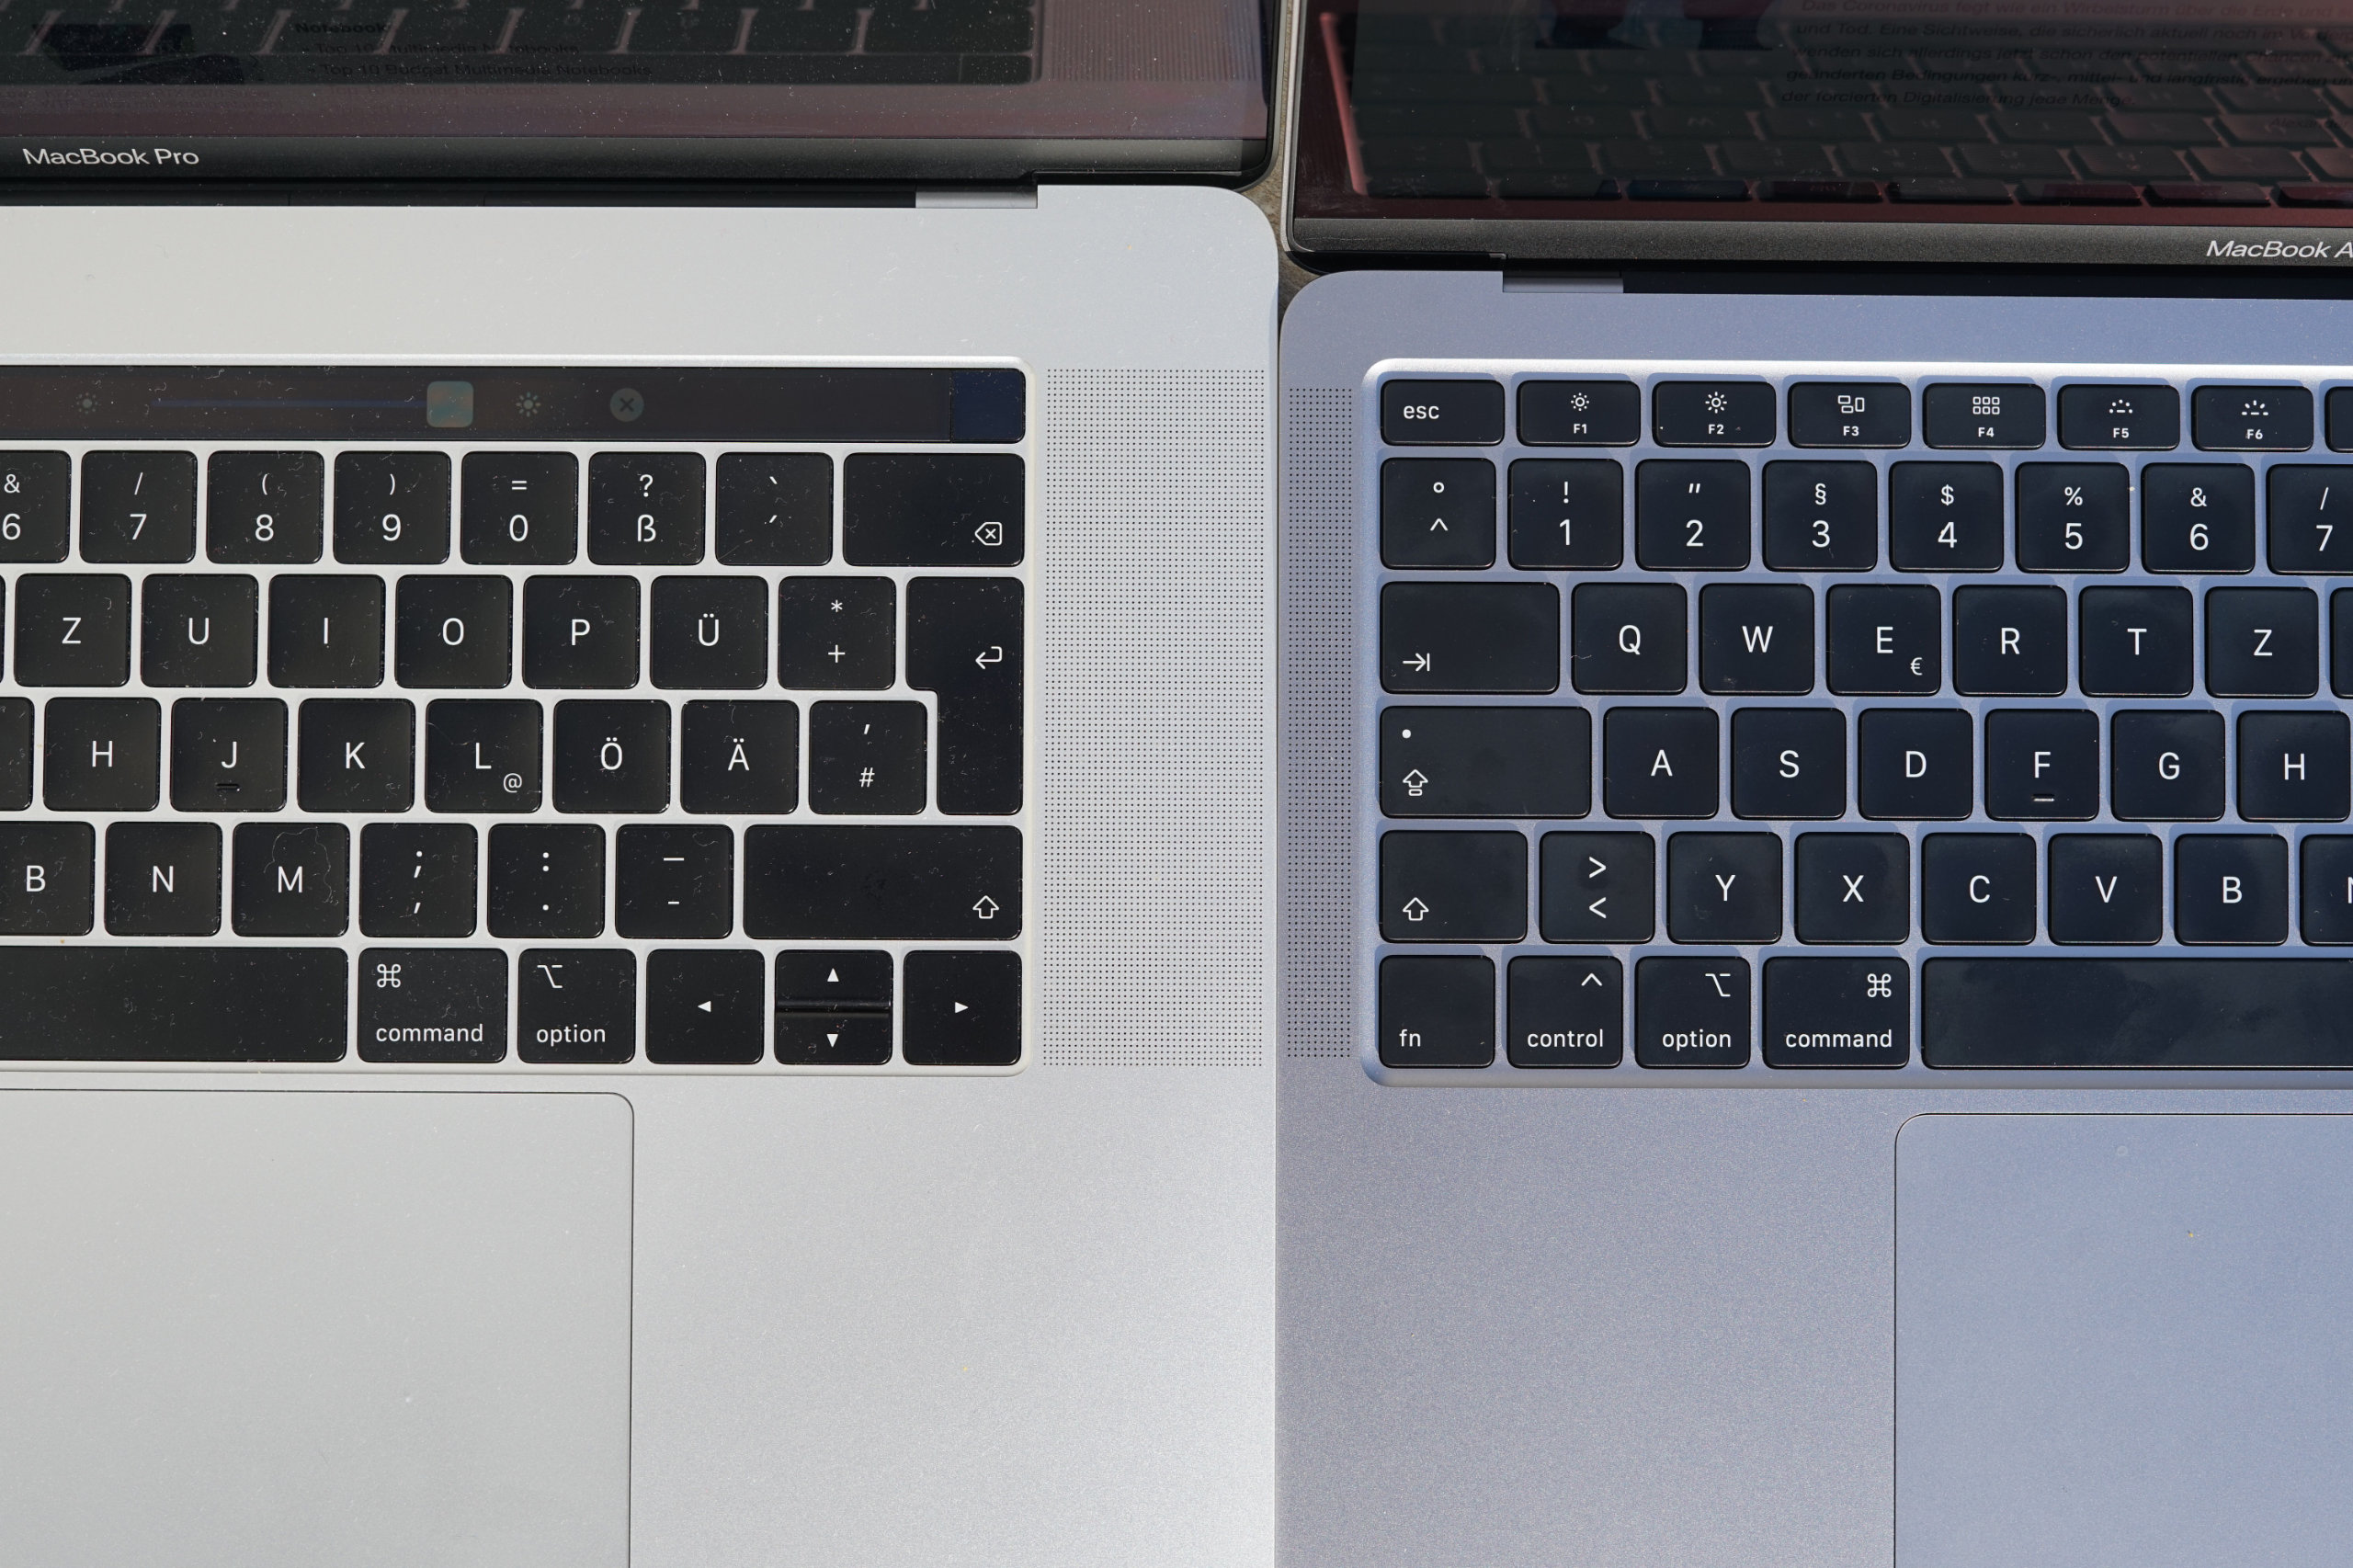
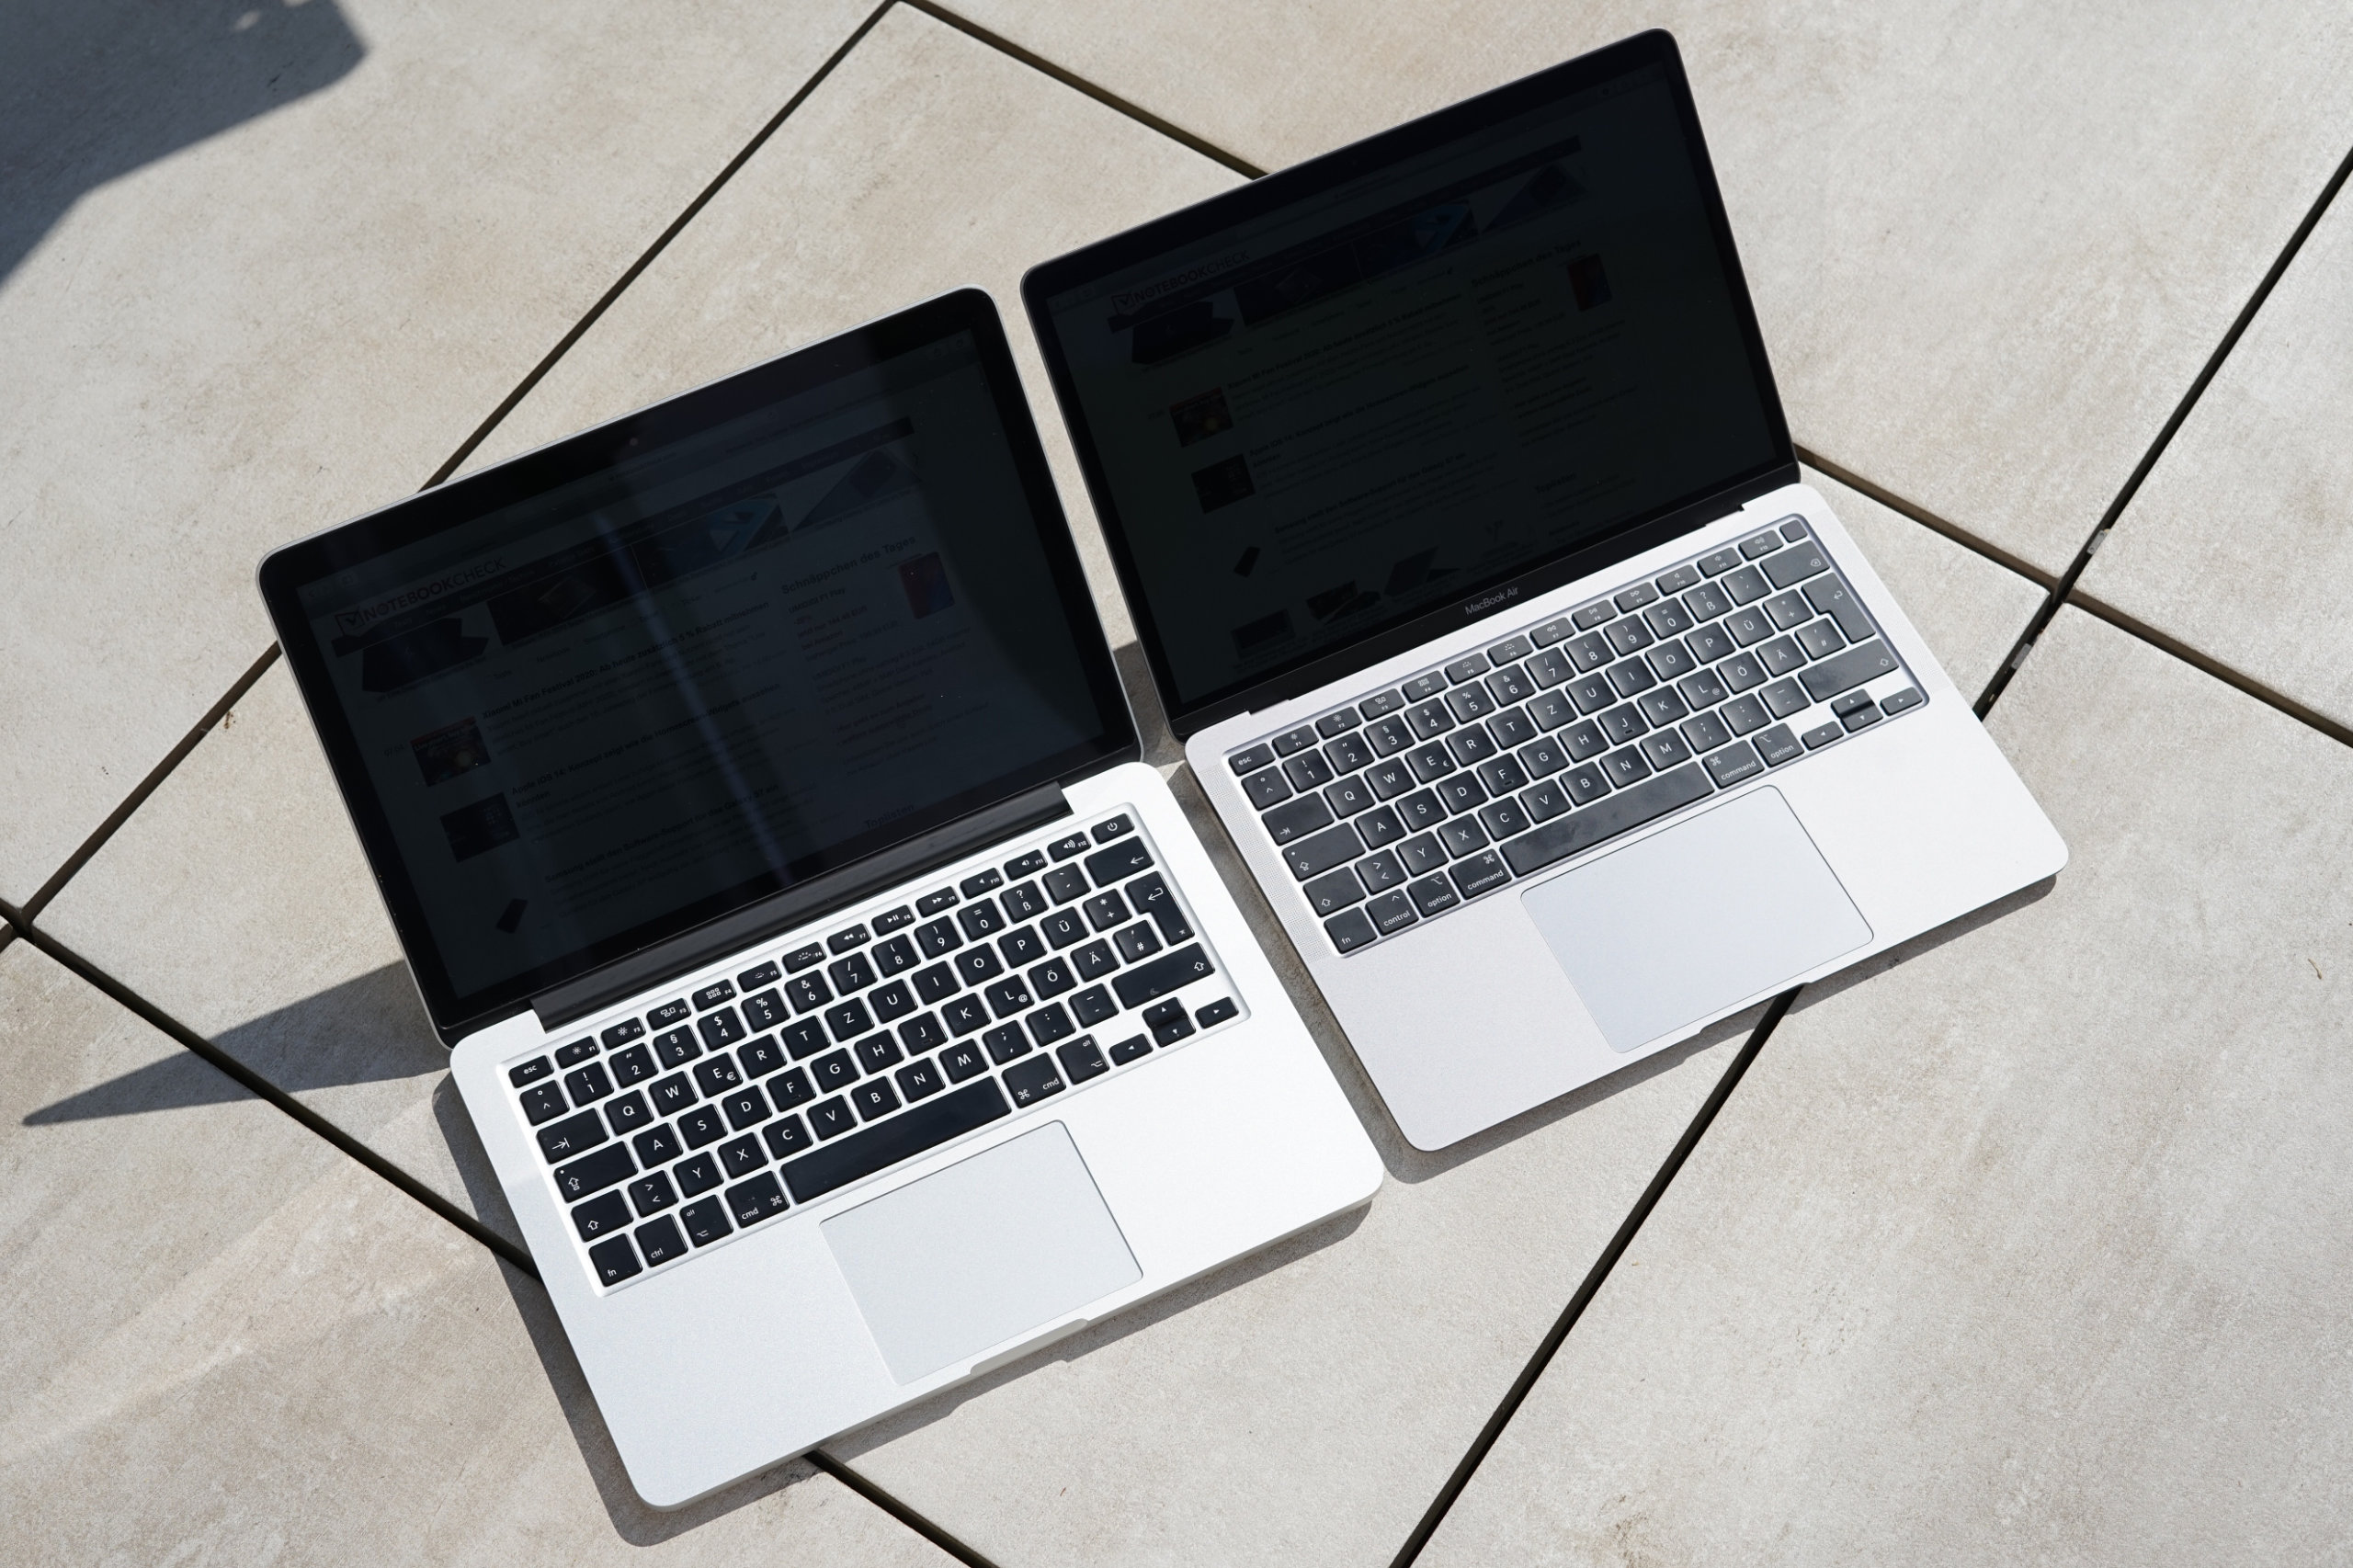
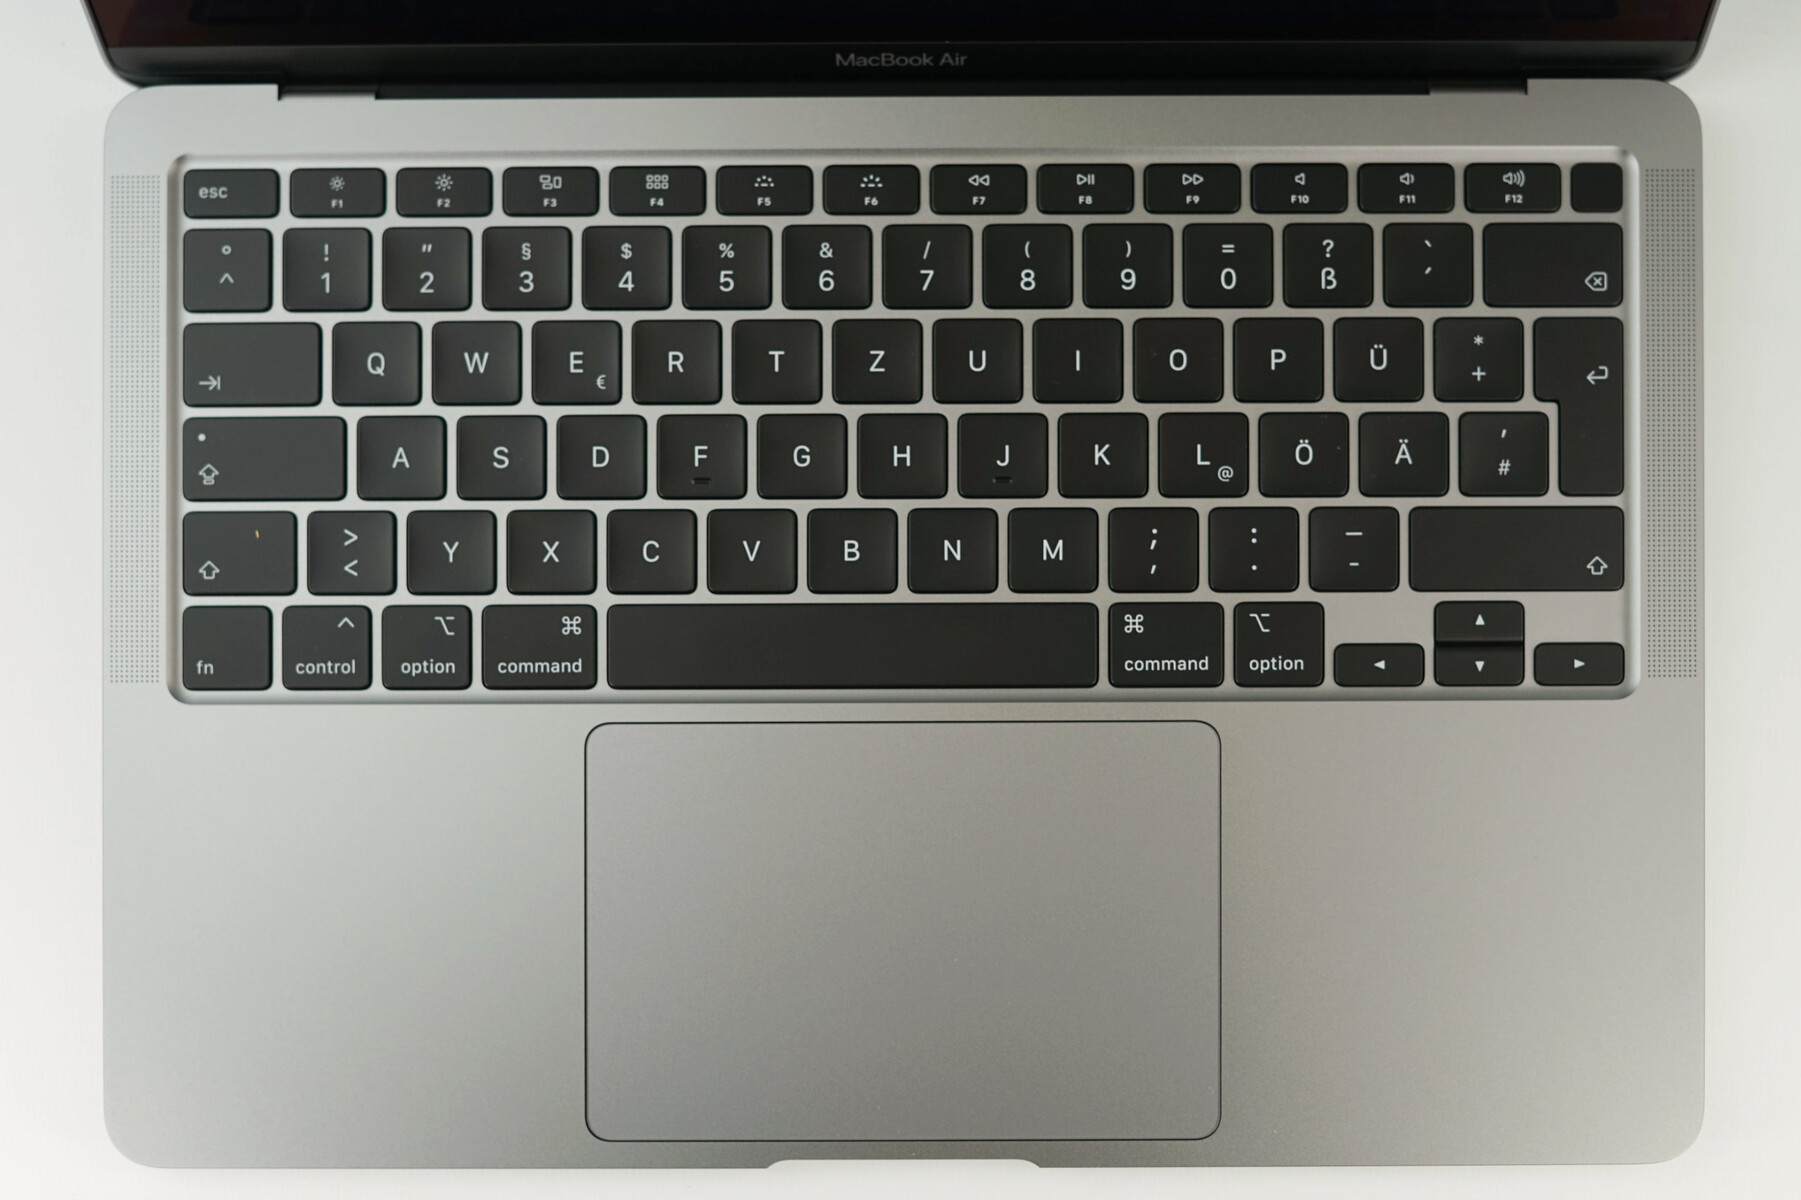
We have already mentioned that the new keyboard is the biggest change on the 2020 MacBook Air. Apple returns to scissor switches and removes the heavily criticized butterfly keys. Personally, the author actually appreciated the butterfly keyboard in the MacBook Pro 15 thanks to its precise key stroke and well-defined pressure point. With the 2018 models, there were no more problems with ignored keys due to dust particles. The new "Magic Keyboard" will still please more users and should also be the more reliable option for the upcoming years. Especially users of older MacBooks do not have to get used to anew keyboard and just get a familiar typing experience as well as a similar layout.
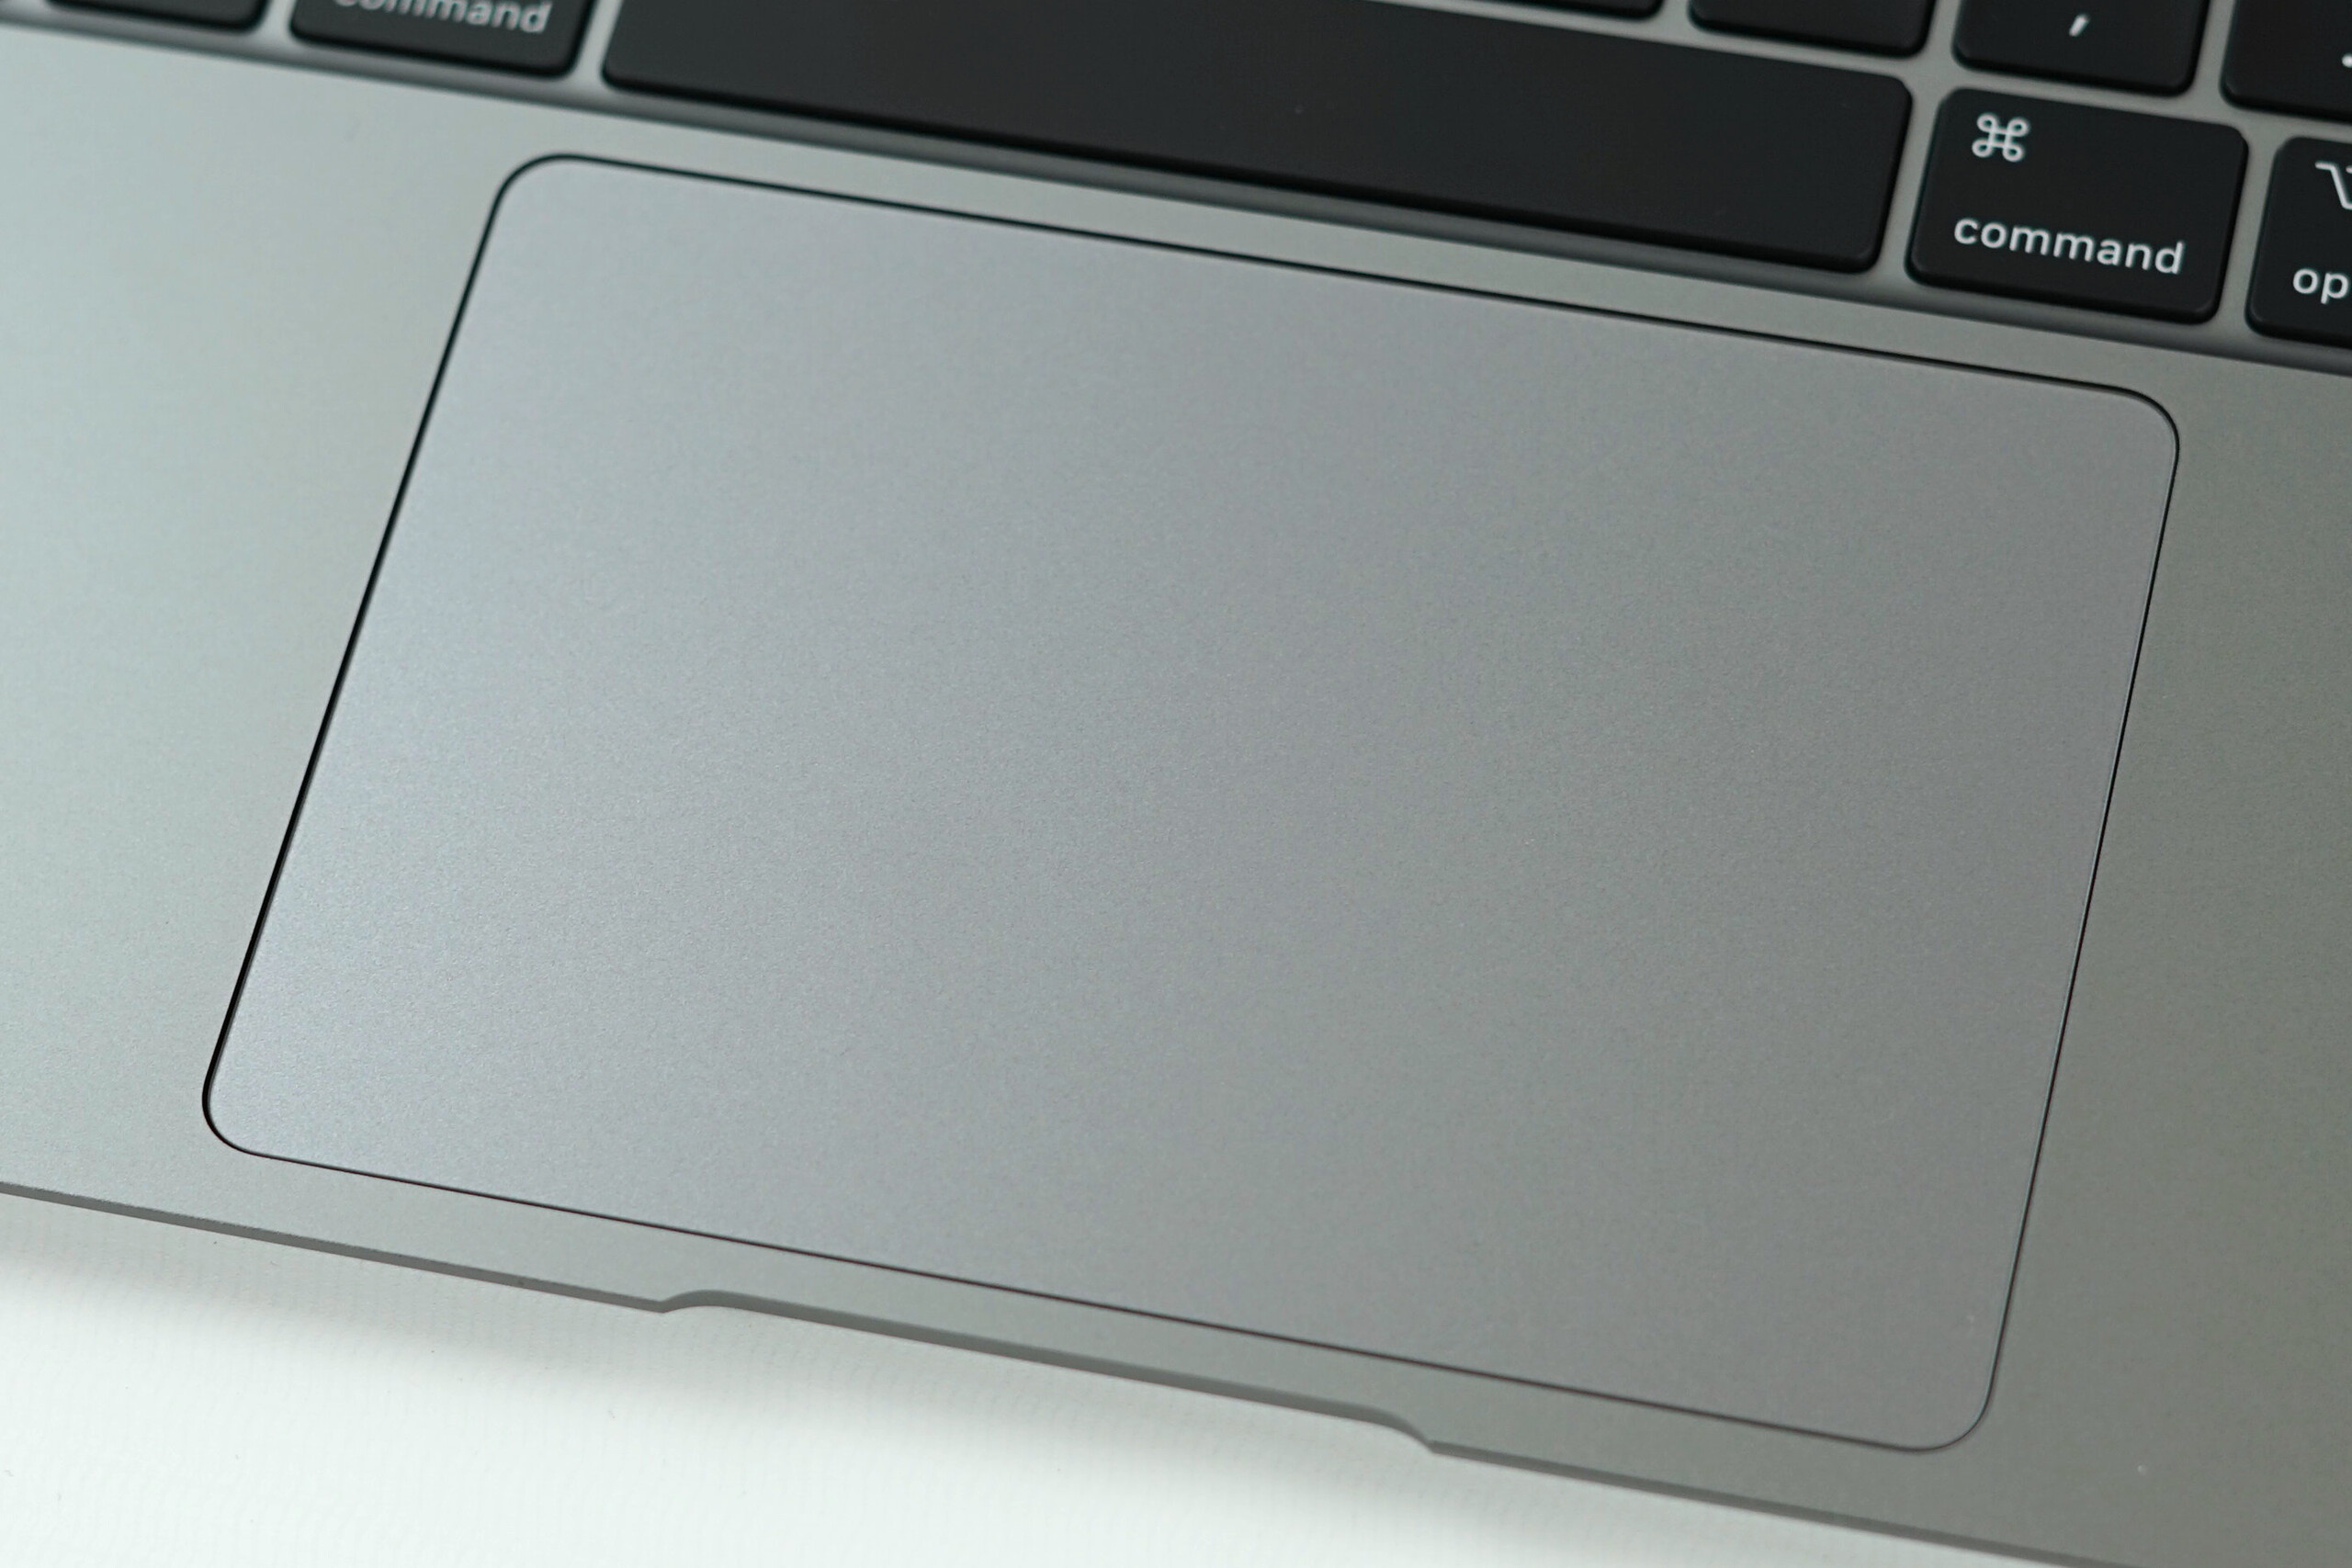
Touchpad
As always, the large Force Touch trackpad is a joy to use thanks to excellent gliding capabilities and the still unique Force Touch. We cannot find any issues here.
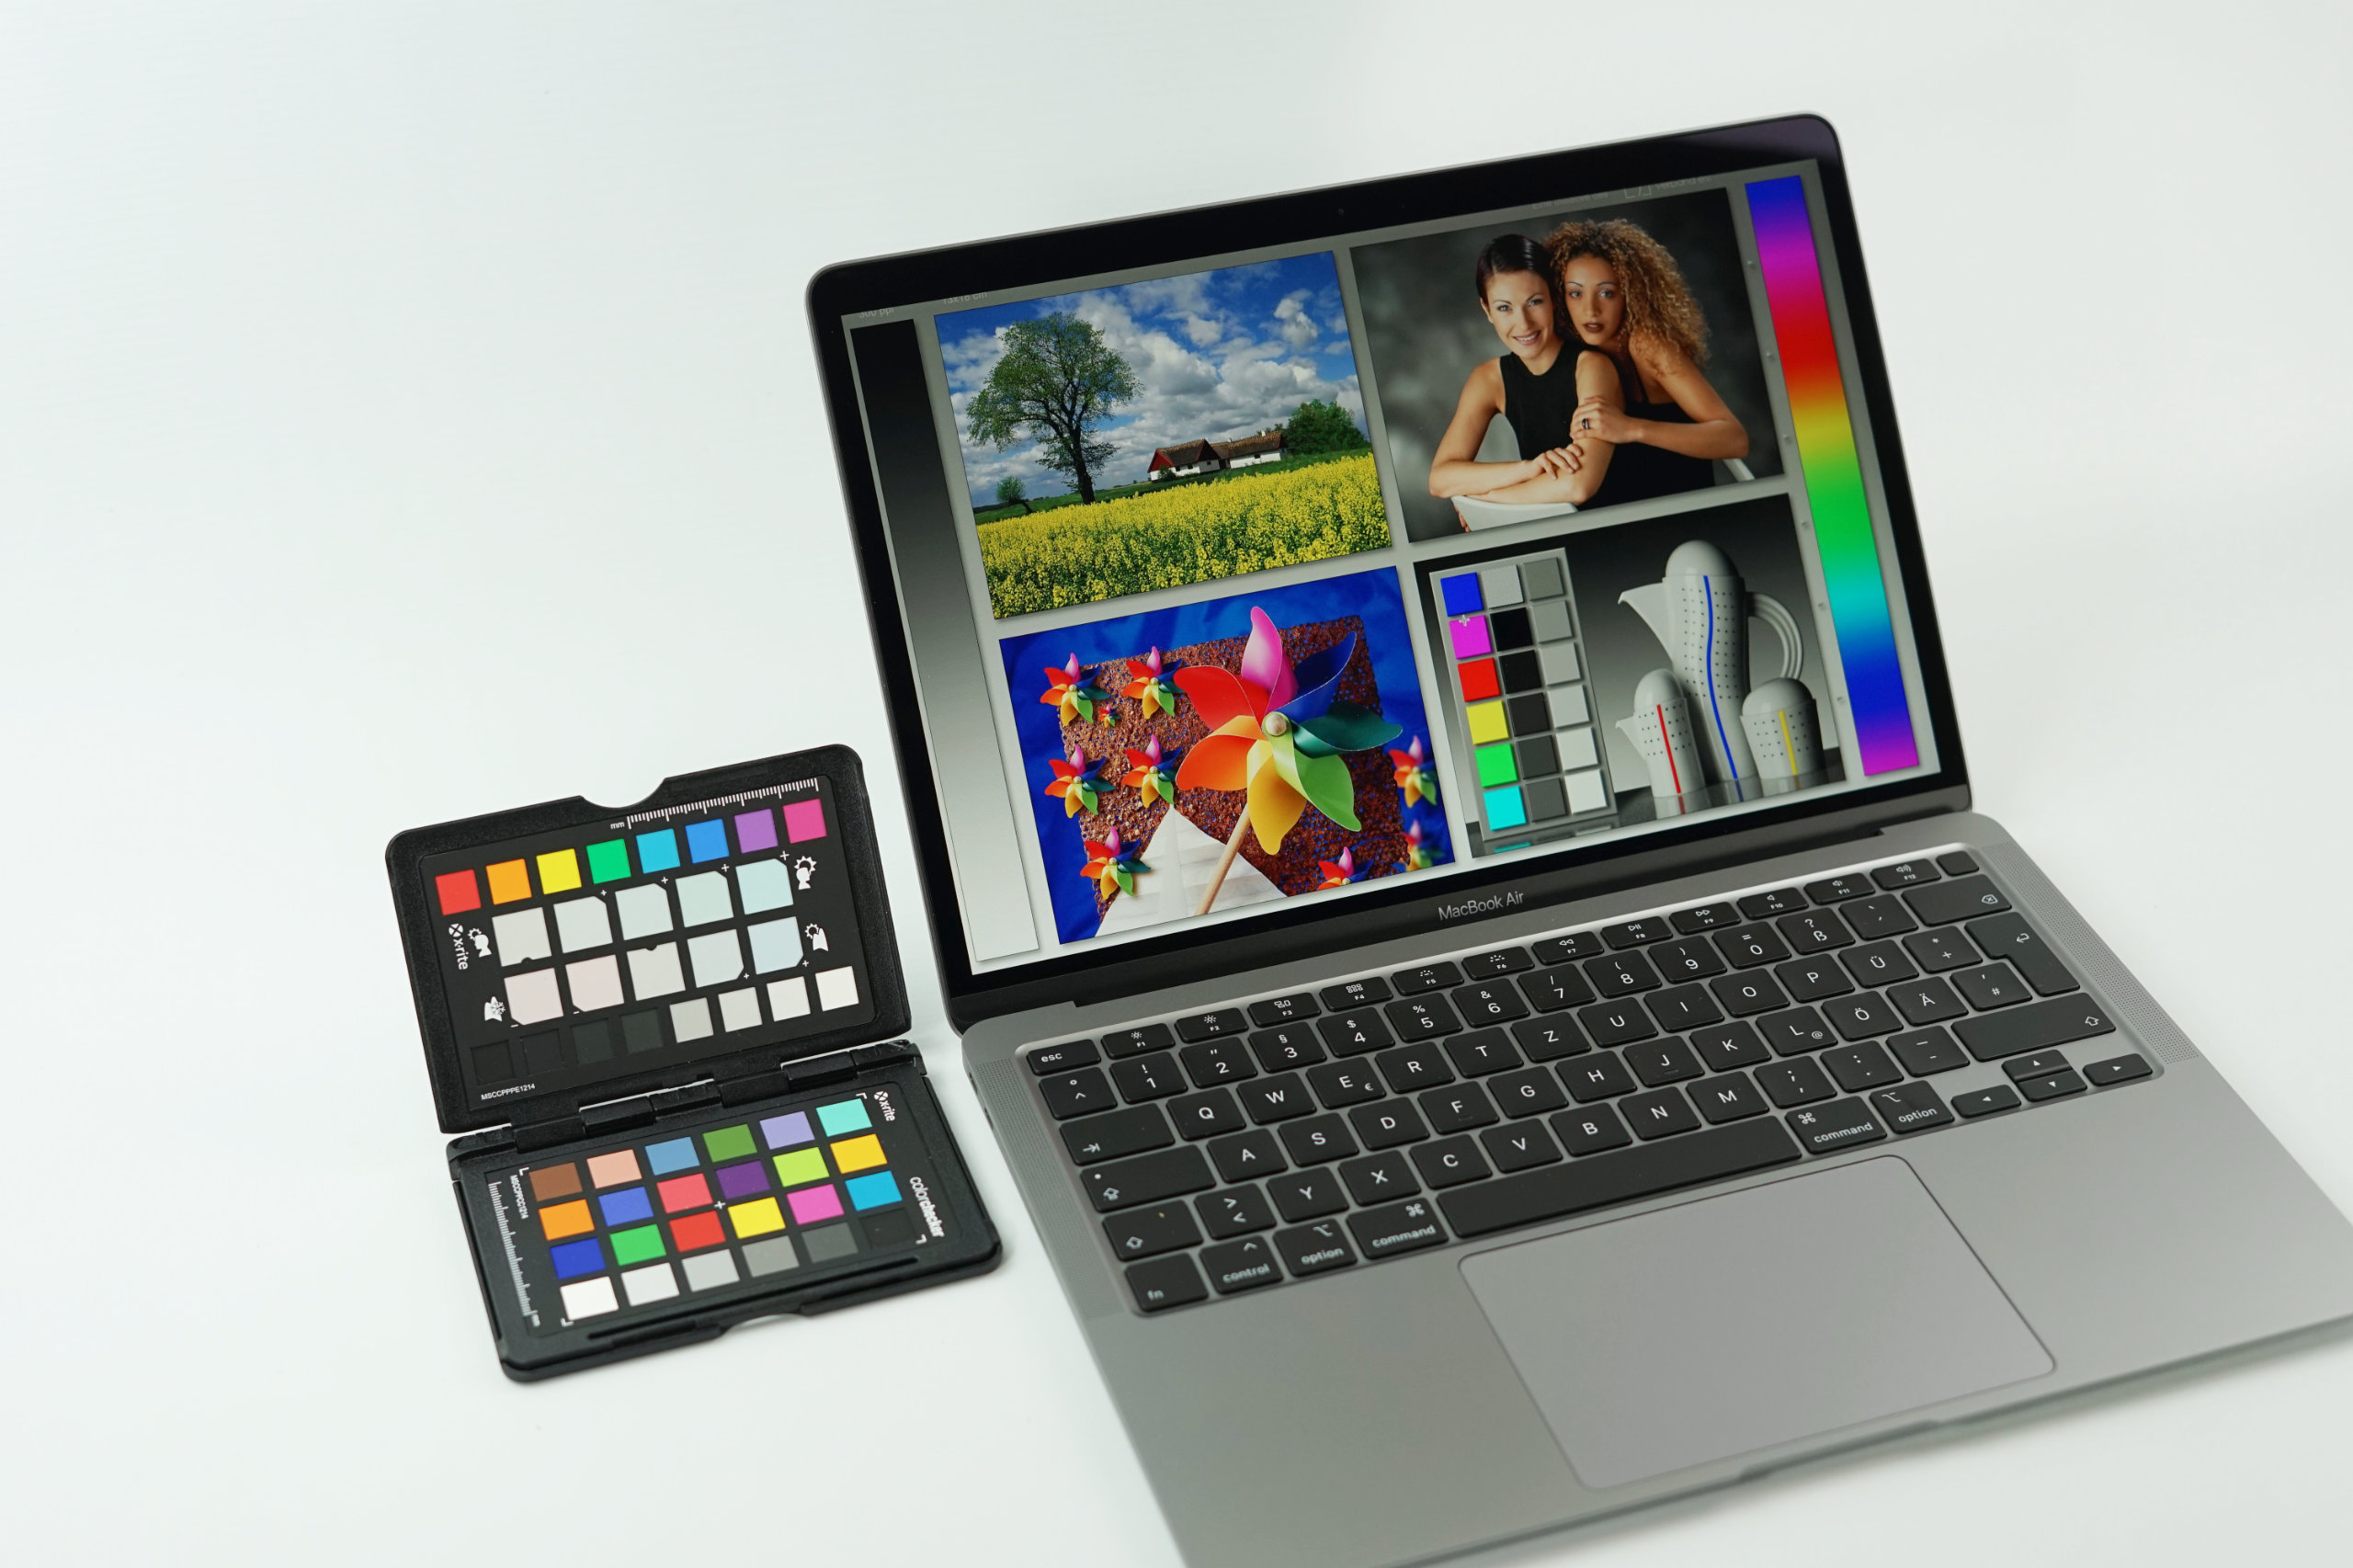
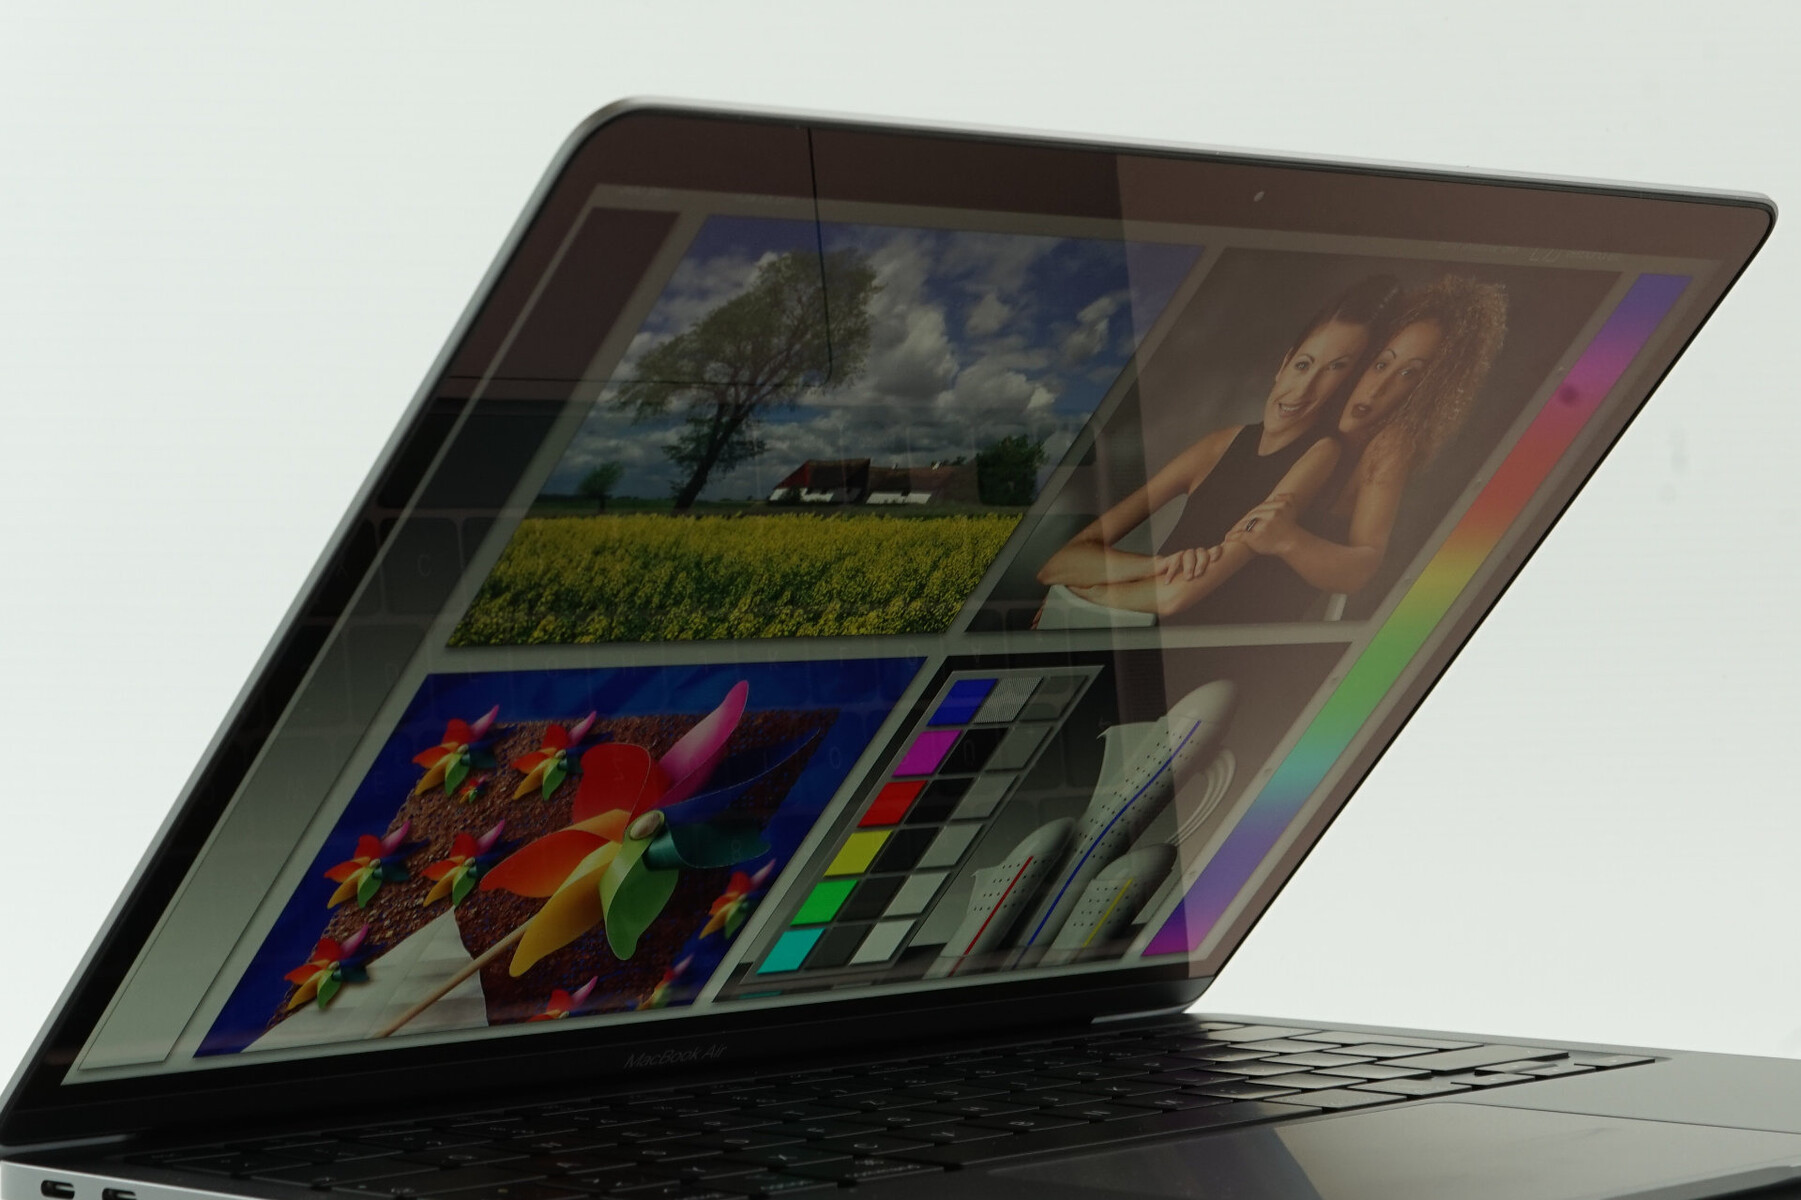
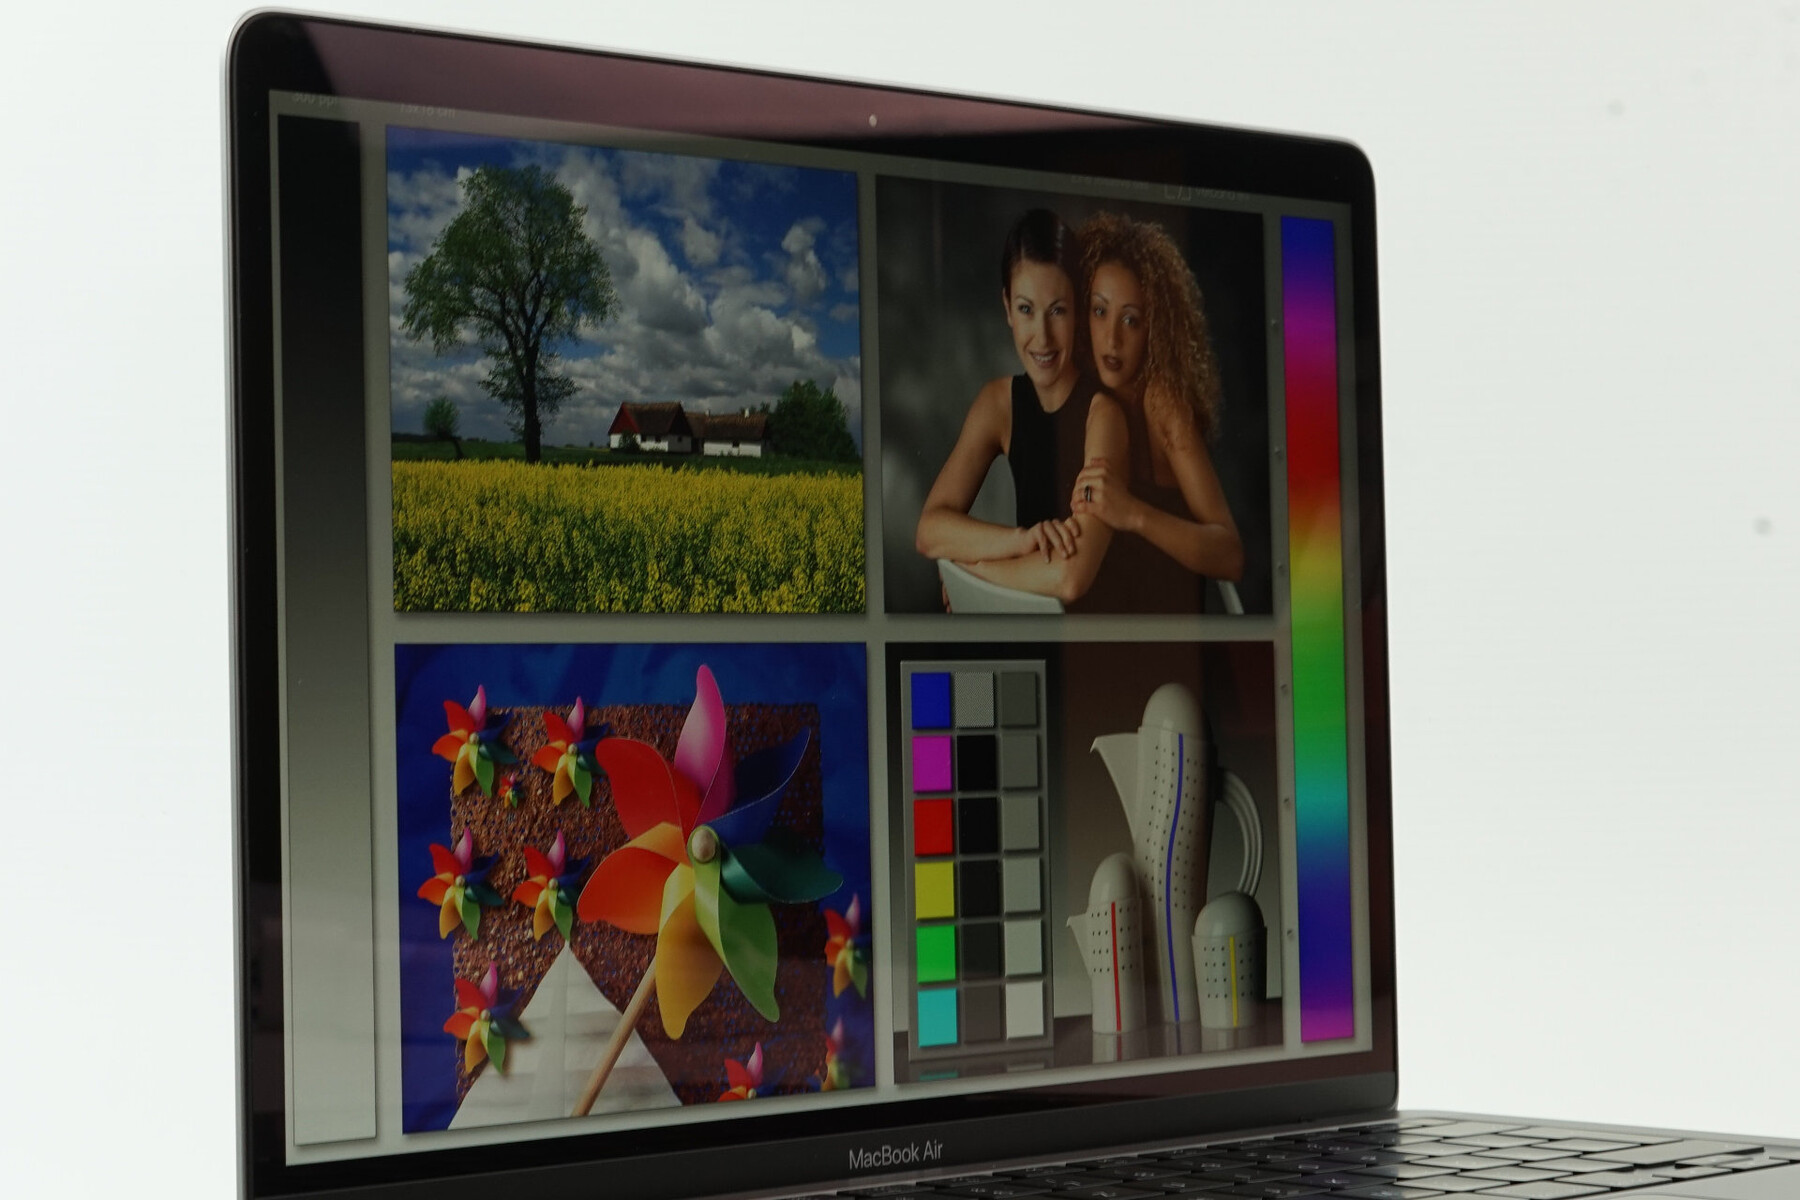
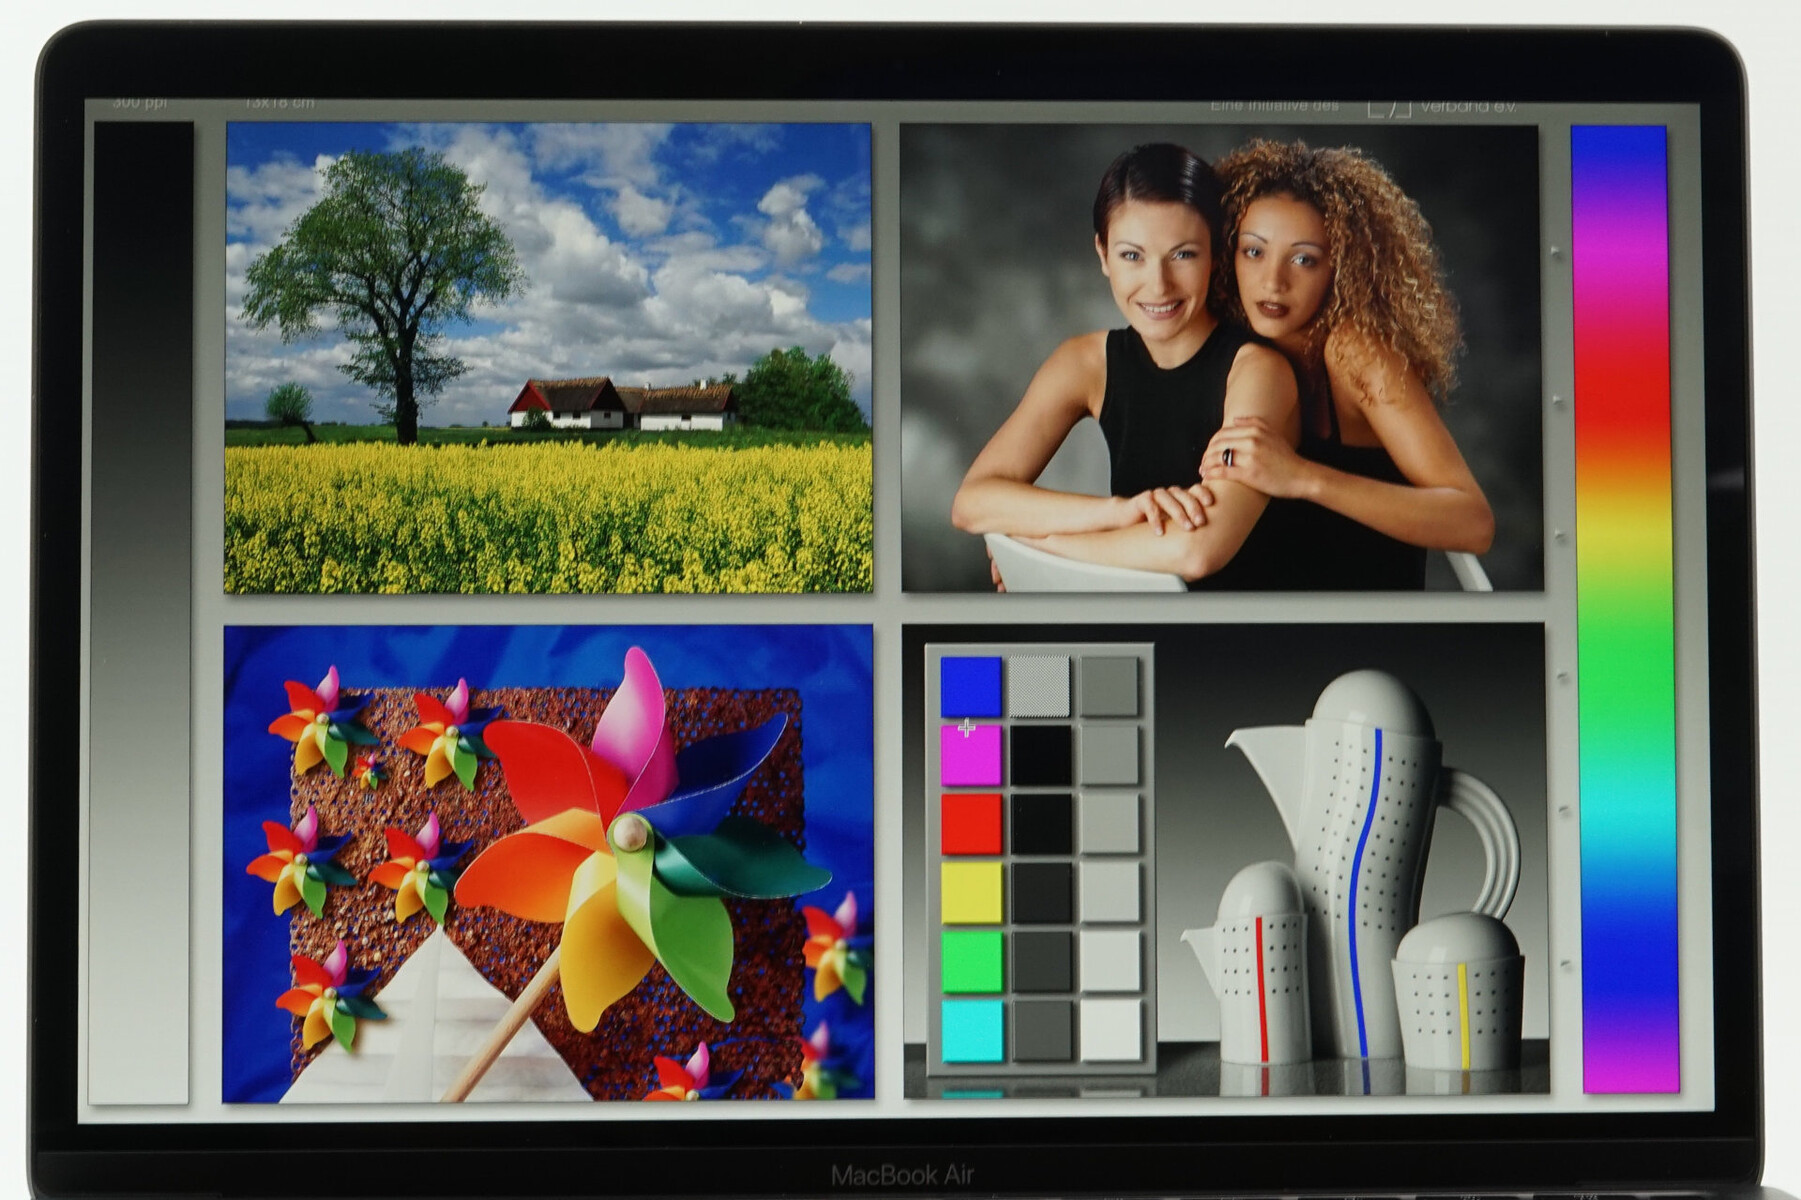
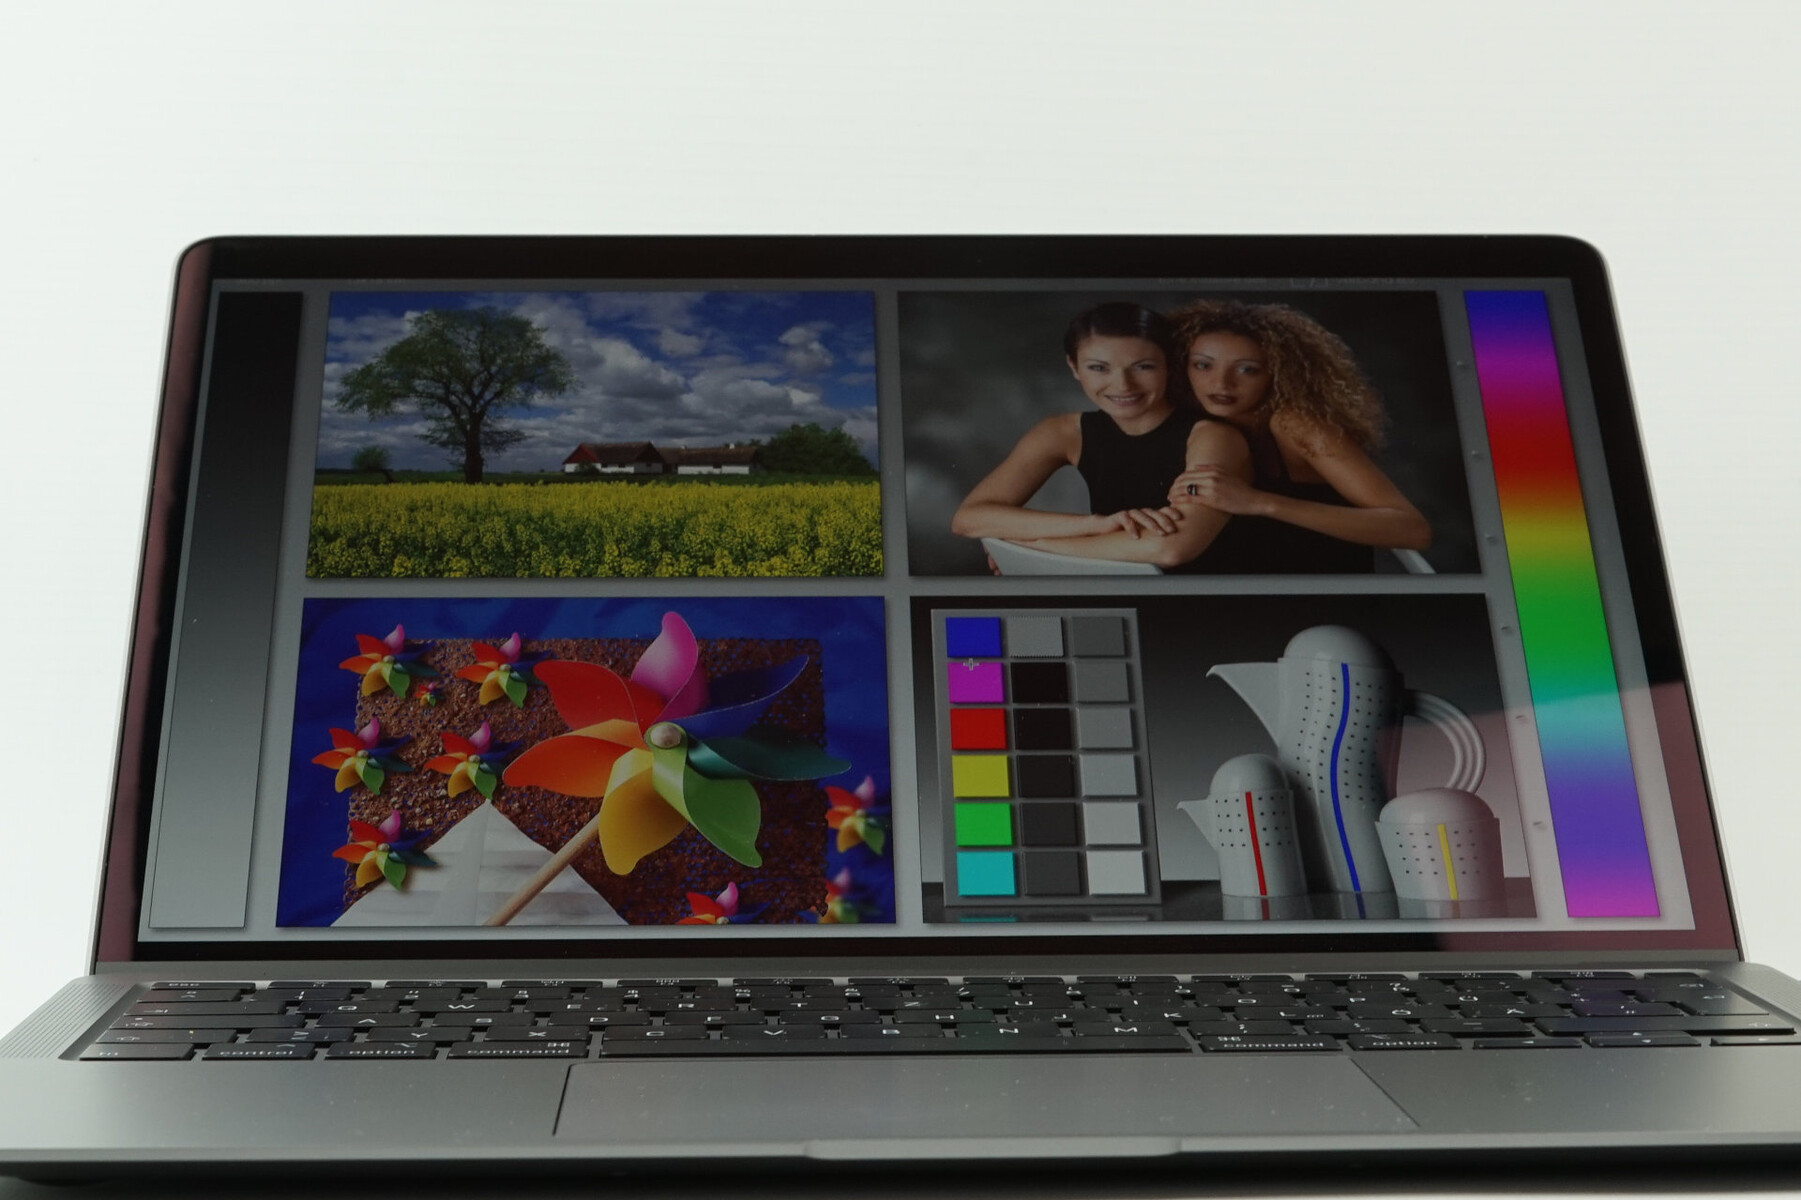
Display – Retina with True Tone
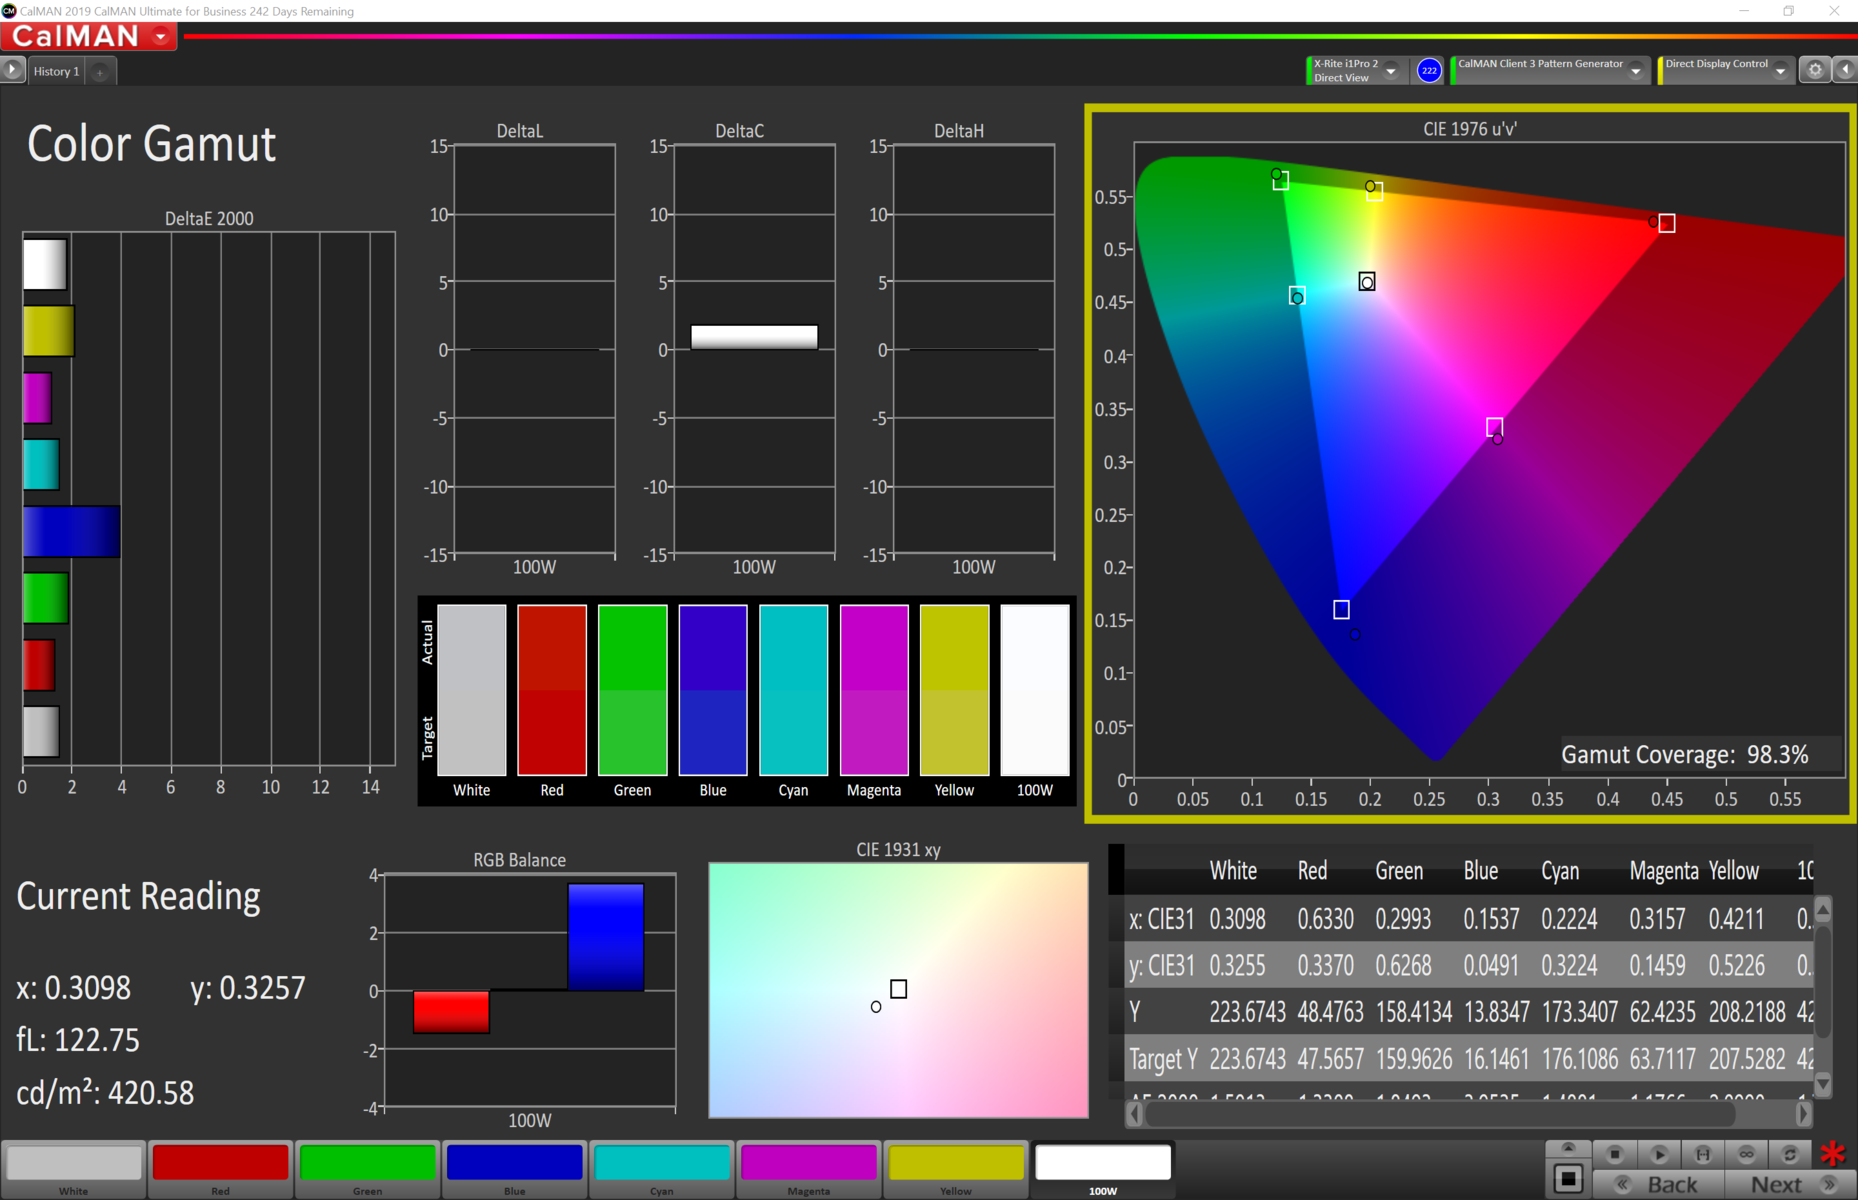
It looks like the display has not changed: IPS, 16:10, 2560 x 1600 pixels, and a glossy surface, even though Apple's screens are actually pretty good in this regard and they are not as glossy as many other panels/touchscreens (thanks to an anti-reflective layer). Apple's entry-level laptop also supports the True Tone technology, which automatically adjusts the color temperature based on the environment. The panel ID has changed compared to the old model (now APPA042), but our measurements do not show any significant changes. The average luminance is at around 400 nits and the contrast ratio surpasses 1300:1. The subjective picture impression is very good, but the competition is at least on the same level and even better in some regards like the brightness.
Apple uses PWM to regulate the brightness at 75% or lower. We determine a very high frequency above 100 kHz, but we have received multiple mails from users with problems when working on some of the latest MacBooks. We recommend you test the device for as long a period as possible, to be on the safe side, if you are sensitive to PWM flickering.
| |||||||||||||||||||||||||
Brightness Distribution: 89 %
Center on Battery: 427 cd/m²
Contrast: 1344:1 (Black: 0.32 cd/m²)
ΔE ColorChecker Calman: 1.8 | ∀{0.5-29.43 Ø4.72}
calibrated: 1.6
ΔE Greyscale Calman: 1.1 | ∀{0.09-98 Ø4.97}
98.3% sRGB (Calman 2D)
97.6% sRGB (Argyll 1.6.3 3D)
64.2% AdobeRGB 1998 (Argyll 1.6.3 3D)
71.7% AdobeRGB 1998 (Argyll 3D)
97.7% sRGB (Argyll 3D)
70.4% Display P3 (Argyll 3D)
CCT: 6644 K
| Apple MacBook Air 2020 i5 APPA042, IPS, 2560x1600, 13.3" | Apple Macbook Air 2019 APPA041, IPS, 2560x1600, 13.3" | Apple MacBook Pro 13 2019 2TB3 APPA03D, IPS, 2560x1600, 13.3" | Microsoft Surface Laptop 3 13 Core i5-1035G7 Sharp LQ135P1JX51, IPS, 2256x1504, 13.5" | Acer Swift 3 SF313-52-71Y7 BOE, NE135FBM-N41, IPS, 2256x1504, 13.5" | Dell XPS 13 9300 i5 FHD SHP14CB, IPS, 1920x1200, 13.4" | |
|---|---|---|---|---|---|---|
| Display | -4% | 19% | -4% | 0% | 2% | |
| Display P3 Coverage (%) | 70.4 | 67.4 -4% | 96.1 37% | 65.7 -7% | 70.1 0% | 71.5 2% |
| sRGB Coverage (%) | 97.7 | 94.7 -3% | 99.4 2% | 98.6 1% | 99.8 2% | 99.4 2% |
| AdobeRGB 1998 Coverage (%) | 71.7 | 69.1 -4% | 85.6 19% | 67.8 -5% | 71.2 -1% | 73.5 3% |
| Response Times | -4% | -23% | -45% | -22% | -32% | |
| Response Time Grey 50% / Grey 80% * (ms) | 38.7 ? | 42.4 ? -10% | 50.4 ? -30% | 59.2 ? -53% | 55 ? -42% | 60 ? -55% |
| Response Time Black / White * (ms) | 30.44 ? | 29.6 ? 3% | 35.2 ? -16% | 41.6 ? -37% | 31 ? -2% | 33.2 ? -9% |
| PWM Frequency (Hz) | 117000 ? | 111100 ? | 116300 ? | 21740 ? | 208 ? | 2500 ? |
| Screen | -0% | 12% | 10% | -30% | -33% | |
| Brightness middle (cd/m²) | 430 | 421 -2% | 603 40% | 403.4 -6% | 474 10% | 619 44% |
| Brightness (cd/m²) | 405 | 393 -3% | 577 42% | 397 -2% | 426 5% | 591 46% |
| Brightness Distribution (%) | 89 | 88 -1% | 92 3% | 89 0% | 82 -8% | 91 2% |
| Black Level * (cd/m²) | 0.32 | 0.34 -6% | 0.35 -9% | 0.34 -6% | 0.29 9% | 0.35 -9% |
| Contrast (:1) | 1344 | 1238 -8% | 1723 28% | 1186 -12% | 1634 22% | 1769 32% |
| Colorchecker dE 2000 * | 1.8 | 1.5 17% | 1.7 6% | 0.94 48% | 2.38 -32% | 3 -67% |
| Colorchecker dE 2000 max. * | 4.6 | 3.8 17% | 3.1 33% | 2.92 37% | 5.88 -28% | 8.2 -78% |
| Colorchecker dE 2000 calibrated * | 1.6 | 0.7 56% | 0.99 38% | 2.69 -68% | 1 37% | |
| Greyscale dE 2000 * | 1.1 | 1.2 -9% | 2.1 -91% | 0.9 18% | 3.75 -241% | 5.2 -373% |
| CCT | 6644 98% | 6694 97% | 6843 95% | 6620 98% | 6466 101% | 6340 103% |
| Color Space (Percent of AdobeRGB 1998) (%) | 64.2 | 61.3 -5% | 76.7 19% | 62.3 -3% | 65 1% | 66.9 4% |
| Color Space (Percent of sRGB) (%) | 97.6 | 94.6 -3% | 99.4 2% | 98.7 1% | 100 2% | 99.3 2% |
| Gamma | 2.21 100% | 2.18 101% | 2.13 103% | 2.37 93% | 2.14 103% | |
| Total Average (Program / Settings) | -3% /
-1% | 3% /
9% | -13% /
1% | -17% /
-23% | -21% /
-26% |
* ... smaller is better
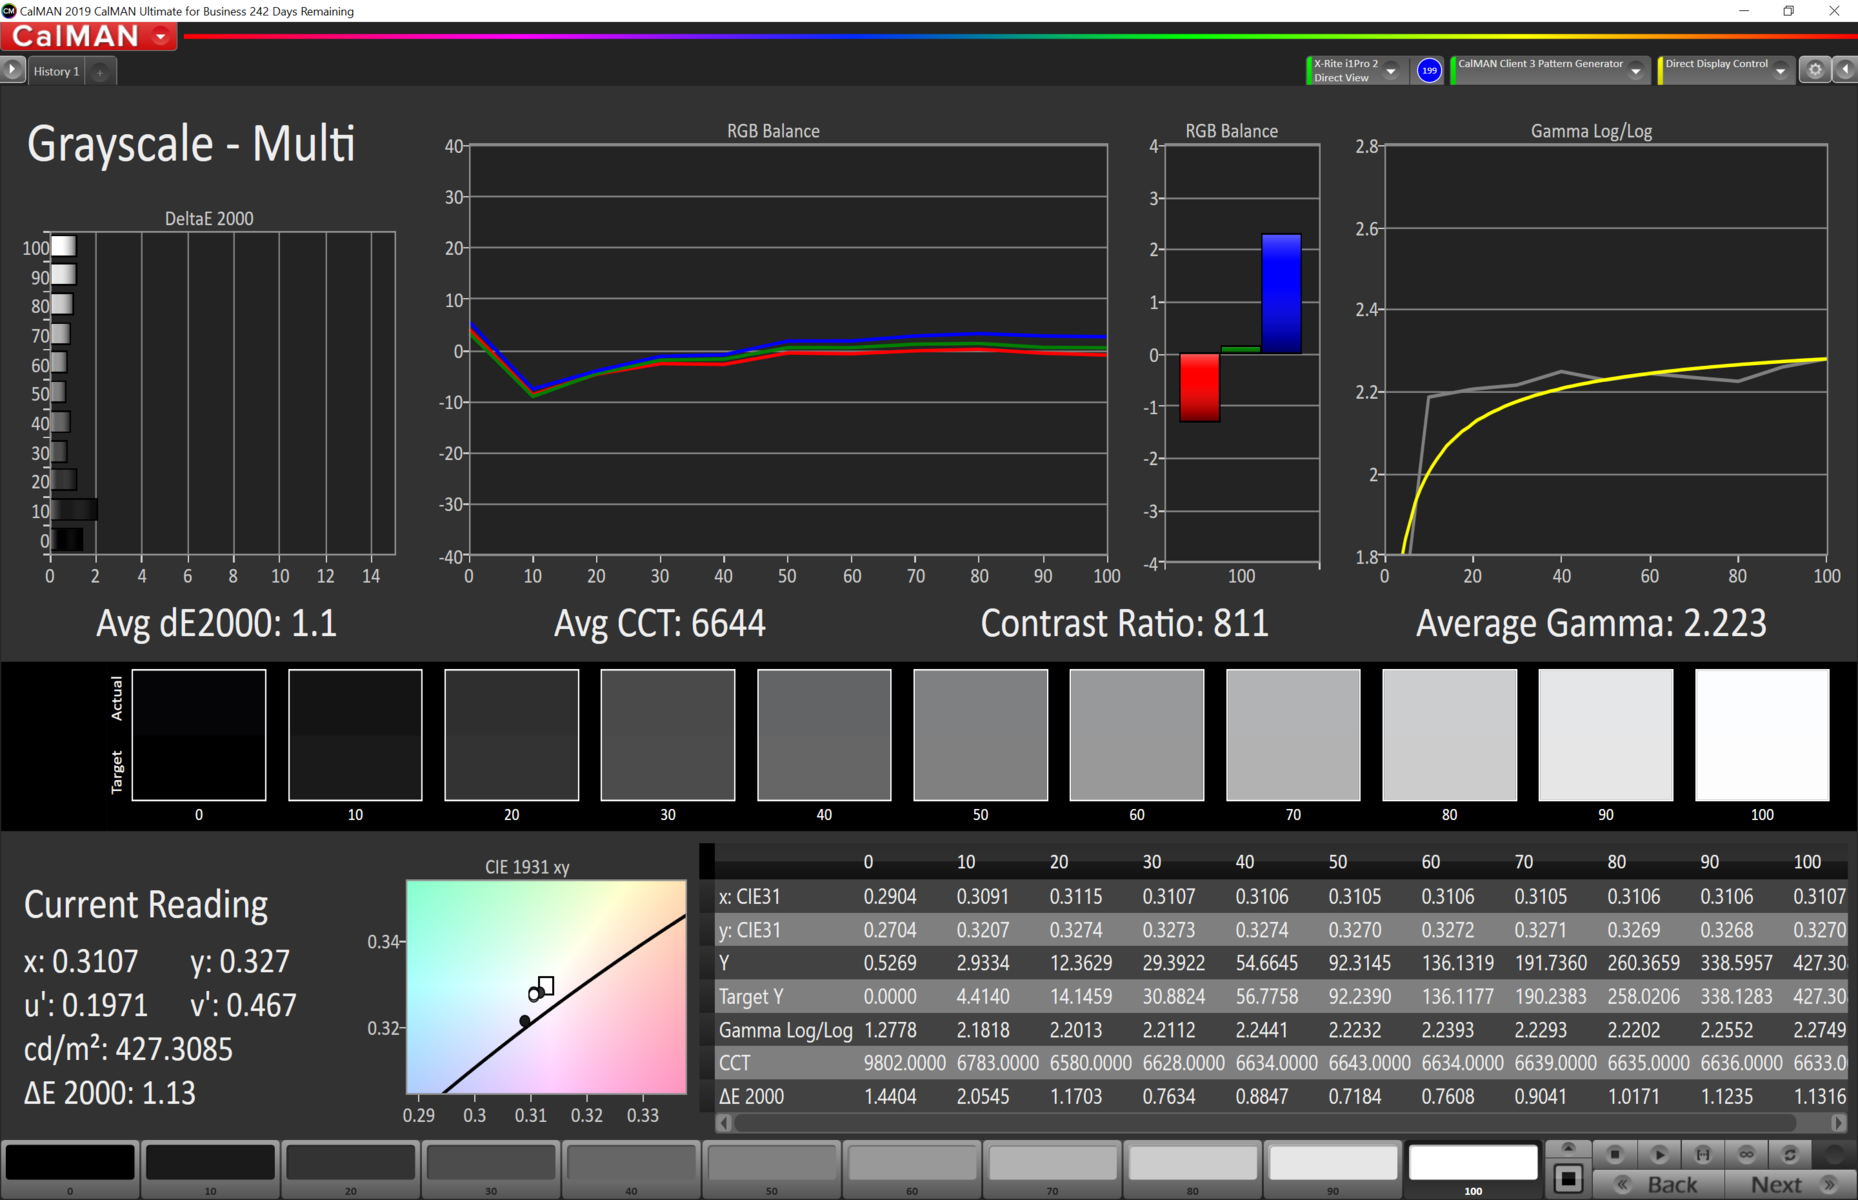
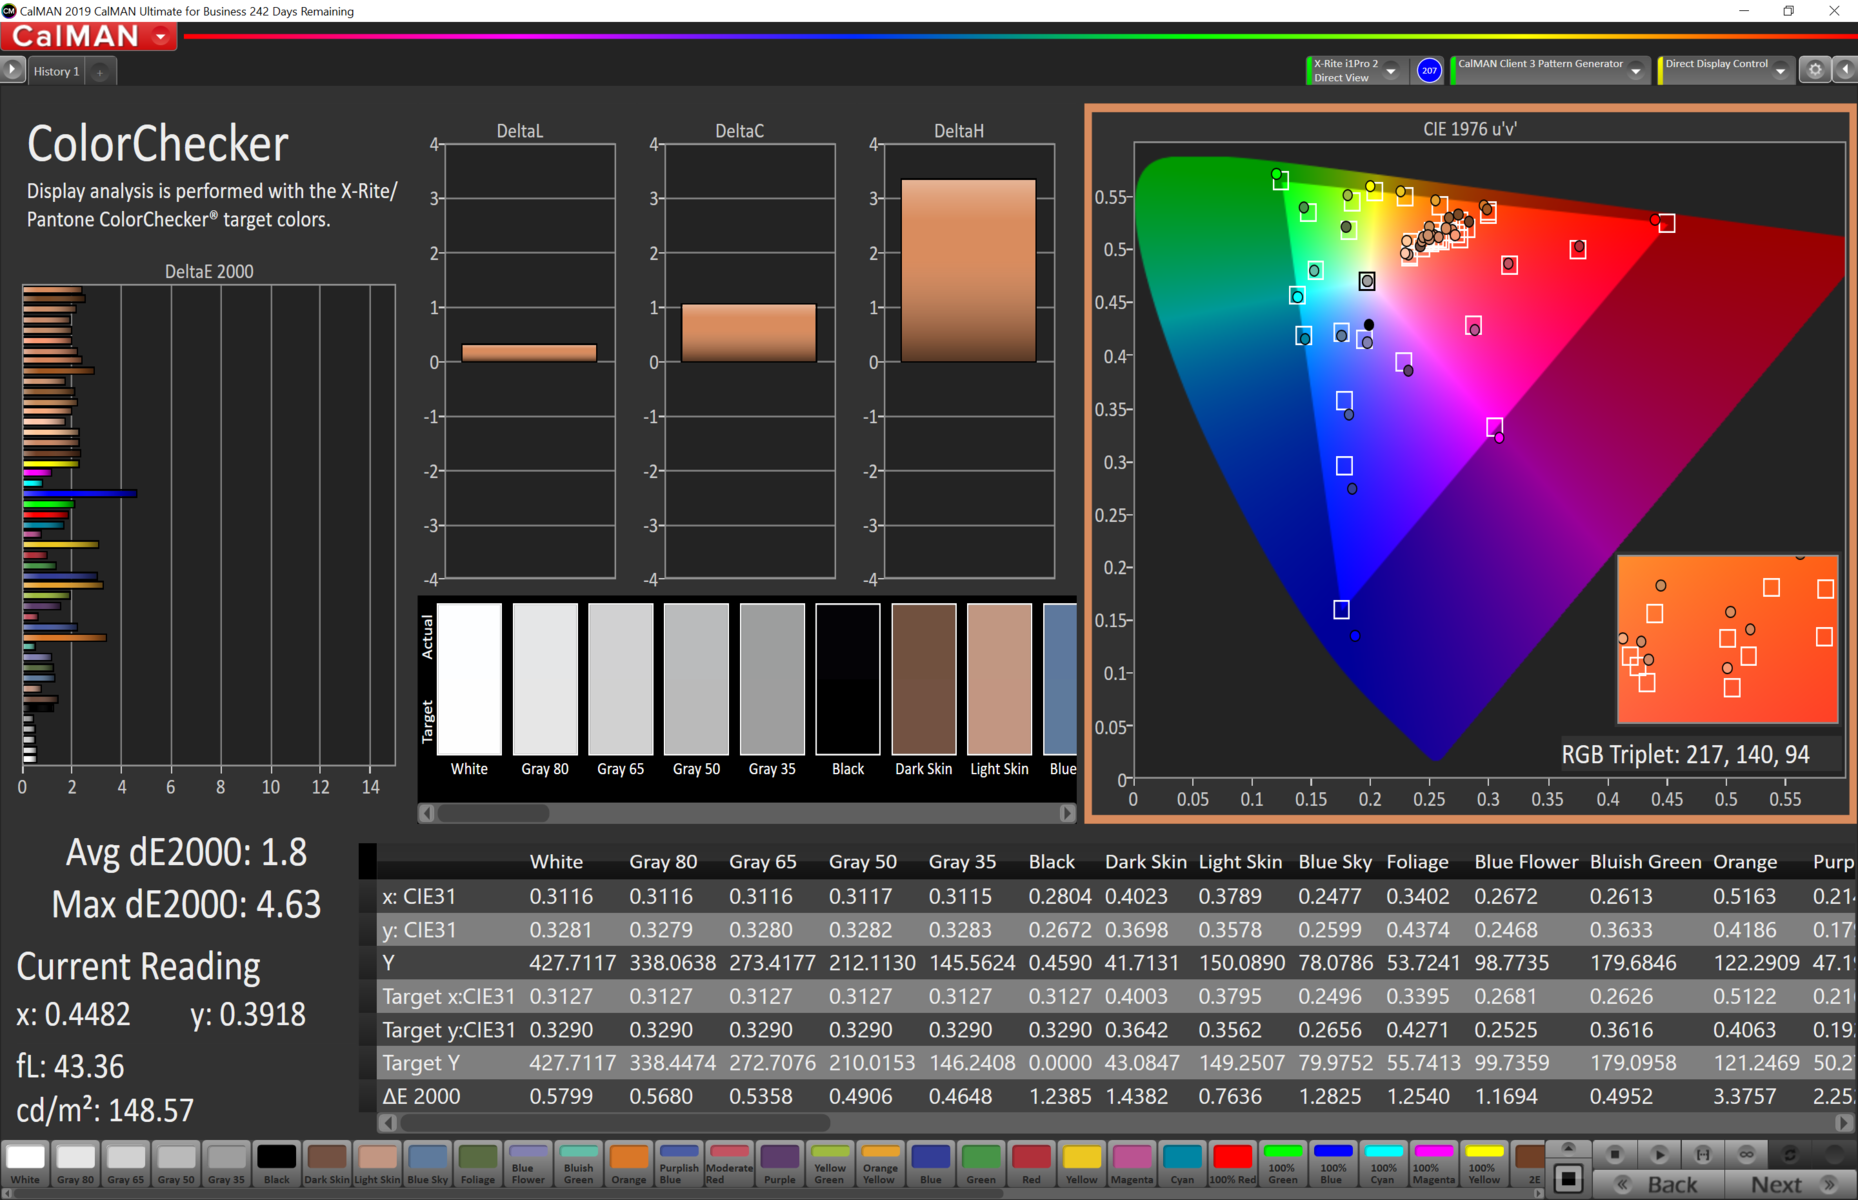
The display of the MacBook Air is very well calibrated out of the box and almost all the values are within the target range. We have calibrated the panel with the X-Rite i1 Pro 2 spectrophotometer and the professional CalMAN software (icm profile is linked in the box above), but this is not really necessary. Only the 100% blue value is slightly above the target deviation of 3. The MacBook Air still covers the smaller sRGB gamut completely, while the MacBook Pro models are targeting the wider P3 color space.


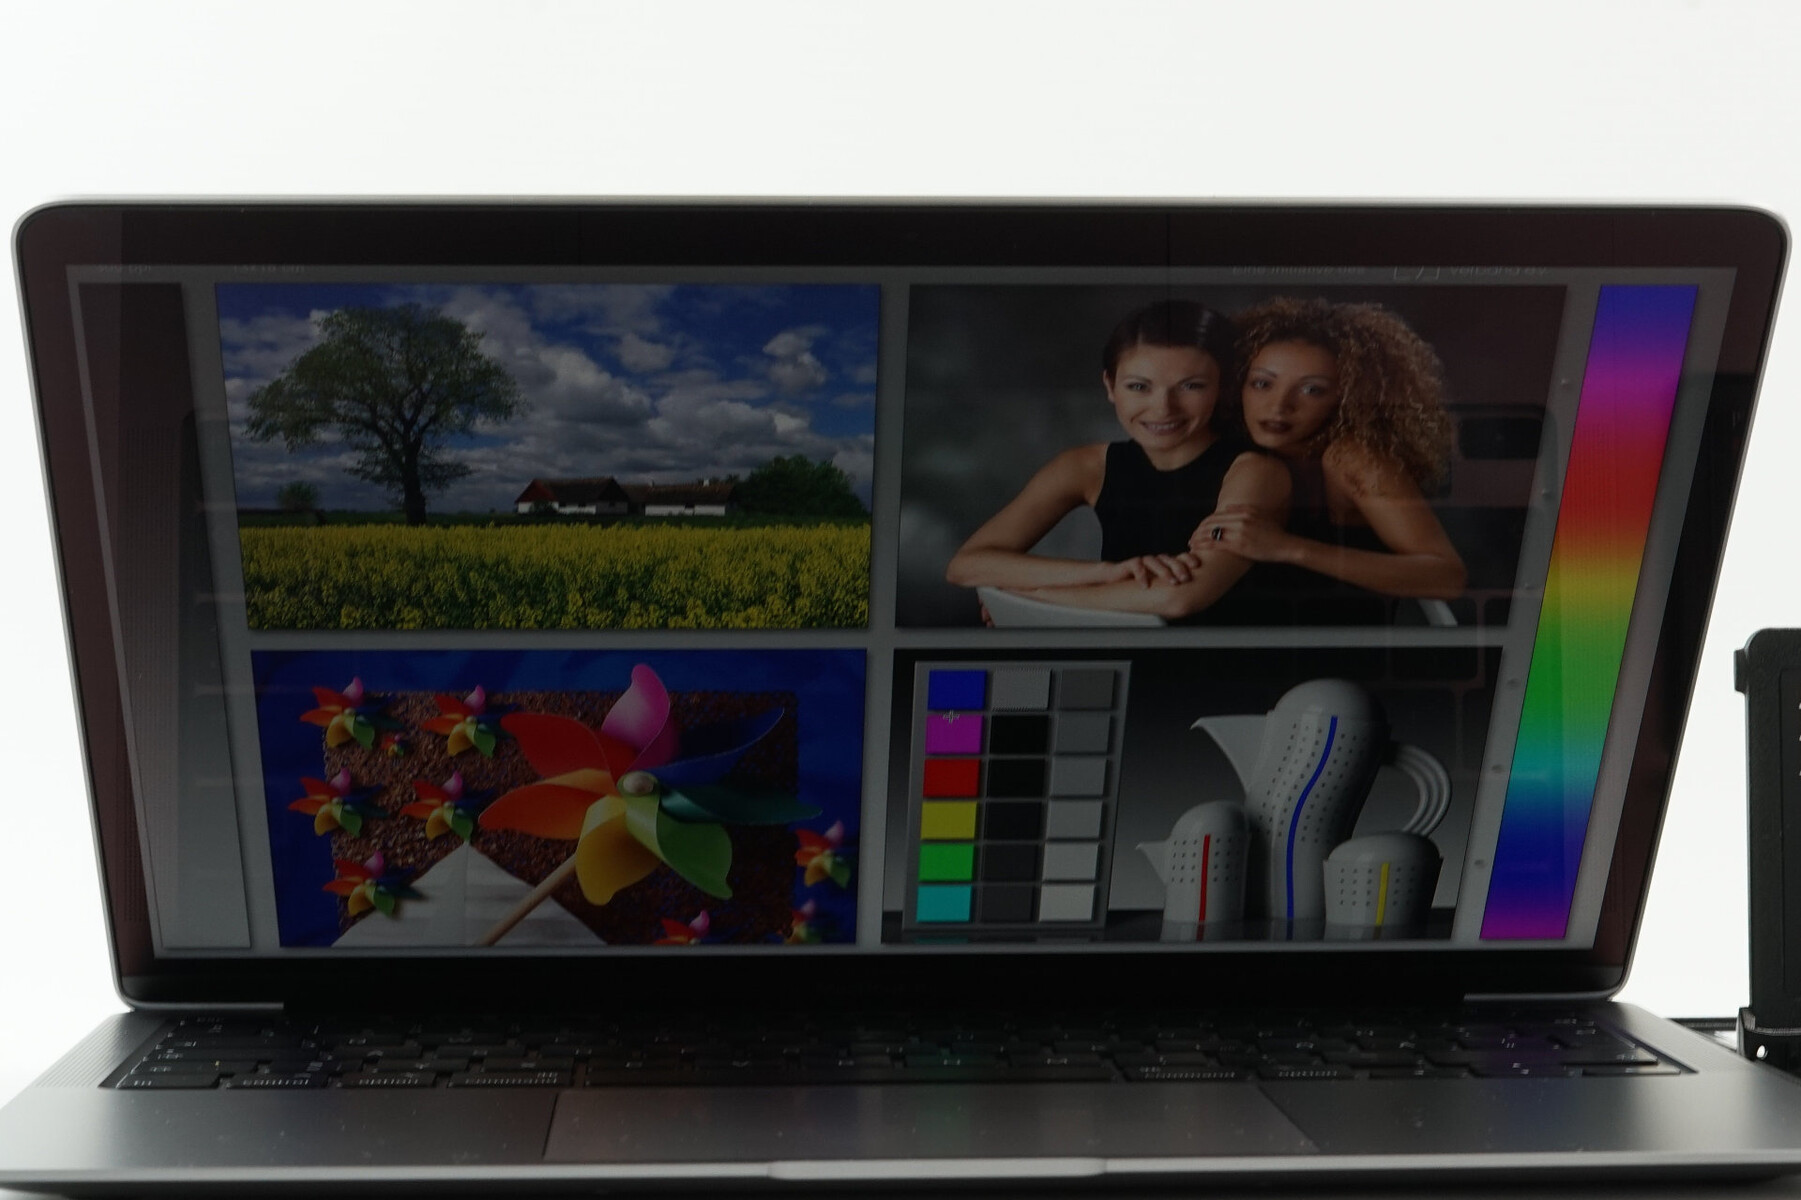
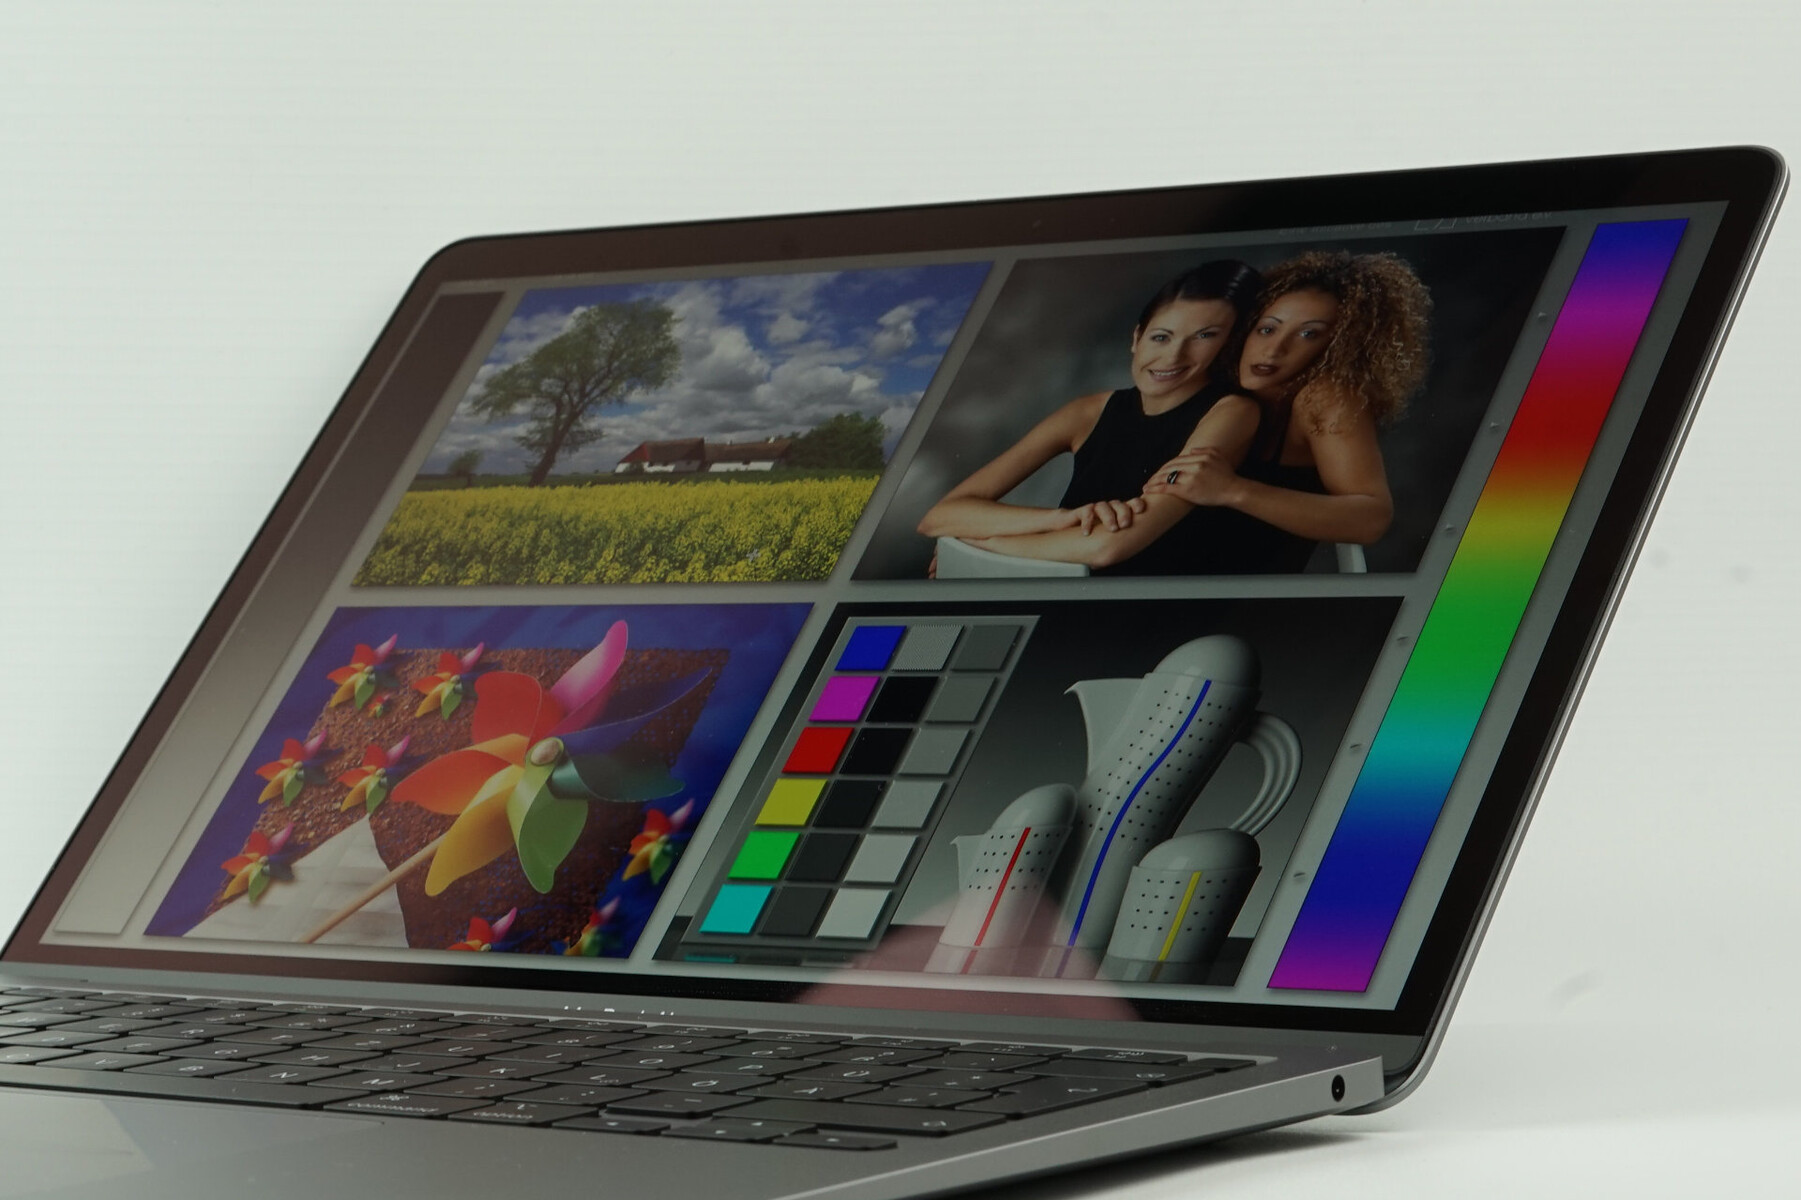
Outdoors, the 400-nit display is unfortunately only really sufficient in the shade. The background illumination is not able to compensate for the reflections in direct sunlight. The Pro models with their brighter panels are better in this regard, just like the current Dell XPS 13 9300.
Display Response Times
| ↔ Response Time Black to White | ||
|---|---|---|
| 30.44 ms ... rise ↗ and fall ↘ combined | ↗ 17.9 ms rise | 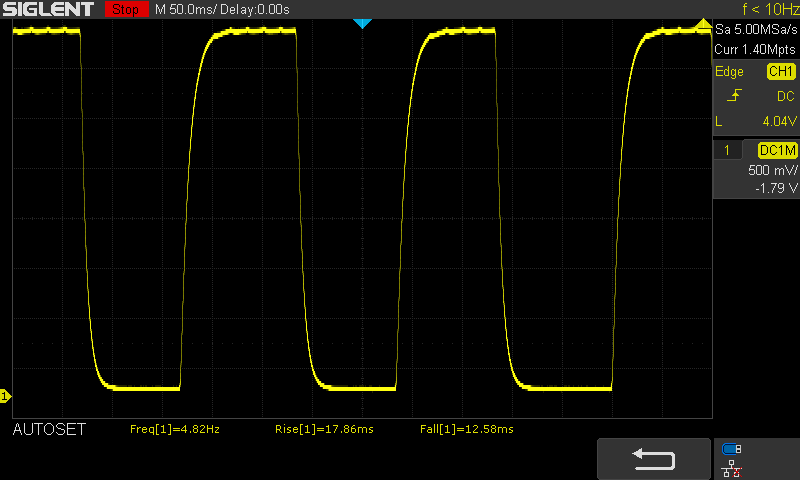 |
| ↘ 12.6 ms fall | ||
| The screen shows slow response rates in our tests and will be unsatisfactory for gamers. In comparison, all tested devices range from 0.1 (minimum) to 240 (maximum) ms. » 83 % of all devices are better. This means that the measured response time is worse than the average of all tested devices (19.8 ms). | ||
| ↔ Response Time 50% Grey to 80% Grey | ||
| 38.7 ms ... rise ↗ and fall ↘ combined | ↗ 19.6 ms rise | 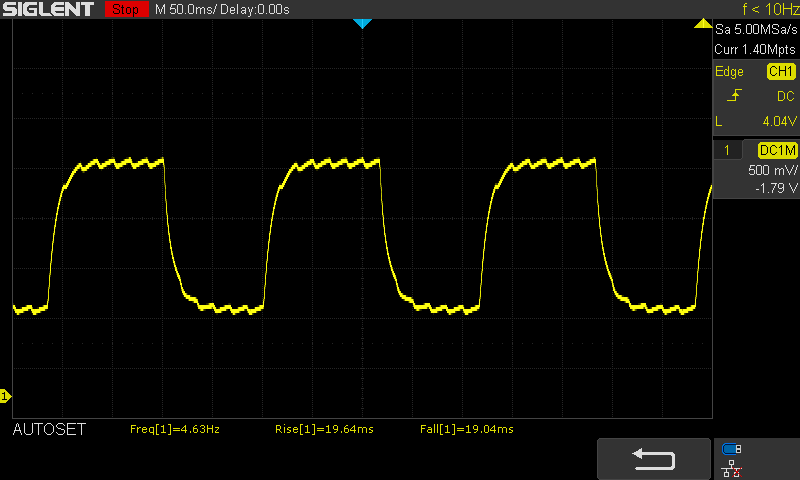 |
| ↘ 19 ms fall | ||
| The screen shows slow response rates in our tests and will be unsatisfactory for gamers. In comparison, all tested devices range from 0.165 (minimum) to 636 (maximum) ms. » 58 % of all devices are better. This means that the measured response time is worse than the average of all tested devices (31 ms). | ||
Screen Flickering / PWM (Pulse-Width Modulation)
| Screen flickering / PWM detected | 117000 Hz | ≤ 75 % brightness setting | 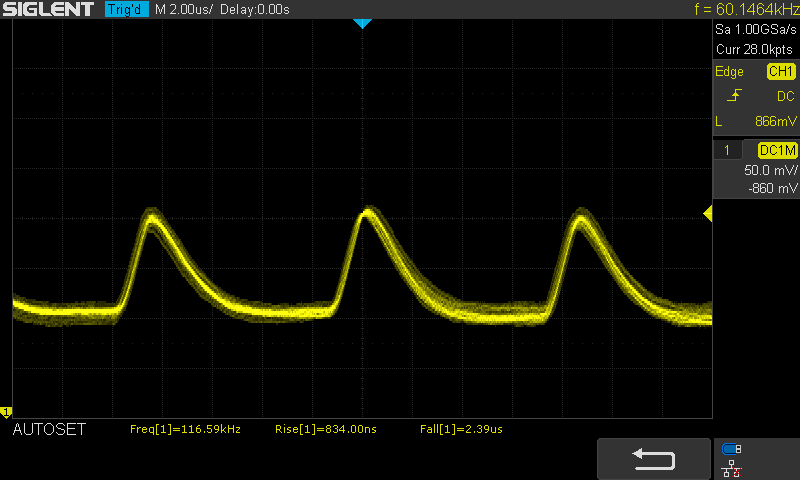 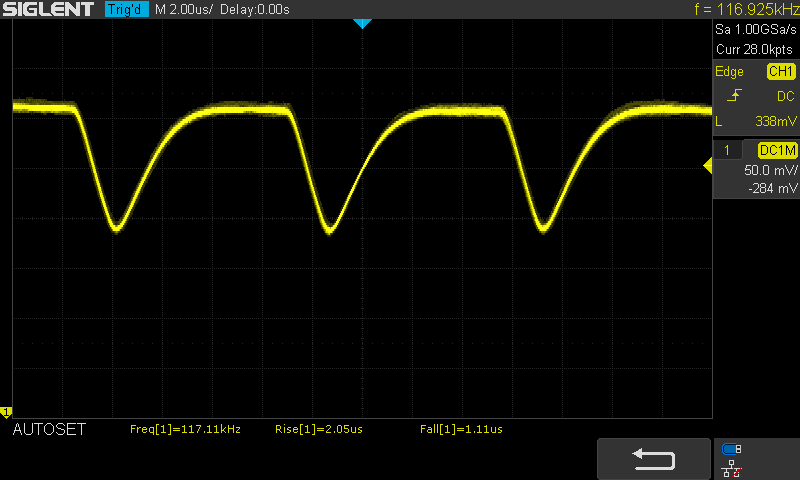 |
The display backlight flickers at 117000 Hz (worst case, e.g., utilizing PWM) Flickering detected at a brightness setting of 75 % and below. There should be no flickering or PWM above this brightness setting. The frequency of 117000 Hz is quite high, so most users sensitive to PWM should not notice any flickering. In comparison: 52 % of all tested devices do not use PWM to dim the display. If PWM was detected, an average of 7747 (minimum: 5 - maximum: 343500) Hz was measured. | |||
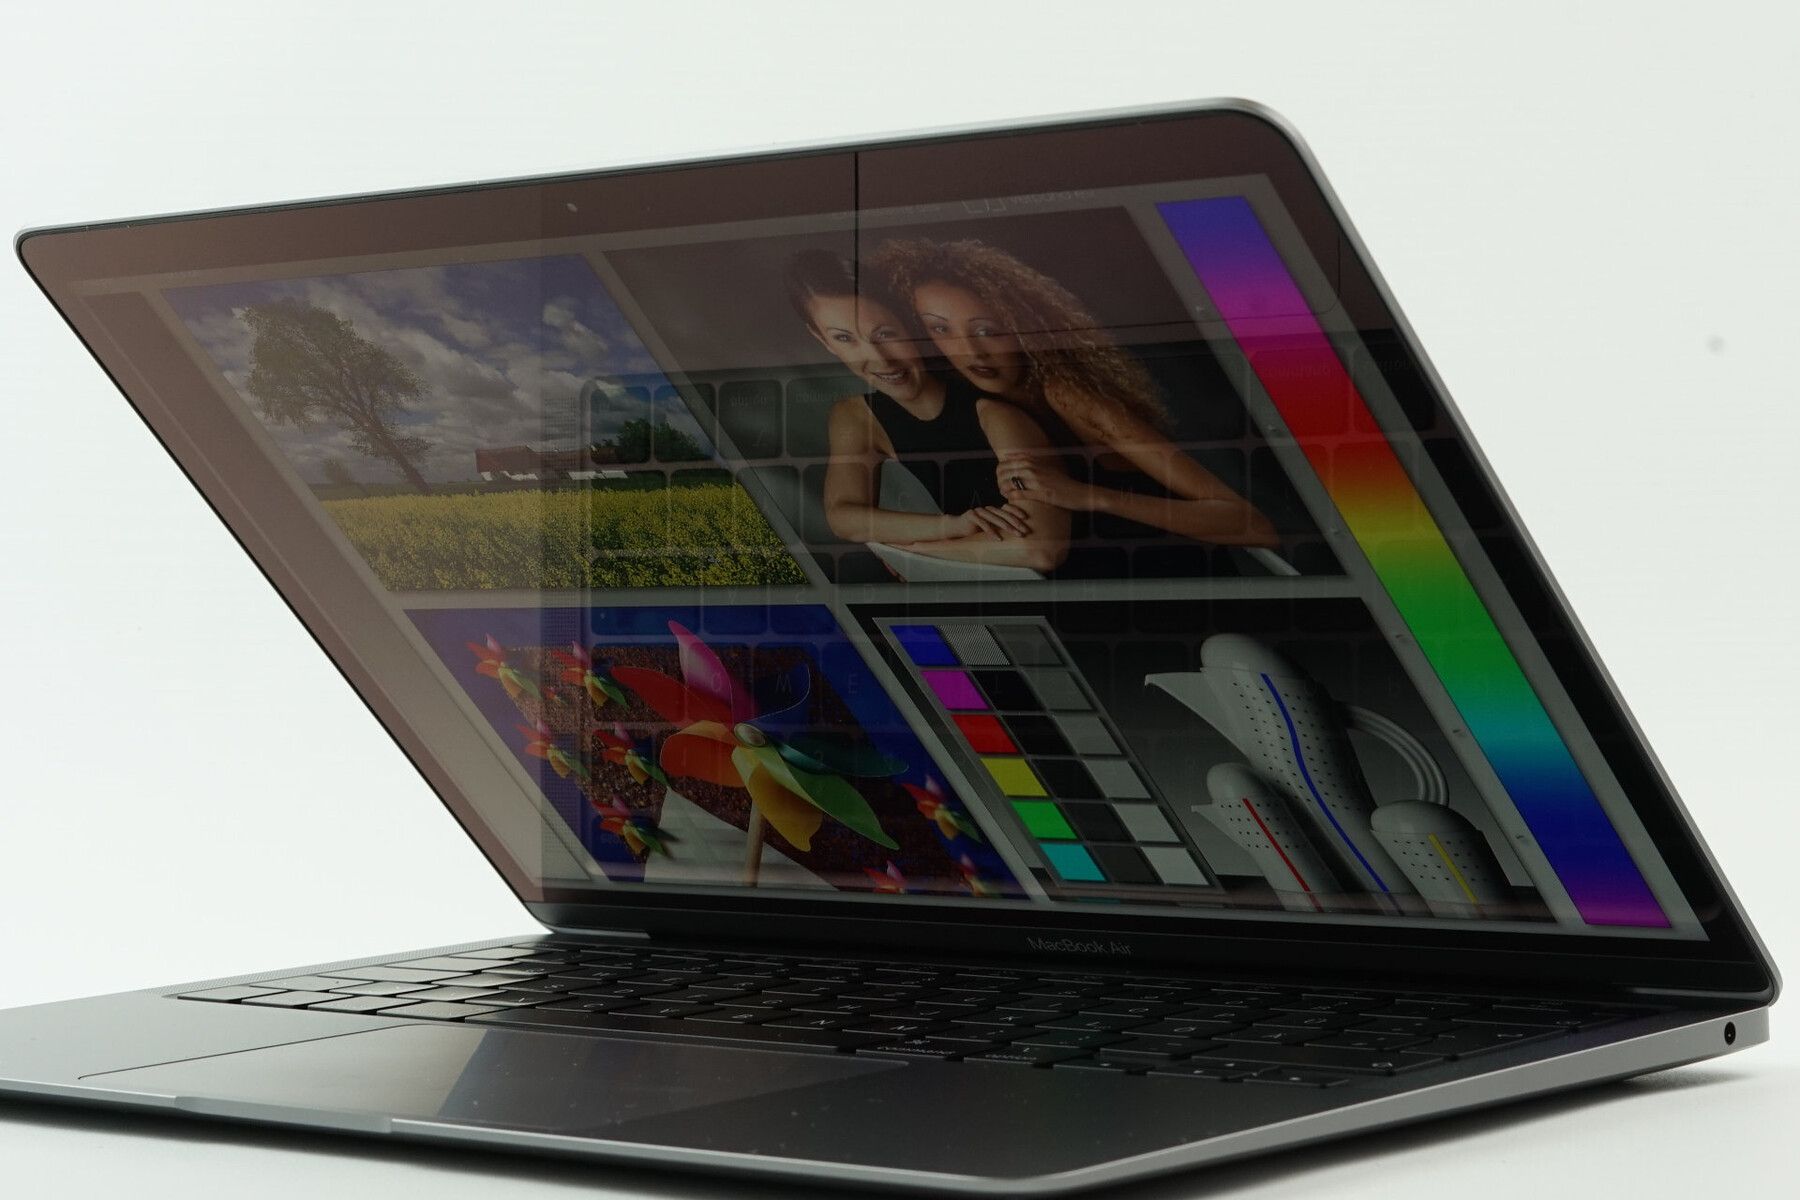
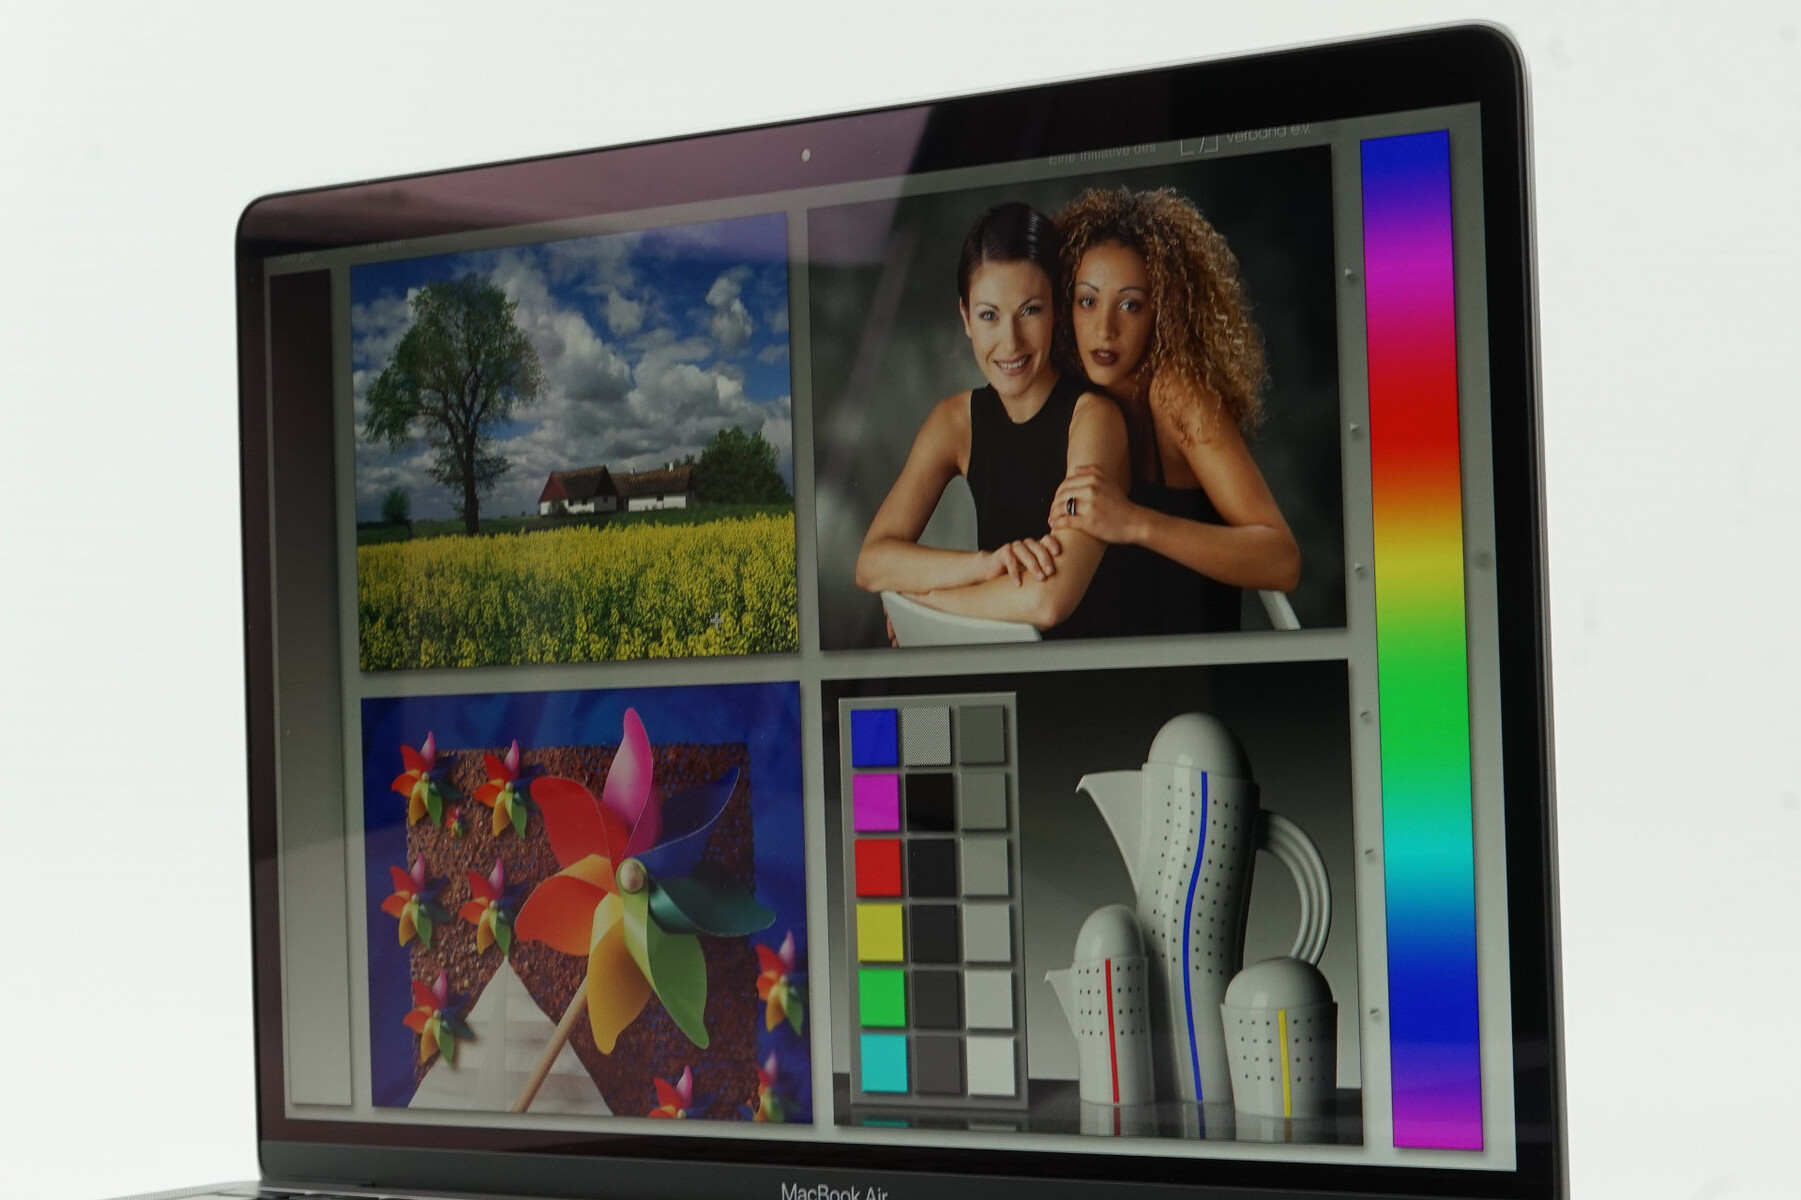
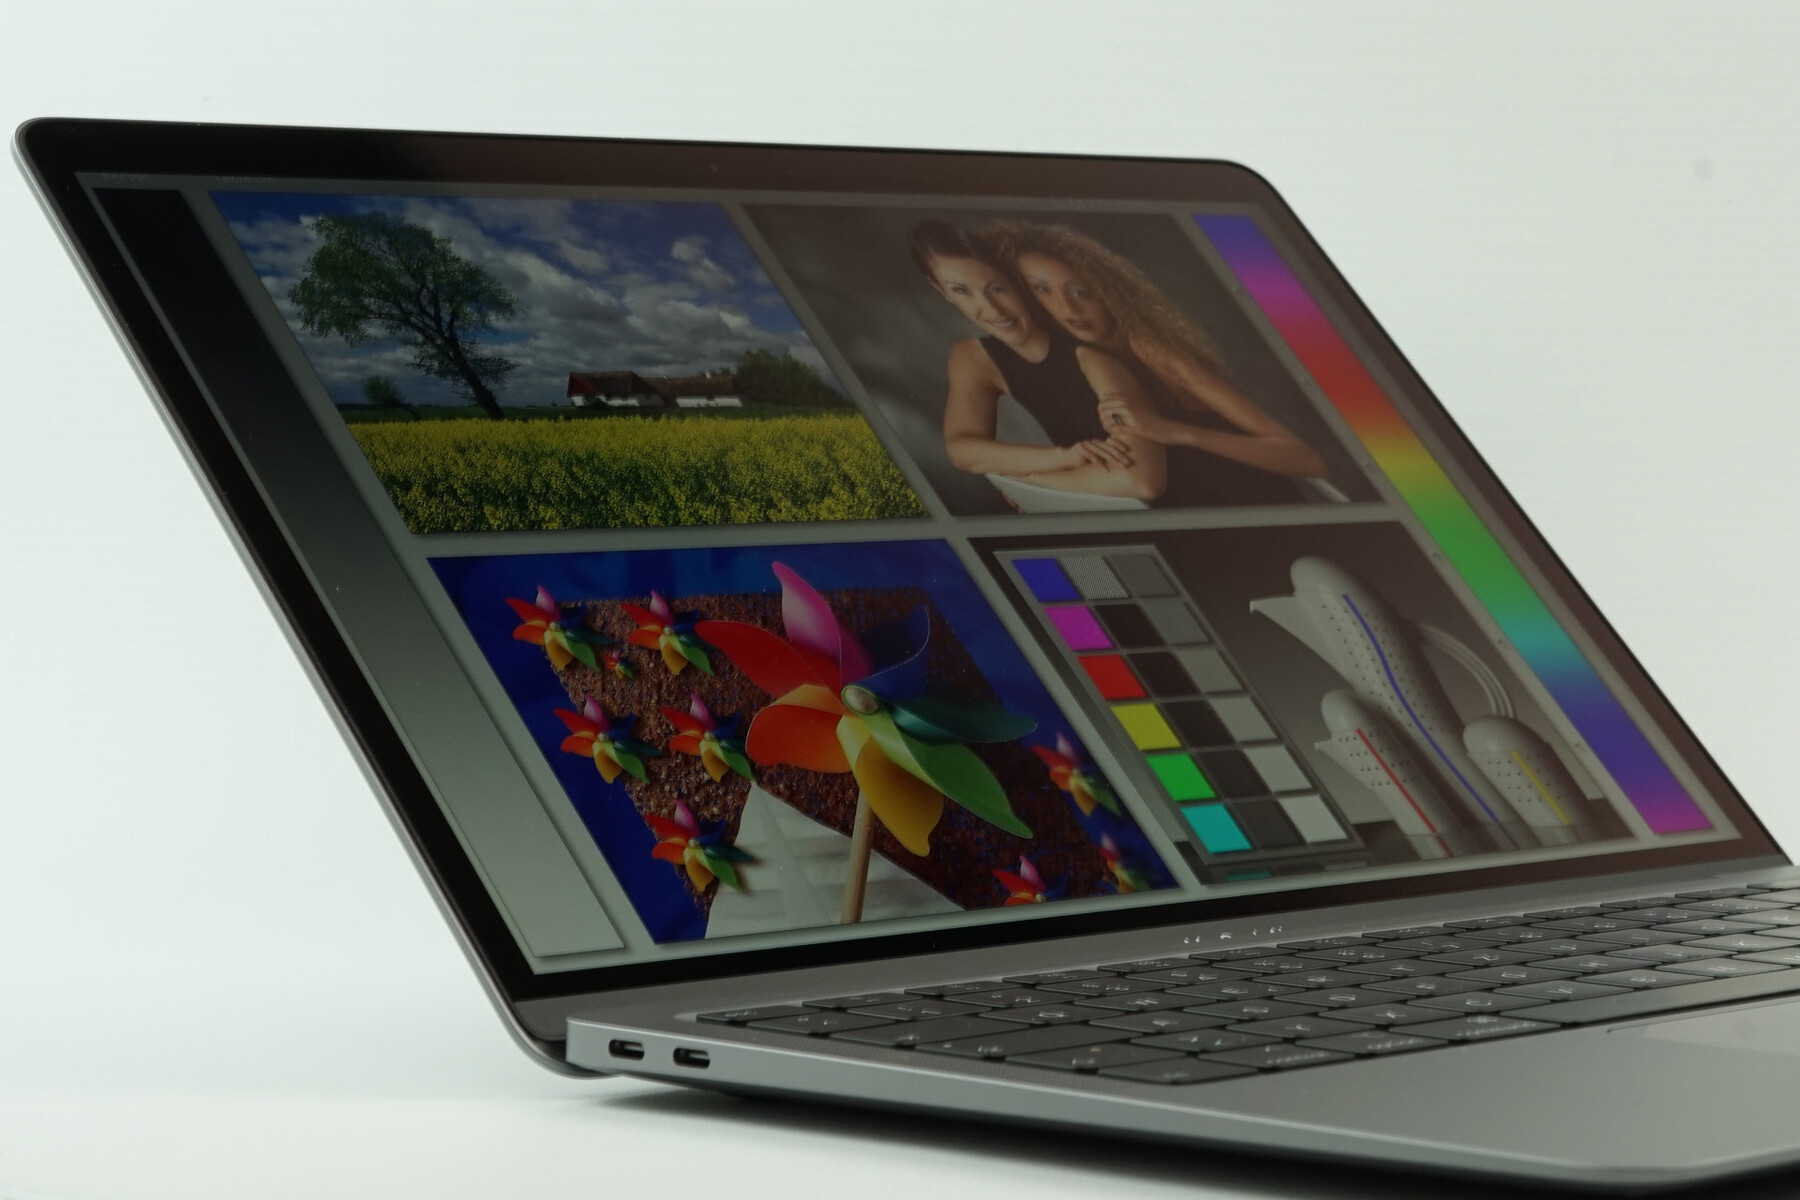
Except for the reflections, there are no problems with the viewing angle stability of the IPS screen. Colors are stable and the brightness drop is not unusually strong.
Performance – MacBook Air only for light workloads
Quad-core processor, sufficient RAM, and fast PCIe-SSD: The look at the spec sheet suggests a performance level, especially in combination with the price, that you just don't get in practice. Yes, there is a performance improvement thanks to the new quad-core processors, but the MacBook Air is still aimed at casual users that want to write some mails, browse the web, stream videos, or do the occasional light picture editing. The additional price from the Core i3 (2 cores) to the Core i5 (4 cores) is pretty low at 50 Euros ($100 US) for Apple's standards, so we definitely recommend this update.
Note: Some of our benchmarks are performed running on Windows 10 (Bootcamp) for comparison purposes. It is no problem to use the alternative OS, but we don't know how much optimization has been done by Apple. Our power consumption figures in particular show that there are still big differences between the operating systems. Cross-platform benchmarks (like Geekbench) also show a performance advantage for macOS.
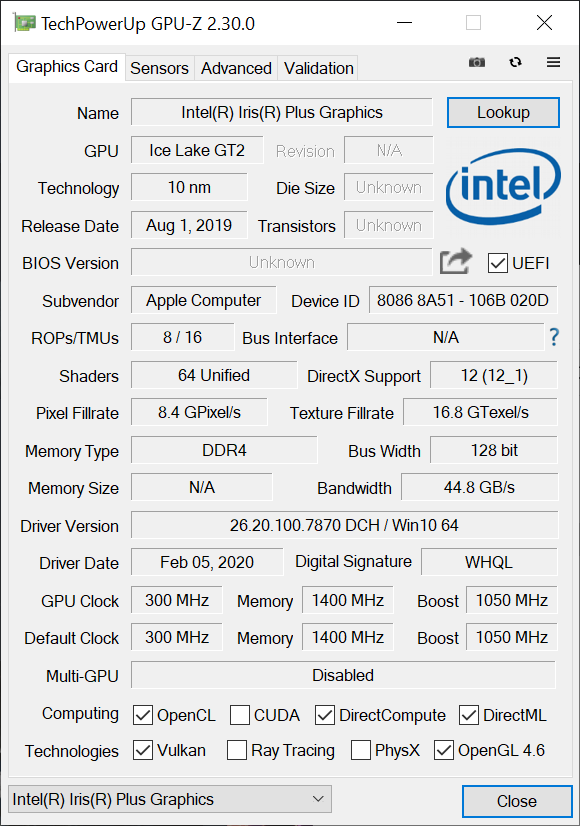
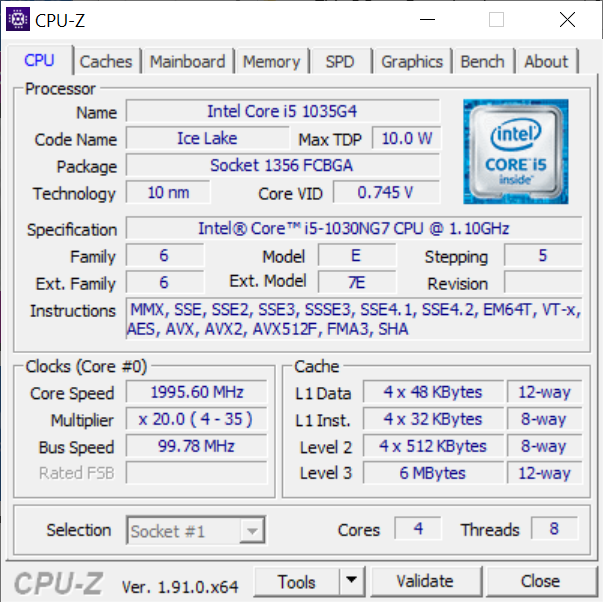
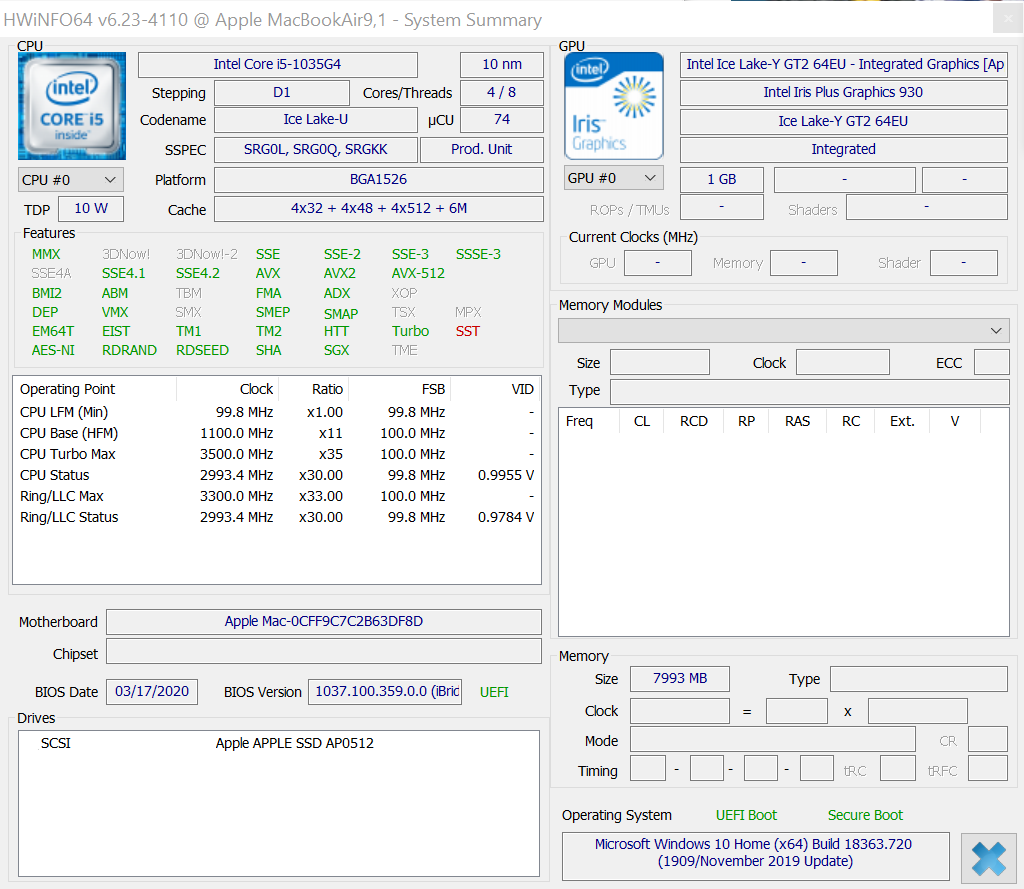
Processor – Core i5 Ice Lake-Y with 4 cores
The MacBook Air is Apple's first laptop equipped with 10nm chip from Intel. The Core i5-1030NG7 is part of the ultra-low voltage Ice Lake-Y generation. It is a custom SoC for Apple in a slightly smaller package size and it has a 1W higher TDP (now 10W) compared to the standard chip without the "N" in the designation. Please see our tech section for more technical details.
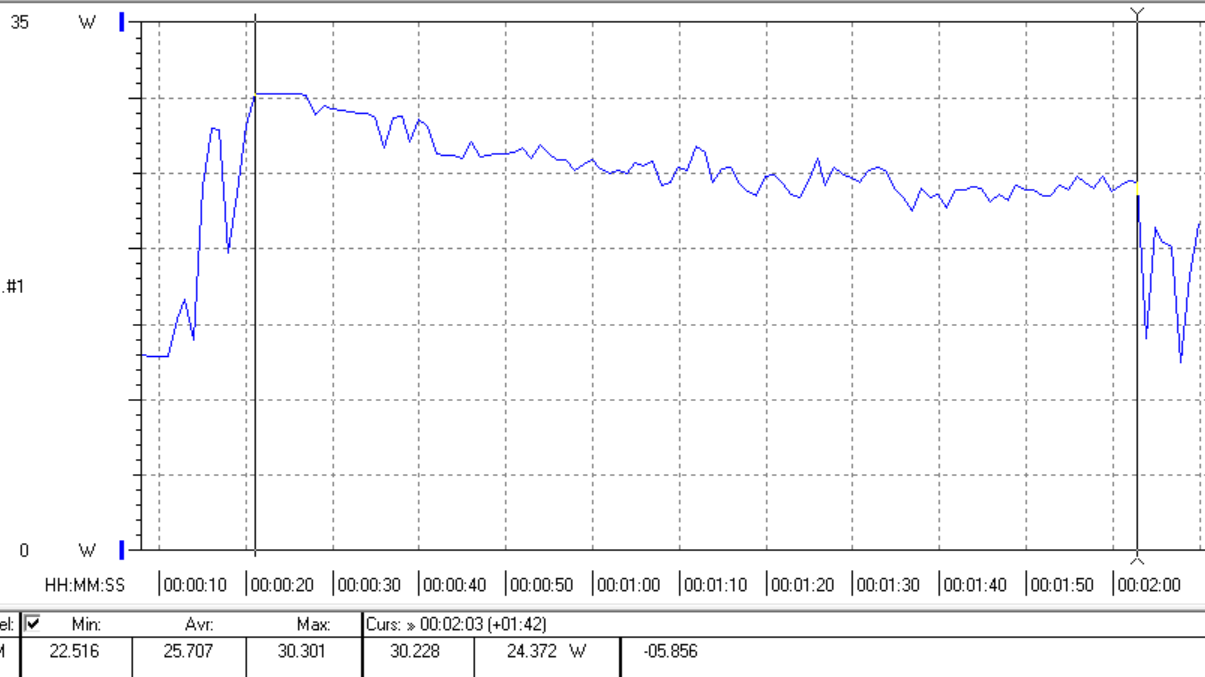
Compared to the old MacBook Air with its dual-core i5-8210Y, we obviously see increased multi-core performance, but the Air still falls short against the typical 15W chips, which are common in this price range of ultrabooks. After a couple of seconds, we can also observe a performance drop of around 10%. The performance is at least identical on battery power.
The compact MacBook Air performs a bit better in the Geekbench tests, especially the single-core result shows a smaller gap to the competition. Still, the Core i5-1030NG7 once again cannot keep up when we stress all cores. It is quite interesting to compare the result with the iPad Pro 11, which is faster than the MacBook Air in both tests. It looks like it is just a matter of time before the Air is shipped with Apple's own ARM processors.
| Blackmagic RAW Speed Test - 12:1 8K CPU | |
| Average of class Subnotebook (22 - 49, n=5, last 2 years) | |
| Apple MacBook Pro 16 2019 i9 5500M | |
| Apple MacBook Air 2020 i5 | |
| R Benchmark 2.5 - Overall mean | |
| Apple MacBook Air 2020 i5 (macOS) | |
| Apple MacBook Air 2020 i5 (Win 10) | |
| Dell XPS 13 9300 i5 FHD | |
| Acer Swift 3 SF313-52-71Y7 | |
| Apple MacBook Pro 16 2019 i9 5500M (macOS) | |
| Apple MacBook Pro 16 2019 i9 5500M (Win 10) | |
| Average of class Subnotebook (0.4024 - 1.456, n=58, last 2 years) | |
* ... smaller is better
This leaves us with the question of the two alternative processors. The Core i3-1000NG4 should only be a little bit faster than last year's Core i5-8210Y with two cores, and also has the slower G4 version of the integrated graphics card. If you know that you are just doing basic stuff with your MacBook Air, then the Core i3 should suffice, but the additional price for the 4-core Core i5 should pay off with the next years in mind. The Core i7-1060NG7 on the other hand should benefit from a slightly higher single-core performance, at least for a very short period of time. However, it is doubtful that you will notice this difference in you day-to-day workloads. We will try to review the two alternative processors as soon as possible.
System Performance
There is no good system benchmark for macOS, so we still test the MacBook Air with the PCMark products from Furturemark running on Windows 10. The results are a bit surprising: The 2020 model with the Core i5 is on average not faster than the i5 model from 2019 – despite 2 additional cores, new 10nm process, and new architecture. There is still a difference to the MacBook Pro 13 and the Windows competition is much faster. Here we can clearly see the limitation of the cooling system and that Apple (intentionally) limits the performance of its entry-level series.
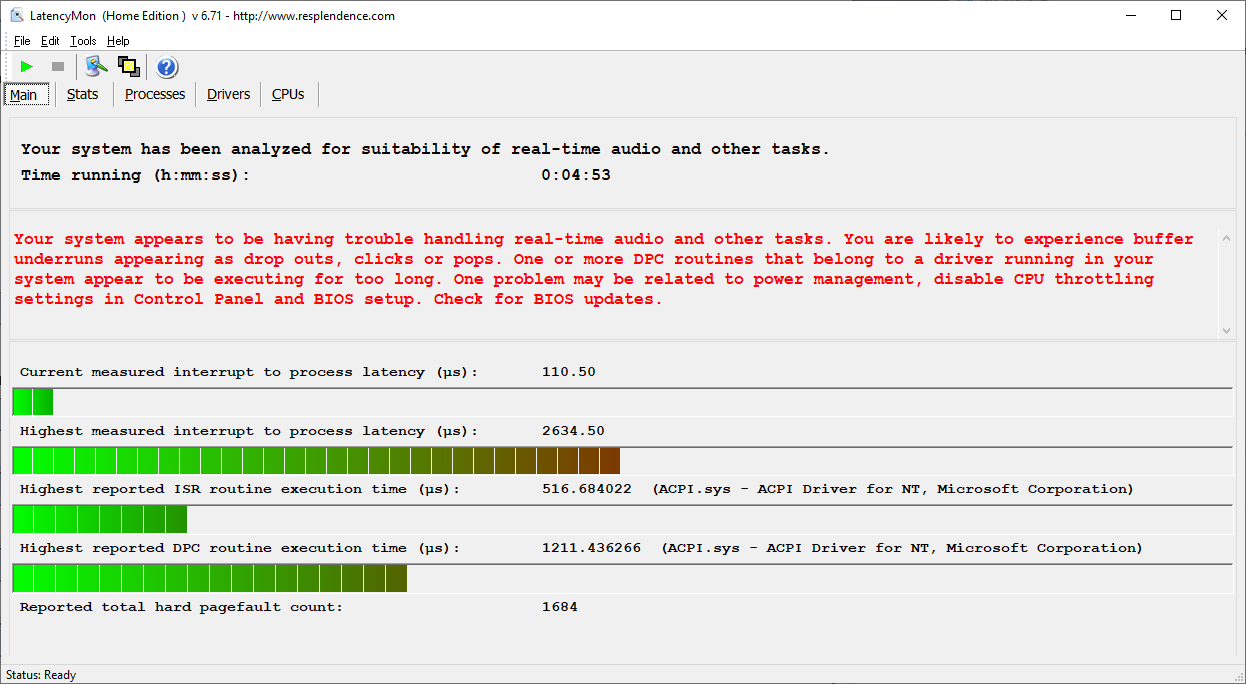
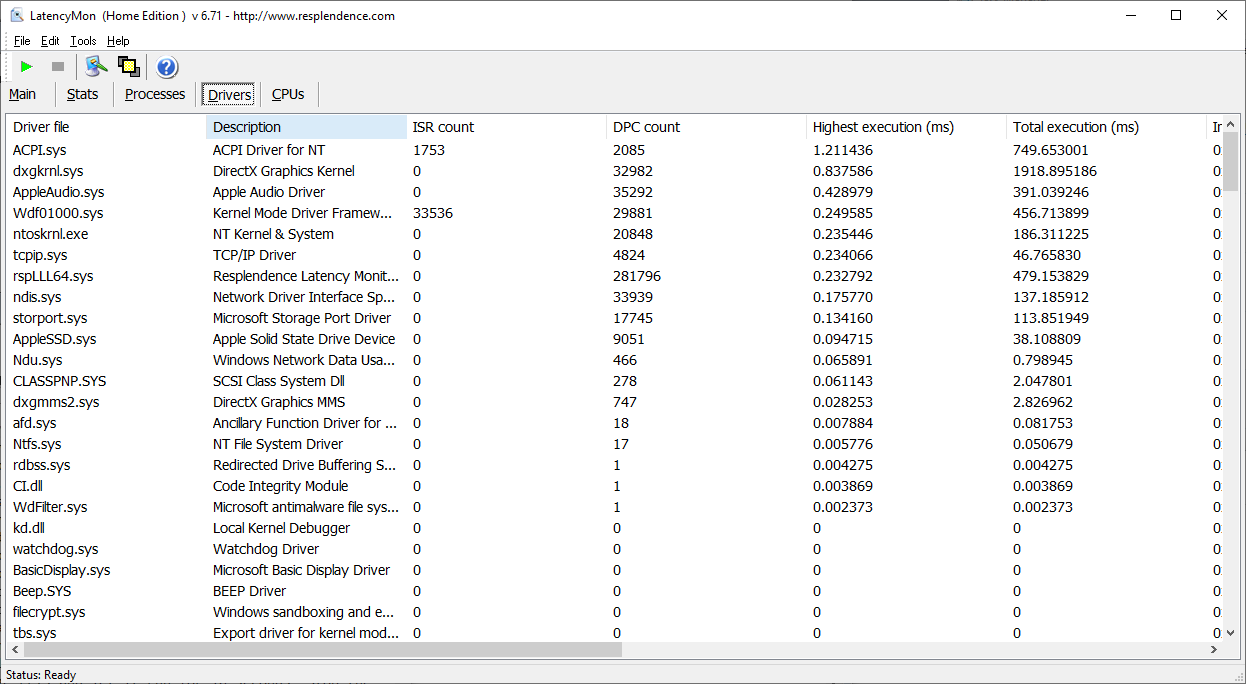
DPC Latencies Windows
The measured DPC latencies via LatencyMon and our test sequence (web browsing, YouTube video, CPU load) only show a mediocre result. It is evident that Apple did not really optimize the Windows drivers. You cannot transfer the result to macOS though, where we have no suitable tool for tests.
| DPC Latencies / LatencyMon - interrupt to process latency (max), Web, Youtube, Prime95 | |
| Dell XPS 13 9300 Core i7-1065G7 | |
| Lenovo ThinkPad X1 Carbon G7 20R1-000YUS | |
| Eve-Tech Eve V i7 | |
| Asus Zephyrus G14 GA401IV | |
| Apple MacBook Air 2020 i5 | |
| Schenker VIA 14 | |
| BMAX MaxBook Y11 H1M6 | |
| Average of class Subnotebook (316 - 8148, n=40, last 2 years) | |
| Dell XPS 13 9300 i5 FHD | |
| LG Gram 14T90N | |
| Dell XPS 13 2016 9350 (FHD, i7-6560U) | |
* ... smaller is better
Integrated NVMe-SSD - Not the fastest drive
Apple has doubled the storage capacity for the different SKUs, but the SSD performance is still average at best and clearly behind faster drives in the Acer Swift 3 or MacBook Pro 16. Even the average for this laptop category is slightly better. Whether you notice the faster performance of high-end SSDs is another question though and also depends on the usage scenario.
| Apple MacBook Air 2020 i5 Apple SSD AP0512 | Apple Macbook Air 2019 Apple SSD AP0256 | Apple MacBook Pro 13 2019 2TB3 Apple SSD AP0256 | Microsoft Surface Laptop 3 13 Core i5-1035G7 SK hynix BC501 HFM256GDGTNG | Acer Swift 3 SF313-52-71Y7 Intel SSD 660p 1TB SSDPEKNW010T8 | Dell XPS 13 9300 i5 FHD Toshiba XG6 KXG60ZNV512G | Apple MacBook Pro 16 2019 i9 5500M Apple SSD AP1024 7171 | Average of class Subnotebook | |
|---|---|---|---|---|---|---|---|---|
| AS SSD | -16% | -4% | 50% | 139% | 218% | 194% | 291% | |
| Seq Read (MB/s) | 1153 | 933 -19% | 974 -16% | 1387 20% | 1703 48% | 2328 102% | 2531 120% | 4491 ? 290% |
| Seq Write (MB/s) | 1367 | 1139 -17% | 1340 -2% | 504 -63% | 1373 0% | 1137 -17% | 2289 67% | 2933 ? 115% |
| 4K Read (MB/s) | 12.95 | 10.53 -19% | 11.35 -12% | 42.35 227% | 56.8 339% | 48.07 271% | 15.85 22% | 59 ? 356% |
| 4K Write (MB/s) | 24.52 | 15.03 -39% | 15.95 -35% | 120 389% | 164.4 570% | 120.6 392% | 39.88 63% | 165.1 ? 573% |
| 4K-64 Read (MB/s) | 665 | 534 -20% | 643 -3% | 497.4 -25% | 584 -12% | 899 35% | 1267 91% | 854 ? 28% |
| 4K-64 Write (MB/s) | 159.5 | 181.6 14% | 163 2% | 354.9 123% | 783 391% | 1220 665% | 1749 997% | 1694 ? 962% |
| Score Read (Points) | 793 | 638 -20% | 752 -5% | 678 -15% | 811 2% | 1180 49% | 1536 94% | 1360 ? 72% |
| Score Write (Points) | 321 | 311 -3% | 313 -2% | 525 64% | 1085 238% | 1455 353% | 2018 529% | 2153 ? 571% |
| Score Total (Points) | 1528 | 1283 -16% | 1465 -4% | 1520 -1% | 2313 51% | 3189 109% | 4317 183% | 4146 ? 171% |
| Copy ISO MB/s (MB/s) | 1433 | 1205 -16% | 1404 -2% | 764 -47% | 1401 -2% | 1995 39% | 2564 ? 79% | |
| Copy Program MB/s (MB/s) | 363 | 302.1 -17% | 406.9 12% | 256.1 -29% | 480.4 32% | 584 61% | 819 ? 126% | |
| Copy Game MB/s (MB/s) | 725 | 627 -14% | 850 17% | 368.4 -49% | 820 13% | 1135 57% | 1766 ? 144% |

GPU Performance – Ice-Lake-GPU with 64 Shaders
Intel's new Ice Lake processors are equipped with much faster integrated GPUs. The two quad-core models get the Iris Plus Graphics G7 with 64 EUs; the entry-level Core i3 only the 48 EU iGPU. Our synthetic benchmarks show almost twice the GPU performance compared to the previous MacBook Air and pretty much the same level of performance as the 2019 MacBook Pro 13 (2x TB3) and its Iris Plus Graphics 645. However, the performance is not steady, because the 3DMark stress test shows a performance drop of around 20%.
| Unigine Valley 1.0 - 1920x1080 Extreme HD Preset OpenGL AA:x8 | |
| Apple MacBook Pro 16 2019 i9 5500M | |
| Average of class Subnotebook (4.7 - 26.2, n=6, last 2 years) | |
| Apple MacBook Pro 13 2018 Touchbar i5 | |
| Apple MacBook Pro 13 2017 Touchbar i5 | |
| Apple MacBook Air 2020 i5 | |
| Average Intel Iris Plus Graphics G7 (Ice Lake 64 EU) (n=1) | |
| Basemark GPU 1.2 | |
| 3840x2160 Metal High Offscreen | |
| Apple iPad Pro 11 2020 | |
| Apple MacBook Pro 16 2019 i9 5500M | |
| Apple MacBook Air 2020 i5 | |
| Average Intel Iris Plus Graphics G7 (Ice Lake 64 EU) (n=1) | |
| 1920x1080 Metal Medium Offscreen | |
| Apple MacBook Pro 16 2019 i9 5500M | |
| Apple iPad Pro 11 2018 | |
| Apple iPad Pro 11 2020 | |
| Apple MacBook Air 2020 i5 | |
| Average Intel Iris Plus Graphics G7 (Ice Lake 64 EU) (n=1) | |
| 3DMark 06 Standard Score | 8821 points | |
| 3DMark 11 Performance | 2848 points | |
| 3DMark Fire Strike Score | 1605 points | |
| 3DMark Time Spy Score | 587 points | |
Help | ||
Gaming Performance
The gaming performance is definitely limited by the CPU or more precisely the low TDP configuration. The iGPU itself is pretty powerful, but you are still limited to the lowest details, even when you want to play older titles. However, there is still the problem with the reduced performance after a little while, which is also evident in our Witcher 3 loop (in this case with the Min preset). The MacBook Air starts with strong 40 fps, but then quickly drops to just ~20 fps, so it is not playable smoothly anymore.
| The Witcher 3 - 1024x768 Low Graphics & Postprocessing | |
| Average of class Subnotebook (38.8 - 176, n=13, last 2 years) | |
| Microsoft Surface Laptop 3 13 Core i5-1035G7 | |
| Average Intel Iris Plus Graphics G7 (Ice Lake 64 EU) (28.2 - 58, n=20) | |
| Apple MacBook Air 2020 i5 | |
| Shadow of the Tomb Raider - 1280x720 Lowest Preset | |
| Average of class Subnotebook (41 - 109, n=7, last 2 years) | |
| Average Intel Iris Plus Graphics G7 (Ice Lake 64 EU) (15.6 - 33, n=13) | |
| Microsoft Surface Laptop 3 13 Core i5-1035G7 | |
| Apple MacBook Air 2020 i5 | |
| low | med. | high | ultra | |
|---|---|---|---|---|
| BioShock Infinite (2013) | 55.6 | 33.5 | 29.1 | 10.9 |
| GTA V (2015) | 24.8 | |||
| The Witcher 3 (2015) | 28.2 | 5.13 | ||
| Dota 2 Reborn (2015) | 59.4 | 30.7 | 20.5 | 19.8 |
| Rocket League (2017) | 22.1 | 24.9 | ||
| X-Plane 11.11 (2018) | 24 | 11.6 | 10.8 | |
| World of Tanks enCore (2018) | 92.9 | 14.6 | ||
| Far Cry 5 (2018) | 11 | |||
| Shadow of the Tomb Raider (2018) | 15.6 | |||
| Battlefield V (2018) | 7.87 | |||
| Anno 1800 (2019) | 19 | |||
| FIFA 20 (2019) | 0 game wont start |
Our tests with macOS confirm the results from our Windows benchmarks. Even the quad-core SKU we are reviewing cannot offer decent gaming performance due to the poor cooling performance and the low TDP limits for sustained workloads. Fortnite, Counterstrike GO and Dota 2 suffered from annoying stutters, even though the system requirements are not very high. Fortnite was hardly playable at all, the other two games only with limitations. League of Legends ran well at the lowest settings and the very undemanding Hearthstone provided the best gaming experience. It either ran at the native resolution in combination with medium details or maximum details and 1440 x 900 pixels.
Emissions – The MacBook Air is just too loud
System Noise
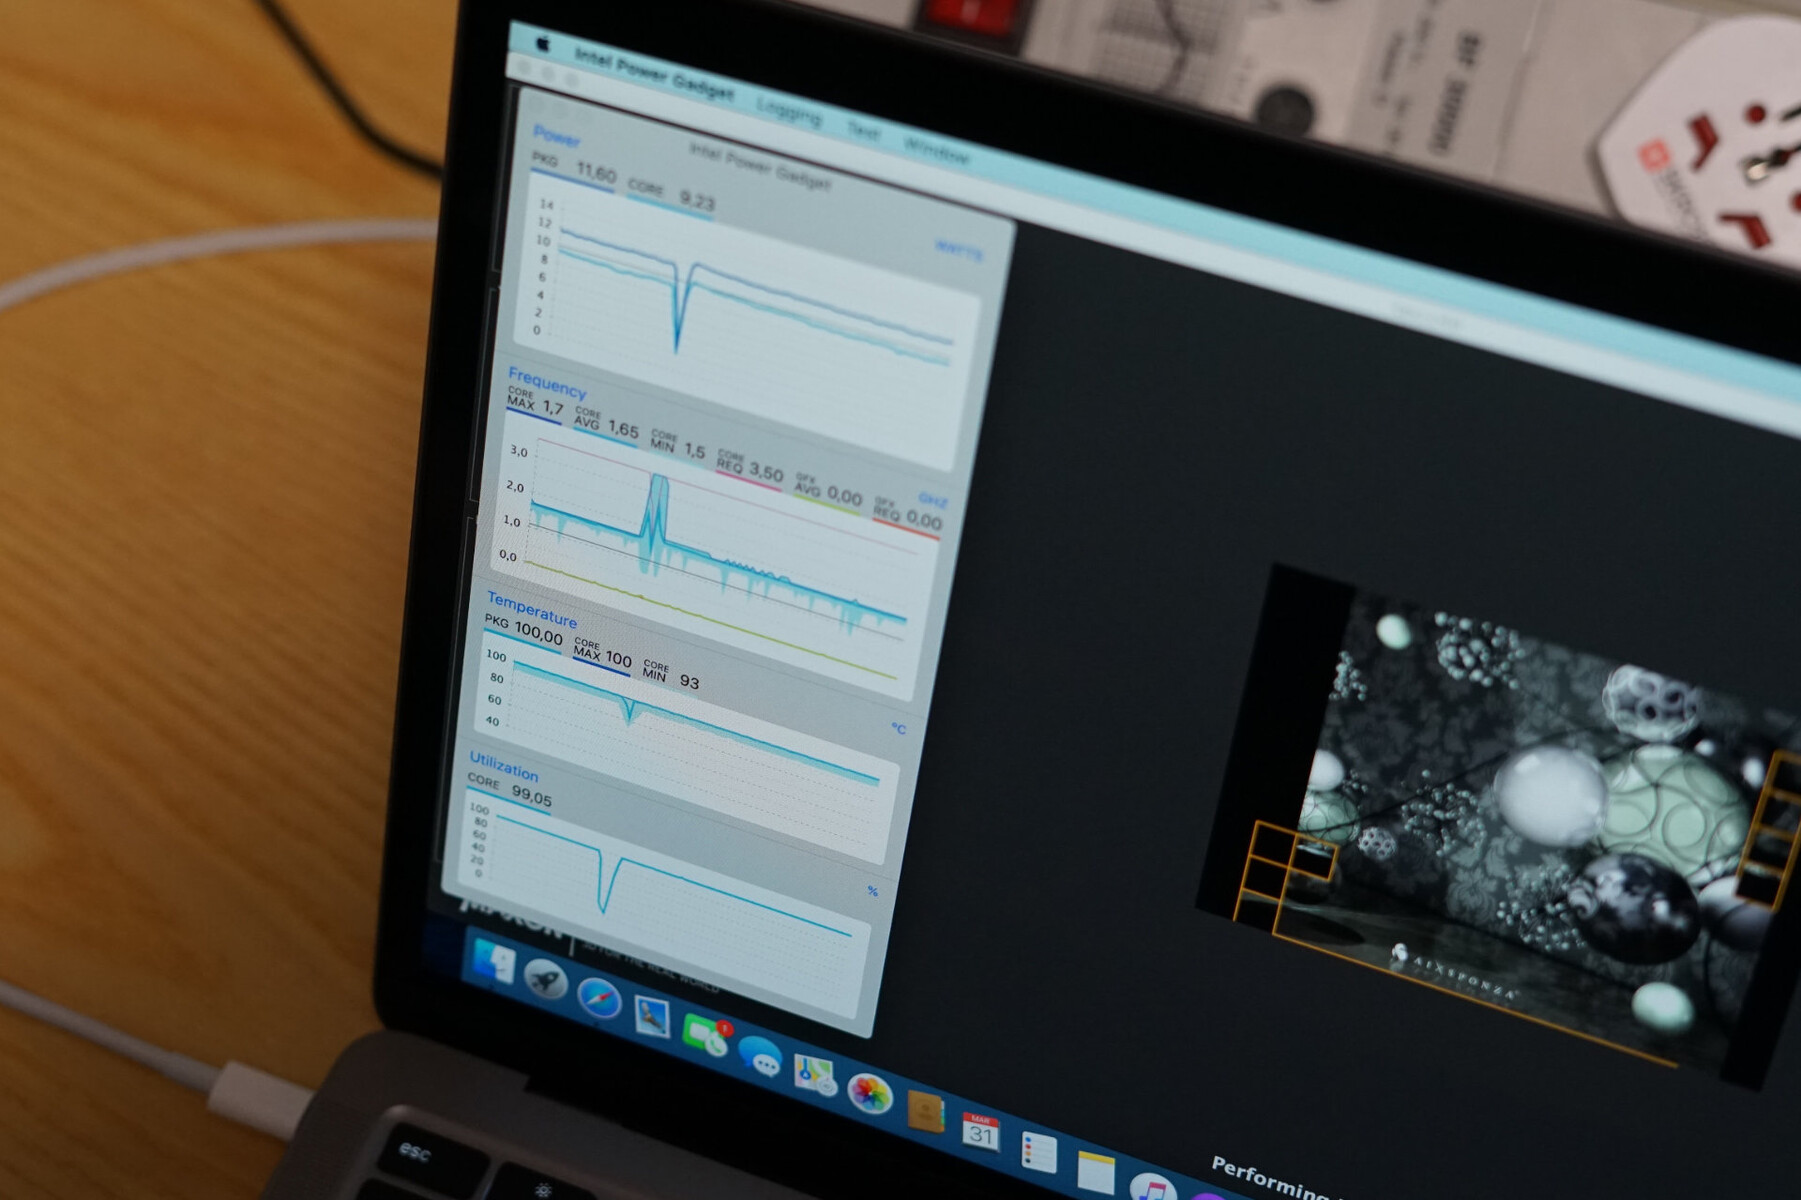
The basic cooling system has not changed, which means the processor of the MacBook Air is still cooled passively. There is a small fan inside the chassis, but there is no direct connection with the heat sink from the processor. The only task of the fan is to improve the air circulation inside the chassis. The new quad-core Core i5 processor, however, produces much more heat than the old dual-core, and the slightly larger heat sink does not really help, either. Compared to the previous model, this means the fan is running more often and it also gets louder. We are not only talking about extreme load scenarios, but daily stuff, like the installation of applications or OS updates. At more than 40 dB(A), the small fan is clearly audible under sustained workloads.
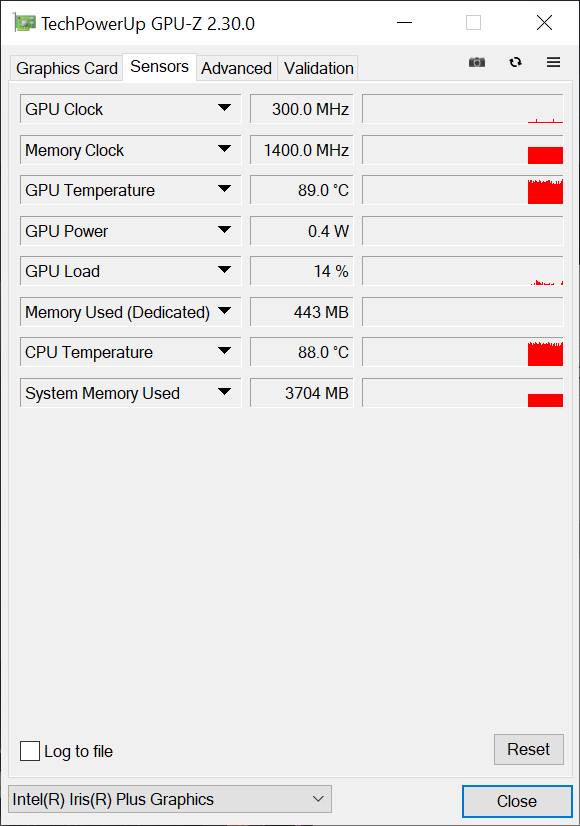
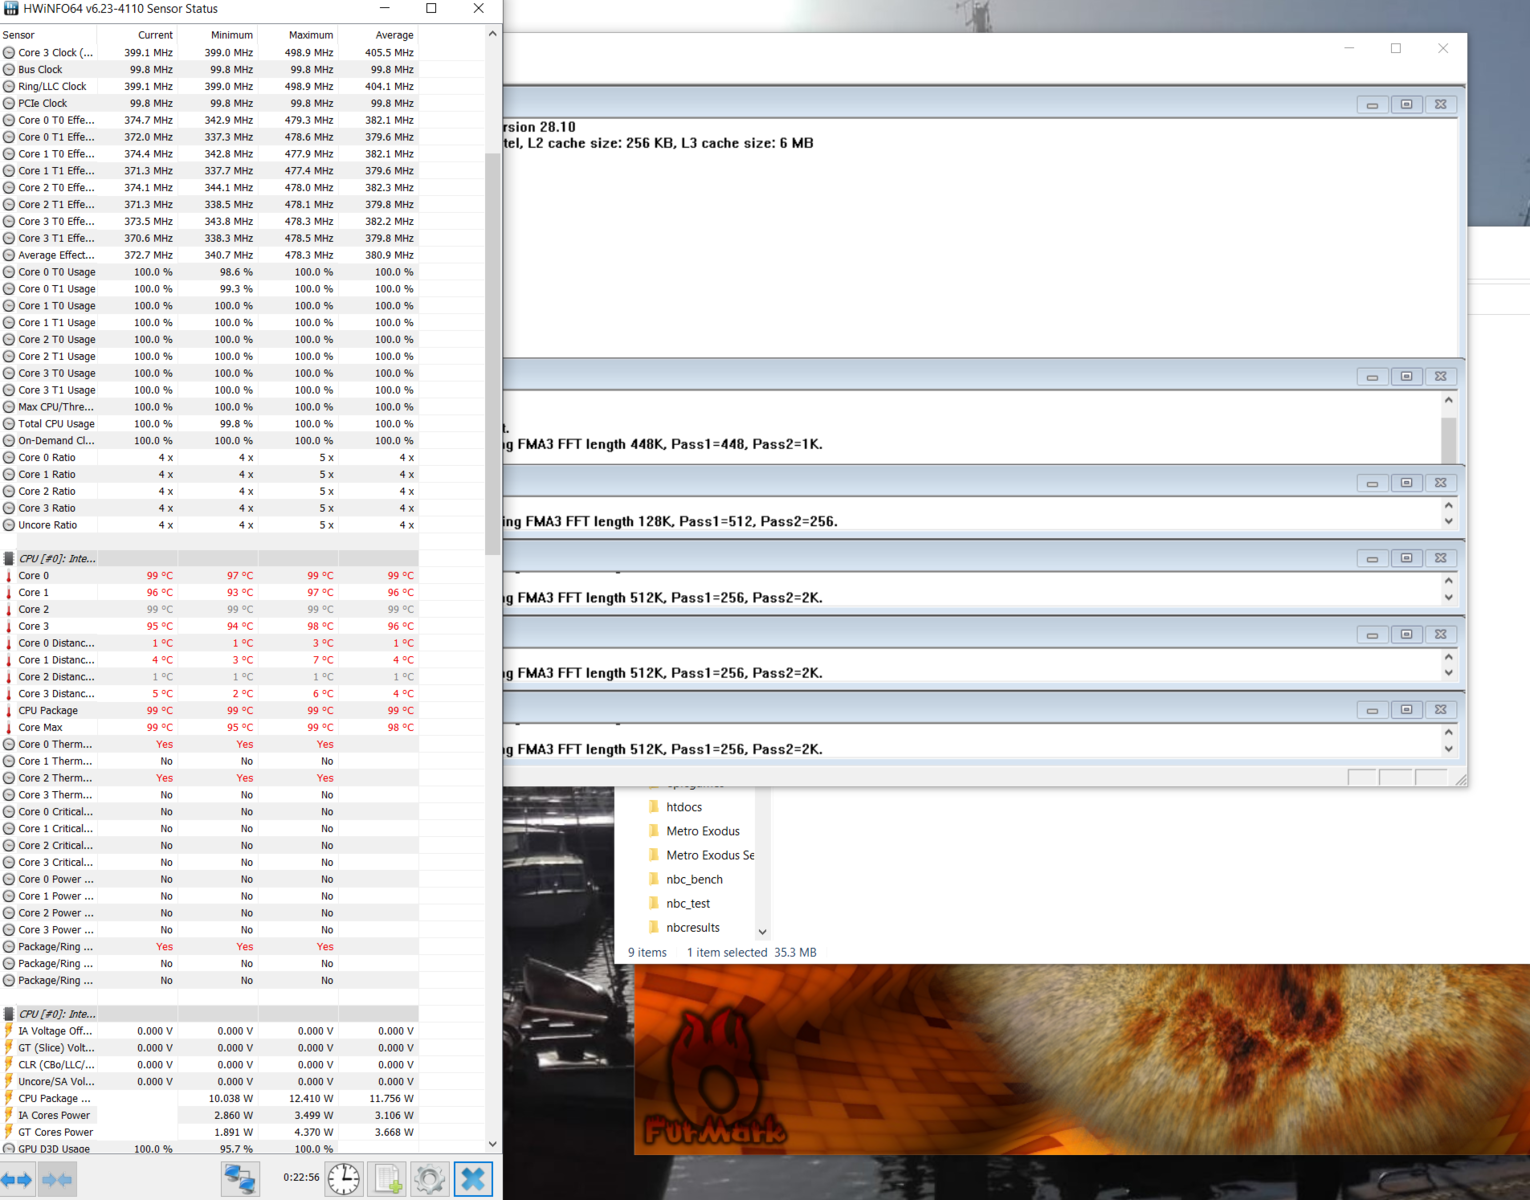
However, the MacBook Air is usually silent while idling or light workloads like web browsing with a few tabs. We usually saw around 2700 rpm with an external monitor and light multi-tasking (e.g. YouTube video and web browsing), where the notebook is still not audible from a normal working distance. Even light picture editing via Affinity Photo (JPG) is possible without activity of the fan. When you start to stress the processor or even the graphics card though, the fan will speed up to its maximum 8100 rpm and loud 45.8 dB(A) within a couple of minutes. In addition to a comparatively slow device, you also have to live with a loud device and a chip temperature of 100 °C (212 °F).
Noise level
| Idle |
| 30 / 30 / 30 dB(A) |
| Load |
| 45.5 / 45.8 dB(A) |
 | ||
30 dB silent 40 dB(A) audible 50 dB(A) loud |
||
min: | ||
| Apple MacBook Air 2020 i5 Iris Plus Graphics G7 (Ice Lake 64 EU), i5-1030NG7, Apple SSD AP0512 | Apple Macbook Air 2019 UHD Graphics 617, i5-8210Y, Apple SSD AP0256 | Apple MacBook Pro 13 2019 2TB3 Iris Plus Graphics 645, i5-8257U, Apple SSD AP0256 | Microsoft Surface Laptop 3 13 Core i5-1035G7 Iris Plus Graphics G7 (Ice Lake 64 EU), i5-1035G7, SK hynix BC501 HFM256GDGTNG | Acer Swift 3 SF313-52-71Y7 Iris Plus Graphics G7 (Ice Lake 64 EU), i7-1065G7, Intel SSD 660p 1TB SSDPEKNW010T8 | Dell XPS 13 9300 i5 FHD UHD Graphics G1 (Ice Lake 32 EU), i5-1035G1, Toshiba XG6 KXG60ZNV512G | |
|---|---|---|---|---|---|---|
| Noise | 7% | 9% | 12% | 9% | 12% | |
| off / environment * (dB) | 30 | 29.5 2% | 29.5 2% | 28.5 5% | 30.3 -1% | 29.3 2% |
| Idle Minimum * (dB) | 30 | 29.5 2% | 29.5 2% | 28.5 5% | 30.3 -1% | 29.3 2% |
| Idle Average * (dB) | 30 | 29.5 2% | 29.5 2% | 28.5 5% | 30.3 -1% | 29.3 2% |
| Idle Maximum * (dB) | 30 | 29.5 2% | 29.5 2% | 28.5 5% | 30.3 -1% | 29.3 2% |
| Load Average * (dB) | 45.5 | 34 25% | 31.1 32% | 28.5 37% | 31.7 30% | 30 34% |
| Load Maximum * (dB) | 45.8 | 41 10% | 39.3 14% | 40.4 12% | 32.7 29% | 32.4 29% |
| Witcher 3 ultra * (dB) | 40.4 |
* ... smaller is better
Temperature
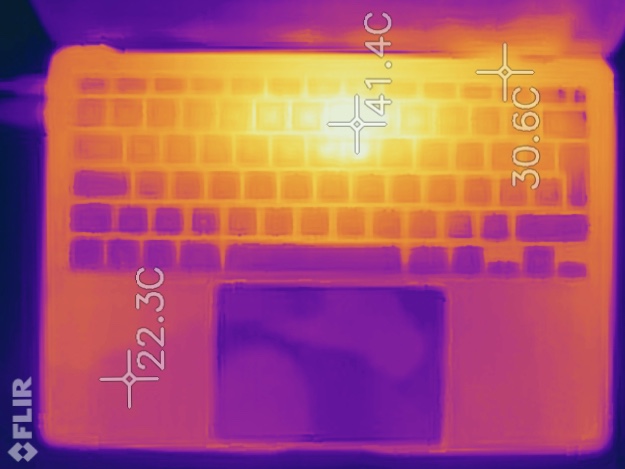
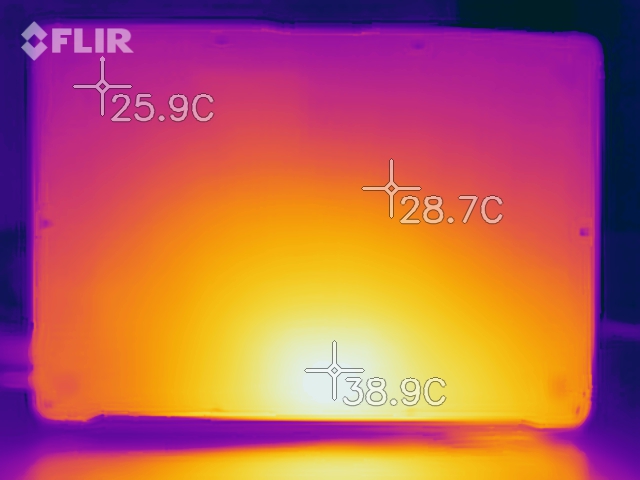
Contrary to the internal temperatures, the external temperatures of the aluminum chassis are completely okay. Even after one hour of extreme load, we can only measure up to 42 °C (107.6 °F) at the top of the base unit. The chassis stays comfortably cool while idling or during light workloads and the hotspot is in the upper part of the chassis, so the palm rests are never too warm.
(-) The maximum temperature on the upper side is 48 °C / 118 F, compared to the average of 35.9 °C / 97 F, ranging from 21.4 to 59 °C for the class Subnotebook.
(±) The bottom heats up to a maximum of 40 °C / 104 F, compared to the average of 39.2 °C / 103 F
(+) In idle usage, the average temperature for the upper side is 27.7 °C / 82 F, compared to the device average of 30.8 °C / 87 F.
(±) Playing The Witcher 3, the average temperature for the upper side is 32.8 °C / 91 F, compared to the device average of 30.8 °C / 87 F.
(+) The palmrests and touchpad are cooler than skin temperature with a maximum of 29 °C / 84.2 F and are therefore cool to the touch.
(±) The average temperature of the palmrest area of similar devices was 28.2 °C / 82.8 F (-0.8 °C / -1.4 F).
The internal temperatures are a different story. The CPU and therefore also the integrated graphics adapter quickly reach 100 °C (212 °F), even during short peak load. This is not a great indicator for the durability. Apple just implemented a weak cooling system to keep the distance to the Pro models under sustained workloads.
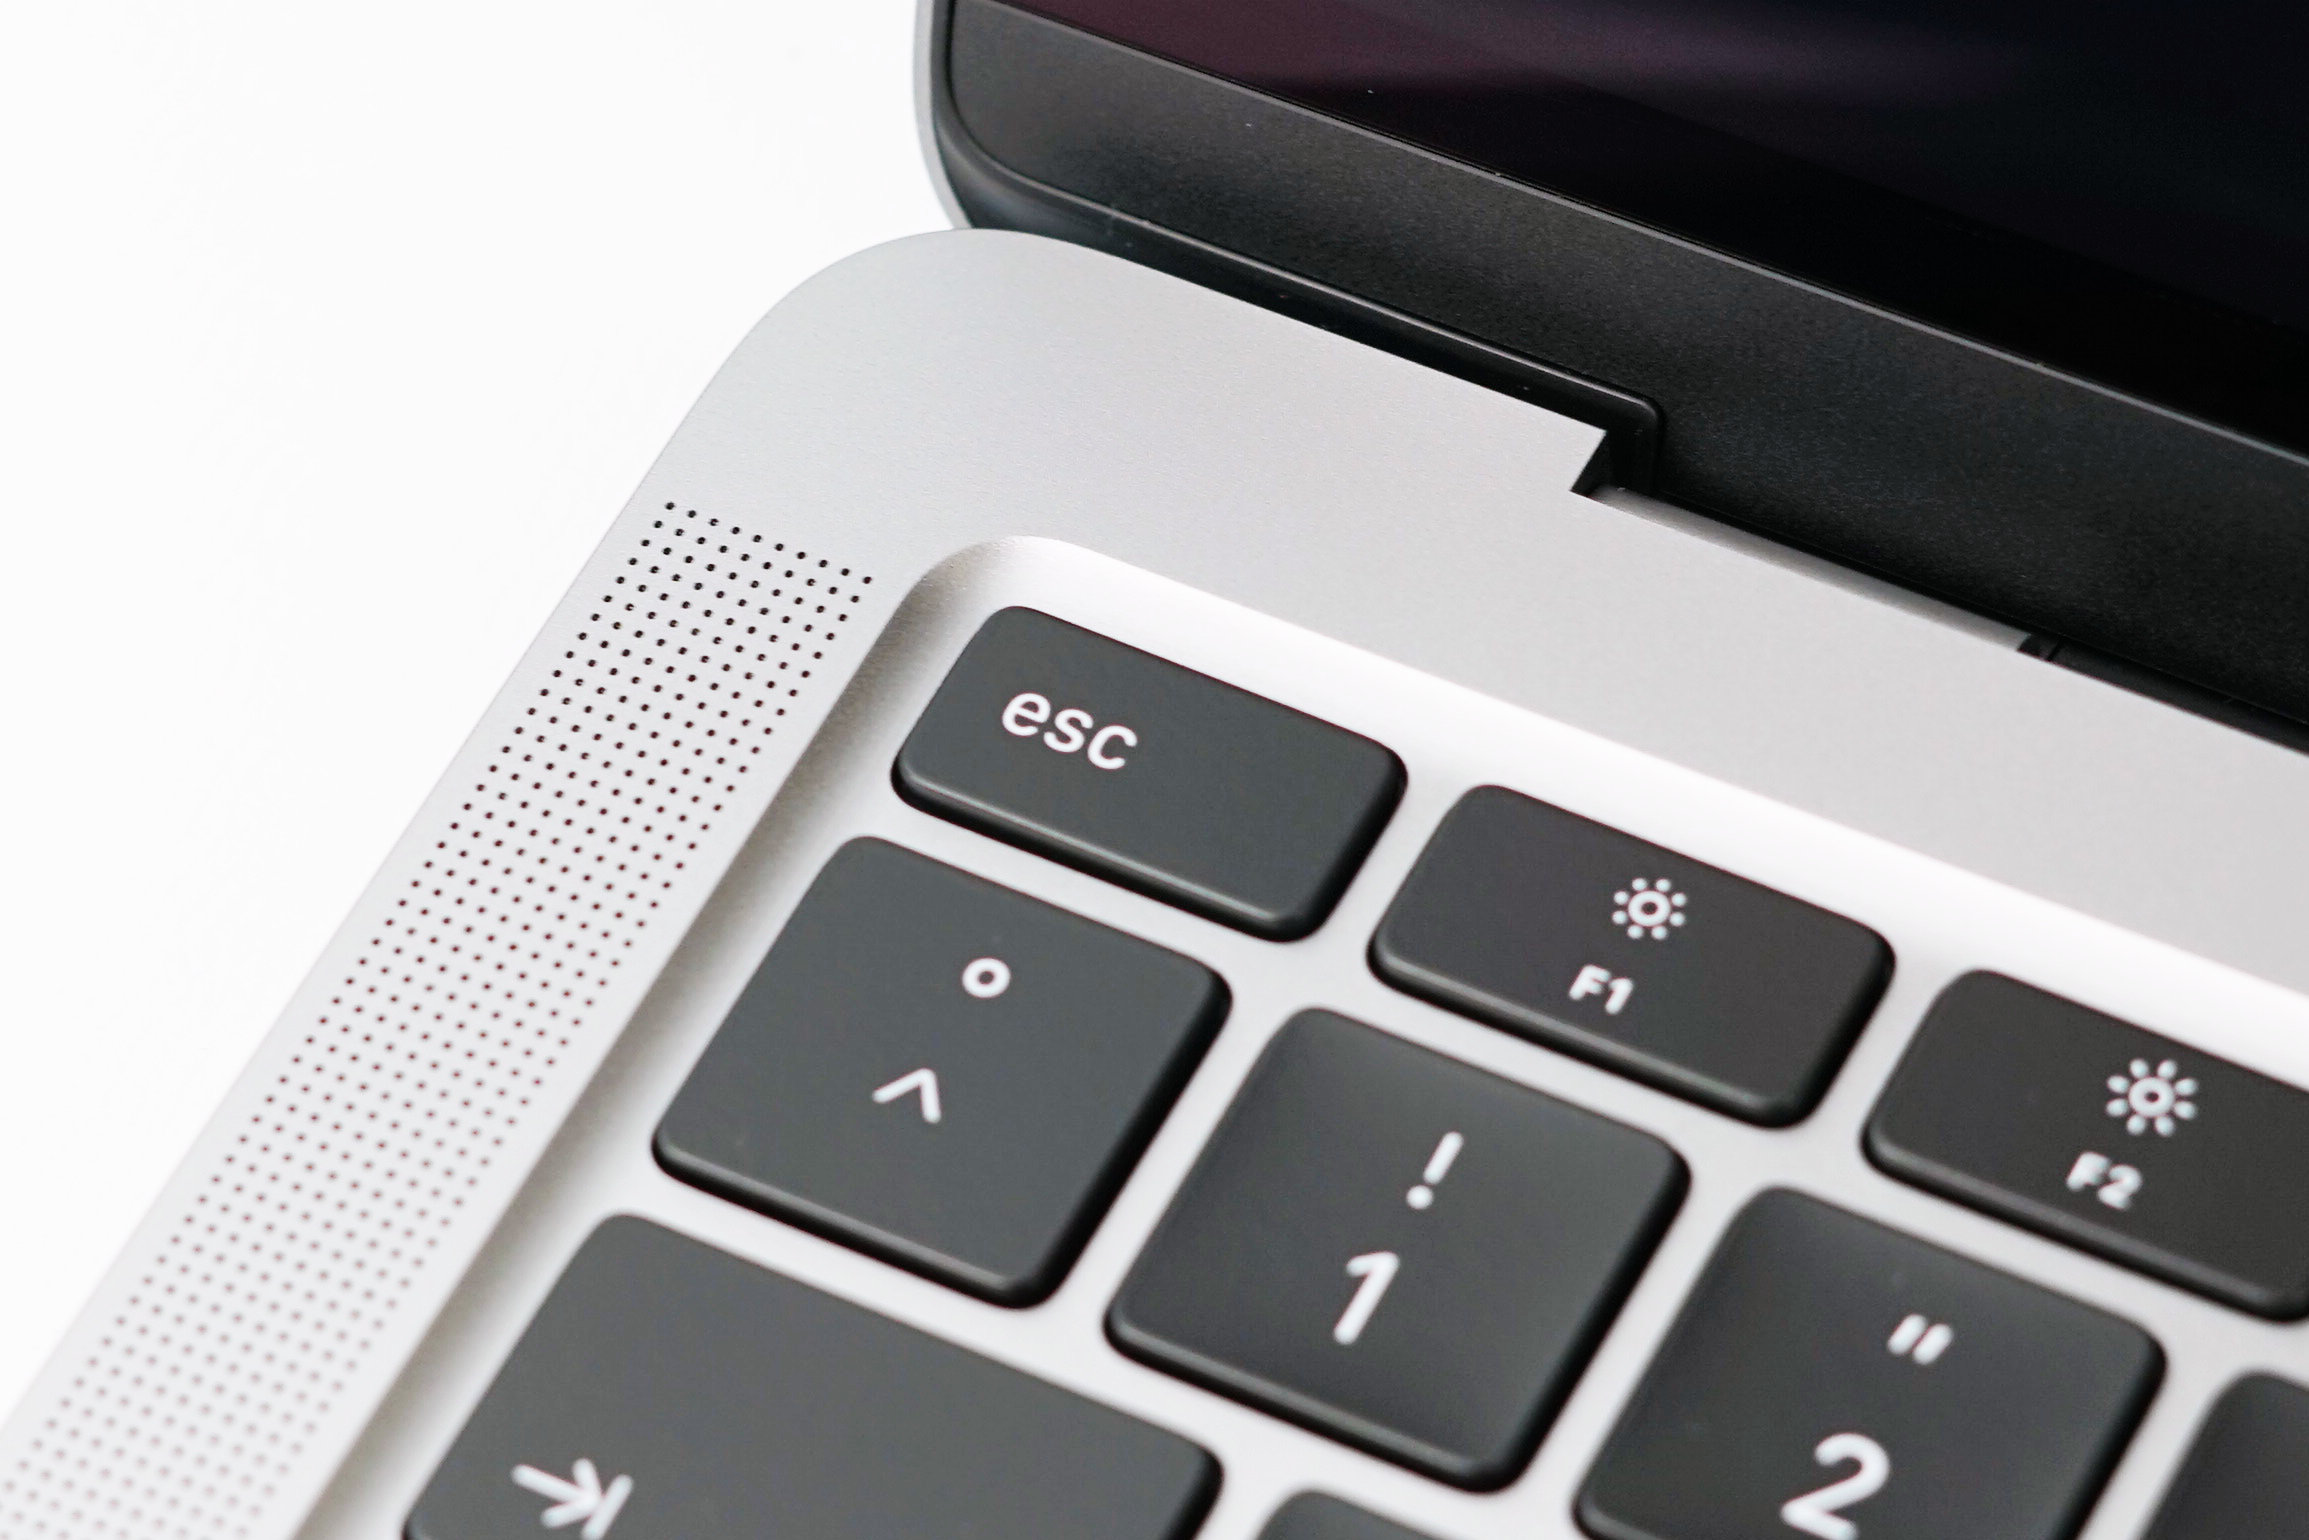
Speakers
Apple also improved the stereo speakers of the 2020 MacBook Air. It looks like the manufacturer uses the slightly thicker chassis of the notebook for better speaker modules. The frequency diagram shows a much more linear curve across the audible frequencies very similar to the Surface Laptop 3. The Dell XPS 13 and typical notebooks are clearly beaten, but the current MacBook Pro 16 is still the best laptop in terms of notebook speakers.
Apple MacBook Air 2020 i5 audio analysis
(±) | speaker loudness is average but good (78.1 dB)
Bass 100 - 315 Hz
(+) | good bass - only 4.3% away from median
(±) | linearity of bass is average (11.5% delta to prev. frequency)
Mids 400 - 2000 Hz
(+) | balanced mids - only 3.4% away from median
(+) | mids are linear (6.2% delta to prev. frequency)
Highs 2 - 16 kHz
(+) | balanced highs - only 2% away from median
(+) | highs are linear (3.7% delta to prev. frequency)
Overall 100 - 16.000 Hz
(+) | overall sound is linear (9.9% difference to median)
Compared to same class
» 7% of all tested devices in this class were better, 1% similar, 92% worse
» The best had a delta of 5%, average was 18%, worst was 53%
Compared to all devices tested
» 4% of all tested devices were better, 1% similar, 95% worse
» The best had a delta of 4%, average was 23%, worst was 134%
Apple Macbook Air 2019 audio analysis
(±) | speaker loudness is average but good (75.8 dB)
Bass 100 - 315 Hz
(±) | reduced bass - on average 8.9% lower than median
(±) | linearity of bass is average (11.6% delta to prev. frequency)
Mids 400 - 2000 Hz
(+) | balanced mids - only 3% away from median
(+) | mids are linear (5.1% delta to prev. frequency)
Highs 2 - 16 kHz
(+) | balanced highs - only 2.9% away from median
(+) | highs are linear (4.7% delta to prev. frequency)
Overall 100 - 16.000 Hz
(+) | overall sound is linear (14.3% difference to median)
Compared to same class
» 28% of all tested devices in this class were better, 6% similar, 66% worse
» The best had a delta of 5%, average was 18%, worst was 53%
Compared to all devices tested
» 17% of all tested devices were better, 4% similar, 78% worse
» The best had a delta of 4%, average was 23%, worst was 134%
Apple MacBook Pro 16 2019 i9 5500M audio analysis
(+) | speakers can play relatively loud (82.3 dB)
Bass 100 - 315 Hz
(+) | good bass - only 2.3% away from median
(+) | bass is linear (5% delta to prev. frequency)
Mids 400 - 2000 Hz
(+) | balanced mids - only 2.7% away from median
(+) | mids are linear (3.4% delta to prev. frequency)
Highs 2 - 16 kHz
(+) | balanced highs - only 2.1% away from median
(+) | highs are linear (2.6% delta to prev. frequency)
Overall 100 - 16.000 Hz
(+) | overall sound is linear (6.9% difference to median)
Compared to same class
» 5% of all tested devices in this class were better, 1% similar, 94% worse
» The best had a delta of 5%, average was 17%, worst was 45%
Compared to all devices tested
» 1% of all tested devices were better, 0% similar, 99% worse
» The best had a delta of 4%, average was 23%, worst was 134%
Microsoft Surface Laptop 3 13 Core i5-1035G7 audio analysis
(±) | speaker loudness is average but good (79 dB)
Bass 100 - 315 Hz
(+) | good bass - only 4.2% away from median
(±) | linearity of bass is average (10.5% delta to prev. frequency)
Mids 400 - 2000 Hz
(+) | balanced mids - only 3.6% away from median
(±) | linearity of mids is average (7.1% delta to prev. frequency)
Highs 2 - 16 kHz
(+) | balanced highs - only 1.8% away from median
(+) | highs are linear (6.5% delta to prev. frequency)
Overall 100 - 16.000 Hz
(+) | overall sound is linear (11.4% difference to median)
Compared to same class
» 3% of all tested devices in this class were better, 2% similar, 95% worse
» The best had a delta of 7%, average was 21%, worst was 53%
Compared to all devices tested
» 7% of all tested devices were better, 2% similar, 90% worse
» The best had a delta of 4%, average was 23%, worst was 134%
Dell XPS 13 9300 i5 FHD audio analysis
(±) | speaker loudness is average but good (78.4 dB)
Bass 100 - 315 Hz
(±) | reduced bass - on average 9.4% lower than median
(±) | linearity of bass is average (12.5% delta to prev. frequency)
Mids 400 - 2000 Hz
(±) | higher mids - on average 6.7% higher than median
(+) | mids are linear (5.6% delta to prev. frequency)
Highs 2 - 16 kHz
(+) | balanced highs - only 4% away from median
(+) | highs are linear (5% delta to prev. frequency)
Overall 100 - 16.000 Hz
(±) | linearity of overall sound is average (19.8% difference to median)
Compared to same class
» 63% of all tested devices in this class were better, 7% similar, 31% worse
» The best had a delta of 5%, average was 18%, worst was 53%
Compared to all devices tested
» 50% of all tested devices were better, 7% similar, 42% worse
» The best had a delta of 4%, average was 23%, worst was 134%
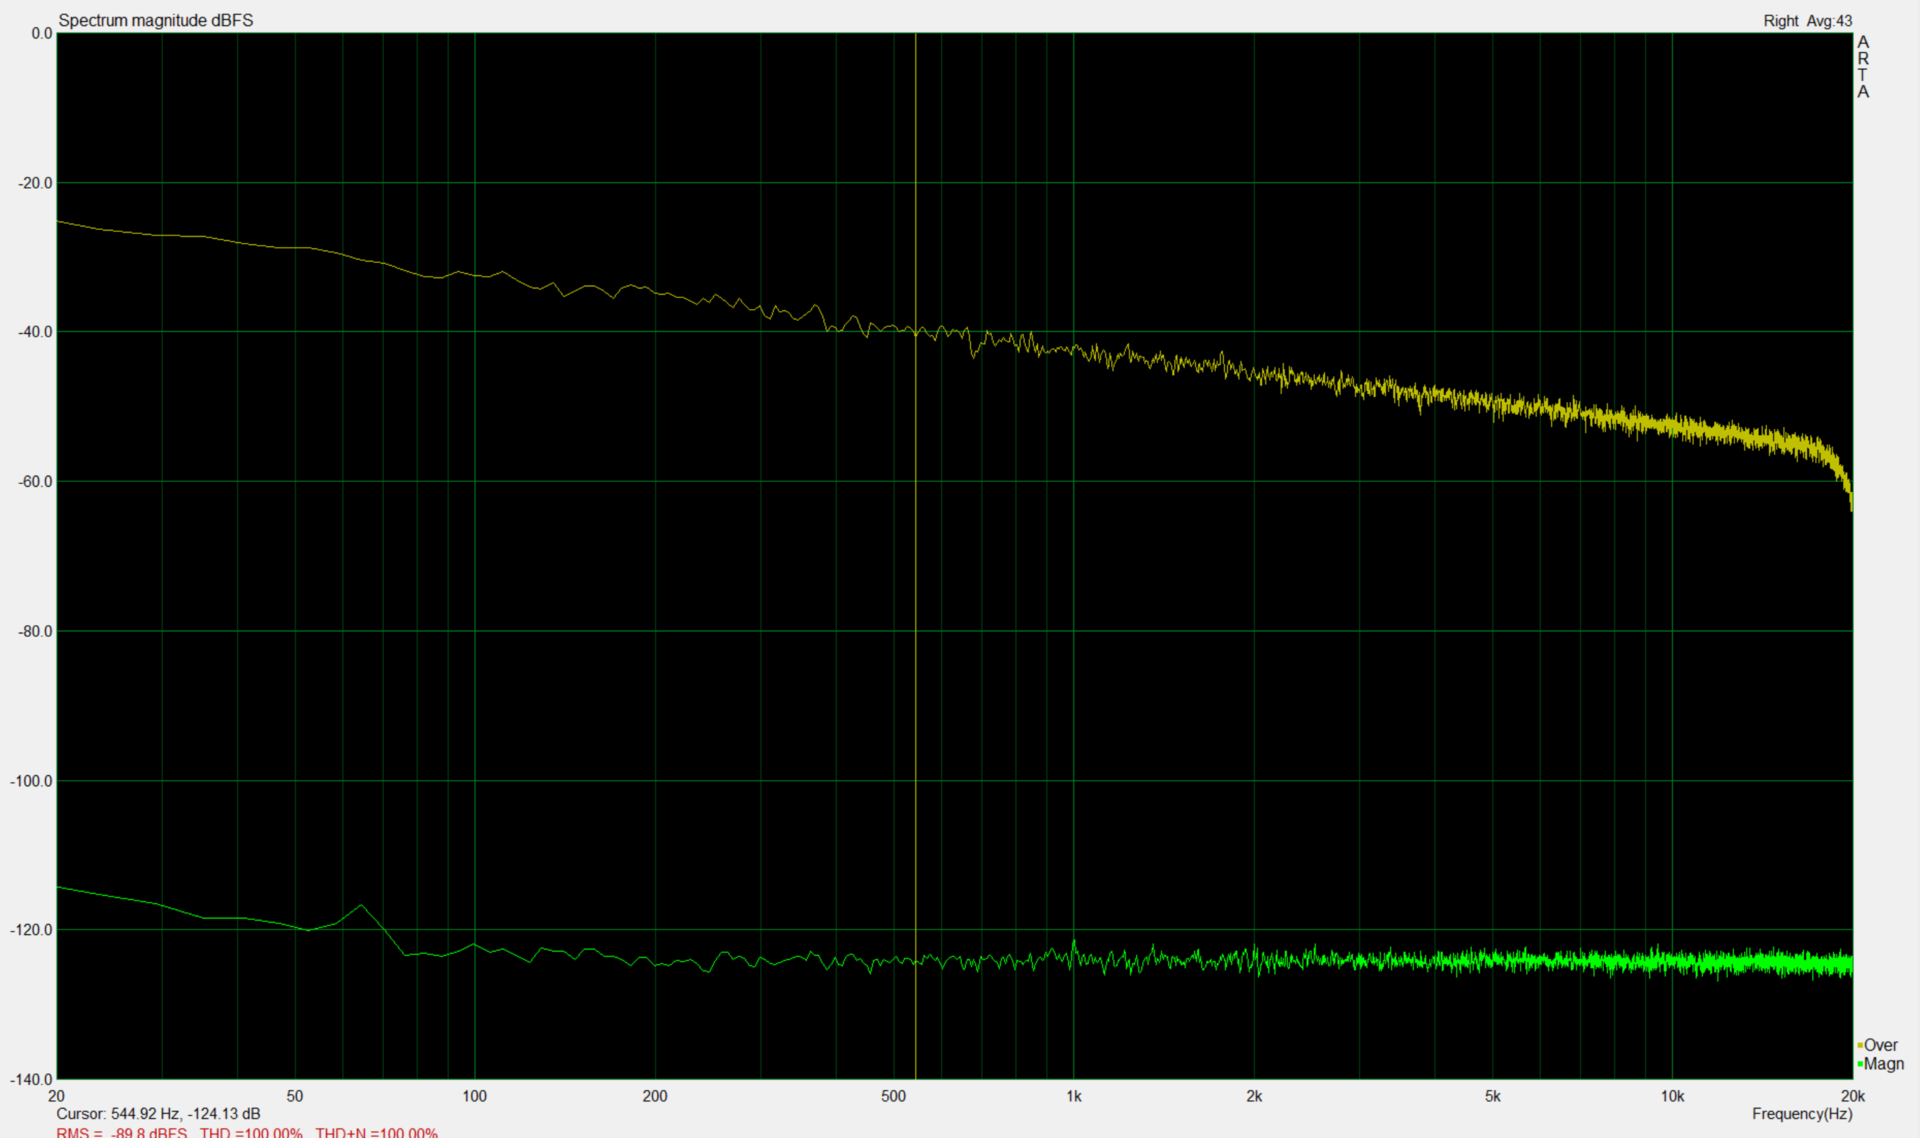
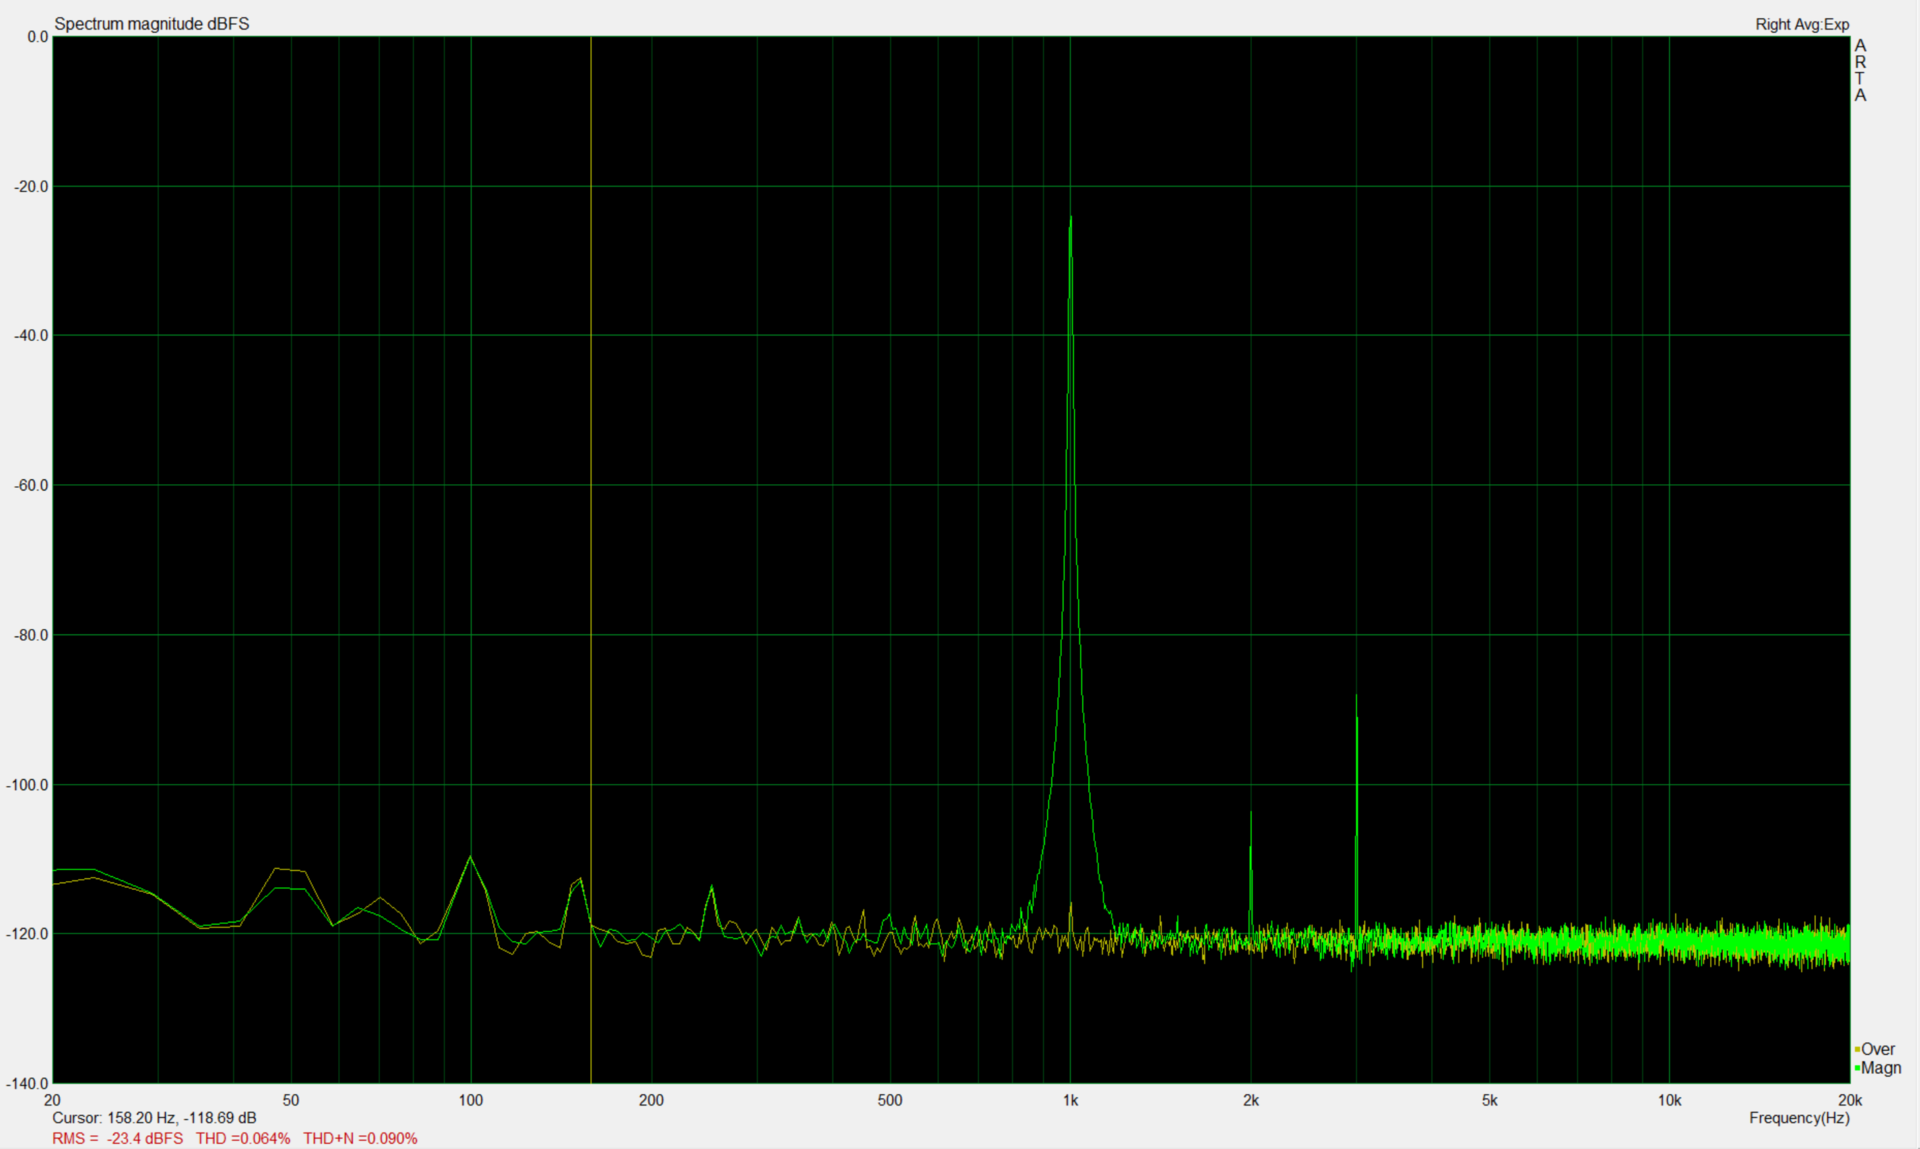
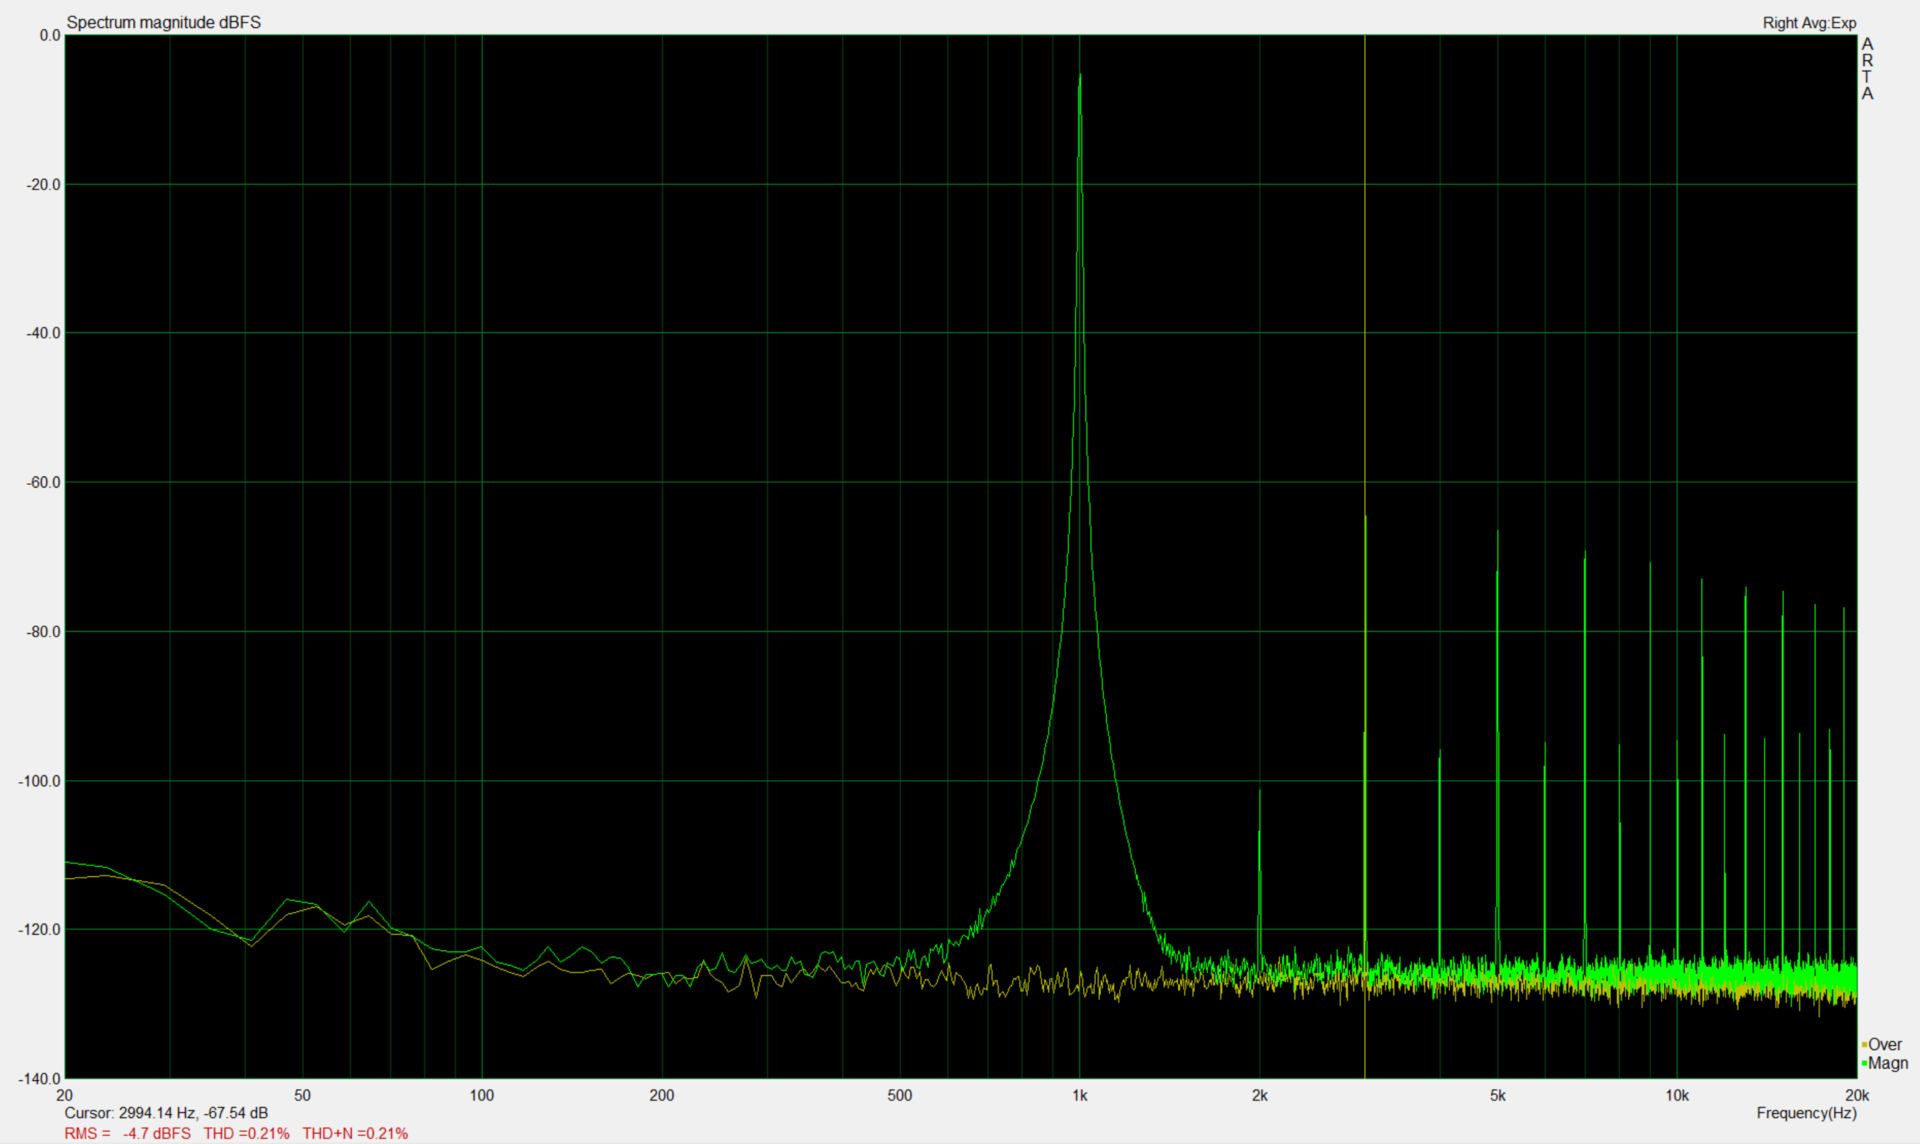
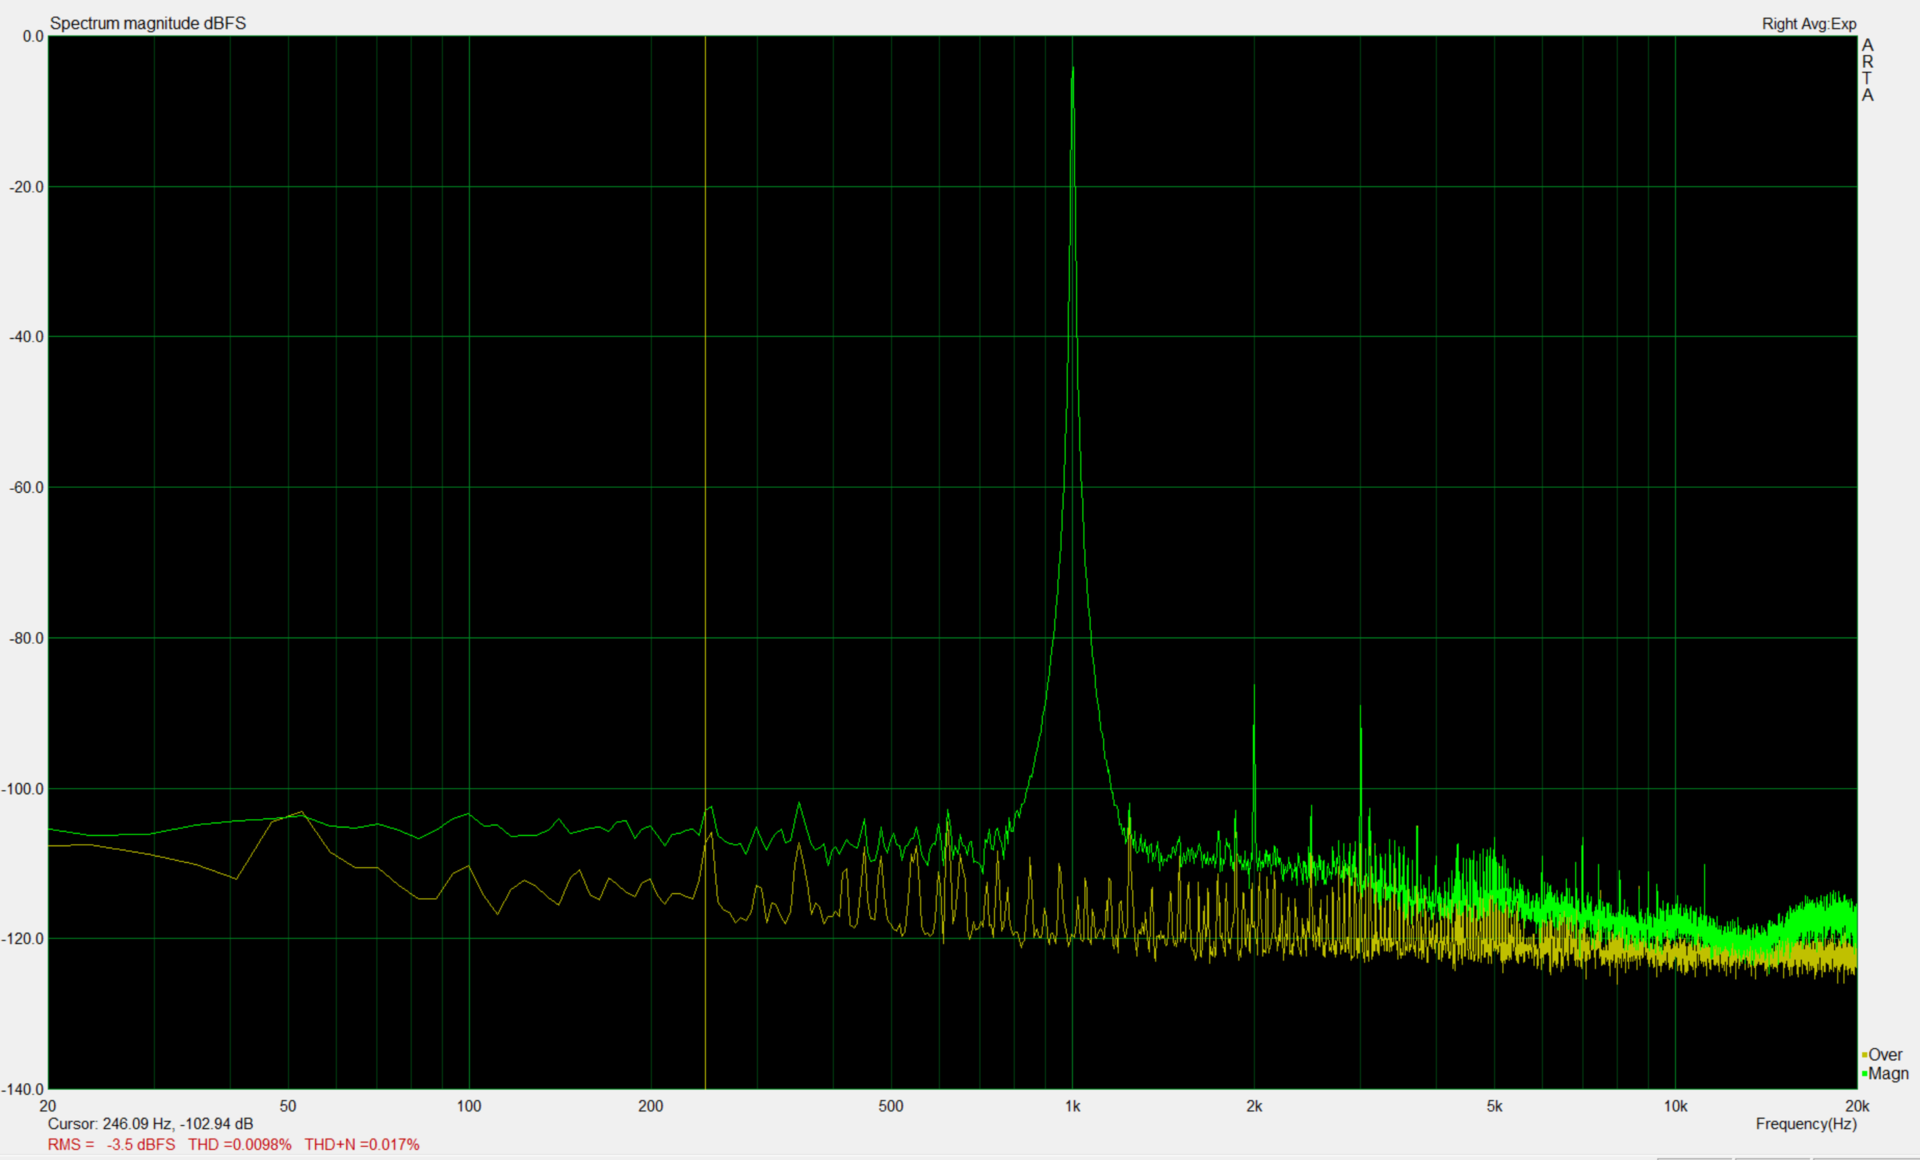
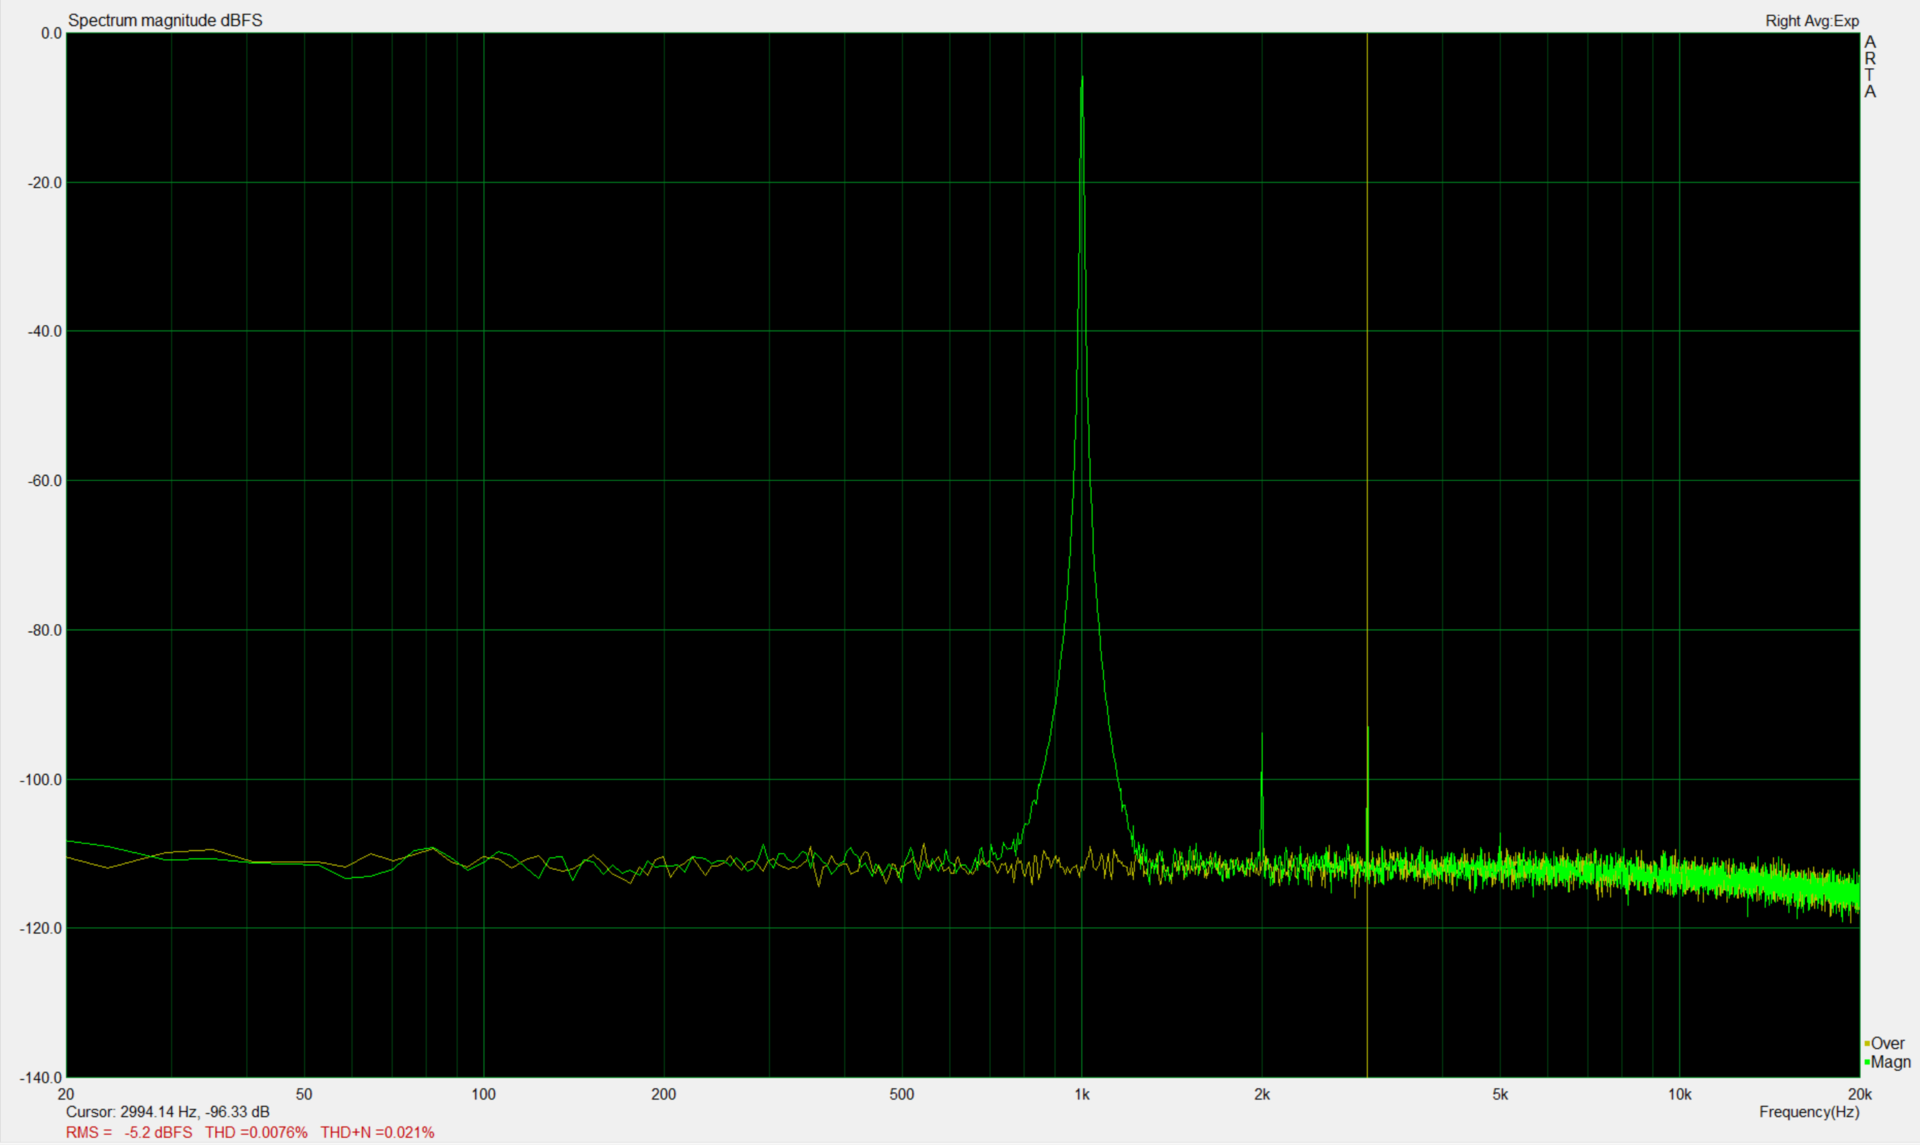
We are less convinced by the integrated headset port. Our measurements with the external sound card Steinberg UR22 do not show a very good SNR (signal to noise ratio). Audiophile users will not be happy with the Air, but casual users should not notice any problems with the quality.
Energy Management
Power Consumption
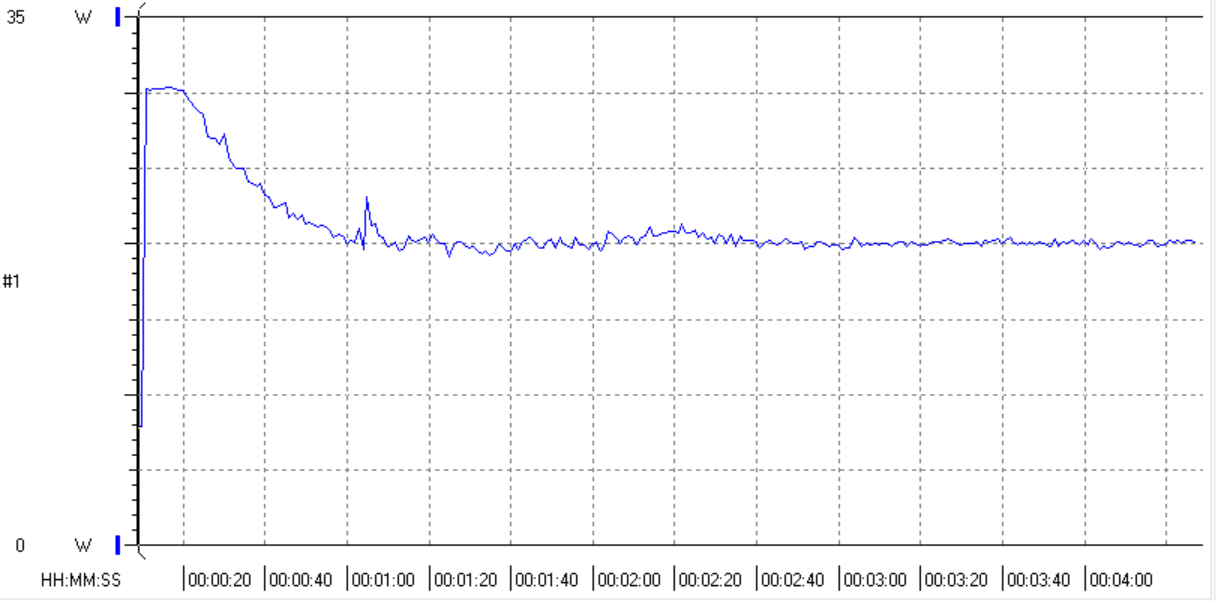
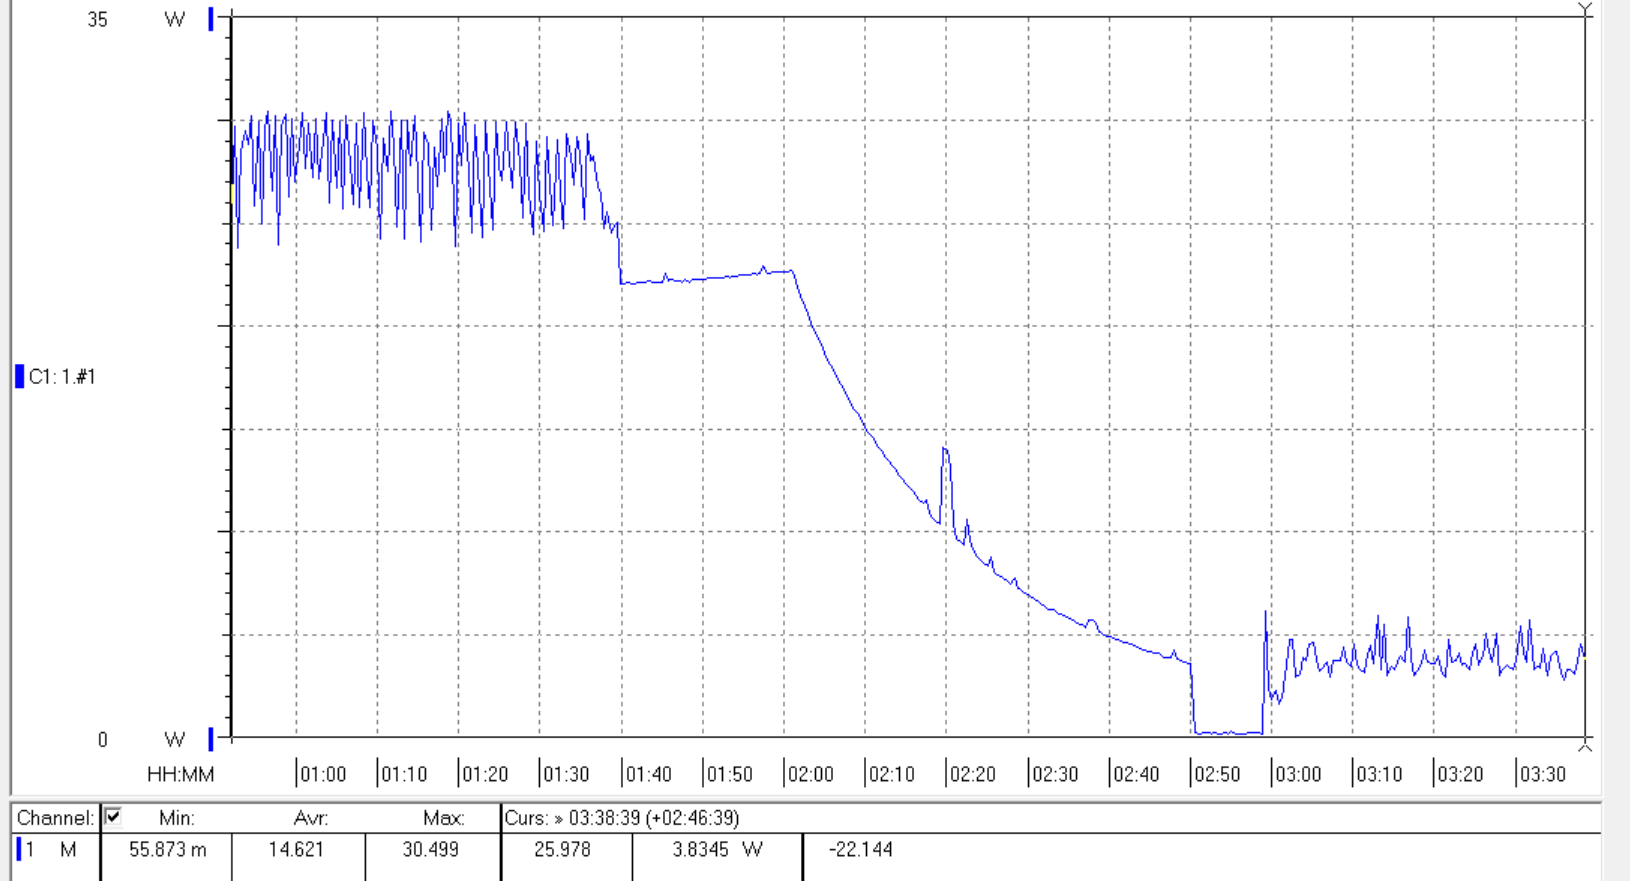
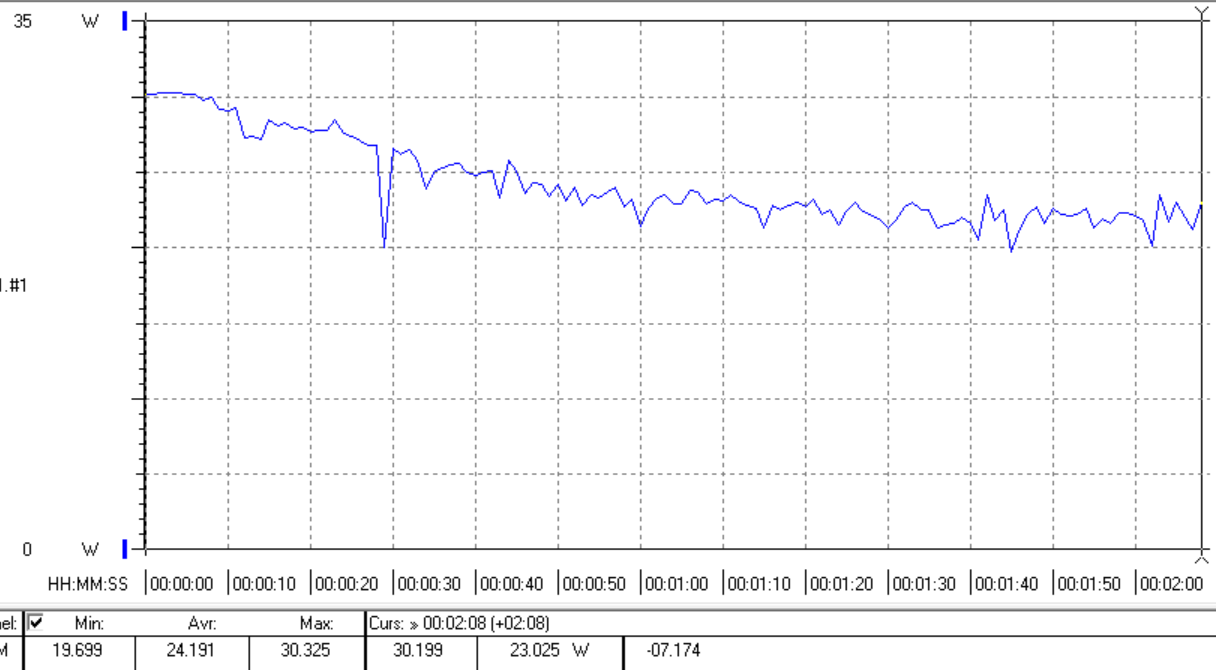
Despite the addition of the quad-core processor, we can see very similar consumption values compared to the 2019 model. Here we can see that the TDP configuration dictates the power consumption under load, not the CPU itself. The Air is very efficient compared to more powerful rivals like the XPS 13 or the class average, only the Acer Swift 3 is even more efficient.
The idle consumption for Windows 10 (Bootcamp) is surprisingly high. The MacBook Air consumes much more power compared to macOS, so you should expect significantly shorter battery runtimes. For example: We measure idle values between 7 and 12.8 W (min - max).
| Off / Standby | |
| Idle | |
| Load |
|
Key:
min: | |
| Apple MacBook Air 2020 i5 i5-1030NG7, Iris Plus Graphics G7 (Ice Lake 64 EU), Apple SSD AP0512, IPS, 2560x1600, 13.3" | Apple MacBook Air 2018 i5-8210Y, UHD Graphics 617, Apple SSD AP0256, IPS, 2560x1600, 13.3" | Apple MacBook Pro 13 2019 2TB3 i5-8257U, Iris Plus Graphics 645, Apple SSD AP0256, IPS, 2560x1600, 13.3" | Microsoft Surface Laptop 3 13 Core i5-1035G7 i5-1035G7, Iris Plus Graphics G7 (Ice Lake 64 EU), SK hynix BC501 HFM256GDGTNG, IPS, 2256x1504, 13.5" | Acer Swift 3 SF313-52-71Y7 i7-1065G7, Iris Plus Graphics G7 (Ice Lake 64 EU), Intel SSD 660p 1TB SSDPEKNW010T8, IPS, 2256x1504, 13.5" | Dell XPS 13 9300 i5 FHD i5-1035G1, UHD Graphics G1 (Ice Lake 32 EU), Toshiba XG6 KXG60ZNV512G, IPS, 1920x1200, 13.4" | Average Intel Iris Plus Graphics G7 (Ice Lake 64 EU) | Average of class Subnotebook | |
|---|---|---|---|---|---|---|---|---|
| Power Consumption | 5% | -28% | -51% | 21% | -26% | -35% | -41% | |
| Idle Minimum * (Watt) | 2.4 | 2.2 8% | 2.1 12% | 4.4 -83% | 1.8 25% | 3.4 -42% | 3.91 ? -63% | 3.76 ? -57% |
| Idle Average * (Watt) | 6.8 | 5.7 16% | 6.9 -1% | 7.5 -10% | 4.6 32% | 6 12% | 7.33 ? -8% | 6.54 ? 4% |
| Idle Maximum * (Watt) | 10.5 | 10.3 2% | 7.8 26% | 7.8 26% | 6.1 42% | 10.2 3% | 9.16 ? 13% | 7.89 ? 25% |
| Load Average * (Watt) | 25.7 | 25.6 -0% | 42 -63% | 41.9 -63% | 27.4 -7% | 36.6 -42% | 39.2 ? -53% | 42 ? -63% |
| Witcher 3 ultra * (Watt) | 24.5 | 40.8 -67% | ||||||
| Load Maximum * (Watt) | 30.4 | 30.6 -1% | 64.5 -112% | 63.9 -110% | 27 11% | 49.3 -62% | 49.8 ? -64% | 64.8 ? -113% |
* ... smaller is better
Battery Runtime
The battery capacity is unchanged at 49.9 Wh, so the slightly thicker chassis was mainly used for the new keyboard. The runtimes in our practical scenarios (WLAN and video) are a bit shorter, so the quad-core seems to affect the results a bit. We once again notice that you get much longer runtimes when you use the full-screen mode. Our WLAN test, for example, runs more than 1.5 hours longer in full-screen mode, and the H.264 test 107 minutes longer. You should keep that in mind when there is no socket around.
| Apple MacBook Air 2020 i5 i5-1030NG7, Iris Plus Graphics G7 (Ice Lake 64 EU), 49.9 Wh | Apple MacBook Air 2018 i5-8210Y, UHD Graphics 617, 50.3 Wh | Apple Macbook Air 2019 i5-8210Y, UHD Graphics 617, 49.9 Wh | Apple MacBook Pro 13 2019 2TB3 i5-8257U, Iris Plus Graphics 645, 58.2 Wh | Microsoft Surface Laptop 3 13 Core i5-1035G7 i5-1035G7, Iris Plus Graphics G7 (Ice Lake 64 EU), 45 Wh | Acer Swift 3 SF313-52-71Y7 i7-1065G7, Iris Plus Graphics G7 (Ice Lake 64 EU), 54.5 Wh | Dell XPS 13 9300 i5 FHD i5-1035G1, UHD Graphics G1 (Ice Lake 32 EU), 52 Wh | Average of class Subnotebook | |
|---|---|---|---|---|---|---|---|---|
| Battery runtime | -0% | 12% | 26% | -27% | -8% | 22% | 16% | |
| H.264 (h) | 10.7 | 12.3 15% | 10.5 -2% | 14.4 35% | 15.4 ? 44% | |||
| WiFi v1.3 (h) | 10.3 | 11.1 8% | 11.5 12% | 13 26% | 8.3 -19% | 10.3 0% | 11.7 14% | 14 ? 36% |
| Load (h) | 2.9 | 2.2 -24% | 1.9 -34% | 2.3 -21% | 3.4 17% | 1.969 ? -32% | ||
| Reader / Idle (h) | 34.4 | 21.4 | 28.6 ? |
Pros
Cons
Verdict – Performance is still the Achilles heel of the MacBook Air

You can currently read many reports that say the new MacBook Air is the best MacBook you can get right now. After our comprehensive review, we cannot confirm these statements. Yes, the keyboard is now better and the performance is a bit higher, but Apple still (unnecessarily) limits the capabilities with the cooling system. The small chassis fan is just not very efficient, because it cannot prevent a performance drop. It is also really loud under more demanding workloads.
It actually makes sense for Apple to implement a slower processor and keep a distance to the MacBook Pro 13. And this is not a bad thing in general, because the performance is sufficient for basic tasks without a lot of multi-tasking. However, we would have liked to see a completely passively cooled device. A completely silent device would have made it much easier to accept the lower performance figures. Maybe Apple wants to reserve this step for upcoming generations with its own ARM processors (which have been rumored for a long time).
The price is just too high: The processor of the new MacBook Air is just not competitive in a machine for 1500 Euros (~$1641) and the cooling system is too noisy under load. If you still want the new MacBook Air, we recommend you wait for special offers.
The problem is the high price, because you can get much more powerful laptops for 1500 Euros (~$1641), including Apple's own MacBook Pro 13. But the Windows competition, like the new Dell XPS 139300 or the Acer Swift 3 do not have to hide and even offer more features like Wi-Fi 6 in addition to higher performance figures.
If you can live with the performance of the MacBook Air and only need it for basic stuff, but require a great chassis, good display, and long battery runtimes, then you will once again get a very good mobile companion with the new MacBook Air.
There is also definitely a lot to like about the new 2020 MacBook Air, and the product name alone will attract many customers. The performance is currently completely sufficient for basic stuff, display and chassis are still very good, the keyboard was finally improved and the reliability issues are hopefully a thing of the past. If it has to be the new MacBook Air, we would recommend to wait for special offers or discounts, which will definitely be available.
Apple MacBook Air 2020 i5
- 04/08/2020 v7 (old)
Klaus Hinum, Andreas Osthoff
Price comparison

