BMAX MaxBook Y11 H1M6 Convertible Review
Rating | Class | Date | Model | Weight | Height | Size | Resolution | Price |
|---|---|---|---|---|---|---|---|---|
| 74.9 % v7 (old) | Convertible | 03 / 2020 | BMAX MaxBook Y11 H1M6 Celeron N4100, UHD Graphics 600 | 1 kg | 14.4 mm | 11.60" | 1920x1080 | |
| 83.3 % v7 (old) | Convertible | 10 / 2018 | Microsoft Surface Go MHN-00003 Pentium 4415Y, UHD Graphics 615 | 523 g | 8.3 mm | 10.00" | 1800x1200 | |
| 84.2 % v6 (old) | Convertible | 12 / 2018 | Lenovo Yoga Book C930 YB-J912F i5-7Y54, HD Graphics 615 | 778 g | 9.9 mm | 10.80" | 2560x1660 | |
| 70 % v7 (old) | Convertible | 12 / 2019 | Chuwi UBook CWI509 Celeron N4100, UHD Graphics 600 | 810 g | 9 mm | 11.60" | 1920x1080 | |
| 88.4 % v7 (old) | Convertible | 11 / 2019 | Microsoft Surface Pro 7 Core i5-1035G4 i5-1035G4, Iris Plus Graphics G4 (Ice Lake 48 EU) | 1.1 kg | 8.5 mm | 12.30" | 2736x1824 | |
| 82.5 % v7 (old) | Convertible | 09 / 2019 | HP ProBook x360 11 G4 m3-8100Y, UHD Graphics 615 | 1.4 kg | 19.9 mm | 11.60" | 1366x768 | |
| 78.9 % v6 (old) | Convertible | 07 / 2017 | Acer Spin 1 SP111-31-C79E Celeron N3450, HD Graphics 500 | 1.5 kg | 20.3 mm | 11.60" | 1920x1080 | |
v (old) | Convertible | 11 / 2017 | Acer Spin 1 SP111-32N-P9VD Pentium N4200, HD Graphics 505 | 1.3 kg | 14 mm | 11.60" | 1920x1080 | |
v (old) | Convertible | 05 / 2017 | Acer Spin 1 SP113-31-P0ZN Pentium N4200, HD Graphics 505 | 1.6 kg | 20.4 mm | 13.30" | 1920x1080 | |
| 77.3 % v7 (old) | Convertible | Acer TravelMate Spin B1 B118-G2-RN-P7ED Pentium N5000, UHD Graphics 605 | 1.5 kg | 23.3 mm | 11.60" | 1920x1080 | ||
| 84 % v6 (old) | Convertible | 05 / 2019 | VAIO A12-92993 i7-8500Y, UHD Graphics 615 | 1.1 kg | 24 mm | 12.50" | 1920x1080 | |
| 89.8 % v7 (old) | Tablet | 11 / 2018 | Apple iPad Pro 11 2018 A12X Bionic, A12X Bionic GPU | 468 g | 5.9 mm | 11.00" | 2388x1668 |
Case & Features
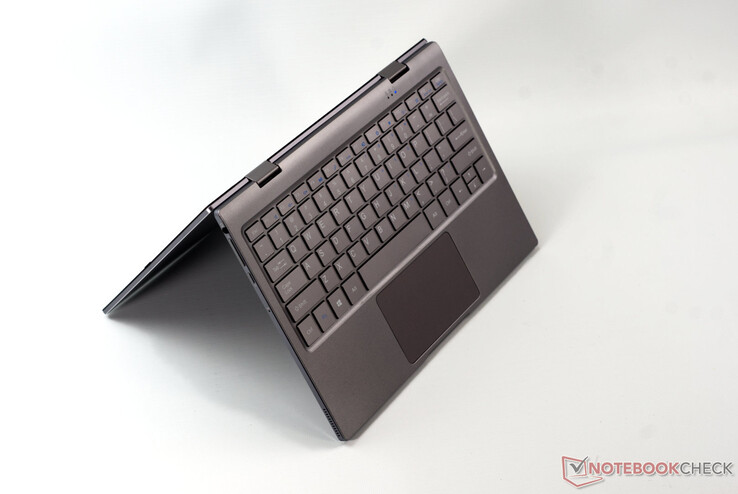
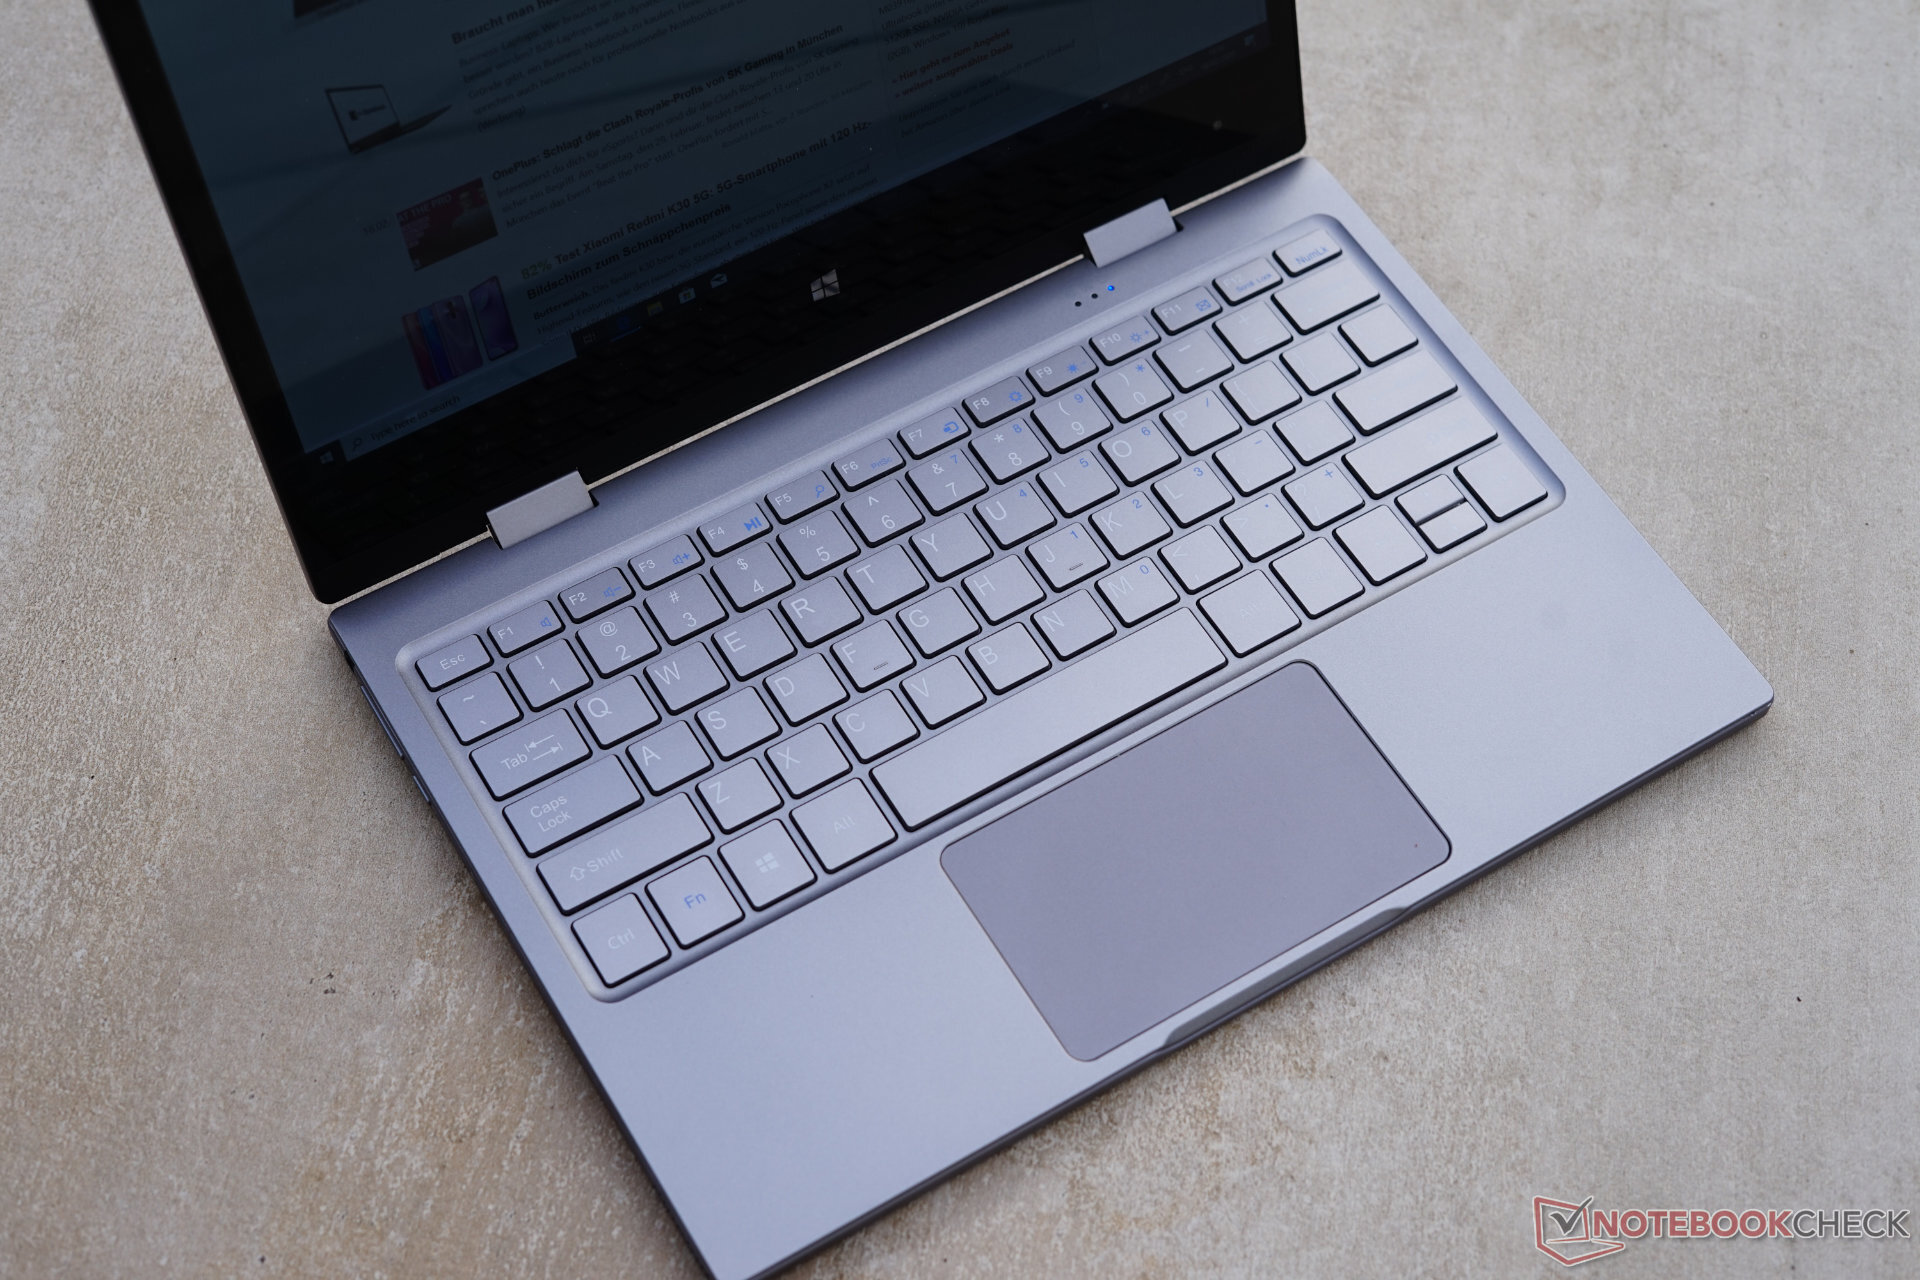
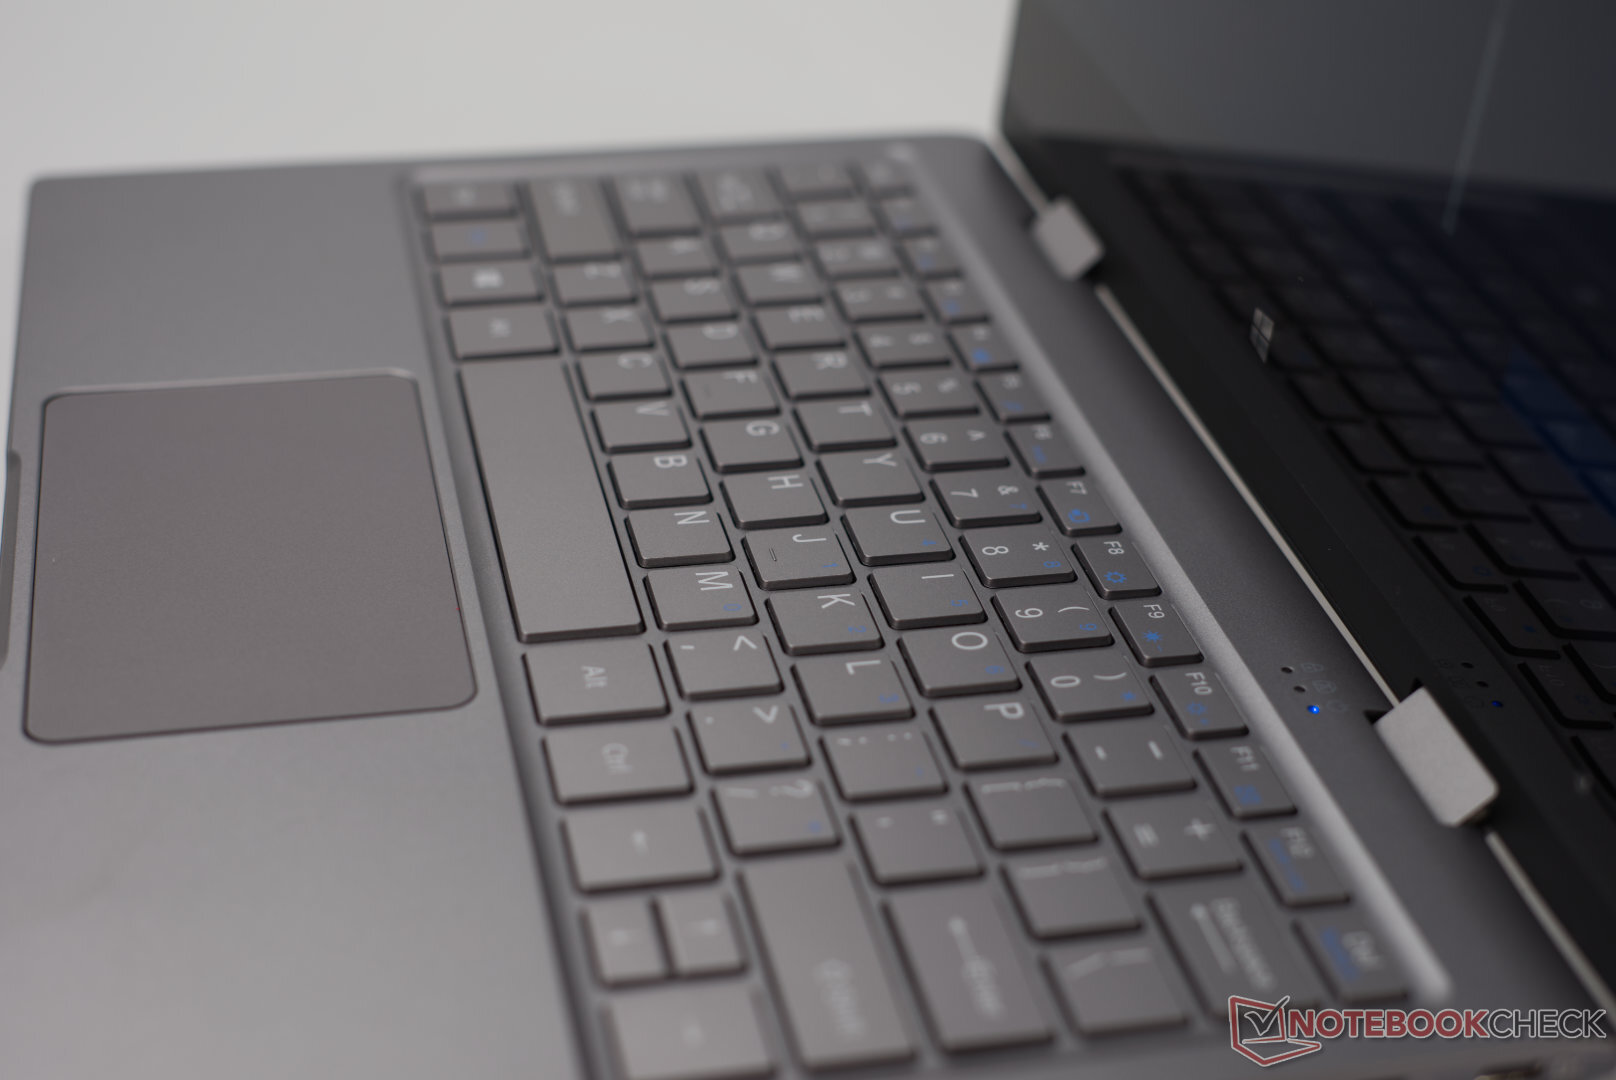
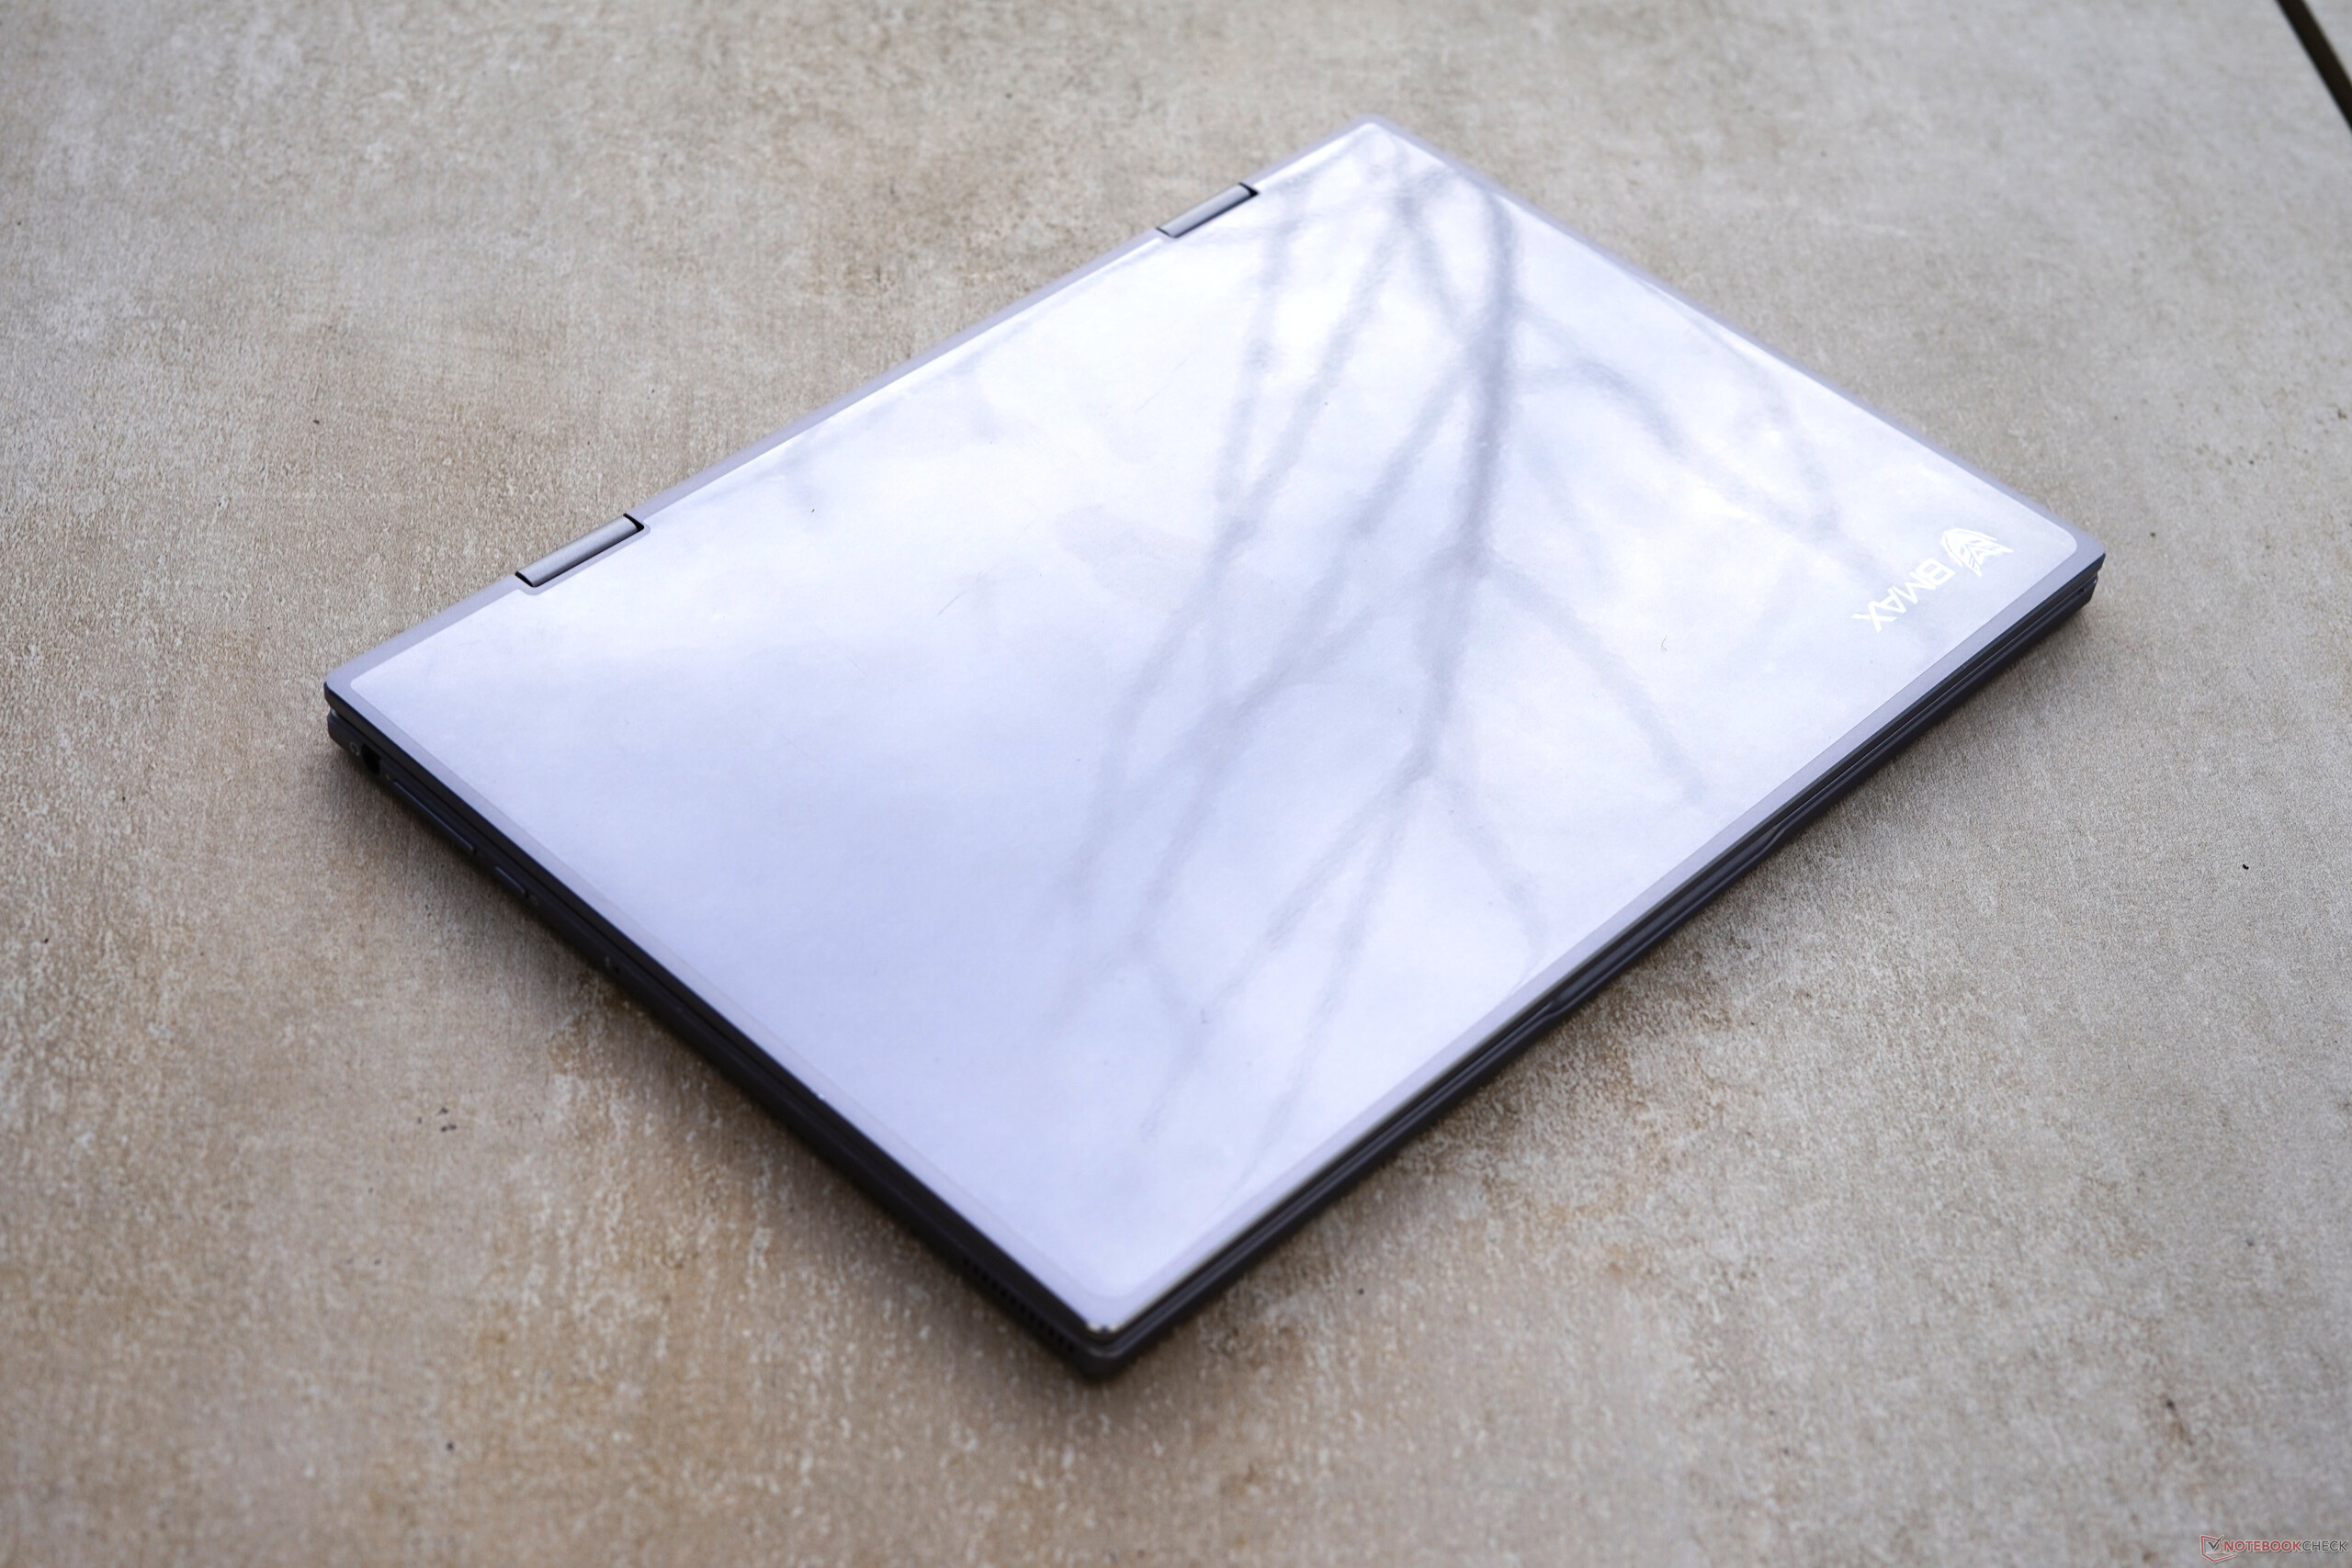
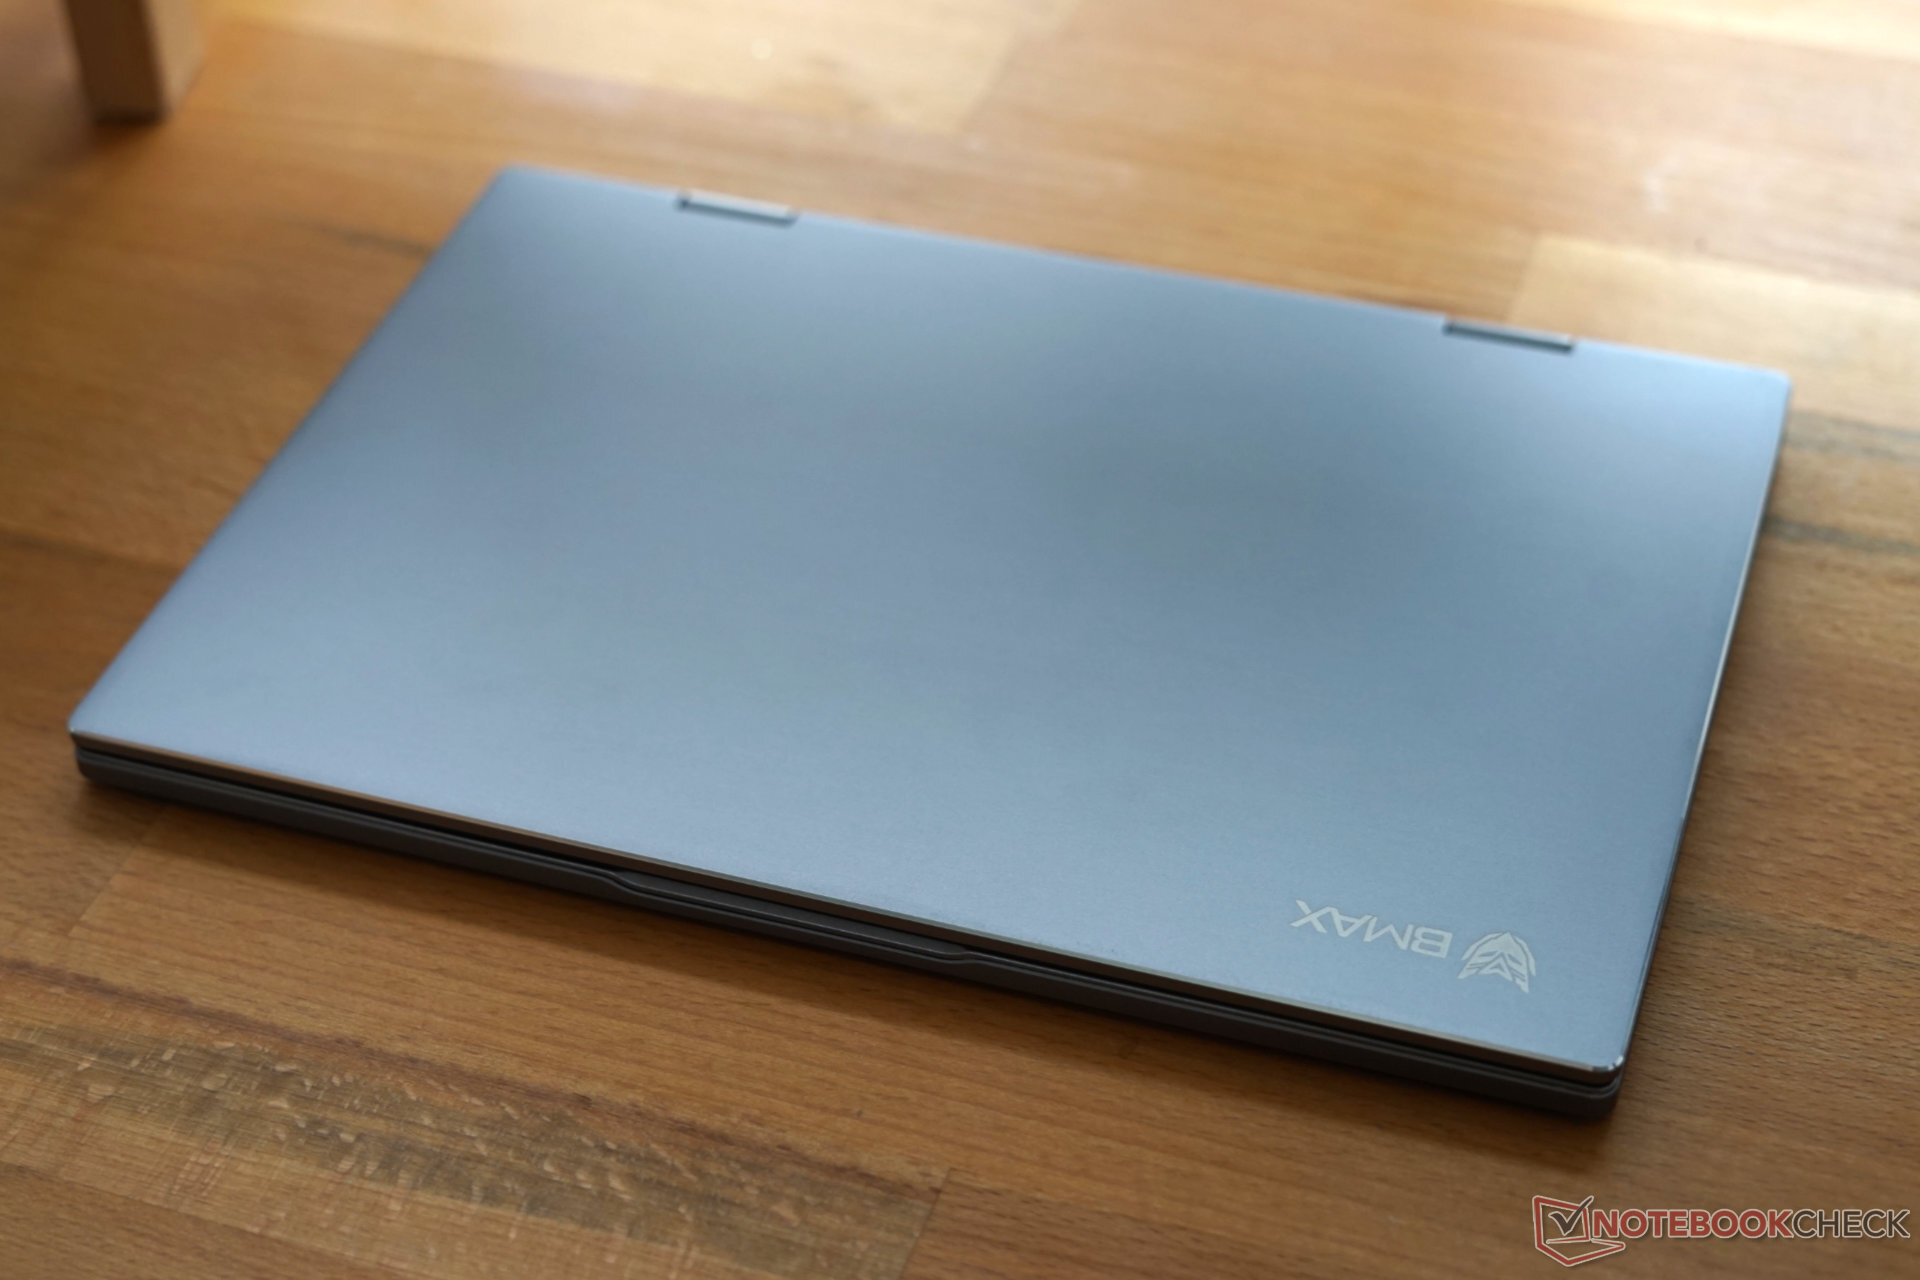
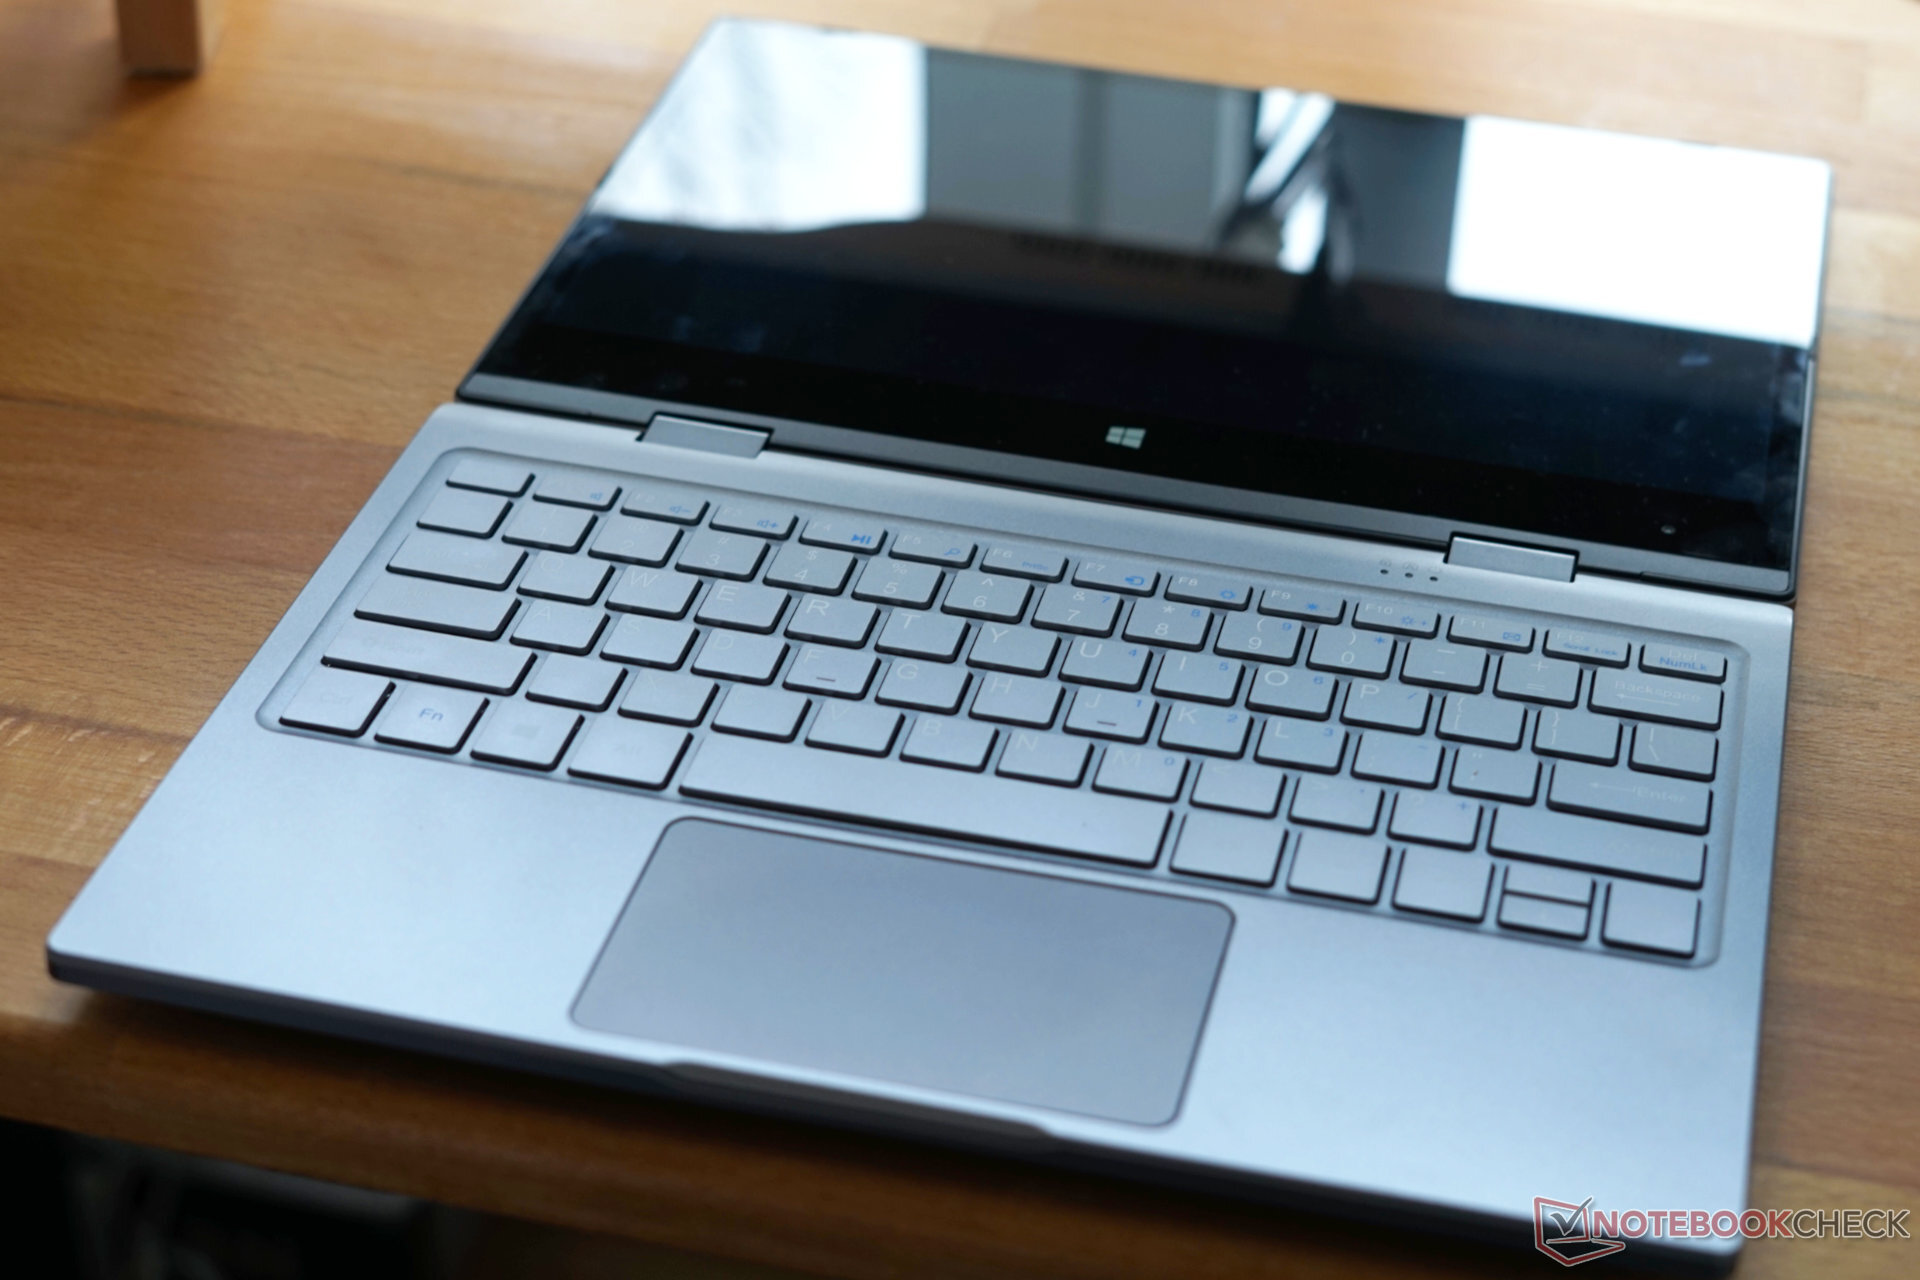
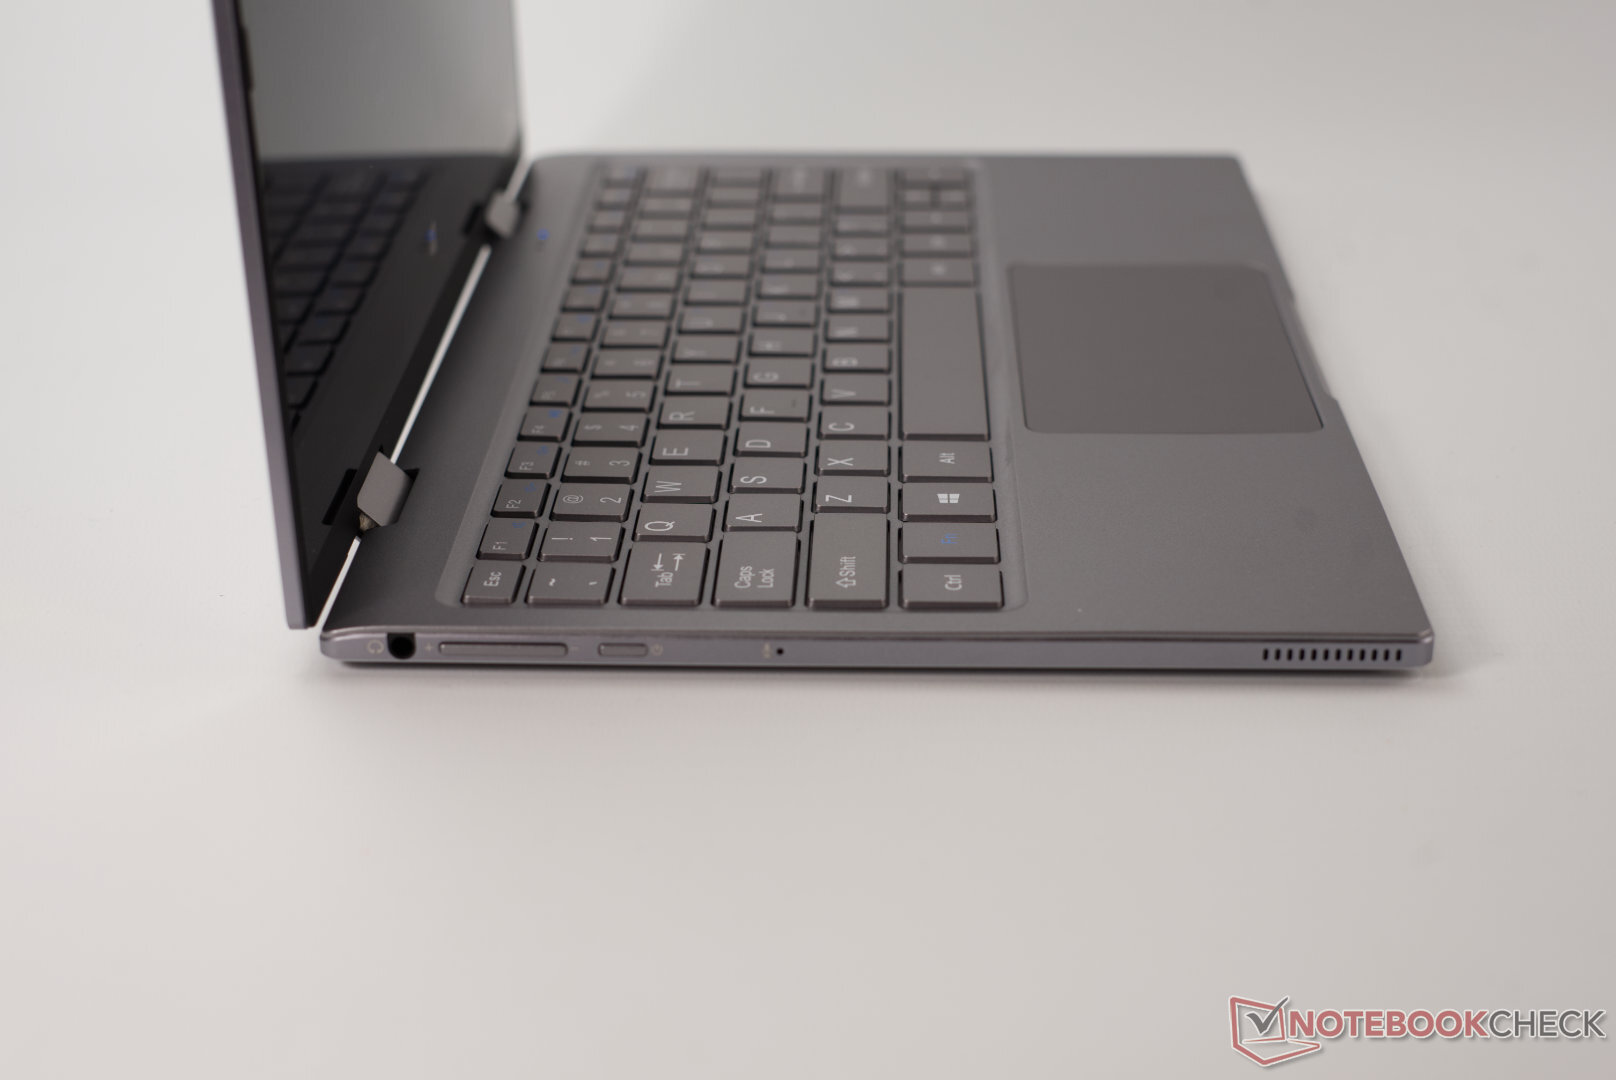
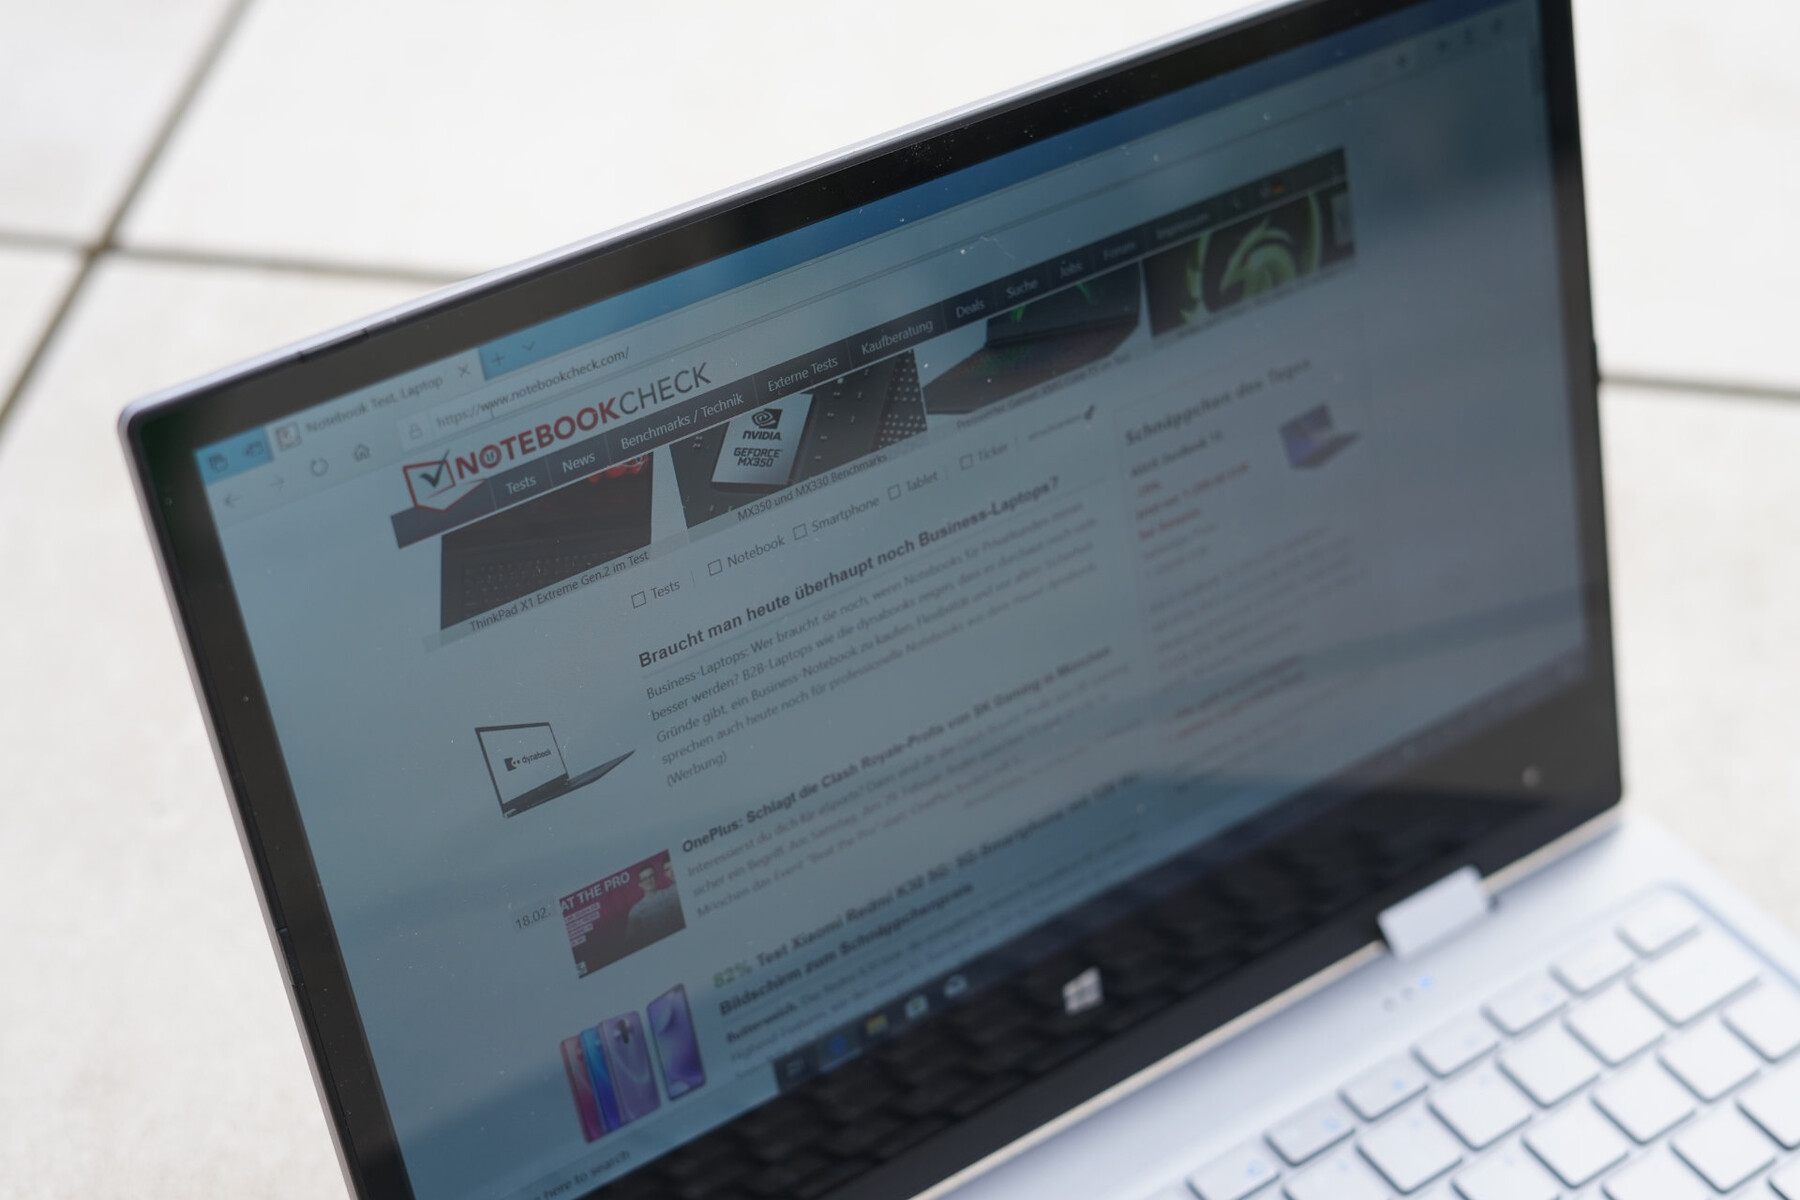
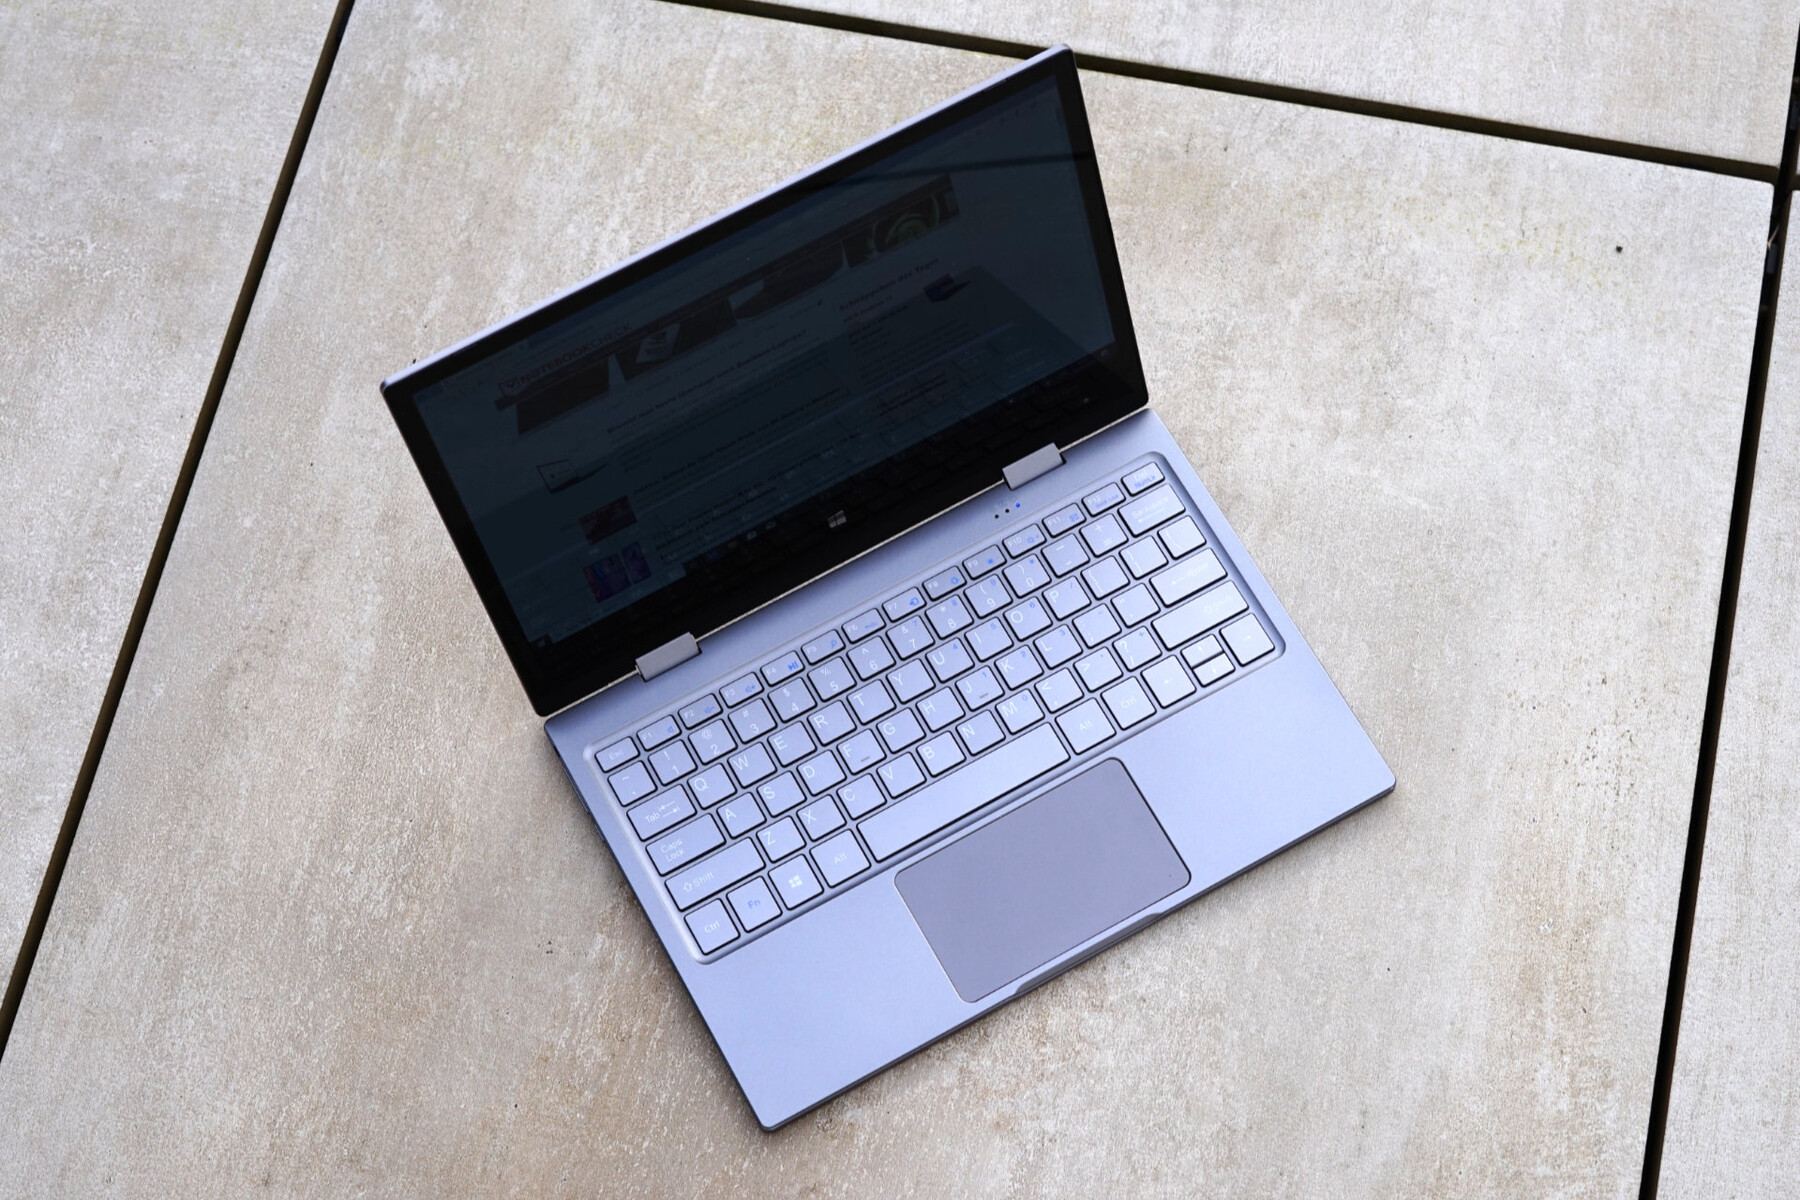
Although the BMAX Y11 uses an identical aluminum chassis as the Teclast F5R, the keyboard is silver this time around. While this results in a more premium look, it also impairs the visibility of the keys due to their white key legends. The exterior of the solid chassis consists of aluminum and offers a high-quality look and feel. Meanwhile, the areas next to the keyboard are made of similarly colored plastic. During our review, we were impressed by the 360-degree hinge, which holds the display firmly in place regardless of the angle. On our test device however, the glue that is supposed to attach the panel to the case came off - this manifests in the top right edge coming loose when opening the lid.
Maintenance and Upgrade Options
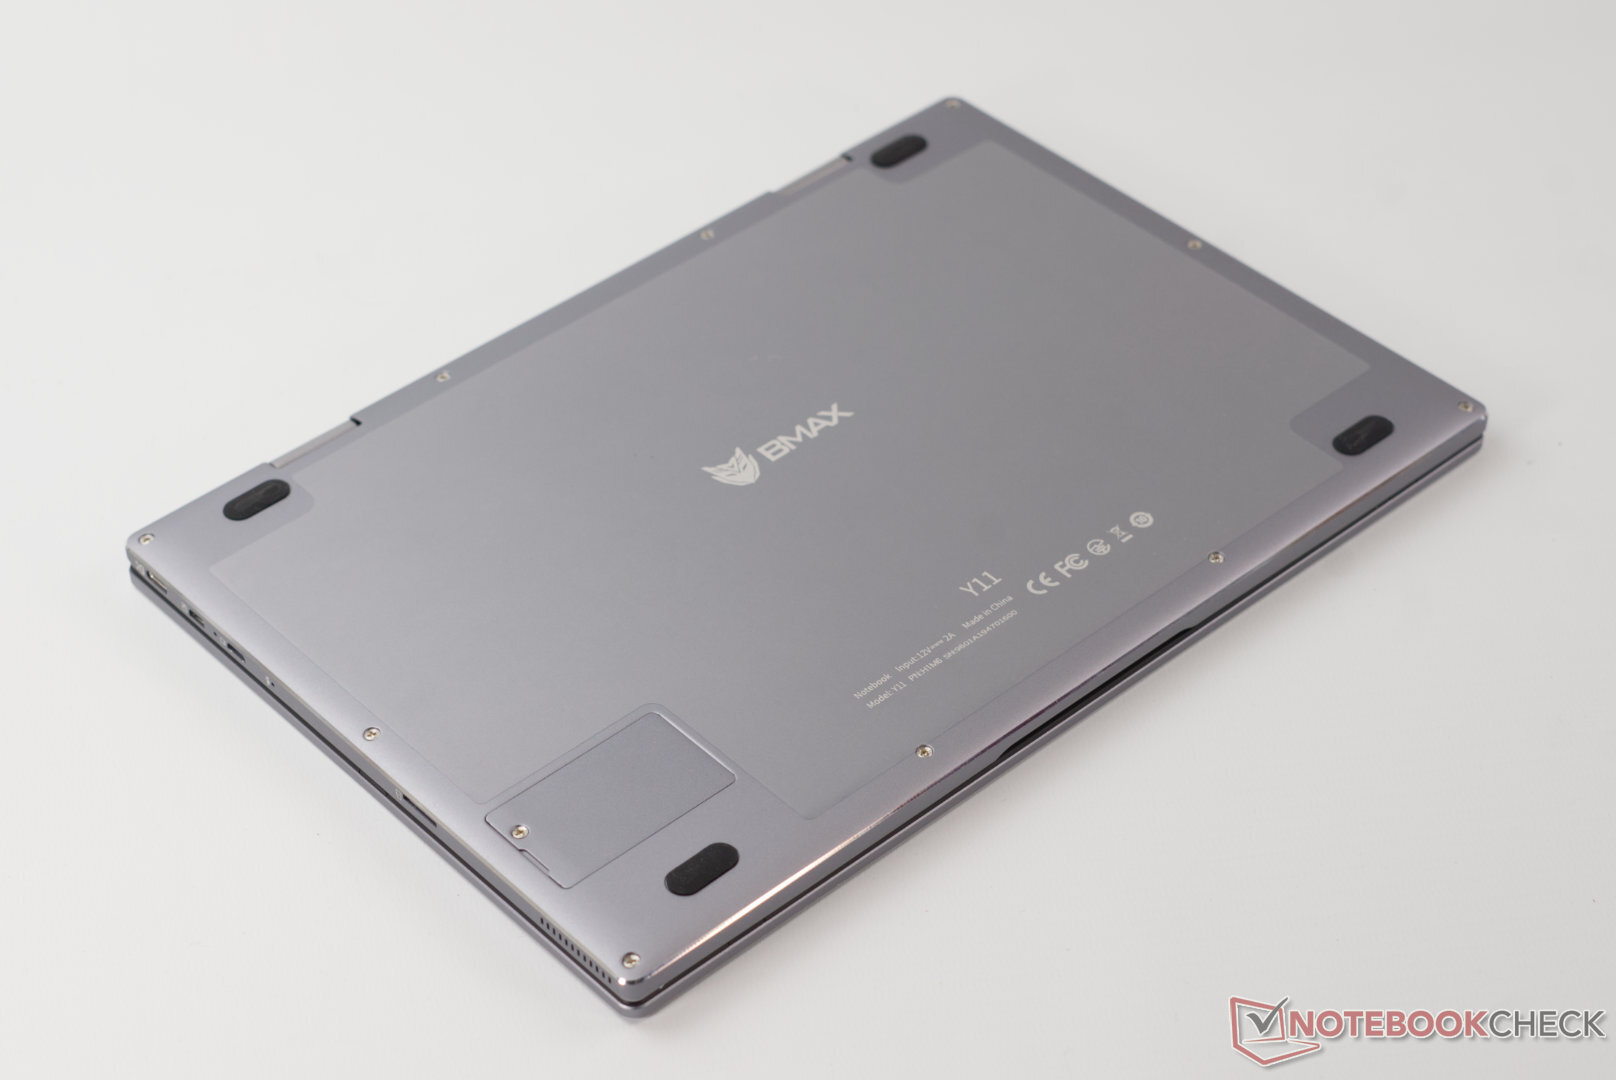
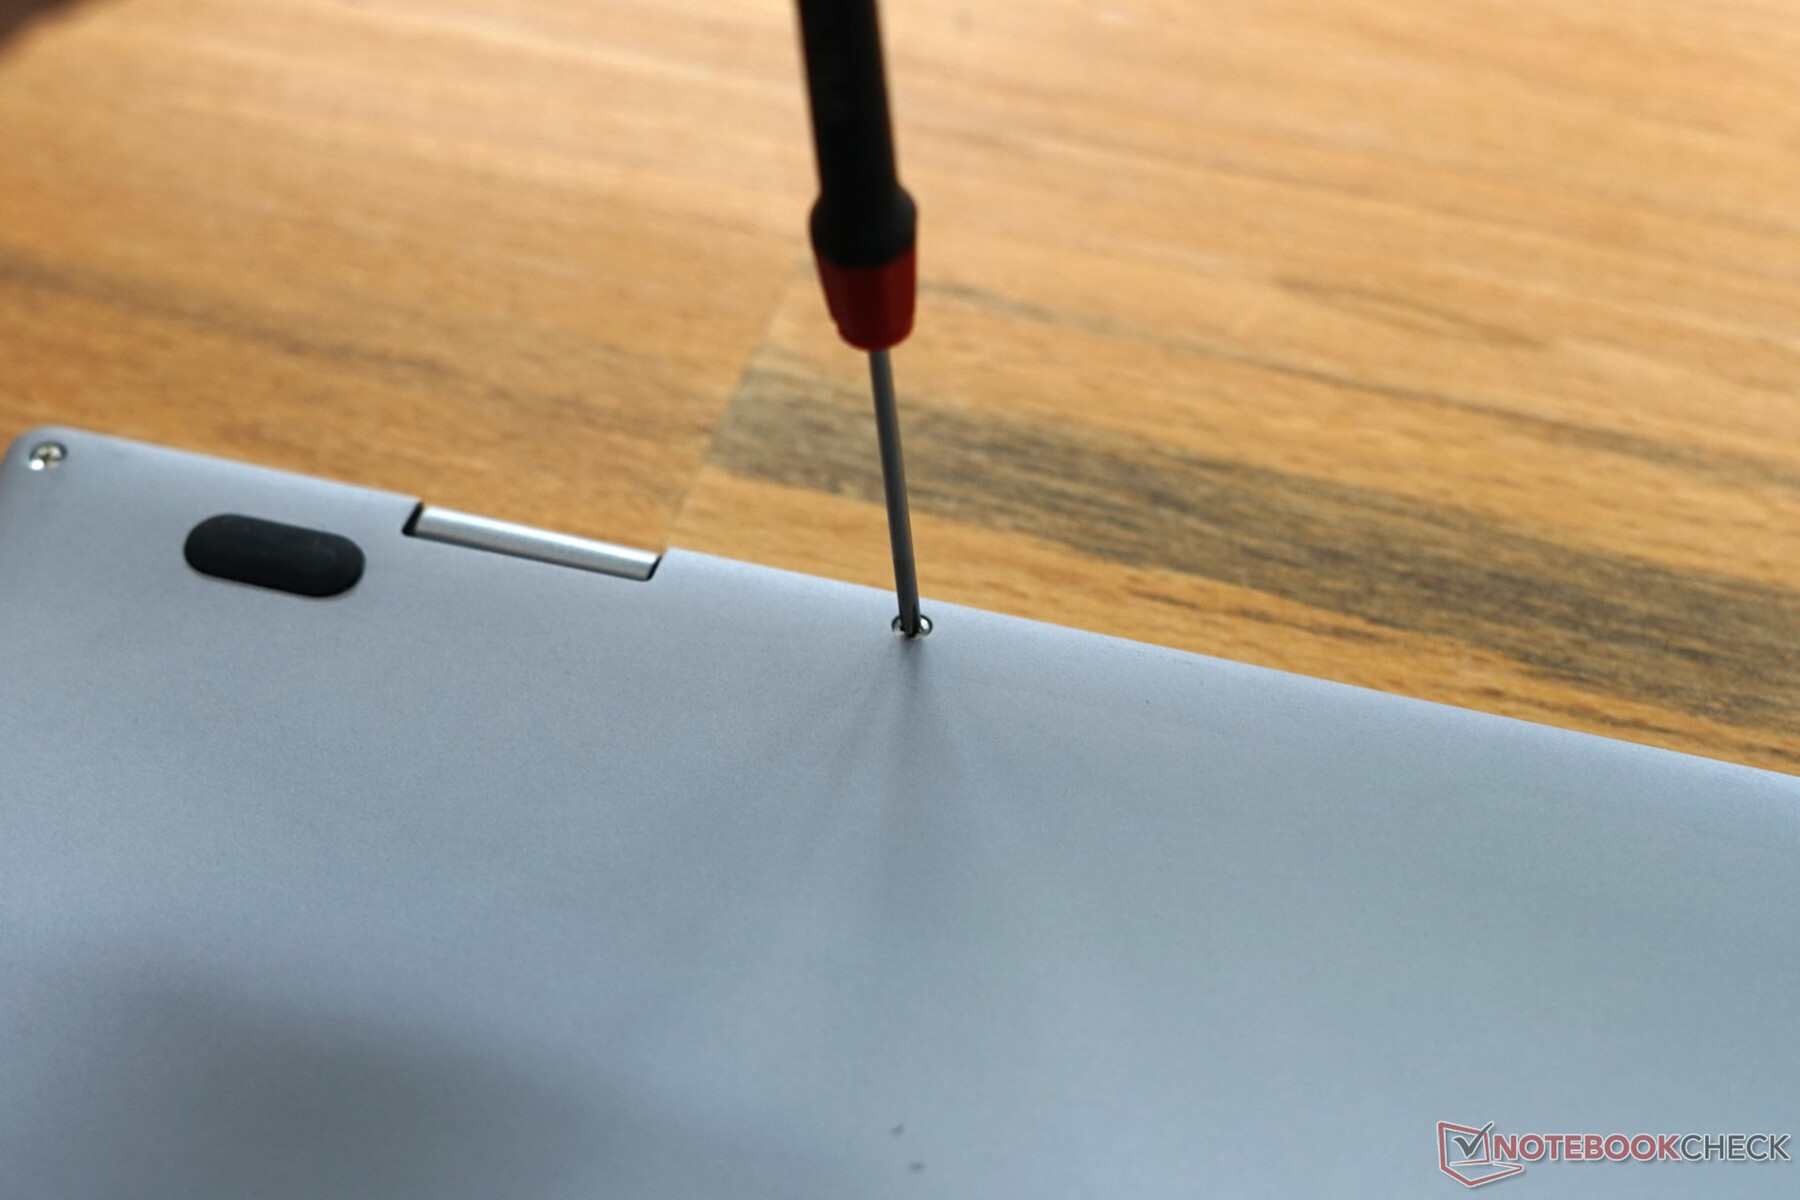
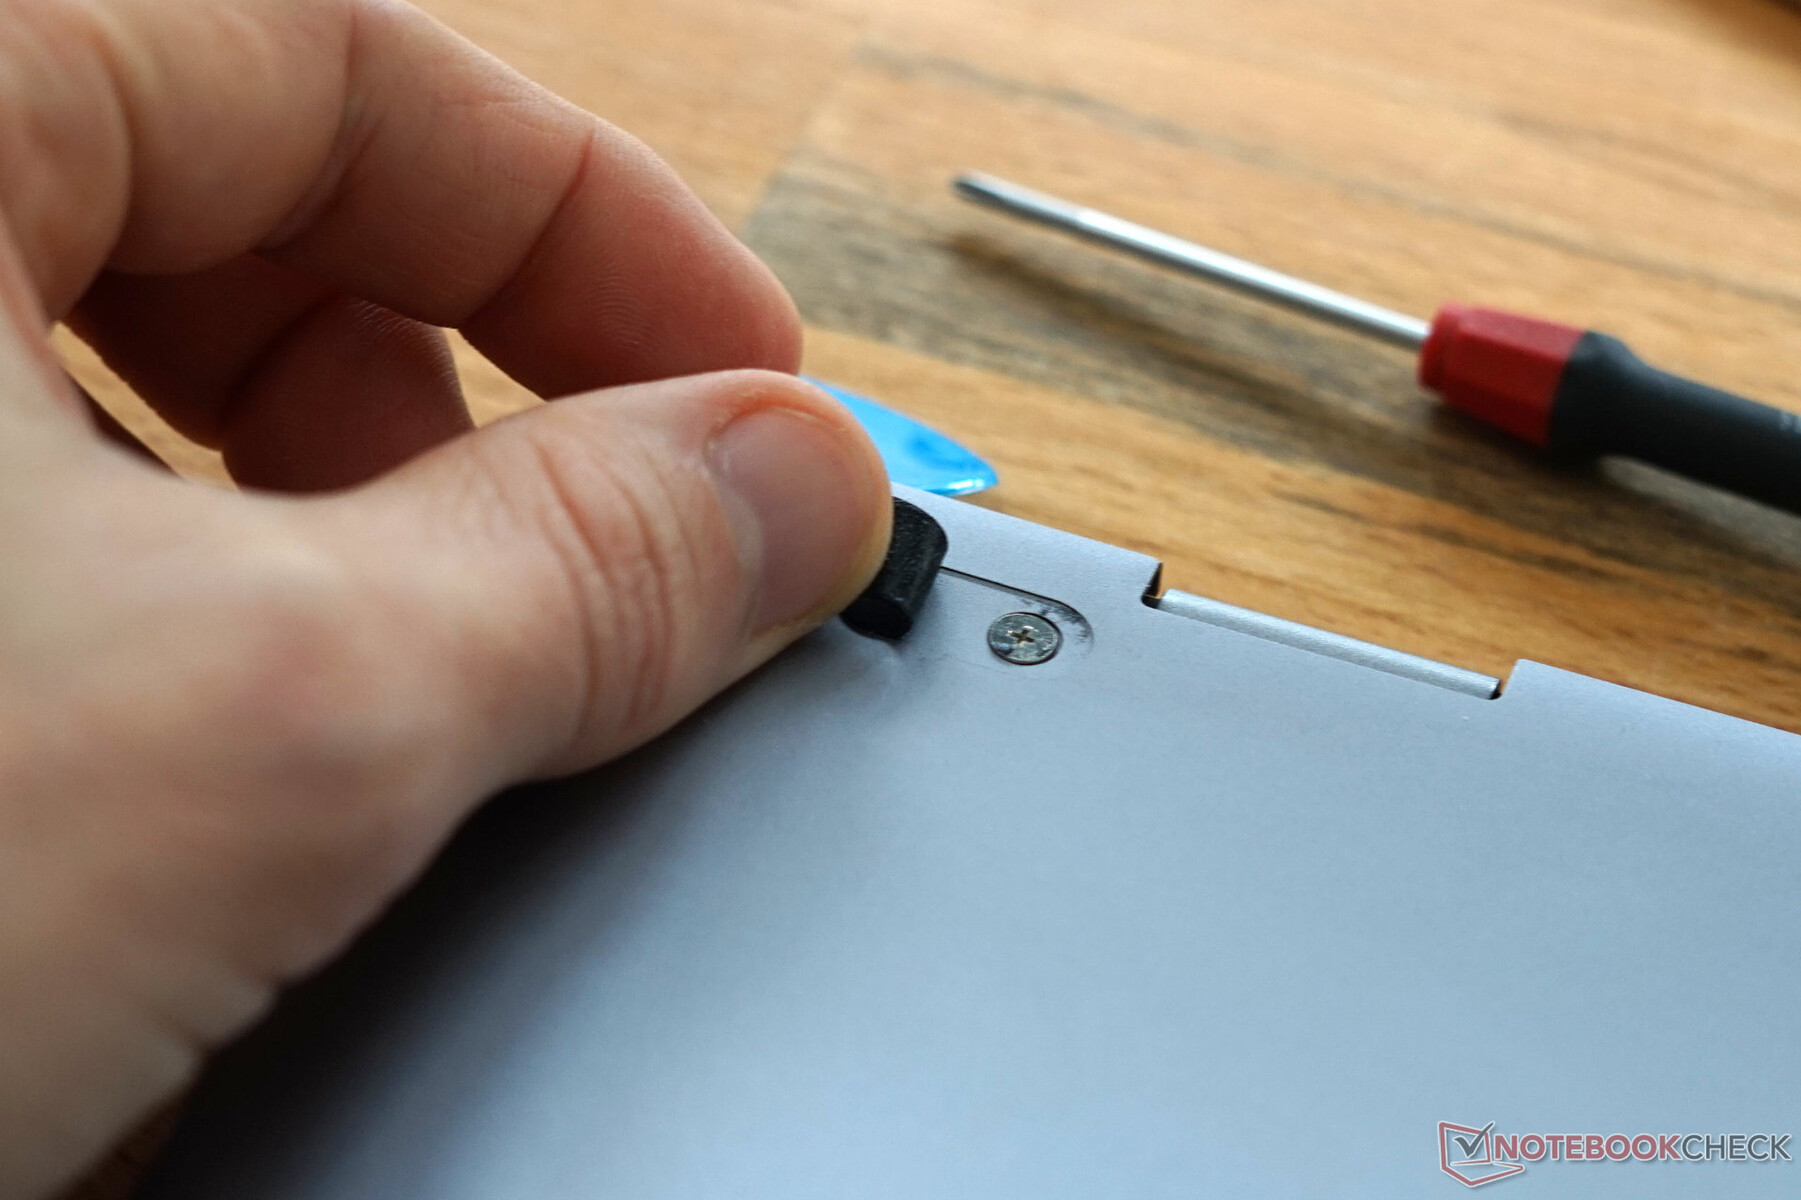
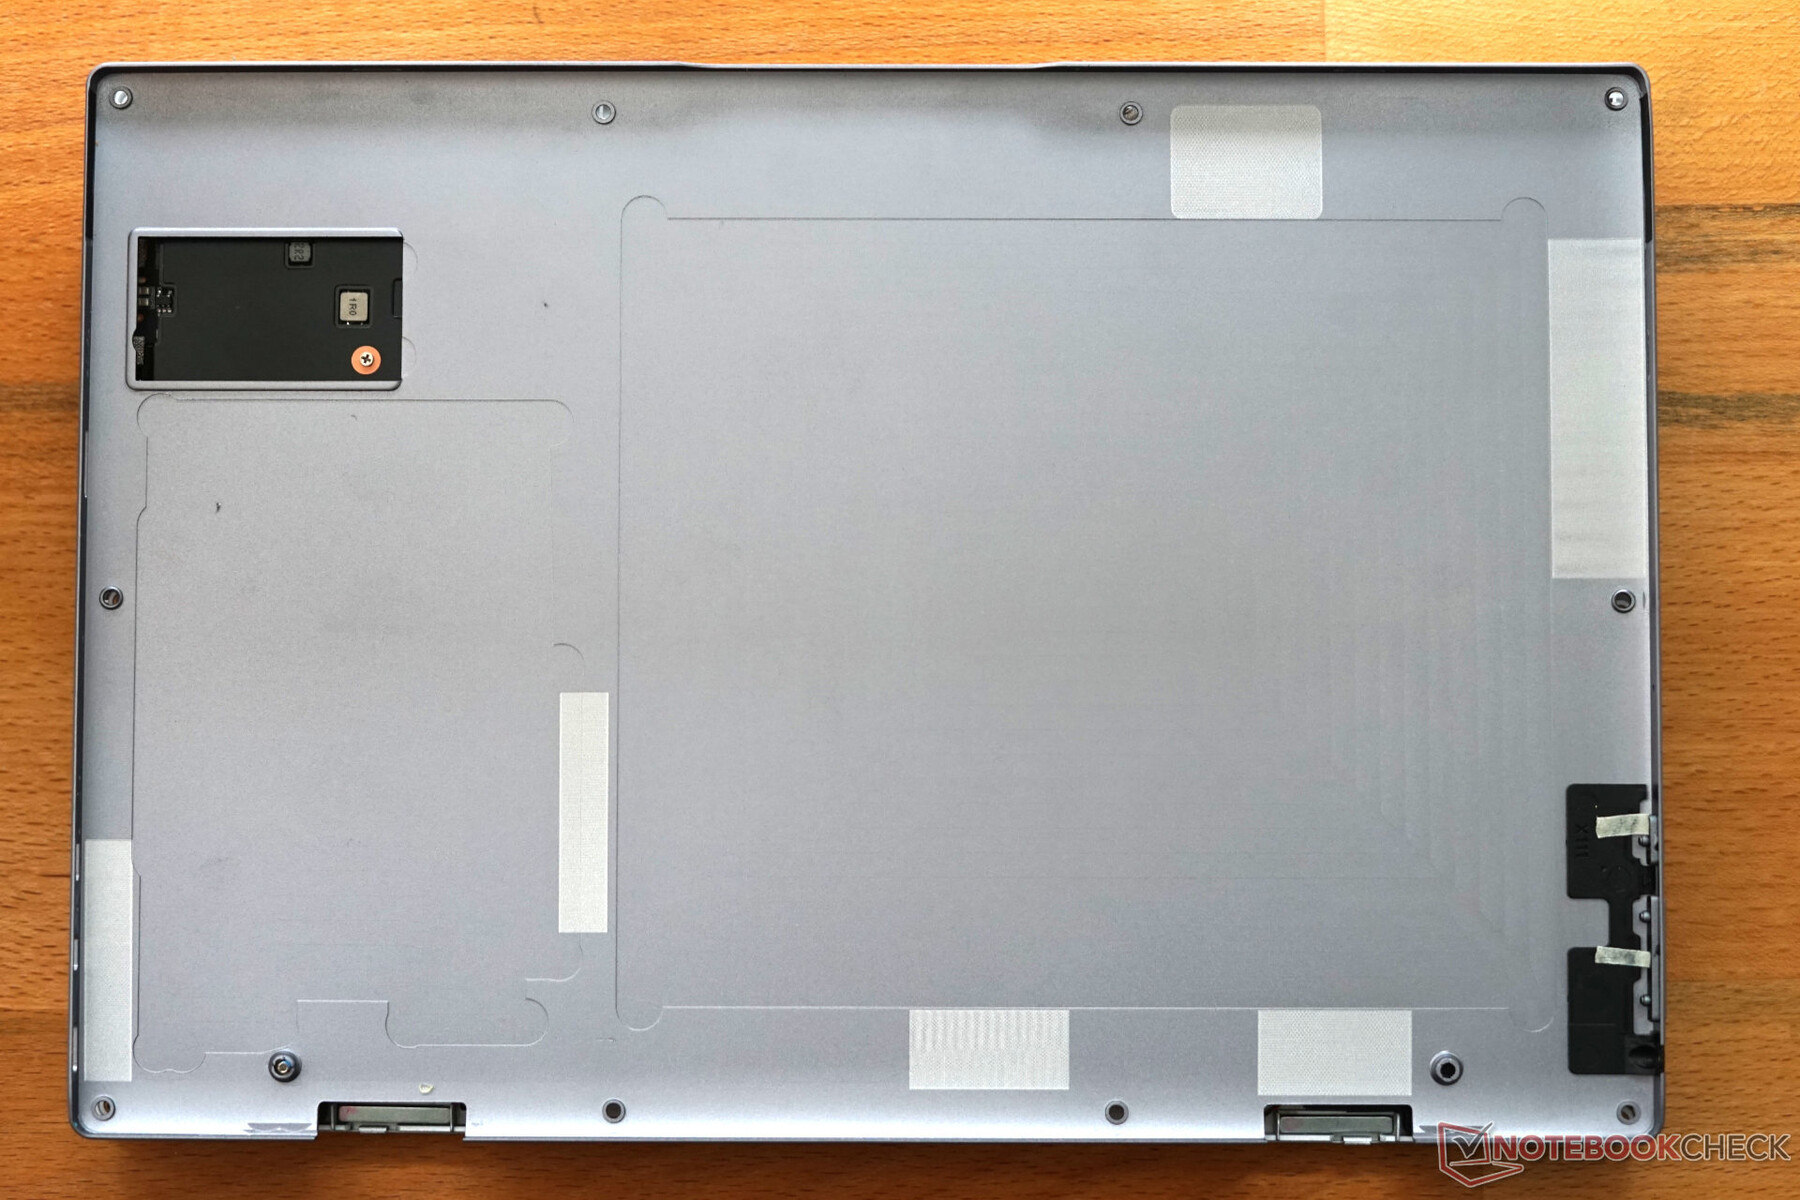
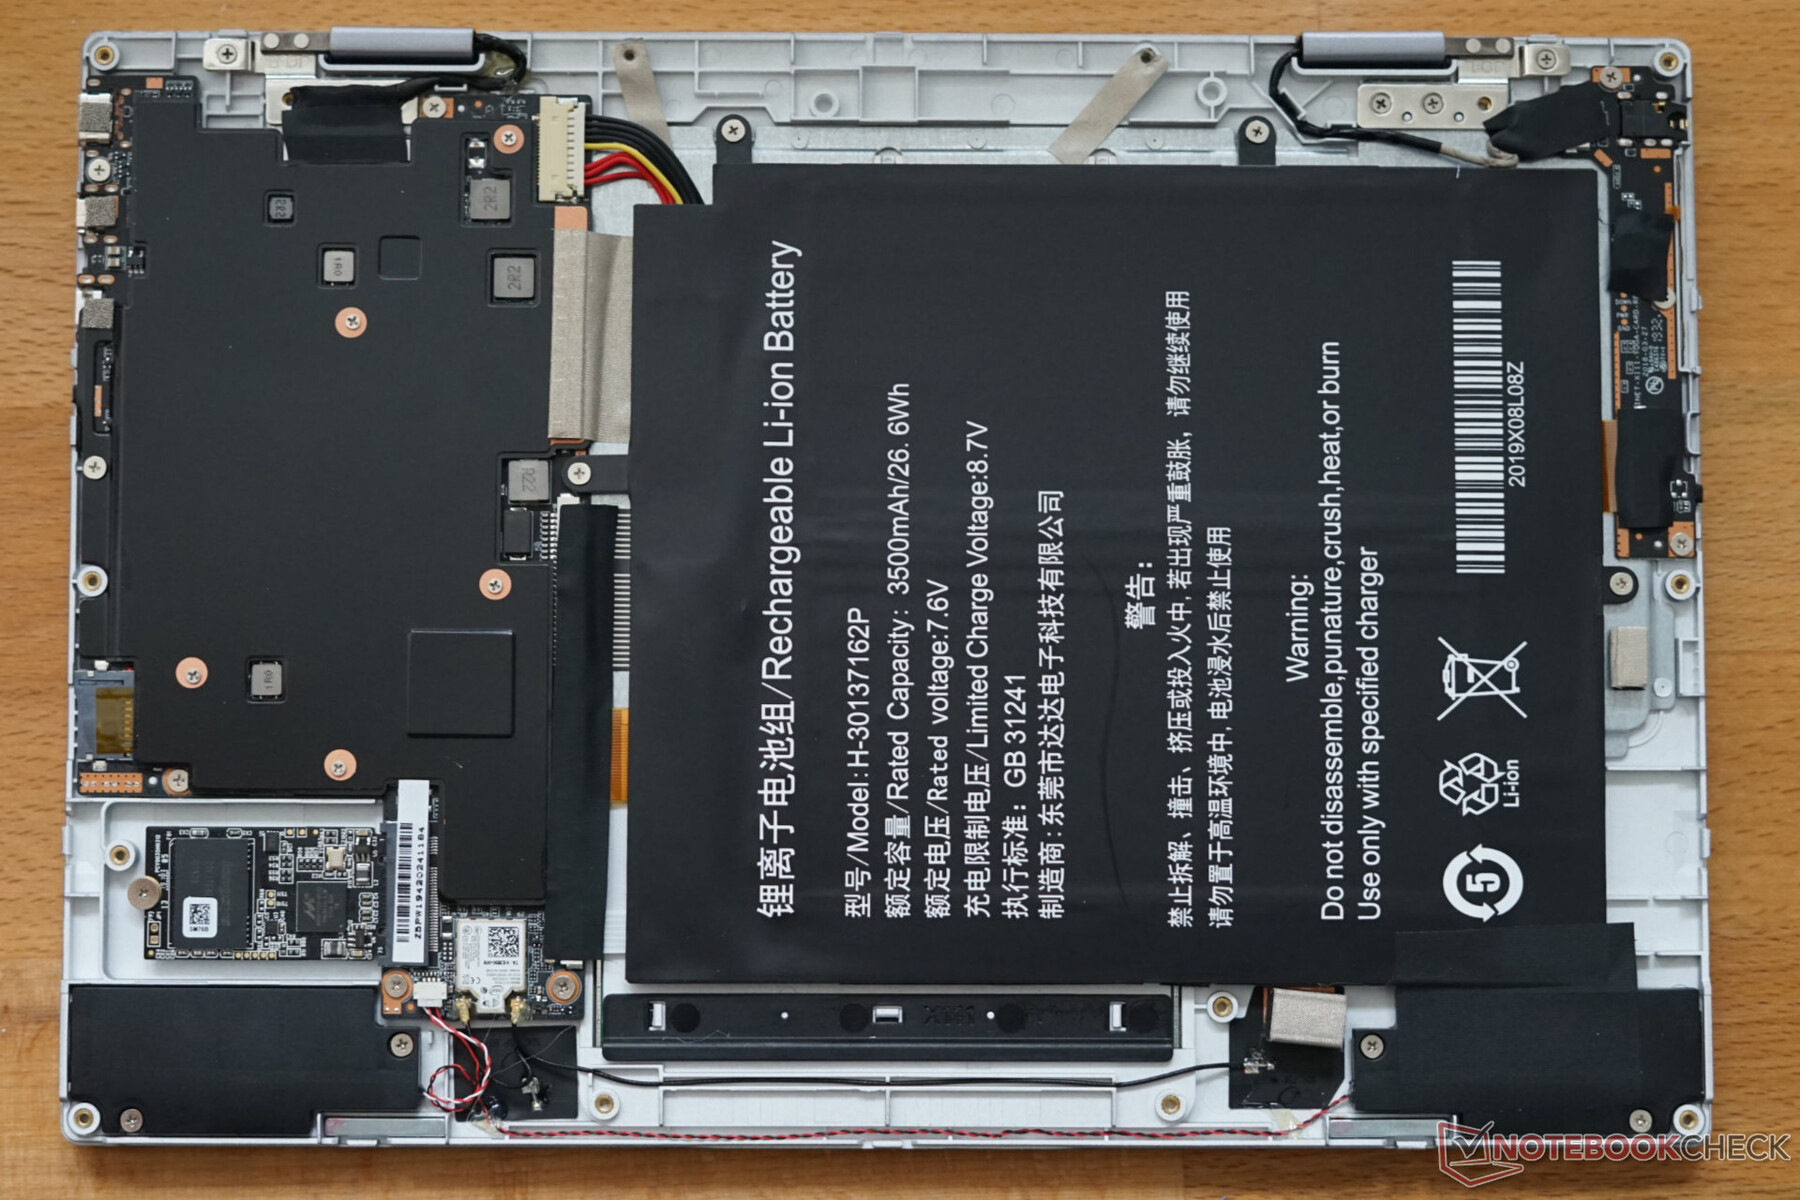
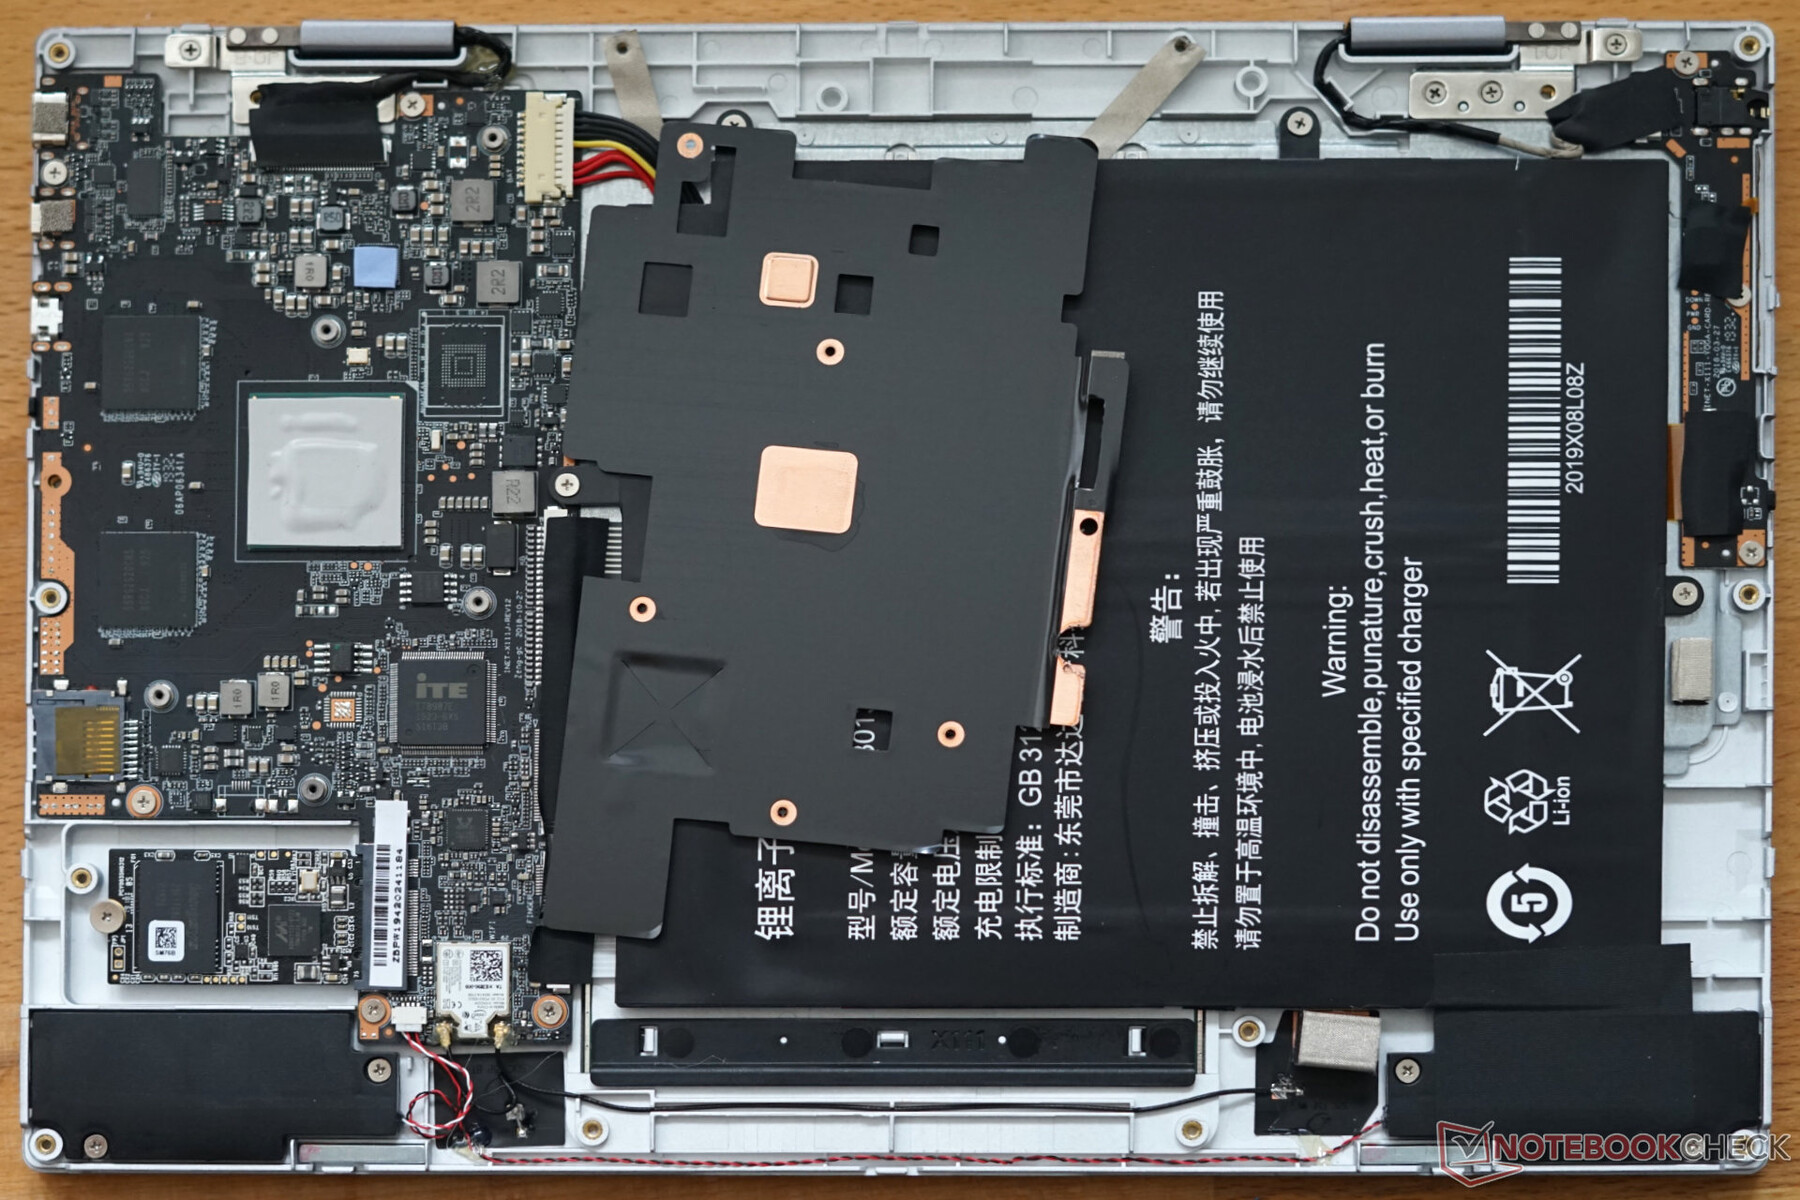
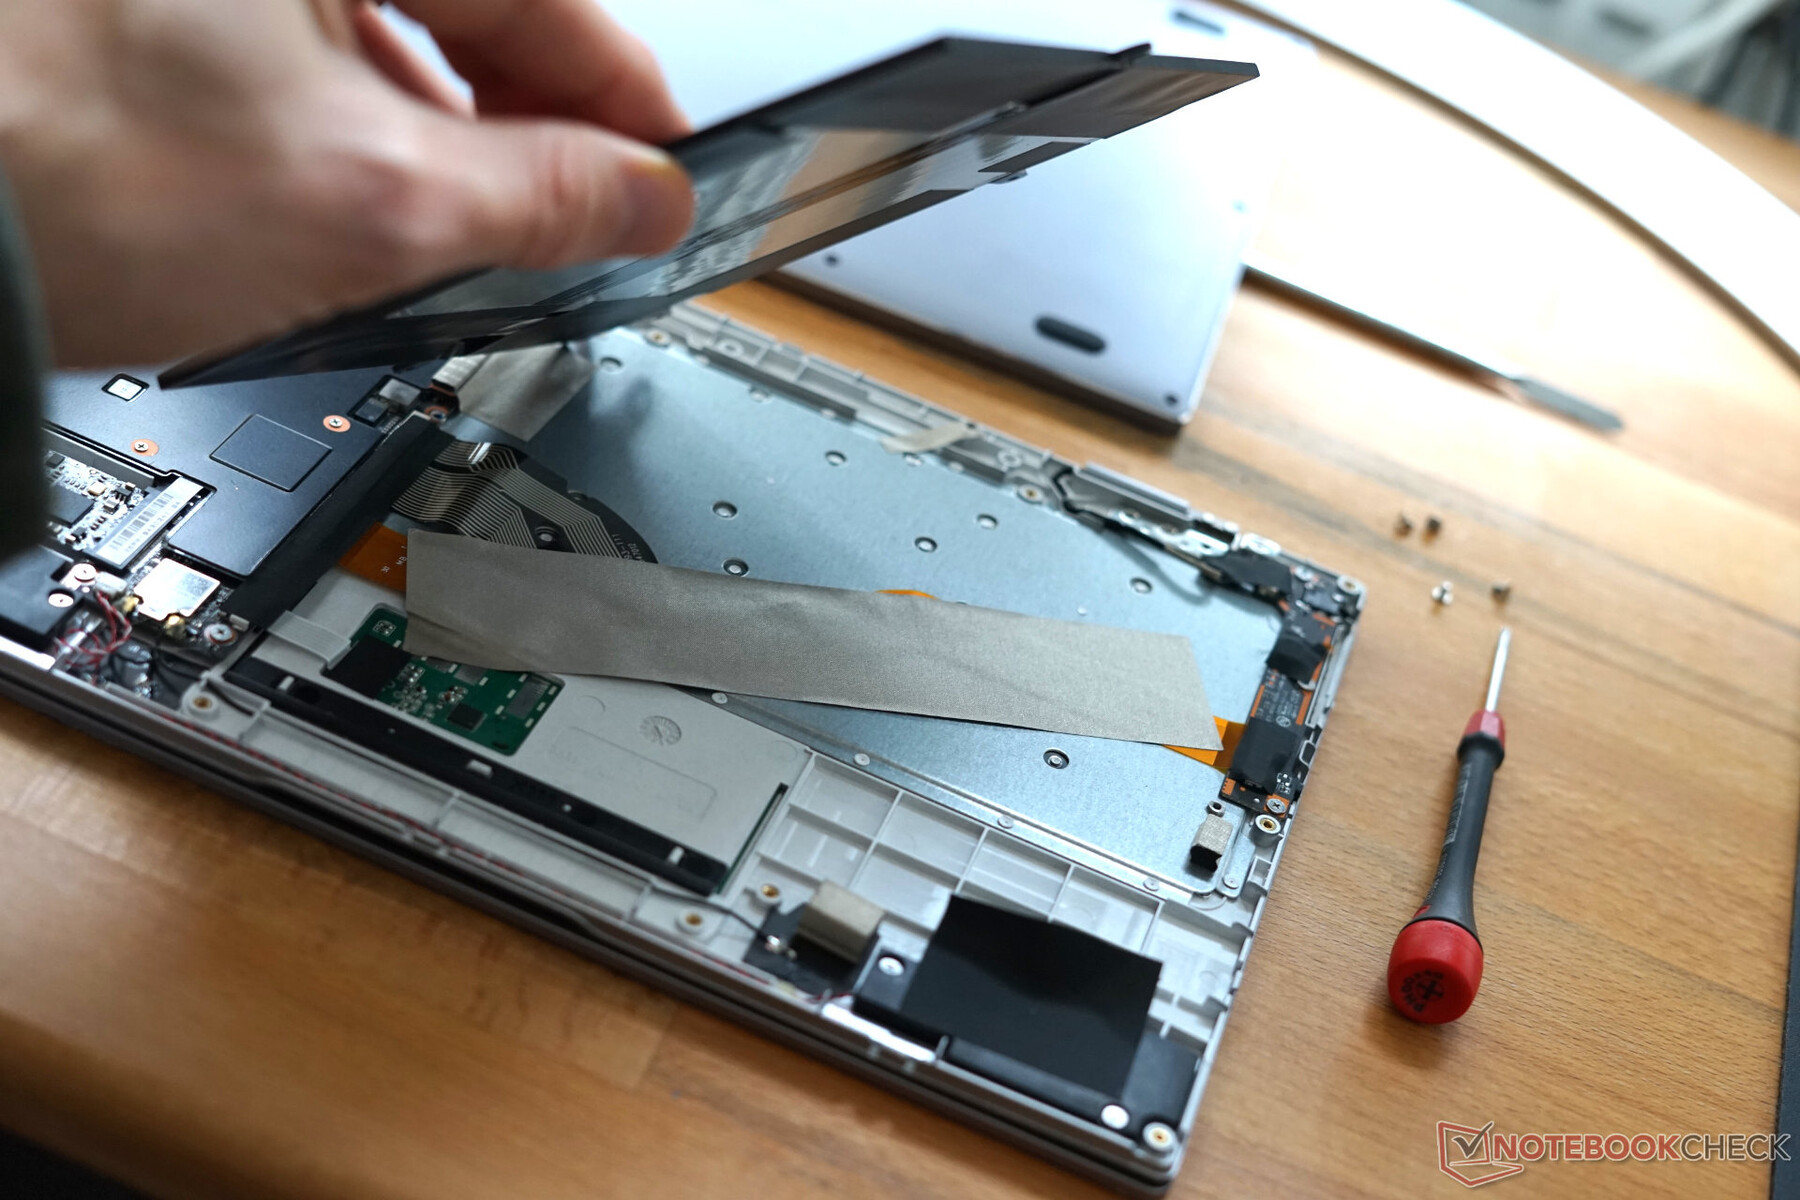
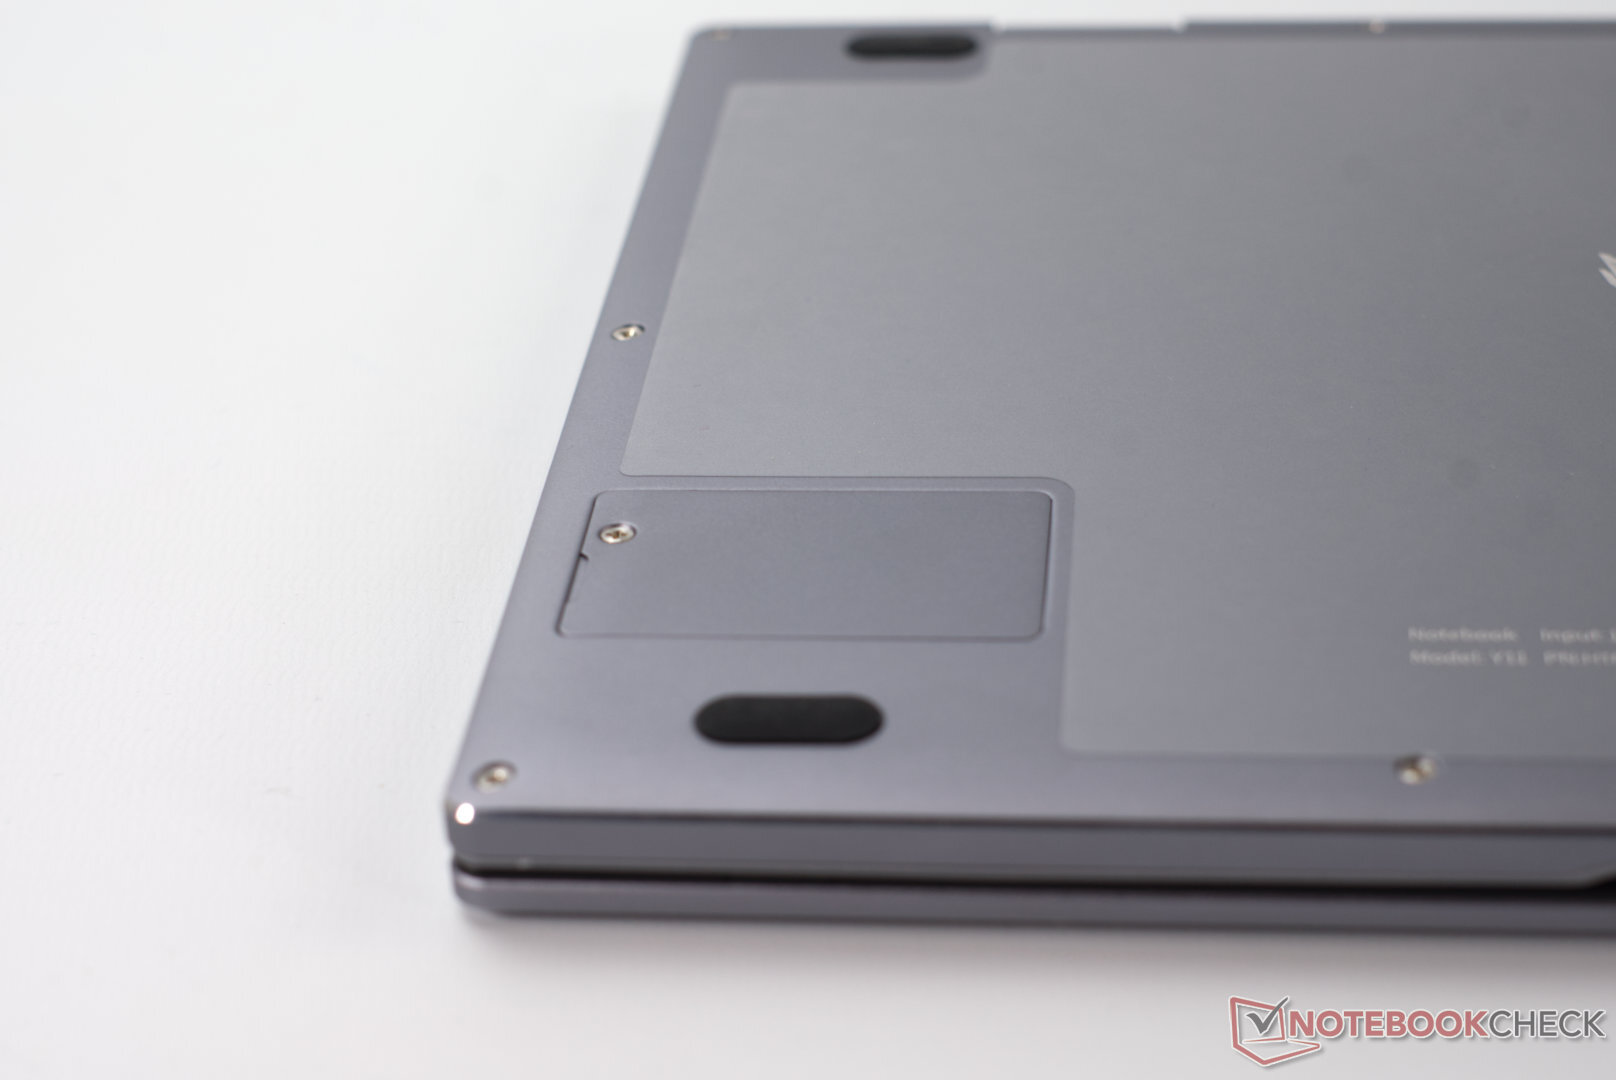
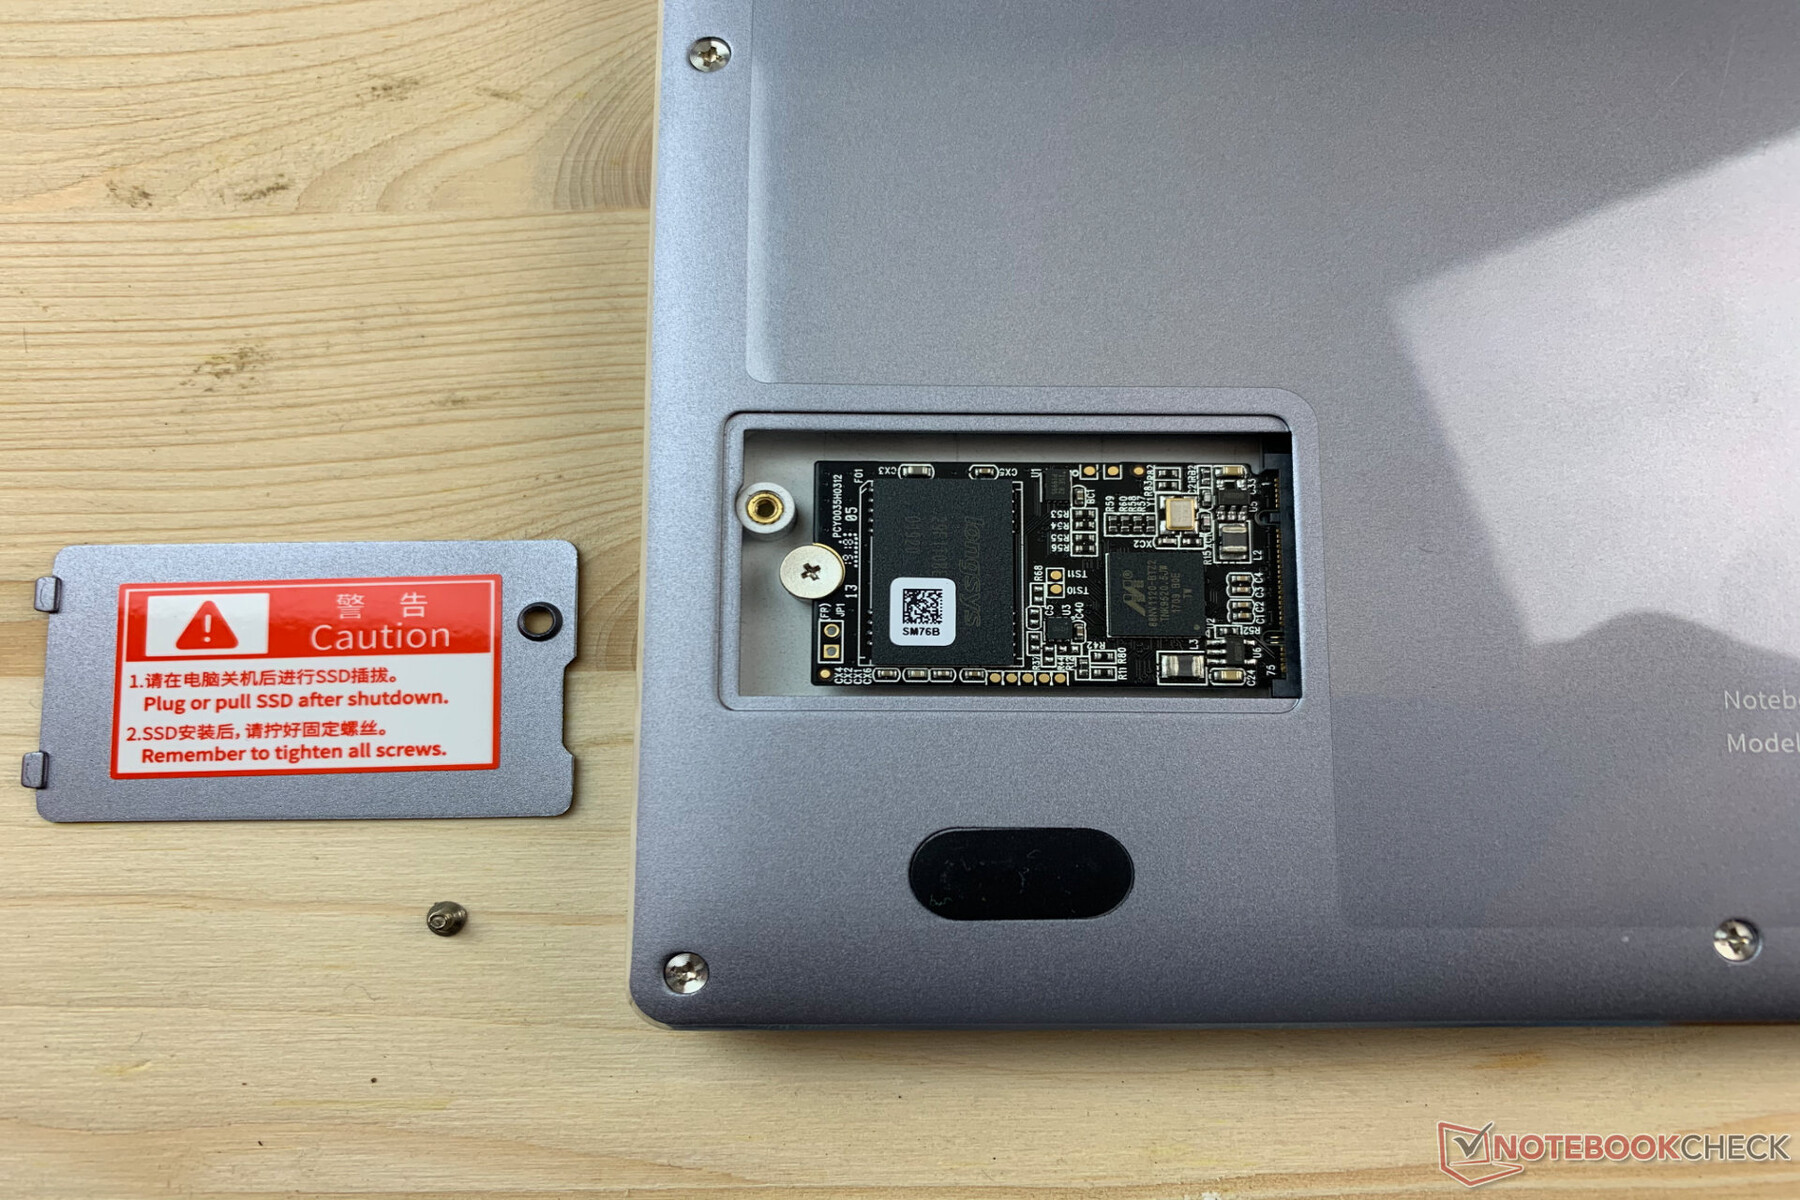
Thanks to the small hatch on the bottom, the M.2 2242 SSD can be swapped fairly easily after the two screws have been removed - perfect. Removing the entire bottom plate is not all that difficult, either. Users will only have to be careful not to forget the two screws hidden underneath the rubber feet in the back. After loosening all of the 13 screws, the aluminum plate can be detached from the plastic parts with relative ease. Here, using a thin plastic spudger is very useful to prevent scratching the case. On the interior, there are no additional upgradeable components. Both the RAM and the Wi-Fi module are soldered and the fanless cooling solution also does not really require maintenance. Thus, a more massive copper cooler is the only thing users could realistically install.
Port Selection
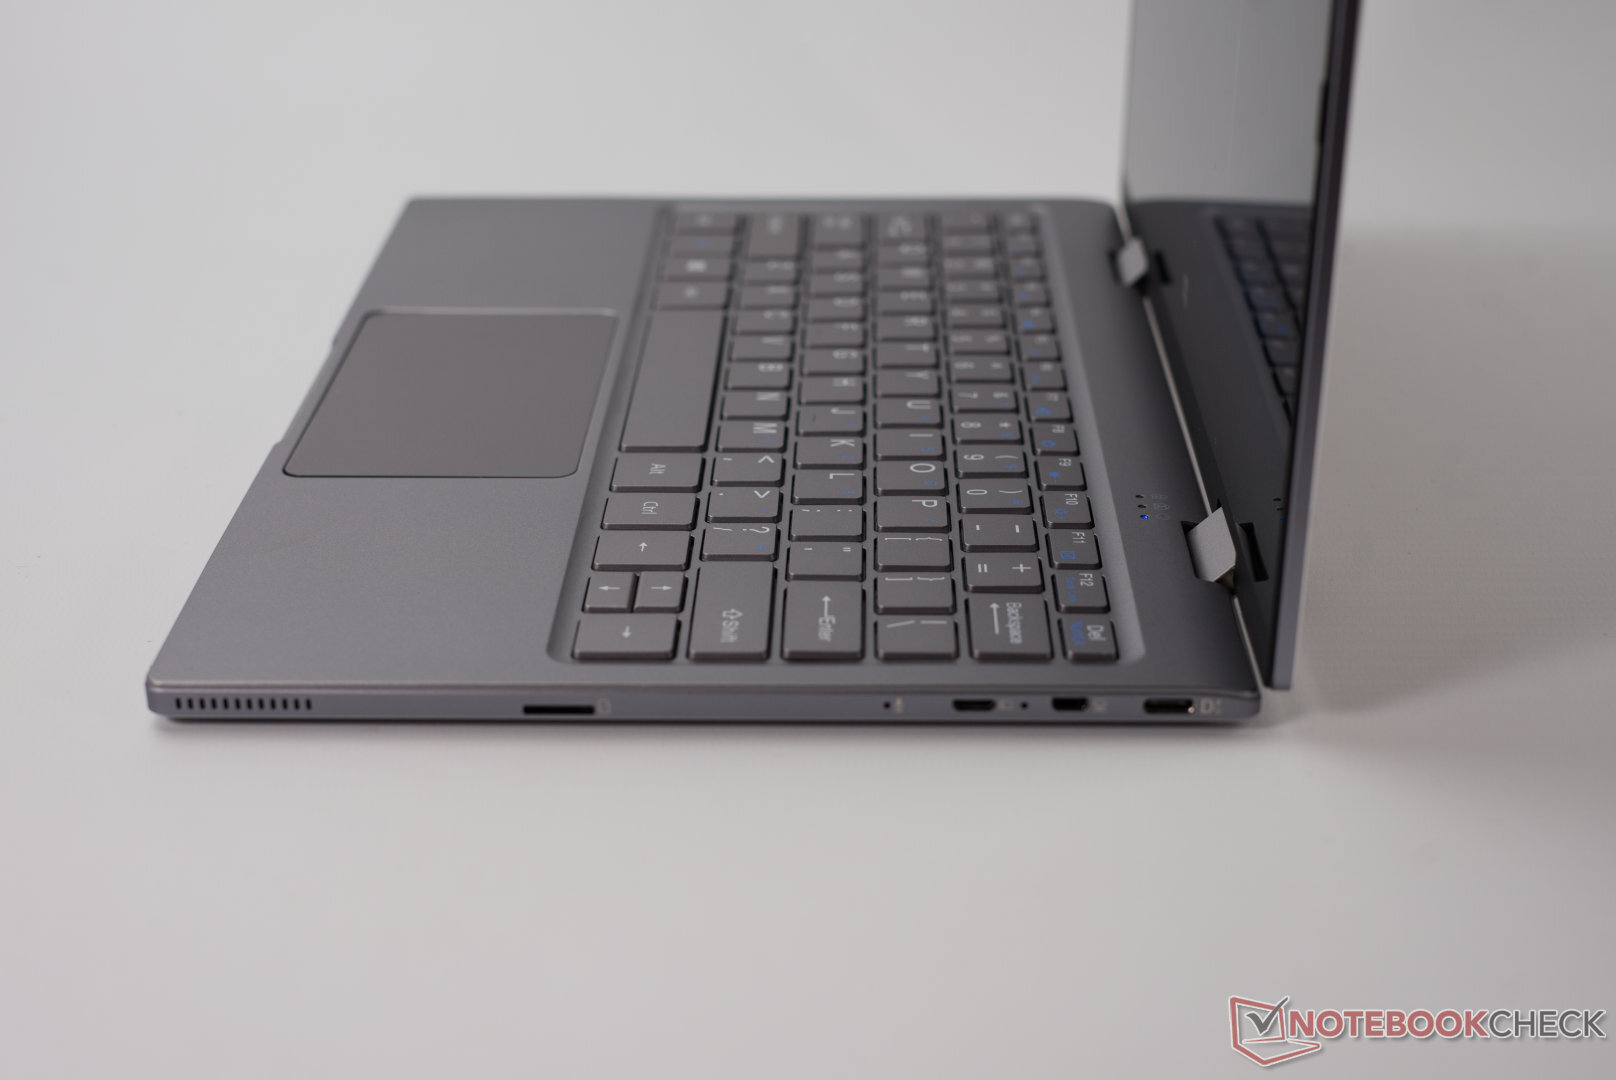
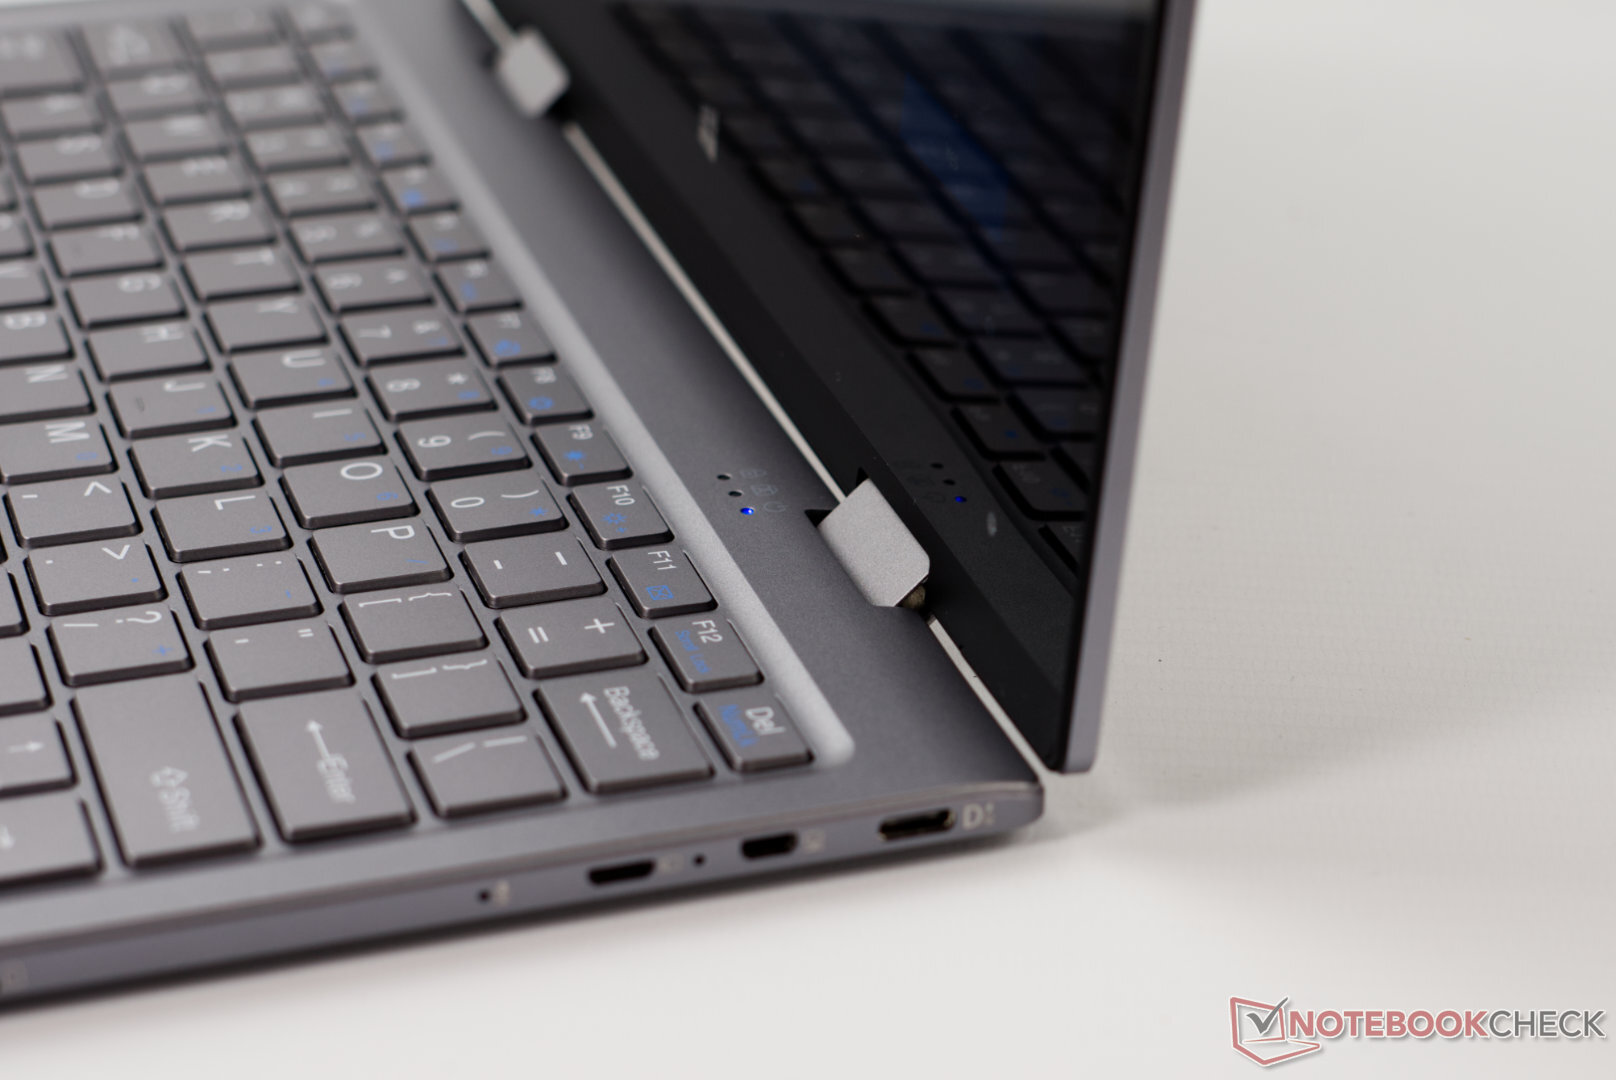
Despite the small dimensions, the BMAX Y11 offers quite a few ports. However, a full size USB Type-A port is unfortunately missing and instead users will have to contend with a small Micro-USB port. At least, a USB Type-A adapter, which worked well in conjunction with both external hard drives and SSDs in our test, is included. The integrated mini-HDMI port is somewhat uncommon and again creates a need for an adapter or specific cables. Meanwhile, the USB Type-C port also supports video output via DisplayPort. While Power Delivery, 4K60 and the integrated USB hub of the LG 27UD88 monitor worked well, we were unable to get the Philips 239P9H to display anything. This shows that USB Type-C is not as hassle-free as it should be. We did not run into any issues with our external USB Type-C battery (Anker PowerCore 20000). With the Inateck USB-C power adapter and the MacBook Pro 16 charger, the BMAX Y11 alternated between mains and battery operation. Unfortunately, the microSD card reader is one of the slower models and only able to transfer data at 25 MB/s in conjunction with our fast Toshiba card.
| SD Card Reader / JPG Copy Test (av. of 3 runs) | |
| Dell Latitude 7400 2-in-1 (Toshiba Exceria Pro M501 UHS-II) | |
| HP Spectre x360 13-ap0312ng (Toshiba Exceria Pro M501 64 GB UHS-II) | |
| Chuwi UBook CWI509 (Toshiba Exceria Pro M501 64 GB UHS-II) | |
| Microsoft Surface Go MHN-00003 (Toshiba Exceria Pro M501) | |
| Average of class Convertible (28.1 - 197, n=23, last 2 years) | |
| Dell Latitude 3189 (Toshiba Exceria Pro M401) | |
| BMAX MaxBook Y11 H1M6 (Toshiba Exceria Pro M501 64 GB UHS-II) | |
| SD Card Reader / AS SSD Seq Read Test (1GB) | |
| Dell Latitude 7400 2-in-1 (Toshiba Exceria Pro M501 UHS-II) | |
| HP Spectre x360 13-ap0312ng (Toshiba Exceria Pro M501 64 GB UHS-II) | |
| Average of class Convertible (28.9 - 254, n=22, last 2 years) | |
| Microsoft Surface Go MHN-00003 (Toshiba Exceria Pro M501) | |
| Dell Latitude 3189 (Toshiba Exceria Pro M401) | |
| Chuwi UBook CWI509 (Toshiba Exceria Pro M501 64 GB UHS-II) | |
| Trekstor Primetab T13B | |
| BMAX MaxBook Y11 H1M6 (Toshiba Exceria Pro M501 64 GB UHS-II) | |
| Chuwi Hi10 Air (Toshiba Exceria Pro M501 microSDXC 64GB) | |
The Y11 relies on the well-known Intel AC 3165 for wireless communication and thus supports Bluetooth 4.2 and Wi-Fi 5. The BMAX performs well compared to other laptops that are equipped with the AC 3165. That being said, the 3165 is still very much an entry-level card compared to other Wi-Fi solutions and falls far behind devices such as the Surface Go, which comes with a Qualcomm module.


Input Devices
With a size of 14x13mm (0.55 x 0.51 inches), the individual keys of the installed chiclet keyboard are fairly small. However, this is an obvious consequence of the small chassis. As mentioned, the visibility of the white key legends is not very good and the lack of a keyboard backlight turns typing in dark environments into a guessing game. That being said, the keyboard felt comfortable while typing even long texts.
It should also be noted that the keys are held in place firmly and that the layout is rather well designed in light of the device's size. Currently, only a keyboard with a US layout is available, which makes using the keyboard even more difficult for international users.
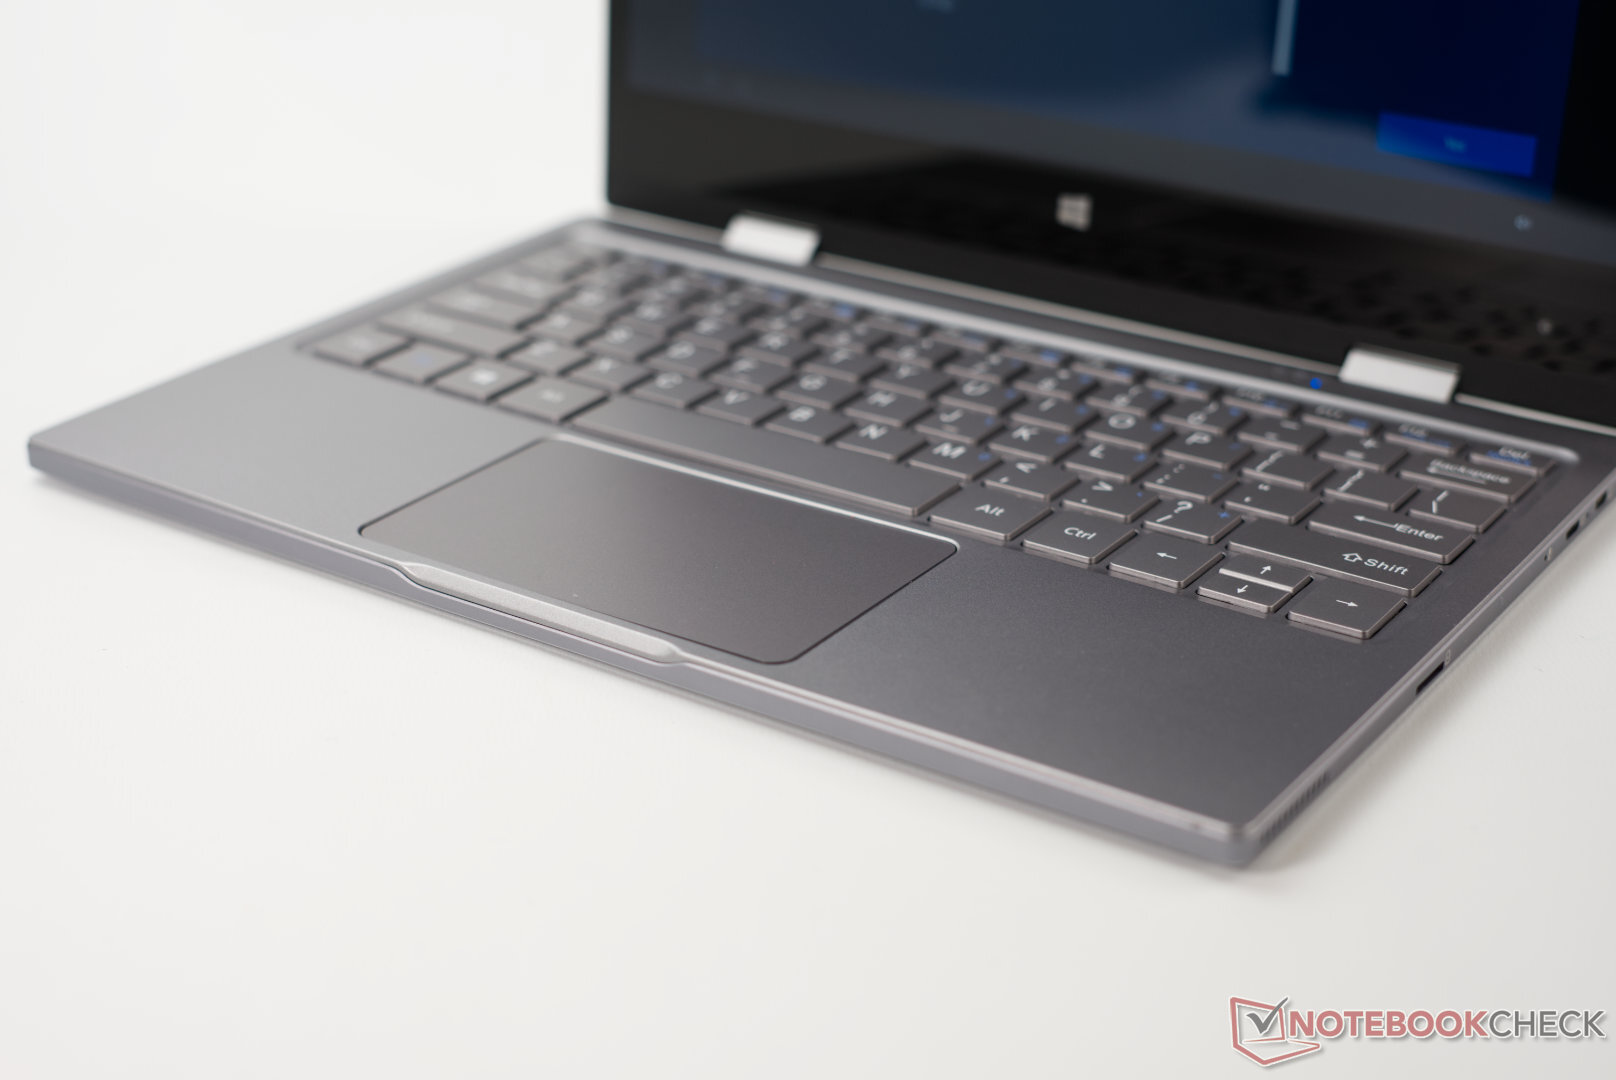
The integrated touchpad uses up all of the remaining surface area, which brings it to an acceptable size. Since it is a ClickPad, there are no dedicated mouse buttons and the plastic surface only offers "good" gliding properties. It is still suitable for occasional use.
Additionally, the Y11 offers a multi-touch screen to enable users to navigate through the OS in tablet mode. The response time is not exactly snappy (due to the weak components). There are noticeable delays during use.
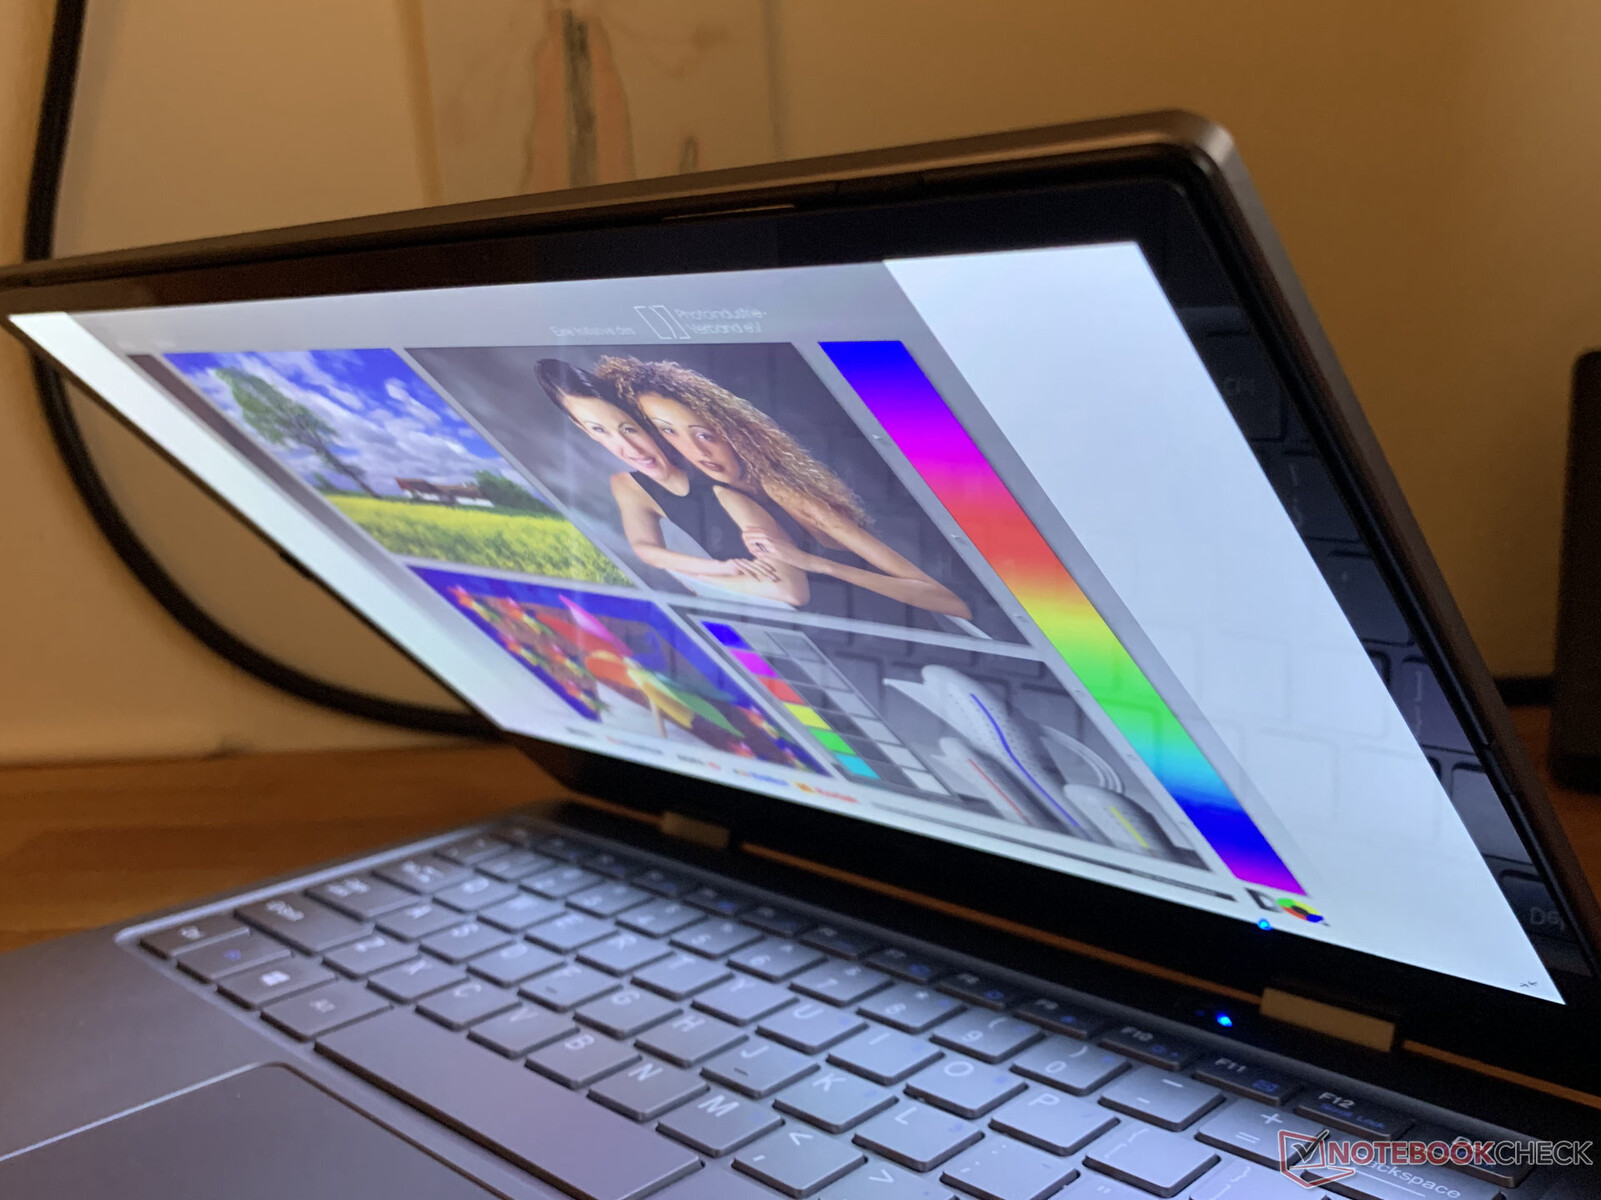
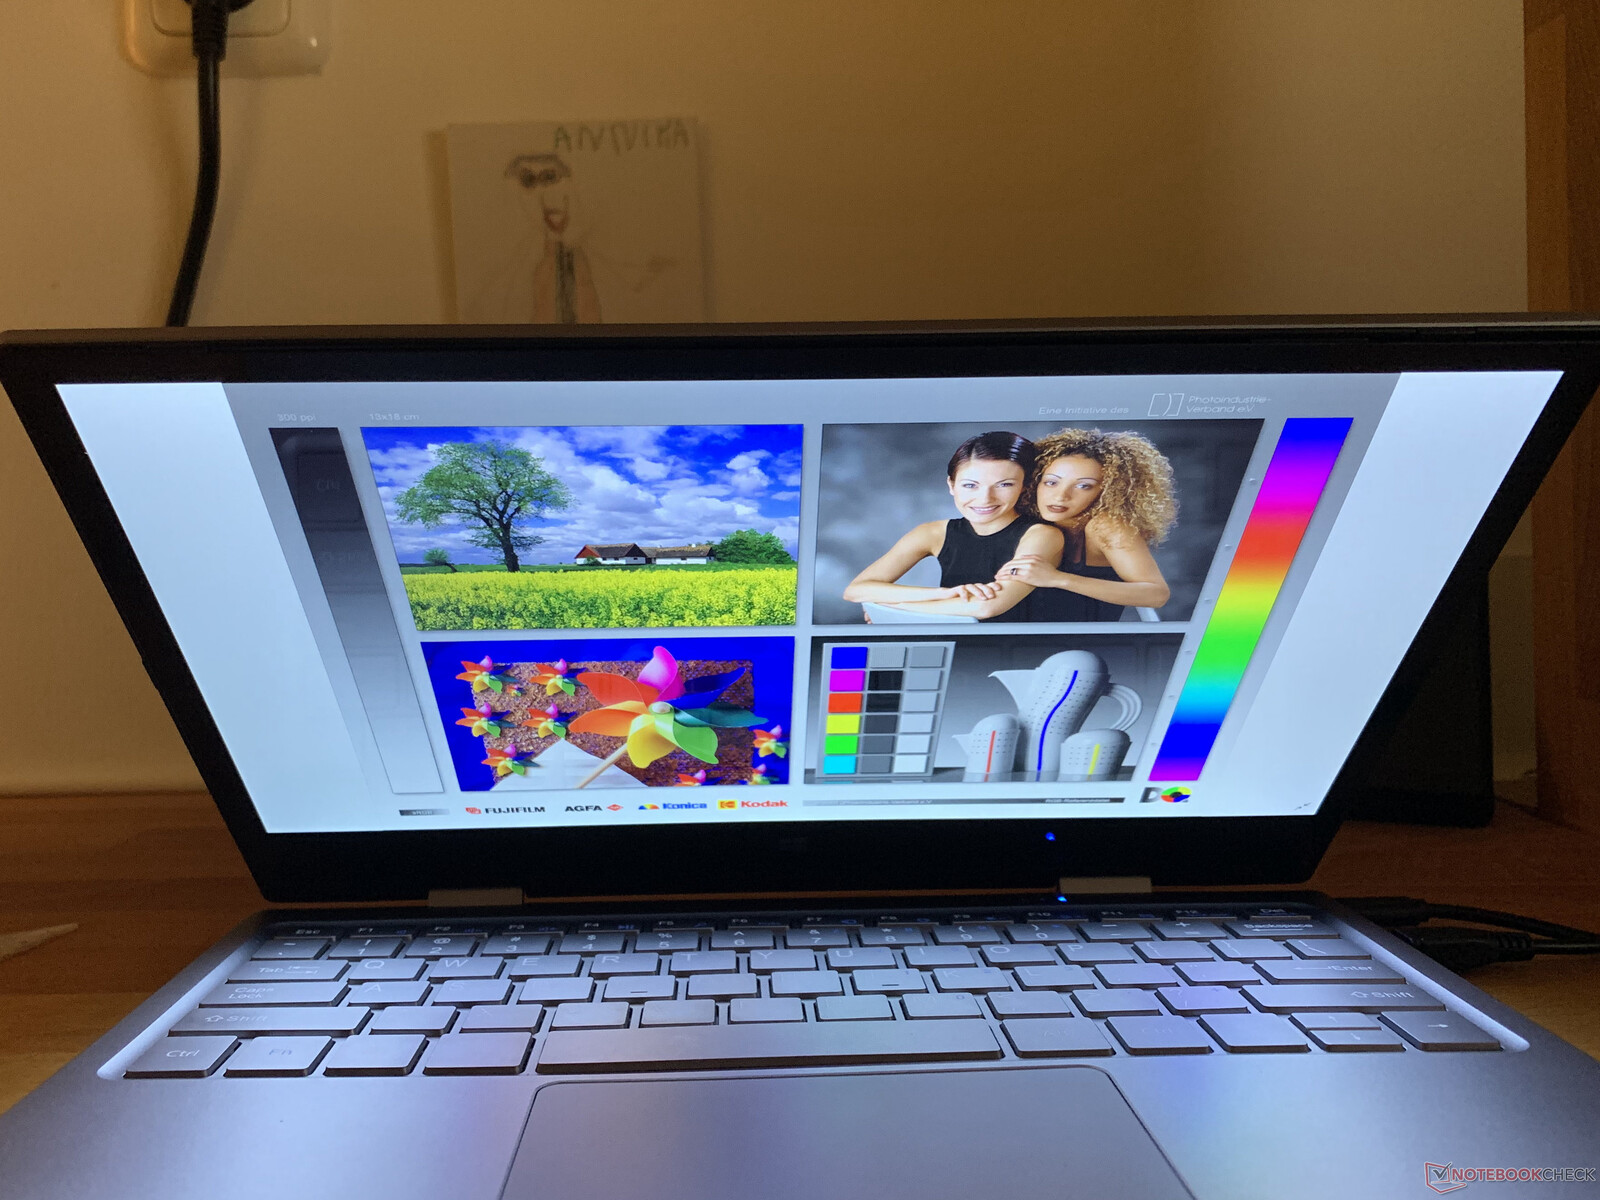
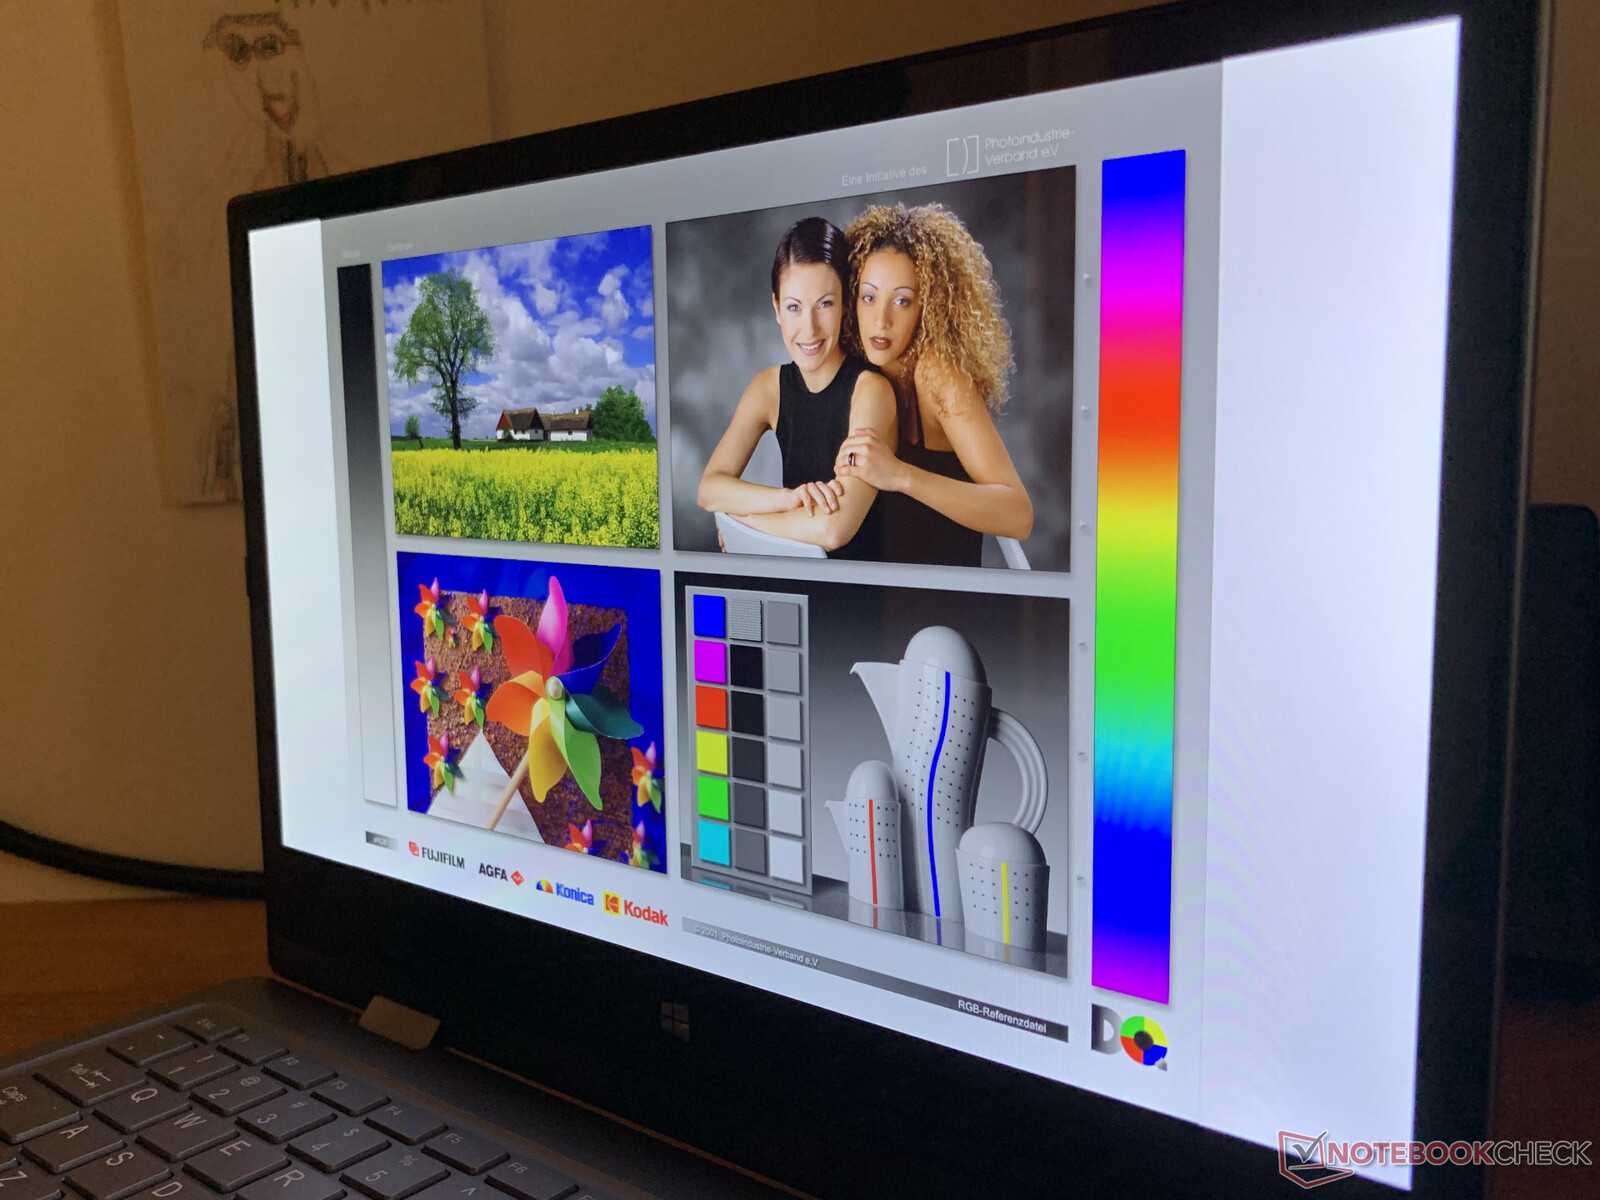
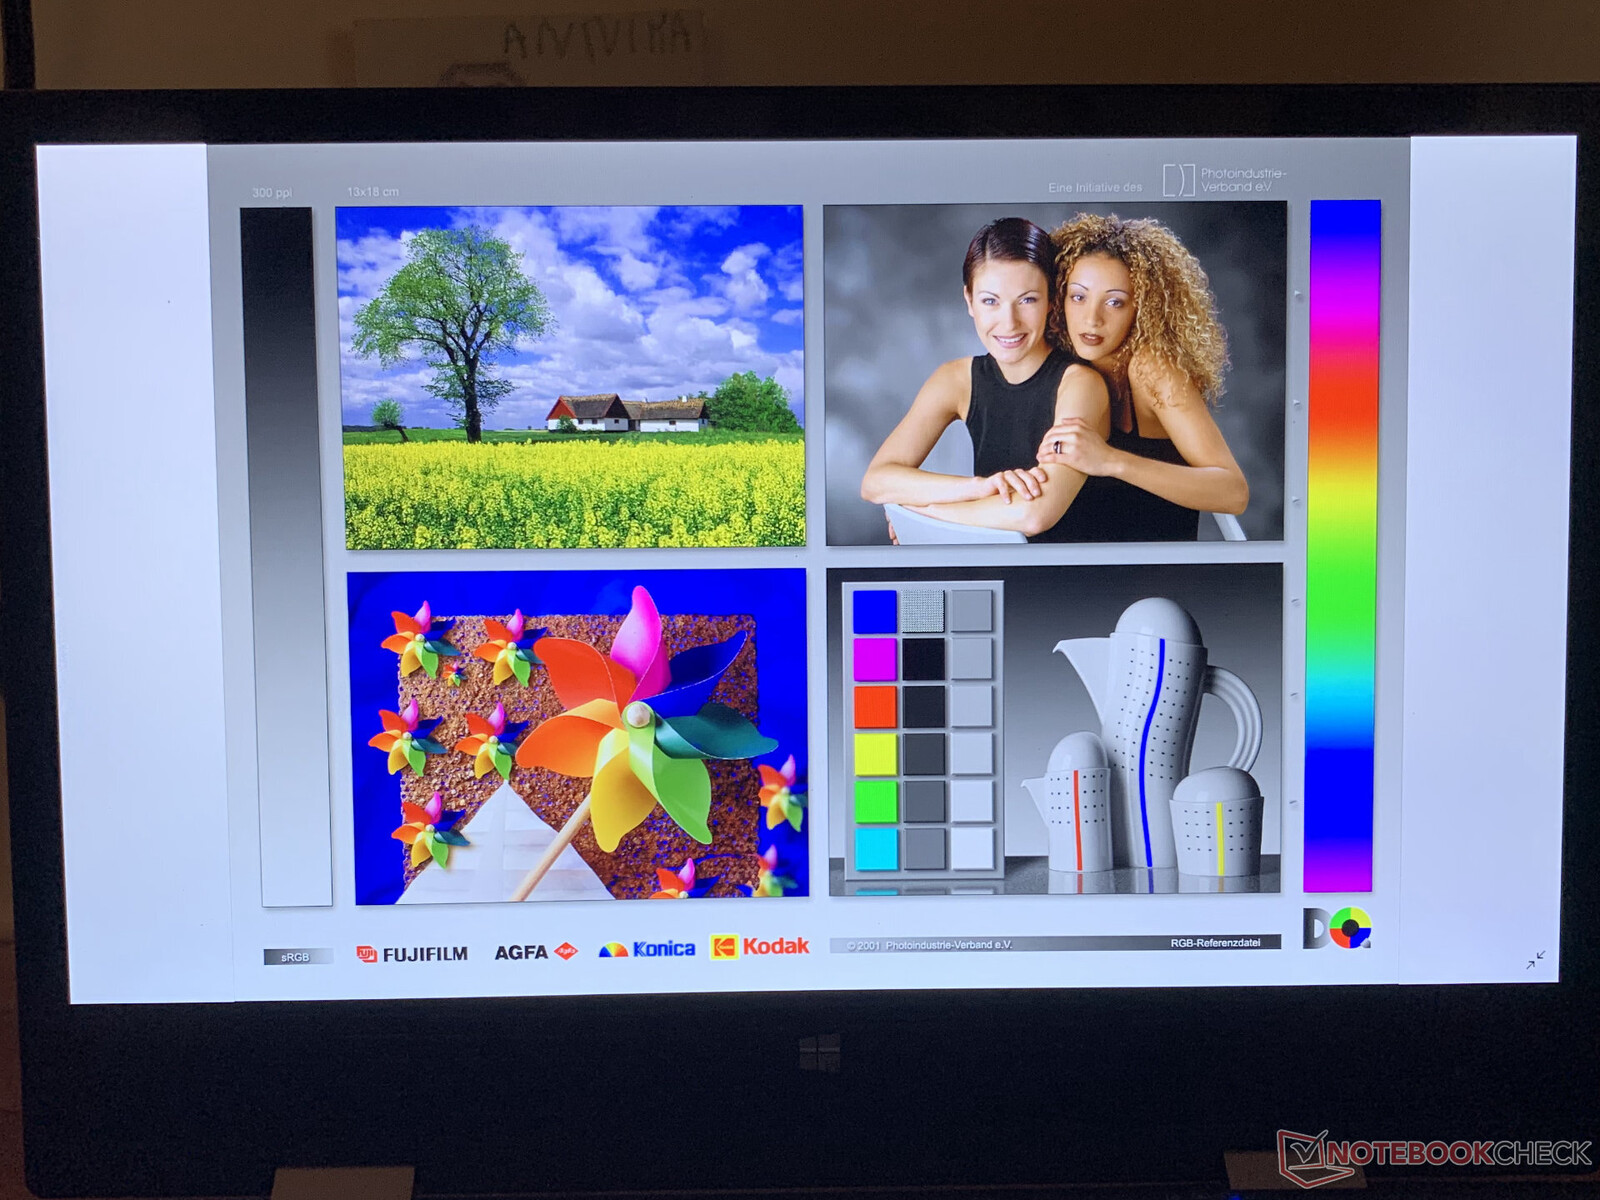
Display
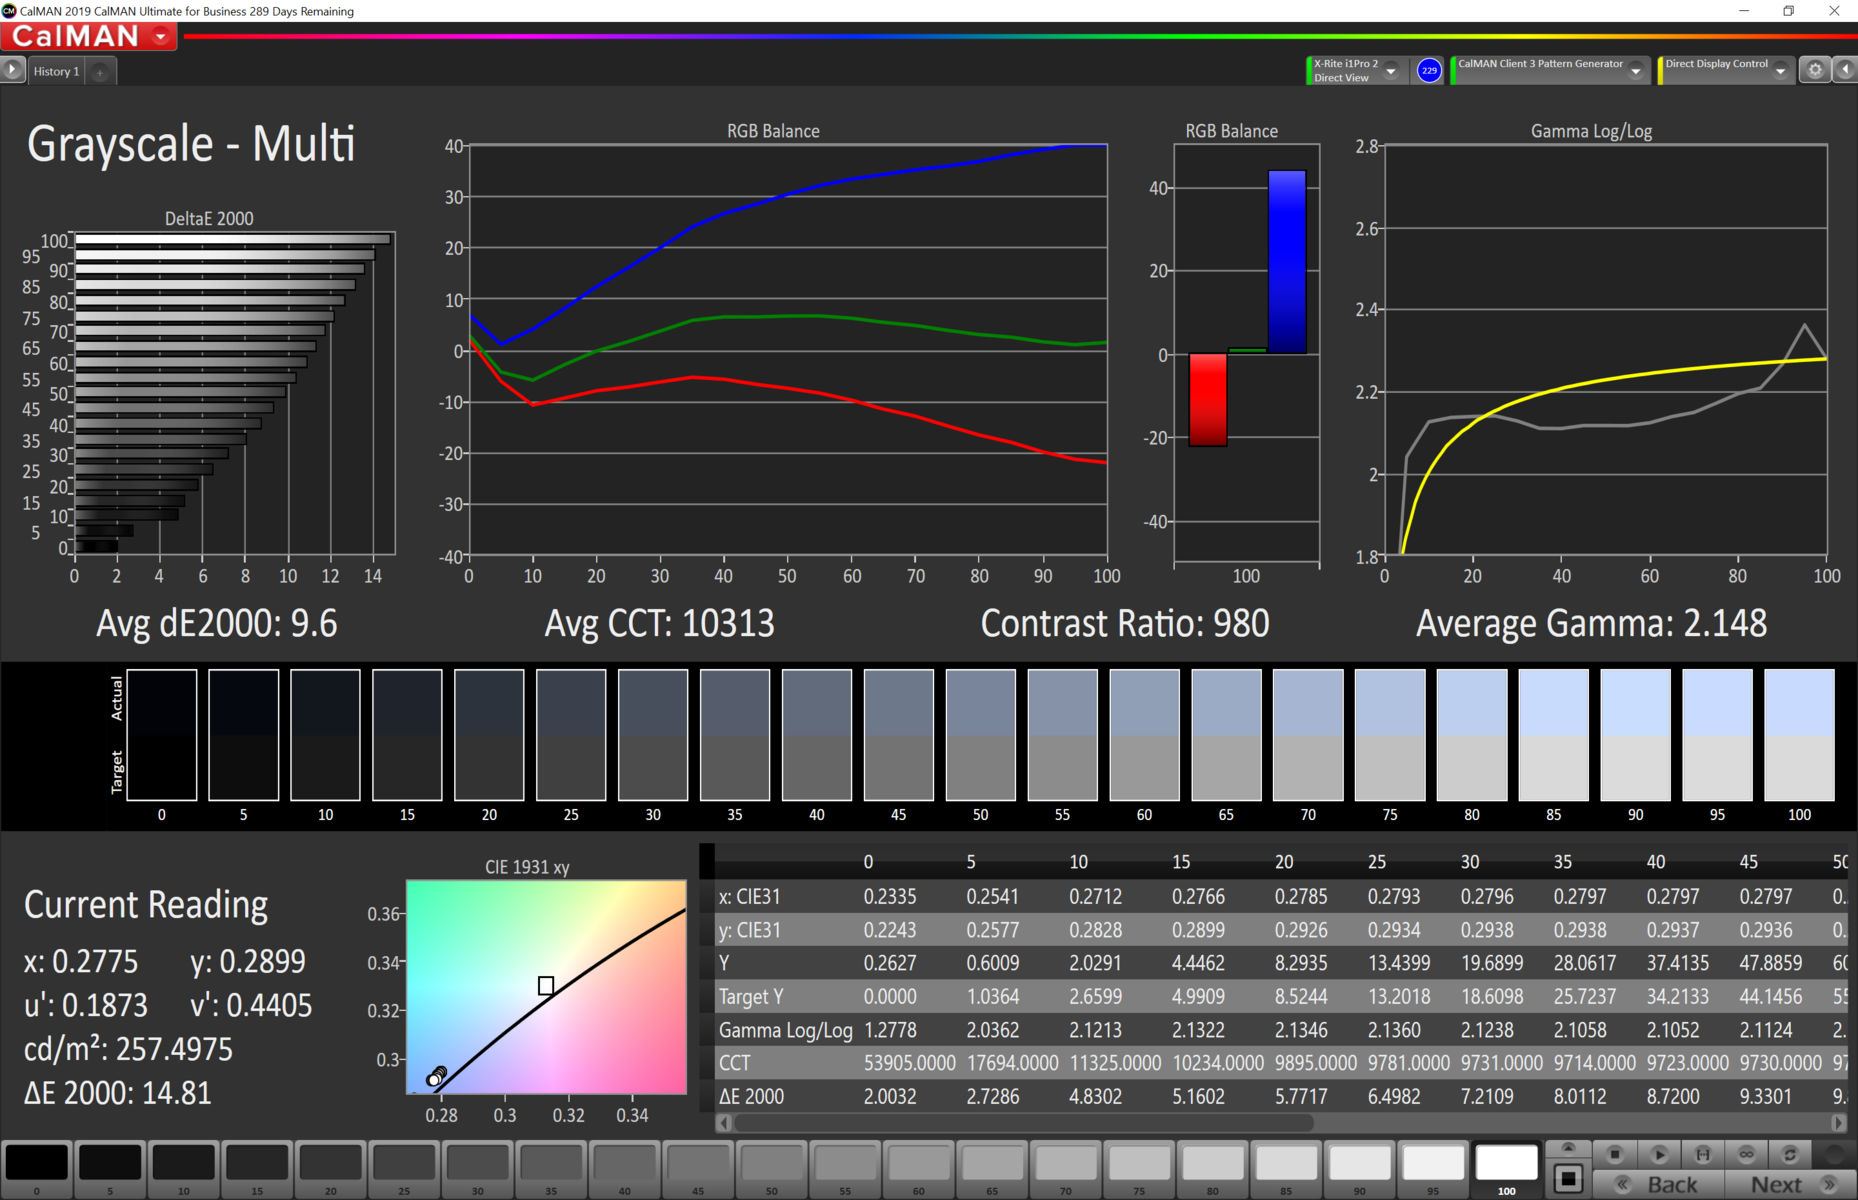
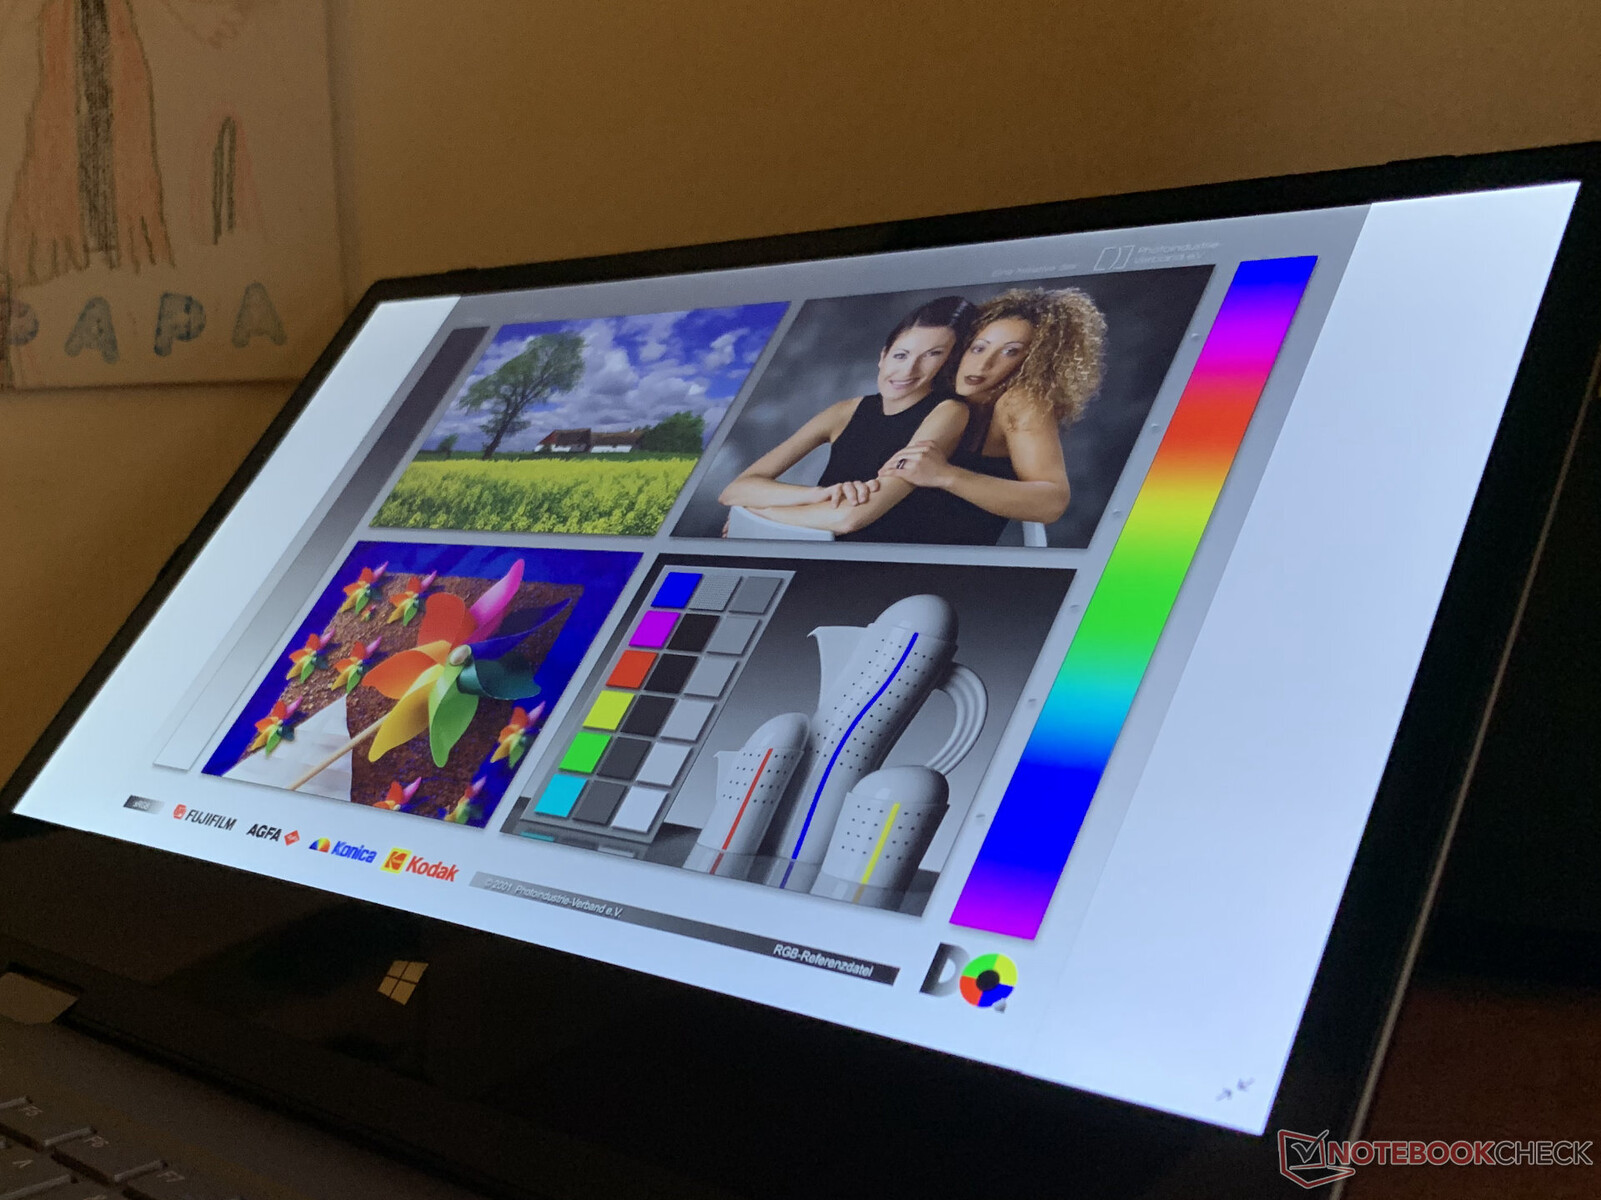
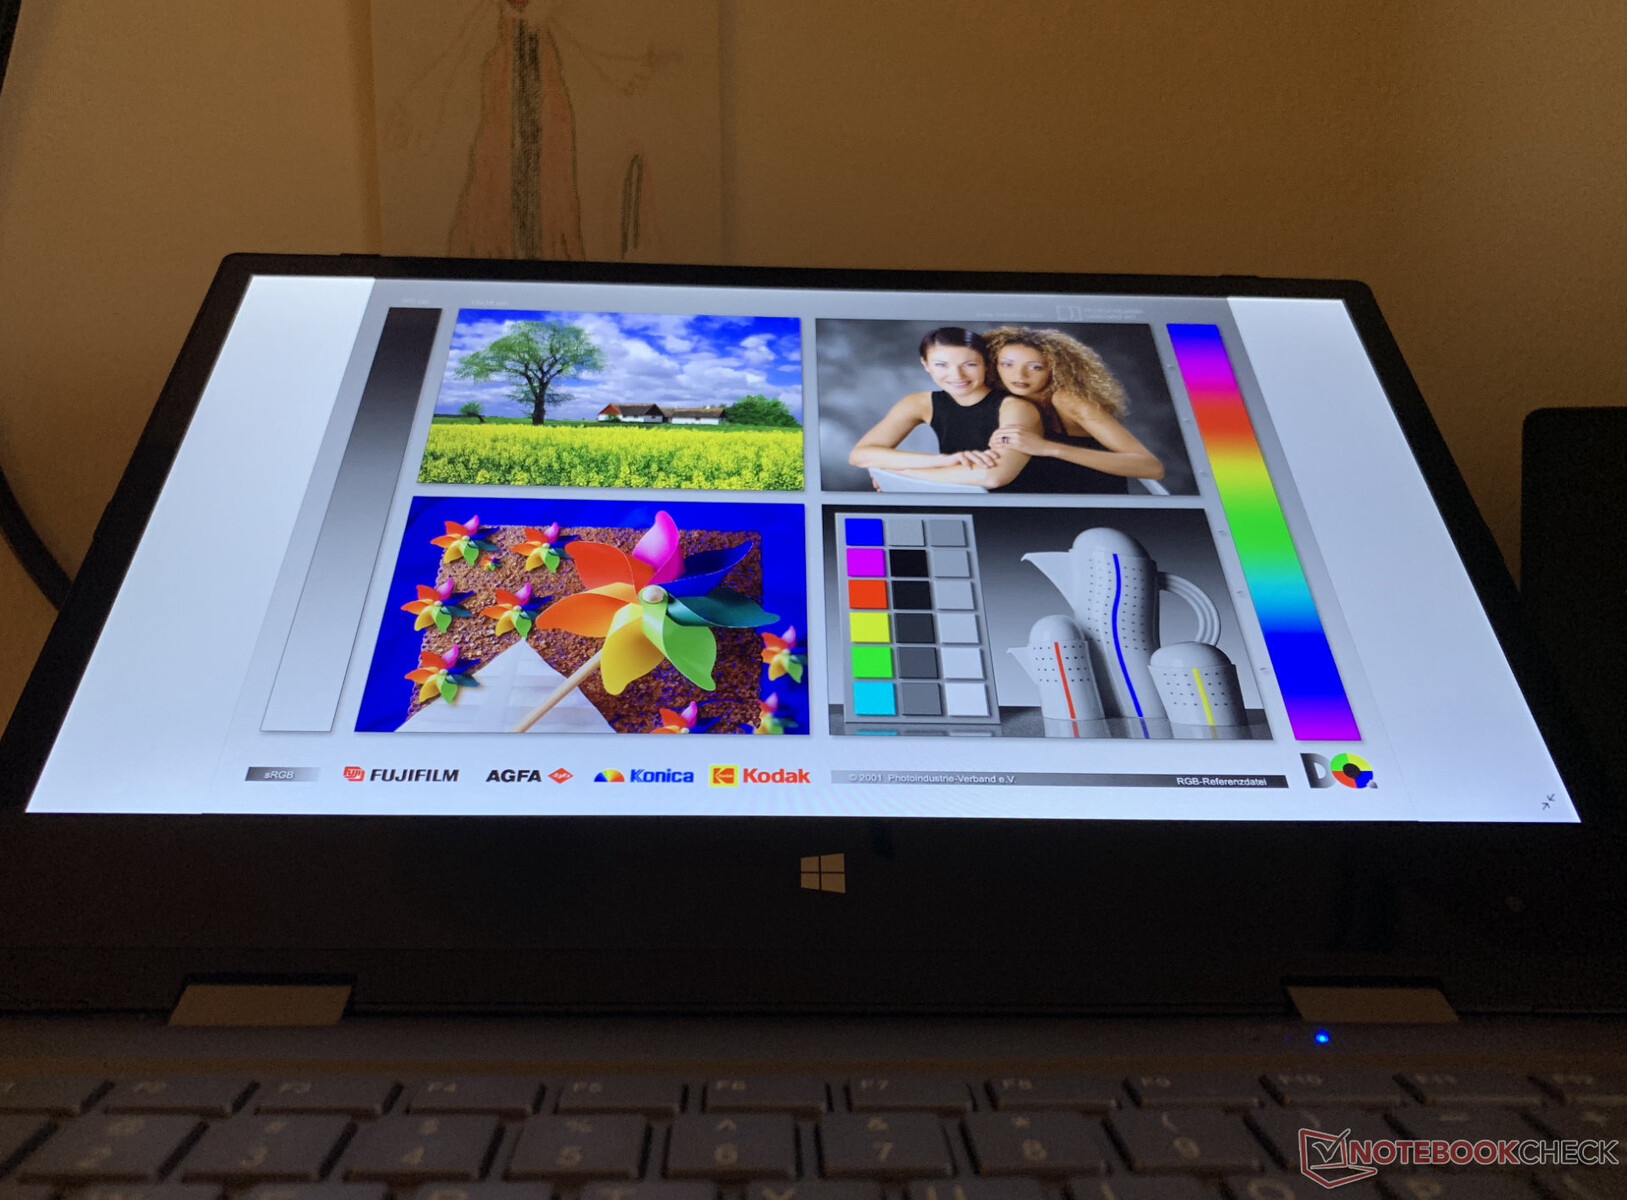
The glossy 11.6-inch display offers a high native resolution of 1920x1080 pixels (Full HD) and a moderate brightness of only 248 cd/m². As a result, users will have to look for shade when using the device outdoors. At 94%, the illumination is excellent. We also did not observe noticeable backlight bleeding during normal use of our test device.
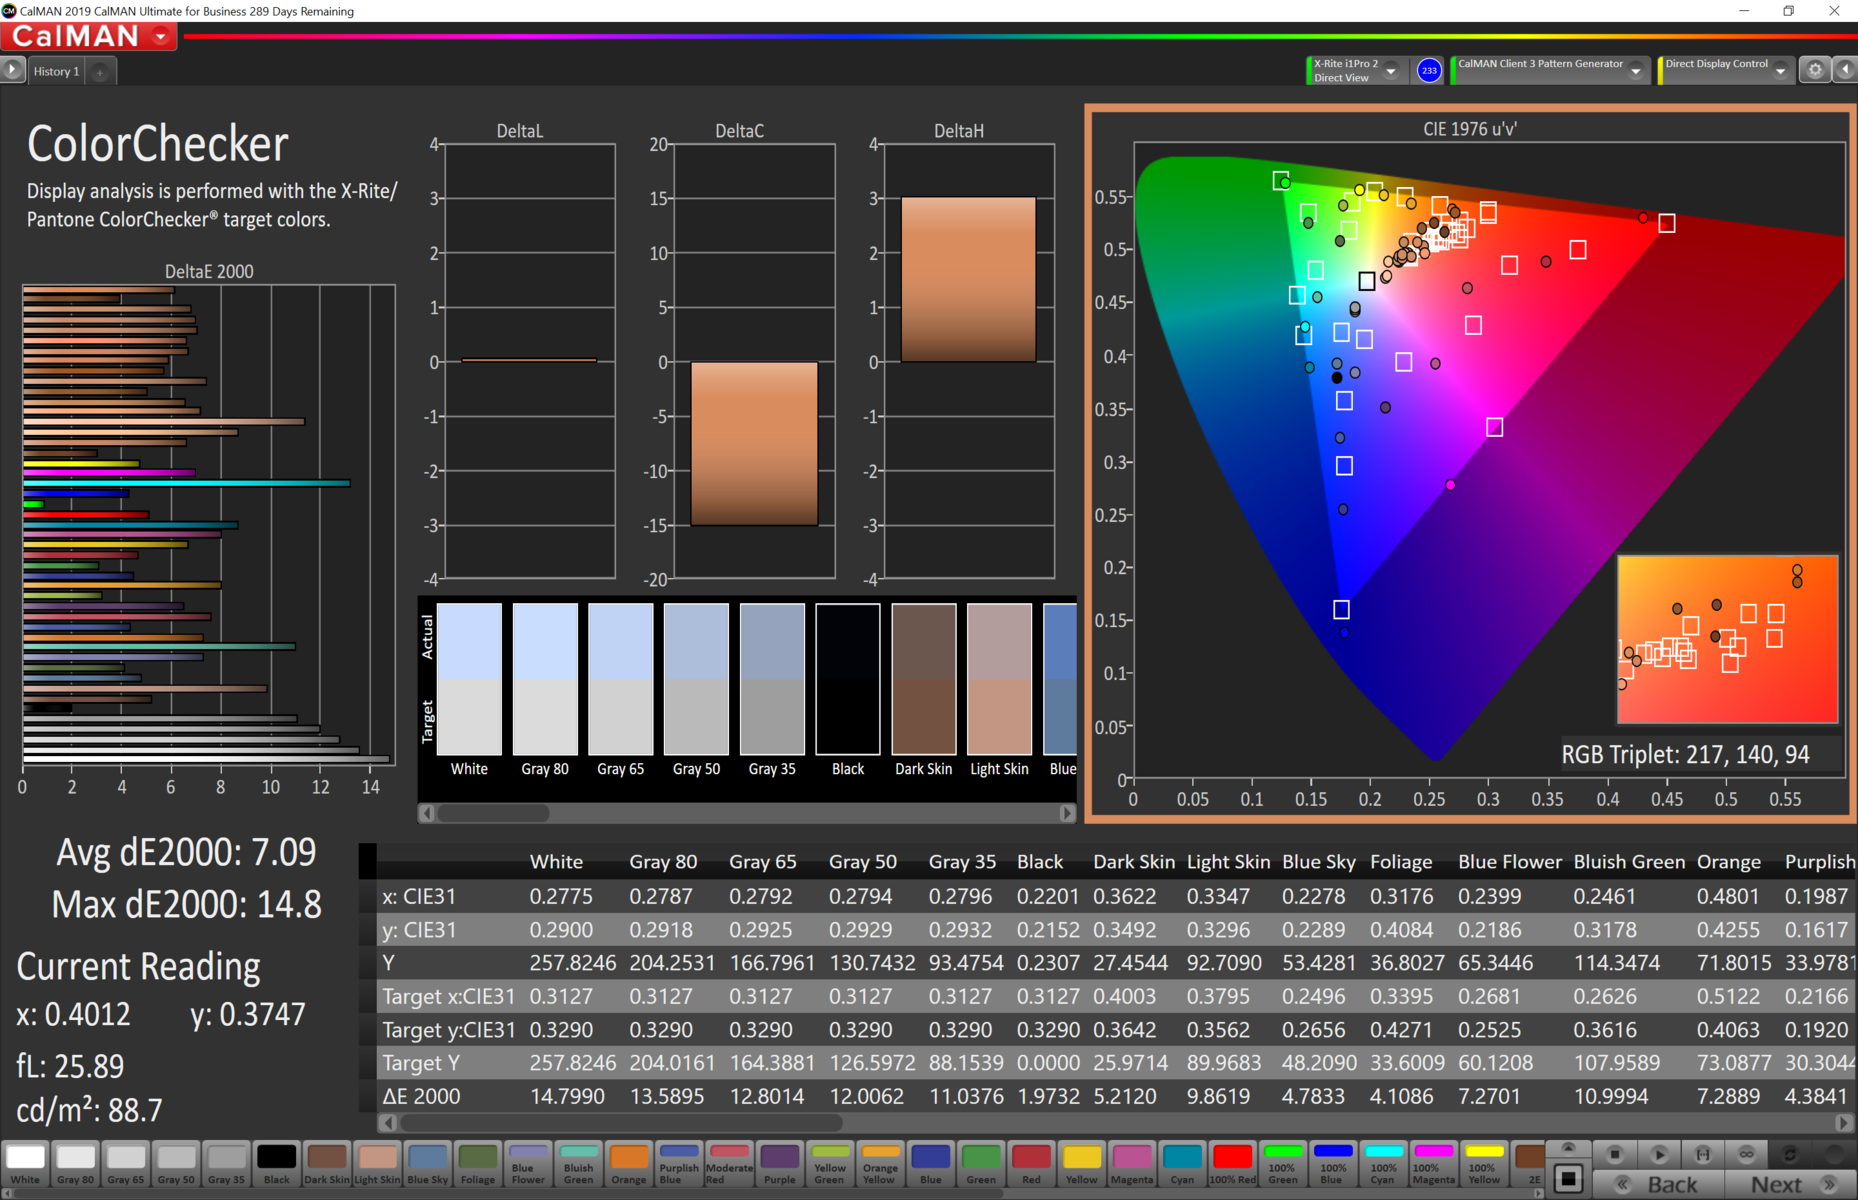
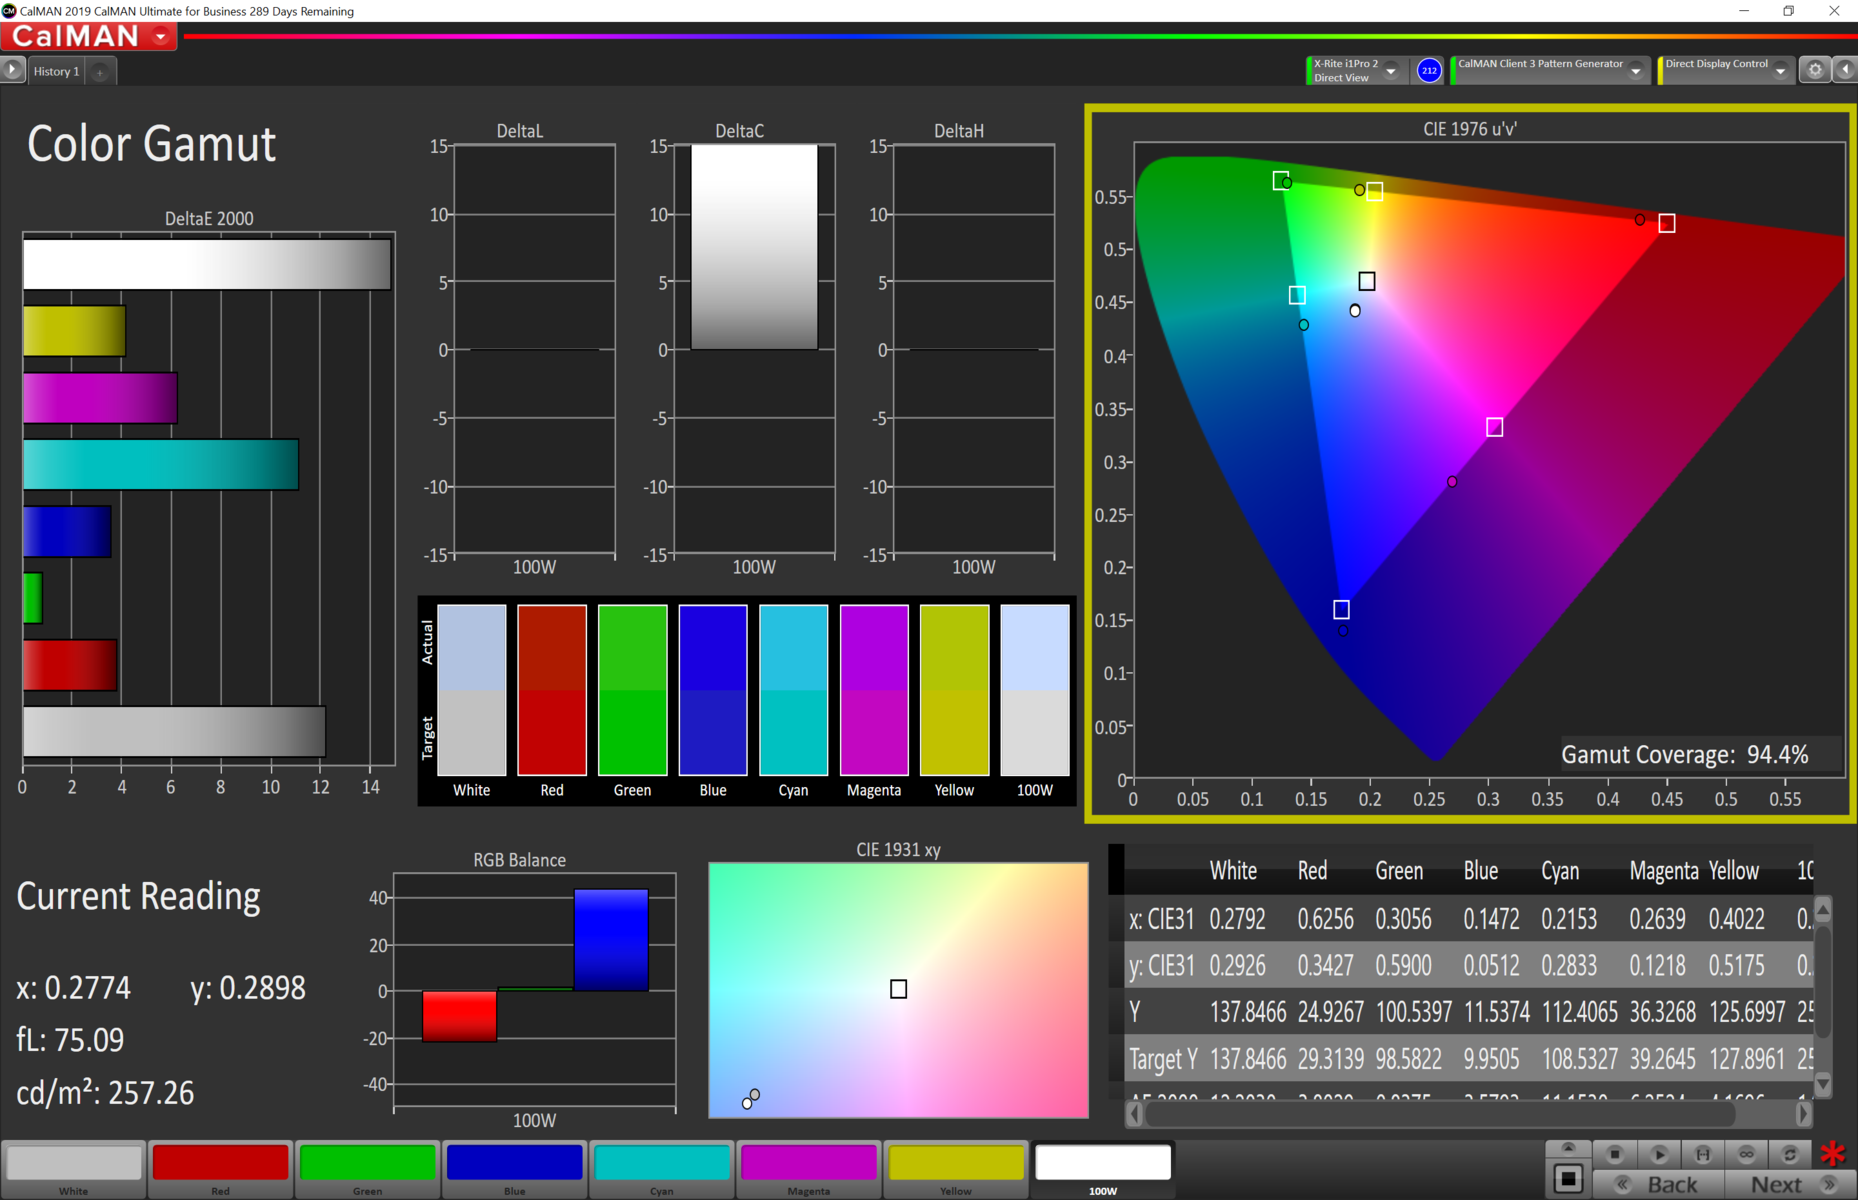
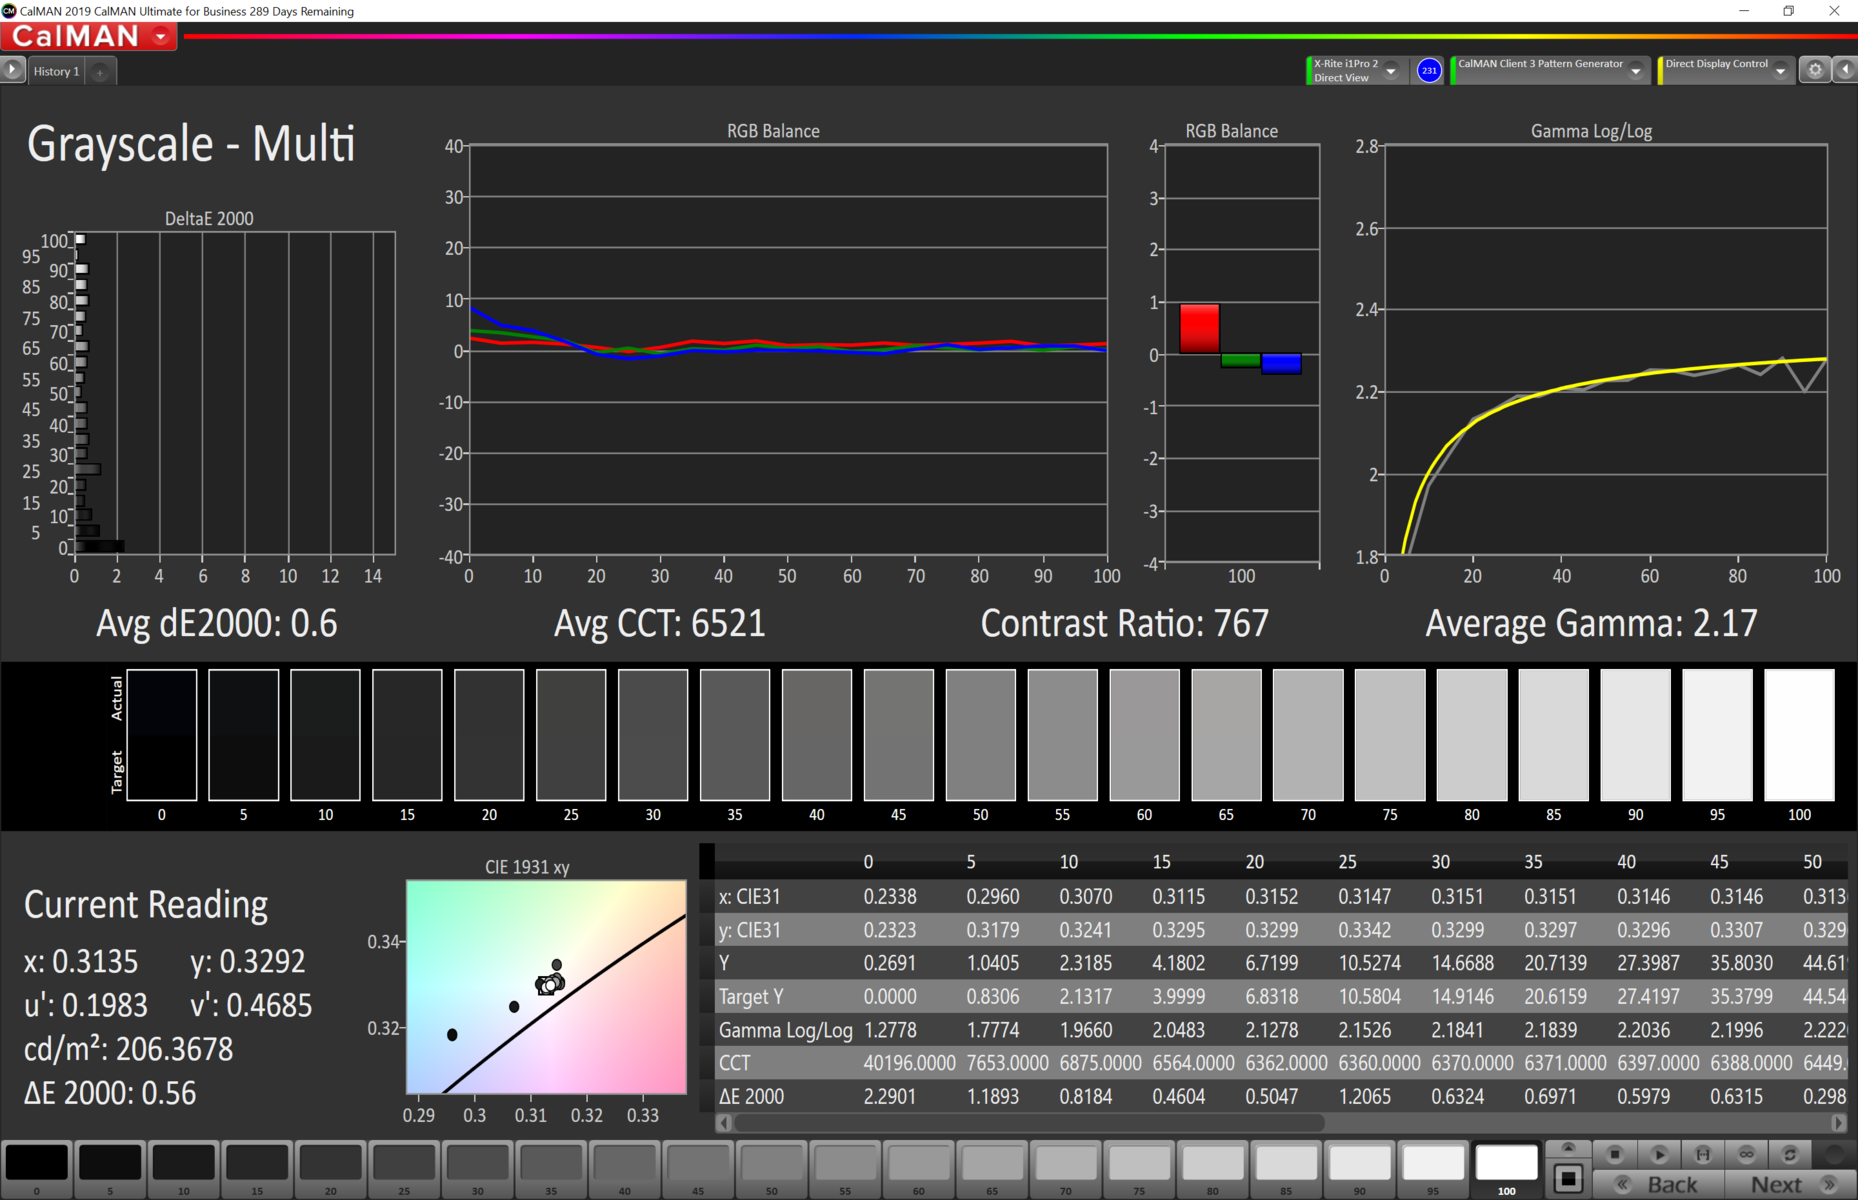
The color accuracy ex-factory is rather weak. The grayscale exhibits a distinct blue tint and our ColorChecker test showed that almost all colors significantly deviate from their ideal values. However, our calibration attempt with the i1Pro 2 significantly improves the colors that, except for bright red and blue tones, are very accurately displayed. The screen then even becomes suitable for photo editing (as always, the free download of our calibration profile can be found in the info box).

| |||||||||||||||||||||||||
Brightness Distribution: 94 %
Center on Battery: 258 cd/m²
Contrast: 992:1 (Black: 0.26 cd/m²)
ΔE ColorChecker Calman: 7.1 | ∀{0.5-29.43 Ø4.72}
calibrated: 1.3
ΔE Greyscale Calman: 9.6 | ∀{0.09-98 Ø4.97}
94.4% sRGB (Calman 2D)
64.2% AdobeRGB 1998 (Argyll 3D)
93.4% sRGB (Argyll 3D)
62.4% Display P3 (Argyll 3D)
Gamma: 2.148
CCT: 10313 K
| BMAX MaxBook Y11 H1M6 LC116LF3L01, IPS, 1920x1080, 11.6" | Microsoft Surface Go MHN-00003 Sharp SHP14A6, IPS, 1800x1200, 10" | Apple iPad 7 2019 IPS, 2160x1620, 10.2" | Acer Spin 1 SP111-31-C79E AU Optronics B116HAN05.0, IPS, 1920x1080, 11.6" | Chuwi LapBook Pro BOE CQ HV140FHNM-N61, IPS, 1920x1080, 14" | HP ProBook x360 11 G4 AU Optronics AUO405C, IPS, 1366x768, 11.6" | Lenovo Yoga Book C930 YB-J912F BOE 0765, IPS, 2560x1660, 10.8" | Microsoft Surface Pro 7 Core i5-1035G4 LG Philips LP123WQ112604, IPS, 2736x1824, 12.3" | |
|---|---|---|---|---|---|---|---|---|
| Display | 5% | -21% | 10% | -30% | 26% | 3% | ||
| Display P3 Coverage (%) | 62.4 | 66.5 7% | 49.67 -20% | 73 17% | 43.78 -30% | 88.5 42% | 66 6% | |
| sRGB Coverage (%) | 93.4 | 97.5 4% | 72.6 -22% | 96.1 3% | 65.7 -30% | 99.9 7% | 93.8 0% | |
| AdobeRGB 1998 Coverage (%) | 64.2 | 67.5 5% | 51.4 -20% | 70.3 10% | 45.27 -29% | 83.2 30% | 66.9 4% | |
| Response Times | -3% | 18% | 11% | -6% | 2% | -4% | 9% | |
| Response Time Grey 50% / Grey 80% * (ms) | 36.1 ? | 44 ? -22% | 38 ? -5% | 36 ? -0% | 42 ? -16% | 40 ? -11% | 43 ? -19% | 34.8 ? 4% |
| Response Time Black / White * (ms) | 30.4 ? | 25.6 ? 16% | 18 ? 41% | 24 ? 21% | 29 ? 5% | 26 ? 14% | 27 ? 11% | 26.4 ? 13% |
| PWM Frequency (Hz) | 20000 ? | 1020 ? | 200 ? | 21550 ? | ||||
| Screen | 48% | 44% | 19% | -12% | 17% | 11% | 14% | |
| Brightness middle (cd/m²) | 258 | 456 77% | 499 93% | 251 -3% | 297 15% | 211 -18% | 351 36% | 480.4 86% |
| Brightness (cd/m²) | 248 | 426 72% | 470 90% | 247 0% | 268 8% | 211 -15% | 338 36% | 485 96% |
| Brightness Distribution (%) | 94 | 88 -6% | 87 -7% | 86 -9% | 77 -18% | 88 -6% | 87 -7% | 91 -3% |
| Black Level * (cd/m²) | 0.26 | 0.31 -19% | 0.49 -88% | 0.21 19% | 0.625 -140% | 0.15 42% | 0.23 12% | 0.48 -85% |
| Contrast (:1) | 992 | 1471 48% | 1018 3% | 1195 20% | 475 -52% | 1407 42% | 1526 54% | 1001 1% |
| Colorchecker dE 2000 * | 7.1 | 1.3 82% | 0.97 86% | 4.27 40% | 5.23 26% | 4.32 39% | 4.59 35% | 5 30% |
| Colorchecker dE 2000 max. * | 14.8 | 3 80% | 1.98 87% | 11 26% | 9.53 36% | 18.44 -25% | 9.81 34% | 7.72 48% |
| Colorchecker dE 2000 calibrated * | 1.3 | 1.1 15% | 3.26 -151% | 2.44 -88% | ||||
| Greyscale dE 2000 * | 9.6 | 1.4 85% | 0.9 91% | 3.77 61% | 6.72 30% | 2.39 75% | 5.2 46% | 5.9 39% |
| Gamma | 2.148 102% | 2.24 98% | 2.135 103% | 2.26 97% | 2.38 92% | 2.38 92% | 2.41 91% | 2.38 92% |
| CCT | 10313 63% | 6687 97% | 6571 99% | 6524 100% | 7015 93% | 6815 95% | 7712 84% | 7805 83% |
| Color Space (Percent of AdobeRGB 1998) (%) | 62.3 | 47 | 63 | 42 | 74 | 60.3 | ||
| Color Space (Percent of sRGB) (%) | 96.8 | 72 | 96 | 65 | 100 | 93.2 | ||
| Total Average (Program / Settings) | 17% /
32% | 31% /
39% | 3% /
9% | -3% /
-6% | -4% /
4% | 11% /
12% | 9% /
11% |
* ... smaller is better
As per usual, the response times of the IPS screen are fairly high. Thus, the ghosting effect will be quite noticeable for hardcore gamers.
Unfortunately, BMAX uses PWM to control the brightness at a level of 25% and below. Since the frequency is in the high 20 kHz range, most users will most likely not be affected and since the display is already very dim at 50%, reducing the brightness further will not be required in most environments.
Display Response Times
| ↔ Response Time Black to White | ||
|---|---|---|
| 30.4 ms ... rise ↗ and fall ↘ combined | ↗ 16.8 ms rise | 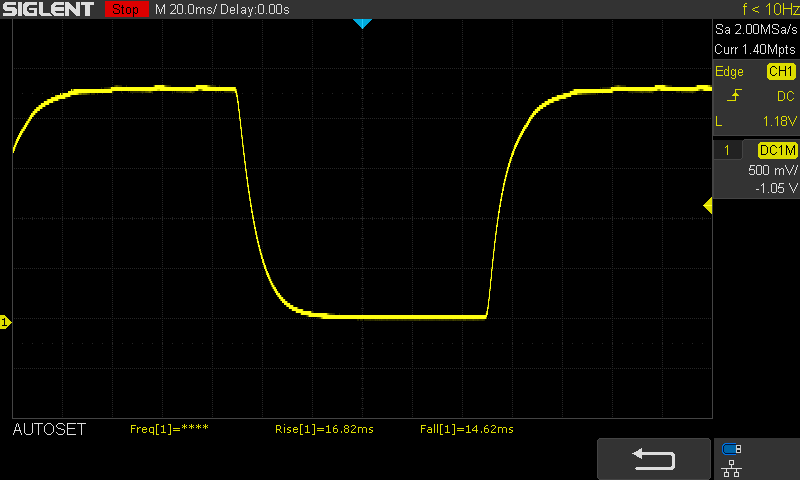 |
| ↘ 14.6 ms fall | ||
| The screen shows slow response rates in our tests and will be unsatisfactory for gamers. In comparison, all tested devices range from 0.1 (minimum) to 240 (maximum) ms. » 82 % of all devices are better. This means that the measured response time is worse than the average of all tested devices (19.8 ms). | ||
| ↔ Response Time 50% Grey to 80% Grey | ||
| 36.1 ms ... rise ↗ and fall ↘ combined | ↗ 16.9 ms rise | 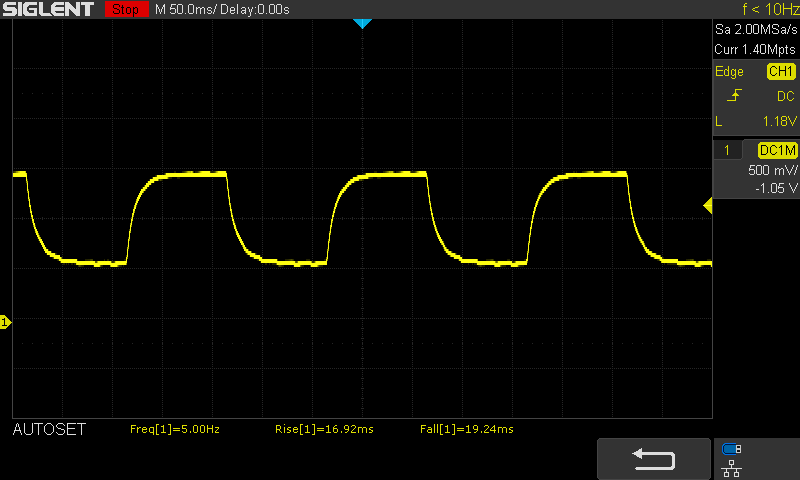 |
| ↘ 19.2 ms fall | ||
| The screen shows slow response rates in our tests and will be unsatisfactory for gamers. In comparison, all tested devices range from 0.165 (minimum) to 636 (maximum) ms. » 52 % of all devices are better. This means that the measured response time is worse than the average of all tested devices (31 ms). | ||
Screen Flickering / PWM (Pulse-Width Modulation)
| Screen flickering / PWM detected | 20000 Hz | ≤ 25 % brightness setting | 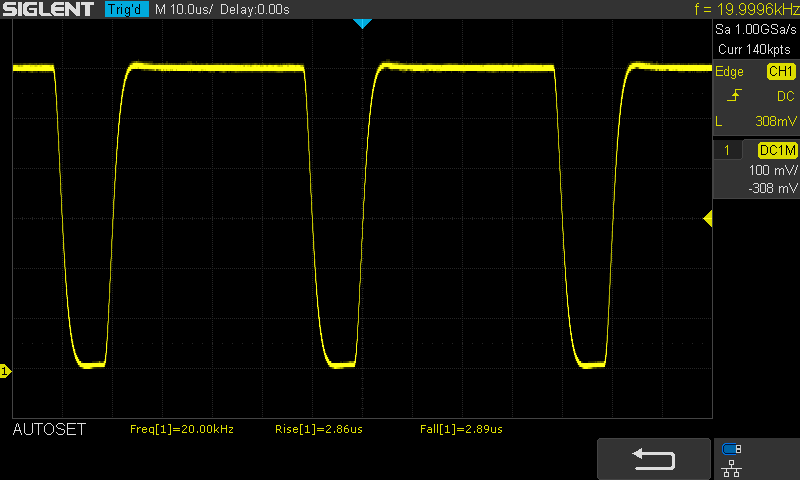 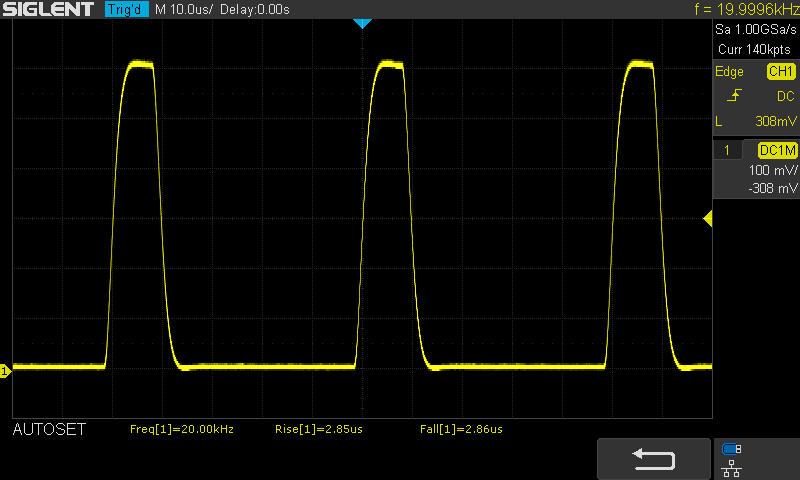  |
The display backlight flickers at 20000 Hz (worst case, e.g., utilizing PWM) Flickering detected at a brightness setting of 25 % and below. There should be no flickering or PWM above this brightness setting. The frequency of 20000 Hz is quite high, so most users sensitive to PWM should not notice any flickering. In comparison: 52 % of all tested devices do not use PWM to dim the display. If PWM was detected, an average of 7753 (minimum: 5 - maximum: 343500) Hz was measured. | |||
The viewing angles are very good thanks to the IPS panel. The colors remain accurate and the observed brightness does not decrease dramatically, either.
Performance
The BMAX is currently equipped with the Intel Celeron N4100 or N4120 (refresh). Both processors are part of the old Gemini Lake generation and based on the 14nm process. They come with four small Tremont cores with a core clock speed of 1.1-2.4 GHz, a UHD Graphics 600 graphics unit and a dual-channel LPDDR4-2400 memory controller. In our case, the Celeron N4100 is accompanied by 8 GB of LPDDR4-2133 RAM. Thankfully, BMAX has opted for an SSD instead of slower eMMC storage. However, the Foresee SATA SSD is a slower model.
Processor
The Celeron N4100 was fairly stable during our test despite the passive cooling and there is only a slight dip after the first Cinebench R15 loop as well as a second dip after the 16th loop. At worst, the performance difference between the maximum and minimum speed amounts to 9%. With a score of 200 points, an average N4100 in our database is slightly faster. The difference is less striking in other CPU benchmarks and the MaxBook Y11 is even slightly faster than average in the long-term blender test.
Geekbench 5.5: Single-Core | Multi-Core
LibreOffice : 20 Documents To PDF
Cinebench R20: CPU (Single Core) | CPU (Multi Core)
Blender: v2.79 BMW27 CPU
7-Zip 18.03: 7z b 4 | 7z b 4 -mmt1
HWBOT x265 Benchmark v2.2: 4k Preset
R Benchmark 2.5: Overall mean
| Cinebench R15 / CPU Single 64Bit | |
| Average of class Convertible (149.8 - 317, n=50, last 2 years) | |
| Eve-Tech Eve V i7 | |
| Topjoy Falcon | |
| Asus N551ZU-CN007H | |
| Chuwi LapBook SE | |
| Chuwi LapBook Pro | |
| Average Intel Celeron N4100 (62 - 71, n=12) | |
| BMAX MaxBook Y11 H1M6 | |
| Jumper EZbook 3 | |
| Teclast Tbook 16 Power | |
| Cinebench R15 / CPU Multi 64Bit | |
| Average of class Convertible (478 - 4940, n=50, last 2 years) | |
| Chuwi LapBook Pro | |
| Eve-Tech Eve V i7 | |
| Topjoy Falcon | |
| Asus N551ZU-CN007H | |
| Average Intel Celeron N4100 (161 - 254, n=12) | |
| BMAX MaxBook Y11 H1M6 | |
| Chuwi LapBook SE | |
| Teclast Tbook 16 Power | |
| Jumper EZbook 3 | |
| Geekbench 5.5 / Single-Core | |
| Average of class Convertible (806 - 2275, n=50, last 2 years) | |
| Asus N551ZU-CN007H | |
| Topjoy Falcon | |
| Chuwi LapBook SE | |
| Average Intel Celeron N4100 (378 - 414, n=7) | |
| BMAX MaxBook Y11 H1M6 | |
| Jumper EZbook 3 | |
| Teclast Tbook 16 Power | |
| Geekbench 5.5 / Multi-Core | |
| Average of class Convertible (1608 - 22023, n=50, last 2 years) | |
| Topjoy Falcon | |
| Asus N551ZU-CN007H | |
| BMAX MaxBook Y11 H1M6 | |
| Average Intel Celeron N4100 (1082 - 1419, n=7) | |
| Chuwi LapBook SE | |
| Teclast Tbook 16 Power | |
| Jumper EZbook 3 | |
| LibreOffice / 20 Documents To PDF | |
| Jumper EZbook 3 | |
| Teclast Tbook 16 Power | |
| Chuwi LapBook SE | |
| BMAX MaxBook Y11 H1M6 | |
| Average Intel Celeron N4100 (155 - 178, n=5) | |
| Topjoy Falcon | |
| Asus N551ZU-CN007H | |
| Eve-Tech Eve V i7 | |
| Average of class Convertible (42.5 - 84.3, n=50, last 2 years) | |
| Cinebench R20 / CPU (Single Core) | |
| Average of class Convertible (273 - 834, n=51, last 2 years) | |
| Eve-Tech Eve V i7 | |
| Eve-Tech Eve V i7 | |
| Asus N551ZU-CN007H | |
| Topjoy Falcon | |
| Chuwi LapBook Pro | |
| Average Intel Celeron N4100 (151 - 155, n=7) | |
| BMAX MaxBook Y11 H1M6 | |
| Chuwi LapBook SE | |
| Jumper EZbook 3 | |
| Teclast Tbook 16 Power | |
| Cinebench R20 / CPU (Multi Core) | |
| Average of class Convertible (595 - 12102, n=51, last 2 years) | |
| Chuwi LapBook Pro | |
| Eve-Tech Eve V i7 | |
| Eve-Tech Eve V i7 | |
| Topjoy Falcon | |
| Average Intel Celeron N4100 (368 - 560, n=7) | |
| Asus N551ZU-CN007H | |
| BMAX MaxBook Y11 H1M6 | |
| Chuwi LapBook SE | |
| Teclast Tbook 16 Power | |
| Jumper EZbook 3 | |
| Blender / v2.79 BMW27 CPU | |
| Jumper EZbook 3 | |
| Teclast Tbook 16 Power | |
| Chuwi LapBook SE | |
| BMAX MaxBook Y11 H1M6 | |
| Average Intel Celeron N4100 (2437 - 3527, n=7) | |
| Topjoy Falcon | |
| Chuwi LapBook Pro | |
| Eve-Tech Eve V i7 | |
| Average of class Convertible (105 - 1051, n=50, last 2 years) | |
| 7-Zip 18.03 / 7z b 4 | |
| Average of class Convertible (12977 - 121368, n=50, last 2 years) | |
| Eve-Tech Eve V i7 | |
| Chuwi LapBook Pro | |
| Topjoy Falcon | |
| Average Intel Celeron N4100 (5620 - 7835, n=7) | |
| BMAX MaxBook Y11 H1M6 | |
| Chuwi LapBook SE | |
| Jumper EZbook 3 | |
| 7-Zip 18.03 / 7z b 4 -mmt1 | |
| Average of class Convertible (3672 - 6655, n=50, last 2 years) | |
| Eve-Tech Eve V i7 | |
| Topjoy Falcon | |
| Average Intel Celeron N4100 (2125 - 2459, n=7) | |
| Chuwi LapBook SE | |
| Chuwi LapBook Pro | |
| BMAX MaxBook Y11 H1M6 | |
| Jumper EZbook 3 | |
| HWBOT x265 Benchmark v2.2 / 4k Preset | |
| Average of class Convertible (3.43 - 36.2, n=50, last 2 years) | |
| Eve-Tech Eve V i7 | |
| Asus N551ZU-CN007H | |
| Chuwi LapBook Pro | |
| Topjoy Falcon | |
| Average Intel Celeron N4100 (0.974 - 1.5, n=6) | |
| BMAX MaxBook Y11 H1M6 | |
| Jumper EZbook 3 | |
| Teclast Tbook 16 Power | |
| R Benchmark 2.5 / Overall mean | |
| Teclast Tbook 16 Power | |
| Jumper EZbook 3 | |
| Chuwi LapBook SE | |
| Average Intel Celeron N4100 (1.75 - 1.786, n=5) | |
| BMAX MaxBook Y11 H1M6 | |
| Topjoy Falcon | |
| Asus N551ZU-CN007H | |
| Eve-Tech Eve V i7 | |
| Average of class Convertible (0.3915 - 0.84, n=50, last 2 years) | |
* ... smaller is better
System Performance
In PCMark 8 and 10, the performance is slightly below average compared to other laptops equipped with the Celeron N4100 as well. The fact that the Y11 falls short of other recent laptops becomes immediately apparent. This can also be felt during daily use. In most tests, the CPU is the limiting factor. The performance is still fast enough for simple tasks such as browsing with a few tabs and using office applications. While Core i3 and Ryzen 3 laptops are noticeably faster most of the time, they do not tend to be passively cooled and are usually bigger.
| PCMark 8 Home Score Accelerated v2 | 1864 points | |
| PCMark 8 Creative Score Accelerated v2 | 2026 points | |
| PCMark 8 Work Score Accelerated v2 | 2838 points | |
| PCMark 10 Score | 1580 points | |
Help | ||
Storage Solution
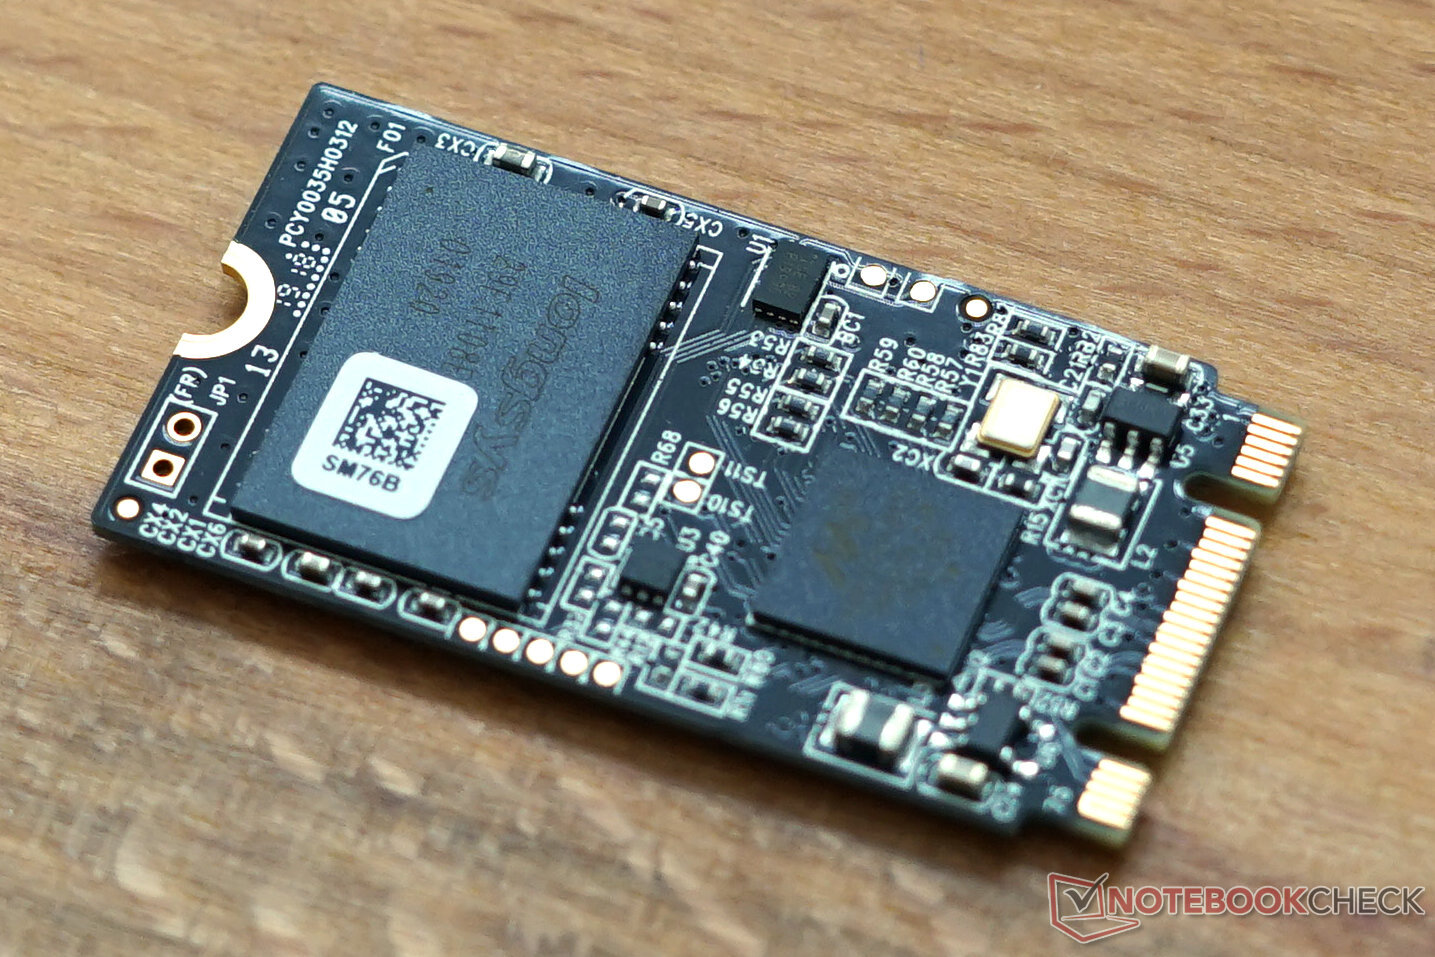
The Foresee M.2 SSD is housed within the handy and easily accessible hatch on the bottom and connected via SATA. With 400-450 MB/s, the sequential data rates are within the normal range.
| BMAX MaxBook Y11 H1M6 FORESEE 256GB | Topjoy Falcon FORESEE 256GB | Lenovo Legion Y740-17IRHg-81UJ001VGE Samsung SSD PM981 MZVLB1T0HALR | Microsoft Surface Go MHN-00003 64 GB eMMC Flash | Average Intel Celeron N4100 | Average of class Convertible | |
|---|---|---|---|---|---|---|
| AS SSD | 9% | 511% | -36% | -15% | 558% | |
| Copy Game MB/s (MB/s) | 114 | 344 202% | 1278 1021% | 76.5 -33% | 206 ? 81% | 1614 ? 1316% |
| Copy Program MB/s (MB/s) | 129.6 | 150 16% | 582 349% | 44.34 -66% | 125.6 ? -3% | 781 ? 503% |
| Copy ISO MB/s (MB/s) | 458 | 474 3% | 2148 369% | 99.1 -78% | 288 ? -37% | 2604 ? 469% |
| Score Total (Points) | 569 | 482 -15% | 4630 714% | 225 -60% | 407 ? -28% | 4284 ? 653% |
| Score Write (Points) | 289 | 257 -11% | 2034 604% | 92 -68% | 190 ? -34% | 2205 ? 663% |
| Score Read (Points) | 181 | 147 -19% | 1729 855% | 88 -51% | 141.8 ? -22% | 1408 ? 678% |
| Access Time Write * (ms) | 0.383 | 0.444 -16% | 0.039 90% | 0.233 39% | 0.628 ? -64% | 0.0835 ? 78% |
| Access Time Read * (ms) | 0.794 | 0.23 71% | 0.05 94% | 0.151 81% | 0.3806 ? 52% | 0.07532 ? 91% |
| 4K-64 Write (MB/s) | 205.1 | 188 -8% | 1697 727% | 44.48 -78% | 126.8 ? -38% | 1740 ? 748% |
| 4K-64 Read (MB/s) | 113.4 | 87.9 -22% | 1406 1140% | 40.27 -64% | 91.5 ? -19% | 920 ? 711% |
| 4K Write (MB/s) | 39.11 | 26.05 -33% | 94.8 142% | 35.07 -10% | 33.9 ? -13% | 165.9 ? 324% |
| 4K Read (MB/s) | 20.03 | 12.06 -40% | 42.77 114% | 18.29 -9% | 14.8 ? -26% | 60.8 ? 204% |
| Seq Write (MB/s) | 445 | 431.4 -3% | 2424 445% | 126.7 -72% | 291 ? -35% | 2993 ? 573% |
| Seq Read (MB/s) | 476 | 472.2 -1% | 2800 488% | 289.8 -39% | 356 ? -25% | 4271 ? 797% |
| DiskSpd | -14% | 4% | -30% | 661% | ||
| 4k q1 t1 write (MB/s) | 44 | 32.42 -26% | 40.19 -9% | 26.4 ? -40% | 144.4 ? 228% | |
| 4k q1 t1 read (MB/s) | 16 | 10 -37% | 21.8 36% | 12.7 ? -21% | 59.6 ? 273% | |
| 4k q32 t16 write (MB/s) | 208 | 100.6 -52% | 117.7 -43% | 124.3 ? -40% | 650 ? 213% | |
| 4k q32 t16 read (MB/s) | 69.3 | 95.1 37% | 112.6 62% | 54.8 ? -21% | 1084 ? 1464% | |
| seq write (MB/s) | 415 | 366.1 -12% | 412.5 -1% | 251 ? -40% | 2927 ? 605% | |
| seq read (MB/s) | 406 | 369.2 -9% | 414.2 2% | 328 ? -19% | 2895 ? 613% | |
| seq q8 t1 write (MB/s) | 477 | 442.2 -7% | 453 -5% | 279 ? -42% | 4510 ? 845% | |
| seq q8 t1 read (MB/s) | 506 | 461.7 -9% | 451.5 -11% | 403 ? -20% | 5812 ? 1049% | |
| Total Average (Program / Settings) | -3% /
0% | 258% /
327% | -36% /
-36% | -23% /
-21% | 610% /
595% |
* ... smaller is better

GPU Performance
Unsurprisingly, the synthetic benchmarks of the integrated Intel UHD Graphics 600 GPU paint the same picture as the processor benchmarks. Compared to other UHD Graphics 600, it comes in at the bottom of the scale. Faster Core models have a significant lead over our GPU. Only previous generations offer even less in terms of graphics performance. Under prolonged load, the GPU also throttles due to the passive cooling. The 3DMark Sky Diver stress test shows a 92.8% after 20 loops, which amounts to a deficit of 7.2% due to throttling for the UHD 600. This should not have a significant impact on gaming.
| 3DMark 06 Standard Score | 3731 points | |
| 3DMark 11 Performance | 519 points | |
| 3DMark Cloud Gate Standard Score | 2687 points | |
| 3DMark Fire Strike Score | 323 points | |
| 3DMark Time Spy Score | 104 points | |
Help | ||
Gaming Performance
The iGPU of the Celeron N4100 and N4120 is only suitable for very undemanding and old games. In our test, we were able to run titles such as Trackmania Nations Forever (now free2play) and Hearthstone. While Counter-Strike: GO ran smoothly in our benchmark, many internet games and other maps cause severe stuttering.
| GTA V - 1024x768 Lowest Settings possible | |
| Average of class Convertible (50.6 - 172, n=40, last 2 years) | |
| Eve-Tech Eve V i7 | |
| Chuwi LapBook Pro | |
| Average Intel UHD Graphics 600 (12.6 - 16, n=2) | |
| BMAX MaxBook Y11 H1M6 | |
| low | med. | high | ultra | |
|---|---|---|---|---|
| World of Warcraft (2005) | 43.9 | 3.3 | ||
| Trackmania Nations Forever (2008) | 153 | 25.1 | 12.3 | |
| Diablo III (2012) | 24.6 | 15.8 | ||
| Counter-Strike: GO (2012) | 44.2 | |||
| StarCraft II: Heart of the Swarm (2013) | 78.8 | 16.3 | ||
| BioShock Infinite (2013) | 19.4 | 11.5 | ||
| GTA V (2015) | 12.6 | 11.6 | ||
| The Witcher 3 (2015) | 4.69 | |||
| Dota 2 Reborn (2015) | 18.3 | 11.9 | 6.1 | 5.7 |
| Rocket League (2017) | 14.4 | |||
| World of Tanks enCore (2018) | 34.8 | 4.63 | ||
| Strange Brigade (2018) | 8 | |||
| Forza Horizon 4 (2018) | 5.1 | |||
| F1 2019 (2019) | 5.66 | |||
| Fall Guys (2020) | 11.3 | |||
| Hearthstone (2020) | 29 | 28.9 | 14.9 | |
| Gears Tactics (2020) | 5.1 | |||
| Valorant (2020) | 31.9 | 12.8 | 11.3 |
Emissions & Energy
System Noise
The economical Celeron N4100 does not need active cooling, which means the Y11 is completely silent even while under load. We also did not observe coil whine or electronic noise on our test device.
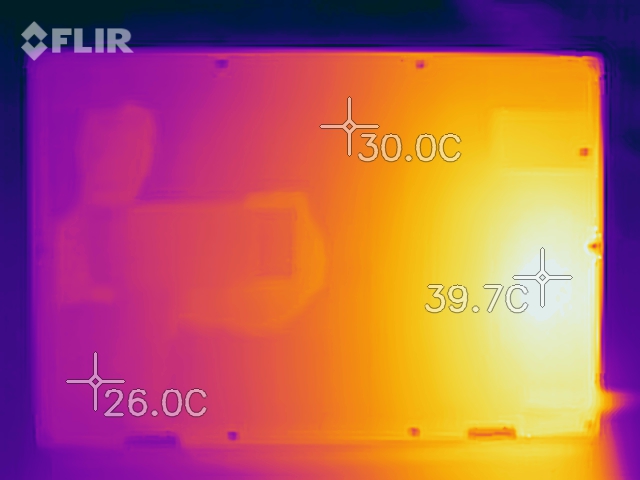
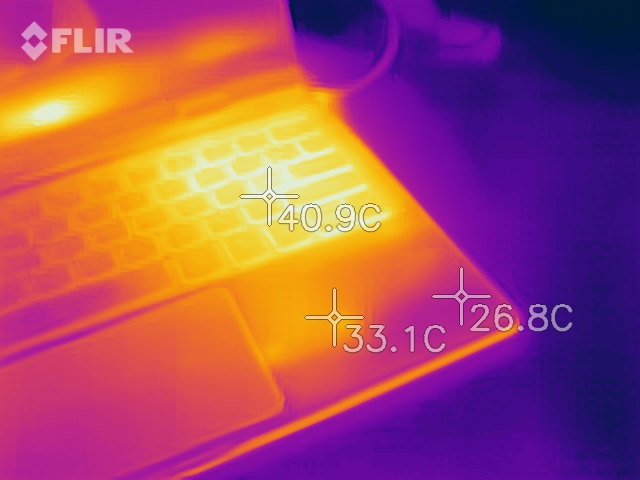
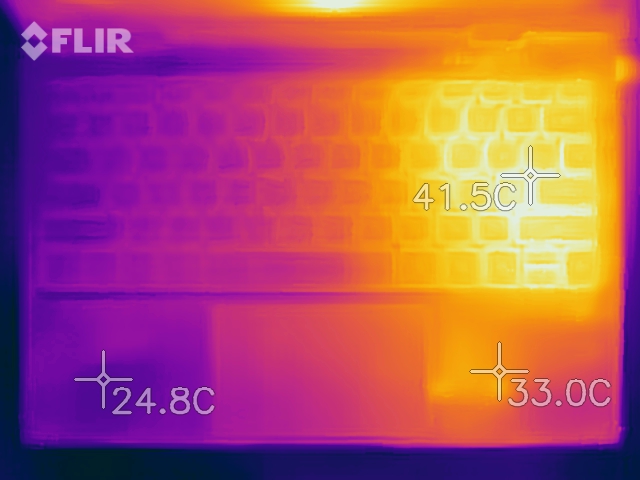
Temperature
In spite of the passive cooling and the compact chassis, the surface temperatures of the Y11 do not reach critical levels. Our calibrated probe registered a peak temperature of 38 °C (100.4 °F) after a prolonged period of extreme stress.
(+) The maximum temperature on the upper side is 37 °C / 99 F, compared to the average of 35.4 °C / 96 F, ranging from 19.6 to 60 °C for the class Convertible.
(+) The bottom heats up to a maximum of 38 °C / 100 F, compared to the average of 36.9 °C / 98 F
(+) In idle usage, the average temperature for the upper side is 24.4 °C / 76 F, compared to the device average of 30.3 °C / 87 F.
(+) The palmrests and touchpad are cooler than skin temperature with a maximum of 30 °C / 86 F and are therefore cool to the touch.
(±) The average temperature of the palmrest area of similar devices was 28 °C / 82.4 F (-2 °C / -3.6 F).
The thermal image shows the hot spot above the Celeron N4100 SoC.
Speakers
Unfortunately, the installed speakers do not reach a very high maximum volume and due to their mediocre characteristics, they will not be satisfactory for audiophiles. That being said, they are still suitable for undemanding sound applications and listening to YouTube in quiet environments.
BMAX MaxBook Y11 H1M6 audio analysis
(-) | not very loud speakers (71.1 dB)
Bass 100 - 315 Hz
(±) | reduced bass - on average 11.9% lower than median
(±) | linearity of bass is average (12.5% delta to prev. frequency)
Mids 400 - 2000 Hz
(±) | higher mids - on average 7.1% higher than median
(±) | linearity of mids is average (8.6% delta to prev. frequency)
Highs 2 - 16 kHz
(+) | balanced highs - only 3.9% away from median
(±) | linearity of highs is average (11.8% delta to prev. frequency)
Overall 100 - 16.000 Hz
(±) | linearity of overall sound is average (25.1% difference to median)
Compared to same class
» 76% of all tested devices in this class were better, 7% similar, 17% worse
» The best had a delta of 6%, average was 20%, worst was 57%
Compared to all devices tested
» 77% of all tested devices were better, 5% similar, 18% worse
» The best had a delta of 4%, average was 23%, worst was 134%
Apple MacBook 12 (Early 2016) 1.1 GHz audio analysis
(+) | speakers can play relatively loud (83.6 dB)
Bass 100 - 315 Hz
(±) | reduced bass - on average 11.3% lower than median
(±) | linearity of bass is average (14.2% delta to prev. frequency)
Mids 400 - 2000 Hz
(+) | balanced mids - only 2.4% away from median
(+) | mids are linear (5.5% delta to prev. frequency)
Highs 2 - 16 kHz
(+) | balanced highs - only 2% away from median
(+) | highs are linear (4.5% delta to prev. frequency)
Overall 100 - 16.000 Hz
(+) | overall sound is linear (10.2% difference to median)
Compared to same class
» 7% of all tested devices in this class were better, 2% similar, 91% worse
» The best had a delta of 5%, average was 18%, worst was 53%
Compared to all devices tested
» 5% of all tested devices were better, 1% similar, 94% worse
» The best had a delta of 4%, average was 23%, worst was 134%
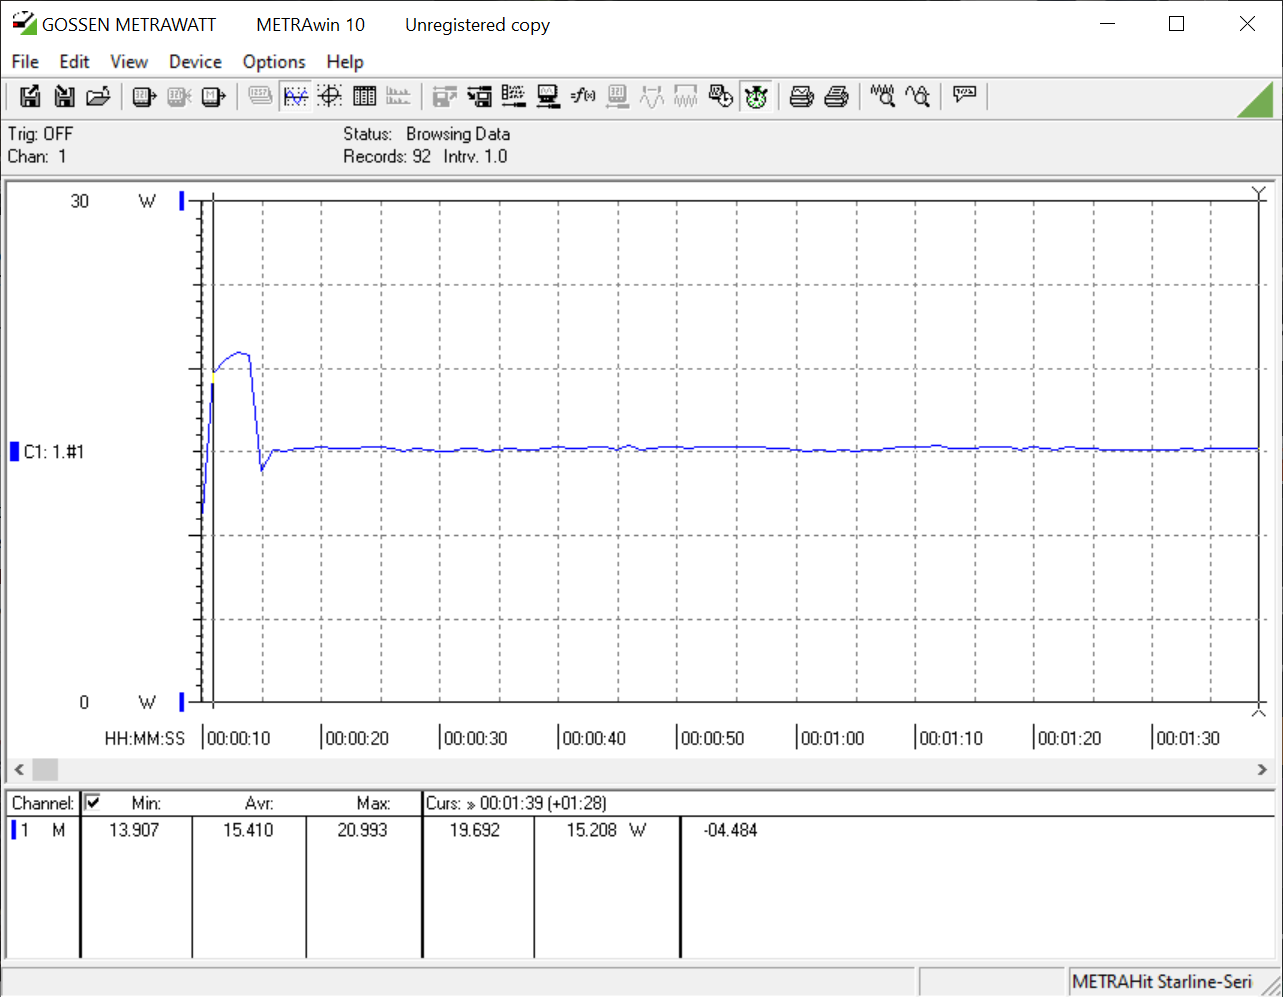
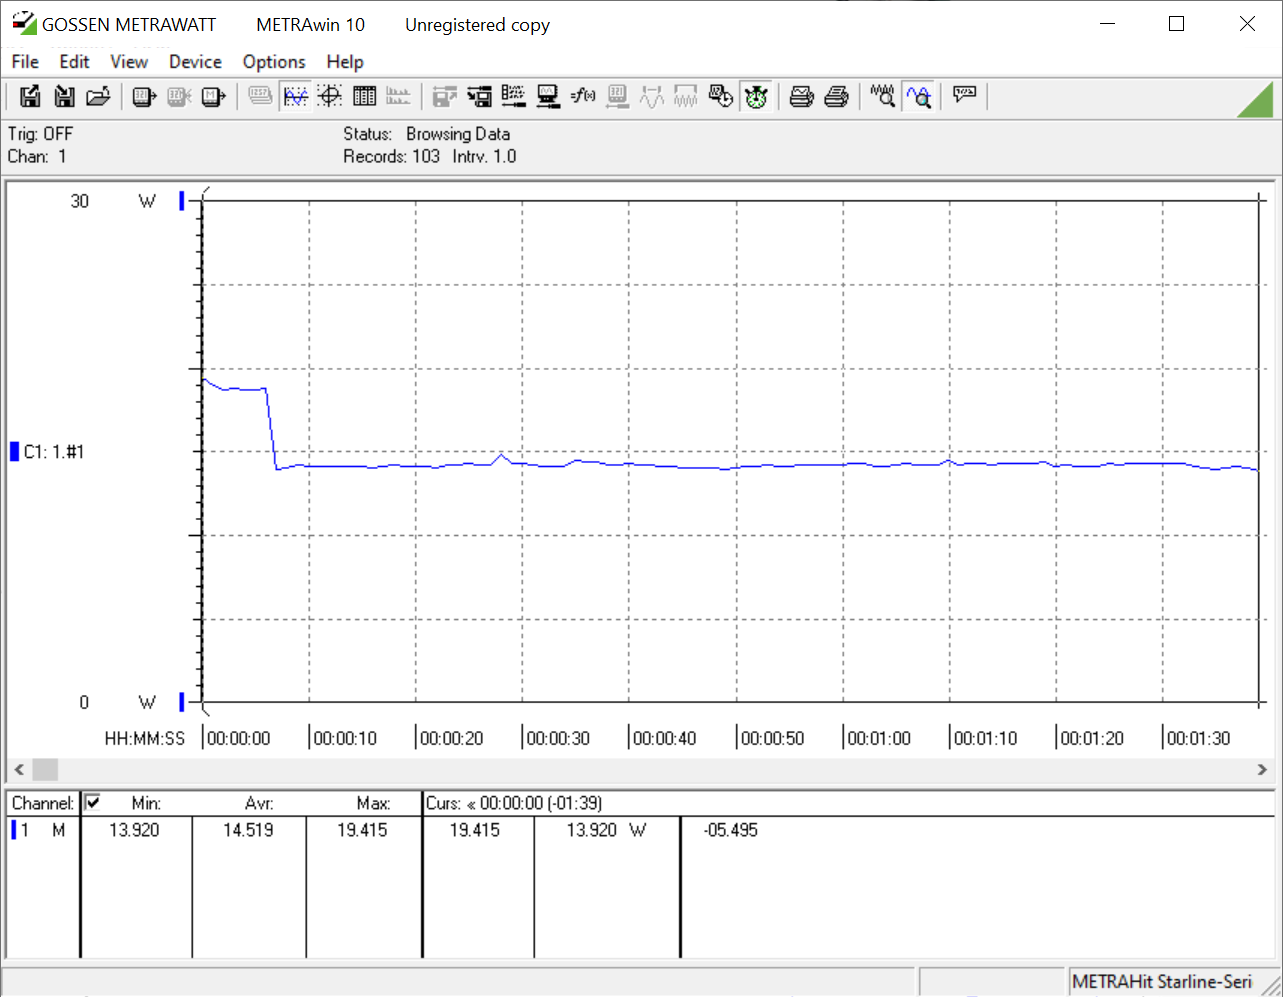
Energy Consumption
While idling, the Y11 is not very economical when taking into account the installed hardware. Here, an average laptop with the Celeron N4100 consumes significantly less power (about 20%). Under load, the consumption matches the average exactly. Stronger devices such as the Eve V, which is equipped with a Core i7-Y processor, tend to draw significantly more power on average.
| Off / Standby | |
| Idle | |
| Load |
|
Key:
min: | |
| BMAX MaxBook Y11 H1M6 UHD Graphics 600, Celeron N4100, FORESEE 256GB | Microsoft Surface Go MHN-00003 UHD Graphics 615, Pentium 4415Y, 64 GB eMMC Flash | Chuwi LapBook SE UHD Graphics 600, Celeron N4100, SanDisk DF4032 | Chuwi LapBook Pro UHD Graphics 600, Celeron N4100, 64 GB eMMC Flash | Eve-Tech Eve V i7 HD Graphics 615, i7-7Y75, Intel SSD 600p SSDPEKKW512G7 | Teclast Tbook 16 Power HD Graphics 405 (Braswell), Z8750, 64 GB eMMC Flash | Jumper EZbook 3 HD Graphics 500, Celeron N3350, Toshiba 064G93 64 GB eMMC | Apple iPad Pro 11 2018 A12X Bionic GPU, A12X Bionic, TSB3247M61710TWNA1 64GB NVMe | Dell Latitude 3189 HD Graphics 505, Pentium N4200, Liteonit CV3-8D128 | Trekstor Primetab T13B HD Graphics 505, Pentium N4200, SanDisk SEM64G | Chuwi UBook CWI509 UHD Graphics 600, Celeron N4100, Netac SSD 256GB | VAIO A12-92993 UHD Graphics 615, i7-8500Y, Samsung SSD PM981 MZVLB512HAJQ | Average Intel Celeron N4100 | |
|---|---|---|---|---|---|---|---|---|---|---|---|---|---|
| Power Consumption | 11% | 13% | 2% | -22% | 44% | 23% | 34% | 21% | 0% | -14% | -8% | 15% | |
| Idle Minimum * (Watt) | 4.1 | 2.88 30% | 2.7 34% | 3.3 20% | 4.5 -10% | 2.6 37% | 3.18 22% | 1.2 71% | 2.17 47% | 3.9 5% | 5.2 -27% | 4.4 -7% | 3.27 ? 20% |
| Idle Average * (Watt) | 7.7 | 4.8 38% | 6.3 18% | 6.1 21% | 7.6 1% | 2.7 65% | 6.14 20% | 4.1 47% | 4.31 44% | 9.3 -21% | 8.3 -8% | 6.5 16% | 5.85 ? 24% |
| Idle Maximum * (Watt) | 9 | 7.5 17% | 7.6 16% | 8 11% | 8.1 10% | 2.7 70% | 6.4 29% | 7.5 17% | 5.79 36% | 10.9 -21% | 8.7 3% | 7.1 21% | 6.82 ? 24% |
| Load Average * (Watt) | 14.5 | 16.9 -17% | 12.6 13% | 17.3 -19% | 22 -52% | 12.7 12% | 13.3 8% | 13.6 6% | 15.8 -9% | 12.6 13% | 15.8 -9% | 20.2 -39% | 14.7 ? -1% |
| Load Maximum * (Watt) | 21 | 23.8 -13% | 24.6 -17% | 25.7 -22% | 33.1 -58% | 13.1 38% | 13.6 35% | 15.2 28% | 24.2 -15% | 15.6 26% | 27.1 -29% | 28 -33% | 19.5 ? 7% |
* ... smaller is better
Battery Life
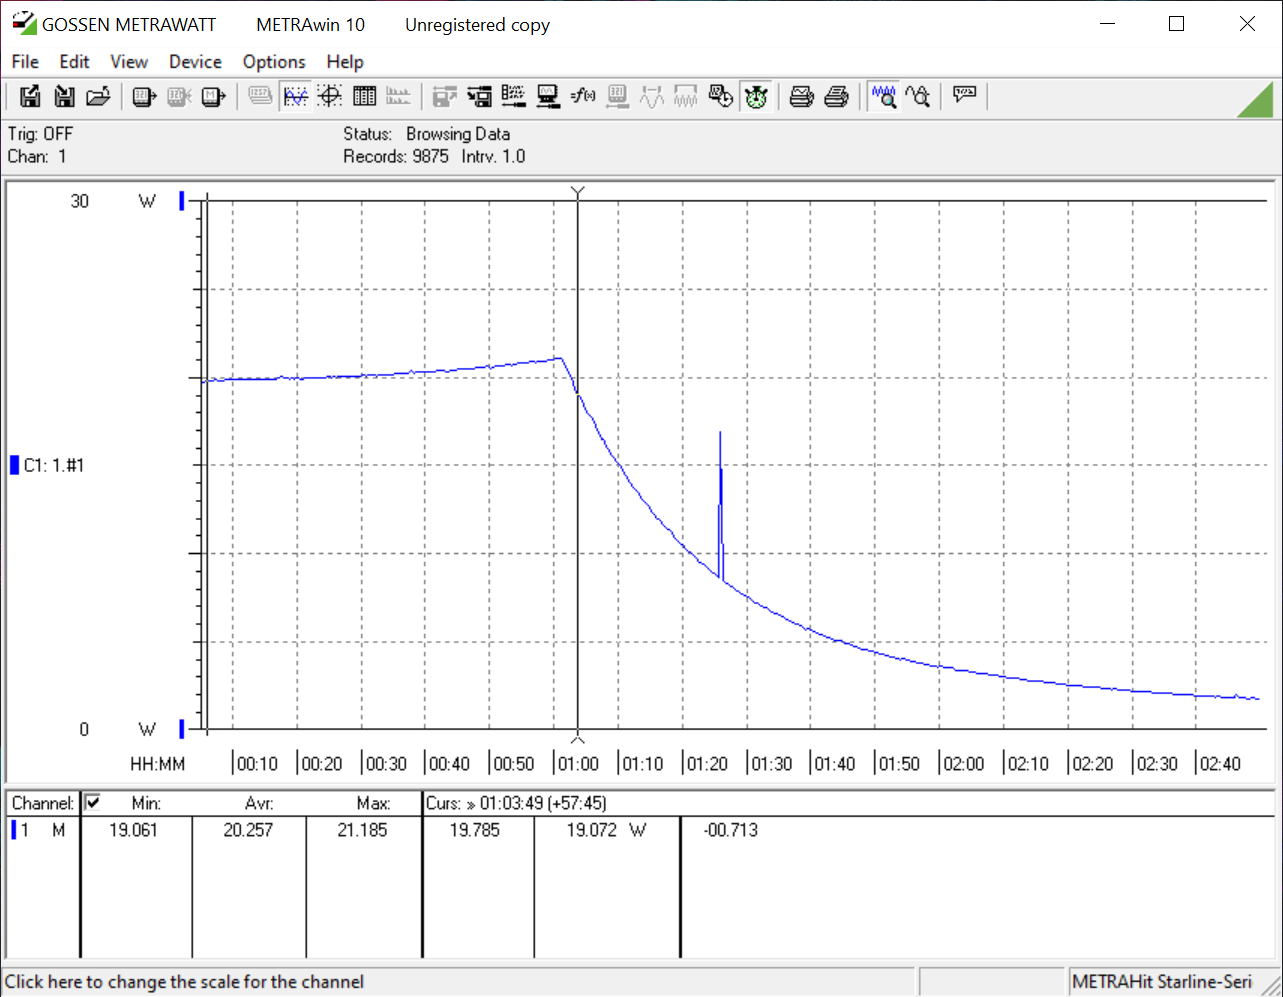
According to BMAX, the Y11 is equipped with a 26.6-Wh lithium-ion battery. Windows detects 29.6 Wh and uses 28 Wh over the course of the preset 100-5% (according to the powercfg report). While users cannot expect record runtimes due to the small battery capacity, the battery life is very poor even compared to the Chuwi UBook CWI509, which is equipped with a similarly sized battery.
Pros
Cons
Verdict
The BMAX MaxBook Y11 is a small convertible with a 360-degree hinge (yoga style), an aluminum chassis and a cheap price tag. 8 GB of LPDDR4 dual-channel RAM and a swappable M.2 SSD with a capacity of 256 GB are the highlights of the system. The display offers multi-touch functionality and an overall pleasant visual experience. The color accuracy is fairly good, particularly after our calibration.
Compared to other devices in our database with the same SoC, the Celeron 4100 performs slightly below average. The older Gemini Lake processor is the system's bottleneck. Demanding tasks and games are not the Y11's area of expertise. Instead, the small dimensions and the rigid design of the convertible make it ideal for traveling. However, the small battery limits mobile use to just 4 hours. Thanks to USB Type-C Power Delivery, an external battery can be used to extend the battery life.
Good chassis and cheap price, but poor battery life.
At about 280 Euros (~$313), the BMAX Y11 belongs to the budget entry-level range. However, due to the Chinese manufacturer's base of operations, returns can be tricky. The cost of shipping the device off to China (at your own expense) can quickly turn this process into a poor economical choice. We were also confronted with this issue, since we had originally planned to buy the newer model with the Celeron N4120, but missed a small note on the Banggood webpage stating that devices from the European warehouse would still be equipped with the N4100. Users should also be aware of the customs and warranty conditions as well as CE marking requirements.
BMAX MaxBook Y11 H1M6
- 04/23/2020 v7 (old)
Klaus Hinum
Price comparison

