Intel Core i5-8260U debut: BMAX B5 Pro G7H8 mini PC review
Much like Chuwi, BMax specializes in inexpensive laptops, monitors, and mini PCs that are generally hundreds of dollars cheaper than even the most basic SKUs from larger and more well-known manufacturers. Their secret is the use of older generation CPUs which can bring down the cost of the devices significantly.
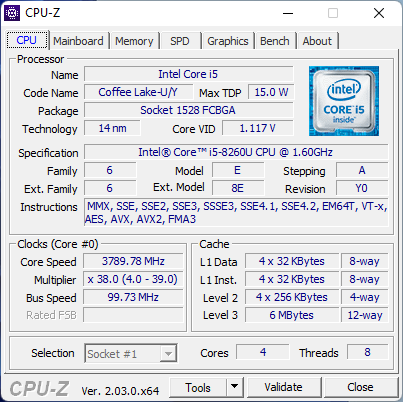
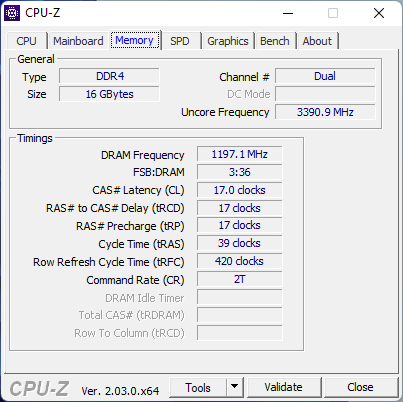
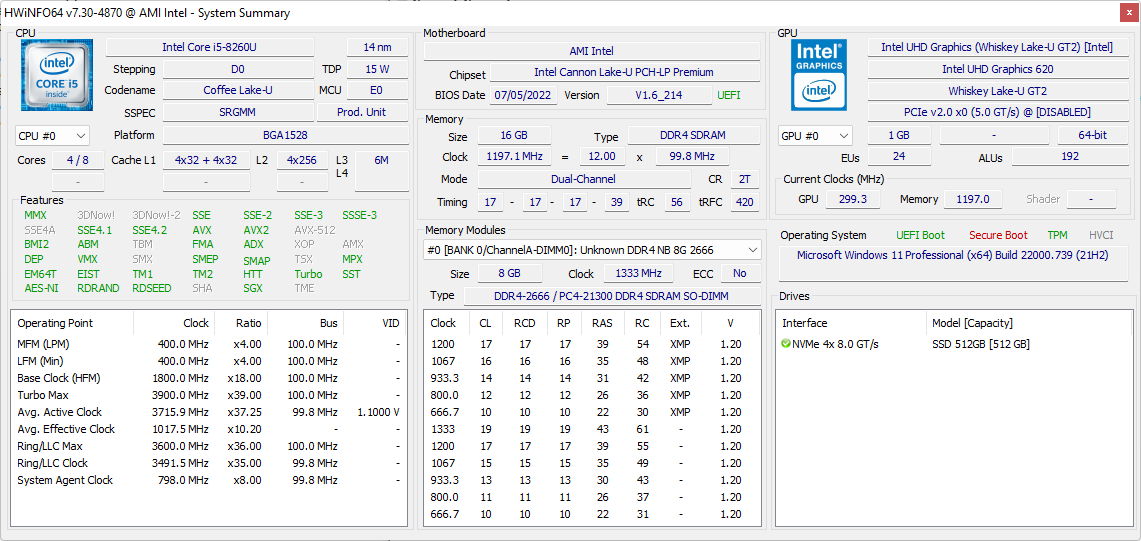
The BMax B5 Pro is the latest mini PC from the manufacturer targeting HTPC users on tighter budgets. It is notable for sporting an older 8th gen Intel Core U-series CPU whereas the latest mini PCs are using 12th gen options. Our specific configuration comes with the uncommon Coffee Lake Core i5-8260U CPU with 16 GB of RAM, 512 GB NVMe SSD, and Windows 11 preloaded for only $280 USD at the time of writing. The B5 Pro competes directly with other inexpensive mini PCs like the Beelink SEi8 or the GMK NucBox 2.
More BMax reviews:
Potential Competitors in Comparison
Rating | Date | Model | Weight | Height | Size | Resolution | Price |
|---|---|---|---|---|---|---|---|
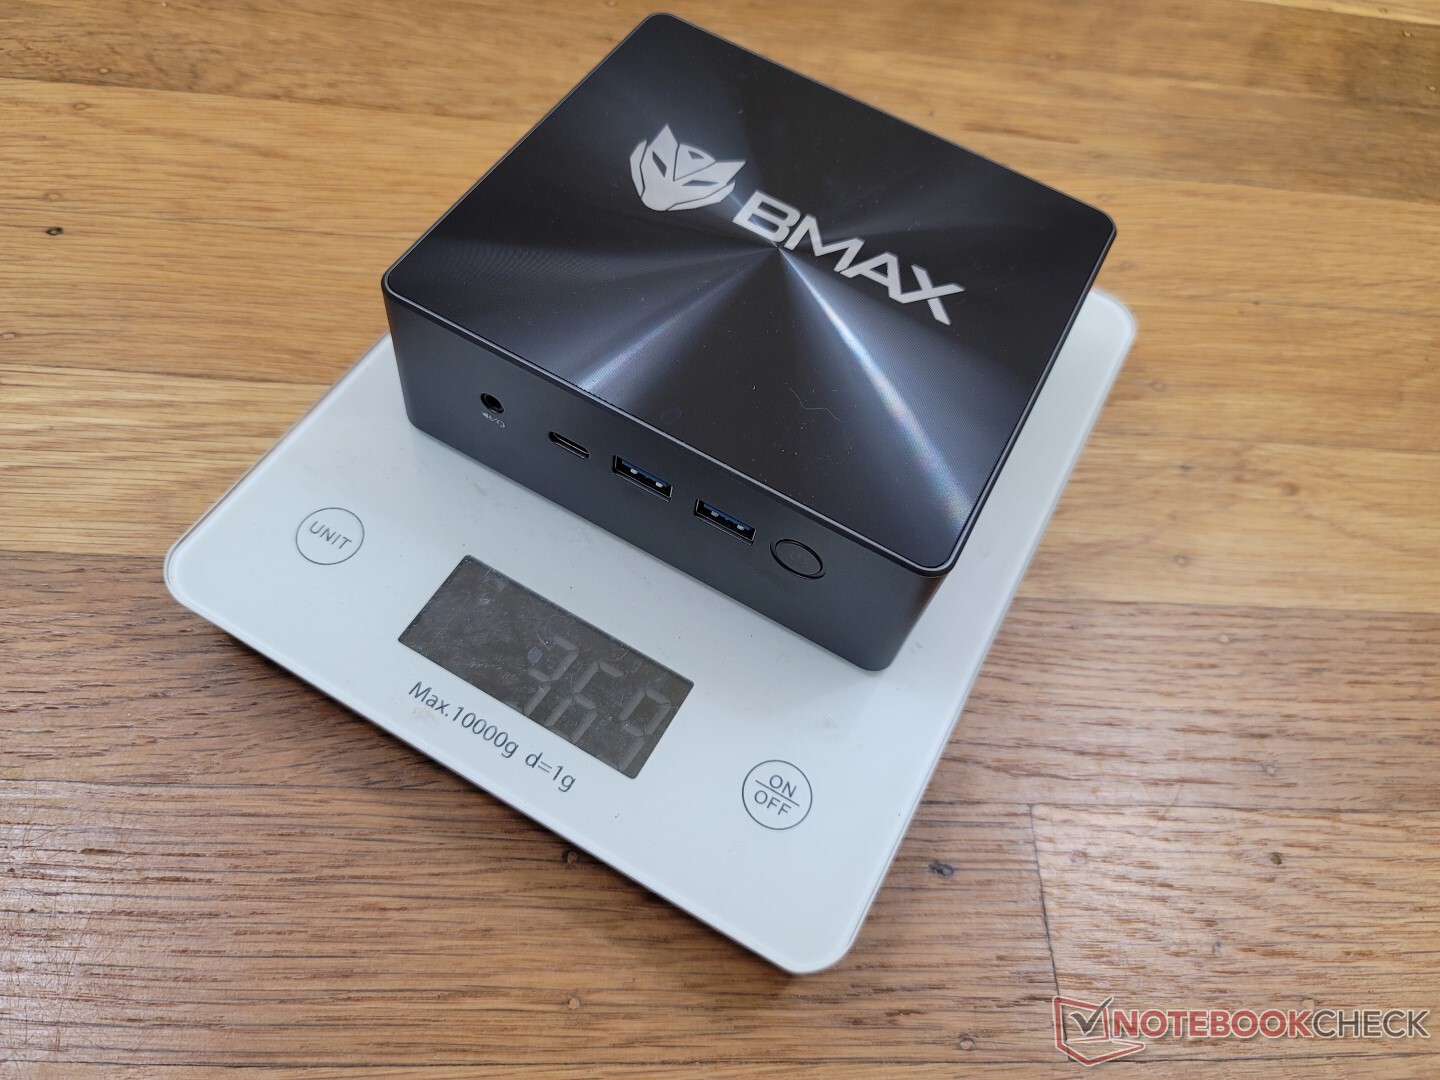
v (old) | 11 / 2022 | BMAX B5 Pro G7H8 i5-8260U, UHD Graphics 620 | 369 g | 43.2 mm | x | ||
v (old) | 09 / 2022 | Beelink SEi11 Pro i5-11320H, Iris Xe G7 96EUs | 440 g | 40 mm | x | ||
v (old) | 09 / 2022 | Beelink U59 N5105 Celeron N5105, UHD Graphics (Jasper Lake 24 EU) | 320 g | 42 mm | x | ||
v (old) | 04 / 2022 | Beelink SEi8 i3-8109U, Iris Plus Graphics 655 | 346 g | 41 mm | x | ||
v (old) | 10 / 2022 | Beelink SER Pro Ryzen 5 5600H R5 5600H, Vega 7 | 498 g | 42 mm | x | ||
v (old) | 04 / 2021 | Intel NUC11TNKi5 i5-1135G7, Iris Xe G7 80EUs | 504 g | 37 mm | x |
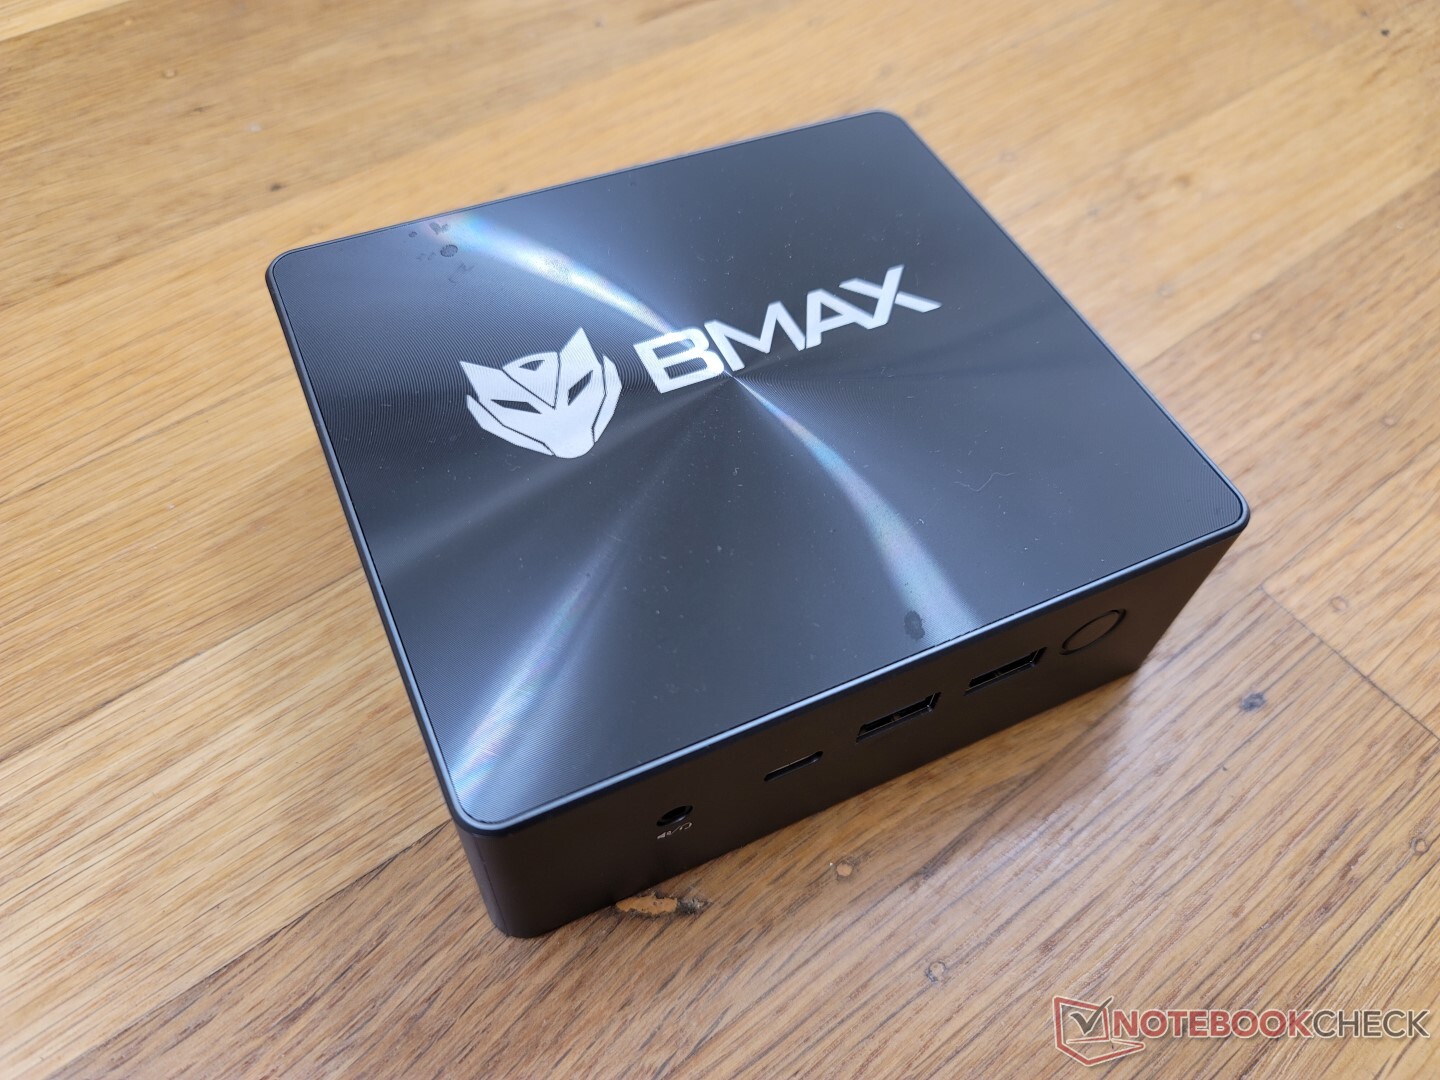
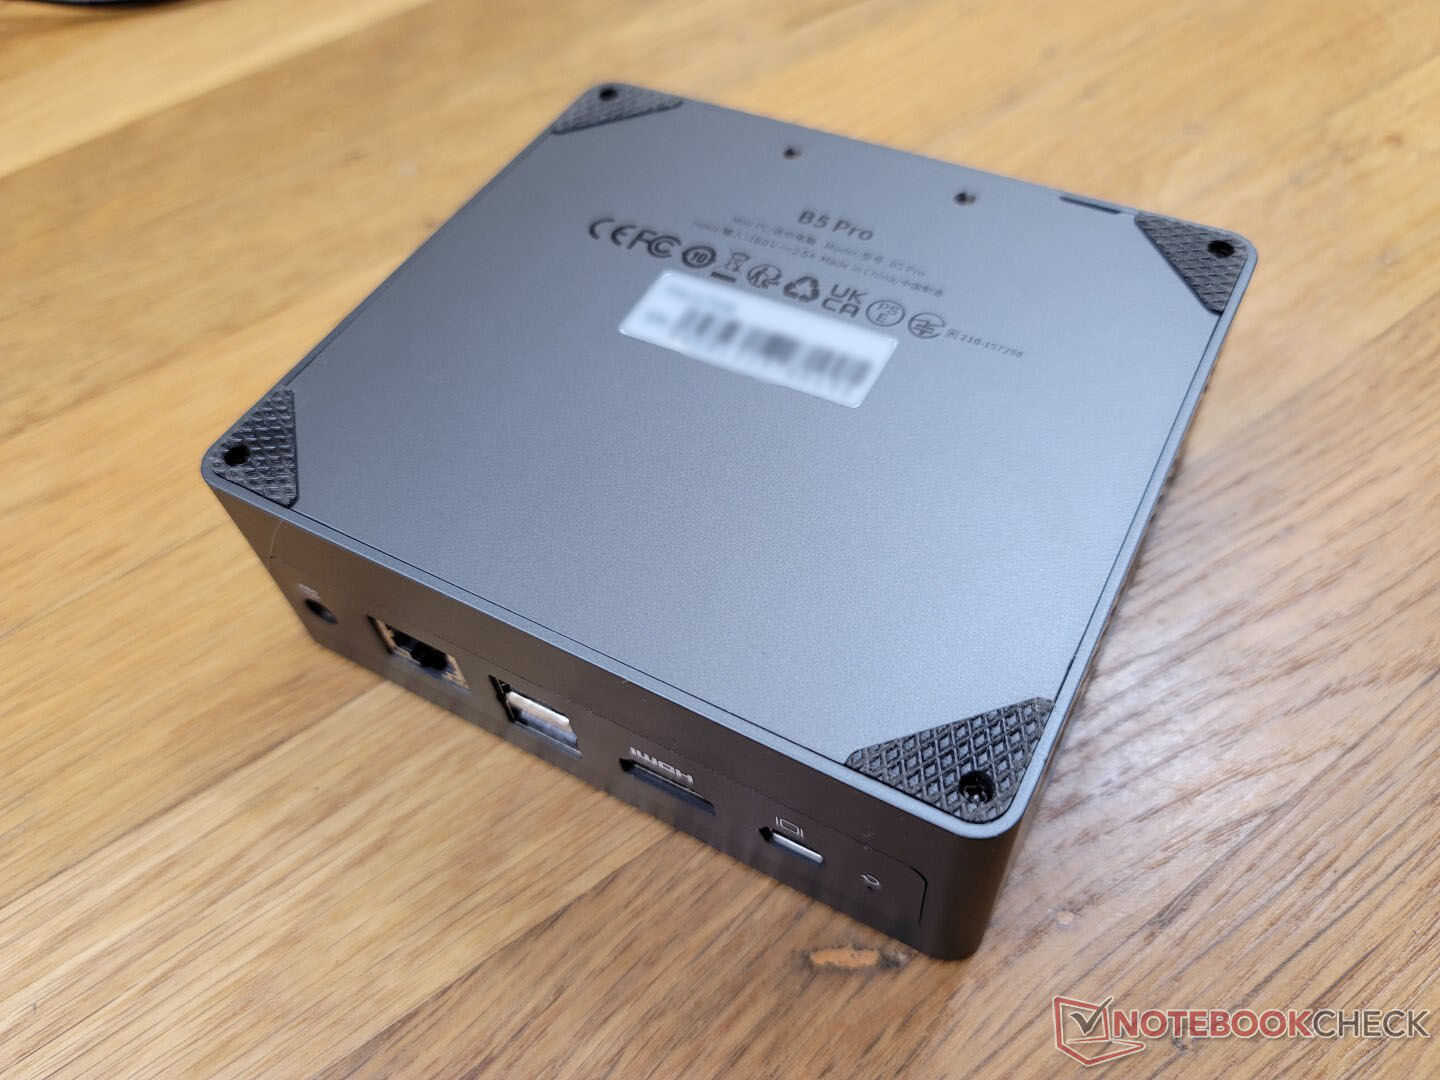
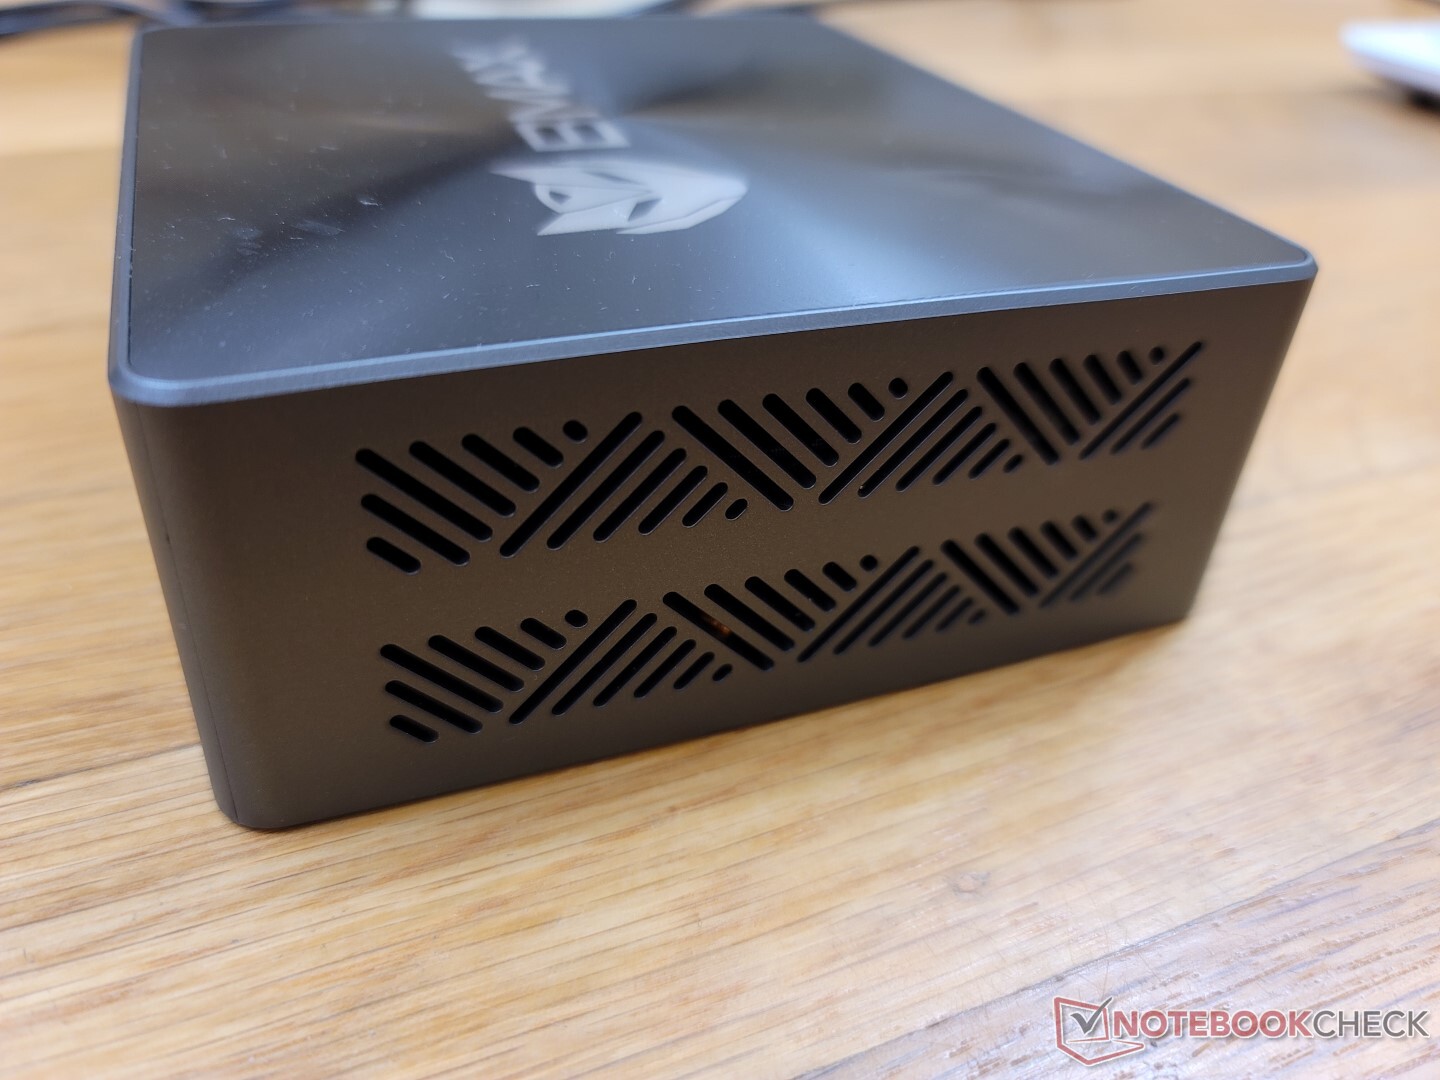
Case — Nothing Out Of The Ordinary
The case is slightly thicker than the Intel NUC11TNKi5 to be almost identical to the Beelink SEi8. Rigidity is strong around the edges and bottom since these areas are metal whereas the top is cheaper plastic and more susceptible to warping. It's still a strong design with no obvious faults even if it's not as heavy as an Intel NUC.
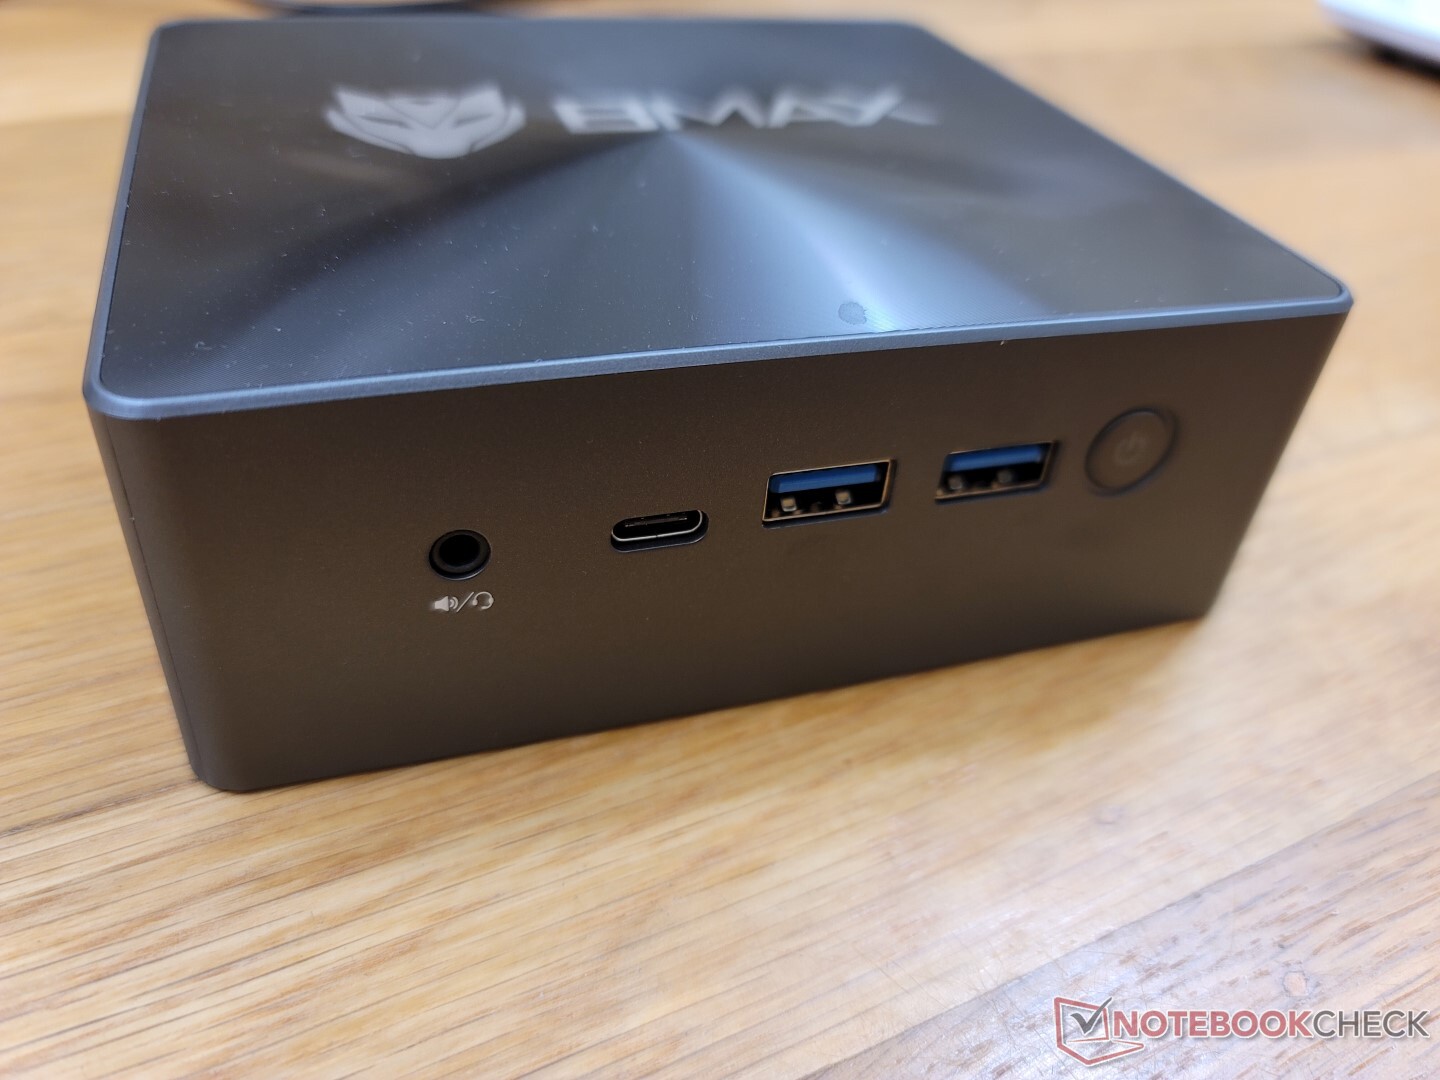
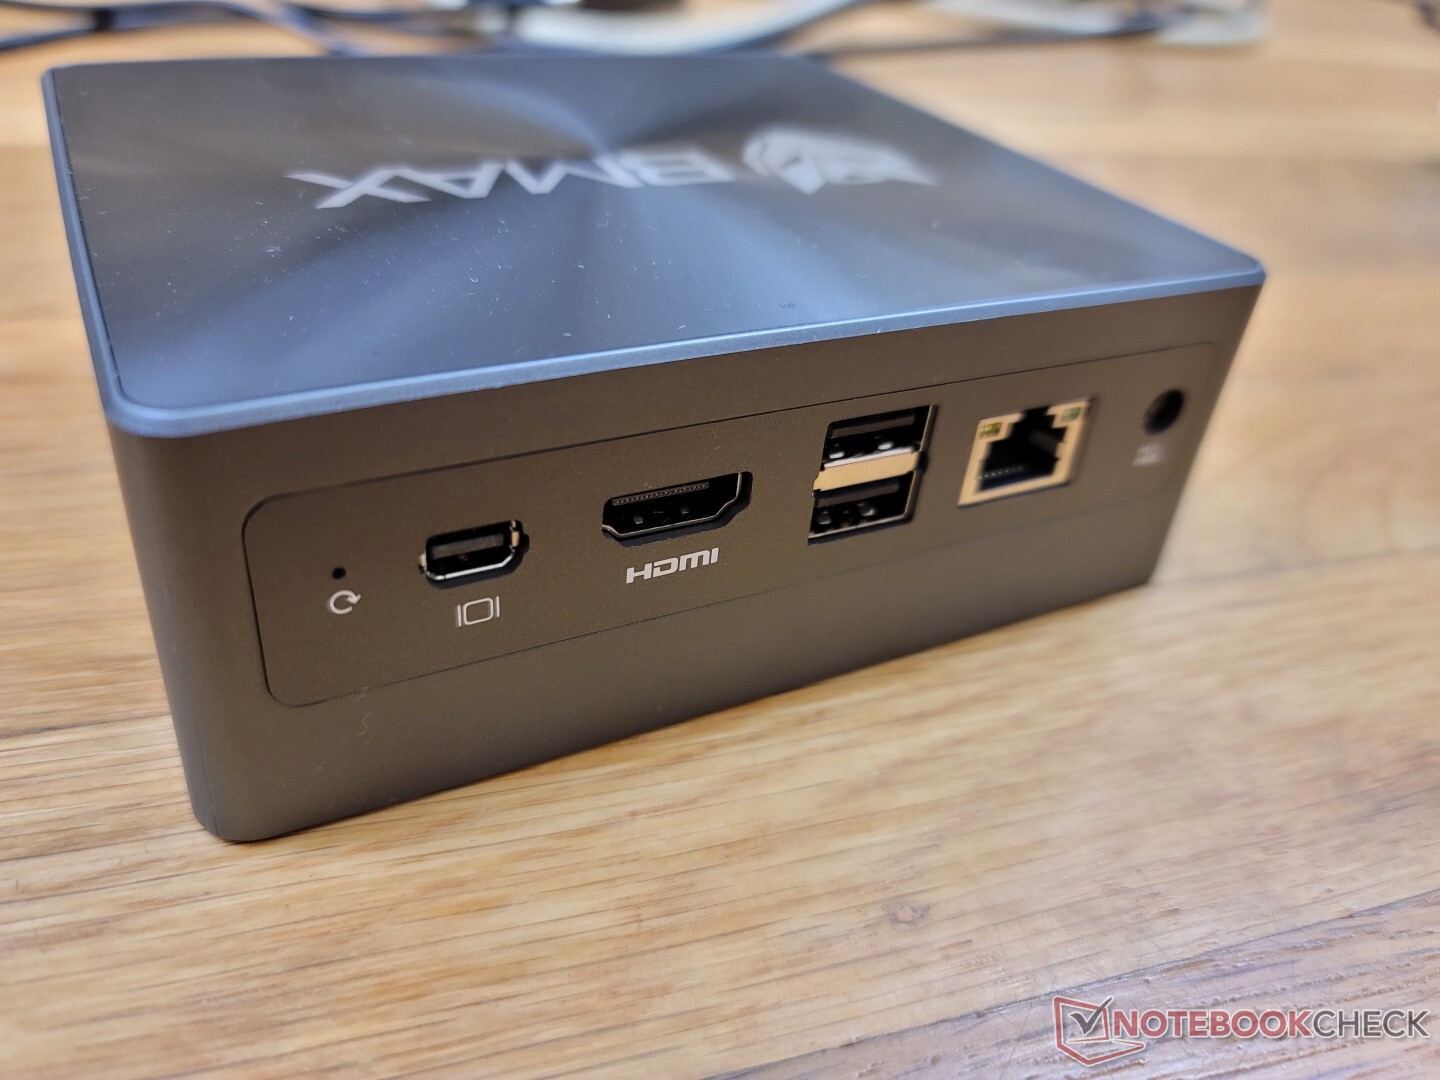
Connectivity — No Thunderbolt Support
The most notable port on the B5 Pro is the mini DisplayPort as most other mini PCs in this price range do not have a mini DisplayPort at all. 4K monitors at 60 Hz is not supported through HDMI.
The USB-C port on front supports external monitors, but it does not support Power-in or Thunderbolt.
Communication
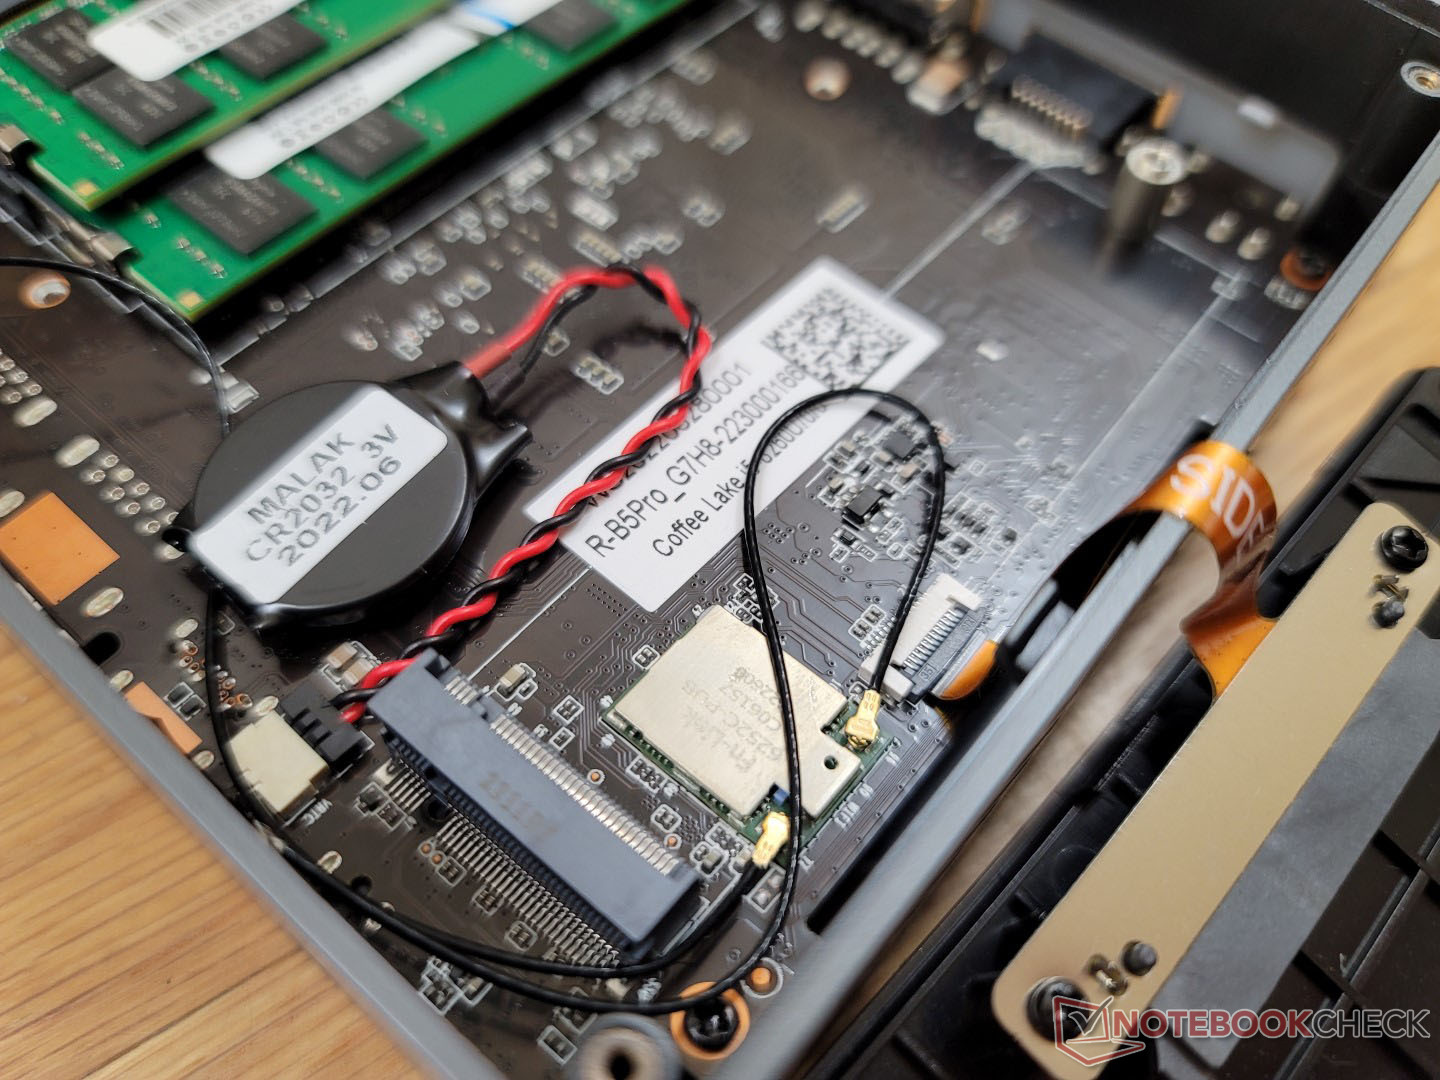
A RealTek RTL8852BE comes standard for Wi-Fi 6 and Bluetooth 5.2 connectivity. There is no Wi-Fi 6E support likely to save on costs. Transfer rates are otherwise steady and without any issues even if it they aren't nearly as fast as the more common Intel AX200/201 series.
| Networking | |
| iperf3 transmit AX12 | |
| Intel NUC11TNKi5 | |
| Beelink SEi8 | |
| iperf3 receive AX12 | |
| Intel NUC11TNKi5 | |
| Beelink SEi8 | |
| iperf3 receive AXE11000 6GHz | |
| Beelink SER Pro Ryzen 5 5600H | |
| Beelink SEi11 Pro | |
| iperf3 receive AXE11000 | |
| BMAX B5 Pro G7H8 | |
| Beelink U59 N5105 | |
| iperf3 transmit AXE11000 6GHz | |
| Beelink SER Pro Ryzen 5 5600H | |
| Beelink SEi11 Pro | |
| iperf3 transmit AXE11000 | |
| BMAX B5 Pro G7H8 | |
| Beelink U59 N5105 | |
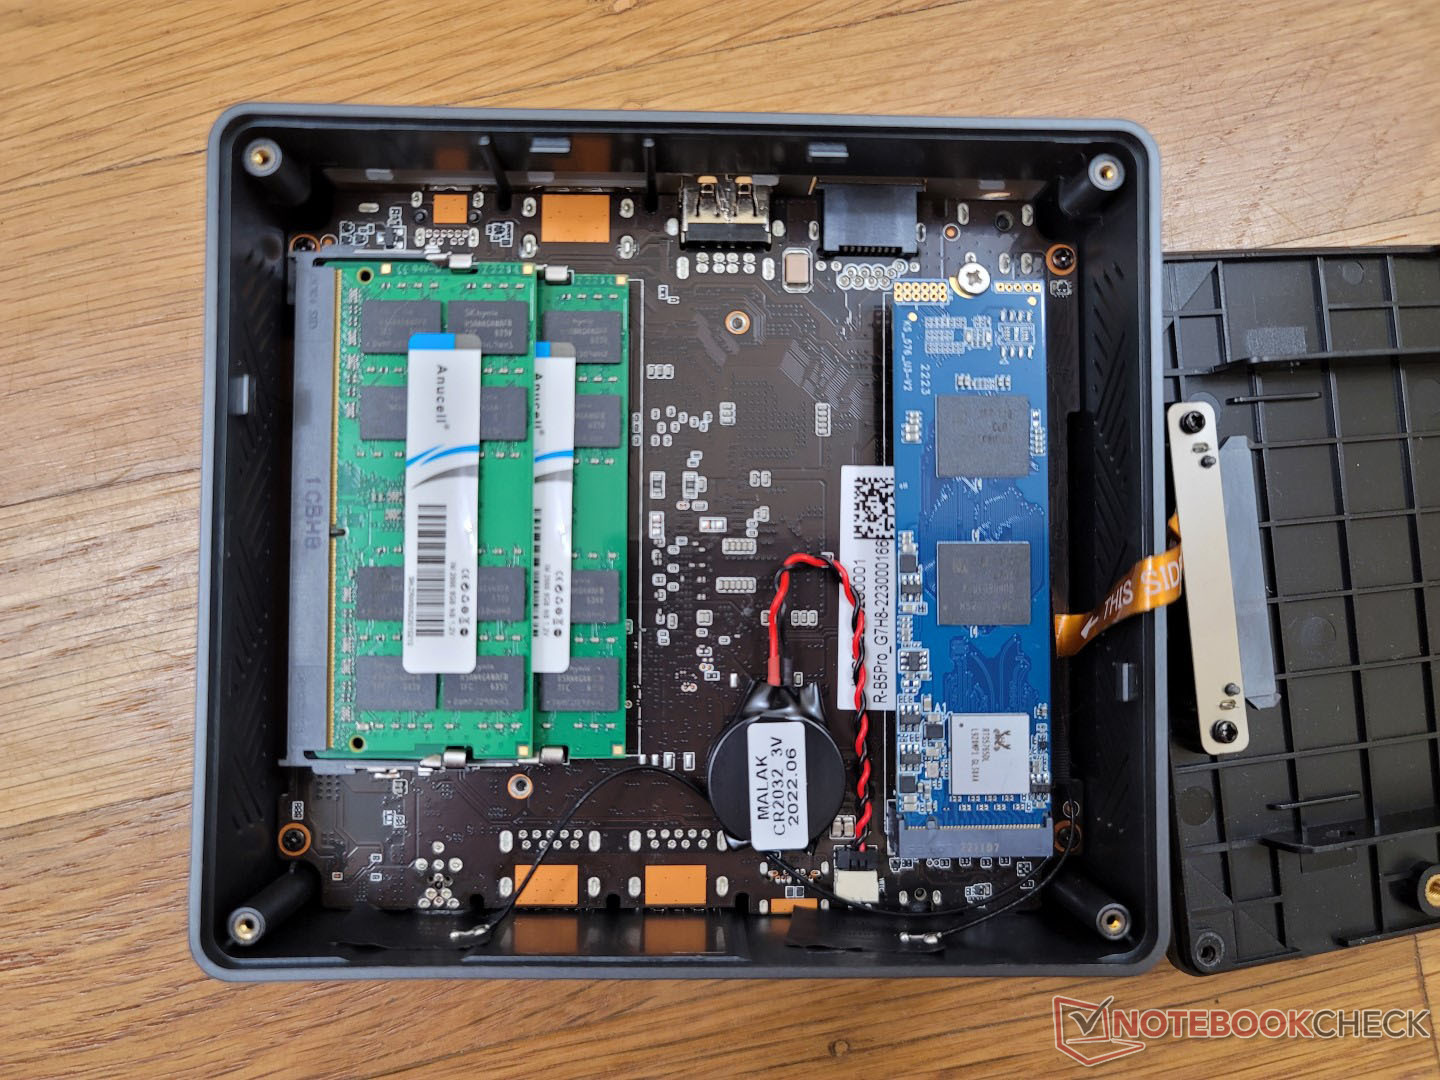
Maintenance
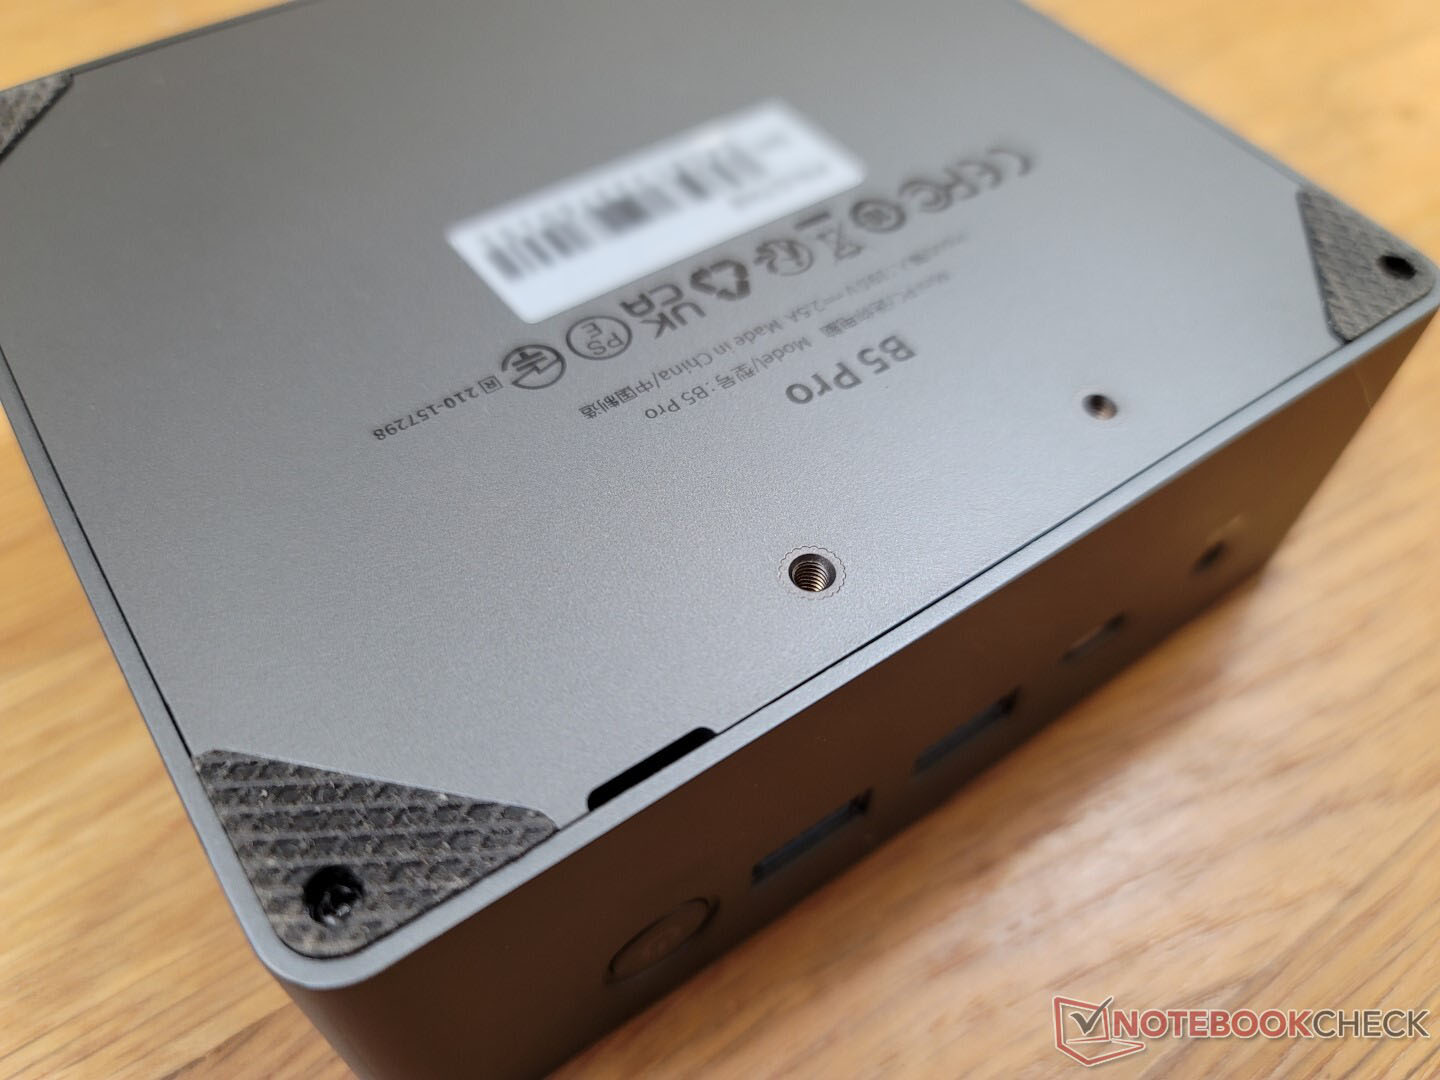
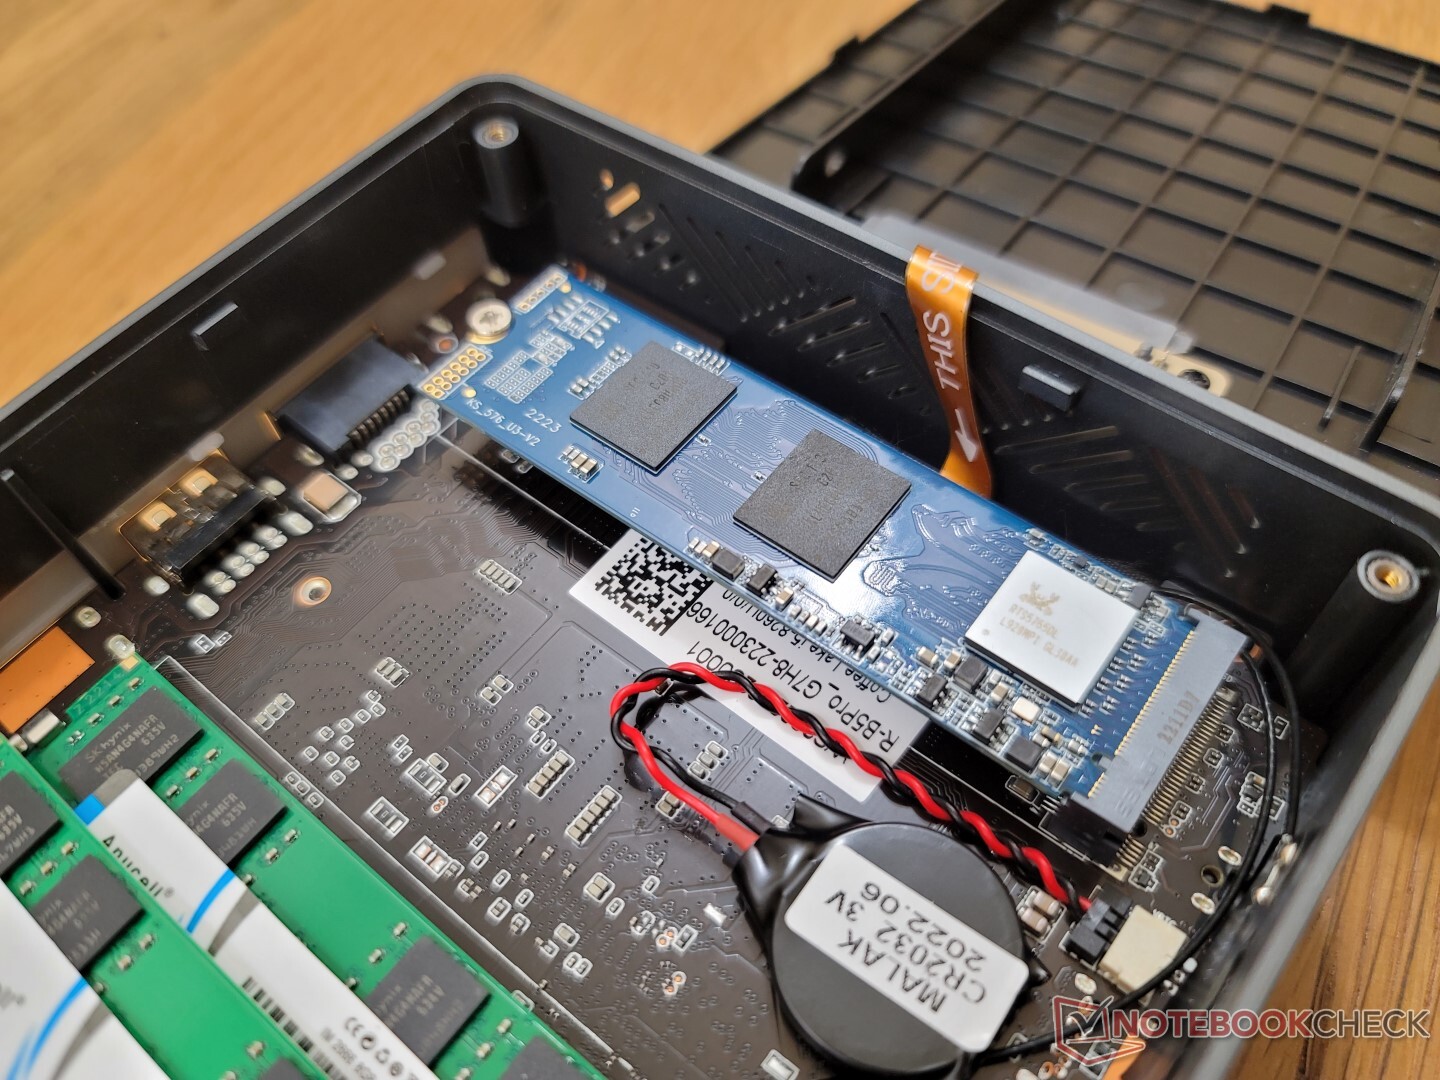
The bottom panel is secured by four Philips screws for easy servicing. Unlike on the Beelink SEi8, however, the bottom panel on the BMax has a small slit along an edge for easier gripping and removal.
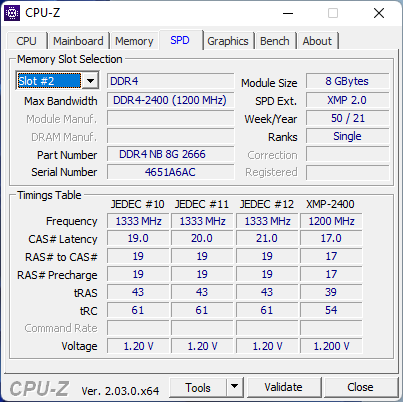
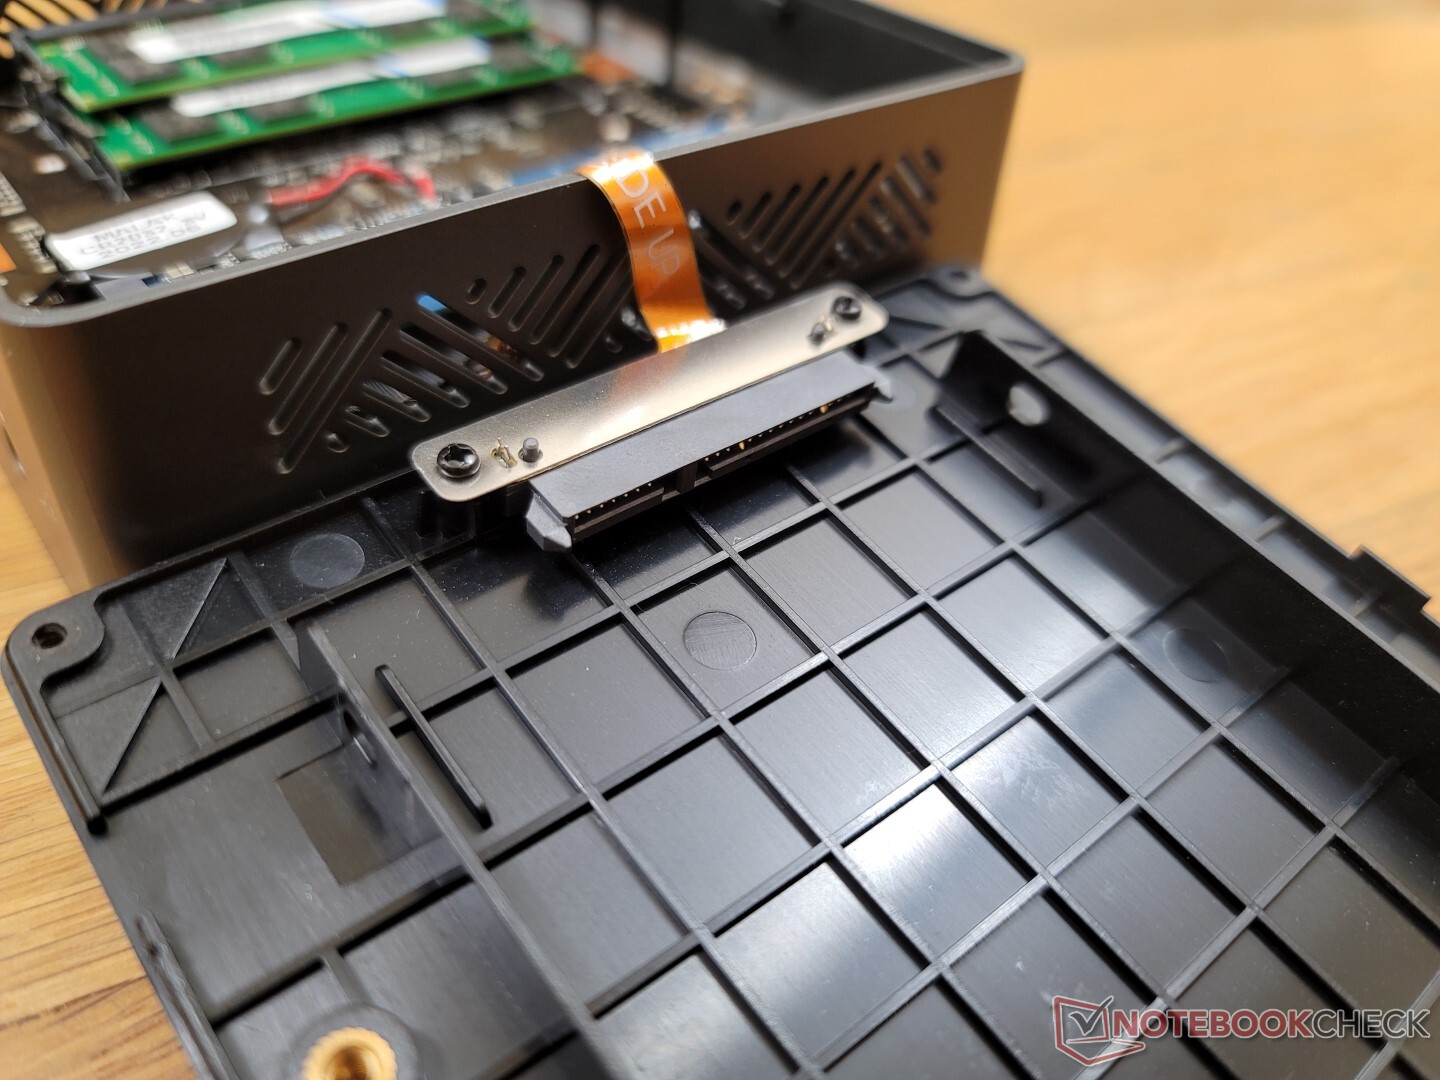
Users can install up to two DDR4 SODIMM modules and up to two storage drives once inside.
Accessories and Warranty
The retail box includes an HDMI cable and removable VESA mounting bracket with screws alongside the AC adapter. The standard one-year limited warranty applies if purchased in the US.
Performance — 8th Gen vs. 12 Gen

Testing Conditions
We set our unit to Performance mode via Windows prior to running any benchmarks below for the highest possible scores. There are no pre-installed applications from the manufacturer for a clean Windows user experience.
Processor
Raw CPU performance is generally comparable to the 10th gen Core i7-1065G7 or Core i5-8259U. Though much slower than the 11th gen Core i5-1135G7 by up to 50 percent, it's still fast enough for common multimedia purposes like web browsing, video streaming, and moderate multi-tasking.
The 12th gen Core i5-1235U, which is several generations ahead of our Core i5-8260U, offers roughly 60 percent and 80 percent faster single-thread and multi-thread performance, respectively.
Performance sustainability is decent. When running CineBench R15 xT in a loop, performance would dip by about 11 percent over time.
Cinebench R15 Multi Loop
Cinebench R23: Multi Core | Single Core
Cinebench R15: CPU Multi 64Bit | CPU Single 64Bit
Blender: v2.79 BMW27 CPU
7-Zip 18.03: 7z b 4 | 7z b 4 -mmt1
Geekbench 5.5: Multi-Core | Single-Core
HWBOT x265 Benchmark v2.2: 4k Preset
LibreOffice : 20 Documents To PDF
R Benchmark 2.5: Overall mean
| Cinebench R23 / Multi Core | |
| Beelink SER Pro Ryzen 5 5600H | |
| Beelink SEi11 Pro | |
| Asus Vivobook 15 K513EQ | |
| Intel NUC11TNKi5 | |
| Geekom Mini IT8-GM08i5T | |
| Infinix INBook X2 | |
| BMAX B5 Pro G7H8 | |
| Beelink U59 N5105 | |
| Beelink SEi8 | |
| Cinebench R23 / Single Core | |
| Asus Vivobook 15 K513EQ | |
| Beelink SEi11 Pro | |
| Intel NUC11TNKi5 | |
| Beelink SER Pro Ryzen 5 5600H | |
| Infinix INBook X2 | |
| Beelink SEi8 | |
| BMAX B5 Pro G7H8 | |
| Beelink U59 N5105 | |
| Geekbench 5.5 / Multi-Core | |
| Beelink SER Pro Ryzen 5 5600H | |
| Beelink SEi11 Pro | |
| Intel NUC11TNKi5 | |
| Geekom Mini IT8-GM08i5T | |
| Fujitsu Lifebook U939 i5 | |
| Infinix INBook X2 | |
| Beelink U59 N5105 | |
| Beelink SEi8 | |
| BMAX B5 Pro G7H8 | |
| Geekbench 5.5 / Single-Core | |
| Beelink SEi11 Pro | |
| Beelink SER Pro Ryzen 5 5600H | |
| Intel NUC11TNKi5 | |
| Infinix INBook X2 | |
| Fujitsu Lifebook U939 i5 | |
| Geekom Mini IT8-GM08i5T | |
| Beelink SEi8 | |
| Beelink U59 N5105 | |
| BMAX B5 Pro G7H8 | |
* ... smaller is better
AIDA64: FP32 Ray-Trace | FPU Julia | CPU SHA3 | CPU Queen | FPU SinJulia | FPU Mandel | CPU AES | CPU ZLib | FP64 Ray-Trace | CPU PhotoWorxx
| Performance rating | |
| Beelink SER Pro Ryzen 5 5600H | |
| Beelink SEi11 Pro | |
| Intel NUC11TNKi5 | |
| BMAX B5 Pro G7H8 | |
| Beelink SEi8 | |
| Beelink U59 N5105 | |
| AIDA64 / FP32 Ray-Trace | |
| Beelink SER Pro Ryzen 5 5600H | |
| Beelink SEi11 Pro | |
| Intel NUC11TNKi5 | |
| BMAX B5 Pro G7H8 | |
| Beelink SEi8 | |
| Beelink U59 N5105 | |
| AIDA64 / FPU Julia | |
| Beelink SER Pro Ryzen 5 5600H | |
| Beelink SEi11 Pro | |
| Intel NUC11TNKi5 | |
| BMAX B5 Pro G7H8 | |
| Beelink SEi8 | |
| Beelink U59 N5105 | |
| AIDA64 / CPU SHA3 | |
| Beelink SER Pro Ryzen 5 5600H | |
| Beelink SEi11 Pro | |
| Intel NUC11TNKi5 | |
| BMAX B5 Pro G7H8 | |
| Beelink SEi8 | |
| Beelink U59 N5105 | |
| AIDA64 / CPU Queen | |
| Beelink SER Pro Ryzen 5 5600H | |
| Beelink SEi11 Pro | |
| Intel NUC11TNKi5 | |
| BMAX B5 Pro G7H8 | |
| Beelink SEi8 | |
| Beelink U59 N5105 | |
| AIDA64 / FPU SinJulia | |
| Beelink SER Pro Ryzen 5 5600H | |
| Beelink SEi11 Pro | |
| Intel NUC11TNKi5 | |
| BMAX B5 Pro G7H8 | |
| Beelink SEi8 | |
| Beelink U59 N5105 | |
| AIDA64 / FPU Mandel | |
| Beelink SER Pro Ryzen 5 5600H | |
| Beelink SEi11 Pro | |
| Intel NUC11TNKi5 | |
| BMAX B5 Pro G7H8 | |
| Beelink SEi8 | |
| Beelink U59 N5105 | |
| AIDA64 / CPU AES | |
| Beelink SER Pro Ryzen 5 5600H | |
| Beelink SEi11 Pro | |
| Intel NUC11TNKi5 | |
| Beelink U59 N5105 | |
| BMAX B5 Pro G7H8 | |
| Beelink SEi8 | |
| AIDA64 / CPU ZLib | |
| Beelink SER Pro Ryzen 5 5600H | |
| Intel NUC11TNKi5 | |
| Beelink SEi11 Pro | |
| BMAX B5 Pro G7H8 | |
| Beelink U59 N5105 | |
| Beelink SEi8 | |
| AIDA64 / FP64 Ray-Trace | |
| Beelink SER Pro Ryzen 5 5600H | |
| Beelink SEi11 Pro | |
| Intel NUC11TNKi5 | |
| BMAX B5 Pro G7H8 | |
| Beelink SEi8 | |
| Beelink U59 N5105 | |
| AIDA64 / CPU PhotoWorxx | |
| Beelink SEi11 Pro | |
| Beelink SER Pro Ryzen 5 5600H | |
| BMAX B5 Pro G7H8 | |
| Intel NUC11TNKi5 | |
| Beelink SEi8 | |
| Beelink U59 N5105 | |
System Performance
PCMark 10 results are comparable to the Beelink SEi8 which also uses an older 8th generation Core CPU. Mini PCs with newer 11th gen CPUs like the Intel NUC11TNKi5 are able to offer significantly higher Digital Content Creation scores because of their faster integrated GPUs.

CrossMark: Overall | Productivity | Creativity | Responsiveness
| PCMark 10 / Score | |
| Beelink SER Pro Ryzen 5 5600H | |
| Beelink SEi11 Pro | |
| Intel NUC11TNKi5 | |
| BMAX B5 Pro G7H8 | |
| Beelink SEi8 | |
| Beelink U59 N5105 | |
| PCMark 10 / Essentials | |
| Beelink SER Pro Ryzen 5 5600H | |
| Beelink SEi11 Pro | |
| Intel NUC11TNKi5 | |
| BMAX B5 Pro G7H8 | |
| Beelink SEi8 | |
| Beelink U59 N5105 | |
| PCMark 10 / Productivity | |
| Beelink SER Pro Ryzen 5 5600H | |
| Beelink SEi11 Pro | |
| BMAX B5 Pro G7H8 | |
| Intel NUC11TNKi5 | |
| Beelink SEi8 | |
| Beelink U59 N5105 | |
| PCMark 10 / Digital Content Creation | |
| Beelink SER Pro Ryzen 5 5600H | |
| Beelink SEi11 Pro | |
| Intel NUC11TNKi5 | |
| BMAX B5 Pro G7H8 | |
| Beelink SEi8 | |
| Beelink U59 N5105 | |
| CrossMark / Overall | |
| Beelink SEi11 Pro | |
| Beelink SER Pro Ryzen 5 5600H | |
| BMAX B5 Pro G7H8 | |
| Beelink U59 N5105 | |
| CrossMark / Productivity | |
| Beelink SEi11 Pro | |
| Beelink SER Pro Ryzen 5 5600H | |
| BMAX B5 Pro G7H8 | |
| Beelink U59 N5105 | |
| CrossMark / Creativity | |
| Beelink SER Pro Ryzen 5 5600H | |
| Beelink SEi11 Pro | |
| BMAX B5 Pro G7H8 | |
| Beelink U59 N5105 | |
| CrossMark / Responsiveness | |
| Beelink SEi11 Pro | |
| Beelink SER Pro Ryzen 5 5600H | |
| BMAX B5 Pro G7H8 | |
| Beelink U59 N5105 | |
| PCMark 10 Score | 3921 points | |
Help | ||
| AIDA64 / Memory Copy | |
| Beelink SER Pro Ryzen 5 5600H | |
| Beelink SEi11 Pro | |
| Beelink SEi8 | |
| BMAX B5 Pro G7H8 | |
| Beelink U59 N5105 | |
| Intel NUC11TNKi5 | |
| AIDA64 / Memory Read | |
| Beelink SER Pro Ryzen 5 5600H | |
| Beelink SEi11 Pro | |
| BMAX B5 Pro G7H8 | |
| Beelink SEi8 | |
| Intel NUC11TNKi5 | |
| Beelink U59 N5105 | |
| AIDA64 / Memory Write | |
| Beelink SEi11 Pro | |
| Beelink SER Pro Ryzen 5 5600H | |
| BMAX B5 Pro G7H8 | |
| Beelink U59 N5105 | |
| Intel NUC11TNKi5 | |
| Beelink SEi8 | |
| AIDA64 / Memory Latency | |
| BMAX B5 Pro G7H8 | |
| Intel NUC11TNKi5 | |
| Beelink SEi11 Pro | |
| Beelink SER Pro Ryzen 5 5600H | |
| Beelink U59 N5105 | |
| Beelink SEi8 | |
* ... smaller is better
DPC Latency
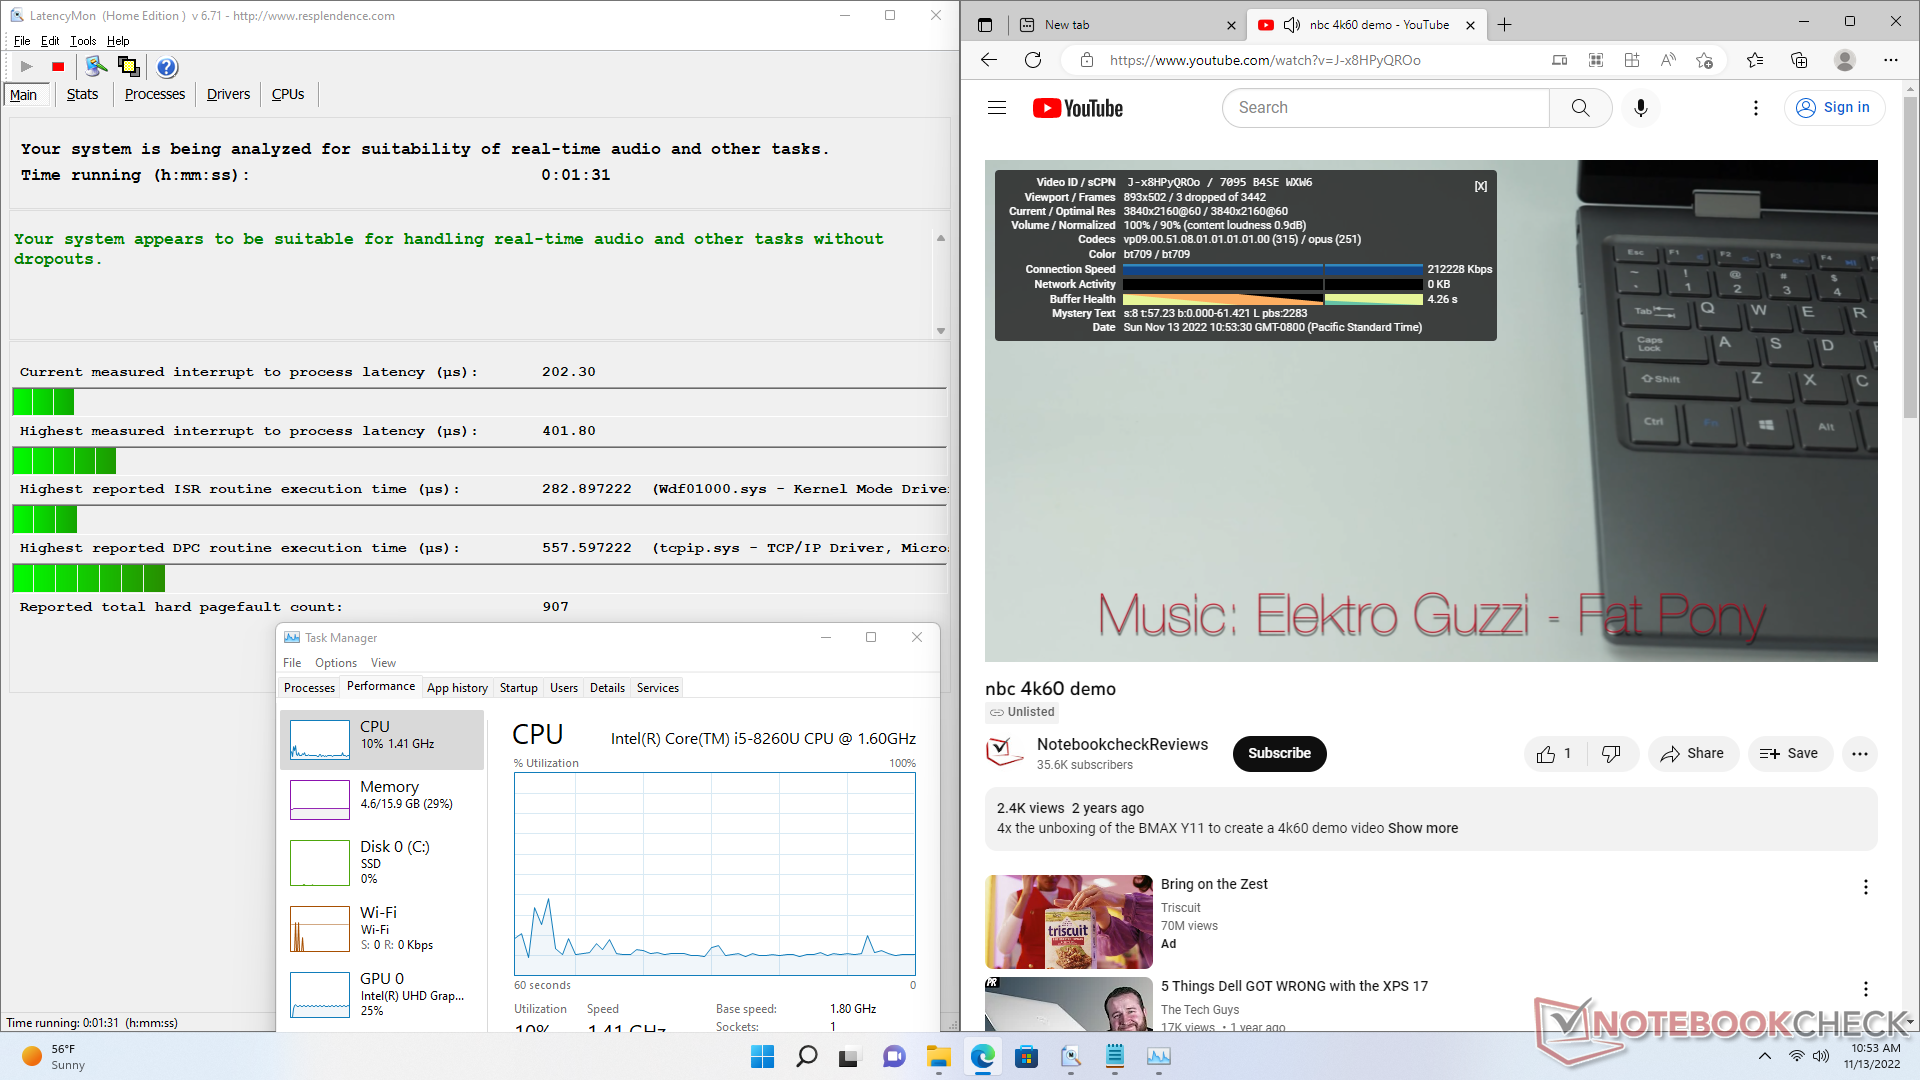
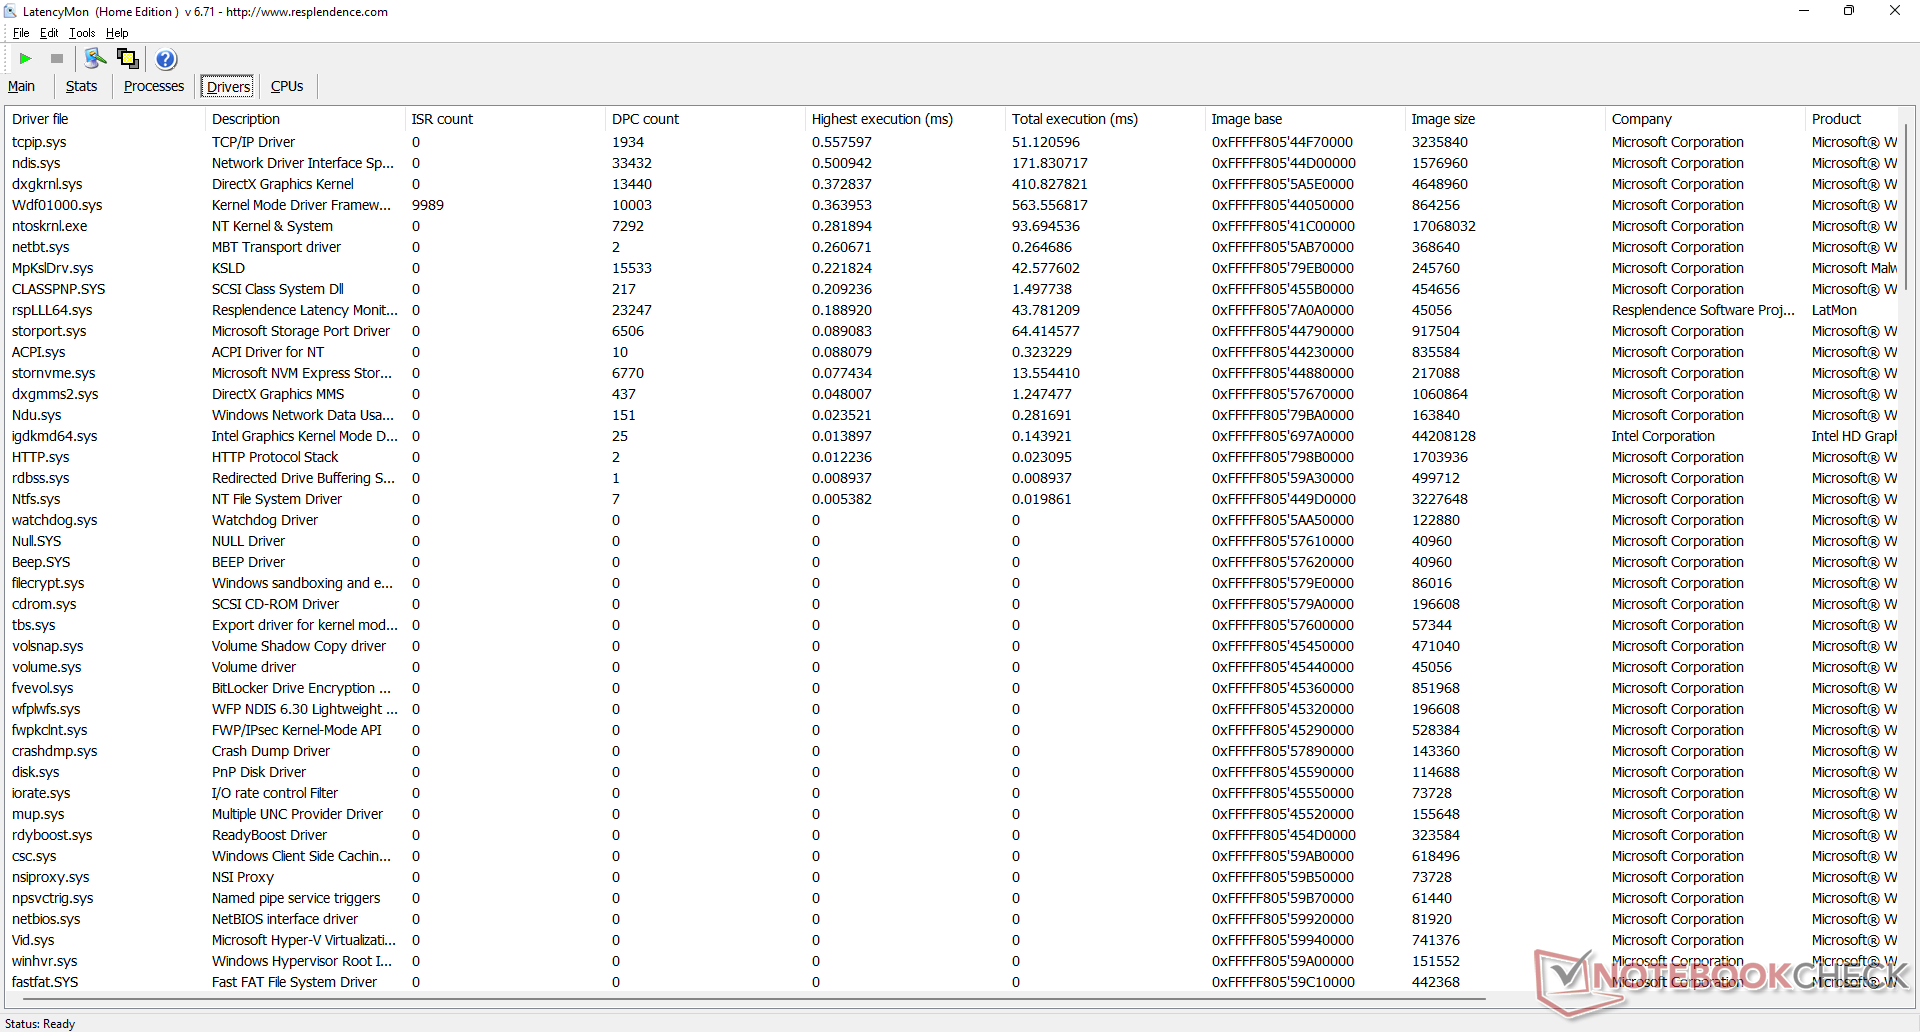
LatencyMon reveals no major DPC issues when browsing the web. 4K video playback at 60 FPS is excellent as well with just 3 dropped frames during our minute-long playtest.
| DPC Latencies / LatencyMon - interrupt to process latency (max), Web, Youtube, Prime95 | |
| Beelink SEi8 | |
| Beelink U59 N5105 | |
| Beelink SER Pro Ryzen 5 5600H | |
| Intel NUC11TNKi5 | |
| BMAX B5 Pro G7H8 | |
| Beelink SEi11 Pro | |
* ... smaller is better
Storage Devices — Up To Two Drives
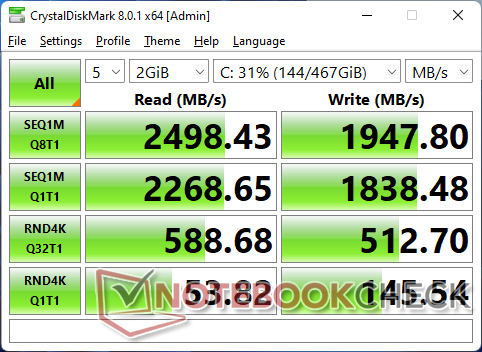
The B5 Pro utilizes a generic M.2 PCIe3 x4 SSD with a RealTek RTS5763DL controller in order to save on costs. Performance is not optimal, however, as read rates would fall from its initial high of ~2400 MB/s to just ~1700 MB/s when the drive is stressed.


| Drive Performance rating - Percent | |
| Beelink SER Pro Ryzen 5 5600H -11! | |
| BMAX B5 Pro G7H8 | |
| Beelink SEi11 Pro | |
| Beelink SEi8 | |
| Beelink U59 N5105 | |
| Intel NUC11TNKi5 | |
* ... smaller is better
Disk Throttling: DiskSpd Read Loop, Queue Depth 8
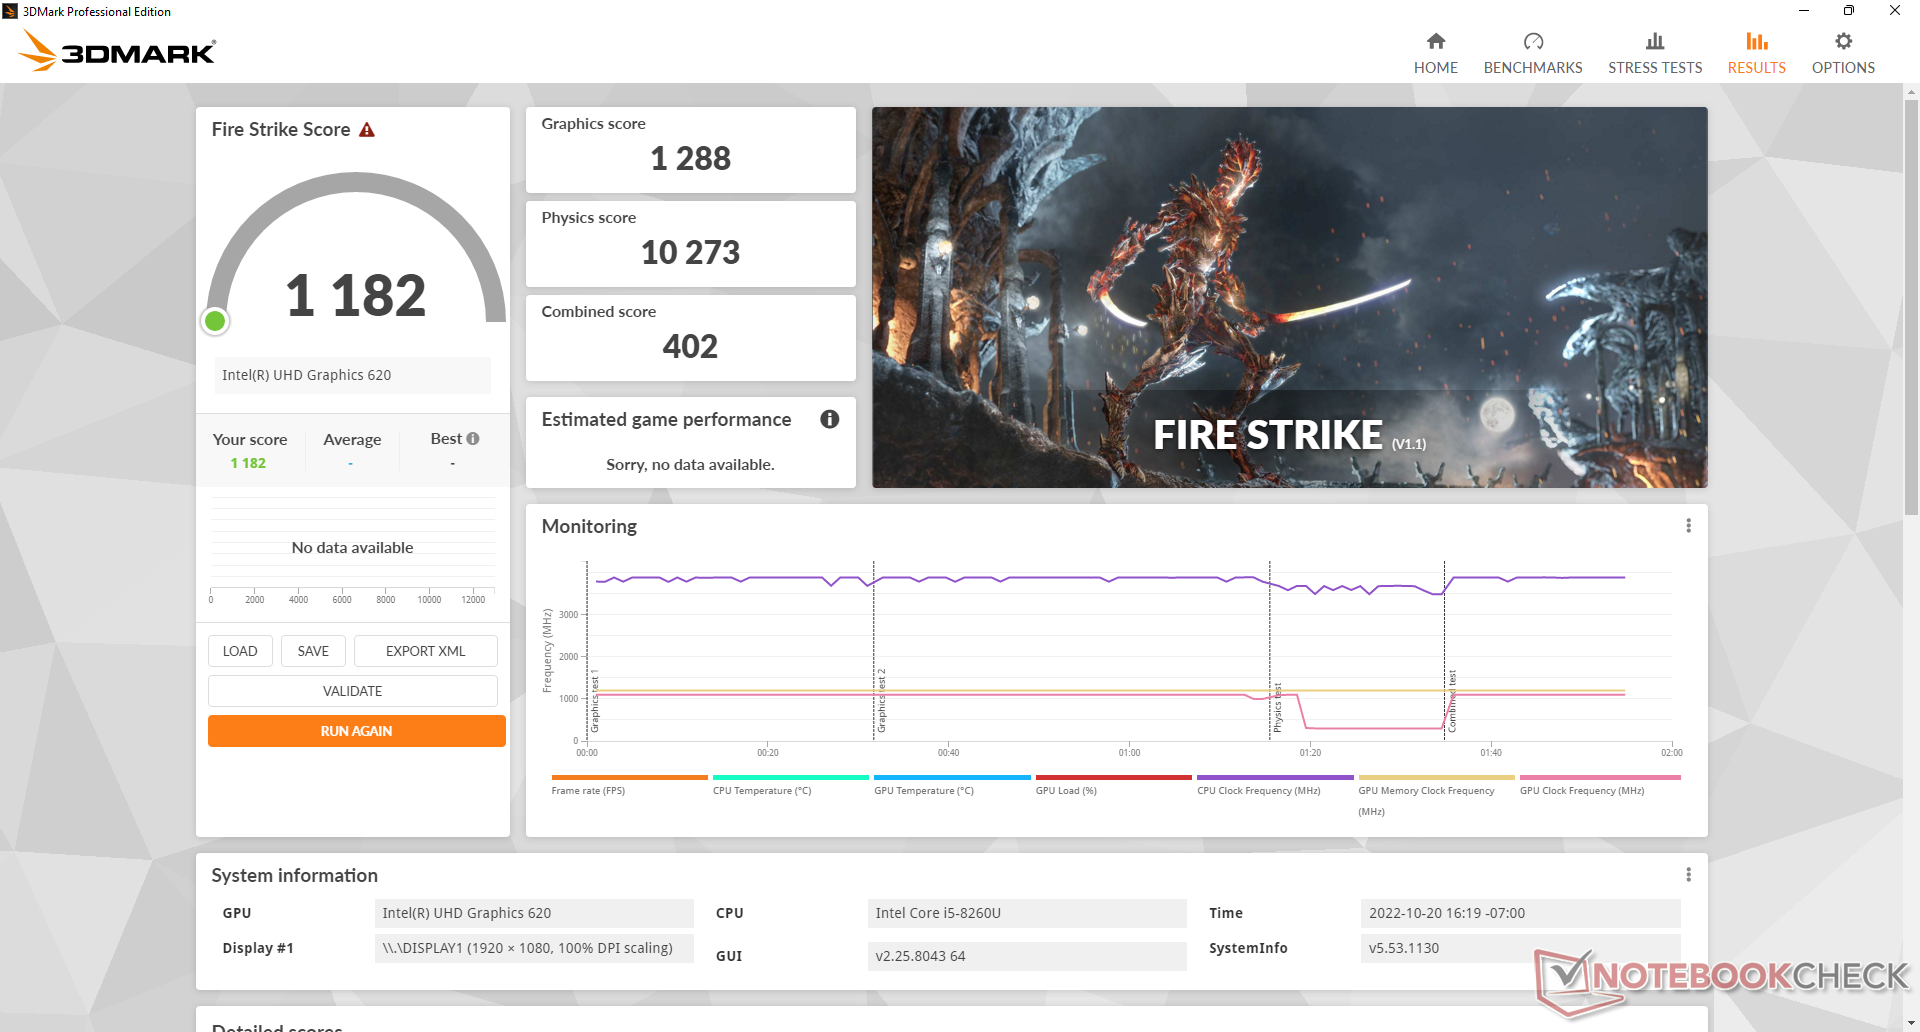
GPU Performance
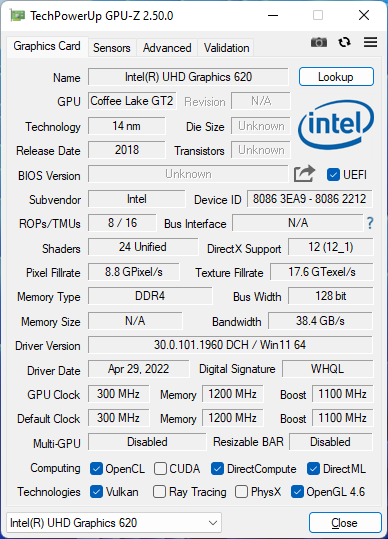
Graphics performance is poor by today's standards. The Iris Xe 80 EUs in many modern Core i5 U-series CPUs, for example, offers 2x to 2.5x faster performance than our aging UHD Graphics 620. Most games are unplayable and some would not even launch at all including X-Plane.
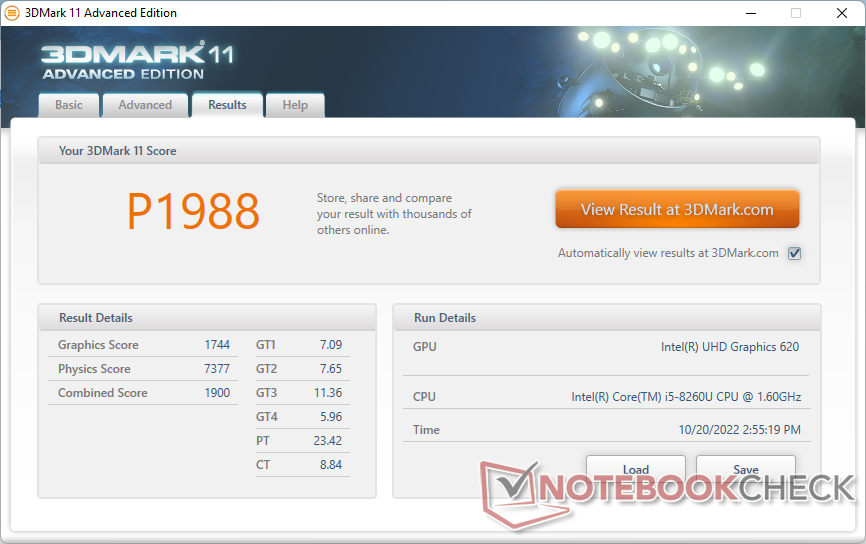

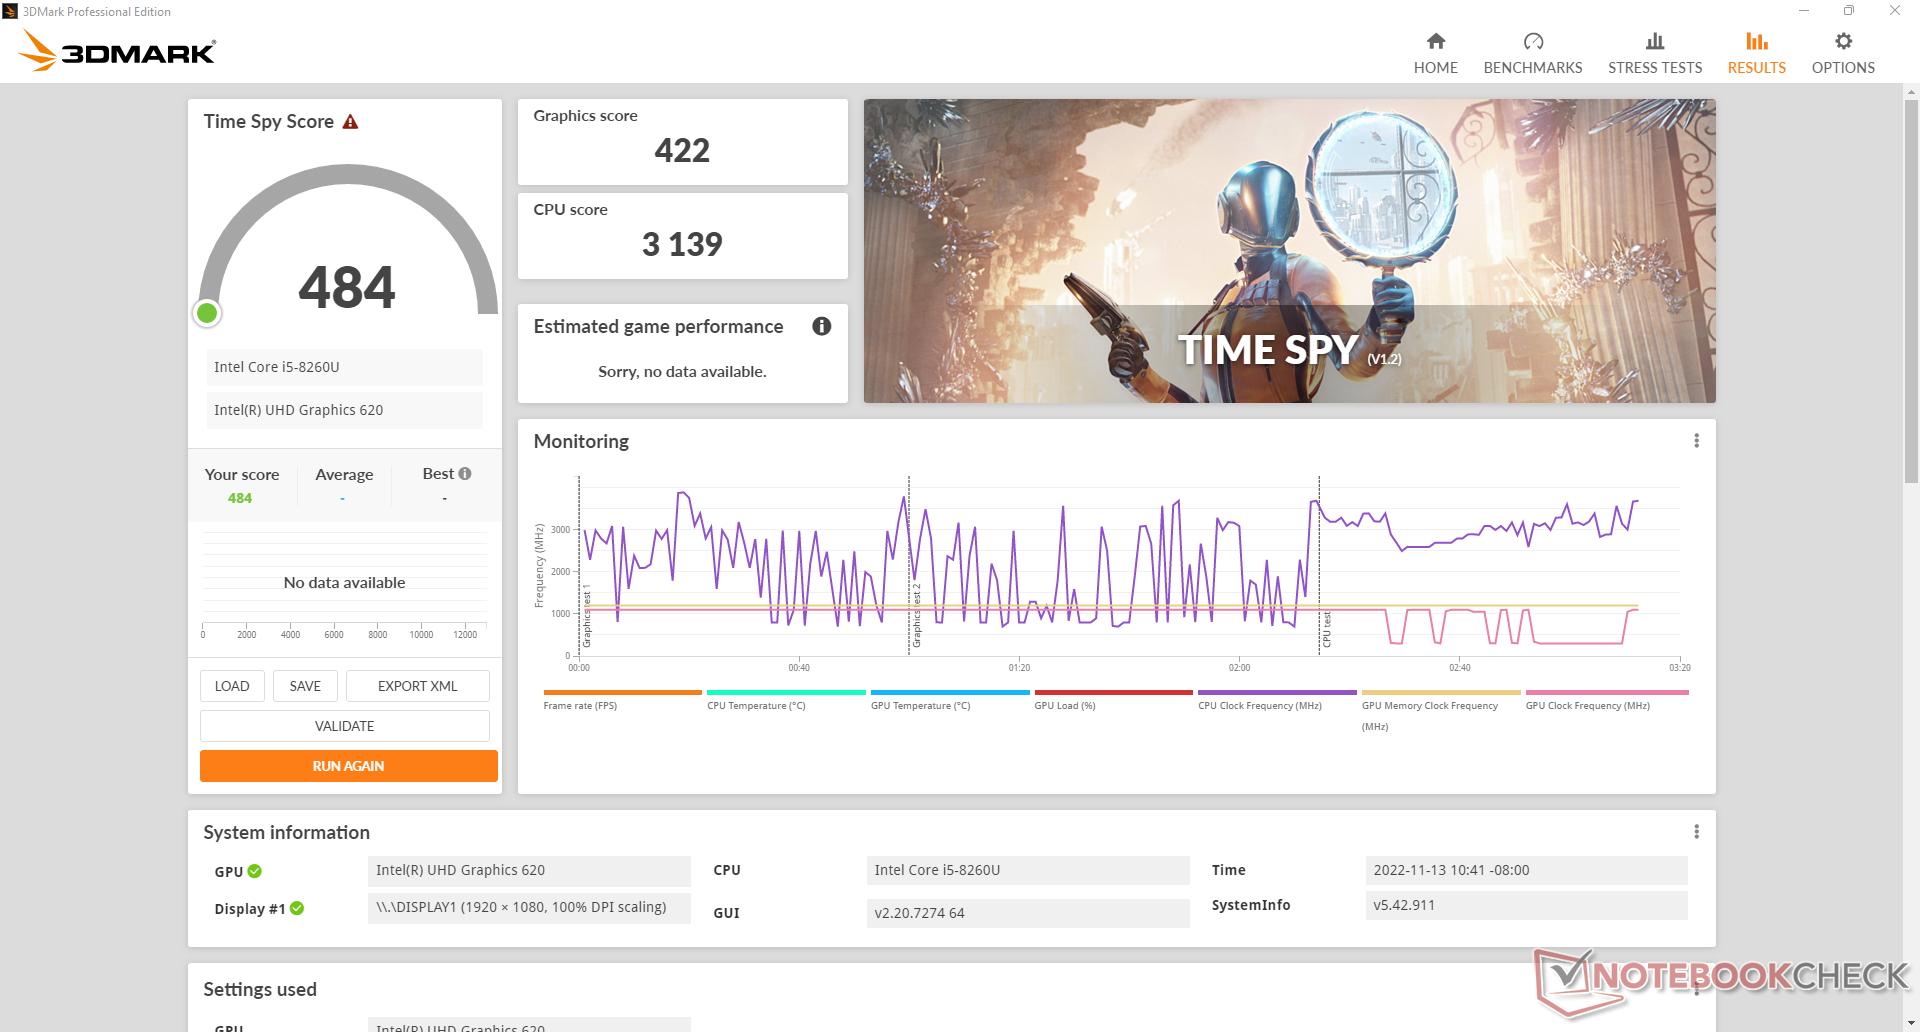
| 3DMark 11 Performance | 1988 points | |
| 3DMark Cloud Gate Standard Score | 8873 points | |
| 3DMark Fire Strike Score | 1182 points | |
| 3DMark Time Spy Score | 484 points | |
Help | ||
| Blender - v3.3 Classroom CPU (sort by value) | |
| BMAX B5 Pro G7H8 | |
| Beelink SEi11 Pro | |
| Beelink U59 N5105 | |
| Beelink SER Pro Ryzen 5 5600H | |
* ... smaller is better
| Performance rating - Percent | |
| Asus Vivobook 15 K513EQ | |
| Beelink SER Pro Ryzen 5 5600H | |
| Beelink SEi11 Pro -1! | |
| Intel NUC11TNKi5 -3! | |
| Infinix INBook X2 -2! | |
| Beelink SEi8 -3! | |
| Fujitsu Lifebook U939 i5 -4! | |
| Beelink U59 N5105 -3! | |
| BMAX B5 Pro G7H8 -5! | |
| The Witcher 3 - 1920x1080 Ultra Graphics & Postprocessing (HBAO+) | |
| Asus Vivobook 15 K513EQ | |
| Beelink SER Pro Ryzen 5 5600H | |
| Beelink SEi11 Pro | |
| Infinix INBook X2 | |
| Beelink U59 N5105 | |
| GTA V - 1920x1080 Highest AA:4xMSAA + FX AF:16x | |
| Asus Vivobook 15 K513EQ | |
| Beelink SER Pro Ryzen 5 5600H | |
| Final Fantasy XV Benchmark - 1920x1080 High Quality | |
| Beelink SEi11 Pro | |
| Asus Vivobook 15 K513EQ | |
| Beelink SER Pro Ryzen 5 5600H | |
| Intel NUC11TNKi5 | |
| Infinix INBook X2 | |
| Beelink SEi8 | |
| Strange Brigade - 1920x1080 ultra AA:ultra AF:16 | |
| Beelink SER Pro Ryzen 5 5600H | |
| Beelink SEi11 Pro | |
| Asus Vivobook 15 K513EQ | |
| Dota 2 Reborn - 1920x1080 ultra (3/3) best looking | |
| Asus Vivobook 15 K513EQ | |
| Beelink SER Pro Ryzen 5 5600H | |
| Beelink SEi11 Pro | |
| Intel NUC11TNKi5 | |
| Infinix INBook X2 | |
| Beelink SEi8 | |
| Fujitsu Lifebook U939 i5 | |
| Beelink U59 N5105 | |
| BMAX B5 Pro G7H8 | |
| X-Plane 11.11 - 1920x1080 high (fps_test=3) | |
| Asus Vivobook 15 K513EQ | |
| Beelink SEi11 Pro | |
| Beelink SER Pro Ryzen 5 5600H | |
| Intel NUC11TNKi5 | |
| Infinix INBook X2 | |
| Fujitsu Lifebook U939 i5 | |
| Beelink SEi8 | |
| Beelink U59 N5105 | |
| The Witcher 3 | |
| 1024x768 Low Graphics & Postprocessing | |
| Beelink SEi11 Pro | |
| Asus Vivobook 15 K513EQ | |
| Beelink SER Pro Ryzen 5 5600H | |
| Intel NUC11TNKi5 | |
| Infinix INBook X2 | |
| BMAX B5 Pro G7H8 | |
| Beelink U59 N5105 | |
| Fujitsu Lifebook U939 i5 | |
| 1366x768 Medium Graphics & Postprocessing | |
| Beelink SEi11 Pro | |
| Beelink SER Pro Ryzen 5 5600H | |
| Asus Vivobook 15 K513EQ | |
| Infinix INBook X2 | |
| Beelink U59 N5105 | |
| BMAX B5 Pro G7H8 | |
| 1920x1080 High Graphics & Postprocessing (Nvidia HairWorks Off) | |
| Asus Vivobook 15 K513EQ | |
| Beelink SEi11 Pro | |
| Beelink SER Pro Ryzen 5 5600H | |
| Infinix INBook X2 | |
| Beelink U59 N5105 | |
| BMAX B5 Pro G7H8 | |
| Final Fantasy XV Benchmark - 1280x720 Lite Quality | |
| Asus Vivobook 15 K513EQ | |
| Beelink SER Pro Ryzen 5 5600H | |
| Beelink SEi11 Pro | |
| Intel NUC11TNKi5 | |
| Infinix INBook X2 | |
| Geekom Mini IT8-GM08i5T | |
| Beelink SEi8 | |
| Beelink U59 N5105 | |
| BMAX B5 Pro G7H8 | |
Witcher 3 FPS Chart
| low | med. | high | ultra | |
|---|---|---|---|---|
| The Witcher 3 (2015) | 23.8 | 13.5 | 7.3 | |
| Dota 2 Reborn (2015) | 42.4 | 8.6 | 5.6 | 5.6 |
| Final Fantasy XV Benchmark (2018) | 5.61 |
Emissions
System Noise — Not Loud At All
The internal fan is almost always active at about 25 dB(A) against a silent background of 23 dB(A) even when not running any applications. Fortunately, this low of a range is quiet enough to be unnoticeable in most scenarios. Running higher loads like games induces a fan noise in the 30 to 34 dB(A) range which is still very quiet especially in HTPC environments.
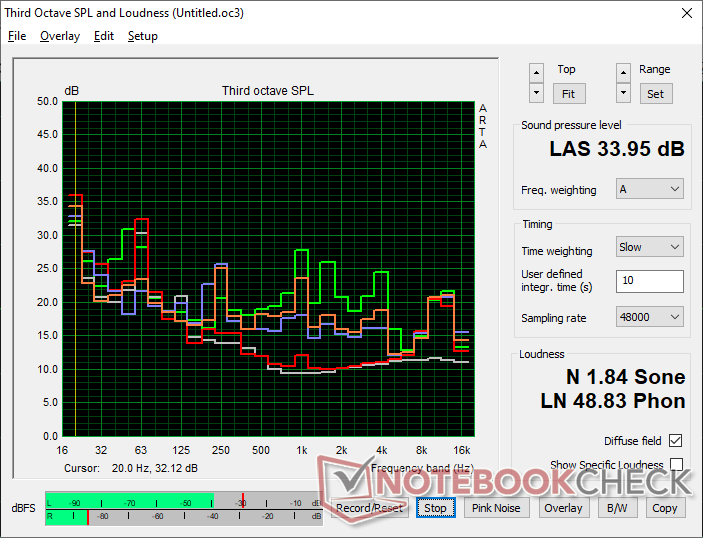
Noise level
| Idle |
| 25.1 / 25.1 / 25.1 dB(A) |
| Load |
| 28.6 / 34 dB(A) |
 | ||
30 dB silent 40 dB(A) audible 50 dB(A) loud |
||
min: | ||
| BMAX B5 Pro G7H8 UHD Graphics 620, i5-8260U | Beelink SEi11 Pro Iris Xe G7 96EUs, i5-11320H, Kingston NV1 SNVS/500GCN | Beelink U59 N5105 UHD Graphics (Jasper Lake 24 EU), Celeron N5105, Silicon Motion AZW 512G NV428 | Beelink SEi8 Iris Plus Graphics 655, i3-8109U, Intel SSD 660p SSDPEKNW512G8 | Beelink SER Pro Ryzen 5 5600H Vega 7, R5 5600H, Kingston NV1 SNVS/500GCN | Intel NUC11TNKi5 Iris Xe G7 80EUs, i5-1135G7, Transcend M.2 SSD 430S TS512GMTS430S | |
|---|---|---|---|---|---|---|
| Noise | -5% | 14% | -14% | -7% | -32% | |
| off / environment * (dB) | 23 | 22.8 1% | 21.5 7% | 24.5 -7% | 22.8 1% | 24.8 -8% |
| Idle Minimum * (dB) | 25.1 | 24.7 2% | 22.1 12% | 26.5 -6% | 26.1 -4% | 35.6 -42% |
| Idle Average * (dB) | 25.1 | 24.7 2% | 22.1 12% | 26.5 -6% | 26.1 -4% | 35.6 -42% |
| Idle Maximum * (dB) | 25.1 | 25.3 -1% | 22.1 12% | 31.1 -24% | 28.7 -14% | 35.6 -42% |
| Load Average * (dB) | 28.6 | 33.2 -16% | 23.9 16% | 37.7 -32% | 32.3 -13% | 36.2 -27% |
| Witcher 3 ultra * (dB) | 30.1 | 34.5 -15% | 24.4 19% | 32.8 -9% | 38 -26% | |
| Load Maximum * (dB) | 34 | 37.8 -11% | 26.8 21% | 37.5 -10% | 36.4 -7% | 47.6 -40% |
* ... smaller is better
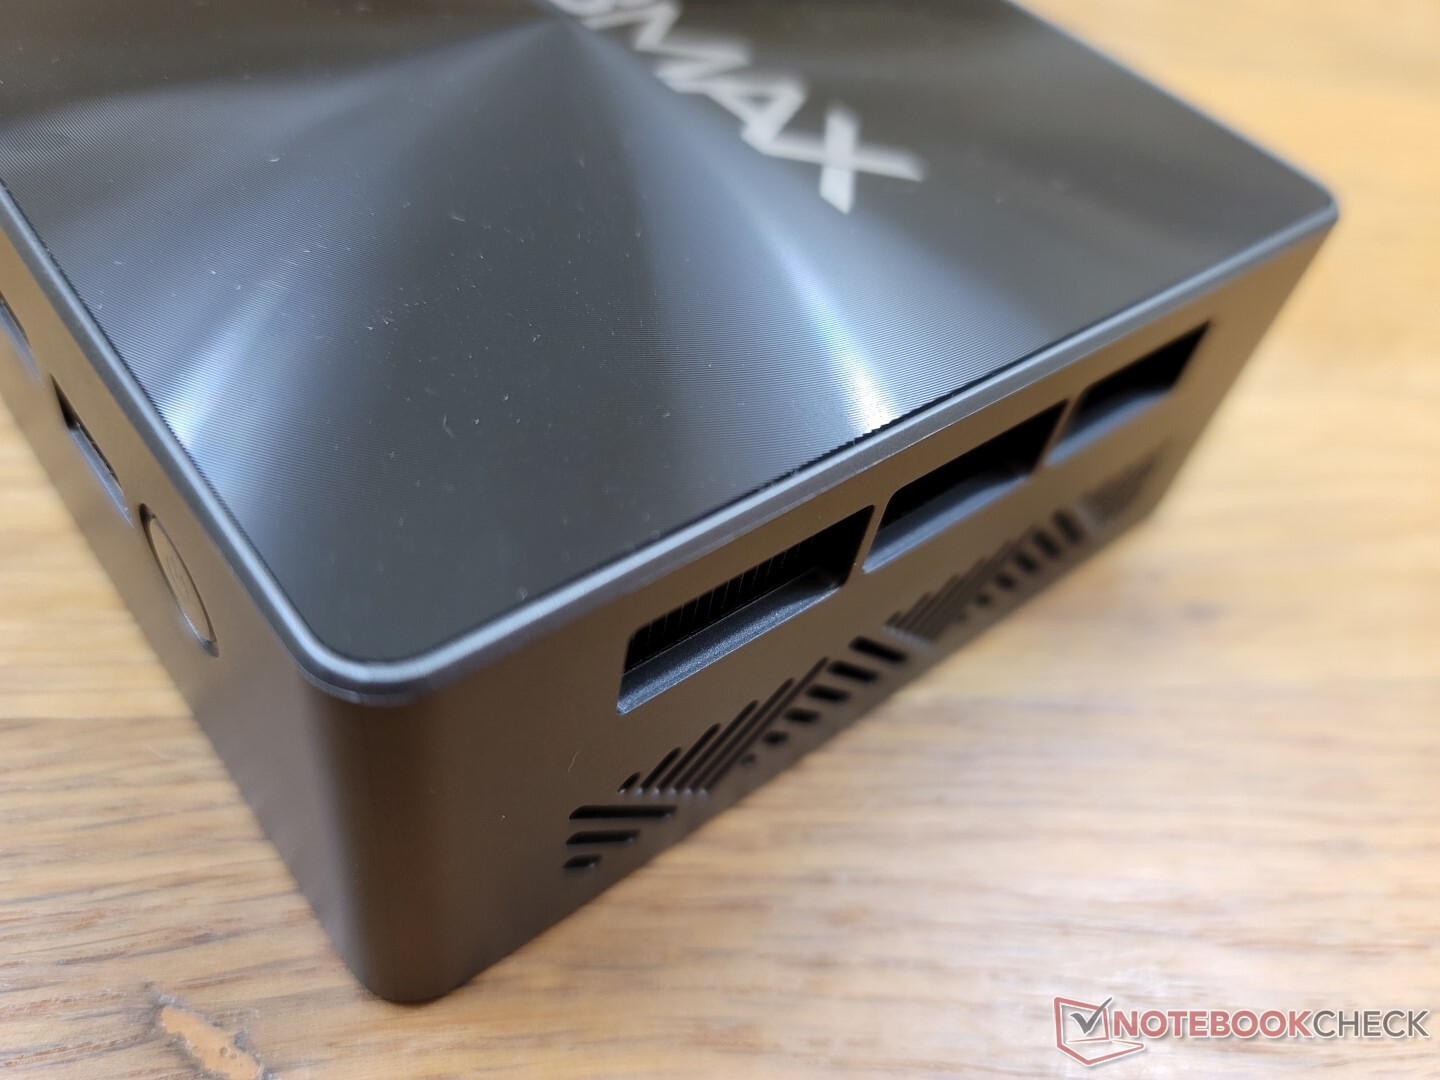
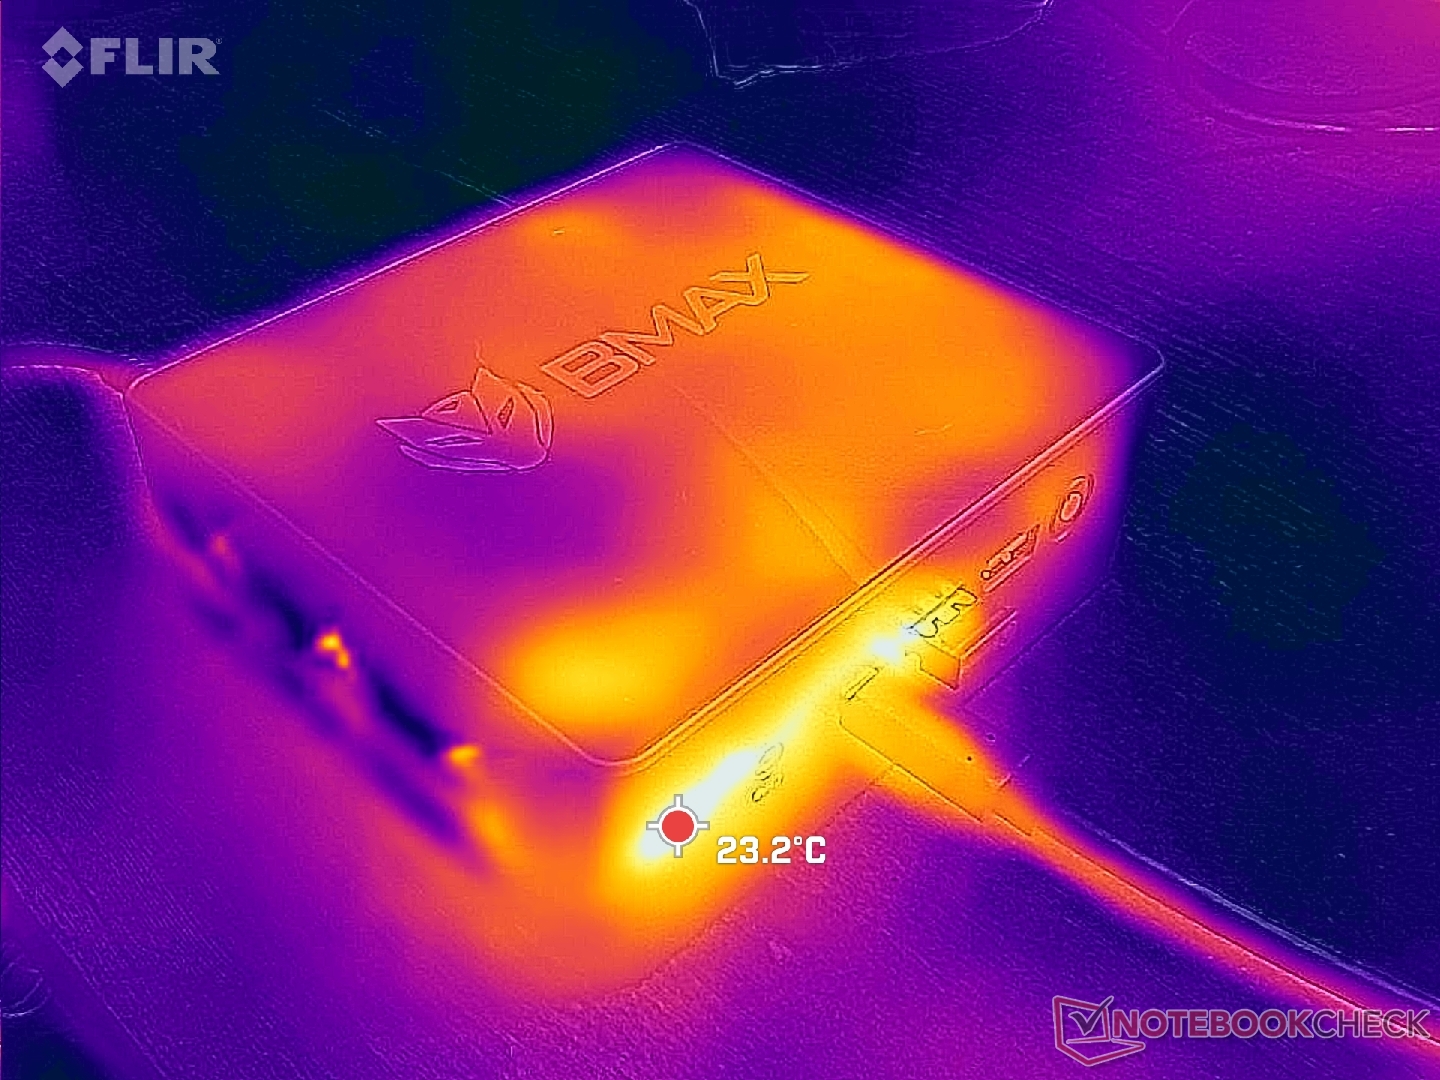
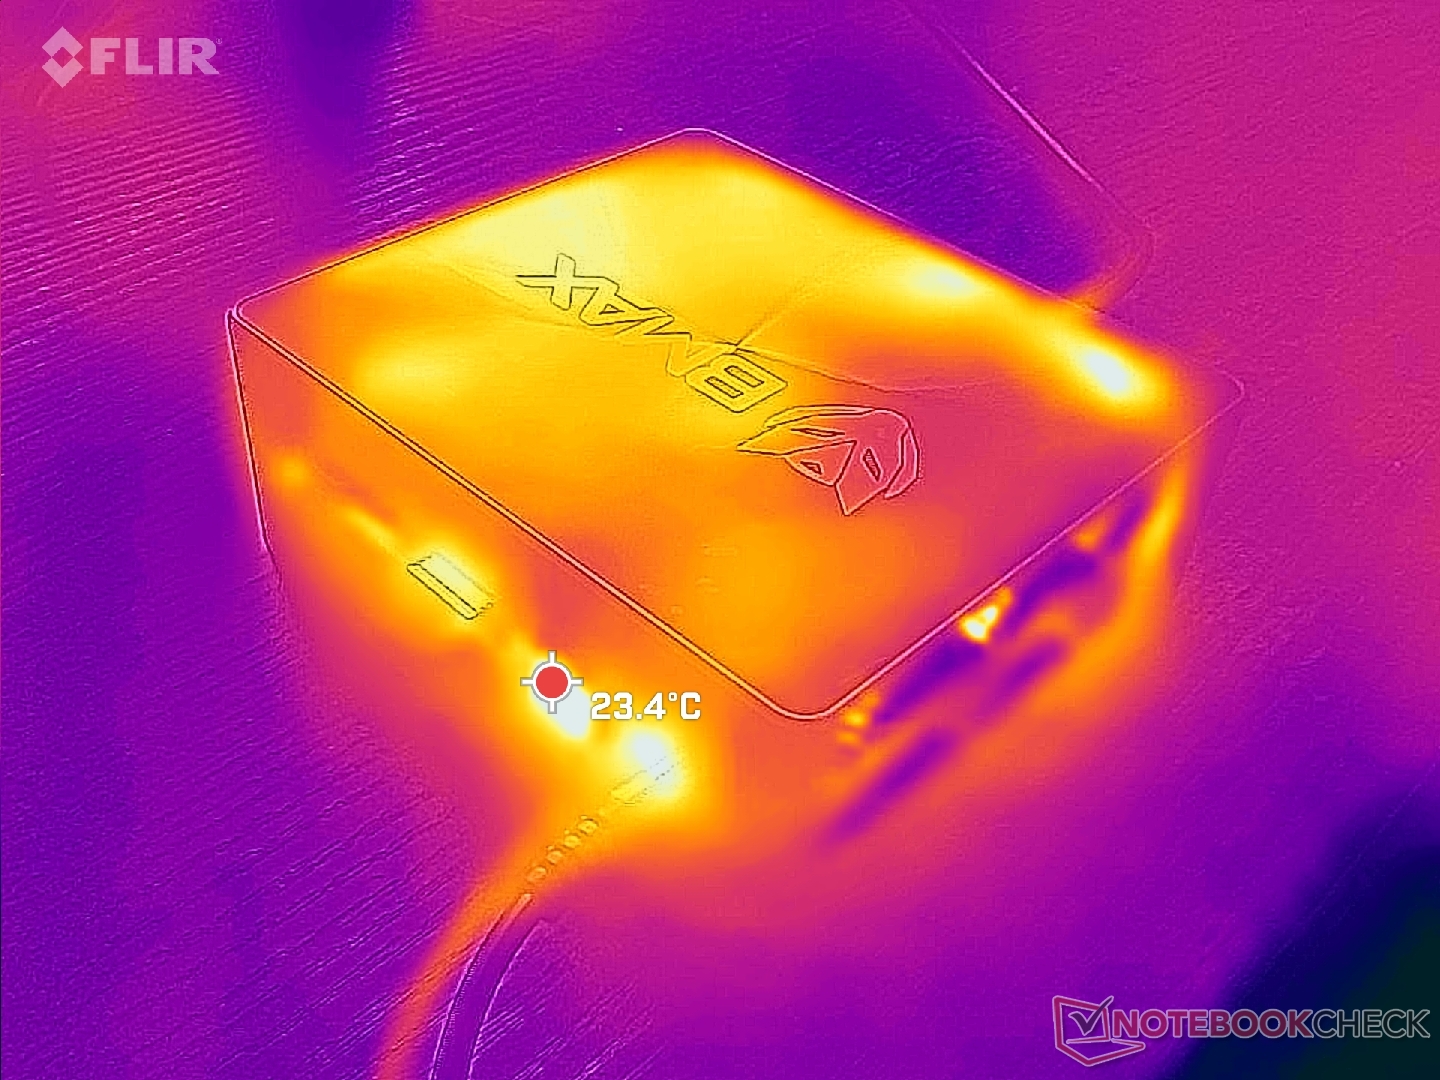
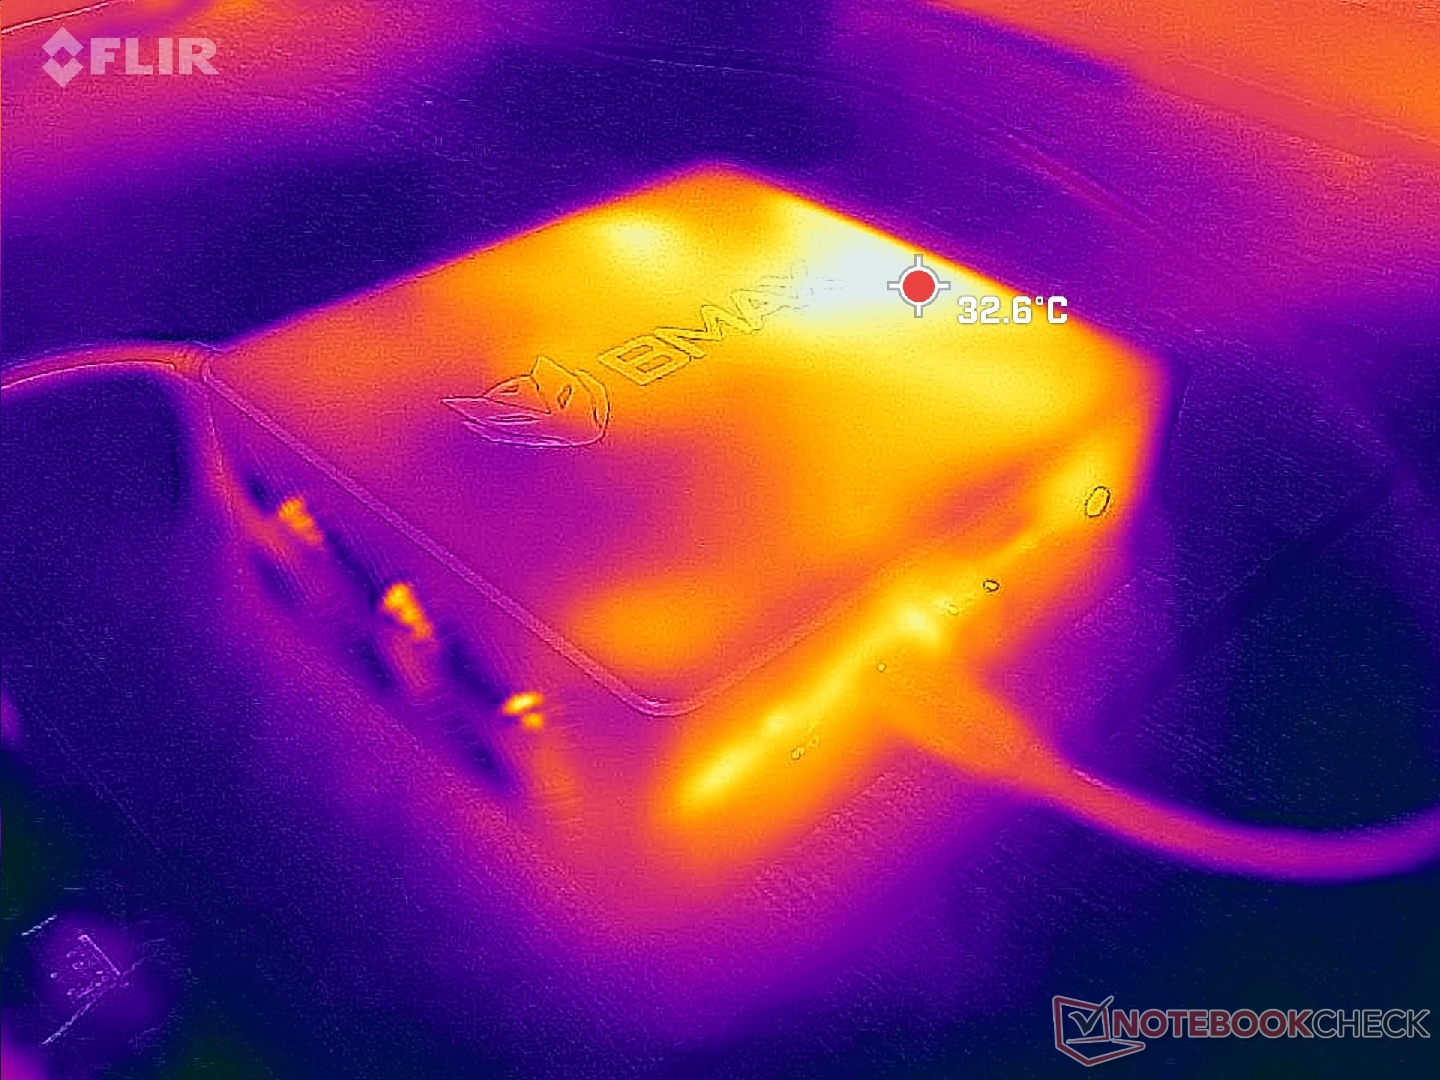
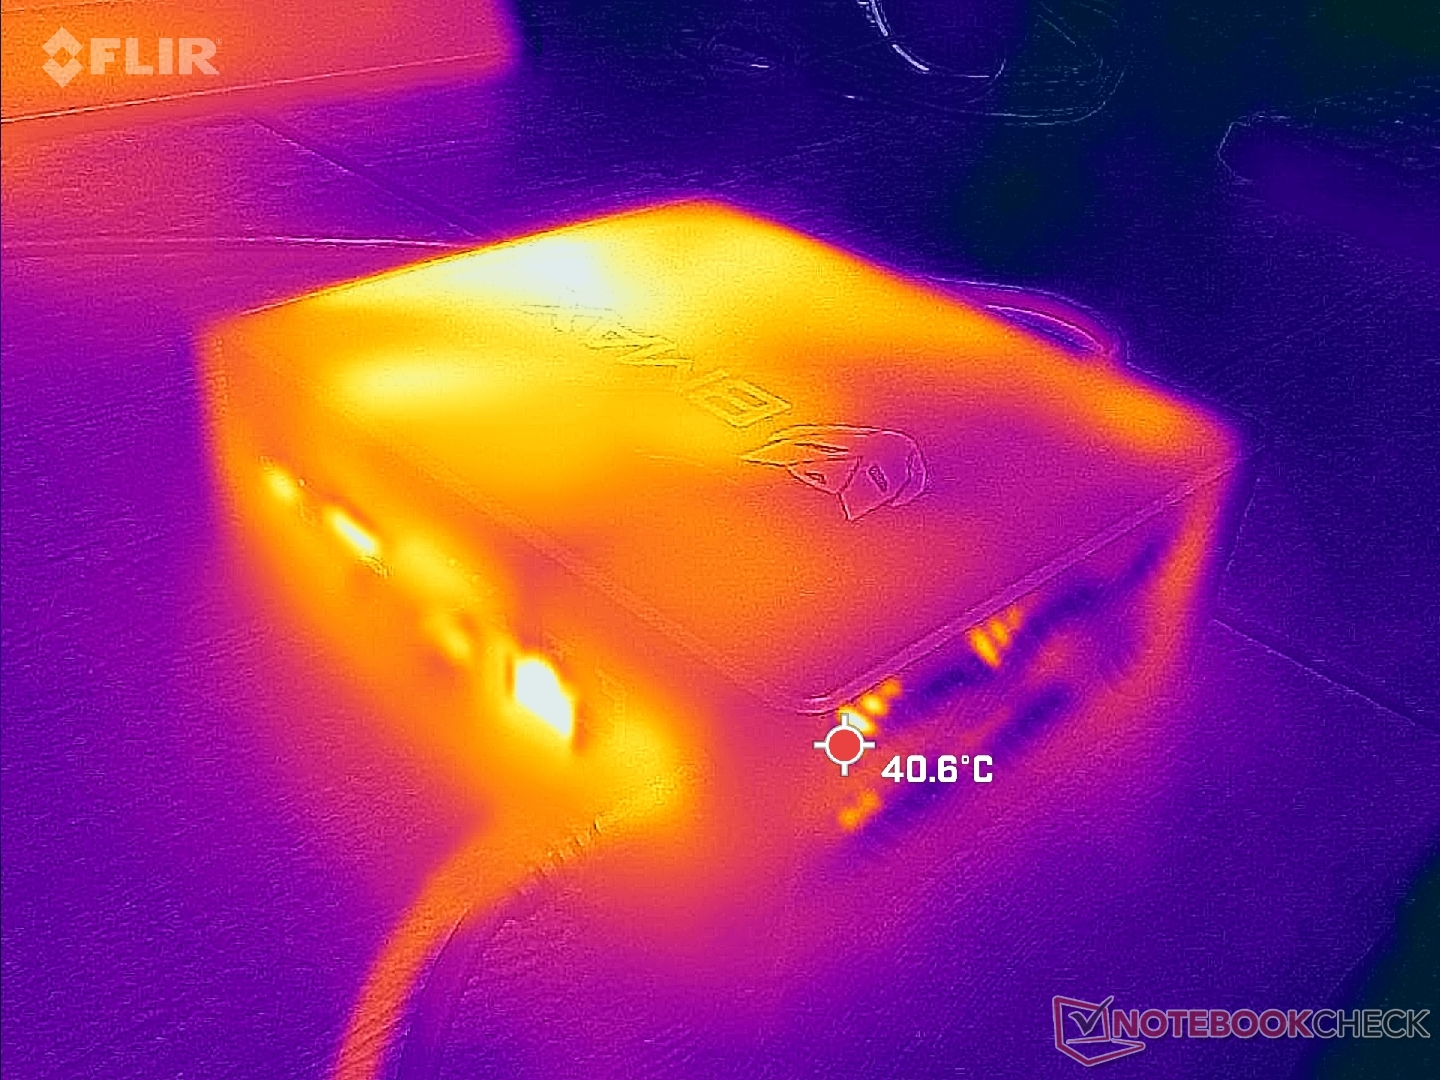
Temperature
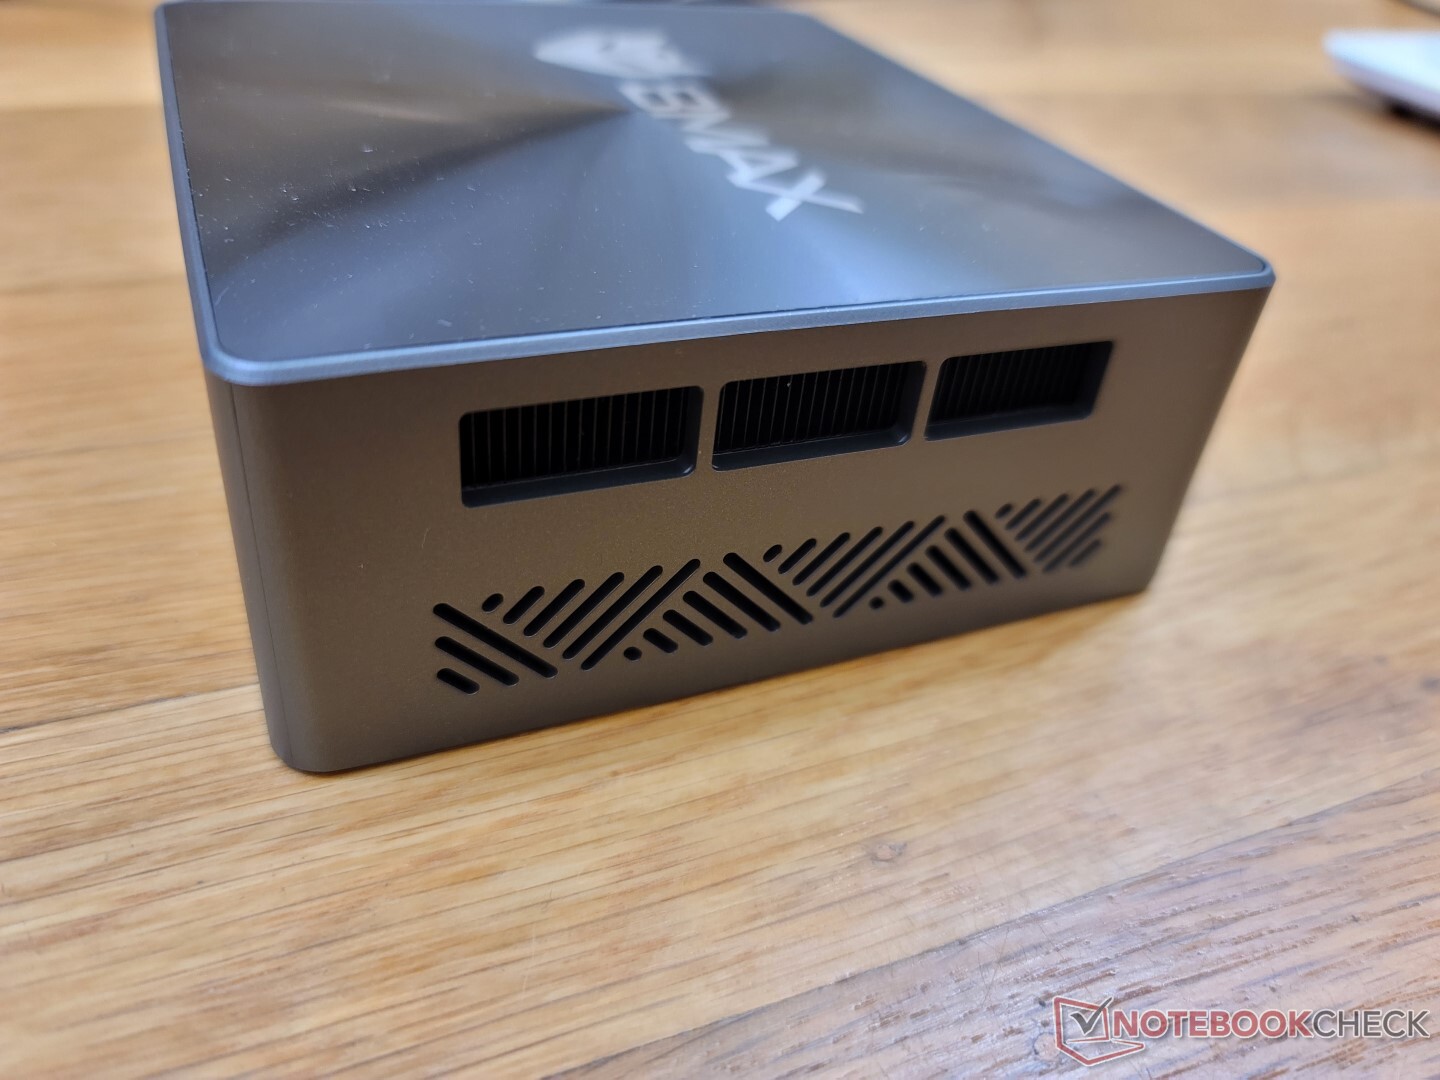
Surface temperatures are never uncomfortably warm. The hot spot on top, for example, only reaches around 33 C when under high processing stress. Heat escapes from the right side of the chassis unlike on the Intel NUC where heat escapes from the rear.
Items can be safely placed on top of the unit since there are no ventilation grilles there.
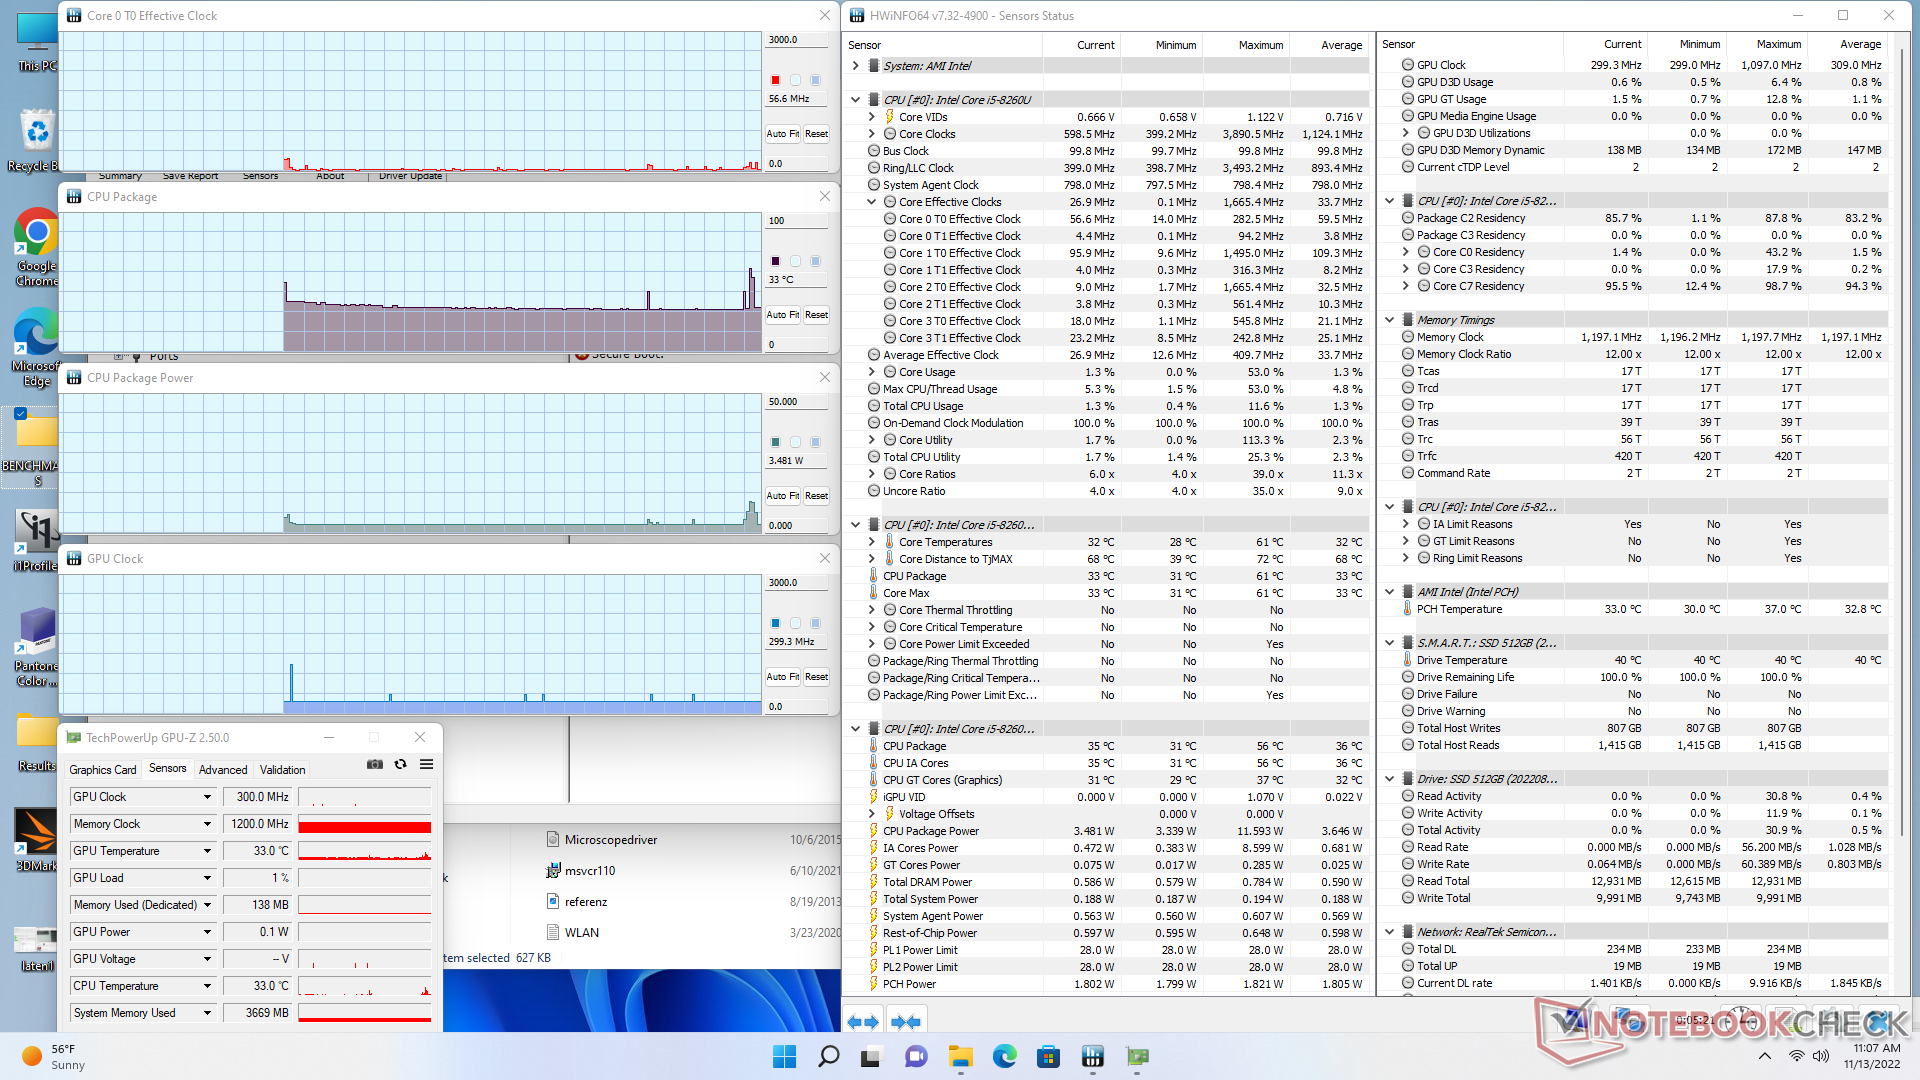
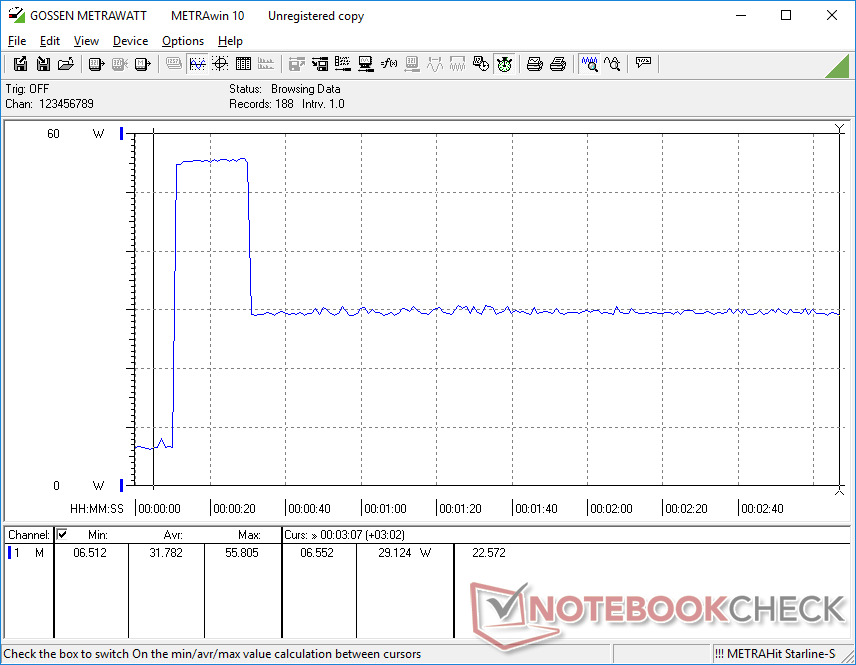
Stress Test
When stressed under Prime95, the CPU would boost to 2.8 GHz and 28 W for about 20 seconds or until core temperature reaches 76 C. Clock rates and board power draw would then stabilize at 1.5 GHz and 12 W, respectively, in order to maintain a cooler core temperature of 60 C. Repeating this same test on the Beelink SEi8 would result in faster core clocks and warmer temperatures of 2.8 GHz and 80 C, respectively. The Turbo Boost potential of the B5 Pro is therefore limited which follows what we observed during our CineBench stress test above.
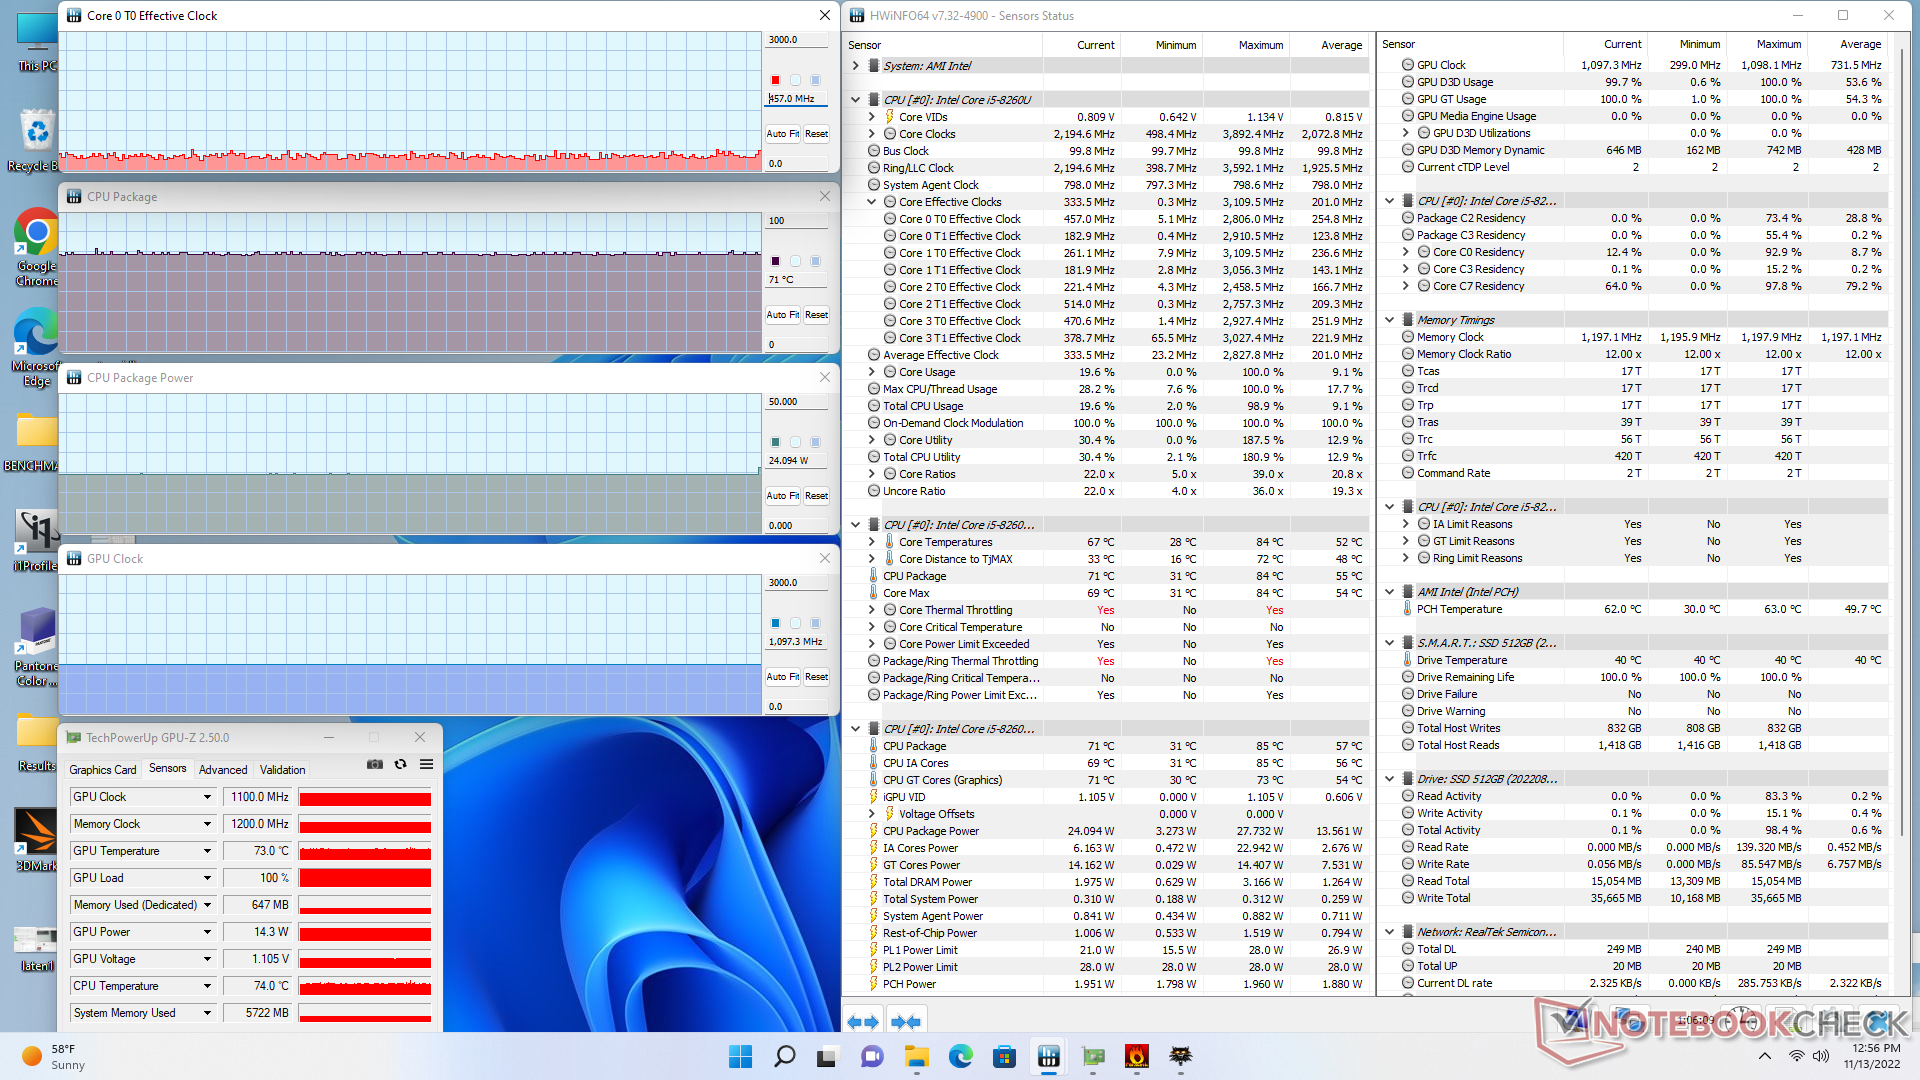
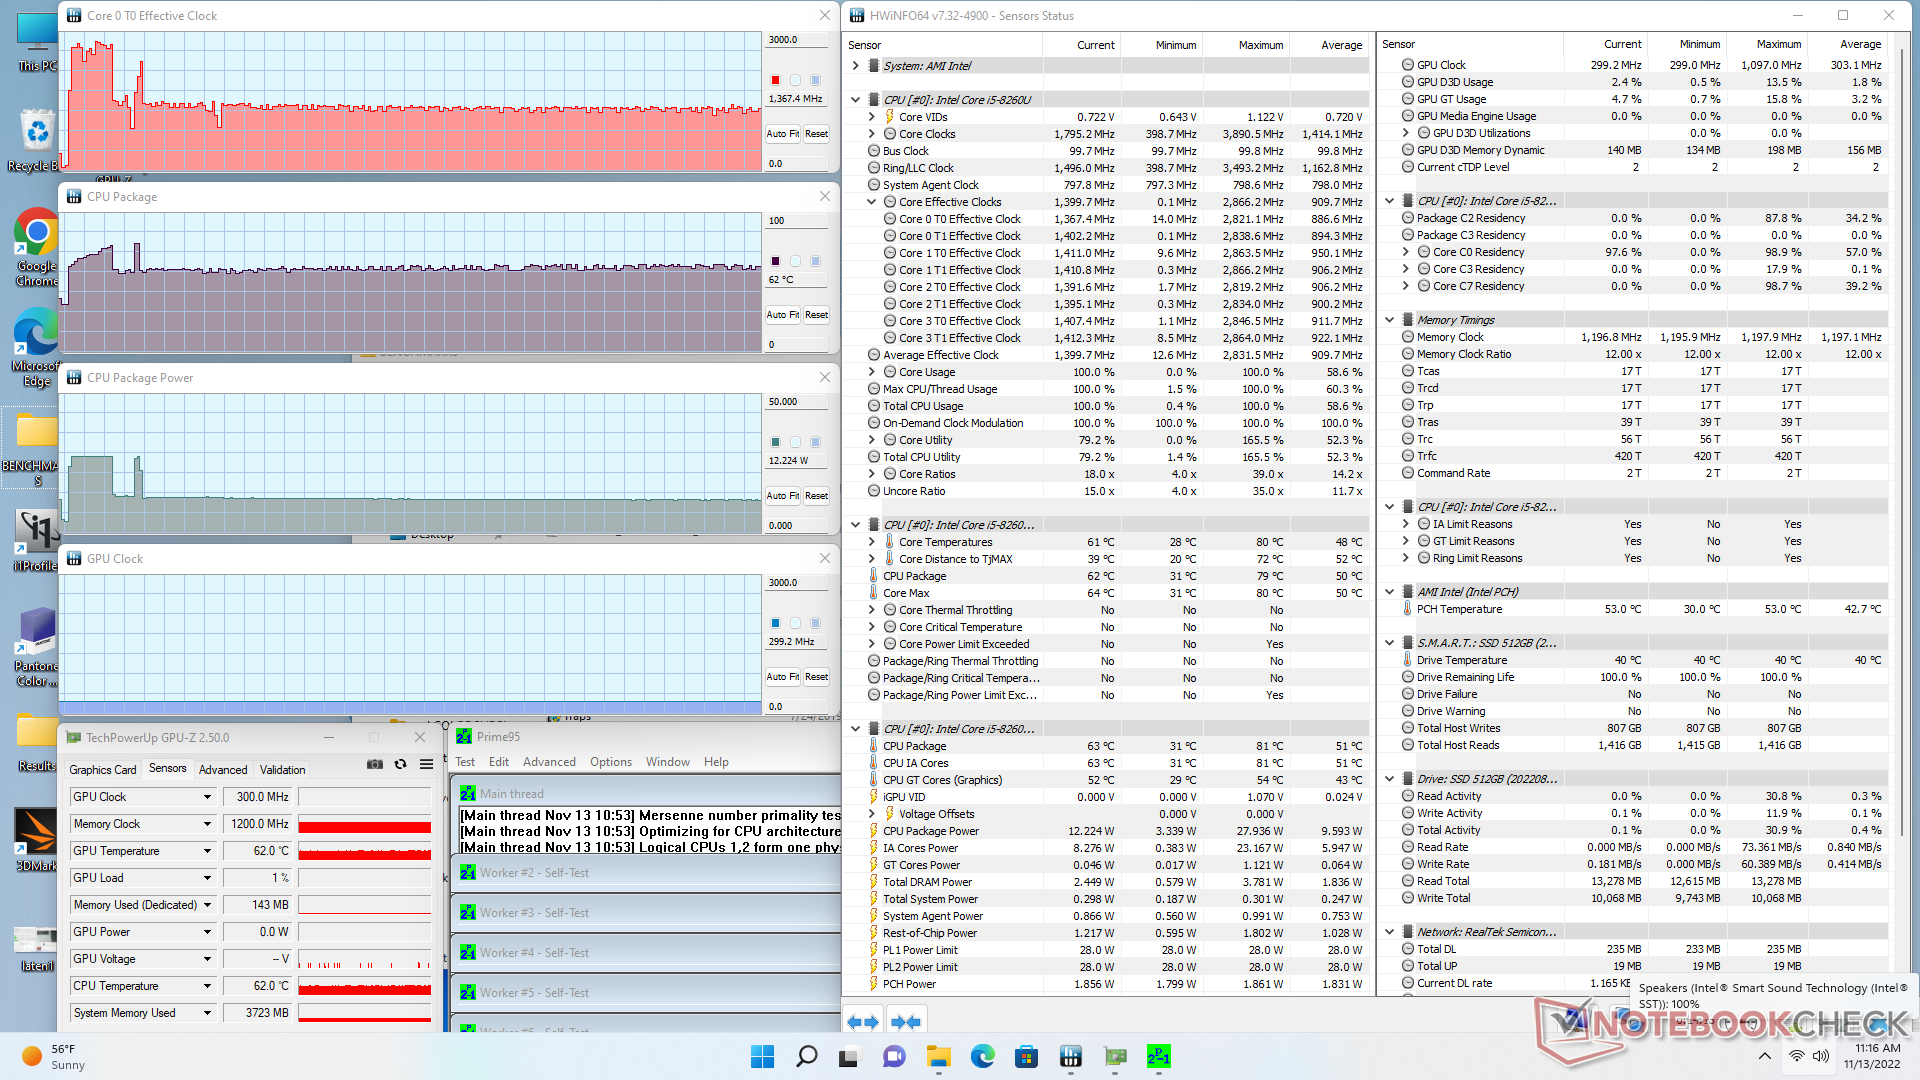
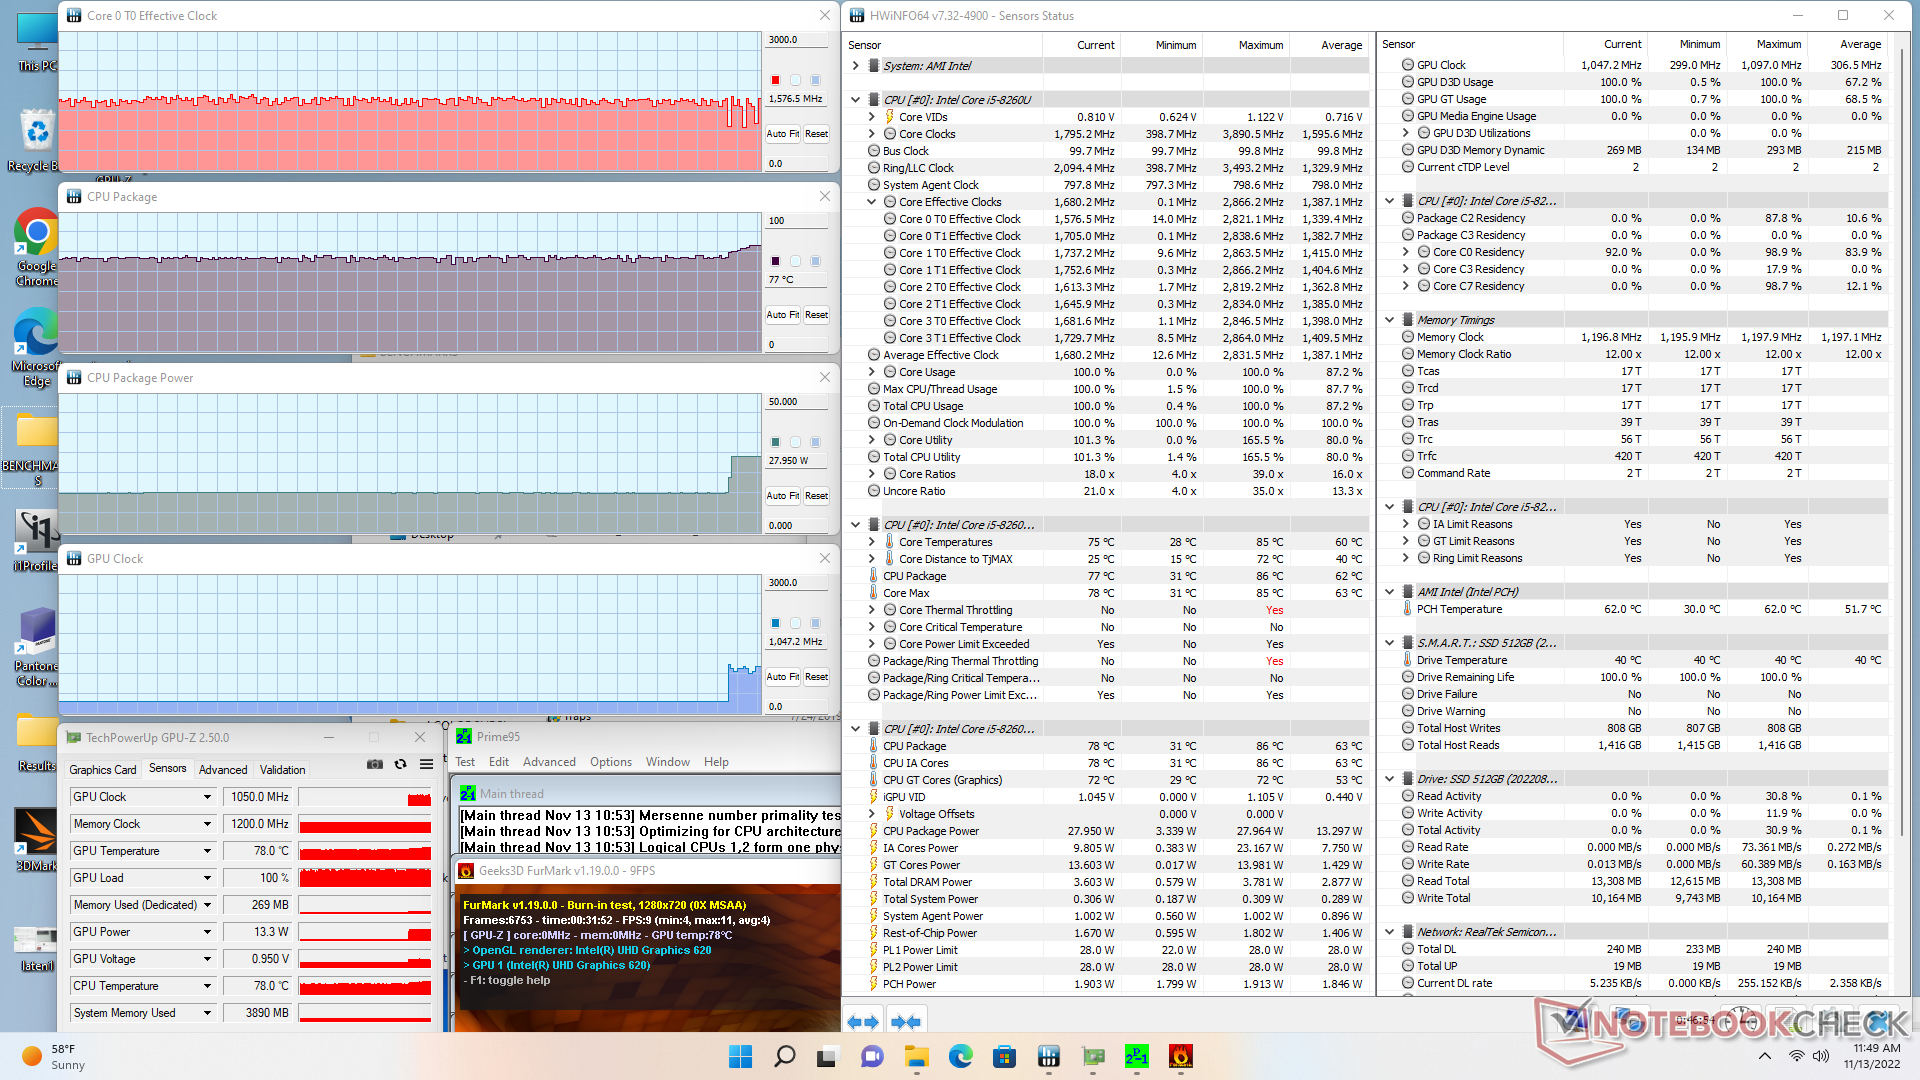
| CPU Clock (GHz) | GPU Clock (MHz) | Average CPU Temperature (°C) | |
| System Idle | -- | -- | 33 |
| Prime95 Stress | 1.3 | -- | 62 |
| Prime95 + FurMark Stress | 1.6 | 300 | 67 |
| Witcher 3 Stress | ~400 | 1100 | 71 |
Energy Management
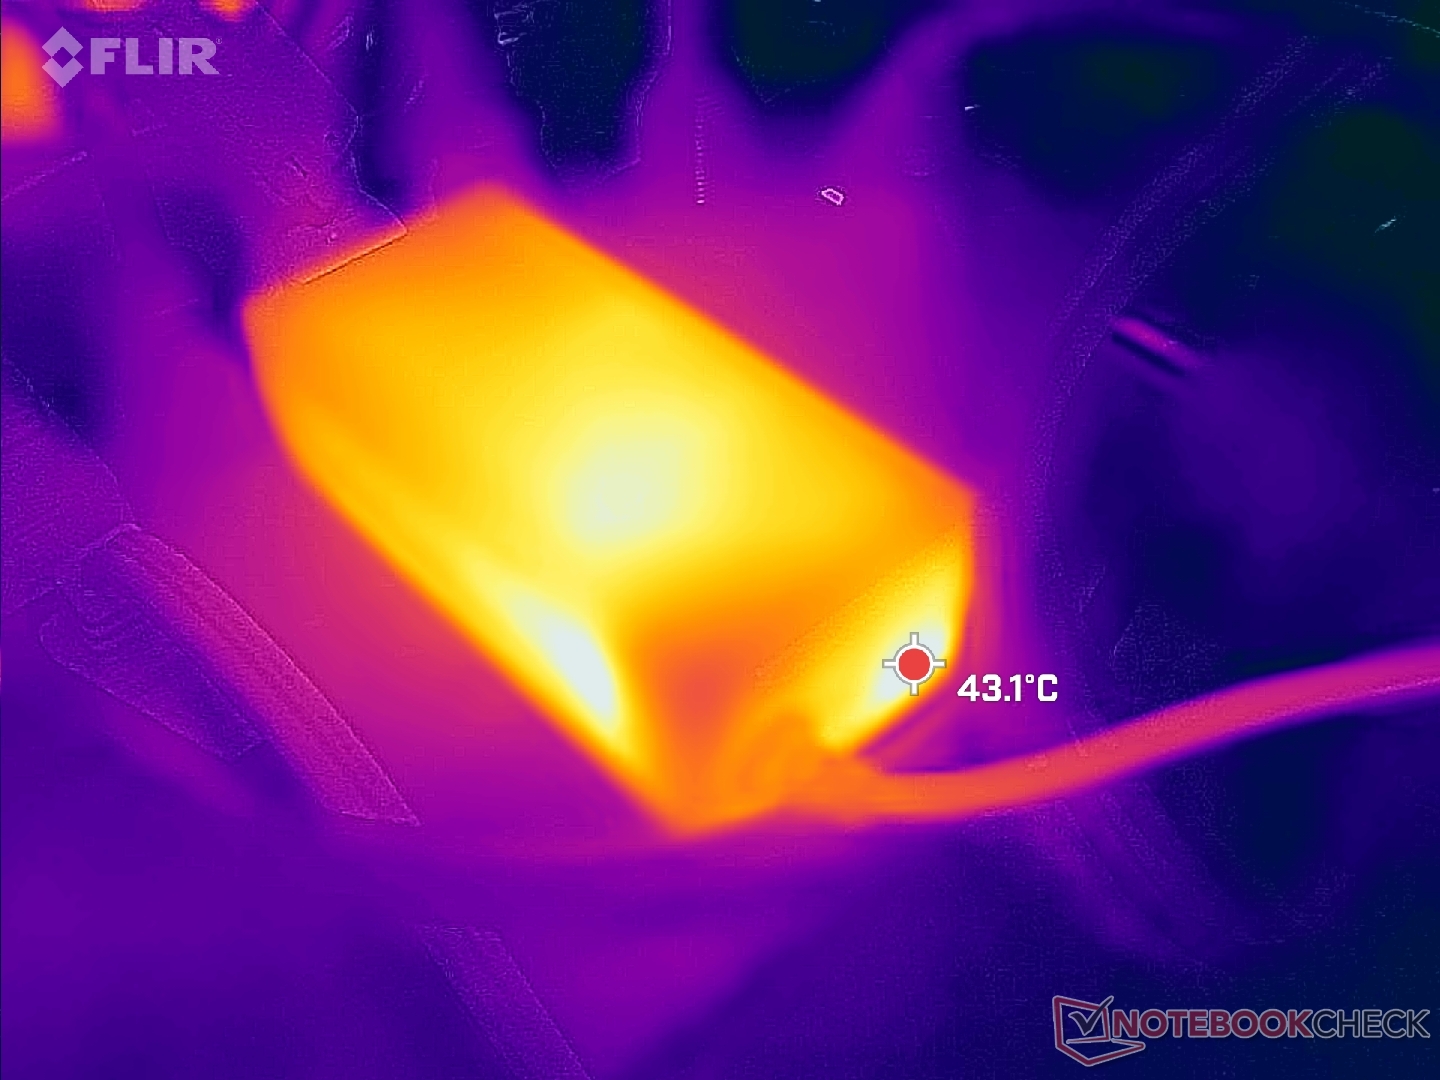
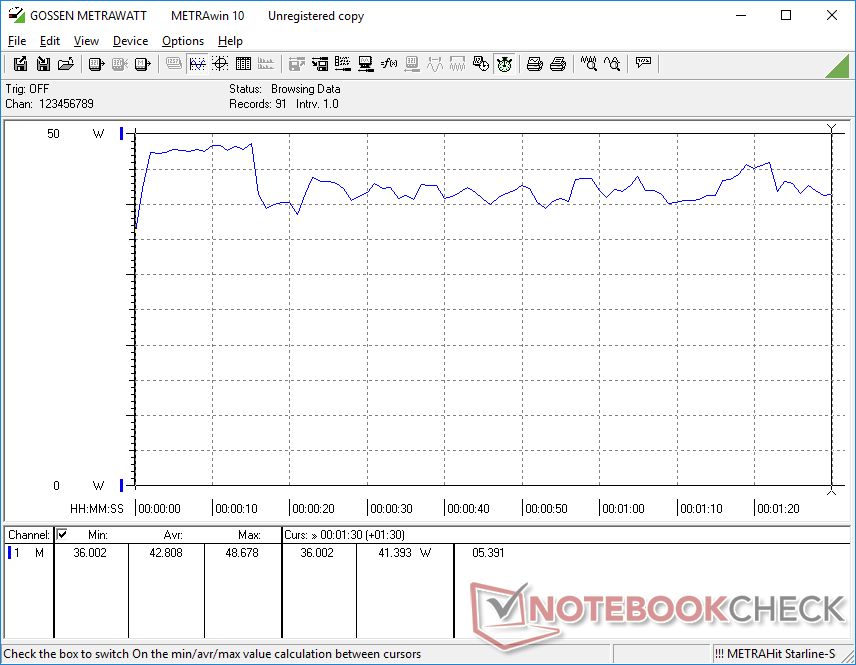
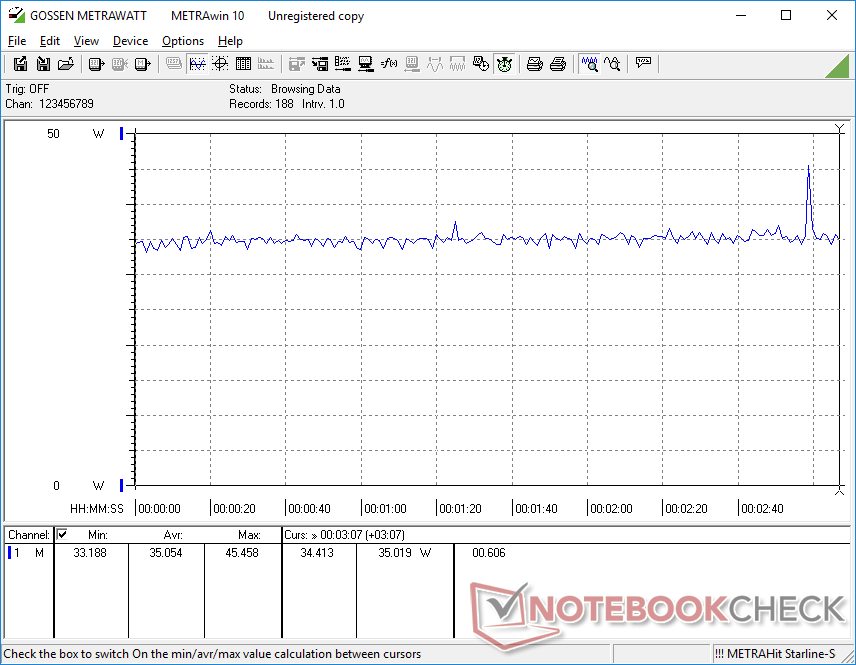
Power Consumption — Very Undemanding
Overall consumption is lower than on many mini PCs with newer CPUs like the Intel NUC11TNKi5 and its 11th gen Core i5-1135G7. Performance-per-watt, however, favors the latter significantly. Though users can save a few watts with the BMax, mini PCs with newer generation CPUs like the aforementioned NUC can offer over 2x the graphics performance or 50 percent higher CPU performance.
We're able to record a maximum draw of 55.9 W from the small (~9.8 x 4.3 x 3.7 cm) 48 W AC adapter when the CPU is at 100 percent utilization. This rate is only temporary as shown by our graphs below.
| Off / Standby | |
| Idle | |
| Load |
|
Key:
min: | |
| BMAX B5 Pro G7H8 i5-8260U, UHD Graphics 620, , , x, | Beelink SEi11 Pro i5-11320H, Iris Xe G7 96EUs, Kingston NV1 SNVS/500GCN, , x, | Beelink U59 N5105 Celeron N5105, UHD Graphics (Jasper Lake 24 EU), Silicon Motion AZW 512G NV428, , x, | Beelink SEi8 i3-8109U, Iris Plus Graphics 655, Intel SSD 660p SSDPEKNW512G8, , x, | Beelink SER Pro Ryzen 5 5600H R5 5600H, Vega 7, Kingston NV1 SNVS/500GCN, , x, | Intel NUC11TNKi5 i5-1135G7, Iris Xe G7 80EUs, Transcend M.2 SSD 430S TS512GMTS430S, , x, | |
|---|---|---|---|---|---|---|
| Power Consumption | -47% | 2% | -13% | -15% | -58% | |
| Idle Minimum * (Watt) | 6 | 9.8 -63% | 6.7 -12% | 7.5 -25% | 5.4 10% | 11.5 -92% |
| Idle Average * (Watt) | 6.2 | 10.3 -66% | 8.1 -31% | 7.6 -23% | 8.2 -32% | 12.4 -100% |
| Idle Maximum * (Watt) | 6.3 | 10.5 -67% | 11.6 -84% | 9.2 -46% | 8.3 -32% | 12.9 -105% |
| Load Average * (Watt) | 42.8 | 54.2 -27% | 23.9 44% | 41.1 4% | 49.3 -15% | 40.7 5% |
| Witcher 3 ultra * (Watt) | 35 | 53.1 -52% | 19.1 45% | 46.1 -32% | 43.9 -25% | |
| Load Maximum * (Watt) | 55.8 | 59 -6% | 28.8 48% | 41.4 26% | 50.2 10% | 73.5 -32% |
* ... smaller is better
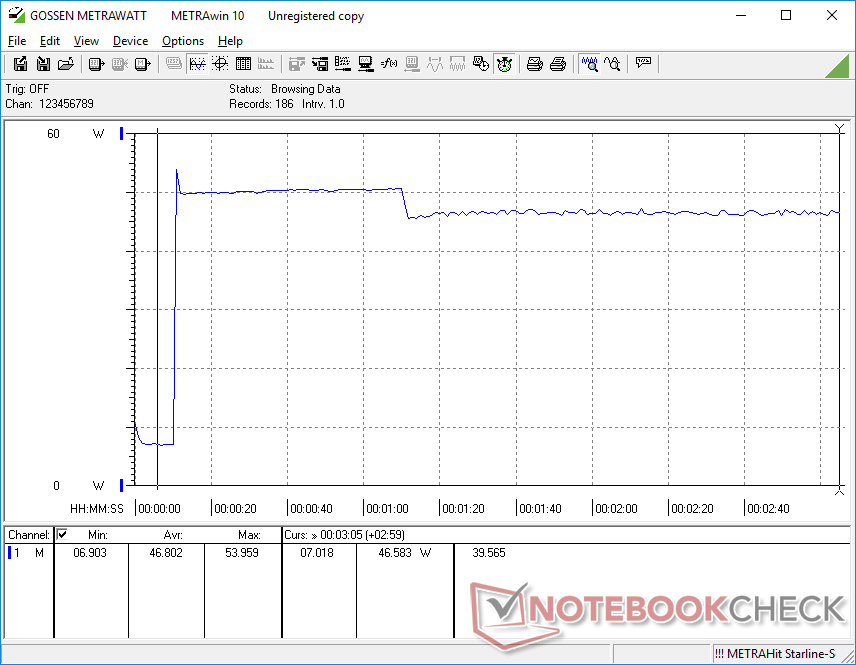
Power Consumption Witcher 3 / Stresstest
Power Consumption external Monitor
Pros
Cons
Verdict — Inexpensive Option For Basic HTPC Purposes
If you're looking to maximize your bang for the buck, then the BMax B5 Pro should be near the top of your list. It offers a roomy 512 GB NVMe SSD, space for a second SSD, 16 GB of removable RAM, licensed Windows 11 Pro already installed, quiet fan noise, and a processor that's comparable to the 10th gen Core i7-1065G7 all for under $300 USD. The Core i5-8260U runs laps over any current Core i3, Celeron, Atom, or Ryzen 3 alternative that are all too common in this price range.
The BMax B5 Pro is a complete package for nearly half the price of a barebones Intel NUC without needing to settle for low-tier Celeron or Atom processors.
The main drawback to the model is its weak graphics performance which really shouldn't be a problem as nobody should be buying the B5 Pro for gaming purposes. Graphics performance is still sufficient for comfortable 4K60 streaming.
We would like to see more USB-C ports, support for USB-C Power Delivery, and an HDMI 2.0 port or better on future revisions.
Price and Availability
Amazon is currently shipping our exact BMax B5 Pro configuration for $380 USD or $280 USD after applying the coupon code at the time of publishing.
Price comparison
