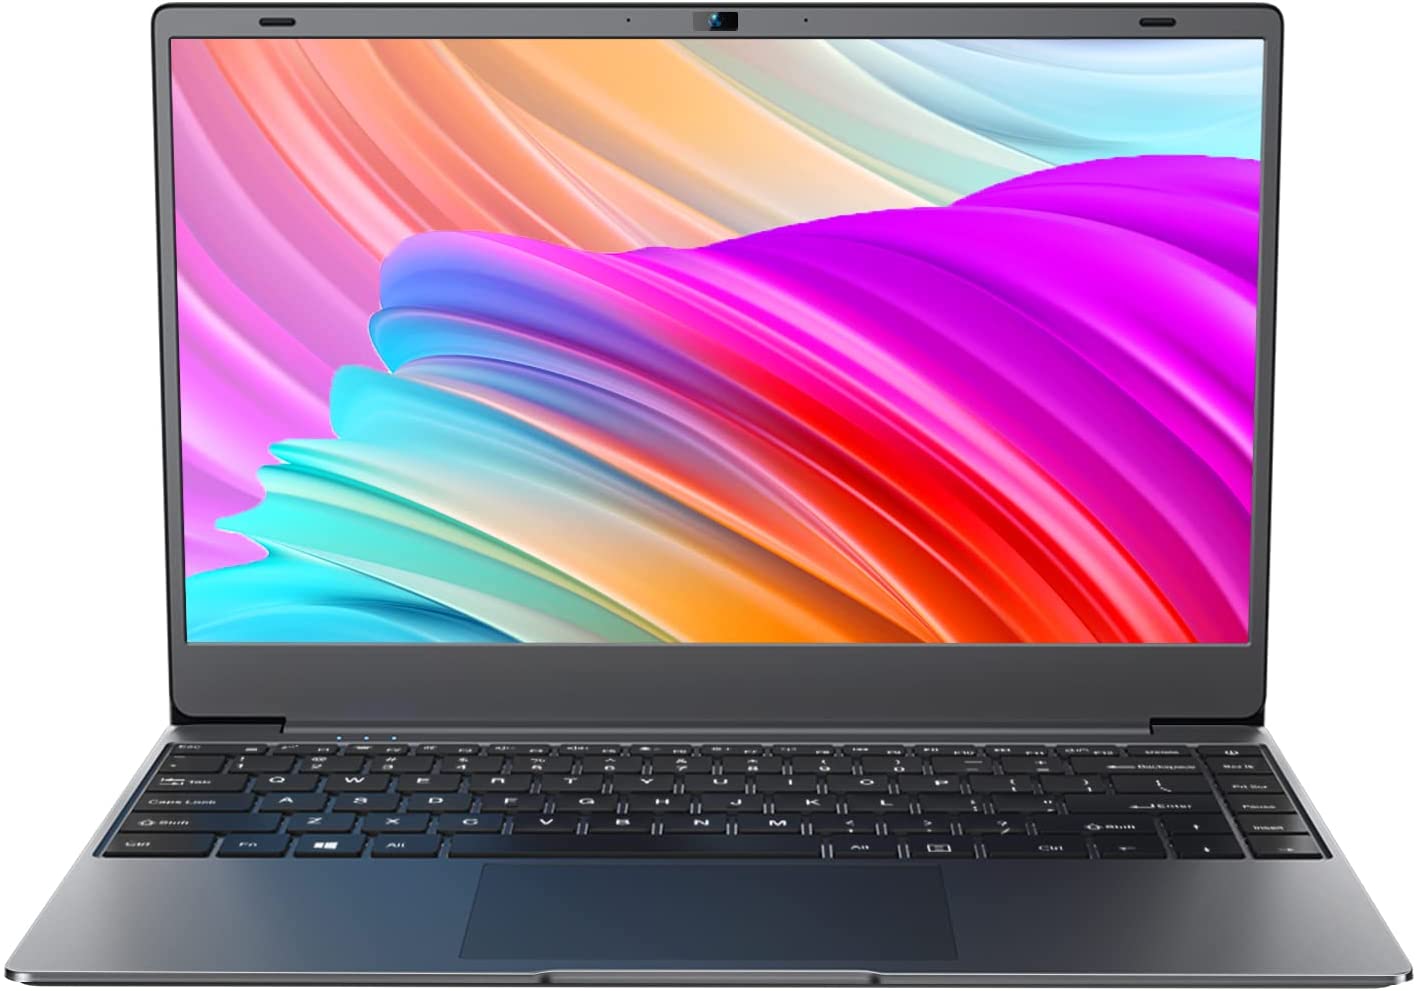
BMAX X14 Pro laptop review: Attractive with AMD Ryzen 5 for under $500 USD
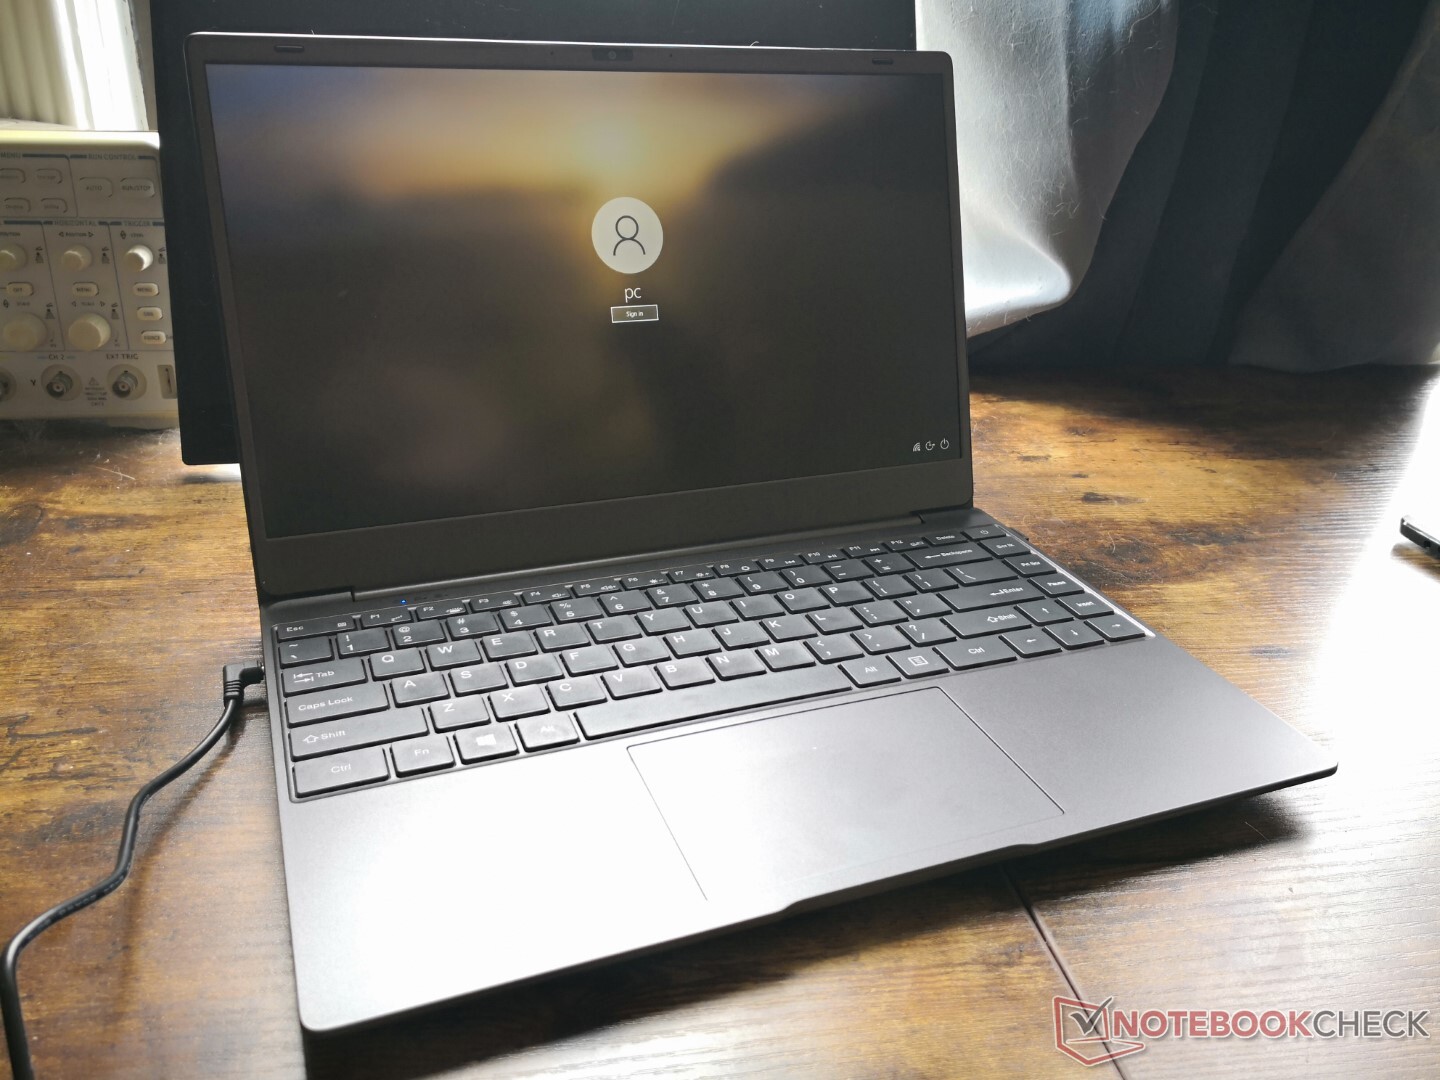
The 14-inch BMax X14 Pro subnotebook follows on the footsteps of the 11.6-inch MaxBook Y11 convertible that launched two years ago. Both are budget models in their respective categories designed to have more attractive aluminum profiles than competing models in the same price range.
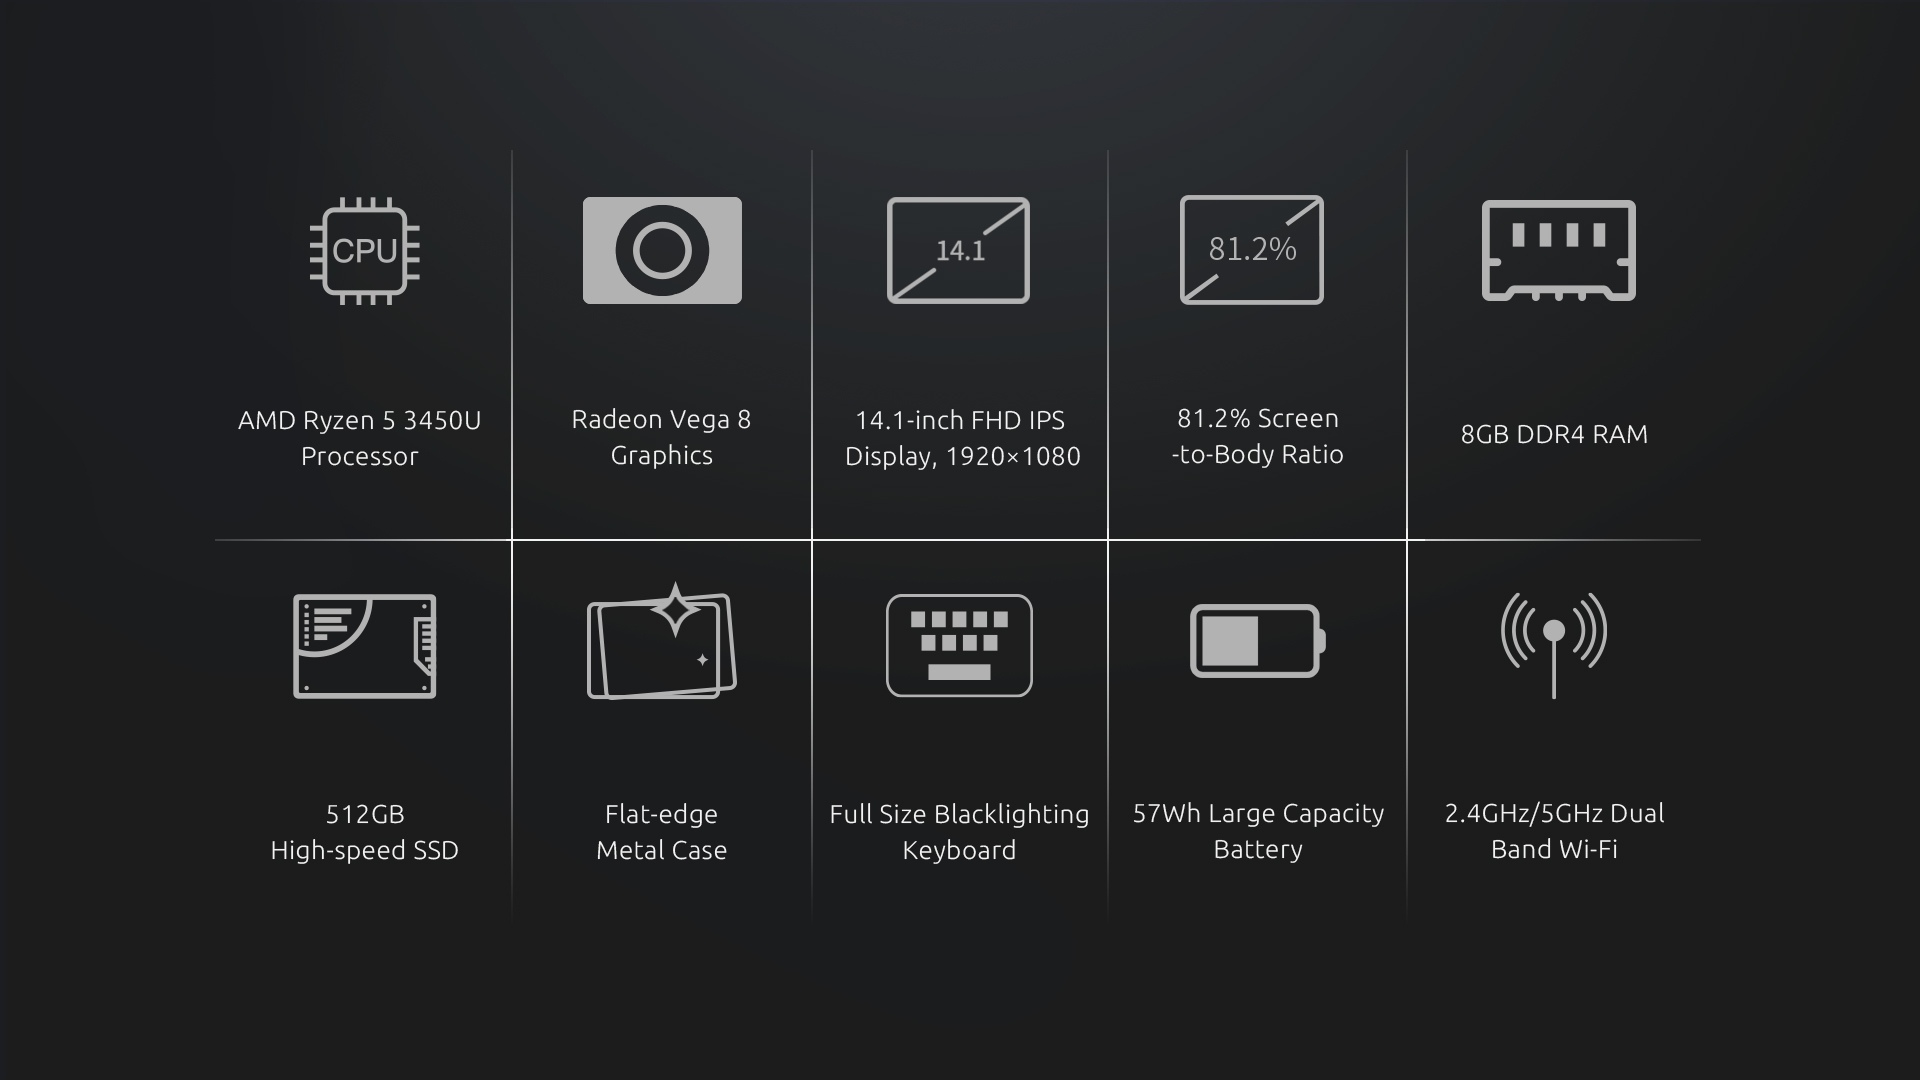
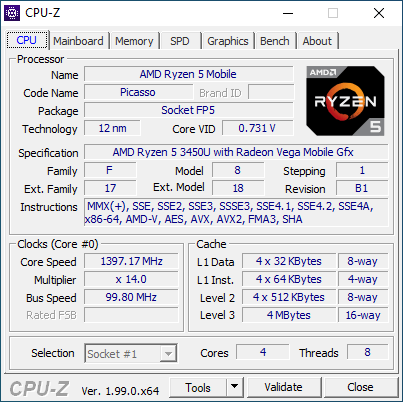
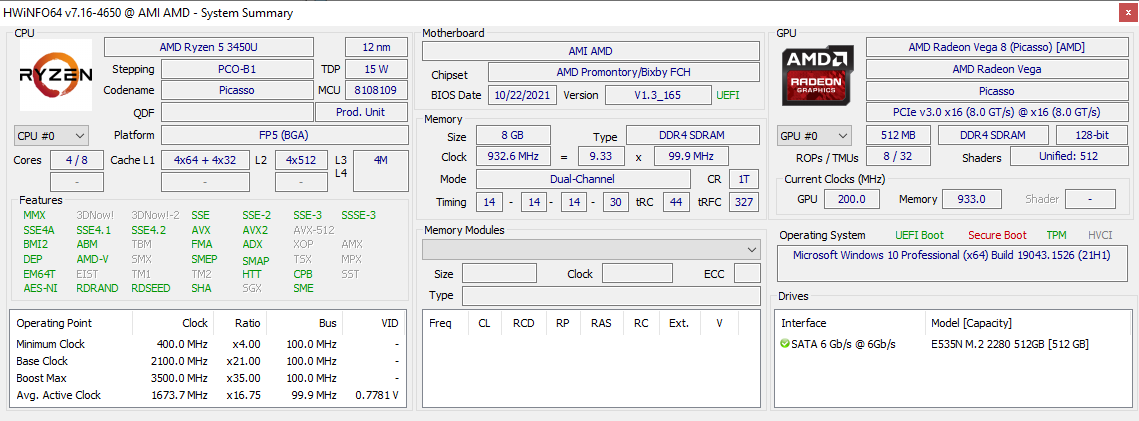
Internally, the BMax X14 Pro utilizes the older but relatively uncommon AMD Zen+ Ryzen 5 3450U CPU which should be an upgrade from any Celeron or Atom solutions commonly found on competing sub $500 laptops. Other features include a 1080p IPS display, backlit keyboard, and a spacious 512 GB SSD that are more typical of pricier laptops.
Alternatives to the X14 Pro include other inexpensive 14-inch models like the Asus VivoBook series, Lenovo IdeaPad 3 series, Infinix INBook X2, Chuwi CoreBook X, or the Dell Inspiron 14 3000 series.
Potential Competitors in Comparison
Rating | Date | Model | Weight | Height | Size | Resolution | Price |
|---|---|---|---|---|---|---|---|
| 76 % v7 (old) | 02 / 2022 | BMAX X14 Pro R5 3450U, Vega 8 | 1.4 kg | 18.3 mm | 14.00" | 1920x1080 | |
| 85.5 % v7 (old) | 11 / 2021 | Lenovo IdeaPad 5 Pro 14ACN6 R5 5600U, Vega 7 | 1.5 kg | 17.9 mm | 14.00" | 2240x1400 | |
| 82.9 % v7 (old) | 09 / 2021 | Dell Inspiron 14 7400 7415 2-in-1 R7 5700U, Vega 8 | 1.5 kg | 17.95 mm | 14.00" | 1920x1080 | |
| 84.8 % v7 (old) | 01 / 2022 | HP Pavilion 14-dv0357ng i5-1135G7, Iris Xe G7 80EUs | 1.4 kg | 19 mm | 14.00" | 1920x1080 | |
| 86.3 % v7 (old) | 12 / 2020 | Huawei MateBook 14 2020 Intel i7-10510U, GeForce MX350 | 1.5 kg | 15.9 mm | 14.00" | 2160x1440 | |
| 79.5 % v7 (old) | 01 / 2022 | Infinix INBook X2 i7-1065G7, Iris Plus Graphics G7 (Ice Lake 64 EU) | 1.2 kg | 14.8 mm | 14.00" | 1920x1080 |
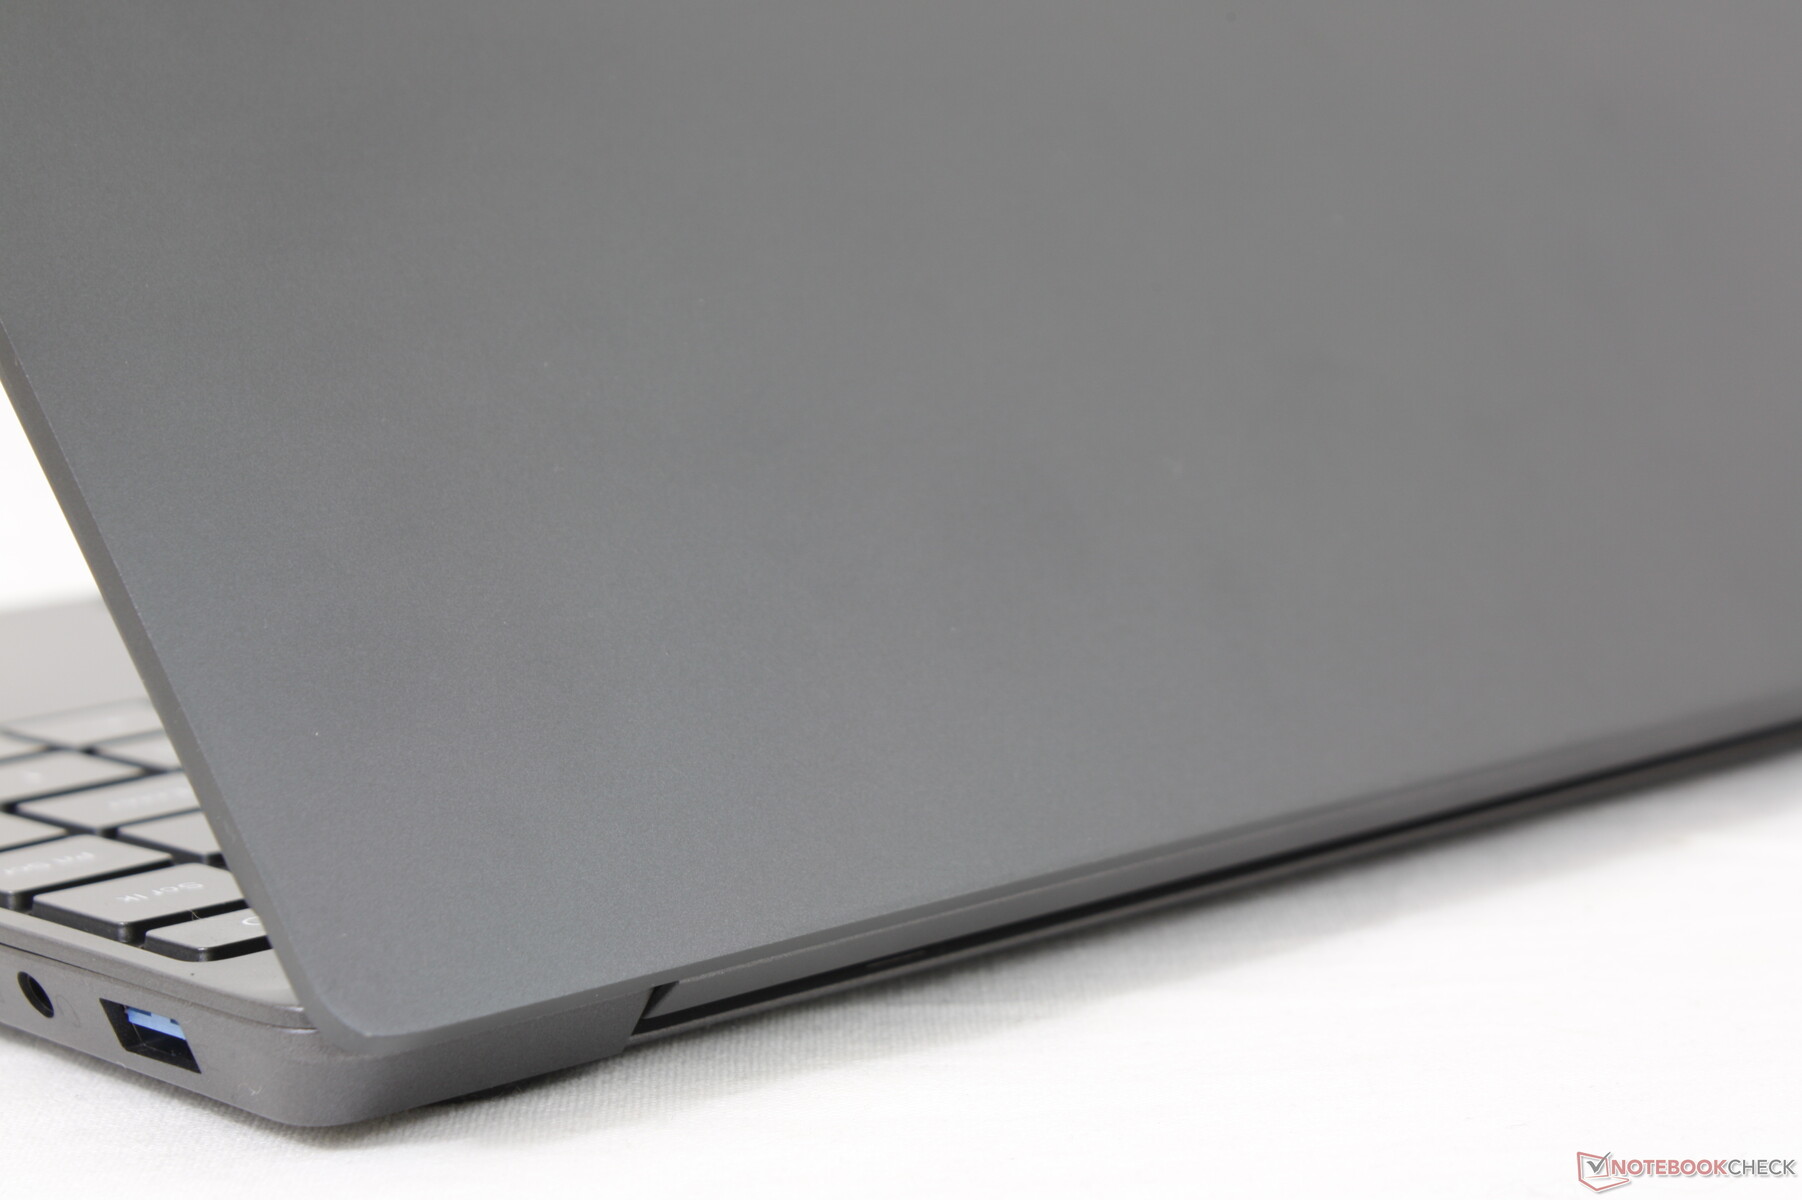
Case
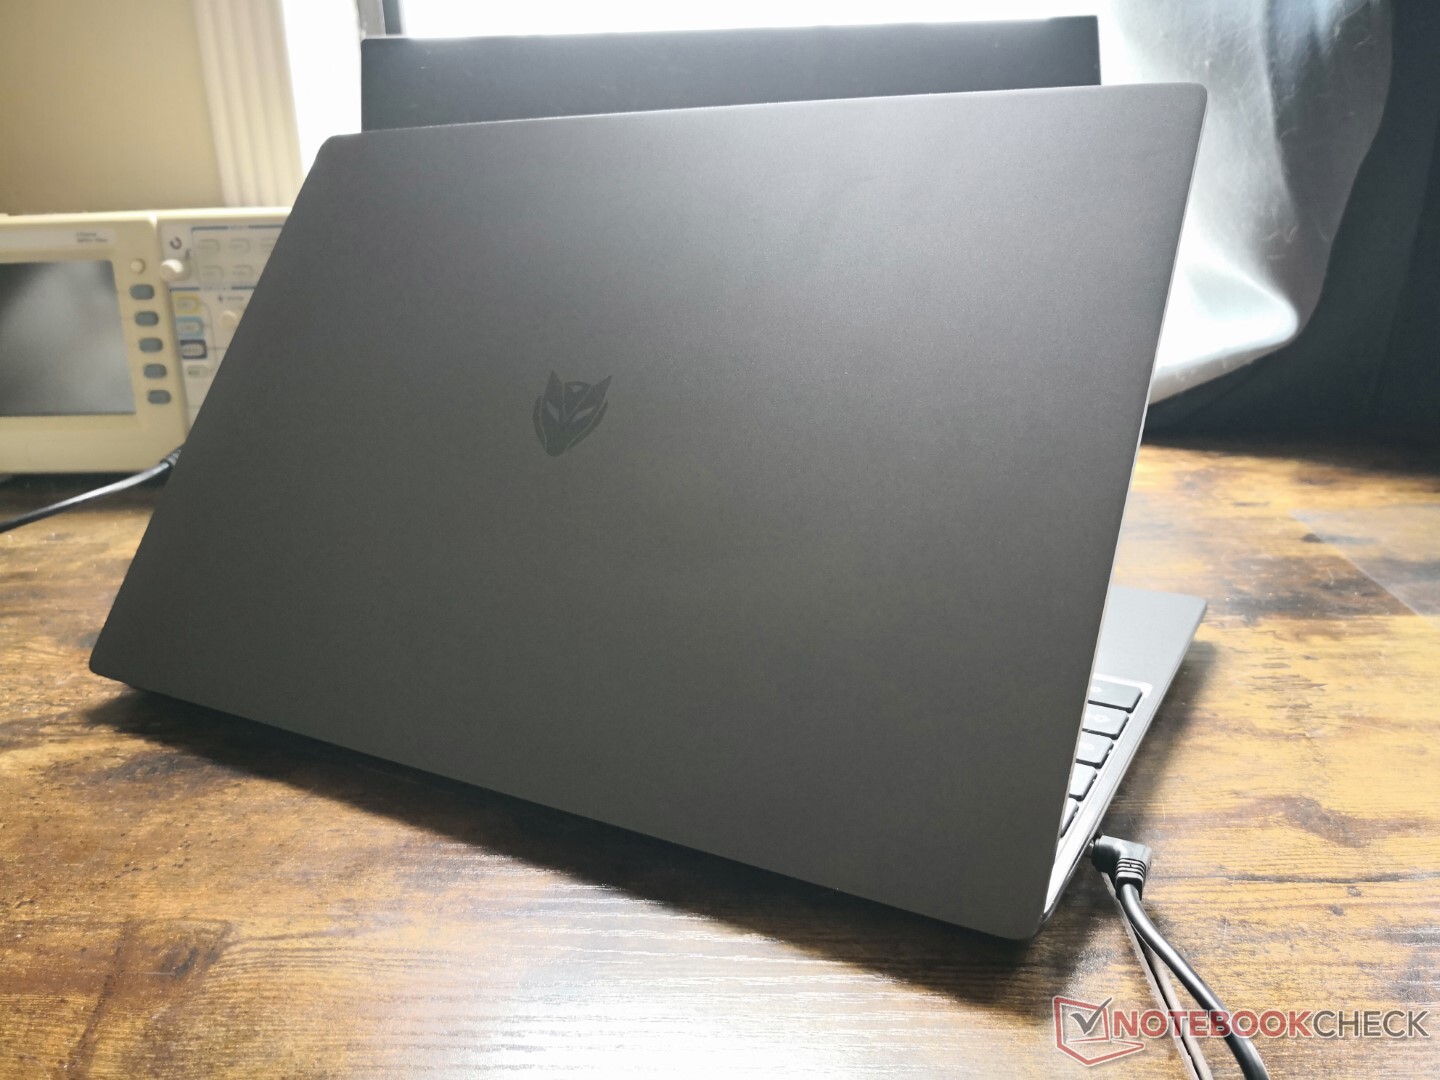
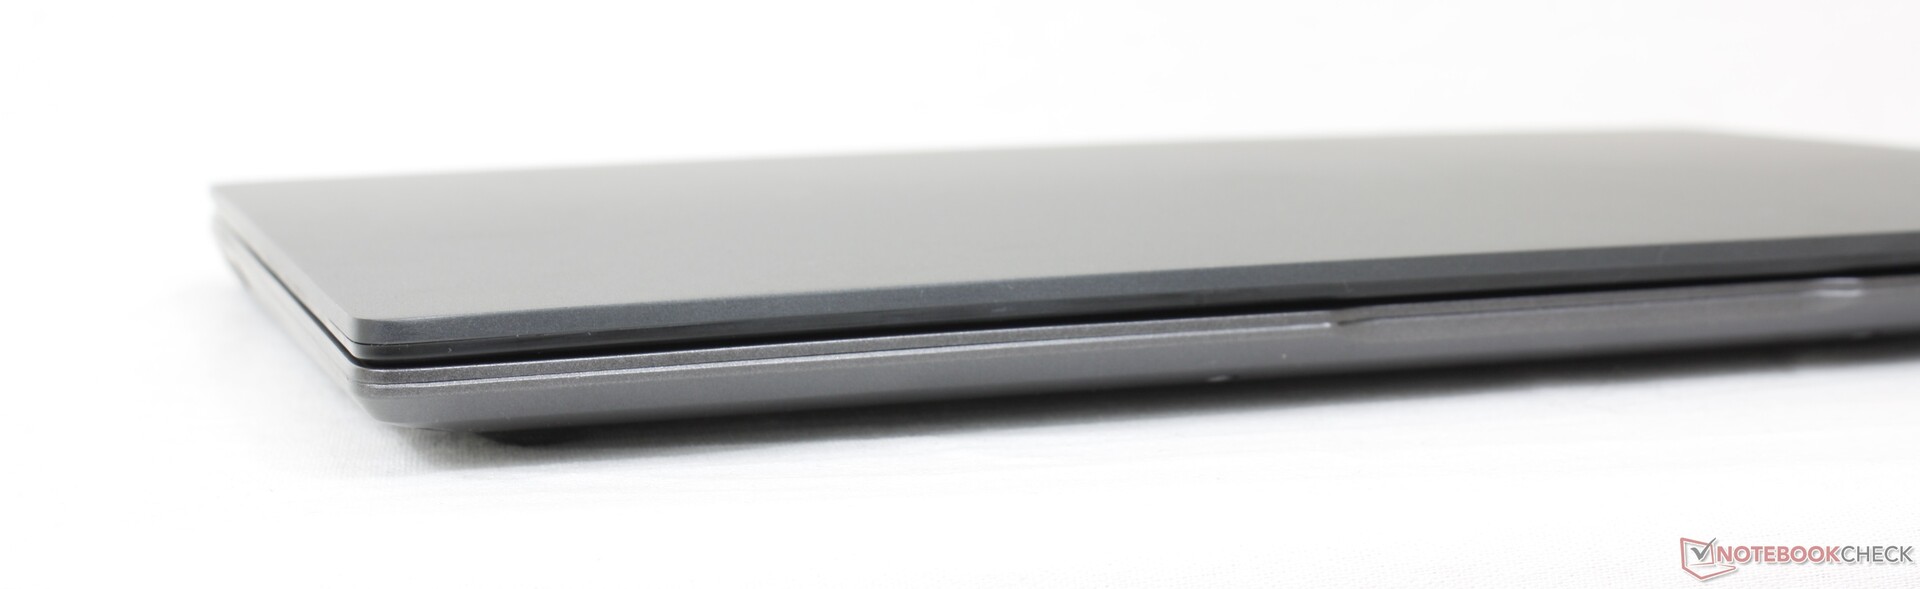
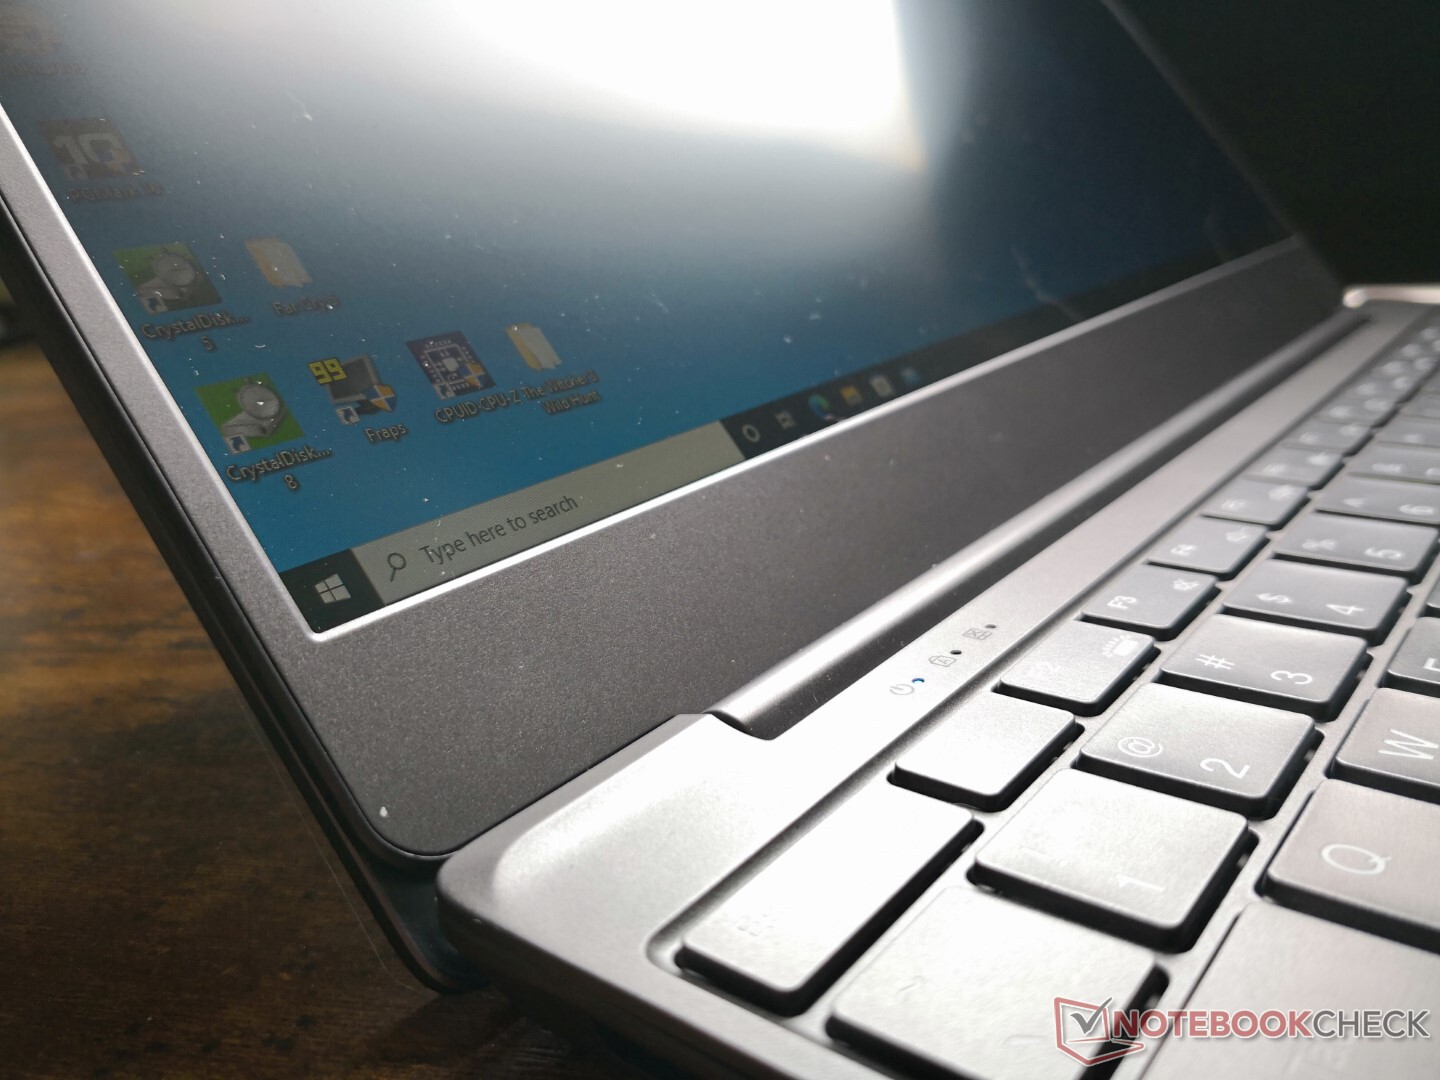
The chassis looks excellent from a distance much like with many Chuwi laptops. However, its weaknesses become more apparent once held as the metal chassis flexes and creaks much more easily than the metal skeletons of a Dell XPS, HP Spectre, or Asus ZenBook. The corners of the base, keyboard center, outer lid, and hinges all exhibit moderate levels of twisting here. Thus, while the X14 Pro looks like a laptop that should retail for more than $500, it's also not any stronger or more rigid than other cheap models like the Asus VivoBook or Lenovo IdeaPad 3 14 that are predominately plastic.
Connectivity
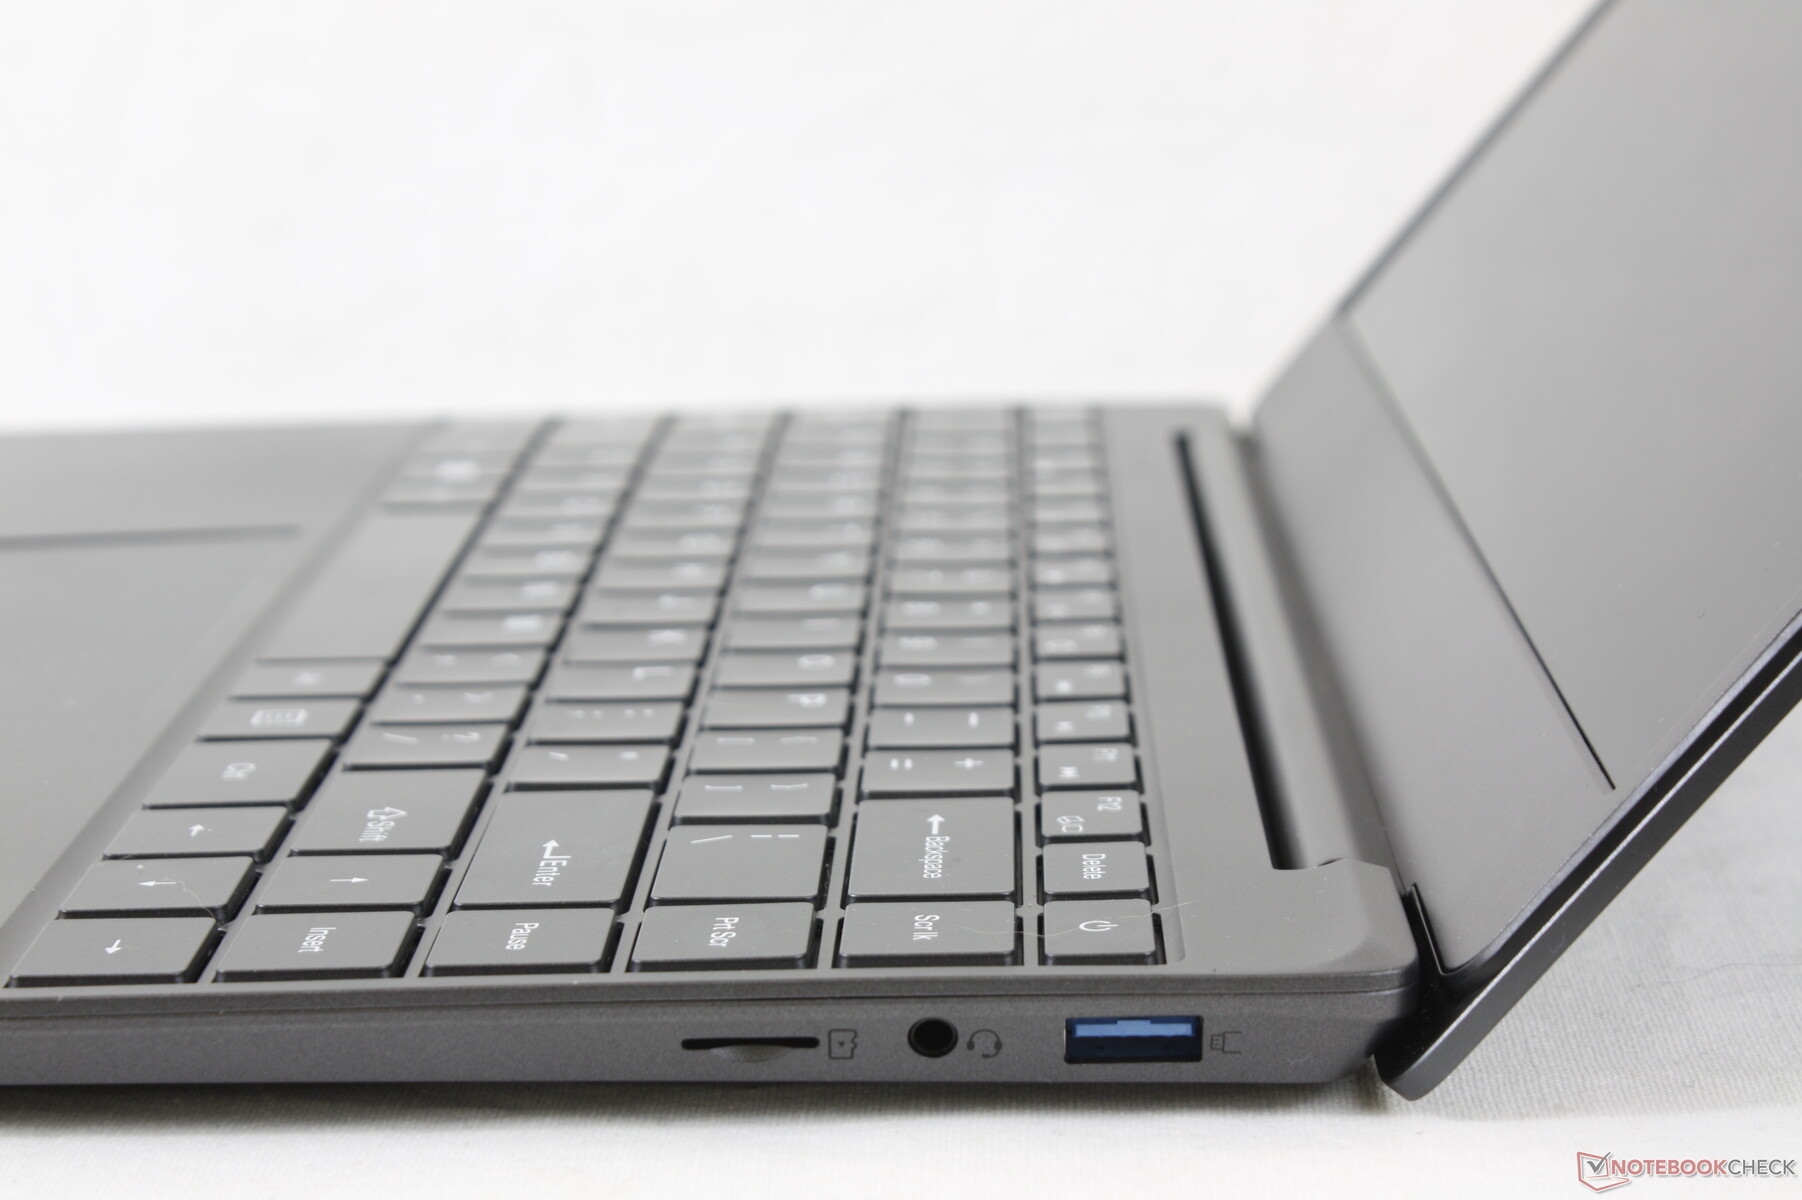
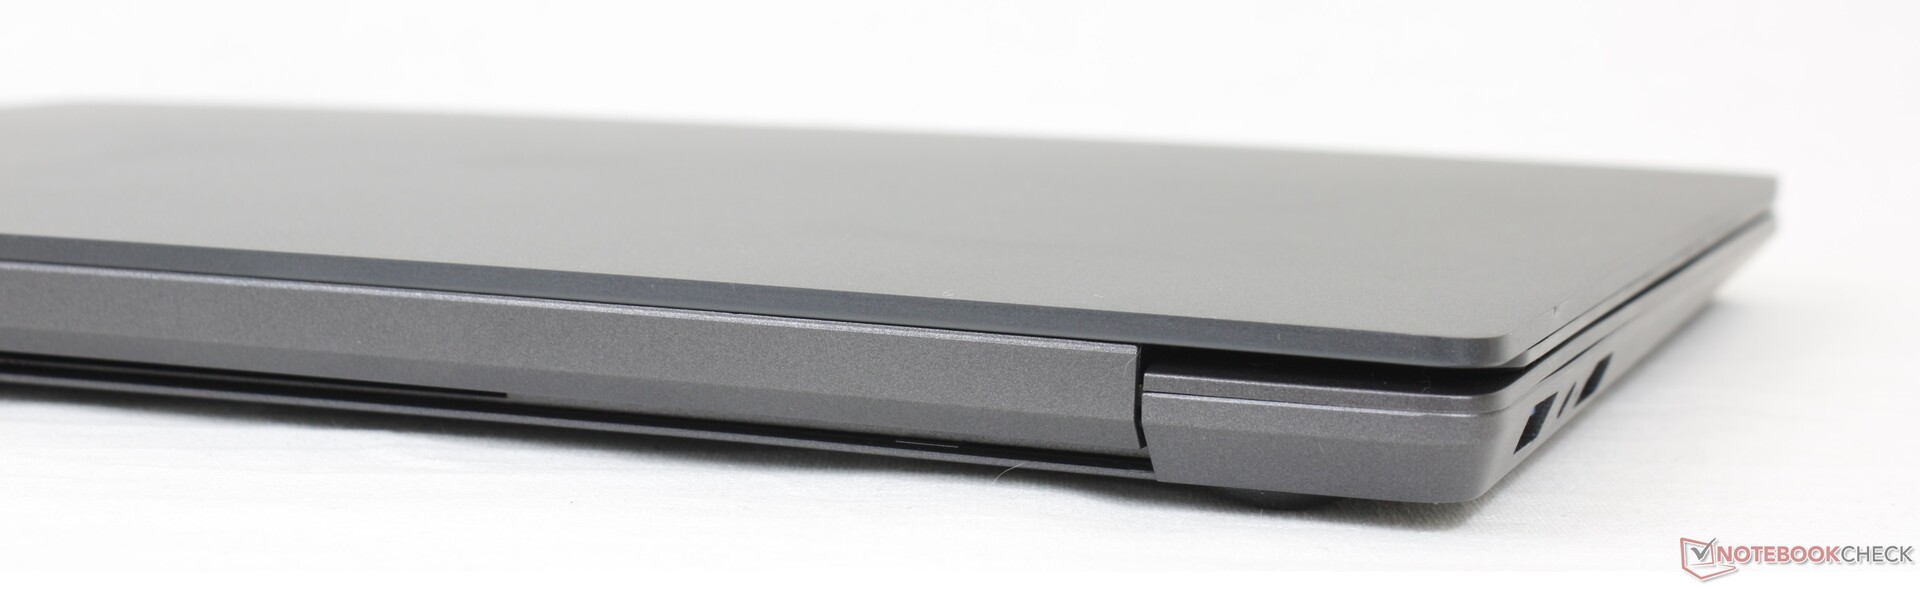
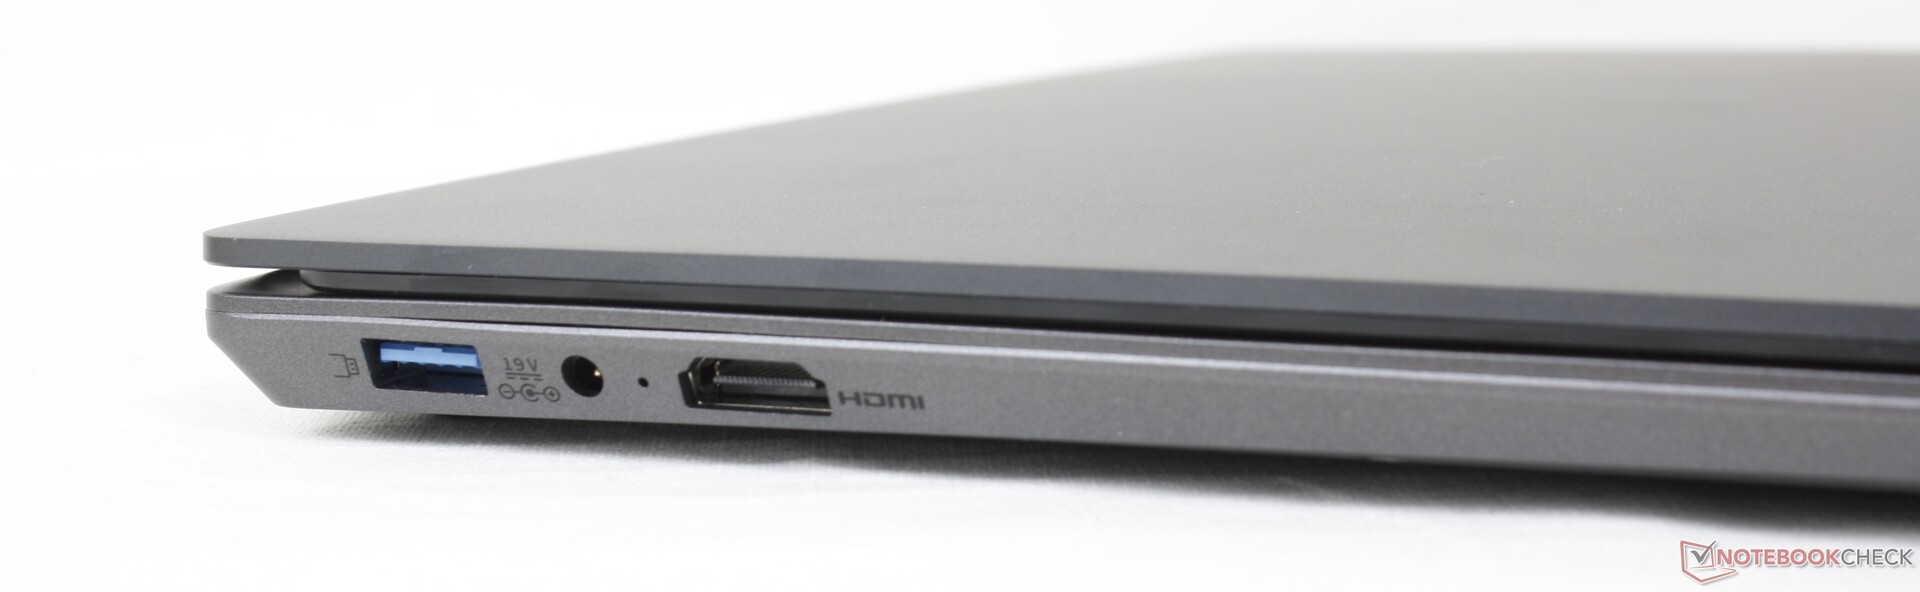
Port options are reasonable for a 14-inch laptop albeit the positioning can be rather tight. Cables along the left edge, for example, can frequently tangle.
BMax doesn't advertise the HDMI port version, but we can confirm that it is an HDMI 2.0 port as it supports external monitors at 4K and 60 Hz.
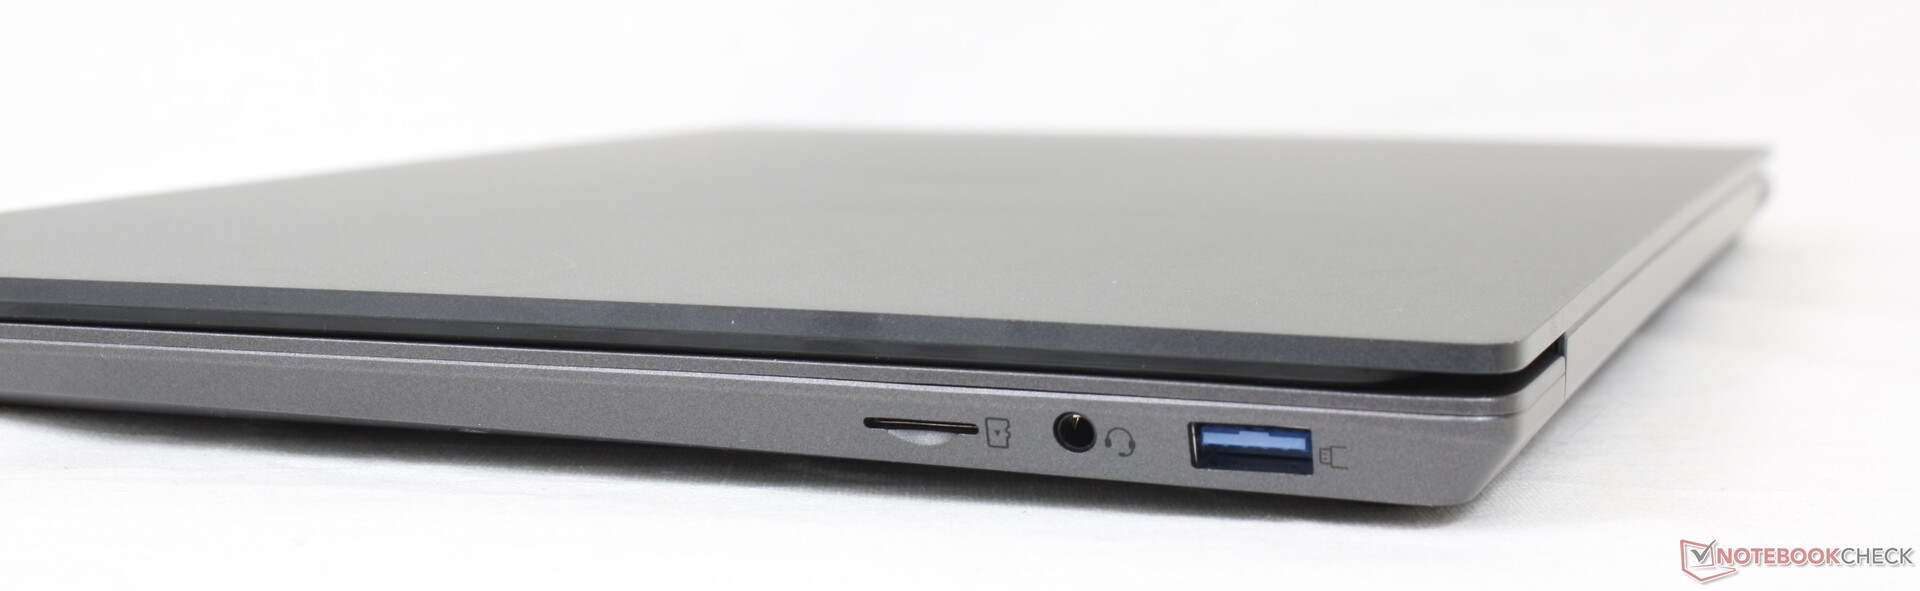
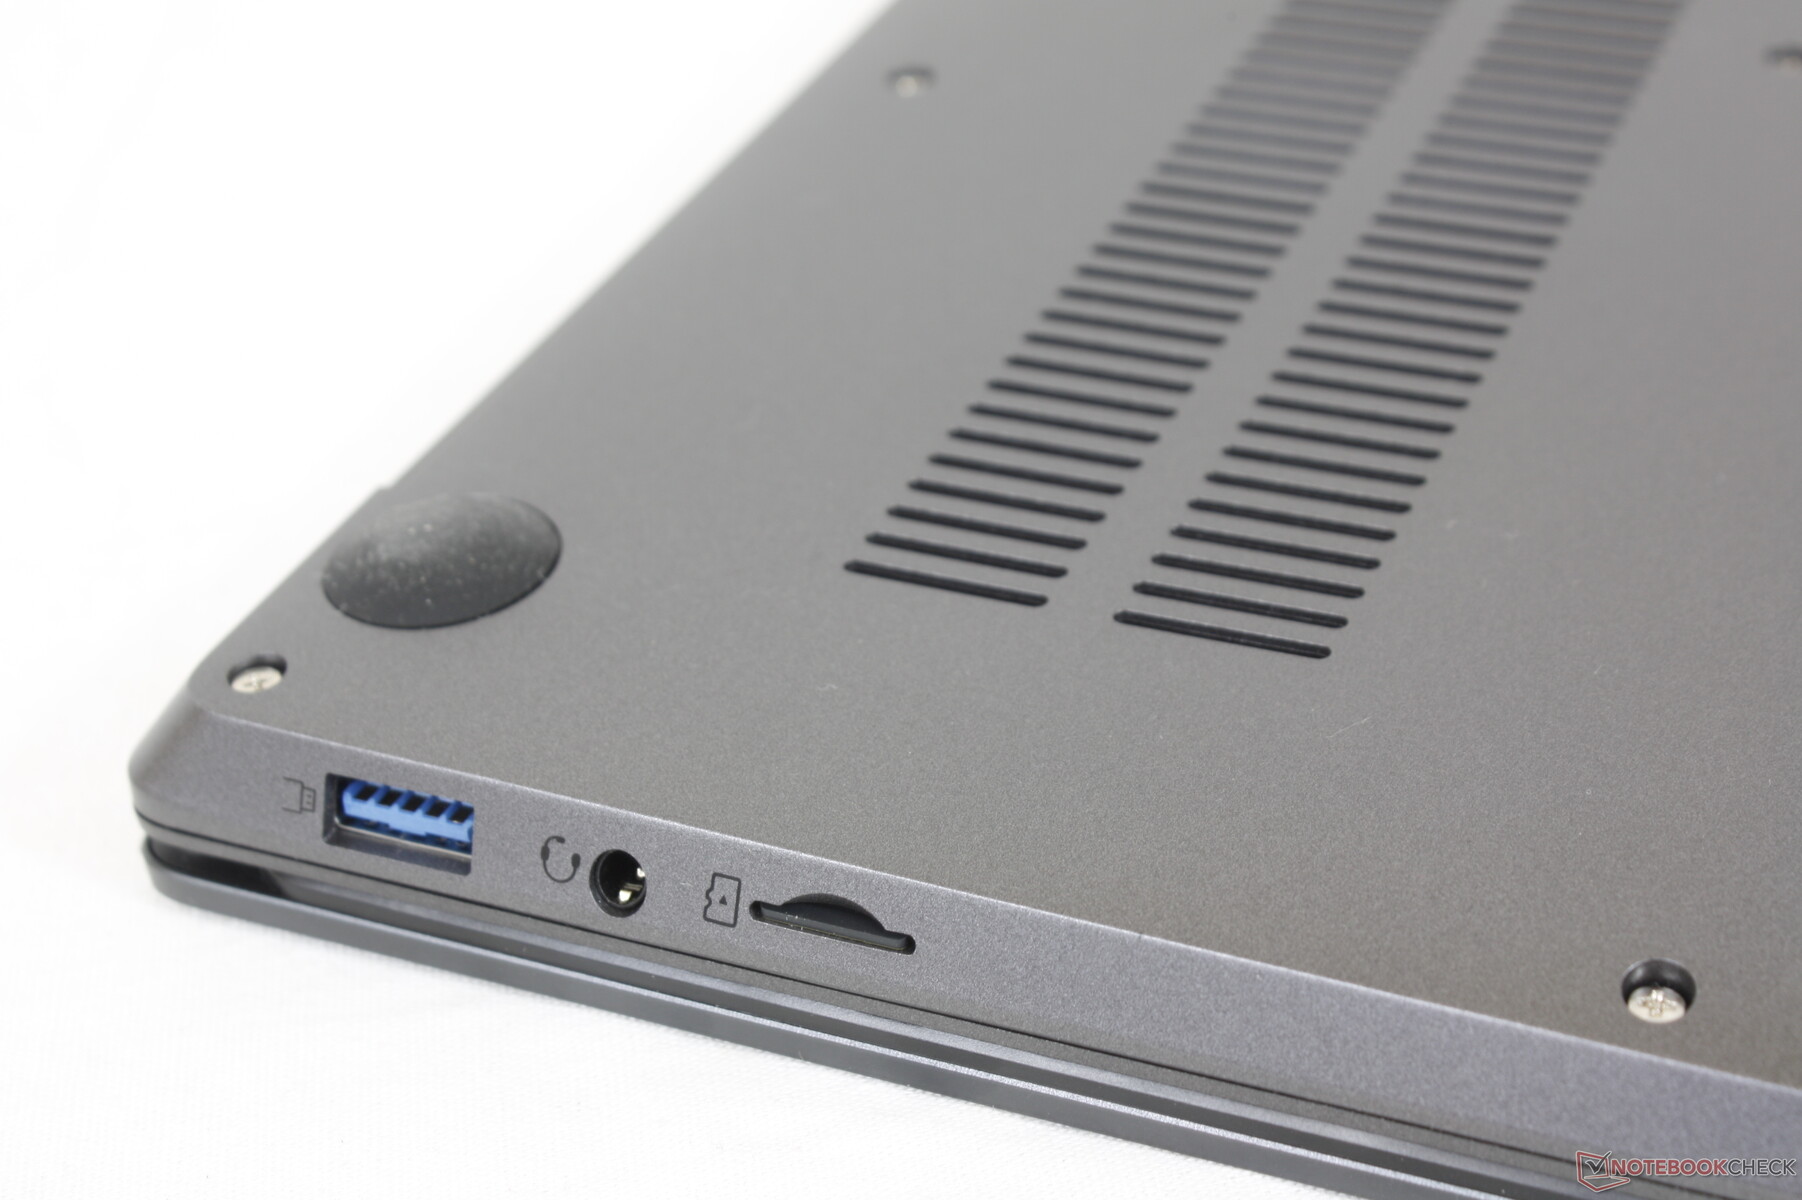
SD Card Reader
The spring-loaded MicroSD reader offers slow transfer rates. Keep in mind that the MicroSD card must be inserted upside-down and that it can be difficult to eject.
| SD Card Reader | |
| average JPG Copy Test (av. of 3 runs) | |
| Lenovo IdeaPad 5 Pro 14ACN6 (AV PRO V60) | |
| HP Pavilion 14-dv0357ng | |
| BMAX X14 Pro (AV Pro V60) | |
| Dell Inspiron 14 7400 7415 2-in-1 (AV Pro V60) | |
| Infinix INBook X2 (AV Pro V60) | |
| maximum AS SSD Seq Read Test (1GB) | |
| HP Pavilion 14-dv0357ng | |
| Lenovo IdeaPad 5 Pro 14ACN6 (AV PRO V60) | |
| BMAX X14 Pro (AV Pro V60) | |
| Dell Inspiron 14 7400 7415 2-in-1 (AV Pro V60) | |
| Infinix INBook X2 (AV Pro V60) | |
Communication
The integrated Wi-Fi 5 module is stable albeit very slow with transfer rates averaging 250 Mbps in either direction.
Webcam
720p webcam with no Windows Hello support or privacy shutter.


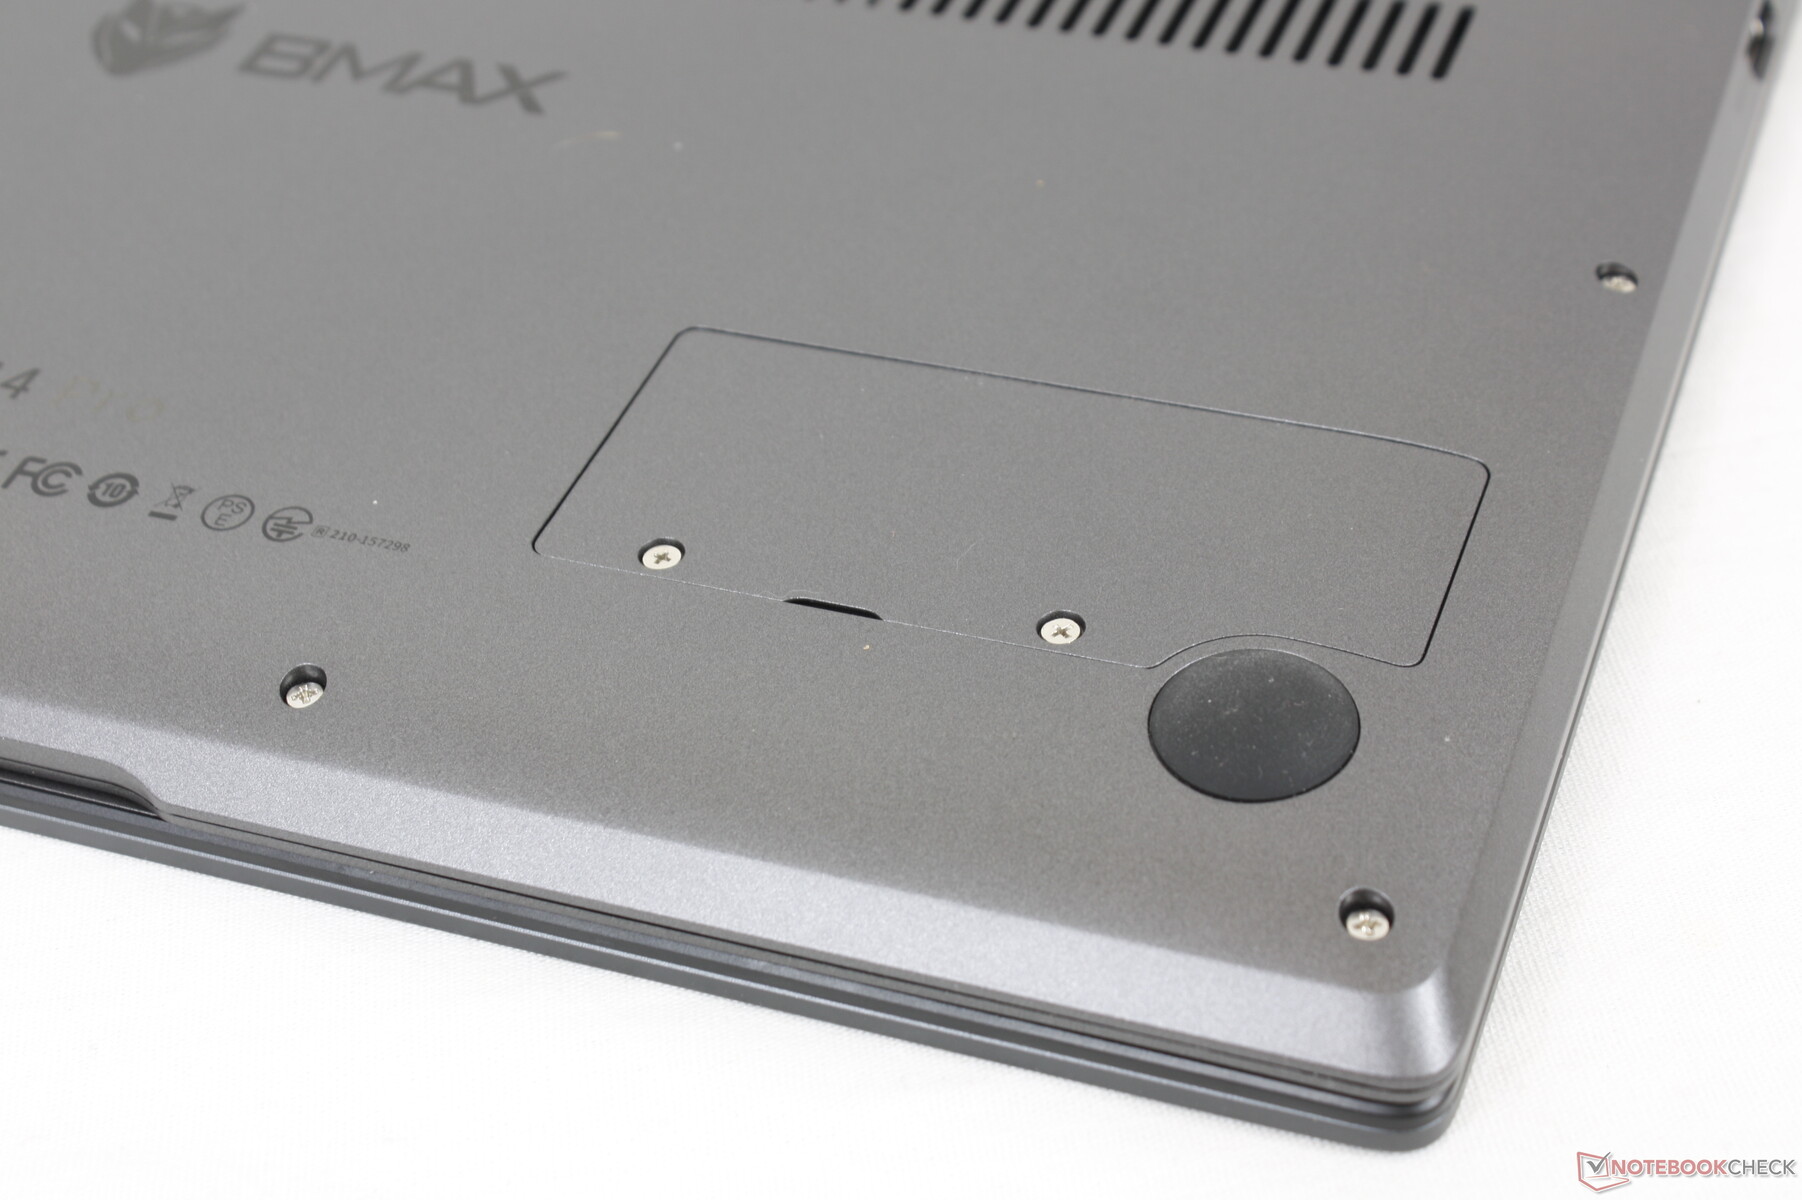
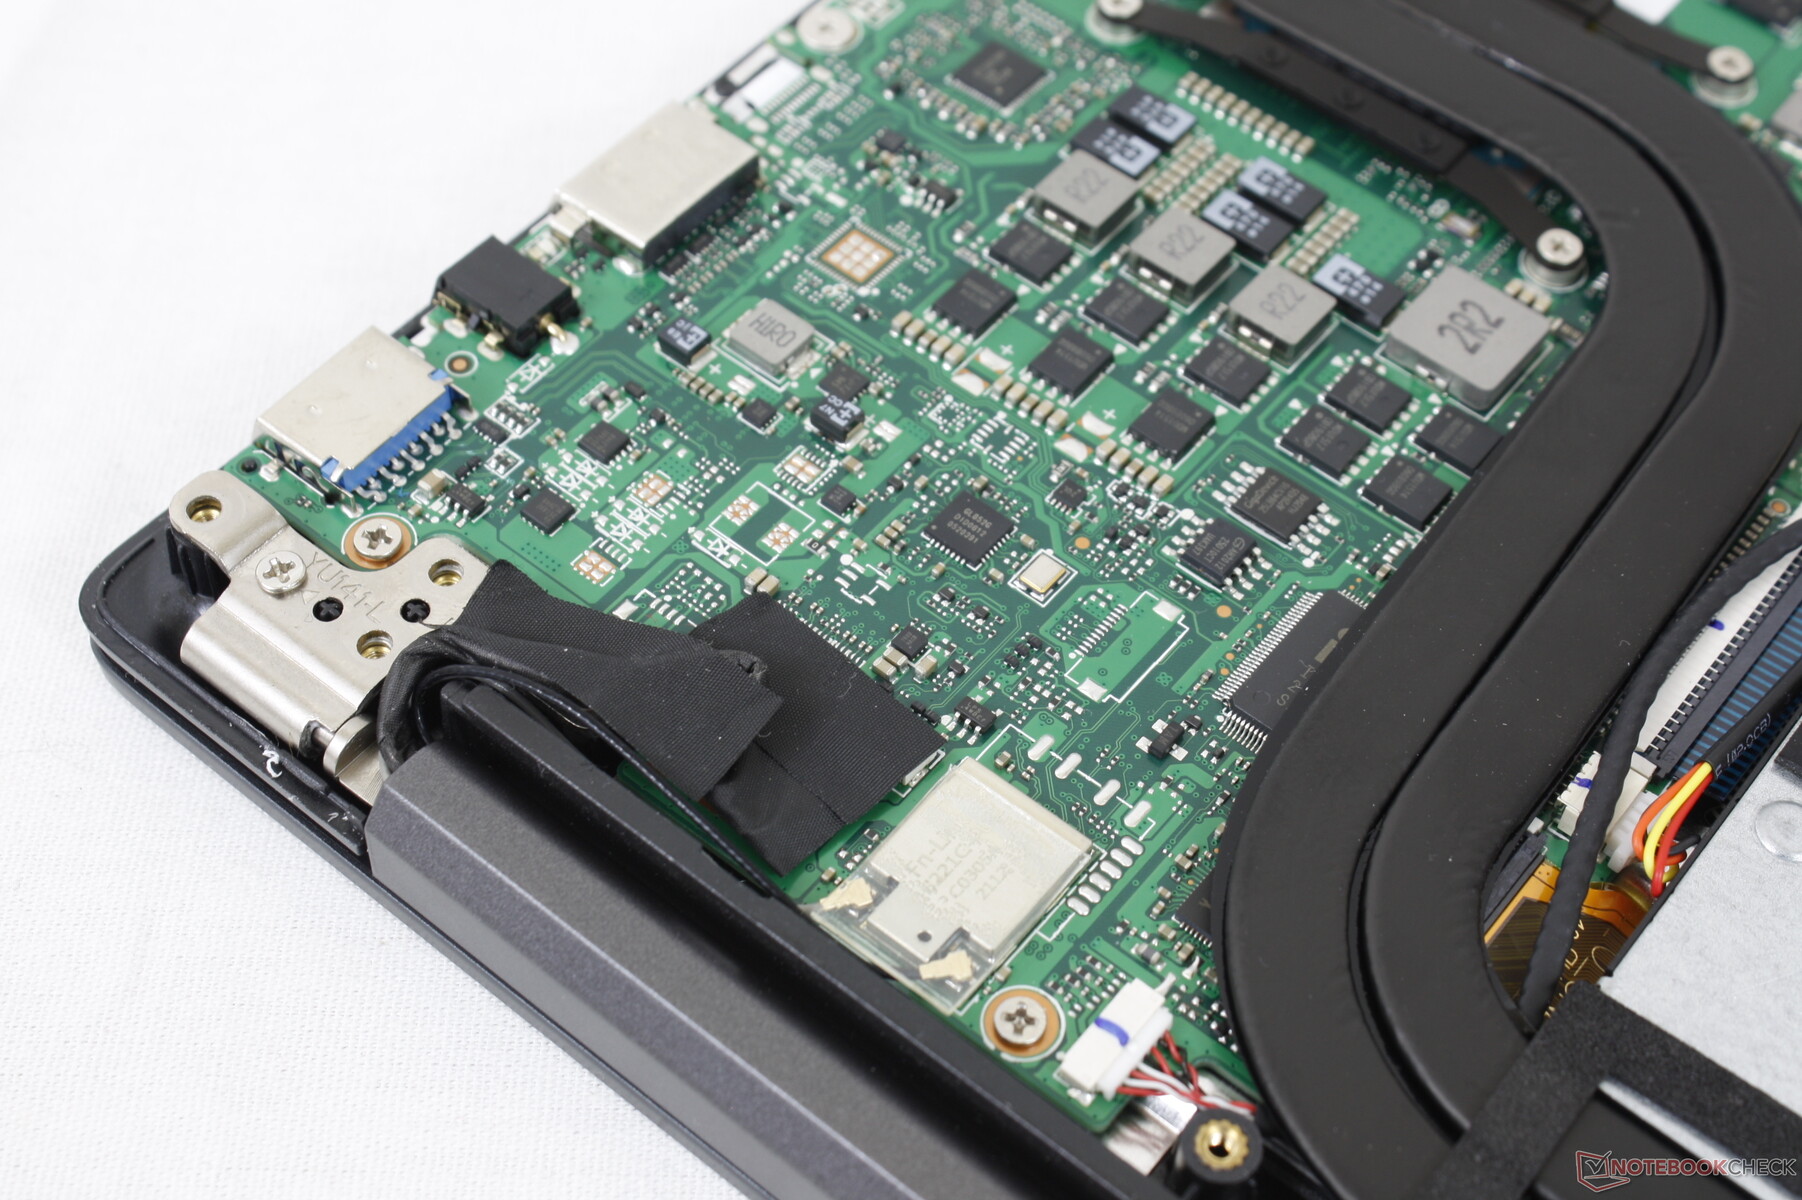
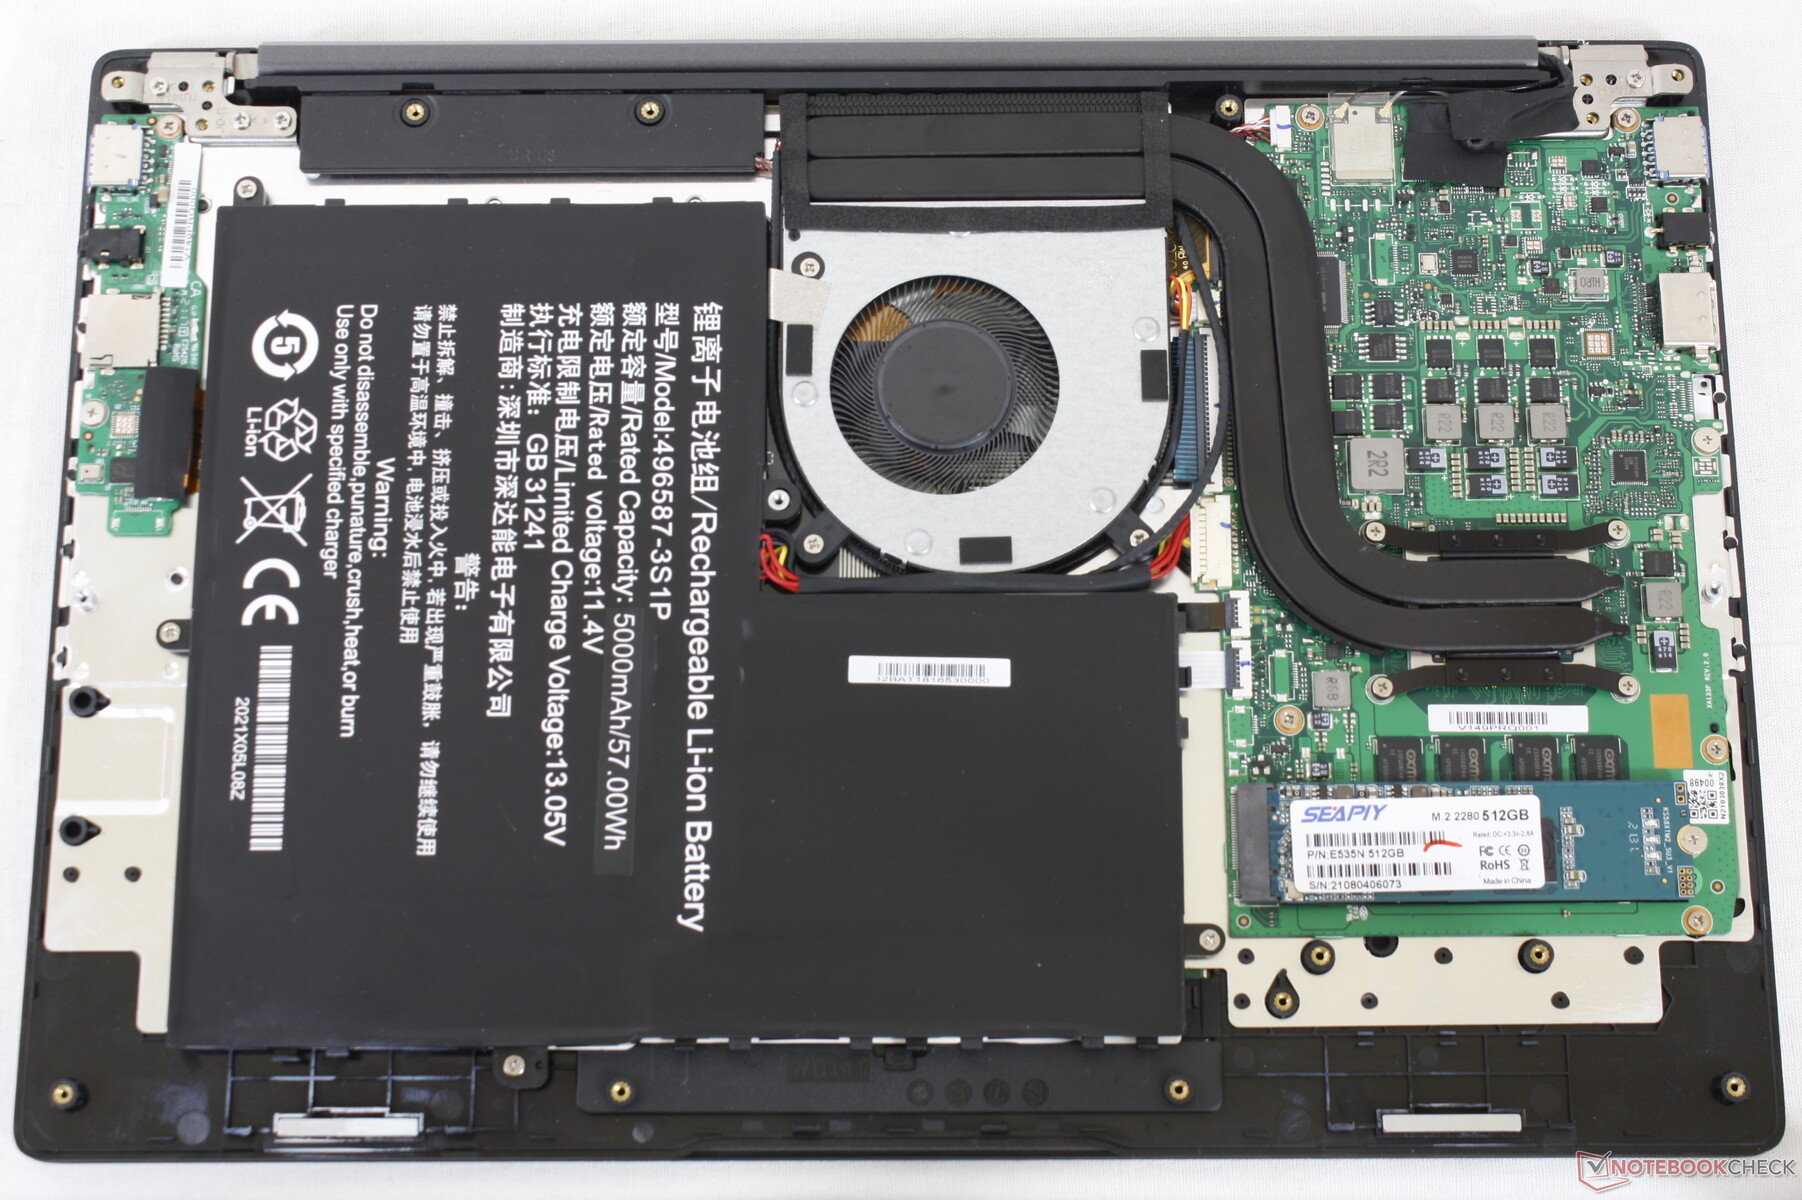
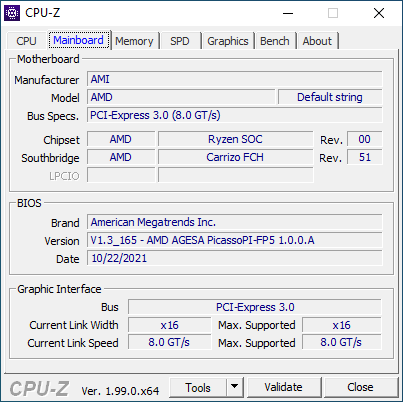
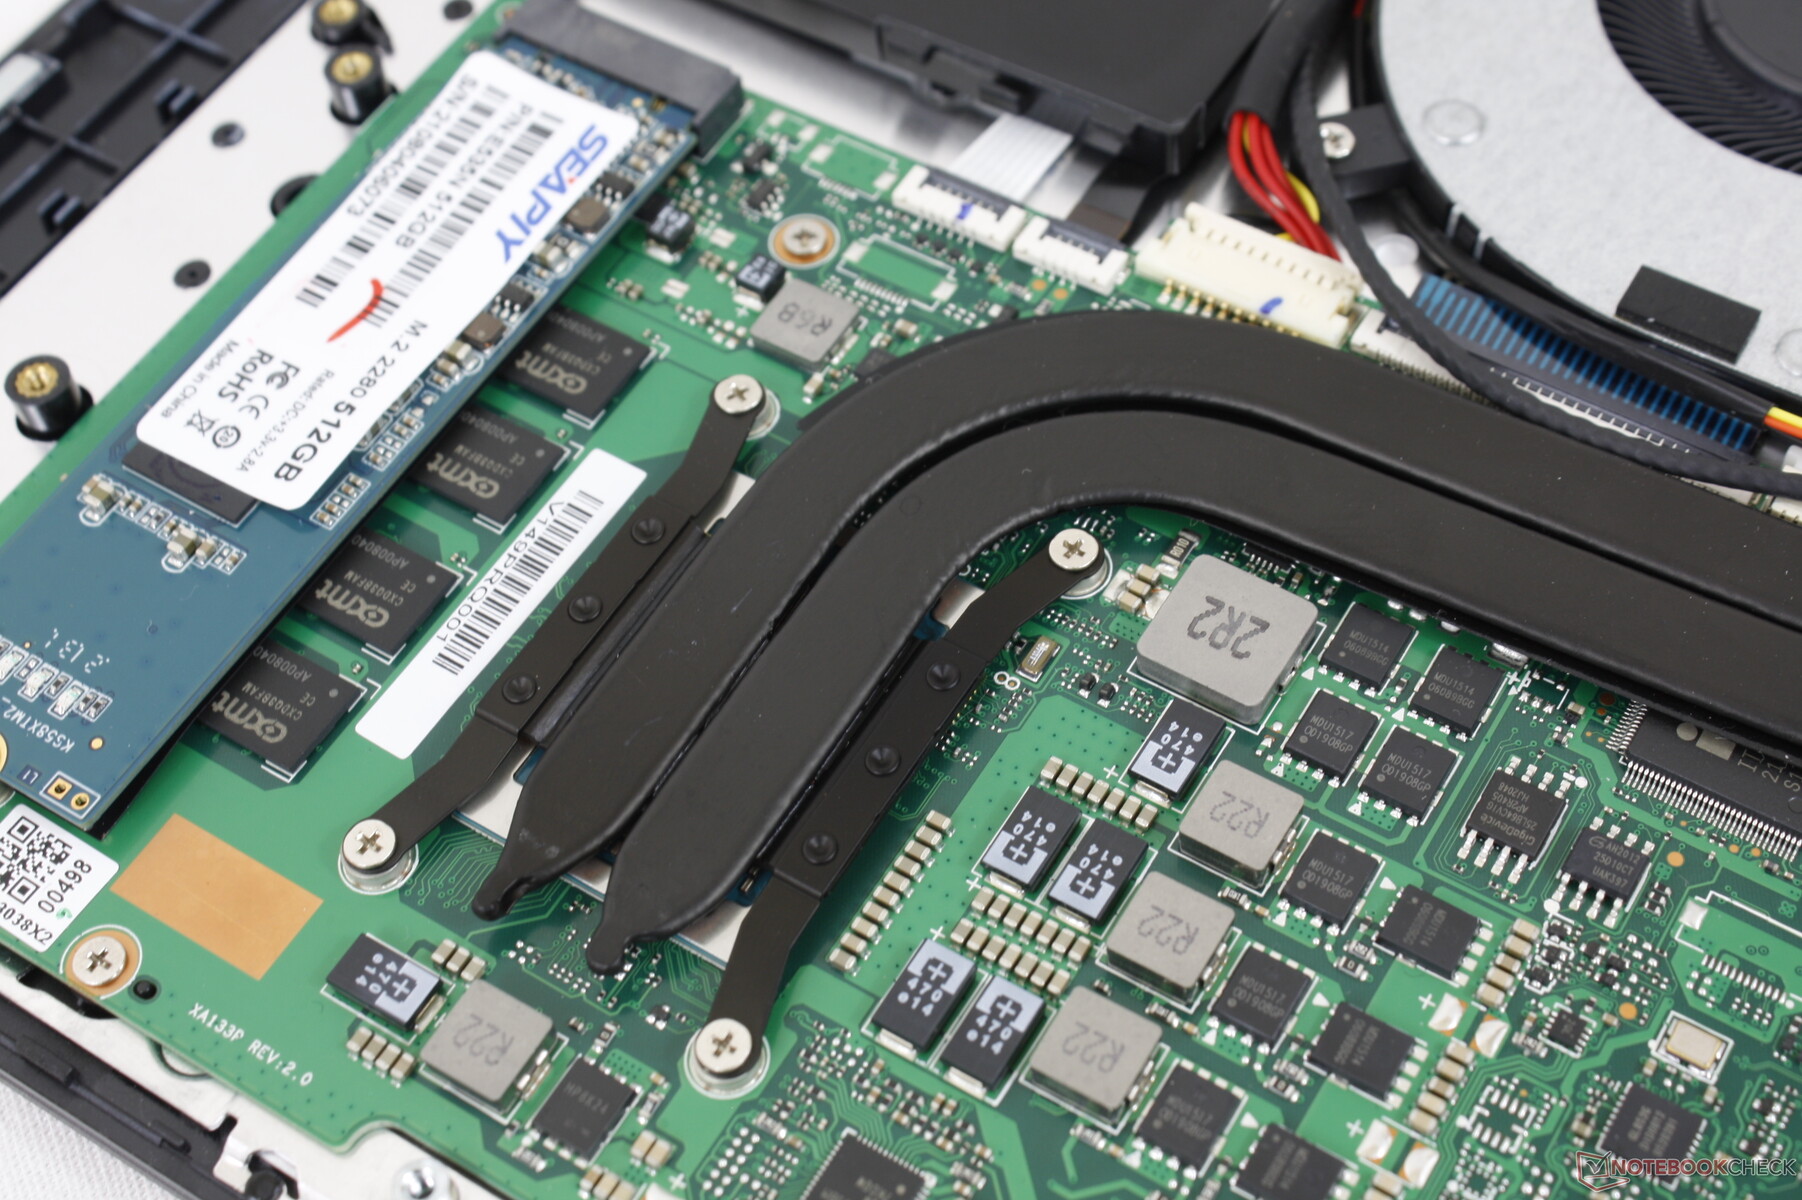
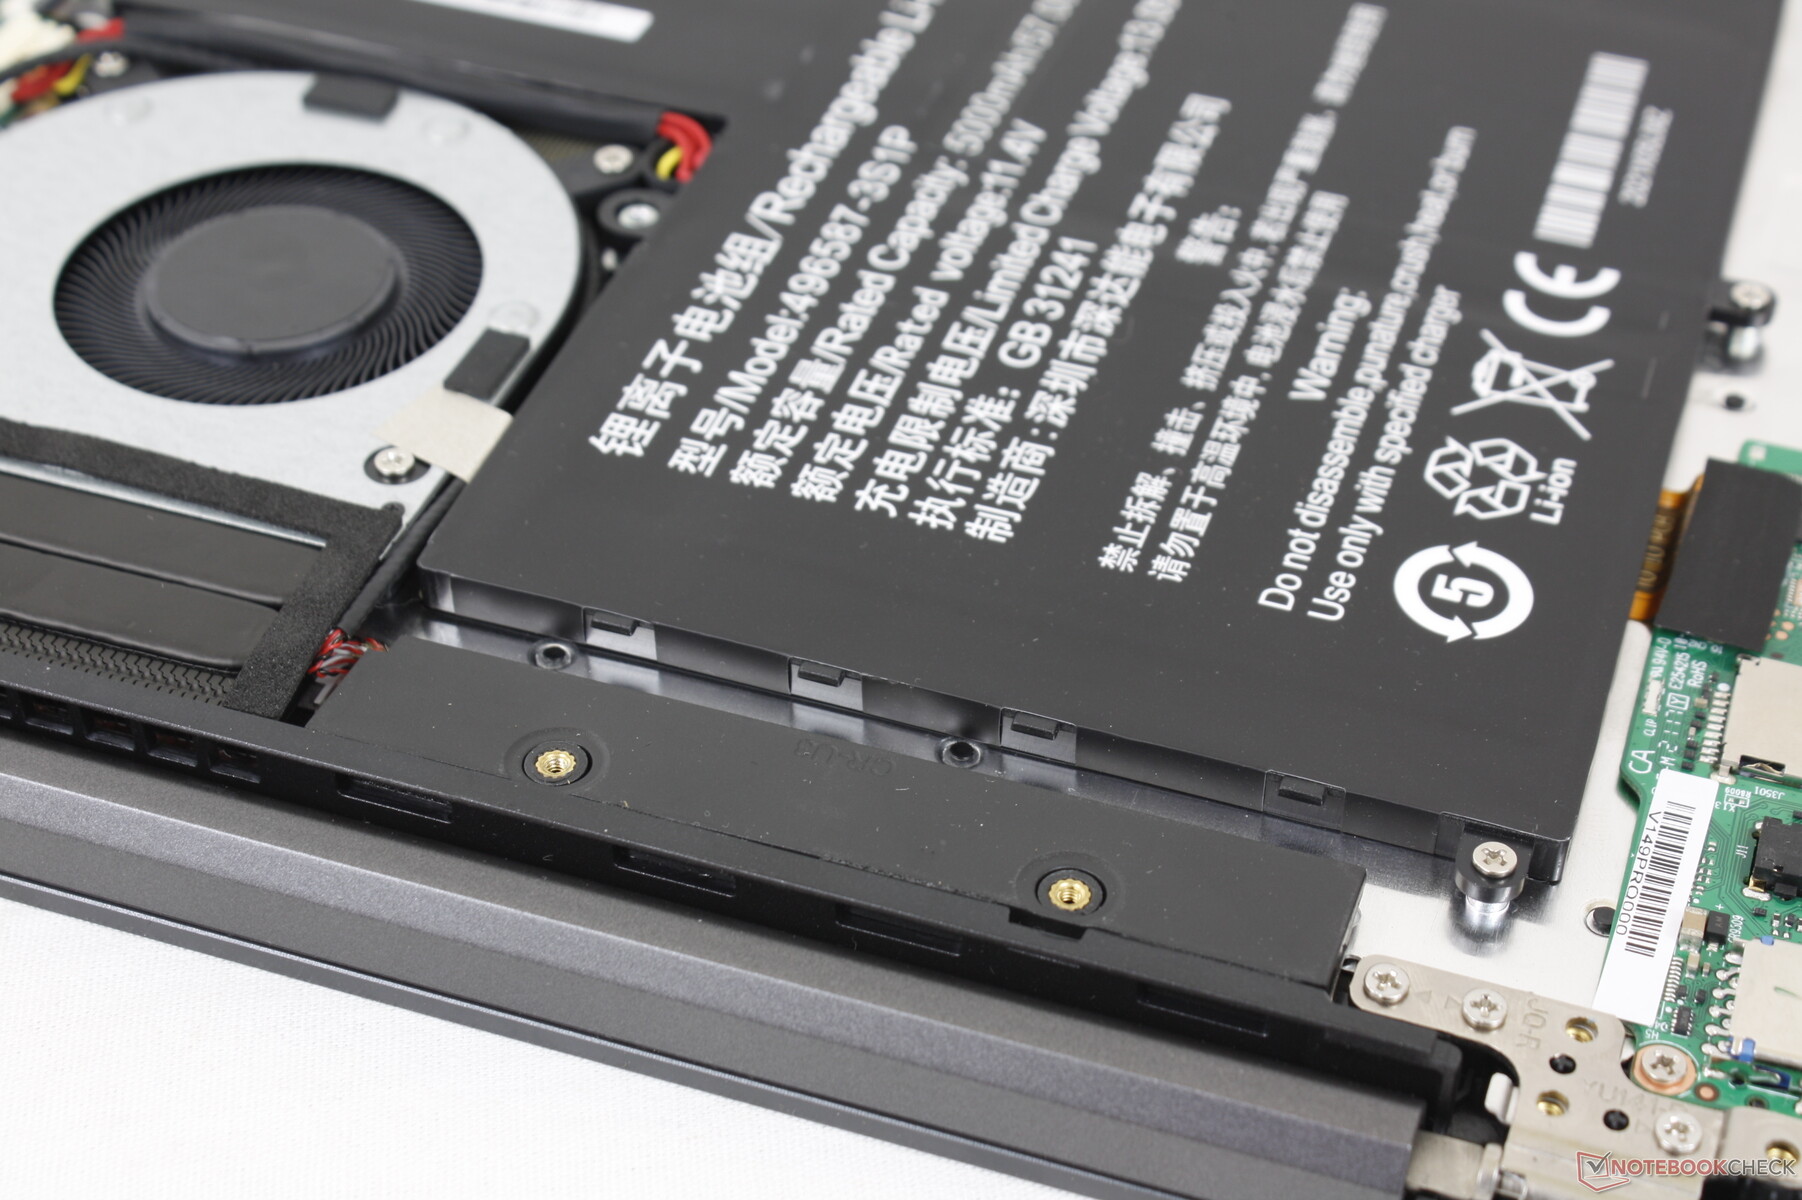
Maintenance
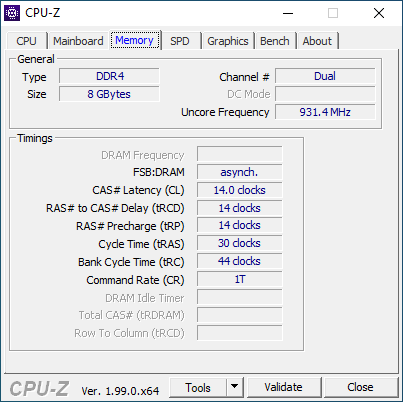
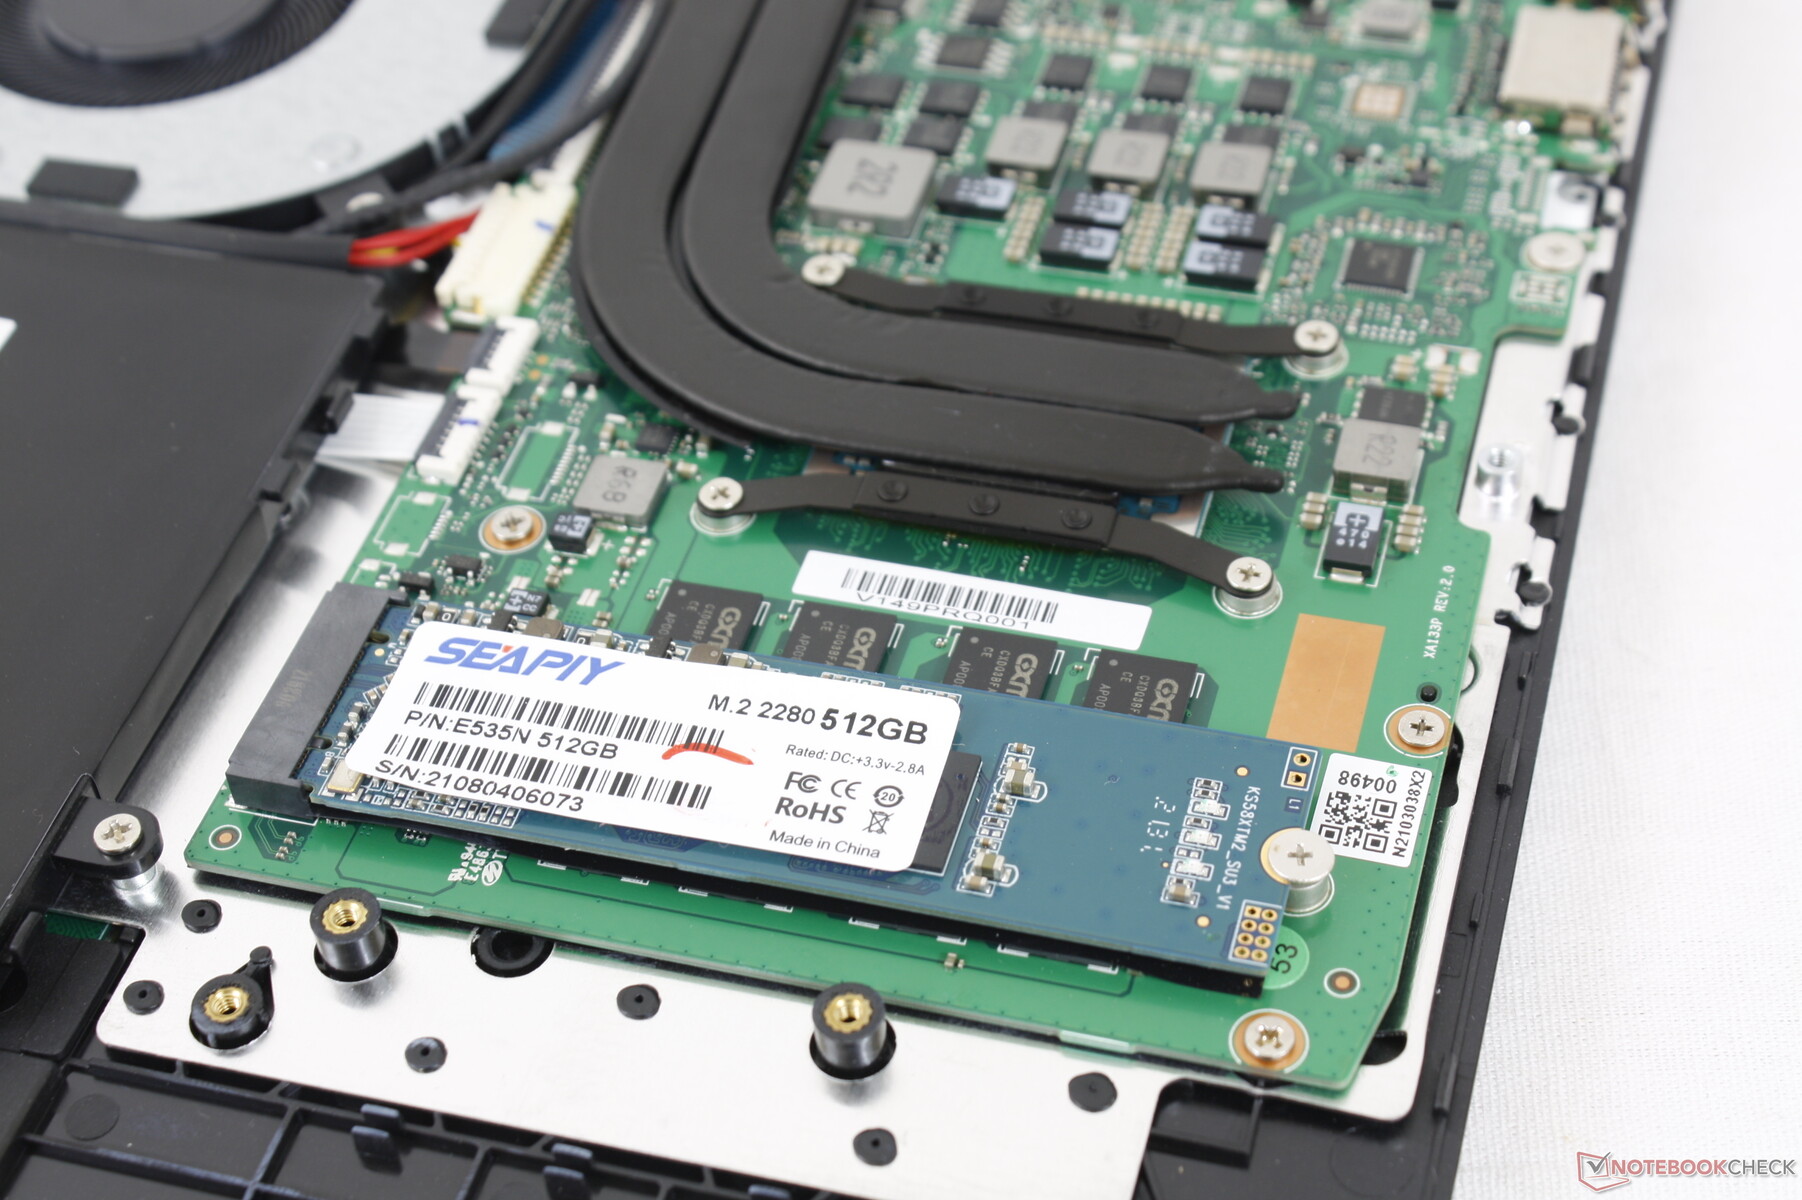
The bottom panel is secured by 11 Philips screws plus 2 more hidden underneath the rear rubber feet. Users can only upgrade the M.2 2280 storage as both the RAM and WLAN modules are soldered. RAM is thankfully in dual-channel mode.
Accessories and Warranty
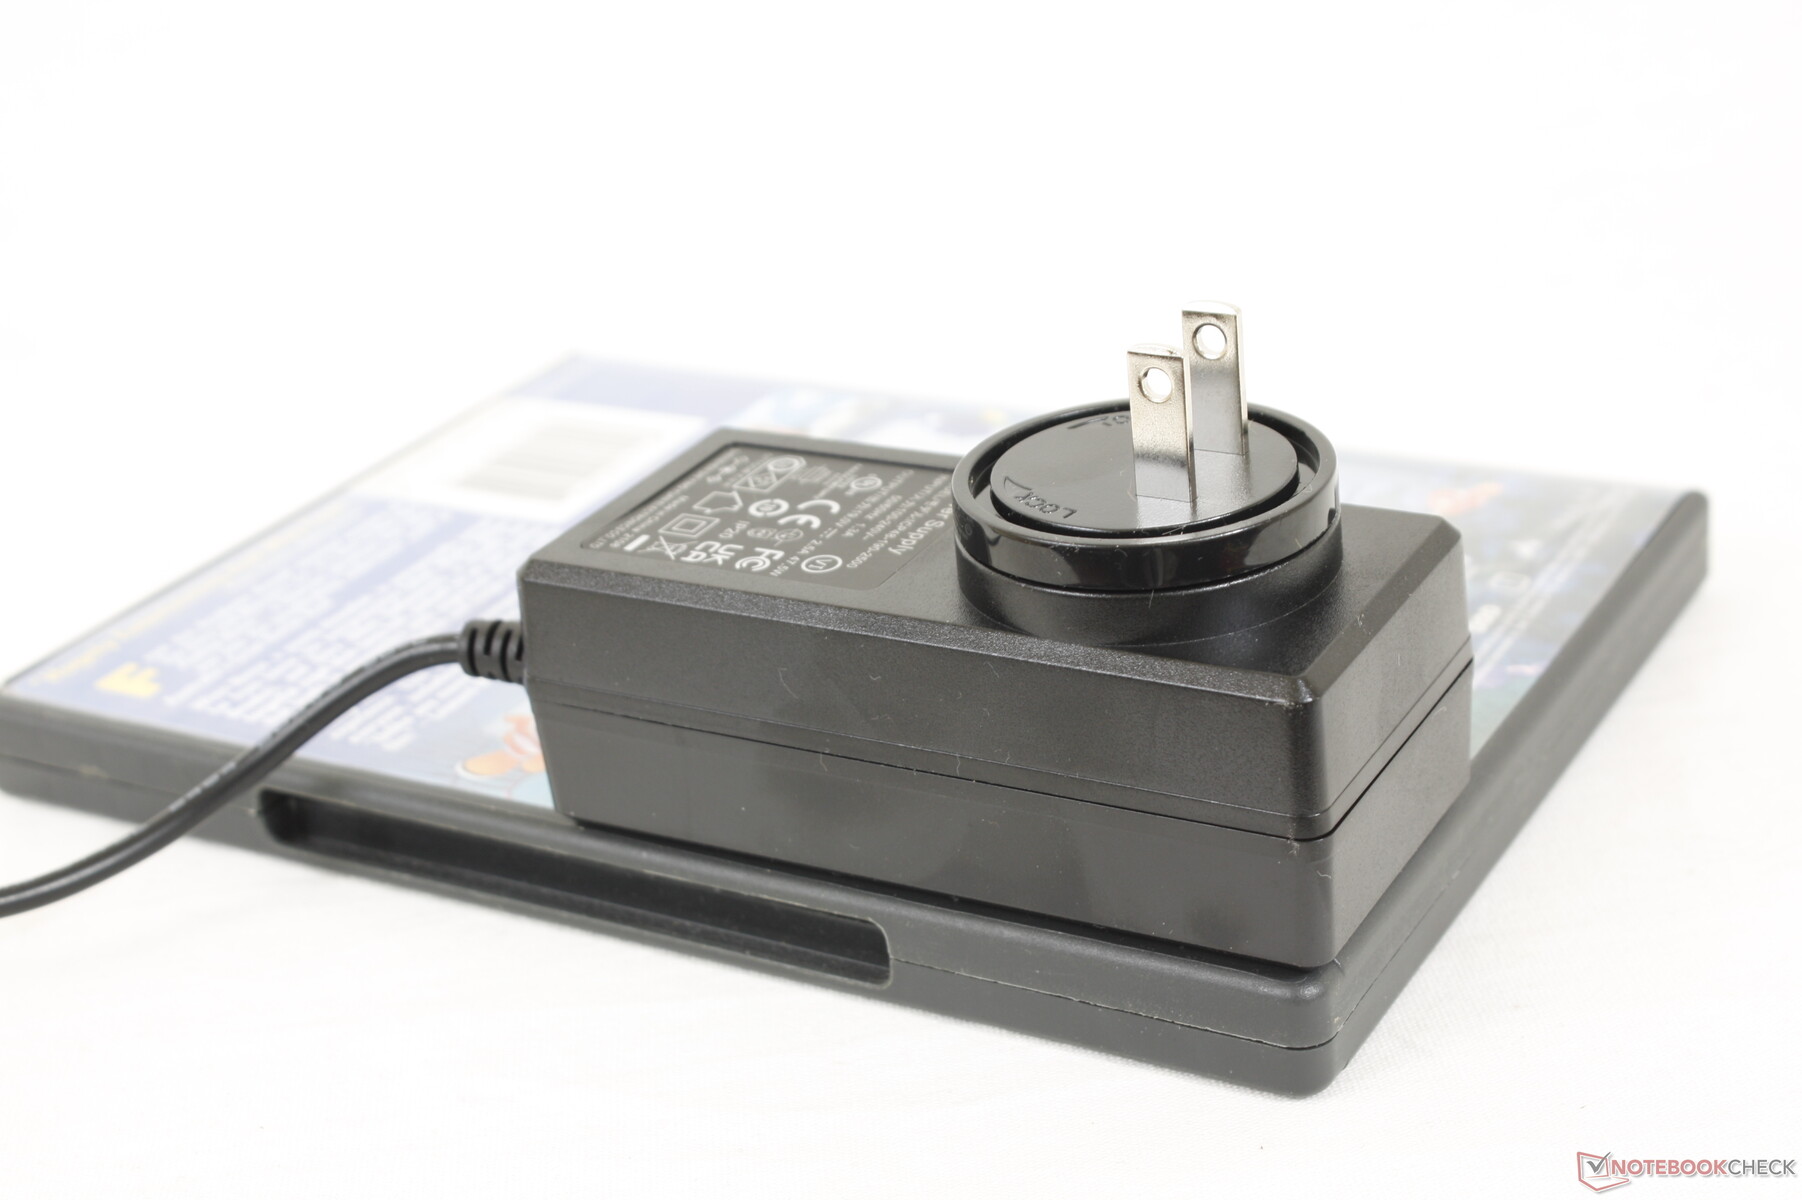
There are no extras in the box beyond the AC adapter and paperwork. Claiming manufacturer warranty may be timely or costly due to overseas shipping.
Input Devices
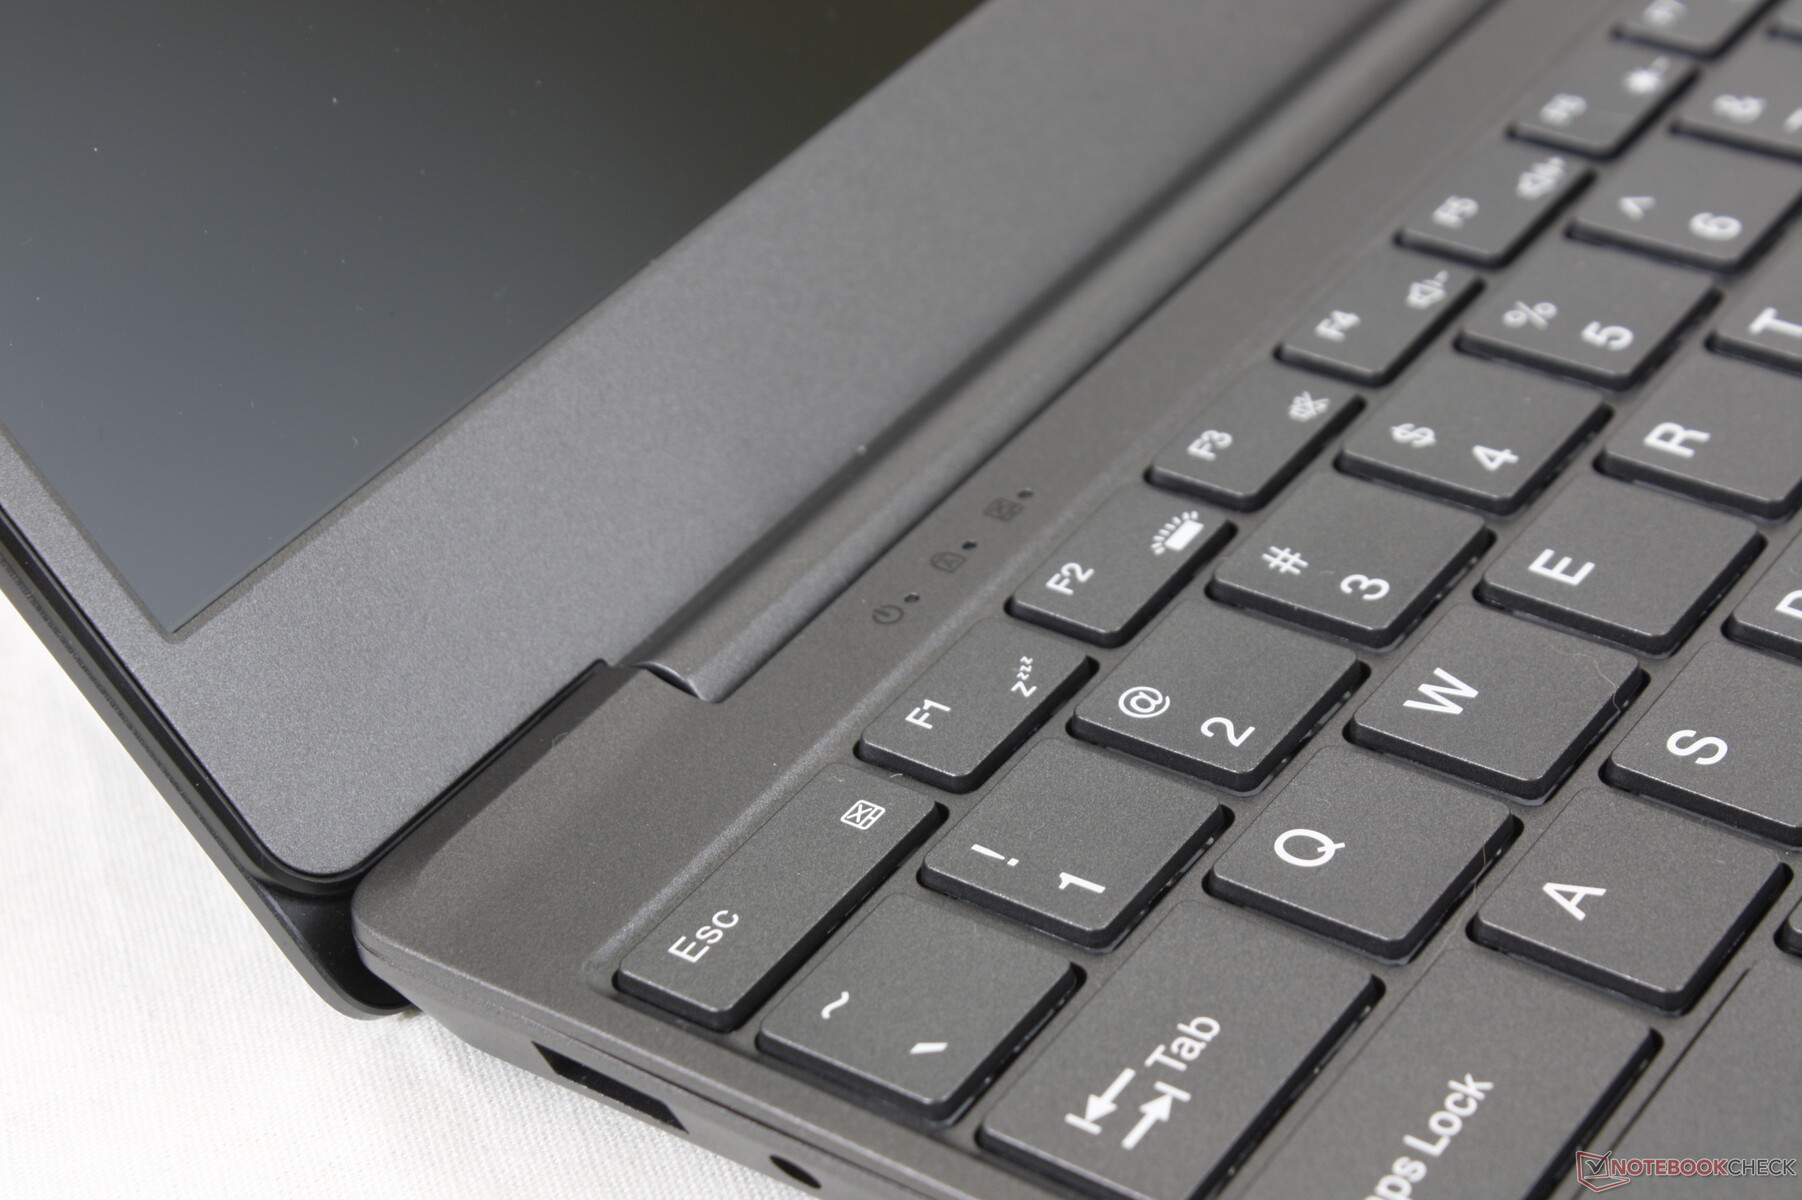
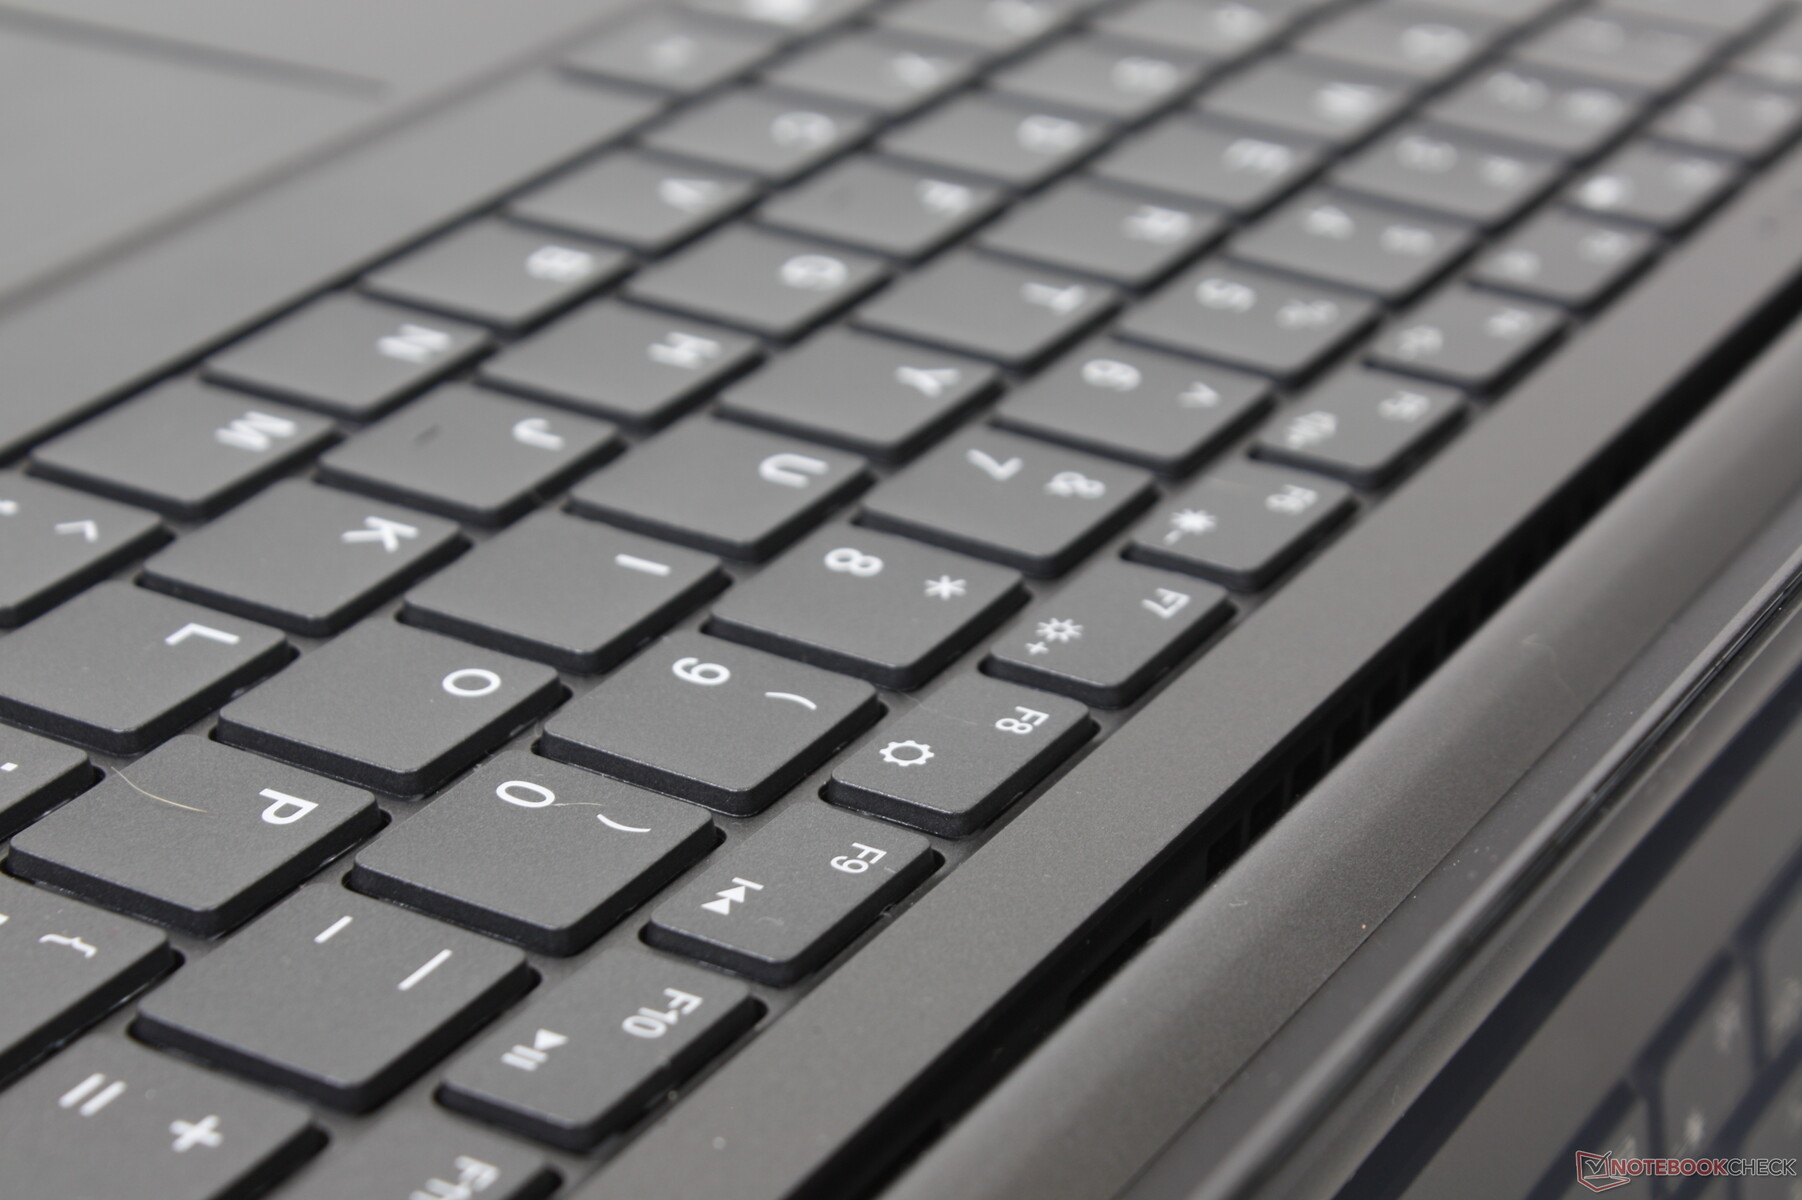
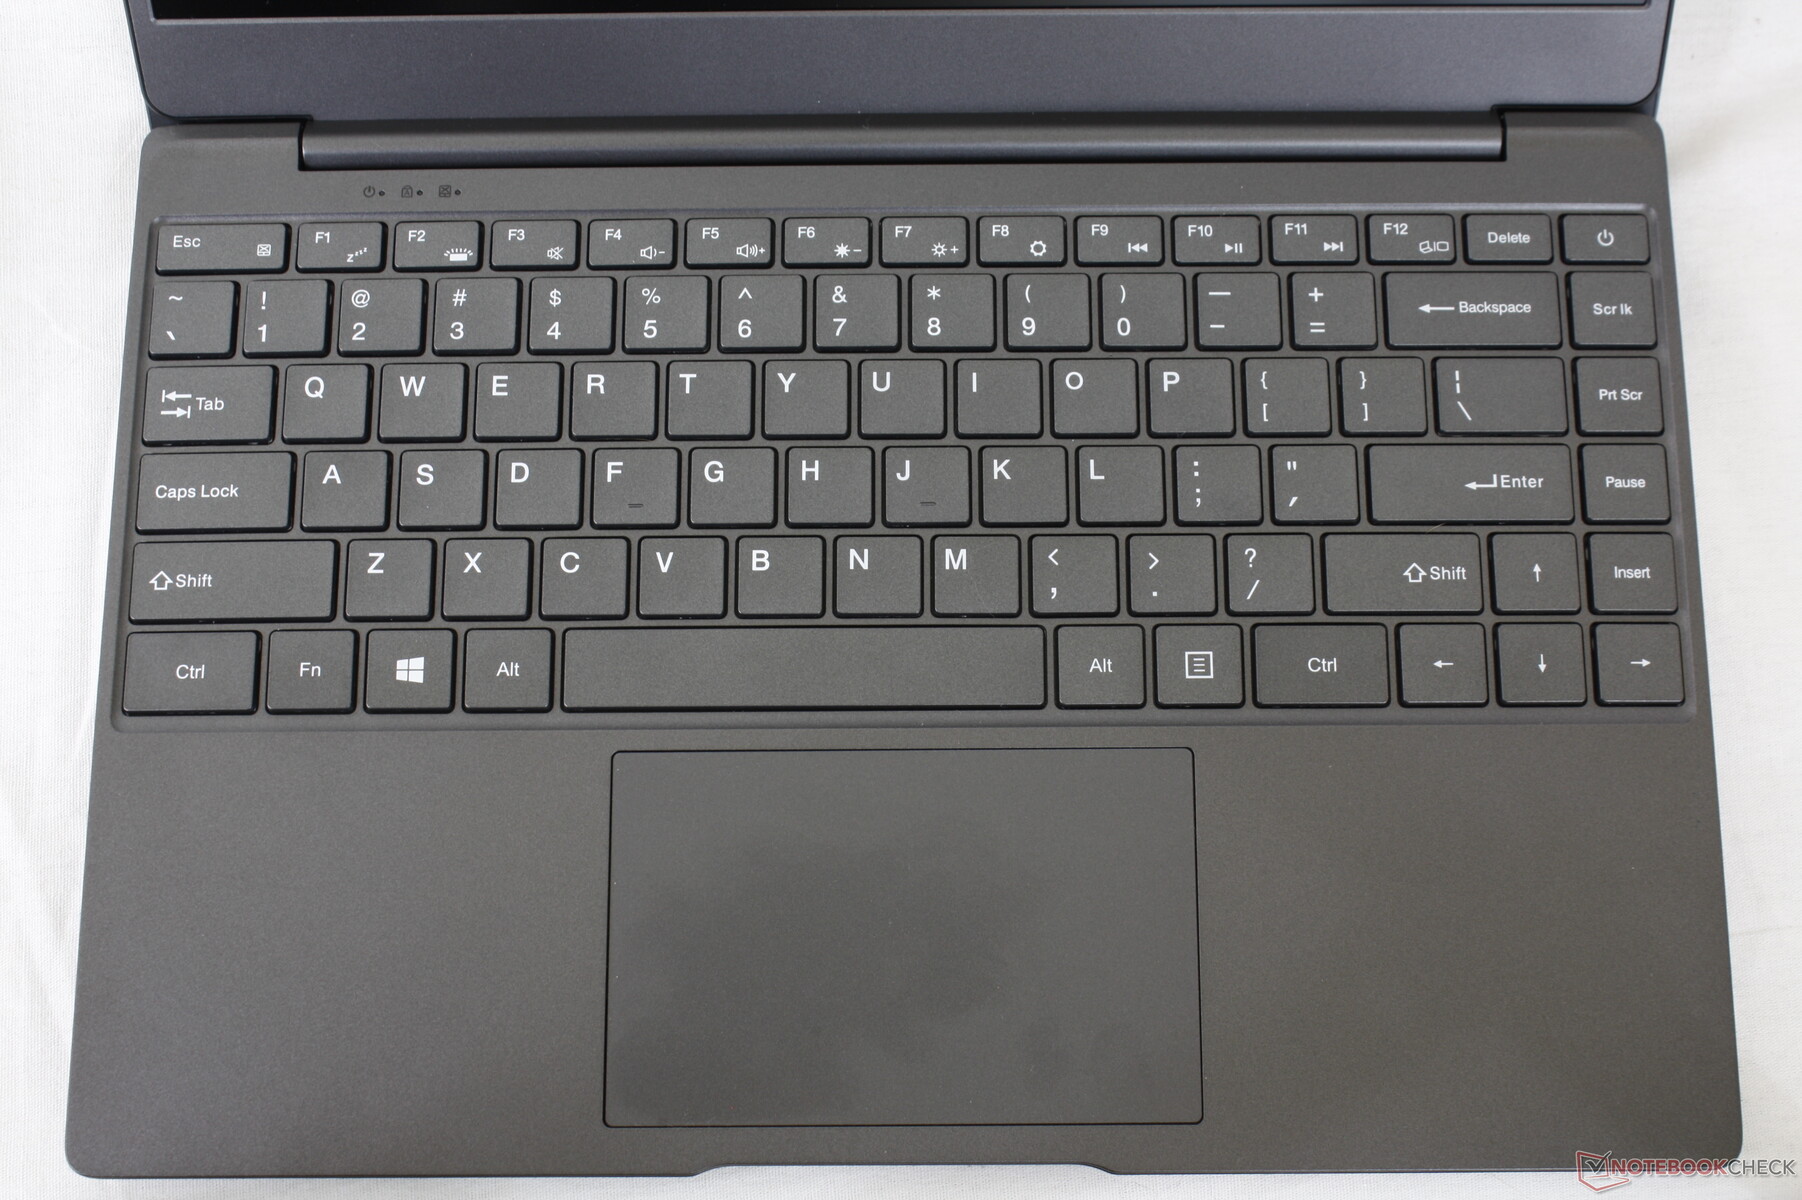
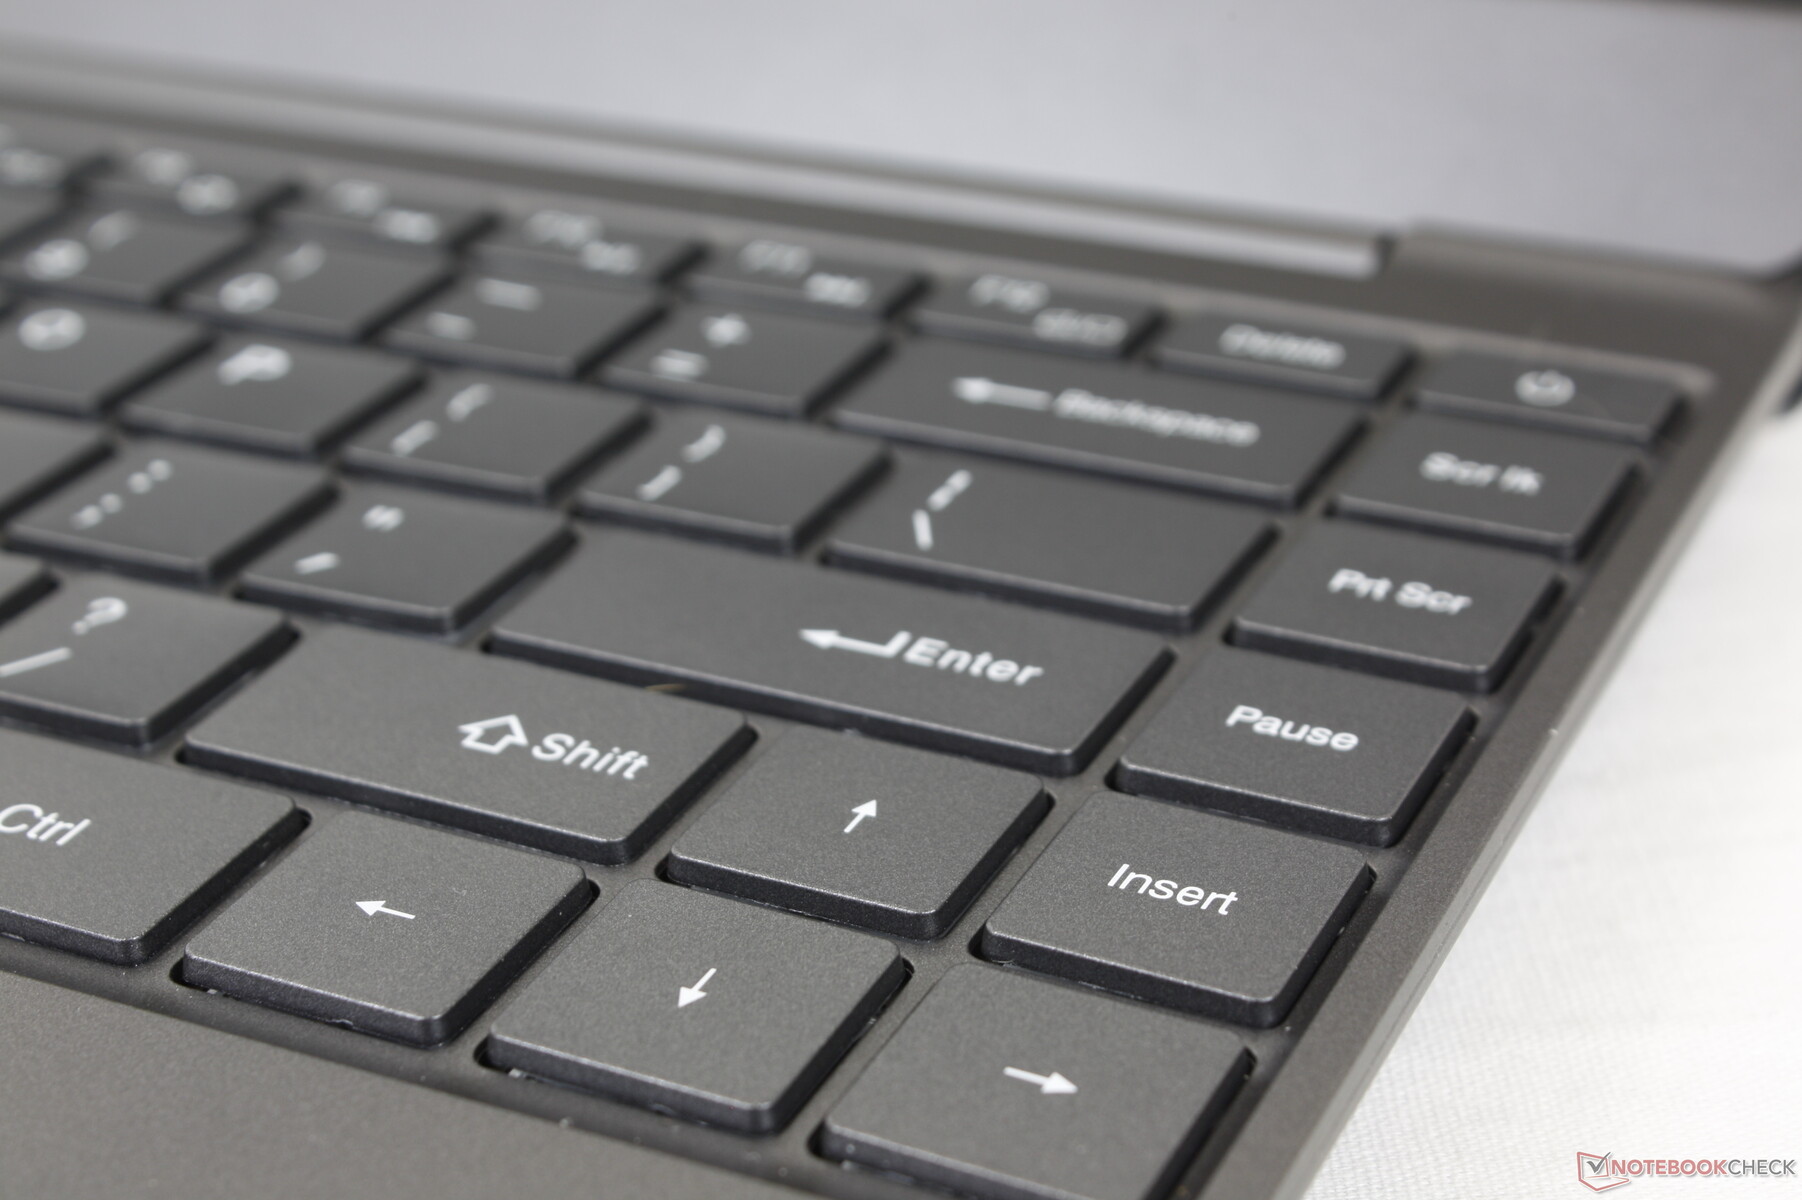
Keyboard
Key feedback and travel are slightly deeper and firmer than the keys on a Lenovo IdeaPad laptop. However, key feedback uniformity is poor as certain keys are much spongier than others. The Space key in particular is significantly softer in feedback which ruins the typing experience on the BMax.
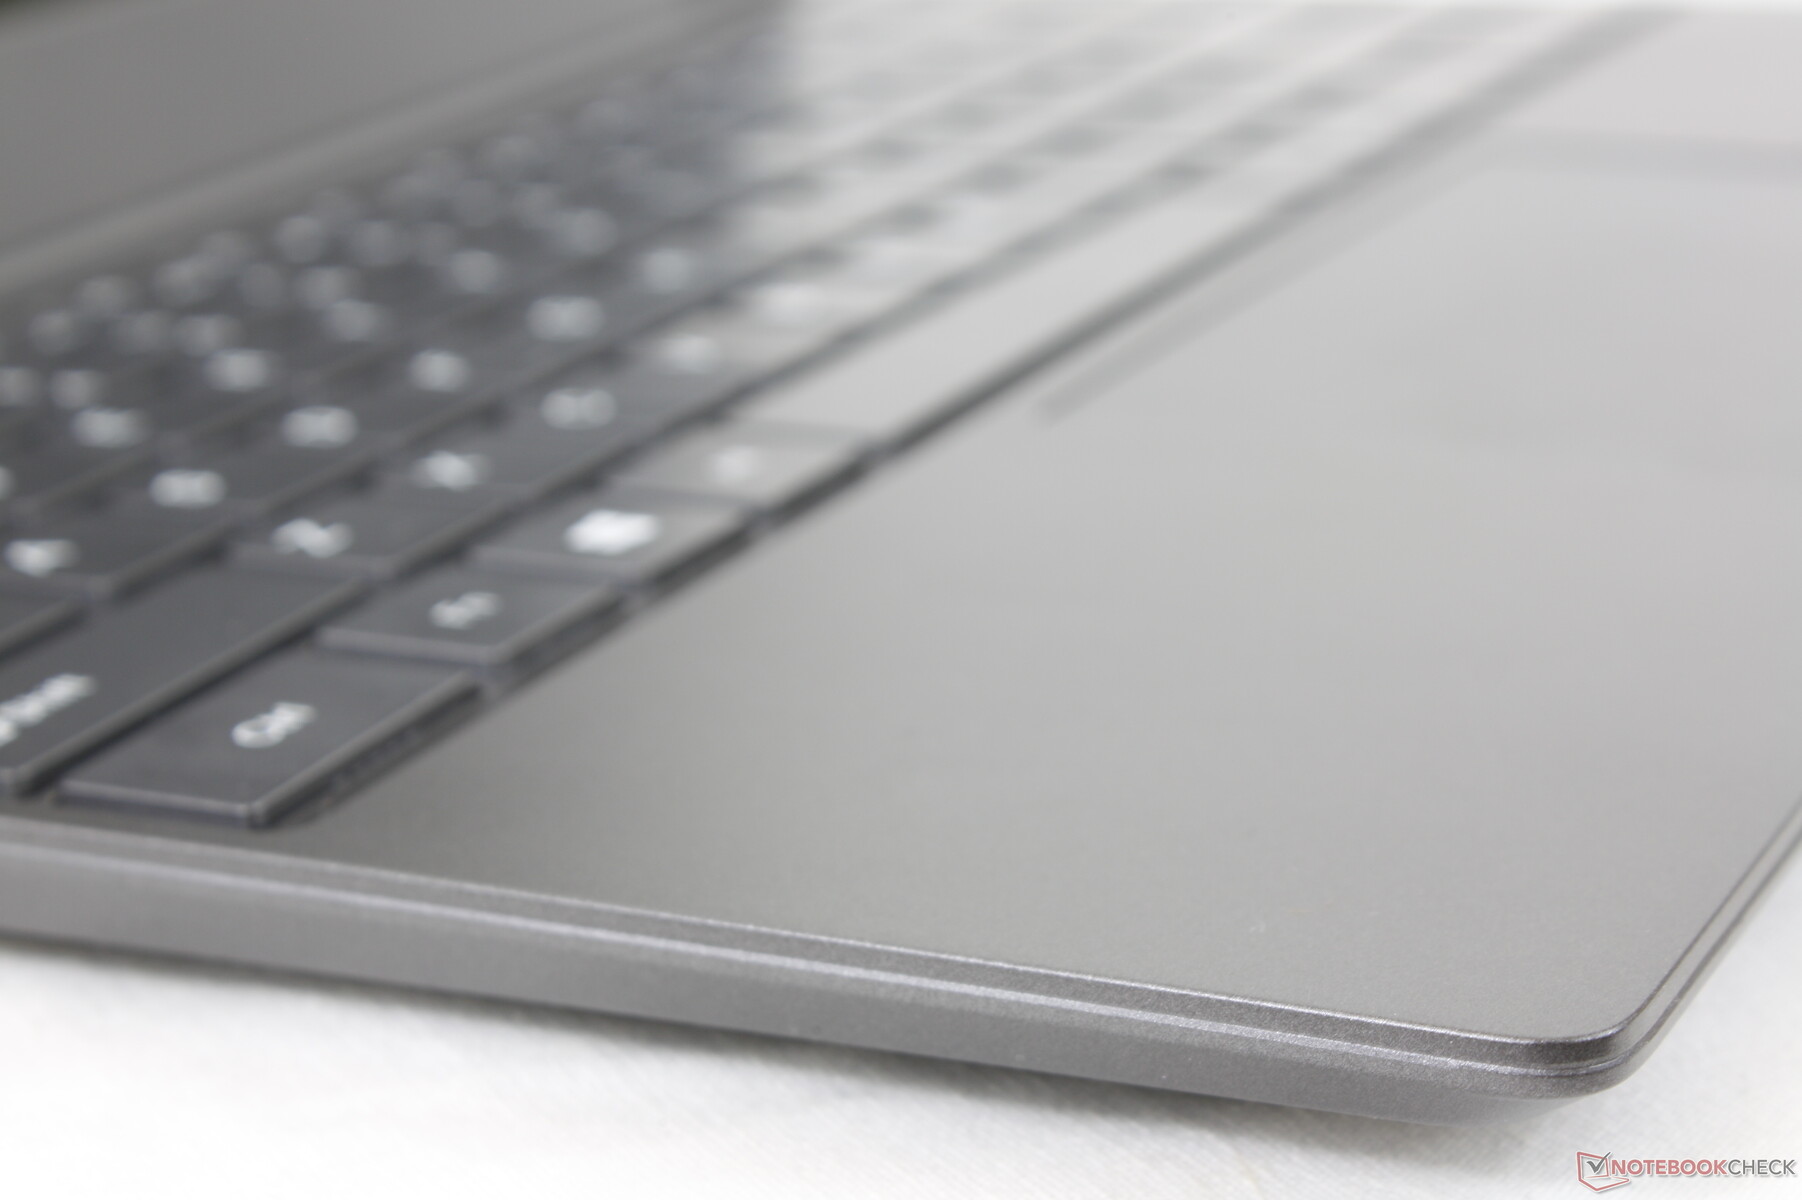
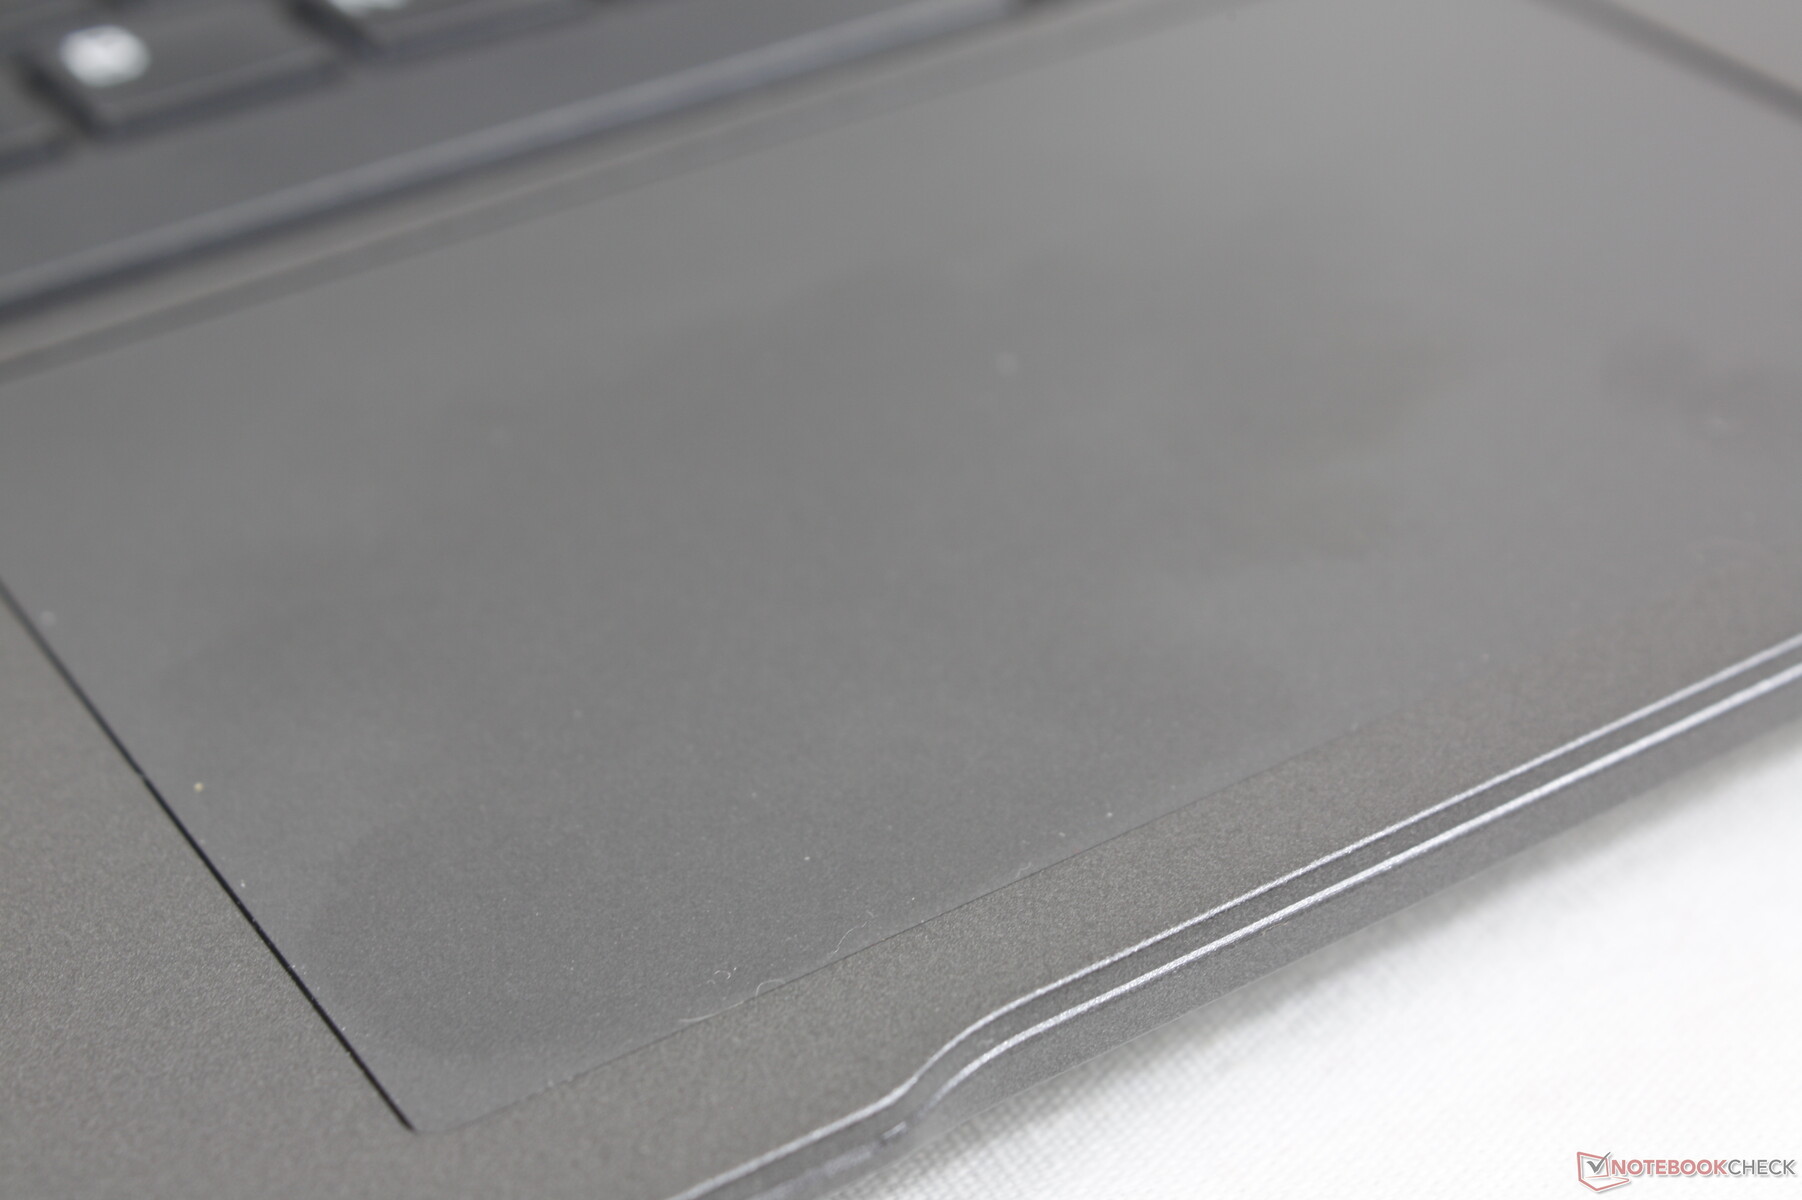
Touchpad
The Precision-enabled clickpad is reasonably large at 11.5 x 7.3 cm compared to 10.5 x 7 cm on the Lenovo IdeaPad 5 Pro 14. Unlike the clickpads on some Chuwi laptops, the one on the BMax is reliable and without any cursor jumping issues. Its surface is smooth when gliding at medium or higher speeds while lower speeds tend to be stickier.

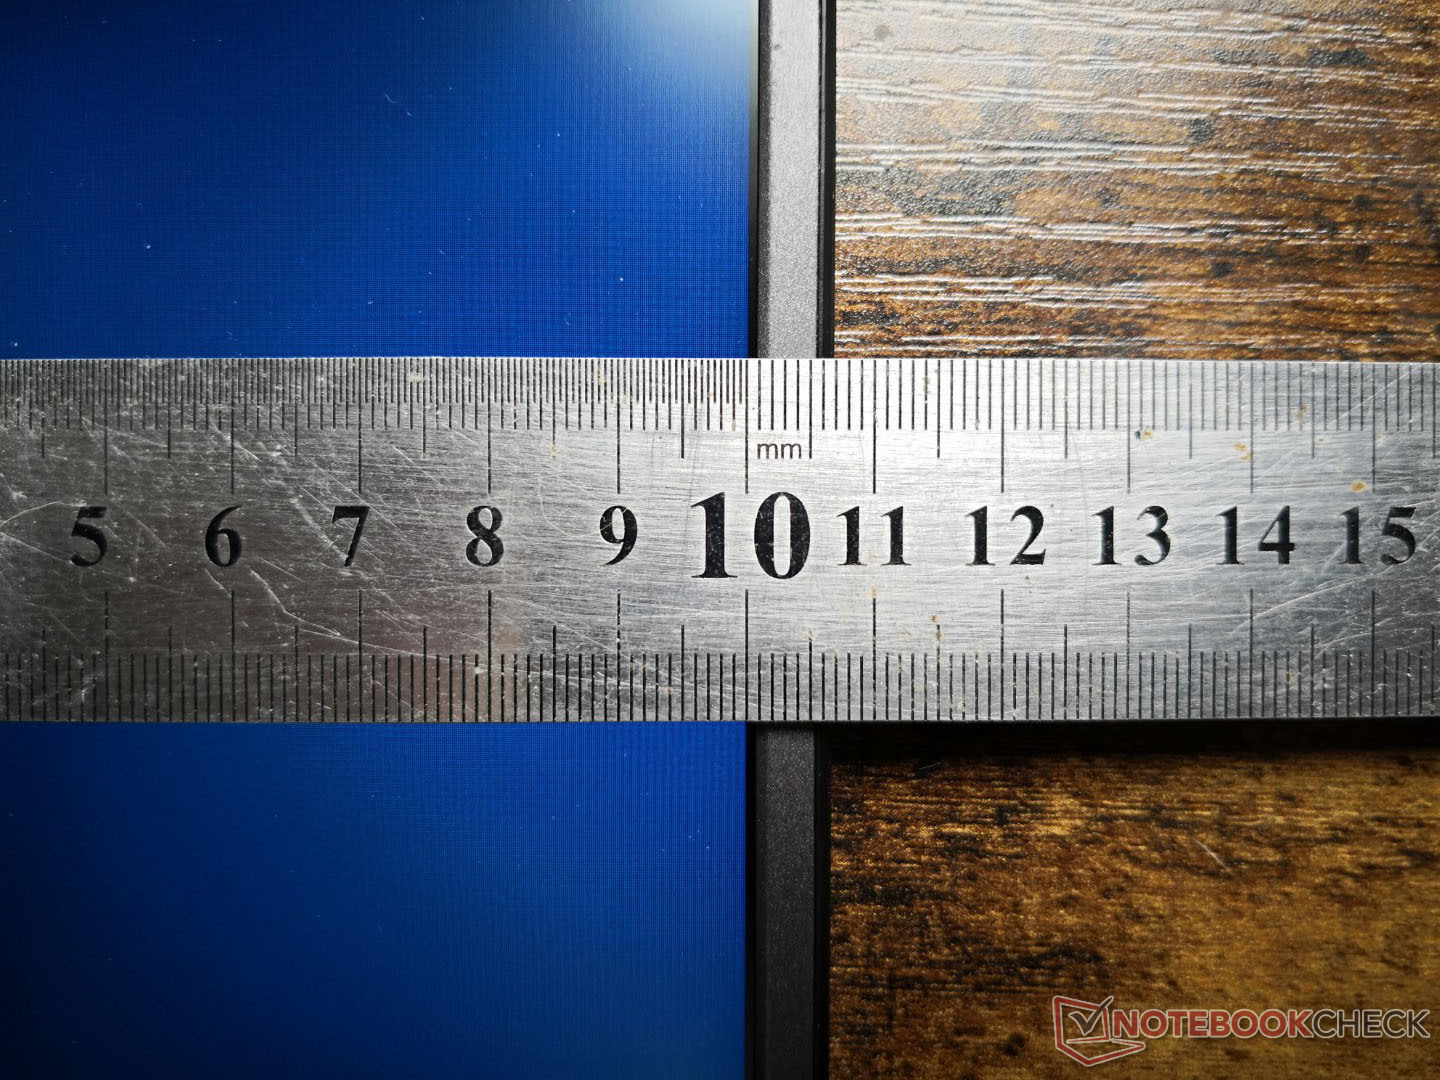
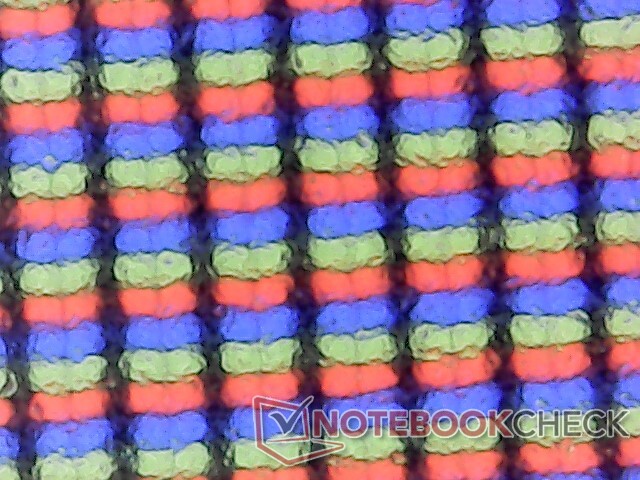
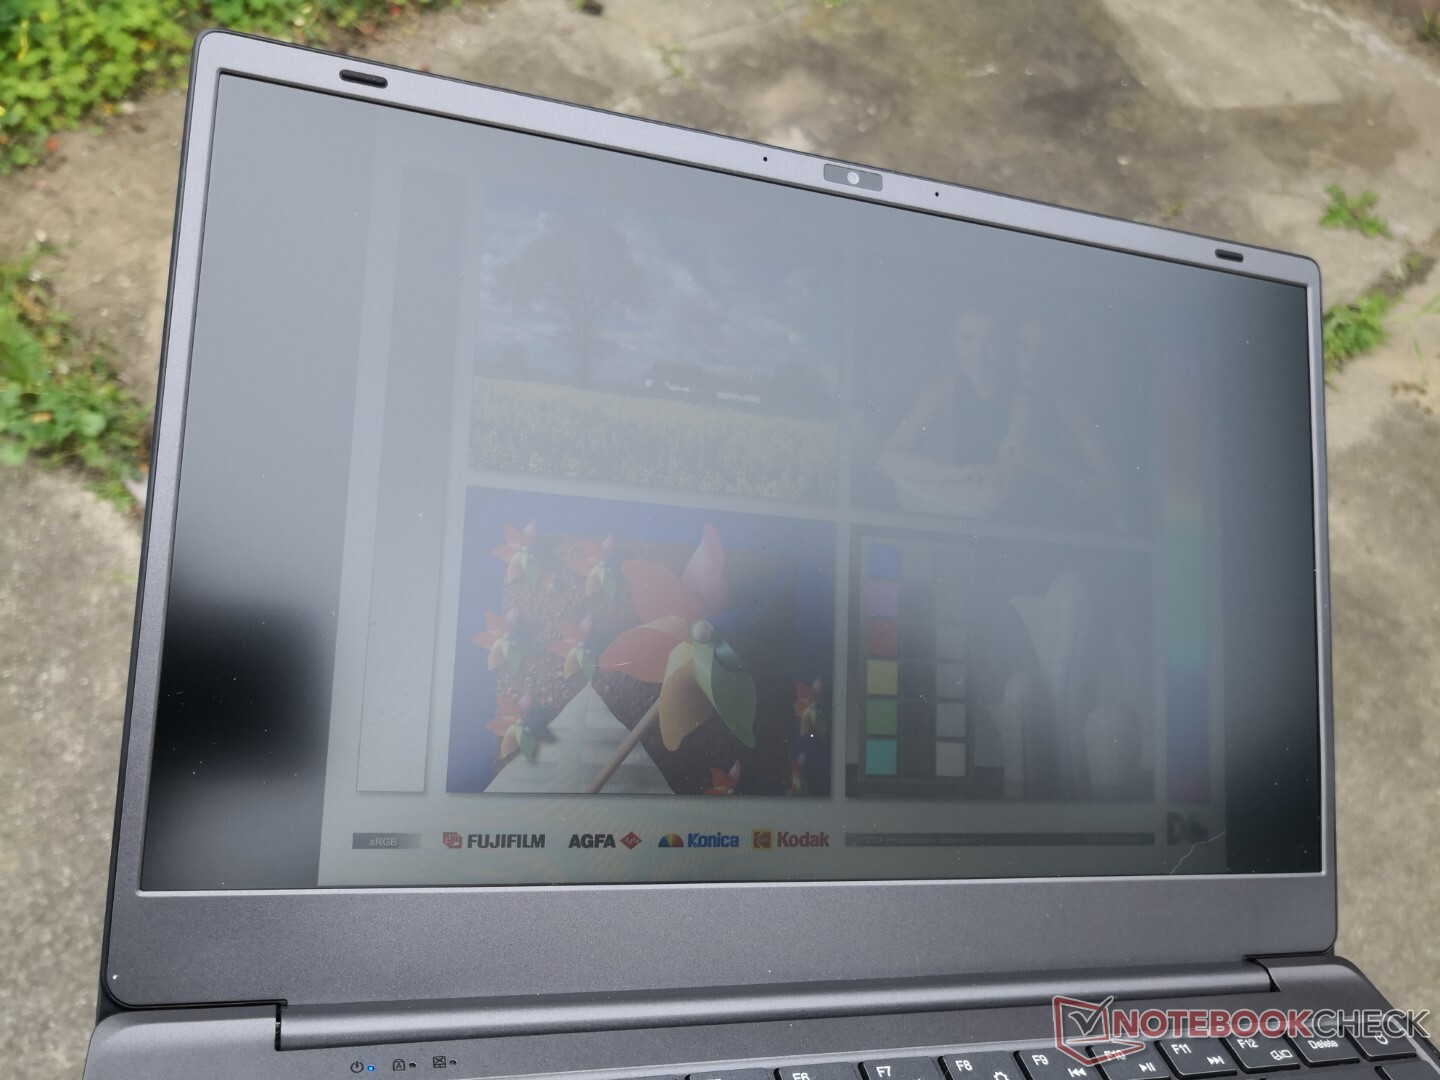
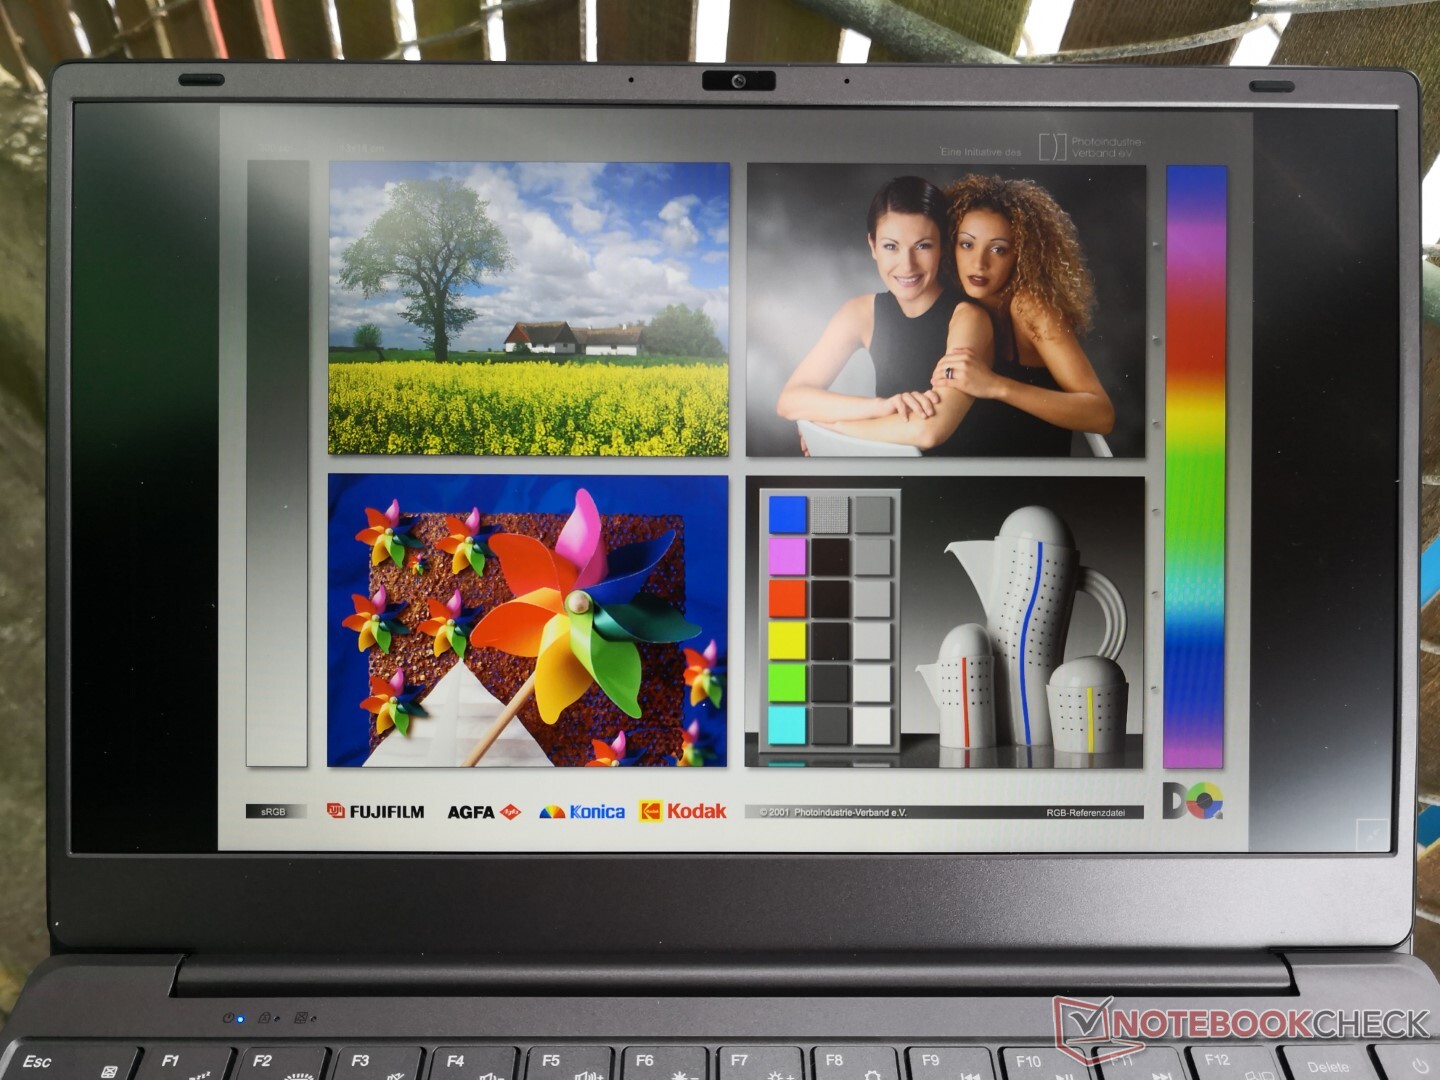
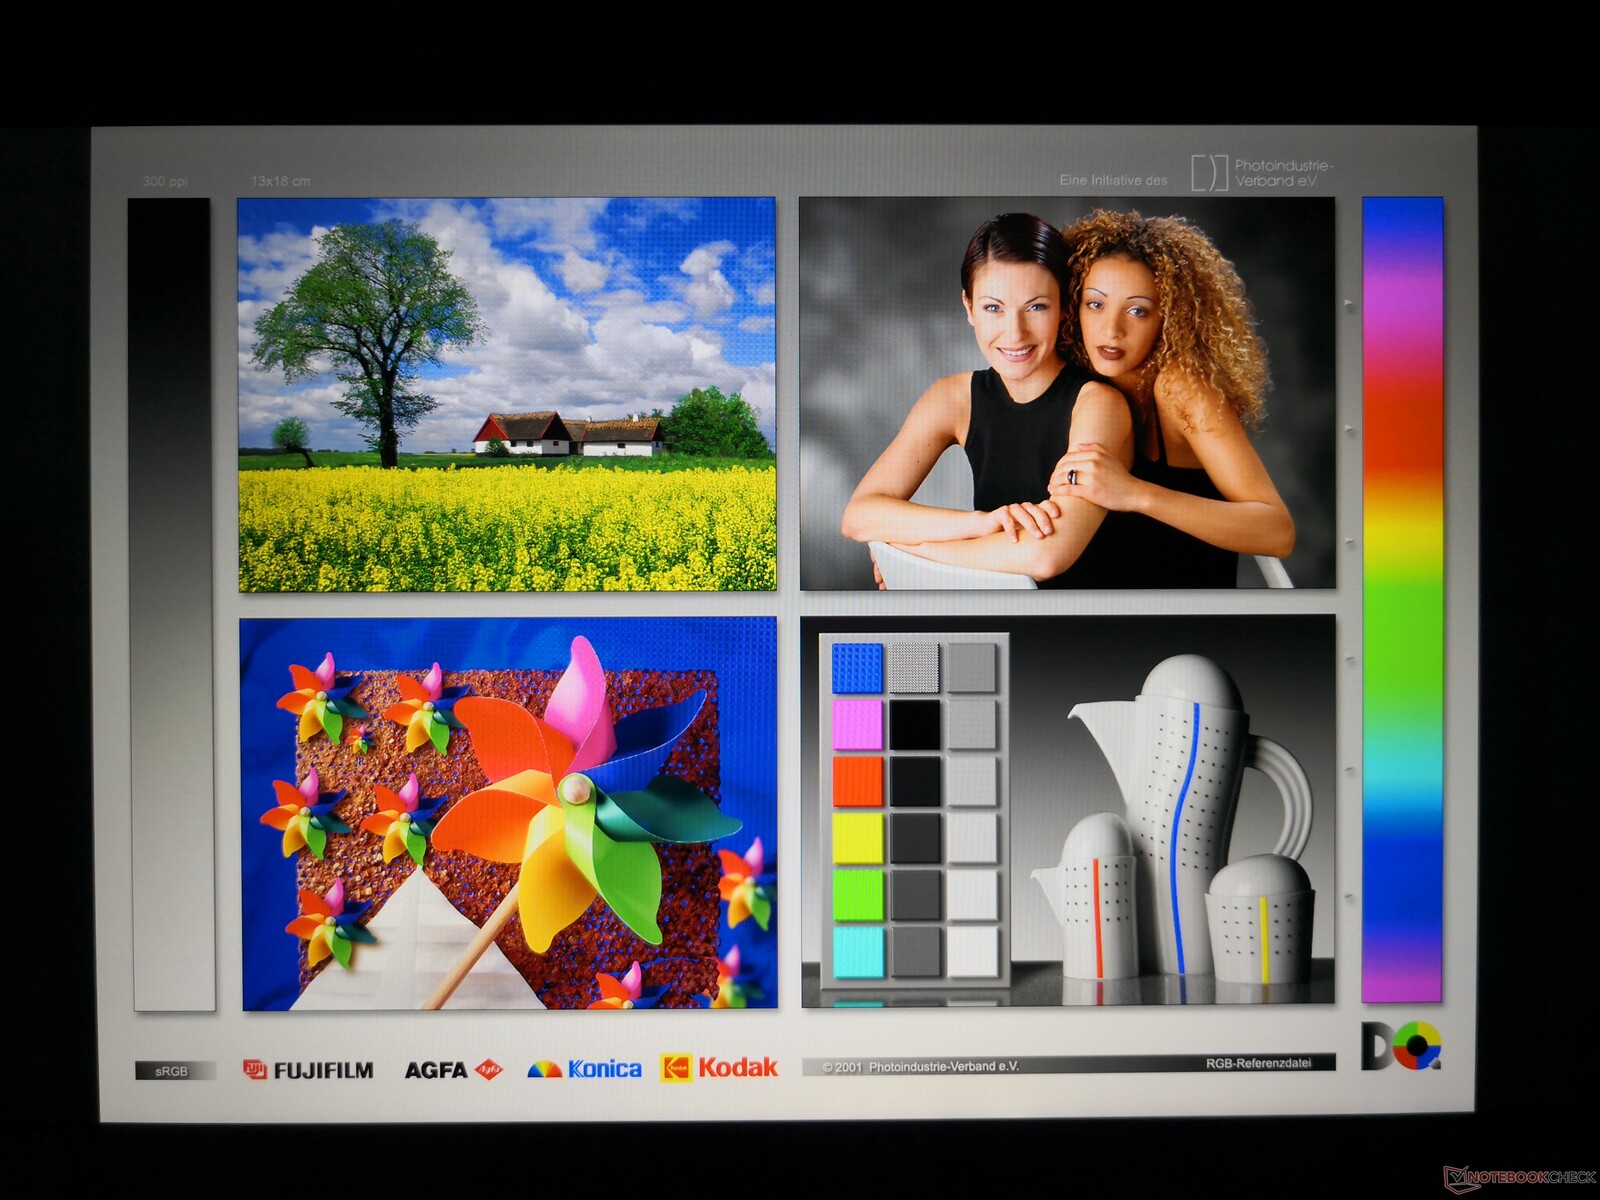
Display
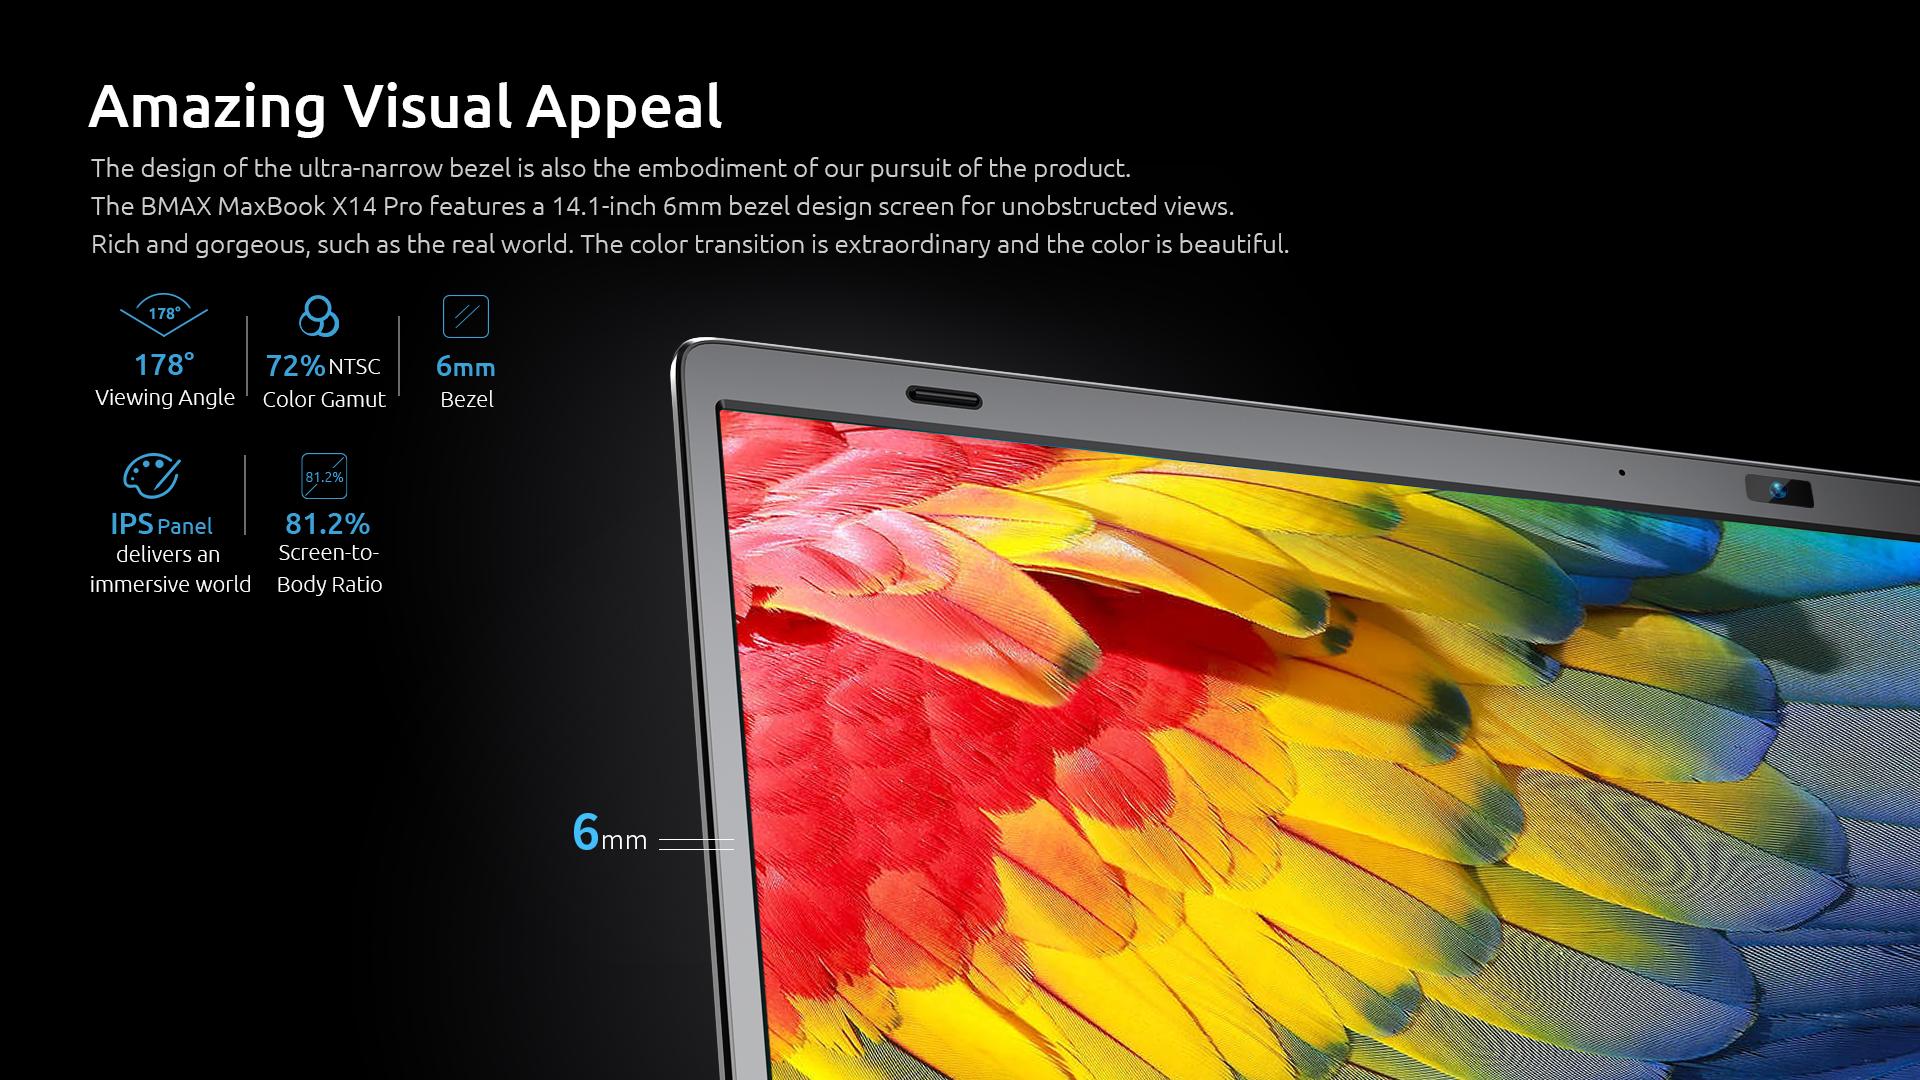
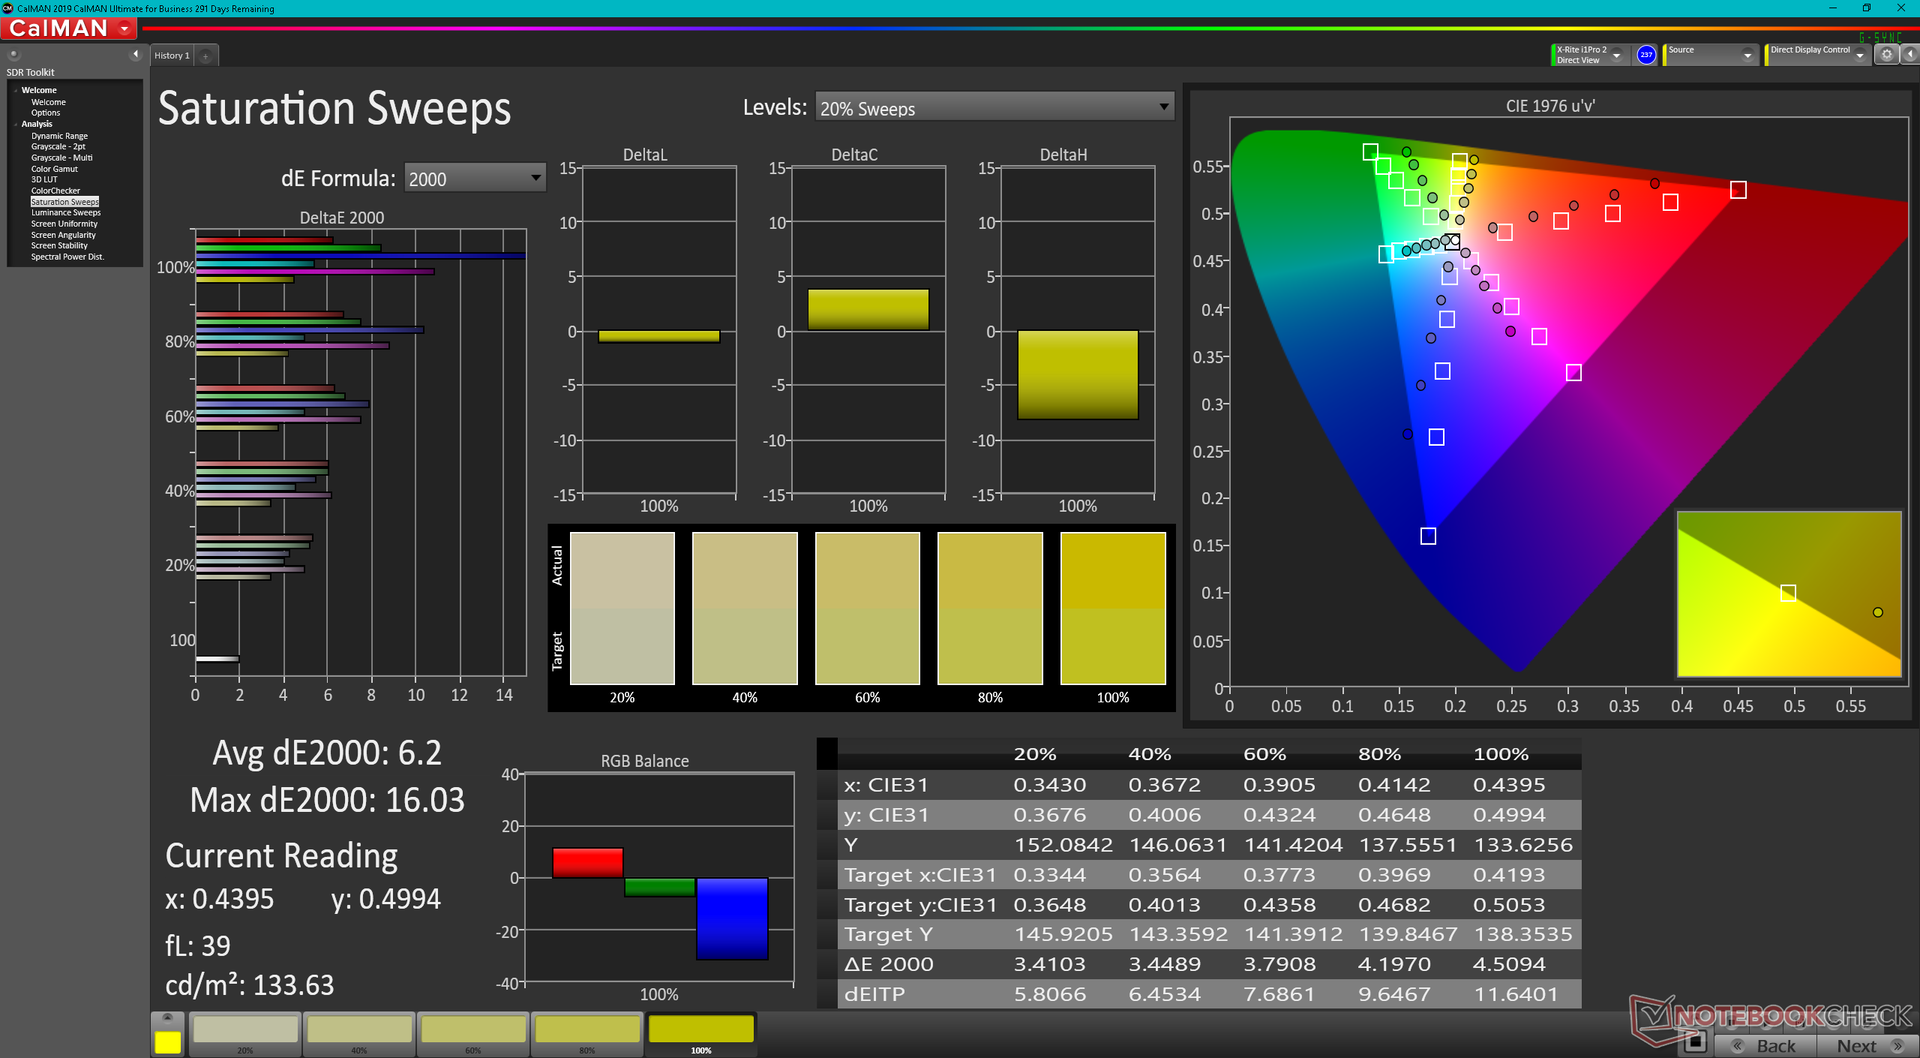
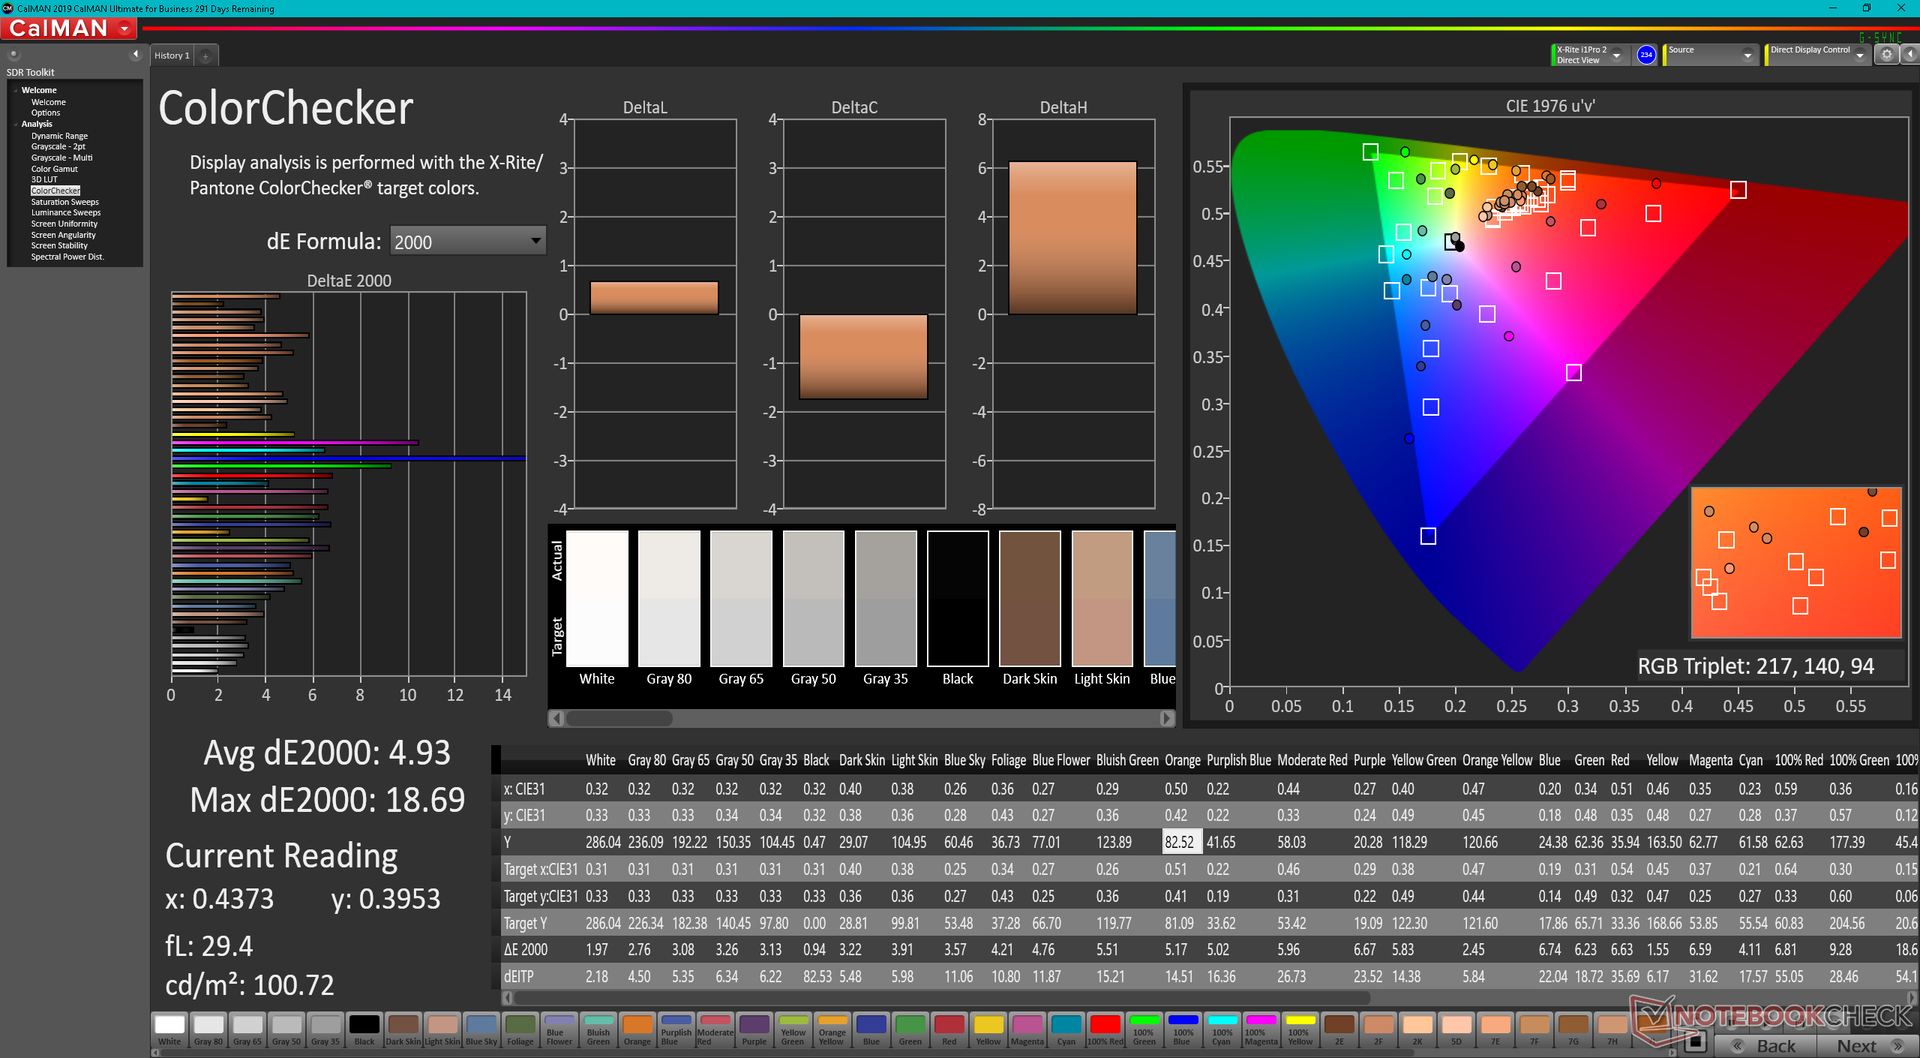
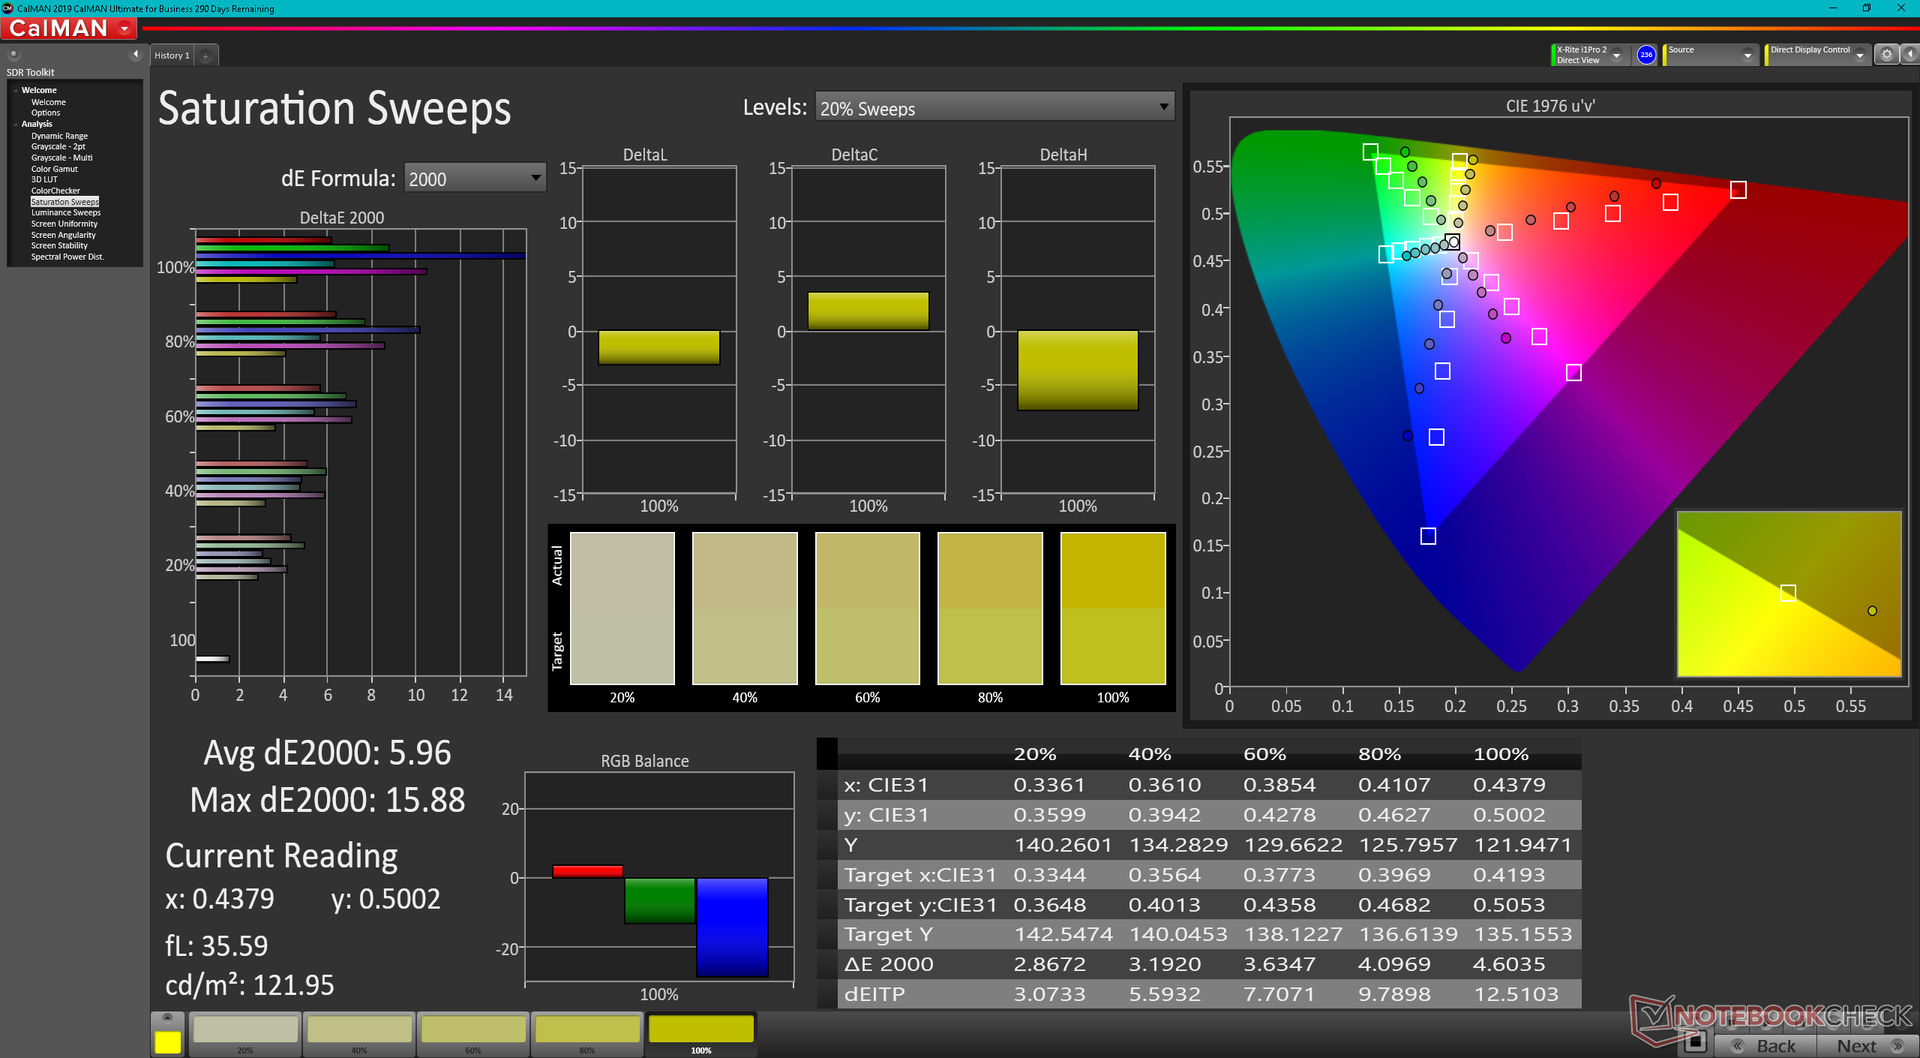
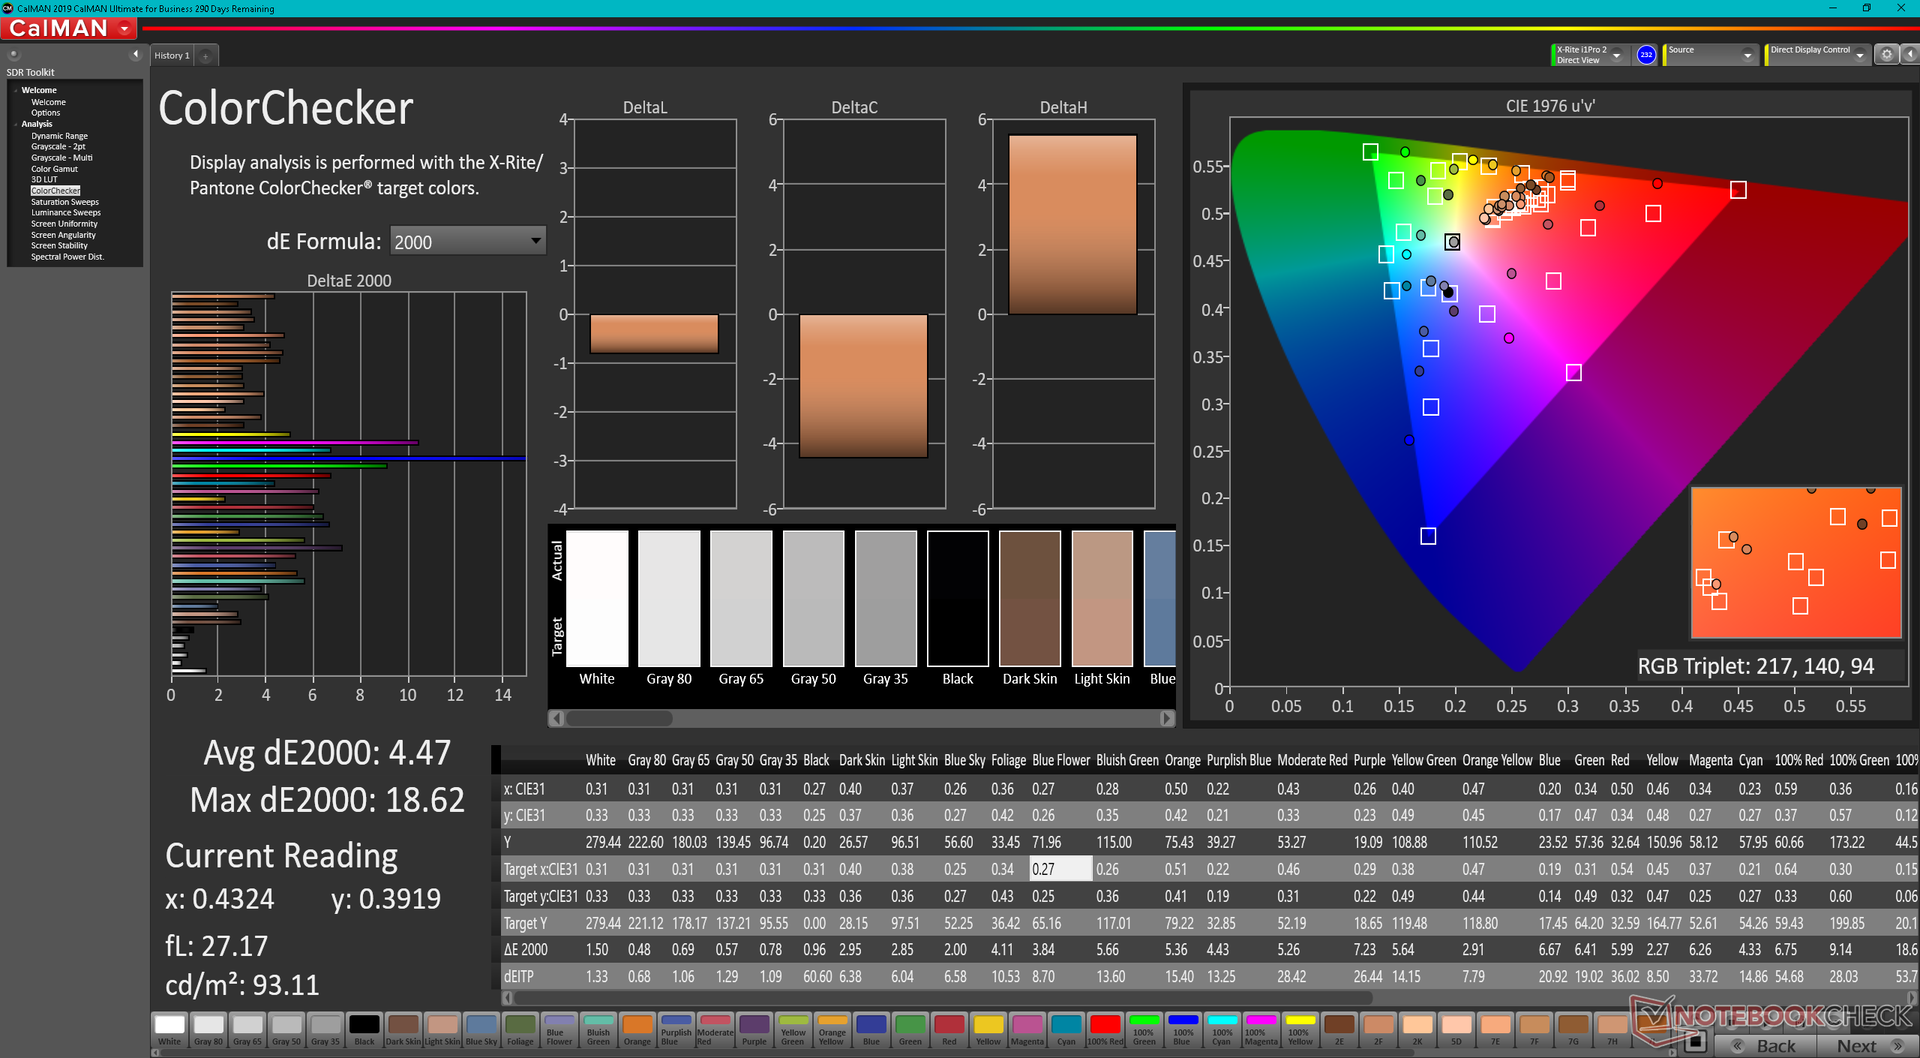
The BMax uses the same BOE NV140FHM-N48 IPS panel as found on the Lenovo ThinkPad E14, ThinkPad L14 G2, or IdeaPad S540. This is a budget panel with limited color coverage, slow black-white and gray-gray response times, and limited contrast as shown by our X-Rite measurements below.
It's worth mentioning that the manufacturer is currently advertising a 14.1-inch screen size with full sRGB coverage. In reality, the X14 Pro has a 14.0-inch display with just 59 percent sRGB coverage. We don't recommend buying this BMax if full sRGB coverage is important for your workloads.
| |||||||||||||||||||||||||
Brightness Distribution: 87 %
Center on Battery: 285.4 cd/m²
Contrast: 571:1 (Black: 0.5 cd/m²)
ΔE ColorChecker Calman: 4.93 | ∀{0.5-29.43 Ø4.73}
calibrated: 4.47
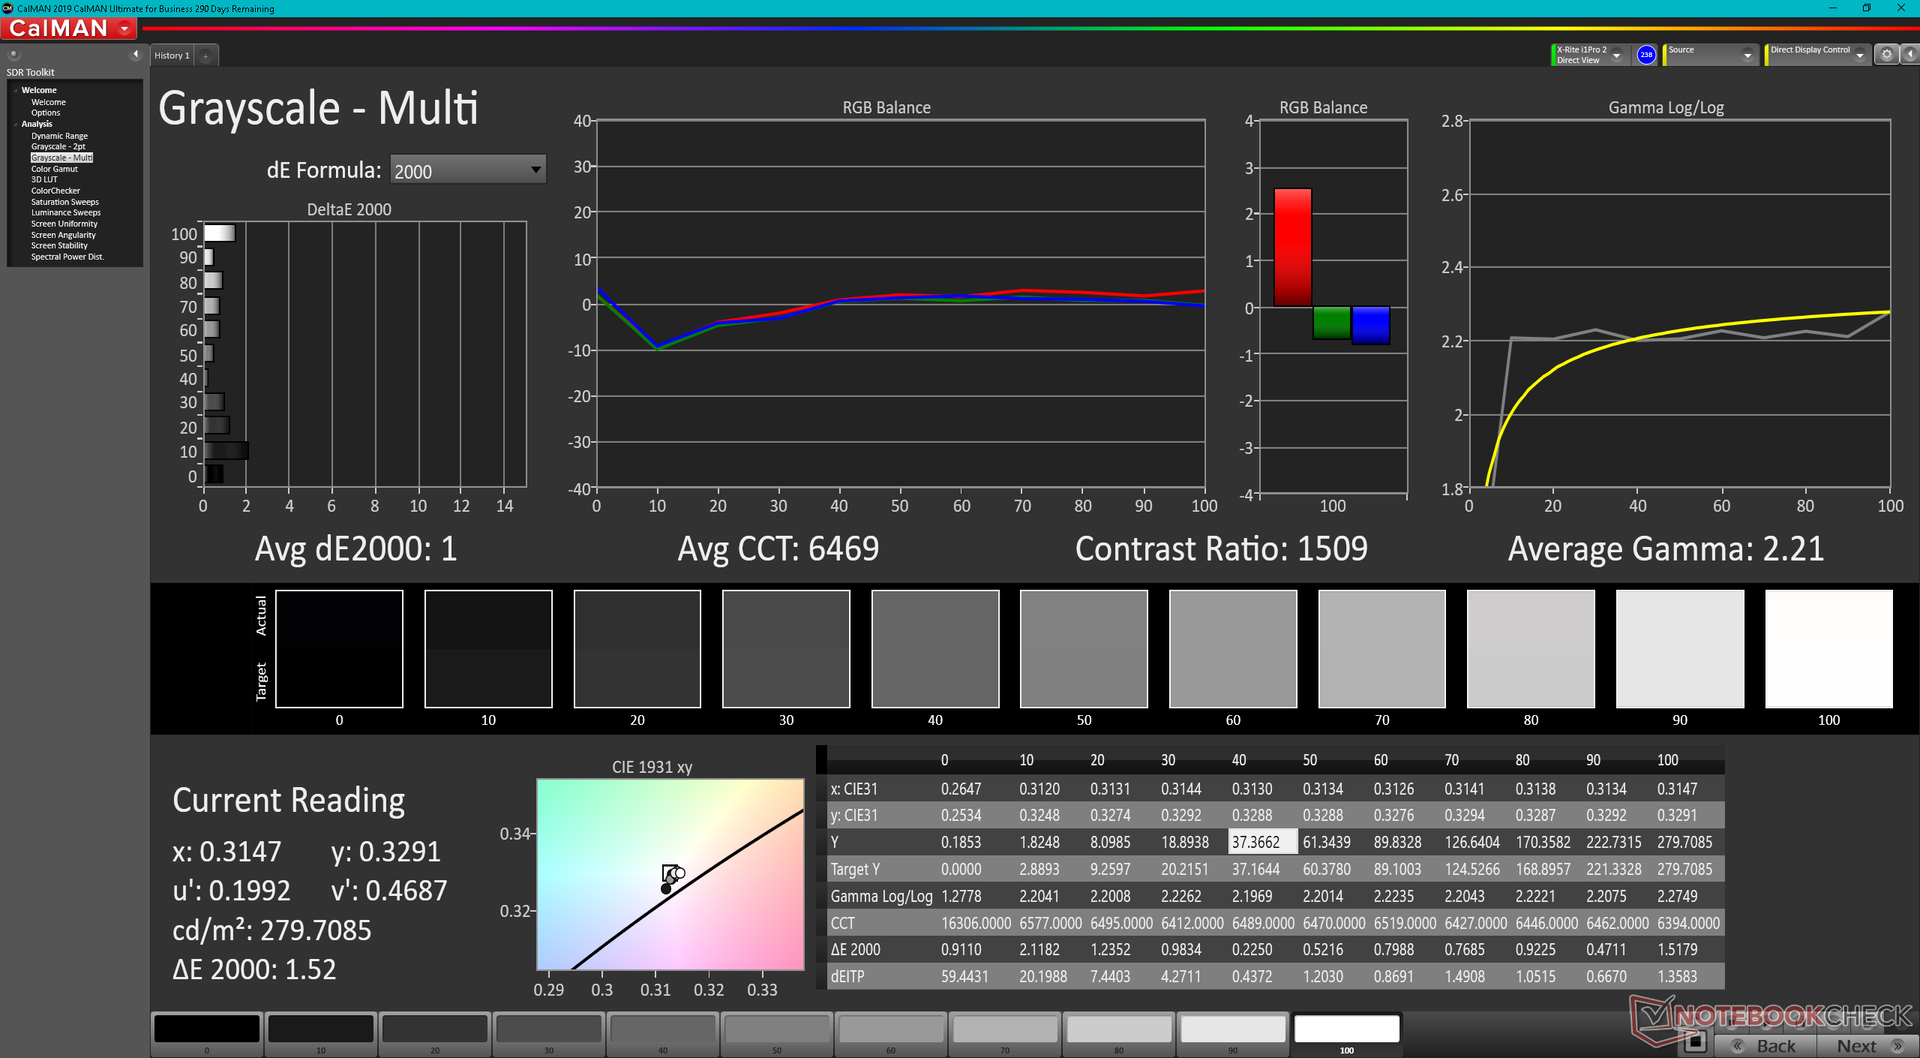
ΔE Greyscale Calman: 2.4 | ∀{0.09-98 Ø4.97}
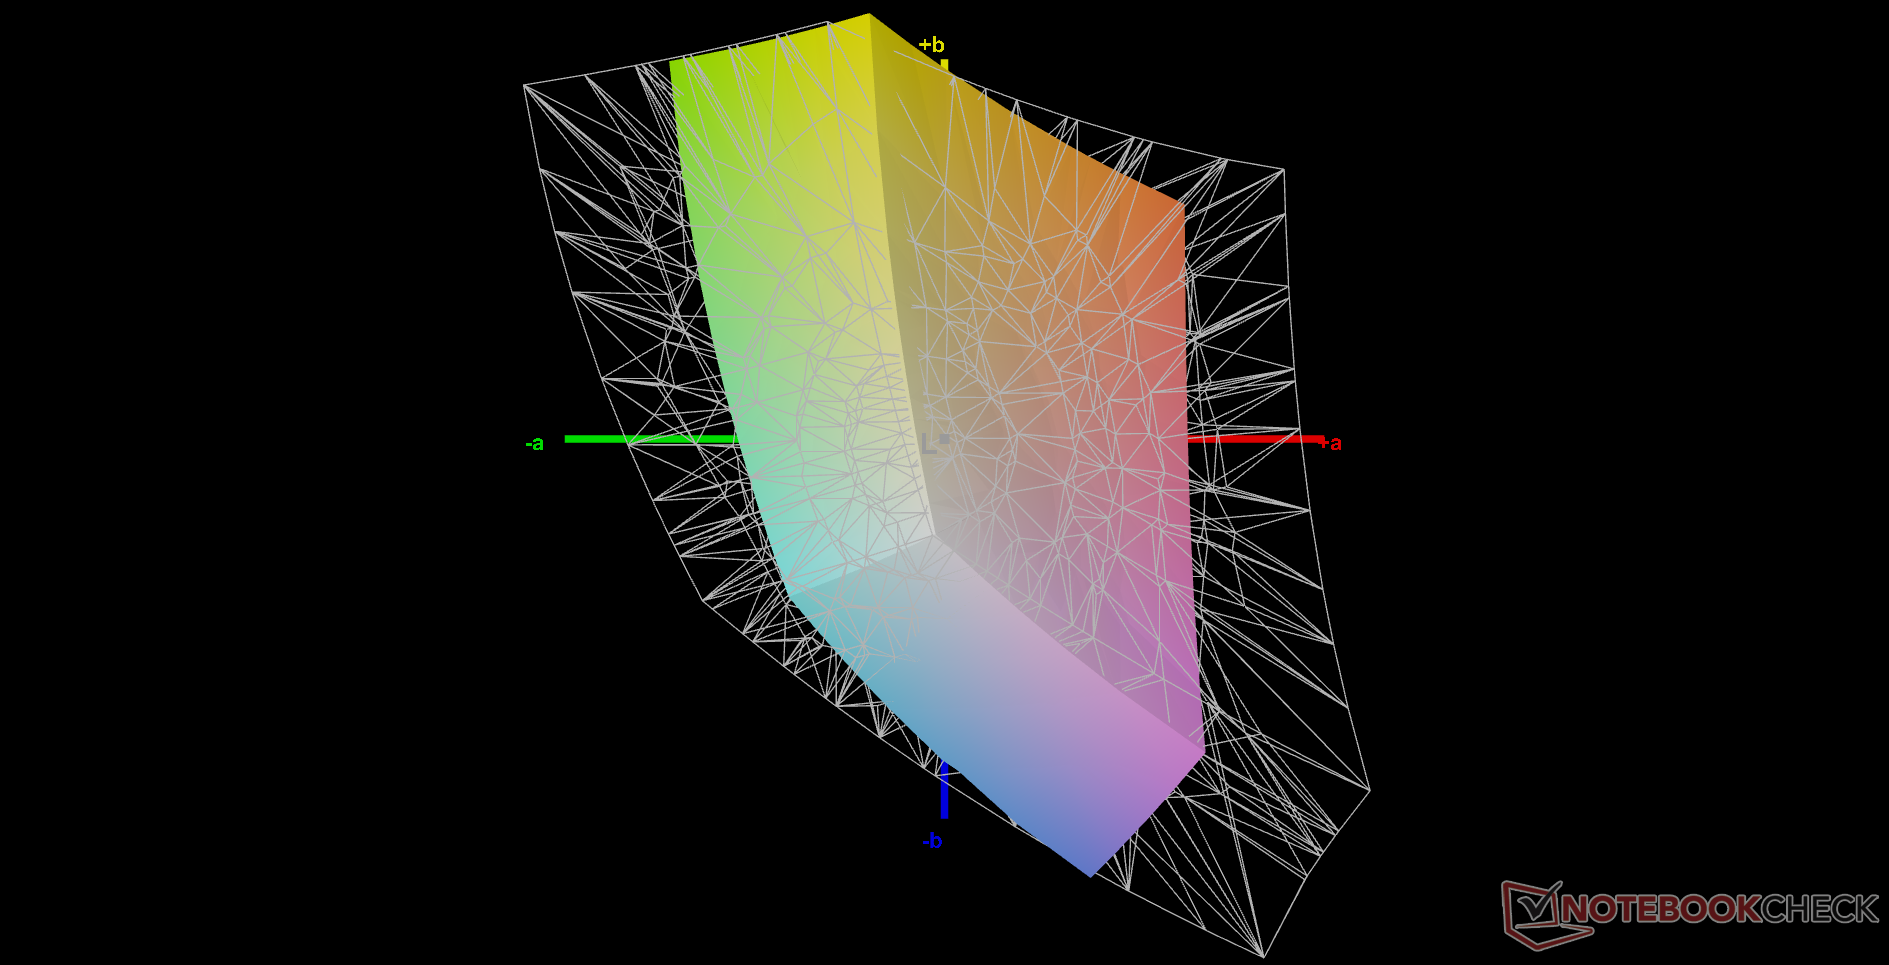
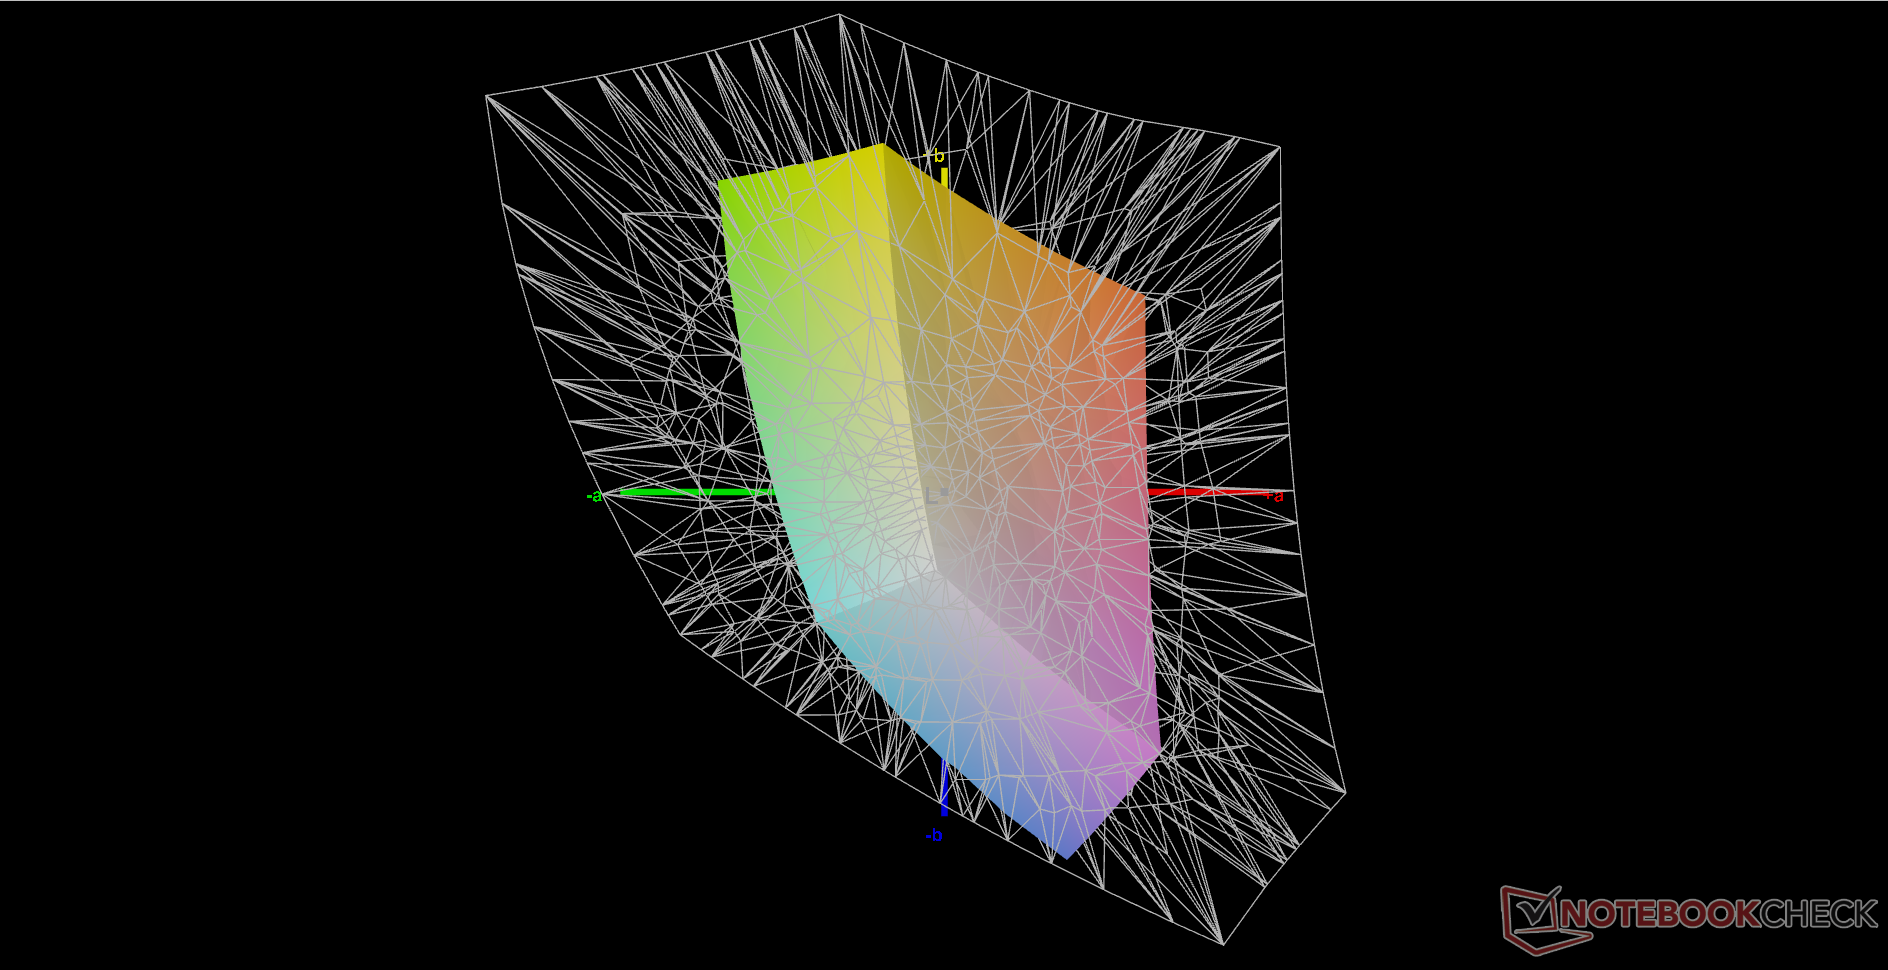
41.7% AdobeRGB 1998 (Argyll 3D)
59.2% sRGB (Argyll 3D)
40.4% Display P3 (Argyll 3D)
Gamma: 2.07
CCT: 6117 K
| BMAX X14 Pro BOE NV140FHM-N48, IPS, 1920x1080, 14" | Lenovo IdeaPad 5 Pro 14ACN6 LEN140WUXGA+, IPS, 2240x1400, 14" | Dell Inspiron 14 7400 7415 2-in-1 Chi Mei 140HCA, IPS, 1920x1080, 14" | HP Pavilion 14-dv0357ng LGD0619, IPS, 1920x1080, 14" | Huawei MateBook 14 2020 Intel TV140WTM-NH0, IPS LED, 2160x1440, 14" | Infinix INBook X2 140PM42D1568, IPS, 1920x1080, 14" | |
|---|---|---|---|---|---|---|
| Display | 75% | 6% | 53% | 66% | 53% | |
| Display P3 Coverage (%) | 40.4 | 72.2 79% | 42.5 5% | 62 53% | 67.1 66% | 62.7 55% |
| sRGB Coverage (%) | 59.2 | 99.5 68% | 63.1 7% | 92 55% | 99.1 67% | 89.2 51% |
| AdobeRGB 1998 Coverage (%) | 41.7 | 74.3 78% | 44 6% | 63 51% | 69 65% | 64.1 54% |
| Response Times | 14% | 38% | 46% | 38% | -14% | |
| Response Time Grey 50% / Grey 80% * (ms) | 62.8 ? | 45.2 ? 28% | 28.8 ? 54% | 37 ? 41% | 37.6 ? 40% | 65.2 ? -4% |
| Response Time Black / White * (ms) | 34.8 ? | 35.2 ? -1% | 27.6 ? 21% | 17 ? 51% | 22.4 ? 36% | 43.2 ? -24% |
| PWM Frequency (Hz) | 59520 ? | 10000 ? | ||||
| Screen | 39% | -17% | 14% | 50% | 13% | |
| Brightness middle (cd/m²) | 285.4 | 310.6 9% | 262.7 -8% | 387 36% | 458 60% | 368 29% |
| Brightness (cd/m²) | 267 | 302 13% | 245 -8% | 359 34% | 448 68% | 331 24% |
| Brightness Distribution (%) | 87 | 92 6% | 84 -3% | 84 -3% | 89 2% | 82 -6% |
| Black Level * (cd/m²) | 0.5 | 0.22 56% | 0.37 26% | 0.55 -10% | 0.25 50% | 0.39 22% |
| Contrast (:1) | 571 | 1412 147% | 710 24% | 704 23% | 1832 221% | 944 65% |
| Colorchecker dE 2000 * | 4.93 | 2.67 46% | 6.23 -26% | 4.04 18% | 3.4 31% | 4.9 1% |
| Colorchecker dE 2000 max. * | 18.69 | 4.54 76% | 22.62 -21% | 8.28 56% | 6.7 64% | 8.22 56% |
| Colorchecker dE 2000 calibrated * | 4.47 | 2.33 48% | 1.8 60% | 1 78% | 1.7 62% | 1.59 64% |
| Greyscale dE 2000 * | 2.4 | 3.7 -54% | 7.1 -196% | 5 -108% | 4.9 -104% | 5.8 -142% |
| Gamma | 2.07 106% | 2.12 104% | 2.22 99% | 2.62 84% | 2.16 102% | 2.13 103% |
| CCT | 6117 106% | 6398 102% | 6241 104% | 7123 91% | 7704 84% | 7163 91% |
| Color Space (Percent of AdobeRGB 1998) (%) | 63.5 | |||||
| Color Space (Percent of sRGB) (%) | 99.1 | |||||
| Total Average (Program / Settings) | 43% /
43% | 9% /
-4% | 38% /
27% | 51% /
52% | 17% /
18% |
* ... smaller is better
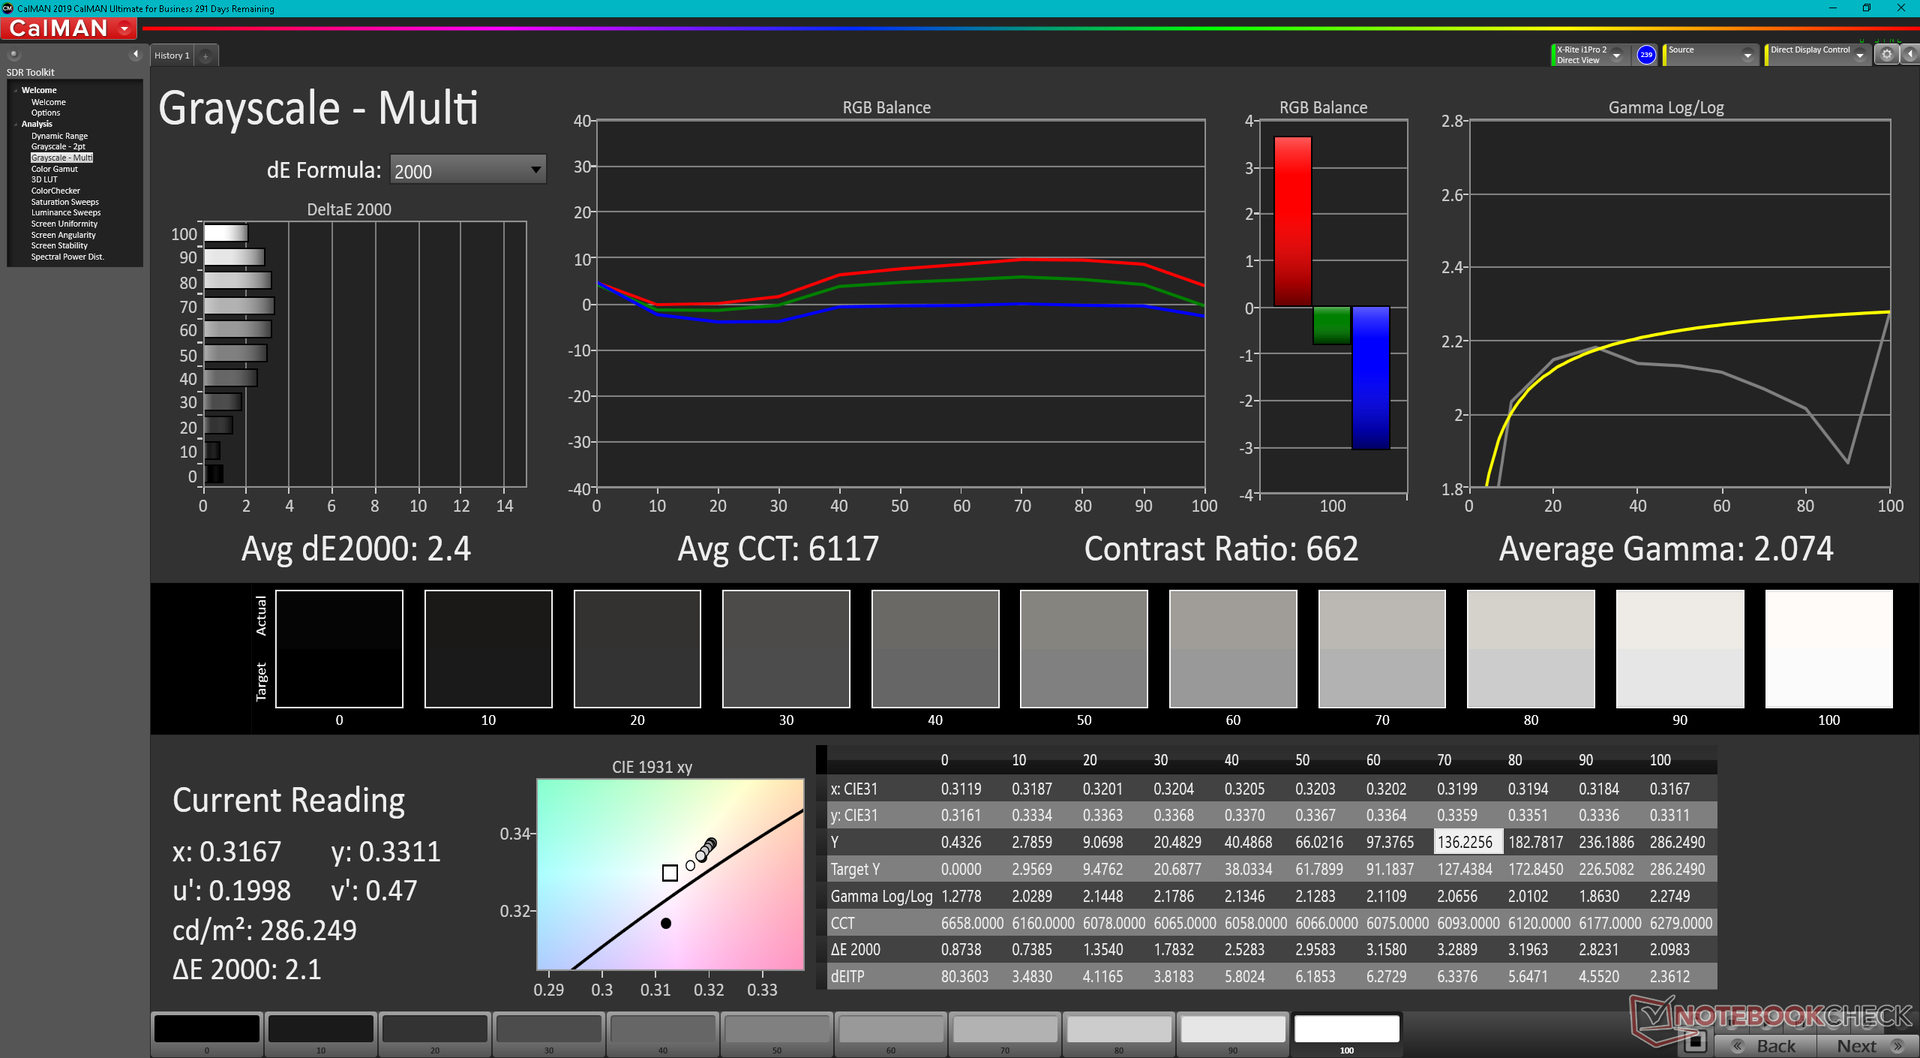
The display is decently calibrated out of the box despite the warm color temperature. Average DeltaE values would improve just marginally after calibrating with our X-Rite colorimeter due to the narrow color space of the panel mentioned above.
Display Response Times
| ↔ Response Time Black to White | ||
|---|---|---|
| 34.8 ms ... rise ↗ and fall ↘ combined | ↗ 18.4 ms rise | 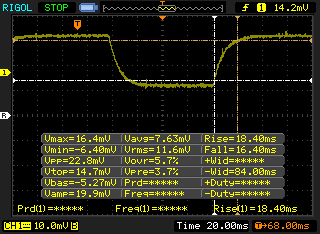 |
| ↘ 16.4 ms fall | ||
| The screen shows slow response rates in our tests and will be unsatisfactory for gamers. In comparison, all tested devices range from 0.1 (minimum) to 240 (maximum) ms. » 92 % of all devices are better. This means that the measured response time is worse than the average of all tested devices (19.9 ms). | ||
| ↔ Response Time 50% Grey to 80% Grey | ||
| 62.8 ms ... rise ↗ and fall ↘ combined | ↗ 32.8 ms rise | 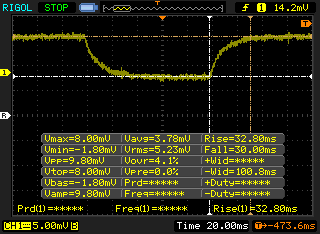 |
| ↘ 30 ms fall | ||
| The screen shows slow response rates in our tests and will be unsatisfactory for gamers. In comparison, all tested devices range from 0.165 (minimum) to 636 (maximum) ms. » 97 % of all devices are better. This means that the measured response time is worse than the average of all tested devices (31.1 ms). | ||
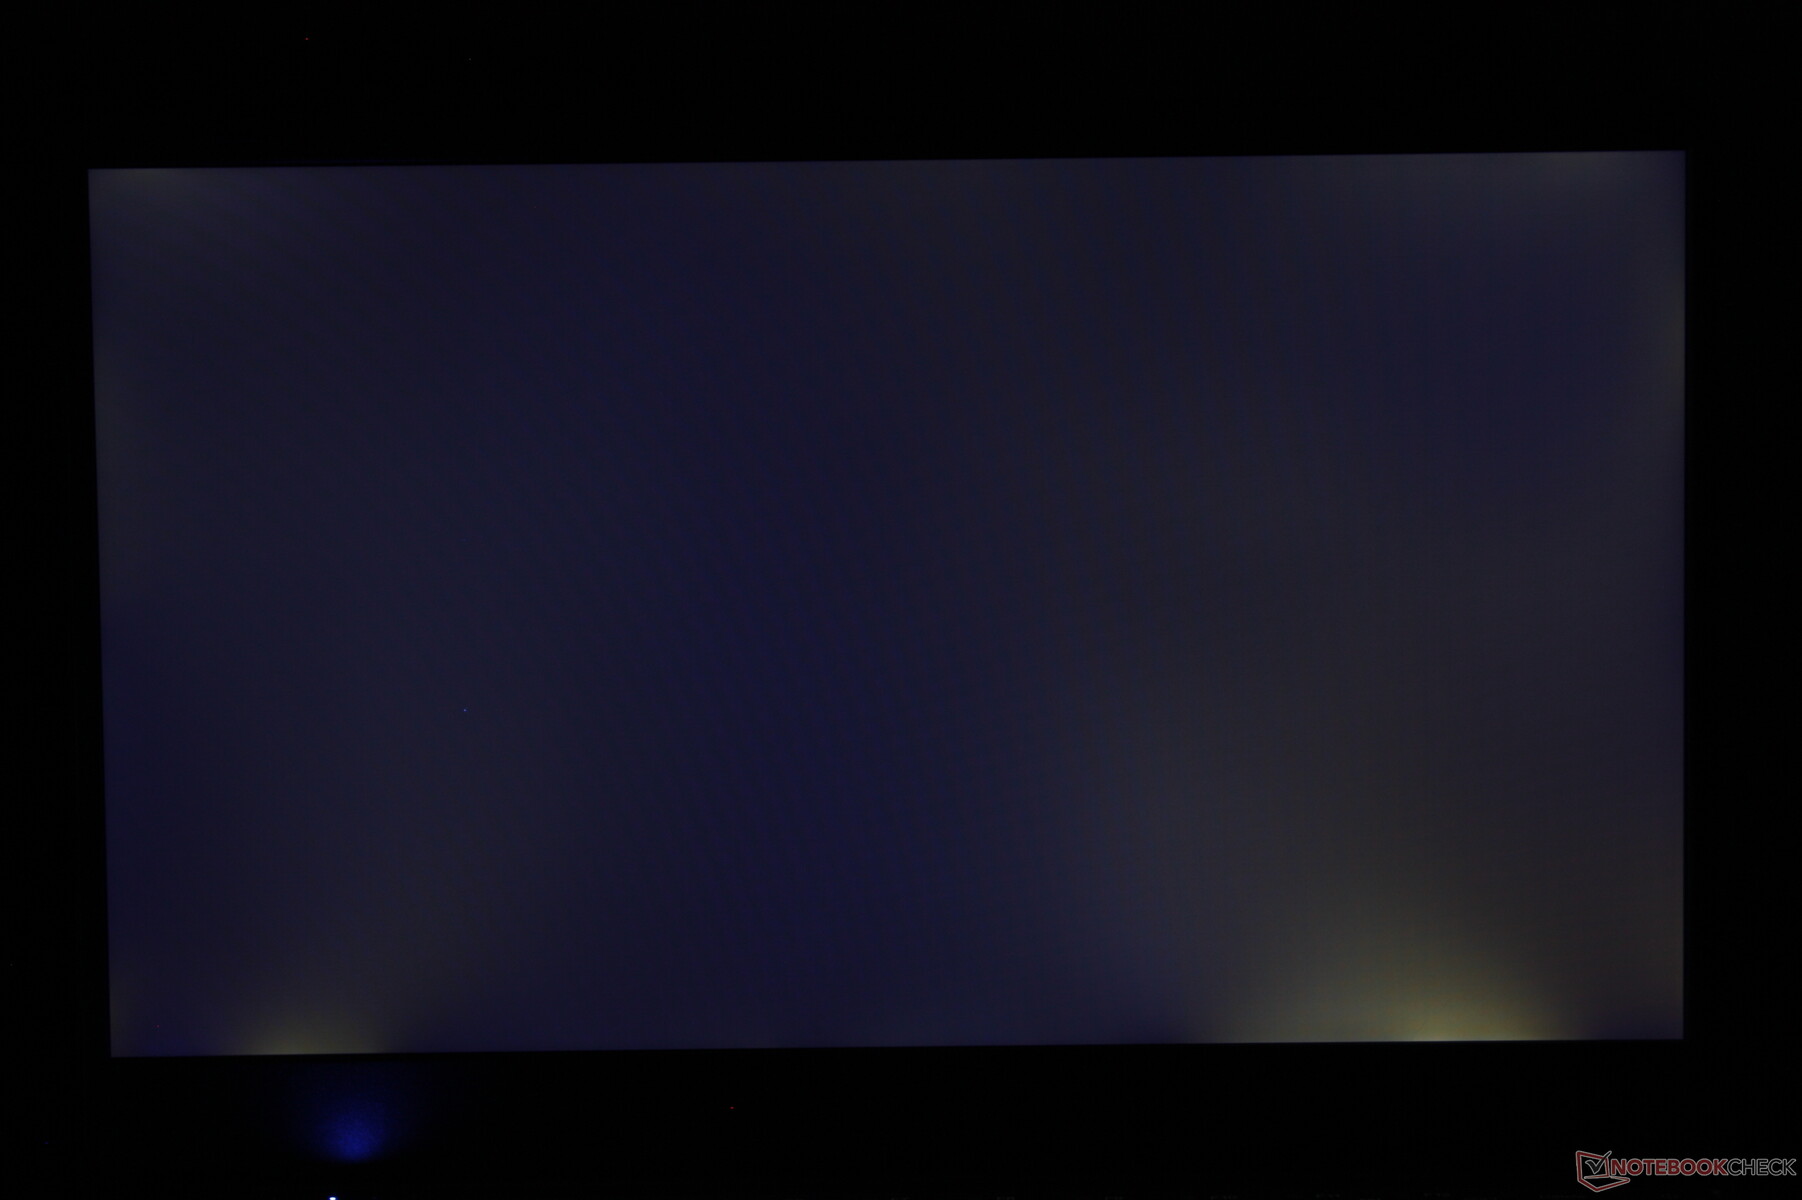
Screen Flickering / PWM (Pulse-Width Modulation)
| Screen flickering / PWM not detected | 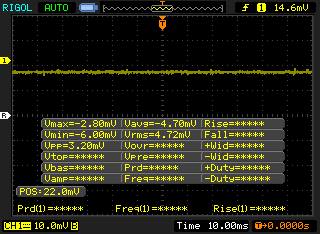 | ||
In comparison: 52 % of all tested devices do not use PWM to dim the display. If PWM was detected, an average of 7801 (minimum: 5 - maximum: 343500) Hz was measured. | |||
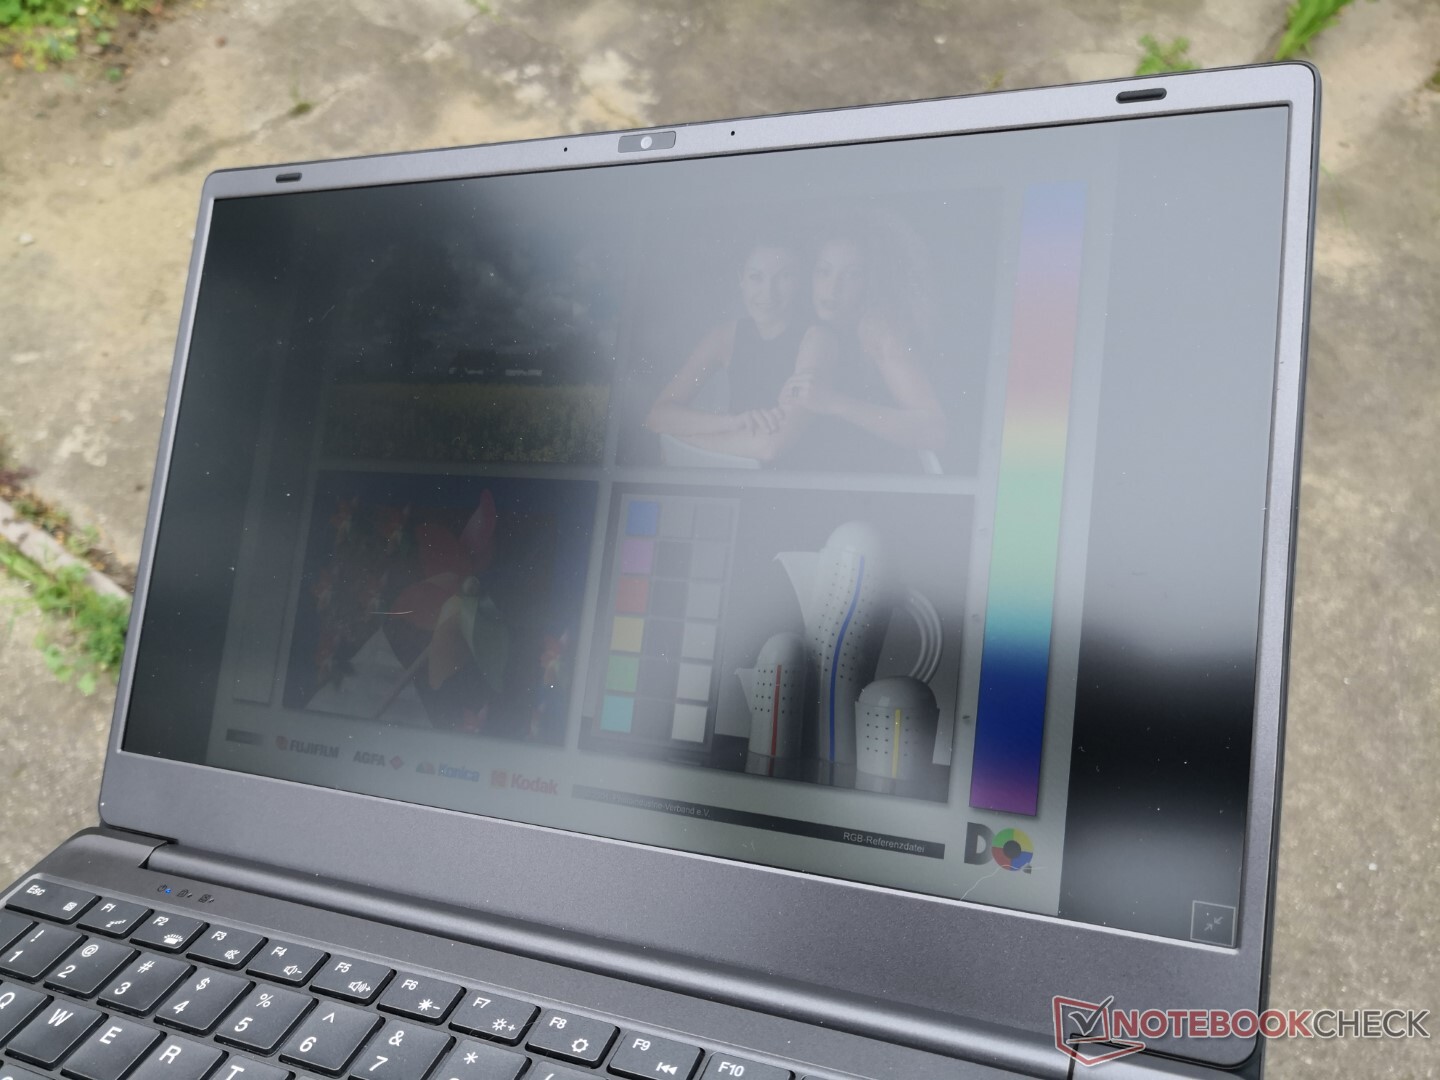
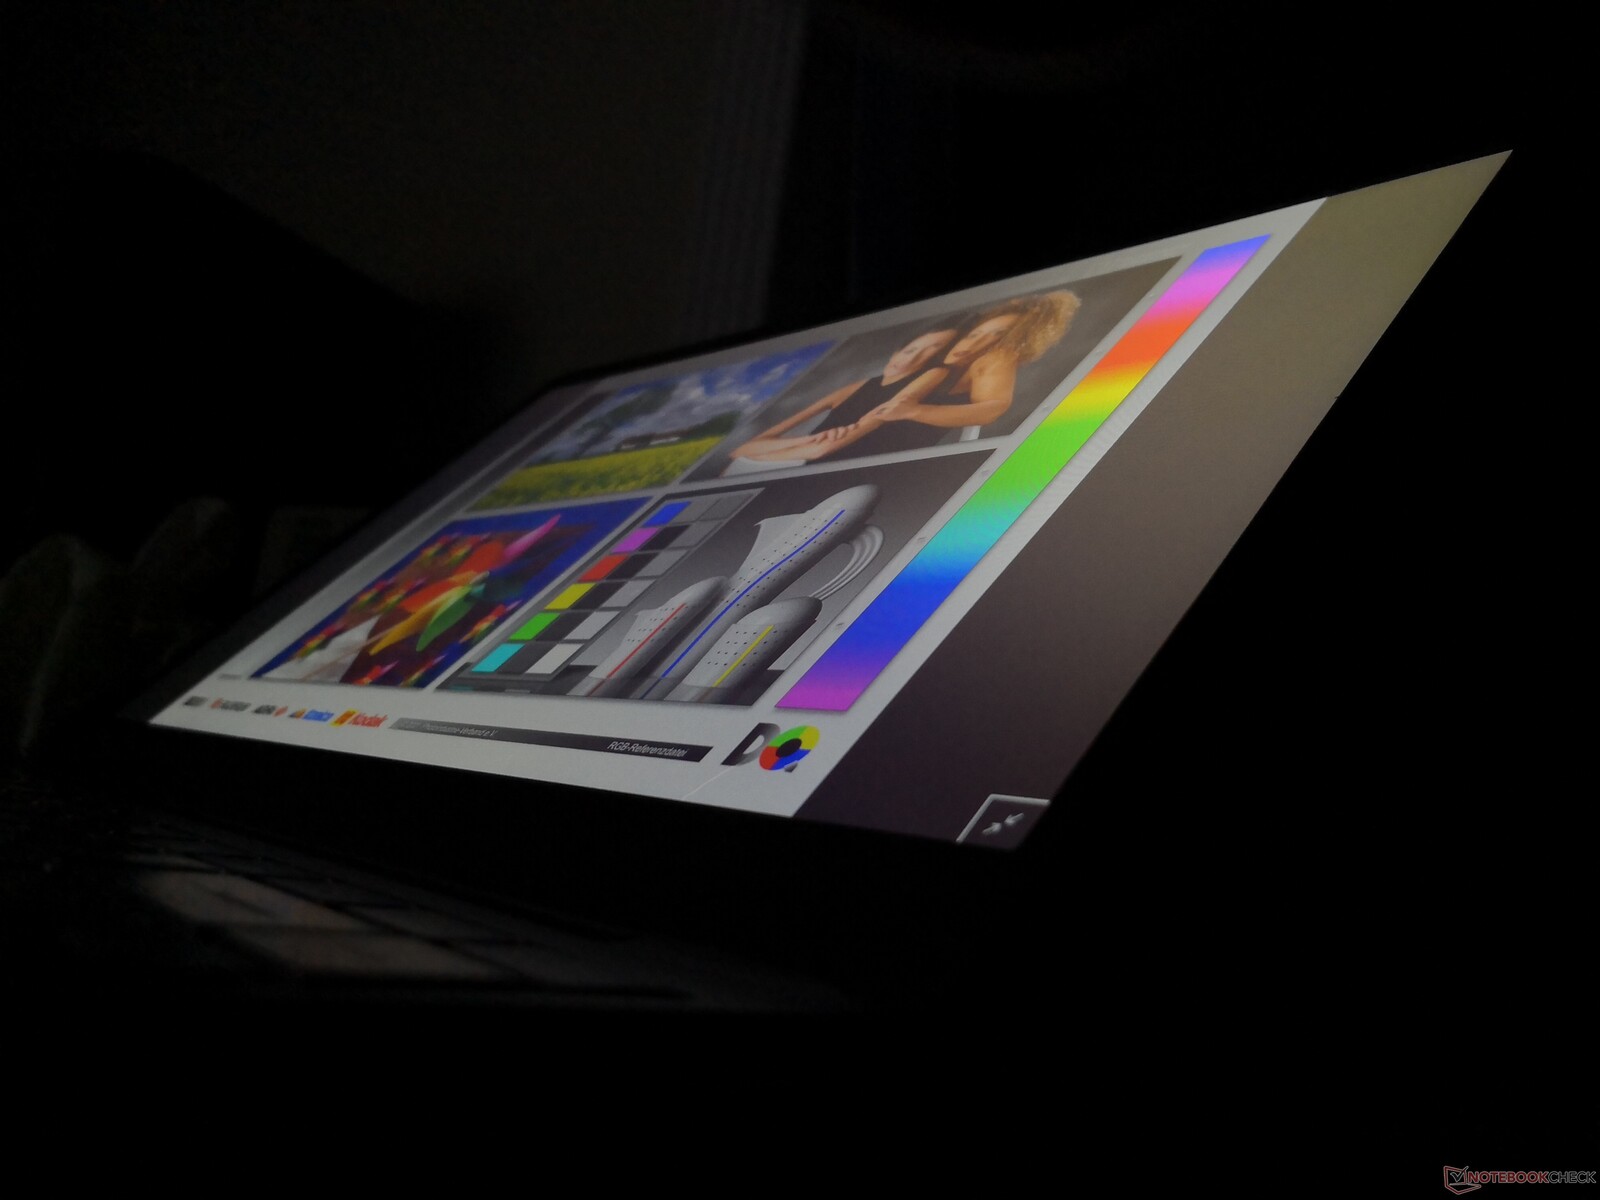
Outdoor visibility is relatively poor to average at best due to the <300 nit backlight. Be sure to disable AMD Vari-Bright under the Radeon Graphics menu or else the maximum brightness of the panel will be just 166 nits when running on battery power.
Performance
Testing Conditions
Our unit was set to Performance mode with the latest AMD drivers and Windows updates prior to running any benchmarks below for the highest possible scores.
Processor
Raw multi-thread performance is similar to the 11th gen Core i3-1115G4 while single-thread performance is slower and most similar to the 10th gen Core i5-1035G1. AMD's mobile Zen series didn't really take off in terms of performance until the Zen 2 generation and so the Zen+ Ryzen 5 3450U is only comparable to lower-end Intel Core CPUs.
Cinebench R15 Multi Loop
Cinebench R23: Multi Core | Single Core
Cinebench R15: CPU Multi 64Bit | CPU Single 64Bit
Blender: v2.79 BMW27 CPU
7-Zip 18.03: 7z b 4 | 7z b 4 -mmt1
Geekbench 5.5: Multi-Core | Single-Core
HWBOT x265 Benchmark v2.2: 4k Preset
LibreOffice : 20 Documents To PDF
R Benchmark 2.5: Overall mean
| Cinebench R20 / CPU (Multi Core) | |
| Lenovo IdeaPad 5 Pro 14ACN6 | |
| Dell Inspiron 14 7400 7415 2-in-1 | |
| Asus VivoBook Flip 14 TM420IA | |
| Asus ExpertBook B7 Flip B7402FEA | |
| HP Pavilion 14-dv0357ng | |
| Acer Swift 3 SF314-42-R27B | |
| Infinix INBook X2 | |
| Lenovo ThinkBook 14 G2 ITL 20VDS02G00 | |
| BMAX X14 Pro | |
| Average AMD Ryzen 5 3450U (1089 - 1247, n=2) | |
| Lenovo IdeaPad 3 14IIL05 | |
| Cinebench R20 / CPU (Single Core) | |
| Asus ExpertBook B7 Flip B7402FEA | |
| Lenovo IdeaPad 5 Pro 14ACN6 | |
| Lenovo ThinkBook 14 G2 ITL 20VDS02G00 | |
| Dell Inspiron 14 7400 7415 2-in-1 | |
| Asus VivoBook Flip 14 TM420IA | |
| Acer Swift 3 SF314-42-R27B | |
| Infinix INBook X2 | |
| HP Pavilion 14-dv0357ng | |
| BMAX X14 Pro | |
| Lenovo IdeaPad 3 14IIL05 | |
| Average AMD Ryzen 5 3450U (292 - 351, n=2) | |
| Cinebench R23 / Multi Core | |
| Lenovo IdeaPad 5 Pro 14ACN6 | |
| Dell Inspiron 14 7400 7415 2-in-1 | |
| Asus ExpertBook B7 Flip B7402FEA | |
| HP Pavilion 14-dv0357ng | |
| Infinix INBook X2 | |
| Lenovo ThinkBook 14 G2 ITL 20VDS02G00 | |
| BMAX X14 Pro | |
| Average AMD Ryzen 5 3450U (2658 - 3195, n=2) | |
| Cinebench R23 / Single Core | |
| Asus ExpertBook B7 Flip B7402FEA | |
| Lenovo IdeaPad 5 Pro 14ACN6 | |
| Lenovo ThinkBook 14 G2 ITL 20VDS02G00 | |
| HP Pavilion 14-dv0357ng | |
| Dell Inspiron 14 7400 7415 2-in-1 | |
| Infinix INBook X2 | |
| BMAX X14 Pro | |
| Average AMD Ryzen 5 3450U (858 - 892, n=2) | |
| Cinebench R15 / CPU Multi 64Bit | |
| Lenovo IdeaPad 5 Pro 14ACN6 | |
| Dell Inspiron 14 7400 7415 2-in-1 | |
| Asus VivoBook Flip 14 TM420IA | |
| Asus ExpertBook B7 Flip B7402FEA | |
| HP Pavilion 14-dv0357ng | |
| Acer Swift 3 SF314-42-R27B | |
| Infinix INBook X2 | |
| Average AMD Ryzen 5 3450U (530 - 603, n=2) | |
| BMAX X14 Pro | |
| Lenovo ThinkBook 14 G2 ITL 20VDS02G00 | |
| Lenovo IdeaPad 3 14IIL05 | |
| Cinebench R15 / CPU Single 64Bit | |
| Asus ExpertBook B7 Flip B7402FEA | |
| Lenovo IdeaPad 5 Pro 14ACN6 | |
| Dell Inspiron 14 7400 7415 2-in-1 | |
| Asus VivoBook Flip 14 TM420IA | |
| Lenovo ThinkBook 14 G2 ITL 20VDS02G00 | |
| Acer Swift 3 SF314-42-R27B | |
| Lenovo IdeaPad 3 14IIL05 | |
| Infinix INBook X2 | |
| Average AMD Ryzen 5 3450U (137 - 138, n=2) | |
| BMAX X14 Pro | |
| Blender / v2.79 BMW27 CPU | |
| Lenovo IdeaPad 3 14IIL05 | |
| Lenovo ThinkBook 14 G2 ITL 20VDS02G00 | |
| Average AMD Ryzen 5 3450U (834 - 976, n=3) | |
| Acer Swift 3 SF314-42-R27B | |
| Infinix INBook X2 | |
| BMAX X14 Pro | |
| HP Pavilion 14-dv0357ng | |
| Asus ExpertBook B7 Flip B7402FEA | |
| Asus VivoBook Flip 14 TM420IA | |
| Dell Inspiron 14 7400 7415 2-in-1 | |
| Lenovo IdeaPad 5 Pro 14ACN6 | |
| 7-Zip 18.03 / 7z b 4 | |
| Lenovo IdeaPad 5 Pro 14ACN6 | |
| Dell Inspiron 14 7400 7415 2-in-1 | |
| Asus VivoBook Flip 14 TM420IA | |
| Asus ExpertBook B7 Flip B7402FEA | |
| HP Pavilion 14-dv0357ng | |
| BMAX X14 Pro | |
| Average AMD Ryzen 5 3450U (15163 - 16305, n=3) | |
| Infinix INBook X2 | |
| Acer Swift 3 SF314-42-R27B | |
| Lenovo ThinkBook 14 G2 ITL 20VDS02G00 | |
| Lenovo IdeaPad 3 14IIL05 | |
| 7-Zip 18.03 / 7z b 4 -mmt1 | |
| Asus ExpertBook B7 Flip B7402FEA | |
| Lenovo IdeaPad 5 Pro 14ACN6 | |
| HP Pavilion 14-dv0357ng | |
| Lenovo ThinkBook 14 G2 ITL 20VDS02G00 | |
| Dell Inspiron 14 7400 7415 2-in-1 | |
| Asus VivoBook Flip 14 TM420IA | |
| Lenovo IdeaPad 3 14IIL05 | |
| Acer Swift 3 SF314-42-R27B | |
| Average AMD Ryzen 5 3450U (3355 - 3411, n=3) | |
| BMAX X14 Pro | |
| Infinix INBook X2 | |
| Geekbench 5.5 / Multi-Core | |
| Asus VivoBook Flip 14 TM420IA | |
| Asus ExpertBook B7 Flip B7402FEA | |
| Infinix INBook X2 | |
| Acer Swift 3 SF314-42-R27B | |
| BMAX X14 Pro | |
| Average AMD Ryzen 5 3450U (2565 - 3123, n=5) | |
| Lenovo ThinkBook 14 G2 ITL 20VDS02G00 | |
| Lenovo IdeaPad 3 14IIL05 | |
| Geekbench 5.5 / Single-Core | |
| Asus ExpertBook B7 Flip B7402FEA | |
| Lenovo ThinkBook 14 G2 ITL 20VDS02G00 | |
| Infinix INBook X2 | |
| Lenovo IdeaPad 3 14IIL05 | |
| Asus VivoBook Flip 14 TM420IA | |
| Acer Swift 3 SF314-42-R27B | |
| BMAX X14 Pro | |
| Average AMD Ryzen 5 3450U (698 - 866, n=5) | |
| HWBOT x265 Benchmark v2.2 / 4k Preset | |
| Lenovo IdeaPad 5 Pro 14ACN6 | |
| Dell Inspiron 14 7400 7415 2-in-1 | |
| Asus VivoBook Flip 14 TM420IA | |
| Asus ExpertBook B7 Flip B7402FEA | |
| Infinix INBook X2 | |
| Acer Swift 3 SF314-42-R27B | |
| Lenovo IdeaPad 3 14IIL05 | |
| Lenovo ThinkBook 14 G2 ITL 20VDS02G00 | |
| BMAX X14 Pro | |
| Average AMD Ryzen 5 3450U (2.77 - 3.43, n=3) | |
| LibreOffice / 20 Documents To PDF | |
| Average AMD Ryzen 5 3450U (86.5 - 90.6, n=3) | |
| BMAX X14 Pro | |
| Infinix INBook X2 | |
| Acer Swift 3 SF314-42-R27B | |
| Dell Inspiron 14 7400 7415 2-in-1 | |
| Asus VivoBook Flip 14 TM420IA | |
| Lenovo IdeaPad 3 14IIL05 | |
| Lenovo IdeaPad 5 Pro 14ACN6 | |
| Asus ExpertBook B7 Flip B7402FEA | |
| Lenovo ThinkBook 14 G2 ITL 20VDS02G00 | |
| R Benchmark 2.5 / Overall mean | |
| Average AMD Ryzen 5 3450U (0.76 - 0.806, n=3) | |
| BMAX X14 Pro | |
| Lenovo IdeaPad 3 14IIL05 | |
| Infinix INBook X2 | |
| Acer Swift 3 SF314-42-R27B | |
| Lenovo ThinkBook 14 G2 ITL 20VDS02G00 | |
| Asus VivoBook Flip 14 TM420IA | |
| Dell Inspiron 14 7400 7415 2-in-1 | |
| Asus ExpertBook B7 Flip B7402FEA | |
| Lenovo IdeaPad 5 Pro 14ACN6 | |
* ... smaller is better
AIDA64: FP32 Ray-Trace | FPU Julia | CPU SHA3 | CPU Queen | FPU SinJulia | FPU Mandel | CPU AES | CPU ZLib | FP64 Ray-Trace | CPU PhotoWorxx
| Performance rating | |
| Lenovo IdeaPad 5 Pro 14ACN6 | |
| Dell Inspiron 14 7400 7415 2-in-1 | |
| Infinix INBook X2 | |
| Huawei MateBook 14 2020 Intel | |
| BMAX X14 Pro | |
| Average AMD Ryzen 5 3450U | |
| AIDA64 / FP32 Ray-Trace | |
| Lenovo IdeaPad 5 Pro 14ACN6 | |
| Dell Inspiron 14 7400 7415 2-in-1 | |
| Infinix INBook X2 | |
| Huawei MateBook 14 2020 Intel | |
| BMAX X14 Pro | |
| Average AMD Ryzen 5 3450U (2205 - 2813, n=3) | |
| AIDA64 / FPU Julia | |
| Lenovo IdeaPad 5 Pro 14ACN6 | |
| Dell Inspiron 14 7400 7415 2-in-1 | |
| Huawei MateBook 14 2020 Intel | |
| Infinix INBook X2 | |
| BMAX X14 Pro | |
| Average AMD Ryzen 5 3450U (12782 - 15357, n=3) | |
| AIDA64 / CPU SHA3 | |
| Lenovo IdeaPad 5 Pro 14ACN6 | |
| Dell Inspiron 14 7400 7415 2-in-1 | |
| Infinix INBook X2 | |
| Huawei MateBook 14 2020 Intel | |
| BMAX X14 Pro | |
| Average AMD Ryzen 5 3450U (671 - 798, n=3) | |
| AIDA64 / CPU Queen | |
| Dell Inspiron 14 7400 7415 2-in-1 | |
| Lenovo IdeaPad 5 Pro 14ACN6 | |
| Huawei MateBook 14 2020 Intel | |
| Average AMD Ryzen 5 3450U (41757 - 43786, n=3) | |
| BMAX X14 Pro | |
| Infinix INBook X2 | |
| AIDA64 / FPU SinJulia | |
| Dell Inspiron 14 7400 7415 2-in-1 | |
| Lenovo IdeaPad 5 Pro 14ACN6 | |
| BMAX X14 Pro | |
| Average AMD Ryzen 5 3450U (4760 - 5335, n=3) | |
| Huawei MateBook 14 2020 Intel | |
| Infinix INBook X2 | |
| AIDA64 / FPU Mandel | |
| Lenovo IdeaPad 5 Pro 14ACN6 | |
| Dell Inspiron 14 7400 7415 2-in-1 | |
| Infinix INBook X2 | |
| Huawei MateBook 14 2020 Intel | |
| BMAX X14 Pro | |
| Average AMD Ryzen 5 3450U (6504 - 7962, n=3) | |
| AIDA64 / CPU AES | |
| Lenovo IdeaPad 5 Pro 14ACN6 | |
| Dell Inspiron 14 7400 7415 2-in-1 | |
| Infinix INBook X2 | |
| BMAX X14 Pro | |
| Average AMD Ryzen 5 3450U (23172 - 26298, n=3) | |
| Huawei MateBook 14 2020 Intel | |
| AIDA64 / CPU ZLib | |
| Dell Inspiron 14 7400 7415 2-in-1 | |
| Lenovo IdeaPad 5 Pro 14ACN6 | |
| BMAX X14 Pro | |
| Average AMD Ryzen 5 3450U (271 - 295, n=3) | |
| Infinix INBook X2 | |
| Huawei MateBook 14 2020 Intel | |
| AIDA64 / FP64 Ray-Trace | |
| Dell Inspiron 14 7400 7415 2-in-1 | |
| Lenovo IdeaPad 5 Pro 14ACN6 | |
| Infinix INBook X2 | |
| Huawei MateBook 14 2020 Intel | |
| BMAX X14 Pro | |
| Average AMD Ryzen 5 3450U (1181 - 1472, n=3) | |
| AIDA64 / CPU PhotoWorxx | |
| Infinix INBook X2 | |
| Huawei MateBook 14 2020 Intel | |
| Dell Inspiron 14 7400 7415 2-in-1 | |
| Lenovo IdeaPad 5 Pro 14ACN6 | |
| BMAX X14 Pro | |
| Average AMD Ryzen 5 3450U (7659 - 15275, n=3) | |
System Performance
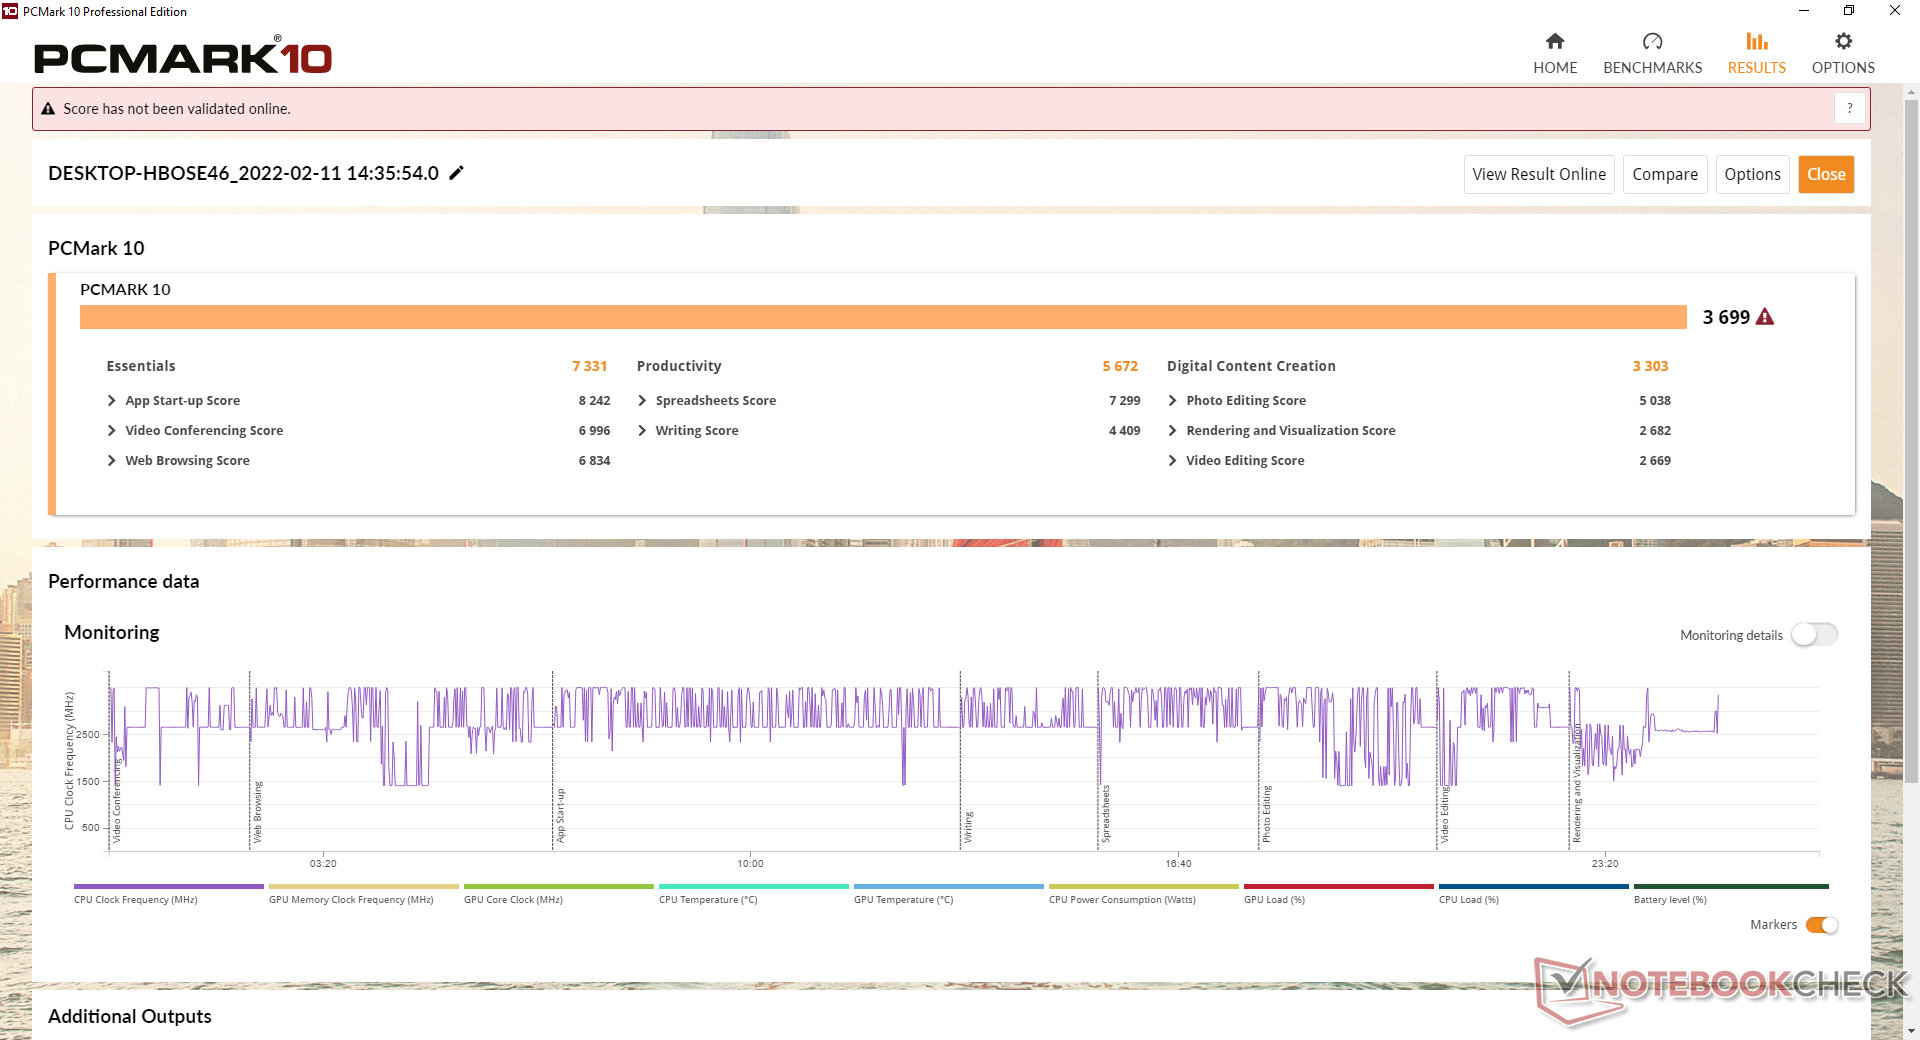
PCMark results are lower than many Core i3 or Core i5 alternatives likely due to the slower single-thread and integrated graphics performance of the Ryzen 3450U processor.
Annoyingly, the AMD Radeon software would occasionally crash on our unit thus forcing a driver reinstall.
| PCMark 10 / Score | |
| Lenovo IdeaPad 5 Pro 14ACN6 | |
| Dell Inspiron 14 7400 7415 2-in-1 | |
| HP Pavilion 14-dv0357ng | |
| Huawei MateBook 14 2020 Intel | |
| Infinix INBook X2 | |
| BMAX X14 Pro | |
| Average AMD Ryzen 5 3450U, AMD Radeon RX Vega 8 (Ryzen 2000/3000) (3485 - 3699, n=2) | |
| PCMark 10 / Essentials | |
| Lenovo IdeaPad 5 Pro 14ACN6 | |
| HP Pavilion 14-dv0357ng | |
| Dell Inspiron 14 7400 7415 2-in-1 | |
| Huawei MateBook 14 2020 Intel | |
| Infinix INBook X2 | |
| BMAX X14 Pro | |
| Average AMD Ryzen 5 3450U, AMD Radeon RX Vega 8 (Ryzen 2000/3000) (7067 - 7331, n=2) | |
| PCMark 10 / Productivity | |
| Lenovo IdeaPad 5 Pro 14ACN6 | |
| Dell Inspiron 14 7400 7415 2-in-1 | |
| Huawei MateBook 14 2020 Intel | |
| HP Pavilion 14-dv0357ng | |
| Average AMD Ryzen 5 3450U, AMD Radeon RX Vega 8 (Ryzen 2000/3000) (5672 - 5801, n=2) | |
| BMAX X14 Pro | |
| Infinix INBook X2 | |
| PCMark 10 / Digital Content Creation | |
| Lenovo IdeaPad 5 Pro 14ACN6 | |
| Dell Inspiron 14 7400 7415 2-in-1 | |
| HP Pavilion 14-dv0357ng | |
| Infinix INBook X2 | |
| Huawei MateBook 14 2020 Intel | |
| BMAX X14 Pro | |
| Average AMD Ryzen 5 3450U, AMD Radeon RX Vega 8 (Ryzen 2000/3000) (2802 - 3303, n=2) | |
| PCMark 10 Score | 3699 points | |
Help | ||
| AIDA64 / Memory Copy | |
| Infinix INBook X2 | |
| Dell Inspiron 14 7400 7415 2-in-1 | |
| Lenovo IdeaPad 5 Pro 14ACN6 | |
| Huawei MateBook 14 2020 Intel | |
| BMAX X14 Pro | |
| Average AMD Ryzen 5 3450U (15343 - 28077, n=3) | |
| AIDA64 / Memory Read | |
| Infinix INBook X2 | |
| Dell Inspiron 14 7400 7415 2-in-1 | |
| Lenovo IdeaPad 5 Pro 14ACN6 | |
| Huawei MateBook 14 2020 Intel | |
| BMAX X14 Pro | |
| Average AMD Ryzen 5 3450U (17983 - 33524, n=3) | |
| AIDA64 / Memory Write | |
| Infinix INBook X2 | |
| Dell Inspiron 14 7400 7415 2-in-1 | |
| Lenovo IdeaPad 5 Pro 14ACN6 | |
| Huawei MateBook 14 2020 Intel | |
| BMAX X14 Pro | |
| Average AMD Ryzen 5 3450U (17811 - 33371, n=3) | |
| AIDA64 / Memory Latency | |
| BMAX X14 Pro | |
| Average AMD Ryzen 5 3450U (100 - 125, n=3) | |
| Infinix INBook X2 | |
| Dell Inspiron 14 7400 7415 2-in-1 | |
| Lenovo IdeaPad 5 Pro 14ACN6 | |
| Huawei MateBook 14 2020 Intel | |
* ... smaller is better
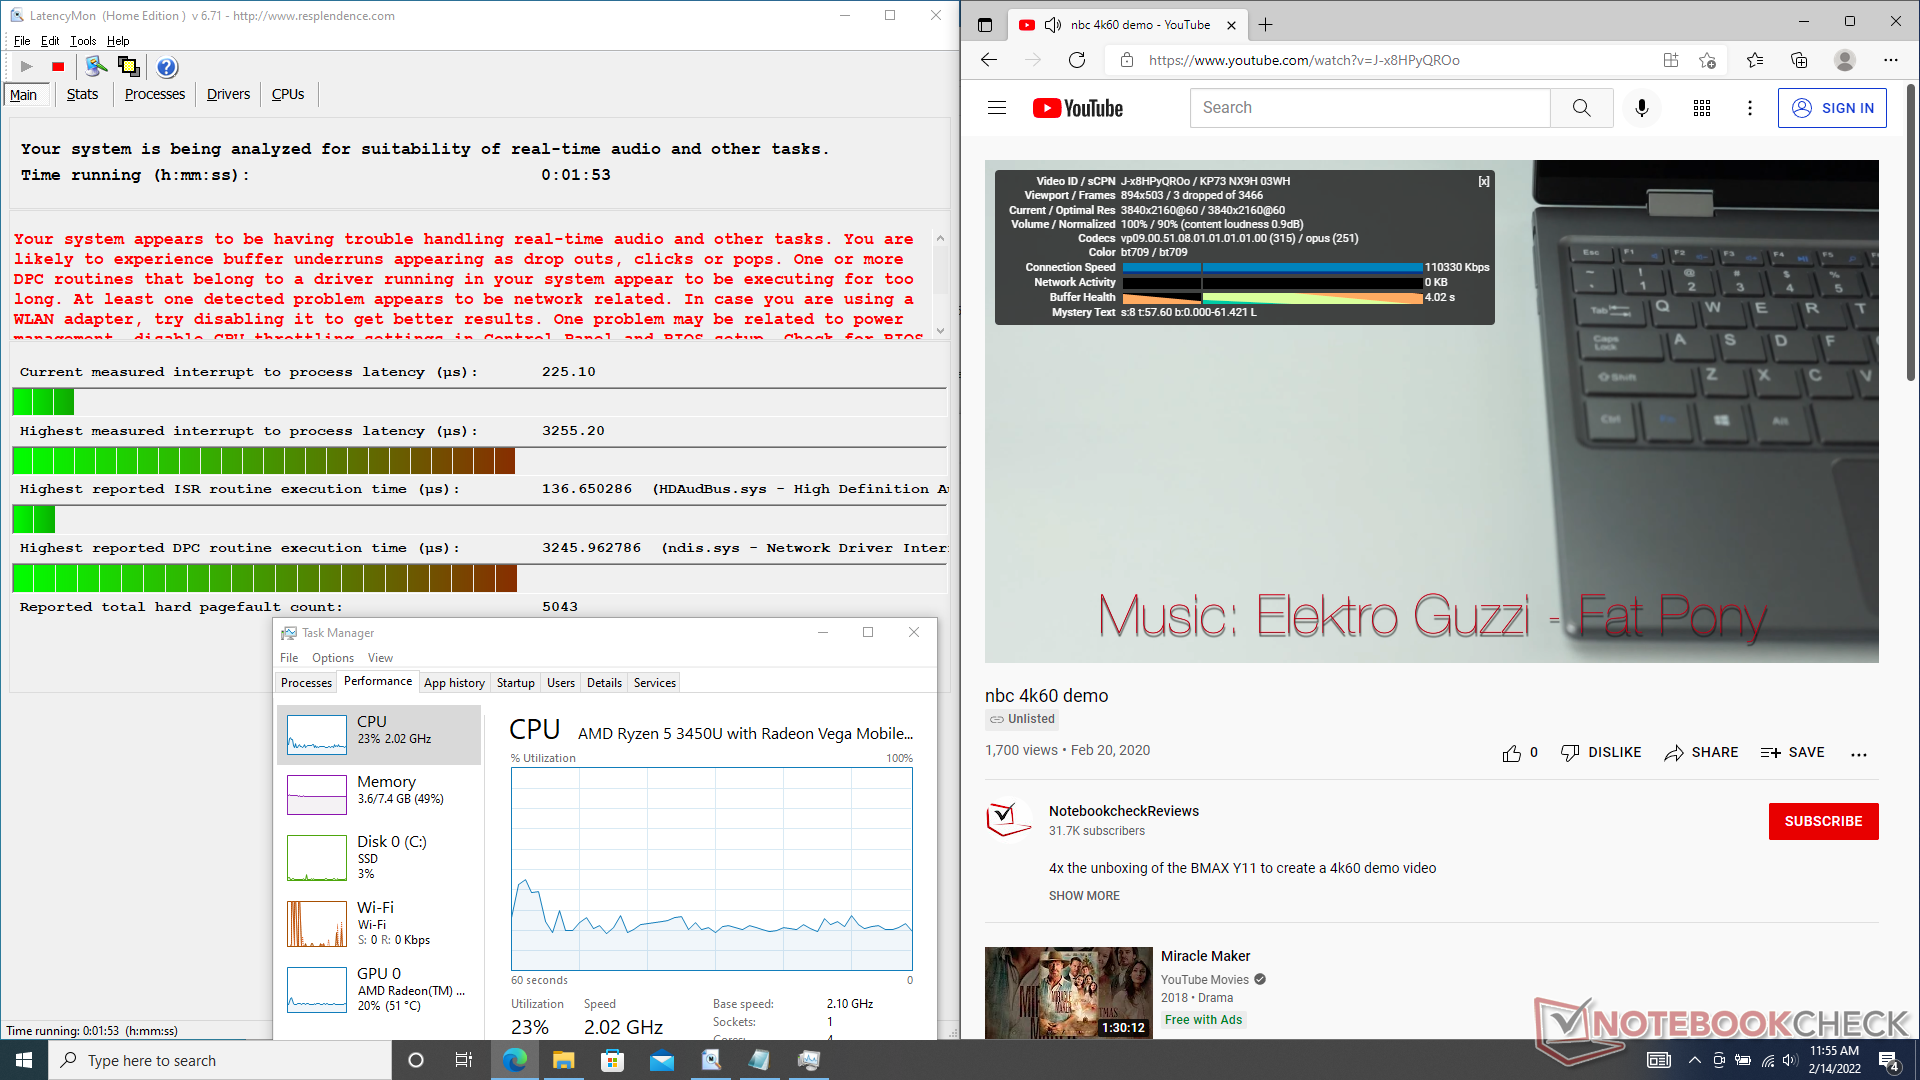
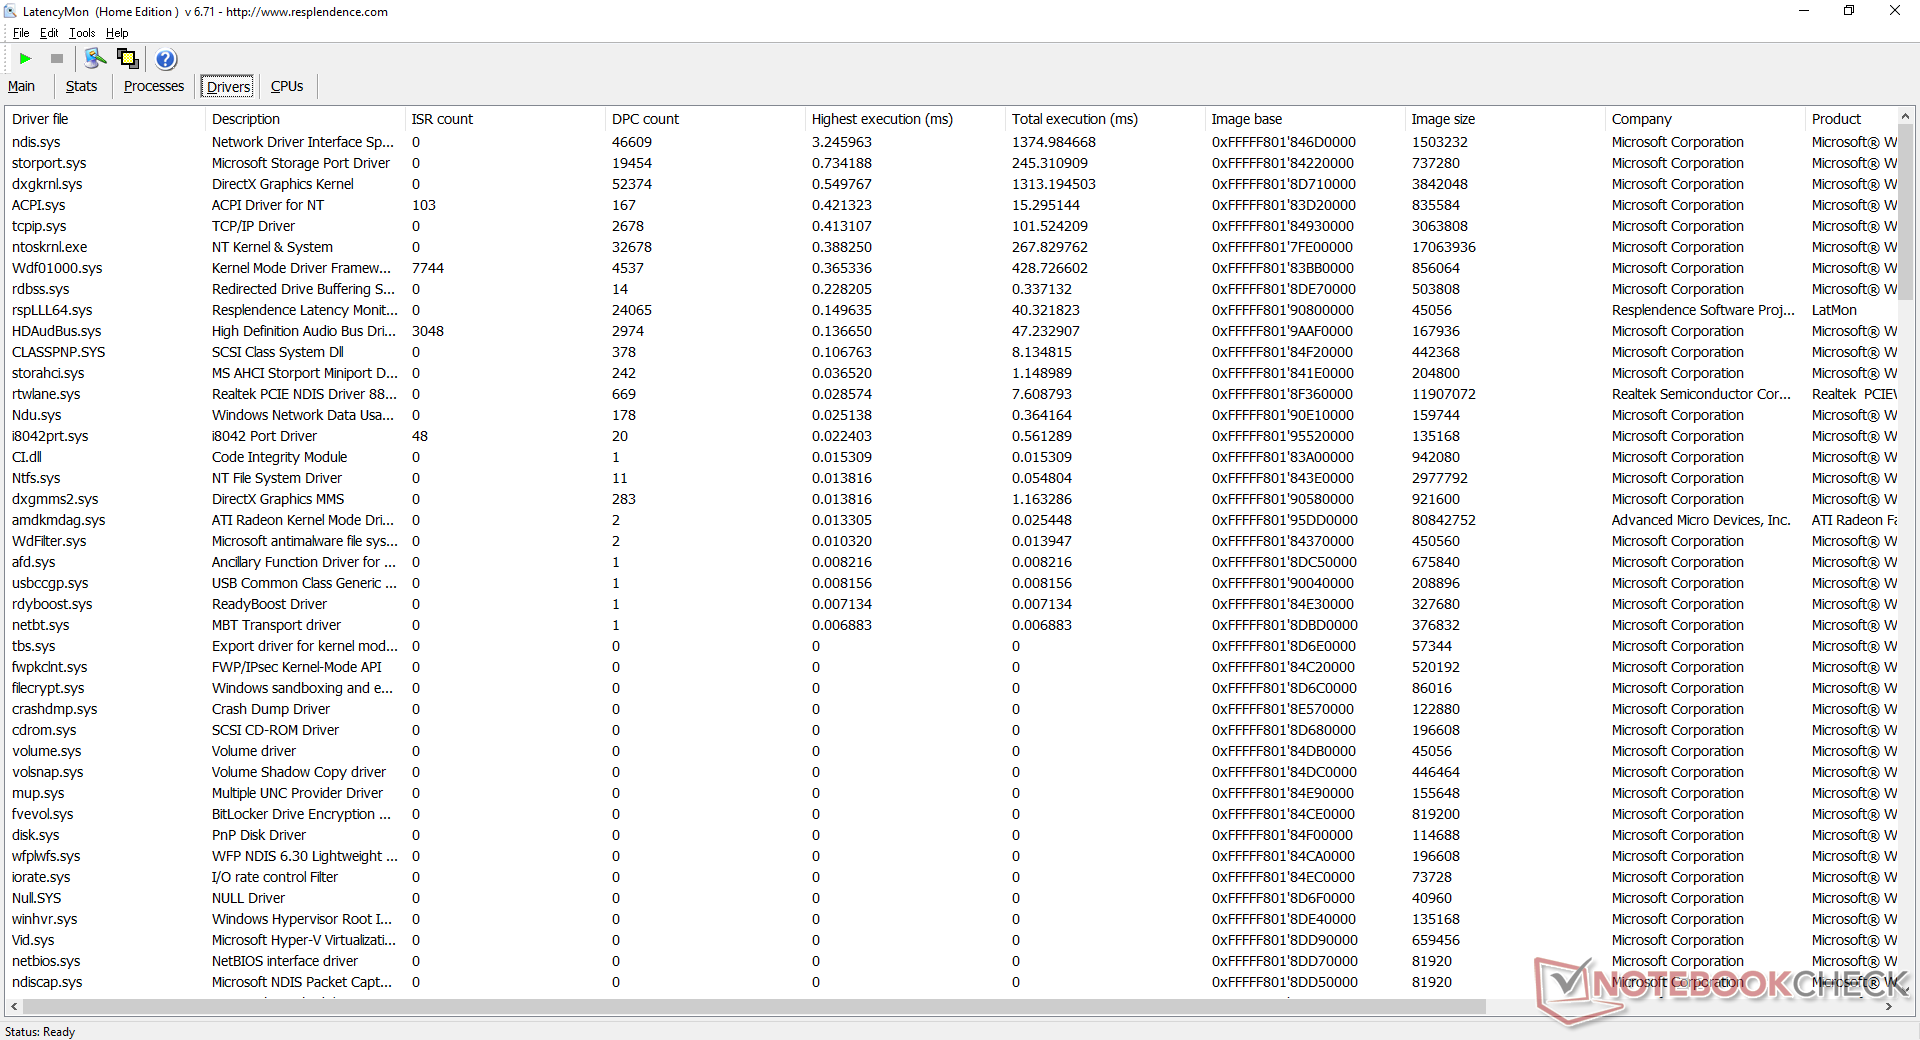
DPC Latency
LatencyMon reveals DPC issues when opening multiple tabs on our homepage. 4K video playback at 60 FPS is otherwise smooth with only 3 dropped frames during our minute-long test video.
| DPC Latencies / LatencyMon - interrupt to process latency (max), Web, Youtube, Prime95 | |
| BMAX X14 Pro | |
| HP Pavilion 14-dv0357ng | |
| Dell Inspiron 14 7400 7415 2-in-1 | |
| Lenovo IdeaPad 5 Pro 14ACN6 | |
| Infinix INBook X2 | |
| Huawei MateBook 14 2020 Intel | |
* ... smaller is better
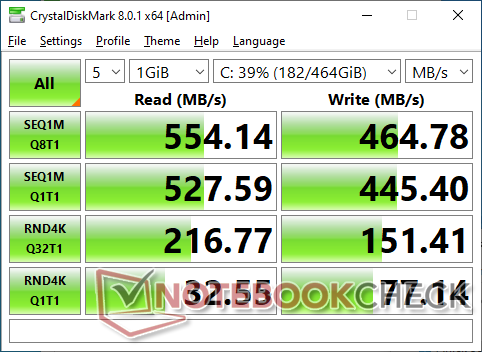
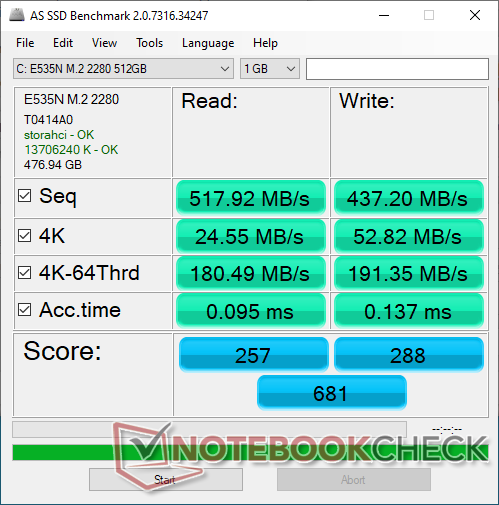
Storage Devices
The SEAPIY M.2 SSD offers sequential read and write rates ranging from 450 MB/s to 550 MB/s which are standard for most SATA III SSDs. Nonetheless, the drive appears to have issues maintaining these higher transfer rates as exemplified by our DiskSpd loop test results below.

| Drive Performance rating - Percent | |
| Huawei MateBook 14 2020 Intel | |
| Lenovo IdeaPad 5 Pro 14ACN6 | |
| Infinix INBook X2 | |
| Dell Inspiron 14 7400 7415 2-in-1 | |
| HP Pavilion 14-dv0357ng -8! | |
| BMAX X14 Pro | |
* ... smaller is better
Disk Throttling: DiskSpd Read Loop, Queue Depth 8
GPU Performance
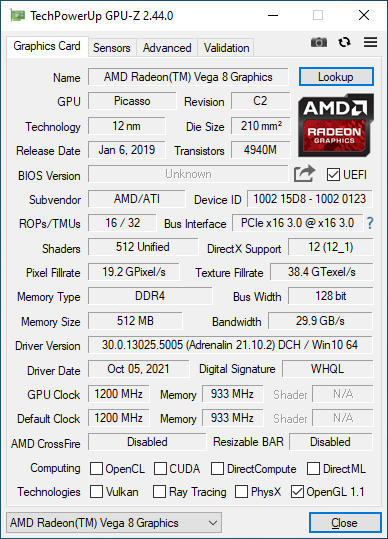
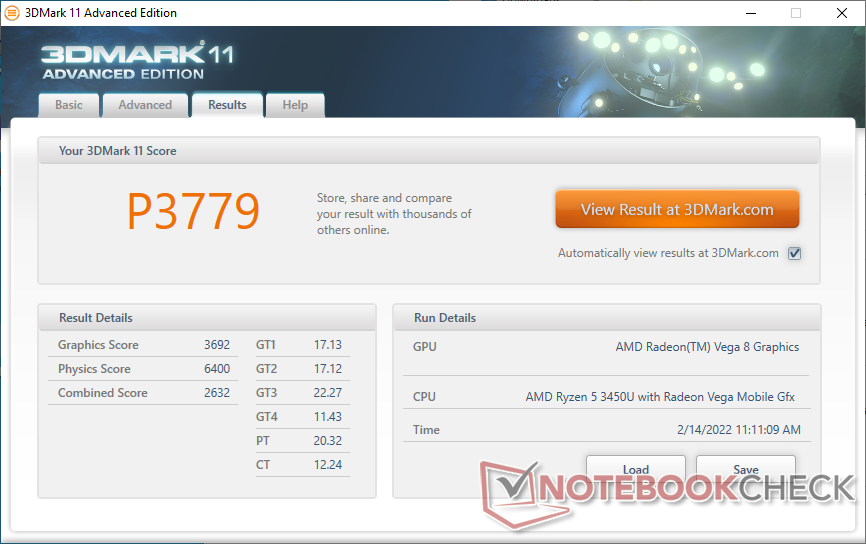
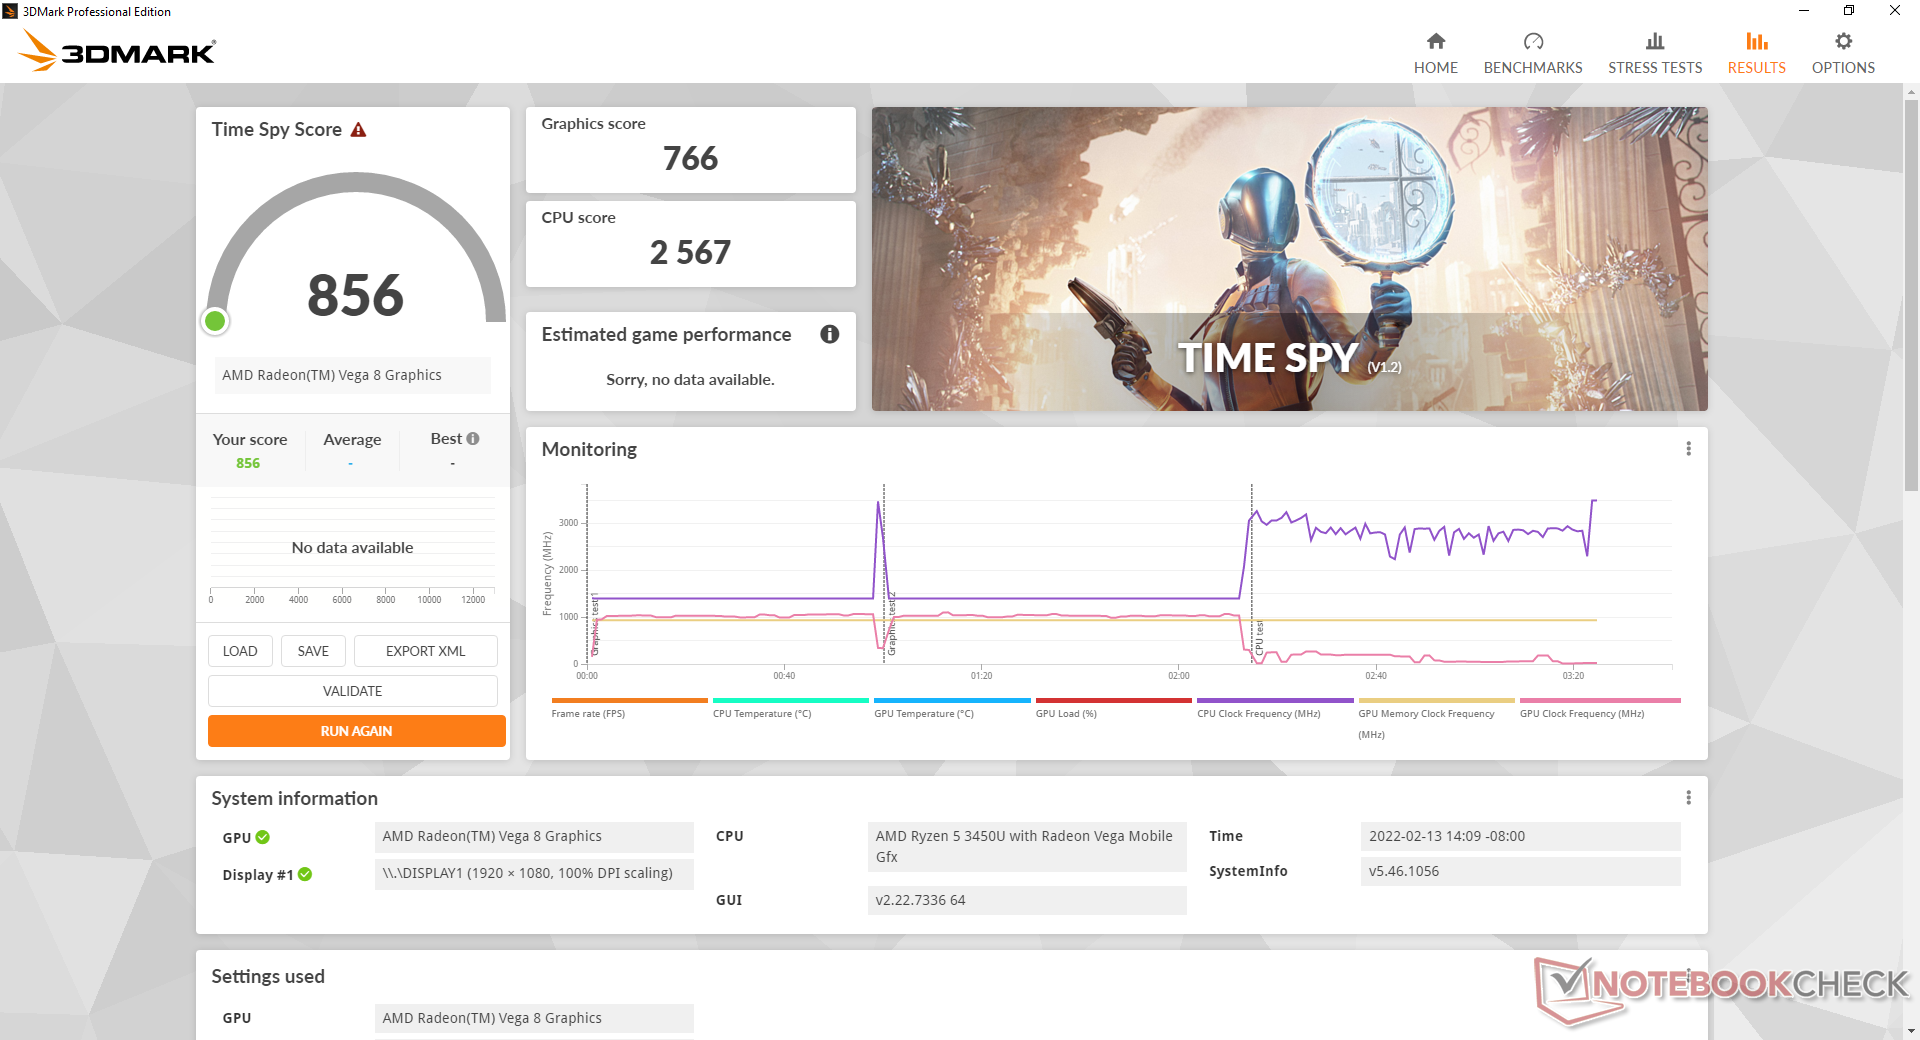
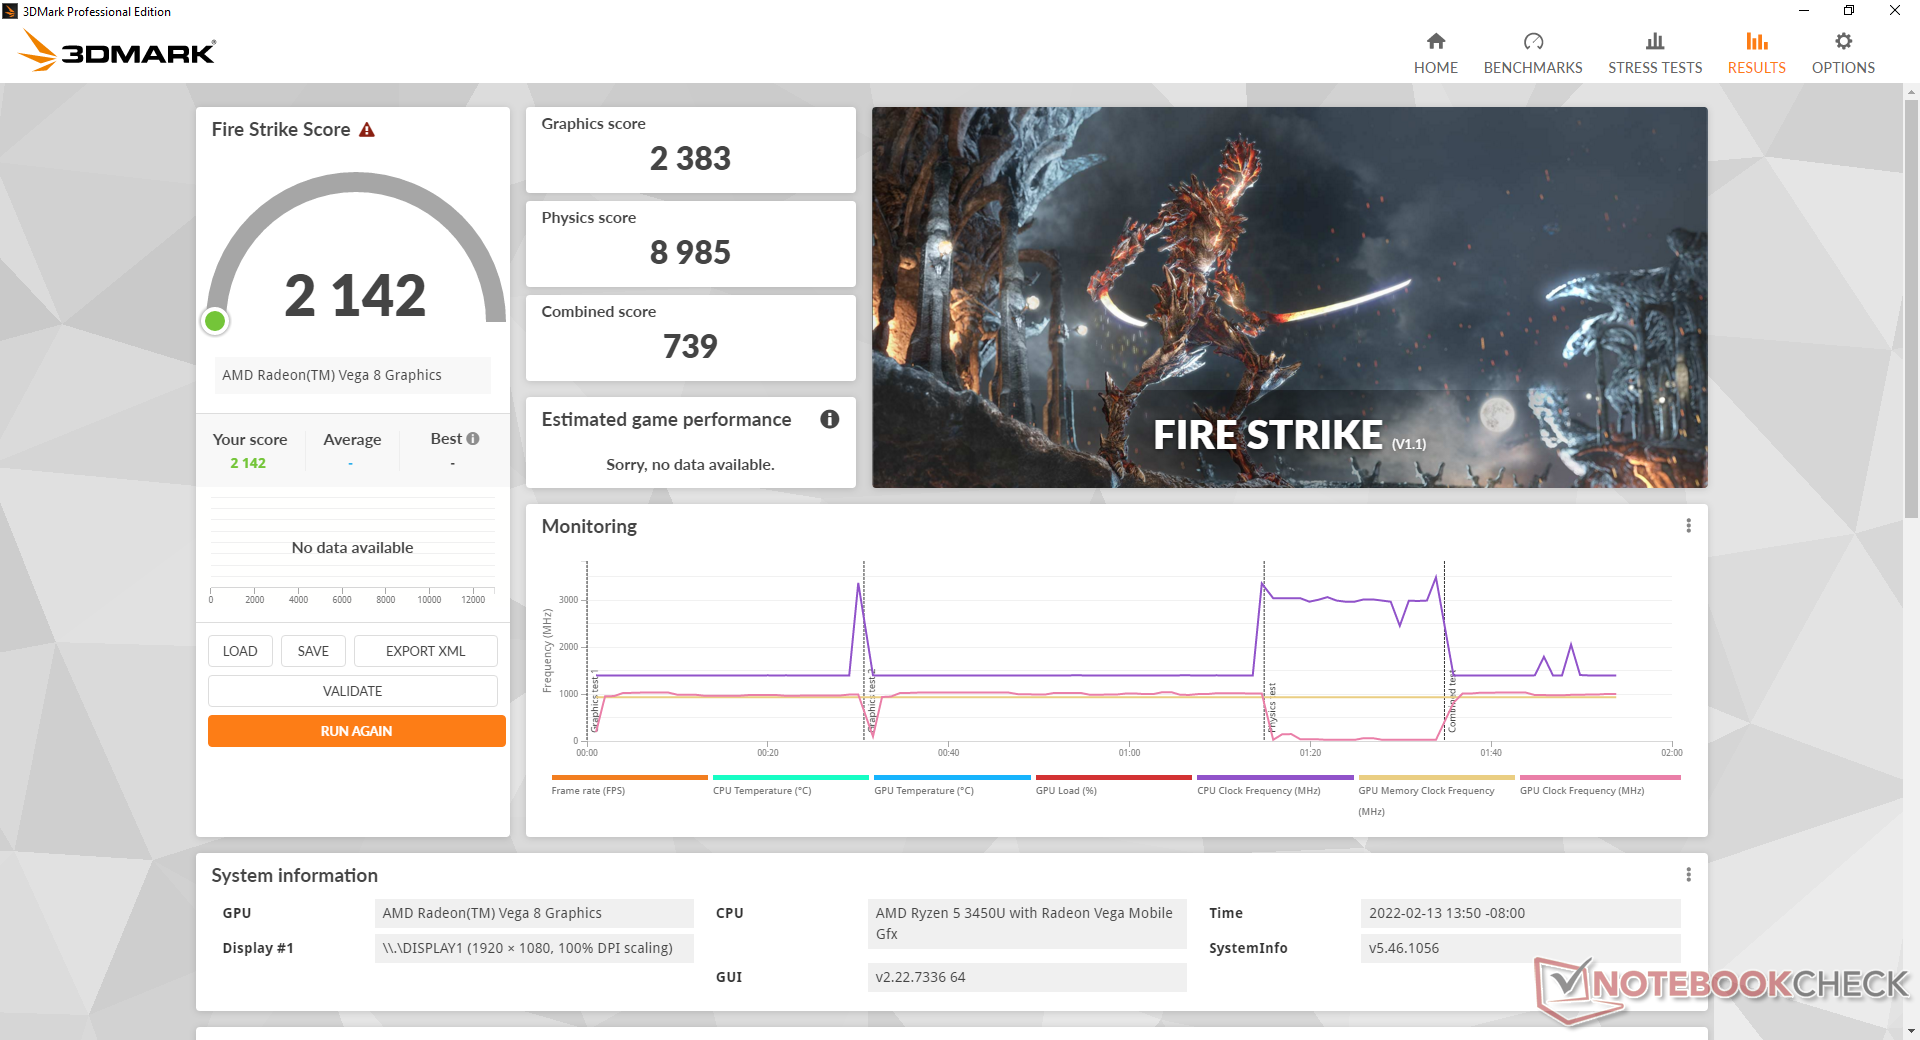
Graphics performance is slightly slower than the integrated Iris Plus Graphics G7 as found on the 10th gen Intel Ice Lake series. Though outdated and generally unfit for gaming, our Radeon RX Vega 8 is still significantly faster than the common UHD Graphics solution.
| 3DMark 11 - 1280x720 Performance GPU | |
| Asus ExpertBook B7 Flip B7402FEA | |
| Dell Inspiron 14 7400 7415 2-in-1 | |
| HP Pavilion 14-dv0357ng | |
| Lenovo IdeaPad 5 Pro 14ACN6 | |
| Asus VivoBook Flip 14 TM420IA | |
| Infinix INBook X2 | |
| BMAX X14 Pro | |
| Acer Swift 3 SF314-42-R27B | |
| Average AMD Radeon RX Vega 8 (Ryzen 2000/3000) (1668 - 4317, n=44) | |
| Lenovo ThinkBook 14 G2 ITL 20VDS02G00 | |
| Lenovo IdeaPad 3 14IIL05 | |
| 3DMark 11 Performance | 3779 points | |
| 3DMark Cloud Gate Standard Score | 12145 points | |
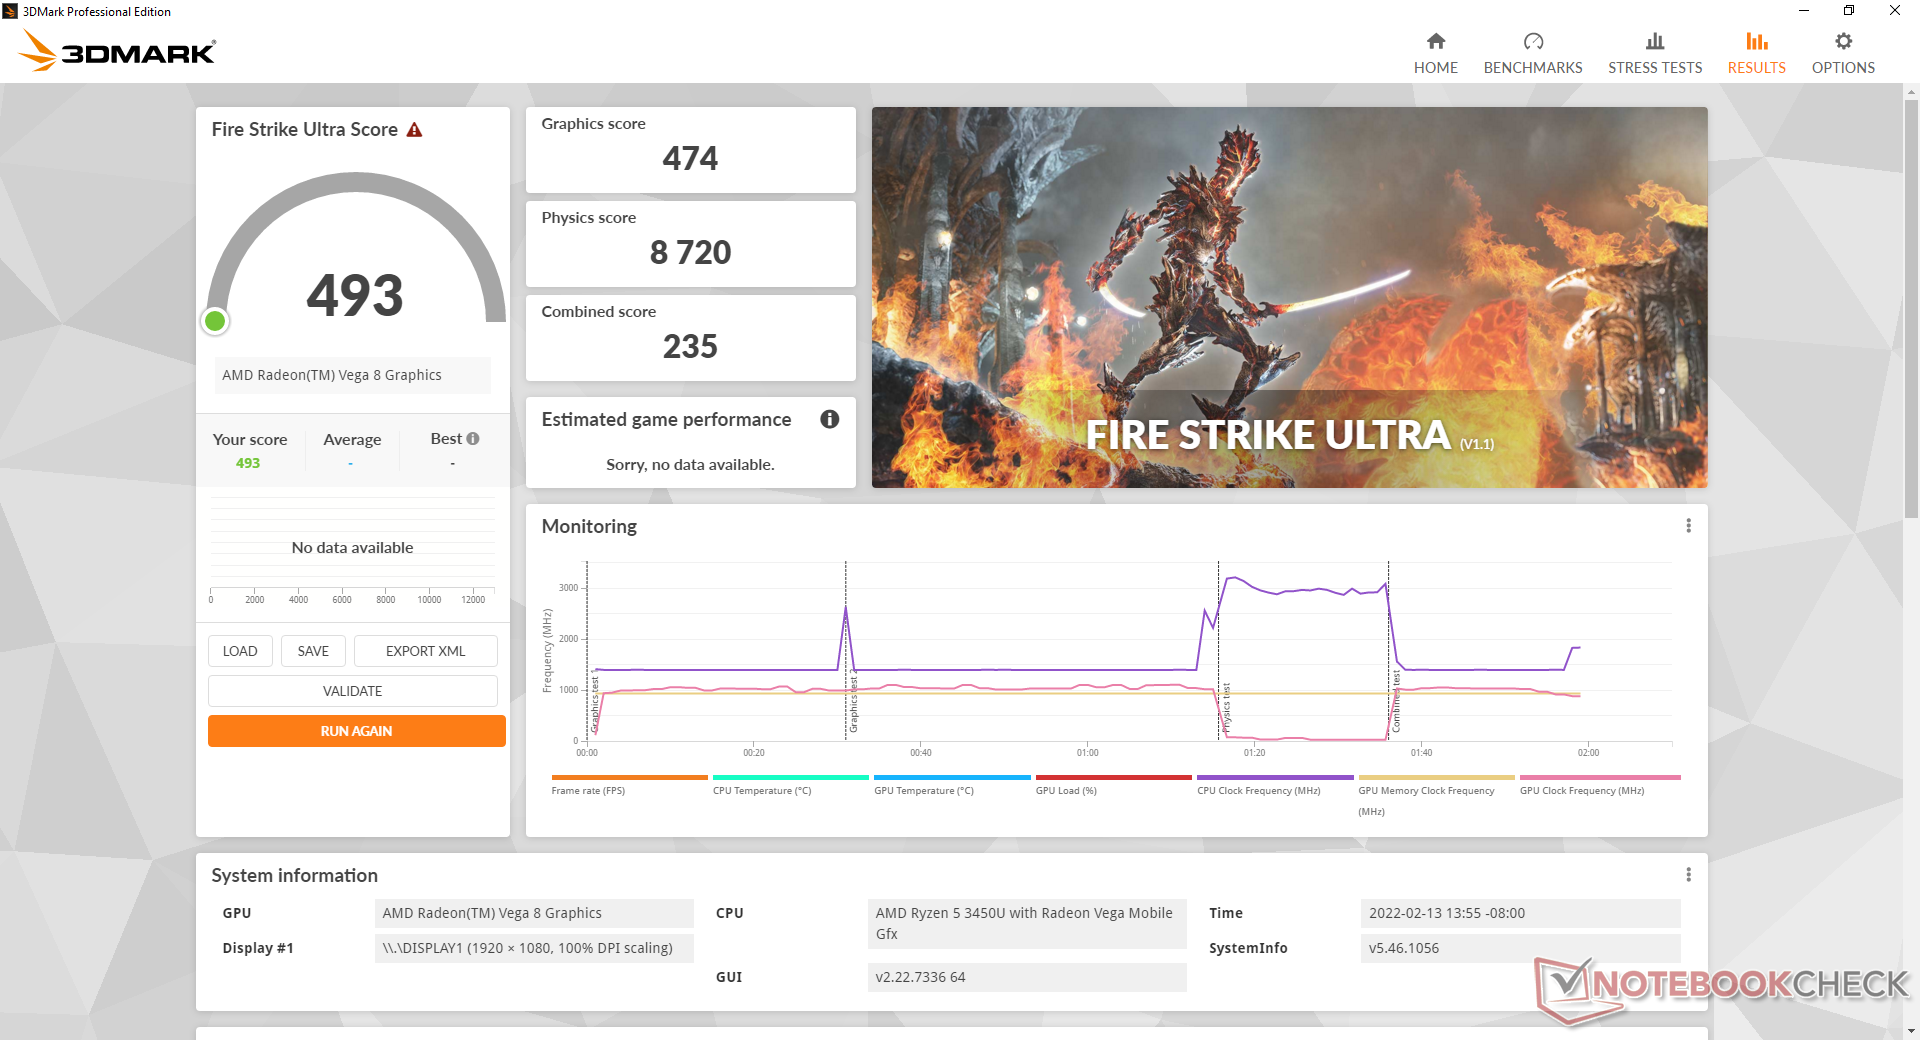
| 3DMark Fire Strike Score | 2142 points | |
| 3DMark Time Spy Score | 856 points | |
Help | ||
| X-Plane 11.11 | |
| 1280x720 low (fps_test=1) | |
| Lenovo IdeaPad 5 Pro 14ACN6 | |
| Asus VivoBook Flip 14 TM420IA | |
| Dell Inspiron 14 7400 7415 2-in-1 | |
| Acer Swift 3 SF314-42-R27B | |
| Lenovo ThinkBook 14 G2 ITL 20VDS02G00 | |
| Average AMD Radeon RX Vega 8 (Ryzen 2000/3000) (11.5 - 39.9, n=26) | |
| BMAX X14 Pro | |
| Asus ExpertBook B7 Flip B7402FEA | |
| Lenovo IdeaPad 3 14IIL05 | |
| Infinix INBook X2 | |
| 1920x1080 med (fps_test=2) | |
| Lenovo IdeaPad 5 Pro 14ACN6 | |
| Asus VivoBook Flip 14 TM420IA | |
| Dell Inspiron 14 7400 7415 2-in-1 | |
| Acer Swift 3 SF314-42-R27B | |
| Asus ExpertBook B7 Flip B7402FEA | |
| Infinix INBook X2 | |
| Lenovo ThinkBook 14 G2 ITL 20VDS02G00 | |
| Average AMD Radeon RX Vega 8 (Ryzen 2000/3000) (10.5 - 31, n=26) | |
| BMAX X14 Pro | |
| Lenovo IdeaPad 3 14IIL05 | |
| 1920x1080 high (fps_test=3) | |
| Lenovo IdeaPad 5 Pro 14ACN6 | |
| Asus VivoBook Flip 14 TM420IA | |
| Dell Inspiron 14 7400 7415 2-in-1 | |
| Acer Swift 3 SF314-42-R27B | |
| Asus ExpertBook B7 Flip B7402FEA | |
| Lenovo ThinkBook 14 G2 ITL 20VDS02G00 | |
| Infinix INBook X2 | |
| Average AMD Radeon RX Vega 8 (Ryzen 2000/3000) (9.58 - 27.3, n=25) | |
| BMAX X14 Pro | |
| Lenovo IdeaPad 3 14IIL05 | |
Witcher 3 FPS Chart
| low | med. | high | ultra | |
|---|---|---|---|---|
| The Witcher 3 (2015) | 41.9 | 27.9 | 13.9 | 8.9 |
| Dota 2 Reborn (2015) | 68.5 | 57.6 | 36.1 | 31.2 |
| Final Fantasy XV Benchmark (2018) | 21.2 | 10.7 | 7.28 | |
| X-Plane 11.11 (2018) | 25.2 | 18.4 | 16.6 | |
| Far Cry 5 (2018) | 29 | 11 | 10 | 9 |
Emissions
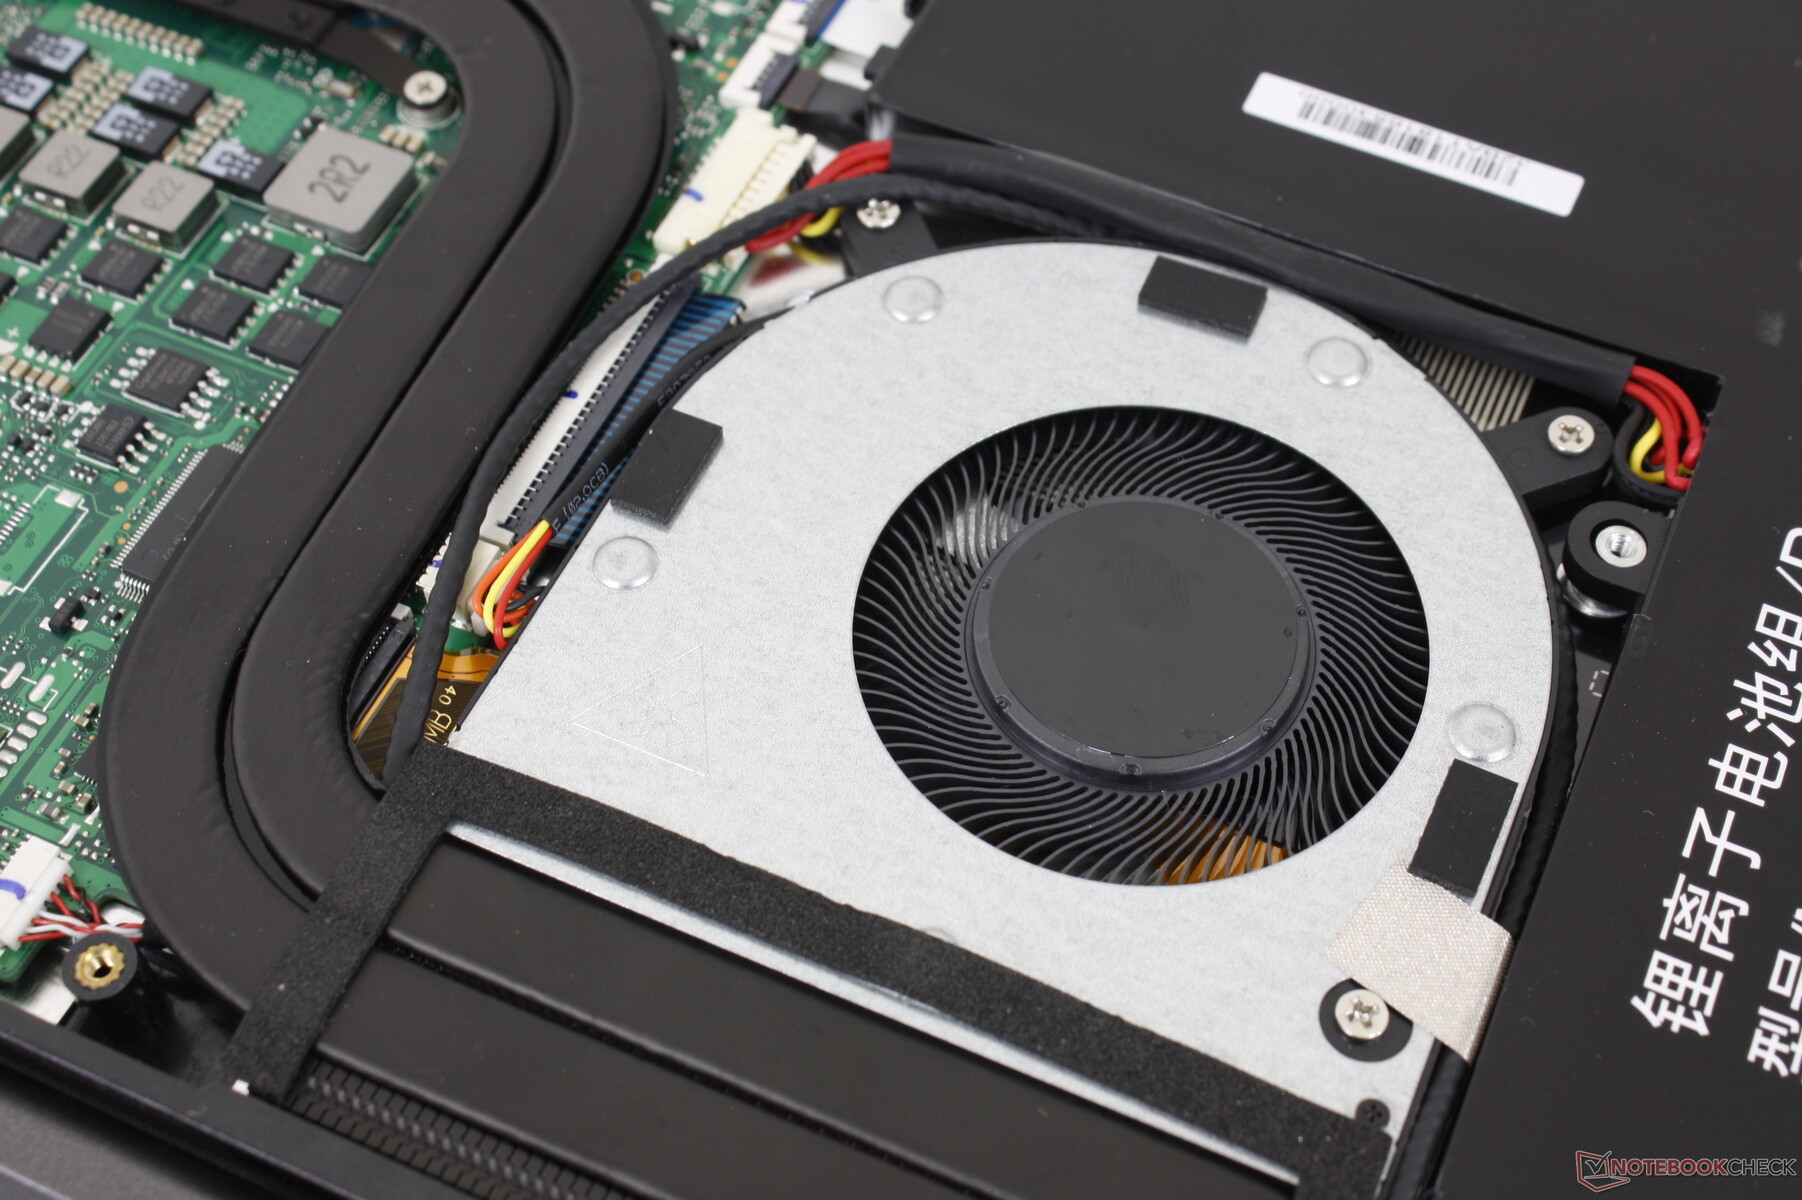
System Noise
Fan noise is noticeable but tolerable when simply web browsing or streaming video. The fan tends to top out at 30 dB(A) when under such loads while higher loads like games will range between 35 to 40 dB(A). These are pretty standard ranges for Ultrabooks powered by U-series CPUs.
Noise level
| Idle |
| 25.7 / 25.7 / 25.7 dB(A) |
| Load |
| 34.5 / 40 dB(A) |
 | ||
30 dB silent 40 dB(A) audible 50 dB(A) loud |
||
min: | ||
| BMAX X14 Pro Vega 8, R5 3450U, SEAPIY E535N 512GB | Lenovo IdeaPad 5 Pro 14ACN6 Vega 7, R5 5600U, WDC PC SN730 SDBPNTY-512G | Dell Inspiron 14 7400 7415 2-in-1 Vega 8, R7 5700U, WDC PC SN530 SDBPTPZ-512G | HP Pavilion 14-dv0357ng Iris Xe G7 80EUs, i5-1135G7, Intel Optane Memory H10 with Solid State Storage 32GB + 1TB HBRPEKNX0203AH(L/H) | Huawei MateBook 14 2020 Intel GeForce MX350, i7-10510U, Lite-On CA5-8D512 | Infinix INBook X2 Iris Plus Graphics G7 (Ice Lake 64 EU), i7-1065G7, Foresee GSYAPGC-512G | |
|---|---|---|---|---|---|---|
| Noise | 5% | 4% | 2% | -7% | 4% | |
| off / environment * (dB) | 25.2 | 24.6 2% | 24.3 4% | 25.4 -1% | 29.3 -16% | 23.1 8% |
| Idle Minimum * (dB) | 25.7 | 24.6 4% | 24.3 5% | 25.4 1% | 29.3 -14% | 24.3 5% |
| Idle Average * (dB) | 25.7 | 24.6 4% | 24.3 5% | 25.4 1% | 29.3 -14% | 24.3 5% |
| Idle Maximum * (dB) | 25.7 | 25.1 2% | 24.3 5% | 25.4 1% | 30.8 -20% | 24.5 5% |
| Load Average * (dB) | 34.5 | 29.6 14% | 35.7 -3% | 35.4 -3% | 35.7 -3% | 35.2 -2% |
| Witcher 3 ultra * (dB) | 40 | 31.9 20% | 37.5 6% | 35.7 11% | 38 5% | |
| Load Maximum * (dB) | 40 | 45.5 -14% | 37.3 7% | 35.5 11% | 37.9 5% | 38 5% |
* ... smaller is better
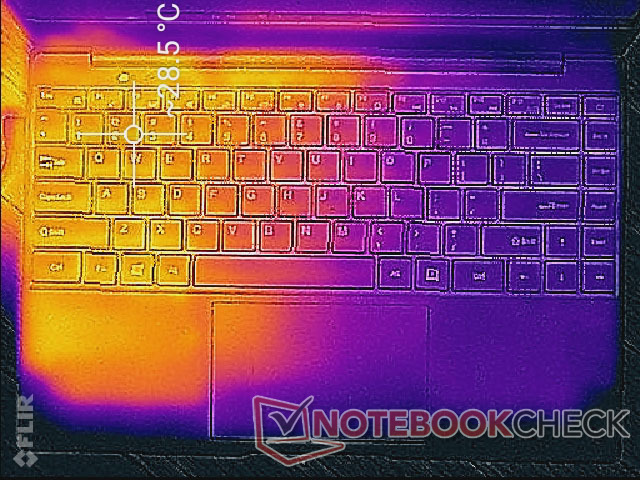
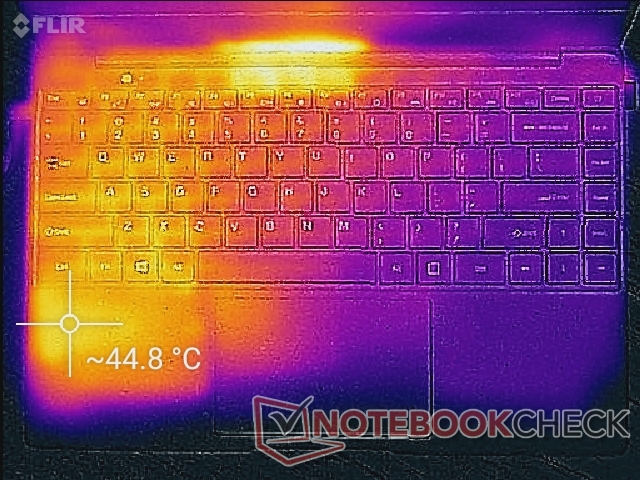
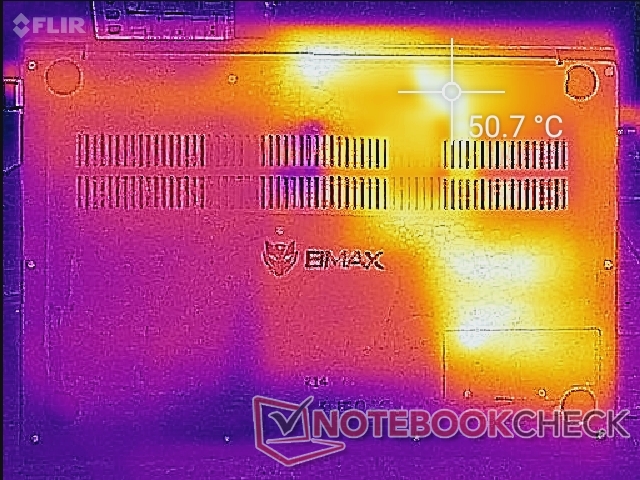
Temperature
The left half of the laptop will always be warmer than the right half since the processor, SSD, and RAM modules are all concentrated on one side of the system. The temperature difference between the two sides of the chassis can be potentially uncomfortable to some users. When running higher loads for extended periods, for example, the left palm rest can be as warm as 45 C compared to only 30 C on the right palm rest. Most other Ultrabooks do not have this issue as their processors and heat pipes are almost always toward the rear of the chassis instead.
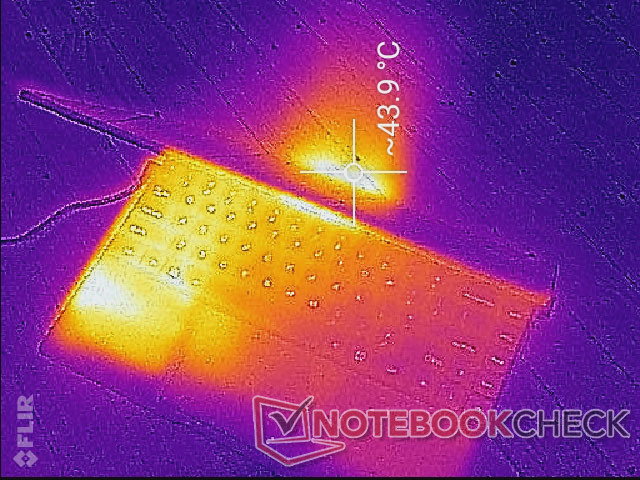
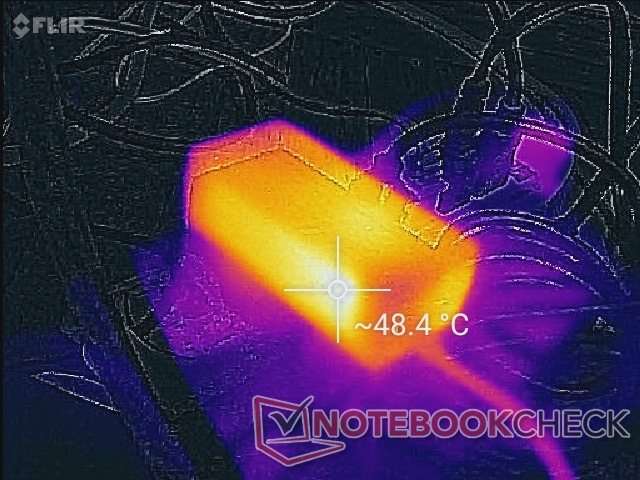
(-) The maximum temperature on the upper side is 48.4 °C / 119 F, compared to the average of 35.9 °C / 97 F, ranging from 21.4 to 59 °C for the class Subnotebook.
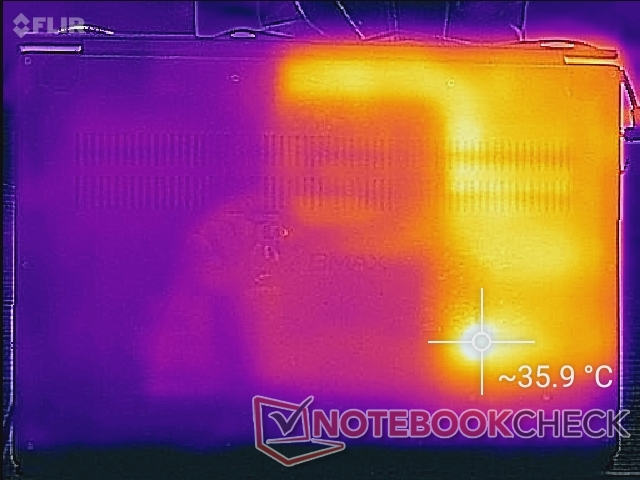
(-) The bottom heats up to a maximum of 51.6 °C / 125 F, compared to the average of 39.2 °C / 103 F
(+) In idle usage, the average temperature for the upper side is 25 °C / 77 F, compared to the device average of 30.8 °C / 87 F.
(-) The palmrests and touchpad can get very hot to the touch with a maximum of 44.8 °C / 112.6 F.
(-) The average temperature of the palmrest area of similar devices was 28.2 °C / 82.8 F (-16.6 °C / -29.8 F).
| BMAX X14 Pro AMD Ryzen 5 3450U, AMD Radeon RX Vega 8 (Ryzen 2000/3000) | Lenovo IdeaPad 5 Pro 14ACN6 AMD Ryzen 5 5600U, AMD Radeon RX Vega 7 | Dell Inspiron 14 7400 7415 2-in-1 AMD Ryzen 7 5700U, AMD Radeon RX Vega 8 (Ryzen 4000/5000) | HP Pavilion 14-dv0357ng Intel Core i5-1135G7, Intel Iris Xe Graphics G7 80EUs | Huawei MateBook 14 2020 Intel Intel Core i7-10510U, NVIDIA GeForce MX350 | Infinix INBook X2 Intel Core i7-1065G7, Intel Iris Plus Graphics G7 (Ice Lake 64 EU) | |
|---|---|---|---|---|---|---|
| Heat | 21% | 10% | 11% | 13% | 12% | |
| Maximum Upper Side * (°C) | 48.4 | 35.8 26% | 39.4 19% | 40.5 16% | 44 9% | 45 7% |
| Maximum Bottom * (°C) | 51.6 | 42.8 17% | 51 1% | 39.9 23% | 51.3 1% | 44.2 14% |
| Idle Upper Side * (°C) | 28.4 | 25 12% | 26.2 8% | 31.3 -10% | 25.1 12% | 26.2 8% |
| Idle Bottom * (°C) | 36.6 | 26.2 28% | 32.4 11% | 31.1 15% | 26.1 29% | 29.2 20% |
* ... smaller is better
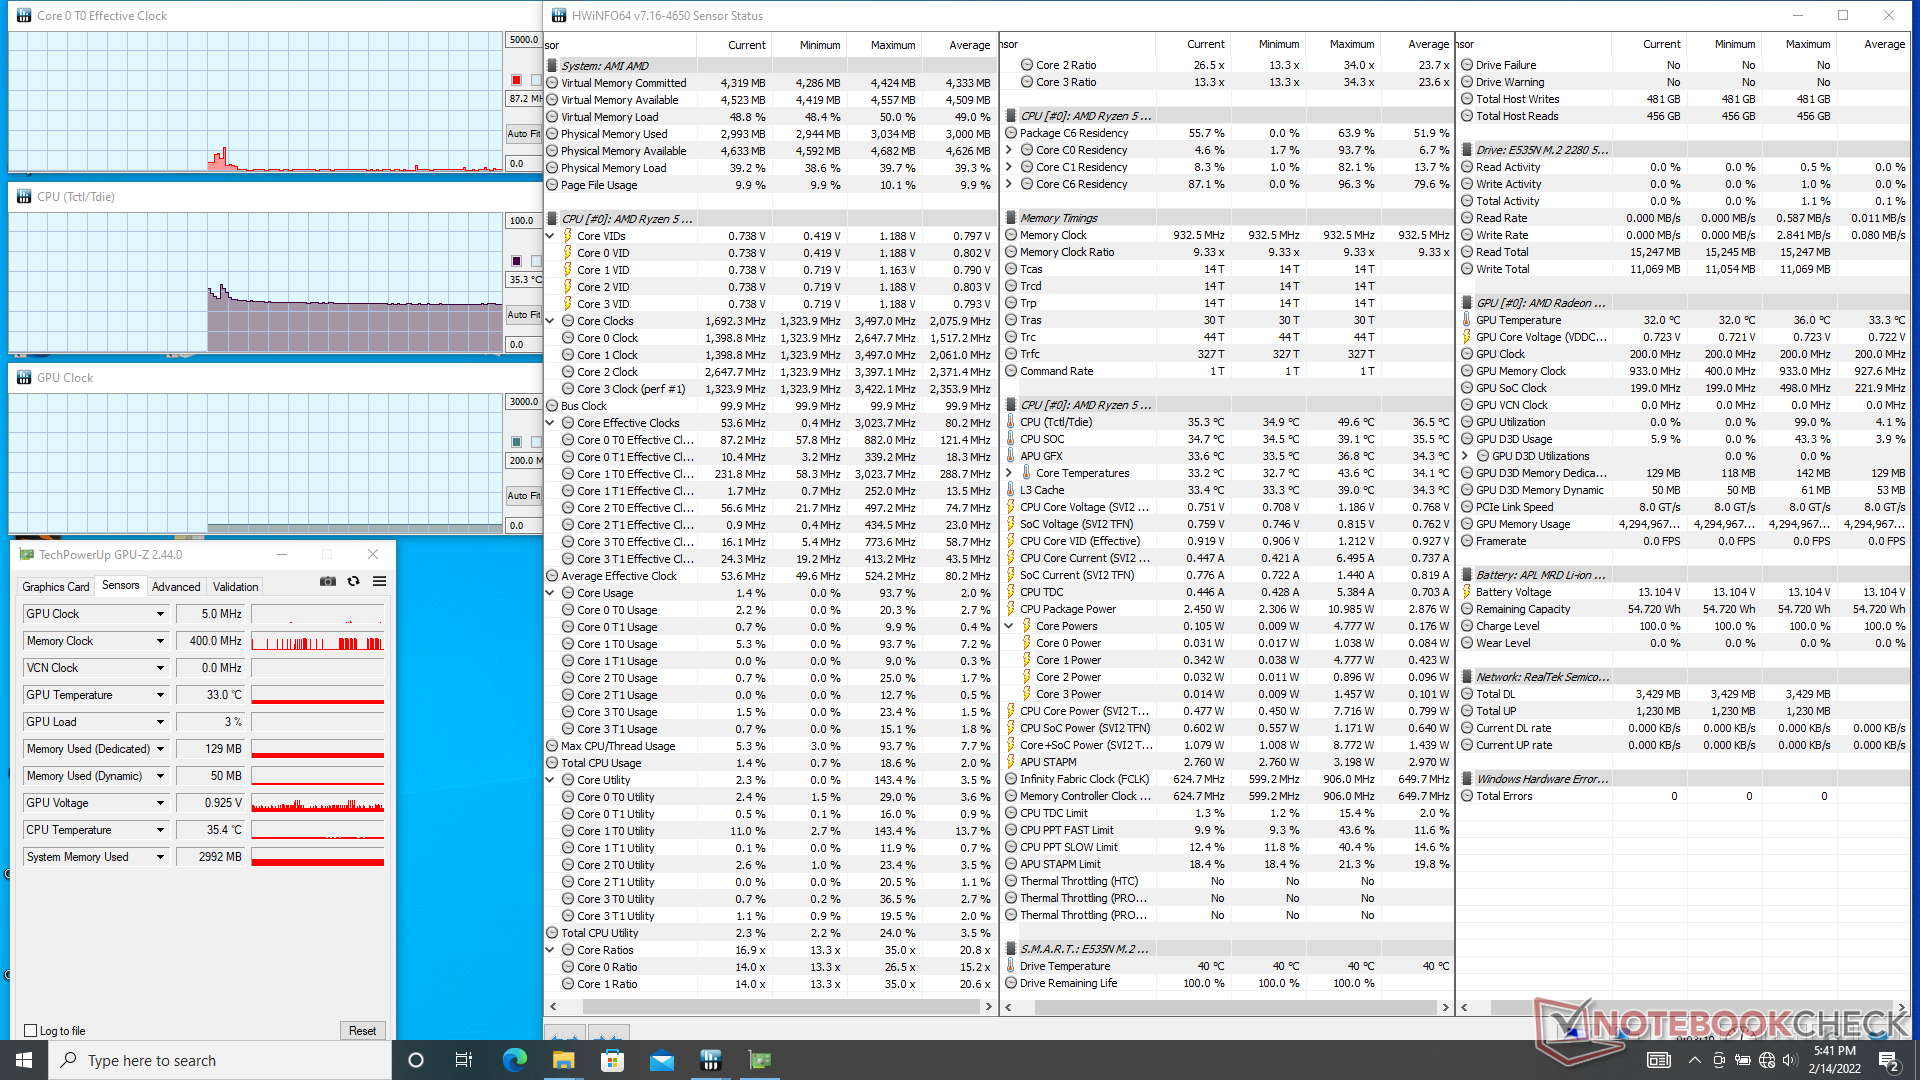
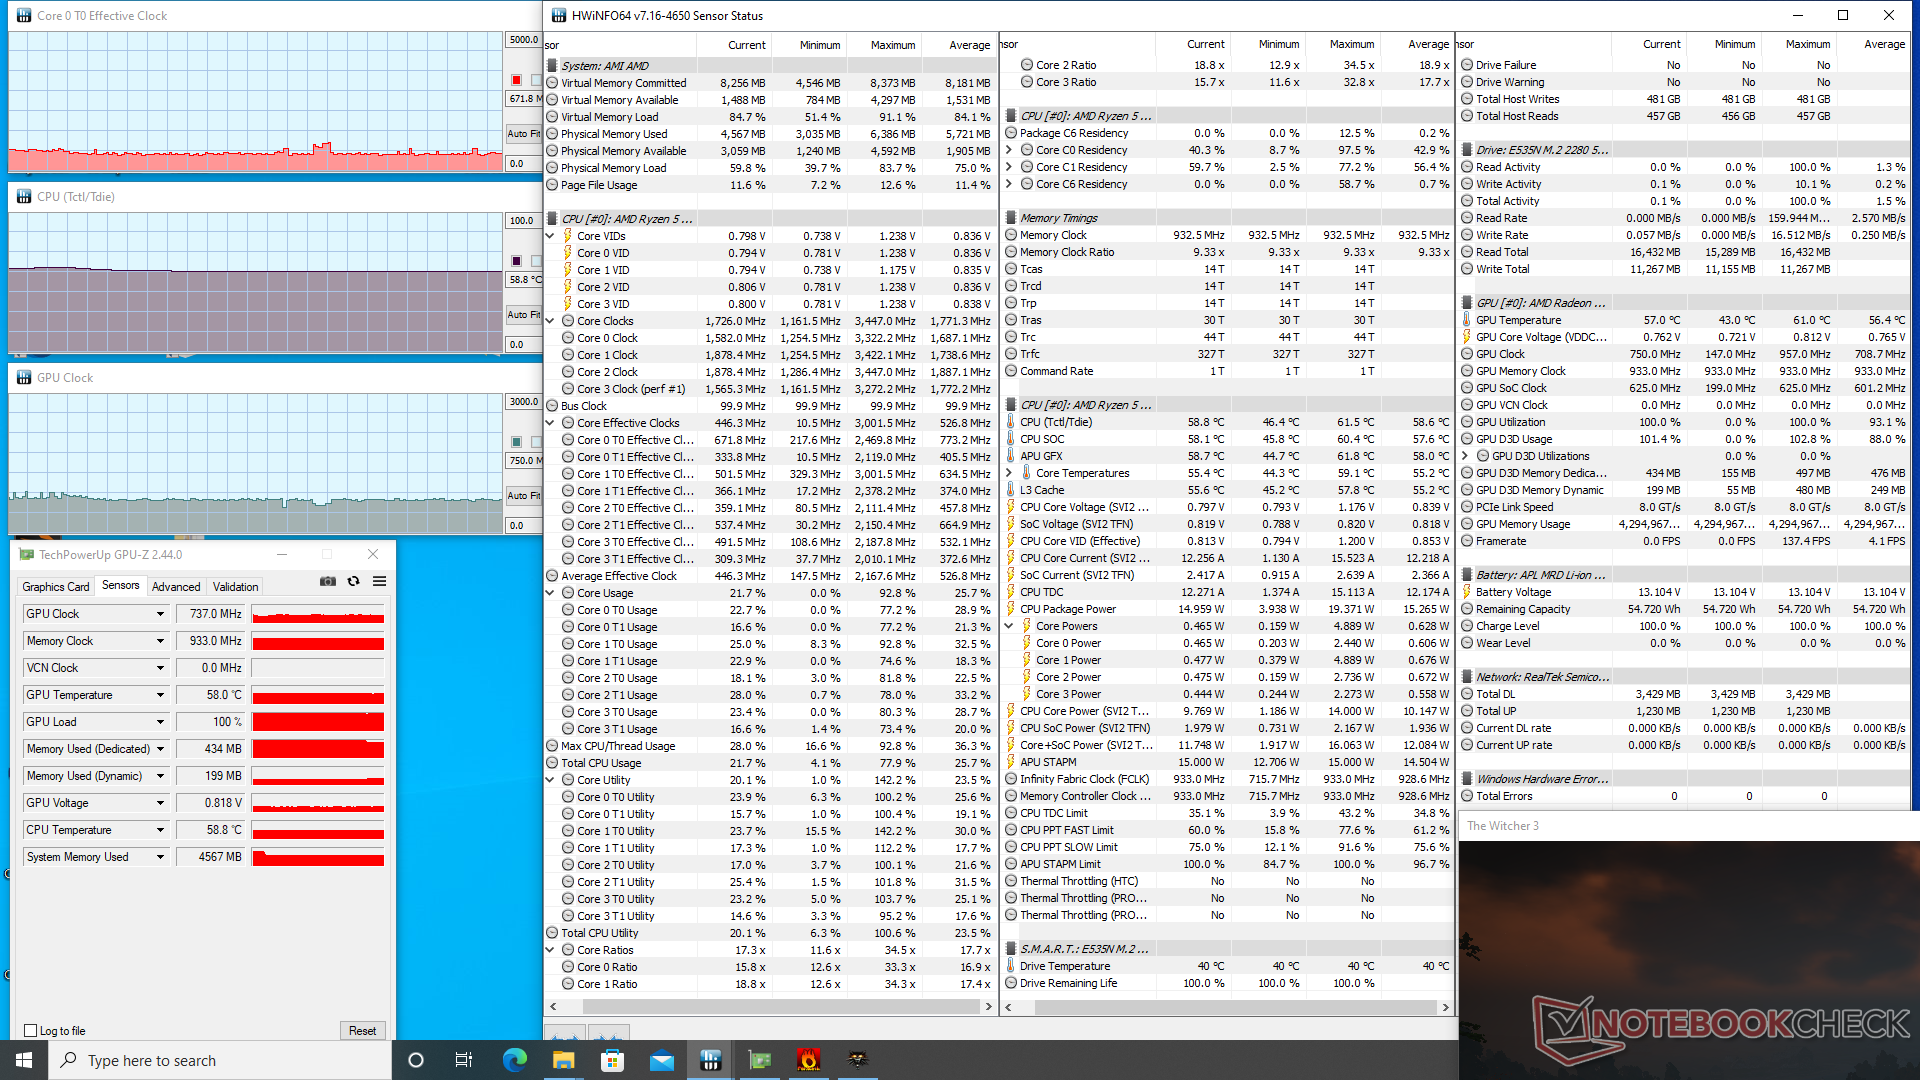
Stress Test
When running Prime95 to stress the CPU, clock rates would boost to 2.9 GHz for just a couple of seconds before dropping to 2.5 GHz and eventually settling at 2.2 GHz after a few minutes. Core temperature also appears to plateau at 59 C when subjected to stressful conditions such as gaming.
When running Witcher 3, GPU clock rates would start out relatively high at the 800 to 900 MHz range before eventually falling below 800 MHz likely due to thermal limitations. Frame rates are thus slightly higher during the first minute of gaming or so.
Running on battery power will not limit performance. A 3DMark 11 test on batteries would return nearly identical results.
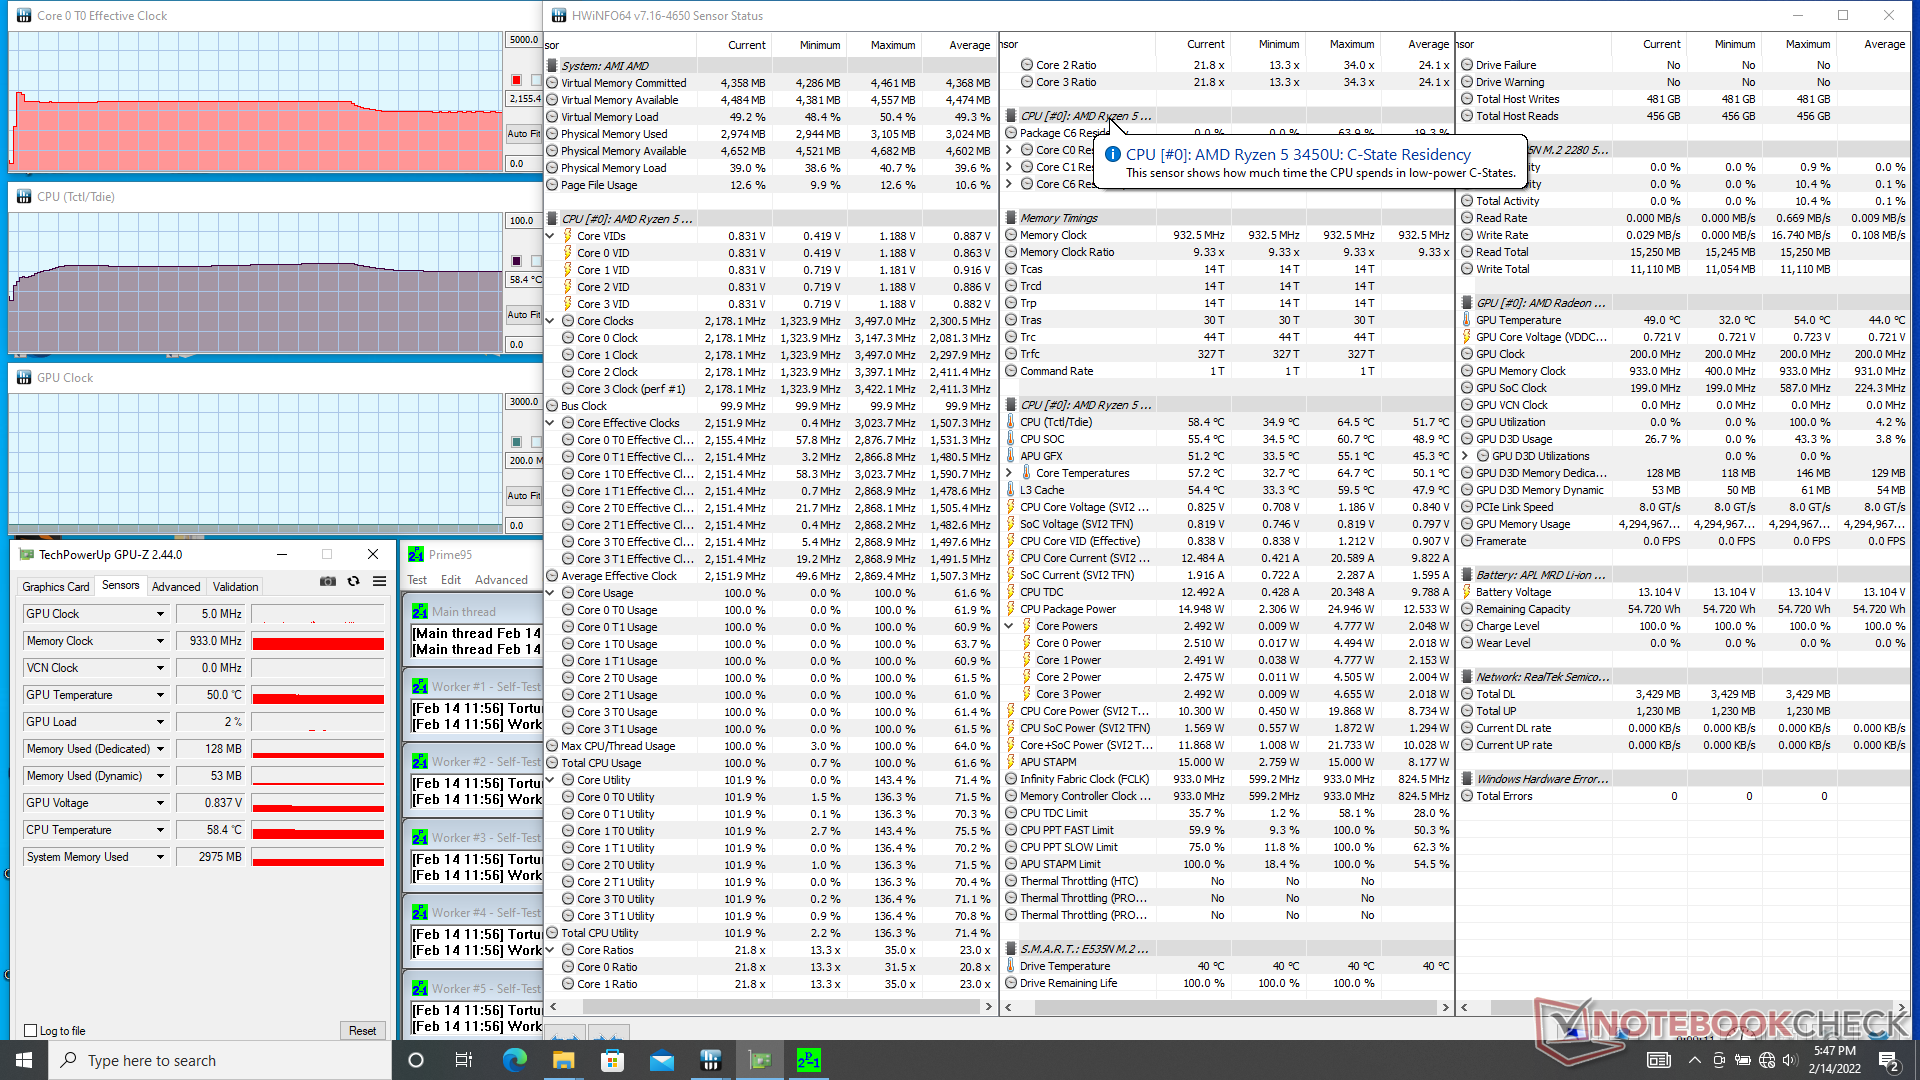
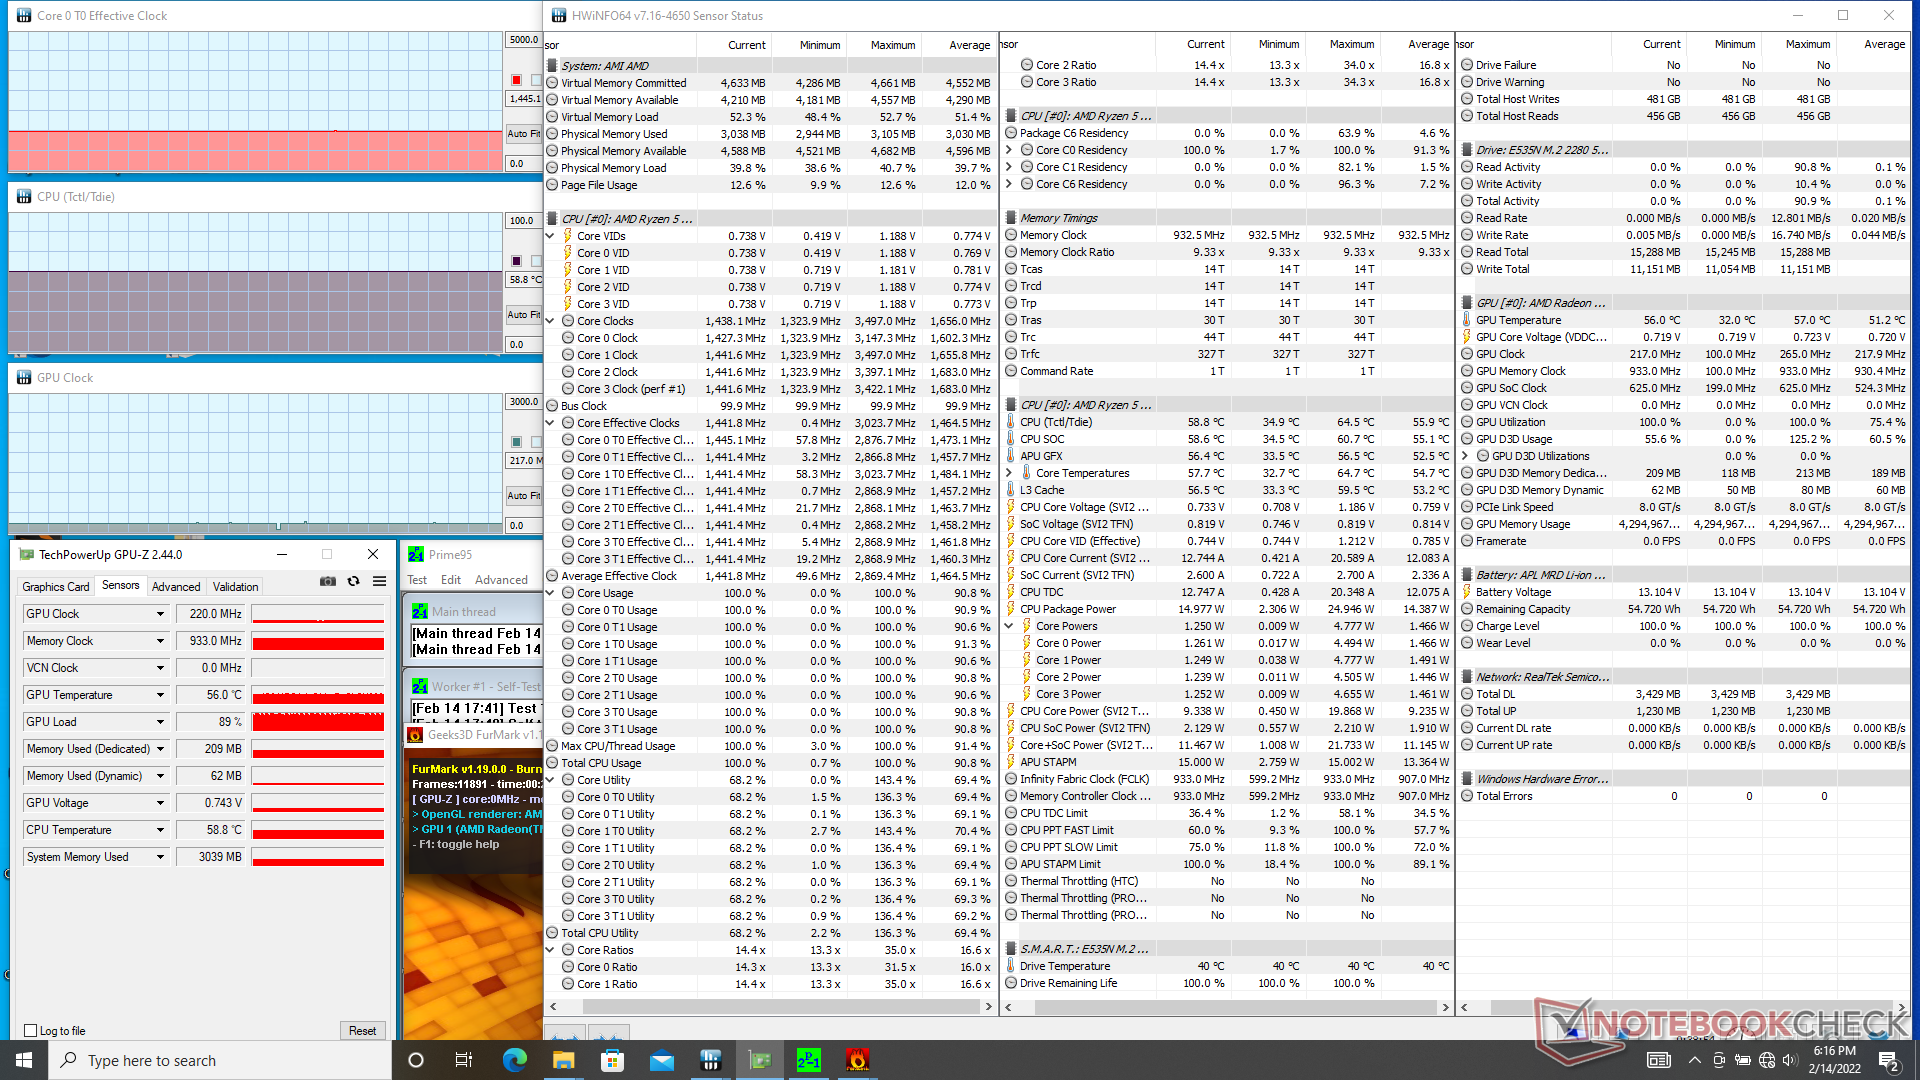
| CPU Clock (GHz) | GPU Clock (MHz) | Average CPU Temperature Tctl/Tidle (°C) | |
| System Idle | -- | -- | 35 |
| Prime95 Stress | 2.2 | -- | 59 |
| Prime95 + FurMark Stress | 1.5 | 220 | 59 |
| Witcher 3 Stress | 0.7 | 737 | 59 |
Speakers
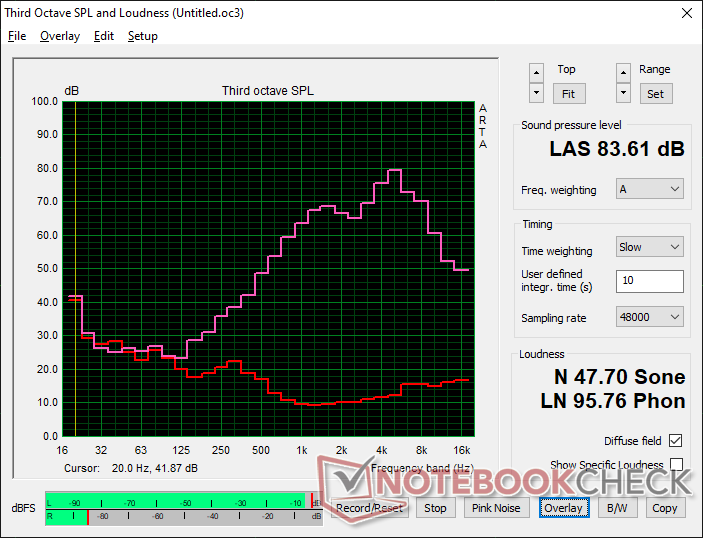
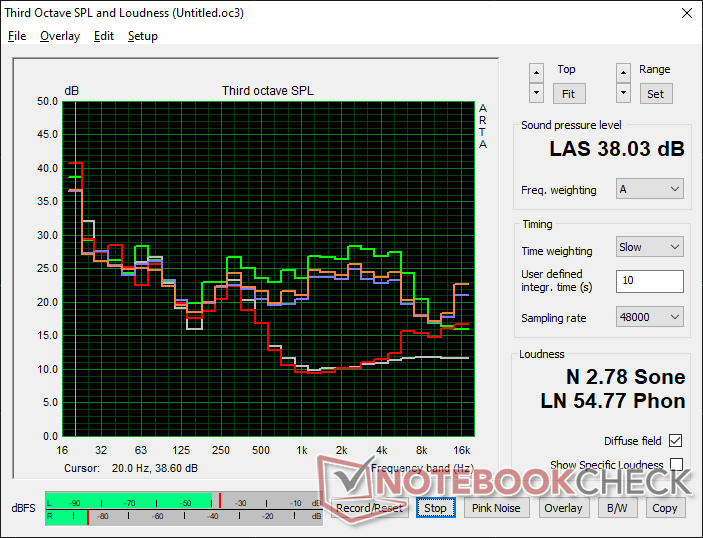
BMAX X14 Pro audio analysis
(+) | speakers can play relatively loud (83.6 dB)
Bass 100 - 315 Hz
(-) | nearly no bass - on average 29.2% lower than median
(±) | linearity of bass is average (7% delta to prev. frequency)
Mids 400 - 2000 Hz
(±) | reduced mids - on average 7.8% lower than median
(±) | linearity of mids is average (9.2% delta to prev. frequency)
Highs 2 - 16 kHz
(±) | higher highs - on average 11.1% higher than median
(±) | linearity of highs is average (11.2% delta to prev. frequency)
Overall 100 - 16.000 Hz
(-) | overall sound is not linear (33.5% difference to median)
Compared to same class
» 95% of all tested devices in this class were better, 1% similar, 3% worse
» The best had a delta of 5%, average was 18%, worst was 53%
Compared to all devices tested
» 92% of all tested devices were better, 1% similar, 6% worse
» The best had a delta of 4%, average was 24%, worst was 134%
Apple MacBook Pro 16 2021 M1 Pro audio analysis
(+) | speakers can play relatively loud (84.7 dB)
Bass 100 - 315 Hz
(+) | good bass - only 3.8% away from median
(+) | bass is linear (5.2% delta to prev. frequency)
Mids 400 - 2000 Hz
(+) | balanced mids - only 1.3% away from median
(+) | mids are linear (2.1% delta to prev. frequency)
Highs 2 - 16 kHz
(+) | balanced highs - only 1.9% away from median
(+) | highs are linear (2.7% delta to prev. frequency)
Overall 100 - 16.000 Hz
(+) | overall sound is linear (4.6% difference to median)
Compared to same class
» 0% of all tested devices in this class were better, 0% similar, 100% worse
» The best had a delta of 5%, average was 17%, worst was 45%
Compared to all devices tested
» 0% of all tested devices were better, 0% similar, 100% worse
» The best had a delta of 4%, average was 24%, worst was 134%
Energy Management
Power Consumption
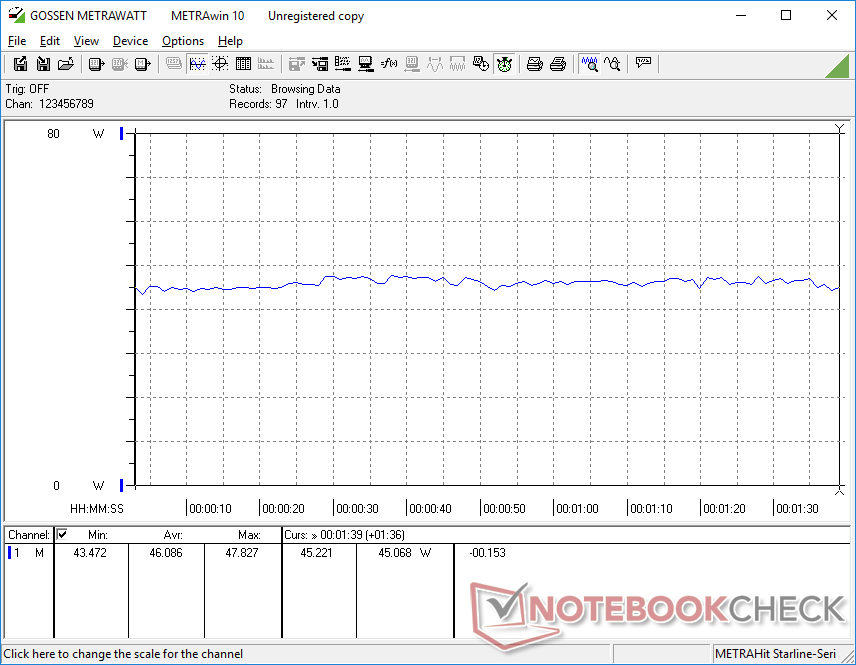
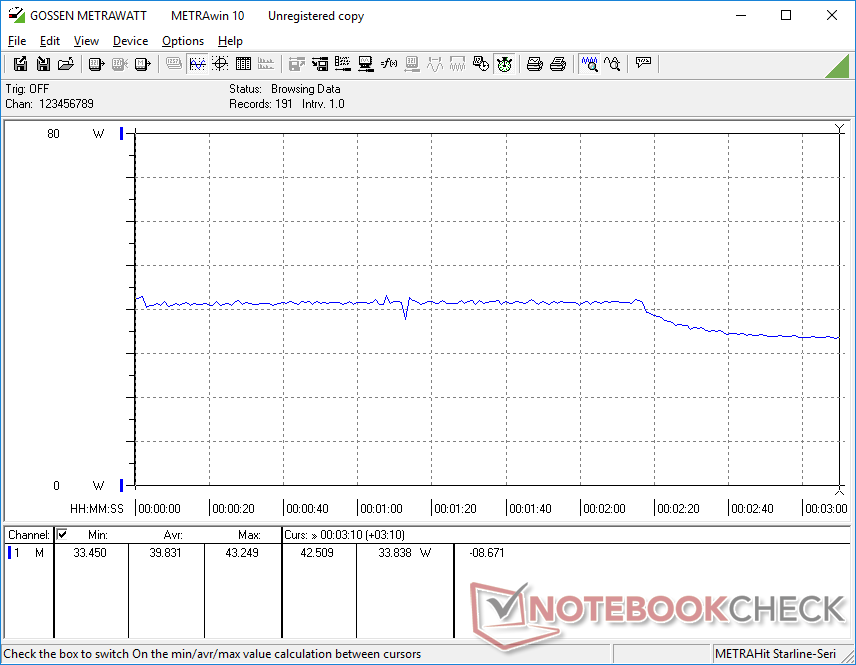
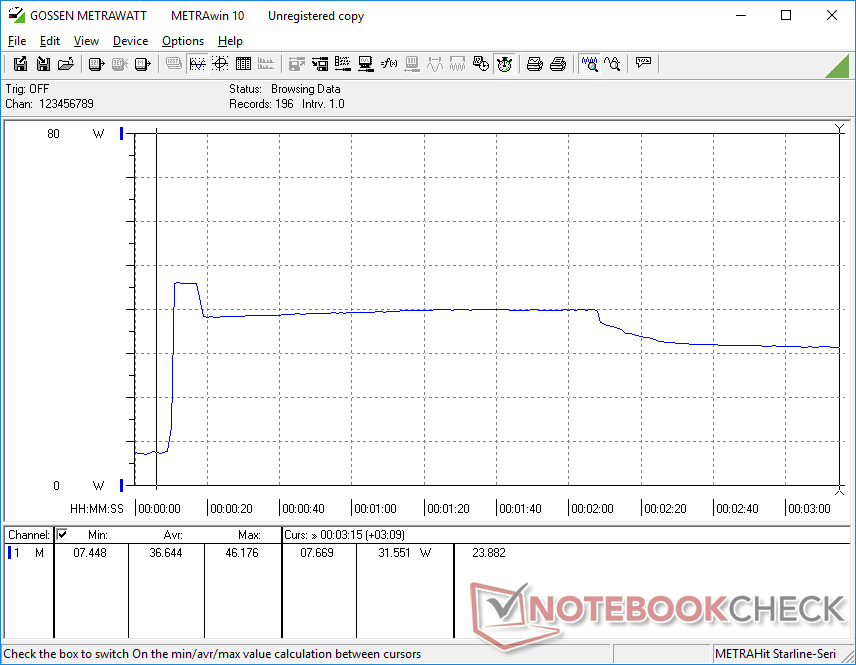
The system draws slightly more power than most other newer Ultrabooks since it is using an older generation AMD CPU. Running demanding loads will draw between 40 W to 46 W compared to 35 W to 42 W on the Dell Inspiron 14 7400 or HP Pavilion 14 even though the BMax comes with slower performance. The lower performance-per-watt is a common price to pay when choosing older generation CPUs.
We're able to record a temporary maximum draw of 50 W from the small (~9.5 x 4.1 x 6 cm) 47.5 W AC adapter when running Prime95 and FurMark simultaneously.

| Off / Standby | |
| Idle | |
| Load |
|
Key:
min: | |
| BMAX X14 Pro R5 3450U, Vega 8, SEAPIY E535N 512GB, IPS, 1920x1080, 14" | Lenovo IdeaPad 5 Pro 14ACN6 R5 5600U, Vega 7, WDC PC SN730 SDBPNTY-512G, IPS, 2240x1400, 14" | Dell Inspiron 14 7400 7415 2-in-1 R7 5700U, Vega 8, WDC PC SN530 SDBPTPZ-512G, IPS, 1920x1080, 14" | HP Pavilion 14-dv0357ng i5-1135G7, Iris Xe G7 80EUs, Intel Optane Memory H10 with Solid State Storage 32GB + 1TB HBRPEKNX0203AH(L/H), IPS, 1920x1080, 14" | Huawei MateBook 14 2020 Intel i7-10510U, GeForce MX350, Lite-On CA5-8D512, IPS LED, 2160x1440, 14" | Infinix INBook X2 i7-1065G7, Iris Plus Graphics G7 (Ice Lake 64 EU), Foresee GSYAPGC-512G, IPS, 1920x1080, 14" | |
|---|---|---|---|---|---|---|
| Power Consumption | 9% | 19% | 8% | -9% | 17% | |
| Idle Minimum * (Watt) | 6.3 | 3.8 40% | 4.5 29% | 4.8 24% | 3 52% | 4.3 32% |
| Idle Average * (Watt) | 9.6 | 6.9 28% | 6.5 32% | 8.5 11% | 9 6% | 6.3 34% |
| Idle Maximum * (Watt) | 9.9 | 8.8 11% | 7.1 28% | 12.4 -25% | 11 -11% | 9.6 3% |
| Load Average * (Watt) | 46 | 42.2 8% | 40.4 12% | 37.7 18% | 60.8 -32% | 40.7 12% |
| Witcher 3 ultra * (Watt) | 39.8 | 37.7 5% | 31.7 20% | 35.4 11% | 56 -41% | 36.9 7% |
| Load Maximum * (Watt) | 50.3 | 68.4 -36% | 54.3 -8% | 45.3 10% | 65.6 -30% | 44.4 12% |
* ... smaller is better
Power Consumption Witcher 3 / Stresstest
Power Consumption external Monitor
Battery Life
WLAN runtimes are pretty good at approximately 6.5 hours on a full charge. Charging from empty to full, however, is relatively slow at 3.5 hours compared to only 1.5 hours on most other Ultrabooks.
| BMAX X14 Pro R5 3450U, Vega 8, 55 Wh | Lenovo IdeaPad 5 Pro 14ACN6 R5 5600U, Vega 7, 57 Wh | Dell Inspiron 14 7400 7415 2-in-1 R7 5700U, Vega 8, 54 Wh | HP Pavilion 14-dv0357ng i5-1135G7, Iris Xe G7 80EUs, 43 Wh | Huawei MateBook 14 2020 Intel i7-10510U, GeForce MX350, 56 Wh | Infinix INBook X2 i7-1065G7, Iris Plus Graphics G7 (Ice Lake 64 EU), 50 Wh | |
|---|---|---|---|---|---|---|
| Battery runtime | 39% | 64% | -9% | 94% | 2% | |
| WiFi v1.3 (h) | 6.6 | 9.2 39% | 10.8 64% | 6 -9% | 12.8 94% | 6.7 2% |
| Reader / Idle (h) | 21.6 | 18.6 | ||||
| Load (h) | 1 | 2.3 | 2 | |||
| H.264 (h) | 5.9 | 13.9 | ||||
| Witcher 3 ultra (h) | 2 |
Pros
Cons
Verdict
The best aspects of the BMax X14 Pro are its low price of under $500 USD and relatively fast AMD Ryzen 5 CPU for the price. It also looks more expensive than it is when compared to other cheap models like the Dell Inspiron 3000 series, HP 14 series, or the Lenovo IdeaPad 3 series.
Drawbacks to the X14 Pro are similar to many Chuwi laptops in that the model focuses on visual design at the expense of quality assurance or other hardware cutbacks. Our Space key, for example, is spongier than all the other keys when feedback should be uniform while the chassis flexes, twists, and creaks more readily than we would like. Its display also covers just 59 percent of sRGB despite the claims of 100 percent coverage.
If you're looking for an inexpensive 14-inch laptop that maximizes performance and portability, then the BMax X14 Pro can fill that niche. For fuller colors and better reliability, however, you'll have to spend a little more on midrange Ultrabooks from more well-known makers like the Lenovo IdeaPad 5 series or HP Envy series.
Price and Availability
The BMax X14 Pro is now shipping on Amazon for $499 USD or $439 after applying the $60 coupon code.
BMAX X14 Pro
- 02/16/2022 v7 (old)
Allen Ngo
Price comparison
