Walmart Motile M142 Laptop Review: Pretty Good for $500
Walmart only recently started offering its own line of branded laptops which, perhaps unsurprisingly, are much cheaper than the laptops from more well-known manufacturers. The new Walmart Motile series encompasses affordable Ultrabooks aimed at users on tighter budgets.
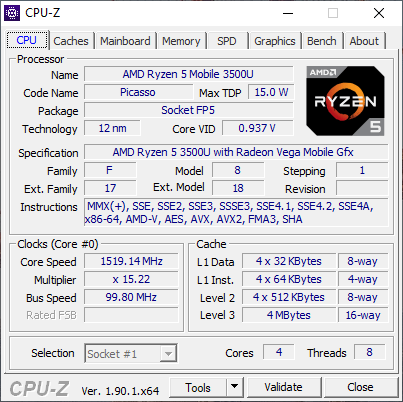
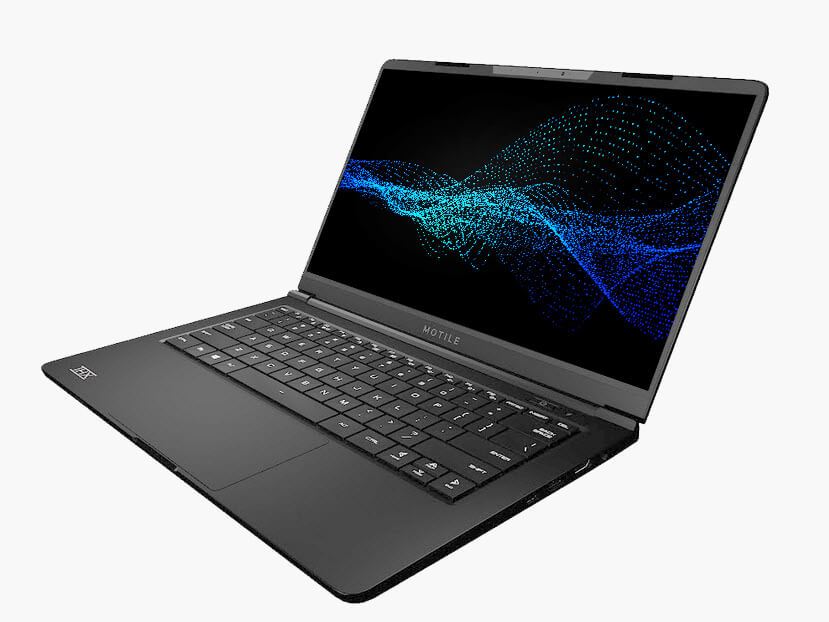
One of the first Motile laptops is the 14-inch M142 equipped with the latest generation AMD Ryzen 5 3500U CPU, 8 GB of expandable single-channel RAM, 256 GB SSD, and a 14-inch FHD display for $700 USD on Walmart or $550 on Newegg. Walmart has this exact model on sale for just $380 for Black Friday shoppers. A lesser SKU with the slower Ryzen 3 3300U CPU and just half the RAM and storage is also available.
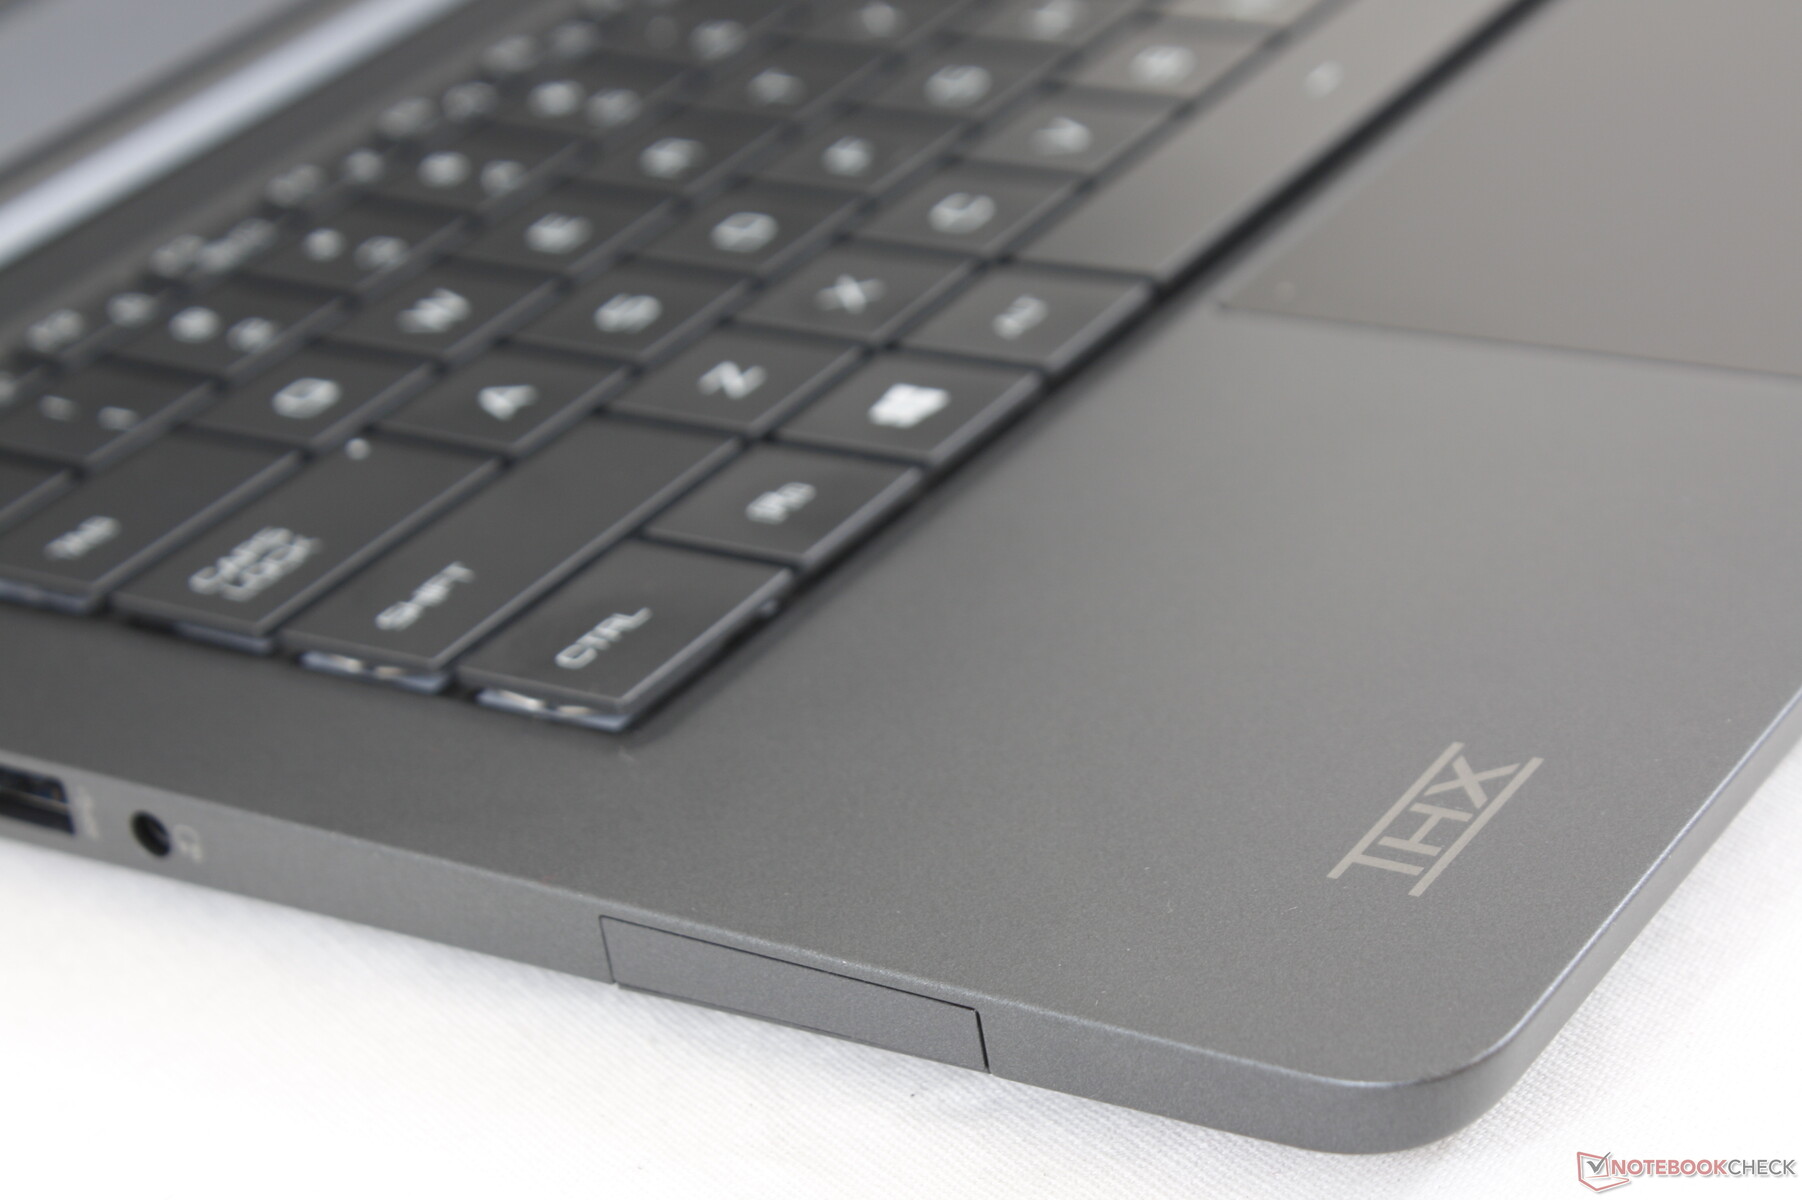
Beyond the low barrier of entry, the Motile M142 is notable for being optimized by THX to meet THX audio and visual standards.
The 14-inch Motile competes directly with other thin-and-light budget laptops like the Lenovo IdeaPad 330S, HP 14, Asus VivoBook, or the Dell Inspiron 3000/5000 series.
Rating | Date | Model | Weight | Height | Size | Resolution | Price |
|---|---|---|---|---|---|---|---|
| 77.7 % v7 (old) | 11 / 2019 | Walmart Motile M142 R5 3500U, Vega 8 | 1.1 kg | 18 mm | 14.00" | 1920x1080 | |
| 82.7 % v7 (old) | 11 / 2019 | Acer Swift 3 SF314-41-R8HZ R5 3500U, Vega 8 | 1.5 kg | 18 mm | 14.00" | 1920x1080 | |
| 79.7 % v6 (old) | 08 / 2019 | Dell Inspiron 15 5000 5585 R7 3700U, Vega 10 | 1.8 kg | 19.5 mm | 15.60" | 1920x1080 | |
| 80.7 % v6 (old) | 05 / 2018 | Asus VivoBook 15 X542UF-DM143T i5-8250U, GeForce MX130 | 2.3 kg | 23 mm | 15.60" | 1920x1080 | |
| 84.9 % v6 (old) | 07 / 2019 | Lenovo IdeaPad S540-14IWL i5-8265U, GeForce MX250 | 1.4 kg | 15.9 mm | 14.00" | 1920x1080 |
Case
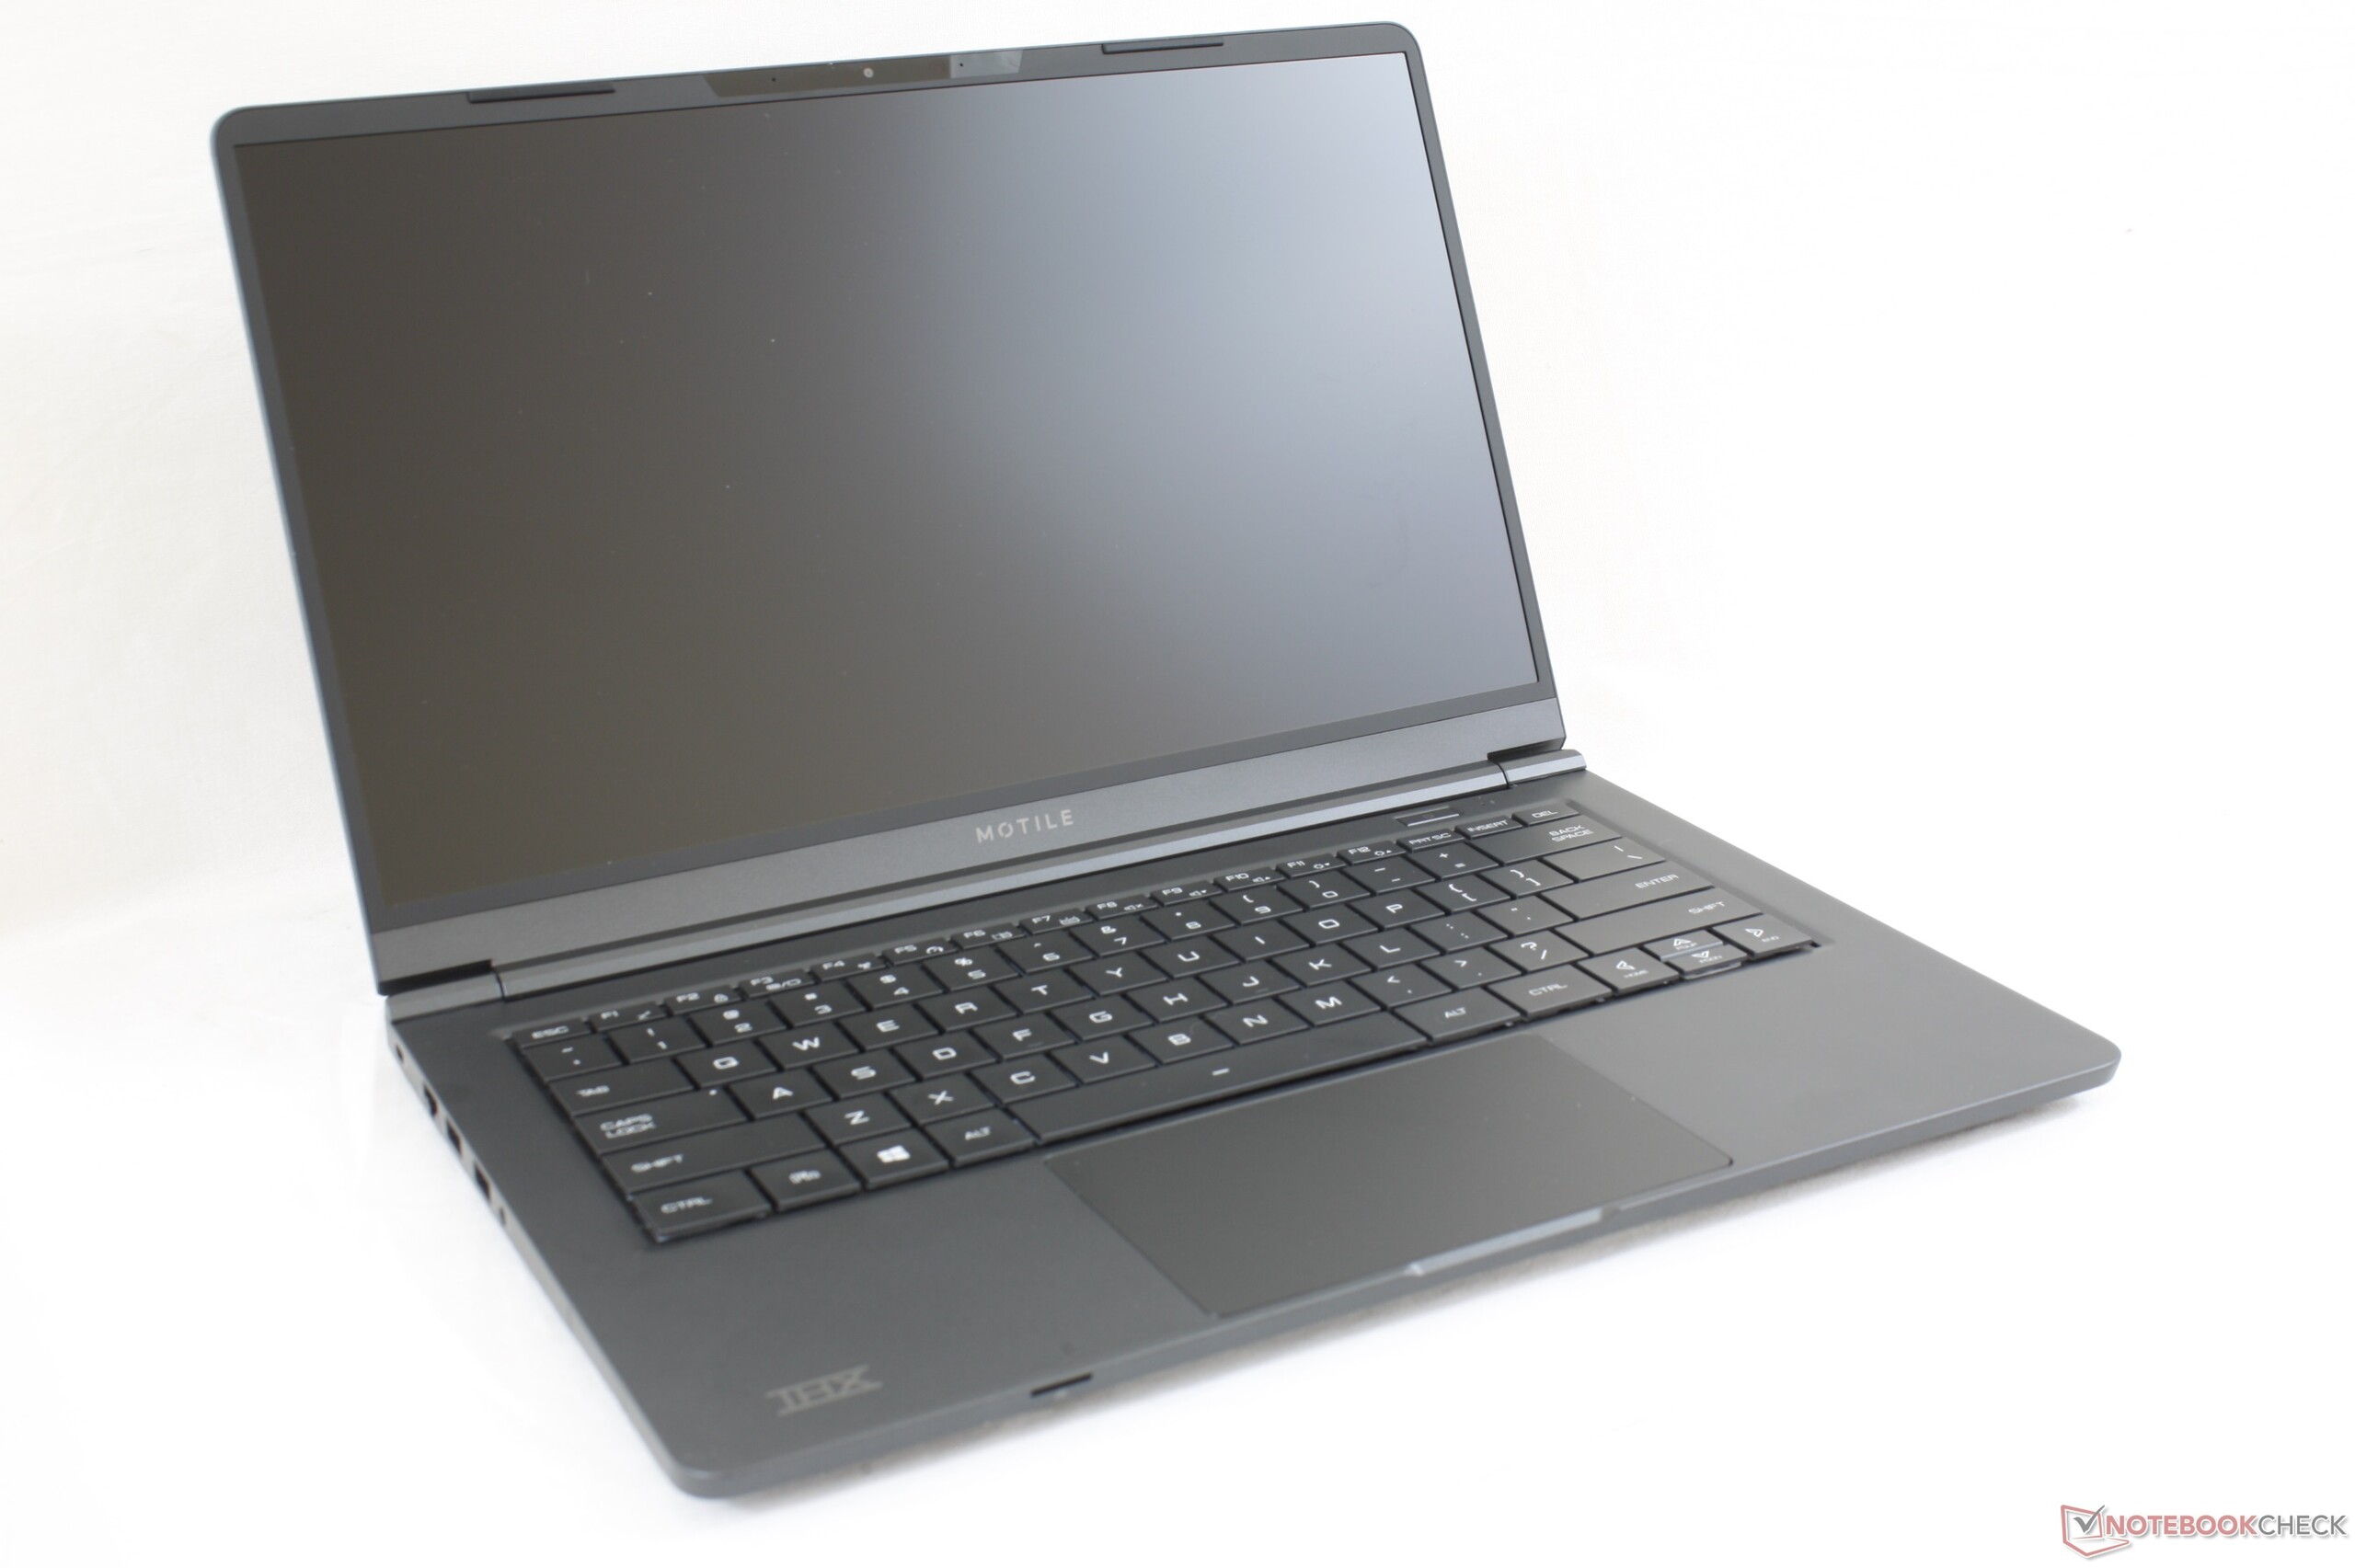
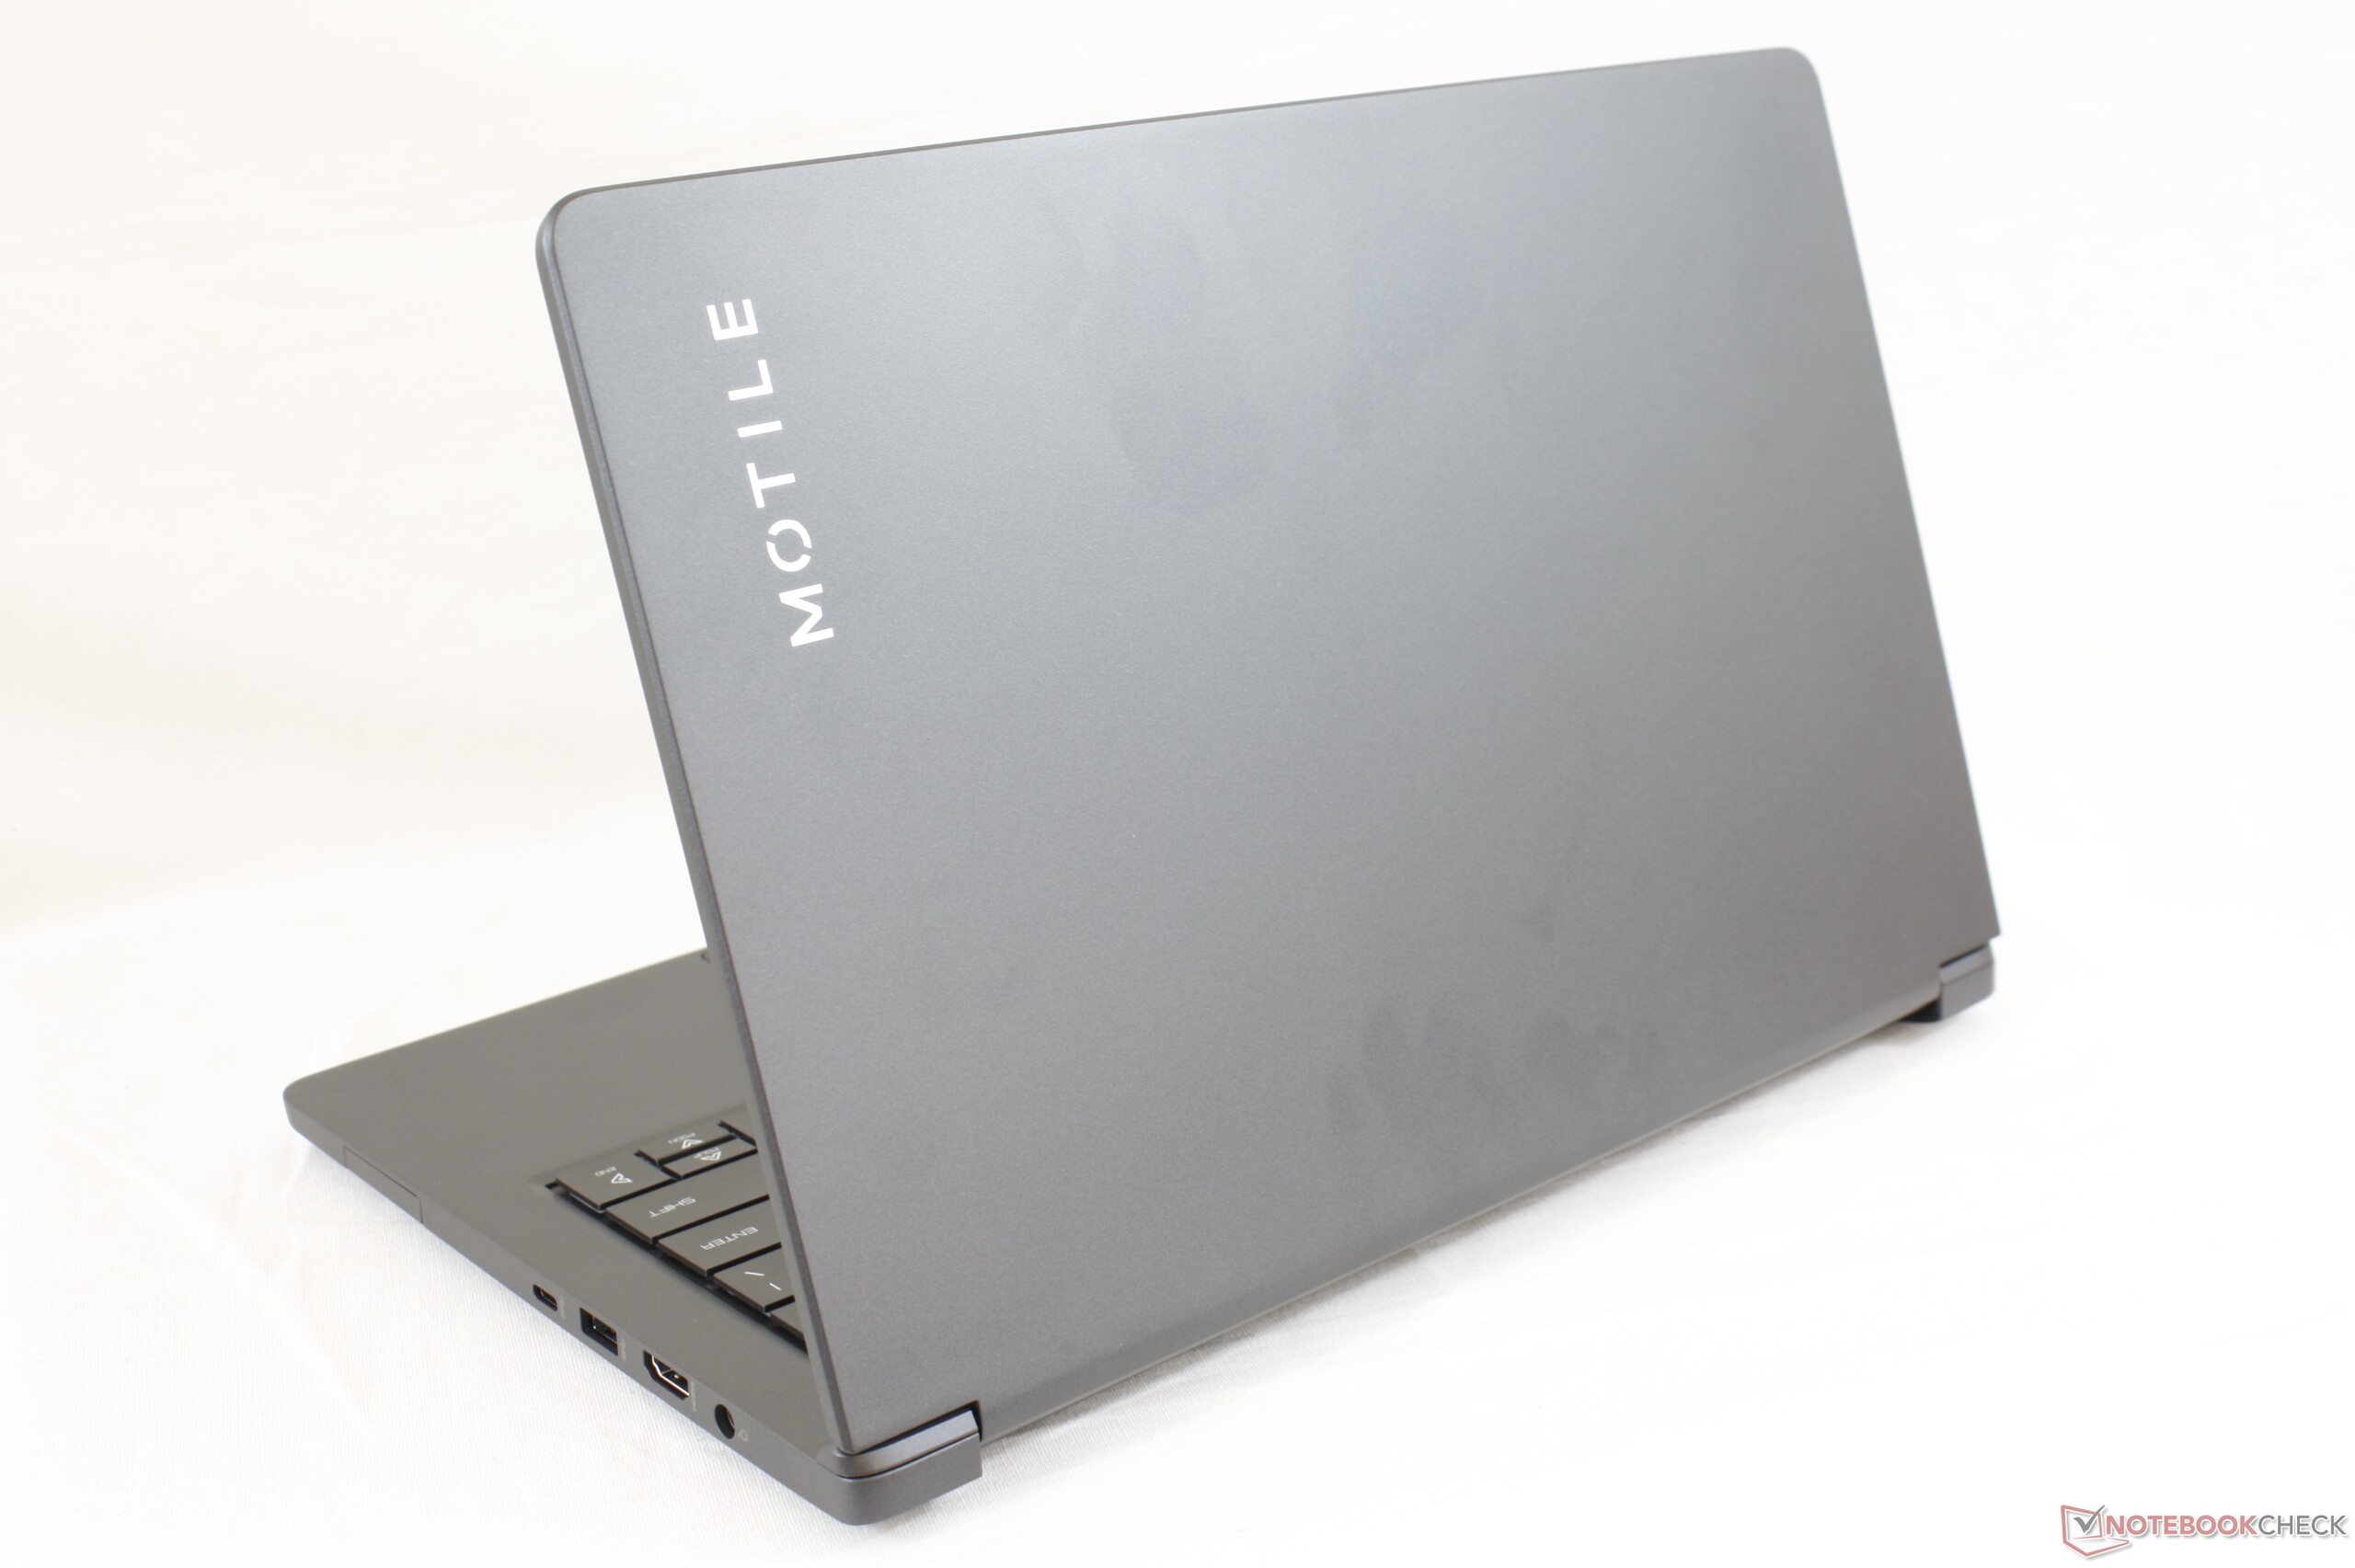
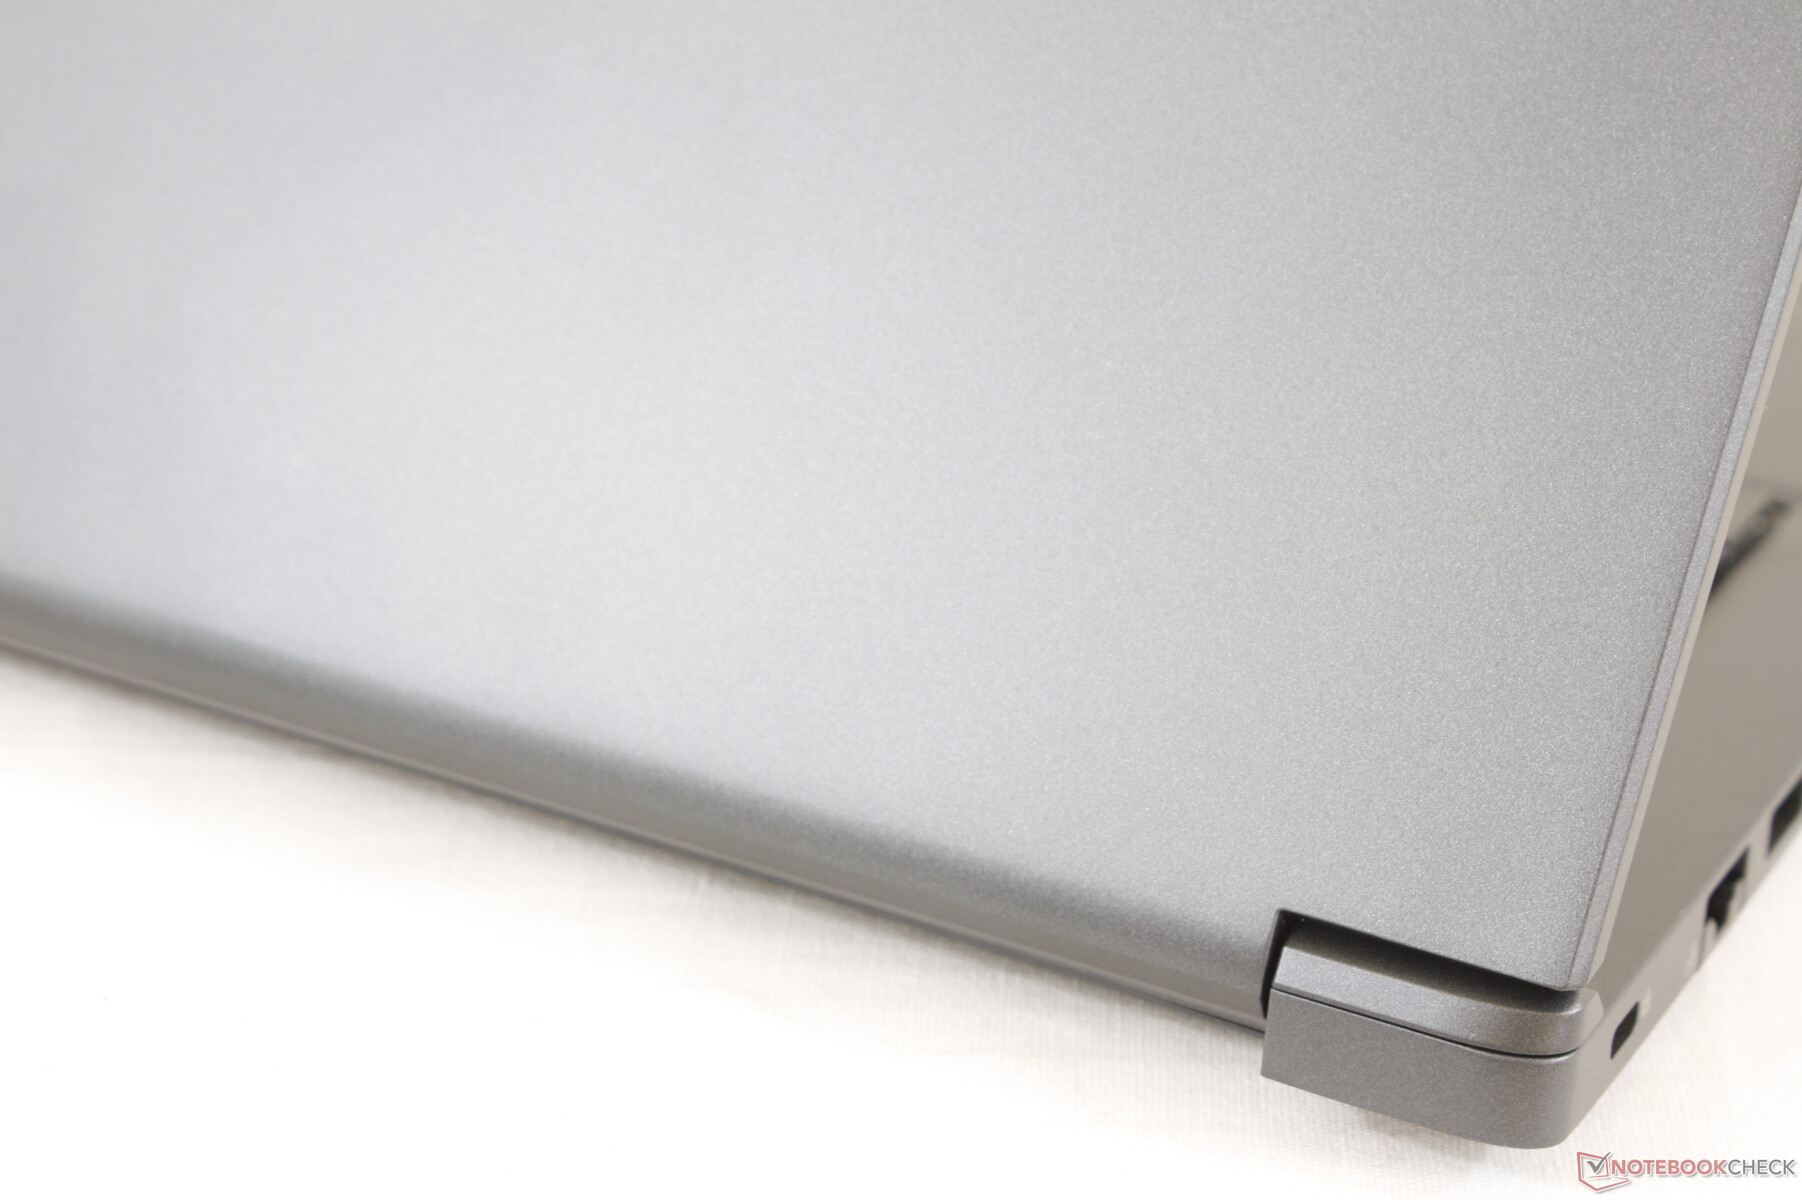
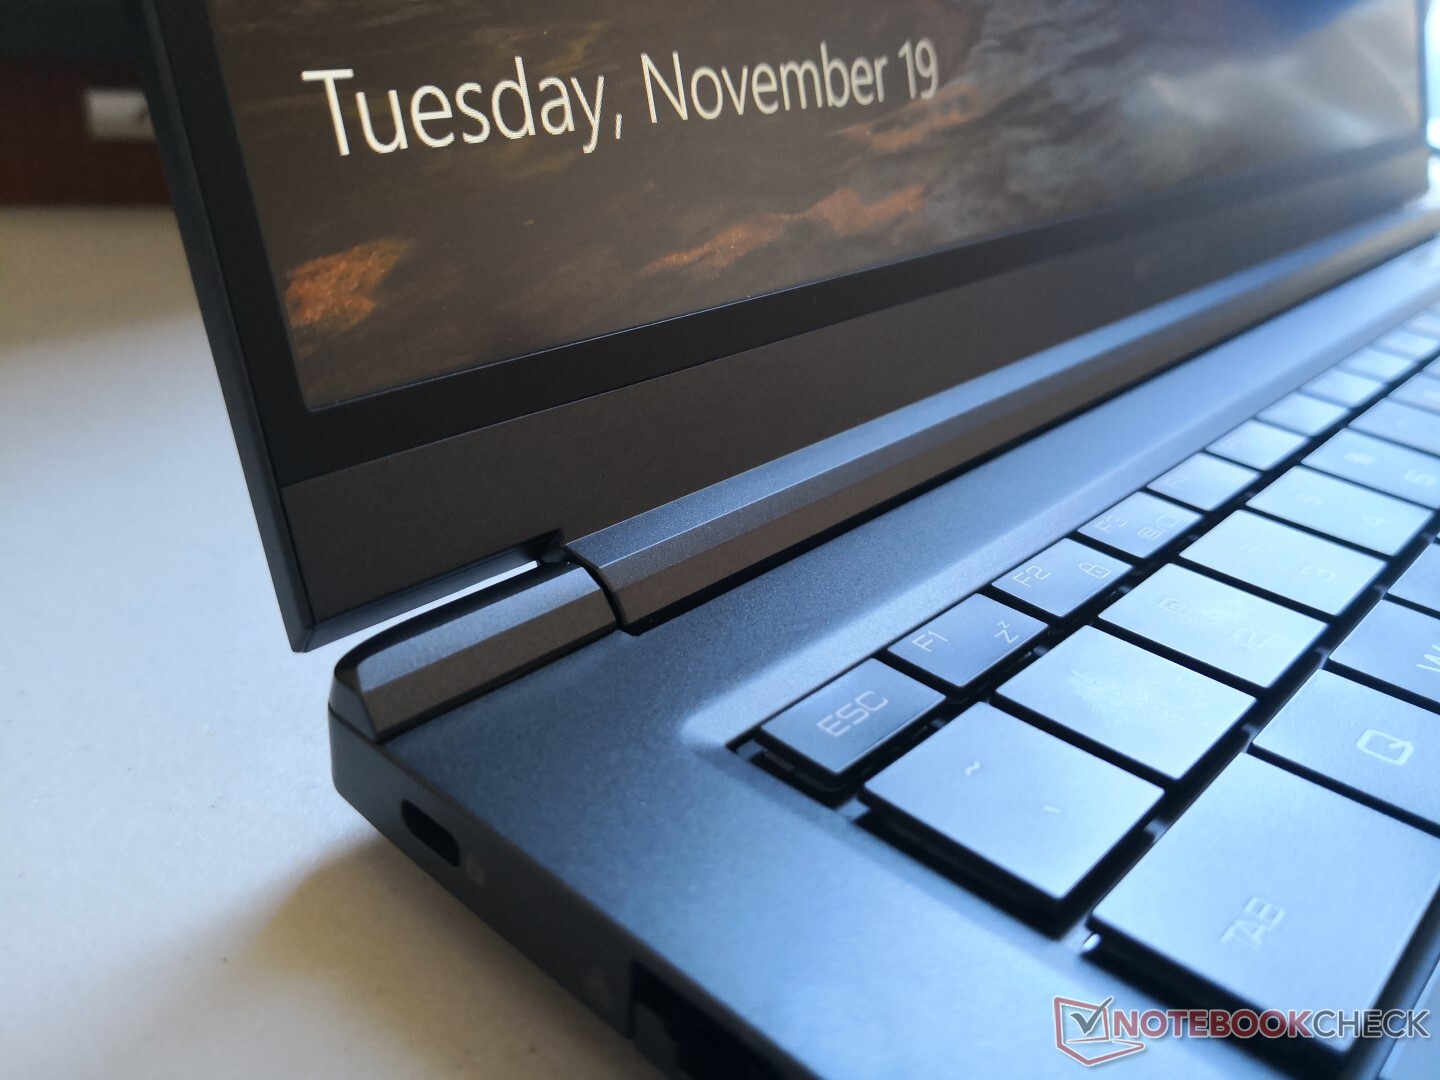
The word "quality" is probably not the first thing users think of when purchasing Walmart-branded products. Indeed, the plastic Motile M142 is simply no match when up against the likes of an XPS 13, HP Spectre 13, Asus ZenBook S13, Lenovo Yoga C930, or Acer Swift 7 in terms of looks or rigidity. Its lid in particular flexes too easily and the hinges feel like they'll be ready to call it quits after just a year or two. For its sub $500 budget category, however, the Motile M142 holds its own pretty well. The lightweight chassis, understated design, and smooth aluminum-like surfaces leave great first impressions considering the price.

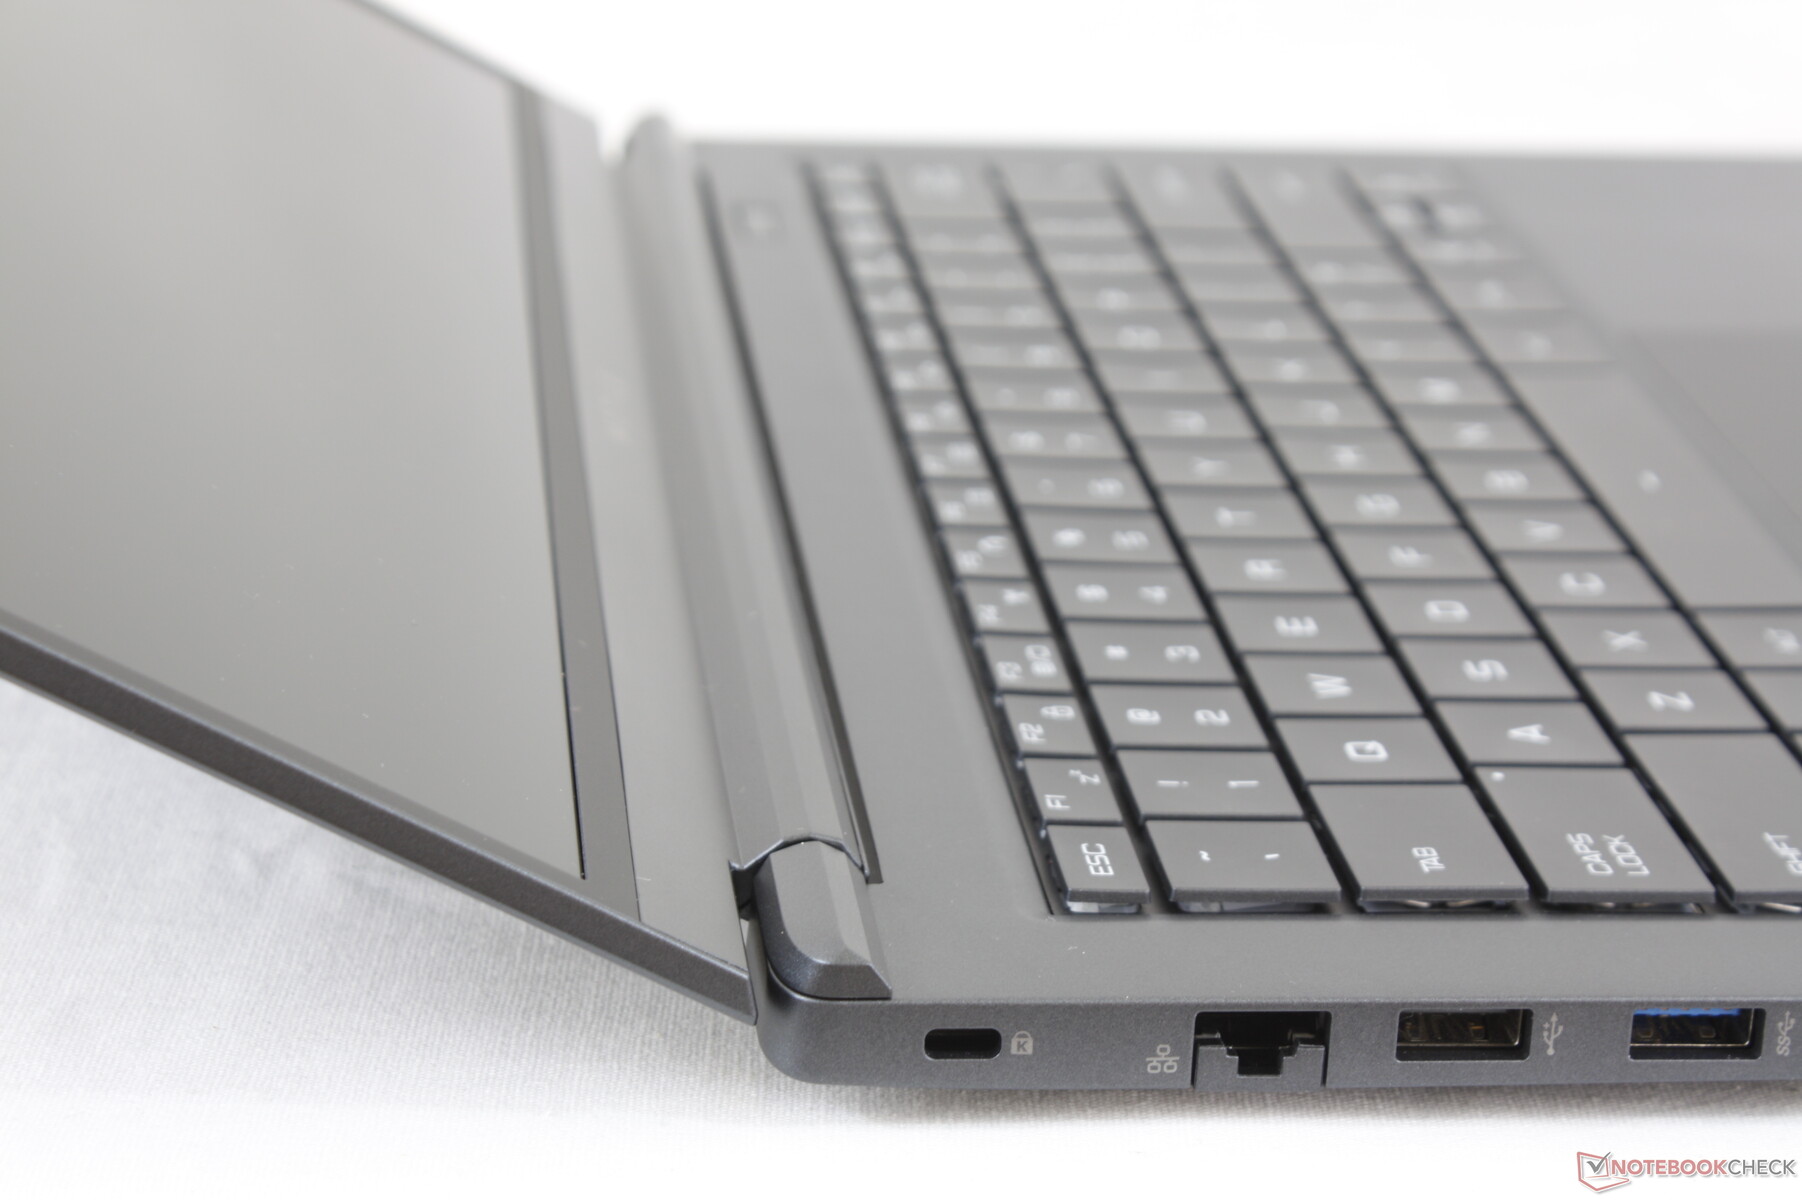
Connectivity
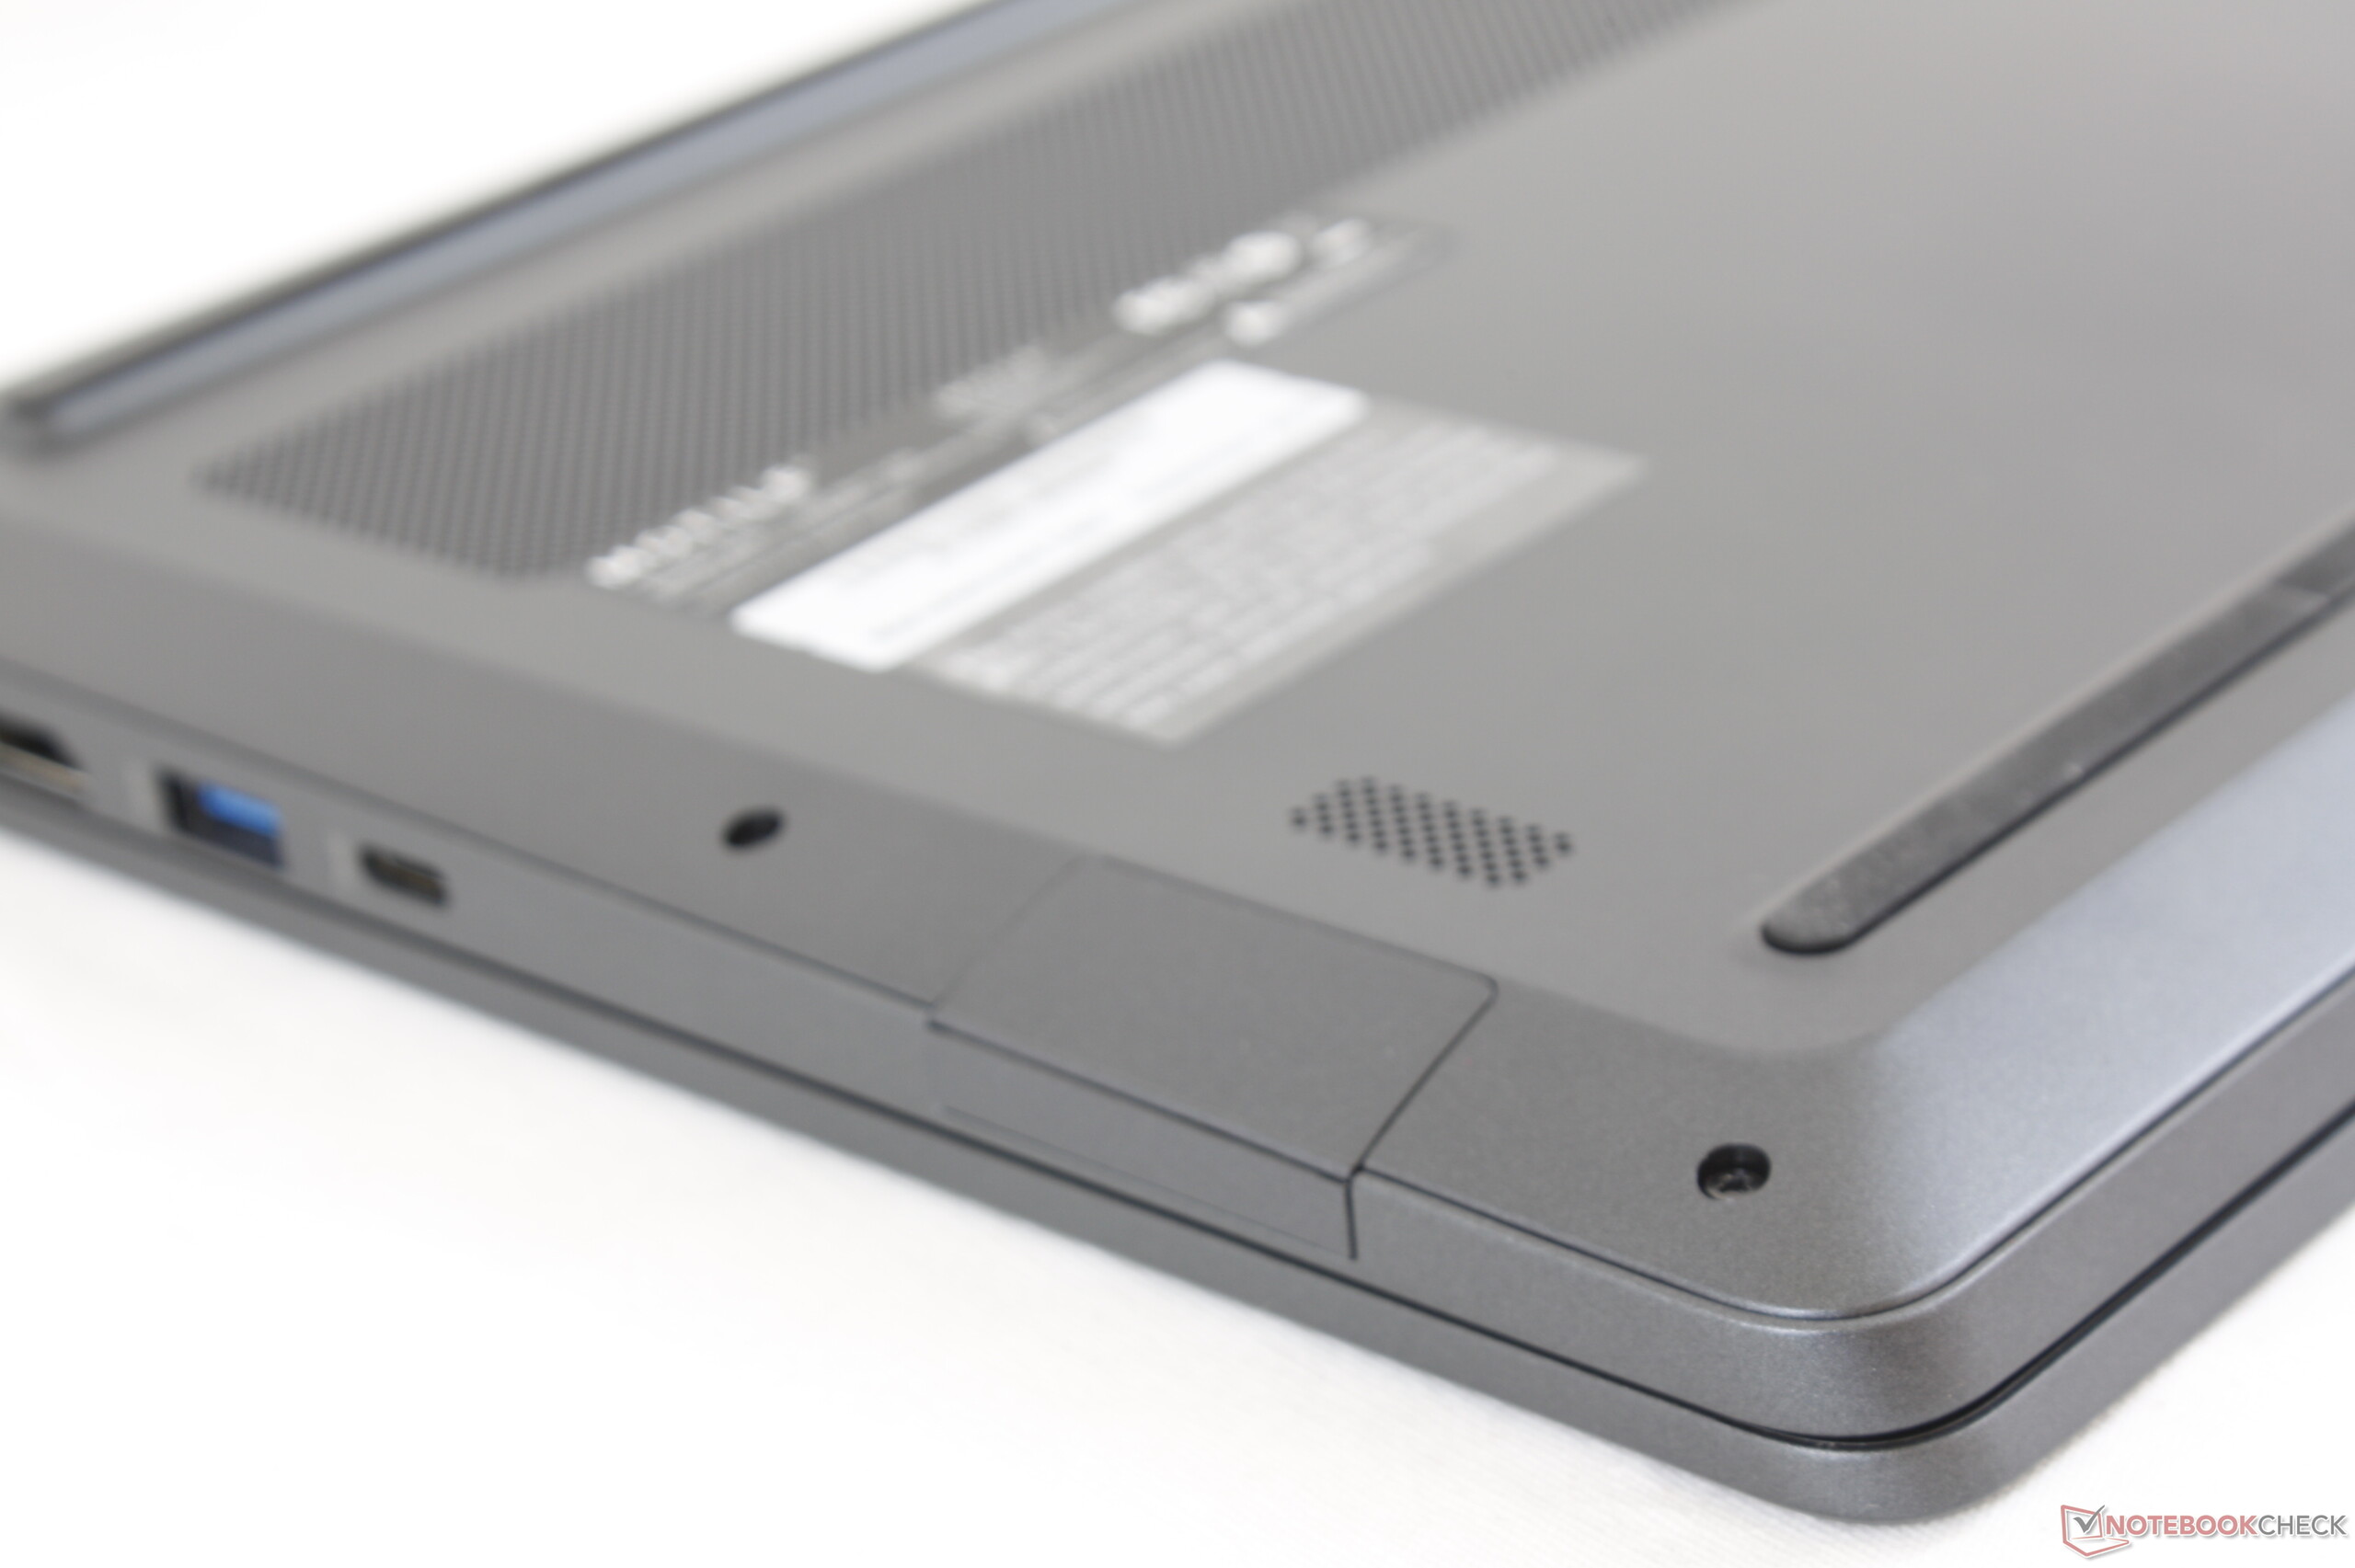
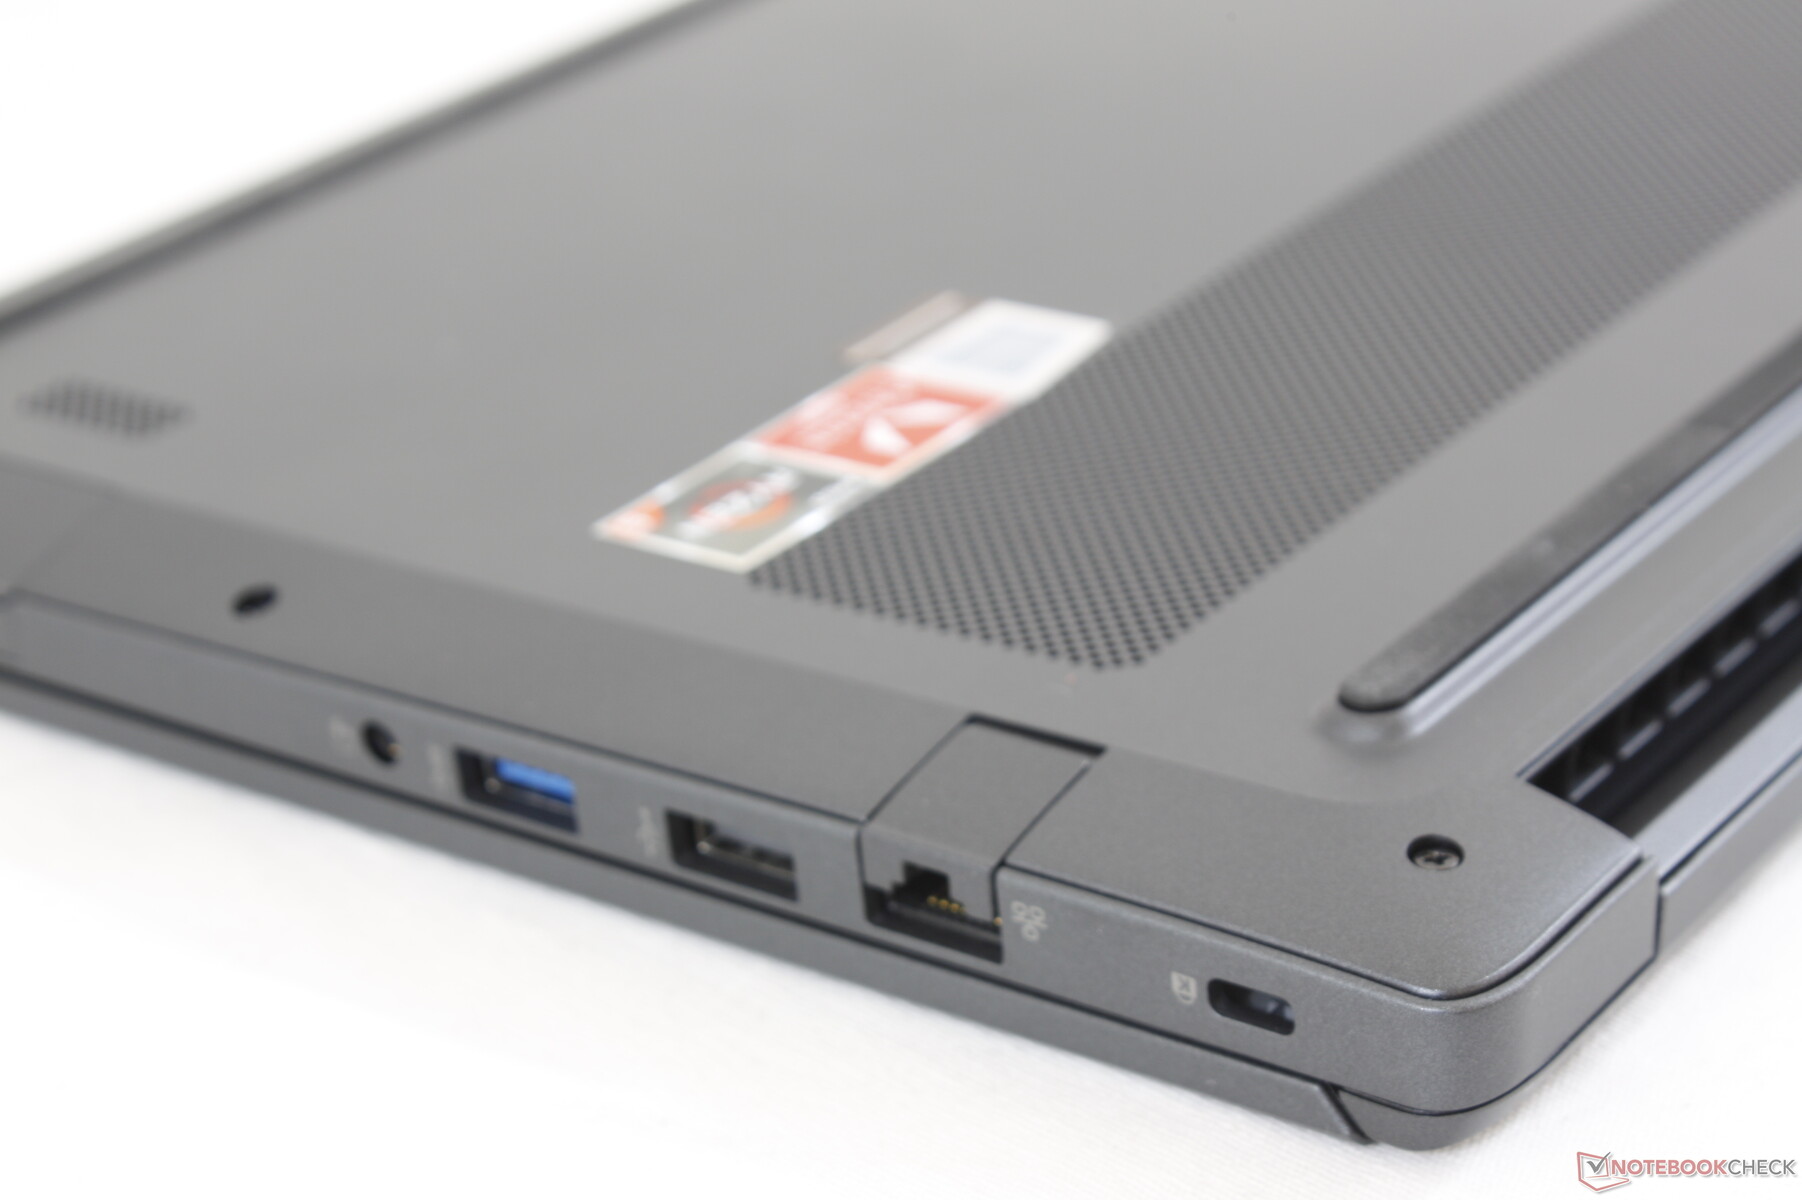
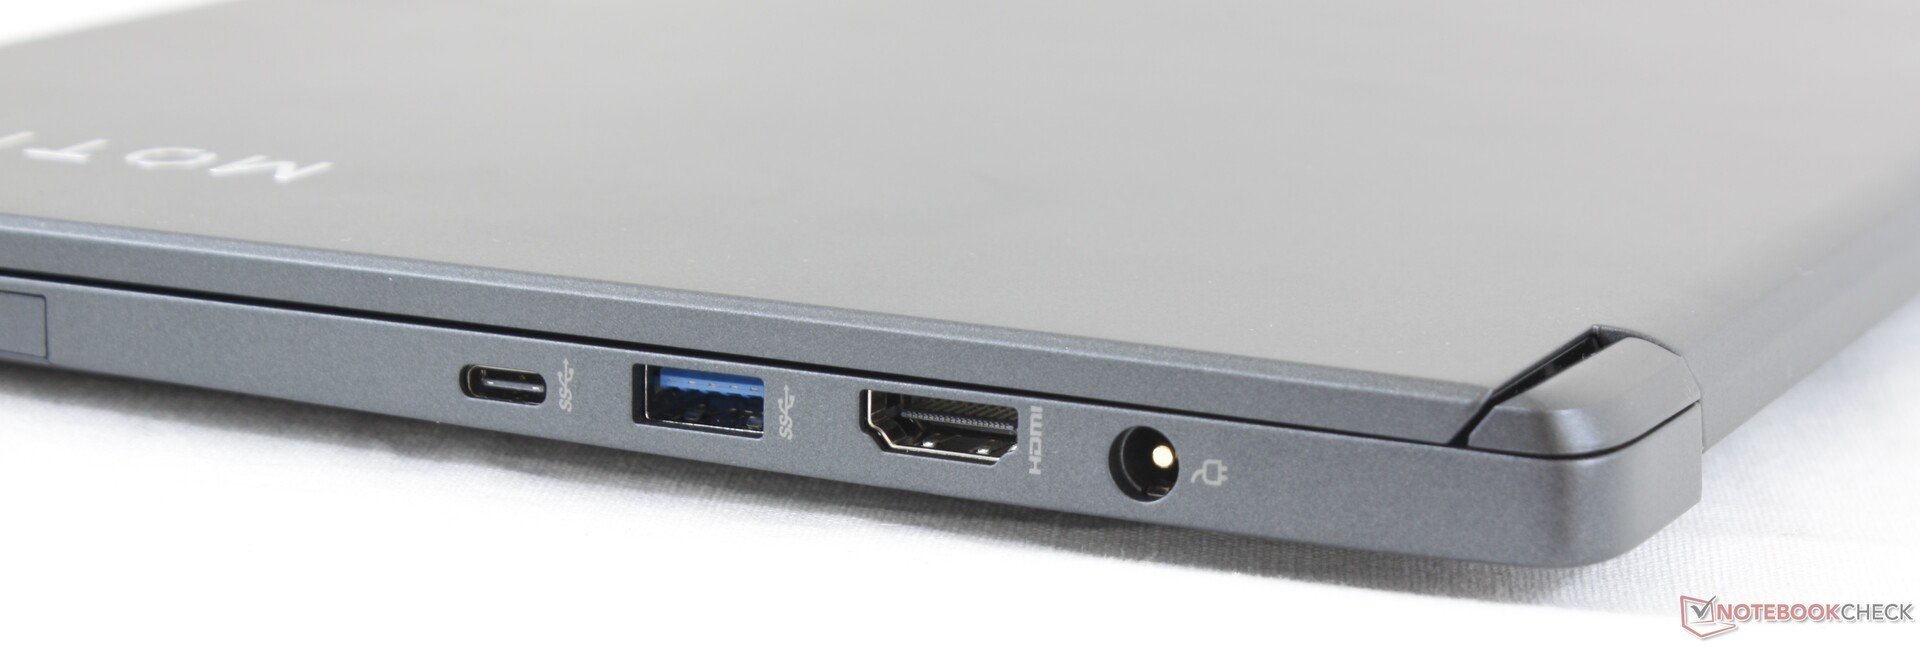
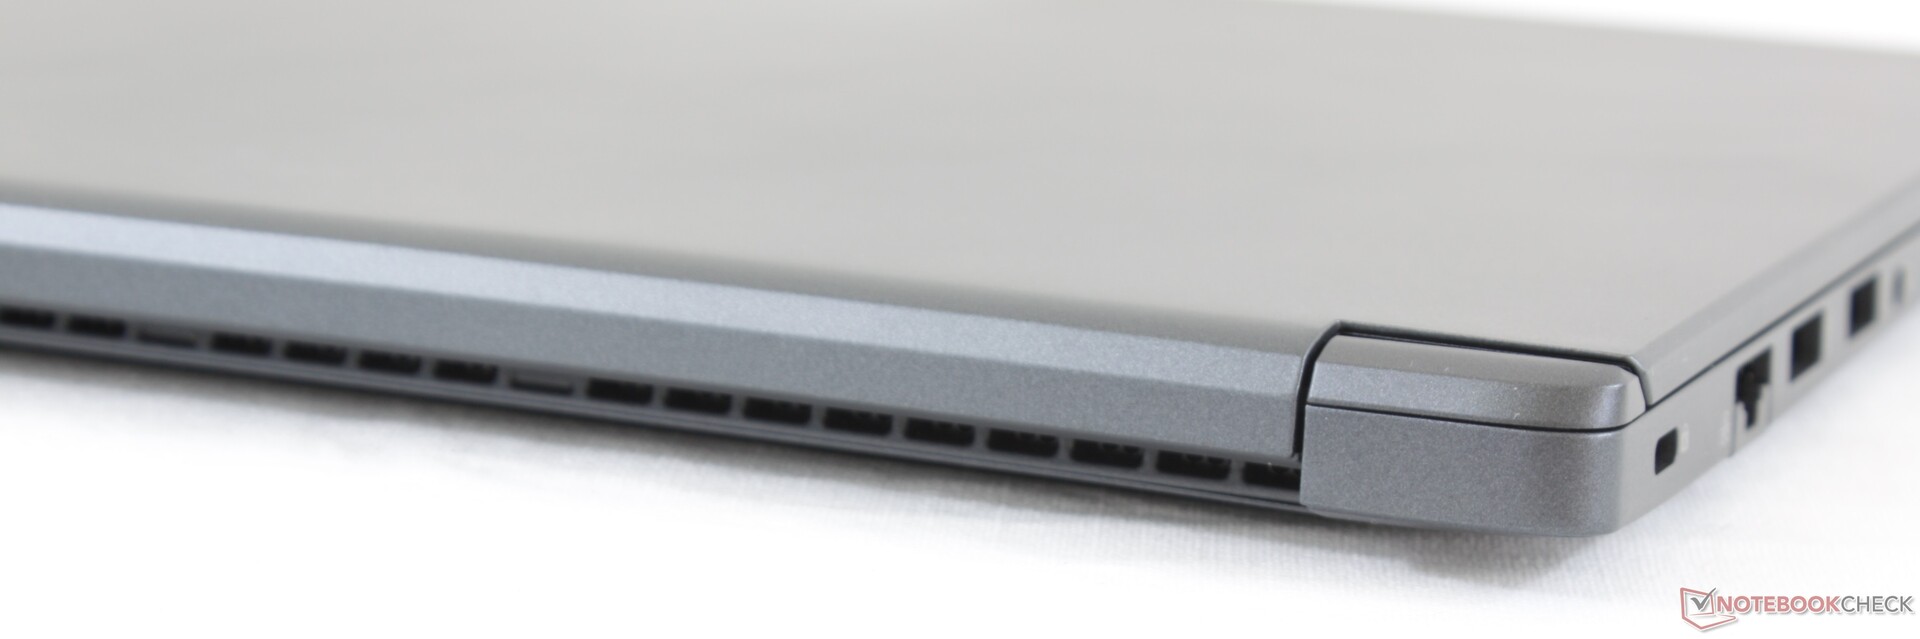
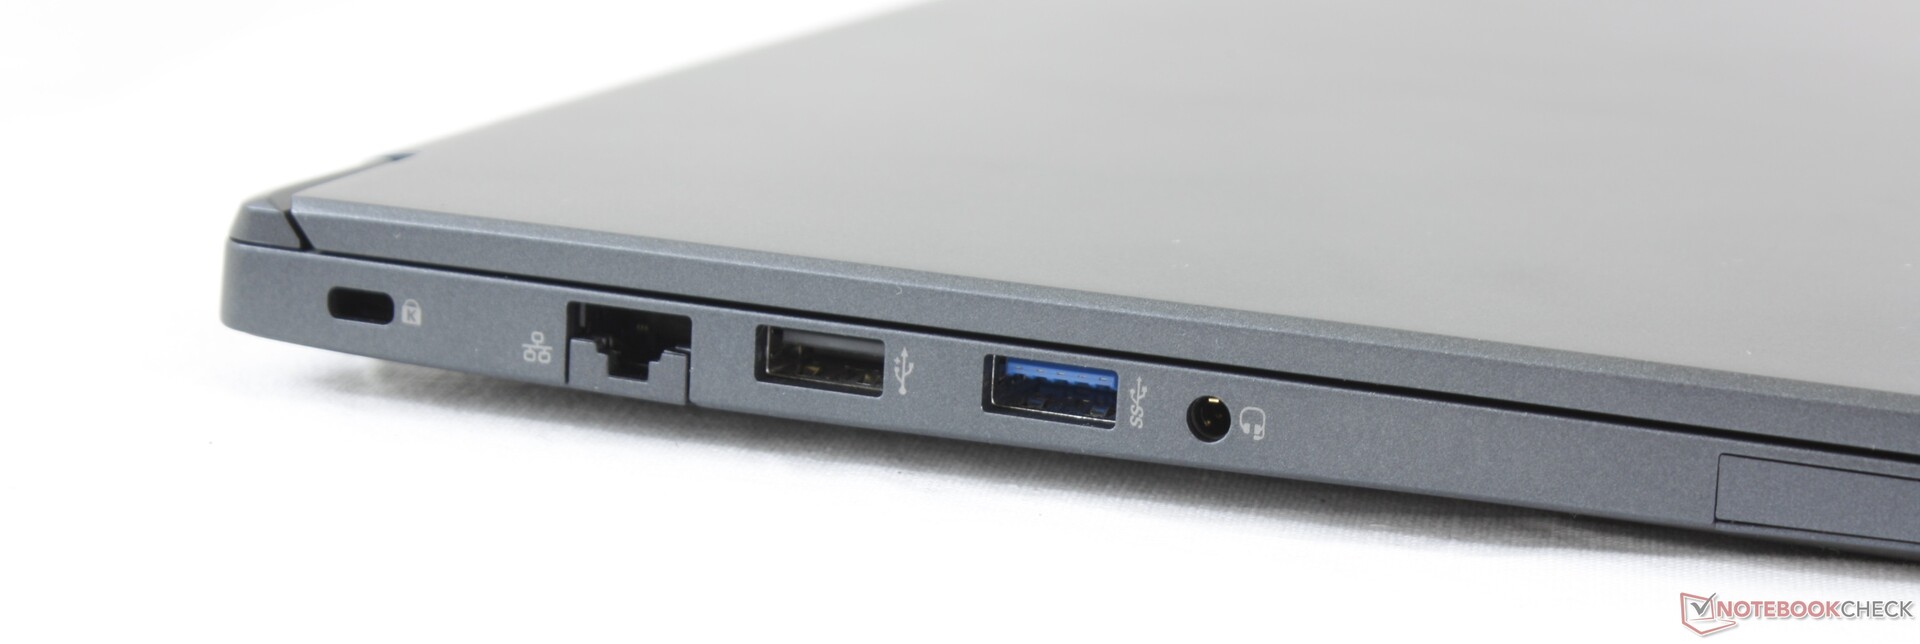
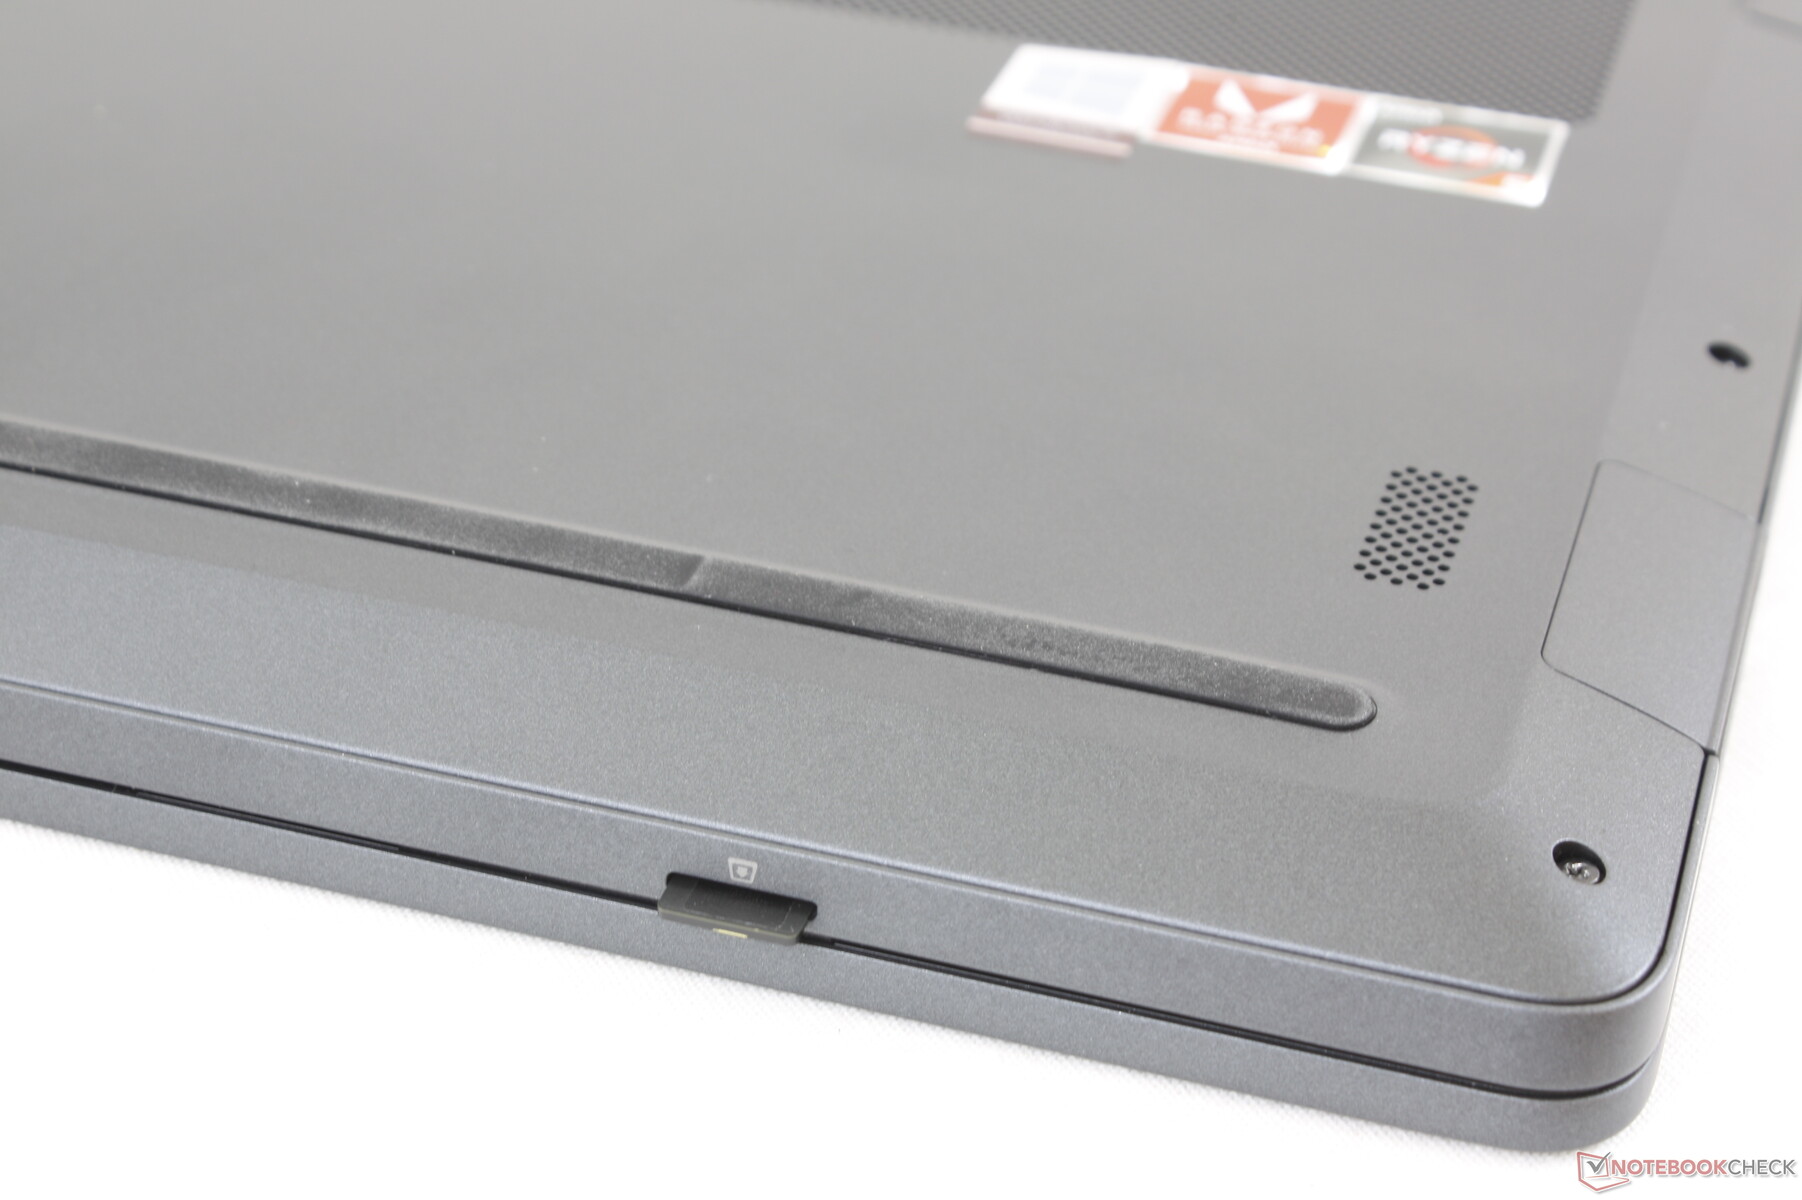
All the basic ports are here and they're evenly spaced along the left and right edges for easy access. The only exception is the MicroSD slot along the front edge which is an oddity on any laptop, but having a card reader is still better than none at all.
USB Power Delivery is not supported meaning that the system cannot be recharged via USB Type-C.
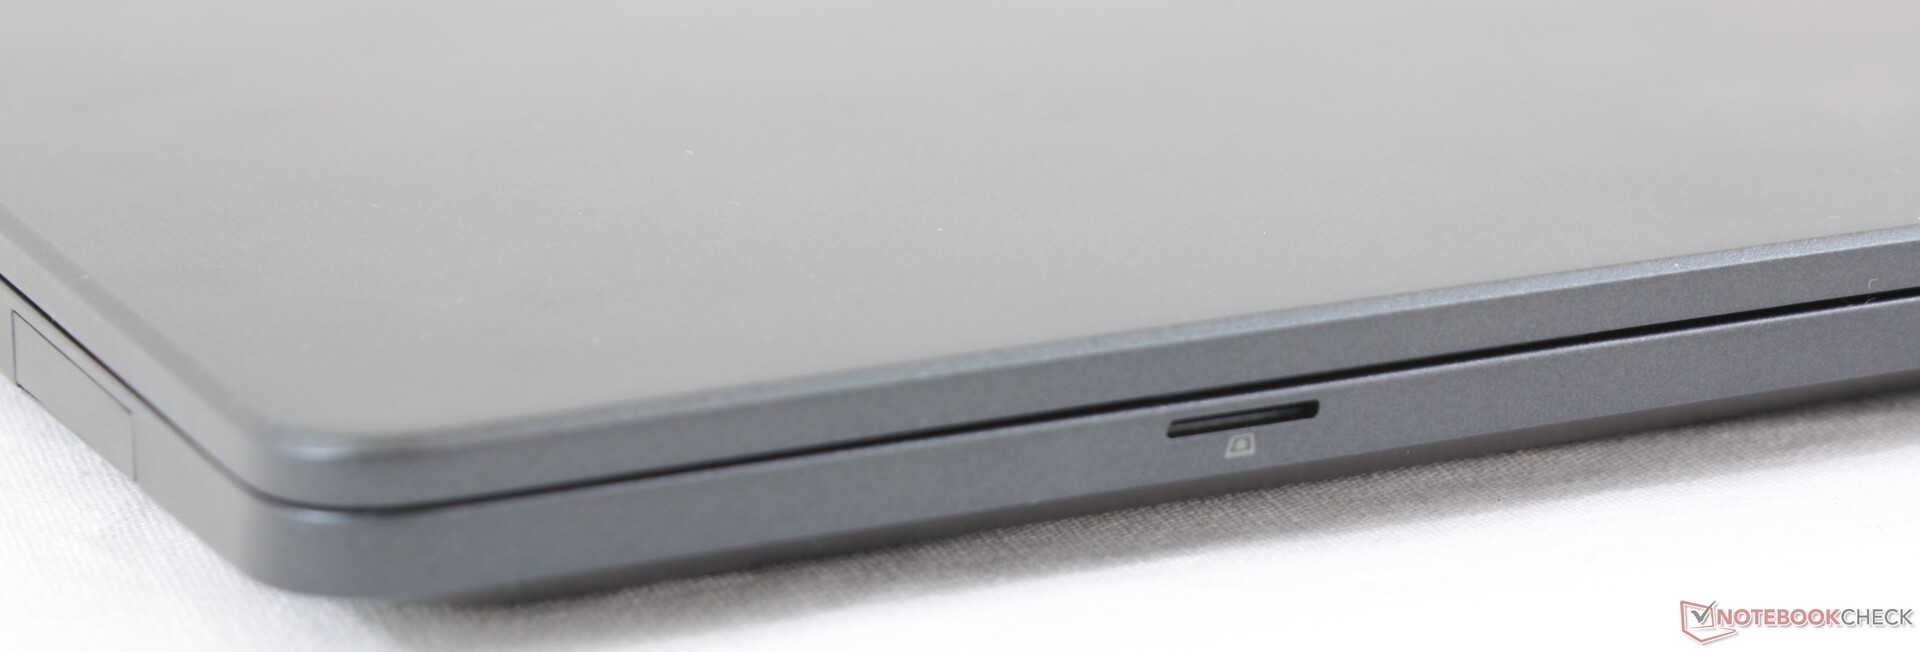
SD Card Reader
Transferring 1 GB of images from our UHS-II test card to desktop takes about 30 seconds. The slot is not spring-loaded and so we don't recommend keeping the MicroSD card inserted for longer than it needs to be.
| SD Card Reader | |
| average JPG Copy Test (av. of 3 runs) | |
| Lenovo IdeaPad S540-14IWL (Toshiba Exceria Pro SDXC 64 GB UHS-II) | |
| Acer Swift 3 SF314-41-R8HZ (Toshiba Exceria Pro SDXC 64 GB UHS-II) | |
| HP 14-dk0008ng (Toshiba Exceria Pro SDXC 64 GB UHS-II) | |
| Walmart Motile M142 (Toshiba Exceria Pro M501 64 GB UHS-II) | |
| Asus VivoBook 14 X403FA (Toshiba Exceria Pro SDXC 64 GB UHS-II) | |
| maximum AS SSD Seq Read Test (1GB) | |
| Lenovo IdeaPad S540-14IWL (Toshiba Exceria Pro SDXC 64 GB UHS-II) | |
| HP 14-dk0008ng (Toshiba Exceria Pro SDXC 64 GB UHS-II) | |
| Acer Swift 3 SF314-41-R8HZ (Toshiba Exceria Pro SDXC 64 GB UHS-II) | |
| Walmart Motile M142 (Toshiba Exceria Pro M501 64 GB UHS-II) | |
| Asus VivoBook 14 X403FA (Toshiba Exceria Pro SDXC 64 GB UHS-II) | |
Communication
The system ships with the older 1x1 Intel 3168 compared to the 2x2 Intel 9560 as found on most newer Ultrabooks likely to save on costs. Theoretical transfer rates are limited to just 433 Mbps when on an 802.11ac network.
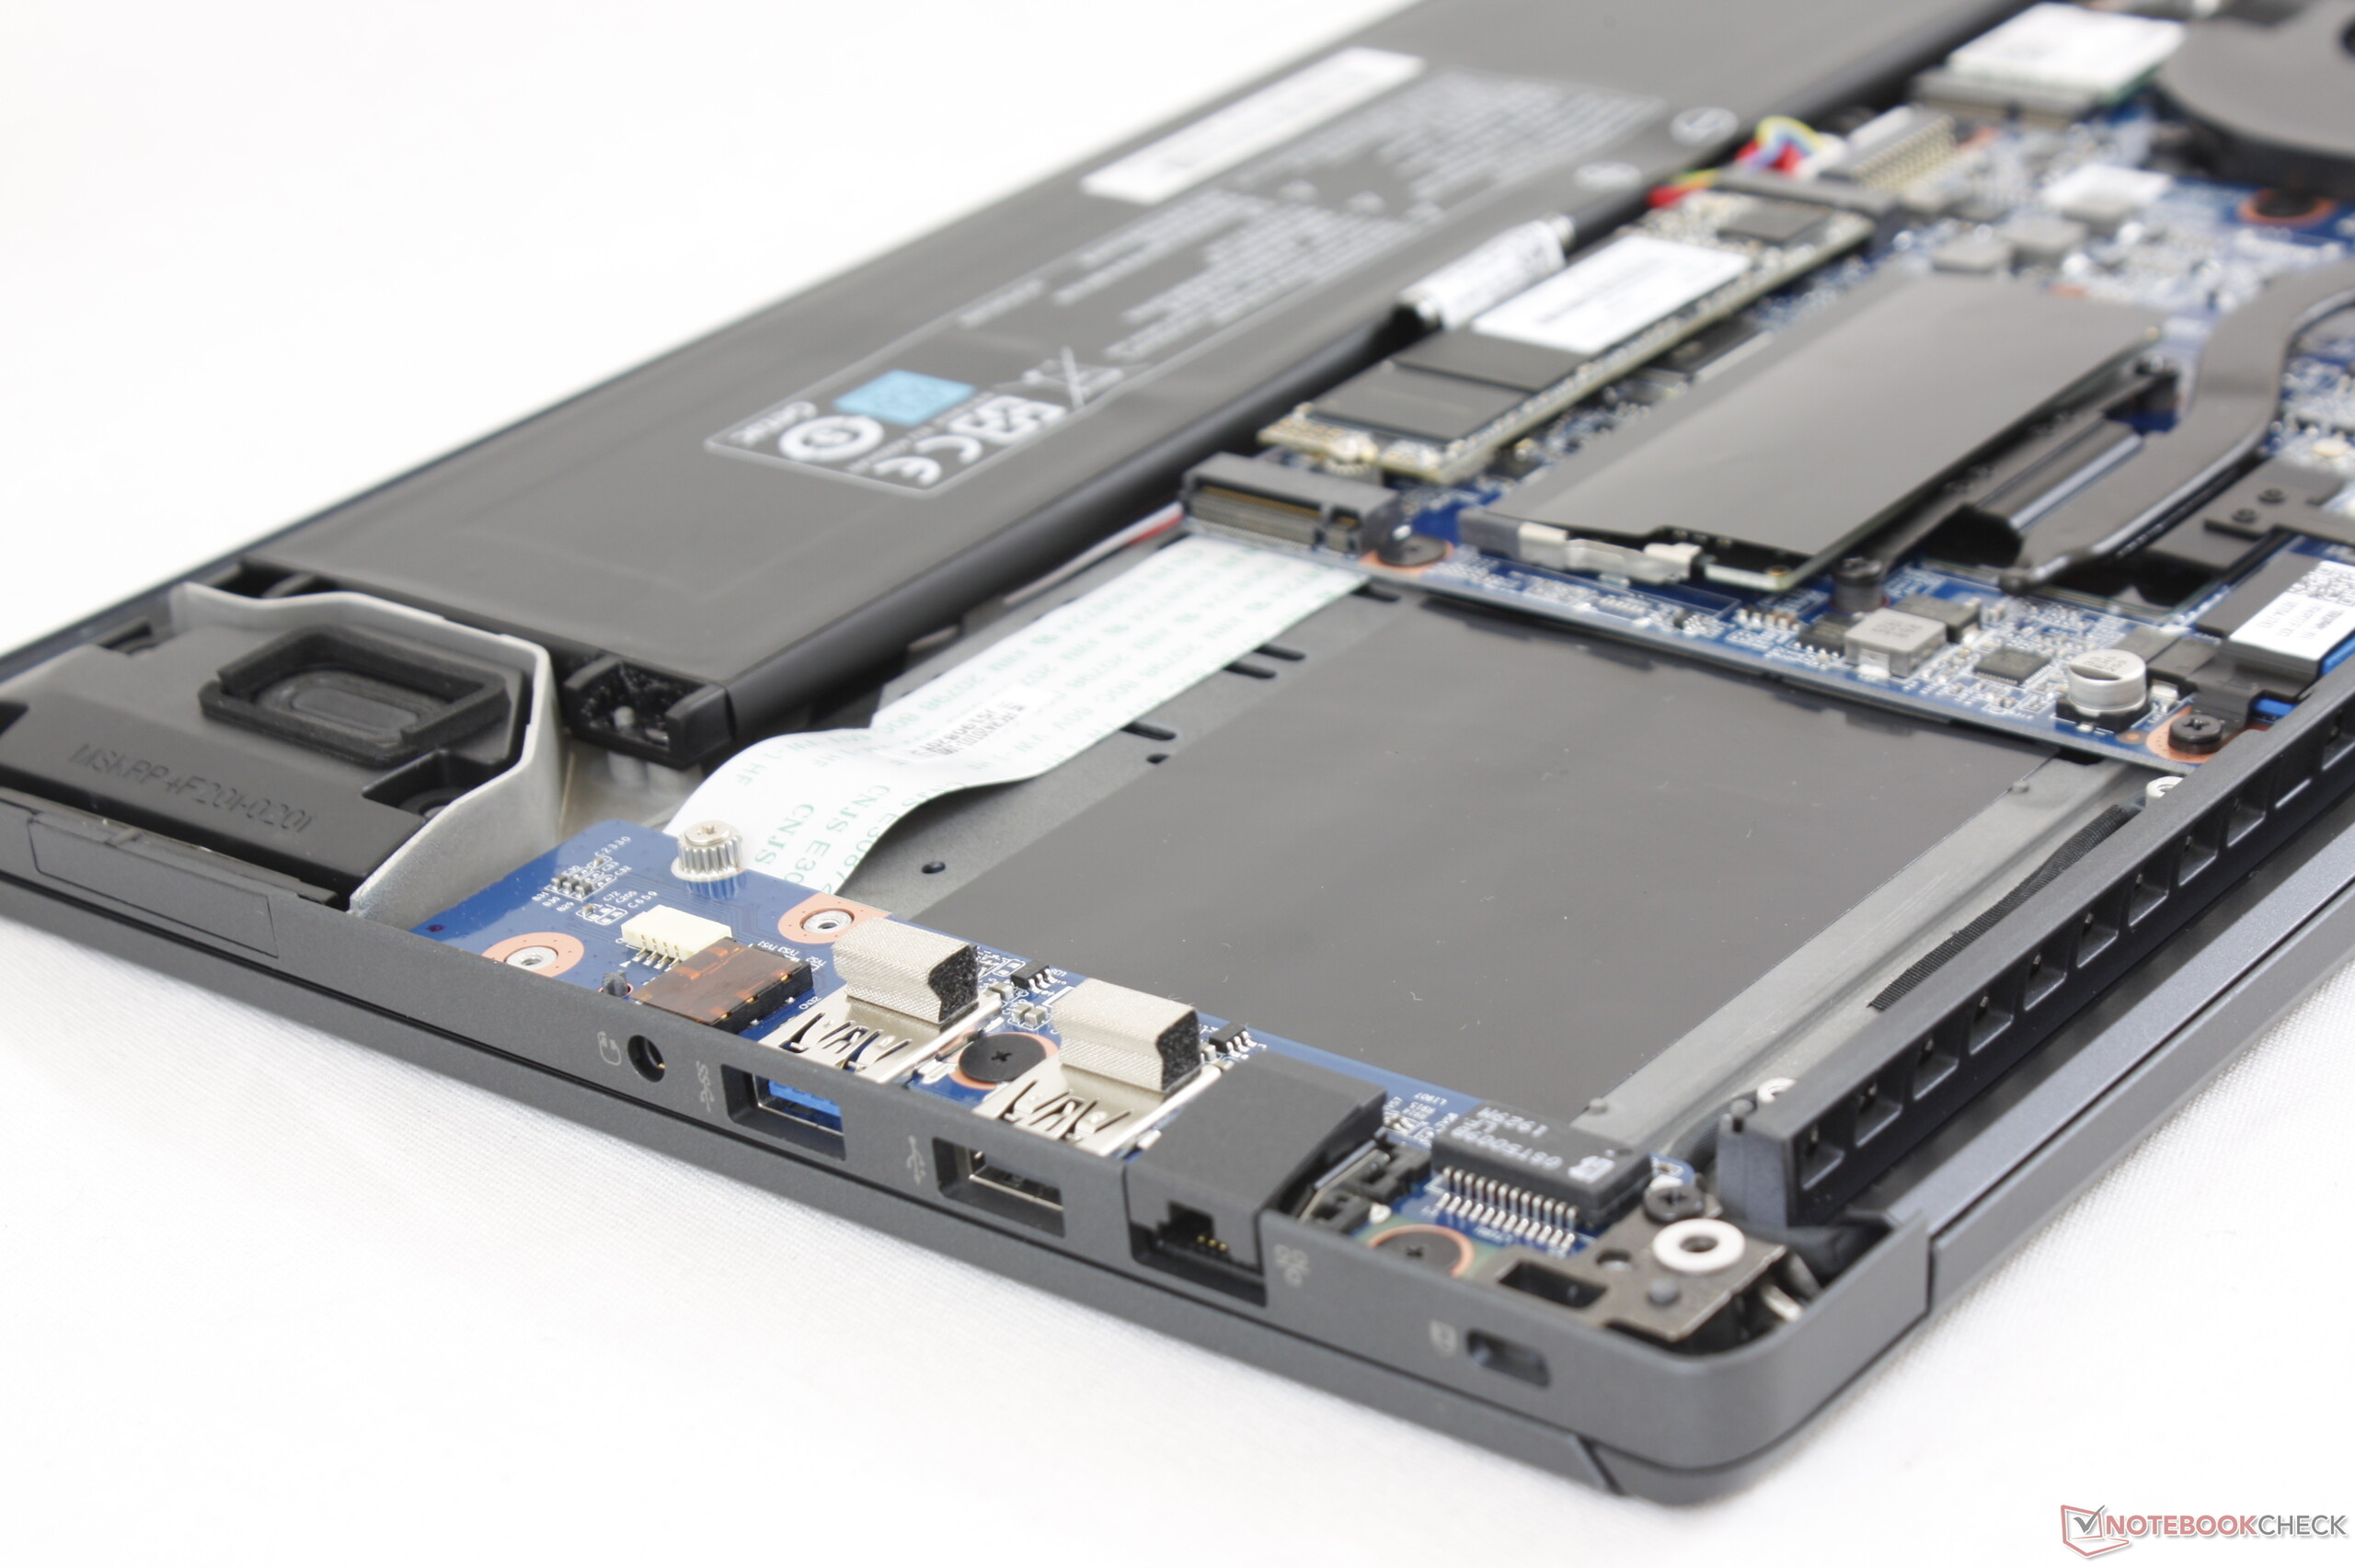
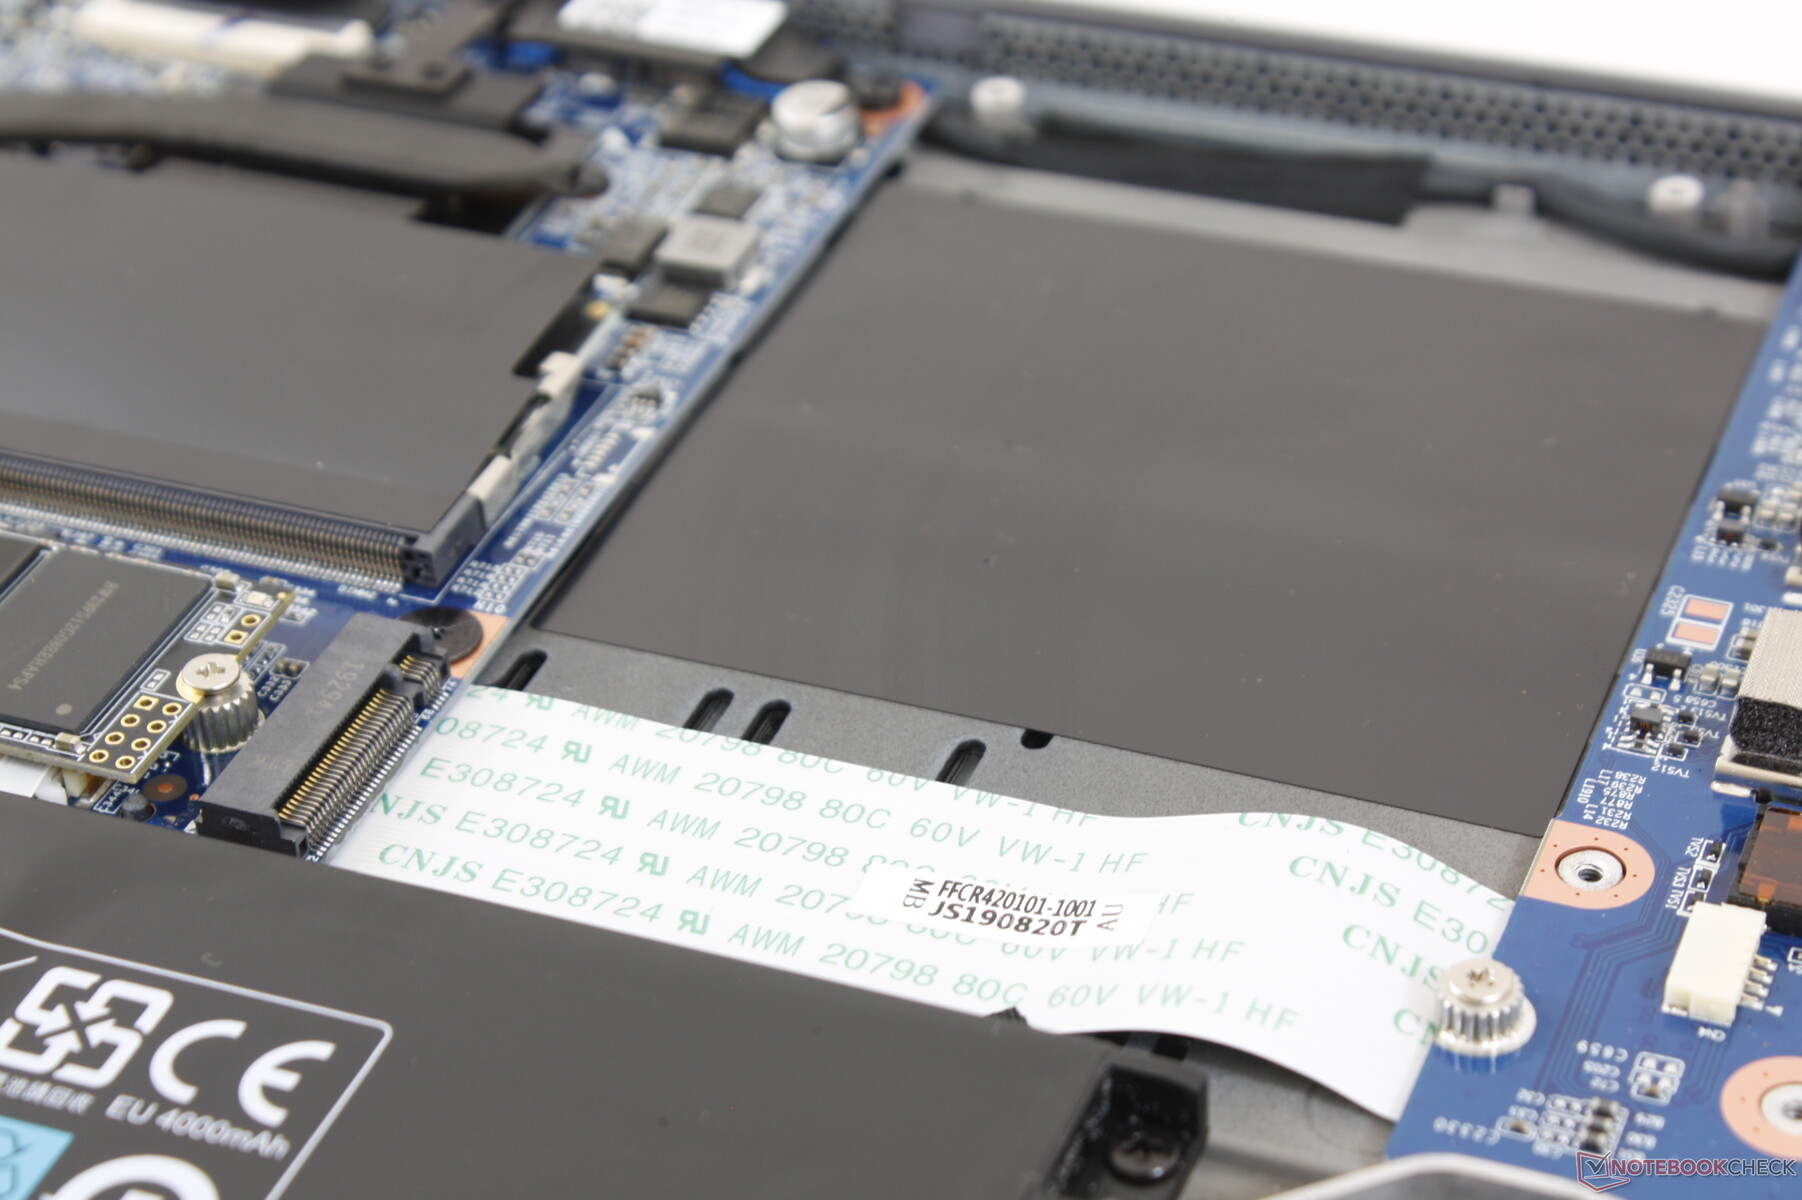
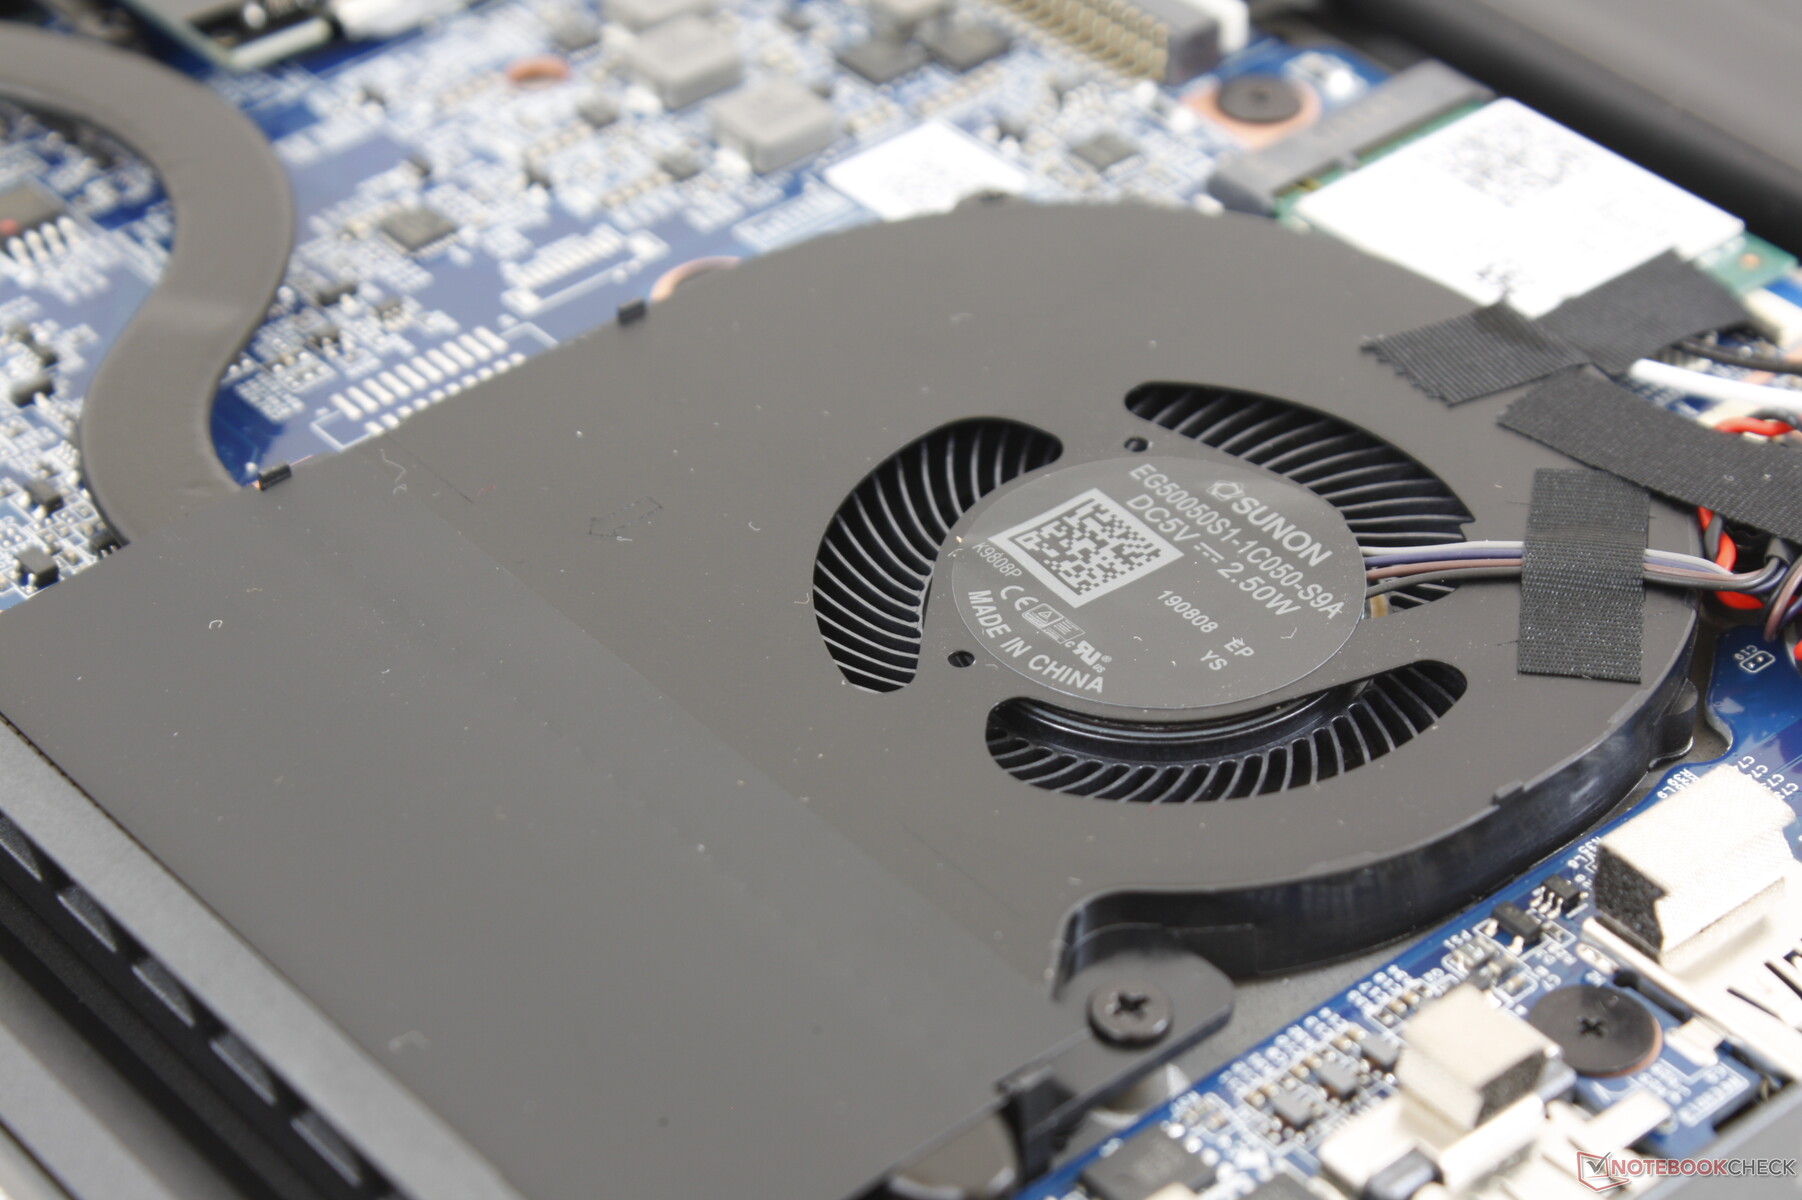
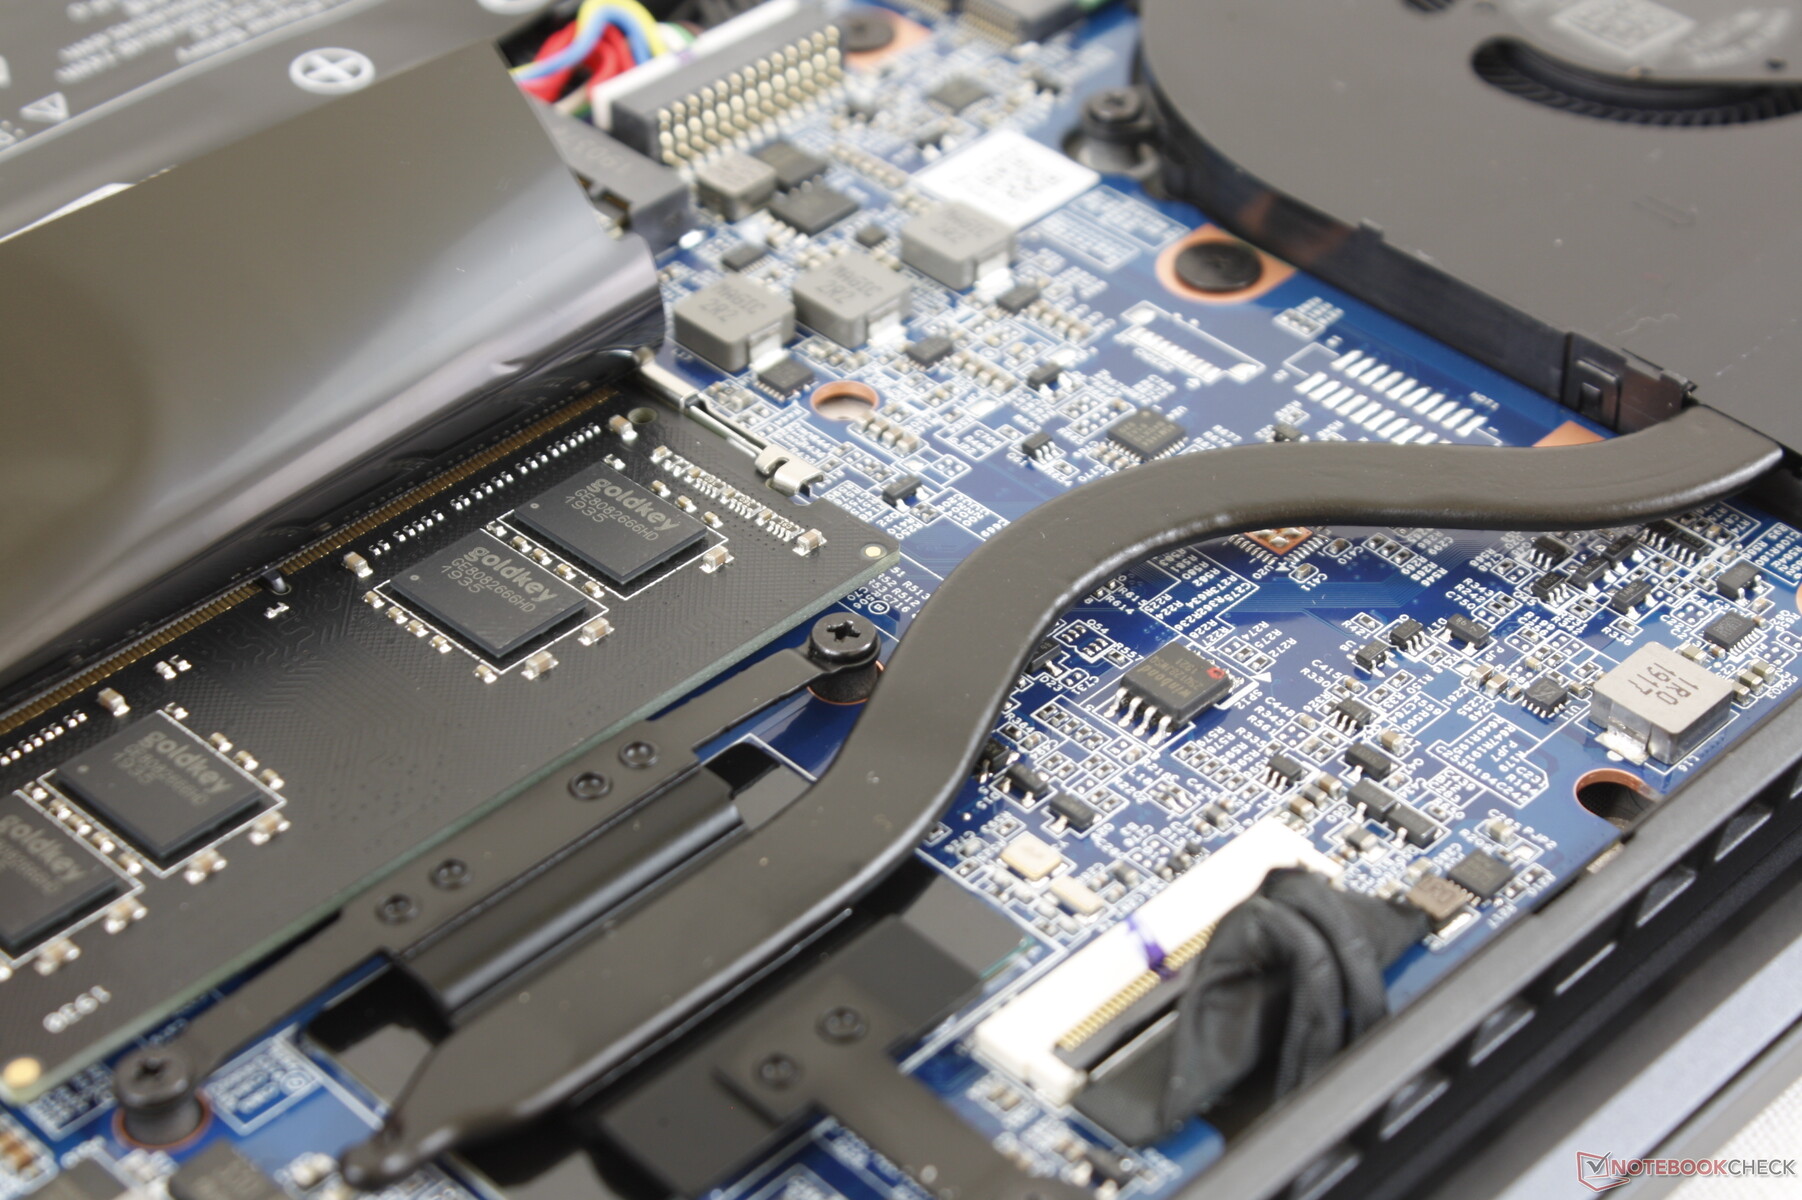
Maintenance
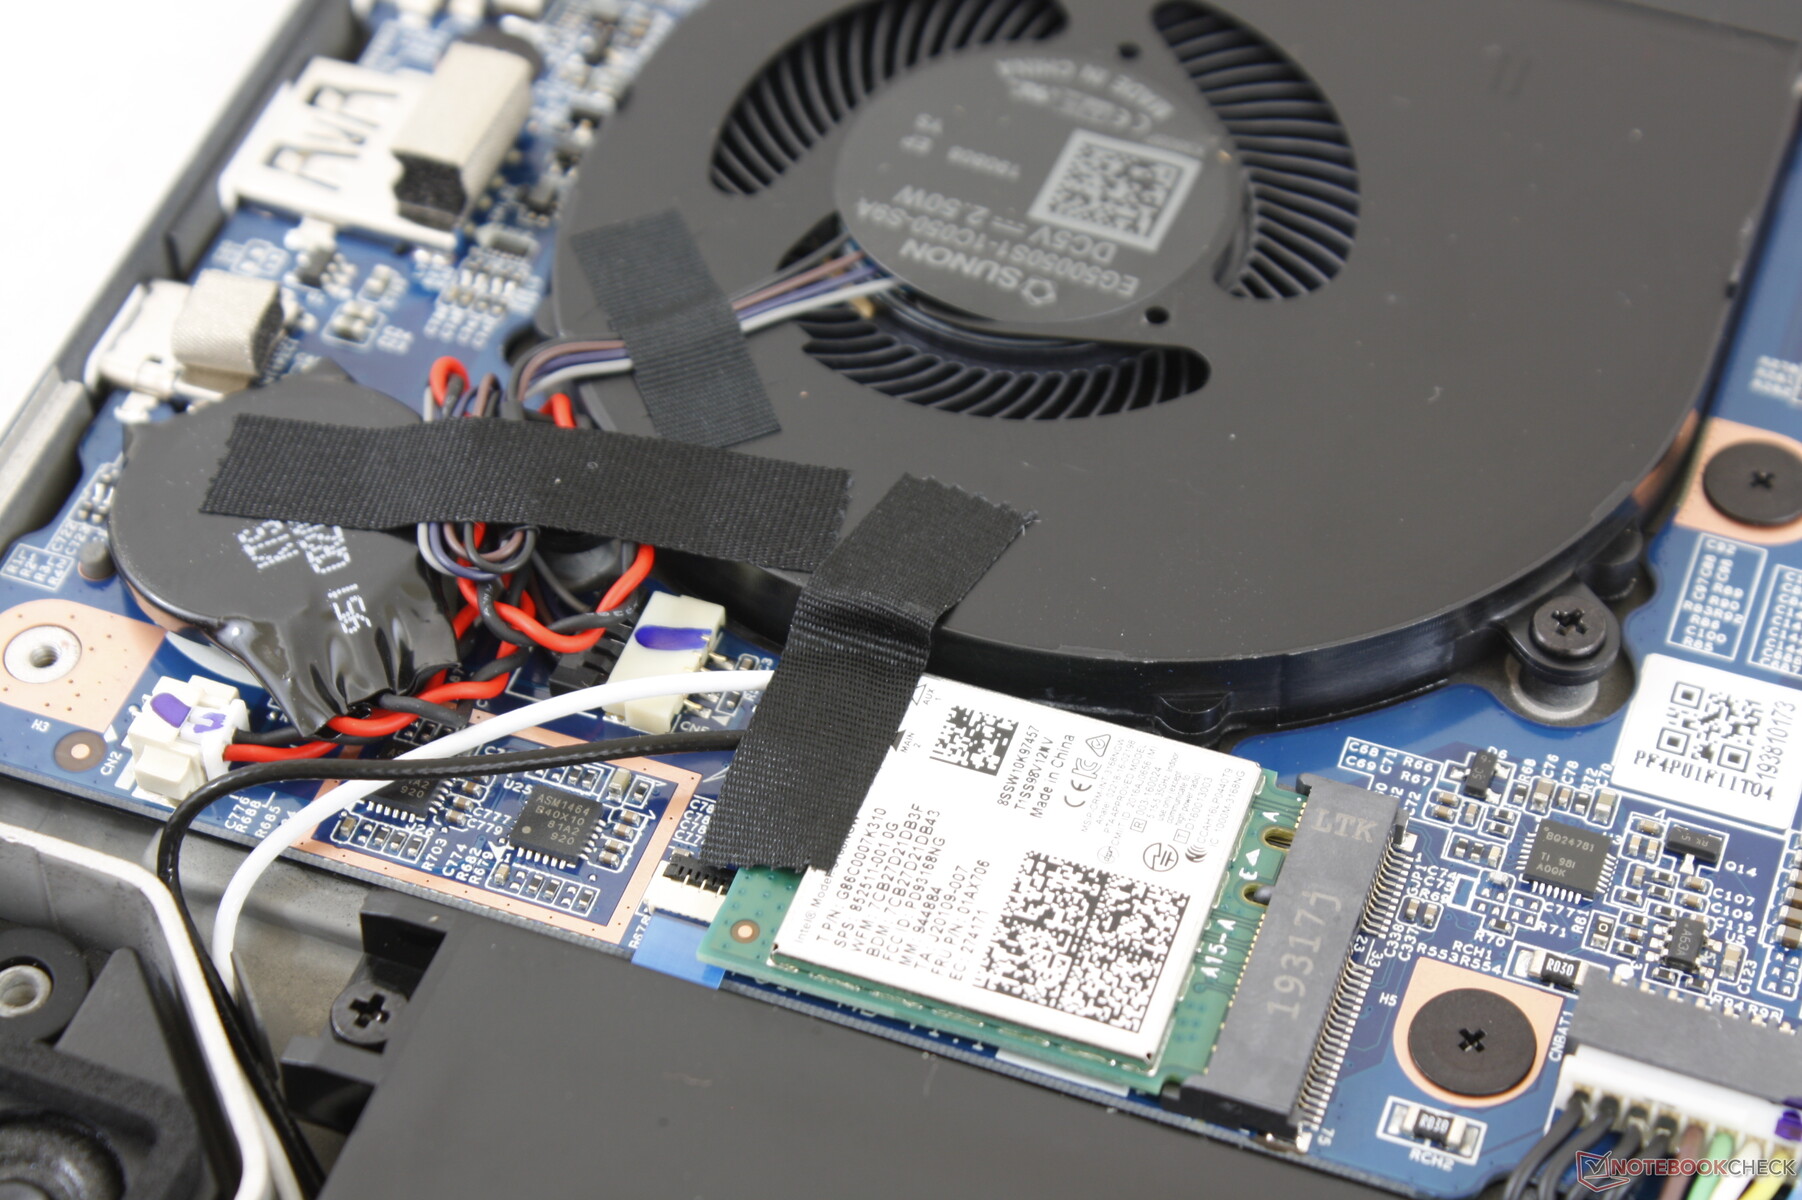
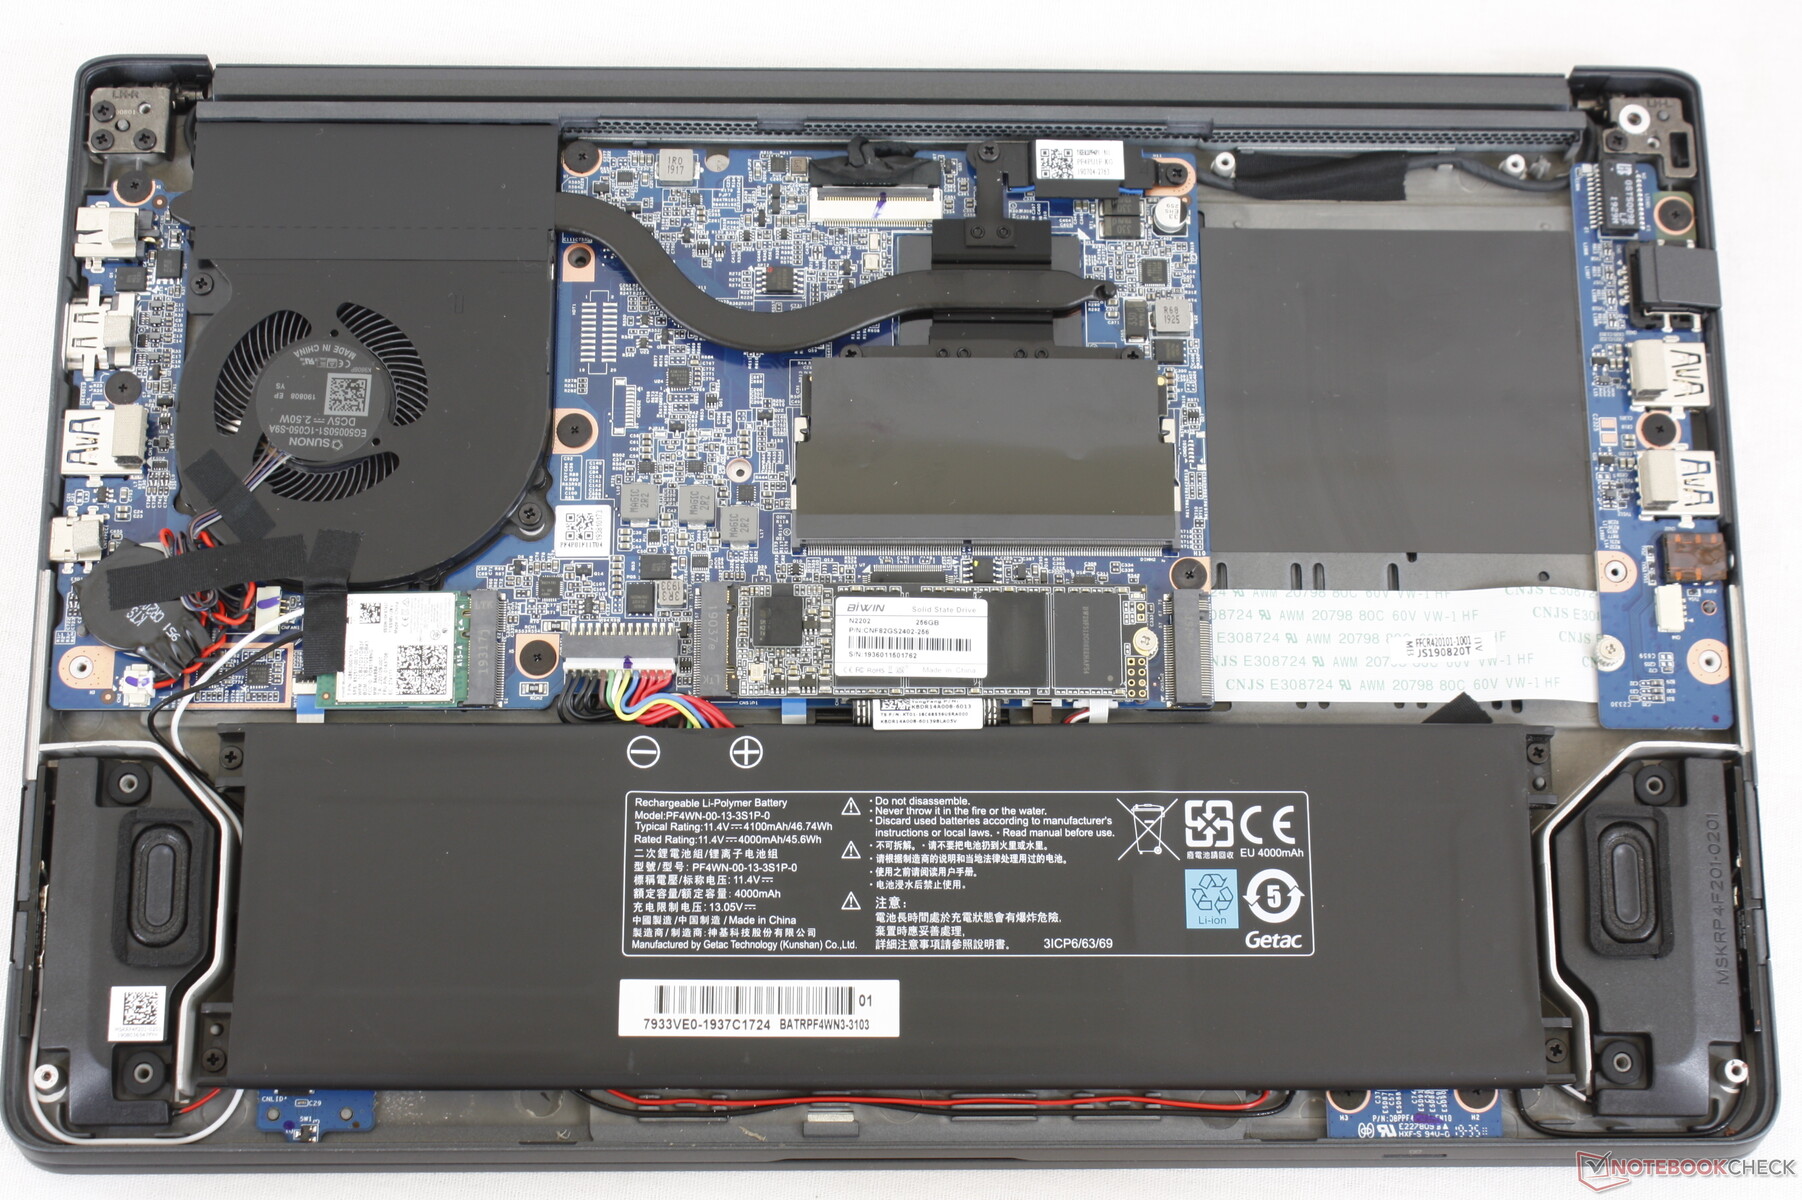
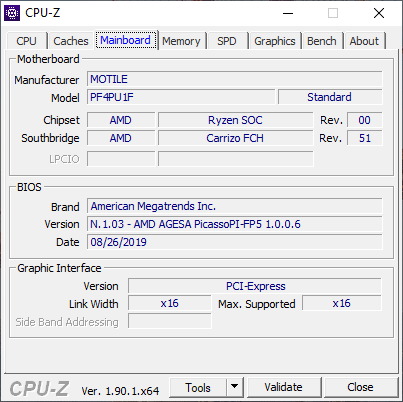
Servicing is relatively easy as it requires only a Philips screwdriver. Users have access to two M.2 slots, one DDR4 SODIMM slot, WLAN module, and the BIOS battery.
Accessories and Warranty
There are no extras in the box other than the paperwork and AC adapter.
The usual one-year limited manufacturer warranty applies.
Input Devices
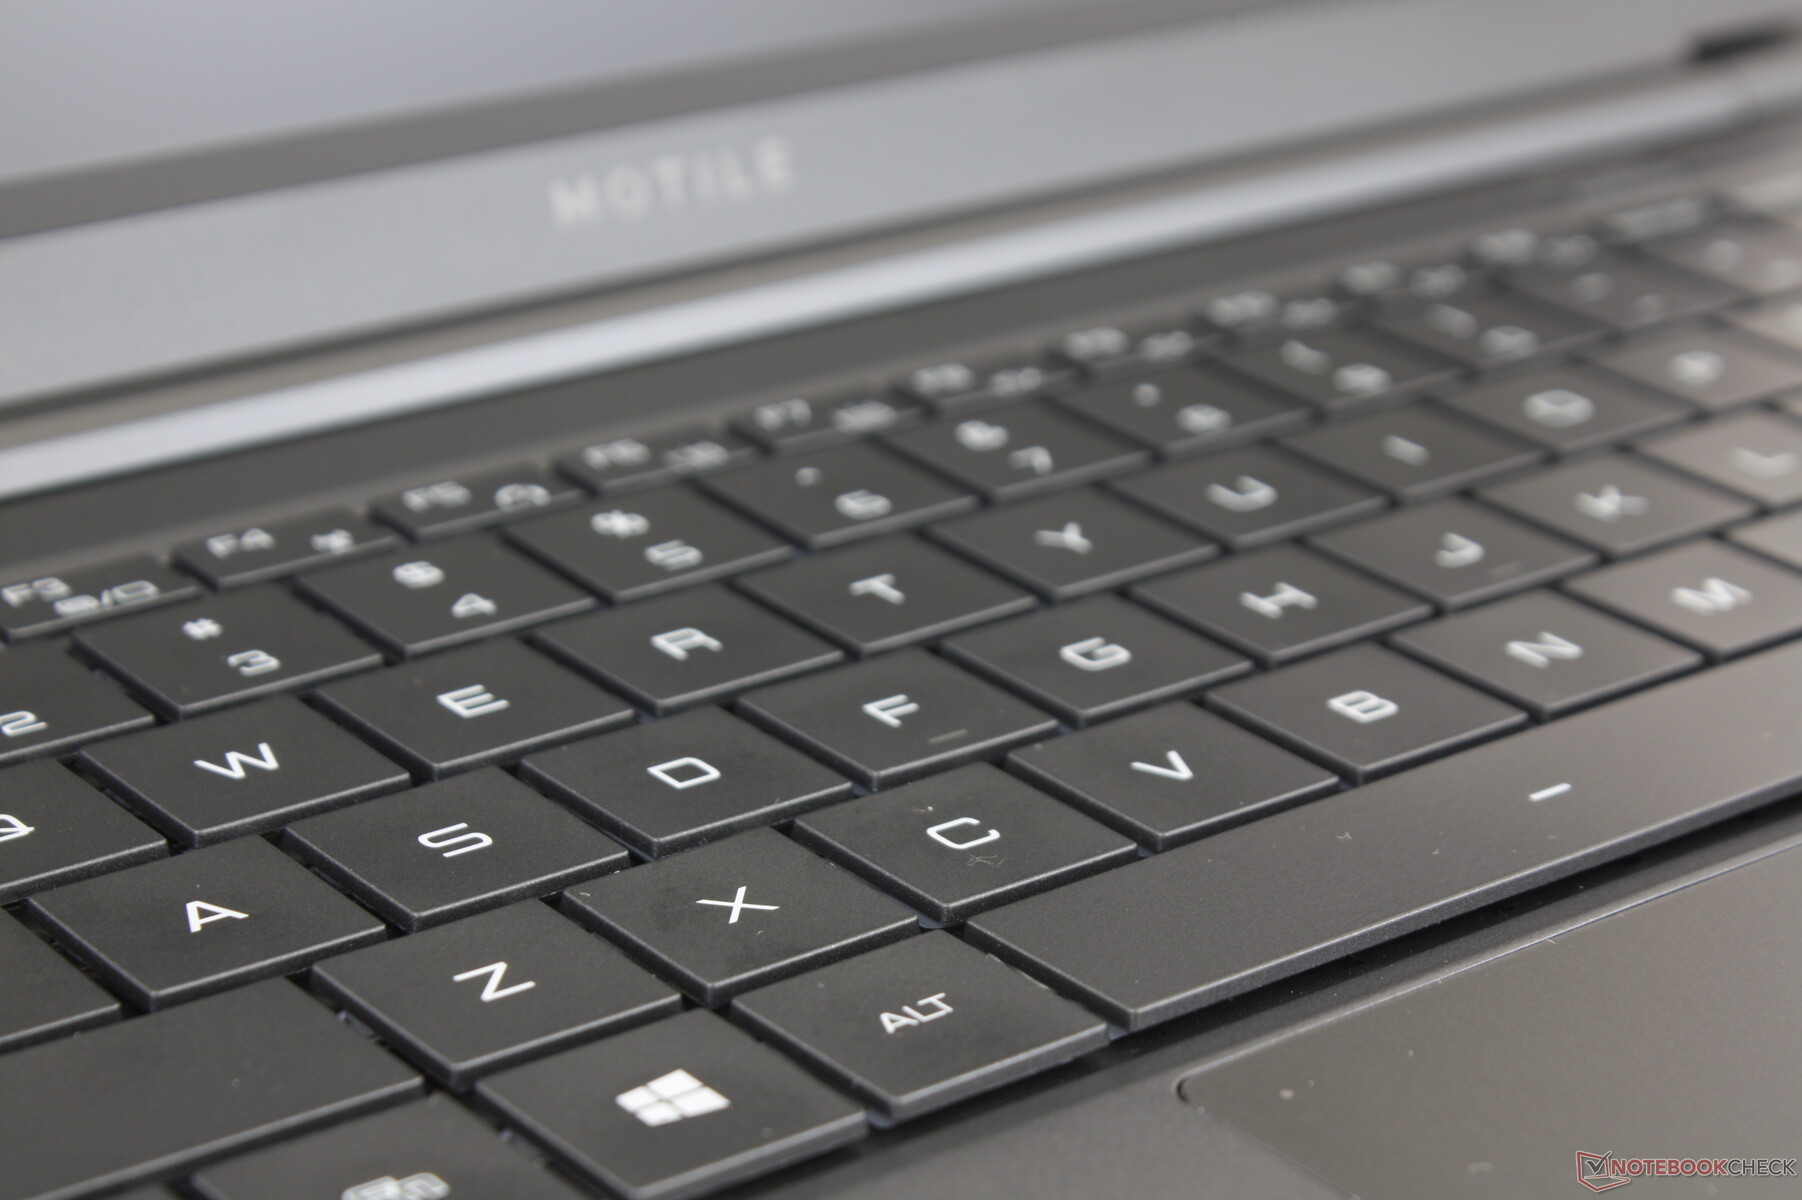
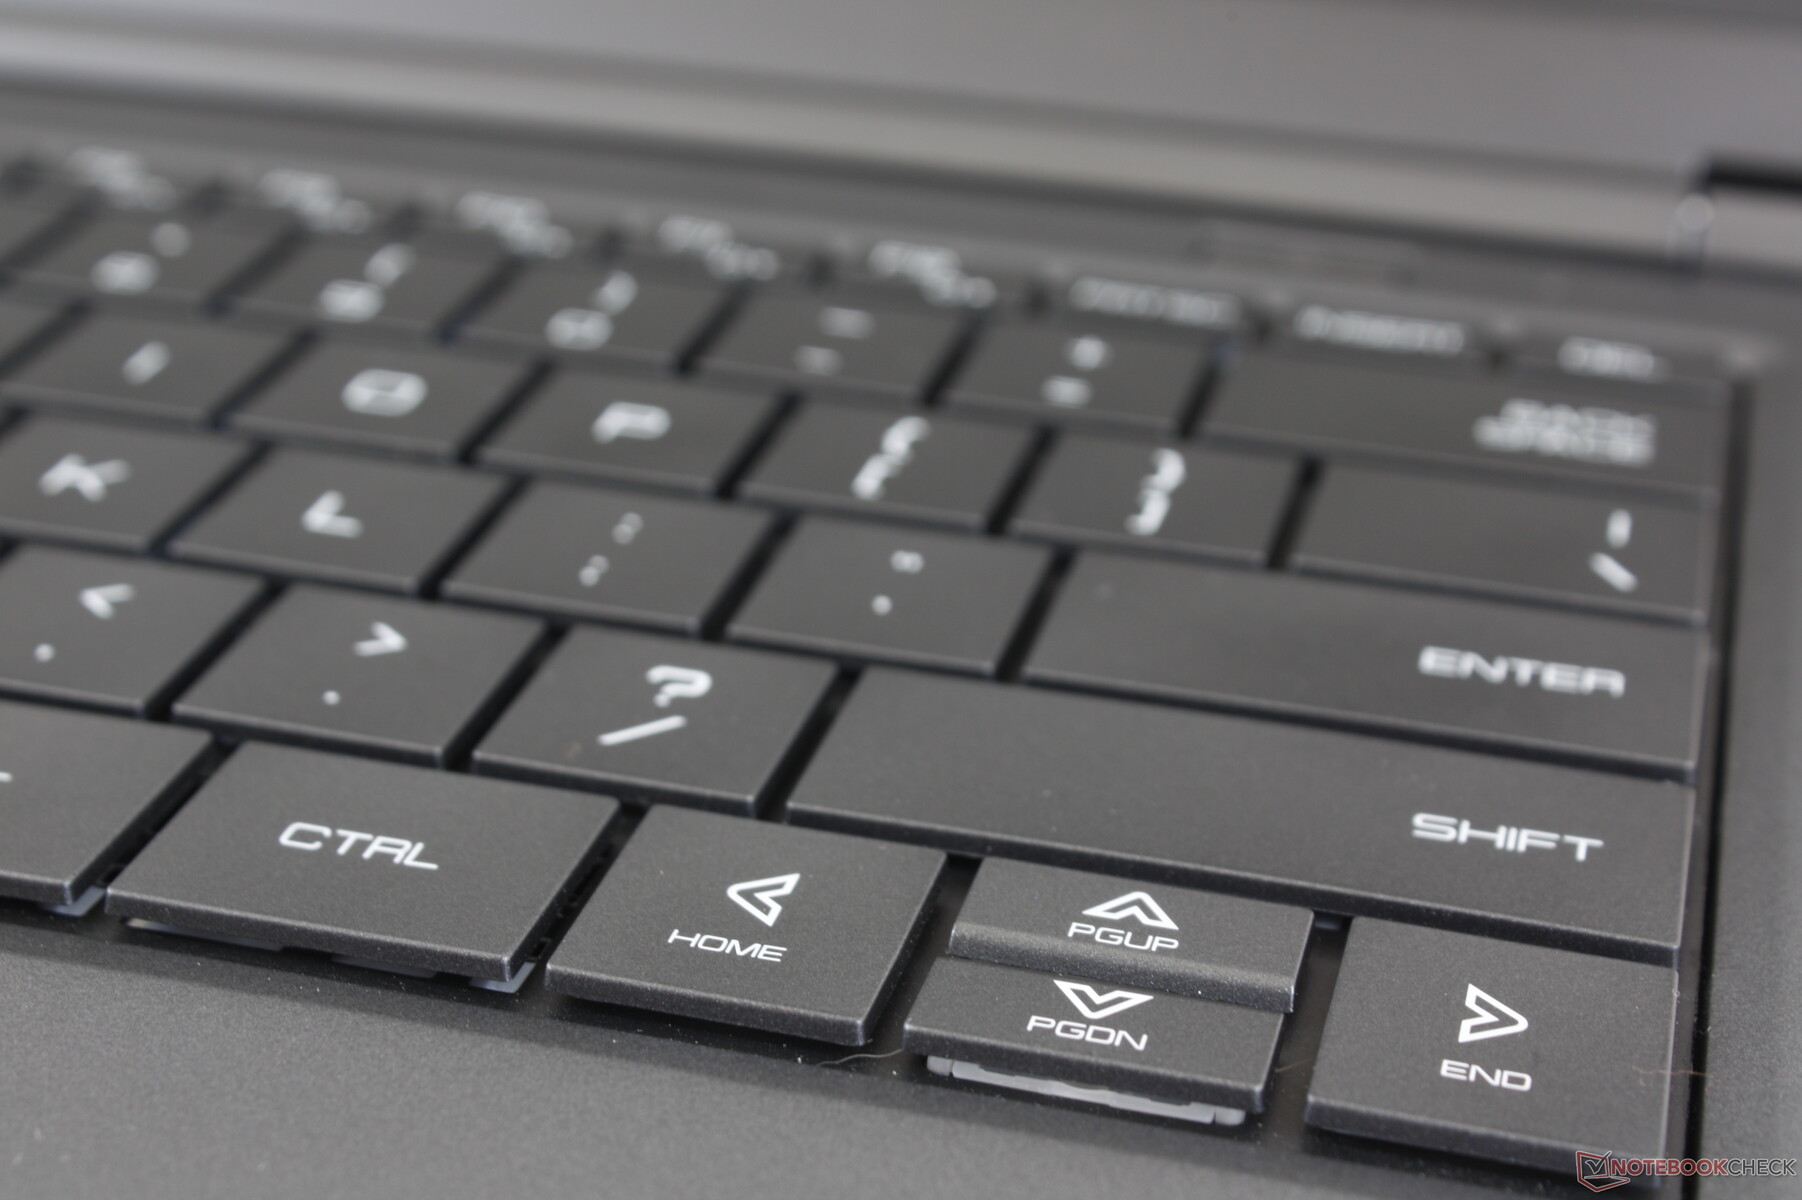
Keyboard
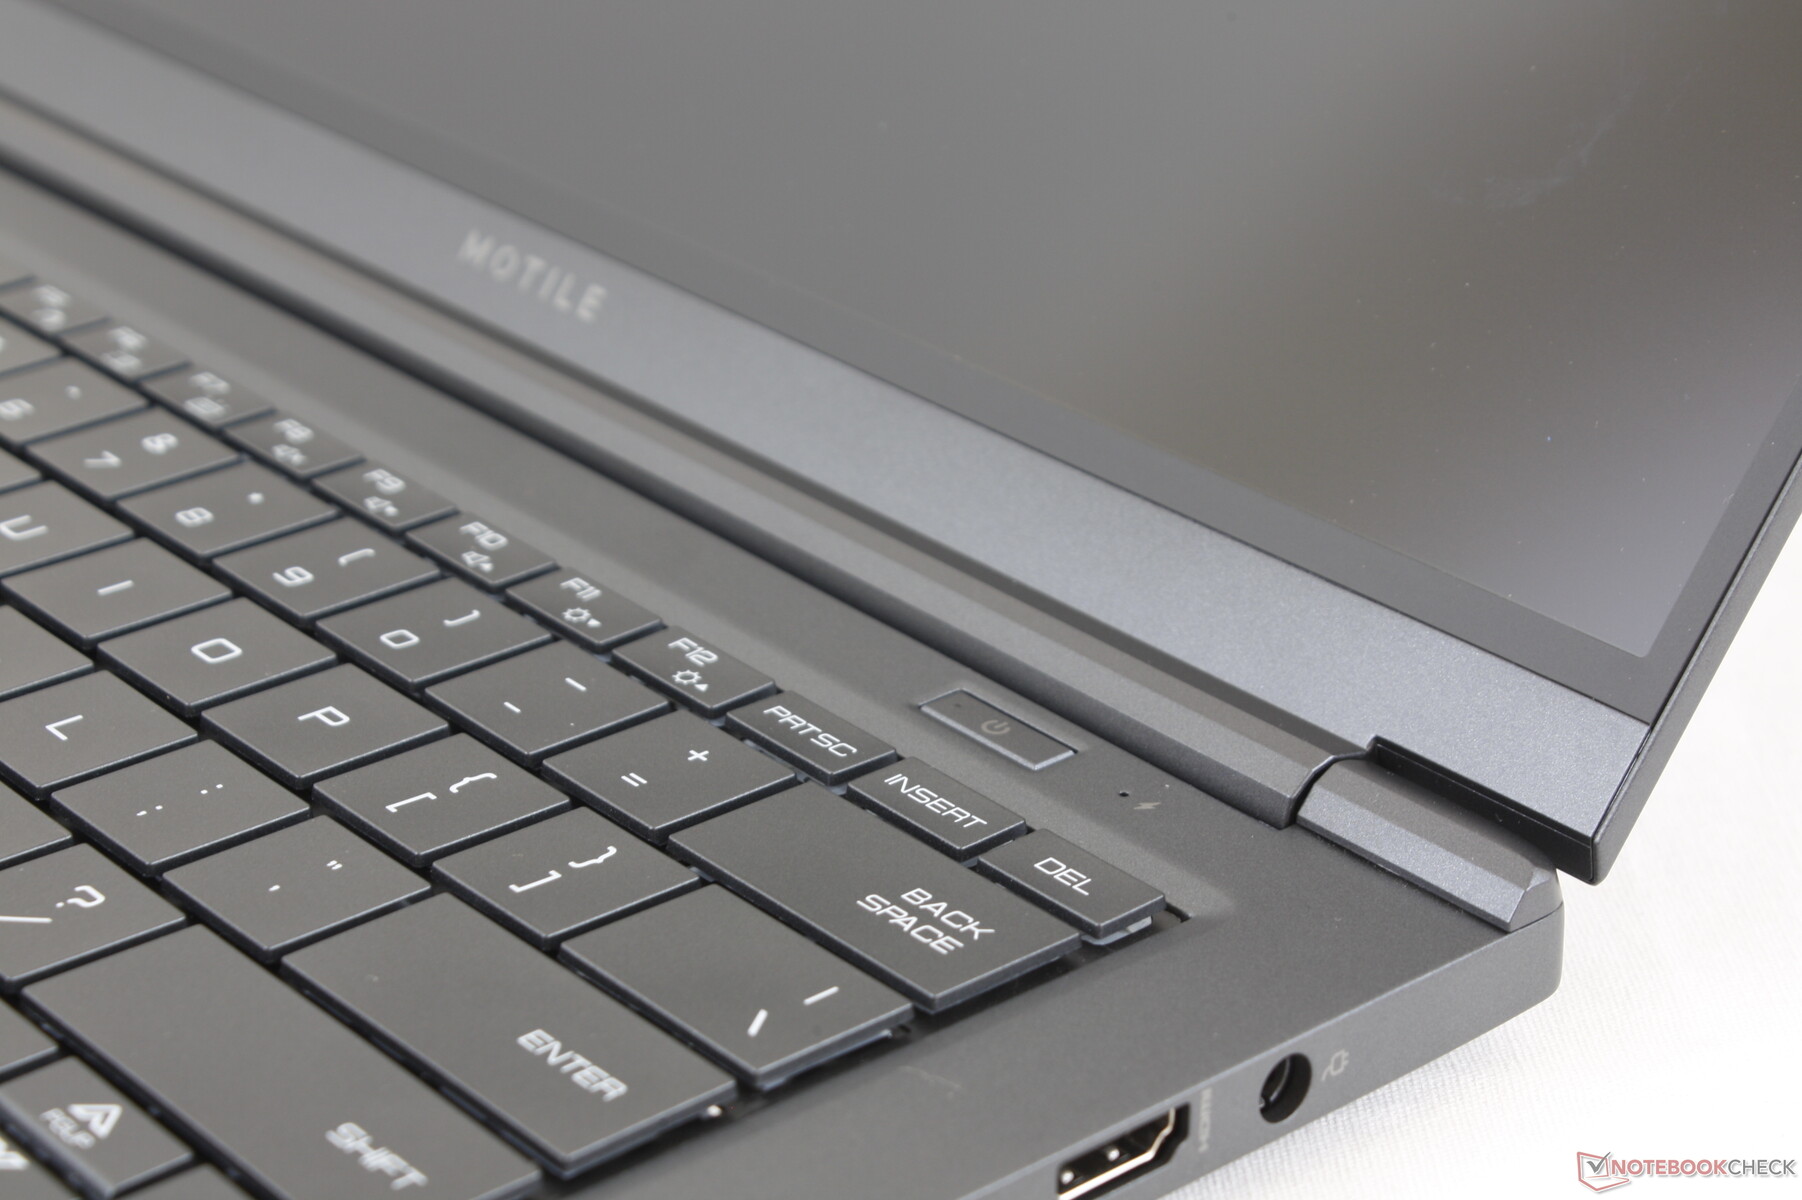
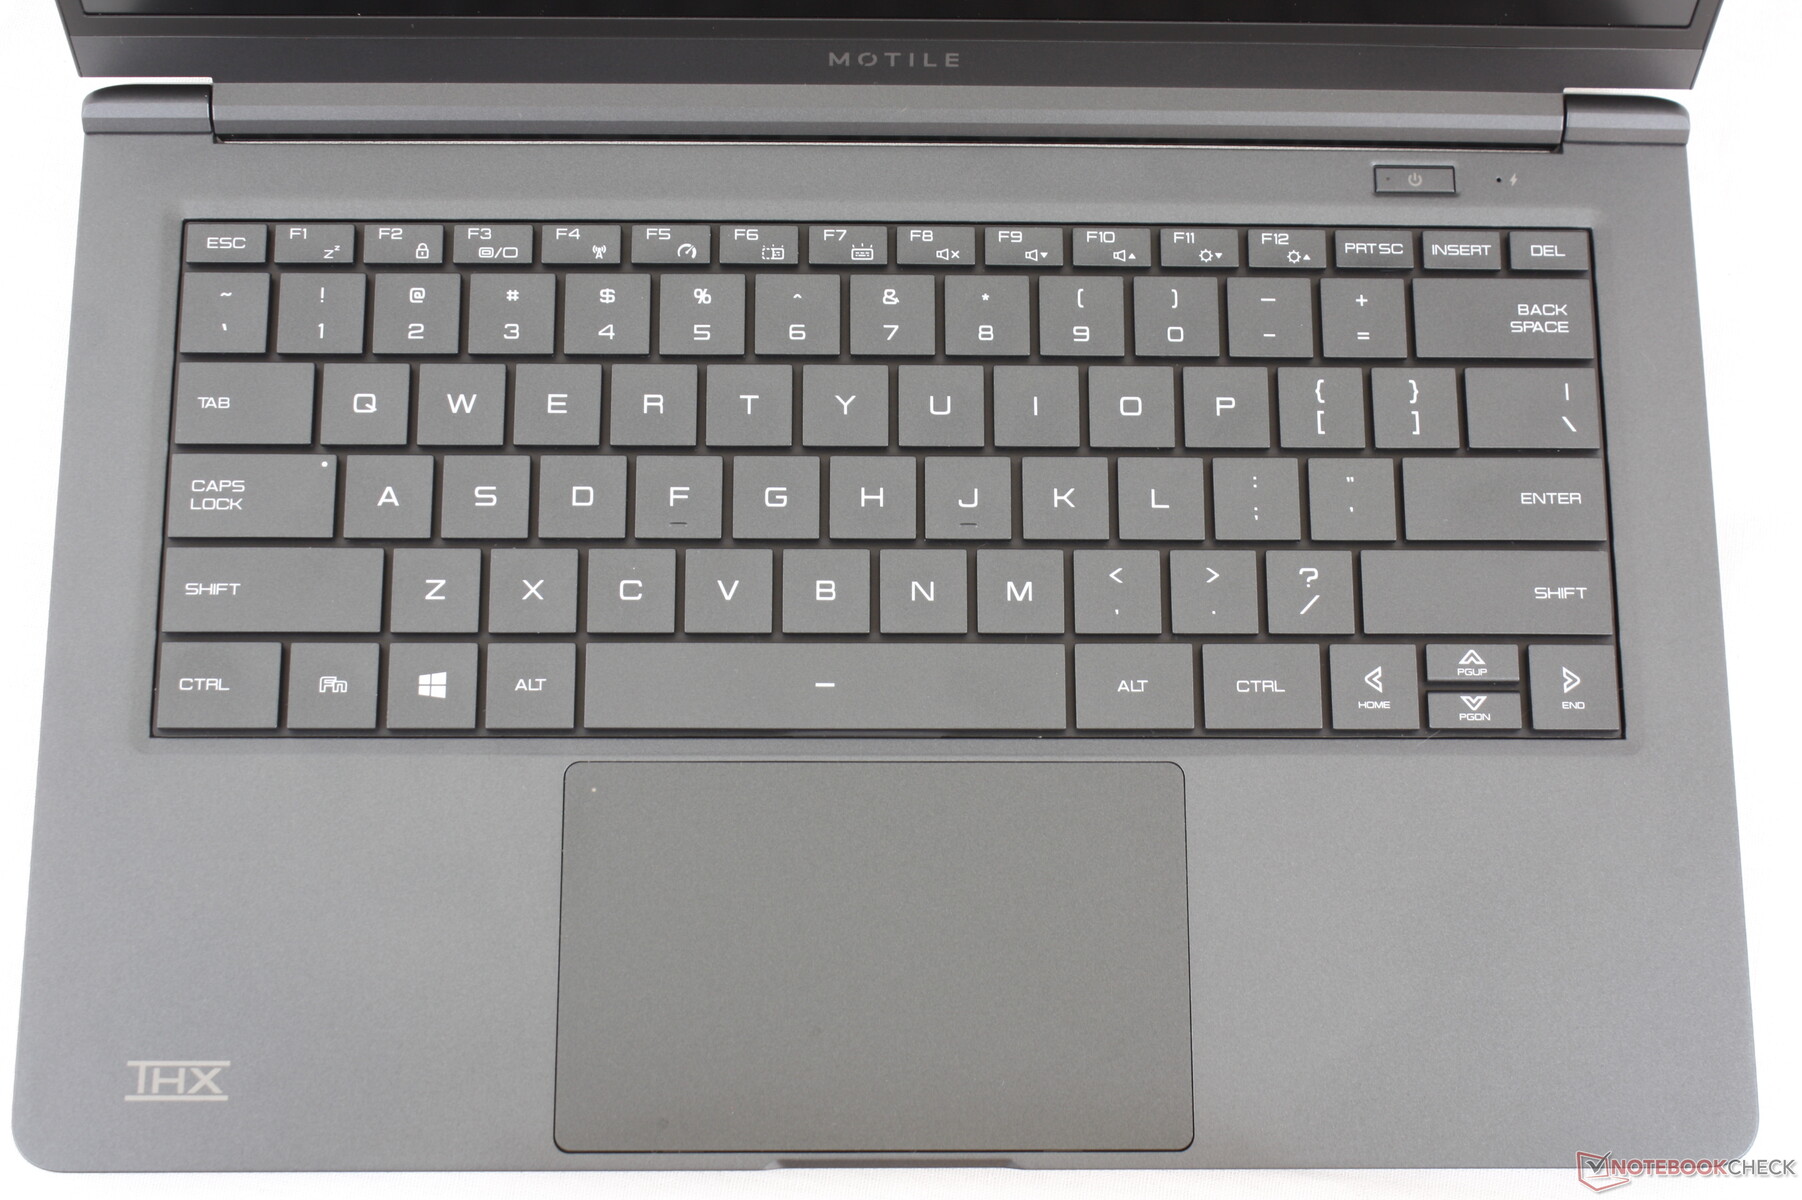
Feedback from the backlit keyboard keys is on the soft side as to be expected from a cheap laptop. On the other hand, clatter is minimal and relatively quiet. Firmer keys like on a Lenovo ThinkPad T series or the HP Spectre series would have been better.
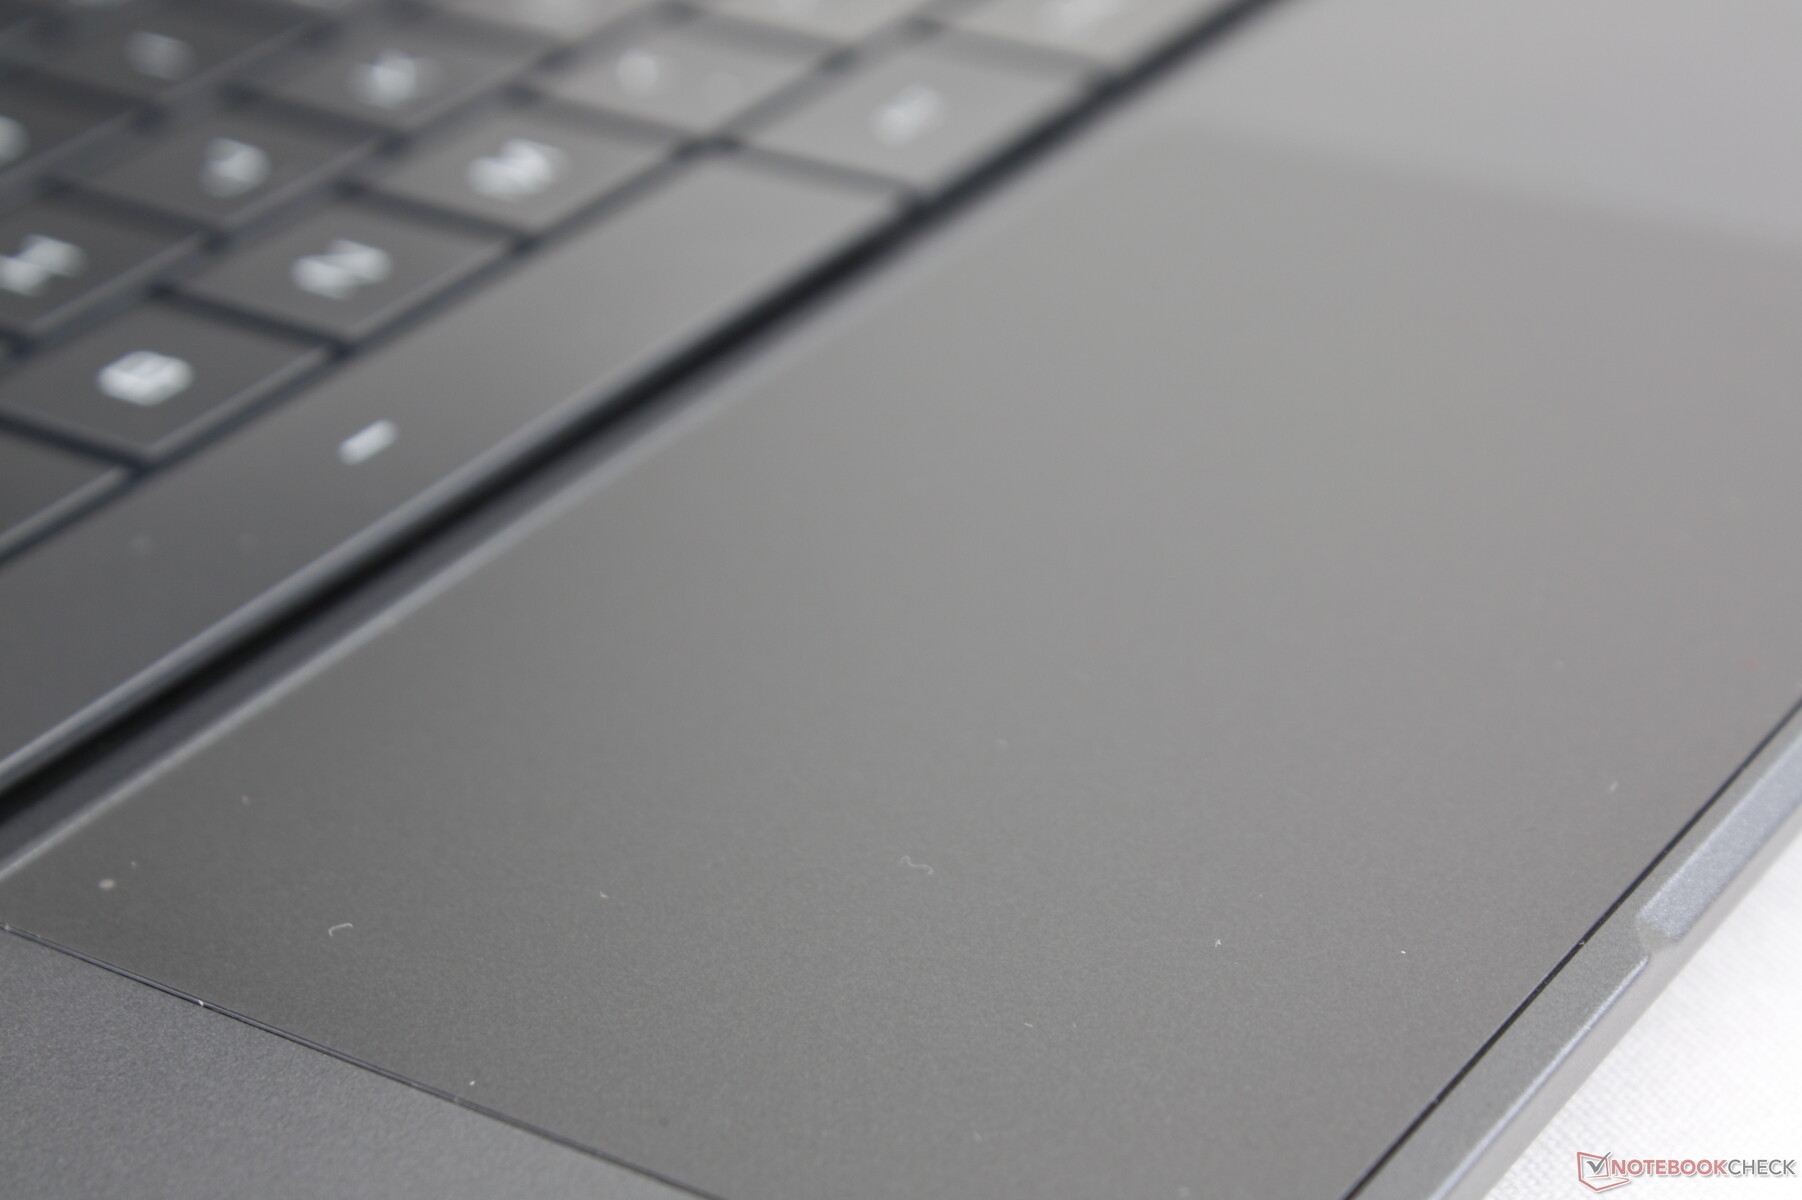
Touchpad
The Precision-enabled clickpad is relatively large (~11.7 x 7.3 cm) for easier multi-touch inputs. Its surface is smooth with minimal sticking for easier cursor control as well. The integrated mouse clicks, however, are shallow with very weak feedback.
Display
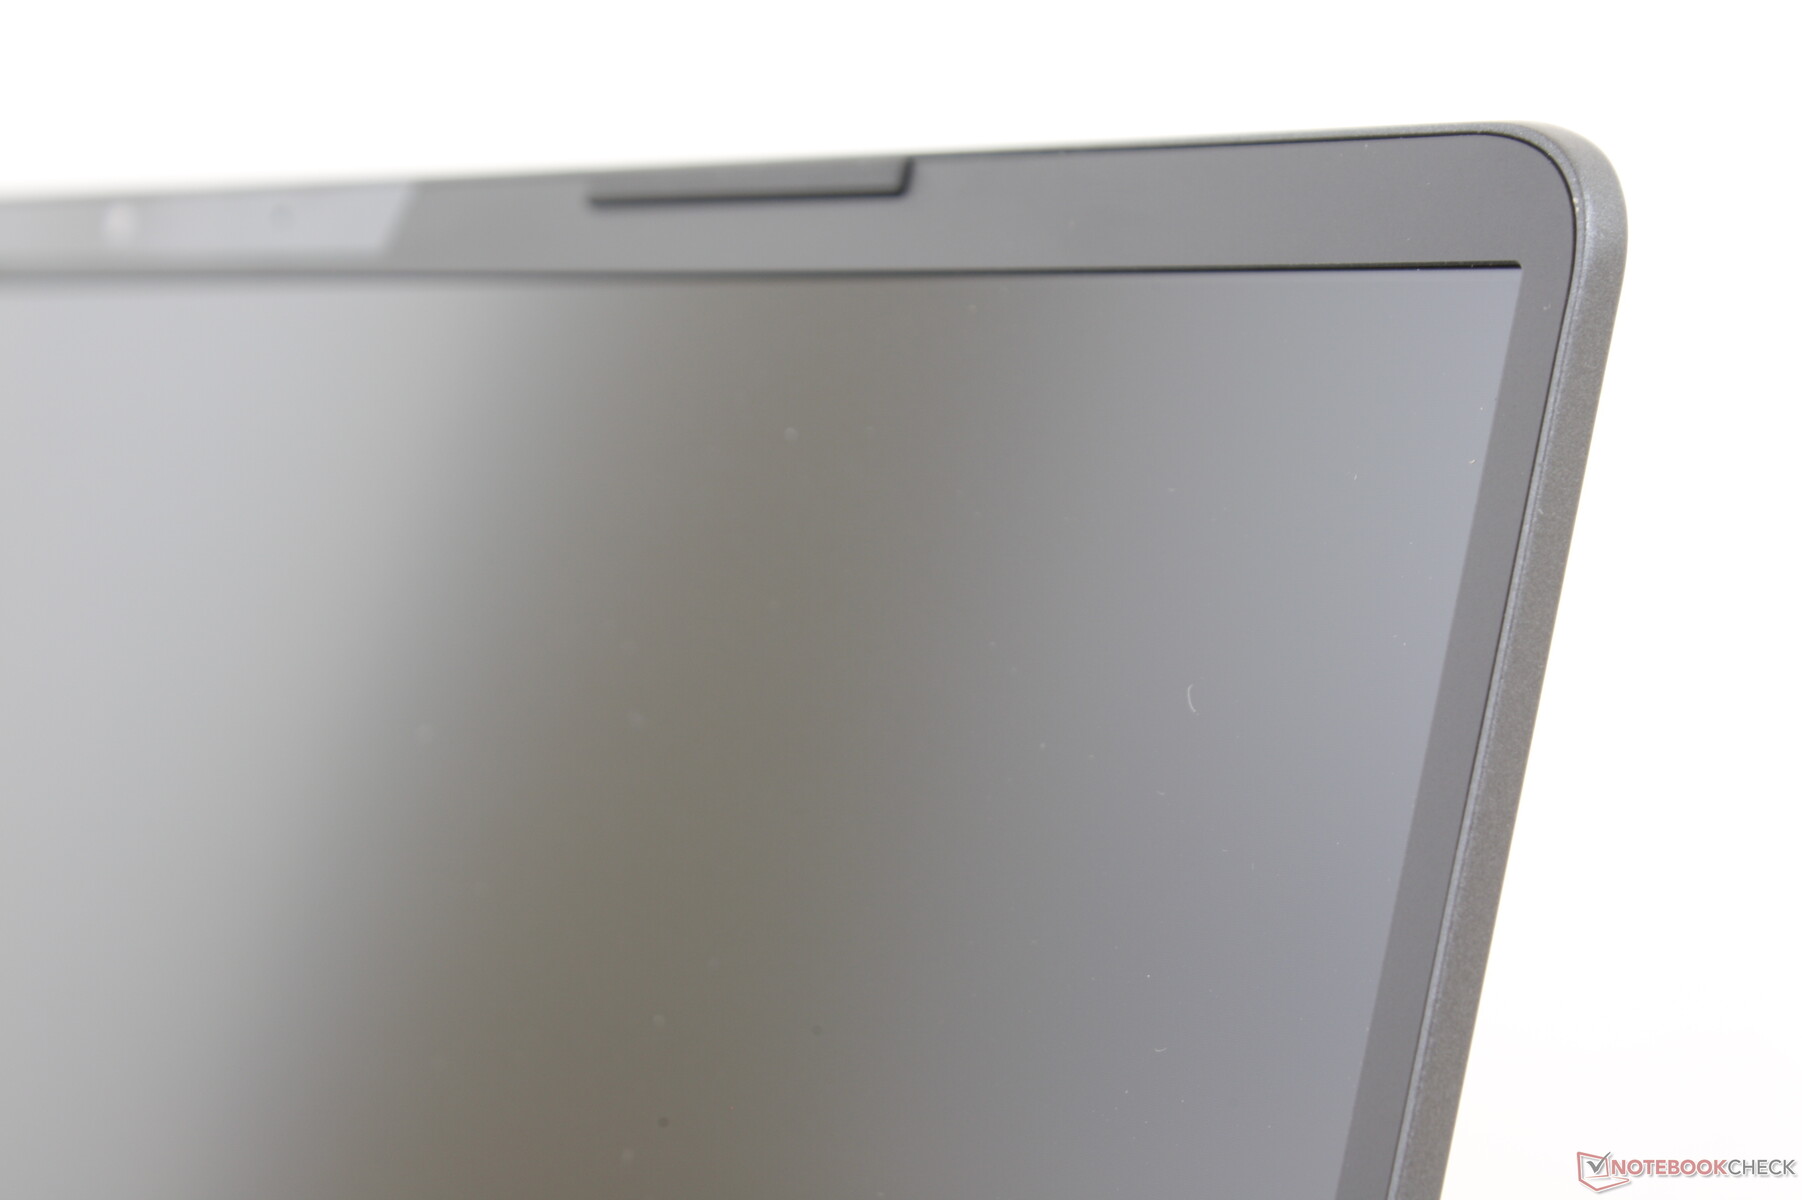
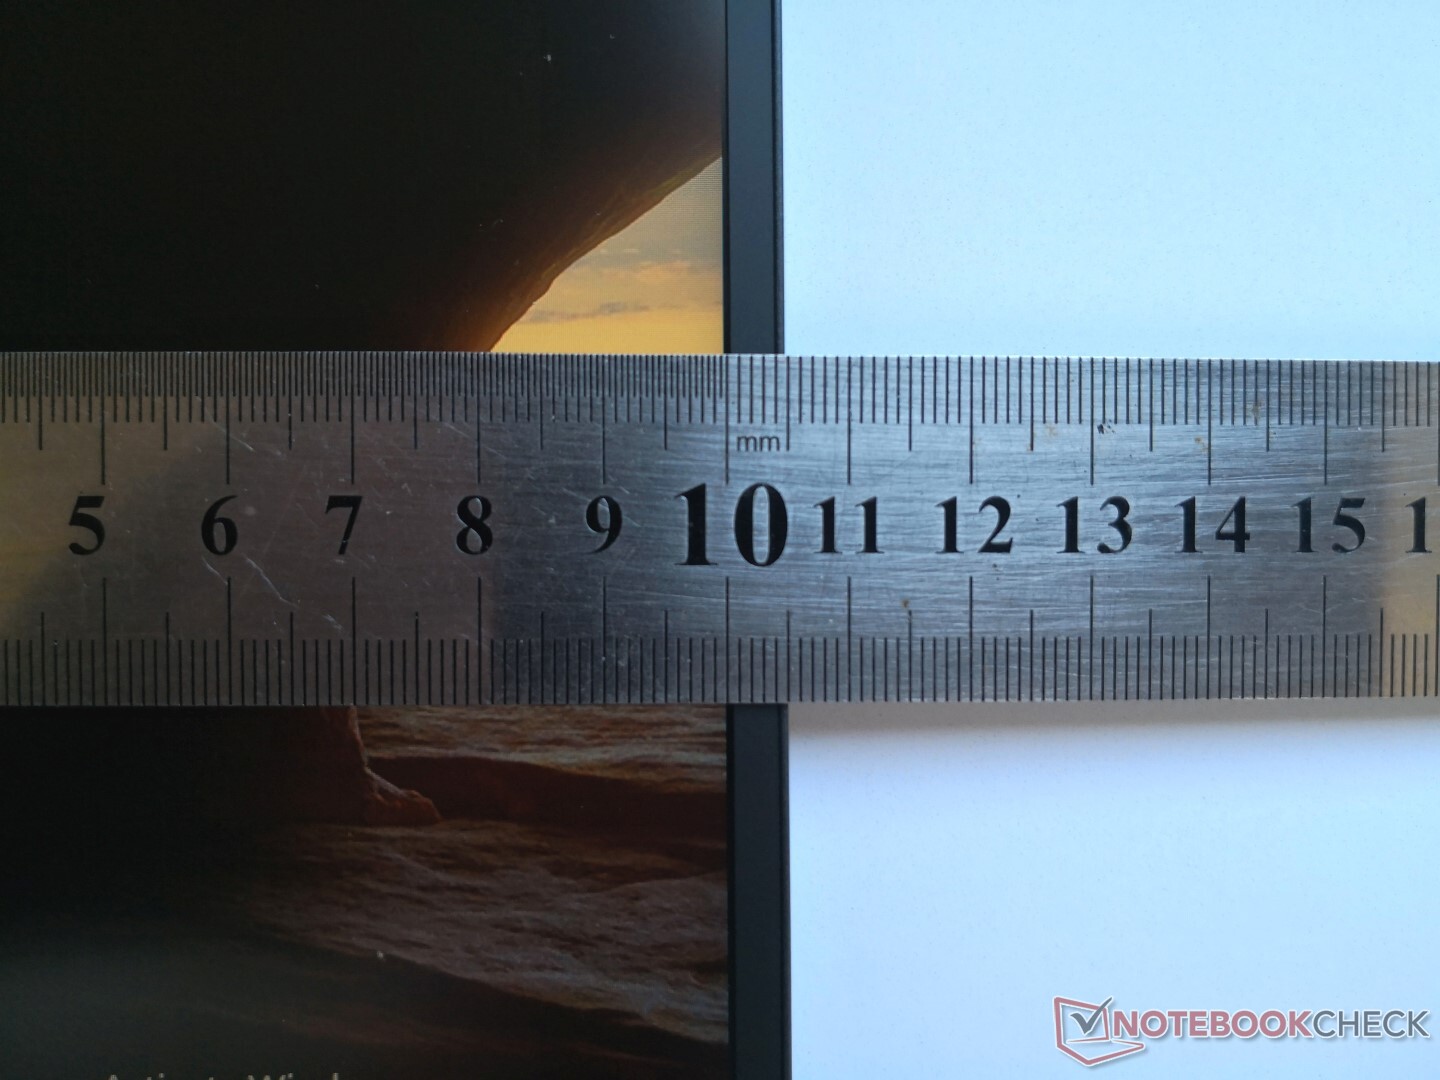
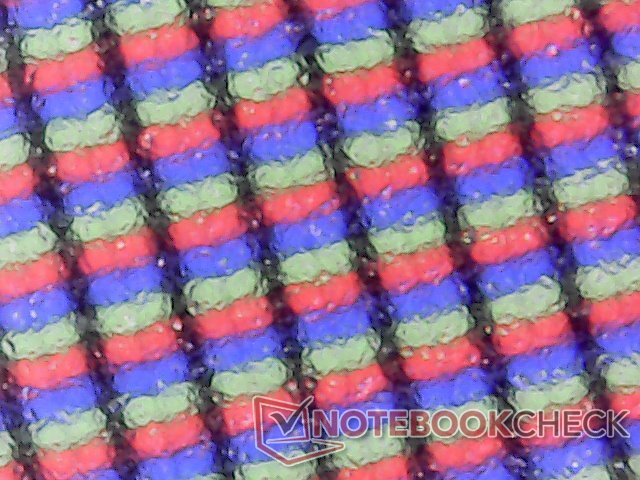
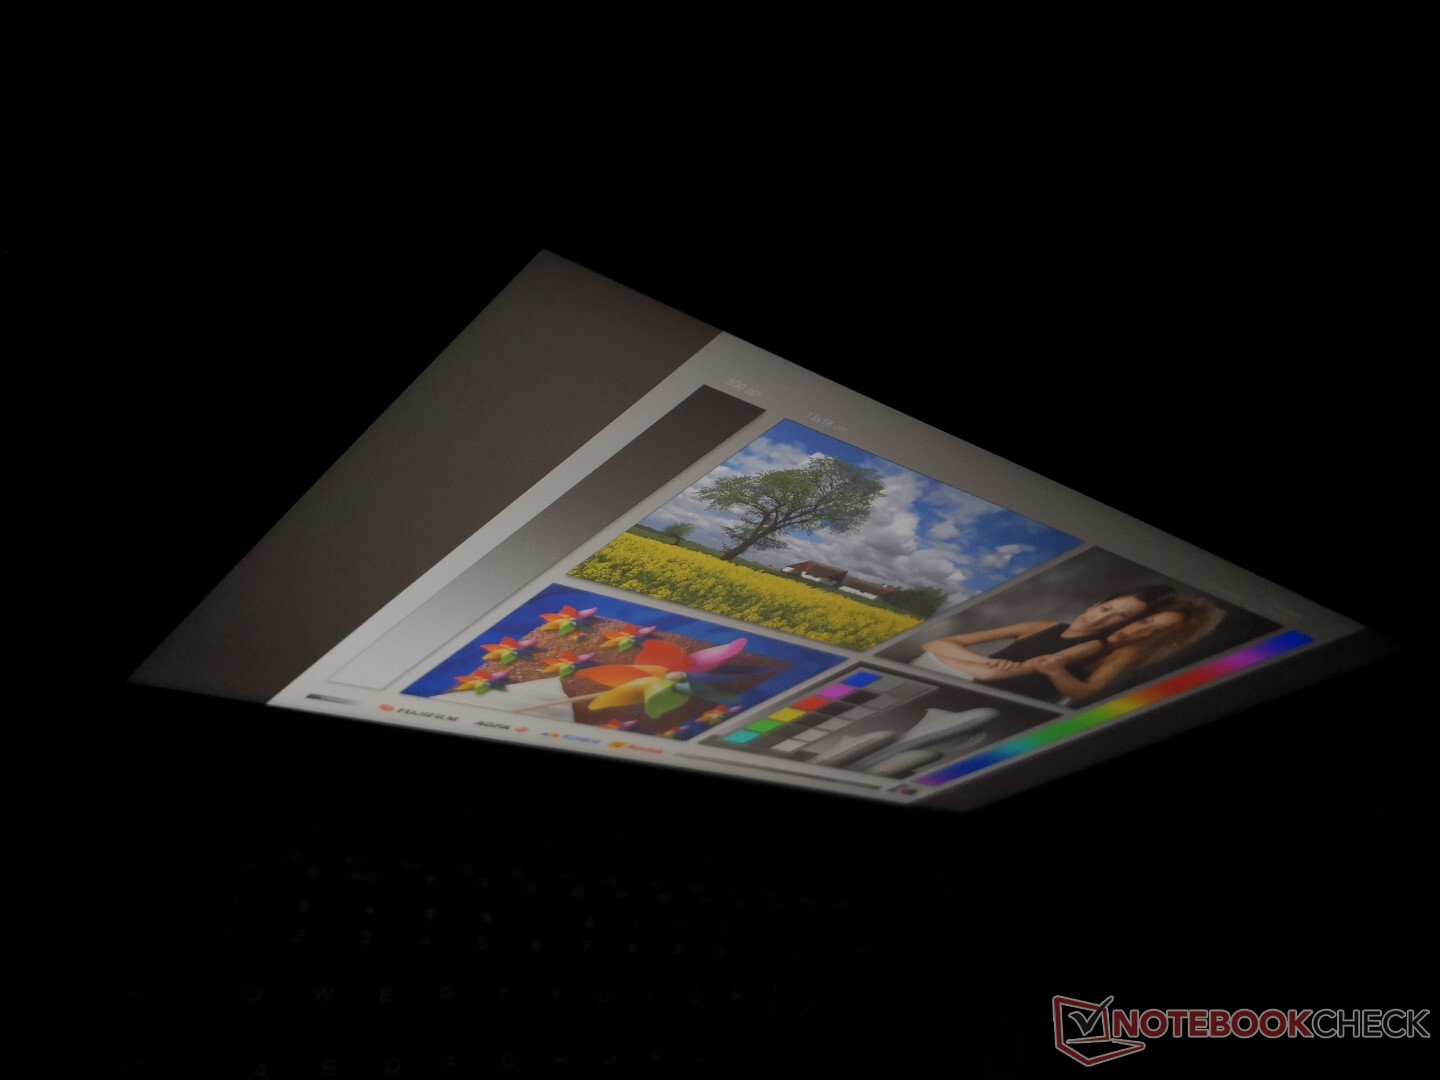
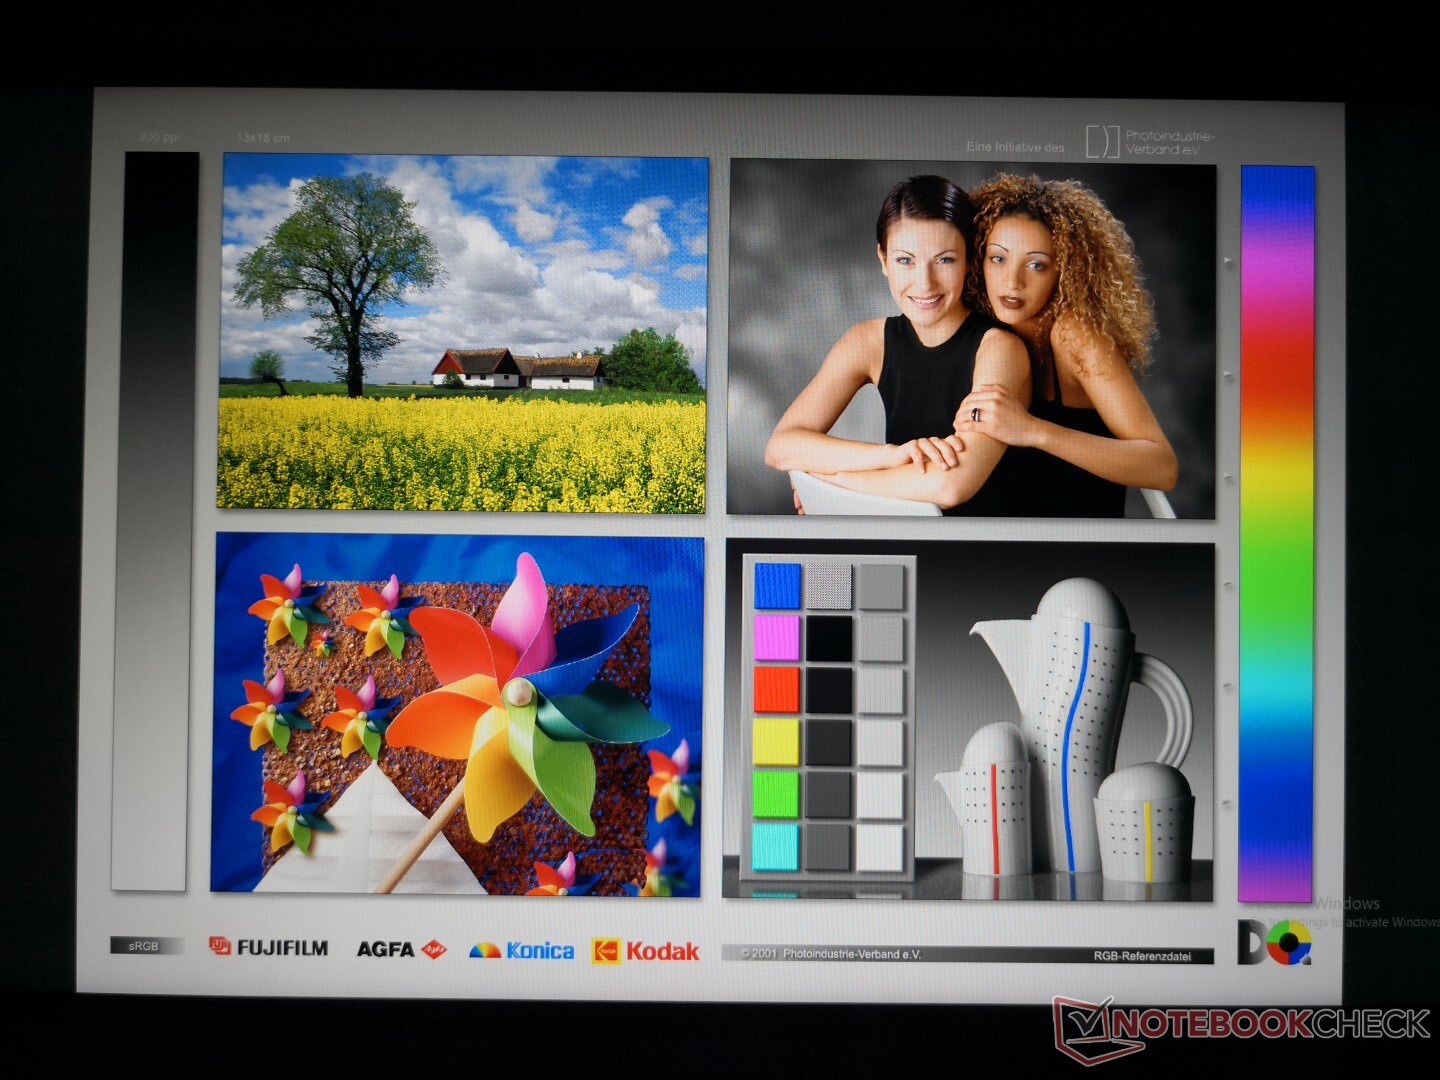
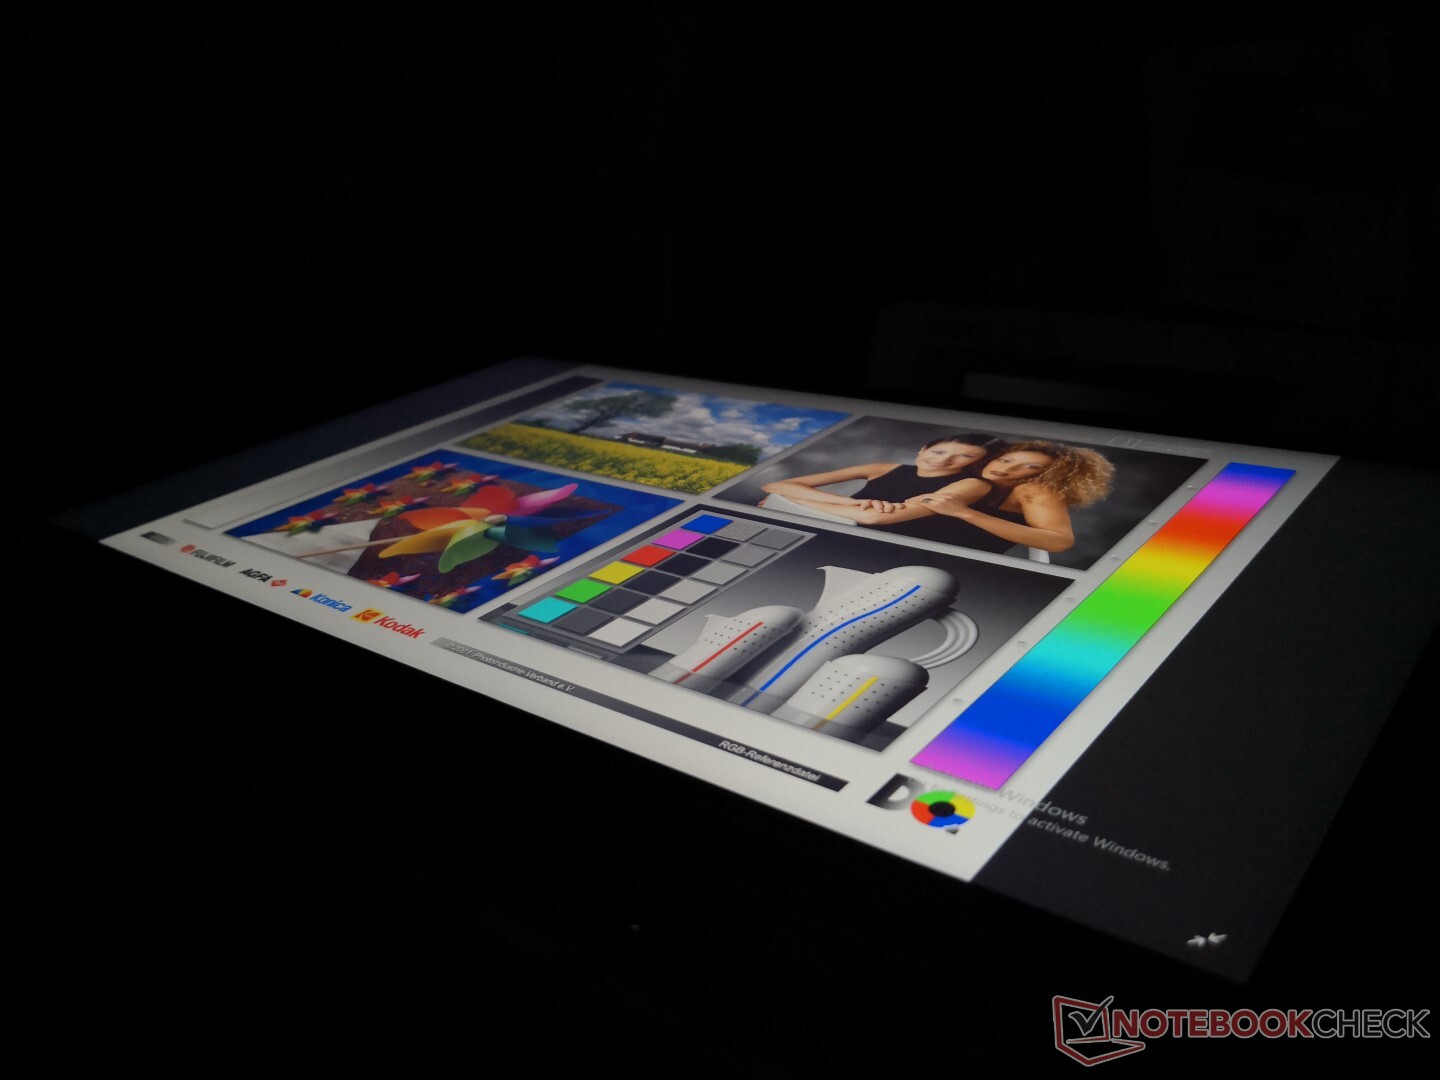
The Motile M141/M142 uses the exact same Chi Mei N140HCA-EAC IPS panel as found on the competing Acer Swift 3 SF314 and Asus VivoBook 14. Thus, core characteristics like contrast ratios, colors, response times, and brightness are all very close between them. While text and images appear sharp with almost no noticeable graininess issues, colors are not as vibrant as they would be on pricier Ultrabooks like the Dell XPS or HP Spectre.
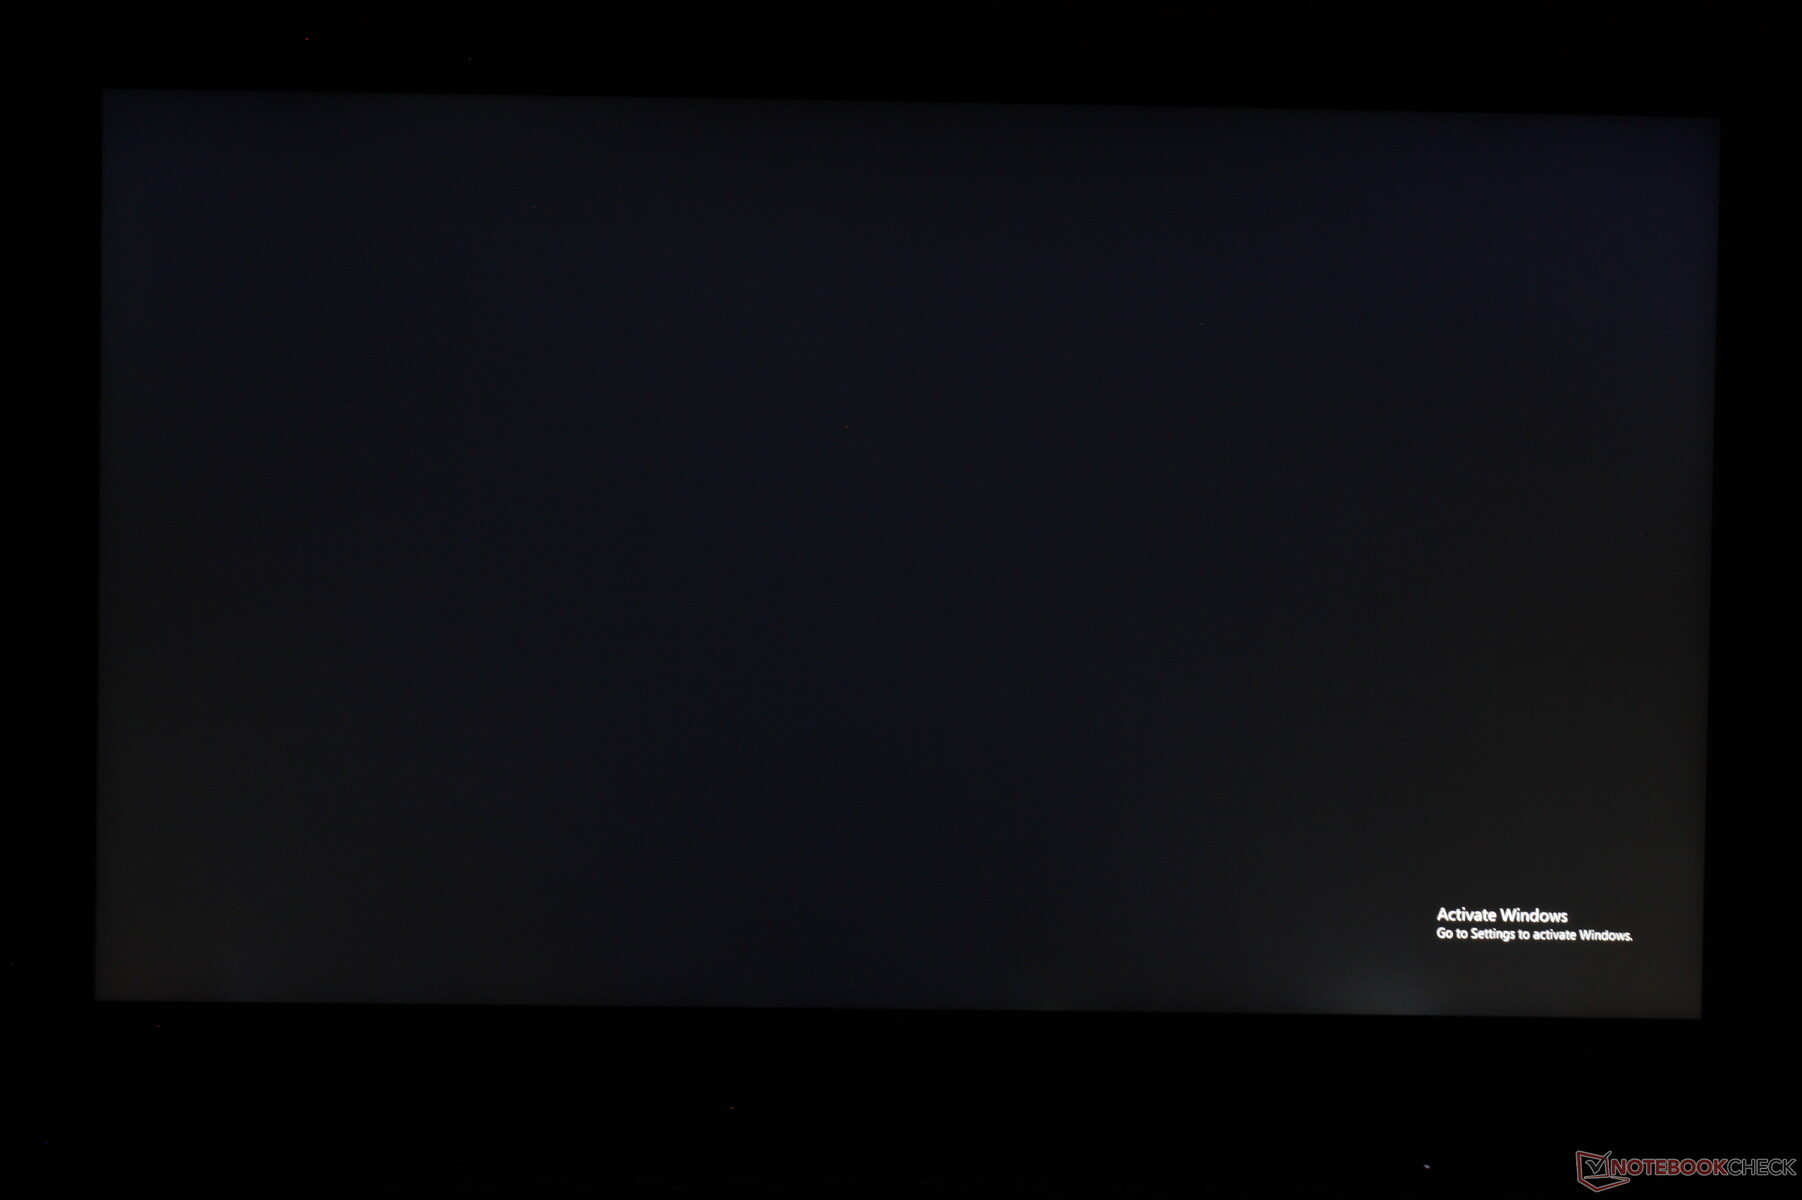
Slight uneven backlight bleeding is present along the bottom edge of our test unit.
| |||||||||||||||||||||||||
Brightness Distribution: 82 %
Center on Battery: 229 cd/m²
Contrast: 890:1 (Black: 0.27 cd/m²)
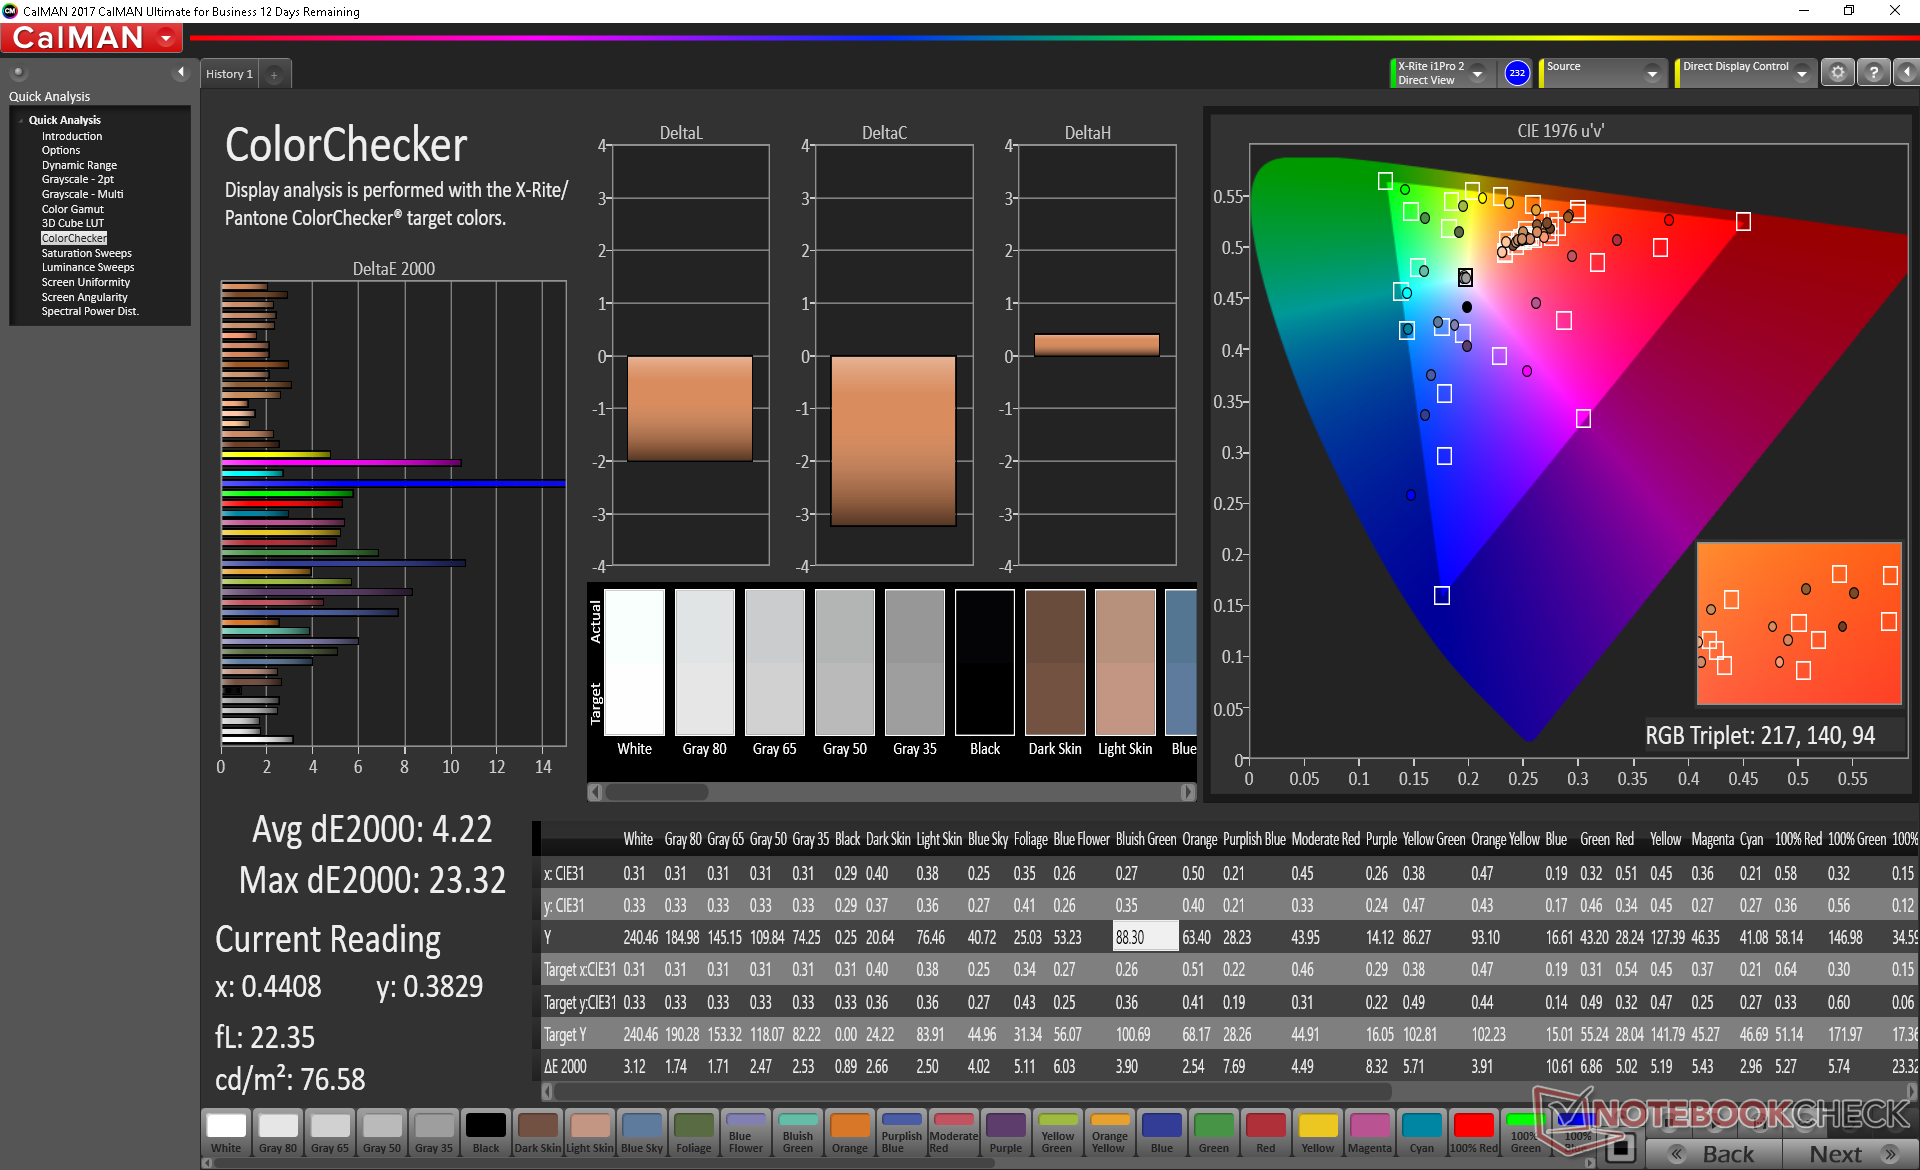
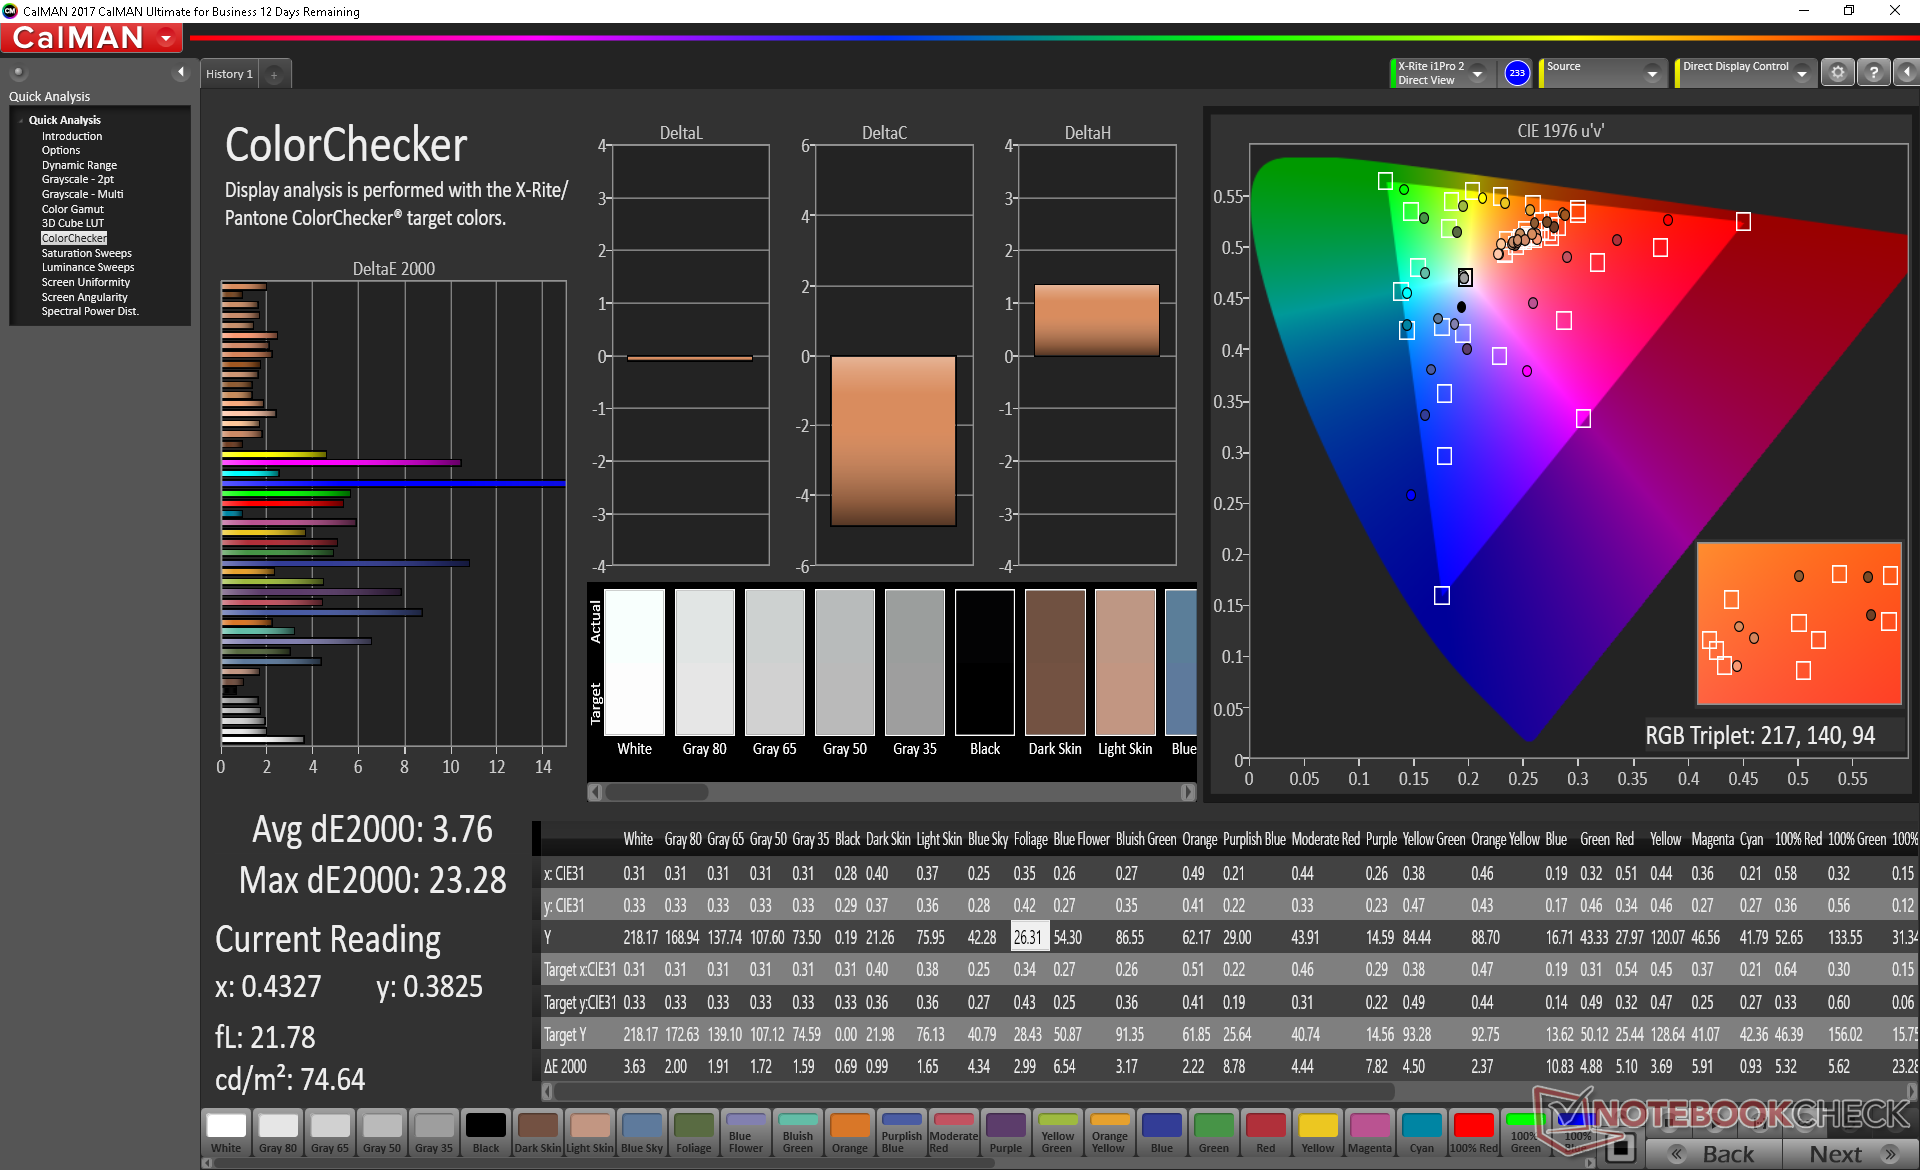
ΔE ColorChecker Calman: 4.22 | ∀{0.5-29.43 Ø4.71}
calibrated: 3.76
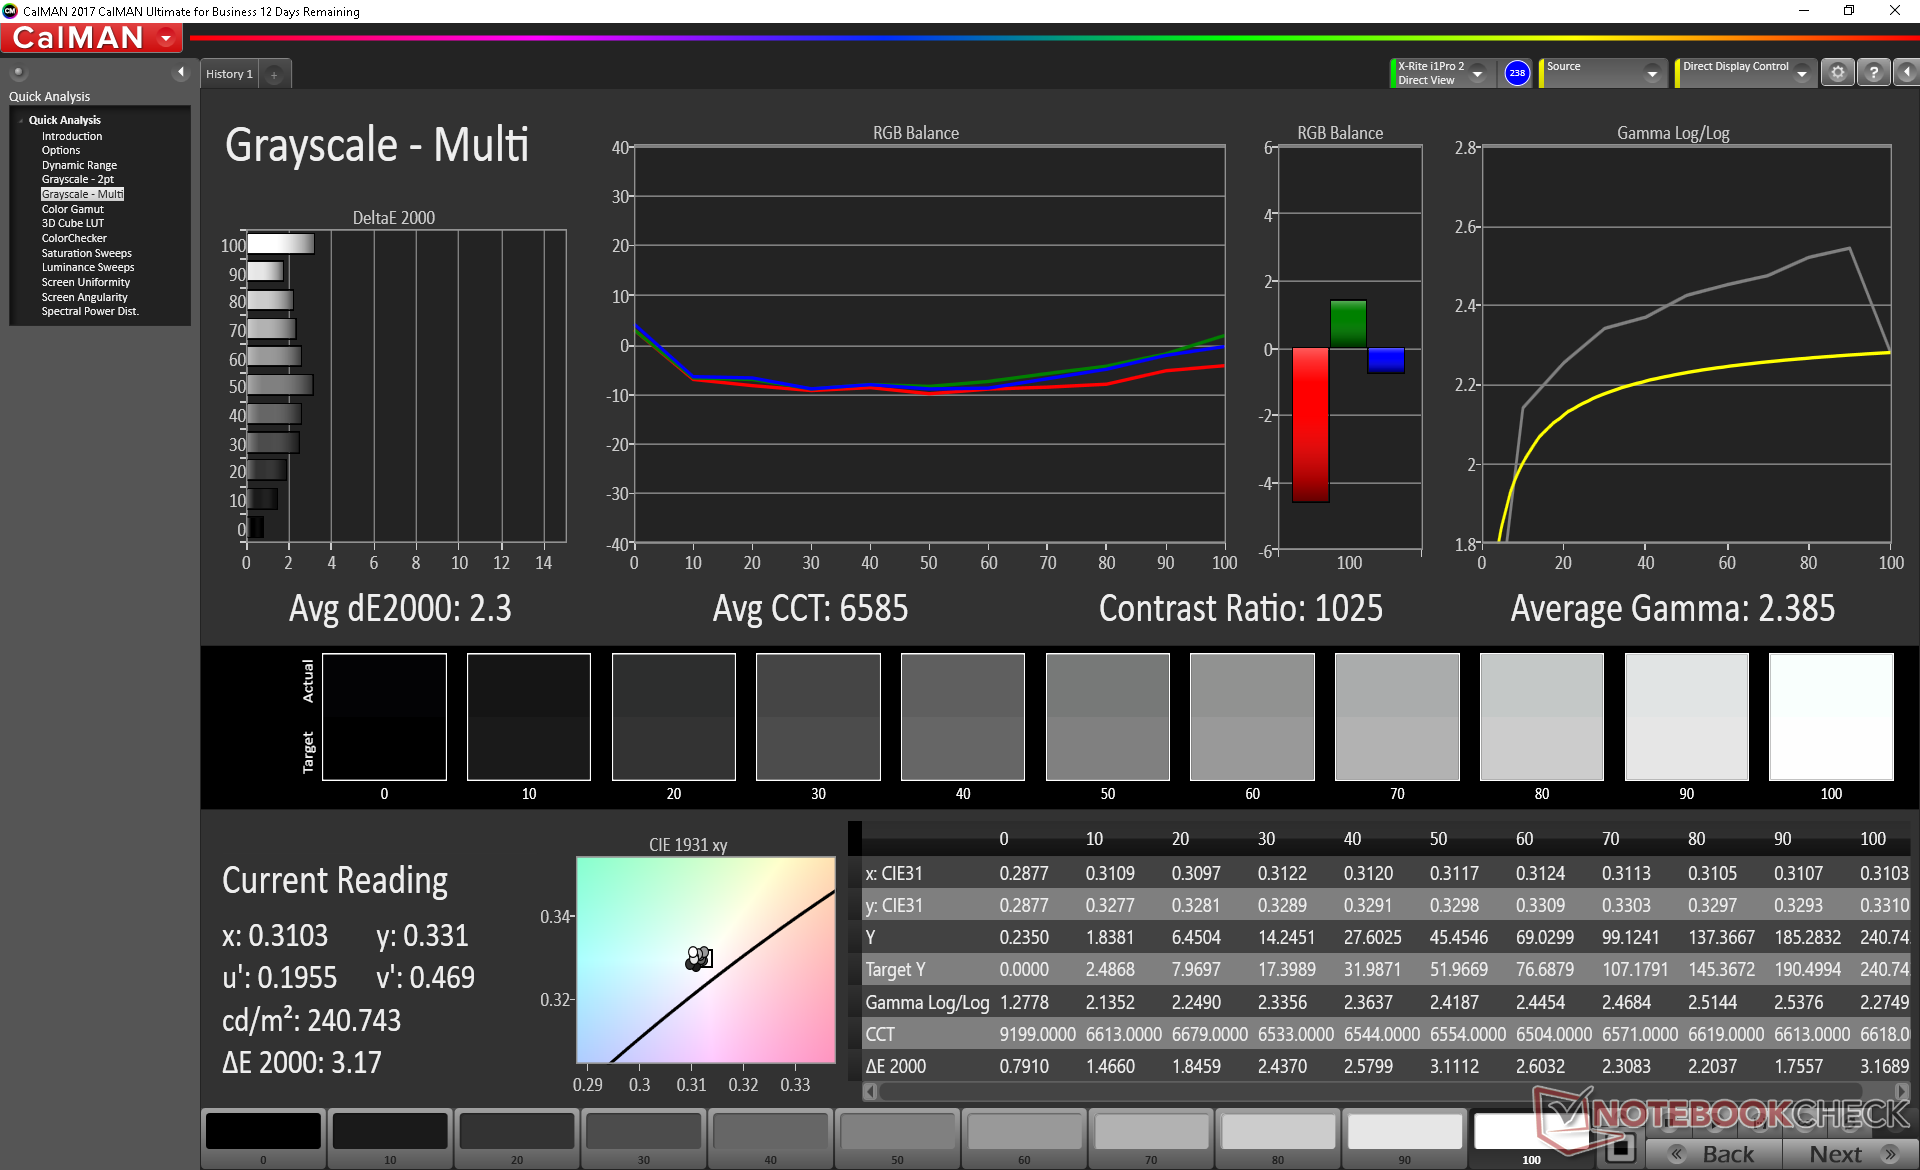
ΔE Greyscale Calman: 2.3 | ∀{0.09-98 Ø4.96}
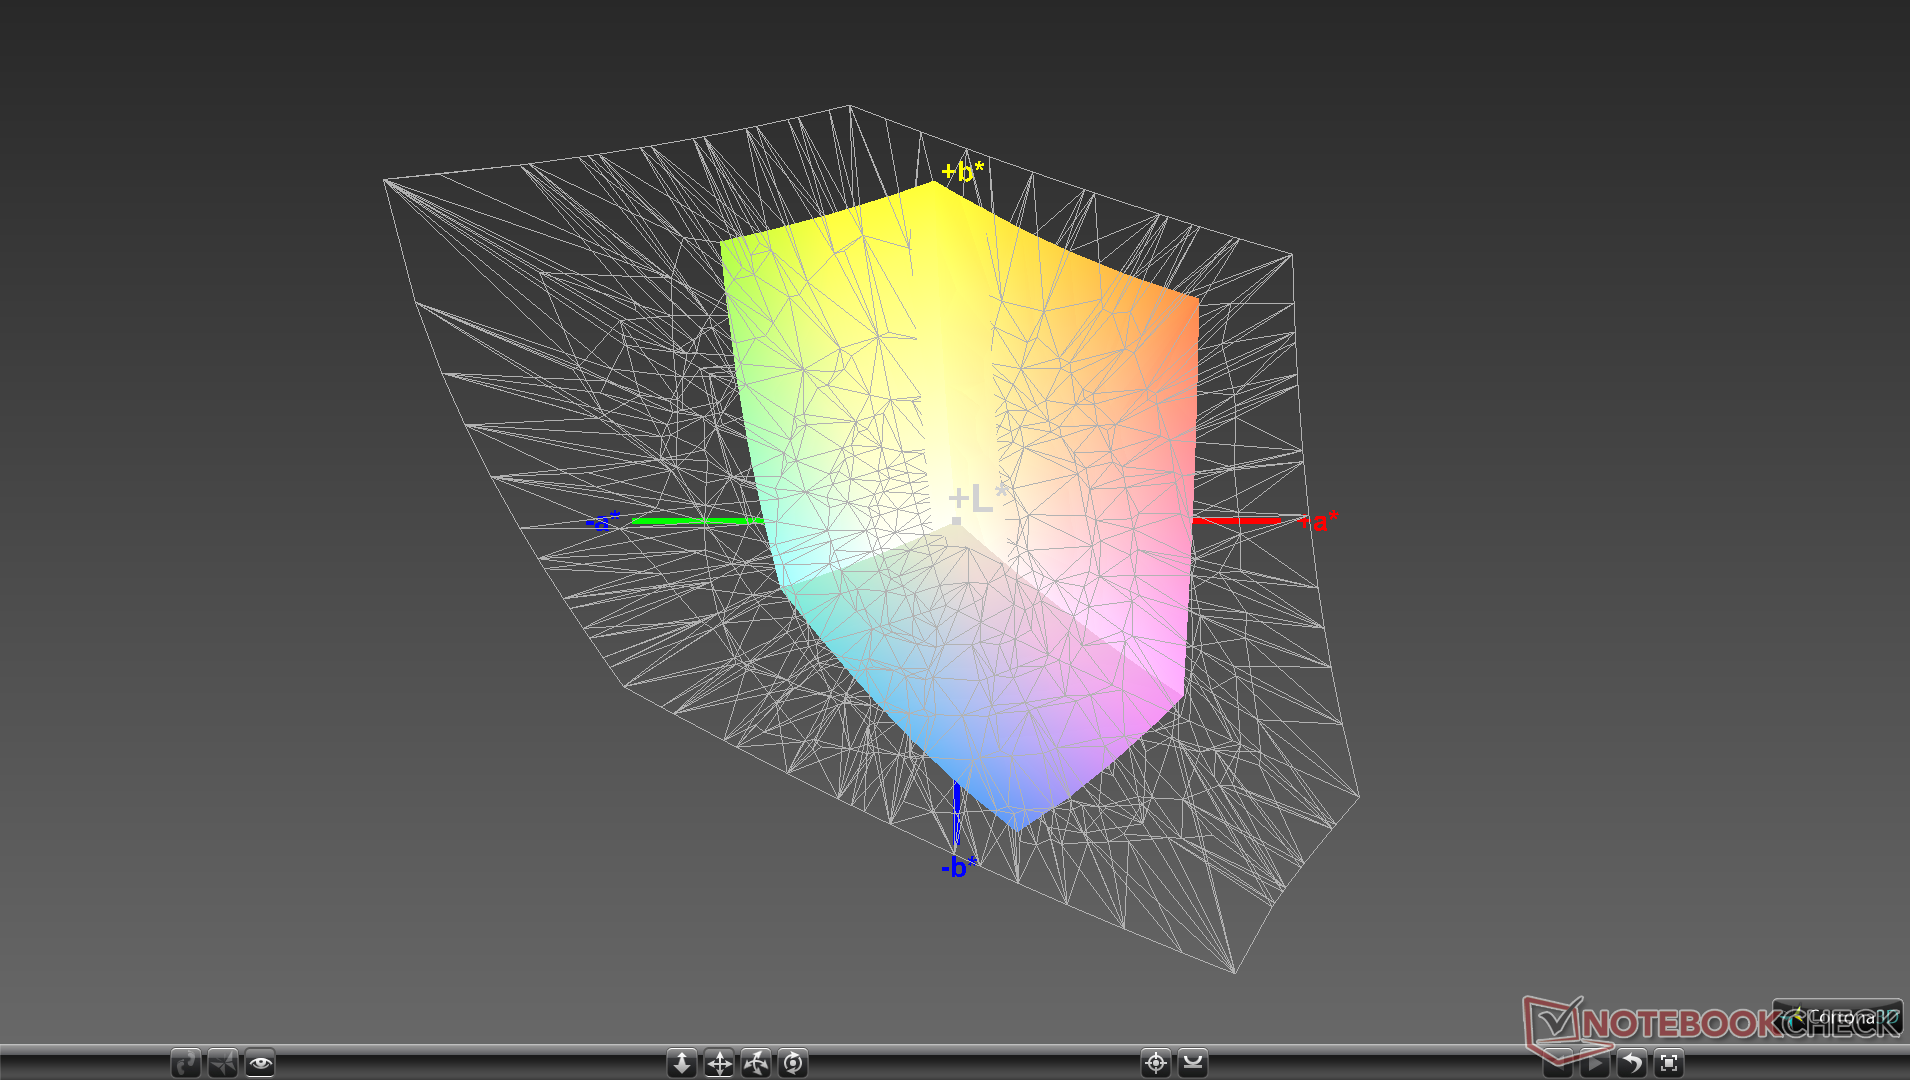
62.1% sRGB (Argyll 1.6.3 3D)
39.9% AdobeRGB 1998 (Argyll 1.6.3 3D)
43.43% AdobeRGB 1998 (Argyll 3D)
62.5% sRGB (Argyll 3D)
41.95% Display P3 (Argyll 3D)
Gamma: 2.39
CCT: 6585 K
| Walmart Motile M142 Chi Mei N140HCA-EAC, IPS, 14", 1920x1080 | Acer Swift 3 SF314-41-R8HZ Chi Mei N140HCA-EAC, IPS, 14", 1920x1080 | Lenovo Yoga C940-14IIL LP140WF9-SPE2, IPS LED, 14", 1920x1080 | Asus VivoBook 14 X403FA Chi Mei N140HCA-EAC, IPS, 14", 1920x1080 | Lenovo IdeaPad S540-14IWL NV140FHM-N48, IPS, 14", 1920x1080 | HP 14-dk0008ng AU Optronics AUO403D, IPS, 14", 1920x1080 | |
|---|---|---|---|---|---|---|
| Display | -1% | 56% | -3% | -5% | -6% | |
| Display P3 Coverage (%) | 41.95 | 41.43 -1% | 66 57% | 40.85 -3% | 40.1 -4% | 39.53 -6% |
| sRGB Coverage (%) | 62.5 | 61.8 -1% | 97.9 57% | 61.1 -2% | 59.2 -5% | 59.1 -5% |
| AdobeRGB 1998 Coverage (%) | 43.43 | 42.85 -1% | 67.3 55% | 42.25 -3% | 41.43 -5% | 40.84 -6% |
| Response Times | -8% | -30% | -12% | -20% | -8% | |
| Response Time Grey 50% / Grey 80% * (ms) | 35.2 ? | 38 ? -8% | 49.6 ? -41% | 40.8 ? -16% | 39.6 ? -13% | 38 ? -8% |
| Response Time Black / White * (ms) | 25.2 ? | 27 ? -7% | 30 ? -19% | 27.2 ? -8% | 32 ? -27% | 27 ? -7% |
| PWM Frequency (Hz) | 25000 ? | 250 ? | 24510 ? | 352.1 ? | ||
| Screen | -3% | 45% | -2% | 4% | 16% | |
| Brightness middle (cd/m²) | 240.3 | 233 -3% | 384 60% | 250 4% | 316 32% | 269 12% |
| Brightness (cd/m²) | 233 | 219 -6% | 363 56% | 236 1% | 301 29% | 257 10% |
| Brightness Distribution (%) | 82 | 75 -9% | 90 10% | 78 -5% | 88 7% | 89 9% |
| Black Level * (cd/m²) | 0.27 | 0.14 48% | 0.17 37% | 0.27 -0% | 0.28 -4% | 0.2 26% |
| Contrast (:1) | 890 | 1664 87% | 2259 154% | 926 4% | 1129 27% | 1345 51% |
| Colorchecker dE 2000 * | 4.22 | 5.9 -40% | 3.5 17% | 5 -18% | 5.3 -26% | 3.68 13% |
| Colorchecker dE 2000 max. * | 23.32 | 22.8 2% | 5.5 76% | 20.7 11% | 18.5 21% | 7.36 68% |
| Colorchecker dE 2000 calibrated * | 3.76 | 1 73% | 4.3 -14% | 4.8 -28% | 4.8 -28% | |
| Greyscale dE 2000 * | 2.3 | 4.8 -109% | 4.6 -100% | 2.4 -4% | 2.4 -4% | 1.69 27% |
| Gamma | 2.39 92% | 2.06 107% | 2.32 95% | 2.05 107% | 2.05 107% | 2.49 88% |
| CCT | 6585 99% | 6589 99% | 6884 94% | 6697 97% | 6644 98% | 6406 101% |
| Color Space (Percent of AdobeRGB 1998) (%) | 39.9 | 39 -2% | 62 55% | 38.9 -3% | 37.6 -6% | 38 -5% |
| Color Space (Percent of sRGB) (%) | 62.1 | 62 0% | 97.7 57% | 61 -2% | 58.3 -6% | 59 -5% |
| Total Average (Program / Settings) | -4% /
-3% | 24% /
38% | -6% /
-4% | -7% /
-1% | 1% /
9% |
* ... smaller is better
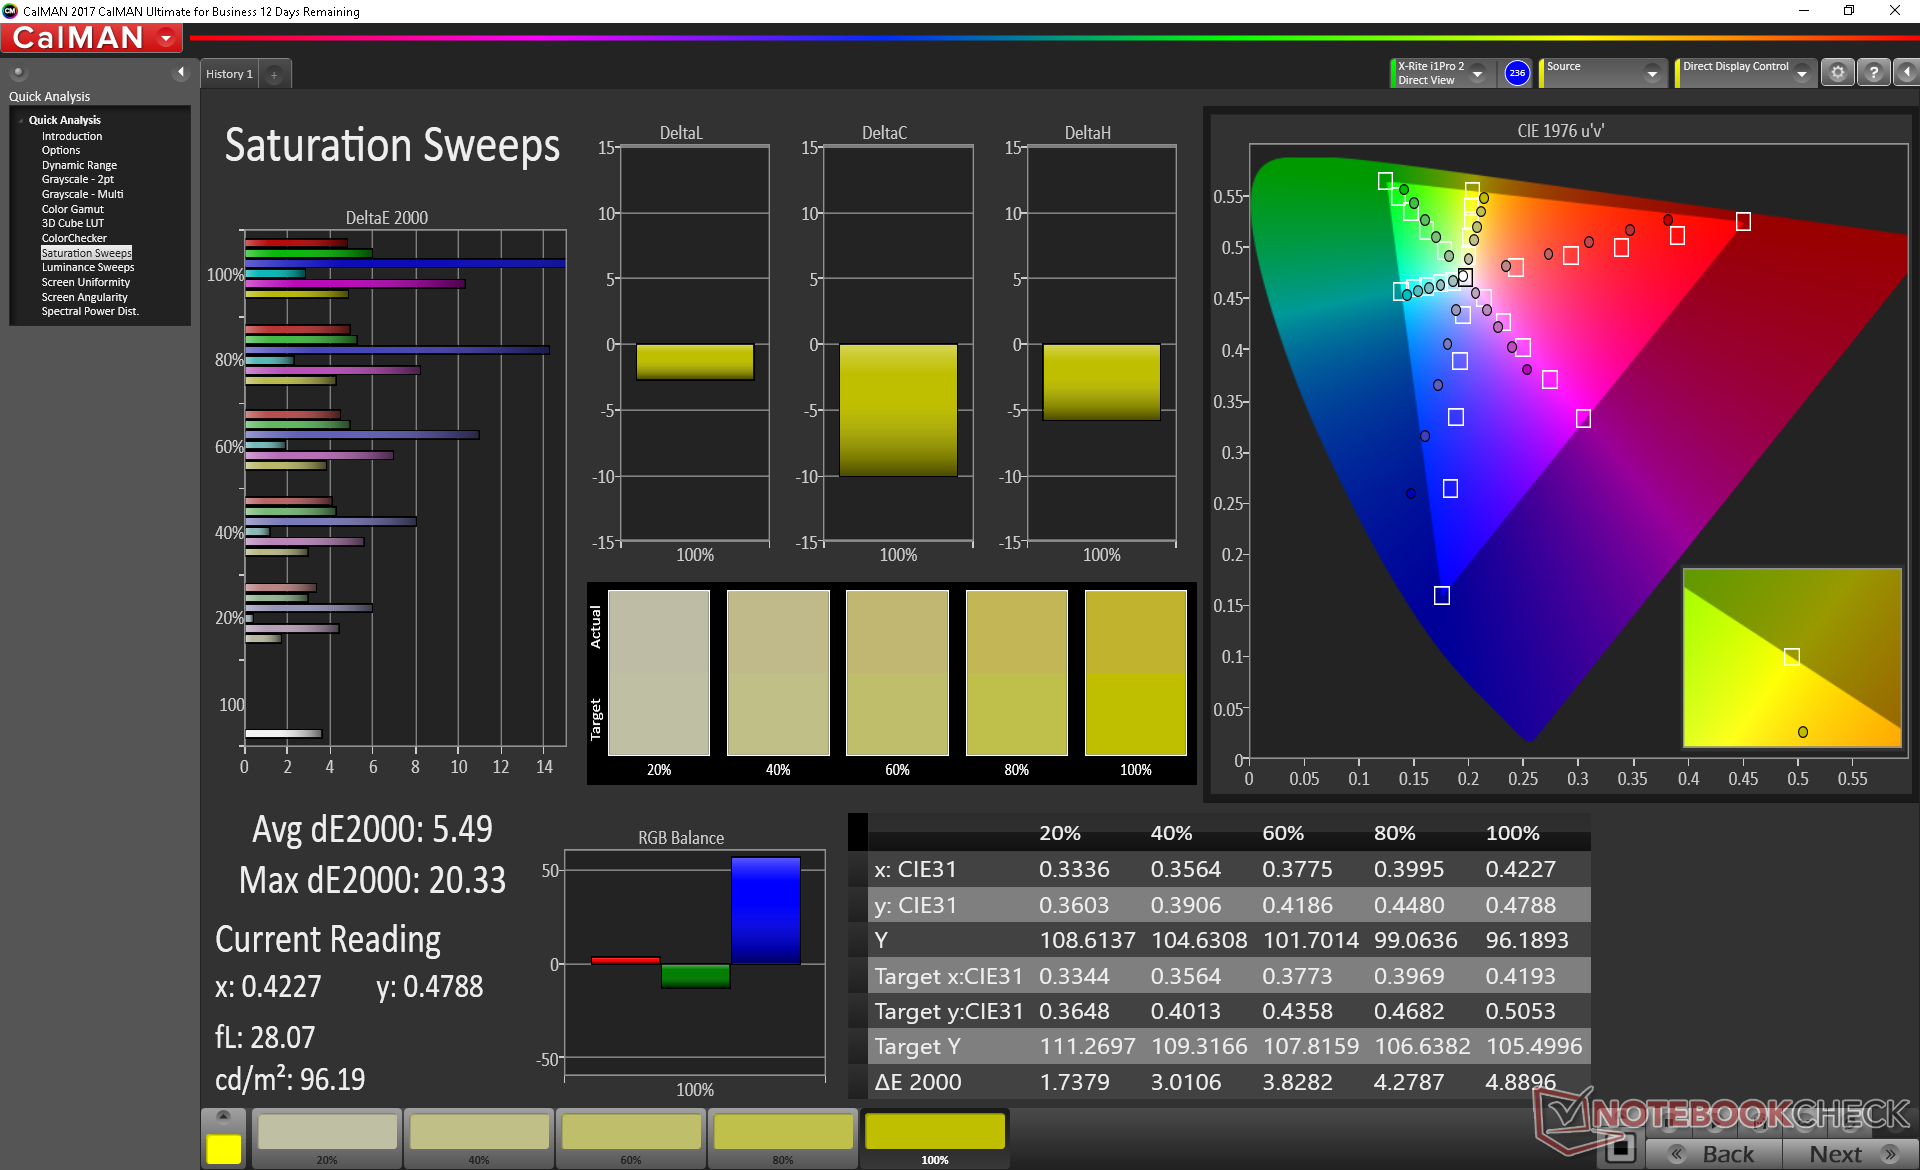
Color space is narrow at just 62 percent and 40 percent of the sRGB and AdobeRGB standards, respectively, to be in line with the displays on most other budget laptops.
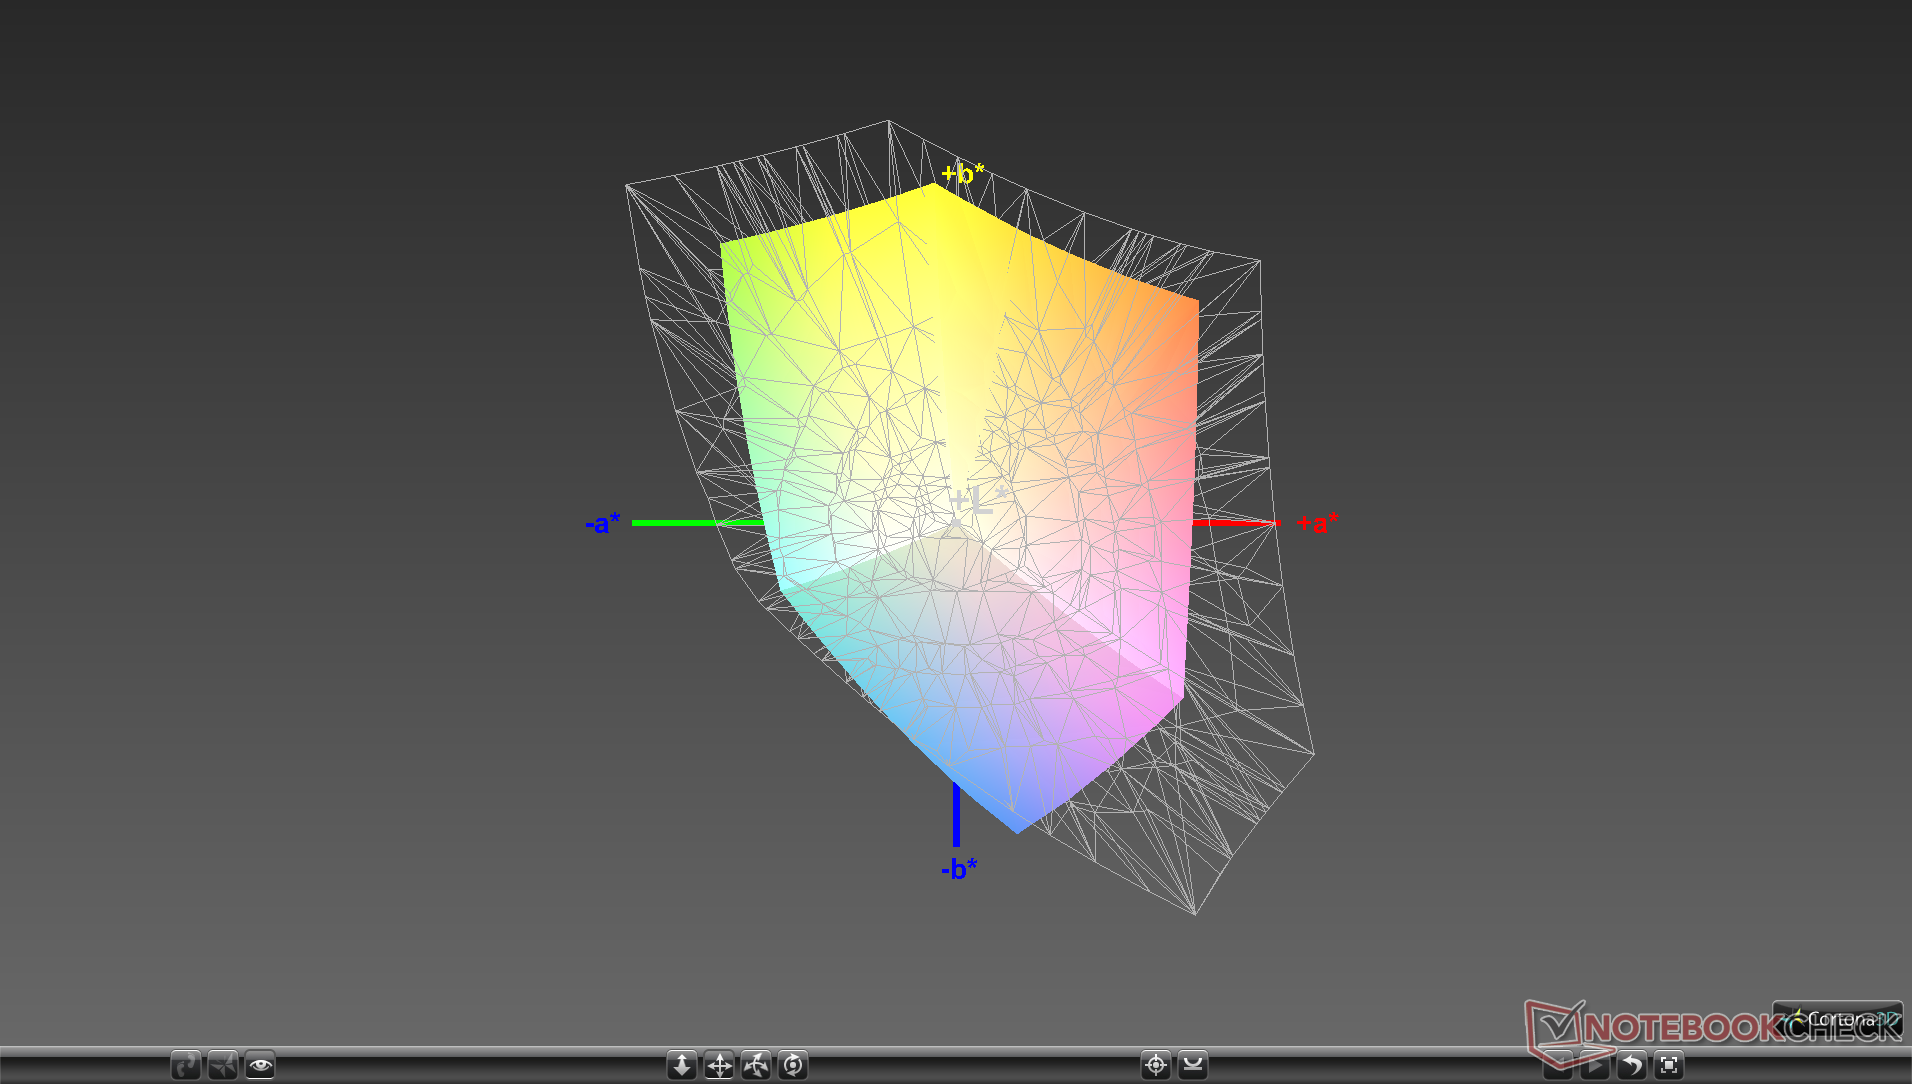
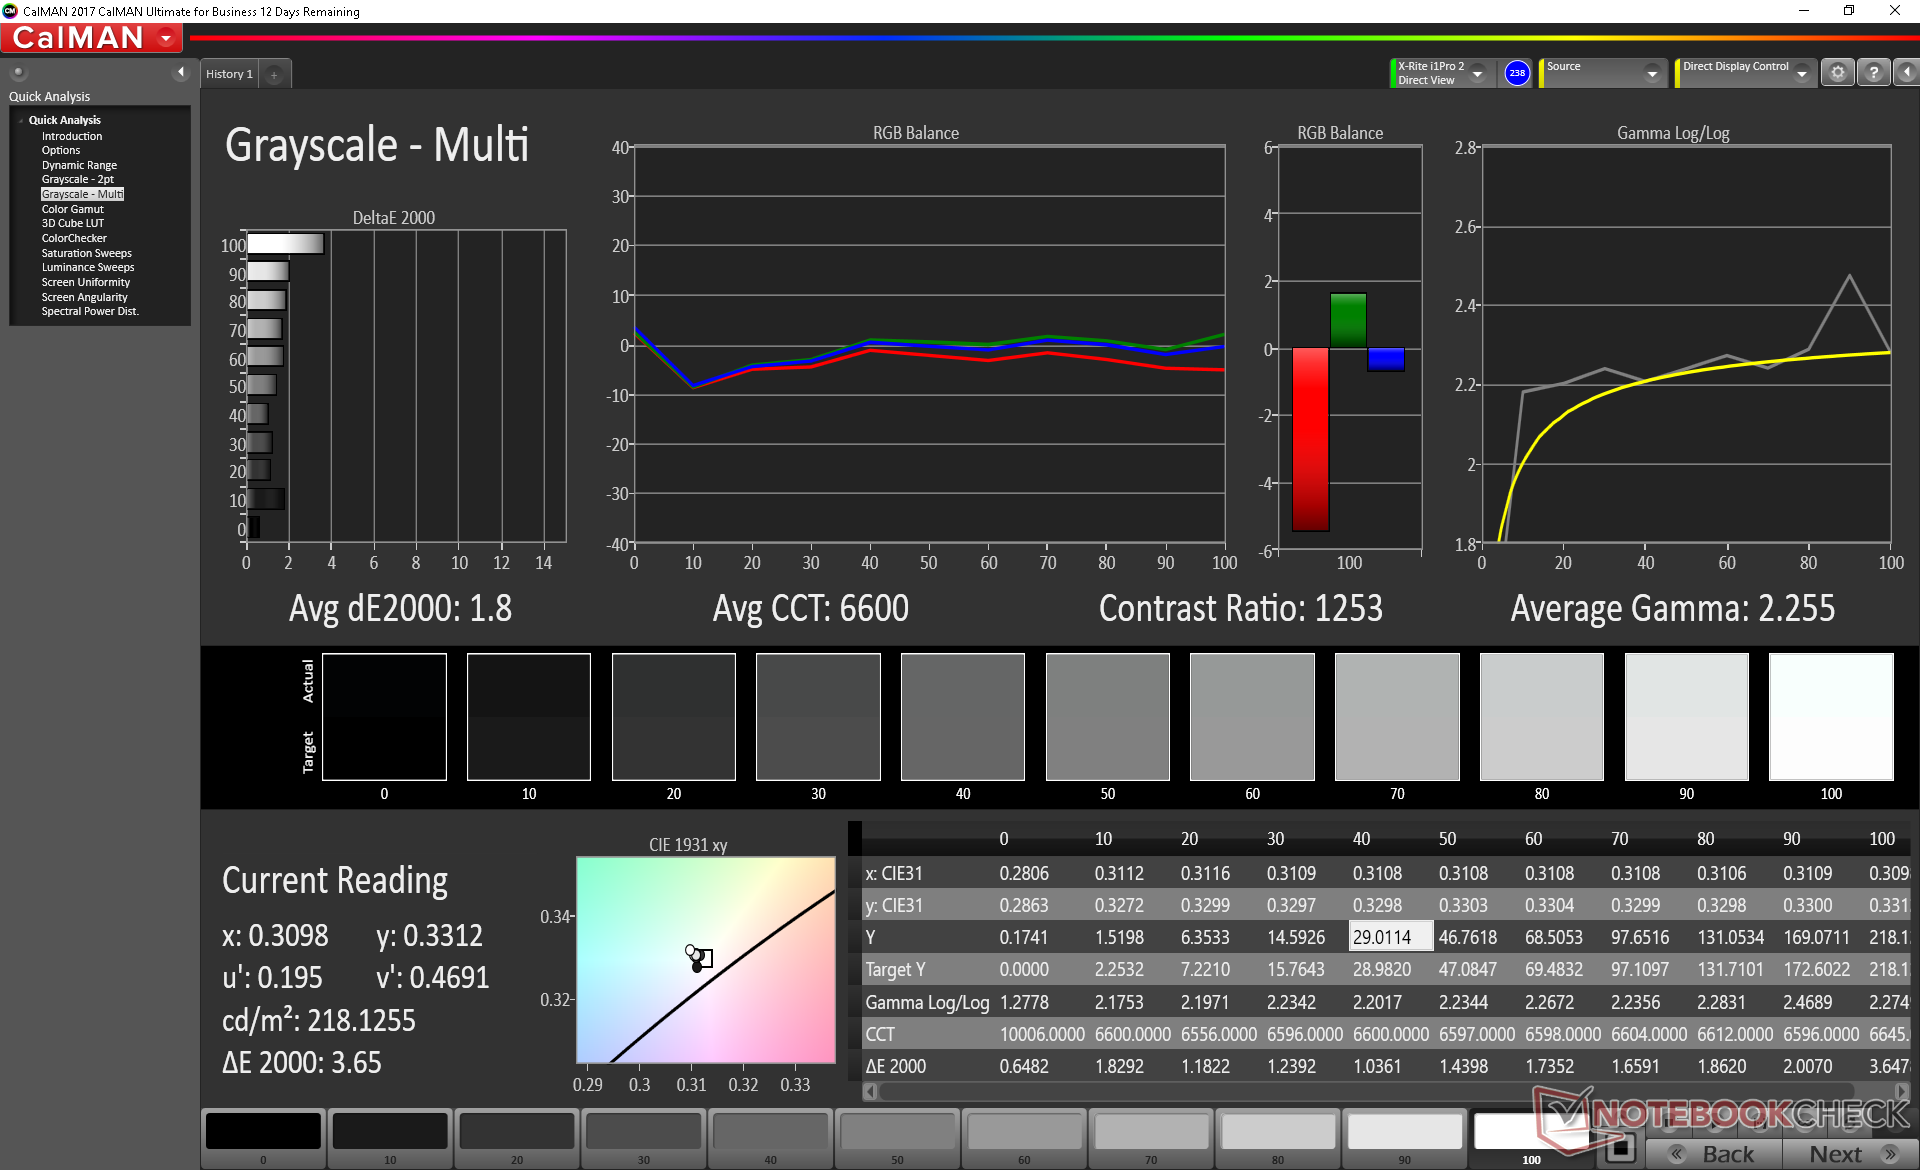
The display is surprisingly well calibrated in spite of its limited gamut and low price. Average grayscale and color deltaE values improve just marginally from 2.3 and 4.22 to 1.8 and 3.76, respectively, after calibrating the display ourselves. This is uncommon on budget laptops where panels are almost always poorly calibrated out of the box.

Display Response Times
| ↔ Response Time Black to White | ||
|---|---|---|
| 25.2 ms ... rise ↗ and fall ↘ combined | ↗ 14.8 ms rise | 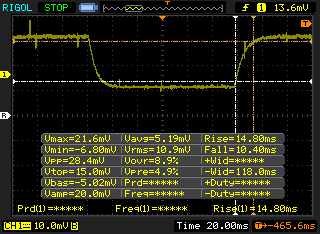 |
| ↘ 10.4 ms fall | ||
| The screen shows relatively slow response rates in our tests and may be too slow for gamers. In comparison, all tested devices range from 0.1 (minimum) to 240 (maximum) ms. » 61 % of all devices are better. This means that the measured response time is worse than the average of all tested devices (19.8 ms). | ||
| ↔ Response Time 50% Grey to 80% Grey | ||
| 35.2 ms ... rise ↗ and fall ↘ combined | ↗ 23.6 ms rise | 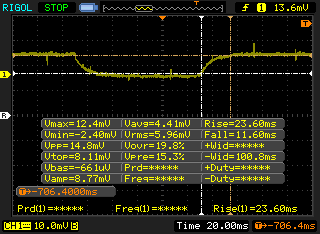 |
| ↘ 11.6 ms fall | ||
| The screen shows slow response rates in our tests and will be unsatisfactory for gamers. In comparison, all tested devices range from 0.165 (minimum) to 636 (maximum) ms. » 49 % of all devices are better. This means that the measured response time is worse than the average of all tested devices (30.9 ms). | ||
Screen Flickering / PWM (Pulse-Width Modulation)
| Screen flickering / PWM detected | 25000 Hz | ≤ 34 % brightness setting | 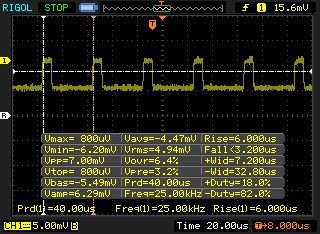 |
The display backlight flickers at 25000 Hz (worst case, e.g., utilizing PWM) Flickering detected at a brightness setting of 34 % and below. There should be no flickering or PWM above this brightness setting. The frequency of 25000 Hz is quite high, so most users sensitive to PWM should not notice any flickering. In comparison: 52 % of all tested devices do not use PWM to dim the display. If PWM was detected, an average of 7744 (minimum: 5 - maximum: 343500) Hz was measured. | |||
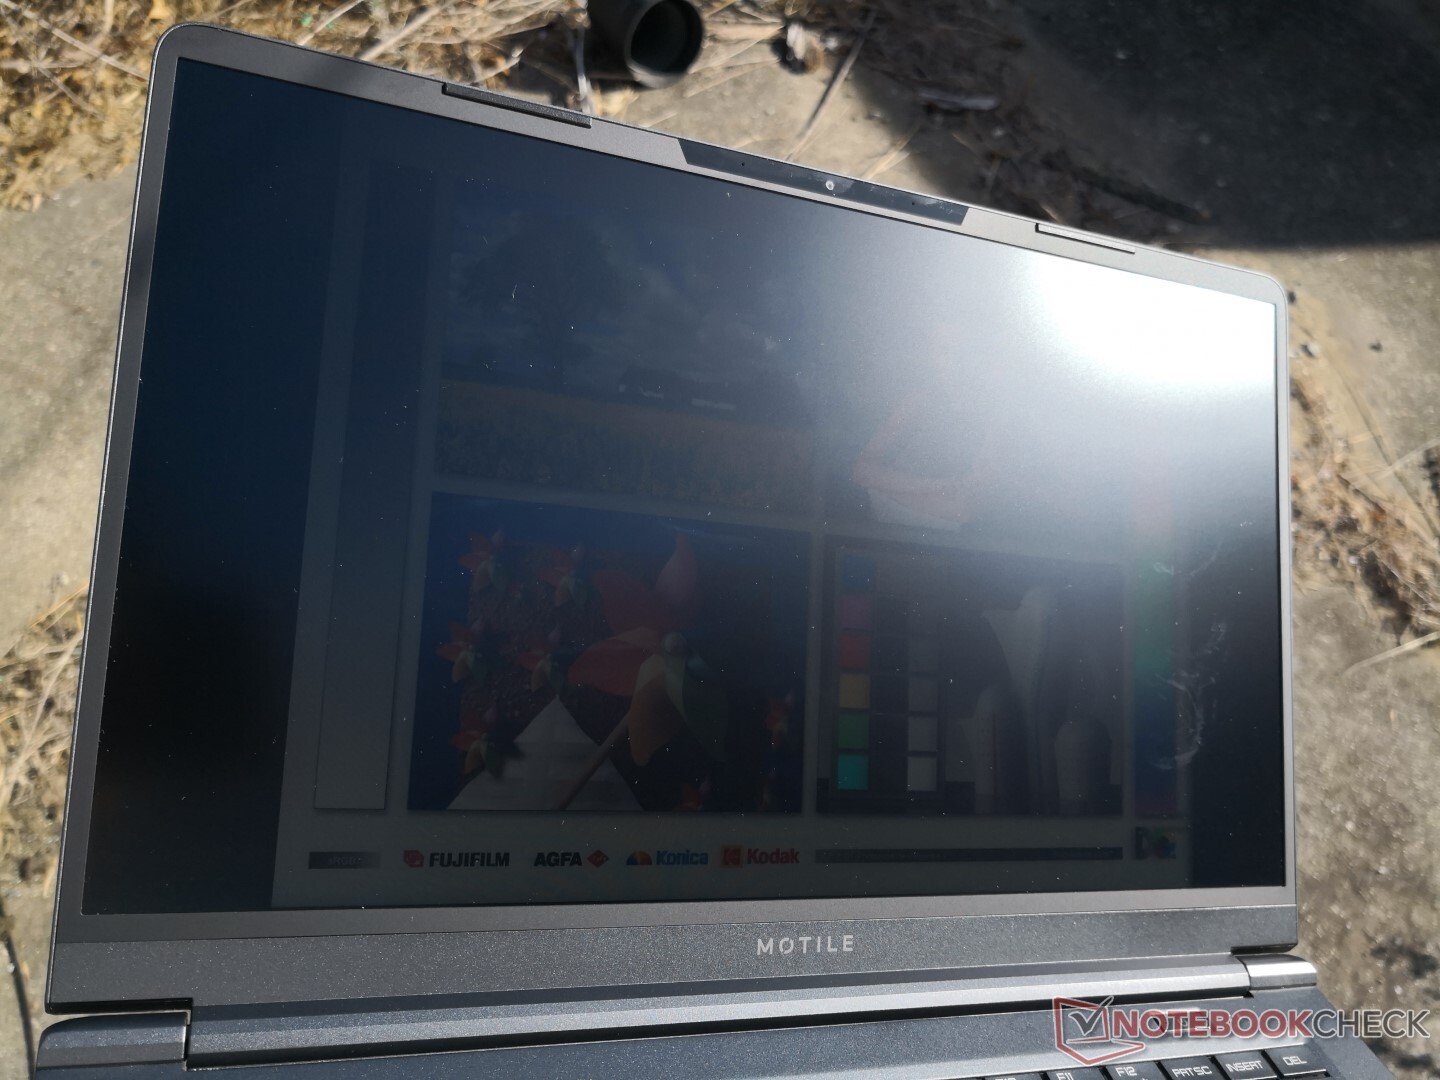
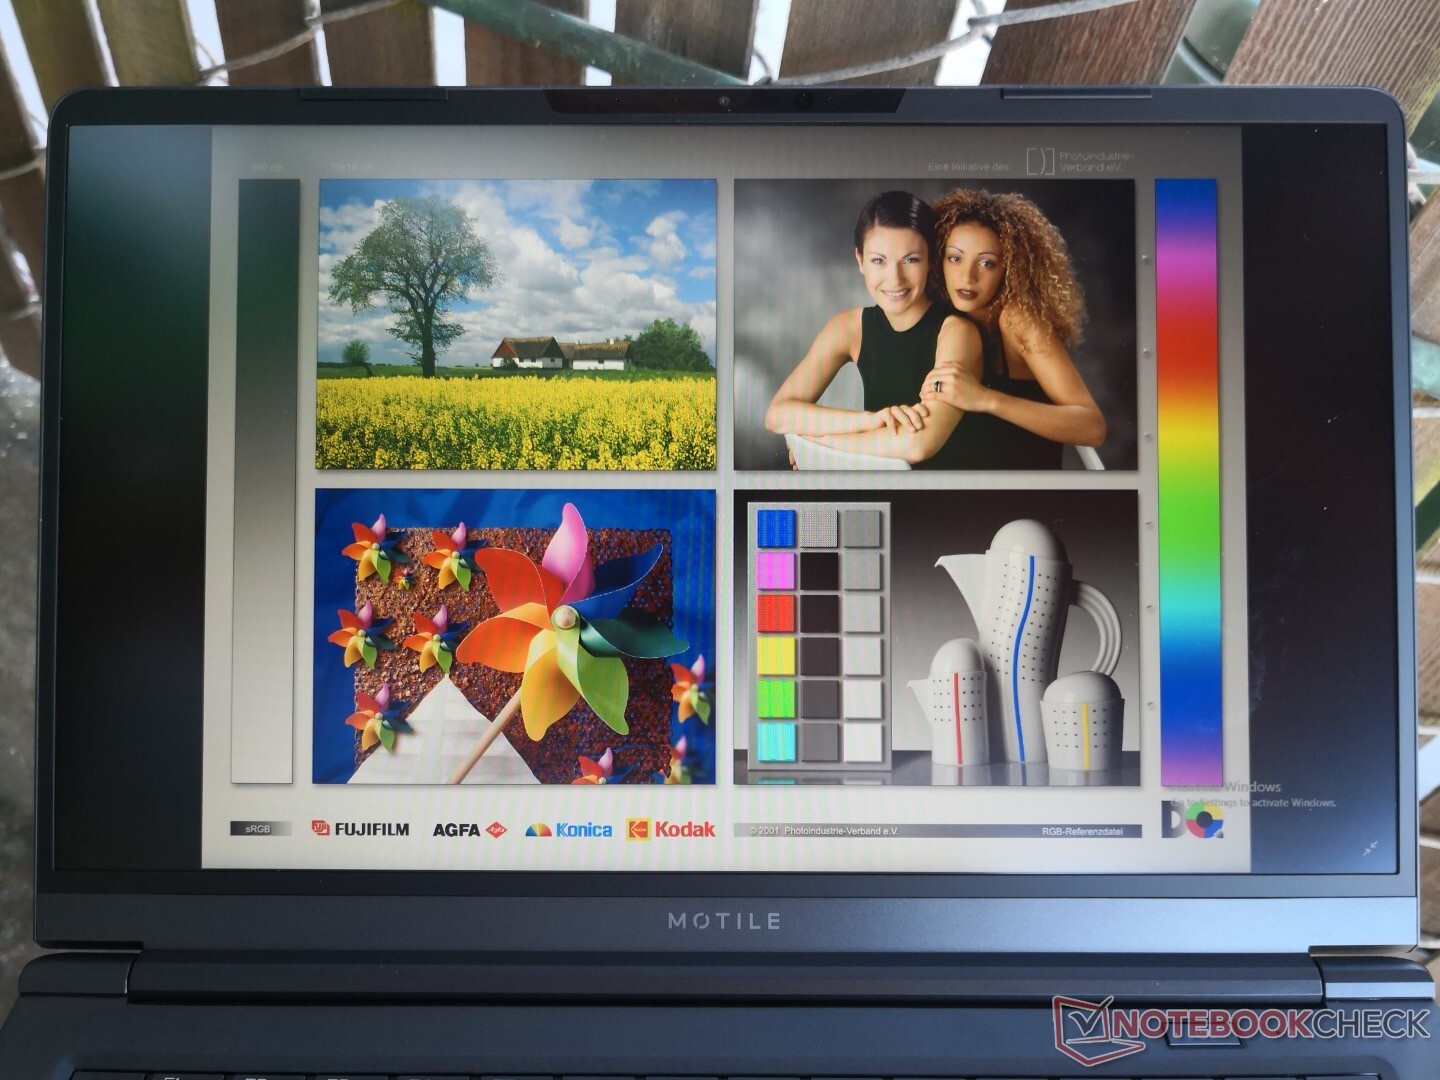
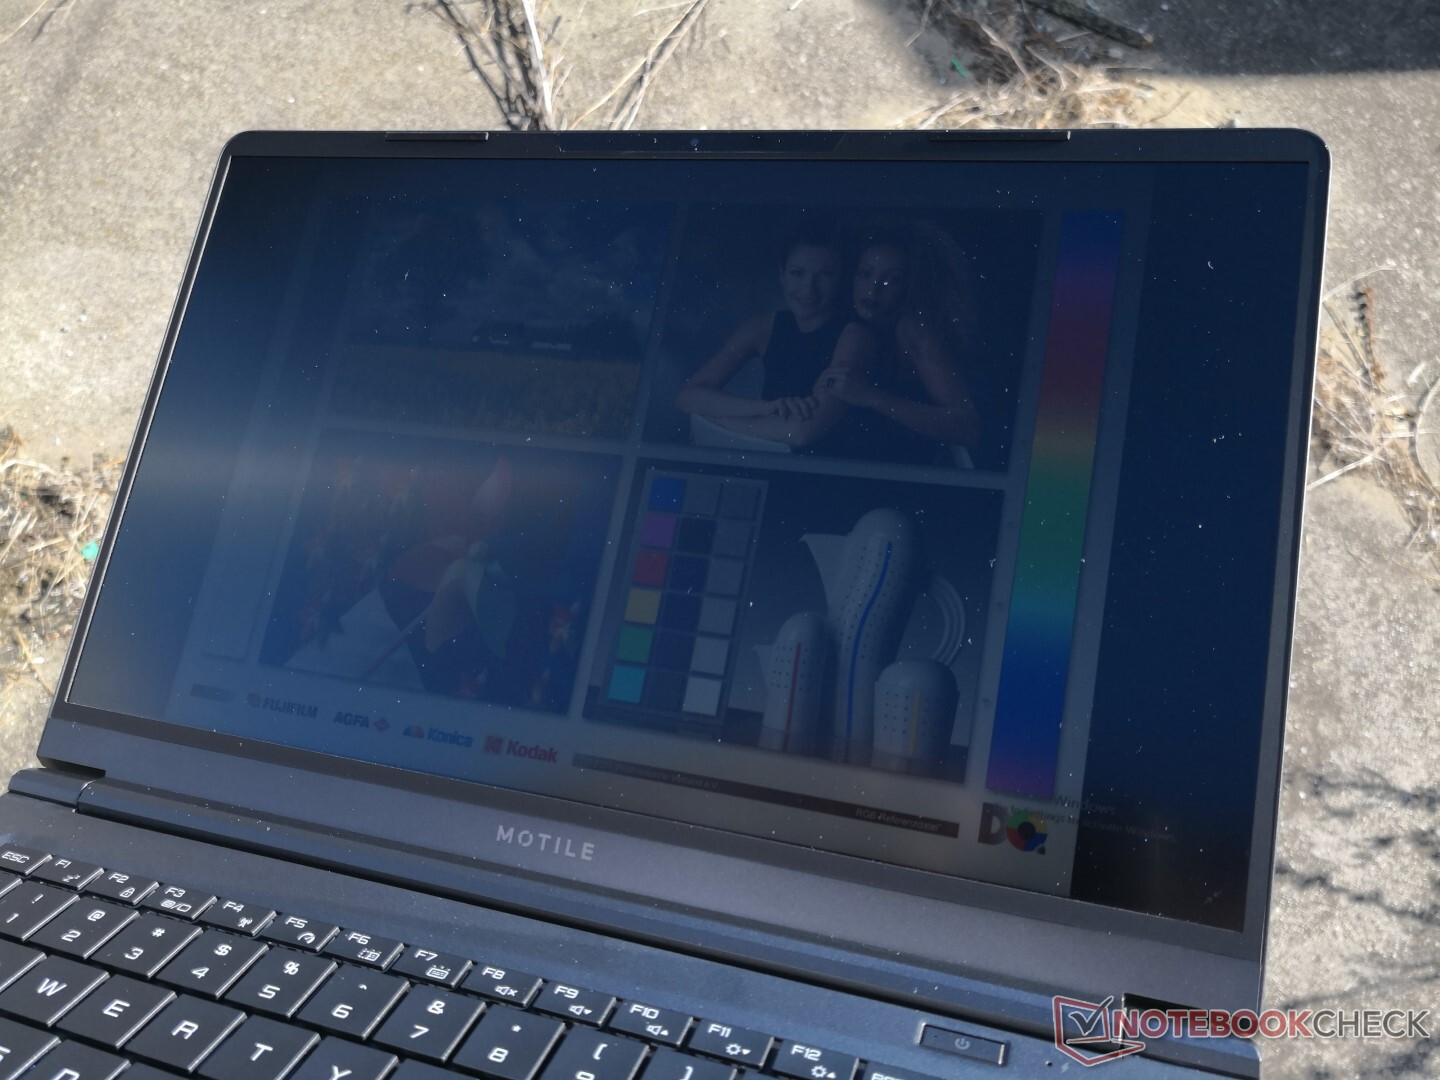
Outdoor visibility is poor with washed out colors since the backlight is relatively dim. Maximum brightness drops ever-so-slightly if running on battery power (240 nits to 229 nits). Pricier alternatives like the Dell XPS 15 or Apple MacBook Pro 15 can be over two times brighter for easier outdoor use.
Performance
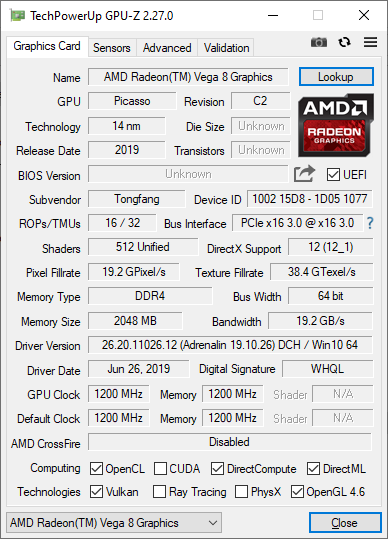
The AMD Zen+ Ryzen 3 3300U and Ryzen 5 3500U on the current Motile series compete directly with the Intel Core i3-8145U and Core i5-8265U, respectively. The Ryzen 5 3500U in particular can even stand toe-to-toe with the Core i7-8565U as found on most of the latest flagship Ultrabooks. Meanwhile, the integrated RX Vega 8 GPU can handily outperform the common UHD Graphics 620 albeit at slightly higher power consumption levels.
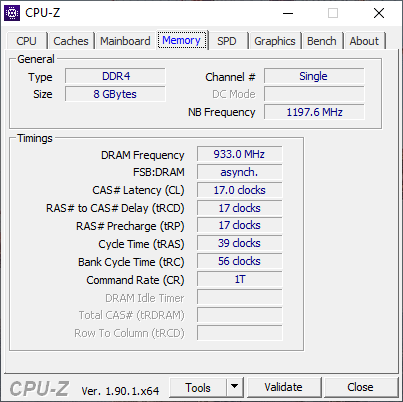
There is no soldered RAM and only one SODIMM slot is available. Thus, the Motile is limited to single-channel RAM only.
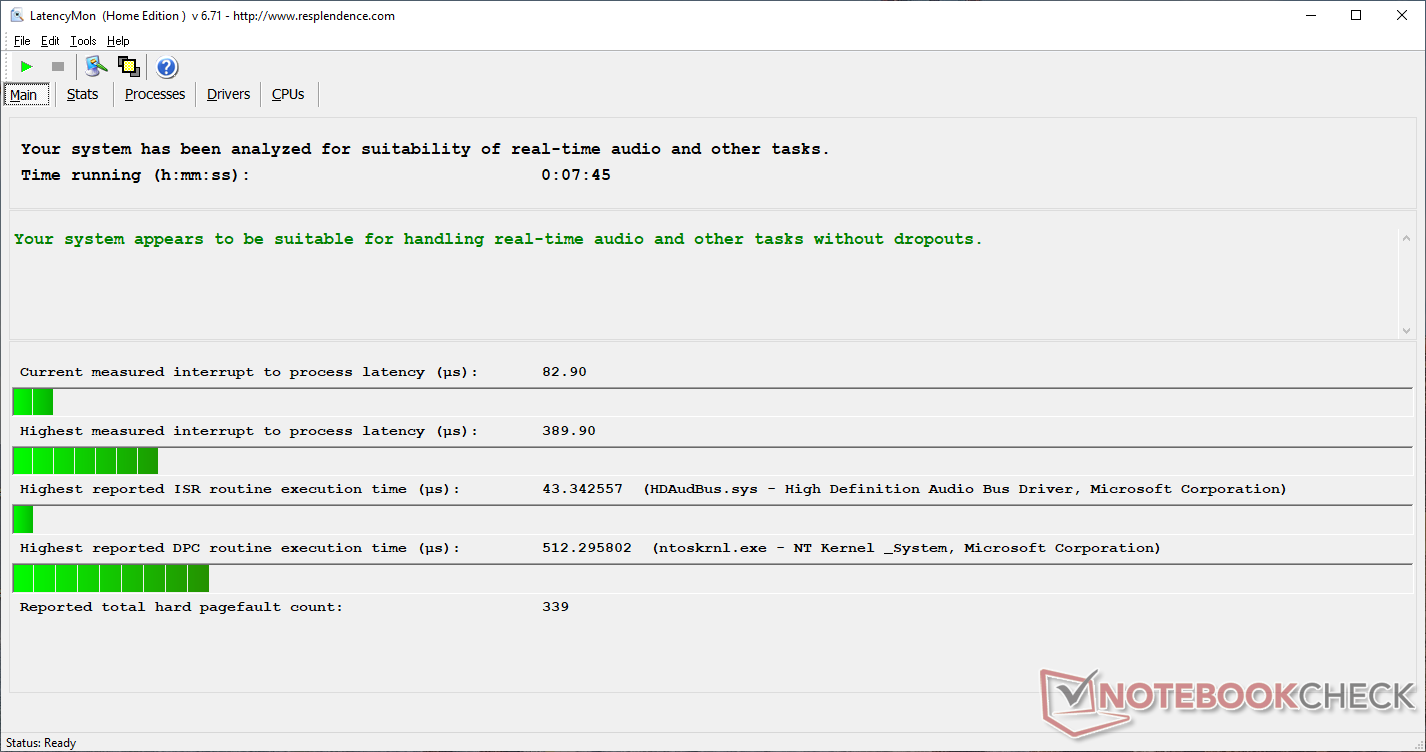
LatencyMon shows no DPC latency issues even when wireless is enabled.
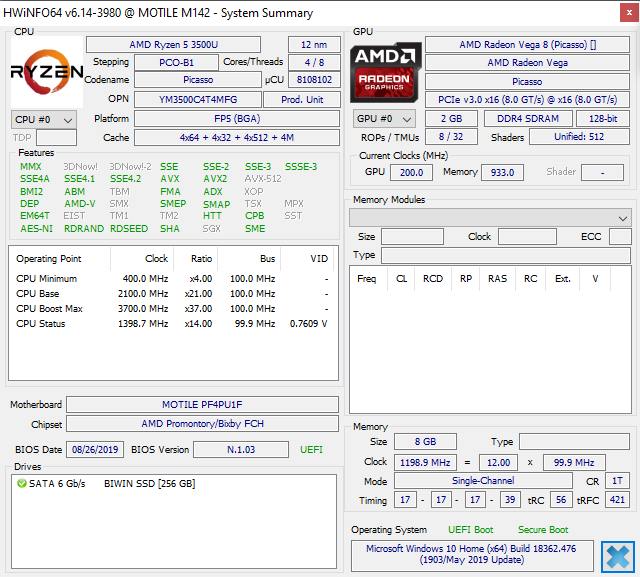
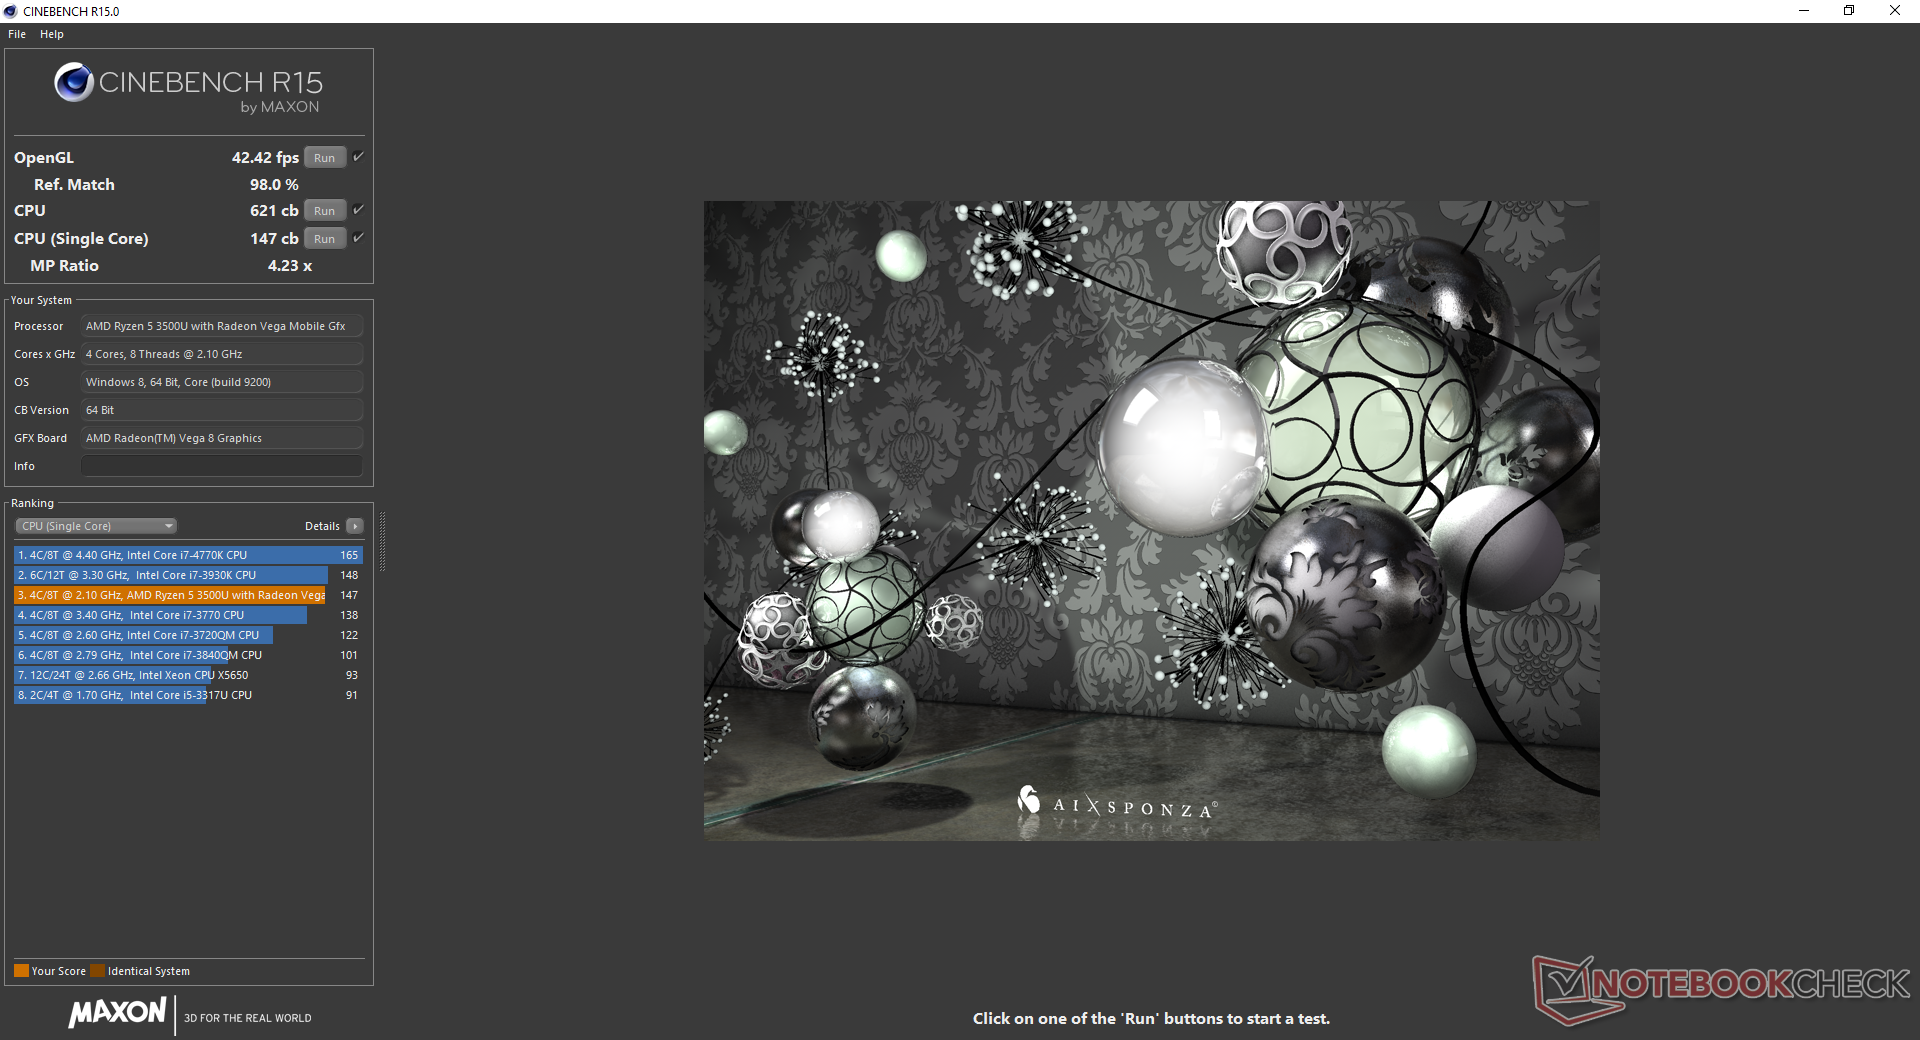
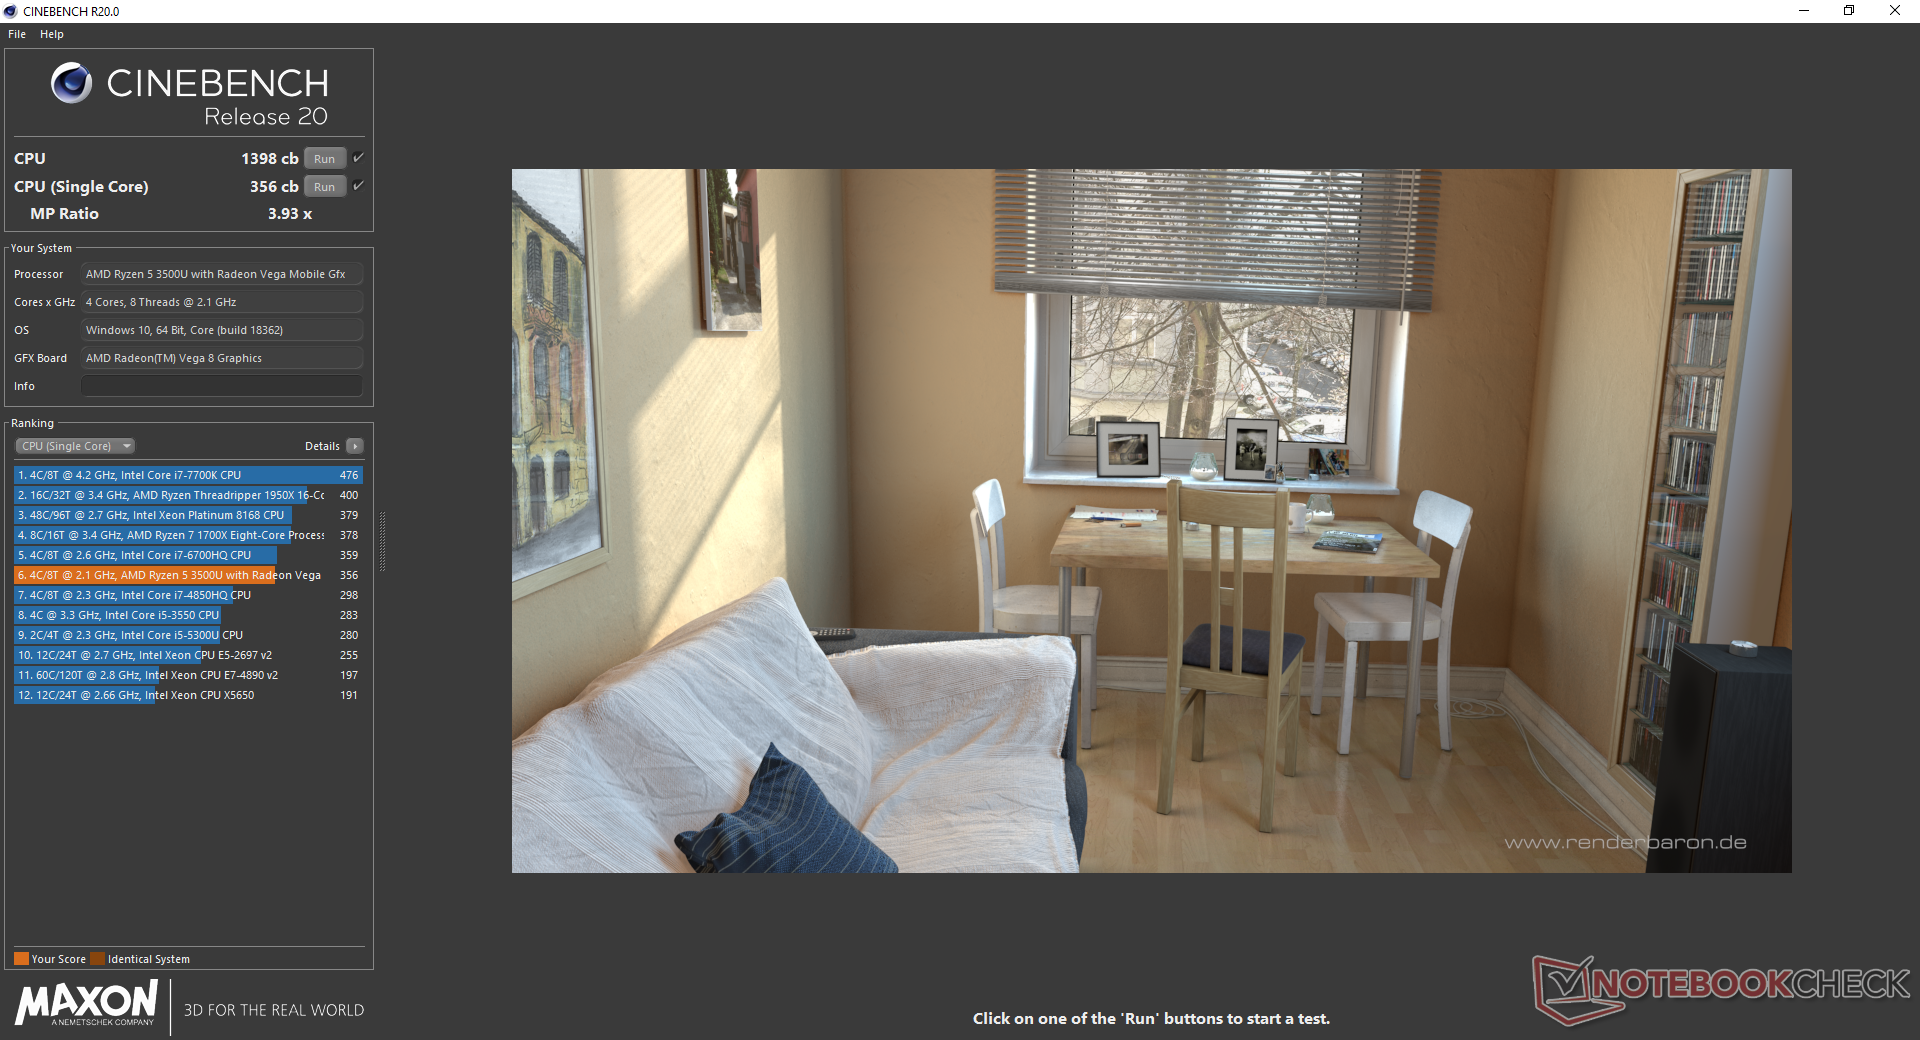
Processor
CPU performance is most similar to the last generation Zen Ryzen 7 2700U. It's generally comparable to both the Intel Kaby Lake-R Core i7-8550U and Whiskey Lake-U Core i7-8565U as found on pricier flagship Ultrabooks like the Asus ZenBook or Lenovo Yoga. Upgrading from the Ryzen 3 3300U SKU will bring roughly 30 percent faster multi-thread performance.
See our dedicated page on the Ryzen 5 3700U for more technical information and benchmark comparisons.
System Performance
PCMark benchmarks rank our Motile within single-digit percentage points of direct competitors like the Asus VivoBook, Acer Swift 3, and HP 14 despite their price differences. We experienced no software or hardware issues during our time with the test unit.
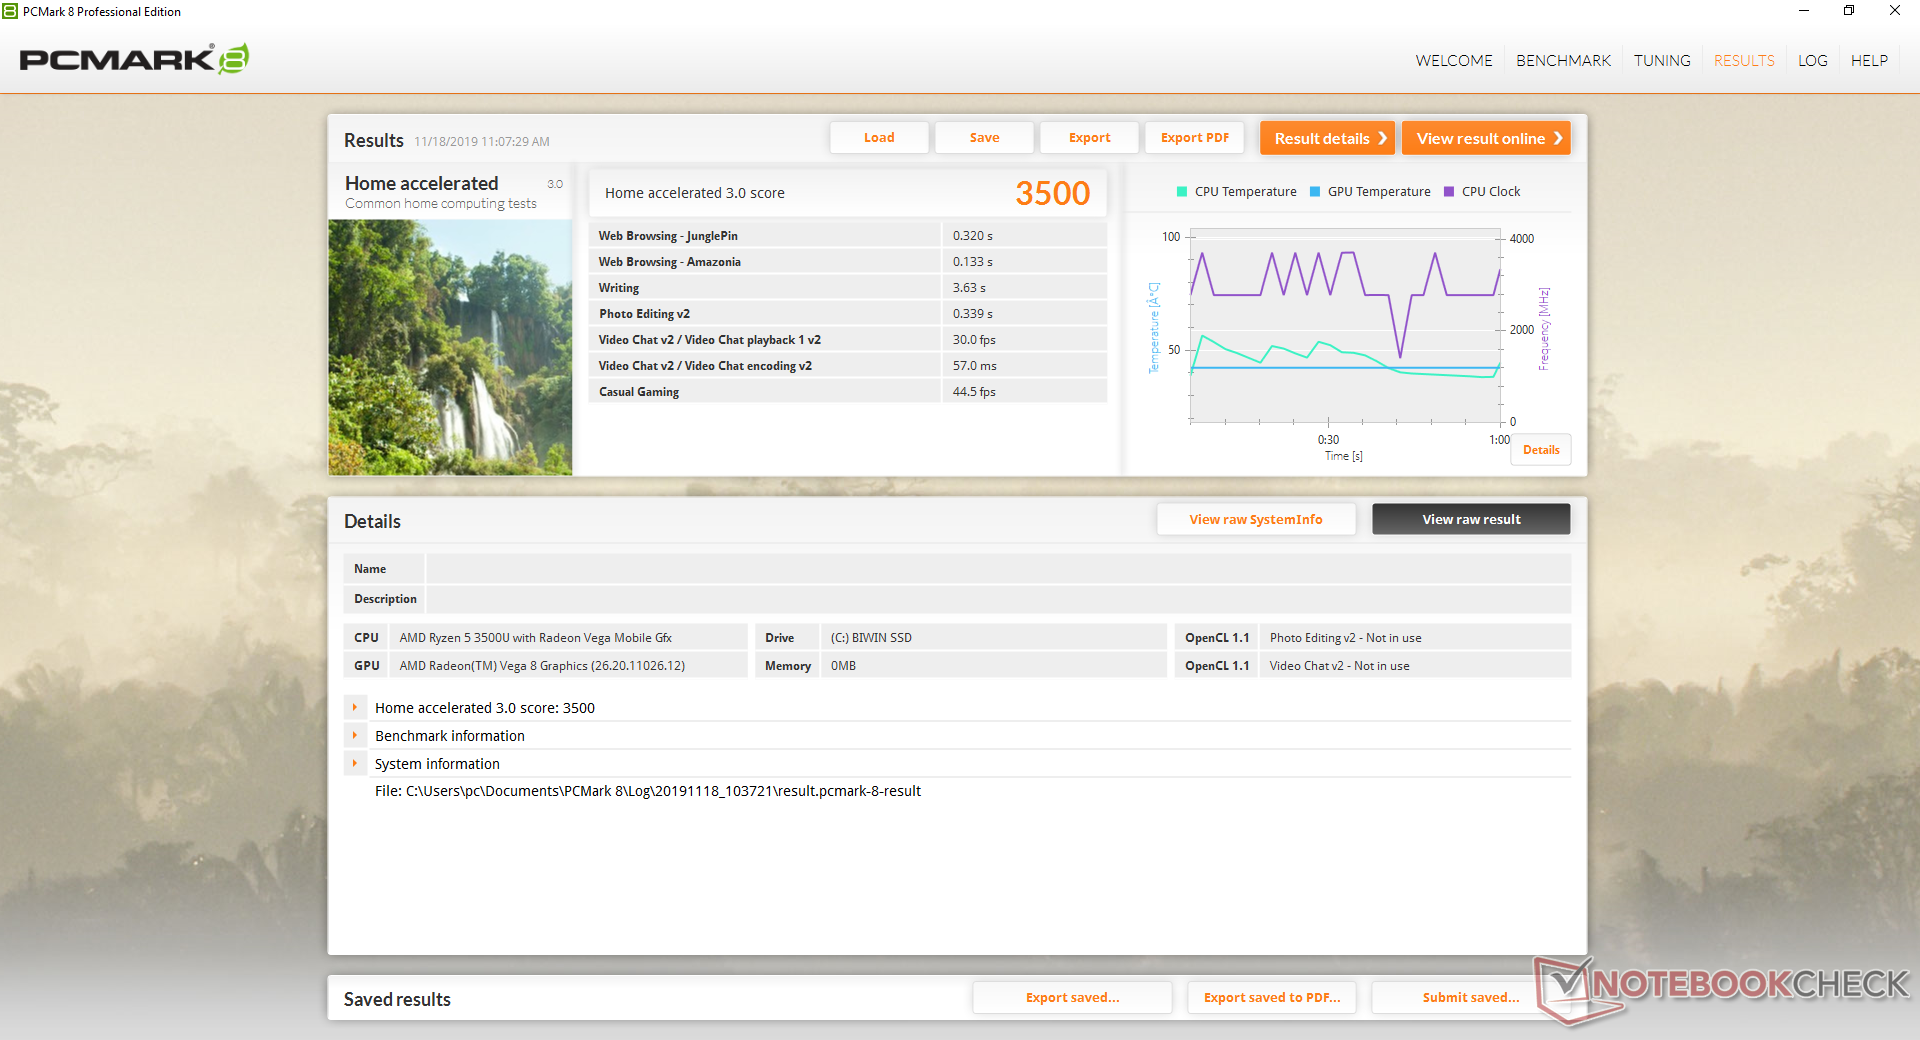
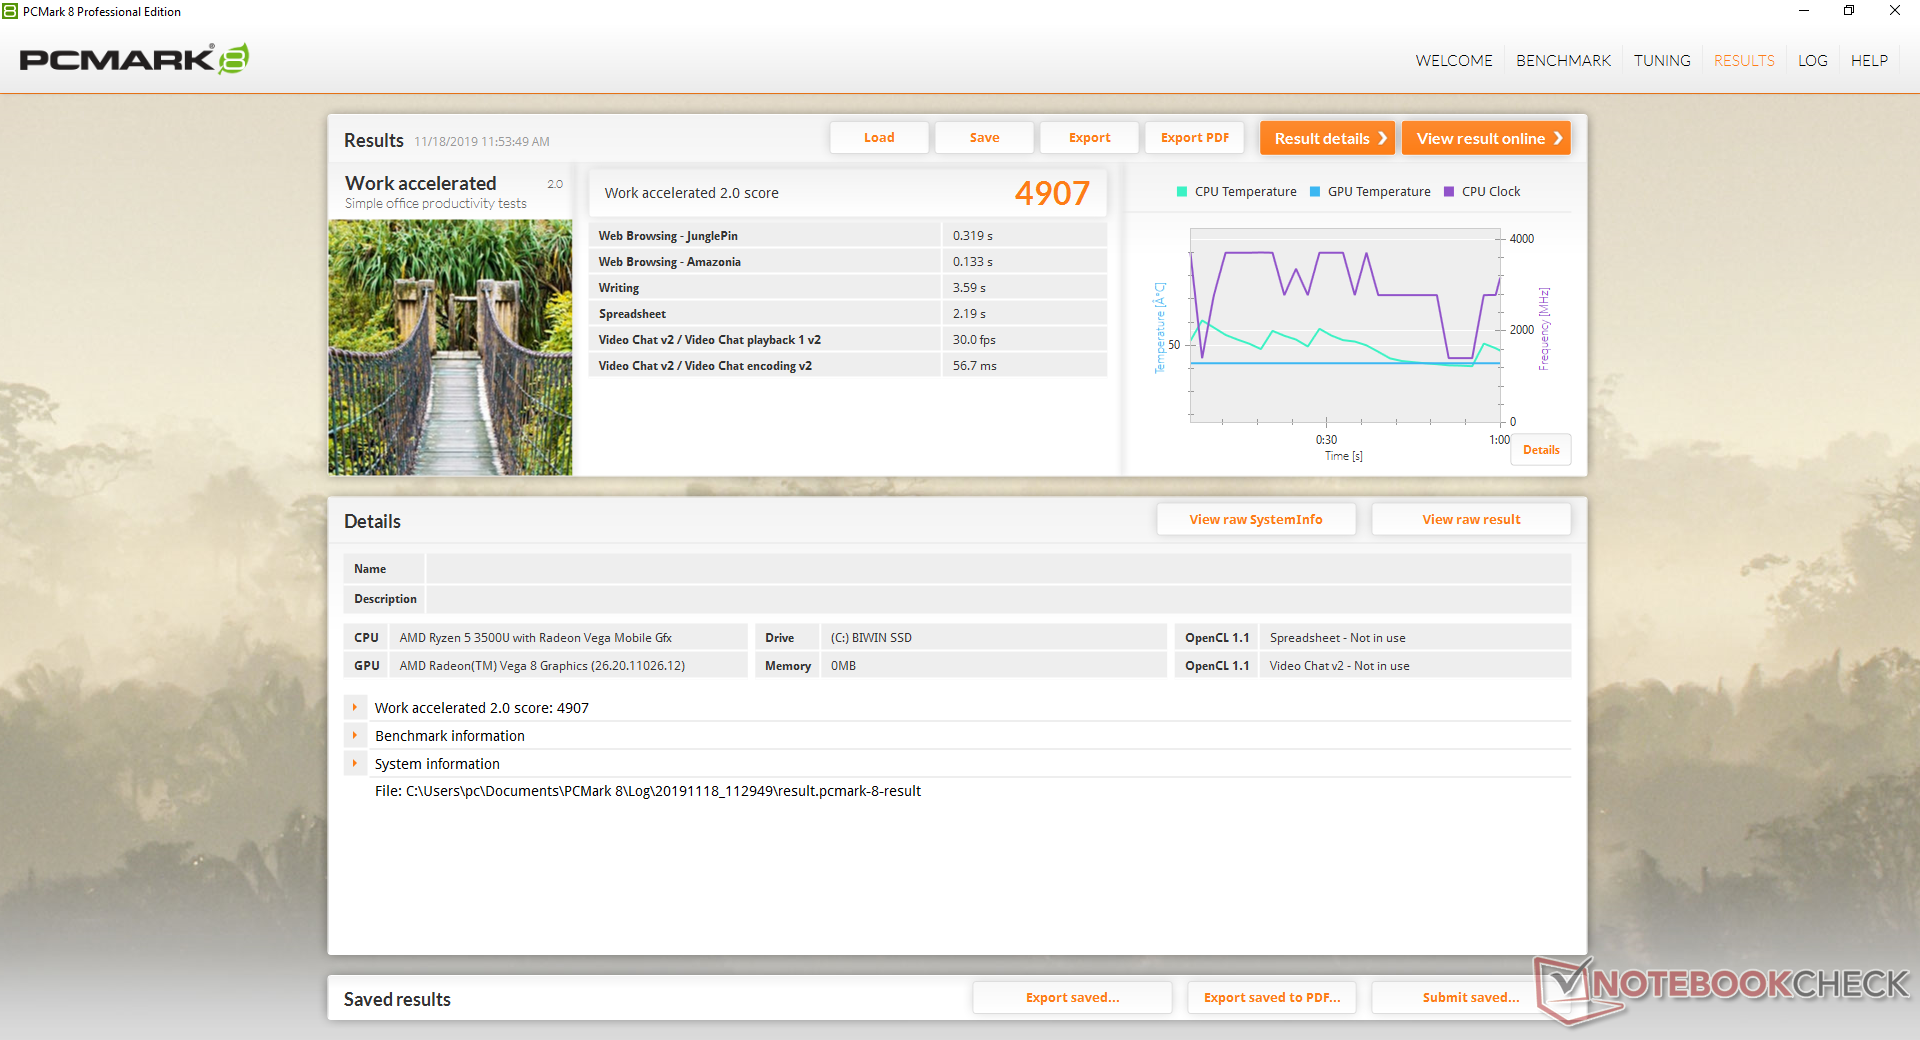
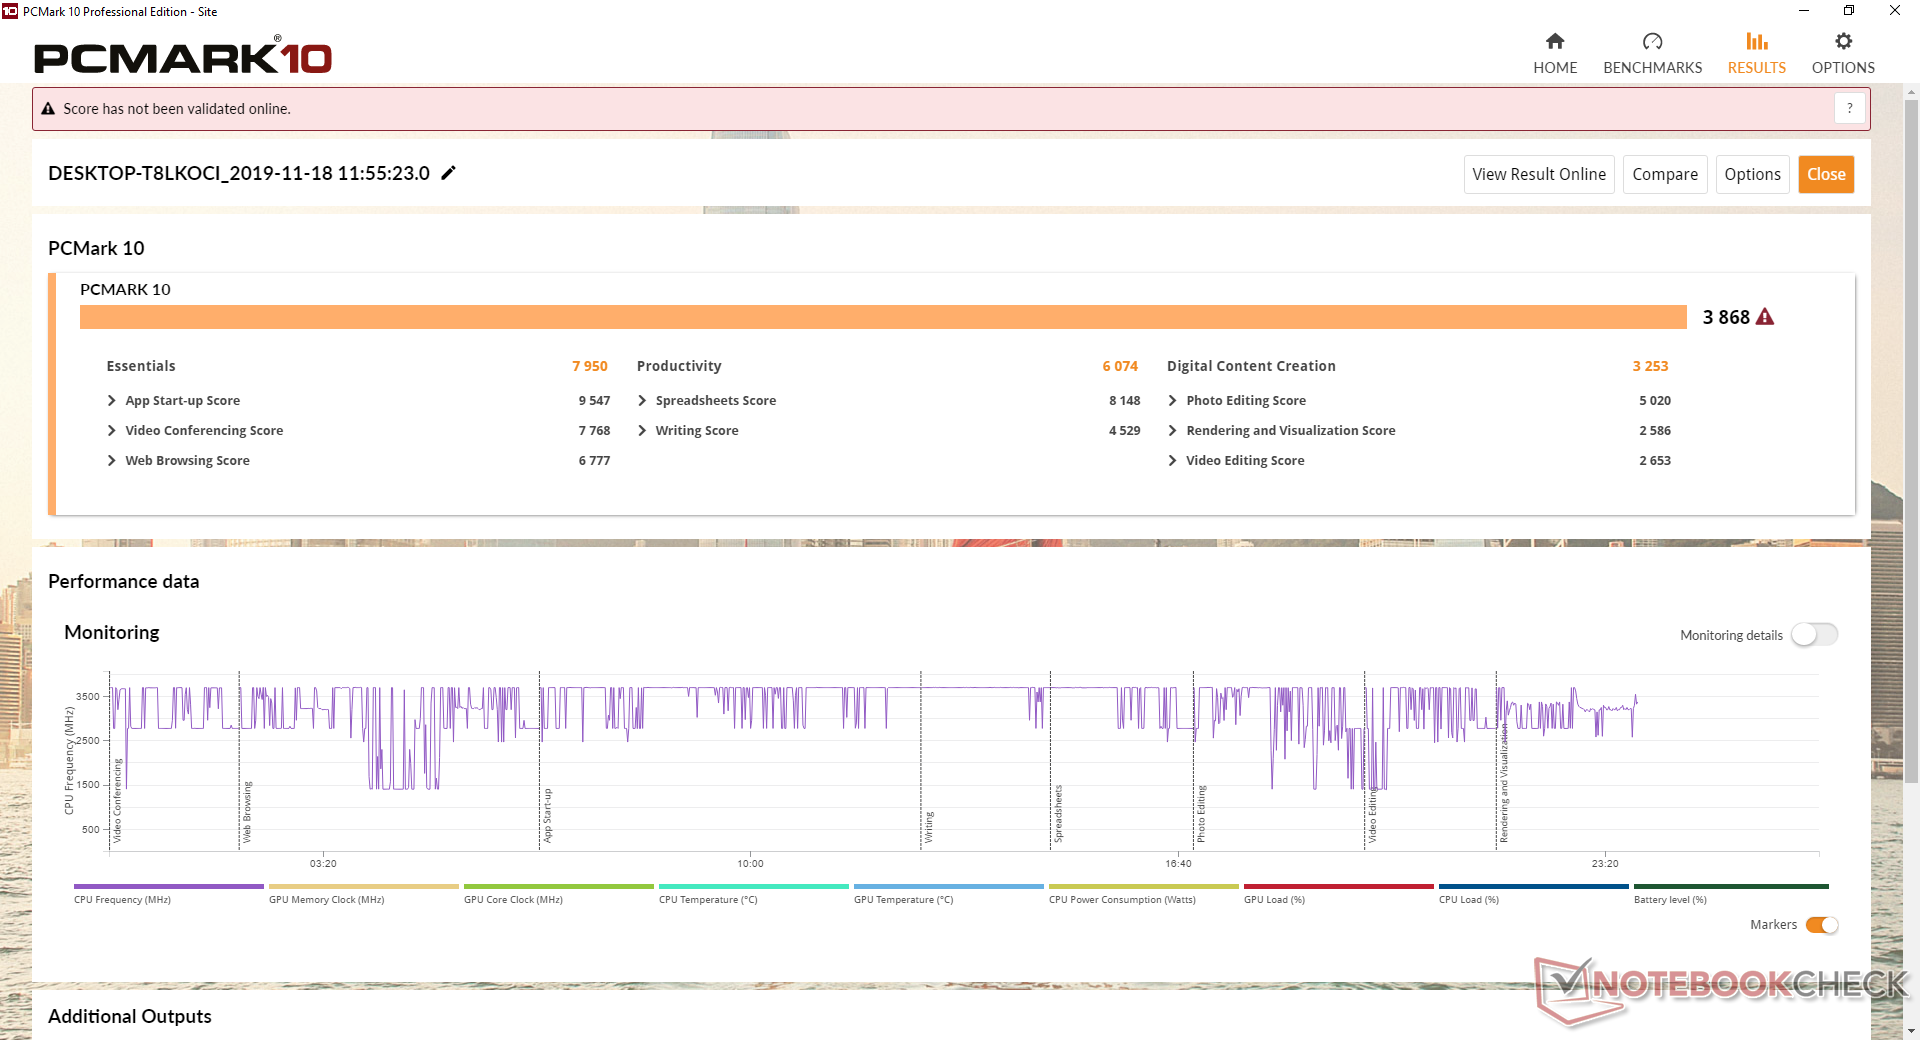
| PCMark 8 Home Score Accelerated v2 | 3500 points | |
| PCMark 8 Work Score Accelerated v2 | 4907 points | |
| PCMark 10 Score | 3868 points | |
Help | ||
Storage Devices
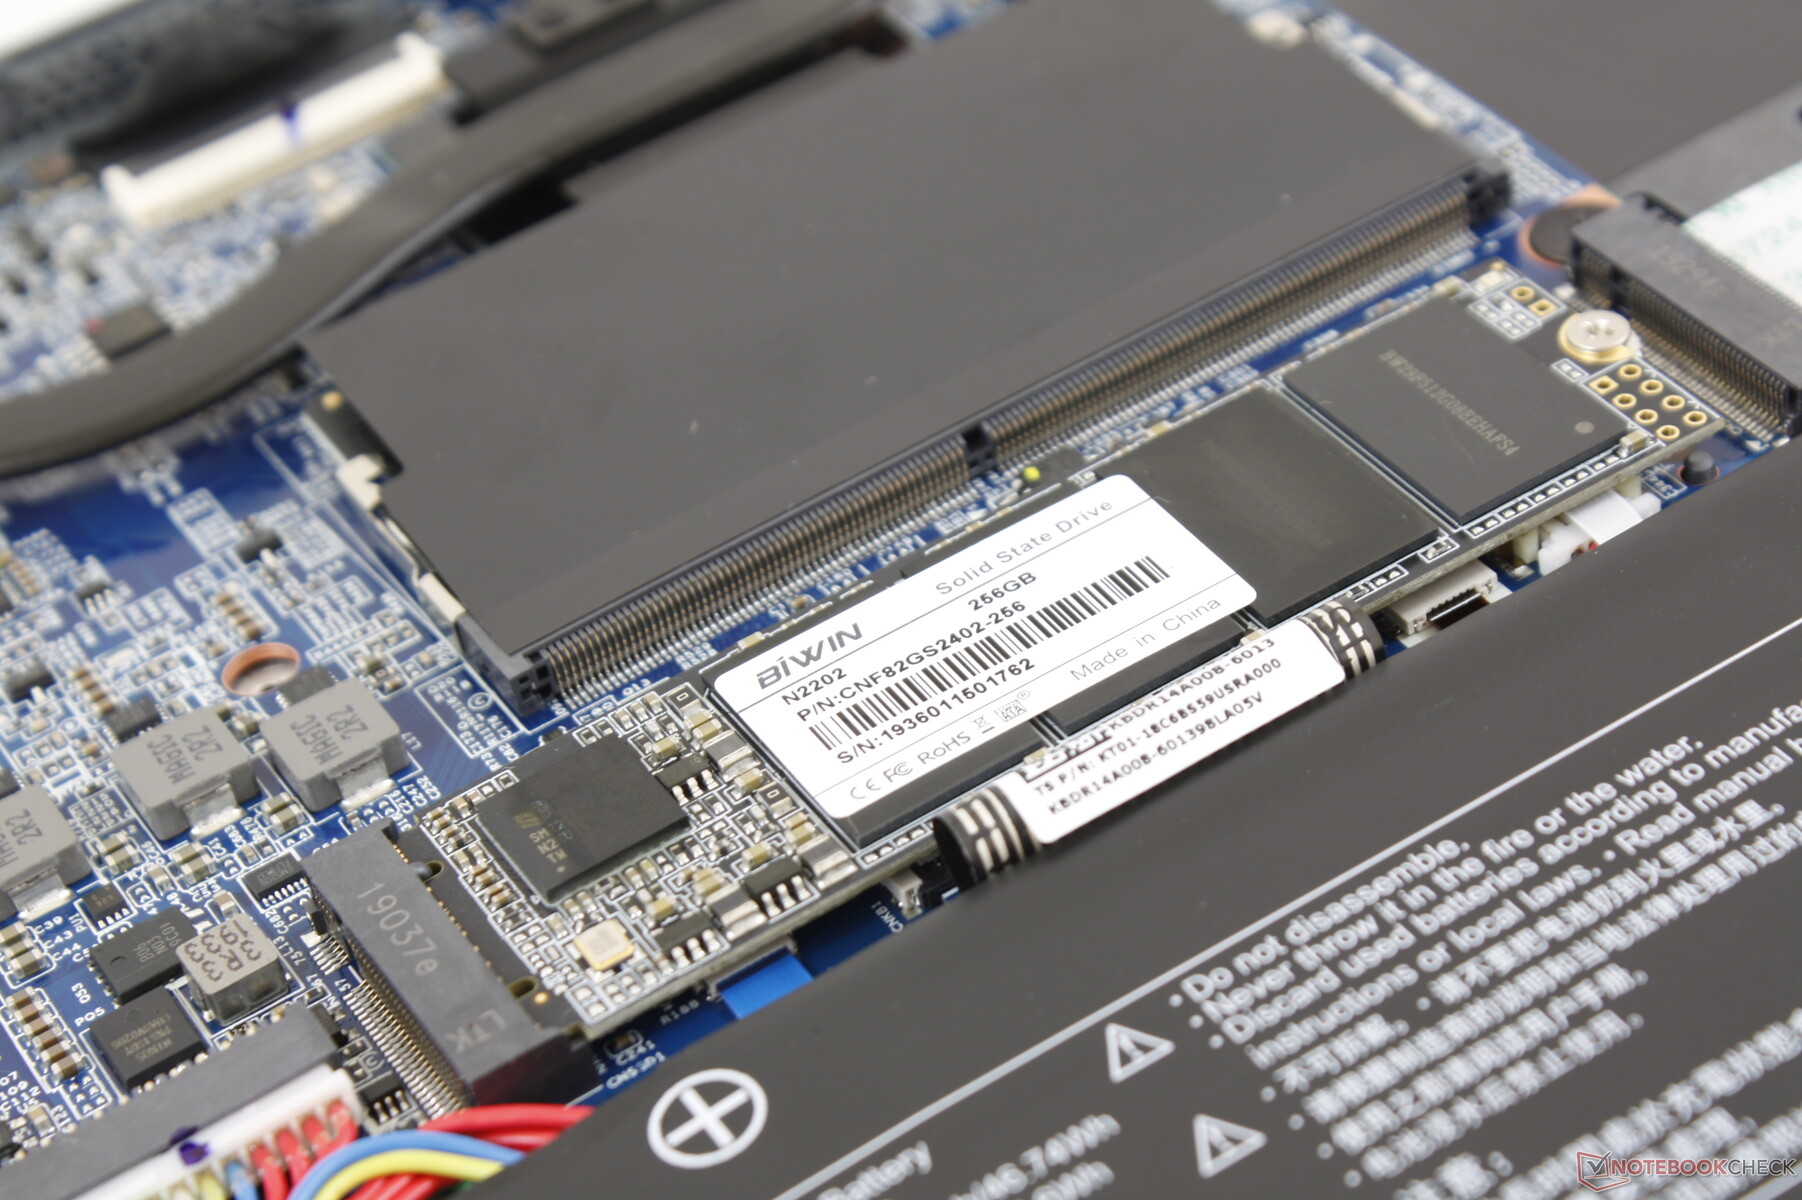
Two M.2 bays are available with no 2.5-inch options. Our test unit ships with an M.2 SATA III SSD from the relatively unknown manufacturer BIWIN likely in an attempt to save on costs. Performance is otherwise most similar to the budget Samsung PM871b.
See our table of HDDs and SSDs for more benchmark comparisons.
| Walmart Motile M142 BIWIN SSD 256 GB | Acer Swift 3 SF314-41-R8HZ WDC PC SN520 SDAPNUW-512G | Lenovo Yoga C940-14IIL Samsung SSD PM981 MZVLB512HAJQ | Asus VivoBook 14 X403FA Intel SSD 660p SSDPEKNW512G8 | Lenovo IdeaPad S540-14IWL Samsung SSD PM981 MZVLB512HAJQ | HP 14-dk0008ng Samsung PM871b MZNLN128HAHQ | |
|---|---|---|---|---|---|---|
| AS SSD | 170% | 278% | 130% | 262% | -13% | |
| Seq Read (MB/s) | 466.1 | 1466 215% | 2525 442% | 1633 250% | 1939 316% | 491.6 5% |
| Seq Write (MB/s) | 451.9 | 1360 201% | 1253 177% | 906 100% | 1755 288% | 473.9 5% |
| 4K Read (MB/s) | 26.42 | 38.06 44% | 59.1 124% | 56.6 114% | 61 131% | 26.82 2% |
| 4K Write (MB/s) | 77 | 86 12% | 134.1 74% | 152 97% | 138.9 80% | 57.8 -25% |
| 4K-64 Read (MB/s) | 192.1 | 1008 425% | 1010 426% | 322.9 68% | 1271 562% | 244.3 27% |
| 4K-64 Write (MB/s) | 198.4 | 956 382% | 1461 636% | 814 310% | 1330 570% | 154.9 -22% |
| Access Time Read * (ms) | 0.089 | 0.062 30% | 0.052 42% | 0.086 3% | 0.04 55% | 0.119 -34% |
| Access Time Write * (ms) | 0.123 | 0.042 66% | 0.029 76% | 0.045 63% | 0.028 77% | 0.062 50% |
| Score Read (Points) | 265 | 1193 350% | 1322 399% | 543 105% | 1526 476% | 320 21% |
| Score Write (Points) | 321 | 1178 267% | 1721 436% | 1056 229% | 1645 412% | 260 -19% |
| Score Total (Points) | 731 | 2981 308% | 3670 402% | 1863 155% | 3955 441% | 753 3% |
| Copy ISO MB/s (MB/s) | 452.1 | 802 77% | 2016 346% | 1406 211% | 1134 151% | 171.1 -62% |
| Copy Program MB/s (MB/s) | 267.8 | 205.2 -23% | 542 102% | 309.9 16% | 350.4 31% | 93.2 -65% |
| Copy Game MB/s (MB/s) | 411 | 509 24% | 1278 211% | 802 95% | 736 79% | 140.6 -66% |
| CrystalDiskMark 5.2 / 6 | 116% | 225% | 108% | 178% | -3% | |
| Write 4K (MB/s) | 88.8 | 134.3 51% | 128.4 45% | 130.8 47% | 157.6 77% | 90.6 2% |
| Read 4K (MB/s) | 35.67 | 43.56 22% | 46.37 30% | 55.1 54% | 46.39 30% | 33.17 -7% |
| Write Seq (MB/s) | 461.9 | 1434 210% | 1863 303% | 962 108% | 1214 163% | 483 5% |
| Read Seq (MB/s) | 536 | 1448 170% | 2340 337% | 1634 205% | 1295 142% | 511 -5% |
| Write 4K Q32T1 (MB/s) | 212 | 239.1 13% | 451.1 113% | 343.5 62% | 370.7 75% | 170.7 -19% |
| Read 4K Q32T1 (MB/s) | 228.2 | 327.6 44% | 415.3 82% | 339.7 49% | 461.1 102% | 235 3% |
| Write Seq Q32T1 (MB/s) | 476.8 | 1456 205% | 2985 526% | 984 106% | 1888 296% | 496.5 4% |
| Read Seq Q32T1 (MB/s) | 554 | 1734 213% | 2565 363% | 1858 235% | 3540 539% | 534 -4% |
| Write 4K Q8T8 (MB/s) | 451.4 | 1814 | ||||
| Read 4K Q8T8 (MB/s) | 1004 | 1023 | ||||
| Total Average (Program / Settings) | 143% /
150% | 252% /
259% | 119% /
122% | 220% /
232% | -8% /
-9% |
* ... smaller is better

GPU Performance
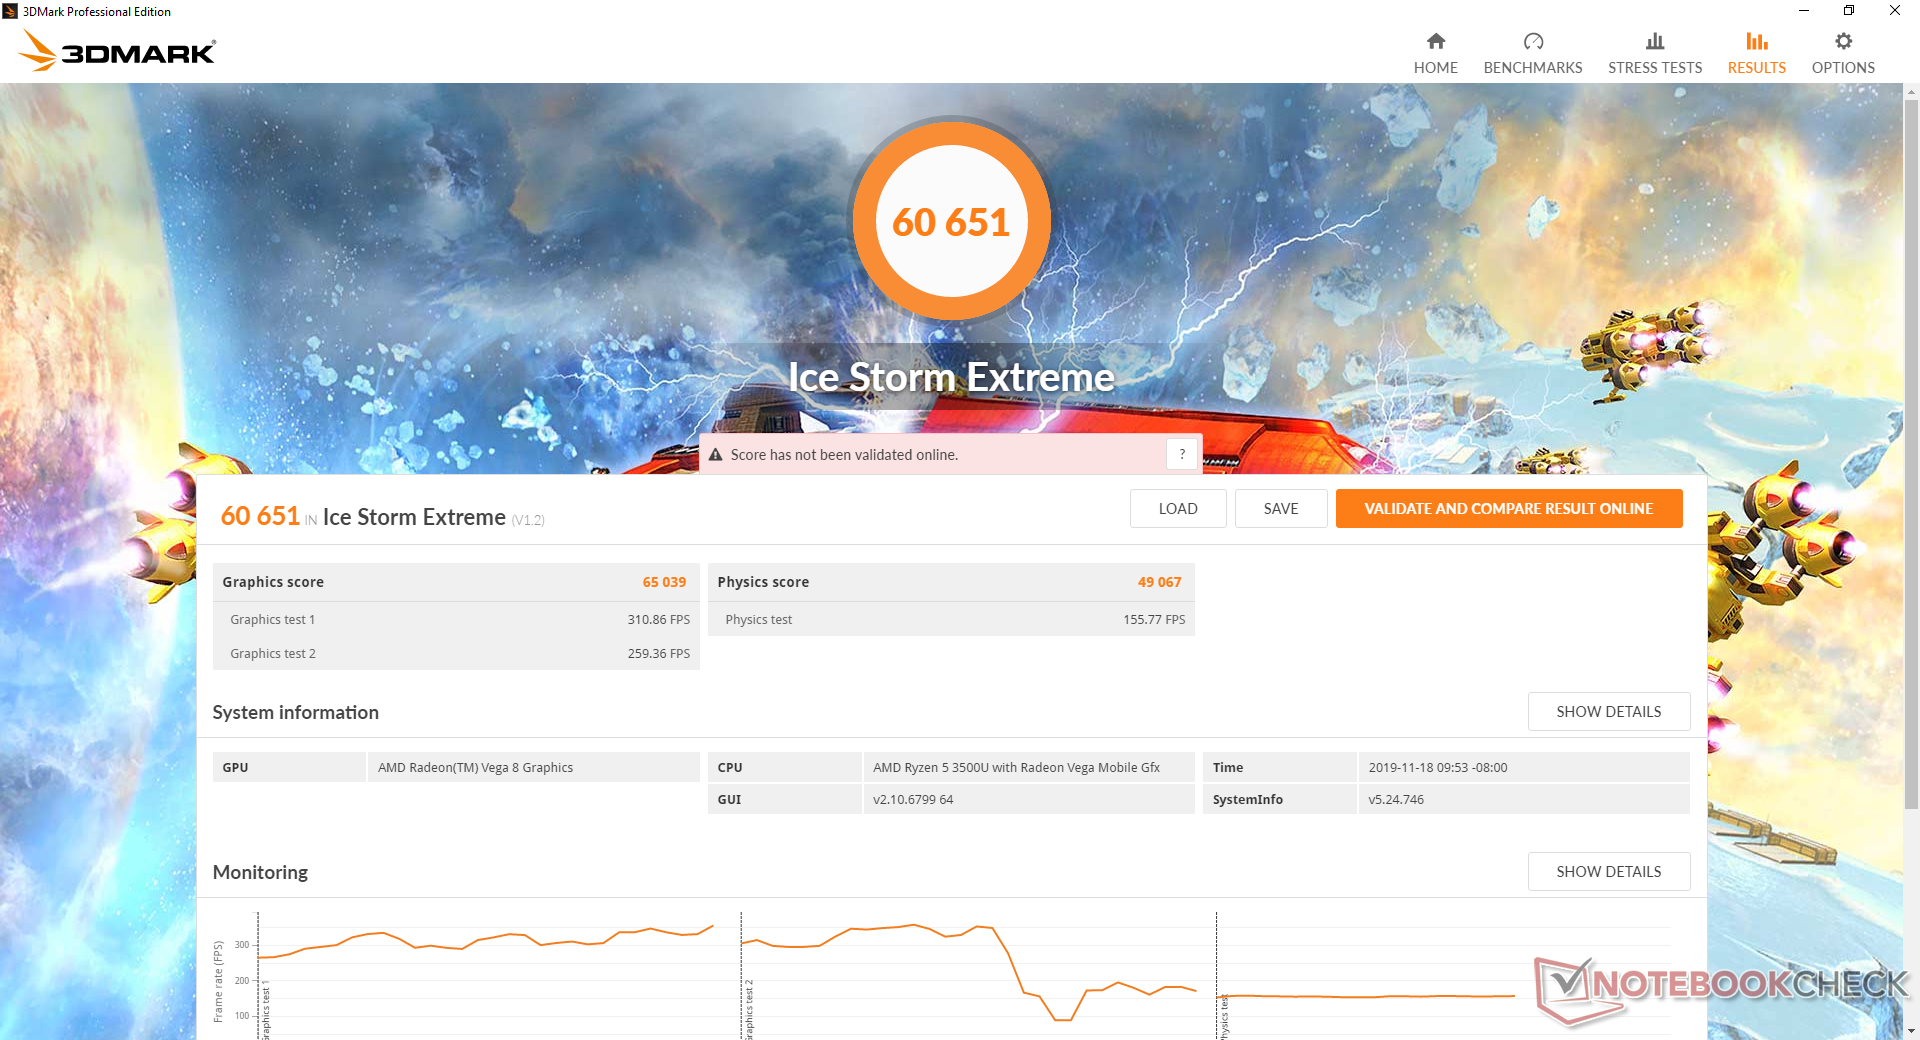
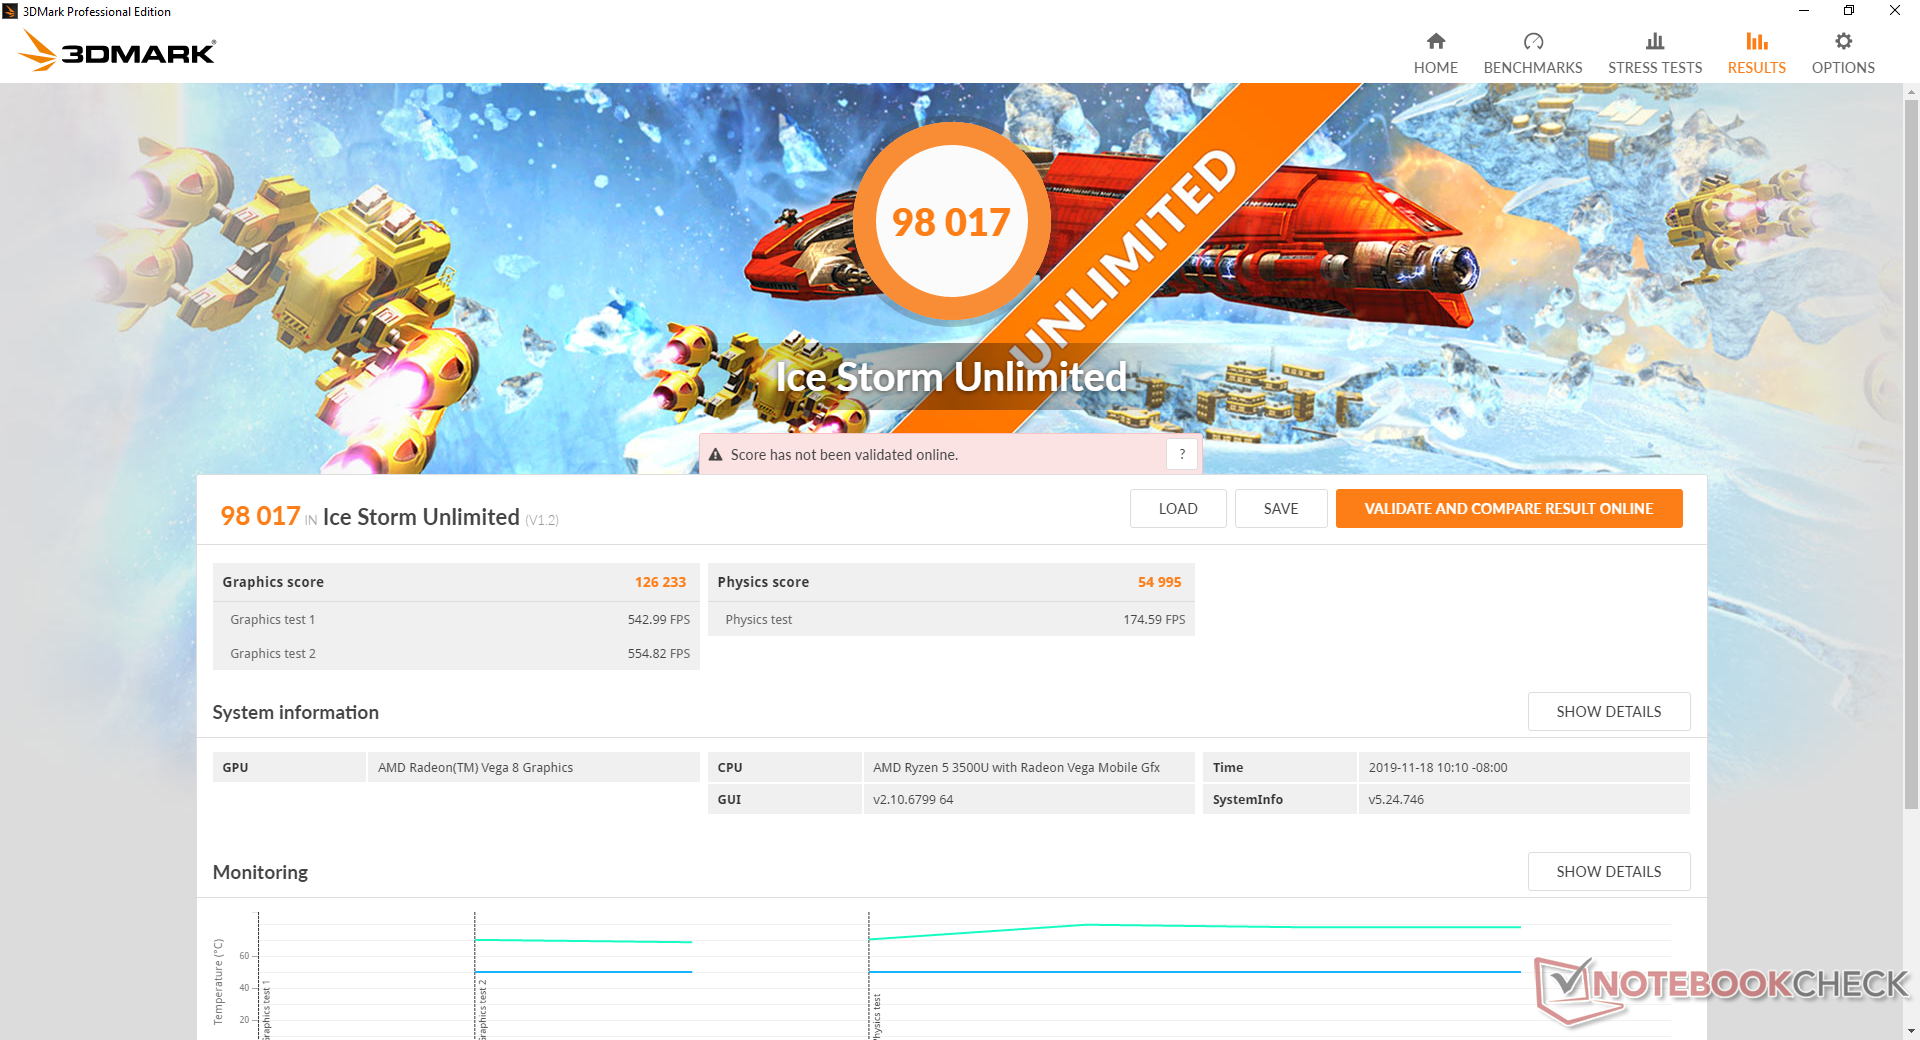
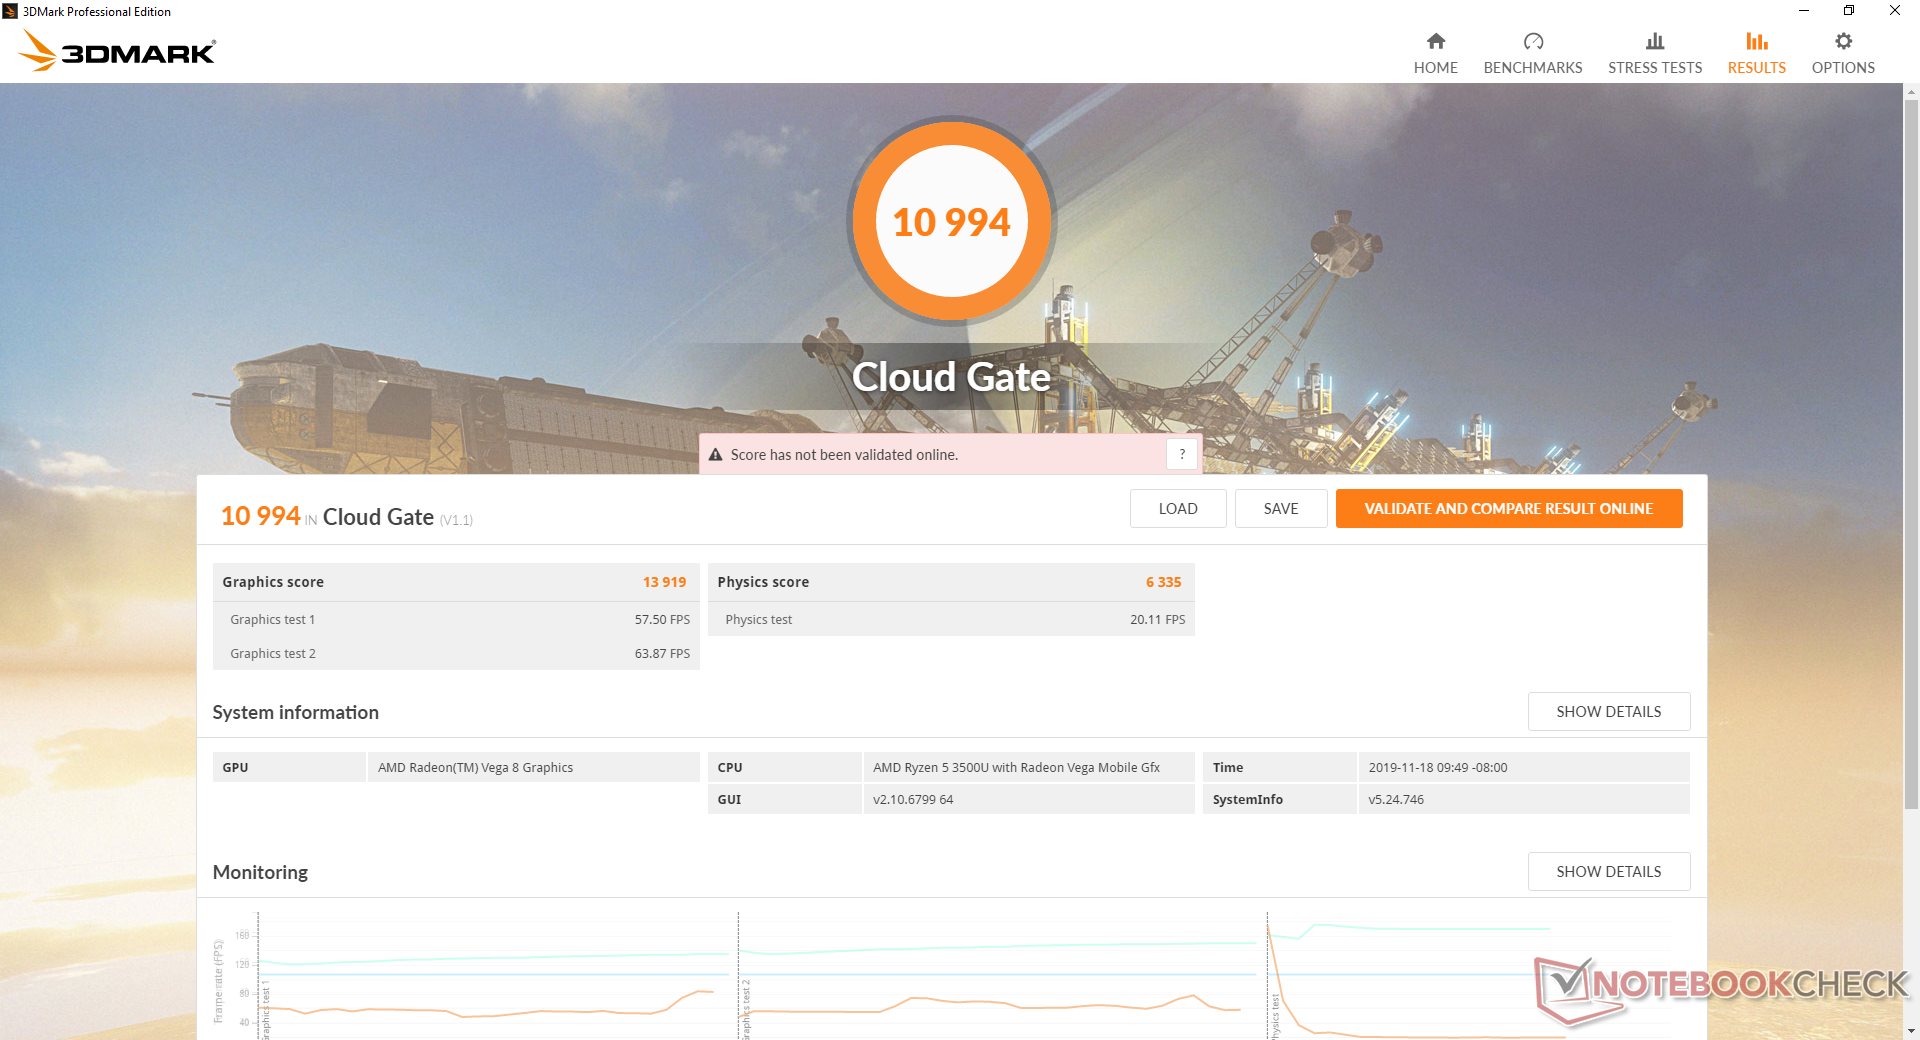
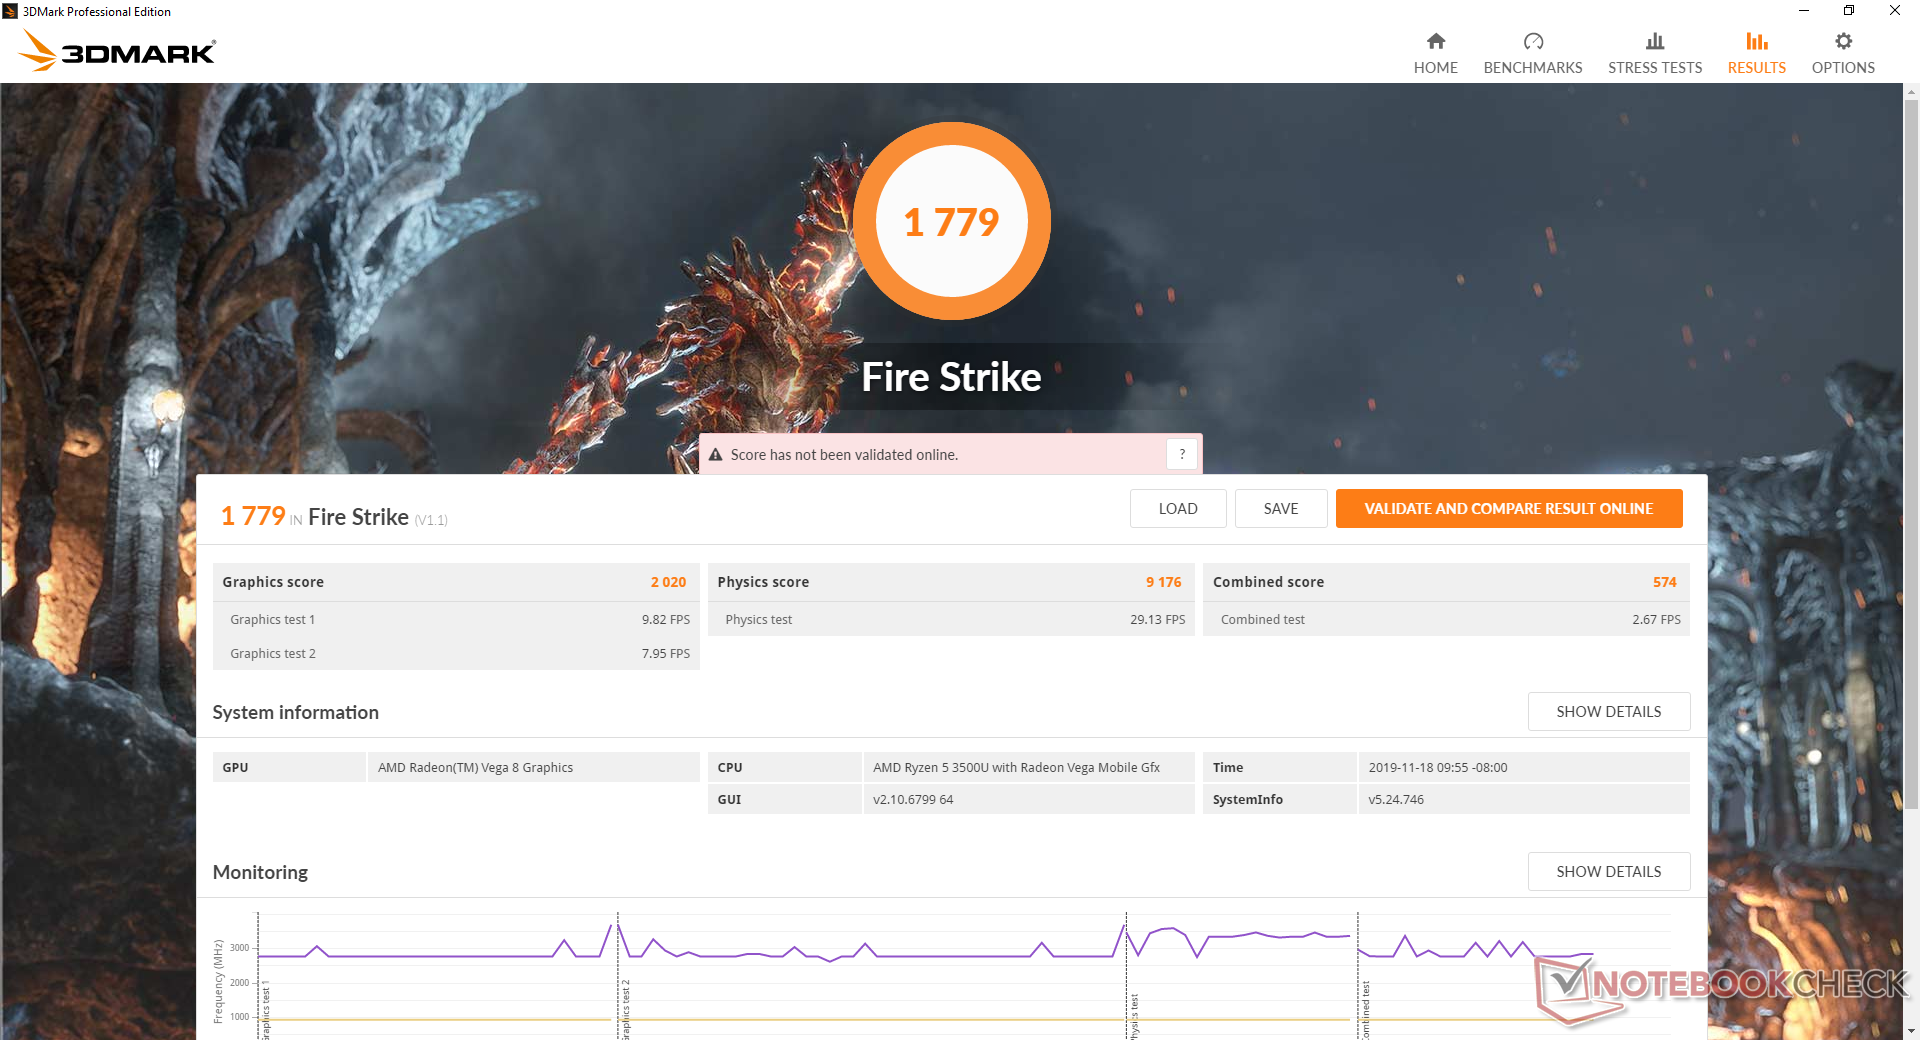
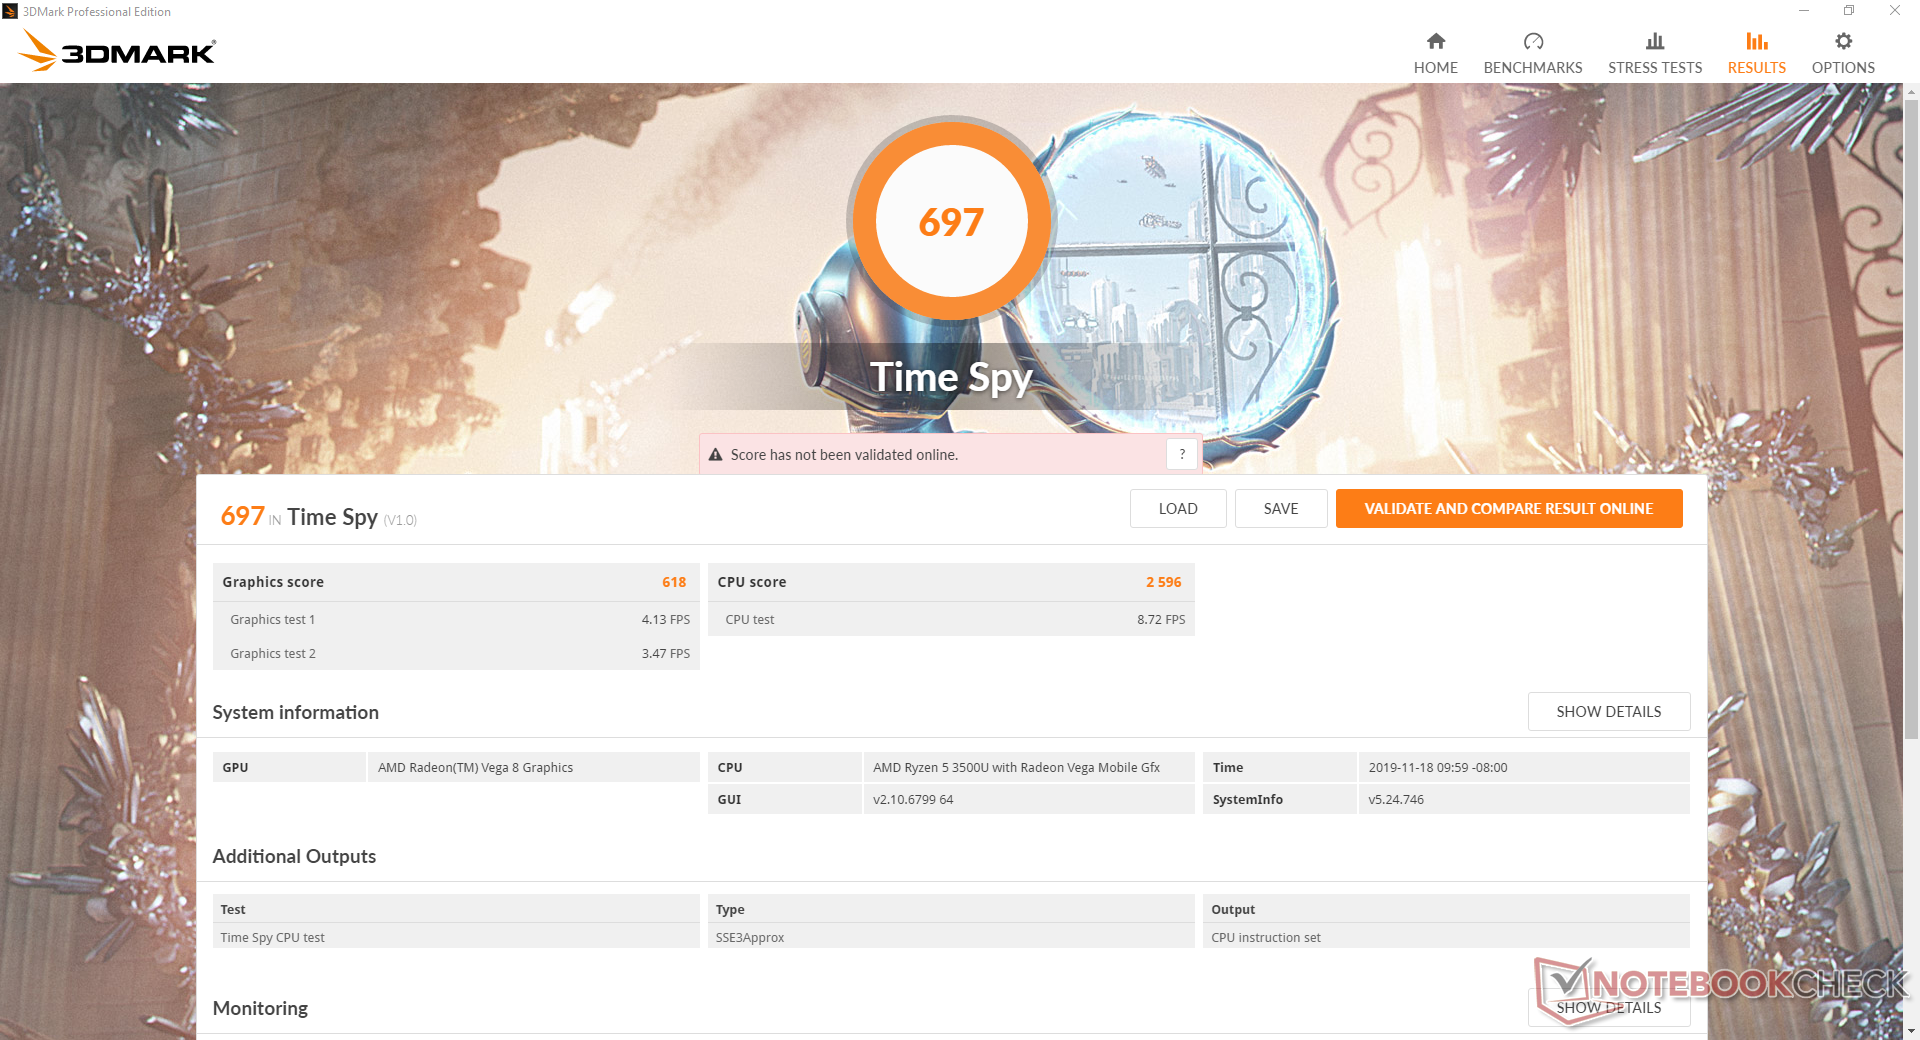
3DMark benchmarks rank the RX Vega 8 within 10 to 15 percent of the GeForce MX130. Though much faster than the outdated Intel UHD Graphics 620 series by about 80 percent, raw performance is nowhere near fast enough to play most games outside of undemanding ones like Overcooked. The single-channel RAM hits hardest in this regard.
See our dedicated page on the Radeon RX Vega 8 for more technical information and benchmark comparisons.
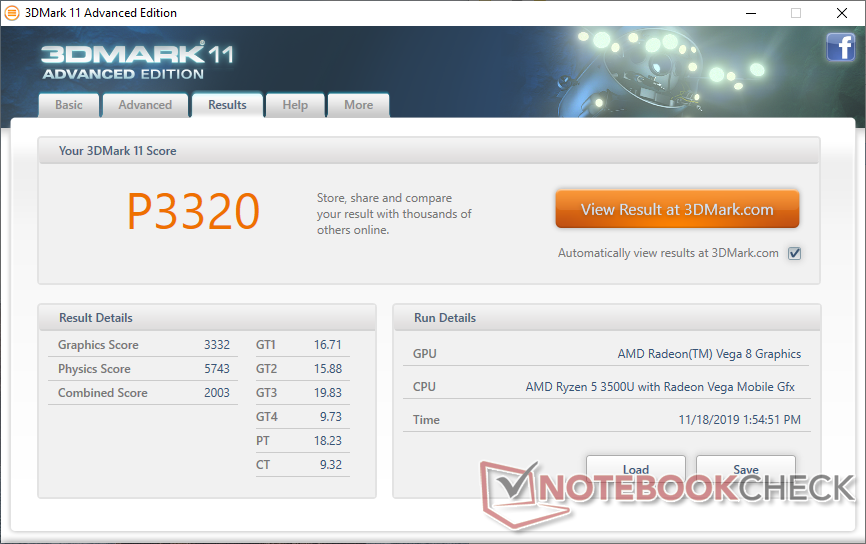
| 3DMark 11 Performance | 3320 points | |
| 3DMark Ice Storm Standard Score | 76281 points | |
| 3DMark Cloud Gate Standard Score | 10994 points | |
| 3DMark Fire Strike Score | 1779 points | |
| 3DMark Time Spy Score | 697 points | |
Help | ||
| low | med. | high | ultra | |
|---|---|---|---|---|
| BioShock Infinite (2013) | 91.2 | 15.4 |
Emissions
System Noise
Fan noise never becomes distracting during day-to-day browsing or streaming loads. At worst, we're able to record a fan noise of 31.1 dB(A) when under such conditions. Higher loads like games will bump fan noise to 35 dB(A) or 40.5 dB(A) which is typical of most Ultrabooks.
We can notice no electronic noise or coil whine from our test unit.
| Walmart Motile M142 Vega 8, R5 3500U, BIWIN SSD 256 GB | Acer Swift 3 SF314-41-R8HZ Vega 8, R5 3500U, WDC PC SN520 SDAPNUW-512G | Lenovo Yoga C940-14IIL Iris Plus Graphics G7 (Ice Lake 64 EU), i7-1065G7, Samsung SSD PM981 MZVLB512HAJQ | Asus VivoBook 14 X403FA UHD Graphics 620, i5-8265U, Intel SSD 660p SSDPEKNW512G8 | Lenovo IdeaPad S540-14IWL GeForce MX250, i5-8265U, Samsung SSD PM981 MZVLB512HAJQ | HP 14-dk0008ng Vega 10, R7 3700U, Samsung PM871b MZNLN128HAHQ | |
|---|---|---|---|---|---|---|
| Noise | -5% | 1% | 1% | -0% | -2% | |
| off / environment * (dB) | 29.1 | 30.4 -4% | 29.3 -1% | 28.8 1% | 29.3 -1% | 30.6 -5% |
| Idle Minimum * (dB) | 29.1 | 30.4 -4% | 29.3 -1% | 28.8 1% | 29.3 -1% | 31.4 -8% |
| Idle Average * (dB) | 29.1 | 30.9 -6% | 29.3 -1% | 28.8 1% | 29.3 -1% | 31.4 -8% |
| Idle Maximum * (dB) | 29.1 | 30.9 -6% | 29.3 -1% | 29.2 -0% | 29.3 -1% | 31.4 -8% |
| Load Average * (dB) | 31.1 | 36.3 -17% | 33.3 -7% | 35.2 -13% | 34.4 -11% | 32.5 -5% |
| Load Maximum * (dB) | 40.5 | 36.6 10% | 33.3 18% | 35.2 13% | 34.9 14% | 32.5 20% |
| Witcher 3 ultra * (dB) | 34.4 |
* ... smaller is better
Noise level
| Idle |
| 29.1 / 29.1 / 29.1 dB(A) |
| Load |
| 31.1 / 40.5 dB(A) |
 | ||
30 dB silent 40 dB(A) audible 50 dB(A) loud |
||
min: | ||
Temperature
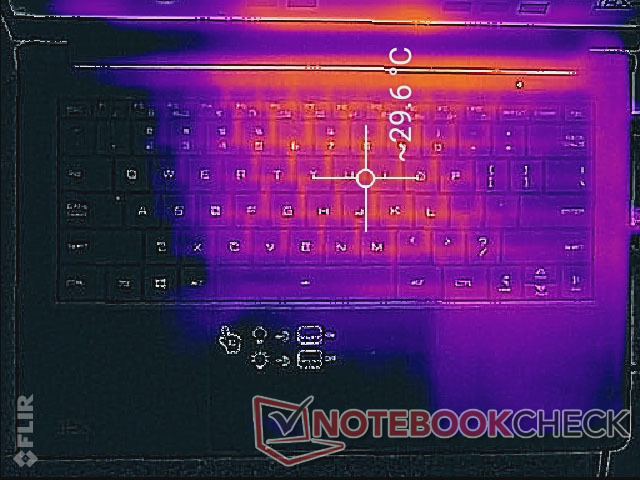
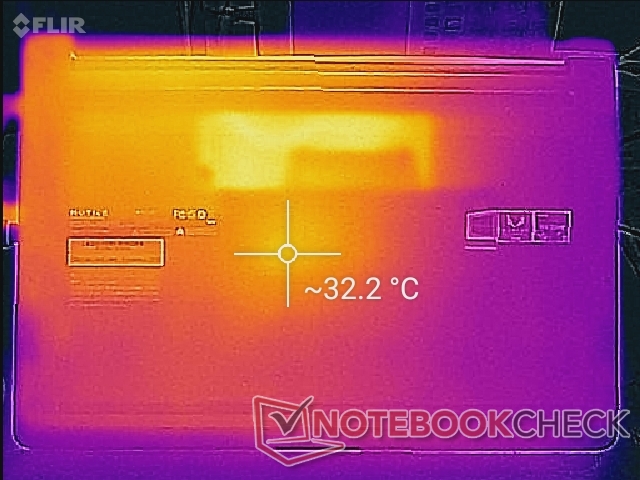
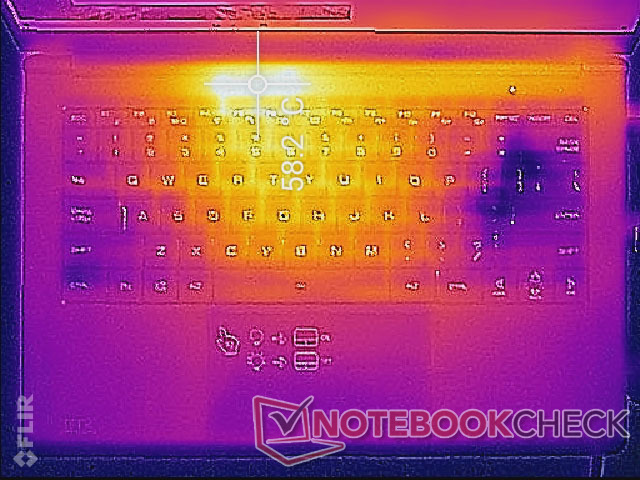
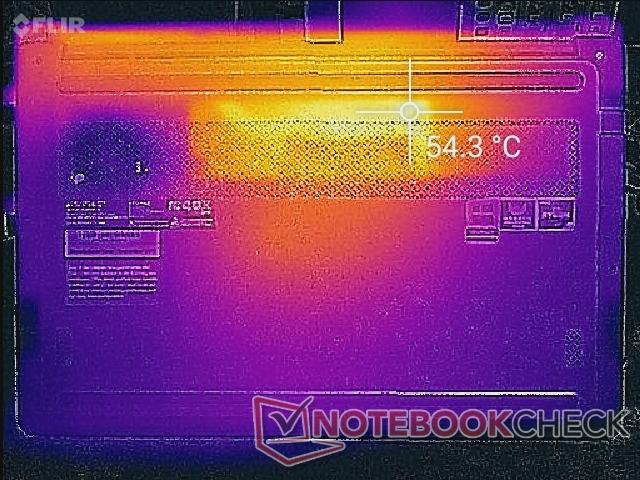
Surface temperatures are never uncomfortable on the palm rests or keyboard keys. Hot spots can become as warm as 54 C to almost 60 C when under very high loads, but these areas are thankfully toward the rear as shown by the temperature maps below.
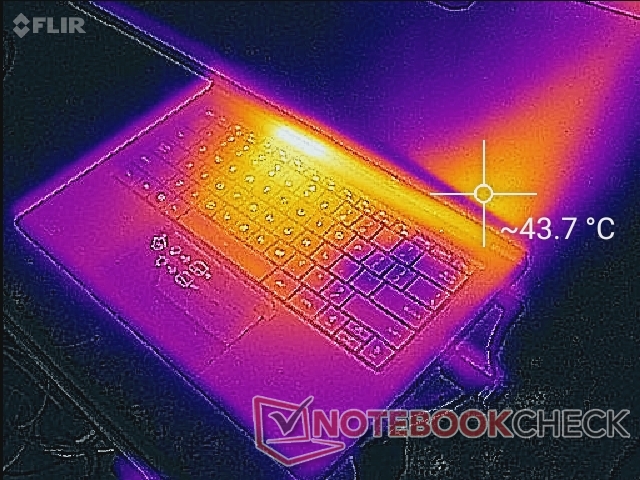
(-) The maximum temperature on the upper side is 58.4 °C / 137 F, compared to the average of 36.8 °C / 98 F, ranging from 21 to 71 °C for the class Multimedia.
(-) The bottom heats up to a maximum of 53.8 °C / 129 F, compared to the average of 39.1 °C / 102 F
(+) In idle usage, the average temperature for the upper side is 26.4 °C / 80 F, compared to the device average of 31.3 °C / 88 F.
(+) The palmrests and touchpad are reaching skin temperature as a maximum (33 °C / 91.4 F) and are therefore not hot.
(-) The average temperature of the palmrest area of similar devices was 28.7 °C / 83.7 F (-4.3 °C / -7.7 F).
Stress Test
We stress the laptop to identify for any potential throttling issues. When running Prime95, the CPU can be observed running at up to 3.3 GHz for the first few seconds until hitting a core temperature of 80 C. Thereafter, clock rates drop to a steady 2.1 GHz in order to maintain a cooler core temperature of about 81 C. Interestingly, clock rate jumps back up to 2.8 GHz when running both Prime95 and FurMark simultaneously.
Running on battery will not limit performance. A 3DMark Cloud Gate run on batteries returns Physics and Graphics scores of 6440 and 12968 points, respectively, compared to 6335 and 13919 points when on mains.
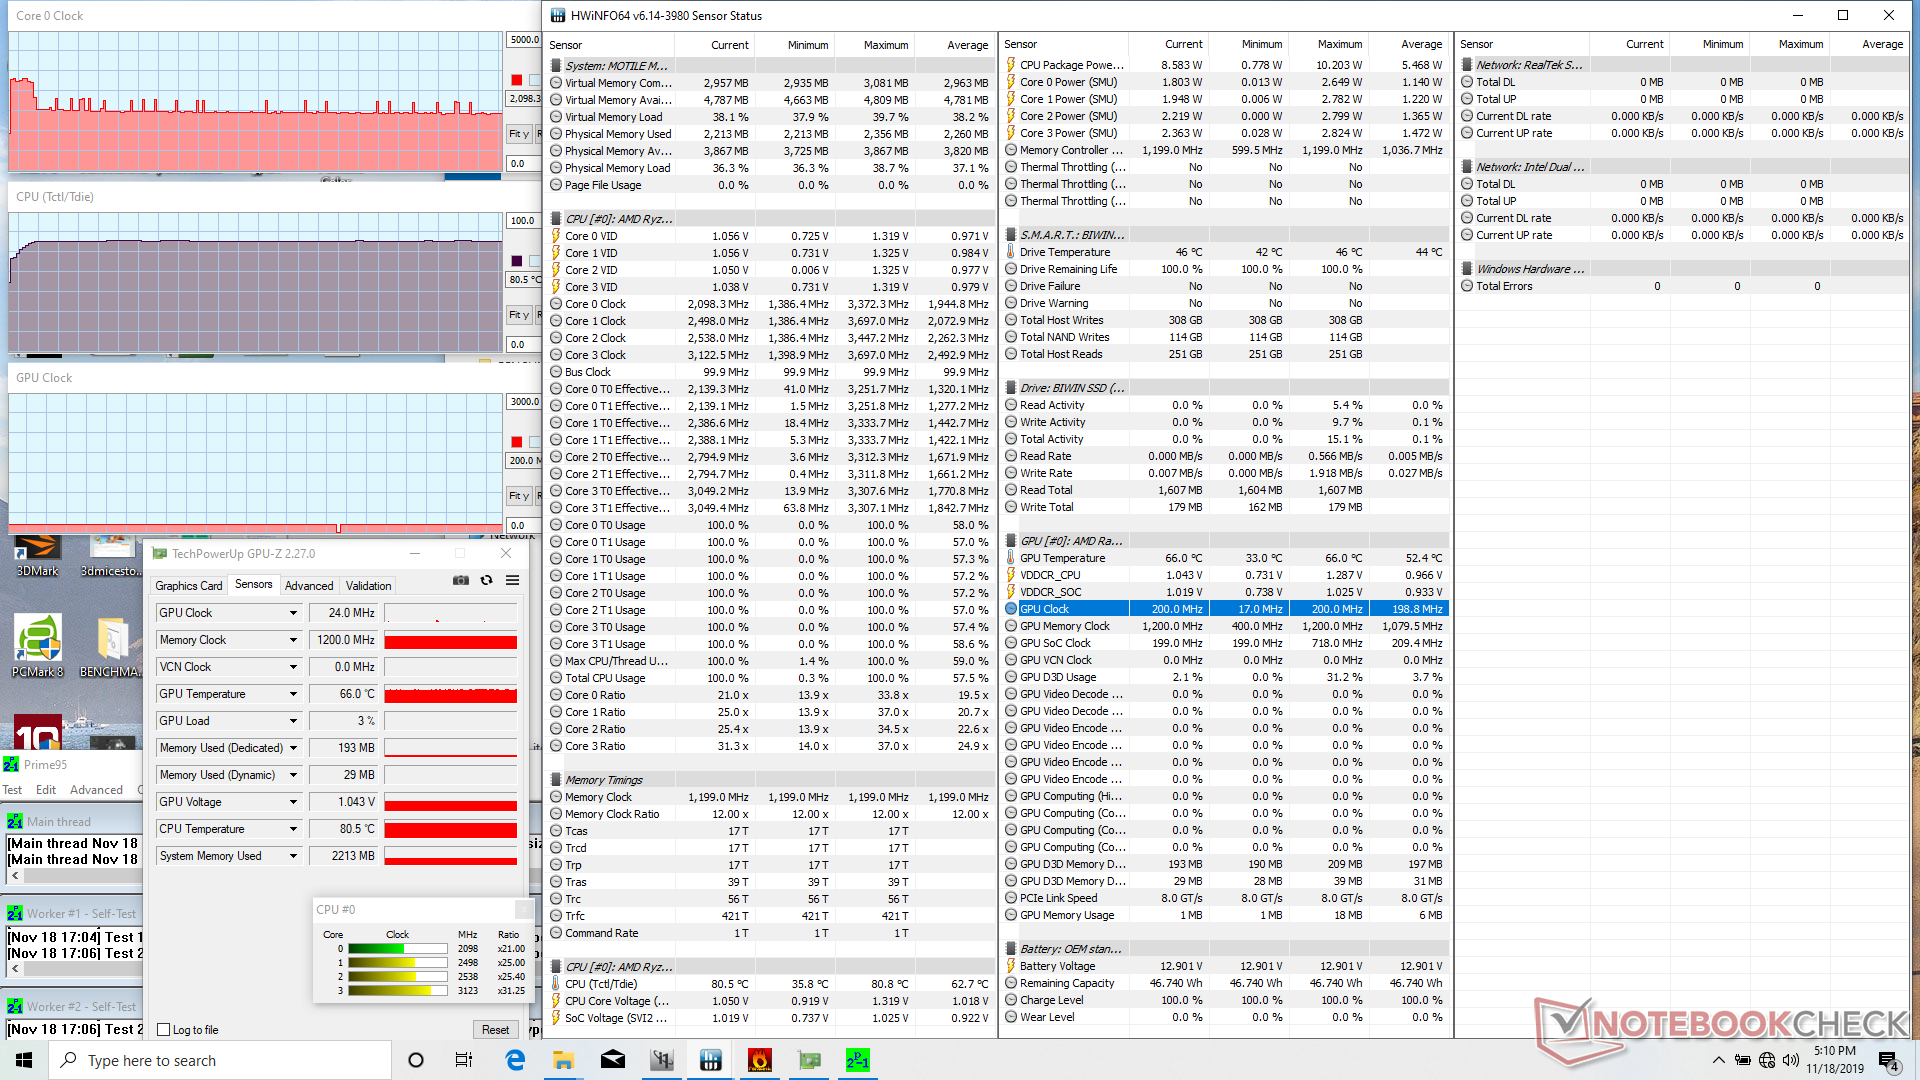
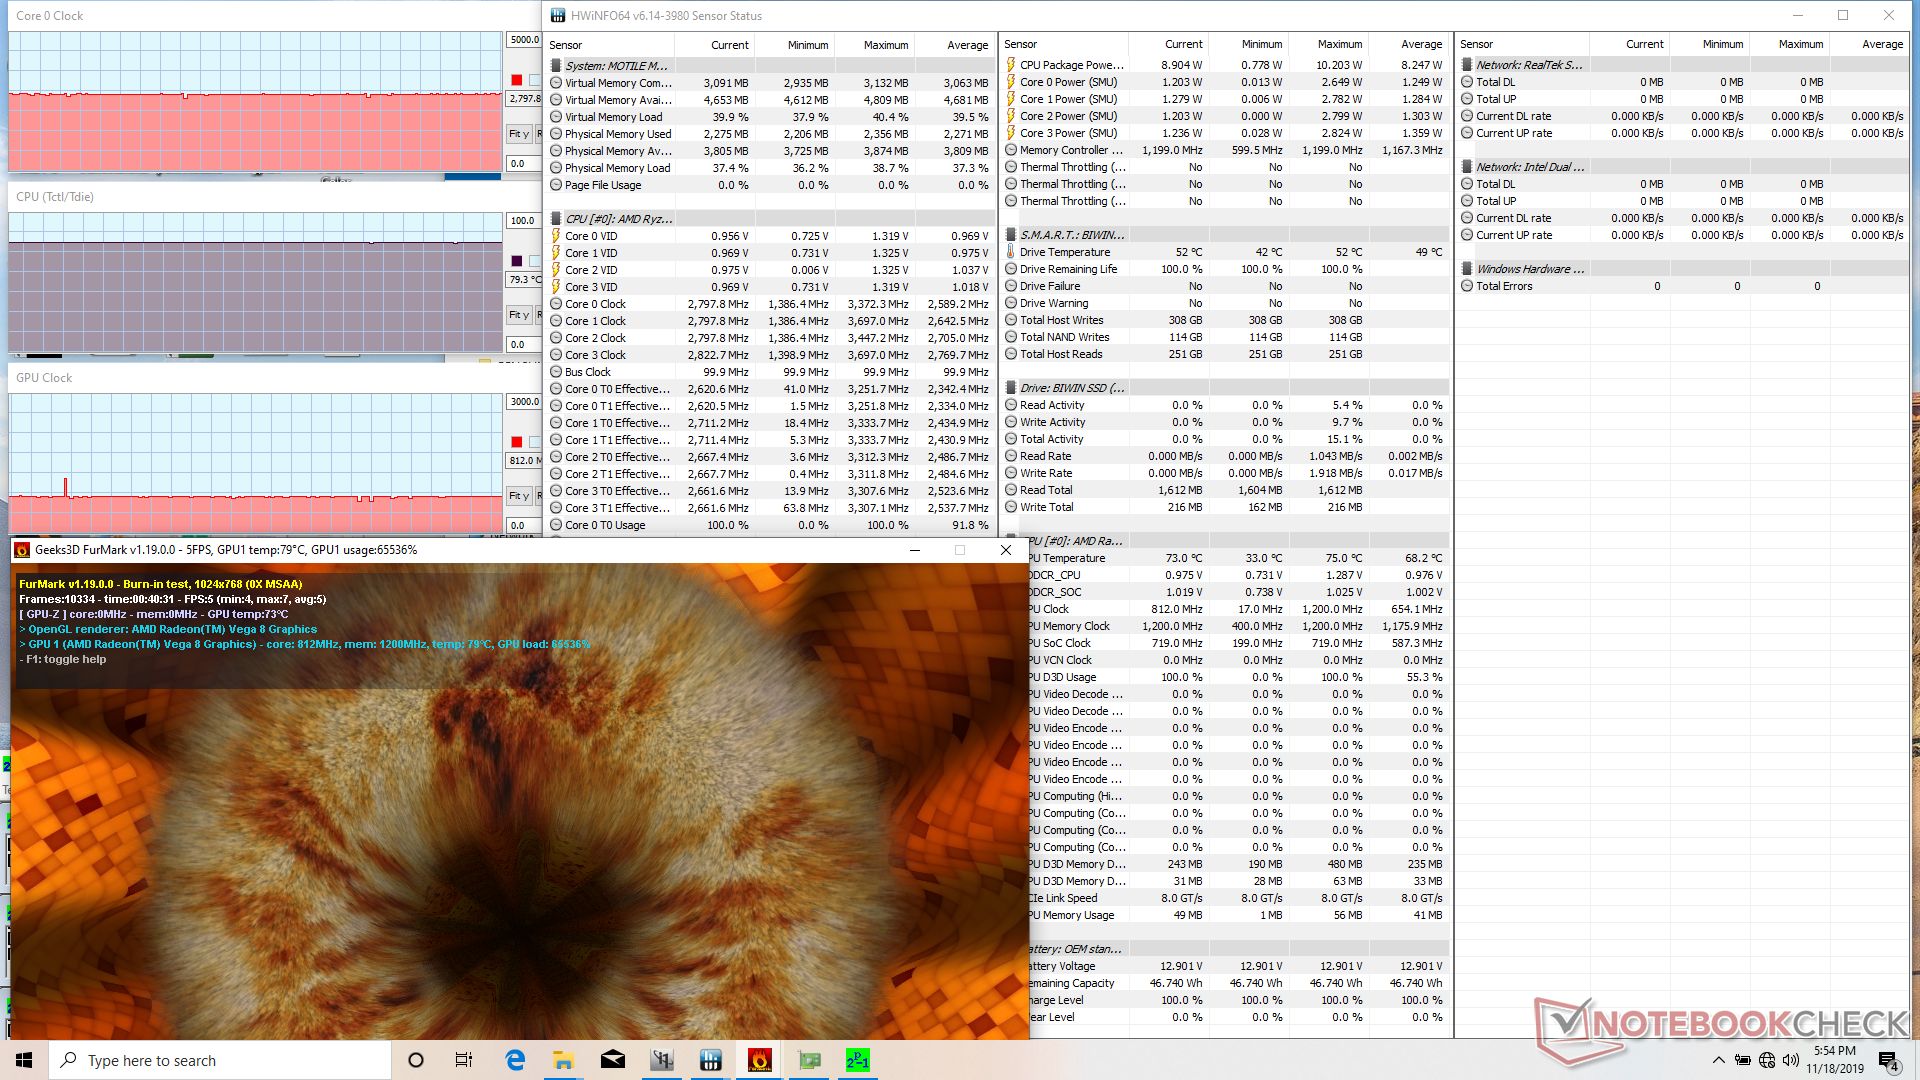
| CPU Clock (GHz) | GPU Clock (MHz) | Average CPU Temperature (Tctl/Tidle °C) | |
| System Idle | -- | -- | 39 |
| Prime95 Stress | 2.1 | -- | 81 |
| Prime95 + FurMark Stress | 2.8 | 812 | 79 |
Speakers


Walmart Motile M142 audio analysis
(±) | speaker loudness is average but good (80.7 dB)
Bass 100 - 315 Hz
(-) | nearly no bass - on average 19.8% lower than median
(±) | linearity of bass is average (11.3% delta to prev. frequency)
Mids 400 - 2000 Hz
(±) | higher mids - on average 6% higher than median
(±) | linearity of mids is average (11.7% delta to prev. frequency)
Highs 2 - 16 kHz
(+) | balanced highs - only 2.6% away from median
(±) | linearity of highs is average (9.4% delta to prev. frequency)
Overall 100 - 16.000 Hz
(±) | linearity of overall sound is average (27.9% difference to median)
Compared to same class
» 94% of all tested devices in this class were better, 1% similar, 5% worse
» The best had a delta of 5%, average was 17%, worst was 45%
Compared to all devices tested
» 85% of all tested devices were better, 3% similar, 12% worse
» The best had a delta of 4%, average was 23%, worst was 134%
Apple MacBook 12 (Early 2016) 1.1 GHz audio analysis
(+) | speakers can play relatively loud (83.6 dB)
Bass 100 - 315 Hz
(±) | reduced bass - on average 11.3% lower than median
(±) | linearity of bass is average (14.2% delta to prev. frequency)
Mids 400 - 2000 Hz
(+) | balanced mids - only 2.4% away from median
(+) | mids are linear (5.5% delta to prev. frequency)
Highs 2 - 16 kHz
(+) | balanced highs - only 2% away from median
(+) | highs are linear (4.5% delta to prev. frequency)
Overall 100 - 16.000 Hz
(+) | overall sound is linear (10.2% difference to median)
Compared to same class
» 7% of all tested devices in this class were better, 2% similar, 90% worse
» The best had a delta of 5%, average was 18%, worst was 53%
Compared to all devices tested
» 5% of all tested devices were better, 1% similar, 94% worse
» The best had a delta of 4%, average was 23%, worst was 134%
Energy Management
Power Consumption
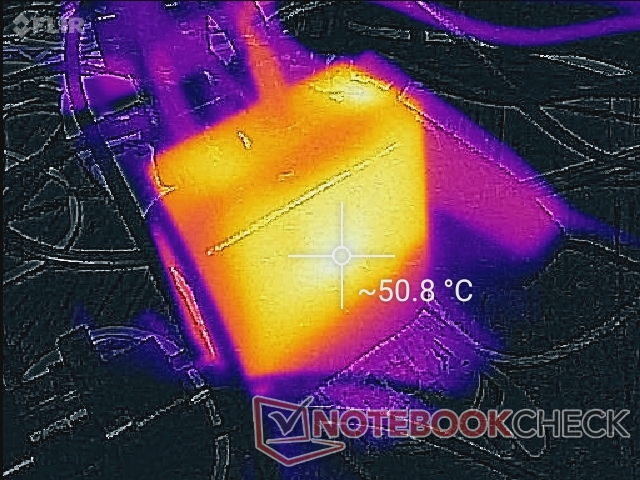
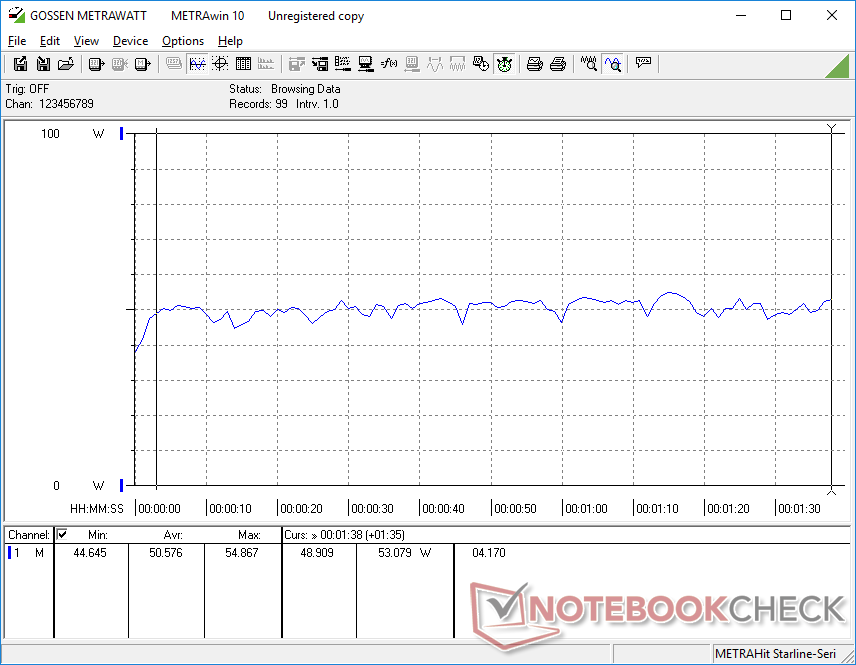
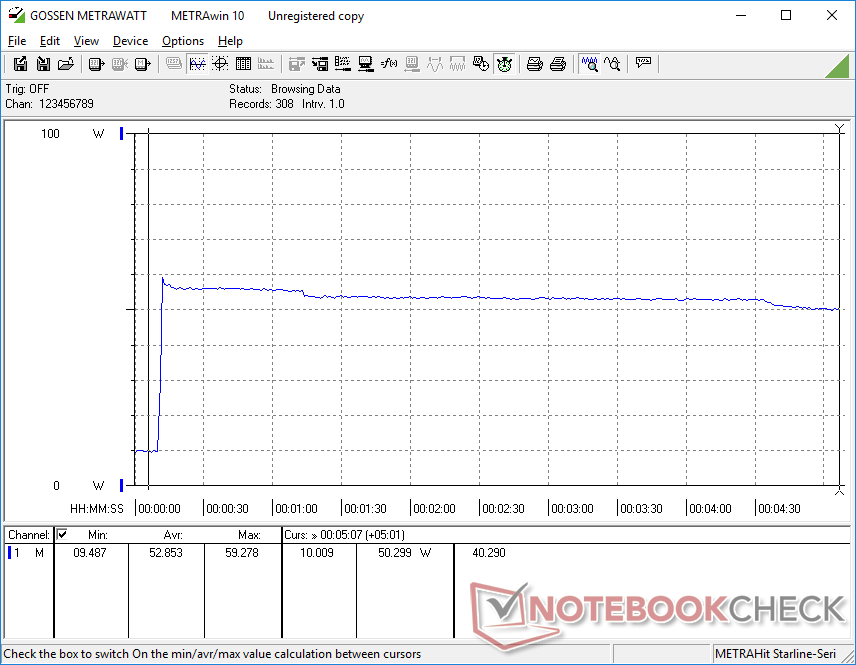
Idling on desktop demands between 5 W and 13 W compared to 9 W at most from the Acer Swift 3 SF314 or Intel-powered Lenovo Yoga C940. We're able to record a maximum draw of 61.6 W when running Prime95 that eventually falls over time to as low as 46.7 W as shown by the screenshots below.
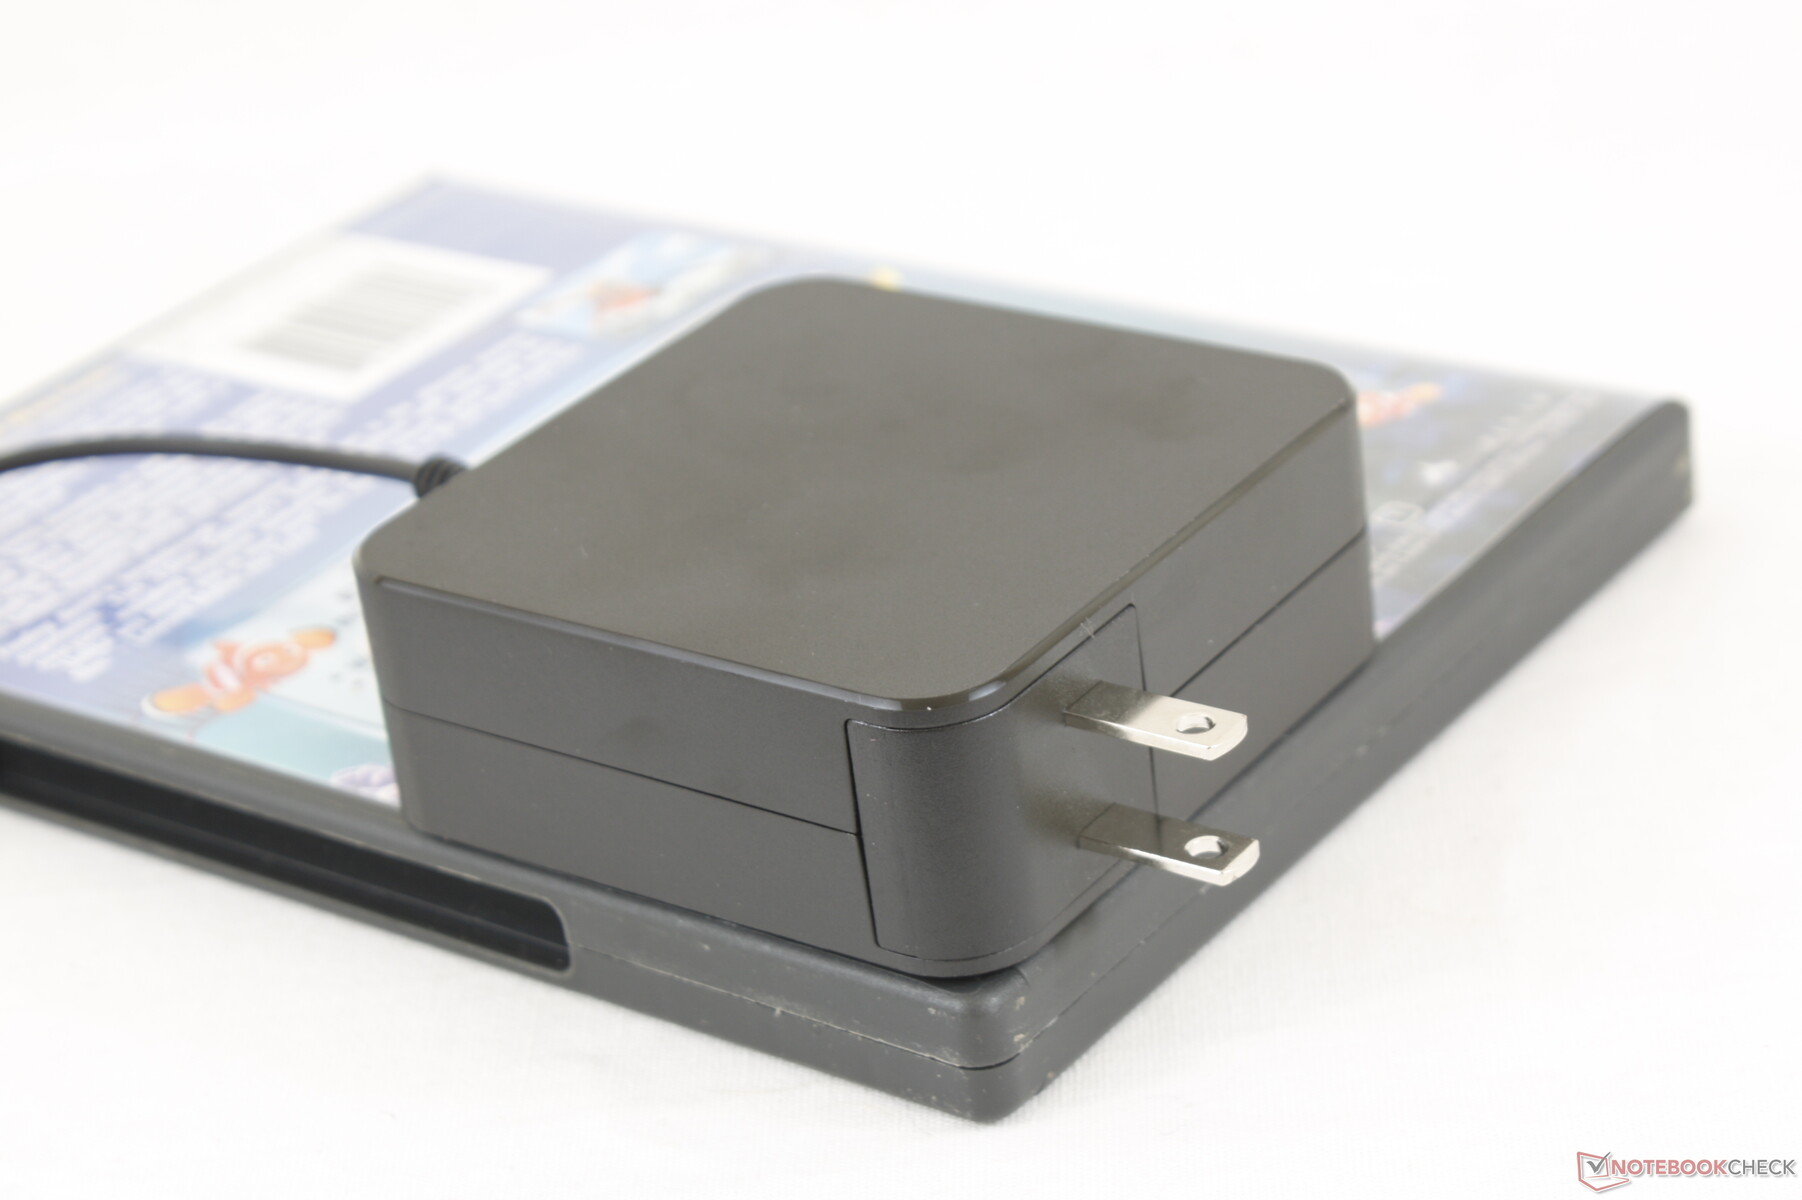
The small (~7.5 x 7.5 x 3 cm) 65 W AC adapter offers just enough juice for both running demanding applications and charging the system simultaneously.

| Off / Standby | |
| Idle | |
| Load |
|
Key:
min: | |
| Walmart Motile M142 R5 3500U, Vega 8, BIWIN SSD 256 GB, IPS, 1920x1080, 14" | Acer Swift 3 SF314-41-R8HZ R5 3500U, Vega 8, WDC PC SN520 SDAPNUW-512G, IPS, 1920x1080, 14" | Lenovo Yoga C940-14IIL i7-1065G7, Iris Plus Graphics G7 (Ice Lake 64 EU), Samsung SSD PM981 MZVLB512HAJQ, IPS LED, 1920x1080, 14" | Asus VivoBook 14 X403FA i5-8265U, UHD Graphics 620, Intel SSD 660p SSDPEKNW512G8, IPS, 1920x1080, 14" | Lenovo IdeaPad S540-14IWL i5-8265U, GeForce MX250, Samsung SSD PM981 MZVLB512HAJQ, IPS, 1920x1080, 14" | HP 14-dk0008ng R7 3700U, Vega 10, Samsung PM871b MZNLN128HAHQ, IPS, 1920x1080, 14" | |
|---|---|---|---|---|---|---|
| Power Consumption | 17% | 19% | 42% | 17% | 26% | |
| Idle Minimum * (Watt) | 5.3 | 5.7 -8% | 3.2 40% | 2.7 49% | 2.74 48% | 4.8 9% |
| Idle Average * (Watt) | 8.6 | 7.6 12% | 7 19% | 4.6 47% | 5.64 34% | 7.1 17% |
| Idle Maximum * (Watt) | 13.1 | 9 31% | 8.9 32% | 5.2 60% | 8.4 36% | 7.3 44% |
| Load Average * (Watt) | 50.6 | 40.1 21% | 47.6 6% | 35.9 29% | 61.3 -21% | 34 33% |
| Load Maximum * (Watt) | 61.6 | 42.4 31% | 63.1 -2% | 46 25% | 69.4 -13% | 45 27% |
| Witcher 3 ultra * (Watt) | 49.2 |
* ... smaller is better
Battery Life
Expect about 7.5 hours of real-world WLAN use from the internal 47 Wh battery. While slightly shorter than what we recorded on some alternatives, runtimes are still quite long considering the low price. Recharging from empty to full capacity takes about 1.5 hours.
| Walmart Motile M142 R5 3500U, Vega 8, 47 Wh | Acer Swift 3 SF314-41-R8HZ R5 3500U, Vega 8, 48 Wh | Lenovo Yoga C940-14IIL i7-1065G7, Iris Plus Graphics G7 (Ice Lake 64 EU), 60 Wh | Asus VivoBook 14 X403FA i5-8265U, UHD Graphics 620, 72 Wh | Lenovo IdeaPad S540-14IWL i5-8265U, GeForce MX250, 48 Wh | HP 14-dk0008ng R7 3700U, Vega 10, 41.04 Wh | |
|---|---|---|---|---|---|---|
| Battery runtime | 8% | 38% | 65% | 9% | -6% | |
| WiFi v1.3 (h) | 7.7 | 8.3 8% | 10.6 38% | 12.7 65% | 8.4 9% | 7.2 -6% |
| Load (h) | 1.1 | 2.6 | 1.5 | 0.8 | ||
| Reader / Idle (h) | 35.7 | 21.4 | 11.8 |
Pros
Cons
Verdict
The Walmart Motile M142 launched earlier this year for $700 USD to be just slightly cheaper than the competing Asus VivoBook, Acer Aspire 3, Dell Inspiron, or Lenovo IdeaPad series. It was a fair asking price since the Ryzen 5 3500U performs similarly to most Core i7 Ultrabooks but in a more affordable budget-midrange chassis.
At a sale price of $400 or $500, however, the Motile M142 becomes a steal. It's almost as fast as an Ultrabook worth twice the price while being easy to service and with a decent selection of ports. The display is better calibrated out of the box than any sub $500 laptop we've tested even though color space is still limited.
There are still a handful of cut corners to keep in mind. The dim display, slow 1x1 wireless, single-channel RAM, SATA III SSD, weak hinges, and lack of USB Type-C PD are all reflective of a budget laptop. While some of these drawbacks will be mostly unnoticeable to the target home user, the weak hinges have us concerned about the longevity of the system. Otherwise, you'd be hard pressed to find a 14-inch system that can match the Motile M142 in both performance and portability for under $500.
For tasks like web surfing, streaming, word processing, and note-taking between classes, the lightweight Walmart Motile M142 works wonders when considering its low price. It's an excellent "stopgap" laptop before deciding to invest in a longer-lasting flagship alternative.
Walmart Motile M142
- 11/21/2019 v7 (old)
Allen Ngo
Price comparison
