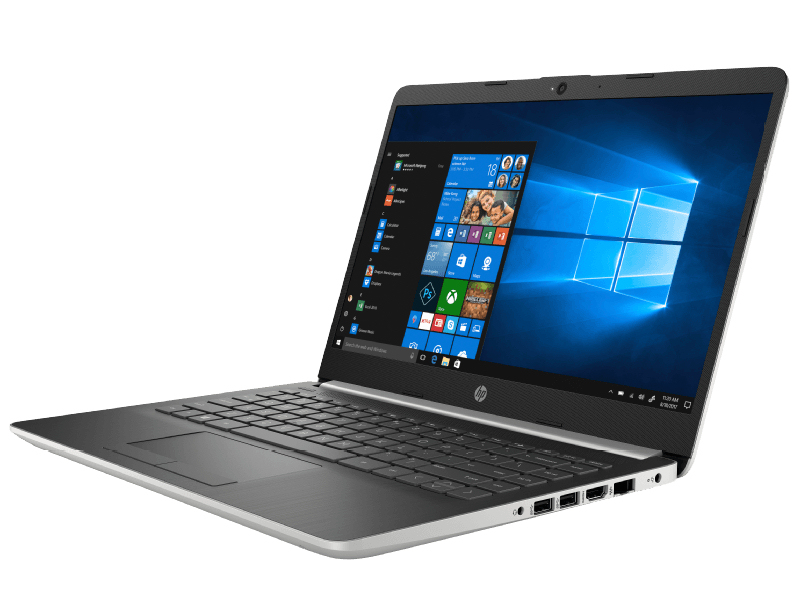
HP 14 (i5-8250U, Intel Optane Memory, HD Display) Laptop Review

HP Inc. introduces a new HP 14, a 14-inch notebook that is powered by a ULV quad-core processor. The HP 14-ma0312ng is the sister model of the HP 14-bp001ng, a device that we reviewed in March. We have chosen to compare the 14-ma0312ng against not only its sibling but also the ASUS VivoBook S14 S406UA, the Lenovo IdeaPad 320s-14IKB and the Acer Swift 1 SF114-32.
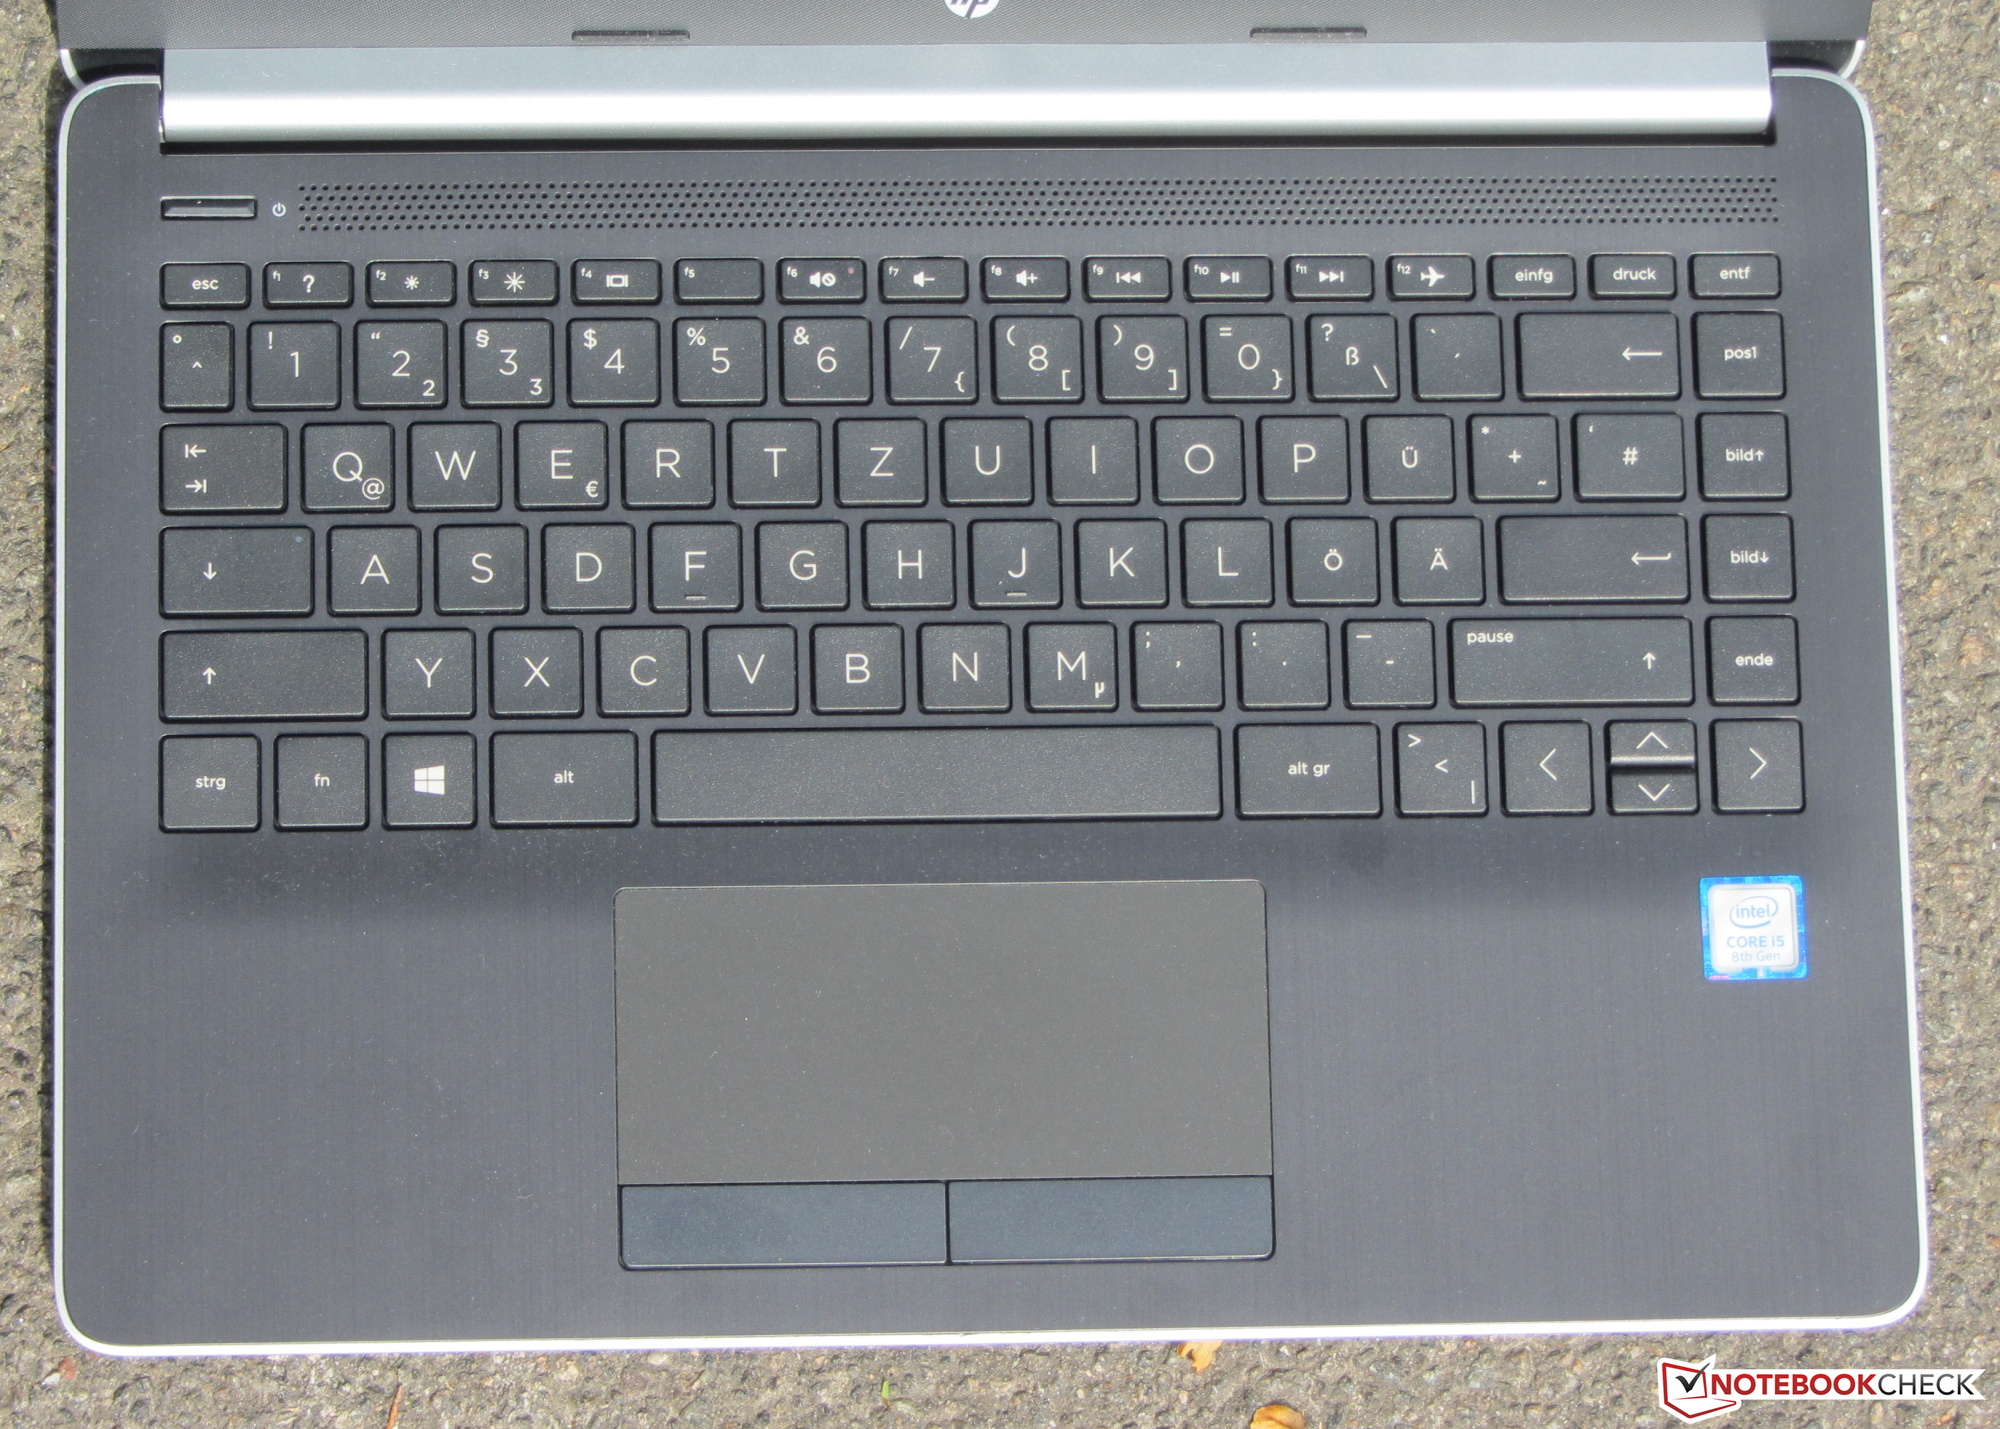
We will not be examining the case, the connectivity, the input devices or the speakers in this review as they resemble that which HP used in the 14-bp001ng. Please see our HP-14bp001ng review for a detailed examination of these areas.
The BIOS slows down the computer
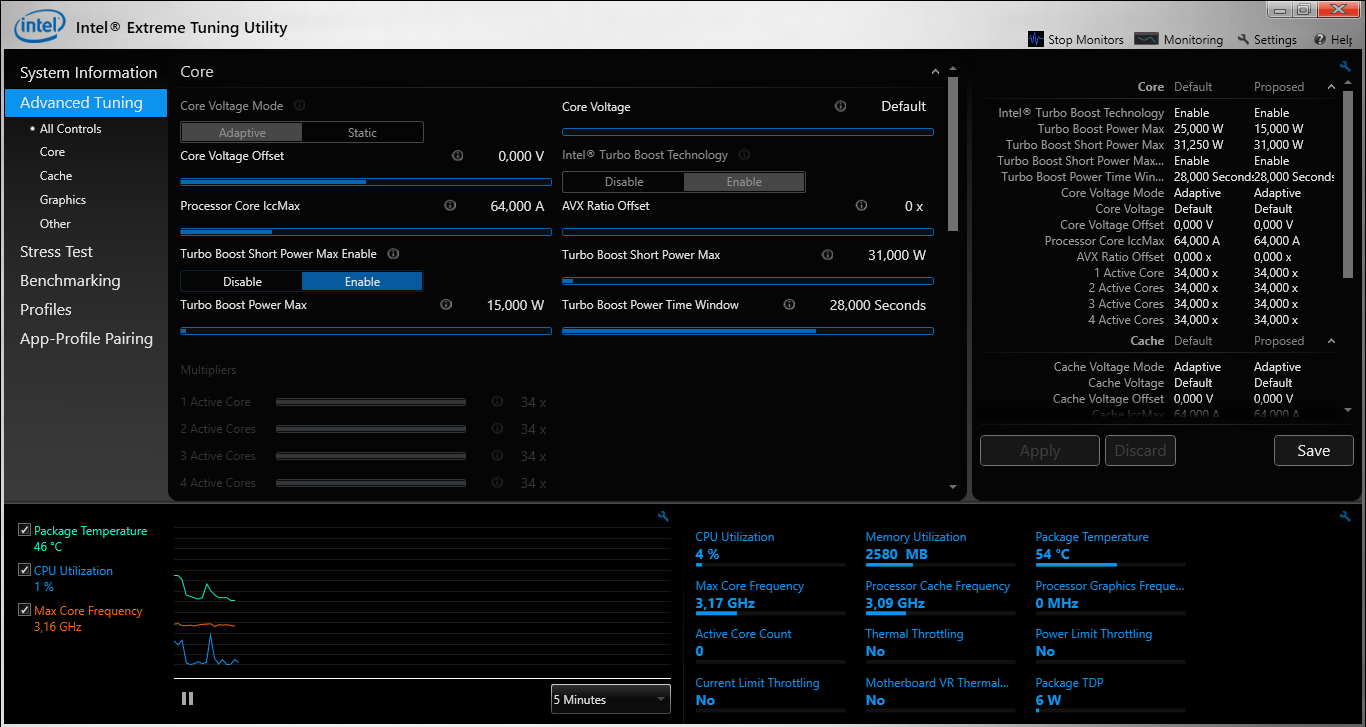
Our test device performed poorly in our first set of benchmarks with the system fully exploiting neither the CPU nor the integrated GPU. Initially, the CPU clocked at between 1.2-1.3 GHz in a Cinebench R15 multi-threaded benchmark, which is 300-400 MHz slower than the CPU’s base clock speed. Moreover, our test device started to thermal throttle once the CPU reached 50 °C (122 °F), which is a particularly low-temperature threshold and one which our test device quickly reached.
After several hours of debugging we isolated the issue to the BIOS, specifically to revisions F.11 and F.12. We managed to resolve the thermal issue by downgrading our test device to BIOS revision F.05. HP released a BIOS revision F.14 at the end of August but we were unable to test it with our test device.
Case and Connectivity
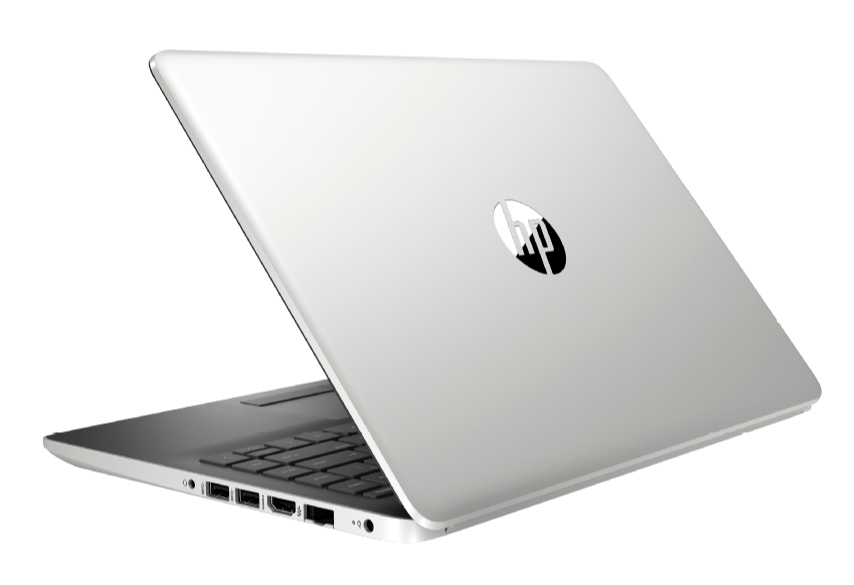
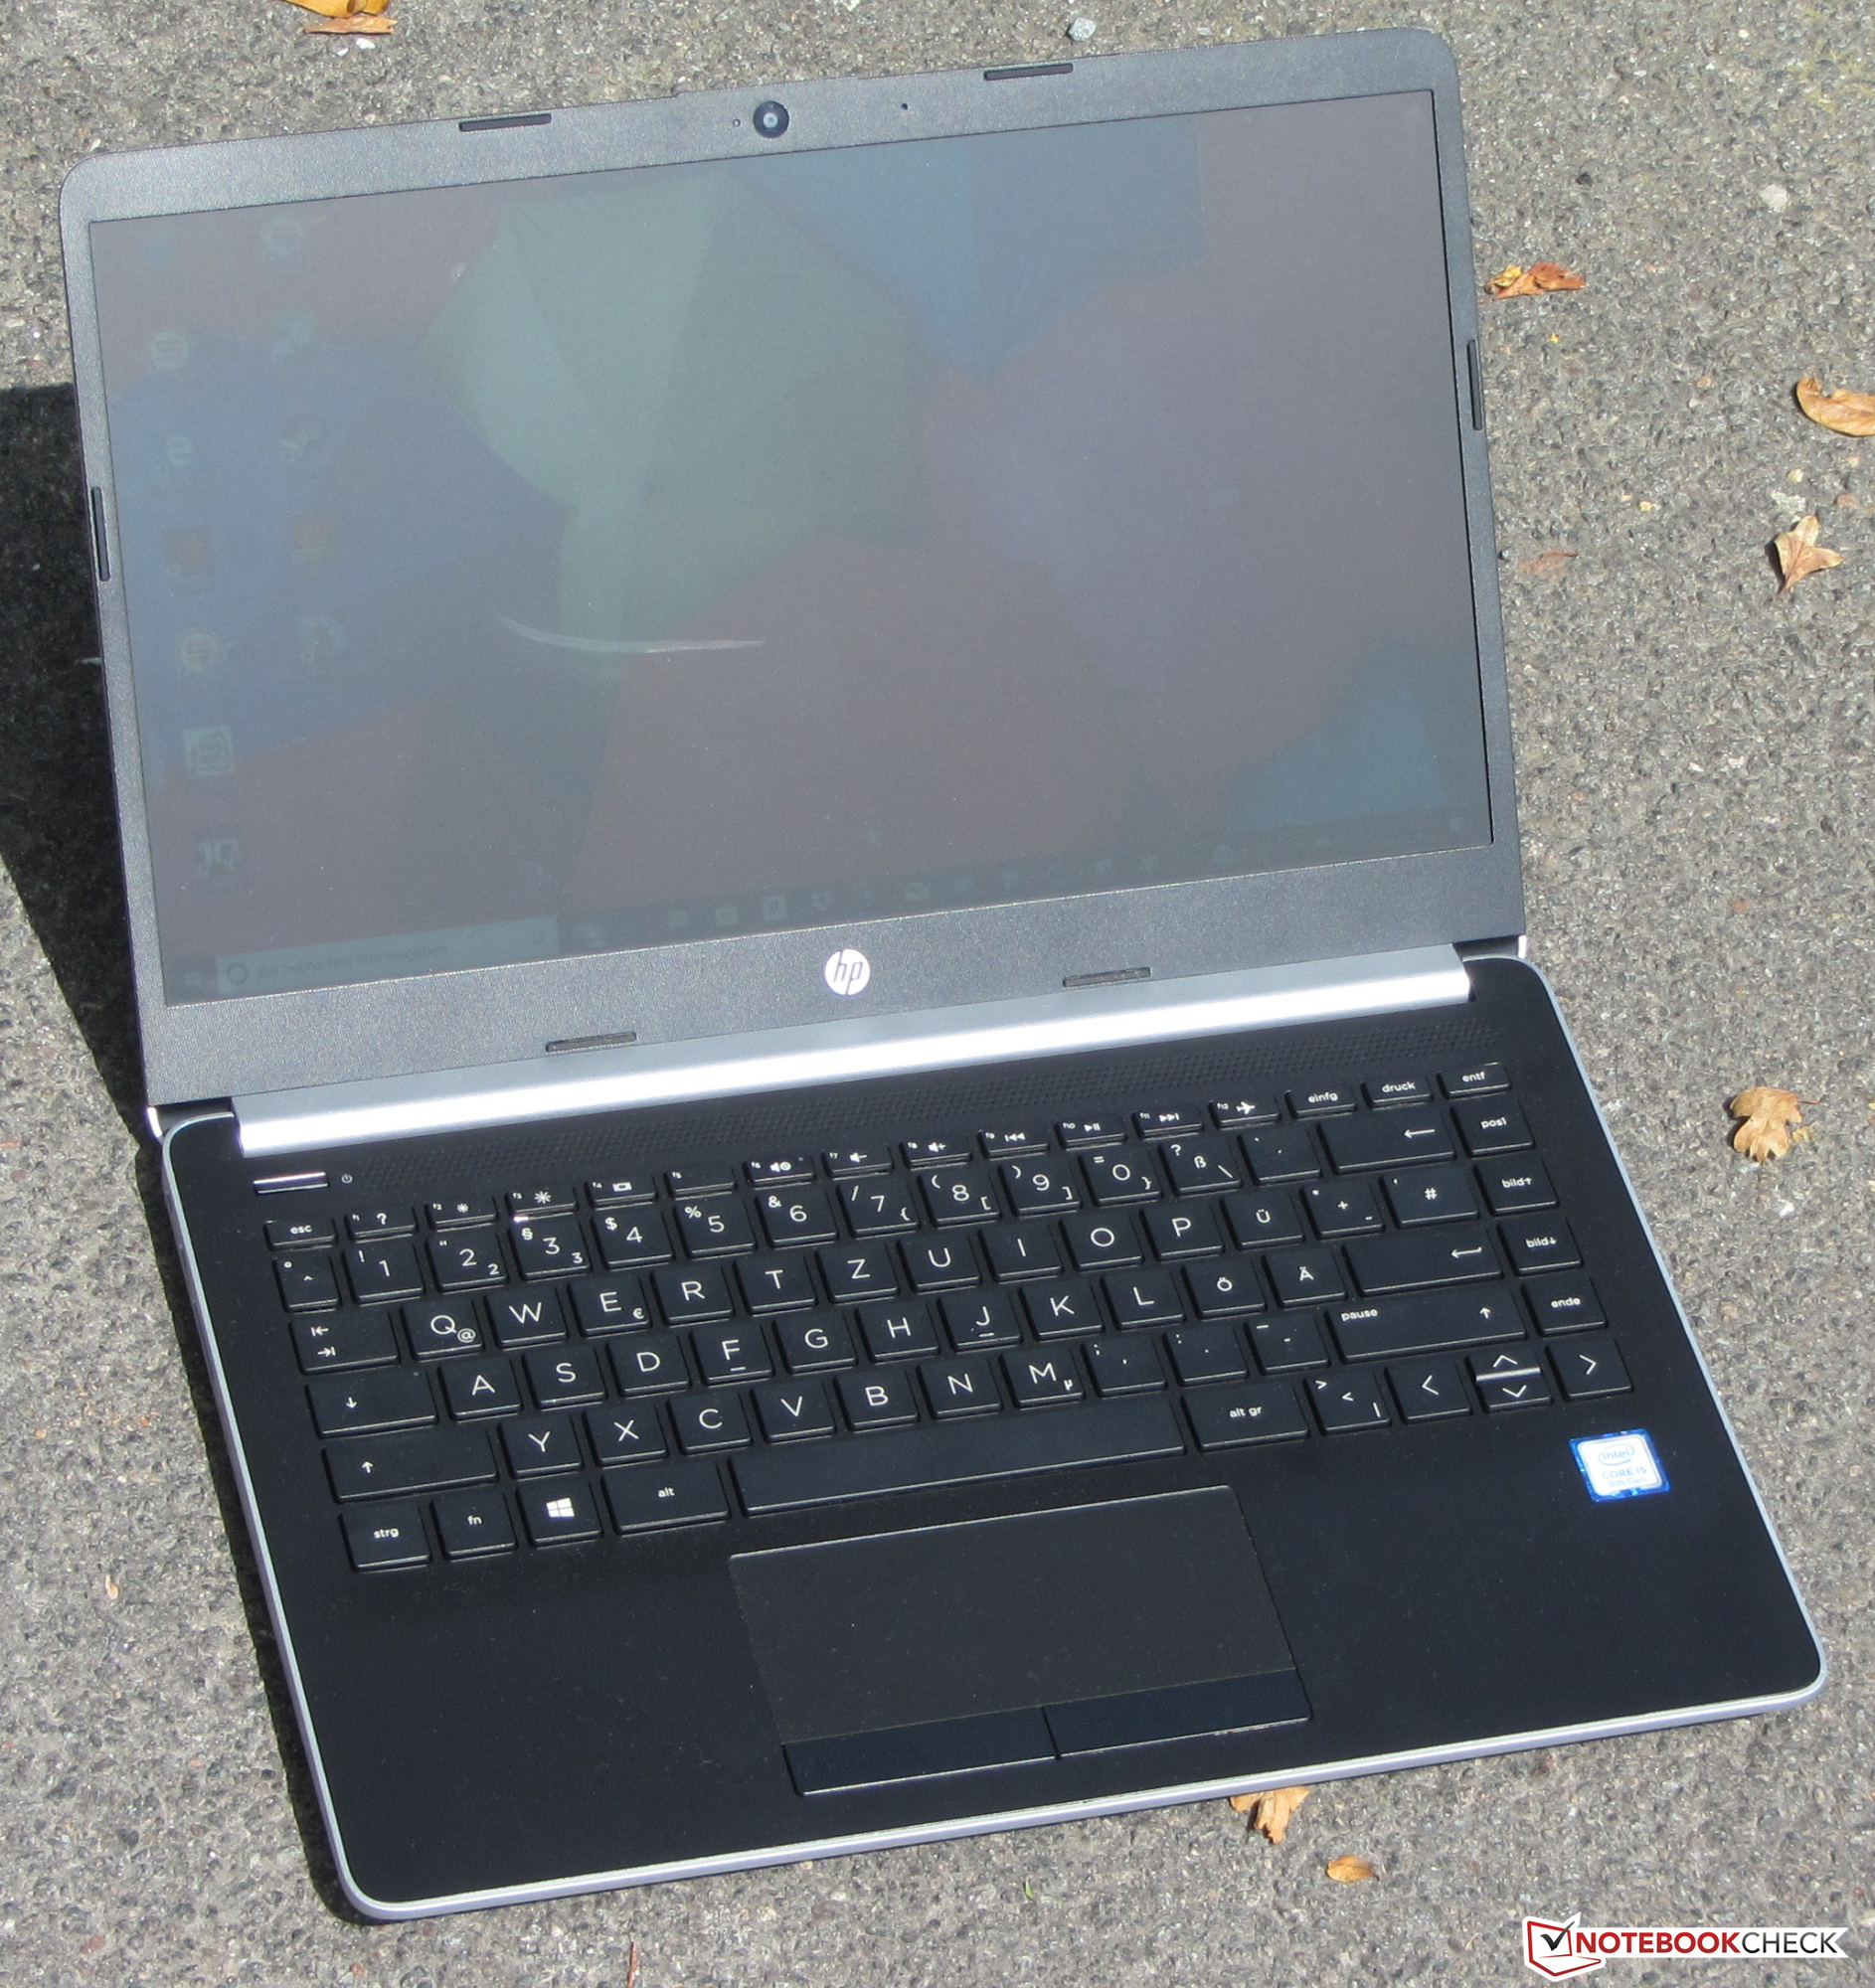
- While the 14-bq001ng has a solid black body, HP has used a combination of dark anthracite and a silver-gray color for our test device.
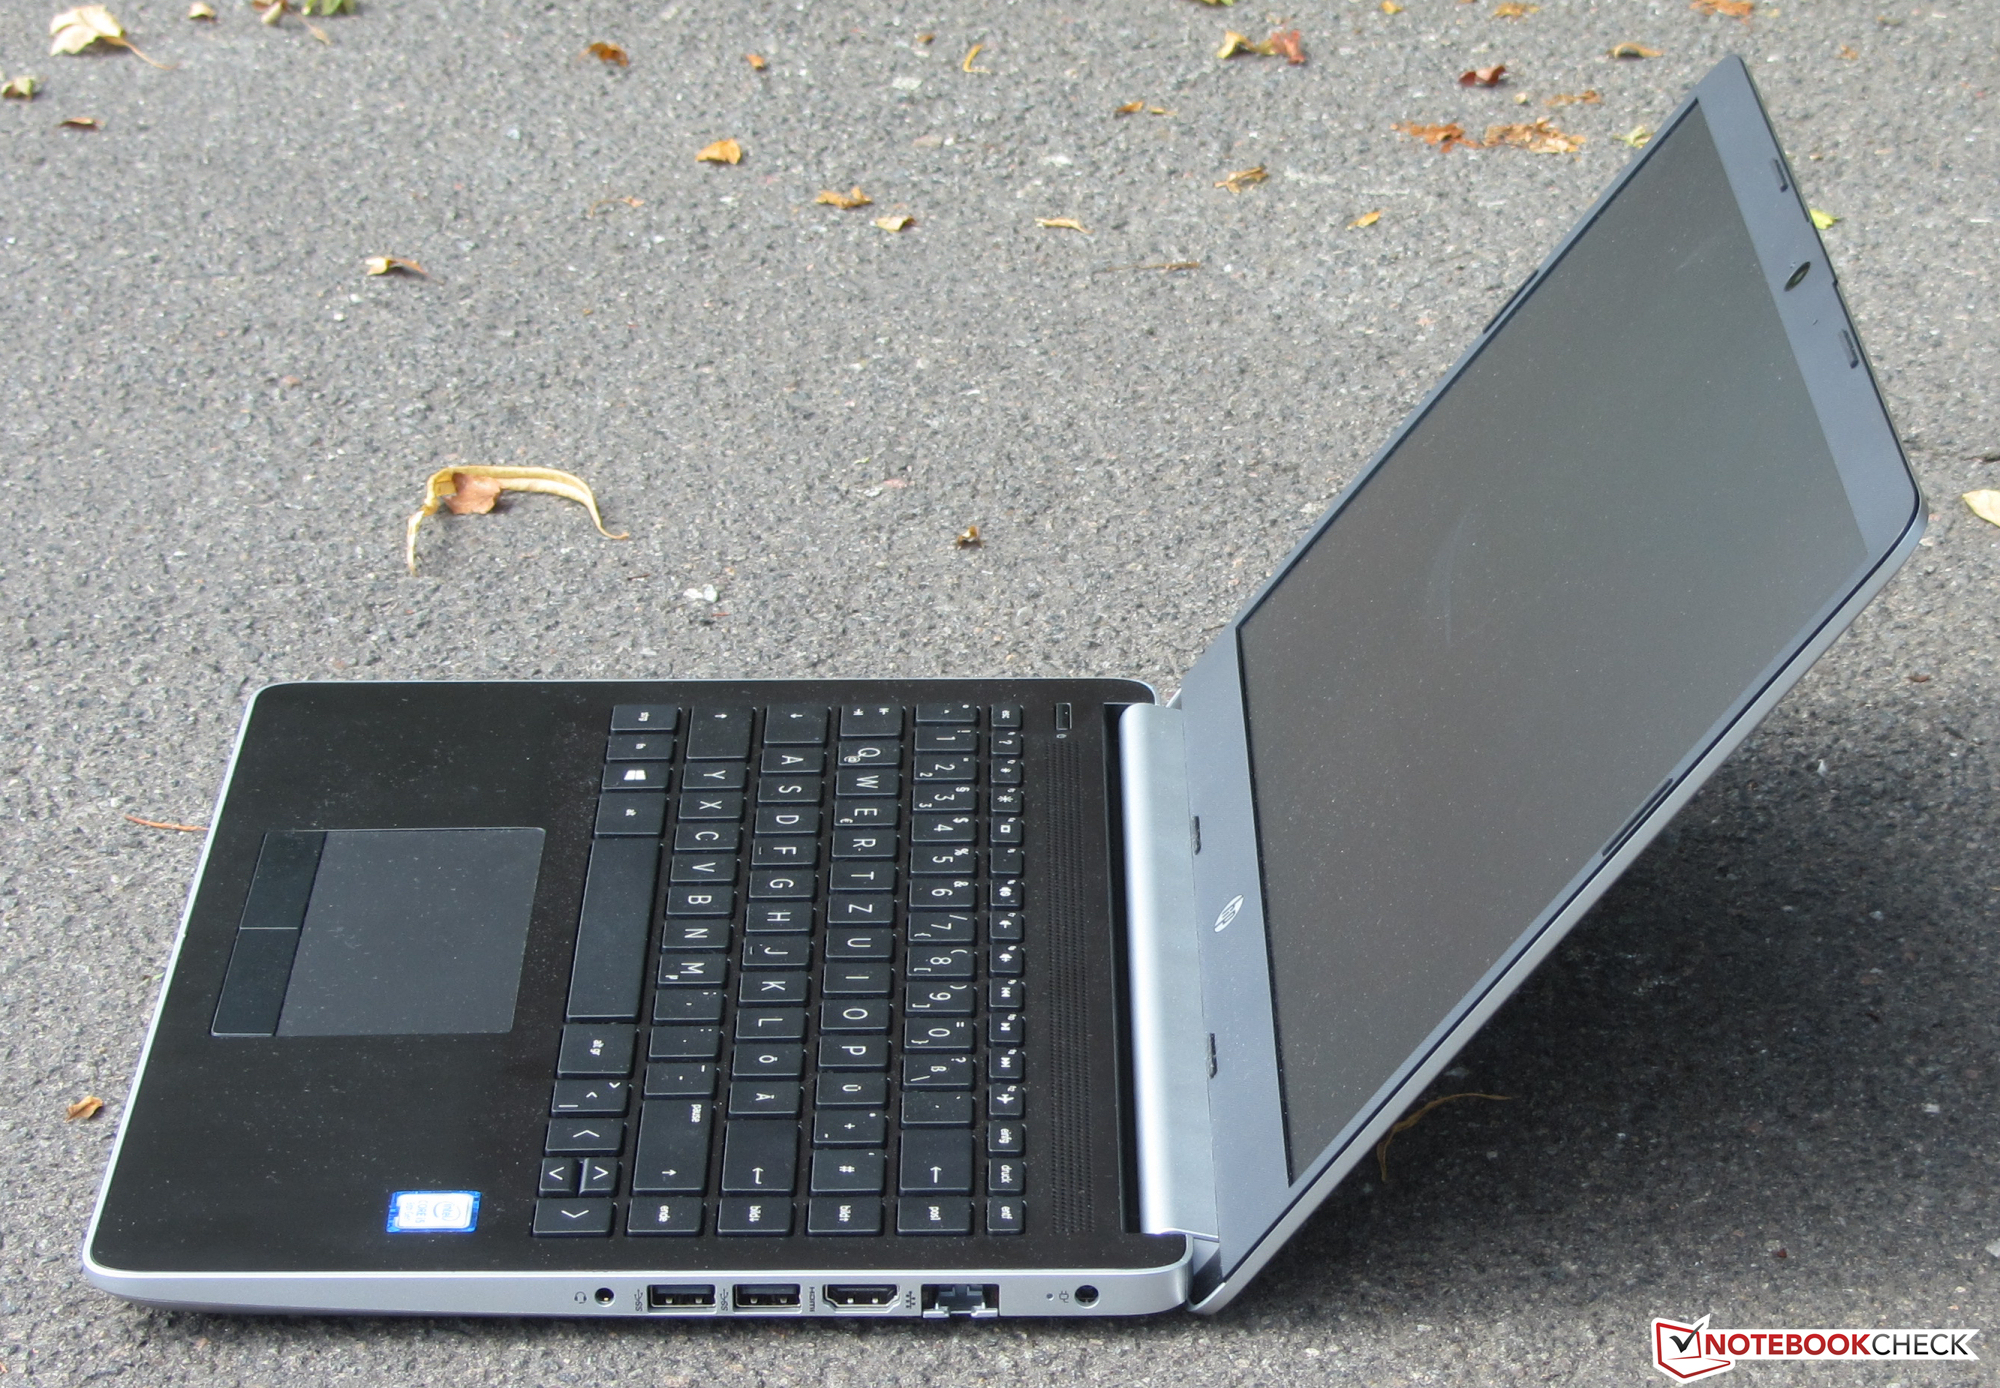
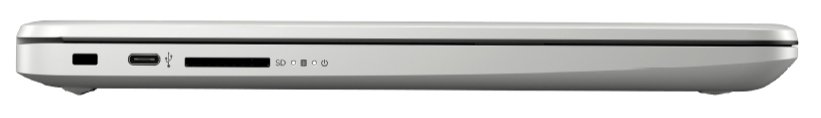
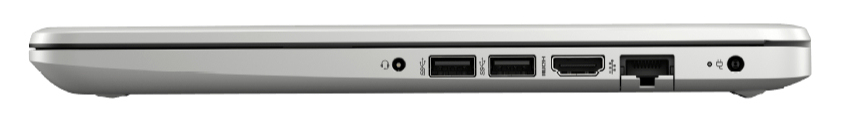
- Both devices have the same ports, but they are arranged differently. For example, while our test device has two USB Type-A ports on its right-hand side, HP has placed them on the opposite side with its sister model.
- Additionally, our test device has two SO-DIMM RAM slots and is actively cooled whereas the 14-bq001ng only has one and is passively cooled.
Connectivity
| SD Card Reader | |
| average JPG Copy Test (av. of 3 runs) | |
| Lenovo IdeaPad 320s-14IKB (Toshiba Exceria Pro SDXC 64 GB UHS-II) | |
| Average of class Office (19.8 - 198.5, n=22, last 2 years) | |
| Asus VivoBook S14 S406UA-BV023T (Toshiba Exceria Pro M501 microSDXC 64GB) | |
| Acer Swift 1 SF114-32-P8GG (Toshiba Exceria Pro SDXC 64 GB UHS-II) | |
| HP 14-ma0312ng (Toshiba Exceria Pro SDXC 64 GB UHS-II) | |
| maximum AS SSD Seq Read Test (1GB) | |
| Lenovo IdeaPad 320s-14IKB | |
| Average of class Office (27.4 - 249, n=21, last 2 years) | |
| Asus VivoBook S14 S406UA-BV023T (Toshiba Exceria Pro M501 microSDXC 64GB) | |
| Acer Swift 1 SF114-32-P8GG (Toshiba Exceria Pro SDXC 64 GB UHS-II) | |
| HP 14-ma0312ng (Toshiba Exceria Pro SDXC 64 GB UHS-II) | |
| Networking | |
| iperf3 transmit AX12 | |
| Acer Swift 1 SF114-32-P8GG | |
| Lenovo IdeaPad 320s-14IKB | |
| Asus VivoBook S14 S406UA-BV023T | |
| HP 14-ma0312ng | |
| iperf3 receive AX12 | |
| Acer Swift 1 SF114-32-P8GG | |
| Asus VivoBook S14 S406UA-BV023T | |
| Lenovo IdeaPad 320s-14IKB | |
| HP 14-ma0312ng | |
Maintenance
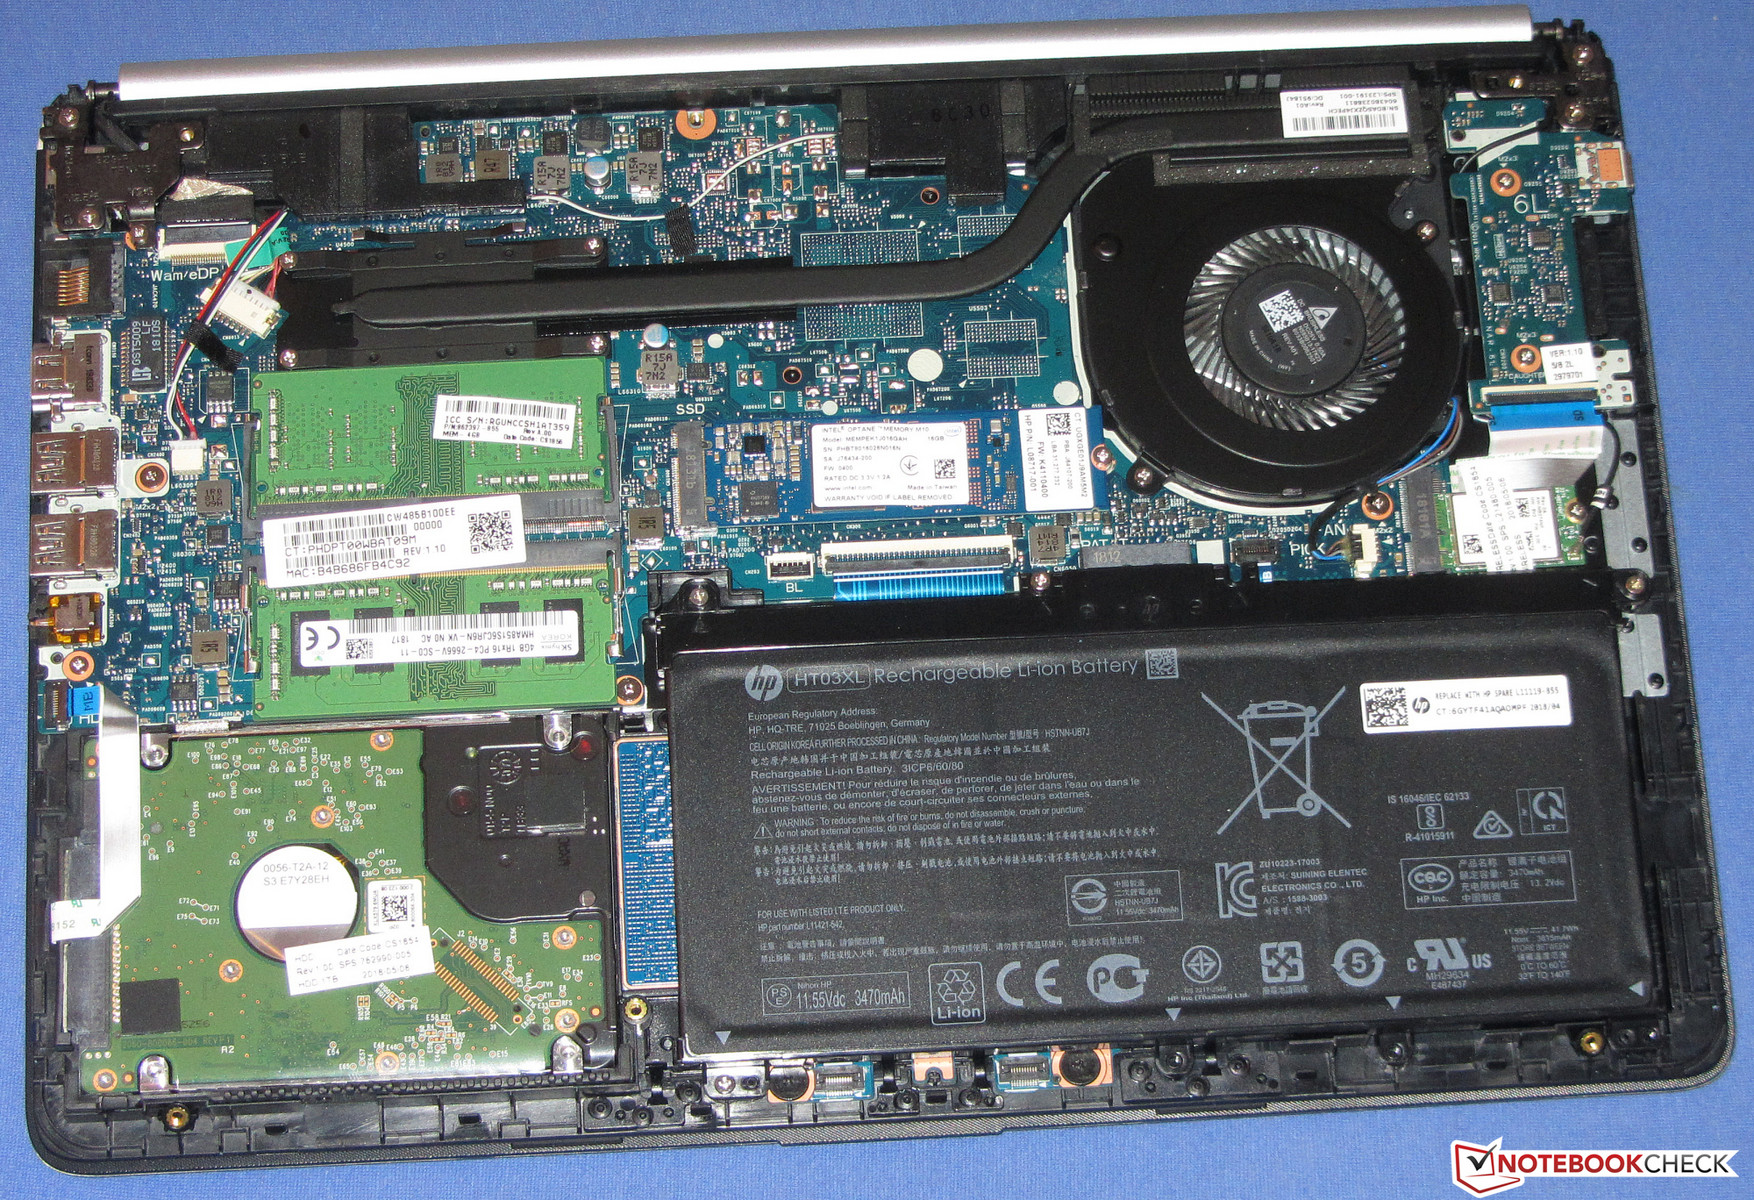
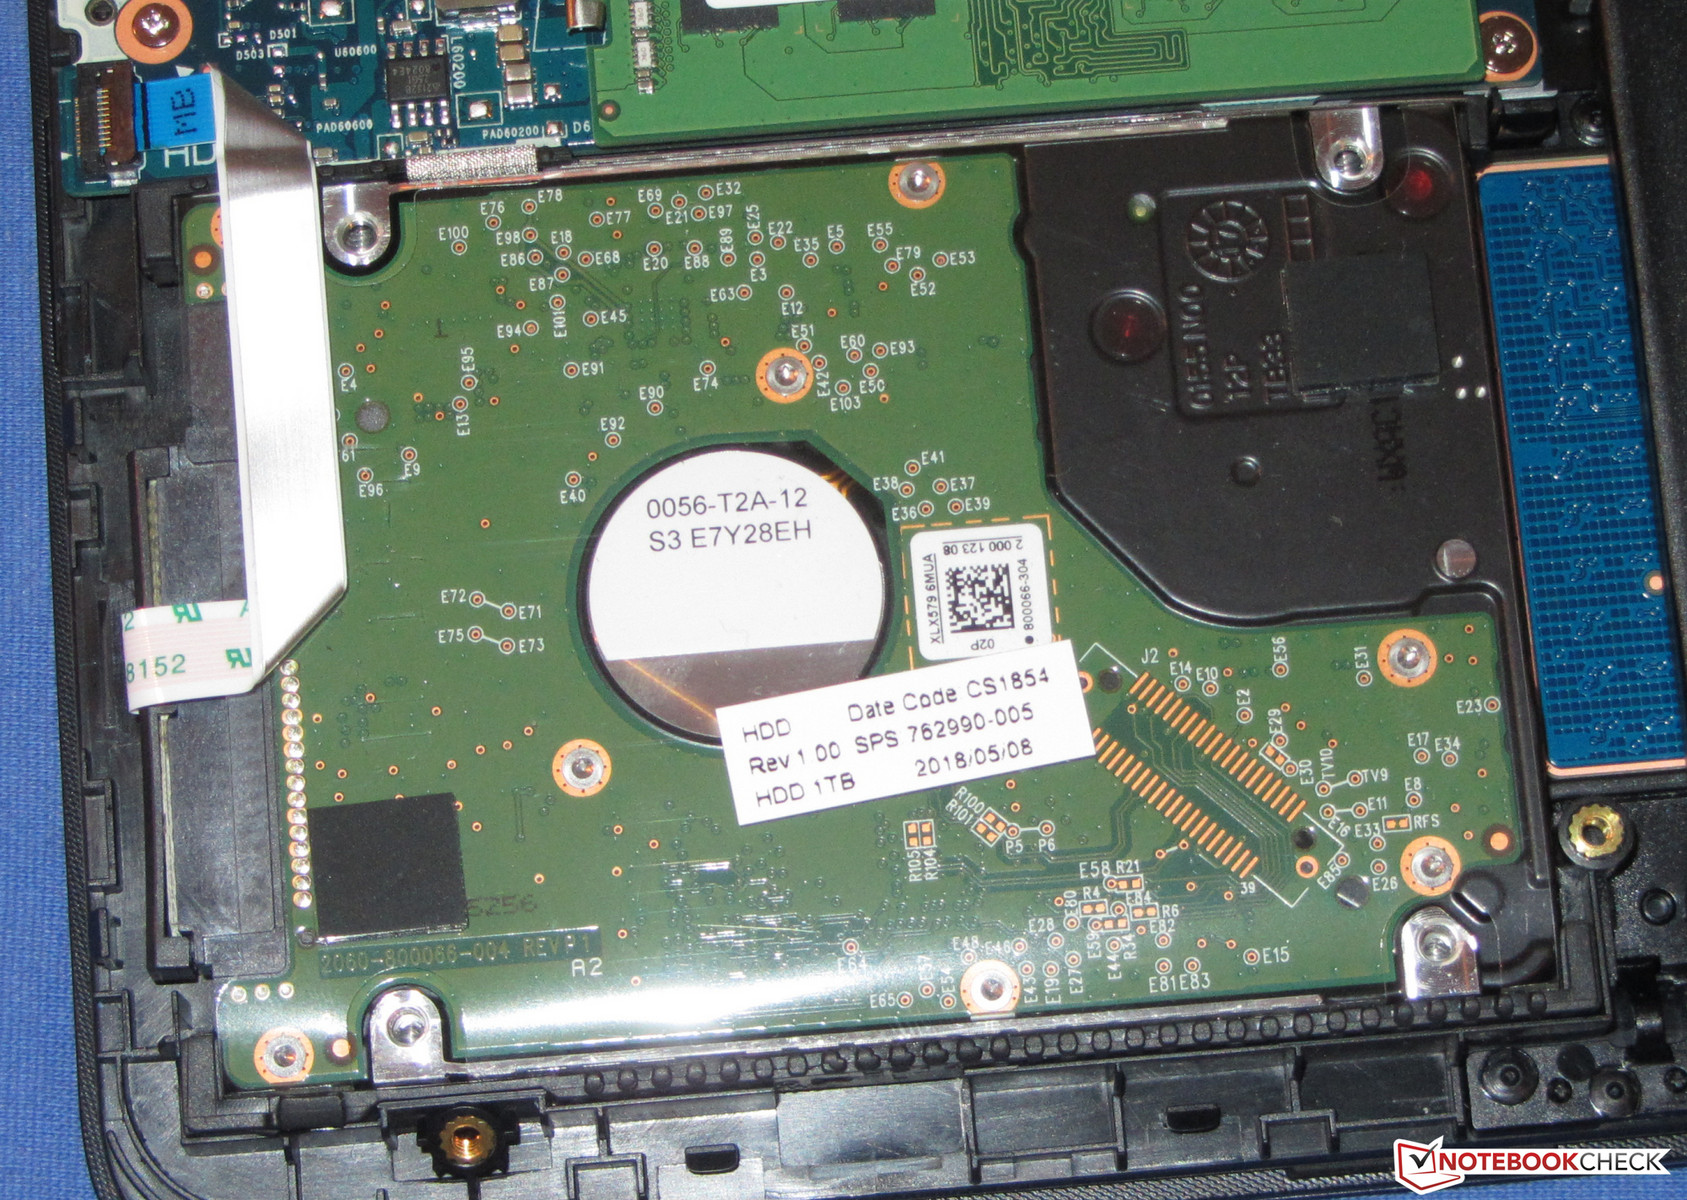
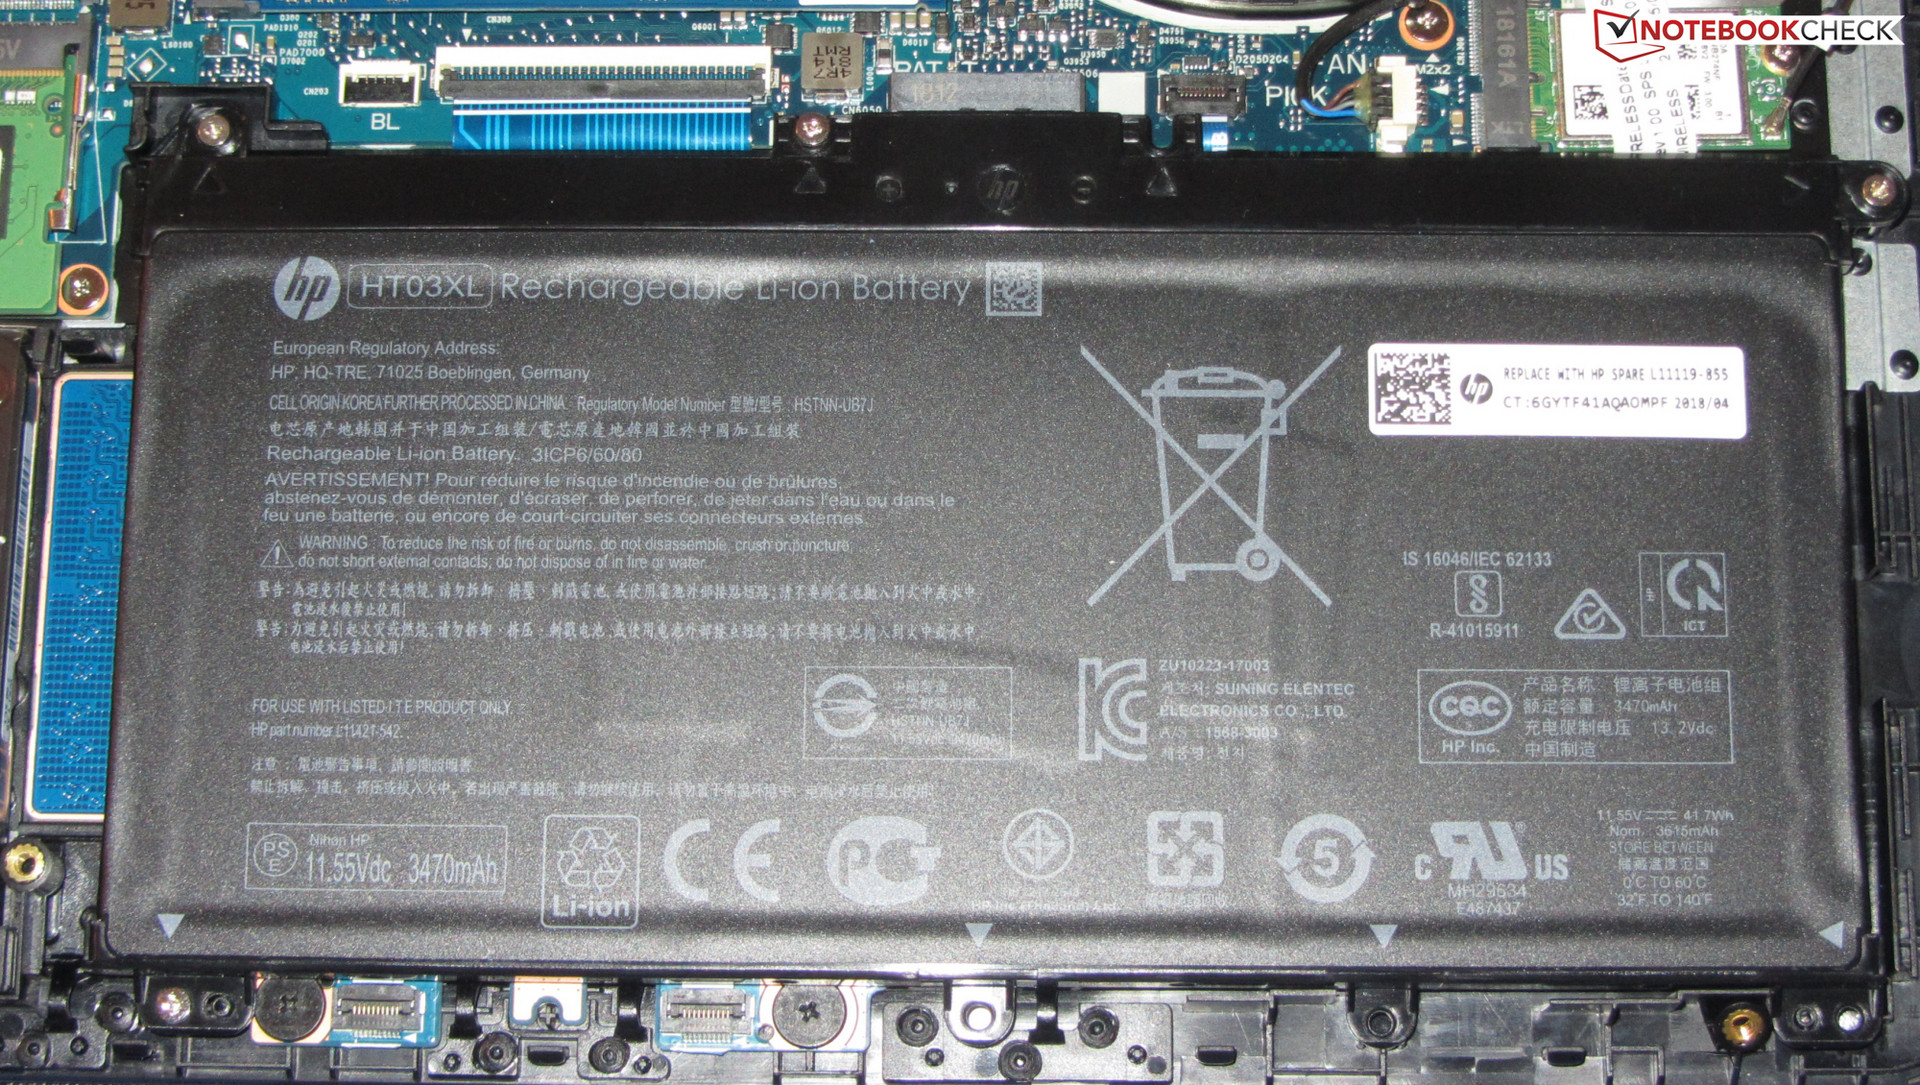
Our test model lacks a maintenance cover, so accessing internal components requires removing the bottom case. This is relatively easy to remove but does require taking some care when doing so. You will need to remove all screws from the bottom case, most of which are hidden behind two long rubber strips. These are easy to remove but we suggest taking care to not break or bend them. Once these have been removed the bottom case can be pried up with a flat tool, preferably a tool that will not cause any damage like a plastic pry tool. Upon removing the bottom case you will have immediate access to the hard drives, the SO-DIMM slots, the heatsink, the Wi-Fi card and the battery.
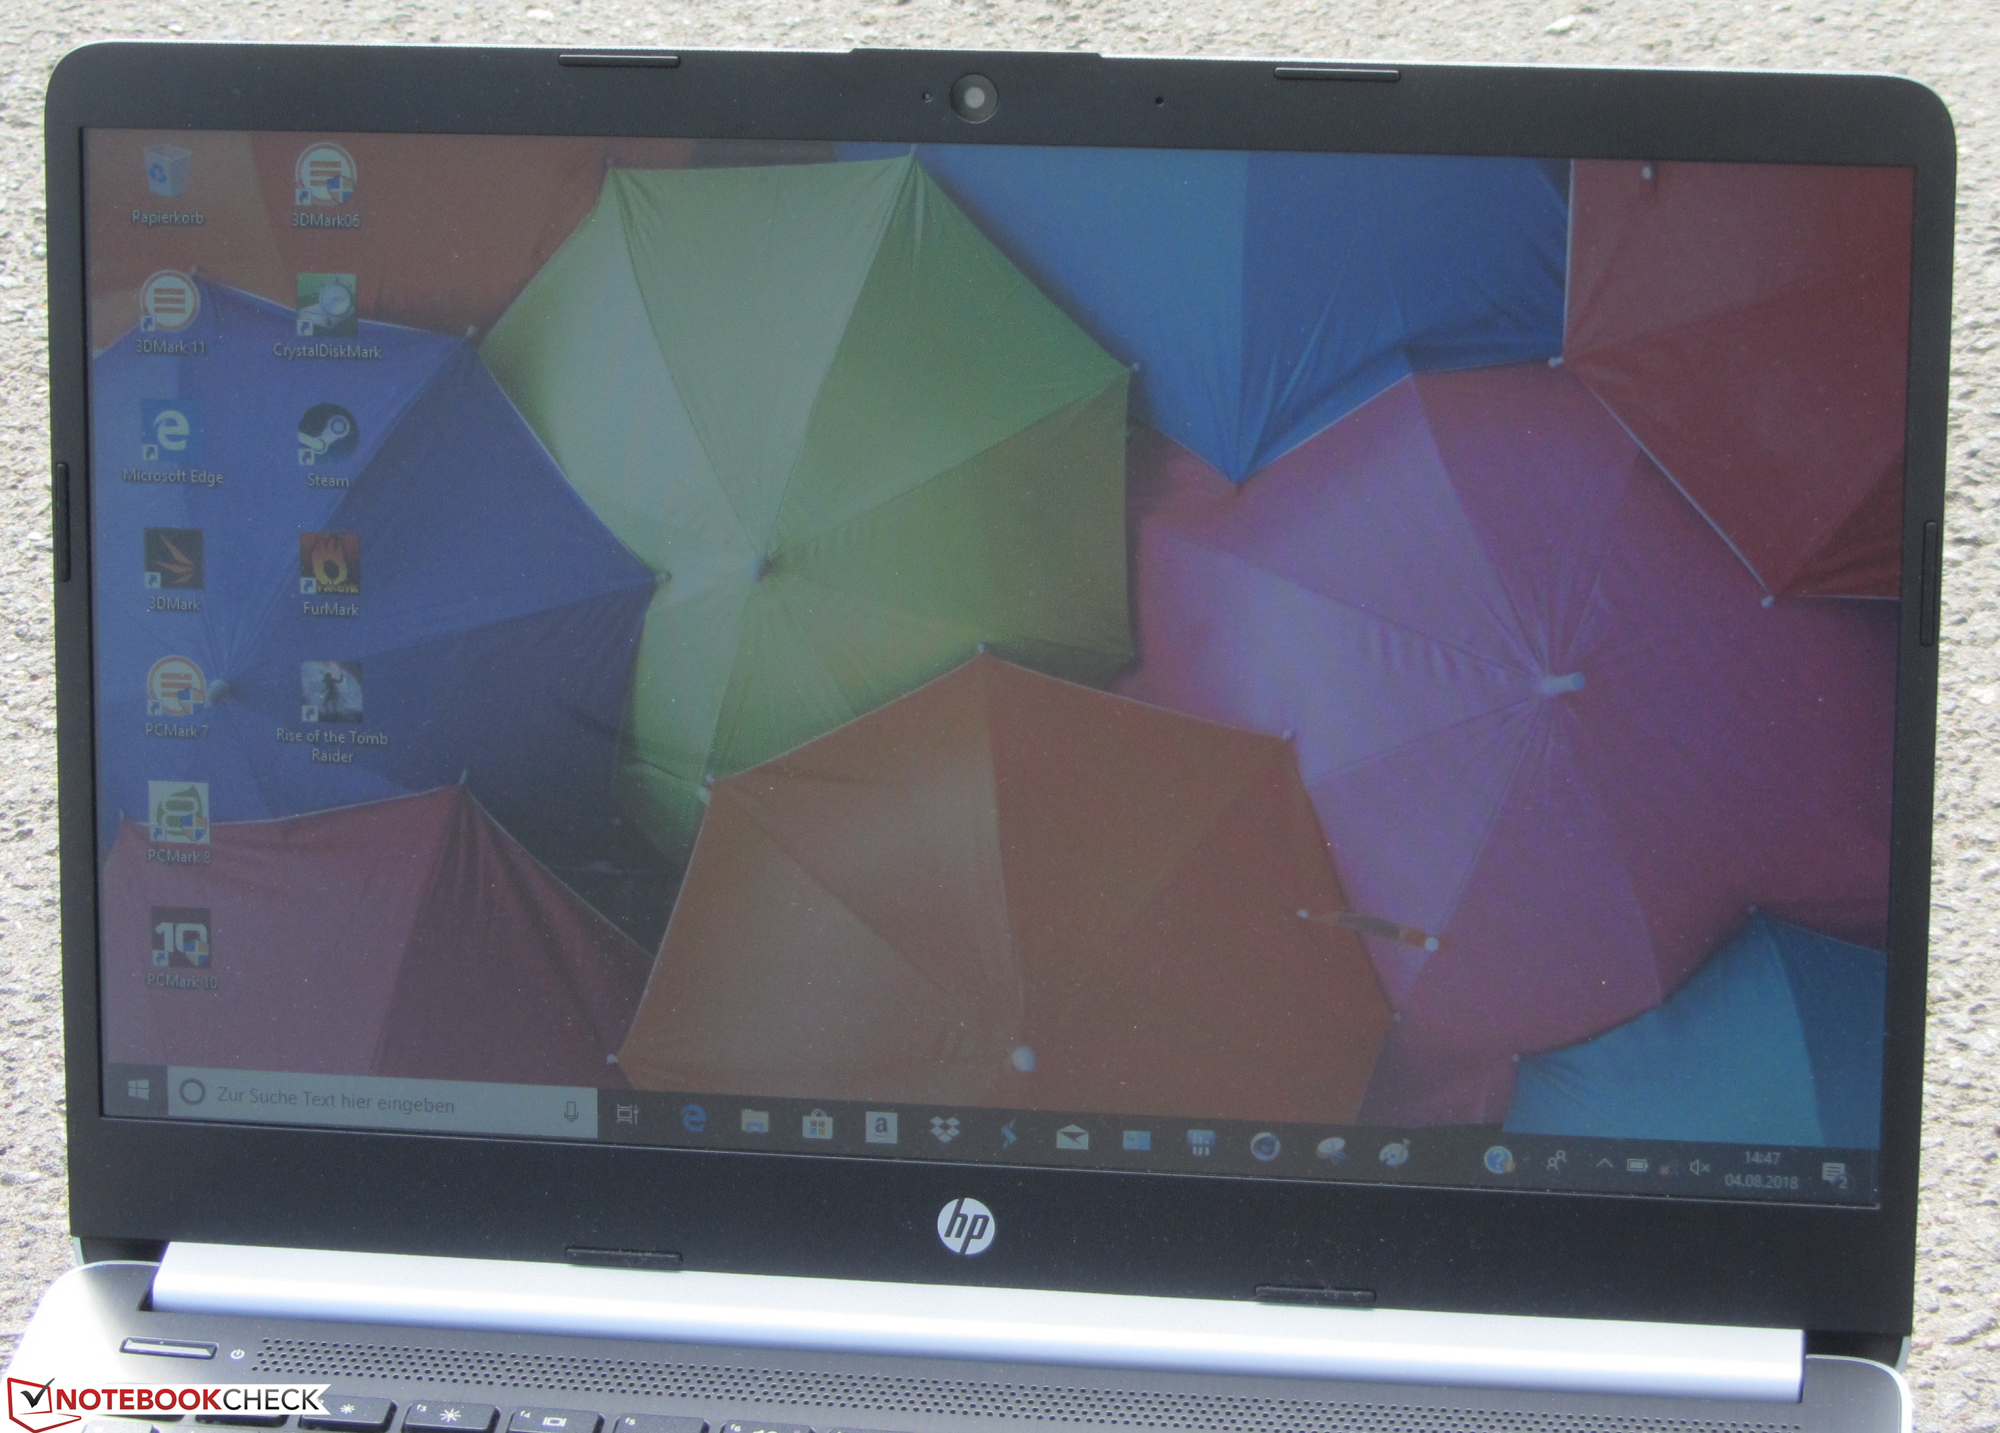
Display
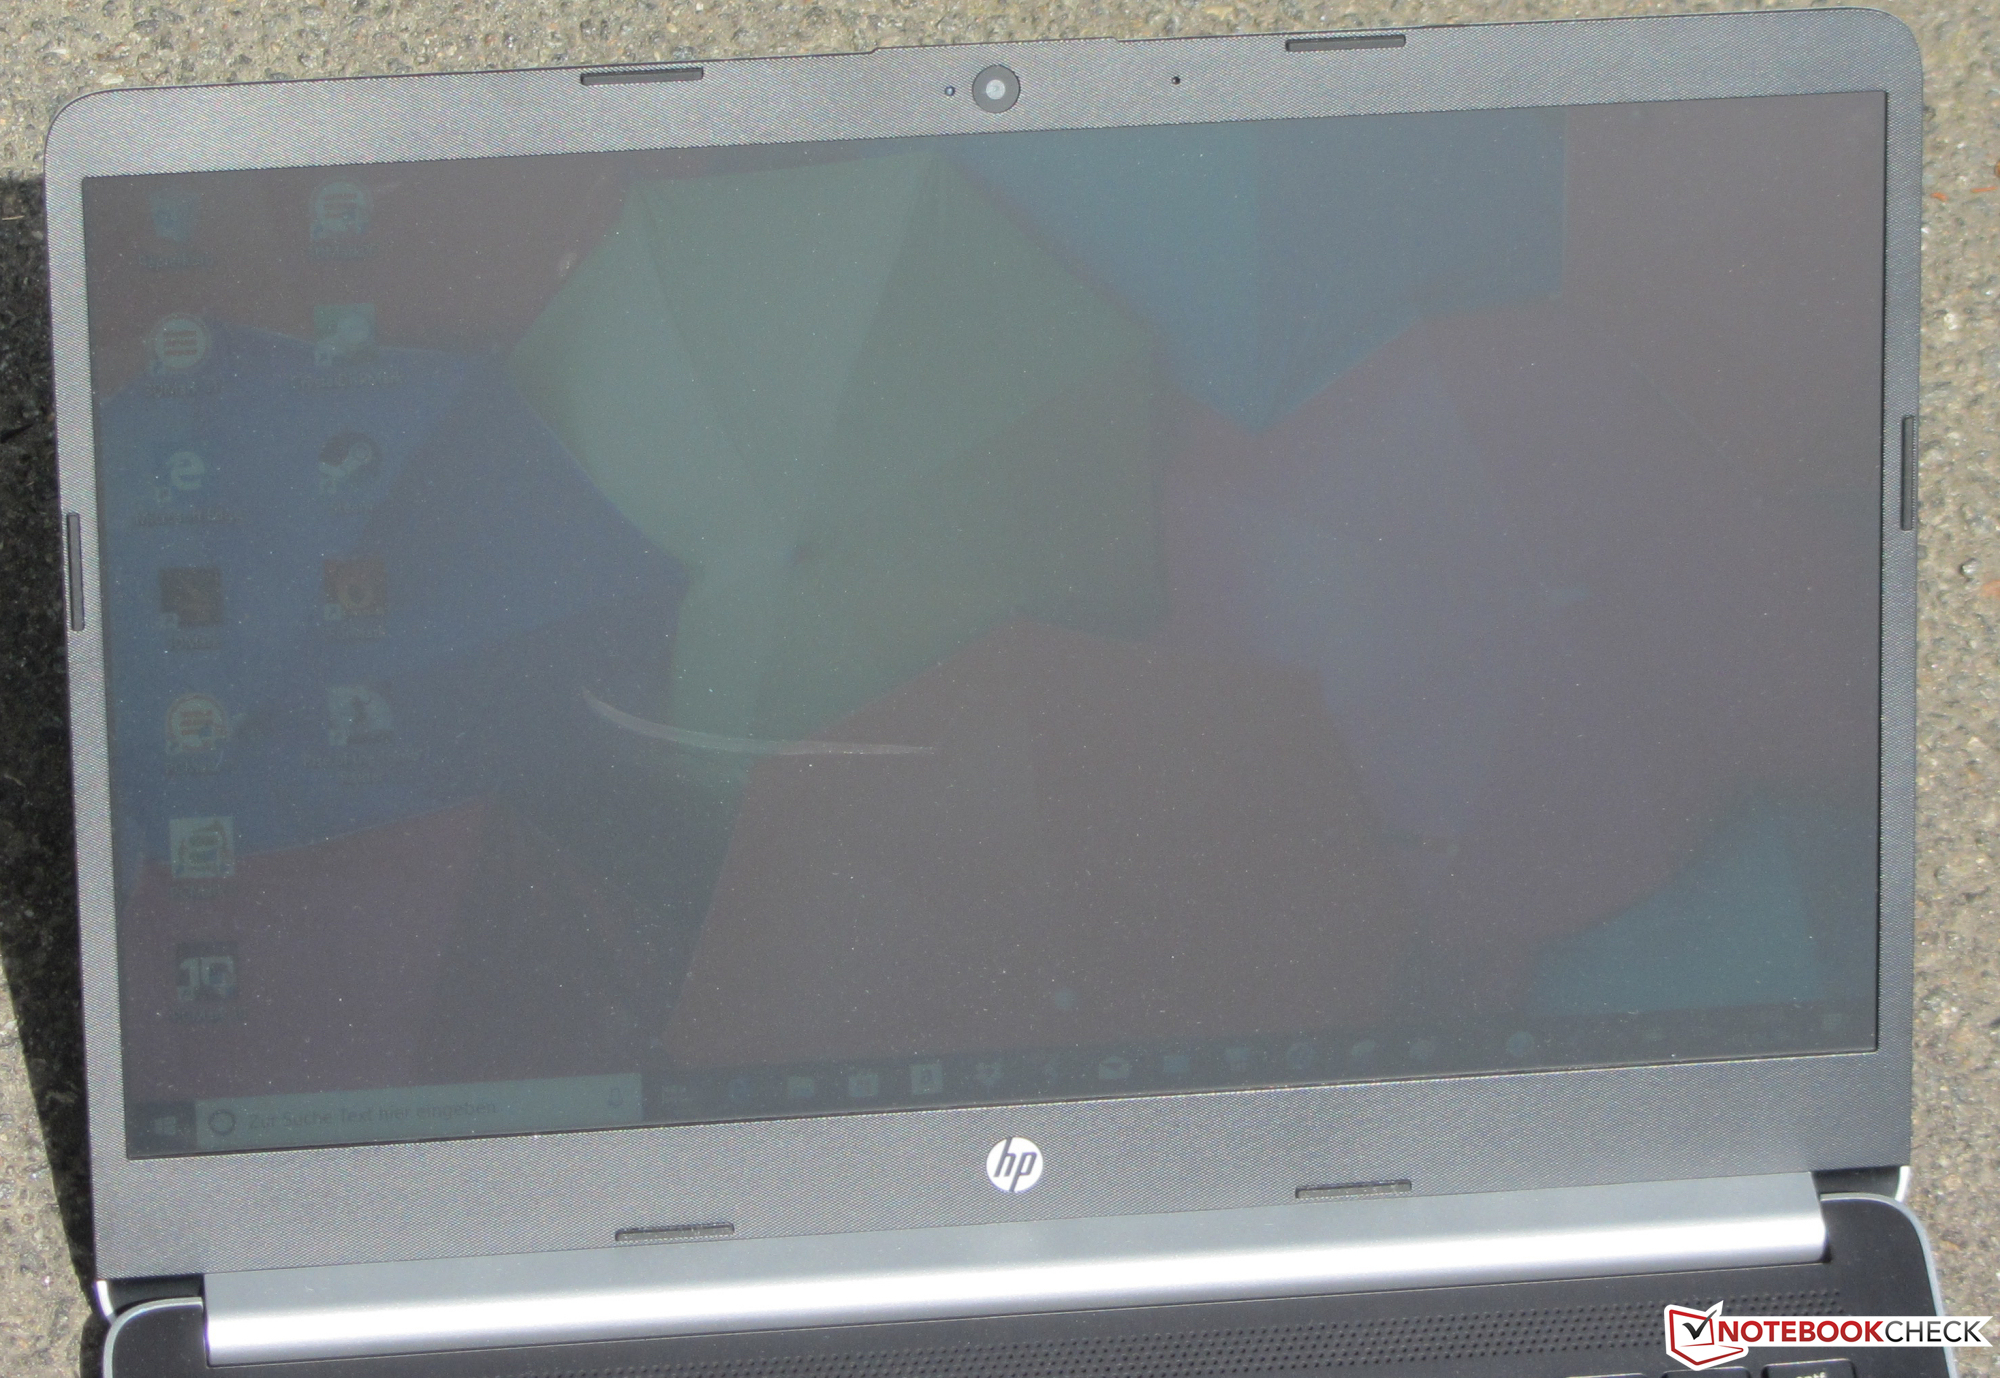
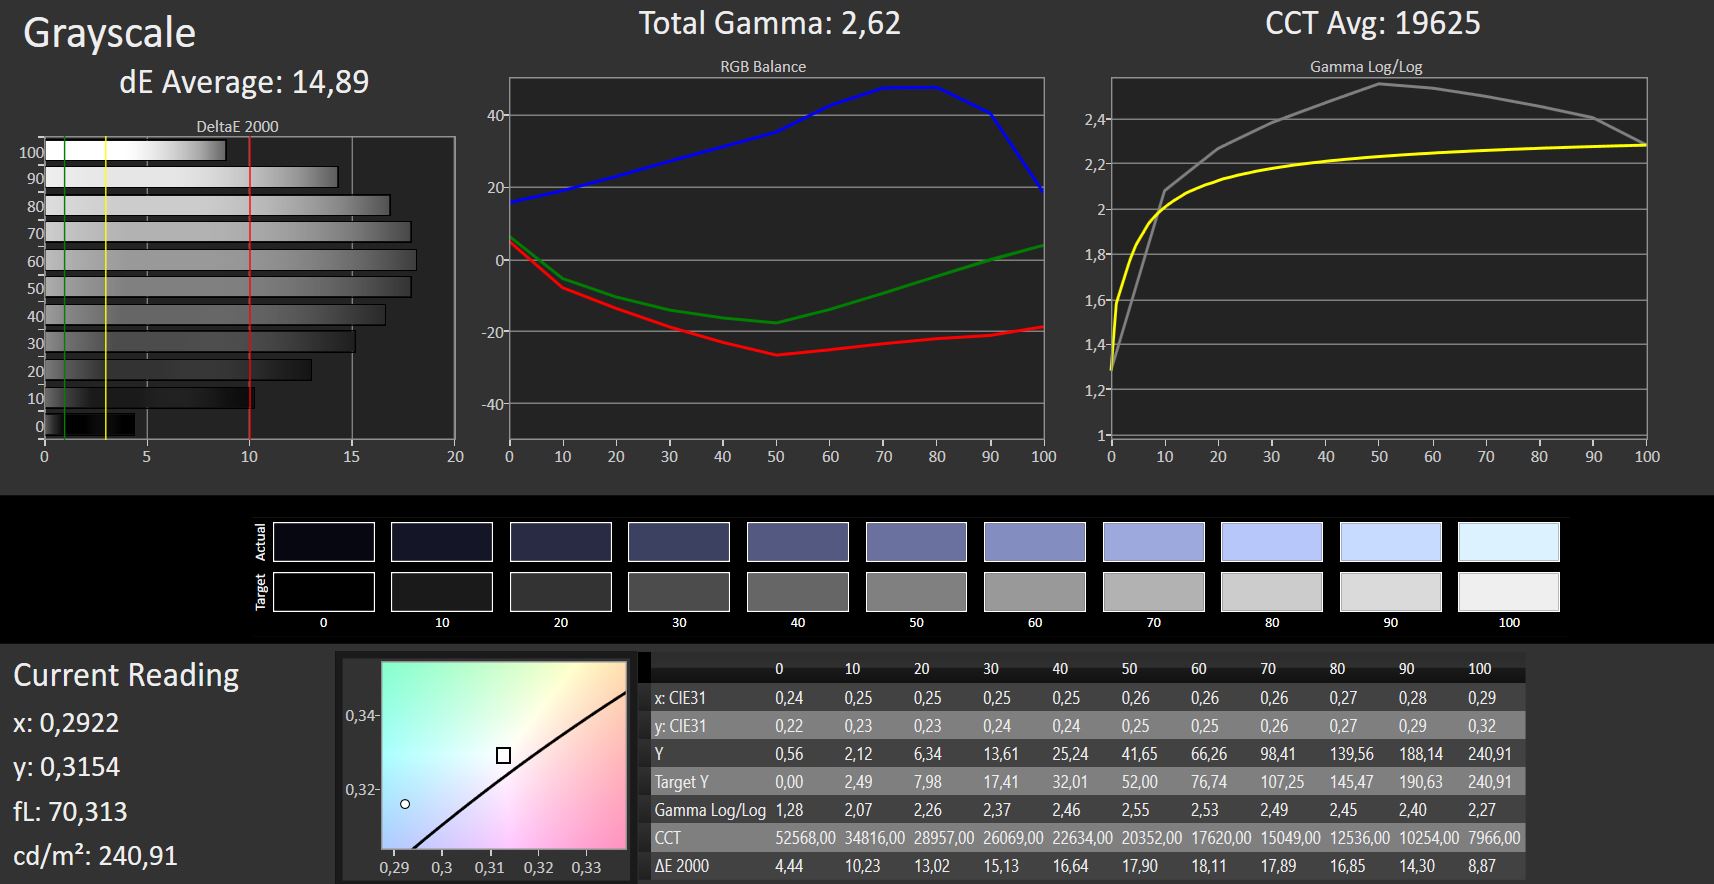
The 14-ma0312ng has a 14-inch matte TN display that has a 1,366 x 768 native resolution. Our test device achieved an average maximum brightness of 215.9 cd/m² as measured by X-Rite i1Pro 2 and has an 84% uniformly bright display. These values are on par with our comparison devices, although the Lenovo IdeaPad 320s-14IKB gets 14% brighter than our test device. Our test device has a 0.56 cd/m² black level, which is comparatively high. This value contributes to the poor 429:1 contrast ratio, which is resoundingly beaten by our comparison devices. The Acer Swift 1 has a 1,923:1 contrast ratio, which will make colors appear more vividly onscreen among other improvements. While our test device is largely comparable to our comparison devices in terms of display quality, our test device fails to meet our expectations. Generally, a display with a 1,000:1 contrast ratio and a 300 cd/m² average maximum brightness will be considered good, both of which the HP 14 falls short. Positively, our test device exhibits no pulse-width modulation (PWM) to regulate display brightness.
| |||||||||||||||||||||||||
Brightness Distribution: 84 %
Center on Battery: 229 cd/m²
Contrast: 429:1 (Black: 0.56 cd/m²)
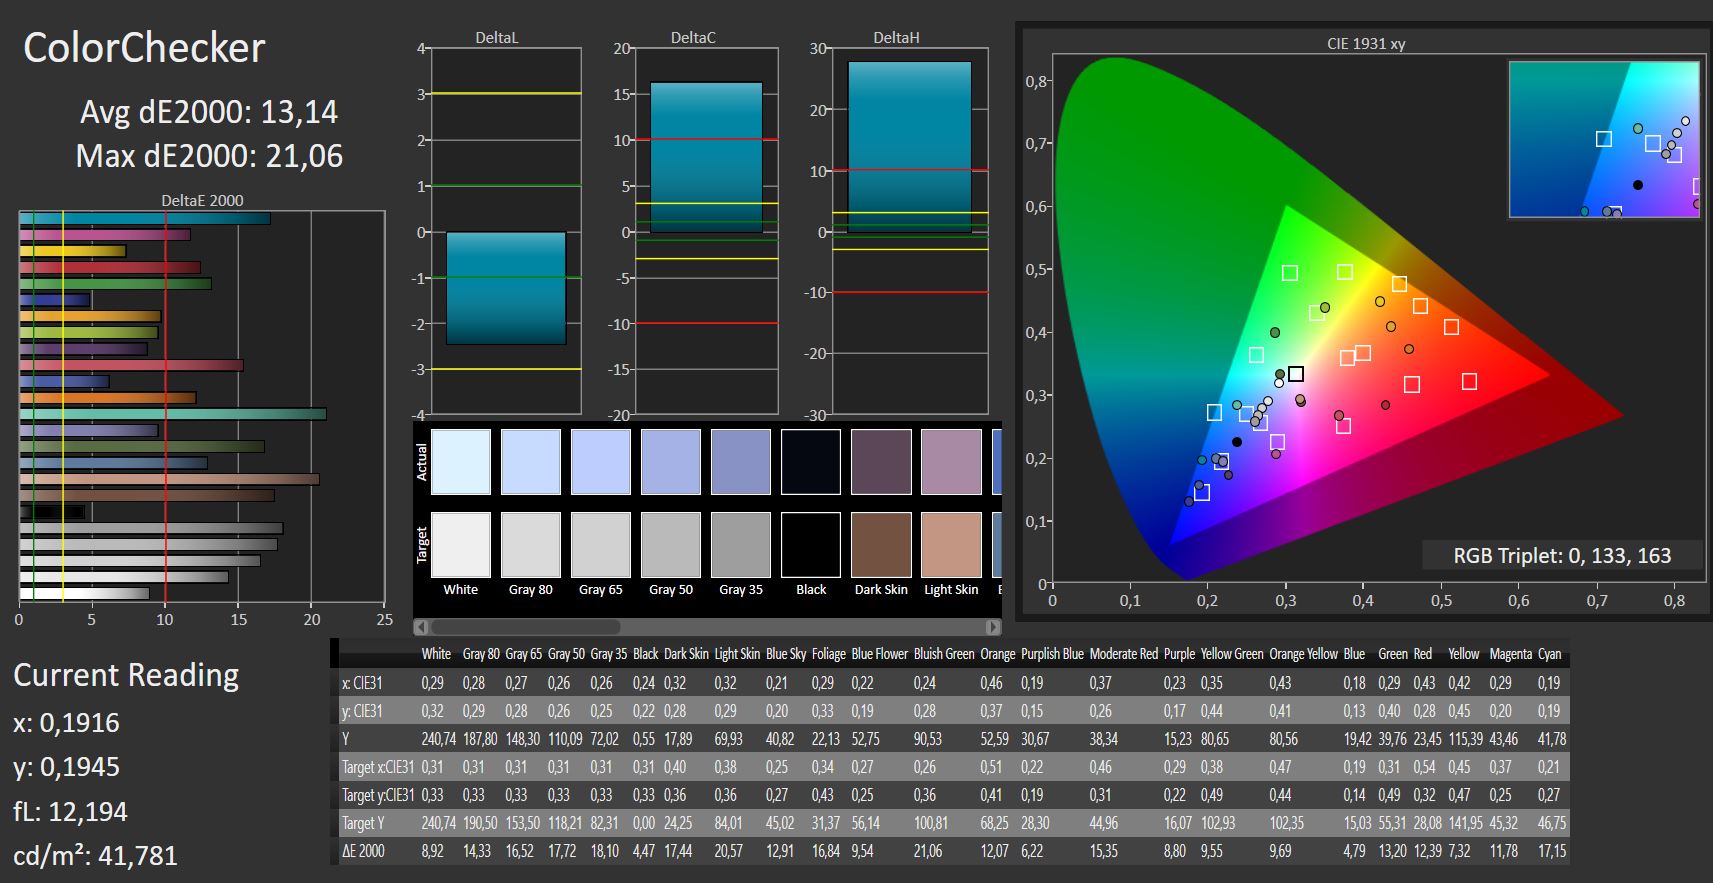
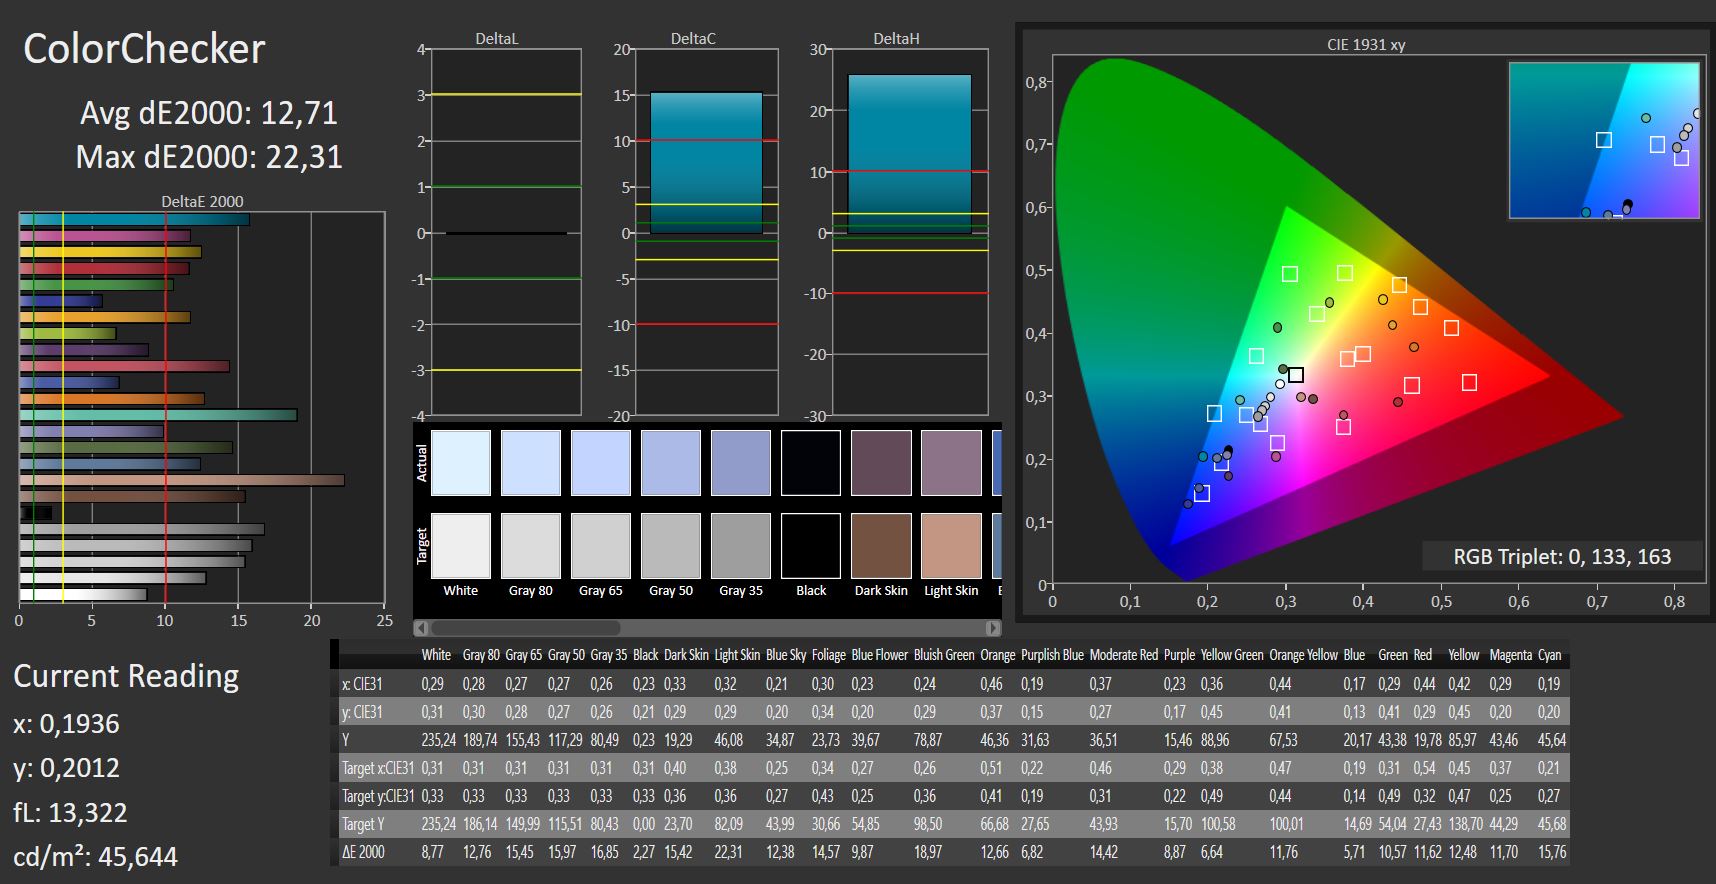
ΔE ColorChecker Calman: 13.14 | ∀{0.5-29.43 Ø4.72}
calibrated: 12.71
ΔE Greyscale Calman: 14.89 | ∀{0.09-98 Ø4.97}
59% sRGB (Argyll 1.6.3 3D)
38% AdobeRGB 1998 (Argyll 1.6.3 3D)
40.61% AdobeRGB 1998 (Argyll 3D)
59.2% sRGB (Argyll 3D)
39.31% Display P3 (Argyll 3D)
Gamma: 2.62
CCT: 19625 K
| HP 14-ma0312ng TN LED, 1366x768, 14" | Acer Swift 1 SF114-32-P8GG IPS, 1920x1080, 14" | Lenovo IdeaPad 320s-14IKB IPS, 1920x1080, 14" | Asus VivoBook S14 S406UA-BV023T TN LED, 1366x768, 14" | |
|---|---|---|---|---|
| Display | -4% | 5% | -1% | |
| Display P3 Coverage (%) | 39.31 | 37.96 -3% | 41.65 6% | 38.82 -1% |
| sRGB Coverage (%) | 59.2 | 56.5 -5% | 61.8 4% | 58.2 -2% |
| AdobeRGB 1998 Coverage (%) | 40.61 | 39.22 -3% | 43.03 6% | 40.11 -1% |
| Response Times | -40% | -50% | 7% | |
| Response Time Grey 50% / Grey 80% * (ms) | 40 ? | 42 ? -5% | 42 ? -5% | 42 ? -5% |
| Response Time Black / White * (ms) | 16 ? | 28 ? -75% | 31 ? -94% | 13 ? 19% |
| PWM Frequency (Hz) | 352 ? | 200 ? | ||
| Screen | 60% | 38% | 11% | |
| Brightness middle (cd/m²) | 240 | 250 4% | 274 14% | 215 -10% |
| Brightness (cd/m²) | 216 | 240 11% | 253 17% | 208 -4% |
| Brightness Distribution (%) | 84 | 81 -4% | 85 1% | 81 -4% |
| Black Level * (cd/m²) | 0.56 | 0.13 77% | 0.31 45% | 0.4 29% |
| Contrast (:1) | 429 | 1923 348% | 884 106% | 538 25% |
| Colorchecker dE 2000 * | 13.14 | 5.54 58% | 5.74 56% | 9.37 29% |
| Colorchecker dE 2000 max. * | 21.06 | 10.5 50% | 8.26 61% | 15.84 25% |
| Colorchecker dE 2000 calibrated * | 12.71 | |||
| Greyscale dE 2000 * | 14.89 | 5.2 65% | 4.61 69% | 10.52 29% |
| Gamma | 2.62 84% | 2.29 96% | 2.14 103% | 2.45 90% |
| CCT | 19625 33% | 5796 112% | 7281 89% | 11214 58% |
| Color Space (Percent of AdobeRGB 1998) (%) | 38 | 36 -5% | 39 3% | 37 -3% |
| Color Space (Percent of sRGB) (%) | 59 | 56 -5% | 61 3% | 58 -2% |
| Total Average (Program / Settings) | 5% /
34% | -2% /
19% | 6% /
8% |
* ... smaller is better
Screen Flickering / PWM (Pulse-Width Modulation)
| Screen flickering / PWM not detected | 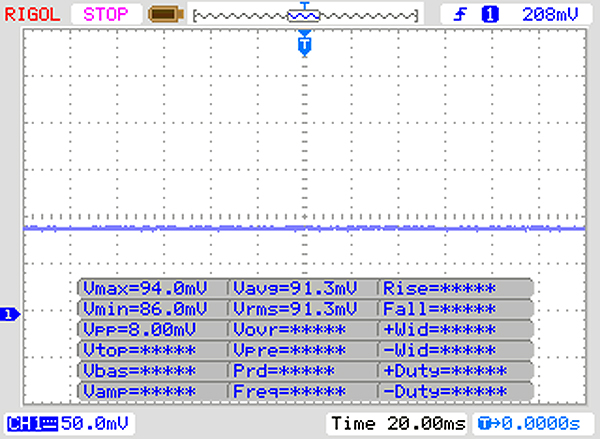 | ||
In comparison: 52 % of all tested devices do not use PWM to dim the display. If PWM was detected, an average of 7747 (minimum: 5 - maximum: 343500) Hz was measured. | |||
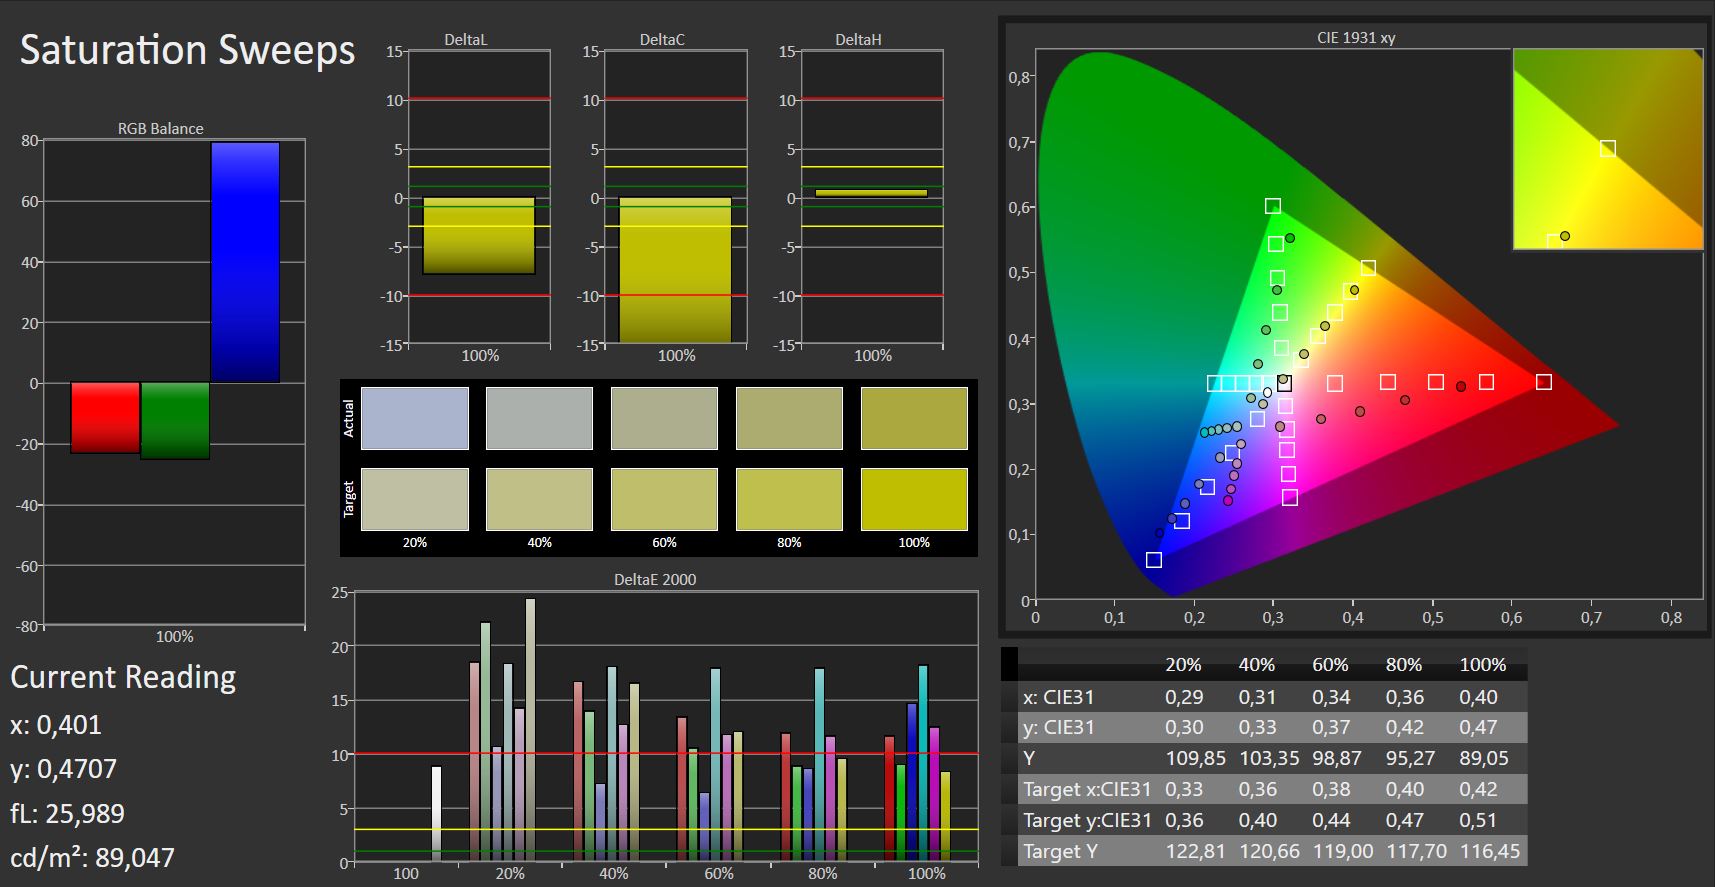
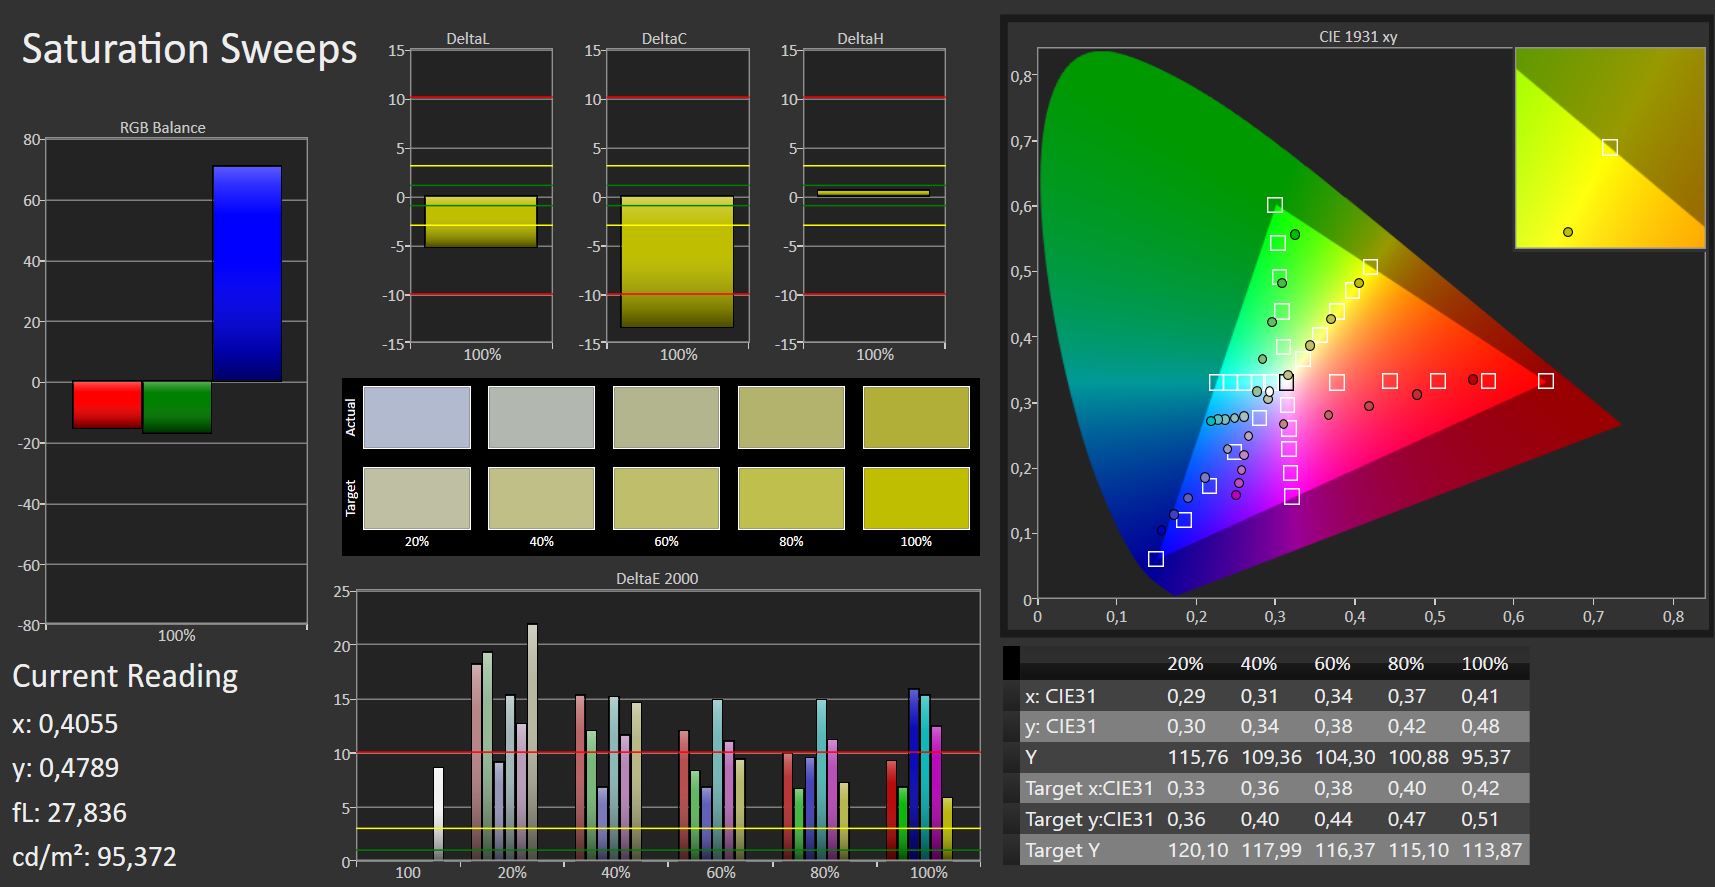
We do not like our test device’s color accuracy either. At default settings we measured Delta E 2000 color deviations at 13.14, which is magnitudes higher than the ideal value of 3. The display has a clear blue tint to it, while our test device is only 38% AdobeRGB accurate and 59% sRGB accurate. Unfortunately, we could not improve color accuracy with additional calibration.

Display Response Times
| ↔ Response Time Black to White | ||
|---|---|---|
| 16 ms ... rise ↗ and fall ↘ combined | ↗ 11 ms rise | 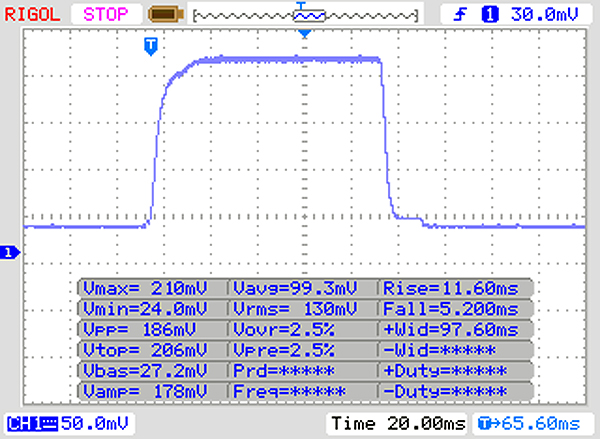 |
| ↘ 5 ms fall | ||
| The screen shows good response rates in our tests, but may be too slow for competitive gamers. In comparison, all tested devices range from 0.1 (minimum) to 240 (maximum) ms. » 37 % of all devices are better. This means that the measured response time is better than the average of all tested devices (19.8 ms). | ||
| ↔ Response Time 50% Grey to 80% Grey | ||
| 40 ms ... rise ↗ and fall ↘ combined | ↗ 21 ms rise | 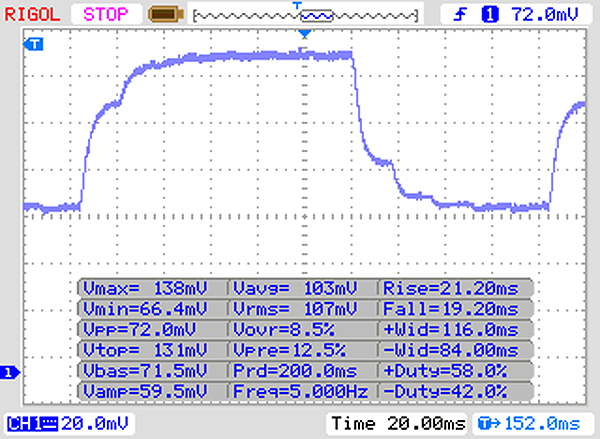 |
| ↘ 19 ms fall | ||
| The screen shows slow response rates in our tests and will be unsatisfactory for gamers. In comparison, all tested devices range from 0.165 (minimum) to 636 (maximum) ms. » 61 % of all devices are better. This means that the measured response time is worse than the average of all tested devices (31 ms). | ||
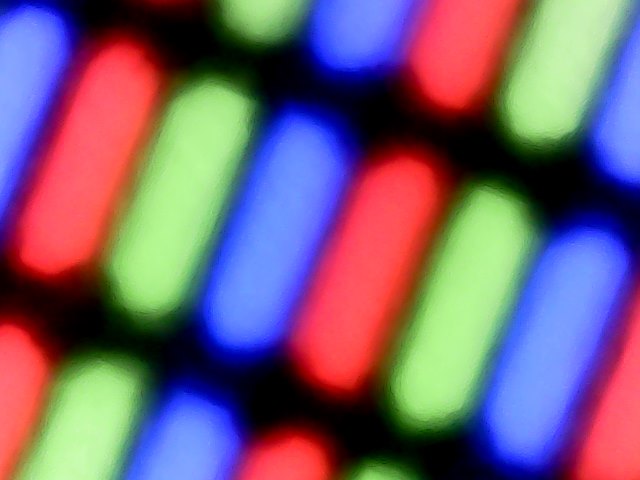
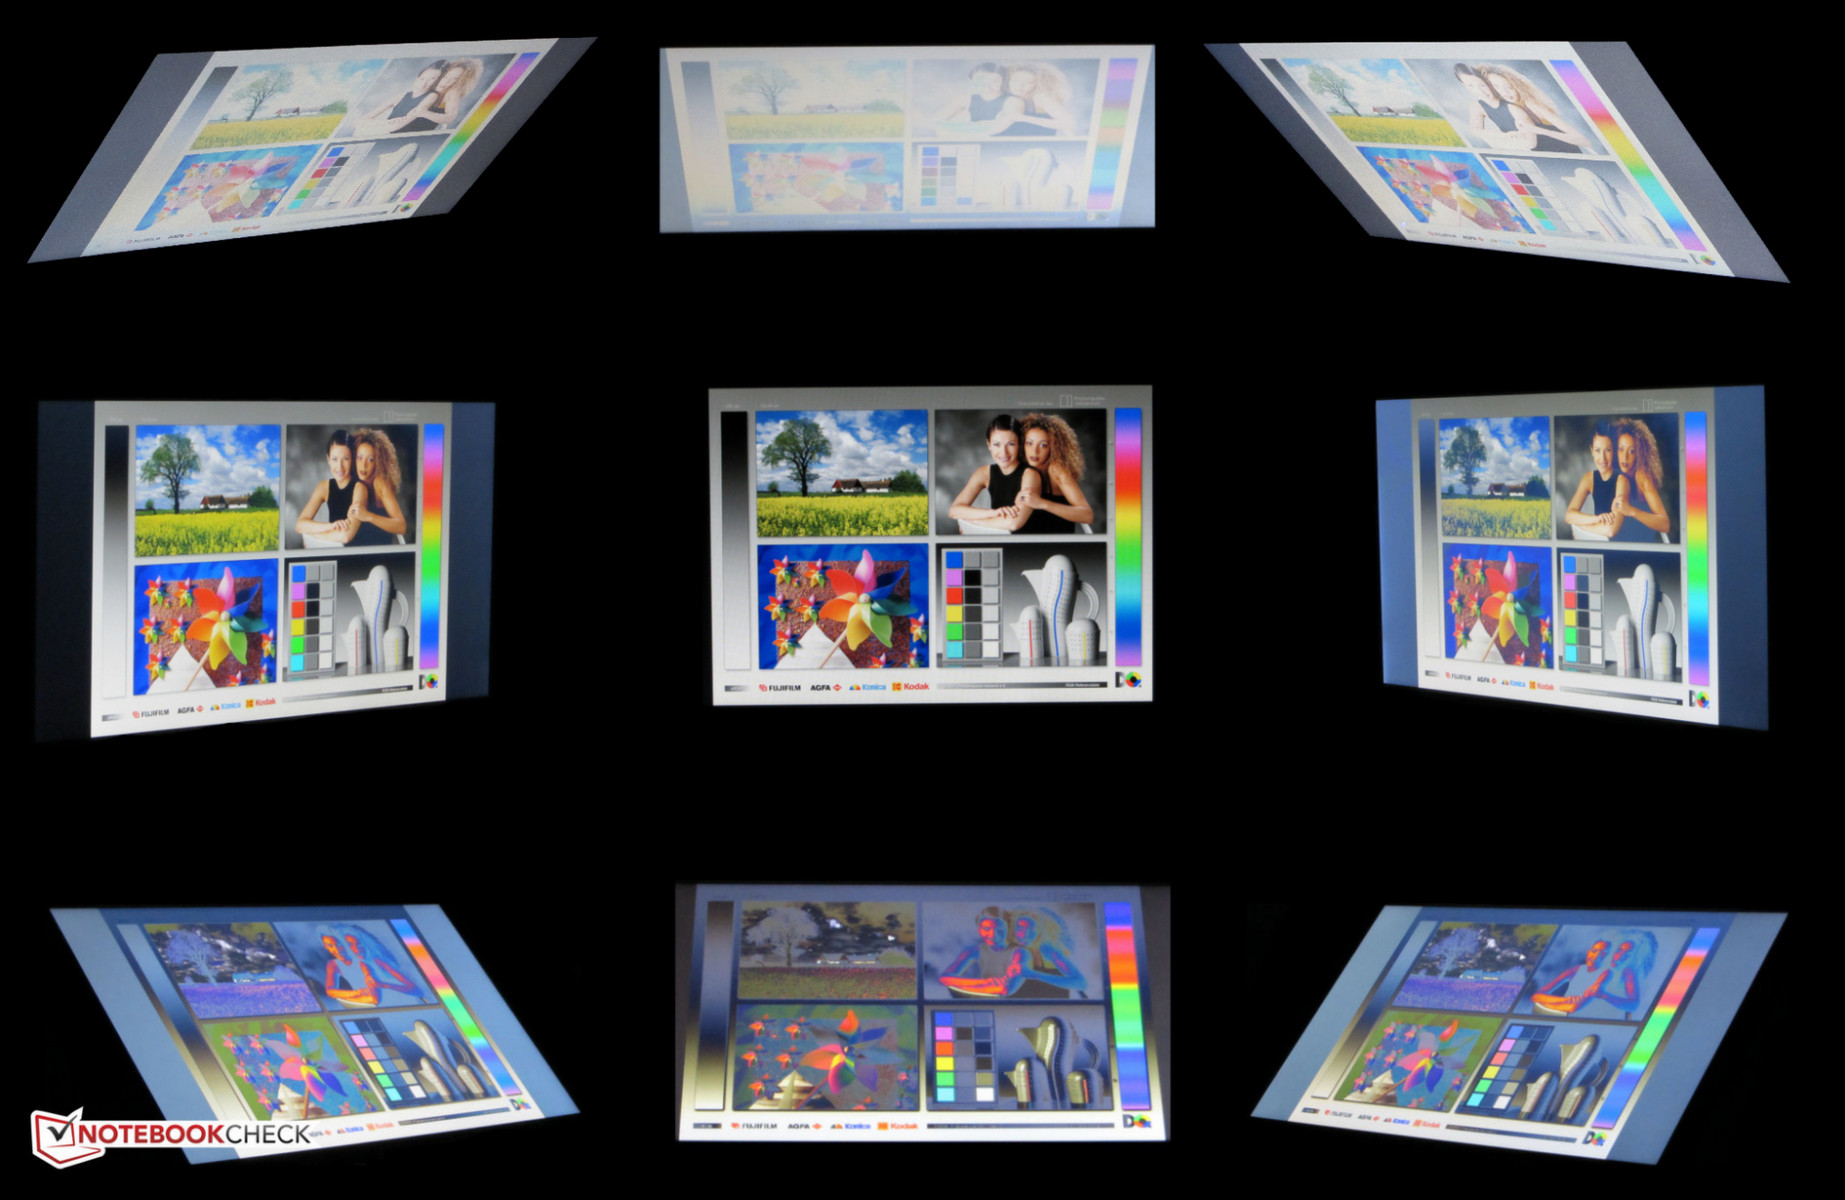
The 14-ma0312ng is equipped with a TN display, which are prone to having poor viewing angles. Our test device is practically unreadable from any off-centred angle. Moreover, our test device is difficult to use outdoors because of its relatively low maximum brightness. We would recommend finding a shady spot to use the 14-ma0312ng if you must use it outdoors.


Performance
The 14-ma0312ng is a 14-inch office notebook that should be powerful enough for most office and Internet-based applications. Our test device’s configuration costs around €600 (~$700) at the time of writing. Other variants are available too.
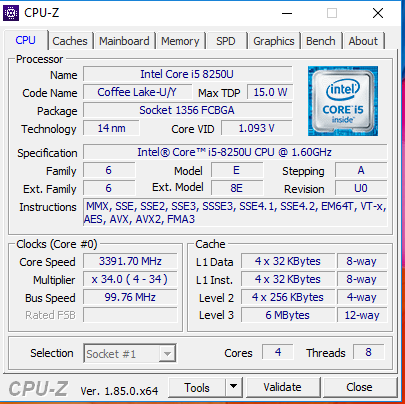
Processor
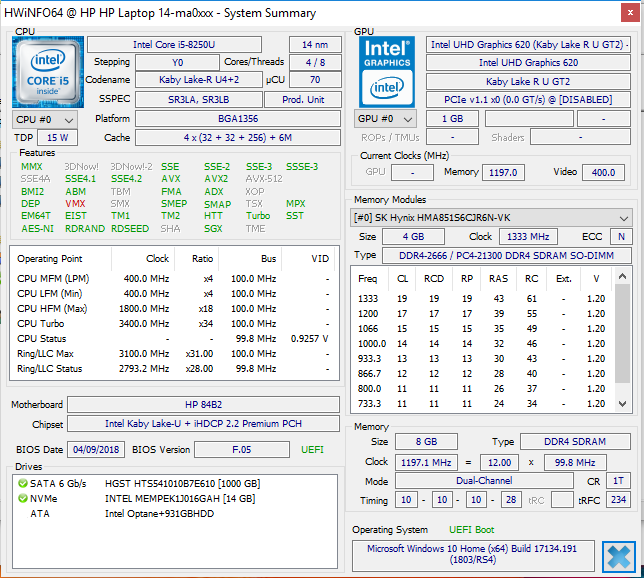
The 14-ma0312ng is powered by an Intel Core i5-8250U processor. The Core i5-8250U is a quad-core, ultra-low voltage (ULV) CPU with a 15 W thermal design platform (TDP). The Core i5-8250U in our test device has a 1.6 GHz base clock speed that can temporarily increase up to 3.4 GHz thanks to Intel Turbo Boost. Overall, the Core i5-8250U should be powerful enough for the needs of most users.
When running a Cinebench R15 multi-threaded benchmark our test device starts by operating at between 2.8-3.2 GHz. After a few seconds, this drops to between 2.2-2.3 GHz. By contrast, Cinebench R15 single-threaded benchmarks run consistently at 3.4 GHz. This benchmark behaviour applies to when the device is used on either battery or mains power.
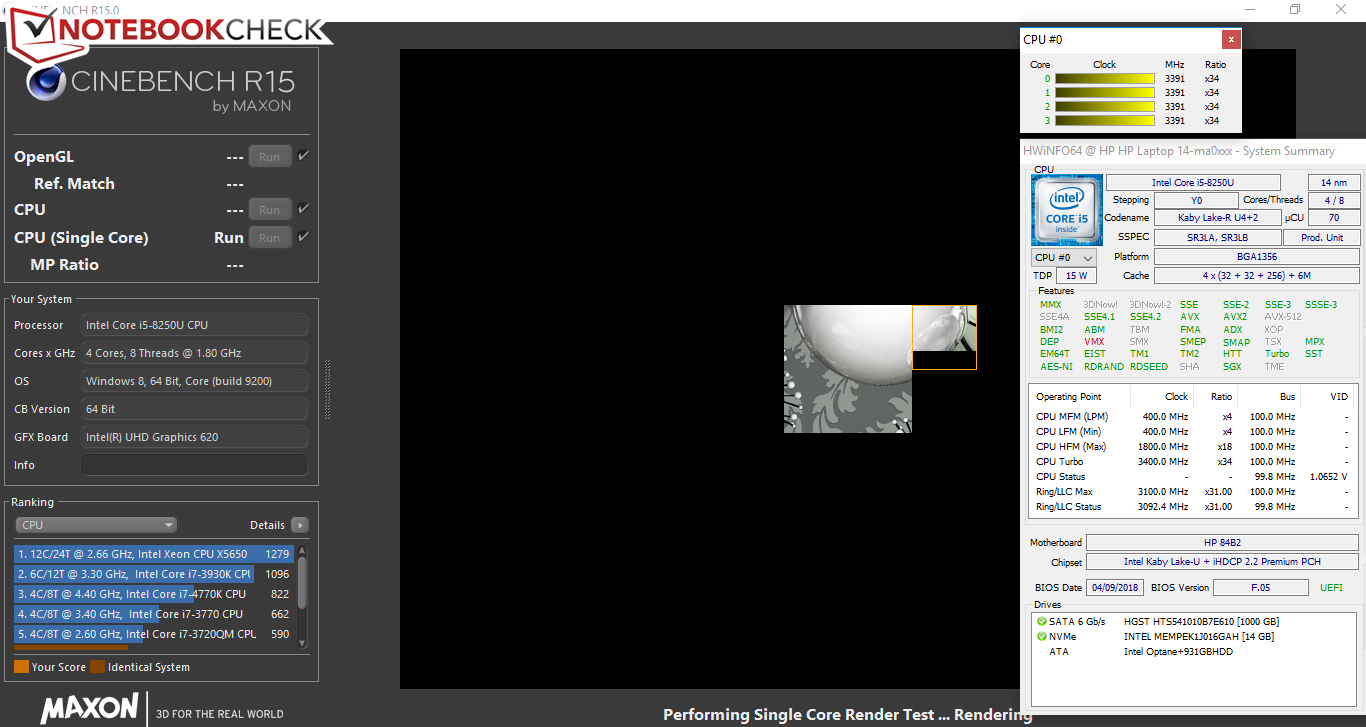
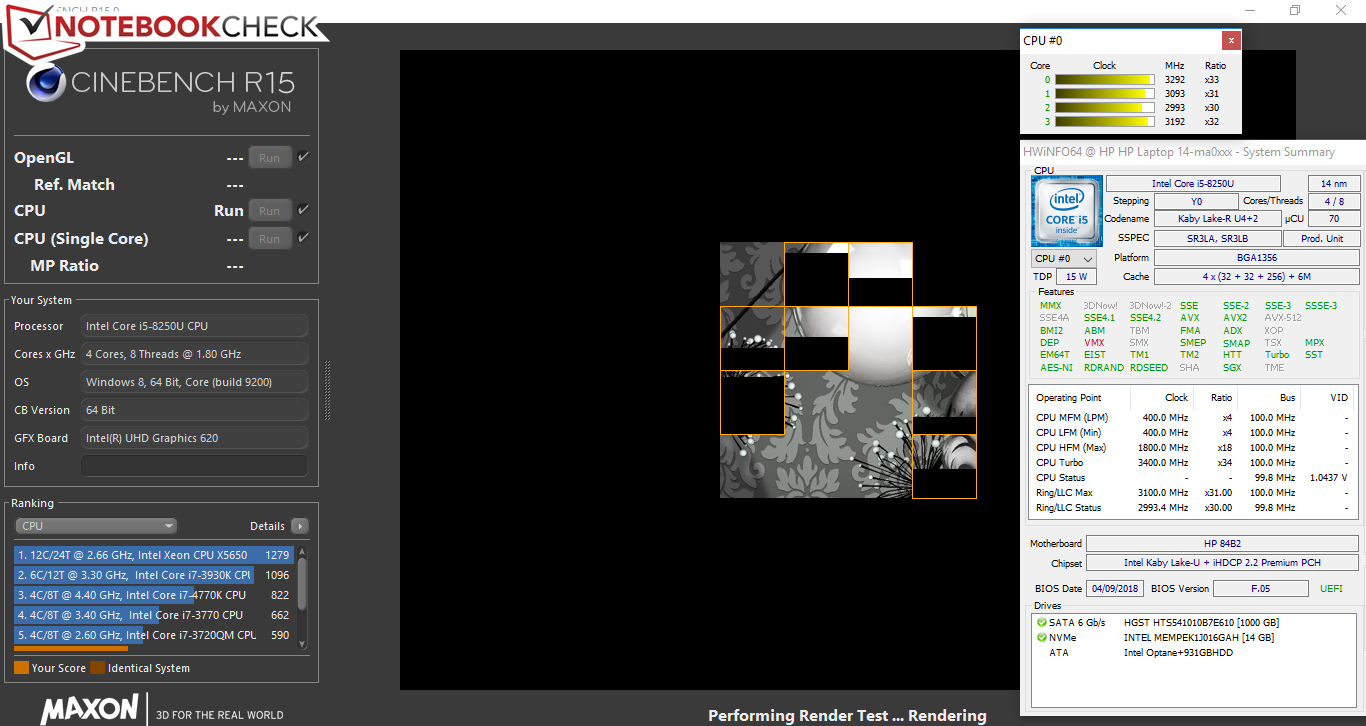
We checked the extent of our test device’s Turbo Boost performance by running a Cinebench R15 multi-threaded benchmark on a thirty-minute loop. Initially, our test device scored 514 points, when then decreased on the second benchmark run to 492, which represents around a 5% performance drop. Our test device then settled at between 491 and 495 for the remained of the benchmark loop. While the turbo is used throughout the test, our test device cannot operate at peak CPU clock speeds.
The results from our CPU benchmarks are at the expected level for a Core i5-8250U powered device.
| Geekbench 3 | |
| 32 Bit Multi-Core Score | |
| Asus VivoBook S14 S406UA-BV023T | |
| HP 14-ma0312ng | |
| Average Intel Core i5-8250U (10893 - 13553, n=18) | |
| Acer Swift 1 SF114-32-P8GG | |
| 32 Bit Single-Core Score | |
| HP 14-ma0312ng | |
| Asus VivoBook S14 S406UA-BV023T | |
| Average Intel Core i5-8250U (3148 - 3503, n=18) | |
| Acer Swift 1 SF114-32-P8GG | |
| Mozilla Kraken 1.1 - Total | |
| Acer Swift 1 SF114-32-P8GG (Edge 42) | |
| HP 14-ma0312ng (Edge 42) | |
| Average Intel Core i5-8250U (986 - 1532, n=59) | |
| Average of class Office (391 - 1297, n=75, last 2 years) | |
| Octane V2 - Total Score | |
| Average of class Office (49011 - 126830, n=19, last 2 years) | |
| HP 14-ma0312ng (Edge 42) | |
| Average Intel Core i5-8250U (22772 - 35817, n=54) | |
| Acer Swift 1 SF114-32-P8GG (Edge 42) | |
| JetStream 1.1 - 1.1 Total | |
| Asus VivoBook S14 S406UA-BV023T (Edge 41) | |
| HP 14-ma0312ng (Edge 42) | |
| Average Intel Core i5-8250U (151.5 - 256, n=78) | |
| Acer Swift 1 SF114-32-P8GG (Edge 42) | |
| Lenovo IdeaPad 320s-14IKB | |
* ... smaller is better
System Performance
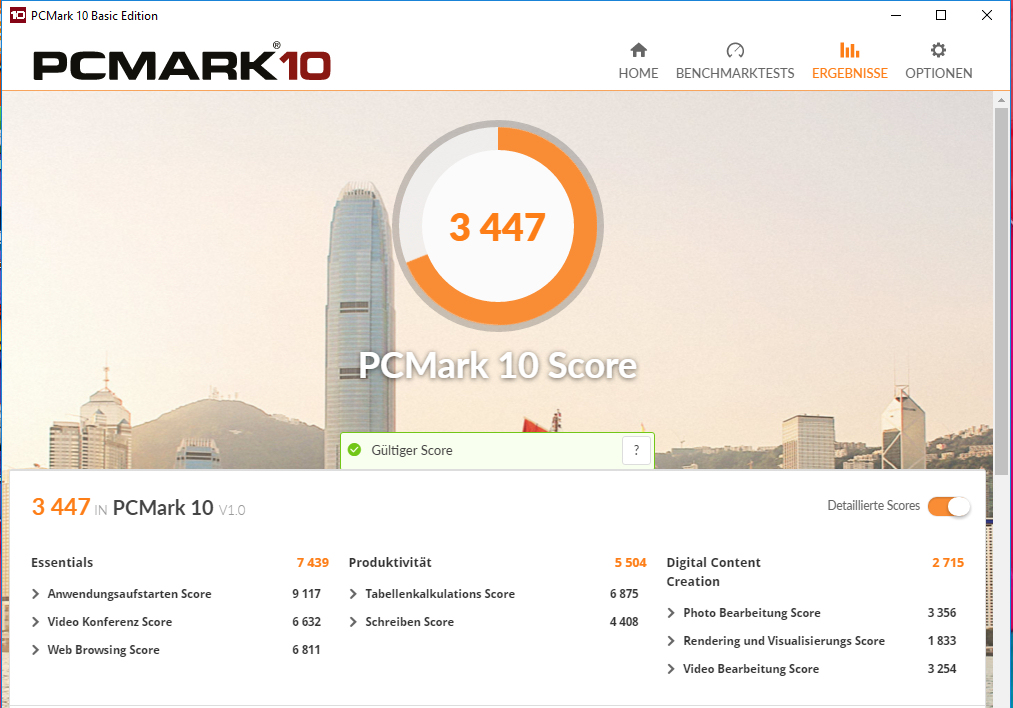
The combination of a quad-core processor, dual-channel RAM and Intel Optane Memory ensures smooth system performance. The CPU is more than capable for most office and Internet-based applications too. Our test device scored well in PCMark benchmarks, confirming our initial impressions. We encountered no problems with our test device during testing either.
| PCMark 7 Score | 5603 points | |
| PCMark 8 Home Score Accelerated v2 | 3709 points | |
| PCMark 8 Creative Score Accelerated v2 | 4053 points | |
| PCMark 8 Work Score Accelerated v2 | 4909 points | |
| PCMark 10 Score | 3447 points | |
Help | ||
Storage Devices
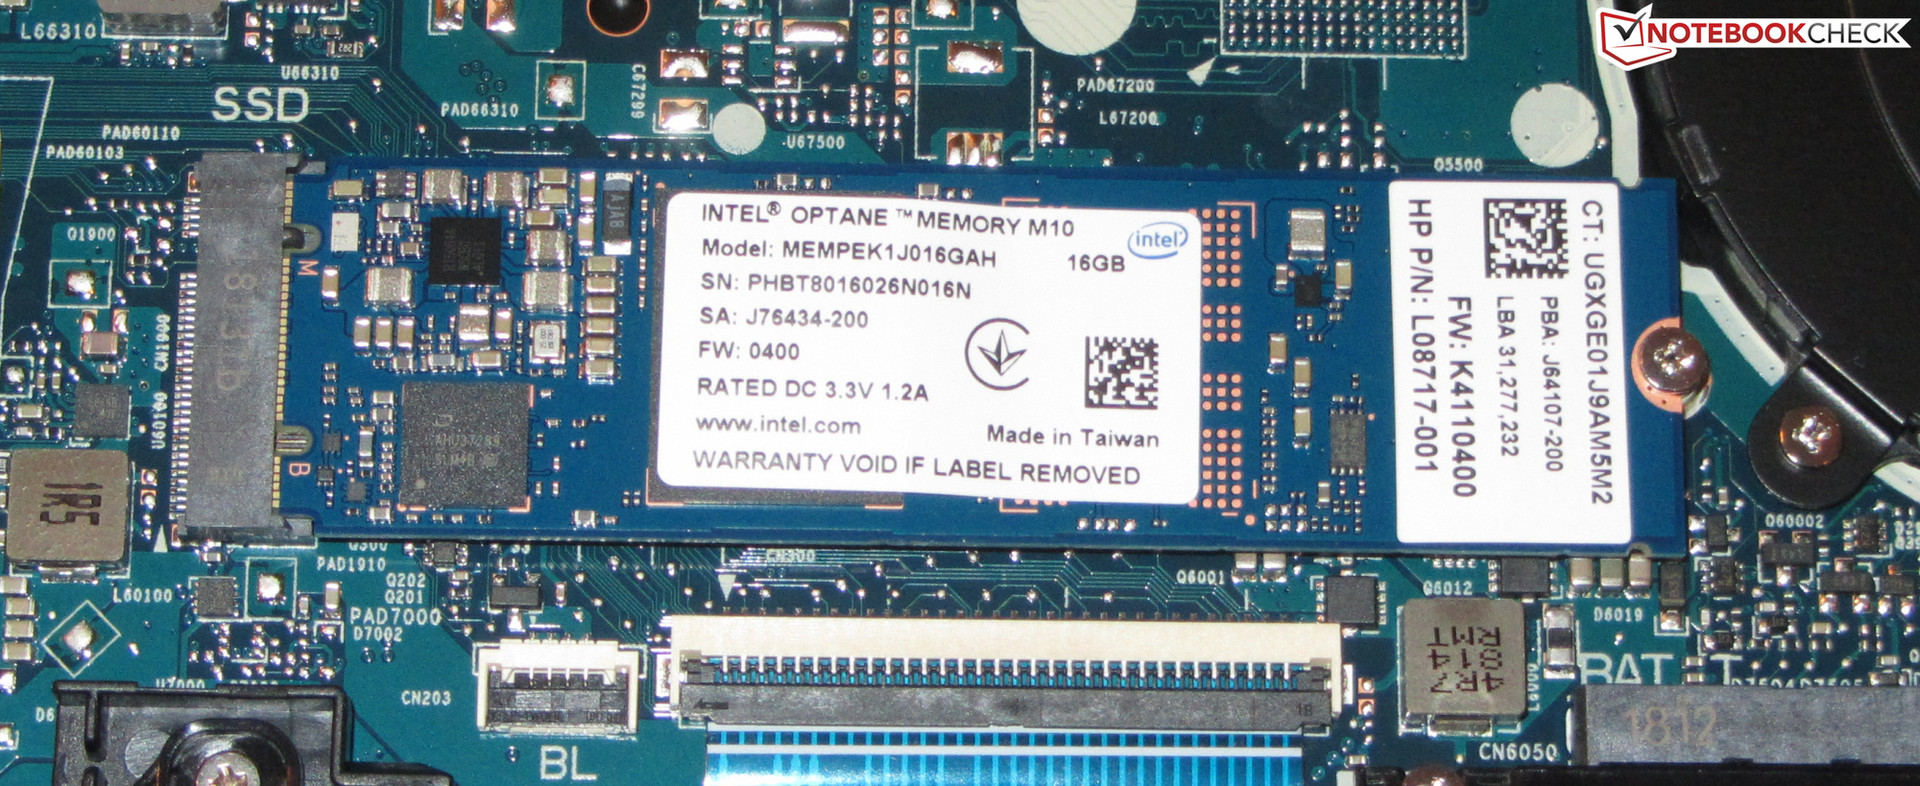
The 14-ma0312ng is equipped with a 1 TB 2.5-inch HDD and 16 GB of Intel Optane Memory. The latter acts as a dedicated cache for the larger HDD that is intended to reduced boot times and improve general system performance like reducing the time to save large files. Subjectively, our test device feels snappier than comparable devices also equipped with a 5,400 RPM HDD.
The transfer speeds in CrystalDiskMark reflect this with our test device achieving particularly high random access read speeds. The Optane Memory cannot match NVMe SSDs for sequential data transfer speeds though; our test device is roughly between SATA III and NVMe SSDs in this regard.
It is worth keeping in mind that you do not have to use the Optane Memory drive. You could instead use the M.2-2280 slot for higher volume SATA III and NVMe SSDs. You could then run the HDD and a larger SSD together or remove the HDD too and just run the device from an SSD.

| HP 14-ma0312ng Intel Optane 16 GB MEMPEK1J016GAH + HGST HTS541010B7E610 1 TB HDD | Acer Swift 1 SF114-32-P8GG Micron 1100 MTFDDAV256TBN | Lenovo IdeaPad 320s-14IKB Samsung PM961 NVMe MZVLW128HEGR | Asus VivoBook S14 S406UA-BV023T SanDisk SD8SN8U256G1002 | Average Intel Optane 16 GB MEMPEK1J016GAH + HGST HTS541010B7E610 1 TB HDD | |
|---|---|---|---|---|---|
| CrystalDiskMark 3.0 | -7% | 29% | 3% | 0% | |
| Read Seq (MB/s) | 855 | 425.2 -50% | 991 16% | 480.1 -44% | 855 ? 0% |
| Write Seq (MB/s) | 157.3 | 377.3 140% | 792 403% | 440.3 180% | 157.3 ? 0% |
| Read 512 (MB/s) | 797 | 280.3 -65% | 482.2 -39% | 277.5 -65% | 797 ? 0% |
| Write 512 (MB/s) | 154.6 | 346.6 124% | 138.5 -10% | 300.6 94% | 154.6 ? 0% |
| Read 4k (MB/s) | 147.9 | 19.78 -87% | 28.11 -81% | 28.18 -81% | 147.9 ? 0% |
| Write 4k (MB/s) | 81.6 | 62.4 -24% | 79 -3% | 52.6 -36% | 81.6 ? 0% |
| Read 4k QD32 (MB/s) | 474.2 | 148.7 -69% | 320.9 -32% | 273.4 -42% | 474 ? 0% |
| Write 4k QD32 (MB/s) | 162.1 | 123 -24% | 124.8 -23% | 192.4 19% | 162.1 ? 0% |
Intel Optane Memory – useful or unnecessary?
The benefits of Intel Optane Memory will be negligible to most users. Ultimately, Intel Optane Memory is suitable for those who use programs that benefit from fast random read speeds of small files, like database software. The drive would also be suitable for those who have a system that is equipped with one HDD, but they do not want to entirely rebuild the system on a new SSD.
There are some physical requirements for equipping a system with an Intel Optane drive though. Intel Optane Memory only supports devices that are equipped with at least seventh generation Intel CPUs, a 200 series chipset, an M.2-2280 NVMe port and a 2.5-inch drive bay. Evidently, this limits the use of Intel Optane Memory to a specific set of devices that most users will not possess.
Lastly, Intel Optane Memory is expensive. The 16 GB drive used in our test device costs around €30 (~$35), which is considerably more expensive per gigabyte than SATA III and NVMe SSDs. Overall, an upgrade to a fast SSD would be a more economical solution for those who are looking to upgrade from traditional HDDs than buying a dedicated cache SSD.
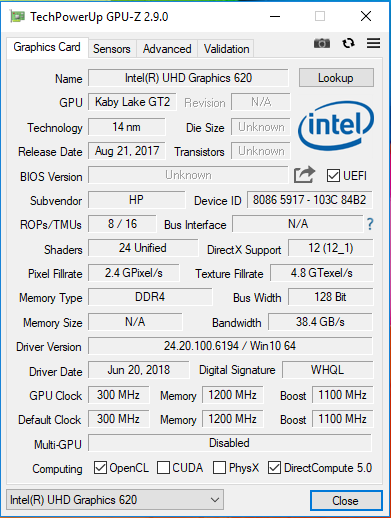
Graphics Card
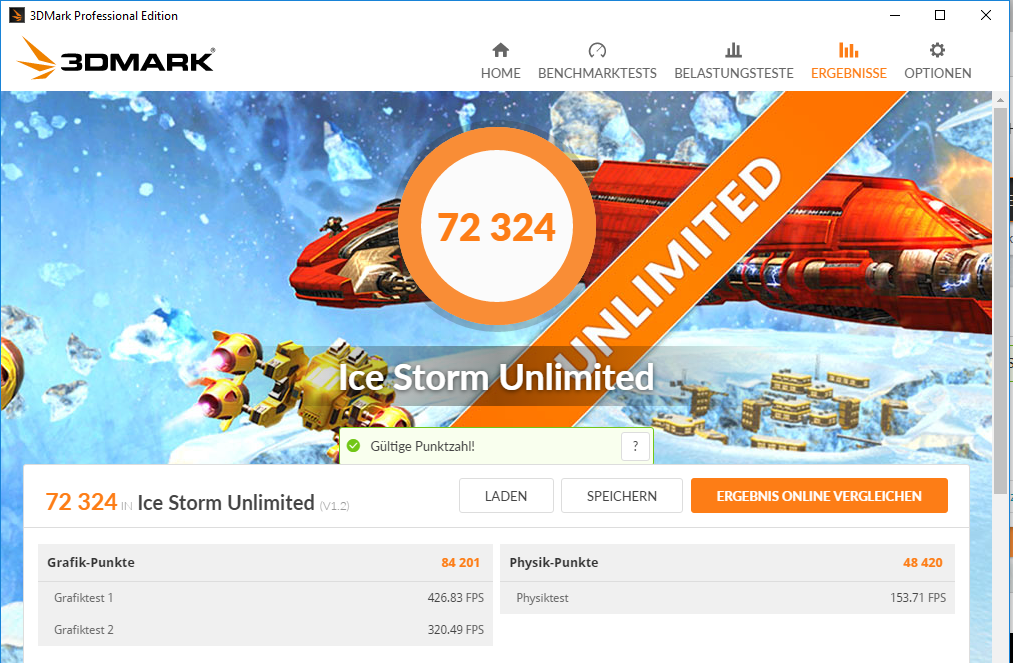
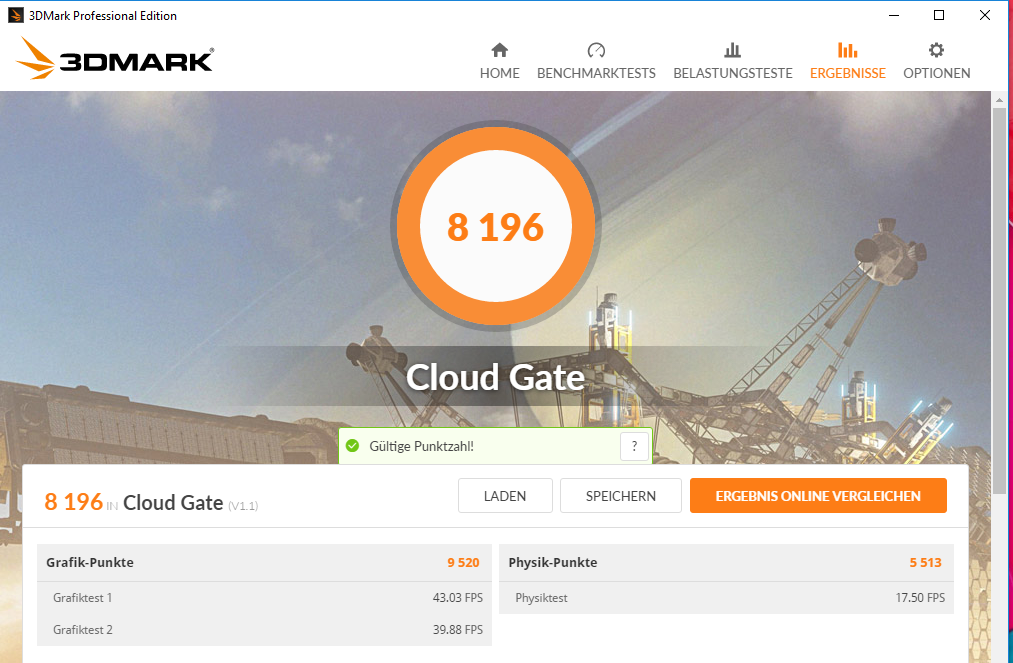
Intel UHD Graphics 620 handles graphics and operates at between 300-1,100 MHz. The DirectX 12 supporting GPU performs 3DMark benchmarks as expected for a system running in dual-channel mode. Dual-channel memory helps a system get the best performance from a GPU, which in turn improves graphics performance.

| 3DMark 11 Performance | 1838 points | |
| 3DMark Ice Storm Standard Score | 58047 points | |
| 3DMark Cloud Gate Standard Score | 8196 points | |
| 3DMark Fire Strike Score | 1053 points | |
Help | ||
Gaming Performance
The CPU and integrated GPU can play some games, primarily those that have relatively moderate system requirements. Our test device can play some games at low quality and at low resolutions as our gaming benchmark table demonstrates. The dual-channel memory helps give the 14-ma0312ng better gaming performance than comparable devices that run in single-channel mode.
| low | med. | high | ultra | |
|---|---|---|---|---|
| Tomb Raider (2013) | 89.4 | 46.2 | 29.8 | |
| BioShock Infinite (2013) | 64.9 | 34.1 | 28.7 | |
| Rise of the Tomb Raider (2016) | 20.7 | 12.5 | ||
| Fortnite (2018) | 39 | |||
| Kingdom Come: Deliverance (2018) | 13.1 | |||
| X-Plane 11.11 (2018) | 25.5 | |||
| Far Cry 5 (2018) | 13 | |||
| The Crew 2 (2018) | 19.8 |
Emissions
Fan Noise
The fan is always on by default, the culprit of which is found in the BIOS. Switching off the “Fan always on” BIOS setting rectifies this. Thereafter the fan is usually silent and only reaches a maximum of 33.7 dB(A) when running a stress test. This is notably quiet.
Noise level
| Idle |
| 31.4 / 31.4 / 31.6 dB(A) |
| Load |
| 31.5 / 33.7 dB(A) |
 | ||
30 dB silent 40 dB(A) audible 50 dB(A) loud |
||
min: | ||
| HP 14-ma0312ng i5-8250U, UHD Graphics 620 | Lenovo IdeaPad 320s-14IKB Pentium 4415U, HD Graphics 610 | Asus VivoBook S14 S406UA-BV023T i5-8250U, UHD Graphics 620 | Average Intel UHD Graphics 620 | Average of class Office | |
|---|---|---|---|---|---|
| Noise | -1% | -6% | 2% | 9% | |
| off / environment * (dB) | 30.25 | 30.2 -0% | 29 ? 4% | 24.2 ? 20% | |
| Idle Minimum * (dB) | 31.4 | 31.1 1% | 30.2 4% | 29.1 ? 7% | 24.4 ? 22% |
| Idle Average * (dB) | 31.4 | 31.1 1% | 30.2 4% | 29.1 ? 7% | 24.6 ? 22% |
| Idle Maximum * (dB) | 31.6 | 31.1 2% | 31.3 1% | 29.7 ? 6% | 25.4 ? 20% |
| Load Average * (dB) | 31.5 | 34.8 -10% | 40.1 -27% | 33.5 ? -6% | 34.2 ? -9% |
| Load Maximum * (dB) | 33.7 | 33.7 -0% | 40.4 -20% | 36.1 ? -7% | 41.3 ? -23% |
* ... smaller is better
Temperature
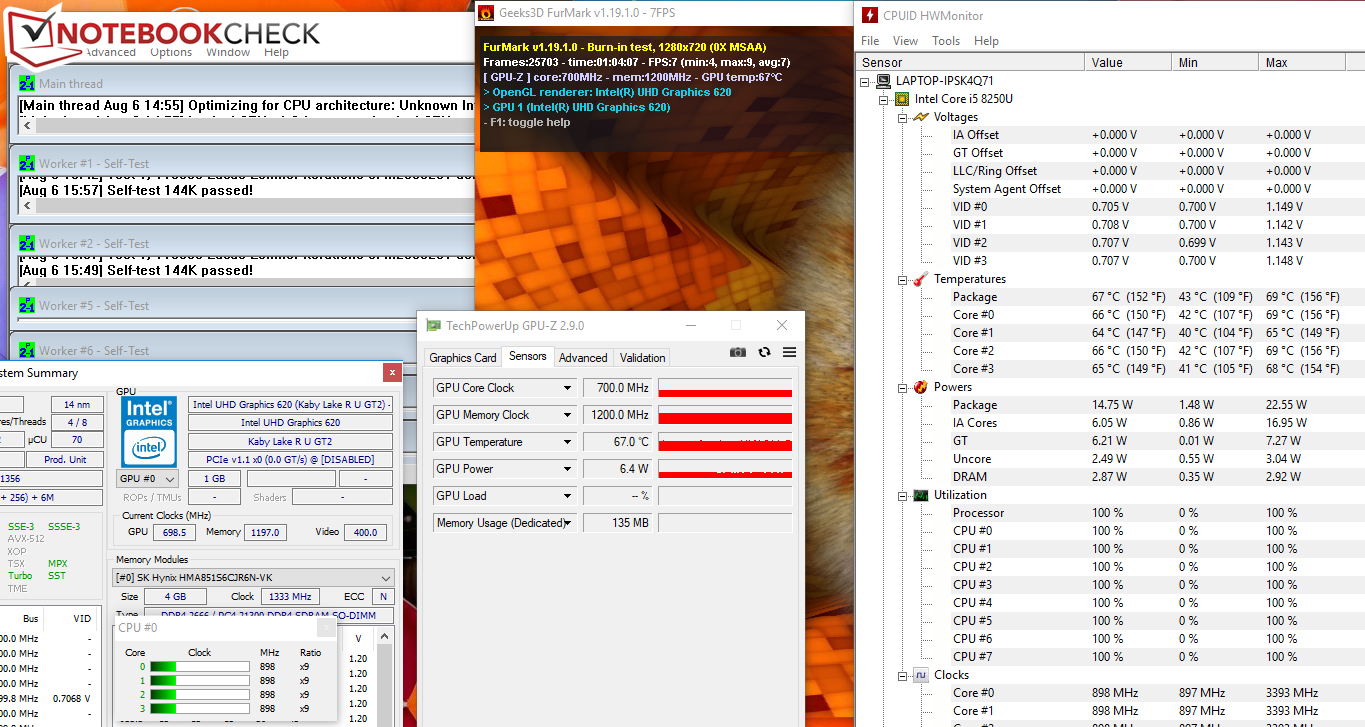
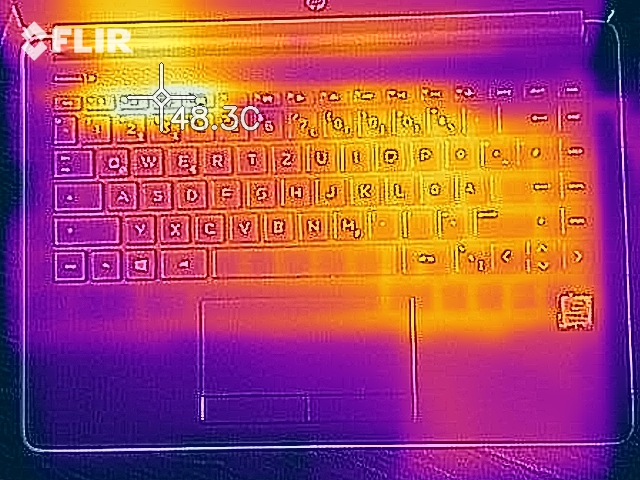
Our combined FurMark and Prime95 one-hour stress test runs equally well on battery as it does on mains power. The CPU operates at 2.2 GHz during the first couple of minutes of stress testing after which it throttles to 900 MHz. When this happens the GPU clock speed increases from 300 MHz to 700 MHz. The CPU and GPU share the same TDP so as the CPU throttles and reduces its wattage the GPU can tap into the freed-up wattage.
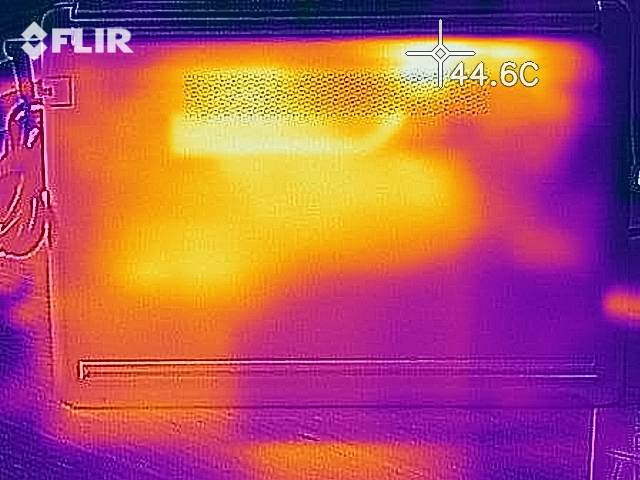
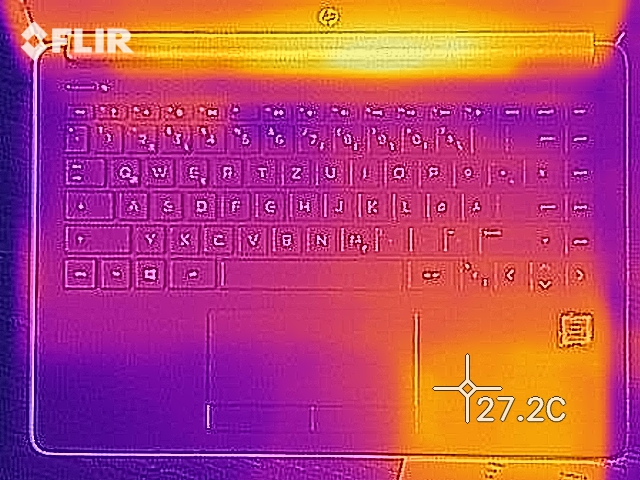
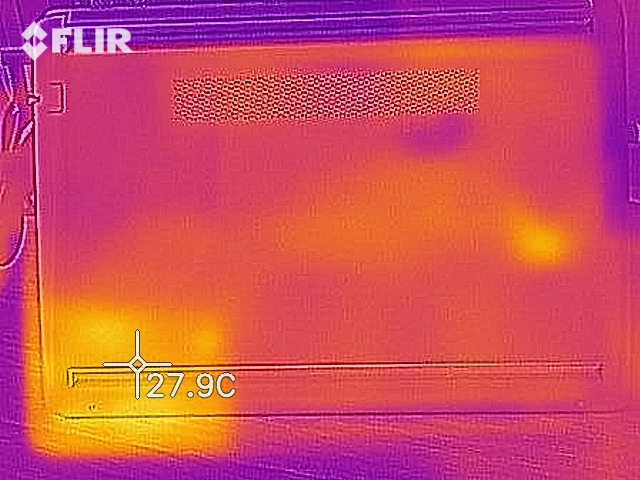
The 14-ma0312ng is a relatively cool laptop even under load. Our test device averages around 30 °C (86 °F) under maximum load and only reaches a maximum of 36.6 °C (98 °F); this is at the top right of the top case. Surface temperatures at idle reach a maximum of 28 °C (82.4 °F) and averages 26 °C (78.8 °F). These are impressively low surface temperatures at idle.
It is worth bearing in mind that the surface temperatures we measured at maximum load are rather artificial. We achieved these during stress testing, which subjects the components to extreme load conditions that would not occur during daily use. We run these stress tests to ensure that our test devices are stable under maximum load.
(+) The maximum temperature on the upper side is 36.6 °C / 98 F, compared to the average of 34.3 °C / 94 F, ranging from 21.2 to 62.5 °C for the class Office.
(+) The bottom heats up to a maximum of 31.8 °C / 89 F, compared to the average of 36.8 °C / 98 F
(+) In idle usage, the average temperature for the upper side is 26.3 °C / 79 F, compared to the device average of 29.5 °C / 85 F.
(+) The palmrests and touchpad are cooler than skin temperature with a maximum of 28.4 °C / 83.1 F and are therefore cool to the touch.
(±) The average temperature of the palmrest area of similar devices was 27.5 °C / 81.5 F (-0.9 °C / -1.6 F).
| HP 14-ma0312ng i5-8250U, UHD Graphics 620 | Acer Swift 1 SF114-32-P8GG Pentium N5000, UHD Graphics 605 | Lenovo IdeaPad 320s-14IKB Pentium 4415U, HD Graphics 610 | Asus VivoBook S14 S406UA-BV023T i5-8250U, UHD Graphics 620 | Average Intel UHD Graphics 620 | Average of class Office | |
|---|---|---|---|---|---|---|
| Heat | -4% | 4% | -10% | -11% | -11% | |
| Maximum Upper Side * (°C) | 36.6 | 36.5 -0% | 34.3 6% | 42.2 -15% | 41.1 ? -12% | 40.4 ? -10% |
| Maximum Bottom * (°C) | 31.8 | 39.7 -25% | 30.1 5% | 39.4 -24% | 44.3 ? -39% | 42.6 ? -34% |
| Idle Upper Side * (°C) | 28.4 | 26.6 6% | 28.1 1% | 28.1 1% | 26.8 ? 6% | 27.3 ? 4% |
| Idle Bottom * (°C) | 28 | 26.8 4% | 27.5 2% | 28.1 -0% | 27.7 ? 1% | 28.5 ? -2% |
* ... smaller is better
Speakers
HP 14-ma0312ng audio analysis
(±) | speaker loudness is average but good (72 dB)
Bass 100 - 315 Hz
(-) | nearly no bass - on average 27.5% lower than median
(±) | linearity of bass is average (11% delta to prev. frequency)
Mids 400 - 2000 Hz
(+) | balanced mids - only 2.8% away from median
(+) | mids are linear (6.7% delta to prev. frequency)
Highs 2 - 16 kHz
(+) | balanced highs - only 2.4% away from median
(+) | highs are linear (4.9% delta to prev. frequency)
Overall 100 - 16.000 Hz
(±) | linearity of overall sound is average (22.6% difference to median)
Compared to same class
» 61% of all tested devices in this class were better, 8% similar, 31% worse
» The best had a delta of 7%, average was 21%, worst was 53%
Compared to all devices tested
» 67% of all tested devices were better, 6% similar, 28% worse
» The best had a delta of 4%, average was 23%, worst was 134%
Apple MacBook 12 (Early 2016) 1.1 GHz audio analysis
(+) | speakers can play relatively loud (83.6 dB)
Bass 100 - 315 Hz
(±) | reduced bass - on average 11.3% lower than median
(±) | linearity of bass is average (14.2% delta to prev. frequency)
Mids 400 - 2000 Hz
(+) | balanced mids - only 2.4% away from median
(+) | mids are linear (5.5% delta to prev. frequency)
Highs 2 - 16 kHz
(+) | balanced highs - only 2% away from median
(+) | highs are linear (4.5% delta to prev. frequency)
Overall 100 - 16.000 Hz
(+) | overall sound is linear (10.2% difference to median)
Compared to same class
» 7% of all tested devices in this class were better, 2% similar, 90% worse
» The best had a delta of 5%, average was 18%, worst was 53%
Compared to all devices tested
» 5% of all tested devices were better, 1% similar, 94% worse
» The best had a delta of 4%, average was 23%, worst was 134%
Power Management
Power Consumption
The 14-ma0312ng is a relatively power efficient device. We measured a maximum power consumption of 6.8 W at idle, which is considerably lower than the average of Intel UHD Graphics 620 equipped devices that we have currently tested. This increases to 30.4 W during a combined FurMark and Prime95 stress test, which is 9% lower than the ASUS VivoBook S14, our only Core i5-8250U powered comparison device.
HP includes a 45 W power supply with the 14-ma0312ng. As our power consumption table demonstrates, the included charger will comfortably be able to charge the 14-ma0312ng even when it is under maximum load.
| Off / Standby | |
| Idle | |
| Load |
|
Key:
min: | |
| HP 14-ma0312ng i5-8250U, UHD Graphics 620 | Acer Swift 1 SF114-32-P8GG Pentium N5000, UHD Graphics 605 | Lenovo IdeaPad 320s-14IKB Pentium 4415U, HD Graphics 610 | Asus VivoBook S14 S406UA-BV023T i5-8250U, UHD Graphics 620 | Average Intel UHD Graphics 620 | Average of class Office | |
|---|---|---|---|---|---|---|
| Power Consumption | 16% | 0% | -28% | -42% | -67% | |
| Idle Minimum * (Watt) | 4.7 | 3.4 28% | 3.4 28% | 3.7 21% | 3.81 ? 19% | 4.3 ? 9% |
| Idle Average * (Watt) | 6.3 | 5.9 6% | 6.3 -0% | 5.6 11% | 6.94 ? -10% | 7.33 ? -16% |
| Idle Maximum * (Watt) | 6.8 | 7.5 -10% | 6.7 1% | 7.6 -12% | 8.75 ? -29% | 8.59 ? -26% |
| Load Average * (Watt) | 15 | 14.5 3% | 24.5 -63% | 37.4 -149% | 35 ? -133% | 43.6 ? -191% |
| Load Maximum * (Watt) | 30.4 | 15 51% | 20.2 34% | 33 -9% | 47.5 ? -56% | 64.4 ? -112% |
* ... smaller is better
Battery life
The 14-ma0312ng has a 41.7 Wh battery. This is considerably smaller than the 53.9 Wh battery used in the Acer Swift 1 SF114 but is larger than the batteries used in our other comparison devices. It is worth noting that we set our test device to the "Balanced" profile Windows power profile and the display to 150 cd/m². Under these conditions, our test device achieved a runtime of seven hours and twenty-five minutes in our Wi-Fi battery test, during which we run a script that simulates the load required to render websites. Likewise, our test device lasted for six hours and thirty-nine minutes with the film Big Buck Bunny playing in H.264 on a continuous loop at 1,920 x 1,080.
| HP 14-ma0312ng i5-8250U, UHD Graphics 620, 41.7 Wh | Acer Swift 1 SF114-32-P8GG Pentium N5000, UHD Graphics 605, 53.9 Wh | Lenovo IdeaPad 320s-14IKB Pentium 4415U, HD Graphics 610, 30 Wh | Asus VivoBook S14 S406UA-BV023T i5-8250U, UHD Graphics 620, 39 Wh | Average of class Office | |
|---|---|---|---|---|---|
| Battery runtime | 66% | 4% | 7% | 59% | |
| Reader / Idle (h) | 15.6 | 24.5 ? 57% | |||
| H.264 (h) | 6.7 | 15.5 ? 131% | |||
| WiFi v1.3 (h) | 7.4 | 12.3 66% | 7.7 4% | 7.9 7% | 13 ? 76% |
| Load (h) | 2.5 | 1.808 ? -28% |
Verdict
Pros
Cons
The HP 14-ma0312ng is a 14-inch office notebook that is powerful enough for all typical Internet-based and office applications thanks to its Core i5-8250U quad-core processor. Additionally, the device runs in dual-channel mode and is equipped with an Intel Optane Memory drive that distinguishes it from the competition.
While the keyboard is good enough for daily use the lack of backlighting is a shame. The 14-ma0312ng won’t break any battery life records, but it is enough for most uses.
The HP 14-ma0312ng is an otherwise good office device that is let down by some outdated hardware.
The remaining hardware is uninspired. The display is a dark TN panel, with low-contrast and poor viewing-angle screen. The display has a low-resolution too at 1,366 x 768. Moreover, Wi-Fi speeds are slow and there is no support for 802.11 ac Wi-Fi, which should be standard issue for devices released in 2018. Even the memory card reader is slow.
HP 14-ma0312ng
- 09/01/2018 v6 (old)
Sascha Mölck
Price comparison

