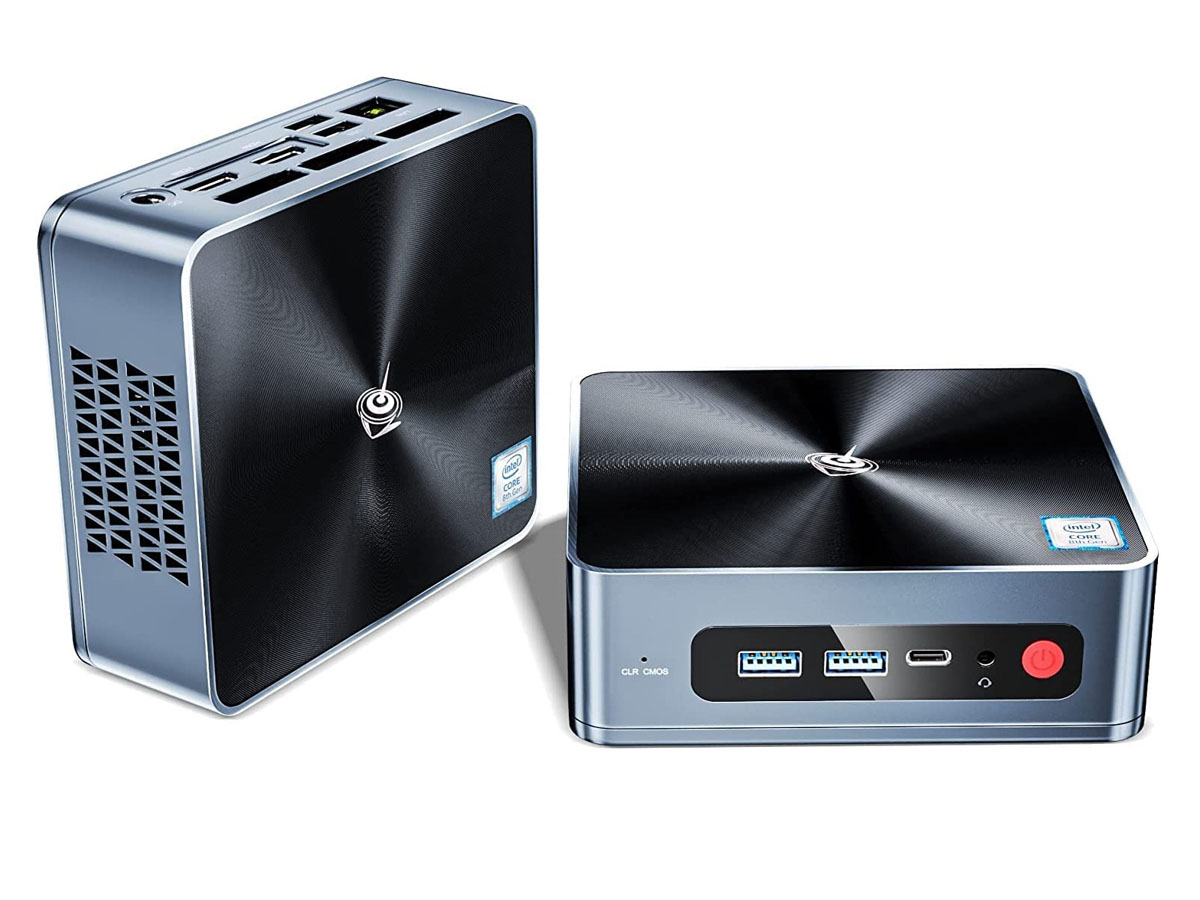
Beelink SEi8 review: Uncommon Core i3-8109U for a new mini PC
Beelink is steadily becoming a major alternative to the Intel NUC series with its growing range of mini PCs. The recent SER4, for example, has proven to be just as fast as many Intel NUC models with 11th gen Core U-series CPUs while costing hundreds of dollars less.
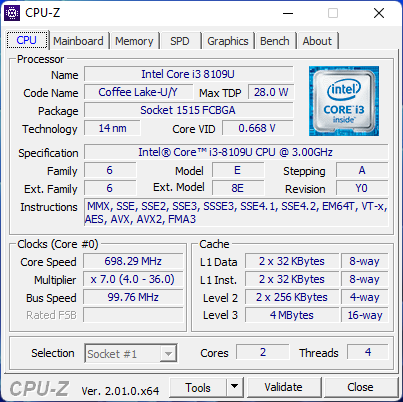
The SEi8 comes with an older 8th gen Core i3-8109U or Core i5-8259U whereas last year's SEi10 comes with 10th gen Core U-series options instead. The older Core i3 makes the model even more affordable and an attractive alternative to Core i3-powered Intel NUCs.
Beelink is currently shipping the SEi8 starting at $320 USD with 8 GB of RAM or $380 with 16 GB of RAM. If configured with the Core i5-8279U, the price increases to the $400 USD range.
More Beelink reviews:
Potential Competitors in Comparison
Rating | Date | Model | Weight | Height | Size | Resolution | Price |
|---|---|---|---|---|---|---|---|
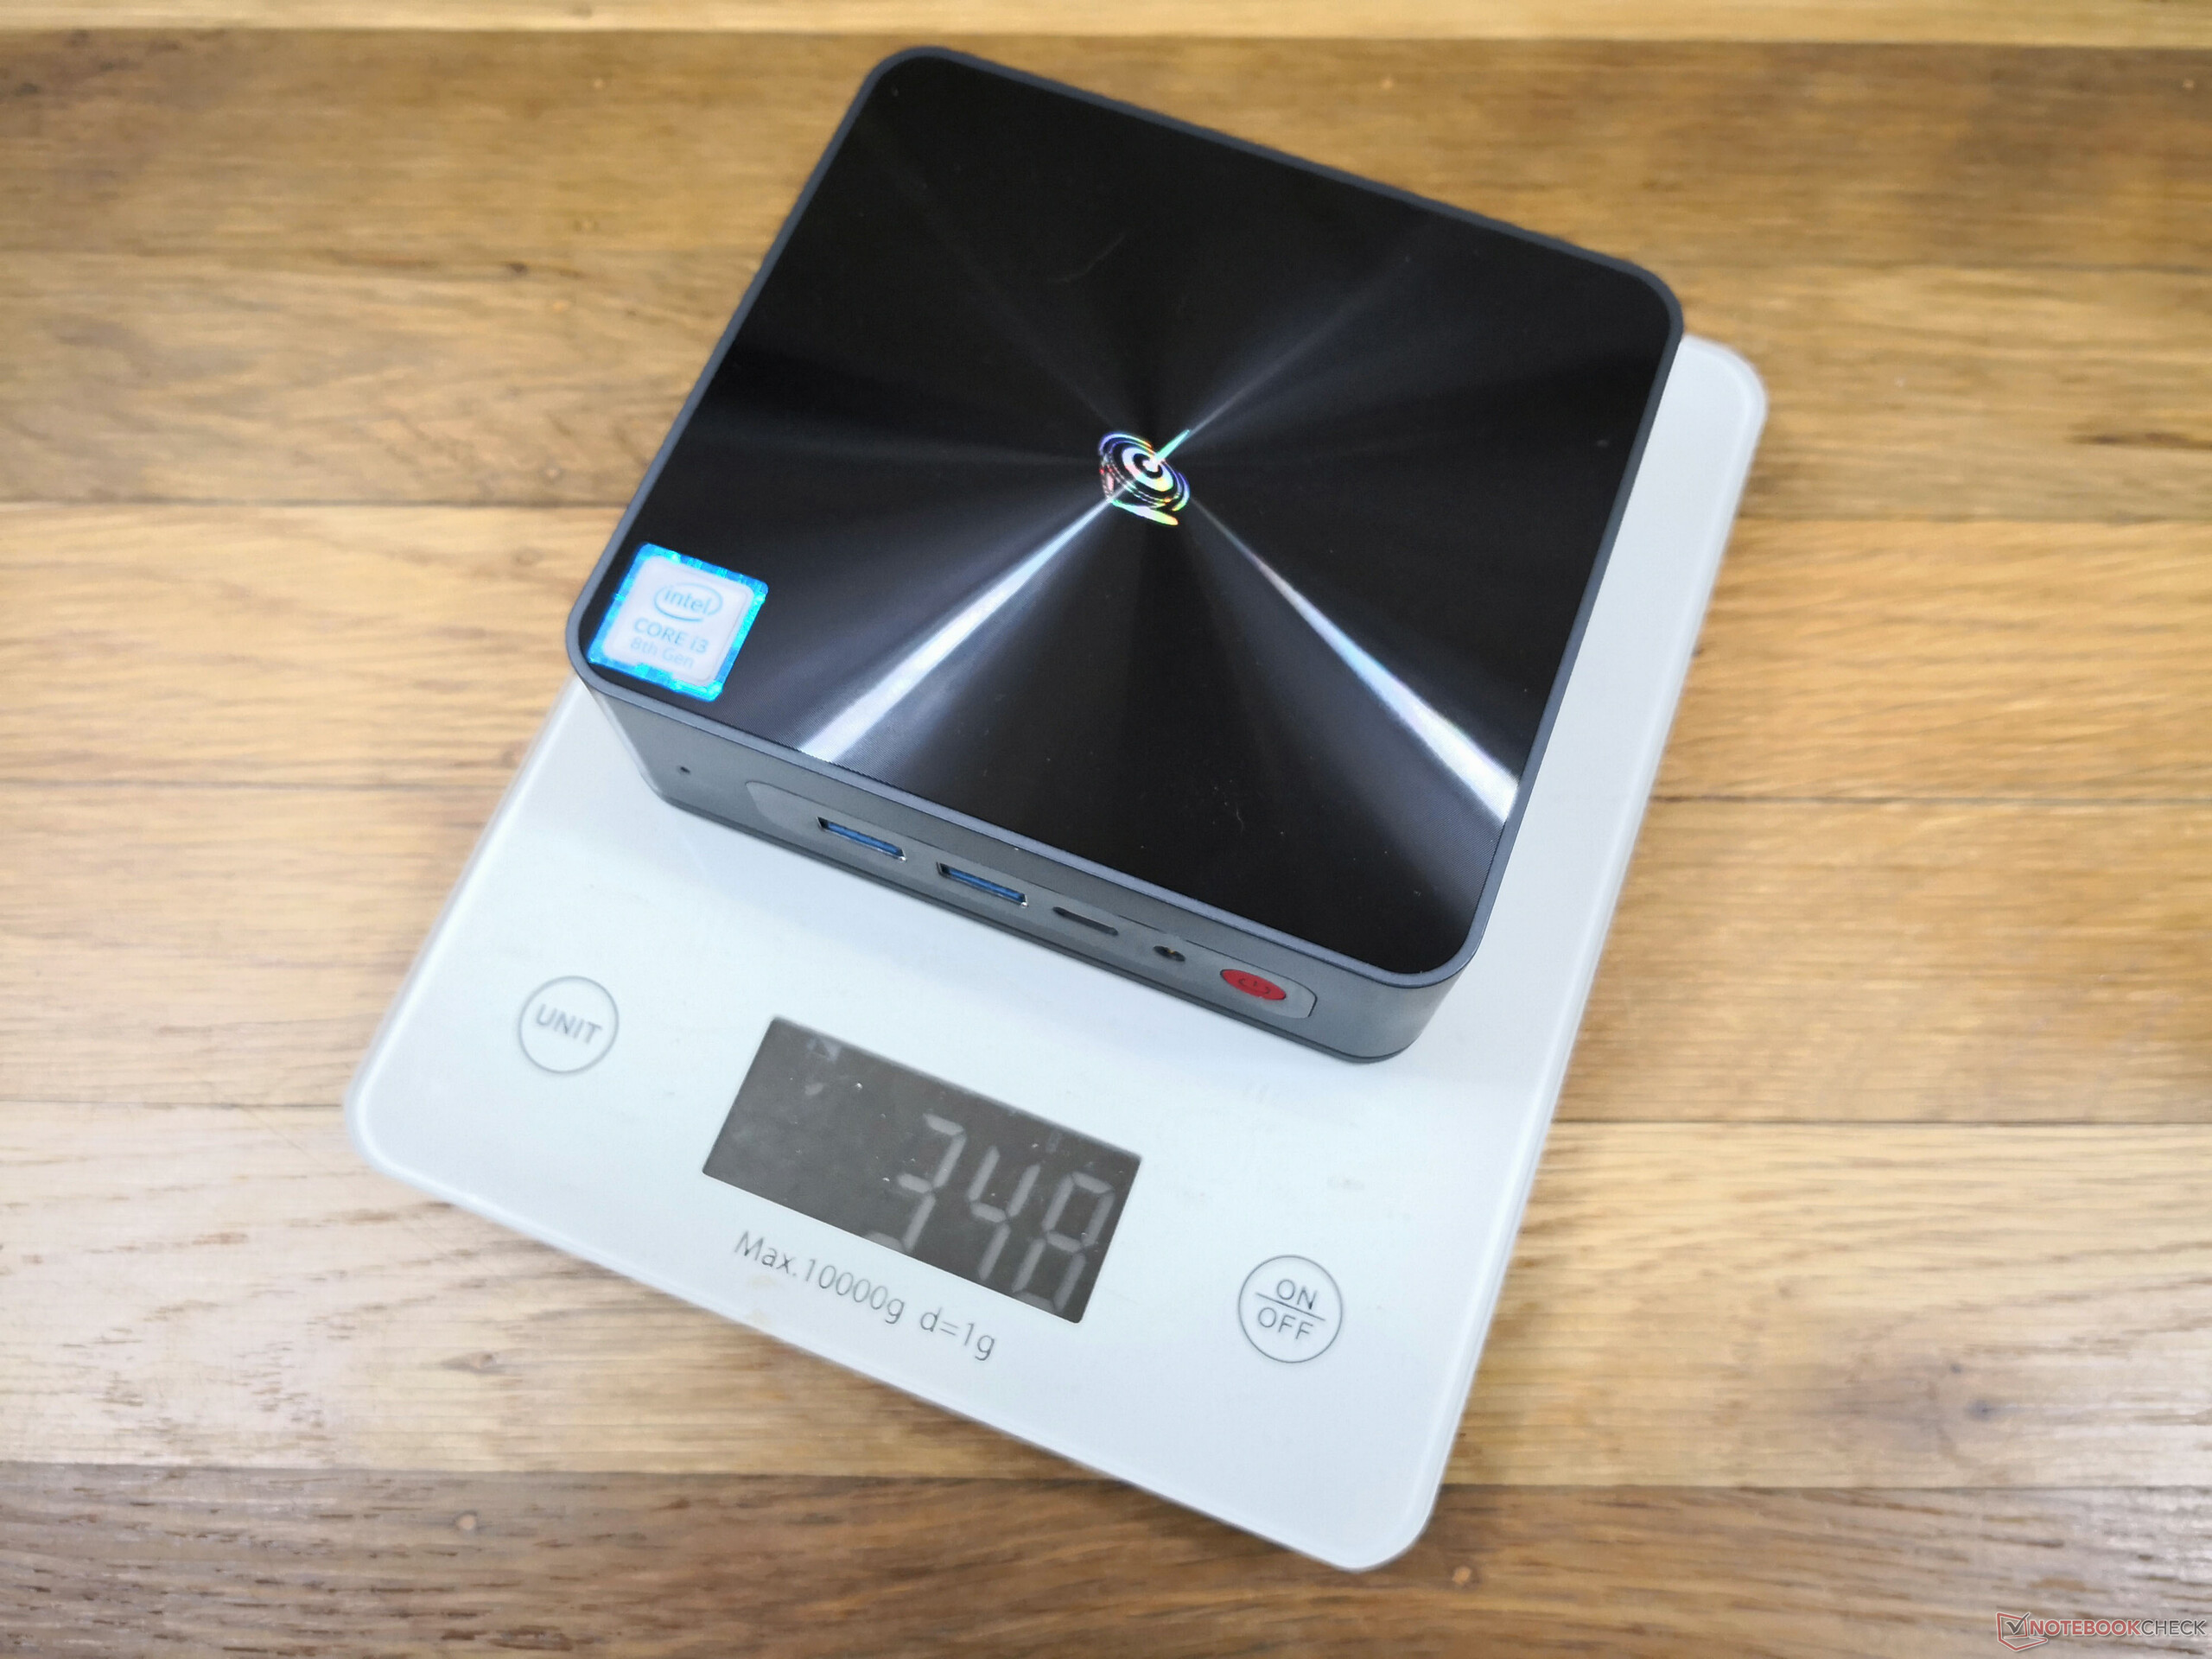
v (old) | 04 / 2022 | Beelink SEi8 i3-8109U, Iris Plus Graphics 655 | 346 g | 41 mm | x | ||
v (old) | 12 / 2020 | Beelink SEi10 i3-1005G1, UHD Graphics G1 (Ice Lake 32 EU) | 350 g | 41 mm | x | ||
v (old) | 04 / 2022 | Beelink SER4 R7 4800U, Vega 8 | 494 g | 40 mm | x | ||
v (old) | 04 / 2021 | Intel NUC11TNKi5 i5-1135G7, Iris Xe G7 80EUs | 504 g | 37 mm | x | ||
v (old) | 11 / 2018 | Intel NUC8i7BE i7-8559U, Iris Plus Graphics 655 | 683 g | 51 mm | x | ||
v (old) | 03 / 2021 | GMK NucBox 2 i5-8259U, Iris Plus Graphics 655 | 430 g | 50 mm | x |
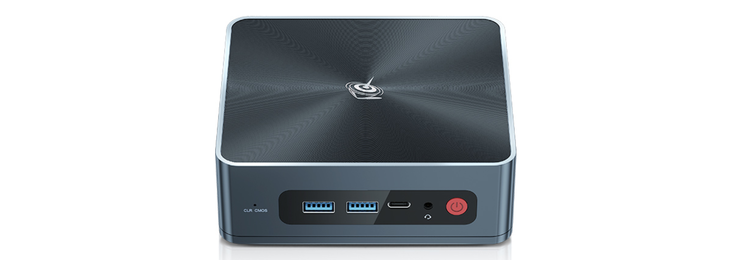
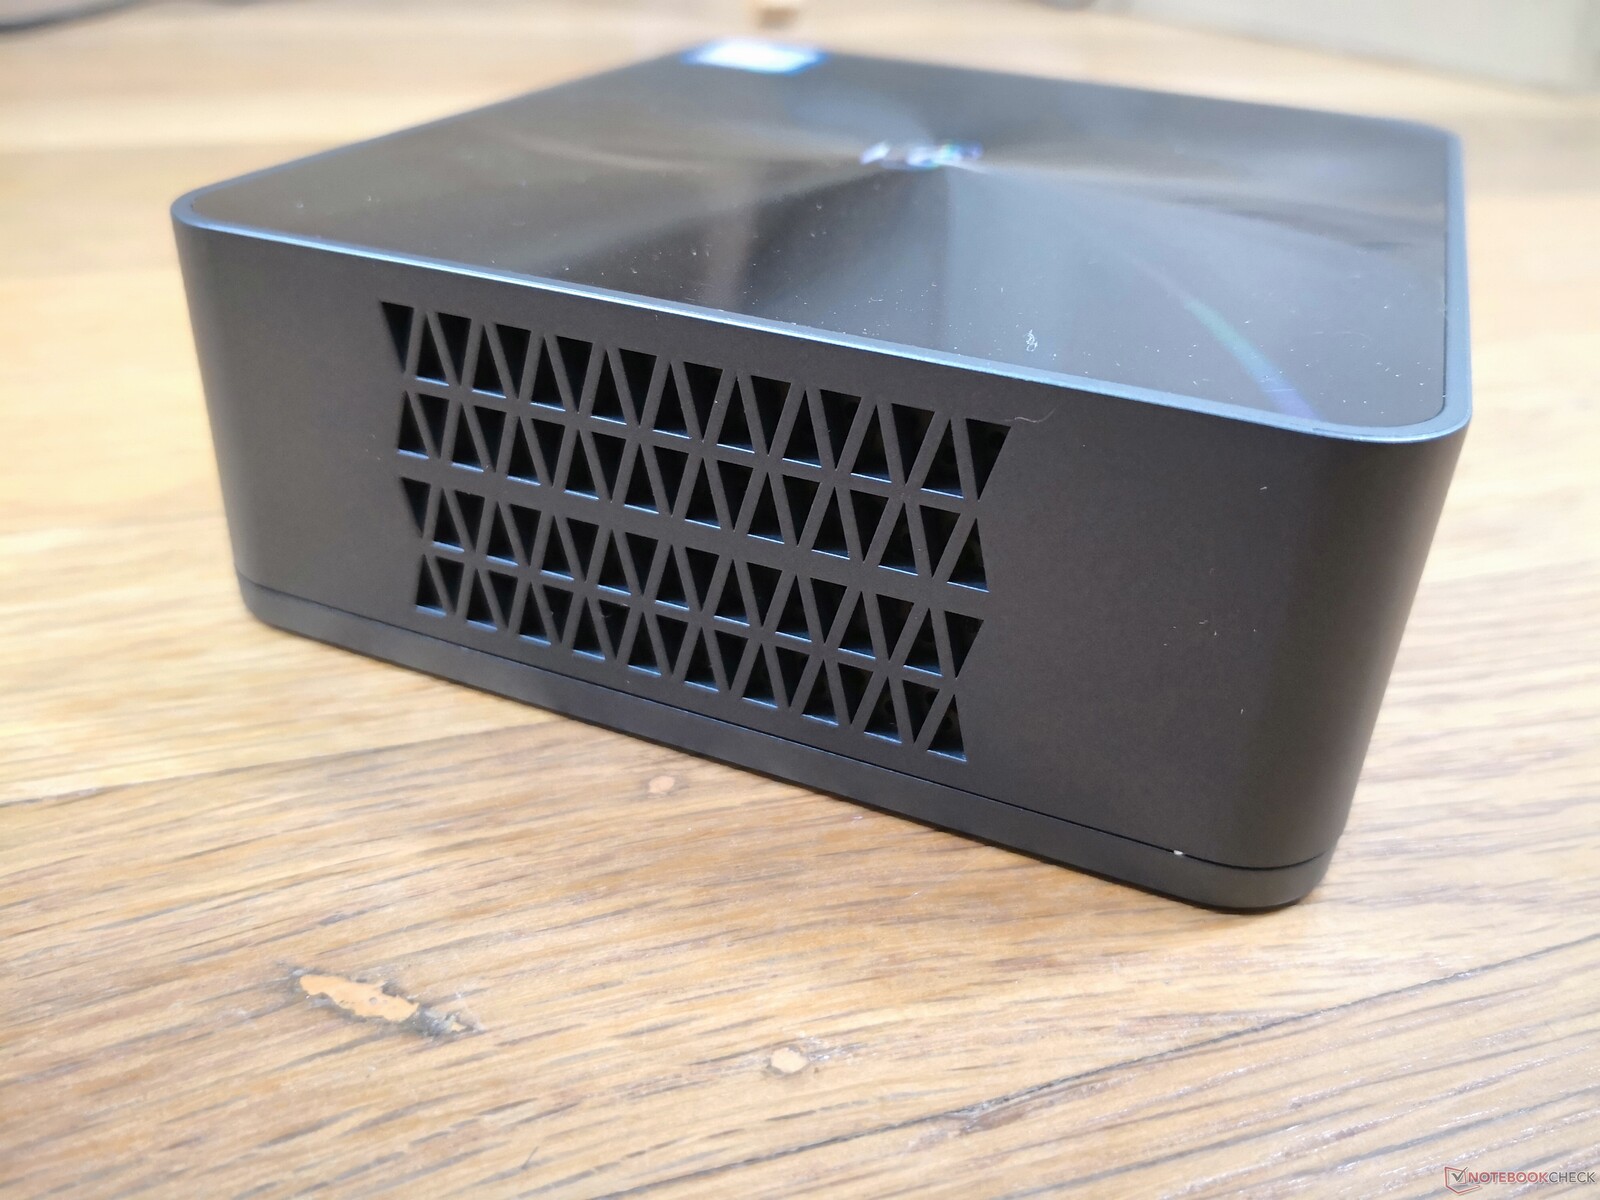
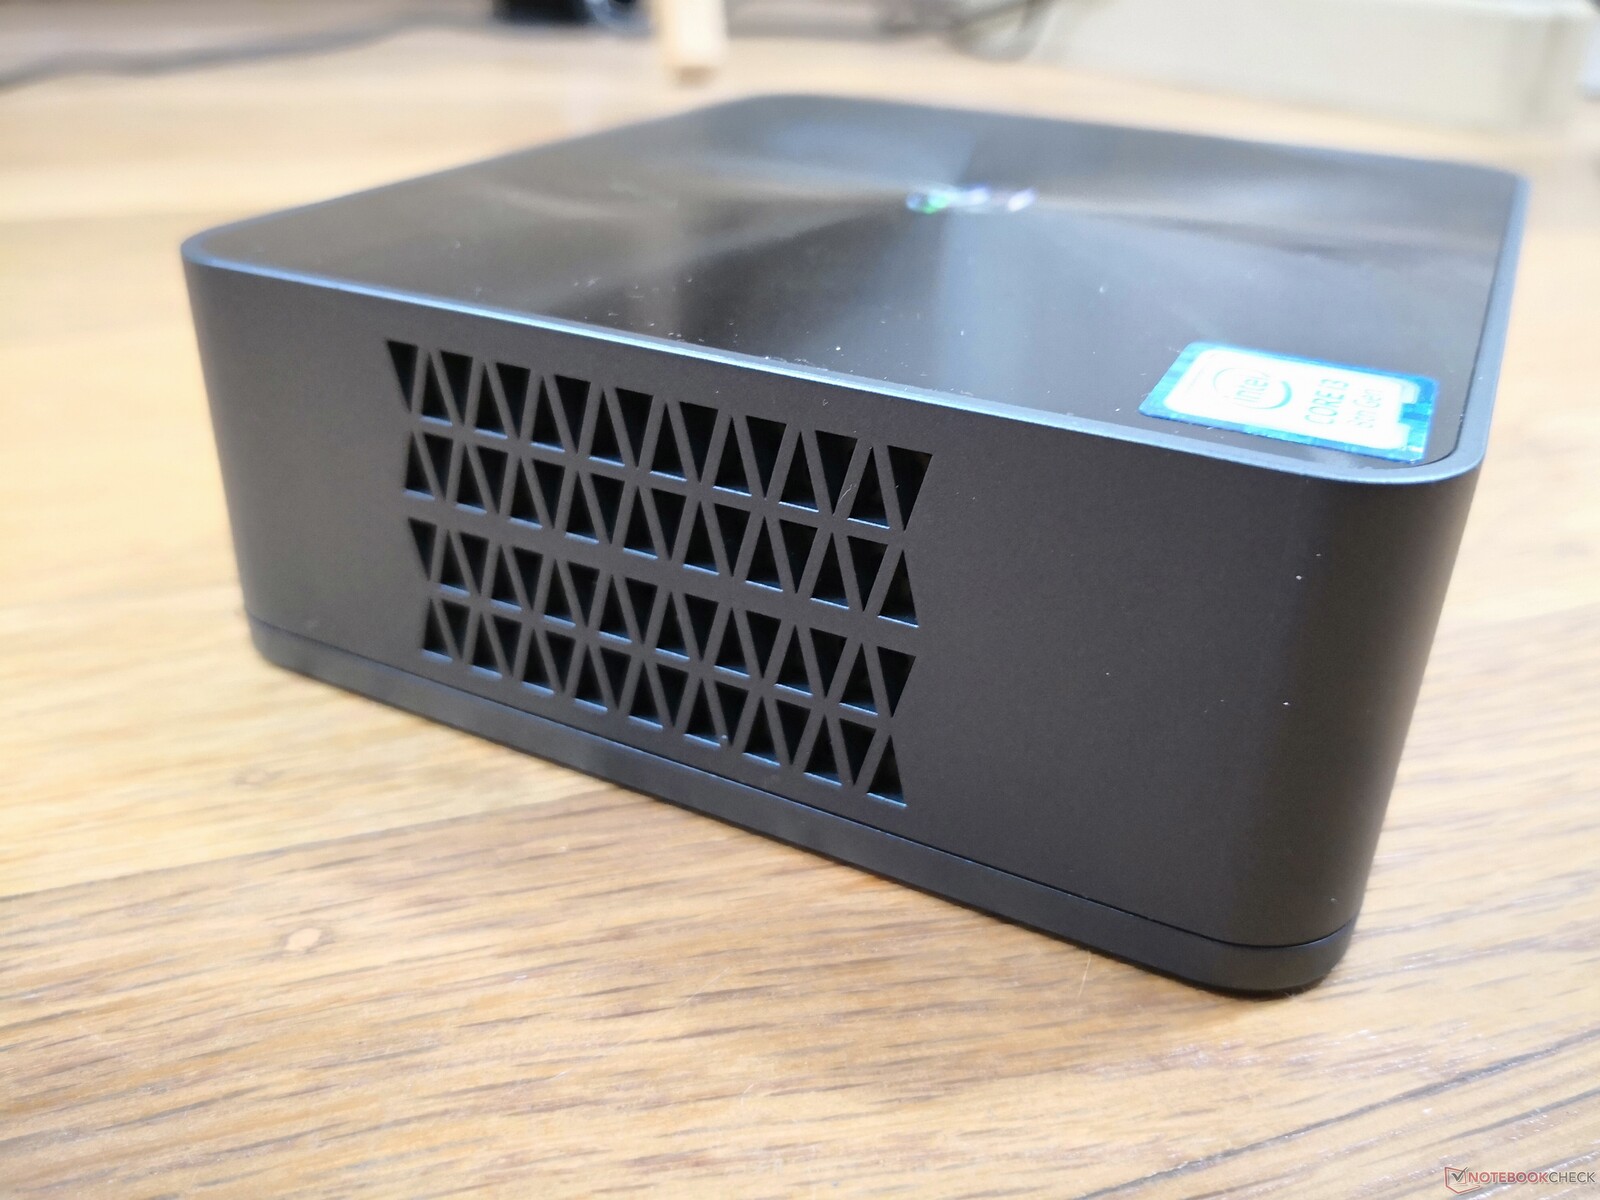
Case
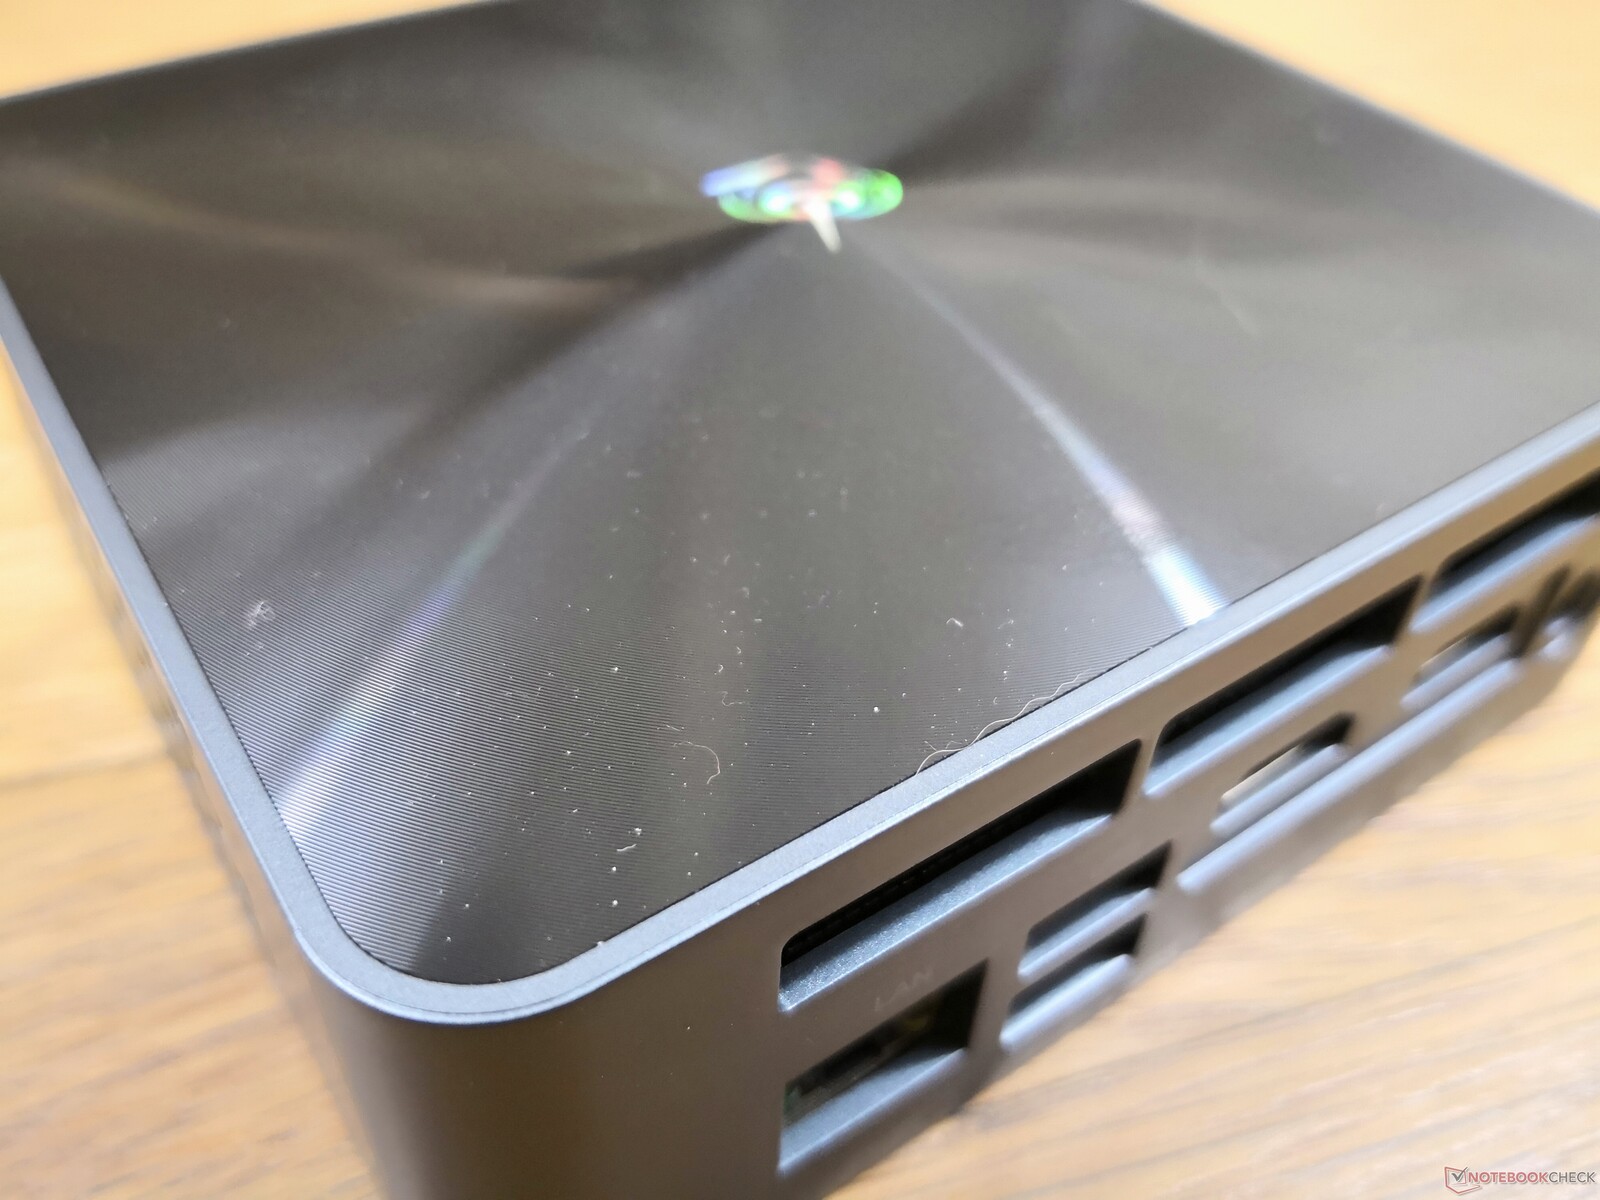
The external chassis is identical to the SEi10. Its design is notable for being about the same size as an Intel NUC while weighing 30 percent lighter. The chassis material, while still rigid, isn't nearly as thick or sturdy as a NUC.
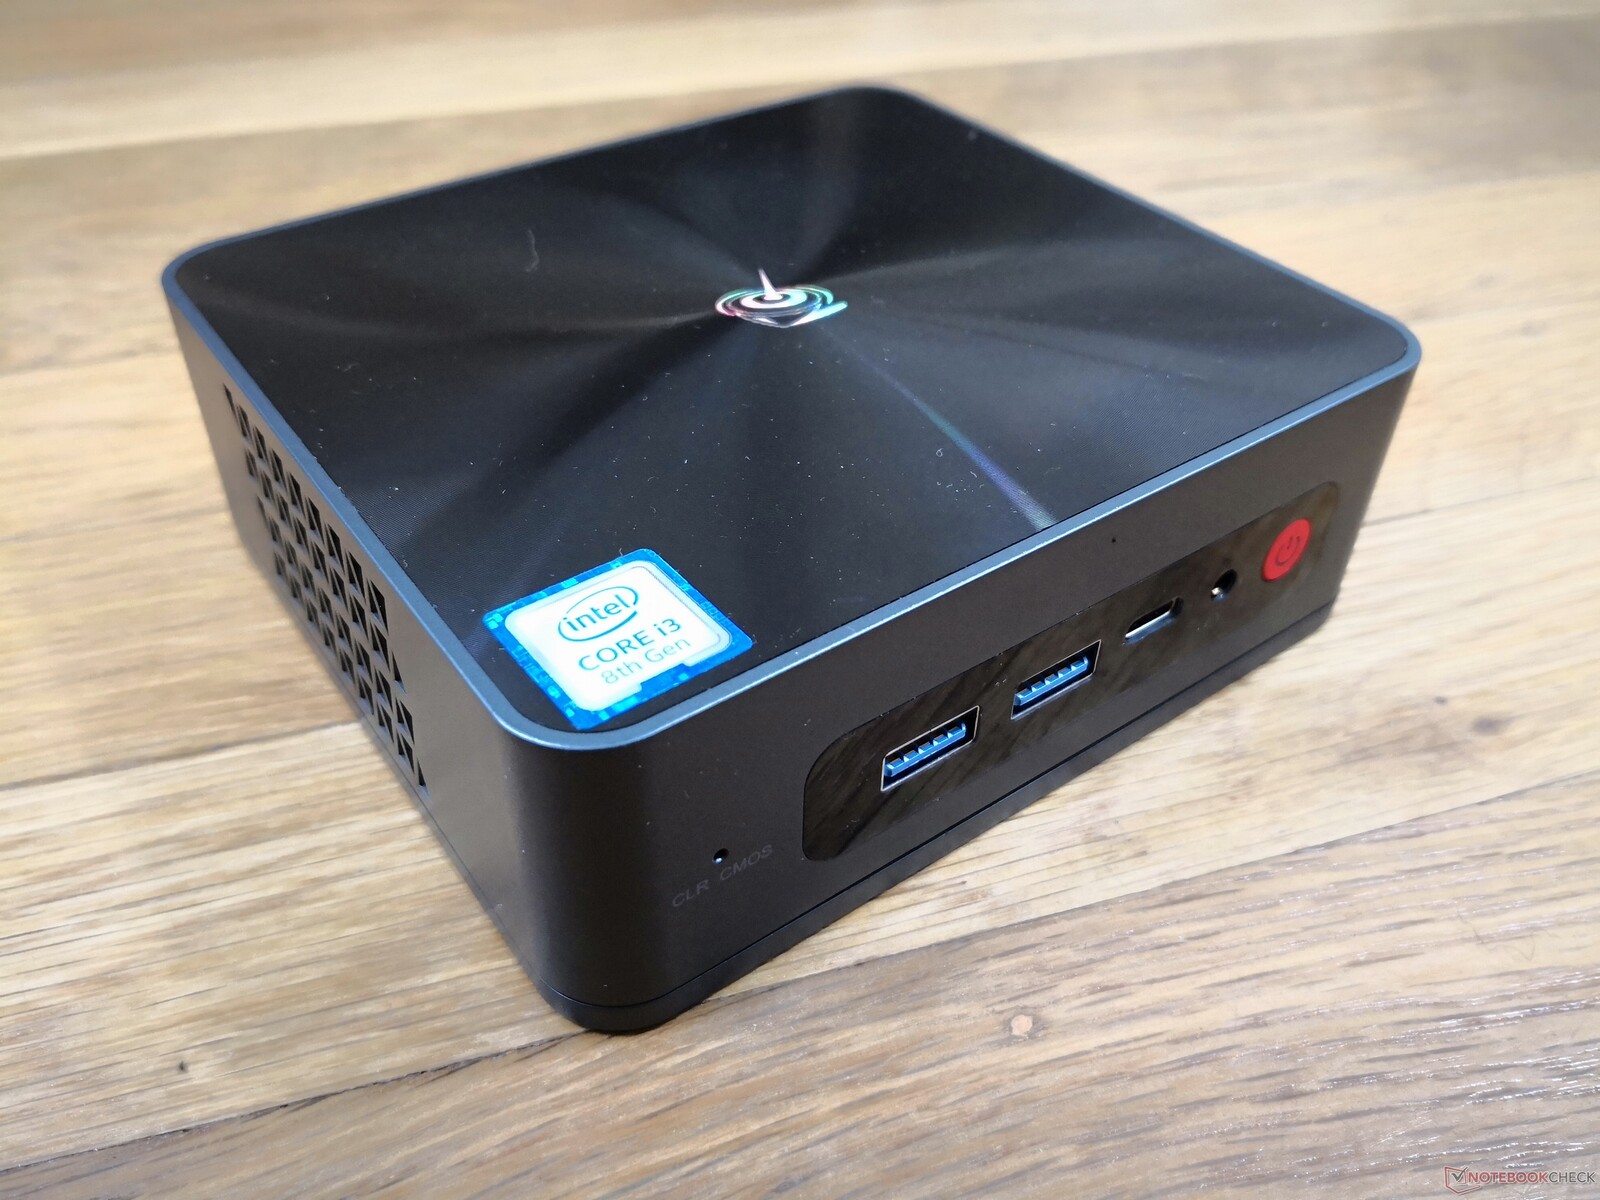
Connectivity
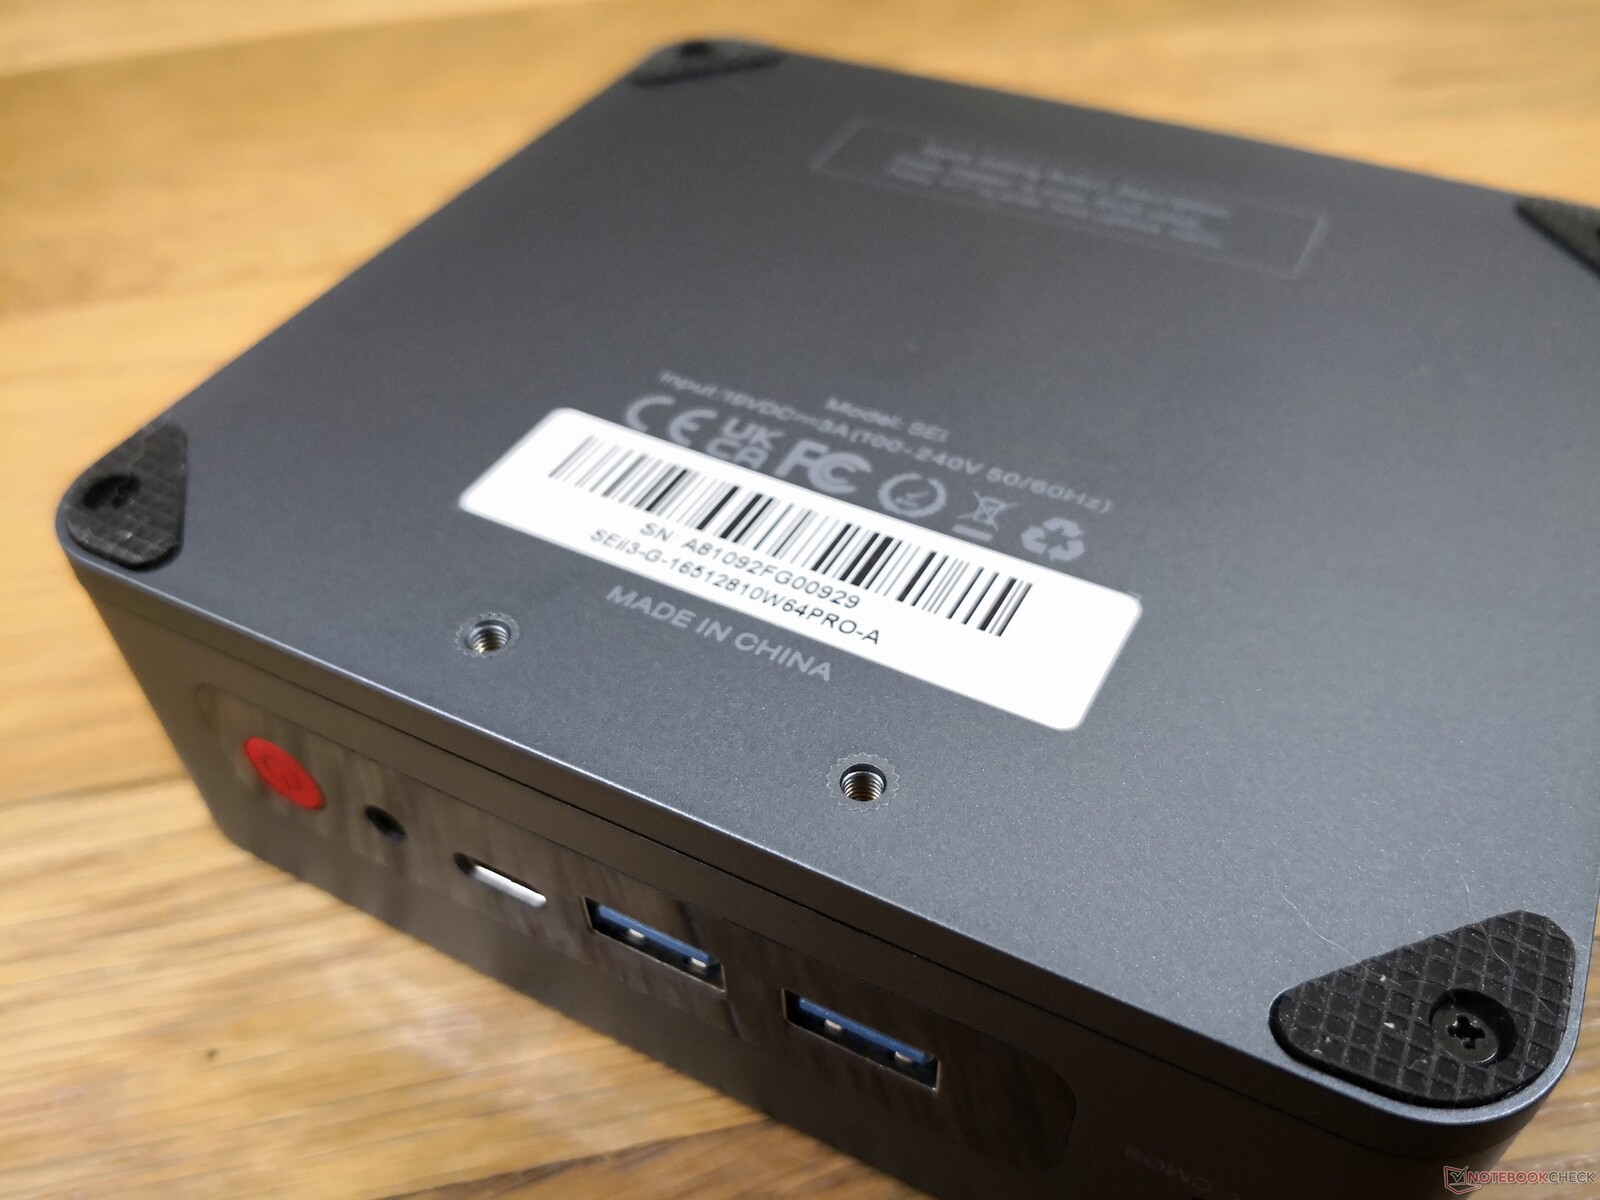
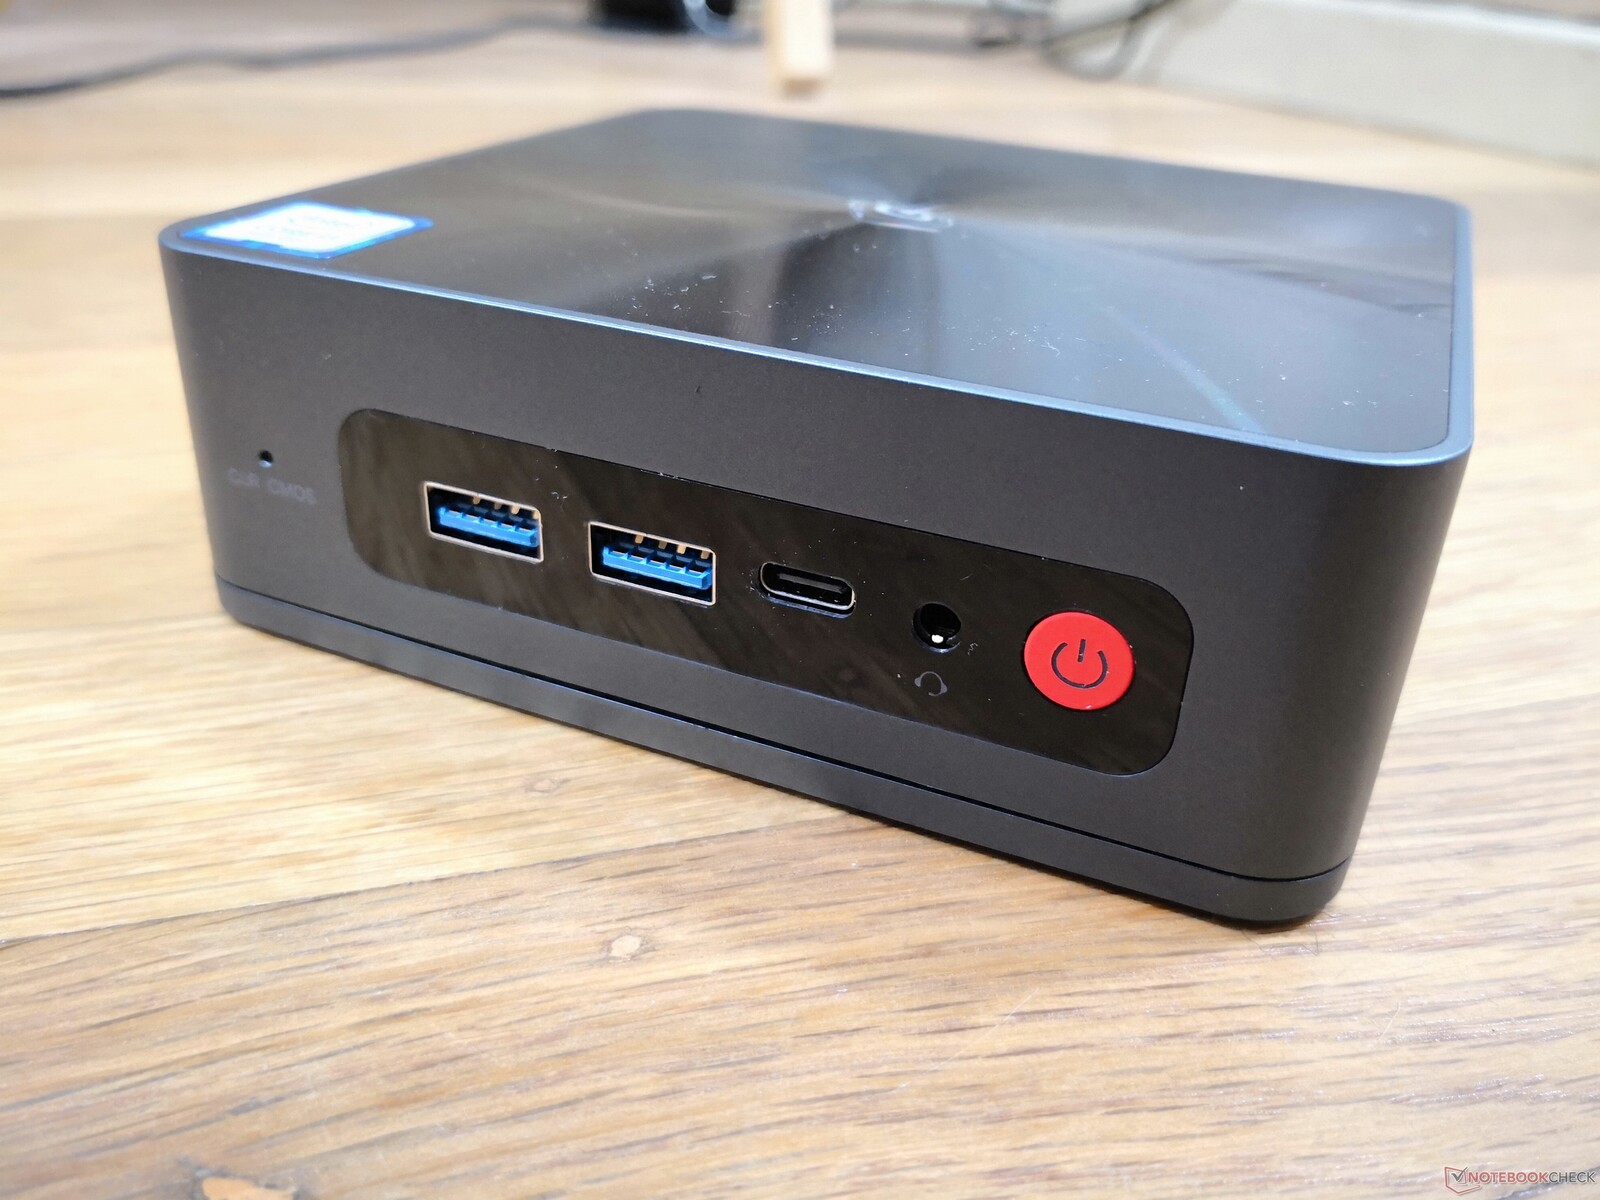
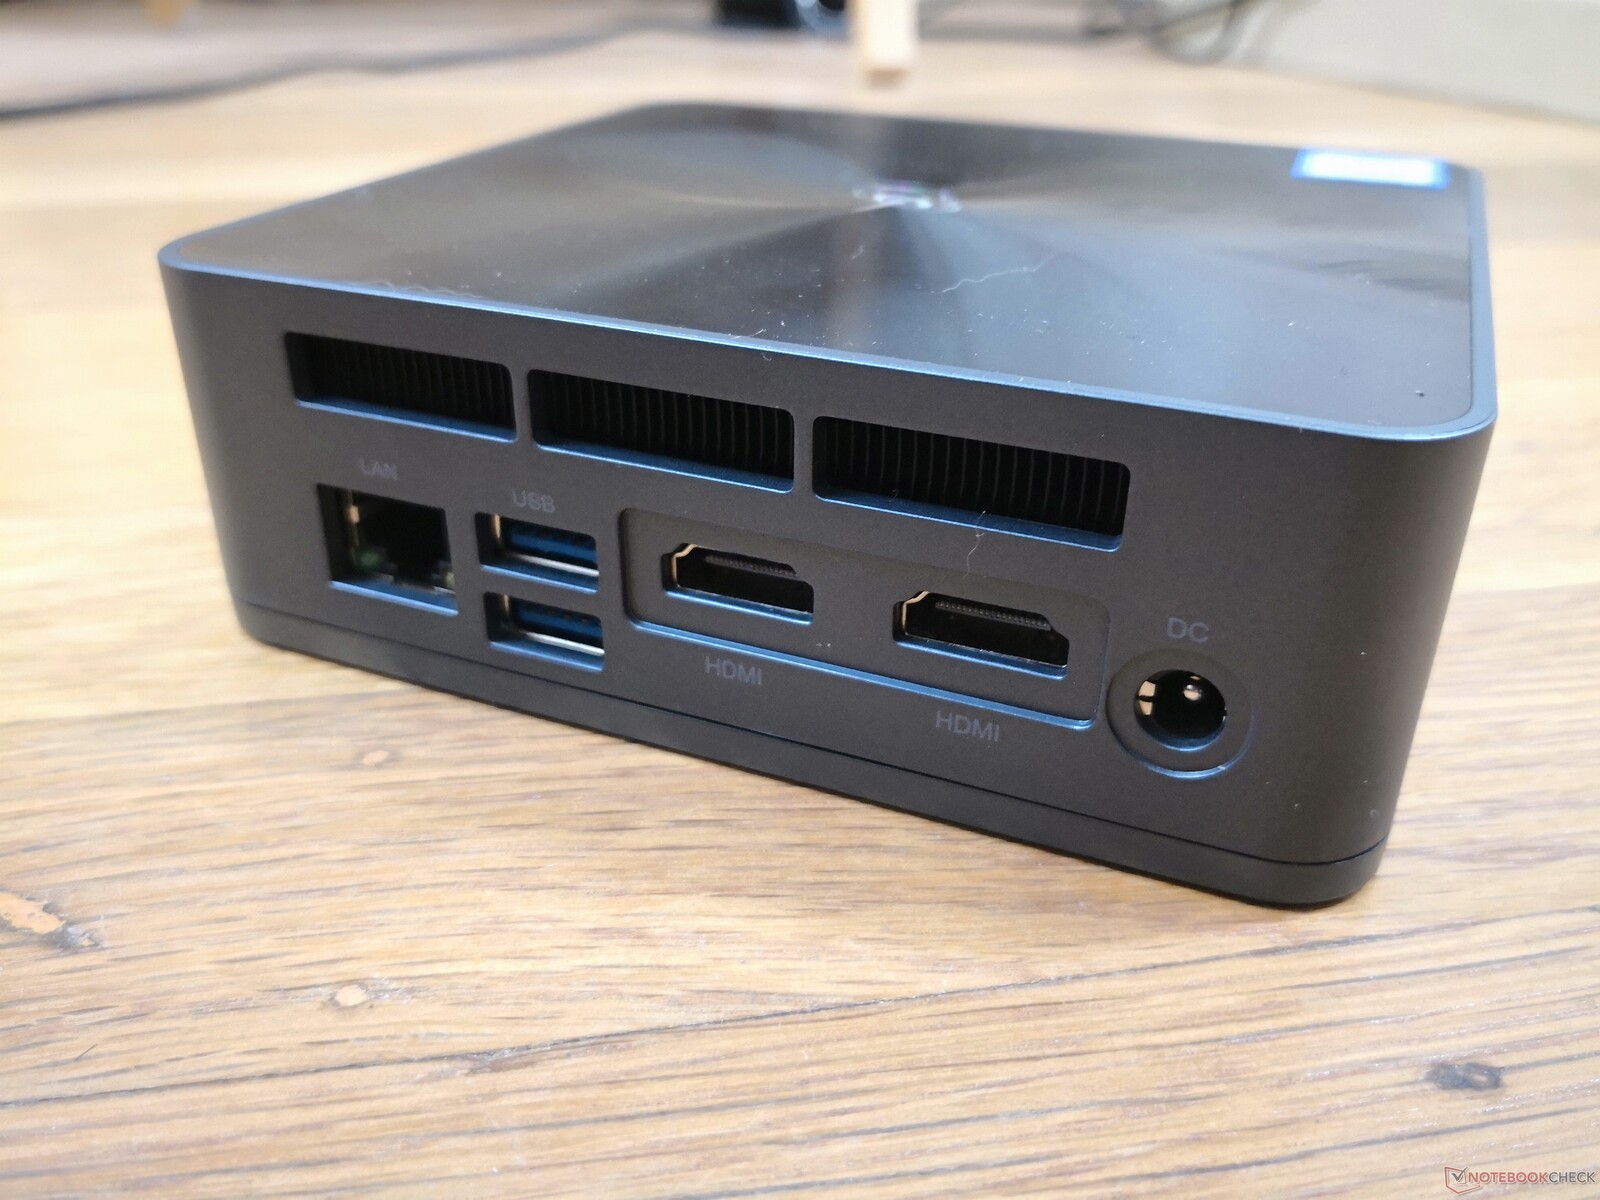
Port options are identical to the SEi10 except that Thunderbolt is not supported and that there is no longer an integrated SD card reader. We can confirm that the USB-C port still supports DisplayPort, but it cannot be used to power the mini PC unlike on the SER4.
Communication
Built-in wired and wireless communication modules, compare Networking test data to competitors, alternative solutions available (5G/LTE)?, Irregularities (radio reception)?
| Networking | |
| iperf3 transmit AX12 | |
| Intel NUC11TNKi5 | |
| Beelink SER4 | |
| Beelink SEi10 | |
| Intel NUC8i7BE | |
| GMK NucBox 2 | |
| Beelink SEi8 | |
| iperf3 receive AX12 | |
| Intel NUC11TNKi5 | |
| Beelink SEi10 | |
| Beelink SER4 | |
| GMK NucBox 2 | |
| Intel NUC8i7BE | |
| Beelink SEi8 | |
Maintenance
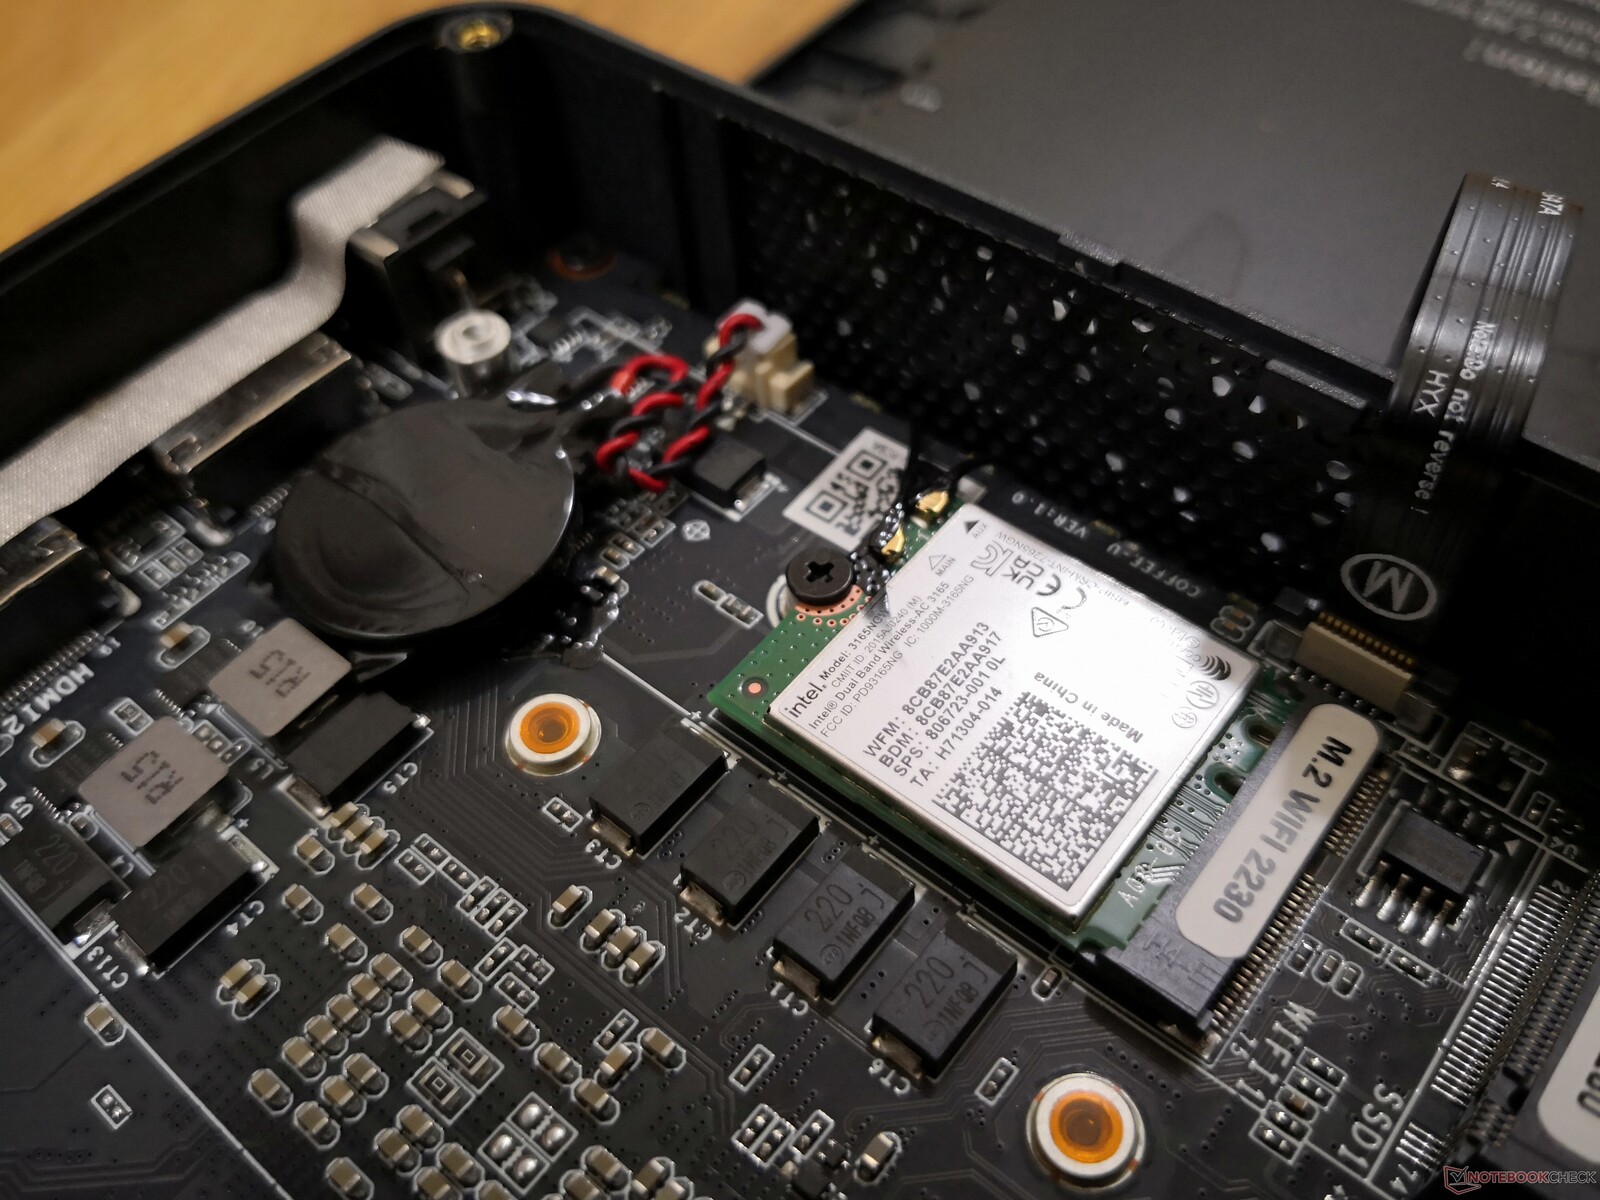
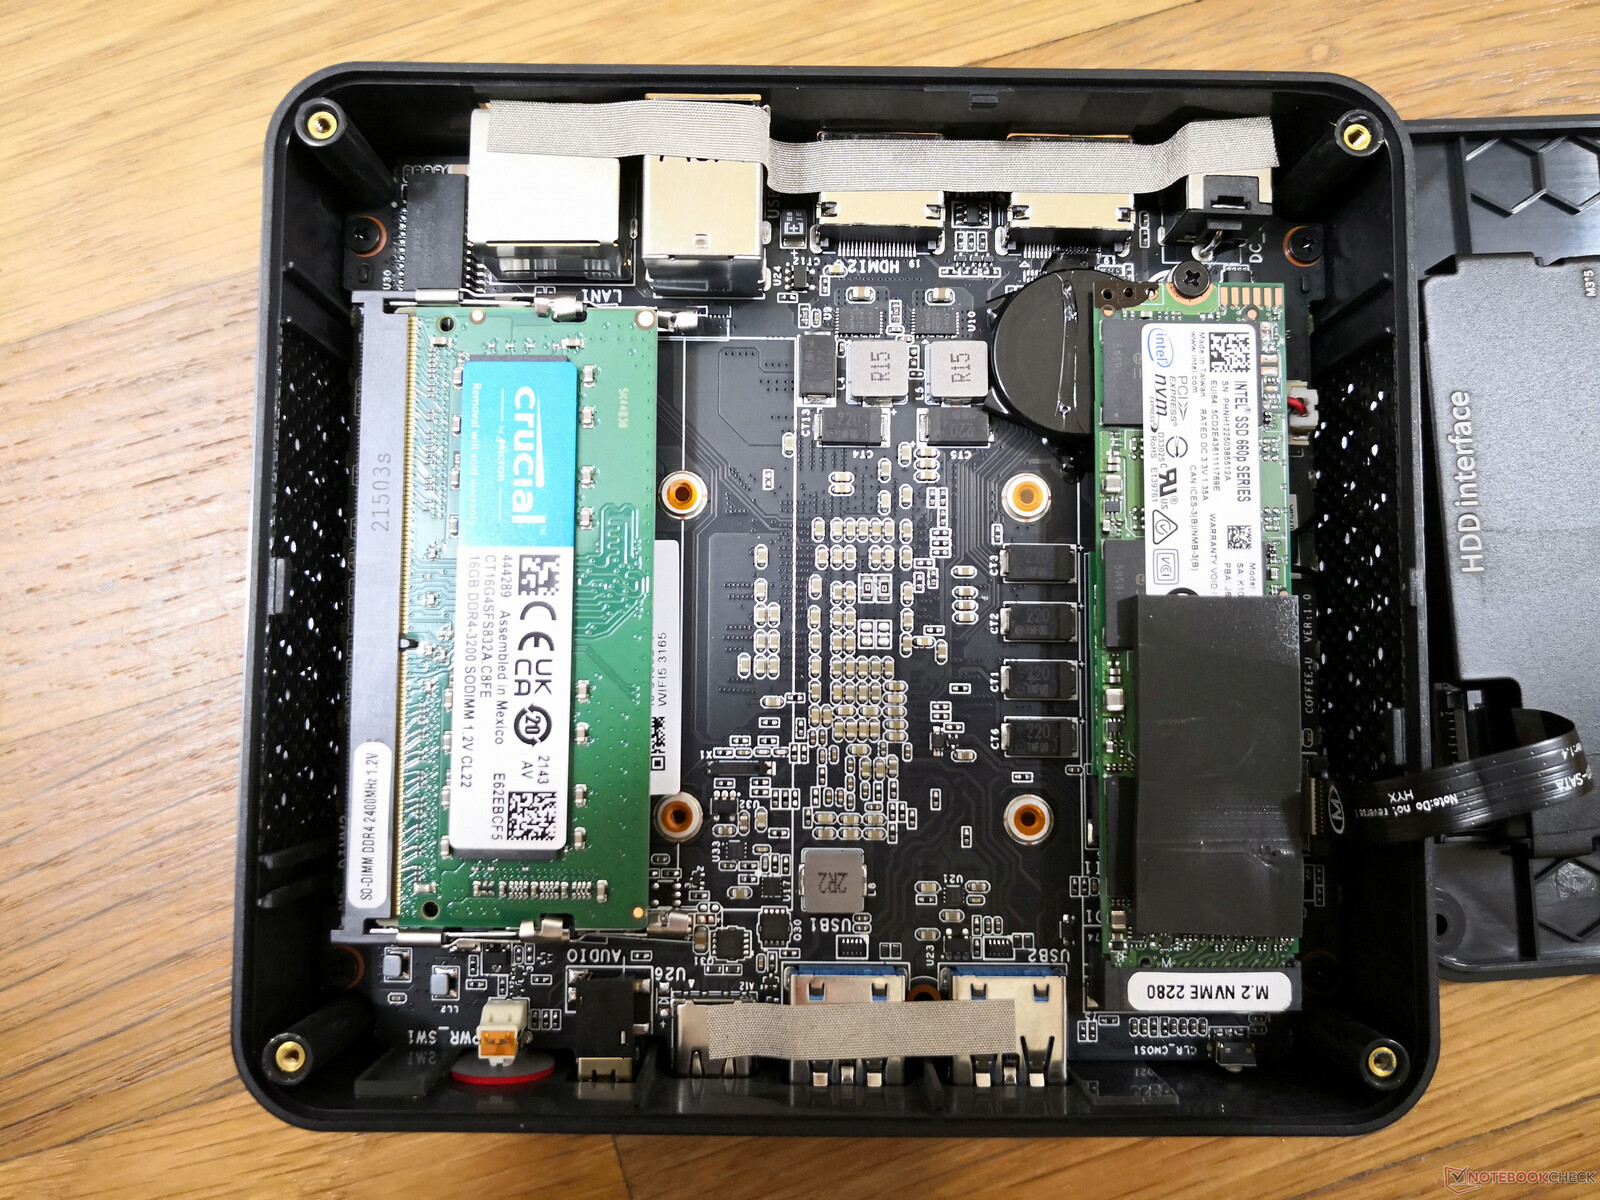
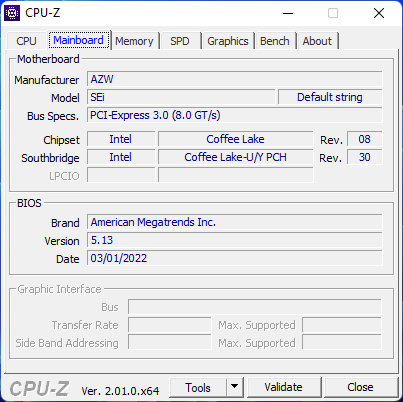
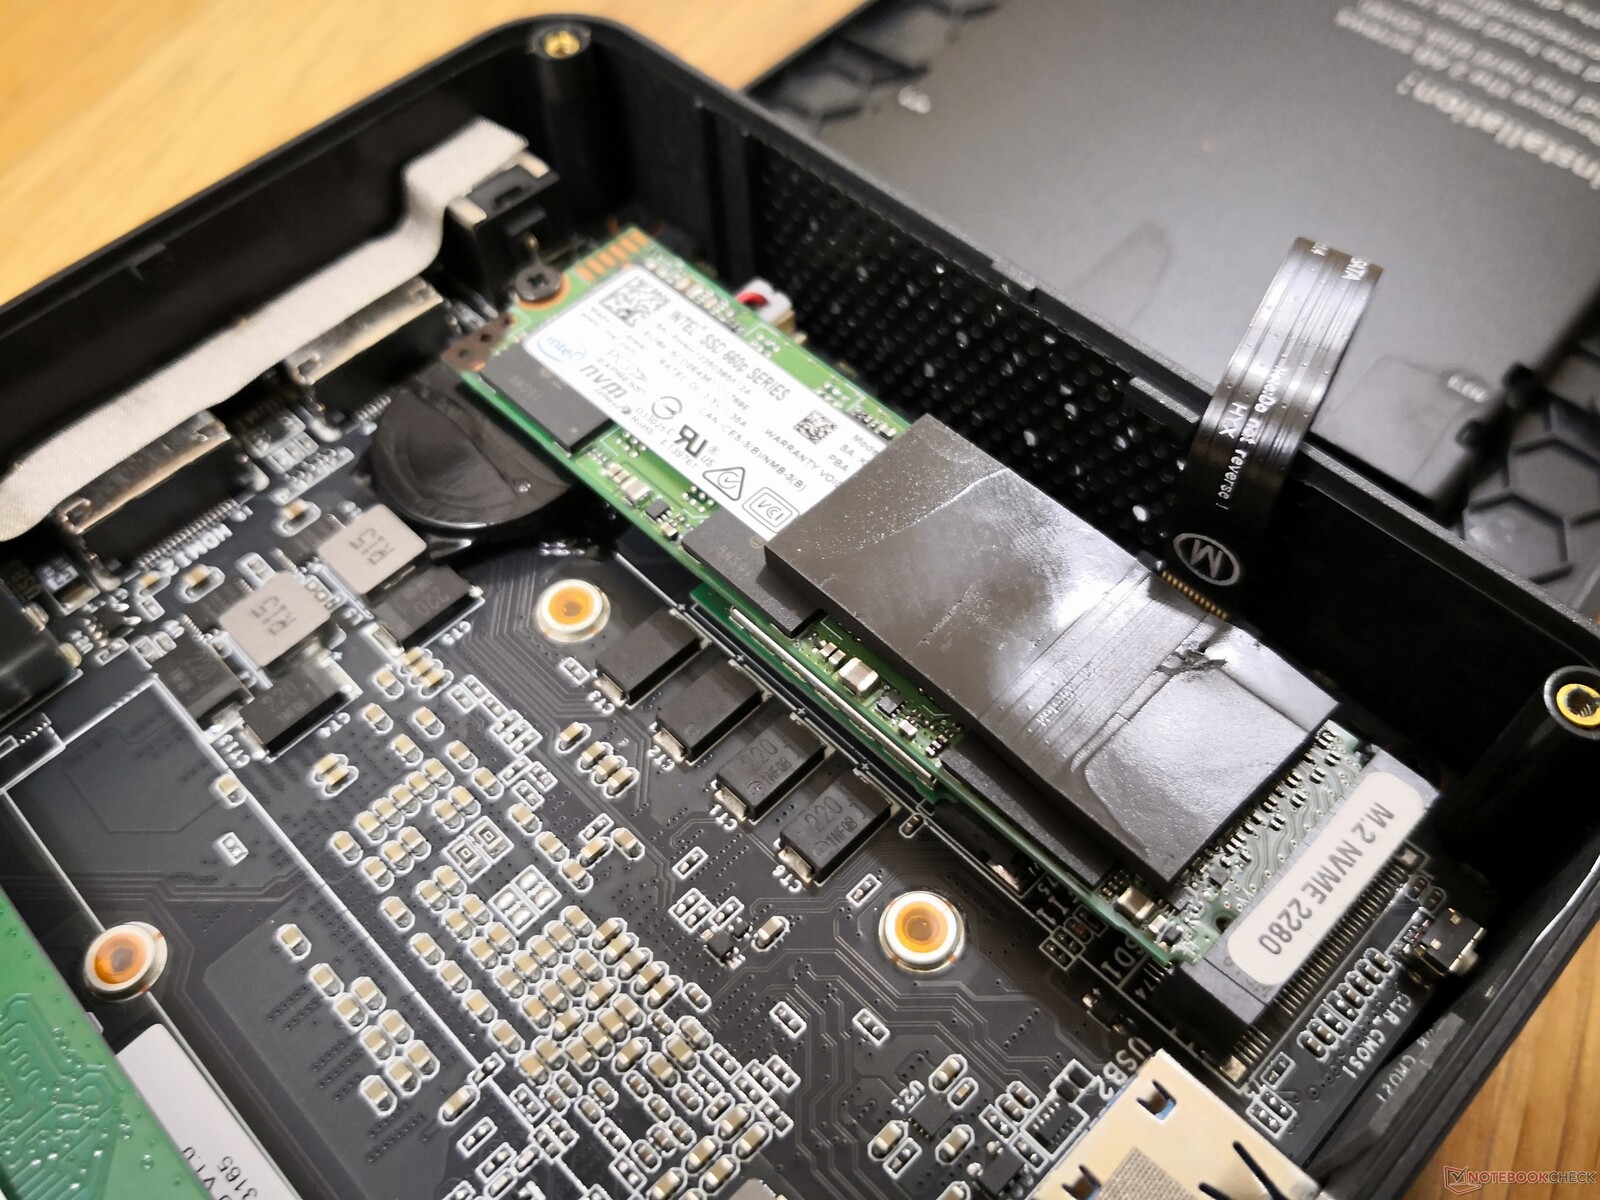
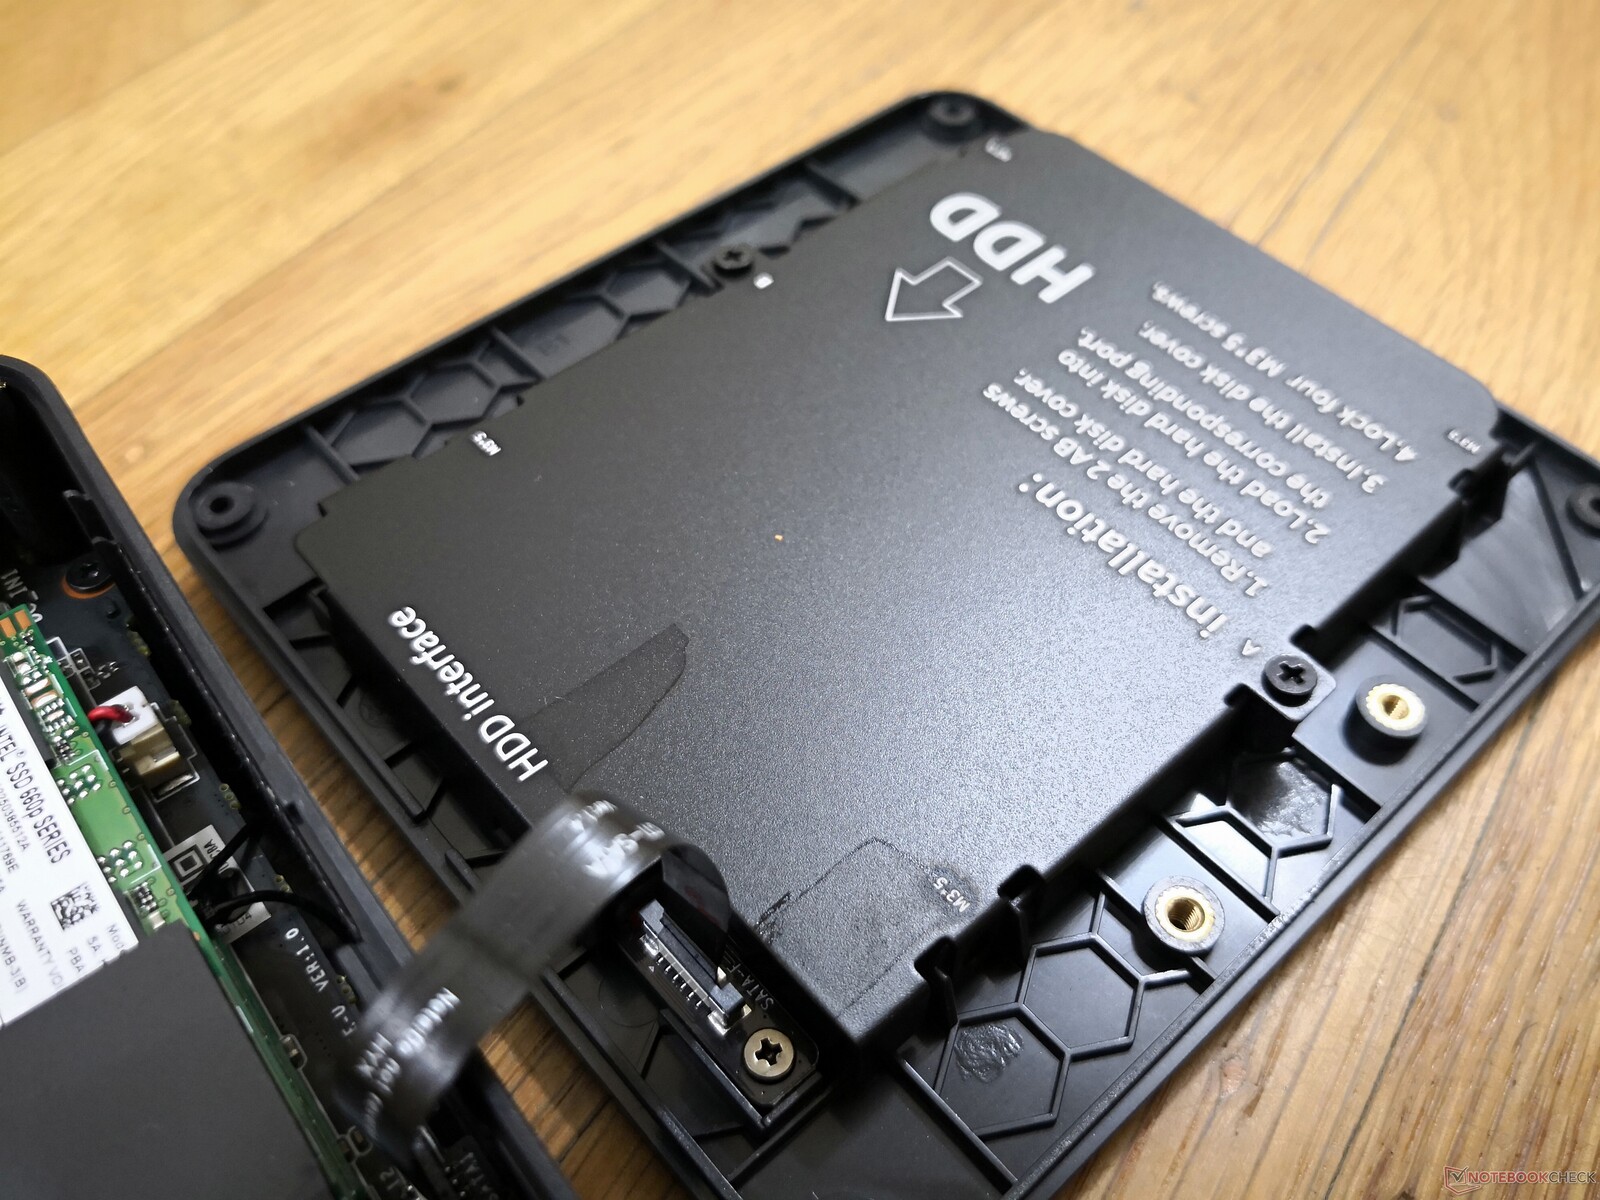
The motherboard in the SEi8 is slightly different than the motherboard on the SEi10. The M.2 SSD slot, for example, is now facing the opposite direction while the BIOS battery is now more easily accessible.
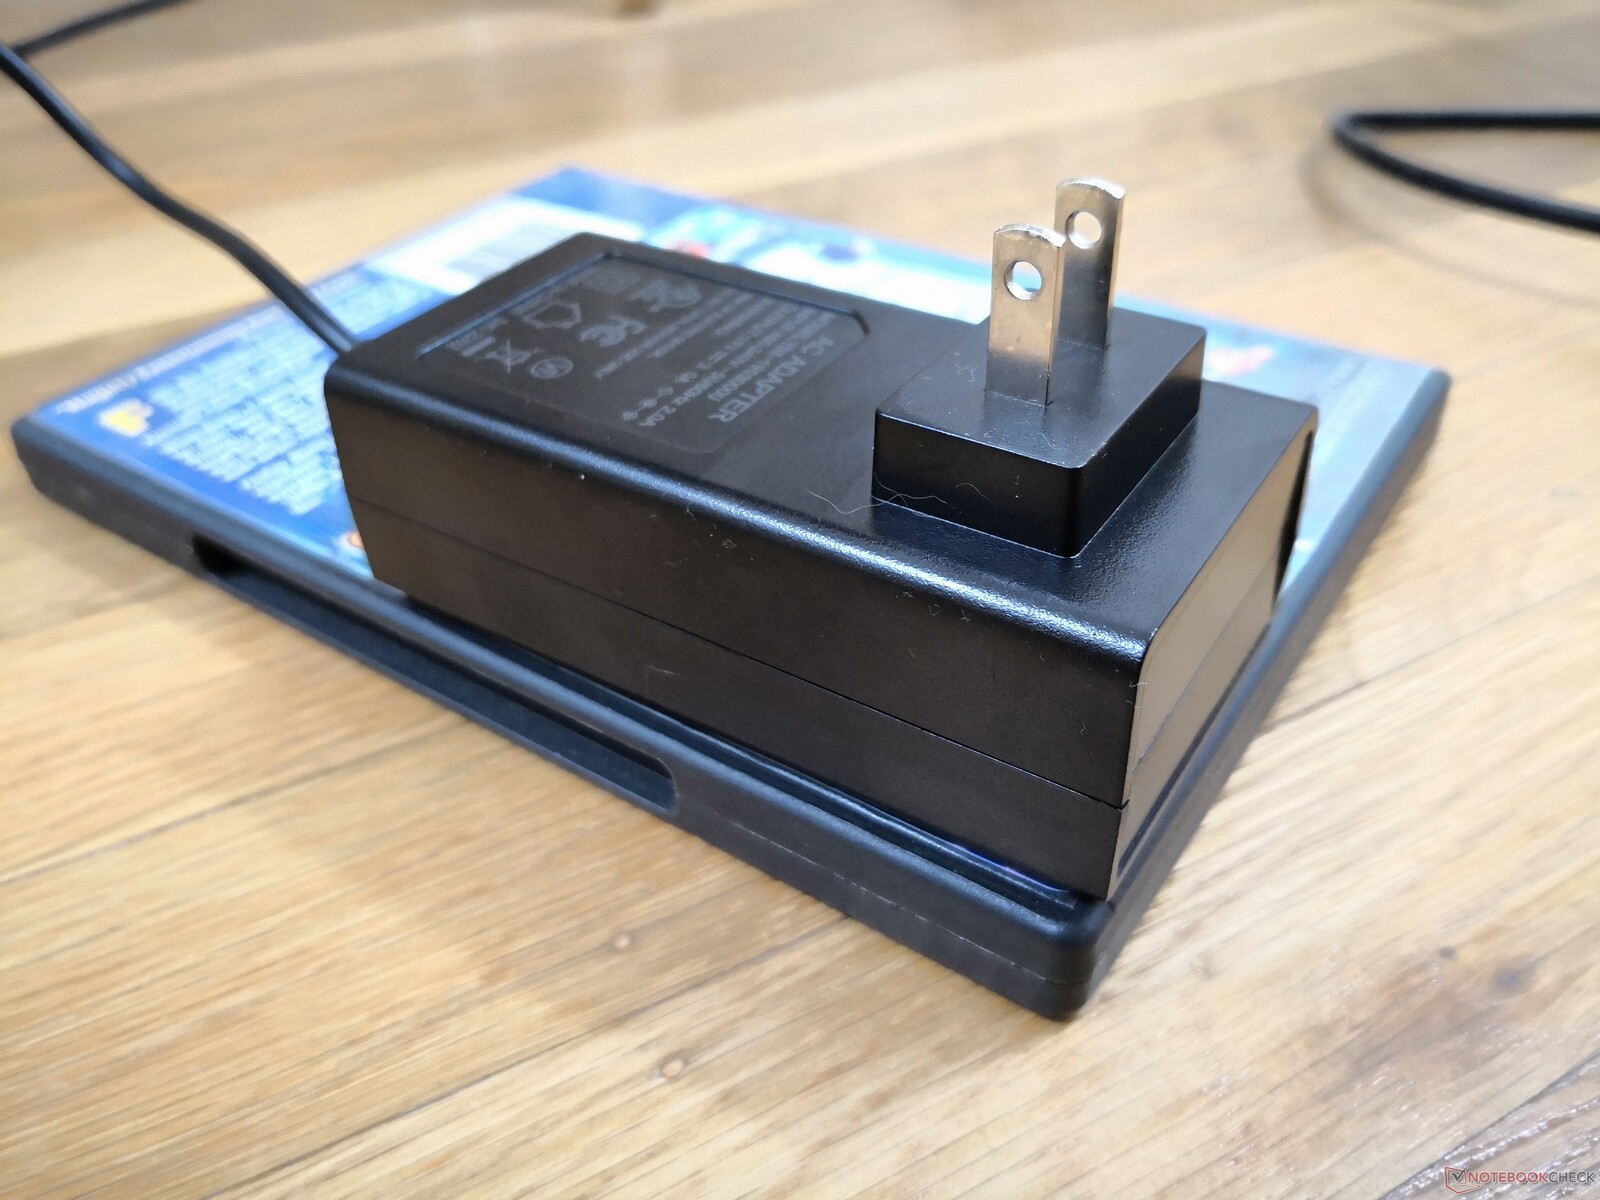
Accessories and Warranty
The retail box includes additional screws, manual, and a removable VESA mount. Claiming warranty can be difficult as it may involve overseas shipping. Only a base one-year warranty is provided unlike the three years on most Intel NUCs.
Performance
Testing Conditions
Our unit was set to Windows Performance mode prior to running any benchmarks below.
Processor
Raw CPU performance sits in between the Celeron and Atom series and the higher-end Core i5 U-series. Perhaps most notably, it is noticeably faster than the competing Ryzen 3 3200U and passively-cooled Core i3-10100Y as found on the Microsoft Surface Go 3. The Surface Go 3 processor was highly criticized for its slow-as-molasses performance relative to the Surface Pro.
Beelink offers the SEi8 with Core i5-8279U as an upgrade which would provide roughly 20 percent faster single-thread performance and over 2x the multi-thread performance over our Core i3-8109U.
Cinebench R15 Multi Loop
Cinebench R23: Multi Core | Single Core
Cinebench R15: CPU Multi 64Bit | CPU Single 64Bit
Blender: v2.79 BMW27 CPU
7-Zip 18.03: 7z b 4 | 7z b 4 -mmt1
Geekbench 5.5: Multi-Core | Single-Core
HWBOT x265 Benchmark v2.2: 4k Preset
LibreOffice : 20 Documents To PDF
R Benchmark 2.5: Overall mean
| Cinebench R20 / CPU (Multi Core) | |
| Beelink SER4 | |
| Intel NUC11TNKi5 | |
| Apple MacBook Pro 13 2019 i5 4TB3 | |
| Intel NUC8i7BE | |
| Acer Swift 3 SF314-42-R27B | |
| GMK NucBox 2 | |
| Beelink SEi10 | |
| Beelink U59 | |
| Beelink SEi8 | |
| Average Intel Core i3-8109U (n=1) | |
| Microsoft Surface Go 3 Core i3 | |
| HP 255 G7 159P1EA | |
| GMK NucBox 3 | |
| Chuwi LapBook Plus | |
| Teclast Tbook 16 Power | |
| Cinebench R20 / CPU (Single Core) | |
| Intel NUC11TNKi5 | |
| Beelink SER4 | |
| Intel NUC8i7BE | |
| Acer Swift 3 SF314-42-R27B | |
| Apple MacBook Pro 13 2019 i5 4TB3 | |
| Beelink SEi10 | |
| GMK NucBox 2 | |
| Beelink SEi8 | |
| Average Intel Core i3-8109U (n=1) | |
| Microsoft Surface Go 3 Core i3 | |
| HP 255 G7 159P1EA | |
| Beelink U59 | |
| GMK NucBox 3 | |
| Chuwi LapBook Plus | |
| Teclast Tbook 16 Power | |
| Cinebench R23 / Multi Core | |
| Beelink SER4 | |
| Intel NUC11TNKi5 | |
| GMK NucBox 2 | |
| Beelink U59 | |
| Beelink SEi8 | |
| Average Intel Core i3-8109U (n=1) | |
| HP 255 G7 159P1EA | |
| Microsoft Surface Go 3 Core i3 | |
| GMK NucBox 3 | |
| Teclast Tbook 16 Power | |
| Cinebench R23 / Single Core | |
| Intel NUC11TNKi5 | |
| Beelink SER4 | |
| GMK NucBox 2 | |
| Beelink SEi8 | |
| Average Intel Core i3-8109U (n=1) | |
| Microsoft Surface Go 3 Core i3 | |
| HP 255 G7 159P1EA | |
| Beelink U59 | |
| GMK NucBox 3 | |
| Teclast Tbook 16 Power | |
| Geekbench 5.5 / Multi-Core | |
| Beelink SER4 | |
| Intel NUC11TNKi5 | |
| Intel NUC8i7BE | |
| GMK NucBox 2 | |
| Acer Swift 3 SF314-42-R27B | |
| Beelink SEi10 | |
| Microsoft Surface Go 3 Core i3 | |
| Beelink SEi8 | |
| Average Intel Core i3-8109U (n=1) | |
| HP 255 G7 159P1EA | |
| GMK NucBox 3 | |
| Teclast Tbook 16 Power | |
| Geekbench 5.5 / Single-Core | |
| Intel NUC11TNKi5 | |
| Beelink SER4 | |
| Beelink SEi10 | |
| Acer Swift 3 SF314-42-R27B | |
| Microsoft Surface Go 3 Core i3 | |
| GMK NucBox 2 | |
| Beelink SEi8 | |
| Average Intel Core i3-8109U (n=1) | |
| HP 255 G7 159P1EA | |
| Intel NUC8i7BE | |
| GMK NucBox 3 | |
| Teclast Tbook 16 Power | |
| HWBOT x265 Benchmark v2.2 / 4k Preset | |
| Beelink SER4 | |
| Intel NUC11TNKi5 | |
| Apple MacBook Pro 13 2019 i5 4TB3 | |
| Intel NUC8i7BE | |
| Intel NUC8i7BE | |
| GMK NucBox 2 | |
| Acer Swift 3 SF314-42-R27B | |
| Beelink SEi10 | |
| Beelink SEi8 | |
| Average Intel Core i3-8109U (n=1) | |
| Beelink U59 | |
| Microsoft Surface Go 3 Core i3 | |
| HP 255 G7 159P1EA | |
| GMK NucBox 3 | |
| Chuwi LapBook Plus | |
| Teclast Tbook 16 Power | |
| LibreOffice / 20 Documents To PDF | |
| Teclast Tbook 16 Power | |
| GMK NucBox 3 | |
| Microsoft Surface Go 3 Core i3 | |
| Beelink U59 | |
| HP 255 G7 159P1EA | |
| Beelink SEi8 | |
| Average Intel Core i3-8109U (n=1) | |
| GMK NucBox 2 | |
| Beelink SER4 | |
| Acer Swift 3 SF314-42-R27B | |
| Beelink SEi10 | |
| Intel NUC11TNKi5 | |
| R Benchmark 2.5 / Overall mean | |
| Teclast Tbook 16 Power | |
| GMK NucBox 3 | |
| Beelink U59 | |
| Microsoft Surface Go 3 Core i3 | |
| Beelink SEi8 | |
| Average Intel Core i3-8109U (n=1) | |
| HP 255 G7 159P1EA | |
| GMK NucBox 2 | |
| Beelink SEi10 | |
| Acer Swift 3 SF314-42-R27B | |
| Intel NUC8i7BE | |
| Intel NUC11TNKi5 | |
| Beelink SER4 | |
Cinebench R23: Multi Core | Single Core
Cinebench R15: CPU Multi 64Bit | CPU Single 64Bit
Blender: v2.79 BMW27 CPU
7-Zip 18.03: 7z b 4 | 7z b 4 -mmt1
Geekbench 5.5: Multi-Core | Single-Core
HWBOT x265 Benchmark v2.2: 4k Preset
LibreOffice : 20 Documents To PDF
R Benchmark 2.5: Overall mean
* ... smaller is better
AIDA64: FP32 Ray-Trace | FPU Julia | CPU SHA3 | CPU Queen | FPU SinJulia | FPU Mandel | CPU AES | CPU ZLib | FP64 Ray-Trace | CPU PhotoWorxx
| Performance rating | |
| Beelink SER4 | |
| Intel NUC11TNKi5 | |
| Intel NUC8i7BE -1! | |
| GMK NucBox 2 | |
| Beelink SEi8 | |
| AIDA64 / FP32 Ray-Trace | |
| Beelink SER4 | |
| Intel NUC11TNKi5 | |
| Intel NUC8i7BE | |
| GMK NucBox 2 | |
| Beelink SEi8 | |
| AIDA64 / FPU Julia | |
| Beelink SER4 | |
| Intel NUC11TNKi5 | |
| Intel NUC8i7BE | |
| GMK NucBox 2 | |
| Beelink SEi8 | |
| AIDA64 / CPU SHA3 | |
| Intel NUC11TNKi5 | |
| Beelink SER4 | |
| GMK NucBox 2 | |
| Beelink SEi8 | |
| AIDA64 / CPU Queen | |
| Beelink SER4 | |
| Intel NUC8i7BE | |
| Intel NUC11TNKi5 | |
| GMK NucBox 2 | |
| Beelink SEi8 | |
| AIDA64 / FPU SinJulia | |
| Beelink SER4 | |
| Intel NUC8i7BE | |
| Intel NUC11TNKi5 | |
| GMK NucBox 2 | |
| Beelink SEi8 | |
| AIDA64 / FPU Mandel | |
| Beelink SER4 | |
| Intel NUC11TNKi5 | |
| Intel NUC8i7BE | |
| GMK NucBox 2 | |
| Beelink SEi8 | |
| AIDA64 / CPU AES | |
| Intel NUC11TNKi5 | |
| Beelink SER4 | |
| Intel NUC8i7BE | |
| GMK NucBox 2 | |
| Beelink SEi8 | |
| AIDA64 / CPU ZLib | |
| Beelink SER4 | |
| Intel NUC11TNKi5 | |
| Intel NUC8i7BE | |
| GMK NucBox 2 | |
| Beelink SEi8 | |
| AIDA64 / FP64 Ray-Trace | |
| Beelink SER4 | |
| Intel NUC11TNKi5 | |
| Intel NUC8i7BE | |
| GMK NucBox 2 | |
| Beelink SEi8 | |
| AIDA64 / CPU PhotoWorxx | |
| Beelink SER4 | |
| Intel NUC8i7BE | |
| Intel NUC11TNKi5 | |
| Beelink SEi8 | |
| GMK NucBox 2 | |
System Performance
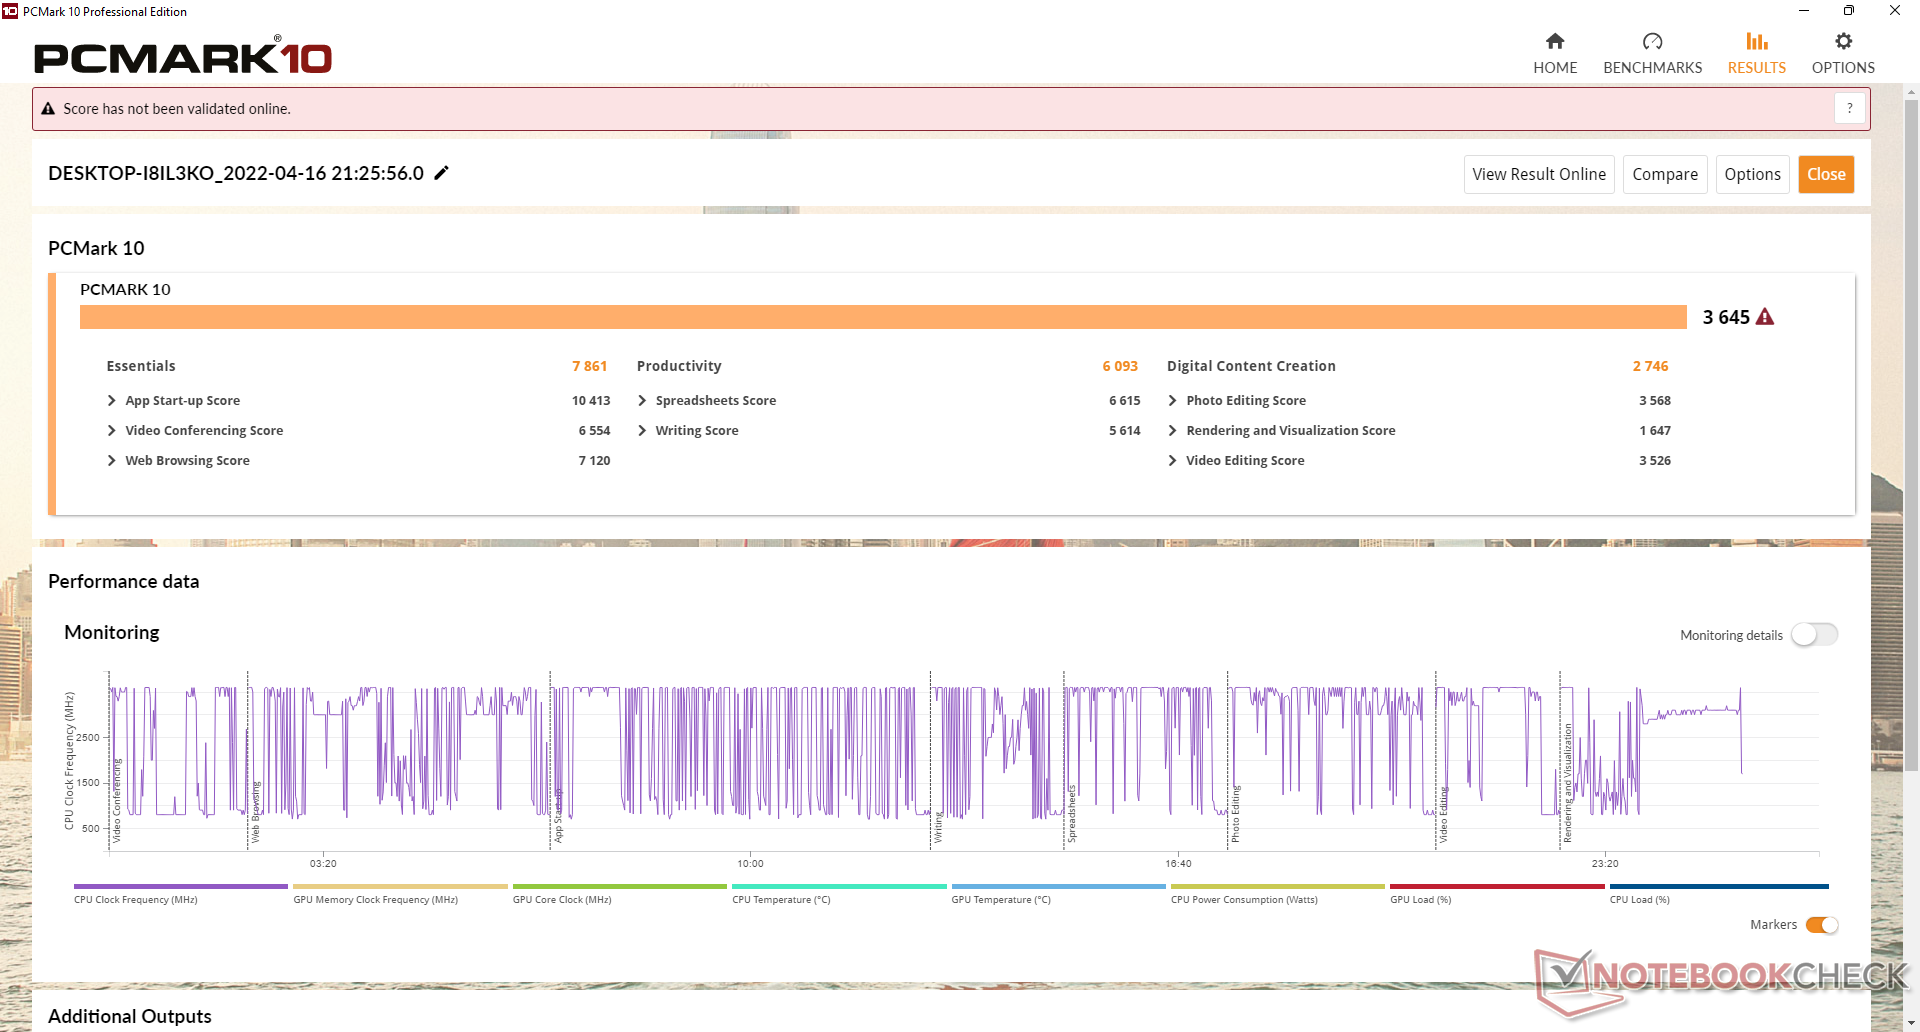
PCMark results are slightly ahead of the SEi10 likely due to the faster integrated Iris graphics of our SEi8. We didn't experience any issues running Windows 11 Pro on our test unit aside from the occasional slowdown when launching applications or during moderate multitasking.
| PCMark 10 / Score | |
| Beelink SER4 | |
| Intel NUC8i7BE | |
| Intel NUC11TNKi5 | |
| GMK NucBox 2 | |
| Beelink SEi8 | |
| Beelink SEi10 | |
| PCMark 10 / Essentials | |
| Beelink SER4 | |
| Intel NUC11TNKi5 | |
| Intel NUC8i7BE | |
| GMK NucBox 2 | |
| Beelink SEi8 | |
| Beelink SEi10 | |
| PCMark 10 / Productivity | |
| Beelink SER4 | |
| Intel NUC8i7BE | |
| GMK NucBox 2 | |
| Intel NUC11TNKi5 | |
| Beelink SEi8 | |
| Beelink SEi10 | |
| PCMark 10 / Digital Content Creation | |
| Beelink SER4 | |
| Intel NUC11TNKi5 | |
| Intel NUC8i7BE | |
| GMK NucBox 2 | |
| Beelink SEi8 | |
| Beelink SEi10 | |
| PCMark 10 Score | 3645 points | |
Help | ||
| AIDA64 / Memory Copy | |
| Intel NUC8i7BE | |
| GMK NucBox 2 | |
| Beelink SER4 | |
| Beelink SEi8 | |
| Intel NUC11TNKi5 | |
| AIDA64 / Memory Read | |
| Intel NUC8i7BE | |
| Beelink SER4 | |
| GMK NucBox 2 | |
| Beelink SEi8 | |
| Intel NUC11TNKi5 | |
| AIDA64 / Memory Write | |
| Intel NUC8i7BE | |
| GMK NucBox 2 | |
| Beelink SER4 | |
| Intel NUC11TNKi5 | |
| Beelink SEi8 | |
| AIDA64 / Memory Latency | |
| Beelink SER4 | |
| Intel NUC11TNKi5 | |
| Beelink SEi8 | |
| GMK NucBox 2 | |
| Intel NUC8i7BE | |
* ... smaller is better
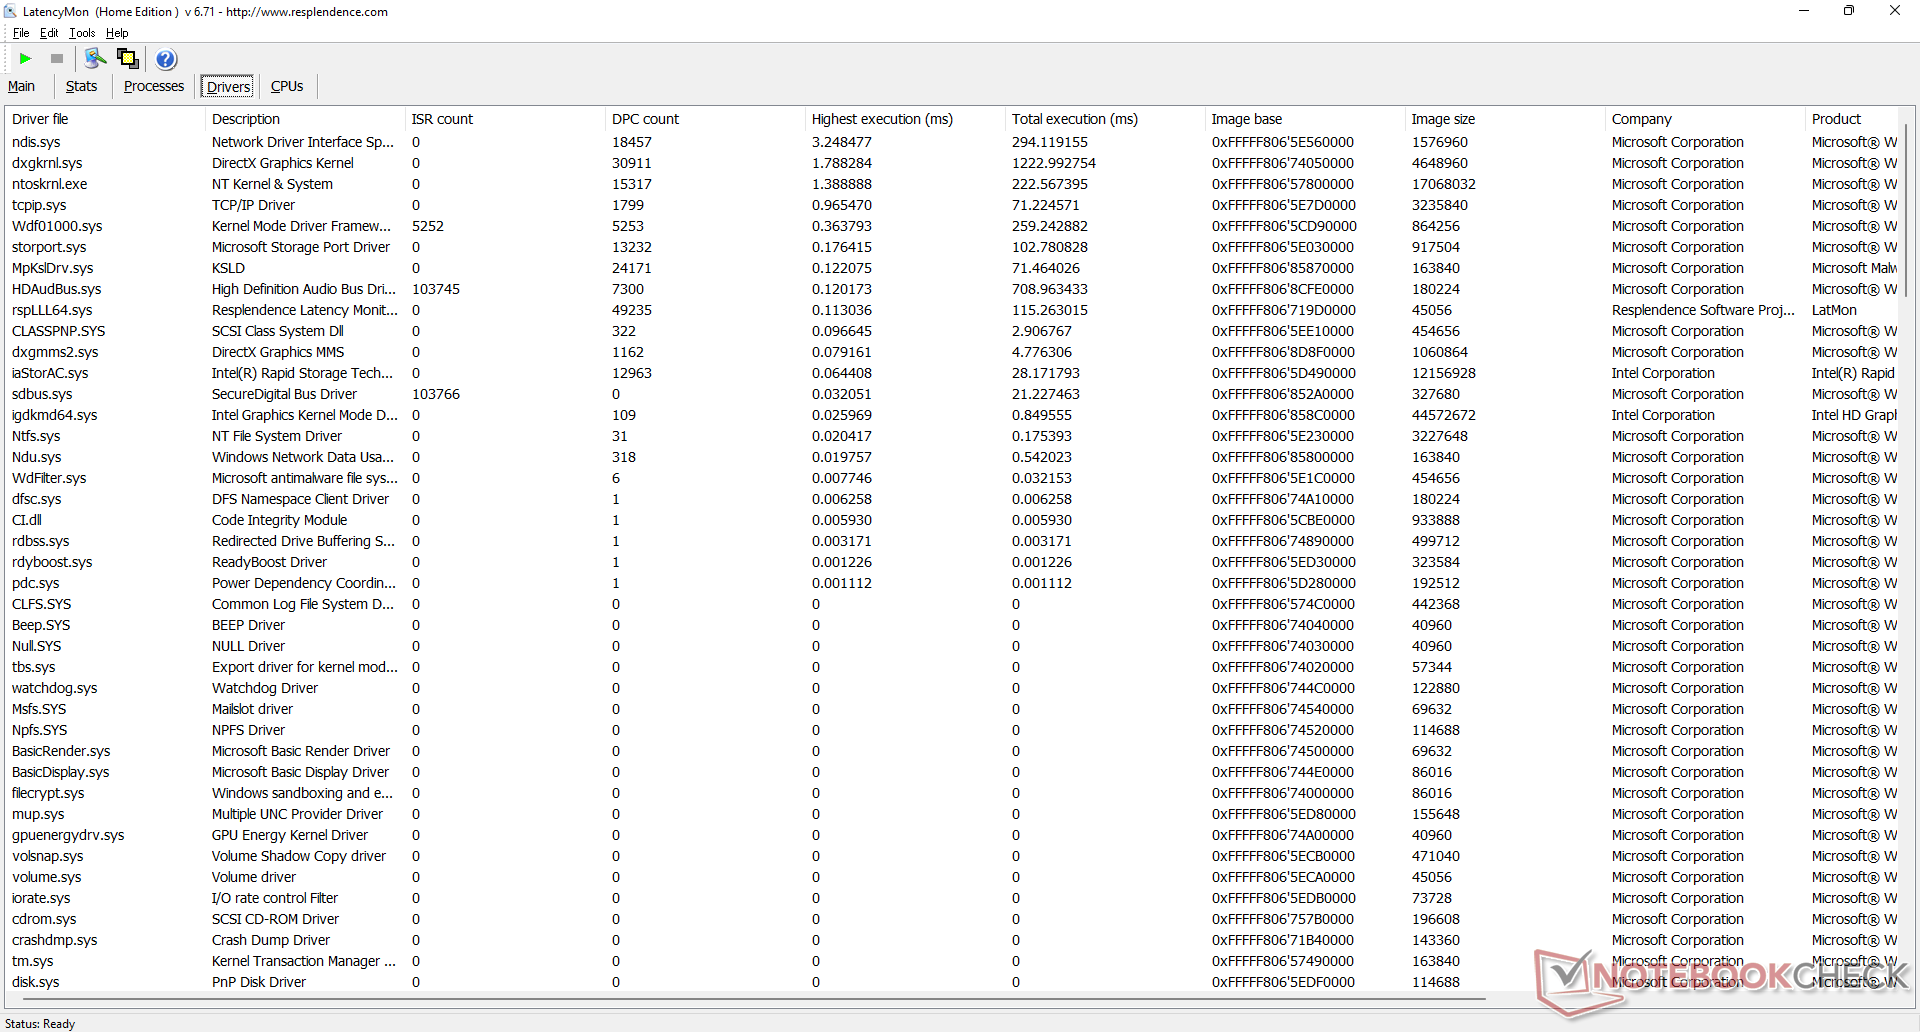
DPC Latency
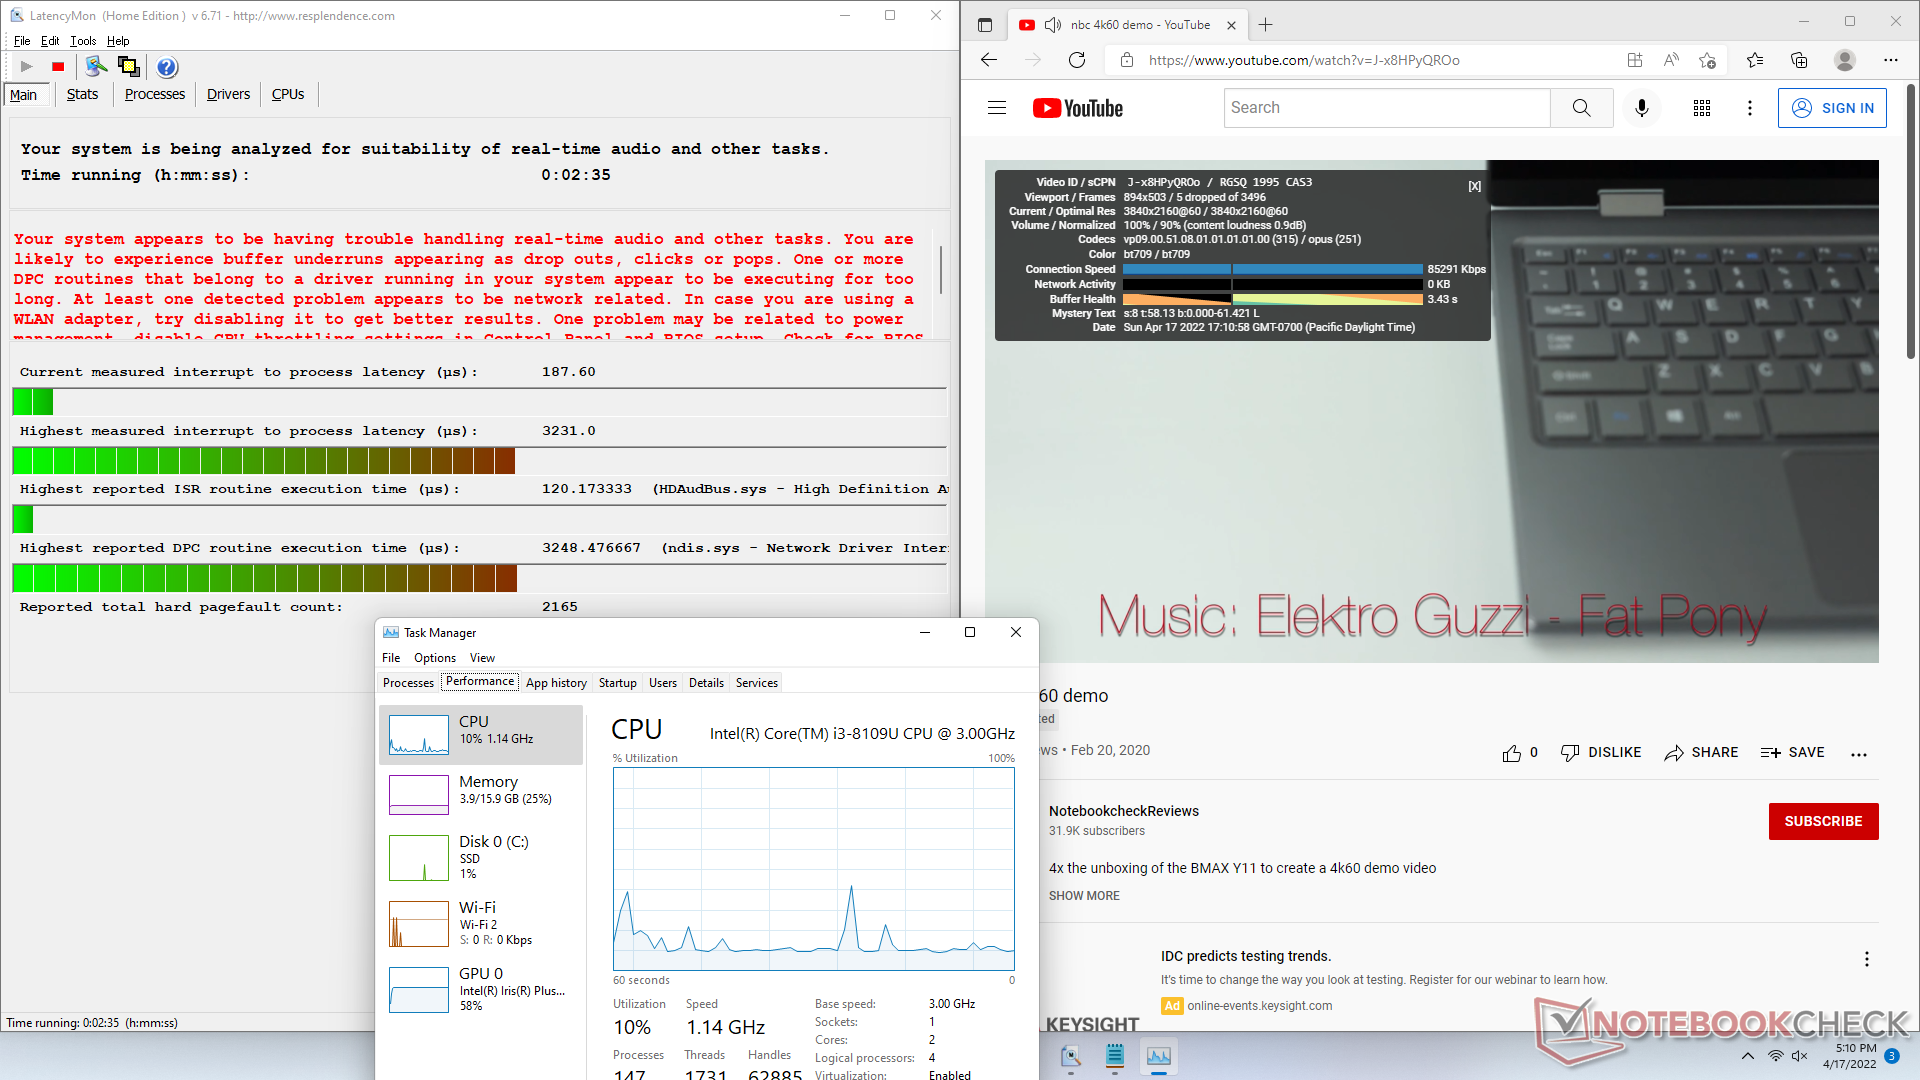
LatencyMon reveals DPC issues when opening multiple browser tabs of our homepage. 4K video playback is mostly smooth with just 5 dropped frames during our minute-long video test.
| DPC Latencies / LatencyMon - interrupt to process latency (max), Web, Youtube, Prime95 | |
| Beelink SEi8 | |
| Beelink SEi10 | |
| GMK NucBox 2 | |
| Intel NUC11TNKi5 | |
| Beelink SER4 | |
* ... smaller is better
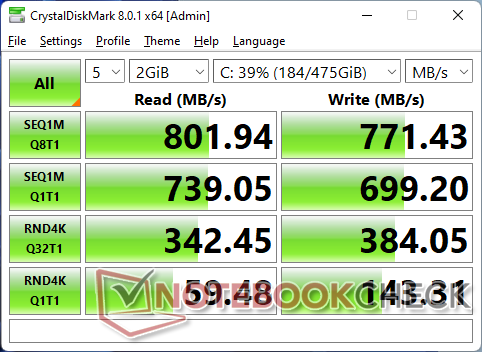
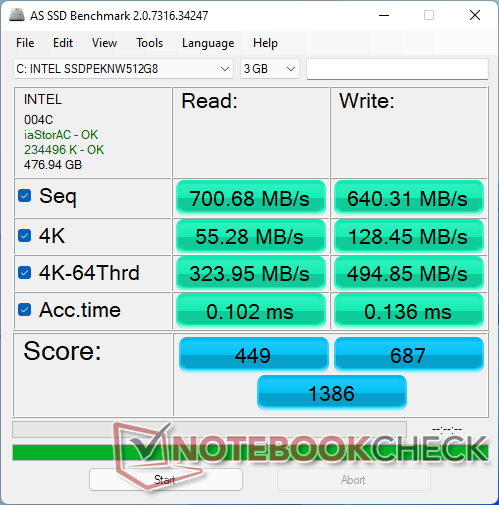
Storage Devices
Our unit comes configured with a budget 512 GB Intel 660p NVMe SSD. Though the drive itself is capable of sequential read and write rates of up to 1500 MB/s and 1000 MB/s, respectively, we're only able to record maximums of 800 MB/s on our SEi8.

| Drive Performance rating - Percent | |
| Beelink SER4 | |
| GMK NucBox 2 | |
| Beelink SEi8 | |
| Beelink SEi10 | |
| Intel NUC11TNKi5 | |
* ... smaller is better
Disk Throttling: DiskSpd Read Loop, Queue Depth 8
GPU Performance
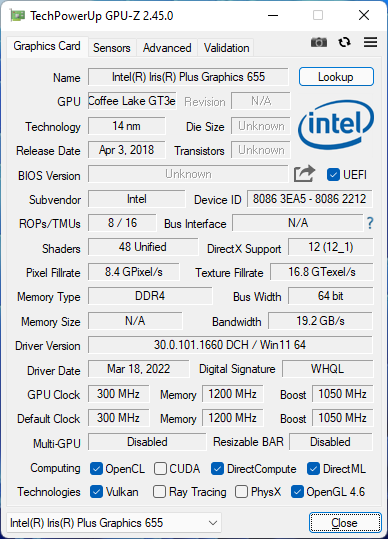
Raw graphics performance from the Iris Plus 655 is roughly 40 to 50 percent faster than the average UHD Graphics 620 as found on many older Intel-powered mini PCs prior to 10th gen Ice Lake. The boost in performance is respectable for tasks like streaming and 4K video playback, but it is nowhere near enough for gaming purposes. Witcher 3, for example, would have issues launching on our test unit even after updating all Windows and graphics drivers.
Since our test unit shipped with single-channel memory only, results will likely be faster than what we've recorded below if configured with dual-channel memory instead.
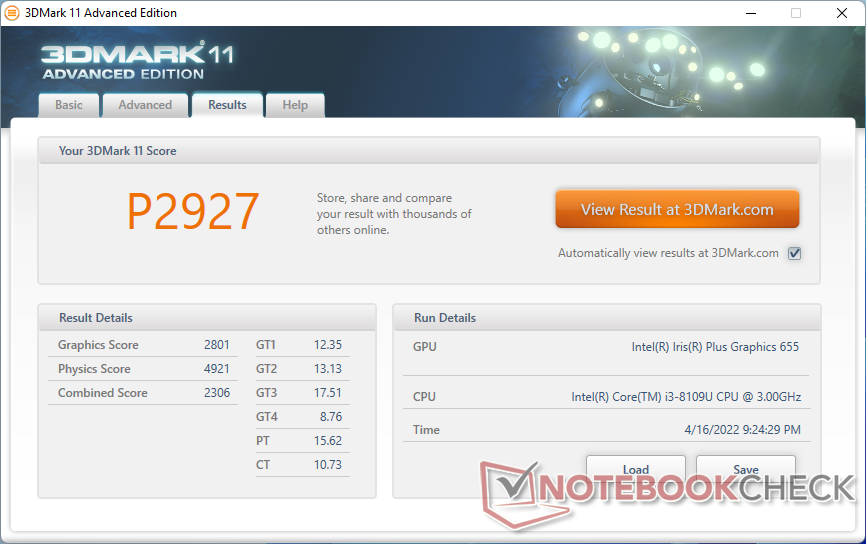
| 3DMark 11 Performance | 2927 points | |
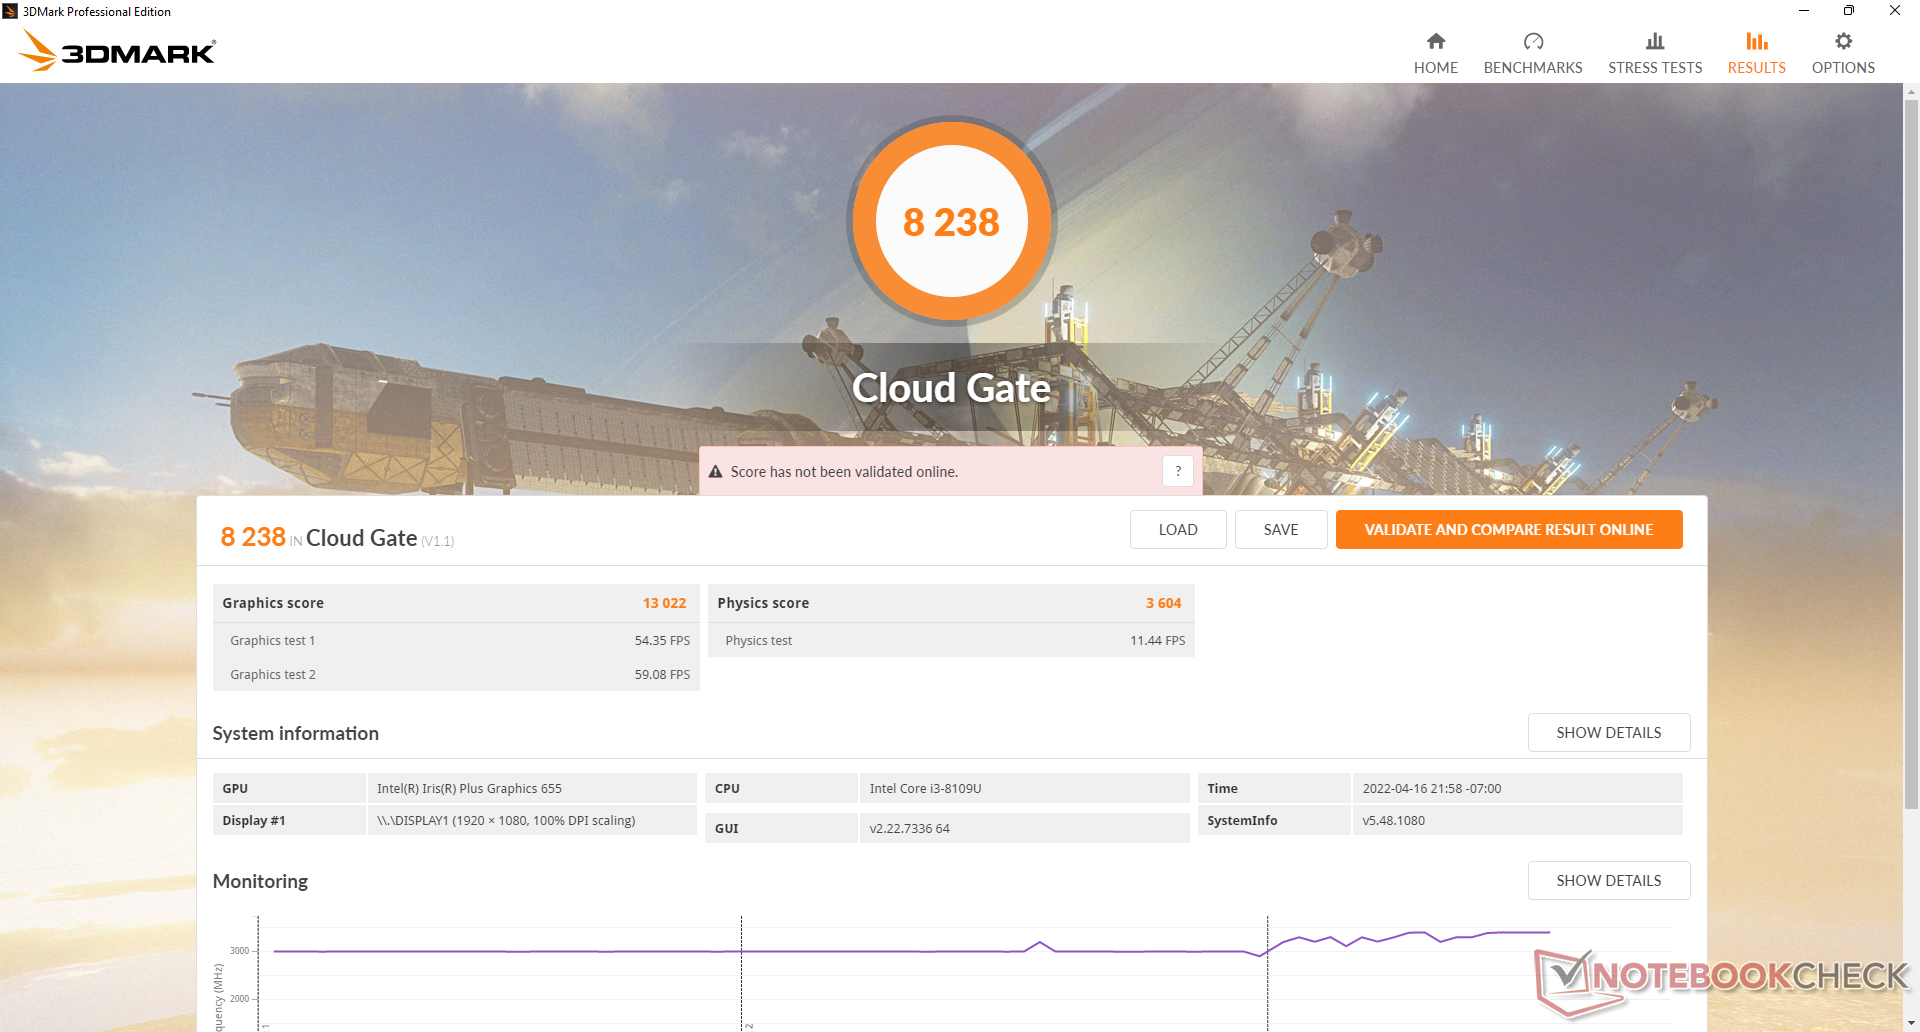
| 3DMark Cloud Gate Standard Score | 8238 points | |
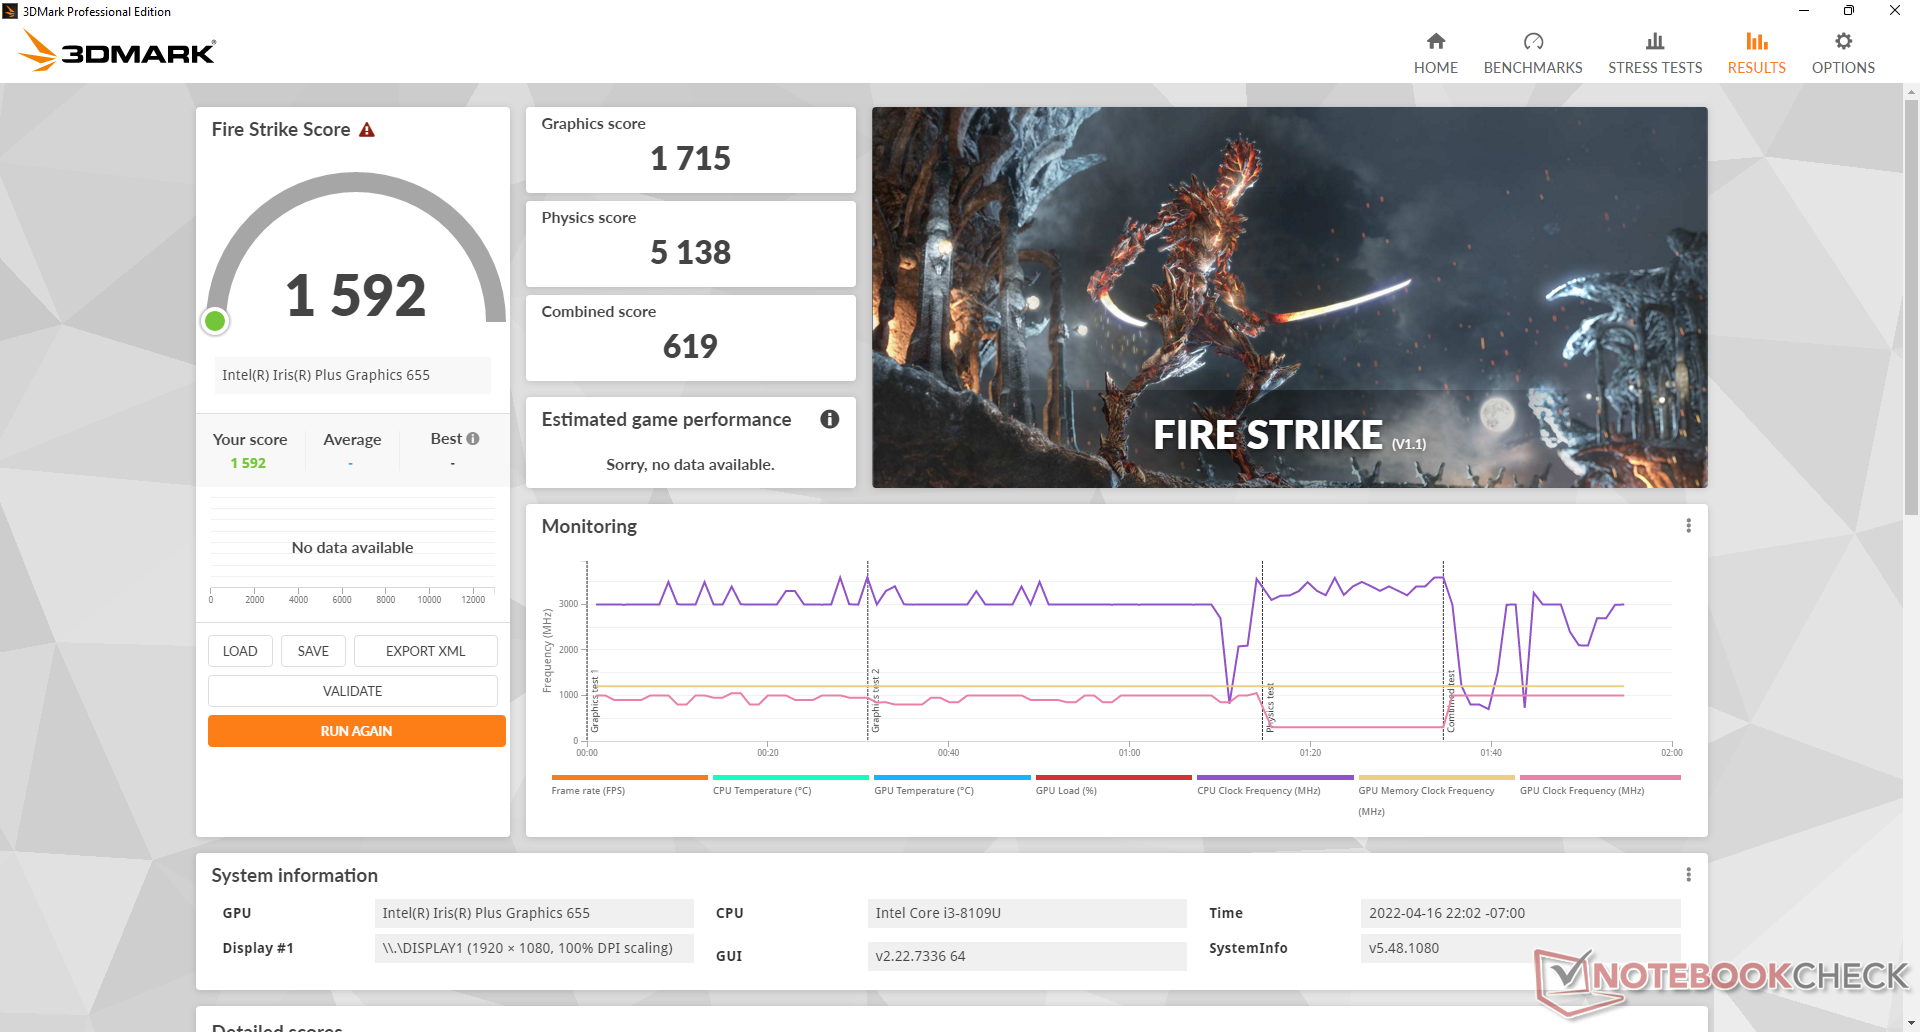
| 3DMark Fire Strike Score | 1592 points | |
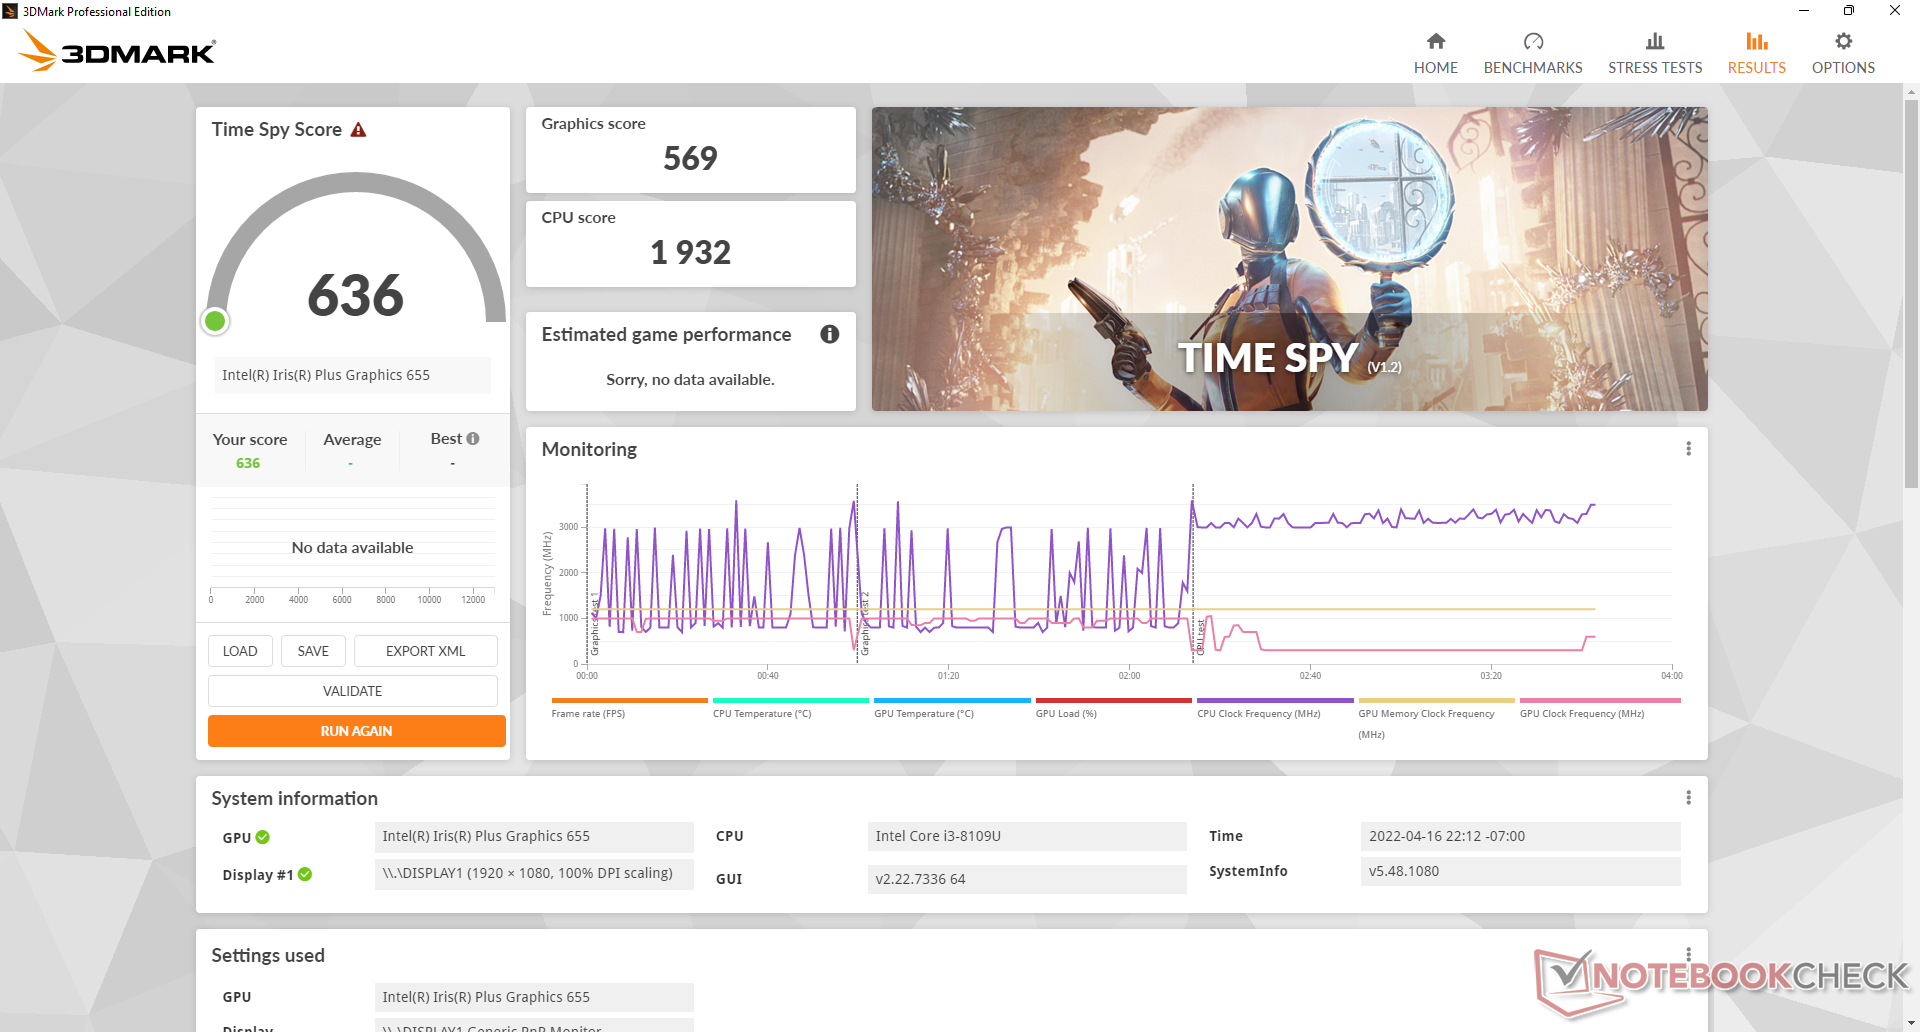
| 3DMark Time Spy Score | 636 points | |
Help | ||
| Final Fantasy XV Benchmark | |
| 1280x720 Lite Quality | |
| Beelink SER4 | |
| Intel NUC11TNKi5 | |
| GMK NucBox 2 | |
| Intel NUC8i7BE | |
| Beelink SEi8 | |
| Average Intel Iris Plus Graphics 655 (9.11 - 18.1, n=8) | |
| Beelink U59 | |
| GMK NucBox 3 | |
| 1920x1080 Standard Quality | |
| Beelink SER4 | |
| Intel NUC11TNKi5 | |
| GMK NucBox 2 | |
| Average Intel Iris Plus Graphics 655 (7.88 - 9.73, n=4) | |
| Beelink SEi8 | |
| 1920x1080 High Quality | |
| Beelink SER4 | |
| Intel NUC11TNKi5 | |
| Beelink SEi8 | |
| GMK NucBox 2 | |
| Average Intel Iris Plus Graphics 655 (5.25 - 6.55, n=4) | |
| low | med. | high | ultra | |
|---|---|---|---|---|
| Dota 2 Reborn (2015) | 94.4 | 34.6 | 25.3 | 22.7 |
| Final Fantasy XV Benchmark (2018) | 16.6 | 8.8 | 6.08 | |
| X-Plane 11.11 (2018) | 22.4 | 15 | 12.3 |
Emissions
System Noise
Fan noise is largely binary in the sense that RPMs tend to fluctuate between minimum and maximum with very little steps in between. In other words, expect the fan to go from quiet to noisy quite frequently when multi-tasking or launching applications. It's not as bad as on the more powerful Beelink GTi11 series or SER4, but the fan noise changes are nonetheless more noticeable and frequent when compared to a NUC.
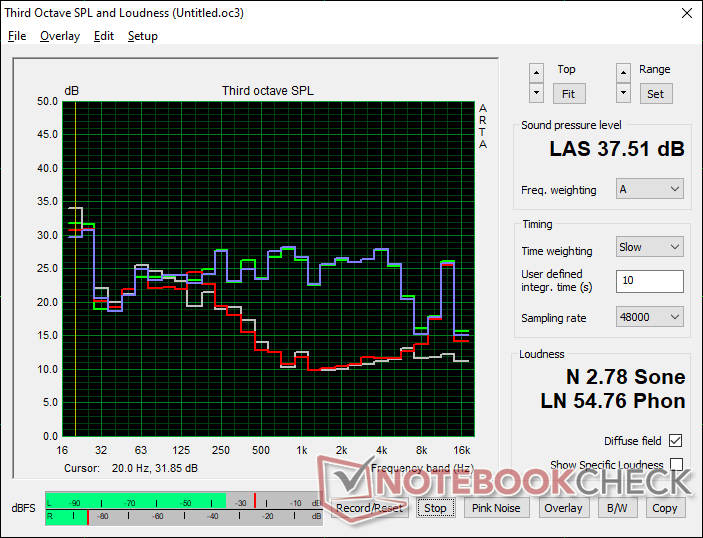
Noise level
| Idle |
| 26.5 / 26.5 / 31.1 dB(A) |
| Load |
| 37.7 / 37.5 dB(A) |
 | ||
30 dB silent 40 dB(A) audible 50 dB(A) loud |
||
min: | ||
| Beelink SEi8 Iris Plus Graphics 655, i3-8109U, Intel SSD 660p SSDPEKNW512G8 | Beelink SEi10 UHD Graphics G1 (Ice Lake 32 EU), i3-1005G1, Silicon Motion AZW 256G M.2280 NVMe 4X 200725 D | Beelink SER4 Vega 8, R7 4800U, Intel SSD 660p SSDPEKNW512G8 | Intel NUC11TNKi5 Iris Xe G7 80EUs, i5-1135G7, Transcend M.2 SSD 430S TS512GMTS430S | Intel NUC8i7BE Iris Plus Graphics 655, i7-8559U | GMK NucBox 2 Iris Plus Graphics 655, i5-8259U, Netac S930E8/256GPN | |
|---|---|---|---|---|---|---|
| Noise | -17% | -11% | -18% | -9% | 5% | |
| off / environment * (dB) | 24.5 | 27.5 -12% | 23.4 4% | 24.8 -1% | 28.7 -17% | 25.6 -4% |
| Idle Minimum * (dB) | 26.5 | 30.9 -17% | 33.2 -25% | 35.6 -34% | 28.7 -8% | 25.7 3% |
| Idle Average * (dB) | 26.5 | 33.5 -26% | 33.2 -25% | 35.6 -34% | 29.3 -11% | 25.7 3% |
| Idle Maximum * (dB) | 31.1 | 33.5 -8% | 33.2 -7% | 35.6 -14% | 31.8 -2% | 25.7 17% |
| Load Average * (dB) | 37.7 | 38.5 -2% | 38.6 -2% | 36.2 4% | 39 -3% | 35.3 6% |
| Load Maximum * (dB) | 37.5 | 51.6 -38% | 40.8 -9% | 47.6 -27% | 41.4 -10% | 35.1 6% |
| Witcher 3 ultra * (dB) | 39.2 | 38 | 39 |
* ... smaller is better
Temperature
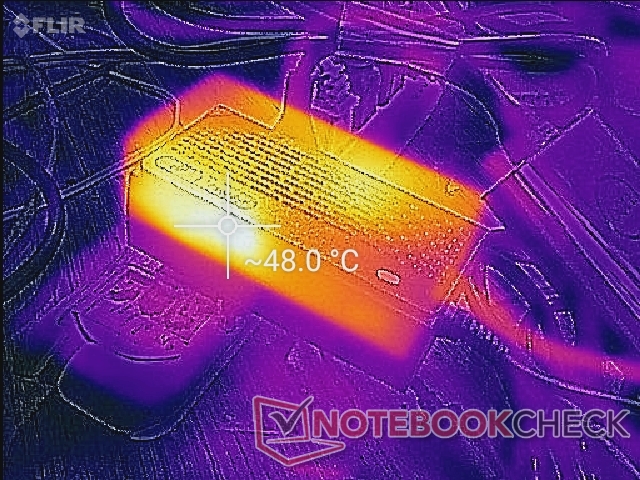
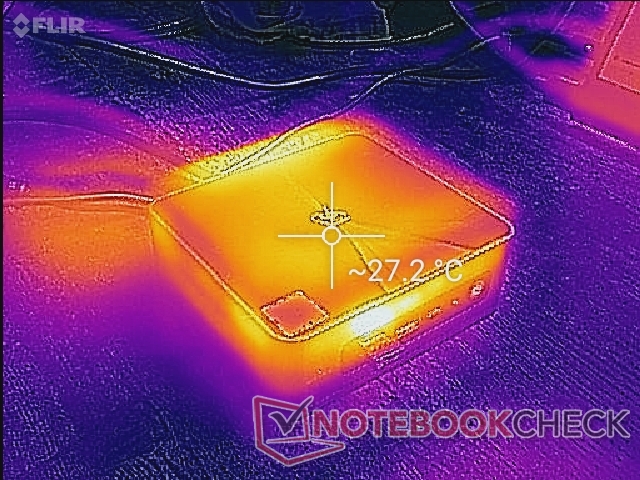
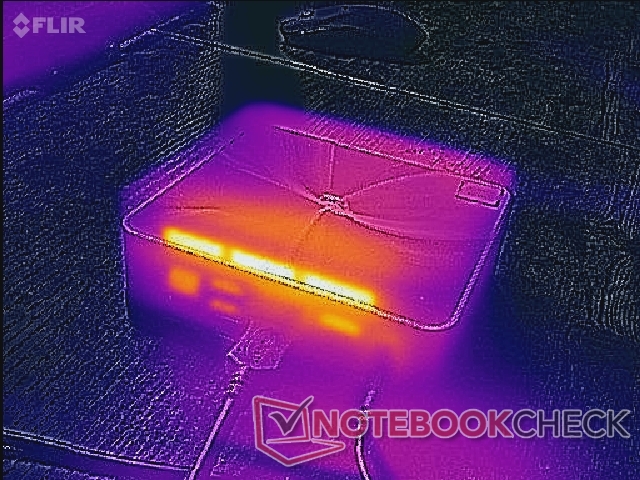
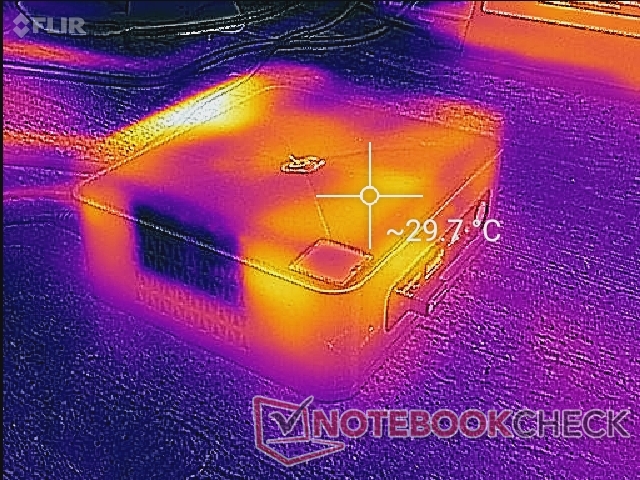
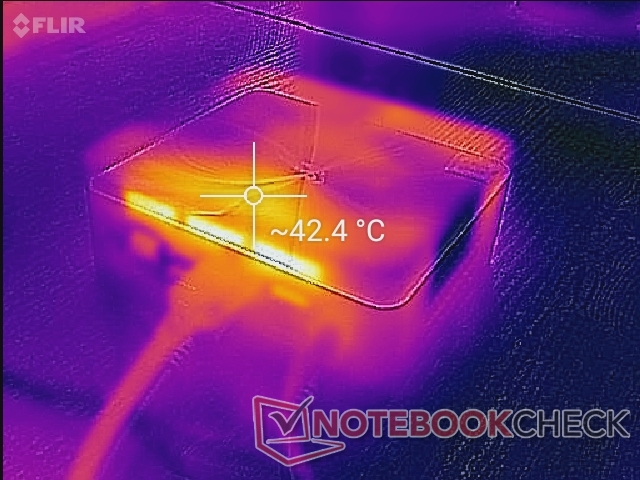
Unlike the more powerful SER4, the SEi8 has no ventilation grilles on the top surface and so users can safely place papers and other objects on top without impacting cooling. The air intake vents are only along the two sides of the chassis. The hot spot can reach over 42 C on the top closest to the rear and next to the exhaust grilles.
Stress Test
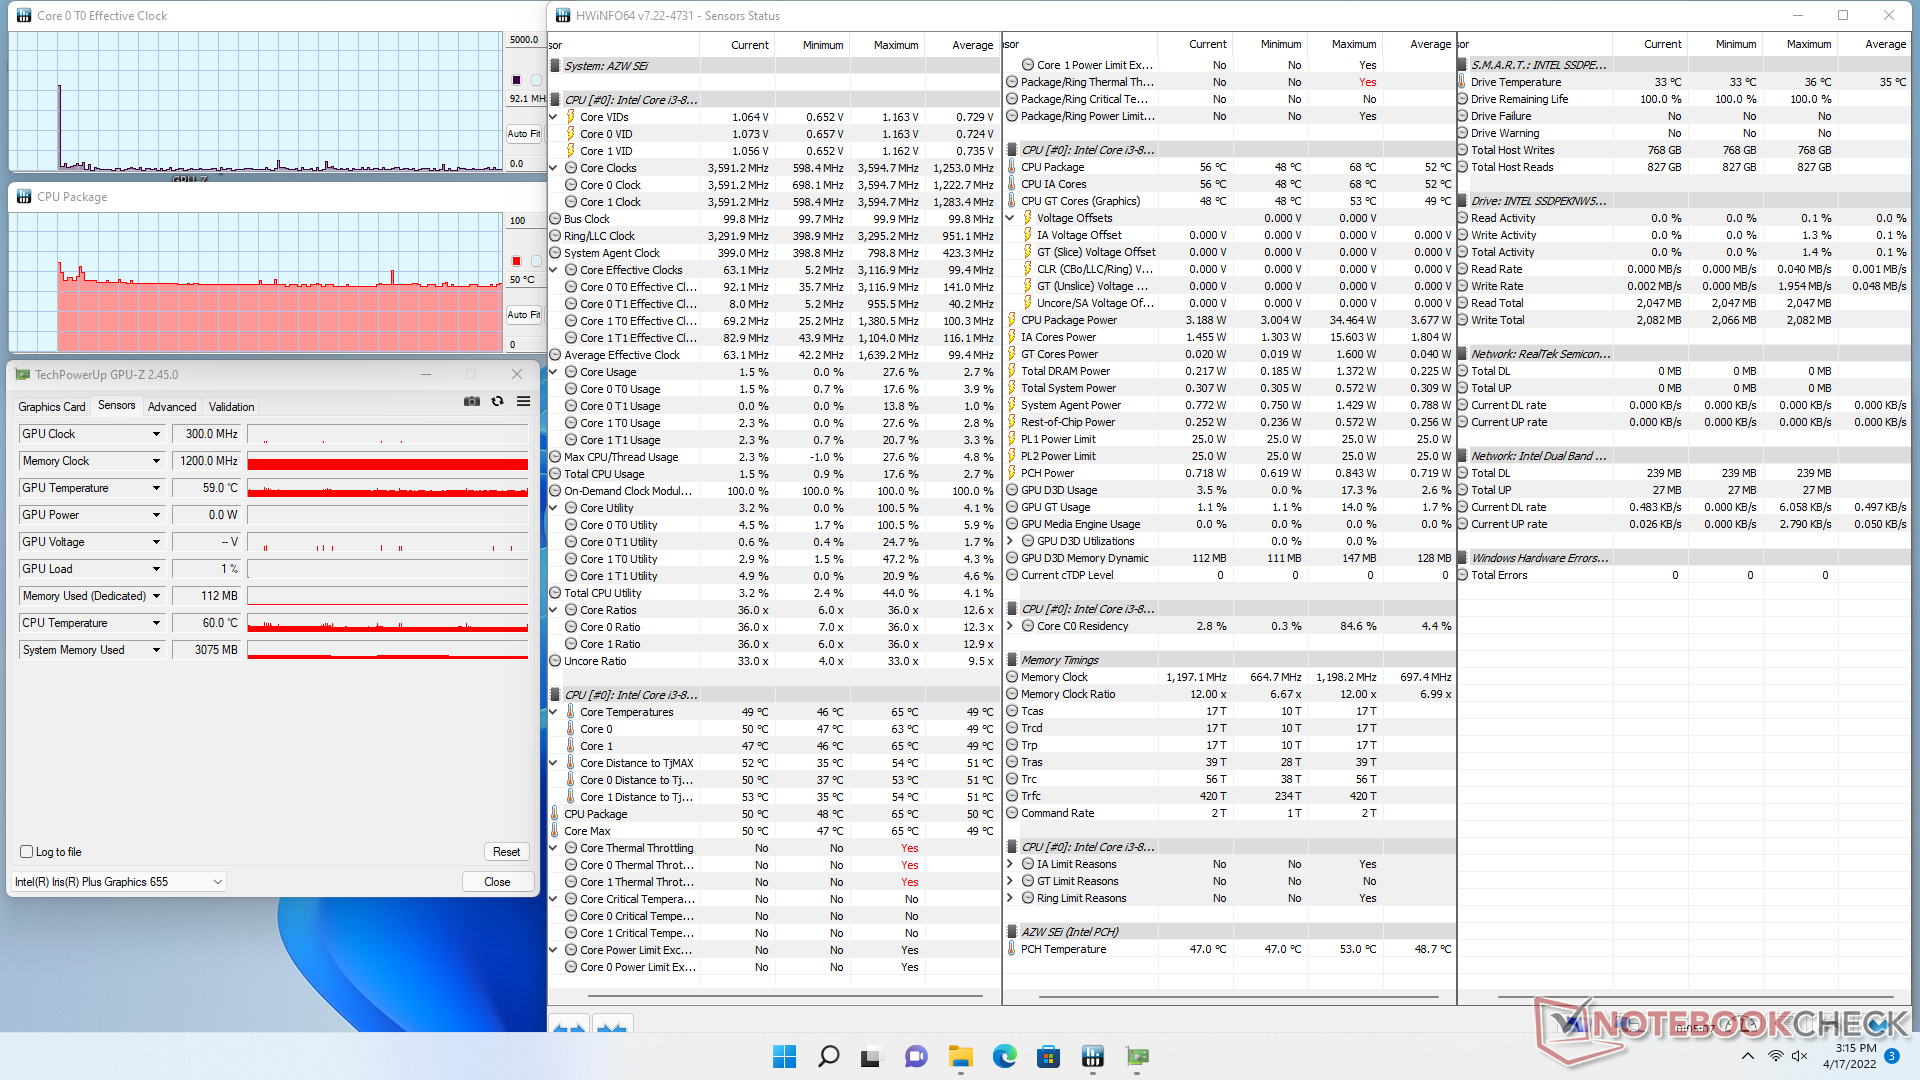
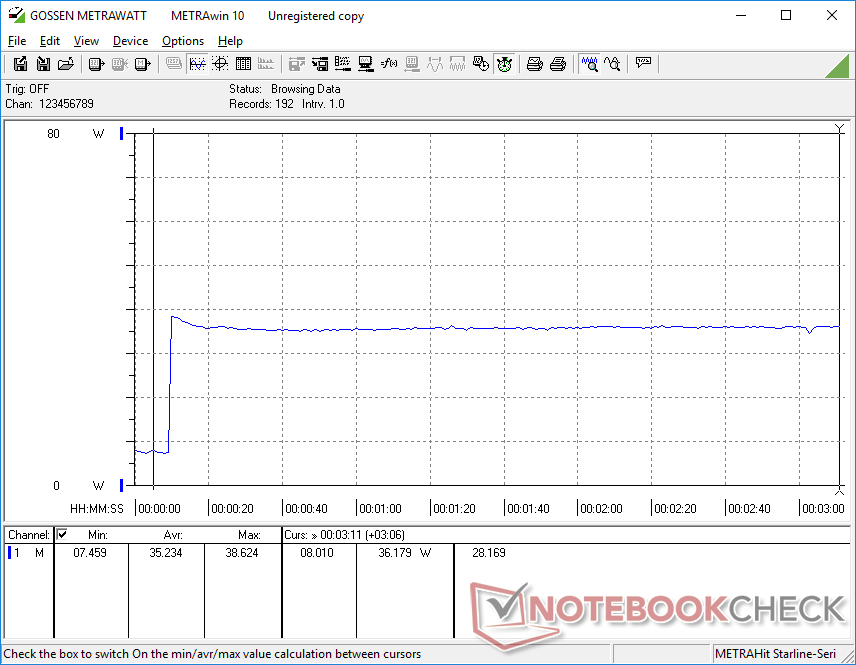
When running Prime95, the CPU would boost to 2.9 GHz before stabilizing at 2.8 GHz and 70 C. CPU package power would also be as high as 34.4 W during the start of the test before falling and stabilizing at 19.4 W. Running this same test on the SEi10 with the newer 10th gen Core i3-1005G1 would see both higher clock rates and core temperatures of 3.4 GHz and 90 C, respectively.
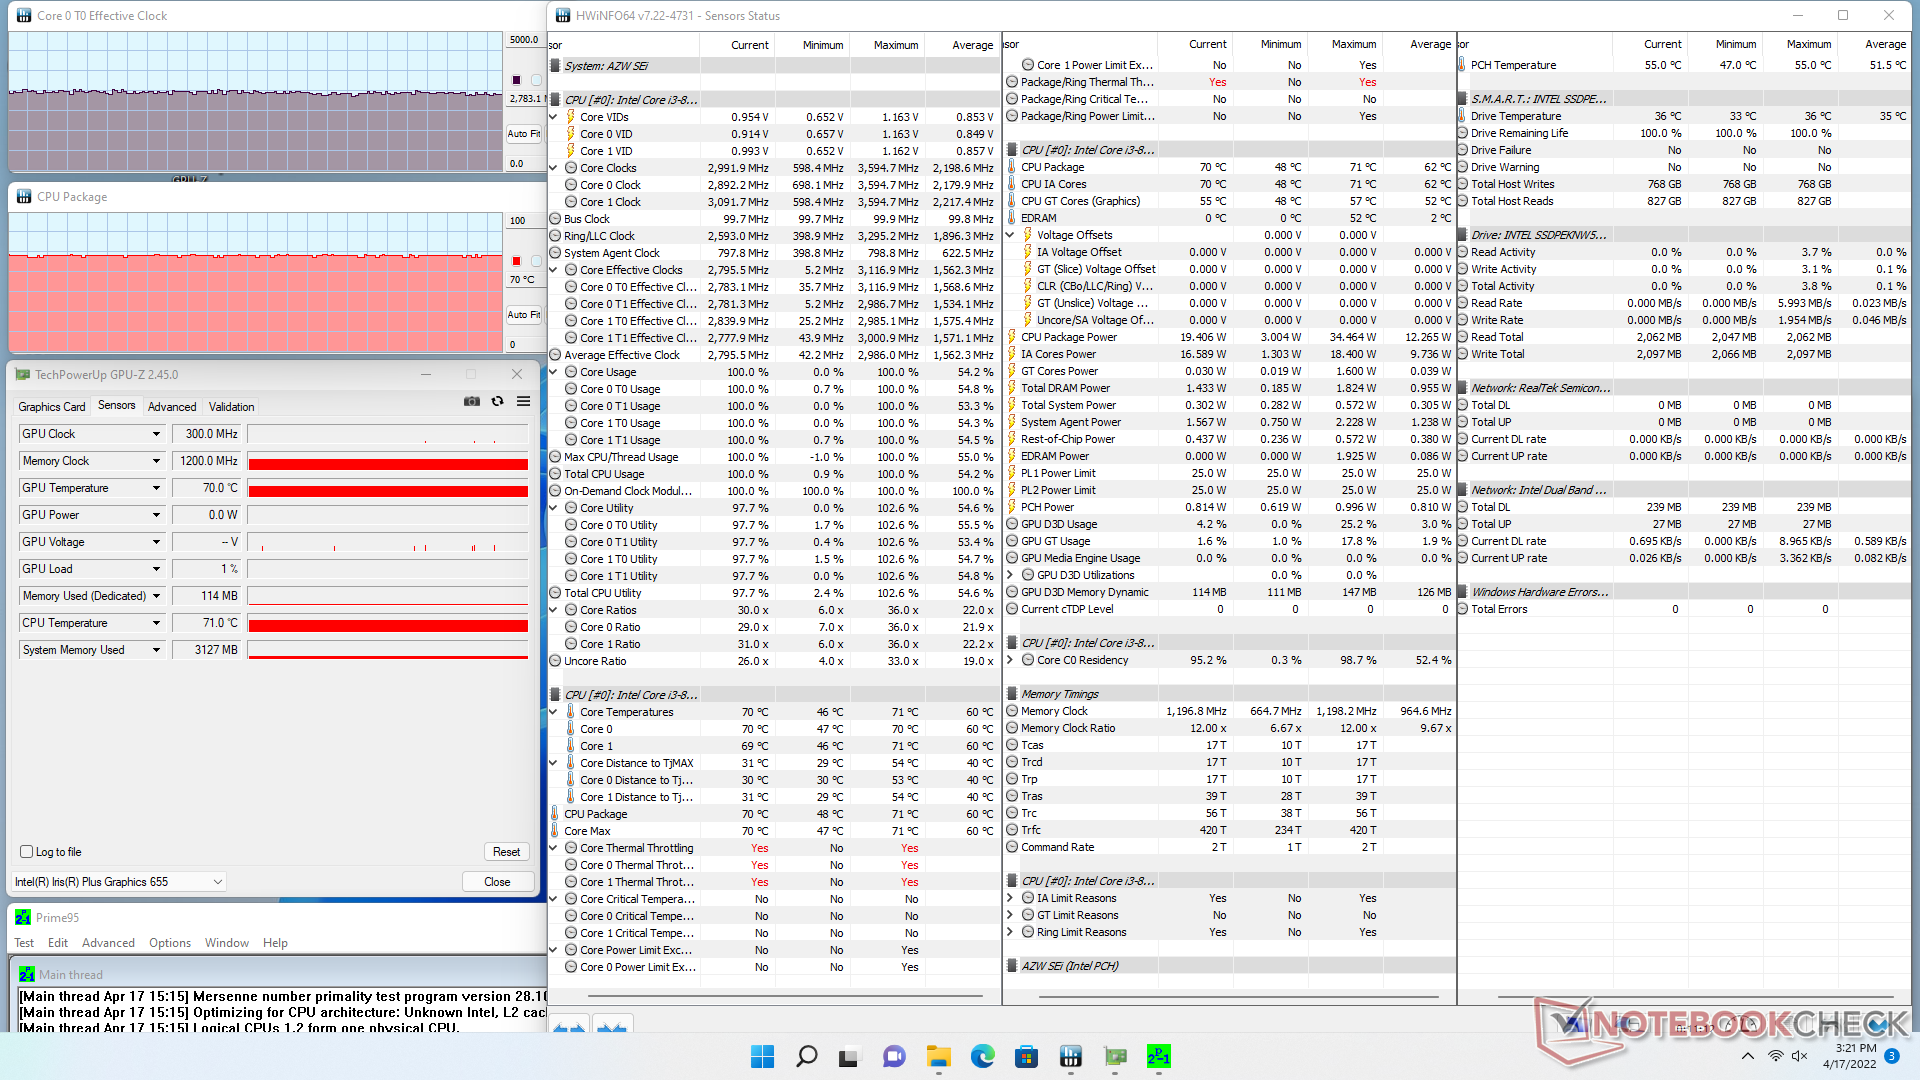
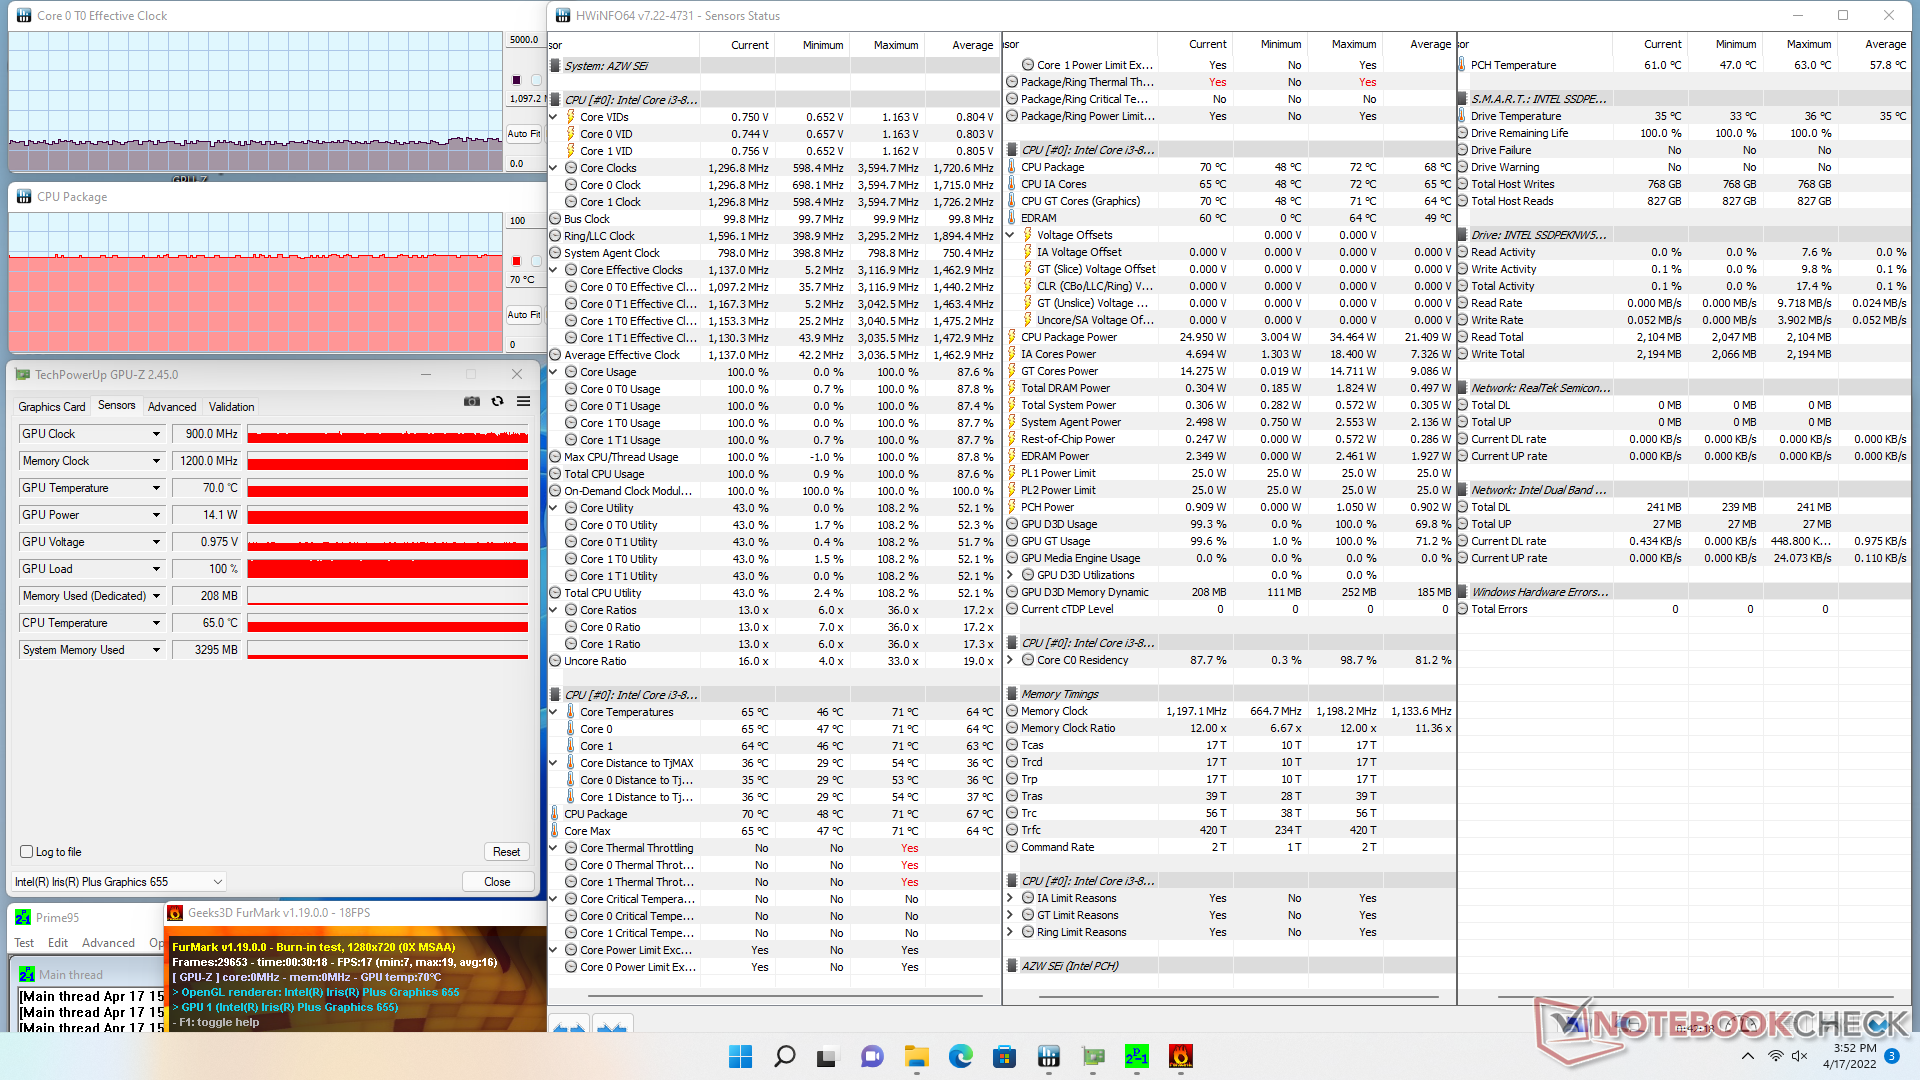
| CPU Clock (GHz) | GPU Clock (MHz) | Average CPU Temperature (°C) | |
| System Idle | -- | -- | 50 |
| Prime95 Stress | 2.8 | -- | 70 |
| Prime95 + FurMark Stress | 1.1 | 900 | 70 |
Energy Management
Power Consumption
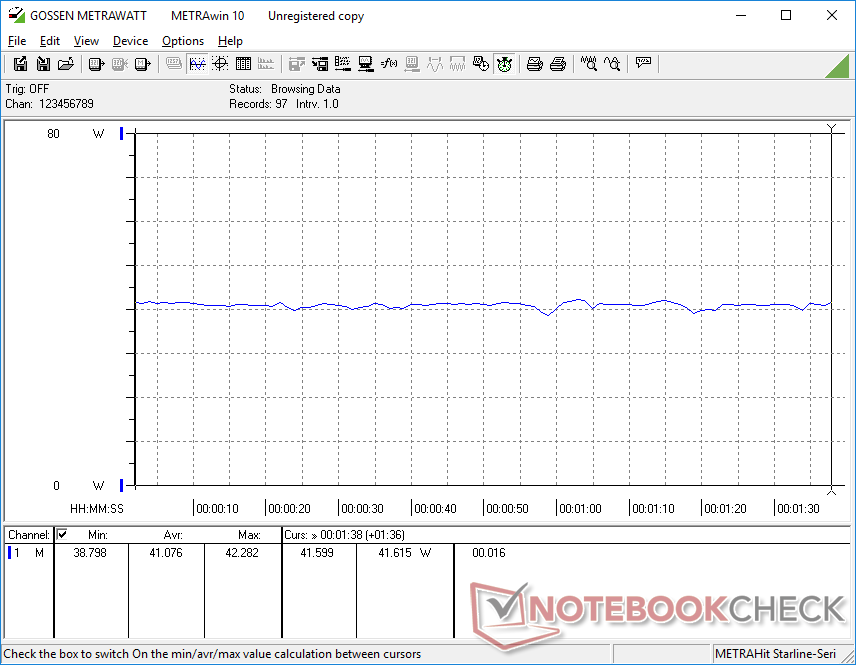
The SEi8 consumes about as much power as the NUC 11 with newer 11th gen CPUs despite the performance advantages of the 11th gen CPU series. This is due to the 8th gen series being much less optimized especially in terms of integrated graphics performance. For higher performance-per-watt, users will want to consider the SEi8 with the Core i5-8279U or SEi10 series instead.
Expect the system to consume just over 40 W when running demanding loads.

| Off / Standby | |
| Idle | |
| Load |
|
Key:
min: | |
| Beelink SEi8 i3-8109U, Iris Plus Graphics 655, Intel SSD 660p SSDPEKNW512G8, , x, | Beelink SEi10 i3-1005G1, UHD Graphics G1 (Ice Lake 32 EU), Silicon Motion AZW 256G M.2280 NVMe 4X 200725 D, , x, | Beelink SER4 R7 4800U, Vega 8, Intel SSD 660p SSDPEKNW512G8, , x, | Intel NUC11TNKi5 i5-1135G7, Iris Xe G7 80EUs, Transcend M.2 SSD 430S TS512GMTS430S, , x, | Intel NUC8i7BE i7-8559U, Iris Plus Graphics 655, , , x, | GMK NucBox 2 i5-8259U, Iris Plus Graphics 655, Netac S930E8/256GPN, , x, | |
|---|---|---|---|---|---|---|
| Power Consumption | 16% | 32% | -47% | 4% | 3% | |
| Idle Minimum * (Watt) | 7.5 | 6.3 16% | 4.1 45% | 11.5 -53% | 2.7 64% | 6.1 19% |
| Idle Average * (Watt) | 7.6 | 6.6 13% | 4.1 46% | 12.4 -63% | 3.1 59% | 6.8 11% |
| Idle Maximum * (Watt) | 9.2 | 6.7 27% | 4.6 50% | 12.9 -40% | 6.3 32% | 7.3 21% |
| Load Average * (Watt) | 41.1 | 25.9 37% | 35.6 13% | 40.7 1% | 59.7 -45% | 46.3 -13% |
| Load Maximum * (Watt) | 41.4 | 46.7 -13% | 39.9 4% | 73.5 -78% | 78 -88% | 50.7 -22% |
| Witcher 3 ultra * (Watt) | 35.6 | 43.9 | 47.2 |
* ... smaller is better
Power Consumption Witcher 3 / Stresstest
Pros
Cons
Verdict
Much like most other Beelink mini PCs, the low price of the SEi8 is its biggest advantage when compared to the competition. A fully loaded SEi8 with the Core i3-3109U CPU, 16 GB RAM, licensed Windows 11 Pro, and 256 GB NVMe SSD retails for about $380 USD while a barebones Intel NUC8I3BEK with the exact same processor but in a barebones configuration can be found online for $350.
For a four-year old processor, the Core i3-8109U is just fast enough for basic HTPC applications like browsing, streaming, OS navigation, and light multi-tasking without the constant slowdowns commonly experienced on weaker Celeron-based or Atom-based solutions. If you're trying to go as cheap as possible while minimizing the impact on the UI experience, then the SEi8 Core i3 should be near the top of your list. Moving up to the SEi8 Core i5 will boost performance significantly without too much of a price increase for users who need a faster processor with longer legs and more multi-tasking potential.
Notable drawbacks to the Intel NUC include the thinner chassis materials, slower WLAN module, shorter warranty, more frequent fan pulsing, no SD card reader, and more limited BIOS options. Thankfully, the cut corners aren't enough to be a deal breaker for the target budget HTPC setup.
Price and Availability
Beelink is now shipping the SEi8 in multiple configurations starting at $319 USD. Alternatively, users can order from Amazon for $359 USD.
Price comparison
