Beelink U59 Mini-S mini PC review: The super inexpensive Intel NUC HTPC alternative
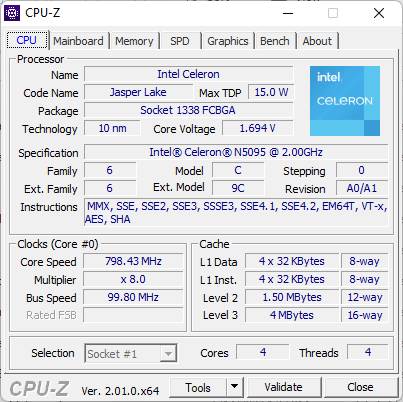
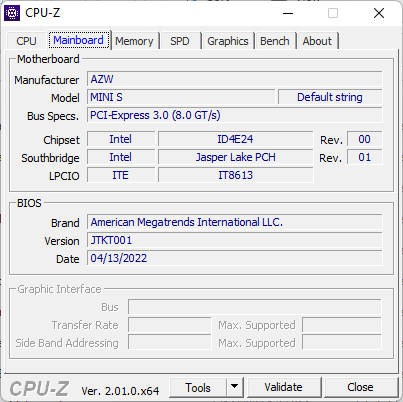
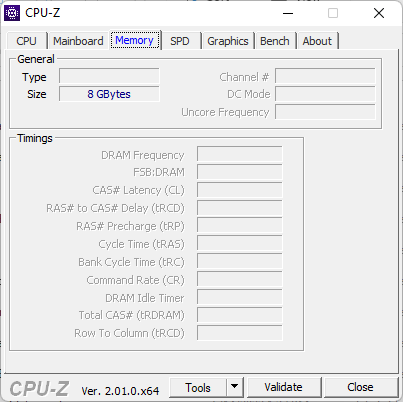
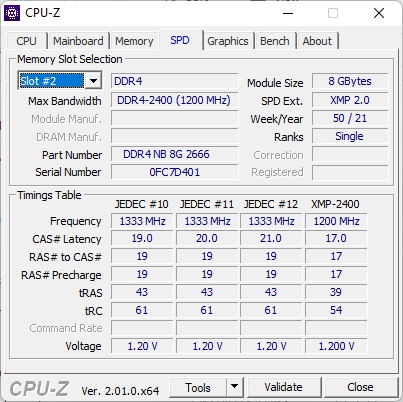
Beelink offers an extensive family of mini PCs ranging from the very inexpensive Celeron-powered U59 up to the insanely fast Ryzen 9 5900HX-powered GTR5. Our U59 Mini-S review model today sits in the lower-end of the spectrum sporting the Celeron N5095 CPU, just 8 GB of single-channel memory, and a 256 GB SSD for approximately $220 USD retail.
Alternatives to the U59 Mini-S include Atom or Celeron-powered mini PCs such as the Chuwi HeroBox, GMK NucBox K1, NucBox 3, or the Intel NUC 11 Essential. The U59 Mini-S in review should not be confused with the slightly more expensive original U59.
More Beelink reviews:
Potential Competitors in Comparison
Rating | Date | Model | Weight | Height | Size | Resolution | Price |
|---|---|---|---|---|---|---|---|
v (old) | 06 / 2022 | Beelink U59 Mini-S Celeron N5095, UHD Graphics (Jasper Lake 16 EU) | 279 g | 41 mm | x | ||
v (old) | 04 / 2022 | Beelink SEi8 i3-8109U, Iris Plus Graphics 655 | 346 g | 41 mm | x | ||
v (old) | 04 / 2021 | Intel NUC11TNKi5 i5-1135G7, Iris Xe G7 80EUs | 504 g | 37 mm | x | ||
v (old) | 11 / 2021 | Beelink U59 Celeron N5095, UHD Graphics (Jasper Lake 16 EU) | 329 g | 42 mm | x | ||
v (old) | 02 / 2022 | GMK NucBox 3 Celeron J4125, UHD Graphics 600 | 410 g | 32.5 mm | x | ||
v (old) | 10 / 2020 | Zotac ZBOX MI642 Nano i5-10210U, UHD Graphics 620 | 472 g | 51 mm | x |
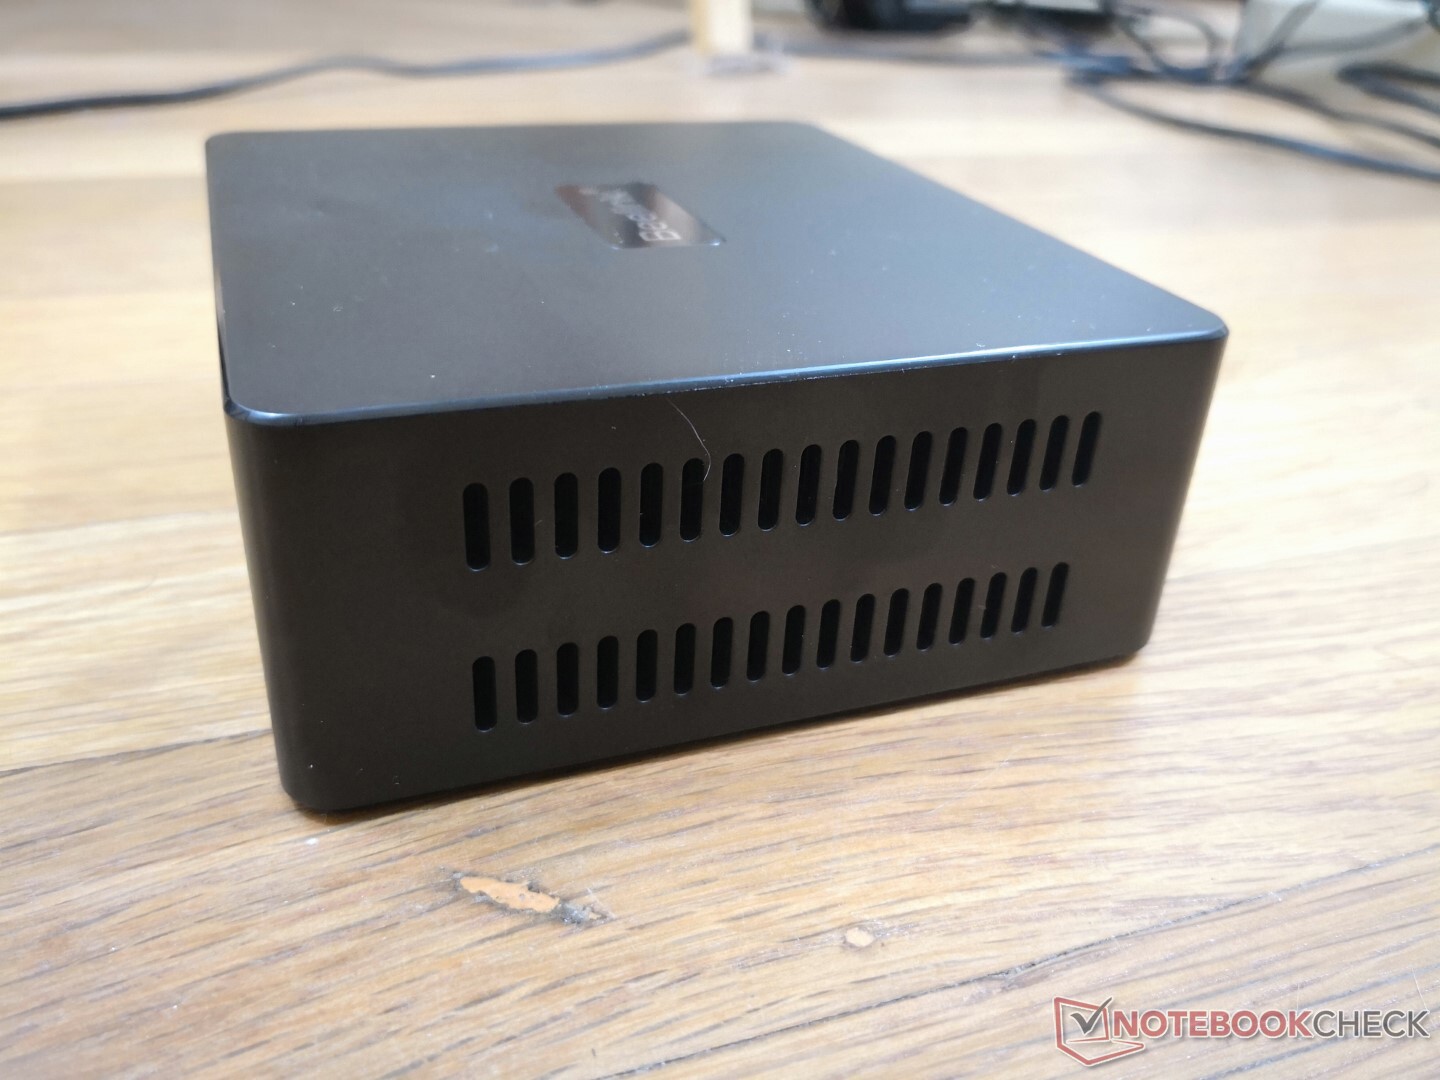
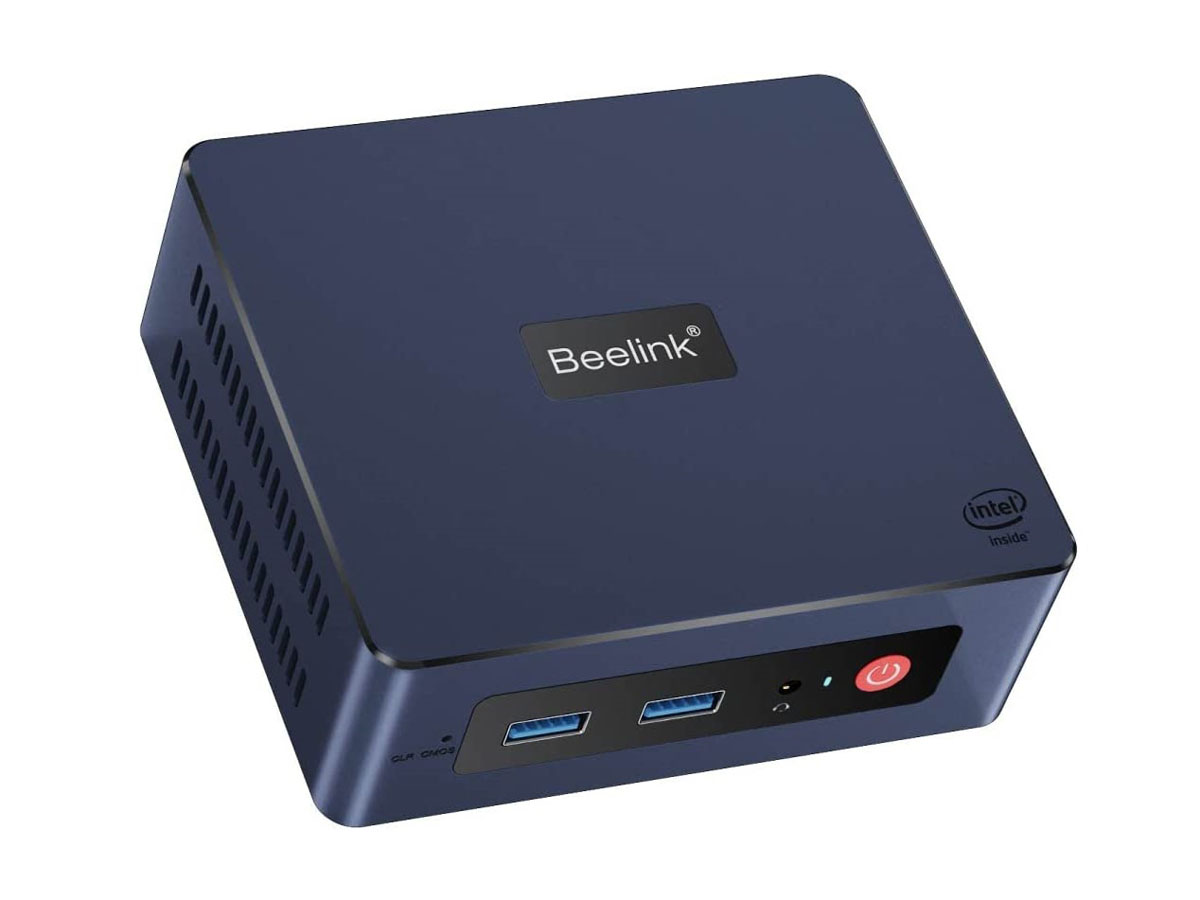
Case — Lighter Than It Looks
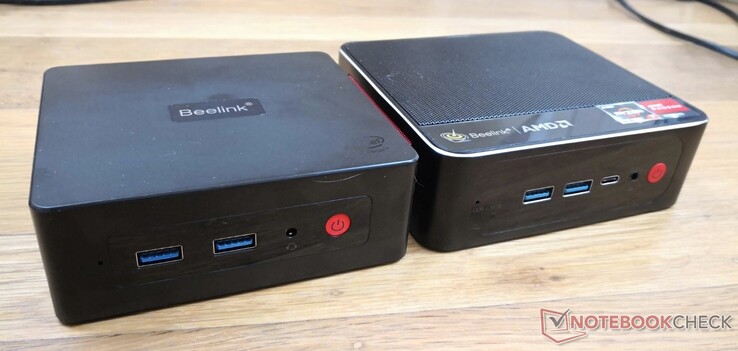
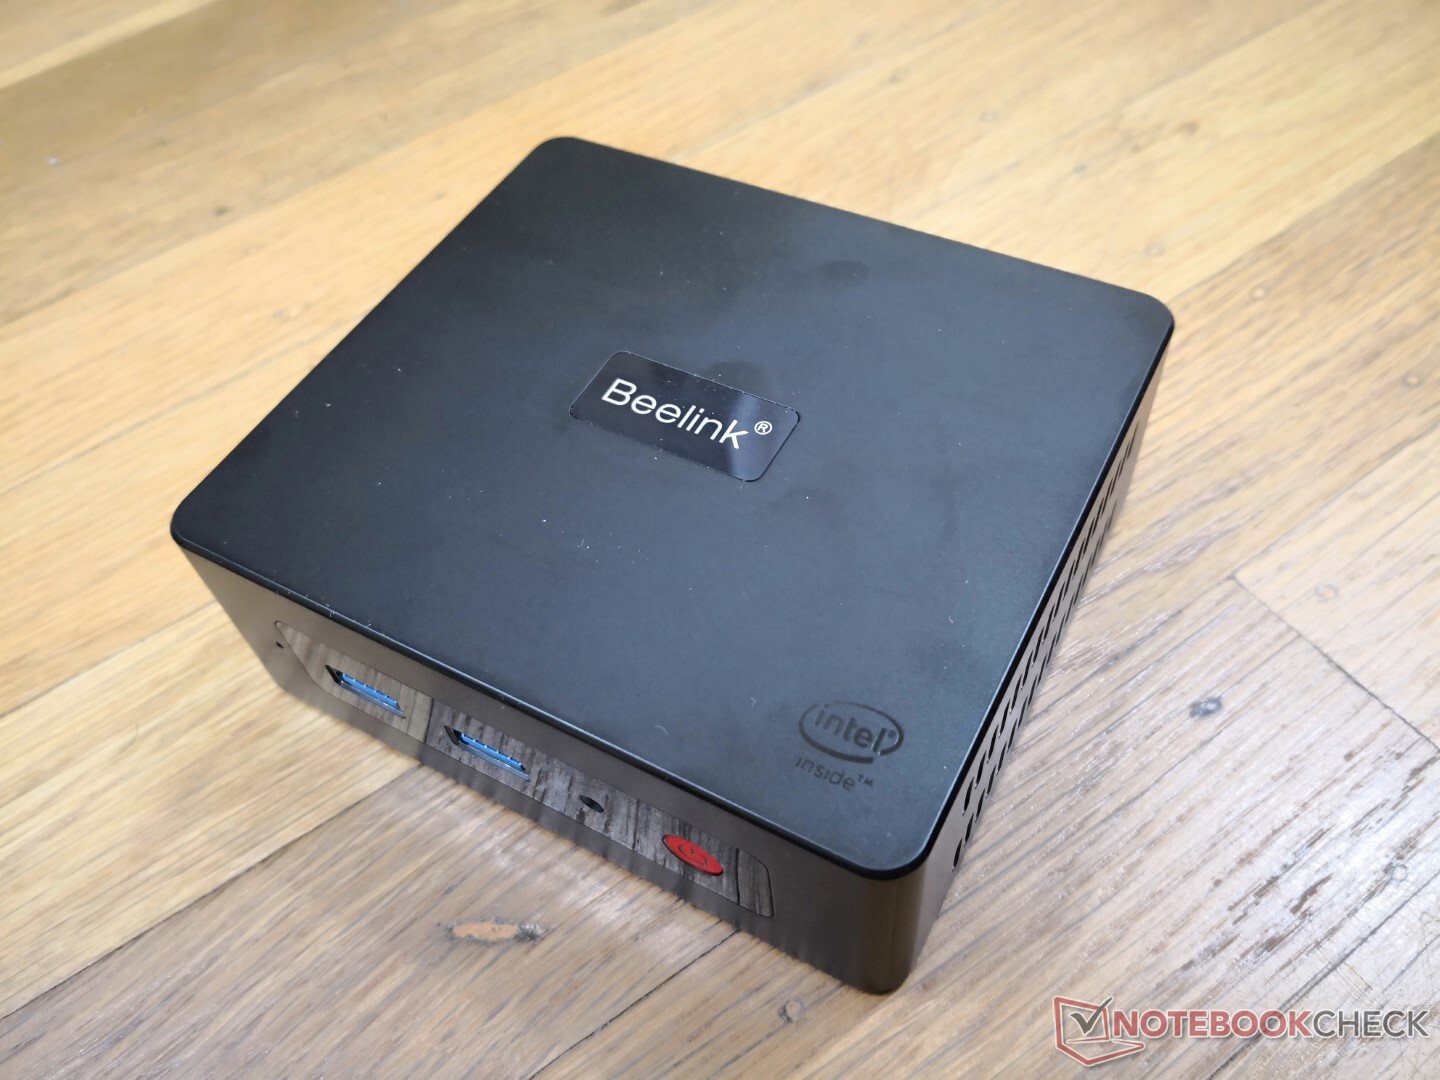
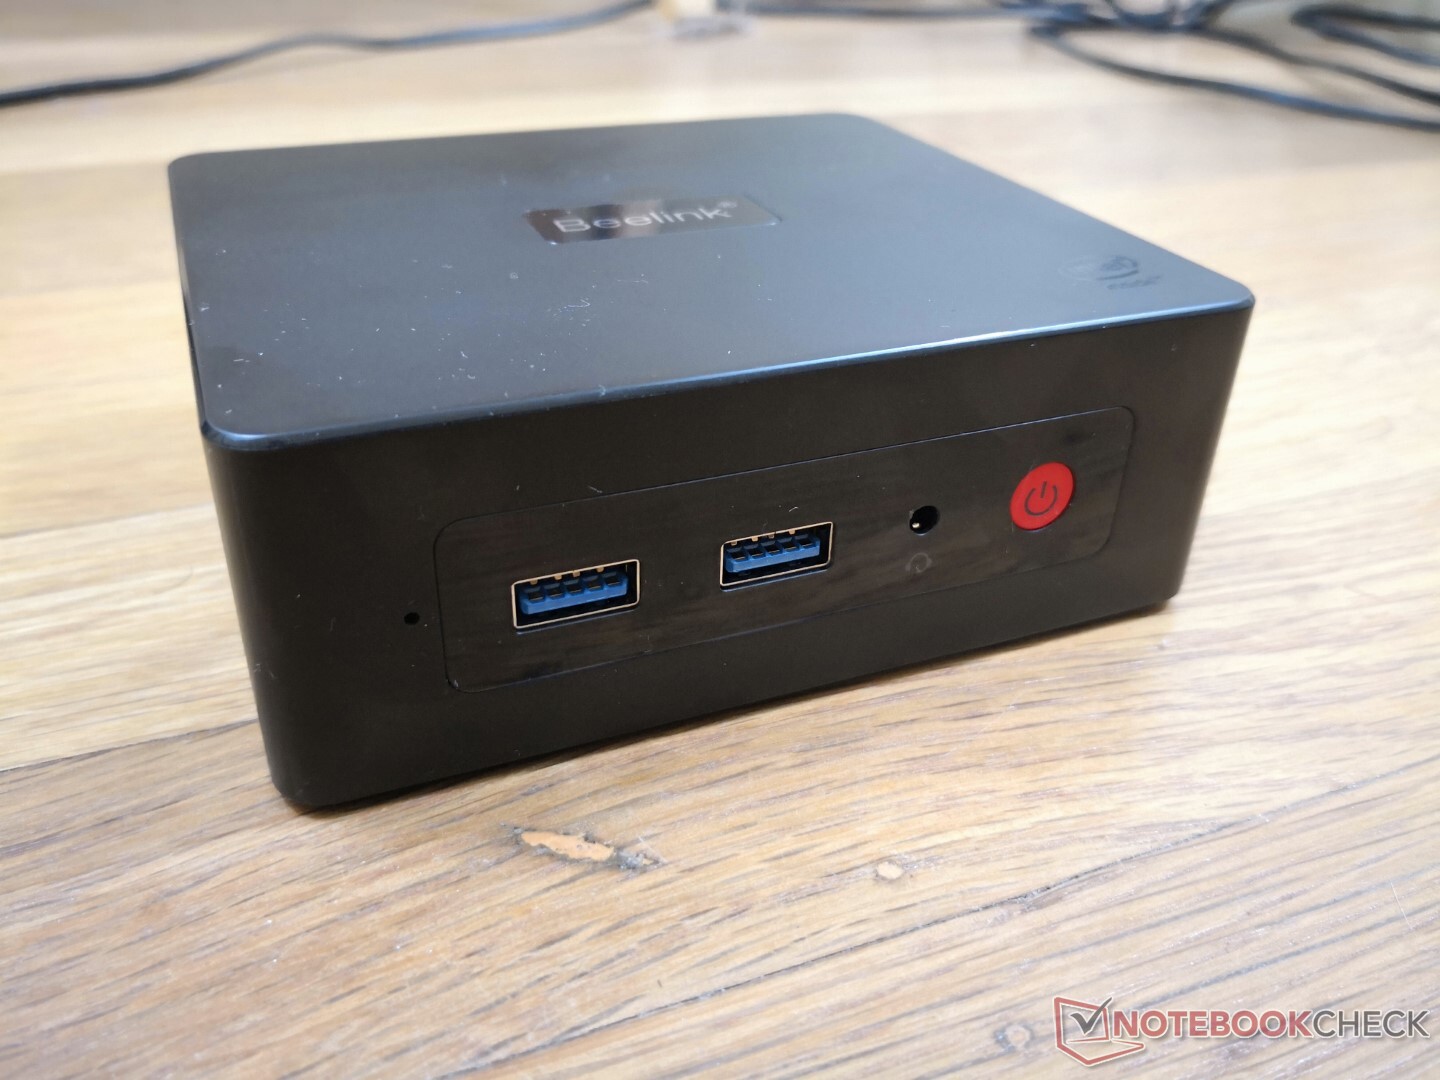
The chassis is nearly identical to the original U59 albeit with a few superficial differences. The top panel, for example, is now smooth matte instead of glossy which we believe is a smart change as the matte surface is more resistant to fingerprints and scuffs. The sides and bottom of the chassis are metal for strong first impressions.
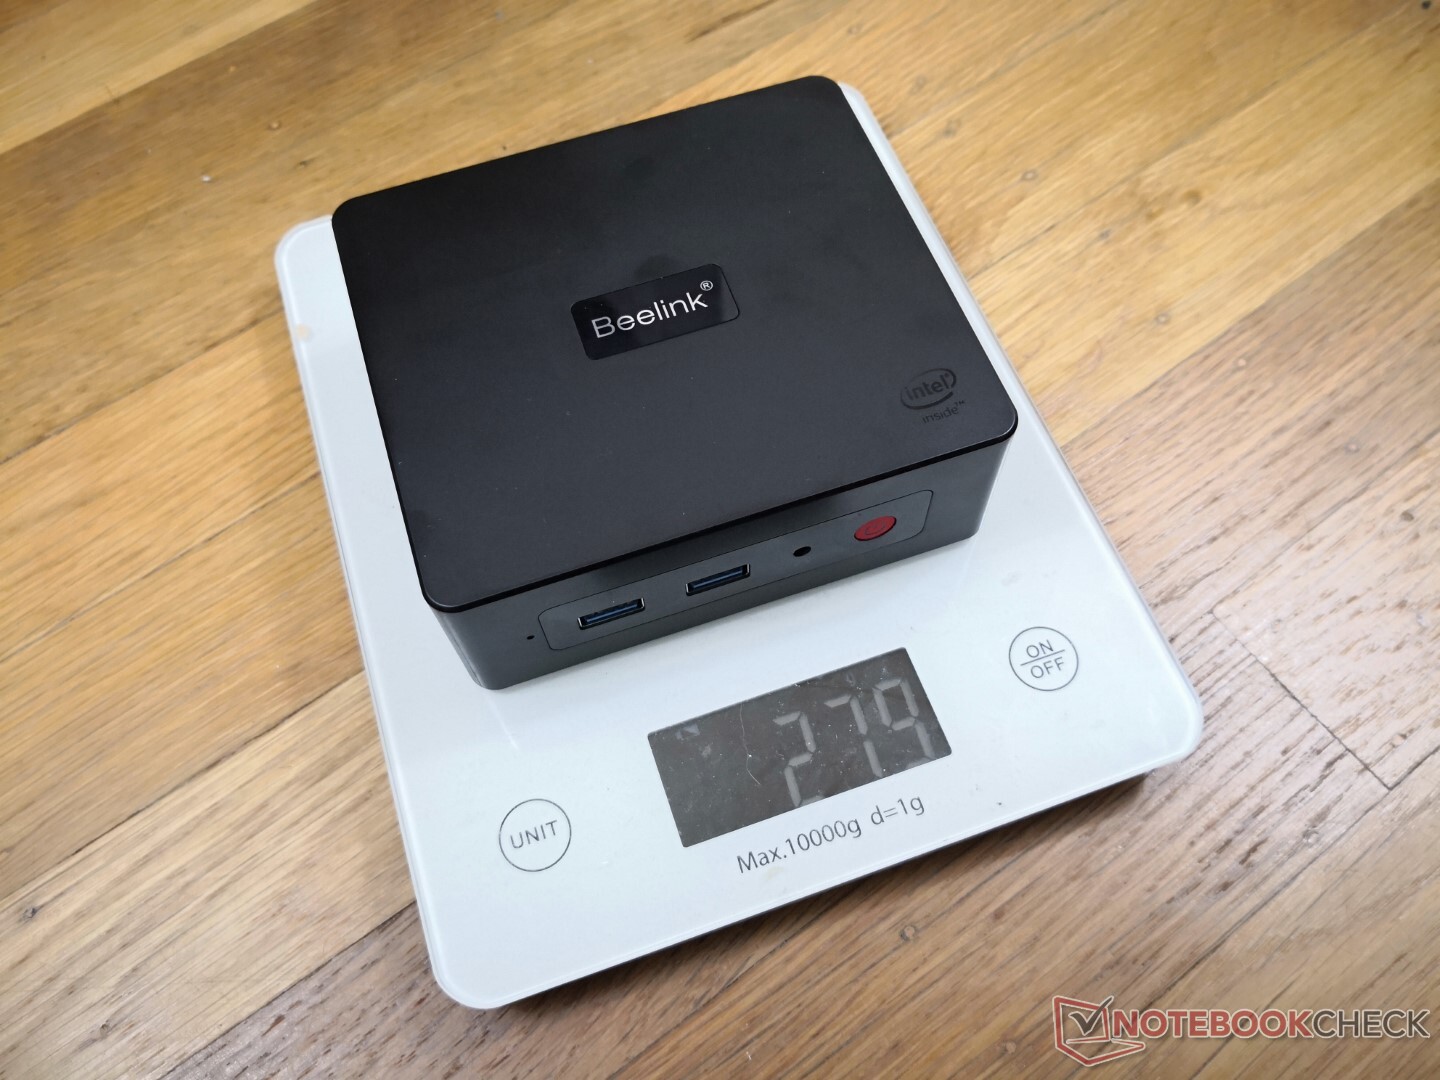
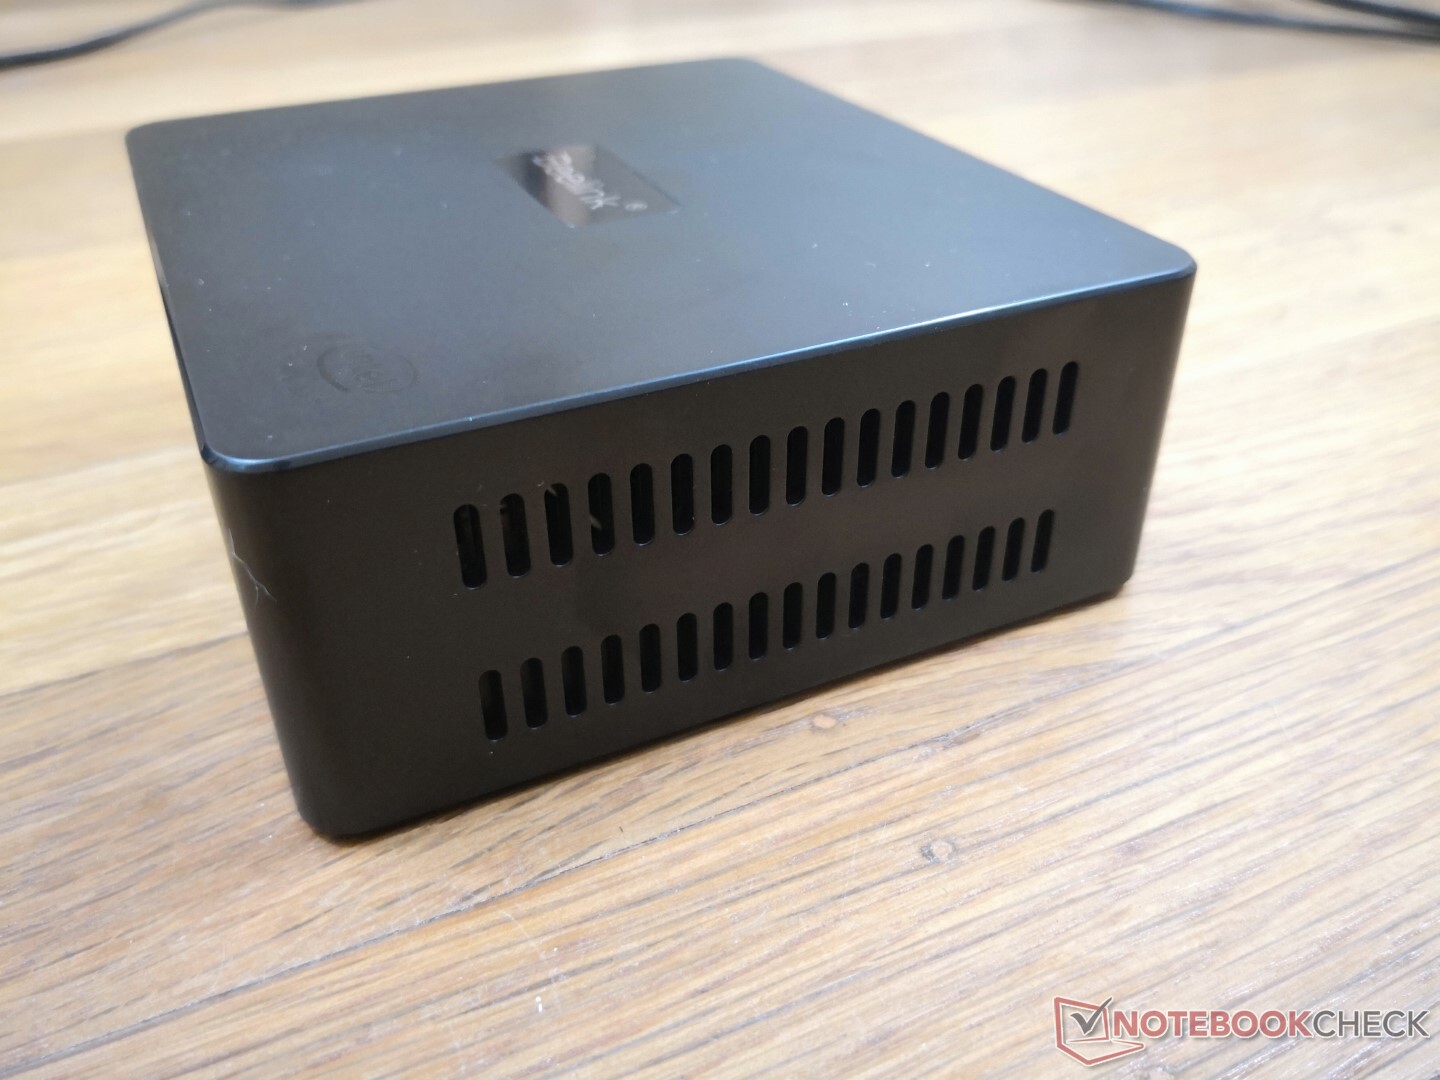
A notable aspect of the Beelink is its very light weight of just 279 g compared to over 500 g on the similarly-sized Intel NUC 11. The thinner chassis materials of the Beelink and its lack of an internal metal cage for additional reinforcement contribute to the significant weight differences between the two models.
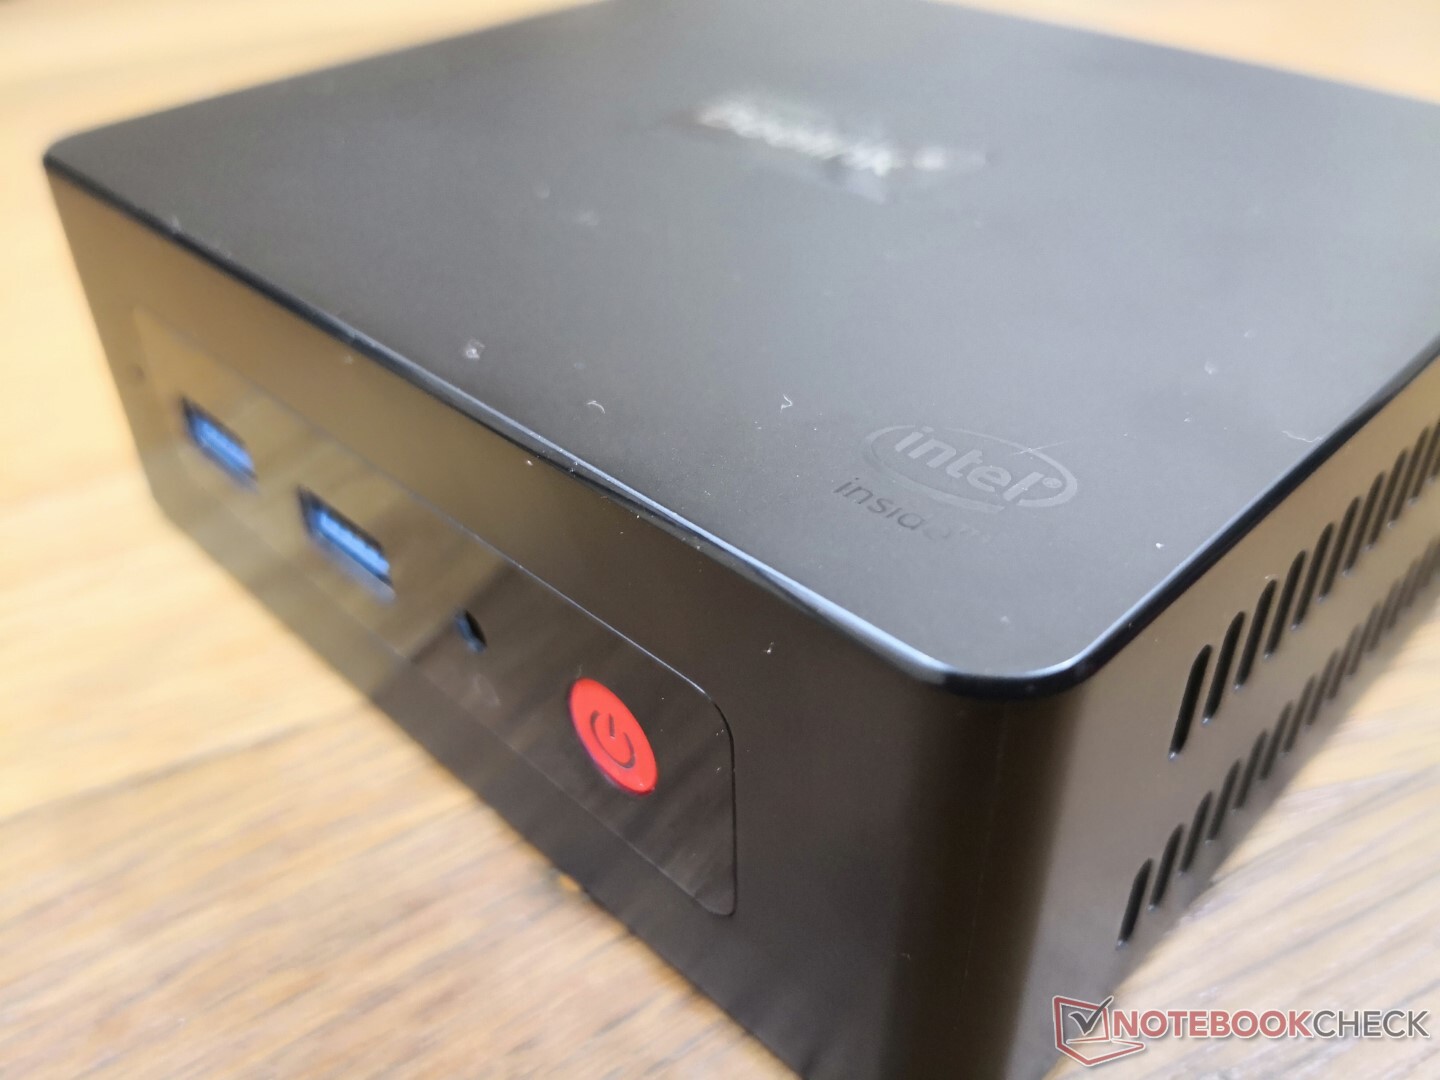
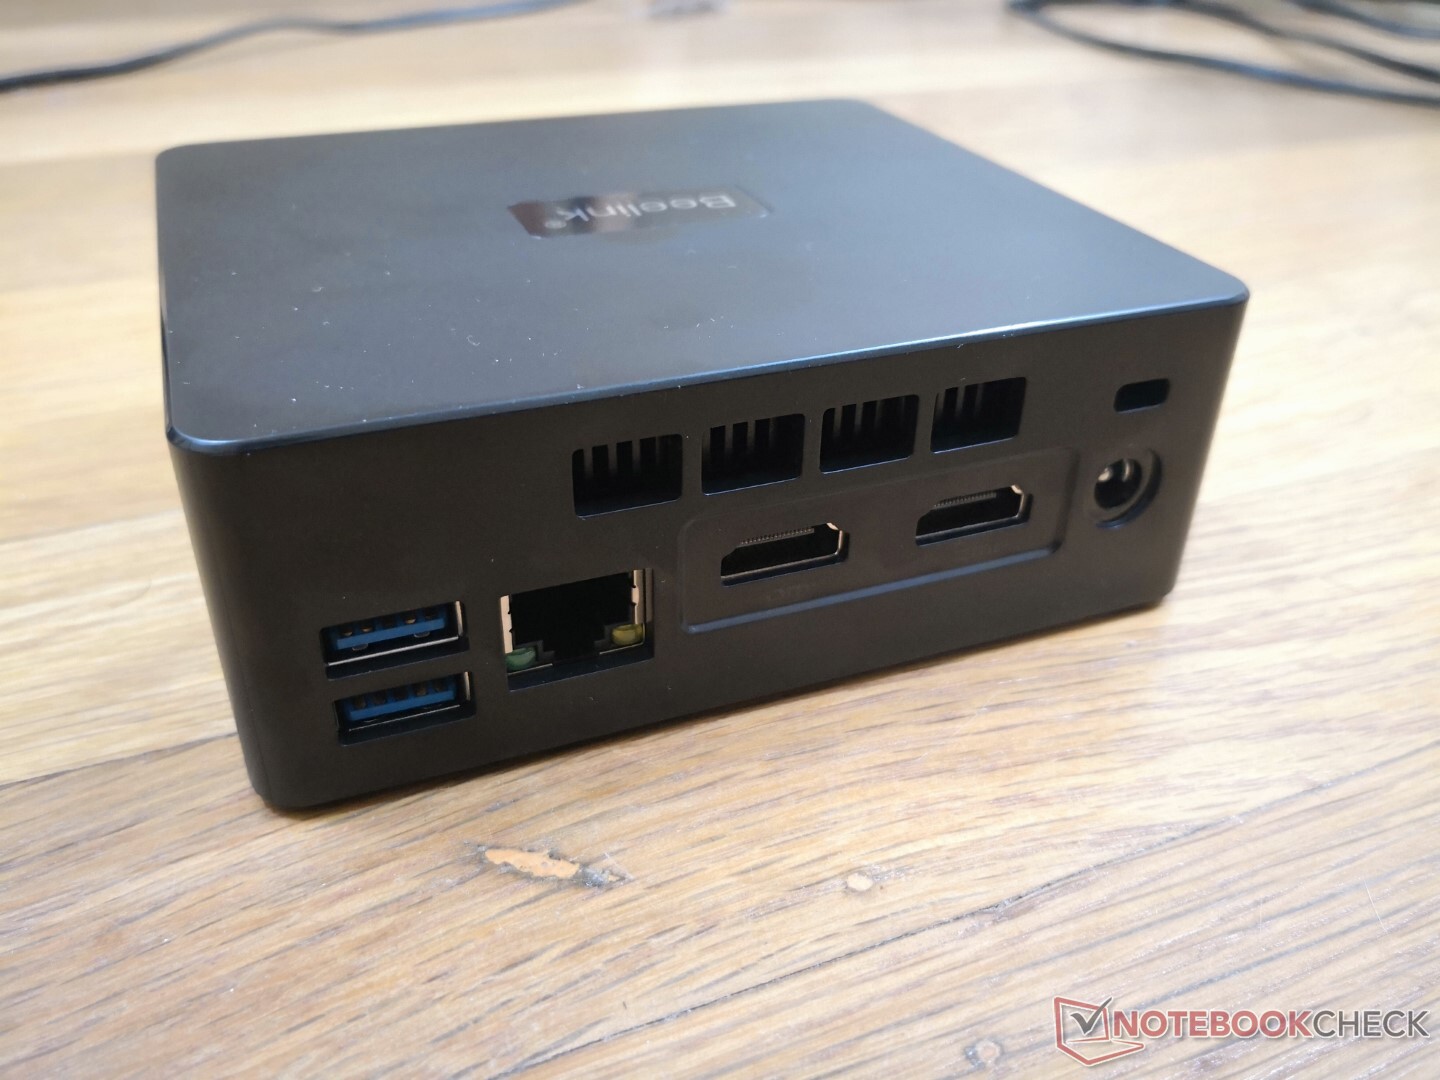
Connectivity — No USB-C
Port options are identical to the U59 but with one major exception: the USB-C port has been dropped. We suspect that this was a cost-saving measure.
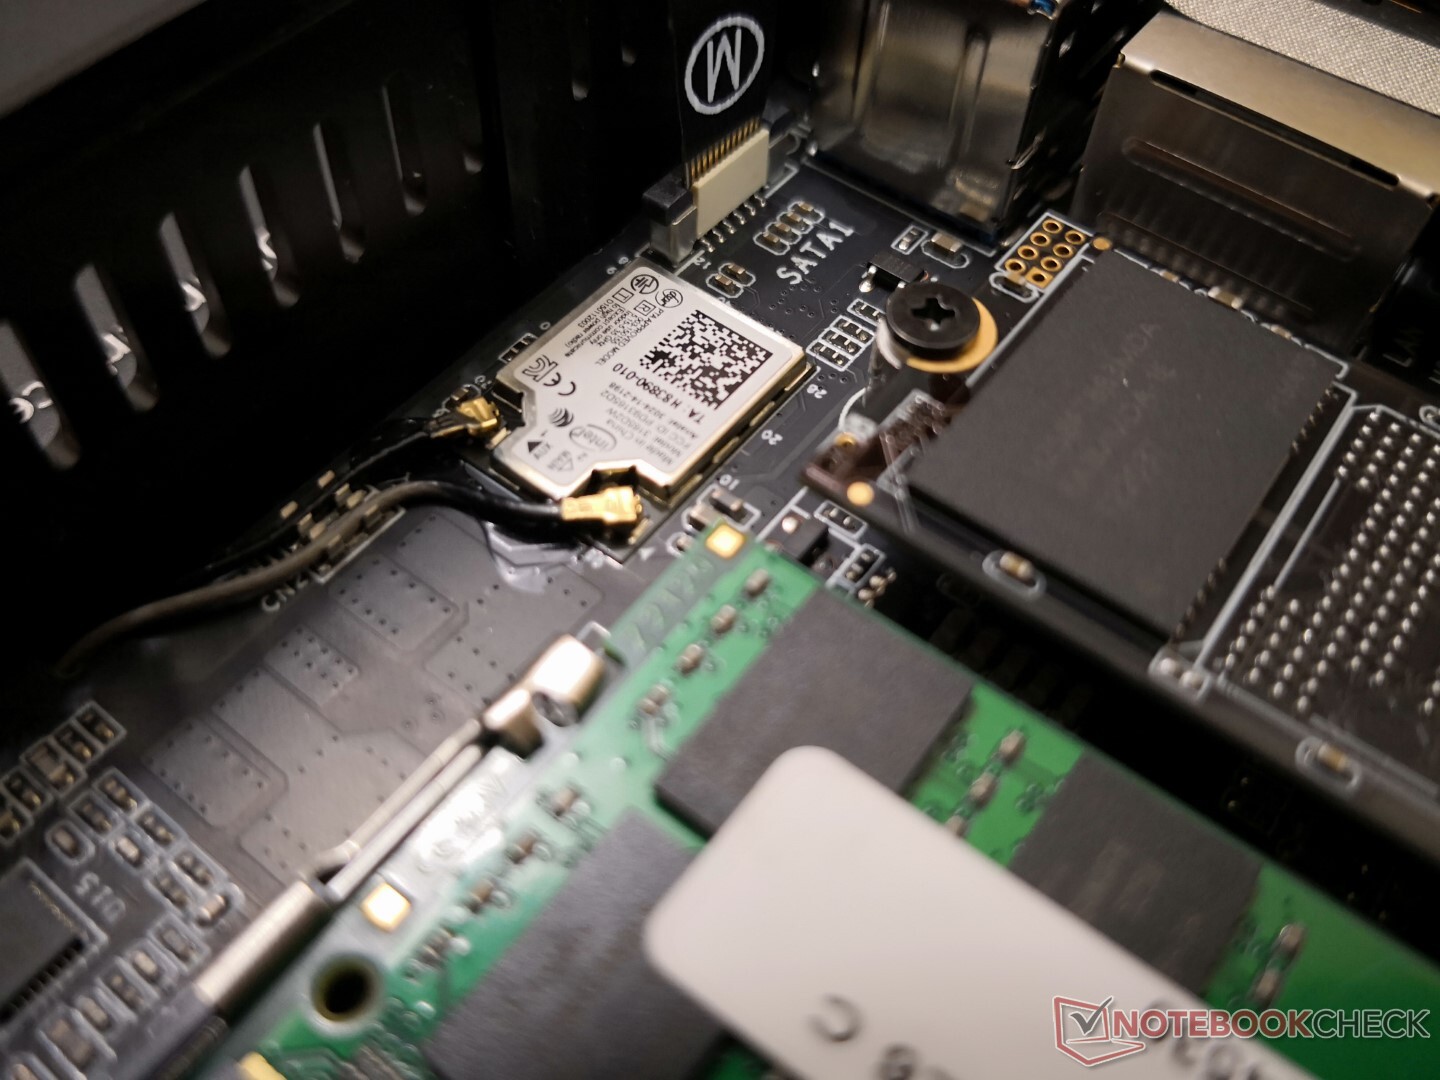
Communication
An Intel 3165 comes standard one again for 1x1 Wi-Fi 5 and Bluetooth 4.2 connectivity. Though slow by today's standards, it's still fast enough for 4K video streaming.
| Networking | |
| iperf3 transmit AX12 | |
| Intel NUC11TNKi5 | |
| Beelink SEi8 | |
| Beelink U59 | |
| GMK NucBox 3 | |
| iperf3 receive AX12 | |
| Intel NUC11TNKi5 | |
| GMK NucBox 3 | |
| Beelink U59 | |
| Beelink SEi8 | |
| iperf3 transmit AXE11000 | |
| Beelink U59 Mini-S | |
| iperf3 receive AXE11000 | |
| Beelink U59 Mini-S | |
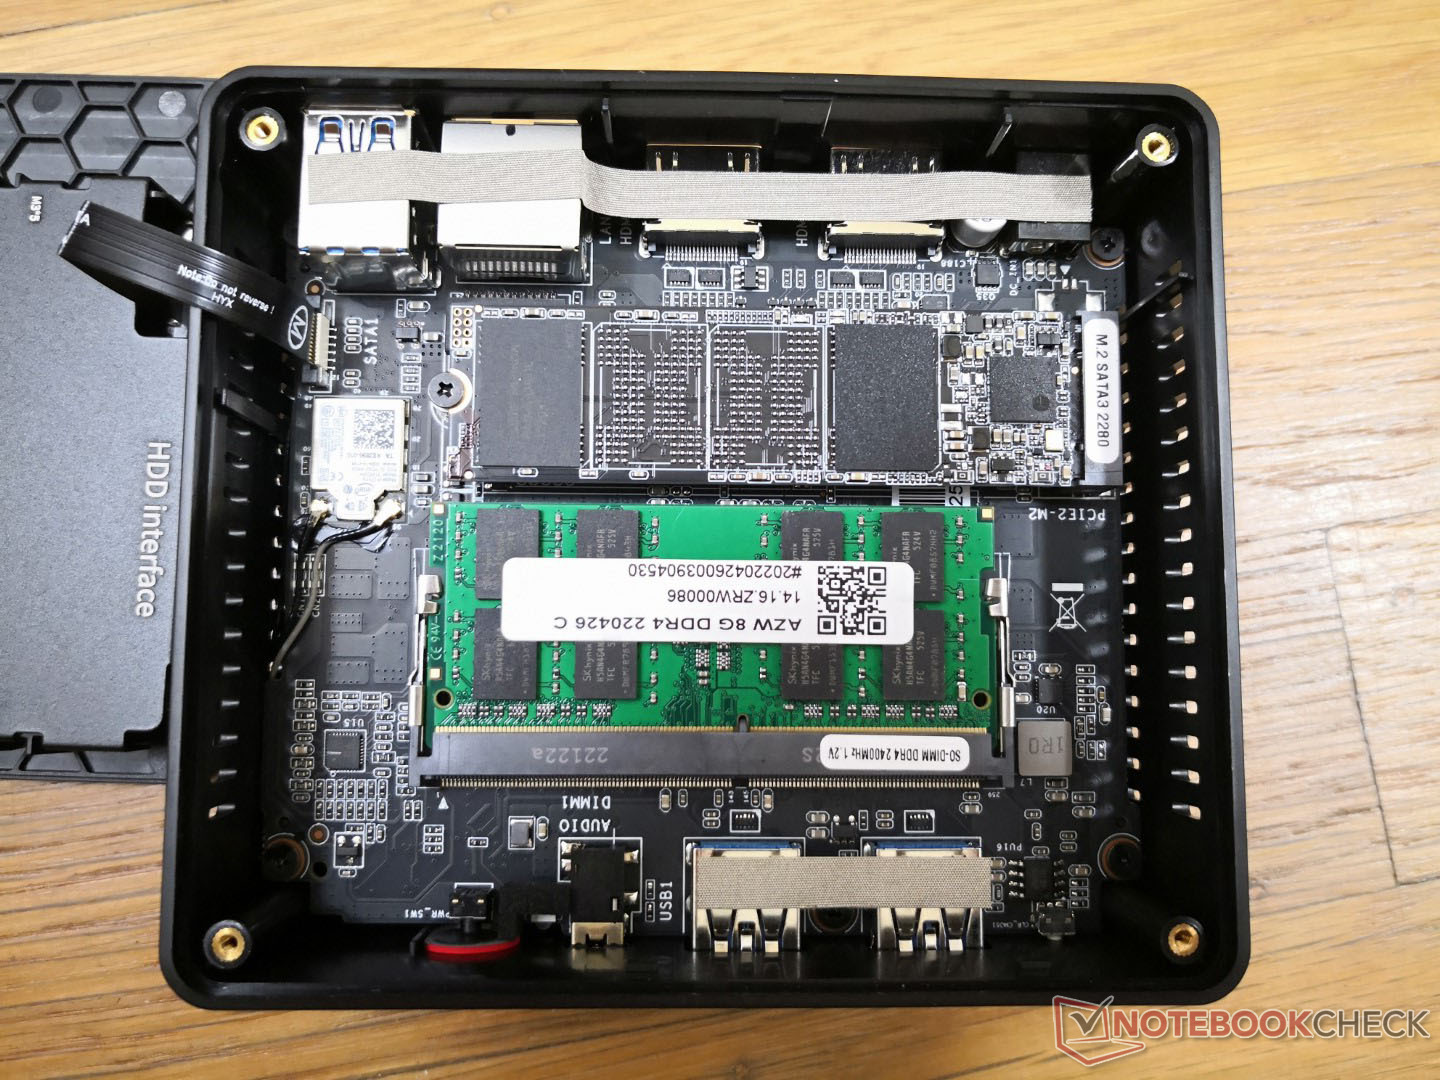
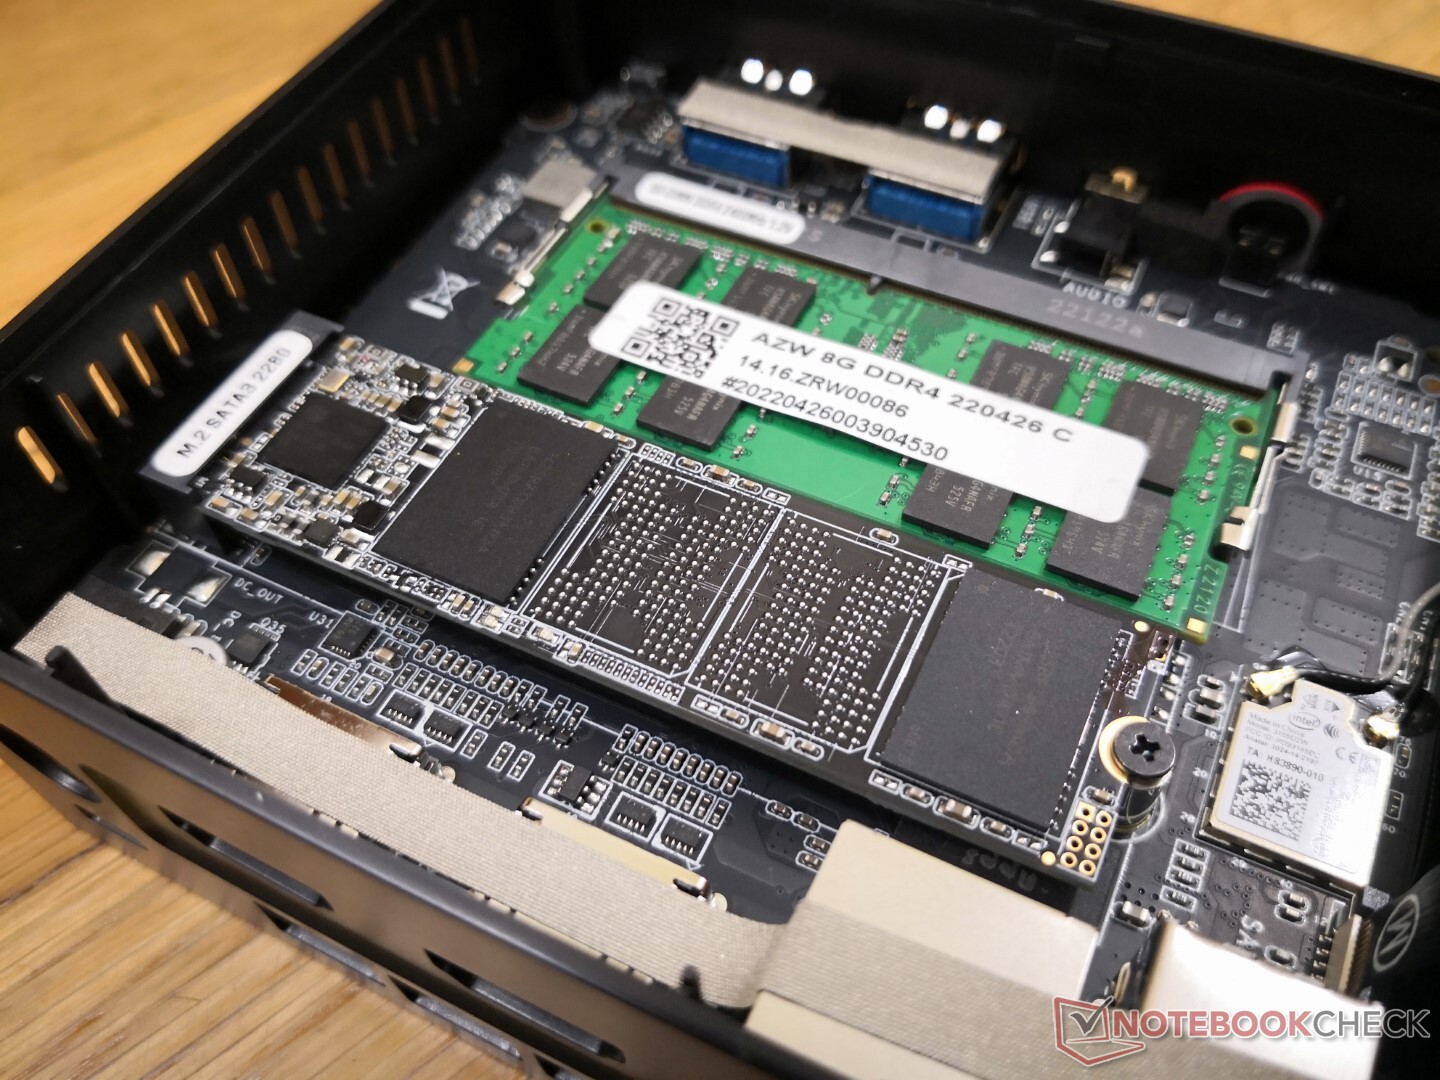
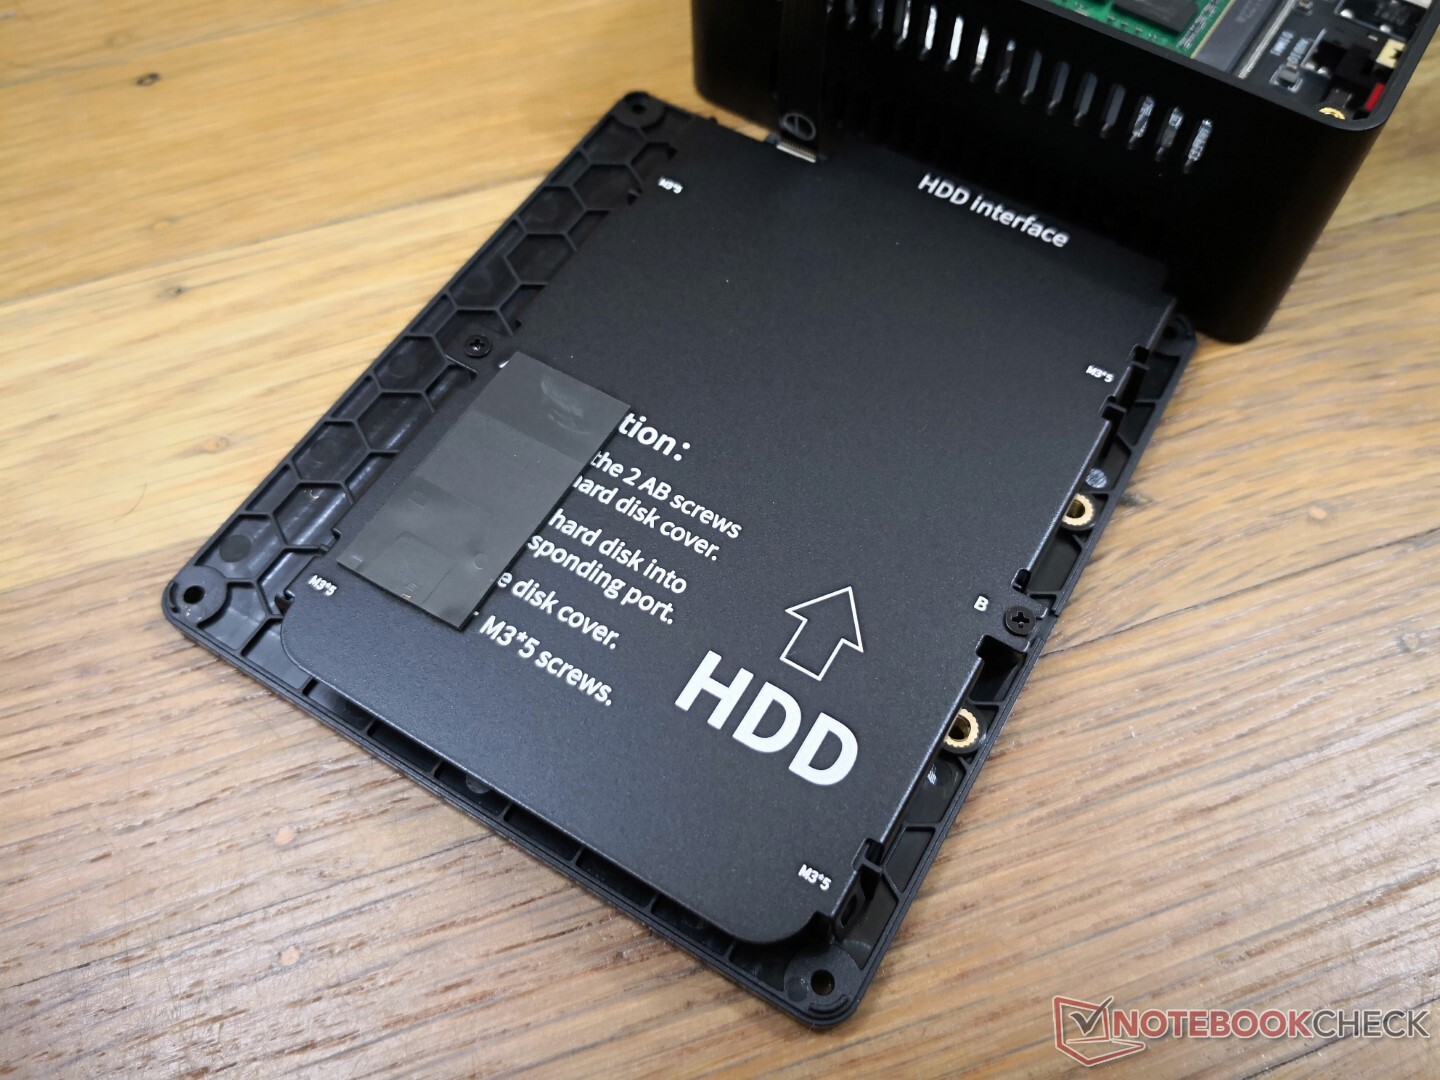
Maintenance
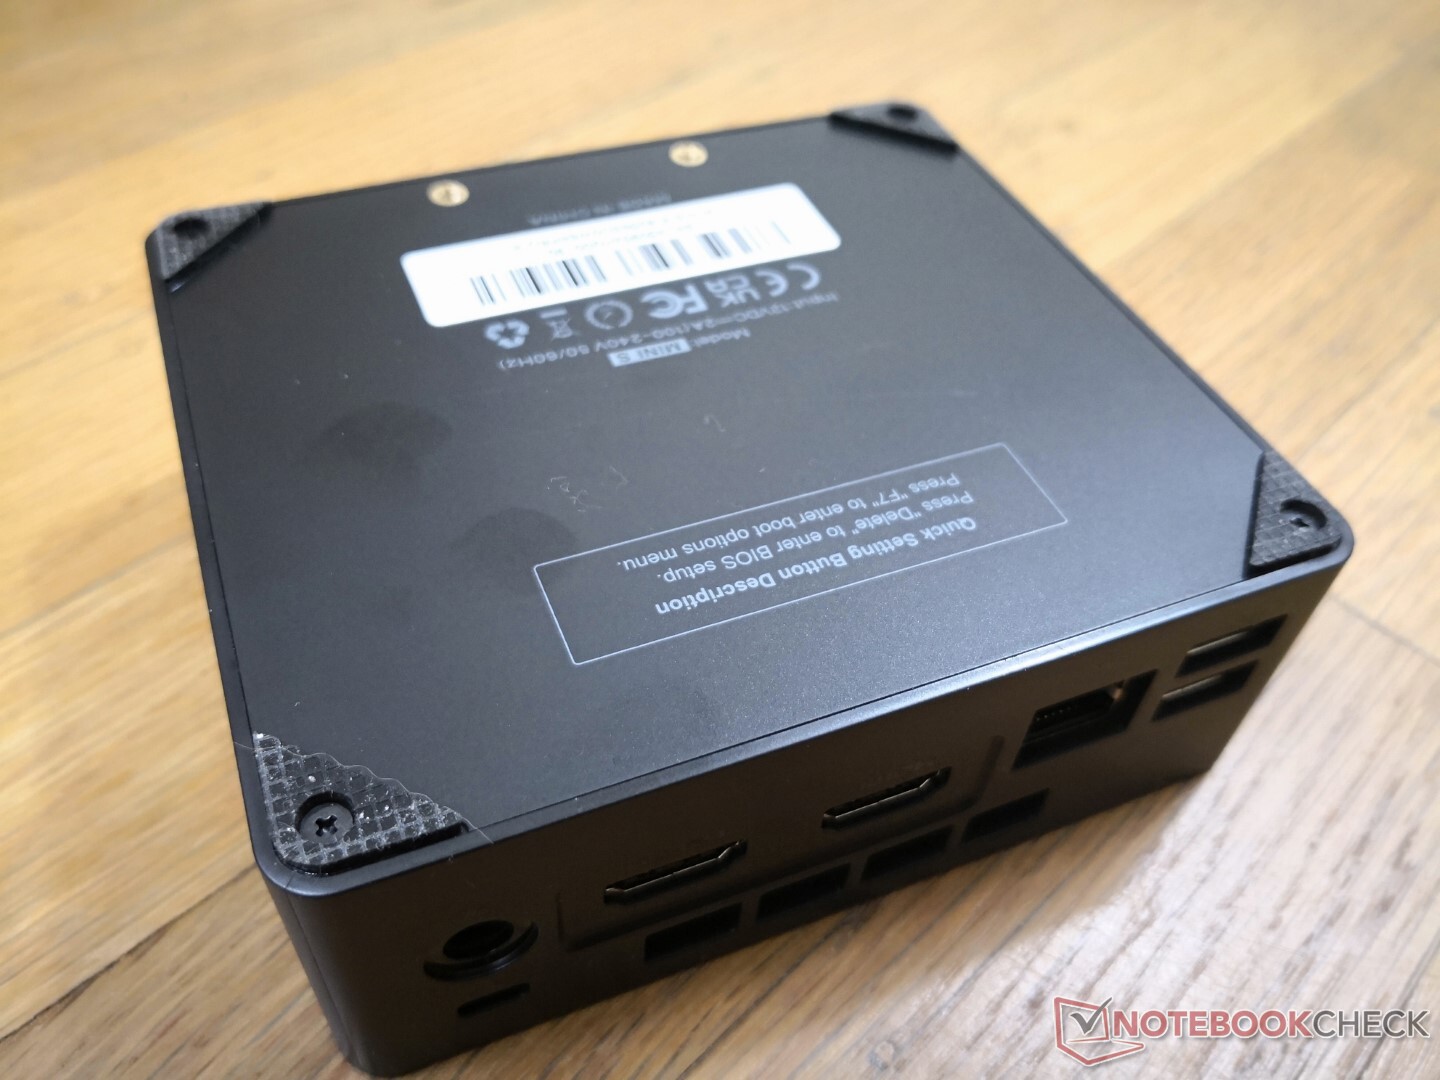
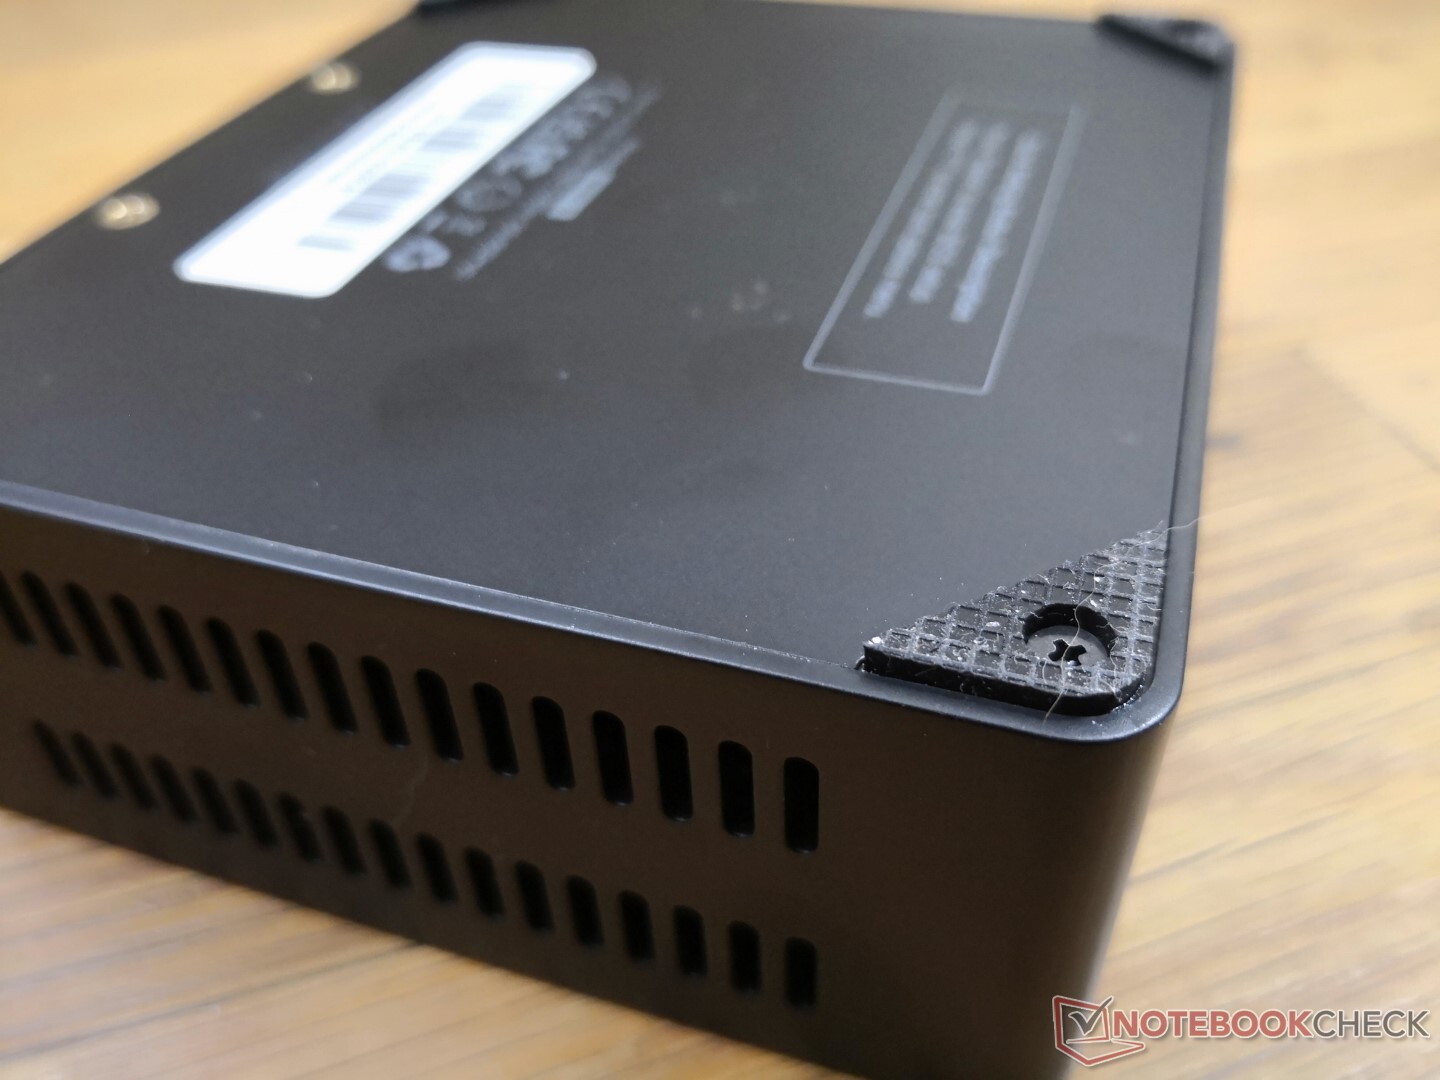
The bottom panel comes off easily after removing the 4 Philips screws around the corners. Users have direct access to two storage bays (1x M.2 2280 SATA III + 1x 2.5-inch SATA III) and a single SODIMM DDR4 slot supporting up to 16 GB of single-channel memory.
Accessories and Warranty
The retail box includes a removable VESA mounting bracket with screws that attach to the bottom plate of the unit. Two HDMI cables are included as well.
The standard one-year limited warranty applies if purchased in the US.
Performance
Testing Conditions
Our test unit was set to Windows Performance mode prior to running any benchmark tests below for the highest possible scores. Aside from the usual BIOS settings, there are no special applications for controlling specific features or behaviors of the U59 Mini-S.
Processor — Faster Than Atom, Slower Than Core i3
Multi-thread performance is comparable to the dual-core quad-thread Core i3-8109U while being about 20 to 45 percent slower in single-thread performance. The Celeron N5095 is nonetheless faster than previous generation Celeron solutions including the J4125 or N4100 by up to 2x in multi-threaded applications.
Performance sustainability is good with no major drops when running CineBench R15 xT in a loop.
Cinebench R15 Multi Loop
Cinebench R23: Multi Core | Single Core
Cinebench R15: CPU Multi 64Bit | CPU Single 64Bit
Blender: v2.79 BMW27 CPU
7-Zip 18.03: 7z b 4 | 7z b 4 -mmt1
Geekbench 5.5: Multi-Core | Single-Core
HWBOT x265 Benchmark v2.2: 4k Preset
LibreOffice : 20 Documents To PDF
R Benchmark 2.5: Overall mean
| Cinebench R20 / CPU (Multi Core) | |
| Lenovo Yoga Slim 7 14ARE05 82A20008GE | |
| Intel NUC11TNKi5 | |
| Acer Swift 3 SF314-42-R27B | |
| Zotac ZBOX MI642 Nano | |
| Average Intel Celeron N5095 (804 - 844, n=5) | |
| Beelink U59 Mini-S | |
| Beelink SEi8 | |
| GMK NucBox 3 | |
| Chuwi UBook CWI509 | |
| Blackview AceBook 1 | |
| Chuwi LapBook Plus | |
| Cinebench R20 / CPU (Single Core) | |
| Intel NUC11TNKi5 | |
| Lenovo Yoga Slim 7 14ARE05 82A20008GE | |
| Acer Swift 3 SF314-42-R27B | |
| Zotac ZBOX MI642 Nano | |
| Beelink SEi8 | |
| Average Intel Celeron N5095 (228 - 239, n=5) | |
| Beelink U59 Mini-S | |
| GMK NucBox 3 | |
| Blackview AceBook 1 | |
| Chuwi UBook CWI509 | |
| Chuwi LapBook Plus | |
| Cinebench R23 / Multi Core | |
| Lenovo Yoga Slim 7 14ARE05 82A20008GE | |
| Intel NUC11TNKi5 | |
| Average Intel Celeron N5095 (2150 - 2219, n=5) | |
| Beelink U59 Mini-S | |
| Beelink SEi8 | |
| GMK NucBox 3 | |
| Blackview AceBook 1 | |
| Cinebench R23 / Single Core | |
| Intel NUC11TNKi5 | |
| Lenovo Yoga Slim 7 14ARE05 82A20008GE | |
| Beelink SEi8 | |
| Beelink U59 Mini-S | |
| Average Intel Celeron N5095 (587 - 621, n=5) | |
| GMK NucBox 3 | |
| Blackview AceBook 1 | |
| Cinebench R15 / CPU Multi 64Bit | |
| Lenovo Yoga Slim 7 14ARE05 82A20008GE | |
| Intel NUC11TNKi5 | |
| Acer Swift 3 SF314-42-R27B | |
| Zotac ZBOX MI642 Nano | |
| Beelink U59 Mini-S | |
| Average Intel Celeron N5095 (221 - 379, n=6) | |
| Beelink SEi8 | |
| Blackview AceBook 1 | |
| GMK NucBox 3 | |
| Chuwi UBook CWI509 | |
| Chuwi LapBook Plus | |
| Cinebench R15 / CPU Single 64Bit | |
| Intel NUC11TNKi5 | |
| Lenovo Yoga Slim 7 14ARE05 82A20008GE | |
| Zotac ZBOX MI642 Nano | |
| Acer Swift 3 SF314-42-R27B | |
| Beelink SEi8 | |
| Average Intel Celeron N5095 (95.4 - 109, n=5) | |
| Beelink U59 Mini-S | |
| Blackview AceBook 1 | |
| Chuwi UBook CWI509 | |
| GMK NucBox 3 | |
| Chuwi LapBook Plus | |
| Blender / v2.79 BMW27 CPU | |
| Chuwi LapBook Plus | |
| GMK NucBox 3 | |
| Blackview AceBook 1 | |
| Beelink U59 Mini-S | |
| Average Intel Celeron N5095 (1502 - 1624, n=5) | |
| Beelink SEi8 | |
| Acer Swift 3 SF314-42-R27B | |
| Zotac ZBOX MI642 Nano | |
| Intel NUC11TNKi5 | |
| Lenovo Yoga Slim 7 14ARE05 82A20008GE | |
| 7-Zip 18.03 / 7z b 4 | |
| Lenovo Yoga Slim 7 14ARE05 82A20008GE | |
| Intel NUC11TNKi5 | |
| Zotac ZBOX MI642 Nano | |
| Acer Swift 3 SF314-42-R27B | |
| Average Intel Celeron N5095 (10924 - 11168, n=5) | |
| Beelink U59 Mini-S | |
| Beelink SEi8 | |
| Blackview AceBook 1 | |
| GMK NucBox 3 | |
| Chuwi LapBook Plus | |
| 7-Zip 18.03 / 7z b 4 -mmt1 | |
| Intel NUC11TNKi5 | |
| Lenovo Yoga Slim 7 14ARE05 82A20008GE | |
| Zotac ZBOX MI642 Nano | |
| Acer Swift 3 SF314-42-R27B | |
| Beelink SEi8 | |
| Beelink U59 Mini-S | |
| Average Intel Celeron N5095 (2935 - 3124, n=5) | |
| Blackview AceBook 1 | |
| GMK NucBox 3 | |
| Chuwi LapBook Plus | |
| Geekbench 5.5 / Multi-Core | |
| Lenovo Yoga Slim 7 14ARE05 82A20008GE | |
| Intel NUC11TNKi5 | |
| Zotac ZBOX MI642 Nano | |
| Acer Swift 3 SF314-42-R27B | |
| Average Intel Celeron N5095 (1933 - 2052, n=4) | |
| Beelink U59 Mini-S | |
| Beelink SEi8 | |
| GMK NucBox 3 | |
| Geekbench 5.5 / Single-Core | |
| Intel NUC11TNKi5 | |
| Lenovo Yoga Slim 7 14ARE05 82A20008GE | |
| Zotac ZBOX MI642 Nano | |
| Acer Swift 3 SF314-42-R27B | |
| Beelink SEi8 | |
| Average Intel Celeron N5095 (637 - 659, n=4) | |
| Beelink U59 Mini-S | |
| GMK NucBox 3 | |
| HWBOT x265 Benchmark v2.2 / 4k Preset | |
| Lenovo Yoga Slim 7 14ARE05 82A20008GE | |
| Intel NUC11TNKi5 | |
| Acer Swift 3 SF314-42-R27B | |
| Zotac ZBOX MI642 Nano | |
| Beelink SEi8 | |
| Beelink U59 Mini-S | |
| Average Intel Celeron N5095 (1.9 - 2.05, n=5) | |
| GMK NucBox 3 | |
| Blackview AceBook 1 | |
| Chuwi LapBook Plus | |
| LibreOffice / 20 Documents To PDF | |
| GMK NucBox 3 | |
| Blackview AceBook 1 | |
| Beelink U59 Mini-S | |
| Average Intel Celeron N5095 (97 - 107.9, n=5) | |
| Beelink SEi8 | |
| Zotac ZBOX MI642 Nano | |
| Lenovo Yoga Slim 7 14ARE05 82A20008GE | |
| Acer Swift 3 SF314-42-R27B | |
| Intel NUC11TNKi5 | |
| R Benchmark 2.5 / Overall mean | |
| Blackview AceBook 1 | |
| GMK NucBox 3 | |
| Beelink U59 Mini-S | |
| Average Intel Celeron N5095 (1.16 - 1.2, n=5) | |
| Beelink SEi8 | |
| Zotac ZBOX MI642 Nano | |
| Acer Swift 3 SF314-42-R27B | |
| Intel NUC11TNKi5 | |
| Lenovo Yoga Slim 7 14ARE05 82A20008GE | |
* ... smaller is better
AIDA64: FP32 Ray-Trace | FPU Julia | CPU SHA3 | CPU Queen | FPU SinJulia | FPU Mandel | CPU AES | CPU ZLib | FP64 Ray-Trace | CPU PhotoWorxx
| Performance rating | |
| Intel NUC11TNKi5 | |
| Zotac ZBOX MI642 Nano | |
| Beelink SEi8 | |
| Beelink U59 | |
| Average Intel Celeron N5095 | |
| Beelink U59 Mini-S | |
| GMK NucBox 3 | |
| AIDA64 / FP32 Ray-Trace | |
| Intel NUC11TNKi5 | |
| Zotac ZBOX MI642 Nano | |
| Beelink SEi8 | |
| Beelink U59 | |
| Beelink U59 Mini-S | |
| Average Intel Celeron N5095 (1241 - 1245, n=5) | |
| GMK NucBox 3 | |
| AIDA64 / FPU Julia | |
| Intel NUC11TNKi5 | |
| Zotac ZBOX MI642 Nano | |
| Beelink SEi8 | |
| Beelink U59 | |
| Average Intel Celeron N5095 (7264 - 7466, n=5) | |
| Beelink U59 Mini-S | |
| GMK NucBox 3 | |
| AIDA64 / CPU SHA3 | |
| Intel NUC11TNKi5 | |
| Zotac ZBOX MI642 Nano | |
| Beelink SEi8 | |
| Beelink U59 | |
| Average Intel Celeron N5095 (508 - 515, n=5) | |
| Beelink U59 Mini-S | |
| GMK NucBox 3 | |
| AIDA64 / CPU Queen | |
| Zotac ZBOX MI642 Nano | |
| Intel NUC11TNKi5 | |
| Beelink SEi8 | |
| Beelink U59 | |
| Average Intel Celeron N5095 (21458 - 22326, n=5) | |
| Beelink U59 Mini-S | |
| GMK NucBox 3 | |
| AIDA64 / FPU SinJulia | |
| Intel NUC11TNKi5 | |
| Zotac ZBOX MI642 Nano | |
| Beelink SEi8 | |
| GMK NucBox 3 | |
| Beelink U59 | |
| Beelink U59 Mini-S | |
| Average Intel Celeron N5095 (1000 - 1003, n=5) | |
| AIDA64 / FPU Mandel | |
| Intel NUC11TNKi5 | |
| Zotac ZBOX MI642 Nano | |
| Beelink SEi8 | |
| Beelink U59 | |
| Average Intel Celeron N5095 (3802 - 3967, n=5) | |
| Beelink U59 Mini-S | |
| GMK NucBox 3 | |
| AIDA64 / CPU AES | |
| Intel NUC11TNKi5 | |
| Average Intel Celeron N5095 (19076 - 19354, n=5) | |
| Beelink U59 | |
| Beelink U59 Mini-S | |
| Zotac ZBOX MI642 Nano | |
| GMK NucBox 3 | |
| Beelink SEi8 | |
| AIDA64 / CPU ZLib | |
| Intel NUC11TNKi5 | |
| Zotac ZBOX MI642 Nano | |
| Beelink U59 | |
| Average Intel Celeron N5095 (187.7 - 190, n=5) | |
| Beelink U59 Mini-S | |
| Beelink SEi8 | |
| GMK NucBox 3 | |
| AIDA64 / FP64 Ray-Trace | |
| Intel NUC11TNKi5 | |
| Zotac ZBOX MI642 Nano | |
| Beelink SEi8 | |
| Beelink U59 | |
| Average Intel Celeron N5095 (673 - 676, n=5) | |
| Beelink U59 Mini-S | |
| GMK NucBox 3 | |
| AIDA64 / CPU PhotoWorxx | |
| Intel NUC11TNKi5 | |
| Zotac ZBOX MI642 Nano | |
| Beelink SEi8 | |
| Beelink U59 | |
| Average Intel Celeron N5095 (7386 - 9899, n=5) | |
| Beelink U59 Mini-S | |
| GMK NucBox 3 | |
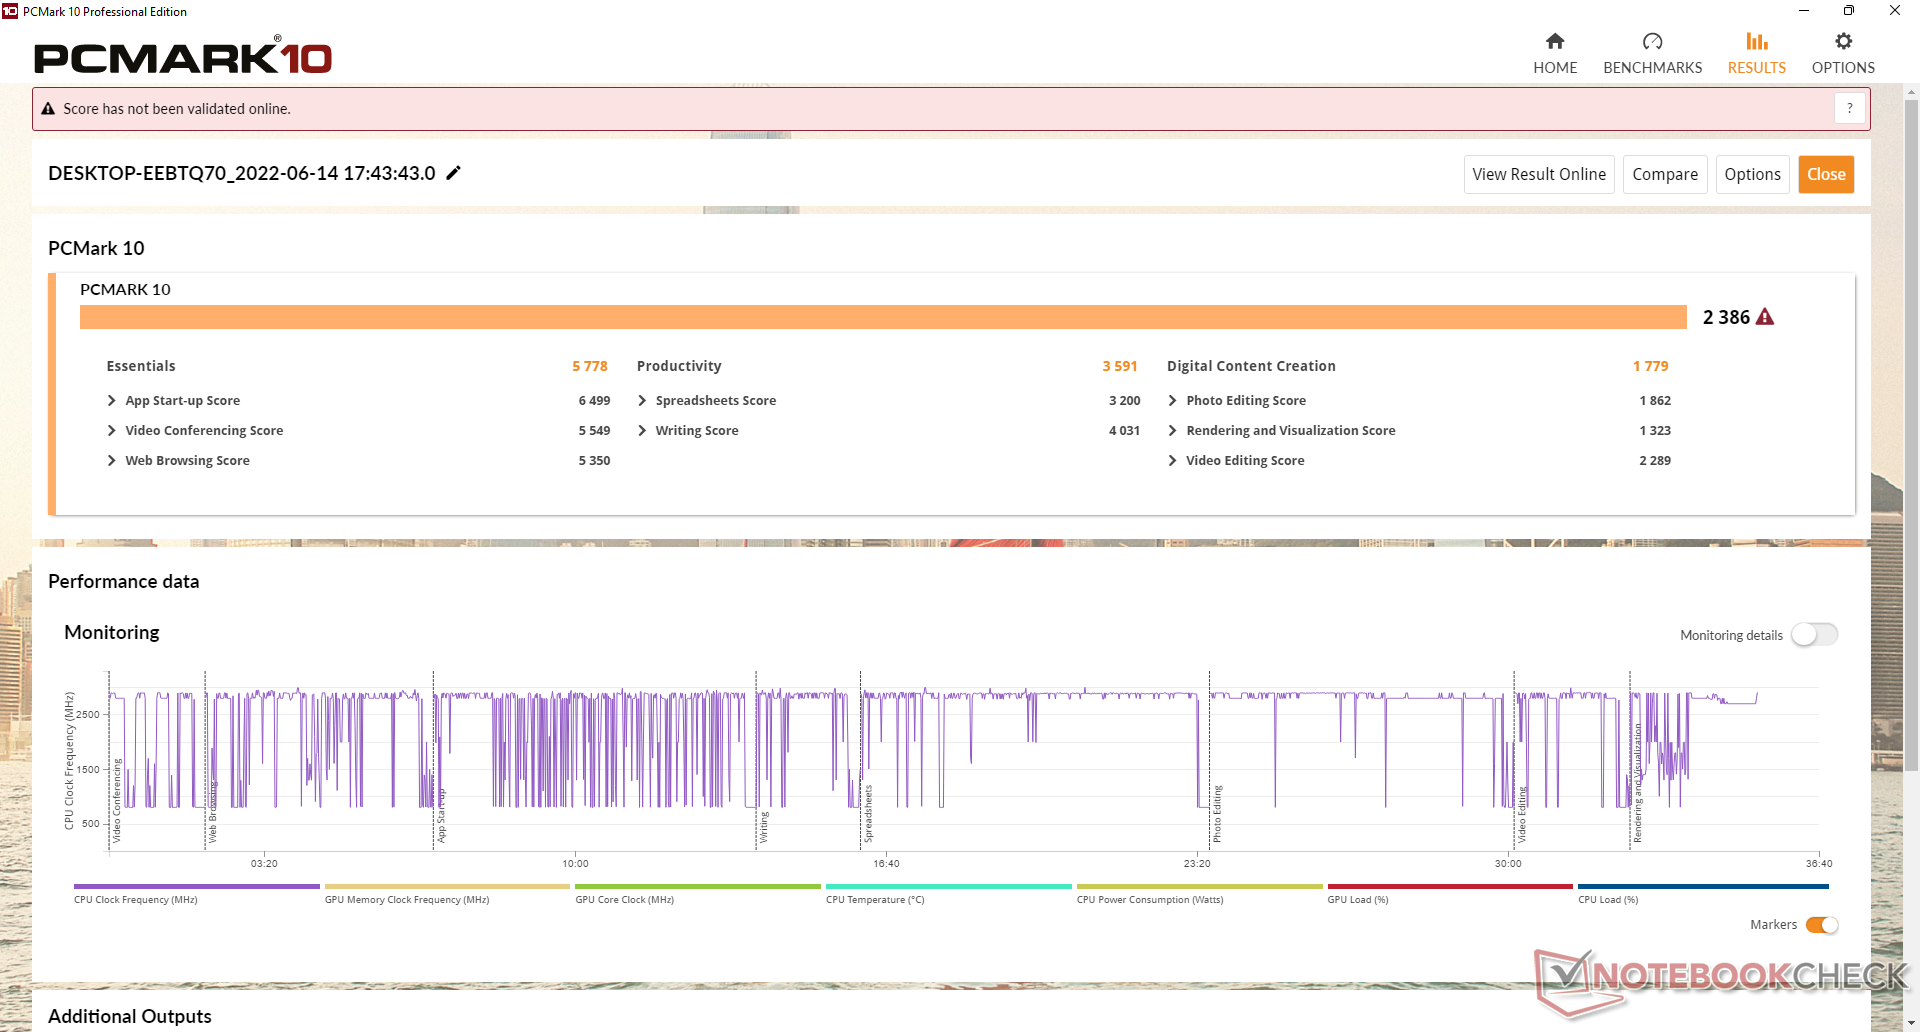
System Performance
PCMark scores sit comfortably in between mini PCs with the older Celeron J4125 like the GMK NucBox 3 and mini PCs powered by Core i3 CPUs like the Beelink SEi8.
CrossMark: Overall | Productivity | Creativity | Responsiveness
| PCMark 10 / Score | |
| Intel NUC11TNKi5 | |
| Zotac ZBOX MI642 Nano | |
| Beelink SEi8 | |
| Beelink U59 | |
| Beelink U59 Mini-S | |
| Average Intel Celeron N5095, Intel UHD Graphics (Jasper Lake 16 EU) (2317 - 2417, n=5) | |
| GMK NucBox 3 | |
| PCMark 10 / Essentials | |
| Intel NUC11TNKi5 | |
| Beelink SEi8 | |
| Zotac ZBOX MI642 Nano | |
| Beelink U59 | |
| Beelink U59 Mini-S | |
| Average Intel Celeron N5095, Intel UHD Graphics (Jasper Lake 16 EU) (5516 - 5874, n=5) | |
| GMK NucBox 3 | |
| PCMark 10 / Productivity | |
| Zotac ZBOX MI642 Nano | |
| Intel NUC11TNKi5 | |
| Beelink SEi8 | |
| Beelink U59 | |
| Beelink U59 Mini-S | |
| Average Intel Celeron N5095, Intel UHD Graphics (Jasper Lake 16 EU) (3454 - 3666, n=5) | |
| GMK NucBox 3 | |
| PCMark 10 / Digital Content Creation | |
| Intel NUC11TNKi5 | |
| Zotac ZBOX MI642 Nano | |
| Beelink SEi8 | |
| Beelink U59 | |
| Beelink U59 Mini-S | |
| Average Intel Celeron N5095, Intel UHD Graphics (Jasper Lake 16 EU) (1752 - 1787, n=5) | |
| GMK NucBox 3 | |
| CrossMark / Overall | |
| Beelink U59 Mini-S | |
| Average Intel Celeron N5095, Intel UHD Graphics (Jasper Lake 16 EU) (473 - 495, n=3) | |
| CrossMark / Productivity | |
| Beelink U59 Mini-S | |
| Average Intel Celeron N5095, Intel UHD Graphics (Jasper Lake 16 EU) (535 - 561, n=3) | |
| CrossMark / Creativity | |
| Average Intel Celeron N5095, Intel UHD Graphics (Jasper Lake 16 EU) (434 - 440, n=3) | |
| Beelink U59 Mini-S | |
| CrossMark / Responsiveness | |
| Beelink U59 Mini-S | |
| Average Intel Celeron N5095, Intel UHD Graphics (Jasper Lake 16 EU) (403 - 497, n=3) | |
| PCMark 10 Score | 2386 points | |
Help | ||
| AIDA64 / Memory Copy | |
| Beelink SEi8 | |
| Zotac ZBOX MI642 Nano | |
| Beelink U59 | |
| Intel NUC11TNKi5 | |
| Average Intel Celeron N5095 (16422 - 23009, n=5) | |
| Beelink U59 Mini-S | |
| GMK NucBox 3 | |
| AIDA64 / Memory Read | |
| Zotac ZBOX MI642 Nano | |
| Beelink SEi8 | |
| Intel NUC11TNKi5 | |
| Beelink U59 Mini-S | |
| Average Intel Celeron N5095 (15464 - 16959, n=5) | |
| Beelink U59 | |
| GMK NucBox 3 | |
| AIDA64 / Memory Write | |
| Zotac ZBOX MI642 Nano | |
| Beelink U59 | |
| Average Intel Celeron N5095 (18612 - 30843, n=5) | |
| Intel NUC11TNKi5 | |
| Beelink U59 Mini-S | |
| Beelink SEi8 | |
| GMK NucBox 3 | |
| AIDA64 / Memory Latency | |
| Zotac ZBOX MI642 Nano | |
| Intel NUC11TNKi5 | |
| GMK NucBox 3 | |
| Average Intel Celeron N5095 (58 - 74.1, n=5) | |
| Beelink U59 | |
| Beelink U59 Mini-S | |
| Beelink SEi8 | |
* ... smaller is better
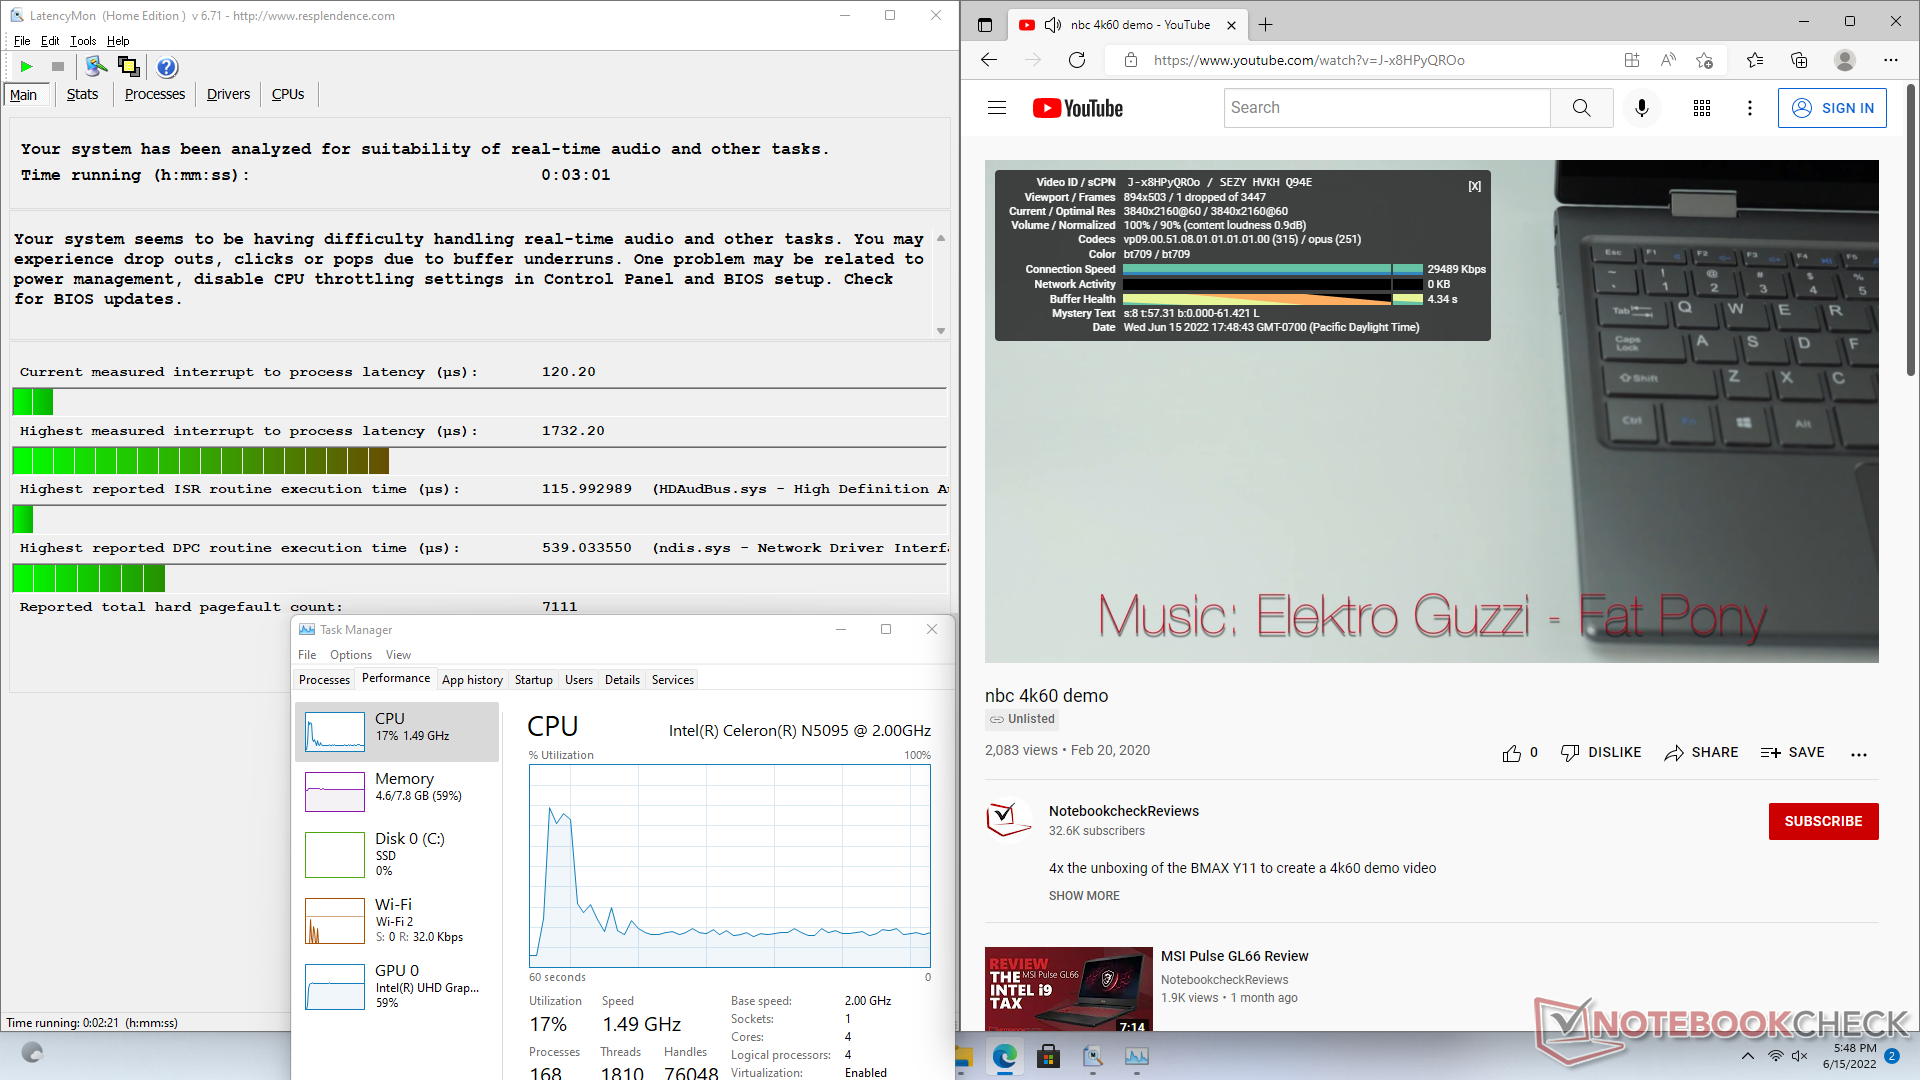
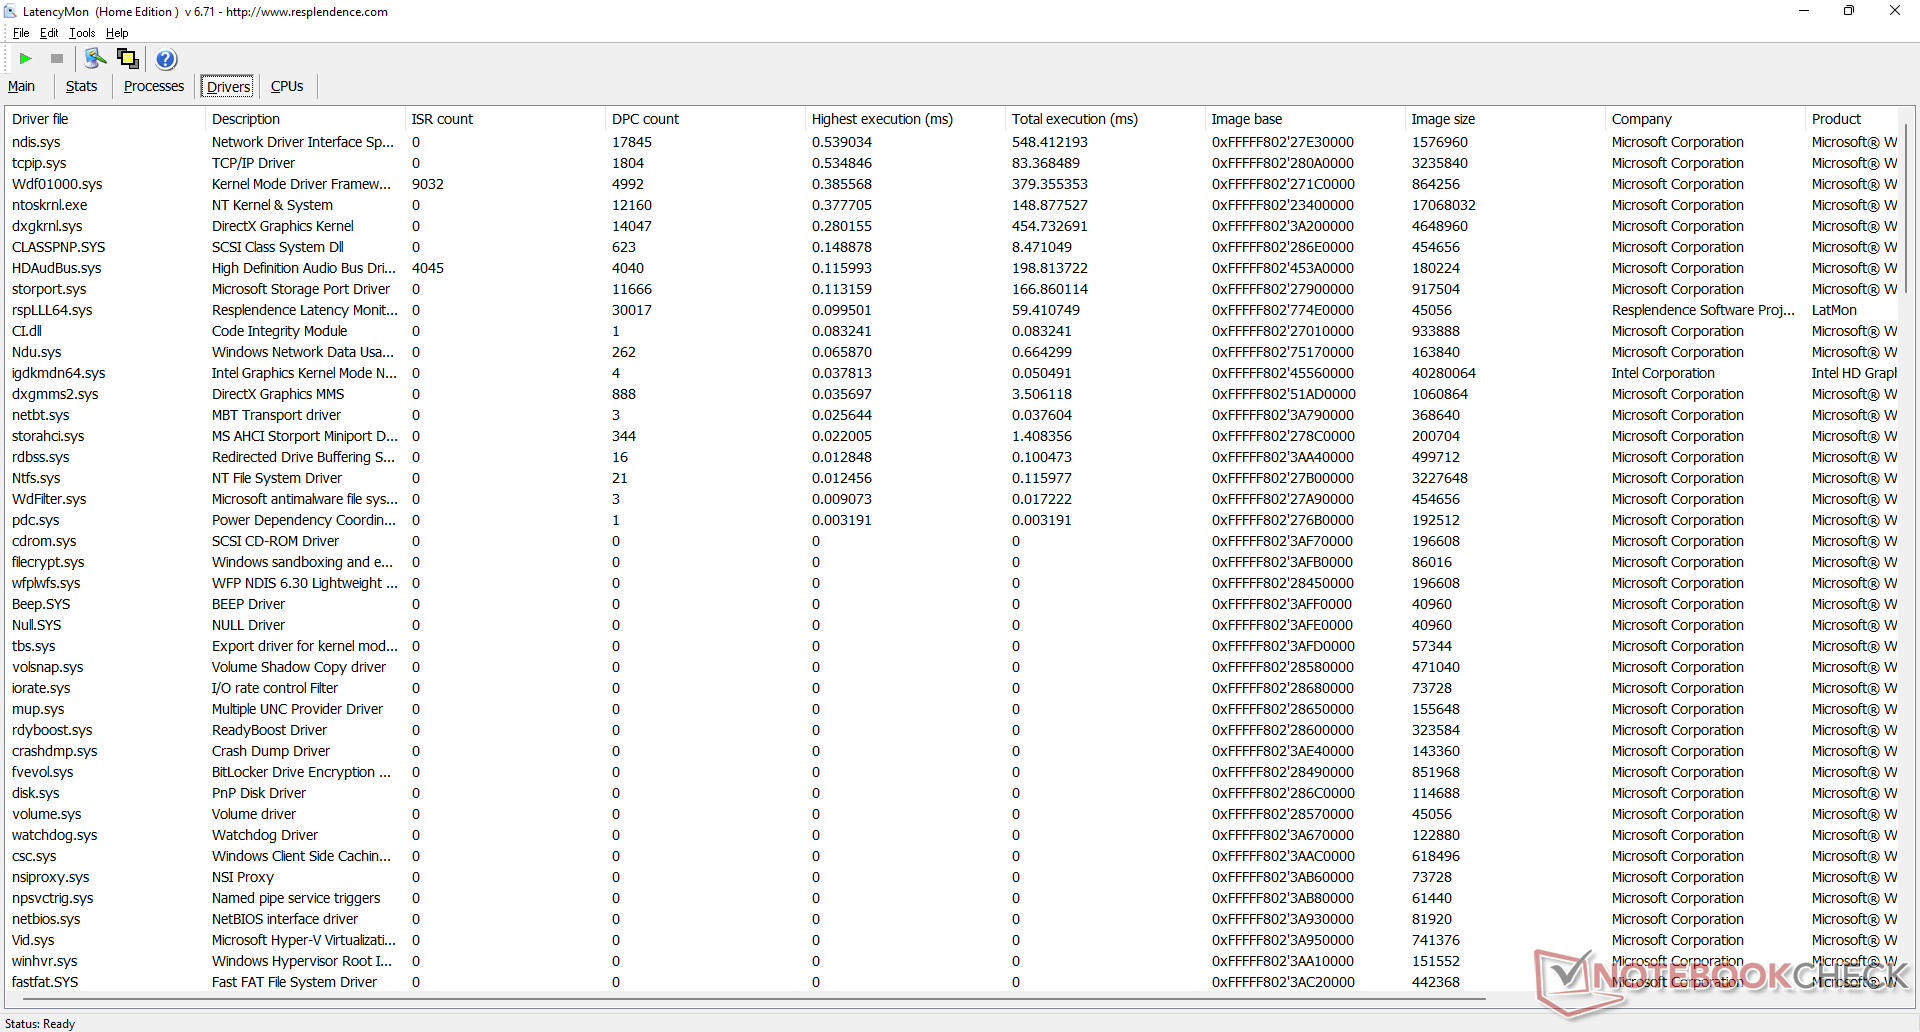
DPC Latency
LatencyMon reveals DPC issues when opening multiple browser tabs of our homepage. 4K video playback at 60 FPS is otherwise smooth and at a reasonably low 17 percent CPU utilization with just one dropped frame during our tests.
| DPC Latencies / LatencyMon - interrupt to process latency (max), Web, Youtube, Prime95 | |
| Beelink SEi8 | |
| GMK NucBox 3 | |
| Beelink U59 Mini-S | |
| Beelink U59 | |
| Intel NUC11TNKi5 | |
* ... smaller is better
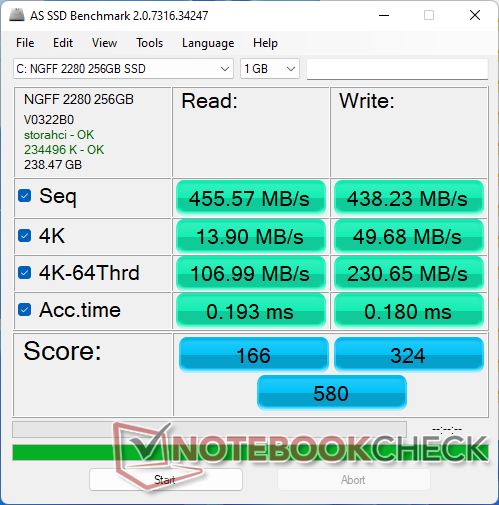
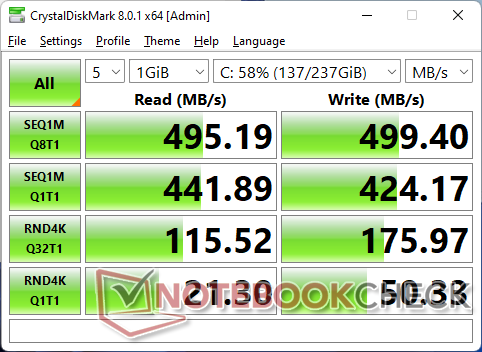
Storage Devices — Up To Two Internal Drives
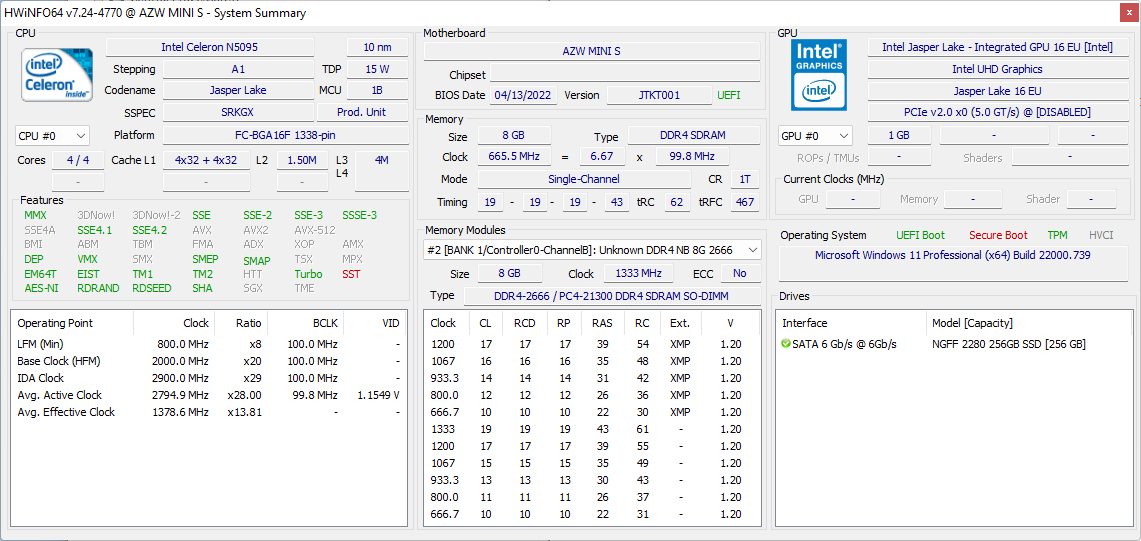
Our unit ships with an uncommon Silicon Motion AZW 256G M.228 220426 SATA III M.2 SSD for sequential transfer rates that max out at around 500 MB/s. Though nowhere near as fast as an NVMe solution, it is nonetheless sufficient considering the target audience and Celeron CPU.

| Drive Performance rating - Percent | |
| Beelink SEi8 | |
| Zotac ZBOX MI642 Nano | |
| Intel NUC11TNKi5 | |
| Beelink U59 Mini-S | |
| Beelink U59 | |
| GMK NucBox 3 | |
* ... smaller is better
Disk Throttling: DiskSpd Read Loop, Queue Depth 8
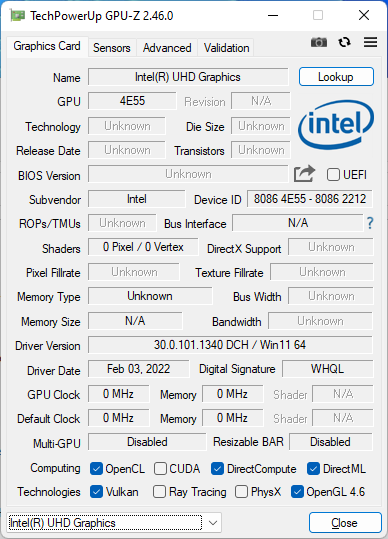
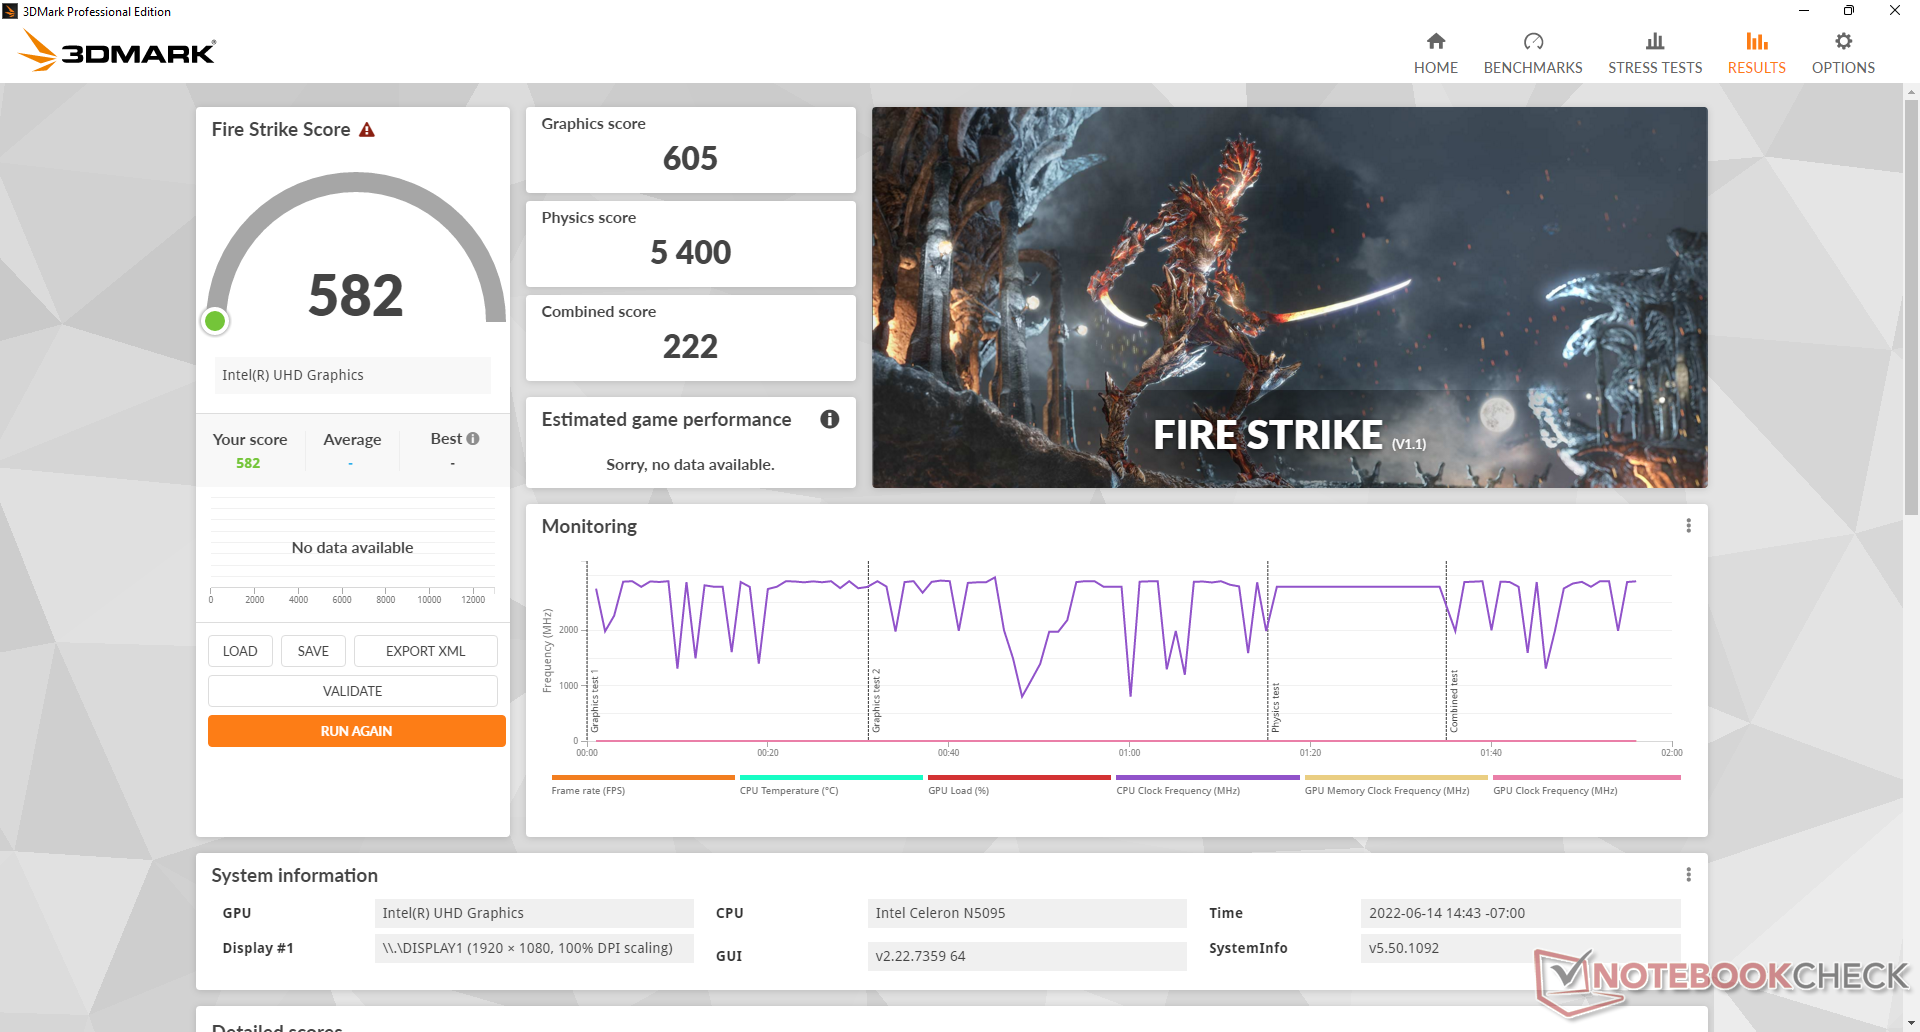
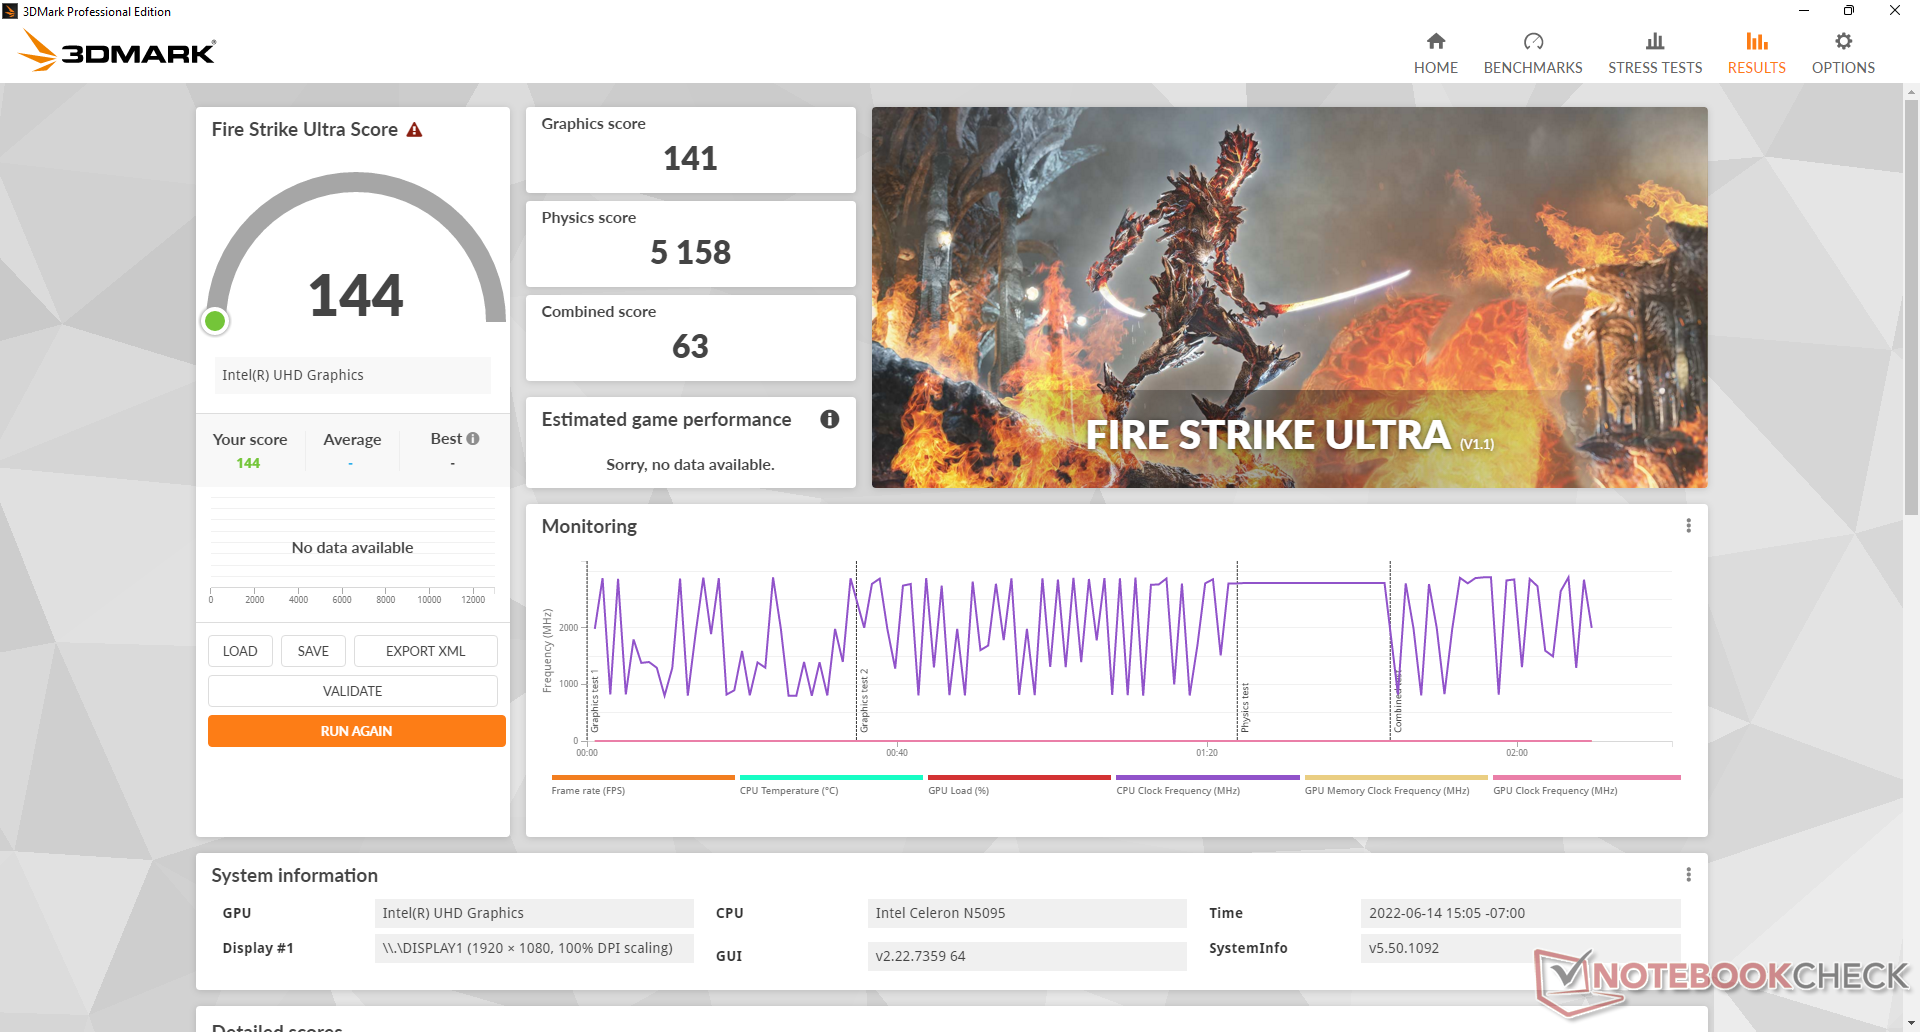
GPU Performance — Too Slow For Games
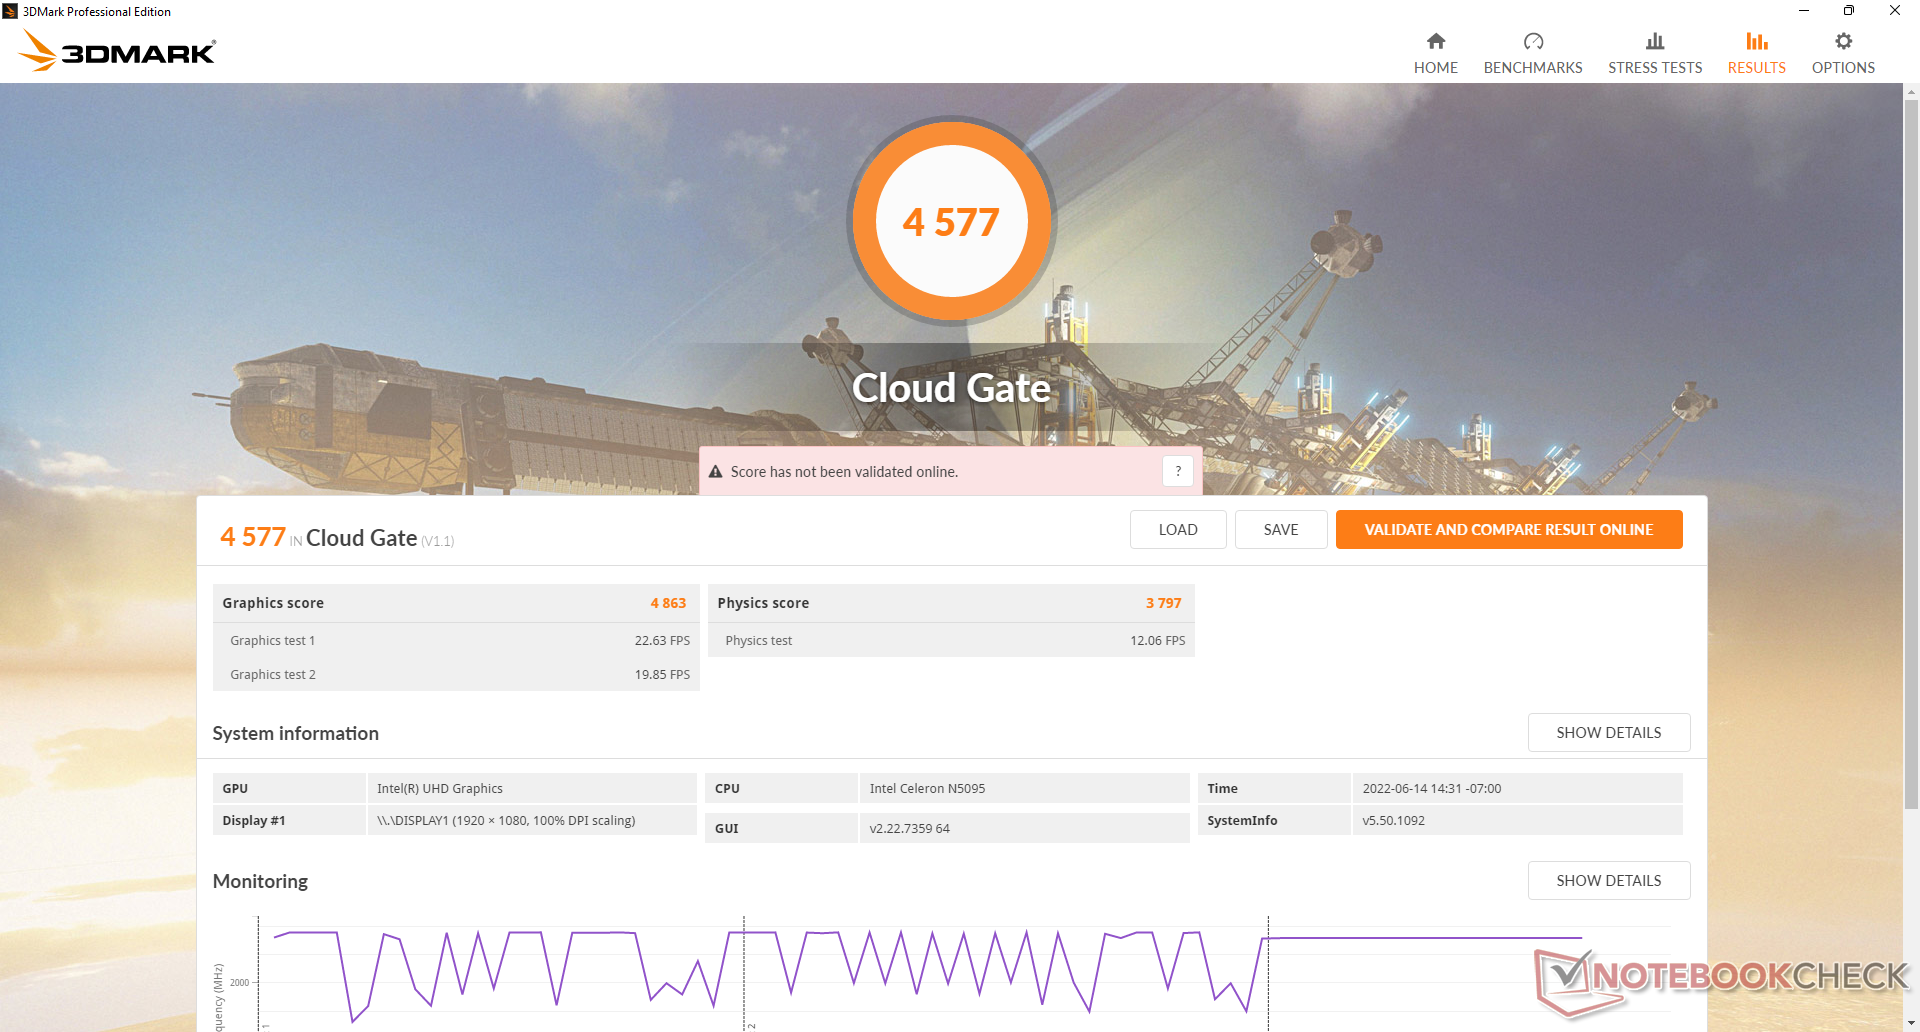
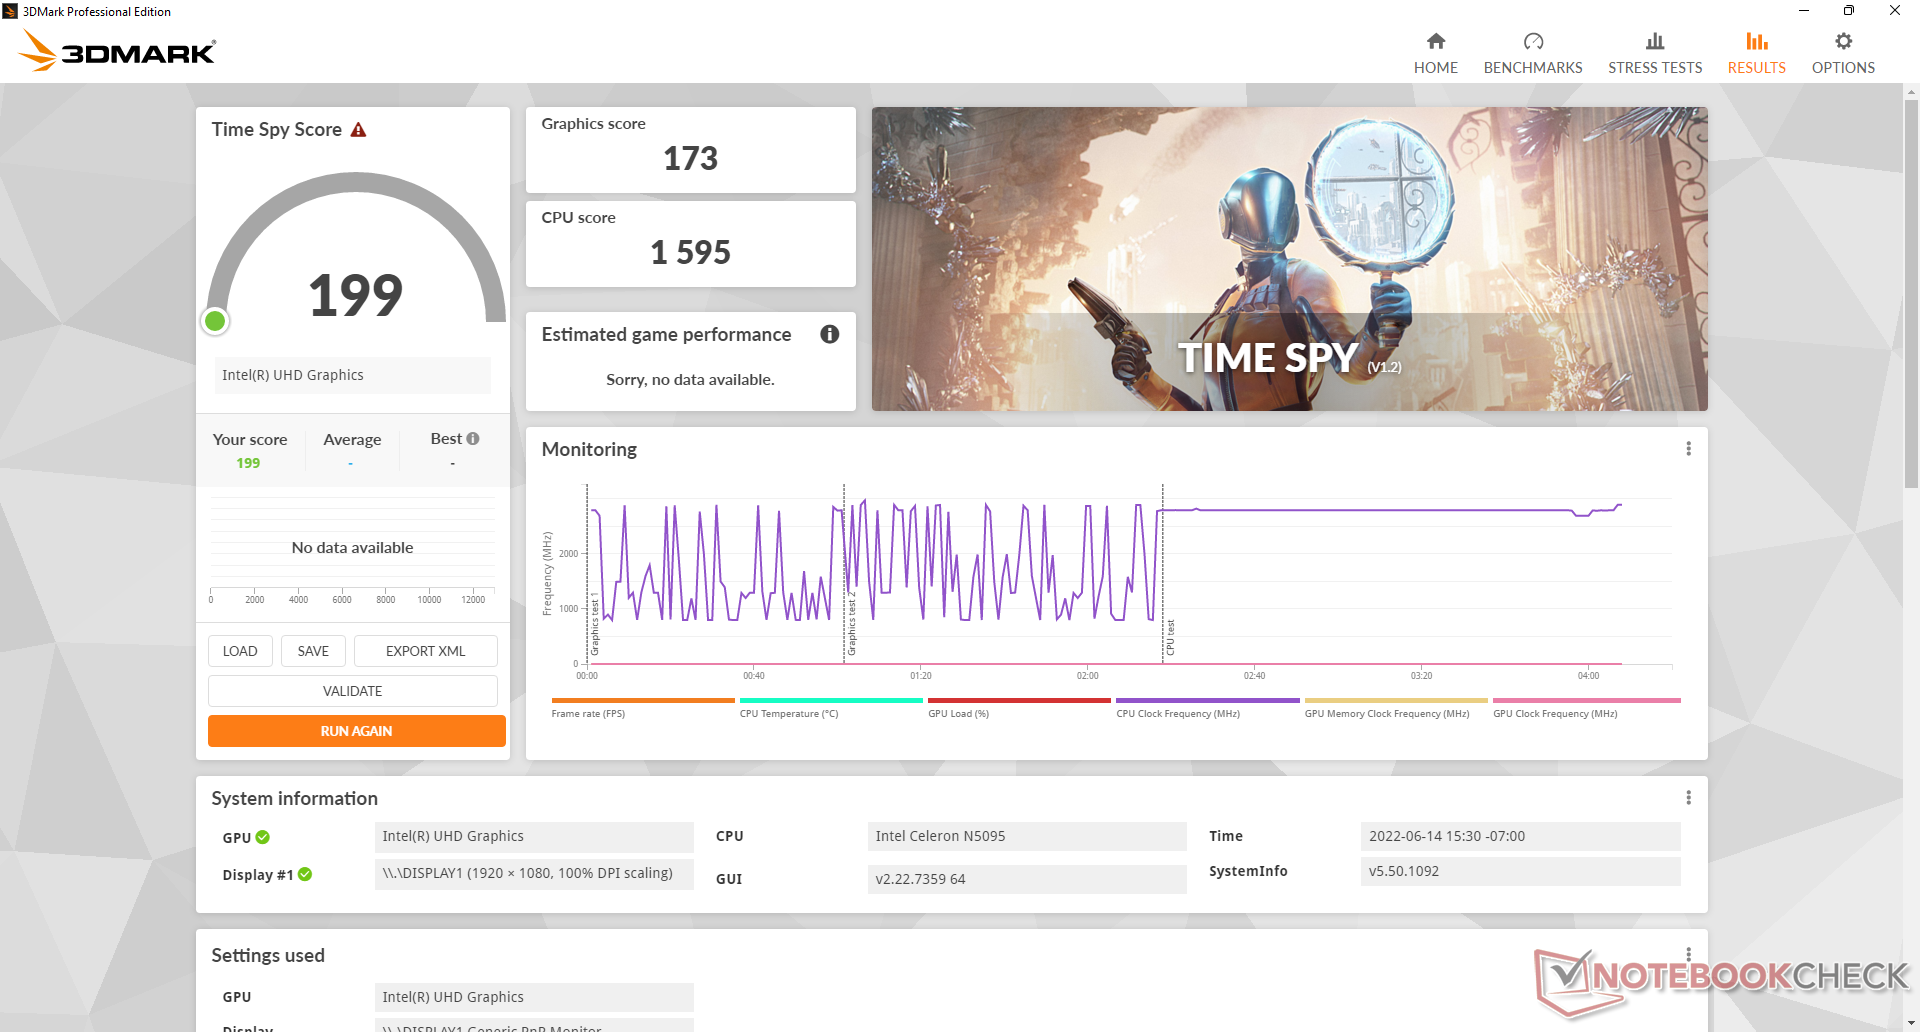
Graphics performance is poor with results that are below even the ancient UHD Graphics 620 by more than 50 percent. Don't expect to be able to run even the most undemanding of 3D games as this particular mini PC was designed more for FHD or 4K video streaming instead.
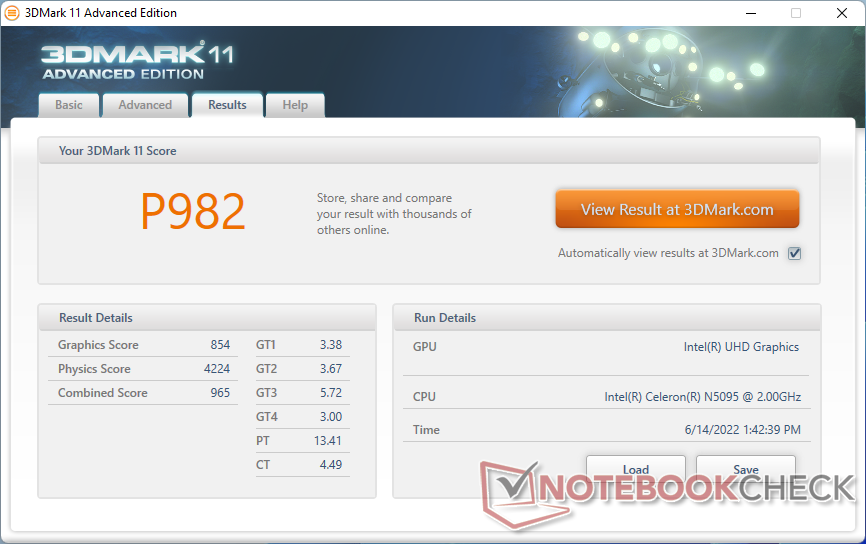
| 3DMark 11 Performance | 982 points | |
| 3DMark Cloud Gate Standard Score | 4577 points | |
| 3DMark Fire Strike Score | 582 points | |
| 3DMark Time Spy Score | 199 points | |
Help | ||
| low | med. | high | ultra | |
|---|---|---|---|---|
| Dota 2 Reborn (2015) | 58.3 | 20.7 | 11.6 | 10.8 |
| Final Fantasy XV Benchmark (2018) | 6.86 | |||
| X-Plane 11.11 (2018) | 13.3 | 7.54 | 7.07 |
Emissions
System Noise — Quiet Under Most Conditions
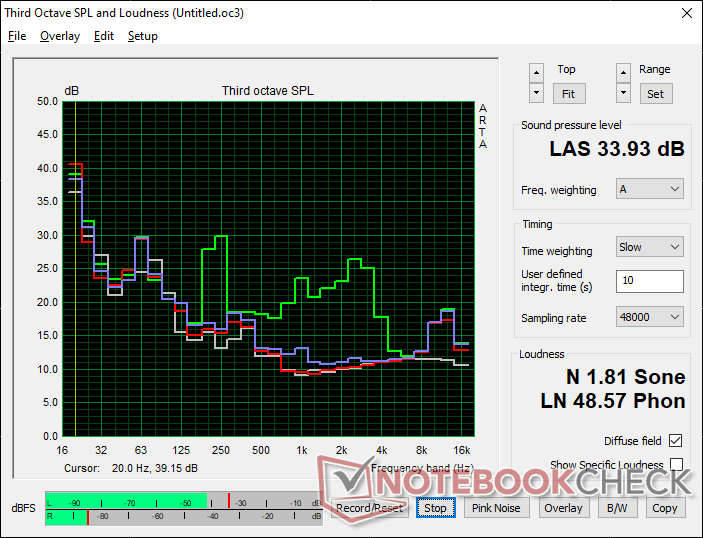
Though the model isn't passively cooled, it may as well be in practice as the fan is idle or barely audible during most loads. When running the first benchmark scene of 3DMark 06, for example, fan noise would only be about 25 dB(A) against a silent background of 23 dB(A). Results are much quieter than what we observed on the Beelink SEi8 or Intel NUC11 each sporting more powerful hardware.
We're able to record up to 34 dB(A) when the CPU is stressed under Prime95. When browsing or video streaming for longer periods, expect fan noise to hover in the 31 dB(A) range.
Noise level
| Idle |
| 24.2 / 24.2 / 24.2 dB(A) |
| Load |
| 25.1 / 33.9 dB(A) |
 | ||
30 dB silent 40 dB(A) audible 50 dB(A) loud |
||
min: | ||
| Beelink U59 Mini-S UHD Graphics (Jasper Lake 16 EU), Celeron N5095, Silicon Motion AZW 256G M.228 220426 C SATA 3 | Beelink SEi8 Iris Plus Graphics 655, i3-8109U, Intel SSD 660p SSDPEKNW512G8 | Intel NUC11TNKi5 Iris Xe G7 80EUs, i5-1135G7, Transcend M.2 SSD 430S TS512GMTS430S | Beelink U59 UHD Graphics (Jasper Lake 16 EU), Celeron N5095, Silicon Motion AZW 512G NV428 | Zotac ZBOX MI642 Nano UHD Graphics 620, i5-10210U, Western Digital WD Blue 3D WDBNCE5000PNC | |
|---|---|---|---|---|---|
| Noise | -19% | -39% | -9% | -36% | |
| off / environment * (dB) | 23.3 | 24.5 -5% | 24.8 -6% | 24.5 -5% | 27.8 -19% |
| Idle Minimum * (dB) | 24.2 | 26.5 -10% | 35.6 -47% | 24.5 -1% | 27.8 -15% |
| Idle Average * (dB) | 24.2 | 26.5 -10% | 35.6 -47% | 24.5 -1% | 33.9 -40% |
| Idle Maximum * (dB) | 24.2 | 31.1 -29% | 35.6 -47% | 28.6 -18% | 33.9 -40% |
| Load Average * (dB) | 25.1 | 37.7 -50% | 36.2 -44% | 29.7 -18% | 43.7 -74% |
| Load Maximum * (dB) | 33.9 | 37.5 -11% | 47.6 -40% | 37.6 -11% | 43.7 -29% |
| Witcher 3 ultra * (dB) | 38 | 30.4 |
* ... smaller is better
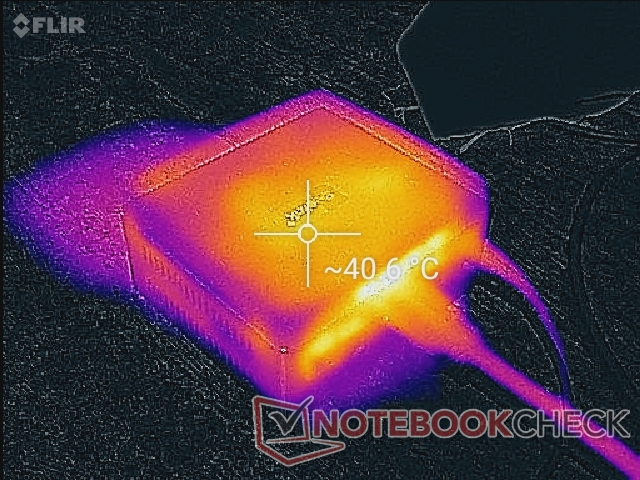
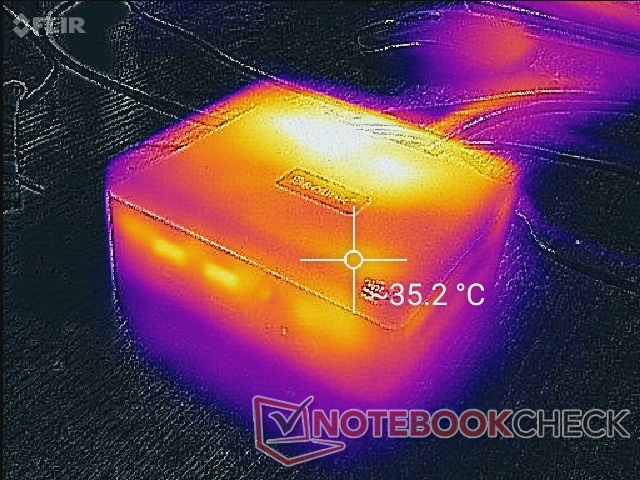
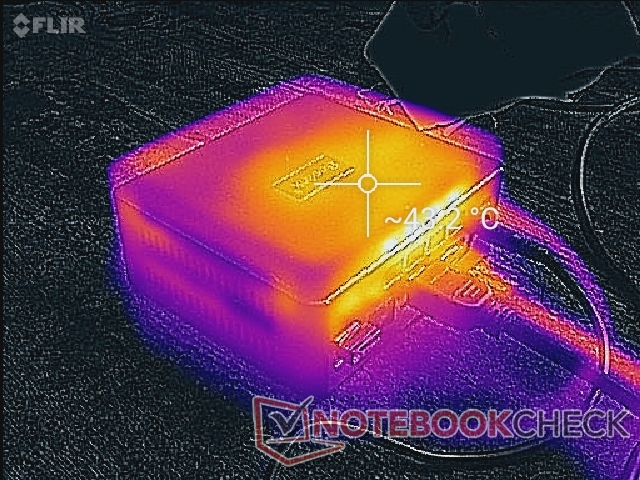
Temperature
Surface temperatures are warmer than expected at up to 40 C on the top even when idling on desktop. When running demanding loads, the top hot spot would rise just slightly to 43 C. The high idling surface temperature can be attributed to the idling fan during low processing loads to keep the system as silent as possible until the fan is needed.
Stress Test
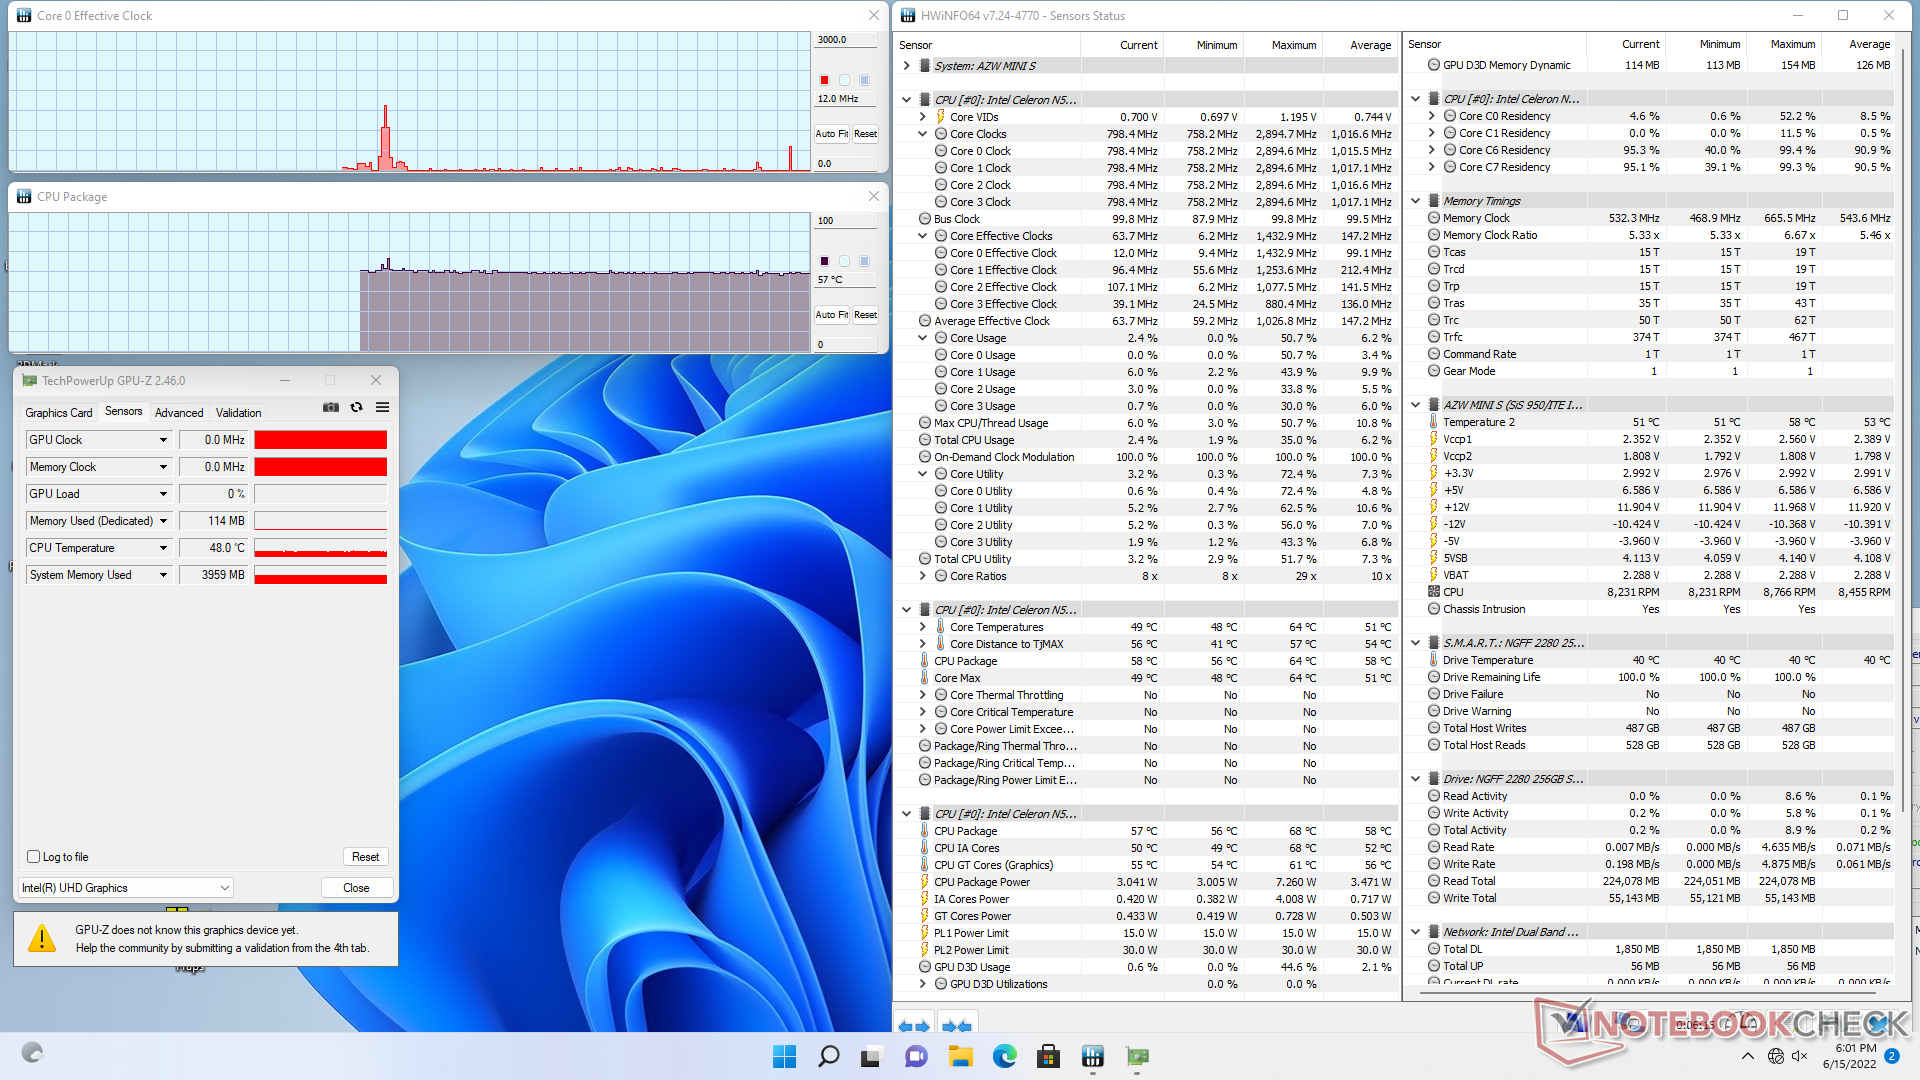
Running Prime95 causes CPU clock rates and temperature to spike to 2.8 GHz and 87 C, respectively. Clock rates would eventually drop to 2.5 to 2.6 GHz after just a short while in order to maintain the 87 C core temperature. CPU power draw would be as high as 16 W during the start of the test before stabilizing at 13 W due to thermal limitations.
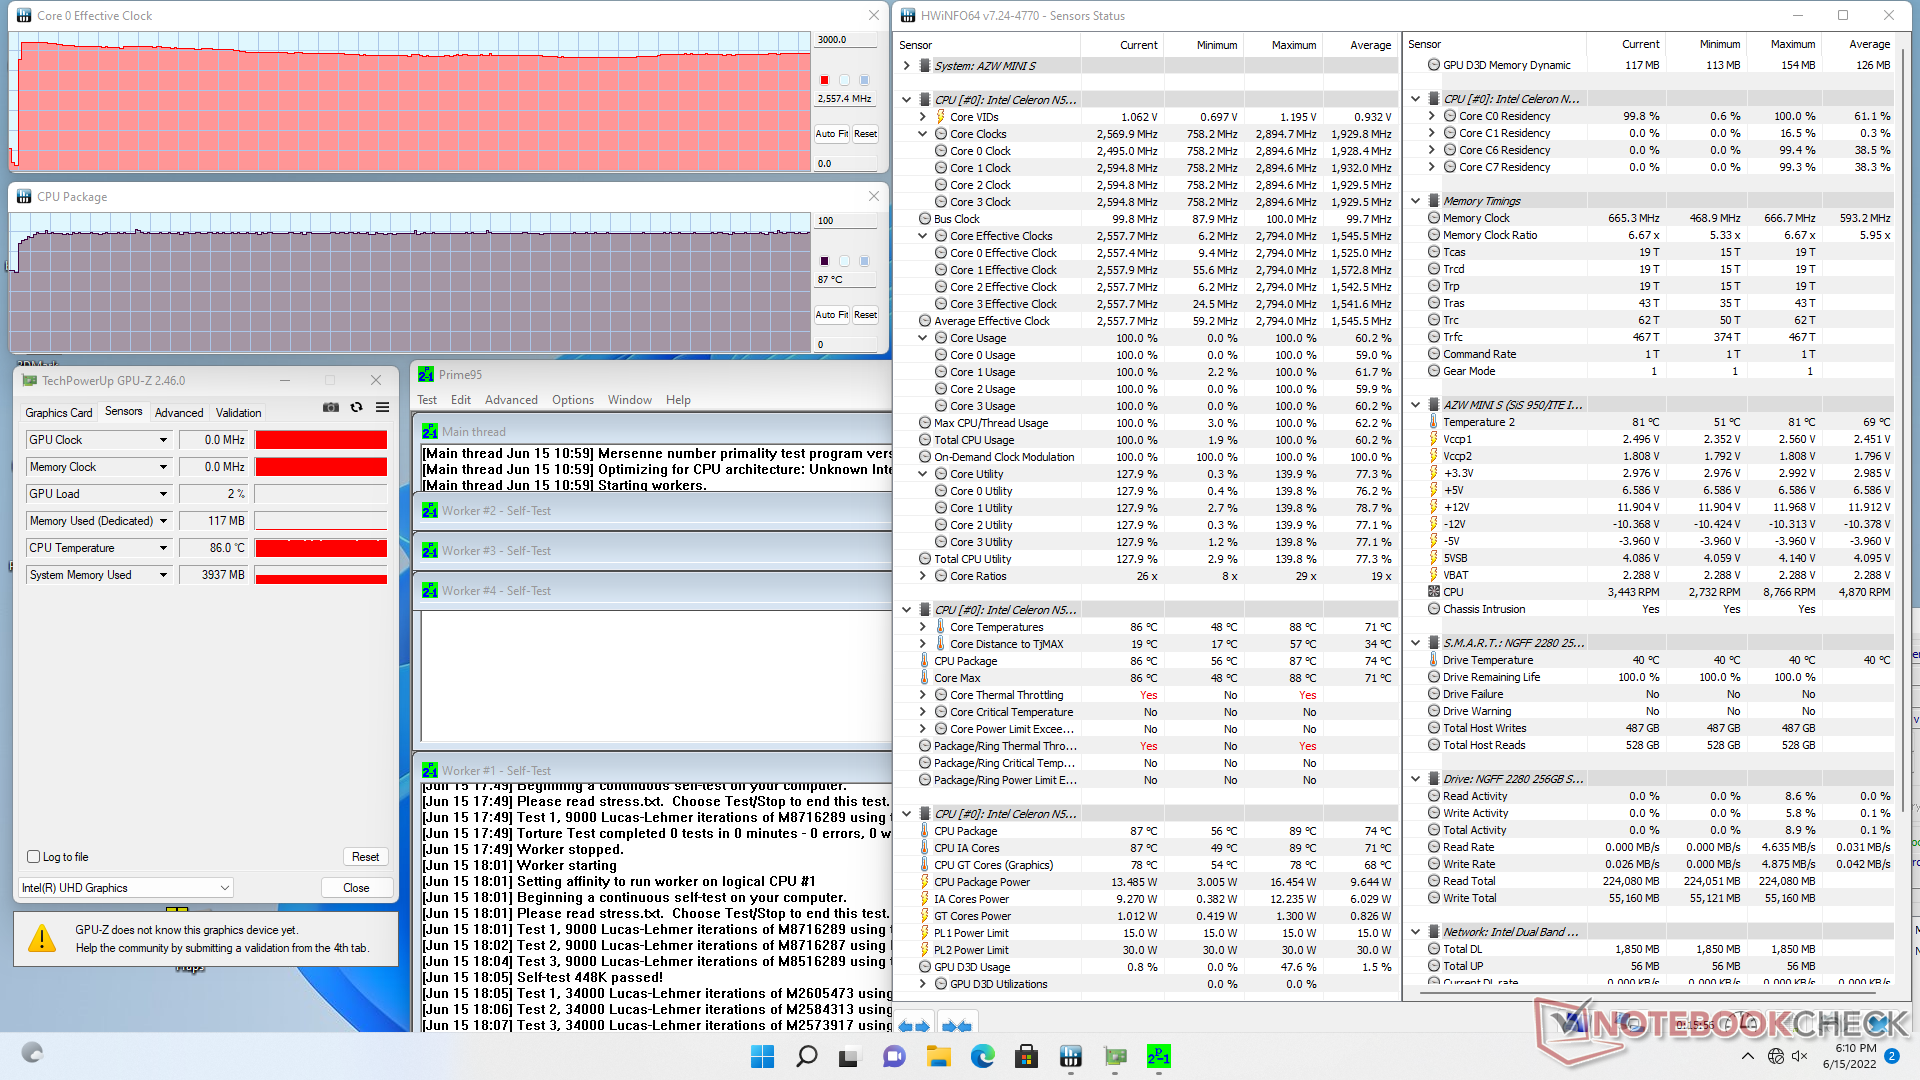
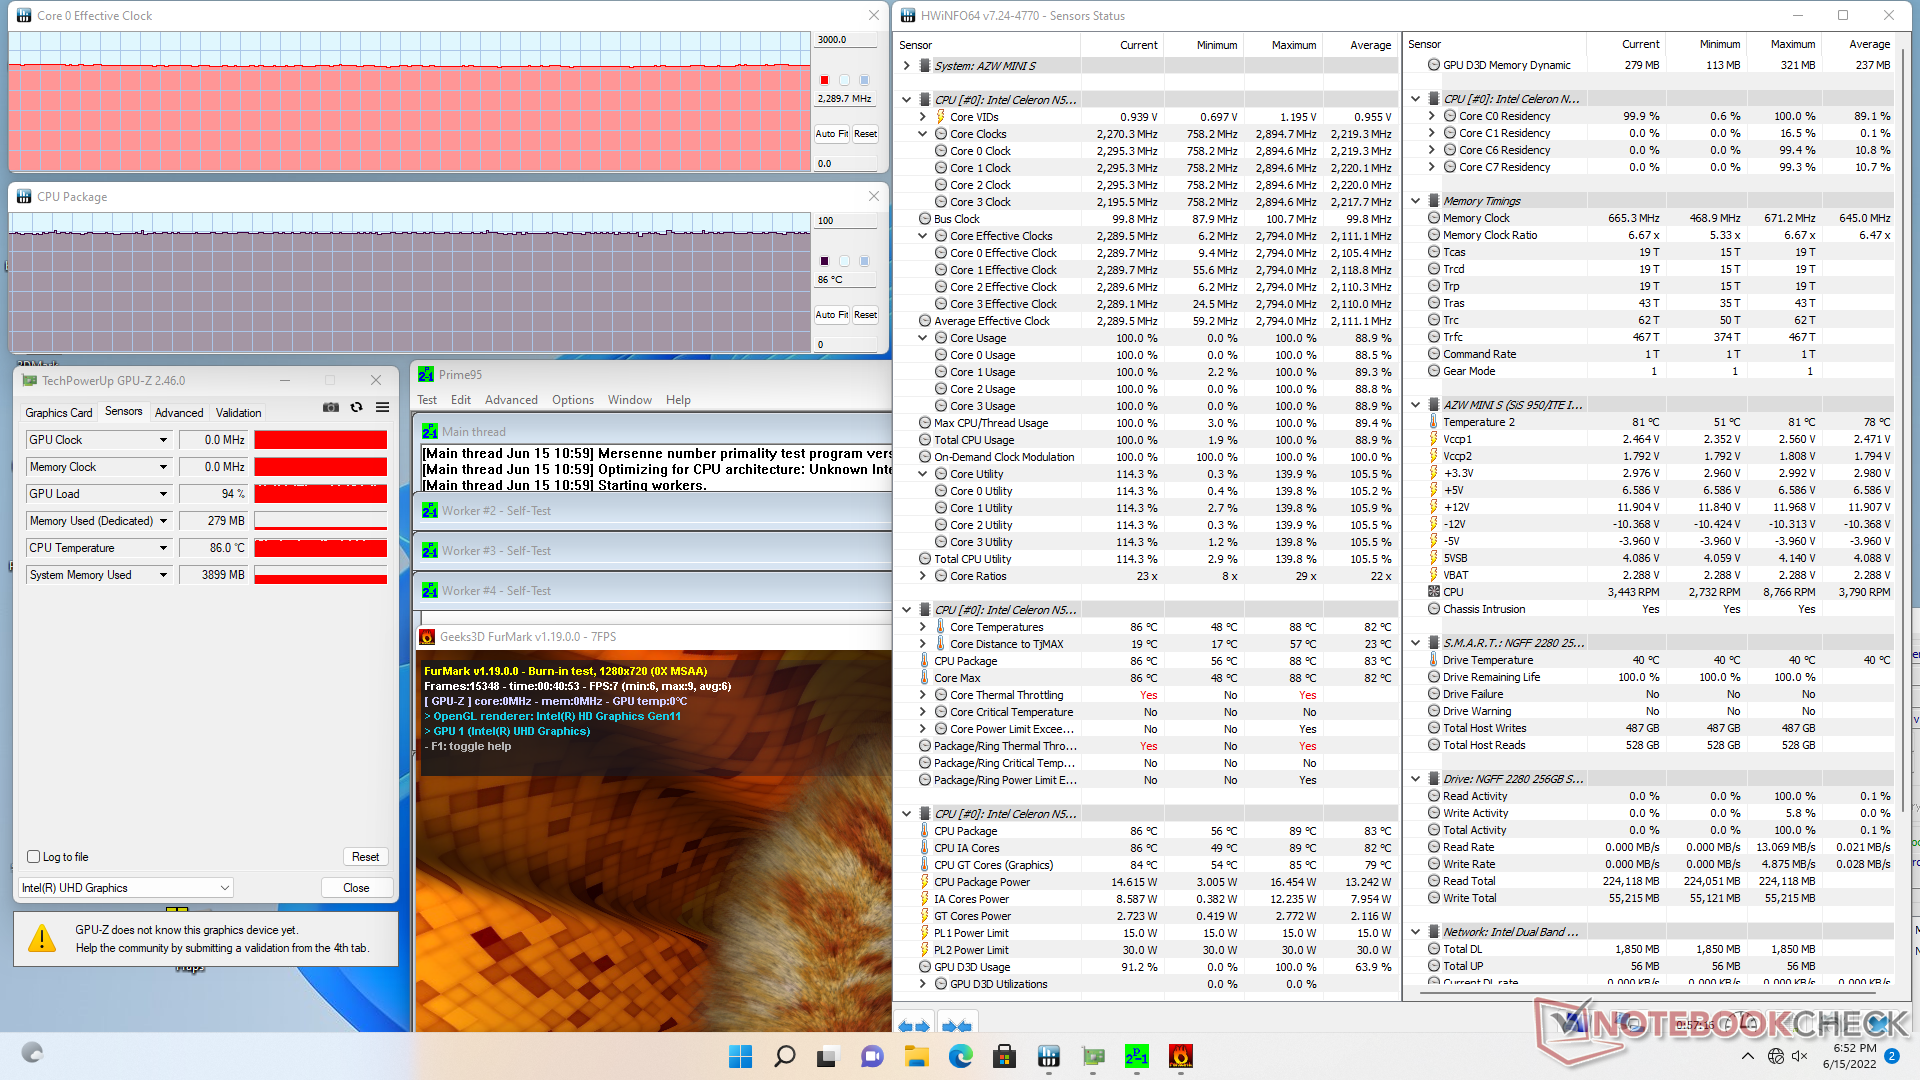
| CPU Clock (GHz) | GPU Clock (MHz) | Average CPU Temperature (°C) | |
| System Idle | -- | -- | 57 |
| Prime95 Stress | 2.6 | -- | 87 |
| Prime95 + FurMark Stress | 2.3 | -- | 86 |
Energy Management — Very Efficient
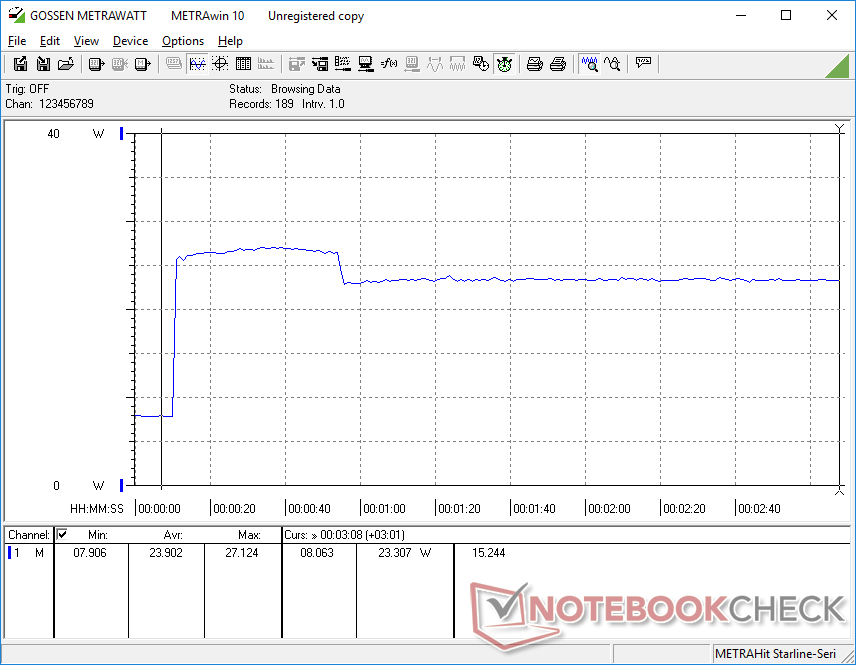
Power Consumption
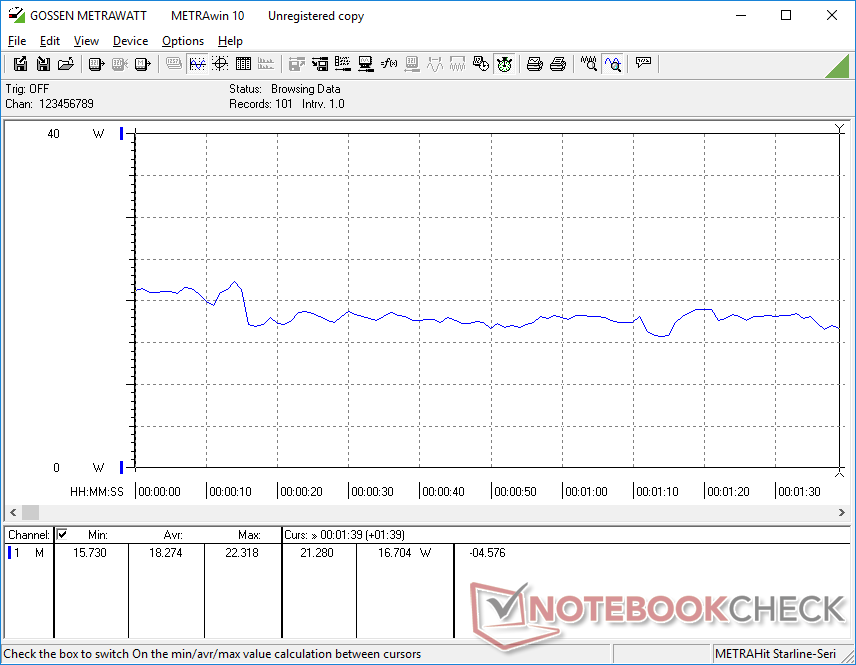
The unit draws about 7 to 8 W when idling on desktop with no running applications which is more efficient than the 11th gen Core i5-powered Intel NUC11 or 10th gen Core i5-powered Zotac ZBox Nano. When running more demanding loads like games, the system will draw only 18 W on average compared to 41 W or 33 W on the aforementioned Intel and Zotac models, respectively. Of course, GPU performance is significantly slower on the Beelink Mini-S and so the lower power demand is expected.
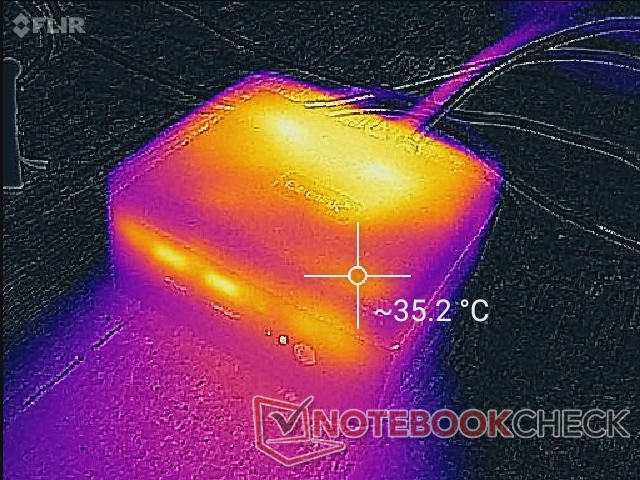
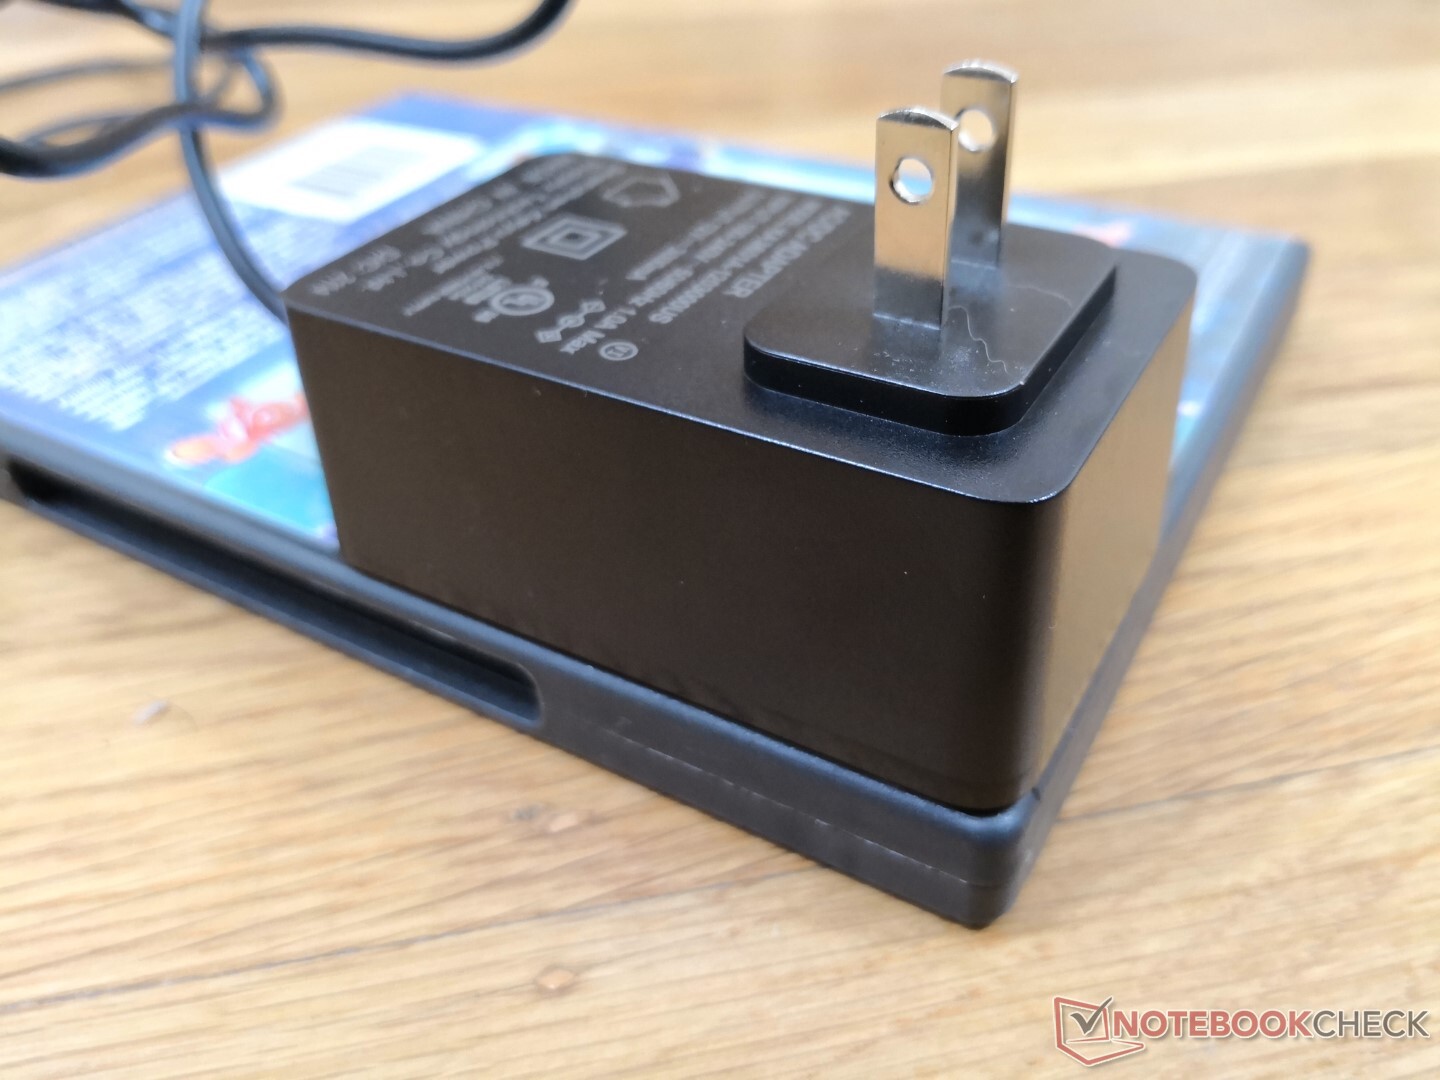
We're able to measure a maximum draw of 27 W from the small (~7.9 x 4.8 x 3.4 cm) 36 W AC adapter. This is the same adapter that also ships with the original U59.
| Off / Standby | |
| Idle | |
| Load |
|
Key:
min: | |
| Beelink U59 Mini-S Celeron N5095, UHD Graphics (Jasper Lake 16 EU), Silicon Motion AZW 256G M.228 220426 C SATA 3, , x, | Beelink SEi8 i3-8109U, Iris Plus Graphics 655, Intel SSD 660p SSDPEKNW512G8, , x, | Intel NUC11TNKi5 i5-1135G7, Iris Xe G7 80EUs, Transcend M.2 SSD 430S TS512GMTS430S, , x, | Beelink U59 Celeron N5095, UHD Graphics (Jasper Lake 16 EU), Silicon Motion AZW 512G NV428, , x, | GMK NucBox 3 Celeron J4125, UHD Graphics 600, Netac S535N8/256GYN, , x, | Zotac ZBOX MI642 Nano i5-10210U, UHD Graphics 620, Western Digital WD Blue 3D WDBNCE5000PNC, , x, | |
|---|---|---|---|---|---|---|
| Power Consumption | -43% | -101% | 6% | 42% | -56% | |
| Idle Minimum * (Watt) | 7 | 7.5 -7% | 11.5 -64% | 6.7 4% | 3 57% | 8.9 -27% |
| Idle Average * (Watt) | 7 | 7.6 -9% | 12.4 -77% | 6.7 4% | 3.1 56% | 9 -29% |
| Idle Maximum * (Watt) | 7.6 | 9.2 -21% | 12.9 -70% | 7.4 3% | 3.6 53% | 9.9 -30% |
| Load Average * (Watt) | 18.3 | 41.1 -125% | 40.7 -122% | 16 13% | 11.1 39% | 33 -80% |
| Load Maximum * (Watt) | 27.1 | 41.4 -53% | 73.5 -171% | 25.6 6% | 25.4 6% | 58 -114% |
| Witcher 3 ultra * (Watt) | 43.9 | 13.1 |
* ... smaller is better
Power Consumption Witcher 3 / Stresstest
Power Consumption external Monitor
Pros
Cons
Verdict — For Budget HTPC Setups
For just over $200 USD, the Beelink U59 Mini-S is one of the least expensive mini PCs you can find that comes fully loaded with RAM, storage, and Windows 11. At this low of a price, the Mini-S can be a decent option for users not willing to spend hundreds more on a faster Core ix-powered mini PC and are not willing to settle for digital media dongles like the Chromecast, Roku, or Amazon Fire TV. The Celeron N5905 isn't particularly fast, but it's still faster than any Atom option out there for relatively smoother operation and excellent 4K video streaming at 60 FPS.
Notable highlights of the Mini-S beyond its affordability include the internal dual storage option and very quiet fan noise.
There are a lot of cut corners to keep in mind mostly relating to the model's lack of features. There is no SD card reader, USB-C, Wi-Fi 6, or dual-channel RAM. The AC adapter cord is also somewhat short at only about 1 meter. Thankfully, these setbacks don't detract from the core HTPC experience too much.
Price and Availability
The Beelink U59 Mini-S is now available on Amazon for $209 USD after applying the current coupon or $229 through the official Beelink website.
Price comparison
