Our top Intel NUC 11 alternative: Beelink GTI 11 mini PC review
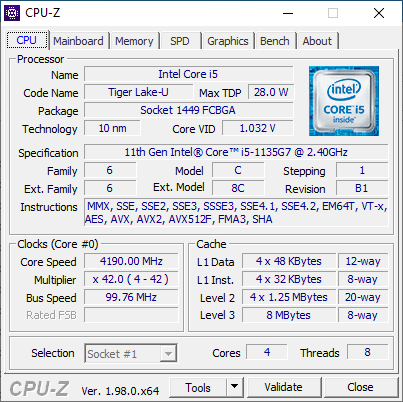
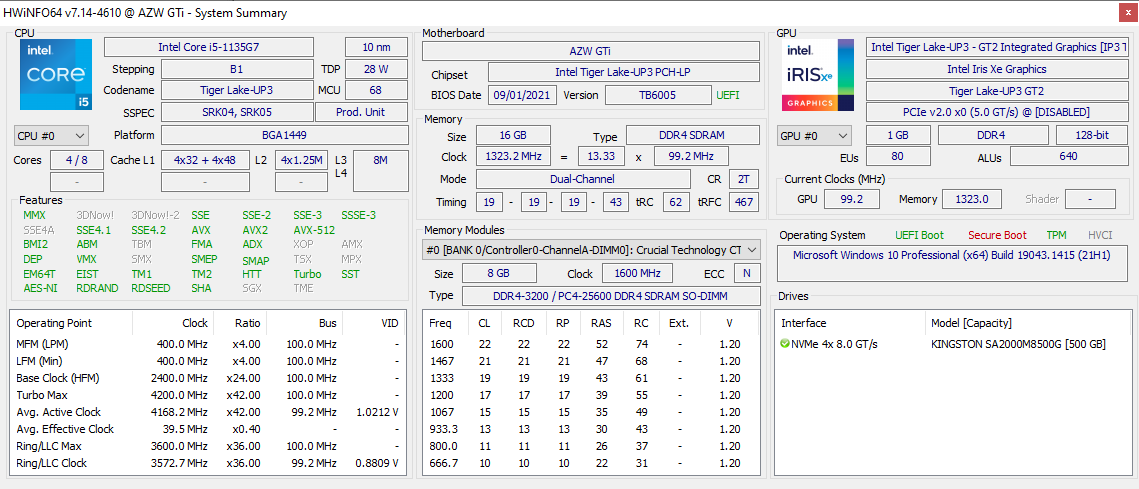
Beelink has a whole range of mini PCs available targeting buyers interested in the Intel NUC experience without having to pay the high Intel NUC prices. The newest model is the GTI 11 which uses the latest 11th gen Tiger Lake-U Core i5-1135G7 processor with integrated Iris Xe 80 EUs graphics. This detail is notable as most other Beelink mini PCs typically rely on older or slower CPUs in order to keep costs at more affordable levels. The GTI 11 is subsequently one of the fastest and priciest mini PCs in Beelink's current lineup.
Alternatives to the GTI 11 include other mini PCs powered by 11th gen Intel Core U-series CPUs like the Intel NUC11 Phantom Canyon, Beelink GMK NucBoc 2, or Zotac ZBox CI665 Nano.
More Beelink reviews:
Potential Competitors in Comparison
Rating | Date | Model | Weight | Height | Size | Resolution | Price |
|---|---|---|---|---|---|---|---|
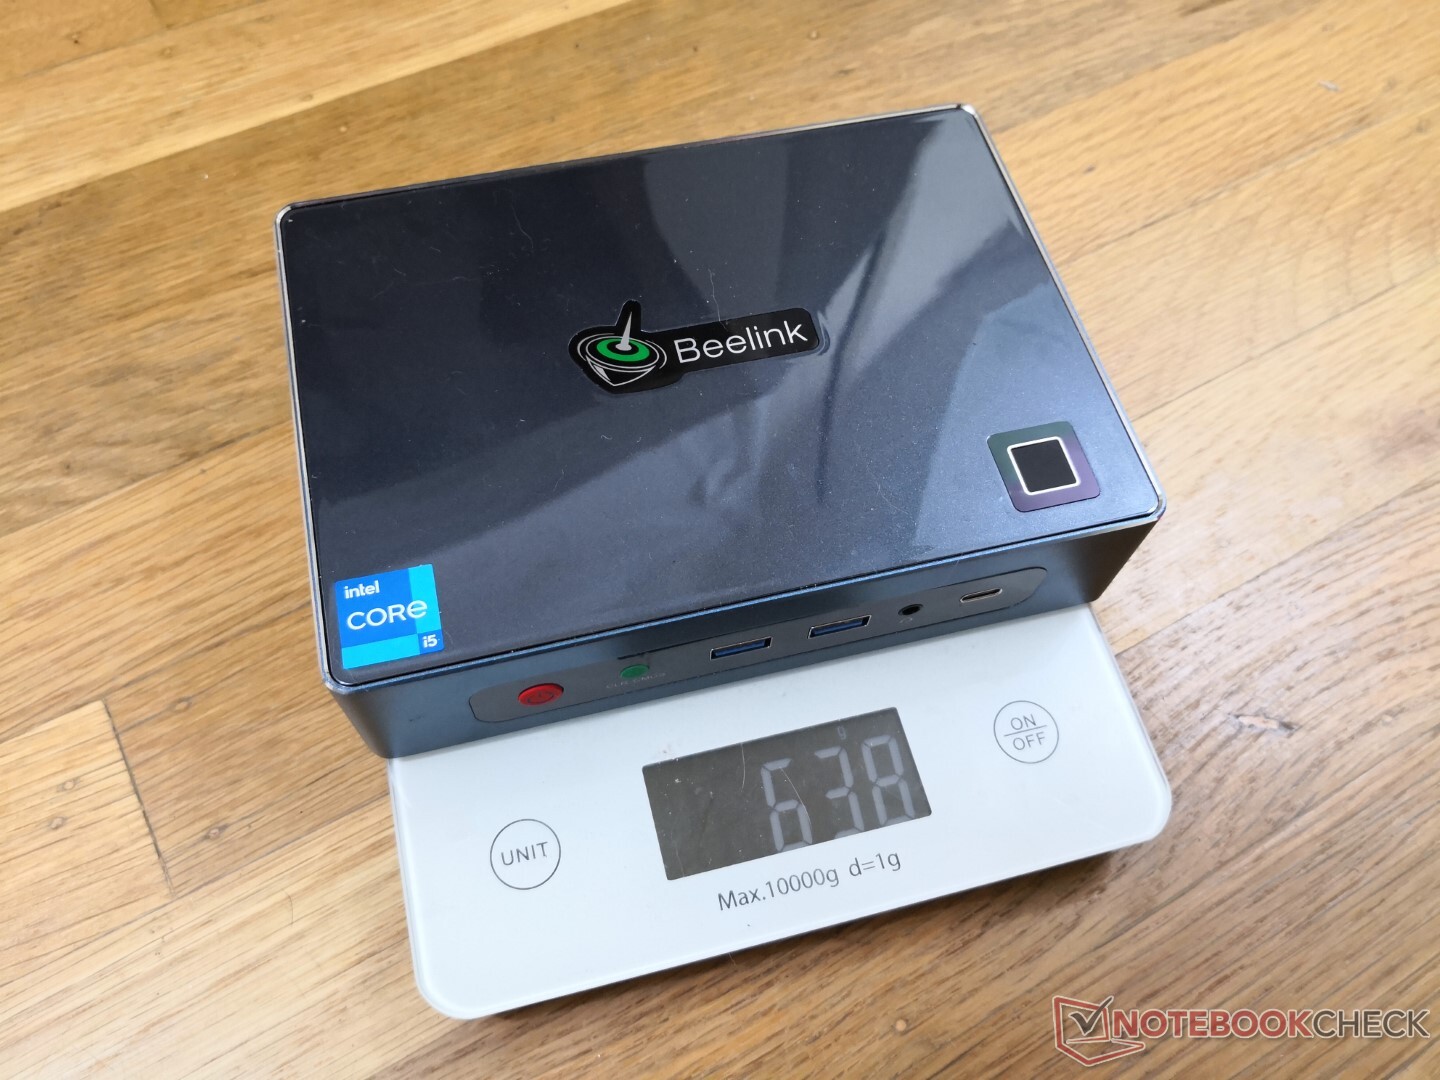
v (old) | 12 / 2021 | Beelink GTI 11 i5-1135G7, Iris Xe G7 80EUs | 638 g | 39 mm | x | ||
v (old) | 11 / 2021 | Beelink SER3 R7 3750H, Vega 10 | 492 g | 40 mm | x | ||
v (old) | 04 / 2021 | Intel NUC11TNKi5 i5-1135G7, Iris Xe G7 80EUs | 504 g | 37 mm | x | ||
v (old) | 02 / 2020 | Intel NUC10i7FNH i7-10710U, UHD Graphics 620 | 697 g | 51 mm | 0.00" | 0x0 | |
v (old) | 03 / 2021 | GMK NucBox 2 i5-8259U, Iris Plus Graphics 655 | 430 g | 50 mm | x | ||
v (old) | 03 / 2018 | Intel Hades Canyon NUC8i7HVK i7-8809G, Vega M GH | 1.3 kg | 39 mm | x |
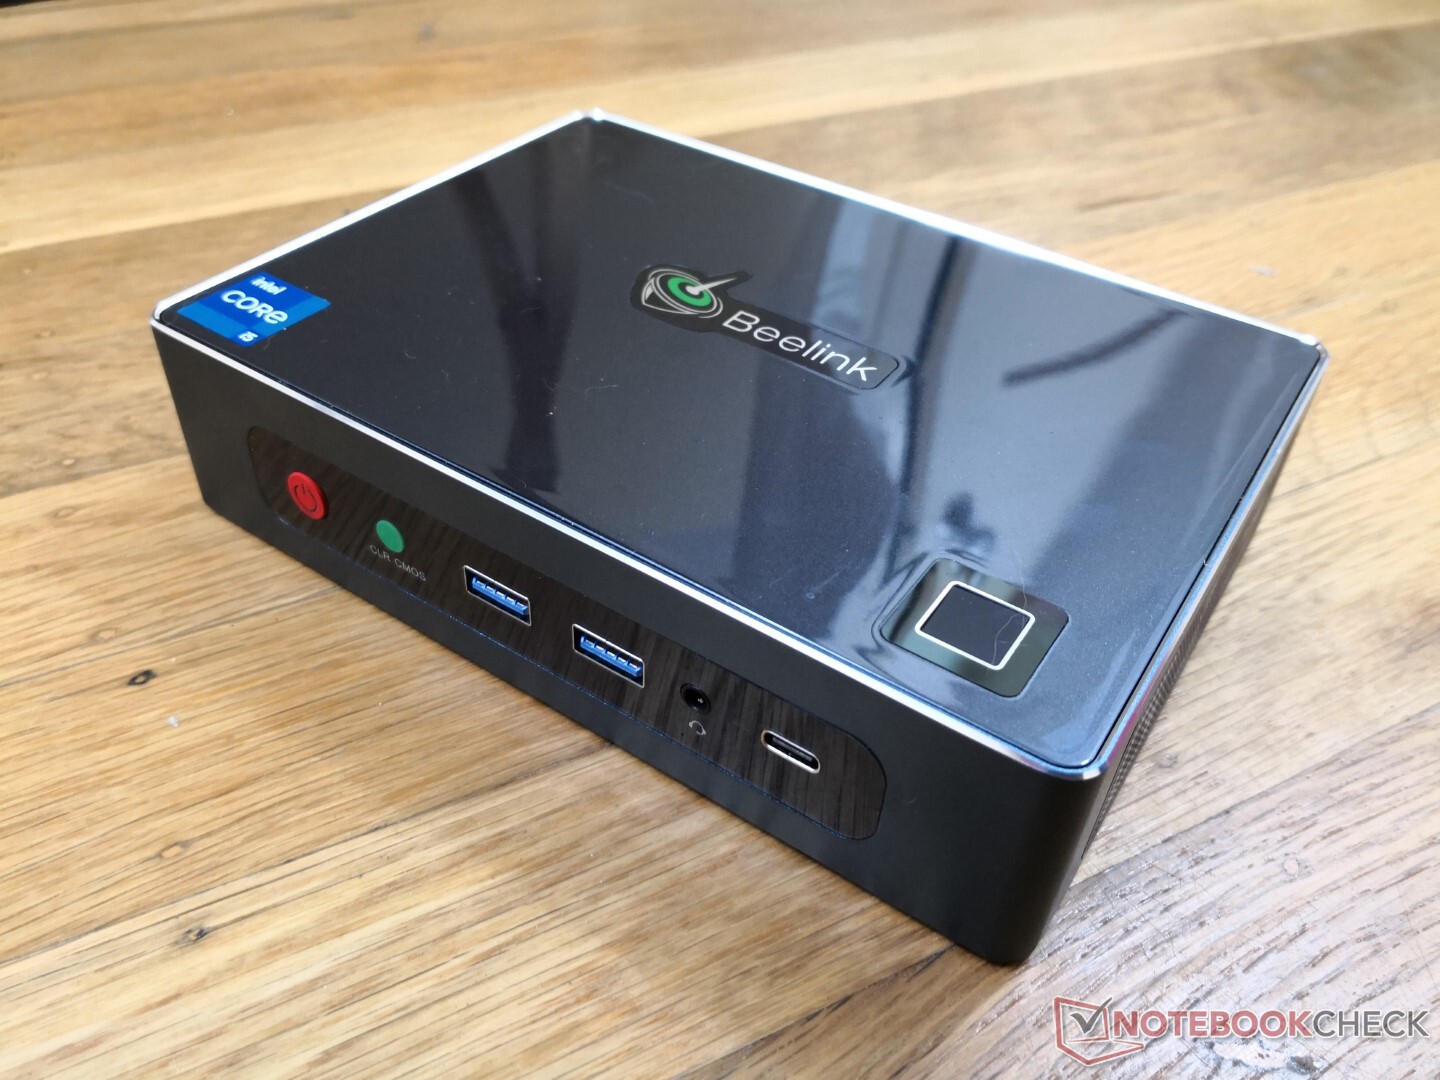
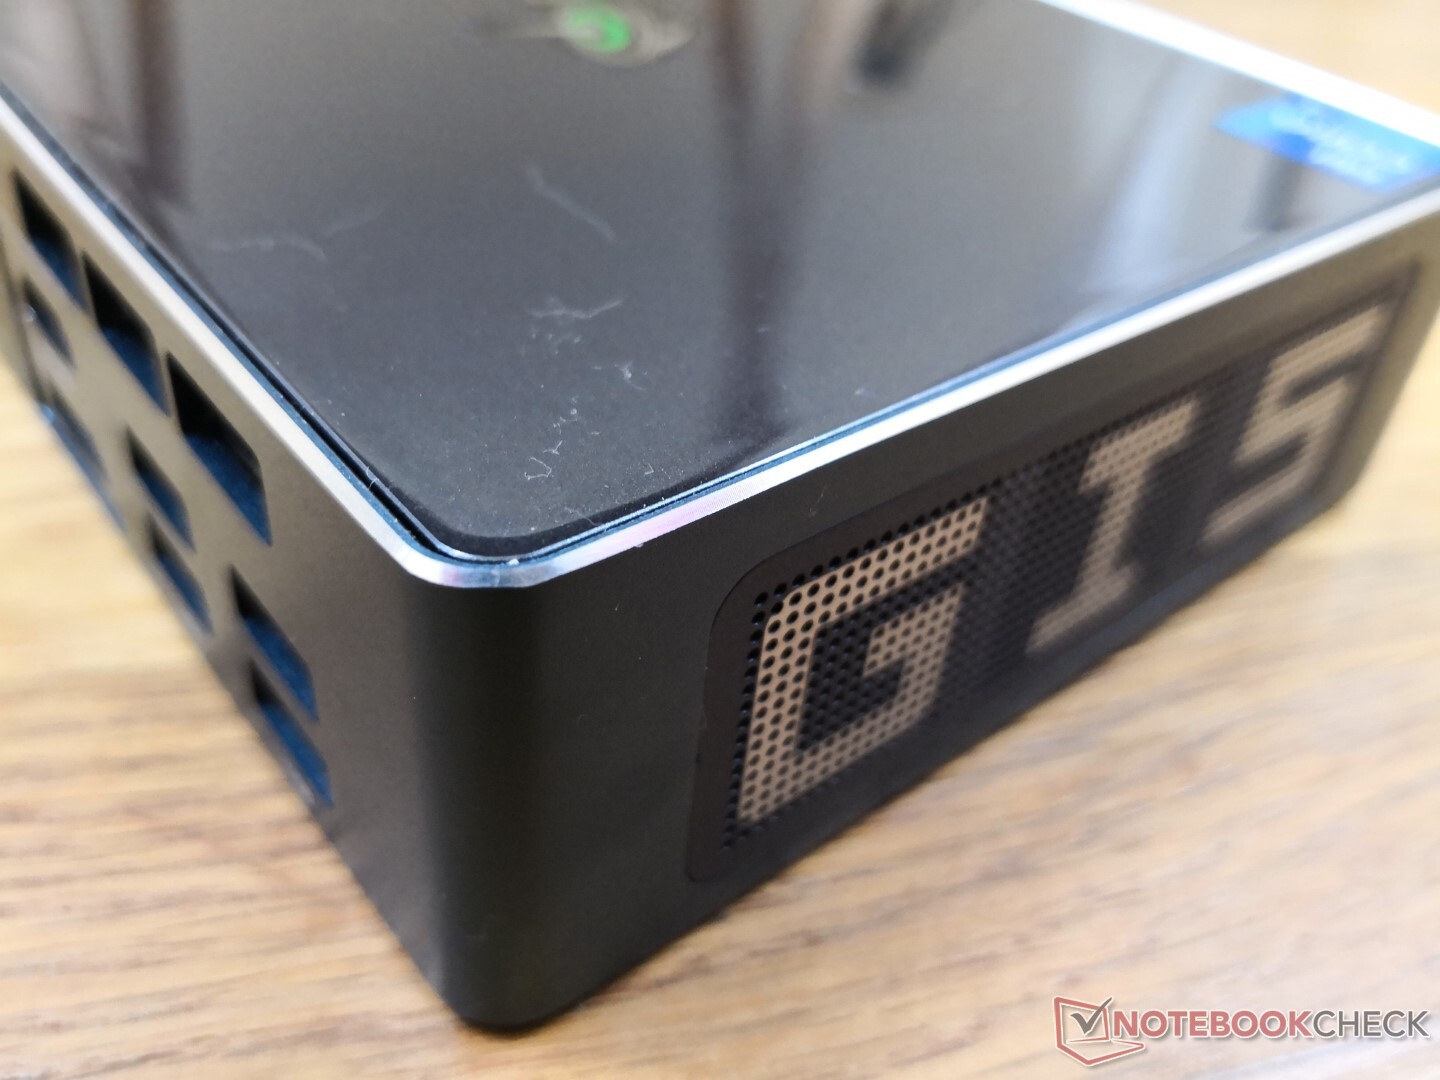
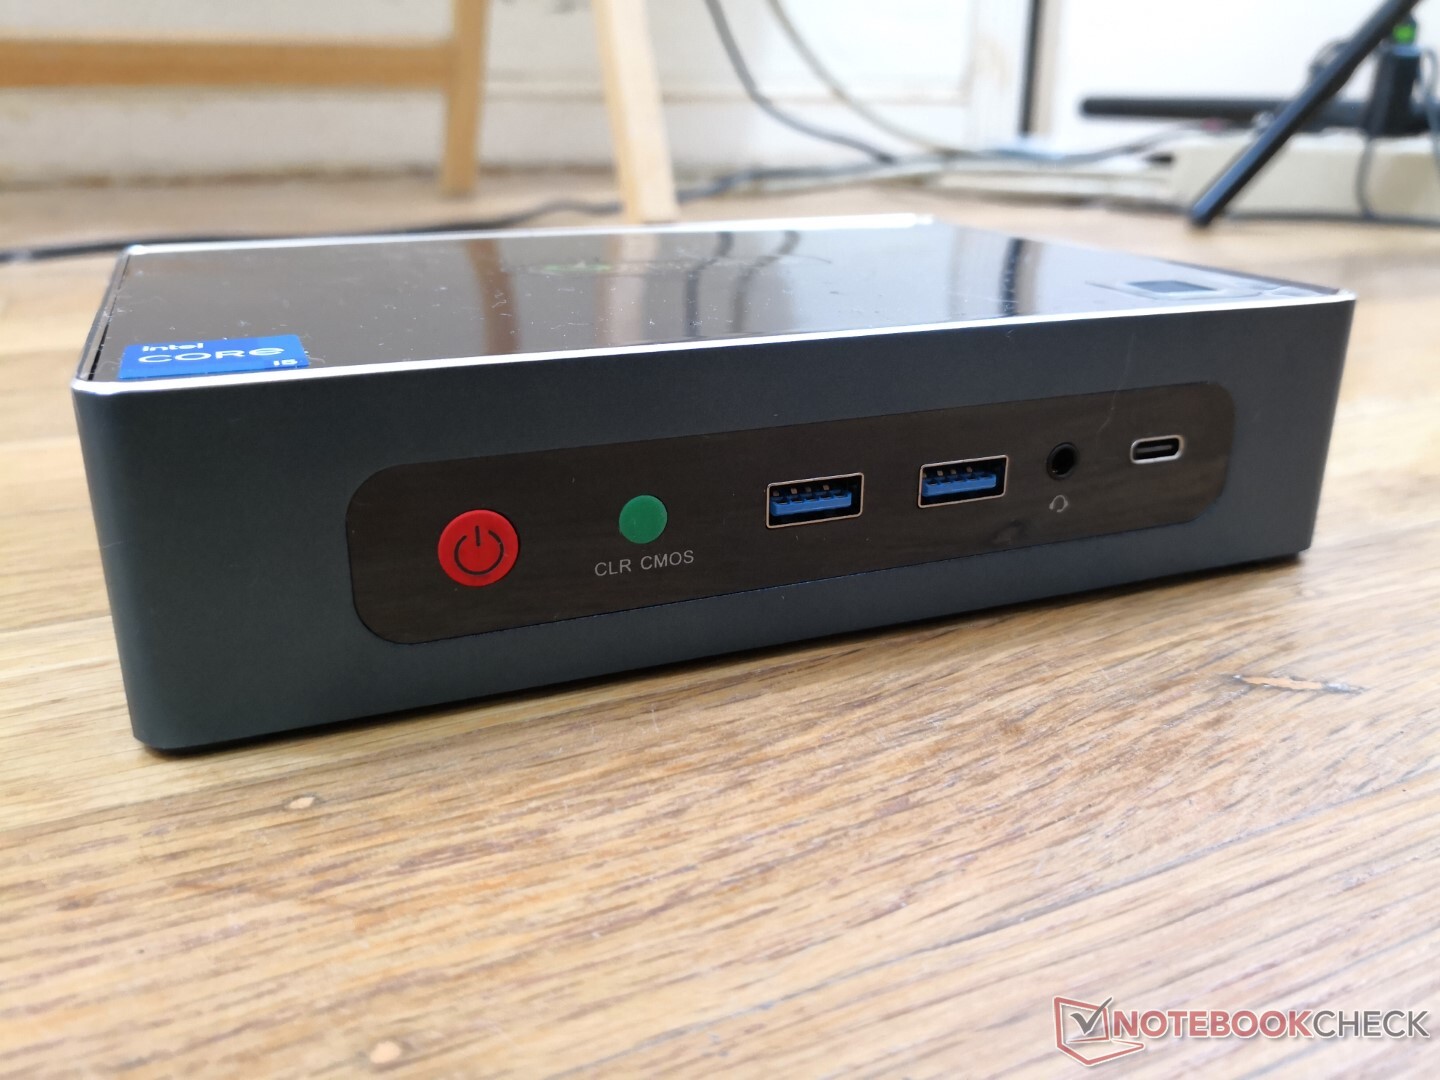
Case
The skeleton is made of thinner materials and less metal than on an Intel NUC likely to keep both costs and weight down. Build quality is still excellent and with no flexing or visibly weak points. We don't particularly like the glossy plastic top, however, as it attracts both fingerprints and scratches very quickly.
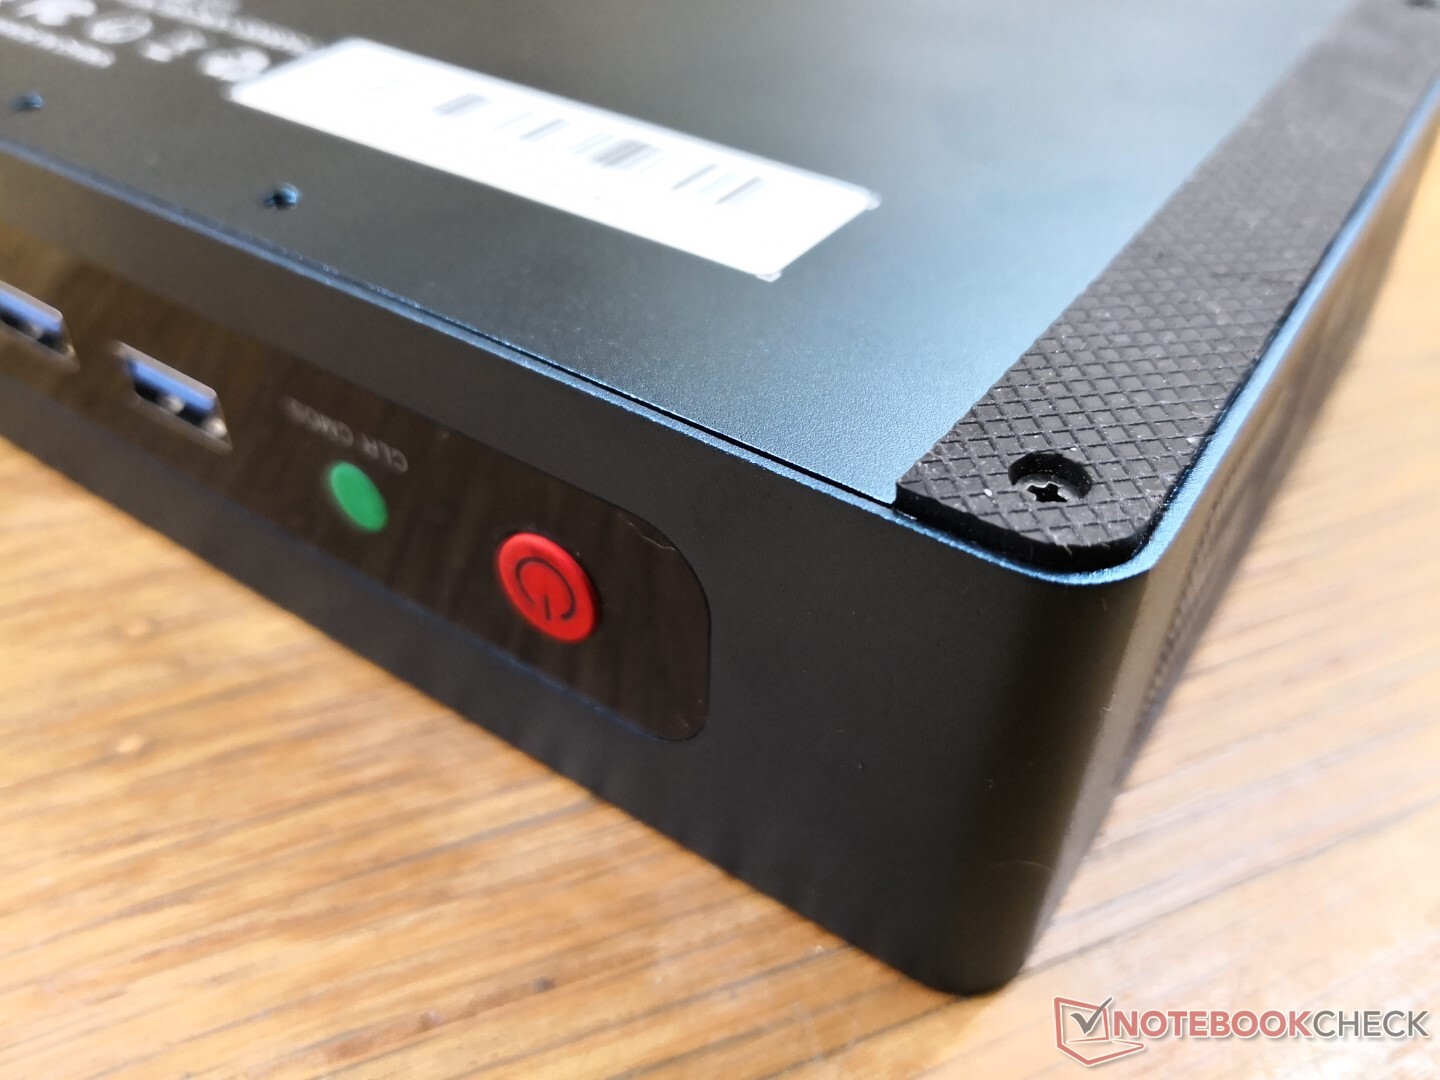
Connectivity
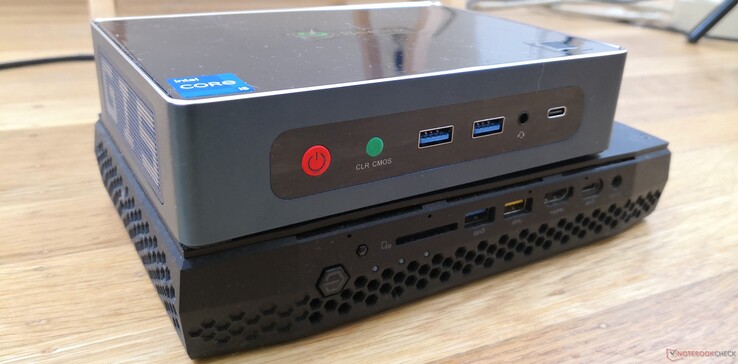
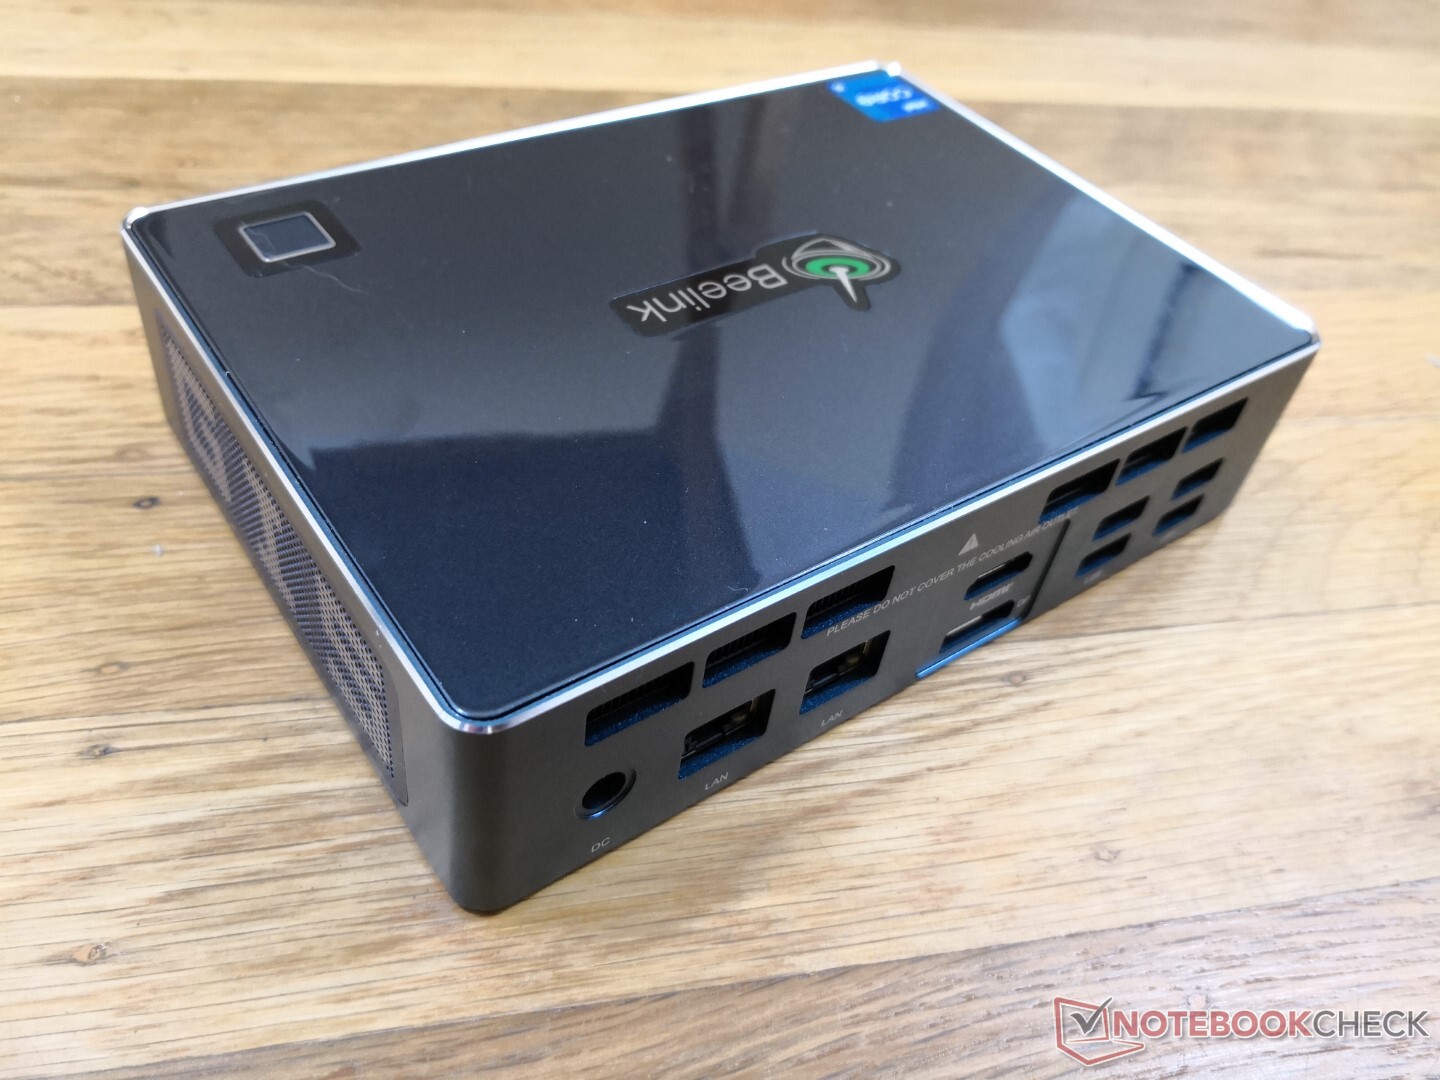
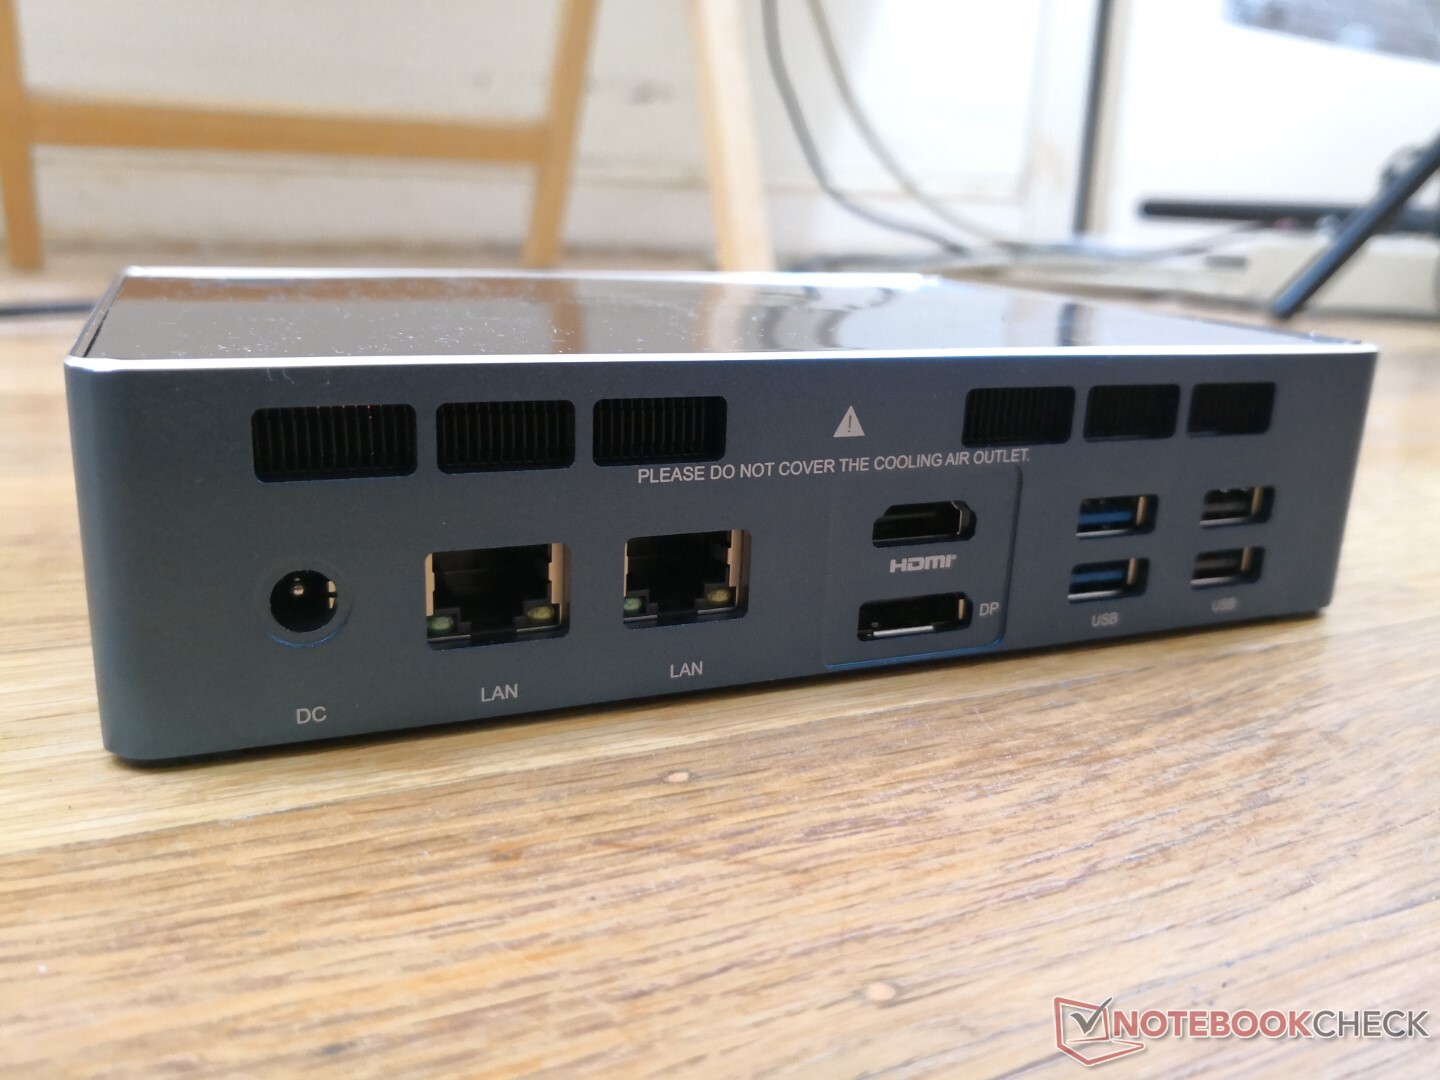
There are plenty of ports to choose from including multiple RJ-45 ports, multiple HDMI ports, and six USB-A ports. The USB-C port supports Thunderbolt 4 devices as well even though the manufacturer does not advertise it. The Thunderbolt Control Center comes pre-installed and its DxDiag file confirms Thunderbolt support as well.
The single USB-C port can feel limiting and there is no mini-DisplayPort or Kensington lock as well in contrast to the Intel NUC11TNKi5 Pro.
Of particular note is that the Beelink can be powered by USB-C in lieu of the proprietary AC adapter. We tested this with a 130 W USB-C adapter from a Dell XPS 15 9500 which worked without issues on our Beelink unit.
Communication
Built-in wired and wireless communication modules, compare Networking test data to competitors, alternative solutions available (5G/LTE)?, Irregularities (radio reception)?
| Networking | |
| iperf3 transmit AX12 | |
| Intel NUC11TNKi5 | |
| Beelink GTI 11 | |
| GMK NucBox 2 | |
| Intel Hades Canyon NUC8i7HVK | |
| Beelink SER3 | |
| iperf3 receive AX12 | |
| Intel NUC11TNKi5 | |
| Beelink GTI 11 | |
| Beelink SER3 | |
| GMK NucBox 2 | |
| Intel Hades Canyon NUC8i7HVK | |
Maintenance
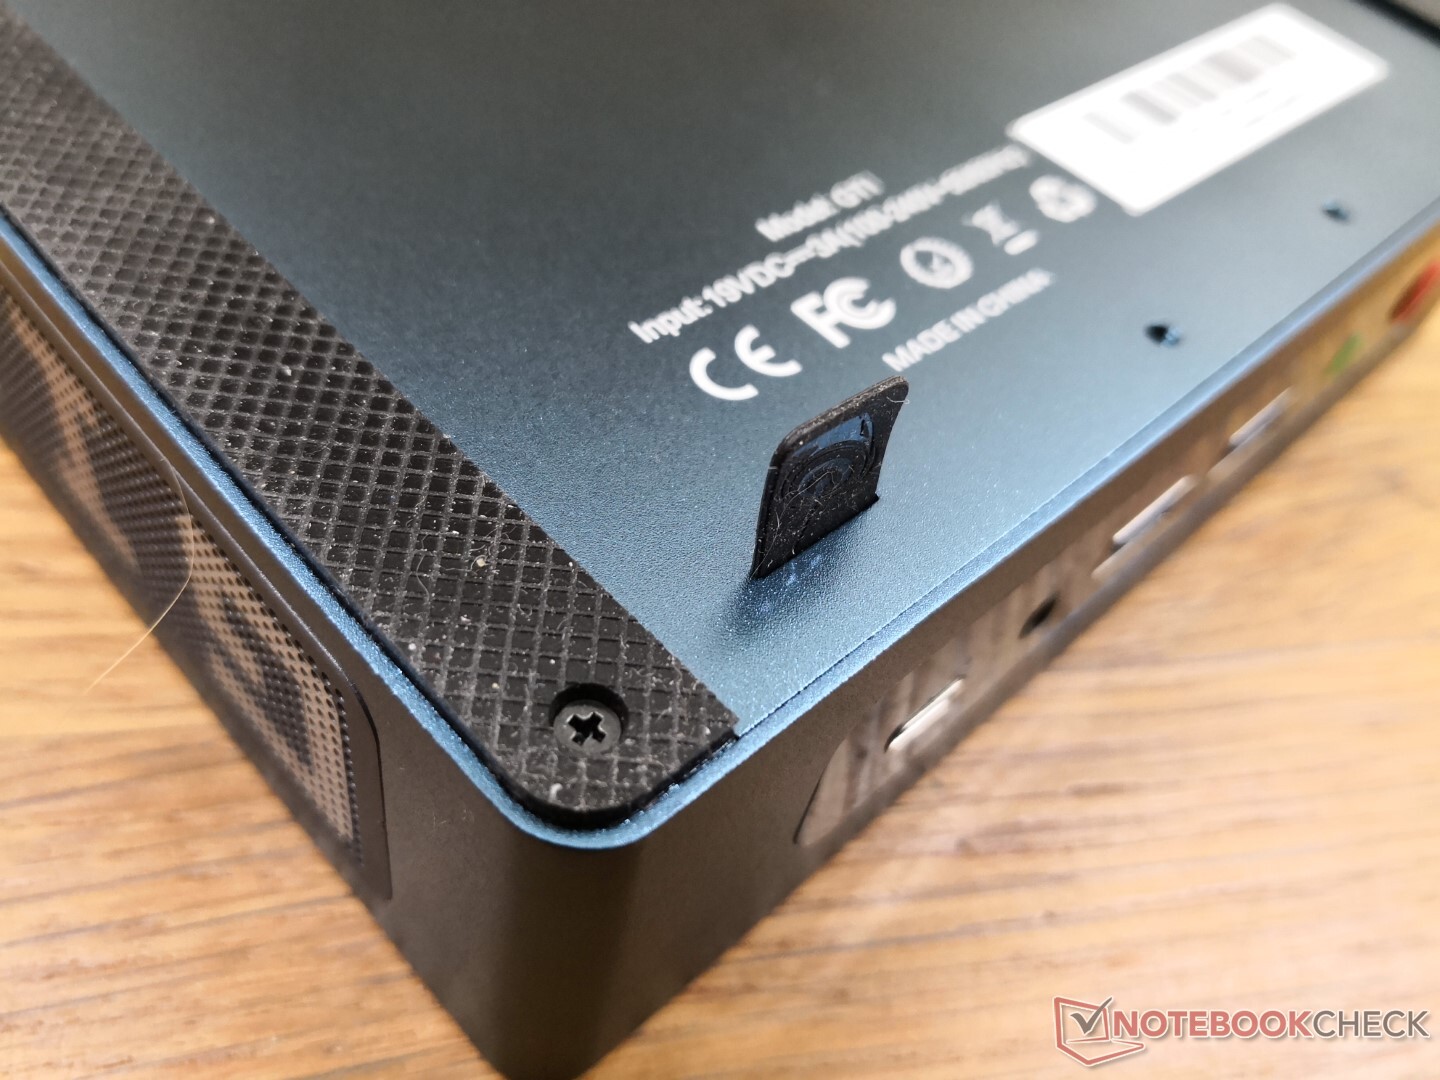
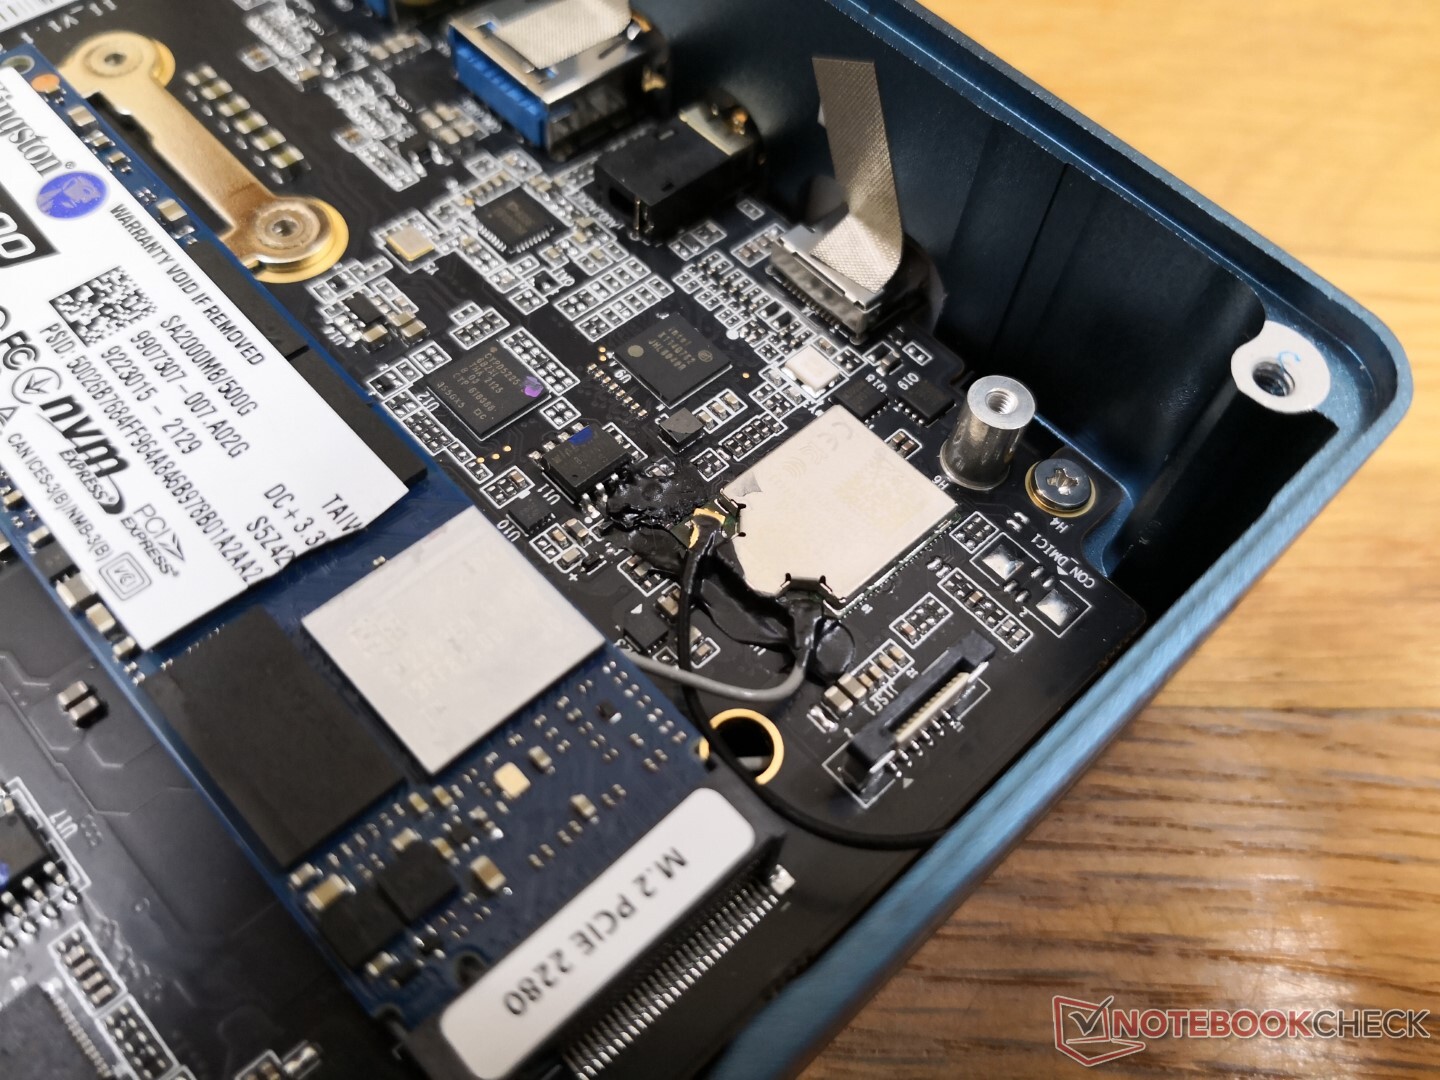
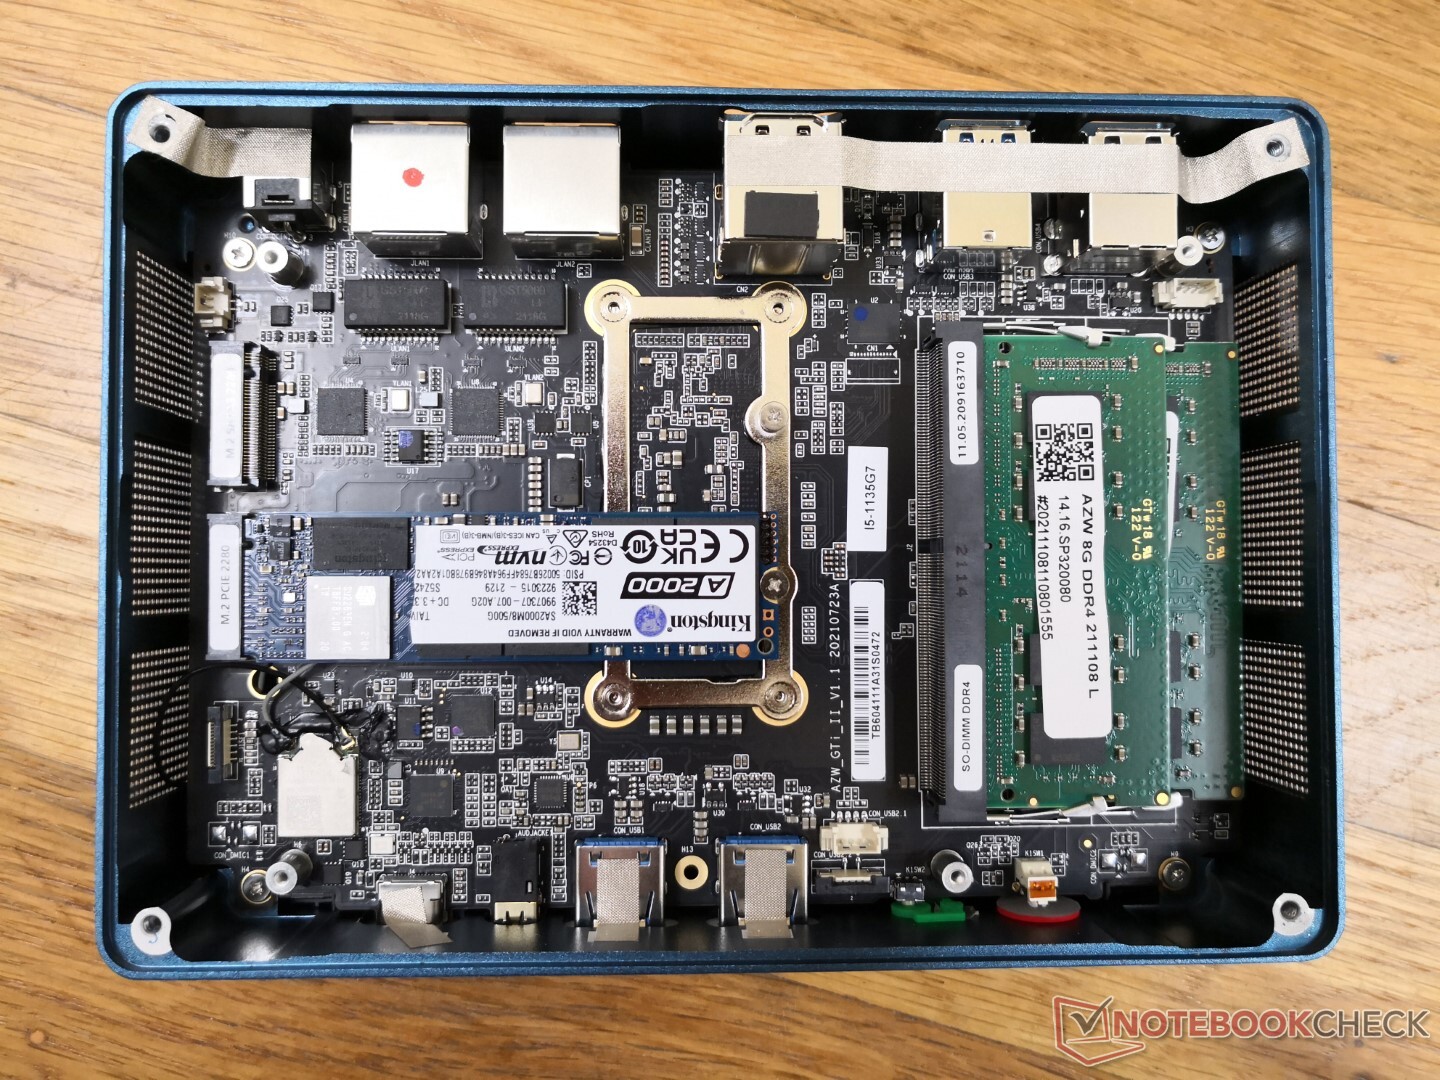
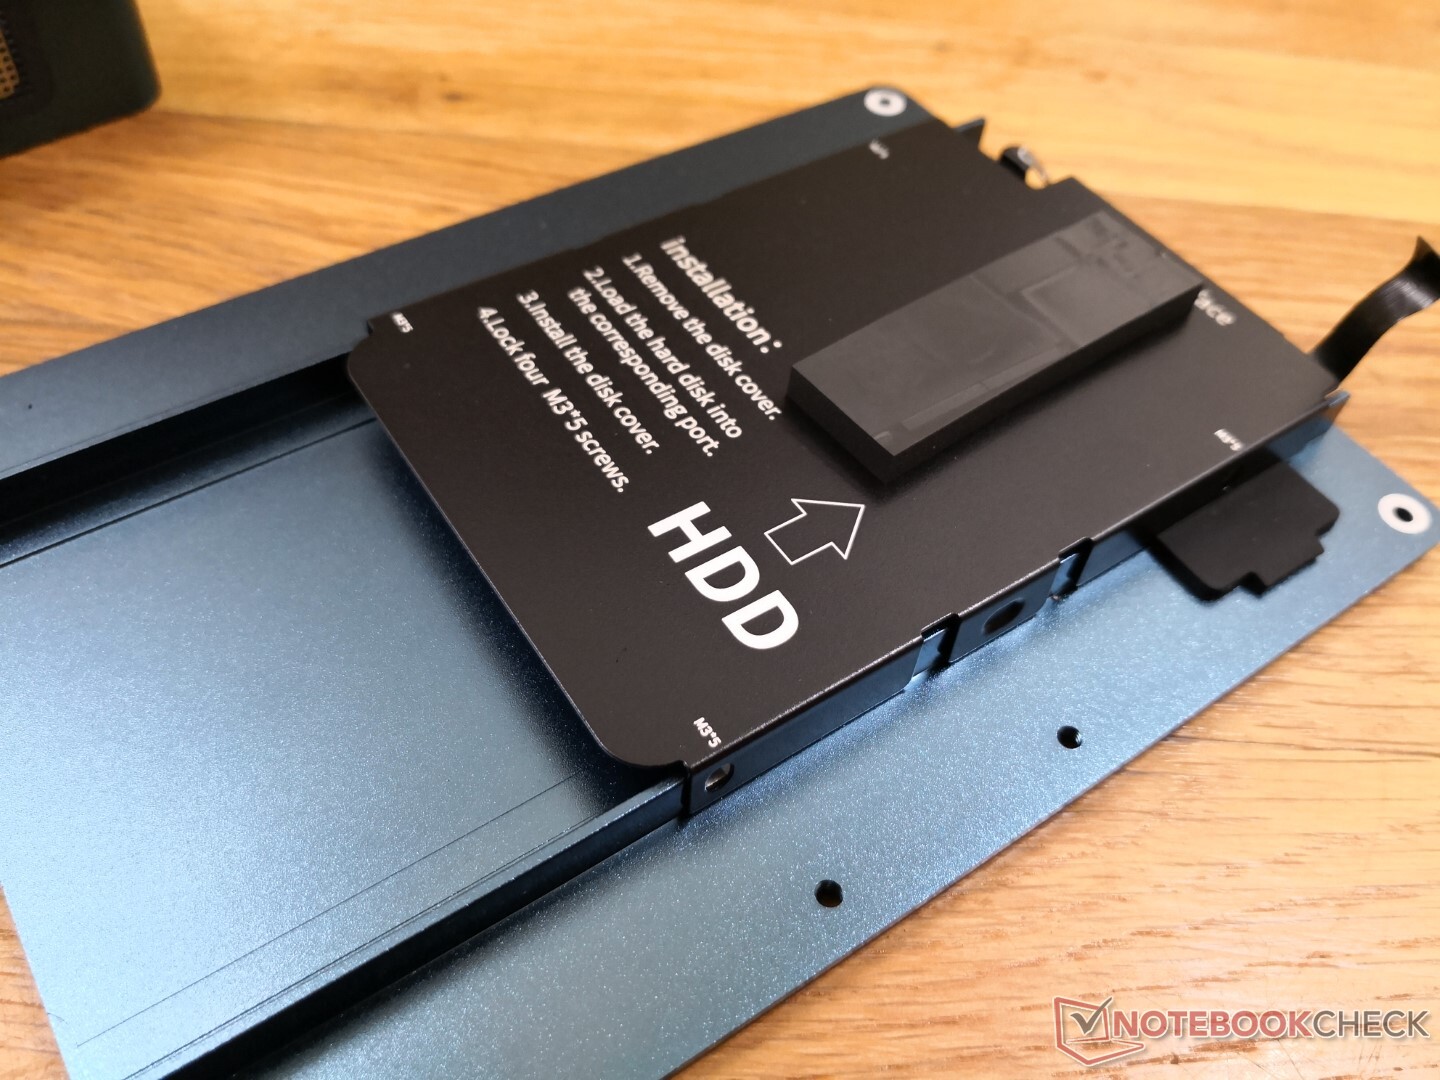
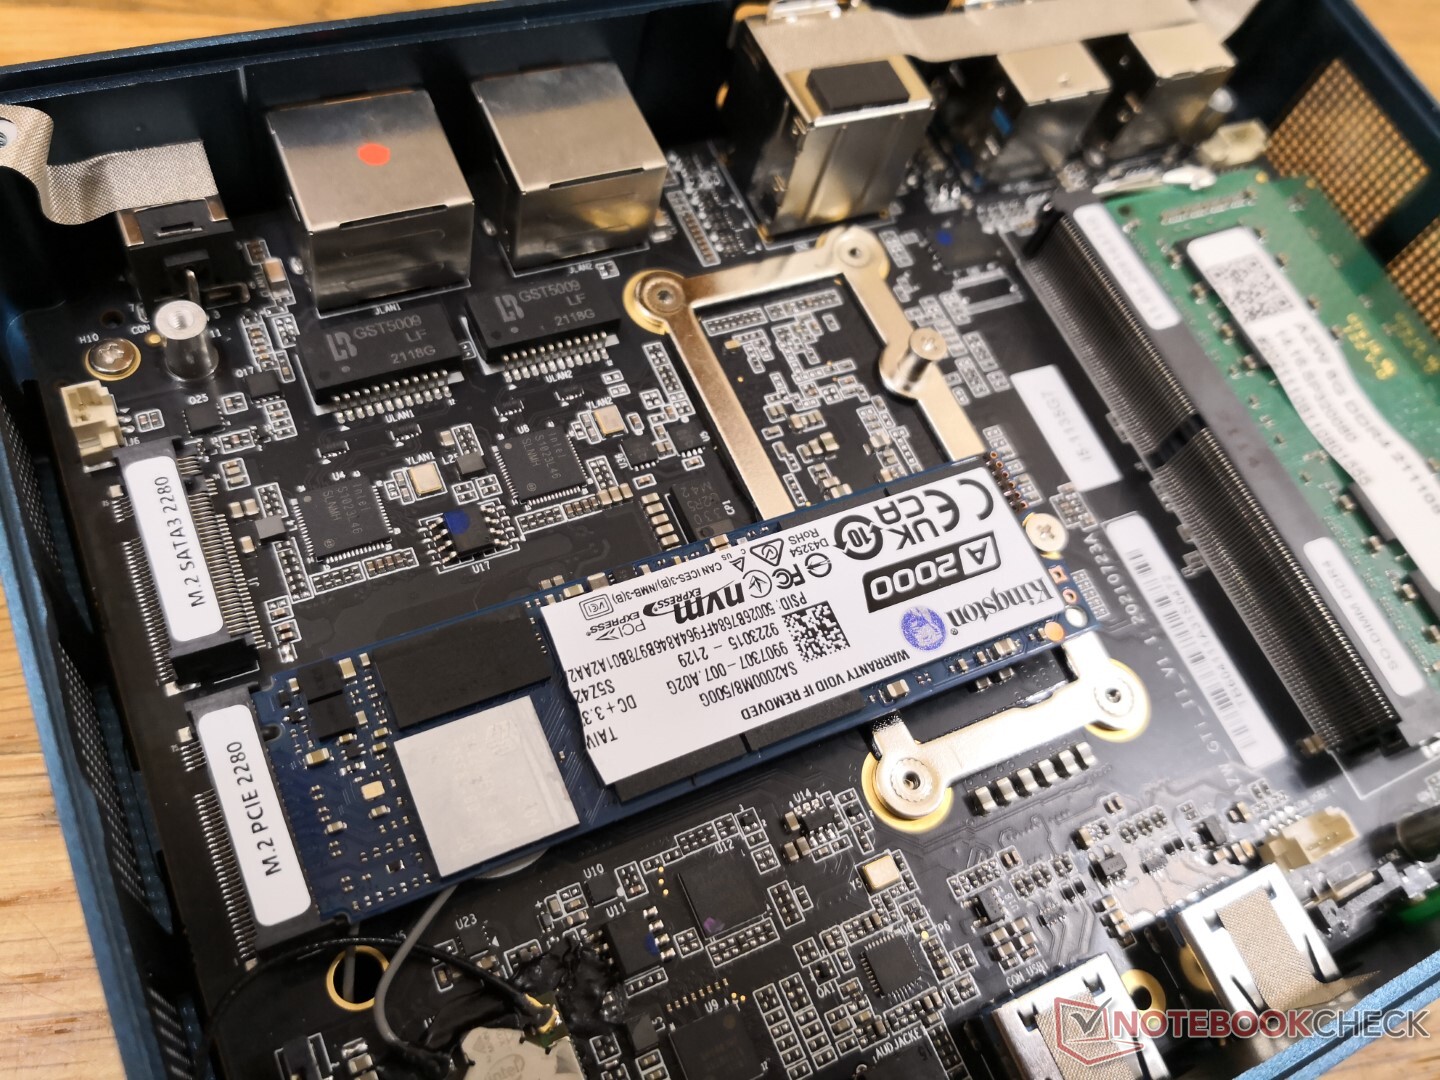
The bottom panel can be removed with just a Philips screwdriver. Users must be careful to also detach the ribbon connecting the bottom panel to the motherboard. There is direct access to both SODIMM slots, both M.2 2280 slots, and the 2.5-inch SATA III bay on the bottom panel once it is removed.
Accessories and Warranty
Extras include two HDMI cables, extra screws, and a VESA 50/100 mm counting bracket.
The standard one-year limited warranty applies. Claiming warranty may be arduous for some users as shipping is overseas.
Performance
Processor
Raw multi-thread CPU performance is 15 to 20 percent faster than the average PC or laptop with the same Core i5-1135G7 CPU. Even the older 100 W Kaby Lake-G Core i7-8809G Hades Canyon mini PC is trailing behind our 11th gen Core i7 CPU. The higher-end Core i7-1165G7, which is not available on the GTI 11, can net users up to 25 percent higher multi-thread performance over our Core i5-1135G7.
When running CineBench R15 xT in a loop, the initial score of 915 points would quickly drop to ~840 points to represent a performance dip of 8 percent due to limited Turbo Boost sustainability as detailed in our Stress Test section below.
Cinebench R15 Multi Loop
Cinebench R23: Multi Core | Single Core
Cinebench R20: CPU (Multi Core) | CPU (Single Core)
Cinebench R15: CPU Multi 64Bit | CPU Single 64Bit
Blender: v2.79 BMW27 CPU
7-Zip 18.03: 7z b 4 | 7z b 4 -mmt1
Geekbench 5.5: Multi-Core | Single-Core
HWBOT x265 Benchmark v2.2: 4k Preset
LibreOffice : 20 Documents To PDF
R Benchmark 2.5: Overall mean
| CPU Performance rating | |
| Intel NUC11PAQi7 -1! | |
| Lenovo Yoga 6 13ALC6 -2! | |
| Intel NUC10i7FNH -3! | |
| Asus Vivobook 15 K513EQ -2! | |
| Beelink GTI 11 | |
| Lenovo Yoga 6 13 82ND0009US -2! | |
| Intel NUC11TNKi5 | |
| Intel Hades Canyon NUC8i7HVK -6! | |
| Average Intel Core i5-1135G7 | |
| Infinix INBook X1 Pro -2! | |
| Asus VivoBook S13 S333JA-DS51 | |
| GMK NucBox 2 | |
| Beelink SER3 -2! | |
| Beelink GTR35 II-G-16512D00W64PRO-1T -2! | |
| Cinebench R23 / Multi Core | |
| Lenovo Yoga 6 13ALC6 | |
| Intel NUC11PAQi7 | |
| Lenovo Yoga 6 13 82ND0009US | |
| Asus Vivobook 15 K513EQ | |
| Beelink GTI 11 | |
| Intel NUC11TNKi5 | |
| Average Intel Core i5-1135G7 (2786 - 6136, n=55) | |
| Infinix INBook X1 Pro | |
| Asus VivoBook S13 S333JA-DS51 | |
| Beelink SER3 | |
| GMK NucBox 2 | |
| Cinebench R23 / Single Core | |
| Asus Vivobook 15 K513EQ | |
| Intel NUC11TNKi5 | |
| Beelink GTI 11 | |
| Average Intel Core i5-1135G7 (1062 - 1373, n=53) | |
| Lenovo Yoga 6 13ALC6 | |
| Infinix INBook X1 Pro | |
| Lenovo Yoga 6 13 82ND0009US | |
| Asus VivoBook S13 S333JA-DS51 | |
| GMK NucBox 2 | |
| Beelink SER3 | |
| Geekbench 5.5 / Multi-Core | |
| Intel NUC10i7FNH | |
| Beelink GTI 11 | |
| Intel NUC11PAQi7 | |
| Average Intel Core i5-1135G7 (3475 - 5472, n=58) | |
| Intel NUC11TNKi5 | |
| Asus VivoBook S13 S333JA-DS51 | |
| GMK NucBox 2 | |
| Beelink GTR35 II-G-16512D00W64PRO-1T | |
| Geekbench 5.5 / Single-Core | |
| Intel NUC11PAQi7 | |
| Beelink GTI 11 | |
| Intel NUC11TNKi5 | |
| Average Intel Core i5-1135G7 (1147 - 1428, n=58) | |
| Intel NUC10i7FNH | |
| Asus VivoBook S13 S333JA-DS51 | |
| GMK NucBox 2 | |
| Beelink GTR35 II-G-16512D00W64PRO-1T | |
| LibreOffice / 20 Documents To PDF | |
| Beelink SER3 | |
| Beelink GTR35 II-G-16512D00W64PRO-1T | |
| Lenovo Yoga 6 13 82ND0009US | |
| GMK NucBox 2 | |
| Lenovo Yoga 6 13ALC6 | |
| Asus VivoBook S13 S333JA-DS51 | |
| Infinix INBook X1 Pro | |
| Beelink GTI 11 | |
| Average Intel Core i5-1135G7 (44.2 - 62.9, n=60) | |
| Intel NUC11TNKi5 | |
| Asus Vivobook 15 K513EQ | |
| Intel NUC11PAQi7 | |
Cinebench R23: Multi Core | Single Core
Cinebench R20: CPU (Multi Core) | CPU (Single Core)
Cinebench R15: CPU Multi 64Bit | CPU Single 64Bit
Blender: v2.79 BMW27 CPU
7-Zip 18.03: 7z b 4 | 7z b 4 -mmt1
Geekbench 5.5: Multi-Core | Single-Core
HWBOT x265 Benchmark v2.2: 4k Preset
LibreOffice : 20 Documents To PDF
R Benchmark 2.5: Overall mean
* ... smaller is better
AIDA64: FP32 Ray-Trace | FPU Julia | CPU SHA3 | CPU Queen | FPU SinJulia | FPU Mandel | CPU AES | CPU ZLib | FP64 Ray-Trace | CPU PhotoWorxx
| Performance rating | |
| Beelink GTI 11 | |
| Intel NUC11TNKi5 | |
| Average Intel Core i5-1135G7 | |
| GMK NucBox 2 | |
| Beelink SER3 | |
| AIDA64 / FP32 Ray-Trace | |
| Beelink GTI 11 | |
| Intel NUC11TNKi5 | |
| Average Intel Core i5-1135G7 (4313 - 7952, n=45) | |
| GMK NucBox 2 | |
| Beelink SER3 | |
| AIDA64 / FPU Julia | |
| Beelink GTI 11 | |
| Intel NUC11TNKi5 | |
| Average Intel Core i5-1135G7 (19402 - 32283, n=45) | |
| GMK NucBox 2 | |
| Beelink SER3 | |
| AIDA64 / CPU SHA3 | |
| Beelink GTI 11 | |
| Intel NUC11TNKi5 | |
| Average Intel Core i5-1135G7 (1316 - 2172, n=45) | |
| GMK NucBox 2 | |
| Beelink SER3 | |
| AIDA64 / CPU Queen | |
| Beelink GTI 11 | |
| Intel NUC11TNKi5 | |
| Average Intel Core i5-1135G7 (39000 - 46951, n=45) | |
| Beelink SER3 | |
| GMK NucBox 2 | |
| AIDA64 / FPU SinJulia | |
| Beelink SER3 | |
| Intel NUC11TNKi5 | |
| Beelink GTI 11 | |
| GMK NucBox 2 | |
| Average Intel Core i5-1135G7 (3497 - 4445, n=45) | |
| AIDA64 / FPU Mandel | |
| Beelink GTI 11 | |
| Intel NUC11TNKi5 | |
| Average Intel Core i5-1135G7 (12569 - 19635, n=45) | |
| GMK NucBox 2 | |
| Beelink SER3 | |
| AIDA64 / CPU AES | |
| Beelink GTI 11 | |
| Intel NUC11TNKi5 | |
| Average Intel Core i5-1135G7 (28988 - 67977, n=45) | |
| Beelink SER3 | |
| GMK NucBox 2 | |
| AIDA64 / CPU ZLib | |
| Intel NUC11TNKi5 | |
| Beelink GTI 11 | |
| Beelink SER3 | |
| Average Intel Core i5-1135G7 (265 - 373, n=51) | |
| GMK NucBox 2 | |
| AIDA64 / FP64 Ray-Trace | |
| Beelink GTI 11 | |
| Intel NUC11TNKi5 | |
| Average Intel Core i5-1135G7 (2226 - 4291, n=45) | |
| GMK NucBox 2 | |
| Beelink SER3 | |
| AIDA64 / CPU PhotoWorxx | |
| Beelink GTI 11 | |
| Average Intel Core i5-1135G7 (9004 - 45366, n=45) | |
| Intel NUC11TNKi5 | |
| Beelink SER3 | |
| GMK NucBox 2 | |
System Performance
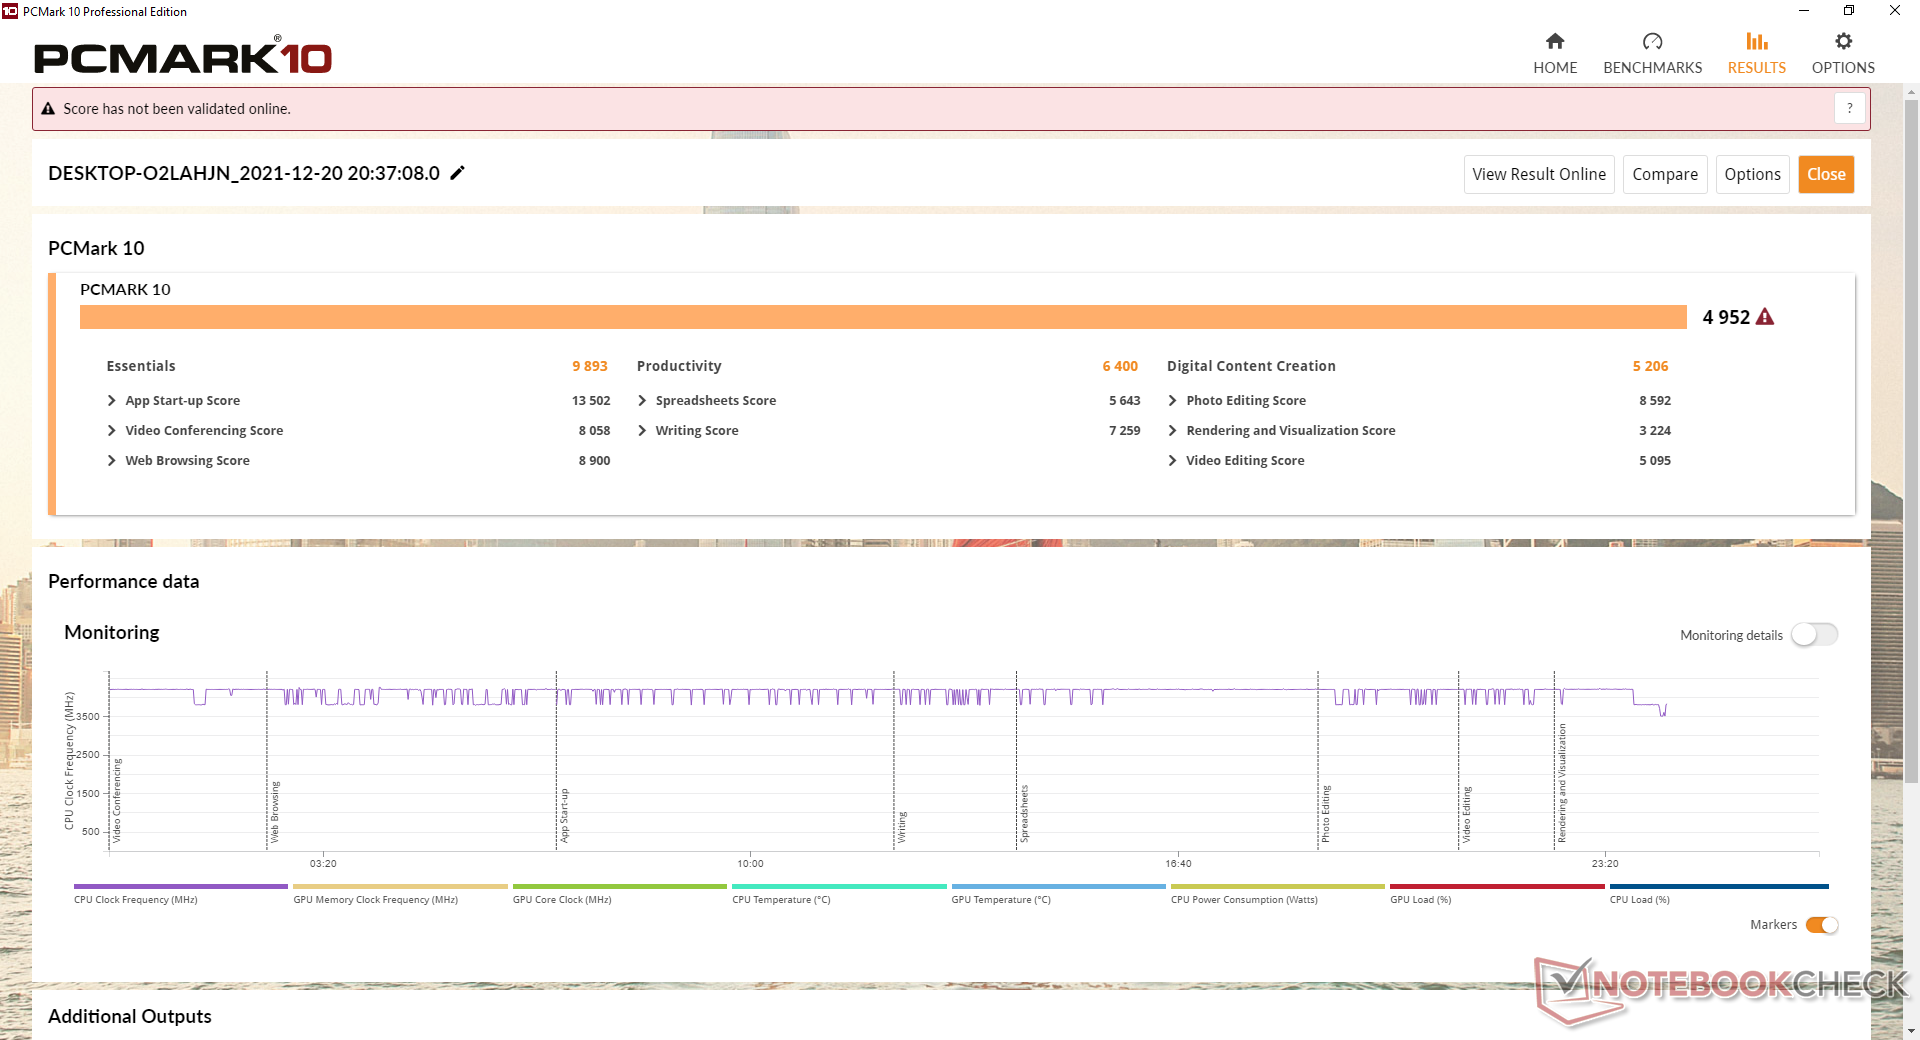
PCMark 10 scores are excellent and consistently above any Beelink system that came before our GTI 11. The benefits of using a leaner and more power efficient 11th gen Intel CPU add up to a smoother user experience.
| PCMark 10 / Score | |
| Intel Hades Canyon NUC8i7HVK | |
| Beelink GTI 11 | |
| Average Intel Core i5-1135G7, Intel Iris Xe Graphics G7 80EUs (4026 - 4952, n=53) | |
| Intel NUC11TNKi5 | |
| Intel NUC10i7FNH | |
| GMK NucBox 2 | |
| Beelink SER3 | |
| PCMark 10 / Essentials | |
| Beelink GTI 11 | |
| Average Intel Core i5-1135G7, Intel Iris Xe Graphics G7 80EUs (8149 - 9917, n=53) | |
| Intel Hades Canyon NUC8i7HVK | |
| Intel NUC10i7FNH | |
| Intel NUC11TNKi5 | |
| GMK NucBox 2 | |
| Beelink SER3 | |
| PCMark 10 / Productivity | |
| Intel Hades Canyon NUC8i7HVK | |
| Intel NUC10i7FNH | |
| Beelink GTI 11 | |
| GMK NucBox 2 | |
| Average Intel Core i5-1135G7, Intel Iris Xe Graphics G7 80EUs (5040 - 6619, n=53) | |
| Intel NUC11TNKi5 | |
| Beelink SER3 | |
| PCMark 10 / Digital Content Creation | |
| Intel Hades Canyon NUC8i7HVK | |
| Beelink GTI 11 | |
| Average Intel Core i5-1135G7, Intel Iris Xe Graphics G7 80EUs (3548 - 5255, n=53) | |
| Intel NUC11TNKi5 | |
| Intel NUC10i7FNH | |
| GMK NucBox 2 | |
| Beelink SER3 | |
| PCMark 10 Score | 4952 points | |
Help | ||
| AIDA64 / Memory Copy | |
| GMK NucBox 2 | |
| Beelink GTI 11 | |
| Average Intel Core i5-1135G7 (17443 - 63889, n=45) | |
| Intel NUC11TNKi5 | |
| Beelink SER3 | |
| AIDA64 / Memory Read | |
| Beelink GTI 11 | |
| Average Intel Core i5-1135G7 (19716 - 63705, n=45) | |
| GMK NucBox 2 | |
| Intel NUC11TNKi5 | |
| Beelink SER3 | |
| AIDA64 / Memory Write | |
| GMK NucBox 2 | |
| Beelink GTI 11 | |
| Average Intel Core i5-1135G7 (18722 - 66778, n=45) | |
| Intel NUC11TNKi5 | |
| Beelink SER3 | |
| AIDA64 / Memory Latency | |
| Beelink SER3 | |
| Intel NUC11TNKi5 | |
| Average Intel Core i5-1135G7 (68.3 - 107, n=51) | |
| Beelink GTI 11 | |
| GMK NucBox 2 | |
* ... smaller is better
DPC Latency
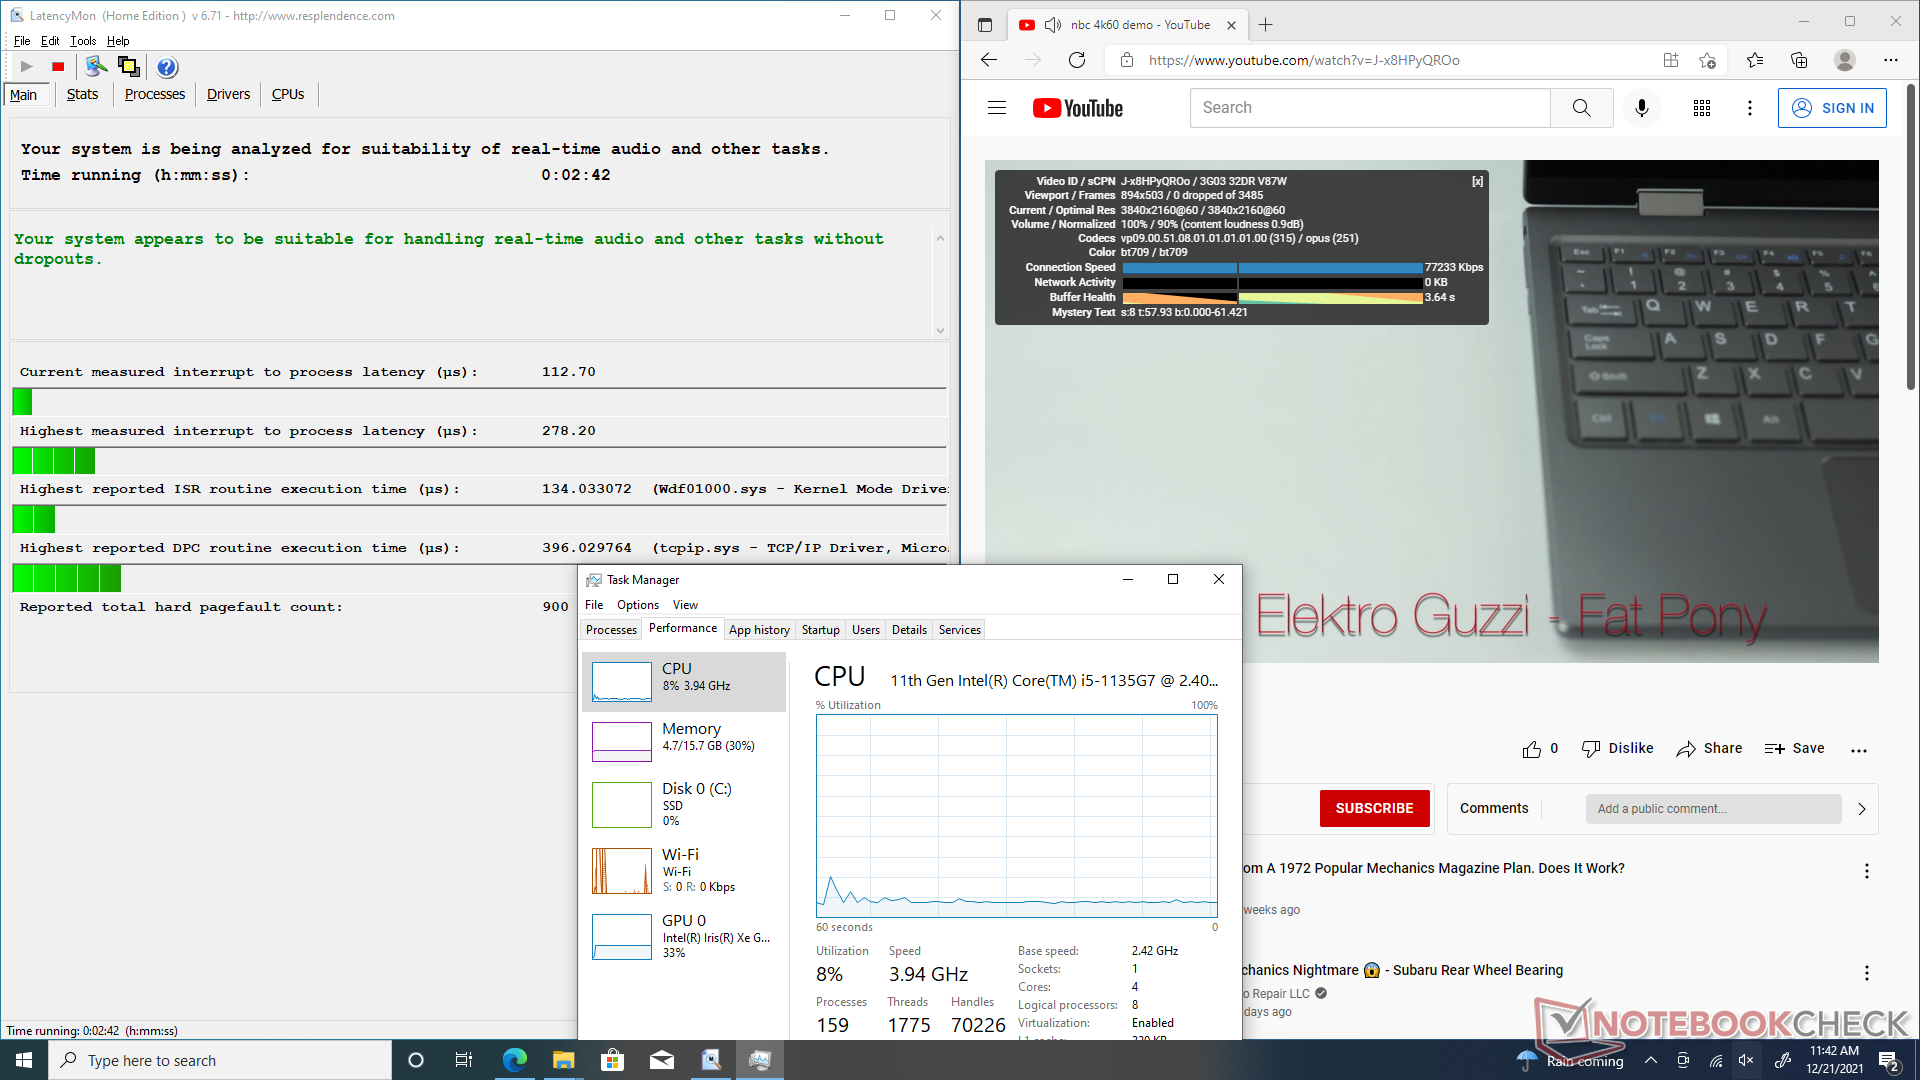
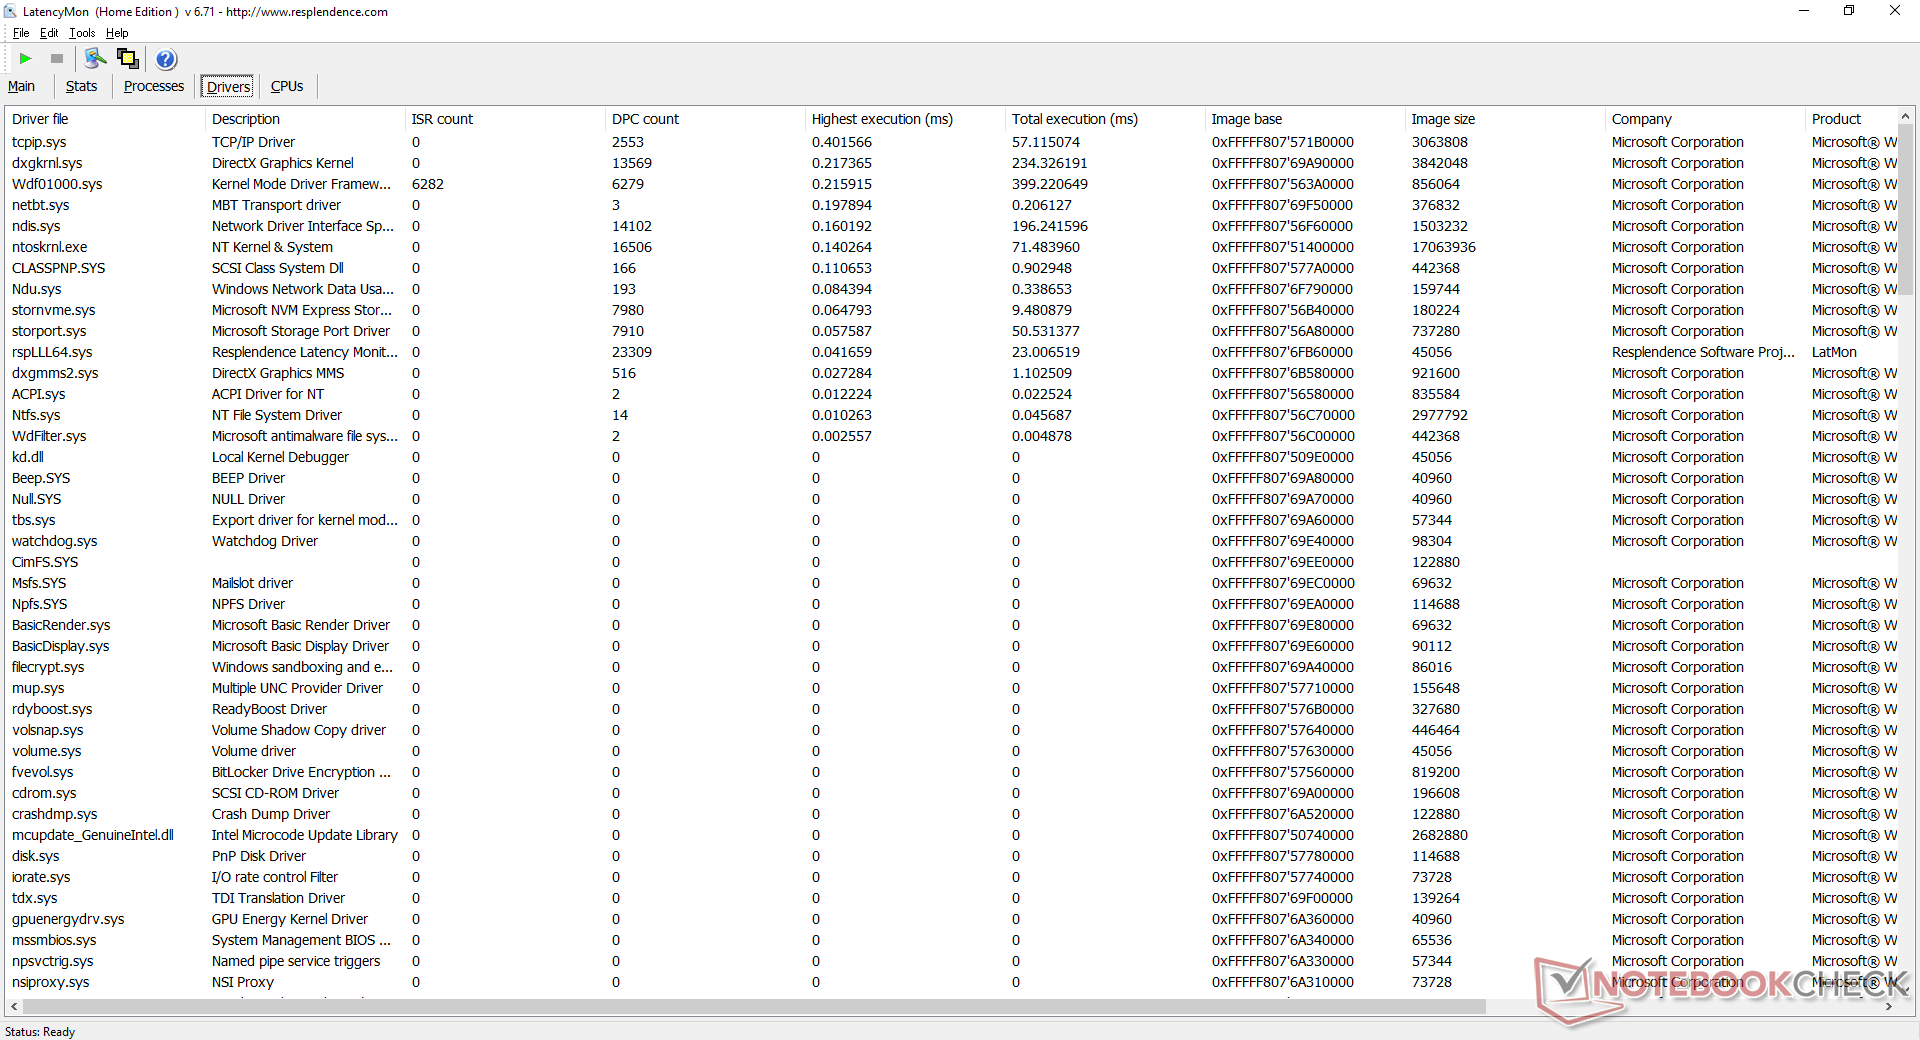
LatencyMon reveals no DPC issues when opening multiple browser tabs on our homepage. 4K video playback at 60 FPS is also smooth and without any dropped frames.
| DPC Latencies / LatencyMon - interrupt to process latency (max), Web, Youtube, Prime95 | |
| GMK NucBox 2 | |
| Beelink SER3 | |
| Intel NUC11TNKi5 | |
| Beelink GTI 11 | |
* ... smaller is better
Storage Devices
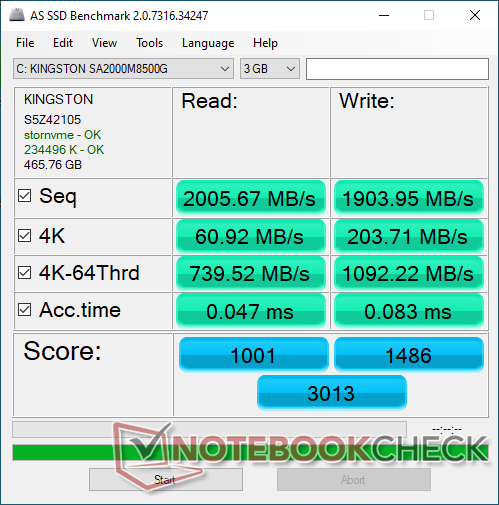
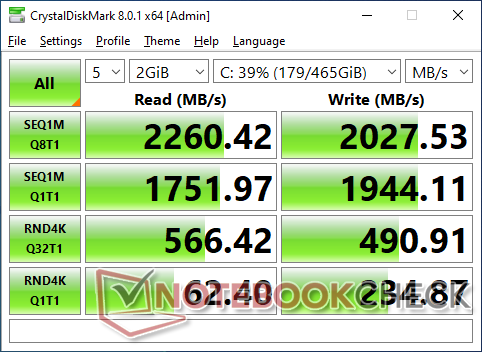
The system can support up to three internal drives (2x M.2 2280 + 1x 2.5-inch SATA III). Keep in mind that the second M.2 drive must be a SATA III drive and not an NVMe drive. The 500 GB Kingston A2000 drive in our unit is a midrange PCIe3 M.2 drive with sequential read and write rates of around 2000 to 2200 MB/s each. Performance sustainability is also excellent with no thermal issues when running DiskSpd in a loop.
The unit ships with a PCIe3 drive instead of PCIe4 likely to save on costs. Users can install their own PCIe4 drives if desired.

| Drive Performance rating - Percent | |
| Beelink GTI 11 | |
| Intel Hades Canyon NUC8i7HVK -8! | |
| Beelink SER3 | |
| GMK NucBox 2 | |
| Intel NUC10i7FNH | |
| Intel NUC11TNKi5 | |
* ... smaller is better
Disk Throttling: DiskSpd Read Loop, Queue Depth 8
GPU Performance
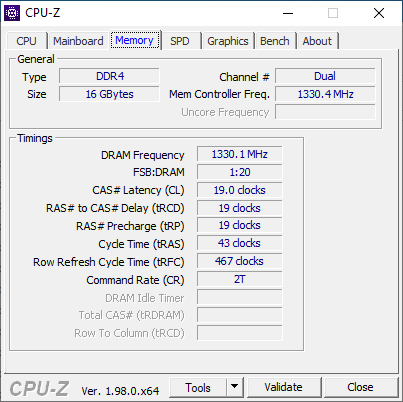
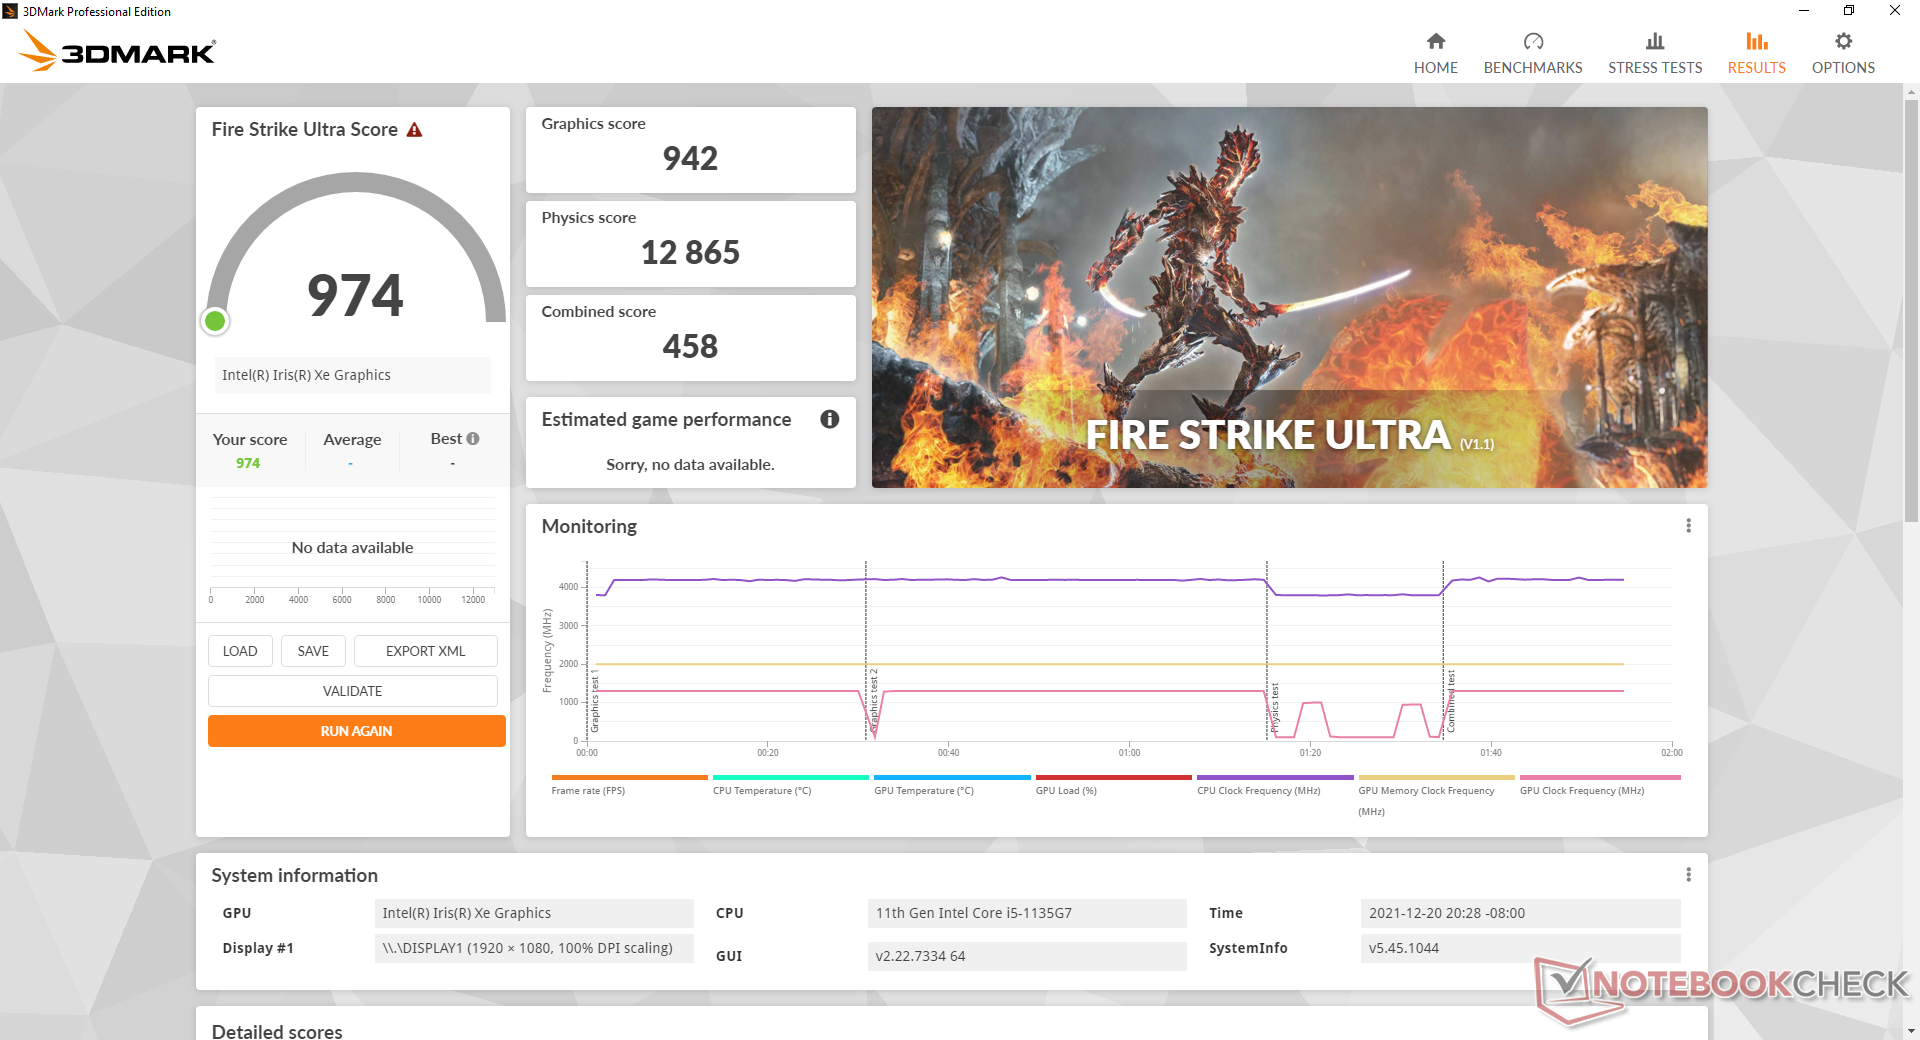
Graphics performance is very good at roughly 13 percent faster than the average laptop or PC equipped with the same integrated Iris Xe 80 EUs. The GTI 11 comes with dual-channel RAM unlike on our Intel NUC11TNKi5 test unit which comes with the same Core i5-1135G7 CPU but with single-channel RAM only. Graphics performance is about 25 percent faster on our Beelink due mostly to their different RAM configurations.
Upgrading to a PC or laptop with the higher-end Core i7-1165G7 and its integrated Iris Xe 96 EUs will result in a performance boost of up to 25 to 35 percent depending on the model.
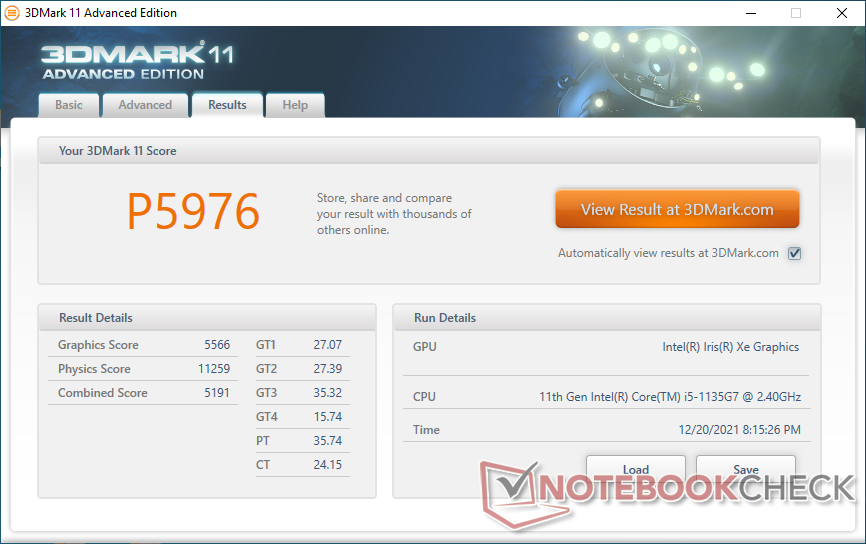

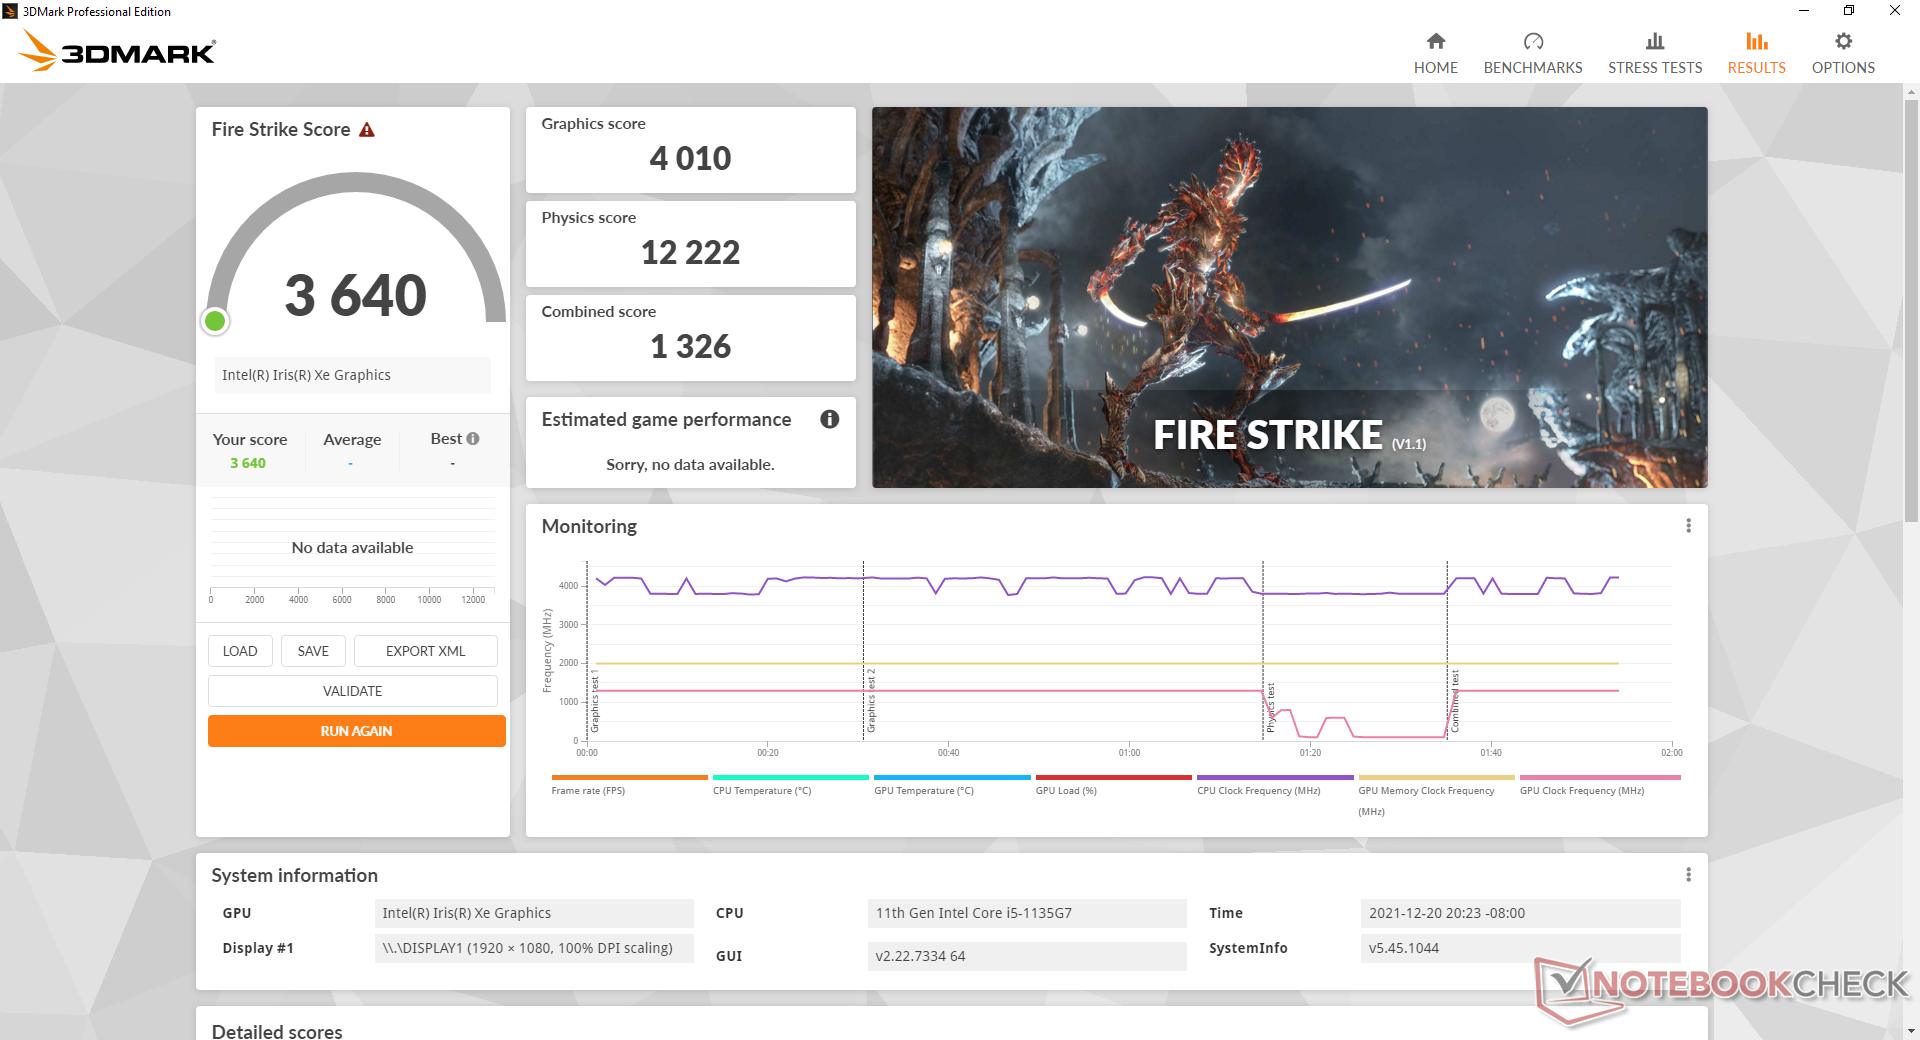
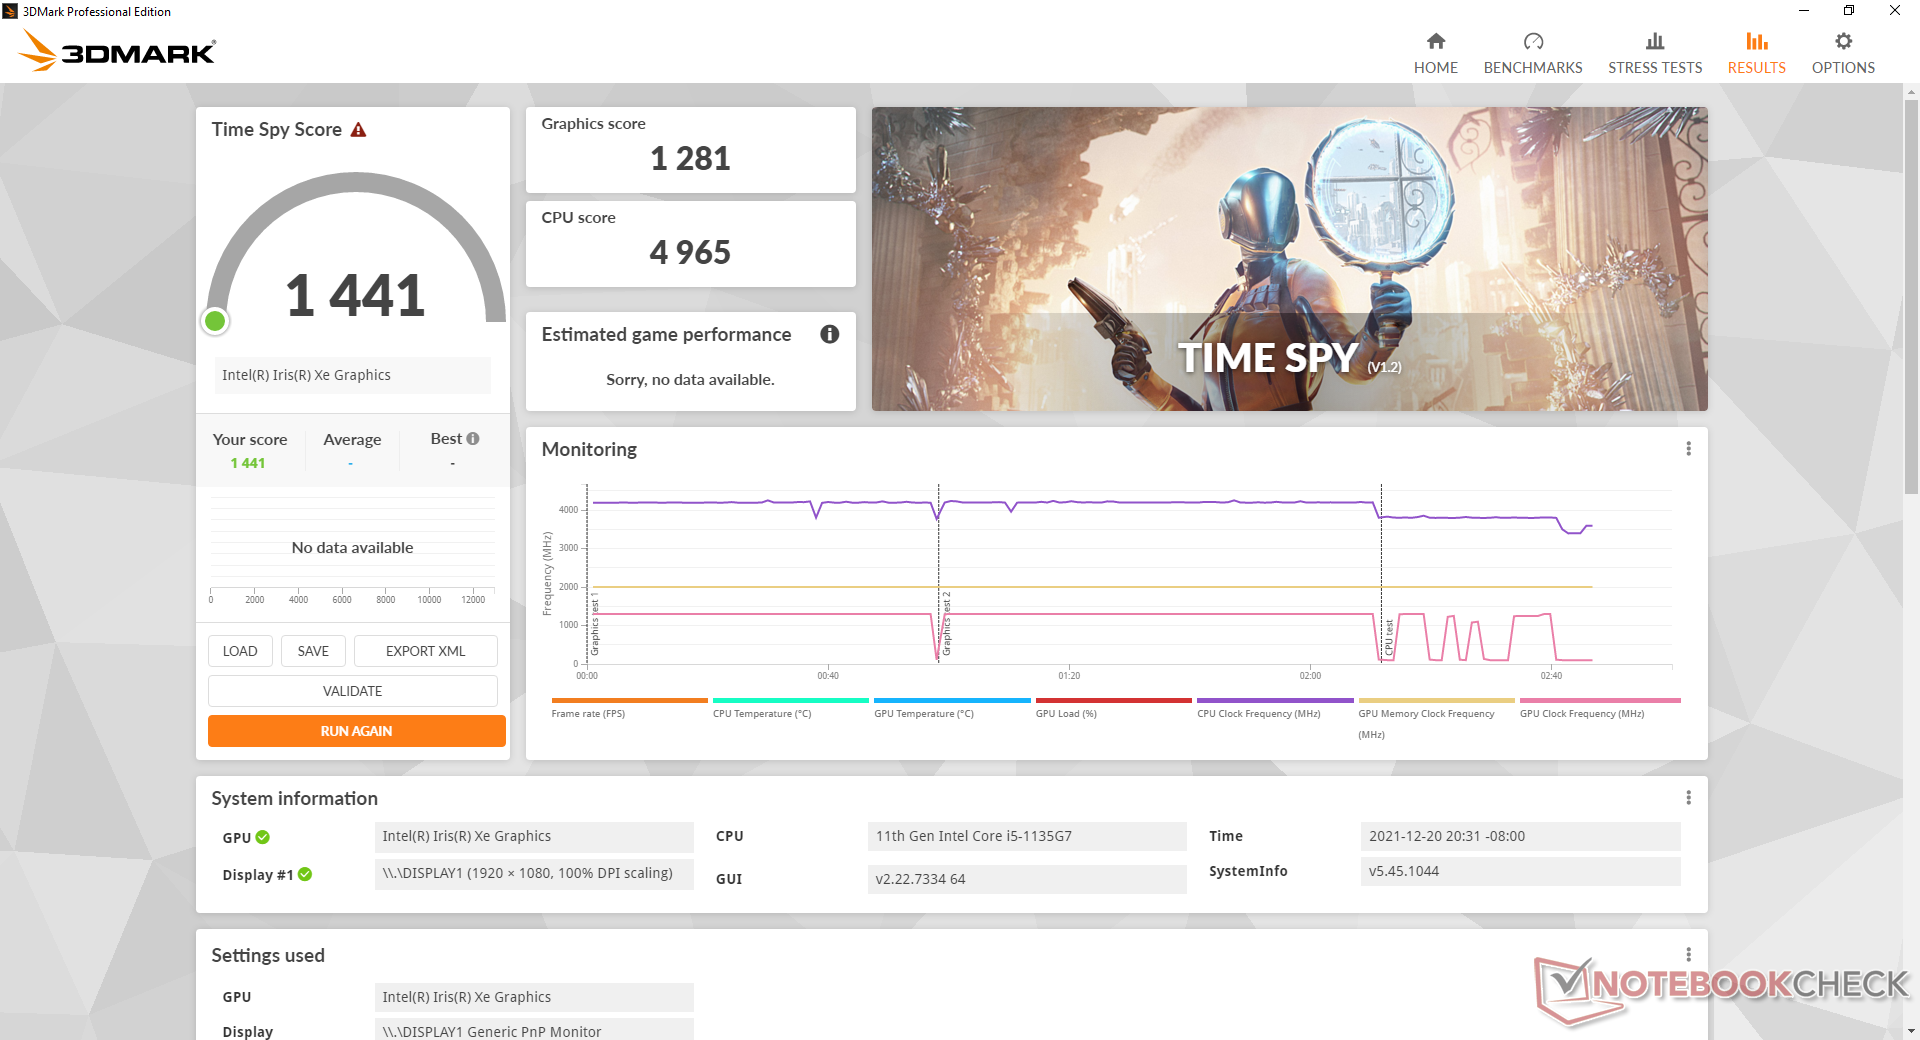
| 3DMark 11 Performance | 5976 points | |
| 3DMark Cloud Gate Standard Score | 18036 points | |
| 3DMark Fire Strike Score | 3640 points | |
| 3DMark Time Spy Score | 1441 points | |
Help | ||
Witcher 3 FPS Chart
| low | med. | high | ultra | |
|---|---|---|---|---|
| GTA V (2015) | 95.1 | 79.5 | 21.1 | 8.17 |
| The Witcher 3 (2015) | 77.1 | 46.6 | 23.1 | 11.5 |
| Dota 2 Reborn (2015) | 123 | 81 | 49.7 | 47.2 |
| Final Fantasy XV Benchmark (2018) | 36.7 | 18.7 | 13.5 | |
| X-Plane 11.11 (2018) | 24 | 21.4 | 21.9 | |
| Far Cry 5 (2018) | 47 | 23 | 22 | 21 |
| Strange Brigade (2018) | 76.5 | 30.8 | 25.2 | 20.2 |
Emissions
System Noise
Fan noise is perhaps the worst aspect of the GTI 11. The two internal fans pulse frequently and noticeably between 28.4 dB(A) and 37.7 dB(A) even when simply idling on desktop or browsing the web. Fan behavior wouldn't change when set to Power Saver mode, either.
Running higher loads like games will induce a fan noise ranging from 44 dB(A) up to 56 dB(A) which is much louder than what we've recorded on most other mini PCs including the Intel NUC series. Our unit would suffer from slight electronic noise or coil whine as well and so it is never truly silent.
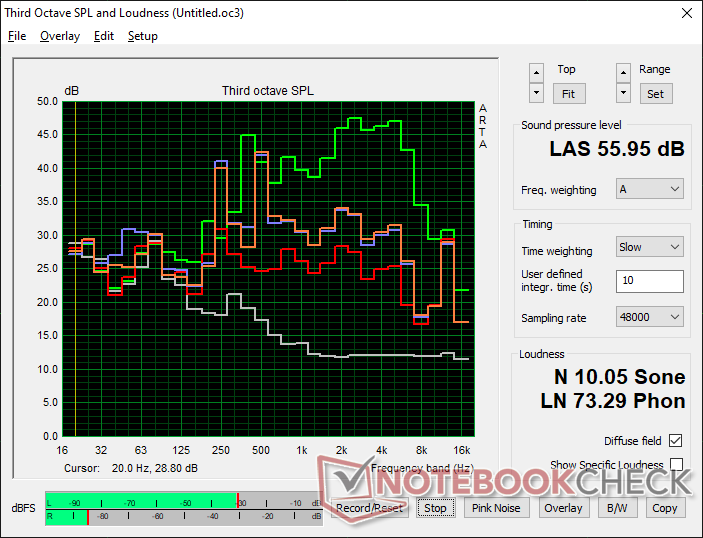
Noise level
| Idle |
| 28.4 / 32 / 37.7 dB(A) |
| Load |
| 44.2 / 56 dB(A) |
 | ||
30 dB silent 40 dB(A) audible 50 dB(A) loud |
||
min: | ||
| Beelink GTI 11 Iris Xe G7 80EUs, i5-1135G7, Kingston SA2000M8500G | Beelink SER3 Vega 10, R7 3750H, GSemi AZW GSDFN512TS3F1OGCX | Intel NUC11TNKi5 Iris Xe G7 80EUs, i5-1135G7, Transcend M.2 SSD 430S TS512GMTS430S | GMK NucBox 2 Iris Plus Graphics 655, i5-8259U, Netac S930E8/256GPN | Intel Hades Canyon NUC8i7HVK Vega M GH, i7-8809G, Intel Optane 120 GB SSDPEK1W120GA | |
|---|---|---|---|---|---|
| Noise | 19% | 3% | 20% | 8% | |
| off / environment * (dB) | 25.7 | 23.4 9% | 24.8 4% | 25.6 -0% | 28.7 -12% |
| Idle Minimum * (dB) | 28.4 | 23.4 18% | 35.6 -25% | 25.7 10% | 29 -2% |
| Idle Average * (dB) | 32 | 23.4 27% | 35.6 -11% | 25.7 20% | 29 9% |
| Idle Maximum * (dB) | 37.7 | 29.4 22% | 35.6 6% | 25.7 32% | 29 23% |
| Load Average * (dB) | 44.2 | 35.2 20% | 36.2 18% | 35.3 20% | 36 19% |
| Witcher 3 ultra * (dB) | 44.5 | 37.2 16% | 38 15% | 42 6% | |
| Load Maximum * (dB) | 56 | 43.3 23% | 47.6 15% | 35.1 37% | 49.4 12% |
* ... smaller is better
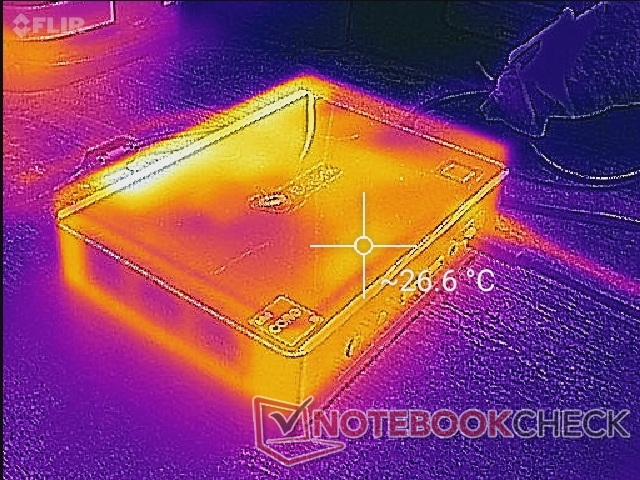
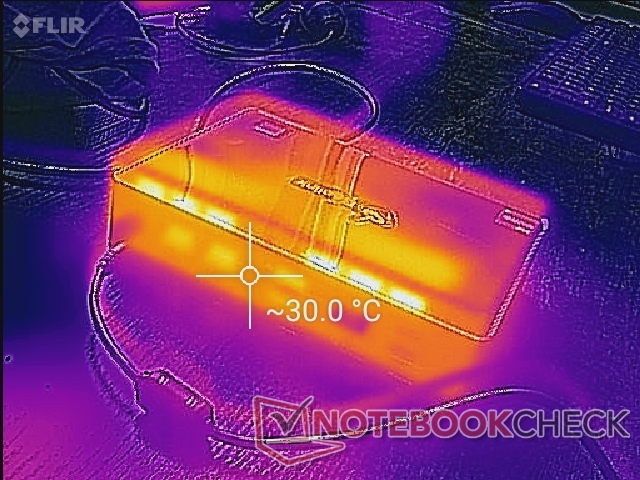
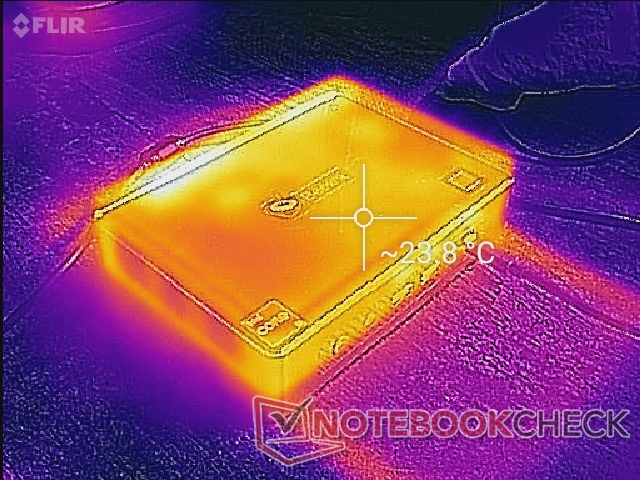
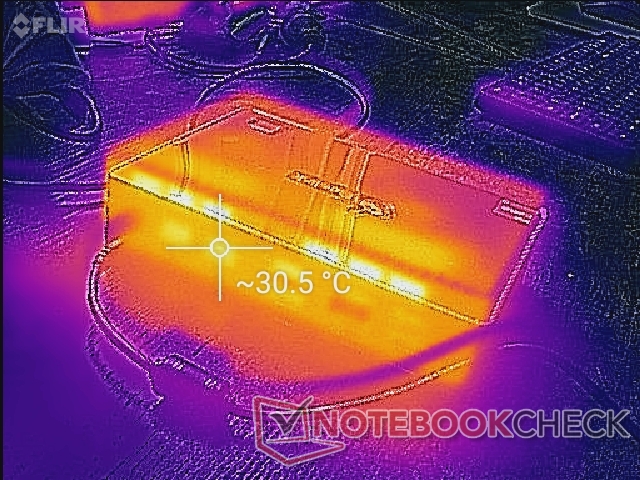
Temperature
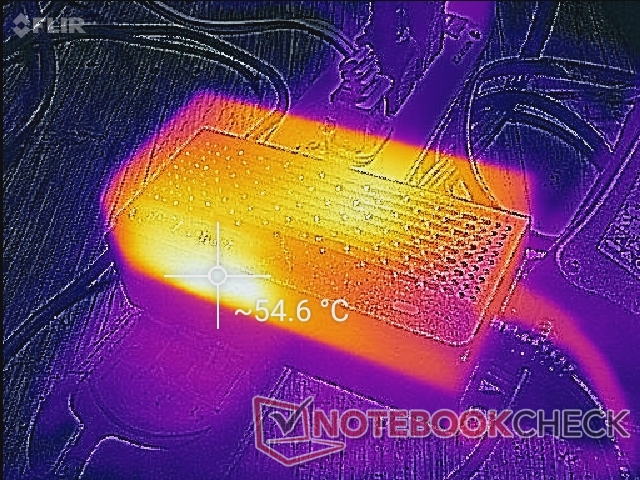
Surface temperatures are not an issue on the GTI 11. In fact, any differences between idling and gaming loads are quite minor as shown by our temperature maps below. Cool air enters from the two sides of the chassis that are farthest apart and hot air exists from the rear. Items can be placed on top of the unit without obstructing airflow, but a vertical orientation may impact fan noise or temperature.
Stress Test
When running Prime95 to stress the CPU, clock rates would boost to 3.8 GHz for the first 20 seconds or so until hitting a core temperature of 89 C. Clock rates would then drop to 2.8 GHz in order to maintain a cooler core temperature of 70 C. CPU package power would also drop from 48 W maximum to a more stable 28 W.
Core temperature and GPU clock rate would stabilize at 64 C and 1300 MHz, respectively, when running Witcher 3 to represent high loads. Results are very similar to what we recorded on the competing NUC11TNKi5 when both systems are subjected to similar conditions.
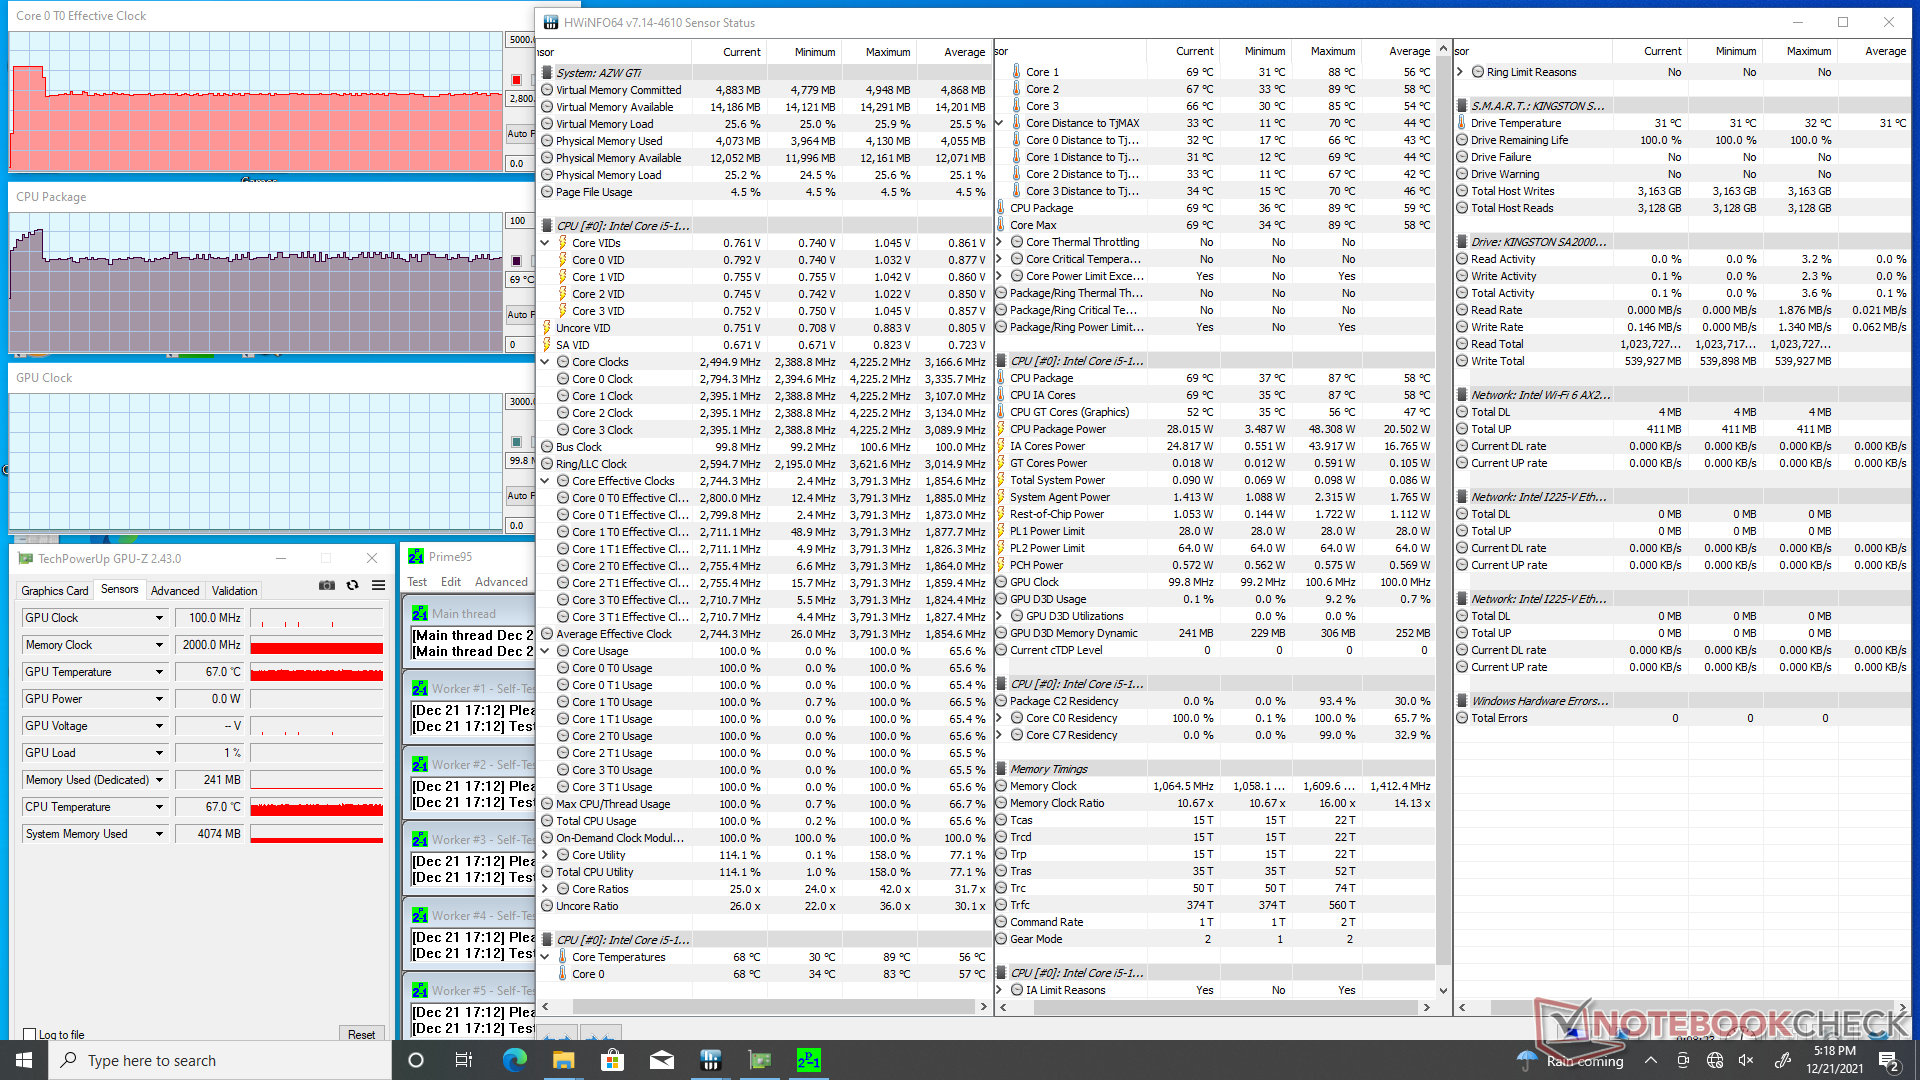
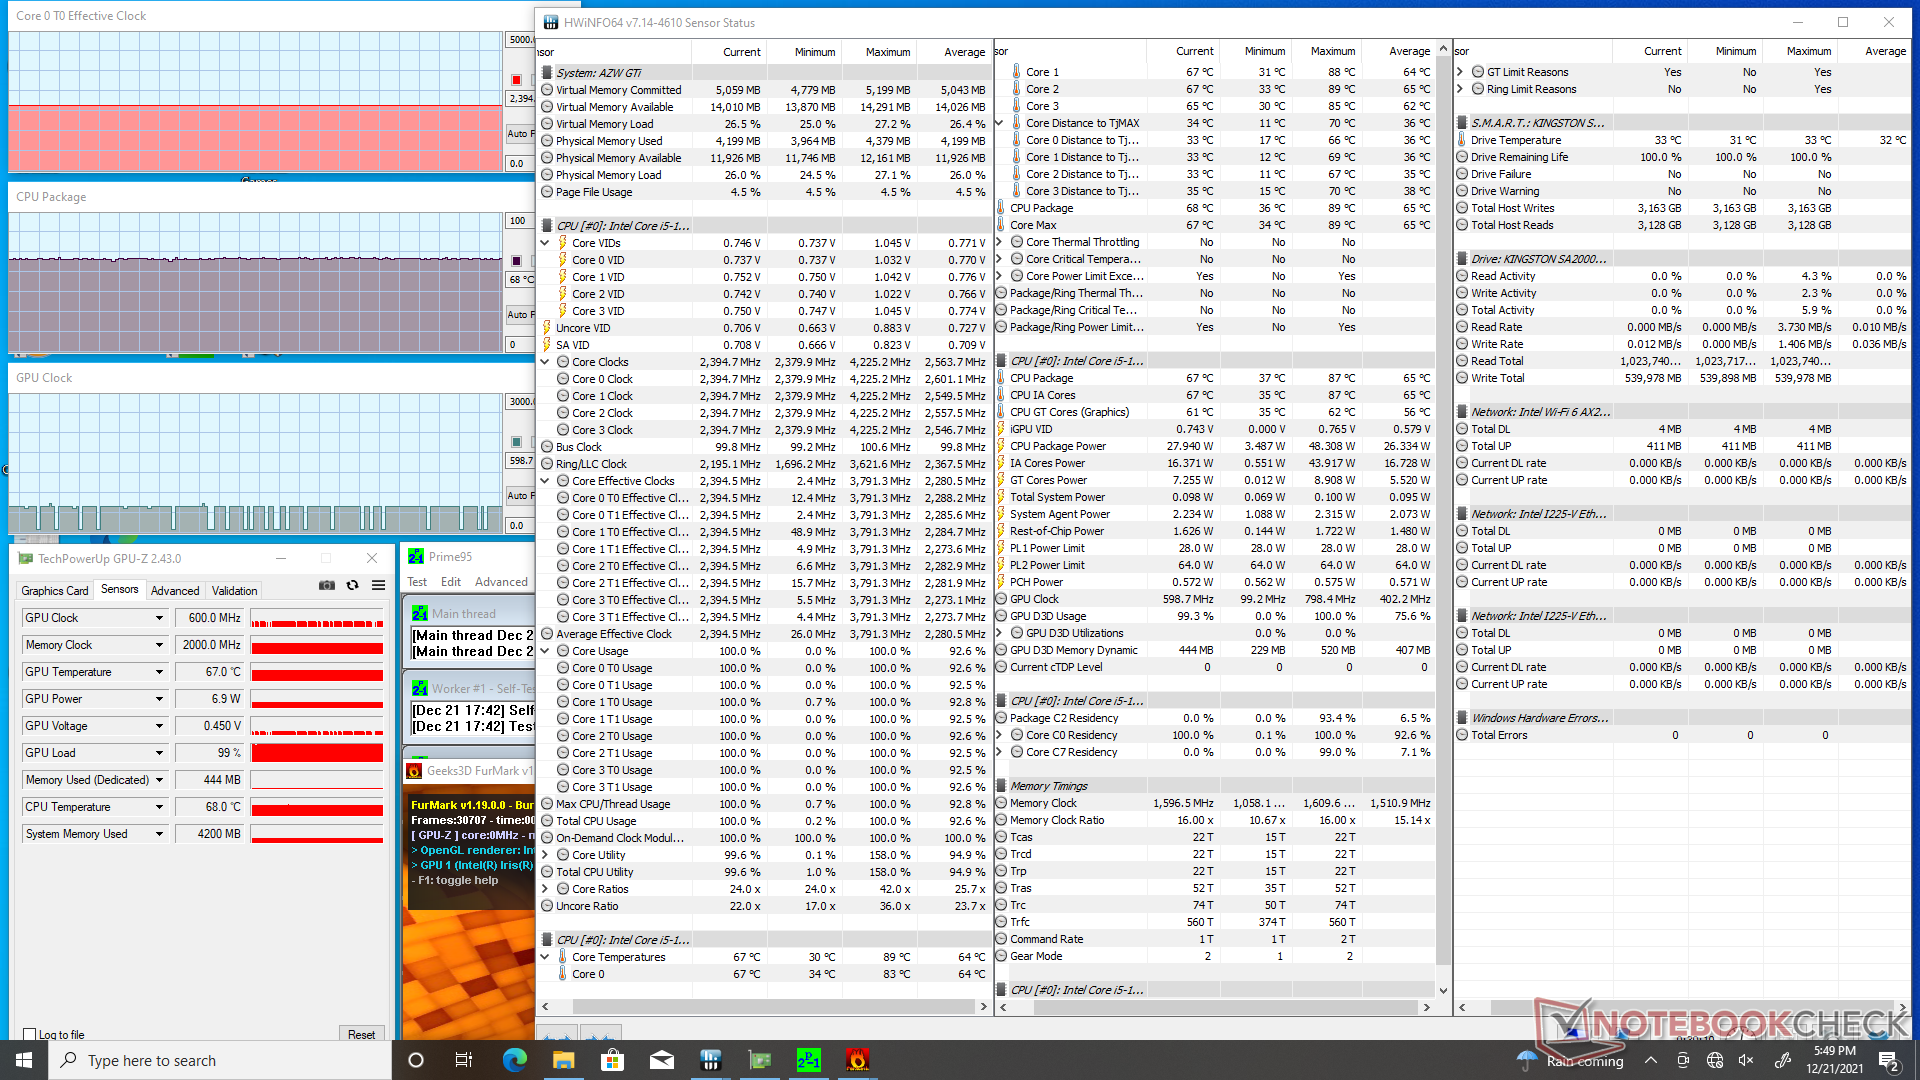
| CPU Clock (GHz) | GPU Clock (MHz) | Average CPU Temperature (°C) | |
| System Idle | -- | -- | 39 |
| Prime95 Stress | 2.8 | -- | 70 |
| Prime95 + FurMark Stress | 2.4 | 100 - 600 | 68 |
| Witcher 3 Stress | 1.6 | 1300 | 64 |
Energy Management
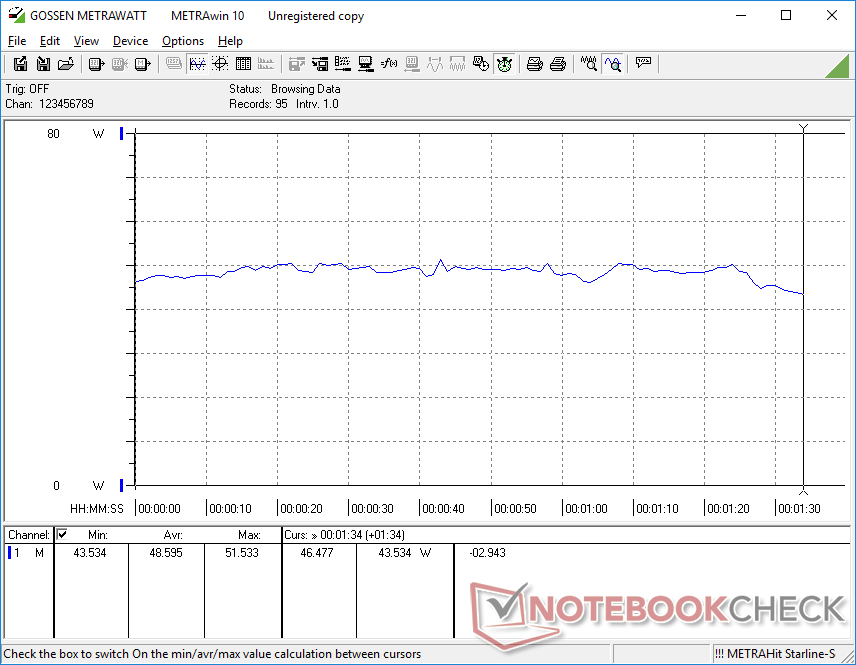
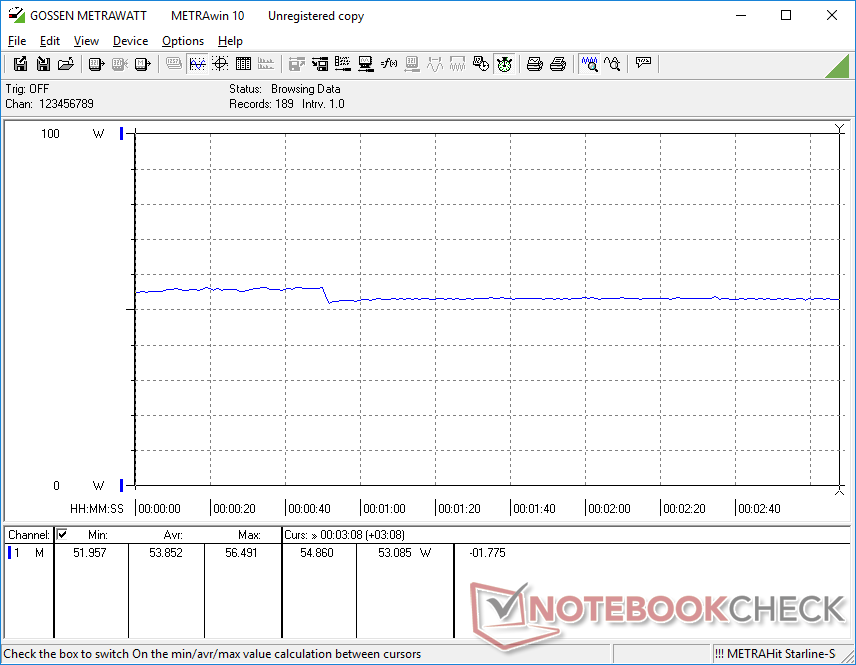
Power Consumption
Overall power consumption is higher than expected. The Intel NUC11TNKi5 with the exact same CPU, for example, would demand several watts less under all tested conditions when compared to our Beelink unit. The faster CPU and GPU performance of the Beelink when compared to the average PC with the same Core i5-1135G7 CPU is likely responsible for its higher power consumption.
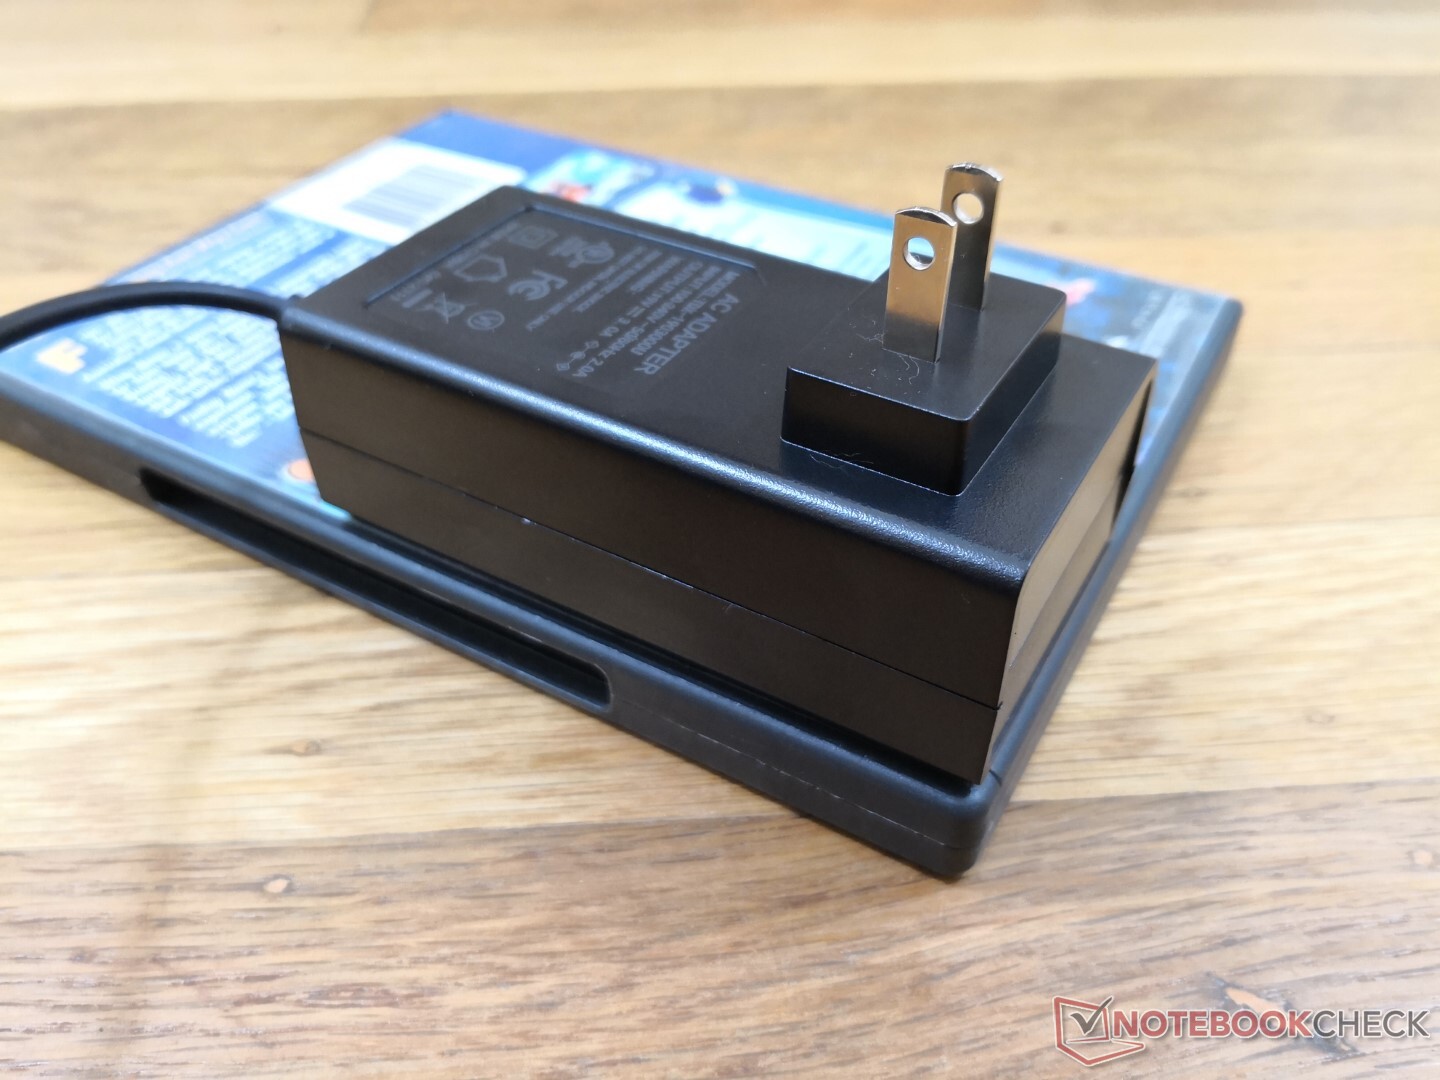
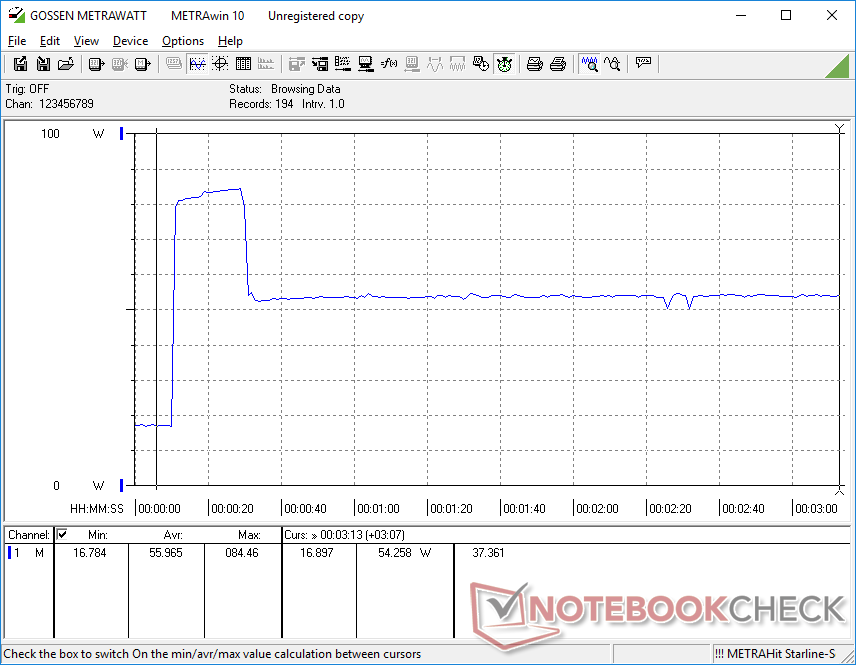
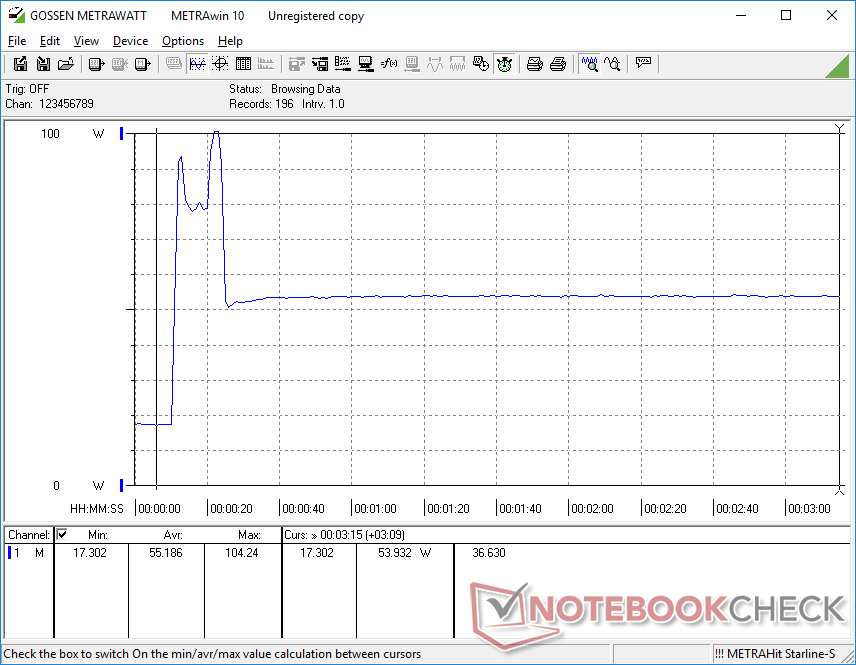
We're able to measure a temporary maximum draw of 104 W from the small-medium (~9.8 x 5 x 3.4 cm) 57 W (19 V, 3A) AC adapter when running Prime95. This spike lasts about 20 seconds before eventually falling and stabilizing at 56 W as shown by our graphs below.
| Off / Standby | |
| Idle | |
| Load |
|
Key:
min: | |
| Beelink GTI 11 i5-1135G7, Iris Xe G7 80EUs, Kingston SA2000M8500G, , x, | Beelink SER3 R7 3750H, Vega 10, GSemi AZW GSDFN512TS3F1OGCX, , x, | Intel NUC11TNKi5 i5-1135G7, Iris Xe G7 80EUs, Transcend M.2 SSD 430S TS512GMTS430S, , x, | Intel NUC10i7FNH i7-10710U, UHD Graphics 620, Kingston RBUSNS8154P3256GJ1, , 0x0, 0" | GMK NucBox 2 i5-8259U, Iris Plus Graphics 655, Netac S930E8/256GPN, , x, | Intel Hades Canyon NUC8i7HVK i7-8809G, Vega M GH, Intel Optane 120 GB SSDPEK1W120GA, , x, | |
|---|---|---|---|---|---|---|
| Power Consumption | 45% | 22% | 33% | 45% | -45% | |
| Idle Minimum * (Watt) | 15.2 | 7 54% | 11.5 24% | 6.1 60% | 15.5 -2% | |
| Idle Average * (Watt) | 16 | 9.1 43% | 12.4 22% | 8.4 47% | 6.8 57% | 16.2 -1% |
| Idle Maximum * (Watt) | 16 | 9.7 39% | 12.9 19% | 7.3 54% | 16.5 -3% | |
| Load Average * (Watt) | 48.6 | 29.5 39% | 40.7 16% | 46.3 5% | 83.4 -72% | |
| Witcher 3 ultra * (Watt) | 53.8 | 32.5 40% | 43.9 18% | 121.7 -126% | ||
| Load Maximum * (Watt) | 104.3 | 48.7 53% | 73.5 30% | 86 18% | 50.7 51% | 173.5 -66% |
* ... smaller is better
Power Consumption Witcher 3 / Stresstest
Power Consumption external Monitor
Pros
Cons
Verdict — Like An Intel NUC, But More Reasonably Priced
The Beelink GTI 11 is very compelling. For under $650 USD, users are getting the complete package with RAM, storage, and Windows 10 Pro whereas an Intel NUC 11 with the same CPU would run for almost $600 as a barebones kit. Thus, you would be spending close to $800 on an Intel NUC just to match the specifications of the Beelink. The fact that it can support Thunderbolt 4 accessories, Wi-Fi 6, and up to three internal SSDs means users don't have to give up on many important features when opting for the Beelink.
The major disadvantage to keep in mind is the poor fan noise behavior of the GTI 11. Fan RPM changes frequently and noticeably for seemingly no reason. Expect the system to be louder overall when compared to most Intel NUC models.
