AMD Ryzen 7 5700U vs. Ryzen 5 5500U: Lenovo Yoga 6 13 convertible review
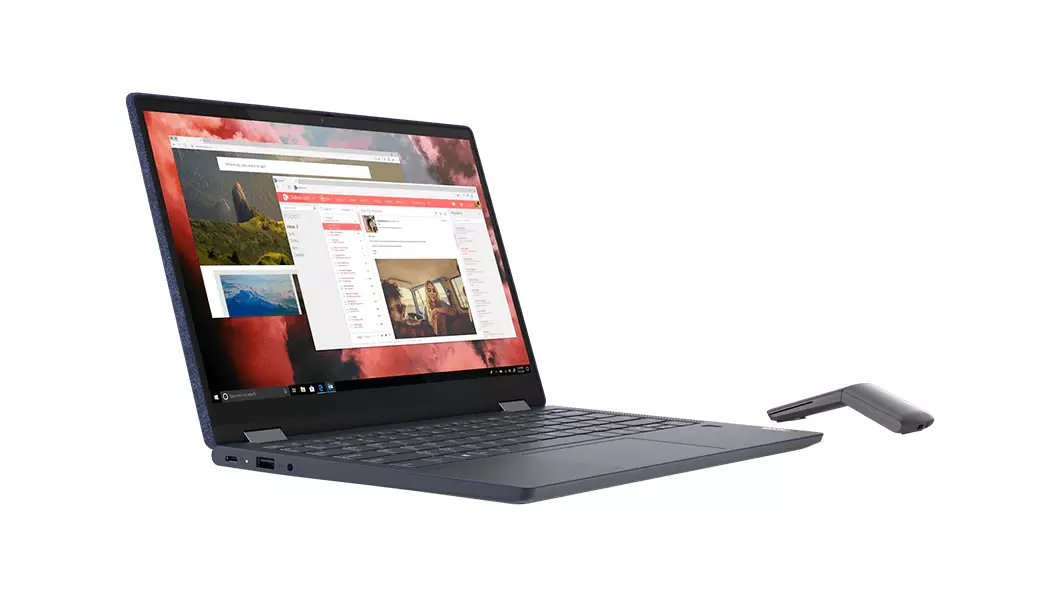
When we reviewed the Lenovo Yoga 6 13 a couple of months ago, we found it to offer better-than-average performance and a great 1080p touchscreen for its mid-range category. Our test unit was the lowest-end configuration, however, with "only" the Ryzen 5 5500U CPU, 8 GB of RAM, and 256 GB NVMe SSD for about $800 USD. This time, we wanted to check out the highest-end $1000 configuration with the Ryzen 7 5700U CPU, 16 GB of RAM, and 1 TB NVMe SSD to see what users can expect if they decide to pay a little extra.
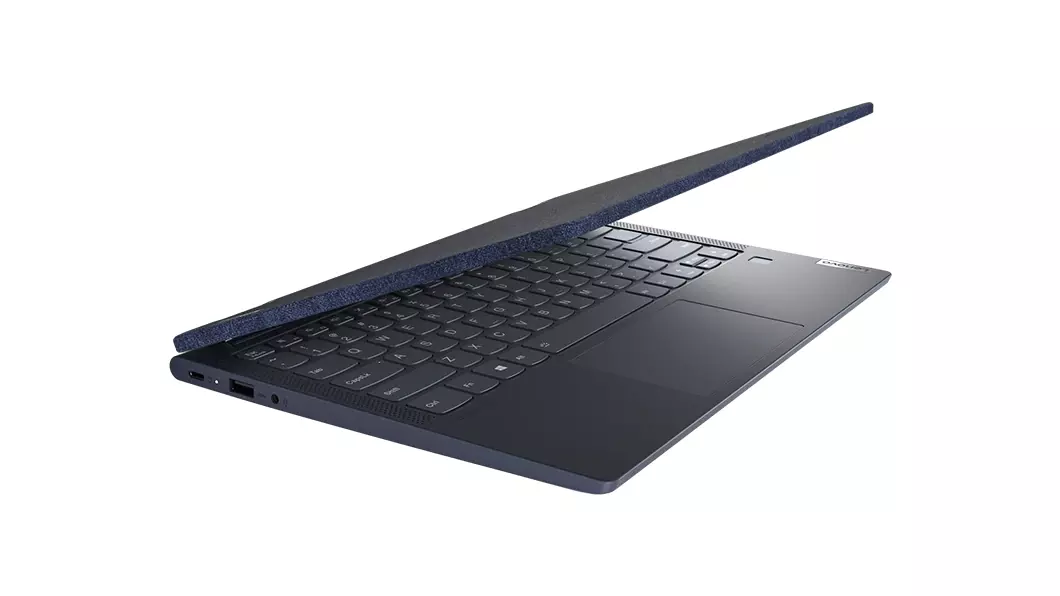
We recommend checking out our existing review on the Ryzen 5 Yoga 6 13 as all our comments on the keyboard, chassis, and other physical features of the model still apply here on the Ryzen 7 Yoga 6 13. The midrange Yoga 6 series sits in between the cheaper budget IdeaPad Flex 3 series and more expensive flagship Yoga 9 series.
More Lenovo reviews:
potential competitors in comparison
Rating | Date | Model | Weight | Height | Size | Resolution | Price |
|---|---|---|---|---|---|---|---|
| 85 % v7 (old) | 10 / 2021 | Lenovo Yoga 6 13ALC6 R7 5700U, Vega 8 | 1.3 kg | 18.2 mm | 13.30" | 1920x1080 | |
| 84.7 % v7 (old) | 07 / 2021 | Lenovo Yoga 6 13 82ND0009US R5 5500U, Vega 7 | 1.3 kg | 18.2 mm | 13.30" | 1920x1080 | |
| 86.7 % v7 (old) | 10 / 2021 | Dell XPS 13 9310 2-in-1 i7-1165G7, Iris Xe G7 96EUs | 1.3 kg | 14.35 mm | 13.40" | 1920x1200 | |
| 85.7 % v7 (old) | 06 / 2021 | Acer Spin 3 SP313-51N-56YV i5-1135G7, Iris Xe G7 80EUs | 1.4 kg | 16 mm | 13.30" | 2560x1600 | |
| 83.7 % v7 (old) | 05 / 2021 | Lenovo IdeaPad Flex 5 CB 13IML05 82B80010GE i5-10210U, UHD Graphics 620 | 1.4 kg | 17.95 mm | 13.30" | 1920x1080 | |
| 85.5 % v7 (old) | 06 / 2020 | HP Envy x360 13-ay0010nr R5 4500U, Vega 6 | 1.3 kg | 16.4 mm | 13.30" | 1920x1080 |
Case

Communication
Webcam


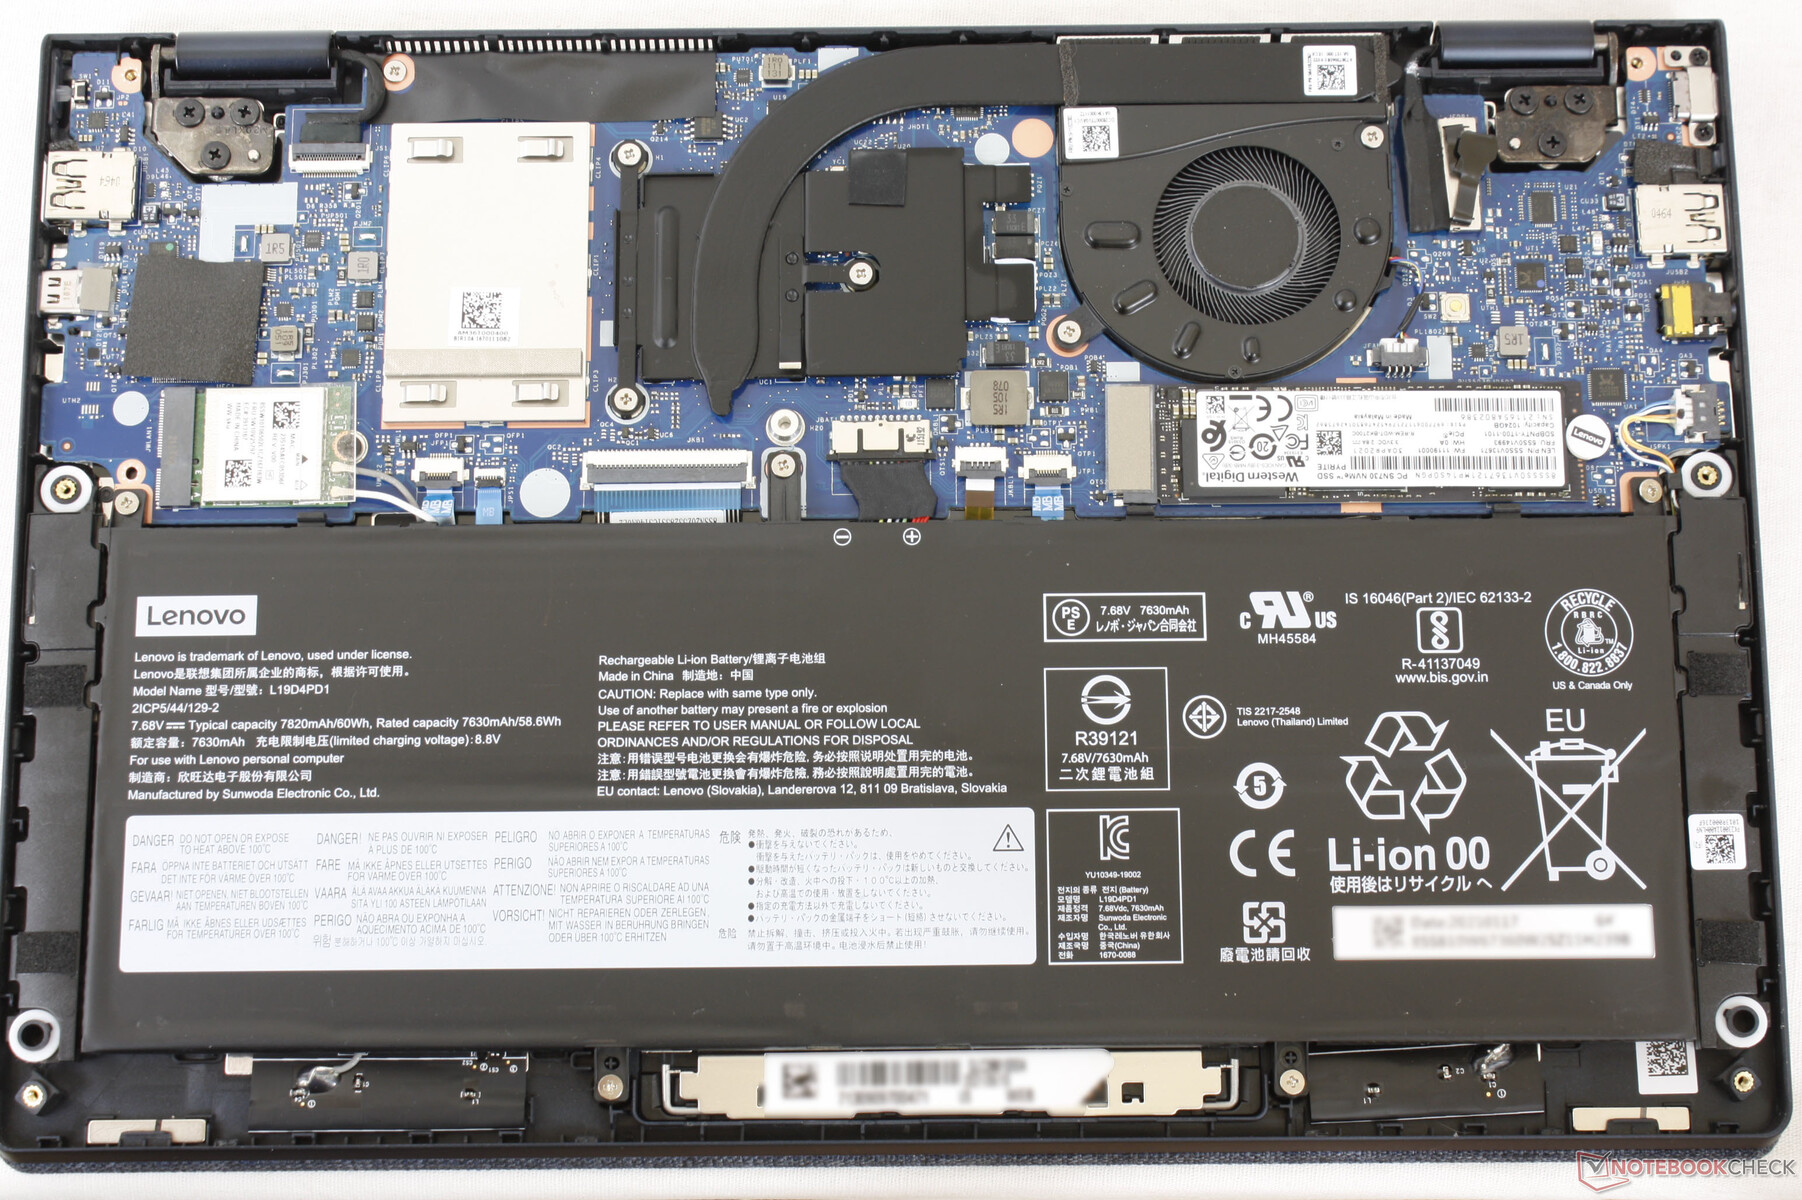
Maintenance
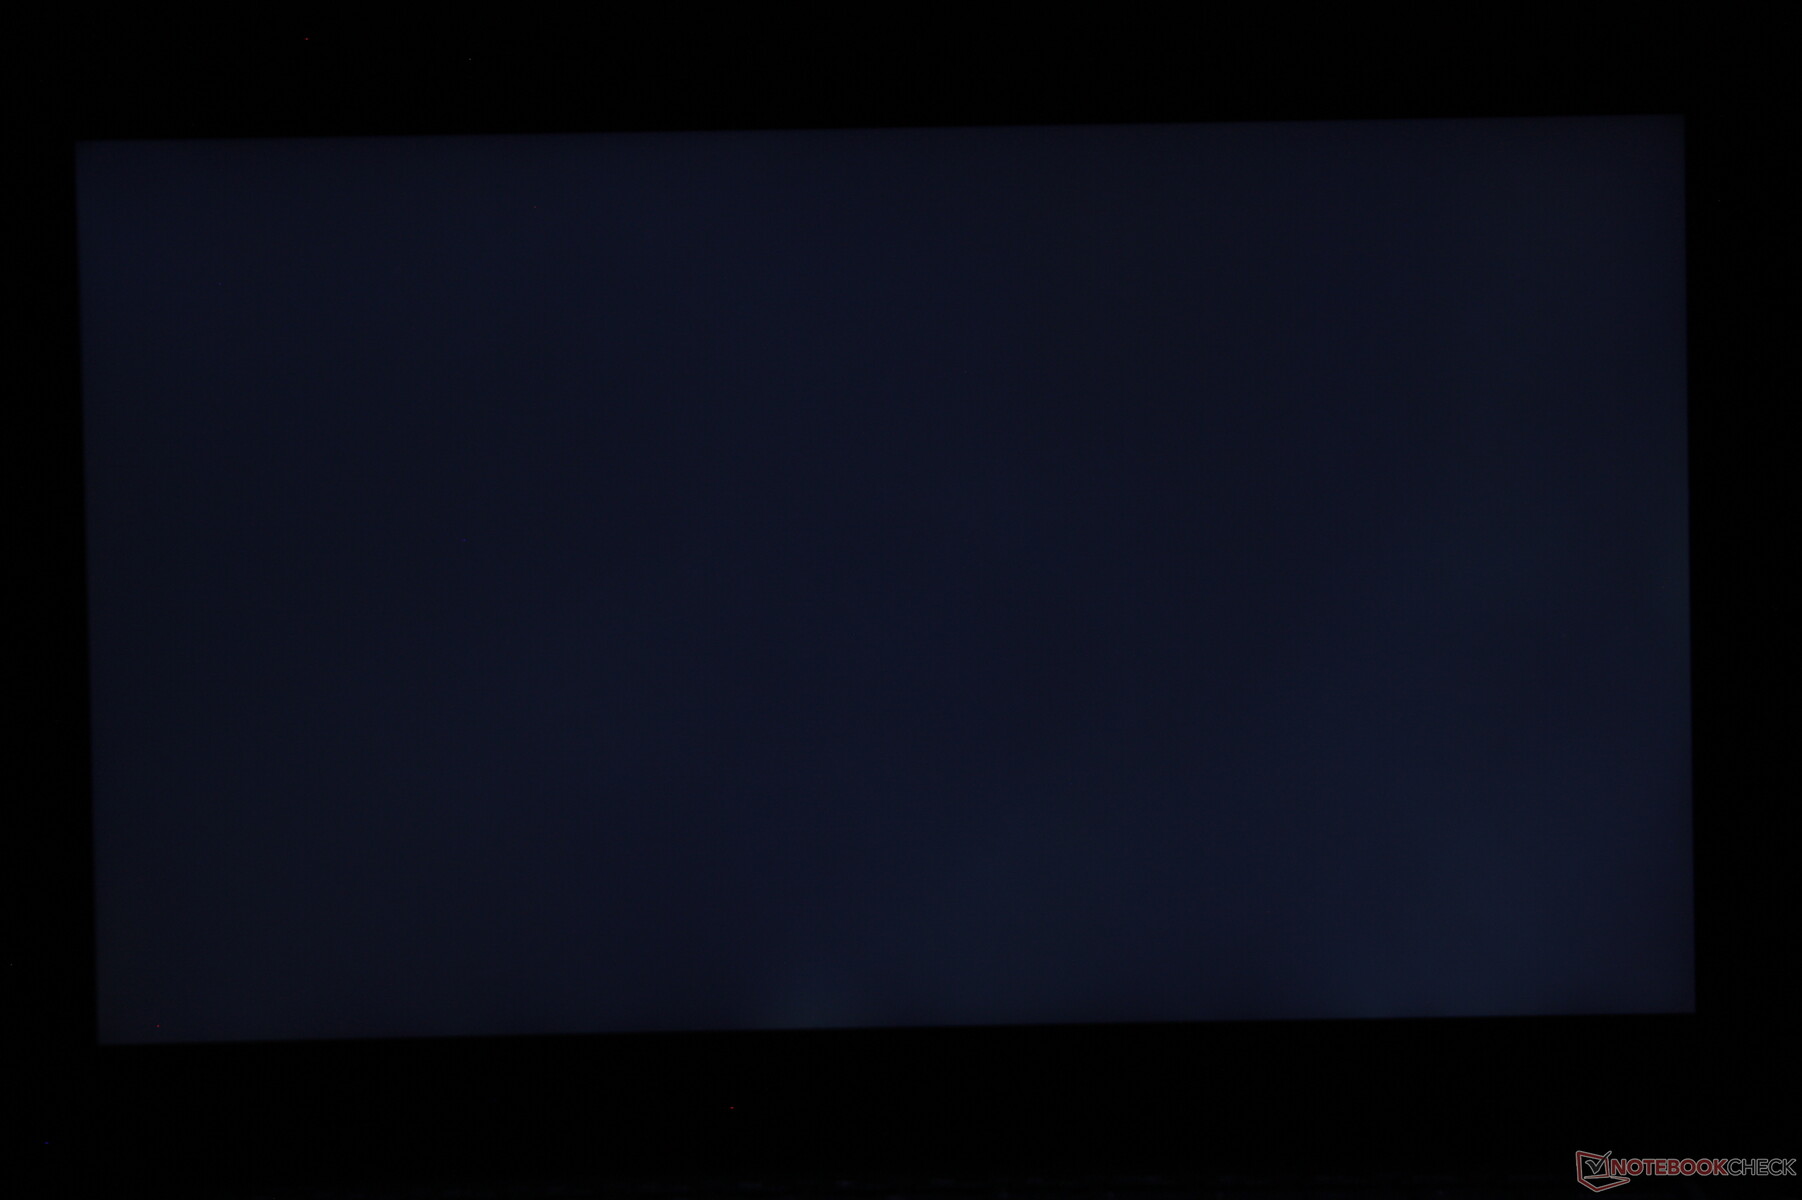
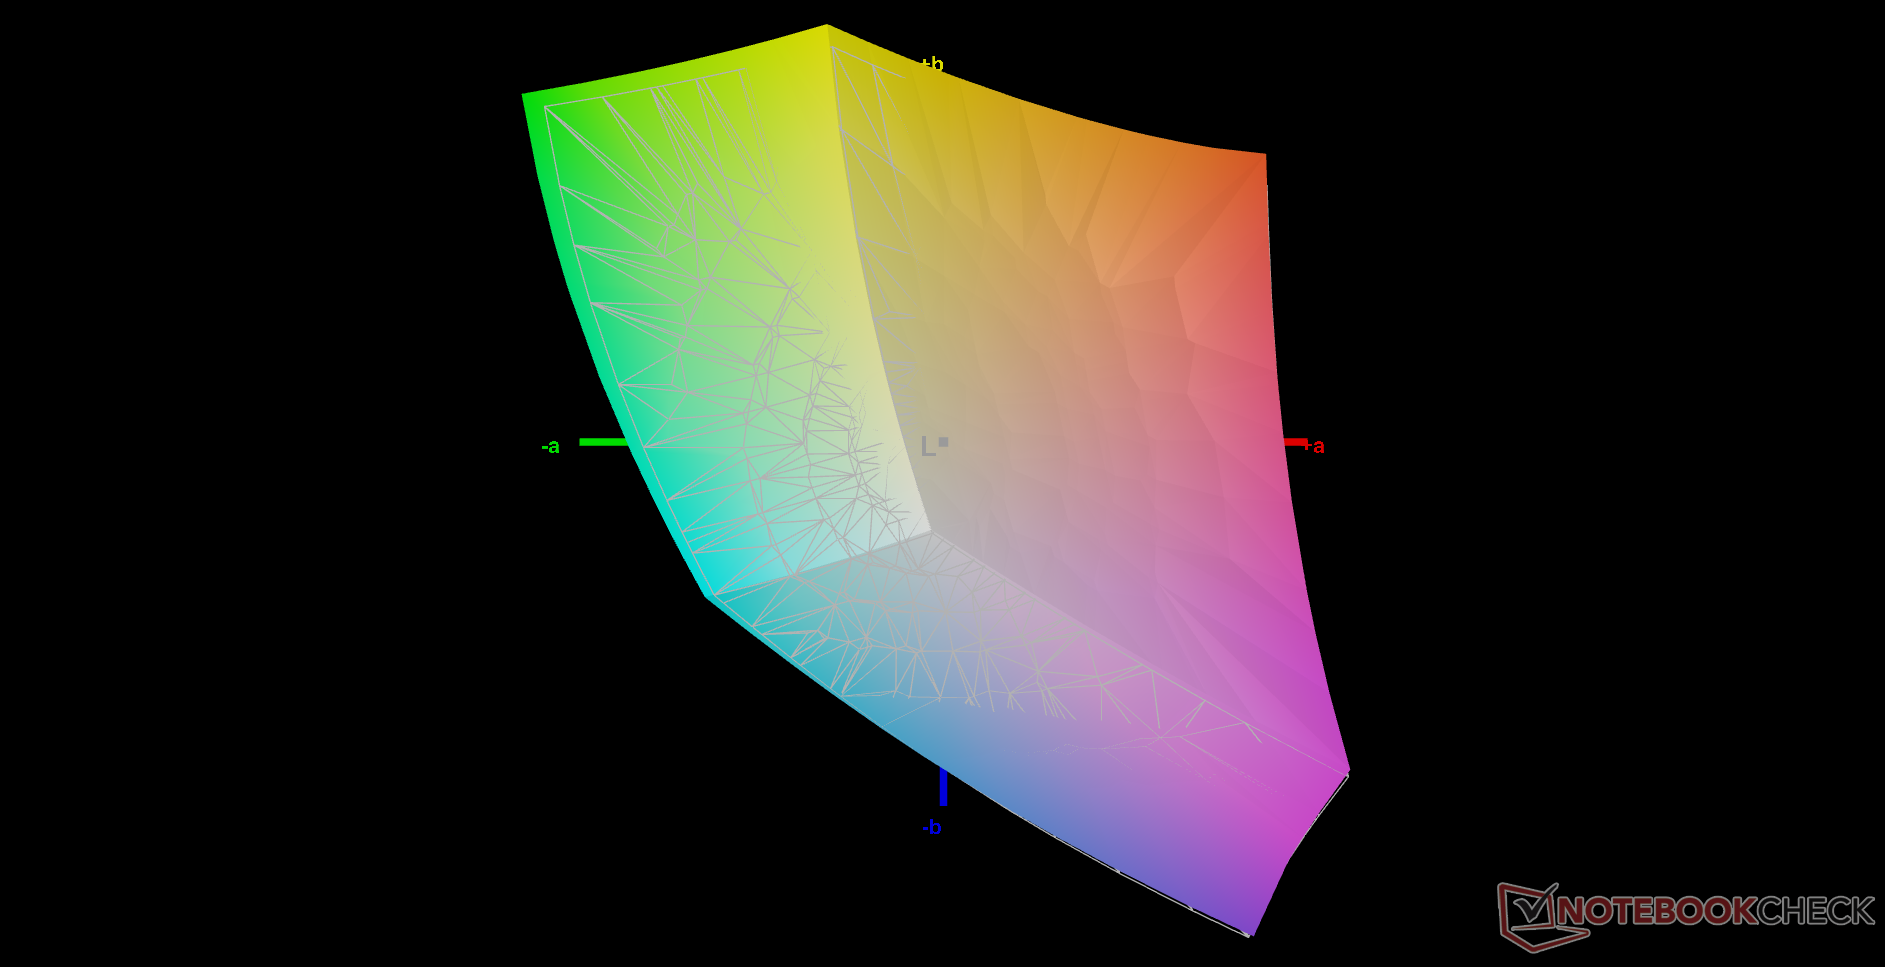
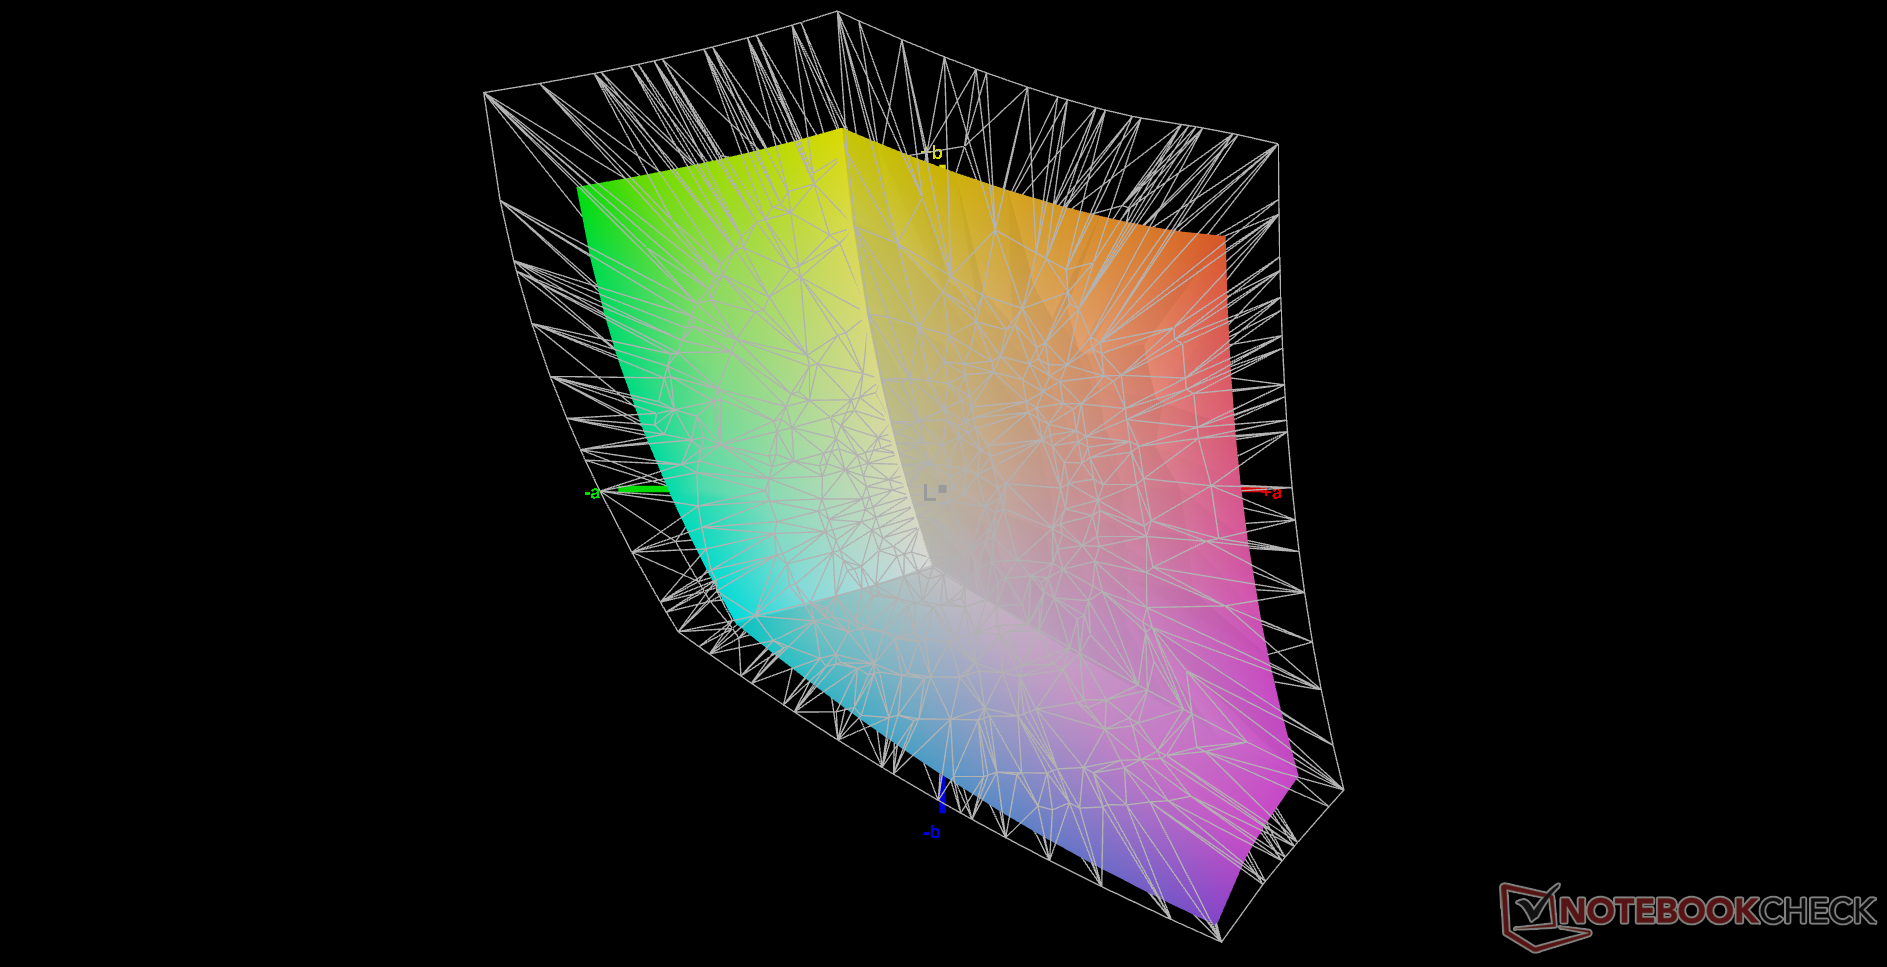
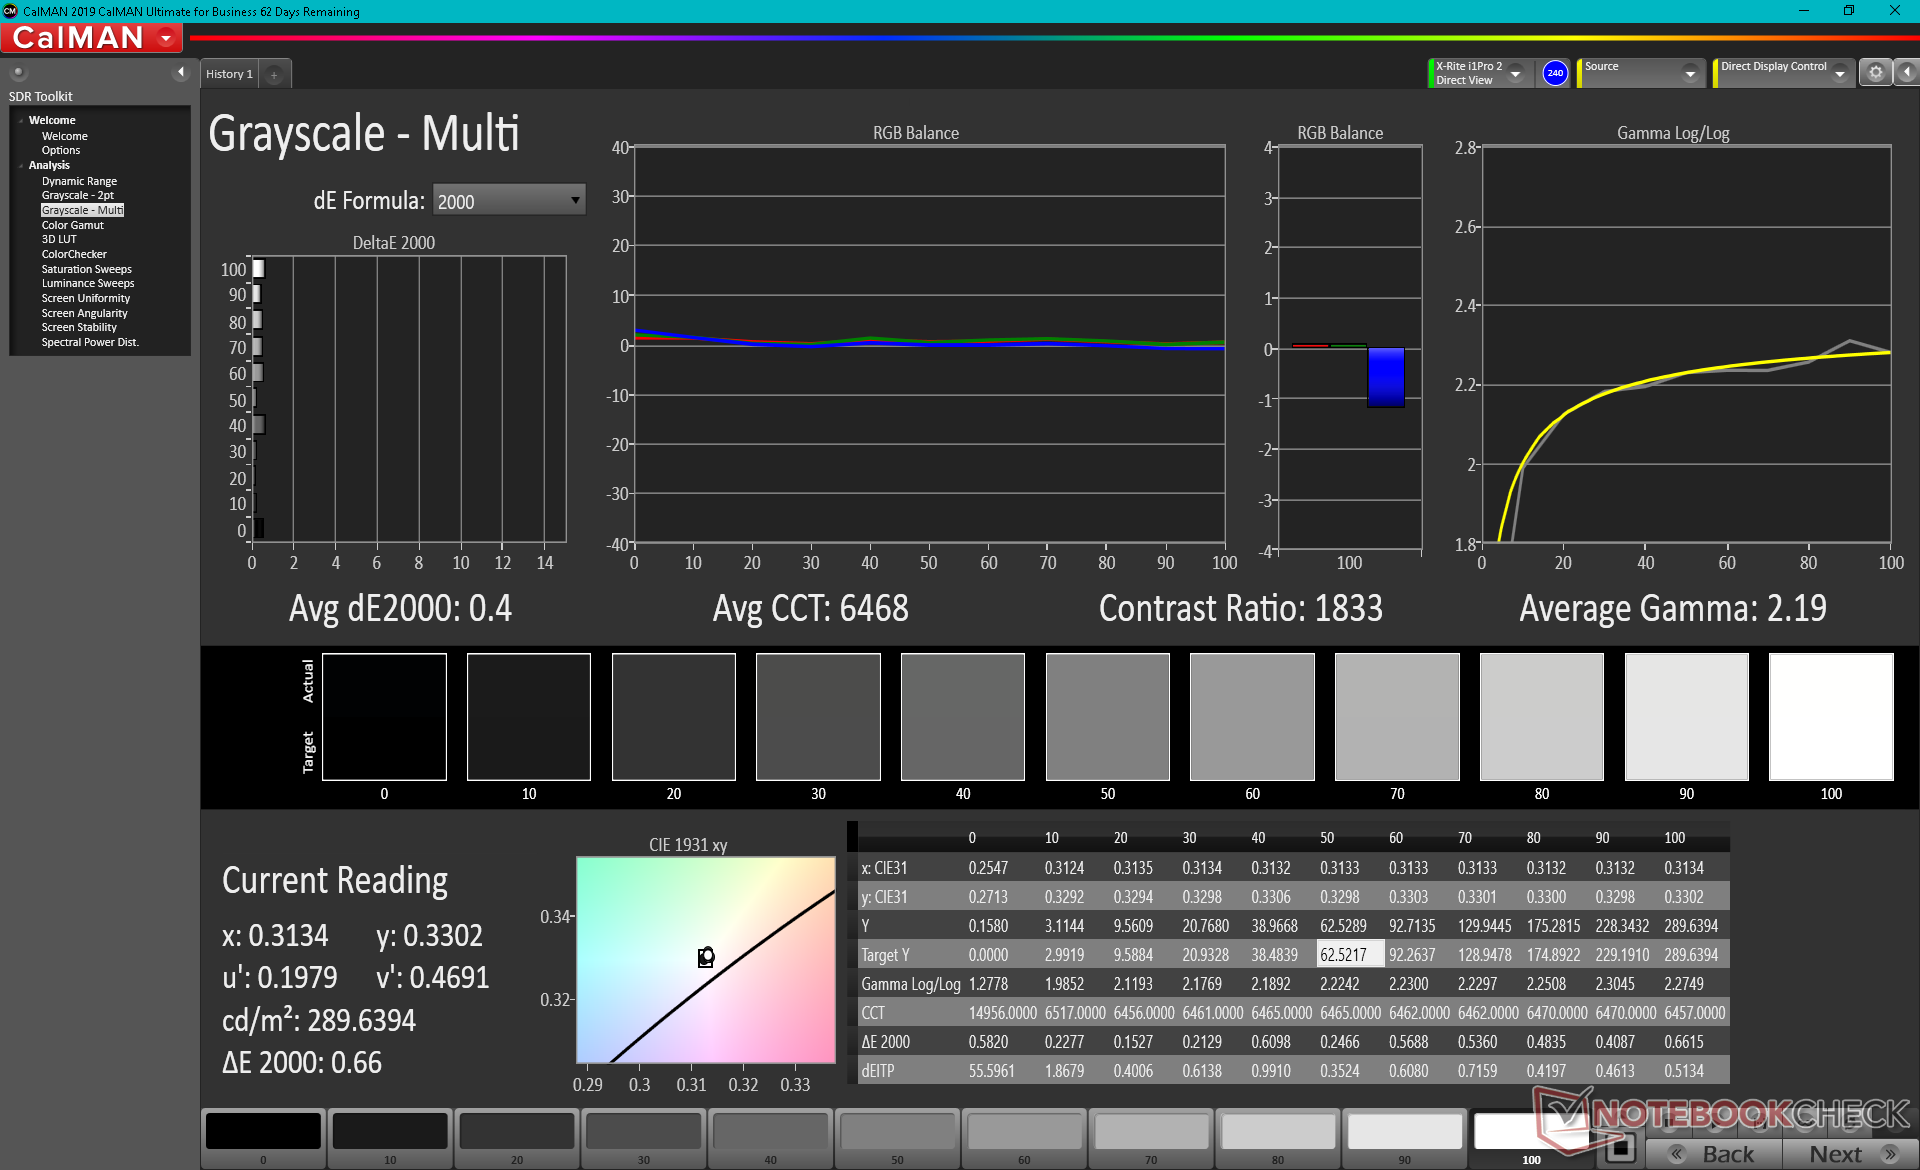
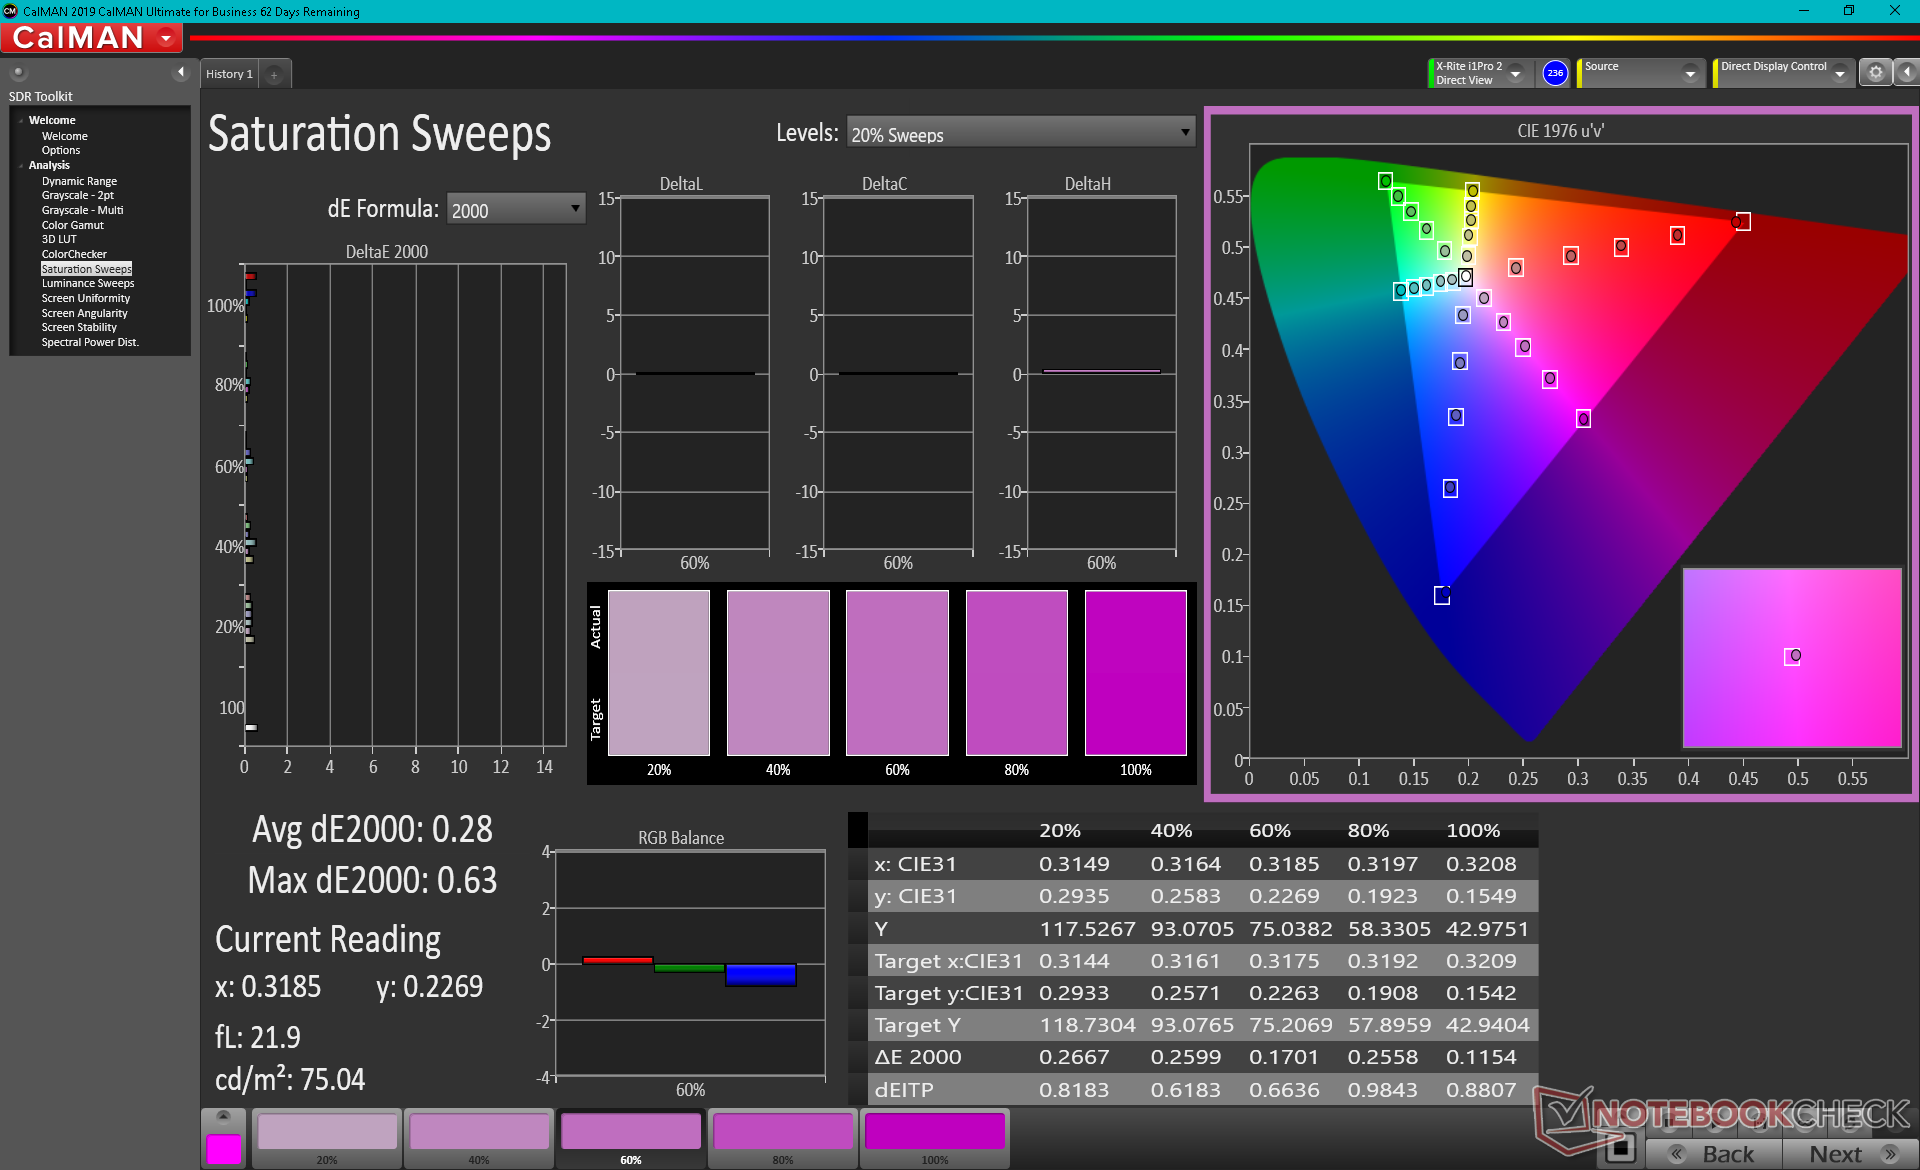
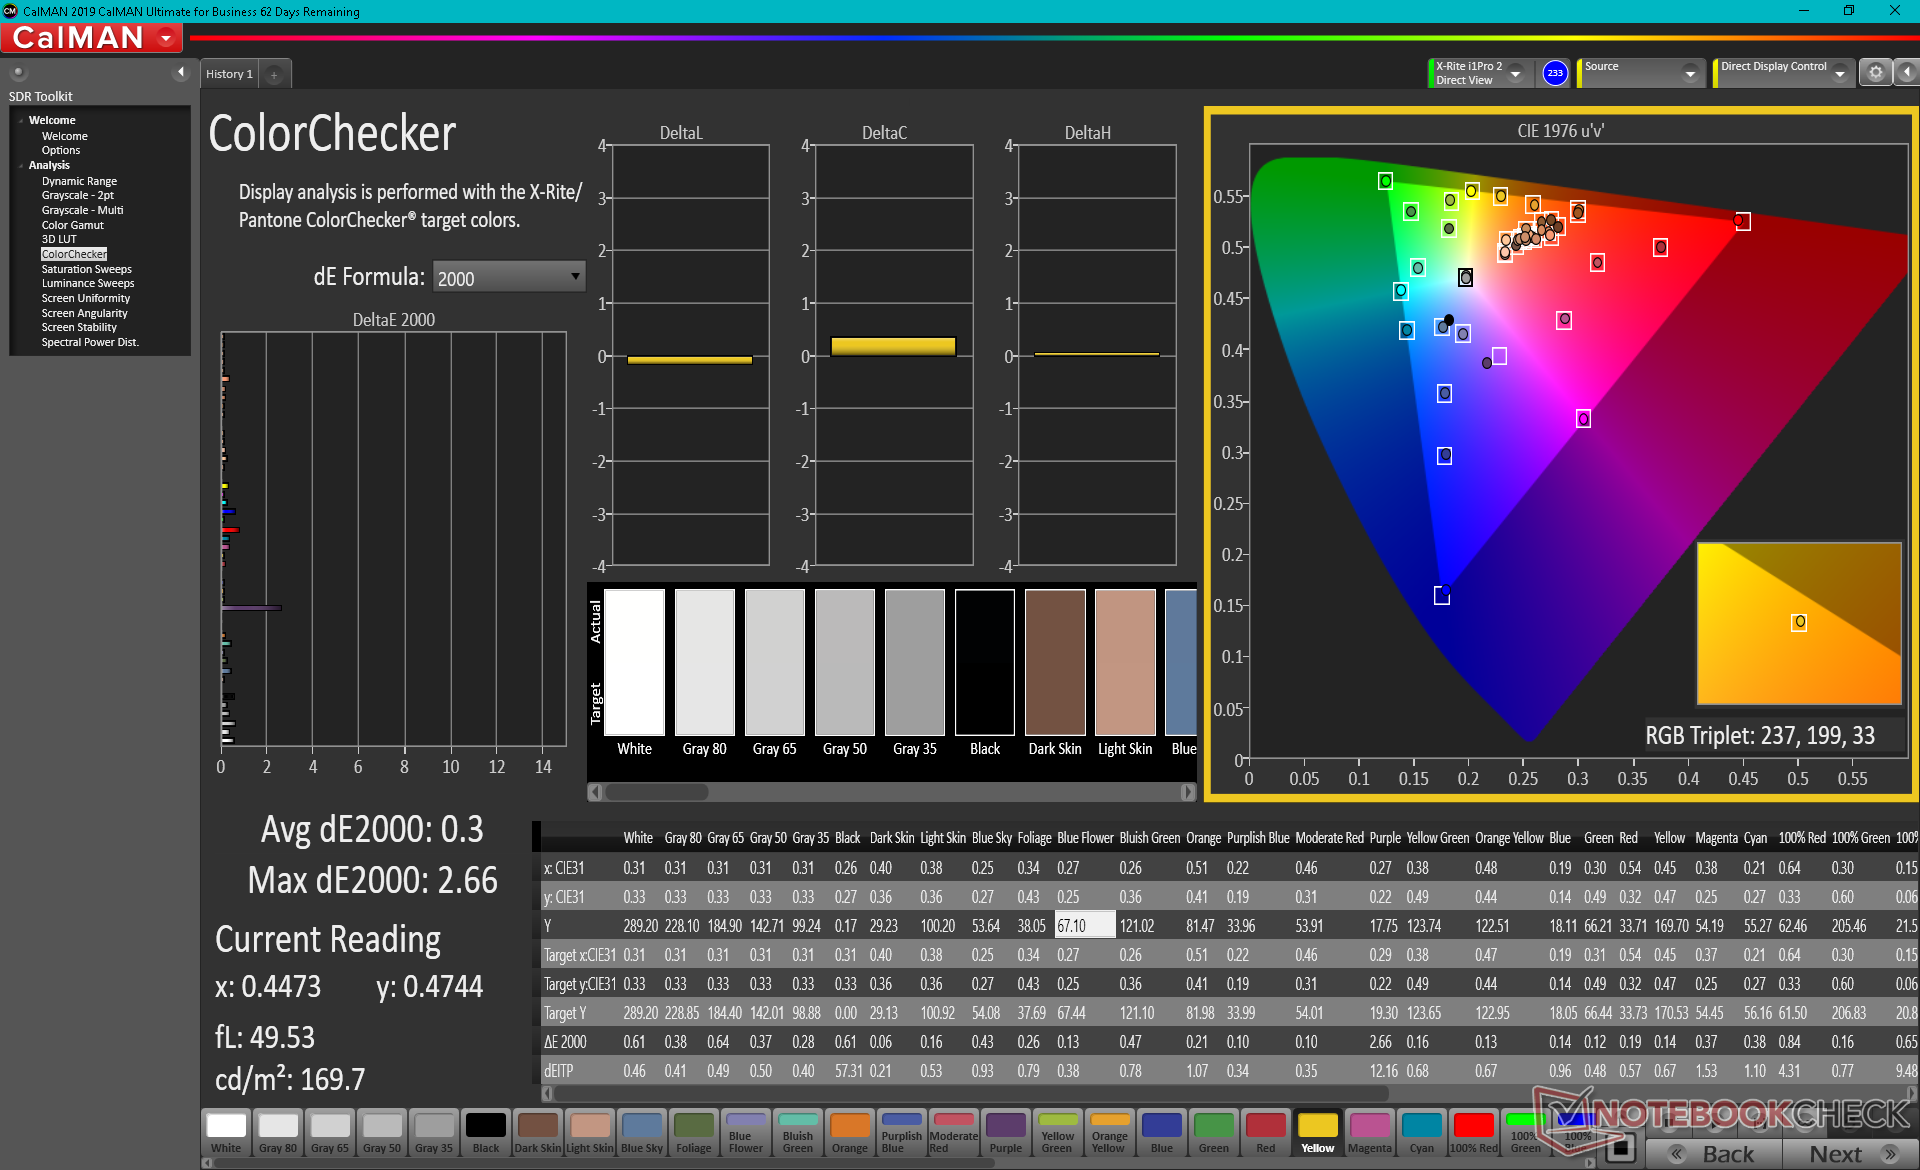
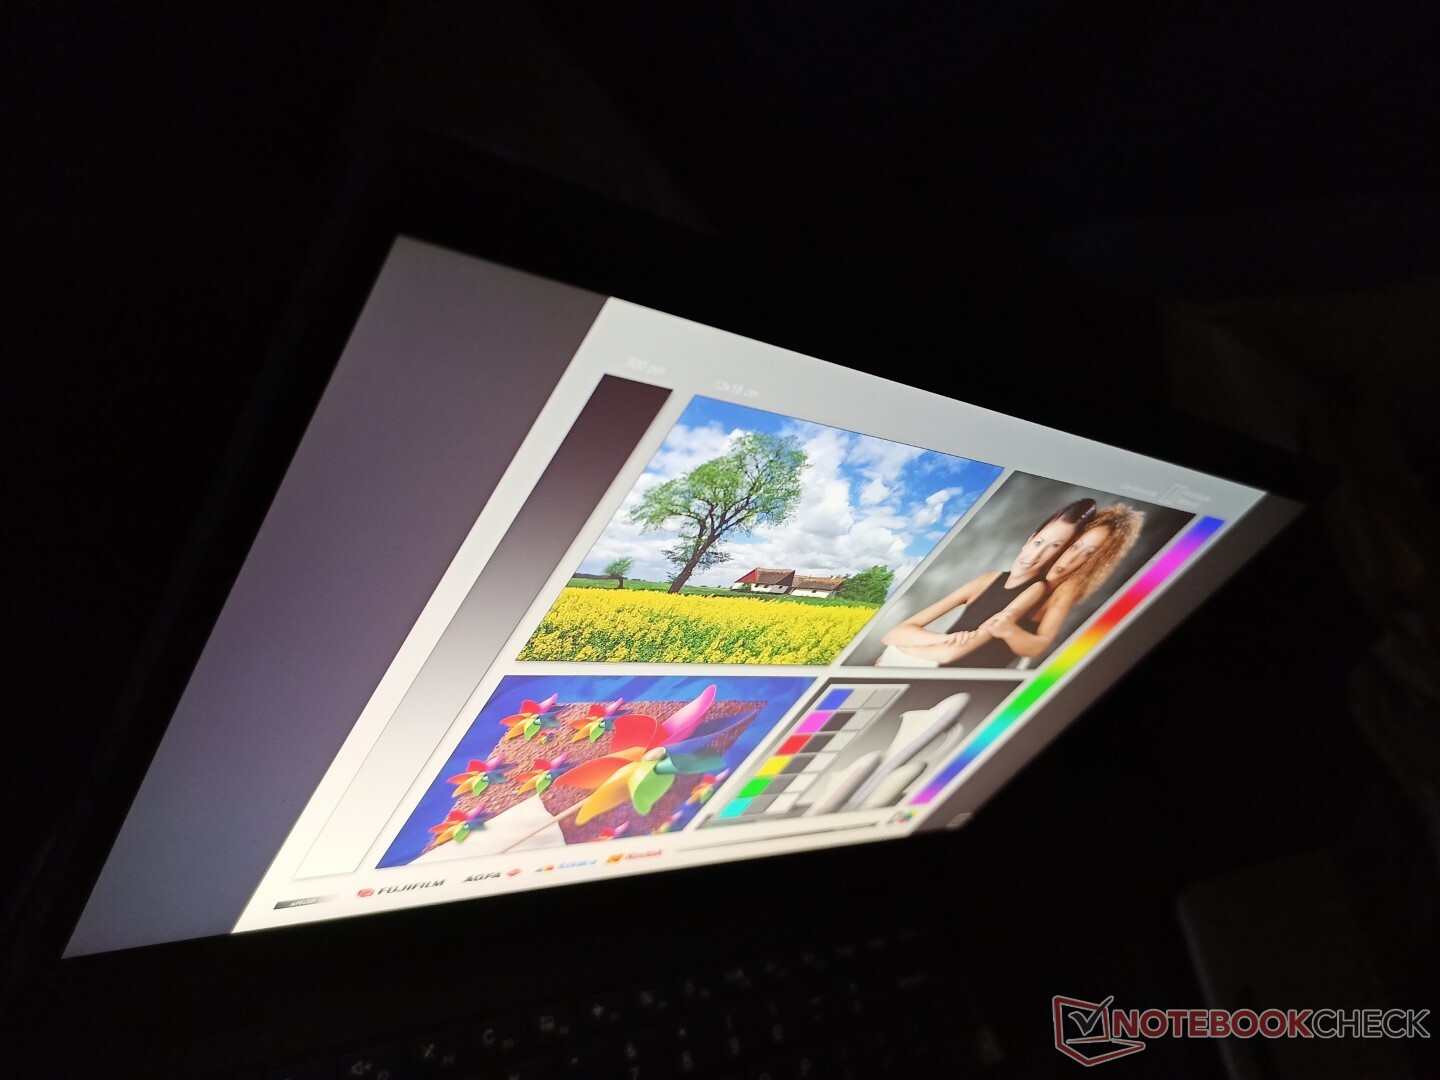
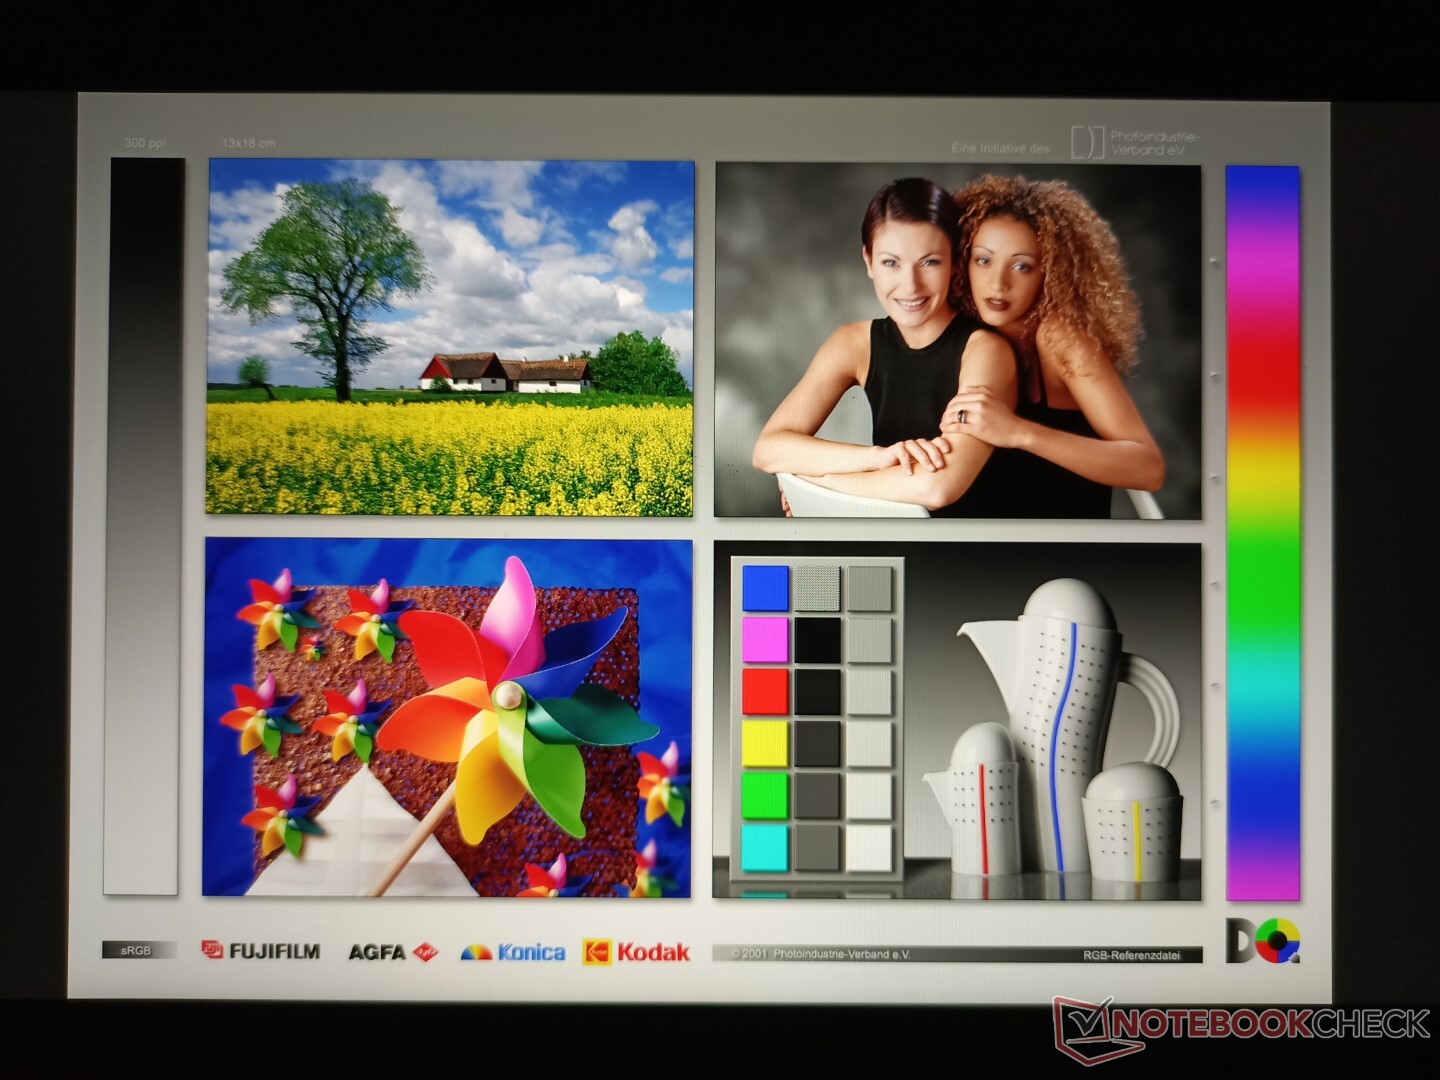
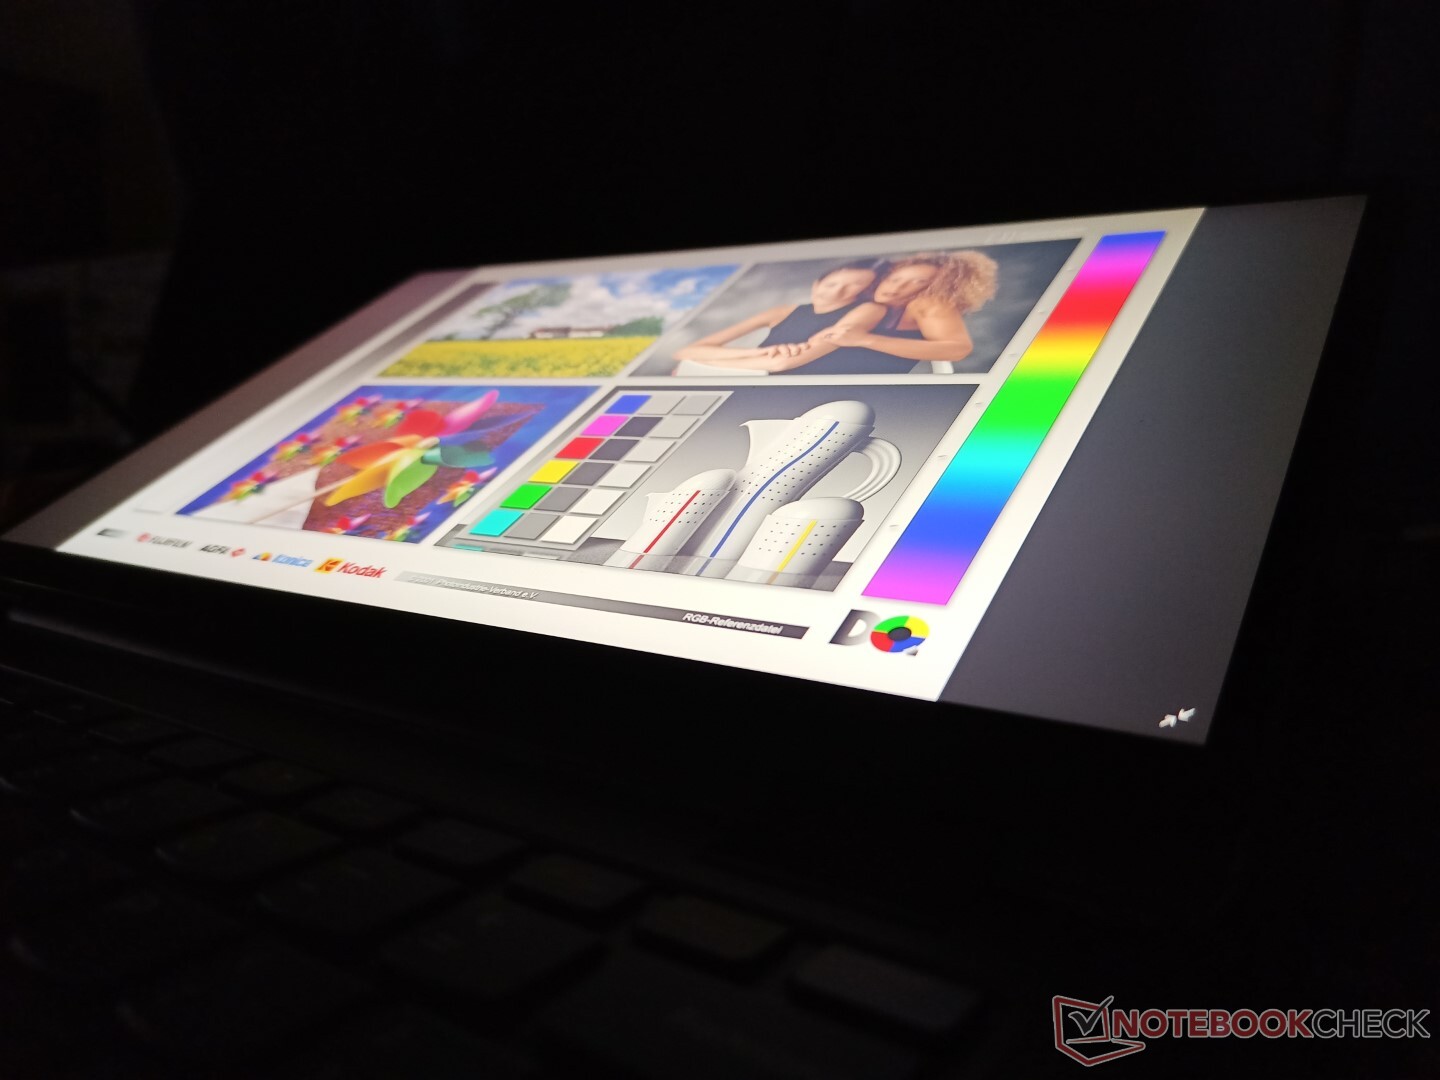
Display — Sharp with Full sRGB Coverage
Lenovo uses the same AU Optronics B133HAN05.F 1080p IPS touchscreen for all of its current Yoga 6 13 SKUs. Both color coverage (>99 percent sRGB) and contrast (~1500:1) are excellent and better than expected for a mid-range convertible, but response times are relatively slow for noticeable ghosting especially if gaming. The maximum brightness of around 300 nits is decent for the price while more expensive alternatives like the XPS 13 9310 2-in-1 or HP Envy x360 13 are noticeably brighter for more comfortable outdoor viewing.

| |||||||||||||||||||||||||
Brightness Distribution: 95 %
Center on Battery: 319.6 cd/m²
Contrast: 1598:1 (Black: 0.2 cd/m²)
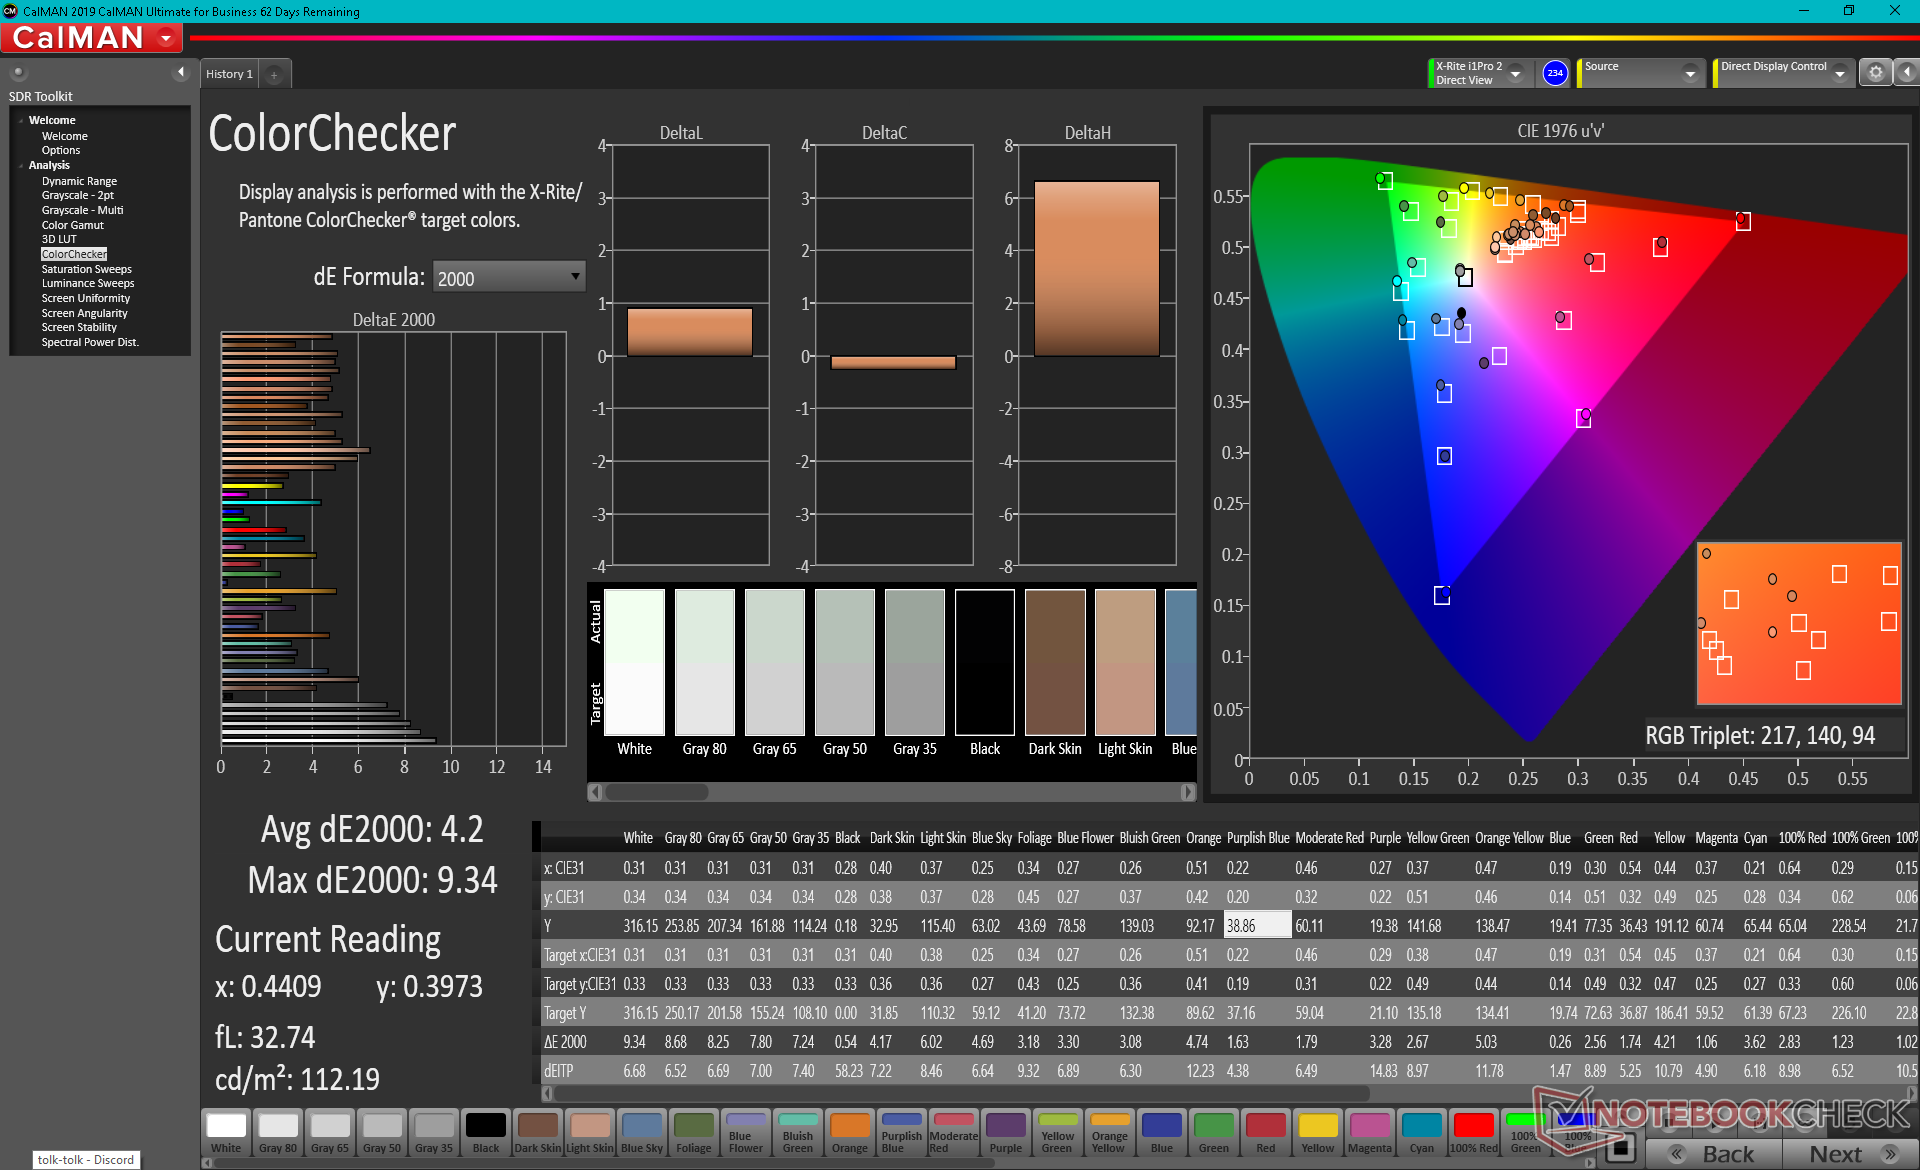
ΔE ColorChecker Calman: 4.2 | ∀{0.5-29.43 Ø4.73}
calibrated: 0.3
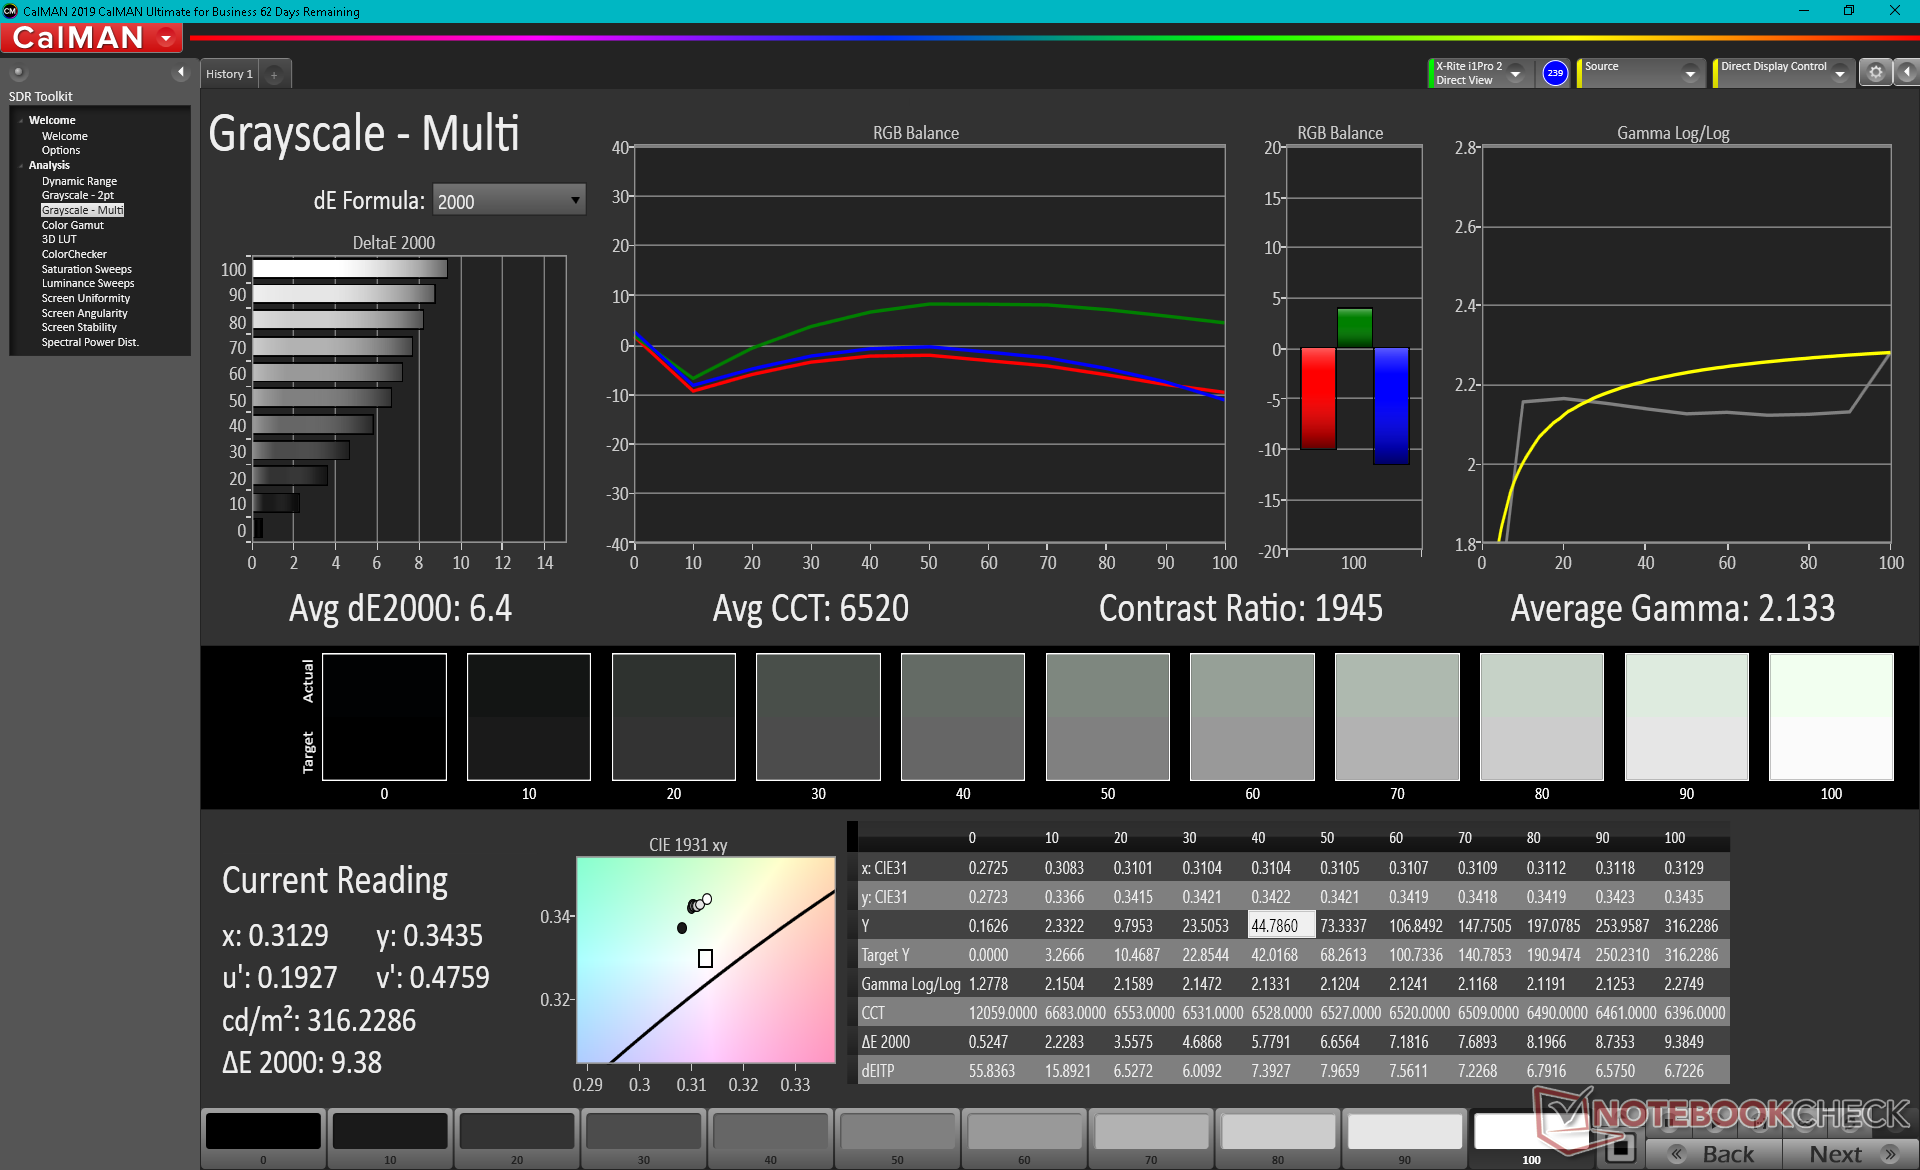
ΔE Greyscale Calman: 6.4 | ∀{0.09-98 Ø4.97}
72% AdobeRGB 1998 (Argyll 3D)
99.1% sRGB (Argyll 3D)
69.9% Display P3 (Argyll 3D)
Gamma: 2.13
CCT: 6520 K
| Lenovo Yoga 6 13ALC6 AU Optronics B133HAN05.F, IPS, 13.3", 1920x1080 | Lenovo Yoga 6 13 82ND0009US AU Optronics B133HAN05.F, IPS, 13.3", 1920x1080 | Dell XPS 13 9310 2-in-1 Sharp LQ134N1, IPS, 13.4", 1920x1200 | Acer Spin 3 SP313-51N-56YV AU Optronics AUOB493, IPS, 13.3", 2560x1600 | Lenovo IdeaPad Flex 5 CB 13IML05 82B80010GE IPS, 13.3", 1920x1080 | HP Envy x360 13-ay0010nr IPS, 13.3", 1920x1080 | |
|---|---|---|---|---|---|---|
| Display | -0% | 0% | 7% | -5% | ||
| Display P3 Coverage (%) | 69.9 | 69.7 0% | 69.7 0% | 78.8 13% | 65.9 -6% | |
| sRGB Coverage (%) | 99.1 | 99.2 0% | 99 0% | 99.8 1% | 97.4 -2% | |
| AdobeRGB 1998 Coverage (%) | 72 | 71.4 -1% | 71.7 0% | 77.6 8% | 67.8 -6% | |
| Response Times | 21% | -2% | 7% | 19% | 15% | |
| Response Time Grey 50% / Grey 80% * (ms) | 52 ? | 46.8 ? 10% | 55.6 ? -7% | 52 ? -0% | 47 ? 10% | 47.6 ? 8% |
| Response Time Black / White * (ms) | 41.6 ? | 28.8 ? 31% | 40.4 ? 3% | 36 ? 13% | 30 ? 28% | 32.4 ? 22% |
| PWM Frequency (Hz) | 2500 ? | 25000 ? | ||||
| Screen | -28% | -10% | -60% | 10% | -18% | |
| Brightness middle (cd/m²) | 319.6 | 291.5 -9% | 555.7 74% | 338 6% | 242 -24% | 452.6 42% |
| Brightness (cd/m²) | 316 | 294 -7% | 528 67% | 307 -3% | 232 -27% | 438 39% |
| Brightness Distribution (%) | 95 | 93 -2% | 90 -5% | 83 -13% | 85 -11% | 93 -2% |
| Black Level * (cd/m²) | 0.2 | 0.19 5% | 0.35 -75% | 0.27 -35% | 0.235 -17% | 0.29 -45% |
| Contrast (:1) | 1598 | 1534 -4% | 1588 -1% | 1252 -22% | 1030 -36% | 1561 -2% |
| Colorchecker dE 2000 * | 4.2 | 3.83 9% | 4.83 -15% | 4.63 -10% | 1.99 53% | 2.67 36% |
| Colorchecker dE 2000 max. * | 9.34 | 8.43 10% | 8.46 9% | 9.99 -7% | 2.77 70% | 4.11 56% |
| Colorchecker dE 2000 calibrated * | 0.3 | 1.07 -257% | 0.76 -153% | 1.64 -447% | 1.36 -353% | |
| Greyscale dE 2000 * | 6.4 | 6.2 3% | 6.1 5% | 6.76 -6% | 1.78 72% | 2.1 67% |
| Gamma | 2.13 103% | 2.2 100% | 1.98 111% | 2.37 93% | 2.31 95% | 2.01 109% |
| CCT | 6520 100% | 6469 100% | 6686 97% | 5934 110% | 6567 99% | 6505 100% |
| Color Space (Percent of AdobeRGB 1998) (%) | 68 | 62.2 | ||||
| Color Space (Percent of sRGB) (%) | 98 | 97.6 | ||||
| Total Average (Program / Settings) | -2% /
-15% | -4% /
-7% | -15% /
-36% | 15% /
12% | -3% /
-10% |
* ... smaller is better
Display Response Times
| ↔ Response Time Black to White | ||
|---|---|---|
| 41.6 ms ... rise ↗ and fall ↘ combined | ↗ 22 ms rise | 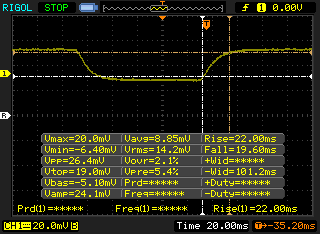 |
| ↘ 19.6 ms fall | ||
| The screen shows slow response rates in our tests and will be unsatisfactory for gamers. In comparison, all tested devices range from 0.1 (minimum) to 240 (maximum) ms. » 98 % of all devices are better. This means that the measured response time is worse than the average of all tested devices (19.9 ms). | ||
| ↔ Response Time 50% Grey to 80% Grey | ||
| 52 ms ... rise ↗ and fall ↘ combined | ↗ 25.2 ms rise | 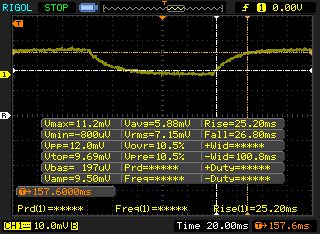 |
| ↘ 26.8 ms fall | ||
| The screen shows slow response rates in our tests and will be unsatisfactory for gamers. In comparison, all tested devices range from 0.165 (minimum) to 636 (maximum) ms. » 88 % of all devices are better. This means that the measured response time is worse than the average of all tested devices (31.1 ms). | ||
Screen Flickering / PWM (Pulse-Width Modulation)
| Screen flickering / PWM not detected | 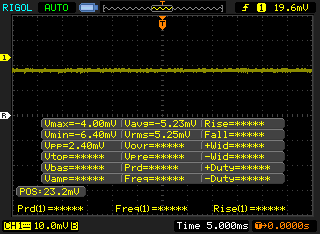 | ||
In comparison: 52 % of all tested devices do not use PWM to dim the display. If PWM was detected, an average of 7798 (minimum: 5 - maximum: 343500) Hz was measured. | |||
Performance — Octa-Core for Less
| Specification | Ryzen 5 5500U Zen 2 | Ryzen 7 5700U Zen 2 |
|---|---|---|
| Cores | 6 (12 threads) | 8 (16 threads) |
| Clock Rate (GHz) | 2.1 - 4.0 | 1.8 - 4.3 |
| L1/L2/L3 Cache | 0.384/3/8 MB | 0.512/4/8 MB |
| Integrated GPU | Radeon Vega 7 4000 Raven Ridge | Radeon Vega 8 4000 Raven Ridge |
| Pipelines | 448 Unified | 512 Unified |
| GPU Clock Rate (MHz) | Up to 1600 | Up to 1750 |
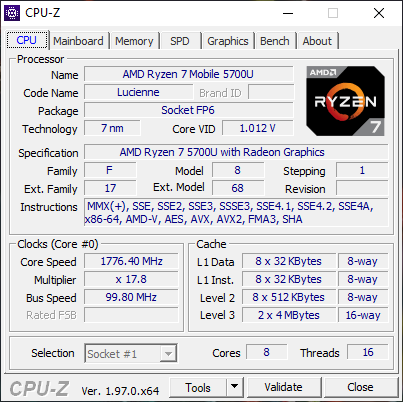
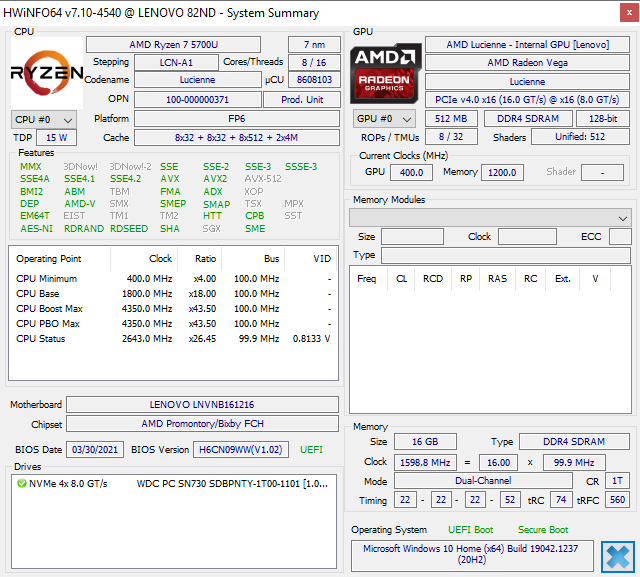
Processor
Raw multi-thread performance is about 15 to 20 percent faster than the Ryzen 5 5500U according to CineBench benchmarks due in part to our Ryzen 7 5700U having two additional cores. Single-thread performance is also slightly faster by a few percentage points. Either option will be faster than the competing Intel Core i7-1165G7 in multi-threaded workloads.
Performance sustainability is excellent especially for a convertible where Turbo Boost clock rates tend to be short-lived. Running CineBench R15 xT in a loop shows consistent scores from start to finish whereas the Core i7-1165G7 in the XPS 13 9310 2-in-1 would cycle heavily.
Cinebench R15 Multi Loop
Cinebench R23: Multi Core | Single Core
Cinebench R15: CPU Multi 64Bit | CPU Single 64Bit
Blender: v2.79 BMW27 CPU
7-Zip 18.03: 7z b 4 -mmt1 | 7z b 4
Geekbench 5.5: Single-Core | Multi-Core
HWBOT x265 Benchmark v2.2: 4k Preset
LibreOffice : 20 Documents To PDF
R Benchmark 2.5: Overall mean
| Cinebench R23 / Multi Core | |
| Lenovo Yoga Slim 7-14ARE | |
| Average AMD Ryzen 7 5700U (4861 - 10139, n=20) | |
| HP Pavilion Aero 13 be0097nr | |
| Lenovo Yoga 6 13ALC6 | |
| Lenovo Yoga 6 13 82ND0009US | |
| Dell XPS 13 9310 2-in-1 | |
| Asus VivoBook S13 S333JA-DS51 | |
| Dell Inspiron 13 5301-0D0XN | |
| Cinebench R23 / Single Core | |
| HP Pavilion Aero 13 be0097nr | |
| Dell XPS 13 9310 2-in-1 | |
| Dell Inspiron 13 5301-0D0XN | |
| Lenovo Yoga 6 13ALC6 | |
| Average AMD Ryzen 7 5700U (1177 - 1268, n=20) | |
| Lenovo Yoga Slim 7-14ARE | |
| Lenovo Yoga 6 13 82ND0009US | |
| Asus VivoBook S13 S333JA-DS51 | |
| Geekbench 5.5 / Single-Core | |
| Dell Inspiron 13 5301-0D0XN | |
| Asus ZenBook 13 UX325JA | |
| Average AMD Ryzen 7 5700U (1105 - 1205, n=19) | |
| Asus VivoBook Flip 14 TM420IA | |
| Lenovo Yoga Slim 7-14ARE | |
| Lenovo Yoga Slim 7-14ARE | |
| Asus VivoBook S13 S333JA-DS51 | |
| Geekbench 5.5 / Multi-Core | |
| Lenovo Yoga Slim 7-14ARE | |
| Lenovo Yoga Slim 7-14ARE | |
| Average AMD Ryzen 7 5700U (4254 - 7635, n=19) | |
| Asus VivoBook Flip 14 TM420IA | |
| Dell Inspiron 13 5301-0D0XN | |
| Asus ZenBook 13 UX325JA | |
| Asus VivoBook S13 S333JA-DS51 | |
| LibreOffice / 20 Documents To PDF | |
| Lenovo Yoga 6 13 82ND0009US | |
| Average AMD Ryzen 7 5700U (52.4 - 75.5, n=20) | |
| Lenovo Yoga 6 13ALC6 | |
| Asus VivoBook S13 S333JA-DS51 | |
| Lenovo Yoga Slim 7-14ARE | |
| Asus VivoBook Flip 14 TM420IA | |
| HP Pavilion Aero 13 be0097nr | |
| Dell Inspiron 13 5301-0D0XN | |
| Asus ZenBook 13 UX325JA | |
Cinebench R23: Multi Core | Single Core
Cinebench R15: CPU Multi 64Bit | CPU Single 64Bit
Blender: v2.79 BMW27 CPU
7-Zip 18.03: 7z b 4 -mmt1 | 7z b 4
Geekbench 5.5: Single-Core | Multi-Core
HWBOT x265 Benchmark v2.2: 4k Preset
LibreOffice : 20 Documents To PDF
R Benchmark 2.5: Overall mean
* ... smaller is better
System Performance
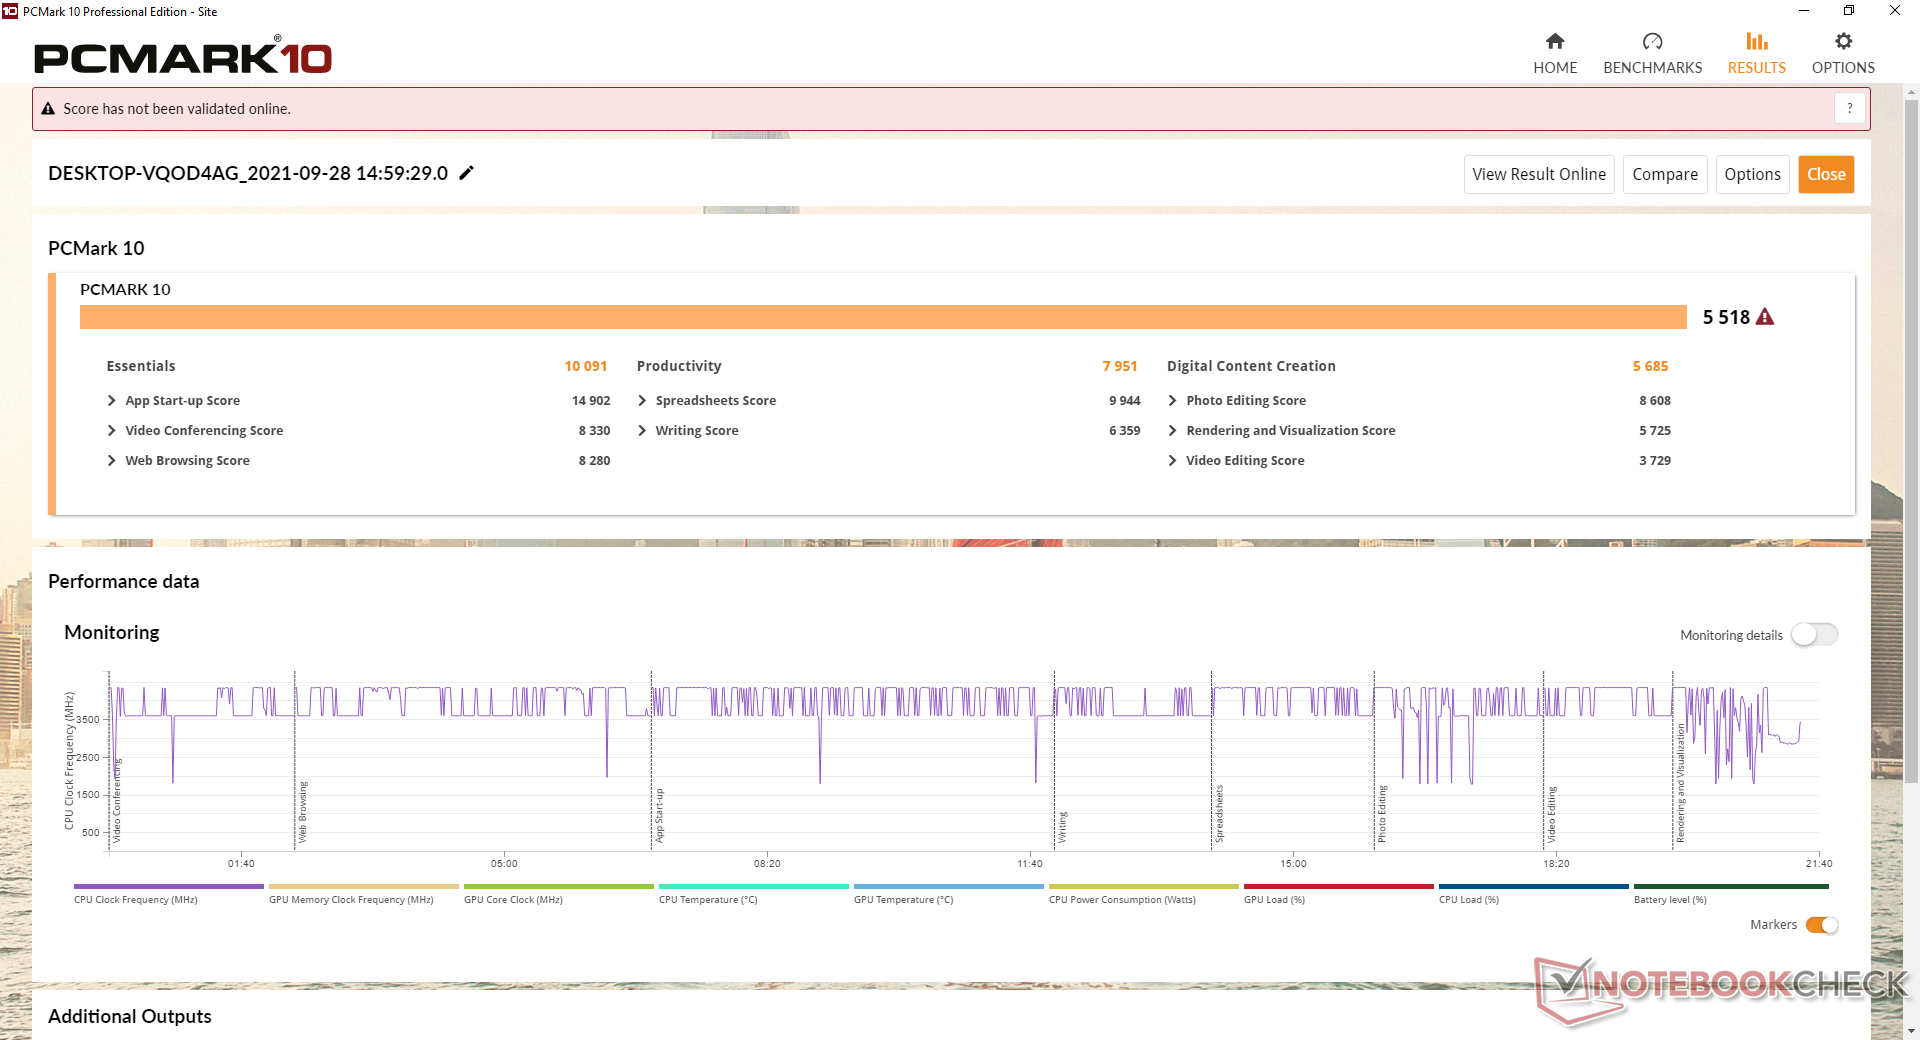
PCMark 10 benchmarks are consistently higher than what we recorded on the Ryzen 5 SKU albeit by only single-digit percentage margins. Overall scores are comparable to the more expensive Intel-powered Dell XPS 13 9310 2-in-1.
| PCMark 10 / Score | |
| Lenovo Yoga 6 13ALC6 | |
| Lenovo Yoga 6 13 82ND0009US | |
| Dell XPS 13 9310 2-in-1 | |
| Average AMD Ryzen 7 5700U, AMD Radeon RX Vega 8 (Ryzen 4000/5000) (4325 - 5518, n=15) | |
| HP Envy x360 13-ay0010nr | |
| Acer Spin 3 SP313-51N-56YV | |
| PCMark 10 / Essentials | |
| Dell XPS 13 9310 2-in-1 | |
| Lenovo Yoga 6 13ALC6 | |
| Lenovo Yoga 6 13 82ND0009US | |
| Acer Spin 3 SP313-51N-56YV | |
| HP Envy x360 13-ay0010nr | |
| Average AMD Ryzen 7 5700U, AMD Radeon RX Vega 8 (Ryzen 4000/5000) (8025 - 10091, n=15) | |
| PCMark 10 / Productivity | |
| Lenovo Yoga 6 13ALC6 | |
| Average AMD Ryzen 7 5700U, AMD Radeon RX Vega 8 (Ryzen 4000/5000) (7001 - 8457, n=15) | |
| HP Envy x360 13-ay0010nr | |
| Lenovo Yoga 6 13 82ND0009US | |
| Dell XPS 13 9310 2-in-1 | |
| Acer Spin 3 SP313-51N-56YV | |
| PCMark 10 / Digital Content Creation | |
| Lenovo Yoga 6 13ALC6 | |
| Average AMD Ryzen 7 5700U, AMD Radeon RX Vega 8 (Ryzen 4000/5000) (3738 - 5964, n=15) | |
| Lenovo Yoga 6 13 82ND0009US | |
| Dell XPS 13 9310 2-in-1 | |
| Acer Spin 3 SP313-51N-56YV | |
| HP Envy x360 13-ay0010nr | |
| PCMark 10 Score | 5518 points | |
Help | ||
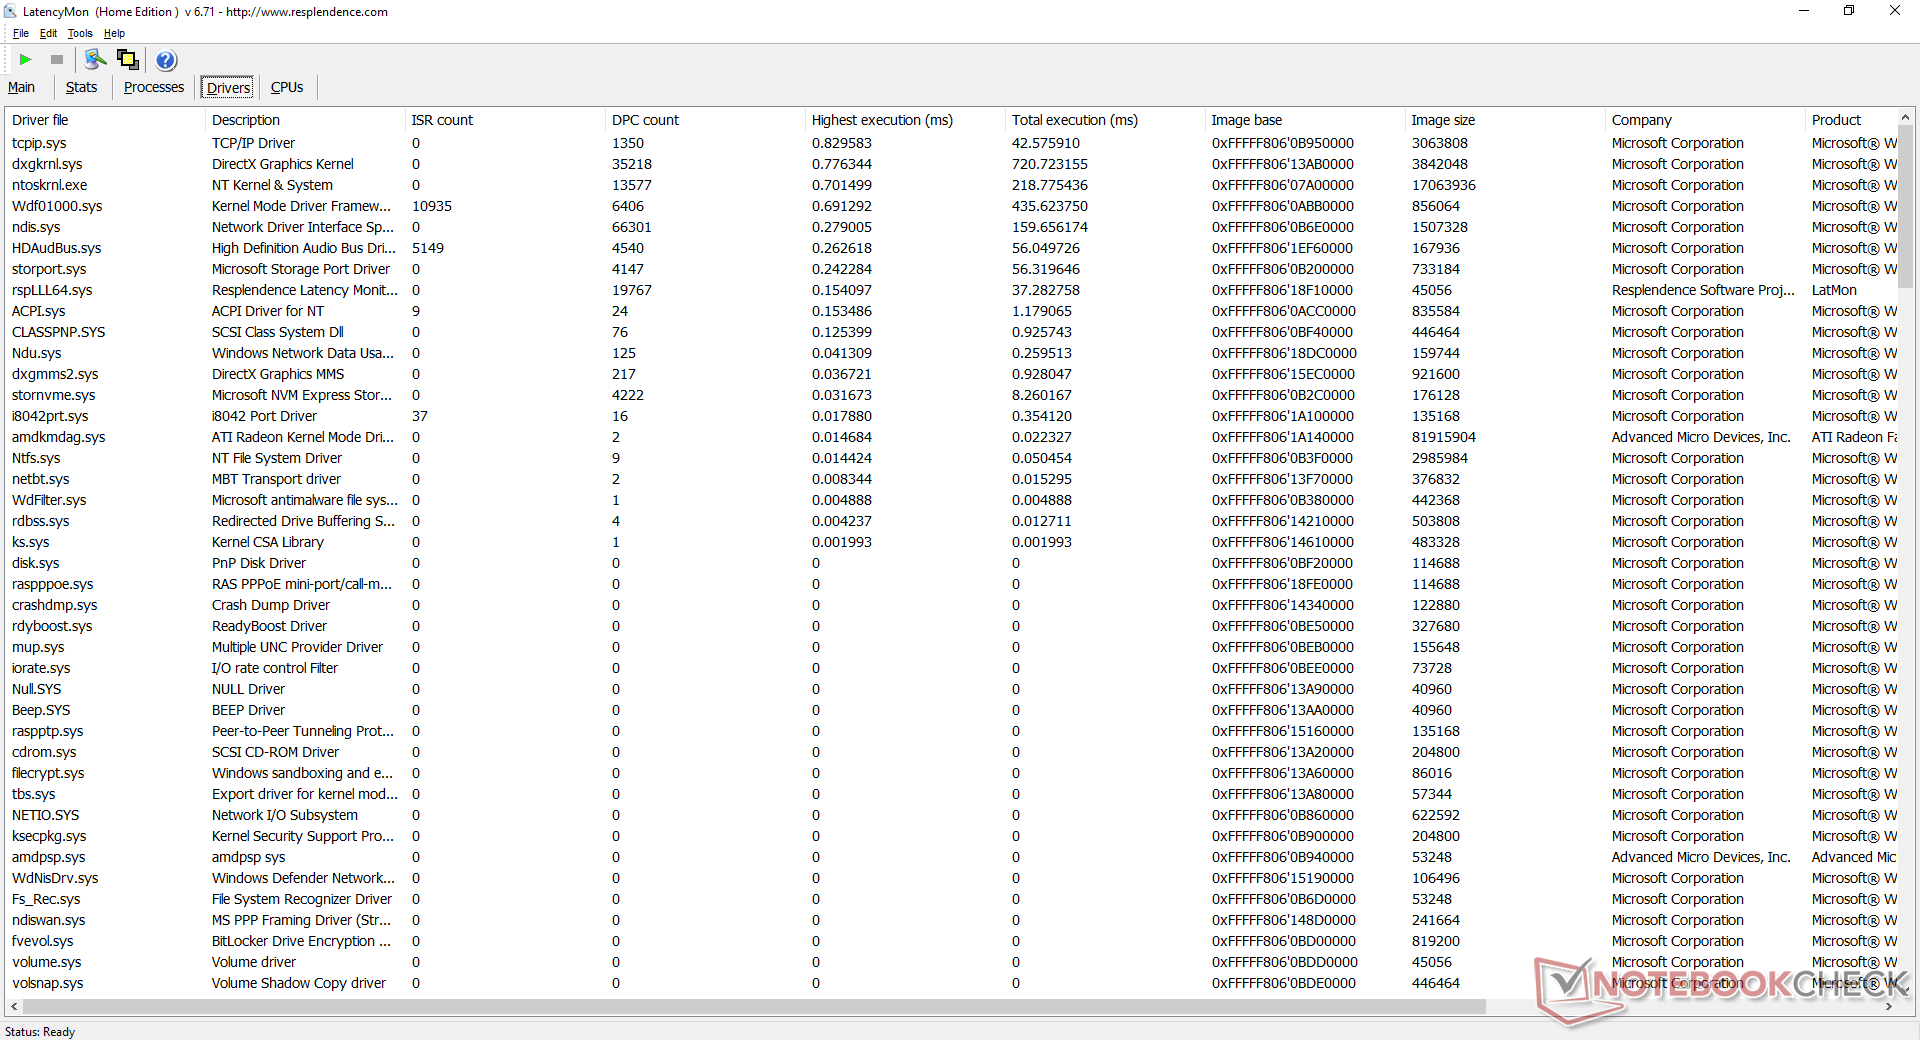
DPC Latency
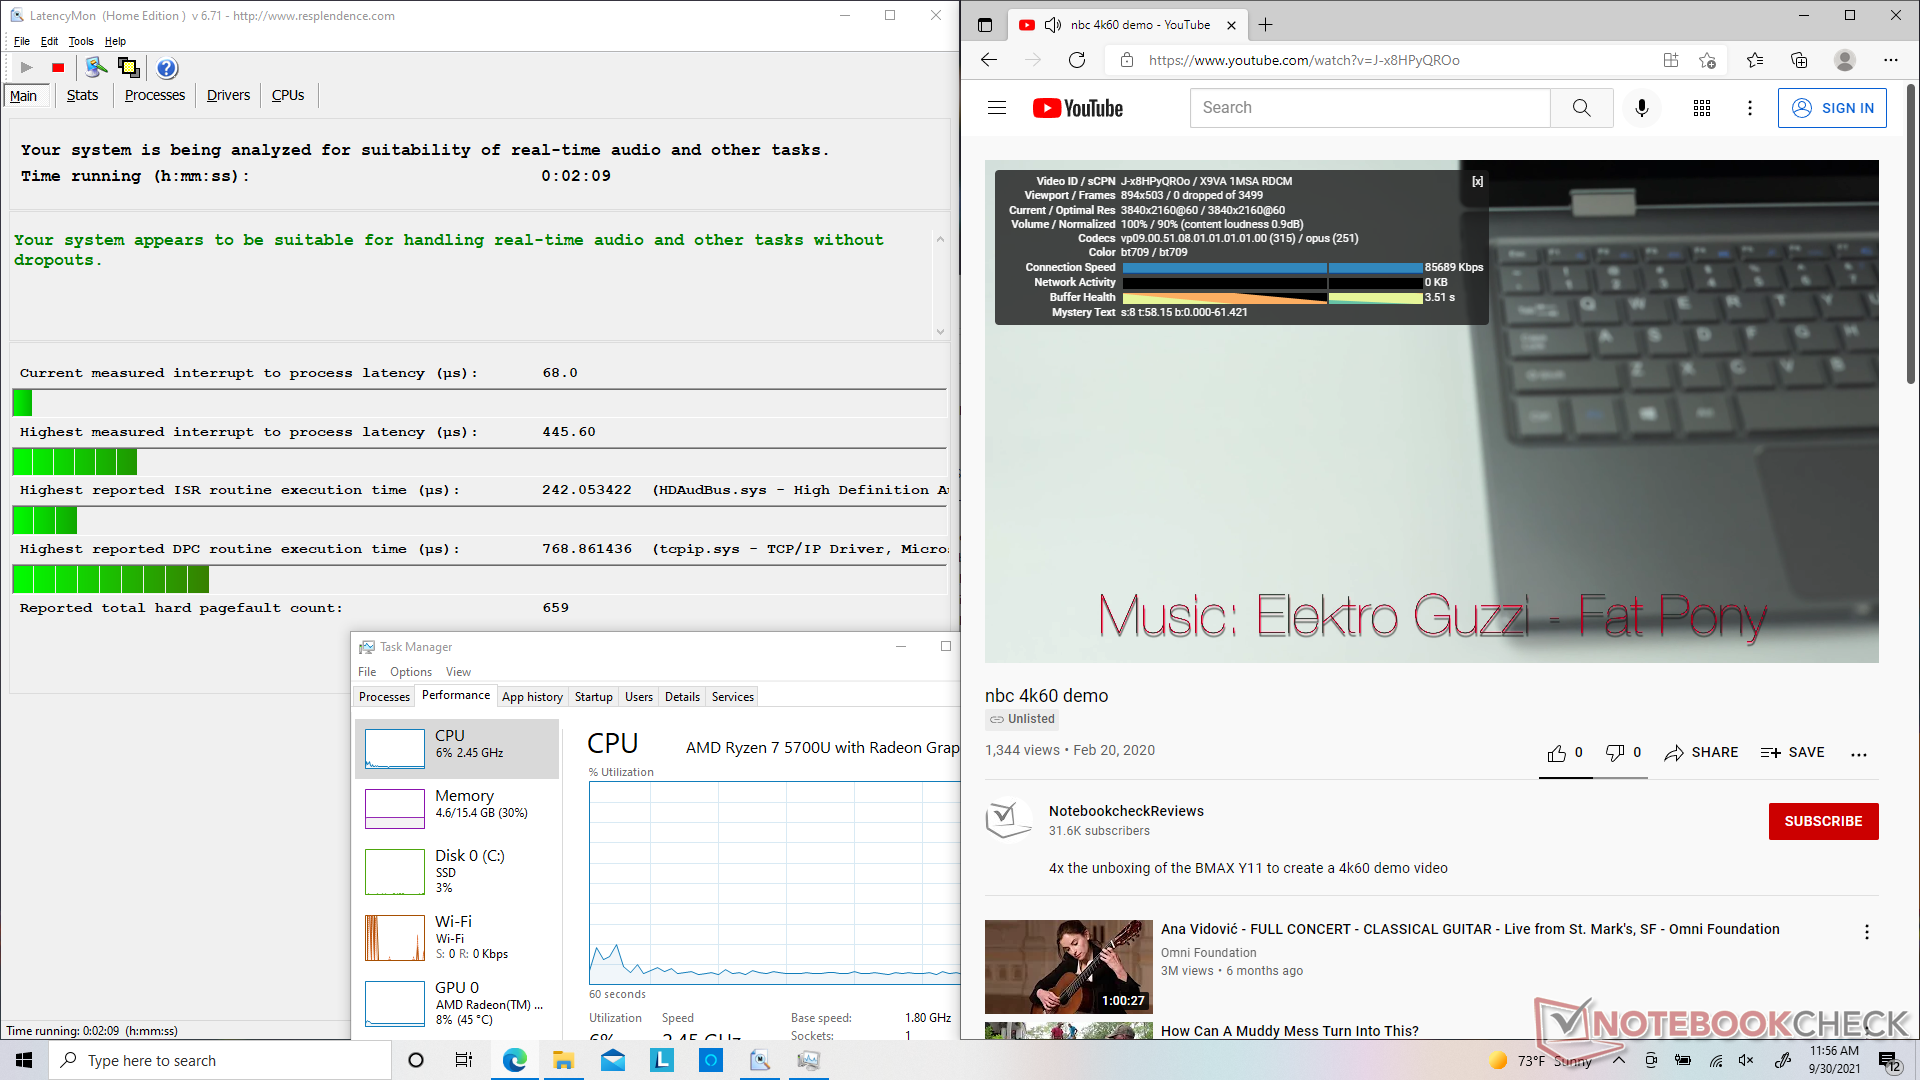
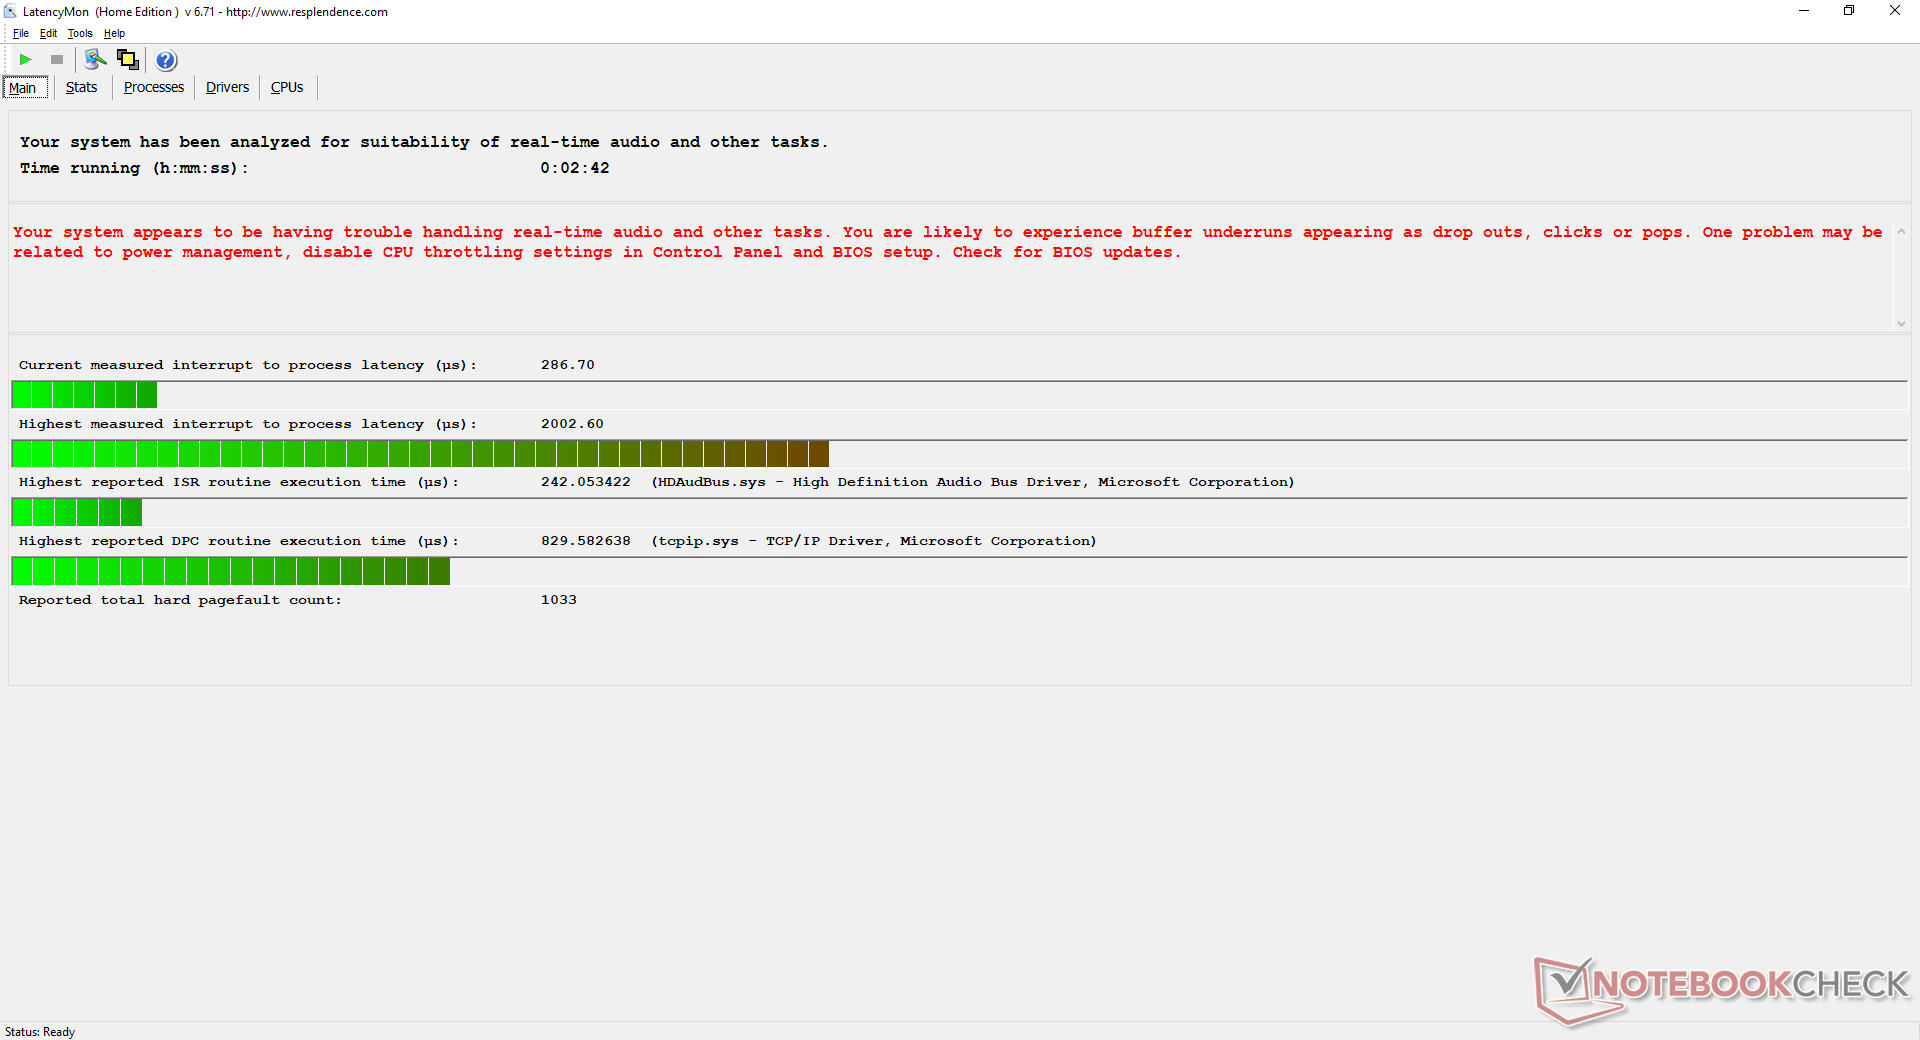
LatencyMon shows no DPC latency issues when opening mulitiple browser tabs on our homepage or when playing back 4K video at 60 FPS. However, latency would jump abruptly when running Prime95 stress which is very similar to what we observed on our Ryzen 5 SKU.
| DPC Latencies / LatencyMon - interrupt to process latency (max), Web, Youtube, Prime95 | |
| Lenovo Yoga 6 13ALC6 | |
| Lenovo Yoga 6 13 82ND0009US | |
| HP Envy x360 13-ay0010nr | |
| Acer Spin 3 SP313-51N-56YV | |
| Dell XPS 13 9310 2-in-1 | |
* ... smaller is better
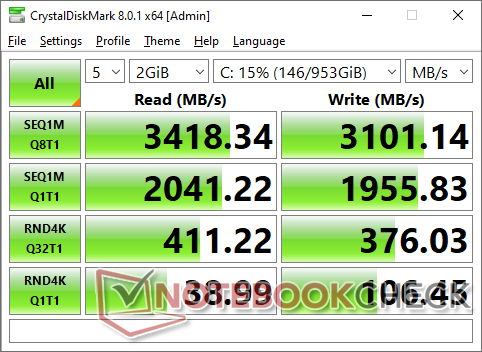
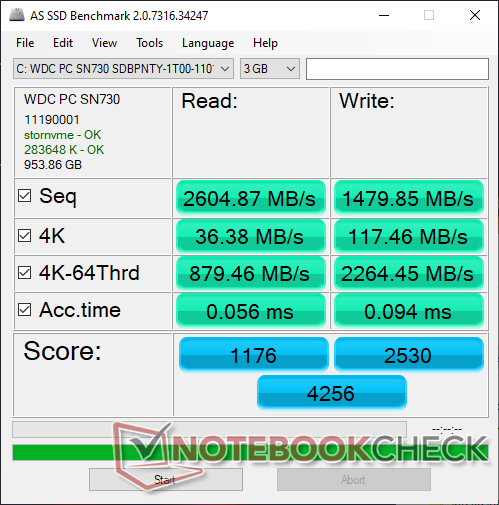
Storage Devices
Our Ryzen 7 unit comes configured with a higher-end 1 TB Western Digital SN730 instead of the 256 GB SN530 on our original Ryzen 5 unit. Transfer rates are significantly faster especially when writing data with speeds approaching 3100 MB/s.
| Lenovo Yoga 6 13ALC6 WDC PC SN730 SDBPNTY-1T00 | Lenovo Yoga 6 13 82ND0009US WDC PC SN530 SDBPMPZ-265G | Dell XPS 13 9310 2-in-1 Toshiba BG4 KBG40ZPZ512G | Acer Spin 3 SP313-51N-56YV Kingston OM8PCP3512F-AB | HP Envy x360 13-ay0010nr Toshiba KBG30ZMV256G | |
|---|---|---|---|---|---|
| AS SSD | -51% | -46% | -33% | -79% | |
| Seq Read (MB/s) | 2605 | 1860 -29% | 2031 -22% | 1748 -33% | 1135 -56% |
| Seq Write (MB/s) | 1480 | 500 -66% | 776 -48% | 941 -36% | 628 -58% |
| 4K Read (MB/s) | 36.38 | 36.26 0% | 49.55 36% | 44.06 21% | 42.49 17% |
| 4K Write (MB/s) | 117.5 | 118.6 1% | 112.2 -5% | 77.7 -34% | 96.9 -18% |
| 4K-64 Read (MB/s) | 879 | 419 -52% | 1058 20% | 451.1 -49% | 614 -30% |
| 4K-64 Write (MB/s) | 2264 | 219 -90% | 328.9 -85% | 926 -59% | 256.4 -89% |
| Access Time Read * (ms) | 0.056 | 0.102 -82% | 0.072 -29% | 0.188 -236% | 0.162 -189% |
| Access Time Write * (ms) | 0.094 | 0.17 -81% | 0.518 -451% | 0.043 54% | 0.592 -530% |
| Score Read (Points) | 1176 | 641 -45% | 1311 11% | 670 -43% | 770 -35% |
| Score Write (Points) | 2530 | 388 -85% | 519 -79% | 1098 -57% | 416 -84% |
| Score Total (Points) | 4256 | 1300 -69% | 2447 -43% | 2084 -51% | 1567 -63% |
| Copy ISO MB/s (MB/s) | 1210 | 880 -27% | 1103 -9% | 969 -20% | 843 -30% |
| Copy Program MB/s (MB/s) | 238.4 | 185.3 -22% | 331.7 39% | 609 155% | 367.9 54% |
| Copy Game MB/s (MB/s) | 715 | 212.7 -70% | 828 16% | 232.4 -67% | 727 2% |
| CrystalDiskMark 5.2 / 6 | -28% | -9% | 3% | -36% | |
| Write 4K (MB/s) | 113.8 | 89.2 -22% | 129.6 14% | 286.1 151% | 94.8 -17% |
| Read 4K (MB/s) | 39.64 | 33.09 -17% | 52.2 32% | 48.89 23% | 45.5 15% |
| Write Seq (MB/s) | 1921 | 988 -49% | 1310 -32% | 982 -49% | 732 -62% |
| Read Seq (MB/s) | 2025 | 1322 -35% | 1726 -15% | 1301 -36% | 959 -53% |
| Write 4K Q32T1 (MB/s) | 339.3 | 332.6 -2% | 334.7 -1% | 625 84% | 224.6 -34% |
| Read 4K Q32T1 (MB/s) | 407.6 | 389.3 -4% | 447.6 10% | 301 -26% | 365.2 -10% |
| Write Seq Q32T1 (MB/s) | 3089 | 984 -68% | 1410 -54% | 981 -68% | 864 -72% |
| Read Seq Q32T1 (MB/s) | 3386 | 2461 -27% | 2390 -29% | 1631 -52% | 1580 -53% |
| Total Average (Program / Settings) | -40% /
-43% | -28% /
-33% | -15% /
-19% | -58% /
-63% |
* ... smaller is better

Disk Throttling: DiskSpd Read Loop, Queue Depth 8
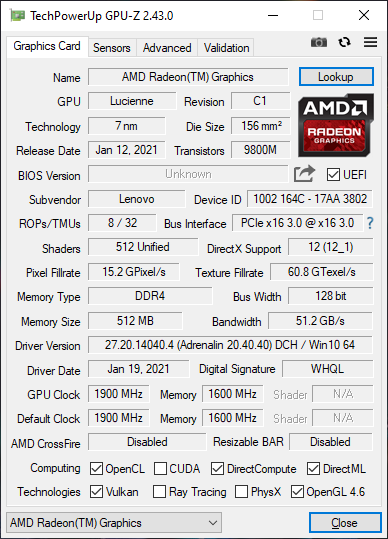
GPU Performance — Close, But Not Quite Iris Xe
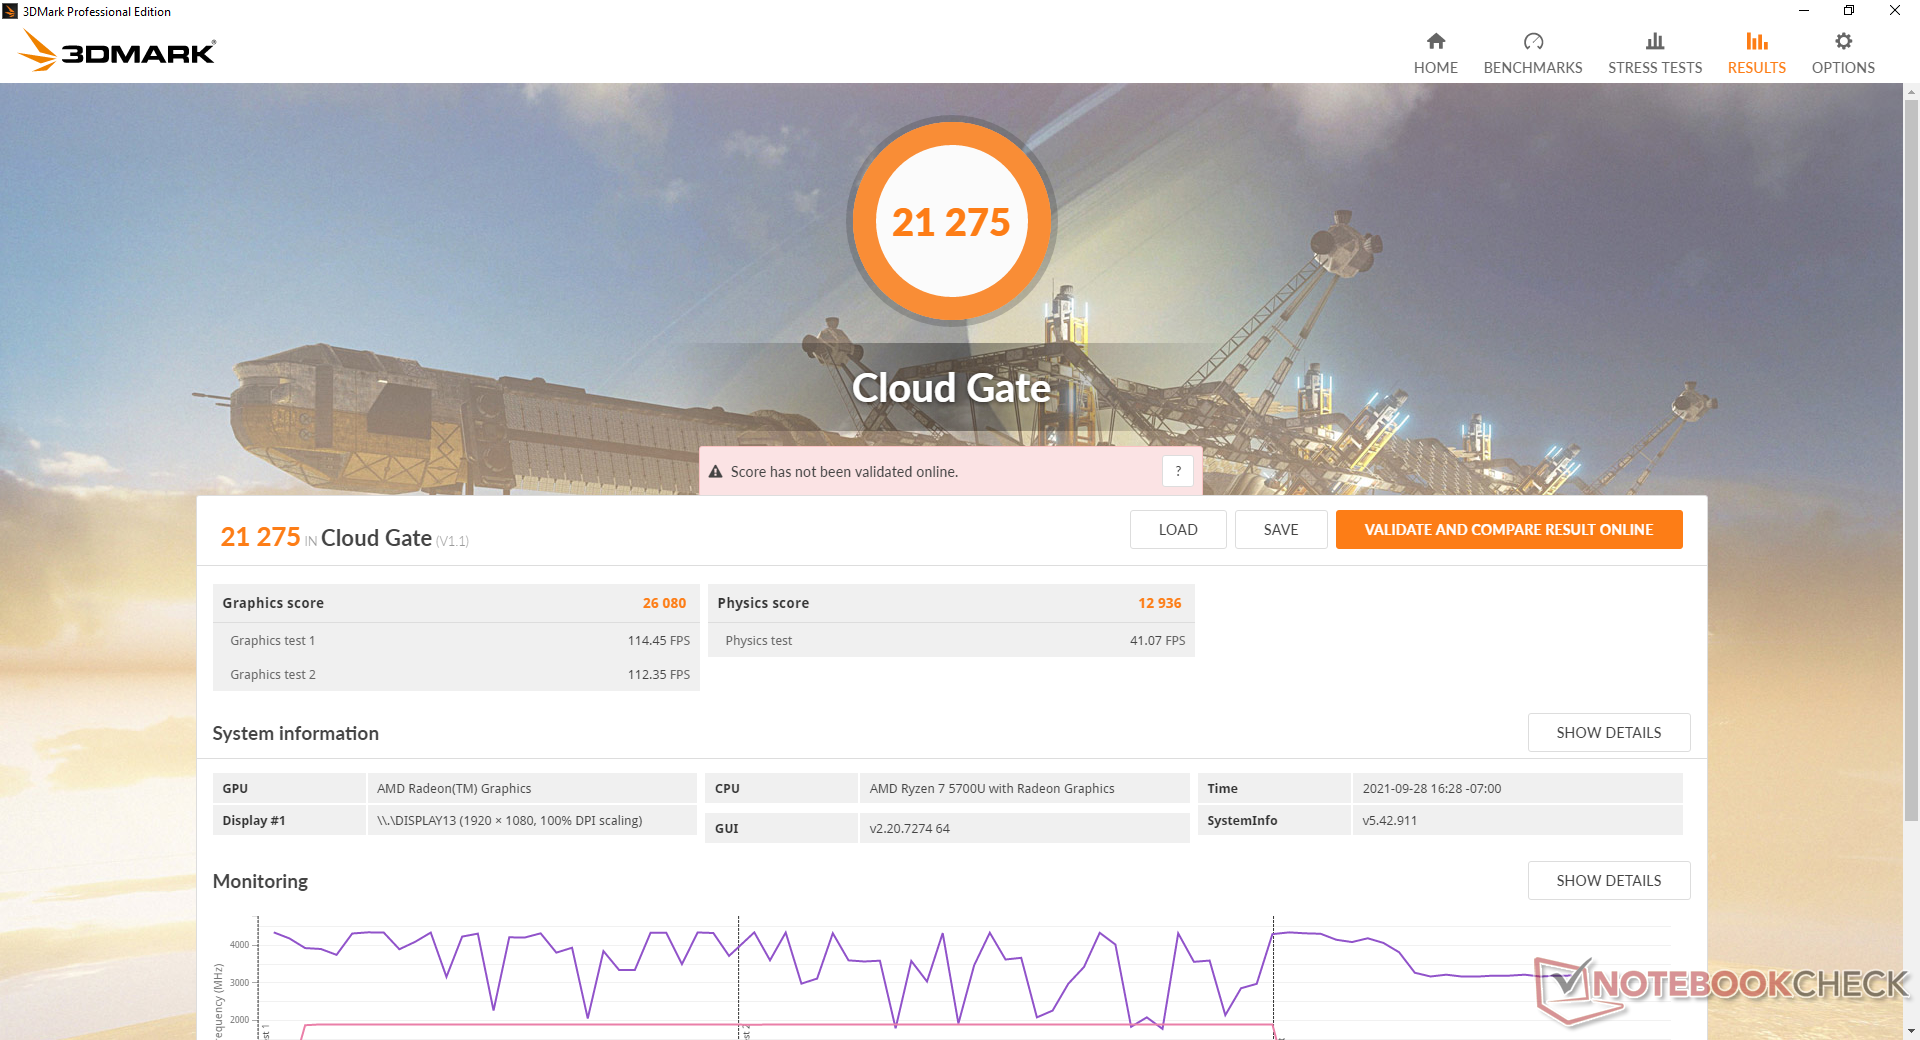
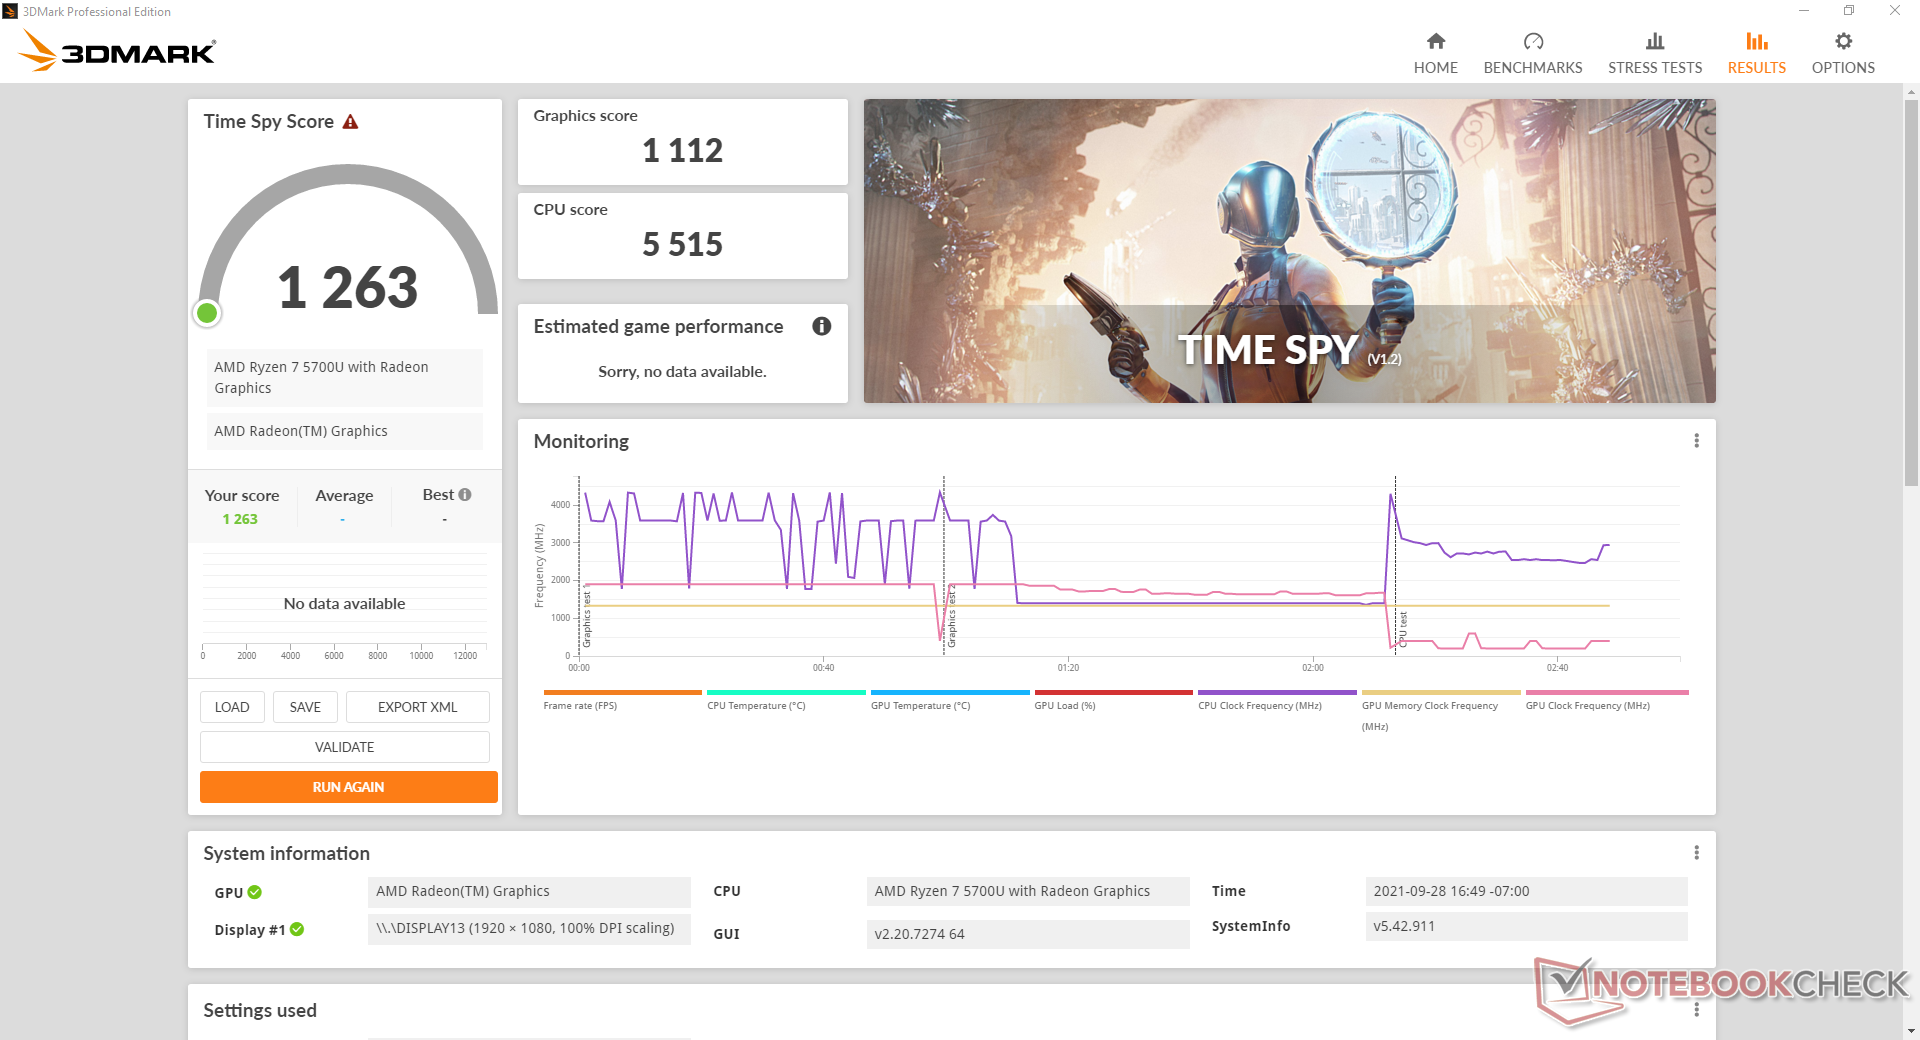
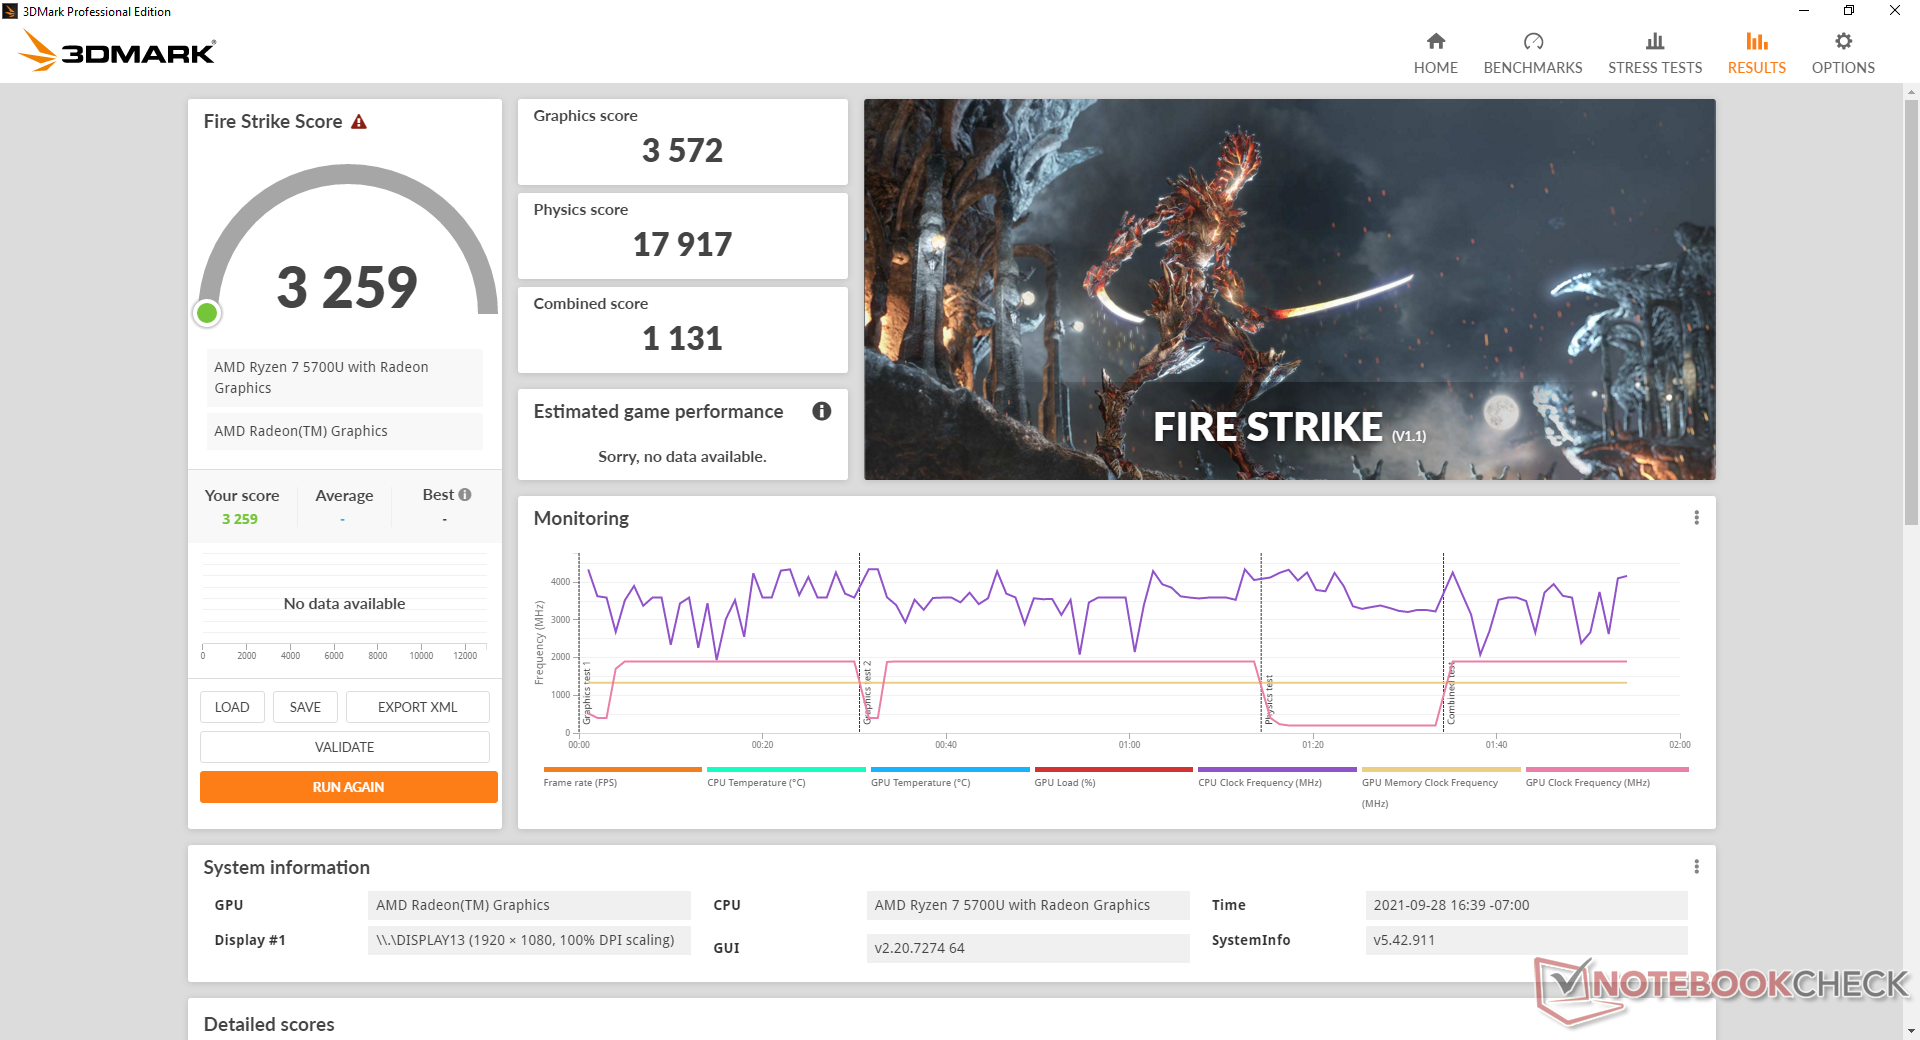
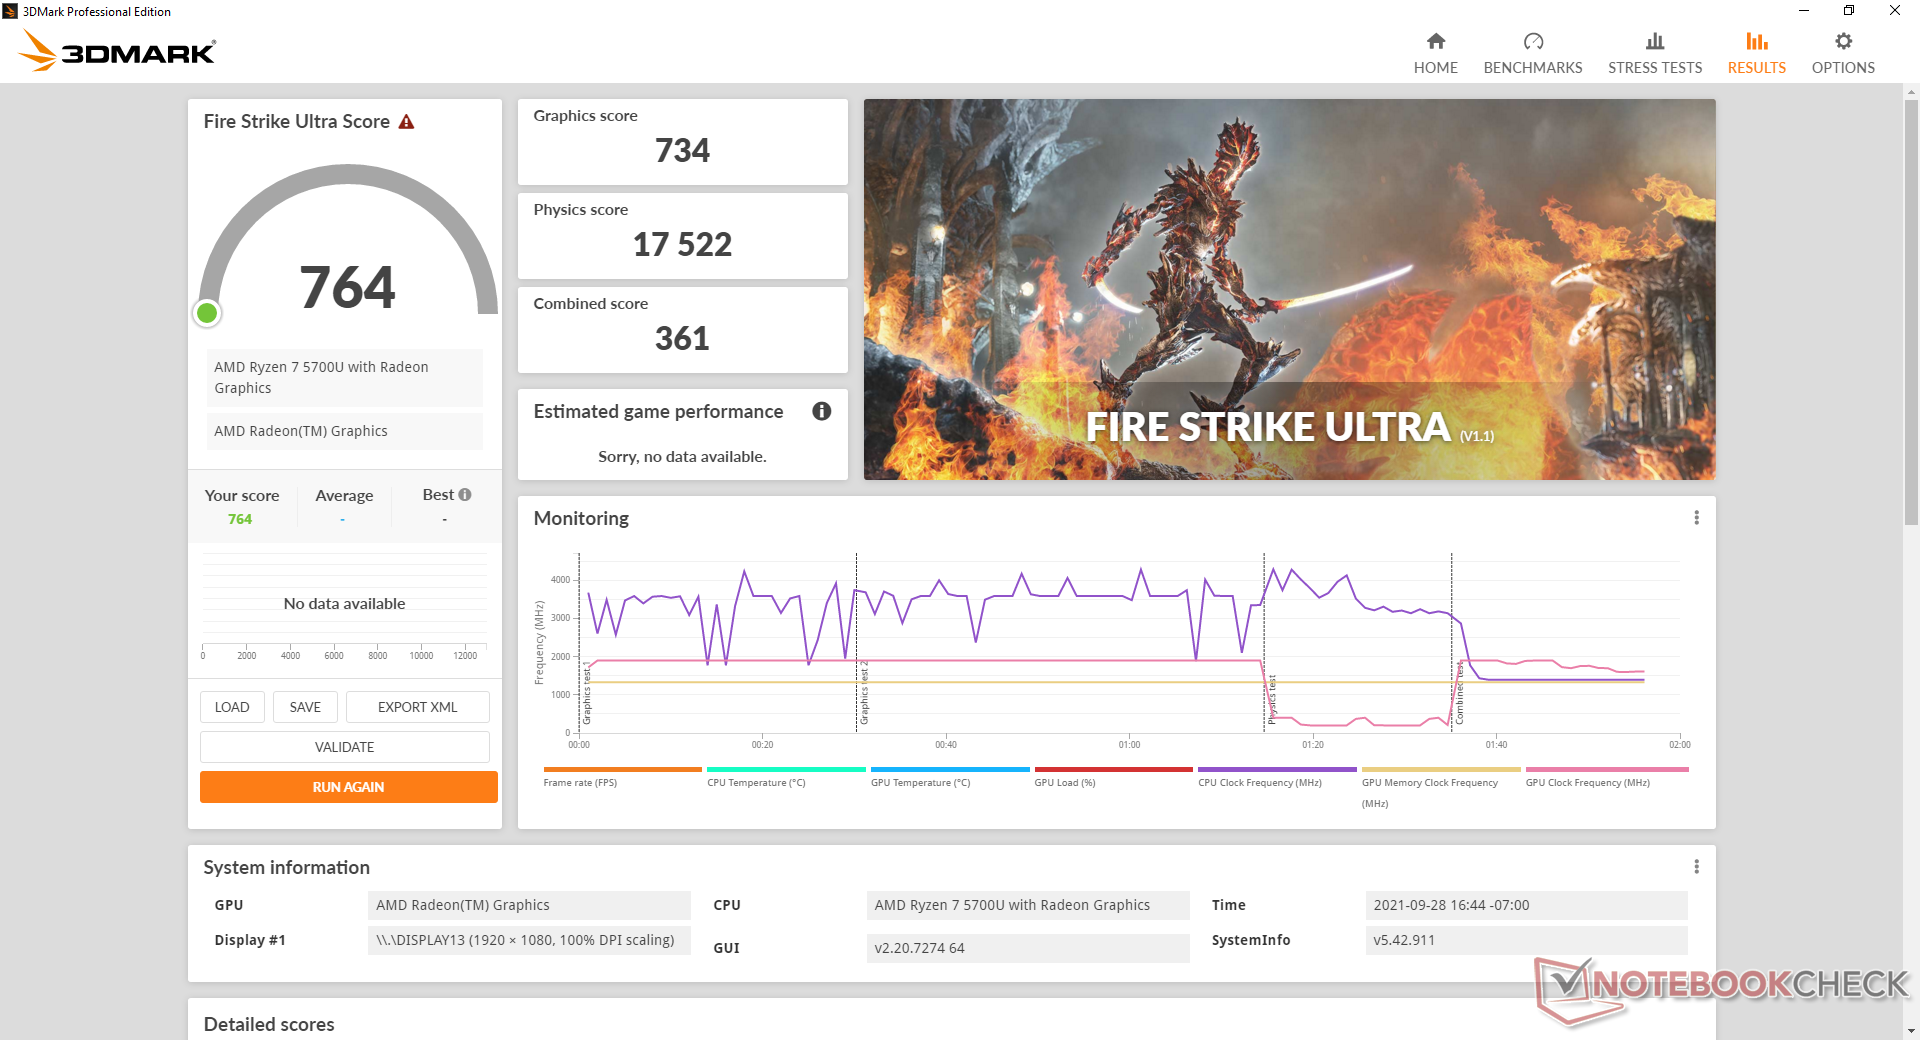
3DMark benchmarks show our integrated Radeon RX Vega 8 in the Ryzen 7 5700U to be around 10 to 15 percent faster than the Radeon RX Vega 7 in the Ryzen 5 5500U. In actual games, however, our Vega 8 would only be about 5 to 10 percent faster despite the fact that our Ryzen 8 test unit comes with double the RAM and additional cores. It's clear that the bottleneck involves the graphics chip in most gaming scenarios.
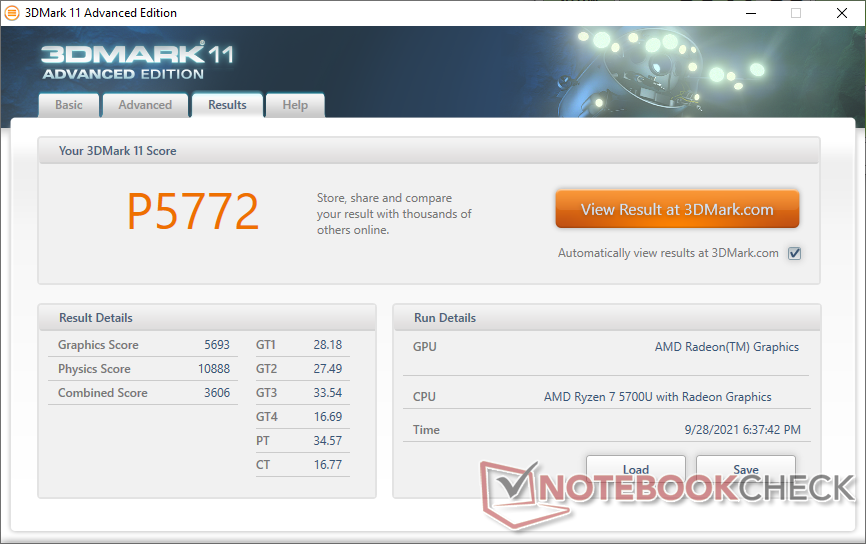
| 3DMark 11 Performance | 5772 points | |
| 3DMark Cloud Gate Standard Score | 21275 points | |
| 3DMark Fire Strike Score | 3259 points | |
| 3DMark Time Spy Score | 1263 points | |
Help | ||
Witcher 3 FPS Chart
| low | med. | high | ultra | |
|---|---|---|---|---|
| GTA V (2015) | 88.7 | 24.5 | 9.82 | |
| The Witcher 3 (2015) | 70.7 | 23.3 | 15.2 | |
| Dota 2 Reborn (2015) | 93.7 | 73.7 | 45.7 | 43.4 |
| Final Fantasy XV Benchmark (2018) | 31.7 | 16.6 | 11.2 | |
| X-Plane 11.11 (2018) | 38.2 | 30.8 | 27 | |
| Far Cry 5 (2018) | 39 | 18 | 17 | 16 |
| Strange Brigade (2018) | 74.1 | 28.9 | 24.3 | 20.7 |
Emissions — Quiet Under Certain Power Profiles
System Noise
Fan noise is similar to what we observed on the Ryzen 5 SKU since the systems operate under similar TDP levels. When set to Extreme Performance mode via the Lenovo Vantage software, fan noise would pulse more frequently and reach maximum RPM more quickly as well. Users will want to set the system to Intelligent Cooling or Battery Saver when browsing or video streaming for a more steady and tolerable fan noise of 27 dB(A).
Our unit would exhibit minor electronic noise or coil whine that's fortunately only audible when placing an ear near the keyboard keys.
| Lenovo Yoga 6 13ALC6 Vega 8, R7 5700U, WDC PC SN730 SDBPNTY-1T00 | Lenovo Yoga 6 13 82ND0009US Vega 7, R5 5500U, WDC PC SN530 SDBPMPZ-265G | Dell XPS 13 9310 2-in-1 Iris Xe G7 96EUs, i7-1165G7, Toshiba BG4 KBG40ZPZ512G | Acer Spin 3 SP313-51N-56YV Iris Xe G7 80EUs, i5-1135G7, Kingston OM8PCP3512F-AB | Lenovo IdeaPad Flex 5 CB 13IML05 82B80010GE UHD Graphics 620, i5-10210U, Samsung PM991 MZALQ128HBHQ-000L2 | HP Envy x360 13-ay0010nr Vega 6, R5 4500U, Toshiba KBG30ZMV256G | |
|---|---|---|---|---|---|---|
| Noise | -1% | 0% | 1% | 0% | -12% | |
| off / environment * (dB) | 24.3 | 25.1 -3% | 24.3 -0% | 25.5 -5% | 26.5 -9% | 28 -15% |
| Idle Minimum * (dB) | 25.2 | 25.1 -0% | 24.8 2% | 25.5 -1% | 26.5 -5% | 28 -11% |
| Idle Average * (dB) | 25.2 | 25.1 -0% | 24.8 2% | 25.5 -1% | 26.5 -5% | 28 -11% |
| Idle Maximum * (dB) | 25.2 | 25.1 -0% | 24.8 2% | 25.5 -1% | 26.5 -5% | 28.5 -13% |
| Load Average * (dB) | 38.6 | 41 -6% | 38 2% | 34.5 11% | 32.6 16% | 41.1 -6% |
| Witcher 3 ultra * (dB) | 38.1 | 38.6 -1% | 38 -0% | |||
| Load Maximum * (dB) | 38.6 | 38.7 -0% | 41.5 -8% | 38.7 -0% | 35.5 8% | 43.5 -13% |
* ... smaller is better
Noise level
| Idle |
| 25.2 / 25.2 / 25.2 dB(A) |
| Load |
| 38.6 / 38.6 dB(A) |
 | ||
30 dB silent 40 dB(A) audible 50 dB(A) loud |
||
min: | ||
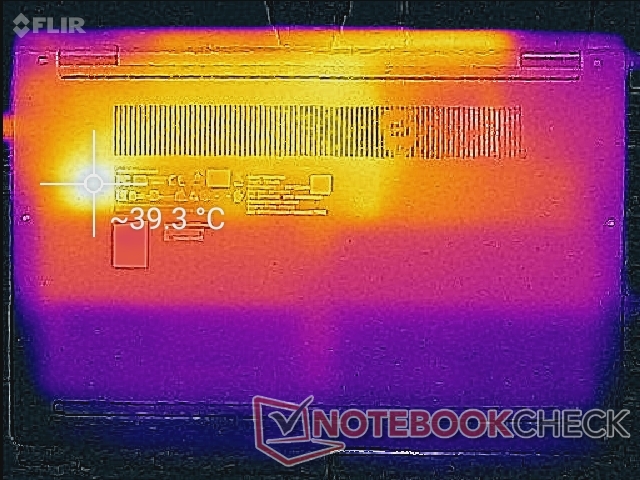
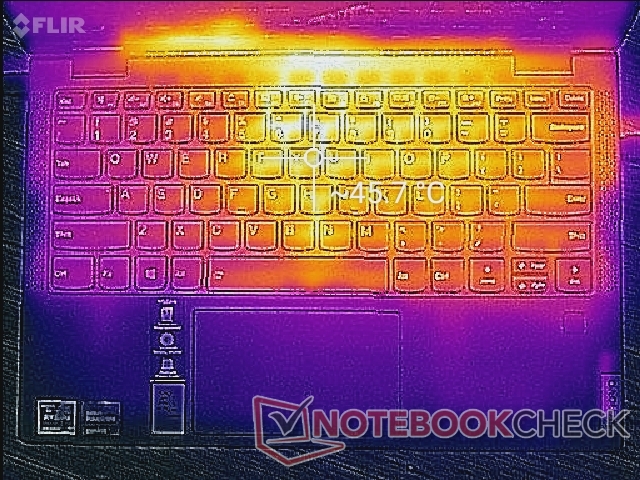
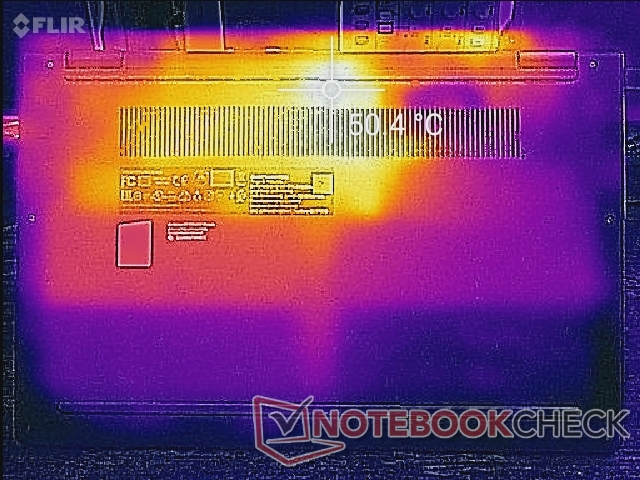
Temperature
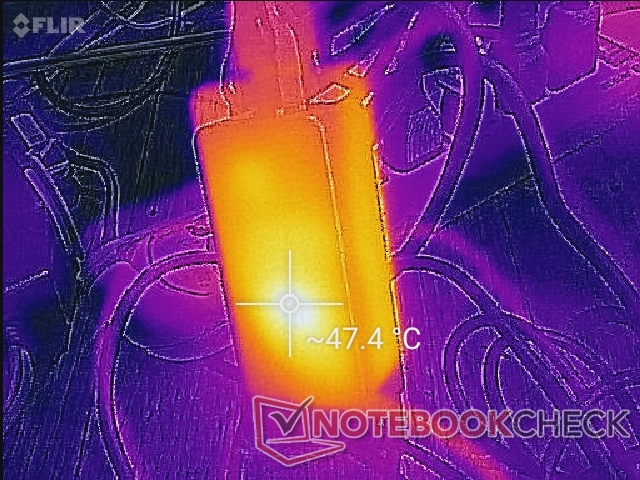
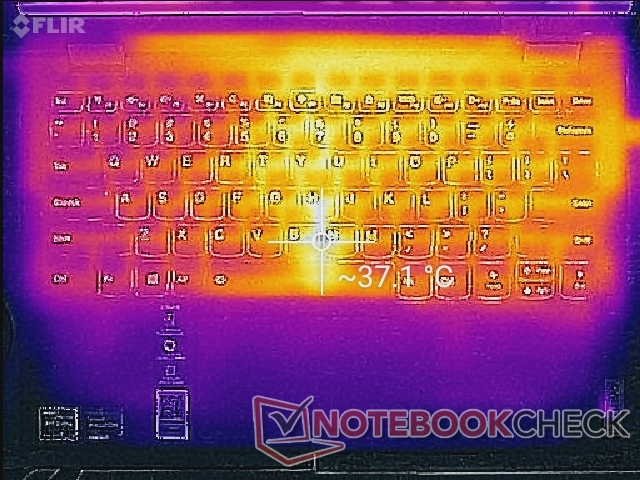
Surface temperatures when under load can be up to 45 to 50 C near the keyboard center and rear similar to what we recorded on the XPS 13 9310 2-in-1. Interestingly, the WLAN module can get quite warm even when simply idling on desktop as shown by our images below perhaps due to background software downloads.
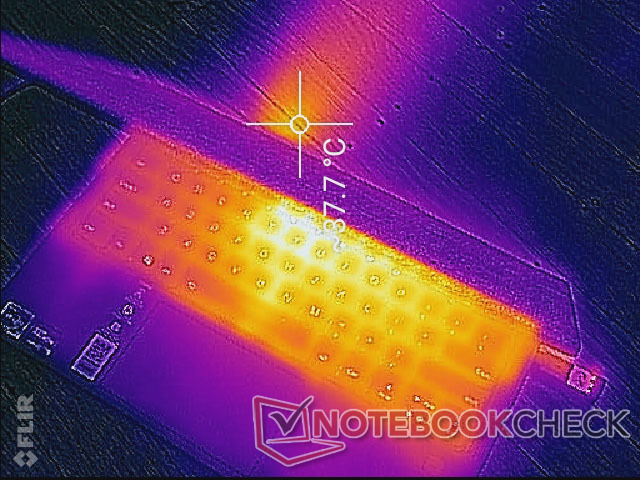
(-) The maximum temperature on the upper side is 45.2 °C / 113 F, compared to the average of 35.4 °C / 96 F, ranging from 19.6 to 60 °C for the class Convertible.
(-) The bottom heats up to a maximum of 50.6 °C / 123 F, compared to the average of 36.9 °C / 98 F
(+) In idle usage, the average temperature for the upper side is 30 °C / 86 F, compared to the device average of 30.3 °C / 87 F.
(+) The palmrests and touchpad are cooler than skin temperature with a maximum of 26 °C / 78.8 F and are therefore cool to the touch.
(±) The average temperature of the palmrest area of similar devices was 28 °C / 82.4 F (+2 °C / 3.6 F).
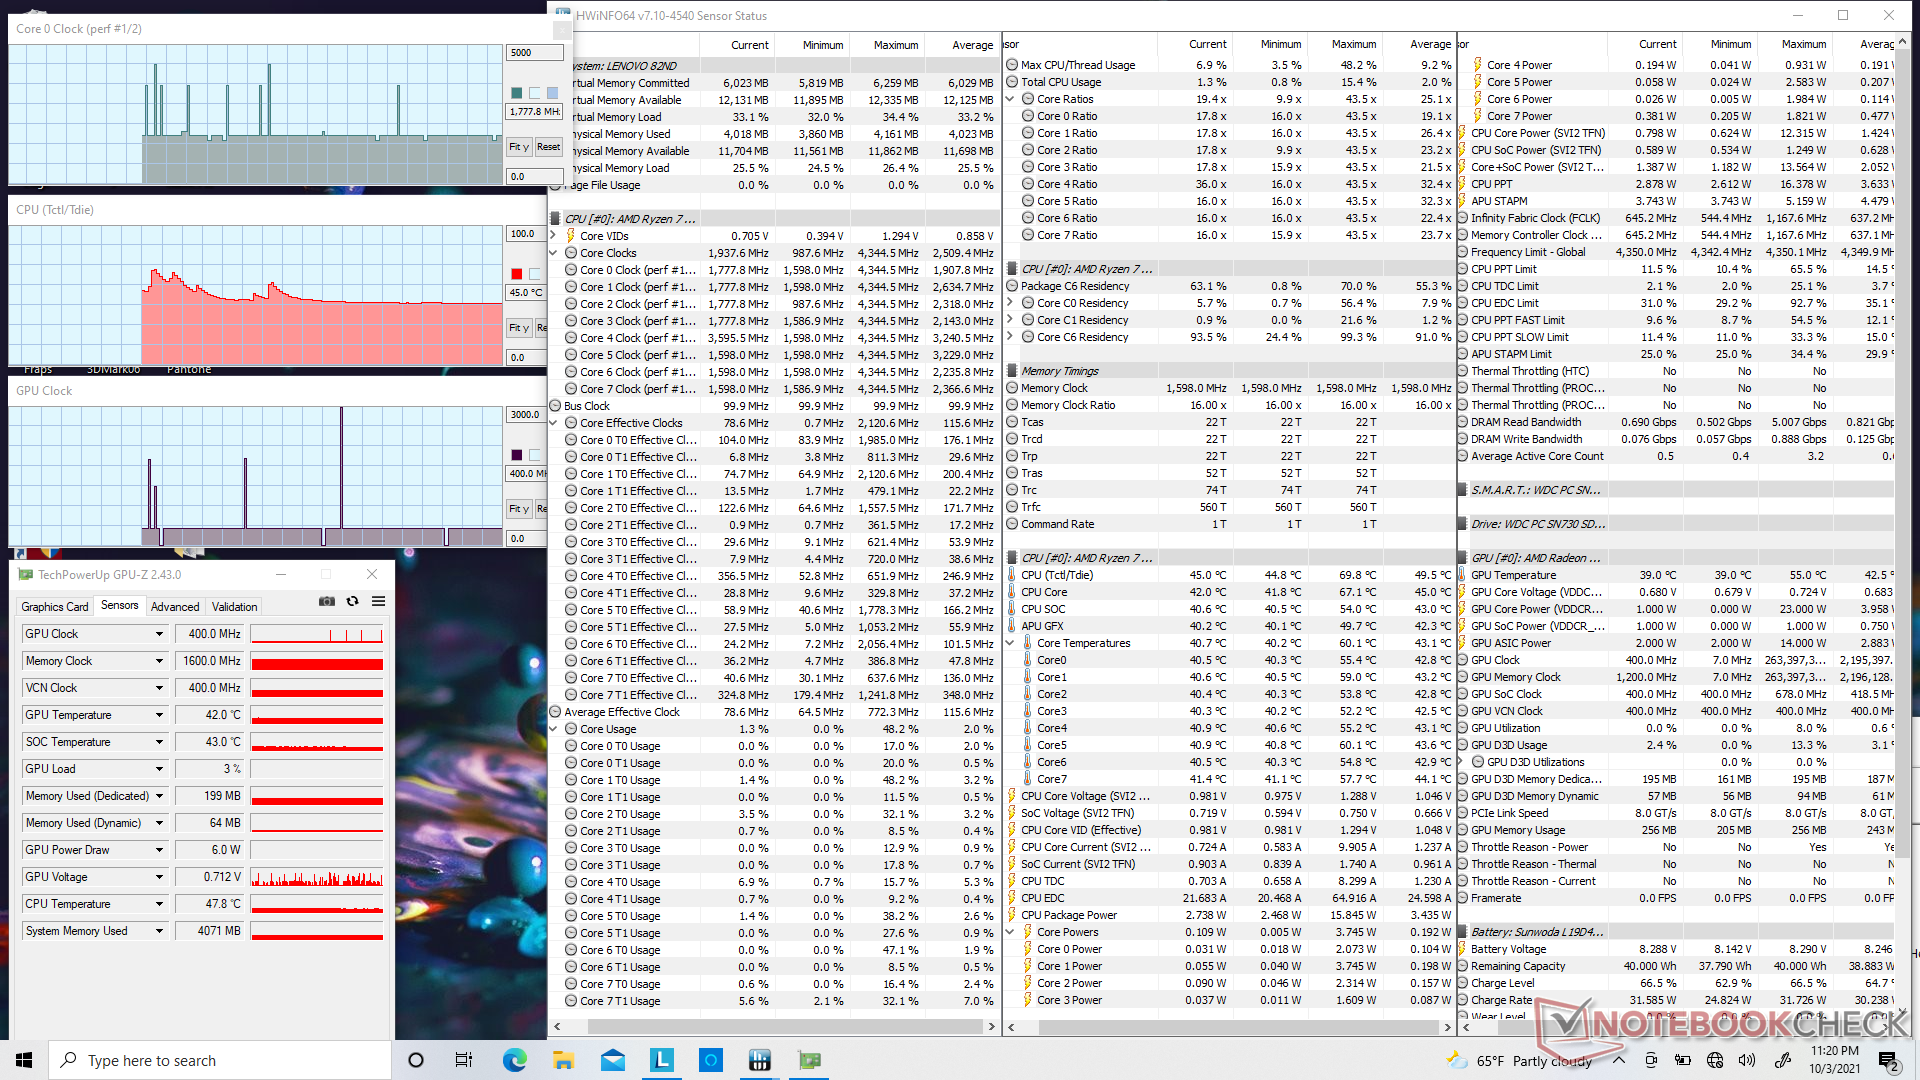
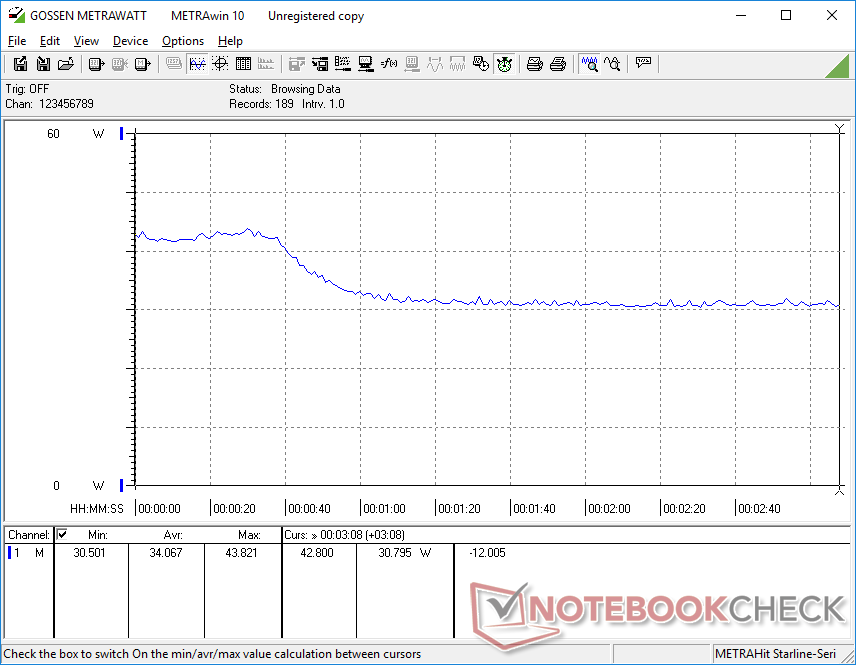
Stress Test — Just Slightly Warmer
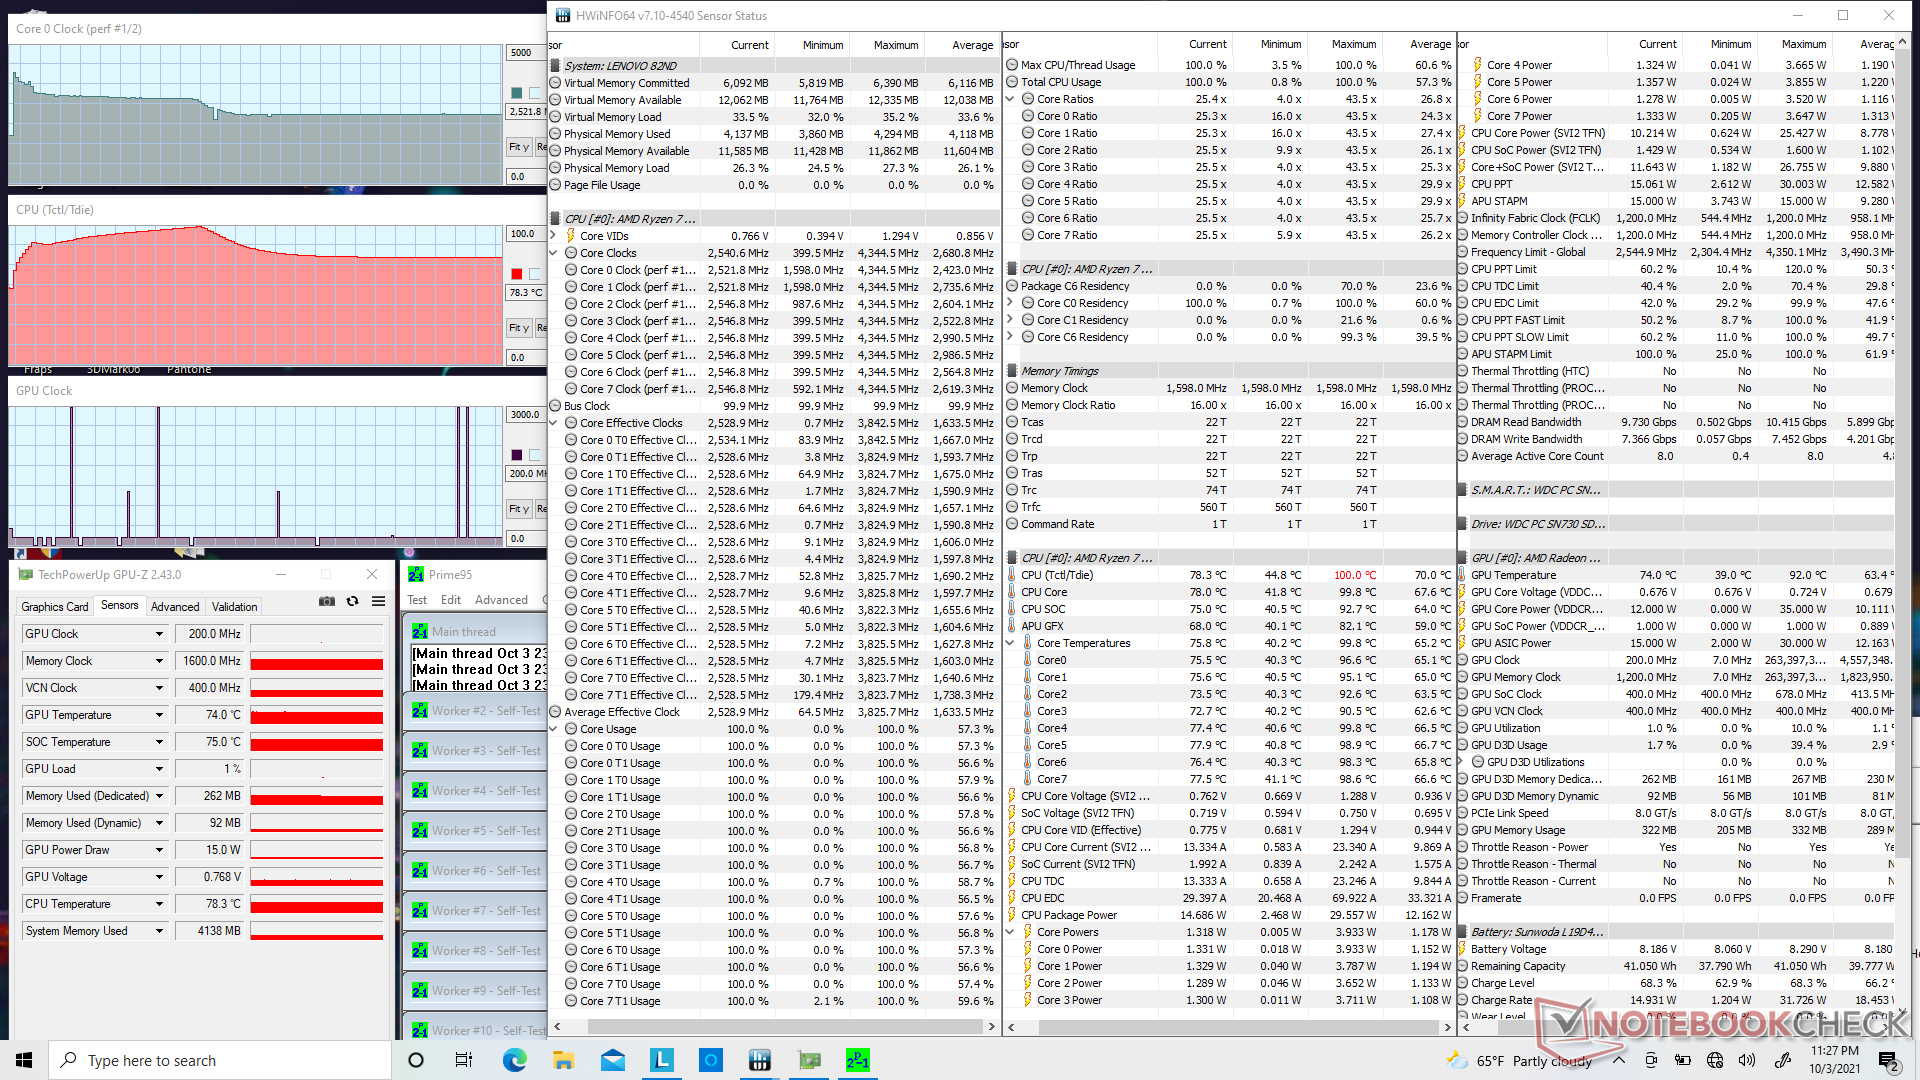
When running Prime95, the CPU would boost to 3.9 GHz for only the first few seconds until hitting a core temperature of 89 C. Thereadter, clock rates would drop to the 3.1 to 3.2 GHz range for the next couple of minutes before finally settling at 2.5 GHz and 78 C. We would observe similar but slightly cooler results on the Ryzen 5 SKU where CPU clock rates and temperature would stabilize at 2.6 GHz and 72 C instead.
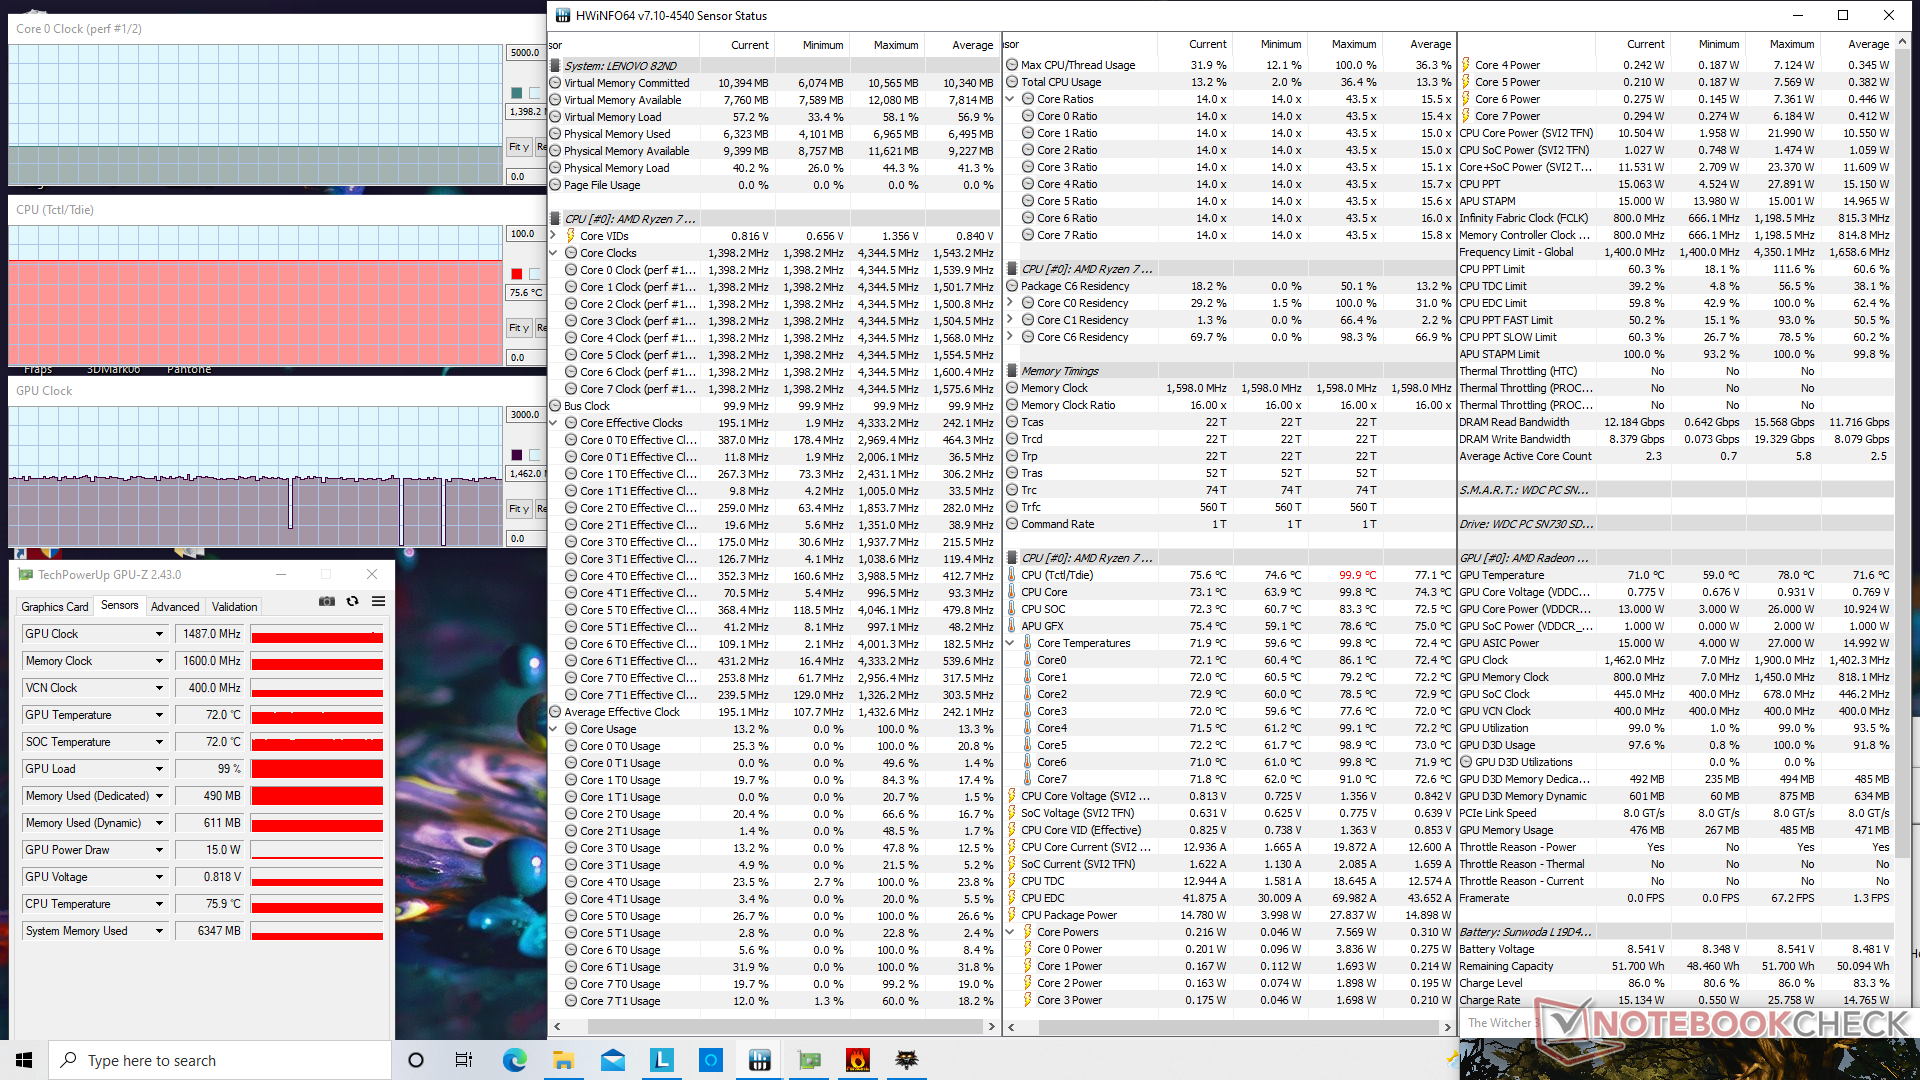
When running Witcher 3, GPU clock rate, memory clock, and temperature would stabilize at 1487 MHz, 1600 MHz, and 72 C compared to 1400 MHz, 1333 MHz, and 66 C on the Ryzen 5 SKU. Users will see faster gaming performance from the Ryzen 7 SKU albeit at slightly higher core temperatures.
Running on battery power will impact performance just slightly. A 3DMark 11 test on batteries would return Physics and Graphics scores of 10889 and 5526 points, respectively, compared to 10888 and 5693 points when on mains.
| CPU Clock (GHz) | GPU Clock (MHz) | Average CPU Temperature (°C) | |
| System Idle | -- | -- | 45 |
| Prime95 Stress | 2.5 | -- | 78 |
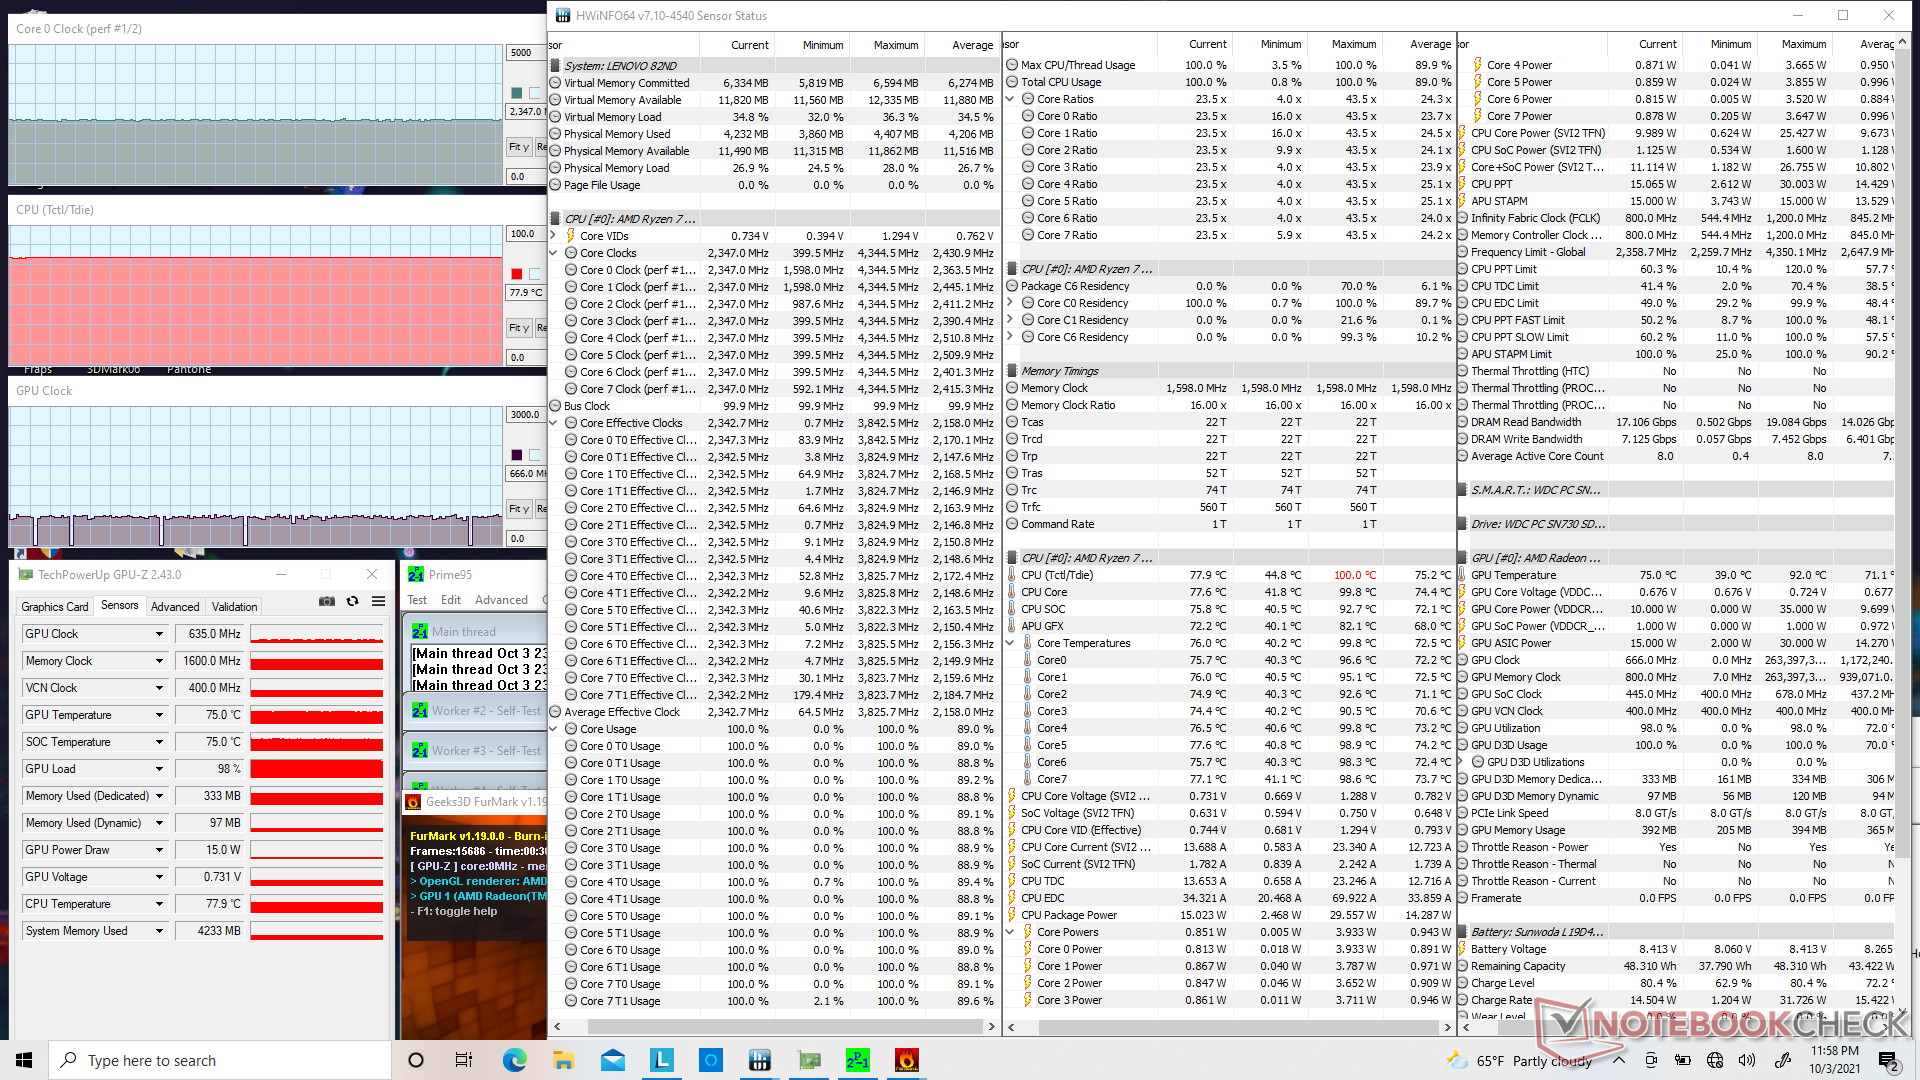
| Prime95 + FurMark Stress | 2.4 | 635 | 78 |
| Witcher 3 Stress | 1.4 | 1487 | 72 |
Speakers

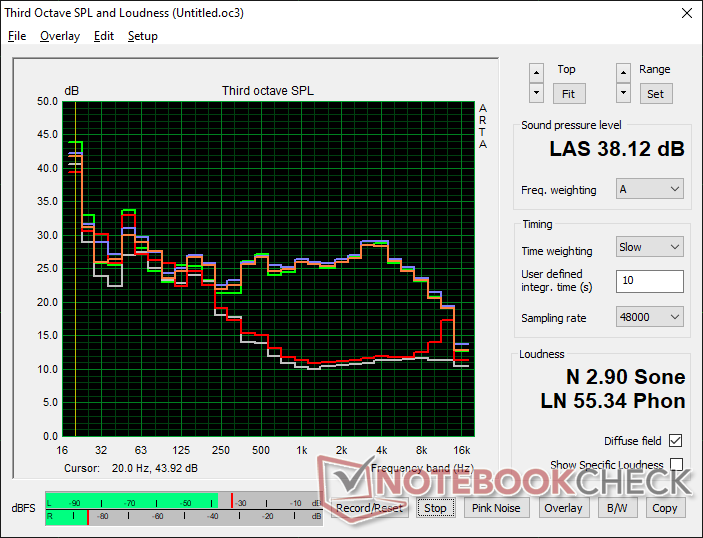
Lenovo Yoga 6 13ALC6 audio analysis
(±) | speaker loudness is average but good (77.7 dB)
Bass 100 - 315 Hz
(-) | nearly no bass - on average 17% lower than median
(±) | linearity of bass is average (9.6% delta to prev. frequency)
Mids 400 - 2000 Hz
(+) | balanced mids - only 3.7% away from median
(+) | mids are linear (3.1% delta to prev. frequency)
Highs 2 - 16 kHz
(+) | balanced highs - only 3.9% away from median
(+) | highs are linear (5.1% delta to prev. frequency)
Overall 100 - 16.000 Hz
(±) | linearity of overall sound is average (17.2% difference to median)
Compared to same class
» 32% of all tested devices in this class were better, 8% similar, 59% worse
» The best had a delta of 6%, average was 20%, worst was 57%
Compared to all devices tested
» 32% of all tested devices were better, 8% similar, 60% worse
» The best had a delta of 4%, average was 24%, worst was 134%
Apple MacBook 12 (Early 2016) 1.1 GHz audio analysis
(+) | speakers can play relatively loud (83.6 dB)
Bass 100 - 315 Hz
(±) | reduced bass - on average 11.3% lower than median
(±) | linearity of bass is average (14.2% delta to prev. frequency)
Mids 400 - 2000 Hz
(+) | balanced mids - only 2.4% away from median
(+) | mids are linear (5.5% delta to prev. frequency)
Highs 2 - 16 kHz
(+) | balanced highs - only 2% away from median
(+) | highs are linear (4.5% delta to prev. frequency)
Overall 100 - 16.000 Hz
(+) | overall sound is linear (10.2% difference to median)
Compared to same class
» 7% of all tested devices in this class were better, 2% similar, 91% worse
» The best had a delta of 5%, average was 18%, worst was 53%
Compared to all devices tested
» 5% of all tested devices were better, 1% similar, 94% worse
» The best had a delta of 4%, average was 24%, worst was 134%
Energy Management
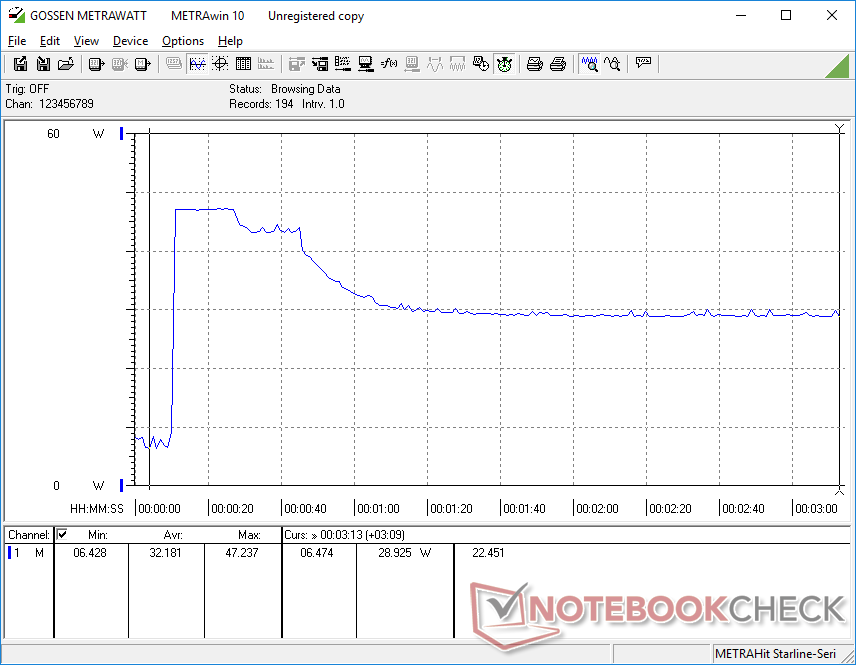
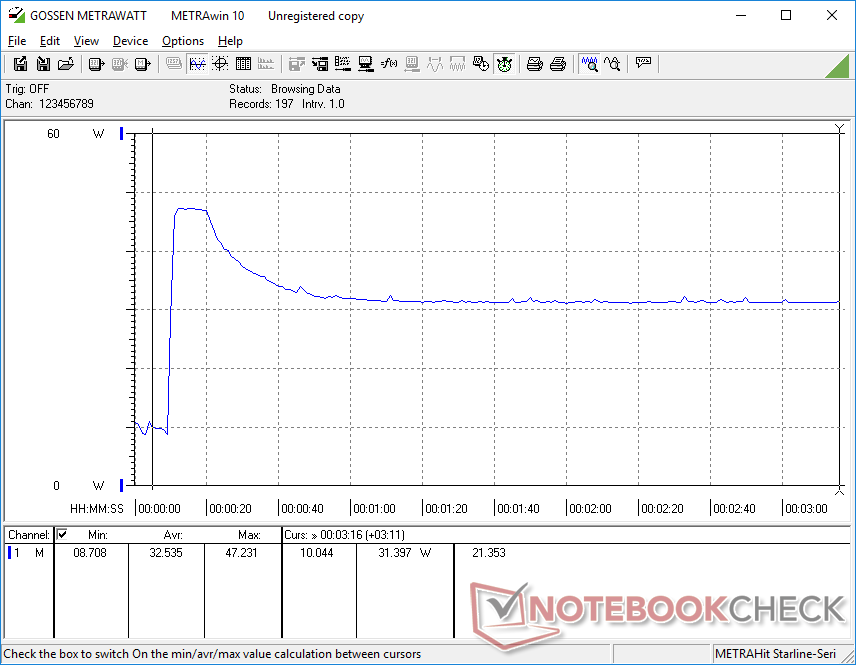
Power Consumption
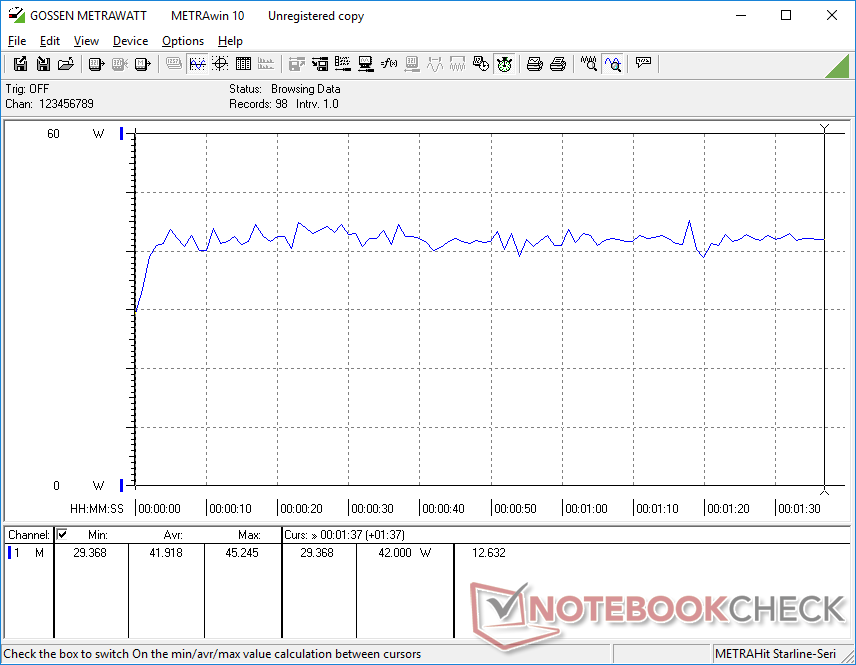
Power consumption is just marginally higher than the Ryzen 5 5500U configuration by only one or two watts at most. In general, the system is more power-hungry than a Tiger Lake-U Core i5 or Core i7 Ultrabook like the Acer Spin 3 SP313 while offering both slightly slower graphics performance and higher multi-thread CPU performance.
| Off / Standby | |
| Idle | |
| Load |
|
Key:
min: | |
| Lenovo Yoga 6 13ALC6 R7 5700U, Vega 8, WDC PC SN730 SDBPNTY-1T00, IPS, 1920x1080, 13.3" | Lenovo Yoga 6 13 82ND0009US R5 5500U, Vega 7, WDC PC SN530 SDBPMPZ-265G, IPS, 1920x1080, 13.3" | Dell XPS 13 9310 2-in-1 i7-1165G7, Iris Xe G7 96EUs, Toshiba BG4 KBG40ZPZ512G, IPS, 1920x1200, 13.4" | Acer Spin 3 SP313-51N-56YV i5-1135G7, Iris Xe G7 80EUs, Kingston OM8PCP3512F-AB, IPS, 2560x1600, 13.3" | Lenovo IdeaPad Flex 5 CB 13IML05 82B80010GE i5-10210U, UHD Graphics 620, Samsung PM991 MZALQ128HBHQ-000L2, IPS, 1920x1080, 13.3" | HP Envy x360 13-ay0010nr R5 4500U, Vega 6, Toshiba KBG30ZMV256G, IPS, 1920x1080, 13.3" | |
|---|---|---|---|---|---|---|
| Power Consumption | 4% | 14% | 13% | 26% | 10% | |
| Idle Minimum * (Watt) | 4.9 | 5 -2% | 2.6 47% | 3.5 29% | 3.7 24% | 3.9 20% |
| Idle Average * (Watt) | 6.6 | 6.3 5% | 6.4 3% | 6.6 -0% | 5.5 17% | 5.8 12% |
| Idle Maximum * (Watt) | 7.8 | 6.9 12% | 7.7 1% | 8.5 -9% | 6.5 17% | 6 23% |
| Load Average * (Watt) | 41.9 | 41.5 1% | 29.9 29% | 32.2 23% | 27 36% | 41.5 1% |
| Witcher 3 ultra * (Watt) | 34.1 | 33.2 3% | 32.2 6% | 32.5 5% | ||
| Load Maximum * (Watt) | 47.3 | 46.5 2% | 47.5 -0% | 34.5 27% | 30.6 35% | 50.4 -7% |
* ... smaller is better
Power Consumption Witcher 3 / Stresstest
Battery Life — Enough for a Work Day
WLAN battery life is about an hour shorter than what we recorded on the Ryzen 5 SKU. Even so, the 12-hour runtime will still be more than enough for most users.
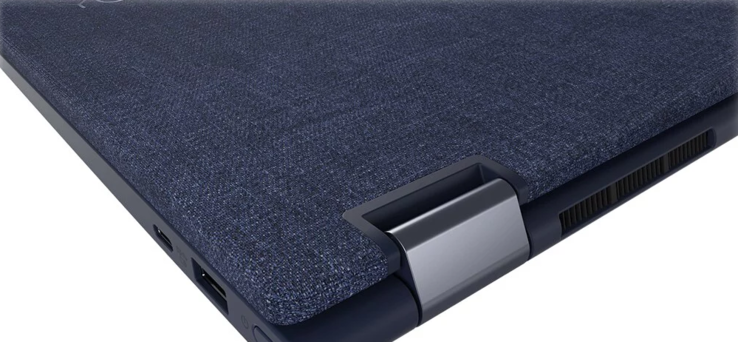
Charging from empty to full capacity takes about 2 hours. Keep in mind that only the left USB-C port supports charging.
| Lenovo Yoga 6 13ALC6 R7 5700U, Vega 8, 60 Wh | Lenovo Yoga 6 13 82ND0009US R5 5500U, Vega 7, 60 Wh | Dell XPS 13 9310 2-in-1 i7-1165G7, Iris Xe G7 96EUs, 51 Wh | Acer Spin 3 SP313-51N-56YV i5-1135G7, Iris Xe G7 80EUs, 48 Wh | Lenovo IdeaPad Flex 5 CB 13IML05 82B80010GE i5-10210U, UHD Graphics 620, 51 Wh | HP Envy x360 13-ay0010nr R5 4500U, Vega 6, 51 Wh | |
|---|---|---|---|---|---|---|
| Battery runtime | 9% | -12% | -33% | -37% | -2% | |
| WiFi v1.3 (h) | 12.1 | 13.2 9% | 10.7 -12% | 8.1 -33% | 7.6 -37% | 11.8 -2% |
| Reader / Idle (h) | 17.5 | 25.4 | 31.9 | |||
| Load (h) | 2 | 3.4 | 1.8 | 1.9 |
Pros
Cons
Verdict — Very Fast Processor for a 13-inch Convertible
Upgrading to the Ryzen 7 5700U configuration from the Ryzen 5 5500U will net users 15 to 20 percent faster multi-thread performance and 10 to 15 percent faster graphics performance at the cost of slightly warmer core temperatures and an hour of shorter battery life. If you want to squeeze as much power as you can from the Lenovo Yoga 6 13, then the Ryzen 7 configuration may be worth considering especially since it is retailing for only $50 more at the moment.
High performance with full sRGB colors and a cheap price all make the visually unique Lenovo Yoga 6 13 convertible very an attractive buy. The soldered RAM, however, is hard to ignore especially when most sales include just 8 GB only.
As for the Lenovo system itself, it remains one of the fastest convertibles in its 13-inch category in terms of CPU performance similar to what we concluded with the 14-inch IdeaPad Flex 5 14. Its outer lid fabric has its pros and cons when compared to the usual aluminum while the soldered RAM can be a turn off for some. If such features are important to you, then the inexpensive AMD-powered Asus VivoBook Flip 14 can offer similar performance levels albeit with a dimmer and less colorful touchscreen.
Price and availability
Lenovo Yoga 6 13ALC6
- 10/04/2021 v7 (old)
Allen Ngo
Price comparison
