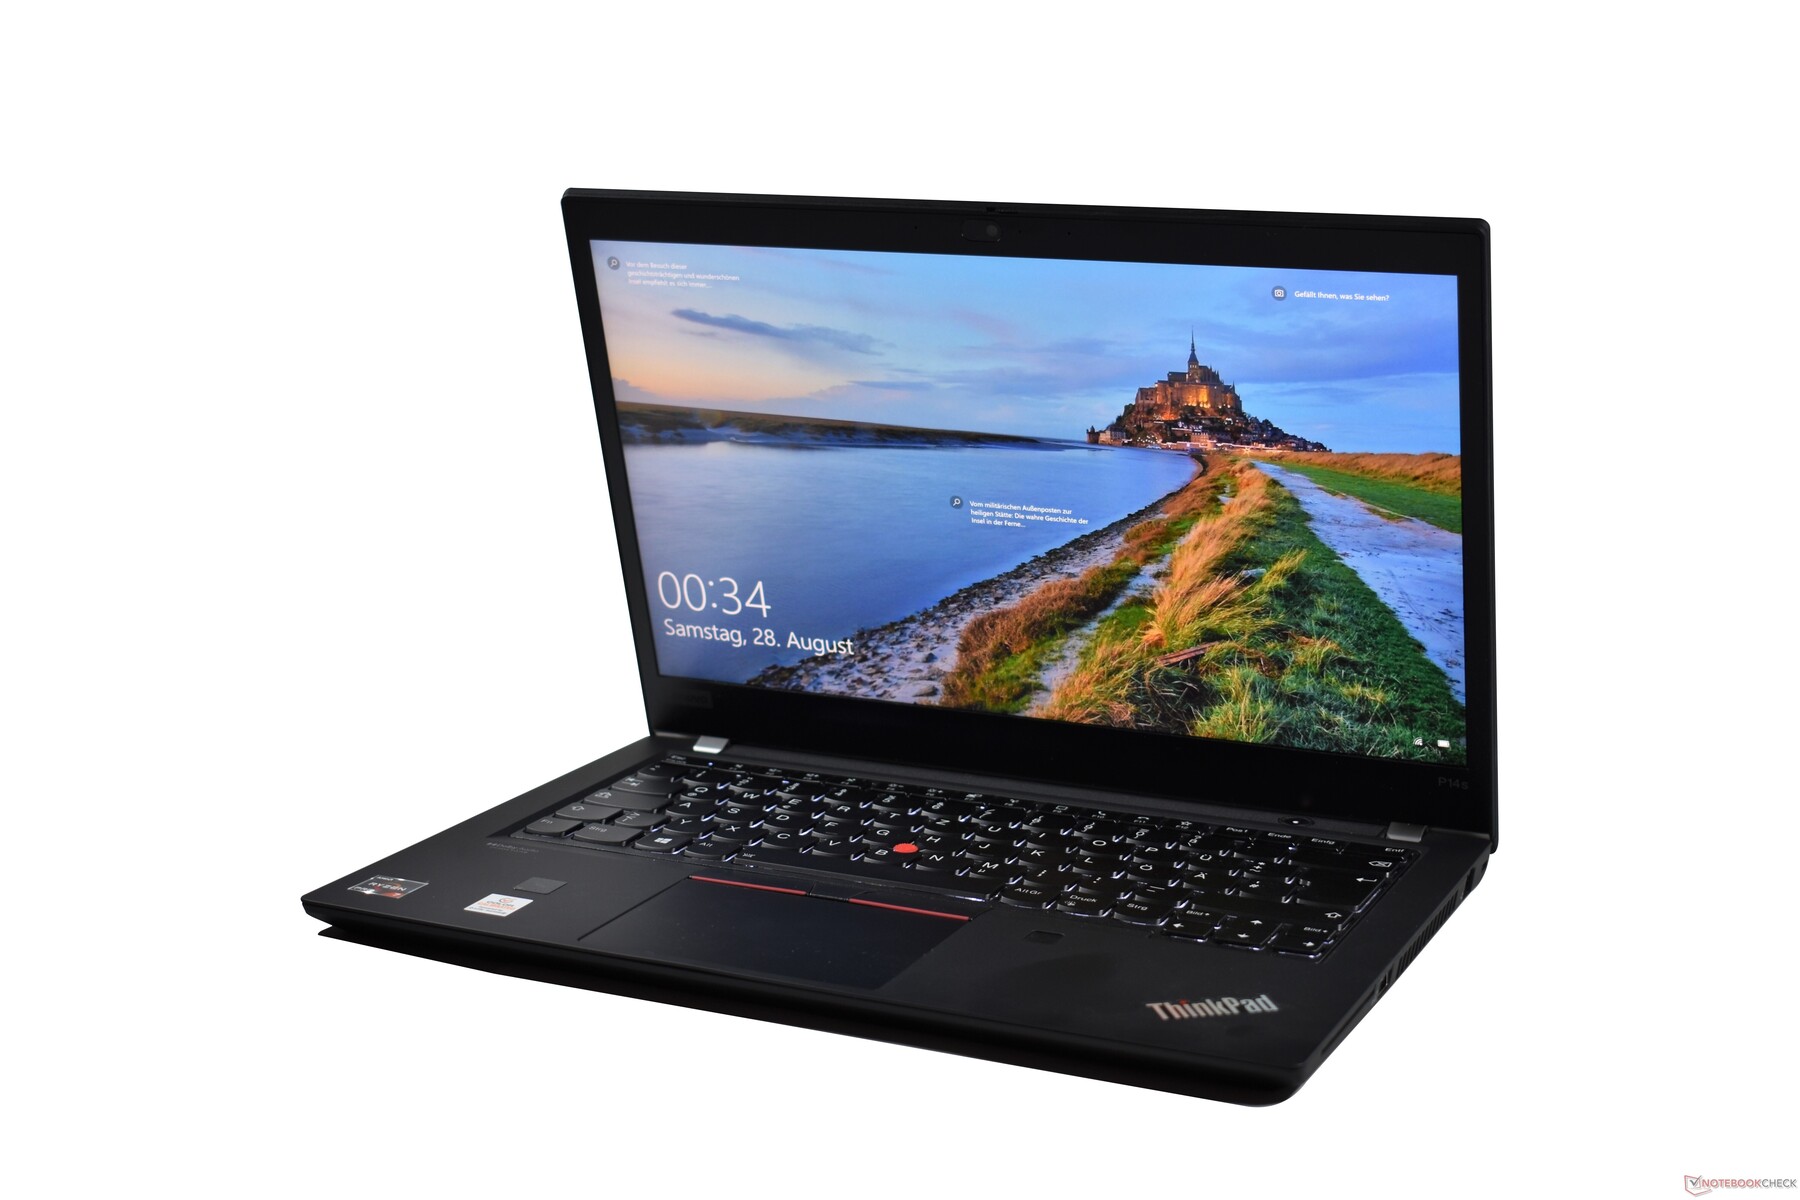
Lenovo ThinkPad P14s G2 AMD laptop review: With a matte 4K LCD and Ryzen 5000
Until now, the Lenovo ThinkPad P series has been a bastion for Intel processors. There is one exception though: The 14-inch Lenovo ThinkPad P14s, a mobile entry level model among the Lenovo workstations, has also been available in a version with AMD Ryzen CPUs since last year. While the Lenovo workstation laptop used the AMD Ryzen Pro 4000 last year, with the ThinkPad P14s G2, the AMD Ryzen Pro 5000 naturally follows.
The ThinkPad P14s AMD predecessor already delivered an excellent CPU performance, but it lacked a dedicated GPU. This unusual lack also concerns the newer model, so it will be interesting to see how it fares in the comparison with more conventional workstations with Intel CPUs and Nvidia GPUs.
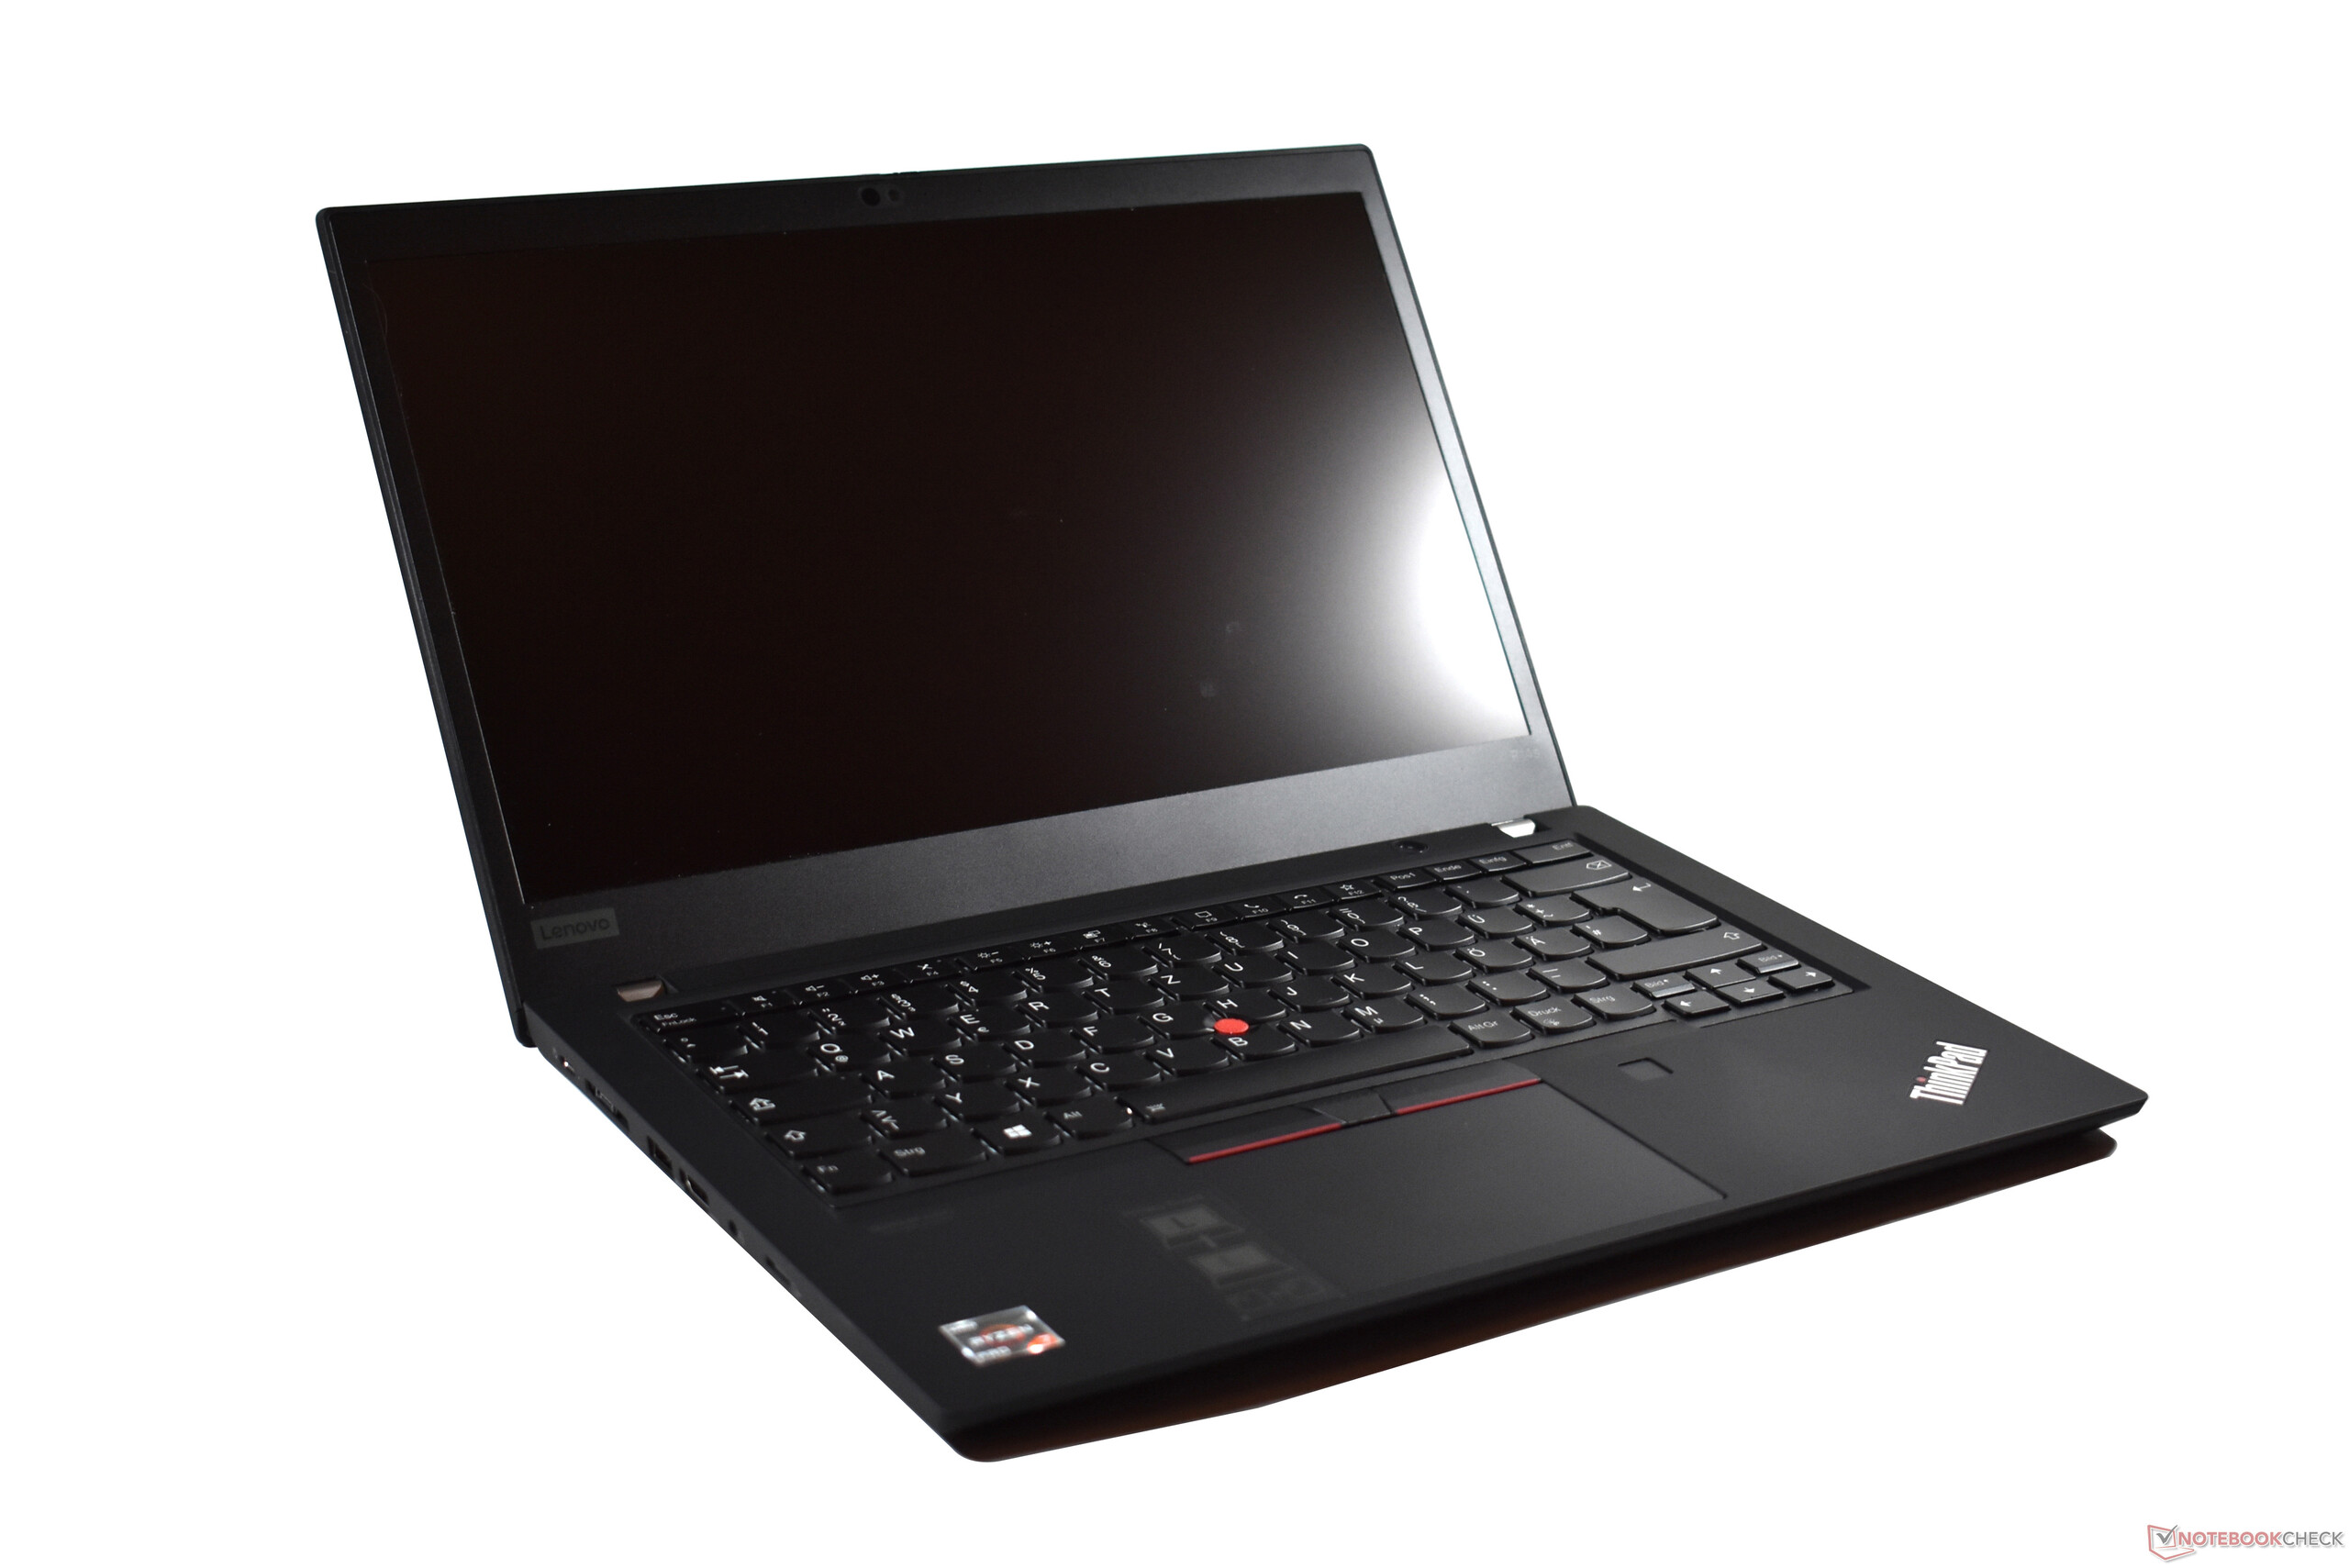
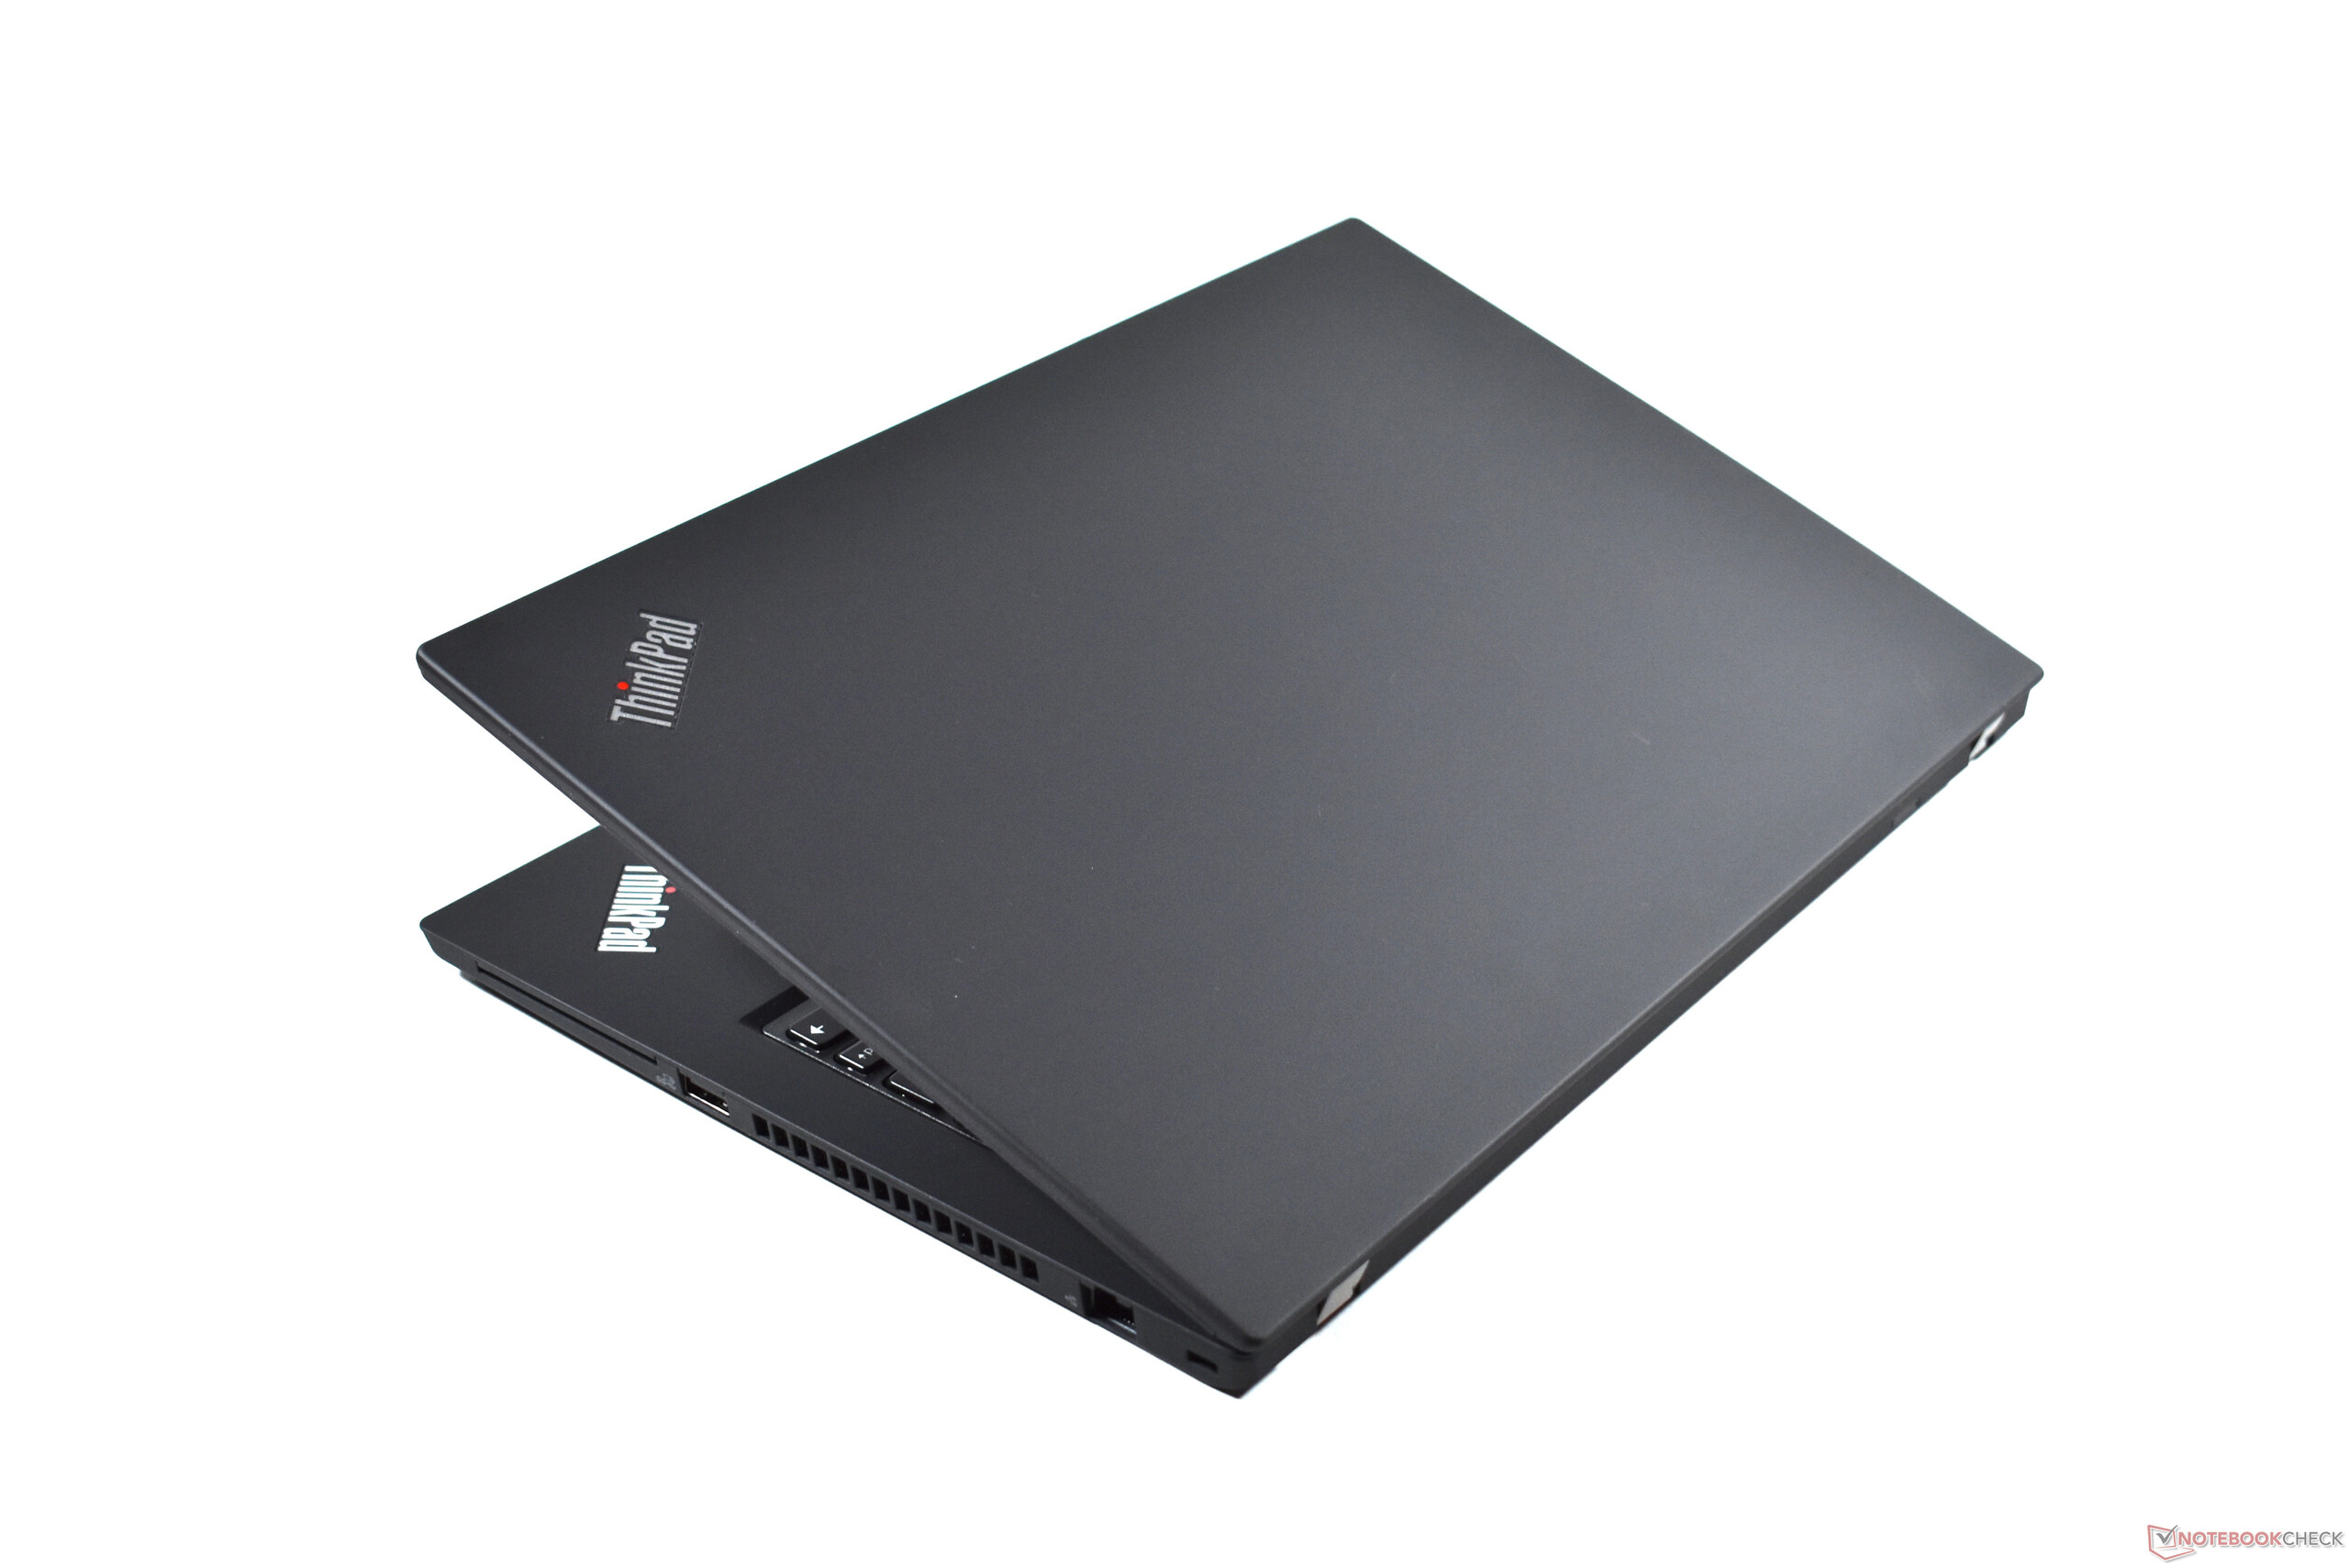
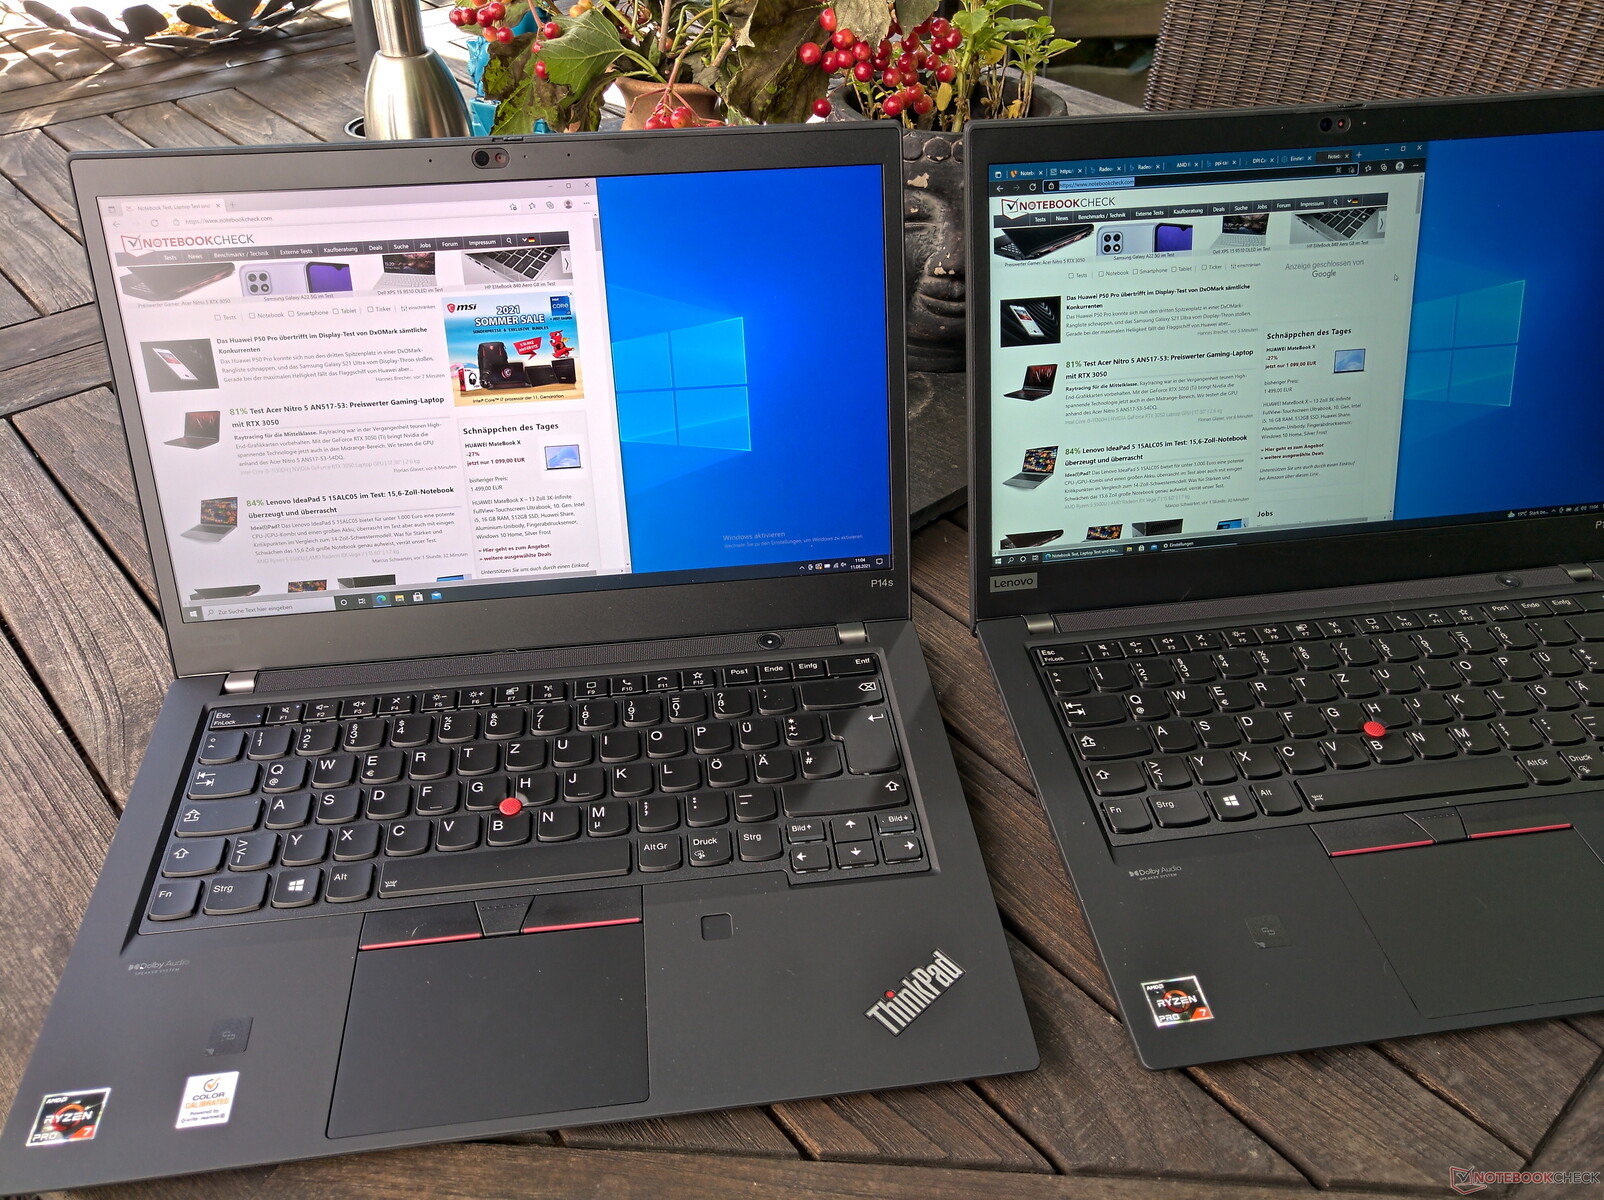
Because Lenovo did not make any changes in the case at all, we refer you to our review of the Lenovo ThinkPad T490 based on the identical design for information on the design, equipment, and input devices.
Possible Competitors in Comparison
Rating | Date | Model | Weight | Height | Size | Resolution | Price |
|---|---|---|---|---|---|---|---|
| 85.2 % v7 (old) | 09 / 2021 | Lenovo ThinkPad P14s G2 AMD R7 PRO 5850U, Vega 8 | 1.5 kg | 17.9 mm | 14.00" | 3840x2160 | |
| 83.8 % v7 (old) | 03 / 2021 | Lenovo ThinkPad P14s Gen1-20Y10002GE R7 PRO 4750U, Vega 7 | 1.6 kg | 17.9 mm | 14.00" | 1920x1080 | |
| 85.1 % v7 (old) | 06 / 2021 | Lenovo ThinkPad P14s Gen2-20VX000GGE i7-1185G7, T500 Laptop GPU | 1.5 kg | 18 mm | 14.00" | 1920x1080 | |
| 85.2 % v7 (old) | 04 / 2021 | HP ZBook Firefly 14 G8 2C9Q2EA i7-1165G7, T500 Laptop GPU | 1.4 kg | 17.9 mm | 14.00" | 1920x1080 |
| SD Card Reader | |
| average JPG Copy Test (av. of 3 runs) | |
| Average of class Workstation (49.6 - 681, n=14, last 2 years) | |
| Lenovo ThinkPad P14s Gen1-20Y10002GE (Toshiba Exceria Pro M501 64 GB UHS-II) | |
| Lenovo ThinkPad P14s Gen2-20VX000GGE (AV Pro V60) | |
| Lenovo ThinkPad P14s G2 AMD (AV PRO V60) | |
| maximum AS SSD Seq Read Test (1GB) | |
| Average of class Workstation (87.6 - 1455, n=14, last 2 years) | |
| Lenovo ThinkPad P14s G2 AMD (AV PRO V60) | |
| Lenovo ThinkPad P14s Gen1-20Y10002GE (Toshiba Exceria Pro M501 64 GB UHS-II) | |
| Lenovo ThinkPad P14s Gen2-20VX000GGE (AV Pro V60) | |


A matte UHD display in the ThinkPad laptop
For laptops that use the same design as their predecessor model, changes in other areas have to provide the arguments for a purchase. The display is one such area. However, in the Lenovo ThinkPad P14s G2 AMD most LCD options are still identical to those of the Lenovo ThinkPad P14s G1 predecessor model, and the 16:9 format of the 14-inch LCDs has unfortunately remained unchanged as well.
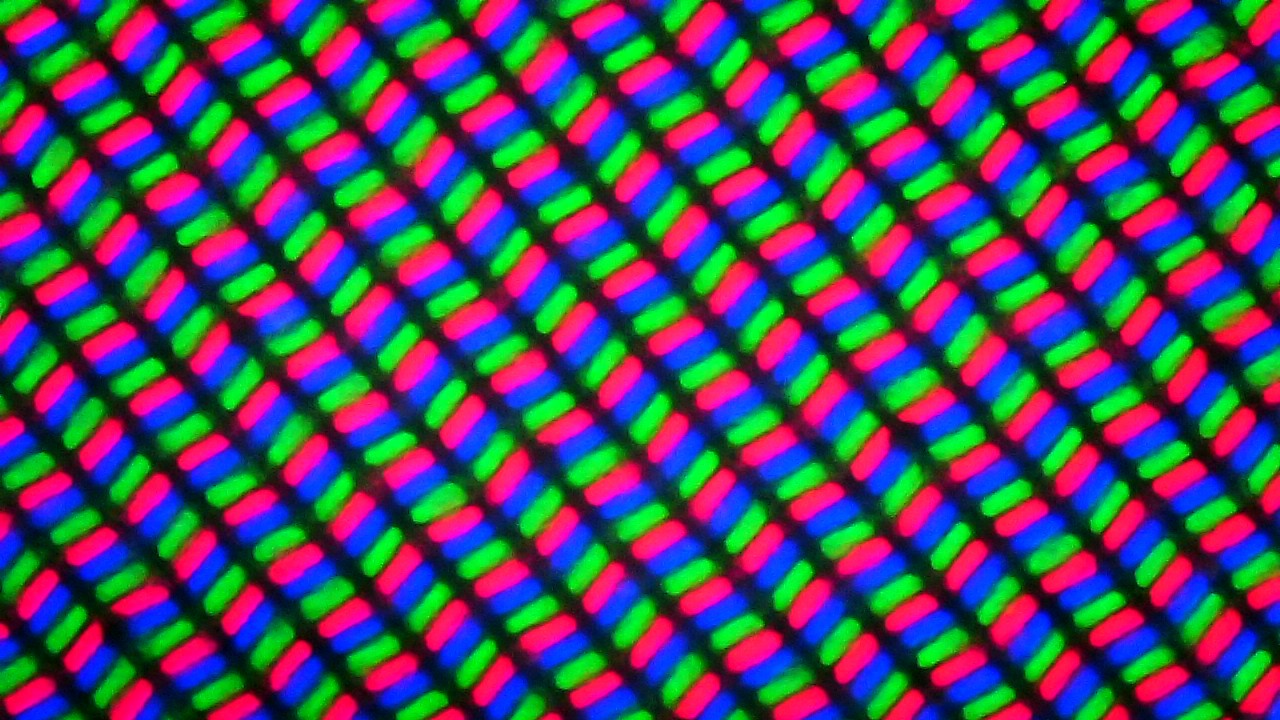
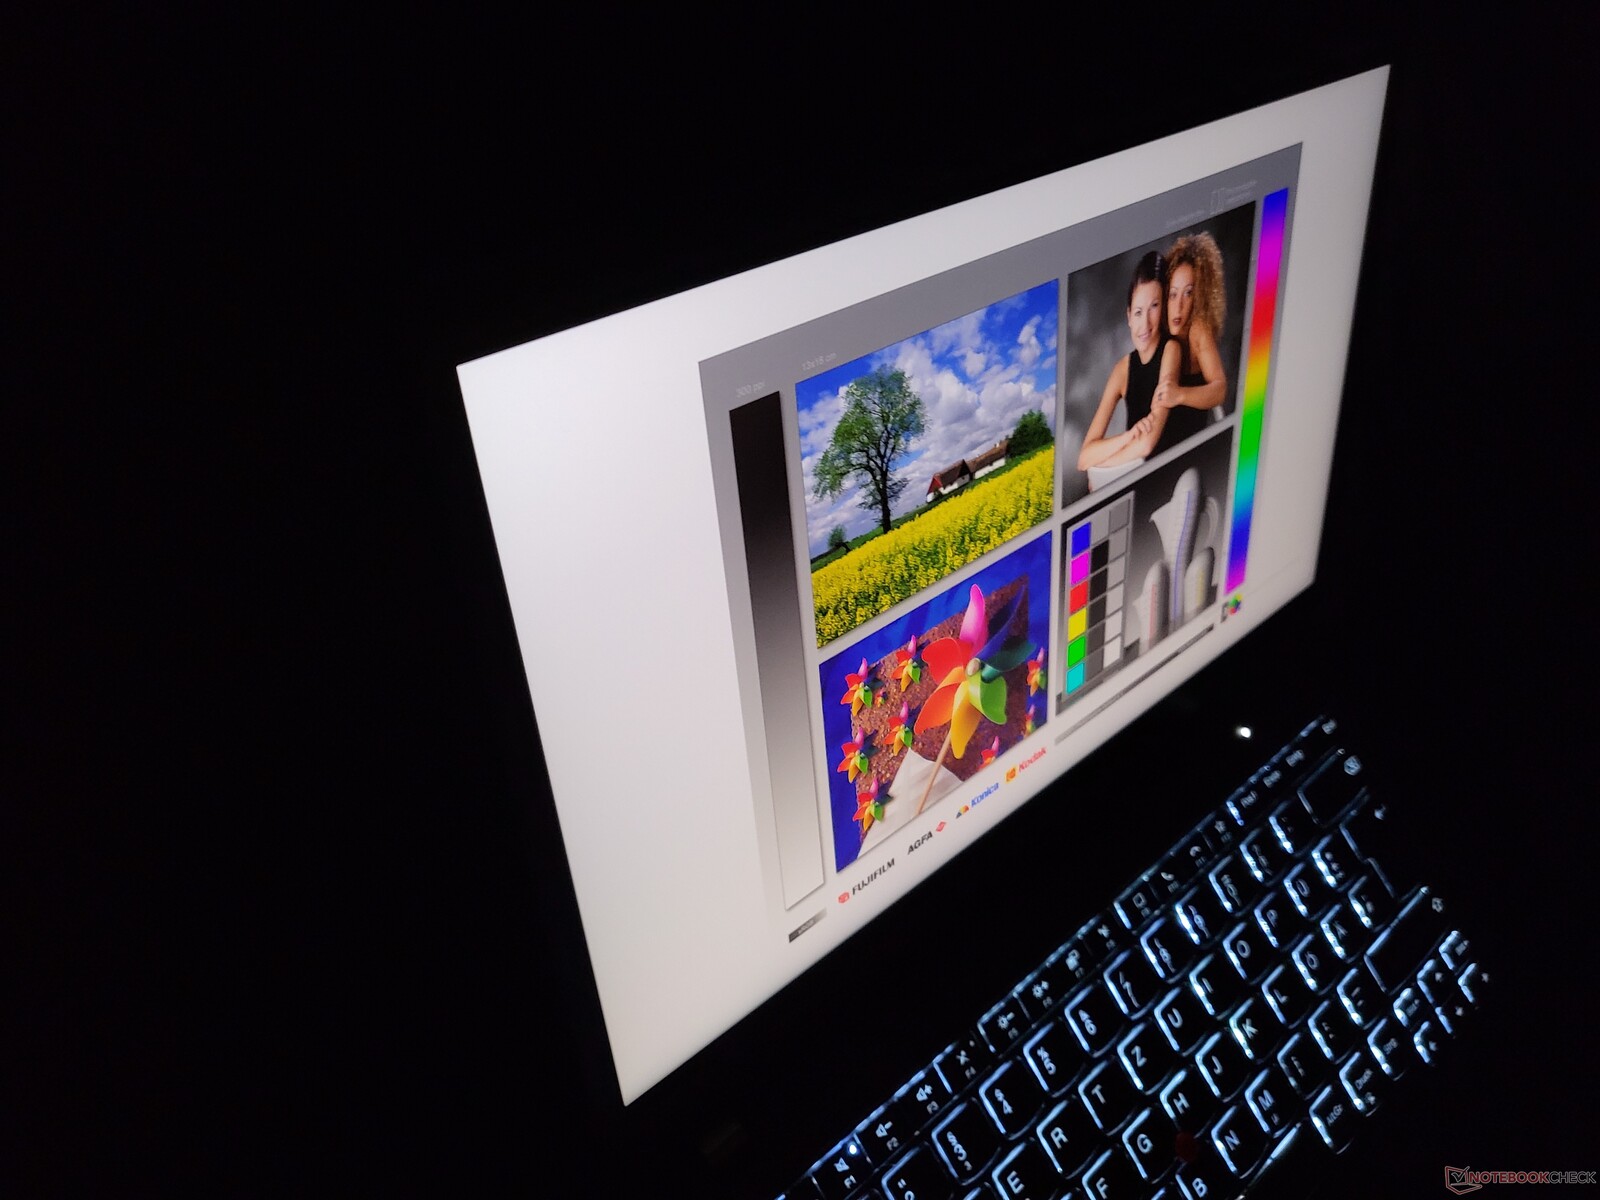
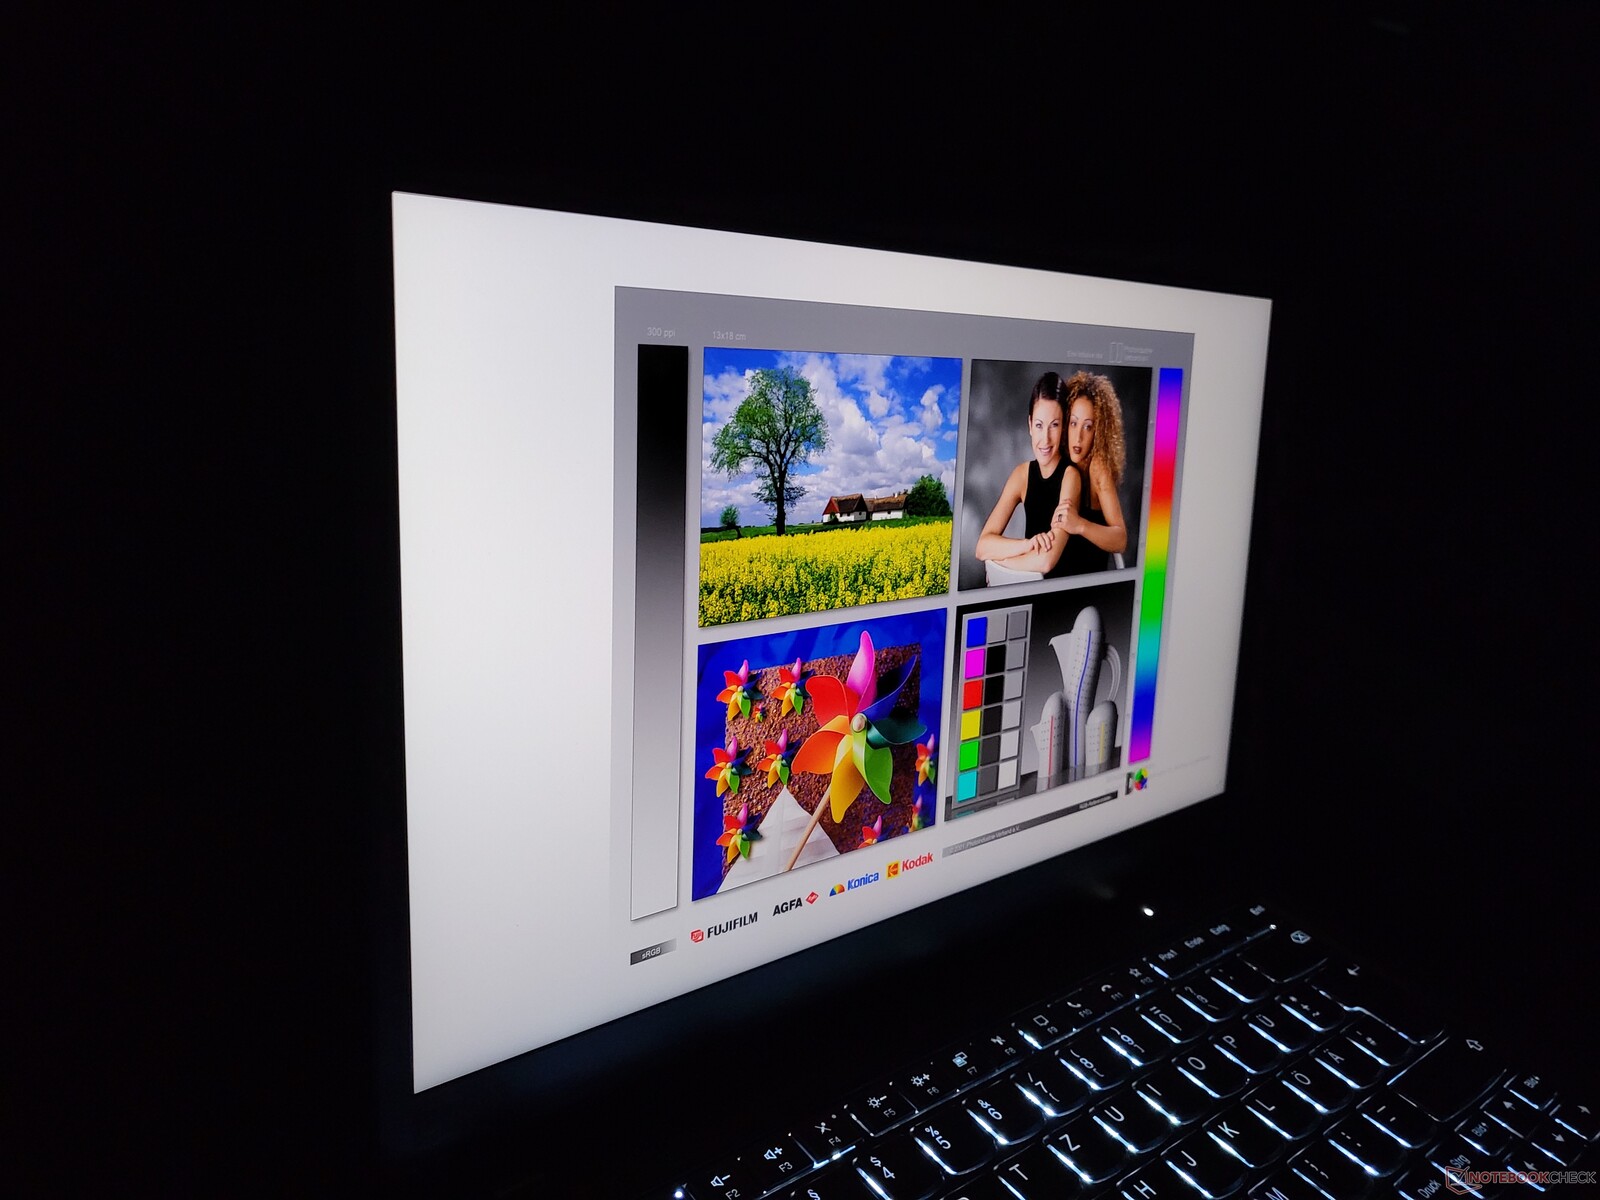
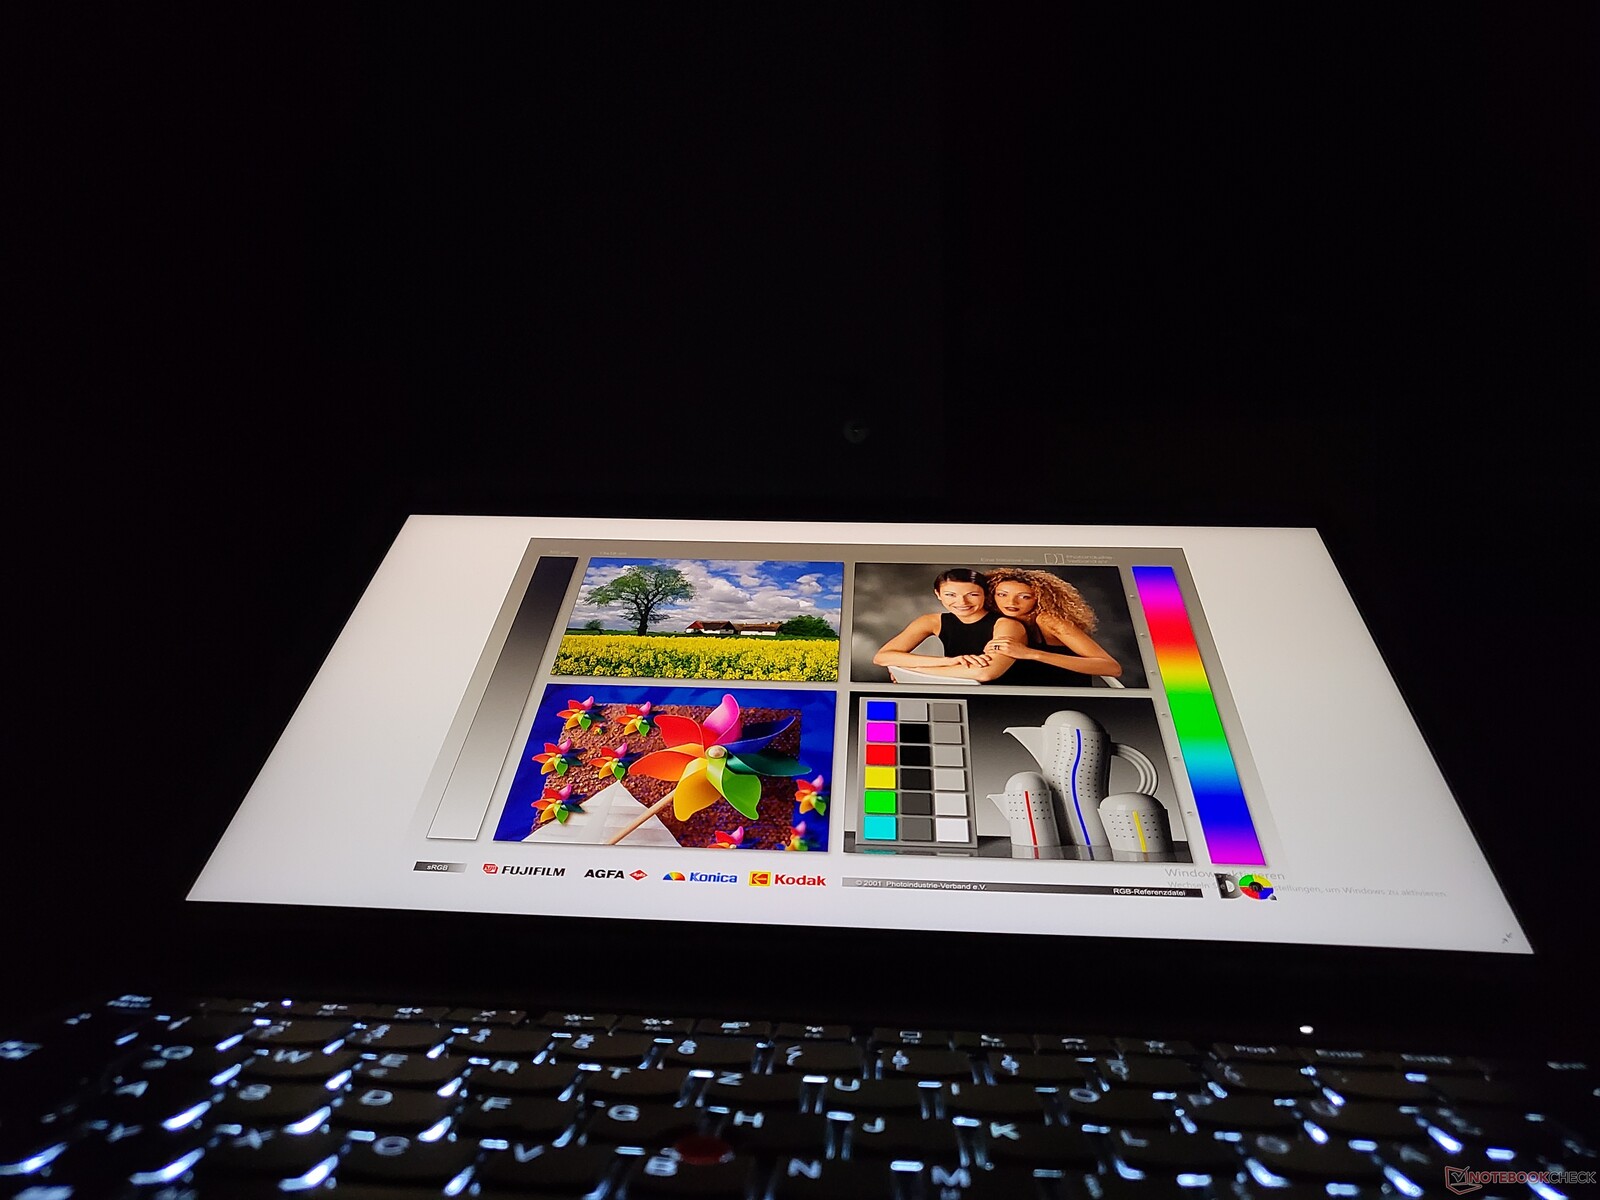
The new change is that for the first time the AMD based model is also offered with a 4K Ultra-HD display (3840 x 2160 pixels), which was still reserved to the Intel ThinkPads last year. In addition, the UHD LCD has been glossy before, but now it is matte. While we were able to test the new, matte UHD LCD as well as the low-power LCD with a Full-HD resolution (1920 x 1080 pixels), the focus of this review is on the model with the 4K UHD LCD.
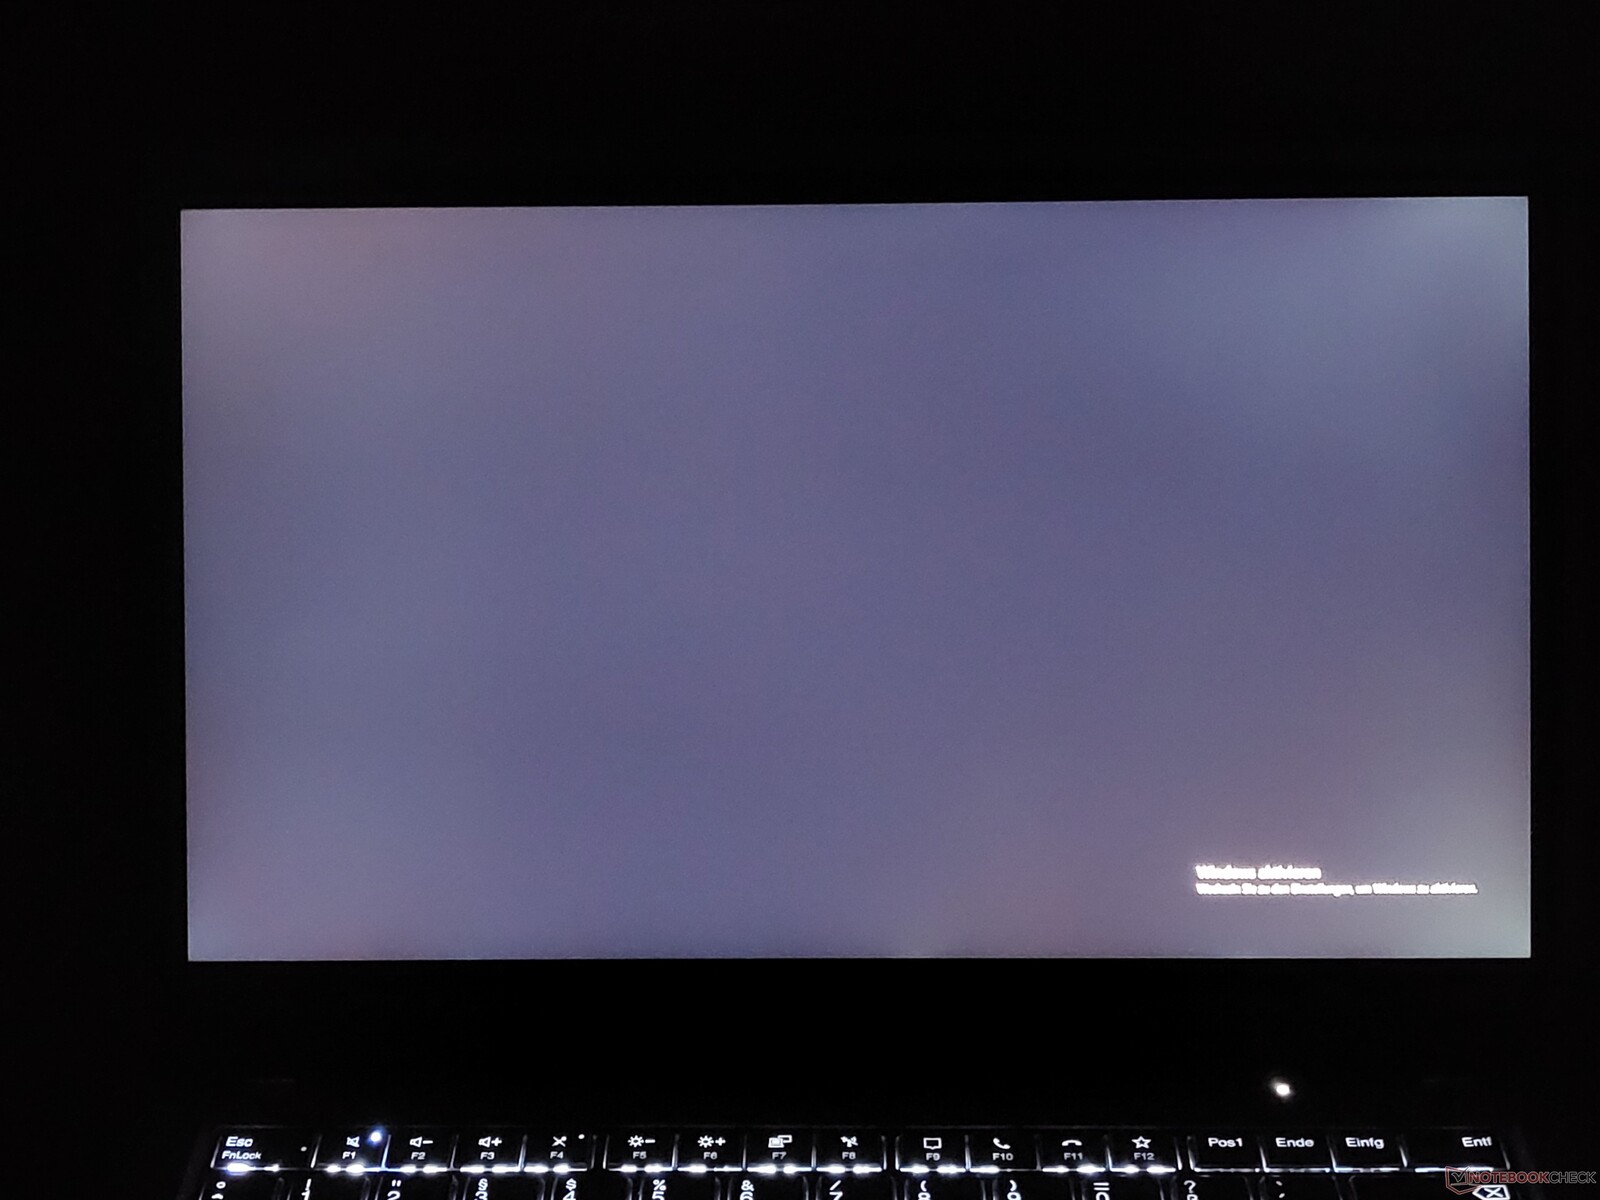
The brightness of the UHD display is supposed to reach 500 cd/m², and this is really the case for the top value. The maximum value is indeed 512 cd/m², but the average brightness of the Lenovo laptop is "only" 486 cd/m². This makes it slightly darker than the glossy UHD LCD that were able to test in the ThinkPad X1 Carbon Gen 8. But in contrast to that, Pulse Width Modulation (PWM) is not used for brightness control here. And another advantage that stands out compared to the low-power FHD LCD is that the response times of the UHD screen are significantly better.
Screen Flickering / PWM (Pulse-Width Modulation)
| Screen flickering / PWM not detected | 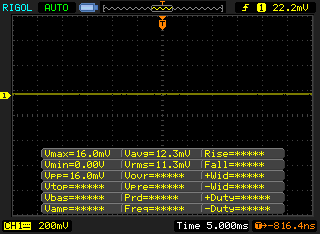 | ||
In comparison: 52 % of all tested devices do not use PWM to dim the display. If PWM was detected, an average of 7781 (minimum: 5 - maximum: 343500) Hz was measured. | |||
| |||||||||||||||||||||||||
Brightness Distribution: 90 %
Center on Battery: 512 cd/m²
Contrast: 1463:1 (Black: 0.35 cd/m²)
ΔE ColorChecker Calman: 3.1 | ∀{0.5-29.43 Ø4.72}
calibrated: 0.4
ΔE Greyscale Calman: 5.5 | ∀{0.09-98 Ø4.97}
Gamma: 2.22
CCT: 6373 K
| Lenovo ThinkPad P14s G2 AMD MNE001EA1-5, IPS LED, 3840x2160, 14" | Lenovo ThinkPad P14s G2 AMD FHD NE140FHM-N61, IPS LED, 1920x1080, 14" | Lenovo ThinkPad P14s Gen1-20Y10002GE N140HCR-GL2, a-Si IPS LED, 1920x1080, 14" | Lenovo ThinkPad P14s Gen2-20VX000GGE B140HAN05.7, IPS, 1920x1080, 14" | HP ZBook Firefly 14 G8 2C9Q2EA AU Optronics AUO068B, IPS, 1920x1080, 14" | Lenovo ThinkPad X1 Carbon 2020-20U9003BGE NV140QUM-N53, , 3840x2160, 14" | |
|---|---|---|---|---|---|---|
| Display | -20% | -17% | -19% | -15% | -7% | |
| Display P3 Coverage (%) | 96.8 | 68.1 -30% | 67.3 -30% | 65.4 -32% | 70 -28% | 82.4 -15% |
| sRGB Coverage (%) | 99.9 | 91.1 -9% | 98.5 -1% | 96.6 -3% | 99.5 0% | 99.4 -1% |
| AdobeRGB 1998 Coverage (%) | 85.8 | 66.6 -22% | 69.4 -19% | 66.5 -22% | 71.4 -17% | 82.7 -4% |
| Response Times | -55% | 20% | -15% | -14% | 23% | |
| Response Time Grey 50% / Grey 80% * (ms) | 52 ? | 72 ? -38% | 38.4 ? 26% | 58.8 ? -13% | 64.4 ? -24% | 47.2 ? 9% |
| Response Time Black / White * (ms) | 28 ? | 48 ? -71% | 24 ? 14% | 32.8 ? -17% | 29.2 ? -4% | 17.6 ? 37% |
| PWM Frequency (Hz) | 200 ? | |||||
| Screen | -47% | 5% | -24% | -7% | -35% | |
| Brightness middle (cd/m²) | 512 | 403 -21% | 430 -16% | 350 -32% | 461 -10% | 574 12% |
| Brightness (cd/m²) | 487 | 395 -19% | 432 -11% | 348 -29% | 439 -10% | 540 11% |
| Brightness Distribution (%) | 90 | 91 1% | 88 -2% | 94 4% | 89 -1% | 86 -4% |
| Black Level * (cd/m²) | 0.35 | 0.25 29% | 0.27 23% | 0.14 60% | 0.24 31% | 0.36 -3% |
| Contrast (:1) | 1463 | 1612 10% | 1593 9% | 2500 71% | 1921 31% | 1594 9% |
| Colorchecker dE 2000 * | 3.1 | 4.4 -42% | 2.2 29% | 4.3 -39% | 2.6 16% | 4.7 -52% |
| Colorchecker dE 2000 max. * | 8.4 | 8.8 -5% | 4.4 48% | 6.7 20% | 5.8 31% | 8.8 -5% |
| Colorchecker dE 2000 calibrated * | 0.4 | 1.9 -375% | 0.7 -75% | 1.5 -275% | 1.1 -175% | 1.4 -250% |
| Greyscale dE 2000 * | 5.5 | 5.7 -4% | 3.3 40% | 5.3 4% | 4.4 20% | 7.2 -31% |
| Gamma | 2.22 99% | 2.18 101% | 2.21 100% | 2.42 91% | 2.29 96% | 2.04 108% |
| CCT | 6373 102% | 7375 88% | 6056 107% | 7631 85% | 6478 100% | 6886 94% |
| Color Space (Percent of AdobeRGB 1998) (%) | 63 | 61.1 | 65.2 | 73.8 | ||
| Color Space (Percent of sRGB) (%) | 98.5 | 96.4 | 99.4 | 99.4 | ||
| Total Average (Program / Settings) | -41% /
-43% | 3% /
3% | -19% /
-22% | -12% /
-10% | -6% /
-21% |
* ... smaller is better
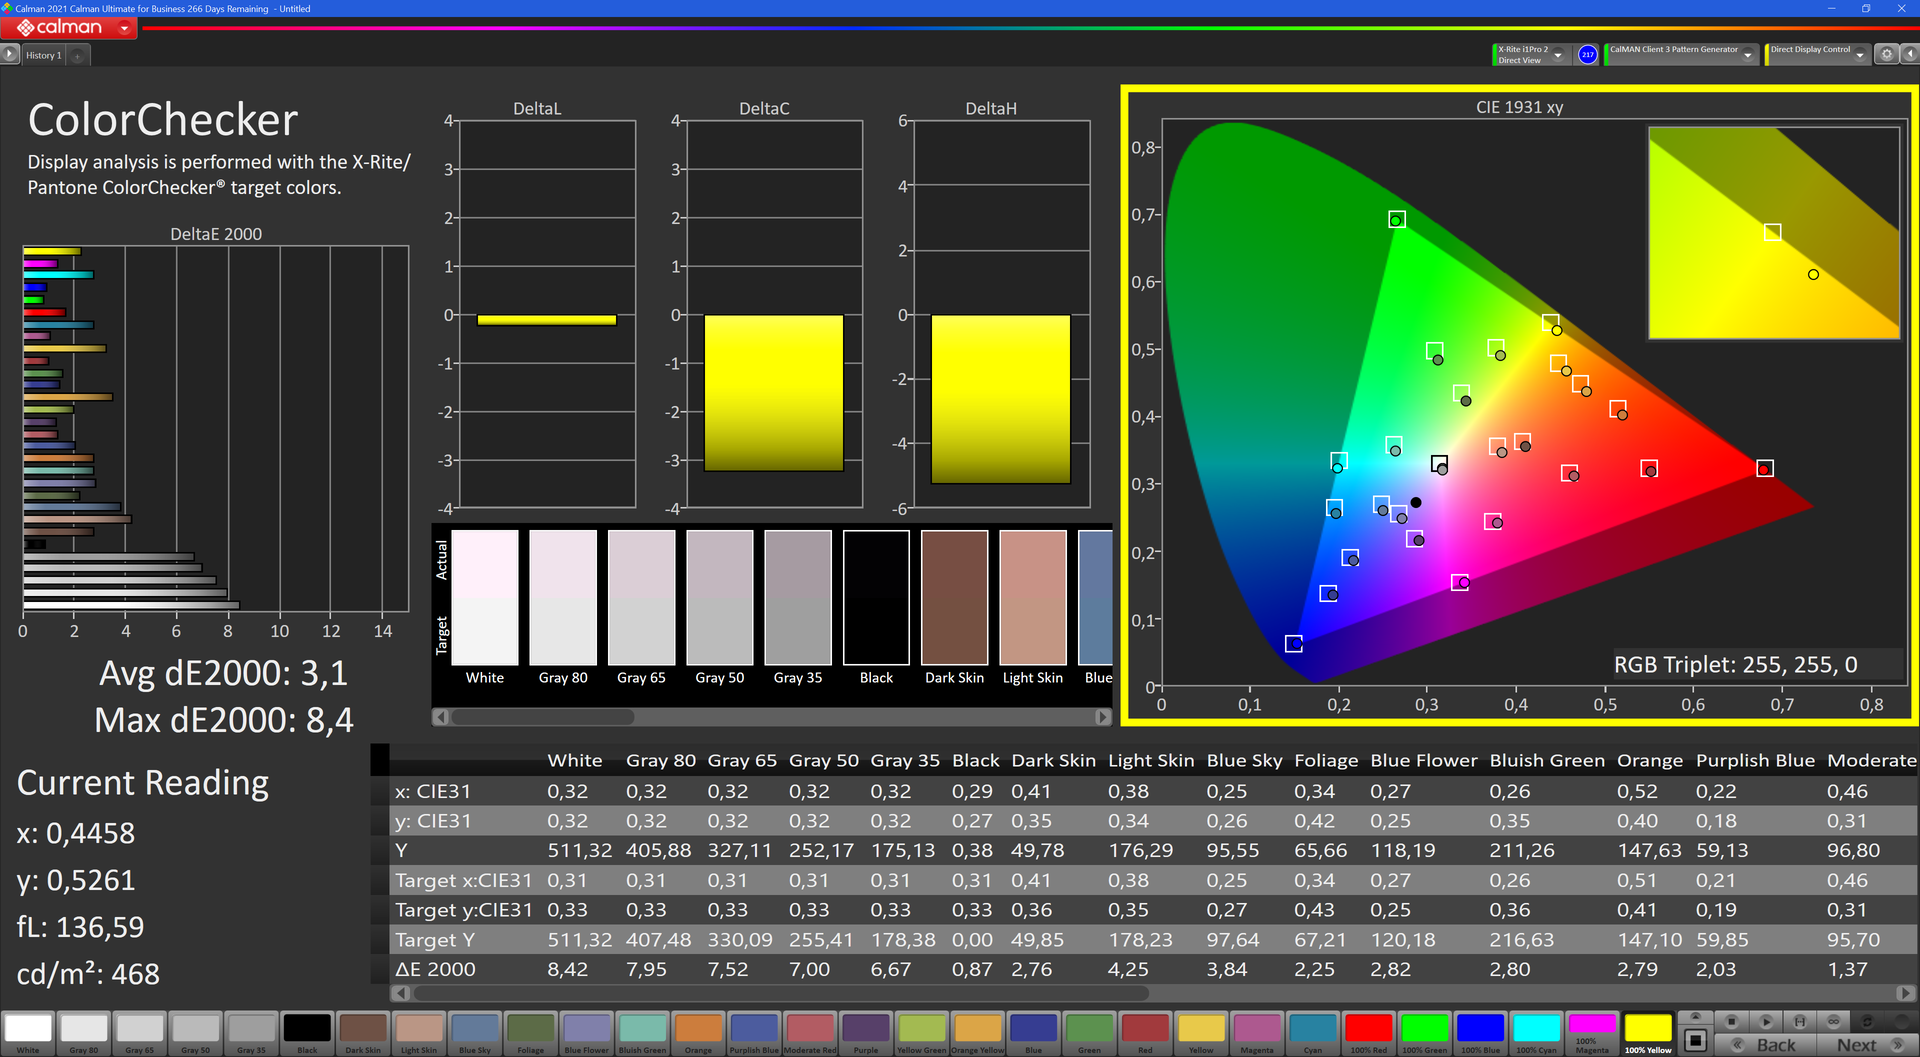
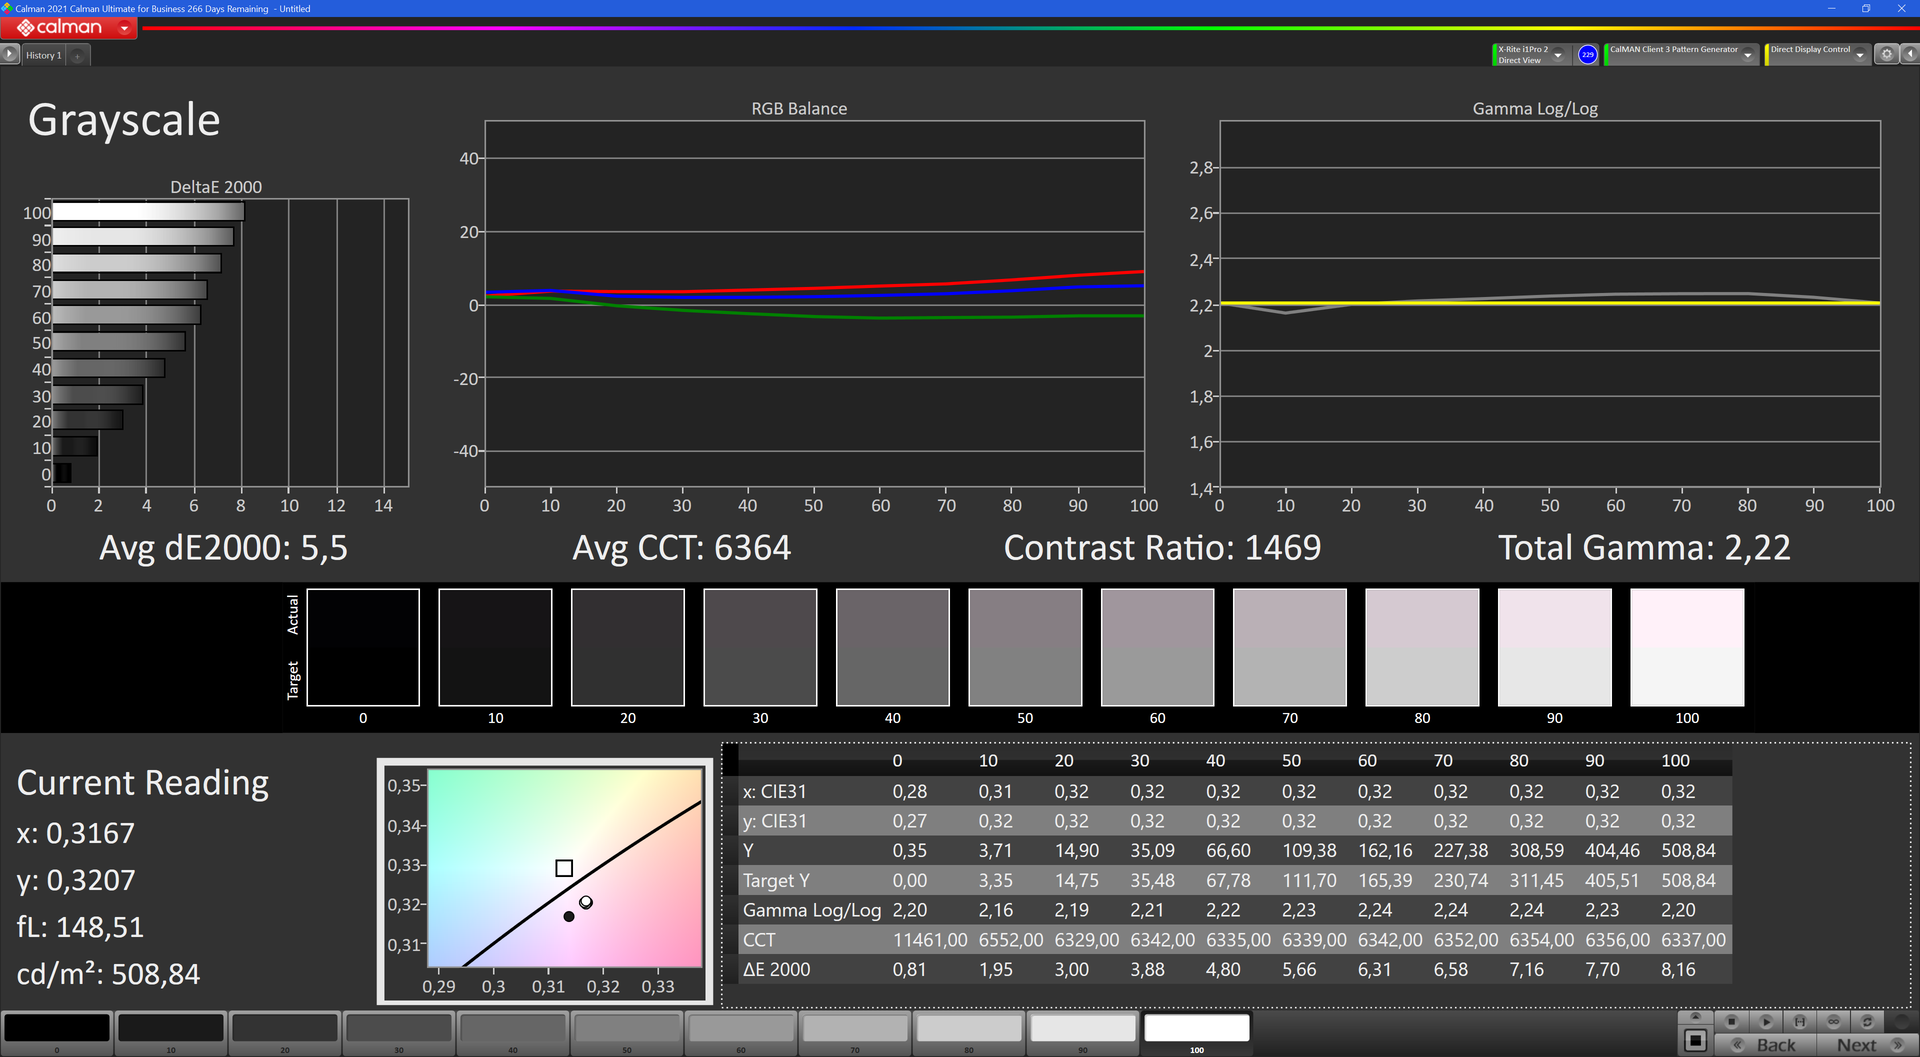
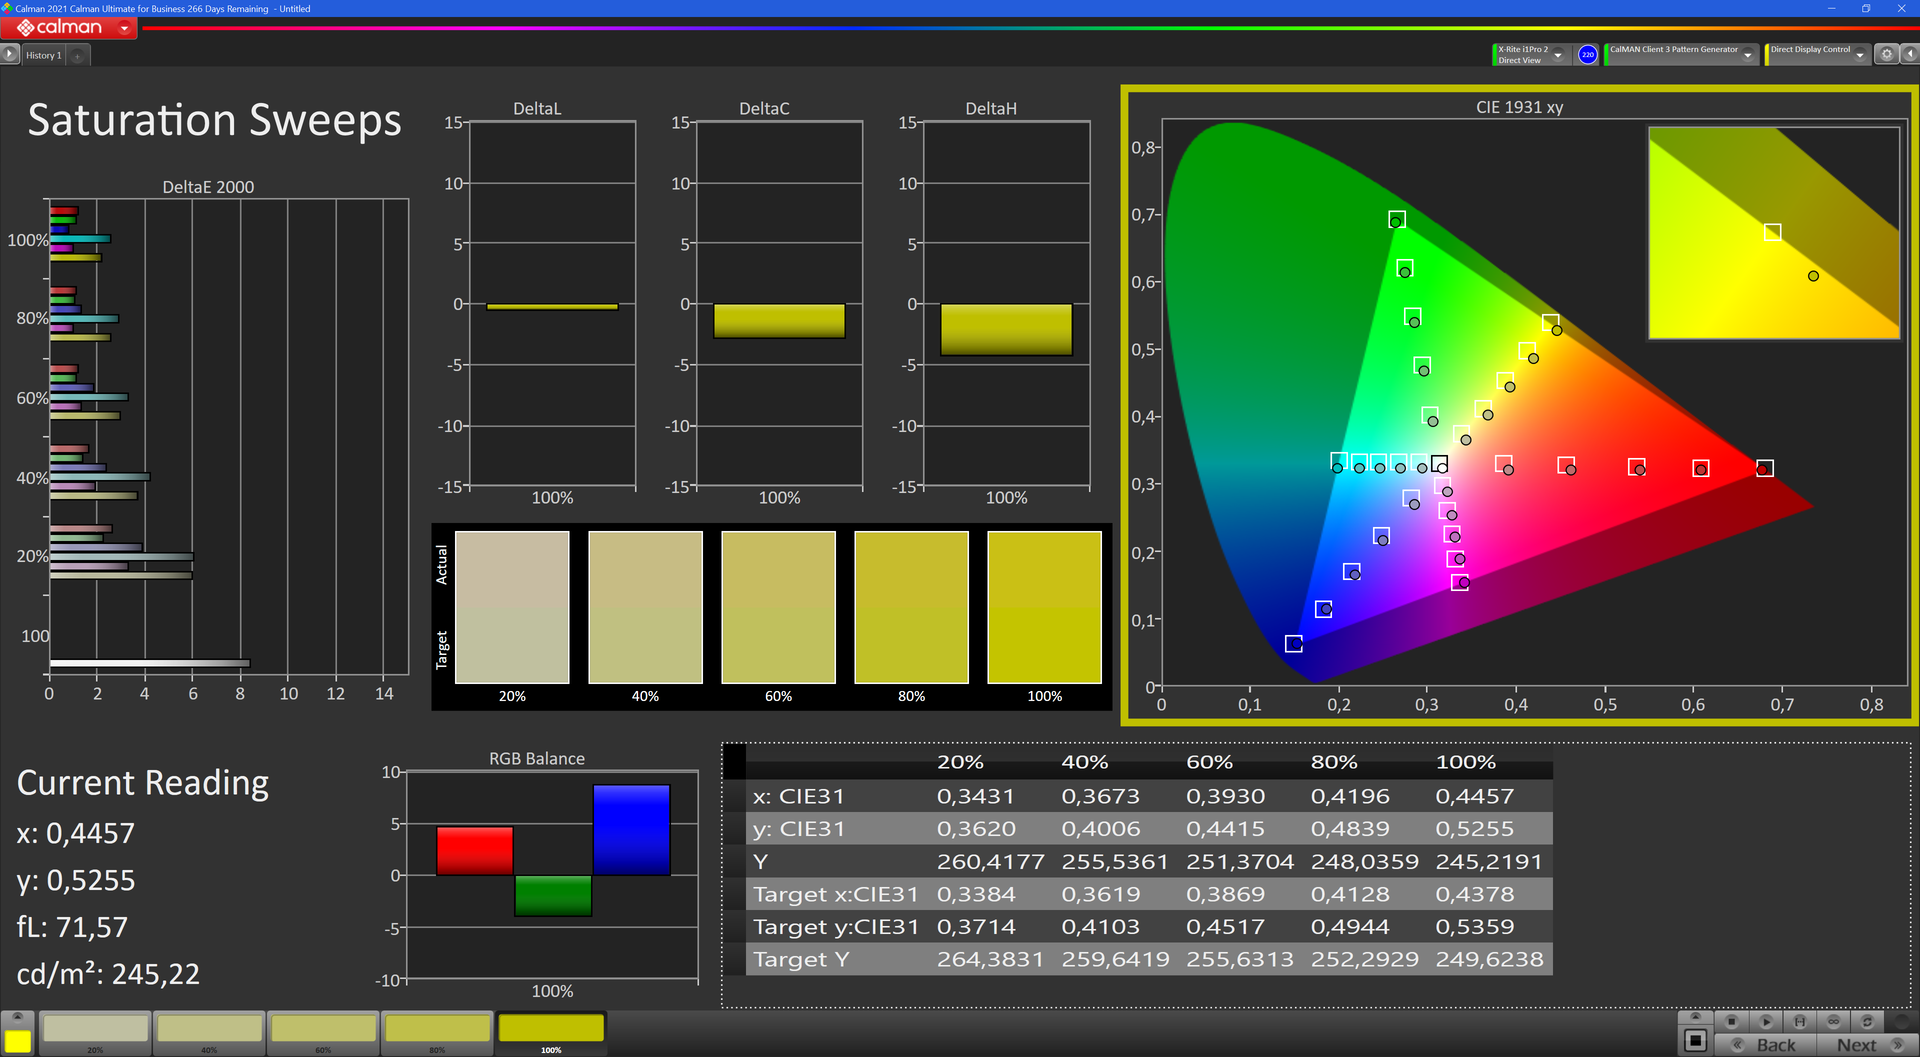
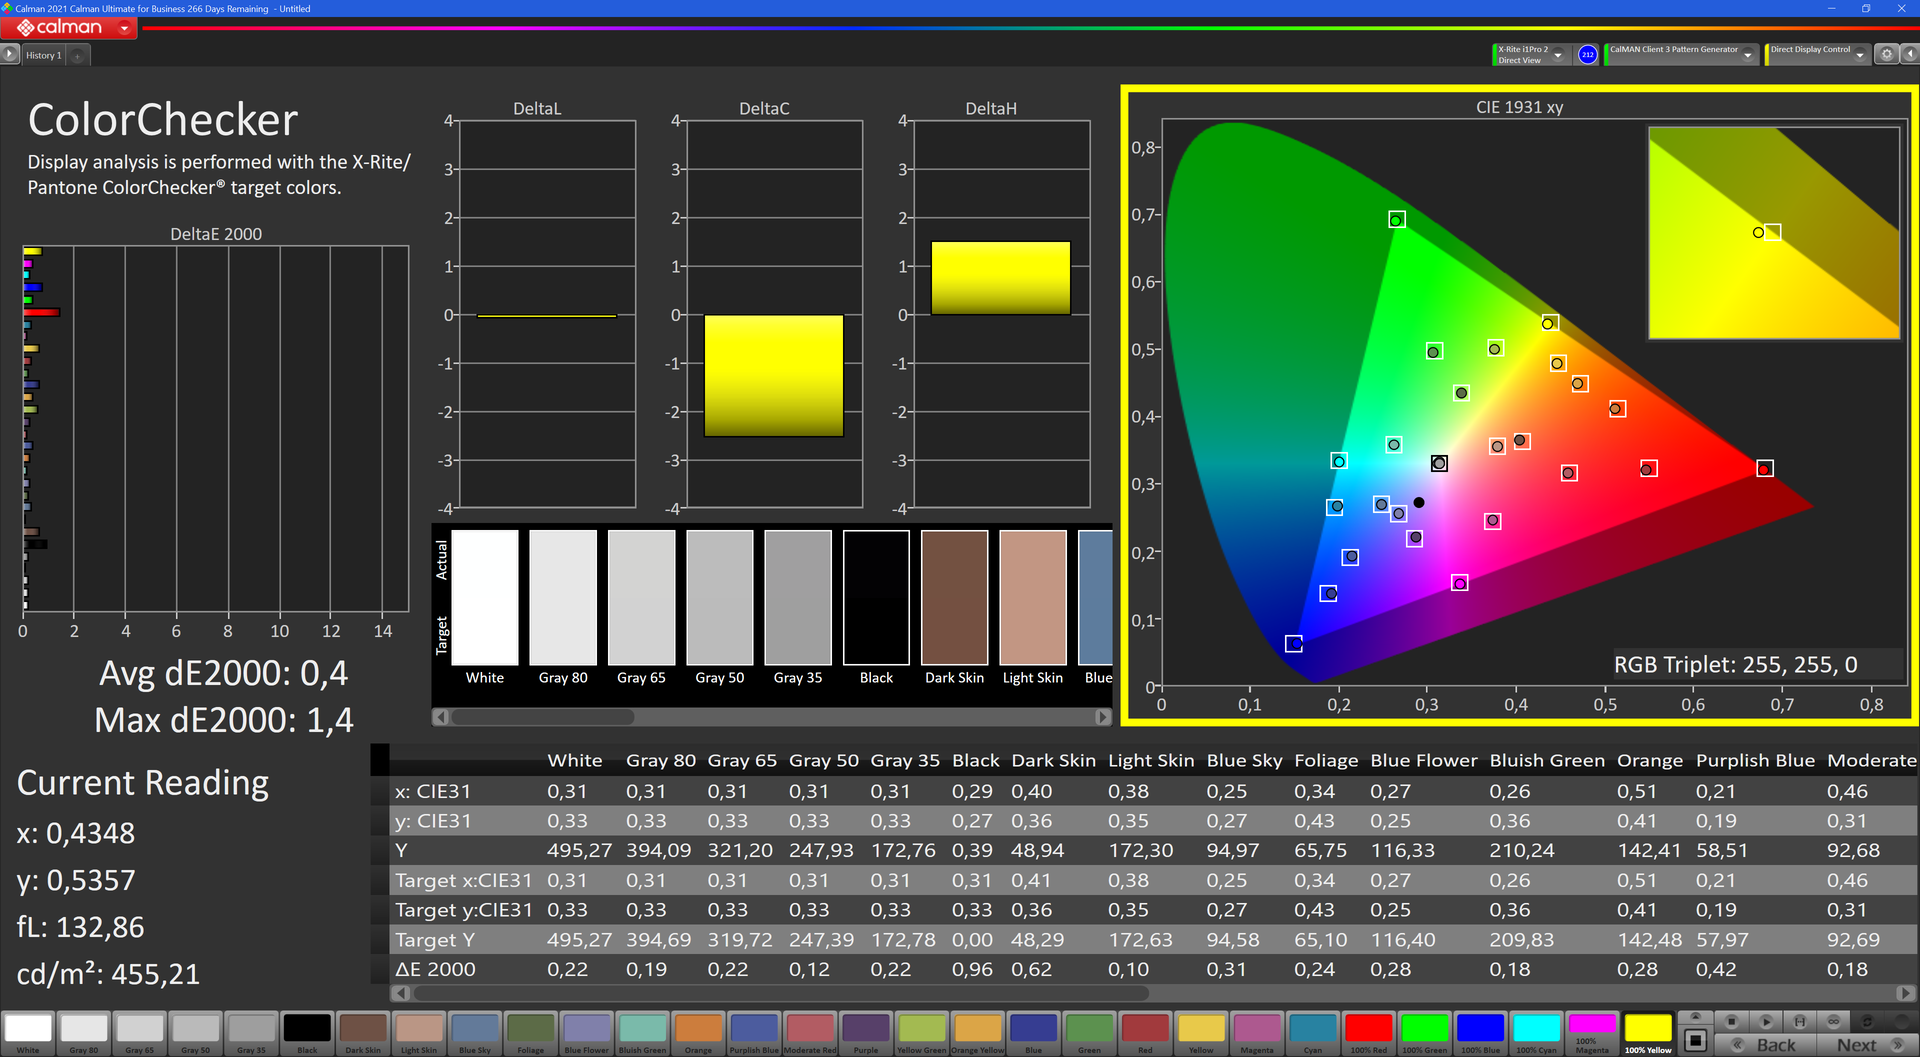
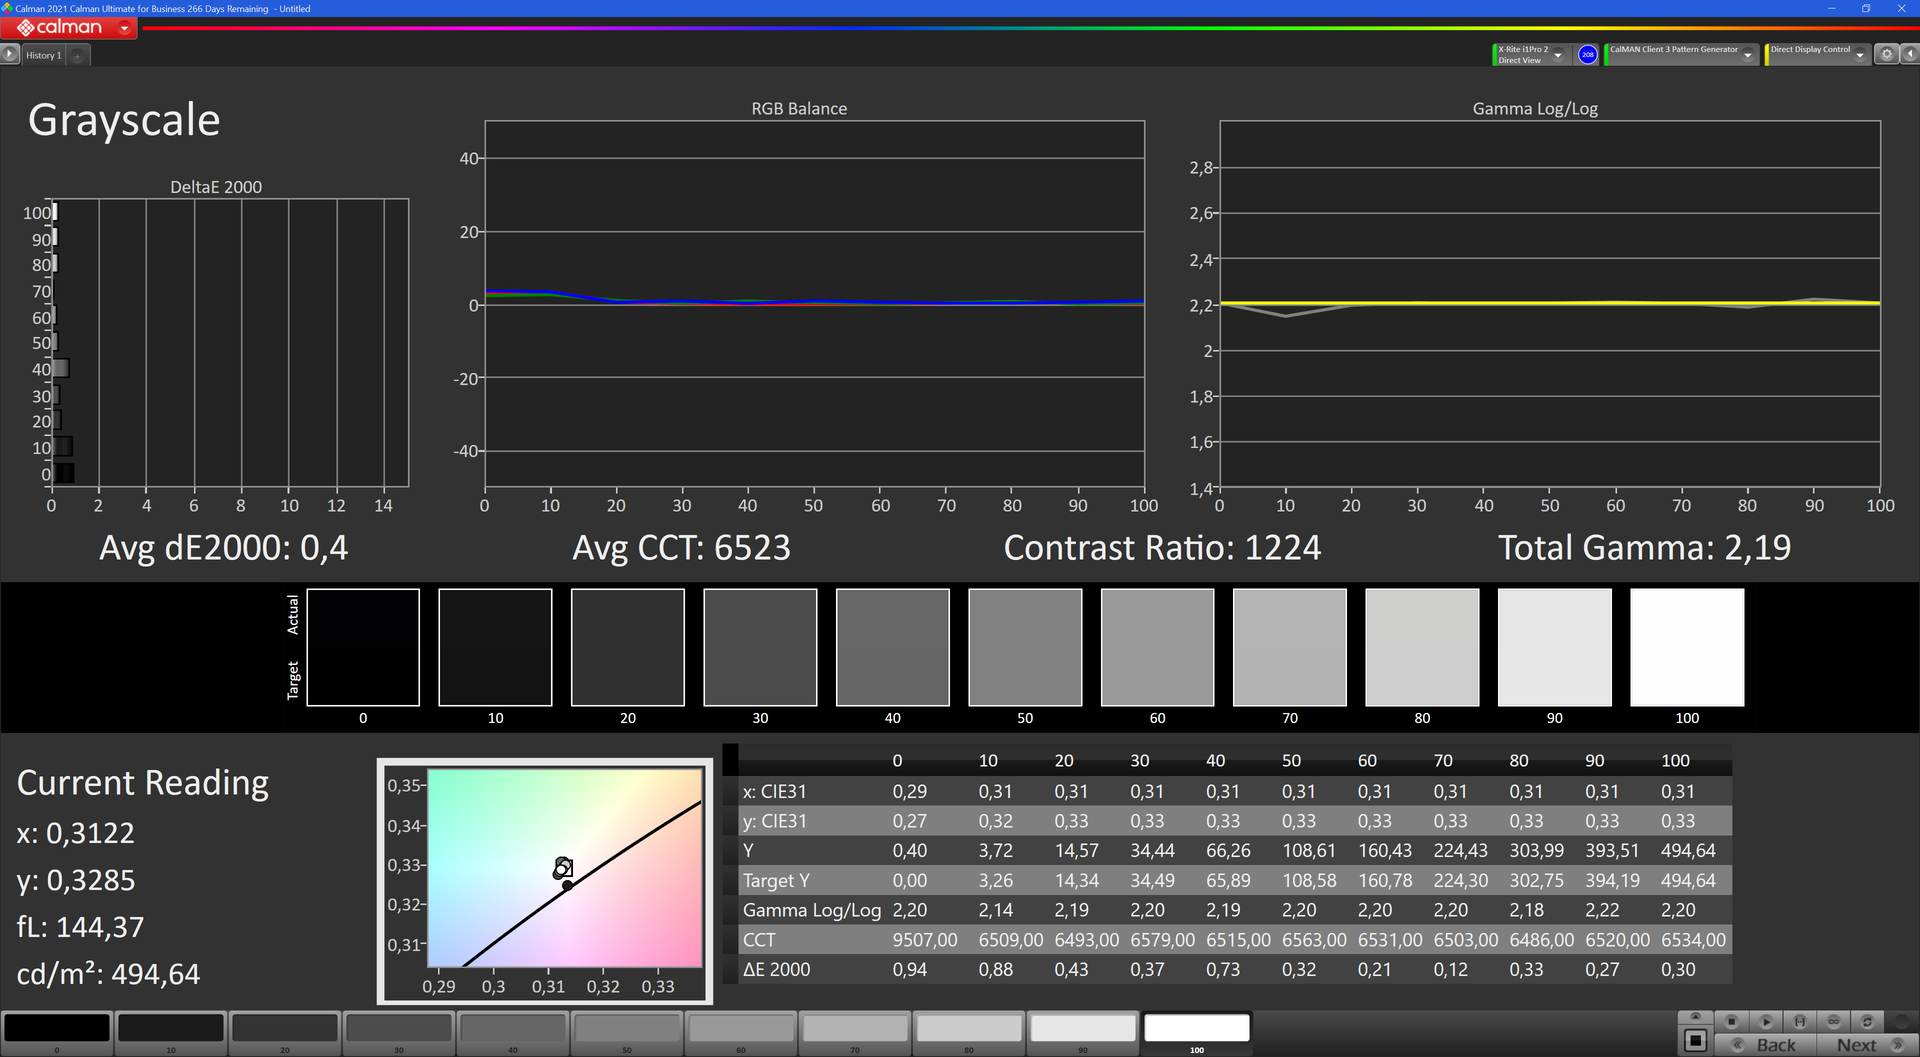
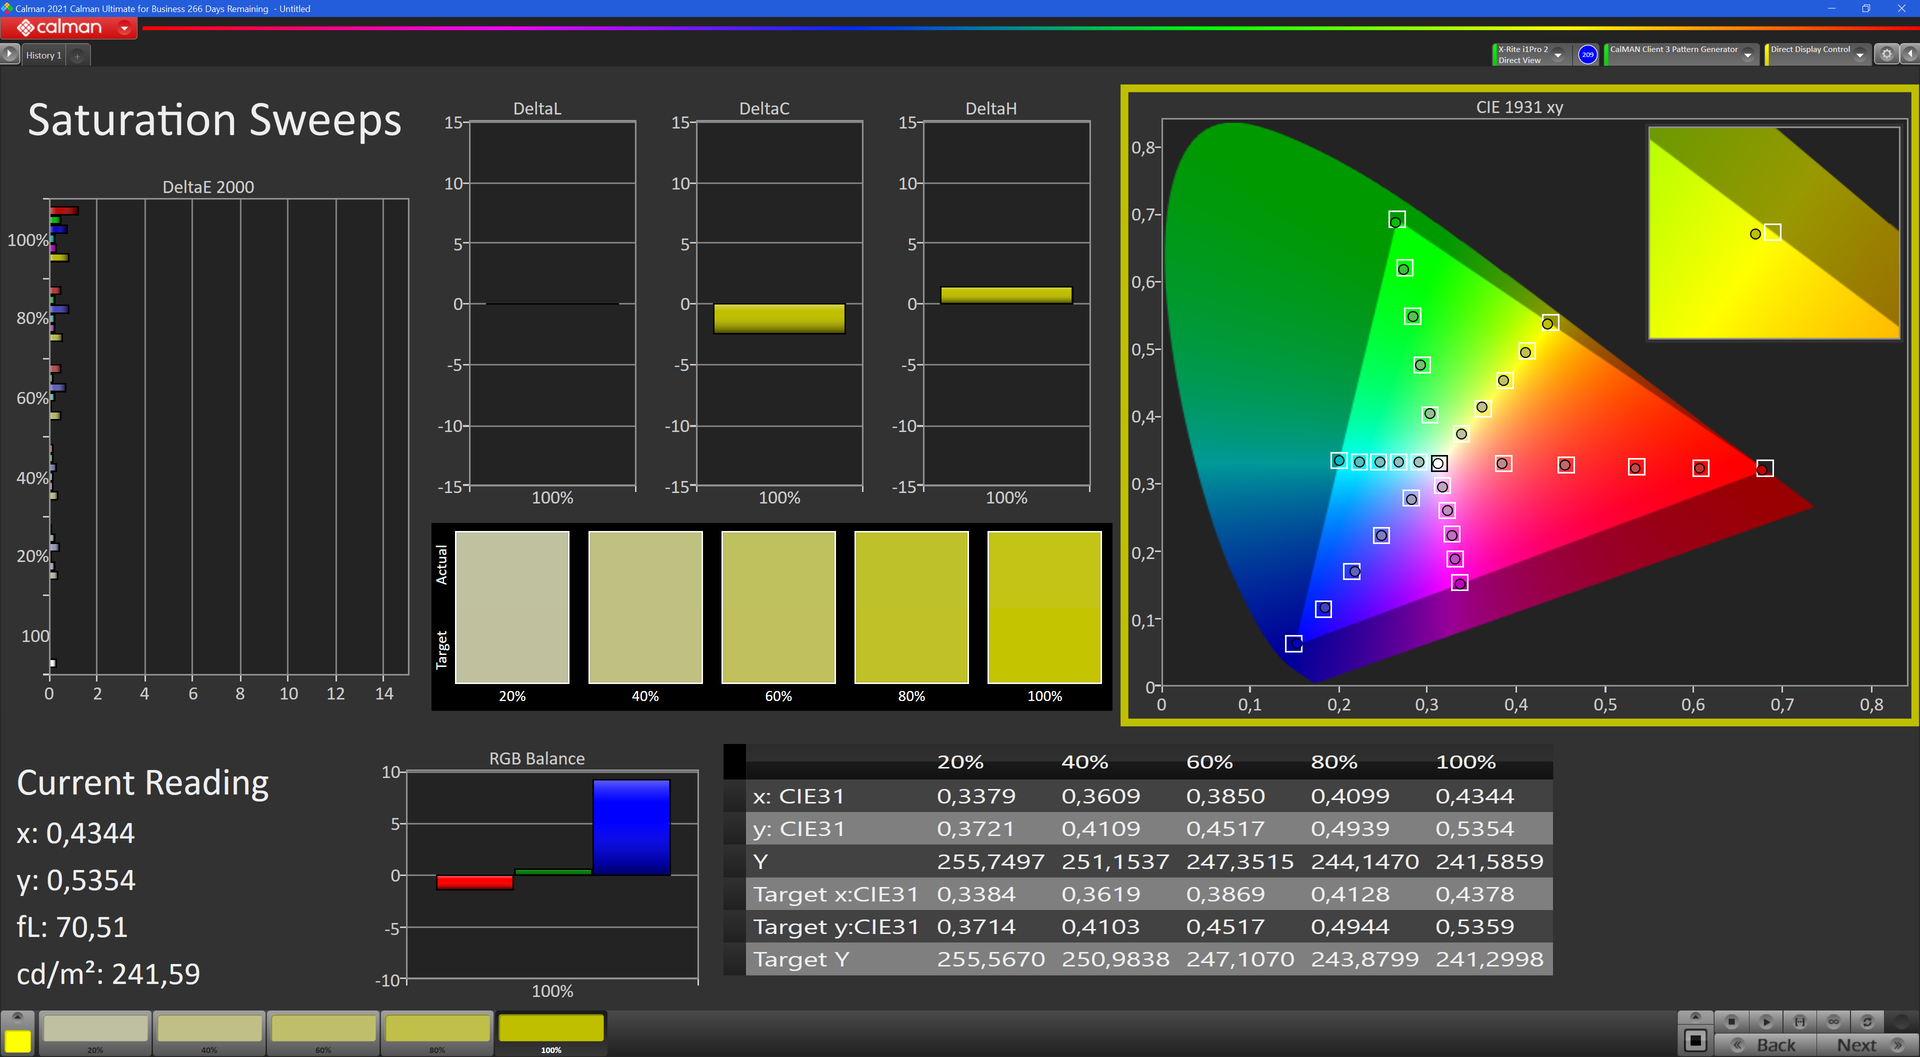
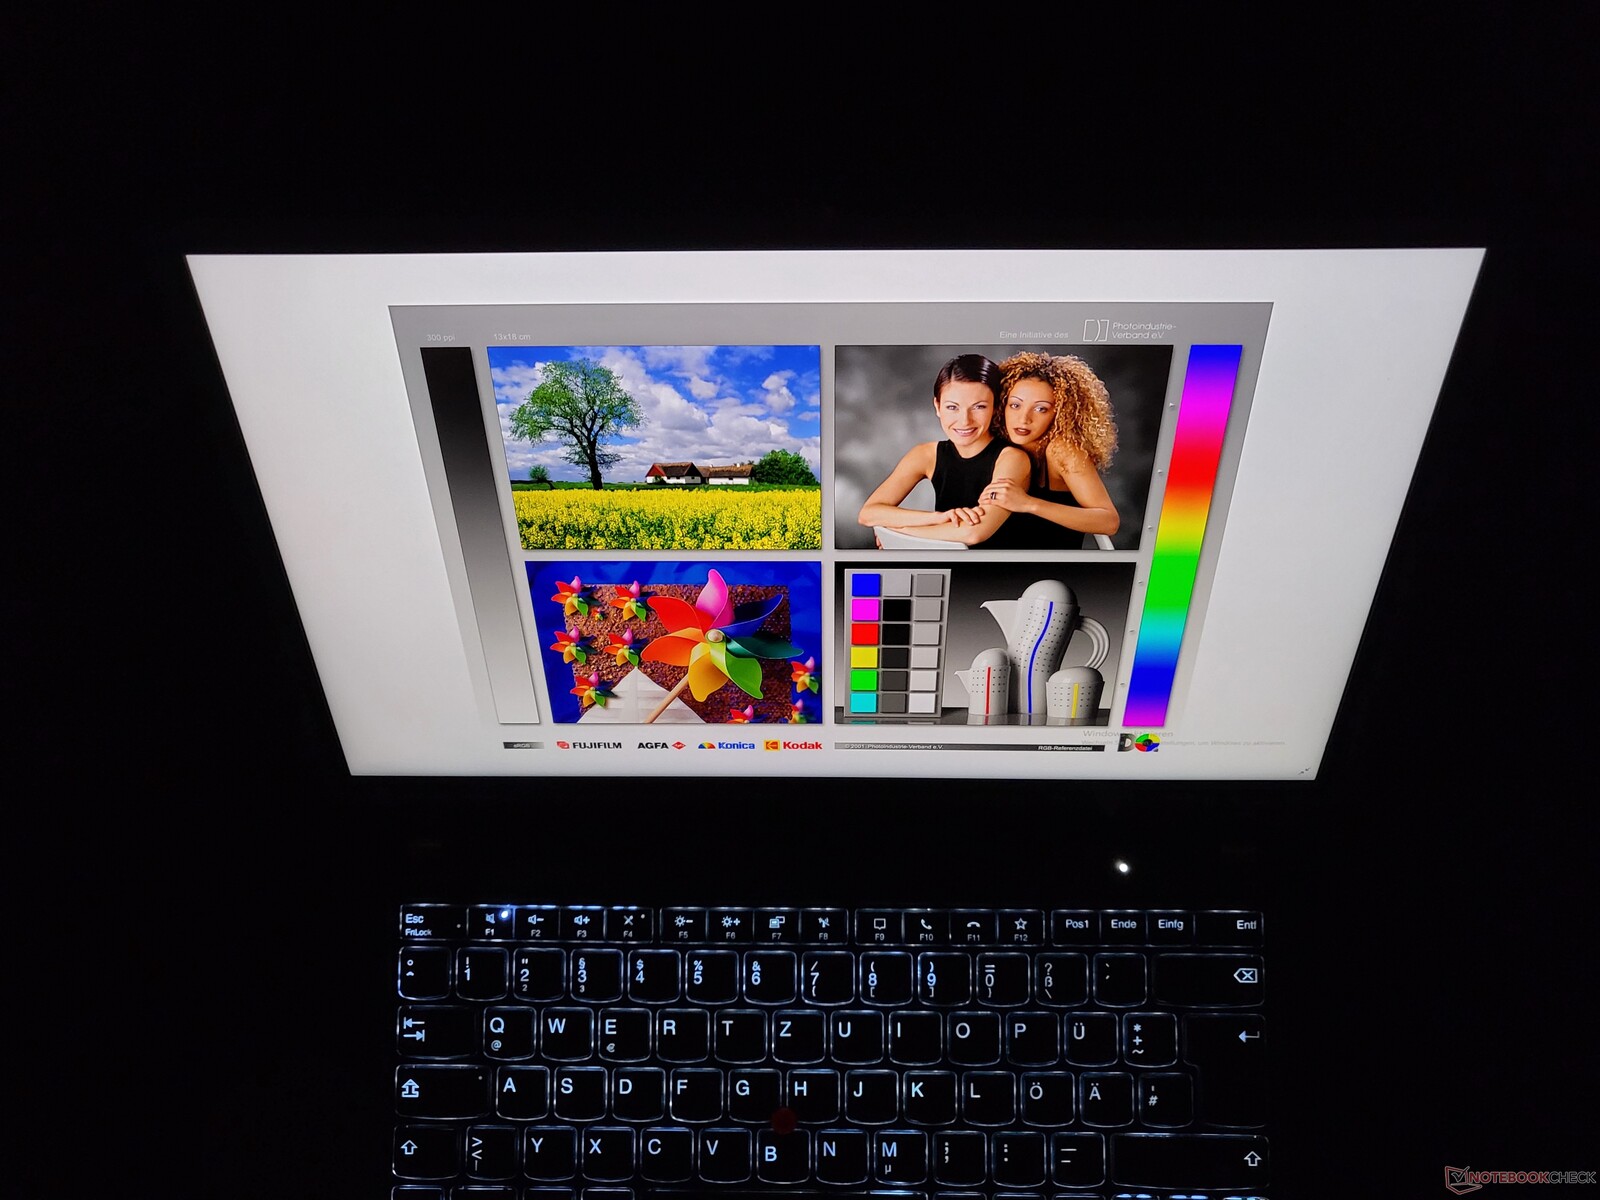
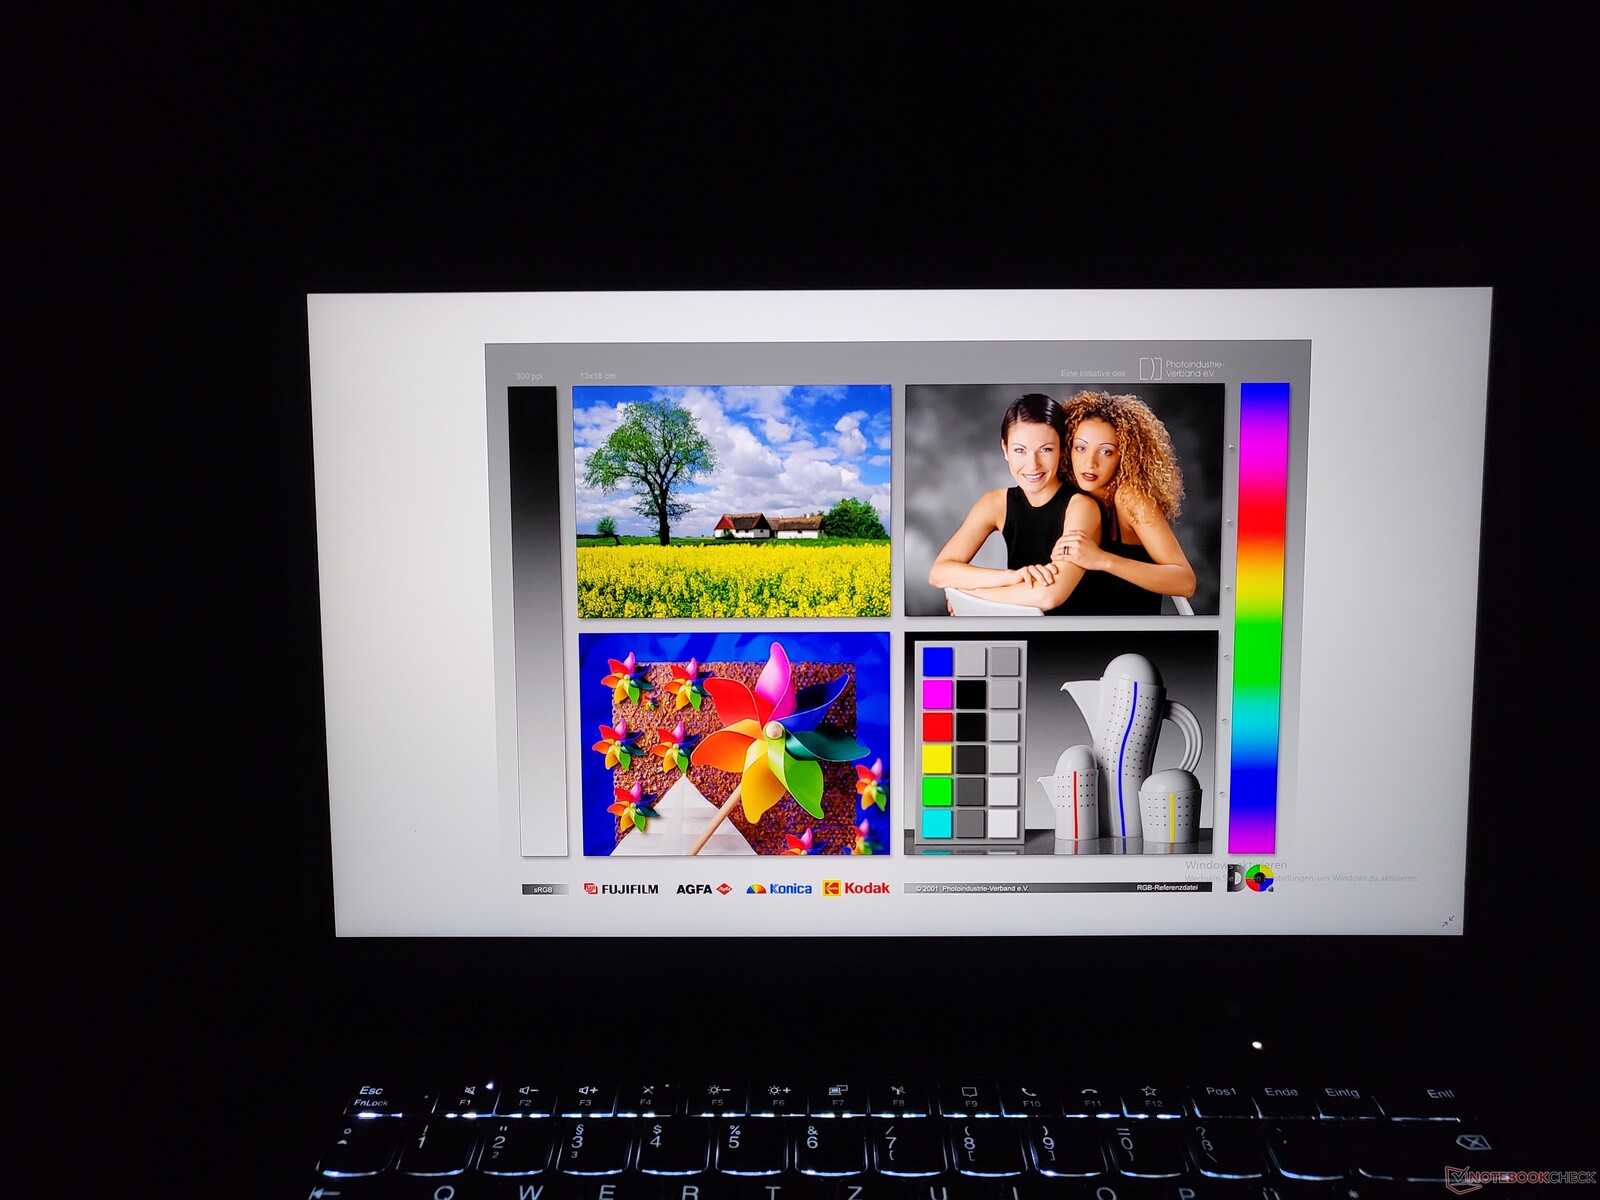
Even though the ThinkPad laptop is supposed to be already calibrated in the state of delivery, our measurements with the X-Rite i1 Pro 2 Colorimeter and Calman show a red tint. Our calibration using the X-Rite i1Profiler removed the tint. The created color profile is available for your free download as usual (see "Download ICC file" link above). After the calibration, the display is excellent, with a very sharp content display and vibrant colors, which is also due to the good contrast value.
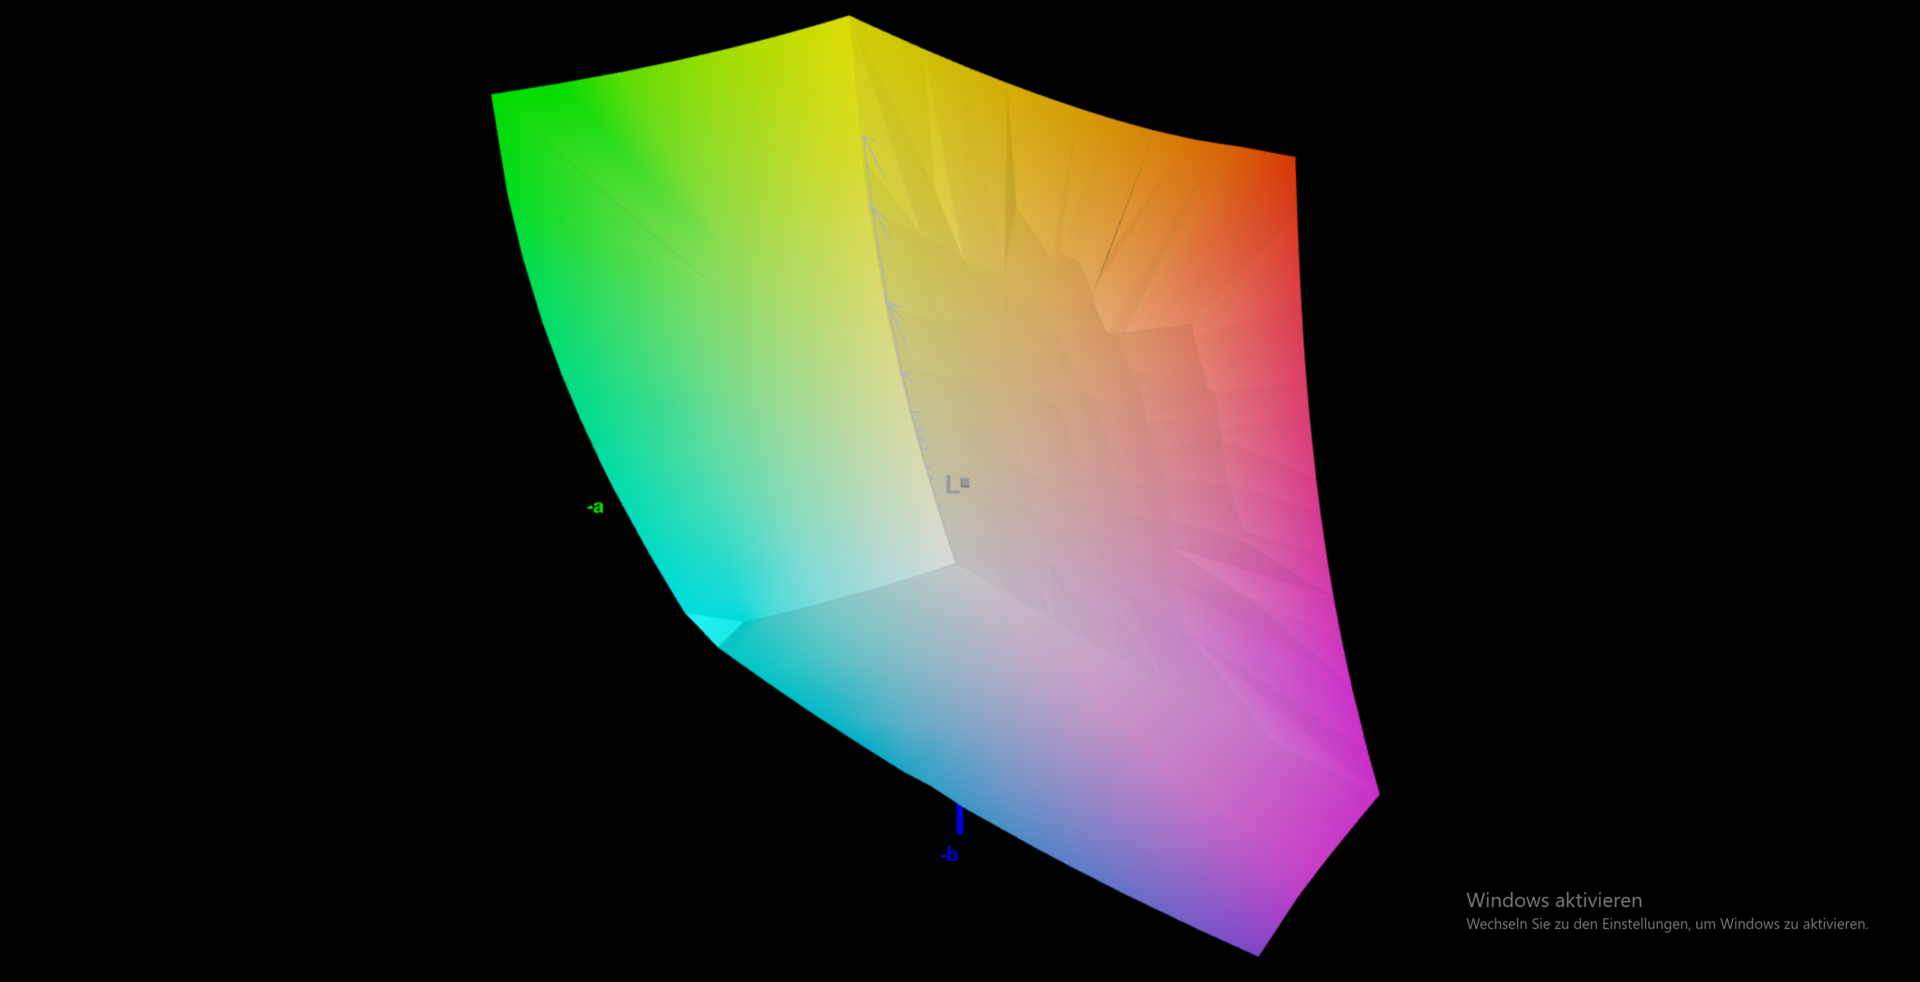
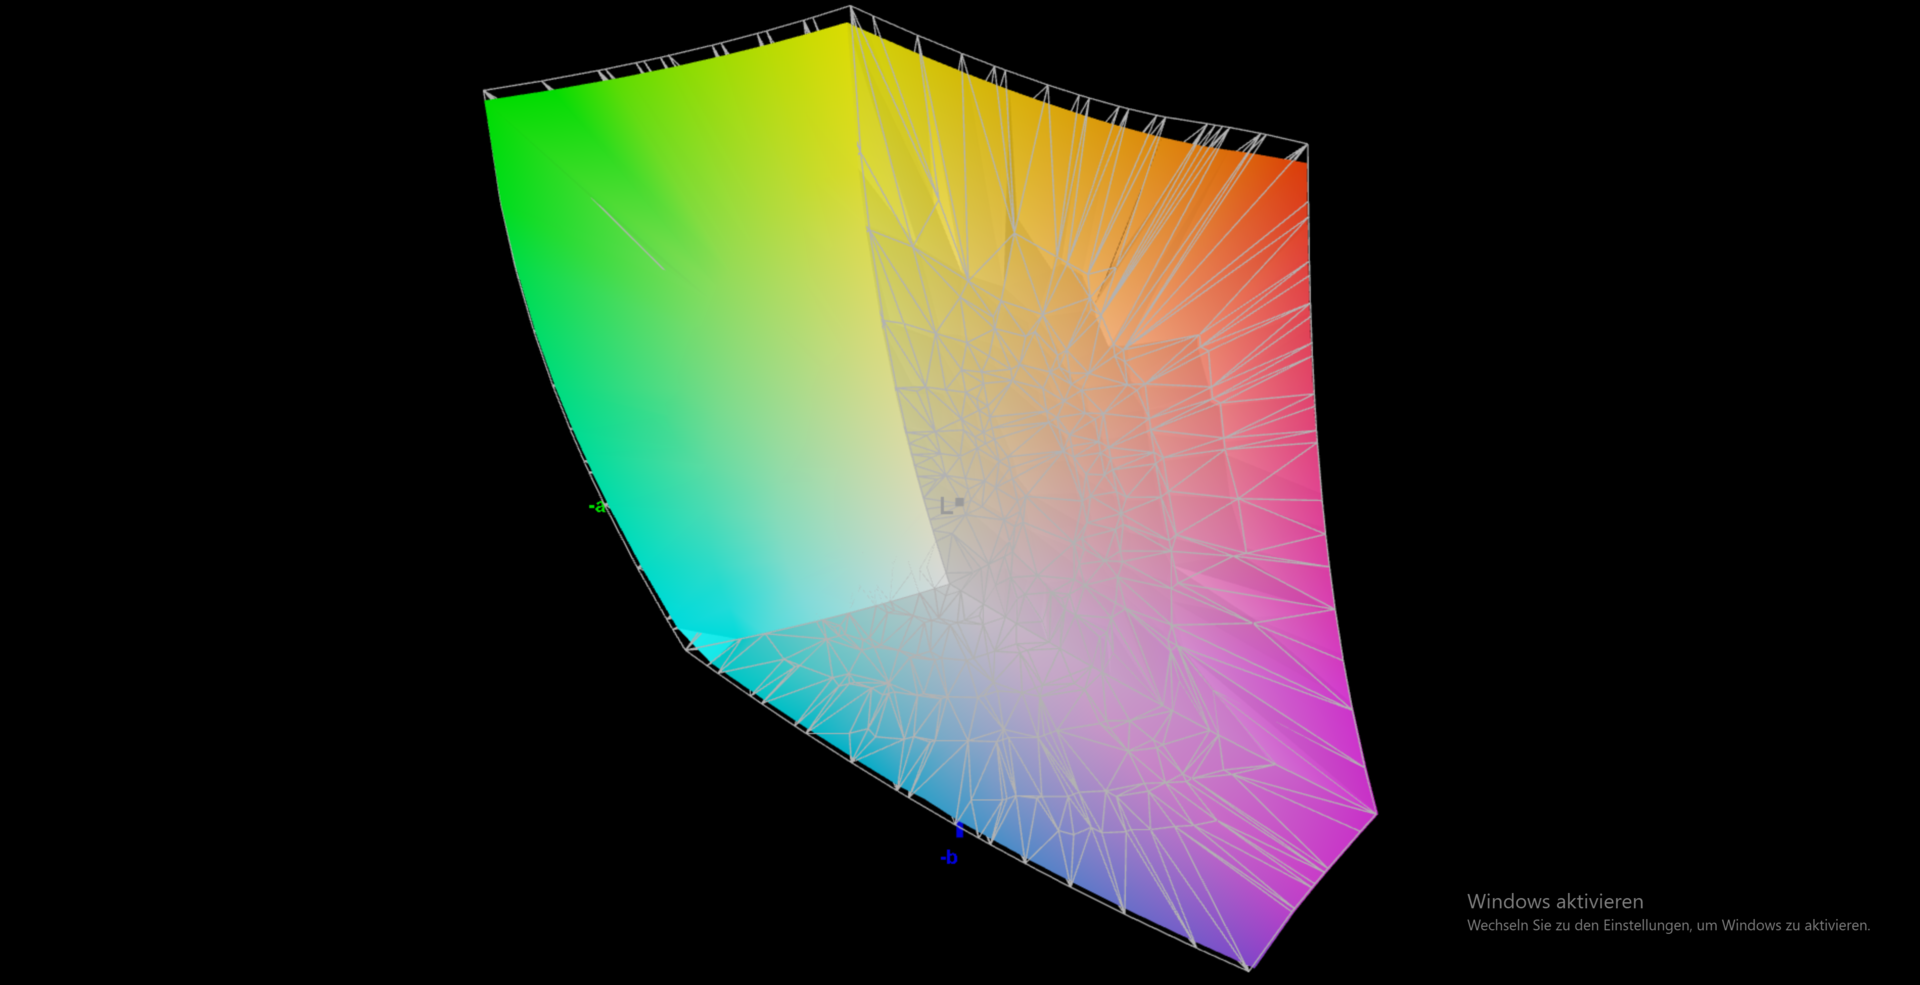
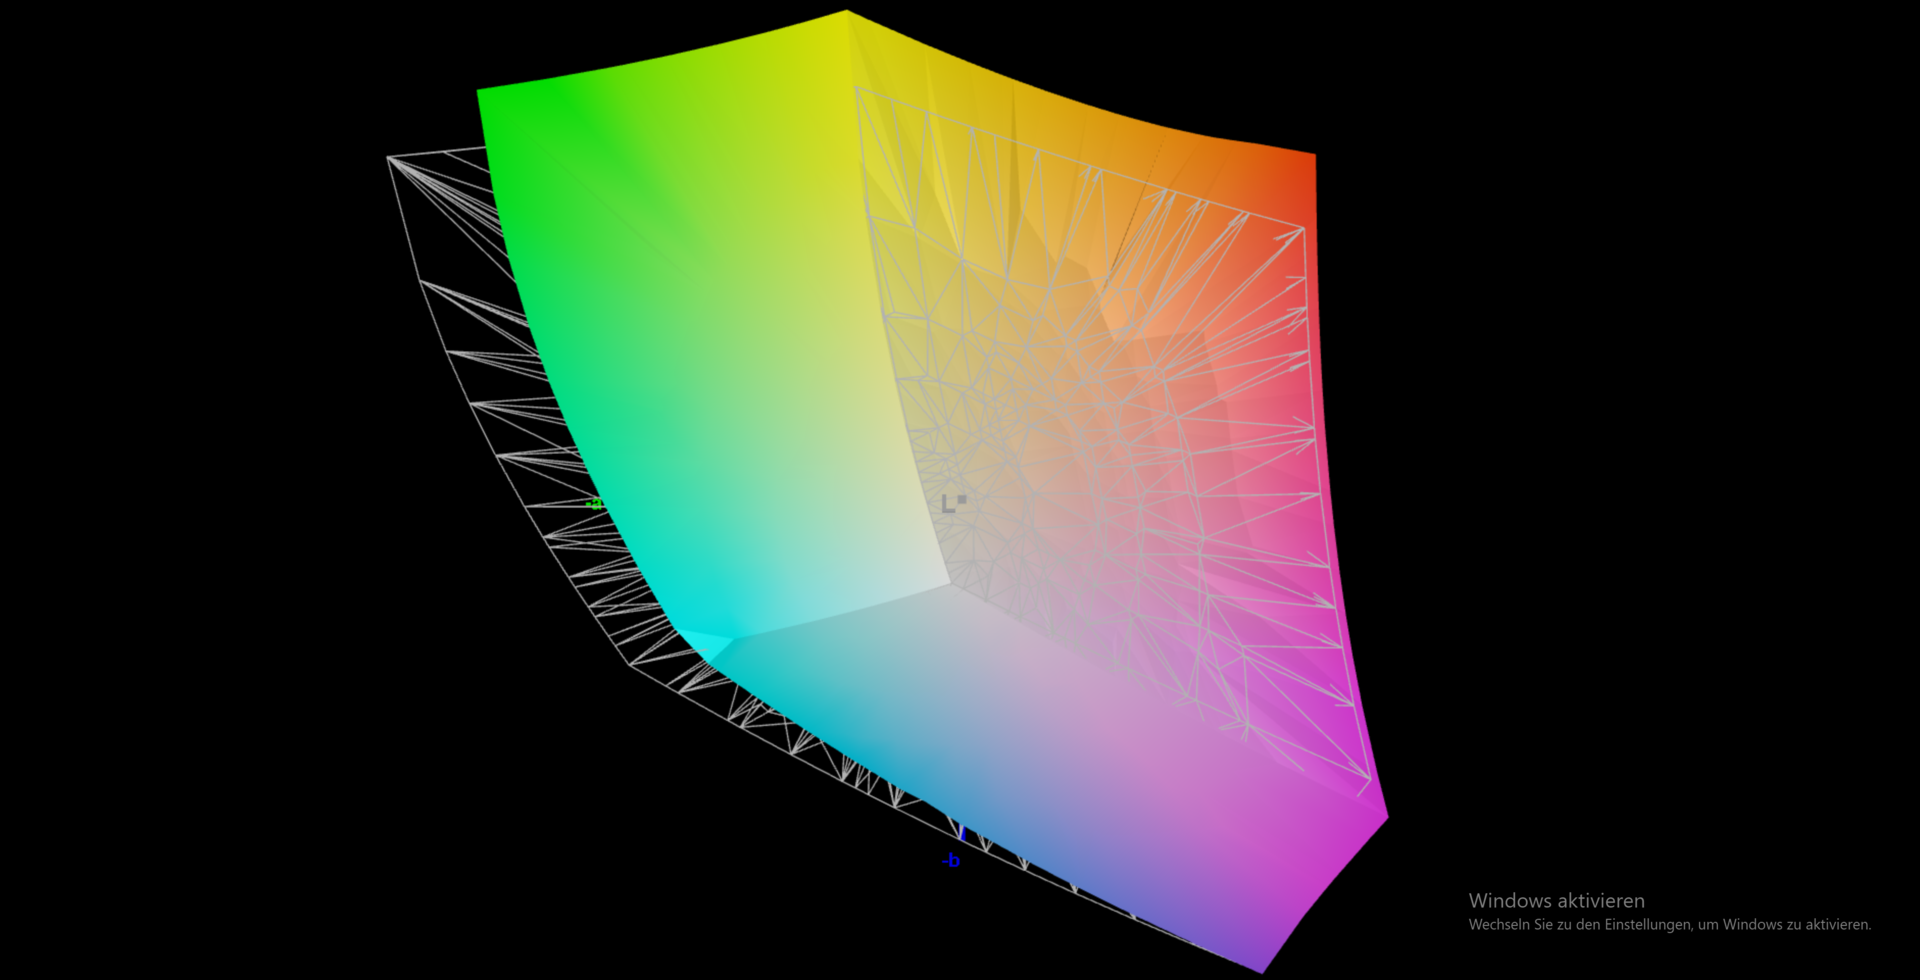
Not only is the sRGB color space covered completely, but the wide DCI-P3 color space is also almost completely covered as well at 96.8%. This means that we can definitely imagine using the Lenovo ThinkPad P14s G2 with its Ultra-HD LCD for image processing.
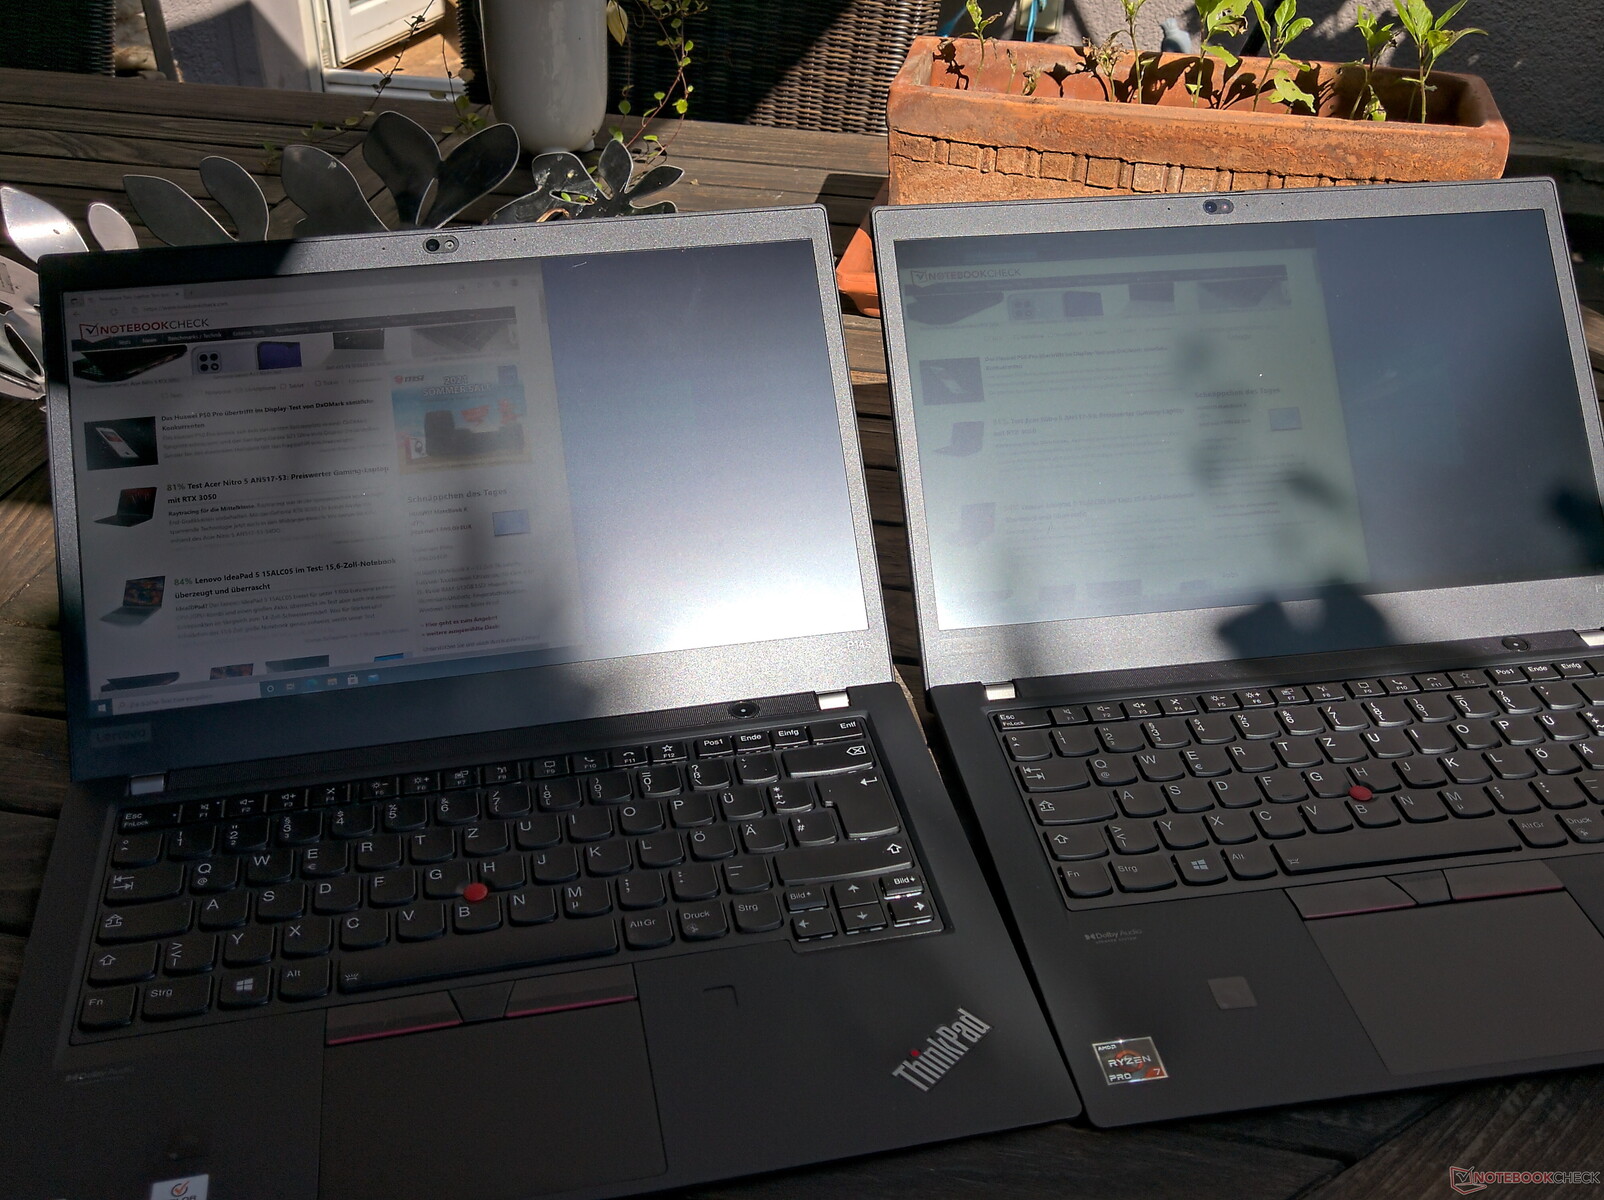
The matte surface is a great improvement for using the laptop outdoors. You don't have to worry about annoying reflections, and the high brightness makes working with it outdoors very comfortable. However, direct sunlight still creates some difficulties.
Display Response Times
| ↔ Response Time Black to White | ||
|---|---|---|
| 28 ms ... rise ↗ and fall ↘ combined | ↗ 13 ms rise | 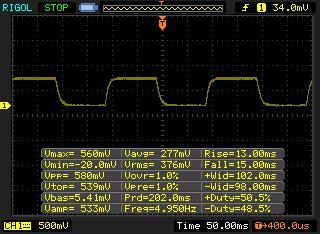 |
| ↘ 15 ms fall | ||
| The screen shows relatively slow response rates in our tests and may be too slow for gamers. In comparison, all tested devices range from 0.1 (minimum) to 240 (maximum) ms. » 71 % of all devices are better. This means that the measured response time is worse than the average of all tested devices (19.8 ms). | ||
| ↔ Response Time 50% Grey to 80% Grey | ||
| 52 ms ... rise ↗ and fall ↘ combined | ↗ 26 ms rise | 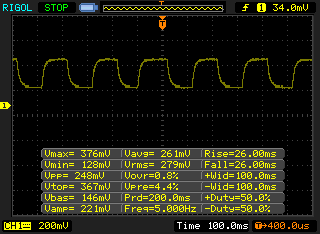 |
| ↘ 26 ms fall | ||
| The screen shows slow response rates in our tests and will be unsatisfactory for gamers. In comparison, all tested devices range from 0.165 (minimum) to 636 (maximum) ms. » 88 % of all devices are better. This means that the measured response time is worse than the average of all tested devices (31 ms). | ||
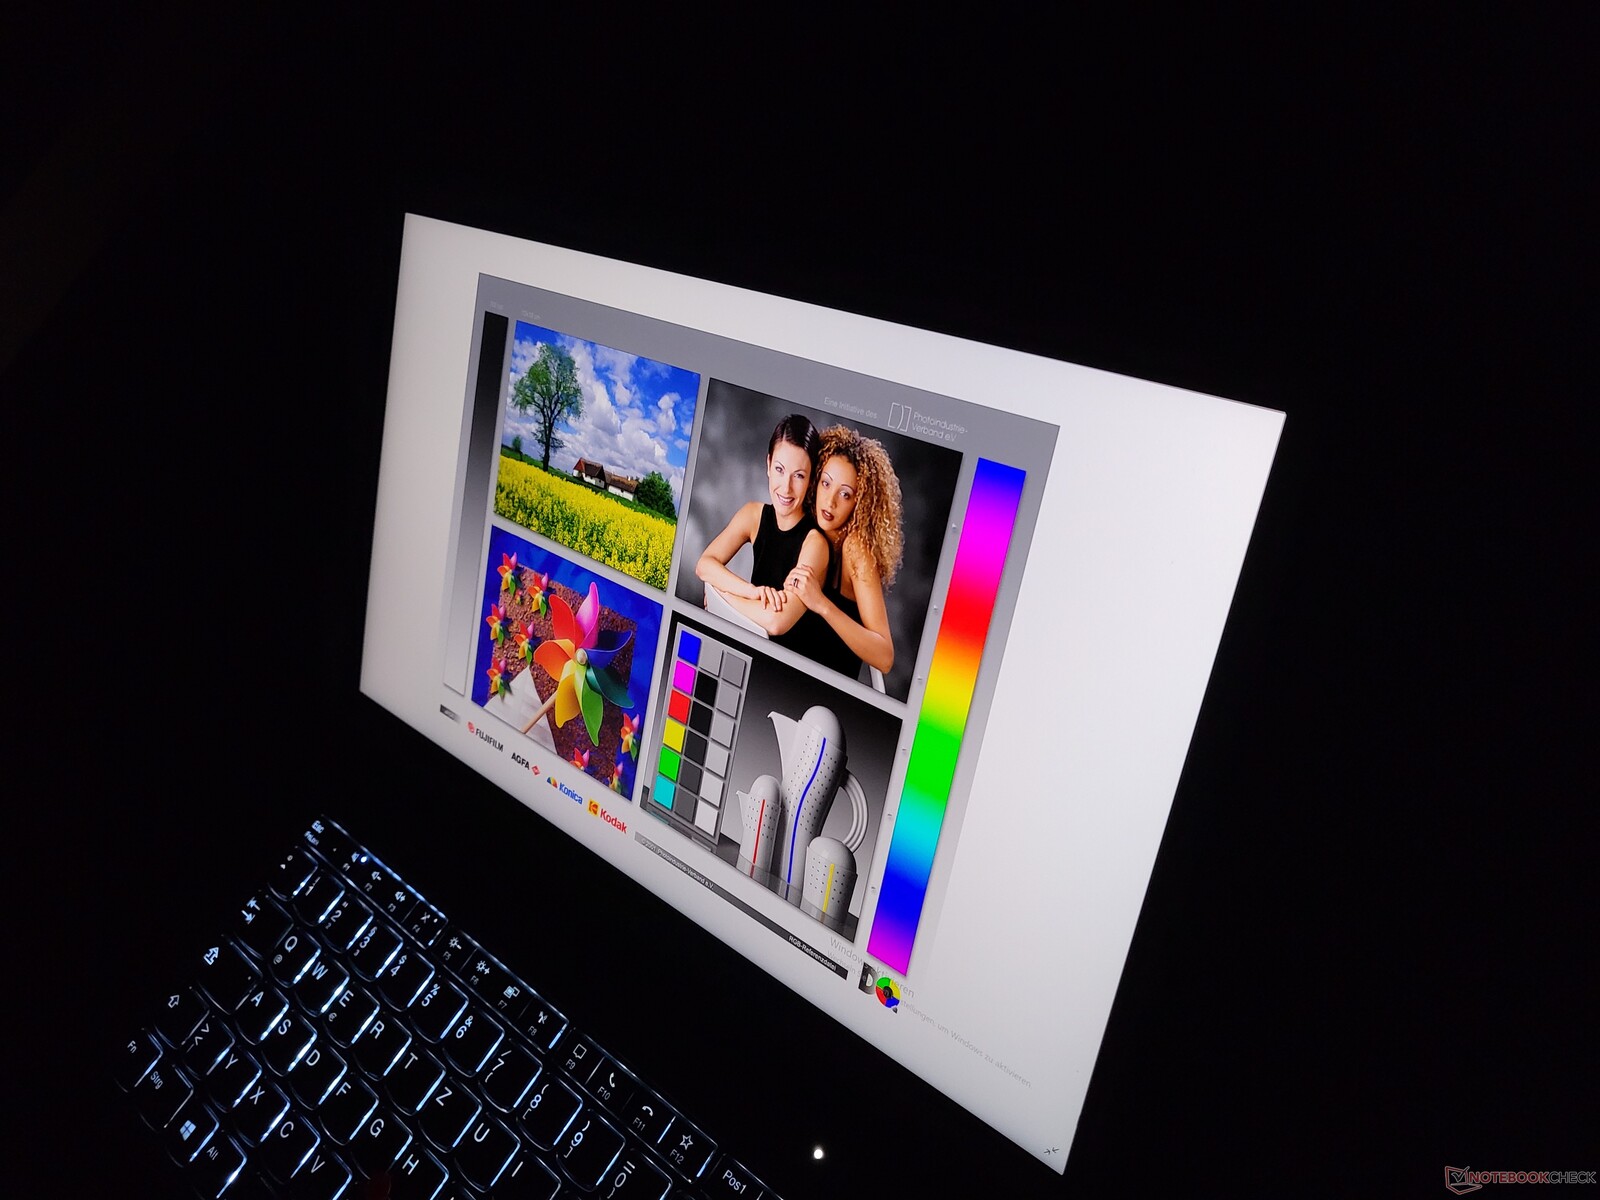
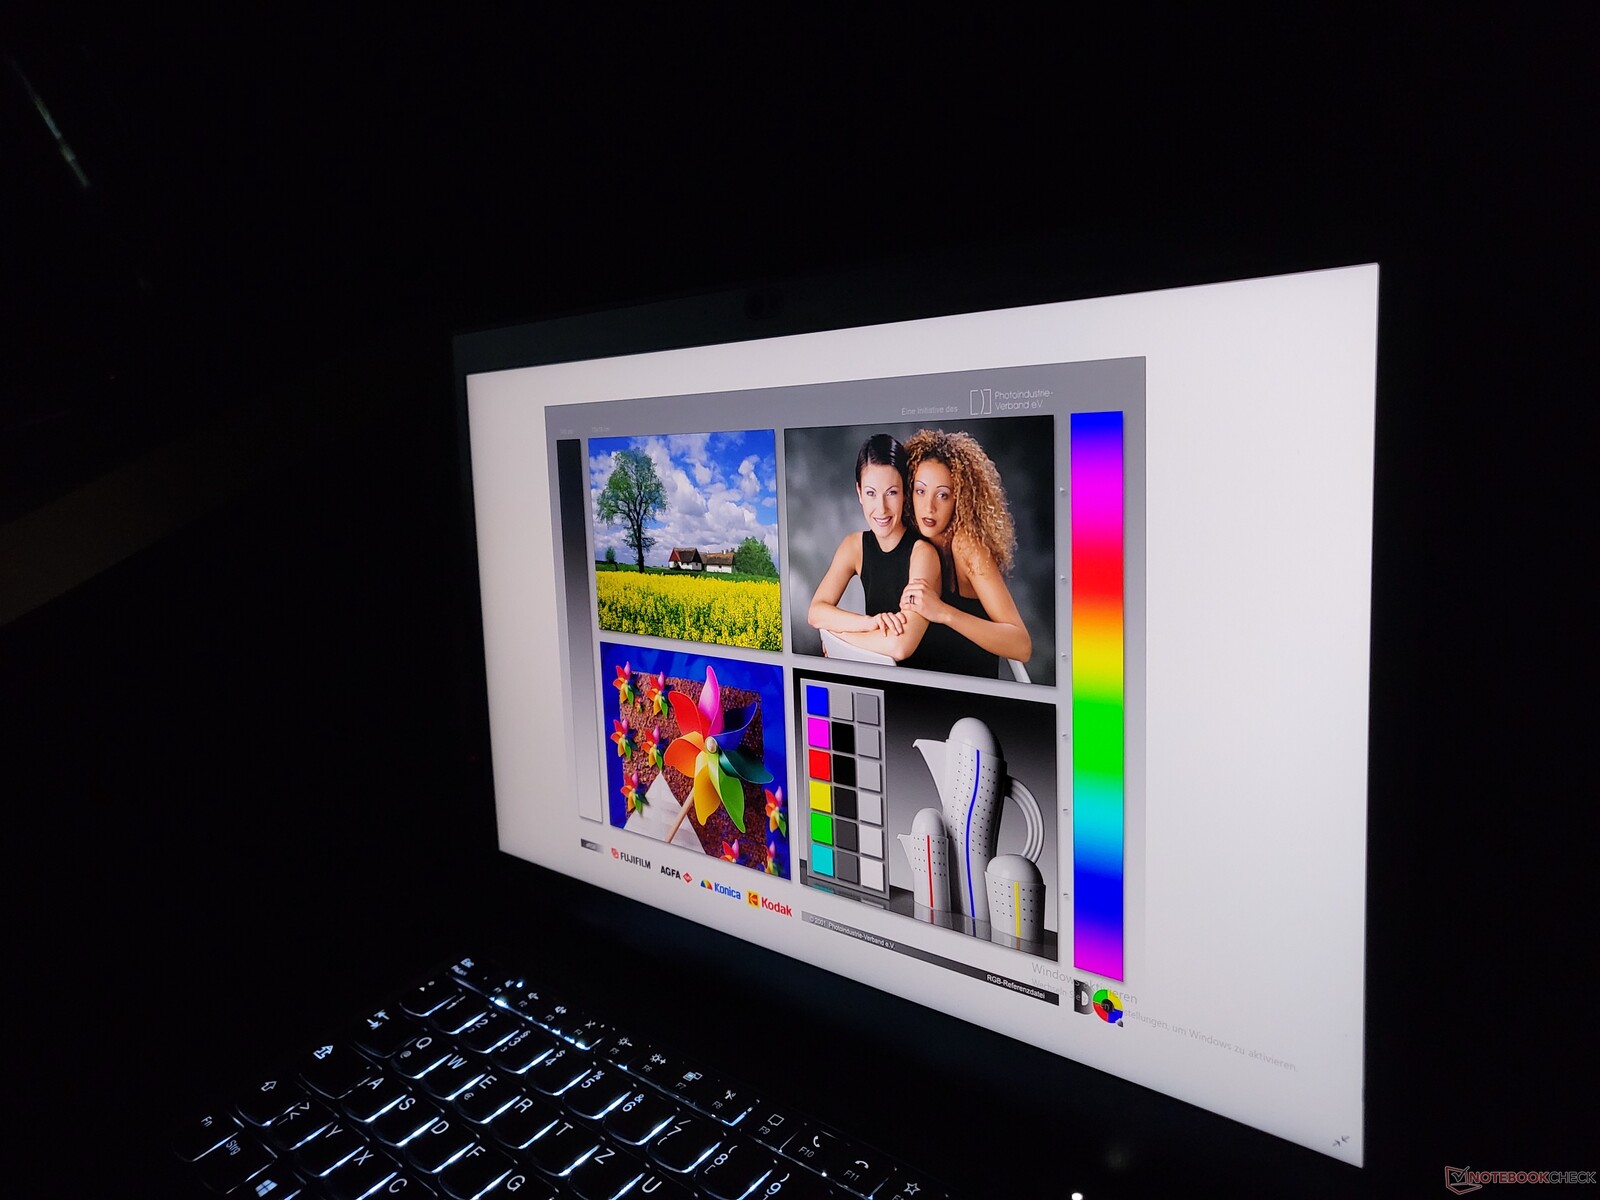
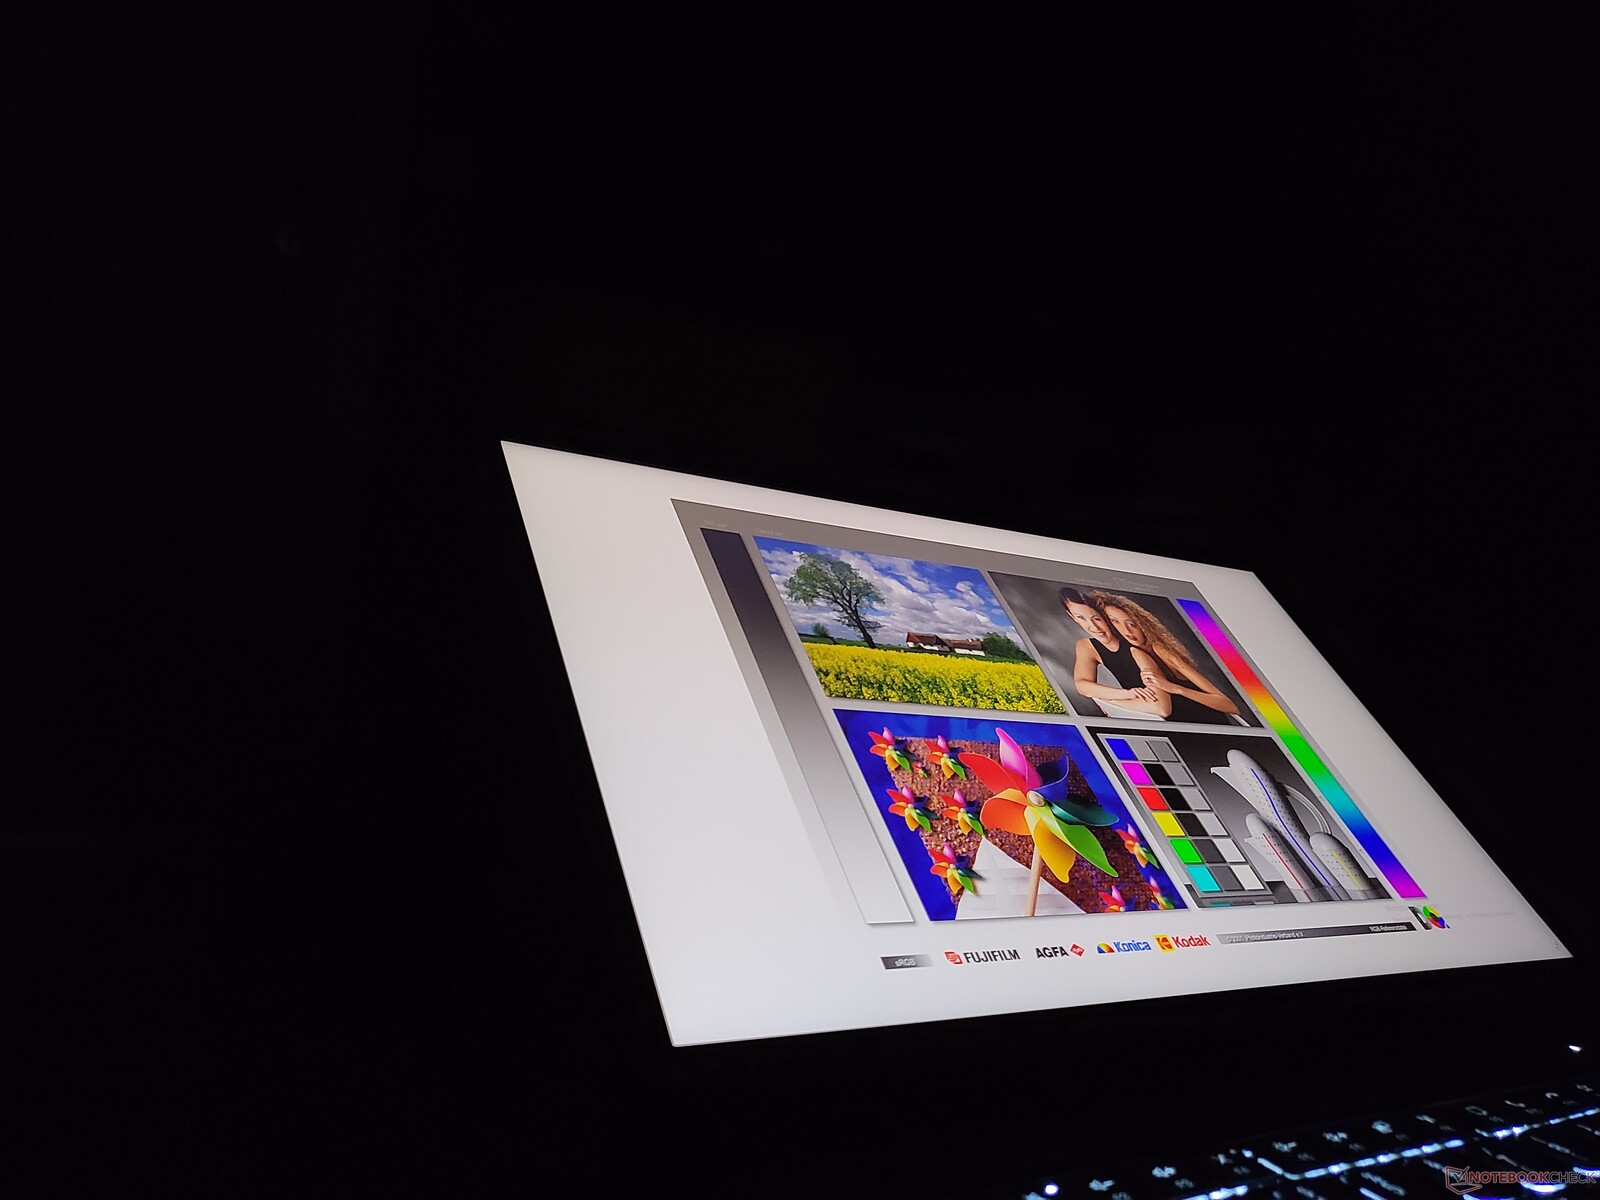
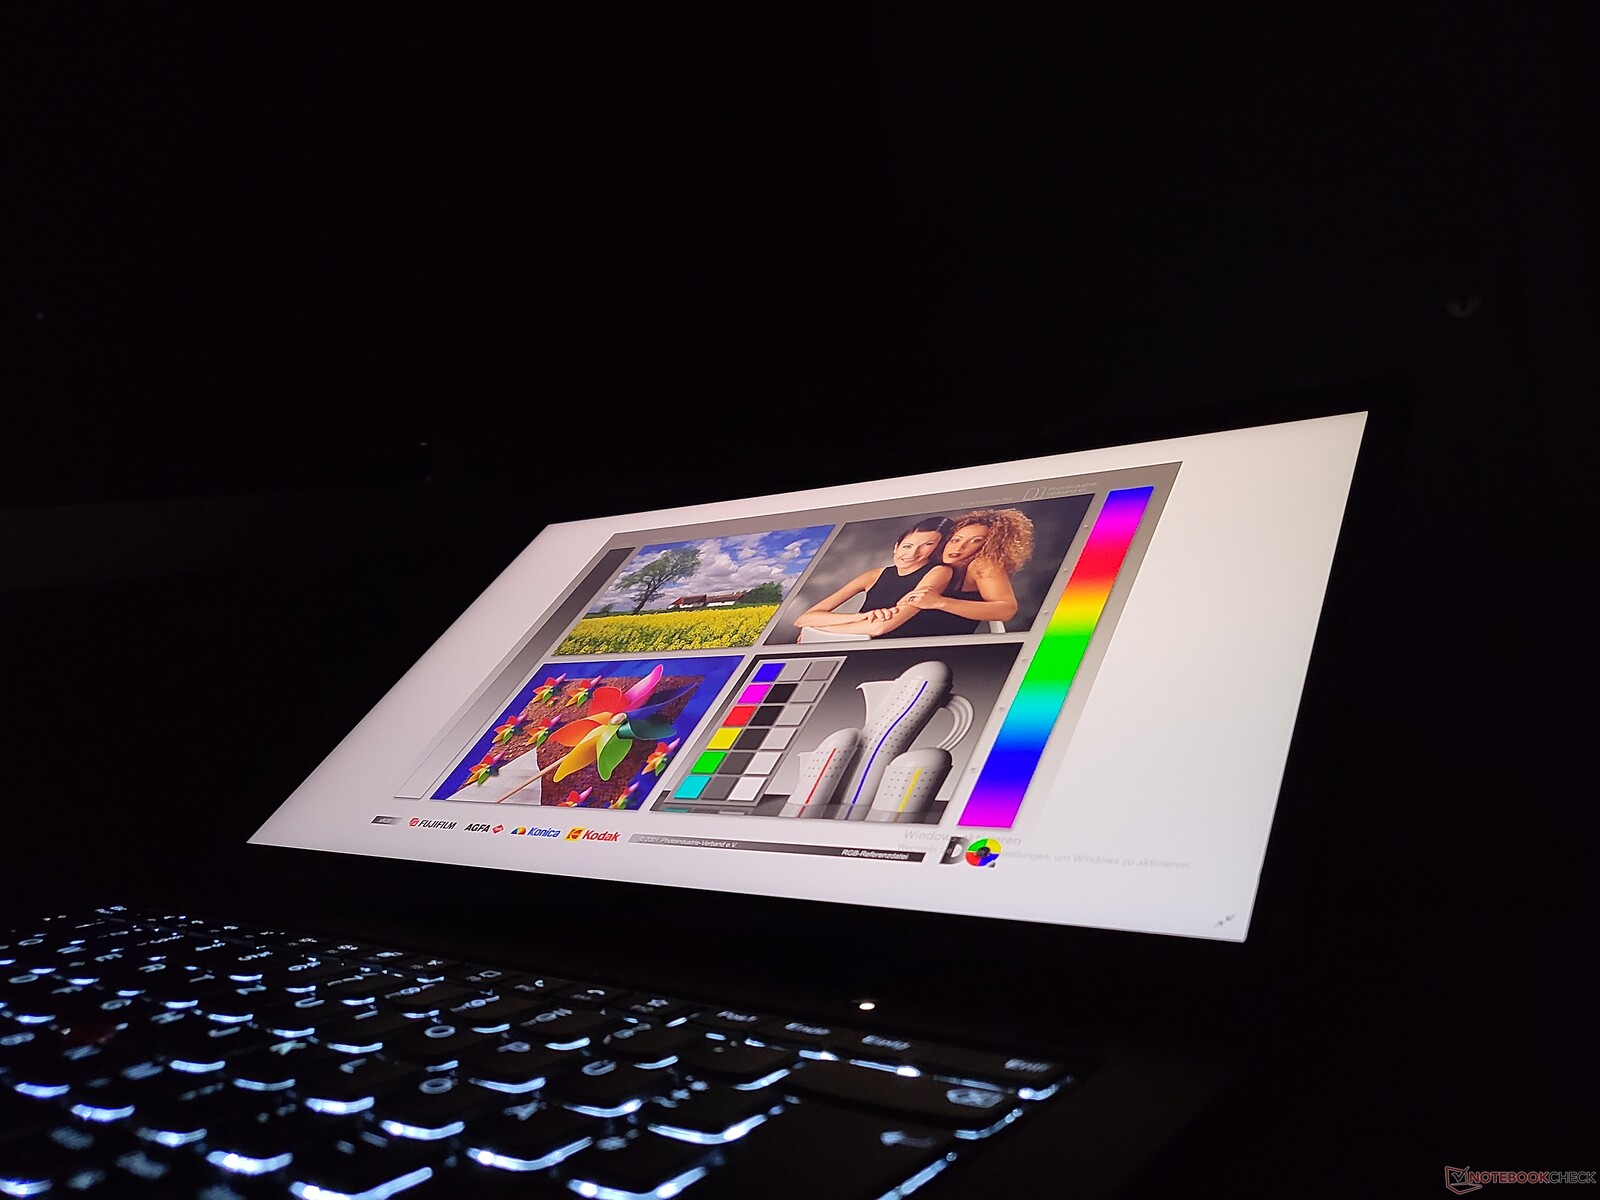
The viewing angle stability? Since IPS displays are used in almost all laptops, this is hardly a problem anymore, and the Lenovo ThinkPad P14s Gen 2 AMD also turns out excellent in this area.
CPU Performance: The Ryzen 5000 improves the single-core performance in the Lenovo laptop
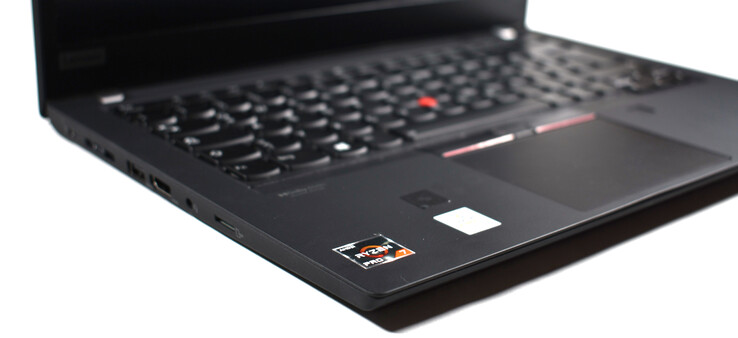
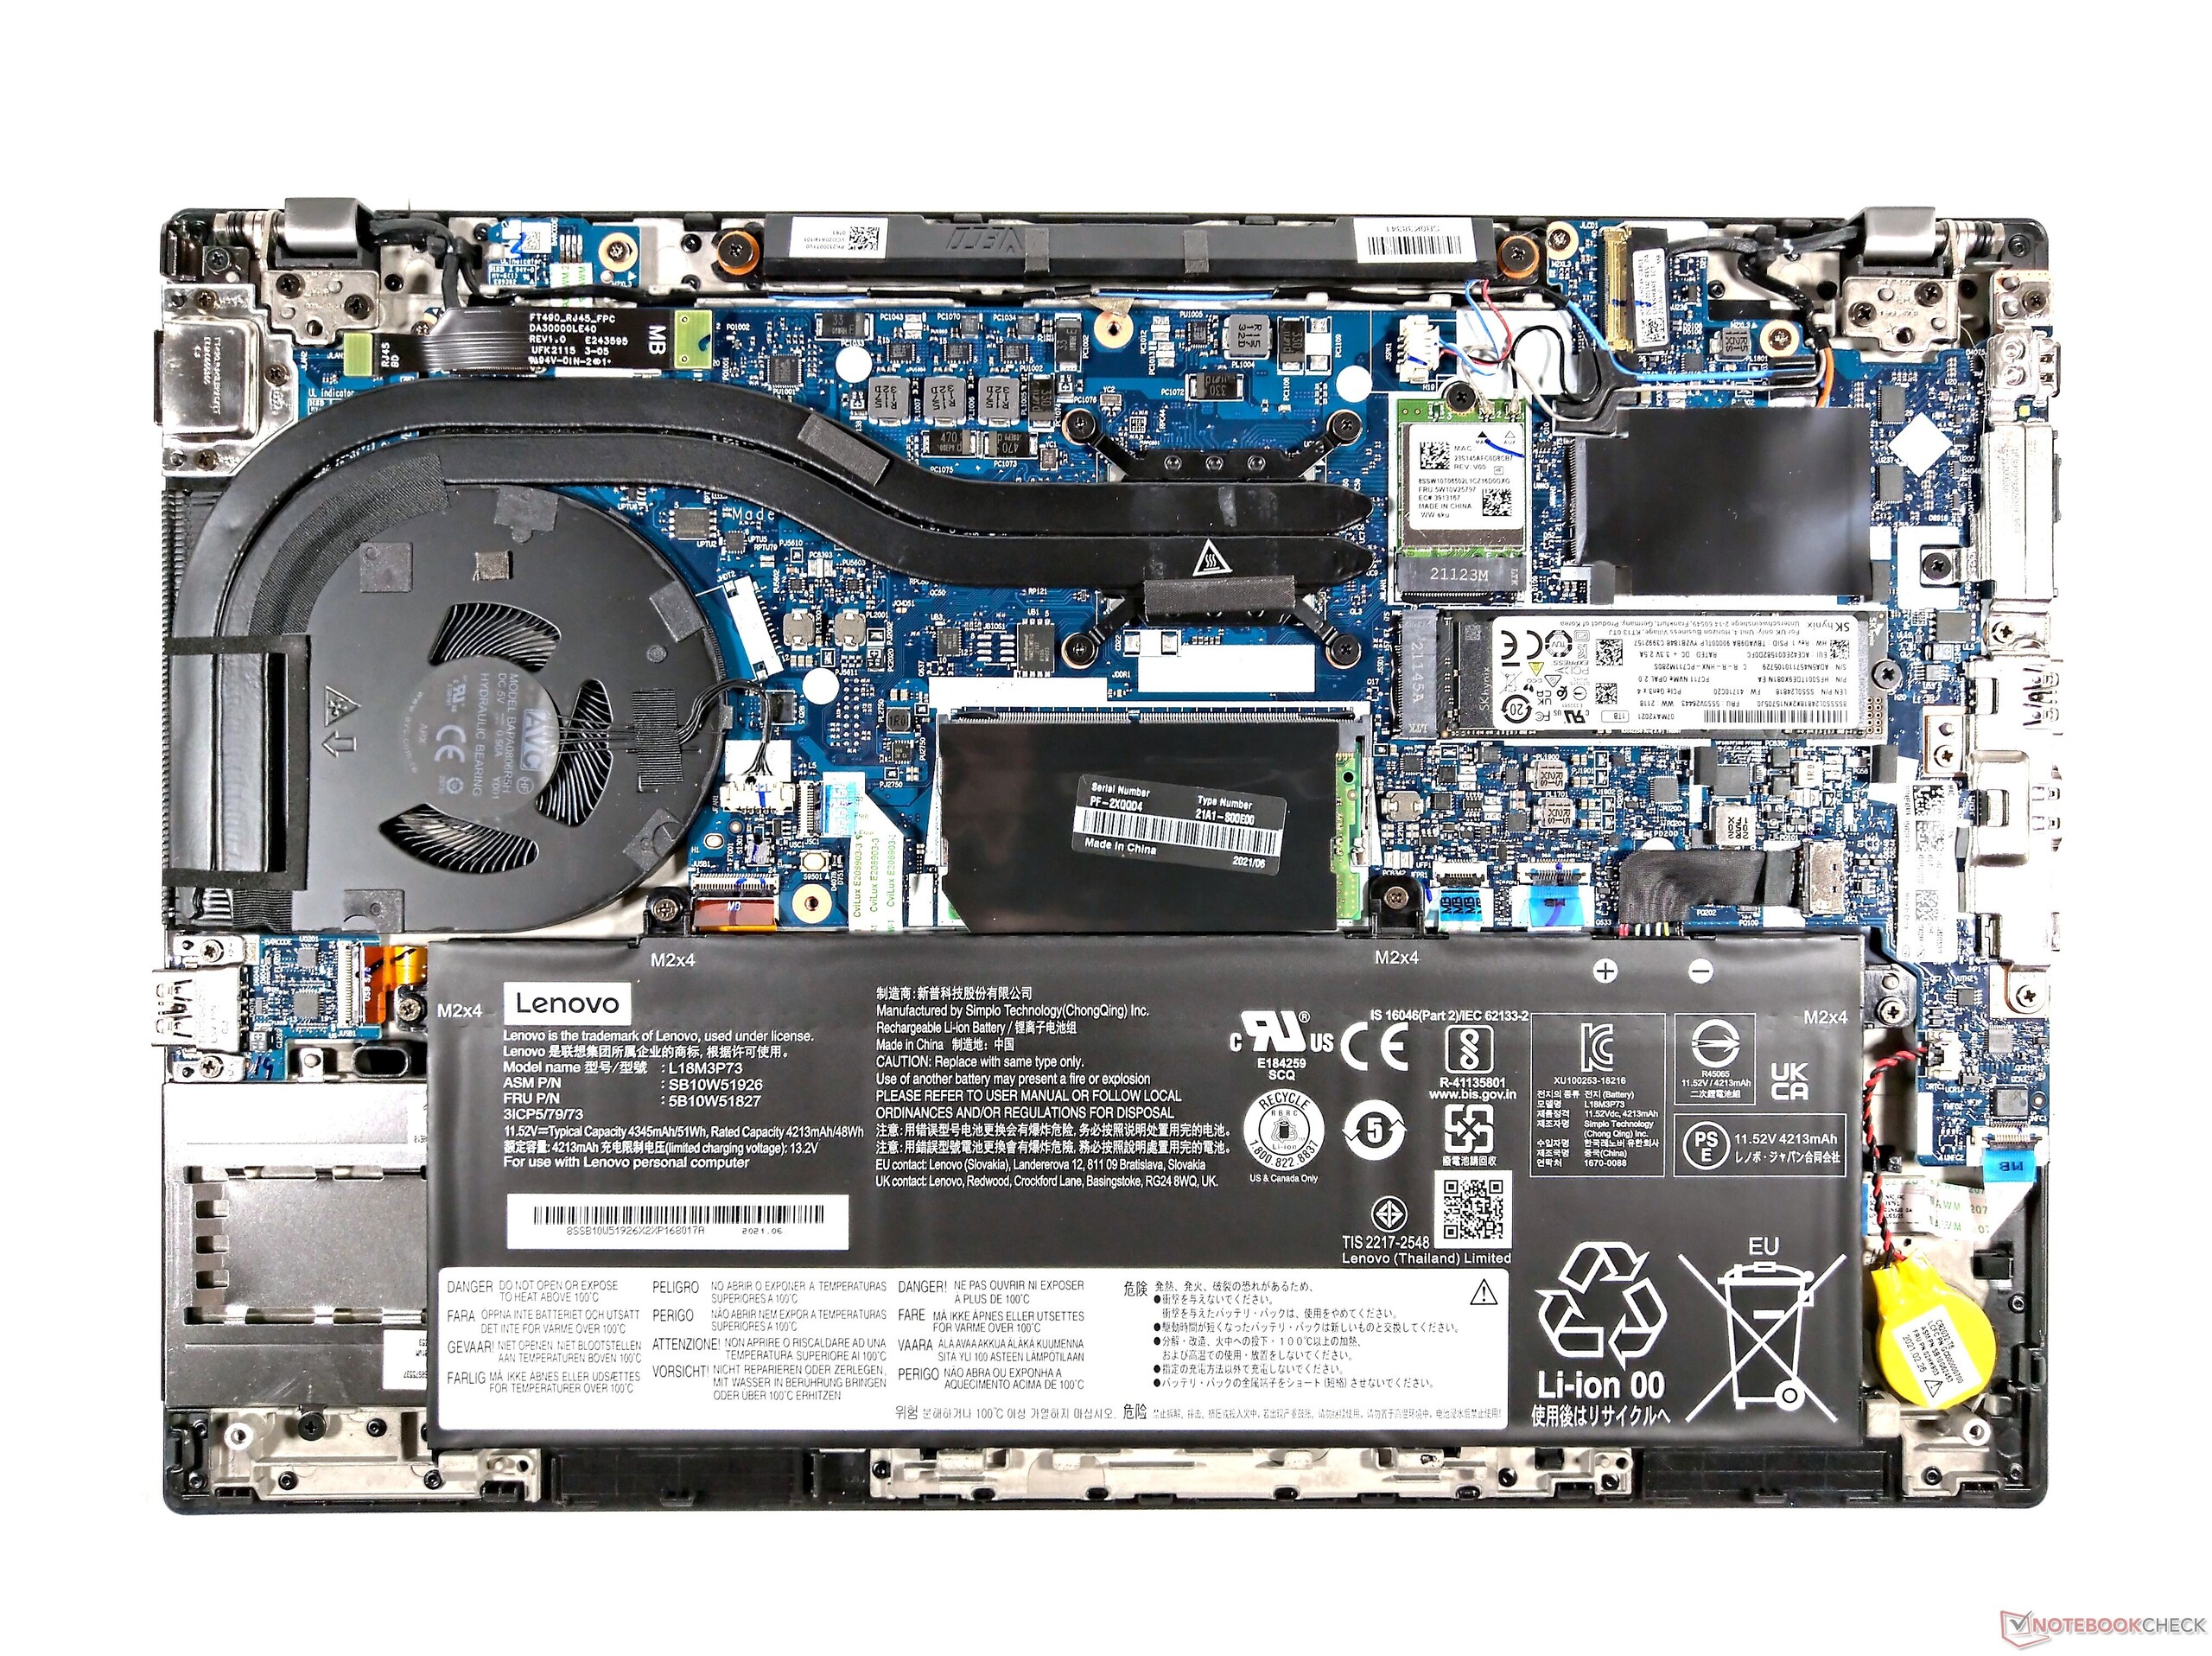
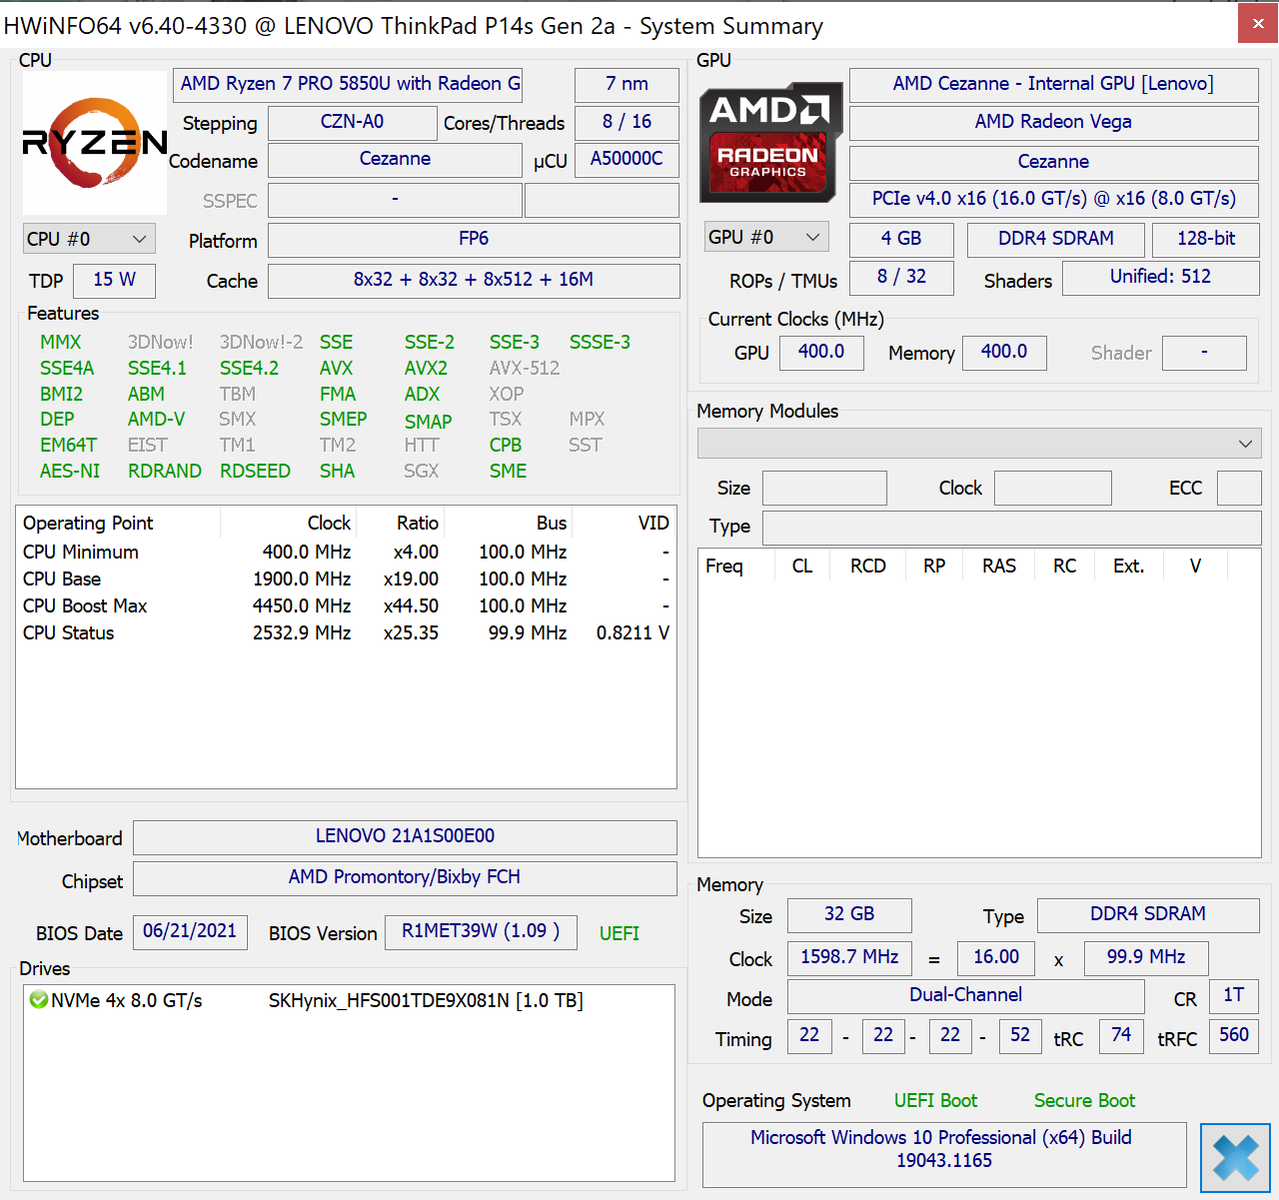
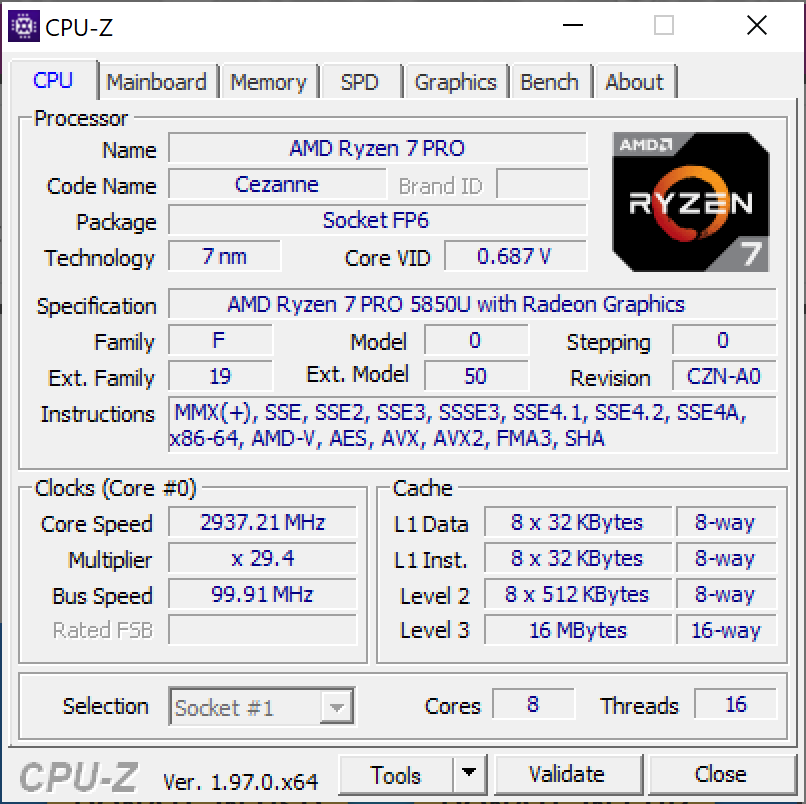
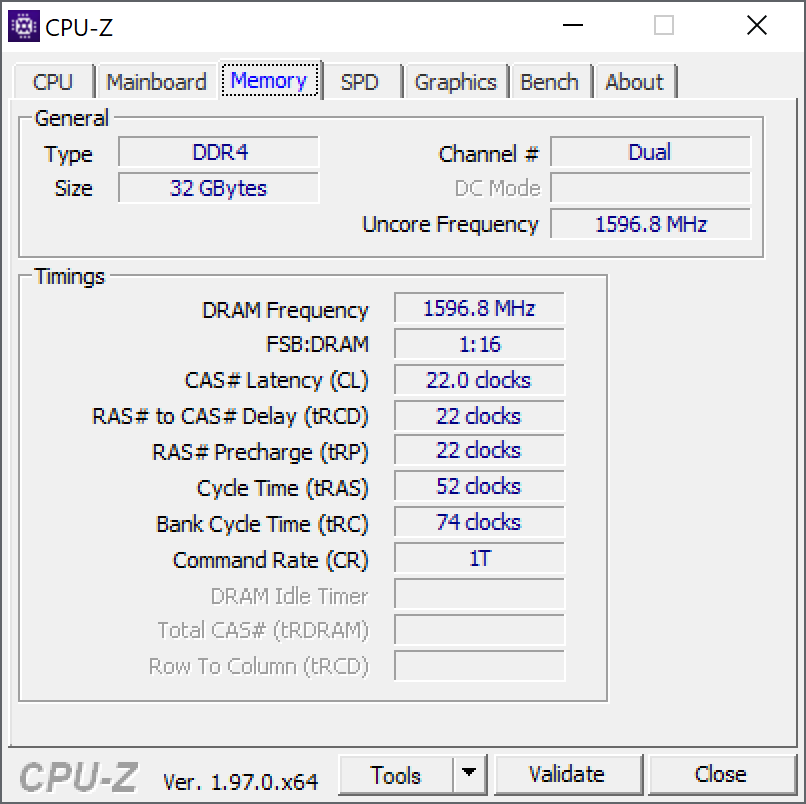
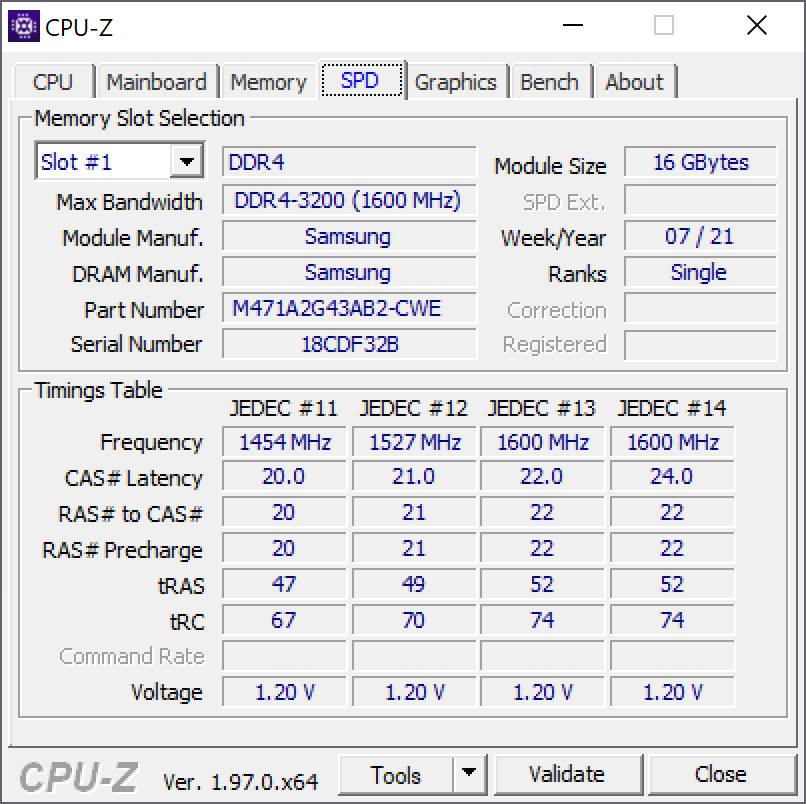
In the Lenovo ThinkPad P14s G2 AMD, you have the choice among two Ryzen Pro CPUs from AMD: the AMD Ryzen 5 Pro 5650U and the AMD Ryzen 7 Pro 5850U. In contrast to other workstations, the P14s AMD is not available with a dedicated GPU. This means that the integrated AMD graphics chip has to do the job. A single M.2-2280 SSD also does the job of the storage solution. In terms of the RAM, the maximum is 48 GB of DDR4-3200 with 16 GB of that being soldered in. The single SO-DIMM slot is able to accept a 32-GB module at most.
Processor
The AMD Ryzen 7 Pro 5850U is a processor with eight cores and sixteen threads that is based on the Zen 3 architecture and the Cezanne U series. As a CPU of the U series, the typical TDP is 15 watts and the clock rates range between 1.9 and 4.4 GHz. You can compare the processor with other current CPUs in our CPU list.
Since we tested the ThinkPad P14s G1 with the Ryzen 7 Pro 4750U, which is the direct predecessor of the 5850U processor, you can easily see the advantage of the Ryzen 5000 compared to the Ryzen 4000. The newer Lenovo ThinkPad P14s Gen 2 AMD is about 10% faster in the multicore benchmark. The advantage is even greater in the single-core test, where the 5850U is on average 17% faster than the predecessor model. Another interesting comparison is with the P14s G2 Intel and the ZBook Firefly 14 G8 that uses the i7-1165G7. The Intel CPUs are significantly slower under load on several cores. They only have some partial advantage in the single-core performance.
In battery operation, the CPU performance in the 3DMark 11 Physics Test turns out about 28% lower.
Cinebench R15 Multi Constant Load Test
Cinebench R20: CPU (Single Core) | CPU (Multi Core)
Cinebench R15: CPU Single 64Bit | CPU Multi 64Bit
Blender: v2.79 BMW27 CPU
7-Zip 18.03: 7z b 4 -mmt1 | 7z b 4
Geekbench 5.5: Single-Core | Multi-Core
HWBOT x265 Benchmark v2.2: 4k Preset
LibreOffice : 20 Documents To PDF
R Benchmark 2.5: Overall mean
| Cinebench R23 / Single Core | |
| Average of class Workstation (1712 - 2228, n=25, last 2 years) | |
| Lenovo ThinkPad P14s Gen2-20VX000GGE | |
| Average AMD Ryzen 7 PRO 5850U (1401 - 1431, n=3) | |
| Lenovo ThinkPad P14s G2 AMD | |
| Lenovo ThinkPad P14s Gen1-20Y10002GE | |
| Cinebench R23 / Multi Core | |
| Average of class Workstation (14055 - 38520, n=25, last 2 years) | |
| Lenovo ThinkPad P14s G2 AMD | |
| Average AMD Ryzen 7 PRO 5850U (8201 - 9111, n=3) | |
| Lenovo ThinkPad P14s Gen1-20Y10002GE | |
| Lenovo ThinkPad P14s Gen2-20VX000GGE | |
| Cinebench R20 / CPU (Single Core) | |
| Average of class Workstation (671 - 857, n=25, last 2 years) | |
| HP ZBook Firefly 14 G8 2C9Q2EA | |
| Average AMD Ryzen 7 PRO 5850U (543 - 558, n=3) | |
| Lenovo ThinkPad P14s G2 AMD | |
| Lenovo ThinkPad P14s Gen2-20VX000GGE | |
| Lenovo ThinkPad P14s Gen1-20Y10002GE | |
| Cinebench R20 / CPU (Multi Core) | |
| Average of class Workstation (5471 - 15043, n=25, last 2 years) | |
| Lenovo ThinkPad P14s G2 AMD | |
| Average AMD Ryzen 7 PRO 5850U (3184 - 3523, n=3) | |
| Lenovo ThinkPad P14s Gen1-20Y10002GE | |
| Lenovo ThinkPad P14s Gen2-20VX000GGE | |
| HP ZBook Firefly 14 G8 2C9Q2EA | |
| Cinebench R15 / CPU Single 64Bit | |
| Average of class Workstation (191.4 - 328, n=25, last 2 years) | |
| Average AMD Ryzen 7 PRO 5850U (225 - 227, n=3) | |
| HP ZBook Firefly 14 G8 2C9Q2EA | |
| Lenovo ThinkPad P14s G2 AMD | |
| Lenovo ThinkPad P14s Gen2-20VX000GGE | |
| Lenovo ThinkPad P14s Gen1-20Y10002GE | |
| Cinebench R15 / CPU Multi 64Bit | |
| Average of class Workstation (2489 - 5810, n=25, last 2 years) | |
| Lenovo ThinkPad P14s G2 AMD | |
| Average AMD Ryzen 7 PRO 5850U (1398 - 1527, n=3) | |
| Lenovo ThinkPad P14s Gen1-20Y10002GE | |
| Lenovo ThinkPad P14s Gen2-20VX000GGE | |
| HP ZBook Firefly 14 G8 2C9Q2EA | |
| Blender / v2.79 BMW27 CPU | |
| Lenovo ThinkPad P14s Gen2-20VX000GGE | |
| HP ZBook Firefly 14 G8 2C9Q2EA | |
| Lenovo ThinkPad P14s Gen1-20Y10002GE | |
| Average AMD Ryzen 7 PRO 5850U (331 - 364, n=3) | |
| Lenovo ThinkPad P14s G2 AMD | |
| Average of class Workstation (91 - 261, n=25, last 2 years) | |
| 7-Zip 18.03 / 7z b 4 -mmt1 | |
| Average of class Workstation (5126 - 6960, n=25, last 2 years) | |
| Lenovo ThinkPad P14s Gen2-20VX000GGE | |
| HP ZBook Firefly 14 G8 2C9Q2EA | |
| Lenovo ThinkPad P14s G2 AMD | |
| Average AMD Ryzen 7 PRO 5850U (5050 - 5300, n=3) | |
| Lenovo ThinkPad P14s Gen1-20Y10002GE | |
| 7-Zip 18.03 / 7z b 4 | |
| Average of class Workstation (54741 - 116969, n=25, last 2 years) | |
| Lenovo ThinkPad P14s G2 AMD | |
| Average AMD Ryzen 7 PRO 5850U (38553 - 45543, n=3) | |
| Lenovo ThinkPad P14s Gen1-20Y10002GE | |
| HP ZBook Firefly 14 G8 2C9Q2EA | |
| Lenovo ThinkPad P14s Gen2-20VX000GGE | |
| Geekbench 5.5 / Single-Core | |
| Average of class Workstation (1781 - 2183, n=25, last 2 years) | |
| Lenovo ThinkPad P14s Gen2-20VX000GGE | |
| HP ZBook Firefly 14 G8 2C9Q2EA | |
| Lenovo ThinkPad P14s G2 AMD | |
| Average AMD Ryzen 7 PRO 5850U (1354 - 1448, n=3) | |
| Lenovo ThinkPad P14s Gen1-20Y10002GE | |
| Geekbench 5.5 / Multi-Core | |
| Average of class Workstation (11542 - 25554, n=25, last 2 years) | |
| Lenovo ThinkPad P14s G2 AMD | |
| Average AMD Ryzen 7 PRO 5850U (5137 - 7039, n=3) | |
| Lenovo ThinkPad P14s Gen1-20Y10002GE | |
| Lenovo ThinkPad P14s Gen2-20VX000GGE | |
| HP ZBook Firefly 14 G8 2C9Q2EA | |
| HWBOT x265 Benchmark v2.2 / 4k Preset | |
| Average of class Workstation (14.4 - 40.5, n=25, last 2 years) | |
| Lenovo ThinkPad P14s G2 AMD | |
| Average AMD Ryzen 7 PRO 5850U (9.89 - 11.6, n=3) | |
| Lenovo ThinkPad P14s Gen1-20Y10002GE | |
| Lenovo ThinkPad P14s Gen2-20VX000GGE | |
| HP ZBook Firefly 14 G8 2C9Q2EA | |
| LibreOffice / 20 Documents To PDF | |
| Lenovo ThinkPad P14s Gen1-20Y10002GE | |
| HP ZBook Firefly 14 G8 2C9Q2EA | |
| Average AMD Ryzen 7 PRO 5850U (49.1 - 51.9, n=3) | |
| Lenovo ThinkPad P14s G2 AMD | |
| Average of class Workstation (37.1 - 74.7, n=25, last 2 years) | |
| Lenovo ThinkPad P14s Gen2-20VX000GGE | |
| R Benchmark 2.5 / Overall mean | |
| Lenovo ThinkPad P14s Gen1-20Y10002GE | |
| HP ZBook Firefly 14 G8 2C9Q2EA | |
| Lenovo ThinkPad P14s Gen2-20VX000GGE | |
| Average AMD Ryzen 7 PRO 5850U (0.536 - 0.557, n=3) | |
| Lenovo ThinkPad P14s G2 AMD | |
| Average of class Workstation (0.3825 - 0.603, n=25, last 2 years) | |
* ... smaller is better
System Performance
The high CPU performance is also reflected in the general system performance. The predecessor was only minimally faster in the PCMark 10 benchmark. In everyday operation, the Lenovo ThinkPad P14s Gen 2 AMD runs extremely smoothly.
| PCMark 10 / Score | |
| Average of class Workstation (6436 - 10409, n=21, last 2 years) | |
| Average AMD Ryzen 7 PRO 5850U, AMD Radeon RX Vega 8 (Ryzen 4000/5000) (5491 - 5933, n=3) | |
| Lenovo ThinkPad P14s Gen2-20VX000GGE | |
| Lenovo ThinkPad P14s G2 AMD | |
| HP ZBook Firefly 14 G8 2C9Q2EA | |
| Lenovo ThinkPad P14s Gen1-20Y10002GE | |
| PCMark 10 / Essentials | |
| Average of class Workstation (9622 - 11157, n=21, last 2 years) | |
| Average AMD Ryzen 7 PRO 5850U, AMD Radeon RX Vega 8 (Ryzen 4000/5000) (8772 - 10331, n=3) | |
| Lenovo ThinkPad P14s Gen2-20VX000GGE | |
| Lenovo ThinkPad P14s Gen1-20Y10002GE | |
| Lenovo ThinkPad P14s G2 AMD | |
| HP ZBook Firefly 14 G8 2C9Q2EA | |
| PCMark 10 / Productivity | |
| Average of class Workstation (8789 - 20616, n=21, last 2 years) | |
| Average AMD Ryzen 7 PRO 5850U, AMD Radeon RX Vega 8 (Ryzen 4000/5000) (8967 - 9512, n=3) | |
| Lenovo ThinkPad P14s Gen2-20VX000GGE | |
| Lenovo ThinkPad P14s G2 AMD | |
| HP ZBook Firefly 14 G8 2C9Q2EA | |
| Lenovo ThinkPad P14s Gen1-20Y10002GE | |
| PCMark 10 / Digital Content Creation | |
| Average of class Workstation (7744 - 15631, n=21, last 2 years) | |
| Lenovo ThinkPad P14s G2 AMD | |
| Lenovo ThinkPad P14s Gen2-20VX000GGE | |
| Average AMD Ryzen 7 PRO 5850U, AMD Radeon RX Vega 8 (Ryzen 4000/5000) (5141 - 5938, n=3) | |
| HP ZBook Firefly 14 G8 2C9Q2EA | |
| Lenovo ThinkPad P14s Gen1-20Y10002GE | |
| PCMark 10 Score | 5491 points | |
Help | ||
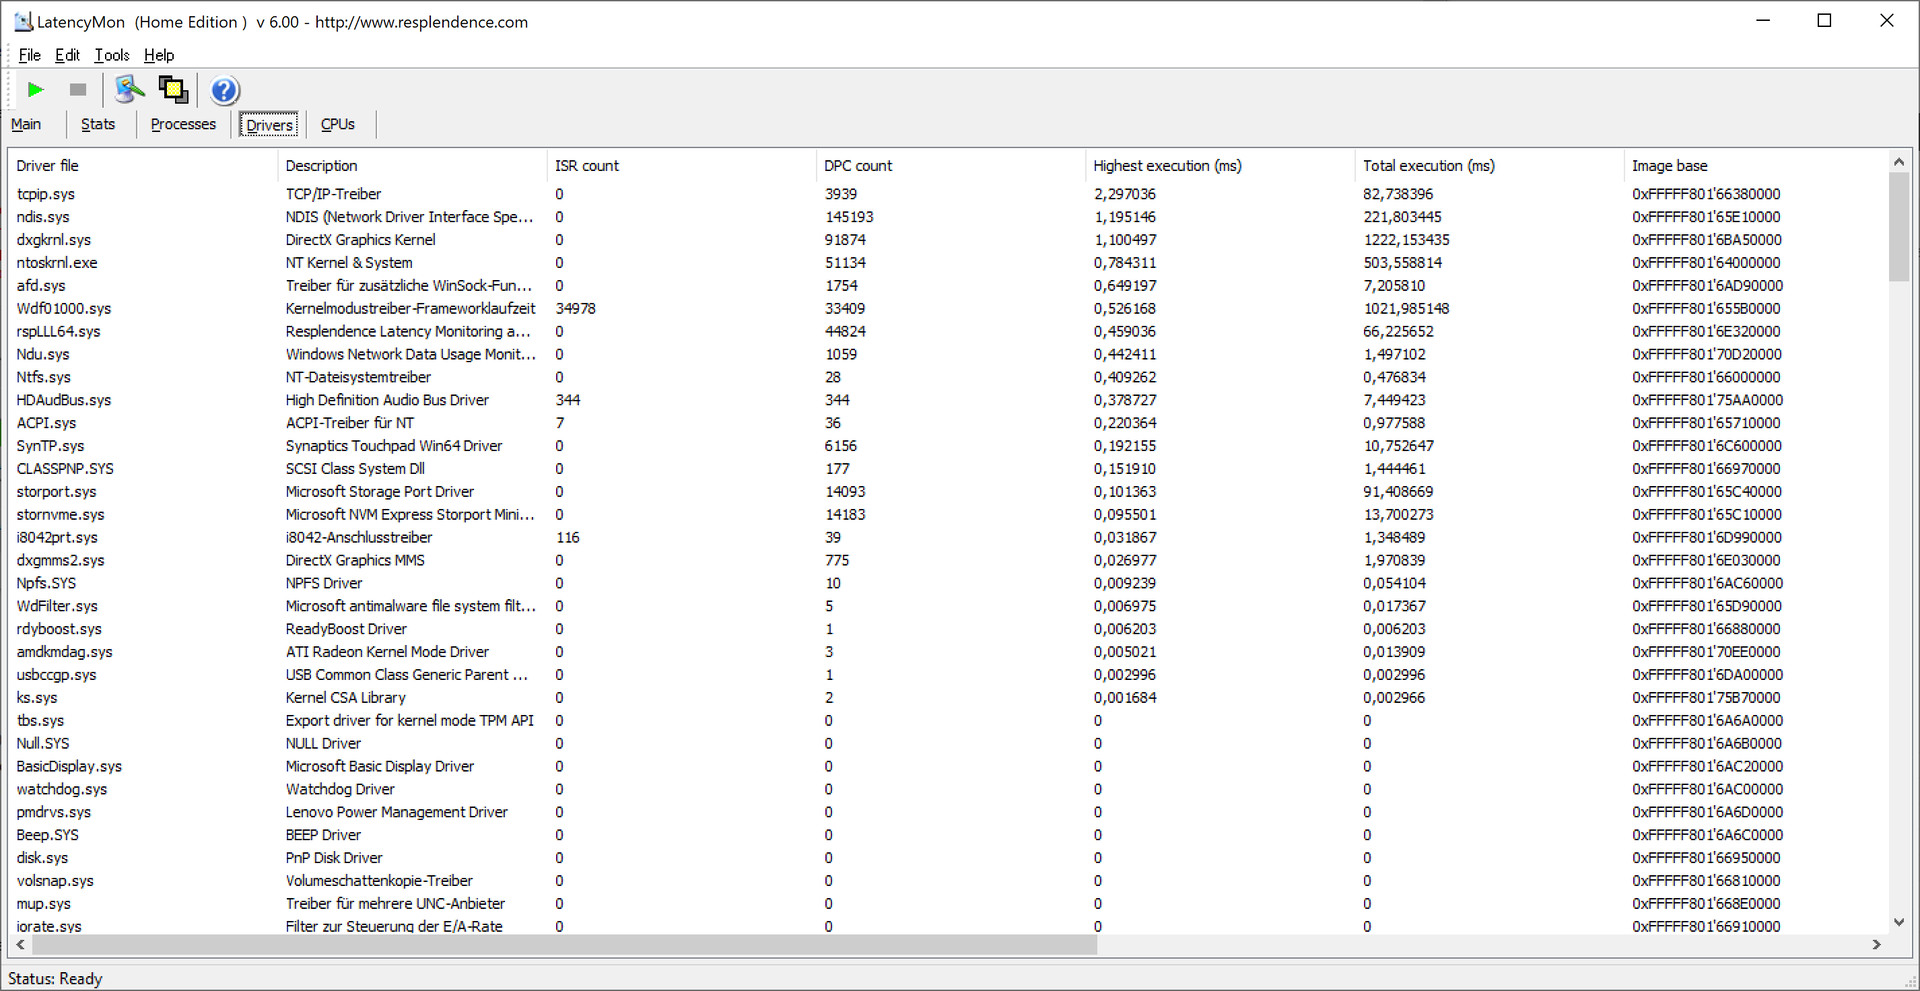
DPC Latencies
Unfortunately, the Lenovo ThinkPad P14s G2 has some problems in the DPC latencies. Apparently the network driver is responsible for this.
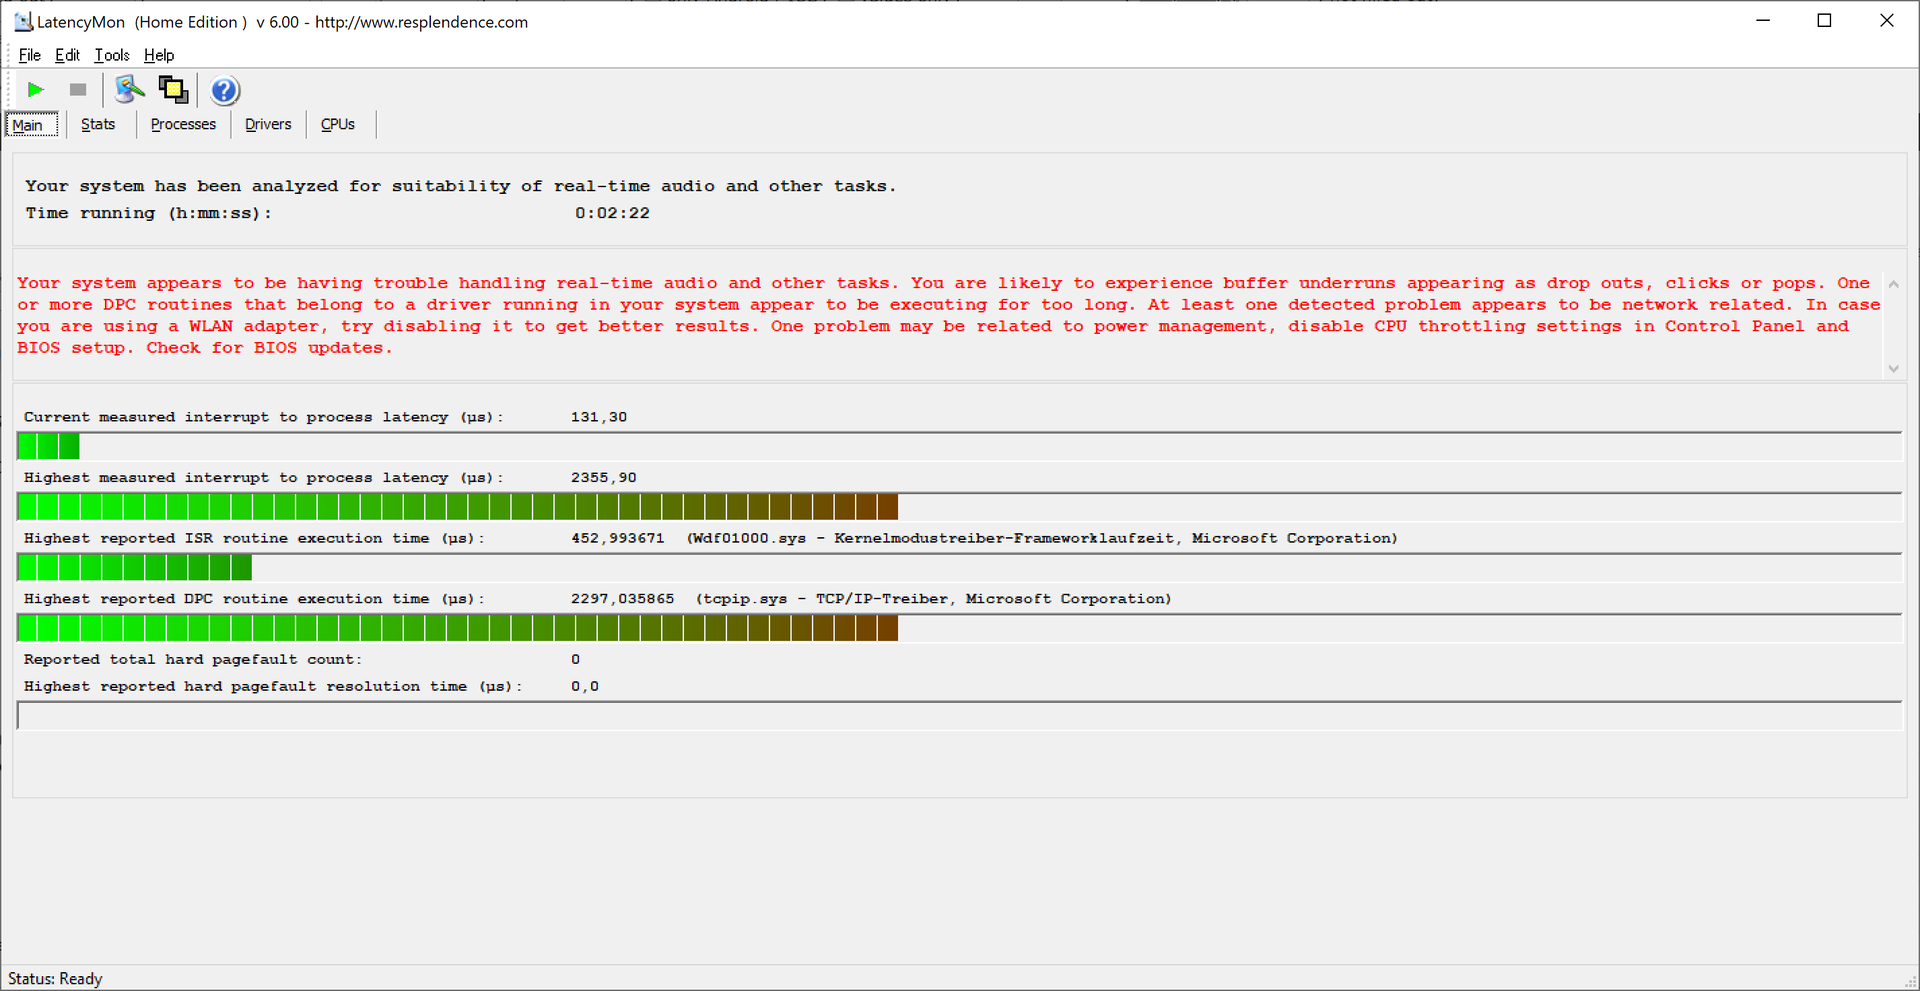
| DPC Latencies / LatencyMon - interrupt to process latency (max), Web, Youtube, Prime95 | |
| HP ZBook Firefly 14 G8 2C9Q2EA | |
| Lenovo ThinkPad P14s G2 AMD | |
| Lenovo ThinkPad P14s Gen2-20VX000GGE | |
* ... smaller is better
Storage Solution
The SK Hynix PC711 used here offers a capacity of 1 TB and is an NVMe PCIe-3.0 SSD in the M.2-2280 format. It operates fast and achieves a good result, even if PCIe 4.0 SSDs are able to bring even more performance.
| Lenovo ThinkPad P14s G2 AMD SK Hynix PC711 1TB HFS001TDE9X081N | Lenovo ThinkPad P14s Gen1-20Y10002GE Samsung PM981a MZVLB1T0HBLR | Lenovo ThinkPad P14s Gen2-20VX000GGE Toshiba XG6 KXG6AZNV1T02 | HP ZBook Firefly 14 G8 2C9Q2EA Toshiba XG6 KXG60ZNV1T02 | Average SK Hynix PC711 1TB HFS001TDE9X081N | |
|---|---|---|---|---|---|
| AS SSD | -7% | 17% | -12% | 19% | |
| Seq Read (MB/s) | 2762 | 2579 -7% | 2632 -5% | 2674 -3% | 2818 ? 2% |
| Seq Write (MB/s) | 1712 | 1456 -15% | 2394 40% | 1289 -25% | 2028 ? 18% |
| 4K Read (MB/s) | 48.36 | 50.9 5% | 57 18% | 49.52 2% | 53.4 ? 10% |
| 4K Write (MB/s) | 126.4 | 115.7 -8% | 198.4 57% | 128 1% | 140 ? 11% |
| 4K-64 Read (MB/s) | 980 | 858 -12% | 1476 51% | 1113 14% | 1455 ? 48% |
| 4K-64 Write (MB/s) | 2179 | 2152 -1% | 1460 -33% | 1470 -33% | 2530 ? 16% |
| Access Time Read * (ms) | 0.05 | 0.053 -6% | 0.044 12% | 0.072 -44% | 0.041 ? 18% |
| Access Time Write * (ms) | 0.029 | 0.032 -10% | 0.021 28% | 0.032 -10% | 0.027 ? 7% |
| Score Read (Points) | 1304 | 1166 -11% | 1796 38% | 1430 10% | 1790 ? 37% |
| Score Write (Points) | 2477 | 2414 -3% | 1897 -23% | 1727 -30% | 2873 ? 16% |
| Score Total (Points) | 4405 | 4132 -6% | 4608 5% | 3827 -13% | 5545 ? 26% |
* ... smaller is better

Constant Performance Reading: DiskSpd Read Loop, Queue Depth 8
Graphics Card
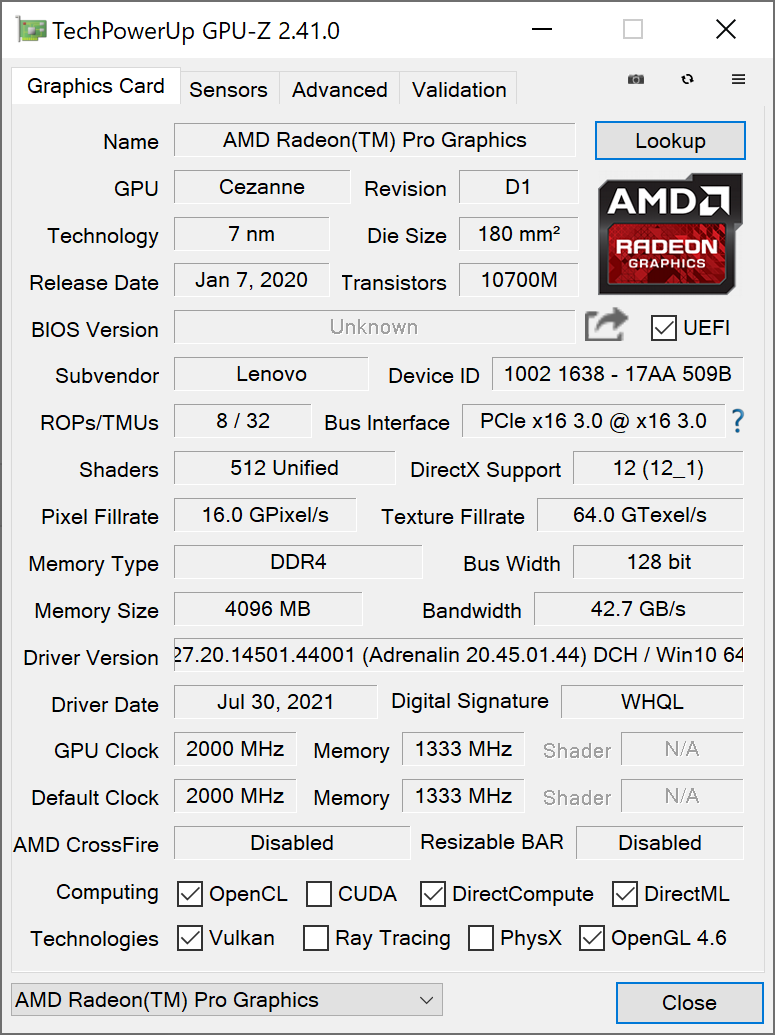
The AMD Radeon RX Vega 8 serves as the single GPU. GPU-Z calls it "AMD Radeon Pro Graphics," which is an indication of the special workstation drivers that are used in the ThinkPad P14s Gen 2.
With the certified drivers, customers that use CAD solutions, for example, will know that their software will run on the ThinkPad laptop. However, the pure performance is as weak as expected. As an entry-level workstation with an integrated graphics chip without its own dedicated storage, the performance capabilities are less than half of the workstation average. But at least the performance is slightly better than that of the predecessor. On the other hand, the ThinkPad P14s Intel and ZBook Firefly 14 G8 are both ahead with their dedicated GPU (Nvidia T500).
If you run the Lenovo ThinkPad P14s G2 AMD on battery power, the GPU performance in the 3DMark 11 GPU Test drops by about 33%.
| 3DMark 11 Performance | 6342 points | |
| 3DMark Fire Strike Score | 3694 points | |
| 3DMark Time Spy Score | 1462 points | |
Help | ||
Gaming Performance
The Lenovo ThinkPad P14s G2 AMD is hardly suited for games. While less demanding games such as "Dota 2" are easily playable, the newer games that demand more performance are only able to run smoothly at the minimal detail setting at most.
| low | med. | high | ultra | QHD | 4K | |
|---|---|---|---|---|---|---|
| GTA V (2015) | 29.1 | 13.3 | 9.13 | 8.82 | ||
| The Witcher 3 (2015) | 71.3 | 20.2 | 11.4 | |||
| Dota 2 Reborn (2015) | 119 | 100 | 59 | 55.6 | 21 | |
| Final Fantasy XV Benchmark (2018) | 36.5 | 17.4 | 12.3 | 8.33 | 4.64 | |
| X-Plane 11.11 (2018) | 45.9 | 36.7 | 31.7 | 17.6 | ||
| Strange Brigade (2018) | 88.3 | 33.8 | 28.6 | 24.5 | 16.4 | 8.6 |
The Witcher 3 FPS Chart
Emissions
Noise Emissions
The fan remains turned off while the Lenovo ThinkPad P14s AMD G2 runs in idle operation, regardless of the selected performance mode. It will therefore also remain silent during everyday surfing and office operations. The noise level changes under load, but the fan still runs very quietly in our Median Test with 3DMark 06. 28.19 dB(A) are hardly audible anymore. After several minutes in the stress test, the noise level increases to 40.77 dB(A), which is clearly noticeable. However, the active cooling never became annoyingly loud.
If you place your ear against the keyboard, you can hear a quiet hiss, but you won't be able to hear this noise anymore in regular working distance from the laptop.
Noise level
| Idle |
| 24.04 / 24.04 / 24.04 dB(A) |
| Load |
| 28.19 / 40.77 dB(A) |
 | ||
30 dB silent 40 dB(A) audible 50 dB(A) loud |
||
min: | ||
Temperature
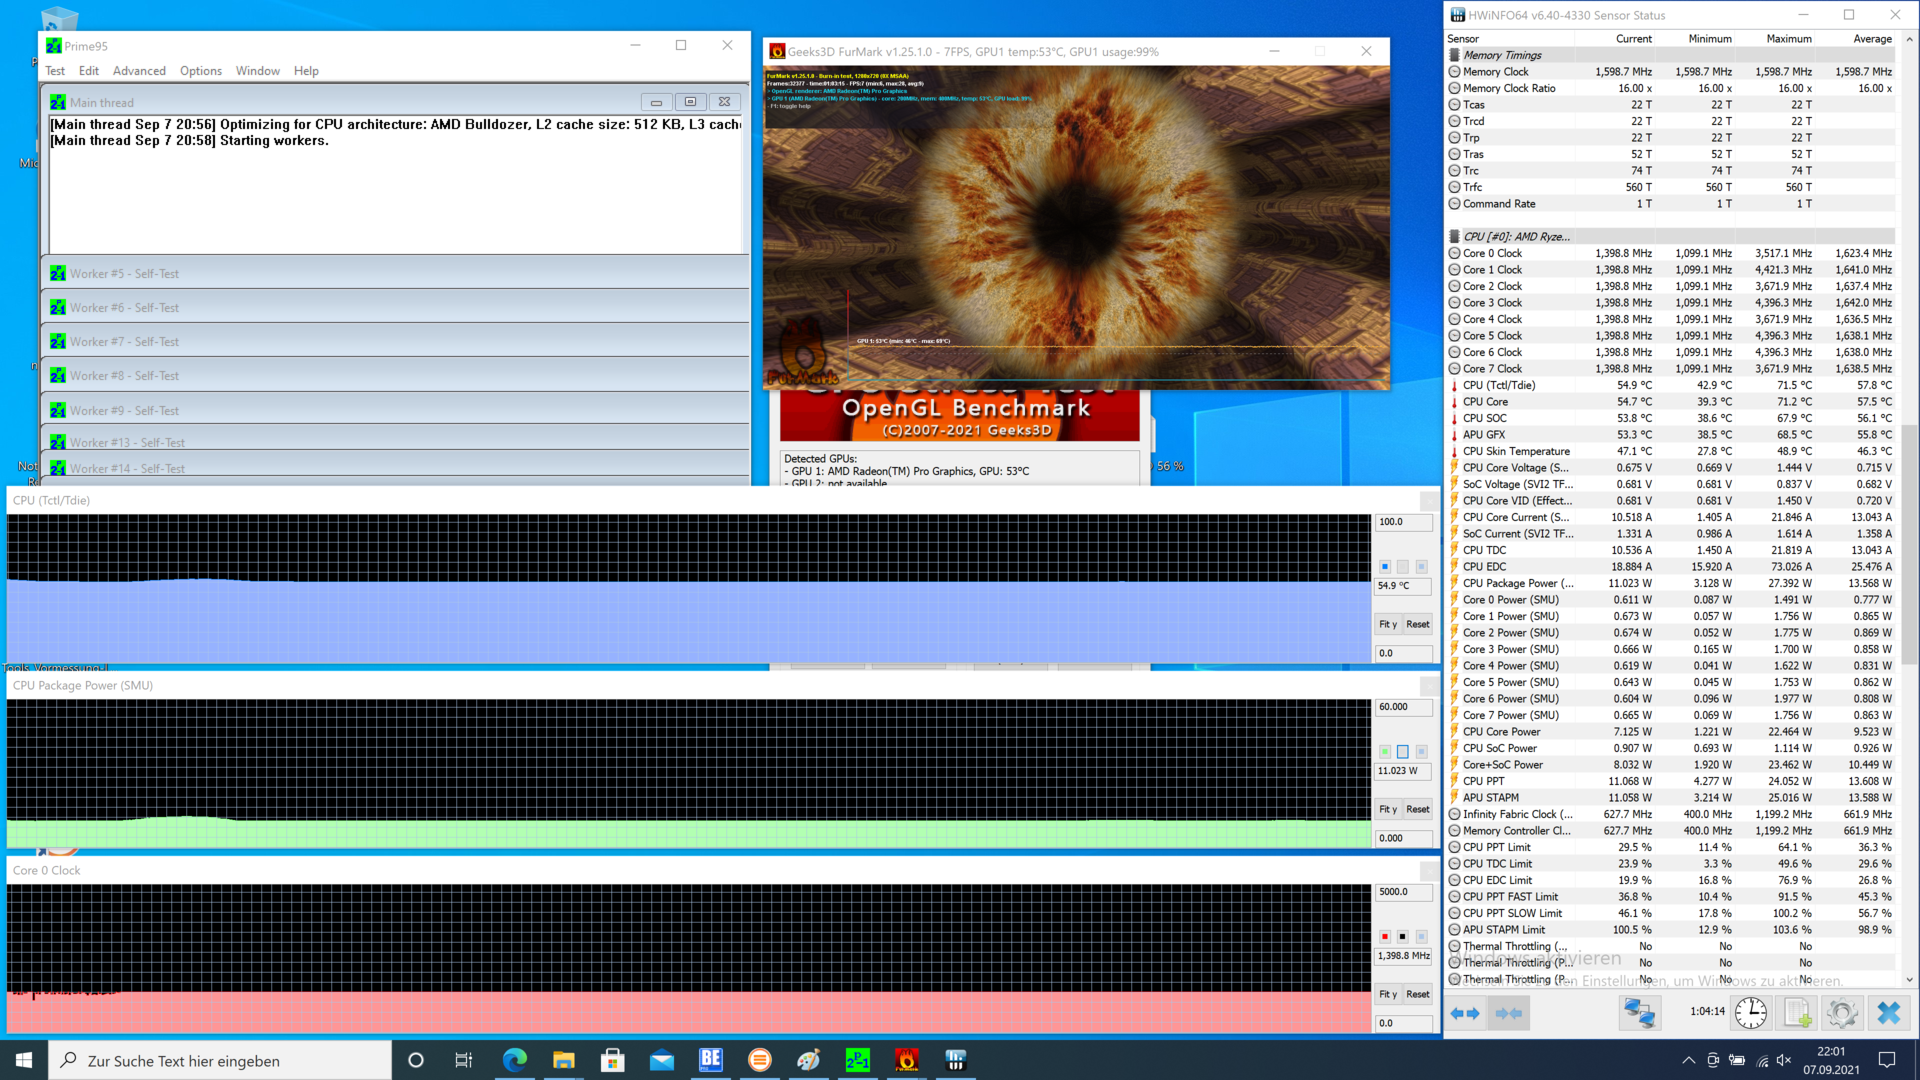
During idle operation, the Lenovo ThinkPad P14s Gen 2 AMD remains almost completely cool. In the stress test with Prime95 and FurMark, the case warms up relatively evenly. The hotspot on the bottom reaches 47.5 ºC (117.5 ºF), and it reaches 42.8 ºC (109 ºF) on the top. This gives no reason for concern. Unfortunately, the palm rest also warms up noticeably, which could lead to some sweaty hands particularly in summer.
During the stress test, the CPU is able to run at full speed in the beginning, but this changes after a while. Towards the end of the hour-long test, the AMD processor in the Lenovo laptop is limited to about 11 watts, which is still sufficient for clock speeds of 1.4 GHz. Right after the stress test, the ThinkPad reached a significantly lower 3DMark 11 result of only 5057 points (-20%), so both the CPU and the iGPU were affected by throttling.
(±) The maximum temperature on the upper side is 42.8 °C / 109 F, compared to the average of 38.2 °C / 101 F, ranging from 22.2 to 69.8 °C for the class Workstation.
(-) The bottom heats up to a maximum of 47.5 °C / 118 F, compared to the average of 41.1 °C / 106 F
(+) In idle usage, the average temperature for the upper side is 25.3 °C / 78 F, compared to the device average of 32 °C / 90 F.
(+) The palmrests and touchpad are reaching skin temperature as a maximum (32.6 °C / 90.7 F) and are therefore not hot.
(-) The average temperature of the palmrest area of similar devices was 27.8 °C / 82 F (-4.8 °C / -8.7 F).
Speakers
The stereo speakers of the Lenovo ThinkPad P14s AMD G2 are located between the keyboard and screen, projecting the sound toward the user. Their volume is acceptable, even if the bass frequencies are lacking. The sound is therefore not ideal for music, but the speakers of the Lenovo laptop are sufficient for video conferences.
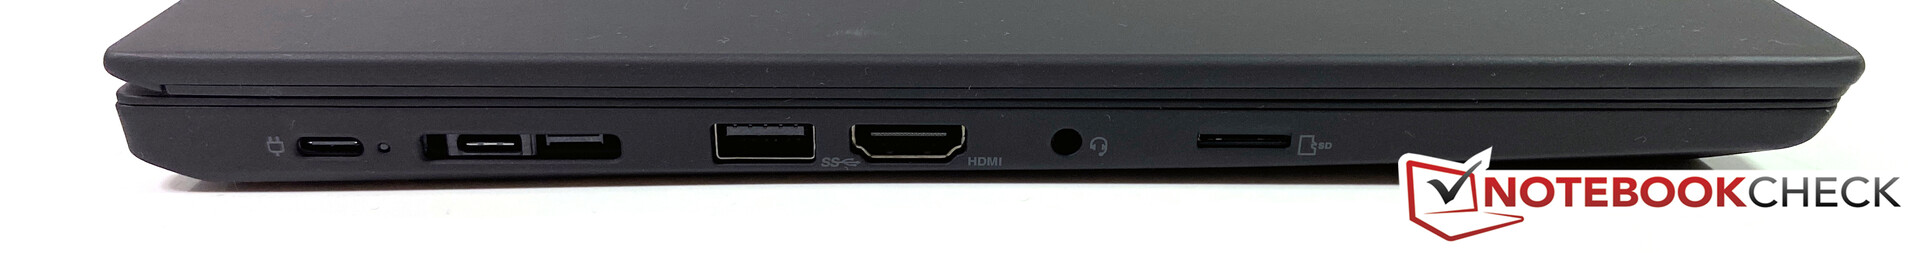
For everything else, an external solution that can be connected via Bluetooth or the flawlessly working 3.5-mm audio port is recommended.
Lenovo ThinkPad P14s Gen2-20VX000GGE audio analysis
(±) | speaker loudness is average but good (75 dB)
Bass 100 - 315 Hz
(-) | nearly no bass - on average 18.6% lower than median
(±) | linearity of bass is average (10.1% delta to prev. frequency)
Mids 400 - 2000 Hz
(±) | higher mids - on average 6% higher than median
(+) | mids are linear (4.7% delta to prev. frequency)
Highs 2 - 16 kHz
(+) | balanced highs - only 2.3% away from median
(+) | highs are linear (3.7% delta to prev. frequency)
Overall 100 - 16.000 Hz
(±) | linearity of overall sound is average (20.4% difference to median)
Compared to same class
» 72% of all tested devices in this class were better, 5% similar, 23% worse
» The best had a delta of 7%, average was 17%, worst was 35%
Compared to all devices tested
» 53% of all tested devices were better, 8% similar, 39% worse
» The best had a delta of 4%, average was 24%, worst was 134%
HP ZBook Firefly 14 G8 2C9Q2EA audio analysis
(±) | speaker loudness is average but good (80.2 dB)
Bass 100 - 315 Hz
(±) | reduced bass - on average 13.5% lower than median
(±) | linearity of bass is average (10.6% delta to prev. frequency)
Mids 400 - 2000 Hz
(+) | balanced mids - only 4% away from median
(+) | mids are linear (3.2% delta to prev. frequency)
Highs 2 - 16 kHz
(+) | balanced highs - only 3.1% away from median
(+) | highs are linear (3.1% delta to prev. frequency)
Overall 100 - 16.000 Hz
(±) | linearity of overall sound is average (15.2% difference to median)
Compared to same class
» 33% of all tested devices in this class were better, 10% similar, 57% worse
» The best had a delta of 7%, average was 17%, worst was 35%
Compared to all devices tested
» 21% of all tested devices were better, 4% similar, 74% worse
» The best had a delta of 4%, average was 24%, worst was 134%
Power Management: ThinkPad P14s G2 AMD with a better battery life than the predecessor
Power Consumption
Since we were also able to test a practically identical configuration of the P14s G2 AMD with a Full-HD low-power LCD, we can easily document the higher power consumption due to the 4K UHD display. During idle operation, the difference is about 10 to 24%, and the low-power display mainly has an advantage at maximum brightness. This means that this configuration offers an advantage particularly for using it outdoors, since you can run it for longer at maximum brightness.
Under maximum load, the lack of a dedicated GPU leads to a lower consumption of the Lenovo ThinkPad P14s G2 AMD compared to the Intel model with an Nvidia GPU. The power supply's performance of 65 watts is not fully used up to the limit.
| Off / Standby | |
| Idle | |
| Load |
|
Key:
min: | |
| Lenovo ThinkPad P14s G2 AMD R7 PRO 5850U, Vega 8, SK Hynix PC711 1TB HFS001TDE9X081N, IPS LED, 3840x2160, 14" | Lenovo ThinkPad P14s G2 AMD FHD R7 PRO 5850U, Vega 8, WDC PC SN730 SDBQNTY-1T00, IPS LED, 1920x1080, 14" | Lenovo ThinkPad P14s Gen1-20Y10002GE R7 PRO 4750U, Vega 7, Samsung PM981a MZVLB1T0HBLR, a-Si IPS LED, 1920x1080, 14" | Lenovo ThinkPad P14s Gen2-20VX000GGE i7-1185G7, T500 Laptop GPU, Toshiba XG6 KXG6AZNV1T02, IPS, 1920x1080, 14" | HP ZBook Firefly 14 G8 2C9Q2EA i7-1165G7, T500 Laptop GPU, Toshiba XG6 KXG60ZNV1T02, IPS, 1920x1080, 14" | Average AMD Radeon RX Vega 8 (Ryzen 4000/5000) | Average of class Workstation | |
|---|---|---|---|---|---|---|---|
| Power Consumption | 13% | -7% | -3% | -12% | -9% | -130% | |
| Idle Minimum * (Watt) | 4.49 | 4.06 10% | 4.8 -7% | 4.5 -0% | 3.1 31% | 5.3 ? -18% | 8.94 ? -99% |
| Idle Average * (Watt) | 9.62 | 7.27 24% | 8.8 9% | 7.1 26% | 4.7 51% | 7.85 ? 18% | 13.8 ? -43% |
| Idle Maximum * (Watt) | 10.24 | 8.2 20% | 11.4 -11% | 9.7 5% | 8.6 16% | 9.31 ? 9% | 17.5 ? -71% |
| Load Average * (Watt) | 31.56 | 29.4 7% | 45.2 -43% | 37.8 -20% | 64.8 -105% | 44.2 ? -40% | 95 ? -201% |
| Witcher 3 ultra * (Watt) | 43.7 | 42.2 3% | 59.6 -36% | ||||
| Load Maximum * (Watt) | 52.37 | 50.1 4% | 50 5% | 64.7 -24% | 68.5 -31% | 58.9 ? -12% | 175.2 ? -235% |
* ... smaller is better
Power Consumption The Witcher 3 / Stress Test
Battery Life
The battery life was still a bad weakness in the Lenovo ThinkPad P14s AMD predecessor, which we had attributed mainly to the PrivacyGuard display. Fortunately, Lenovo gets significantly more battery life from the 50-Wh battery of the Lenovo ThinkPad P14s G2 AMD. Even with the 4K UHD LCD, it still achieved more than 8 hours in the Wi-Fi test at 150 cd/m² display brightness. The configuration with the Full-HD power-saving display lasted for around 10 hours. For the 4K LCD, you only have to keep in mind that the battery life turns out significantly worse if you set the display brightness to the maximum level. Under these conditions, the battery only lasted for barely 6 in the Wi-Fi test.
| Lenovo ThinkPad P14s G2 AMD R7 PRO 5850U, Vega 8, 50 Wh | Lenovo ThinkPad P14s G2 AMD FHD R7 PRO 5850U, Vega 8, Wh | Lenovo ThinkPad P14s Gen1-20Y10002GE R7 PRO 4750U, Vega 7, 50 Wh | Lenovo ThinkPad P14s Gen2-20VX000GGE i7-1185G7, T500 Laptop GPU, 50 Wh | HP ZBook Firefly 14 G8 2C9Q2EA i7-1165G7, T500 Laptop GPU, 53 Wh | Average of class Workstation | |
|---|---|---|---|---|---|---|
| Battery runtime | 22% | -25% | 11% | 131% | -2% | |
| H.264 (h) | 10.6 | 8.2 -23% | 9.51 ? -10% | |||
| WiFi v1.3 (h) | 8.3 | 10.1 22% | 5.8 -30% | 9.2 11% | 12.8 54% | 8.53 ? 3% |
| Load (h) | 1.4 | 1.1 -21% | 4.3 207% | 1.429 ? 2% |
Pros
Cons
Verdict: The ThinkPad P14s G2 AMD remedies weaknesses of the G1
We already evaluated the first generation of the Lenovo ThinkPad P14s AMD as worthy of a recommendation, despite its not very attractive PrivacyGuard display and the low battery life of the tested configuration. So it is not surprising that the newer Lenovo ThinkPad P14s Gen 2 with the AMD Ryzen 5000 will also get a recommendation, since the battery life is significantly better, and the new ThinkPad laptop can be configurated with an excellent, matte 4K UHD display. This option was not available for the predecessor yet.
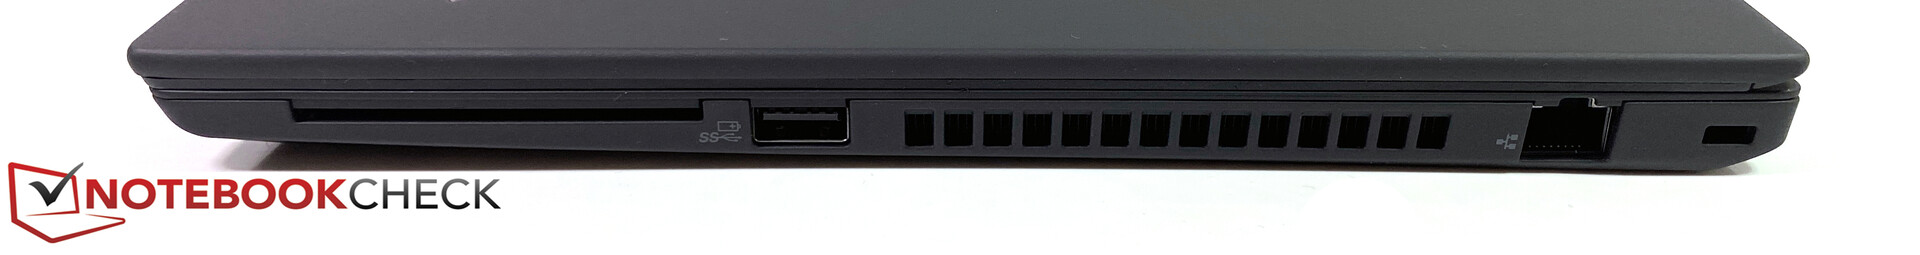
With this, the worst weaknesses have been remedied, which makes the Lenovo ThinkPad P14s G2 AMD a very good entry-level workstation. It is a very good choice particularly for applications that focus on the CPU performance. On the other hand, the GPU performance represents a weakness in the comparison with other workstations, just like the lack of Thunderbolt. In addition, the P14s does not offer a full-size SD card reader, the Realtek Wi-Fi card is limiting, and it would be much better equipped for the target group, if it came in the 16:10 format.
A high-resolution display together with an AMD Ryzen in a Lenovo ThinkPad - the Lenovo ThinkPad P14s G2 AMD is indeed the first Ryzen ThinkPad that offers a very good 4K UHD display.
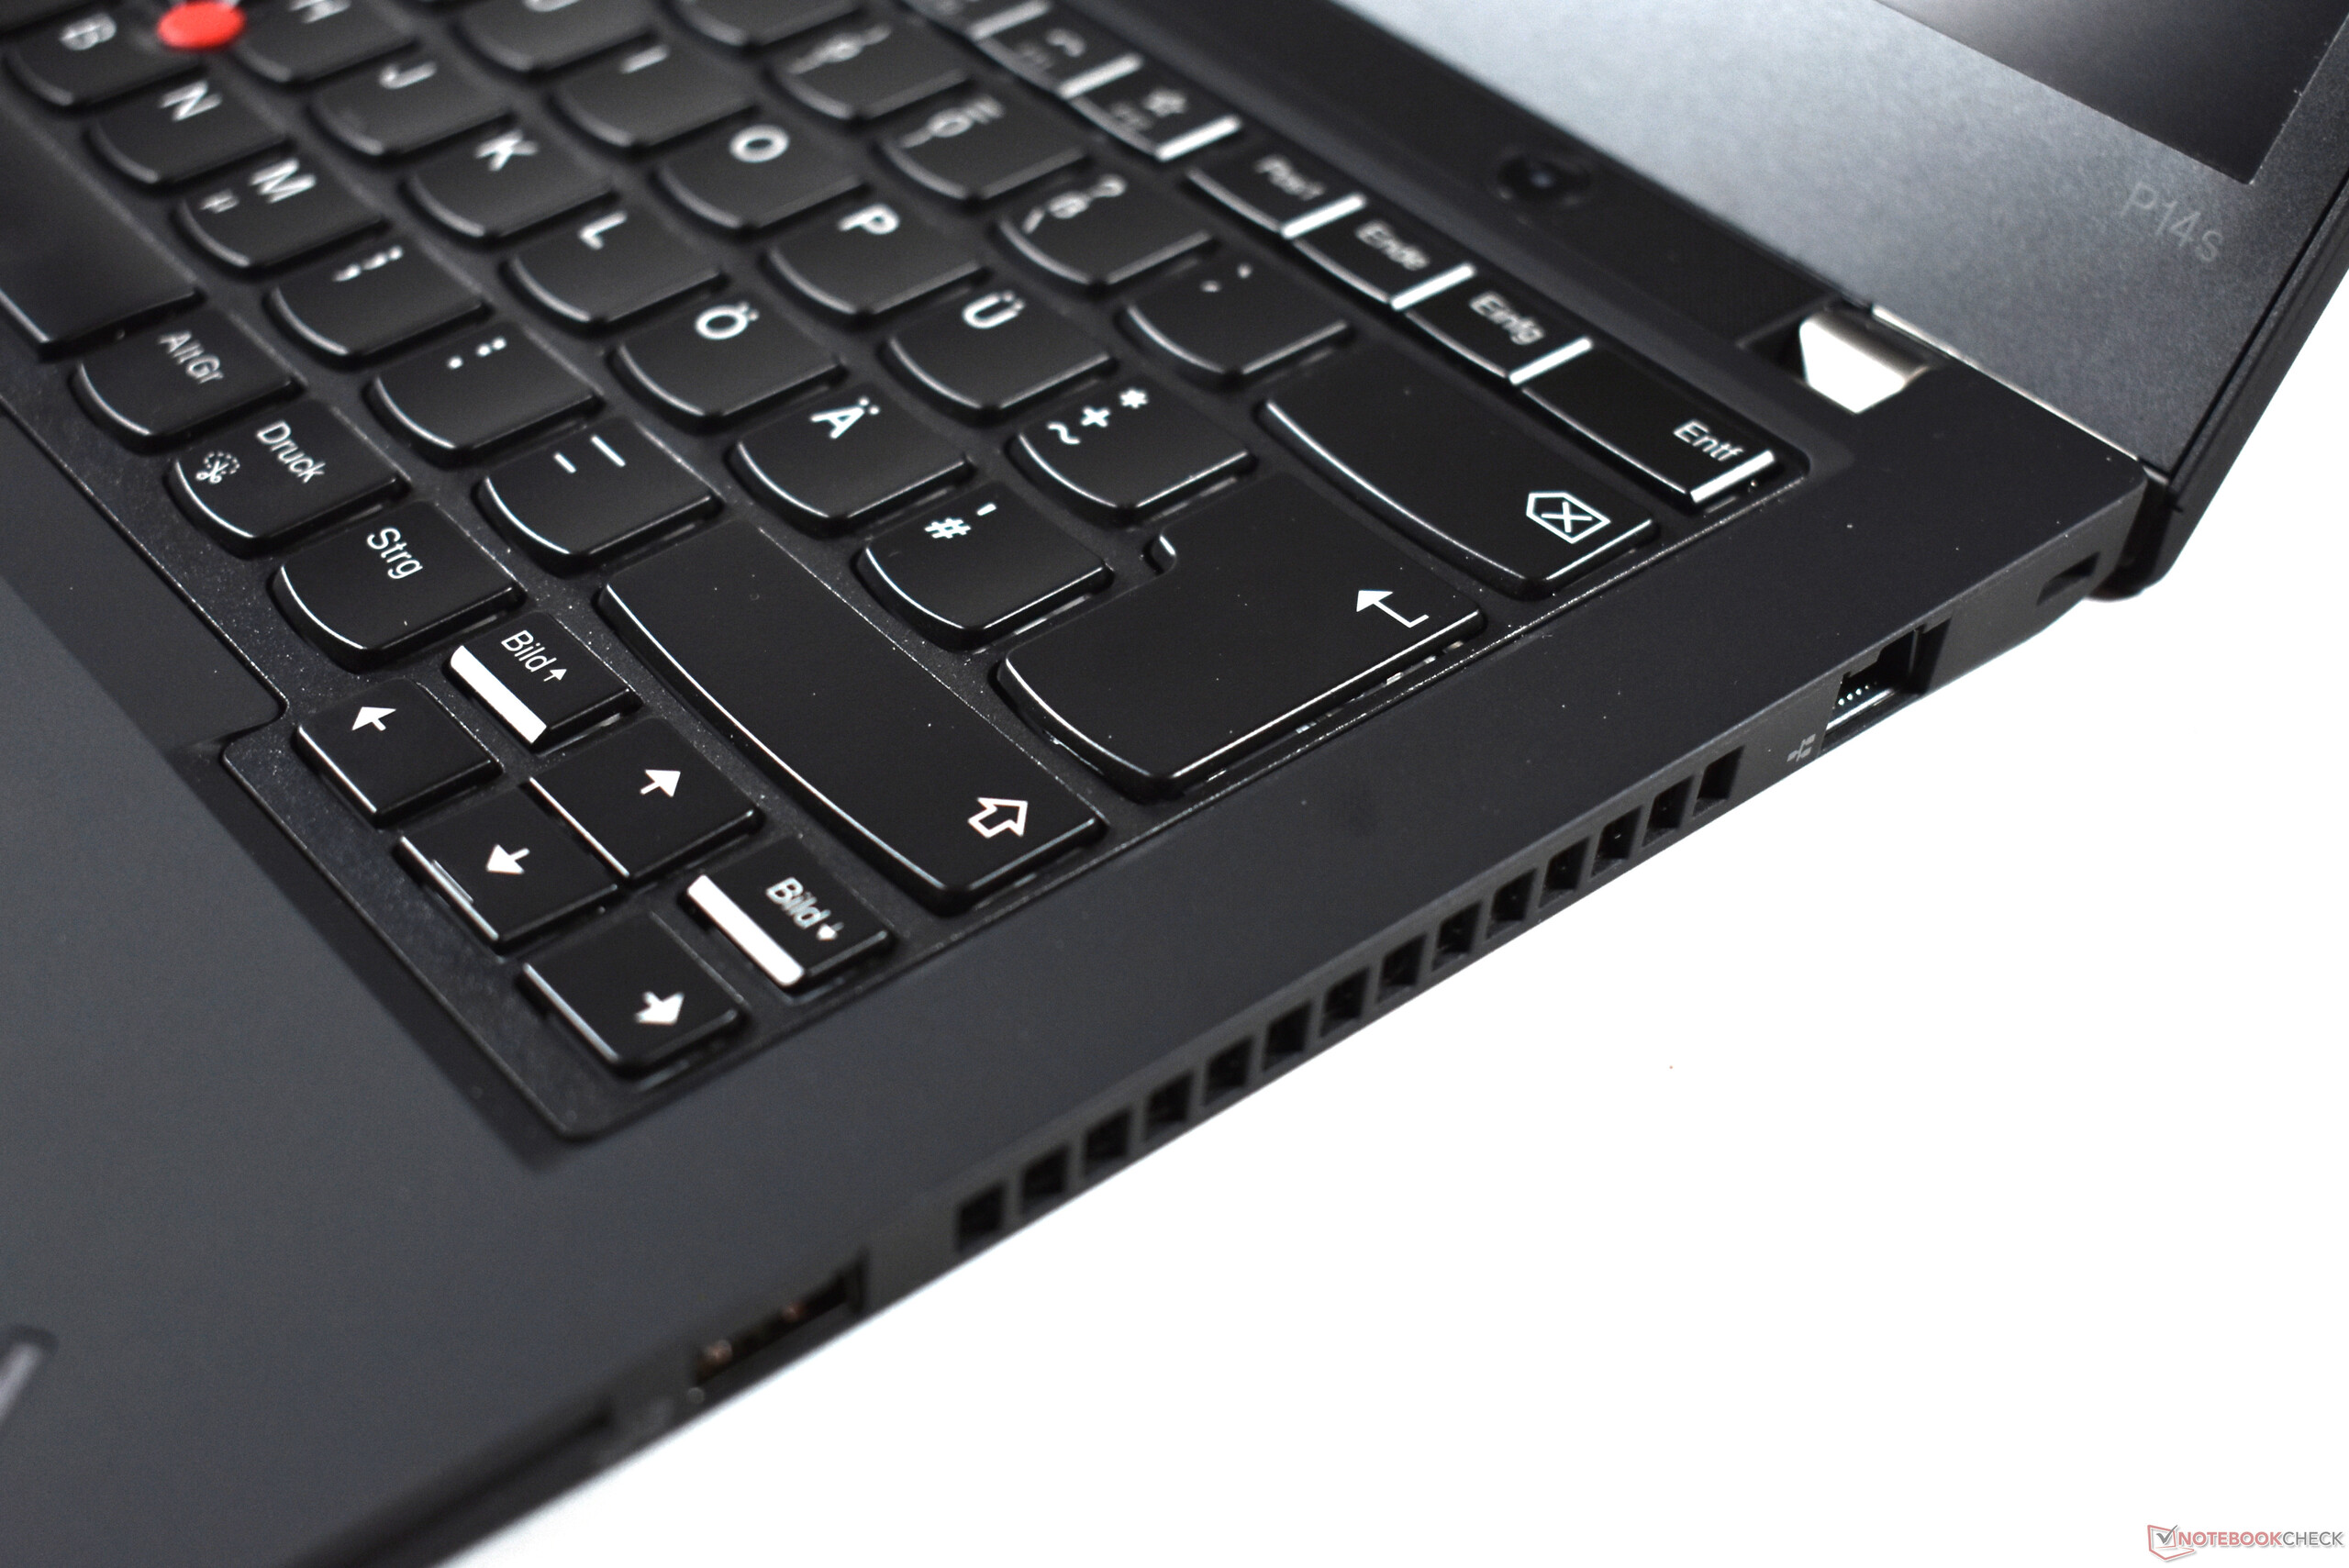
While this represents a disadvantage compared to some of the newer ThinkPad designs such as the Lenovo ThinkPad X1 Carbon G9, the "old" keyboard with 1.8 mm key travel is one of the important strengths of this ThinkPad laptop. Compared to HP's ZBook Firefly 14 G8, the ThinkPad P14s G2 AMD offers the better CPU performance and the expandability of the working memory as important advantages, but the ZBook offers slightly more graphics performance, instead.
Price and Availability
Lenovo currently offers various configurations of the Lenovo ThinkPad P14s G2 AMD starting at $1136 in the US. However, all the currently available configurations appear to use various Full-HD display versions, even though the page specifies a display "up to 14 inch 4K UHD." On the other hand, Amazon offers Intel configurations with the 4K UHD display starting at $2315.
Lenovo ThinkPad P14s G2 AMD
- 09/17/2021 v7 (old)
Benjamin Herzig
Price comparison

